6-1
SESSİONS 5 & 6

6-2
Key Concepts and Skills
• Know the important bond features and bond types
• Understand: – Bond values and why they fluctuate– Bond ratings and what they mean– The impact of inflation on interest rates– The term structure of interest rates and
the determinants of bond yields

6-3
Bond Definitions
• Bond– Debt contract– Interest-only loan
• Par value (face value) ~ $1,000• Coupon rate• Coupon payment• Maturity date• Yield to maturity

6-4
Key Features of a Bond
• Par value: –Face amount–Re-paid at maturity –Assume $1,000 for corporate bonds
• Coupon interest rate: –Stated interest rate –Usually = YTM at issue–Multiply by par value to get coupon
payment
6-5
Key Features of a Bond• Maturity:
– Years until bond must be repaid
• Yield to maturity (YTM): – The market required rate of return for bonds of
similar risk and maturity– The discount rate used to value a bond– Return if bond held to maturity– Usually = coupon rate at issue– Quoted as an APR

6-6
Bond Value
• Bond Value = PV(coupons) + PV(par)• Bond Value = PV(annuity) + PV(lump sum)• Remember:
– As interest rates increase present values decrease ( r → PV )
– As interest rates increase, bond prices decrease and vice versa

6-7
Spreadsheet Formulas
=FV(Rate,Nper,Pmt,PV,0/1) =PV(Rate,Nper,Pmt,FV,0/1)=RATE(Nper,Pmt,PV,FV,0/1)=NPER(Rate,Pmt,PV,FV,0/1)=PMT(Rate,Nper,PV,FV,0/1)
• Inside parens: (RATE,NPER,PMT,PV,FV,0/1)• “0/1” Ordinary annuity = 0 (default)
Annuity Due = 1 (must be entered)

6-8
Graphical Relationship Between Price and Yield-to-maturity
600
700
800
900
1000
1100
1200
1300
1400
1500
0% 2% 4% 6% 8% 10% 12% 14%
Bon
d P
rice
Yield-to-maturity
6-9
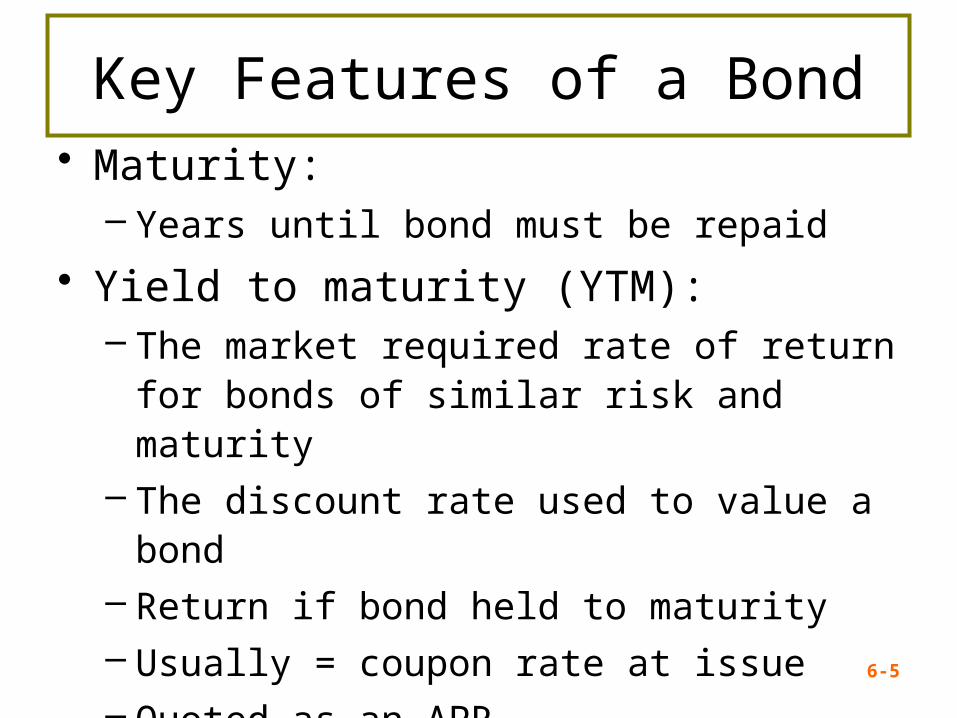
Bond Prices: Relationship Between Coupon and Yield
• Coupon rate = YTM Price = Par• Coupon rate < YTM Price < Par
–“Discount bond” … Why?• Coupon rate > YTM Price > Par
–“Premium bond” … Why?
6-10
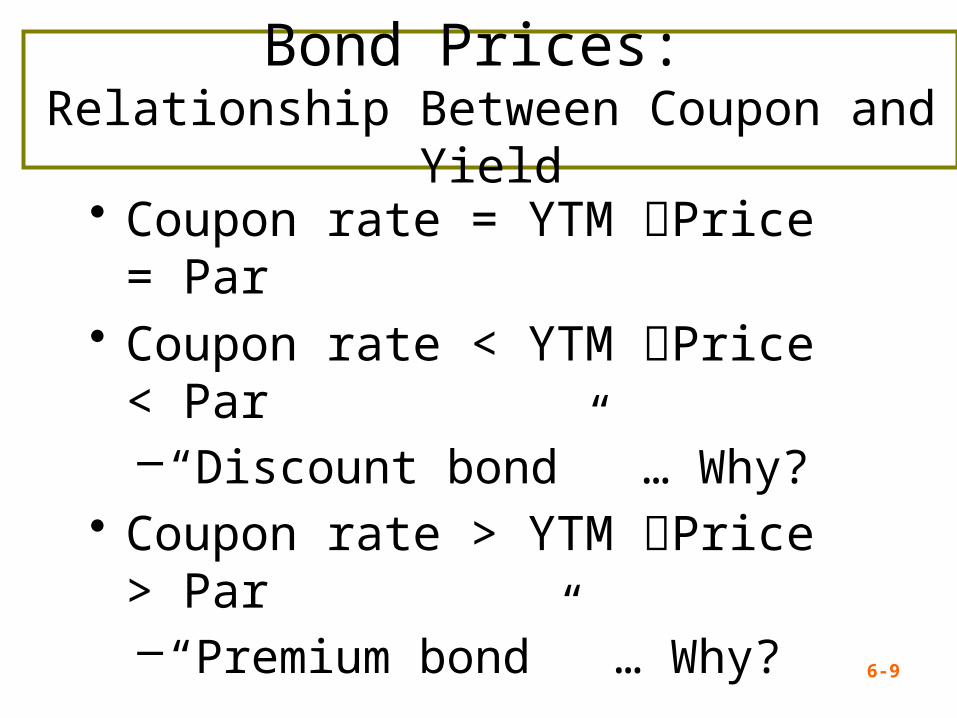
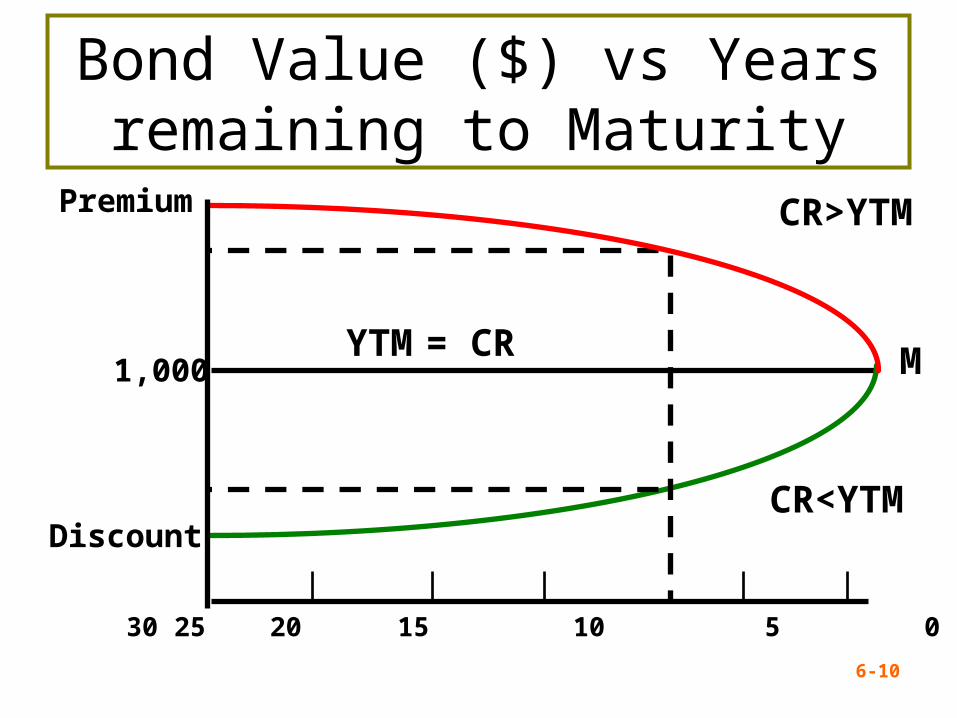
M
Premium
1,000
Discount
30 25 20 15 10 5 0
CR>YTM
CR<YTM
YTM = CR
Bond Value ($) vs Years remaining to Maturity

6-11
Interest Rate Risk
• Price Risk–Change in price due to changes in
interest rates–Long-term bonds have more price risk
than short-term bonds–Low coupon rate bonds have more price
risk than high coupon rate bonds
6-12
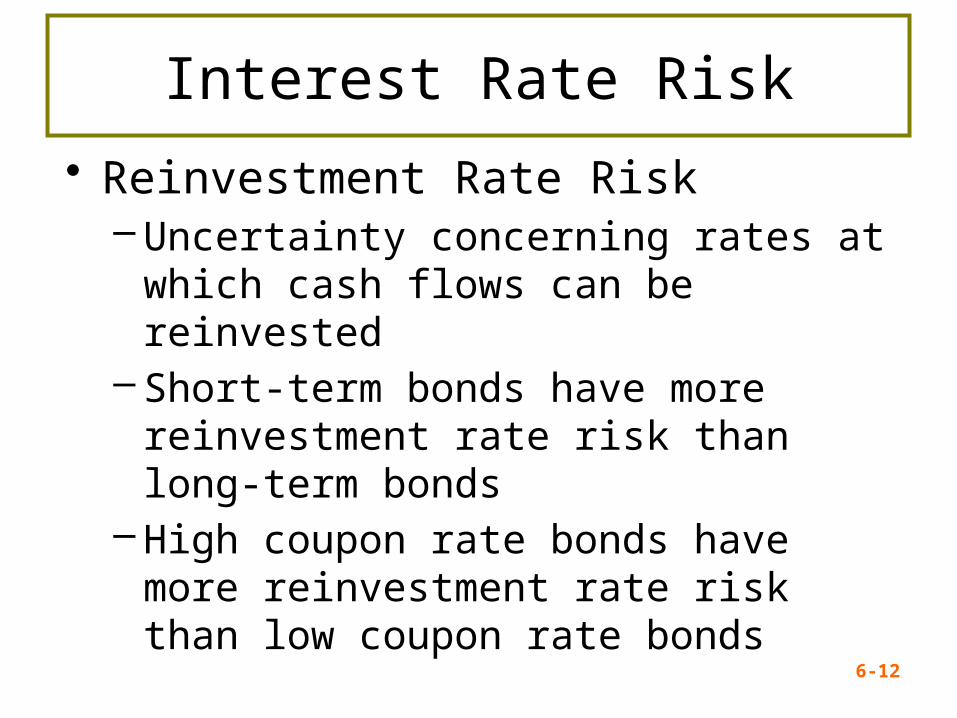
Interest Rate Risk
• Reinvestment Rate Risk– Uncertainty concerning rates at which
cash flows can be reinvested– Short-term bonds have more reinvestment
rate risk than long-term bonds– High coupon rate bonds have more
reinvestment rate risk than low coupon rate bonds
6-13
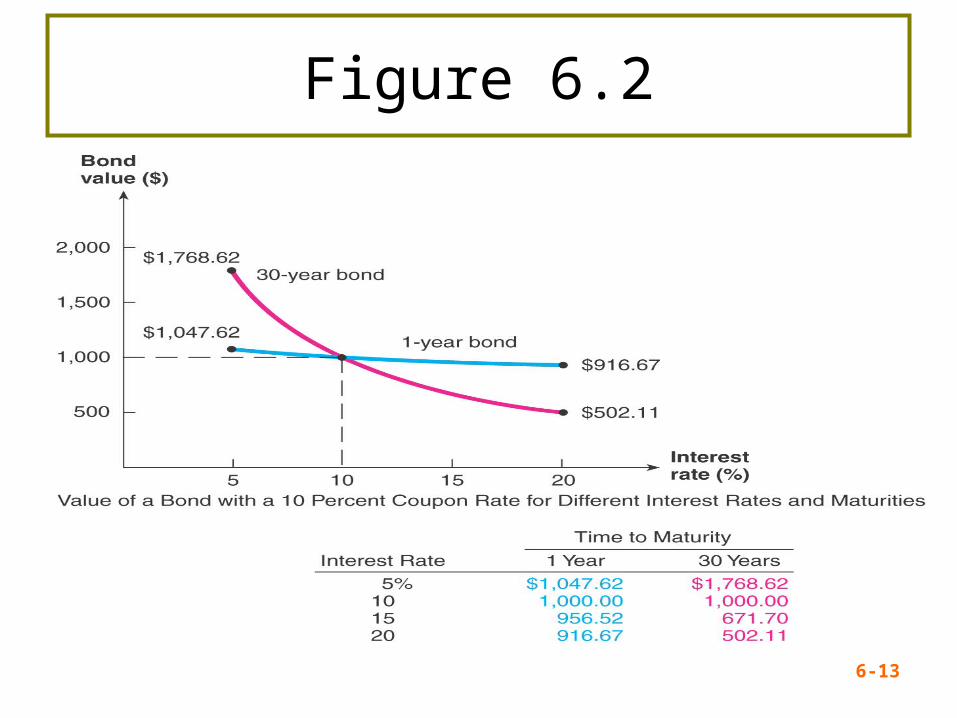
Figure 6.2

6-14
Computing Yield-to-Maturity YTM
• Yield-to-maturity (YTM) = the market required rate of return implied by the current bond price
• With a financial calculator, – Enter ,, ., /, and 0 – Remember the sign convention
• / and 0 need to have the same sign (+)• . the opposite sign (-)• %-
6-15
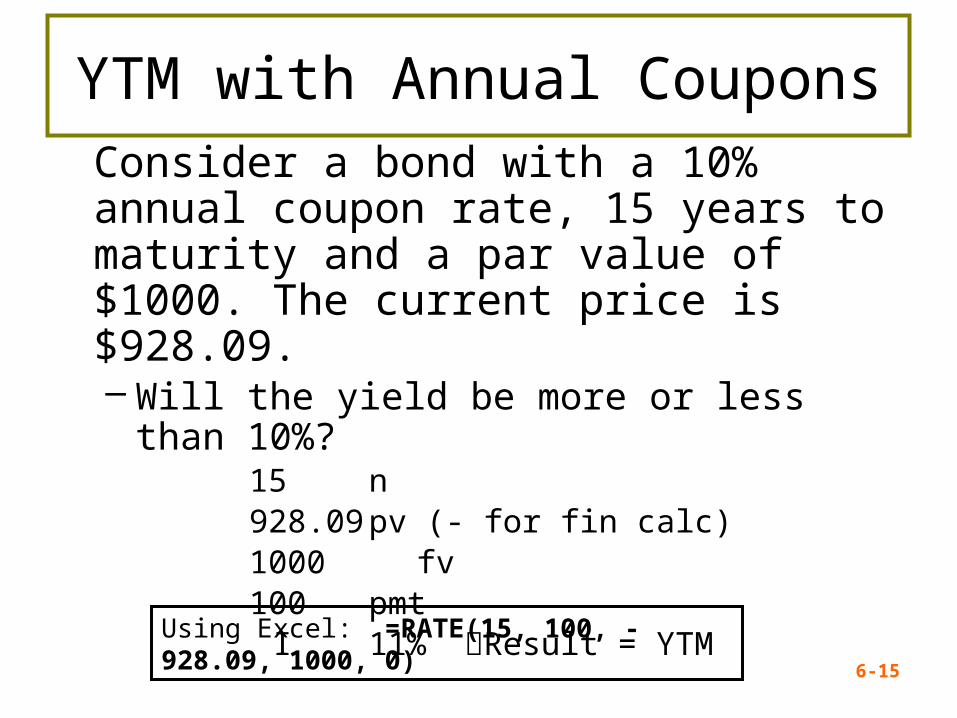
YTM with Annual CouponsConsider a bond with a 10% annual coupon rate, 15 years to maturity and a par value of $1000. The current price is $928.09.– Will the yield be more or less than 10%?
15 n928.09 pv (- for fin calc)1000 fv100 pmt
I 11% Result = YTM
Using Excel: =RATE(15, 100, -928.09, 1000, 0)

6-16
Table 6.1

6-17
Debt versus Equity• Debt
– Not an ownership interest– No voting rights– Interest is tax-deductible– Creditors have legal
recourse if interest or principal payments are missed
– Excess debt can lead to financial distress and bankruptcy
• Equity– Ownership interest– Common stockholders
vote to elect the board of directors and on other issues
– Dividends are not tax deductible
– Dividends are not a liability of the firm until declared. Stockholders have no legal recourse if dividends are not declared
– An all-equity firm cannot go bankrupt

6-18
The Bond Indenture“Deed of Trust”
Contract between issuing company and bondholders includes:
– Basic terms of the bonds– Total amount of bonds issued– Secured versus Unsecured– Sinking fund provisions– Call provisions
• Deferred call• Call premium
– Details of protective covenantsReturn to Quiz
6-19
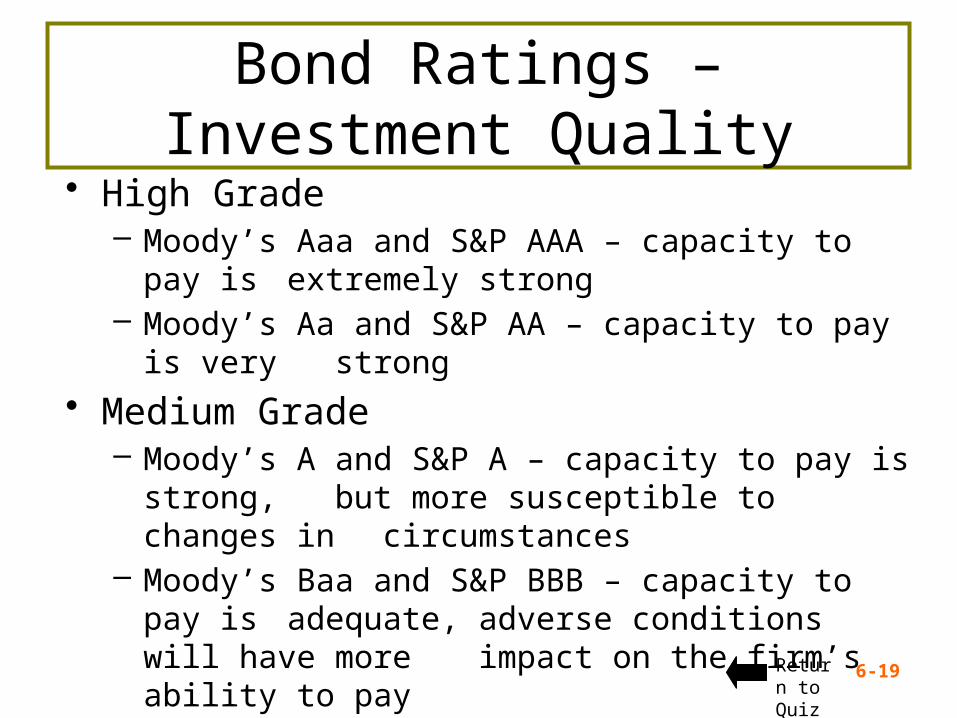
Bond Ratings – Investment Quality
• High Grade– Moody’s Aaa and S&P AAA – capacity to pay is
extremely strong– Moody’s Aa and S&P AA – capacity to pay is very
strong
• Medium Grade– Moody’s A and S&P A – capacity to pay is strong,
but more susceptible to changes in circumstances
– Moody’s Baa and S&P BBB – capacity to pay is adequate, adverse conditions will have more impact on the firm’s ability to pay Return
to Quiz

6-20
Bond Ratings - Speculative• Low Grade
– Moody’s Ba, B, Caa and Ca– S&P BB, B, CCC, CC– Considered speculative with respect to capacity
to pay. The “B” ratings are the lowest degree of speculation.
• Very Low Grade– Moody’s C and S&P C – income bonds with no
interest being paid– Moody’s D and S&P D – in default with
principal and interest in arrears
6-21
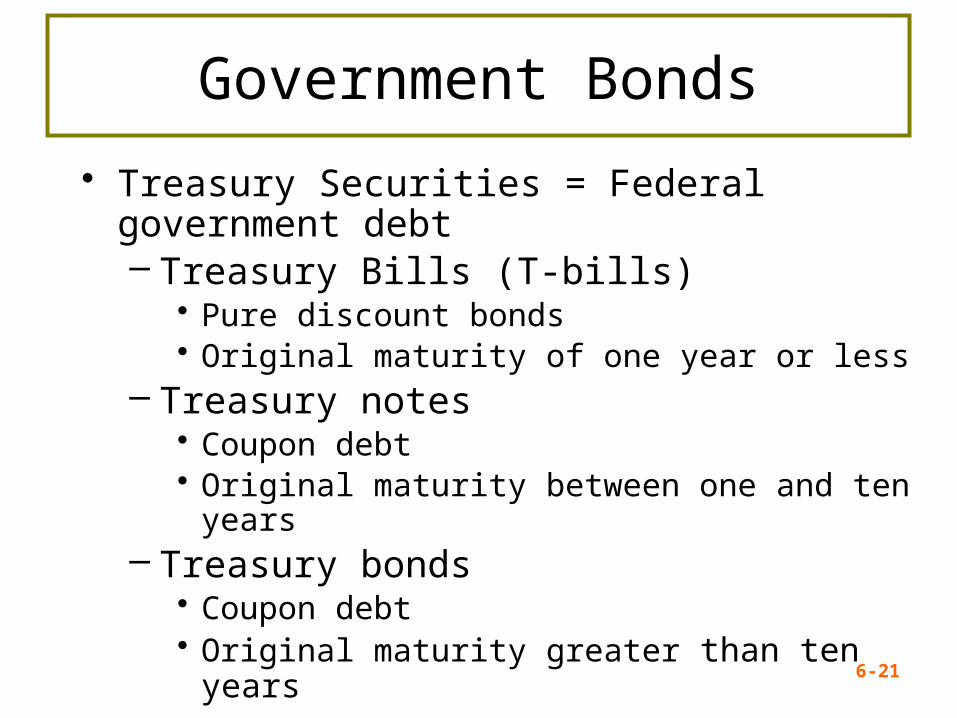
Government Bonds
• Treasury Securities = Federal government debt– Treasury Bills (T-bills)
• Pure discount bonds • Original maturity of one year or less
– Treasury notes • Coupon debt • Original maturity between one and ten years
– Treasury bonds • Coupon debt • Original maturity greater than ten years

6-22
Zero Coupon Bonds• Make no periodic interest payments
(coupon rate = 0%)• Entire yield-to-maturity comes from the
difference between the purchase price and the par value (capital gains)
• Cannot sell for more than par value• Sometimes called zeroes, or deep
discount bonds• Treasury Bills and U.S. Savings bonds are
good examples of zeroes

6-23
Floating Rate Bonds• Coupon rate floats depending on some index
value• Examples – adjustable rate mortgages and
inflation-linked Treasuries• Less price risk with floating rate bonds
– Coupon floats, so is less likely to differ substantially from the yield-to-maturity
• Coupons may have a “collar” – the rate cannot go above a specified “ceiling” or below a specified “floor”
6-24
Bond Markets
• Primarily over-the-counter transactions with dealers connected electronically
• Extremely large number of bond issues, but generally low daily volume in single issues
• Getting up-to-date prices difficult, particularly on small company or municipal issues
• Treasury securities are an exception
6-25
Inflation and Interest Rates
• Real rate of interest =Change in purchasing power
• Nominal rate of interest = Quoted rate of interest,
= Change in purchasing power and inflation• The ex ante nominal rate of interest
includes our desired real rate of return plus an adjustment for expected inflation

6-26
The Fisher Effect
The Fisher Effect defines the relationship
between real rates, nominal rates and
inflation
(1 + R) = (1 + r)(1 + h)R = nominal rate (Quoted rate)
r = real rate
h = expected inflation rate
Approximation: R = r + h
Return to Quiz

6-27
Example 6.6
If we require a 10% real return and we expect inflation to be 8%, what is the nominal rate?– R = (1.1)(1.08) – 1 = .188 = 18.8%– Approximation: R = 10% + 8% = 18%– Because the real return and expected
inflation are relatively high, there is significant difference between the actual Fisher Effect and the approximation.

6-28
Term Structure of Interest Rates
• Term structure: The relationship between time to maturity and yields, all else equal– The effect of default risk, different coupons,
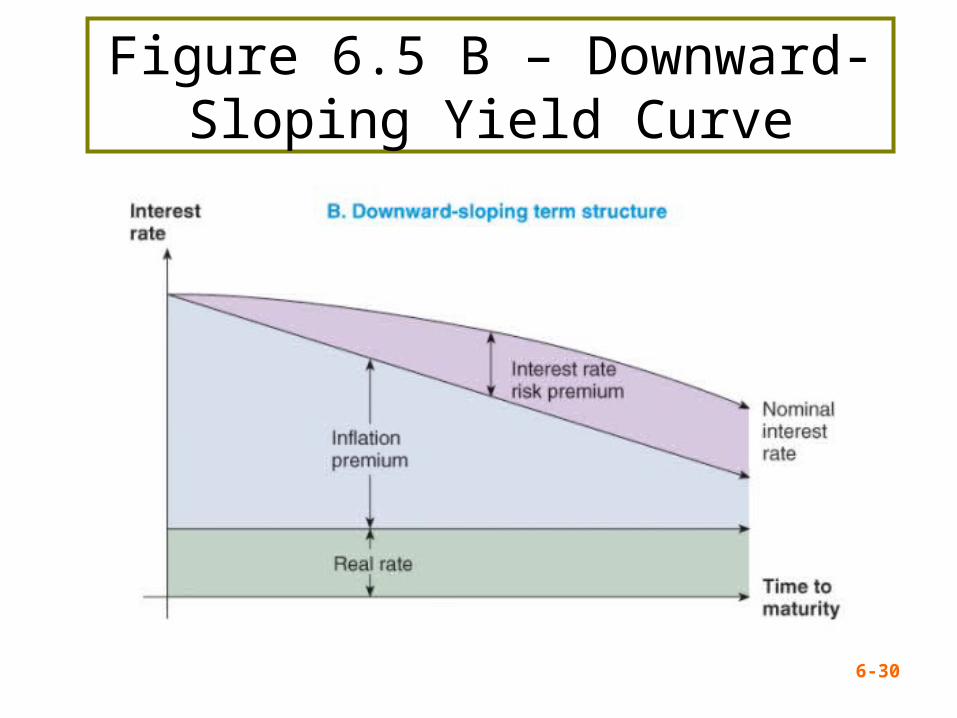
etc. has been removed.• Yield curve: Graphical representation of
the term structure– Normal = upward-sloping L/T > S/T– Inverted = downward-sloping L/T < S/T
Return to Quiz

6-29
Figure 6.5 A – Upward-Sloping Yield Curve
REPLACE with FIGURE 6.5 A
6-30
Figure 6.5 B – Downward-Sloping Yield Curve
6-32
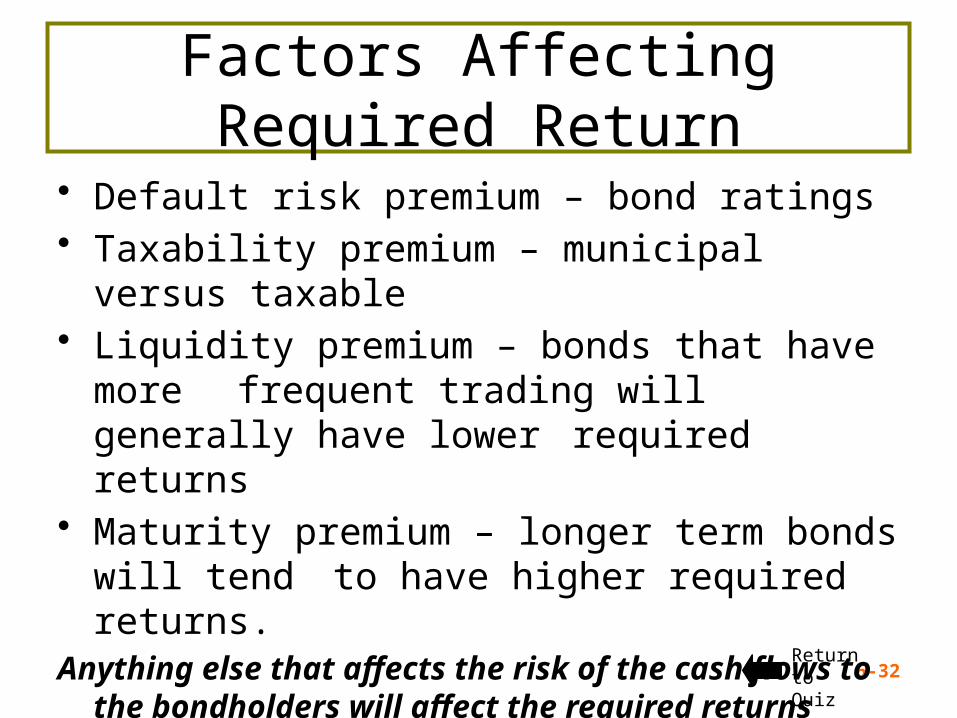
Factors Affecting Required Return
• Default risk premium – bond ratings• Taxability premium – municipal versus taxable• Liquidity premium – bonds that have more
frequent trading will generally have lower required returns
• Maturity premium – longer term bonds will tend to have higher required returns.
Anything else that affects the risk of the cash flows to the bondholders will affect the required returns
Return to Quiz
7-33
Key Concepts and Skills
• Understand how stock prices depend on future dividends and dividend growth
• Be able to compute stock prices using the dividend growth model
• Understand how corporate directors are elected
• Understand how stock markets work• Understand how stock prices are quoted

7-34
Cash Flows for Stockholders
• If you own a share of stock, you can receive cash in two ways– The company pays dividends– You sell your shares, either to another
investor in the market or back to the company• As with bonds, the price of the stock is the
present value of these expected cash flows– Dividends → cash income– Selling → capital gains
7-35
One Period Example
• Suppose you are thinking of purchasing the stock of Moore Oil, Inc. – You expect it to pay a $2 dividend in one year – You believe you can sell the stock for $14 at
that time. – You require a return of 20% on investments of
this risk – What is the maximum you would be willing to
pay?
7-36
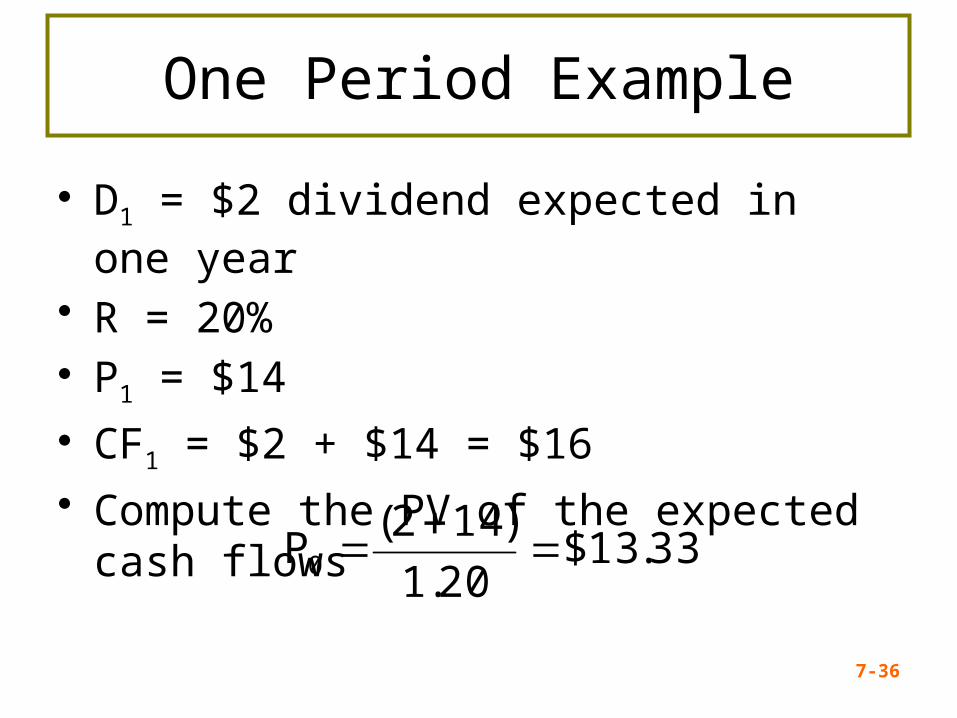
One Period Example
• D1 = $2 dividend expected in one year
• R = 20%• P1 = $14
• CF1 = $2 + $14 = $16
• Compute the PV of the expected cash flows
33.13$20.1
)142(P0
7-37
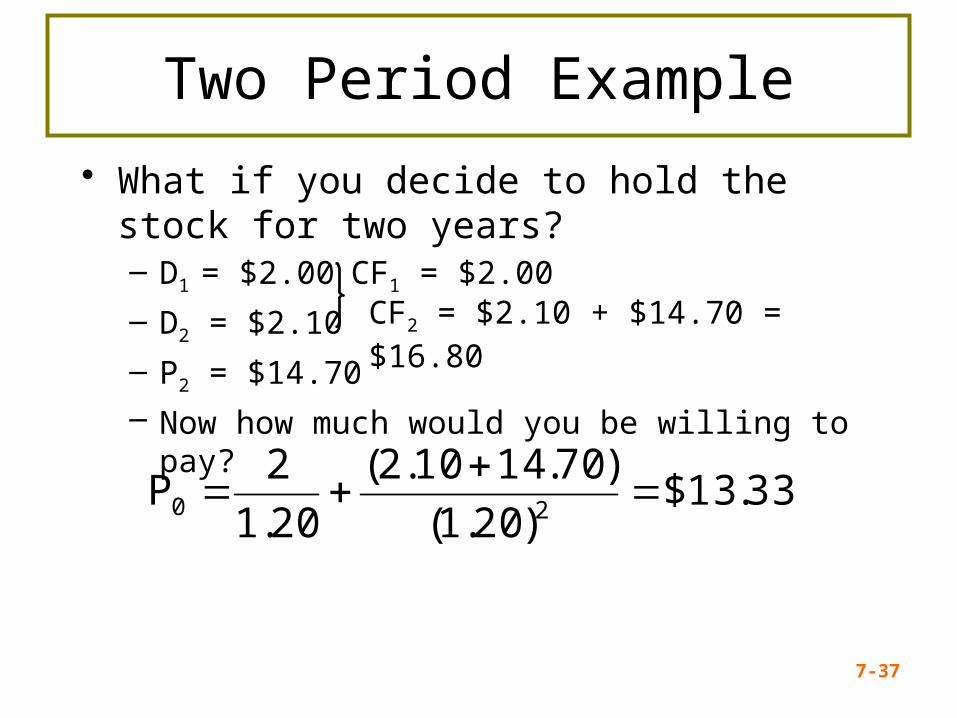
Two Period Example
• What if you decide to hold the stock for two years? – D1 = $2.00 CF1 = $2.00
– D2 = $2.10
– P2 = $14.70
– Now how much would you be willing to pay?
33.13$)20.1(
)70.1410.2(
20.1
2P
20
CF2 = $2.10 + $14.70 = $16.80

7-38
Three Period Example
• What if you decide to hold the stock for three years? – D1 = $2.00 CF1 = $2.00
– D2 = $2.10 CF2 = $2.10
– D3 = $2.205
– P3 = $15.435
– Now how much would you be willing to pay?
33.13$)20.1(
)435.15205.2(
)20.1(
10.2
20.1
2P
320
CF3 = $2.205 + $15.435 = $17.640

7-39
Developing The Model
• You could continue to push back when you would sell the stock
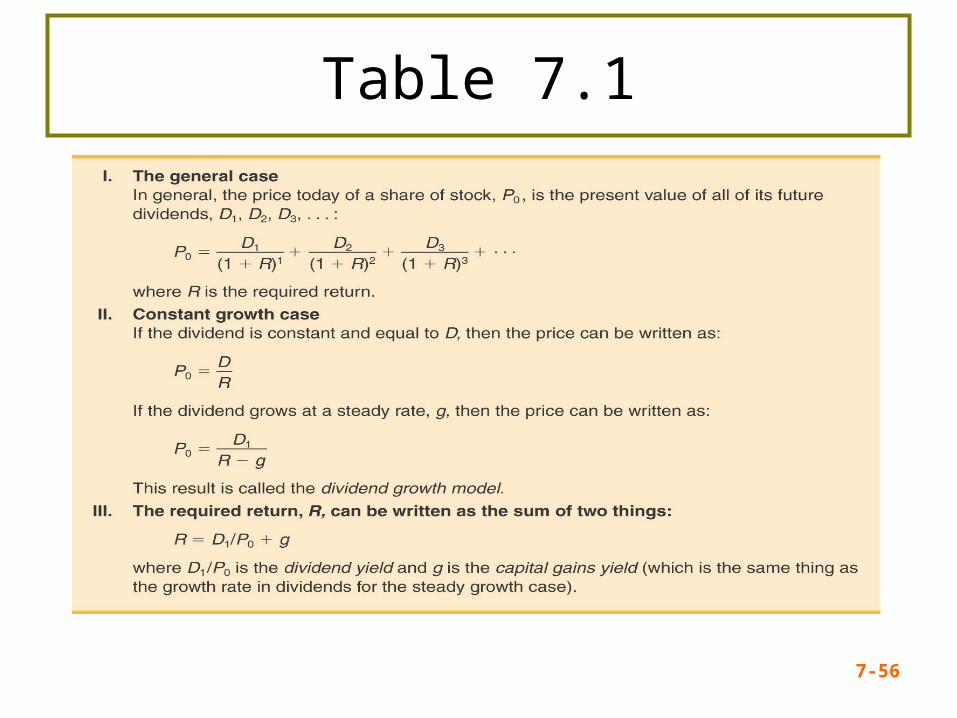
• You would find that the price of the stock is really just the present value of all expected future dividends

7-40
Stock Value = PV of Dividends
P0 =^
(1+R)1 (1+R)2 (1+R)3 (1+R)∞
D1 D2 D3 D∞+ + +…+
1tt
t0 )R1(
DP̂
How can we estimate all future dividend payments?
7-41
Estimating Dividends Special Cases
• Constant dividend/Zero Growth– Firm will pay a constant dividend forever– Like preferred stock– Price is computed using the perpetuity formula
• Constant dividend growth– Firm will increase the dividend by a constant
percent every period
• Supernormal growth– Dividend growth is not consistent initially, but settles
down to constant growth eventually
7-42
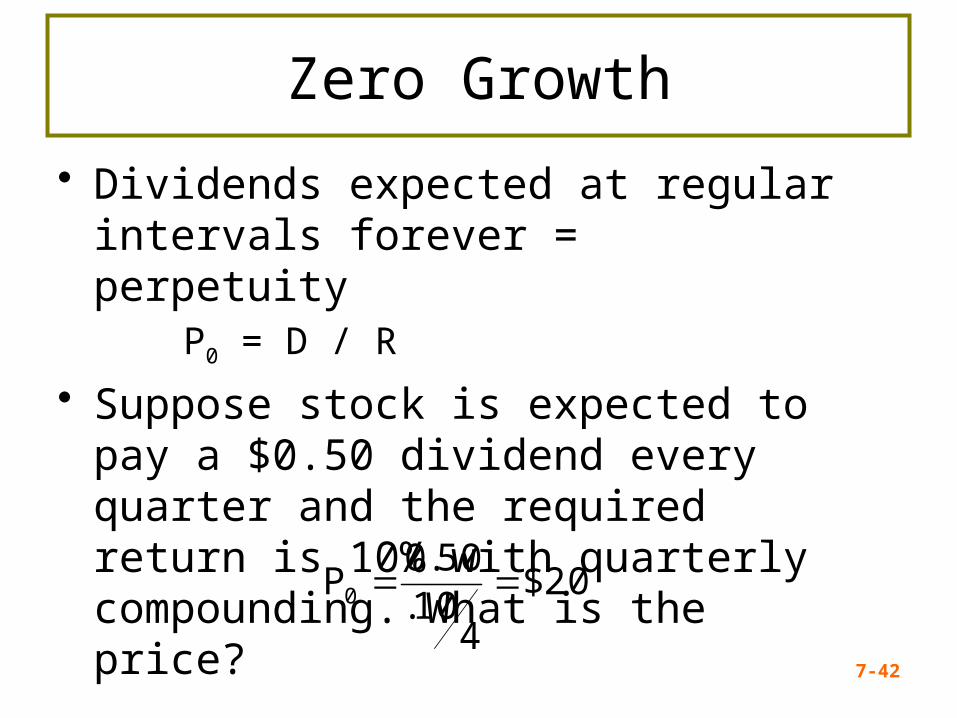
Zero Growth
• Dividends expected at regular intervals forever = perpetuity
P0 = D / R
• Suppose stock is expected to pay a $0.50 dividend every quarter and the required return is 10% with quarterly compounding. What is the price?
20$
410.
50.0P0

7-43
Constant Growth Stock
D1 = D0(1+g)1
D2 = D0(1+g)2
Dt = Dt(1+g)t
One whose dividends are expected togrow forever at a constant rate, g.
D0 = Dividend JUST PAID
D1 – Dt = Expected dividends
7-44
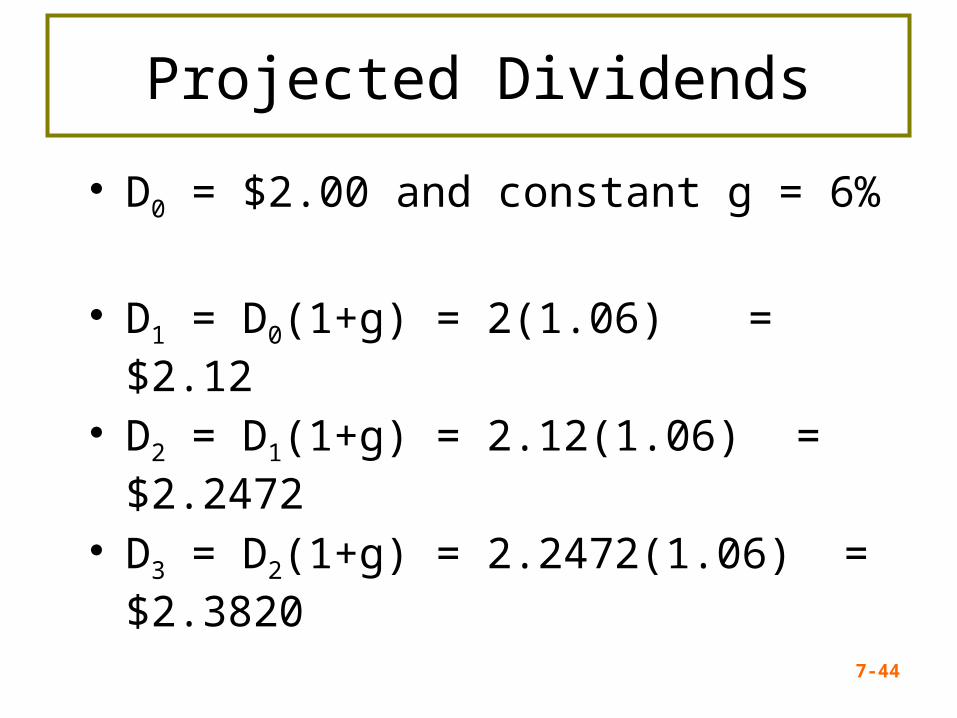
Projected Dividends
• D0 = $2.00 and constant g = 6%
• D1 = D0(1+g) = 2(1.06) = $2.12
• D2 = D1(1+g) = 2.12(1.06) = $2.2472
• D3 = D2(1+g) = 2.2472(1.06) = $2.3820

7-45
P0 = ^ D0(1+g)
R - g=
D1
R - g
1t
t
t
00 )R1(
)g1(DP̂
Dividend Growth Model
“Gordon Growth Model”
7-46
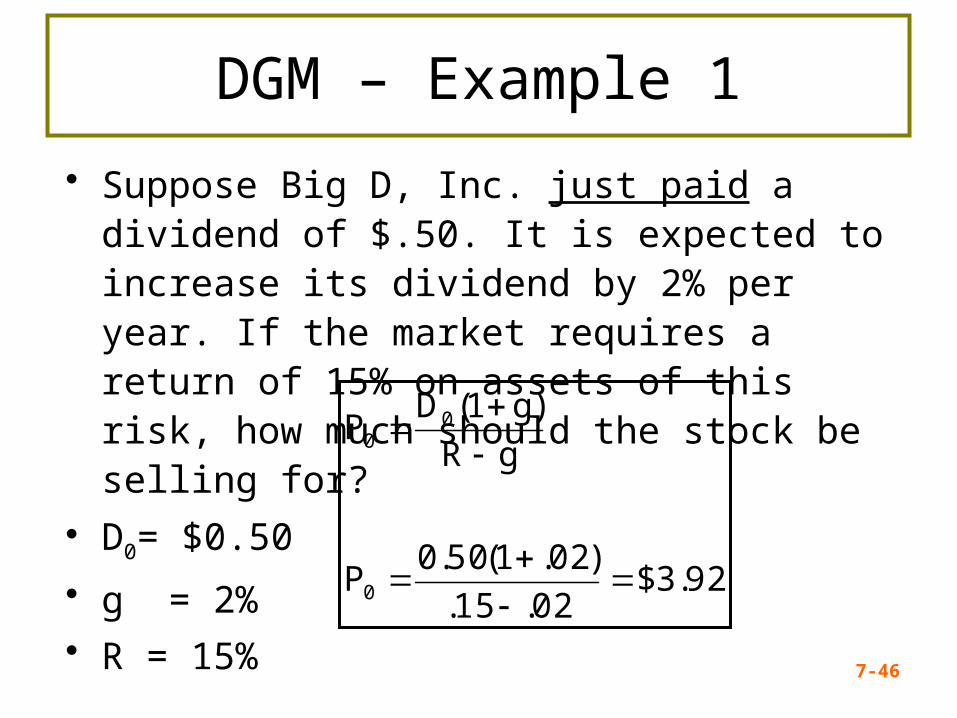
DGM – Example 1
• Suppose Big D, Inc. just paid a dividend of $.50. It is expected to increase its dividend by 2% per year. If the market requires a return of 15% on assets of this risk, how much should the stock be selling for?
• D0= $0.50
• g = 2%• R = 15%
92.3$02.15.
)02.1(50.0P
gR
)g1(DP
0
00

7-47
Constant Growth Model Conditions
1. Dividend expected to grow at g forever2. Stock price expected to grow at g forever3. Expected dividend yield is constant4. Expected capital gains yield is constant
and equal to g5. Expected total return, R, must be > g6. Expected total return (R):
= expected dividend yield (DY) + expected growth rate (g) = dividend yield + g

7-48
Nonconstant Growth
• Suppose a firm is expected to increase dividends by 20% in one year and by 15% in two years. After that dividends will increase at a rate of 5% per year indefinitely. If the last dividend was $1 and the required return is 20%, what is the price of the stock?
• Remember that we have to find the PV of all expected future dividends.
7-49
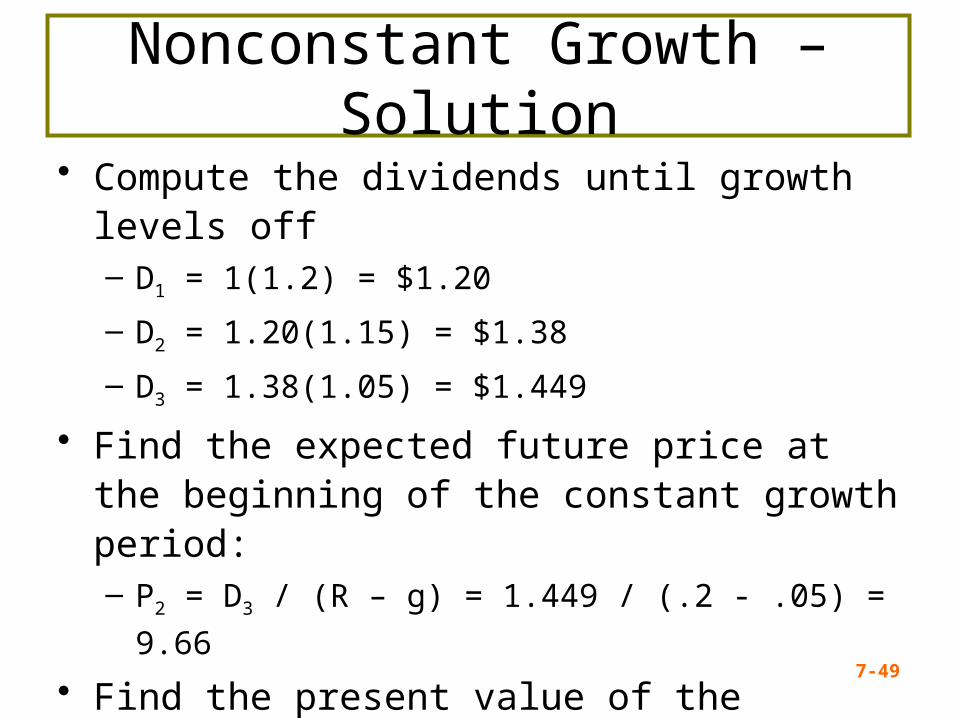
Nonconstant Growth – Solution
• Compute the dividends until growth levels off– D1 = 1(1.2) = $1.20
– D2 = 1.20(1.15) = $1.38
– D3 = 1.38(1.05) = $1.449
• Find the expected future price at the beginning of the constant growth period:– P2 = D3 / (R – g) = 1.449 / (.2 - .05) = 9.66
• Find the present value of the expected future cash flows– P0 = 1.20 / (1.2) + (1.38 + 9.66) / (1.2)2 = 8.67
7-50
R1
D. . .
R1
D
R1
D
R1
DP̂
33
22
11
0
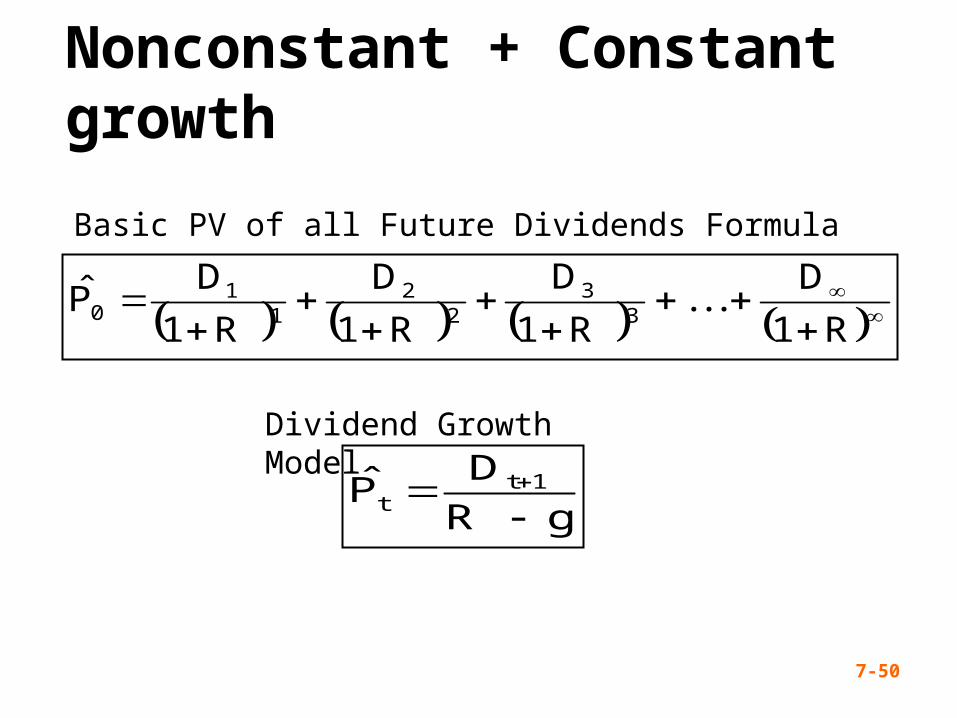
Nonconstant + Constant growth
gR
DP̂ 1t
t
Basic PV of all Future Dividends Formula
Dividend Growth Model
7-51
22
22
11
0 )R1(
P
R1
D
R1
DP̂
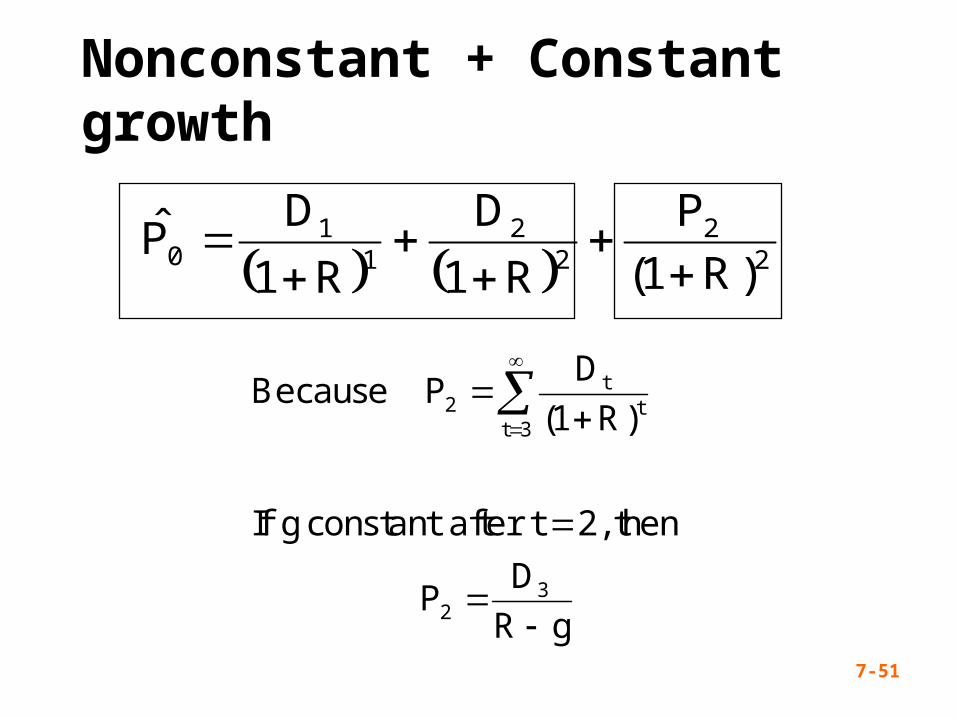
gR
DP
then 2,t after constant g If
)R1(
DP Because
32
3tt
t2
Nonconstant + Constant growth
7-52
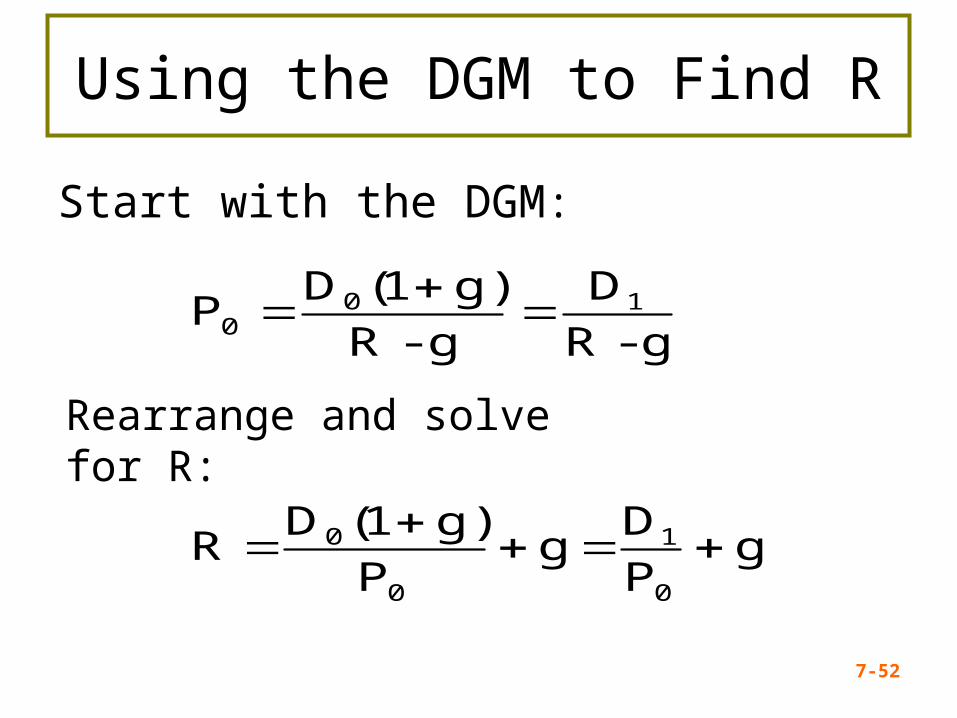
Using the DGM to Find R
Start with the DGM:
gP
D g
P
g)1(D R
g-R
D
g - R
g)1(DP
0
1
0
0
100
Rearrange and solve for R:
7-53
Finding the Required Return Example
• A firm’s stock is selling for $10.50.
They just paid a $1 dividend and
dividends are expected to grow at
5% per year.
• What is the required return?
7-54
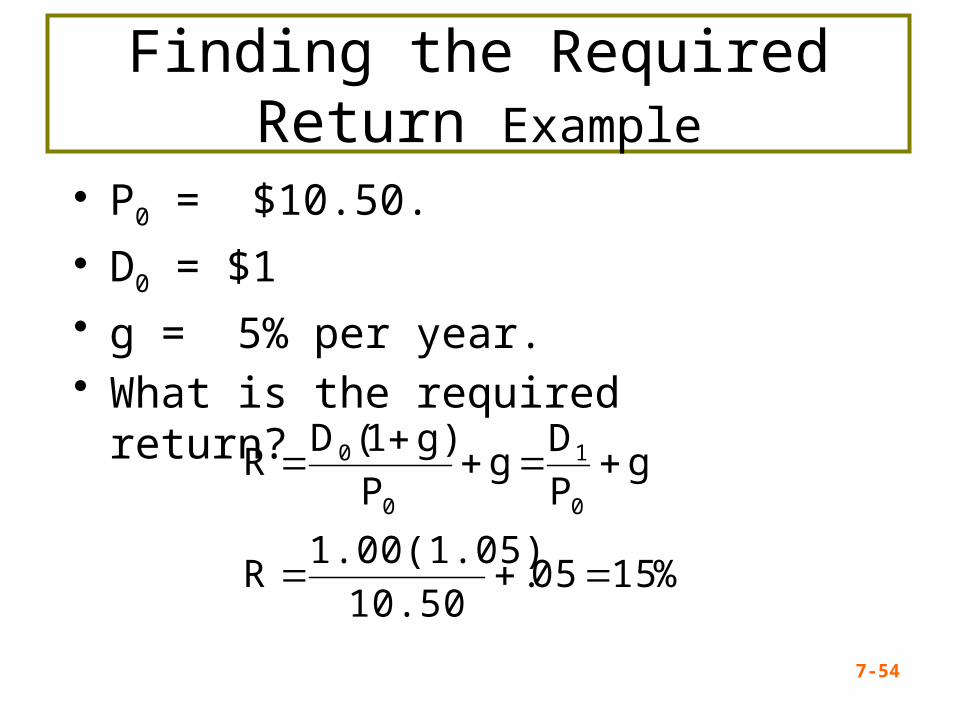
Finding the Required Return Example
• P0 = $10.50.
• D0 = $1
• g = 5% per year. • What is the required return?
%1505.10.50
1.00(1.05) R
gP
D g
P
g)1(D R
0
1
0
0
7-55
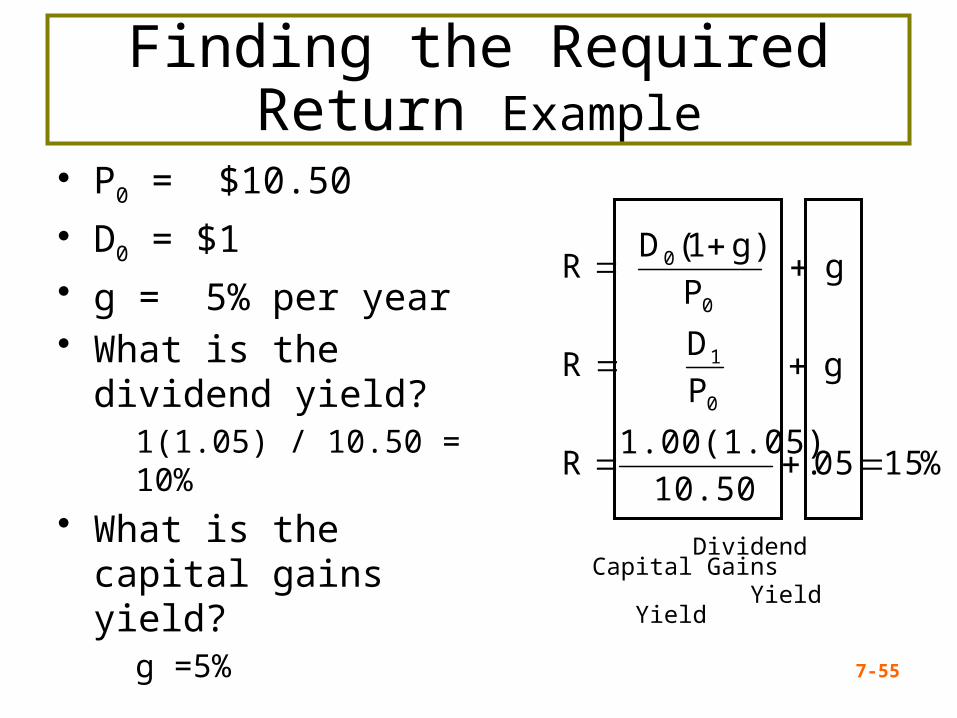
Finding the Required Return Example
• P0 = $10.50
• D0 = $1
• g = 5% per year• What is the dividend
yield?1(1.05) / 10.50 = 10%
• What is the capital gains yield?
g =5% Dividend Capital Gains Yield Yield
%1505. 10.50
1.00(1.05) R
g P
D R
g P
g)1(D R
0
1
0
0
7-56
Table 7.1

7-57
Features of Common Stock
• Voting Rights–Stockholders elect directors–Cumulative voting vs. Straight voting–Proxy voting
• Classes of stock–Founders’ shares–Class A and Class B shares
Return to Quick Quiz

7-58
Features of Common Stock• Other Rights
–Share proportionally in declared dividends
–Share proportionally in remaining assets during liquidation
–Preemptive right • Right of first refusal to buy new stock issue
to maintain proportional ownership if desired
Return to Quick Quiz
7-59
Dividend Characteristics• Dividends are not a liability of the firm until
declared by the Board of Directors– A firm cannot go bankrupt for not declaring
dividends• Dividends and Taxes
– Dividends are not tax deductible for firm– Taxed as ordinary income for individuals – Dividends received by corporations have a
minimum 70% exclusion from taxable income