Go Further
4Q 2015 AND FULL YEAR EARNINGS REVIEW AND 2016 OUTLOOKJANUARY 28, 2016(PRELIMINARY RESULTS)
SLIDE 2
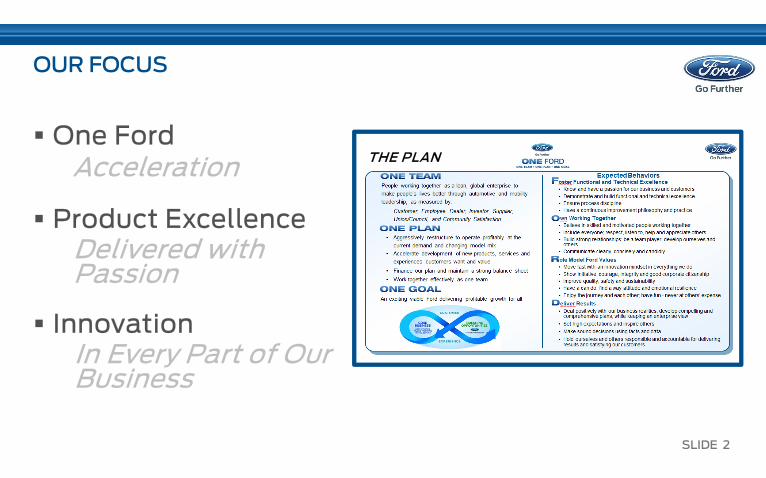
Delivered with Passion
Acceleration
OUR FOCUS
In Every Part of Our Business
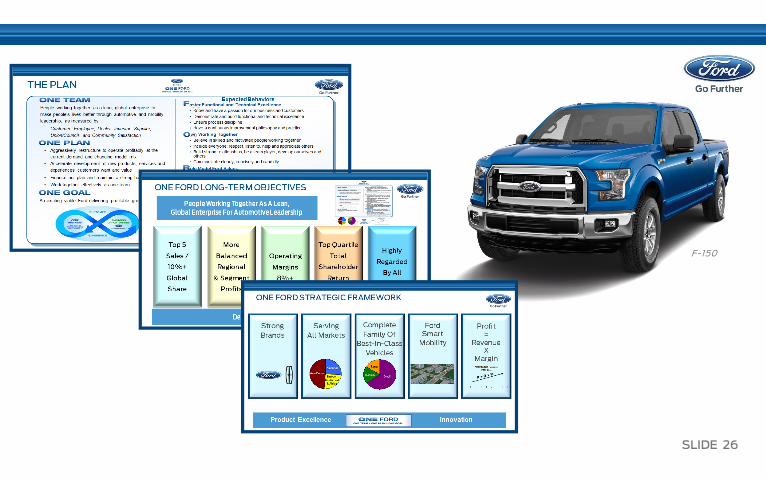
THE PLAN
� One Ford
� Product Excellence
� Innovation
SLIDE 3
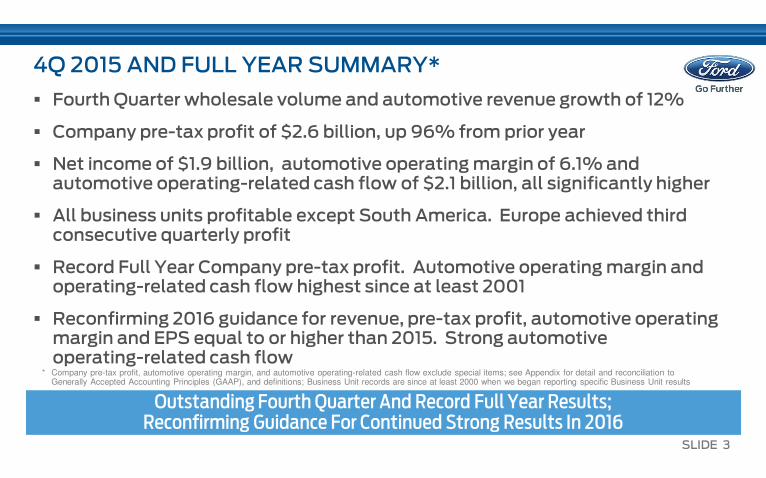
4Q 2015 AND FULL YEAR SUMMARY*
� Fourth Quarter wholesale volume and automotive revenue growth of 12%
� Company pre-tax profit of $2.6 billion, up 96% from prior year
� Net income of $1.9 billion, automotive operating margin of 6.1% and automotive operating-related cash flow of $2.1 billion, all significantly higher
� All business units profitable except South America. Europe achieved third consecutive quarterly profit
� Record Full Year Company pre-tax profit. Automotive operating margin and operating-related cash flow highest since at least 2001
� Reconfirming 2016 guidance for revenue, pre-tax profit, automotive operating margin and EPS equal to or higher than 2015. Strong automotive operating-related cash flow
Outstanding Fourth Quarter And Record Full Year Results;Reconfirming Guidance For Continued Strong Results In 2016
* Company pre-tax profit, automotive operating margin, and automotive operating-related cash flow exclude special items; see Appendix for detail and reconciliation to Generally Accepted Accounting Principles (GAAP), and definitions; Business Unit records are since at least 2000 when we began reporting specific Business Unit results
SLIDE 4
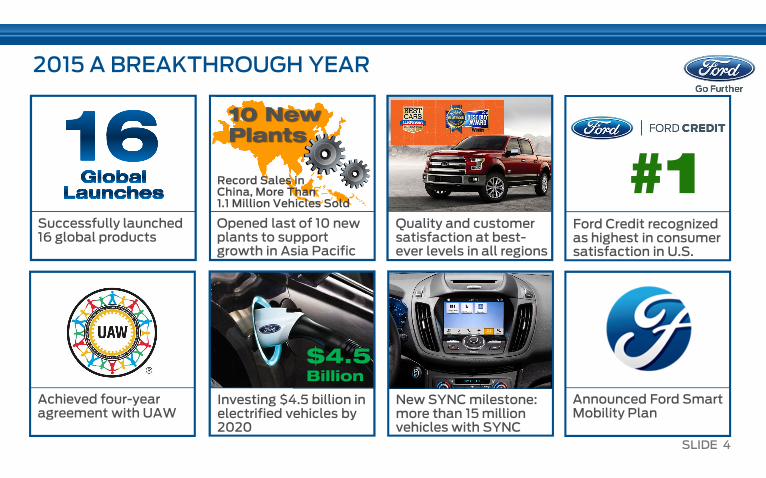
2015 A BREAKTHROUGH YEAR
New SYNC milestone: more than 15 million vehicles with SYNC
Investing $4.5 billion in electrified vehicles by 2020
Announced Ford Smart Mobility Plan
Achieved four-year agreement with UAW
Ford Credit recognized as highest in consumer satisfaction in U.S.
#1Successfully launched 16 global products
Opened last of 10 new plants to support growth in Asia Pacific
10 New Plants
Record Sales in China, More Than 1.1 Million Vehicles Sold
$4.5Billion
Quality and customer satisfaction at best-ever levels in all regions
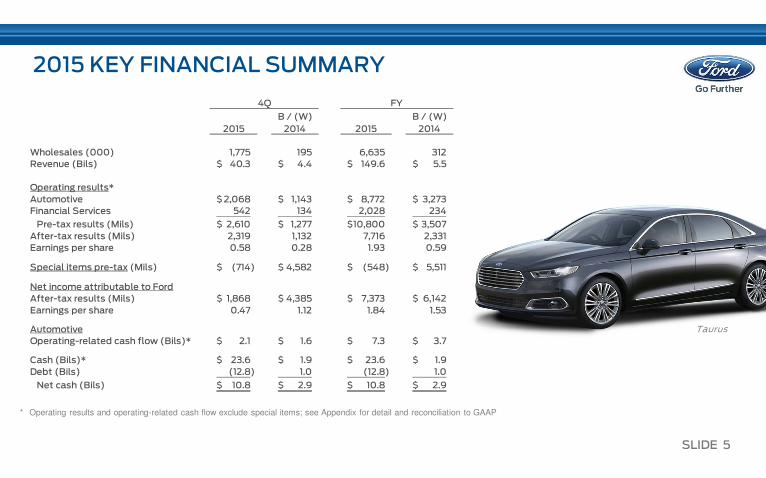
SLIDE 5
B / (W) B / (W)
2015 2014 2015 2014
Wholesales (000) 1,775 195 6,635 312
Revenue (Bils) 40.3$ 4.4$ 149.6$ 5.5$
Operating results*
Automotive 2,068$ 1,143$ 8,772$ 3,273$
Financial Services 542 134 2,028 234
Pre-tax results (Mils) 2,610$ 1,277$ 10,800$ 3,507$
After-tax results (Mils) 2,319 1,132 7,716 2,331
Earnings per share 0.58 0.28 1.93 0.59
Special items pre-tax (Mils) (714)$ 4,582$ (548)$ 5,511$
Net income attributable to Ford
After-tax results (Mils) 1,868$ 4,385$ 7,373$ 6,142$
Earnings per share 0.47 1.12 1.84 1.53
Automotive
Operating-related cash flow (Bils)* 2.1$ 1.6$ 7.3$ 3.7$
Cash (Bils)* 23.6$ 1.9$ 23.6$ 1.9$
Debt (Bils) (12.8) 1.0 (12.8) 1.0
Net cash (Bils) 10.8$ 2.9$ 10.8$ 2.9$
4Q FY
2015 KEY FINANCIAL SUMMARY
* Operating results and operating-related cash flow exclude special items; see Appendix for detail and reconciliation to GAAP
Taurus
SLIDE 6
$(796)
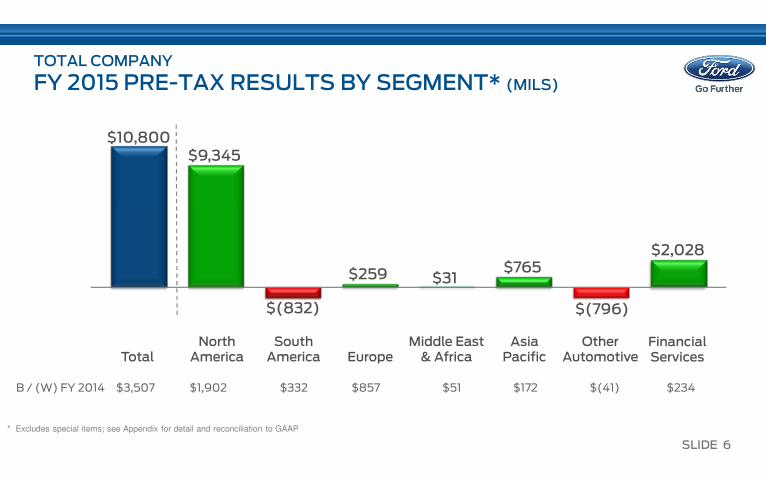
TOTAL COMPANY
FY 2015 PRE-TAX RESULTS BY SEGMENT* (MILS)
* Excludes special items; see Appendix for detail and reconciliation to GAAP
$10,800$9,345
$(832)
$259 $765
B / (W) FY 2014 $3,507 $1,902 $332 $857 $51 $172 $(41) $234
$31
$2,028
SouthAmericaTotal
NorthAmerica
OtherAutomotive
AsiaPacificEurope
Middle East& Africa
Financial Services
SLIDE 7
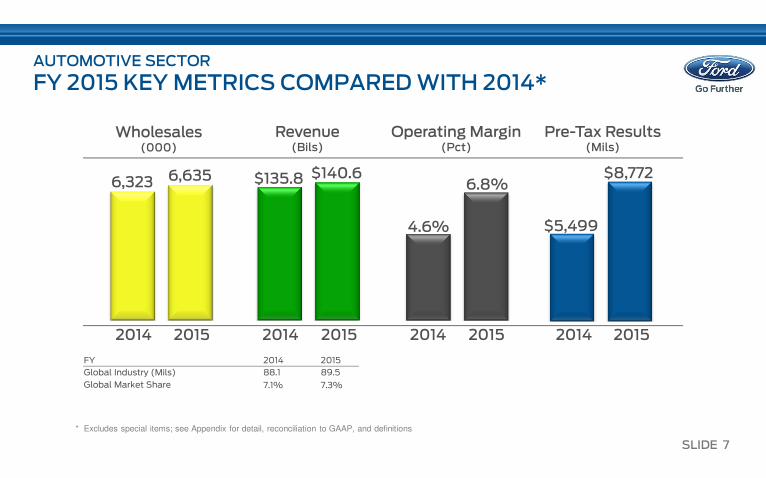
AUTOMOTIVE SECTOR
FY 2015 KEY METRICS COMPARED WITH 2014*
* Excludes special items; see Appendix for detail, reconciliation to GAAP, and definitions
6,6356,323$140.6$135.8 6.8%
4.6%
$8,772
$5,499
20152014 20152014 20152014 20152014
Wholesales(000)
Revenue(Bils)
Operating Margin(Pct)
Pre-Tax Results(Mils)
FY 2014 2015
Global Industry (Mils) 88.1 89.5
Global Market Share 7.1% 7.3%

SLIDE 8
Industry $1,537 Share (163)Stocks 811Mix / Other 1,837
AUTOMOTIVE SECTOR
FY 2015 PRE-TAX RESULTS COMPARED WITH 2014* (MILS)
* Excludes special items; see Appendix for detail, reconciliation to GAAP, and definitions
FY 2015FY 2014Volume /
MixNet
PricingStructural
Cost Exchange
$4,022
$(249) $(741)
$3,425
$(1,816)
Net Interest /Other
Market Factors
Manufacturing Incl. Vol. Related $(1,021)Engineering (573)Other (222)
ContributionCost
$(1,368)
Total Cost
Material Excl. Commodities $(3,682)Commodities 930Warranty / Freight / Other 1,384
$8,772
$5,499 Ratification Bonus $(452)Net Interest (93)Other (196)
$3,273
SLIDE 9
$(254)
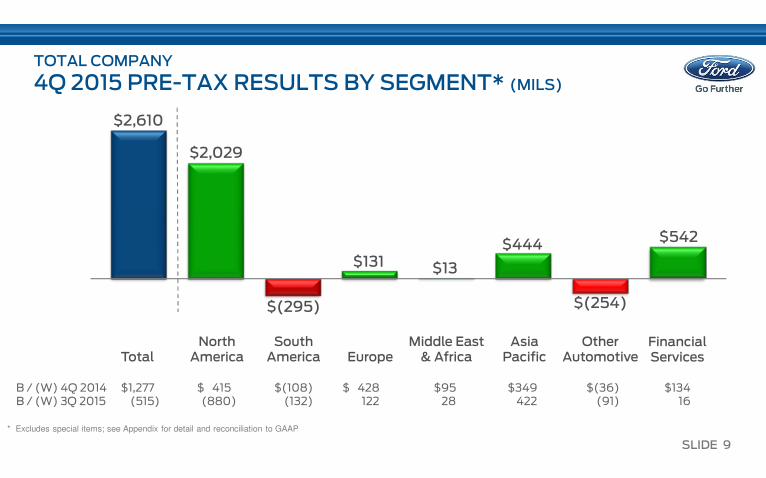
TOTAL COMPANY
4Q 2015 PRE-TAX RESULTS BY SEGMENT* (MILS)
* Excludes special items; see Appendix for detail and reconciliation to GAAP
SouthAmericaTotal
NorthAmerica
OtherAutomotive
AsiaPacificEurope
$2,610
$2,029
$(295)
$131$444
B / (W) 4Q 2014 $1,277 $ 415 $(108) $ 428 $95 $349 $(36) $134B / (W) 3Q 2015 (515) (880) (132) 122 28 422 (91) 16
Middle East& Africa
$13
$542
Financial Services
SLIDE 10
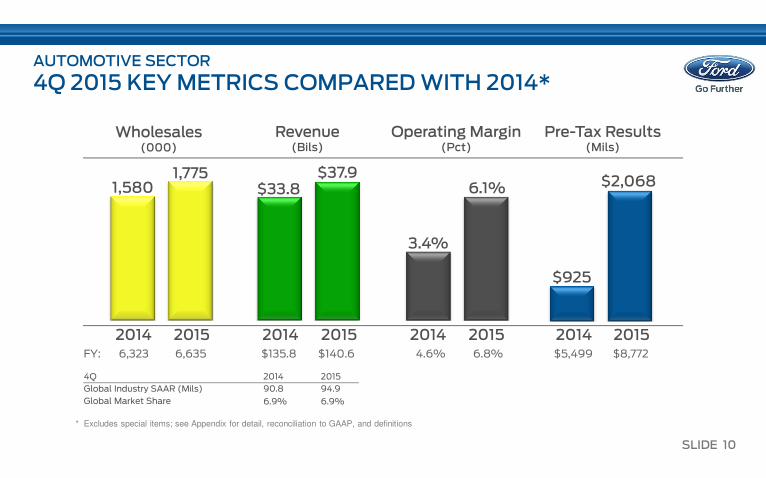
AUTOMOTIVE SECTOR
4Q 2015 KEY METRICS COMPARED WITH 2014*
* Excludes special items; see Appendix for detail, reconciliation to GAAP, and definitions
1,7751,580
$37.9$33.8 6.1%
3.4%
$2,068
$925
20152014 20152014 20152014 20152014
Wholesales(000)
Revenue(Bils)
Operating Margin(Pct)
Pre-Tax Results(Mils)
4Q 2014 2015
Global Industry SAAR (Mils) 90.8 94.9
Global Market Share 6.9% 6.9%
FY: 6,323 6,635 $135.8 $140.6 4.6% 6.8% $5,499 $8,772
SLIDE 11
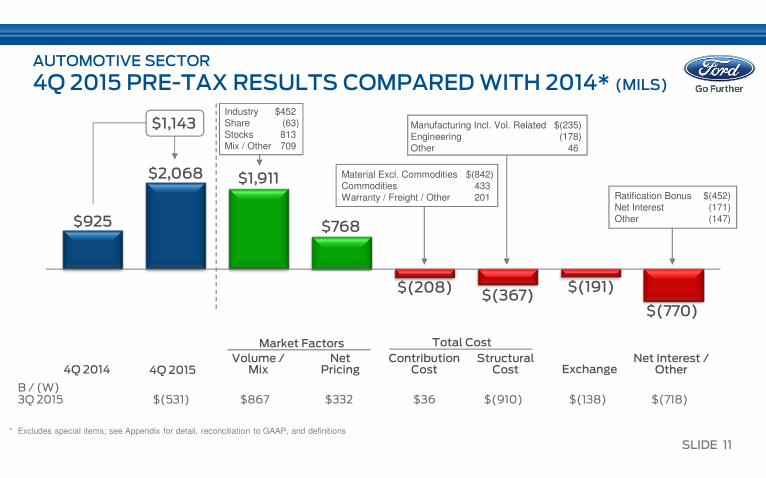
Industry $452 Share (63)Stocks 813Mix / Other 709
AUTOMOTIVE SECTOR
4Q 2015 PRE-TAX RESULTS COMPARED WITH 2014* (MILS)
* Excludes special items; see Appendix for detail, reconciliation to GAAP, and definitions
4Q 20154Q 2014Volume /
MixNet
PricingStructural
Cost Exchange
$1,911
$(191)
$(770)
$768
$(367)
Net Interest /Other
Market Factors
B / (W)3Q 2015 $(531) $867 $332 $36 $(910) $(138) $(718)
Manufacturing Incl. Vol. Related $(235)Engineering (178)Other 46
ContributionCost
$(208)
Total Cost
Material Excl. Commodities $(842)Commodities 433Warranty / Freight / Other 201
$2,068
$925
Ratification Bonus $(452)Net Interest (171)Other (147)
$1,143
SLIDE 12
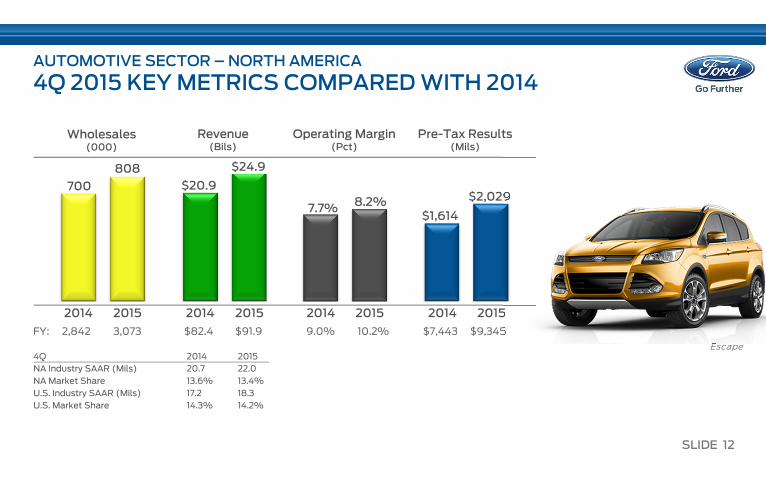
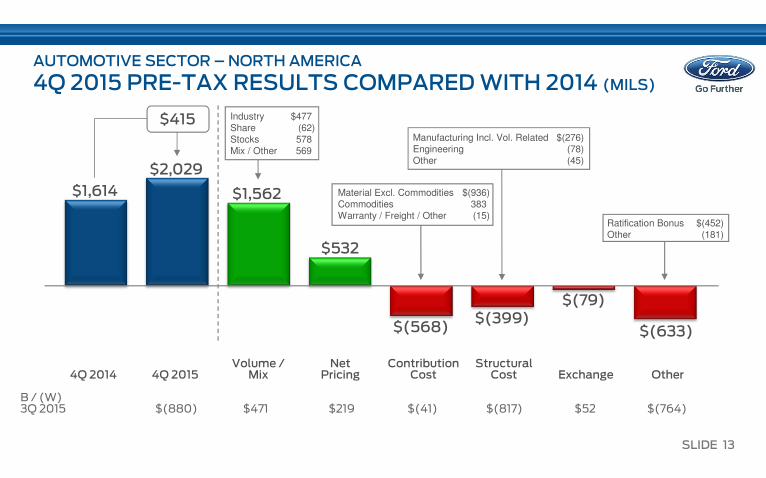
AUTOMOTIVE SECTOR – NORTH AMERICA
4Q 2015 KEY METRICS COMPARED WITH 2014
4Q 2014 2015
NA Industry SAAR (Mils) 20.7 22.0
NA Market Share 13.6% 13.4%
U.S. Industry SAAR (Mils) 17.2 18.3
U.S. Market Share 14.3% 14.2%
700
20152014
$24.9
$20.9
20152014 20152014
$2,029
$1,614
20152014
Wholesales(000)
Revenue(Bils)
Operating Margin(Pct)
Pre-Tax Results(Mils)
8.2%7.7%
FY: 2,842 3,073 $82.4 $91.9 9.0% 10.2% $7,443 $9,345
808
Escape
SLIDE 13
AUTOMOTIVE SECTOR – NORTH AMERICA
4Q 2015 PRE-TAX RESULTS COMPARED WITH 2014 (MILS)
$1,614 $1,562
$532
$(399)$(79)
$(633)
$2,029
$(568)
Industry $477Share (62)Stocks 578Mix / Other 569
B / (W) 3Q 2015 $(880) $471 $219 $(41) $(817) $52 $(764)
4Q 20154Q 2014Volume /
MixNet
PricingStructural
Cost Exchange OtherContribution
Cost
Material Excl. Commodities $(936)Commodities 383Warranty / Freight / Other (15)
Ratification Bonus $(452)Other (181)
Manufacturing Incl. Vol. Related $(276)Engineering (78)Other (45)
$415

SLIDE 14
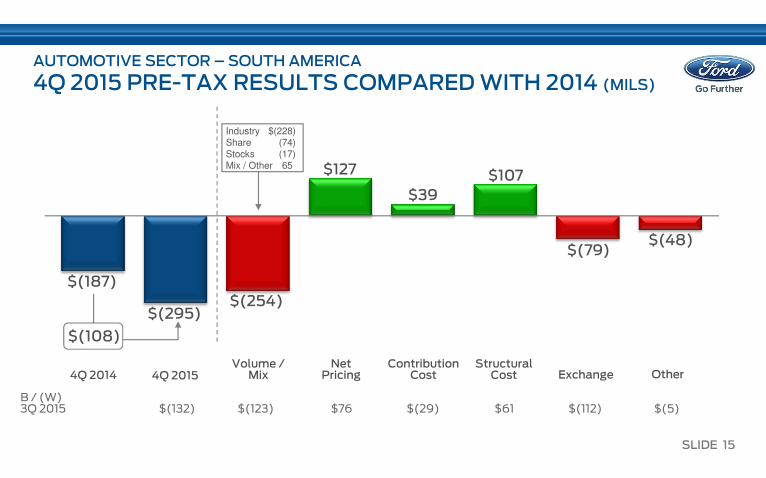
AUTOMOTIVE SECTOR – SOUTH AMERICA
4Q 2015 KEY METRICS COMPARED WITH 2014
4Q 2014 2015
SA Industry SAAR (Mils) 5.4 3.9
SA Market Share 9.4% 8.4%
Brazil Industry SAAR (Mils) 3.6 2.4
Brazil Market Share 10.1% 9.0%
80
132
$1.2
$2.5
(25.1)%
(7.6)%
$(295)
$(187)
FY: 463 381 $8.8 $5.8 (13.2)% (14.4)% $(1,164) $(832)
Wholesales(000)
Revenue(Bils)
Operating Margin(Pct)
Pre-Tax Results(Mils)
20152014 20152014 20152014 20152014
Fiesta
SLIDE 15
$(187)
Industry $(228)Share (74)Stocks (17)Mix / Other 65
AUTOMOTIVE SECTOR – SOUTH AMERICA
4Q 2015 PRE-TAX RESULTS COMPARED WITH 2014 (MILS)
$(295)$(254)
$127 $107
$(79)$(48)
$39
4Q 20154Q 2014Volume /
MixNet
PricingStructural
Cost ExchangeContribution
Cost
B / (W) 3Q 2015 $(132) $(123) $76 $(29) $61 $(112) $(5)
Other
$(108)
SLIDE 16
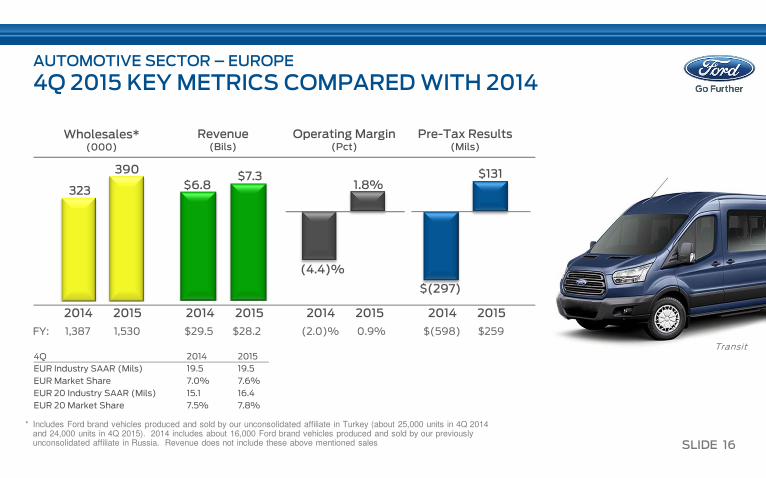
AUTOMOTIVE SECTOR – EUROPE
4Q 2015 KEY METRICS COMPARED WITH 2014
* Includes Ford brand vehicles produced and sold by our unconsolidated affiliate in Turkey (about 25,000 units in 4Q 2014and 24,000 units in 4Q 2015). 2014 includes about 16,000 Ford brand vehicles produced and sold by our previously unconsolidated affiliate in Russia. Revenue does not include these above mentioned sales
4Q 2014 2015
EUR Industry SAAR (Mils) 19.5 19.5
EUR Market Share 7.0% 7.6%
EUR 20 Industry SAAR (Mils) 15.1 16.4
EUR 20 Market Share 7.5% 7.8%
390
323$7.3
$6.8
FY: 1,387 1,530 $29.5 $28.2 (2.0)% 0.9% $(598) $259
1.8%
(4.4)%
$(297)
$131
Wholesales*(000)
Revenue(Bils)
Operating Margin(Pct)
Pre-Tax Results(Mils)
20152014 20152014 20152014 20152014
Transit
SLIDE 17
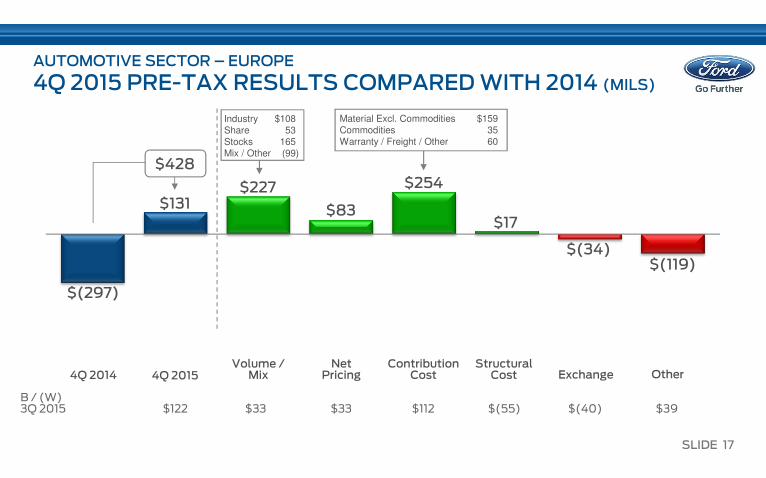
AUTOMOTIVE SECTOR – EUROPE
4Q 2015 PRE-TAX RESULTS COMPARED WITH 2014 (MILS)
$(297)
$131$227
$83
$254
$17
$(34)
Industry $108Share 53Stocks 165Mix / Other (99)
$(119)
B / (W) 3Q 2015 $122 $33 $33 $112 $(55) $(40) $39
4Q 20154Q 2014Volume /
MixNet
PricingStructural
Cost ExchangeContribution
Cost Other
Material Excl. Commodities $159Commodities 35Warranty / Freight / Other 60
$428
SLIDE 18
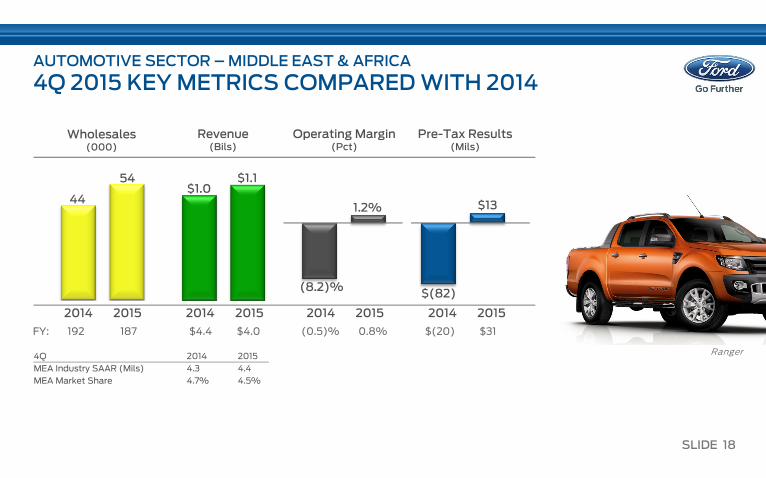
AUTOMOTIVE SECTOR –MIDDLE EAST & AFRICA
4Q 2015 KEY METRICS COMPARED WITH 2014
44$1.0
54 $1.1
$(82)
$13
(8.2)%
1.2%
4Q 2014 2015
MEA Industry SAAR (Mils) 4.3 4.4
MEA Market Share 4.7% 4.5%
FY: 192 187 $4.4 $4.0 (0.5)% 0.8% $(20) $31
Wholesales(000)
Revenue(Bils)
Operating Margin(Pct)
Pre-Tax Results(Mils)
20152014 20152014 20152014 20152014
Ranger
SLIDE 19
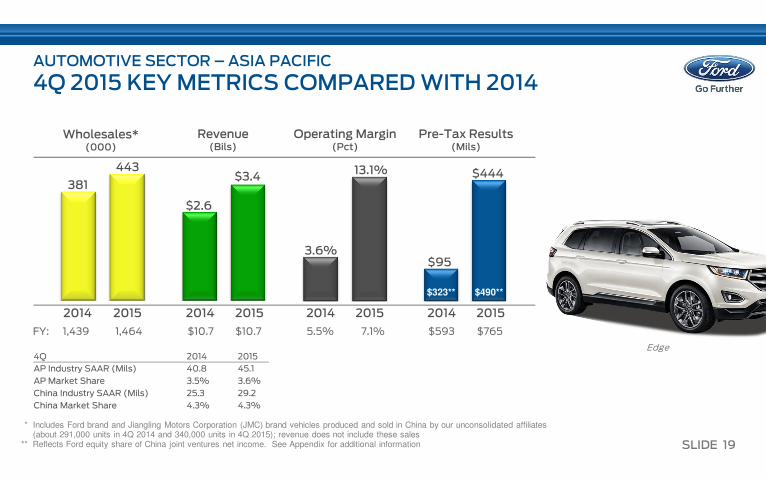
AUTOMOTIVE SECTOR – ASIA PACIFIC
4Q 2015 KEY METRICS COMPARED WITH 2014
* Includes Ford brand and Jiangling Motors Corporation (JMC) brand vehicles produced and sold in China by our unconsolidated affiliates(about 291,000 units in 4Q 2014 and 340,000 units in 4Q 2015); revenue does not include these sales
** Reflects Ford equity share of China joint ventures net income. See Appendix for additional information
4Q 2014 2015
AP Industry SAAR (Mils) 40.8 45.1
AP Market Share 3.5% 3.6%
China Industry SAAR (Mils) 25.3 29.2
China Market Share 4.3% 4.3%
381
$2.6
443$3.4
$95
$444
3.6%
13.1%
$323** $490**
Wholesales*(000)
Revenue(Bils)
Operating Margin(Pct)
Pre-Tax Results(Mils)
20152014 20152014 20152014 20152014
FY: 1,439 1,464 $10.7 $10.7 5.5% 7.1% $593 $765
Edge
SLIDE 20
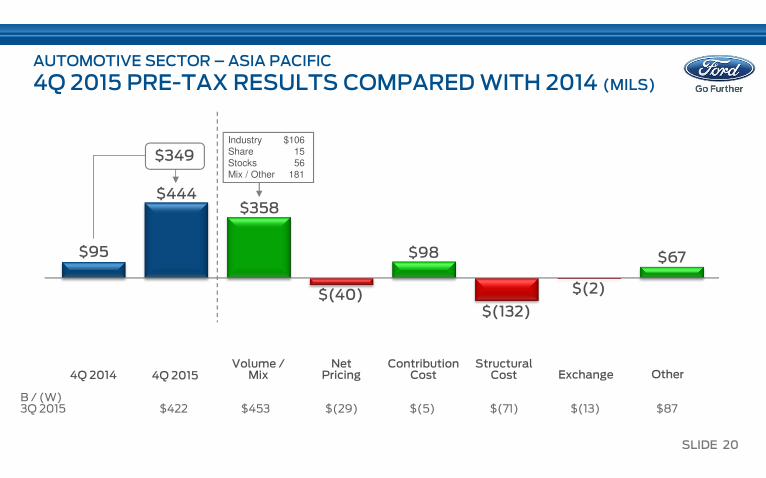
$(132)
$67$95
$(2)
$444
$98
Industry $106Share 15Stocks 56Mix / Other 181
$(40)
$358
AUTOMOTIVE SECTOR – ASIA PACIFIC
4Q 2015 PRE-TAX RESULTS COMPARED WITH 2014 (MILS)
4Q 20154Q 2014Volume /
MixNet
PricingStructural
Cost ExchangeContribution
Cost
B / (W) 3Q 2015 $422 $453 $(29) $(5) $(71) $(13) $87
Other
$349
SLIDE 21
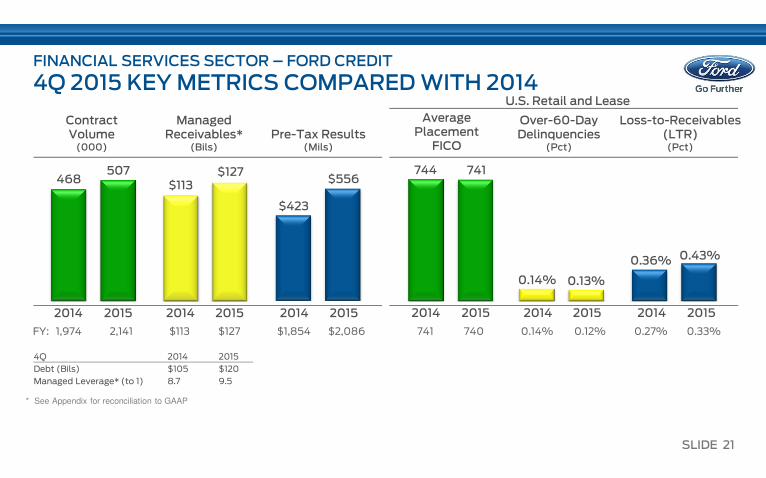
FINANCIAL SERVICES SECTOR – FORD CREDIT
4Q 2015 KEY METRICS COMPARED WITH 2014
507468 $556
$423
Managed Receivables*
(Bils)
Contract Volume(000)
Pre-Tax Results(Mils)
FY: 1,974 2,141 $113 $127 $1,854 $2,086 741 740 0.14% 0.12% 0.27% 0.33%
$113$127
20152014 20152014 20152014
4Q 2014 2015
Debt (Bils) $105 $120
Managed Leverage* (to 1) 8.7 9.5
Over-60-DayDelinquencies
(Pct)
Average Placement
FICO
Loss-to-Receivables (LTR)(Pct)
741744
0.13%0.14%
0.36% 0.43%
20152014 20152014 20152014
U.S. Retail and Lease
* See Appendix for reconciliation to GAAP
SLIDE 22
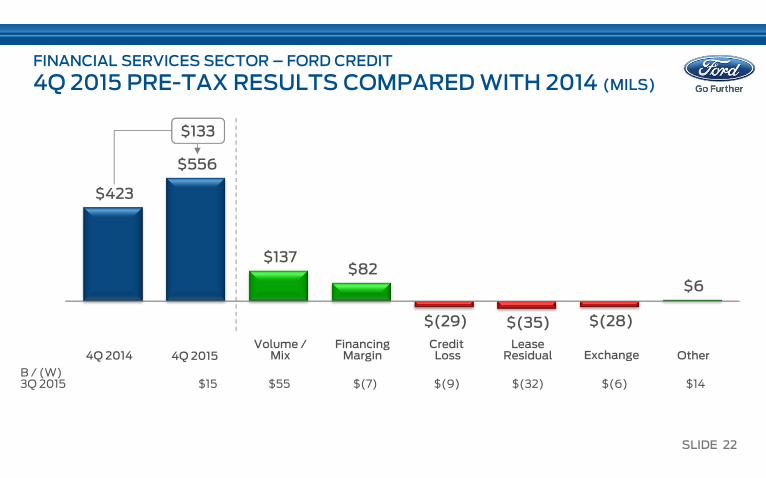
FINANCIAL SERVICES SECTOR – FORD CREDIT
4Q 2015 PRE-TAX RESULTS COMPARED WITH 2014 (MILS)
$423
$556
$137 $82
$(29) $(35) $(28)
$6
4Q 20154Q 2014Volume /
MixFinancing Margin
Lease Residual Exchange Other
B / (W)3Q 2015 $15 $55 $(7) $(9) $(32) $(6) $14
CreditLoss
$133
SLIDE 23
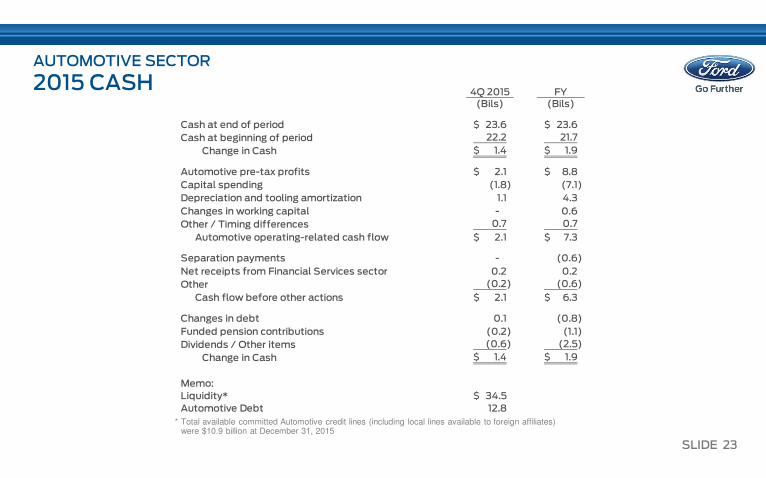
4Q 2015 FY(Bils) (Bils)
Cash at end of period 23.6$ 23.6$
Cash at beginning of period 22.2 21.7
Change in Cash 1.4$ 1.9$
Automotive pre-tax profits 2.1$ 8.8$
Capital spending (1.8) (7.1)
Depreciation and tooling amortization 1.1 4.3
Changes in working capital - 0.6
Other / Timing differences 0.7 0.7
Automotive operating-related cash flow 2.1$ 7.3$
Separation payments - (0.6)
Net receipts from Financial Services sector 0.2 0.2
Other (0.2) (0.6)
Cash flow before other actions 2.1$ 6.3$
Changes in debt 0.1 (0.8)
Funded pension contributions (0.2) (1.1)
Dividends / Other items (0.6) (2.5)
Change in Cash 1.4$ 1.9$
Memo:
Liquidity* 34.5$
Automotive Debt 12.8
AUTOMOTIVE SECTOR
2015 CASH
* Total available committed Automotive credit lines (including local lines available to foreign affiliates) were $10.9 billion at December 31, 2015

SLIDE 24
2014 FY 2015 FY
Results Plan Results
Planning Assumptions (Mils)
Industry Volume -- U.S. 16.8 17.0 - 17.5 17.8
-- Europe 20 14.6 14.8 - 15.3 16.0
-- China* 24.0 24.5 - 26.5 25.1
Key Metrics
Automotive (Compared with 2014):– Revenue (Bils) $ 135.8 Higher $ 140.6
– Operating Margin** 4.6% Higher 6.8%
– Operating-Related Cash Flow (Bils)** $ 3.6 Higher $ 7.3
Ford Credit (Compared with 2014):
– Pre-Tax Profit (Bils) $ 1.9 Equal To Or Higher $ 2.1
Total Company:
– Pre-Tax Profit (Bils)** $ 7.3 $10.0 - $11.0 $ 10.8– After-Tax Five Year Average ROIC*** 16% 16%
2015 PLANNING ASSUMPTIONS AND KEY METRICS
Delivered Record, Breakthrough Year
* China industry volume is based on estimated wholesales** Excludes special items, see Appendix for detail and reconciliation to GAAP and definitions
*** See Appendix for calculation methodology

SLIDE 25
2016 PLANNING ASSUMPTIONS AND KEY METRICS
* Europe industry reflects total Europe, including Turkey and Russia; China industry volume is based on estimated vehicle registrations** Excludes special items; see Appendix for detail and reconciliation to GAAP and definitions
Sustaining Strong Financial Performance In 2016
2015 FY Results 2016 FY Plan GDP Growth Outlook
Planning Assumptions (Mils)
Industry Volume
– U.S. 17.8 17.5 - 18.5 2.3 - 2.8%
– Europe* 19.2 19.0 - 20.0 1.2 - 1.7%
– Brazil 2.6 2.0 - 2.5 (2.0) - (3.0)%
– China* 23.5 23.5 - 25.5 6.5 - 7.0%
Key Metrics
Automotive
– Revenue (Bils) $ 140.6 Equal To or Higher Than 2015
– Operating Margin (Pct) 6.8% Equal To or Higher Than 2015
– Operating-Related Cash Flow (Bils)** $ 7.3 Strong, but Lower Than 2015
Total Company Pre-Tax Profit (Bils)** $ 10.8 Equal To or Higher Than 2015
Operating Effective Tax Rate (Pct.)** 28.6% Low 30s
Operating EPS** $ 1.93 Equal To or Higher than 2015
SLIDE 26
F-150

SLIDE 27
RISK FACTORS
Statements included or incorporated by reference herein may constitute "forward-looking statements" within the meaning of the Private Securities Litigation Reform Act of 1995. Forward-looking statements are based on
expectations, forecasts, and assumptions by our management and involve a number of risks, uncertainties, and other factors that could cause actual results to differ materially from those stated, including, without limitation:
• Decline in industry sales volume, particularly in the United States, Europe, or China due to financial crisis, recession, geopolitical events, or other factors;
• Decline in Ford's market share or failure to achieve growth;
• Lower-than-anticipated market acceptance of Ford's new or existing products or services;
• Market shift away from sales of larger, more profitable vehicles beyond Ford's current planning assumption, particularly in the United States;
• An increase in or continued volatility of fuel prices, or reduced availability of fuel;
• Continued or increased price competition resulting from industry excess capacity, currency fluctuations, or other factors;
• Fluctuations in foreign currency exchange rates, commodity prices, and interest rates;
• Adverse effects resulting from economic, geopolitical, or other events;
• Economic distress of suppliers that may require Ford to provide substantial financial support or take other measures to ensure supplies of components or materials and could increase costs, affect liquidity, or cause production
constraints or disruptions;
• Work stoppages at Ford or supplier facilities or other limitations on production (whether as a result of labor disputes, natural or man-made disasters, tight credit markets or other financial distress, production constraints or
difficulties, or other factors);
• Single-source supply of components or materials;
• Labor or other constraints on Ford's ability to maintain competitive cost structure;
• Substantial pension and postretirement health care and life insurance liabilities impairing our liquidity or financial condition;
• Worse-than-assumed economic and demographic experience for postretirement benefit plans (e.g., discount rates or investment returns);
• Restriction on use of tax attributes from tax law "ownership change”;
• The discovery of defects in vehicles resulting in delays in new model launches, recall campaigns, or increased warranty costs;
• Increased safety, emissions, fuel economy, or other regulations resulting in higher costs, cash expenditures, and / or sales restrictions;
• Unusual or significant litigation, governmental investigations, or adverse publicity arising out of alleged defects in products, perceived environmental impacts, or otherwise;
• A change in requirements under long-term supply arrangements committing Ford to purchase minimum or fixed quantities of certain parts, or to pay a minimum amount to the seller ("take-or-pay" contracts);
• Adverse effects on results from a decrease in or cessation or clawback of government incentives related to investments;
• Inherent limitations of internal controls impacting financial statements and safeguarding of assets;
• Cybersecurity risks to operational systems, security systems, or infrastructure owned by Ford, Ford Credit, or a third-party vendor or supplier;
• Failure of financial institutions to fulfill commitments under committed credit and liquidity facilities;
• Inability of Ford Credit to access debt, securitization, or derivative markets around the world at competitive rates or in sufficient amounts, due to credit rating downgrades, market volatility, market disruption, regulatory
requirements, or other factors;
• Higher-than-expected credit losses, lower-than-anticipated residual values, or higher-than-expected return volumes for leased vehicles;
• Increased competition from banks, financial institutions, or other third parties seeking to increase their share of financing Ford vehicles; and
• New or increased credit, consumer, or data protection or other regulations resulting in higher costs and / or additional financing restrictions.
We cannot be certain that any expectation, forecast, or assumption made in preparing forward-looking statements will prove accurate, or that any projection will be realized. It is to be expected that there may be differences between
projected and actual results. Our forward-looking statements speak only as of the date of their initial issuance, and we do not undertake any obligation to update or revise publicly any forward-looking statement, whether as a result
of new information, future events, or otherwise. For additional discussion, see "Item 1A. Risk Factors" in our Annual Report on Form 10-K for the year ended December 31, 2014, as updated by subsequent Quarterly Reports on
Form 10-Q and Current Reports on Form 8-K.

Q&A

APPENDIX
Appendix No.
• 2016 Business Unit Key Metrics 1• Calculation of Earnings Per Share 2• Calculation of Return On Invested Capital (ROIC) 3• Income from Continuing Operations 4• Special Items 5• Sector Income Statement 6• Pension Update 7• Employment Data 8
Automotive Sector• Production Volumes 9• Dealer Stocks 10• Market Share 11• Automotive Debt 12
Reconciliation to GAAP• Net Interest 13• Cash 14• Operating-Related Cash Flows 15• Net Finance Receivables and Operating Leases 16• Managed Leverage 17
Full Year Key Metrics and Pre-Tax Results • North America 18 - 19• South America 20 - 21• Europe 22 - 23• Middle East & Africa 24• Asia Pacific (incl. China Unconsolidated Affiliates) 25 - 27• Ford Credit 28 - 29
Other• Definitions and Calculations 30
4Q 2015 AND FULL YEAR EARNINGS – APPENDIX INDEX
Lincoln MKZ
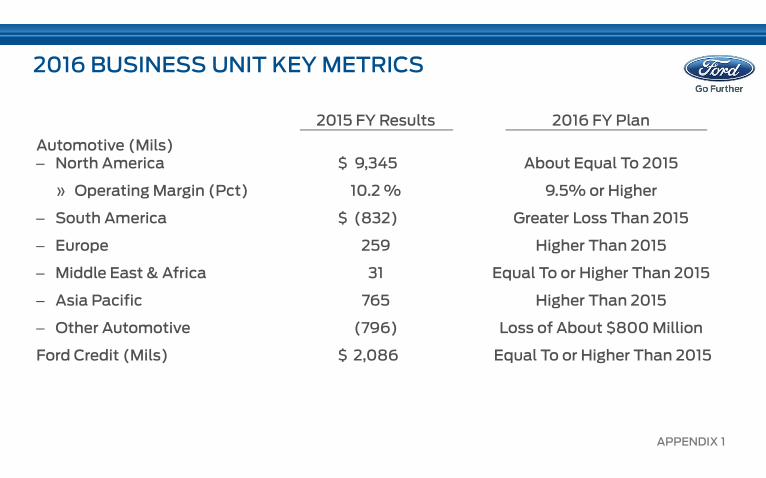
2016 BUSINESS UNIT KEY METRICS
APPENDIX 1
2015 FY Results 2016 FY Plan
Automotive (Mils)– North America $ 9,345 About Equal To 2015
» Operating Margin (Pct) 10.2 % 9.5% or Higher
– South America $ (832) Greater Loss Than 2015
– Europe 259 Higher Than 2015
– Middle East & Africa 31 Equal To or Higher Than 2015
– Asia Pacific 765 Higher Than 2015
– Other Automotive (796) Loss of About $800 Million
Ford Credit (Mils) $ 2,086 Equal To or Higher Than 2015
After-Tax After-Tax
Operating Operating
Results Results
Excluding Excluding
Special Special
Items* Items*
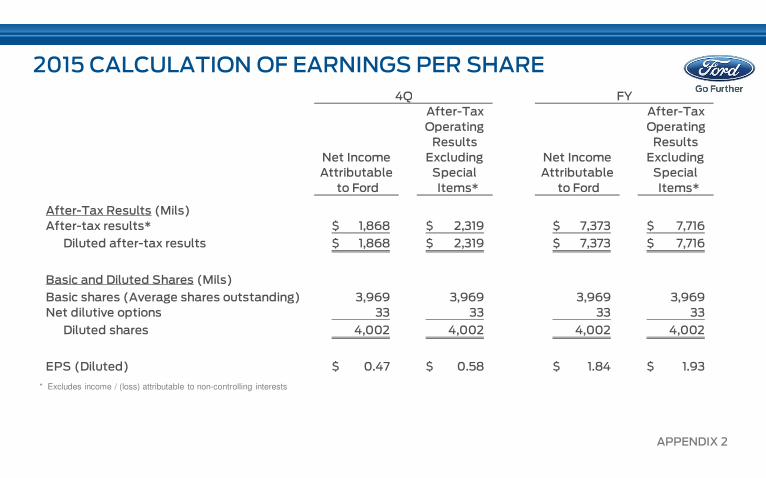
After-Tax Results (Mils)
After-tax results* 1,868$ 2,319$ 7,373$ 7,716$
Diluted after-tax results 1,868$ 2,319$ 7,373$ 7,716$
Basic and Diluted Shares (Mils)
Basic shares (Average shares outstanding) 3,969 3,969 3,969 3,969
Net dilutive options 33 33 33 33
Diluted shares 4,002 4,002 4,002 4,002
EPS (Diluted) 0.47$ 0.58$ 1.84$ 1.93$
to Ford to Ford
4Q FY
Net Income Net Income
Attributable Attributable
2015 CALCULATION OF EARNINGS PER SHARE
APPENDIX 2
* Excludes income / (loss) attributable to non-controlling interests
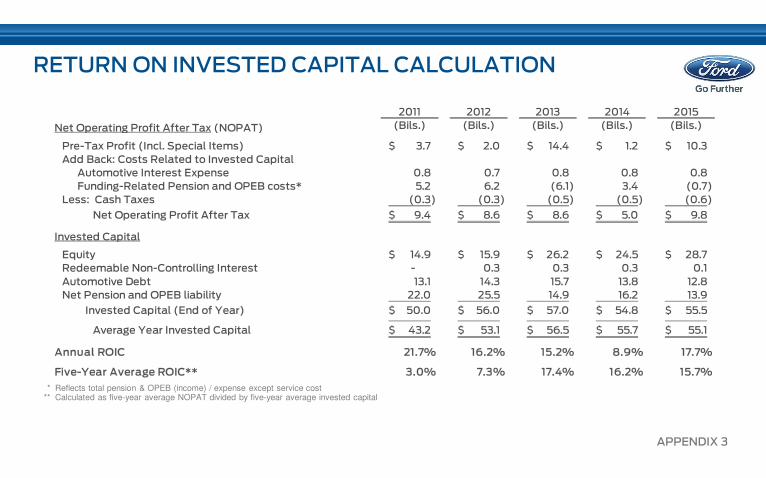
RETURN ON INVESTED CAPITAL CALCULATION
APPENDIX 3
* Reflects total pension & OPEB (income) / expense except service cost ** Calculated as five-year average NOPAT divided by five-year average invested capital
2011 2012 2013 2014 2015
Net Operating Profit After Tax (NOPAT) (Bils.) (Bils.) (Bils.) (Bils.) (Bils.)
Pre-Tax Profit (Incl. Special Items) 3.7$ 2.0$ 14.4$ 1.2$ 10.3$
Add Back: Costs Related to Invested Capital
Automotive Interest Expense 0.8 0.7 0.8 0.8 0.8
Funding-Related Pension and OPEB costs* 5.2 6.2 (6.1) 3.4 (0.7)
Less: Cash Taxes (0.3) (0.3) (0.5) (0.5) (0.6)
Net Operating Profit After Tax 9.4$ 8.6$ 8.6$ 5.0$ 9.8$
Invested Capital
Equity 14.9$ 15.9$ 26.2$ 24.5$ 28.7$
Redeemable Non-Controlling Interest - 0.3 0.3 0.3 0.1
Automotive Debt 13.1 14.3 15.7 13.8 12.8
Net Pension and OPEB liability 22.0 25.5 14.9 16.2 13.9
Invested Capital (End of Year) 50.0$ 56.0$ 57.0$ 54.8$ 55.5$ -
Average Year Invested Capital 43.2$ 53.1$ 56.5$ 55.7$ 55.1$
Annual ROIC 21.7% 16.2% 15.2% 8.9% 17.7%
Five-Year Average ROIC** 3.0% 7.3% 17.4% 16.2% 15.7%
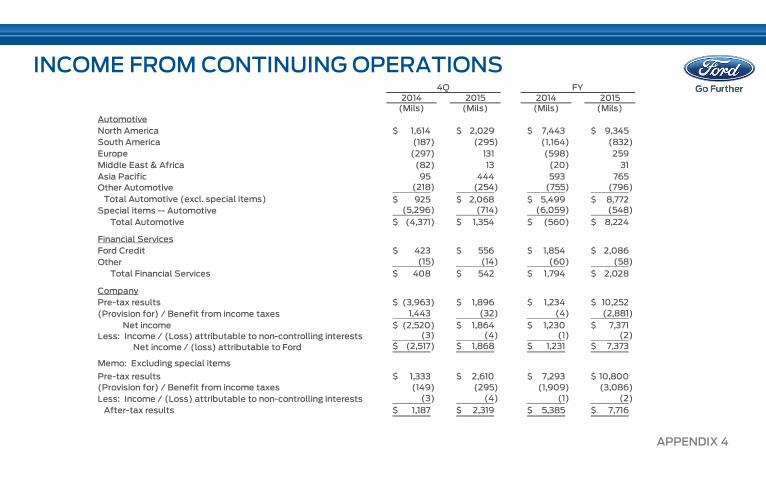
2014 2015 2014 2015(Mils) (Mils) (Mils) (Mils)
Automotive
North America 1,614$ 2,029$ 7,443$ 9,345$
South America (187) (295) (1,164) (832)
Europe (297) 131 (598) 259
Middle East & Africa (82) 13 (20) 31
Asia Pacific 95 444 593 765
Other Automotive (218) (254) (755) (796)
Total Automotive (excl. special items) 925$ 2,068$ 5,499$ 8,772$
Special items -- Automotive (5,296) (714) (6,059) (548)
Total Automotive (4,371)$ 1,354$ (560)$ 8,224$
Financial Services
Ford Credit 423$ 556$ 1,854$ 2,086$
Other (15) (14) (60) (58)
Total Financial Services 408$ 542$ 1,794$ 2,028$
Company
Pre-tax results (3,963)$ 1,896$ 1,234$ 10,252$
(Provision for) / Benefit from income taxes 1,443 (32) (4) (2,881)
Net income (2,520)$ 1,864$ 1,230$ 7,371$
Less: Income / (Loss) attributable to non-controlling interests (3) (4) (1) (2)
Net income / (loss) attributable to Ford (2,517)$ 1,868$ 1,231$ 7,373$
Memo: Excluding special items
Pre-tax results 1,333$ 2,610$ 7,293$ 10,800$
(Provision for) / Benefit from income taxes (149) (295) (1,909) (3,086)
Less: Income / (Loss) attributable to non-controlling interests (3) (4) (1) (2)
After-tax results 1,187$ 2,319$ 5,385$ 7,716$
4Q FY
INCOME FROM CONTINUING OPERATIONS
APPENDIX 4
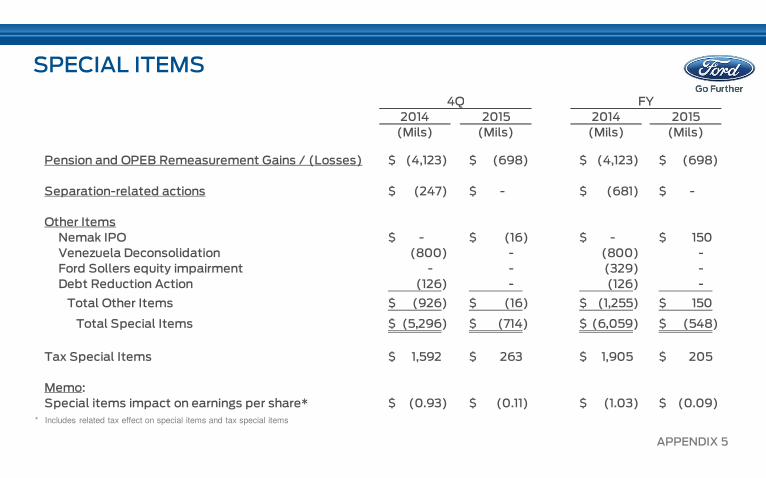
2014 2015 2014 2015
(Mils) (Mils) (Mils) (Mils)
Pension and OPEB Remeasurement Gains / (Losses) (4,123)$ (698)$ (4,123)$ (698)$
Separation-related actions (247)$ -$ (681)$ -$
Other Items
Nemak IPO -$ (16)$ -$ 150$
Venezuela Deconsolidation (800) - (800) -
Ford Sollers equity impairment - - (329) -
Debt Reduction Action (126) - (126) -
Total Other Items (926)$ (16)$ (1,255)$ 150$
Total Special Items (5,296)$ (714)$ (6,059)$ (548)$
Tax Special Items 1,592$ 263$ 1,905$ 205$
Memo:
Special items impact on earnings per share* (0.93)$ (0.11)$ (1.03)$ (0.09)$
4Q FY
SPECIAL ITEMS
APPENDIX 5
* Includes related tax effect on special items and tax special items
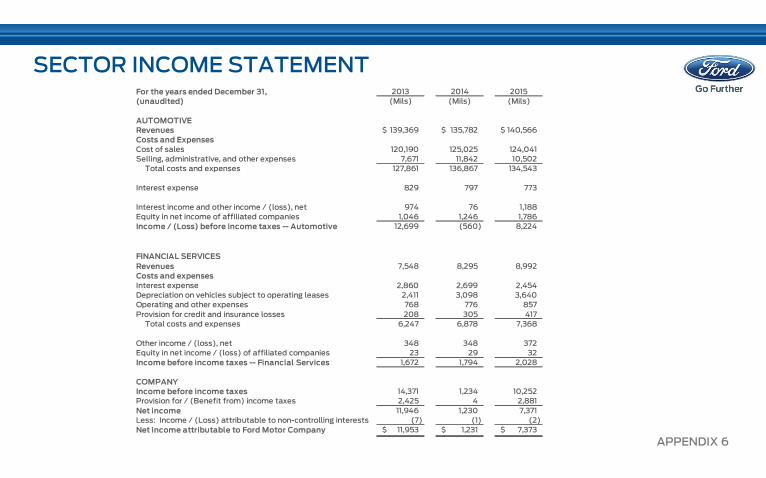
For the years ended December 31, 2013 2014 2015
(unaudited) (Mils) (Mils) (Mils)
AUTOMOTIVE
Revenues 139,369$ 135,782$ 140,566$
Costs and Expenses
Cost of sales 120,190 125,025 124,041
Selling, administrative, and other expenses 7,671 11,842 10,502
Total costs and expenses 127,861 136,867 134,543
Interest expense 829 797 773
Interest income and other income / (loss), net 974 76 1,188
Equity in net income of affiliated companies 1,046 1,246 1,786
Income / (Loss) before income taxes -- Automotive 12,699 (560) 8,224
FINANCIAL SERVICES
Revenues 7,548 8,295 8,992
Costs and expenses
Interest expense 2,860 2,699 2,454
Depreciation on vehicles subject to operating leases 2,411 3,098 3,640
Operating and other expenses 768 776 857
Provision for credit and insurance losses 208 305 417
Total costs and expenses 6,247 6,878 7,368
Other income / (loss), net 348 348 372
Equity in net income / (loss) of affiliated companies 23 29 32
Income before income taxes -- Financial Services 1,672 1,794 2,028
COMPANY
Income before income taxes 14,371 1,234 10,252
Provision for / (Benefit from) income taxes 2,425 4 2,881
Net income 11,946 1,230 7,371
Less: Income / (Loss) attributable to non-controlling interests (7) (1) (2)
Net income attributable to Ford Motor Company 11,953$ 1,231$ 7,373$
SECTOR INCOME STATEMENT
APPENDIX 6
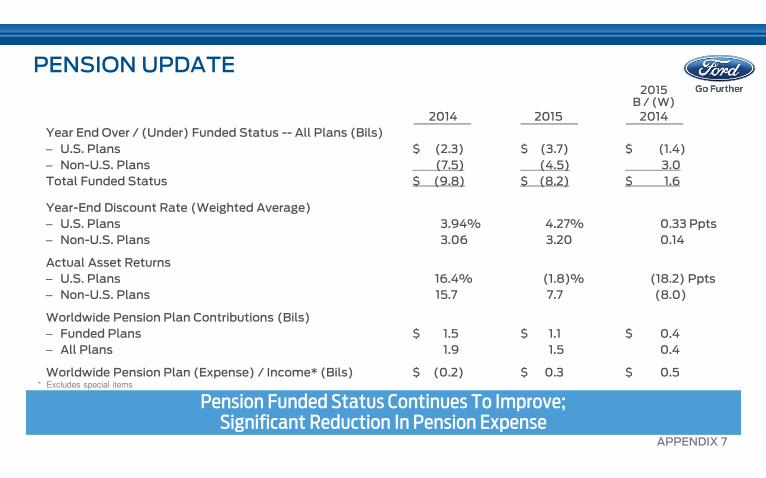
PENSION UPDATE
Pension Funded Status Continues To Improve; Significant Reduction In Pension Expense
2015B / (W)
2014 2015 2014
Year End Over / (Under) Funded Status -- All Plans (Bils)
– U.S. Plans $ (2.3) $ (3.7) $ (1.4)
– Non-U.S. Plans (7.5) (4.5) 3.0
Total Funded Status $ (9.8) $ (8.2) $ 1.6
Year-End Discount Rate (Weighted Average)
– U.S. Plans 3.94% 4.27% 0.33 Ppts
– Non-U.S. Plans 3.06 3.20 0.14
Actual Asset Returns
– U.S. Plans 16.4% (1.8)% (18.2) Ppts
– Non-U.S. Plans 15.7 7.7 (8.0)
Worldwide Pension Plan Contributions (Bils)
– Funded Plans $ 1.5 $ 1.1 $ 0.4
– All Plans 1.9 1.5 0.4
Worldwide Pension Plan (Expense) / Income* (Bils) $ (0.2) $ 0.3 $ 0.5* Excludes special items
APPENDIX 7
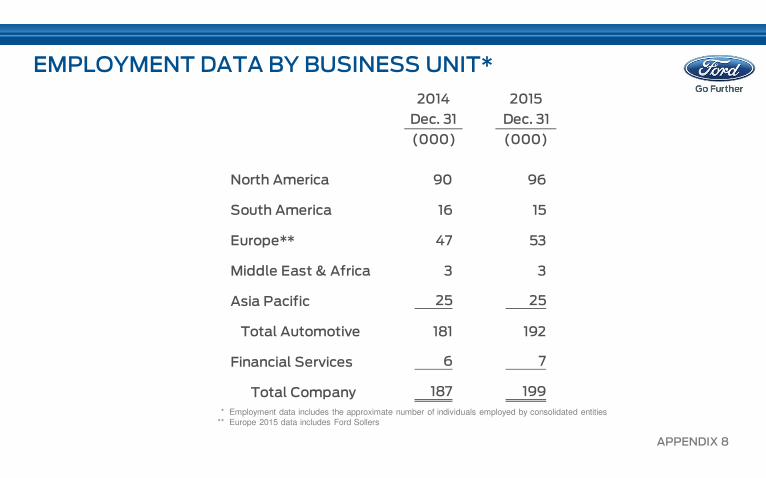
2014 2015
Dec. 31 Dec. 31
(000) (000)
North America 90 96
South America 16 15
Europe** 47 53
Middle East & Africa 3 3
Asia Pacific 25 25
Total Automotive 181 192
Financial Services 6 7
Total Company 187 199
EMPLOYMENT DATA BY BUSINESS UNIT*
* Employment data includes the approximate number of individuals employed by consolidated entities** Europe 2015 data includes Ford Sollers
APPENDIX 8
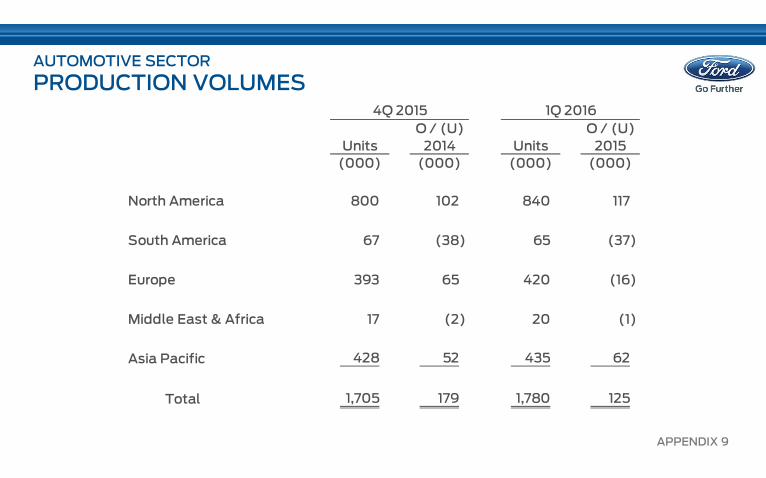
O / (U) O / (U)
Units 2014 Units 2015
(000) (000) (000) (000)
North America 800 102 840 117
South America 67 (38) 65 (37)
Europe 393 65 420 (16)
Middle East & Africa 17 (2) 20 (1)
Asia Pacific 428 52 435 62
Total 1,705 179 1,780 125
4Q 2015 1Q 2016
AUTOMOTIVE SECTOR
PRODUCTION VOLUMES
APPENDIX 9
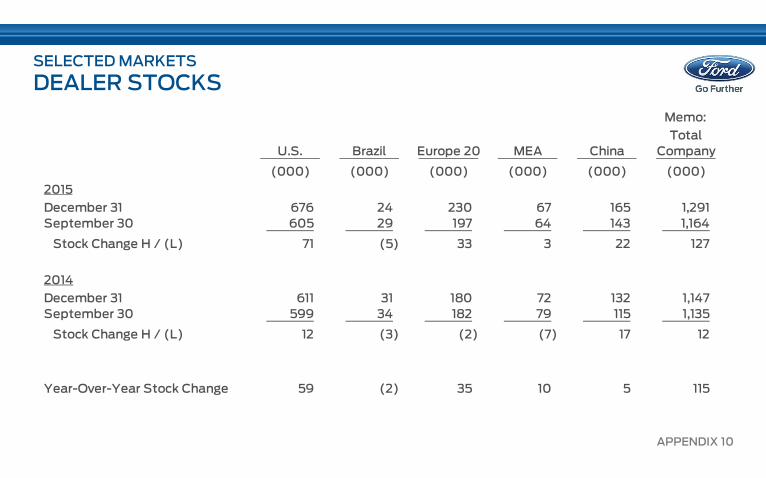
Memo:
Total
U.S. Brazil Europe 20 MEA China Company
(000) (000) (000) (000) (000) (000)
2015
December 31 676 24 230 67 165 1,291
September 30 605 29 197 64 143 1,164
Stock Change H / (L) 71 (5) 33 3 22 127
2014
December 31 611 31 180 72 132 1,147
September 30 599 34 182 79 115 1,135
Stock Change H / (L) 12 (3) (2) (7) 17 12
Year-Over-Year Stock Change 59 (2) 35 10 5 115
SELECTED MARKETS
DEALER STOCKS
APPENDIX 10
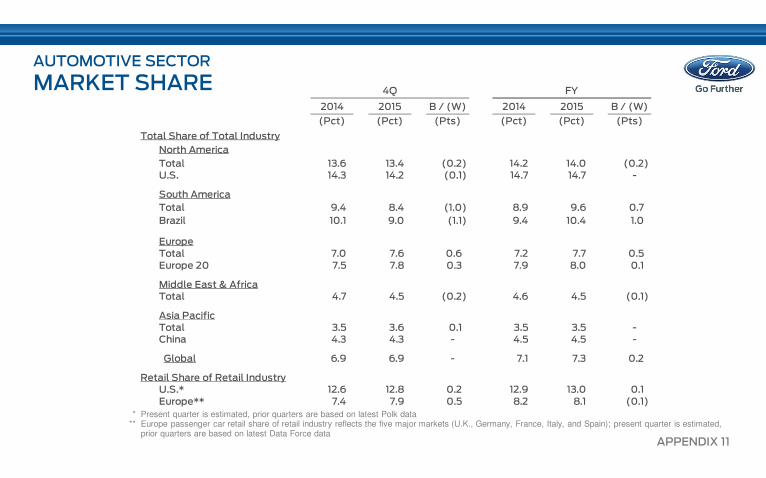
2014 2015 B / (W) 2014 2015 B / (W)
(Pct) (Pct) (Pts) (Pct) (Pct) (Pts)
Total Share of Total Industry
North America
Total 13.6 13.4 (0.2) 14.2 14.0 (0.2) U.S. 14.3 14.2 (0.1) 14.7 14.7 -
South America
Total 9.4 8.4 (1.0) 8.9 9.6 0.7
Brazil 10.1 9.0 (1.1) 9.4 10.4 1.0
Europe
Total 7.0 7.6 0.6 7.2 7.7 0.5
Europe 20 7.5 7.8 0.3 7.9 8.0 0.1
Middle East & AfricaTotal 4.7 4.5 (0.2) 4.6 4.5 (0.1)
Asia Pacific
Total 3.5 3.6 0.1 3.5 3.5 - China 4.3 4.3 - 4.5 4.5 -
Global 6.9 6.9 - 7.1 7.3 0.2
Retail Share of Retail IndustryU.S.* 12.6 12.8 0.2 12.9 13.0 0.1
Europe** 7.4 7.9 0.5 8.2 8.1 (0.1)
4Q FY
AUTOMOTIVE SECTOR
MARKET SHARE
APPENDIX 11
* Present quarter is estimated, prior quarters are based on latest Polk data** Europe passenger car retail share of retail industry reflects the five major markets (U.K., Germany, France, Italy, and Spain); present quarter is estimated,
prior quarters are based on latest Data Force data
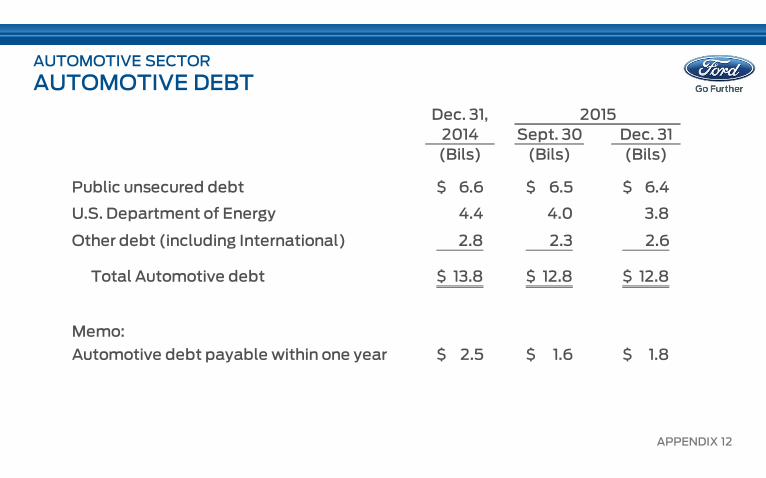
Dec. 31,
2014 Sept. 30 Dec. 31
(Bils) (Bils) (Bils)
Public unsecured debt 6.6$ 6.5$ 6.4$
U.S. Department of Energy 4.4 4.0 3.8
Other debt (including International) 2.8 2.3 2.6
Total Automotive debt 13.8$ 12.8$ 12.8$
Memo:
Automotive debt payable within one year 2.5$ 1.6$ 1.8$
2015
AUTOMOTIVE SECTOR
AUTOMOTIVE DEBT
APPENDIX 12
2014 2015 2014 2015
(Mils) (Mils) (Mils) (Mils)
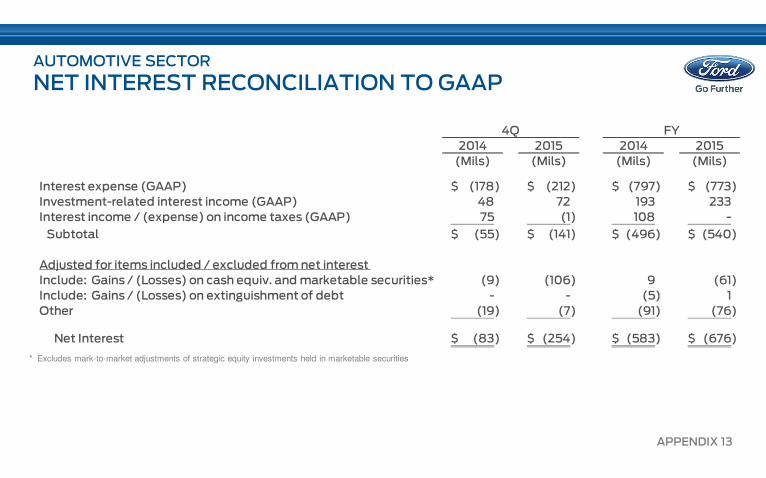
Interest expense (GAAP) (178)$ (212)$ (797)$ (773)$
Investment-related interest income (GAAP) 48 72 193 233
Interest income / (expense) on income taxes (GAAP) 75 (1) 108 -
Subtotal (55)$ (141)$ (496)$ (540)$
Adjusted for items included / excluded from net interest
Include: Gains / (Losses) on cash equiv. and marketable securities* (9) (106) 9 (61)
Include: Gains / (Losses) on extinguishment of debt - - (5) 1
Other (19) (7) (91) (76)
Net Interest (83)$ (254)$ (583)$ (676)$
4Q FY
AUTOMOTIVE SECTOR
NET INTEREST RECONCILIATION TO GAAP
APPENDIX 13
* Excludes mark-to-market adjustments of strategic equity investments held in marketable securities

2014 Sept. 30 Dec. 31
(Bils) (Bils) (Bils)
Cash and cash equivalents 4.6$ 7.8$ 5.4$
Marketable securities 17.1 14.4 18.2
Total cash and marketable securities (GAAP) 21.7$ 22.2$ 23.6$
Securities in transit* - - -
Cash 21.7$ 22.2$ 23.6$
Dec. 31 2015
AUTOMOTIVE SECTOR
CASH RECONCILIATION TO GAAP
APPENDIX 14
* The purchase or sale of marketable securities for which the cash settlement was not made by period end and the related payable or receivable remained on the balance sheet
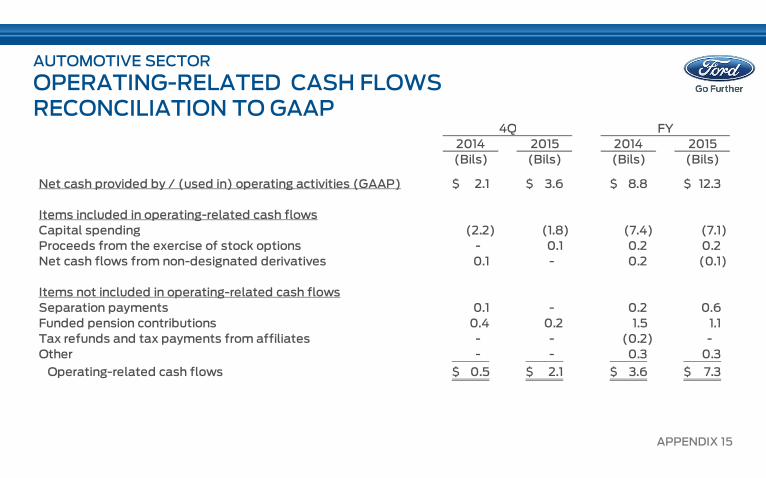
2014 2015 2014 2015
(Bils) (Bils) (Bils) (Bils)
Net cash provided by / (used in) operating activities (GAAP) 2.1$ 3.6$ 8.8$ 12.3$
Items included in operating-related cash flows
Capital spending (2.2) (1.8) (7.4) (7.1)
Proceeds from the exercise of stock options - 0.1 0.2 0.2
Net cash flows from non-designated derivatives 0.1 - 0.2 (0.1)
Items not included in operating-related cash flows
Separation payments 0.1 - 0.2 0.6
Funded pension contributions 0.4 0.2 1.5 1.1
Tax refunds and tax payments from affiliates - - (0.2) -
Other - - 0.3 0.3
Operating-related cash flows 0.5$ 2.1$ 3.6$ 7.3$
4Q FY
AUTOMOTIVE SECTOR
OPERATING-RELATED CASH FLOWSRECONCILIATION TO GAAP
APPENDIX 15
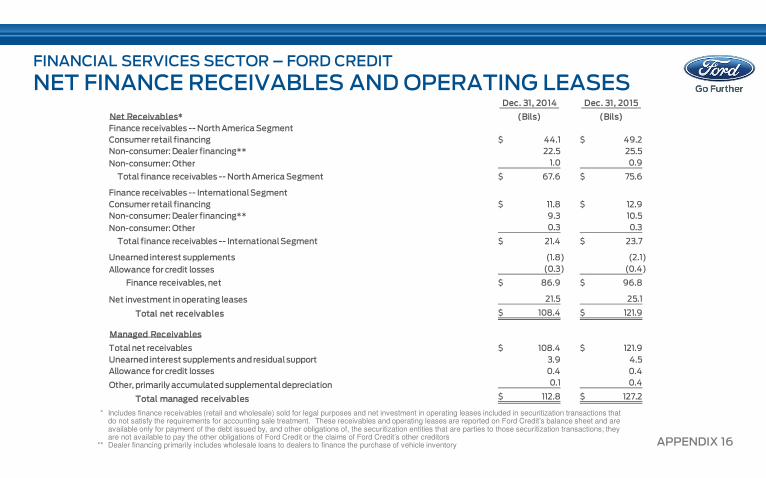
FINANCIAL SERVICES SECTOR – FORD CREDIT
NET FINANCE RECEIVABLES AND OPERATING LEASES
APPENDIX 16
Dec. 31, 2014 Dec. 31, 2015
Net Receivables* (Bils) (Bils)
Finance receivables -- North America Segment
Consumer retail financing 44.1$ 49.2$
Non-consumer: Dealer financing** 22.5 25.5
Non-consumer: Other 1.0 0.9
Total finance receivables -- North America Segment 67.6$ 75.6$
Finance receivables -- International Segment
Consumer retail financing 11.8$ 12.9$
Non-consumer: Dealer financing** 9.3 10.5
Non-consumer: Other 0.3 0.3
Total finance receivables -- International Segment 21.4$ 23.7$
Unearned interest supplements (1.8) (2.1)
Allowance for credit losses (0.3) (0.4)
Finance receivables, net 86.9$ 96.8$
Net investment in operating leases 21.5 25.1
Total net receivables 108.4$ 121.9$
Managed Receivables
Total net receivables 108.4$ 121.9$
Unearned interest supplements and residual support 3.9 4.5
Allowance for credit losses 0.4 0.4
Other, primarily accumulated supplemental depreciation 0.1 0.4
Total managed receivables 112.8$ 127.2$
* Includes finance receivables (retail and wholesale) sold for legal purposes and net investment in operating leases included in securitization transactions that do not satisfy the requirements for accounting sale treatment. These receivables and operating leases are reported on Ford Credit’s balance sheet and are available only for payment of the debt issued by, and other obligations of, the securitization entities that are parties to those securitization transactions; they are not available to pay the other obligations of Ford Credit or the claims of Ford Credit’s other creditors
** Dealer financing primarily includes wholesale loans to dealers to finance the purchase of vehicle inventory
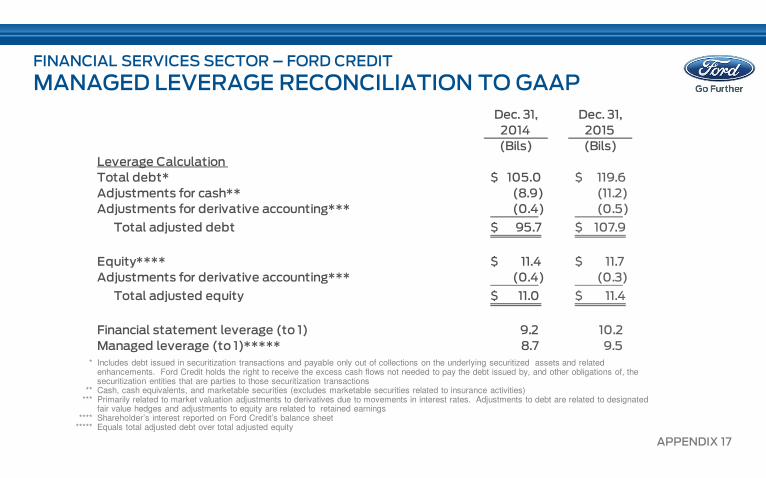
FINANCIAL SERVICES SECTOR – FORD CREDIT
MANAGED LEVERAGE RECONCILIATION TO GAAP
APPENDIX 17
Dec. 31, Dec. 31,
2014 2015
(Bils) (Bils)
Leverage Calculation
Total debt* $ 105.0 [ $ 119.6 ]
Adjustments for cash** (8.9) [ (11.2) ]
Adjustments for derivative accounting*** (0.4) [ (0.5) ]
Total adjusted debt $ 95.7 [ $ 107.9 ]
Equity**** $ 11.4 [ $ 11.7 ]
Adjustments for derivative accounting*** (0.4) [ (0.3) ]
Total adjusted equity $ 11.0 [ $ 11.4 ]
Financial statement leverage (to 1) 9.2 [ 10.2 ]
Managed leverage (to 1)***** 8.7 [ 9.5 ]
* Includes debt issued in securitization transactions and payable only out of collections on the underlying securitized assets and related enhancements. Ford Credit holds the right to receive the excess cash flows not needed to pay the debt issued by, and other obligations of, the securitization entities that are parties to those securitization transactions
** Cash, cash equivalents, and marketable securities (excludes marketable securities related to insurance activities)*** Primarily related to market valuation adjustments to derivatives due to movements in interest rates. Adjustments to debt are related to designated
fair value hedges and adjustments to equity are related to retained earnings**** Shareholder’s interest reported on Ford Credit’s balance sheet
***** Equals total adjusted debt over total adjusted equity

AUTOMOTIVE SECTOR – NORTH AMERICA
FY 2015 KEY METRICS COMPARED WITH 2014
3,0732,842
$91.9$82.4 10.2%
9.0%
$9,345
$7,443
20152014 20152014 20152014 20152014
Wholesales(000)
Revenue(Bils)
Operating Margin(Pct)
Pre-Tax Results(Mils)
FY 2014 2015
NA Industry (Mils) 20.2 21.5
NA Market Share 14.2% 14.0%
U.S. Industry (Mils) 16.8 17.8
U.S. Market Share 14.7% 14.7%
APPENDIX 18
AUTOMOTIVE SECTOR – NORTH AMERICA
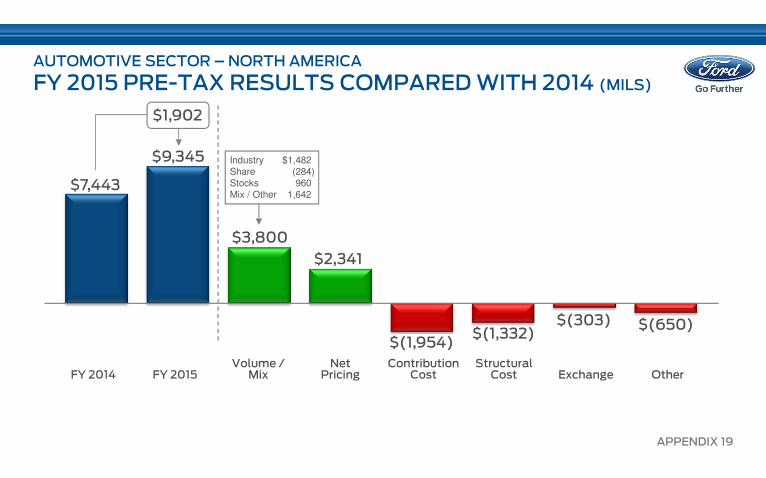
FY 2015 PRE-TAX RESULTS COMPARED WITH 2014 (MILS)
$7,443
$3,800
$2,341
$(1,332)$(303) $(650)
$9,345
$(1,954)
Industry $1,482Share (284)Stocks 960Mix / Other 1,642
FY 2015FY 2014Volume /
MixNet
PricingStructural
Cost Exchange OtherContribution
Cost
APPENDIX 19
$1,902
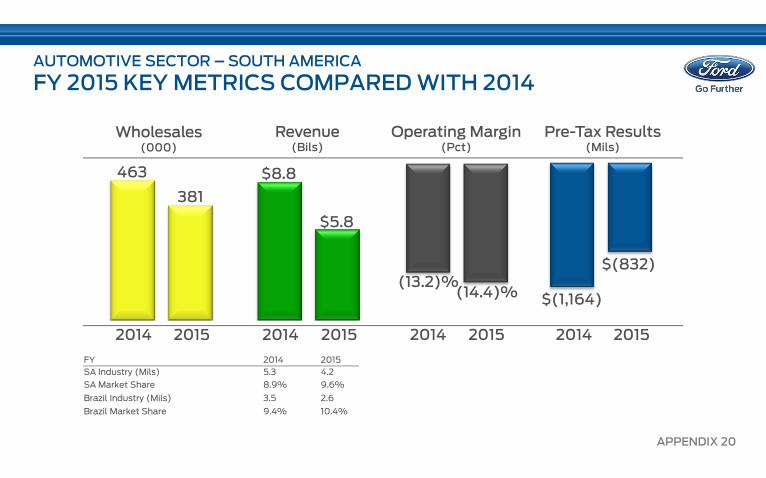
AUTOMOTIVE SECTOR – SOUTH AMERICA
FY 2015 KEY METRICS COMPARED WITH 2014
381
463
$5.8
$8.8
(14.4)%(13.2)%
$(832)
$(1,164)
20152014 20152014 20152014 20152014
Wholesales(000)
Revenue(Bils)
Operating Margin(Pct)
Pre-Tax Results(Mils)
FY 2014 2015
SA Industry (Mils) 5.3 4.2
SA Market Share 8.9% 9.6%
Brazil Industry (Mils) 3.5 2.6
Brazil Market Share 9.4% 10.4%
APPENDIX 20
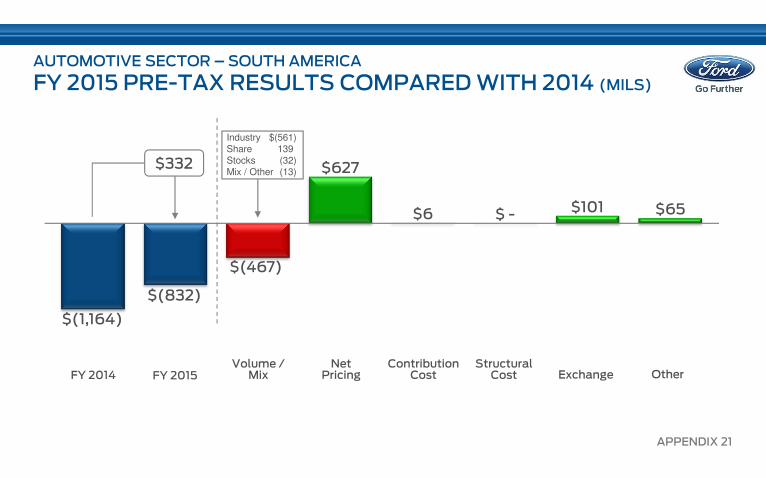
$(1,164)
Industry $(561)Share 139Stocks (32)Mix / Other (13)
AUTOMOTIVE SECTOR – SOUTH AMERICA
FY 2015 PRE-TAX RESULTS COMPARED WITH 2014 (MILS)
$(832)
$(467)
$627
$ - $101 $65$6
FY 2015FY 2014Volume /
MixNet
PricingStructural
Cost ExchangeContribution
Cost
$332
Other
APPENDIX 21
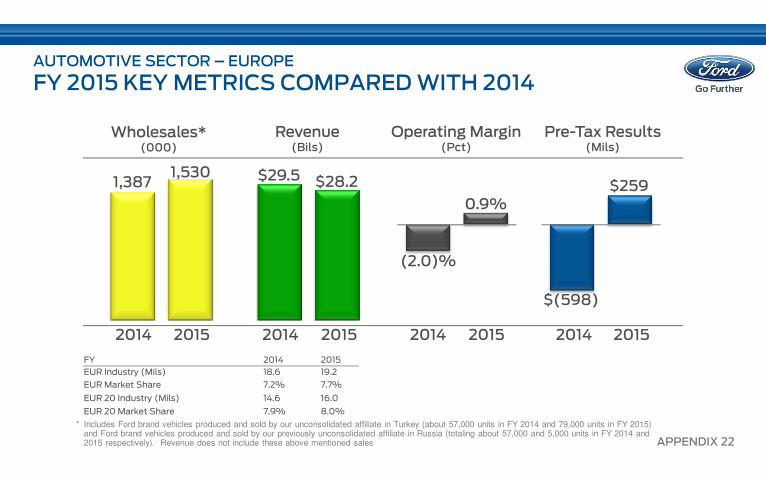
AUTOMOTIVE SECTOR – EUROPE
FY 2015 KEY METRICS COMPARED WITH 2014
1,5301,387 $28.2$29.5
0.9%
(2.0)%
$259
$(598)
20152014 20152014 20152014 20152014
Wholesales*(000)
Revenue(Bils)
Operating Margin(Pct)
Pre-Tax Results(Mils)
FY 2014 2015
EUR Industry (Mils) 18.6 19.2
EUR Market Share 7.2% 7.7%
EUR 20 Industry (Mils) 14.6 16.0
EUR 20 Market Share 7.9% 8.0%
* Includes Ford brand vehicles produced and sold by our unconsolidated affiliate in Turkey (about 57,000 units in FY 2014 and 79,000 units in FY 2015) and Ford brand vehicles produced and sold by our previously unconsolidated affiliate in Russia (totaling about 57,000 and 5,000 units in FY 2014 and 2015 respectively). Revenue does not include these above mentioned sales APPENDIX 22
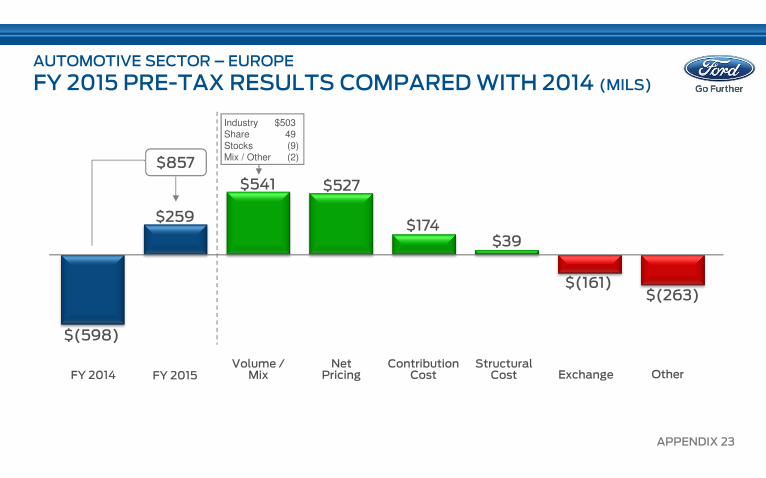
AUTOMOTIVE SECTOR – EUROPE
FY 2015 PRE-TAX RESULTS COMPARED WITH 2014 (MILS)
$(598)
$259
$541 $527
$174$39
$(161)
Industry $503Share 49Stocks (9)Mix / Other (2)
$(263)
FY 2015FY 2014Volume /
MixNet
PricingStructural
Cost ExchangeContribution
Cost Other
$857
APPENDIX 23

AUTOMOTIVE SECTOR –MIDDLE EAST & AFRICA
FY 2015 KEY METRICS COMPARED WITH 2014
187192
$4.0$4.4
0.8%
(0.5)%
$31
$(20)
20152014 20152014 20152014 20152014
Wholesales(000)
Revenue(Bils)
Operating Margin(Pct)
Pre-Tax Results(Mils)
FY 2014 2015
MEA Industry (Mils) 4.3 4.3
MEA Market Share 4.6% 4.5%
APPENDIX 24
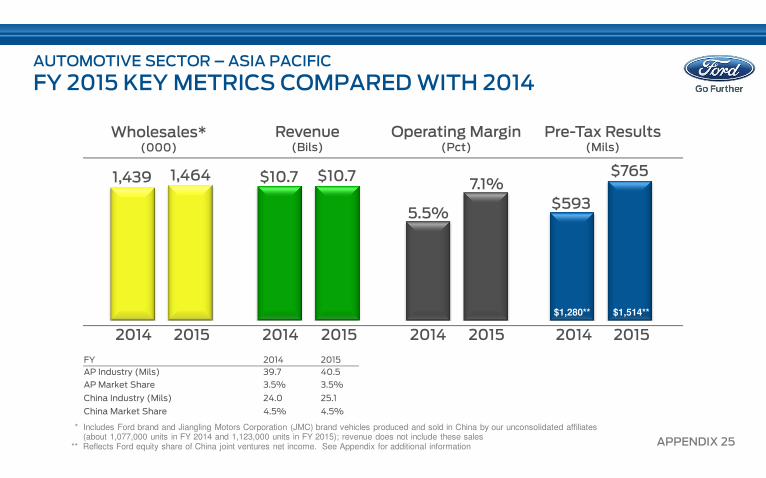
AUTOMOTIVE SECTOR – ASIA PACIFIC
FY 2015 KEY METRICS COMPARED WITH 2014
1,4641,439 $10.7$10.7 7.1%
5.5%
$765
$593
20152014 20152014 20152014 20152014
Wholesales*(000)
Revenue(Bils)
Operating Margin(Pct)
Pre-Tax Results(Mils)
FY 2014 2015
AP Industry (Mils) 39.7 40.5
AP Market Share 3.5% 3.5%
China Industry (Mils) 24.0 25.1
China Market Share 4.5% 4.5%
* Includes Ford brand and Jiangling Motors Corporation (JMC) brand vehicles produced and sold in China by our unconsolidated affiliates(about 1,077,000 units in FY 2014 and 1,123,000 units in FY 2015); revenue does not include these sales
** Reflects Ford equity share of China joint ventures net income. See Appendix for additional information
$1,280** $1,514**
APPENDIX 25
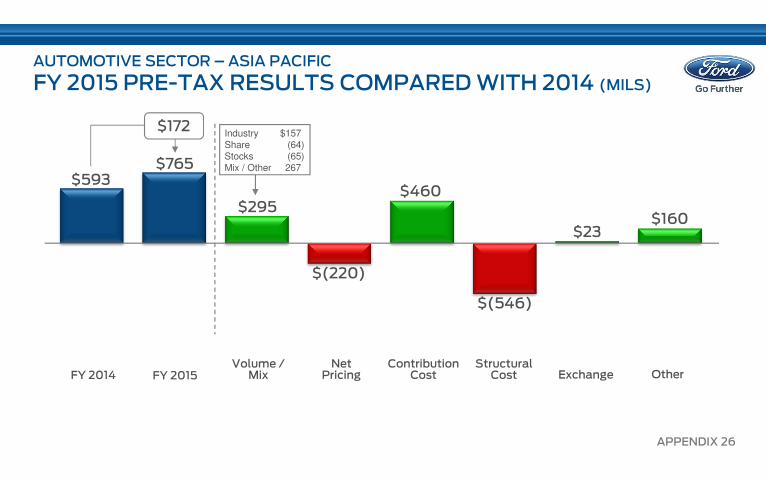
$(546)
$160
$593
$23
$765
$460
Industry $157Share (64)Stocks (65)Mix / Other 267
$(220)
$295
AUTOMOTIVE SECTOR – ASIA PACIFIC
FY 2015 PRE-TAX RESULTS COMPARED WITH 2014 (MILS)
FY 2015FY 2014Volume /
MixNet
PricingStructural
Cost ExchangeContribution
Cost Other
APPENDIX 26
$172

2014 2015 2014 2015
China Unconsolidated Affiliates
Wholesales (000) 291 340 1,077 1,123
Ford Equity Income (Mils)* 323$ 490$ 1,280$ 1,514$
4Q FY
AUTOMOTIVE SECTOR – ASIA PACIFIC
CHINA UNCONSOLIDATED AFFILIATES
APPENDIX 27
* Ford equity share of China joint ventures net income
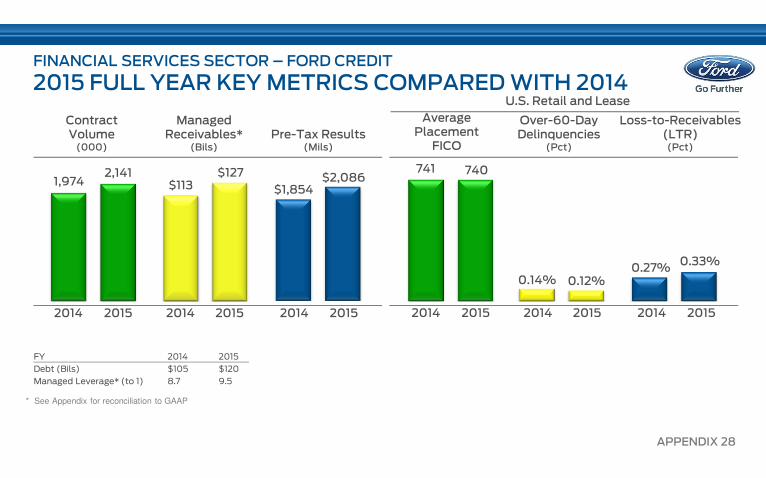
FINANCIAL SERVICES SECTOR – FORD CREDIT
2015 FULL YEAR KEY METRICS COMPARED WITH 2014
APPENDIX 28
2,1411,974 $2,086
$1,854
Managed Receivables*
(Bils)
Contract Volume(000)
Pre-Tax Results(Mils)
$113$127
20152014 20152014 20152014
FY 2014 2015
Debt (Bils) $105 $120
Managed Leverage* (to 1) 8.7 9.5
Over-60-DayDelinquencies
(Pct)
Average Placement
FICO
Loss-to-Receivables (LTR)(Pct)
740741
0.12%0.14%0.27%
0.33%
20152014 20152014 20152014
U.S. Retail and Lease
* See Appendix for reconciliation to GAAP
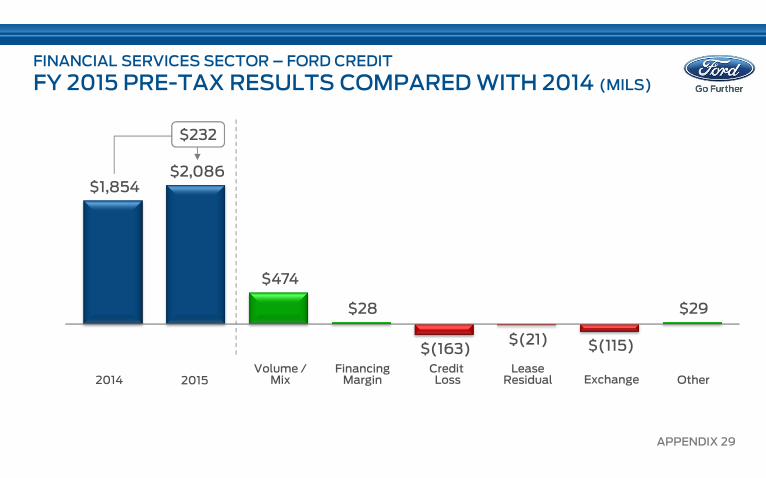
$1,854 $2,086
$474
$28
$(163)$(21) $(115)
$29
FINANCIAL SERVICES SECTOR – FORD CREDIT
FY 2015 PRE-TAX RESULTS COMPARED WITH 2014 (MILS)
20152014Volume /
MixFinancing Margin
Lease Residual Exchange Other
CreditLoss
$232
APPENDIX 29
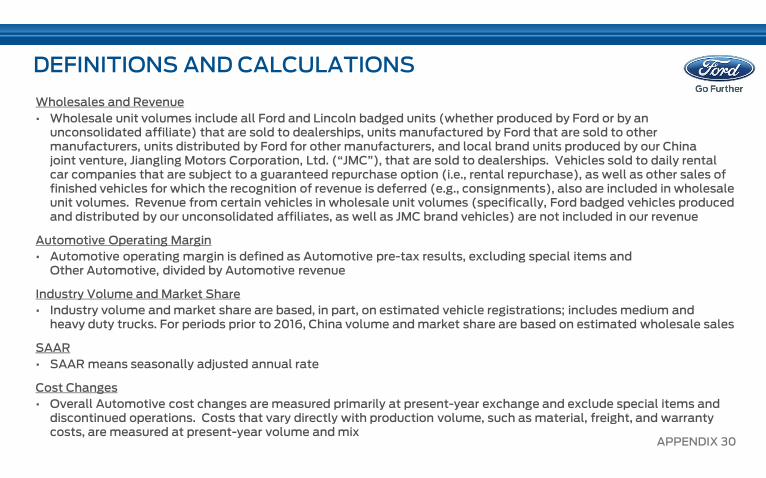
DEFINITIONS AND CALCULATIONS
Wholesales and Revenue
• Wholesale unit volumes include all Ford and Lincoln badged units (whether produced by Ford or by an unconsolidated affiliate) that are sold to dealerships, units manufactured by Ford that are sold to other manufacturers, units distributed by Ford for other manufacturers, and local brand units produced by our China joint venture, Jiangling Motors Corporation, Ltd. (“JMC”), that are sold to dealerships. Vehicles sold to daily rental car companies that are subject to a guaranteed repurchase option (i.e., rental repurchase), as well as other sales of finished vehicles for which the recognition of revenue is deferred (e.g., consignments), also are included in wholesale unit volumes. Revenue from certain vehicles in wholesale unit volumes (specifically, Ford badged vehicles produced and distributed by our unconsolidated affiliates, as well as JMC brand vehicles) are not included in our revenue
Automotive Operating Margin
• Automotive operating margin is defined as Automotive pre-tax results, excluding special items and Other Automotive, divided by Automotive revenue
Industry Volume and Market Share
• Industry volume and market share are based, in part, on estimated vehicle registrations; includes medium and heavy duty trucks. For periods prior to 2016, China volume and market share are based on estimated wholesale sales
SAAR
• SAAR means seasonally adjusted annual rate
Cost Changes
• Overall Automotive cost changes are measured primarily at present-year exchange and exclude special items and discontinued operations. Costs that vary directly with production volume, such as material, freight, and warranty costs, are measured at present-year volume and mix
APPENDIX 30