SQUID
BASS STRAIT
TASMANIA
MARINE SEISMIC SURVEY
1981
202C01
FINAL REPORT
SQUID
MARINE SEISMIC SURVEY
1981
TASMANIA
PERMIT T-15/P
for
WEAVER OIL AND GAS CORPORATION, AUSTRALIA5599 SAN FELIPE, SUITE 1100
HOUSTON, TEXAS 77056-2795
and
109 ST. GEORGE'S TERRACE, 16TH FLOORPERTH, (W.A.) AUSTRALIA 6000
by
WESTERN GEOPHYSICAL COMPANY OF AMERICA10001 RICHMOND AVENUE
HOUSTON, TEXASPARTY 86 M/V WESTERN ODYSSEY
Submitted byWeaver Oil and Gas Corporation
Houston, Texas
202C02
202(:03
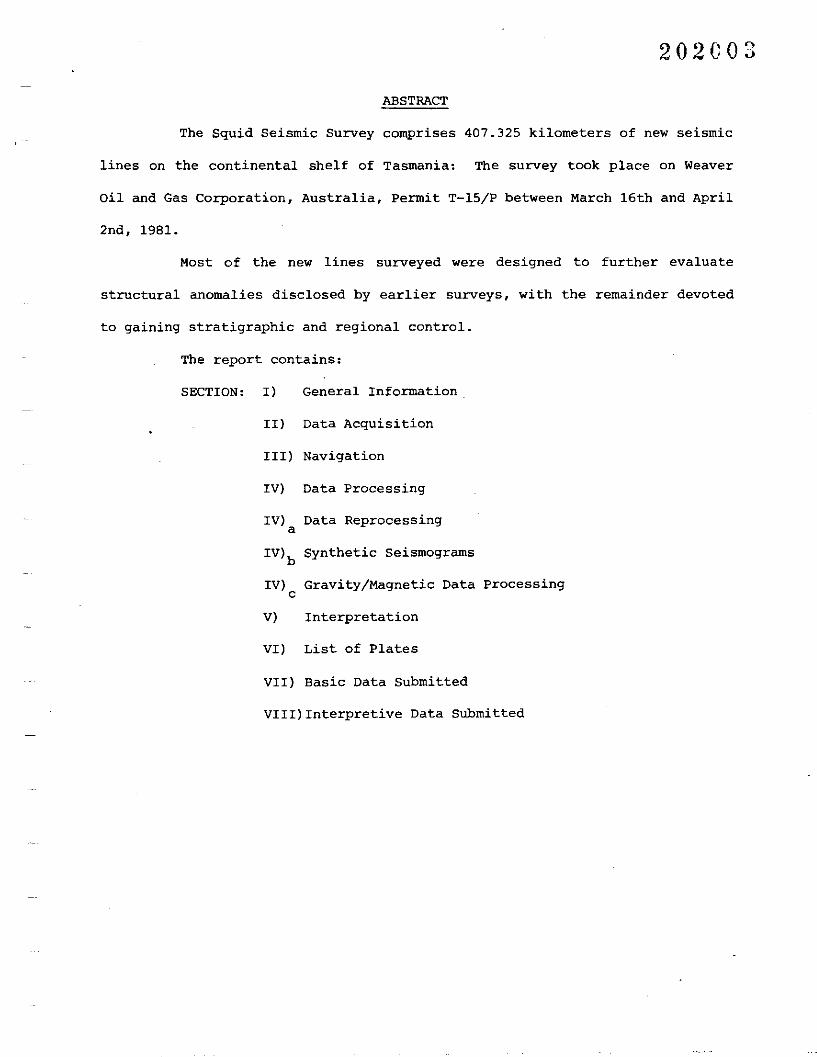
ABSTRACT
The Squid Seismic Survey comprises 407.325 kilometers of new seismic
lines on the continental shelf of Tasmania: The survey took place on Weaver
Oil and Gas Corporation, Australia, Permit T-15/P between March 16th and April
2nd, 1981.
Most of the new lines surveyed were designed to further evaluate
structural anomalies disclosed by earlier surveys, with the remainder devoted
to gaining stratigraphic and regional control.
The report contains:
SECTION: I) General Information.
II) Data Acquisition
III) Navigation
IV) Data Processing
IV) Data Reprocessinga
IV)b Synthetic Seismograms
IV) Gravity/Magnetic Data Processingc
V) Interpretation
VI) List of Plates
VII) Basic Data Submitted
VIII)Interpretive Data Submitted
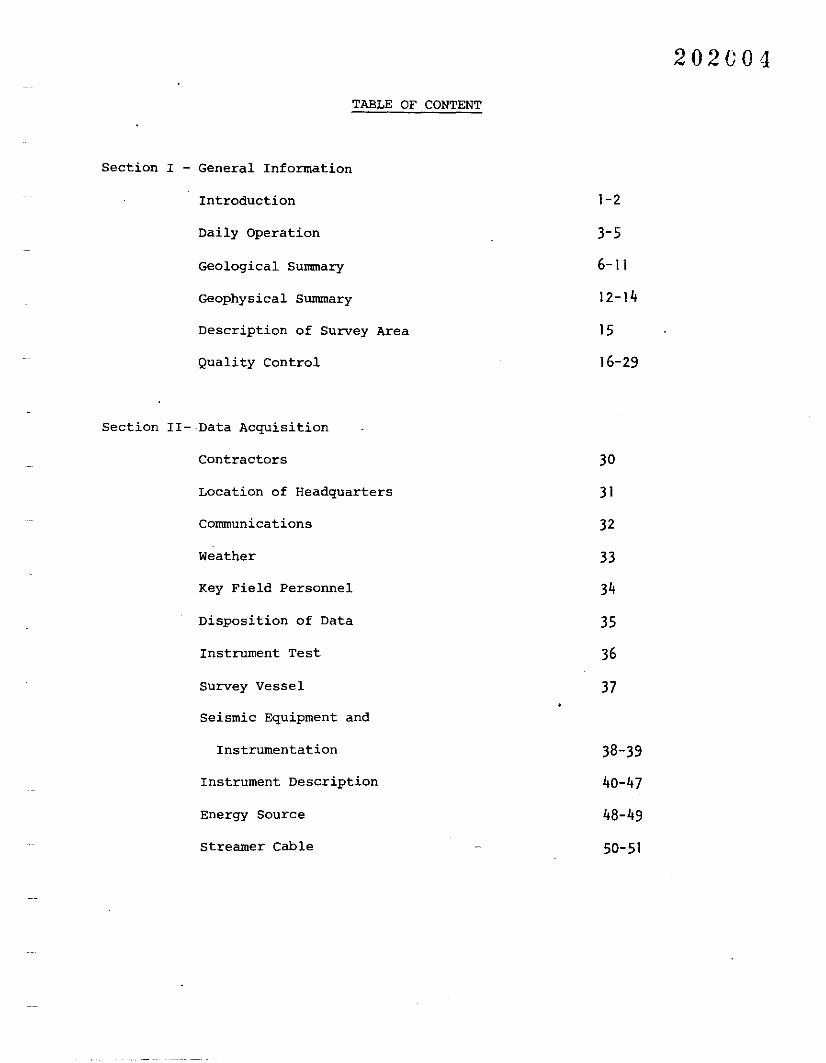
TABLE OF CONTENT
Section I - General Information
Introduction
Daily Operation
Geological Summary
Geophysical Summary
Description of Survey Area
Quality Control
Section II-Data Acquisition
Contractors
Location of Headquarters
Communications
Weather
Key Field Personnel
Disposition of Data
Instrument Test
Survey Vessel
Seismic Equipment and
Instrumentation
Instrument Description
Energy Source
Streamer Cable
1-2
3-5
6-11
12-14
15
16-29
30
31
32
33
34
35
36
37
38-39
40-47
48-49
50-51
202C04
Instrument Settings and
Specifications
Cable Parameters
Airgun Configuration
Statistical Summary
Line SUIllIlIary
section III-Navigation
Navigation System
Doppler Sonar Subsystem
Velocity Resolution and Compensation
Satellite Subsystem
Computer and Peripheral Equipment
Survey Operation
Section IV- Data processing
General
Introduction
EDIT
preprocessor/Deconvolution
Velocity Analysis
NMO and CDP
RAP Process
Migration after stack
Time Variant Filtering
Conclusion
52-53
54
55
56
57-60
61
61-62
62
62-63
63-64
64
65
66
67
68
69
70
71
72
73
74
202005
Section IV -Data Reprocessinga
Introduction
Reflection Strength
weighted Average Frequency
Apparent Polarity
Instantaneous Phase
Instantaneous Frequency
Instantaneous Velocity
Datumization
Section IVb~synthetic Seismograms
Introduction
Section IV -Gravity/Magnetic Data Processingc
Reformat of Navigation Edit Tape
Gravity/Magnetic Edit
Evaluation of Field Data
Navigation Reformat
Navigation Merge
Eotvos Effect Removal
Magnetics Reduction
Gravity and Magnetics Filter
Bouguer and Terrain Correction
Intersection Calculator
Systematic Error Adjustment
Gravity/Magnetic Profile
Map Maker
75
75-76
76
76-77
77
77-78
78
78-79
80
81
81-82
82
82
82
82
83
83
83
83
83
84
84
202C06
Final Adjustment and Contouring
of Maps
Final Profiles and Contour Maps
Gravity and Magnetic Contour Maps
Final Profiles
84
85
85
85
202C07
Section V-Interpretation
General 86
Map Horizons 86
Structural Features of Interest: 86
.Squid Anomaly 87
Chat Anomaly 87
Sea Eagle Anomaly 87
Curlew Anomaly 87
Shearwater Anomaly 87
Section VI-List of Plates
Section VII-Basic Data Submitted
Section VIII-Interpretive Data Submitted
SECTION I
General Information:
Introduction
Daily Operation
Geological Summary
Geophysical Summary
Description of Survey Area
Quality Control
1-2
3-5
6-11
12-14
15
16-29
202008
202C09
GENERAL INFORMATION
Introduction
The 1981 Squid Seismic Survey was conducted on Exploration Permit
T-15/P which was awarded on February 19th, 1980 to Weaver Oil and Gas
Corporation, Australia.
The M/V Western ODYSSEY, a fully equipped seismic vessel operated by
Western Geophysical Company of America, was used to conduct the survey. Some
407.325 kilometers (252.1 miles) of new seismic, gravity and magnetic data
were recorded.
The navigation system. consisted of Western Geophysical's Western
Integrated Navigation System which comprises four main subsystems; a
doppler-sonar system to determine the ship's velocity continuously; a
satellite system to provide the ship's position at intervals averaging two to
four hours, a digital computer and a recording system to record computer data.
Calculations, for all subsystems and data integration were handled by the
on-board general purpose digital computer. The ship's position was
continuously calculated by integrating the sonar velocity and updating with
satellite fixes. The navigation data was shipped to Western Geophysical's
Navigation Department in Singapore for processing.
Seismic recordings were made with a DFS "V" seismic acquisition
system - manufactured by Texas Instruments - consisting of two analog modules,
a controller module and four tape transports.
The digital recorded magnetic tapes were shipped to Western
Geophysical Company in Houston, Texas for disposition to the nominated
processing center.
-1-
The energy source c~nsisted of twenty high pressure Western airguns.
In normal operating circumstances, ten of the airguns were combined to form a
560 cubic inches tuned array. The airguns are operated at a pressure of 5,000
pounds per square inch.
The streamer cable used by the Western ODYSSEY was composed of 48
detachable and interchangeable LRS Marine Active Cable sections. Each section
is 50 meters in length and contains two 25 meter groups of twenty WM2-036
geophones.
Gravity data was acquired with a La Coste Romberg meter while
magnetic data was acquired with a Geometries G80l/3 meter.
Interpretations, of this data were made at Weaver Oil and Gas
corporation, Australia offices in Houston, Texas.
Field tapes and processing tapes are presently at Western
Geophysical's processing center in Houston, Texas and will later be stored at
Geodata Services, Inc. in Houston, Texas.
-2-
202C11
DAILY OPERATIONS
Field supervision was provided by Mr. Jack Downing, Vice President -
Geophysics, Weaver Oil and Gas Corporation, Australia, and Mr. W. Sleator,
Geophysical Consultant, based in Australia. The activities were coordinated
through Mr. David C. Lowry, Consulting Petroleum Geologist and Manager of
Weaver Oil and Gas Corporation, Australia in Perth.
r
!)
I.J
,, 1
iJ
,I Itei
, ,j)l~
i j
DATE
March 16
March 17
March 18
March 19
202012
EVENT
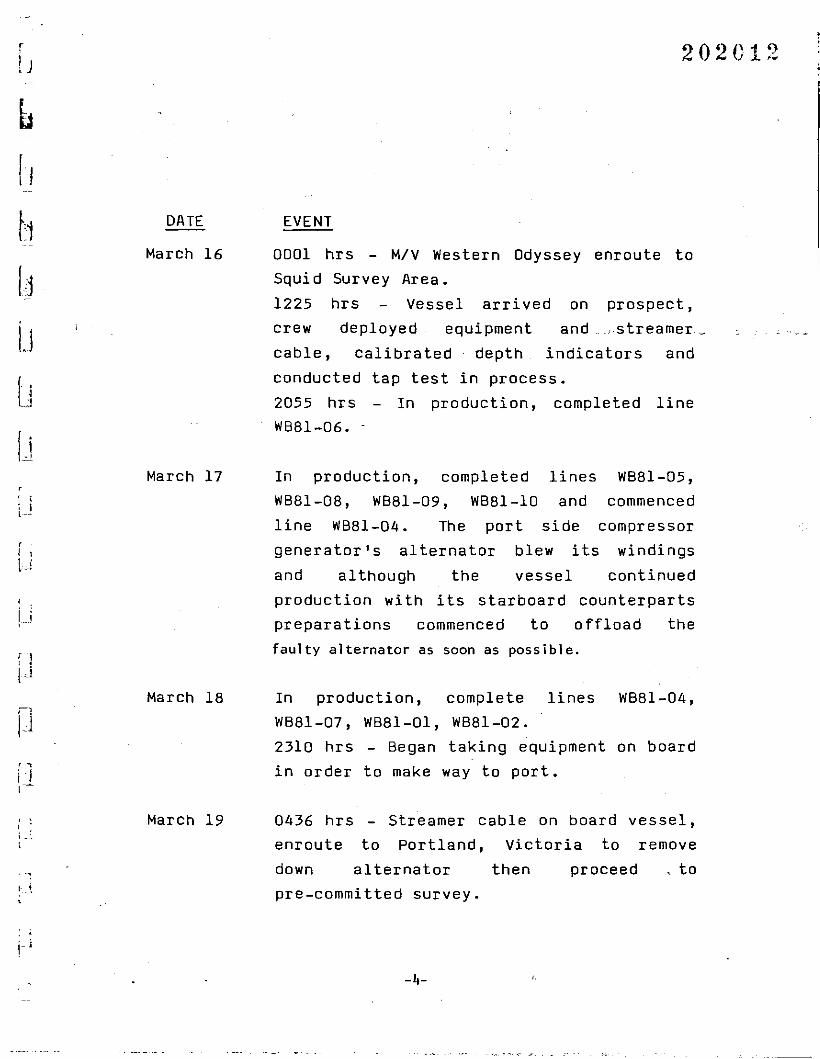
0001 hrs - M/V Western Odyssey enroute toSquid Survey Area.
1225 hrs Vessel arrived on prospect,crew deployed equipment and ... ,.streamer_
cable, calibrated depth indicators and
conducted tap test in process.
2055 hrs - In production, completed lineWB81-06. -
In production, completed lines WB81-05,
WB81-08, WB81-09, WB81-10 and commenced
line WB81-04. The port side compressor
generator's alternator blew its windings
and although the vessel continued
production with its starboard counterparts
preparations commenced to offload the
faulty alternator as soon as possible.
In production, complete lines WB81-04,
WB81-07, WB81-01, WB81-02.
2310 hrs - Began taking equipment on board
in order to make way to port.
0436 hrs - Streamer cable on board vessel,
enroute to Portland, Victoria to remove
down al ternator then proceed . to
pre-committed survey.
-4-
, f'.: :- ~ -- :. ~
. ", ., .
April 1
April 2
202C13
0001 hr s - Vessel enroute to Squi d Surveyarea.
0825 hrs Vessel arrived on prospect,crew began deploying cable, changed out
lead-in, calibrated depth indicators andconducted tap test in process.1920 hrs - In production on line WB81-03.
In production, completed line WB81-03.
202014
GEOLOGICAL SUMMARY
The Squid Marine Seismic Survey took place in the central area of
the Bass Basin.
The Bass Basin is located offshore between the southern coast of
Victoria and the northern coast of Tasmania. It is bounded to the west by
King Island and to the east by Flinders Island and the Basin Rise. Water
depth throughout the basin rarely exceeds 270 feet (82 meters) . The area has
been actively explored for-hydrocarbons since-1963.
The oldest sedimentary rocks encountered while drilling are Early
Cretaceous. However, the great~st volume of sediments accumulated during the
Tertiary Lithologies vary from continental sandstone, siltstone, shale and
coal in the nonmarine Cretaceous to middle Eocene section, while the Upper
Eocene to recent section consists of shale, sandstone, marl mudstone and
limestone. Drilling and seismic data indicate that there was a considerable
amount of volcanic activity in the basin throughout its history.
-The southeastern area of the basin exhibits the earliest structural
growth whereas the structural growth in the central and northwestern areas
occurred later. Structural style also varies from tilted fault blocks with
thousands of feet of vertical displacement in the southeastern area, to low
relief small anticlinal folds and minor faults in the northwestern area. Most
of the prominent structural trends are oriented in a northwestern-southeastern
direction which is parallel or subparallel to the present basin axis.
-6-
202015
Stratigraphic control for the project area is provided by nine
wells, namely:
Pelican #1
Pelican #2
Pelican #3
Pelican #4
Poonboon #1
Dondu #1
Yurongi #1
Bass #2
Nangkero #1
In addition, nine wells drilled in the vicinity are considered
relevant and are included in this report. These are:
Durroon #1
Narimba #1
Tarook #lA
Aroo #1
Bass #1
Cormorant #1
Toolka #1
Konkon #1
Bass #3
The Pelican #1 well was drilled in 1970 to a measured depth of
10,428 feet (3,178.45 meters) penetrating a section ranging in age from Recent
to Upper Paleocene. The deep anticlinal closure was encountered as predicted.
The top of the Eocene Shale or Demons Bluff was intersected at 5,365 feet and
the top of the sand section at 5,760 feet. The first gas-condensate pay zone
-7-
202016
was encountered at 8,110 feet. A total of 12 sands are interpreted to contain
hydrocarbons. The sands below 9,822 feet were found to have abnormally high
pressures. Reservoir qualities of the sands within the Eocene Eastern View
Coal Measures section ·were found to be satisfactory in regards to porosities
and permeabilities. These sands were found to be separated and interbedded
with impermeable siltstones and shales capable of sealing the trap.
The Pelican #2 well was drilled in 1970 to a measured depth of
10.,066 feet
to Eocene.
(3,068.12 meters) penetfating· a section ranging.cin age, from Recent He'
The well was located 2.5 miles northwest of the Pelican #1
discovery well. The first overpressured sand was encountered at 9,779 feet.
Pelican #2. intersected numerous sands which are interpreted to contain
gas-condensate. sand bodies interpreted to contain hydrocarbons above 8,700
feet in the Pelican #1 well were either not present or water bearing in
Pelican #2. The first hydrocarbon bearing sand was recognized at 9,096 feet
and the well eventually bottomed in a high pressure zone without drilling
through the hydrocarbon column into water bearing formations.
The Pelican #3 well was drilled in 1972 to a measured depth of 9,537
feet (2,906.88 meters) penetrating a section ranging in age from Recent to
Paleocene. The prognozed pay section found in the Pelican #1 and #2 wells was
not encountered. However, minor gas shows were reported whilst drilling the
Paleocene section. Abnormal pressure was encountered at approximately 8,432
feet and the sands below this depth were tight.
The Pelican #4 well was drilled in 1979 to a measured depth of
10,009 feet (3,050.74 meters). Significant indications of hydrocarbons were
recorded from 8,950 feet to total depth.
The poonboon #1 well was drilled in 1972 to a measured depth of
10,715 feet (3,266 meters) penetrating a section ranging in age from Recent to
-8-
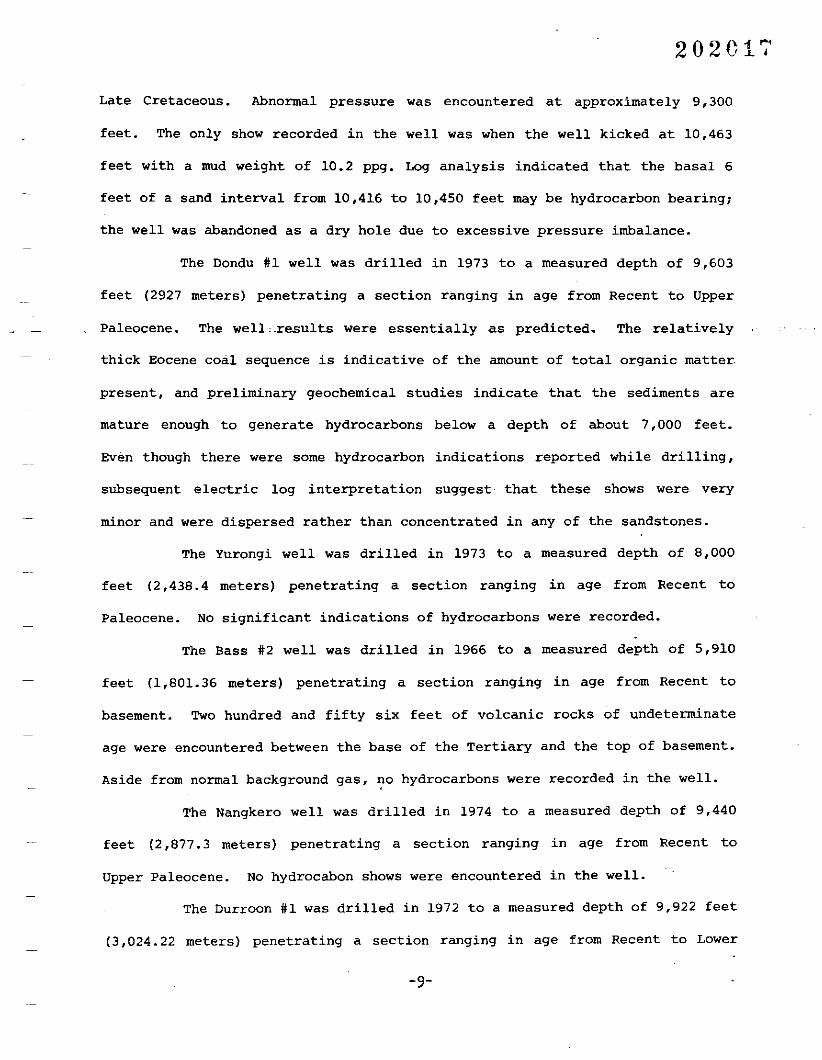
Late Cretaceous.
202017
Abnormal pressure was encountered at approximately 9,300
feet. The only show recorded in the well was when the well kicked at 10,463
feet with a mud weight of 10.2 ppg. Log analysis indicated that the basal 6
feet of a sand interval from 10,416 to 10,450 feet may be hydrocarbon bearing;
the well was abandoned as a dry hole due to excessive pressure imbalance.
The Dondu #1 well was drilled in 1973 to a measured depth of 9,603
feet (2927 meters) penetrating a section ranging in age from Recent to Upper
Paleocene. The well ~results were essentially as predicted. The relatively
thick Eocene coal sequence is indicative of the amount of total organic matter
present, and preliminary geochemical studies indicate that the sediments are
mature enough to generate hydrocarbons below a depth of about 7,000 feet.
Even though there were some hydrocarbon indications reported while drilling,
subsequent electric log interpretation suggest that these shows were very
minor and were dispersed rather than concentrated in any of the sandstones.
The Yurongi well was drilled in 1973 to a measured depth of 8,000
feet (2,438.4 meters) penetrating a section ranging in age from Recent to
Paleocene. No significant indications of hydrocarbons were recorded.
The Bass #2 well was drilled in 1966 to a measured depth of 5,910
feet (1,801.36 meters) penetrating a section ranging in age from Recent to
basement. Two hundred and fifty six feet of volcanic rocks of undeterminate
age were encountered between the base of the Tertiary and the top of basement.
Aside from normal background gas, ~o hydrocarbons were recorded in the well.
The Nangkero well was drilled in 1974 to a measured depth of 9,440
feet (2,877.3 meters) penetrating a section ranging in age from Recent to
Upper Paleocene. No hydrocabon shows were encountered in the well.
The Durroon #1 was drilled in 1972 to a measured depth of 9,922 feet
(3,024.22 meters) penetrating a section ranging in age from Recent to Lower
202018
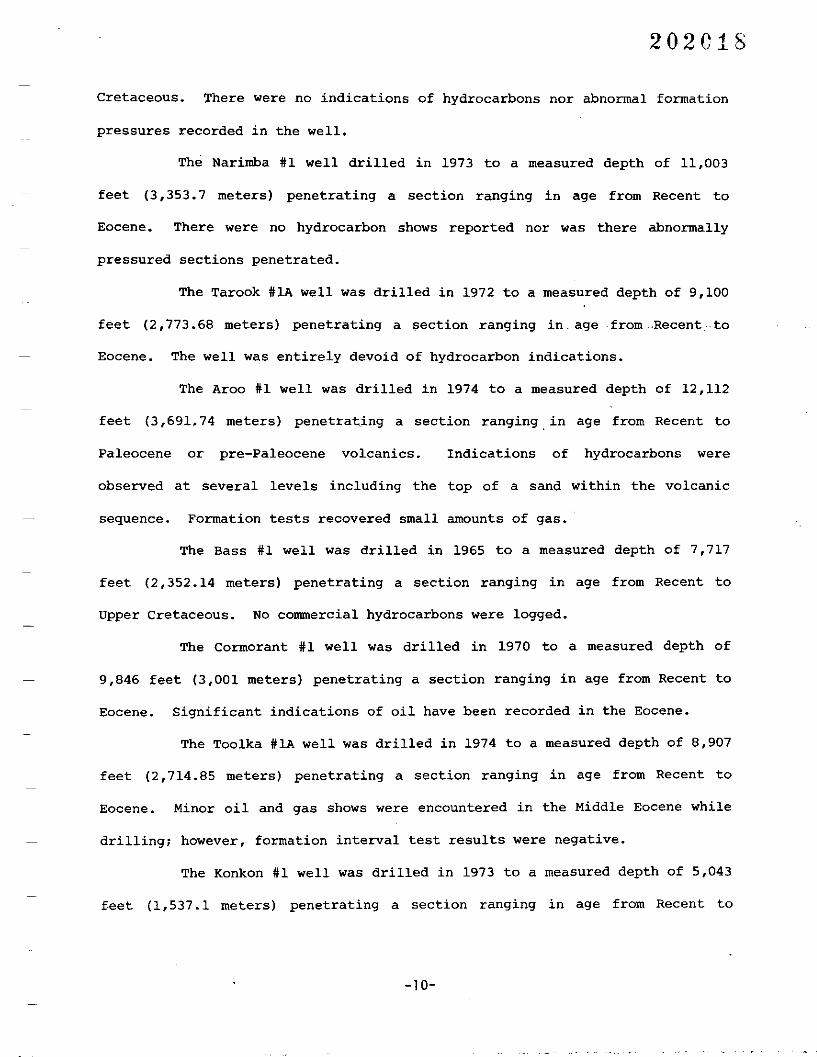
Cretaceous. There were no indications of hydrocarbons nor abnormal formation
pressures recorded in the well.
The Narimba #1 well drilled in 1973 to a measured depth of 11,003
feet (3,353.7 meters) penetrating a section ranging in age from Recent to
Eocene. There were no hydrocarbon shows reported nor was there abnormally
pressured sections penetrated.
The Tarook #lA well was drilled in 1972 to a measured depth of 9,100
feet (2,773.68 meters) penetrating a section ranging in. age from .Recent.to
Eocene. The well was entirely devoid of hydrocarbon indications.
The Aroo #1 well was drilled in 1974 to a measured depth of 12,112
feet (3,691.74 meters) penetrat.ing a section ranging. in age from Recent to
Paleocene or pre-Paleocene volcanics. Indications of hydrocarbons were
observed at several levels including the top of a sand within the volcanic
sequence. Formation tests recovered small amounts of gas.
The Bass #1 well was drilled in 1965 to a measured depth of 7,717
feet (2,352.14 meters) penetrating a section ranging in age from Recent to
Upper Cretaceous. No commercial hydrocarbons were logged.
The Cormorant #1 well was drilled in 1970 to a measured depth of
9,846 feet (3,001 meters) penetrating a section ranging in age from Recent to
Eocene. Significant indications of oil have been recorded in the Eocene.
The Toolka #lA well was drilled in 1974 to a measured depth of 8,907
feet (2,714.85 meters) penetrating a section ranging in age from Recent to
Eocene. Minor oil and gas shows were encountered in the Middle Eocene while
drilling; however, formation interval test results were negative.
The Konkon #1 well was drilled in 1973 to a measured depth of 5,043
feet (1,537.1 meters) penetrating a section ranging in age from Recent to
-10-
202C19
Lower Cretaceous. The well encountered the predicted sequence with no show of
oil or gas and was abandoned in highly altered volcanics.
The Bass #3 well was drilled in 1967 to a measured depth of 7,978
feet (2,431. 7 meters) penetrating a section ranging in age from Recent to
basement. Hydrocarbon indications were recorded while drilling and a
formation interval test recovered gas-condensate and water.
-11-
202020
GEOPHYSICAL SUMMARY
Design and location of the Squid Marine Seismic Survey was based on
the interpretation of seismic lines as well as magnetic and gravity data
previously acquired by the State, the Commonwealth, as well as by the permit
holders of the area. These surveys are:
Bass Stait and Encounter Bay aeromagnetic survey
for Hematite Exploration by Aero Services Limited
1960-1961
Anderson's Inlet aeromagnetic survey for Oil
Development by Aero Services Limited 1961
Flinders Island - Kingston seismic survey for
Hematite Exploration by Western Geophysical
1962-1963
Bass Basin seismic for Esso Australia by Western
Geophysical 1965
King Island East seismic survey for Esso Australia
by Geophysical Services International 1965
Tasmania aeromagnetic survey for the Bureau of
Mineral Resources by Aero Services Limited
1966
-12-
Eastern Bass Strait seismic survey for Esso
Australia by Geophysical Services International
1966
Bass ED-67 seismic survey for Esso Australia by
Geophysical Services International 1967
Bass EF-68 seismic survey for Esso Australia by
Western Geophysical 1968
Bass B69A seismic and magnetic survey for Esso
Australia by Western Geophysical 1968-1969
Bass B69B seismic and magnetic survey for Esso
Australia by Western Geophysical 1969
Bass B70A seismic and magnetic survey for Esso
Australia by Geophysical Services International
1970-1971
Bass B71A seismic and magnetic survey for Esso
Australia by Geophysical services International
1971-1972
Continental Margins Geophysical - seismic,
magnetic and gravity survey - for the Bureau of
Mineral Resources by GG 1971-1972
-13-
202021
Bass B72A seismic survey for Esso Australia
by Geophysical Services International 1972
Bass HB75A seismic survey for Hematite Petroleum
py Geophysical Services Internation~l 1975
-14-
202022
iI I j1
·
11
ri'1[J
0fJ-IJ
j nI
I J]IIi,! n,i
1.,
I f---
l : j·•1 •. '4
1
I -iJ, ,
1 ;. i'jIj f", ~]; I· .
- i i
202023
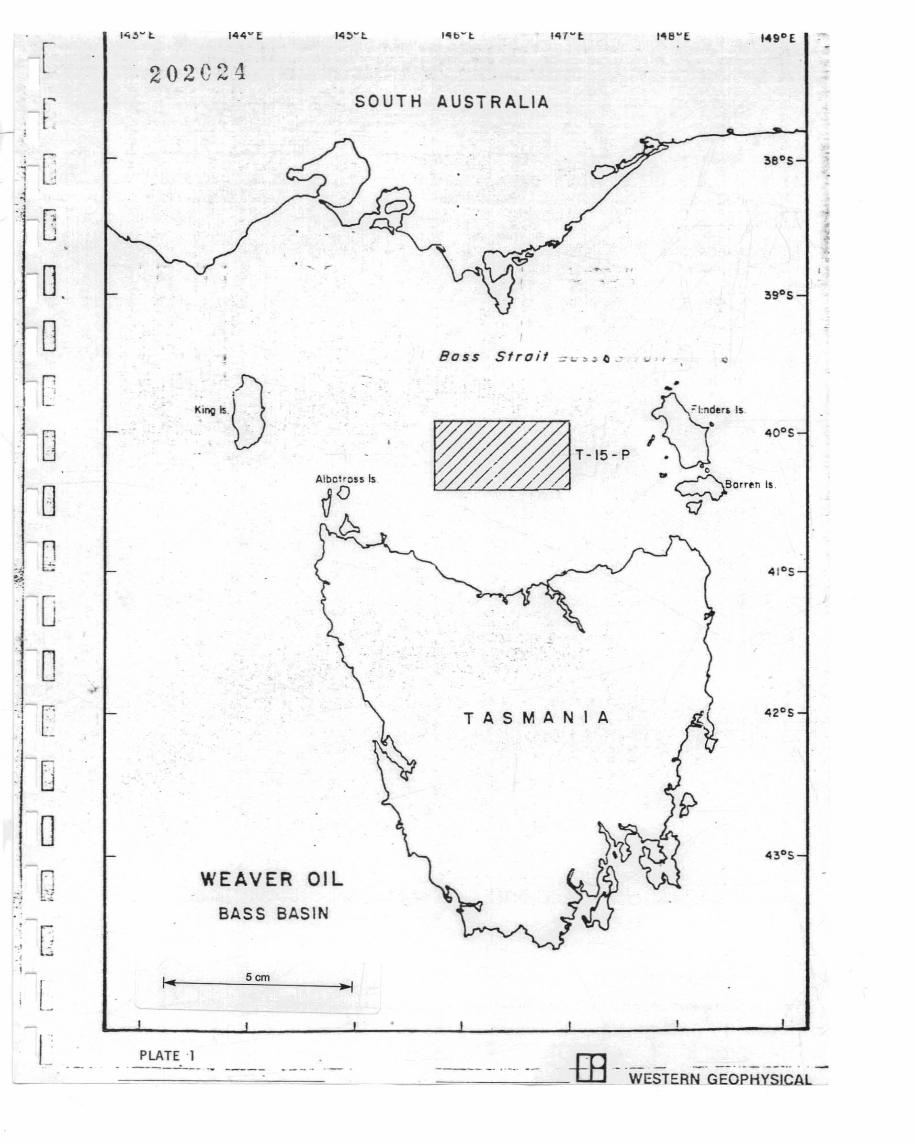
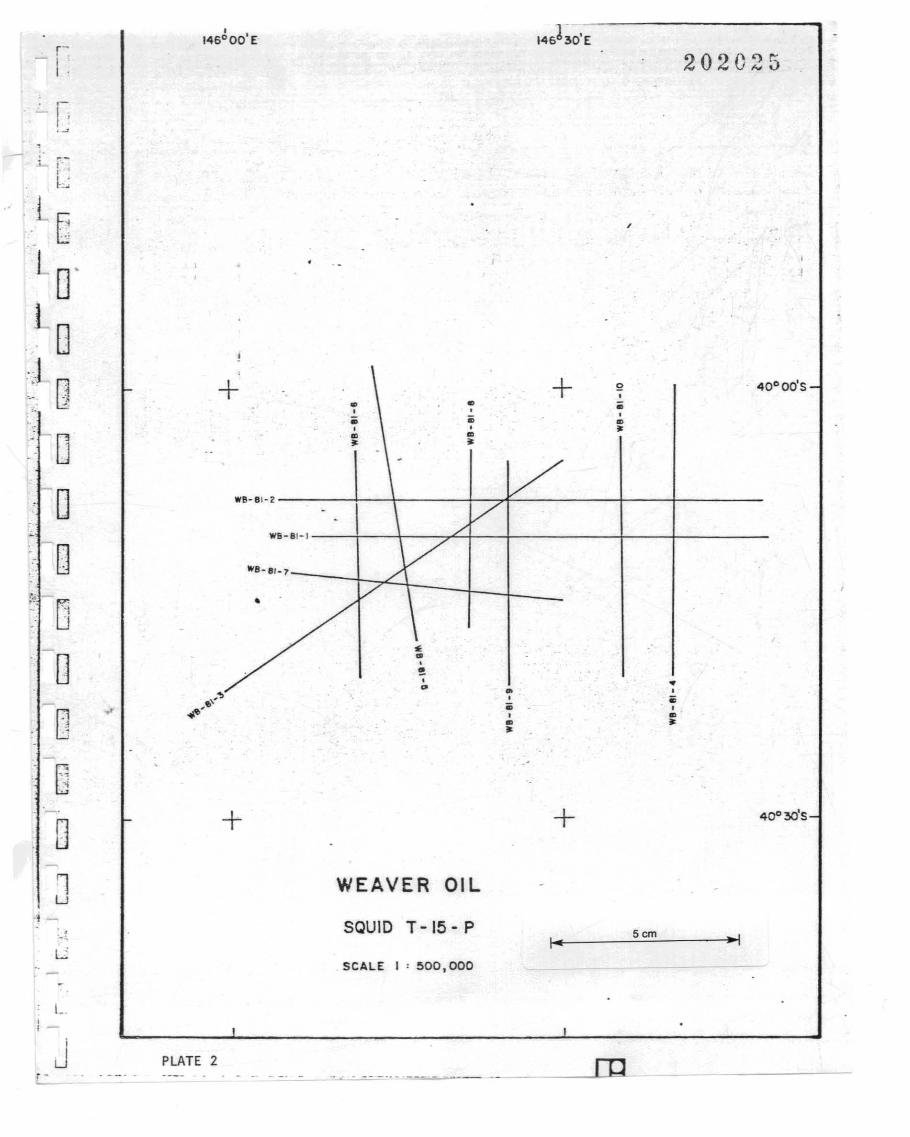
DESCRIPTION OF SURVEY AREA
The prospect was designed as T-15-P. The surveyI
consisted of 10 lines comprising'~a total assigned
program of 410 kilometers. The survey area is in the
WEAVER's Squid Survey area in the Bass Strait off the
coast of Victoria, Australia.
-15-
-f144"'[
202G24
1~7-l I~B-E
SOUTH AUSTRALIA
•
42°5
••
,0.~=1:,::". Is.
I~ 40°5
.. 0
c::;).Sorrf!n Is.
<cJ
_ ... - I'
T -15 - P
TASMANIA
Scm
WEAVER OIL
BASS BASIN
PLATE '1- .----=--- -...
,[r.~ --~
- I
'~G
-0-0-c·-0-0
-~-Q~- -~
'-0'--0. .
" [
oo
~
-' [J;-: -'"
.~ ~..~ lii_
:LI~
,1461~0'E146°00'E
~
r 202025I,
~ I ,,~
II
~~
B ,
L0'
0-1
D + + 40°00'5'. Q.... ,
m m iii.. , , ,iii iii m.. , ,
~
0m ..~ ~
·-0 W8-81~2
- I.- W8-8!-1
;~D"'8-81-7
~j -
G•
,.
0..,~, •.. .. •."" , iii..' iii ,
D." .... , .... ~
~
Q'.~.•--i
_.+ + 40°30'5
01u
l-
WEAVER OIL
SQUID T-15 - P Scm
SCALE I • 500,000
: L.,,-J
r----PLATE 2
',--,---,-=._" _.=~ -L...."..-
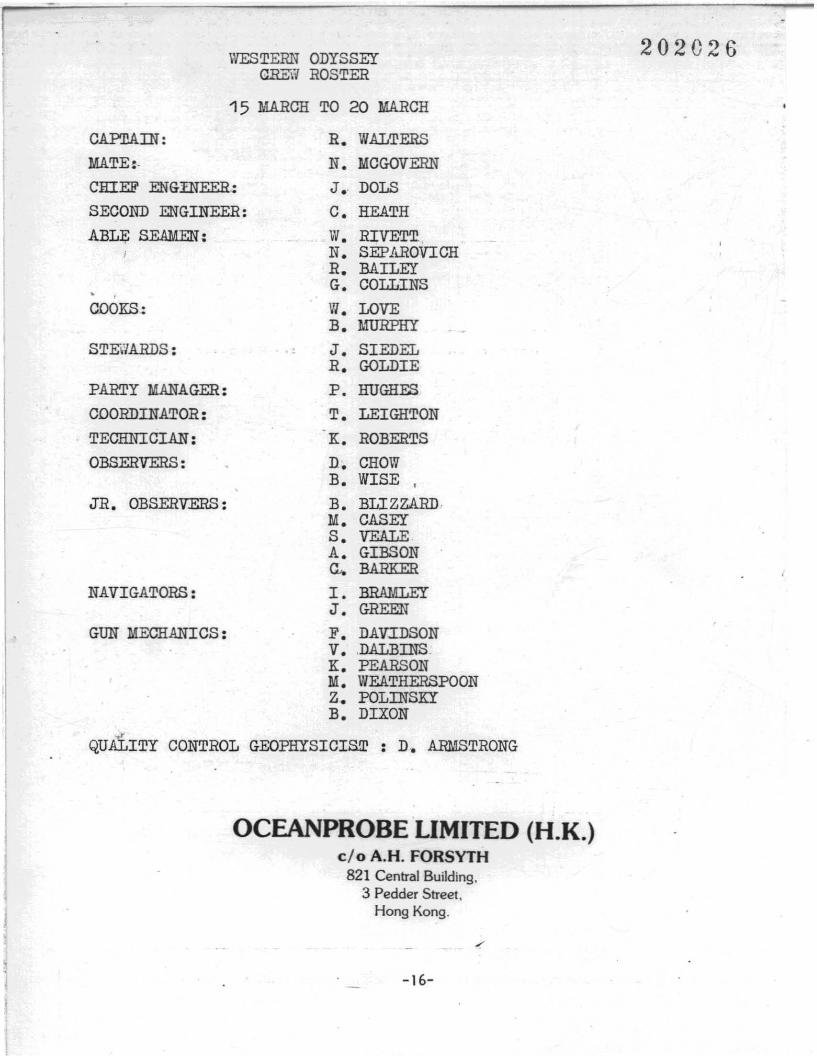
WESTERN ODYSSEYGREW ROSTER
202026
15 MARCH TO 20 MARCH
i
.,CDOKS~
GUN MECHANICS:
JR. OBSERVERS:
PARTY MANAGER:
CDORD.INATOR:
TECHNICIAN:
OBSERVERS:
R. WALTERS
N. MCGOVERN
J. DOLS
C. HEATH
W. RIVETT,N. SEPAROVICHR. BAILEYG. COLLINS
W. LOVEB. MURPHY
J. SIEDELR. GOLDIE
P. HUGHES
T. LEIGHTON
K. ROBERTS
D. CHOWB. WISE ,
B. BLIZZARDM. CASEYS. VEALEA. GIBSONc... BARKER
I. BRAMLEYJ. GREEN
F. DAVJ:DSONV•.DALBINS.K. PEARSONM. WEATHERSPOONZ. POLINSKYB. DIXON
QUALITY CONTROL GEOPHYSICIST : D. ARMSTRONG
CAP.nAIN:
MATE:·
CHIEF ENGINEER:
SECOND ENGINEER:
ABL~ SEAMEN:
NAVIGATORS:
STE\'1ARDS:
OCEANPROBE LIMITED (H.K.)c/o A.H. FORSYTH
821 Central Building.3 Pedder Street.
Hong Kong.
.l -16-
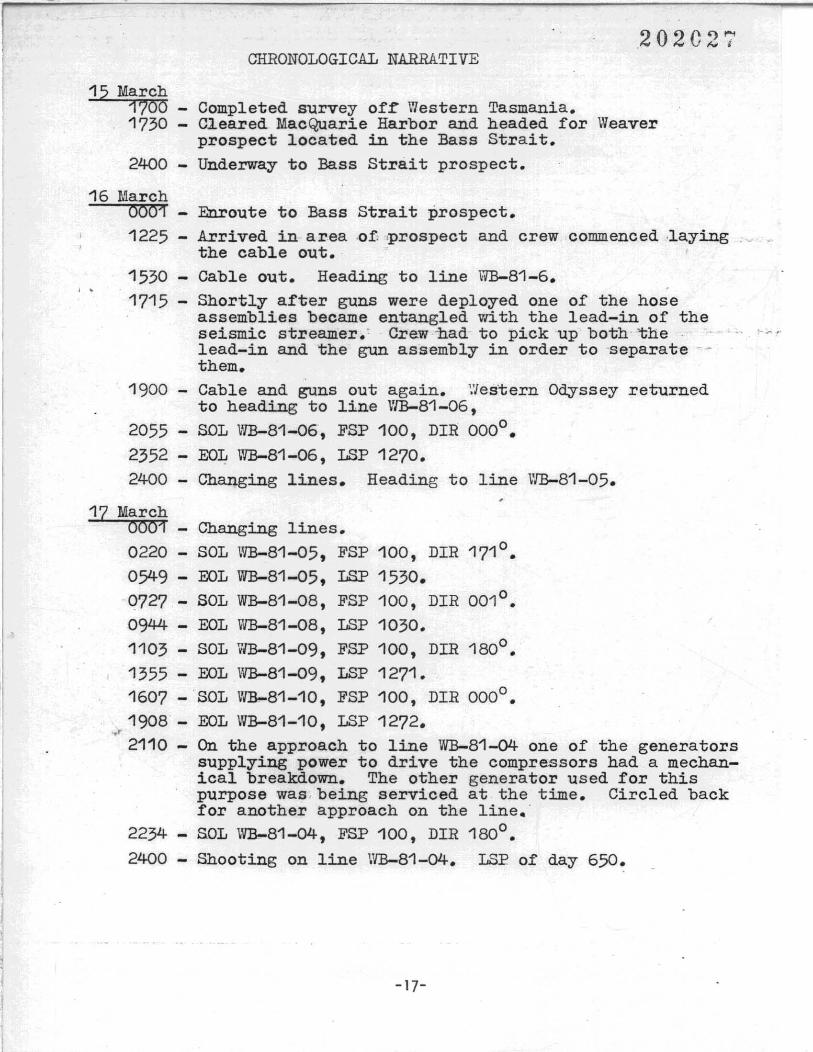
202027CHRONOLOGICAL NARRATIVE
15 March1700 - Completed survey of~ Western Tasmania.1730 - Cleared MacQuarie Harbor and headed for Weaver
prospect located in the Bass Strait.2400 - Underway to Bass Strait prospect.
.~ '- ... ,-
2055 23522400 -
16 March0001 - Enroute to Bass Strait prospect.1225 - Arrived in area ,o~ ~rospect and crew commenced ,laying
the cable out.1530 - Cable out. Heading to line ~81-6.
1715 - Shortly after guns were deployed one of the hoseassemblies became entangled with the lead-in of theseismic streamer.: Crew -had to pick up both' 'the 'lead-in and 'the gun assembly in order to 'separate them.
1900 - Cable and guns out again. ~es'tern Odyssey returnedto heading to line Vr.B-81-06,SOL \r.B-81-06, FSP 100, DIR 000°.EO!,. \r.B-81-06, LSP 1270.Changing lines. Heading to line Vr.B-81-05.
.,
17 March0001 Changing lines.0220 - SOL \r.B-81-05, FSP 100, DIR 171°.0549 - EOL WB-81-05, LSP 1530.
-0727 - SOL WB-81-08, FSP 100, DIR 001°.0944 - EOL WB-81-D8, LSP 1030.1103 SOL WB-81-09, FSP 100, DIR 180°.1355 - EOL Vffi-81-D9, LSP 1271.1607 -SOL WB-81-10, FSP 100, DIR 000°.1908- EOL \VB-81-10, LSP 1272•
.".
2110 - On the approach to line WB-81-Q4 one of the generatorssupplying power to drive the compressors had a mechanical breakdown. The other generator used for thispurpose was, being serviced at the time. Circled backfor another approach on the line.'
2234 - SOL \VB-81-04, FSP 100, DIR 180°.2400 Shooting on line WB-81-04. LSP of day 650.
-17-
J
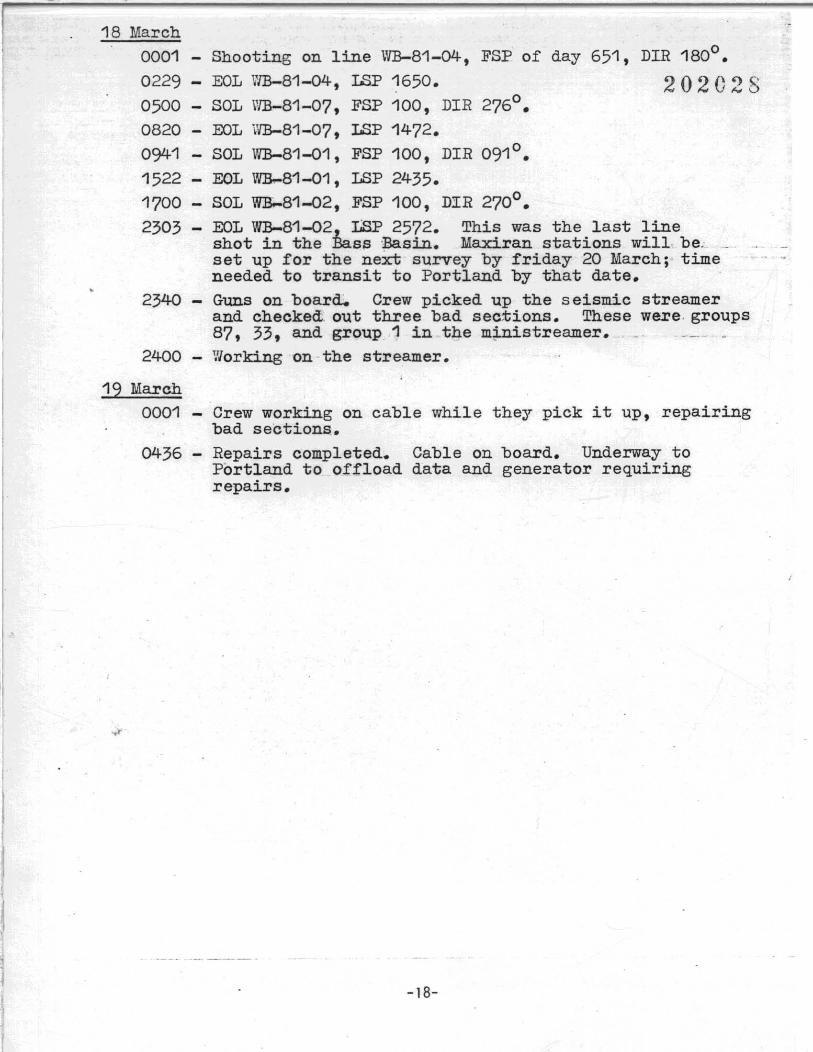
18 March0001 - Shooting on line \VB-81-04, FSP of day 651, DIR 180°.
0229 - EOL VlB-81-o4, LSP 1650. 202 C2 S0500 SOL WB-81-07, FSP 100, DIR 276°.0820 - EOL \VB-81-07, LSP 1472.0941 - SOL WB-81-o1, FSP 100, DIR 091 ° •1522 EOL \VB-81-01, LSP 2435.1700 - SOL WB.-81-o2, FSP 100, DIR 270°.2303 - EOL WB-81-o2 LSP 2572. This was the last line
shot in the Bass Basin. Maxiran stations will, be, _set up for the neXt survey by friday 20 March;' timeneeded to transit to Portland by that date.
2340 - Guns on boar~ Crew picked up the seismic streamerand checked out three bad sections. These were· groups87, 33, and group. 1 in the m~istreamer. _
2400 - Working on-the streamer.
19 March0001 - Crew working on cable while they pick it up, repairing
bad sections..0436 - Repairs completed. Cable on board. Underway to
Portland to offload data and generator requiringrepairs.
-18-
COMMENTS·202029
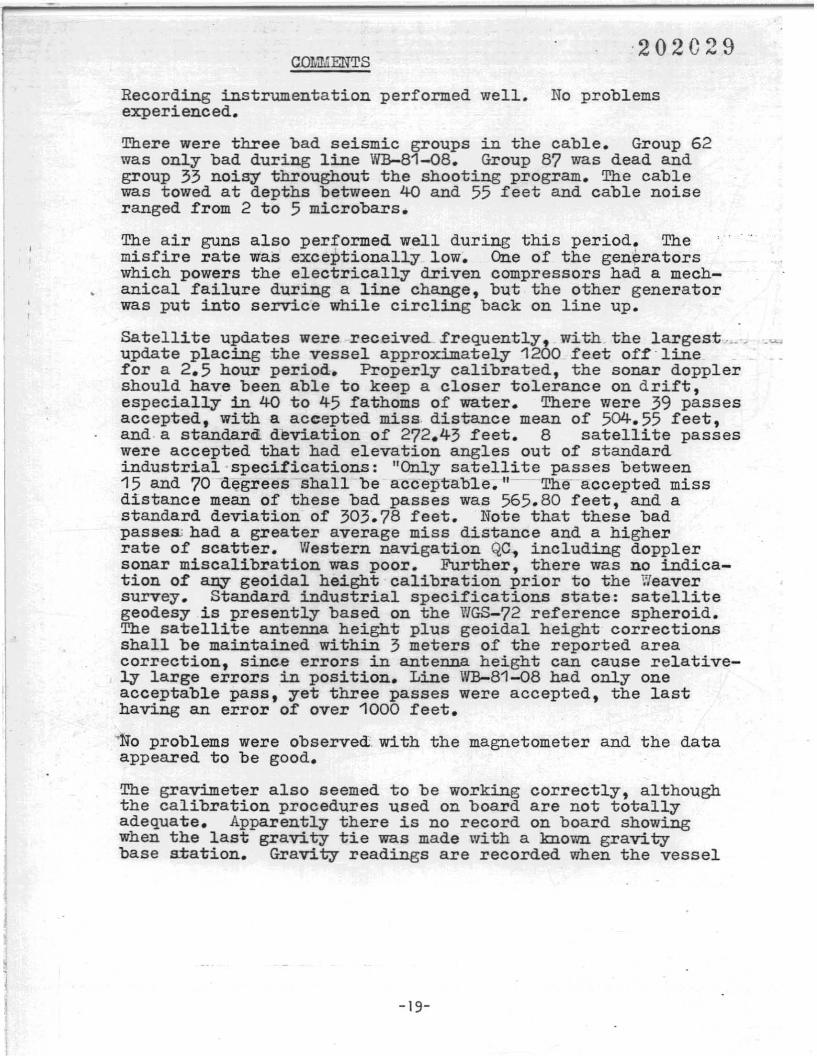
No problemsRecording instrumentation performed well.experienced.
There were three bad seismic groups in the cable. Group 62was only bad during line WB-81-08. Group 87 was dead andgroup 33 noisy throughout the shooting program. The cablewas towed at depths between 40 and 55 feet and cable noiseranged from 2 to 5 microbars.
The air guns also performed well during this period. Themisfire rate was exceptionally low. One of the generatorswhich powers the electrically driven compressors had a mechanical failure during a line change, but the other generatorwas put into service while circling back on line up.
Satellite updates were received...frequently! with the largest,.. _ .~.
update placing the vessel approximately 12uO .feet off' line ..for a 2.5 hour period. Properly calibrated, the sonar dopplershould have been able to keep a closer tolerance on drift,especially in 40 to 45 fathoms of water. There were 39 passesaccepted, with a accepted miss. distance mean of 504.55 .feet,and. a standard deviation of 272.43 .feet. 8 satellite passeswere accepted that had elevation angles out of standardindustrial'specifications: "Only satellite passes between15 and 70 degrees shall be acceptable. ,,- The accepted missdistance mean of these bad passes was 565.80 feet, and astandard deviation of 303.78 feet. Note that these badpasseahad a greater average miss distance and a higherrate of scatter. Western navigation QC, including dopplersonar miscalibration was poor. Further, there was no indication of any geoidal height calibration prior to the ~eaver
survey. Standard industrial specifications state: satellitegeodesy is presently based on the WGS-72 reference spheroid.The satellite antenna height plus geoidal height correctionsshall be maintained within 3 meters of the reported areacorrection, sinc~ errors in antenna height can cause relatively large errors in position. Line IYB-81-Q8 had only oneacceptable pass, yet three passes were accepted, the lasthaving an error of over 1000 feet.
~o problems were observed. with the magnetometer and the dataappeared to be good.
The gravimeter also seemed to be working correctly, althoughthe calibration procedures used on board are not totallyadequate. Apparently there is no record on board showingwhen the last gravity tie was made with a known gravitybase station. Gravity readings are recorded when the vessel
-19-
202030is in port for short periods to determine drift, scalefactor or bias. However, the vessel rarely enters thesame ports which makes it difficult to even measure thelong-term meter drift rate. It is recommended that a portable gravity meter be standard equipment on board enablinga base tie to be made whenever possible.
Seismic data quality overall was good.
It is recommended that for any seismic data collectiontask, regardless of the contractor or area, a qualifiedprofessional quality control geophysicist be engaged tosupervise and control those surveys. A. seismic contractor'sprimary goal is to lmake money. -Be-·assured- this -goal~Wil1.·supercede any quality control goals in every case-unless.the client is represented during the survey.
-20-
. . --
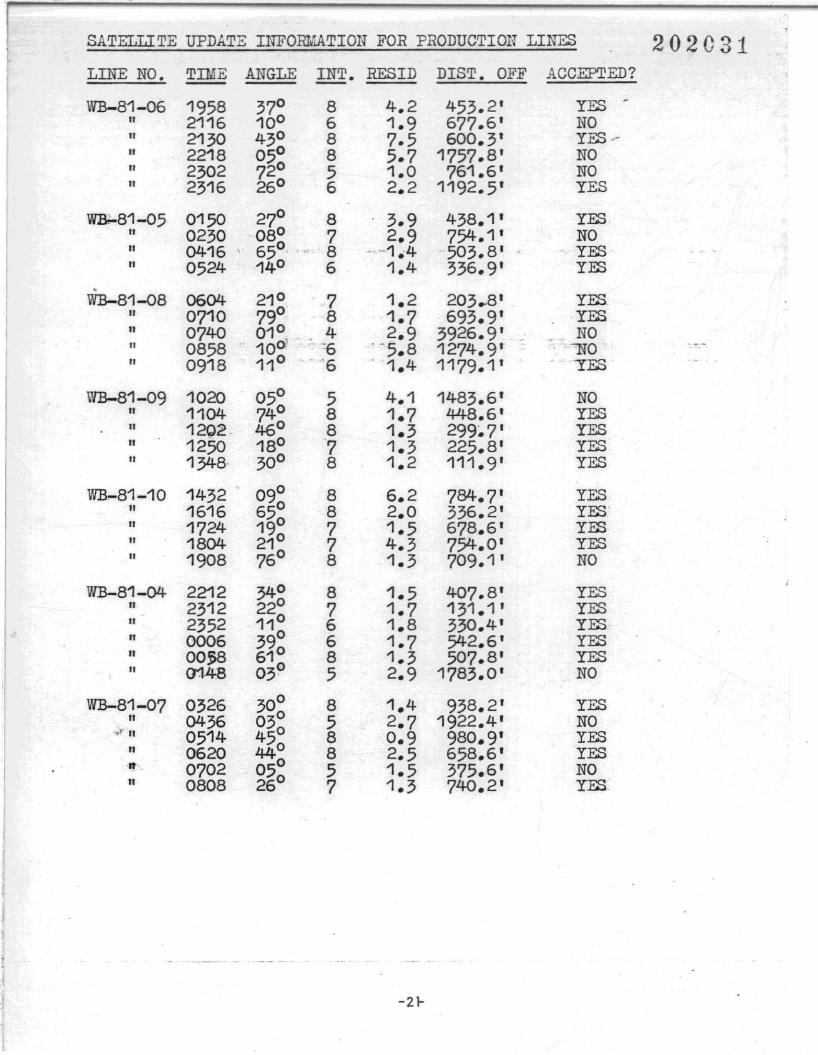
SATELLITE UPDATE INFOm~TION FOR PRODUCTION LINES 202031LINE NO. TIME ANGLE INT. RESID DIST. OFF ACCEPTED?
WB-81-06 1958 37° 8 4.2 453.2' YES -" 2116 10° 6 1.9 677.6' NOII 2130 43° 8 7.5 600.3' YES~II 2218 05° 8 5.7 1757.8' NOII 2302 72° 5 1.0 761.6' NOII 2316 26° 6 2.2 1192.5' YES
WB;-81-05 0150 27° 8 3.9 438.1' YESII 0230 08° 7 2.9 754.1 ' NOII 0416 65° ,. 8 -- -1 ..4 503.8' YESII 0524 14° 6 1.4 336.9' YES
.WB-81-08 0604 21° 7 1.2 203..8' YES,
II 0710 79° 8 1.7 693.9' YESII 0740 01° 4 2.9 3926.9' NO
100' -II 0858 " ~6 ' -5.8 1274.9' ""NOII 0918 11° - '6 ' 1.4 1179.1' 'YES
\'1:6-81-09 1020 05° 5 4.1 1483.6' NOII 1104 74° 8 1.7 448.6' YESII 1202 46° 8 1.3 299~7' YESII 1250 18° -7 1.3 225.8' YESII 1348 30° 8 1.2 111.9' YES
WB-81-10 1432 09° 8 6.2 784.7' YESII 1616 65° 8 2.0 336.2' YES'II 1724 19° 7 1.5 678.6' YESII 1804 21° 7 4.3 754.0' YESII 1908 76° 8 1.3 709.1 ' NO
WB-81-04 2212 34° 8 1.5 407.8' YES" 2312 22° 7 1.7 131.1 ' YES" 2352 11° 6 1.8 330.4' YESII 0006 39° 6 1.7 542.6' YESII
OO~ 61° 8 1.3 507.8' YESII 0148 03? 5 2.9 1783.0' NO
WB-81-07 0326 30° 8 1.4 938.2' YESII 0436 03° 5 2.7 1922.4' NO
.... " 0514 45° 8 0.9 980.9' YESII 0620 44° 8 2.5 658.6' YES'It _ 0702 05° 5 1.5 375.6' NO" 0808 26° 7 1.3 740.2' YES
-2l-
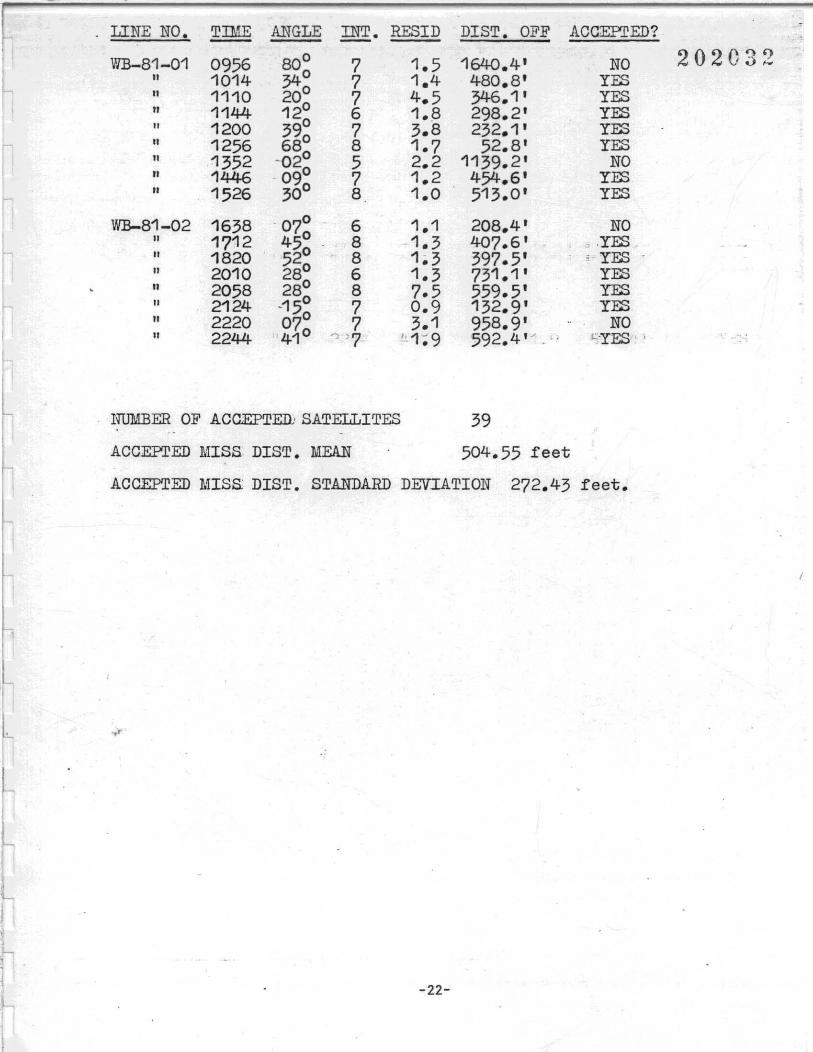
LINE NO. TIME ANGLE INT. RESID DIST. OFF ACCEPl'ED?
WB-81-01 0956 80° 7 1.5 1640.4-' NO 20203211 1014- 34-0 7 1.4- 4-80.8' YES11 1110 20° 7 4-.5 34-6.1 ' YES11 1144- 12° 6 1.~ 298.2' YES" 1200 39° 7 3.8 232.1' YES" 1256 68° 8 1.7 52.8' YES11 1352 -02° 5 2.2 1139.2' NO11 14-4-6 09° 7 1.2 4-54-.6' YES" 1526 30° 8 1.0 513.0' YES
WB-81-02 1638 07° 6 1.1 208.4' NO" 1712 4-5° 8 -1.3 4-07.6' ,YES11 1820 '52° 8 1.3 397.5' ,·YES11 2010 28° 6 1.3 731.1 ' YES11 2058 28° 8 7.5 559.5' YES11 2124 -150
7 0.9 132.9' YES11 2220 07° 7 3.1 958.9' NO" 2244- 41° ,., "7 "1-9 592.4" - - , 'O-YES..- .
NUMBER OF ACCEPTED} SATELLITES
ACCEPl'ED MISS DIST. MEAN
39
504.55 feet
ACCEPTED MISS DIST. STANDARD DEVIATION 272.43 feet.
-22-
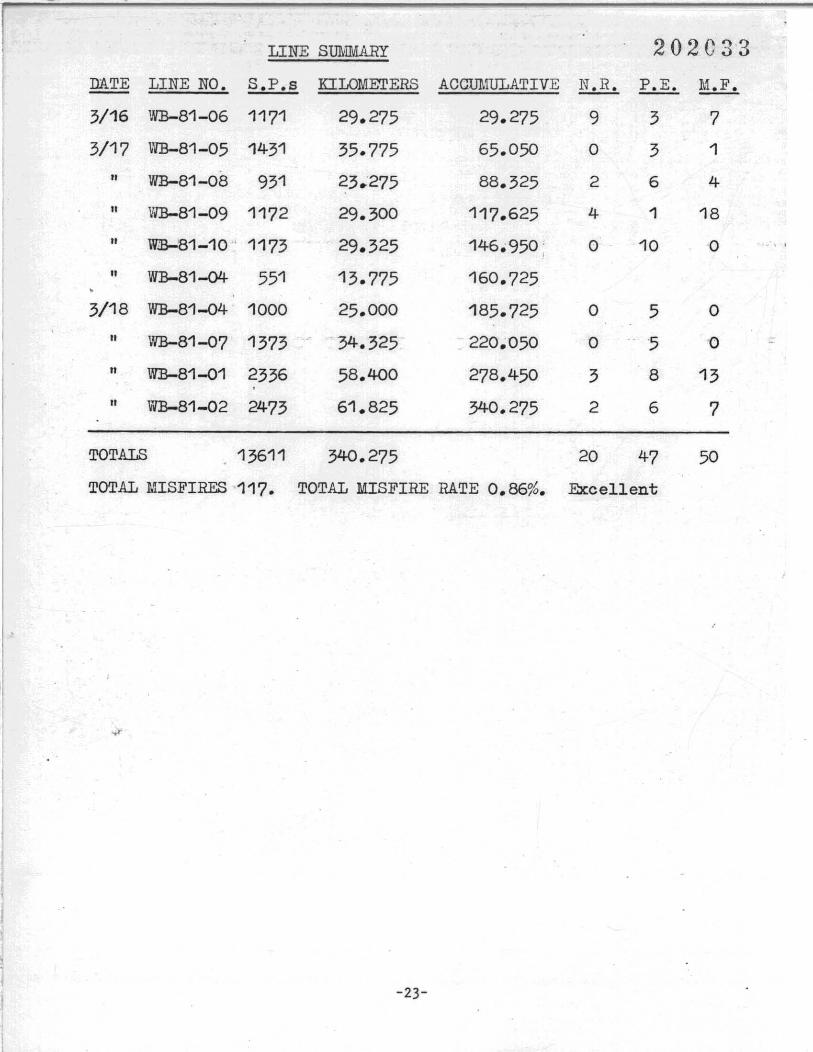
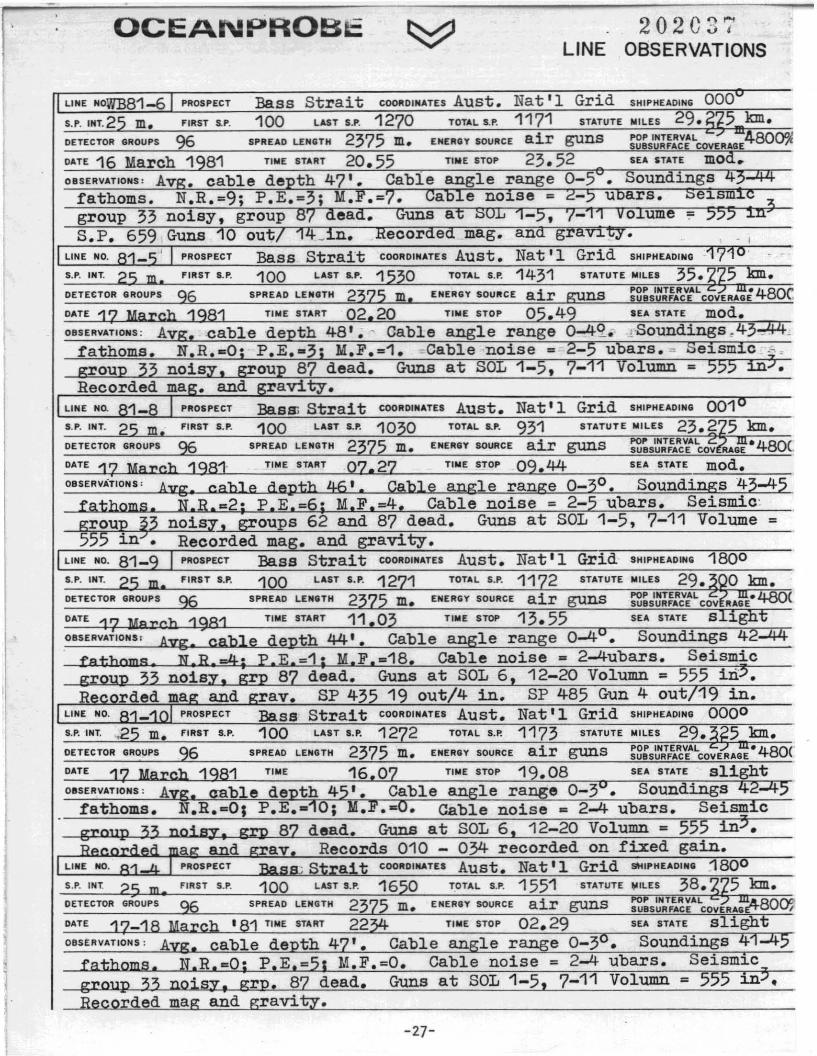
LINE SUMMARY 202033DATE LINE NO. S.P.s KILOMEl'ERS ACCUMULATIVE N.R. P.E. M.F.
3/16 WB-81-06 1171 29.275 29.275 9 3 7
3/17 WB-81-05 14-31 35.775 65.050 0 3 1
" WB-81-08 931 23.275 88.325 2 6 4-
" WB-81-09 1172 29.300 117.625 4- 1 18
" WB-'81-10' 1173 29.325 14-6.950 ; 0 10 0
" WB-81-04- 551 13.775 160.725
3/18 WB-81-o4 1000 25.000 185.725 0 5 0
" WB-81-07 1373 34-.325 .220.050 0 5 0 :::
" WB-81-o1 2336 58.4-00 278.450 3 8 13
" WB-81-02 24-73 61.825 34-0.275 2 6 7
TOTALS . 13611 34-0.275 20 47 50
TOTAL MISFIRES 117. TOTAL MISFIRE RATE 0.86%. Excellent
-23-
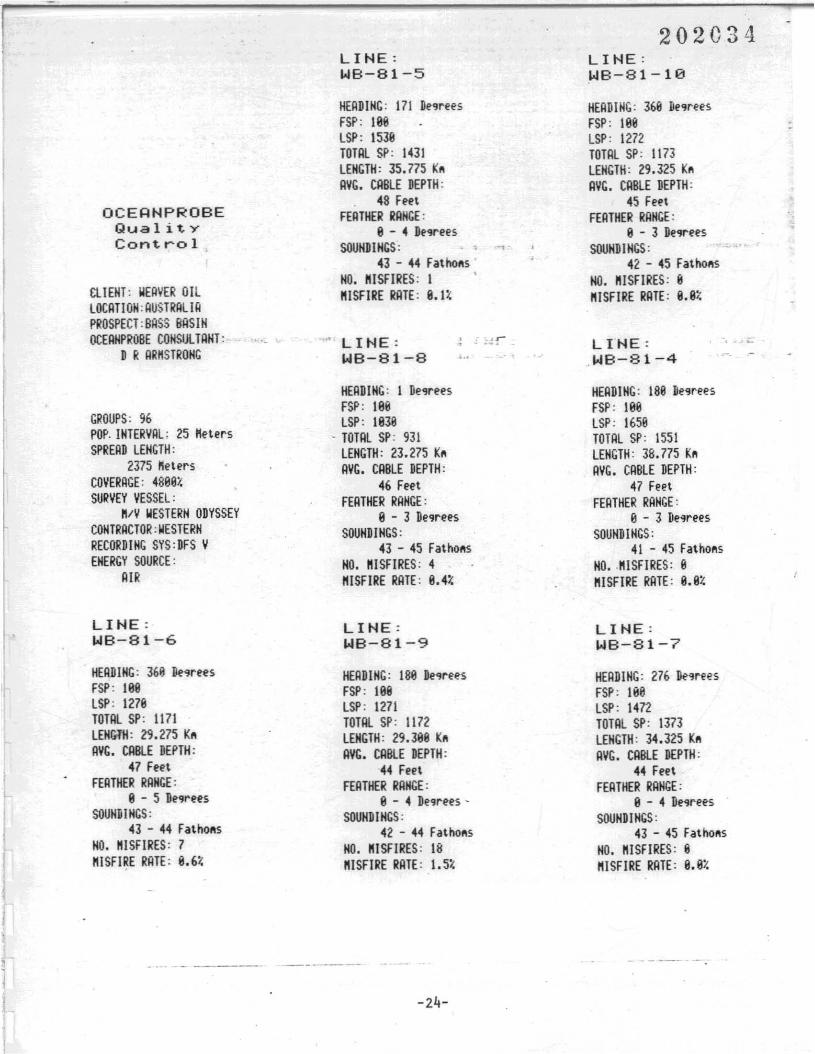
202034LINE: LINE:W8-81-5 W8-81-10
HERDIHG: 171 De9rees HERDIHG: 369 De9reesFSP: 198 FSP: 198 ..LSP: 1539 LSP: 1272TOTRL SP: 1431 TOTRL SP: 1173LENGTH: 35.775 K. LENGTH: 29.325 K.RVG. CABLE DEPTH: RVG. CRBLE DEPTH:
48 Feet 45 FeetOCEl=lNPROBE FERTHER RANGE: FERTHER RRNGE:
Qual ity 8 - 4 De9rees 8 - 3 De9reesControl, SOUNDINGS: , . SOUNDIHGS:
43 - 44 Fatho.s . 42 - 45 Fatho.sHO. MISFIRES: I NO. MISFIRES: 8
CLIENT: WERVER OIL MISFIRE RRTE: 9.1< MISFIRE RRTE: 9.8%LOCRTION:RUSTRALIAPROSPECT:BASS BASINOCEANPROBE CONSULTANT: ,., .. LINE: ~ ;~r LINE: .:-
DRARMSTRONG W8-81-8 J .W8-81-4
HERDING: 1 De9rees HERDIHG: 188 De9reesFSP: 188 FSP: 188
GROUPS: 96 LSP: 1938 LSP: 1659POP. INTERVRL: 25 Meters - TOTAL SP: 931 TOTAL SP: 1551SPRERD LENGTH: LENGTH: 23.275 K. LENGTH: 38.775 K.
2375 Meters AVG. CRBLE DEPTH: RVG. CABLE DEPTH:COVERRGE: 4898% 46 Feet 47 FeetSURVEY VESSEL: FEATHER RRNGE: FEATHER RANGE:
M/V WESTERH ODYSSEY 9 - 3 De9rees 9 - 3 De'lreesCONTRRCTOR:WESTERN SOUNDINGS: SOUNDINGS:RECORDING SYS:DFS V 43 - 45 Fatho.s 41 - 45 Fatho.sENERGY SOURCE: NO. MISFIRES: 4 NO..MISFIRES: 9
RIR MISFIRE RATE: 9.4% MISFIRE RRTE: 8.9%
LINE: LINE: LINE:W8-81-6 W8-81-9 WB-81-7
HERDING: 369 De9rees HERDING: 1B8 De9rees HERDING: 276 De9reesFSP: 188 FSP: 198 FSP: 189LSP: 1278 LSP: 1271 LSP: 1472TOTAL SP: 1171 TOTAL SP: 1172 TOTRL SP: 1373LENGtH: 29.275 K. LENGTH: 29.398 K. LENGTH: 34.325 K.RVG. CABLE DEPTH: RVG. CABLE DEPTH: AVG. CABLE DEPTH:
47 Feet 44 Feet 44 FeetFERTHER RRNGE: FEATHER RANGE: FERTHER RRNGE:
8 - 5 De9rees 8 - 4 De9rees' 8 - 4 De9reesSOUNUNGS: SOUNDINGS: SOUNDINGS:
43 - 44 Fatho.s 42 - 44 Fatho.s 43 - 45 Fatho.sNO. MISFIRES: 7 NO. MISFIRES: 18 NO. MISFIRES: 8MISFI~E RATE: 8.6% MISFIRE RRTE: 1.5% "ISFIRE RRTE: 8.8%
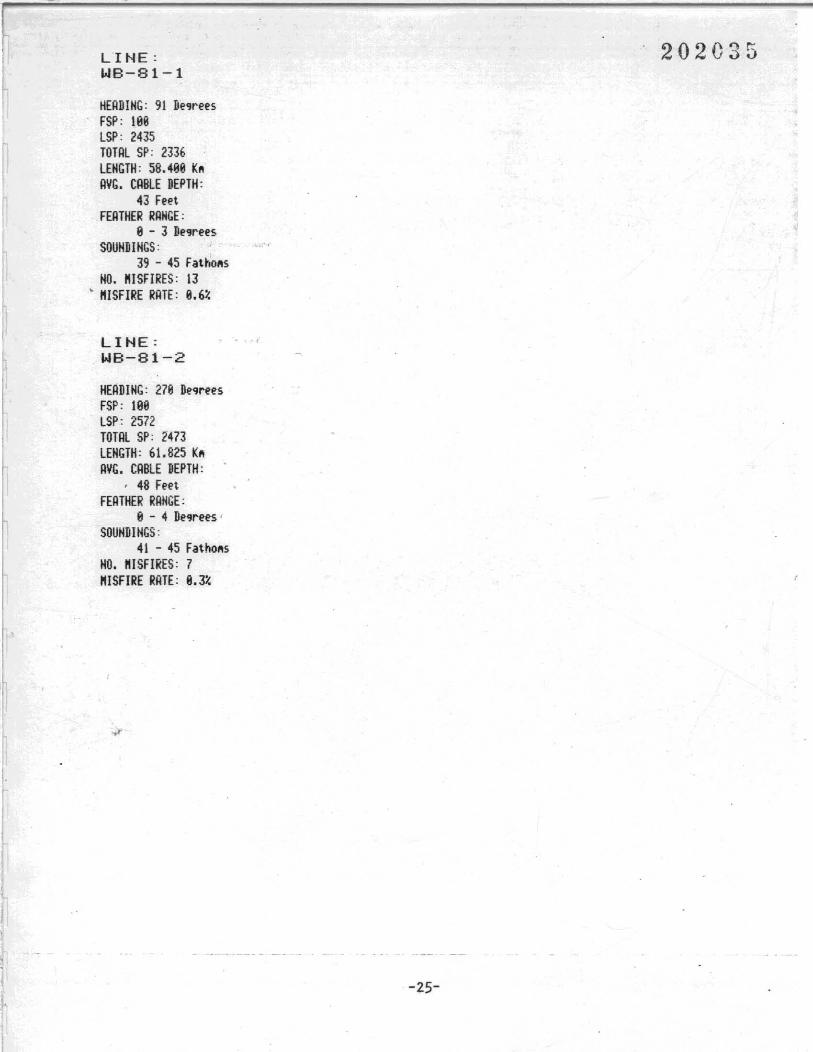
LINE:1018-81-1
HERDING: 91 De,reesFSP: \88LSP: 2435TOTRL SP: 2336LENGTH: 58.488 KftRYG. CRBLE DEPTH:
43 FeetFERTHER RRNGE:
8 - 3 De,reesSOUNDINGS:
39 - 45 Fatt:oftsNO. "ISFIRES: \3
• "ISFIRE RRTE: 8.6%
LINE:'.1018-81-2
HERDING: 278 De,reesFSP: \88LSP: 2572TOTRL SP: 2473LENGTH: 6\.825 KftRYG. CRBLE DEPTH:
, 48 FeetFERTHER RRNGE:
8 - 4 De,rees'SOUNDINGS:
41 - 45 FathOftsNO. "ISFIRES: 7"ISFIRE RRTE: 8.3%
-25-
202035
M
EM
2400",,6
4800",,6
SOL
EOL
SF
SF INT
:NR
PE
MF
NAV
FM
CABLE ANGLE
DEARS
GRP
VOL
GUN X. OUT/Y· IN
12 TR MINICABLE
202036
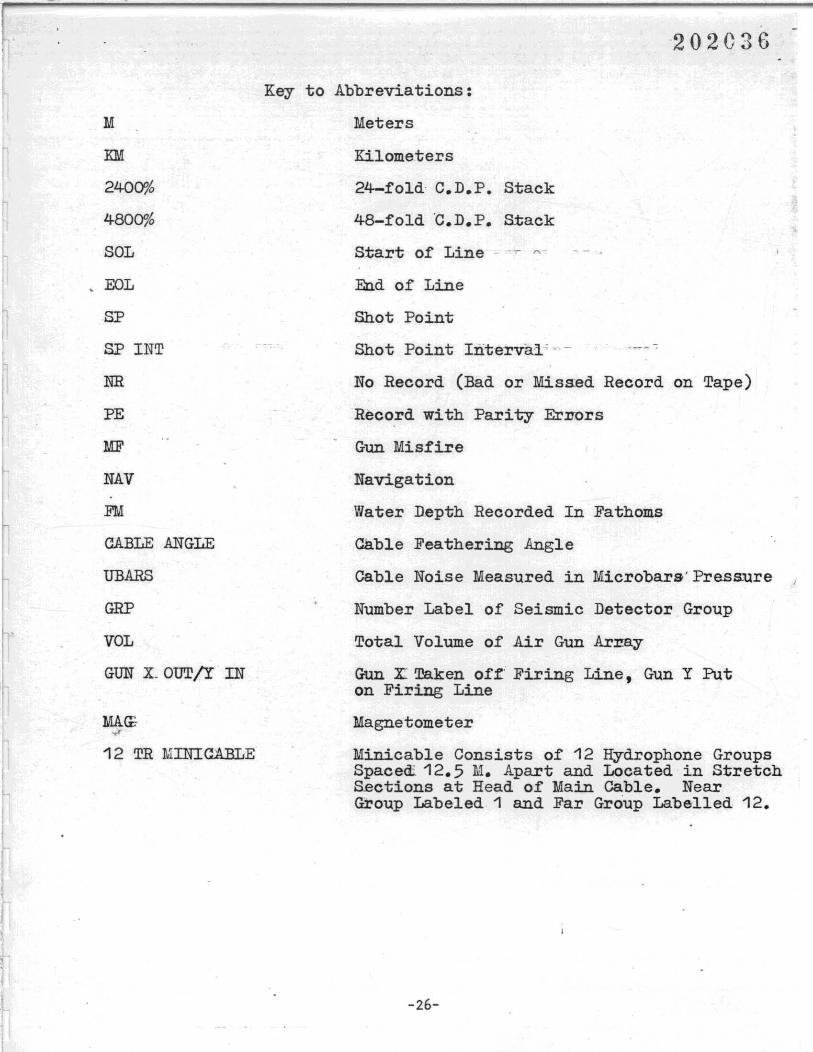
Key to Abbreviations:
Meters
Kilometers
24-fold- C.D.P. Stack
48-fold ~.D.P. Stack
Start of Line - r ~ - - •
End of Line
Shot Point
Shot Point Iriterva:l""--
No Record (Bad or Missed Record on Tape)
Record with Parity Eruors
Gun Misfire
Navigation
Water Depth Recorded In Fathoms
cable Feathering Angle
Cable Noise Measured in Microbars'Presaure
Number Label of Seismic Detector,Group
Total Volume of Air Gun Array
Gun x: Taken of:t Firing Line, Gun Y Puton Firing Line
Magnetometer
Minicable Consists of 12 Hydrophone GroupsSpaced:. 12.5 M. Apart and Located in StretchSections at Head of Main Gable. NearGroup Labeled 1 and Far Group Labelled 12.
-26-
OCEANPROBt: 202037LINE OBSERVATIONS
PROSPECT Bass Strait COORD'NATES Aust. Nat'l Grid SH'PHEAD'NG 000FIRST s.P. 100 LAST S.P. 12 0 TOTAL S.P. 1171 STATUTE N'LES 29. 5 kIn.
SPREAD LENGTH 2375 m. ENERG' SOURCE air guns ;~:s'~~~:~:LCOVERAGE480~DATE 16 March 1 81 T'NE START 20.55 T'NE STOP 23.52 SEA STATE mod.OBSERVATIONS' Av • cable de th 47'. Cable angle range 0-5 • Soundings
fathoms. N.R.-9; P.E.=3; M••-. a e no~se u ars. e~sm
group 33 noisy. group 87 dead. Guns at SOL 1-5. 7-'11 Volume . 555 in'
FIRST S.P. 100 LAST S.P. 10 0 TOTAL s.P. 931 STATUTE N'lES 23.2 5 kIn.
•
. I
group 33 noisy. group 87 dead. Guns at SOL 1-5.
1- Bass; Strait COORDINATES Aust. Nat'l Grid SHIPHEADING 001 0Recorded ma • and ravity.
fathoms. N.R.cO; P.E.-3; M.F.=1. Cable·noise =
S.P. 659,Guns 10 out! 14_1n•.Recorded mag. and gravity.LINE NO. PROSPECT Bass Strait COORDINATES Aust. Nat '1 Grid SH'PHEADING
DATE T'NE START 02 20 T'NE STOP 0.4
S.P. 'Nl: F'RST S.P. 100 lAST s.P. 1 0 TOTAL S.P. 1431 35.DETECTOR GROUPS SPREAD LEN"TH 2375 m. ENERGY SOURCE air guns
OBSERVATIONS' Av .cable de th 48'. - Cable angle range
DATE 17 March 1981· T'NE START 07.27 T'NE STOP 09.44 SEA STATE mod.
group ~2 noisy. groups 62 and 87 dead. Guns at SOL 1-5. 7-11 Volume =
OBSERVAT'ONS' Avg. cab) e depth 46'. Cable angle range 0_30 • Soundings ·43-45.fathoms. N.R.=2; P.E.=6; M,F,=4. Cable noise - 2-5 ubars. Seismic,
Cable noise = 2-4 ubars. Seiam c
16 0 1 .08 SEA STATE slight, Cable an le range 0-3. Soundings
Records 010 - 034 recorded on fixed gain•
LAST '.P. 12 2 TOTAL S.P. 1173 STATUTE N'lES 29. 5 kIn.Strait COORDINATE' Aust. Nat'l Grid SH'PHEADING 0000
T'NE 'TART 0 TINE STOP 13.55
100 16 0 TOTAL S.P. 1551 STATUTE I"LES 38. 5 kIn.
1 lAST TOTAL S.P. 11 2 STATUTE N'lES
'PREAD lEN"TH 2 ENERG. SOURCE air guns
SPREAD lENGTH 23 EHERG. so i ns POP 'NTERVAl 'A-80""m. URCE a r gu SUBSURFACE COVERAGE" VI'
cable depth 47'. Cable angle range 0-3. Soundings 4R =0' P E = M.F,=O. Cable noise = 2-4 ubars. Seismic
PROSPECT Bass Strait COORDINATES Aust. Nat'l Grid SH'PHEAD'NG 1800
N.R.=4; P.E,=1; M,F,=18. Cable noise = 2-4ubars. Seismic
noisy, gr.p 87 dead. Guns at SOL 6. 12-20 Volumn - 555 in'.
nois r 8 dead. Guns at SOL 6 12-20 Volumn = 555 iri~.ma and SP 43 19 out/4 in. SP 485 Gun 4 out 19 in.
SPREAD lENGTH 2375 m. ENERG. SOURCE air guns ~~:SL",iF~~~ALCOVERAGE·480(
, 1 TiNE START 22 TINE STOP 02.29 SEA STATE sligh
.. Sat COORD'NATES Aust. Nat'l Grid siM'PHEADING :180
group 33 noisy, grp. 87 dead. Guns at SOL 1-5, 7-11 Volumn = 5 J..n.
OBSERVAT'DN', Avg. cable depth 44'. Cable angle range 0-4. Soundings 42DATE
Recorded mag and gravity.
-27-
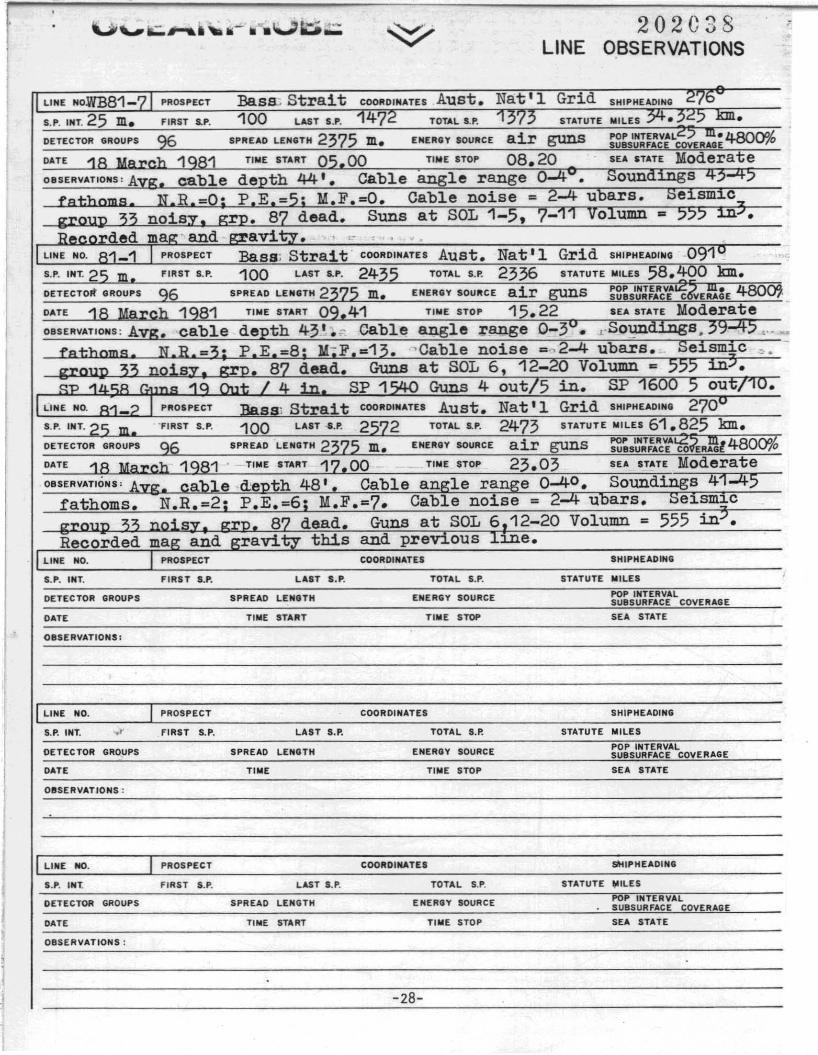
202C38LINE O,BSERVATIONS
,-
LINE No.wB81-71 PROSPECT BaSS: Strait COORDINATES .Aust. Na:t'l Grid SHIPHEADIN. t!.'/b·
S.P. INT. 25 m. FIRST s.P. 100 LAST S.P. 1472 TOTAL S.P. 1~'/~ STATUTE MILES 34• .?t!.5 kIn.
DETECTOR GROUPS 96 SPREAD LENGTH 2375 m. ENEROY SOURCE air guns PDP INTERVAL2' m. 4800";6SUBSURFACE COVERAGE
DATE ..,A u"''''"., 1QA1 T'NE START 0<; 00 TINE STOP 08.20 SEA srATE ModerateOBSERVATIONS: Avg. cable depth 44'. Gable angle range u-.. • Soun s <+;1_'
f'",+,.,nTII" N.R -0' PE ..,c; • M.F.=O. Cable noise - 2=4 ubars. Seismic_
group 33 noisy. grp. 87 dead. Suns at SOL 1-5. 7-1'1 VO.lumn .. ", :LD,.....
'Ra"''''''ded mall:' and In'avit:v. , ~ ..LINE NO. R1-1 I PROSPECT Bass; Strait· COORDINATES Aust. Nat'l Grid SHIPHEADING .091 v
S.P. INT. 2 c; m. FIRST S.P. 100 LAST s.P. 2435 TOTAL S.P. 2336 STATUTE NILES 58.":H;)0 km.DETECTOft" GROUPS 96 SPREAD LEN8TH 2375 m. ENERGY SOURCE air guns POP INTERV~~t'5vEI:i~E 480~SUBSURFACE C
DATE 1R .. . . 1Q81 TINE START oq 41 TINE STOP 15.22 SEA srATE ModerateOBSERVATIONS: Avg.cable depth 43'." Cable angle :range 0_3v
• L'S_O~ s .... .r .r........
f'",+,.,nm" N.R =7;. PE =8' MF ..1:>;. 'Cable noise ..~ 2-4 ubars. Selsml.c ::.' ~
group 33 noisy, grp. 87 dead. Guns at SOL 6, 12-20 Volumn .. »> l.n....qn "'ll.<;A r..".na ..,6 rn,+, I 4 "." SP 1E;4.O Guns 4 outf5 in. SF 1600 5 outj10.
L'NE NO. 1'\1_::> I PROSPECT 'Rasa, Strait COORDINATES Aust. Nat'l Grid SHIPHEAOING 270v
S.P. INT. 2<; m -FIRST S.P. 100 LAIT ....p. 2572 TOTAL s.P. 2473 STATUTE M'LES 61.825 kIn.DETECTOR GROUPS 96 SPREAD LENOTH 2375 m. ENERGY SOURCE air guns POP 'NTERVA,&(,,¥.!' 4800",,"SUBSURFACE CO ERAGI 0
DATE 18 March 1981 . - T'ME START 17,00 TINE STOP 23.03 SEA STATE ModerateOBSERVAT'ONS' Ava-. cable d:enth 48'. Cable ana-le range 0-40 • Soundings 41=45
fathoms. N.R.=2; P.E.=6; M.F.=7. Cable nolse - t!...... uoars. bel.Sml.C
group 33 noisy, grp. 87 dead. Guns at SOL 6,12-20 Volumn = 555 in'.Recorded map; and gravit:v this and preVious ll.ne.
LINE NO. I PROSPECT COORDINATES SHIPHEADING
S.P. INT. FIRST S.P. LAST S.P. TOTAL S.P. STATUTE NILES,
DETECTOR GROUPS SPREAD lENGTH ENERGY SOURCE POP INTERVALSUBSURFACE COVEftAGE
DATE TINE START TIME STOP SEA STATE
OBSERVATIONS:
II liNE NO. I PROSPECT COORDINATES SHIP HEADING
S.P. INT. ...- FIRST S.P. lAST S.P. TOTAL S.P. STATUTE MilES
DETECTOR GROUPS SPREAD LENGTH ENERGY SOURCEPOP INTERVALSUBSURFACE COVERAGE
DATE TINE TINE STOP SEA STATE
08SERVATIONS:
I LINE HO. I PROSPECT COORDINATES SHIPHEADING
S.P. INT. FIRST S.P. LAST S.P. TOTAL S.P. STATUTE ,-ILES
DETECTOR GROUPS SPREAD lENGTH ENERGY SOURCE POP INTERVALSUBSURFACE COVERAGE
DATE TINE START T'ME STOP SEA STATE
OBSERVATIONS:
-28-
202 C'3 9
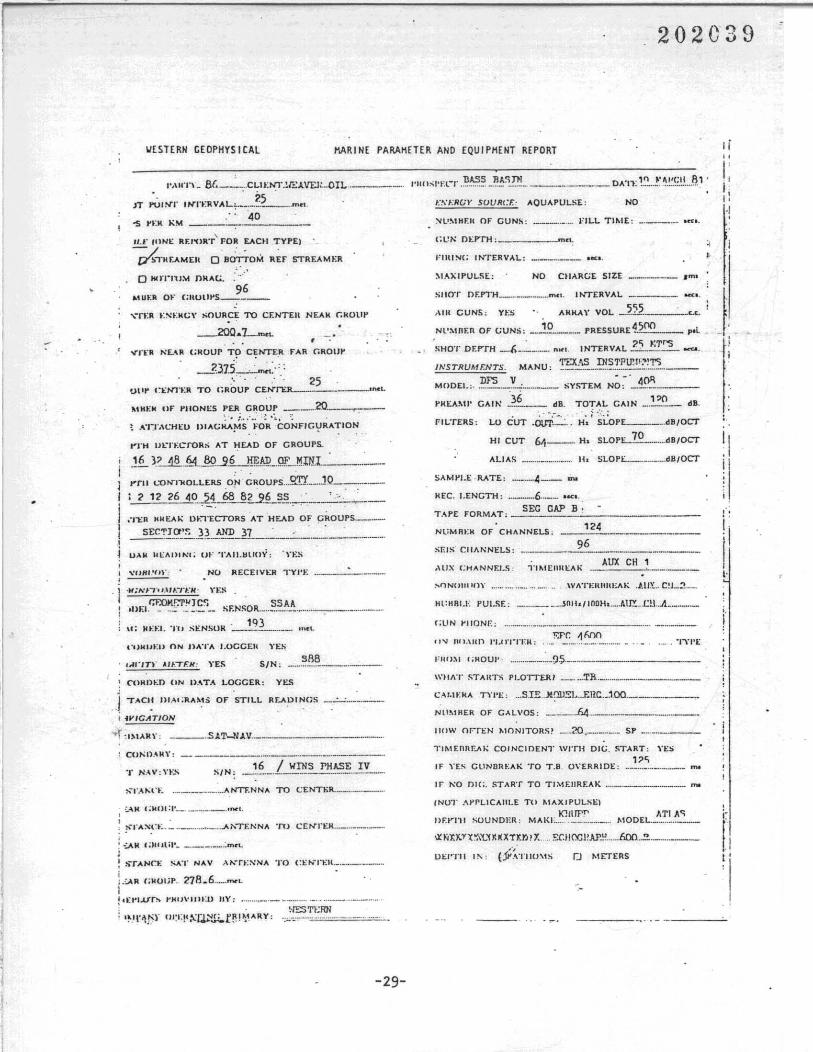
MARINE PARAHETER AND EQUIPH[NT REPORT~[ST[RN CEOPHYSICAL
1',\11"1"\ _ 8r. :.C~I.:~·.~r£A.VEJ:-.OIL ..-------.-~- ..
IT ..uIST IHn·:RvAL-:- .~.~__...rnt"l.
"5 t'Dt KM :.-.;_.~ _
,11.1' IUNt; REI'UR"r FOR EACH TYPE)
~THr.AM[1t O'BdrrOM Jl~r STREAM..:R
1:!\'f:R(;Y SUURI:F.: AQUAPULSE: NO
:"oIl1!<-1HF.lt OF GUNS: • .... J:Il.l. TIME: _. ..
ellN nt.:P'fH :_. ._._m..\.
FlItlS(; INTERVAL:
•« •.
.i
!Iil
II
'::.:Sl.OPE.. .dBJOCT
slof~_I~__....dB/OCT
NO CHARGE SIZE ami
Lu CUT .a;r=~. Ha
HI CUT 64,---" H.
~1."XIPUl.SE:
FIL'fERS:
AU AS _._... ...._•... H. SlOPI::..__.._.__....dB/Ocr
SAM}'I.lc: . RATE: --...-4-.- IN
H.EC. I.ENGTH: •. ..6..._._ •.ct.
T.'P£ FORMAT; _.. SE9_~~_~._;_-_. ... _Nl'MREM OF· CHANNELS: ~.~!-_._. . _SEIS· CIIA"'NElS: 96----_._--_..__._--_._._----_._-_.AllX CHANNELS: TIMEIlIU::,.." .._~~._CH ~ _._. _
SIIOT OF.P1·H_.._ .._. ..•.m .. l. It-rTERVAL ....c:o.
Mit CUNS: Yt-:S AMokAY YOL _.~.~..••__.__~O;.
Nl'Mnr.R OF GUNS: _...!.e fRESSURE4~~ p.l
'SHOT OEP'fH - ..6.----. n ... l. INTERVAL ?.1_~:T.~._ -ea,
J"-'STRUMF:NTS. MANU: ~.:.~__~~_~J.r..~~~ _DFS V. . - -' 40'l
MOO£I~:, ...._._._-:.--:"..~ ... SYSTEM NO: __.~__.. _
)'ItEAMI' CAl!': }~ dB. TOTAL GAIN _.~~__ dB.
RECEIVi::R TV"}:NO,'IJHI.'OL-
_ ?)1.5~":''';,:·· ::., ..' 25·
TO I,ROUP CEN'TER ·~L
,-n:R t:SUt(;\' SOURC~ TO CENTEIt NEAM. r.HUUt'
__200..1_.mc1.
: .'o ..OTIlJM OkAf.,;.
..1Ut:a 0)-" {;nUtlt's__9~__
lUHUC OF t'UONI::5 PER GROUP .20. ..- _
~ A-r:r.\l:HI::U I)JAG~~·S···;·~~R'\::O:~FJG\}RATION·
yrH lH.-n:CrORS AT J:lE:.AD or GROUPS.
.~~ }?....1I!..~.._l!9..'l.2._HJ;NJ._Q!'_.~II!I_.:__._..~_i "TII l.'O~lilOLLERS o~· ~R~UPS.._9.rr.__.JQ__.._._
I: '2-13-26..1-0_~L61!.~s.'l~-~?-.~;--....:.:-~...:--
,"n:::Jl. "MEA": DETECTORS AT HEAD OF ~ROUPS. _
I ~~1_,?_1!'; J~..~_~I ..::.__. ._.._._.,i
Hl:HRI.[ PUU,r.: ...._..._...• _....snli&/IODH•...•.AtI!. ..l:U..A _
.._ . TYI'[
\VA'n:ItIUtI~AK ..UIX.. C!L2....
I''''' 1111.\1111 1'I.ln-IT.lt:
r ;ll I'll "I lONE: ._._•.._ _.__.__.. _._ _ _.__ __. .
~f'r. "l f./)(I
:--t1NllllllflY •..._ ••..
nHUH:U ON U"'I'" ).OCCElt YE~
_} ·N;I\'r""."I-.~n;:H· n·:.""')f-:I.~?~!'::C; _ SF.N~OR ~.~_~_~.~_ _ ..__.._ _.
\I: MH:I. Til SENSUR ~~~ ._. ,"d.
I.I'·,T)· jJI-.TF.H: YESFll!):,\l f ;HOUI" ·······----·--9~·-·-···-··----_·--·..__.---
.;r~'t.x.y'X~\'t.'{~J(xTl.n'y.... £r.J!OO!~AP.=! ....6DO..~ .._._.. .
Utl'Tl1 I!": (iY'ATlIO'1S rJ METERS
\\'HIIT 5TAHTS PI.OTTERI _.... _Tli._..... . .__.__
eM.1EMA TYI'!::: ...S.1£ ..M.~L ...EUC.•lOO.---..-...-.--.-__
Nll!<-1HER OF GALVOS: _.__._ .1i4.._.__. ._. _
1IIlW Or-n::N ~lnNITORS! 20,._..._..._.._ Sf __._.. _
T.MEnnf:.llK COINCIDENT WITH DIG. ITART: YES
IF YES ClINanEAK 'ro T.Il. O\'£RRIOI:::: __:?~__.._._._ mI
IF "'0 DIC;. START TO TIMF.IlRF.AK ..__..._._..._.•.•..._.M...... ,...
,i-
flI'
TIl MAXIPUl.S},;j
ICHfPf'lMAKE._ _ _ .
/NUT ."'»"l.ICAIlI.E
1>F.....111 SOUNDER:
...:AI( 1;lHllil'__..__._.:m"l.
STANc:t; SAT NAV ,\""T.:~NA TO CI::"'I"EI(.•.__.__.__
.-:AR t;MOI;P.. 278.6.._...... t.
.Cluuu:n tiN U ..\TA LOGGER: YE.S
:,rA:-.:t:.~. _ ..__....._•._ ....A ...7ENNA Tn CEWrEM..._. ..__.,
~-r."M ·t~ . .._._.ANTF.NNA TO l:ENTtiR.__._.._._....
an..: (HMo)": .__._.__.._•.__• ..._ ••__•
T N.,,\':n:." SIN: ._!~__.L_~~~!~~~ ..-!.!__.
.., T."CIf UI."C;RAlt.1.i OF STILL REAl)(NGS _
( fV'CATJON
'tf :1)lAR\·: .5AT-N.AV. ._. . .
'~I·I..lJr!'o ".UJ\,IIIEU IIY: •.•....__ .__._ .......•......_..._.
-29-
SECTION II
Data Acquisition:
Contractors
Location of Headquarters
Communications
Weather
Key Field Personnel
Disposition of Data
Instrument Test
Survey Vessel
Seismic Equipment and
Instrumentation
Instrument Description
Energy Source
Streamer Cable
Instrument Settings and
Specifications
Cable Parameters
Airgun Configuration
Statistical Summary
. Line Summary
30
31
32
33
34
35
36
37
38-39
40-47
48-49
50-51
52-53
54
55
56
57-60
202040
(1_.
202041
Contractors
The survey was conducted on behalf of WEAVER OIL
AND GAS CORPORATION of Houston, Texas and Perth, West
Australia.
CORPORATION contracfed WESTERN GEOPHYSICAL COMPANY OF
AMERICA, a Delaware Corporation and a Division of
1
LI
L~
To conduct the survey, WEAVER OIL AND GAS
. I
I ;L.-1
L}
11!
Ii,
Ui
I )I .~,
ilLj,
LITTON INDUSTRIES.
-30-
Location of Headquarters
The principal office of WEAVER OIL AND GAS
CORPORATION is located at 5599 San Felipe Avenue,
Suite 1100, Houston, Texas, U.S.A. The office in
Ioffice 'that
I
Australia and it was to this,
lJ
charge
West
of Australia operations is located in perth,
J. l-.1
communications
directed.
pertaining to the operation was
The principal office of WESTERN GEOPHYSICAL
[1,
n.J
I]
I ]J
[J
COMPANY OF AMERICA is located at 10001 Richmond
Avenue, Houston, Texas, U.S.A. The survey detailed in
this report was conducted out of WESTERN GEOPHYSICAL's
Southeast Asia Division office located at Unit 301,
Union Building, 37 Jalan Pemimpin, Singapore 2057,
Republic of Singapore.
A temporary field office was established by
WESTERN GEOPHYSICAL COMPANY in order to facilitate
communications and logistics involving the operation.
From March 16 to 19, this office was located at Mt.
Gambier, South Australia and shi fted to The Entrance
in New South Wales for the latter portion of the
survey.
-31-
I j
U
t~
[.j
UlJU
I.i--~
n[1q[1
I
fi,
202C43
Communications
Daily production updates and vessel status reports
were issued to both WEAVER OIL AND GAS CORPORATION's
office in Perth and WESTERN GEOPHYSICAL 'soffice in
Singapore via telex from the field office. Periodic
telephone communications were also maintained for
detailed discussions of the vessel's movements.
-32-
i
! !,,1
I [-1 ..,3
Weather 202044
Moderate winds and seas dominated the weather
condi tions during - the survey operation. Al though the
Bass Strait is noted for its severe weather, this was
delayed or interrupted as a result of poor weather.
fortunately not the case during the vessel's time -on
At no time during the survey was itthe prospect.
ooon
I 0
o[
1 0I 01 D
I, -
LI! . rn-----------~------------- Litton WESTERN GEOPHYS!CAL
-33-
202045Ii
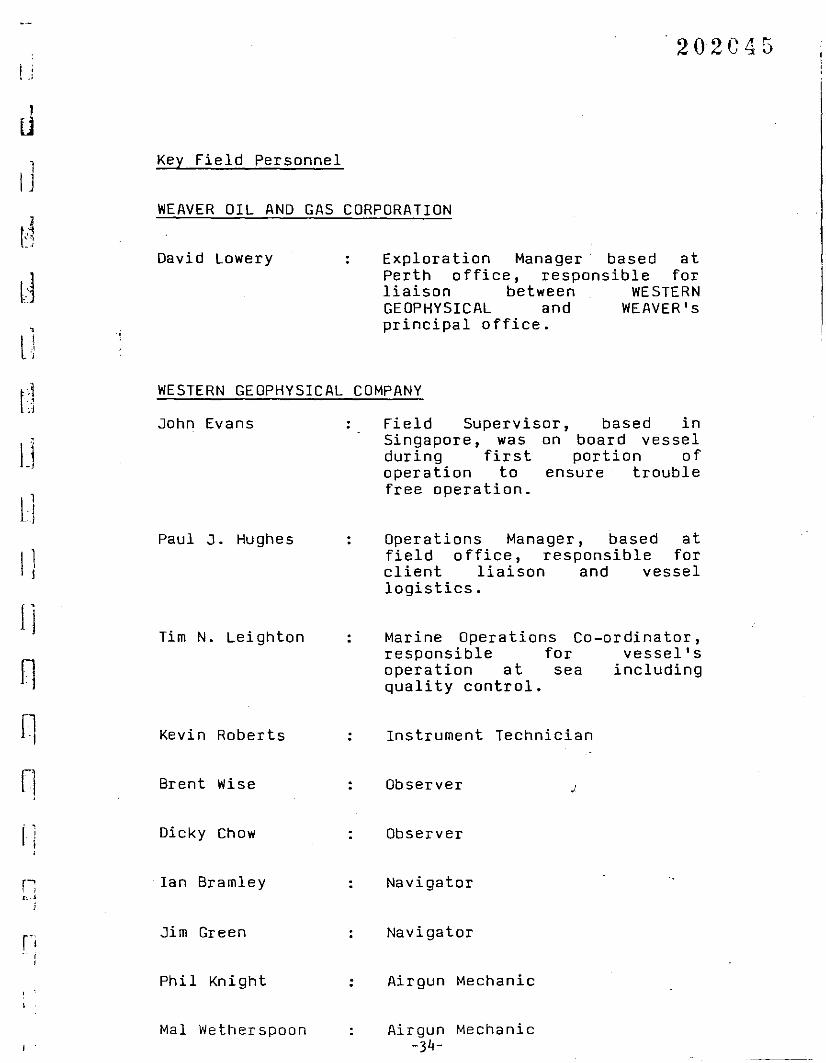
Key Field Personnel
WEAVER OIL AND GAS CORPORATION
t.~...
;.'1_ .i
David Lowery Exploration Manager based atPerth office, responsible forliaison between WESTERNGEOPHYSICAL and WEAVER'sprincipal office .
WESTERN GEOPHYSICAL COMPANY
based inboard vesselportion of
ensure trouble
Field Supervisor,Singapore, was onduring firstoperation tofree operation.
John Evans
uu.t.J,i
I)
11
nn
Paul J. Hughes
Tim N. Lei ghton
Kevin Roberts
Operations Manager, based atfield office, responsible forclient liaison and vessellogistics.
Marine Operations Co-ordinator,responsible for vessel'soperation at sea includingquality control.
Instrument Technician
Brent Wise Observer J
I], Dicky Chow Observer
Ian Bramley Navigator
Jim Green Navigator
Phil Knight : Airgun Mechanic
Mal Wetherspoon Airgun Mechanic-34-
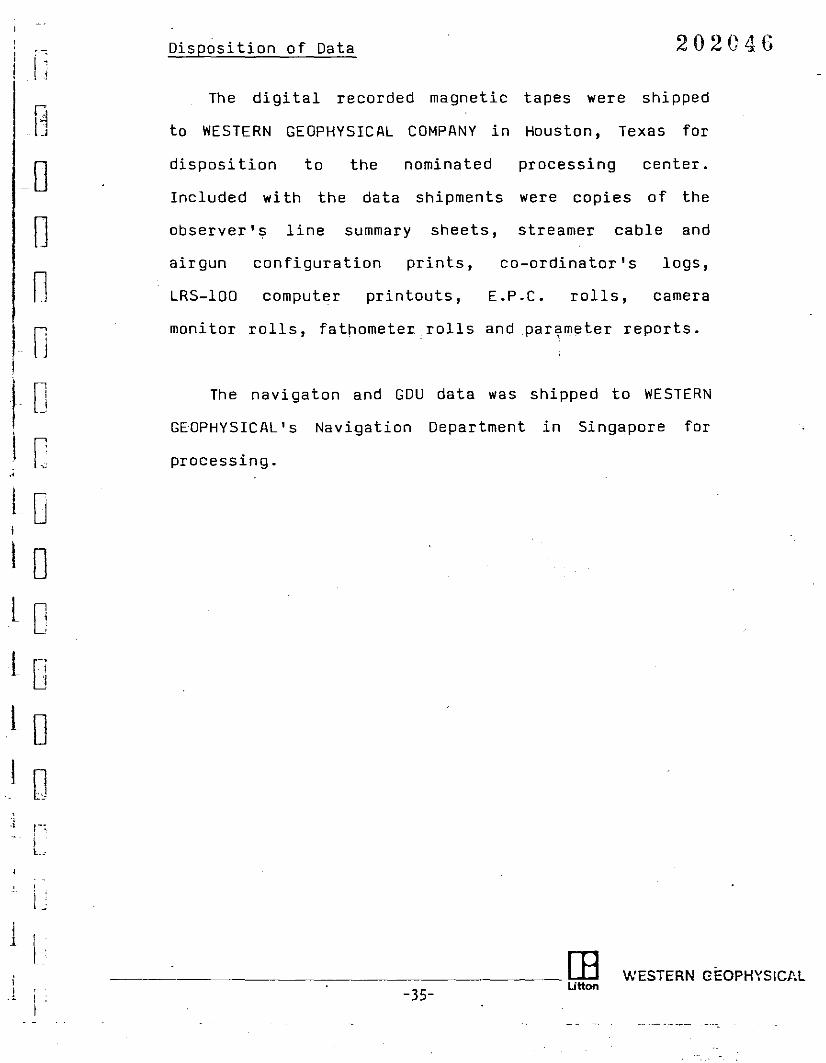
I jDisposi tion of Data 202 C4 \)
The digital recorded magnetic tapes were shipped
to WESTERN GEOPHYSICAL COMPANY in Houston, Texas for
observer's line summary sheets, streamer cable and
Included with the data shipments were copies of the
monitor rolls, fathometer,rolls and par~meter reports.
The navigaton and GDU data was shipped to WESTERN
GEOPHYSICAL's Navigation Department in Singapore for
logs,
camera
center.
rolls,
processing
co-ordinator's
E.P.C.
nominated
printouts,
theto
con figuration prints,
LRS-IOO computer
disposition
airgun
processing .
-0onn
f CI [..
L0I
l 0L 0L0t 01 0,.,
,i j
iI1
ii
rn------------------------- Ulton
-35-WESTERN GEOPHYSICI'.L
202047
Instrument Test
Semi-monthly and monthly instrument test were
conducted on the OFS V system as per the instrument
manual's instructions. The results of these test were
sent to WESTERN GEOPHYSICAL's processing center in
Singapore for processing and initial interpretation,
then forwarded to WESTERN GEOPHYSICAL's Houston office
for final analysis.
In addition to this, daily test were also.,
I:Ij
1,,
111 J
[1[1[1
;
conducted to ensure that the instrument's performance
was consistant with specifications.
I ;
1J, l'''";
r.~
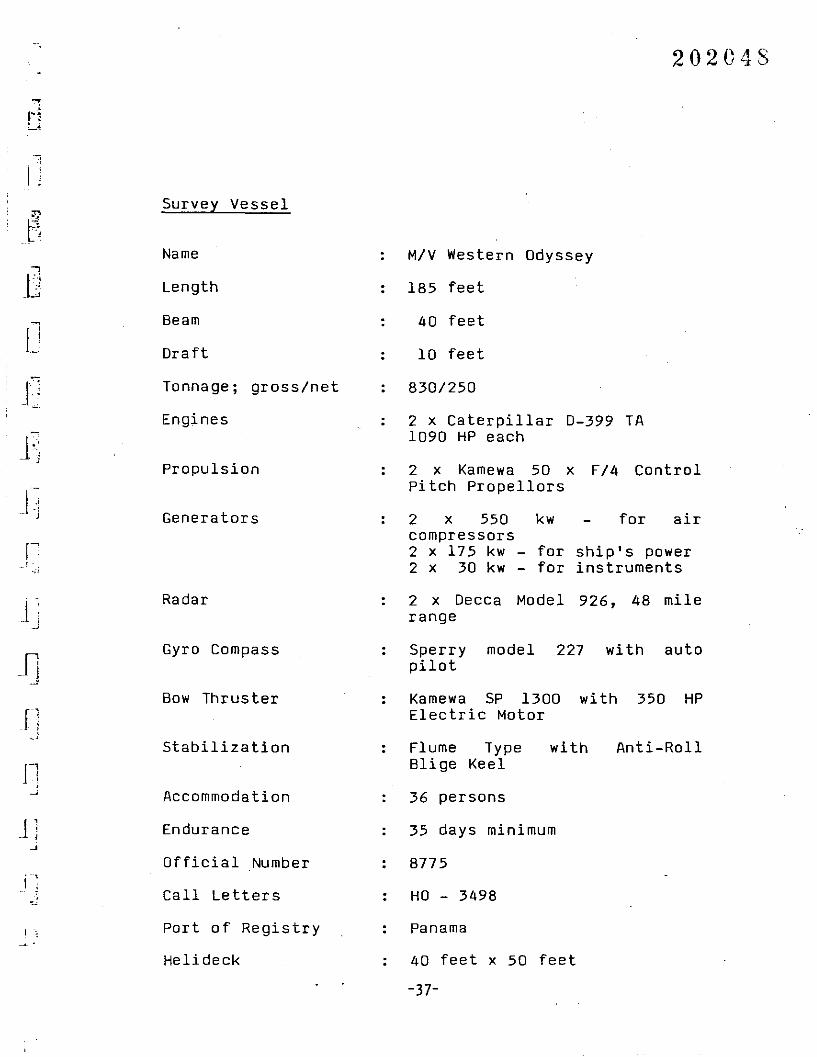
Survey Vessel
Name
Length
Beam
Draft
Tonnage; gross/net
202048
M/V Western Odyssey
: 185 feet
40 feet
10 feet
8301250
2 x Caterpillar 0-399 TA1090 HP each
2 x Kamewa 50 x F/4 Controlpitch Propellors
for ship's powerfor instruments
B]
I j-'-- j
r'I
.;;
Engines
Propulsion
Generators 2 x 550compressors2 x 175 kw 2 x 30 kw -
kw for air
Radar
Gyro Compass
Bow Thrus ter
2 x Decca Model 926, 48 milerange
Sperry model 227 with autopilot
Kamewa SP 1300 with 350 HPElectric Motor
Stabilization
Accommodation
Flume TypeBlige Keel
36 persons
with Anti-Roll
J ]
i !
r -~
Endurance
Official Number
Call Letters
Port of Registry
Helideck
35 days minimum
8775
HO - 3498
Panama
40 feet x 50 feet
-37-
I j
202049
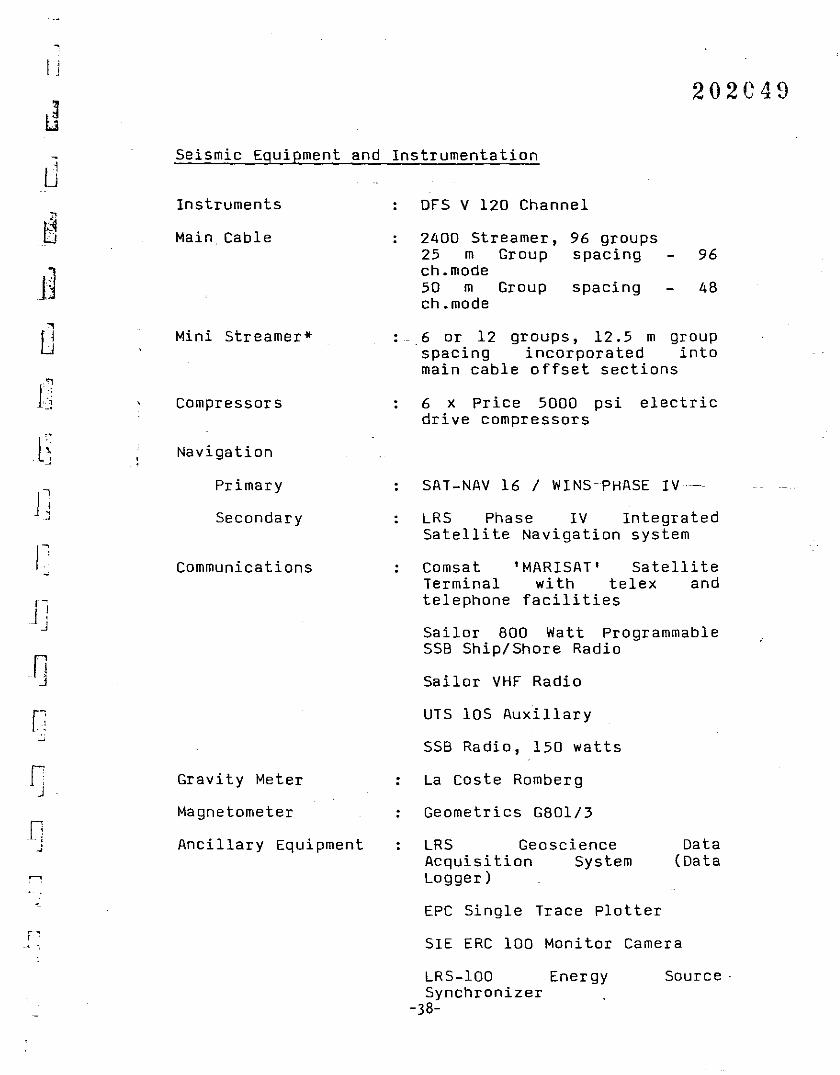
Seismic Equipment and Instrumentation
Instruments : DFS V 120 Channel
Main. Cable 2400 Streamer,25 m Groupch.mode50 m Groupch.mode
96 groupsspacing
spacing
96
48
n.,
,~
J!J
,.
Mini Streamer*
Compressors
Navigation
Primary
Secondary
Communications
._ 6 or 12 groups, 12.5 m groupspacing incorporated intomain cable offset sections
6 x Price 5000 psi electricdrive compressors
SAT-NAV 16 / WINS-PHASE IV-·
LRS Phase IV IntegratedSatellite Navigation system
Comsat 'MARISAT' SatelliteTerminal wi th telex andtelephone facilities
Sailor 800 Watt ProgrammableSSB Ship/Shore Radio
Sailor VHF Radio
UTS IDS AuxilIary
SSB Radio, 150 watts
nj
n-. :~
Gravi ty Meter
Magnetometer
Ancillary Equipment
: La Coste Romberg
Geometrics G801/3
LRS GeoscienceAcquisition SystemLogger)
EPC Single Trace Plotter
Data(Data
SIE ERC 100 Monitor Camera
LRS-IOO EnergySynchronizer
-38-
Source·
,iI r.
L"..,,-
~ ~.,:~~
01
~
rn
oQ
jRI nI1 ~I I.'
L....
fj1 0
r:,
-: .
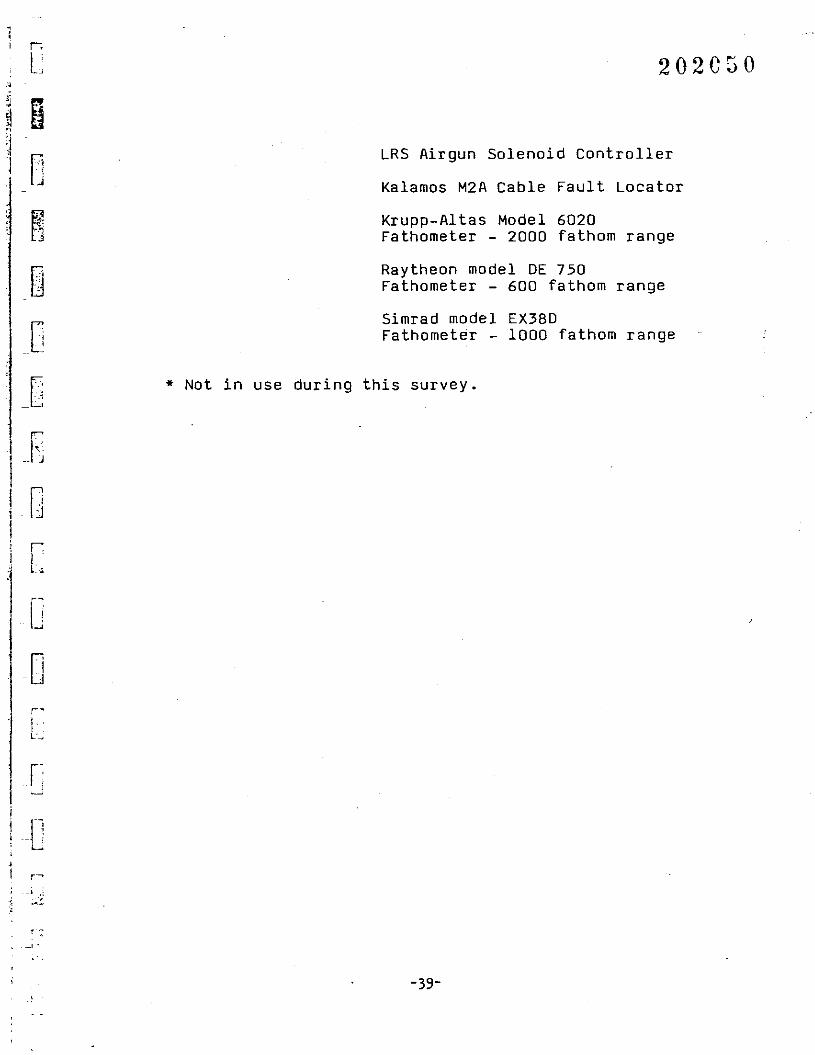
202C50
LRS Airgun Solenoid Controller
Kalamos M2A Cable Fault Locator
Krupp-Altas Model 6020Fathometer - 2000 fathom range
Raytheon model OE 750Fathometer - 600 fathom range
Simrad model EX38DFathometer - 1000 fathom range
* Not in use during this survey.
c ~.
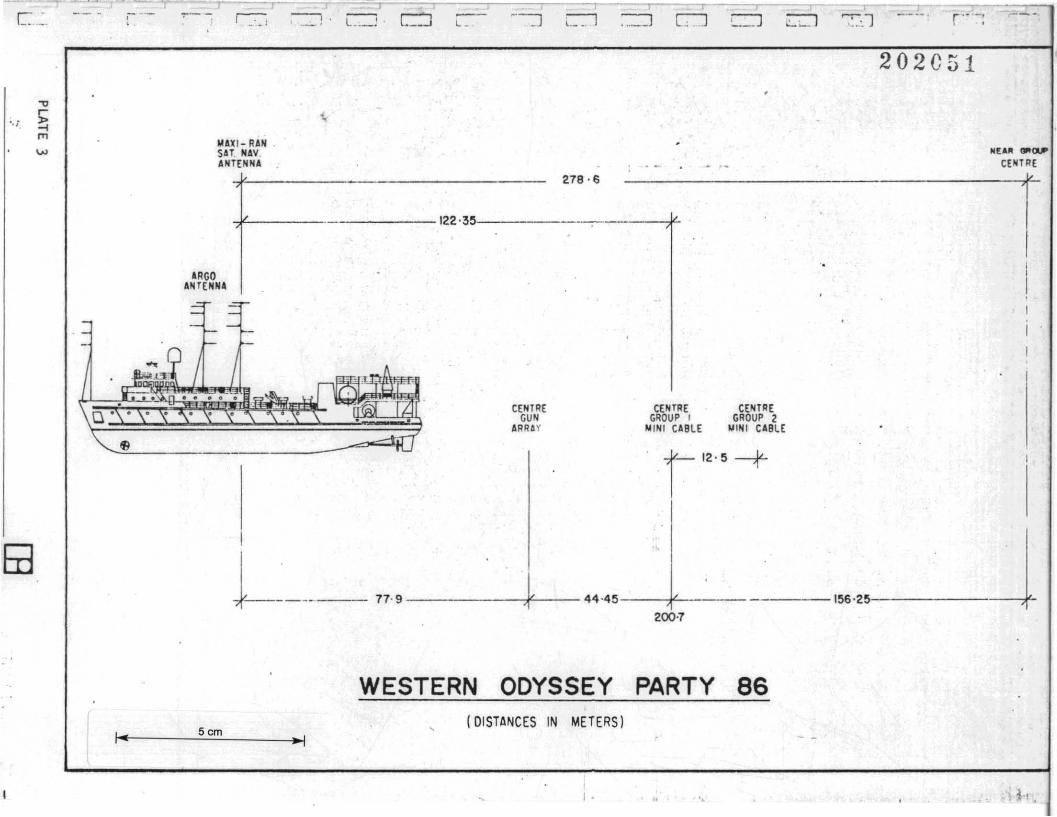
MAXI- RAN.SAT. NAV.ANTENNA
202C51
278·6 ------------1-----122·3~----
ARGOANTENNA
Q" . . . • . CENTRE CENTRE CENTREGUN GROUP I GROUP 2
ARRAY MINI CABLE MINI CABLE
18i-'2.~ -t
II
I
J------- 77·9 t 44.4~-J- 1~6·2~2(X)-7
WESTERN ODYSSEY PARTY 86
Scm"I
,(DISTANCES IN METERS)
I • '. t ~" •
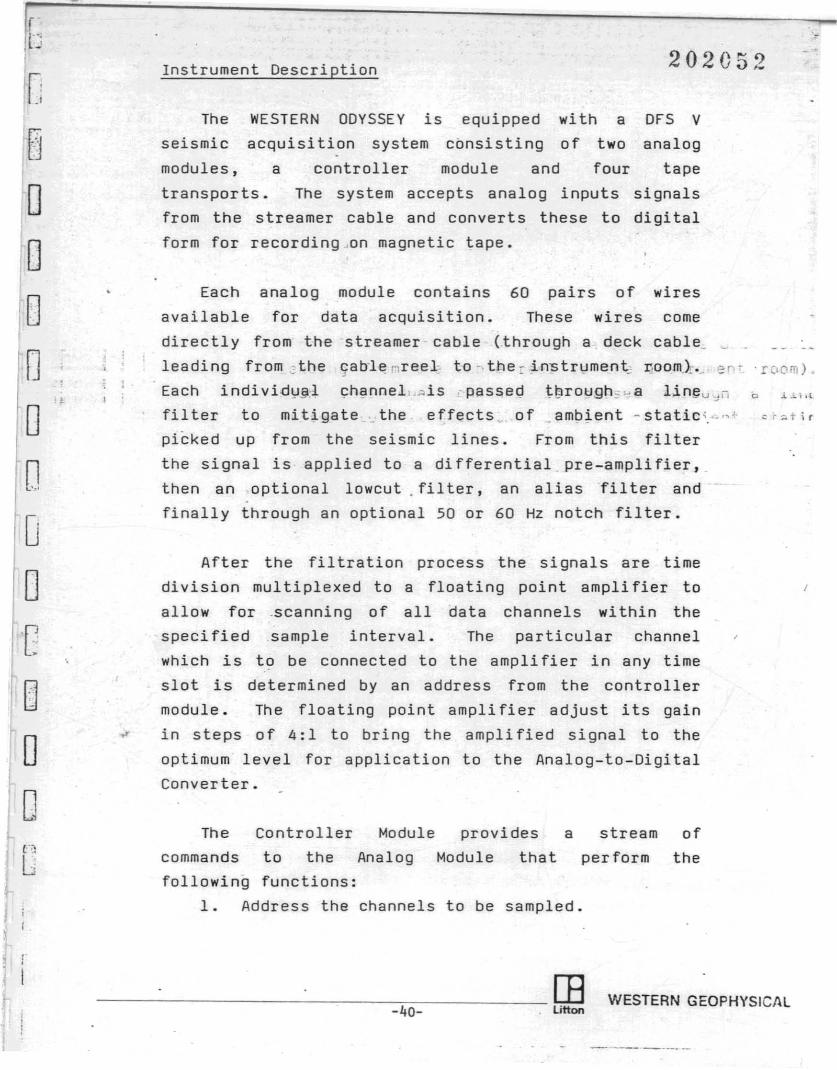
The Controller Module provides a stream of
commands to the Analog Module that perform the
following functions:
1. Address the channels to be sampled.
The WESTERN ODYSSEY is equipped with a DFS V
seismic acquisition system consisting of two analog
modules, a controller module and four tape
transports. The system accepts analog inputs signals
from the streamer cable and converts these to digital
After the filtration process the signals are time
division multiplexed to a floating point amplifier to
allow for .scanning of all data channels wi thin the
specified sample interval. The particular channel
which is to be connected to the ampli fier in any time
slot is determined by an address from the controller
module. The floating point ampli fier adjust its gain
in steps of 4: 1 to bring the ampli fied signal to the
optimum level for application to the Analog-to-Digital
Converter.
Each analog module contains 60 pairs of wires
available for data acquisition. These wires come
directly from the 'streamer cable (.through a deck cable_
leading from ;the rrab'le "reel. too -. tl:le:: ~nstr\,Jmentc l:i.00m.),., ~,,~ . room)
Each indivi-d\,J.9:~ «;:h1?nnel, "is . passec;l t9ro!;J9h~~a l,in~u J" cd','
filter to mit~gate_the effects"of ambient ·static'.-·," ~ .. ,,'ir
picked up from the seismic lines. From this filter
the signal is applied to a differential pre-amplifier,_
then an optional lowcut. fil ter, an alias filter and
finally through an optional 50 or 60 Hz notch filter.
-202Ge'');) ,-Instrument Description
form for recording on magnetic tape.
[Er:B000~
0-
000[
I 000Cc'L;
rn-----------------.-;-4...,,0-.------- Ulton WESTERN GEOPHYSICAL
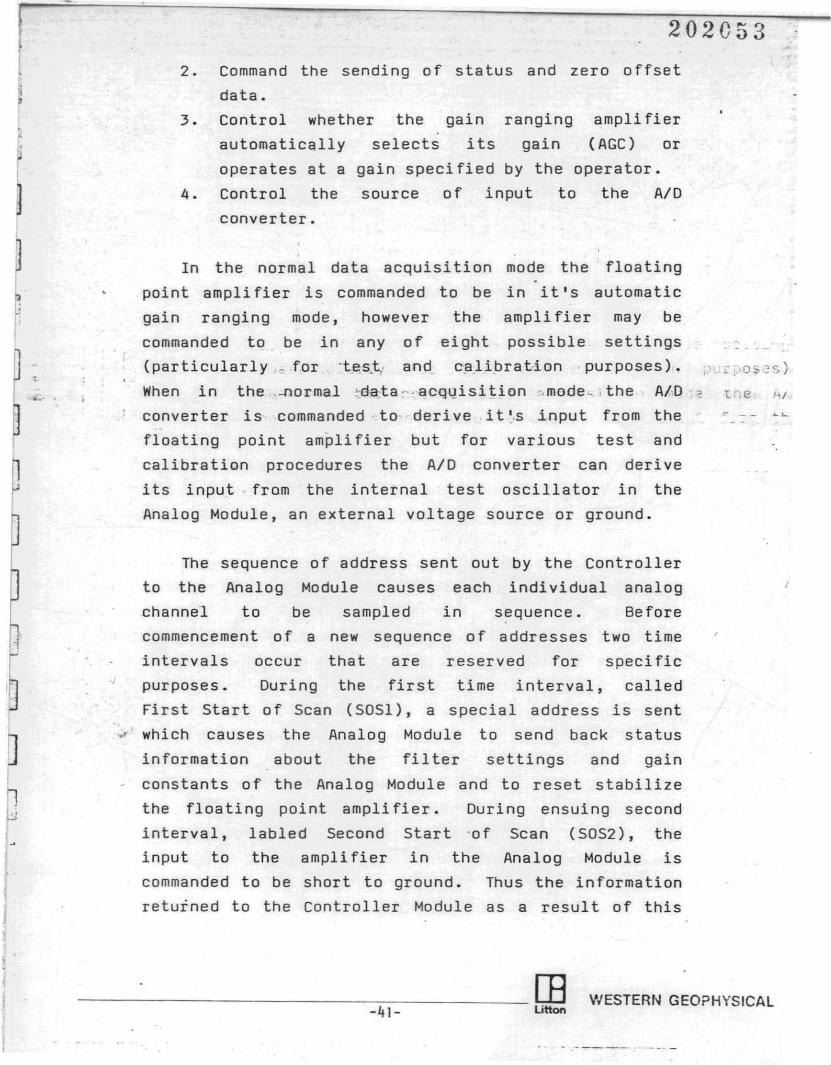
f 202053
2. Command the sending of status and zero offset
data.
3. Control whether the gain ranging amplifier
automatically selects its gain (AGC) or
operates at a gain specified by the operator.
4. Control the source 0 f input to the AID
converter.
In the normal data acquisition mode the floating
point ampli fier is commanded to be in it I S automatic
gain ranging mode, however the amplifier may be
commanded to be in any of ~ight possible settings
(particularly ,~for -t,e,s"t; and, c!"li,brat-ion ,purposes).
When in the ,-normal ~da:ta ",. acql!isi tion ",mode~, the AID ~
converter is commanded to' derive i t ~,s input from the
floating point amplifier but for various test and
calibration procedures the AID converter can derive
its input from the internal test oscillator in the
Analog Module, an external voltage source or ground.
The sequence of address sent out by the Controller
to the Analog Module causes each individual analog
channe'l to be sampled in sequence. Before
commencement of a new sequence of addresses two time
intervals occur that are reserved for speci fic
purposes. During the first time interval, called
First start of Scan (SDSl) , a special address is sent
.... which causes the Analog Module to send back status
information about the filter settings and gain
- constants of the Analog Module and to reset stabilize
the floating point amplifier. During ensuing second
interval, labled Second Start 'of Scan (5052), the
input to the amplifier in the Analog Module is
commanded to be short to ground. Thus the information
returned to the Controller Module as a result of this
'(ire hi
f
rn-----------------_7'4-1_------- litton WESTERN GEOPHYSICAL
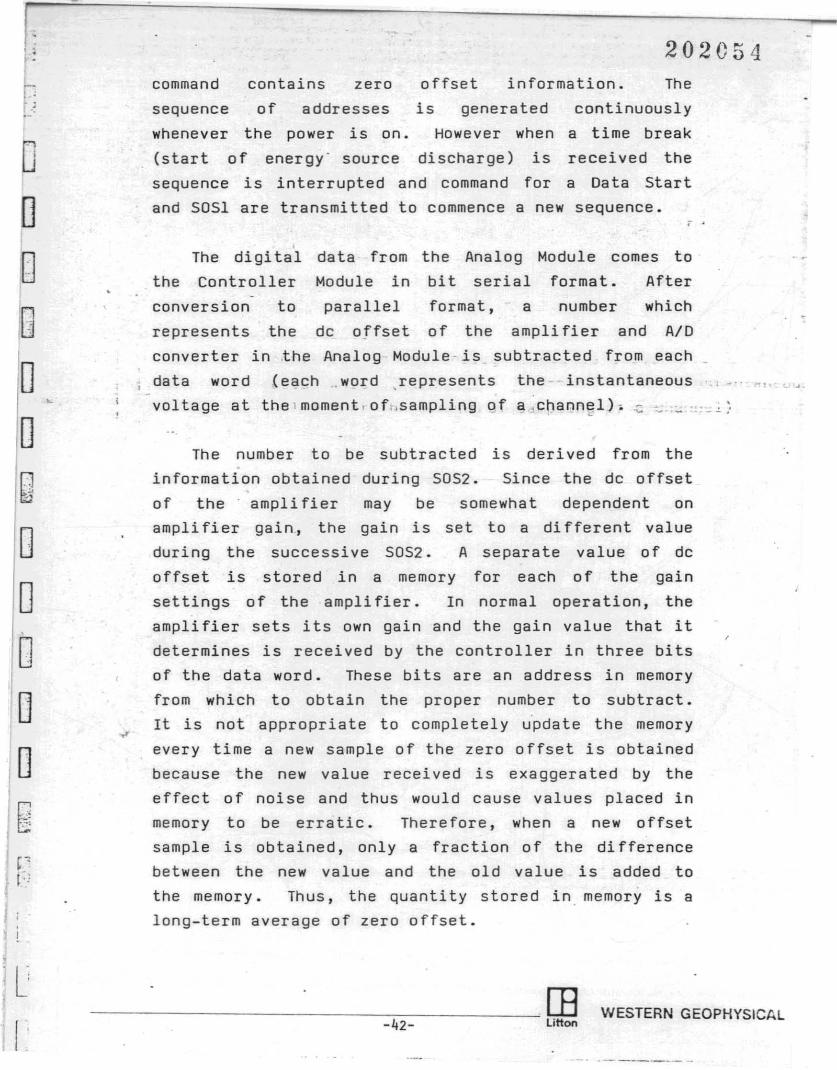
command contains zero offset information.
202054The
sequence of addresses is generated continuously
whenever the power is on. However when a time break
(start of energy source discharge) is received the
sequence is interrupted and command for a Data 5tart
and 5051 are transmitted to commence a new sequence.
conversion to parallel format, - a number which
represents the dc offset of the amplifier and A/D
converter in the Analog Module-i~ subtracted from ~ach
data word (each ,word Jepresents the· instantaneous "" _"
voltage at thBlmomenLofhsampling qf g,chann::l) • .;: _ ,c. ",_,:,
The number to be subtracted is derived from the
information obtained during 5052. 5ince the dc offset
of the ampli fier may be somewhat dependent on
ampli fier gain, the gain is set to a di fferent value
during the successive 5052. A separate value of dc
offset is stored in a memory for each of the gain
set tings 0 f the ampli fier. In normal operation, the
amplifier sets its own gain and the gain value that it
determines is received by the controller in three bits
of the data word. These bits are an address in memory
from which to obtain the proper number to subtract.
It is not appropriate to completely update the memory
every time a new sample of the zero offset is obtained
because the new value received is exaggerated by the
effect of noise and thus would cause values placed in
memory to be erratic. Therefore, when a new offset
sample is obtained, only a fraction 0 f the di fference
between the new value and the old value is added to
the memory. Thus, the quantity stored in memory is a
long-term average of zero offset.
00G0
~
0~
000
10.,r
0B:0:
k~
. (:
the
The digital data from
Controller Module in
the Analog Module comes to
bit serial format. After
-----------------_74.,..2_------~·6§ WESTERN GEOPHYSICAL
I,J
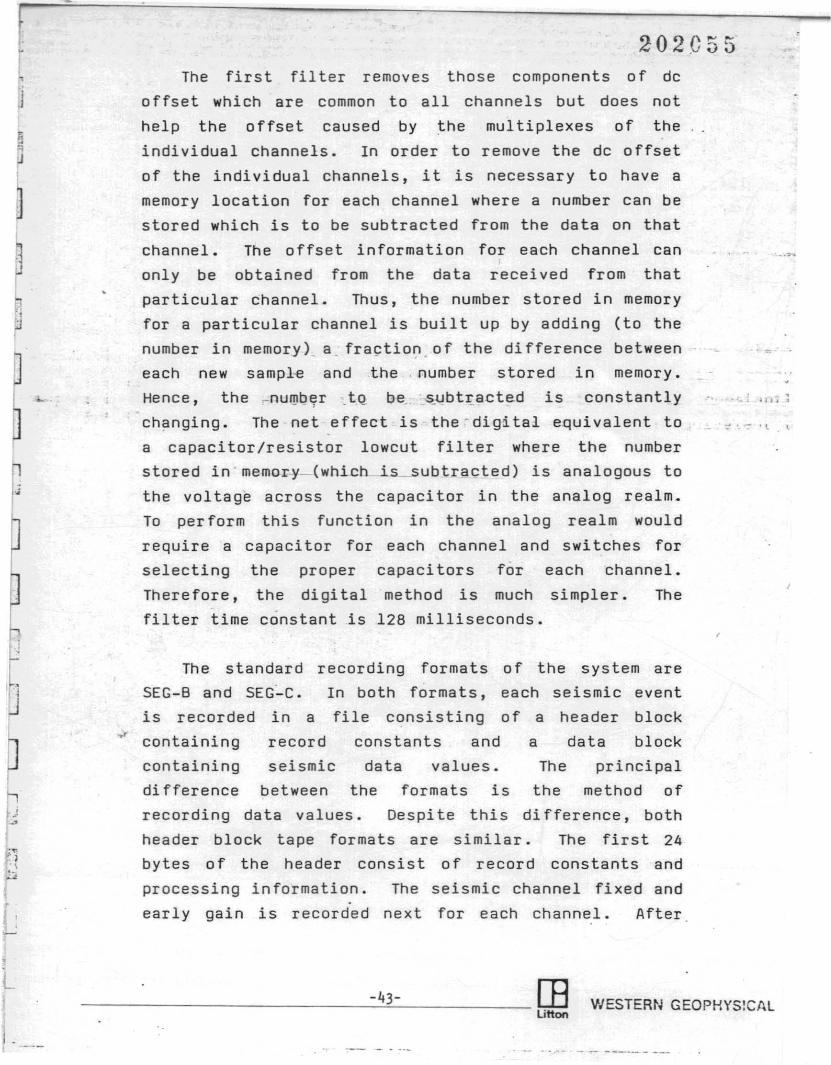
202055The first filter removes those components of dc
offset which are common to all channels but does not
help the offset caused by the multiplexes of the
individual channels. In order to remove the dc offset
of the individual channels, it is necessary to have a
memory location for each channel where a number can be
stored which is to be subtracted from the data on that
channel. The offset information for each channel can
only be obtained from the data received from that
particular channel. Thus, the number stored in memory
for a particular channel is built up by adding (to the
number in memory) _ a _ fra~tio,:. 0 f the di fference between
each new sampl·e and the. number stored in memory.
Hence, the ~nul]Jb!F.tQ be -~ubt:~acted is constantly
changing. The net effect is the-digital equivalent to
a capacitor/resistor lowcut filter where the number
stored in memor~-(which-is_subtracted)is analogous to
the voltage across the capacitor in the analog realm.
To perform this function in the analog realm would
require a capacitor for each channel and switches for
selecting the proper capacitors for each channel.
Therefore, the digital method is much simpler. The
filter time constant is 128 milliseconds.
• I J-' •
recording data values. Despi te this di fference, both
header block tape formats are similar. The first 24
bytes of the header consist of record constants and
processing in formation. The seismic channel fixed and
early gain is recorded next for each channel. After
The standard
SEG-B and SEG:"C.
record
The principal
the method of
of the system are
each seismic event
of a header block
a data block
data values.
the formats is
recording formats
In both formats,
file consisting
constants and
in a
seismic
between
is recorded.... containing
containing
di fference
I 1~
J :
.l
-43- rn----------------....::..:~------- Lillon WESTERN GEOPKYSlCAL
I ---
202C56
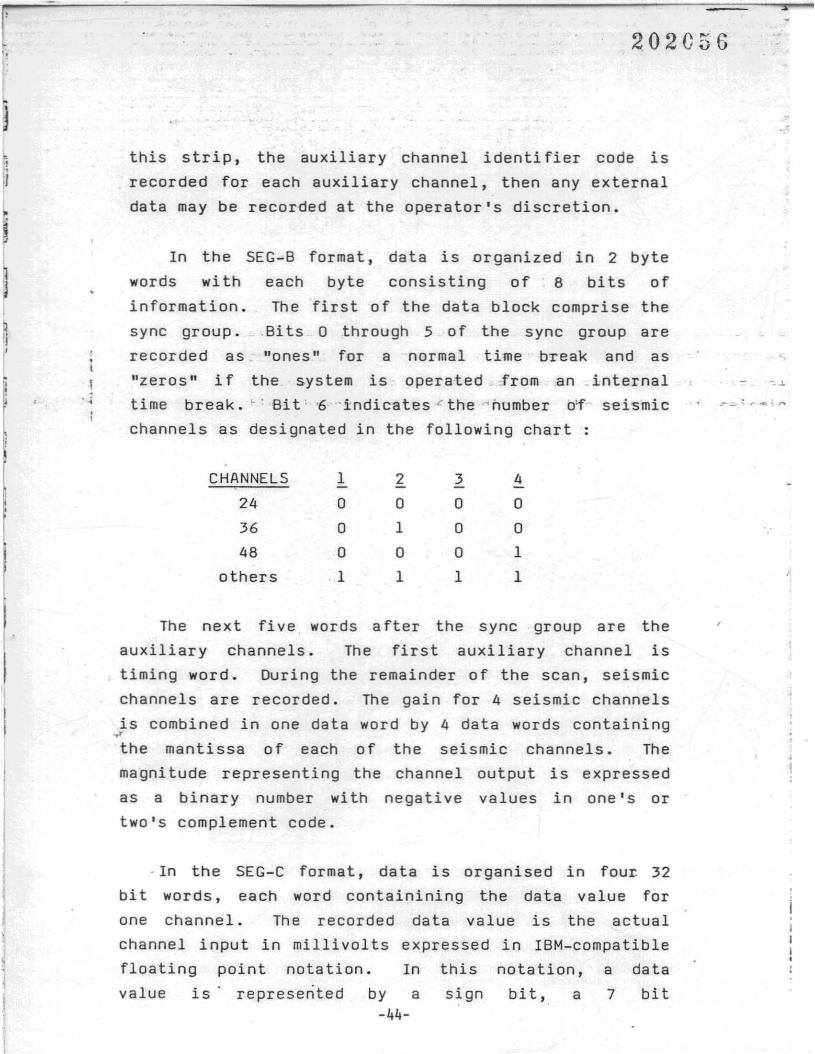
this strip, the auxiliary channel identifier code is
recorded for each auxiliary channel, then any external
data may be recorded at the operator's discretion.
In the SEG-B format, data is organized in 2 byte
words with each byte consisting of 8 bits of
information. The first of the data block comprise the
sync group. Bits 0 through 5 of the sync group are
recorded as "ones" for a normal time break and as
"zeros" if the s.ystem is operated_Jrom an ,internal
time break.'" Bit: "6 'indicates "the "humber of seismic
channels as designated in the following chart
CHANNELS 1 2 3 4
24 0 0 0 0
36 0 1 0 0
48 0 0 0 1
others 1 1 1 1
The next five words a fter the sync group are the
auxiliary channels. The first auxiliary channel is
timing word. During the remainder of the scan, seismic
channels are recorded. The gain for 4 seismic channels
is combined in one data word by 4 data words containing.,r
the mantissa of each of the seismic channels. The
magni tude representing the channel output is expressed
as a binary number with negative values in one's or
two's complement code.
- In the SEG-C format, data is organised in four. 32
bi t words, each word containining the data value for
one channel. The recorded data value is the actual
channel input in millivolts expressed in IBM-compatible
floating point notation. In this notation, a data
value is represented by a sign bit,. a 7 bit-44-
'.
.-_. r .... i,..
characteristic of exponent
characteristic signifies a
64 code. The fraction
significant digit of the,digits of the fraction.
and a 24 bi t fraction. The
power of 16 in binary excess
is normalized to put the
data wi thin the uppermost 4
' ..~ "'-;-
The data coming from the offset filter (data in the
form of a 16 bit two's complement number and a three
bi t gain for" each - sample) mus t· be rearranged to be
placed on the .. hal finch 9 ..t.rack (8 bi ts plus parity)
tape. The logi-c wh1."ch per'forms this~ofunct-ion 'is cal'led',
Format Logic. Only .. 15 of the 16 bits are actually
used. The most signi ficant bit is used to indicate
overflow. The output of the Format Logic is a
progression of 8 bit words arranged in accordance with
either the SEG-B or SEG-C standard formats as chosen by
the plug-in Format Logic board in the Controller
Module. But after the words are generated, it is
further necesssary to encode the bits according to
ei ther the NRZI or the Phase Encoded modes 0 f writing
on the tape. The logic that performs this is called
the Write Logic. The Write Logic is on the NZ board
for NRZI and on the PE board for Phase Encoded. There
must be a timing buffer between the Format Logic and.... 'the Write Logic. That is, the. data may not be
available from the Format Logic at exactly the time
when it is desired to feed information to the Write
Logic. The average data rate will have to be equal.
The required flexibility is provided by a first
in/first out memory (FIFO). This device can load a
number of words into its input and later read them out
of the output in the same order as they were entered.
This reading out can occur at di fferent times. The'"
controller Write Logic translates the "ones" and
"zeros" of each word into appropriate flux direction.. 45-
t . . 1..' I...
202058
signals to be sent to the Tape Transport for writing on
tape. In the case of phase encoded signals, this
requires two flux direction bits sent for each signal
bit. The data is rearranged into 8~bit-plus parity bit
parallel words, and these are encoded into 8-bi t-plus
pari ty flux direction words. After this 4 command bits
are added to each data, word and the resulting data
command words are converted to bit 'serial form and sent _
to Tape Transport. "Clock and sync signals are also
sent to the ~ape ~ransport.- The communication from the
Tape Transport -toTthe-Contrbller 'Module 'is-uividetJ- ihto-'''; - "
2 pa-rts
1. The data read from the tape is communicated to
the controller by 10 wire pairs which carryall
9 tracks from the tape and a read clock for
NRZI to the controller in parallel.
2. The status in forma tion (tape rewind, end 0 f
tape, etc.) is carried Dver a serial interface.
The Tape Transport motion control commands are sent
over the serial inter face wi th the wr i te data. The
commands are issued by the Controller Module, but the
means of executing the commands are in the Tape....Transport Module. Before a record is written on tape,
a header is written which contains file identification
and a number of constants which are introduced from the
controller. Also, there are pieces of information such
as gain constants and filter settings which are
received from- the Analog Module. All this information
is arranged into a procession of 8-bit-plus parity (the
same as the data) and is arranged in· a specified
sequence by the header logic according to SEG-B or
SEG-C format. The header information or the data
information is selected at the appropriate time for-46-
-.:;., .-
- :-,
.; .... -f"'l
i
;•,
1•J
1.!oj
:J
'-.
,1
202059
feeding the FIFO. The Tape Transport Module is the
means by which the digital data from the Controller
Module is recorded on magnetic tape. Four transports
are used in the system to facilitate dual recording
wher'e and when requested by clientele. Each of the 10
inch transports record the data on 1/2 inch tape using
IBM-compatible 9-track dual gap' heads. The recording
can be either 800 bits per inch NRZI or 1600 BPI PE.
The transports consists of the capstan drive,
mechanical s-torage systems, supply and take up reel
serve systems, recor·d/reproduce. ,head data e~ec;tronics
and ~ape position sensors.
-47-
-
-.~ l.
202C60
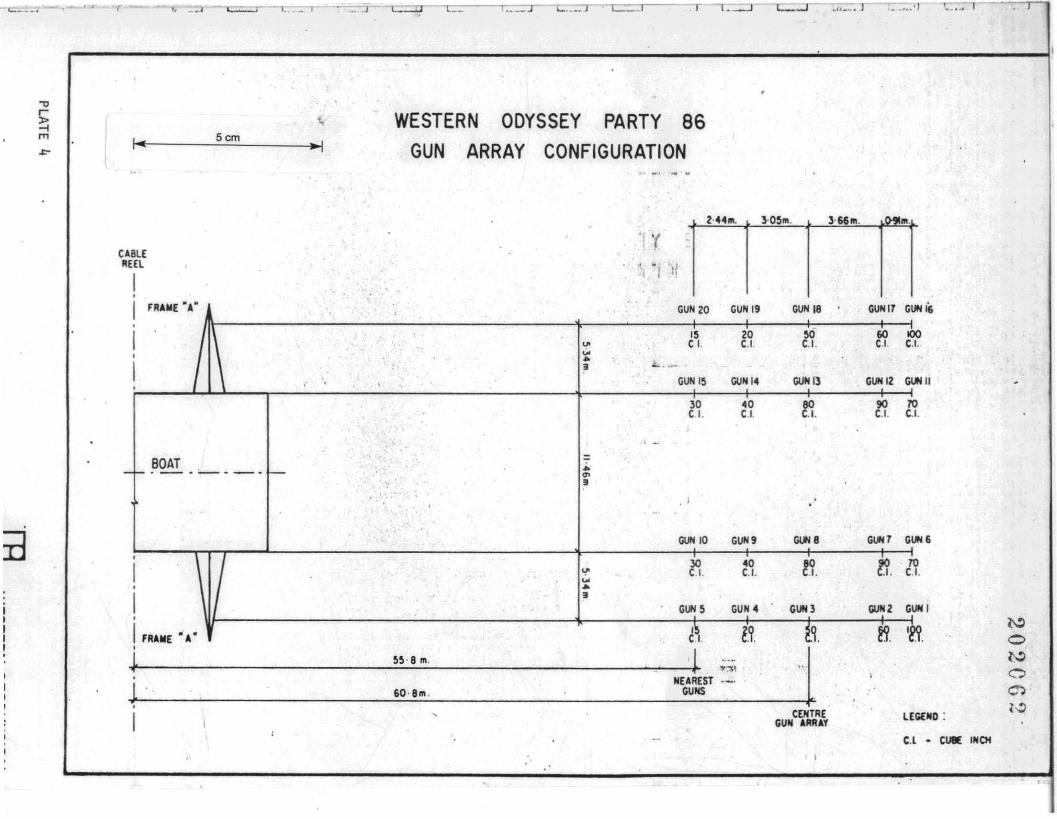
Energy Source
The M/V WESTERN ODYSSEY's high pressure energy
source system consists of twenty high pressure WESTERN
airguns with reservoir capacities ranging from 10 to
100 cubic inches in 10 cu. in. intervals. In normal
operating circumstances, 10 of the airguns are combined
to form a 560 cu. in. tuned array. The airguns are
opera ted a t a pressure 0 f 5,000 psi supplied from 4 0 f
6 available Brice. Air Gun Master Compressors. '.
f:or various reasons, most airguns _ have some
inherent firing delay and do not fire immediately upon
receipt of a "fire" command pulse~ The amount of this
delay tends to dri ft with time and naturally varies
from unit to unit. To overcome this problem and to
assure all airguns fire wi thin specs required for an
optimum energy pulse, the system is controlled by the
LRS 100 Energy Source Synchronizer. The LRS 100 is a
module microprocessor based system designed
speci fically to control the firing of a seismic energy
source array so that all guns fire concurrently or in a
pre-designated staggered time sequence. The system
accomplished this by electronically sensing the....individual gun delays and automatically establishing a
firing sequence to compensate for the variations in
delay. The basic sequence of operation is as follows
1. The Controller Module receives a fire command which
signals the start of the firing cycle. The fire
command signal may be issued by the seismic system
or the LRS 100 Cycle Controller.
,< 1~i
I
I
iI!
1,I
il•.
ir
2. At some pre-calculated point after
fire command, the controller will-48-
receiving the
issue a fire
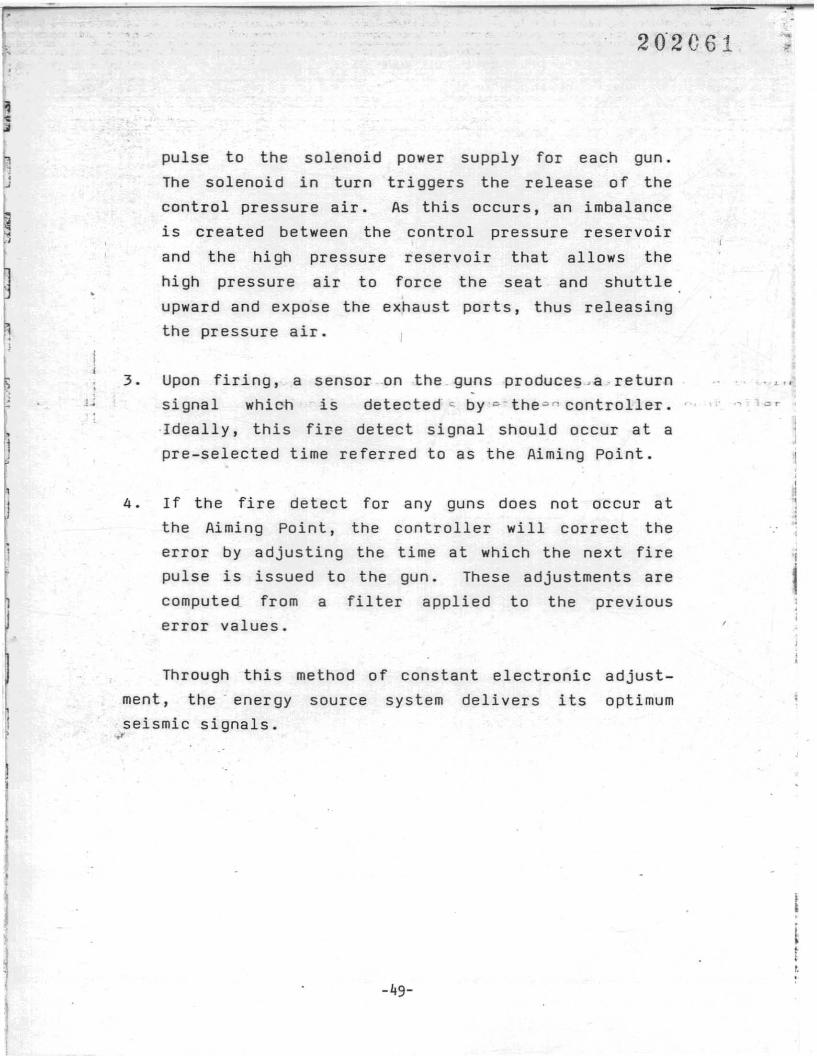
pulse to the solenoid power supply for each gun.
The solenoid in turn triggers the release of the
control pressure air. As this occurs, an imbalance
is created between the control pressure reservoir
and the high pressure reservoir that allows the
high pressure air to force the seat and shuttle
upward and expose the exhaust ports, thus releasing
the pressure air.
3. Upon firing, a sensor on the guns produce~.a"return
signal which is detected"" by c-the c '"' controller.
Ideally, this fiFe detect signal should occur at a
pre-selected time referred to as the Aiming Point.
4. If the fire detect for any guns does not occur at
the Aiming Point, the controller will correct the
error by adjusting the time at which the next fire
pulse is issued to the gun. These adjustments are
computed from a filter applied to the previous
error values.
• ..L I I
" 1 ~ r
Through this method of constant electronic
ment, the' energy source system delivers its
seismic signals.¥'
adjust
optimum
itt.
-.,;;._ .. _.
ScmWESTERN ODYSSEY PARTY 86
GUN ARRAY CONFIGURATION
CABLEREEL
I, ..
. '(~. .. .,I I I,
1,«or '''"j ,,," n
UNI
UN6
UN 16
~.
70I.
100L.
GUN II
70I.
,
J ti·55· 8 m.
";:ojlNEAREST ._.
60·8m. GUNS
I, CENTRE LEGEND:
GUN AIlftAY
C.l • CIJII( INCH
I FRAIfE "A"'. GUN 20 GUN 19 GUN 18 GUN 17 G
I 15 20 50 60~ CI. C.I. C.1. C.1. C., '"..
I • ...........\ .. '. GUN 15 GUN 14 GUN 13 GUN 12,
30 40 80 90C I. C.l. C.1. C.1. C.
. -
BOAT'-- ..-I-. - .'--_. ..•.. ,- .,
• J-
GUN 10 GUN9 GUN 8 GUN 7 G
• I 30 40 n rI.I '!' C I. C.1. C.'"• ..
I •GUN 5 GUN 4 GUN 3 GU~2 G,
I FRAIfE "A" )~ lY ~~. fl. ,C.1.
.,'! 1
20·2 C6 3 ~
streamer Cable
,Modern seismic -marine streamer cables originated
from WW II anti-torpedo technology. The modern cab~es
are 2.5 to 3 inches in diameter and, when fill ed wi th
a special kerosene based fluid, are neutrally buoyant
in the water - column. As wa ter densi ty changes, the
overall buoyancy of the streamer is adjusted by the
addition or removal of thin lead weights taped onto
the streamer at various intervals. c
. .. The streamer cable used by the WESTERN ODYSSEY is
composed of 48 detachable and interchangeable LRS
Marine Active Cable sections. Each section is 50
meters in length and contains two 25 meter groups of
twenty WM2-036 hydrophones. This gives the streamer
an overall length of 2400 meters excluding the lead-in
and elastic sections.
The 500 foot nylon reinforced neoprene lead-in is
heavily weighted in order to depress the front end of
the streamer cable to the desired operating depth. It
is also outfitted with neoprene florings for noise
.,rreduction. In normal operation, two 75 meter elastic
sections are attached at the tail of the lead-in for
additional noise reduction.
To maintain the streamer cable at the speci fied
depth in the water column, a series 0 f Syntron Depth
Controller are employed at equal intervals -along. the
cable. An electronic pulse controls the angle 0 f the
wings and thus controls their influence on the cable's
depth. The cable depth is monitored from the readouts
of pressure sensitive transducers located at regular
intervals along the streamer.-50-
f
I•
20206 L1
A tail buoy is connected at the far end 0 f the
cable and is tracked by the vessel's radar, making it
possible to observe. how closely the cable is trailing
the vessel along its line of motion.
5
In order to give a further indication of the
cables physical orientation along the line of motion,
6 of the 48 ~ctive sections contain Digicouse heading
sensors. Each heading sensor will give the heading in
degrees of the streamer at -the paint _of location of
the heading s-ensor. Using-·the length of cthe streamer'- ,'.
out- from the vessel- and the heading from the sensors.
a simple approximation of the shape of the streamer
can be made by connecting the known points with
straight lines.
'.
-51-
-.
... _-_. .,----.-r·--.,;
202065
2S M.
GROUP BrOVERALL LENGTH C 50 METERS
GROUP A14-32 11-89 '-41
"'53 13-12 10-61
25M.
16-14
11-1S
24[
,-1
Scm
I f' \ (, I~ .. '
I"
HYDROPHONE CONFIGURATIONWESTERN ODYSSEY 96 CHANNEL
100
100K"
PI
I
2-43K"
II
-" 2'JI 2-43
"-, K"19
" I
<r.
, \_-
-202G66
RECOROING PARAMETERS
Instrument Settings and Specifications
Model
System Number
Tape Format
BPI Density
Number of Channels Available
Number Seismic Chann~ls
Auxiliary Ghannels
Pre-Amp Gain
Total Gain
Lo Cut Filter
Hi Cut Filter
Sample Rate
Record Length
Analog Module Specs
Frequency Response
Maximum Gain
Minimum Gain
Input Impedence
Di fference !'-lode
DFS V
408
SEG-B, 9 track
1600
124
96
Timebreak - Channel 1Waterbreak ~ Channel 2
36 dB
120 dB
Out
64 Hz, Slope 70 dB/OCT
4 milliseconds
6 seconds
3 to 256 Hz
132 dB
24 dB
20,000 ohm resistivein parallel ·with0.035 microfarads
(
Common Mode
-52-
500 ohmswith thecombinationmicrofaradsinduction of
parallelseries
of 0.02and
6 Henries
Max. Input Signal Gain Constant
Difference ,Mode: 2426
8
Common Mode: F. Range (Hz)
o - 6060 - 700
700 - lKlK - 3K3K - 10K
20206':'
Voltage(mV RMS)
327.6881.9220.48
voltage(peak)
73.57
1050
'......"
. i
Distortion 0.05% 3 to 256 Hz
, .
Cross feed Isolation
Control Module Specs
Timing Accuracy
Oata Word Rate
80 dB between any 2channels, feeding 1channel only
-0.005%
64 kHz Max
". .
Cable Parameters
~,~
202068 '"
Percent Coverage
Pops per km
Number of Groups
Center Enery .Source to
Center Near Group
Center Near Group to
Center Far Group
Group Center to Group Center:
Number of Phones per Group
Depth Detectors at Head of
Groups
Depth Controllers on Groups'"
Center Near Group to
SAT NAV Antenna
-54-
48DO%
40
96
200.7 meters
2,375 meters
25 meters
20
2, 16, 32, 48, 64, 80,96, Head of Mini
SS 2, 12, 26, 40, 54,
68, 82, 96, SS
278.6 meters
j
j•
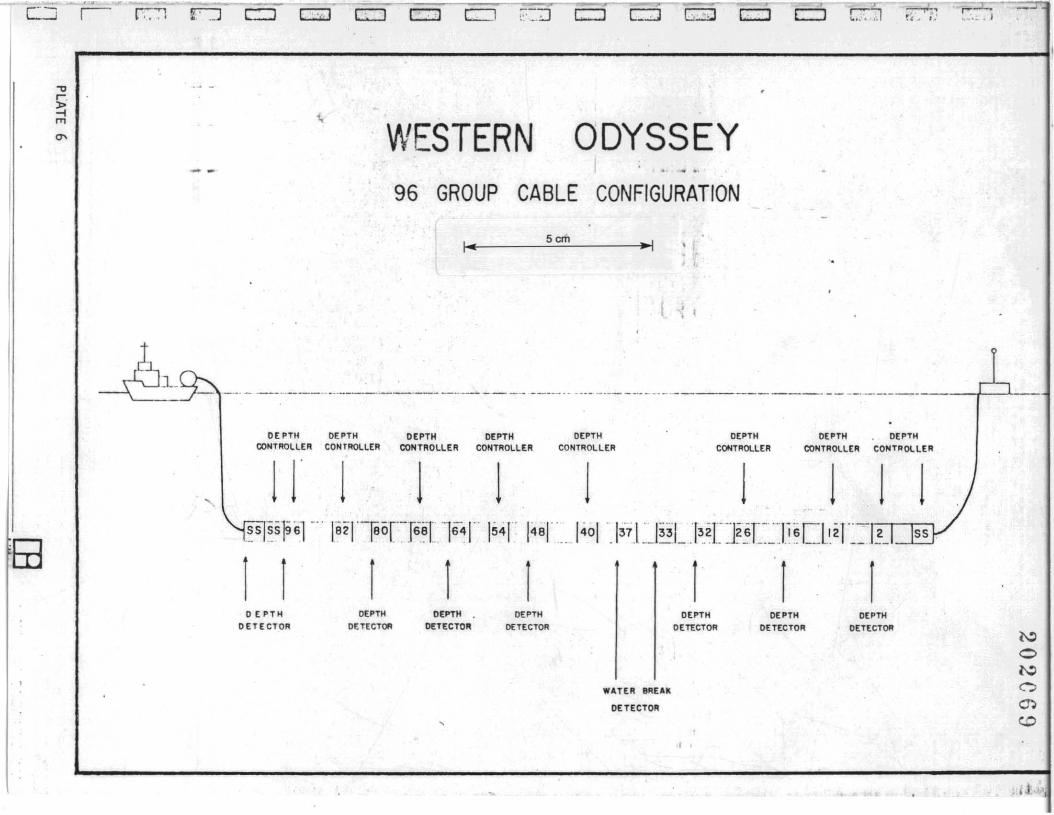
r-- -... " ~ I
WESTERN ODYSSEY96 GROUP CABLE CONFIGURATION
Scm"I
I 'I•
1 ~\f=J]:::~ --- ._. H .:....__• ----•••----•• ---•••••••• - •••-- - ••••- ••-.------~----.-- .-.--.-•••---.-+--'----1
DEPTH DEPTH DEPTH DEPTH OEPTHCONTROllER CONTROLLER CONTROLLER CONTROLLER CONTROLLER
DEPTH DEPTHCONTROLLER CONTROlLER
1 1 1
DEPTH
CONTROLLER
1 1 1 [s.s~S~ 61-' IS2j'-fao[']6sL164r 154!" 148 1" 1401'13'7\' 133113zrJ2iir'lis[]izr' 2 SS.
"Ei3.... . __ :.:1_ ..... __.... _. __ L I I'
i r r 1 r r r rDEPTH DEPTH DEPTH DEPTH DEPTH DEPTH DEPTH
DETECTOR DETECTOR DET£CTO,. DETECTOR DETECTOR DETECTOR DETECTOR
WATER BREAk
DETECTOR
.
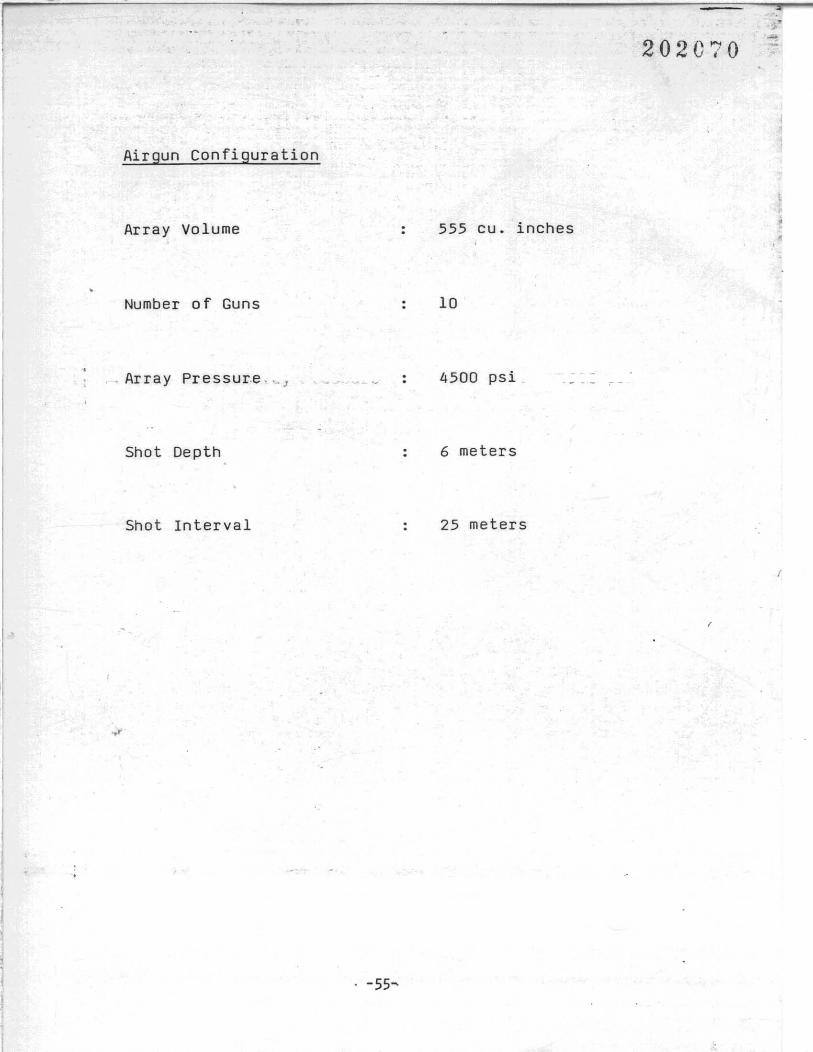
Airgun Configuration
Array Volume
Number 0 f Guns
. Array Pressur.e .._]
Shot Depth
Shot Interval
..
. -55-
555 cu. inches
10
4500 psi
6 meters
25 meters
202070
I
1~ !I II
. ,
1-
......,
, ,
'" ..
I ,-,~R~ I
~ I: I
J I\,..:J1;J.'J ;.';~:J
'i t, , _",- _'.
.. Col ..
, 1JI
[=:J
-.. tit et .....
... +_ N
. rtT-t _. -- ' , , : ,
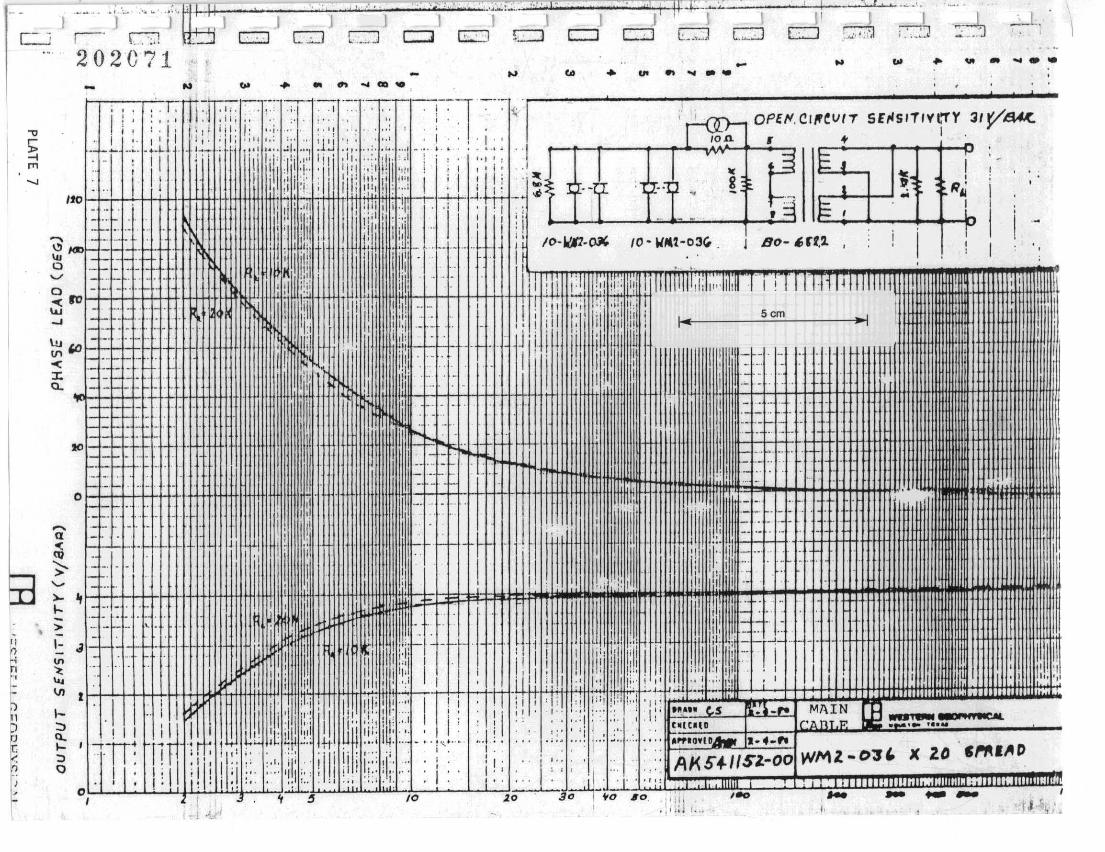
I; i: ::':11.1] ::::~~:"i .-:.:'~~' ',; . i :]-":-,," 'r'~. oput.CI/f~VI1' SE,oISITIVl'TY 31"/~I' ,·1' "I ill.j' "I' .. ·· ,.It ,.,,,,,,, I; , Y·· I ' I' 11 I ;. ; i'; .;" ,,: ., . ;1'; " ; ,,' . I ., . I ., /0 II. ~ '" I
': f-- "1:' 'ill 'r~" Ii' ii11;Iii :i:1 ~ 'Ill' if::;h,::· \. i : : : :.: :;1 Y" ~ 11= J
, I I 1~1~'18:: i ,j ; , I'li in;!i, ~::! I : I : ,I! ~3""'- ~ •......T·:"J.. g_~E. - I J."_, " , . 'In-'- ' , . '.!---H- -> ~ ~ .... ",,- . l.,L"~. ," .--4--4-..J
'VI::.,' .f . !;1 'I i'1:I'I' I 'I ;ii! 1"1' I!~I:III' .~IlIi; ! i :i ~_I'-l------4I"-"--"""",----+--,,,;-..;;;J-~; IE I ..
..., 1-'" f- I " loll,' " /0 lJ ~<>I i I~/(I)~~.-,~: 1iii/lit I tilj i:I:(-r _... I, IO'W~t-~3" j 8D-~rt.1, "
~ rol:~ :...... . illl;W' Illjl~!I: I ill.lu 2, I~!'::;:jil! jlllllllll,i:\;" 1111" 1'1' 111111111111111\\~ _..... 1'l oi1j 'I i'l'l "I' , Itr ," l'iI ",: ';"I!'I' I I.... 1_ --- .._.. ! I;. 11 11 ;", ; "I 1'1' '11'1 ,1
11' i I 5cm 11_1·_ . - . , -- - ' 'h I! Id .- ._. . Ii! II. ~ I I I I!I I .. .. I*~ I - •. .. " lIit. , I Ii: ' .'.' J'i I+ If ill' ,'Ill
~.. .. . . 1111111/1!I iii:! . i illl ...•- I I, , 11.,1
1 i .111 II - ." ,. ttl~ [= ~.. ~: ~ .. mwm If!: !j I j~!.,.' I i II i[I Ii ~ j i i::':·:·: ... . 11
:.' ':. Ir il .. " - .. j' II i·:"::':' ,10:: :.::. :.: __ . ' I~ i-. '., ! lIilill -_.. 1--:1-'.1-:1--1'.'~+H+HHI+1
,. ..-_. . .. _. . . - ,
o 1-1.:+-::+->:-+-._+-1.. f-+.+++.'.H.-f++!f-H I I :1
,
t-=~ . . ...'. !1-·· ..". -- ... ,
J~:'::"~:. ~, \' ,I!t~. . l ill 11, 1'11,1 J 111'11]] Itr:..J~ -1-, .
..... ··1 I I! I '1111 ::1' I I :ill : M;I:'III;I!lli l ,lii·llil·· I I ~ I II i III~, I, ~ ! d Ii !I,! Ii!, I' , I. II !.., . ,I I, ",' '!II ., I i I I I I ' I' . ,:1
tH-+-t-\-H+H+++-+#fltttl+tllfIjjjJ,l [I lll~r I ':' I U-lr :,,1 I "! 1~' tl~':'~J.S:±J'::'~..t±!:J~lli!I!I~~'='±t:b:t±#!:tij;W!Jilirlfililt.~twn'i d"~· I .! I ;.. . ;' liil;: 1 lili I" I I .I'! i , 'I, "i i"l I;!' 1,,11'1"1,. ..... I . ::i' III'" ,,' II "''''1' .... , . II " '1 .. ,." [ .. ,.. 'II" ..... '·s I\':~-"" MAIN. '~I' lil[': I ~"';:!'I"" I' " .; "":'1:"" .,. I if·ZlnT.'" !It::!:!.'-- iii ...! II ,I III Itt. ll:lll'jl! [1111:1""'" "Iil ., l" ';1 , CIl(C.(D " .., --;r-IT~ ~f1.:r,: 1" ~.:k .'l--:-:p, ..... Tt, i I ;::: ~ ..... :'i':" .. ;, ... I":' ".: I.. : ~ :.. ", ......u.., 1-4·" .
Ii: I: III ii iii 11:1' :: ;:~: 'ill';:. illl di If:: :1:: ,: : II :. i!; .. i ;.; • ...<, A~H·IISZ.-00 WMZ -03' X ZD ,,.'U}lP· , • I. .' I • ..., "....., .. , '." I. .... , , . . I . i ,I . .,. ;,I~,'li"bCl3lg:=:cl:!!I~IIIIIm1~I:::I:!D!!l!~mrr:mn.o .',,' . i ~ --I-~ ,
, , ~ ~ 10 20 . ' 30 I-to 10. ,;i, ,_ - - - - I. ~''':- --i ~ •• 1Id I.,. I- 't\f'~L' ~
.....n-(<V
~'-':>-I-
, >
0 1--
~In~...
r VI
~ I-:,
) n.I-::J
n 0J,
-0
I ~,'"
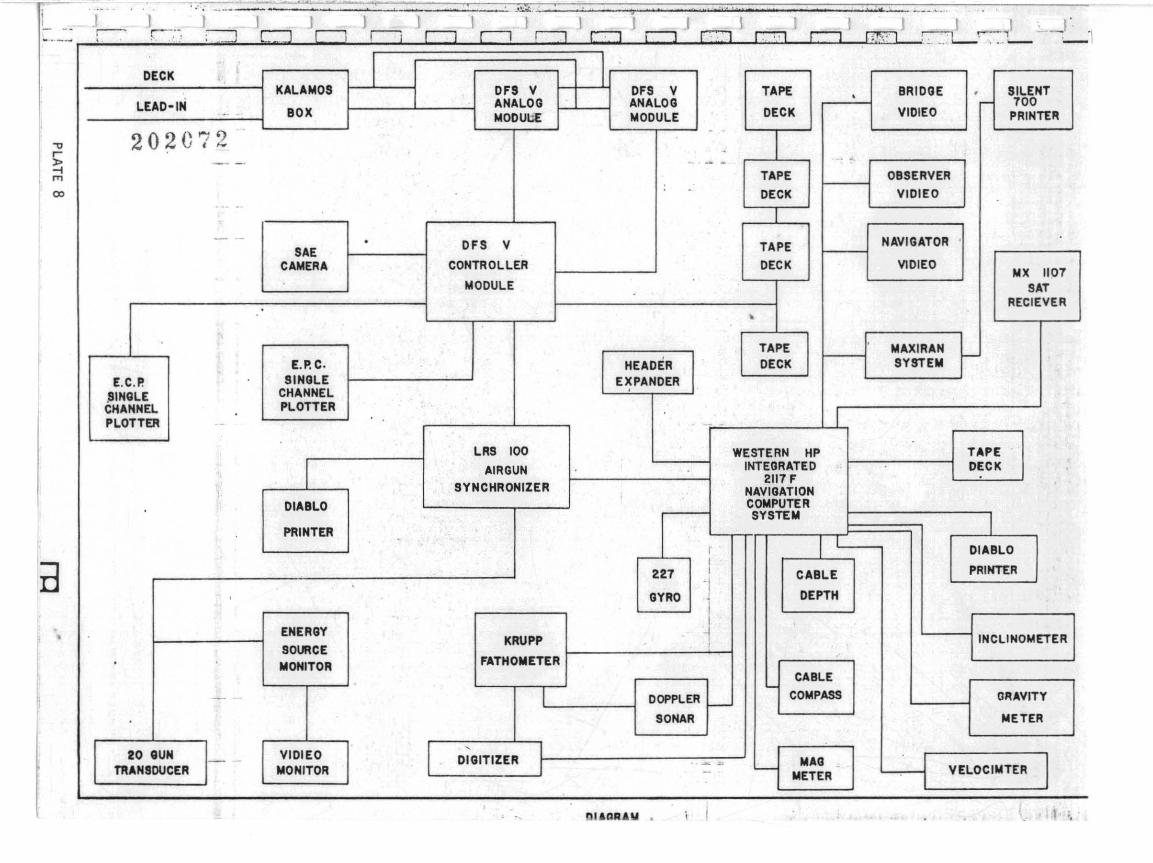
1'. - .._-=~:::::::::::::;:::::~=======~_..:i.C-, ==::::::;:::===:;:=~.,..=.====.c·=:----::-:----j
J j J j 1.. ~ .
Jr-- ...-" ~ r-:-l II II II II II rI ..-,' rI r:-"71 ..-, IT1<7l' ~~
. -, , -IDECK ,,
KALAMOS OFS V DFS V TAPE , BRIOGE . SILENTLEAD-IN ANALOG ANALOG r- 700
. BOX MODUtiE MODULE DECK VIDIEO PRINTER. - ·202072-_. .. - ..
TAPE OBSERVER;
DECK VIOl EO-
- - . OFS V NAVIGATORSAE TAPE
CAMERA CONTROLLER DECK VlDIEO"IX 1107
MODULE SATRECIEVER,
,TAPE
,MAXIRAN -E.P. C. HEADER DECK SYSTEM
E.C.P. SINGLE EXPANOER.SINGLE CHANNEL
,
CHANNEL PLOTTERIPLOTTER - · -
LRS 100 WESTERN HP TAPE
AIRGUN INTEGRATED DECK
SYNCHRONIZER2117 F
NAVIGATION,COMPUTERDIABLOSYSTEM
PRINTER
r DIABLOI
PRINTER227 I CABLE
GYRO-j
DEPTH,
JENERGYKRUPP INCLINOMETER,
SOURCEFATHOMETERMONITOR
CABLE
I - COMPASS GRAVITY- OOPPLERf--
SONAR METER
, I20 GUN VIDIEO DIGITIZER I- I . -.. :;. MAGTRANSDUCER MONITOR - - METER VELOCIMTER
I
·
."r=;ITl
co
IlIAQR&V • '.
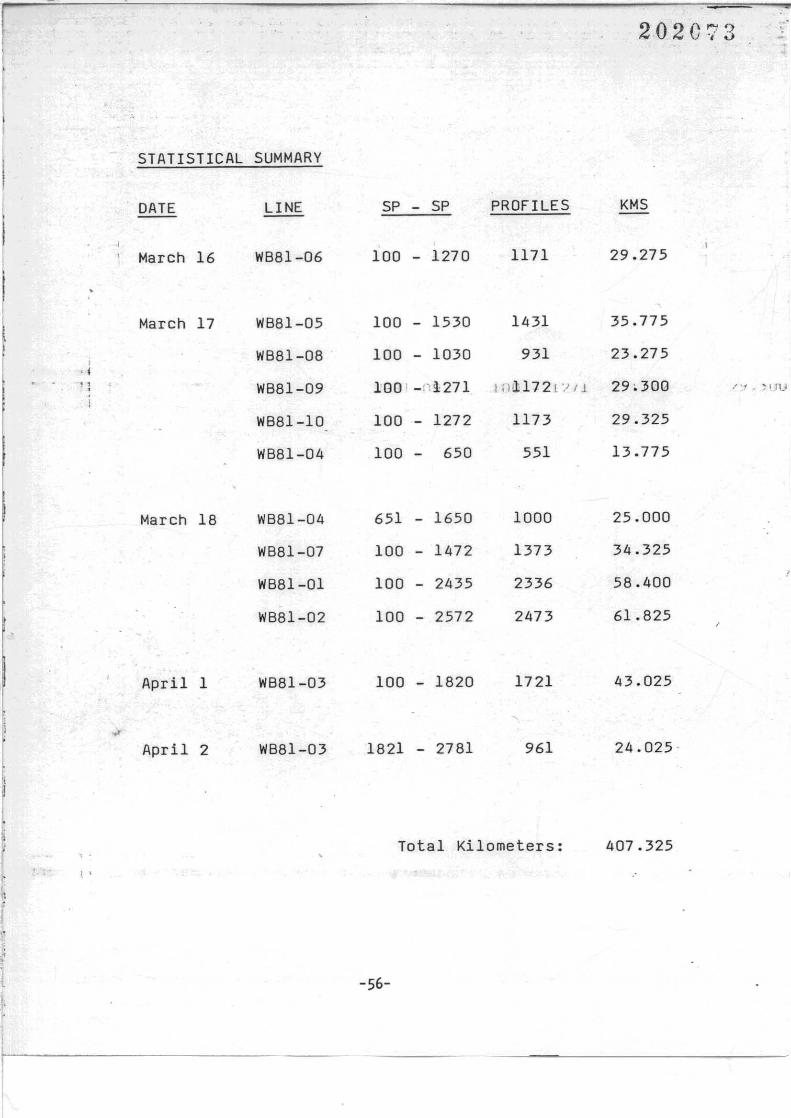
r
STATISTICAL SUMMARY
20207351
."
-
DATE
March 16
LINE--
WB81-06
SP - SP PROFILES
100 - 1270 1171
KMS
29.275
March 17 WB81-05 100 - 1530 1431 35.775
, WB81-08 . 100 - 1030 931 23.275, l
" WB81-09 180l-n!l:271 Irli);172l'/ll 29;300.. / '1 . "; IJll
WB81-10 100 - 1272 1173 29.325
WB81-04 100 - 650 551 13.775
March 18 WB81-04 651 - 1650 1000 25.000
April 1
April 2
WB81-07
WB81-01
WB81-02
WB81-03
WB81-03
100 - 1472
100 - 2435
100 - 2572
100 - 1820
1821 - 2781
1373
2336
2473
1721
961
34.325
58.400
61.825
43.025
24.025-
•,l
, ,
Total Kilometers:
-56-
407.325
Ir------~
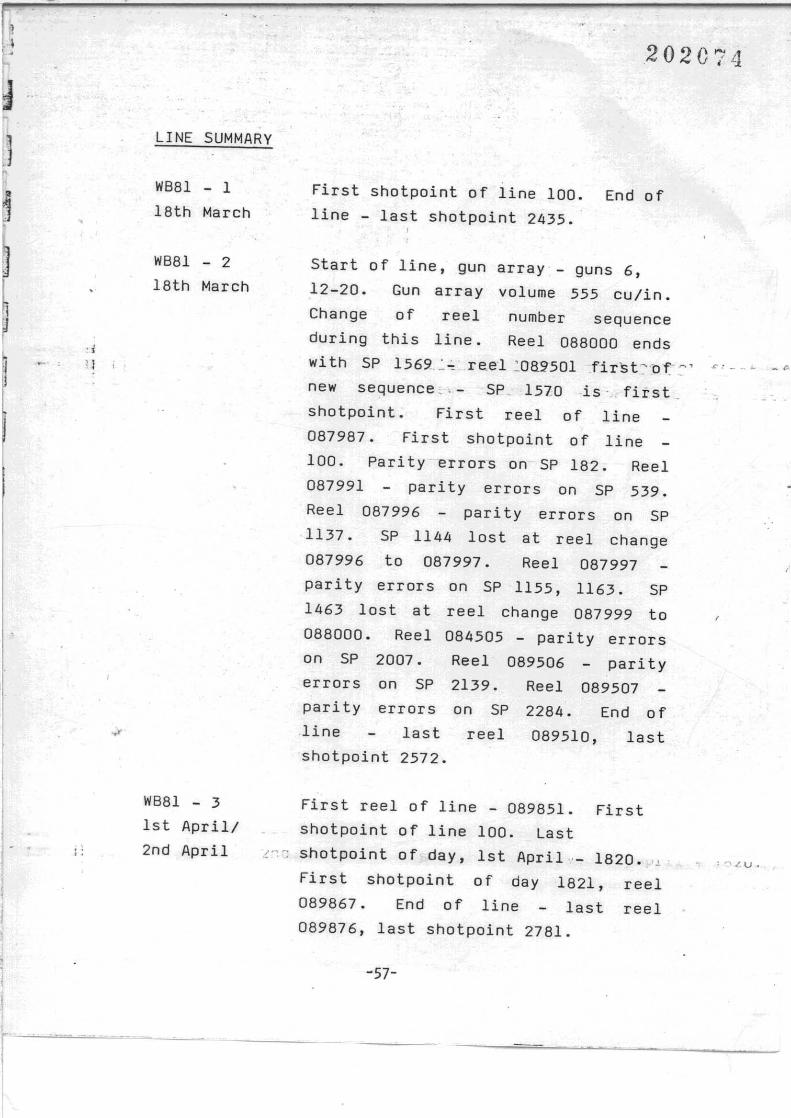
!
] 202074
First shotpoint of line 100. End of
line - last shotpoint 2435.
. I
11 i
start of line, gun array- guns 6,
12-20. Gun array volume 555 cu/in.
Change of reel number sequence
during this line. Reel 088000 ends
with SP 1569~':' ree·l ~Oa2501 :first::-~of-:'
new sequence .. - SP. 1510 is· fitst
shotpoint. First reel of line
087987. First shotpoint of line
100. Parity errors on SP 182. Reel
087991 - parity errors on SP 539.
Reel 087996 parity errors on SP
1137. SP 1144 lost at reel change
087996 to 087997. Reel 087997
parity errors on SP 1155, 1163. SP
1463 lost at reel change 087999 to
088000. Reel 084505 - parity errors
on SP 2007. Reel 089506 parity
errors on SP 2139. Reel 089507
parity errors on SP 2284. End of
line last reel 089510, last
shotpoint 2572.
;
WB81 - 3 First reel of line - 089851. First1st April/ shot point of line 100. Last
i; 2nd April i'" :: snotpoint of day, 1st April.·- 1820. 'L . '''ILU.
First shotpoint of day 1821, reel089867. End of line last reel089876, last shotpoint 2781.
-57-
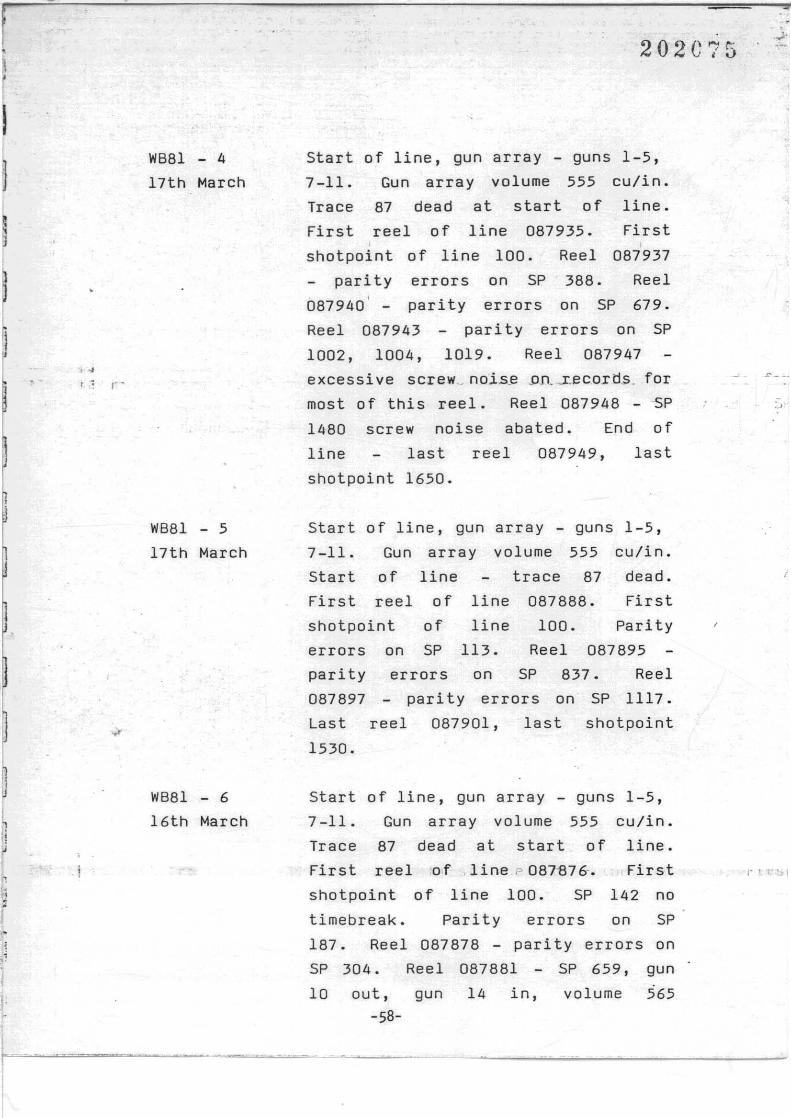
, .,r:= ,. -
WB81 - 4
17th March
202C75
start of line, gun array - guns 1-5,
7-11. Gun array volume 555 cu/in.
Trace 87 dead at start of line.
First reel of line 087935. First;
shotpoint of line 100. Reel 087937
parity errors on SP 388. Reel
087940 parity errors on SP 679.
Reel 087943 pari ty errors on SP
1002, 1004, 1019. Reel 087947
excessive screw" noj.s_e .oD.J.ecortJ.s. for
most of this reel. Reel 087948 - SP
1480 screw noise abated. End of
line last reel 087949, last
shotpoint 1650.
5
"
!j
j
WB81 - 5
17th March
WB81 - 6
16th March
Start of line, gun array - guns 1-5,
7-11. Gun array volume 555 cu/in.
Start 0 f line trace 87 dead.
First reel of line 087888. First
shotpoint 0 f line 100. Par i ty
errors on SP 113. Reel 087895
pari ty errors on SP 837. Reel
087897 - parity errors on SP 1117.
Last reel 087901, last shotpoint
1530.
start of line, gun array - guns 1-5,
7-11. Gun array volume 555 cu/in.
Trace 87 dead at start of line.
First reel 'of line p 087"876-. First
shotpoint of line 100. SP 142 no
timebreak. Par i ty error s on SP
187. Reel 087878 - parity errors on
SP 304. Reel 087881 - SP 659, gun
10 out, gun 14 in, volume 565
-58-
/
r I ~ • I
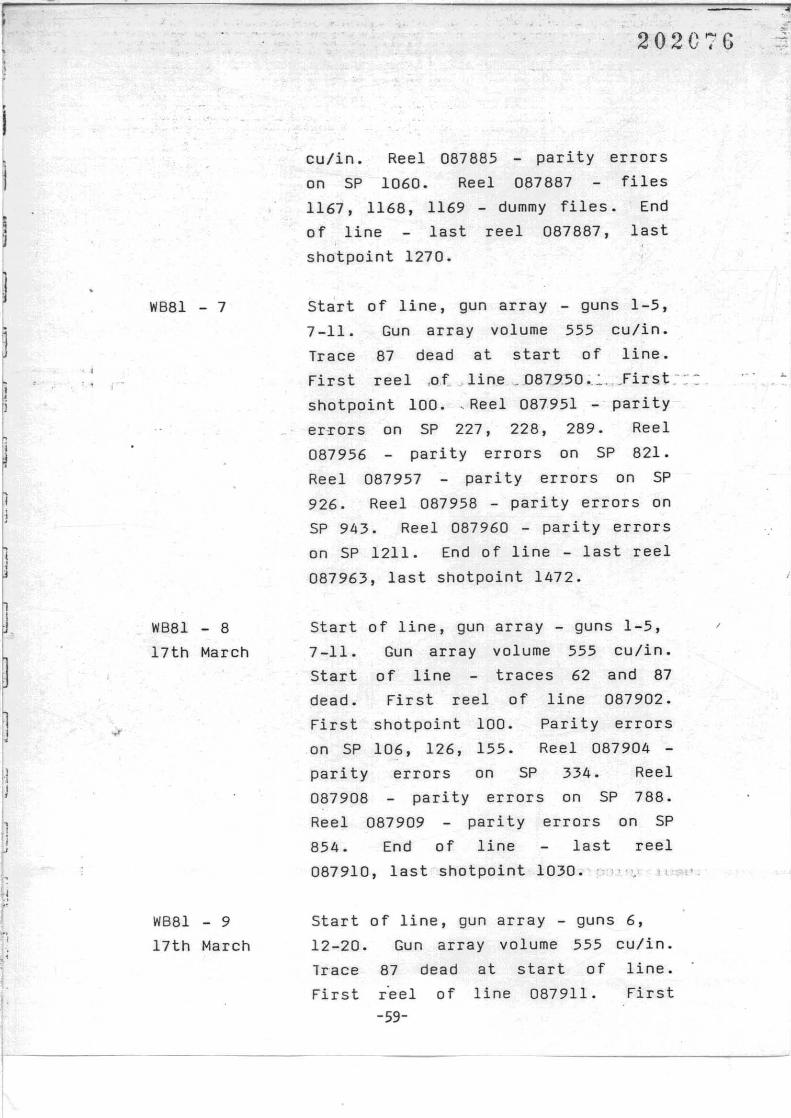
f
,IJ
,I
i
,,
. I
WB81 - 7
WB81 - 8
17th March
WB81 - 9
17th March
202076
cu/in. Reel 087885 - parity errors
on SP 1060. Reel 0a7887 files
1167, 1168, 1169 - dummy files. End
of line last reel 087887, last
shotpoint 1270.
start of line, gun array - guns 1-5,
7 -11. Gun array volume 555 cu/in.
Trace 87 dead at start of line .
First reel ,of. ,line _087..9:50;.~,IirsL:=.
shotpoint 100.. Reel 087951 - parity
er~ors on SP 227, 228, 289. Reel
087956 - pari ty errors on SP 821.
Reel 087957 - parity errors on SP
926. Reel 087958 - parity errors on
SP 943. Reel 087960 - parity errors
on SP 1211. End of line - last reel
087963, last shotpoint 1472.
Start of line, gun array - guns 1-5, I
7 -11. Gun array volume 555 cu/in.
Start 0 f line traces 62 and 87
dead. Fir st reel 0 f line 087902.
First shotpoint 100. Parity errors
on SP 106, 126, 155. Reel 087904 -
pari ty errors on SP 334. Reel
087908 parity errors on SP 788.
Reel 087909 - parity errors on SP
854. End of line last reel
087910, last shotpoint 1030. "1''', " ".
start of line, gun array - guns 6,
12-20. Gun array volume 555 cu/in.
Trace 87 dead at start of line.
First r'eel of line 087911. First
-59-
~.
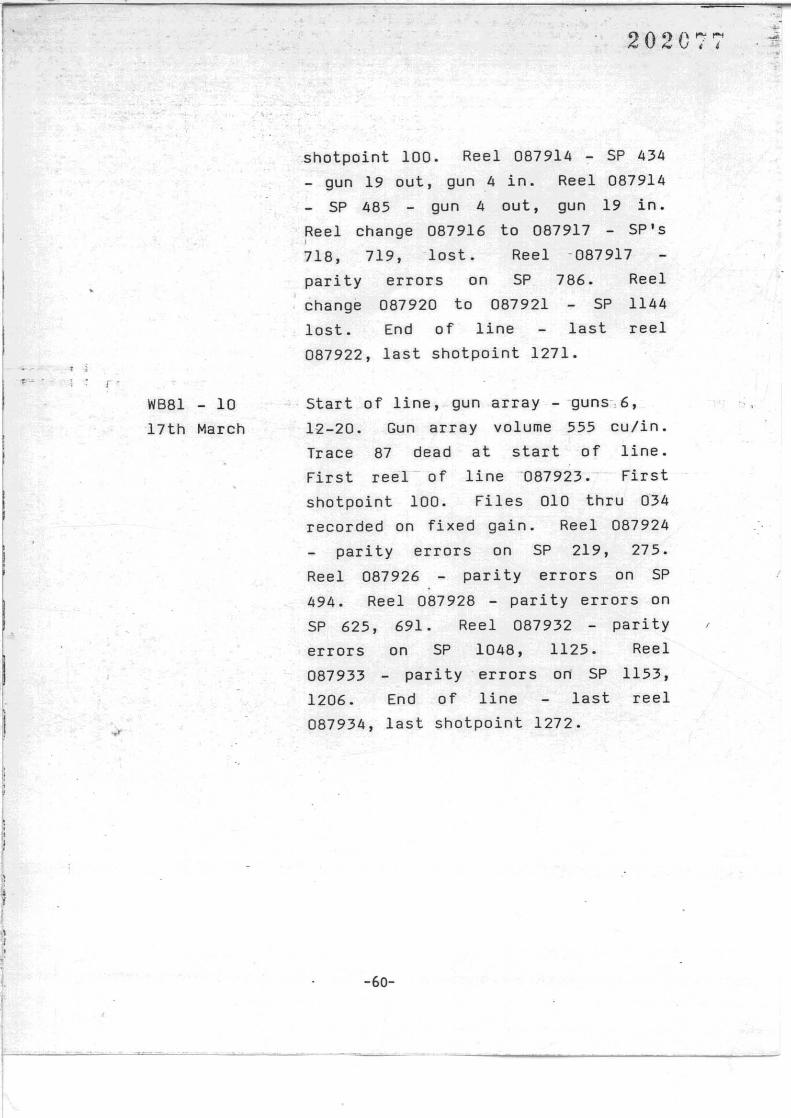
r .
1'-'" • r .
',~ .
202077
shotpoint 100. Reel 087914 :- SP 434
- gun 19 out, gun 4 in. Reel 087914
- SP 485 - gun 4 out, gun 19 in.
Reel change 087916 to 087917 - SP 's,718, 719, lost. Reel -087917
pari ty errors on SP 786. Reel
change 087920 to 087921 SP 1144
lost. End of line last reel
087922, last shotpoint 1271.
s
;i
I,,.
WB81 - 10
17th March
. start of line, gun array - guns~6,
12-20. Gun array volume 555 cu/in.
Trace 87 dead at start of line.
First reel of line -087923.- First
shotpoint 100. Files 010 thru 034
recorded on fixed gain. Reel 087924
parity errors on SP 219, 275.
Reel 087926 parity errors on SP
494. Reel 087928 - parity errors on
SP 625, 691. Reel 087932 - pari ty
errors on SP 1048, 1125. Reel
087933 - parity errors on SP 1153,
1206. End of line last reel
087934, last shot point 1272.
-60-
r
r
Navigation:
~avigation System
Doppler Sonar Subsystem
Velocity Resolution and
Compensation
Satellite Subsystem
Computer and Peripheral
Equipment
Survey Operation
•
SECTION III
61
61-62
62
62-63
63-64
64
202078
r
•
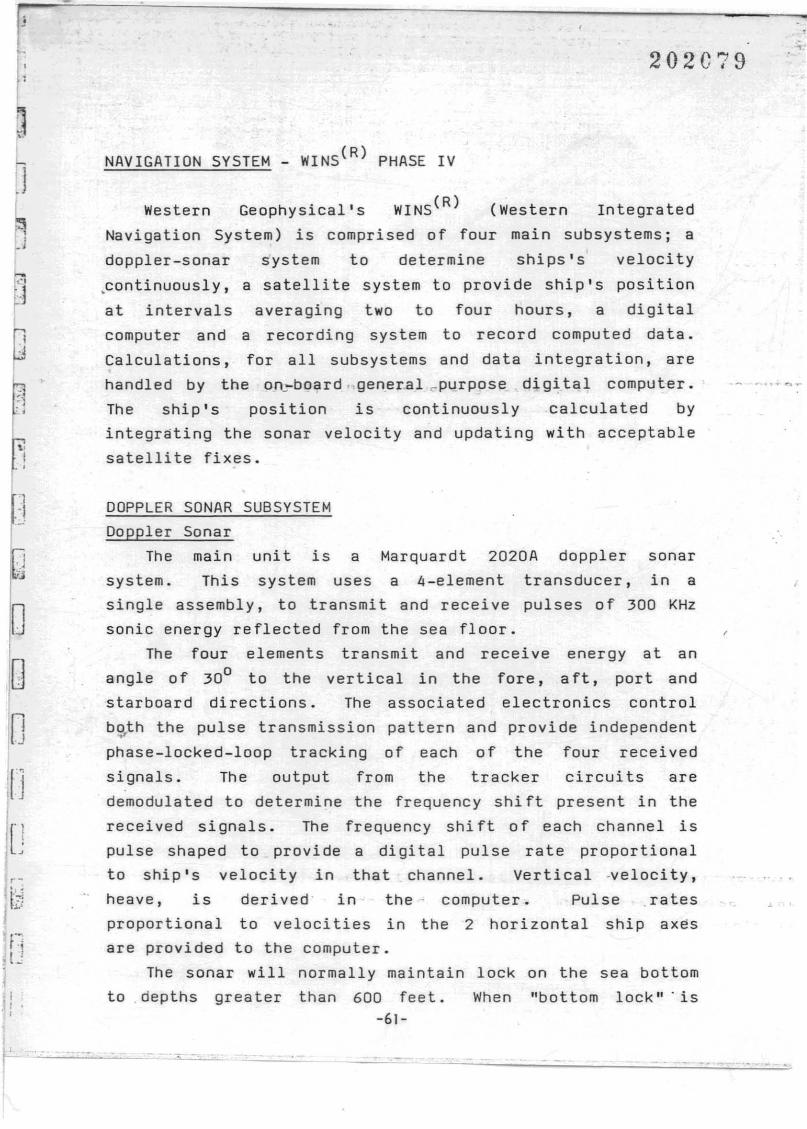
~]
,"
J
"j
,;I
, ,
202C79
NAVIGATION SYSTEM - WINS(R) PHASE IV
Western Geophysical's WINS(R) (Western Integrated
Navigation System) is comprised of four main subsystems; a
doppler-sonar system to determine ships's velocity
~ontinuously, a satellite system to provide ship's position
at intervals averaging two to four hours, a digital
computer and a recording system to record computed data.
~alculations, for all subsystems and data integration, are
handled by the on.::-board .,gener.al rPlJrpose digital computer.
The ship's position is continuously calculated by
integrating the sonar velocity and updating with acceptable
satelli te fixes.
..- ... ,.., ....
'1
.j
,j!J
oQ
8IJ[J
f~tJ
DOPPLER SONAR SUBSYSTEM
Doppler Sonar
The main unit is a Marquardt 2020A doppler sonar
system. This system uses a 4-element transducer, in a
single assembly, to transmit and receive pulses of 300 KHz
sonic energy reflected from the sea floor.
The four elements transmit and receive energy a t an
angle of 300 to the vertical in the fore, aft, port and
starboard directions. The associated electronics control
b~th the pulse transmission pattern and provide independent
phase-lacked-loop tracking of each of the four received
signals. The output from the tracker circuits are
demodulated to determine the frequency shift present in the
received signals. The frequency shi ft of each channel is
pulse shaped to provide a digital pulse rate proportional
to ship's velocity in that channel. Vertical ·velocity,
heave, is derived' in the - computer. Pulse rates
proportional to velocities in the 2 horizontal ship axes
are provided to the computer.
The sonar will normally maintain lock on the sea bottom
to , depths greater than 600 feet. When "bottom lock'" is-61-
,
,
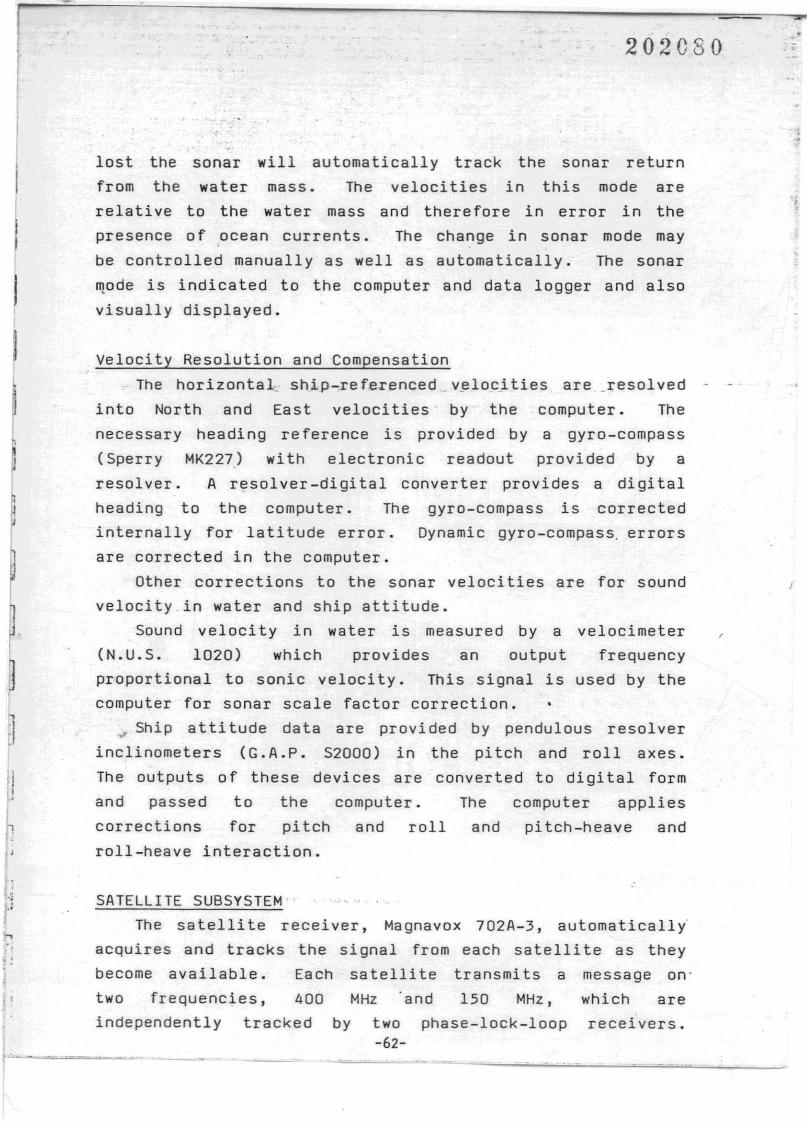
·202080
lost the sonar will automatically track the sonar return
from the water mass. The velocities in this mode are
relative to the water mass and therefore in error in the
presence of ocean currents. The change in sonar mode may,be controlled manually as well as automatically. The sonar
~ode is indicated to the computer and data logger and also
visually displayed.
Velocity Resolution and Compensation
The horizontal" ship-refe.renced _v_elocities are resolved
into North and East velocities by the computer. The
necessary heading reference is provided by a gyro-compass
(Sperry MK227) with electronic readout provided by a
resolver. A resolver-digital converter provides a digital
heading to the computer. The gyro-compass is corrected
internally for latitude error. Dynamic gyro-compass. errors
are corrected in the computer.
Other corrections to the sonar velocities are for sound
velocity.in water and ship attitude.
Sound veloci ty in water is measured by a velocimeter
(N.U.S. 1020) which provides an output frequency
proportional to sonic velocity. This signal is used by the
computer for sonar scale factor correction •
.... Ship attitude data are provided by pendulous resolver
inclinometers (G.A.P. 52000) in the pitch and roll axes.
The outputs of these devices are converted to digital form
and passed to the computer. The computer applies
corrections for pitch and roll and pi tch-heave and
roll-heave interaction.
;
I
SATELLITE SUBSYSTEM , -
The satellite receiver, Magnavox 702A-3, automaticalli
acquires and tracks the signal from each satelli te as they
become available. Each satellite transmits a message on·
two frequencies, 400 MHz and 150 MHz, which are
independently tracked by two phase-lock-loop receivers.-62-
202C8-1
magneti'c tape.
punched tape.
!,
The doppler shi ft on each frequency is measured. Digital
data representing the high channel doppler-shift cycle
count, low channel doppler -shi ft cycle count and satellite
message are passed to the computer.
The satellite fix program is a "short doppler" program
wpich employs the accumulated doppler data in 23-second
intervals instead of the 2 minute interval used in the
earlier programs. Use of the 23-second interval allows
accurate fix computation under reception and pass length
conditions whieh would prevent a 2 minute in~erval ~rogram
from computing a fix.
Fix accuracy is very much a function of the accuracy of
the measurement of the ship's velocity during the pass. In
particular one knot error in measurement of the north
veloci ty can induce a position error 0 f up to 1500 ft. in
the satellite fix. Accurate knowledge of velocity from the
sonar subsystem reduces this error to negligible
proportions.
COMPUTER AND PERIPHERAL EQUIPMENT
The computer (HP 2100A) is a general purpose digital
computer. The computer accepts data from all the sensor
uni ts and a manual entry keyboard. A CRT display unit is
fed~ by the computer to provide a display of present
latitude, longitude, heading, cross-course velocity and
distance, and along-course velocity and distance. Several
other parameters are also displayed. Initialization
parameters, such as G.M.T., satellite antenna height,
shotpoint interval, etc. are entered by the operator via a
keyboard.
A digital line printer is used to provide a visual
history by printing time and position at 10-minute'
intervals. The printer is also used to provide a printout
of the satellite fix parameters.
The computer program is loaded from
Program may also be loaded with paper-mylar
-63-
,
•
I
202082
system is interfaced to the computer in
the seismic file and reel number on the
to allow the .posi-tive positioning of- 'each
This interface also allows the navigation
computed na"v i gation
form every twenty seconds.
accumulated in a core
IBM-compatible, 9-track,intervals. Satellite data
•sa telli te pass and wri t ten
pass.
The seismic
order to record
8avigation tape,
seismic record.
data, are sampled in digital
The resulting data scan is
memory and written onto
magnetic tape at lO-minute
is accumulated for the entire
onto tape at the end of each
J,
,1..
I•:J
r;
system -to control the -seismic recording interval on the
basis of elapsed distance, instead of the more normal
elapsed time method. The required distance is -part-of the--
computer initialization data.
To ensure recorded data validity, data recorded on
magnetic tape is read back to the computer and compared
wi th the da ta wr i t ten to the tape. Thi s da ta may aLso be
printed for visual verification.
SURVEY OPERATION
The system is initialized with the Lati tude/Longi tude
end points of the line and shotpoint control parameters;
p~ and shot point interval, initial shot point number and
direction of count.
The system displays along-course and cross-course
distance and velocity relative to the great circile line
passing through the specified line end points. These
displays are also available in the wheel house. The
problems of bringing the vessel on line and keeping it
there are thus simpli fied and do not require voluminous
preplot tabulations or track plotter charts.
The system described above provides a reliable means of
navigation to the accuracy required for geophysical survey
work on the continental shelf independent of any shore base
___-'s"-'u::.J::jc;0::..:r t. - 64-----------------
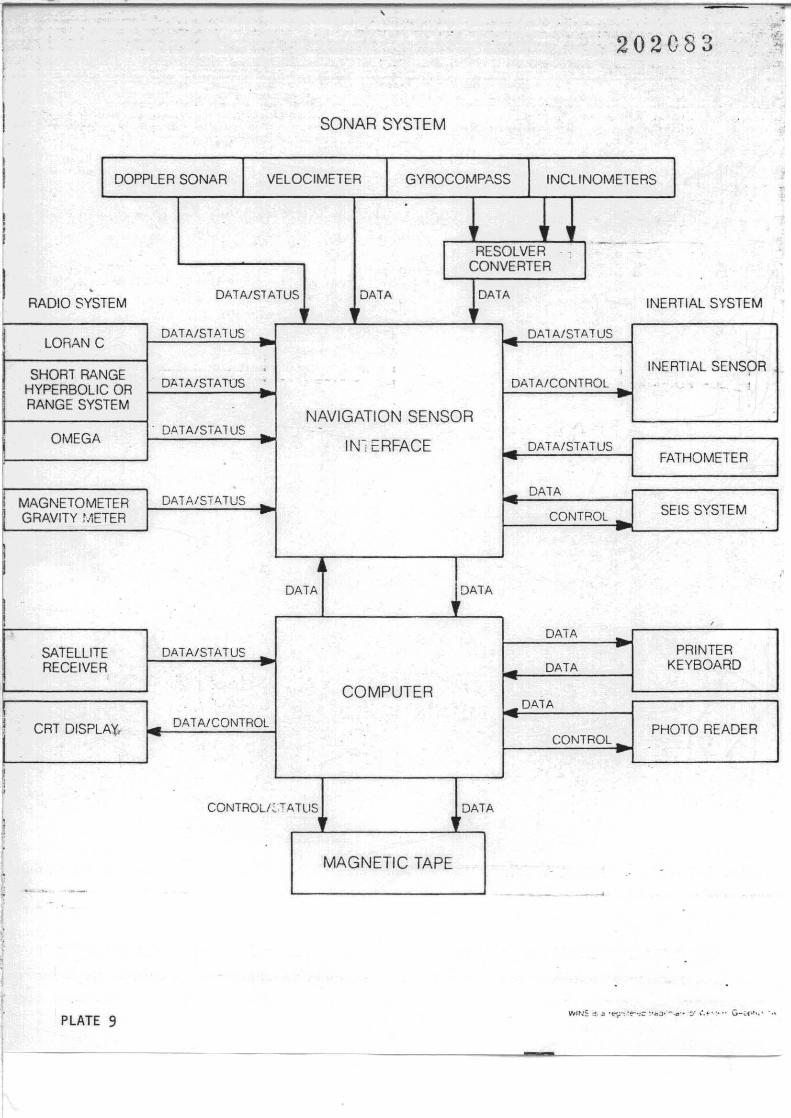
,
SONAR SYSTEM
202083
DOPPLER SONAR VELOCIMETER GYROCOMPASS INCLINOMETERS.
1 1 ._- --RESOLVER . ,
CONVERTER
. OATAlST ATUS DATA DATARADIO SYSTEM • INERTIAL SYSTEM
LORAN CDATA/ST/I.TUS DATA/STATUS
SHORT RANGE, ,
I INERTIAL SENS9RDI\TA/STATOS - - , DATA/CONTROL
HYPERBOLIC OR - - I
RANGE SYSTEM• .
NAVIGATION SENSOR. D.A.TA/STATUS -
OMEGAIN~ERFACE DATA/STATUS
FATHOMETER
DATA-MAGNETOMETER DATA/ST'"TUS - SEIS SYSTEMGRAVITY t,'ETER CONTROL
•DATA DATA
,DATA
SAiELLITE DATA/STATUS PRINTER
RECEIVER . DATA KEYBOARD
COMPUTERDATA
CRT DISPLAy,. DATA/CONTROLPHOTO READER
CONTROL _
CONTROL/eTATUS DATA
MAGNETIC TAPE - -,'"- .- -_. - - ._~
PLATE 9
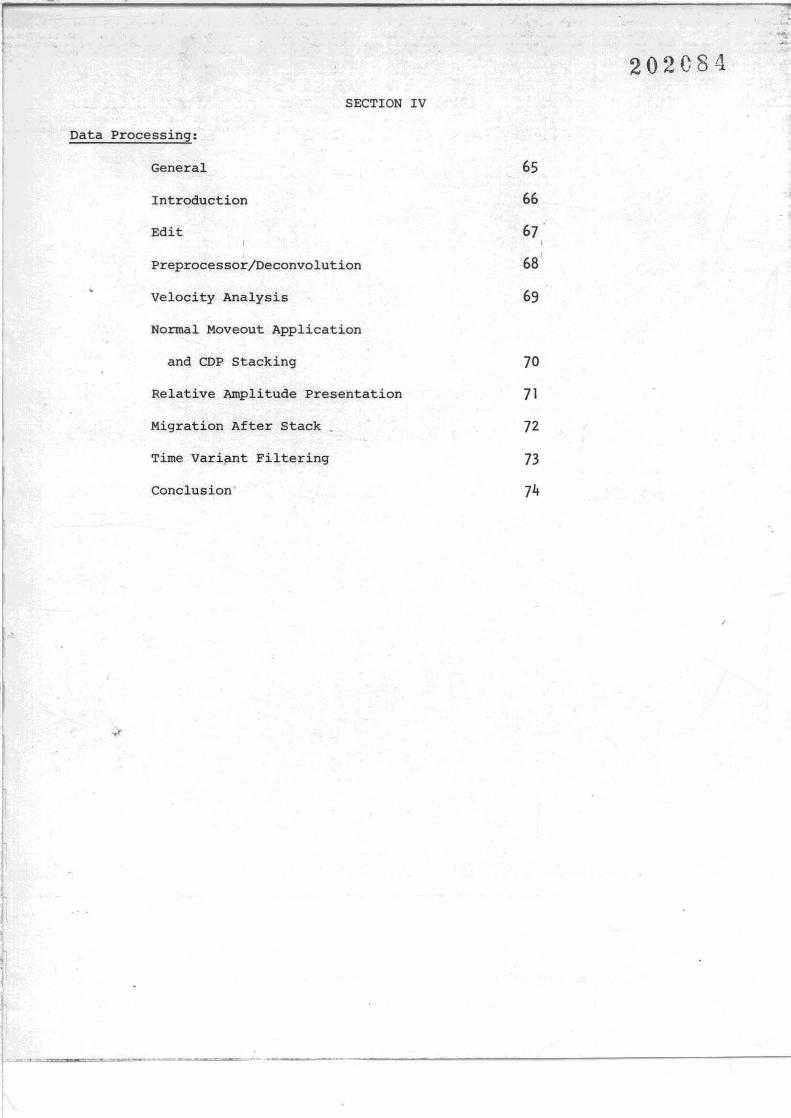
SECTION IV
Data Processing:
General
Introduction
Edit
Preprocessor/Deconvolution
Velocity Analysis
Normal Moveout Application
and CDP Stacking
Relative Amplitude Presentation
Migration After Stack _
Time Variant Filtering
Conclusion
65
66
67I
68'
69
70
71
72
73
74
202084
1
·.
202085GENERAL
Water depths were recorded in fathans every 40th shotpoint using
an Echograph 600 S, model Atlas by Krupp.
A magnetic survey was taken with a Geanetrics SSAA magnetaneter.
The magnetic reel to sensor was 193 meters. A data logger was used to,record the survey.
A SIN S88 gravity meter was used for the gravity survey. A data
logger was also used for this survey.
The following are descriptions of the programs and procedures in
the order in which they were applied.
I
-65-INIISTIIRN[EO.O~HV.ICAL
=
~.
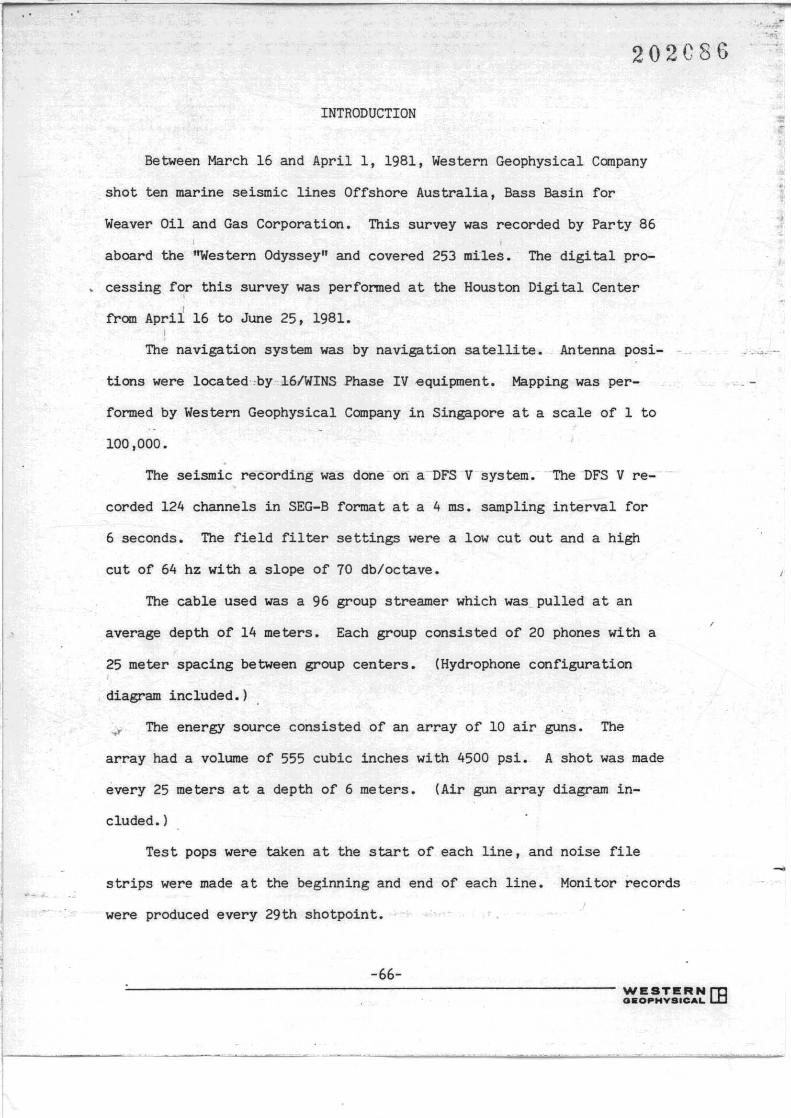
..
...
202C86
INTRODUCTION
Between March 16 and April 1, 1981, Western Geophysical Company
shot ten marine seismic lines Offshore Australia, Bass Basin for
Weaver Oil and Gas Corporation. This survey was recorded by Party 86
aboard the "Wes tern Odyssey" and covered 253 miles. The digi tal pro-
cessing for this survey was performed at the Houston Digital Center,I
from April 16 to June 25, 1981.!
The navigation system was by navigation satellite. Antenna posi-
tions were located·,by·16IWINS Phase IV equipment. Mapping was per-
formed by Western Geophysical Company in Singapore at a scale of 1 to
100,000.
The seismic recording was done on allFS V system. "The 'DFS V re-
corded 124 channels in SEG-B format at a 4 ms. sampling interval for
6 seconds. The field filter settings were a low cut out and a high
cut of 64 hz with a slope of 70 db/octave.
The cable used was a 96 group streamer which was pulled at an
average depth of 14 meters. Each group consisted of 20 phones with a
25 meter spacing between group centers. (Hydrophone configuration
diagram included.)
The energy source consisted of an array of 10 air guns. The
array had a volume of 555 cubic inches with 4500 psi. A shot was made
every 25 meters at a depth of 6 meters. (Air gun array diagram in-
eluded. )
Test pops were taken at the start of each line. and noise file
strips were made at the beginning and end of each line. Monitor records
were produced every 29th shotpoint.
-66-WI!STI!RN rnO.O~HY.'CALL.D
. ...~....
....
f 202C87
EDIT
The edit program demultiplexed the 96 recorded channels into a
trace sequential format retaining the full-word floating point format.
No summing of field pops was done.
A near trace section for each line was displayed to check the..
results of the editing process and to determine velocity analysis
locations.
f
-6]-WI!STI!;RN rnoaorHVSICAL L.D
202088
PREPROCESSOR/DECONVOLUTION
Line WB-8I-1 was selected as a test line. Three types of predic-
tive deconvolution tests were performed on the above line. After re-
viewing the tests with the client, it was decided that the 4 ms. pre-
dictive distance was the optimum decon to use for these data. Operator
lengths were also based on autocorrelatidn information.
The preprocessor program generates_common depth family (CDF).
ordered tapes which conform to the SEG -Itexchange tape It specii'ications
incorporating in reel and trace headers all basic information regarding
field parameters such as spread distances and line geometry.
Prior to deconvolution-a-geometric-spreading function was applied
to compensate for spherical divergence. Deconvolution wasI
then performed
using the Weiner-Levinson least squares minimum phase algorithm. The
prediction operator was constructed from an autocorrelation function in
a time variant manner only in the sense that the autocorrelation start
time and resultant operator for each trace was a function of the distance I
of the trace from the source. A new operator was calculated for each trace.
Autocorrelations were computed before and after deconvolution providing
a continuing check on the effectiveness of the decon •...
I
-
1-
.I -68-
WI!STI!RN rnO.OPHV••CAL
202C89
VELOCITY ANALYSIS
Vertical velocities are automatically determined in the VELA~
(velocity analysis) program using cross-correlation techniques on
deconvolved COP gathers from the decon program. Two adjacent COP
families were used for each velocity analysis. Cross-correlations
for each COP family were obtained with the output of both families
then summed to a'single output, i.e., the VELAN velocity table was
the average of two consecutive COP family analyses.
'The calcomp plot that-was printed and sent to you is a plot of
RMS velocity versus two-way time with a cross-correlation output
trace at 40 millisecond intervals. Velocity increments of 250 feet
per second were used. Velocity analysis locations were determined by
examining near trace gathers.
• ~ • - "i
/
WESTERN rna.C..HVSICAL
,1
,.
202CDO
NORMAL MOVEOUT APPLICATION AND CDP STACKING
Normal moveout calculations were performed independently for each
trace, with the.velocity.JUnction ~eing the same for each member of a
CDP family. A straight-ray iso-velocity interpolative method was used
between velocity analysis locations: Muting was applied after normal
moveout and the application of mute was done for each trace, the
members of each CDP family'were-sUmmed"tpgether to'produ~e a stacked
output trace. Each sample of time of the stacked output trace was
then divided by the number. of "live" samples at that time which were
summed to proQuce that stacked sample. Effectively, this retains
relative recorded time-varying amplitude of the trace.
Quality control of the applied velocity functions was performed
by outputting a stack monitor section. Where deemed necessary, revised
velocity functions were used to compute residual normal moveout cor-
rections for the final stack sections.
-70-WESTERN rna.orHYSICAL
202091
RApl!> PROCESS
A Relative Amplitude Preservation (RAP) section was produced on
selected lines picked by the c~ient.
To produce the RAP section the no-gain stack tape was run through
an amplitude decay analysis in order to obtain a set of multipliers to
compensate for the loss of energy at depth.
An average set of multipliers was used for the area· and applied to -- ~~-::
the stack in the residual amplitude compensation program •
.The da ta was then fil, tered wi th a 6-60 band pass for the final RAP
display.
I
-71-WI!STI!RN rnO.O~HY.IC"L.
"
202092
MIGRATION AFTER STACK
The finite-difference method of migration was used for this data.
• In this program approximatioos are first made to the Scalar wave
equation itself rather than an integral solution, such as used in the
diffraction-SUllllDation program. This method, is accanplished by pro-
pagating waves -recorded at the earth's surface backward in time down
•
into the subsurface until scatterers or~reflectors are encountered. =
This backward propagation is accomplished by using discrete (finite-
difference) approximations to a differential equation that governs
wave motion and results in a migration of the data into a position
closely approximating their true position in space.
,
-]2-weSTeRN[EO.O~HY.'CAL
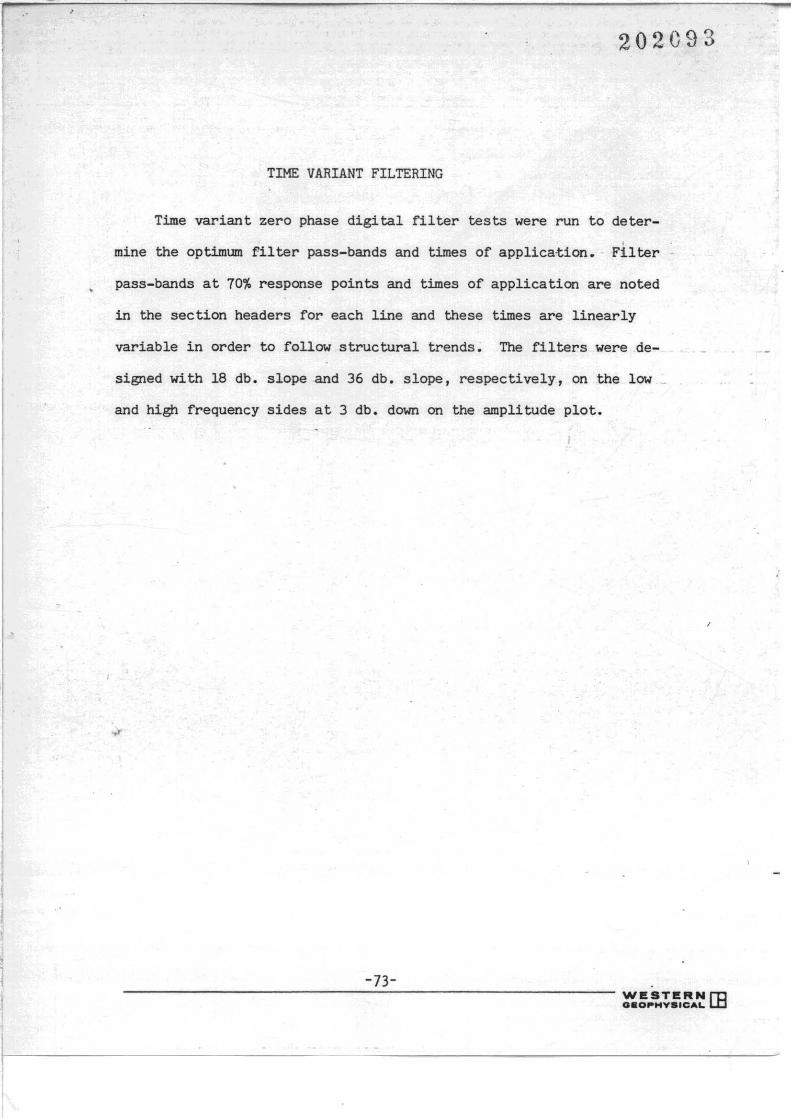
202C93
TIME VARIANT FILTERING
Time variant zero phase digital filter tests were run to deter-,
mine the optimum filter pass-bands and times of applica·tion •. Filter
pass-bands at 70% response points and times of application are noted
in the section headers for each line and these times are linearly
variable in order to follow structural trends. The filters were.de-
signed with 18 db. slope and 36 db. slope, respectively, on the low _
and high frequency sides at 3 db. down on the amplitude plot.
-73-WESTERN rna.O.-HVSICA.L.
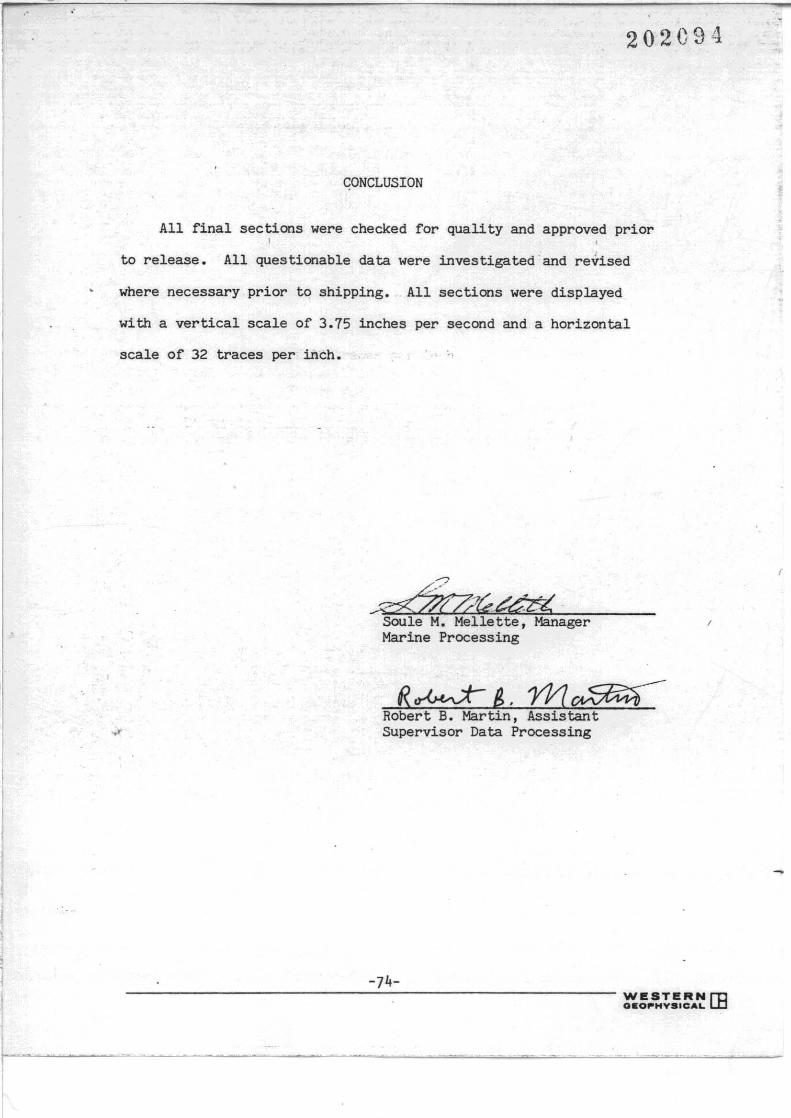
..
202094
C:0NCLUSION
All final sections were checked for quality and approved priorI
to release. All questionable data were investigated and revised
where necessary prior to shipping. All sections were displayed
with a vertical scale of 3.75 inches per second and a horizontal
scale of 32 traces per inch. ..,
~k~-Soule M. Mellette, ManagerMarine Processing
R~8.m~Robert B. Martin, AssistantSupervisor Data Processing
I
-]4-WI!STI!RN rno.a..HYSICAL
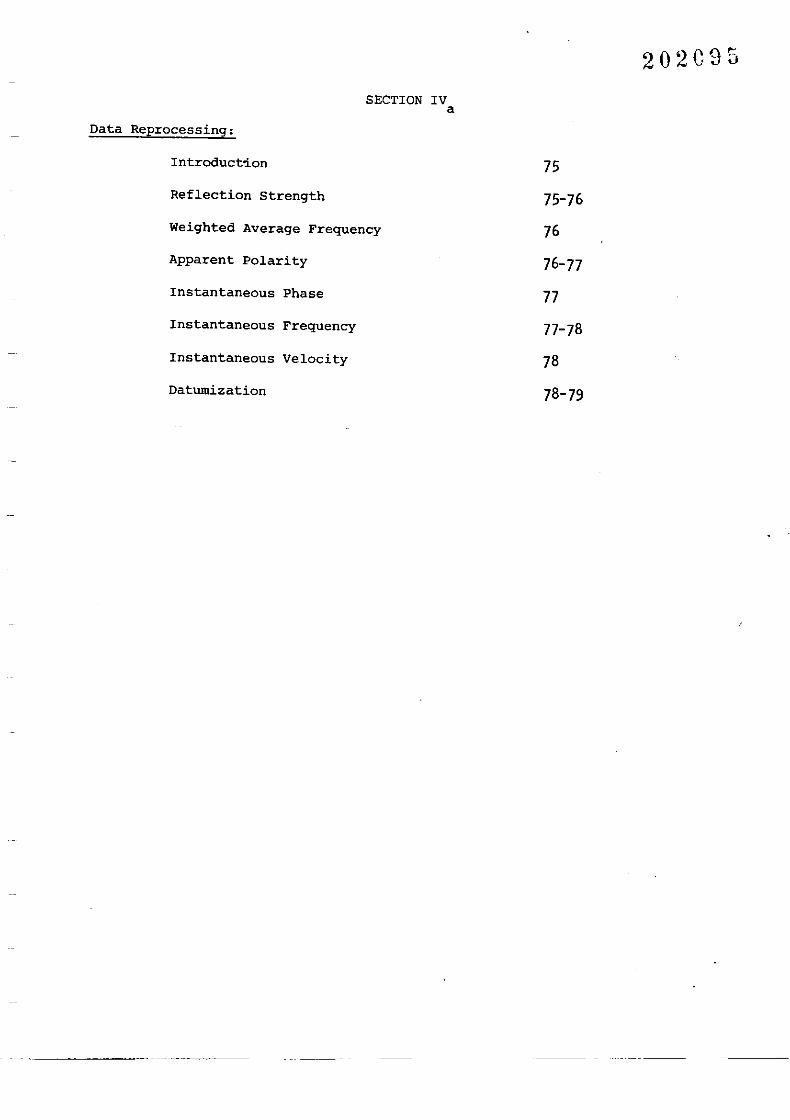
SECTION IVa
Data Reprocessing:
Introduct,;on
Reflection Strength
Weighted Average Frequency
Apparent Polarity
Instantaneous Phase
Instantaneous Frequency
Instantaneous Velocity
Datumization
75
75-76
76
76-77
77
77-78
78
78-79
202C95
REP ROC E S SIN G REP 0 R T
202e96
CLI ENT:
PROSPECT:
WEAVER OIL & GAS CORPORATION
BASS BASIN; SQUID PROSPECT
Prepared by Sue SniderSEISCOM DELTA INC.August 26, 1981
INTRODUCTION
The following is a report summarizing the post-stack and attribute
processing of line WA-81-1 for Weaver Oil and Gas Corporation, Australia.
Seiscom Delta Inc. received a tape containing the final stack data
for line WA-81-1 in the Bass Basin area. This tape was reformated to SEGY
format and the shotpoints to be processed (shotpoints 196-600) were output
onto another tape.
The processing consisted of three streams:
I. Attribute Analysis
II. Instantaneous Velocity
III. Datumization
Attribute Analysis
The data went into Seiscom's Attribute Analysis Program and
SEISCHROMER
displays were generated. The displays are quantitative
presentations of Reflection Strength, Phase, Polarity, Instantaneous
Frequency, and Average Frequency.
were generated.
Reflection Strength
Two SEISCHROMER
prints of each attribute
Reflection strength is independent of phase.
High reflection strength is often associated with major lithologic
changes between adjacent rock layers, such as across unconformities or
depositional environments. High reflection strength also is often associated
with gas accumulations.
Lateral variations in bed thicknesses change the interference of
reflections; such changes usually occur over appreciable distance and so
produce gradual lateral changes in reflection strength. Sharp local changes
may indicate faulting, or hydrocarbon accumulations where trapping conditions
-75-
are favorable. Hydrocarbon accumulations, especially gas, may show as
Frequencies lower than 6 Hz are usually left
high-amplitude reflections or "bright-spots". However, such bright spots may
be non-commercial and conversely some gas productive zones may not have
associated bright spots.
The usual color-encoding of reflection strength is referenced to the
maximum reflection strength which occurs on a seismic section or in an area,
using a different color for each dB step.
Frequency is usually color-coded in 2-Hz steps. The red-orange end
of the spectrum usually indicates the lower frequencies and the blue-green
end, the higher frequencies.
uncolored.
Weighted Average Frequency
Weighted average frequency emphasizes the frequency of the stronger
reflection events and smooths irregularities caused by noise. The frequency
values approximate "dominant frequency" values determined by measuring
peak-to-peak times or times between other similar phase points. Like
instantaneous frequency displays, weighted average frequency displays are
sometimes excellent for enhancing reflection continuity. Hydrocarbon
accumulations often are evidenced by low frequencies.
Apparent Polarity
While all attribute measurements depend on data quality and the
quality of the recording and processing, apparent polarity measurements are
especially sensitive to data quality. The analysis of apparent polarity
assumes a single reflector, a zero-phase wavelet, and no ambiguity due to
phase inversion.
Polarity sometimes distinguishes between different kinds of bright
spots. Bright spots associated with gas accumulations in clastic sediments
-76-
202G99
usually have lower acoustic impedance than surrounding beds and hence show
negative polarity for reservoir top reflections and positive polarity for
reflections from gas-oil or gas-water interfaces (often called "flat spots").
Ordinarily, apparent polarity is color-coded magenta and blue for
positive and negative, respectively, with the hue intensity graded in five
steps according to reflection strength.
Instantaneous Phase
The Instantaneous phase emphasizes the continuity of events.
Because phase is independent of reflection strength, it often makes
weak coherent events clearer. Phase displays are effective in showing
discontinuities, faults, pincho)lts, angularities, and events with different
dip attitudes which interfere with each other.
Phase displays use the colors of the color wheel so that plus 1800
o .and minus 180 are the same color because they are the same phase angle.
Instantaneous Frequency
Instantaneous frequency is a value associated with a point in time,
like instantaneous phase. Frequency character often provides a useful
coorelation tool. The character of a composite reflection will change
gradually as the sequence of layers gradually changes in thickness or
lithology. Variations, as at pinchouts and the edges of hydrocarbon-water
interfaces tend to change the instantaneous frequency more rapidly.
A shift toward lower frequencies is often observed on reflections
from reflectors below gas sands, condensate and oil reservoirs. Low-frequency
shadows often occur only on reflections from reflectors immediately below the
petroliferous zone, reflections from deeper reflectors appearing normal. A
gas sand actually filters out higher frequencies because of
-77-
202100
frequency-dependent absorption or natural resonance, or that travel time
through the gas sand is increased by lower velocity.
Fracture zones in brittle rocks are also sometimes associated with
low-frequency shadows.
Instantaneous Velocity
The Instantaneous Velocity processing consisted of four steps:
A) The data went into the XPASTA processor which
estimates the seismic wavelet and the reflec
tivity series. The output of XPASTA is a tape
containing the approximated reflectivity series.
B1 The general interval velocity field was calcu
lated using the RMS velocities provided by the
Client.
C) The XINVEL processor was run which combined the
reflectivity series output from XPASTA with the
general interval velocity field to calculate
velocity logs.
D) The velocity logs output from the XINVEL processor
were displayed as a function of time with cali
brated colors. The seismic data were used as a
background for this SEISCHROMER
display. Two
SEISCHROMER
prints were generated.
Datumization
The seismic reflector with a two-way time of 1.55 seconds at
shotpoint 196 and 1.48 seconds at shotpoint 600 was flattened to 1.5 seconds.
This was accomplished by applying the appropriate time shifts to the stacked
-78-
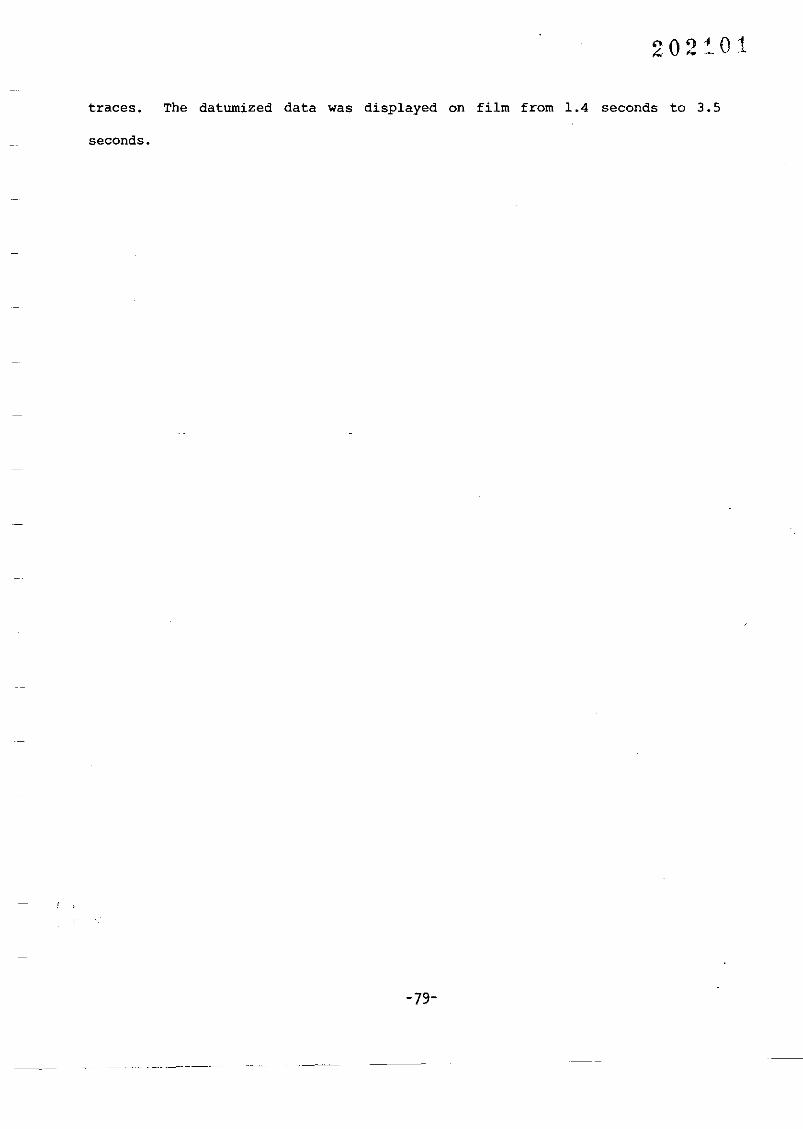
202~Ol
traces. The datumized data was displayed on film from 1.4 seconds to 3.5
seconds.
-79-
------- ---
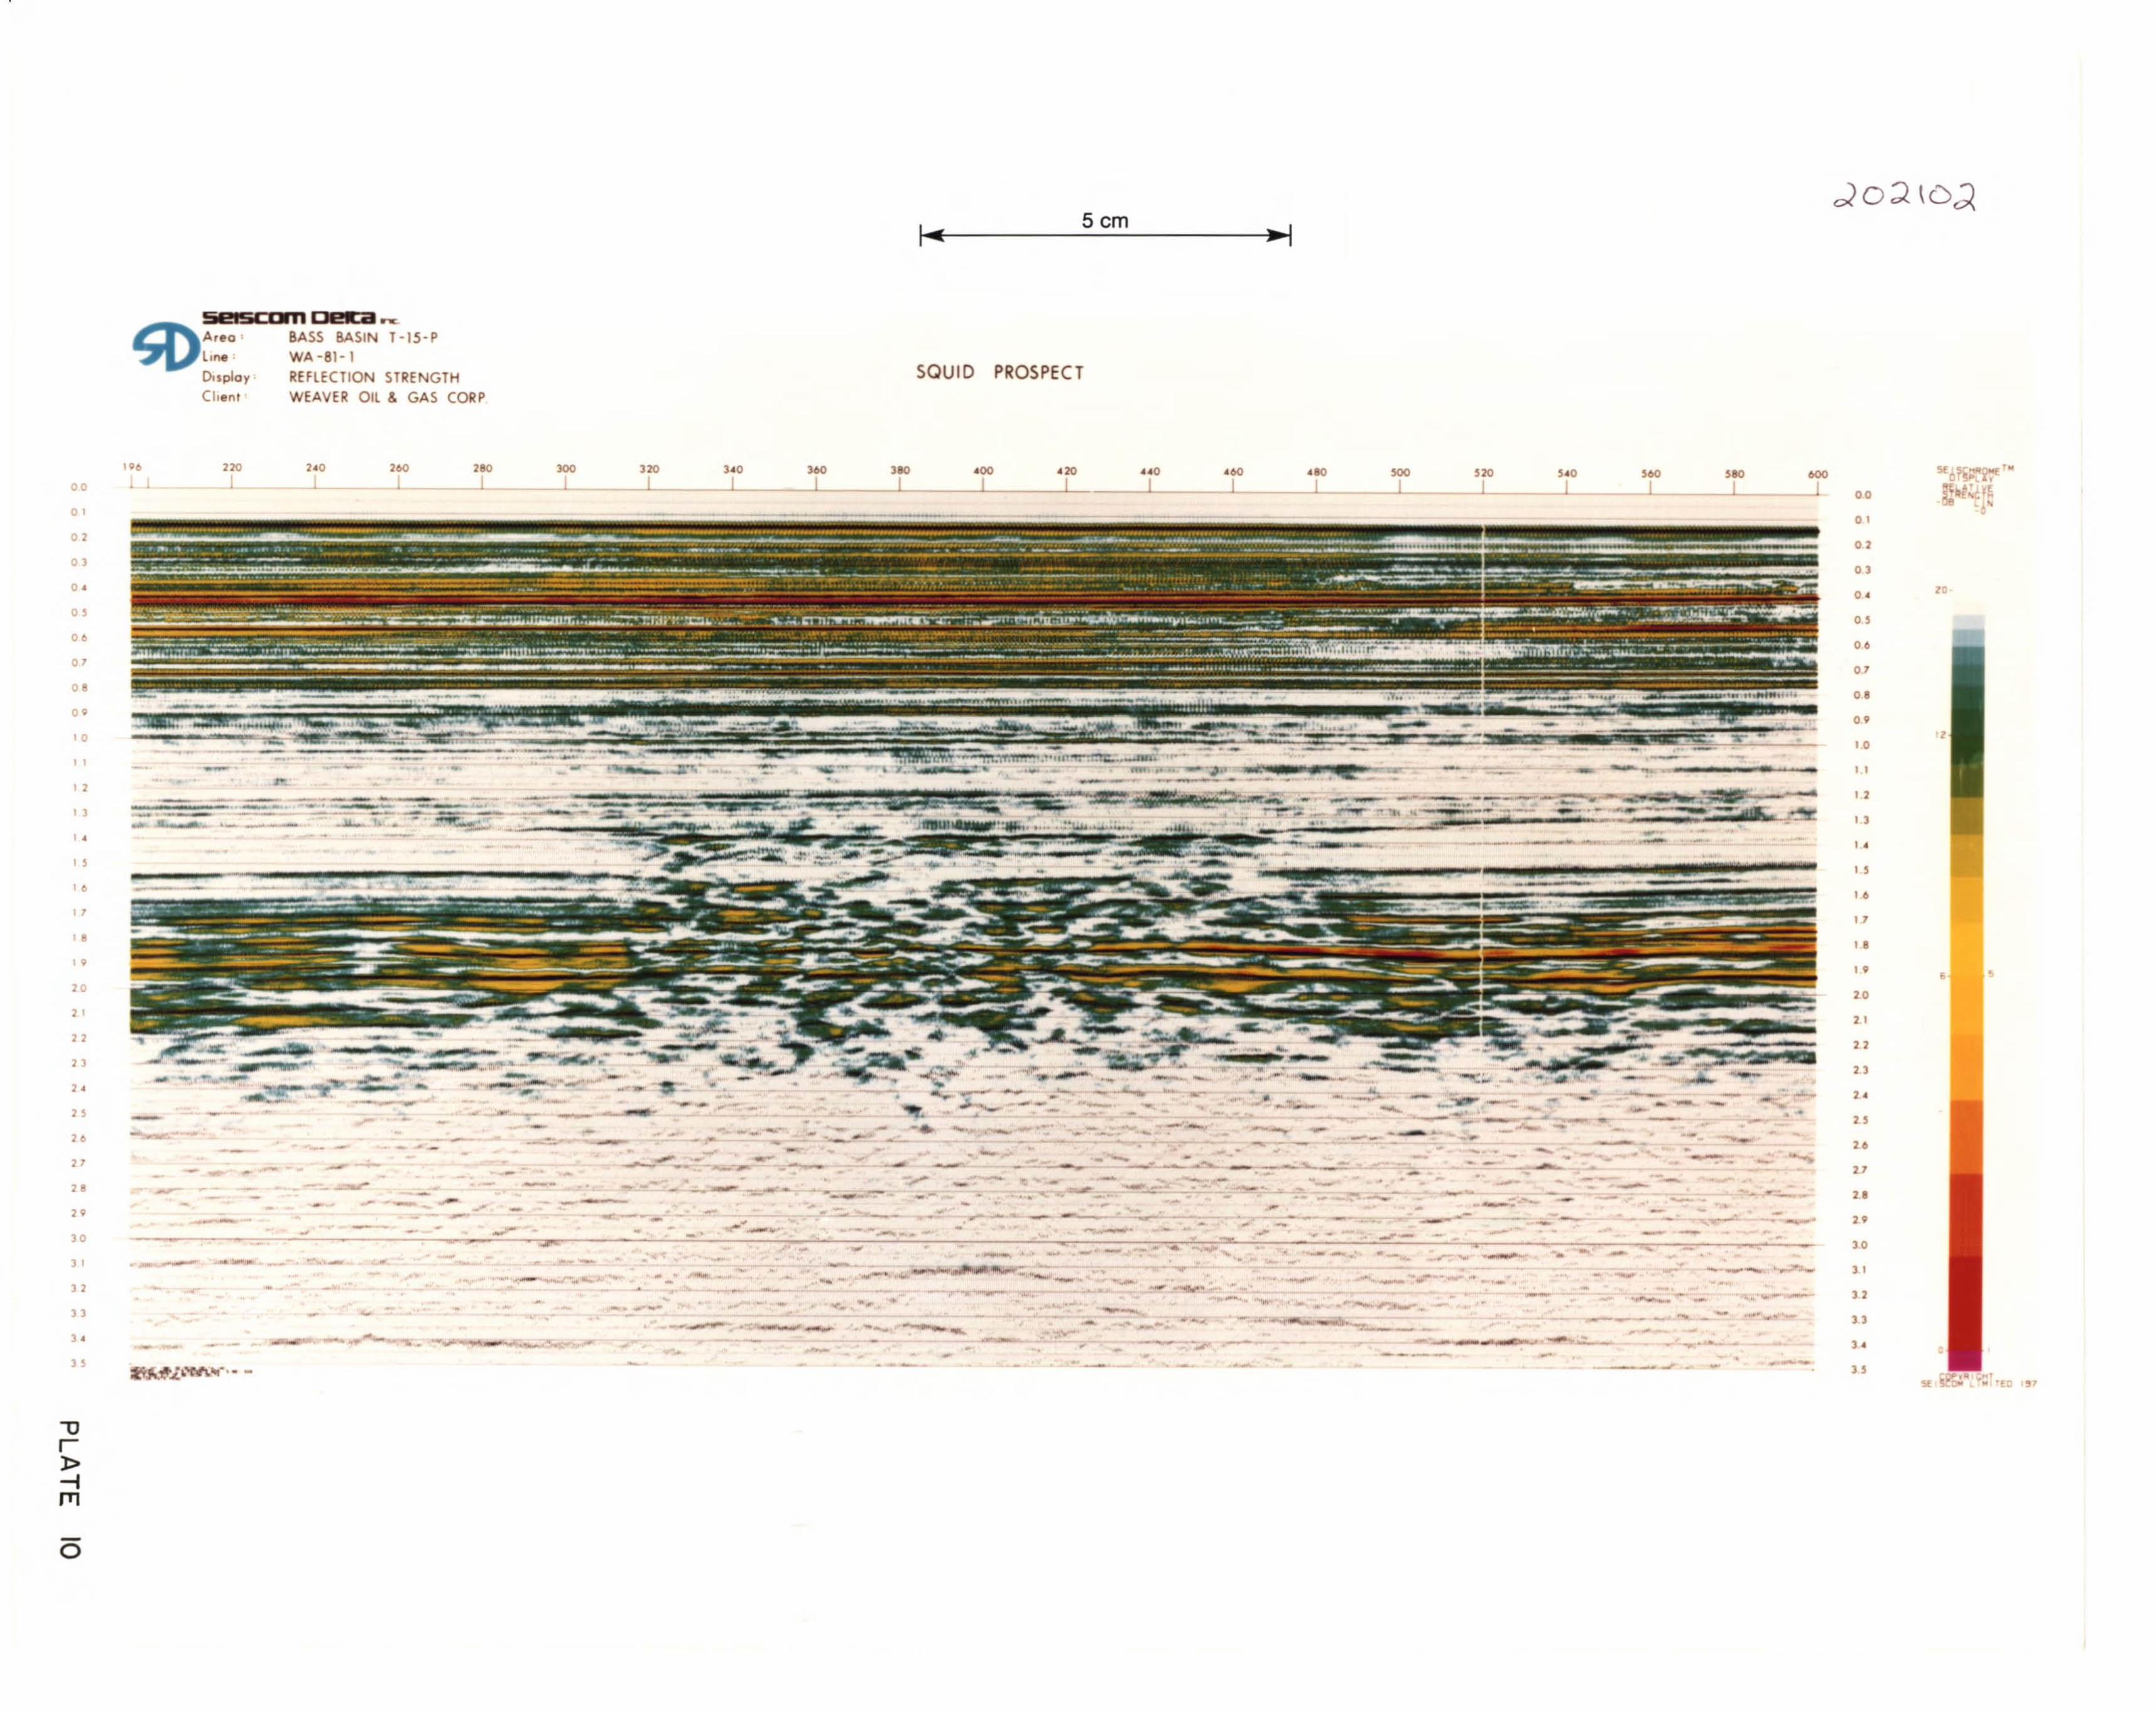
5cm\-4i----.::.-::..:..c-------:~
PROSPECTSQUIDCORPGAS
T-15-P5eISCDm
BASS BASINWA -81-1
REflECTION STRENGTH
WEAVER Oil &
Area'LIne
Display
Chent
,
.,".. ·£0
z
•
lO
02
0]
o.
00
o I
]
o.
18
08
21
"
"
"
2J
1 0
•
1 1
2 •
o.
]0
0'
20
0'
"
"
].
..
""
"
"-
....
d "
._........
-
•
tt,
..-.-"-
,
.-_.•.,
'80 600_-,1 1
--•
•
......... -- --
--
... '- -.-..::...
-
'60__1-
-. ---.-
'.
..
"0
-
-•
-
---
-
•
--
.-:::=:."~-
•
--
-
-... ,_.
•
-• •
- .- -
_..-- -..
'20
-
-
--
"'-""....--
- -
-
-•-
---..-..,
-
"'"-'-
•
- ,
--=,--
,
.. --
-
•- -
•
-- -
..-~-. ~•••
•_ .~-_~...:..::-""",JC"
, -
-
..
•
. "
.=:::?:. •. - -..
..... ..
_.~.
,
... ,,~
• •
•
-
-"- -_... _-,~..-
--
•
•.' '.t,•
--
-""-.-
- •--••
............
...-'-,•.-,,-
-
-
,
..•.-
--
•
---
".
•--
360 310 .00 420 ...0 460 4101l-__I ....I.I L __I__--l.I IL._
-
•
-•
-
-
•
.._.~---. -
-.
•
--••
-"._--"'-",.-
•
-.... ~ .......
•......-
300 320 ).01,-__1-_1 _
•
.....'
_.-'~'-
-"--
,....
--
-
-
-
..;;0=
•
•
--'
-~--
•
260 280--l,,-- 1 _
•~---
--
."-
,-
•
-•
2.0
-
••---
•
----
220
-
---- -
•
-..-
---
._--
...I I
8
"
"
] .
I 0
21
• I
•]
2J
o.
2
20
2
08
•
2.
28
]0
o.
"
o I
"
0'
o.
0'
"
"
"
00
"""
..
02
0]
"'Url>-l/Tl
-o
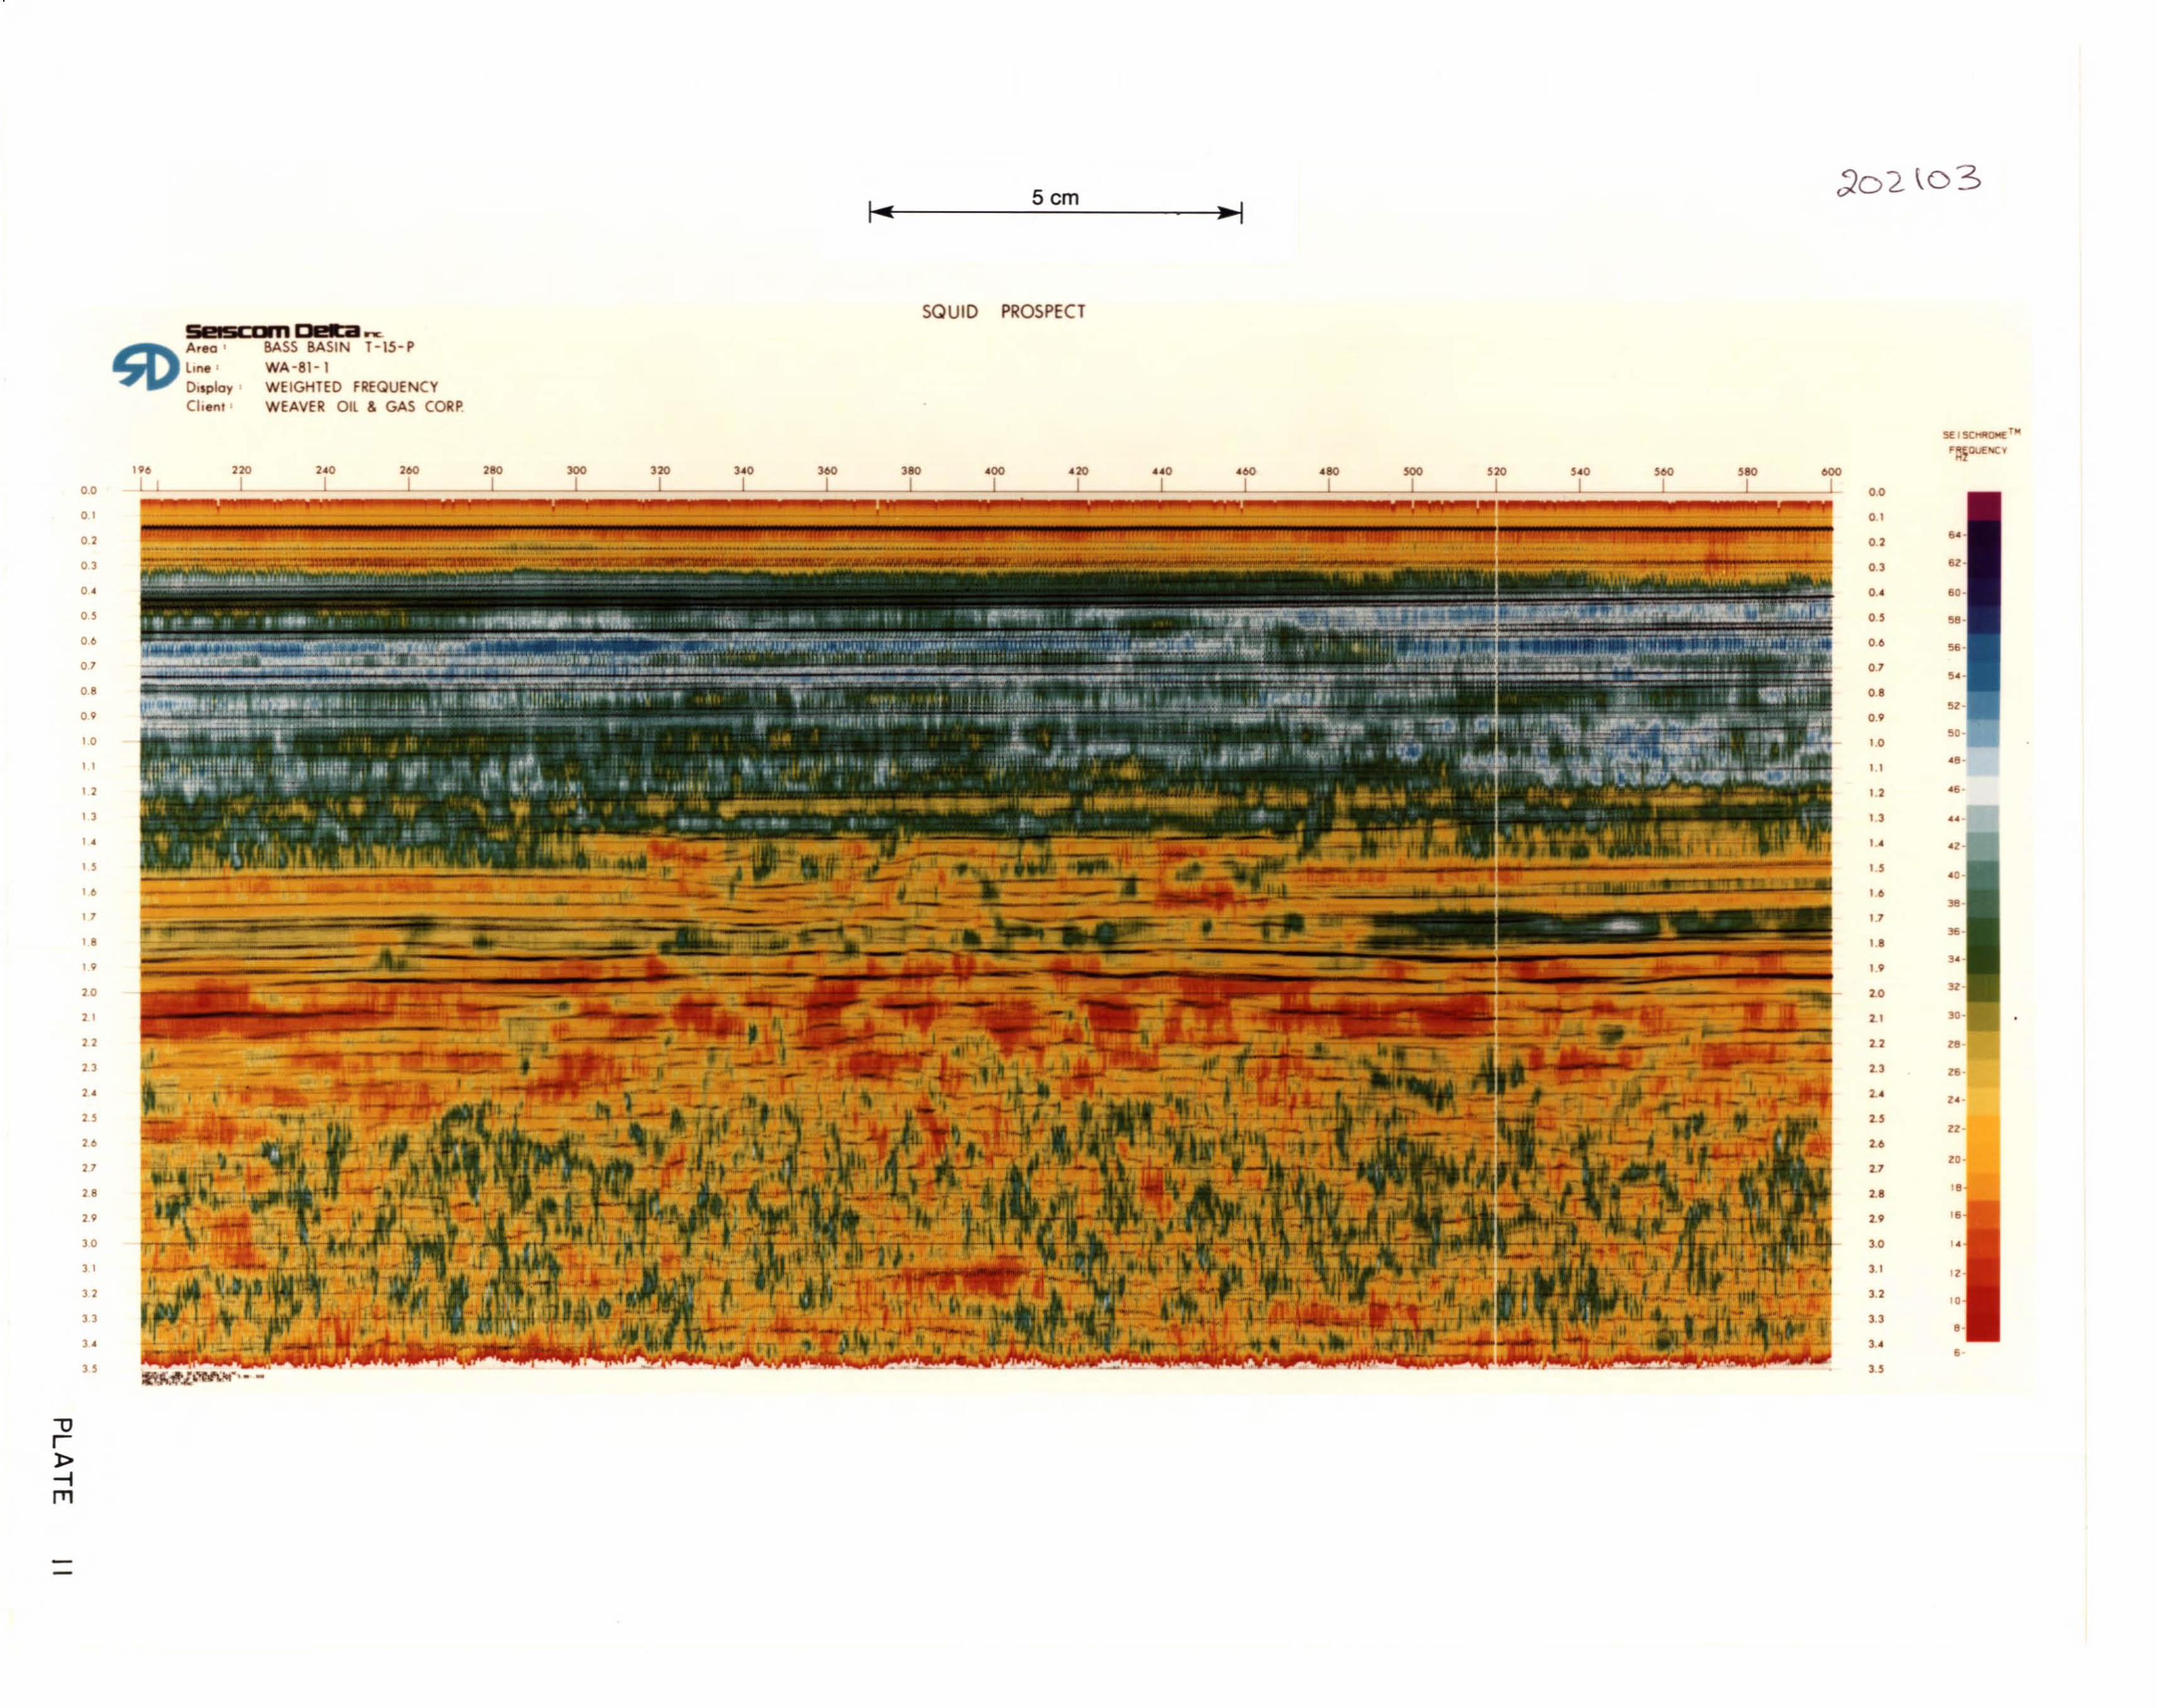
Scm~:------------~
;)02 \03
SQUID PROSPECT• :.... r:SI!I!iCDI'n ~
A'eo ' BASS BASIN T-15- Pline' WA-81-1D"ploy WEIGHTED FREQUENCYCI,en" WEAVER Oil & GAS CORP.
SlI5CHftOMf™
'~iout:,
'" 220 2'0 200 200 300 .00 500 500 000
Lt I J I I J I I I L 0000
o 1 o 1
0'·02 02
03 oz·03
O' 0.' 0'
0' 0.5 50·
O' 0.' 56·
07 0.7 ..-08 0.8
oz·O' O'
50'0 1 0
d·, 1 , 1
" 12 '0·
13 13 u-..1 • 'Z
" "1616
" 1.7
18 18 ,.1 • 1 •
2.020
21 2.1 •
22 2.2
2.323 26-
2. 2.' Z'-
25 2.5zz-
20 2.0zo
27 2.7
2.8 '028
29 2.'
30 30
3.1"3.Z32
3.333
3 • 3.'0
J5 "iI:'t";",,..£,'M/tI"'- -
--
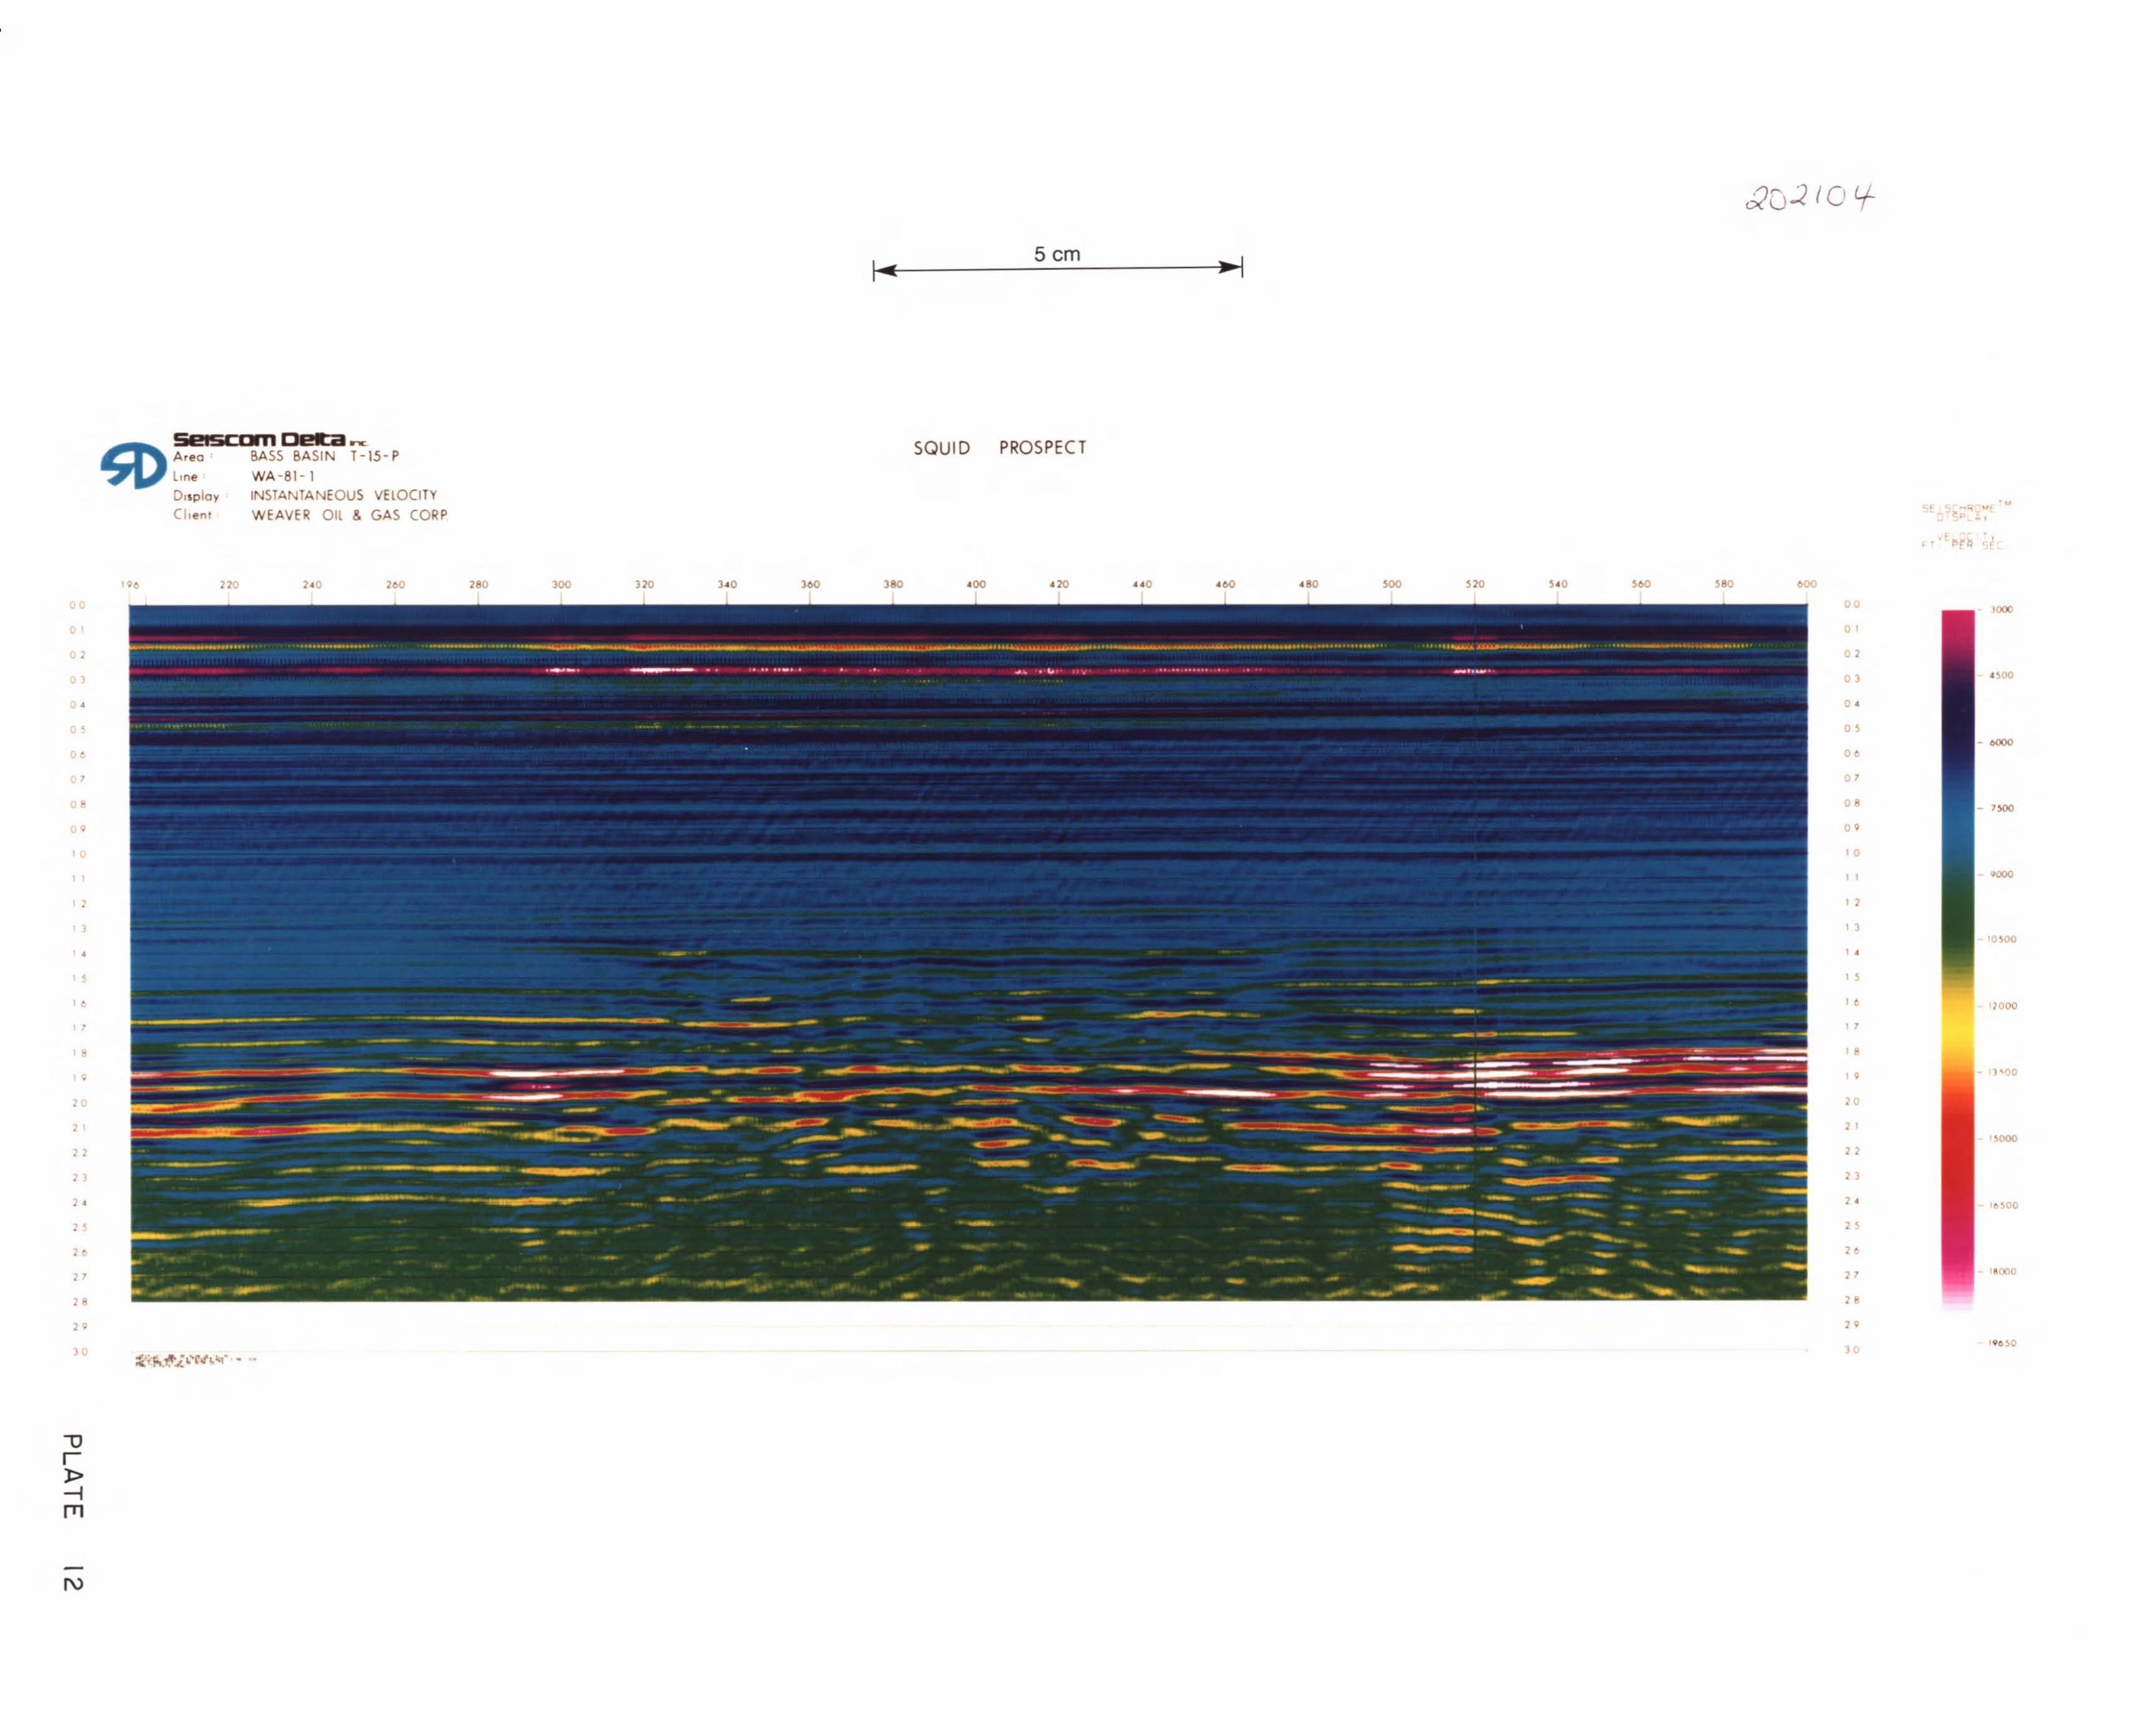
5 emr-------'-'--------~
Area
LmeDIsplay(Ilenl
,
PROSPECTSQUID5elSCDm Delta~BASS BASIN T-15-P
WA-81-jINSTANTANEOUS VELOCITY
WEAVER Oil & GAS CORP,f
- 0000
"000
5000
Jooo
'o~OO
')'>1)0
'O~OO
"00
- 1>00
28
23
10
1 3
19
2 1
"
1 5
1 2
"
1 1
1 8
01
2 •
21
20
01
O'
"
"
O'
00
0'
00
03
02
08
000'.0"0'20••0..0.20.003603203002.02.02.0220"0
2
5
•
,
5
l
•
o
1
,
28
3
•
21
20
"
2 •
"
12
20
1J
"
"
"
" "30 30
-N
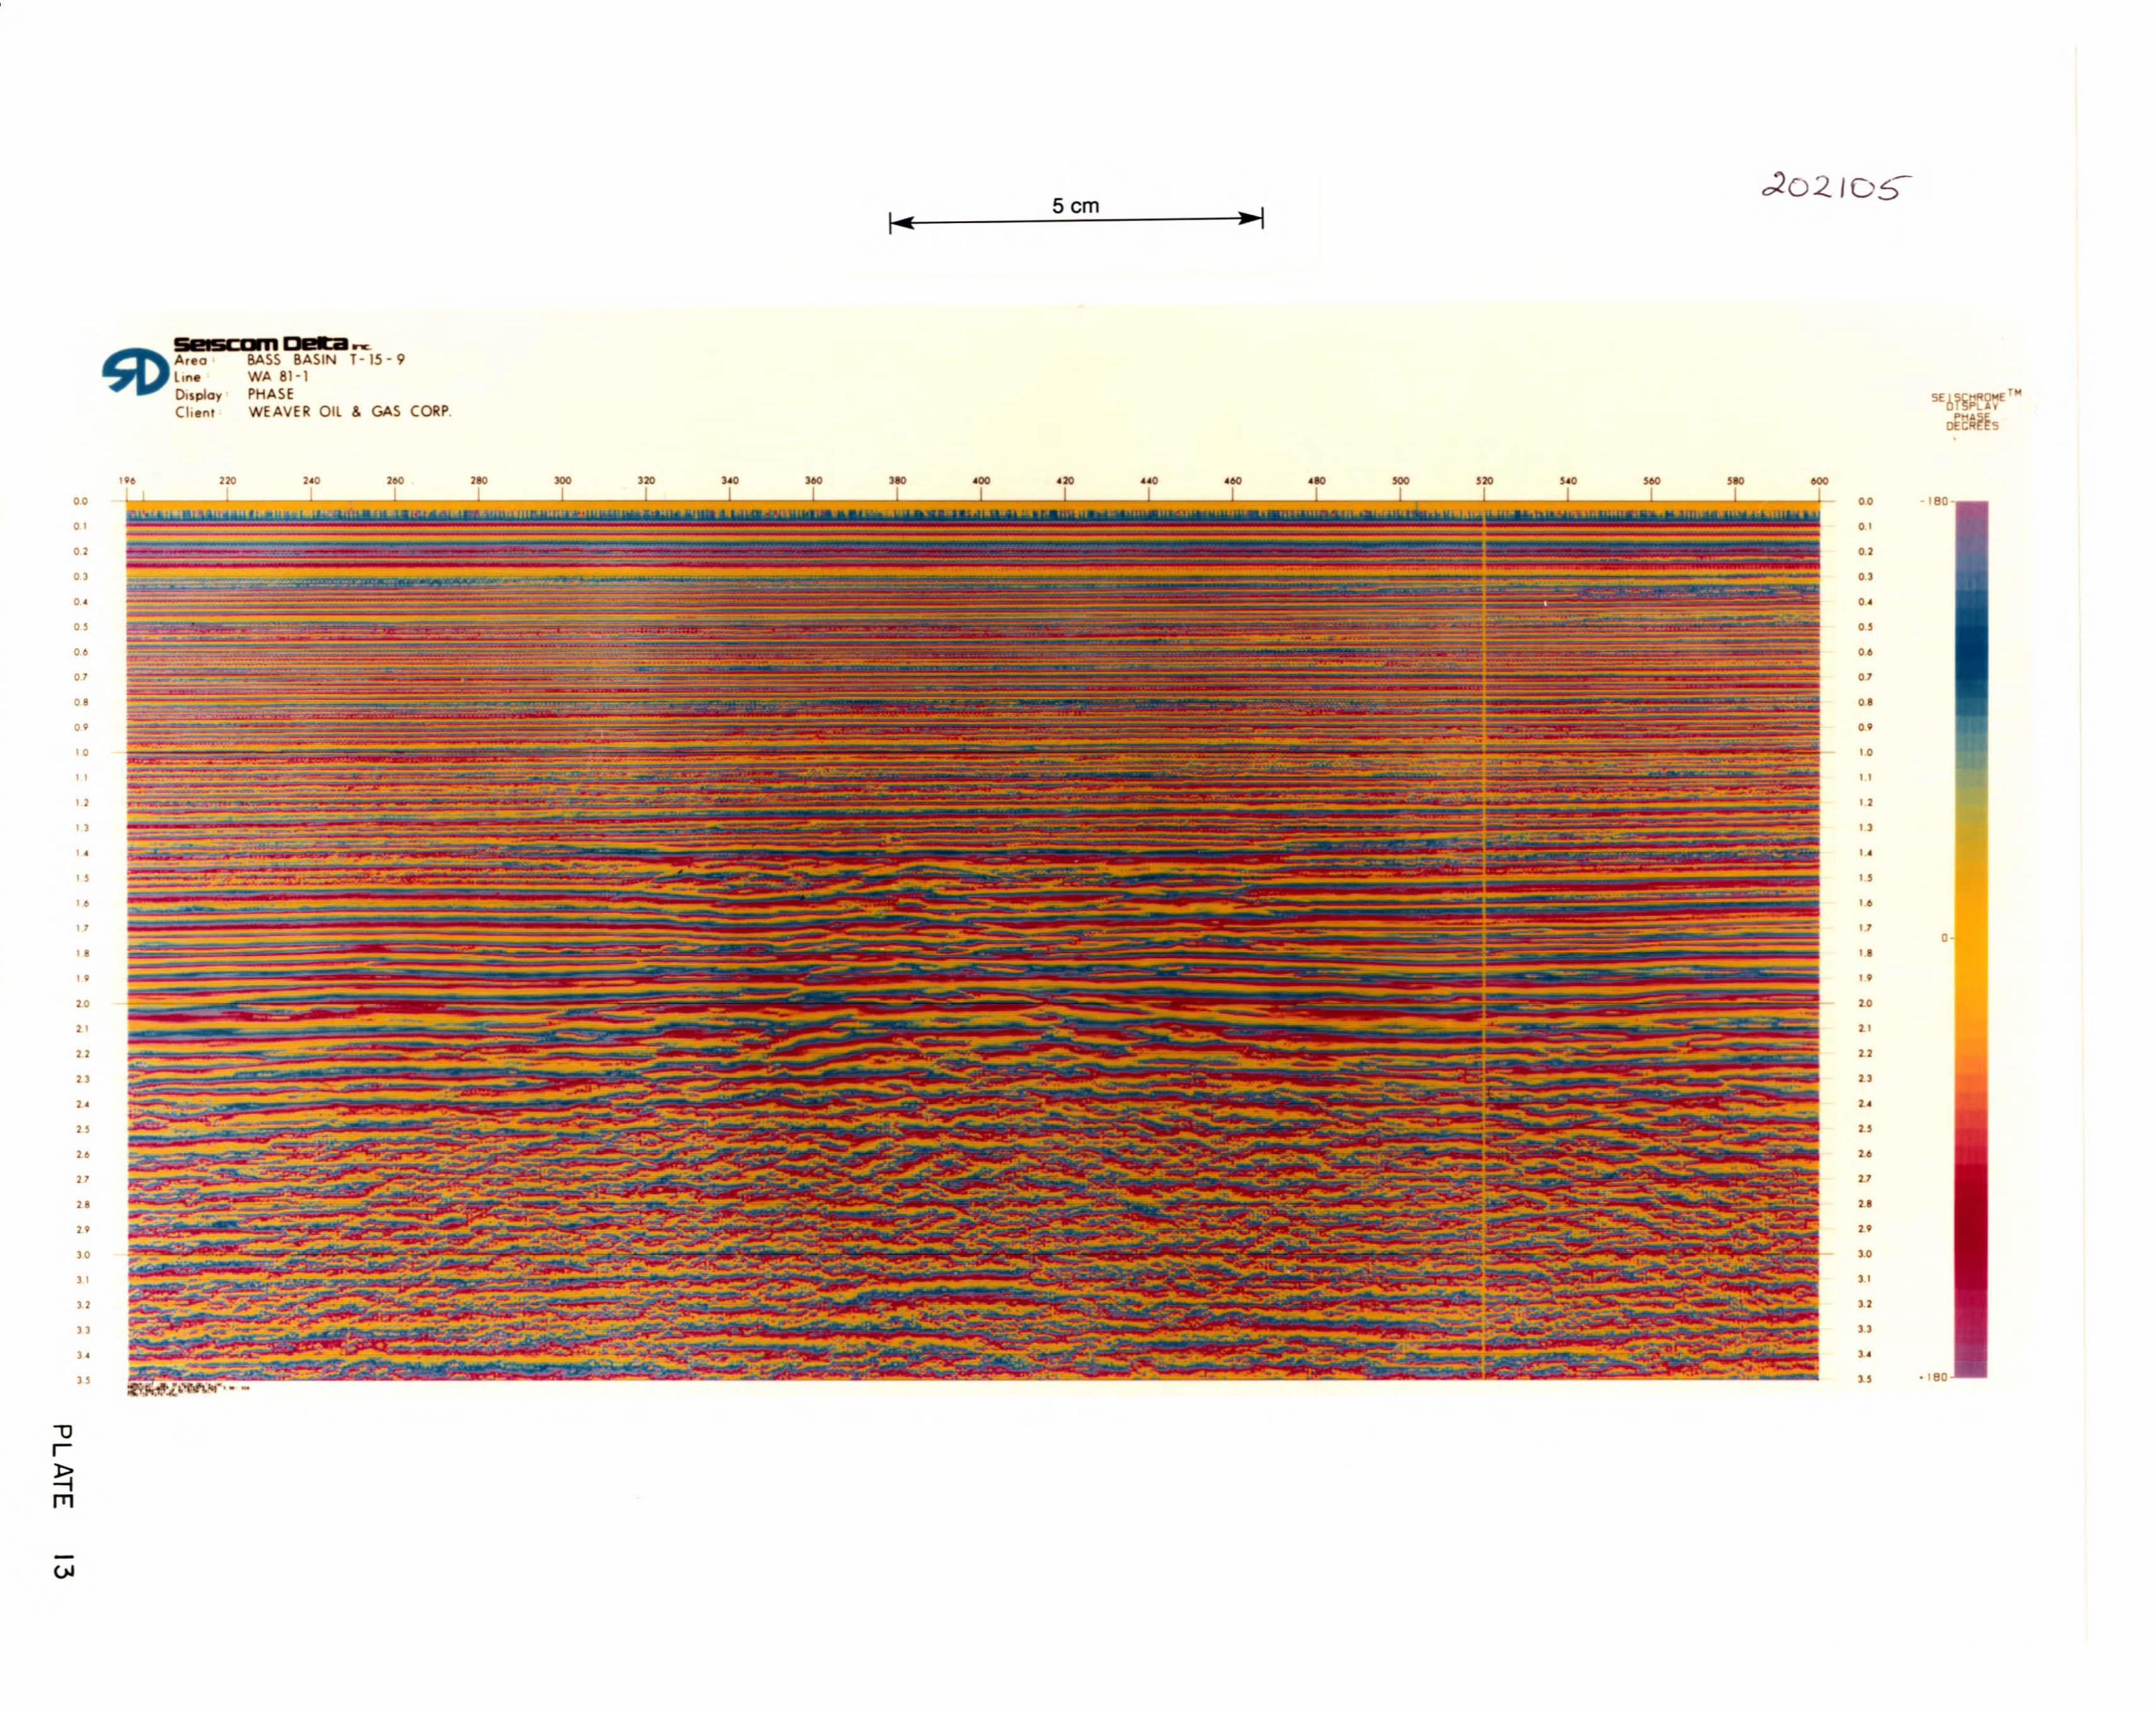
5cmr-'-------=-=~-----;~
.;202./D~
. :.... ...-:SI!ISCDI11 one.A..o BASS BASIN T- 15 - 9line WA 81·1O"plo, PHASE(10.01 WEAVER Oil & GAS (ORP.
'" "" "0 ,.. 200 >00 ,,. "0 ,.. '00 .,. ..0 ... ... ". ..0 ,.. ...00 00 - I BO-
01 01
o I 0'
o , 0'
O' O'
o l 0'
O' O'
0' 0'
O' O'
O' O'
, 0 10
" "" "" "" "" ".. .." 1J
0
" "" "'0 ~O
" ~,
""" "~. ~.
" ~,
,. ,.17 ""
,.
" "'0 '.0
" "" "" ",. ,.." " • 1BO
-
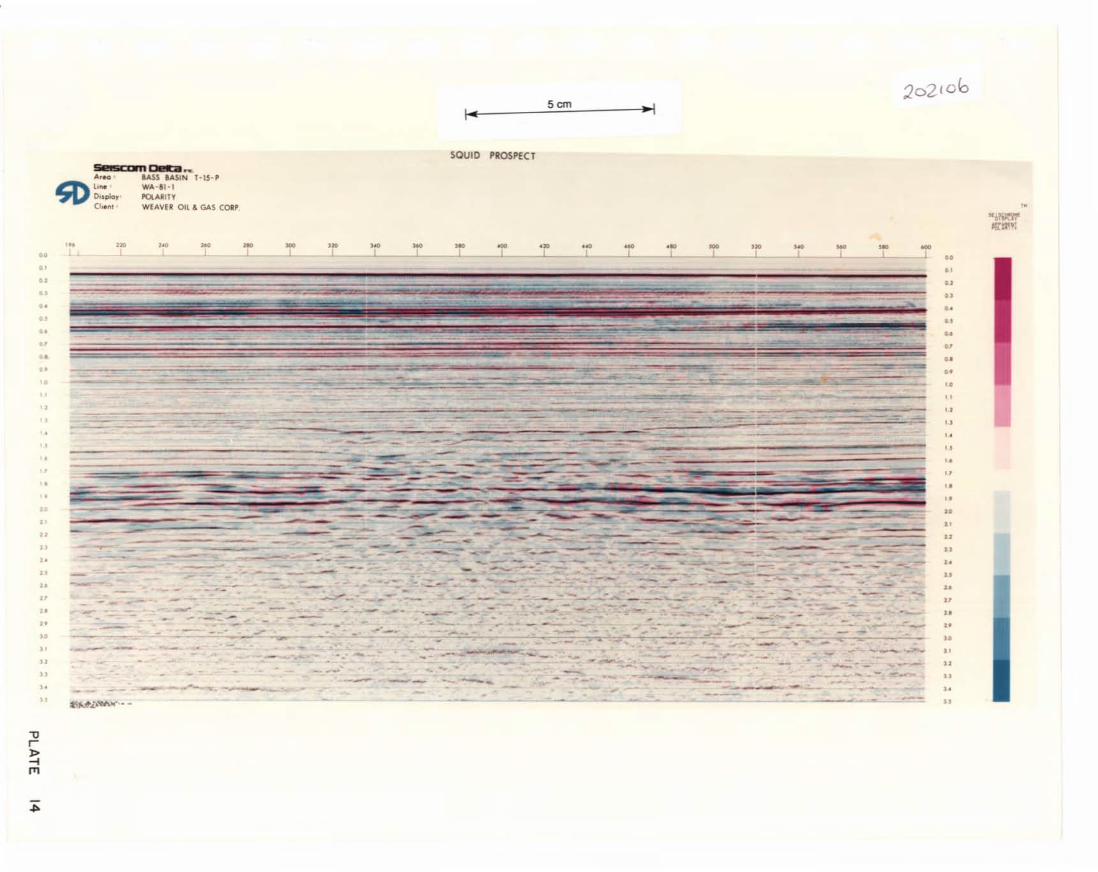
Scm
"""
"
""
"
"
""
"
"
"",.
"
"
""
"
,."
""
""
.."""
••........"
,
---- ~..
---
~--
-~
---
--
--'
-..._---
-.J.
----:- _::--......:::::=-;~;.~-
-
••
--- .............
____'L-
--
••
--
..
- -
.--~--
'.
-
•
--
SOUID
--
...
----- ---..
--- ----'----
..--
--~--- ----- --
.'
--
--
-=-
,.~
--
..
--
-
-
---
--
,.
---'-
,.
--
-
--
'..
•
"
"
"
"
"
"
"
,.
"
"
"
"
"
"",.
"""••"
"
"
......
..
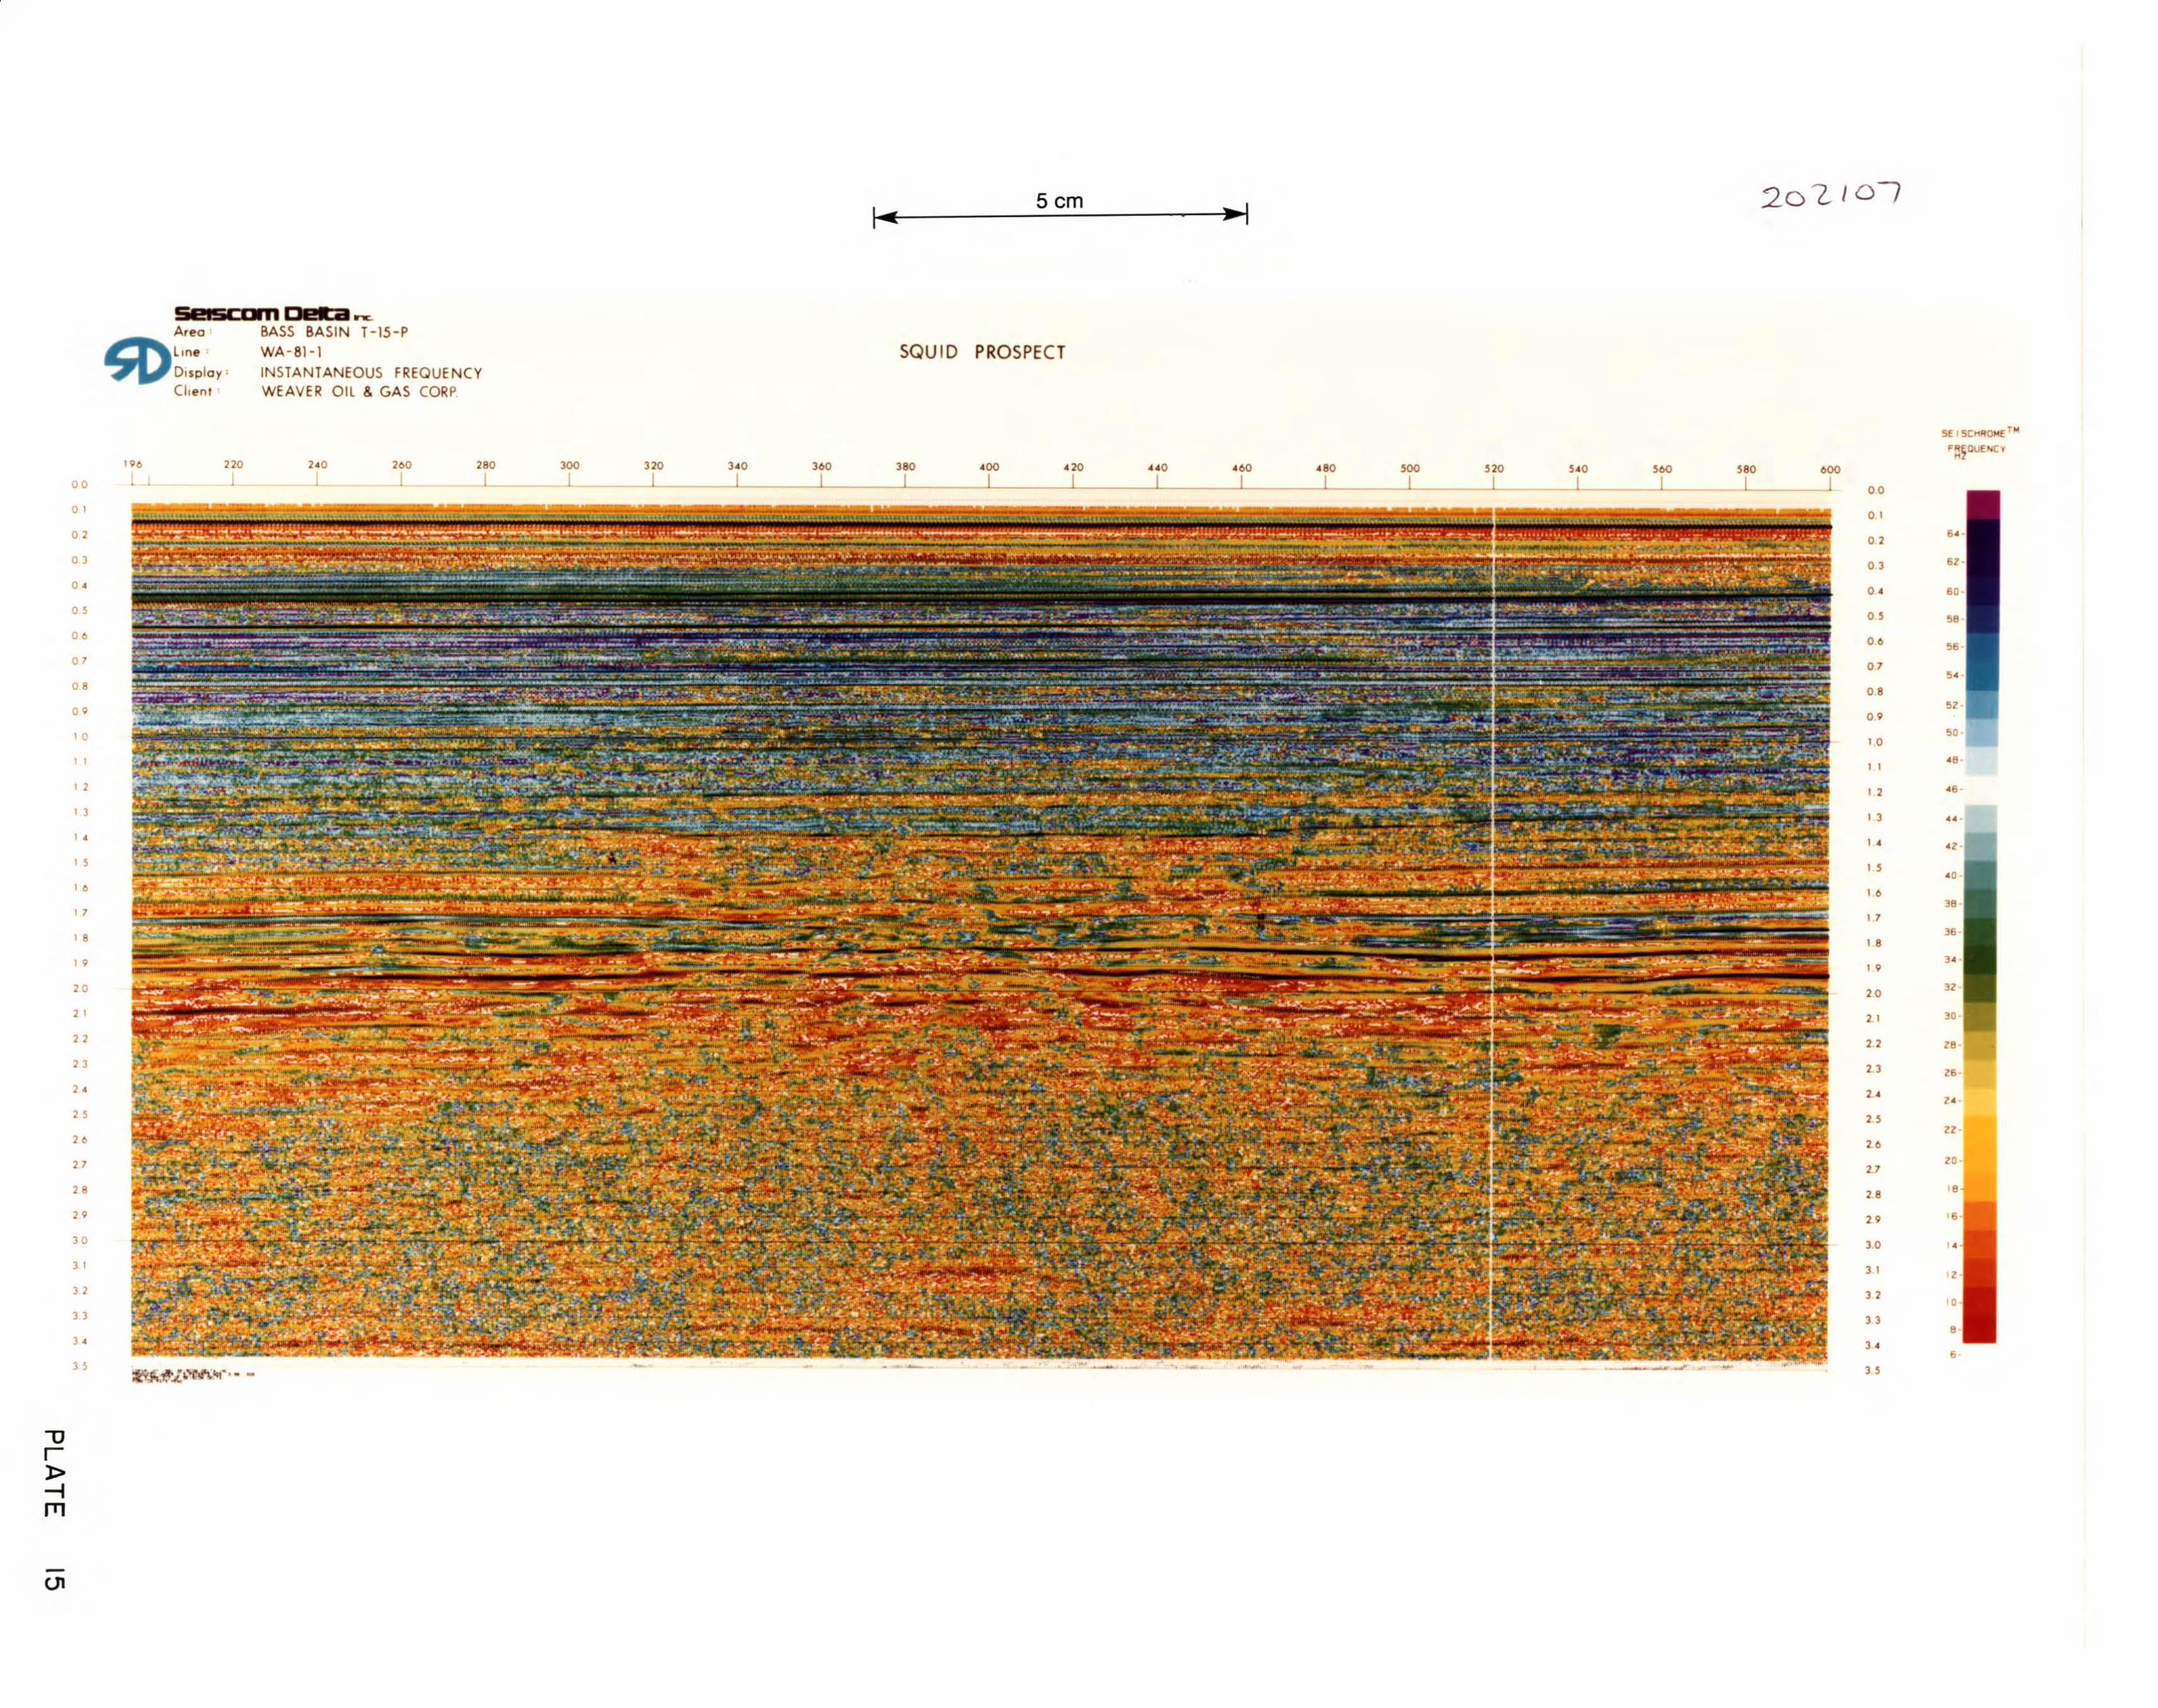
. :... ...-:SI!ISCDmA,ea' BASS BASIN T-15-Pline: WA~81-1
DISplay' INSTANTANEOUS FREQUENCYCl,ent· WEAVER Oil & GAS CORP.
Scm~'-----~~---~
SQUID PROSPECT
20 L.-I 0/
-(]I
00
o 1
01
03
0'
00
07
08
0'
10
I I
11
".."10
17
18
"10
11
11
13
1 •
"1 0
17
18
"30
J1
""3.
"
190
1 1110
1,.01
100
1180
--l-300
I310
J1-3.0 360 380 "00 .. 20 440 460 .. 80
-1L__-'I I I__--ll I'-__I__---'--1_ 500 .520_IL I_
"0I
'00 '80 000
--l.- L 00
o 1
01
03
O.
0'
00
07
08
0'
10
1 I
I 1
".."I 0
17
18
1 •
10
11
11
13
1.'
"10
17
18
"30
J1
""3.
"
Sf I SCP'lIltOME flo!
F~;OUENC'l'
50·
'8·
...
1.-
z.-
"11-
10-I.
•
Synthetic seismograms:
Introduction
SECTION IVb
80
202108
Plate 16/17/18 Synthetic Seismogram - Bass #2
Plate 19/20/21 Synthetic Seismogram - Konkon #1
Plate 22/23/24 Synthetic Seismogram - Durroon #1
Plate 25/26/27 Synthetic Seismogram - Cormorant #1
Plate 28/29/30 Synthetic Seismogram - Pelican #1
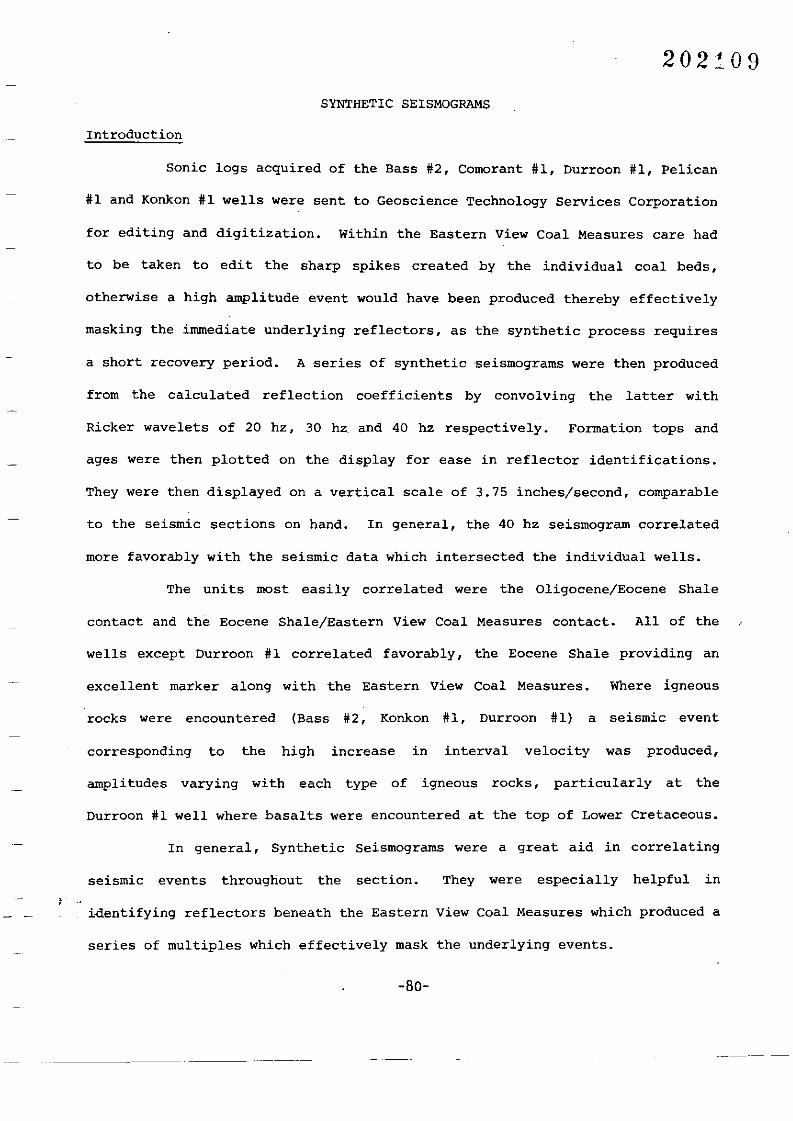
202109
SYNTHETIC SEISMOGRAMS
Introduction
Sonic logs acquired of the Bass #2, Comorant #1, Durroon #1, Pelican
#1 and Konkon #1 wells were sent to Geoscience Technology Services Corporation
for editing and digitization. Within the Eastern View Coal Measures care had
to be taken to edit the sharp spikes created by the individual coal beds,
otherwise a high amplitude event would have been produced thereby effectively
masking the immediate underlying reflectors, as the synthetic process requires
a short recovery period. A series of synthetic seismograms were then produced
from the calculated reflection coefficients by convolving the latter with
Ricker wavelets of 20 hz, 30 hz and 40 hz respectively. Formation tops and
ages were then plotted on the display for ease in reflector identifications.
They were then displayed on a vertical scale of 3.75 inches/second, comparable
to the seismic sections on hand. In general, the 40 hz seismogram correlated
more favorably with the seismic data which intersected the individual wells.
The units most easily correlated were the Oligocene/Eocene Shale
contact and the Eocene Shale/Eastern View Coal Measures contact. All of the
wells except Durroon #1 correlated favorably, the Eocene Shale providing an
excellent marker along with the Eastern View Coal Measures. Where igneous
rocks were encountered (Bass #2, Konkon #1, Durroon #1) a seismic event
corresponding to the high increase in interval velocity was produced,
amplitUdes varying with each type of igneous rocks, particularly at the
Durroon #1 well where basalts were encountered at the top of Lower Cretaceous.
In general, Synthetic Seismograms were a great aid in correlating
seismic events throughout the section. They were especially helpful in
identifying reflectors beneath the Eastern View Coal Measures which produced a
series of multiples which effectively mask the underlying events.
-80-
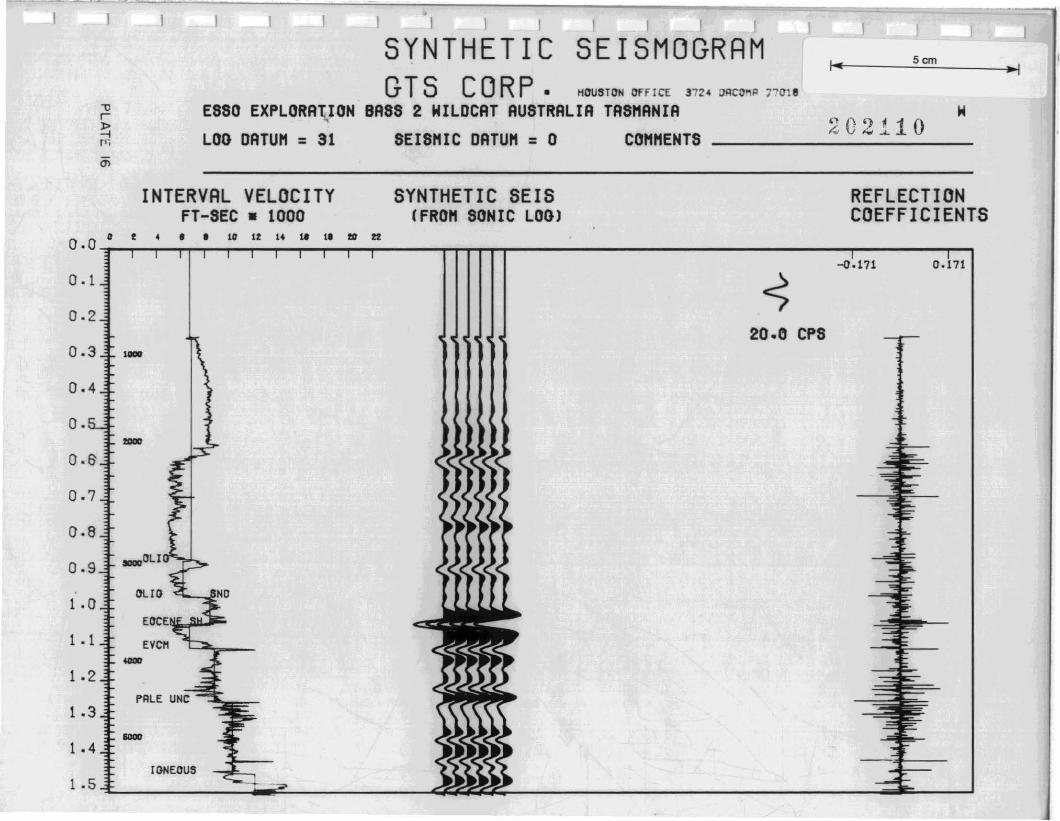
J
5cm/..I I I I
SEISMOGRRMI I I I
SYNTHETICGTS COR P. HOUSH1N OfF ICE 3724 OACO"P 771118
ESSO EXPLORA1;,ION BASS 2 WILDCAT AUSTRALIA TASMANIA 20211 0LOG DATUM = 31 SEISMIC DATUM = 0 COMMENTS ___
."r1>--iPi
INTERVAL VELOCITYFT-SEC • 1000
SYNTHETIC SEIS(FROM SONIC LOG)
REFLECTIONCOEFFICIENTS
it r 4" 10lf14~t.mno.0 "'I'"'"...,.......,.......,...,.....,........,.........,....---r----r----r---,.--,.------rr-T'"I"'T'"r-r--------------------------------r---------,--,-0.171 0.171
0.1
0.220.0 CPS
0.4
O. ....,0.6'
0.7
0.8
0.9
l)UO1 .0
1 • 1
1 .2
1 .3 ....1 .4
1.5.L ~l.:=~---__DW~ ....::=~_.J
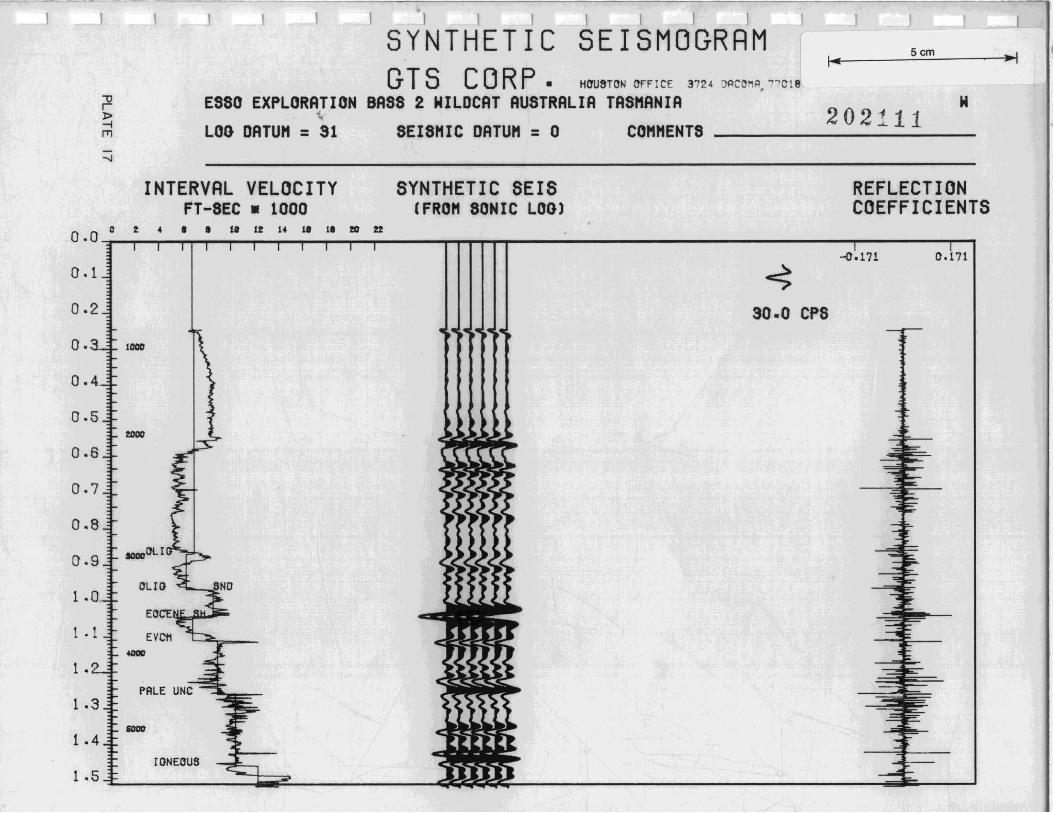
II
5cm
I J J I
SEISMOGRAMI I J
SYNTHETICGTS COR P. HllUSTON OFFICE 3724 JACOMR. '7018
ESSO EXPLORATION BASS 2 WILDCAT AUSTRALIA TASMANIA, 202111LOG DATUM = 31 SEISMIC DATUM = 0 COMMENTS ___
<Jr1>
""'rn
JJ
INTERVAL VELOCITYFT-SEC • 1000
SYNTHETIC SEIS(FROM SONIC LOG)
REFLECTIONCOEFFICIENTS
Ct. • • U it 14 a a m ft
o.0 ~""-""-"'T'T'''''-''''-''''-''''-''''-''''-''''-''''-------"'T'"'I"'T'"'I"'T'"'I------------------------------------------""T""---------""T""''-0.171 0.171
0.1 ~
0.2 30.0 CPS
O. 1_
O.
0.5
0.6
0.7
0.8
0.9
1 .0
1 . 1
1 •
1 .4
_ill I
OUll
.....
[()NECUS
1 .5-L------=::::Jo~-----_!ll:U='=':~---------------=~~--.J
J
.. \
J
5cm
202112
J . JJJ
SYNTHETIC SEISMOGRRMGTS COR P. HI)USTllN llfF (CE 3724 OACOMA 77(118
E880 EXPLORATION BASS 2 WILDCAT AUSTRALIA TAS"ANIALOO DATU" =31 8EI8"IC DATU" =0 CO""ENTS __
"rl>-Irn
INTERVRL VELOCITYFT-SEC • 1000
SYNTHETIC SEIS(FRO" SONIC LOO)
REFLECTIONCOEFFICIENTS
(}. (} "3°-,.-,'--,•.,....,.-,'_°..,'-'..,'-'..,"-,'-'..,..-,..------,"T1"T1n-----------------------------r--------r--1-1).171 1).171
0.1 ~
0.2 40.0 CPS
0.3 'olio
o.
0.5
0.6
0.7
0.8
0.9
1 •1
1 .2
1.3
1 .4IONEI)US
1.5-L -=::::t;~-----~~~-------------::=3~-..J
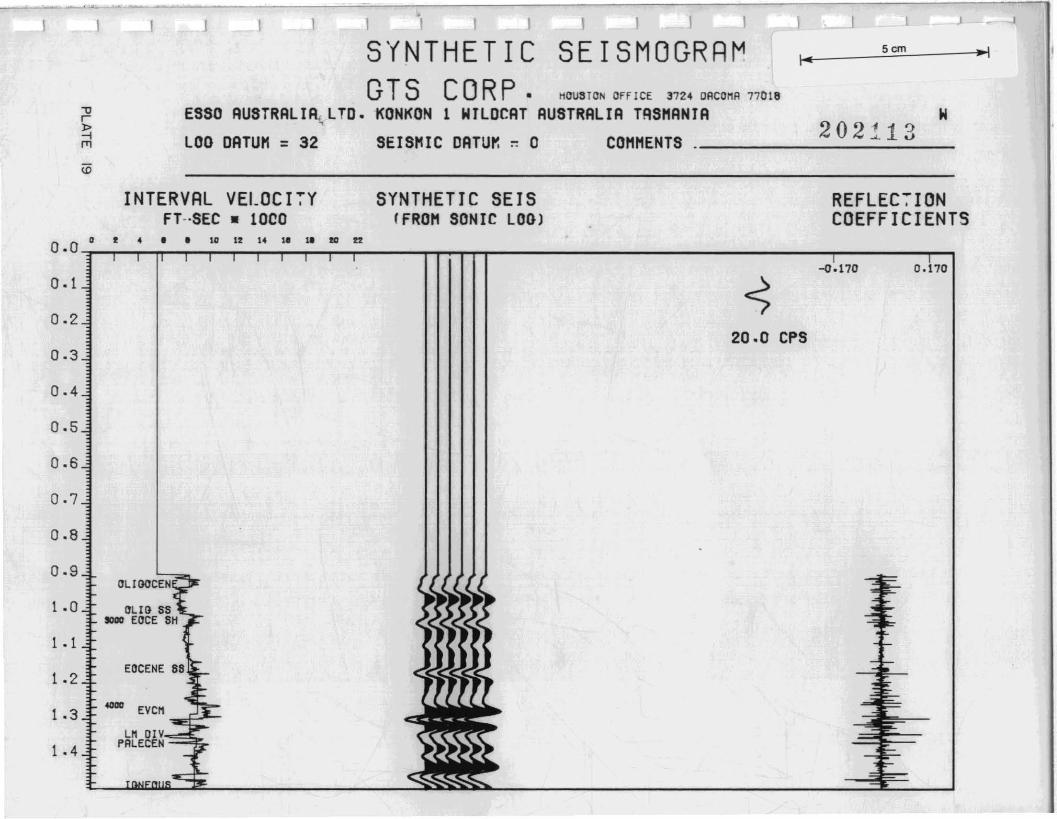
J J J
--I5cmI~SYNTHETIC SEISMOGRR~
GTS COR P. HOUSTON Off ICE 3724 OACOHA 77018
ESSO AUSTRALI~LTD. KONKON 1 WILDCAT AUSTRALIA TASMANIALOO DATUM = 32 SEISMIC DATUro ~ 0 COMMENTS 2_0_2__1_1__3 __
-ur~rn
REFLECIONCOEFFICIENTS
-0.170 0.170
20.0 CPS
INTERVAL VELOCI":Y SYNTHETIC SEISFT--SEC • lOCO (FROM SONIC LOOl
0.0 • • • • • I • .. " It It '" ..0.1
0.2
0.3
0.4
0.5
0.6
0.7
0.8
0.9
1 .0
1 . 1
1 .2
..... EVCH1 .3LH OIV
1 .4 PALECEN
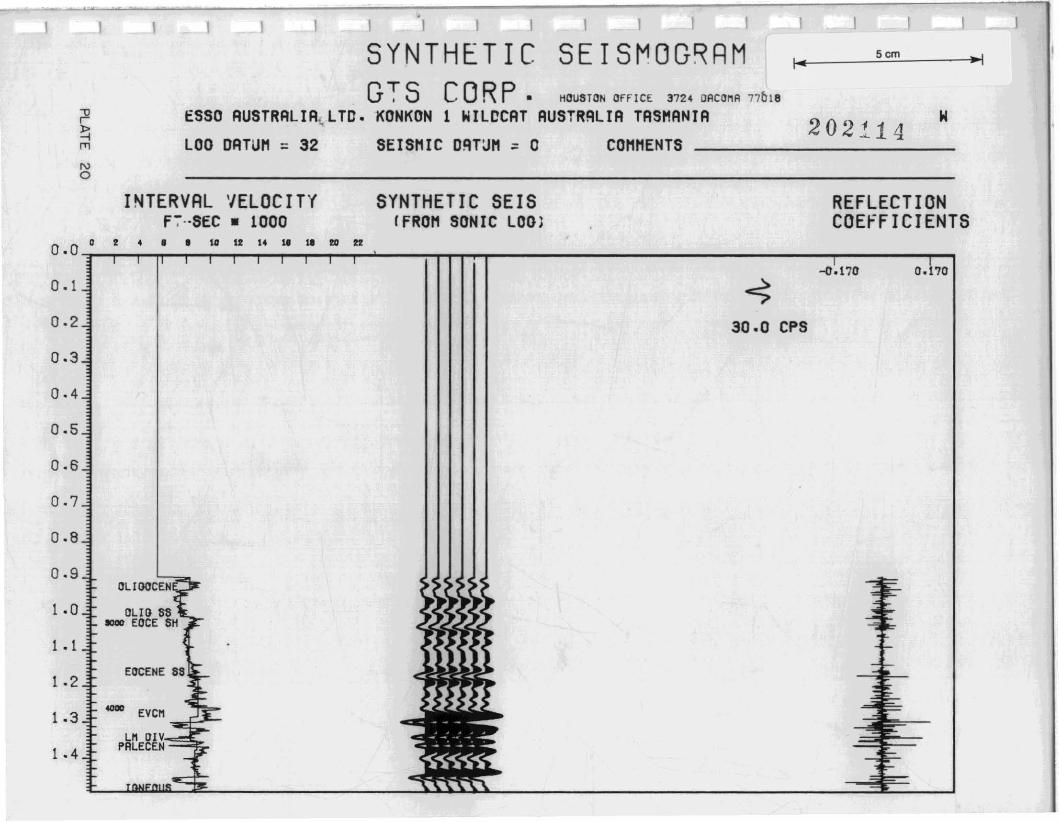
Scm
"
SYNTHETIC SEISMOG~RM
G:- S COR p. HllU5TllN llfflCE 3724 llACOM 77b18
ESSO AUSTRALIA~LTO. KONKON 1 WILCCAT AUSTRALIA TASMANIA 202114LOO DATUM = 32 SEISMIC OqT~M ~ 0 COMMENTS _
No
INTERVAL VELOCITYF7··SEC • 1000
SYNTHETIC SEISIFROM SONIC LOO)
REFLECTIONCOEfFICIENTS
t 4 • • ~ " 14 ~ U m n0.0 •""?'""-r-...,.......,.,...."""T'"-r.....,........,........,........,...--,.......,--'---:-T"'T"'T"..-r--------------.....,...---......,~
0.1
0.2 30.0 CPS
0.3
0.4
0.5
0.6
0.7
0.8
EllCENE 85[ .2
1 .4l---.l.llllElnL~L ~~~~~ =~ ~_----'
[ .a
1 • 1
1.3
0.9
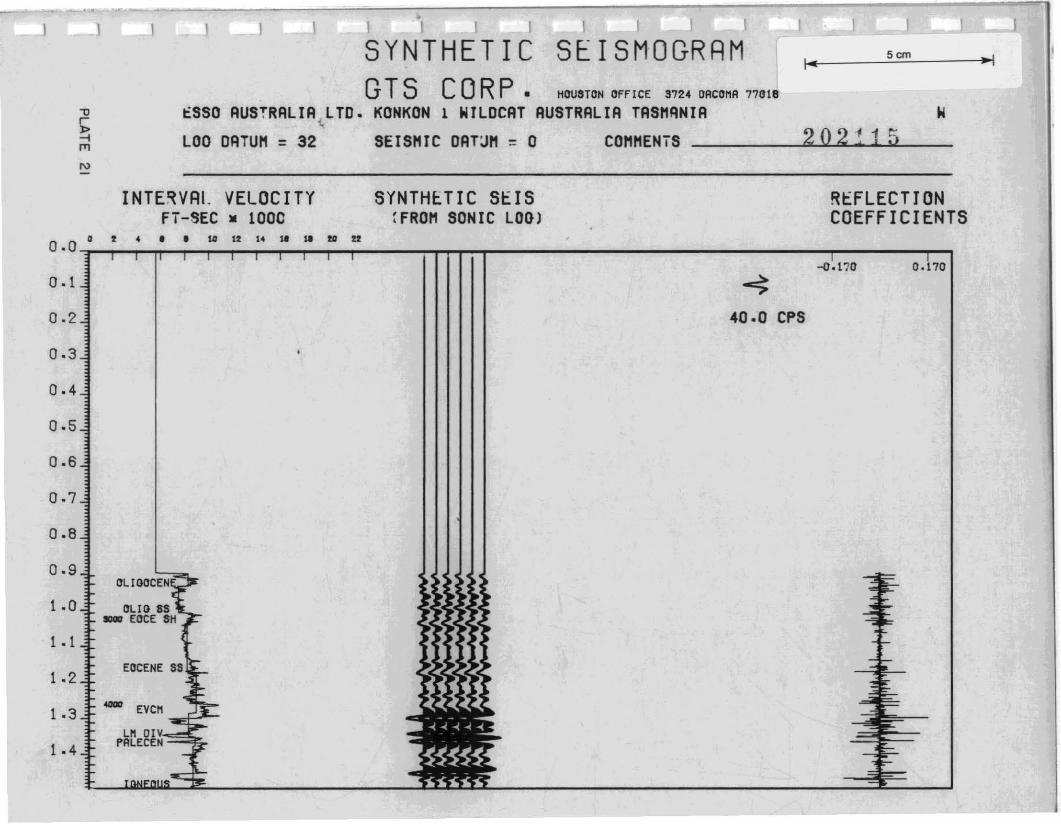
j I) I
SYNTHETIC SEISMOGRRMGTS COR P. HOUSTON OffICE 3724 DACOMA 771118
eSSO AUSTRALIA~LTD. KONKON 1 WILDCAT AUSTRALIA TAS"ANIA
LOO DATU" = 32 SEIS"IC DAT~" = 0 CO""ENTS
5cm
W
202~15
I NTE~VAI. VELOC ITYFT-SEC II 1000
SYNTHETIC St:IS(FRO" SONIC LOG)
Rt:FLECTJONCOEFFICIENTS
o t 4 • • to It 14 ~ 11 fa !I
a.a1"""...,......,.....".....,......,.......,.......,......,......,.~---,---:-T'"T""T"....,..--------------.....,.---.....,~-0.170 0.170
0.1
0.2 40.0 CPS
0.3
0.4
0.5
0.6
0.7
0.8
0.9
1.0
1 • 1
1 .2EOCENE SS
- EveH1 .3LM OIV
1 .4 PALECEN

5cm
202116
SYNTHETIC SEISMOGRRMGTS COR p.. HOUSTllN' OFFICE 3724 OACO~A 77018
ESSO AUSTRAlIR lTD DURROO~ 1 NIlDCRT RUSTRRlIR TRSM~IA
lOG DRTlJt1 = 32 SEIStlIC DRTUM = 0 COtlMEN'TS _
I~TERVRL VELOCITYfT-SEC • 1000
SY~TIiETIC SEIS(fRO" SONIC lOG)
REfLECTIONCOEFFICIENTS
o % , • • ~ It If 11 ~ m tt
o.0 .....-r--r""T1rr--r---r---r-,.~-.,.--:I---rrrrrr---------------------,,.,
0.1
0.220.0 CPS
....1.8 ....
KC EROOEOt~~~=-7
,....
"'ON CRET
....
2.0 t ~!~ j~~~ j~~J
1.9
1 .4
1 .6
1.3
1.5
0.5 Stl
0.6 .... ~ SAl
0.7
0.8 ....0.9
lIP CRET1 .0 ....1 .1 ...1 .2
0.4
0.3
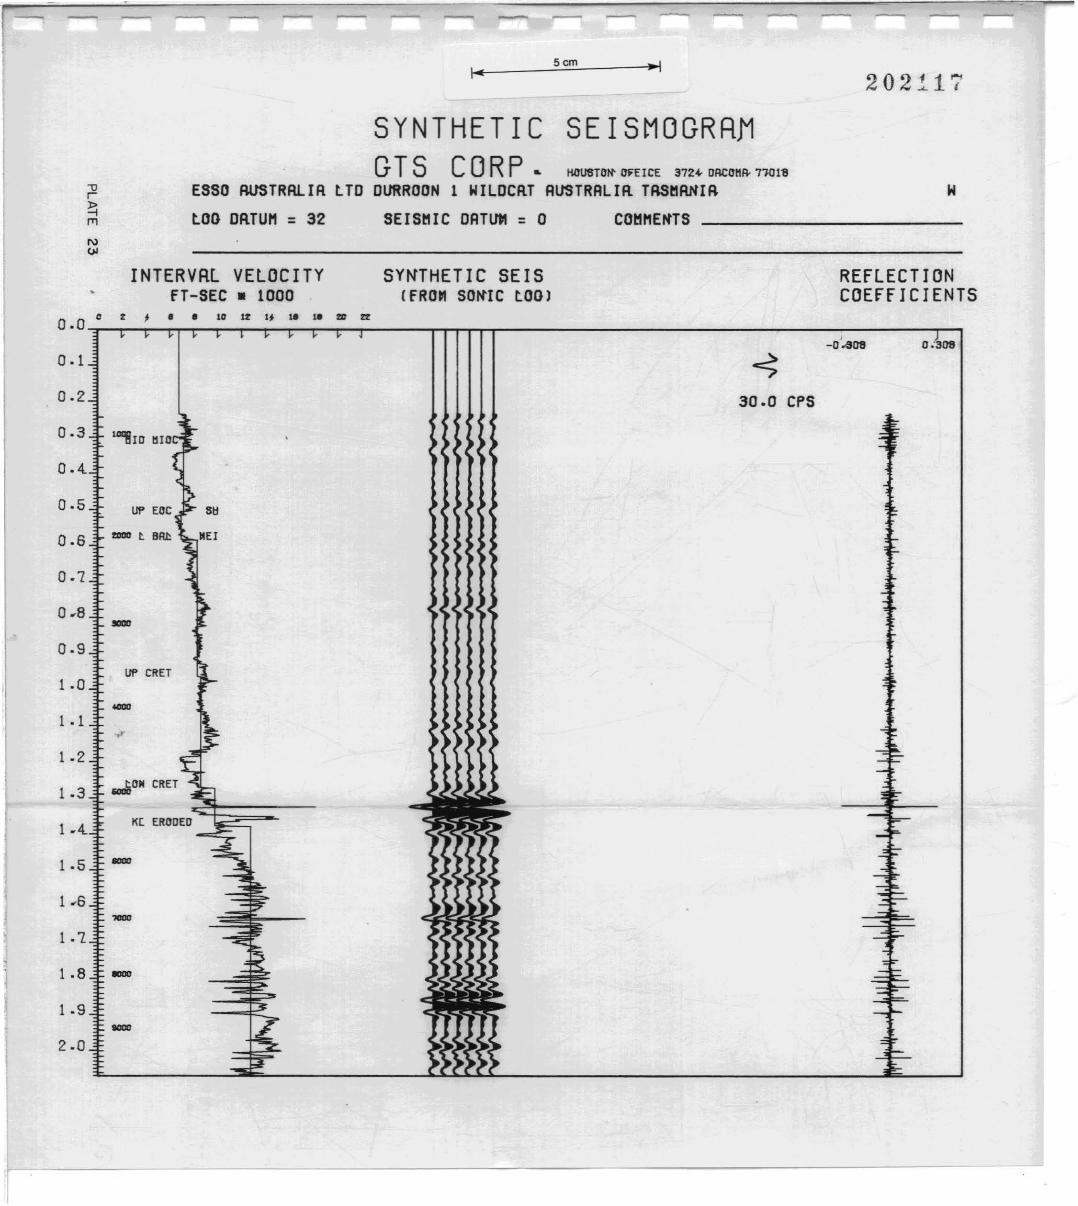
-Scm --I
202117
SYNTHETIC SEISMOGRA~
GTS COR P.. llllutlTOtl' omCE 372+ OflCO"fl- 710111
ESSO AUSTRRLIR lTD DURROON 1 WILDCRT AUSTRALIR TAS~RNIB
lOO DRTUM = 32 SEISMIC DATUM = 0 CO~ME~TS
N01
INTERVRl VELOCITYFT-SEC • 1000
SYNTHETIC SEIS(FROM SO~IC lOOI
REFLECTIONCOEfFICIENTS
Dr, • • 14 Ir l' ~ W m ~
o.O..,..................,.,........,.,.............--r---.----.----.---.,.......,,......,,...---r-rT""T'"T""T'"-------------------,..--,
0.1 ~
0.2 30.0 CPS
1.8 ....
o.3 ""tIio "10
Ul' EOC
Ul' CRET
K[ EROOEO"-i:;;;;;::;:;;;;=--
.... t 8R1>
...,a0N CRET
-
....
....
1 .1
1 •2
1 .3
1 • 1
1 •5
1 . 0
0.4.
1 .9
2.0
0.9
0.1
0.6
0.5
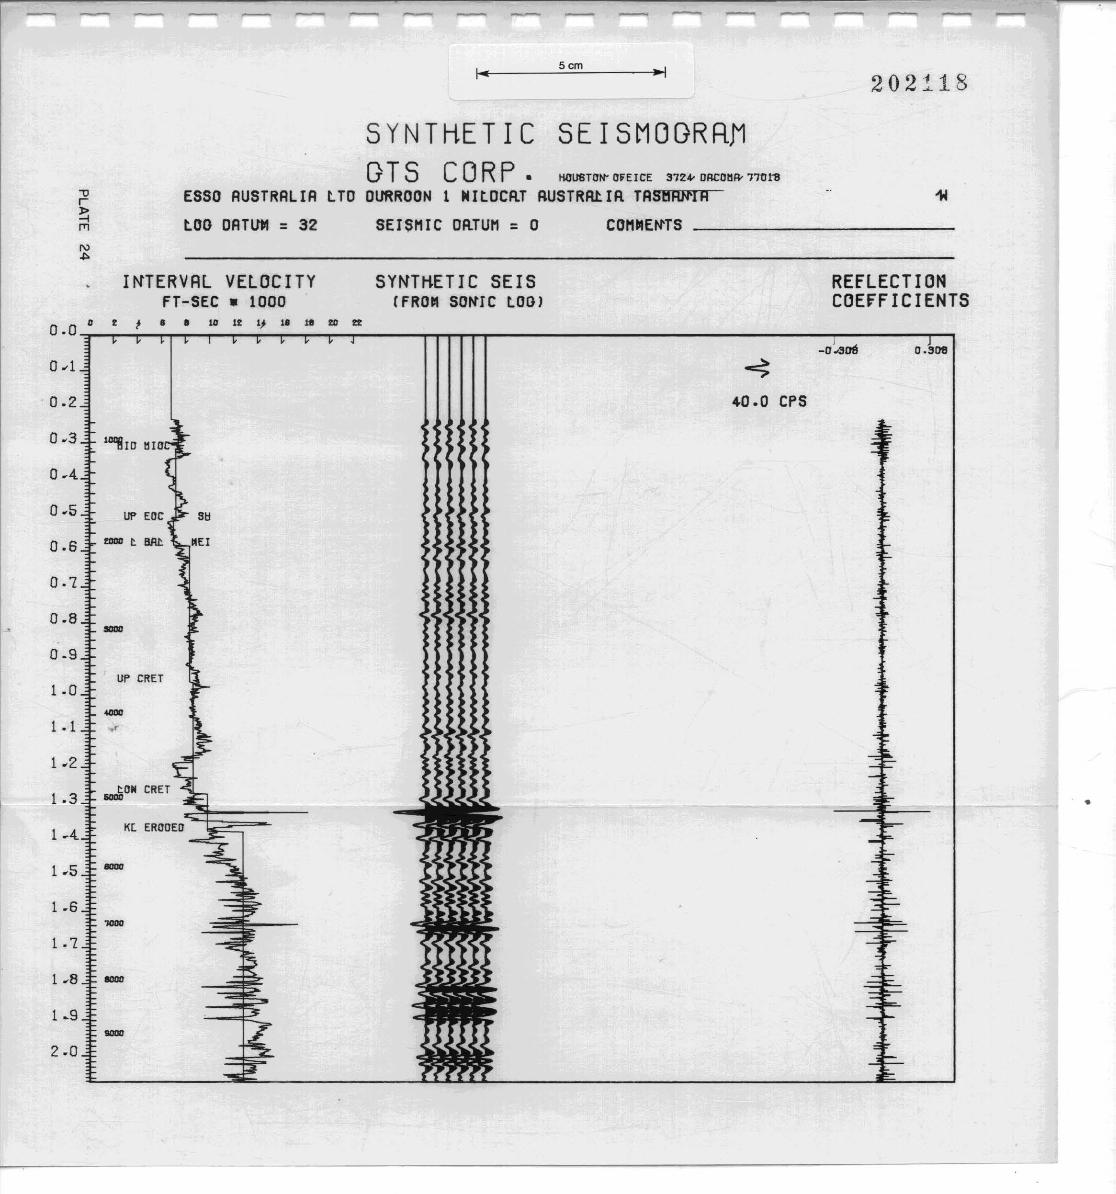
- -5cm
"I
- - --
202118
ESSO AUSTRALIA tTD
tOO DATUM = 32
INTERVAL VELOCITYfT-SEC • 1000
SYNTKETIC SEISMOGRR~
GTS COR P. HlllJ6TllN" llfEICE 3124- ORCll~n-l1alllDURROON 1 NItDCRT RUSTRRtIR TAS6RN1R
SEISMIC DRTUM = 0 COM"E~TS
SYNTHETIC SEIS(fROM so~rc tOOl
REfLECTIONCOEfFICIENTS
D t f • • to It 1f 1. 18 to tro.O..,.......,......."..--,-T"""!"---.-.--".....,--..".....-.---.-----,-"T""T""T""1-.----------------.,....----.....".......,
-0 -sOli II .308
0.2
0.3 1I1"!I1D ~ III
0.4.
0.5 lJl' EllC S~
0.6 .... t IlIIt
0.'1
0.8 ....0.9
UP CRET1 .0 ....1 . 1 '""1 .2
tllN CRET1.3 ....1 .4. KC ERllOEO
....1.6
1 • '1
1 .8 IlIOlI
1.9
2.0
40.0 CPS
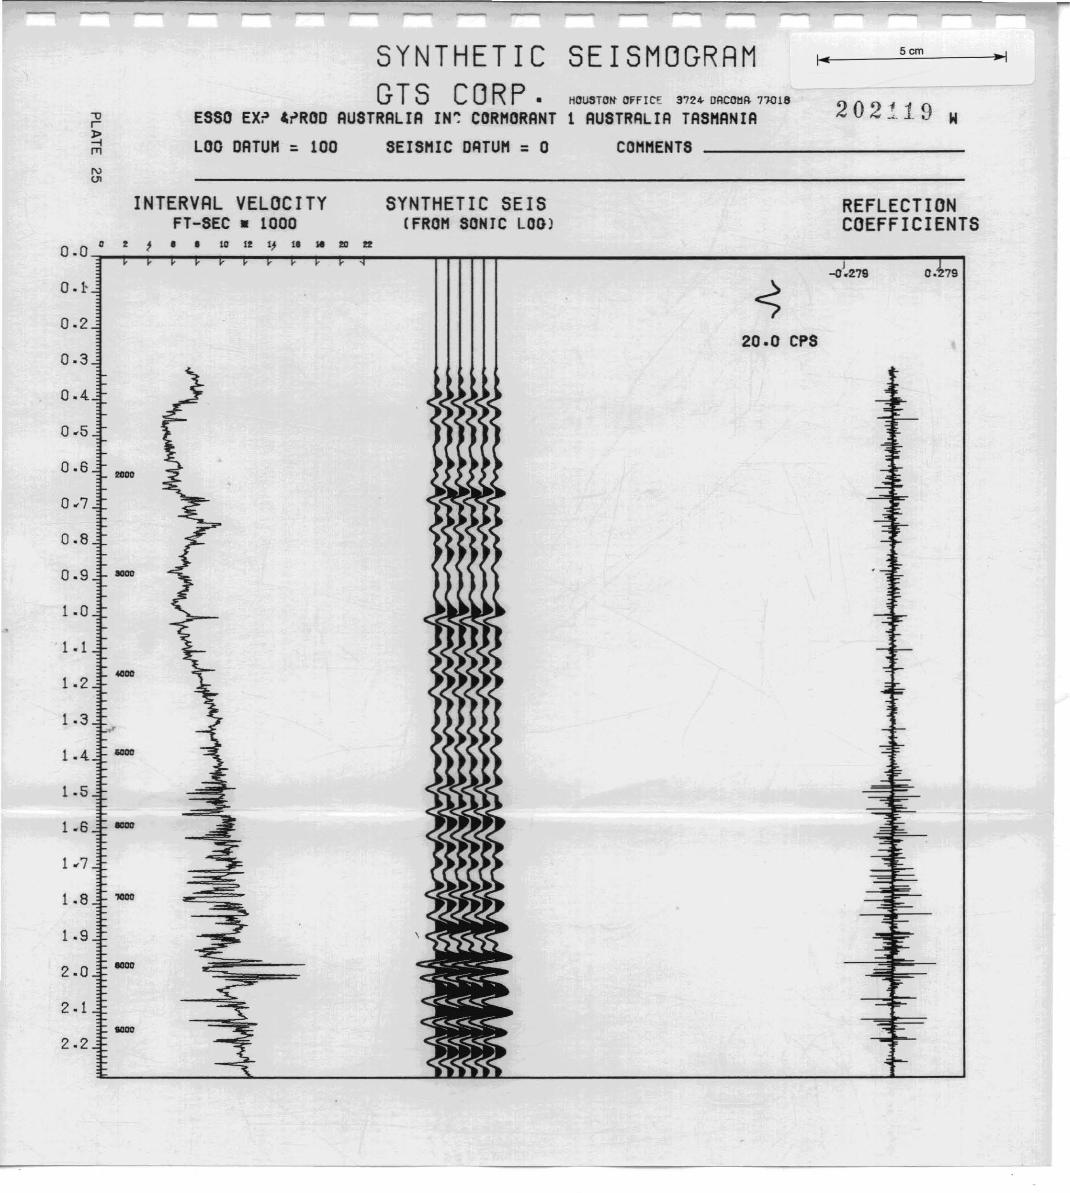
~ ---, - - - - - ~ - - ~ -SYNTHETIC SEISMOGRRM 1-
50m"I
GTS CORP. HCUSTC~ CFFICE 372+ OACC~A 71018202_~19-U ESSO EX~ &~ROD AUSTRALIA IN~ CORMORANT 1 AUSTRALIA TASMANIA IIr
:l>-; LOa DATU" :; 100 SEISMIC DATUM :; a COMttENTSfT1
N(]I
INTERVAL VELOCITYFT-SEC • 1000
SYNTHETI C SE IS(FROtt SONTC LOO)
REFLECTIONCOEFFICIENTS
0.0. • , • • .... 'I 11 Ie III ..
0.1-
0.2
0.320.0 CPS
1.~ MOO
....
....
....
....1 .1
1 .0
1.3
1.9
1.2
1 .8 'IOOIl
1.6 ....
1.5
0.9 aooo
0.4.
2.1
2.2
0.6
0.8
2.0
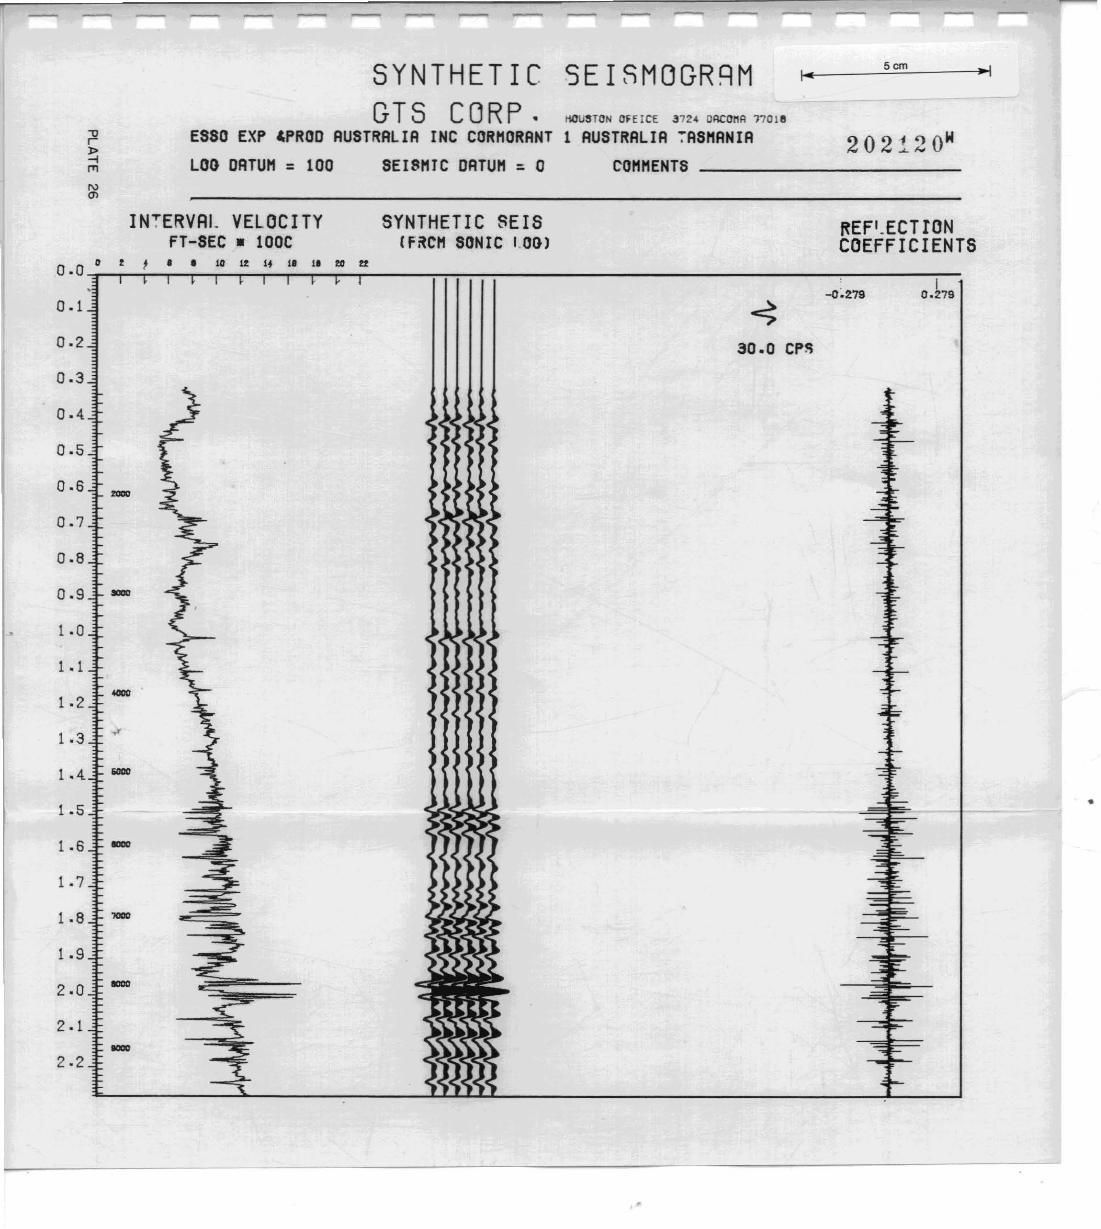
- - - - -
~I5cmSEISMOGRQM
HOUSTON OFEICE 3724 OACOMR 77018
1 AUSTRALIA 7AS"ANIACO""ENTS _
SYNTHETICGTS CORP.
ESSO EXP &PROD AUSTRALIA INC COR"ORANT
LOO DATU" = 100 SEI8"JC DATU" = 0
IN:ERVAI. VELOCITYfT-SEC • 100C
SYNTHETIC SEISIFRC" SONIC 1.00)
REF'.ECTIONCOEFFICIENTS
0.0 0 t , • • "' It '4 II II to tt
0.1I
0.279
0.2 30.0 CP~
0.3
1.6 IDDD
<000
-1 .4.
1.8 'JOCIO
1 .3
1 .2
1 .0
1.1
0.9 1000
1.5
1.7
1.9
2.1
2.0
2.2
0.8
0.6
0.7
0.5
•
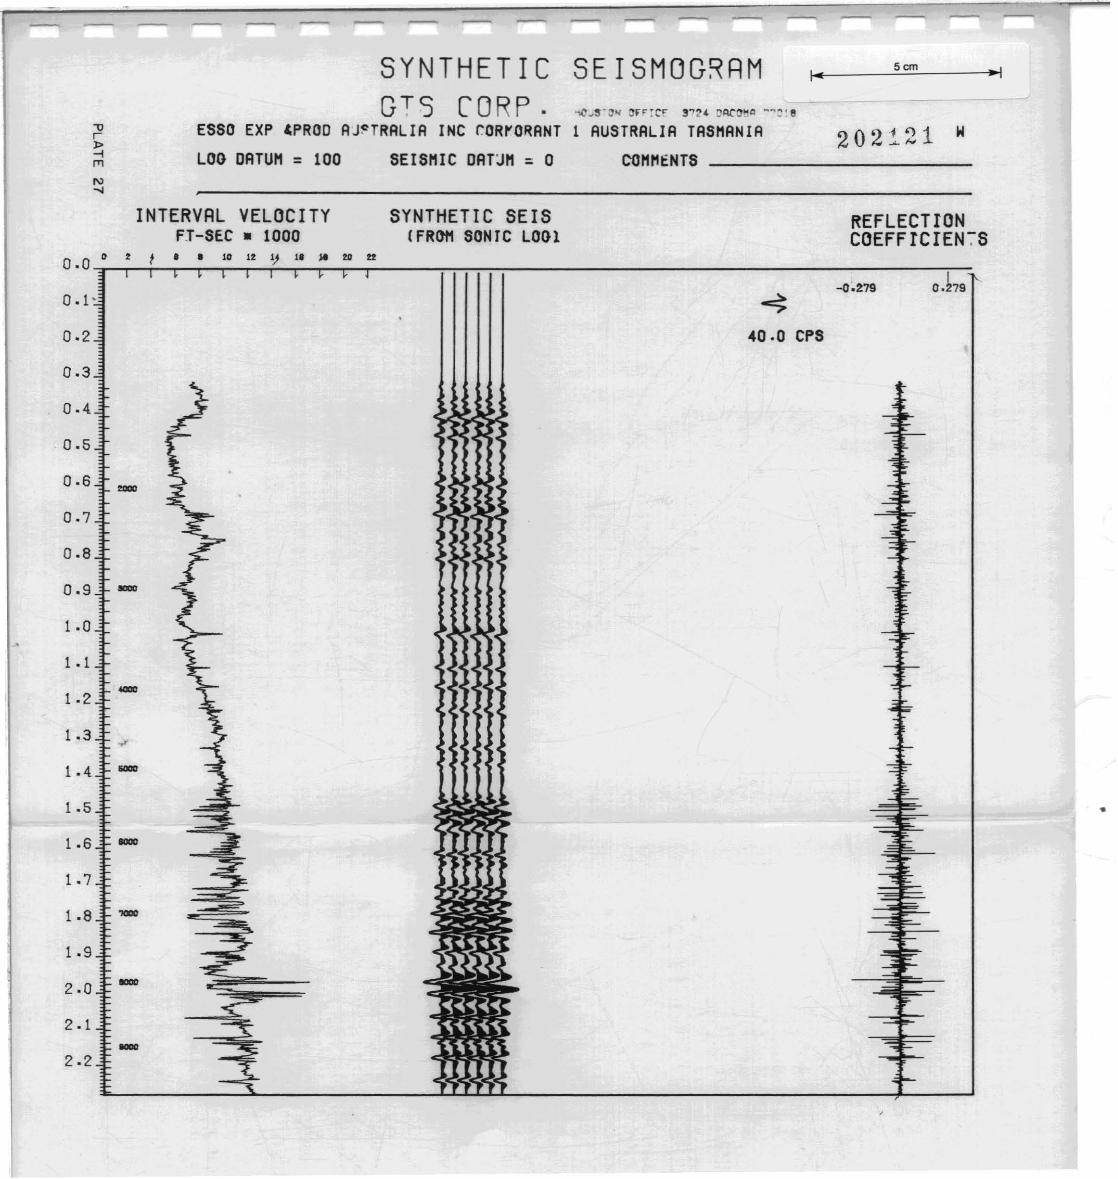
"I5cm
202121
\ ..,c~S'O~ orr:cr S'24 DACO~O --:'8
1 AUSTRALIA TASMANIACOMl'lfNTS _
SEISMOG~RMSYNTHETICG,..S CORP.
ESSO EXP ~PROO AJ~TRALIA INC r.ORrO~ANT
LOG DATUM = 100 SEISMIC DAT~M = a
INTERVAL VELOCITYFJ-SEC • 1000
0.0 0 • t • • 10 If I) 1. )I to ..
SYNTHETIC SEISIFR(}t1 SONTC LOGl
REFLECTIONCOEFFrCIEN:-S
I0.279
40.0 CPS
0.9 -1.0
1 .1 -1.2
1.3 .,r
1.4 -1.5 •
1 .6 -1 .7
1.8 .....1.9
2.0 -2.1 -2.2
0.1'
0.2
0.3
0.4
0.5
0.6 ....0.7
0.8
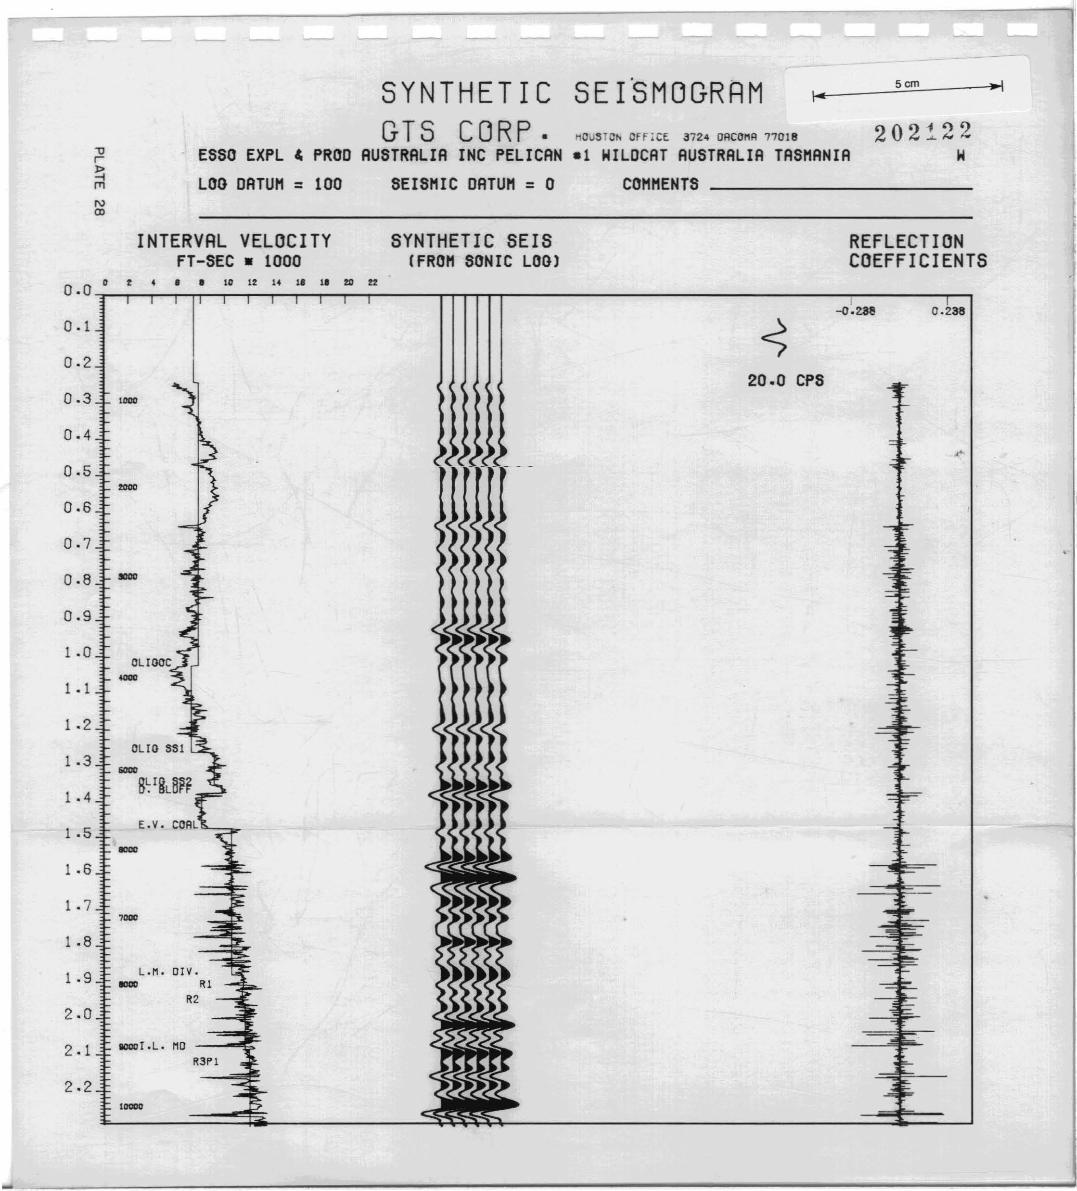
- - ~
5cm
202!-22W
SE r'SMOGRRM"OU~TOh OffiCE 3724 OACOMA 77018
-1 WILDCAT AUSTRALIA TASMANIACOMMENTS _
SYNTHETICGTS CORP.
ESSO EXPL ~ PROD AUSTRALIA INC PELICAN
LOO DATUM = 100 SEISMIC DATUM = 0
-ur
~fTl
NCD
INTERVAL VELOCITYFT-SEC • 1000
SYNTHETIC SEIS(FROM SONIC LOO)
REFLECTIONCOEFFI CIEN TS
o t 4 • • 10 12 14 I' II to t2
o.0 "T""-r--r--r-"'TT""---.---.-.---r---r--r---r------,rr-rrrr--------------""""'1"'-----,--,I-0.288 0.238
20.0 CPS
R3Pl
OLTO SSt
'OlIO
1011110
OLTOOC4lllIO
-
....
2.1
1 .4
1 .7
1 .3
1 .5
1 .8
1 .9
1 .6
1.0
1 • 1
2.0
o. 1
o.3 10110
2.2
0.9
0.4
0.2
0.5
0.8
0.6
0.7
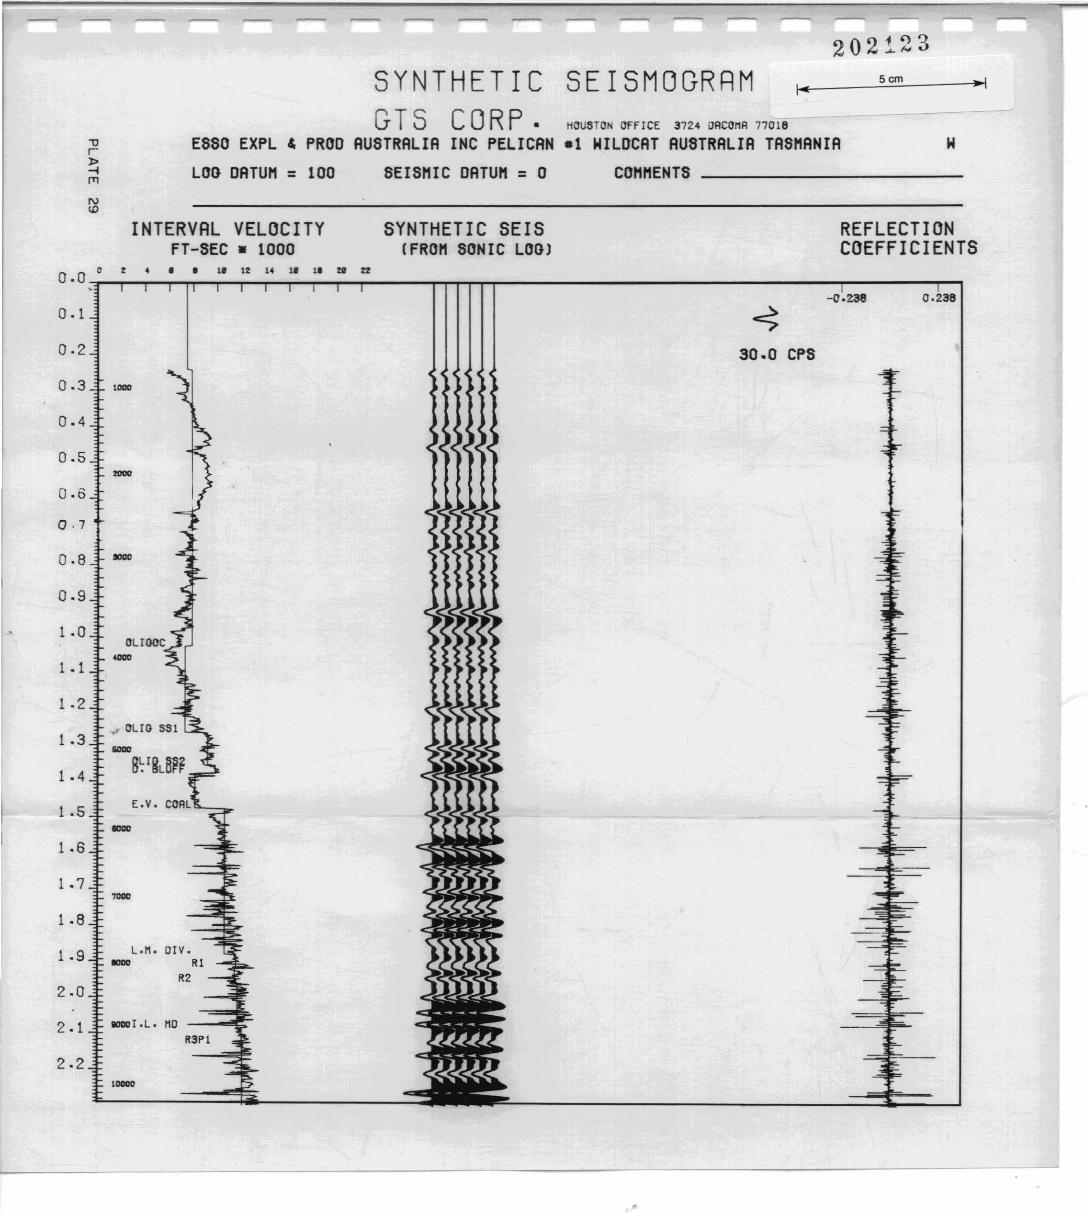
SYNTHETICGTS CORP.
ESSO EXPL & PROD AUSTRALIA INC PELICANHOUSTON OffICE 3724 OACOMA 77018
-1 WILDCAT AUSTRALIA TAS"ANIACO""ENTS _
Scm
202123
SEISMOGRAM
SEIS"IC DATU" = 0LOG DATU" = 100
"Url>--trnN:D
INTERVAL VELOCITYFT-SEC • 1000
SYNTHETIC SEIS(FRO" SONIC LOG)
REFLECTIONCOEFFICIENTS
t 4 • • 1. 12 14 1. l' tI tr0.0 •.'"--.--.r--l"'"'T.....-.....-.,...-..................,........,.........,....--"""T""r-T'"T""T'".....---------------..,......---.........,
-0.238 0.238
0.1 ~
0.2 30.0 CPS
,00II
.,r OLIO 551
-....
R3Pl
1 •a
1 .2
0.3 ,00II
1 • 1
1 .5
1 .6
1 .4
1 .7
1 .3
0.5
0.8 JlJOO
1 .9
0·7
0.6
0.9
2.1 _r.L. MO --
0.4
1 .8
2.0
2.2
•
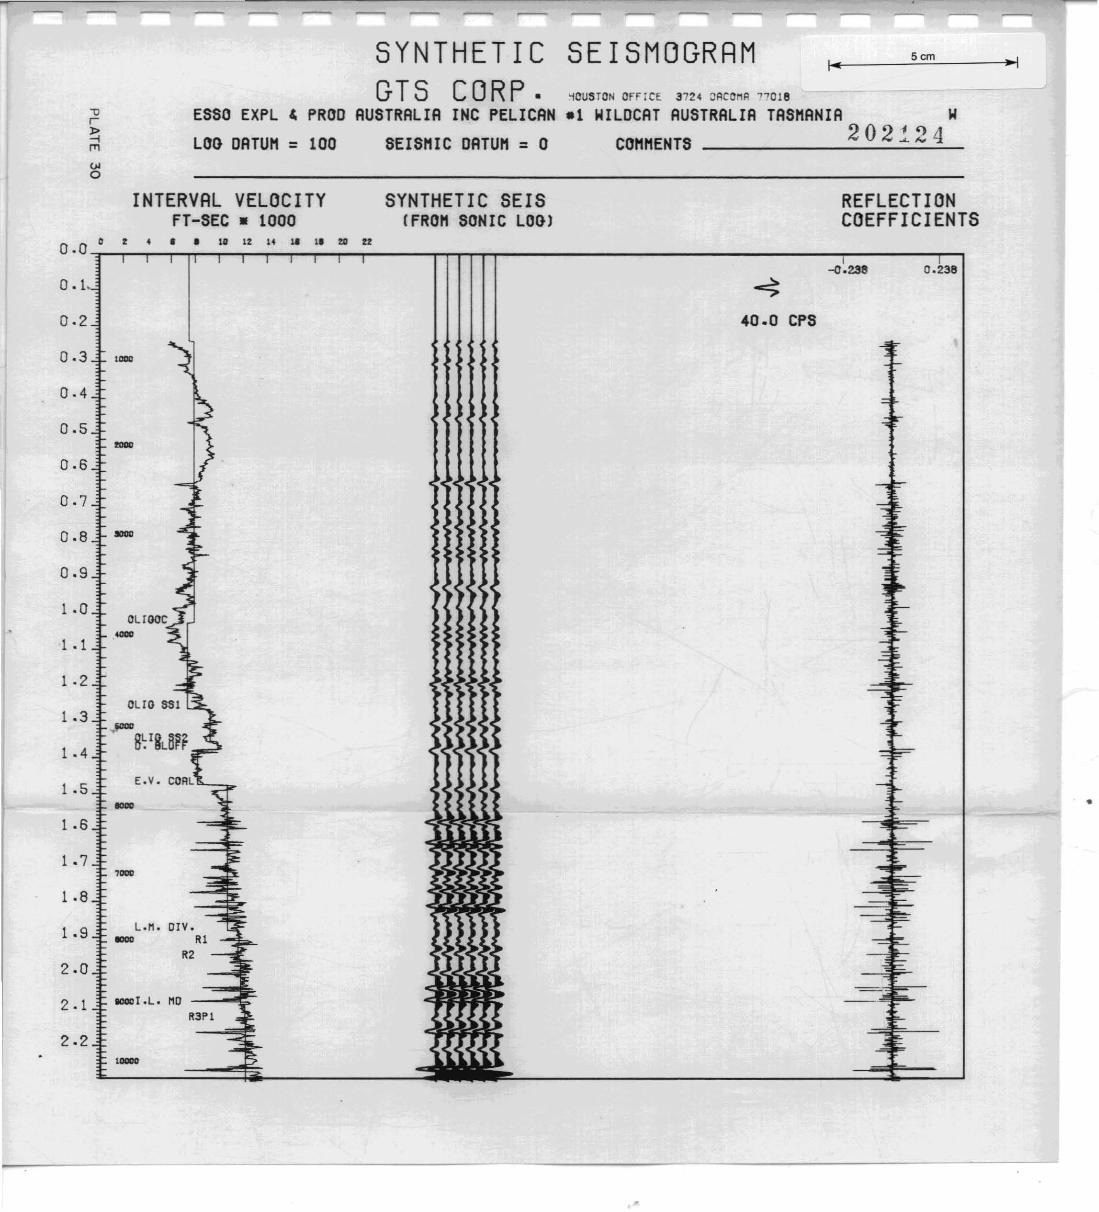
.--
WILDCAT AUSTRALIA TASMANIA WCOMMENTS 2 0 2 1 2 4
Scm
REFLECTIONCOEFFICIENTS
SYNTHETIC SEIS(FROM SONIC LOO)
SYNTHETIC SEISMOGRAMGTS COR p. ~OUSTON OffICE 3724 OACOMA "7018
ESSO EXPL ~ PROD AUSTRALIA INC PELICAN -1
LOO DATUM = 100 SEISMIC DATUM = 0
INTERVAL VELOCITYFT-SEC • 1000
It t 4 • • 10 1% 14 11 11 !:O f!
o.0 ""3"""".,...,..-r"'TT'"""'T"""'T"-r--r--r.....,......,.----,rr-rT'""T"T'"----------------r1 --,---,-0.238 0.238
0.1
0.2 40.0 CPS
0.3 .-0.4
0.5!OOO
0.6
0.7
0.8 .....0.9
1 .0.....
1 . 1
1 .2OLIO SSI
1 .3
1 .4.-8~lgLBrr
1 .5 - •1 .6
1.77_
1 .8
1 .9
2.0
_1.L. MO2.1
2.2 .-
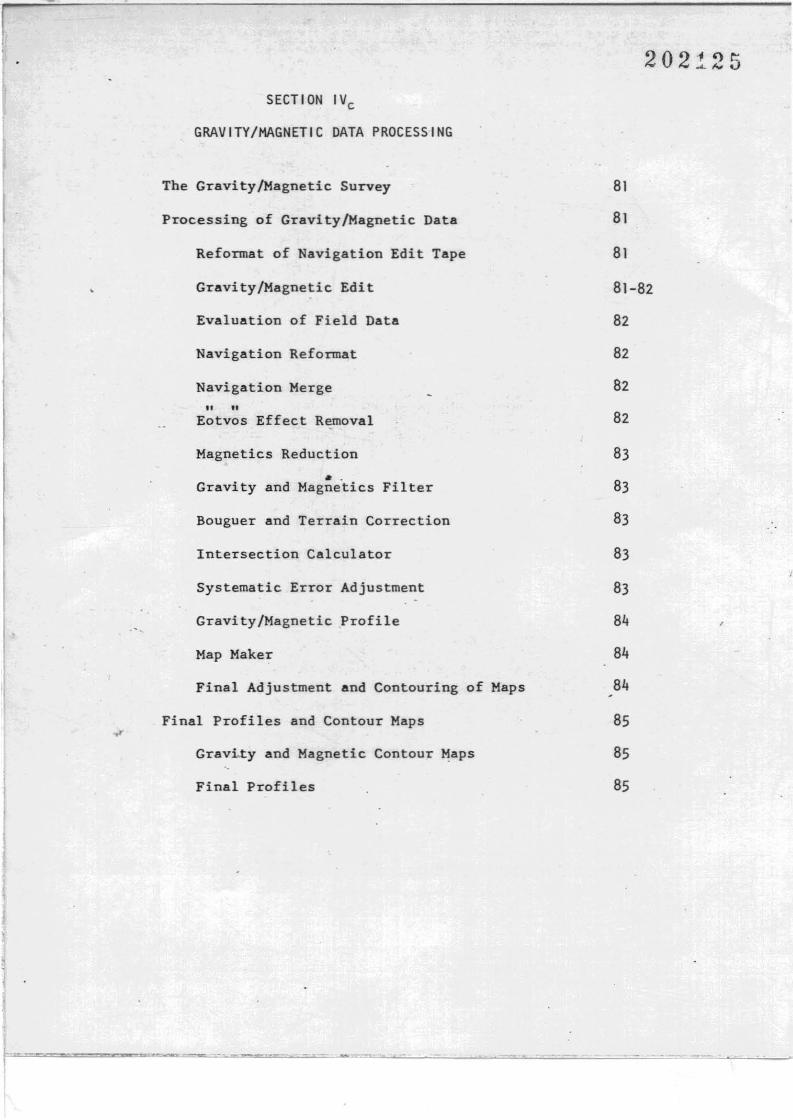
SECTION IVc
GRAVITY/MAGNETIC OATA PROCESSING
The Gravity/Magnetic Survey
Processing of GravityfMagnetic Data
Reformat of Navigation Edit Tape
Gravity/Magnetic Edit
Evaluation of Field Data
Navigation Reformat
Navigation MergeIt ..
Eotvos Effect Removal
Magnetics Reduction. -Gravity and Magnetics Filter
Bouguer and Terrain Correction
Intersection Calculator
Systematic Error Adjustment
Gravity/Magnetic Profile
Map Maker
Final Adjustment and Contouring of Maps
Final Profiles and Contour Maps
Gravity and Magnetic Contour Maps
Final Profiles
202125
81
81
81
81-82
82
82
82
82
83
83
83
83
83
84
84
84
85
85
85
" 7
GRAVITY/MAGNETIC DATA PROCESSING
IN
OFFSHORE TASMANIASQUID AREA
. FOR
WEAVER OIL COMPANY
BY
AERO SERVICE DIVISIONWESTERN GEOPHYSICAL COMPANY
OF AMERICA
AUGUST, 1981
202~26
f
)
202127
THE GRAVITY MAGNETIC SURVEY
The gravity/magnetic field survey was performed between March 16,
1981 and April 2, 1981, in conjunction with a seismic survey by party
86 on the M.V. Western Odyssey. The gravity meter used was LaCoste
~ and Romberg S-88, which has a constant of 0.09961 milligals per counter
division. All data was ~imultaneously recorded on analog strip charts
end magnetic tape.
The in port reading for meter S-88 was made at Portland, Australia
and a base value of 980025.53 was used.
The sea bottom density used on this survey was 2.2 grams per cubic
centimeter.
Latitude correction was applied as computed by the gravity formula
for the geodetic reference system, 1967 (GFGRS, 1967).
Navigation was by Western Navigation using (phase 4) navigation
system.
PROCESSING OF GRAVITY/MAGNETIC DATA
Aero Service uses a versatile suite of computer programs in processing,
profiling, and contouring of gravity and magnetic data. These programs
use the same "GMI Intermediate Tape Format" for interactive utility, and
are organized logically to form a truly interrelated gravity/magnetic
data base system•
...Reformat of Navigation Edit Tape
The navigation reformat program is. run to change the tape format of
the navigation edit tape to the gravity/magnetic intermediate (GMI) format.
Gravity/Magnetic Edit
The program is designed to edit gravity/magnetic field data recorded
at irregular time intervals on GMI tape. Primary edit capabilities
include assigning line numbers, changing GMI word position,
-81-
_ t
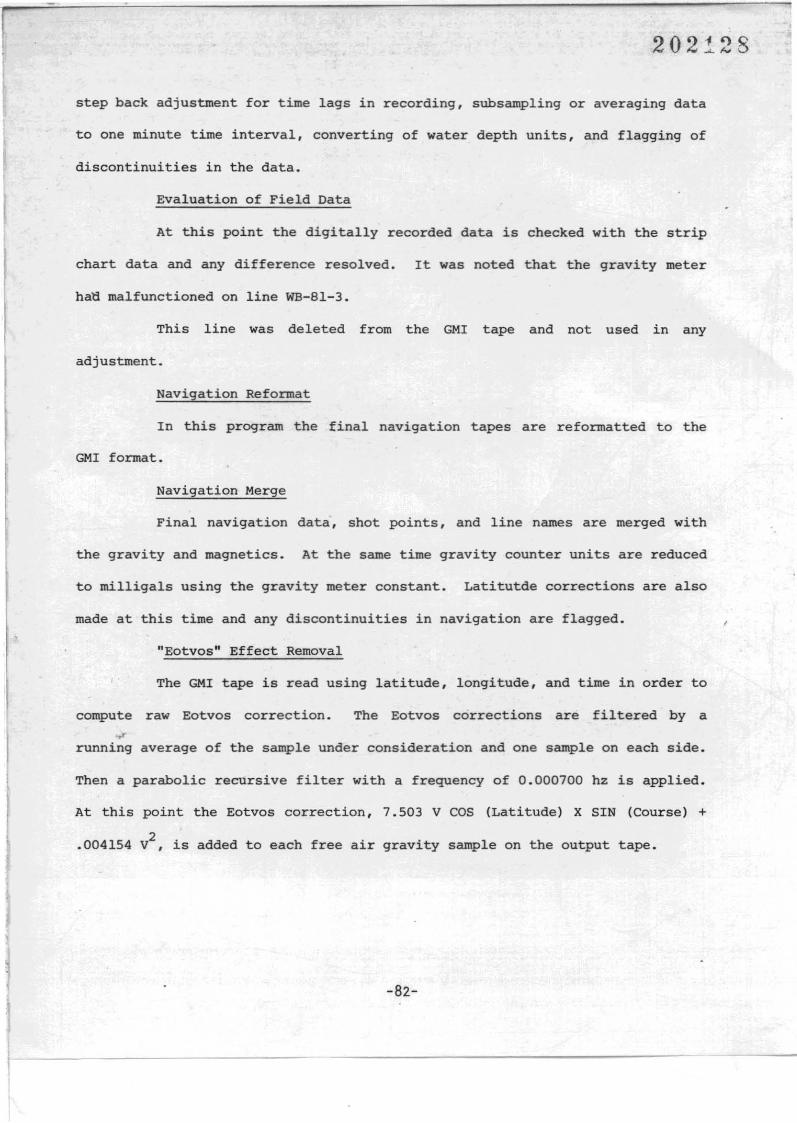
202128
step back adjustment for time lags in recording, subsampling or averaging data
to one minute time interval, converting of water depth units, and flagging of
discontinuities in the data.
Evaluation of Field Data
At this point the digitally recorded data is checked with the strip
chart data and any difference resolved. It was noted that the gravity meter
hatl malfunctioned on line WB-Bl-3.
This line was deleted from the GMI tape and not used in any
adjustment.
Navigation Reformat
In this program the final navigation tapes are reformatted to the
GMI format.
Navigation Merge
Final navigation data, shot points, and line names are merged with
the gravity and magnetics. At the same time gravity counter units are reduced
to milligals using the gravity meter constant. Latitutde corrections are also
made at this time and any discontinuities in navigation are flagged.
"Eotvos" Effect Removal
The GMI tape is read using latitude, longitude, and time in order to
compute raw Eotvos correction . The Eotvos corrections are filtered by a
.,rrunning average of the sample under consideration and one sample on each side.
Then a parabolic recursive filter with a frequency of 0.000700 hz is applied.
At this point the Eotvos correction, 7.503 V COS (Latitude) X SIN (Course) +
2.004154 V , is added to each free air gravity sample on the output tape.
-82-
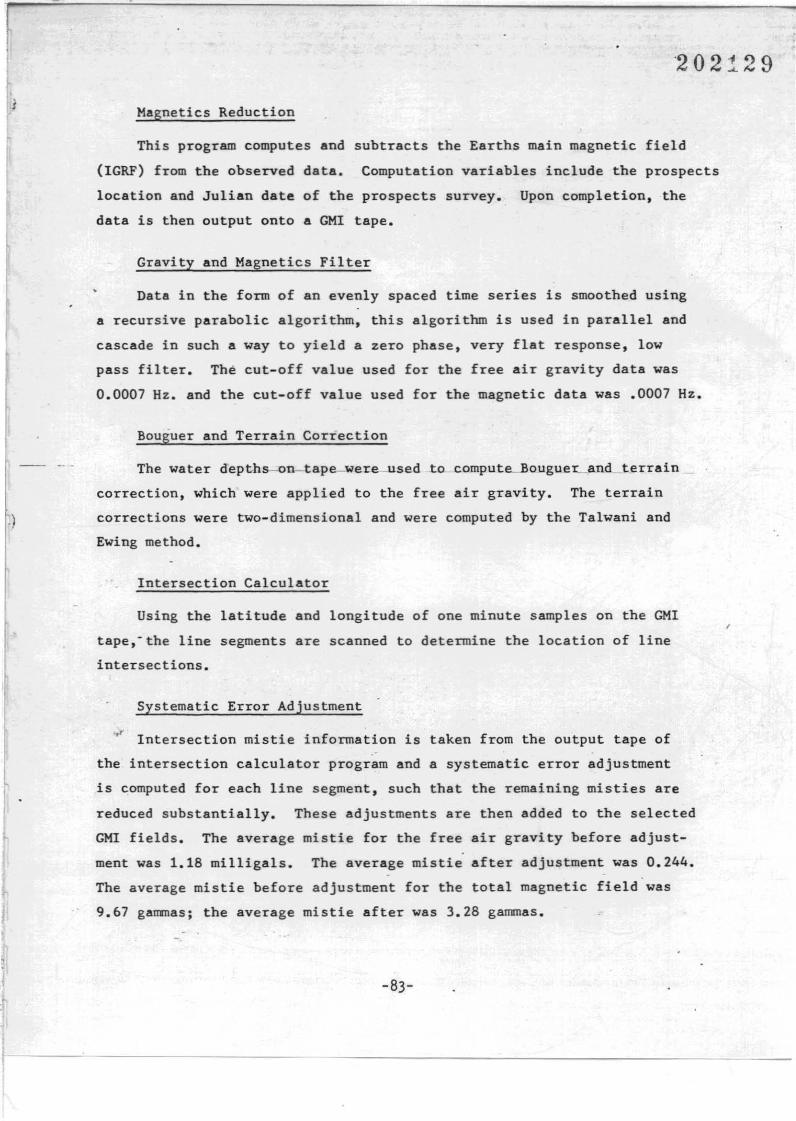
j
.)
202129
Magnetics Reduction
This program computes and subtracts the Earths main magnetic field
(IGRF) from the observed data. Computation variables include the prospects
location and Julian date of the prospects survey. Upon completion, the
data is then output onto a GMI tape.
Gravity and Magnetics Filter
Data in the form of an evenly spaced time series is smoothed using
a recursive parabolic algorithm, this algorithm is used in parallel and
cascade in such a way to yield a zero phase, very flat response, low
pass filter. The cut-off value used for the free air gravity data was
0.0007 Hz. and the cut-off value used for the magnetic data was .0007 Hz.
Bouguer and Terrain Correction
The water depths-on-tape-were-used to compute-Bougue~aQd__terrain
correction, which were applied to the free air gravity. The terrain
corrections were two-dimensional and were computed by the Talwani and
Ewing method.
Intersection Calculator
Using the latitude and longitude of one minute samples on the GMI
tape,-the line segments are scanned to determine the location of line
intersections.
Systematic Error Adjustment
~ Intersection mistie information is taken from the output tape of
the intersection calculator program and a systematic error adjustment
is computed for each line segment, such that the remaining misties are
reduced substantially. These adjustments are then added to the selected
GMI fields. The average mistie for the free air gravity before adjust
ment was 1.18 milligals. The average mistie after adjustment was 0.244.
The average mistie before adjustment for the total magnetic field was
9.67 gammas; the average mistie after was 3.28 gammas.
-83-
,
,,
202130
Gravity/Magnetic Profile
The profile program is a'general prupose program that produces
a profile plot on a Cal-Comp drum plotter with up to eight fields
displayed simultaneously with a variety of scale options. There were
two sets of profiles made at this time. Gravity profiles displayed.. It
water depths. Eotvos correction. free air. and Bouguer gravity.
Map Maker
A GMI tape is input to the map maker program and produces a value
posted shot point map on any scale. using almost any type of prescribed
projection or spheroid.
Final Adjustment and Contouring of Maps '.
, -The remaining mistiest called random error. are then resolved by
a technician comparing .paralle!_and=!,~rpendicular_profiles_and"distributing
the misties in such a way that no legitimate anomaly is destroyed nor
created; then from the corrected profiles the maps are manually contoured.
-84-
.,
202131
FINAL PROFILES AND CONTOUR MAPS
Gravity and Magnetic Contour Maps
The maps are plotted on mylar at a scale of 1:100,000. The spheroid
used was Australian National with the projection being Universal Transverse
Mercator. The central meridian is 147 E. The maps are bounded on the
S~uth by latitude 400 -2"4' S,on the North by latitude 390 55' S and extends
eastward from longitude 1450 45~ to longitude 1470~ 00 I E.
The contour interval for the Bouguer gravity maps is 1 milligal and
for the total magnetic intensity map is 10 gammas.
Final Profiles
Final profiles are 10 inches wide plotted on graded paper at a
horizontal scale of 2540 meters per inch corresponding to contour maps.
In addi tion, another set of profiles were produced on 10 grided paper-------
at a horizontal scale of 400 meters per inch matching the seismic sections.
The fields and vertical scales of both sets of profiles are as follows:
A. Gravity
(a) Free air gravity, adjusted @ 5 milligals per inch
(b) Bouguer gravity @ 5 milligals per inch
(c) Eotvos correction @ 5 milligals per inch
(d) Water depths @ 100 meters per inch
-.£. Magnetics
(a) Raw magnetics @ 20 gammas per inch
(b) Total magnetic intensity @ 20 gammas per inch.
-85-
f..-----------
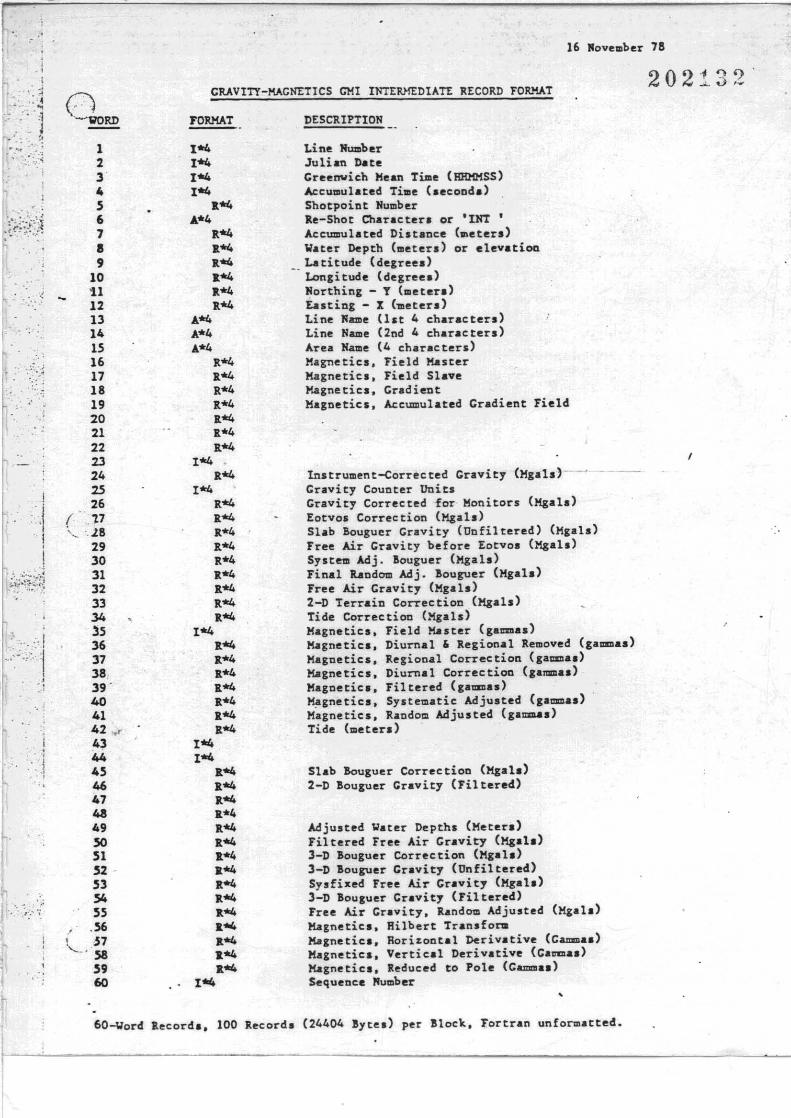
GRAVITY-IlAGllEncs eMI IIITERHEDIATE RECORD FORIIAT
16 lIove..ber 78
I
202132
DESCRIPTION
Adjusted Yater Depths (Metera'Filtered Free Air Gr~vity (Mgala)3-D Bouguer Correction (Kgals)3-D !ouguer Gravity (Unfiltered)Sy.fixed Free Air Gravity (Mgala)3-D Bouguer Cravity (Filtered)Free Air Gravity, ~ndOlD Adju.ted (Miala)~gnetic•• Hilbert Transform~gnetics, Bori~oot.l Derivative (Cammas)Magnetic., Vertical Derivative (Camma.)~gnetics. Reduced to Pole (Cammal)Sequence "umber
Slab Bouguer Correction (Mgala)2-D !ouguer Gravity (Filtered)
lnstrument-Corrected Gravity -(Hgals)-~ Cravity Counter UnitsCravity Corrected for Monitors (Mgela)Eotvol Correction (Mgals)Sl~b 80uguer Gravity (Unfiltered) (Mg.I.)Free Air Cravity before [otvos (Mgal.)Syste.. Adj. !ouguer (Mgal.)Final ~ndOlD Adj. !ouguer (Mgala)Free Air Gravity (Mgal.)2-D Terrain Correction (Mgal,)Tide Correction (Mgals)Magnetics. Field ~ster (gamma.)~gnetic•• Diurnal' Regional Removed (gammas)Magnetics. Regional Correction (gamma.)~gnetics. Diurnal Correction (gamma.)Magnetic •• Filtered (gamma,)Magnetic •• Systematic Adjusted (gammas'M~gnetics. R~Ddom Adjusted (gammAs)Tide (..eters)
Line HumberJulian DateGreenwich Mean TilDe (HRHMSS)~cumul.ted Time (.econd.)Shotpoint NumberRe-Shot Character. or 'INT •Accumulated Distance (meters)W~ter Depth (meters) or elevatiouL.titude (degreea)
-. Longi tude (degree.)Northinc - T (metera)&osting - X (~etera)
Line Name (1st 4 character,)Line Name (2nd 4 characters)Area Name (4 characters)Magnetics, Field MasterMagnetics, Field SlaveMagnetics. CradientMagnetics, Accumulated Cradient Field
1*41*41*41*4
1t*41.*4
1\*41t*41\*41t*41\*41l*4
1.*41.*41.*4
1\*41l*41\*41\*41t*41t*41l*4
1*4 .1l*4
1*41\*41l*41l*41l*41l*41l*41\*41\*41\*4
1*41t*41l*41l*41l*41l*41t*41t*4
1*41*4
1t*41.*41\*41.*41l*41l*41.*41.*41.*41\*41t*4It...1t*41t*41t*4
1*4
FORMAT
'.
1234567II9
1011121314IS1617181920212223242S26
( .'P,~ '.18
2930313233343s36373839'404142 ....43444546474849SO5152 .53545S
.' .56! 57'-..'58
5960
.'
...
i. ·l.. ,!
'.. ""
">.,;
'.·1>.-.\.I
"
,
60~ord Records, 100 Records (24404 !yte.' per Block, fortran unformatted.
SECTION V
Interpretation:
General
Map Horizons
Structural Features of Interest:
Squid Anomaly
Chat Anomaly
Sea Eagle Anomaly
Curlew Anomaly
Shearwater Anomaly
86
86
86-87
202 1 ')')...... <t.i V
202~34
General
The Squid Marine seismic program detailed structural leads developed
in preceding surveys, and furnished a fill-in of .some wide reconnaissance
traverses, thus permiting a more reliable definition of the principal
structural and fault trends.
It will be obviou~ that the interpretation is still incomplete and
that some faults can be aligned differently, however, it is doubtful that this
incompleteness would significantly affect the evaluation of this area.
A seismic tie between the survey area and the Pelican #1 well has
been established. The correlation is somewhat tenuous due to the great
distance involved and the significant variations in signal character,
nevertheless it does provide some valuable stratigraphic control.
Map Horizons
Semi-continuous reflector horizons have been mapped. These map
horizons are within the oligocene section, within the M. diversus assemblage
zone of the Eocene, at the Upper Cretaceous reflector level and at an
intra-Lower Cretaceous reflector level. Their exact stratigraphic position is
not always well known due to the lack of nearby stratigraphic control, as well
as the magnitude and relief of the uplifted areas.
Structural Features of Interest
The prominent features have been recognized, partially mapped, and
assigned names at this stage of the interpretation.
An area in the northeast portion of Permit T-15/p has been mapped at
an intra-Eocene M. diversus reflector level.
interrupted by minor low amplitude anomalies.
-86-
It only shows regional dip
deep-seated dormal feature well
Squid Anomaly
The Squid anomaly is a major
illustrated by the seismic lines of the Squid survey. It is considered
prospective at the Oligocene as well as Eocene and deeper levels. The anomaly
is adequately defined by existing seismic data.
Chat Anomaly
The Chat anomaly is a relatively small tilted fault block closure
controlled by a down-to-the northeast fault. It is best illustrated by the
seismic lines of the Squid survey. The anomaly is adequately defined by
existing seismic data.
Sea Eagle Anomaly
The Sea Eagle anomaly is a tilted fault block closure controlled by
a down-to-the northeast normal fault. It is located in the southeast corner
of Permit T-15/P and at this stage is defined by the older seismic data only.
Curlew Anomaly
The Curlew anomaly is also a tilted fault block closure controlled
by a down-to-the northeast normal fault. It is located in the southeast
corner of Permit T-15/P and at this stage is defined by the older seismic data
only.
Shearwater Anomaly
The Shearwater anomaly is also a tilted fault block closure
controlled by a down-to-the northeast normal fault. It is located in the
southeast corner of Permit T-15/P and at this stage is partially defined by
the older seismic data only.
anomaly.
Additional seismic data is needed on this
-87-
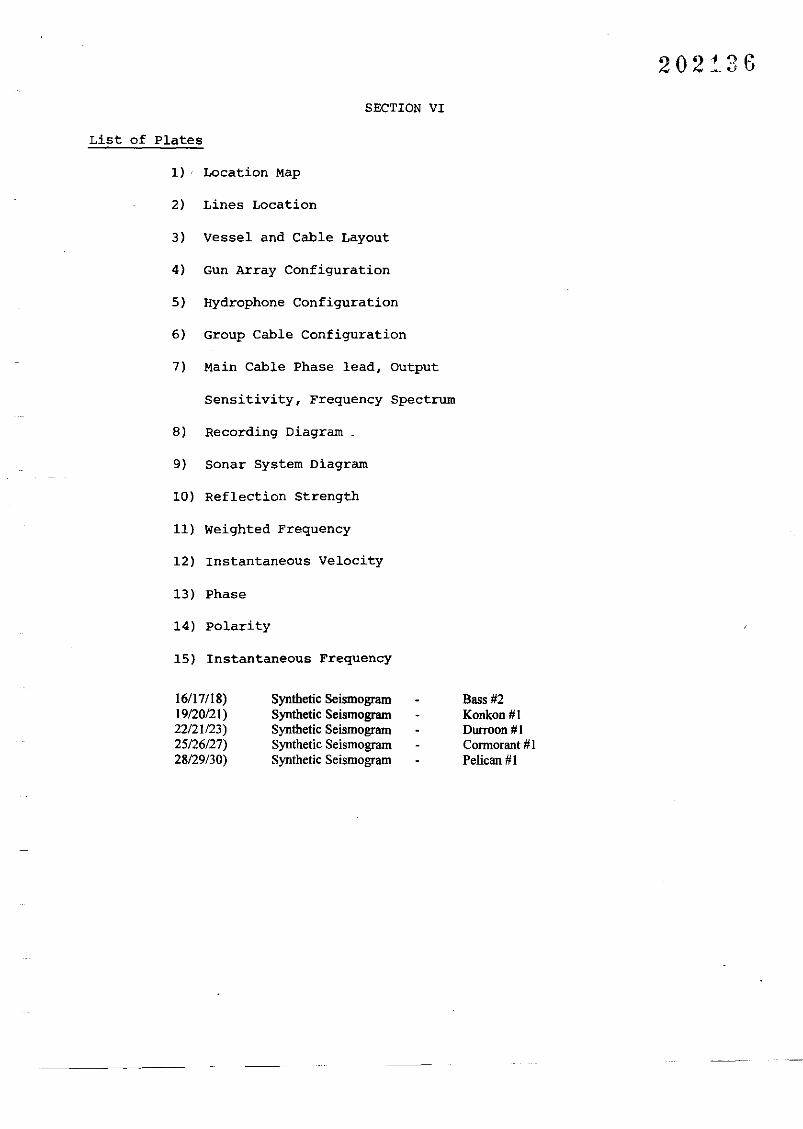
SECTION VI
List of Plates
1) Location Map
2) Lines Location
3) Vessel and Cable Layout
4) Gun Array Configuration
5) Hydrophone Configuration
6) Group Cable Configuration
7) Main Cable Phase lead, Output
Sensitivity, Frequency Spectrum
8) Recording Diagram _
9) Sonar System Diagram
10) Reflection Strength
11) Weighted Frequency
12) Instantaneous Velocity
13) Phase
14) Polarity
15) Instantaneous Frequency
16/17118)19/20121)22/21123)25/26/27)28/29/30)
Synthetic SeismogramSynthetic SeismogramSynthetic SeismogramSynthetic SeismogramSynthetic Seismogram
Bass #2Konkon#1Durroon#1Connorant # IPelican #1
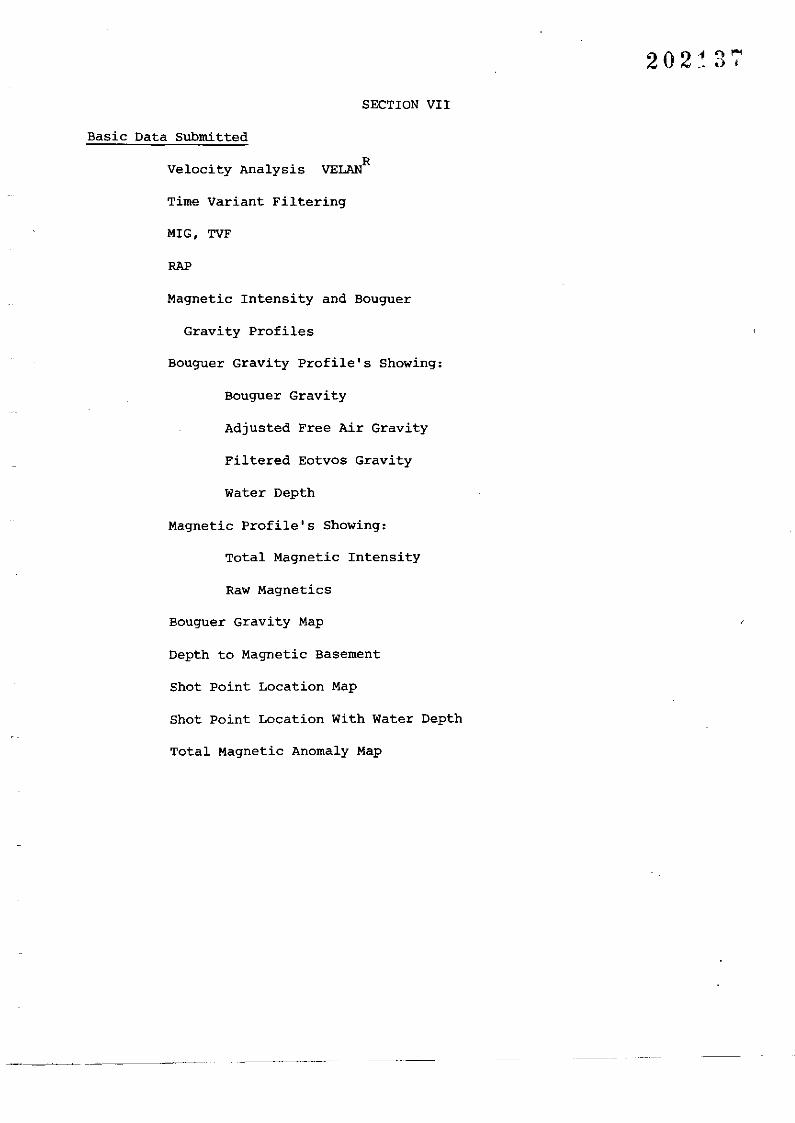
SECTION VII
Basic Data Submitted
Velocity Analysis VELANR
Time Variant Filtering
MIG, TVF
RAP
Magnetic Intensity and Bouguer
Gravity Profiles
Bouguer Gravity Profile's Showing:
Bouguer Gravity
Adjusted Free Air Gravity
Filtered Eotvos Gravity
Water Depth
Magnetic Profile's Showing:
Total Magnetic Intensity
Raw Magnetics
Bouguer Gravity Map
Depth to Magnetic Basement
Shot Point Location Map
Shot Point Location With Water Depth
Total Magnetic Anomaly Map
202!-37
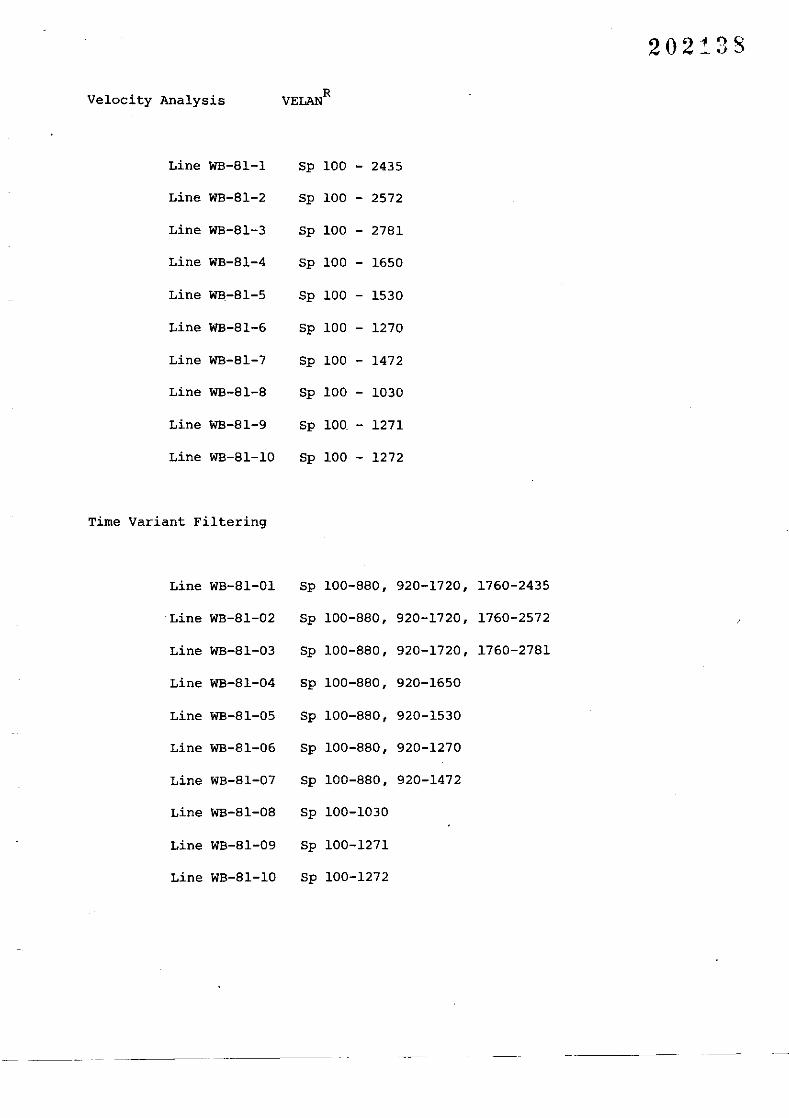
Velocity Analysis
202!.38
Line WB-81-1 Sp 100 - 2435
Line WB-81-2 Sp 100 - 2572
Line WB-81-3 Sp 100 - 2781
Line WB-81-4 Sp 100 - 1650
Line WB-81-5 Sp 100 - 1530
Line WB-81-6 Sp 100 - 1270
Line WB-81-7 Sp 100 - 1472
Line WB-81-8 Sp 100 - 1030
Line WB-81-9 Sp 100 - 1271
Line WB-81-10 Sp 100 - 1272
Time Variant Filtering
Line WB-81-01 Sp 100-880, 920-1720, 1760-2435
Line WB-81-02 Sp 100-880, 920-1720, 1760-2572
Line WB-81-03 Sp 100-880, 920-1720, 1760-2781
Line WB-81-04 Sp 100-880, 920-1650
Line WB-81-05 Sp 100-880, 920-1530
Line WB-81-06 Sp 100-880, 920-1270
Line WB-81-07 Sp 100-880, 920-1472
Line WB-81-08 Sp 100-1030
Line WB-81-09 Sp 100-1271
Line WB-81-10 Sp 100-1272
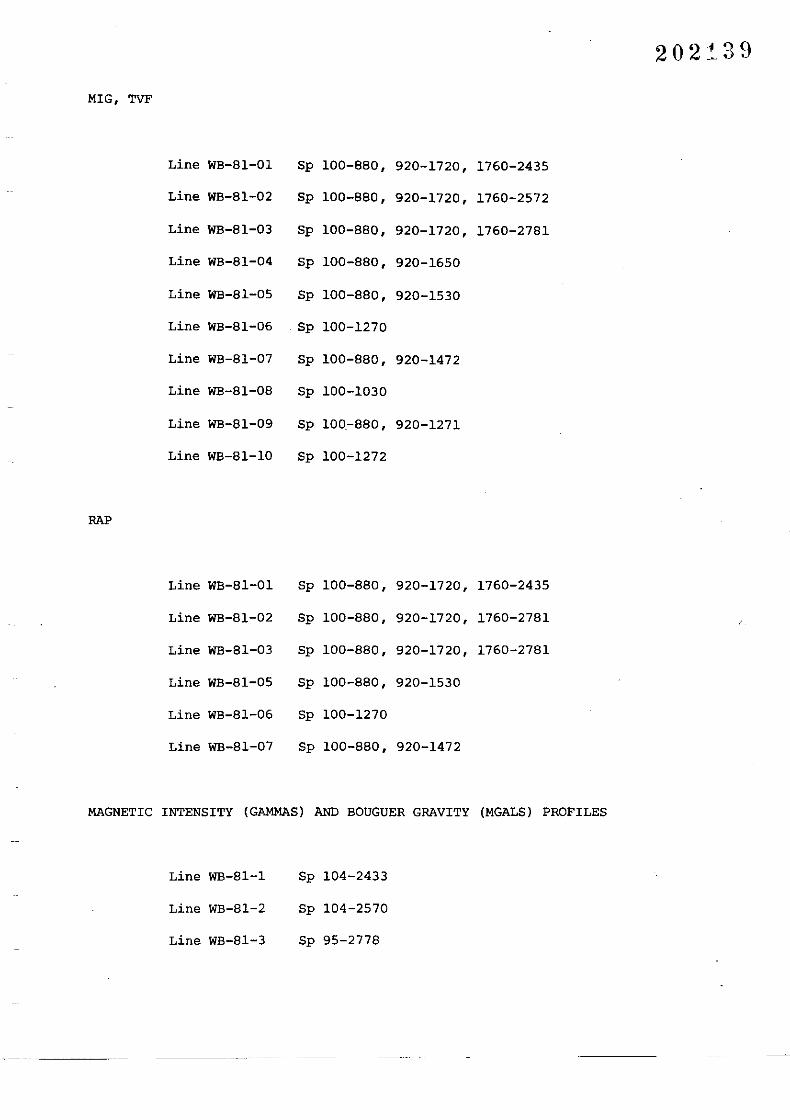
MIG, TVF
Line WB-81-01 Sp 100-880, 920-1720, 1760-2435
Line WE-81-02 Sp 100-880, 920-1720, 1760-2572
Line WE-81-03 Sp 100-880, 920-1720, 1760-2781
Line WB-81-04 Sp 100-880, 920-1650
Line WE-81-05 Sp 100-880, 920-1530
Line WE-81-06 Sp 100-1270
Line WB-81-07 Sp 100-880, 920-1472
Line WE-81-08 Sp 100-1030
Line WE-81-09 Sp 100_-880, 920-1271
Line WB-81-10 Sp 100-1272
RAP
Line WB-81-01 Sp 100-880, 920-1720, 1760-2435
Line WE-81-02 Sp 100-880, 920-1720, 1760-2781
Line WE-81-03 Sp 100-880, 920-1720, 1760-2781
Line WE-81-05 Sp 100-880, 920-1530
Line WB-81-06 Sp 100-1270
Line WE-81-07 Sp 100-880, 920-1472
MAGNETIC INTENSITY (GAMMAS) AND BOUGUER GRAVITY (MGALS) PROFILES
202!-39
Line WE-81-1
Line WE-81-2
Line WB-81-3
Sp 104-2433
Sp 104-2570
Sp 95-2778
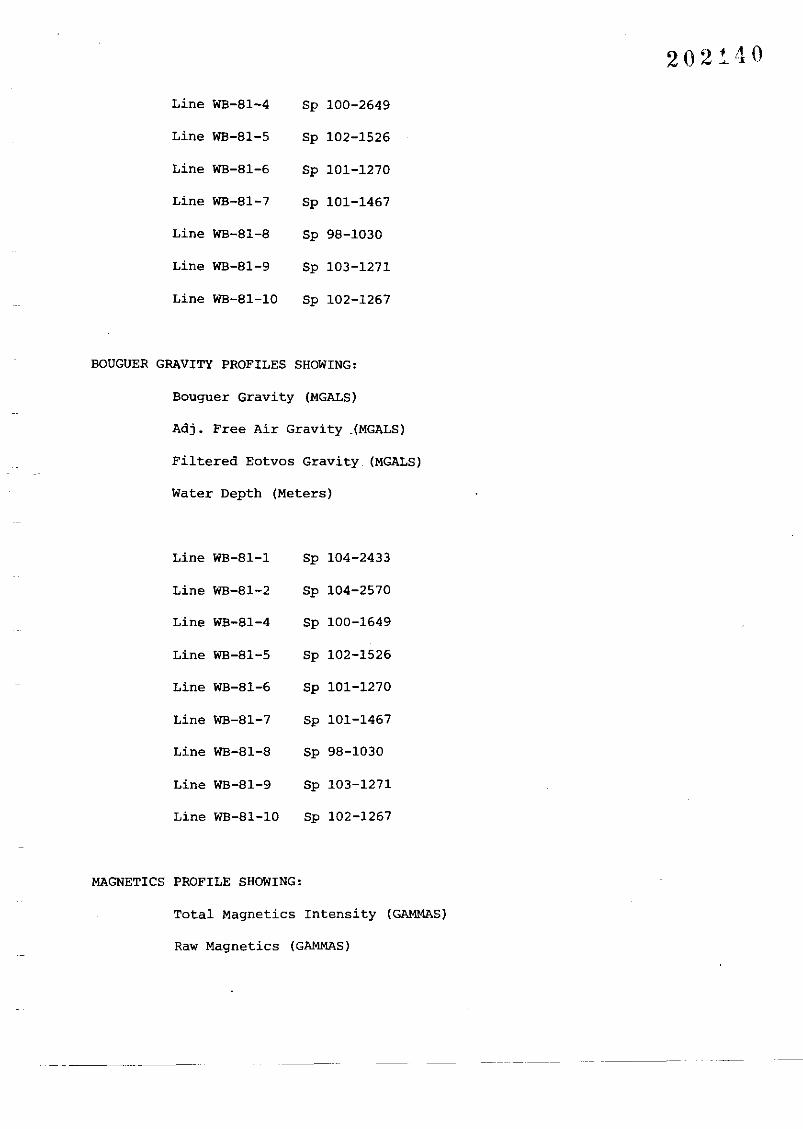
202~-'10
Line WB-81-4 Sp 100-2649
Line WB-81-5 Sp 102-1526
Line WB-81-6 Sp 101-1270
Line WB-81-7 Sp 101-1467
Line WB-81-8 Sp 98-1030
Line WB-81-9 Sp 103-1271
Line WB-81-10 Sp 102-1267
BOUGUER GRAVITY PROFILES SHOWING:
Bouguer Gravity (MGALS)
Adj. Free Air Gravity -!MGALS)
Filtered Eotvos Gravity (MGALS)
Water Depth (Meters)
Line WB-81-1 Sp 104-2433
Line WB-81-2 Sp 104-2570
Line WB-81-4 Sp 100-1649
Line WB-81-5 Sp 102-1526
Line WB-81-6 Sp 101-1270
Line WB-81-7 Sp 101-1467
Line WB-81-8 Sp 98-1030
Line WB-81-9 Sp 103-1271
Line WB-81-10 Sp 102-1267
MAGNETICS PROFILE SHOWING:
Total Magnetics Intensity (GAMMAS)
Raw Magnetics (GAMMAS)
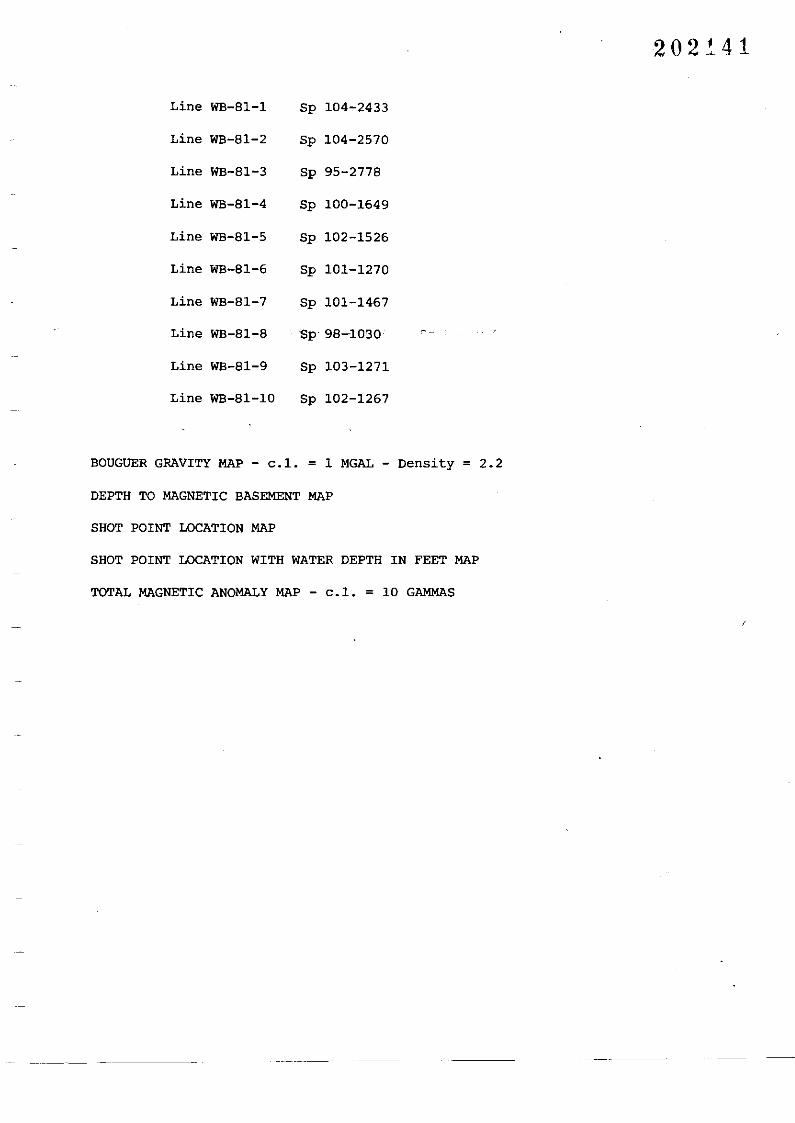
Line WB-81-1 Sp 104-2433
Line WB-81-2 Sp 104-2570
Line WB-81-3 Sp 95-2778
Line WB-81-4 Sp 100-1649
Line WB-81-5 Sp 102-1526
Line WB-81-6 Sp 101-1270
Line WB-81-7 Sp 101-1467
Line WB-81-8 Sp 98-1030
Line WB-81-9 Sp 103-1271
Line WB-81-10 Sp 102-1267
BOUGUER GRAVITY MAP - colo = 1 MGAL - Density = 202
DEPTH TO MAGNETIC BASEMENT MAP
SHOT POINT LOCATION MAP
SHOT POINT LOCATION WITH WATER DEPTH IN FEET MAP
TOTAL MAGNETIC ANOMALY MAP - colo = 10 GAMMAS
SECTION VIII
Interpretive Data Submitted:
- Seismic Time Structure Map
Intra-Eocene M. diversus Reflector
(northeast portion of Permit T-~5/P)
- Seismic Time Structure Map - Squid Anomaly
Mid. Oligocene Reflector
- Seismic Time Structure Map, -, Squid Anomaly
Oligocene Reflector
- Isochron Map - Squid Anomaly
Oligocene, to M. diversus Reflector
- Seismic Time Structure Map - Squid Survey Area
Lower M. diversus Reflector
- Seismic Time Structure Map - squid and Stoney Head
Survey Areas
Upper Cretaceous Reflector
- Seismic Time Structure Map - Squid and Stoney Head
Survey Areas
Intra-Lower Cretaceous Reflector
- Seismic Time Structure Map - Chat Anomaly
Eocene M. diversus Reflector
202!42
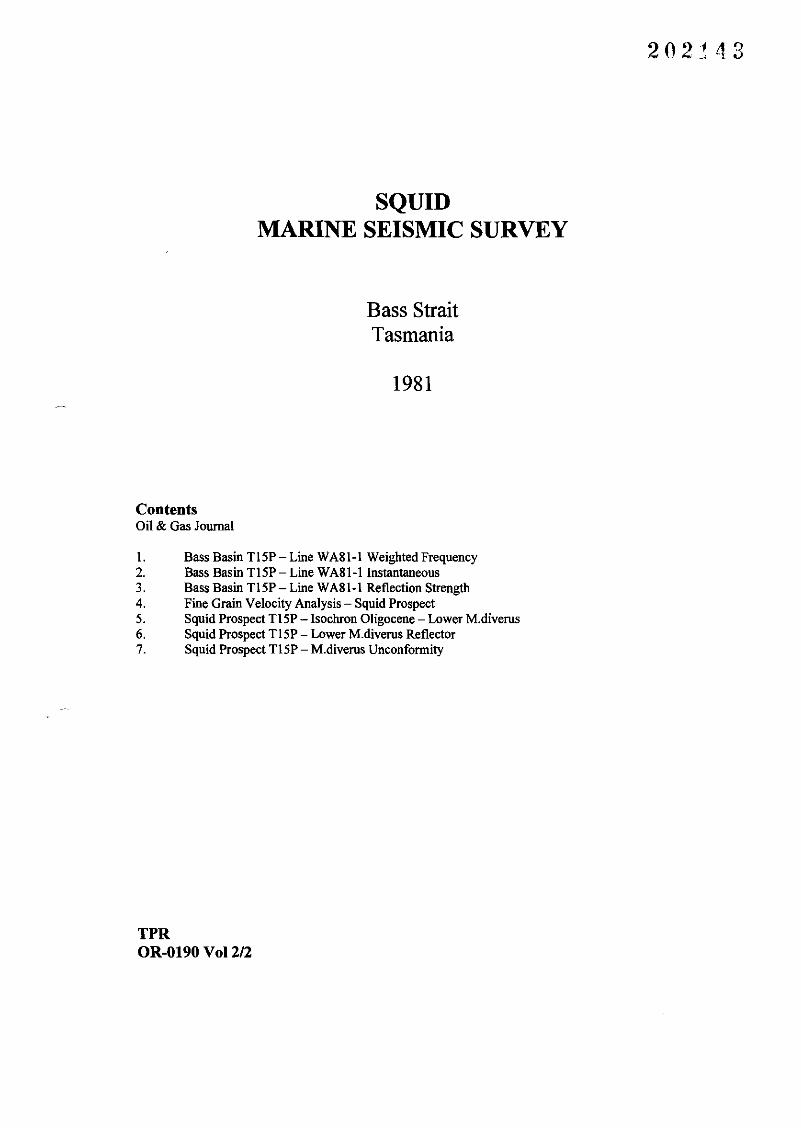
SQUIDMARINE SEISMIC SURVEY
Bass StraitTasmania
1981
ContentsOil & Gas Journal
I. Bass Basin T15P - Line WASI-I Weighted Frequency2. Bass Basin Tl5P - Line WASI-I Instantaneous3. Bass Basin T15P - Line WASI-I Reflection Strength4. Fine Grain Velocity Analysis - Squid Prospect5. Squid Prospect Tl5P - Isochron Oligocene - Lower M.diverus6. Squid Prospect Tl5P - Lower M.diverus Reflector7. Squid Prospect Tl5P - M.diverus Unconformity
TPROR-0190 Vol 2/2

•

202145
EXPLORATION
OIL&GASJOURNAL
Bass basin set for new exploration
Dr. 0.0. WeaverYvon HoudeJack Downingjim SmithermanChris NettelsWeaver Oil & Gas Corp.AustraliaA Kaneb company
Reprinted from the January 4, 1981 edition of Oil & Gas JournalCopyright 1981 by PennWell Publishing Co.
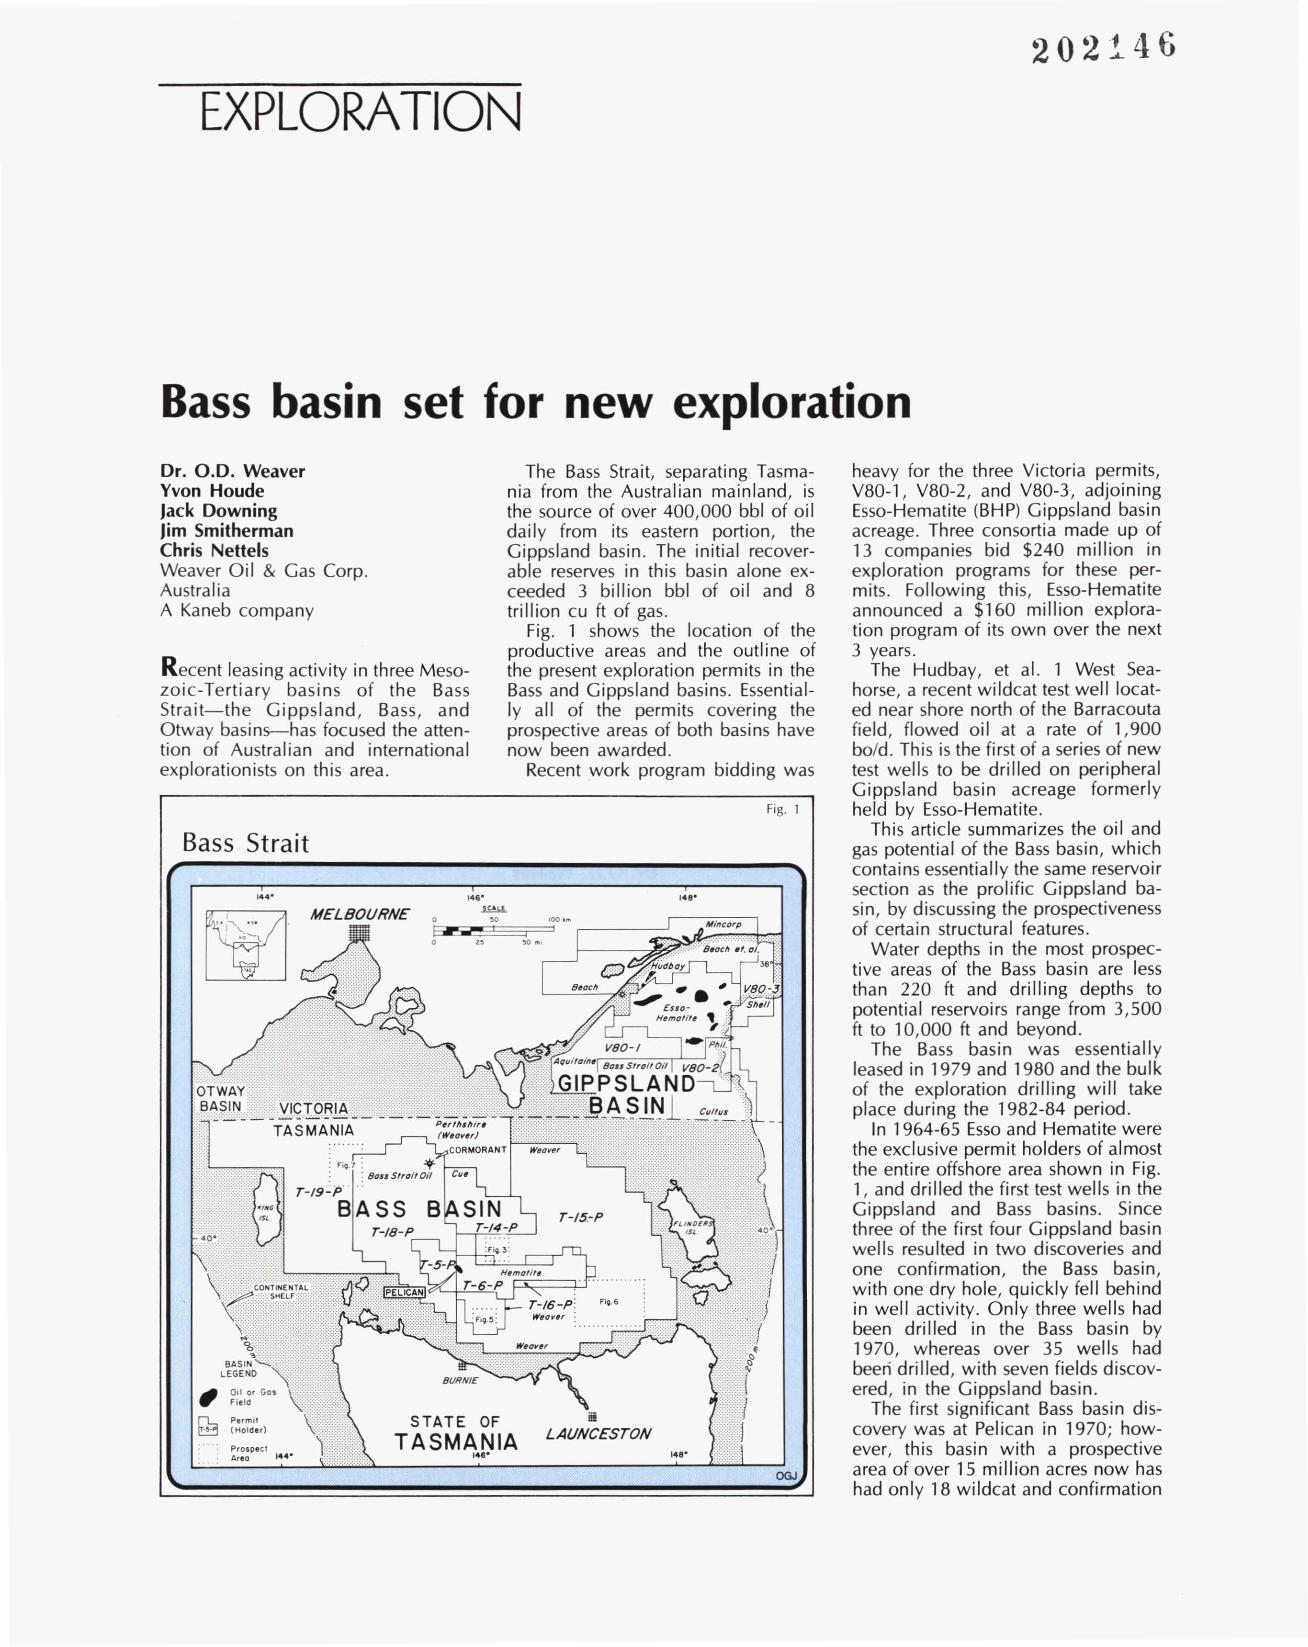
202.!.46
EXPLORATION
Bass basin set for new exploration
Fig. 1
The Bass Strait, separating Tasmania from the Australian mainland, isthe source of over 400,000 bbl of oildaily from its eastern portion, theGippsland basin. The initial recoverable reserves in this basin alone exceeded 3 billion bbl of oil and 8trillion cu ft of gas.
Fig. 1 shows the location of theproductive areas and the outline ofthe present exploration permits in theBass and Gippsland basins. Essentially all of the permits covering theprospective areas of both basins havenow been awarded.
Recent work program bidding was
Recent leasing activity in three Mesozoic-Tertiary basi ns of the BassStrait-the Gippsland, Bass, andOtway basins-has focused the attention of Australian and internationalexplorationists on this area.
heavy for the three Victoria permits,V80-1, V80-2, and V80-3, adjoiningEsso-Hematite (BHP) Gippsland basinacreage. Three consortia made up of13 companies bid $240 million inexploration programs for these permits. Following this, Esso-Hematiteannounced a $160 million exploration program of its own over the next3 years.
The Hudbay, et al. 1 West Seahorse, a recent wildcat test well located near shore north of the Barracoutafield, flowed oi I at a rate of 1,900bold. This is the first of a series of newtest wells to be drilled on peripheralGippsland basin acreage formerlyheld by Esso-Hematite.
This article summarizes the oil andgas potential of the Bass basin, whichcontains essentially the same reservoirsection as the prolific Gippsland basin, by discussing the prospectivenessof certain structural features.
Water depths in the most prospective areas of the Bass basin are lessthan 220 ft and drilling depths topotential reservoirs range from 3,500ft to 10,000 ft and beyond.
The Bass basin was essentiallyleased in 1979 and 1980 and the bulkof the exploration drilling will takeplace during the 1982-84 period.
In 1964-65 Esso and Hematite werethe exclusive permit holders of almostthe entire offshore area shown in Fig.1, and drilled the first test wells in theGippsland and Bass basins. Sincethree of the first four Gippsland basinwells resulted in two discoveries andone confirmation, the Bass basin,with one dry hole, quickly fell behindin well activity. Only three wells hadbeen drilled in the Bass basin by1970, whereas over 35 wells hadbeen drilled, with seven fields discovered, in the Gippsland basin.
The first significant Bass basin discovery was at Pelican in 1970; however, this basin with a prospectivearea of over 15 million acres now hashad only 18 wildcat and confirmation
OGJ
••••••• ...,., .•...:•....,.,·:•...,:•...,.,;.,:',••.,·,1
•••••••::::~
••••
iiiLAUNCESTON
146
~. ,.I 'ooO"'! I. "
STATE OF
TASMANIA146-
MELBOURNE
Bass Strait
Dr. 0.0. WeaverYvon HoudeJack DowningJim SmithermanChris NettelsWeaver Oil & Gas Corp.AustraliaA Kaneb company
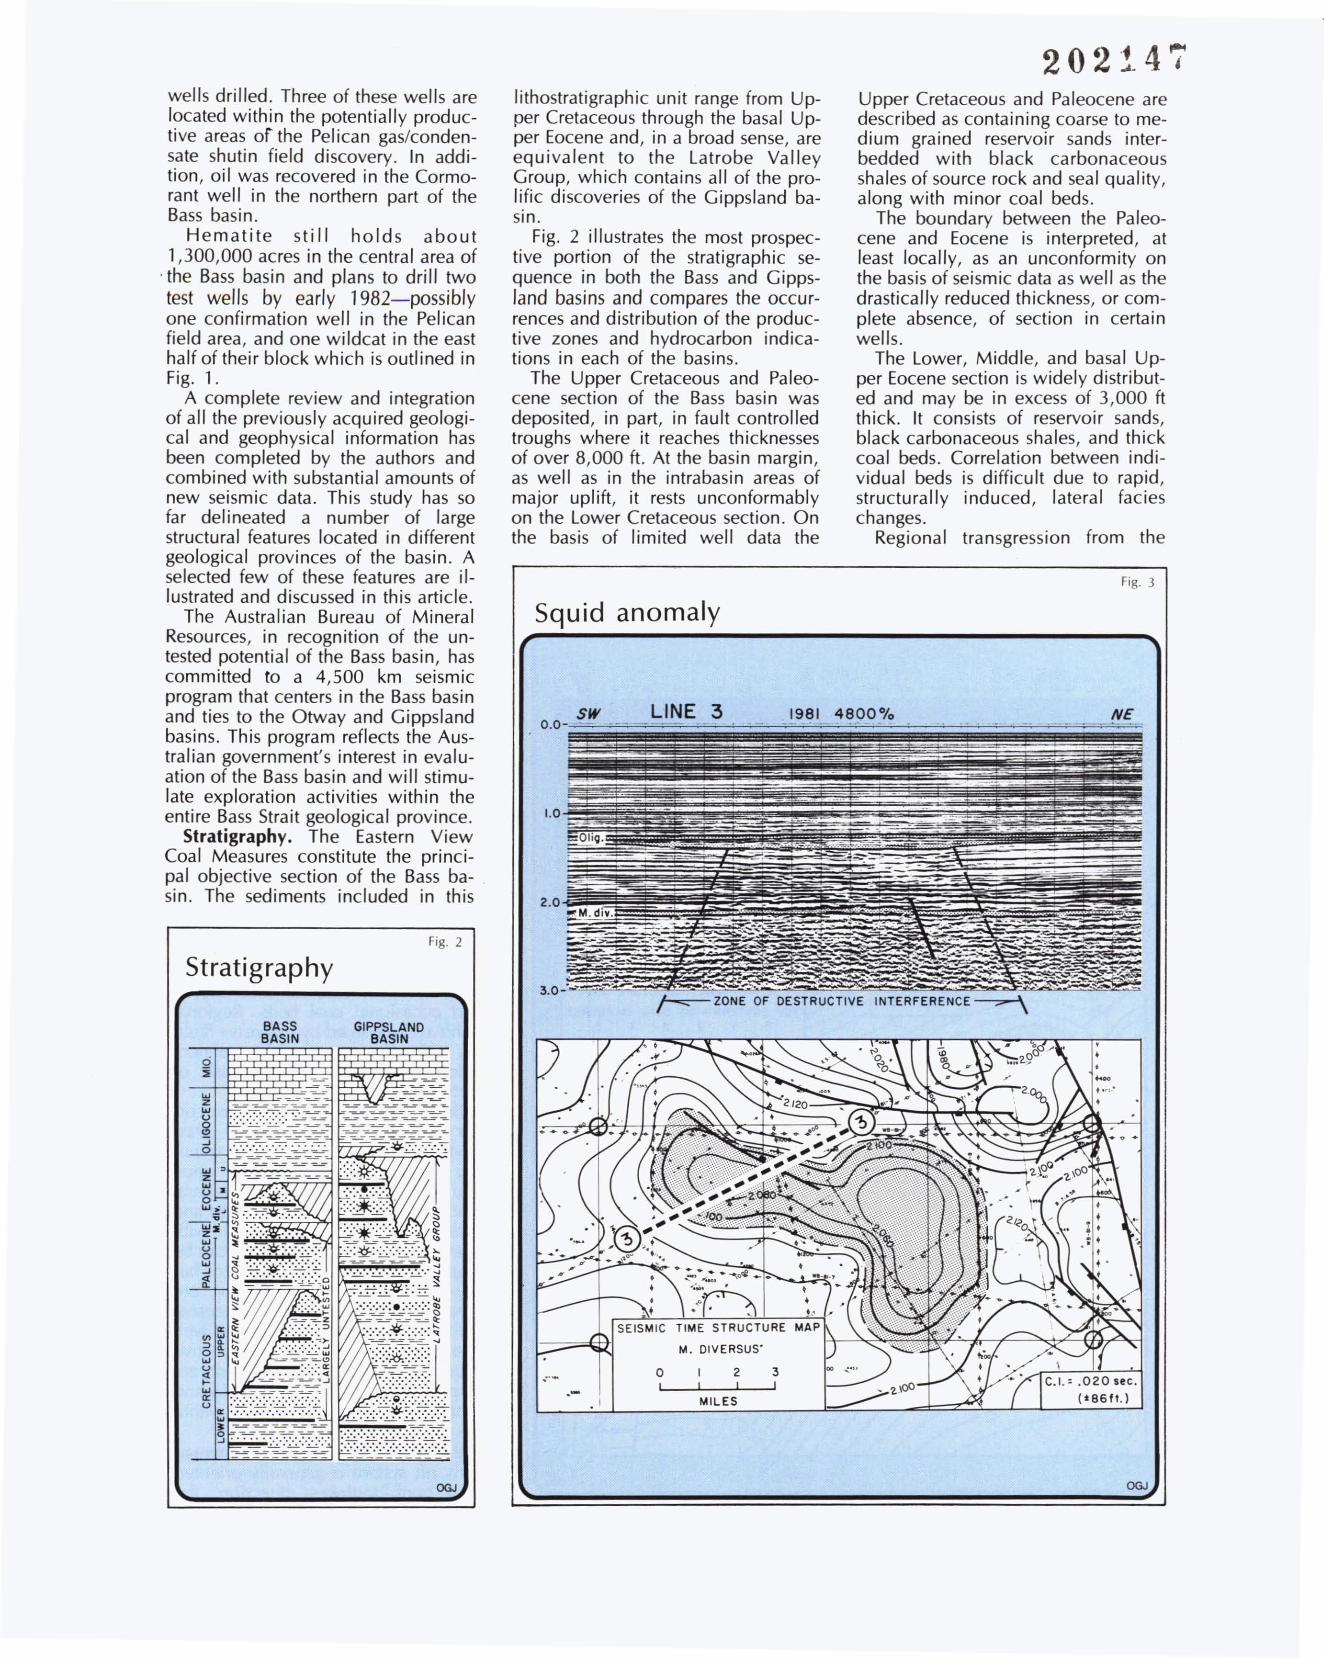
202t47
HE
C.I.' .020 .ec.(*86ft.)
•...... ,INTERFERENCE
Fig. 3
Upper Cretaceous and Paleocene aredescribed as containing coarse to medium grained reservoir sands interbedded with black carbonaceousshales of source rock and seal quality,along with minor coal beds.
The boundary between the Paleocene and Eocene is interpreted, atleast locally, as an unconformity onthe basis of seismic data as well as thedrastically reduced thickness, or complete absence, of section in certainwells.
The Lower, Middle, and basal Upper Eocene section is widely distributed and may be in excess of 3,000 ftthick. It consists of reservoir sands,black carbonaceous shales, and thickcoal beds. Correlation between individual beds is difficult due to rapid,structurally induced, lateral facieschanges.
Regional transgression from the
1981 4800%
3I
2I
MILES
o.-
sw L1NE:30.0- - .-- ---.
1.0
2.0
Squid anomaly
lithostratigraphic unit range from Upper Cretaceous through the basal Upper Eocene and, in a broad sense, areequivalent to the Latrobe ValleyGroup, which contains all of the prolific discoveries of the Gippsland baSin.
Fig. 2 illustrates the most prospective portion of the stratigraphic sequence in both the Bass and Gippsland basins and compares the occurrences and distribution of the productive zones and hydrocarbon indications in each of the basins.
The Upper Cretaceous and Paleocene section of the Bass basin wasdeposited, in part, in fault controlledtroughs where it reaches thicknessesof over 8,000 ft. At the basin margin,as well as in the intrabasin areas ofmajor uplift, it rests unconformablyon the Lower Cretaceous section. Onthe basis of limited well data the
............................lr :.=.:.:.:.=.:. :.=.:.:.:.:.-:-:-
BASS GIPPSLAND
~~O~'ll;B~AISIIN~~ BASIN~
~ -~ = - t-":-:':~
'"ug:Jo
Fig. 2
Stratigraphy
wells drilled. Three of these wells arelocated within the potentially productive areas of the Pelican gas/condensate shutin field discovery. In addition, oil was recovered in the Cormorant well in the northern part of theBass basin.
Hematite still holds about1,300,000 acres in the central area of
. the Bass basin and plans to drill twotest wells by early 1982-possiblyone confirmation well in the Pelicanfield area, and one wildcat in the easthalf of their block which is outlined inFig. 1.
A complete review and integrationof all the previously acquired geological and geophysical information hasbeen completed by the authors andcombined with substantial amounts ofnew seismic data. This study has sofar delineated a number of largestructural features located in differentgeological provinces of the basin. Aselected few of these features are illustrated and discussed in this article.
The Australian Bureau of MineralResources, in recognition of the untested potential of the Bass basin, hascommitted [0 a 4,500 km seismicprogram that centers in the Bass basinand ties to the Otway and Gippslandbasins. This program reflects the Australian government's interest in evaluation of the Bass basin and will stimulate exploration activities within theentire Bass Strait geological province.
Stratigraphy. The Eastern ViewCoal Measures constitute the principal objective section of the Bass basin. The sediments included in this
OGJ OGJ
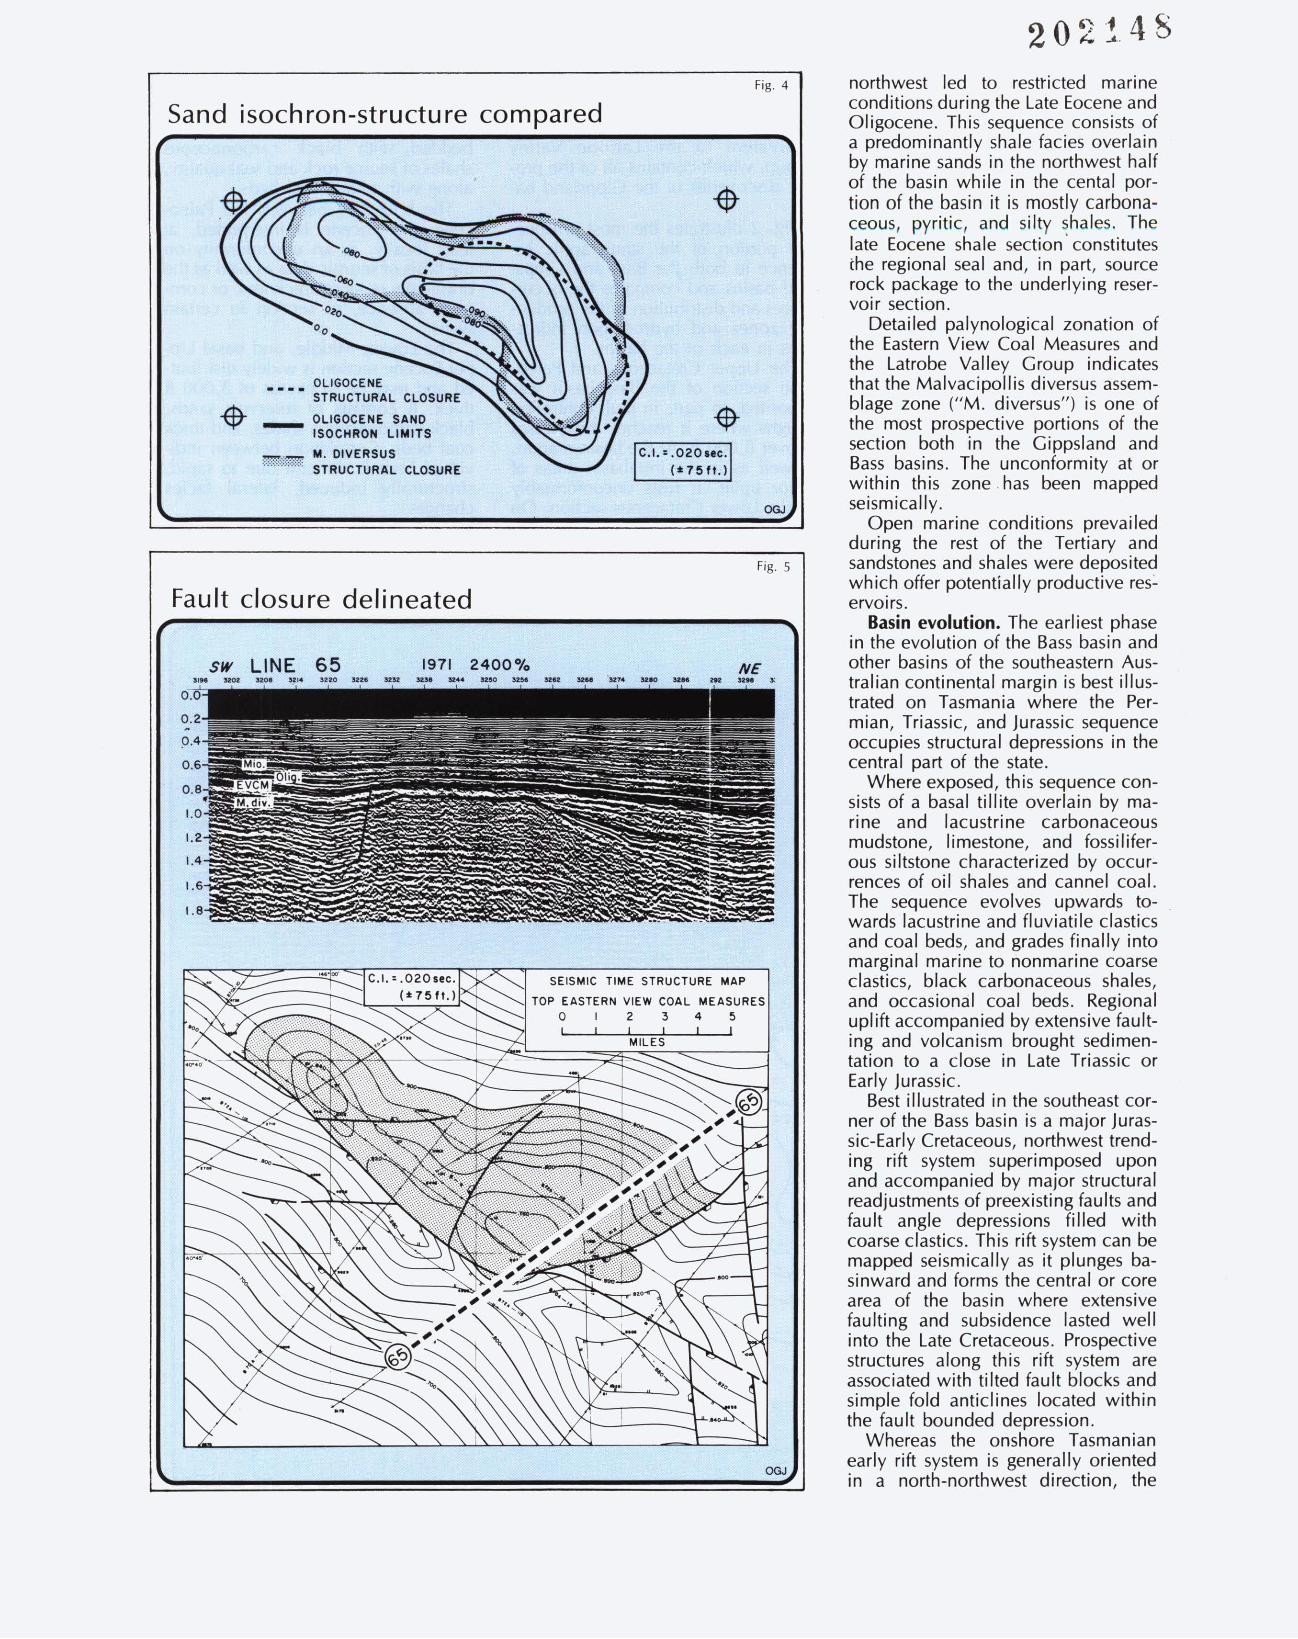
202!48
OGJ
Fig. 4 northwest led to restticted marineconditions during the Late Eocene andOligocene. This sequence consists ofa predominantly shale facies overlainby marine sands in the northwest halfof the basin while in the cental portion of the basin it is mostly carbonaceous, pyritic, and silty shales. Thelate Eocene shale section' constitutesthe regional seal and, in part, sourcerock package to the underlying reservoi r section.
Detailed palynological zonation ofthe Eastern View Coal Measures andthe Latrobe Valley Group indicatesthat the Malvacipollis diversus assemblage zone ("M. diversus") is one ofthe most prospective portions of thesection both in the Gippsland andBass basins. The unconformity at orwithin this zone. has been mappedseismically.
Open marine conditions prevailedduring the rest of the Tertiary andsandstones and shales were depositedwhich offer potentially productive res~
ervolrs.Basin evolution. The earliest phase
in the evolution of the Bass basin andother basins of the southeastern Australian continental margin is best illustrated on Tasmania where the Permian, Triassic, and jurassic sequenceoccupies structural depressions in thecentral part of the state.
Where exposed, this sequence consists of a basal tillite overlain by marine and lacustrine carbonaceousmudstone, limestone, and fossiliferous siltstone characterized by occurrences of oil shales and cannel coal.The sequence evolves upwards towards lacustrine and fluviatile clasticsand coal beds, and grades finally intomarginal marine to nonmarine coarseclastics, black carbonaceous shales,and occasional coal beds. Regionaluplift accompanied by extensive faulting and volcanism brought sedimentation to a close in Late Triassic orEarly jurassic.
Best illustrated in the southeast corner of the Bass basin is a major jurassic-Early Cretaceous, northwest trending rift system superimposed uponand accompanied by major structuralreadjustments of preexisting faults andfault angle depressions filled withcoarse clastics. This rift system can bemapped seismically as it plunges basinward and forms the central or corearea of the basin where extensivefaulting and subsidence lasted wellinto the Late Cretaceous. Prospectivestructures along this rift system areassociated with tilted fault blocks andsimple fold anticlines located withinthe fault bounded depression.
Whereas the onshore Tasmanianearly rift system is generally orientedin a north-northwest direction, the
OGJ
Fig. 5
..
C.I.:.020 ••e.(075ft.)
MILES
SEISMIC TIME STRUCTURE MAP
TOP EASTERN VIEW COAL MEASURESo I 2 3 4 5
I I I I
"..;...............:.:;.::~ ...
OLIGOCENE._ ..STRUCTURAL CLOSURE
_ OLIGOCENE SANDISOCHRON LIMITS
_._ M. DIVERSUS"""""""""""" STRUCTURAL CLOSURE
sw LINE 65 1971 2400% NE'~~~~14u~~uun~~~~~~~~~~m~$
Fault closure delineated
Sand isochron-structure compared
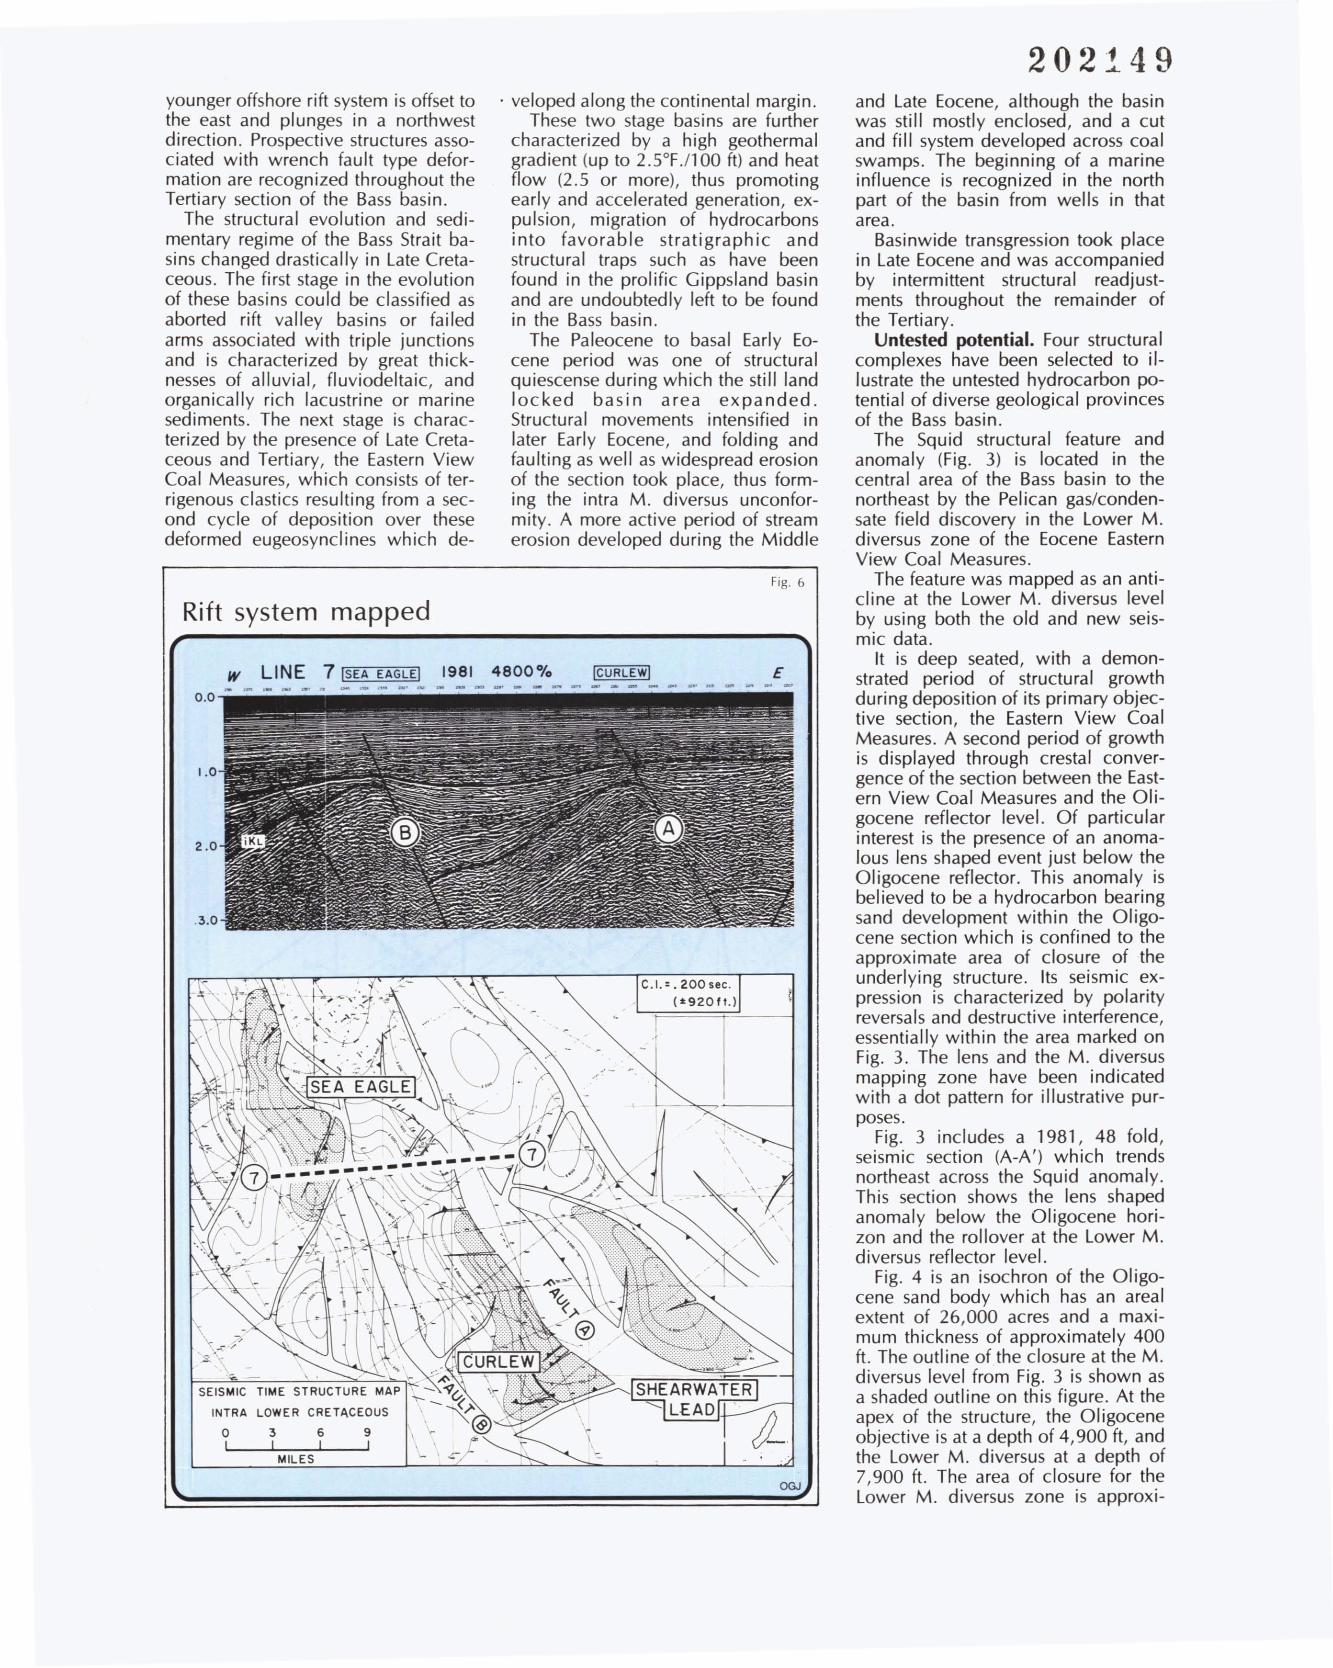
202149
w LINE 71sEA EAGLEI 1981 4800%
Fig. 6
and Late Eocene, although the basinwas still mostly enclosed, and a cutand fill system developed across coalswamps. The beginning of a marineinfluence is recognized in the northpart of the basin from wells in thatarea.
Basinwide transgression took placein Late Eocene and was accompaniedby intermittent structural readjustments throughout the remainder ofthe Tertiary.
Untested potential. Four structuralcomplexes have been selected to illustrate the untested hydrocarbon potential of diverse geological provincesof the Bass basin.
The Squid structural feature andanomaly (Fig. 3) is located in thecentral area of the Bass basin to thenortheast by the Pelican gas/condensate field discovery in the Lower M.diversus zone of the Eocene EasternView Coal Measures.
The feature was mapped as an anticline at the Lower M. diversus levelby using both the old and new seismic data.
It is deep seated, with a demonstrated period of structural growthduring deposition of its primary objective section, the Eastern View CoalMeasures. A second period of growthis displayed through crestal convergence of the section between the Eastern View Coal Measures and the Oligocene reflector level. Of particularinterest is the presence of an anomalous lens shaped event just below theOligocene reflector. This anomaly isbelieved to be a hydrocarbon bearingsand development within the Oligocene section which is confined to theapproximate area of closure of theunderlying structure. Its seismic expression is characterized by polarityreversals and destructive interference,essentially within the area marked onFig. 3. The lens and the M. diversusmapping zone have been indicatedwith a dot pattern for illustrative purposes.
Fig. 3 includes a 1981, 48 fold,seismic section (A-A') which trendsnortheast across the Squid anomaly.This section shows the lens shapedanomaly below the Oligocene horizon and the rollover at the Lower M.diversus reflector level.
Fig. 4 is an isochron of the Oligocene sand body which has an arealextent of 26,000 acres and a maximum thickness of approximately 400ft. The outline of the closure at the M.diversus level from Fig. 3 is shown asa shaded outline on this figure. At theapex of the structure, the Oligoceneobjective is at a depth of 4,900 ft, andthe Lower M. diversus at a depth of7,900 ft. The area of closure for theLower M. diversus zone is approxi-
OGJ
£
I.(
C.I.'.200.oc.(t920ft.l
\\
ICURLEWI
. veloped along the continental margin.These two stage basins are further
characterized by a high geothermalgradient (up to 2SF.l100 ft) and heatflow (2.5 or more), thus promotingearly and accelerated generation, expulsion, migration of hydrocarbonsinto favorable stratigraphic andstructural traps such as have beenfound in the prolific Gippsland basinand are undoubtedly left to be foundin the Bass basin.
The Paleocene to basal Early Eocene period was one of structuralquiescense during which the still landlocked basin area expanded.Structural movements intensified inlater Early Eocene, and folding andfaulting as well as widespread erosionof the section took place, thus forming the intra M. diversus unconformity. A more active period of streamerosion developed during the Middle
SEISMIC
INTRA LOWER CRETf\CEOUS
o 3 6 9! I I I
MILES
1.0
2.0
0.0
.3.0
Rift system mapped
younger offshore rift system is offset tothe east and plunges in a northwestdirection. Prospective structures associated with wrench fault type deformation are recognized throughout theTertiary section of the Bass basin.
The structural evolution and sedimentary regime of the Bass Strait basins changed drastically in Late Cretaceous. The first stage in the evolutionof these basins could be classified asaborted rift valley basins or failedarms associated with triple junctionsand is characterized by great thicknesses of alluvial, fluviodeltaic, andorganically rich lacustrine or marinesediments. The next stage is characterized by the presence of Late Cretaceous and Tertiary, the Eastern ViewCoal Measures, which consists of terrigenous clastics resulting from a second cycle of deposition over thesedeformed eugeosynclines which de-
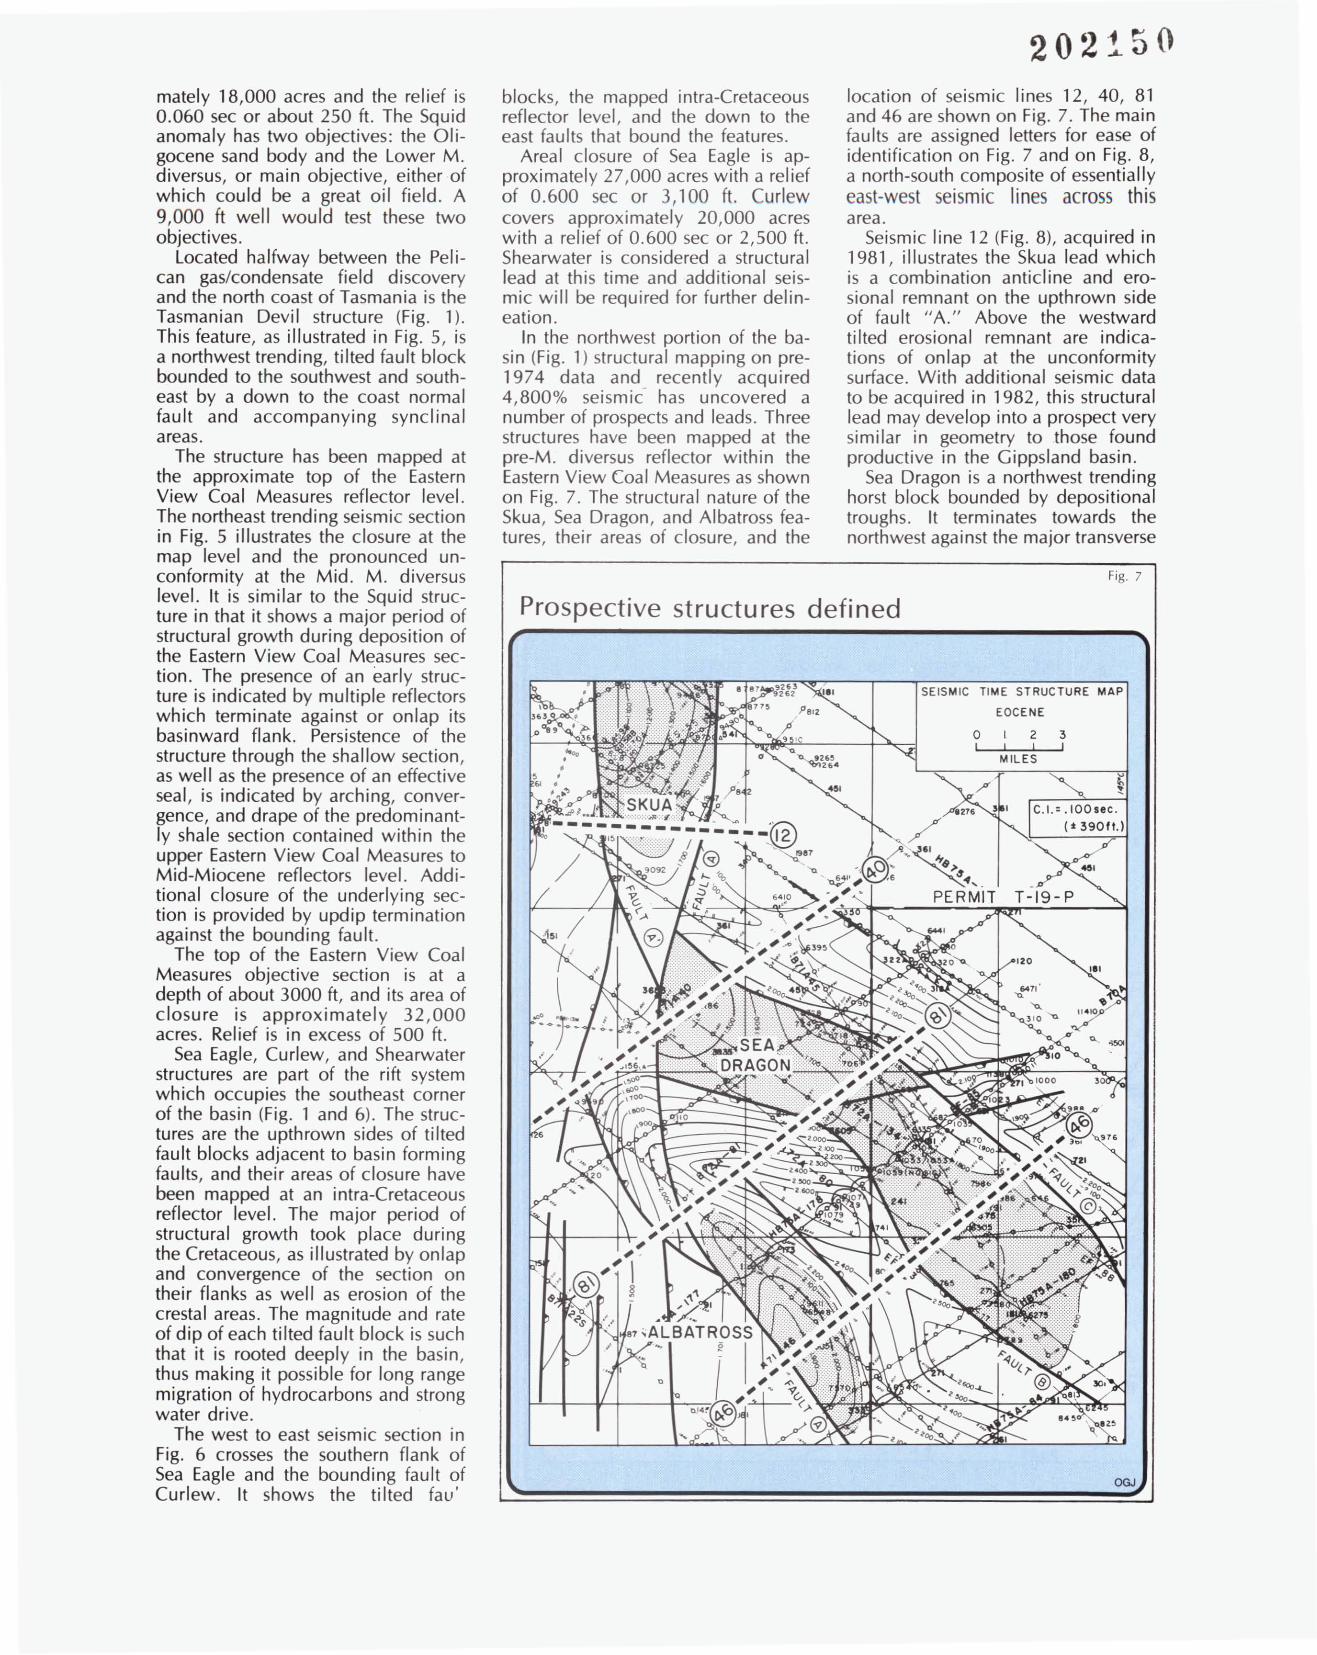
202150
Fig. 7
Prospective structures defined
OGJ
.21. 'I C.I.=.IOOsec.
(*390ft.)
SEISMIC TIME STRUCTURE MAP
EOCENE
o 2 3, I I
MILES
location of seismic lines 12, 40, 81and 46 are shown on Fig. 7. The mainfaults are assigned letters for ease ofidentification on Fig. 7 and on Fig. 8,a north-south composite of essentiallyeast-west seismic lines across thisarea.
Seismic line 12 (Fig. 8), acquired in1981, illustrates the Skua lead whichis a combination anticline and erosional remnant on the upthrown sideof fault "A." Above the westwardtilted erosional remnant are indications of onlap at the unconformitysurface. With additional seismic datato be acquired in 1982, this structurallead may develop into a prospect verysimilar in geometry to those foundproductive in the Gippsland basin.
Sea Dragon is a northwest trendinghorst block bounded by depositionaltroughs. It terminates towards thenorthwest against the major transverse
.51
'" _'26'~26.
blocks, the mapped intra-Cretaceousreflector level, and the down to theeast faults that bound the features.
Areal closure of Sea Eagle is approximately 27,000 acres with a reliefof 0.600 sec or 3,100 ft. Curlewcovers approximately 20,000 acreswith a relief of 0.600 sec or 2,500 ft.Shearwater is considered a structurallead at this time and additional seismic will be required for further delineation.
In the northwest portion of the basin (Fig. 1) structural mapping on pre1974 data and recently acquired4,800% seismic' has uncovered anumber of prospects and leads. Threestructures have been mapped at thepre-M. diversus reflector within theEastern View Coal Measures as shownon Fig. 7. The structural nature of theSkua, Sea Dragon, and Albatross features, their areas of closure, and the
mately 18,000 acres and the relief is0.060 sec or about 250 ft. The Squidanomaly has two objectives: the Oligocene sand body and the Lower M.diversus, or main objective, either ofwhich could be a great oil field. A9,000 ft well would test these twoobjectives.
Located halfway between the Pelican gas/condensate field discoveryand the north coast of Tasmania is theTasmanian Devil structure (Fig. 1).This feature, as illustrated in Fig. 5, isa northwest trending, tilted fault blockbounded to the southwest and southeast by a down to the coast normalfault and accompanying synclinalareas.
The structure has been mapped atthe approximate top of the EasternView Coal Measures reflector level.The northeast trending seismic sectionin Fig. 5 illustrates the closure at themap level and the pronounced unconformity at the Mid. M. diversuslevel. It is similar to the Squid structure in that it shows a major period ofstructural growth during deposition ofthe Eastern View Coal Measures section. The presence of an early structure is indicated by multiple reflectorswhich terminate against or onlap itsbasinward flank. Persistence of thestructure through the shallow section,as well as the presence of an effectiveseal, is indicated by arching, convergence, and drape of the predominantly shale section contained within theupper Eastern View Coal Measures toMid-Miocene reflectors level. Additional closure of the underlying section is provided by updip terminationagainst the bounding fault.
The top of the Eastern View CoalMeasures objective section is at adepth of about 3000 ft, and its area ofclosure is approximately 32,000acres. Relief is in excess of 500 ft.
Sea Eagle, Curlew, and Shearwaterstructures are part of the rift systemwhich occupies the southeast cornerof the basin (Fig. 1 and 6). The structures are the upthrown sides of tiltedfault blocks adjacent to basin formingfaults, and their areas of closure havebeen mapped at an intra-Cretaceousreflector level. The major period ofstructural growth took place duringthe Cretaceous, as illustrated by onlapand convergence of the section ontheir flanks as well as erosion of thecrestal areas. The magnitude and rateof dip of each tilted fault block is suchthat it is rooted deeply in the basin,thus making it possible for long rangemigration of hydrocarbons and strongwater drive.
The west to east seismic section inFig. 6 crosses the southern flank ofSea Eagle and the bounding fault ofCurlew. It shows the tilted fau'
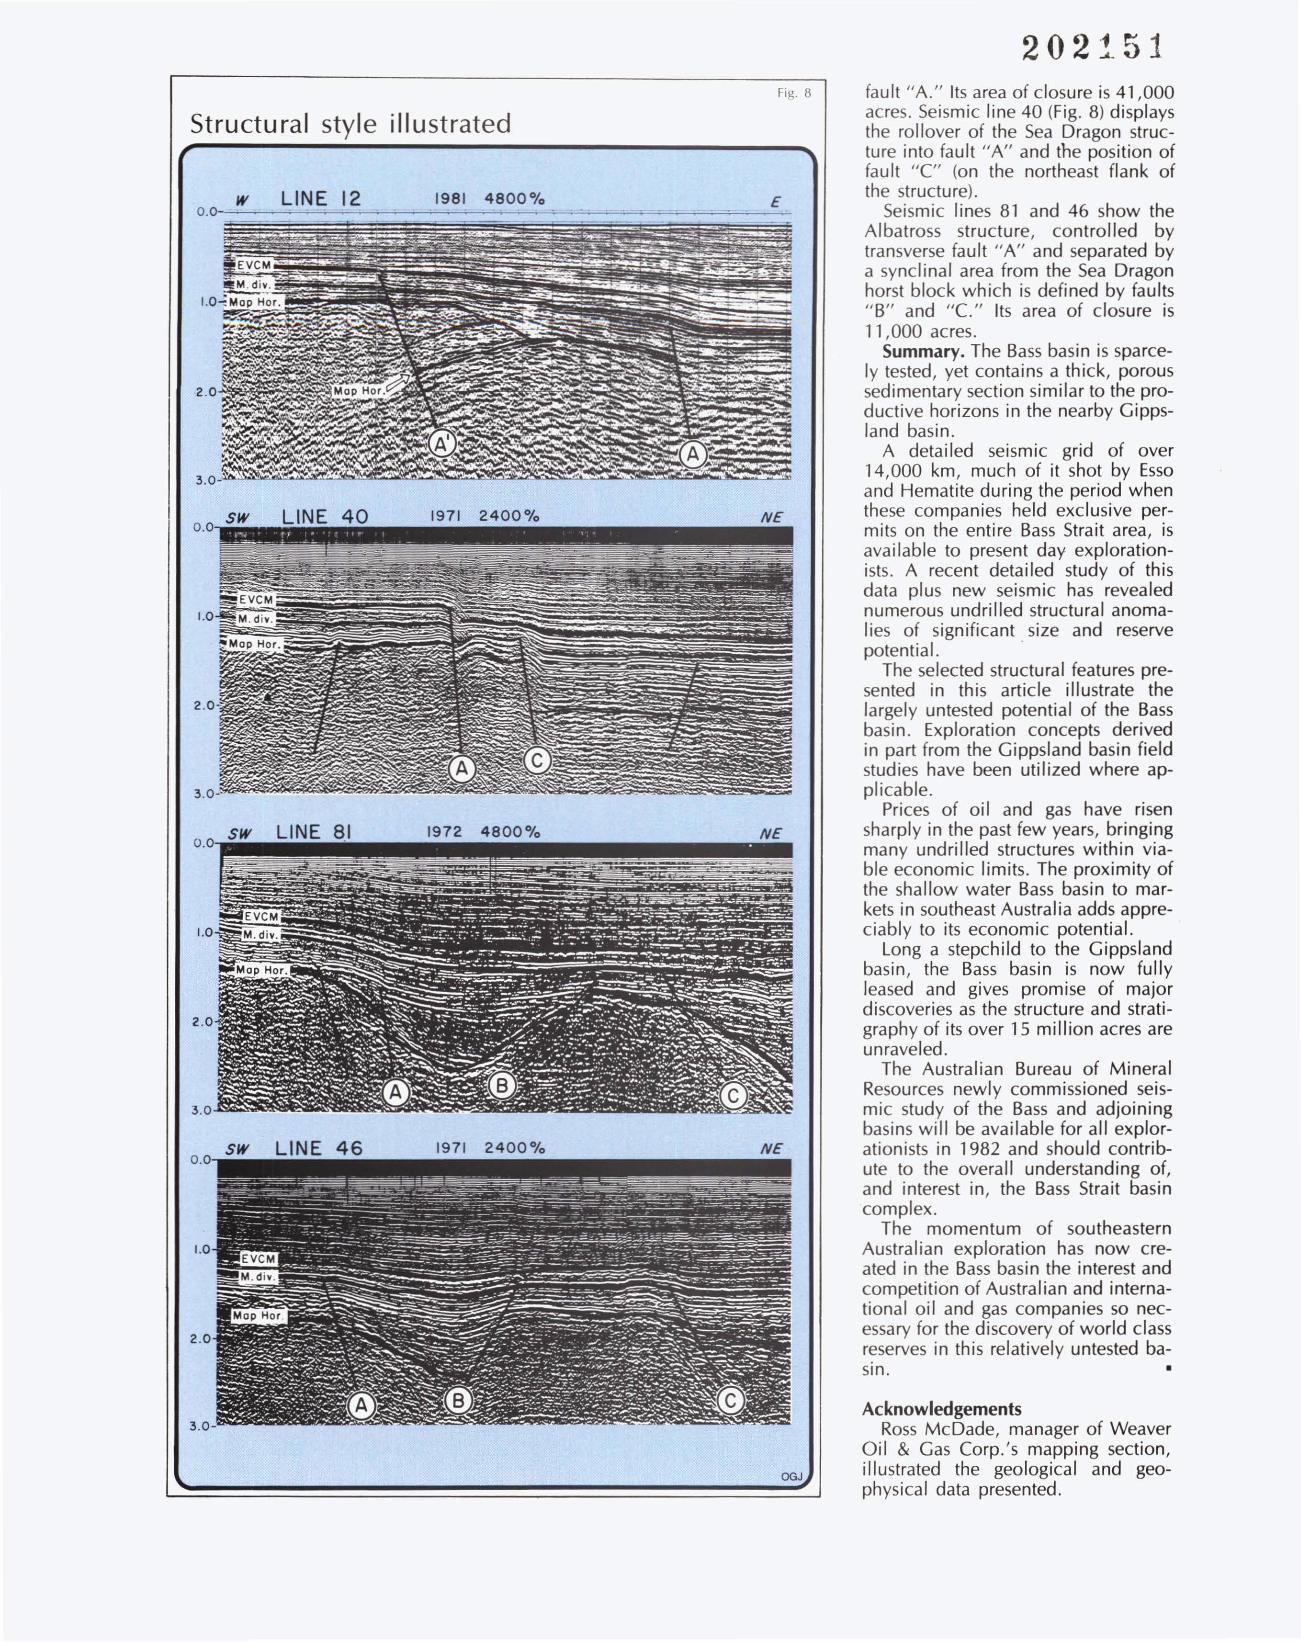
202151
AcknowledgementsRoss McDade, manager of Weaver
Oil & Gas Corp.'s mapping section,illustrated the geological and geophysical data presented.
fault "A." Its area of closure is 41,000acres. Seismic line 40 (Fig. 8) displaysthe rollover of the Sea Dragon structure into fault "A" and the position offau It "c" (on the northeast flank ofthe structu re).
Seismic lines 81 and 46 show theAlbatross structure, controlled bytransverse fault "A" and separated bya synclinal area from the Sea Dragonhorst block which is defined by faults"B" and "C" Its area of closure is11,000 acres.
Summary. The Bass basin is sparceIy tested, yet contains a thick, poroussedimentary section similar to the productive horizons in the nearby Gippsland basin.
A detailed seismic grid of over14,000 km, much of it shot by Essoand Hematite during the period whenthese companies held exclusive permits on the entire Bass Strait area, isavailable to present day explorationists. A recent detailed study of thisdata plus new seismic has revealednumerous undrilled structural anomalies of significant size and reservepotential.
The selected structural features presented in this article illustrate thelargely untested potential of the Bassbasin. Exploration concepts derivedin part from the Gippsland basin fieldstudies have been utilized where applicable.
Prices of oil and gas have risensharply in the past few years, bringingmany undrilled structures within viable economic limits. The proximity ofthe shallow water Bass basin to markets in southeast Australia adds appreciably to its economic potential.
Long a stepchild to the Gippslandbasin, the Bass basin is now fullyleased and gives promise of majordiscoveries as the structure and stratigraphy of its over 15 million acres areunraveled.
The Australian Bureau of MineralResources newly commissioned seismic study of the Bass and adjoiningbasins will be available for all explorationists in 1982 and should contribute to the overall understanding of,and interest in, the Bass Strait basincomplex.
The momentum of southeasternAustral ian exploration has now created in the Bass basin the interest andcompetition of Australian and international oil and gas companies so necessary for the discovery of world classreserves in this relatively untested basin. •
OGJ
Fig. 8
NE
NE
NE
1971 2400%
1971 2400%
1972 4800%
LINE 40
LINE 12w
1.0
3.0 C
0.0 sw LINE 8.1
2.0
0.0 SW
3.0
sw LINE 460.0
Structural style illustrated
2.0
202152
WEAVER OIL AND GAS CORPORATION5599 SAN FELIPE, SUITE 1100, HOUSTON, TEXAS 77056
A Kaneb company
()Kaneb Services. Inc.
--------'1---------------,1I Management
Energy Related Seroices Information Seroices
Oil and Gas Exploration & Production
Professional Engineering
Contract Drilling
Petroleum Products TransportationCoal Extraction & MarketingGeneral Contracting
Weaver Oil & Gas Corp.OTEK Equipment Mfg., Inc.
Intercomp Resource Development& Engineering, PLT EngineeringDiamond M CompanyWelsh Drilling & ServiceKaneb Pipe Line
Computer Data ProcessingFinancial Service Printing
K aneb operates a diverse fleet ofmobile drilling vessels and platformrigs engaged in international
contract drilling and production. Thecompany conducts domestic and foreignexploration projects in its search for anddevelopment of oil and gas reserves. Thecompany is also a supplier of wellheadcontrol systems and pumping units used inthe production of oil and gas.
The company provides worldwideprofessional engineering and managementservices in the areas of pipeline technology,reservoir engineering, geologic surveys,and advanced recovery methods applicableto the production of hydrocarbons. Kanebowns and operates a 1,500-mile longcommon carrier pipeline and terminalsystem through five mid-continent states.
Kaneb produces steam grade
bituminous coal from its own mines inthe Appalachian area and sells purchasedand brokered coal from other sources.Kaneb's coal is marketed principally toelectric power generating customers and,to a lesser extent, to industrial users.
Kaneb's specialized generalcontracting services include theconstruction of locks, dams and dikes,flood control reservoirs, and highwaywork. Principal customers include utilitycompanies and governmental agencies.
Kaneb designs, sells, and installs avariety of minicomputers tailored to theinsurance agency and retail chain storebusinesses; provides data processingservices to these same industries. Thecompany also,performs specializedfinancial and business forms printingservIces.
• '.,:Kaneb Services~ Inc.
a concern for energy
The Kaneb Bldg. 5251 Westheirner Road Houston, Texas 77027 Phone: (713) 622-3456
NYSE Symbol: KAB Telex: 910-881-1737
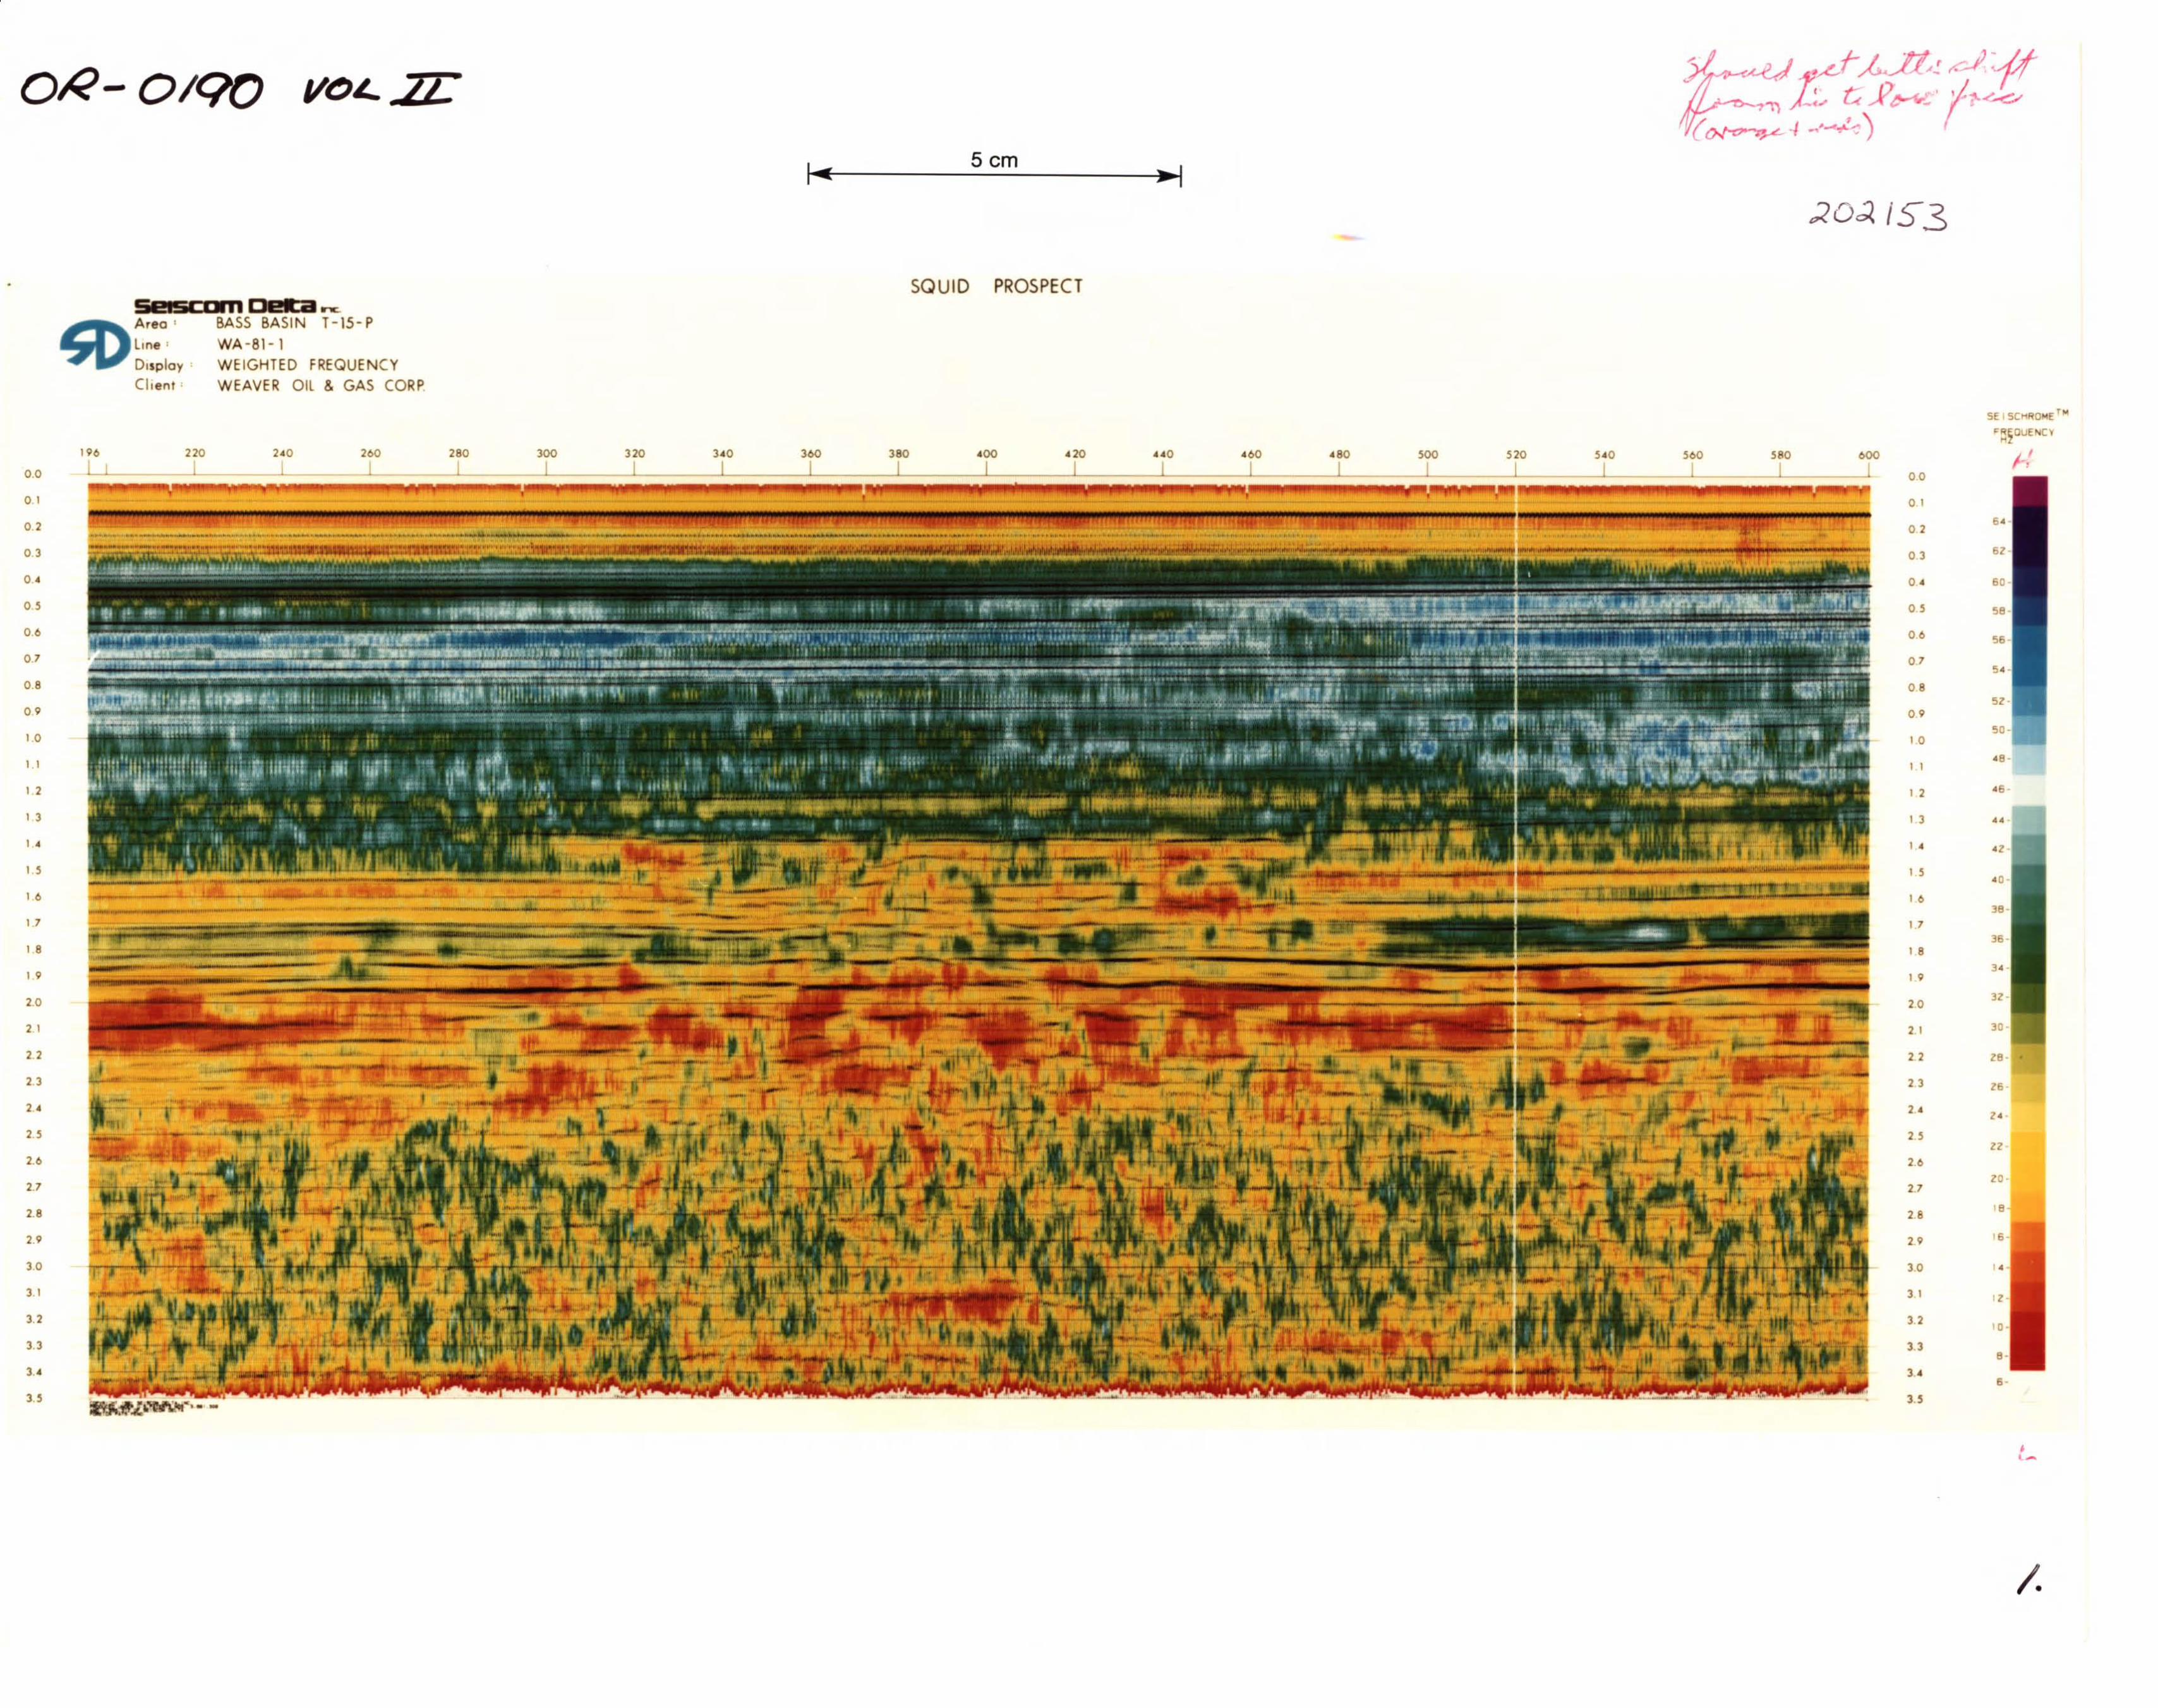
o/<-o/QO5cmf-o«--------.-j
.20;< /53
SQUID PROSPECT. :.. .-:SI!ISCDn1 "<-Aroo' BASS BASIN T-15-P
Llno' WA-Bl-lDlSploy WEIGHTED FREQUENCYCI,ont· WEAVER OIL & GAS CORP
•
••
'0-
•••
".
.0-
50·
3D.
•••
3.·
51-
3.·
.,.
,...,.
".
"
,..
"
,..
,..
•••
,..
I.
Sf SCHROHE ™
F~lOUENCV
J.:"0 '60 '80 600
I I I l 00
o I
02
03
O.
0'
06
07
08
09
10
,,I 2
I 3
I •
I ,
'6
17
I 8
"20
21
22
23
2 •
"26
2.7
28
29
30
31
32
3.3
3.'
3.'
196 220 2.0 260 280 300 320 340 360 380 400 .20 HO "60 .80
LJ~;;;;.;;;;';;;:I;;;;;;;;;,;;;;;;;;~I;;;;;;;;;;,;;;;;;;;;;;;1;;,.;;;;;;;1;;;;;;,;;;;;:;;;;1;;;;;...;;;:I;;;;;;;;;;~I ;;;;;;;;;~I;;;;~;'I...;;;;;;;.1__I~_~I;;;;;;;;;;;~I;;;;;;;;;;;;:;L;...,;.~;",.,;;;; ~;;;;~__;:;;;;.,;;;;;;;;.~
21
2.7
23
2.8
22
31
I 2
3.3
20
17
I I
2.
29
18
3.0
19
2.6
16
I ,
3.2
3.'
10
I 3
"
3.'
0'
0.0
02
o.
08
09
07
03
06
0'
•<-
/.
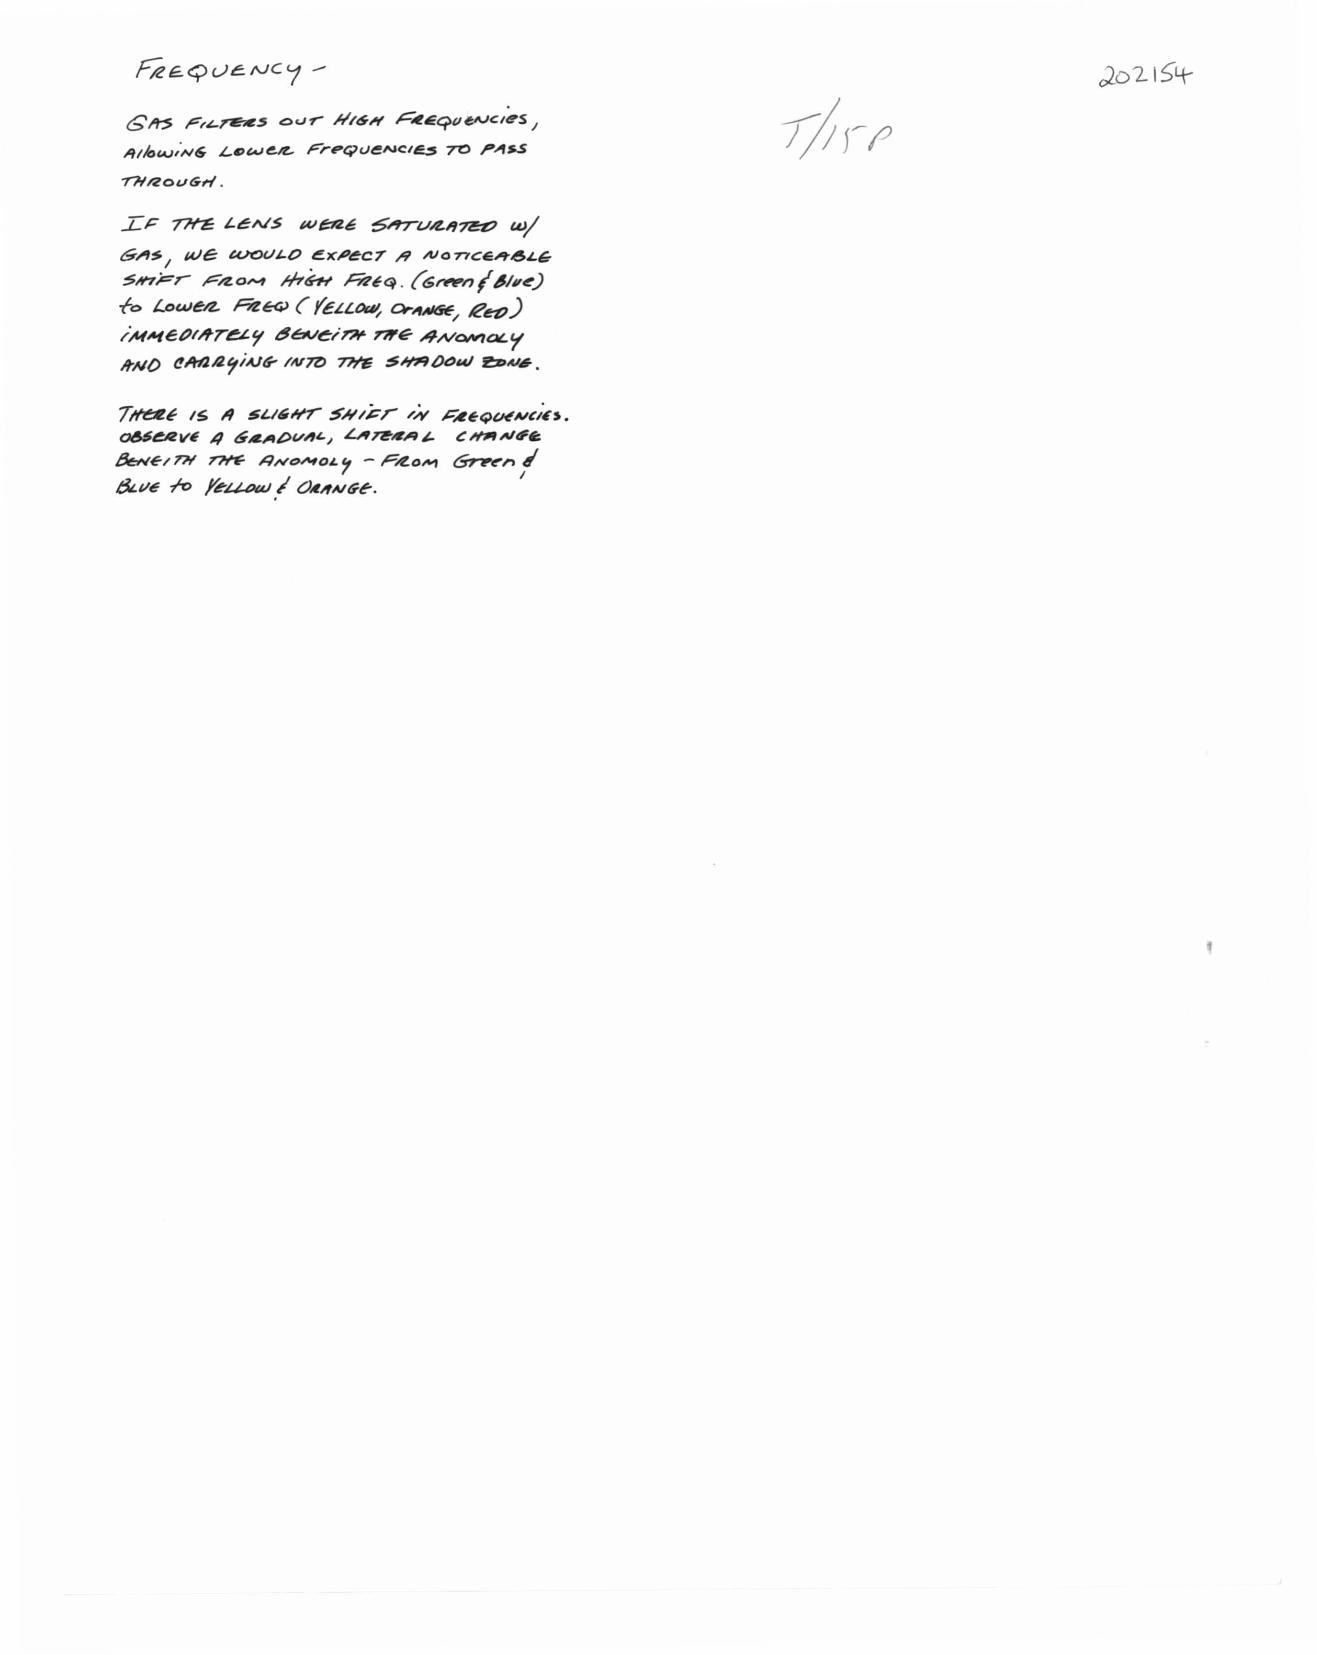
c£~ r'L~5 our H/6-H .c-~~q>"uvclesI
,l//llotAJIN(S. L."&Ne~ FrpC¥ueNC/e 70 p.If$S
-nI/20LJGrl .
.LP ~ t.eNS W~6 6hTl.//u/~ wiGA:S I we: tuOLlLO eXP~c7 /9 AJ077CE~~LG
:SHTi<:r rao,"" Hr6-H H2~q. (GrY'tf'n 14/ve)
-fo Lowe-a Az~ (yeLLOUI, a.-"'Af6'€/ R~)/if,(A1etJ/Rr~'I d&./t!:irH nI'€- -4/1/Q/VIaLY
ItNO t!MIJ'tiA.Jtr /1V7Z) -nn: $tW"/()CuJ 2;z>.cI6.
7~~ IS II 5U.Hr SNIj:r /..¥ ,c""e~QlN.cI~i£J.
06$~v~ 4 &.c.A&>VALJ LAn!!''''''~ CH1l1lNtF~
&Ne!nI ~ !Q/VDMOL ~ - F~o,.., Gr'Ptt'n 8'I
&iI~ ~ ~~/ OAIf.cltT~.
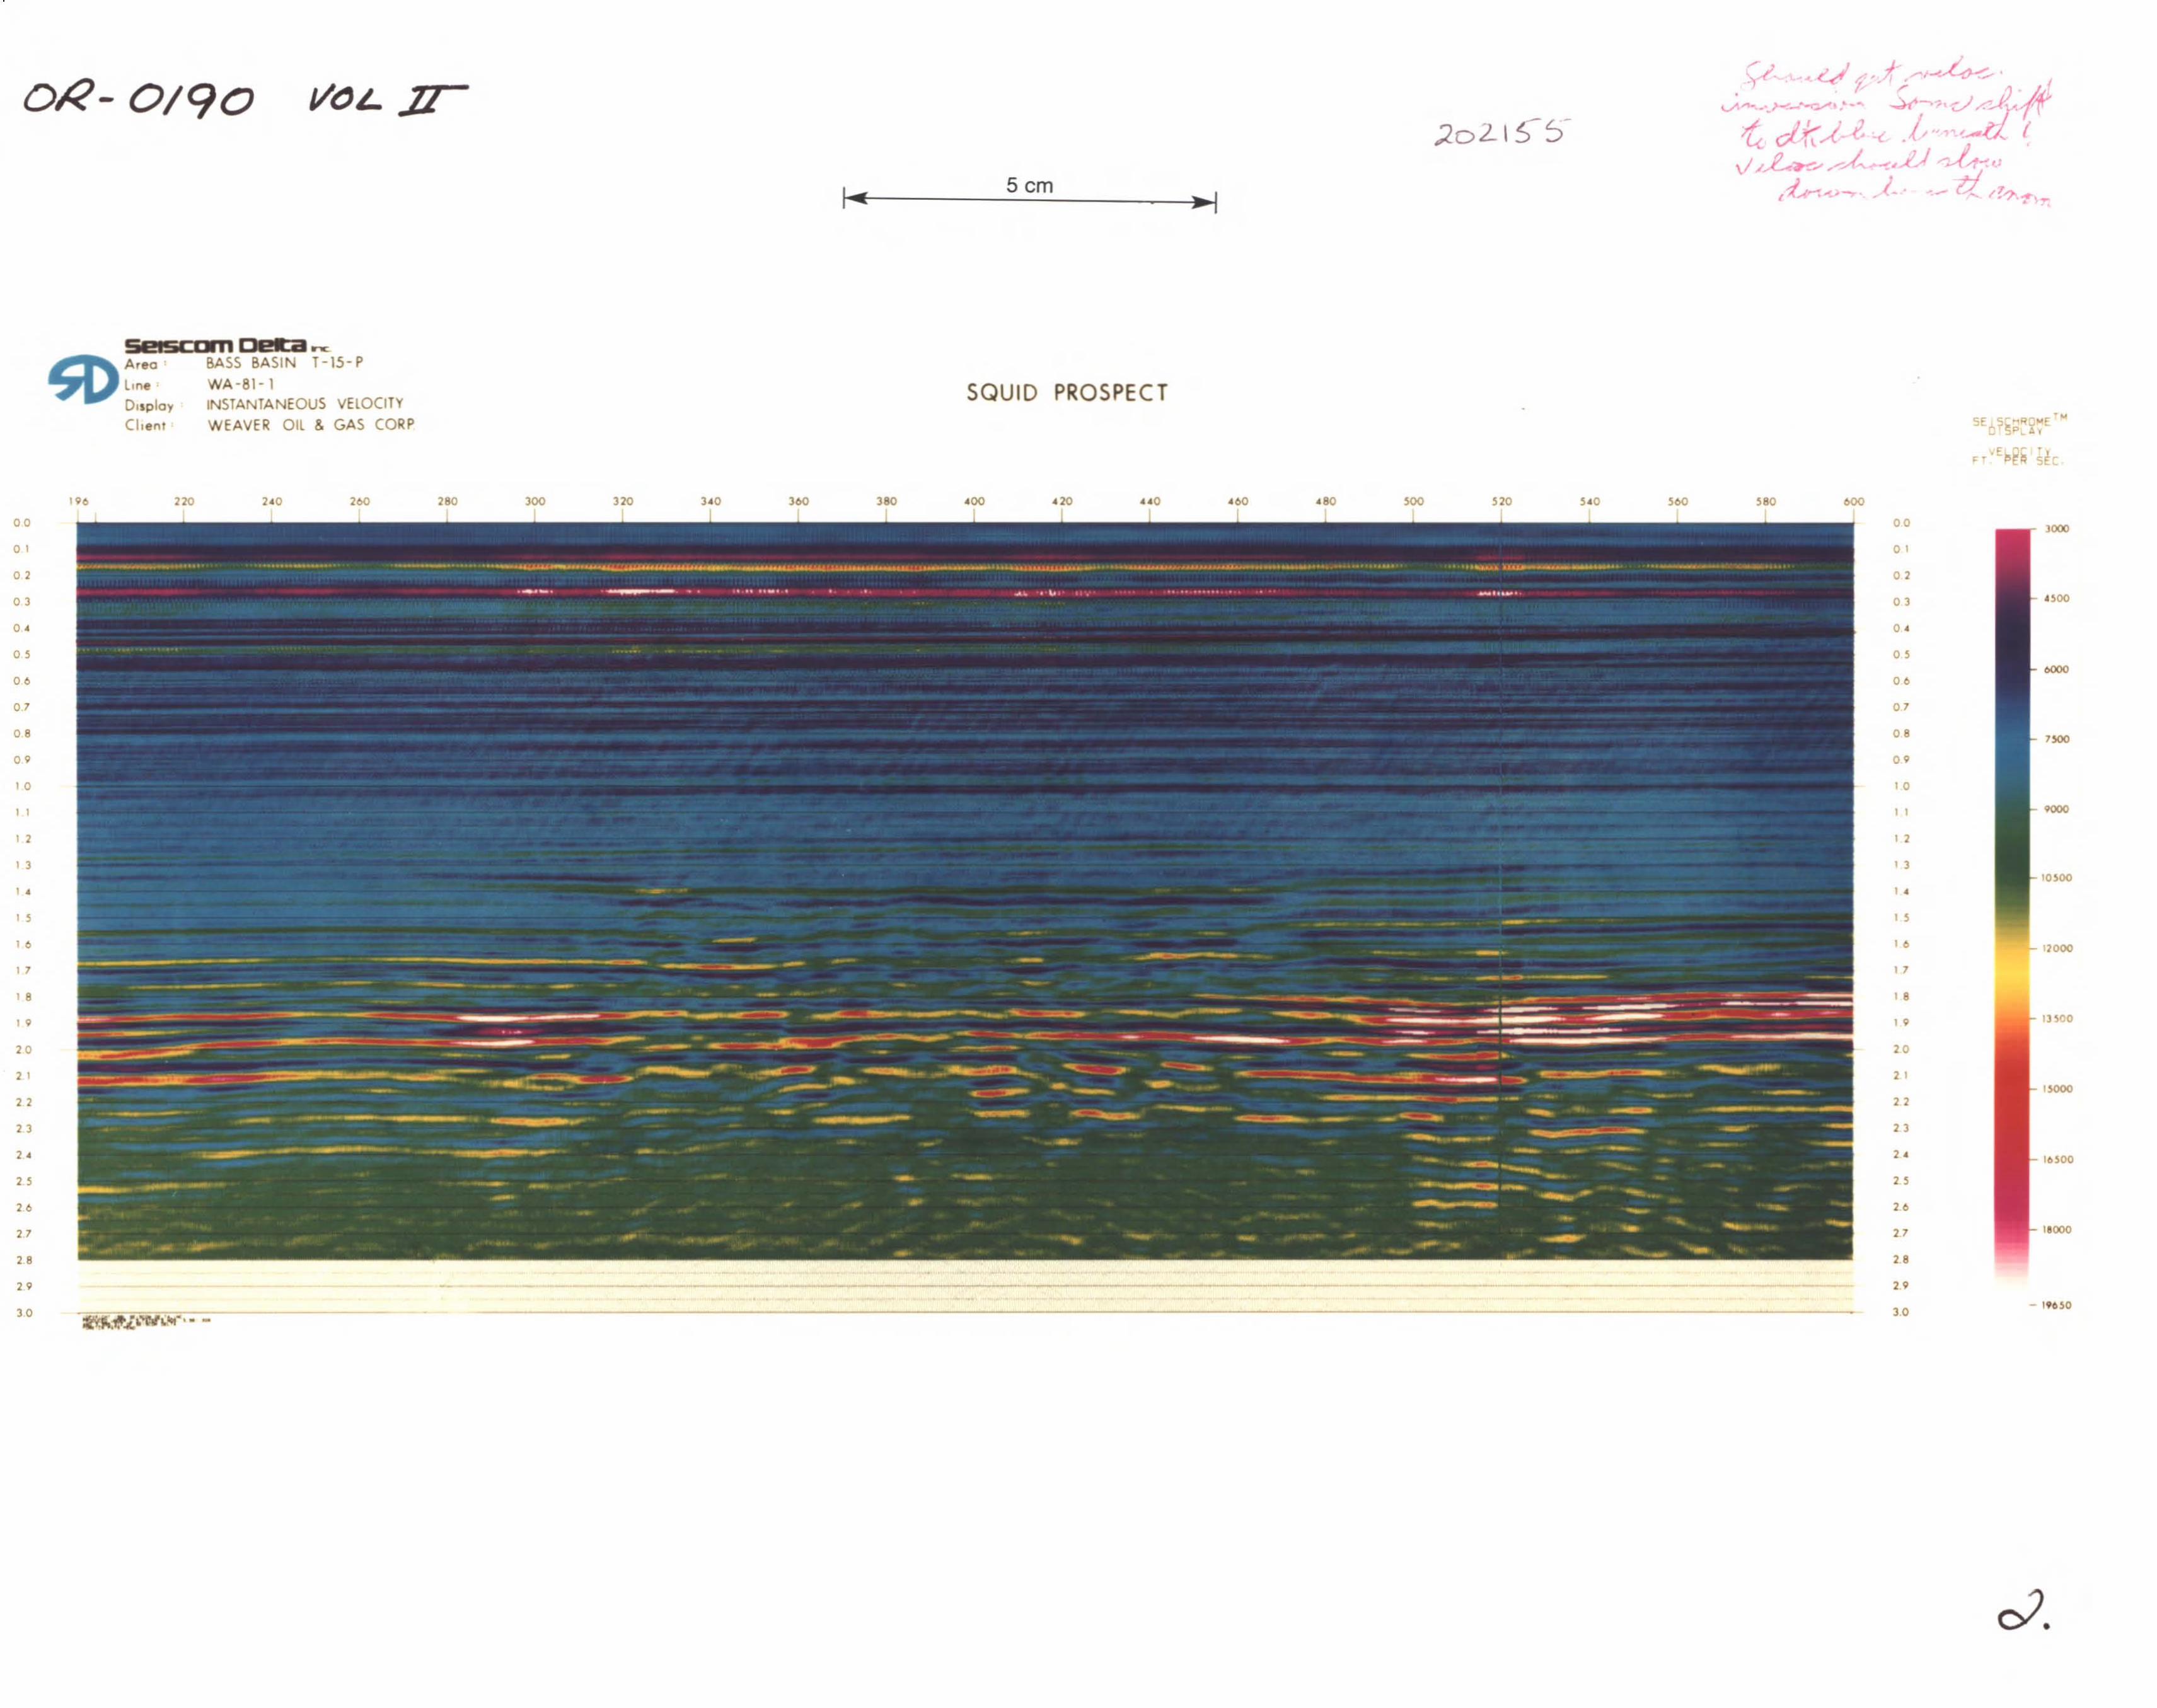
o,Q- 0/90
5 emf-c-----=-..::.:..:..:..----~
• :... IF'::
SQUID PROSPECT
~
BASS BASIN T-15-PWA-BI-lINSTANTANEOUS VElOCITYWEAVER OIL & GAS CORP
Area
Line
D.splayChent
.E ..... ~,. .~~ SE
0/.

:I..P ~,£N5 AJ~4€ $A7VIflArE-O ~/T7t' GAS,
II'~(J/T/~S :SNCc/,LO u"()u;A~ A P4I11-MAric.
I'lVye4$/oN/ 6~ff'lVl: $,L04oJen... "~N4.rT;'" A-tut>""fD£7
AI/TN iU>LOAS SNlp-n'A/t: "pA~D6MiAJ'"n!:L'1 7D
t/"'A.,r;:. IJL"J:. I ~A(;bVr~.
rH~ ,P~r r;vPICA~5 t9 :SL./~Nr :SN'~ PAO~
G~~ 'TO VI9'n..t::. &V~ /MNCp,,,,re,'1 &w~,h,I.
rNtf. L4!;tIS.
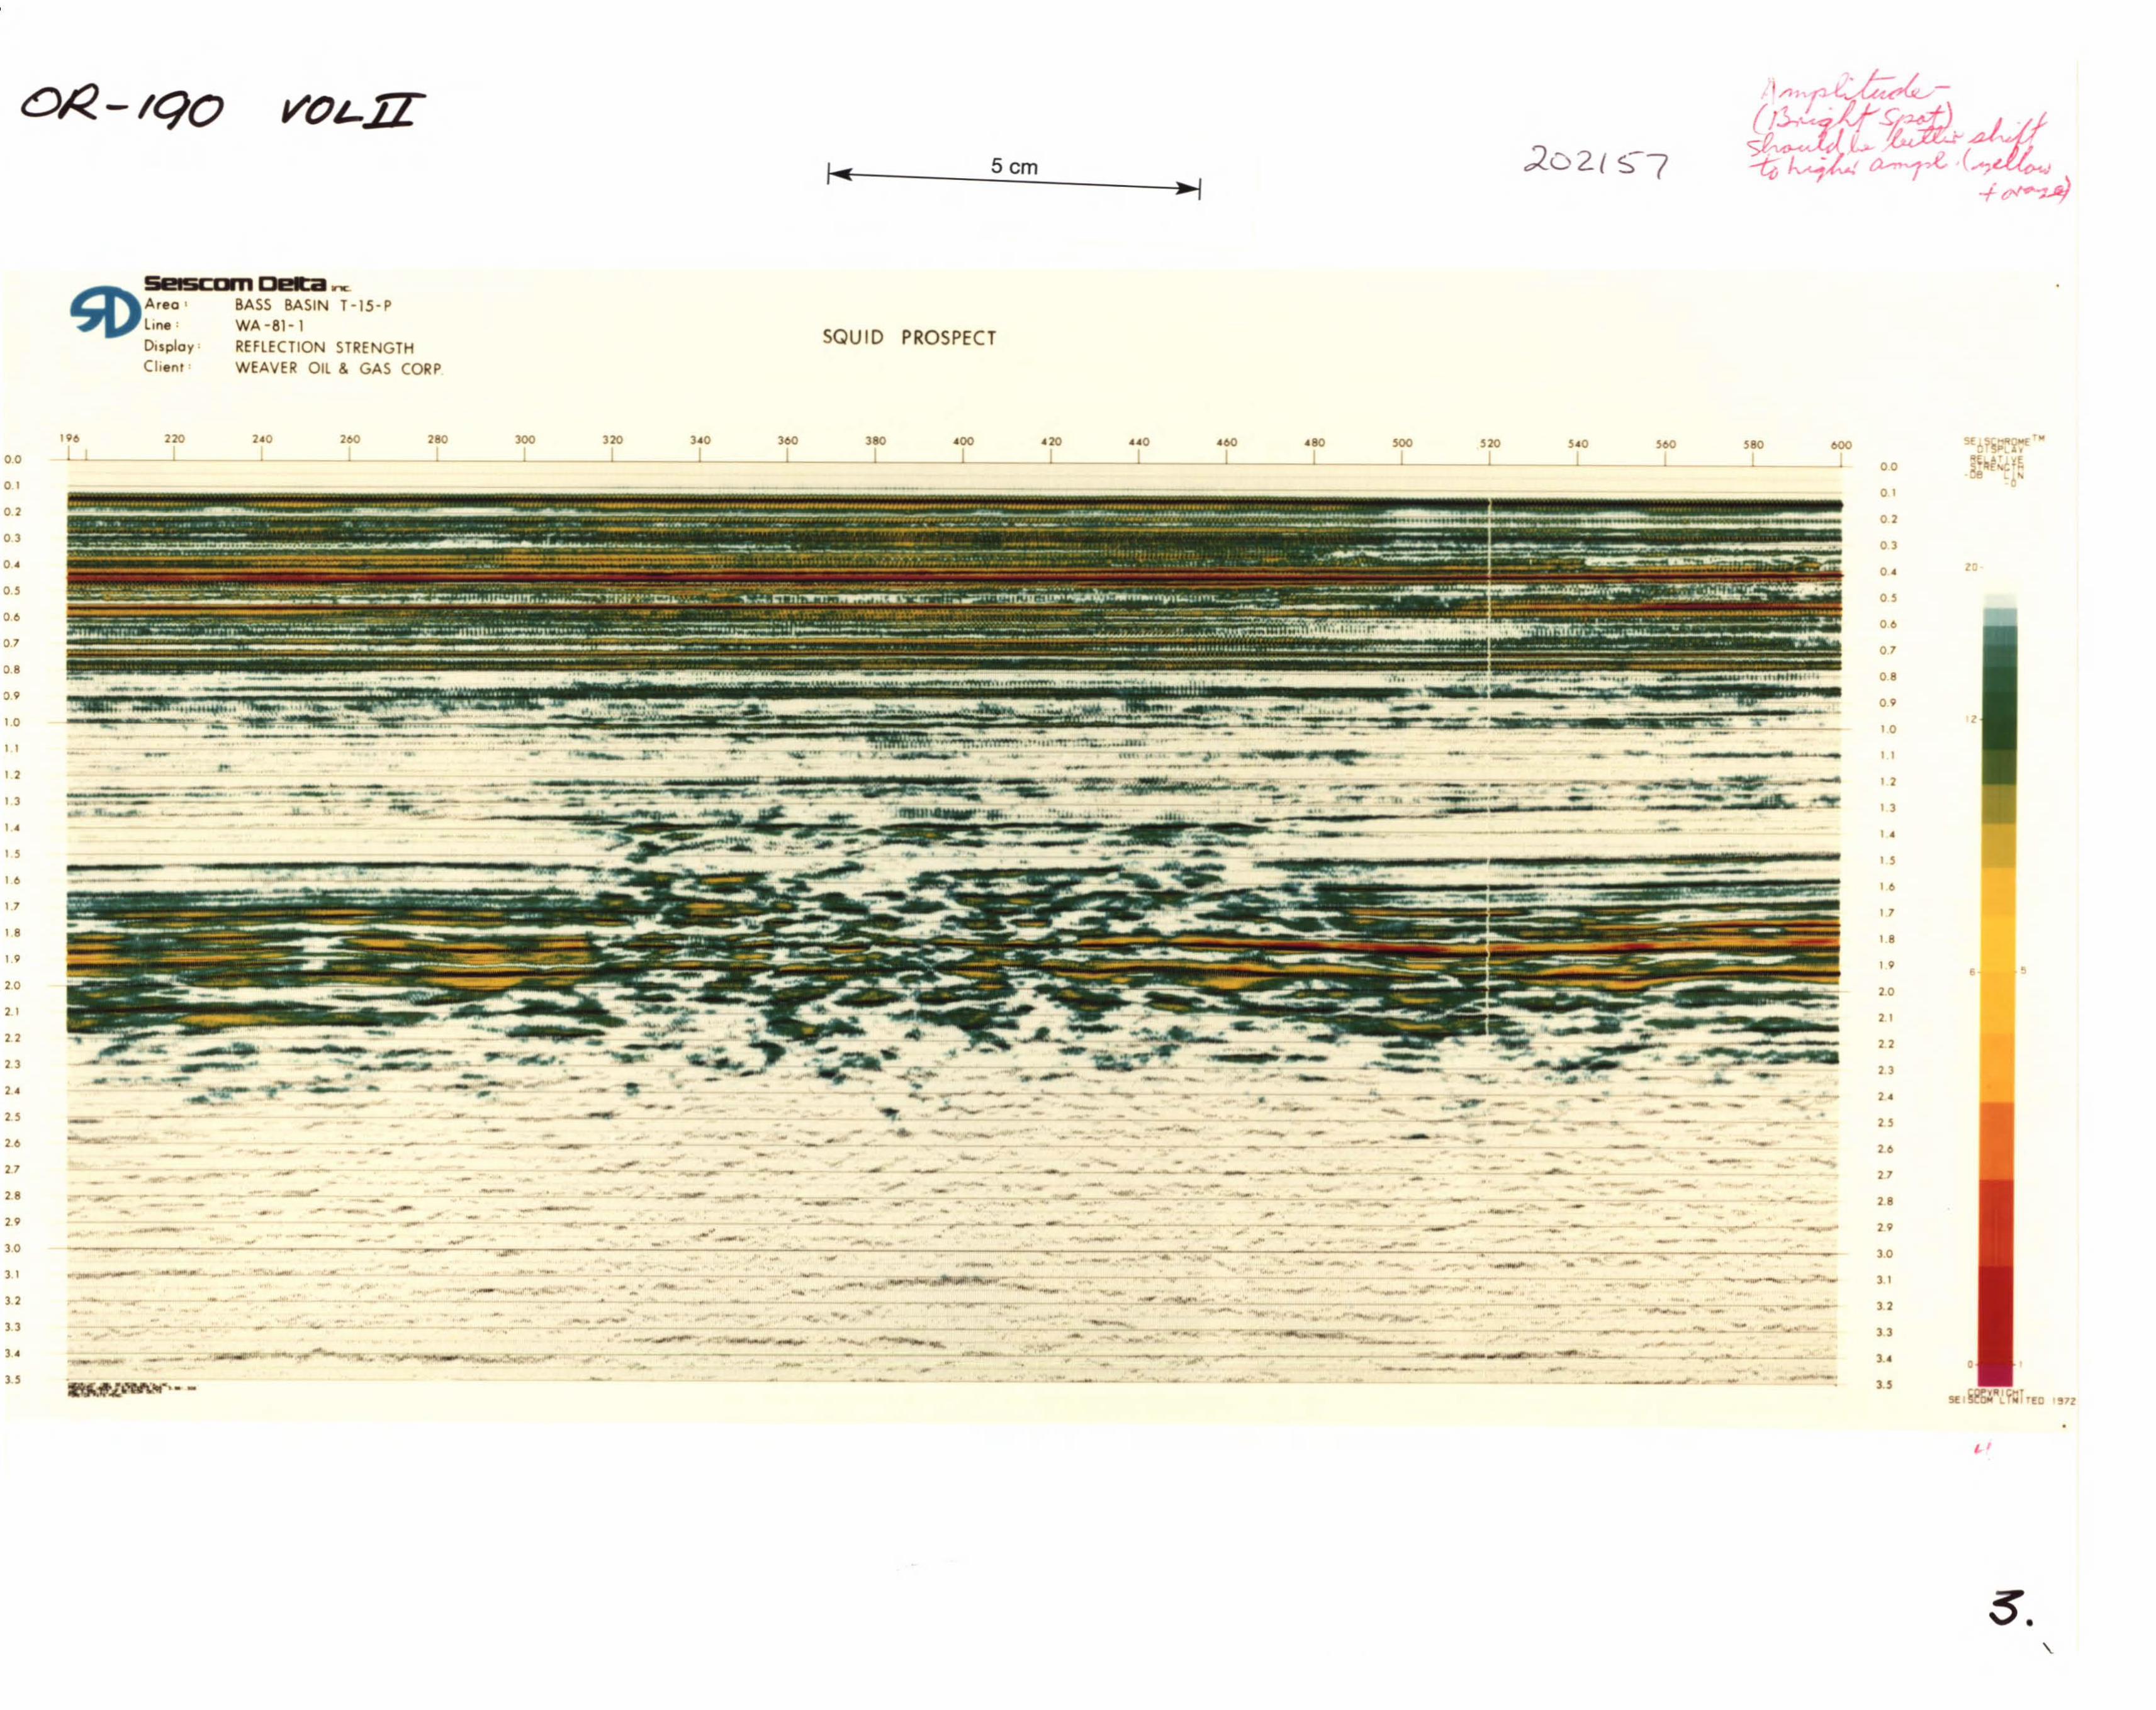
VOL1IL.- 5 emr-:-----~~______,~
.202{ S7
Area
line:Display:
C1.ent
BASS BASIN T-15- PWA -B1-1
REFLECTION STRENGTH
WEAVER OIL & GAS CORP
SQUID PROSPECT
•
'12
-.
1
•
•
lO
COfO.,,, I eMT5(, sec UNI TfO
00
o 1
02
03
O'
oe
"
I 2
06
22
01
1 ,
1 1
I 6
21
1 e
3
I 9
'0
09
23
21
20
30
2.
26
3 1
0'
29
3 ,
..
33
,e
•
•
•
• ••-
.--
"_.----
.
600
at'
••
--
...~.. "",,' -•..
-
'80
•
-
..---'_.--
-
--
.-
-•--
..
-
--....
--.
•
•
-
-'-
-•
-_-.III-
-_.
•
,
--._.. ~-::_..
-
--
-
.. ---
-
.....,.---
-
•--
.......
:::::.'::""."'-~. ~..,~=-..~--- - ___".J.,~"
,
•
..
-
-
--
-;:..:;:';:-:" - .•~-::..-;::.3~;:':'.. •. :.:: - 0"-
-•
• ••
..
-
•
... '-._...-
-
--
----
- .
- -- - -,,---"',
-
-
• 60 dO SOO 520 S'O 560_I IL--__I I'-_---'I I_
--:.:;?~':'._--
•-- ..
••
--
~-,_.-~ -
-
.-
"0_1,-_
---'0'_._-_~---
-
..
-
--•- -
-.----
''',,,,,,_..-
..00 410_IL--__I_
-
~::;~r.;"'~: ..::11~.~ ...-.JI .""", I •--
--_. -. .'......----
-
•
-•
-
-
380_ 1_-
,,,. ,"'" ~ ".",
•
•--•
-...<•
---
-
••
--
•
'..... ."--'-•
_~ oJ I "''''._:.~:.:-'' _.
-
••
... _ '" • If'~_•. '.
•
•
-_...---.
........ ...........
-
-"..---,_0"-.
-
_-....._..-
-
•
•-
..
-• I.'
. .........
.
-
••
•
•
..
-
•-
--
. ..
•
-
•
280 300 320 3AO 360_--'I I__--'I I__IL.-
-
- ...··0•• -
-
•
-
•
-
--
•
..
•
260
_ 1-
--
•
-
-.•"'-''''-
-
...
-
-.
--
--- -
------
..
-
...
..
--
...............,....,)
-
196 210 2.0U'-- 1"-- .1..1_
I 6
J2
I ,
1 e
3 3
2.9
I 3
30
'.e
2.'
20
1 9
1 •
1 0
11
3.
2.2
2. 1
o 1
"
03
O'
oe
1 I
1 2
00
06
0.1
02
09
0'
•
t ,
5.\.
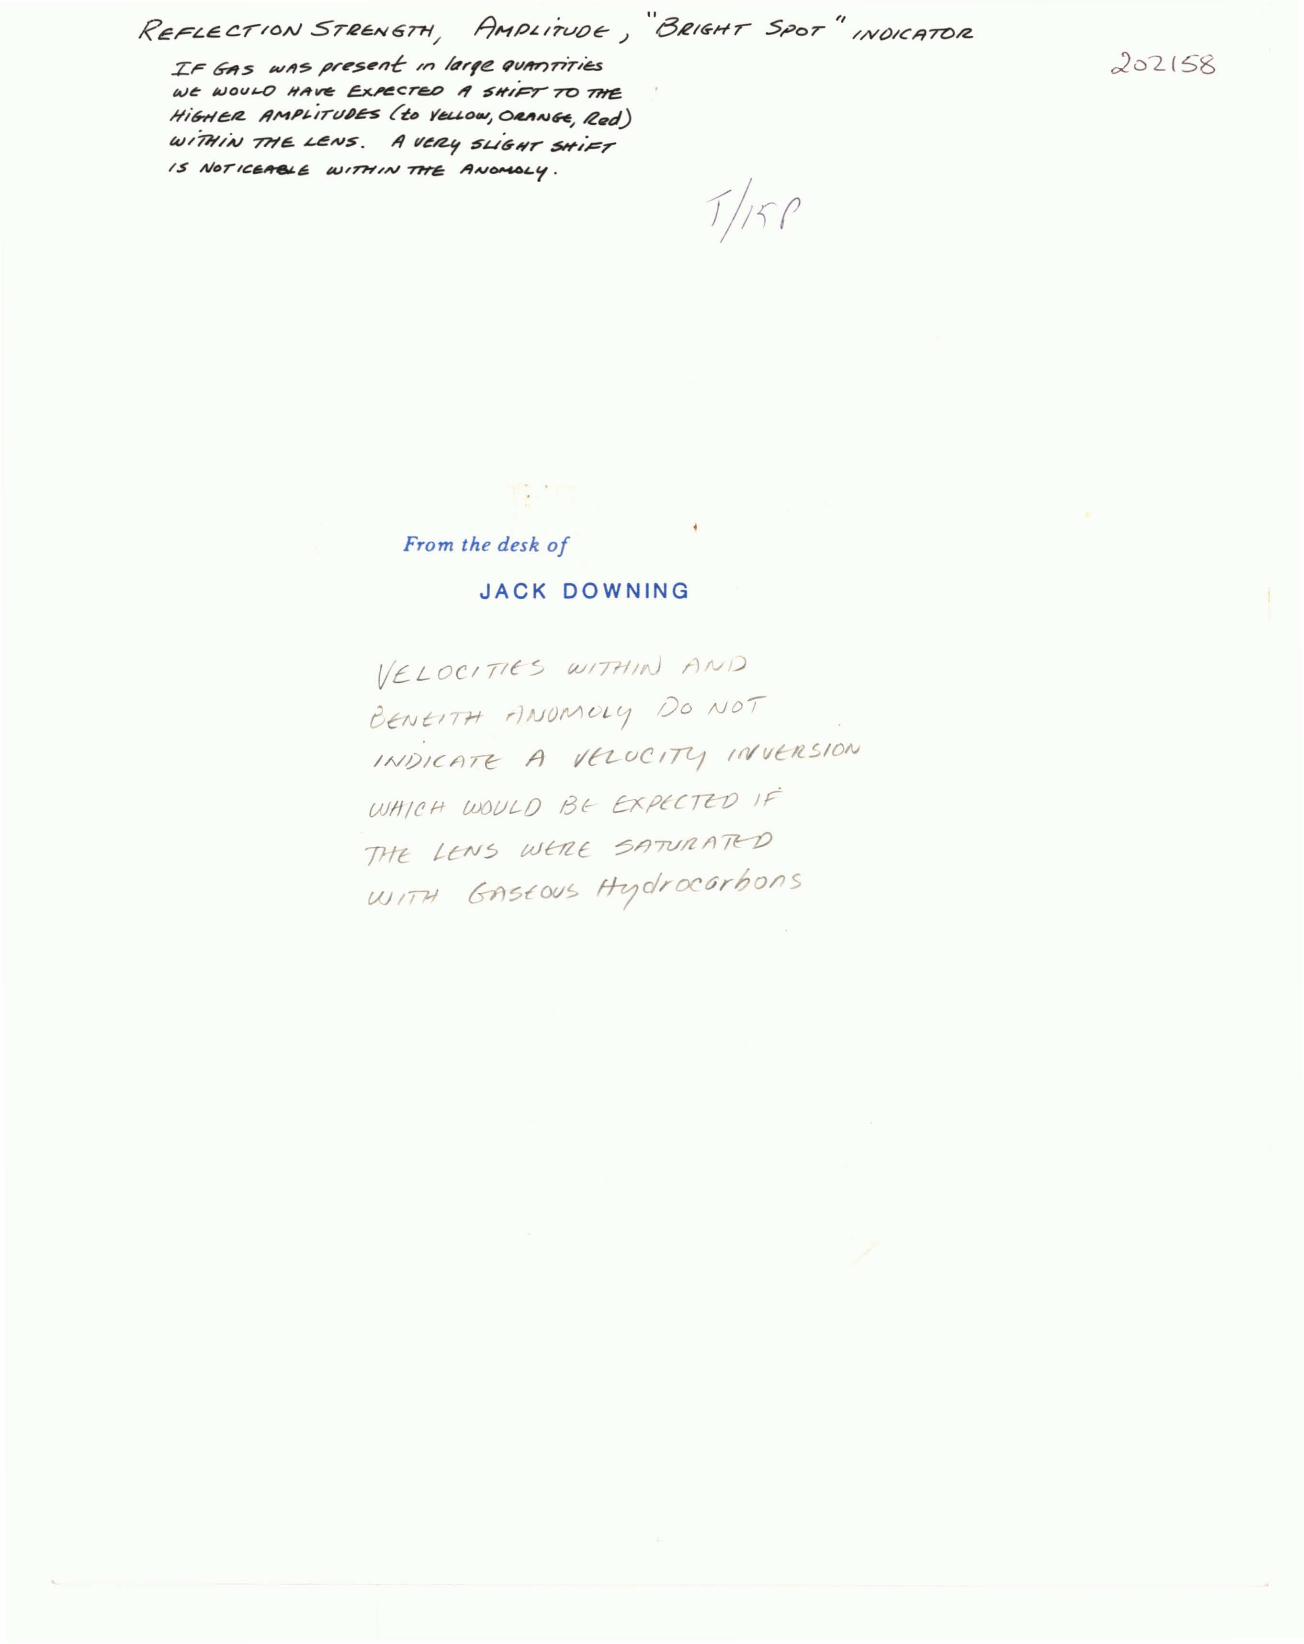
PerLe: c.r/CMJ SrReN67?i/ I1HP~ /7-VO& .)
IF 6715 _/fS ~/"$'/1C m krfe fi1VI'1'r)77T/~
w~ /CJov/-O H""~ ~creo '" ~H/P'r"70 7JYt!E;
1I/~el2. /lMPJ.irv~.es ct., Y4U0-'J oc"A/lfo!, ~gd)
{,(J17J,-/A./ ~6. .t..bvS. 1'1 Vl!~ 5~./G""r :5#"/F7"
IS /tIorIC~6. I4.JIr1"1'NV -nnE: AIV_LY.
From the desk of
020'2/58
JACK DOWNING
Vt: L oc I TIC ~ WITIIIf') i) t"" ~
r3CNt.I7H r) uOt/lv/,V; Do NO!
/ A/0 Ie/) It::: A t/f't-. u C I 77--/ / tV r/t It. 5-10/1.1
WII/ff+ MtJt-O 13E-- ~'p~creo IF
pit LcN~ WhZt ?/)7V/Z/l~/
W ITU ("d)~c()(/> fh;d1'OC6r1?O/I S
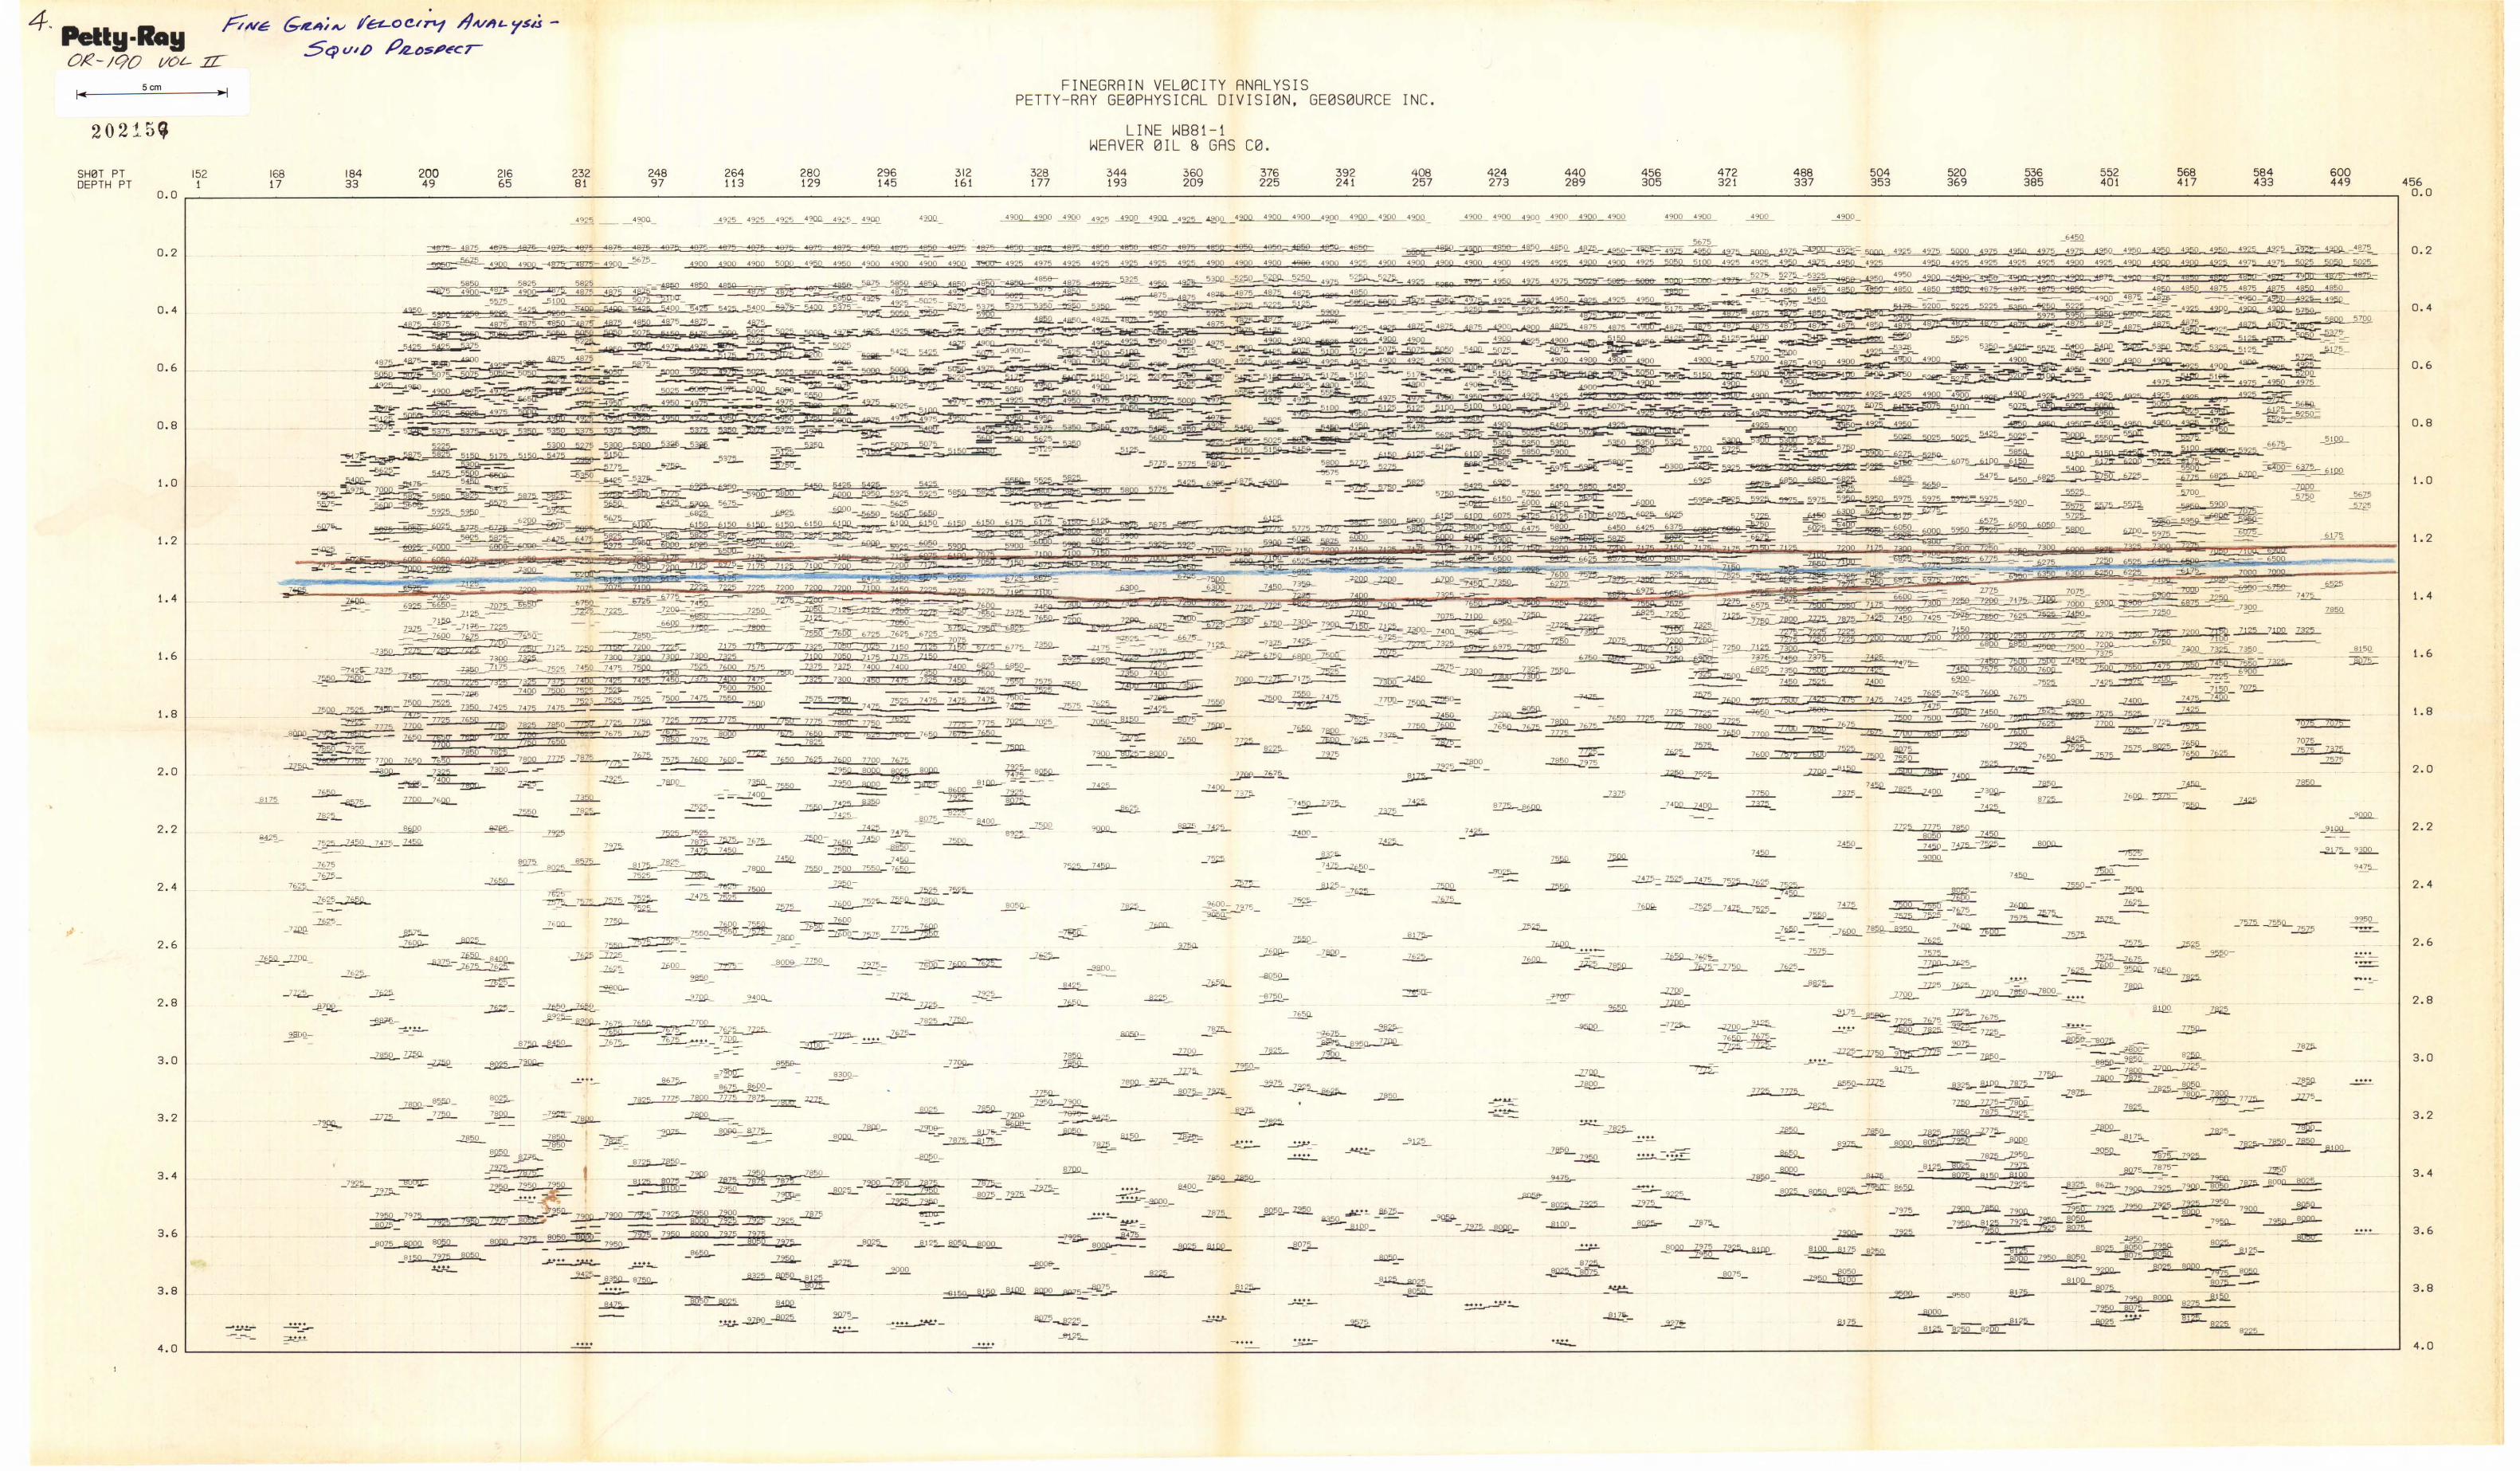
•l"ce-oe/1"l1 AA/A'- ys,.s
P/L"5.P~Cr
Scm FINEGRAIN VEL0CITY ANALYSISPETTY-RAY GE0PHYSICAL DIVISI0N. GE0S0URCE INC.
20215~ LINE WB81-1WEAVER 0IL B GAS C0.
600449
584433
568417
552401
536385
520369
504353
488337
472321
456305
440289
424273
408257
392241
376225
360209
344193
328177
312161
296145
280129
264113
24897
23281
21665
20049
18433
16817
1521 456, ----, 0.0
0.0
SHeT PTDEPTH PT
4900 4900 4900_
10750.2
0.4
0.6
0.8
1.0
1.2
1.4-
::c!41!"!':ie'=...;41!8117::!5C-~~!l:7<lS'=::'1lI8!i'7!>. =4075
~75 ....:4,,9~"'0'-..:4,,9"'0,.Q_-4875"~
1875 1875
..2.6Z.5 _490L
XVtt- 4~..A-__~87~_
5025 5050 50;?5
4~PU 4§;S 4875
5675
~5
6175
0.2
0.4
0.6
0.8
1.0
1.2
1.4
1.6 1.6
1.81615 7075
1.8
2.0
70l2..-7575 7375
..12...52.0
3.6
2.8
4.0
2.6
3.8
3.0
3.2
3.4
2.4
2.2
9475......
.~
~~
~ -2,.oOIQo-,8;l\0L<2,,5_
7~ 755Q....- ~:..22Z.5
7875 79~
~--
....zf2!l.-- 8175-~-
792~
26W-- .z.?o....7575
7775-/B~7875 7925
71fiO
..JW75--2!75-- - --
~~25~~222-0- 7925~
-- 7950 7905 7925 79502900 7B:i0..1..2QA.... ~95O= 7925 ".§.QJ1.Q. - 72QL
7~~2~~~O§2... -- - _79~ --l.72:95:>lO~-'8"'O~O~0--- ~50 ~5--~___ _2.''"0_ ~ ~
~ ~025 1l950~~ J.1l'-::).~ 7950 8052. --:]p'7~=
- 9?nn ~005 SODO -~ _m5 8llJill.
8~00~ ~ __
7959 800n. 8275 ~I~_7950 807L ~a.. _~ ..:.:.;-.
~50
7775 7850
~ 7850 -J.775.-8059 7952- - .....a01lQ.
78z:L.-Z95!l.8125 E5 .2:1).fL
eQZl 6150 SlOP
BODO
~50
7775
~
....J.E..5__ B.§..2L
2i2P_
7725
-~-
7725
7~
~
~_~ ~.JU'lL8025 _8~8£25. -7%0:: 8650
~o
~....2.95,,0 8100
8OQQ.......L975 7925..--W.PD-- --=:2950
--•••• • ••r-~-
....~
.26D..Q.........!.!..._
.lli!O- W5 7~
...J3!l:>J'- 8025. ~
~7 75
B025
~50
8.125
..=-
-~-....-
7950_
.t..•••--~
8125.---
78Z5......--
••• 1~
- ....
..2).7"
~_=us-8075__~_
B£l5D-
745L
....--~.
7525
---
....-
_-"78,,2,,5,--,,,7750
_~ 7675-~- - ....._~
~ lll2.5!L 8125~
....2.2.50 7850IB75 7875::JiL .
-2.9~ 7900.=-----
7850_
79nn
tYeE ---8725
7525 75257875..~ 2.6z:l-7475 7450
~~~ :::L22U.....
-- -~ 7500-2475 -~
~_8~OO_
...2'~8O:25>-...;'U'~7::;5-L78!ll080L.!.7J.7L75"-...L7875 =zm... 1.llL
....-....---9425_
-- .J!.3~ 822l!-
~...
8075 85758025
8050
7850"",,-850
~_~V5-
7975 :t.JI2£ t~:li... '950 '950 I
---'-'-:-; ~a....7950 79'27~5-::~!lL::J~tL"7.:!Z?=-8o!m'Eilri~~__2.5 7990 7900 :ry!2S- 7925 -U50 L990.~_ - )925 j95Q ZlL":J _ _ __ .allQQ.......l2t2 :::Jii~
_.!l2C.1l..-'7",9",7..0,- 8056 1mf&- ~_ J2~Q BgDo _7975JV?BODO - ~==~=2792!5iJQ"": -WQ
_8~
_80,!.752..-.Iljap~0~Q
~O
_" 5~2"'5L..-'7"'4"'5!!.0_7!;4!.£75_ l.1.2.Q.
2)lD0-
...2fi!....5_7§]5_
76~~
-262",5,_.t-.z02"""Q....
....-----.....:----~-
3.6
3.0
2.6
3.8
3.2
2.8
3.4
2.4
4.0
2.2
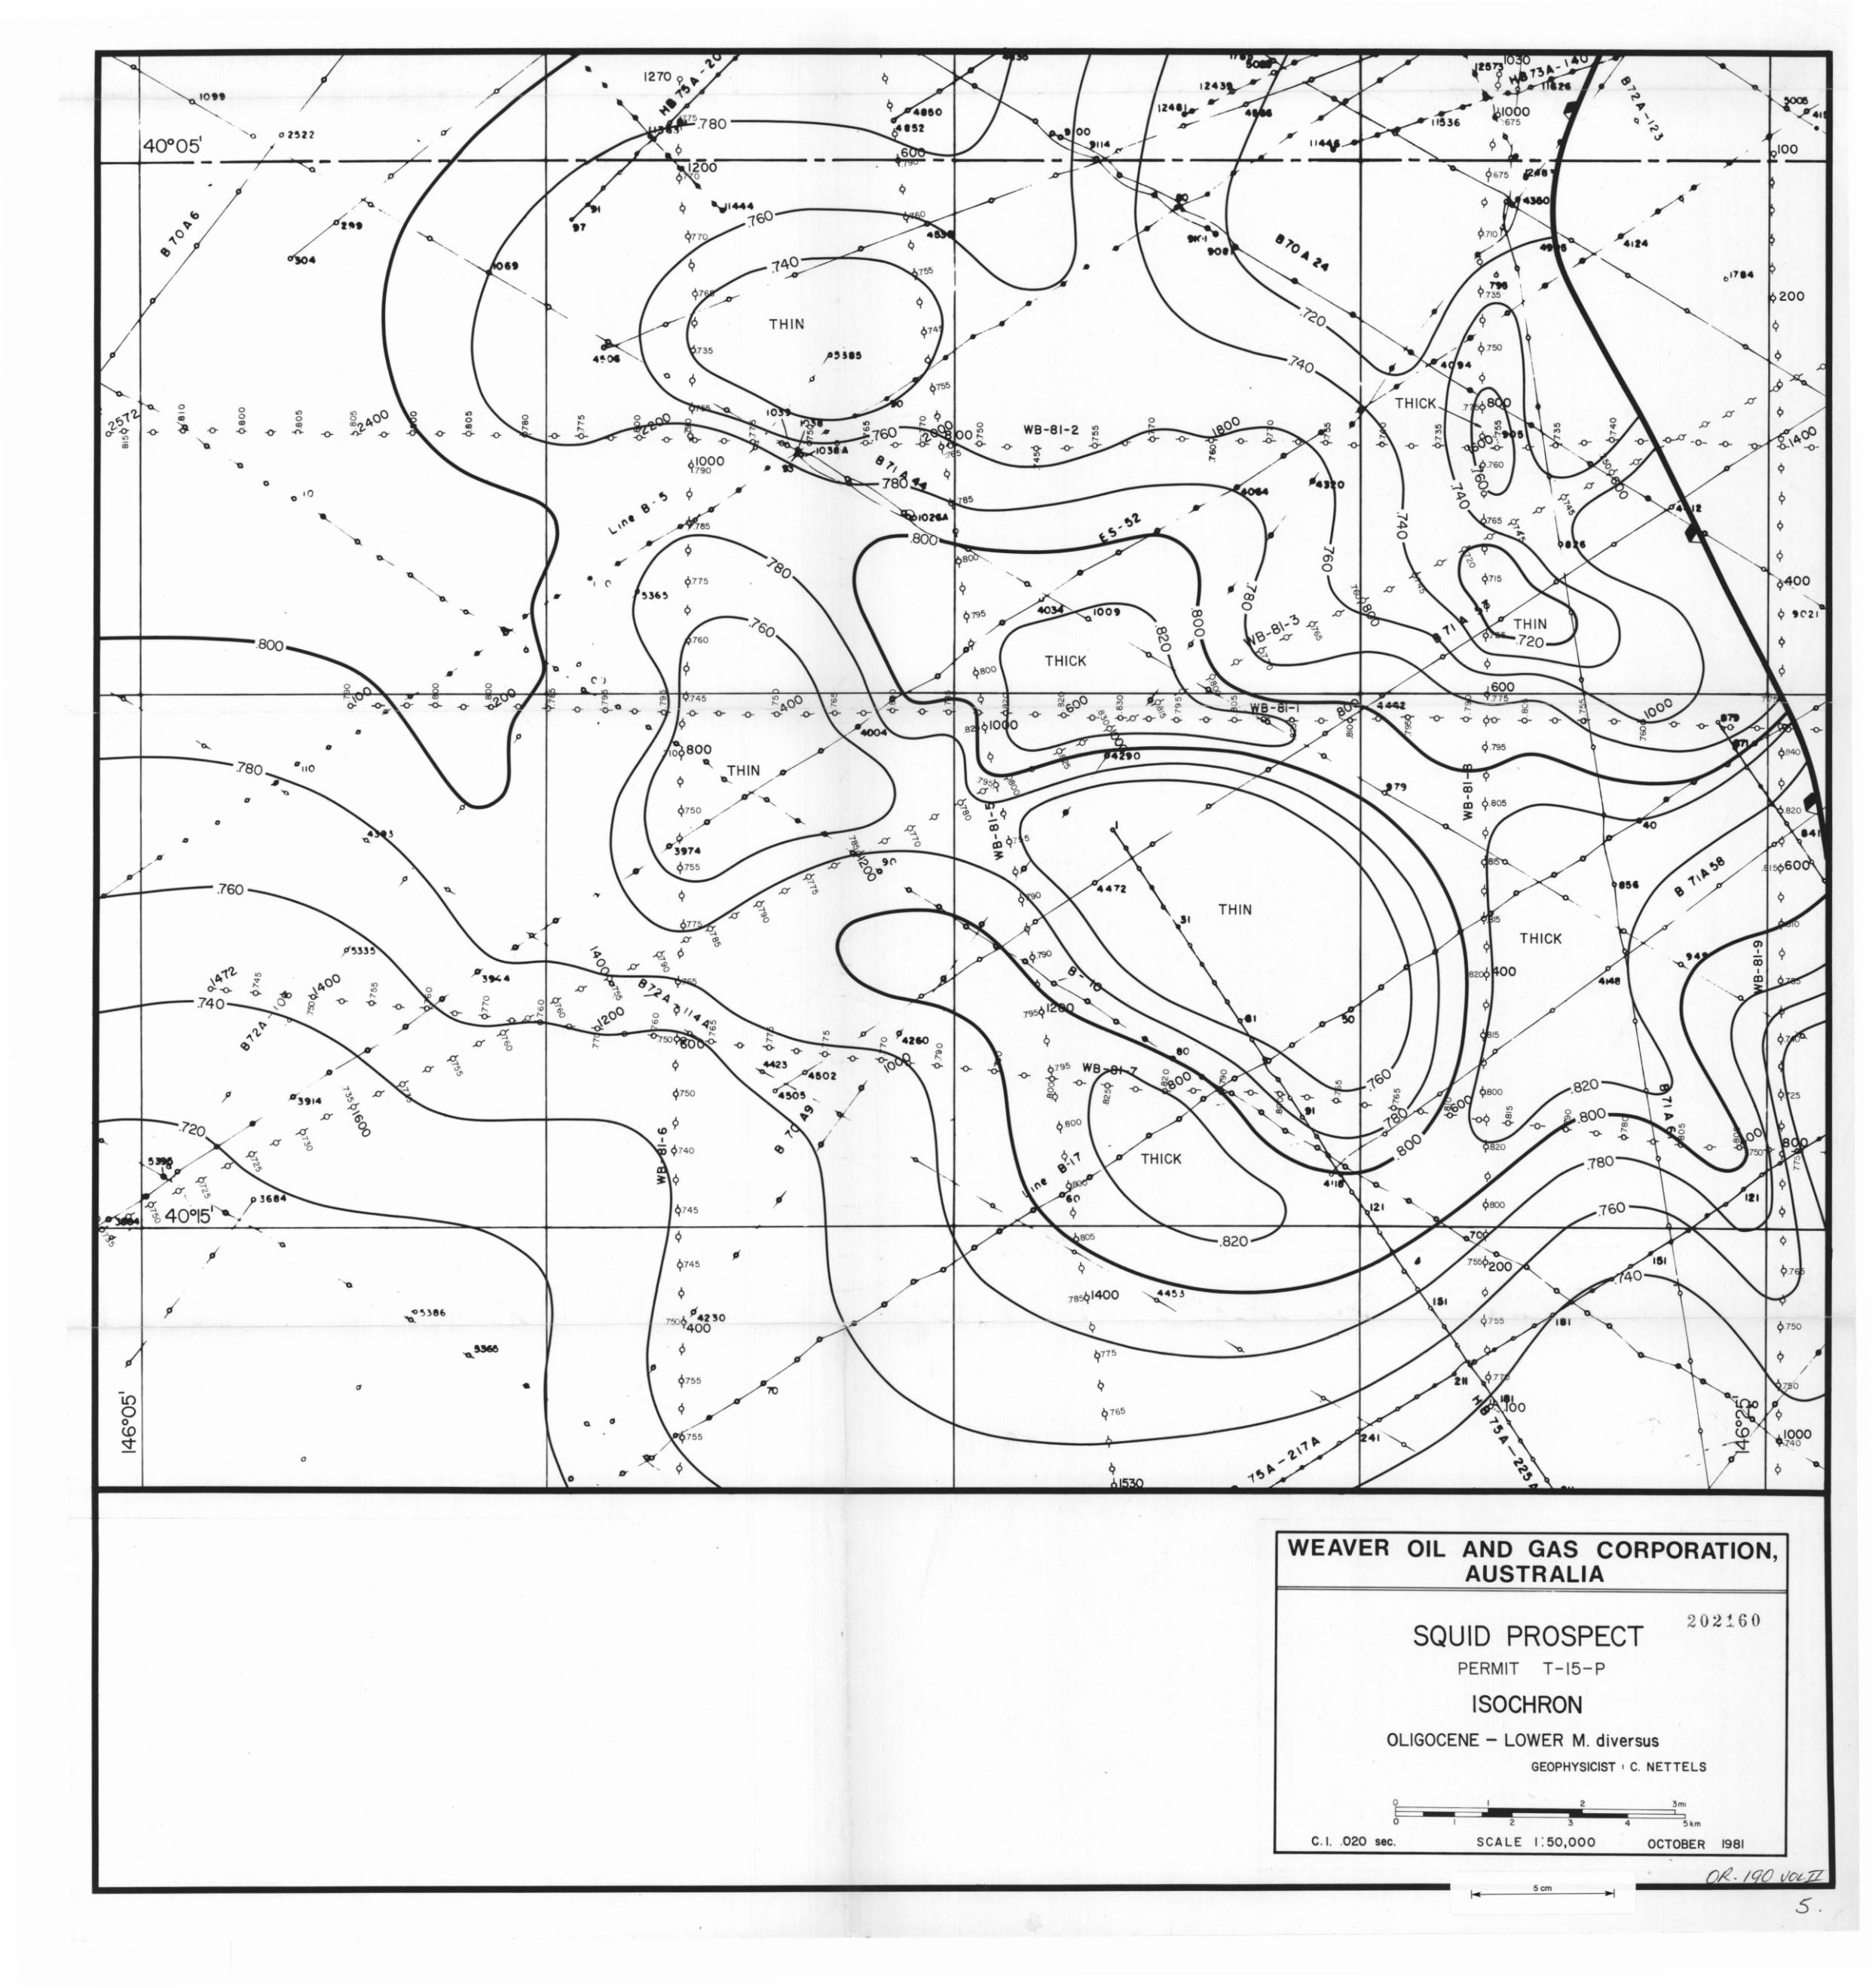
/
00
¢
¢
9750
¢ tC'll
.820
THICK
q775 -------~--
~~~-+-- - ---+-.....- - ---+-- - ~~_--l/l- - +---- - --~....r'-ilia
q600
I
THIN
1'0
.---- - ---...!~"::_:-;::=---
AIOOO'1"790
q 'wI"''' _-----~~ ___JoO
~770
~745
¢
9
"noA 4130'1'400
o
'"1270 9 ..'~
~.
75.780 ---------~~
o
"
....
........
C 'J
s-O
., C'
0.
"
o
o~<D 6'.... 0
o........-0-
ono
'"-0-
''0
" 1~12
0. '0
ono
'"-0- -<'i-
0.
.800 ---
oo
'"-<>
.I /----1')~...) <Q~ - ---7~- ~,-----+--
,
1099
I
o
.780
I
"
lOoo<.0~
~::::"-r--- .760
WEAVER OIL AND GAS CORPORATION,AUSTRALIA
SQUID PROSPECTPERMIT T-15-P
202!.60
ISOCHRONOLIGOCENE - LOWER M. diversus
GEOPHYSICIST' C. NETTELS
oIo 2 3
2
4i !
5~m
C. I. .020 sec. seA LEI: 50,000 OCTOBER 1981
5cm
5.
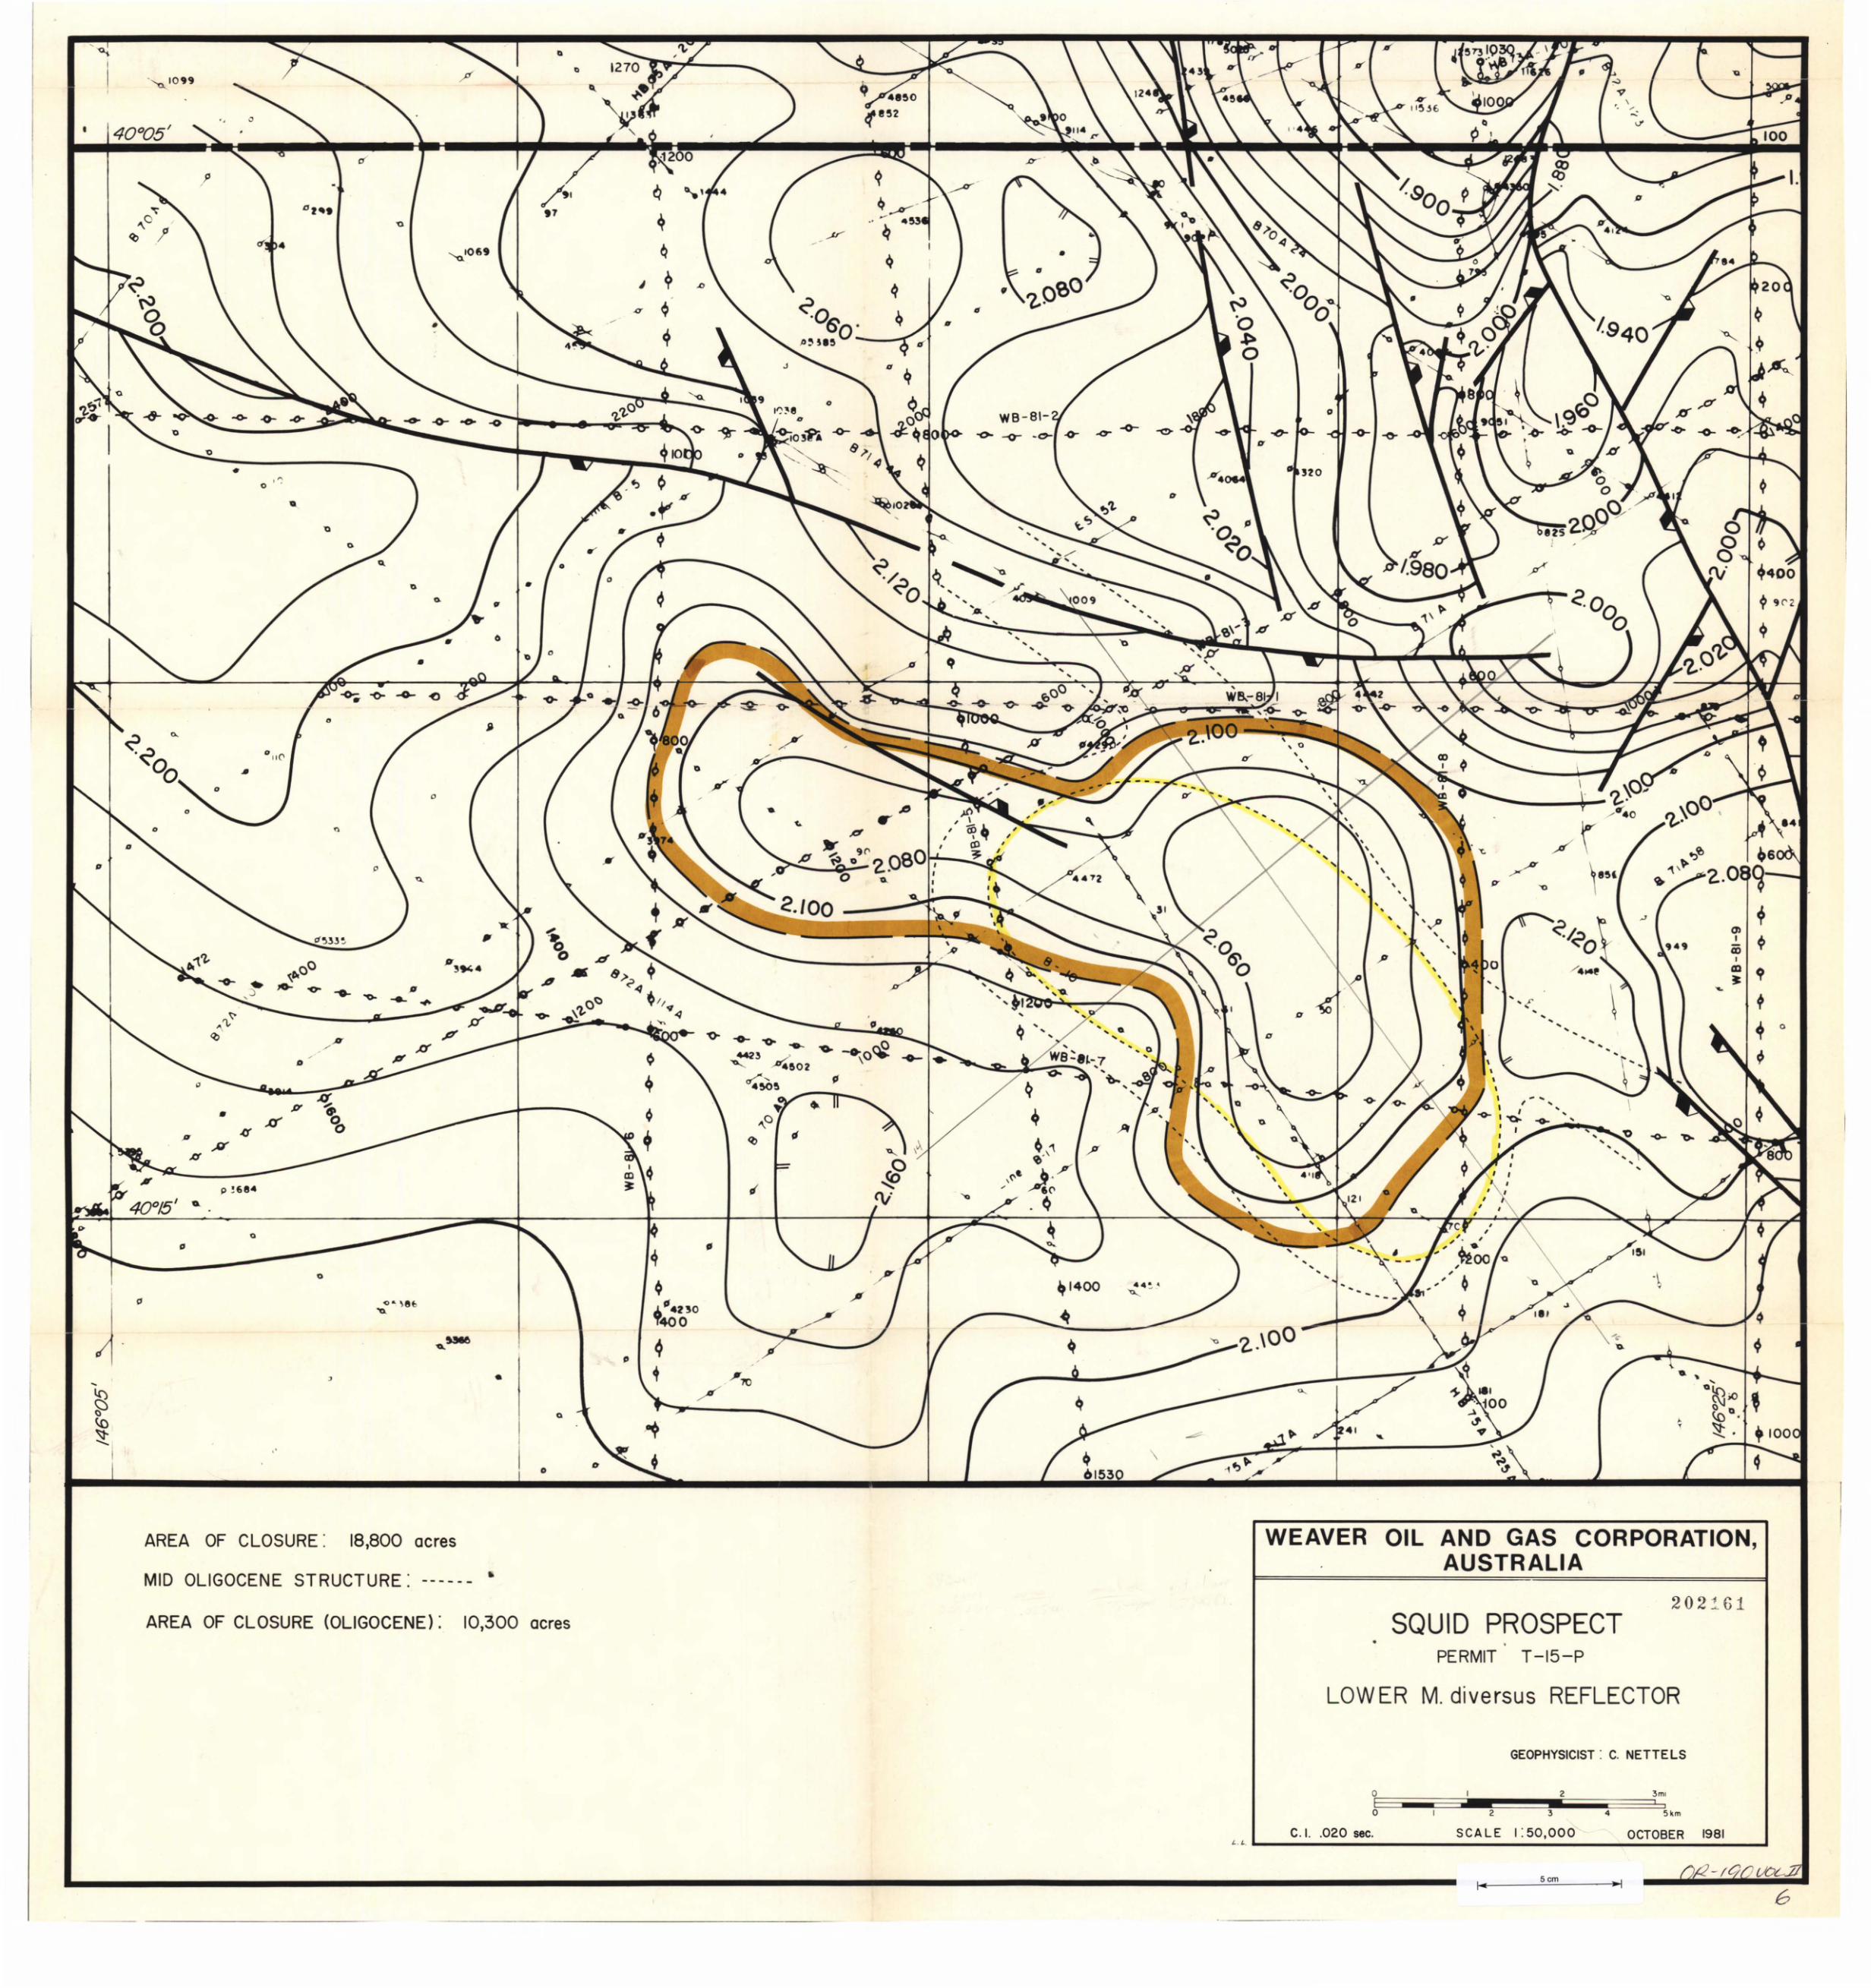
...,..Q
#'
III #'
'''0...1099I
~e52'. ~
"..:
• 40°051 V'
,P ~q!.--o---D2_'
~ .' 453q'0.1069 ~ •
9II
J 'l,proOq ¢ ~ fI
~ ·O~ •~ P'§lfjO' 11'
J II
?-~1 rz.'z.°0
I':'~eWB-81-
gcr'- -e> -0- .0- .- -0- __
-0.,
I -0- -<>-D'
1) u
..0'.
AREA OF CLOSURE: 18,800 acres
MID OLIGOCENE STRUCTURE: ------ •
AREA OF CLOSURE (OLIGOCENE): 10,300 acres
WEAVER OIL AND GAS CORPORATION,AUSTRALIA
202161SQUID PROSPECT
•PERMIT T -15-P
LOWER M. diversus REFLECTOR
GEOPHYSICIST: C. NETTELS
2oIo 2 4
! j
5km
C.1. .020 sec. SCALE I :50,000 OCTOBER 1981L. L. L.... ......: .:.:..:..:.::.:.:..;.......;.:.:.;_....J
5cm
6
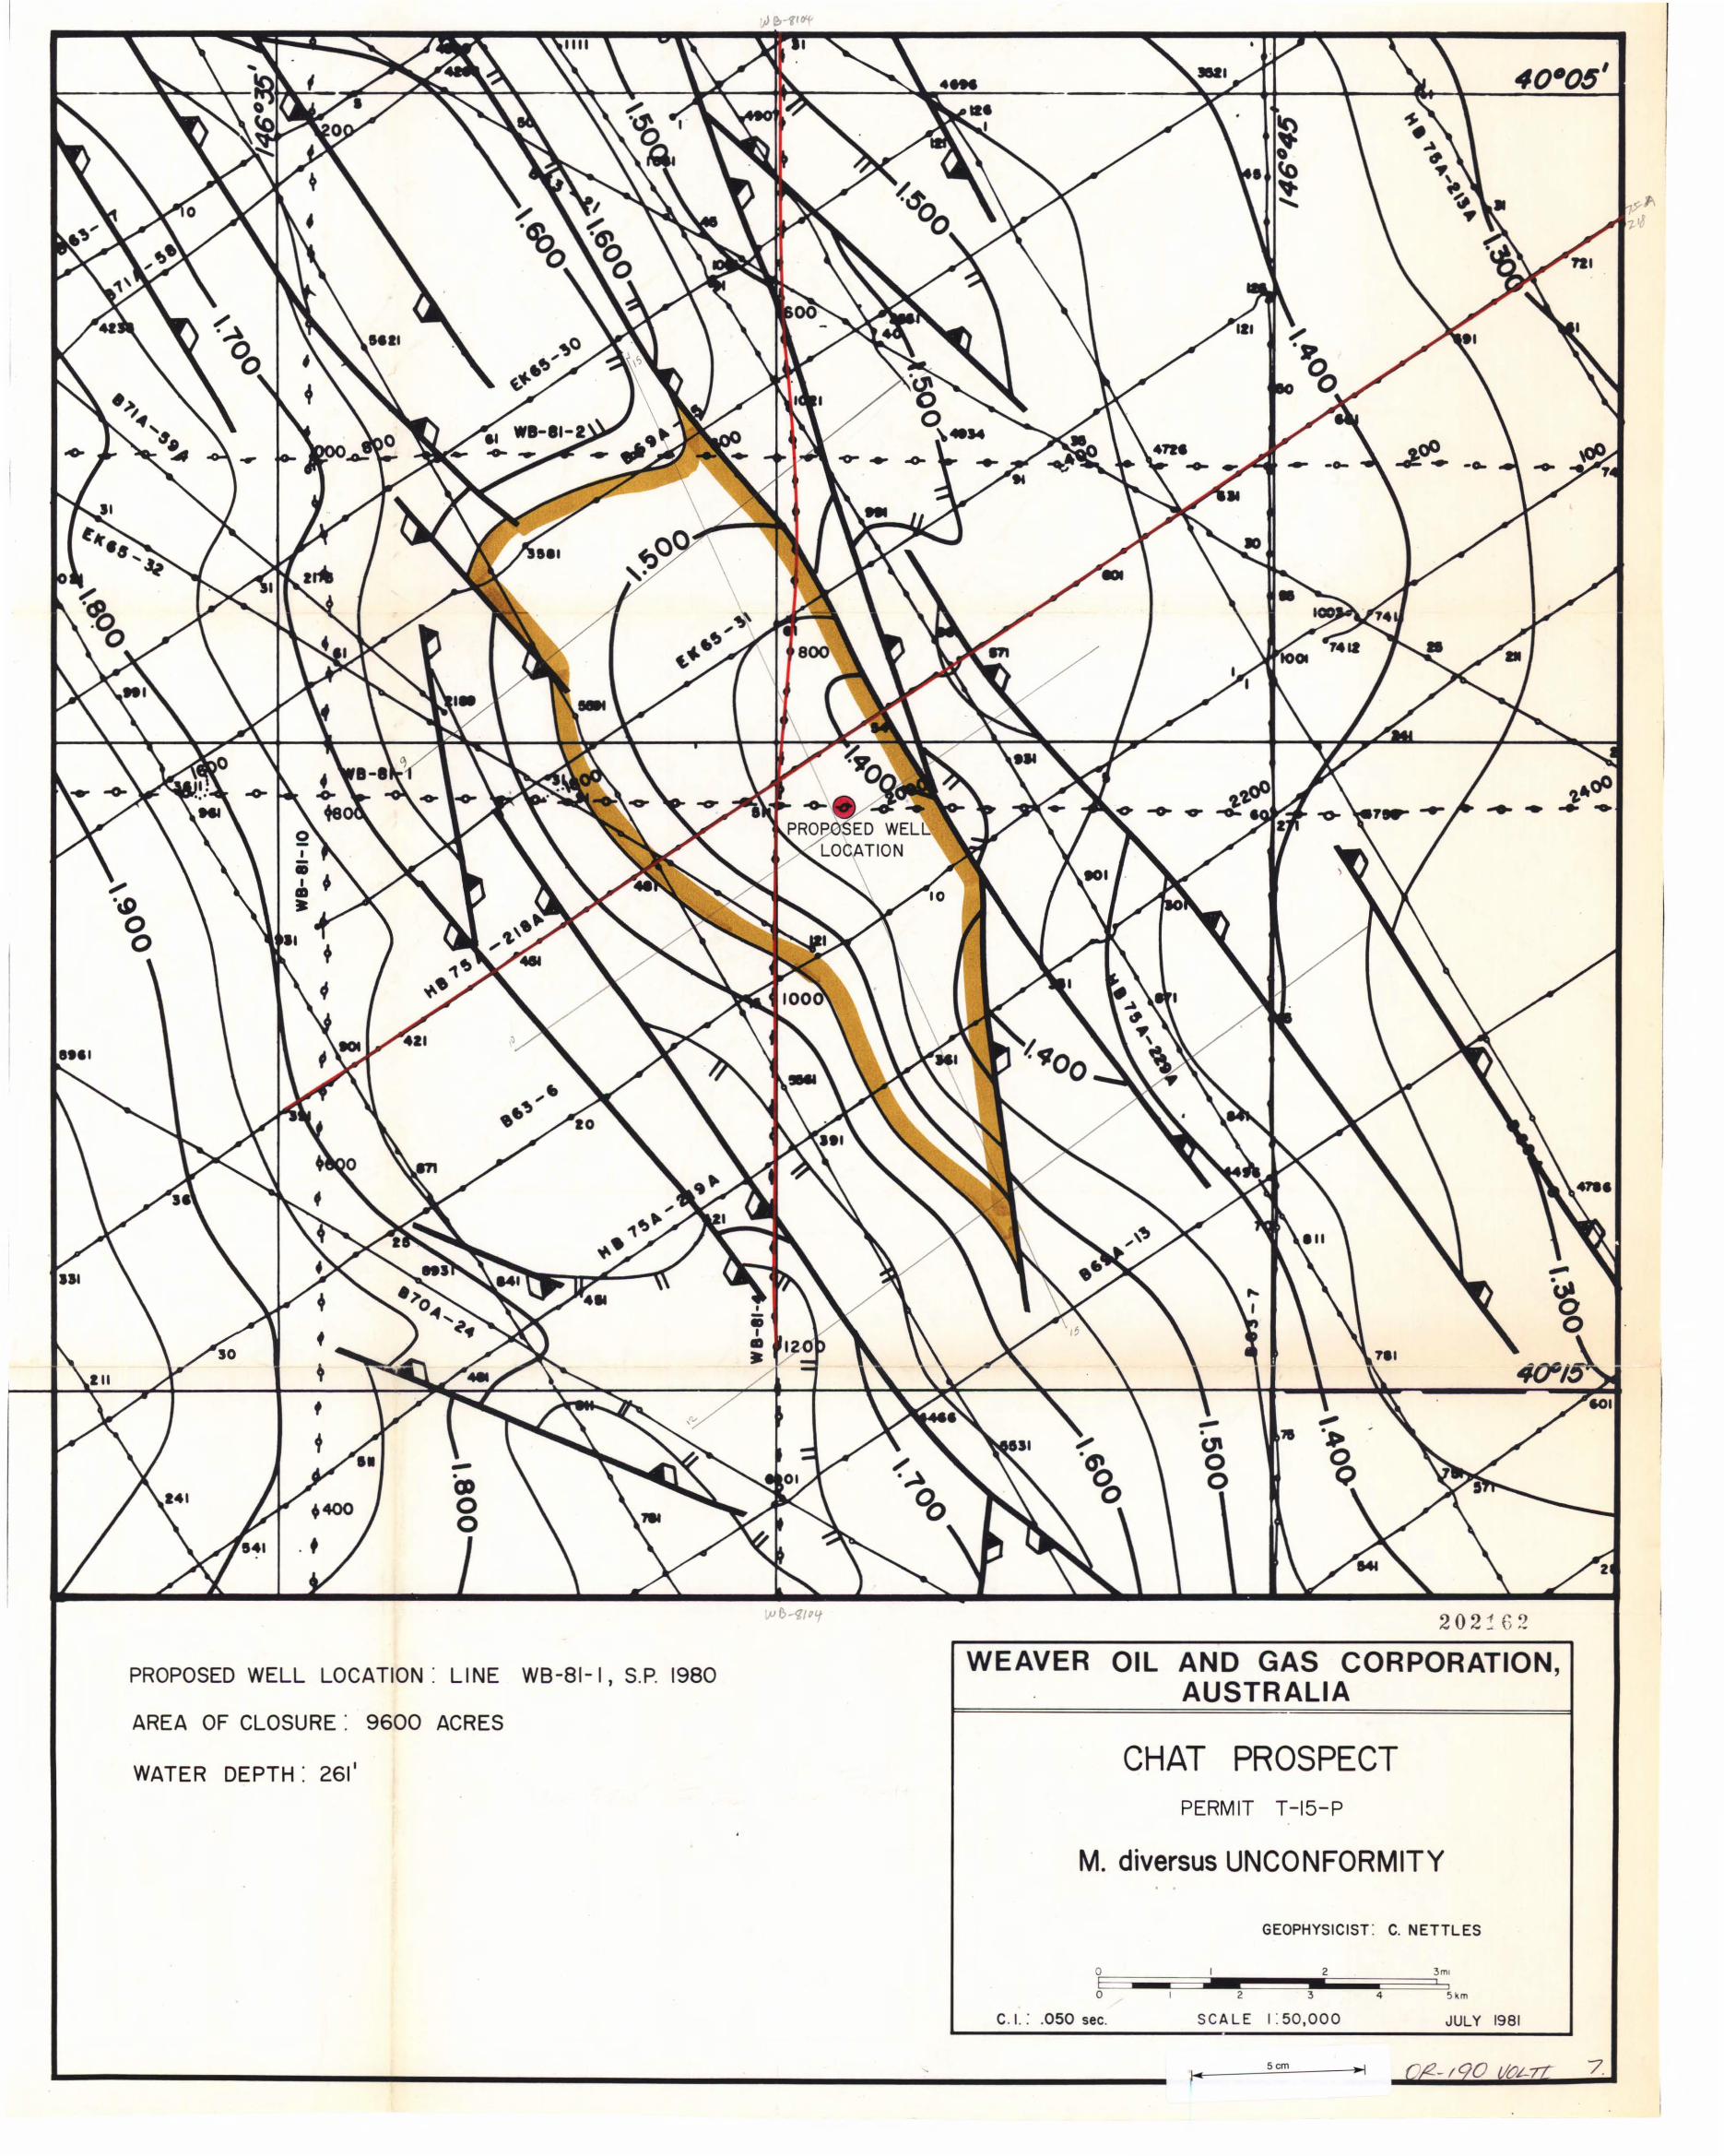
"...,poo
f
+f
(-
+filii'
11 .,s. -". U'
• -(~.~ 0 ~(J) ~ 0
0 °00
••
'I."cP..... - .. -
202~62
PROPOSED WELL LOCATION: LINE WB-81-1, S.P. 1980
AREA OF CLOSURE: 9600 ACRES
WATER DEPTH: 2611
WEAVER OIL AND GAS CORPORATION,AUSTRALIA
CHAT PROSPECTPERMIT T-15-P
M. diversus UNCONFORMITY
oIo
C. I.: .050 sec.
GEOPHYSICIST: C. NETTLES
2 3mli
I
2 3 4 5km
SCALE 1:50,000 JULY 1981
5cm --I/.. 7.