2018INTEGRATED ANNUAL REPORT

N E C S A A N N U A L R E P O R T 2 0 1 7 / 1 8 002 G E N E R A L I N F O R M A T I O N 1

N E C S A A N N U A L R E P O R T 2 0 1 7 / 1 8 1 G E N E R A L I N F O R M A T I O N 1
T A B L E O F C O N T E N T S
1 GENERAL INFORMATION
2
About this Integrated Annual Report 3
Necsa’s Origins 4
Abbreviations and Acronyms 5
Necsa Strategy 6
Organisational Structure 8
2 FOREWORD OF THE CHAIRPERSON
12
3 CEO’S OVERVIEW
15
4 HIGHLIGHTS OF 2017/18
18
5 KEY PERFORMANCE INFORMATION
24
Statement of Responsibility for Performance Information 25
Auditor-General’s Report: Predetermined Objectives 26
Overview of Public Entity’s Performance 26
Strategic Outcome Oriented Goals 27
Performance Information by Programme Cluster 28
Summary of Financial Information 32
6 NECSA DIVISIONS AND KEY SUBSIDIARIES
36
Group Functions 37
Chief Technology Office 45
Nuclear Compliance and Services 60
Pelindaba Enterprise 63
Business Development and Innovation 64
Finance Division 67
Pelchem SOC Ltd 70
NTP Radioisotopes SOC Ltd 71
7HUMAN RESOURCES & REAL ESTATE ASSET MANAGEMENT
74
Introduction 75
Staff Financial Statistics 76
Staff Social Statistics 79
Staff Development 84
Key Human Resources Challenges 87
8 GOVERNANCE 88
Accounting Authority – Necsa Board 89
Committees of the Board 94
Executive Management Committee - EXCO 98
Risk Management 101
9 SUSTAINABILITY REPORT 104
Economic Sustainability 105
Social Sustainability 106
Environmental Sustainability 107
10 FINANCIAL REPORT
108
General Information 110
Director’s Responsibilities and Approval 111
Report of the Audit and Risk Committee 112
Directors’ Report 114
Independent Auditor’s Report 120
Consolidated Statement of Financial Position 127
Consolidated Statement of Comprehensive Income 130
Consolidated Statement of Changes in Equity 132
Consolidated Statement of Cash Flows 134
Accounting Policies 135
Notes to the Annual Financial Statements 152
11 KNOWLEDGE DISSEMINATION
244
Articles Published in ISI Listed Journals 245

N E C S A A N N U A L R E P O R T 2 0 1 7 / 1 8 2 G E N E R A L I N F O R M A T I O N 1
G E N E R A L I N F O R M A T I O N
11
N E C S A A N N U A L R E P O R T 2 0 1 7 / 1 8 3 G E N E R A L I N F O R M A T I O N 1
ABOUT THIS INTEGRATEDANNUAL REPORTSignificant Frameworks Applied
Complementary national and international frameworks were used to evaluate material matters included in this report. The primary guidance is from the Treasury Guide on the Preparation of the Annual Report for Public Entities, April 2013. This was enhanced with the requirements from the International Integrated Reporting Council’s International Integrated Reporting Framework, December 2013. Finally, care was exercised to address all material topics covered in the previous annual report.
Guidance was also taken from the King III Report on Corporate Governance, September 2009 and an assessment of compliance to the King III Report is presented in the chapter on Governance. The performance of the Corporation in terms of sustainable development is examined in Chapter 9.
The reporting of Risk Management was informed by Treasury’s Public Sector Risk Management Framework as well as the ISO 31000 Standard on Risk Management.
The Annual Financial Statements are prepared in accordance with the International Financial Reporting Standards (IFRS), the Companies Act of 2008, as amended, and the Public Finance Management Act (PFMA) of 1999.
Materiality Determination Process
Material matters for inclusion in this Integrated Annual Report are in large part prescribed by the Treasury Guide on the Preparation of the Annual Report for Public Entities. Within this framework, department heads are expected to contribute significant information concerning their areas of responsibility. Internal reviewers evaluated the report for overall balance and prioritisation of material issues.
Scope and Reporting Boundary
This Integrated Annual Report covers the operations of the Necsa Group for the financial year beginning 1 April 2017 and ending 31 March 2018. The Necsa Group – as financial reporting entity - consists of Necsa SOC Ltd and its subsidiaries, most notably NTP Radioisotopes SOC Ltd and Pelchem SOC Ltd. Other subsidiaries, as well as those of NTP Radioisotopes SOC Ltd and Pelchem SOC Ltd are reported on to the extent that they materially affect the
Necsa Group. The organisational structure in terms of both Divisions and Programme Clusters is presented on pages 8,9 and 10.
Structure of Report
This report has been significantly restructured compared to previous editions. This was necessitated in order to comply with the reporting frameworks discussed above while improving logical flow of information.
Assurance Statement
The Board Audit and Risk Committee has evaluated the Annual Financial Statements as well as performance information for the year ended 31 March 2018. Additionally, the Committee reviewed the reports of the Group’s Internal Audit Department, the Auditor-General’s Management report and Management’s response thereto, as well as any significant adjustments resulting and has recommended the approval of the Annual Financial Statements to the Board in the separate Annual Financial Statements.
The Auditor-General of South Africa has audited the Annual Financial Statements, performance against predetermined objectives, compliance with legislation as well as internal controls of the Necsa Group, see separate Annual Financial Statements.
Directors’ Responsibility and Approval
The Necsa Board of Directors acknowledges their respon-sibility to ensure the integrity of the 2017/18 Integrated Annual Report. The Board confirms that the report addresses all material issues and fairly presents the performance of the Necsa Group in accordance with the International Integrated Reporting Framework. The Board approved the 2017/18 Integrated Annual Report in the separate Annual Financial Statements.
Enquiries
Any enquiries regarding this report can be directed to the General Manager: Finance at +27 12 305 5678/5707 or [email protected]

N E C S A A N N U A L R E P O R T 2 0 1 7 / 1 8 4 G E N E R A L I N F O R M A T I O N 1
NECSA’S ORIGINSOn 13 August 1944, the United Kingdom first requested South Africa’s assistance in obtaining uranium for the Manhattan Project. After World War II, interest in the extraction of uranium oxide continued from the USA and UK for both military and peaceful applications. This led to the establishment in February 1946 of the “Uranium Research Committee” and in September 1948, the South African Atomic Energy Board (AEB) was constituted. Following international developments in nuclear power and radioisotope applications, construction of the National Nuclear Research Centre, including the SAFARI-1 Research Reactor, started at Pelindaba in 1961.
In 1970, the Uranium Enrichment Corporation (UCOR) was created and tasked to establish a nuclear fuel cycle programme at Valindaba, adjacent to the then Pelindaba site. The ostensible aim was to investigate the feasibility of nuclear explosives for peaceful applications. However, in 1977 the emphasis changed to a strategic nuclear weapons deterrent capability and in November 1979 the first nuclear explosive device was equipped with highly enriched uranium.
Application of the nuclear fuel cycle technologies to civilian nuclear power generation started with construction of the “Z” Enrichment Plant in 1978. A fuel element manufacturing facility supplying Koeberg Nuclear Power Station started production in 1987.
Meanwhile, the Nuclear Energy Act of 1982 renamed the AEB to NUCOR and combined it with UCOR under the Atomic Energy Corporation (AEC) as the controlling body. On 1 July 1985, the NUCOR and UCOR subsidiaries were combined into the AEC. Dismantling of the nuclear deterrent capability started in 1989 while the civilian nuclear fuel cycle services proved uncompetitive post 1994. A drive to industrialise technologies emanating from the nuclear programme was launched. In 1999, the current Nuclear Energy Act transitioned the AEC to the South African Nuclear Energy Corporation – Necsa.
Name and Registration Number
The South African Nuclear Energy Corporation, trading as Necsa, is a state owned company (SOC).
Registration number: 2000/003735/06
Holding Company: Department of Energy
Country of Incorporation and
Domicile:
South Africa
Physical and Business Address:
Elias Motsoaledi Street Extension(Church Street West)
R104 Pelindaba Brits Magisterial District Madibeng Municipality
North West Province 0240
Postal Address: PO Box 582, Pretoria 0001
South Africa
Telephone Number: +27 12 305 4911
Fax Number: +27 12 305 3111
E-mail Address: [email protected]
Website Address: www.necsa.co.za
External Auditors: Auditor-General of South Africa 300 Middel StreetNew Muckleneuk
Pretoria
Bankers: Nedbank Limited 135 Rivonia Road
Sandown Sandton
Company Secretary: Fulufhulani Corporate Governance and Legal Advisory (Pty) Ltd
105 Ninth Road CarlswaldMidrand
Johannesburg 1685
Enquiries regarding this report:
General Manager: Finance at +27 12 305 5678/5707 or [email protected]
N E C S A A N N U A L R E P O R T 2 0 1 7 / 1 8 5 G E N E R A L I N F O R M A T I O N 1
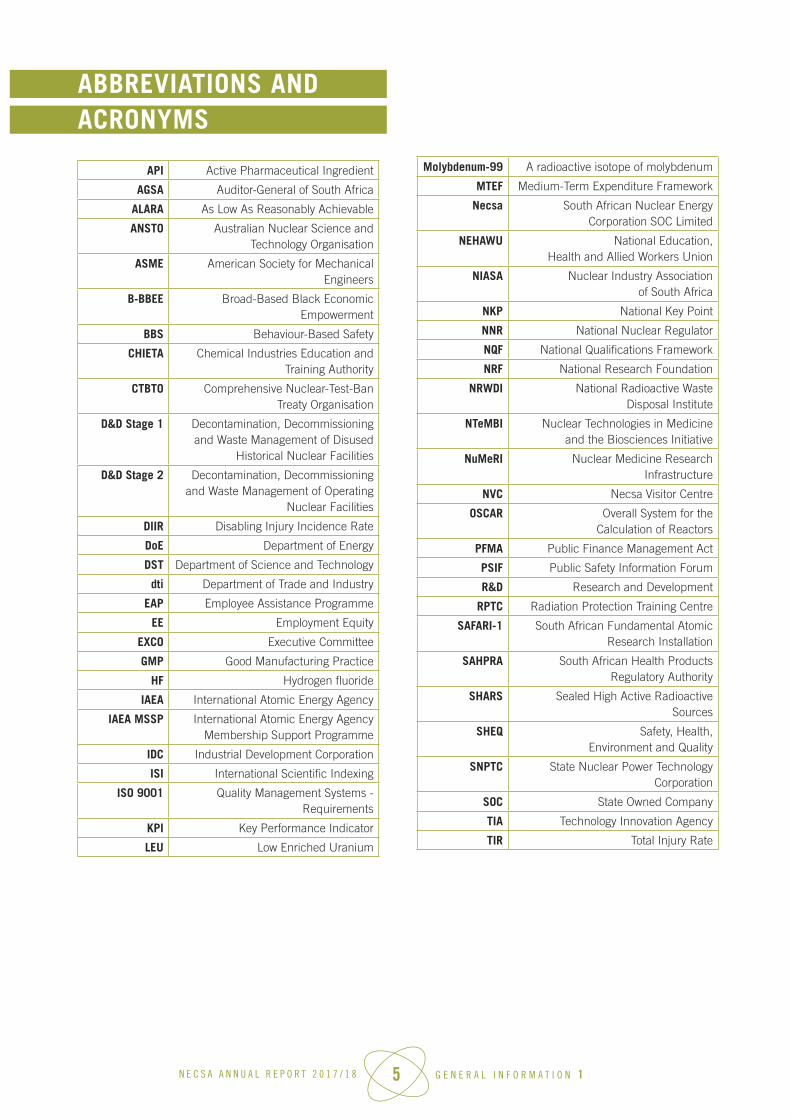
ABBREVIATIONS ANDACRONYMS
API Active Pharmaceutical Ingredient
AGSA Auditor-General of South Africa
ALARA As Low As Reasonably Achievable
ANSTO Australian Nuclear Science and Technology Organisation
ASME American Society for Mechanical Engineers
B-BBEE Broad-Based Black Economic Empowerment
BBS Behaviour-Based Safety
CHIETA Chemical Industries Education and Training Authority
CTBTO Comprehensive Nuclear-Test-Ban Treaty Organisation
D&D Stage 1 Decontamination, Decommissioning and Waste Management of Disused
Historical Nuclear Facilities
D&D Stage 2 Decontamination, Decommissioning and Waste Management of Operating
Nuclear Facilities
DIIR Disabling Injury Incidence Rate
DoE Department of Energy
DST Department of Science and Technology
dti Department of Trade and Industry
EAP Employee Assistance Programme
EE Employment Equity
EXCO Executive Committee
GMP Good Manufacturing Practice
HF Hydrogen fluoride
IAEA International Atomic Energy Agency
IAEA MSSP International Atomic Energy Agency Membership Support Programme
IDC Industrial Development Corporation
ISI International Scientific Indexing
ISO 9001 Quality Management Systems - Requirements
KPI Key Performance Indicator
LEU Low Enriched Uranium
Molybdenum-99 A radioactive isotope of molybdenum
MTEF Medium-Term Expenditure Framework
Necsa South African Nuclear Energy Corporation SOC Limited
NEHAWU National Education, Health and Allied Workers Union
NIASA Nuclear Industry Association of South Africa
NKP National Key Point
NNR National Nuclear Regulator
NQF National Qualifications Framework
NRF National Research Foundation
NRWDI National Radioactive Waste Disposal Institute
NTeMBI Nuclear Technologies in Medicine and the Biosciences Initiative
NuMeRI Nuclear Medicine Research Infrastructure
NVC Necsa Visitor Centre
OSCAR Overall System for the Calculation of Reactors
PFMA Public Finance Management Act
PSIF Public Safety Information Forum
R&D Research and Development
RPTC Radiation Protection Training Centre
SAFARI-1 South African Fundamental Atomic Research Installation
SAHPRA South African Health Products Regulatory Authority
SHARS Sealed High Active Radioactive Sources
SHEQ Safety, Health, Environment and Quality
SNPTC State Nuclear Power Technology Corporation
SOC State Owned Company
TIA Technology Innovation Agency
TIR Total Injury Rate
N E C S A A N N U A L R E P O R T 2 0 1 7 / 1 8 6 G E N E R A L I N F O R M A T I O N 1
NECSA STRATEGY
Strategic Overview
Our Vision
The Necsa group is a world leading nuclear technology organisation that adds significant value to the economy and quality of life of citizens.
Our Mission
To develop and utilise nuclear technologies to make socio-economic impact through materials beneficiation and commercialisation of technologies, through environmentally responsible application of core nuclear and related technologies.
Our Values• Foundational values – Integrity, Respect and
Accountability;
• Business values – Excellence, Innovation and Stakeholder Orientation; and
• People values – Trust and People Orientation.
Our Strategy• The long-term strategy of the Necsa Group builds on its
core research and technology development mandate to ensure sustainability and growth of the Necsa Group while meeting the nuclear related needs of South Africa. The reality of constrained government funding, challenging commercial operating conditions and its transformation imperatives were incorporated into the current strategy.
The following seven impact areas were identified as key areas from which Necsa derives most of its value:
• Industrial Applications;
• Medical Diagnostics and Therapy;
• Materials Beneficiation;
• Nuclear Waste;
• Non-Proliferation of Nuclear Materials;
• Nuclear Manufacturing, and
• Clean Energy.
Legislative Mandate
The South African Nuclear Energy Corporation is listed as a Major Public Entity in PFMA Schedule 2.
The company’s legislative mandate in terms of Section 13 of the Nuclear Energy Act, No. 46 of 1999, is to:
• Undertake and promote research and development in the field of nuclear energy and radiation sciences and technology and, subject to the Safeguards Agreement, to make these generally available;
• Process source material, special nuclear material and restricted material and to reprocess and enrich source and nuclear material; and
• Co-operate with any person or institution in matters falling within these functions, subject to the approval of the Minister.
According to Section 14 of the Act, Necsa must execute institutional responsibilities on behalf of government. For example, operation and utilisation of SAFARI-1, decommissioning and waste management, international obligations.
The South African Nuclear Energy Policy of 2008 directs Necsa to:
• Investigate the entire nuclear fuel cycle with the aim of re-establishing viable fuel cycle facilities and
• Serve as the anchor for nuclear energy research, development and innovation in South Africa.
According to the Integrated Resource Plan (IRP 2010-2030), Necsa is an integral role player in the nuclear new build programme. In November 2016, Cabinet confirmed Necsa as the owner, operator and procurer for the Nuclear Fuel Cycle and Multi-Purpose Research Reactor.
Business Model
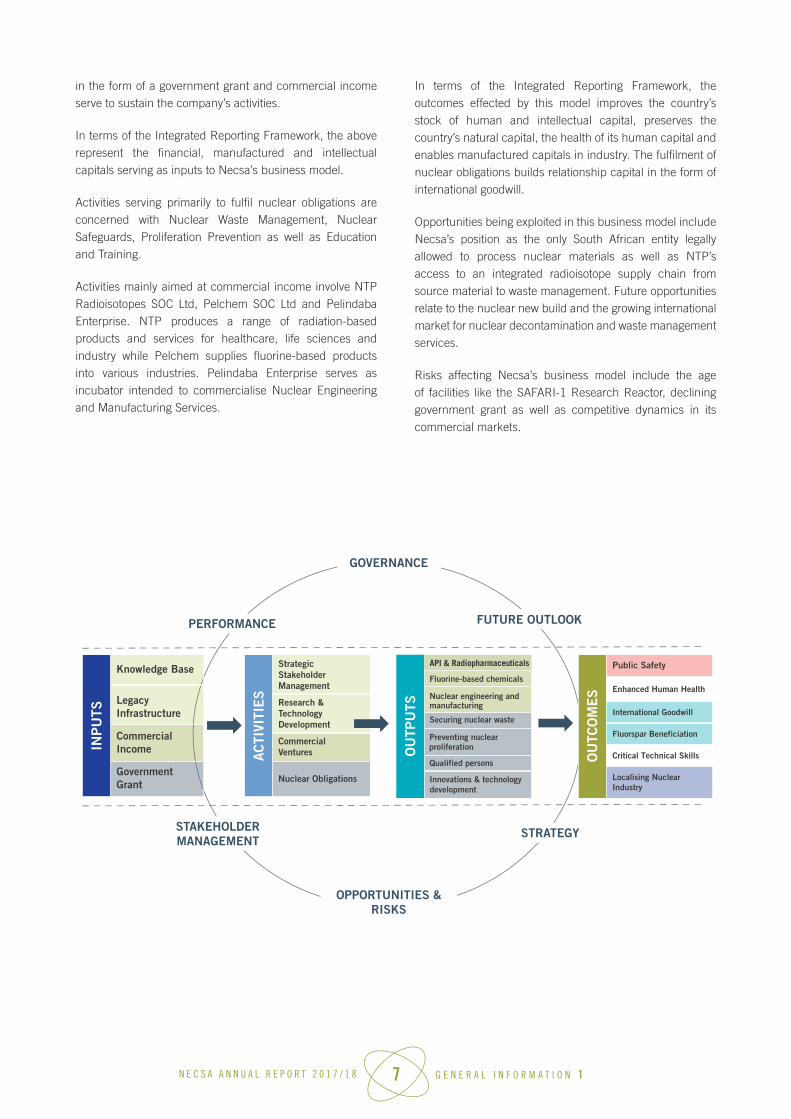
The figure below depicts Necsa’s business model which leverages Necsa’s knowledge base, legacy infrastructure investment and ongoing R&D in the fulfilment of the State’s nuclear obligations and pursuit of commercial ventures. Uniquely among the major public entities, Necsa needed to significantly repurpose its strategic legacy investment to the benefit of the new South Africa. This includes core facilities such as the SAFARI-1 Research Reactor being used both for research and radioisotope production. Financial inputs
N E C S A A N N U A L R E P O R T 2 0 1 7 / 1 8 7 G E N E R A L I N F O R M A T I O N 1
in the form of a government grant and commercial income serve to sustain the company’s activities.
In terms of the Integrated Reporting Framework, the above represent the financial, manufactured and intellectual capitals serving as inputs to Necsa’s business model.
Activities serving primarily to fulfil nuclear obligations are concerned with Nuclear Waste Management, Nuclear Safeguards, Proliferation Prevention as well as Education and Training.
Activities mainly aimed at commercial income involve NTP Radioisotopes SOC Ltd, Pelchem SOC Ltd and Pelindaba Enterprise. NTP produces a range of radiation-based products and services for healthcare, life sciences and industry while Pelchem supplies fluorine-based products into various industries. Pelindaba Enterprise serves as incubator intended to commercialise Nuclear Engineering and Manufacturing Services.
In terms of the Integrated Reporting Framework, the outcomes effected by this model improves the country’s stock of human and intellectual capital, preserves the country’s natural capital, the health of its human capital and enables manufactured capitals in industry. The fulfilment of nuclear obligations builds relationship capital in the form of international goodwill.
Opportunities being exploited in this business model include Necsa’s position as the only South African entity legally allowed to process nuclear materials as well as NTP’s access to an integrated radioisotope supply chain from source material to waste management. Future opportunities relate to the nuclear new build and the growing international market for nuclear decontamination and waste management services.
Risks affecting Necsa’s business model include the age of facilities like the SAFARI-1 Research Reactor, declining government grant as well as competitive dynamics in its commercial markets.
API & Radiopharmaceuticals
N E C S A A N N U A L R E P O R T 2 0 1 7 / 1 8 8 G E N E R A L I N F O R M A T I O N 1
ORGANISATIONAL STRUCTURE
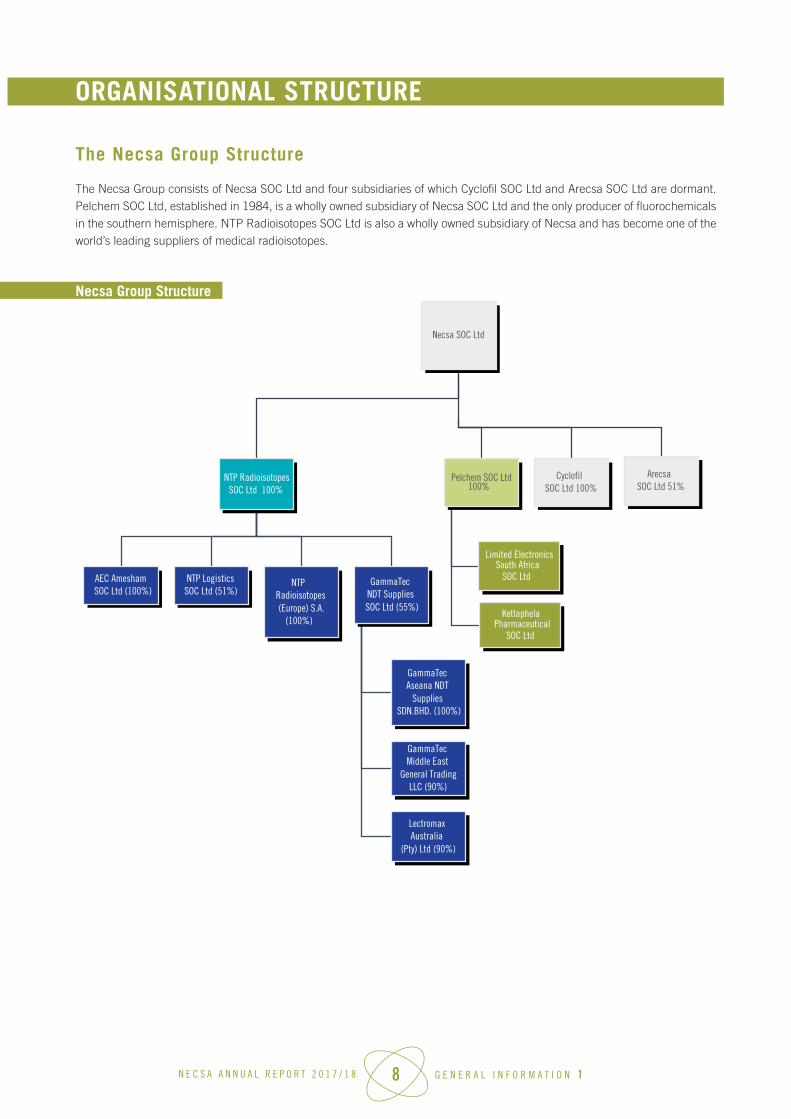
The Necsa Group Structure
The Necsa Group consists of Necsa SOC Ltd and four subsidiaries of which Cyclofil SOC Ltd and Arecsa SOC Ltd are dormant. Pelchem SOC Ltd, established in 1984, is a wholly owned subsidiary of Necsa SOC Ltd and the only producer of fluorochemicals in the southern hemisphere. NTP Radioisotopes SOC Ltd is also a wholly owned subsidiary of Necsa and has become one of the world’s leading suppliers of medical radioisotopes.
Necsa SOC Ltd
NTP Radioisotopes SOC Ltd 100%
AEC Amesham SOC Ltd (100%)
NTP Logistics SOC Ltd (51%)
NTP Radioisotopes(Europe) S.A.
(100%)
GammaTec NDT SuppliesSOC Ltd (55%)
GammaTec Aseana NDT
Supplies SDN.BHD. (100%)
GammaTec Middle East
General TradingLLC (90%)
Lectromax Australia
(Pty) Ltd (90%)
Pelchem SOC Ltd 100%
Limited Electronics South Africa
SOC Ltd
Ketlaphela Pharmaceutical
SOC Ltd
Cyclofil SOC Ltd 100%
Arecsa SOC Ltd 51%
Necsa Group Structure

N E C S A A N N U A L R E P O R T 2 0 1 7 / 1 8 9 G E N E R A L I N F O R M A T I O N 1
Nec
sa C
orpo
rate
Str
uctu
re
SENI
OR M
ANAG
ER:
SECU
RITY
SER
VICE
S
SENI
OR M
ANAG
ER:
LICE
NSI
NG
AND
ANAL
YSIS
SENI
OR M
ANAG
ER:
SAFE
GUAR
DS
SENI
OR M
ANAG
ER:
SAFE
TY S
ERVI
CES
NECS
A BO
ARD
OF D
IREC
TORS
CHIE
F FI
NANC
IAL
OFFI
CER
GROU
P EX
ECUT
IVE:
H
UM
AN R
ESOU
RCES
& R
EAL
ESTA
TE A
SSET
MAN
AGEM
ENT
(REA
M)
CHIE
F TE
CHNO
LOGY
OFF
ICER
GROU
P EX
ECUT
IVE:
BU
SIN
ESS
DEVE
LOPM
ENT
&
INN
OVAT
ION
GROU
P EX
ECUT
IVE:
PE
LIN
DABA
EN
TERP
RISE
GROU
P EX
ECUT
IVE:
NU
CLEA
R CO
MPL
IAN
CE &
SER
VICE
S
GENE
RAL
MAN
AGER
: FI
NAN
CE
GENE
RAL
MAN
AGER
: H
UM
AN R
ESOU
RCES
GENE
RAL
MAN
AGER
: RE
SEAR
CH A
ND
TECH
NOL
OGY
DEVE
LOPM
ENT
SENI
OR M
ANAG
ER:
BUSI
NES
S DE
VELO
PMEN
TEX
ECUT
IVE
MAN
AGER
: PE
LIN
DABA
EN
GIN
EERI
NG
SENI
OR M
ANAG
ER:
SUPP
LY C
HAI
N
SENI
OR M
ANAG
ER:
NEC
SA L
EARN
ING
ACAD
EMY
GENE
RAL
MAN
AGER
: N
UCL
EAR
FUEL
CYC
LE
GENE
RAL
MAN
AGER
: M
ARKE
TIN
GPO
RTFO
LIO
MAN
AGER
: BU
SIN
ESS
DEVE
LOPM
ENT
CHIE
F IN
FORM
ATIO
N OF
FICE
R
SENI
OR M
ANAG
ER:
REAM
GENE
RAL
MAN
AGER
: OP
ERAT
ION
S
SENI
OR M
ANAG
ER:
INVE
STM
ENT
GROU
P CE
O
GROU
P CE
OIN
TERN
AL A
UDIT
GROU
P CE
OST
RATE
GY &
PER
FORM
ANCE
GROU
P CE
OCO
RPOR
ATE
COM
MUN
ICAT
ION
& ST
AKEH
OLDE
R RE
LATI
ONS
GROU
P CE
ORI
SK M
ANAG
EMEN
T
GROU
P CE
OLE
GAL
SERV
ICES
GROU
P CE
OTE
CHNO
LOGY
DEV
ELOP
MEN
T
FULU
FHUL
ANI C
ORPO
RATE
GOV
ERNA
NCE
AND
LEGA
L AD
VISO
RY (P
TY) L
TD
N E C S A A N N U A L R E P O R T 2 0 1 7 / 1 8 10 G E N E R A L I N F O R M A T I O N 1
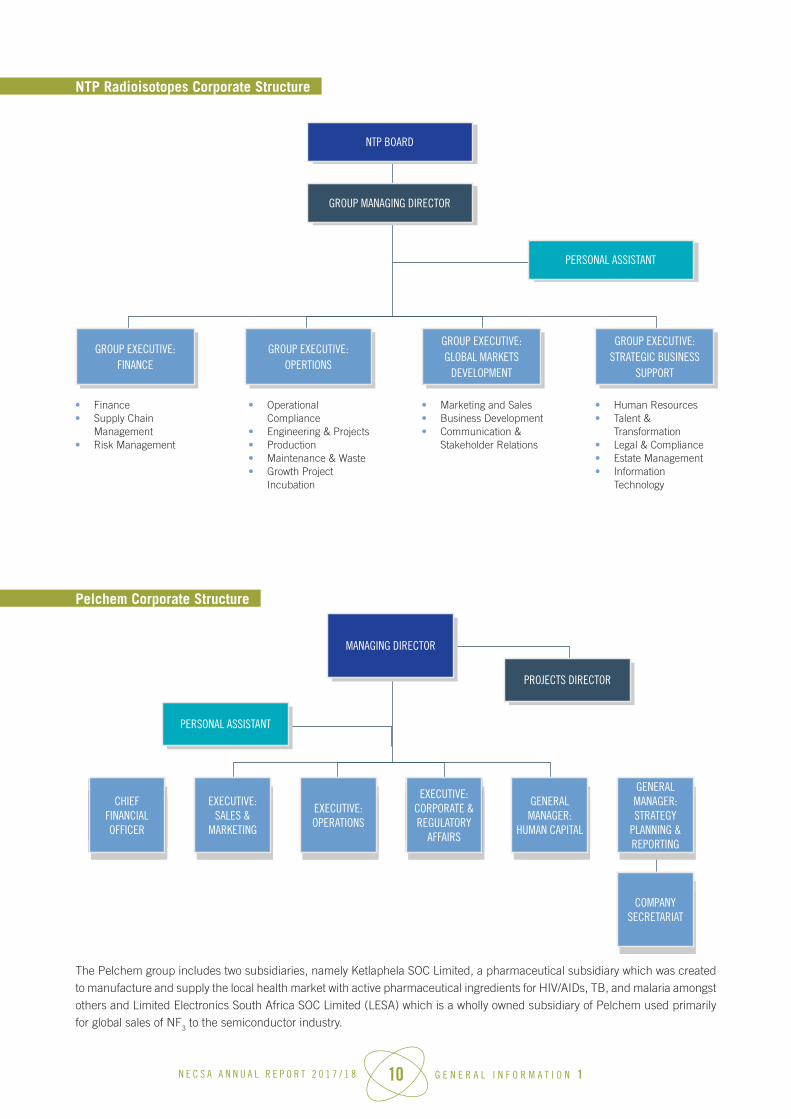
The Pelchem group includes two subsidiaries, namely Ketlaphela SOC Limited, a pharmaceutical subsidiary which was created to manufacture and supply the local health market with active pharmaceutical ingredients for HIV/AIDs, TB, and malaria amongst others and Limited Electronics South Africa SOC Limited (LESA) which is a wholly owned subsidiary of Pelchem used primarily for global sales of NF3 to the semiconductor industry.
NTP Radioisotopes Corporate Structure
Pelchem Corporate Structure
NTP BOARD
PERSONAL ASSISTANT
• Finance• Supply Chain
Management• Risk Management
• Operational Compliance
• Engineering & Projects• Production• Maintenance & Waste• Growth Project
Incubation
• Human Resources• Talent &
Transformation• Legal & Compliance• Estate Management• Information
Technology
• Marketing and Sales• Business Development• Communication &
Stakeholder Relations
GROUP MANAGING DIRECTOR
GROUP EXECUTIVE: FINANCE
GROUP EXECUTIVE: OPERTIONS
GROUP EXECUTIVE: GLOBAL MARKETS
DEVELOPMENT
GROUP EXECUTIVE: STRATEGIC BUSINESS
SUPPORT
MANAGING DIRECTOR
PROJECTS DIRECTOR
PERSONAL ASSISTANT
GROUP CEOCHIEF
FINANCIAL OFFICER
GROUP CEOEXECUTIVE:
SALES & MARKETING
GROUP CEOEXECUTIVE:OPERATIONS
GROUP CEOEXECUTIVE:
CORPORATE ®ULATORY
AFFAIRS
GROUP CEOGENERAL MANAGER:
HUMAN CAPITAL
GROUP CEO
GENERAL MANAGER: STRATEGY
PLANNING & REPORTING
GROUP CEOCOMPANY SECRETARIAT
N E C S A A N N U A L R E P O R T 2 0 1 7 / 1 8 11 G E N E R A L I N F O R M A T I O N 1
NTP Radioisotopes SOC Ltd
NTP Radioisotopes SOC Ltd is a wholly owned subsidiary of Necsa and is based at Pelindaba. NTP operated as a division of Necsa from the early 1990s and was incorporated as a limited liability company in October 2003.
Pelindaba has produced small volumes of medical radioisotopes since 1973, initially to supply the South African nuclear medicine market. In the 1990s this scheme was commercialised and the hot cell complex previously used for nuclear fuel testing was converted into radiochemical production facilities. The first export orders for the key medical radioisotope Molybdenum-99 were shipped in 1994.
In less than 25 years NTP has grown to become one of the world’s leading suppliers of medical radioisotopes. From just 30 employees in 1992, NTP now boasts over 440 skilled employees, and the company was one of the top global producers of Molybdenum-99 in 2016/17.
NTP is a pioneer in the integrated use of medical radioisotopes, making South Africa a hub of nuclear medicine excellence on the African continent. In 1989 NTP began producing and distributing its own high-yield Technetium-99m generators, used by nuclear medicine practitioners. In 2005 the company also began to produce on-site cyclotron-based FDG F-18, which is used for cancer diagnosis. Following the successful conversion of the SAFARI-1 Research Reactor core to low-enriched uranium (LEU) fuel in 2009, in 2010 NTP became the first large-scale producer to offer commercial all-LEU based Mo-99 and Iodine-131, in which both the fuel and the targets were LEU-based. In 2012, NTP began the first African-based production of the beta-emitter Lutetium-177 n.c.a., which has diagnostic and therapeutic applications. NTP later facilitated the first medical procedure in South Africa using Lu-177 no-carrier added labelled with prostate-specific membrane antigen (PSMA) for the treatment of prostate cancer.
NTP Group Subsidiaries:
AEC-Amersham SOC Ltd
AEC-Amersham is the African and Indian Ocean Islands region distributor for NTP radiopharmaceutical products, a range of life science products and service offerings. The company is ISO 9001 certified and complies with all regulatory requirements that enable the company to import and export its products.
NTP Logistics SOC Ltd
NTP Logistics provides end-to-end supply chain logistics services specialising in the global distribution of hazardous, time-sensitive, temperature-sensitive and high-value goods offering a full spectrum of land, air and sea solutions. The company is a market leader with experience in national and international regulatory requirements. NTP Logistics holds permits and licences from the National Nuclear Regulator, Department of Energy, Department of Health and the Department of Transport and is an active member of the World Nuclear Transport Institute. The company maintains ISO 9001 certification.
Gammatec NDT Supplies SOC Ltd
Gammatec NDT is a supplier, distributor, manufacturer and turnkey solution provider of non-destructive testing equipment, accessories and consumables. Technologies provided include acoustic emission, ultrasonic, phased array, visual inspection, dye penetrant, eddy current, magnetic particle as well as radiography sources such as iridium-192, caesium and selenium. The company is ISO 9001 accredited.
Gammatec NDT exports to over 70 countries with a focus on Africa, the Middle East, Southeast Asia and Australasia. In 2018 a strategic decision was made to close its subsidiaries in Dubai and Kuala Lumpur and focus on supporting customers through its distribution network and direct contact. Gammatec’s equity associate, Oserix SA, based in Belgium, services the gamma radiation isotopes market in Europe, North Africa and the Americas.
NTP Radioisotopes (Europe) S.A.
Following the decision of the extraordinary shareholders meeting in August 2017, NTP Europe, which is situated in Belgium, is now in the process of being liquidated.
Gamwave (Pty) Ltd
NTP Radioisotopes is a minority shareholder (40%) of Gamwave Pty Ltd, which provides irradiation and gamma sterilisation services for agricultural, food, and medical sectors.
N E C S A A N N U A L R E P O R T 2 0 1 7 / 1 8 12 C H A I R P E R S O N S F O R E W O R D 2
Overall Performance
Necsa has had a successful year in continuing operations in the complex nuclear environment, and also in developing ambitious expansion plans. We are totally aware of the need to continue working towards generating an increasing income earned from domestic and international customers.
Plans have therefore been developed and implemented to enhance and expand commercial operations.
Necsa has also continued to provide for South Africa’s international nuclear obligations in terms of international nuclear treaties and operating standards. Safeguards and nuclear waste management were all executed without incident, thereby maintaining South Africa’s excellent record in the international nuclear industry.
The group’s financial performance was, once again, boosted by nuclear products produced at the NTP subsidiary with
net profit being 5.3% ahead of budget, although significantly lower than the previous year, as a result of a stoppage of the radiochemical facility at NTP due to procedural deviations from standard operating protocols. Necsa corporate external sales were below target. As a world leader in the field of nuclear medicine, we are setting ambitious expansion goals to consolidate our dominance even further.
A significant strategy agreement was signed between Necsa and Rusatom Health alongside the BRICS Tenth Anniversary meeting in Sandton in July 2018. This entails a cooperation with the Russian nuclear medicine company Rusatom Health in expanding Necsa nuclear medicine production capacity and sales. The relative strengths of the two companies are being brought together to achieve a set of exciting goals.
The Pelchem subsidiary recorded a loss, as expected, due to the commercialisation strategy being pursued. However Pelchem systems have improved, leading towards the goal of commercial profitability for Pelchem as a whole. Pelchem
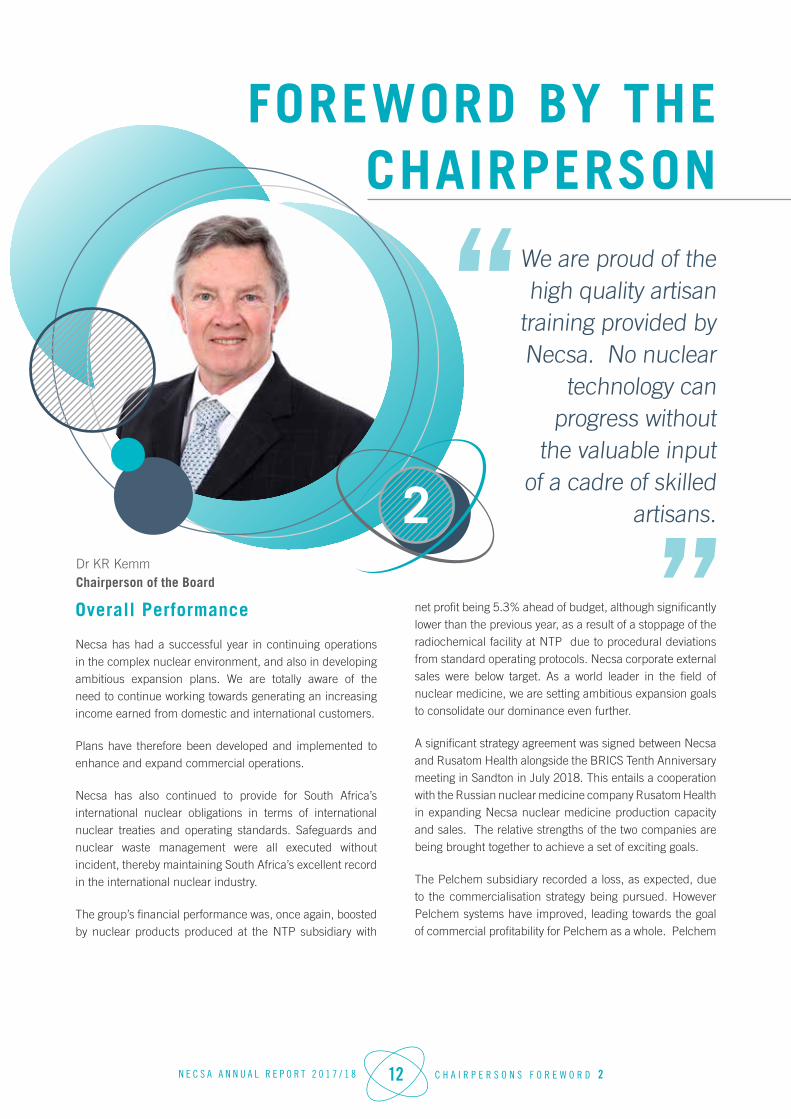
We are proud of the high quality artisan
training provided by Necsa. No nuclear
technology can progress without
the valuable input of a cadre of skilled
artisans.
Dr KR KemmChairperson of the Board
FOREWORD BY THE CHAIRPERSON
2

N E C S A A N N U A L R E P O R T 2 0 1 7 / 1 8 13 C H A I R P E R S O N S F O R E W O R D 2
produces about 25 unique chemicals based on highly complex and dangerous chemistry. The approach required in altering chemical production lines is one of extreme caution and precision. Some of these chemicals are of extreme strategic value to the country, since Pelchem is the only producer of the chemicals in the southern hemisphere. About half of the Pelchem chemicals are sold profitably and the other half at a loss. However the Board instructed Pelchem to maintain production of all, due to their strategic nature. A major market exists worldwide and Pelchem is being pressured by the market to supply which is a very good sign. A significant engineering upgrade is underway to re-design certain production lines to increase output in quantum leaps.
Necsa continued to carry out valuable scientific investigations and development in support of a range of nuclear applications. Research papers were published internationally and Necsa specialists contributed to international conferences and study groups, thereby enhancing the international image of South Africa.
In Sochi, Russia in April 2018, Necsa was honoured by being presented with a trophy for being the ‘best nuclear medicine company in the world’. I was honoured to be called up on stage, in front of a hall of 1000 people from 72 countries, to receive the award on behalf of Necsa. The international enhancement that resulted is most valuable.
For both nuclear power development and the commercial generation of nuclear products, the entire production chain is of utmost importance. From a staff point of view, this includes not only the scientists and engineers but also skilled artisans, production line operators, and administrative staff. Necsa continues to provide training to the highest international levels, to many skilled categories of staff. Transformation objectives continue to receive attention and black employees now constitute 71.2% of Necsa group staff.
Strategic Relationships
A network of key strategic relationships in the nuclear and related technology domain is of vital importance. Necsa has continued to support the National System of Innovation through initiatives such as its partnership with the National Research Foundation’s iThemba LABS and NTeMBI. Involvement was also fostered in strategic international collaborative programmes relating to the application of nuclear and radiation science and technology.
Numbers of strategic relationships are being developed with other African countries, and also with companies domestically with a view to establishing profitable business ventures.
Challenges
Nuclear power and nuclear technology around the world
continues to be a subject of controversy. South Africa is
currently experiencing an interesting phenomenon and that
is that our country is a central world battleground in this
respect. That fact results in Necsa having to operate in a
business space which is not at all normal.
The general depressed state of the economy also brings
pressure to bear on Necsa activities such as the design and
fabrication of high technology components and the supply of
Non Destructive Testing (NDT) radioactive sources to industry.
There has also been a declining government grant, in real
terms, plus a general nation-wide rise in operational costs.
Outlook
It is interesting to note how many leaders of African countries
have announced intentions to follow a nuclear future, both
in nuclear power and in technology such as nuclear medical
diagnostics. One close neighbour, Zambia, has this year
started on the construction of their first nuclear reactor.
Representatives from a number of African countries have
spoken to Necsa about collaboration in the Nuclear field. This
indicates the nature of the nuclear market which is evolving.
Necsa continues to export nuclear medicine and other items
to over 60 countries worldwide, thereby maintaining our
international footprint.
Necsa is of the firm opinion that major nuclear power
expansion is essential for the South African economy.
A major nuclear programme will immediately create
sustainable jobs, develop skills, expand infrastructure,
advance manufacturing capability and capacity, and lead
to an immediate visible economic advance in areas around
new nuclear sites. All initial site work and preparations will
lead to billions of rands of economic activity with no foreign
involvement whatsoever.
Necsa is actively working towards fulfilling its role in nuclear
power development and associated technology in Africa.
This is to the benefit of our country directly. Also to the
advancement of nuclear power and associated technology
in Africa.
Necsa is actively working towards making the existing
African and wider international nuclear outlook a source of
benefit to South Africa.

N E C S A A N N U A L R E P O R T 2 0 1 7 / 1 8 14 C H A I R P E R S O N S F O R E W O R D 2
Acknowledgements
Necsa faces a large range of exciting opportunities which promise to result in significant commercial and scientific developments. However, achieving these goals requires dedicated staff who exhibit the desire to take on the challenges in such ventures. On behalf of the Board I wish to thank all the dedicated people who work through the night, and who work with drive to target our goals. Without them we could not succeed.
The larger team can only be as good as the leaders, so I wish to recognise the stellar, performance of the Group CEO Mr Phumzile Tshelane and his executive team. The Board really appreciates their enthusiastic efforts.
The Board also appreciates the guidance and support received from our Executive Authority, the Department of Energy.
Conclusion
There is a world force moving nuclear technology forward and this will not stop, no matter what anti-nuclear to impede its progress.
This movement includes not only new highly advanced nuclear power stations being built but also amazing cancer cures being developed using nuclear technology. Such advanced cancer therapy is carried out in South Africa in collaboration with Necsa and then produces astounding results. South Africa is a world leader in many aspects of nuclear technology and we cannot afford to be left behind. Necsa realises this and is ready to continue with the demands placed on the organisation.
As the South African nuclear industry enters a new era, Necsa remains robust and ready to tackle the demands to be placed on it. We look forward to developing and expanding new opportunities and markets to the benefit of Necsa and the whole country.
Dr KR Kemm
Chairperson of the Board
N E C S A A N N U A L R E P O R T 2 0 1 7 / 1 8 15 C E O ’ S O V E R V I E W 3
Introduction
During the reporting period, the local manufacturing sector continued to reflect the global economic malaise which has had specific impact on Pelindaba Enterprise and Pelchem. This aggravated the severe financial constraints on Necsa due to its comparatively high fixed cost base.
In spite of this, Necsa met or exceeded seven of its 12 key performance indicators. The most noteworthy successes include SAFARI-1 operational availability, the very low public radiation dose impact and increase in black technical staff. Two of the performance indicators that were not met, relate to the financial performance of Pelchem and Necsa corporate.
Key turnaround initiatives required for Necsa’s sustainability have been identified as part of a recent strategic planning process focussing on seven impact areas.
Achievements by Programme Cluster
Nuclear Energy Programme Cluster
While Pelchem is the Necsa Group custodian of fluorine technology vital to re-establishment of the Nuclear Fuel Cycle, its operating loss of R35.57m is concerning. This is attributable to an unreliable plant, as well as declining demand for some of its products. However, there are good prospects to rationalise offerings and exploit new growth opportunities. Plant availability remains a serious concern, but the IDC loan which was approved will enable Pelchem to deal with this. Pelchem has initiated Project Thuthukani which entails the construction of appropriately scaled fluorochemicals plants in alignment with government policy to increase beneficiation of local fluorspar. Pelchem also intends entering the domestic pharmaceutical market to supply essential medicines for HIV/AIDs, TB, Malaria through its subsidiary Ketlaphela SOC Ltd. This programme will be run in partnership with the dti and the National Department of Health.
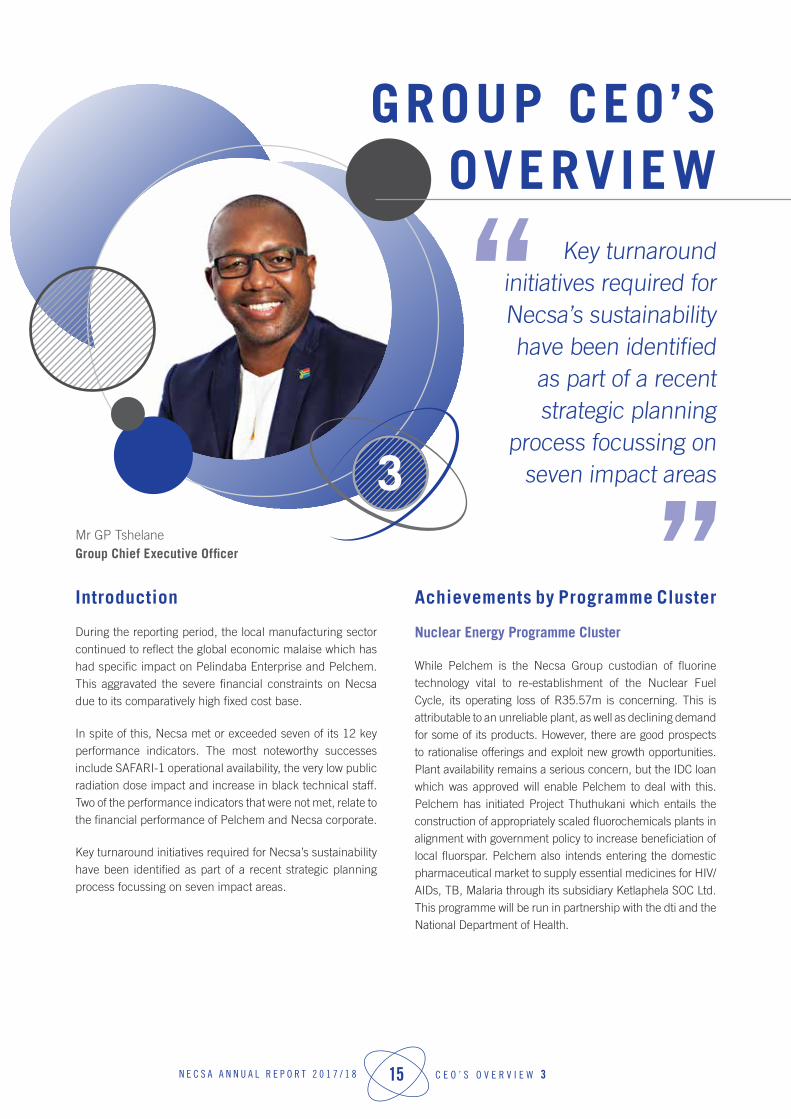
Key turnaround initiatives required for Necsa’s sustainability have been identified
as part of a recent strategic planning
process focussing on seven impact areas
Mr GP TshelaneGroup Chief Executive Officer
GROUP CEO’S OVERVIEW
3
N E C S A A N N U A L R E P O R T 2 0 1 7 / 1 8 16 C E O ’ S O V E R V I E W 3
Radiation Products and Services Programme Cluster
The NTP Group profit after tax was R131.1m, 5.3% over budget. Another excellent performance is from the SAFARI-1 Reactor yielded 12 more operational days than planned. The Necsa Group, through NTP, is among the world’s top producers of lifesaving Mo-99 radioisotopes used to diagnose diseases such as cancer. During June 2017, NTP received authorisation from the National Nuclear Regulator for routine operation of cell 19. However, NTP Mo-99 production operations were stopped on 17 November 2017 after it discovered procedural deviations related to a set of standard operating protocols. While the National Nuclear Regulator had approved limited production readiness runs between February and April 2018, the financial consequences were significant.
The Security of Supply of Fuel and Target Plates Programme for the sustained operation of SAFARI-1 and NTP Radioisotopes remains in progress.
Execution of DST NuMeRI (Nuclear Medicine Research Infrastructure) programme is in full swing. The microSPECT was successfully installed and commissioned. Training was also concluded. The optical imaging tender has been advertised. The NuMeRI host for the main facility (NuMaCS), Steve Biko Academic Hospital is being contracted after their bid. A draft agreement has been concluded.
Further evidence of Necsa’s excellence in the area of radiation science was the development of the OSCAR-5 system which underwent a few years of stringent testing and benchmarking. The roll-out of the system for client use, is underway, and progressing well. It represents a change in the development history of the OSCAR system, as it is now moving into a high fidelity, multi-code, multi-physics space, as opposed to a pure neutronic nodal diffusion package.
Necsa as Host of Nuclear Programmes Cluster
Excellent performance was achieved in the execution of the Decommissioning and Decontamination Programme. Emanating from this work, the Necsa Mobile Hot Cell remains one of the only safe mechanisms in the world for the handling of disused high activity sealed radioactive sources.
Necsa’s safety performance improved in comparison to the previous financial year. A disabling incident injury rate of 1.01 was achieved.
In February 2018, the Republic of South Africa – Support Programme (RSA-SP) reached its 15th anniversary of being a member of the IAEA Member Support Programme (MSSP). Dr Pitswane from the RSA Permanent Mission in Vienna received the anniversary award on behalf of South Africa.
A total of 70 inspections were performed at various facilities under the Comprehensive Safeguards Agreement and the Additional Protocol during the reporting period. All inspections that were carried out were conclusive and met the safeguards requirements.
Cross-Cutting Programmes Cluster
Necsa Corporate sales were not achieved mainly due to the Operations Division not achieving budgeted sales and Pelindaba Enterprise divisions recording an operating loss of R95.8m.
Publication of referred research publications again exceeded target. This includes work in neutron diffraction for non-destructive investigation of advanced materials and X-ray tomography that resulted in the first known identification of cancer in early hominins.
Technical staff as percentage of total staff fell slightly below target, but black technical staff continued their upward trajectory reaching 61.51% of all technical staff.
Necsa continued to produce a pipeline of skills for South Africa across the spectrum, from artisans to graduates and to post-doctoral candidates. The Nuclear Skills Development Centre trained 200 apprentices.
International collaboration continued through participation in a variety of IAEA meetings, expert missions and technical co-operation programmes.
Outlook
Sluggish, albeit improved, economic growth is expected to continue impacting negatively on commercial revenues and also constraining the support that can be provided by Government. In addition, political and legal challenges to the growth of the South African nuclear industry will need to be navigated.

N E C S A A N N U A L R E P O R T 2 0 1 7 / 1 8 17 C E O ’ S O V E R V I E W 3
Highlights of Future Plans and Projects
The Necsa Group primary focus going forward is for all businesses and functions to operate sustainably. Specific growth prospects for the near future include:
• Nuclear new build programme in which Necsa will be instrumental in localisation and the nuclear fuel cycle;
• New commercial production reactor (CPR) project to replace SAFARI-1;
• Pelchem’s continued progress with product line ratio-nalisation, plant refurbishments, the Thuthukani project and the Ketlaphela project;
• New NTP production capacity and business initiatives;
• Demonstration of the Uranium recovery process proven on laboratory scale;
• Expansion of the NTeMBI network and radio-pharmaceutical clinical trials; and
• Further leveraging Necsa’s intellectual property portfolio by the Business Development & Innovation Division.
Acknowledgements
I wish to express my sincere gratitude to the entire Necsa Group staff for their efforts, the Office of the CEO for unfailing support, members of EXCO for their commitment and the Necsa Board for its sound guidance.
Conclusion
The South African Nuclear Energy Corporation will continue on its challenging, but exciting mission to bring the benefits of nuclear technologies and nuclear power to the people of our country.
Mr GP Tshelane Group Chief Executive Officer
N E C S A A N N U A L R E P O R T 2 0 1 7 / 1 8 18 H I G H L I G H T S O F 2 0 1 7 / 1 8 4
4
H I G H L I G H T S O F 2 0 1 7 / 1 8
4
N E C S A A N N U A L R E P O R T 2 0 1 7 / 1 8 19 H I G H L I G H T S O F 2 0 1 7 / 1 8 4
HIGHLIGHTS OF 2017/18
1
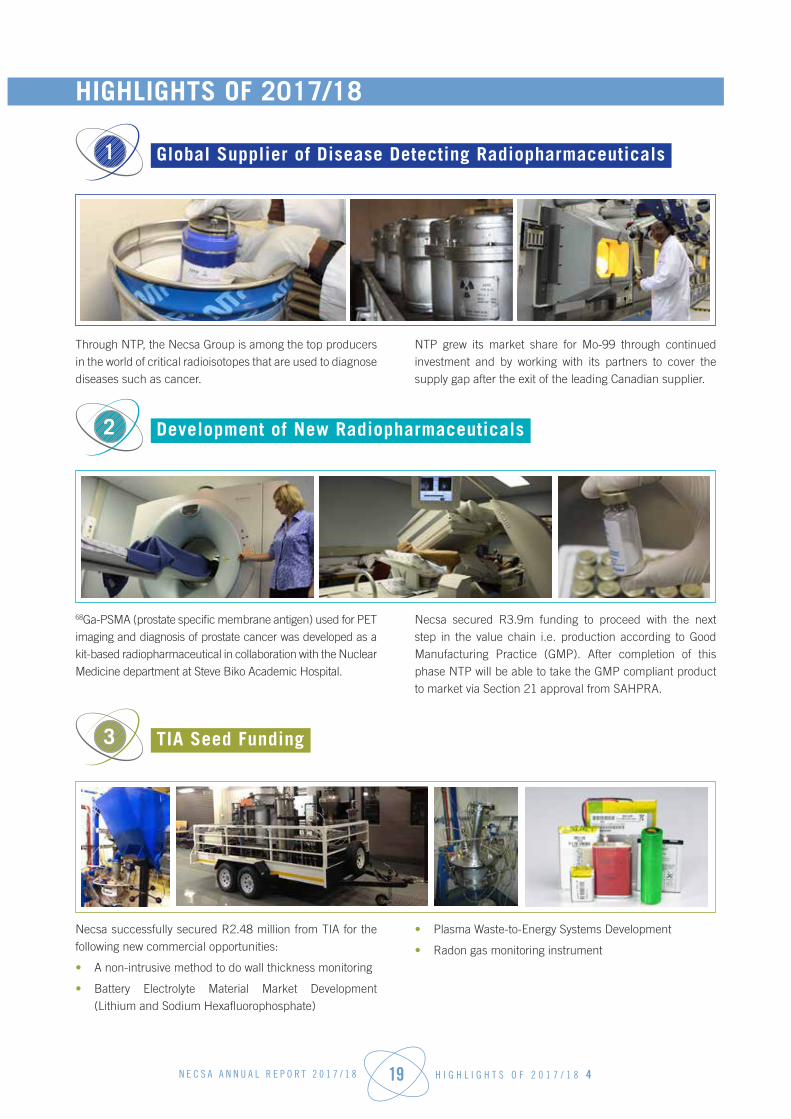
Global Supplier of Disease Detecting Radiopharmaceuticals
Through NTP, the Necsa Group is among the top producers in the world of critical radioisotopes that are used to diagnose diseases such as cancer.
NTP grew its market share for Mo-99 through continued investment and by working with its partners to cover the supply gap after the exit of the leading Canadian supplier.
2
Development of New Radiopharmaceuticals
68Ga-PSMA (prostate specific membrane antigen) used for PET imaging and diagnosis of prostate cancer was developed as a kit-based radiopharmaceutical in collaboration with the Nuclear Medicine department at Steve Biko Academic Hospital.
Necsa secured R3.9m funding to proceed with the next step in the value chain i.e. production according to Good Manufacturing Practice (GMP). After completion of this phase NTP will be able to take the GMP compliant product to market via Section 21 approval from SAHPRA.
3
TIA Seed Funding
Necsa successfully secured R2.48 million from TIA for the following new commercial opportunities:
• A non-intrusive method to do wall thickness monitoring
• Battery Electrolyte Material Market Development (Lithium and Sodium Hexafluorophosphate)
• Plasma Waste-to-Energy Systems Development
• Radon gas monitoring instrument

N E C S A A N N U A L R E P O R T 2 0 1 7 / 1 8 20 H I G H L I G H T S O F 2 0 1 7 / 1 8 4
4
Revealing Hidden Properties with Radiation
Necsa’s Micro Focus X-ray Tomography system was central to producing 3D-results for the first known identification of cancer in early hominins.
The SAFARI-1 Neutron Diffraction beamlines complemented by X-ray Diffraction provide powerful, non-destructive
insight into the microstructural properties of materials for advanced manufacturing. This includes residual stresses in weldments and 3D printed titanium alloy components as well as chemical and magnetic phenomena in various chemical systems.
5
Nuclear Medicine Research Infrastructure Project
Execution of the DST NuMeRI (Nuclear Medicine Research Infrastructure) programme is in full swing. The microSPECT was successfully installed and commissioned. Training was also concluded.
The NuMeRI host for the main facility (NuMaCS), Steve Biko Academic Hospital is being contracted after their successful bid. NuMeRI is currently being incubated at Necsa.
6
OSCAR-5 Reactor Calculation Code
Further evidence of Necsa’s excellence in the area of Radiation Science was the development of the OSCAR-5 system. The roll-out of the system for client use has pro-gressed well so far.
OSCAR system is now moving into a high fidelity, multi-code, multi-physics space.

N E C S A A N N U A L R E P O R T 2 0 1 7 / 1 8 21 H I G H L I G H T S O F 2 0 1 7 / 1 8 4
7
Pelchem
The successful execution of the short-term strategy bodes extremely well for futureproofing the organisation. Despite the stronger rand, the organisation has demonstrated
resilience in the cutthroat market by securing new export markets and its revenue is almost evenly balanced between local and export business.
8
MECA SENS 2017
Approximately 100 nuclear scientists from around the world gathered at the Skukuza rest camp in the Kruger National Park, between 18 – 22 September 2017, for a specialist nuclear conference.
The topic of discussion: how to use nuclear particle beams to look inside metals to determine their structure. The host was Dr Andrew Venter of Necsa who is a specialist in this field.
9
NTP Radioisotopes Award
On 12 September 2017, NTP Radioisotopes received an Award for Outstanding Achievement given by the US National Nuclear Security Administration (NNSA). The
award marked the company’s ground breaking conversion of medical radioisotope production from weapons-grade highly enriched uranium (HEU) to low enriched uranium (LEU).
10
Transformation and Representivity
Black employees now constitute 71.2% of Necsa Group staff with black technical staff as percentage of all technical staff amounting to 61.5%, well in excess of the 55% target set.
Percentage of females across race grew from 32.1% in 2016/17 to 34.2% in 2017/18.
During 2017/18 financial year, 93,75% of all appointments on post level C4 (skilled technical and academically qualified workers) and higher at NTP were black people (African, Coloured, Indian and Asians).

N E C S A A N N U A L R E P O R T 2 0 1 7 / 1 8 22 H I G H L I G H T S O F 2 0 1 7 / 1 8 4
11
Developing Highly Skilled People
Necsa continued to produce a pipeline of skills for industry through training and trade testing, internships, graduate-in-training and study assistance schemes. No fewer than 200 apprentices were trained with 437 trade tests and 426 trade test preparations conducted.
Necsa is in partnership with the Gauteng Department of Education’s Schools of Specialisation programme which saw 3 schools in Atteridgeville launched as nuclear science and technology schools.
Five young masters graduates returned from international universities from countries like South Korea and Russia.
193 Department of Energy, Necsa, NNR, iTemba Labs, Kouga Municipality, COEGA and Eskom employees were sent to China for training in various nuclear expertise.
NTP Radioisotope’s internship programme placed a total of 29 interns within the company during the financial year of whom 16 were retained into permanent positions post completion of the internship programme, which is an increase of 10 from the previous year. So far a total of 22 permanent jobs for young professionals have been created since 2016.
The NTP bursary scheme introduced in 2016 is progressing well, with one student pursuing their degree in mechanical engineering obtaining 4 distinctions in the previous academic year. Two of the students are pursuing degrees in pharmacy, with 5 distinctions obtained by one student. The objective of the bursary programme is to create opportunities for academically deserving students to gain access to education, while at the same time creating a talent pipeline for NTP.
12
Collective Bargaining Outcomes
The signing of the Necsa Group bargaining and Consultative Forum Constitution paved the way for the 2018 to 2021 collective bargaining process.
Minimum Wages• 85 cleaning staff were absorbed, previously outsourced.
• Improved job security; benefits such as pension and medical aid.
• Insourcing of personnel further saved the company operational budget to an excess of R 500,000.00.
• Minimum wage starts at R 118 788.00 for permanent employees.
• Parity: equal pay for equal work, was finalised in the
financial year under review.
Leave Benefits• Males: 3 days paternity leave.
• Adoption leave: 3 months for a child less than 7 years of age; 1 month for a child 7 years and older.
• Leave extended to contract workers: 27 days annual leave including 6 days discretionary leave.

N E C S A A N N U A L R E P O R T 2 0 1 7 / 1 8 23 H I G H L I G H T S O F 2 0 1 7 / 1 8 4
Necsa strives to develop their young workforce that will take the organisation forward and meet transformational objectives.

N E C S A A N N U A L R E P O R T 2 0 1 7 / 1 8 24 K E Y P E R F O R M A N C E I N F O R M A T I O N 5
K E Y P E R F O R M A N C E I N F O R M A T I O N
5

N E C S A A N N U A L R E P O R T 2 0 1 7 / 1 8 25 K E Y P E R F O R M A N C E I N F O R M A T I O N 5
Performance measurement facilitates accountability by enabling parliament and members of the public to track Necsa’s progress. There is effective alignment in terms of Necsa’s Strategic Outcome Orientated Goals and Performance Indicators across the Shareholder Compact with the Department of Energy, Corporate Plan and Estimates of Expenditure.
STATEMENT OF RESPONSIBILITY FOR PERFORMANCE INFORMATION
The Board is responsible for implementing a system of internal controls to provide reasonable assurance as to the integrity of the performance information, human resources information and the Annual Financial Statements.
The Group Chief Executive Officer is responsible for the preparation of Necsa’s performance information and for the judgements made in this information.
This Annual Report has been prepared in accordance with the guidelines issued by National Treasury. The Annual Financial Statements have been prepared in accordance with the International Financial Reporting Standard (IFRS).
The Auditor-General of South Africa has examined the company’s Annual Financial Statements and Predetermined Objectives for the year ended 31 March 2018 and their report is presented on page 26. All information disclosed in this Annual Report is consistent with the Annual Financial Statements as audited by the Auditor-General.
In our opinion, the Annual Report fairly reflects the operations, performance information, human resources information and the financial affairs of Necsa for the financial year ended 31 March 2018.
Yours faithfully
Mr GP Tshelane Group Chief Executive Officer
Dr KR Kemm Chairperson of the Board

N E C S A A N N U A L R E P O R T 2 0 1 7 / 1 8 26 K E Y P E R F O R M A N C E I N F O R M A T I O N 5
AUDITOR-GENERAL’S REPORT: PREDETERMINED OBJECTIVES The Auditor-General of South Africa currently performs the necessary audit procedures on the performance information to provide reasonable assurance in the form of an audit conclusion. The audit conclusion on the performance against predetermined objectives is included in the report
to management, with material findings being reported under the Predetermined Objectives heading in this report.
Refer to page 120 of this report for the Independent Auditor’s Report on Predetermined Objectives (section 22 to 32).
OVERVIEW OF PUBLIC ENTITY’S PERFORMANCE Service Delivery Environment
Given Necsa’s mandates relating to research and develop-ment and national nuclear obligations, the company is not directly involved in service delivery to the public.
Prevailing economic conditions affected Necsa significantly, both limiting support from the fiscus as well as commercial revenues. Pelchem suffered from plant reliability issues as well as competitiveness in global markets. Pelindaba Enterprise was impacted by continued weakness in the local manufacturing sector although ageing related replacement of equipment at the Koeberg Nuclear Power Station is providing opportunity. Prior to the unexpected shutdown in November 2017, NTP was able to grow its market share by working with partners to cover the supply gap after the exit of the leading Canadian radioisotope supplier.
A Necsa Concerns Register continues to be maintained and captures the concerns raised by stakeholders via channels such as email, Facebook and the Public Safety Information Forum. One such concern from the local community was that future meetings be held in Atteridgeville to enable broader participation by local communities. The next PSIF meeting during June 2018 will be held in Atteridgeville.
Legal challenges against Necsa were successfully dealt with as reported in the Legal Services section on page 37.
The proposed nuclear new build programme was negatively affected by uncertainty regarding its political support as well as the apparent success of competing renewable energy sources. Favouring nuclear power though is the increasing
threat posed by global warming.
Organisational Environment
The single most significant internal organisational challenge continues to be the financial constraints faced by it.
Key Policy Developments and Legislative Changes
During the reporting period there were no changes to legislation impacting Necsa.
Government policy on energy is under review in the form of the updated Integrated Energy and Resource Plans gazetted for public comment on 25 November 2016. The period for public comment was extended to 31 March 2017. While the updated draft base case assumes that the first new nuclear reactor would only be required by 2037, Necsa is destined to play an integral role with respect to production of nuclear fuel and procurement of a new commercial production reactor.
One of six 200 m3 condensate tanks for Eskom Madupi Power Station manufactured by Pelindaba Enterprise

N E C S A A N N U A L R E P O R T 2 0 1 7 / 1 8 27 K E Y P E R F O R M A N C E I N F O R M A T I O N 5
STRATEGIC OUTCOME ORIENTED GOALS The long term strategy of the Necsa Group builds on its core research and development mandate to ensure sustainability and growth of the Necsa Group while meeting the nuclear related needs of South Africa.
Necsa’s Vision statement is described below:
In terms of Necsa’s long-term strategy, in 2027 Necsa envisages itself as a highly profitable, world-class organisation that boasts a substantive and successfully commercialised portfolio of intellectual property and the capability to manufacture nuclear products and components. Having introduced a new multi-purpose research reactor, the company owes its success to its world class technological capability, R&D programmes and increased national competence in terms of design, quality management, project management and architect engineering. Its robust incentive schemes (for workers and suppliers) have resulted in sustainable income streams with positive impacts on society and key stakeholder groups.
The Necsa EXCO defined the following critical success factors for attaining the 2027 vision:
• Innovation and Growth;
• Performance Management (Business and Financial);
• Applied Research and Technology Development;
• People Development;
• Stakeholder Management;
• Strategy Execution and Operational Excellence; and
• Business Process and Procedures including Security, Safety, Health, Environment and Quality.
Necsa’s objectives are grouped into three Strategic Clusters:
Nuclear Power Cluster
The Nuclear Power Cluster comprises Necsa’s nuclear fuel development and production programmes. Projects in support of the South African nuclear power programme will expand Necsa’s expertise, technology base and infrastructure to enhance the security of local nuclear fuel supply and enter the global market. The key strategic objectives for this cluster are:
• To assess the viability of a future industry servicing the front end nuclear fuel cycle in South Africa and to progress towards the development and demonstration of the required technologies;
• To prove the viability of Pelindaba Enterprise (Pelindaba Manufacturing; Pelindaba Engineering Services and Pelindaba Consulting Services) and Necsa Learning Academy; and
• To ensure the retention of competitive commercial fluorine capability through Pelchem’s strategy for growth and sustainability.
Radiation Science and Applications Cluster
This cluster includes radiation science research and products based on the SAFARI-1 Reactor and Necsa’s related expertise. The Necsa Group will maintain and expand its global leadership position in the supply of medical radioisotopes through partnerships, expansion of its product portfolio and the eventual replacement of the SAFARI-1 Research Reactor. The key strategic objectives for this cluster include:
• To maintain full operational capability of SAFARI-1 and implement the reactor’s ageing management programme;
• To expand SAFARI-1 based R&D facilities and outputs;
• To develop and implement the project to ensure security of supply of LEU, LEU fuel and LEU target plates;
• To secure core strategic capability through the replacement of SAFARI-1 by a Multi-Purpose Research Reactor before it reaches the end of its operational lifetime; and
• To grow NTP Group net profit from R95.3m (2016/17 forecast) to R285.0m by 2020/21.
Necsa as Host of Nuclear Programmes Cluster
This cluster refers to Necsa’s capacity to house nuclear programmes due to its licensed nuclear infrastructure, specialised supporting capabilities and integrated SHEQ management system. The key strategic objectives for this cluster include:
• To increase Necsa’s research, development and innovation outputs;
• To constantly improve SHEQ management performance
• Improving pre-disposal waste management activities; and
• To maintain infrastructure at a suitable level.

N E C S A A N N U A L R E P O R T 2 0 1 7 / 1 8 28 K E Y P E R F O R M A N C E I N F O R M A T I O N 5
PERFORMANCE INFORMATION BY PROGRAMME CLUSTERPerformance against planned indicators and targets, as contracted in the Shareholder Compact – 2017/18 between Necsa and
the Minister of Energy, is presented in the prescribed tabular format.
Nuclear Energy Programme Cluster
The purpose and strategic objectives relating to this programme are described in the preceding section. During the year under review there were no amendments to the planned targets.
Nuclear Energy Programme Cluster: Performance Indicators, Planned Targets and Actual Achievements
Key Performance Area
Key Performance Indicator
Actual Achievement 2016/17
Planned Target 2017/18
Actual Achievement2017/18
Deviation from Planned Target 2017/18
Comment on Deviation
Pelchem Group financials
Net profit after tax
(R35.50m) (R18.90m) (R35.57m) (R16.67m) Target not met - Due to lower HF sales resulting from low availability of ageing HF plant. *
* Pelchem’s short term strategy is to improve operational performance and focus only on commercially viable products. In the
longer term, sustainability will be pursued by expanding market share based on commercially scaled production plants.
Radiation Products and Services Programme Cluster
The purpose and strategic objectives relating to this programme are described in the preceding section. During the year under review, there were no amendments to the planned targets.
Radiation Products and Services Programme Cluster: Performance Indicators, Planned Targets and Actual Achievements
Key Performance Area
Key Performance Indicator
Actual Achievement 2016/17
Planned Target 2017/18
Actual Achievement2017/18
Deviation from Planned Target 2017/18
Comment on Deviation
NTP Group financials
Net profit after tax R196.35m R124.5m R97.2m R27.3m During the quarter there was a cessation of production in P1701, which led to loss of sales.
SAFARI-1 Operation
Operational availability (days per year)
297.9 days 287 days 299.68 days 12.68 days Target exceeded - Due to hours gained by shortening planned outages.#
# The SAFARI-1 Operational Availability can be compared to the normal availability of the High Flux Reactor (HFR) in Petten at 275 days/year and ANSTO’s Open Pool Australian Lightwater Reactor (OPAL) at 300 days/year.

N E C S A A N N U A L R E P O R T 2 0 1 7 / 1 8 29 K E Y P E R F O R M A N C E I N F O R M A T I O N 5
Key Performance Area
Key Performance Indicator
Actual Achievement 2016/17
Planned Target 2017/18
Actual Achievement2017/18
Deviation from Planned Target 2017/18
Comment on Deviation
Establish sustainable supply of LEU fuel and target plates
Achievement of project objectives
Business case completed;
Screening assessment of alternate suppliers updated;
Documentation for qualifying second fuel supplier nearing finalisation;
Negotiations with routine fuel supplier for 2017 nearing completion;
Five year LEU metal supply order concluded.
Implementation of the recom-mendations from the busi-ness case.
• Capability and Capacity assessment of 6 potential suppliers completed.
• Order for 70 FA’s, 10 CR’s and 3600 targets placed on Areva NP.
• Pre-feasibility study – Local Target Manufacture completed.
• Initiation of Feasibility Study for local Target plate manufacturing plant.
No material deviations.
Target met.
Necsa as Host of Nuclear Programmes Cluster
The purpose and strategic objectives relating to this programme are described in the preceding section. During the year under review there were no amendments to the planned targets.
Necsa as Host of Nuclear Programmes Cluster: Performance Indicators, Planned Targets and Actual Achievements
Key Performance Area
Key Performance Indicator
Actual Achievement 2016/17
Planned Target 2017/18
Actual Achievement2017/18
Deviation from Planned Target 2017/18
Comment on Deviation
D&D programme execution
Execution of Annual Plan of Action as approved by DoE
98.67% 100% 113.65% 13.65% Target exceed-ed due to the majority of Decontamina-tion and Waste management’s KPAs that exceeded the targets.

N E C S A A N N U A L R E P O R T 2 0 1 7 / 1 8 30 K E Y P E R F O R M A N C E I N F O R M A T I O N 5
Key Performance Area
Key Performance Indicator
Actual Achievement 2016/17
Planned Target 2017/18
Actual Achievement2017/18
Deviation from Planned Target 2017/18
Comment on Deviation
Compliance to SHEQ, license and other regulatory requirements
Disabling Injury Incidence Rate (DIIR)
1.1 <1.5 1.01 33% * Target met.
Public dose impact (expressed as % of NNR allowable limit)
2.23% <20% 2.780% (86%) Target exceeded.
* The Necsa Group’s Safety Culture will be targeted for further enhancement.
Cross-Cutting Programmes Cluster
The purpose of this programme is to manage activities of a cross-cutting nature not readily classified into the three preceding clusters. During the year under review there were no amendments to the planned targets.
Cross-Cutting Programmes Cluster: Performance Indicators, Planned Targets and Actual Achievements
Key Performance Area
Key Performance Indicator
Actual Achievement 2016/17
Planned Target 2017/18
Actual Achievement2017/18
Deviation from Planned Target 2017/18
Comment on Deviation
Necsa Corporate Financials
External Sales (Including Intra- Group Sales)
R407.0m R385.3m R362.50m (R22.8m) Local sales significantly below budget. The negative variance is mainly due to income that Pelindaba Enterprise budgeted for which was not realised.
Innovation Value Chain
Innovation Disclosures
15 15 10 (5) Target not met - Due to unpredictable process as well as a lack of TRL2 projects.
Research Outputs
Research Publications
43 31 45 14 Target exceeded.
Staff composition
Technical staff as % of total staff
47.83% 46.5% 45.33% (1.17%) Target not met – Amongst others, decline in technical staff due to retirements.
Black technical staff as % of all technical staff
58.48% 55% 61.51% 6.51% Target exceeded – Due to Employment Equity interventions.

N E C S A A N N U A L R E P O R T 2 0 1 7 / 1 8 31 K E Y P E R F O R M A N C E I N F O R M A T I O N 5
Researchers comparing their results

N E C S A A N N U A L R E P O R T 2 0 1 7 / 1 8 32 K E Y P E R F O R M A N C E I N F O R M A T I O N 5
SUMMARY OF FINANCIAL INFORMATIONSalient features of 2017/18
Changes from 2017 Nominal % Real %
State dependence for operating costs 13,6% 9,8%
Group sales (3,5%) (7,3%)
Company sales (3,1%) (6,9%)
Group sales per capita (11,9%) (15,7%)
Company sales per capita (11,7%) (15,5%)
Group expenses 0,6% (3,2%)
Company expenses 17,1% 13,3%
Group personnel costs 13,3% 9,5%
Company personnel costs 7,2% 3,4%
Group operating expenses (salaries and allowances excluded) (4,9%) (8,7%)
Company operating expenses (salaries and allowances excluded) 26,7% 22,9%
Inflation adjustment used in all calculations is 3.8%
2018 2017 2016 2015 2014
Group R'000 R'000 R'000 R'000 R'000
Income generated
Sales and other income 1 689 900 1 781 488 1 881 844 1 512 054 1 289 512
Construction contracts 30 026 6 445 (21 349) 25 568
Government grant
Operating Activities 491 738 446 046 436 479 417 421 395 730
Decommissioning and decontamination 73 473 61 691 58 609 57 997 57 934
LEU Fuel and conversion 21 344 8 418 1 087 - 535
Security 9 394 8 372 8 113 8 206 7 821
Deferred R&D Safari Grant Used 276 169 - - -
Safari 1 - - 116 3 671 1 609
Deferred MTEF Grant Utilised for Activities 766 766 - - -
Other grants 61 255 37 774 38 411 32 781 59 007
Income from Investments 320 046 318 106 321 834 75 129 42 717
2 698 218 2 669 275 2 725 144 2 132 827 1 854 866
Income distributed
Employees 985 583 869 532 803 457 717 481 629 522
Providers of services. materials and products 1 461 067 1 554 793 1 394 575 1 322 710 1 063 331
Training and development 9 533 18 335 15 990 15 031 9 893
Government 53 412 108 974 98 254 47 878 69 092
Depreciation 95 438 81 560 77 965 65 770 74 276
Retained Income 109 863 42 213 327 210 (42 503) 2 116
Minority interest share of profit 5 999 6 159 7 693 6 460 6 636
2 720 895 2 681 566 2 725 144 2 132 827 1 854 866

N E C S A A N N U A L R E P O R T 2 0 1 7 / 1 8 33 K E Y P E R F O R M A N C E I N F O R M A T I O N 5
2018 2017 2016 2015 2014
Group % % % % %
Income generated
Sales and other income 62,6% 67,2% 69,1% 70,9% 69,5%
Construction contracts 1,1% 0,5% (0,8%) 1,2% -
Government grant
Operating Activities 18,2% 16,8% 16,0% 19,6% 21,3%
Decommissioning and decontamination 2,7% 2,3% 2,2% 2,7% 3,1%
LEU Fuel and conversion 0,8% 0,3% 0,0% - 0,0%
Security 0,3% 0,3% 0,3% 0,4% 0,4%
Deferred R&D Safari Grant Used 0,0% 0,0% - - -
Safari 1 - - 0,0% 0,2% 0,1%
Deferred MTEF Grant Utilised for Activities 0,0% 0,0% - - -
Other grants 2,3% 1,4% 1,4% 1,5% 3,2%
Income from Investments 11,9% 12,0% 11,8% 3,5% 2,3%
100,0% 100,0% 100,0% 100,0% 100,0%
Income distributed
Employees 35,7% 31,6% 29,5% 33,6% 33,9%
Providers of services. materials and products 54,1% 58,7% 51,2% 62,0% 57,3%
Training and development 0,4% 0,7% 0,6% 0,7% 0,5%
Government 2,0% 4,1% 3,6% 2,2% 3,7%
Depreciation 3,5% 3,1% 2,9% 3,1% 4,0%
Retained Income 4,1% 1,6% 12,0% (2,0%) 0,1%
Minority interest share of profit 0,2% 0,2% 0,3% 0,3% 0,4%
100,0% 100,0% 100,0% 100,0% 100,0%
Aerial view of Necsa site

N E C S A A N N U A L R E P O R T 2 0 1 7 / 1 8 34 K E Y P E R F O R M A N C E I N F O R M A T I O N 5
Sales
Income Generated
Income Distributed
Sales and other income
Construction contracts
Investment income
Government grants
Other grants
Sales - Foreign
Sales - Local
Sales - Foreign
Sales - Local
Sales and other income
Construction contracts
Investment income
Government grants
Other grants
Employees
Providers of services, materials and products
Training and development
Government
Depreciation
Retained income
Minority interest share of profit
Employees
Providers of services, materials and products
Training and development
Government
Depreciation
Retained income
Minority interest share of profit
Group 2018 Company 2018
Group 2018 Company 2018
Company 2018Group 2018
62%
38%
6%
94%
63%
1%
12%
22%
2% 4%
33%
2%
23%
38%
36%
54%
0%
2%4%
4%
42%
49%
0%
1%
4%-4% 0%0%

N E C S A A N N U A L R E P O R T 2 0 1 7 / 1 8 35 K E Y P E R F O R M A N C E I N F O R M A T I O N 5
Medium-term Expenditure Framework (MTEF) 2017-18: Critical Infrastructure Investment
In 2014, DoE and the National Treasury allocated funding specifically for critical priority investment in Necsa site infrastructure during the 2015 to 2017 MTEF period. The programme was divided into five projects addressing ageing management sub-projects in Analytical and Calibration Services, Liquid Effluent Management Services, Material Test Reactor, Site Security Department and Site Infrastructure.
The programme was planned for the period 01 April 2015 to 31 March 2017 with overall progress on 31 March 2018 reported at 92%. The MTEF funding granted to Necsa by the DoE amounted to R166m excluding VAT. This amount was reduced by R55m for overheads and other priorities, and supplemented by R5m for insurance proceeds, resulting in an effective budget of R116m. Actual committed expenditure to March 2018 amounted to R89.5m.

N E C S A A N N U A L R E P O R T 2 0 1 7 / 1 8 36 N E C S A D I V I S I O N S A N D K E Y S U B S I D I A R I E S 6
N E C S A D I V I S I O N S A N D K E Y
S U B S I D I A R I E S
6

N E C S A A N N U A L R E P O R T 2 0 1 7 / 1 8 37 N E C S A D I V I S I O N S A N D K E Y S U B S I D I A R I E S 6
The functions and performance of the Necsa Group Divisions are summarised below with reference to the organisational structure depicted on page 9. This is provided at the level of the Departments in each Division and in some instances for the major groups comprising a Department.
GROUP FUNCTIONSCompany Secretary
During the 2017/18 fiscal year, Company Secretariat services were provided by Fulufhulani Corporate Governance and Legal Advisory (Pty) Ltd. Functions provided include preparing the annual Board schedule of meetings, timeous distribution of correspondence, record keeping, preparing resolutions for meetings as well as preparing draft Board and Board Committee minutes. In addition, new Board members received induction. The returns required by the Companies Act, complete and accurate, were lodged in time.
Legal Services
The Necsa Legal Services department is responsible for rendering legal advisory services with respect to contracting and statutory compliance issues while liaising with external parties as required. In addition, the department manages Necsa’s litigation matters and submits quarterly litigation report. Highlights for the 2017/18 fiscal year included, in conjunction with Human Resources, three year wage deal with organised labour.
Internal audit
As part of Necsa’s internal control function, Internal Audit evaluates the effectiveness of the Necsa Group’s risk management systems and internal controls systems, including financial internal controls, governance and ethics related processes. Assurance and consulting services regarding these matters are provided to the Board Audit and Risk Committee.
The key activities of Internal Audit include the continuous evaluation of risks associated with the integrity of finan-cial and operational information, resource utilisation, asset management as well as compliance with legal requirements. In addition, consultation services are provided to the Necsa Group for improving performance and applying corporate governance best practices.
Planned and ad-hoc audit projects are carried out in accordance with both an annual plan and a three year rolling plan approved by the Audit and Risk Committee. A risk based approach to audit projects is followed and the following audit focus areas are included with the results
reported to the Audit and Risk Committee on a regular basis.
These include the following:
• Systems and Compliance Audit;
• Corporate Governance and Ethics Related Audit;
• Risk Based Performance Audit;
• Predetermined Objectives Audit;
• Information Technology Audit; and
• Ad-Hoc Audits and Special Investigations.
Strategy and Performance
The Strategy and Performance department is responsible for implementation of a coherent strategy to achieve the Necsa Group’s business, social and environmental objectives. Performance is evaluated against predetermined objectives and key indicators in accordance with the compact between the Minister of Energy and Necsa.
The department supports the Necsa Group in the following areas:
• Integrated business planning and performance monitoring;
• Driving the achievement of strategic and operational objectives;
• Management of Risk and Compliance;
• Organisational competency in Project Management;
• Organisational competency for Quality;
• Occupational Health and Safety;
• Prefeasibility studies on nuclear fuel facilities; and
• Ad hoc matters assigned by the CEO.
The Strategic Planning and Performance Management section is responsible for business planning and reporting performance in terms of predetermined goals and objectives, as reflected under “Performance Information by Programme” on page 26. All required performance reports were prepared and submitted to the Necsa Board and the Department of Energy.
The Risk and Compliance unit maintains the strategic risk register, based on departmental and divisional risk registers, and presents it to the Audit and Risk Committee. More
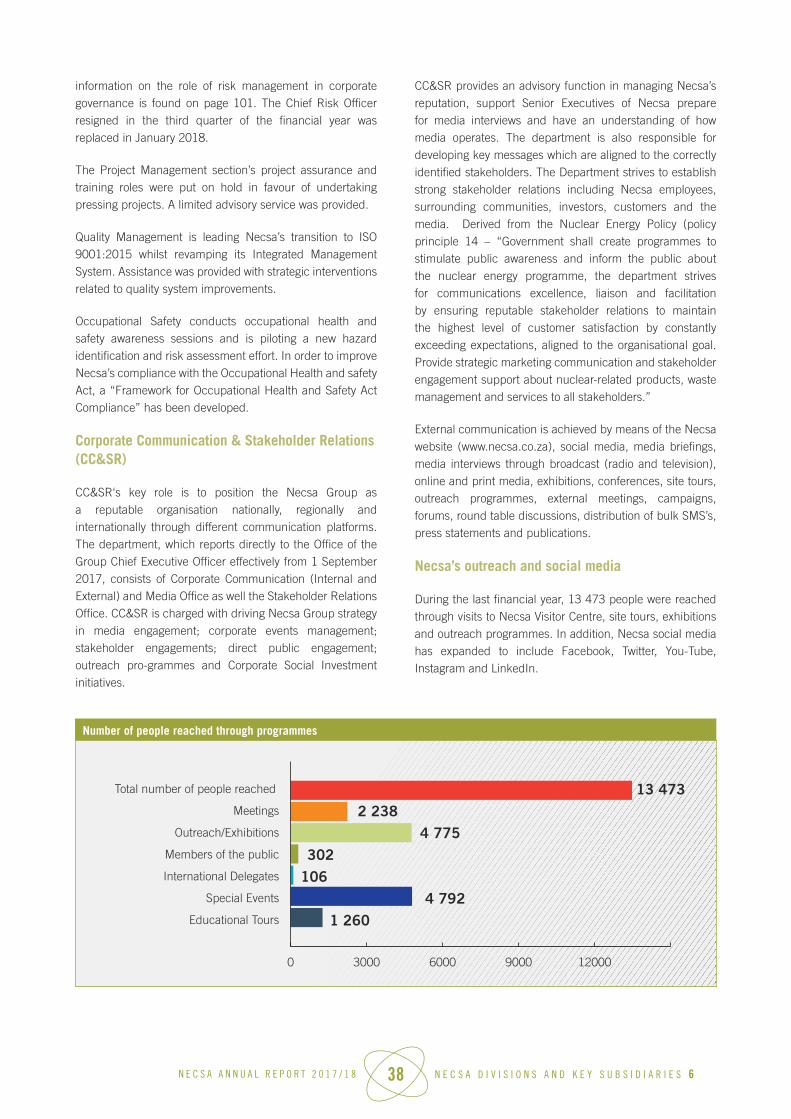
N E C S A A N N U A L R E P O R T 2 0 1 7 / 1 8 38 N E C S A D I V I S I O N S A N D K E Y S U B S I D I A R I E S 6
information on the role of risk management in corporate governance is found on page 101. The Chief Risk Officer resigned in the third quarter of the financial year was replaced in January 2018.
The Project Management section’s project assurance and training roles were put on hold in favour of undertaking pressing projects. A limited advisory service was provided.
Quality Management is leading Necsa’s transition to ISO 9001:2015 whilst revamping its Integrated Management System. Assistance was provided with strategic interventions related to quality system improvements.
Occupational Safety conducts occupational health and safety awareness sessions and is piloting a new hazard identification and risk assessment effort. In order to improve Necsa’s compliance with the Occupational Health and safety Act, a “Framework for Occupational Health and Safety Act Compliance” has been developed.
Corporate Communication & Stakeholder Relations (CC&SR)
CC&SR‘s key role is to position the Necsa Group as a reputable organisation nationally, regionally and internationally through different communication platforms. The department, which reports directly to the Office of the Group Chief Executive Officer effectively from 1 September 2017, consists of Corporate Communication (Internal and External) and Media Office as well the Stakeholder Relations Office. CC&SR is charged with driving Necsa Group strategy in media engagement; corporate events management; stakeholder engagements; direct public engagement; outreach pro-grammes and Corporate Social Investment initiatives.
CC&SR provides an advisory function in managing Necsa’s reputation, support Senior Executives of Necsa prepare for media interviews and have an understanding of how media operates. The department is also responsible for developing key messages which are aligned to the correctly identified stakeholders. The Department strives to establish strong stakeholder relations including Necsa employees, surrounding communities, investors, customers and the media. Derived from the Nuclear Energy Policy (policy principle 14 – “Government shall create programmes to stimulate public awareness and inform the public about the nuclear energy programme, the department strives for communications excellence, liaison and facilitation by ensuring reputable stakeholder relations to maintain the highest level of customer satisfaction by constantly exceeding expectations, aligned to the organisational goal. Provide strategic marketing communication and stakeholder engagement support about nuclear-related products, waste management and services to all stakeholders.”
External communication is achieved by means of the Necsa website (www.necsa.co.za), social media, media briefings, media interviews through broadcast (radio and television), online and print media, exhibitions, conferences, site tours, outreach programmes, external meetings, campaigns, forums, round table discussions, distribution of bulk SMS’s, press statements and publications.
Necsa’s outreach and social media
During the last financial year, 13 473 people were reached through visits to Necsa Visitor Centre, site tours, exhibitions and outreach programmes. In addition, Necsa social media has expanded to include Facebook, Twitter, You-Tube, Instagram and LinkedIn.
Number of people reached through programmes
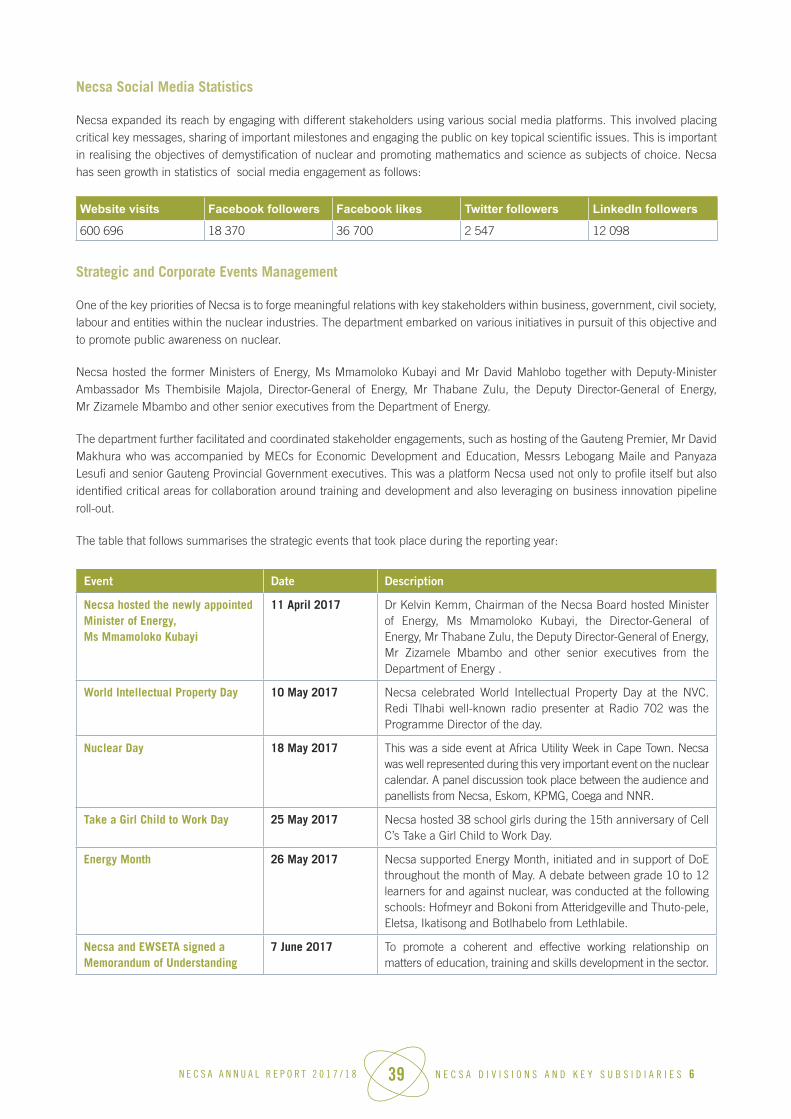
N E C S A A N N U A L R E P O R T 2 0 1 7 / 1 8 39 N E C S A D I V I S I O N S A N D K E Y S U B S I D I A R I E S 6
Necsa Social Media Statistics
Necsa expanded its reach by engaging with different stakeholders using various social media platforms. This involved placing critical key messages, sharing of important milestones and engaging the public on key topical scientific issues. This is important in realising the objectives of demystification of nuclear and promoting mathematics and science as subjects of choice. Necsa has seen growth in statistics of social media engagement as follows:
Website visits Facebook followers Facebook likes Twitter followers LinkedIn followers
600 696 18 370 36 700 2 547 12 098
Strategic and Corporate Events Management
One of the key priorities of Necsa is to forge meaningful relations with key stakeholders within business, government, civil society, labour and entities within the nuclear industries. The department embarked on various initiatives in pursuit of this objective and to promote public awareness on nuclear.
Necsa hosted the former Ministers of Energy, Ms Mmamoloko Kubayi and Mr David Mahlobo together with Deputy-Minister Ambassador Ms Thembisile Majola, Director-General of Energy, Mr Thabane Zulu, the Deputy Director-General of Energy, Mr Zizamele Mbambo and other senior executives from the Department of Energy.
The department further facilitated and coordinated stakeholder engagements, such as hosting of the Gauteng Premier, Mr David Makhura who was accompanied by MECs for Economic Development and Education, Messrs Lebogang Maile and Panyaza Lesufi and senior Gauteng Provincial Government executives. This was a platform Necsa used not only to profile itself but also identified critical areas for collaboration around training and development and also leveraging on business innovation pipeline
roll-out.
The table that follows summarises the strategic events that took place during the reporting year:
Event Date Description
Necsa hosted the newly appointed Minister of Energy, Ms Mmamoloko Kubayi
11 April 2017 Dr Kelvin Kemm, Chairman of the Necsa Board hosted Minister of Energy, Ms Mmamoloko Kubayi, the Director-General of Energy, Mr Thabane Zulu, the Deputy Director-General of Energy, Mr Zizamele Mbambo and other senior executives from the Department of Energy .
World Intellectual Property Day 10 May 2017 Necsa celebrated World Intellectual Property Day at the NVC. Redi Tlhabi well-known radio presenter at Radio 702 was the Programme Director of the day.
Nuclear Day 18 May 2017 This was a side event at Africa Utility Week in Cape Town. Necsa was well represented during this very important event on the nuclear calendar. A panel discussion took place between the audience and panellists from Necsa, Eskom, KPMG, Coega and NNR.
Take a Girl Child to Work Day 25 May 2017 Necsa hosted 38 school girls during the 15th anniversary of Cell C’s Take a Girl Child to Work Day.
Energy Month 26 May 2017 Necsa supported Energy Month, initiated and in support of DoE throughout the month of May. A debate between grade 10 to 12 learners for and against nuclear, was conducted at the following schools: Hofmeyr and Bokoni from Atteridgeville and Thuto-pele, Eletsa, Ikatisong and Botlhabelo from Lethlabile.
Necsa and EWSETA signed a Memorandum of Understanding
7 June 2017 To promote a coherent and effective working relationship on matters of education, training and skills development in the sector.
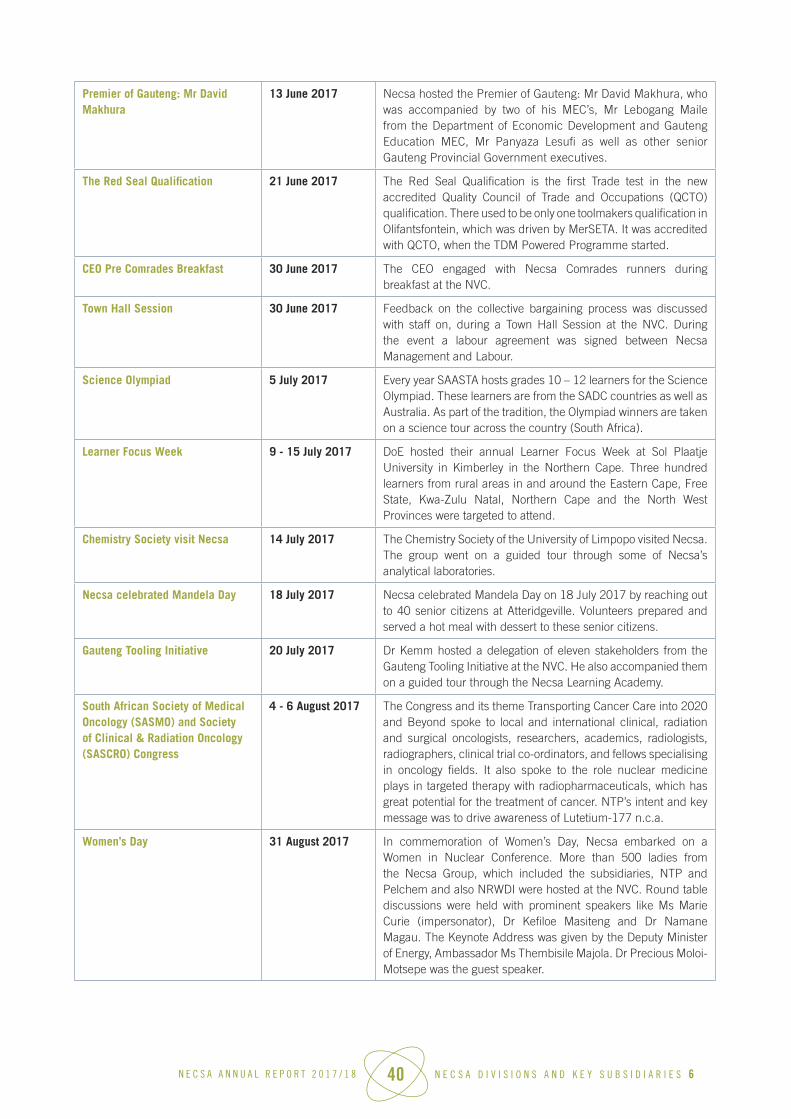
N E C S A A N N U A L R E P O R T 2 0 1 7 / 1 8 40 N E C S A D I V I S I O N S A N D K E Y S U B S I D I A R I E S 6
Premier of Gauteng: Mr David Makhura
13 June 2017 Necsa hosted the Premier of Gauteng: Mr David Makhura, who was accompanied by two of his MEC’s, Mr Lebogang Maile from the Department of Economic Development and Gauteng Education MEC, Mr Panyaza Lesufi as well as other senior Gauteng Provincial Government executives.
The Red Seal Qualification 21 June 2017 The Red Seal Qualification is the first Trade test in the new accredited Quality Council of Trade and Occupations (QCTO) qualification. There used to be only one toolmakers qualification in Olifantsfontein, which was driven by MerSETA. It was accredited with QCTO, when the TDM Powered Programme started.
CEO Pre Comrades Breakfast 30 June 2017 The CEO engaged with Necsa Comrades runners during breakfast at the NVC.
Town Hall Session 30 June 2017 Feedback on the collective bargaining process was discussed with staff on, during a Town Hall Session at the NVC. During the event a labour agreement was signed between Necsa Management and Labour.
Science Olympiad 5 July 2017 Every year SAASTA hosts grades 10 – 12 learners for the Science Olympiad. These learners are from the SADC countries as well as Australia. As part of the tradition, the Olympiad winners are taken on a science tour across the country (South Africa).
Learner Focus Week 9 - 15 July 2017 DoE hosted their annual Learner Focus Week at Sol Plaatje University in Kimberley in the Northern Cape. Three hundred learners from rural areas in and around the Eastern Cape, Free State, Kwa-Zulu Natal, Northern Cape and the North West Provinces were targeted to attend.
Chemistry Society visit Necsa 14 July 2017 The Chemistry Society of the University of Limpopo visited Necsa. The group went on a guided tour through some of Necsa’s analytical laboratories.
Necsa celebrated Mandela Day 18 July 2017 Necsa celebrated Mandela Day on 18 July 2017 by reaching out to 40 senior citizens at Atteridgeville. Volunteers prepared and served a hot meal with dessert to these senior citizens.
Gauteng Tooling Initiative 20 July 2017 Dr Kemm hosted a delegation of eleven stakeholders from the Gauteng Tooling Initiative at the NVC. He also accompanied them on a guided tour through the Necsa Learning Academy.
South African Society of Medical Oncology (SASMO) and Society of Clinical & Radiation Oncology (SASCRO) Congress
4 - 6 August 2017 The Congress and its theme Transporting Cancer Care into 2020 and Beyond spoke to local and international clinical, radiation and surgical oncologists, researchers, academics, radiologists, radiographers, clinical trial co-ordinators, and fellows specialising in oncology fields. It also spoke to the role nuclear medicine plays in targeted therapy with radiopharmaceuticals, which has great potential for the treatment of cancer. NTP’s intent and key message was to drive awareness of Lutetium-177 n.c.a.
Women’s Day 31 August 2017 In commemoration of Women’s Day, Necsa embarked on a Women in Nuclear Conference. More than 500 ladies from the Necsa Group, which included the subsidiaries, NTP and Pelchem and also NRWDI were hosted at the NVC. Round table discussions were held with prominent speakers like Ms Marie Curie (impersonator), Dr Kefiloe Masiteng and Dr Namane Magau. The Keynote Address was given by the Deputy Minister of Energy, Ambassador Ms Thembisile Majola. Dr Precious Moloi-Motsepe was the guest speaker.

N E C S A A N N U A L R E P O R T 2 0 1 7 / 1 8 41 N E C S A D I V I S I O N S A N D K E Y S U B S I D I A R I E S 6
Meeting on Technological Innovations on end-of-life management of DSRS
25 - 29 September 2017
Meeting on Technological Innovations on end-of-life management of Disposal Sealed Radioactive Sources is a technical meeting under the Interregional Project INT 9182: Sustaining the Cradle to Grave Management of Sealed Radioactive Sources that was hosted by South Africa (Necsa) at the Protea Hotel in Menlyn. The purpose of the meeting was to discuss innovative disposal technologies as well as to showcase the very first demonstration of the modified MHC and associated pre-disposal and disposal activities. The activities related to the modification of the MHC was successfully demonstrated on the Necsa site to 35 participants from 18 member states and witnessed by IAEA experts.
National Heritage Day 29 September 2017
Necsa celebrated the National Heritage Day which highlighted the importance of respect and appreciation of each other among staff members.
Long Service Awards 6 October 2017 Necsa celebrated the loyalty and commitment of 67 employees at the Long Service Awards function held at the NVC. Employees were acknowledged for working at Necsa for 20, 30 and 40 years.
IAEA/TSAN Niger Conference 6 and 17 November 2017
South-Africa hosted sixteen delegates from the Niger Nuclear Power project in nuclear sciences and engineering (IAEA/TSAN Niger) to obtain knowledge and develop the skills and abilities needed for success in developing a nuclear power infrastructure.
Necsa Pensioners Day 8 November 2017 Necsa Pensioners Day was hosted at the NVC. New Pensioner’s Forum members were elected during the meeting. The aim of this day was to share information on medical scheme changes and pension fund. Basic tests for Blood Pressure, Cholesterol and Blood Glucose were offered to those interested.
Necsa Golf Day 28 November 2017 Necsa hosted a very successful Golf Day at Pecanwood Golf and Country Club.
Official hand-over of Air-Receiver 24 January 2018 Necsa Group successfully supplied the first locally produced safety-related ASME III- designed and -certified air receiver pressure vessel to Koeberg Nuclear Power Plant. This vessel was manufactured by Nuclear Manufacturing, a department of the Pelindaba Enterprise Division.
Minister of Energy, Mr David Mahlobo Visits Necsa
1 February 2018 Minister of Energy, Mr David Mahlobo honoured the Necsa Group with a very important visit. It was mainly to gain first-hand knowledge regarding the safety issues around the closure of NTP’s radioisotope facility.
Minister of Energy, Mr David Mahlobo – follow up visit to Necsa
22 February 2018 The Minister of Energy, Mr David Mahlobo arranged a follow-up visit to Necsa, where he had a meeting with the BoD of Necsa and NTP. Strategic issues were discussed.

N E C S A A N N U A L R E P O R T 2 0 1 7 / 1 8 42 N E C S A D I V I S I O N S A N D K E Y S U B S I D I A R I E S 6
Necsa hosts International delegates annually. It is an opportunity to maintain positive diplomatic relations between countries and maintain mutual benefit. This is also essential for realisation of organisational strategic business objectives, as illustrated in the
table that follows.
International delegations hosted by Necsa
Date Delegation Hosted
3 April 2017 The Argentinian Minister of Science, Technology and Productive Innovation, Dr Lino Barañao and his delegation. The existing collaboration between Necsa and Argentina and ways to strengthen this partnership were discussed.
4 April 2017 International Master Program in Nuclear Engineering and Management (SNPTC) invited Necsa to participate in the Introduction of International Master Programme in Nuclear Engineering and Management. This two-year graduate program, in which all professional courses will be offered in English, is aimed at cultivating high quality technology and management oriented talents in the nuclear energy field. Eleven candidates were interviewed at the NVC.
15 May 2017 Necsa and French electric utility company, EDF signed a Memorandum of Understanding to advance training and development of technical skills and for the continuous education and training of technicians in the nuclear energy sector.
7 June 2017 Scientists sponsored by IAEA: A group of scientists specialising in analytical chemistry and pure chemistry, visited Necsa on 7 June 2017. They were from Africa and sponsored by the IAEA.
13 - 16 June 2017 IAEA Training on Nuclear New Build Stakeholder Engagement Programme: Gilbert Lekwe, Educationalist at the NVC, attended a week long training session presented by the IAEA in Vienna. This training session (technical meeting), focused on stakeholder engagement and public information in the nuclear domain.
7 July 2017 The Department of Environmental Health Sciences in Botswana visited Necsa’s Pelstore. The objective of this visit was to expose environmental students of the department, to facilities in South Africa that Botswana do not have in their home country.
18-22 September 2017
The IAEA hosted their 61st General Conference at the Vienna International Centre (VIC). Necsa was one of the exhibitors at the conference.
10 - 11 October 2017
Dr Margaret Mkhosi (CNSS Director) coordinated the OECD Halden Reactor Project meeting at the NNR. Mr. Dieter Zimolong from Necsa attended the meeting and also accompanied the two visitors from the Institute for Energiteknikk (IFE) in Norway, Dr Margaret McGrath, General Manager of the OECD Halden Reactor Project and Mr. Jon Kvalem, Deputy Manager of the OECD Halden Reactor Project to visit the SAFARI-1 nuclear reactor .
Necsa GCEO, Mr Phumzile Tshelane meeting with an international delegation
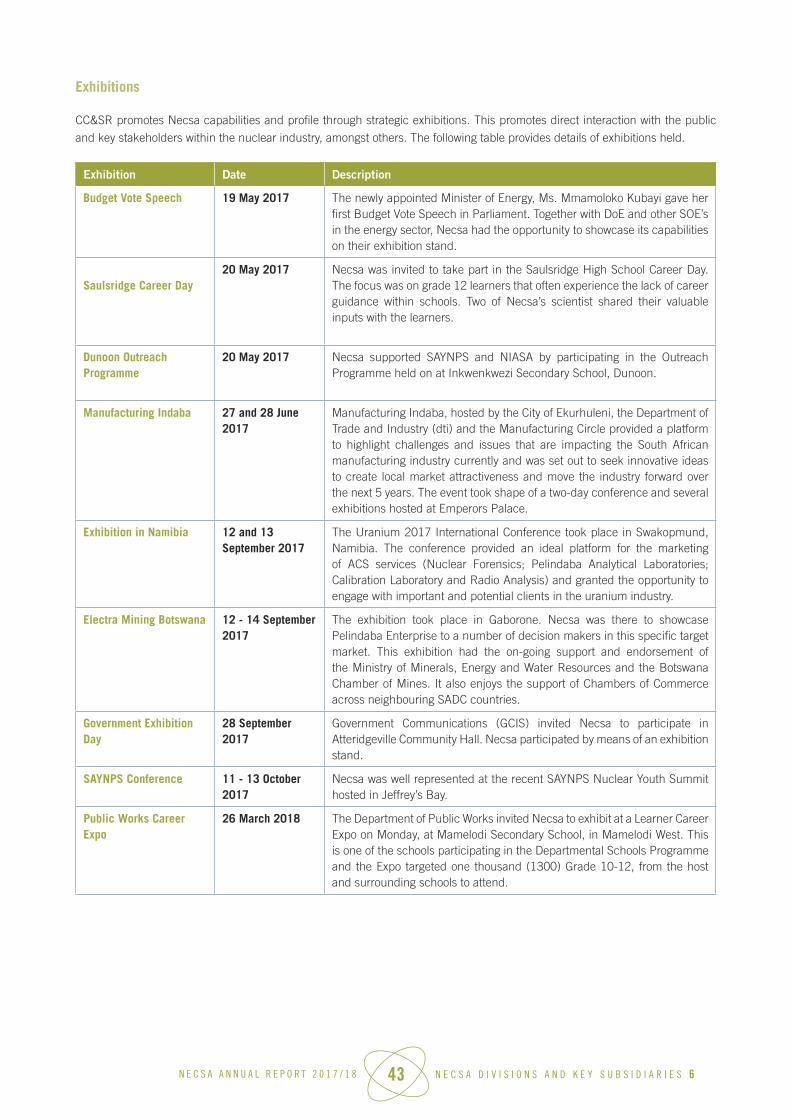
N E C S A A N N U A L R E P O R T 2 0 1 7 / 1 8 43 N E C S A D I V I S I O N S A N D K E Y S U B S I D I A R I E S 6
Exhibitions
CC&SR promotes Necsa capabilities and profile through strategic exhibitions. This promotes direct interaction with the public
and key stakeholders within the nuclear industry, amongst others. The following table provides details of exhibitions held.
Exhibition Date Description
Budget Vote Speech 19 May 2017 The newly appointed Minister of Energy, Ms. Mmamoloko Kubayi gave her first Budget Vote Speech in Parliament. Together with DoE and other SOE’s in the energy sector, Necsa had the opportunity to showcase its capabilities on their exhibition stand.
Saulsridge Career Day20 May 2017 Necsa was invited to take part in the Saulsridge High School Career Day.
The focus was on grade 12 learners that often experience the lack of career guidance within schools. Two of Necsa’s scientist shared their valuable inputs with the learners.
Dunoon Outreach Programme
20 May 2017 Necsa supported SAYNPS and NIASA by participating in the Outreach Programme held on at Inkwenkwezi Secondary School, Dunoon.
Manufacturing Indaba 27 and 28 June 2017
Manufacturing Indaba, hosted by the City of Ekurhuleni, the Department of Trade and Industry (dti) and the Manufacturing Circle provided a platform to highlight challenges and issues that are impacting the South African manufacturing industry currently and was set out to seek innovative ideas to create local market attractiveness and move the industry forward over the next 5 years. The event took shape of a two-day conference and several exhibitions hosted at Emperors Palace.
Exhibition in Namibia 12 and 13 September 2017
The Uranium 2017 International Conference took place in Swakopmund, Namibia. The conference provided an ideal platform for the marketing of ACS services (Nuclear Forensics; Pelindaba Analytical Laboratories; Calibration Laboratory and Radio Analysis) and granted the opportunity to engage with important and potential clients in the uranium industry.
Electra Mining Botswana 12 - 14 September 2017
The exhibition took place in Gaborone. Necsa was there to showcase Pelindaba Enterprise to a number of decision makers in this specific target market. This exhibition had the on-going support and endorsement of the Ministry of Minerals, Energy and Water Resources and the Botswana Chamber of Mines. It also enjoys the support of Chambers of Commerce across neighbouring SADC countries.
Government Exhibition Day
28 September 2017
Government Communications (GCIS) invited Necsa to participate in Atteridgeville Community Hall. Necsa participated by means of an exhibition stand.
SAYNPS Conference 11 - 13 October 2017
Necsa was well represented at the recent SAYNPS Nuclear Youth Summit hosted in Jeffrey’s Bay.
Public Works Career Expo
26 March 2018 The Department of Public Works invited Necsa to exhibit at a Learner Career Expo on Monday, at Mamelodi Secondary School, in Mamelodi West. This is one of the schools participating in the Departmental Schools Programme and the Expo targeted one thousand (1300) Grade 10-12, from the host and surrounding schools to attend.

N E C S A A N N U A L R E P O R T 2 0 1 7 / 1 8 44 N E C S A D I V I S I O N S A N D K E Y S U B S I D I A R I E S 6
Communication and Media
CC&SR ‘s key role is to position the Necsa Group as a reputable organisation nationally, regionally and internationally through different communication platforms. The unit reporting directly to the office of the Group Chief Executive Officer consists of Communication (Internal and External) and Media Office as well the Stakeholder Relations Office.
Necsa appeared in various media publications and broadcasts.
Media Interviews, Statements and Enquiries
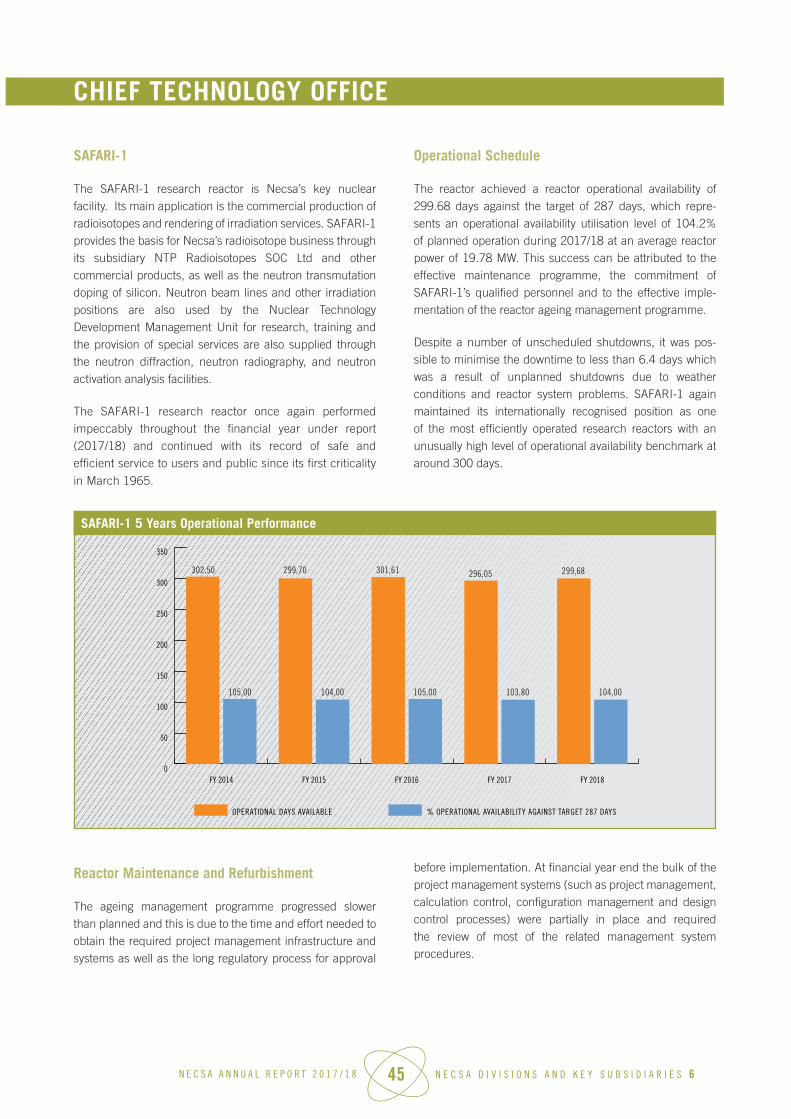
N E C S A A N N U A L R E P O R T 2 0 1 7 / 1 8 45 N E C S A D I V I S I O N S A N D K E Y S U B S I D I A R I E S 6
CHIEF TECHNOLOGY OFFICE
SAFARI-1
The SAFARI-1 research reactor is Necsa’s key nuclear facility. Its main application is the commercial production of radioisotopes and rendering of irradiation services. SAFARI-1 provides the basis for Necsa’s radioisotope business through its subsidiary NTP Radioisotopes SOC Ltd and other commercial products, as well as the neutron transmutation doping of silicon. Neutron beam lines and other irradiation positions are also used by the Nuclear Technology Development Management Unit for research, training and the provision of special services are also supplied through the neutron diffraction, neutron radiography, and neutron activation analysis facilities.
The SAFARI-1 research reactor once again performed impeccably throughout the financial year under report (2017/18) and continued with its record of safe and efficient service to users and public since its first criticality
in March 1965.
Operational Schedule
The reactor achieved a reactor operational availability of 299.68 days against the target of 287 days, which repre-sents an operational availability utilisation level of 104.2% of planned operation during 2017/18 at an average reactor power of 19.78 MW. This success can be attributed to the effective maintenance programme, the commitment of SAFARI-1’s qualified personnel and to the effective imple-mentation of the reactor ageing management programme.
Despite a number of unscheduled shutdowns, it was pos-sible to minimise the downtime to less than 6.4 days which was a result of unplanned shutdowns due to weather conditions and reactor system problems. SAFARI-1 again maintained its internationally recognised position as one of the most efficiently operated research reactors with an unusually high level of operational availability benchmark at around 300 days.
SAFARI-1 5 Years Operational Performance
Reactor Maintenance and Refurbishment
The ageing management programme progressed slower than planned and this is due to the time and effort needed to obtain the required project management infrastructure and systems as well as the long regulatory process for approval
before implementation. At financial year end the bulk of the project management systems (such as project management, calculation control, configuration management and design control processes) were partially in place and required the review of most of the related management system procedures.
302,50
105,00 105,00104,00 104,00103,80
299,70 301,61 296,05 299,68
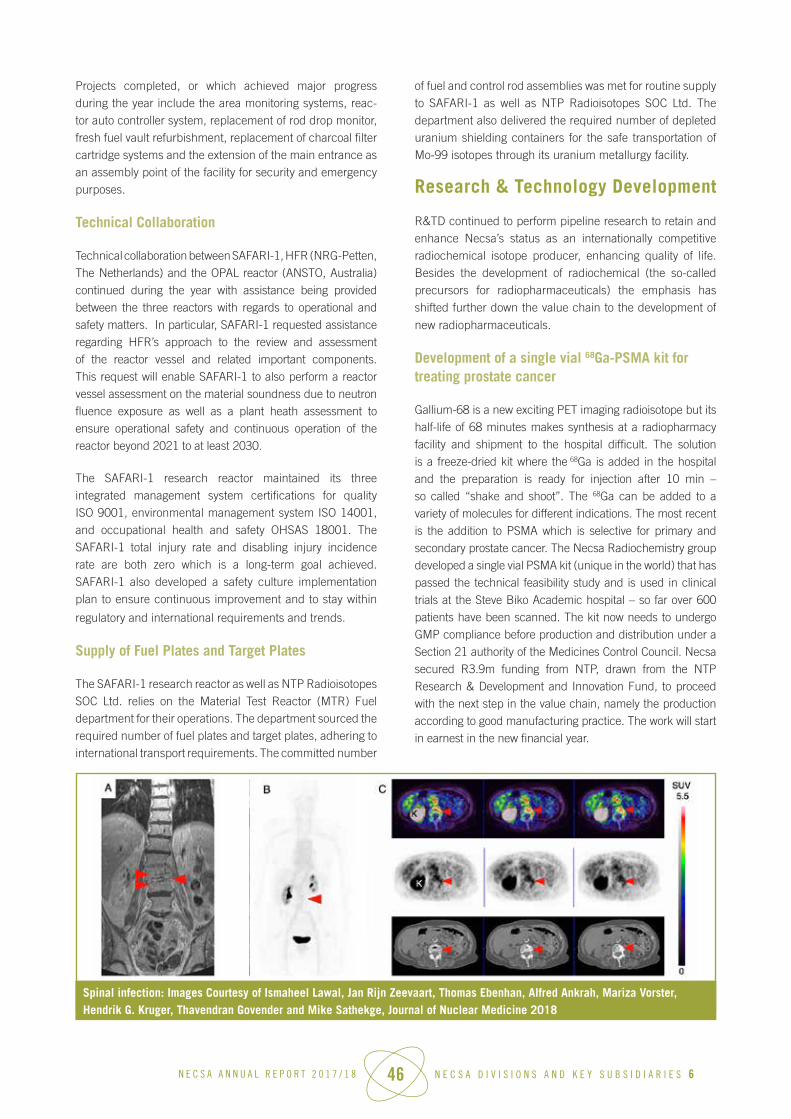
N E C S A A N N U A L R E P O R T 2 0 1 7 / 1 8 46 N E C S A D I V I S I O N S A N D K E Y S U B S I D I A R I E S 6
Projects completed, or which achieved major progress during the year include the area monitoring systems, reac-tor auto controller system, replacement of rod drop monitor, fresh fuel vault refurbishment, replacement of charcoal filter cartridge systems and the extension of the main entrance as an assembly point of the facility for security and emergency purposes.
Technical Collaboration
Technical collaboration between SAFARI-1, HFR (NRG-Petten, The Netherlands) and the OPAL reactor (ANSTO, Australia) continued during the year with assistance being provided between the three reactors with regards to operational and safety matters. In particular, SAFARI-1 requested assistance regarding HFR’s approach to the review and assessment of the reactor vessel and related important components. This request will enable SAFARI-1 to also perform a reactor vessel assessment on the material soundness due to neutron fluence exposure as well as a plant heath assessment to ensure operational safety and continuous operation of the reactor beyond 2021 to at least 2030.
The SAFARI-1 research reactor maintained its three integrated management system certifications for quality ISO 9001, environmental management system ISO 14001, and occupational health and safety OHSAS 18001. The SAFARI-1 total injury rate and disabling injury incidence rate are both zero which is a long-term goal achieved. SAFARI-1 also developed a safety culture implementation plan to ensure continuous improvement and to stay within
regulatory and international requirements and trends.
Supply of Fuel Plates and Target Plates
The SAFARI-1 research reactor as well as NTP Radioisotopes SOC Ltd. relies on the Material Test Reactor (MTR) Fuel department for their operations. The department sourced the required number of fuel plates and target plates, adhering to international transport requirements. The committed number
of fuel and control rod assemblies was met for routine supply to SAFARI-1 as well as NTP Radioisotopes SOC Ltd. The department also delivered the required number of depleted uranium shielding containers for the safe transportation of Mo-99 isotopes through its uranium metallurgy facility.
Research & Technology Development
R&TD continued to perform pipeline research to retain and enhance Necsa’s status as an internationally competitive radiochemical isotope producer, enhancing quality of life. Besides the development of radiochemical (the so-called precursors for radiopharmaceuticals) the emphasis has shifted further down the value chain to the development of
new radiopharmaceuticals.
Development of a single vial 68Ga-PSMA kit for treating prostate cancer
Gallium-68 is a new exciting PET imaging radioisotope but its half-life of 68 minutes makes synthesis at a radiopharmacy facility and shipment to the hospital difficult. The solution is a freeze-dried kit where the 68Ga is added in the hospital and the preparation is ready for injection after 10 min – so called “shake and shoot”. The 68Ga can be added to a variety of molecules for different indications. The most recent is the addition to PSMA which is selective for primary and secondary prostate cancer. The Necsa Radiochemistry group developed a single vial PSMA kit (unique in the world) that has passed the technical feasibility study and is used in clinical trials at the Steve Biko Academic hospital – so far over 600 patients have been scanned. The kit now needs to undergo GMP compliance before production and distribution under a Section 21 authority of the Medicines Control Council. Necsa secured R3.9m funding from NTP, drawn from the NTP Research & Development and Innovation Fund, to proceed with the next step in the value chain, namely the production according to good manufacturing practice. The work will start in earnest in the new financial year.
Spinal infection: Images Courtesy of Ismaheel Lawal, Jan Rijn Zeevaart, Thomas Ebenhan, Alfred Ankrah, Mariza Vorster, Hendrik G. Kruger, Thavendran Govender and Mike Sathekge, Journal of Nuclear Medicine 2018

N E C S A A N N U A L R E P O R T 2 0 1 7 / 1 8 47 N E C S A D I V I S I O N S A N D K E Y S U B S I D I A R I E S 6
Completion of the Phase I/II Clinical Trial for a Companion Diagnostic
The phase I/II clinical trial on the use of 195mPt-cisplatinum as a companion diagnostic to optimise and individualise the dose for patients was funded by the Technology Innovation Agency (TIA) for completion of the preparation of the trial. This has been concluded in this financial year. The next phase (Part B) is execution of the trial. A due diligence for this part will be started in April 2018 with TIA who has in principle agreed to co-fund this phase. The Medicines Control Council (MCC) inspection of the Rc cleanroom to issue a GMP license is still outstanding. Efforts to contact the MCC continue. A GMP license will be required to produce the 195mPt-cisplatinum for the clinical trial.
A new theranostic for identifying and treating tumours
The molecular compound, GluCABTM is a new theranostic and will initially be used to seek, identify and treat solid mass tumours such as those found in breast and ovarian cancer. The term “theranostics” was coined to define an agent used for diagnosis via imaging followed by therapy and is fast becoming the norm in personalised medicine.
A funding and technology development partnership of R7m was formed in May 2017 between Necsa, University of Cape Town (technology partner) and BGM Pharmaceuticals (funding, marketing and distribution partner) to develop and commercialise this groundbreaking, innovative drug. Necsa and BGM clinched a total deal of up to R600m to take the drug to market, representing a public private partnership in drug research and development.
The project is currently in the preclinical phase and still a few years from market readiness. Micro-PET evaluation in normal mice was successful but tumor uptake was not successful on the first attempt. This will be repeated in the
new financial year.
Ethylenedicysteine Deoxyglucose
Ethylenedicysteine Deoxyglucose (ECDG) is a diagnostic drug used in the detection of lesions. Under the Necsa-BGM Pharmaceuticals partnership, BGM will facilitate the acquisition of funding of approximately R80m to take this drug to the market. Necsa has received R1.6m thus far for the synthesis and kit formulation of ECDG and limited Phase II clinical trials. The kit formulation was a success. After approval for execution of the limited Phase IIa clinical trials was granted by the University of Free State Ethics Committee, the trials were done on five breast cancer patients. The diagnostic accuracy of the 99mTc-ECDG scans
for primary breast tumours were the same as that of an FDG scan (the gold standard tracer for PET-CT scans not used for breast cancer). Yet, advantages of 99mTc-ECDG would be at lower cost (no special equipment) as well as lower radiation dose to patient and staff. Therefore, the Phase II clinical trials were a success for the primary lesions.
Nuclear Medicine Research Infrastructure
The South African Research Infrastructure Roadmap (SARIR) was launched by Minister Naledi Pandor (Department of Science and Technology - DST) on 4 October 2016. Nuclear Medicine is one of the successful areas. The DST has approved the application for Nuclear Medicine Research Infrastructure (NuMeRI) and the revised first three-year budget was awarded to Necsa to carry out the incubation phase. Execution of the NuMeRI is in full swing.
Patient undergoing PET/CT scan at the Western Cape PET Centre, Tygerberg Hospital
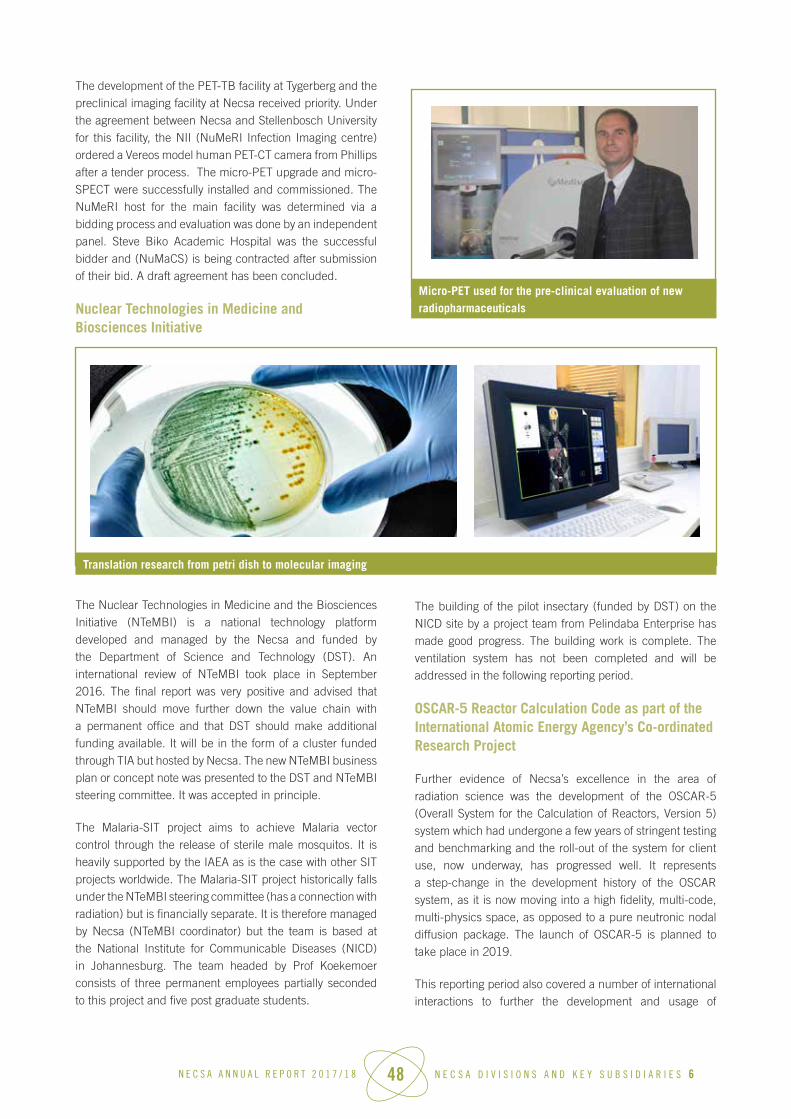
N E C S A A N N U A L R E P O R T 2 0 1 7 / 1 8 48 N E C S A D I V I S I O N S A N D K E Y S U B S I D I A R I E S 6
The development of the PET-TB facility at Tygerberg and the preclinical imaging facility at Necsa received priority. Under the agreement between Necsa and Stellenbosch University for this facility, the NII (NuMeRI Infection Imaging centre) ordered a Vereos model human PET-CT camera from Phillips after a tender process. The micro-PET upgrade and micro-SPECT were successfully installed and commissioned. The NuMeRI host for the main facility was determined via a bidding process and evaluation was done by an independent panel. Steve Biko Academic Hospital was the successful bidder and (NuMaCS) is being contracted after submission of their bid. A draft agreement has been concluded.
Nuclear Technologies in Medicine and Biosciences Initiative
The Nuclear Technologies in Medicine and the Biosciences Initiative (NTeMBI) is a national technology platform developed and managed by the Necsa and funded by the Department of Science and Technology (DST). An international review of NTeMBI took place in September 2016. The final report was very positive and advised that NTeMBI should move further down the value chain with a permanent office and that DST should make additional funding available. It will be in the form of a cluster funded through TIA but hosted by Necsa. The new NTeMBI business plan or concept note was presented to the DST and NTeMBI steering committee. It was accepted in principle.
The Malaria-SIT project aims to achieve Malaria vector control through the release of sterile male mosquitos. It is heavily supported by the IAEA as is the case with other SIT projects worldwide. The Malaria-SIT project historically falls under the NTeMBI steering committee (has a connection with radiation) but is financially separate. It is therefore managed by Necsa (NTeMBI coordinator) but the team is based at the National Institute for Communicable Diseases (NICD) in Johannesburg. The team headed by Prof Koekemoer consists of three permanent employees partially seconded to this project and five post graduate students.
The building of the pilot insectary (funded by DST) on the NICD site by a project team from Pelindaba Enterprise has made good progress. The building work is complete. The ventilation system has not been completed and will be addressed in the following reporting period.
OSCAR-5 Reactor Calculation Code as part of the International Atomic Energy Agency’s Co-ordinated Research Project
Further evidence of Necsa’s excellence in the area of radiation science was the development of the OSCAR-5 (Overall System for the Calculation of Reactors, Version 5) system which had undergone a few years of stringent testing and benchmarking and the roll-out of the system for client use, now underway, has progressed well. It represents a step-change in the development history of the OSCAR system, as it is now moving into a high fidelity, multi-code, multi-physics space, as opposed to a pure neutronic nodal diffusion package. The launch of OSCAR-5 is planned to take place in 2019.
This reporting period also covered a number of international interactions to further the development and usage of
Micro-PET used for the pre-clinical evaluation of new radiopharmaceuticals
Translation research from petri dish to molecular imaging
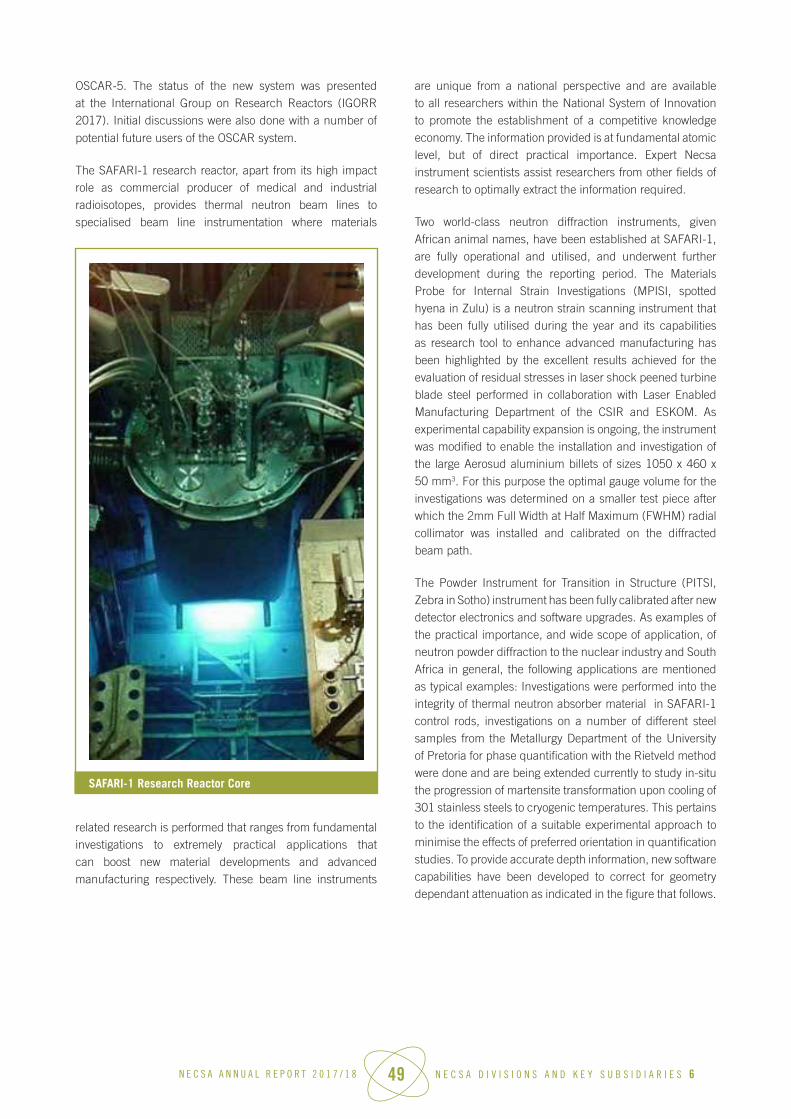
N E C S A A N N U A L R E P O R T 2 0 1 7 / 1 8 49 N E C S A D I V I S I O N S A N D K E Y S U B S I D I A R I E S 6
OSCAR-5. The status of the new system was presented at the International Group on Research Reactors (IGORR 2017). Initial discussions were also done with a number of
potential future users of the OSCAR system.
The SAFARI-1 research reactor, apart from its high impact role as commercial producer of medical and industrial radioisotopes, provides thermal neutron beam lines to specialised beam line instrumentation where materials
related research is performed that ranges from fundamental investigations to extremely practical applications that can boost new material developments and advanced manufacturing respectively. These beam line instruments
are unique from a national perspective and are available to all researchers within the National System of Innovation to promote the establishment of a competitive knowledge economy. The information provided is at fundamental atomic level, but of direct practical importance. Expert Necsa instrument scientists assist researchers from other fields of research to optimally extract the information required.
Two world-class neutron diffraction instruments, given African animal names, have been established at SAFARI-1, are fully operational and utilised, and underwent further development during the reporting period. The Materials Probe for Internal Strain Investigations (MPISI, spotted hyena in Zulu) is a neutron strain scanning instrument that has been fully utilised during the year and its capabilities as research tool to enhance advanced manufacturing has been highlighted by the excellent results achieved for the evaluation of residual stresses in laser shock peened turbine blade steel performed in collaboration with Laser Enabled Manufacturing Department of the CSIR and ESKOM. As experimental capability expansion is ongoing, the instrument was modified to enable the installation and investigation of the large Aerosud aluminium billets of sizes 1050 x 460 x 50 mm3. For this purpose the optimal gauge volume for the investigations was determined on a smaller test piece after which the 2mm Full Width at Half Maximum (FWHM) radial collimator was installed and calibrated on the diffracted beam path.
The Powder Instrument for Transition in Structure (PITSI, Zebra in Sotho) instrument has been fully calibrated after new detector electronics and software upgrades. As examples of the practical importance, and wide scope of application, of neutron powder diffraction to the nuclear industry and South Africa in general, the following applications are mentioned as typical examples: Investigations were performed into the integrity of thermal neutron absorber material in SAFARI-1 control rods, investigations on a number of different steel samples from the Metallurgy Department of the University of Pretoria for phase quantification with the Rietveld method were done and are being extended currently to study in-situ the progression of martensite transformation upon cooling of 301 stainless steels to cryogenic temperatures. This pertains to the identification of a suitable experimental approach to minimise the effects of preferred orientation in quantification studies. To provide accurate depth information, new software capabilities have been developed to correct for geometry dependant attenuation as indicated in the figure that follows.
SAFARI-1 Research Reactor Core

N E C S A A N N U A L R E P O R T 2 0 1 7 / 1 8 50 N E C S A D I V I S I O N S A N D K E Y S U B S I D I A R I E S 6
X-ray Diffraction and Tomography
The Necsa micro-focus X-ray tomography facility (mCT facility), funded through the NRF Equipment Funding program, continued to deliver excellent services to a large number of users from within the National System of Innovation. The facility was particularly influential in providing insight to research students in their study subjects for the purposes of higher degrees and was 100% utilised (apart from maintenance) with a beam time breakdown of 23% for PhD projects, 10% for MSc projects, 12% for other student projects and 47% for non-student researchers from within the NSI.
The latter constituted nine researchers from three institutions in the fields of palaeoanthropology, anatomy, metallurgy and chemical engineering. Figure 2 (a) and (b) provide graphical overviews of the users and scientific disciplines from Higher Educational Institutions and Science Councils in South Africa, as well as a university from abroad for April 2017 to March 2018.
A new micro-focus X-ray three-dimensional reconstruction workstation in addition to a new image analysis workstation were acquired and commissioned for use in improving the capacity to perform tomographic reconstruction at micrometre resolution. In addition to possible commercial services in this field, this was also key in light of Necsa’s relationship with the palaeontology community in heritage studies. Necsa attended the launch of the Palaeontology Department of the University of Johannesburg on 13 November 2017 in the capacity of pivotal role player to
perform 3D CT scans for the heritage study communities.
HIGHER EDUCATIONAL
USERS (a)
USAGE BY SCIENTIFICDISCIPLINE
Visualisation of the geometric and angular dependant intensity fraction (left) and subsequent correction coefficient (right) as implemented in ScanMan analysis software used for neutron diffraction
Graphical depiction of Higher Education users and study fields at the Necsa UCT facility.

N E C S A A N N U A L R E P O R T 2 0 1 7 / 1 8 51 N E C S A D I V I S I O N S A N D K E Y S U B S I D I A R I E S 6
Necsa’s Micro Focus X-ray Tomography system was central to producing 3D-results for the first known identification of cancer in early hominins.
The SAFARI-1 Neutron Diffraction beamlines complemen-ted by X-ray Diffraction, provide powerful, non-destructive insight into the microstructural properties of materials for advanced manufacturing. This includes residual stresses in weldments and 3D printed titanium alloy components as well as chemical and magnetic phenomena in various chemical systems.
MECA SENS 2017: 9th International Conference on Mechanical Stress Evaluation by Neutron and Synchrotron Radiation
Approximately 100 nuclear scientists from around the world gathered at the Skukuza rest camp in the Kruger National Park from 18 to 22 September 2017 for a specialist nuclear conference. The host of the occasion was Dr Andrew Venter from Necsa, who is a specialist in the field of nuclear particle beams.
The topic, how to use particle beams to look inside metals to determine their structure is important in order to design and construct high precision and high integrity nuclear reactor components.
The conference also included a one-day spring school and a Necsa site visit. Prizes for the top student poster and oral presentation were awarded to students associated with projects within Necsa.
A publishing agreement has been established with the Materials Research Forum LLC (MRF) for the publication of the proceedings of the MECA SENS 2017 conference, for
which 94 abstracts have been submitted.
Collaborations
The South African National System of Innovation activities
A senior engineer was appointed as co-study leader for three final year students from the School of Mechanical and Nuclear Engineering at the University of North West and experiential training for Necsa Learning Academy at PLABS (Pelindaba Laboratory for Accelerator Based Science) has been highly successful. A human capacity development
Necsa Chairperson Dr Kelvin Kemm was one of the delegates and presenters at the MECA SENS International Conference 2017
Student visitors learning more about Tomography
3D CT Scan of earliest sign of cancer tumor in earlyhominins

N E C S A A N N U A L R E P O R T 2 0 1 7 / 1 8 52 N E C S A D I V I S I O N S A N D K E Y S U B S I D I A R I E S 6
collaboration has been arranged between the University of Pretoria and Necsa, which will allow for a group of PhD students in their final year to make use of the Rutherford Backscattering facility at the Necsa Van de Graaff accelerator.
Through the Department of Science and Technology initia-tive for global infrastructure development and utilisation, Necsa neutron beam line scientists were incorporated in a European Union funded collaboration as representatives for South Africa to plan and promote future participation in the utilisation of the European Spallation Source (ESS) in Sweden. A proposal was drafted for South Africa’s participation in the BrightnESS2 (work package 2) programme.
The University of Johannesburg (UJ) expressed interest in assisting with the logistics and operational aspects of the establishment of a fossil preparation laboratory at Necsa. Such a laboratory will greatly assist the South African heritage research community to enhance their research output, while also utilising the tomography capabilities at Necsa. Rather than just UJ and Necsa, a comprehensive group of stakeholders will be involved under the oversight of the DST. Necsa (through the Radiation Science Department) further collaborated with the University of Pretoria and Sefako Makgatho University (SMU) for the application of European Union ERASMUS PLUS funding towards a Data Server at Necsa to host 3-dimensional data from bone and paleo collections for the SA heritage communities.
The neutron diffraction and neutron radiography sections have submitted a combined project proposal titled “Extending the Analytical Capabilities of the Neutron Beamline Facilities at the SAFARI-1 Research Reactor” to the Department of Energy, which mediated IAEA Country Framework Programme
medium term call for the period 2020 - 23.
International Collaborations
Necsa’s involvement in the international project to study the irradiation damage in detector components of the ATLAS detector of the Large Hadron Collider at CERN has grown to include the University of Cape Town and the University of Johannesburg with interest also from the University of Chicago. Necsa’s contributions involve application of high radiation doses to detector elements in order to determine their anticipated behaviour under usage in the ATLAS detec-tor environment. The ATLAS/Necsa collaboration already provided results that assisted towards a student receiving his B.Eng. degree with distinction.
In terms of IAEA collaborations, an expert from the Radiogra-phy and Tomography Section was invited to deliver a talk entitled Secrets and Mysteries of our Past Revealed by Neutron and X-Ray Radiography/Tomography at the First IAEA International
Conference on Applications of Radiation Science.
Nuclear Fuel Cycle
The Nuclear Fuel Cycle (NFC) refers to all processes commencing with uranium mining, fabrication of nuclear fuel and the post-reactor processes to manage the nuclear waste created by all these processes. In Necsa, R&D skills development and demonstration of NFC processes are pursued to firstly support isotope production of NTP, but also to prepare for possible future localisation in the case of a new nuclear built programme.
Good progress was made with research related to the purification and homogenisation of uranium feed material for conversion to UF6. First, an ion-exchange based purification process that selectively removes impurities from the uranium feed stream is under development. Second, a membrane-assisted solvent extraction process has been developed to recover uranium from the historic “unburnts” waste stream, and potentially other sources, such as fluoride-based waste streams associated with NFC activities. The process is based on the well-known HNO3/TBP solvent extraction system and could also be used to purify the uranium feed material.
As part of the Advanced Metals Initiative programme a laboratory study for the recovery of uranium from U3Si2 manufacturing scrap is progressing well. The aim is to finally convert the recovered uranium to uranium metal for the production of U3Si2.
Research also continues into the recovery of historically enriched uranium from various un-irradiated matrices for possible reuse in the production of fuel and target plates for
mo-99 production in the SAFARI-1 Research Reactor.
Analytical and Calibration Services
Analytical and Calibration Services (ACS) operates Necsa Laboratories providing Analytical, Calibration and Radiation Protection Consultancy services to internal and external customers. ACS’ main function is to provide third party quality assurance with respect to products produced for markets of interest as well as verification of compliance to regulatory requirements on behalf of its customers. ACS is running four state of the art laboratories namely (1) RadioAnalysis Laboratories (RA), (2) Pelindaba Analytical Laboratories (PAL), (3) Calibration Laboratories (CAL) and (4) Nuclear Forensics Laboratories (NFL) using proven technologies and experienced scientist and technicians. This consists of the following major categories:
• Measurement of natural and man-made radionuclides using laboratory techniques based on the emission of ionising radiation (alpha, beta particles and gamma-rays), neutron activation and radiochemistry.

N E C S A A N N U A L R E P O R T 2 0 1 7 / 1 8 53 N E C S A D I V I S I O N S A N D K E Y S U B S I D I A R I E S 6
• Analysis of the chemistry of materials using instrumentation techniques such as ICP-OES and ICP-MS for elemental, trace and ultra-trace analysis, XRF for elemental analysis, GC and GC-MS for analysis of gas and organics.
• Calibration and metrology of radiation protection monitoring instruments and equipment as well as the provision of radiation protection services which include (amongst other things) conduct of radiation surveys, site clearances, inspections and sampling.
• Supporting law enforcement agencies with criminal investigations involving nuclear materials found out of regulatory control, the temporary storage of police nuclear material evidence, the building of national nuclear forensics database library at Necsa, as well as the regional and the international cooperation and collaborations aimed to develop and optimise human capabilities and infrastructure for nuclear security.
Highlights
Nuclear Forensic Programme
NFL participated in the international collaboration with the International Atomic Energy Agency (IAEA), USA National Laboratories (Lawrence Livermore National Laboratory, Los Alamos National Laboratory & Argon National Laboratory), and the European Commission’s Joint Research Centre (JRC) Institute of Transuranium chemistry (ITU), and the International Technical Working Group (ITWG) experts in nuclear forensics in the development and validation of techniques for forensic analysis.
The IAEA and/or USA DOE (National Nuclear Security Administration) funded the participation of NFL scientists and technicians in the following events:
• the Necsa hosting of the regional training course in nuclear forensics to propagate for the establishment of an IAEA Southern African Regional Nuclear Forensics Centre of Excellence at Necsa.
• NFL technicians specialists training in nuclear forensics methodologies for member states with/developing nuclear forensics capabilities at JRC Institute of Transuranium Chemistry in Karlsruhe, Germany.
• NFL scientist’s attendance of the technical meeting on
nuclear forensics and cooperation with African states held at the IAEA headquarters in Vienna, Austria.
• NFL participation (alongside key national nuclear organisations) in the Galaxy Serpent version 3 (GSv3) table top exercise aimed in assisting nuclear countries to fast track the building and testing of national database libraries for the fingerprinting of nuclear materials origins.
• NFL scientists attendance at the ITWG Global Initiative to Combat Nuclear Terrorism (GICNT) annual nuclear forensics expert’s consultancy meeting on countering illicit nuclear trafficking hosted by the European Commission’s Joint Research Centre in Karlsruhe, Germany.
NFP also secured an NRF/DST development grant for the nuclear forensics capacity building activities alongside Japan Atomic Energy Agency (JAEA). Execution of the Japan Science Promotion Society (JSPS)/NRF grant funded project aimed at the building of a prototype forensic database library and the validation of key forensic analysis methods has been delayed to start in 2018 to the NRF/DST concern.
*Four scientific papers were published in refereed international journals during the period under review.
Accreditation
Three out of four laboratories are SANAS accredited in terms of ISO/IEC 17025 requirements and a process to accredit the remaining lab is under way. PAL is accredited for the inorganics water determinants (ICPMS) and physico-chemical properties excluding microbiological and organics. Five (5) methods were added to the scope of accreditation during this FY. RA is accredited for the wider range of radio-analytical methods in current use with the exception of methods for neutron activation and actinides analysis. No additional methods were added to the scope of accreditation during this FY. CAL has expanded its Measurement Capabilities to cover calibration of radiation protection instruments ranges for efficiencies and surface activity from 2kBq to 7.5kBq ranges, and reduced the measurement uncertainties from to below 14%. This modification enables CAL to calibrate more types of instruments than before. The list of specific accredited methods can be viewed on the SANAS website directory of accredited laboratories (testing lab numbers: T0111, T0168 and calibration lab number: 1203). ACS increased the number of SANAS Technical
Signatories from twelve (12) to fifteen (15).
* Refer to page 239 for journal scientific papers
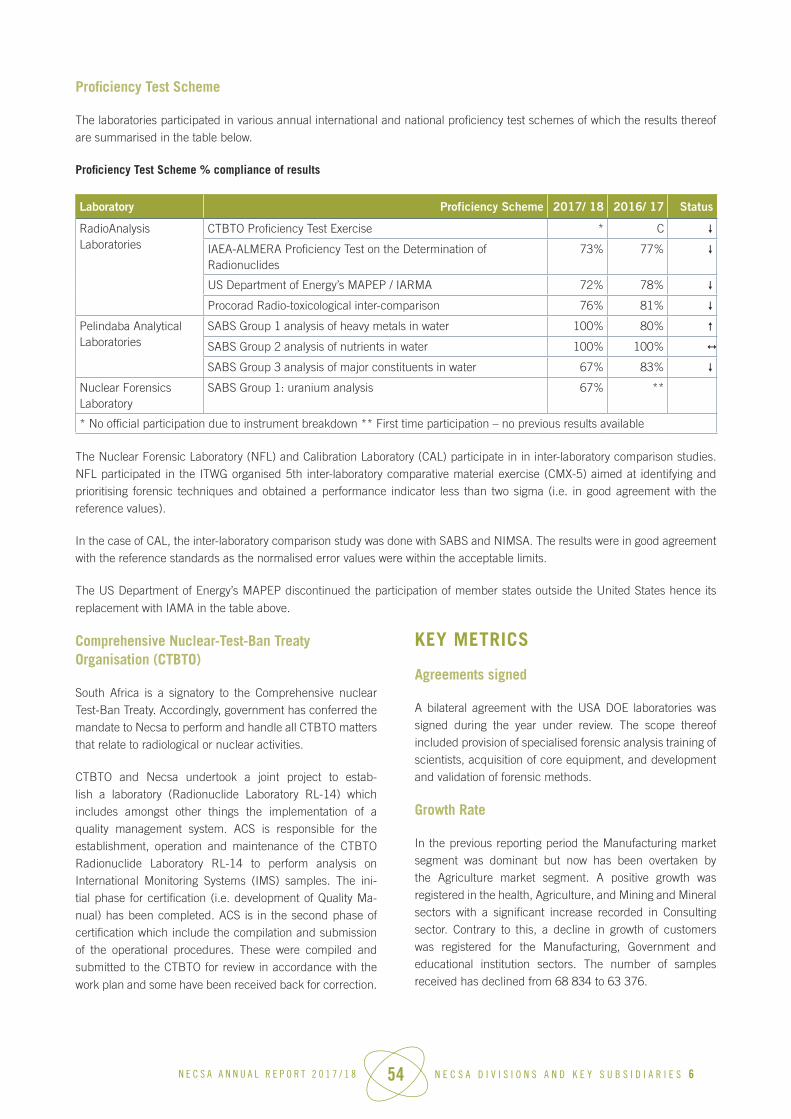
N E C S A A N N U A L R E P O R T 2 0 1 7 / 1 8 54 N E C S A D I V I S I O N S A N D K E Y S U B S I D I A R I E S 6
Proficiency Test Scheme
The laboratories participated in various annual international and national proficiency test schemes of which the results thereof are summarised in the table below.
Proficiency Test Scheme % compliance of results
Laboratory Proficiency Scheme 2017/ 18 2016/ 17 Status
RadioAnalysis Laboratories
CTBTO Proficiency Test Exercise * C
IAEA-ALMERA Proficiency Test on the Determination of Radionuclides
73% 77%
US Department of Energy’s MAPEP / IARMA 72% 78%
Procorad Radio-toxicological inter-comparison 76% 81%
Pelindaba Analytical Laboratories
SABS Group 1 analysis of heavy metals in water 100% 80%
SABS Group 2 analysis of nutrients in water 100% 100%
SABS Group 3 analysis of major constituents in water 67% 83%
Nuclear Forensics Laboratory
SABS Group 1: uranium analysis 67% **
* No official participation due to instrument breakdown ** First time participation – no previous results available
The Nuclear Forensic Laboratory (NFL) and Calibration Laboratory (CAL) participate in in inter-laboratory comparison studies. NFL participated in the ITWG organised 5th inter-laboratory comparative material exercise (CMX-5) aimed at identifying and prioritising forensic techniques and obtained a performance indicator less than two sigma (i.e. in good agreement with the reference values).
In the case of CAL, the inter-laboratory comparison study was done with SABS and NIMSA. The results were in good agreement with the reference standards as the normalised error values were within the acceptable limits.
The US Department of Energy’s MAPEP discontinued the participation of member states outside the United States hence its
replacement with IAMA in the table above.
Comprehensive Nuclear-Test-Ban Treaty Organisation (CTBTO)
South Africa is a signatory to the Comprehensive nuclear Test-Ban Treaty. Accordingly, government has conferred the mandate to Necsa to perform and handle all CTBTO matters that relate to radiological or nuclear activities.
CTBTO and Necsa undertook a joint project to estab-lish a laboratory (Radionuclide Laboratory RL-14) which includes amongst other things the implementation of a quality management system. ACS is responsible for the establishment, operation and maintenance of the CTBTO Radionuclide Laboratory RL-14 to perform analysis on International Monitoring Systems (IMS) samples. The ini-tial phase for certification (i.e. development of Quality Ma-nual) has been completed. ACS is in the second phase of certification which include the compilation and submission of the operational procedures. These were compiled and submitted to the CTBTO for review in accordance with the
work plan and some have been received back for correction.
KEY METRICS
Agreements signed
A bilateral agreement with the USA DOE laboratories was signed during the year under review. The scope thereof included provision of specialised forensic analysis training of scientists, acquisition of core equipment, and development and validation of forensic methods.
Growth Rate
In the previous reporting period the Manufacturing market segment was dominant but now has been overtaken by the Agriculture market segment. A positive growth was registered in the health, Agriculture, and Mining and Mineral sectors with a significant increase recorded in Consulting sector. Contrary to this, a decline in growth of customers was registered for the Manufacturing, Government and educational institution sectors. The number of samples received has declined from 68 834 to 63 376.
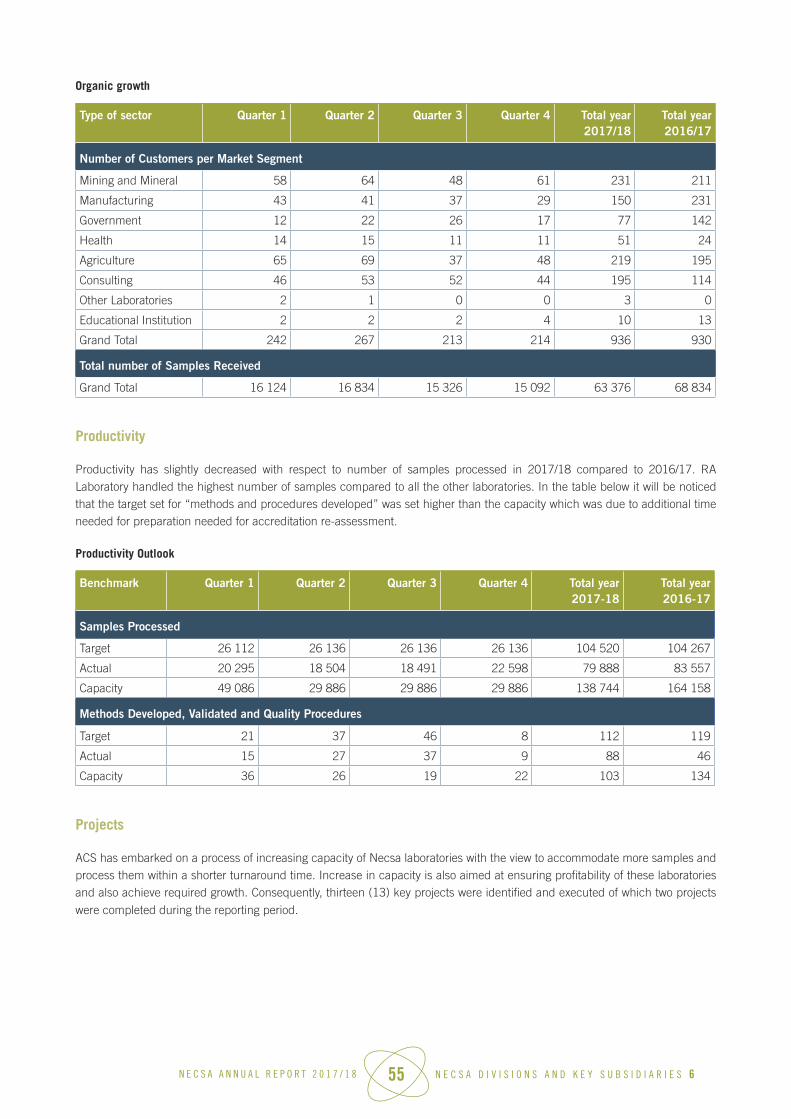
N E C S A A N N U A L R E P O R T 2 0 1 7 / 1 8 55 N E C S A D I V I S I O N S A N D K E Y S U B S I D I A R I E S 6
Organic growth
Type of sector Quarter 1 Quarter 2 Quarter 3 Quarter 4 Total year 2017/18
Total year 2016/17
Number of Customers per Market Segment
Mining and Mineral 58 64 48 61 231 211
Manufacturing 43 41 37 29 150 231
Government 12 22 26 17 77 142
Health 14 15 11 11 51 24
Agriculture 65 69 37 48 219 195
Consulting 46 53 52 44 195 114
Other Laboratories 2 1 0 0 3 0
Educational Institution 2 2 2 4 10 13
Grand Total 242 267 213 214 936 930
Total number of Samples Received
Grand Total 16 124 16 834 15 326 15 092 63 376 68 834
Productivity
Productivity has slightly decreased with respect to number of samples processed in 2017/18 compared to 2016/17. RA Laboratory handled the highest number of samples compared to all the other laboratories. In the table below it will be noticed that the target set for “methods and procedures developed” was set higher than the capacity which was due to additional time needed for preparation needed for accreditation re-assessment.
Productivity Outlook
Benchmark Quarter 1 Quarter 2 Quarter 3 Quarter 4 Total year 2017-18
Total year 2016-17
Samples Processed
Target 26 112 26 136 26 136 26 136 104 520 104 267
Actual 20 295 18 504 18 491 22 598 79 888 83 557
Capacity 49 086 29 886 29 886 29 886 138 744 164 158
Methods Developed, Validated and Quality Procedures
Target 21 37 46 8 112 119
Actual 15 27 37 9 88 46
Capacity 36 26 19 22 103 134
Projects
ACS has embarked on a process of increasing capacity of Necsa laboratories with the view to accommodate more samples and process them within a shorter turnaround time. Increase in capacity is also aimed at ensuring profitability of these laboratories and also achieve required growth. Consequently, thirteen (13) key projects were identified and executed of which two projects
were completed during the reporting period.

N E C S A A N N U A L R E P O R T 2 0 1 7 / 1 8 56 N E C S A D I V I S I O N S A N D K E Y S U B S I D I A R I E S 6
Improvement Projects
Laboratory Project Name Start Date
Target Date % Compl. Status
Calibration Laboratories
Detector response vs. temperature variation (SANAS TR 18, 20 ± 5 ºC)
Apr-16 Aug-17 100% Completed
Radon Instrument Calibration Laboratory in B-C5
Mar-16 Jul-18 48% In Progress
Relocation from V-X1 to B-C5 Apr-15 Aug-17 80% In Progress (1)X-Ray Inspection Body Jun-17 Aug- 18 60% In ProgressThe design of a radon gas monitoring instrument
Nov-17 Mar-19 10% In Progress
Nuclear Forensic Laboratories
Development, Validation and Accreditation of ICP MS test method for analysis of U isotopes in water (NORM) and for isotopic abundances
Aug-16 Ju-18 66% In Progress
Building and Application of a Nuclear Forensics Database Library of Uranium Ore Concentrate (UOC) Materials
May-17 Jun-19 49% In Progress
Pelindaba Analytical Laboratories
Method Development, Validation and Accreditation of Determinands for Drinking Water Standard SANS 241
Sep-2015 Dec-17 60% In Progress(2)
AMS R&D project (ANSTO phase 3)
Dec-16 Apr-17 100% Completed
Analytical services for Council for Geoscience Shale Gas Project
Aug-17 Jul-18 51% In Progress
Radio Analysis Laboratories
Method development for determination of actinides by radiochemical separation and alpha spectrometry.
Aug-16 TBD 39% Placed on hold (3)
Certification of the RA Laboratory in preparation of analysis of CTBTO samples
Sep-15 Feb-17 Dec-17 90%
Analytical and Calibration Services (ACS)
Procure services of a competent service provider to assist with ACS Business cases for new services
Jun-17 Nov-17 35% In Progress (4)
NOTES:
1. The existing contractor was contracted to complete 80% of the project and the remaining 20% still need to go through the procurement process.
2. Accreditation in 2017/18 included determinants outside SANS 241 requirements. 3. Project placed on hold until funding is secured.4. The target date was not met due to shortcomings identified in some of the submitted procedures.
N E C S A A N N U A L R E P O R T 2 0 1 7 / 1 8 57 N E C S A D I V I S I O N S A N D K E Y S U B S I D I A R I E S 6
Nuclear Liabilities Management (NLM)
Decommissioning Services
Decommissioning activities during the financial year focused mainly on the following projects:
• Phase 2 decommissioning of the conversion facility: Pre-decommissioning activities are currently awaiting NNR acceptance/approval of Hazard Assessment and Decommissioning Strategy with regard to the collection of all loose material.
• The de-heeling of UF6 cylinders in Area 27: This project is progressing well, although some challenges were experienced regarding the delivery of nitrogen gas from Utilities Services.
• Phase 2 decommissioning of Area 14 oil basement: Cutting of the oil pipes into smaller sections is progressing well as scheduled. Operational challenges such as leaking roof resulted in a non-compliance challenge.
• Care and maintenance: Various facilities, including BEVA Evaporation pans, (previously radiologically contamina-ted) on the Necsa site are under care and maintenance. These facilities (all under NNR authorisation) are inspec-ted regularly and monitored (radiologically) on a routine basis.
• Liability assessment: The independent liability assess-ment for the operational radiological facilities was conducted and completed in March 2017. The report was sent to Necsa in June 2017. The report gave few recommendations, which were put into an action plan for implementation. The liability assessment of the
disused historical facilities is currently in progress.
Decontamination Services
• The decontamination facility consists of a wet decon-tamination section where chemical or metallurgical decontamination techniques are used to recover nuclear materials, and dry decontamination where nuclear mate-rials are physically and mechanically removed from contaminated materials to recover nuclear materials.
• A total of 278 batches were processed and 99% of the material that was presented for decontamination was cleared from regulatory controls.
• 141 000 kg total scrap material was sold and generated
R1.1m
Shars Mobile Hot Cell
The mobile hot cell (MHC) remains one of the only safe and reliable mechanisms in the world for the handling of disused high activity sealed radioactive sources. The MHC, which was developed by Necsa under a contract from the IAEA,
is owned and operated by Necsa. The MHC is unique and the Necsa teams which operate the unit are regarded as world experts in the handling of disused sealed radioactive sources. Necsa has already performed six successful MHC operations all over the world.
The recent mission which took place in Brazil between March and September 2017, involved the recovery of 87 high activity sealed radioactive sources from the telethe-rapy units. The sources were successfully recovered, packaged and transported (repatriated) to the USA and to Germany for recycling. The project was funded jointly by
the USA and Canadian governments.
Integration of the Mobile Hot Cell And Borehole Disposal Concept
The borehole disposal concept (BDC) was jointly developed by Necsa (Nuclear Liabilities Management) and the IAEA, and various expert missions to implement the concept in Africa and abroad were undertaken in the past years. The purpose is to provide a facility for the disposal of disused sealed radioactive sources for member states without proper facilities.
The need was also identified to safely transfer high activity sources into these boreholes. For this reason, the IAEA pro-ject was launched to integrate the mobile hot cell (MHC) and the BDC. This would allow the MHC to be assembled on top of the borehole, after which the sources could be directly lowered into the borehole. Necsa designed and manufac-tured the additional equipment to enable safe handling and transfer of the disposal containers into the borehole.
A technical meeting under the Interregional Project INT 9182: Sustaining the Cradle to Grave Management of Sealed Radioactive Sources was hosted by South Africa (Necsa) during the week of 25 to 29 September 2017. The purpose of the meeting was to discuss innovative disposal technologies as well as to showcase the very first demonstration of the integrated BHC-MHC facility. The activities related to the modification of the MHC were successfully demonstrated on the Necsa site to 35 participants from 18 member states and
witnessed by IAEA experts.
Management of Nuclear Waste
Solid Waste Management
Nuclear waste from various points of origin was collected and safely stored at Necsa during the review period. A total of 72 concrete waste packages have been transported to and disposed at Vaalputs. The cumulative total number of waste packages transported to and disposed at Vaalputs at 31 March 2018 is 6 100.

N E C S A A N N U A L R E P O R T 2 0 1 7 / 1 8 58 N E C S A D I V I S I O N S A N D K E Y S U B S I D I A R I E S 6
Nuclear Waste Collected and Stored
Type Origin Storage area No. received 2017/18 Total at 31 March 2018
Drums Facilities on Necsa site and external clients
Pelstore and Area 21 1 724(received)72 concrete drums (12 shipments)(Transport to and disposed at Vaalputs)
68 478 (received)6 100(Transport to and disposed at Vaalputs)
Spent fuel elements SAFARI-1 storage pool Thabana Pipe Store 0 957
Spent sealed radioactive sources
Clients throughout SA, specifically the health care sector
Area-24 Source Store 252 10 239
Smoke detectors Clients throughout SA Area-24 Source Store 744 28 591
Area 24 disused source storage facility is now operational. Sources are received from around the country, stored, characterised and conditioned on a continuous basis. The process of conditioning radioactive sources started in November 2015. A total of 252 disused sealed radioactive sources were characterised and conditioned.
South Africa observes the Code of Conduct on the safety and security of Radioactive Sources and Category 3 Disused Sealed radioactive sources were repatriated from Botswana and Namibian borders following regulatory approval from RADCON (Radiation Control) Department of Health. These sources are currently stored in the Area 24 source store facility.
Waste characterisation was conducted on a continuous basis for safeguards (IAEA) and final disposal purposes. A total of 5 216 drums have been scanned using the IQ3 scanner (2 633) or the BNFL Segmented Drum Scanner (2 583).
The contents of 3 870 drums have been physically verified
and registered on the Waste Tracking System.
Liquid Effluent Management
Liquid Effluent Management Services (LEMS) continued to receive, treat and dispose of all industrial, low and medium activity radioactive effluent generated on the Pelindaba site. The facility operates under strict regulation and authorisation from the relevant authorities. A comprehensive laundry service for work wear and personal protective equipment (PPE) is also provided to Pelindaba facilities, as well as other ad hoc services to the NNR.
LEMS provided uninterrupted services to generators and all effluent releases were authorised based on regulatory limits. As a result of budgetary constraints, the extensive maintenance required by ageing facilities remains a growing
concern.
Liquid Effluent Indicators for 2017/18.
Key Performance Area Target Actual
Limit Environmental Impact Annual dose ≤ 150 µSv 3.849 µSv
All Releases to Crocodile River Authorised and within Regulatory Requirements
100% releases authorised 100%
Limit Releases to Crocodile River Annual releases ≤ 250 000 m3
80 229 m3
Zero Downtime to Customers 100% plant availability 100% (365 days)
The recommissioning of the industrial effluent treatment facility was successful. It is currently in full operation, successfully removing contaminants prior to the release of industrial effluent into the Crocodile River. Upgrading the Liquid Effluent Control Software and construction of a roof for the hot yard did not take place due to financial constraints.
LEMS provided uninterrupted services to generators and all effluent releases were authorised based on regulatory limits. As a result of budgetary constraints, the extensive maintenance required by ageing facilities remains a growing concern.

N E C S A A N N U A L R E P O R T 2 0 1 7 / 1 8 59 N E C S A D I V I S I O N S A N D K E Y S U B S I D I A R I E S 6
To ensure proper alignment of the divisional objectives and mandates, LEMS was transferred to NLM to ensure effective implementation of an integrated waste management plan. This resulted in the consolidation of all solid waste and liquid effluent management systems and functions under the NLM
department.
Nuclear Waste Projects
The construction, installation and cold commissioning of the volume reduction facility (VRF) have been completed successfully. NNR approval was obtained for the hot commissioning of the facility. About 90% of the hot commissioning activities have been completed. Actual waste drums were used during the hot commissioning. During the compaction of waste drums, it was found that some drums did not contain dry waste as required in the facility safety assessment. Various corrective actions had to be identified and are in the process of being implemented. Based on the revised schedule, final project handover is projected for August 2018. In order to identify possible non-complying waste in waste drums the use of X-ray equipment is explored.
The safety case for the 210 L metal VRF waste package, which will be used to contain the compacted drums from the VRF, was approved by the NNR. Any waste package destined for Vaalputs must be approved by the NNR before it can be considered for disposal at Vaalputs.
The construction and installation of the smelter facility is completed. The cold commissioning and then hot
commissioning of the facility will follow.
Nuclear Waste Disposal
Necsa continued to manage Vaalputs and will continue to do so until the National Radioactive Waste Disposal Institute is in a position to establish the Nuclear Installation Licence.
Vaalputs disposed a total of 600 waste packages in 18 consignments from Koeberg and Necsa during the 2017/18 financial year.
Waste disposed of at Vaalputs
Waste generator
Concrete waste packages
Metal waste packages
Number of consignments
Koeberg 0 528 6
Necsa 72 0 12
TOTAL 72 528 18
Following a rigorous tendering process, two new disposal trenches were excavated to accommodate low-level waste from Koeberg. Koeberg and Necsa were granted annual approval to resume with waste shipments to Vaalputs in accordance with the Vaalputs waste acceptance criteria.
Vaalputs disposed a total of 528 metal drum waste packages from Koeberg and 66 NTP high Density Concrete waste packages from Necsa. All nuclear waste packages received complied with the requirements of the Vaalputs waste acceptance criteria.
The National Nuclear Regulator (NNR) conducted two nuclear compliance assurance audits and two compliance assurance inspections in 2017 at Vaalputs. In addition, one physical security protection inspection was also conducted by the National Nuclear Regulator (NNR) at Vaalputs. There were no findings.
Vaalputs maintained its ISO 9001:2008 certification. Vaalputs was audited on the ISO 9001:2015 standards and three findings were reported. All findings were closed during the 2017/18 financial year. The results of personnel monitoring, radiological surveillances of facilities, disposal trenches and equipment as well as environmental monitoring were all within regulatory limits.
The Vaalputs Public Safety Information Forum (VPSIF) meetings were held on a quarterly basis as required. A new chairperson and deputy were nominated and appointed in February 2018 during the VPSIF meeting by a process that was led by the NNR.
Truckload of Low Level Waste (LLW) heading to Vaalputs Waste Disposal Site
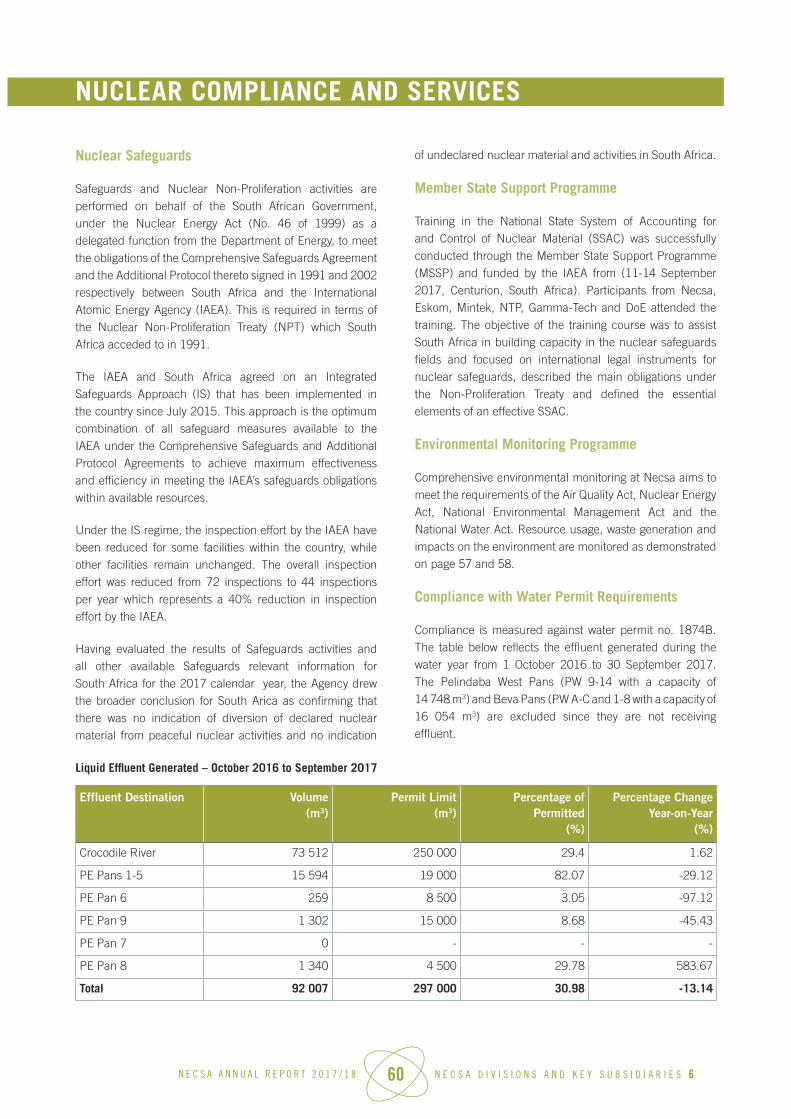
N E C S A A N N U A L R E P O R T 2 0 1 7 / 1 8 60 N E C S A D I V I S I O N S A N D K E Y S U B S I D I A R I E S 6
NUCLEAR COMPLIANCE AND SERVICES
Nuclear Safeguards
Safeguards and Nuclear Non-Proliferation activities are performed on behalf of the South African Government, under the Nuclear Energy Act (No. 46 of 1999) as a delegated function from the Department of Energy, to meet the obligations of the Comprehensive Safeguards Agreement and the Additional Protocol thereto signed in 1991 and 2002 respectively between South Africa and the International Atomic Energy Agency (IAEA). This is required in terms of the Nuclear Non-Proliferation Treaty (NPT) which South Africa acceded to in 1991.
The IAEA and South Africa agreed on an Integrated Safeguards Approach (IS) that has been implemented in the country since July 2015. This approach is the optimum combination of all safeguard measures available to the IAEA under the Comprehensive Safeguards and Additional Protocol Agreements to achieve maximum effectiveness and efficiency in meeting the IAEA’s safeguards obligations within available resources.
Under the IS regime, the inspection effort by the IAEA have been reduced for some facilities within the country, while other facilities remain unchanged. The overall inspection effort was reduced from 72 inspections to 44 inspections per year which represents a 40% reduction in inspection effort by the IAEA.
Having evaluated the results of Safeguards activities and all other available Safeguards relevant information for South Africa for the 2017 calendar year, the Agency drew the broader conclusion for South Arica as confirming that there was no indication of diversion of declared nuclear material from peaceful nuclear activities and no indication
of undeclared nuclear material and activities in South Africa.
Member State Support Programme
Training in the National State System of Accounting for and Control of Nuclear Material (SSAC) was successfully conducted through the Member State Support Programme (MSSP) and funded by the IAEA from (11-14 September 2017, Centurion, South Africa). Participants from Necsa, Eskom, Mintek, NTP, Gamma-Tech and DoE attended the training. The objective of the training course was to assist South Africa in building capacity in the nuclear safeguards fields and focused on international legal instruments for nuclear safeguards, described the main obligations under the Non-Proliferation Treaty and defined the essential elements of an effective SSAC.
Environmental Monitoring Programme
Comprehensive environmental monitoring at Necsa aims to meet the requirements of the Air Quality Act, Nuclear Energy Act, National Environmental Management Act and the National Water Act. Resource usage, waste generation and impacts on the environment are monitored as demonstrated on page 57 and 58.
Compliance with Water Permit Requirements
Compliance is measured against water permit no. 1874B. The table below reflects the effluent generated during the water year from 1 October 2016 to 30 September 2017. The Pelindaba West Pans (PW 9-14 with a capacity of 14 748 m3) and Beva Pans (PW A-C and 1-8 with a capacity of 16 054 m3) are excluded since they are not receiving effluent.
Liquid Effluent Generated – October 2016 to September 2017
Effluent Destination Volume(m3)
Permit Limit(m3)
Percentage of Permitted
(%)
Percentage Change Year-on-Year
(%)
Crocodile River 73 512 250 000 29.4 1.62
PE Pans 1-5 15 594 19 000 82.07 -29.12
PE Pan 6 259 8 500 3.05 -97.12
PE Pan 9 1 302 15 000 8.68 -45.43
PE Pan 7 0 - - -
PE Pan 8 1 340 4 500 29.78 583.67
Total 92 007 297 000 30.98 -13.14

N E C S A A N N U A L R E P O R T 2 0 1 7 / 1 8 61 N E C S A D I V I S I O N S A N D K E Y S U B S I D I A R I E S 6
Discharges of Industrial Effluent and Low Active Effluent to the Crocodile River
Q1 (2017) Apr-Jun
Q2 (2017) Jul-Sept
Q3 (2017)Oct- Dec
Q4 (2018)Jan-March
YTD Apr 2017 - Mar 2018
Industrial Effluent(m3)
16 291 23 383 17 160 18 000 74 834
Low Active Effluent (m3)
1 347 1 969 1 386 693 5 395
Total effluent Discharged to Crocodile River (m3)
17 638 25 352 18 546 18 693 80 229
Dose Impact (µSV)* 1.2353 1.0843 1.0974 0.4997 3.917
* Authorised Dose Impact = 150µSV per annum; ~37.5 µSV per quarter (12,5 µSV per month. Note: Data is reflected in the quarterly Dose Impact Reports; LE-REP-0531, 0543, 0556, 0569.
Compliance with Air Permit Requirements
The total fluoride emissions for the January 2017 to December 2017 period (calendar year) amounted to 1 378 kg, which was higher by 34 kg compared to the previous year’s (2016) of 1 344 kg. The monthly site limit was not exceeded during the year. Total fluoride emissions for the reporting period were 4 % of the annual air emission license
constraint of 37 260 kg/year.
Compliance with Environmental Requirements of the Nuclear License
No nuclear occurrence related to the environment occurred during the 2017/18 financial year. Radiation dose to the public, as modelled on actual authorised releases, indicates that there was no significant dose impact to people or the
environment due to Necsa’s activities.
Modelled Dose to the Public
2015 Calendar YearmSv
2016 Calendar YearmSv
2017 Calendar YearmSv
Liquid to Crocodile River 0.0023 0.0044 0.0057
Gaseous Releases 0.0032 0.0012 0.0012
Total 0.0055 0.0056 0.0069
The environmental monitoring programme at Vaalputs was in full compliance with sample reporting levels. No environmental nuclear occurrences were registered.
Non-Destructive Assay
The technical collaboration between Necsa and Oakridge National Laboratory (ORNL) regarding Necsa’s non-destructive assay activities continued during the reporting period. The uranium residue project that includes the High Activity - Active Well Coincidence Counter (HA-AWCC) is still ongoing. The HA-AWCC will be utilised to quantify and verify the amount of uranium in the uranium residue produced from NTP’s Molybdenum-99 process. The project is currently in the hot commissioning phase and to date eleven hot runs out of the intended twenty approved by the NNR were completed by the end of 2017. The hot commissioning is scheduled to be completed in the first quarter of the 2018/19 financial year.
Safety
A highlight for the Safety Department was the increase in the number of audits conducted with a view to identify and address potential non-compliances within the Necsa Group. The number of SHEQ audits conducted in this reporting period was 47 compared to 40 in the previous year. This was in addition to the establishment of the safety culture function to strengthen safety culture and awareness on site.
For the financial year there were 154 nuclear occurrences registered with the NNR with an INES (International Nuclear Event Rating Scale) rating of 0, and one nuclear occurrence with an INES rating of 1. The Necsa Group’s overall Disabling Injury Incidence Rate (DIIR) improved from 1.1 to 1.03 compared with the previous financial year status.

N E C S A A N N U A L R E P O R T 2 0 1 7 / 1 8 62 N E C S A D I V I S I O N S A N D K E Y S U B S I D I A R I E S 6
A Comparison of Necsa’s Safety Performance for the Last Three Years
*Nuclear Events: 2015/16 2016/17 2017/18 Deterioration / Improvement (-/+)
INES rating = 0 123 125 154 23.2% (-)
INES rating > 0 1 1 2 100% (-)
Disabling Injury Incidence Rate 0.78 1.1 1.03 6.36% (+)
Total Injury Rate 4.21 4.2 2.66 36.67% (+)
Disabling Injuries 15 22 22 0%
Workdays lost due to disabling injuries 651 154 385 150% (-)
Maximum man-hours worked without a disabling injury 809 611 107 659 922 870 757% (+)
* INES (International Nuclear Event Rating Scale) rating is given to nuclear events with 0 having no safety significance and 7 a major accident.
Necsa Emergency Services
Necsa Emergency Services provides emergency response services to Necsa as well as surrounding areas.
Emergency Services Call-Outs 2017/18
Type of Call
Necsa Site Public
Number of Calls Number of Patients Transported
Number of Calls Number of Patients Transported
Fire 20 0 42 0
Vehicle Accidents 3 2 58 34
Ambulance Calls 54 36 122 77
TOTAL 77 38 222 111
Highly skilled Necsa Emergency Team

N E C S A A N N U A L R E P O R T 2 0 1 7 / 1 8 63 N E C S A D I V I S I O N S A N D K E Y S U B S I D I A R I E S 6
PELINDABA ENTERPRISE
Pelindaba Manufacturing
Pelindaba Manufacturing houses Necsa’s fabrication and machining capabilities within its two departmental units Nuclear Manufacturing and Industrial Manufacturing. Nuclear Manufacturing (NM) has achieved a successful audit by an international ASME III audit team that resulted in the ASME recertification of authorisations ‘N’, ‘NA’, ‘NPT’ and ‘NS’ valid until 24 June 2020. These certificates give NM the capability to design, fabricate and assemble nuclear components which includes but are not limited to vessels, piping, supports and tanks. Manufacturing conforms with ISO 9001 for general industrial products, ASME VIII for coded non-nuclear grade components, ASME III for coded nuclear grade components, and ISO 3834 for welding.
During the 2017/18 financial year, Pelindaba Manufacturing successfully passed audits for ISO 9001:2015 by the South African Bureau of Standards.
Pelindaba Manufacturing has successfully produced and supplied an Air Receiver, an ASME III certified vessel, to Koeberg. The Air Receiver is a safety related component that has been designed, fabricated and assembled under the regulatory framework of the RD34 as prescribed by the National Nuclear Regulator (NNR). The project was ground breaking in that this was the first ASME III type component produced on the African continent. This demonstrated NM’s capabilities in designing and fabricating ASME certified vessels.
Following the successful development and the positive reception of the Air Receiver, Pelindaba Manufacturing have undertaken further projects including the development of 48Y and 30B cylinders for the international marketplace.
Necsa has concluded the signing of an enabling contract (NEC3 Term Services Contract) with Eskom which will stretch over a period of 10 years for the following products and services:
• Training of radiation protection officers and the provision of radiation protection officer services.
• Disposal of metallic waste from Koeberg to Vaalputs; - Original steam generators (OSGs) - Reactor pressure vessel head - Control rod drive mechanisms (CRDMs) - PTR Tanks
• Design and manufacturing of nuclear components
• Engineering and licensing support services
Pelindaba Engineering Services
Pelindaba Engineering Services purpose is to develop, design, construct and commission nuclear and nuclear-related chemical facilities in compliance with the requirements of ISO 9001:2015, ASME NQA-1, ASME III, and compliance with the Necsa SHEQ system, as well as applicable and regulatory requirements. Pelindaba Engineering Services successfully achieved its ISO 9001:2015 certification.
• In the 2017/18 financial year, Pelindaba Engineering Services was involved in several projects for internal and external clients such as NTP, Pelchem, Eskom, and Rotek Engineering. The major projects undertaken were:
• Necsa Buildings’ Certificates of Electrical Compliance;
• Completion of Unit 2 Train A and B drawings for SEC Piping project;
• Contracting of Tectubi Raccordi S.p.A to supply ASME III material and;
• Design and technical engineering support for SAFARI-1.
The Certificate of Compliance (COC) programme for certifying existing electrical distribution boards on the Necsa site is an ongoing process. A further 90 electrical distribution boards were certified in the course of the financial year under review. The COC process involves the verification of existing electrical installations, confirmation of the electrical design, updating of drawings and upgrading the electrical installations to comply with statutory requirements.
Pelindaba Engineering Services supplies Industrial Isotope Technology (IIT) services to various industries, mostly external to Necsa. The technology is not intrusive and is particularly valuable for shortening shutdown periods for fault-finding and corrective maintenance. By allowing faster return to service, petrochemical process units gain valuable production time. These services include:
• Radiation safety awareness training;
• Plant inspections to verify that the integrity of radioactive sources used in industry (density or level gauges) is maintained; and
• Plant investigations with radioisotope techniques to diagnose problems or to measure equipment performance. This involves gamma scans (distillation column density profiles and pipeline blockages), neutron back-scatter scans (wall thickness anomalies and levels) and radioisotope tracer studies to obtain a number of parameters.

N E C S A A N N U A L R E P O R T 2 0 1 7 / 1 8 64 N E C S A D I V I S I O N S A N D K E Y S U B S I D I A R I E S 6
IIT projects completed in the 2017/18 fiscal year include:
• Plant inspections for Botash, Kriel Power Station, Kgalagadi Breweries, Debswana, Illovo Sugar Mills, Majuba Power Station; and
• Plant investigations at four columns of Sasol Synfuels, the C2-Splitter at Sasol Monomers and a Reboiler at
Sasol 1.
Pelindaba Consulting Services
Project & Consulting Services (P&CS) provides project management and administrative support services to the
Necsa Group. In order to successfully execute various types
of projects ranging from single to multidisciplinary, P&CS
has developed its own in-house Project Life Cycle (PLC)
model to deal with the unique set of challenges faced by the
project managers.
The Necsa Group has undertaken to upgrade the Security
Systems on site to bring it up to date with recent regulatory
requirements. P&CS has successfully completed the
security system project which included the design, supply
and commissioning of a fit for purpose security system on
Necsa designated facilities.
BUSINESS DEVELOPMENT & INNOVATION
Introduction
The Business Development & Innovation department was divisionalised in September of 2017 to facilitate the identification, protection and exploitation of intellectual property developed and owned by Necsa. They also position their division more optimally within the Necsa Group to provide a leadership role in innovation matters. This includes technology licencing negotiations, securing funding for further development based on sound business principles and overall
leadership on strategic projects with commercial potential.
Investment and Commercial Partnerships
GluCAB™
GluCAB™ is a theranostic drug representing a potential breakthrough in cancer diagnosis and treatment.
A funding and technology development partnership was entered into in May 2017 between Necsa, University of Cape Town (technology partner) and BGM Pharmaceuticals (funding, marketing and distribution partner) to develop and commercialise this groundbreaking, innovative drug. Necsa and BGM clinched a R600m deal to take the drug to market, representing a public private partnership in drug
research and development.
ECDG
ECDG is a diagnostic drug used in the detection of lesions. Under the Necsa-BGM pharmaceuticals partnership, BGM will facilitate the acquisition of funding of approximately R80 million to take this drug to the market. Necsa has received R1.6 million thus far for the synthesis of ECDG,
kit formulation and limited Phase II-clinical trials. Approval for execution of the limited Phase IIa clinical trials was granted by the University of Free State Ethics Committee. The Kit Formulation was a success the limited Phase 11 clinical trial was done on 5 breast cancer patients and the diagnostic accuracy of the 99mTc-EC-DG scan for the primary breast tumour was the same as that of the FDG (gold standard, but nit used for breast cancer) PETCT scan. Yet, advantages of 99mTc-EC-DG would be lower cost (no special equipment) as well as lower radiation dose patient and staff. Therefore, the
Phase II clinical trials were a success for the primary lesions.
Plasma Dissociated Zirconium/Pigments
Process for the production of inorganic doped zircon pigments (blue, yellow and iron pink) and Plasma Dissociated Zircon (PDZ). The technology piqued IDC interest in further industrialisation in partnership with a BBBEE company (Ishango Scientific Systems Pty Ltd) and a newly created start-up company co-owned by IDC and Ishango namely, Brinni Beneficiation Technologies Pty Ltd. It’s the intention that Brinni Beneficiation Technologies shall manufacture zirconium pigments for sale to ceramic industry under a license from Necsa. The IDC has approved R4m for phase I of the commercialisation path (feasibility). This will have the
following impact:
• Job creation;
• Value creation (annual income);
• Mineral beneficiation; and
• Meaningful support for black industrialist programme
using IP as a tool.
N E C S A A N N U A L R E P O R T 2 0 1 7 / 1 8 65 N E C S A D I V I S I O N S A N D K E Y S U B S I D I A R I E S 6
Ga-68-PSMA
Ga-68-PSMA is a diagnostic drug for prostate cancer and breast cancer.
A partnership was secured between the Nuclear Medicine department at Steve Biko Academic Hospital and NTP. The Steve Biko Hospital/Nuclear Medicine Clinician expressed intent to offtake the product, while NTP has expressed interest to fund the commercialisation of the product. Funding to the value of R3.9 million has been secured in 2017, through NTP to take the product to market. The kit formulation has been used in over 300 patients at Steve Biko Hospital. There is global potential beyond RSA market for
the kit validated by a leading international university.
NTP Research & Development and Innovation Fund
NTP has allocated 2% of revenue for research and development in pursuit of growing the NTP. The investment
made by NTP on Ga-68-PSMA was drawn from this fund.
DryKeep and Air-Dust Filters (Flosep Business Expansion)
Necsa has developed and improved the successful transformer moisture management technology to an online Drykeep® technology, with the help of the TIA Seed Fund. This technology provides for the continuous removal of water in transformer oil, thereby eliminating the need for the periodic transformer maintenance shutdowns and associated production losses. The technology has been industry-tested and is already in use even though its use is currently limited to Eskom.
Necsa has formed a public-private partnership with SETTEC Industrial Solutions (a BBBEE partner), in which SETTEC will serve as a Marketing, Sales and distribution partner for the Drykeep and Flosep filter technology ensure expansion of the business to tap into unchartered markets, such as
Mines, Municipalities and Transformer manufacturers.
Manufacture of Neodymium Triflouride (NdF3)
Necsa developed a cost effective and environmentally friendly process for converting pure oxides to fluorides, which form part of the national mineral beneficiation strategic intent. Production of rare-earth fluorides (specifically neodymium trifluoride).
The process, which forms part of a provisional patent, has
been licensed to Thermtron Scientific.
Seed Fund Innovation and Investment Programme
Moisture Miner and New Online DryKeep
The seed fund programme has resulted in innovation outputs in its first year of establishment. The Moisture miner, an atmospheric water harvesting technology has been proven to work from ideation to a functional prototype, producing 500ml of water from the atmospheric moisture using power from the sun executed by a parabolic trough metal material, with no need for electricity, generator or solar panels. It enjoys the support of the Department of Water Affairs and Sanitation with the next stage to pilot it then roll it out.
The DryKeep new and improved version was also delivered as an innovation output and will be placed by the BBBEE commercial partner (SETTEC) at a mine of a potential customer for operational environment demonstration and client satisfaction.
A number of funding applications have been submitted to TIA across various areas in 2017 and R2.482 million was secured for the following new commercial opportunities:
• A non-intrusive method to do wall thickness monitoring;
• Battery Electrolyte Material Market Development (Lithium and Sodium Hexafluorophosphate);
• Plasma Waste-to-Energy Systems Development; and
• Radon gas monitoring instrument.
Benefit Sharing – Rewarding Innovators
An amount of R100 080 was shared to two IP creators in relation to the licensing of C
3F8 that resulted in a once off
license fee.
Innovation Disclosures and Intellectual Property
Necsa filed two provisional patents for Lithium Hexa-phlourophosphate and production of Radioscope, while a PCT was filed for 68Ga-DOTA- Substance P as a novel imaging agent in chronic pain disorders.
Plasma Gasification Technology
Plasma gasification technology was further developed for nuclear as well as non-nuclear applications. In the nuclear field, the technology is applicable to the destruction of toxic waste (e.g. thermal destruction of solvent extracting agents) or for the volume reduction of compressible Low Level Nuclear Waste (LLW). A specification for a plasma destruction unit for compressible LLW was developed for a private entity. This will be followed by the construction of such a unit, which will first be demonstrated using LLW material available on the Necsa site.
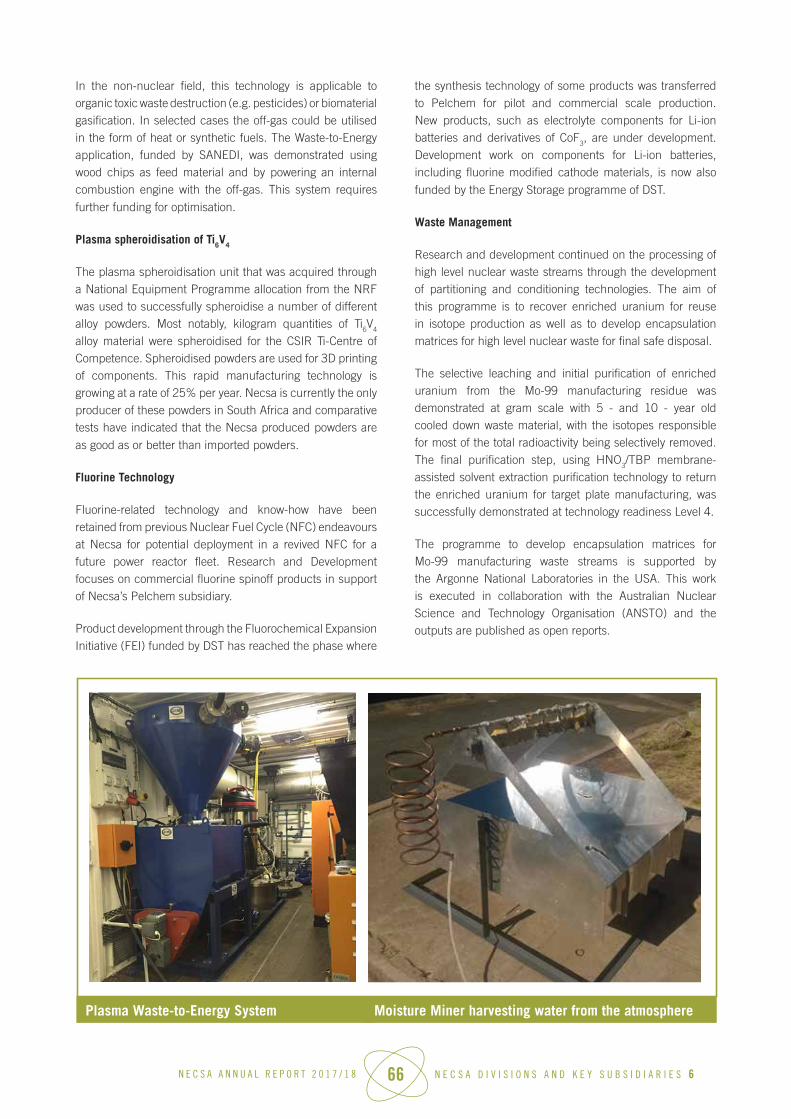
N E C S A A N N U A L R E P O R T 2 0 1 7 / 1 8 66 N E C S A D I V I S I O N S A N D K E Y S U B S I D I A R I E S 6
In the non-nuclear field, this technology is applicable to organic toxic waste destruction (e.g. pesticides) or biomaterial gasification. In selected cases the off-gas could be utilised in the form of heat or synthetic fuels. The Waste-to-Energy application, funded by SANEDI, was demonstrated using wood chips as feed material and by powering an internal combustion engine with the off-gas. This system requires
further funding for optimisation.
Plasma spheroidisation of Ti6V4
The plasma spheroidisation unit that was acquired through a National Equipment Programme allocation from the NRF was used to successfully spheroidise a number of different alloy powders. Most notably, kilogram quantities of Ti6V4
alloy material were spheroidised for the CSIR Ti-Centre of Competence. Spheroidised powders are used for 3D printing of components. This rapid manufacturing technology is growing at a rate of 25% per year. Necsa is currently the only producer of these powders in South Africa and comparative tests have indicated that the Necsa produced powders are
as good as or better than imported powders.
Fluorine Technology
Fluorine-related technology and know-how have been retained from previous Nuclear Fuel Cycle (NFC) endeavours at Necsa for potential deployment in a revived NFC for a future power reactor fleet. Research and Development focuses on commercial fluorine spin off products in support of Necsa’s Pelchem subsidiary.
Product development through the Fluorochemical Expansion Initiative (FEI) funded by DST has reached the phase where
the synthesis technology of some products was transferred to Pelchem for pilot and commercial scale production. New products, such as electrolyte components for Li-ion batteries and derivatives of CoF
3, are under development. Development work on components for Li-ion batteries, including fluorine modified cathode materials, is now also
funded by the Energy Storage programme of DST.
Waste Management
Research and development continued on the processing of high level nuclear waste streams through the development of partitioning and conditioning technologies. The aim of this programme is to recover enriched uranium for reuse in isotope production as well as to develop encapsulation matrices for high level nuclear waste for final safe disposal.
The selective leaching and initial purification of enriched uranium from the Mo-99 manufacturing residue was demonstrated at gram scale with 5 - and 10 - year old cooled down waste material, with the isotopes responsible for most of the total radioactivity being selectively removed. The final purification step, using HNO
3/TBP membrane-assisted solvent extraction purification technology to return the enriched uranium for target plate manufacturing, was successfully demonstrated at technology readiness Level 4.
The programme to develop encapsulation matrices for Mo-99 manufacturing waste streams is supported by the Argonne National Laboratories in the USA. This work is executed in collaboration with the Australian Nuclear Science and Technology Organisation (ANSTO) and the outputs are published as open reports.
Moisture Miner harvesting water from the atmospherePlasma Waste-to-Energy System

N E C S A A N N U A L R E P O R T 2 0 1 7 / 1 8 67 N E C S A D I V I S I O N S A N D K E Y S U B S I D I A R I E S 6
FINANCE DIVISION
Corporate Finance
At a high level, the Corporate Finance Department is responsible for assisting line management to shape the financial direction and sustainability of the company. The core principles are prudence and good corporate governance. The issues of concern must be reported to the decision makers such as executives and the Board.
The Corporate Finance Department is responsible for implementing and monitoring internal controls to ensure the achievement of organisational objectives in operational and strategic spheres. The recording of transactions is conducted timeously to ensure that reliable and accurate information strengthens the efficiency and effectiveness of the financial reports. All transactions are recorded in compliance with the prevailing laws, regulations and policies and procedures. This is to ensure that processing of fraudulent transactions is mitigated. The ultimate aim is to provide decision makers and relevant stakeholders with accurate and complete information at all times.
The above is achieved by ensuring that duties are separated, controlling access to the relevant modules, conducting surprise audits, providing standard documentation, checking the reliability of the trial balances, preparing periodic reconciliations and ensuring the delegation of authority is adhered to.
This department is responsible for assisting line management with the preparation of budgets, forecasting, reporting and related administrative functions. In addition, it manages the accounting cycles including Payroll, Accounts Payable, Accounts Receivable, Inventory Control as well as Treasury and Cash Management. The department acts as custodian of Necsa’s property, plant and equipment (PPE) and maintains the Necsa asset register, thus ensuring that the entity’s PPE are safeguarded and preserved.
The Corporate Finance Department oversees the overall financial strategy of the Necsa Group with respect to its divisions and, to some extent, its subsidiaries. This involves strategic group investment decisions such as Available for Sale Financial Assets, Post-Retirement Medical Aid Liability funding, insurance, bankers and other financial stakeholders. This is to ensure that the company does not invest in risky portfolios or use speculative methods to achieve short term gains that might adversely affect the long term sustainability.
Working closely with internal auditors, assurance is provided that accounts are fairly represented and fraudulent transactions eliminated. Corporate Finance is also involved in providing core information that is utilised in the preparation
of the Necsa Group’s Annual Financial Statements.
Financial Compliance and Reporting
The department’s reporting functions include timeous preparation of management accounts for Executive Management (EXCO), quarterly reports to the Department of Energy and National Treasury and the preparation of Consolidated Necsa Group’s Annual Financial Statements (AFS). The AFS are prepared in compliance with Treasury Regulations, International Financial Reporting Standards (IFRS), Public Finance Management Act (PFMA), Compa-nies Act and other relevant legislation and practices.
The costing and registering of projects in the Enterprise Resource Planning (ERP) system resides in this department. This includes, but is not limited to tracking and reporting on the projects that are registered.
Compliance responsibilities include tracking and reporting on fruitless and wasteful expenditure, irregular expenditure and unauthorised expenditure as well as loss register to mitigate and prevent recurrence. These expenditures are by line management and reports are compiled to the Board of Directors through the Audit and Risk Committee.
The annual highlight of this department is the planning, co-ordination and execution of the year-end reporting and audit by the Auditor-General of South Africa (AGSA) leading to the publication of the Necsa Group’s Annual Financial Statements, see page 108 of the Annual Report. Internal and external audit findings are tracked, followed up and reported to the Audit and Risk Committee of the Necsa Board.
Contributions to financial planning include co-ordination of the company budget as well as preparation of company and group financials for inclusion in the Corporate Plan that is submitted at the end of February in each year. The mandatory National Treasury Templates are prepared and submitted to the National Treasury by this department during July and December of each year.

N E C S A A N N U A L R E P O R T 2 0 1 7 / 1 8 68 N E C S A D I V I S I O N S A N D K E Y S U B S I D I A R I E S 6
This department is responsible for providing professional advisory financial services to Necsa to ensure that Necsa
works within all the compliance and legislative parameters.
Financial Systems
The Corporate Finance Department maintains the full integrity of the Enterprise Resource Planning (ERP) and Payroll systems for Necsa and its major subsidiaries i.e. NTP Radioisotopes SOC Ltd (NTP) and Pelchem SOC Ltd (Pelchem) to extent AEC Amersham SOC Ltd.This is accomplished through acting as system administrators and first line user support, overseeing software change control
and performing of software quality control. User access control policy and procedures are also managed.The largest current project is the integration of Necsa’s ERP system with the Central Supplier Database of National Treasury, and the
upgrade of the ERP System to the latest version.
Supply Chain Management
The Supply Chain Management (SCM) Department develops relevant policies and procedures while also managing compliance with these, legislation and codes of good practice. In addition, SCM provides Contract Management
and Enterprise and Supplier Development support.
Procurement Spend in 2017/18
Area Value
Intra-Group Spend (National) R411 281 320.96
National Spend External to Group R566 885 439.36
International Spend (External to Group) R95 323 574.98
Total Group Procurement Spend R1 073 490 335.30
Top Ten Suppliers to the Necsa Group
No. Supplier Product / Service Rendered
Value Percentage of Procurement
Spend External to Necsa Group
1 Eskom Electricity R62 071 626.31 9.38%
2 National Nuclear Regulator Nuclear licensing R47 566 673.50 7.19%
3 AREVA NP Low enriched uranium R27 912 917.31 4.22%
4 Cerca Fuel Elements R27 879 806.42 4.22%
5 University Of Stellenbosch Numeri Project R27 086 353.94 4.10%
6 Vergenoeg Mining Company (Pty) Raw Materials R26 904 842.75 4.07%
7 Sasol Oil Fuel Marketing (Pty) Fuel R21 107 666.57 3.19%
8 Mahlako A Phala Investments (Pty) Ltd Feasibility study R16 485 172.94 2.49%
9 AON South Africa (Pty) Ltd Insurance brokers R12 609 693.56 1.91%
10 Axim Radiochemistry equipment
R12 057 894.41 1.83%
TOTAL R281 692 647.71 42.54%
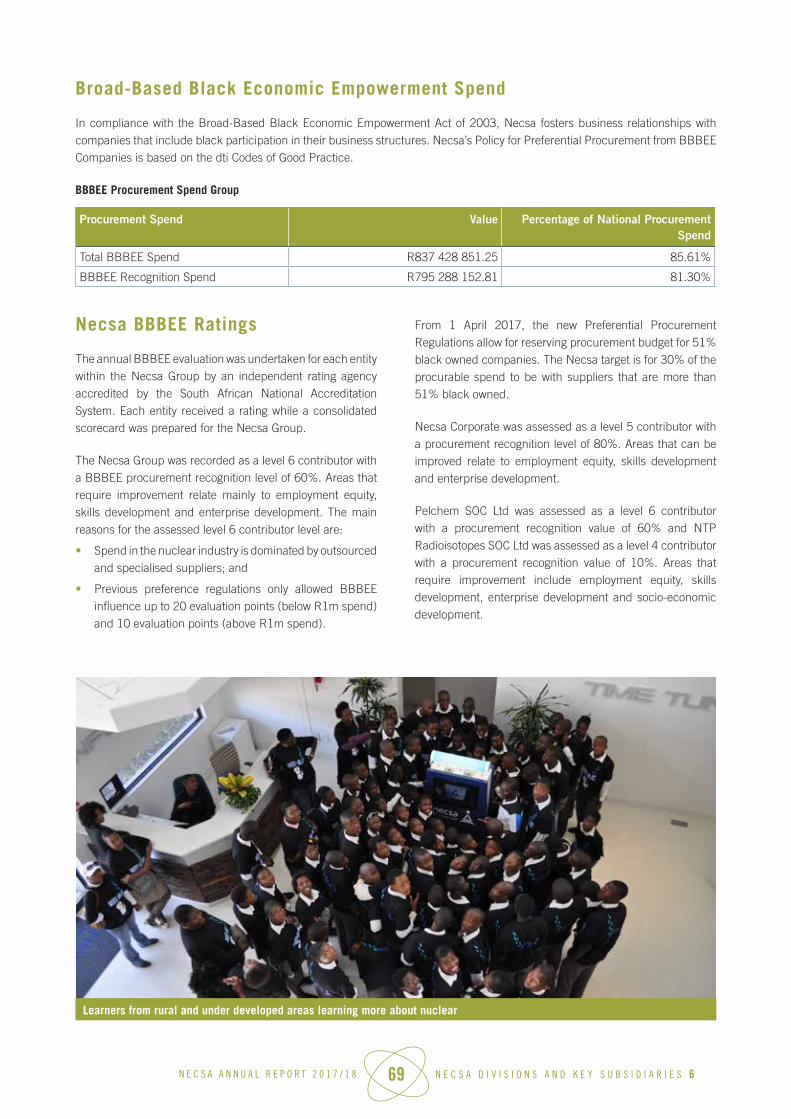
N E C S A A N N U A L R E P O R T 2 0 1 7 / 1 8 69 N E C S A D I V I S I O N S A N D K E Y S U B S I D I A R I E S 6
Broad-Based Black Economic Empowerment Spend
In compliance with the Broad-Based Black Economic Empowerment Act of 2003, Necsa fosters business relationships with companies that include black participation in their business structures. Necsa’s Policy for Preferential Procurement from BBBEE Companies is based on the dti Codes of Good Practice.
BBBEE Procurement Spend Group
Procurement Spend Value Percentage of National Procurement Spend
Total BBBEE Spend R837 428 851.25 85.61%
BBBEE Recognition Spend R795 288 152.81 81.30%
Necsa BBBEE Ratings
The annual BBBEE evaluation was undertaken for each entity within the Necsa Group by an independent rating agency accredited by the South African National Accreditation System. Each entity received a rating while a consolidated scorecard was prepared for the Necsa Group.
The Necsa Group was recorded as a level 6 contributor with a BBBEE procurement recognition level of 60%. Areas that require improvement relate mainly to employment equity, skills development and enterprise development. The main reasons for the assessed level 6 contributor level are:
• Spend in the nuclear industry is dominated by outsourced and specialised suppliers; and
• Previous preference regulations only allowed BBBEE influence up to 20 evaluation points (below R1m spend) and 10 evaluation points (above R1m spend).
From 1 April 2017, the new Preferential Procurement Regulations allow for reserving procurement budget for 51% black owned companies. The Necsa target is for 30% of the procurable spend to be with suppliers that are more than 51% black owned.
Necsa Corporate was assessed as a level 5 contributor with a procurement recognition level of 80%. Areas that can be improved relate to employment equity, skills development and enterprise development.
Pelchem SOC Ltd was assessed as a level 6 contributor with a procurement recognition value of 60% and NTP Radioisotopes SOC Ltd was assessed as a level 4 contributor with a procurement recognition value of 10%. Areas that require improvement include employment equity, skills development, enterprise development and socio-economic development.
Learners from rural and under developed areas learning more about nuclear

N E C S A A N N U A L R E P O R T 2 0 1 7 / 1 8 70 N E C S A D I V I S I O N S A N D K E Y S U B S I D I A R I E S 6
PELCHEM SOC LTD
Pelchem is the only producer of fluorochemicals in the southern hemisphere with a portfolio of over fourteen (14) products exported to more than twenty-five (25) countries. Pelchem’s core mandate is to:
• manufacture and supply fluorochemicals for local and global markets,
• retain, maintain critical technology, Intellectual Property (IP) and strategic capabilities and skills relating to production of hydrofluoric acid (HF) and fluorine gas required for plastics, consumer products, electronics, petrochemicals, stainless steel,
mining, and the nuclear fuel cycle among others.
The successful execution of the short-term strategy bodes extremely well for futureproofing the organisation. Despite the stronger rand, the organisation has demonstrated resilience in the cutthroat market by securing new export markets and its revenue is almost evenly balanced between local and export business.
Highlights
• Successful implementation of the new corporate strategy and organisation structure.
• Approval of the IDC loan to execute the production improvement projects.
• Initiation of the Fluorochemicals Centre of Excellence in partnership with the Services SETA.
• Entry into new markets including Nigeria and Singapore.
• Substantial improvement in the Safety & Health record.
• Improved production performance.
• ISO 14001:2004 certification.
• Appointment of new executives.
Challenges
• Contracting manufacturing base locally, including mining sector putting pressure on local sales.
• Aged and sub-economic production plants.
• Very strong and volatile currency.
• Drought impacted negatively on our packaging customers.
• Increasing high costs of input materials.
• Macroeconomic concerns including Brexit.
• Increasing trade protectionist policies by global powers.
One of the state of the art workshops at Pelchem

N E C S A A N N U A L R E P O R T 2 0 1 7 / 1 8 71 N E C S A D I V I S I O N S A N D K E Y S U B S I D I A R I E S 6
NTP RADIOISOTOPES SOC LTD
Global Supplier of Radiopharmaceuticals
The NTP Group is one of the leading global suppliers of radiation-based products, solutions and services for the healthcare, life sciences and industrial sectors. Isotopes like Molybdenum-99 (Mo-99) support the practice of nuclear medicine, while radioactive sealed sources are used in applications such as non-destructive testing.
Through NTP, the Necsa Group is among the top producers in the world of critical medical radioisotopes that are used to diagnose diseases such as cancer. NTP has grown its market share for Molybdenum-99 through continued investment and by working with its partners to cover the supply gap after the exit of the leading Canadian supplier.
During the third and fourth quarters of the 2017/18 financial year, NTP’s production and revenue were adversely affected following an extended shutdown of operations ordered by the National Nuclear Regulator (NNR) in November 2017, due to non-compliance in connection with safety protocols. Necsa has been working closely with the NNR in order to resolve all of the compliance issues raised by the regulator and to preserve the brand and legacy of NTP. NTP has many unique and valuable assets, which include facilities, skills, expertise, intellectual property and infrastructure. In order to ensure that its legacy is not only preserved, but is passed on and for future generations, NTP has developed and invested in strategies and programmes that will ensure its business
continues to grow in a way that is organic and sustainable.
Highlights
• NTP Group MD Tina Eboka was re-elected as vice-chair of the Organisation for Economic Cooperation and Development (OECD) High-Level Group on Medical Radioisotopes. She was the first isotope producer to be elected to the executive, in 2016;
• The Lutetium-177 n.c.a. active pharmaceutical ingredient (API) production facility was successfully validated and commissioned. The facility is ready for production;
• Supply of locally manufactured Lutetium-177 n.c.a. to the South African market will commence during the 2018/19 financial year;
• The Lutetium-177 n.c.a. API Facility could produce API, but was still not validated. A request for the GMP certification audit has been submitted and NTP will continue to engage SAHPRA to achieve a GMP certified
facility.
Challenges
• A compliance failure in one of NTP’s hot cells led to an unplanned and extended shutdown of all radioisotope production, from mid-November 2017. In February 2018, the NNR allowed NTP to commence with limited production runs. Aside from having serious financial implications for the NTP and for the Necsa Group, the shutdown and its subsequent long closure duration damaged the NTP brand and reputation locally and internationally.
Technetium - 99m Generator used in hospitals
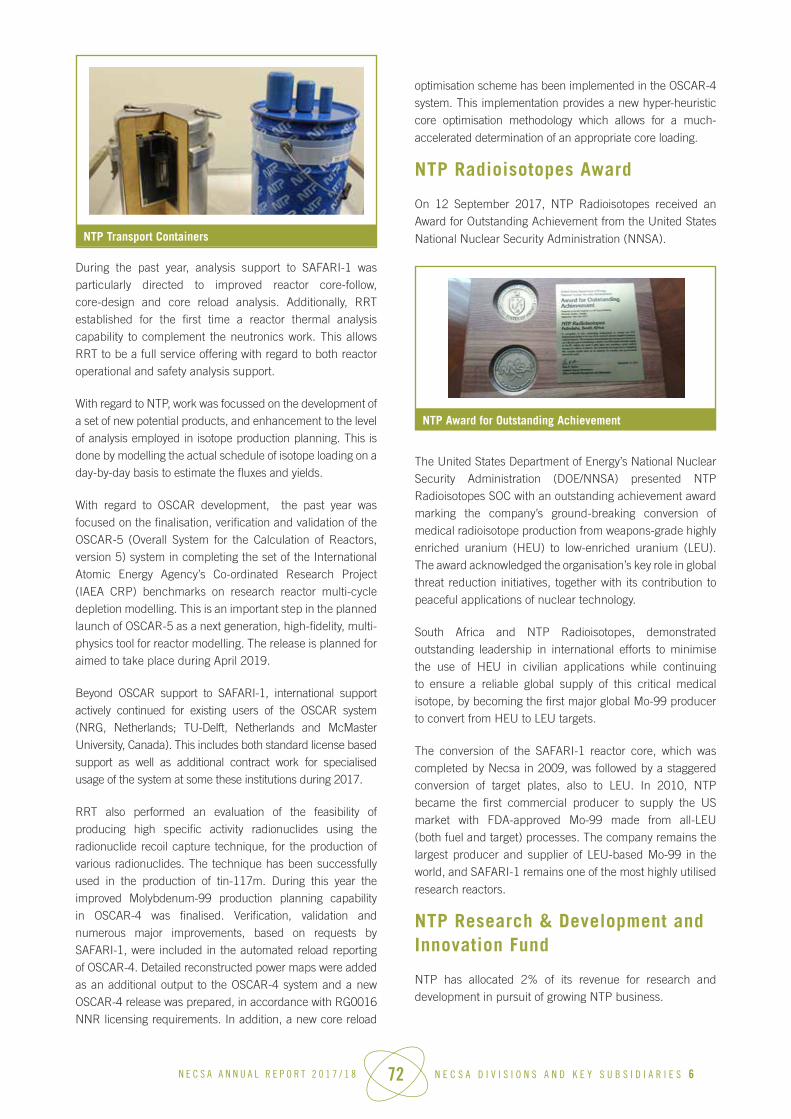
N E C S A A N N U A L R E P O R T 2 0 1 7 / 1 8 72 N E C S A D I V I S I O N S A N D K E Y S U B S I D I A R I E S 6
During the past year, analysis support to SAFARI-1 was particularly directed to improved reactor core-follow, core-design and core reload analysis. Additionally, RRT established for the first time a reactor thermal analysis capability to complement the neutronics work. This allows RRT to be a full service offering with regard to both reactor operational and safety analysis support.
With regard to NTP, work was focussed on the development of a set of new potential products, and enhancement to the level of analysis employed in isotope production planning. This is done by modelling the actual schedule of isotope loading on a day-by-day basis to estimate the fluxes and yields.
With regard to OSCAR development, the past year was focused on the finalisation, verification and validation of the OSCAR-5 (Overall System for the Calculation of Reactors, version 5) system in completing the set of the International Atomic Energy Agency’s Co-ordinated Research Project (IAEA CRP) benchmarks on research reactor multi-cycle depletion modelling. This is an important step in the planned launch of OSCAR-5 as a next generation, high-fidelity, multi-physics tool for reactor modelling. The release is planned for aimed to take place during April 2019.
Beyond OSCAR support to SAFARI-1, international support actively continued for existing users of the OSCAR system (NRG, Netherlands; TU-Delft, Netherlands and McMaster University, Canada). This includes both standard license based support as well as additional contract work for specialised usage of the system at some these institutions during 2017.
RRT also performed an evaluation of the feasibility of producing high specific activity radionuclides using the radionuclide recoil capture technique, for the production of various radionuclides. The technique has been successfully used in the production of tin-117m. During this year the improved Molybdenum-99 production planning capability in OSCAR-4 was finalised. Verification, validation and numerous major improvements, based on requests by SAFARI-1, were included in the automated reload reporting of OSCAR-4. Detailed reconstructed power maps were added as an additional output to the OSCAR-4 system and a new OSCAR-4 release was prepared, in accordance with RG0016 NNR licensing requirements. In addition, a new core reload
optimisation scheme has been implemented in the OSCAR-4 system. This implementation provides a new hyper-heuristic core optimisation methodology which allows for a much-
accelerated determination of an appropriate core loading.
NTP Radioisotopes Award
On 12 September 2017, NTP Radioisotopes received an Award for Outstanding Achievement from the United States
National Nuclear Security Administration (NNSA).
The United States Department of Energy’s National Nuclear Security Administration (DOE/NNSA) presented NTP Radioisotopes SOC with an outstanding achievement award marking the company’s ground-breaking conversion of medical radioisotope production from weapons-grade highly enriched uranium (HEU) to low-enriched uranium (LEU). The award acknowledged the organisation’s key role in global threat reduction initiatives, together with its contribution to peaceful applications of nuclear technology.
South Africa and NTP Radioisotopes, demonstrated outstanding leadership in international efforts to minimise the use of HEU in civilian applications while continuing to ensure a reliable global supply of this critical medical isotope, by becoming the first major global Mo-99 producer to convert from HEU to LEU targets.
The conversion of the SAFARI-1 reactor core, which was completed by Necsa in 2009, was followed by a staggered conversion of target plates, also to LEU. In 2010, NTP became the first commercial producer to supply the US market with FDA-approved Mo-99 made from all-LEU (both fuel and target) processes. The company remains the largest producer and supplier of LEU-based Mo-99 in the world, and SAFARI-1 remains one of the most highly utilised
research reactors.
NTP Research & Development and Innovation Fund
NTP has allocated 2% of its revenue for research and development in pursuit of growing NTP business.
NTP Transport Containers
NTP Award for Outstanding Achievement
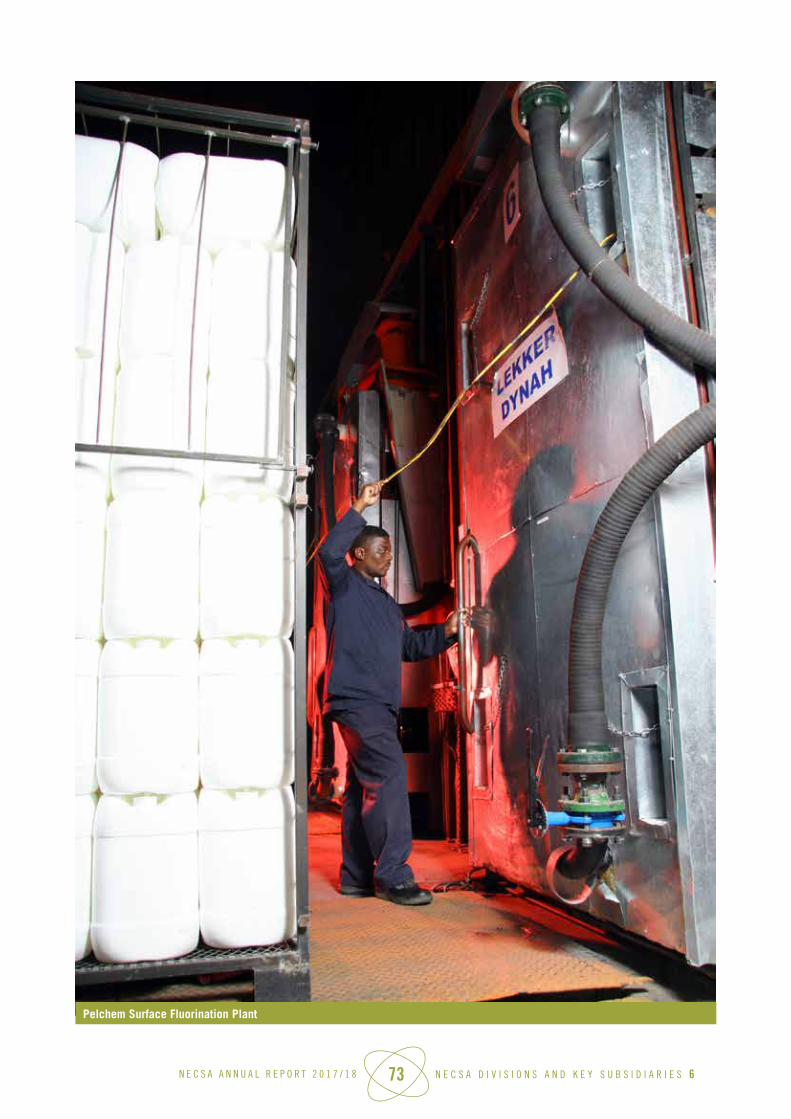
N E C S A A N N U A L R E P O R T 2 0 1 7 / 1 8 73 N E C S A D I V I S I O N S A N D K E Y S U B S I D I A R I E S 6
Pelchem Surface Fluorination Plant

N E C S A A N N U A L R E P O R T 2 0 1 7 / 1 8 74 HUMAN RESOURCES & REAL ESTATE ASSET MANAGEMENT 7
H U M A N R E S O U R C E S A N D R E A L E S T A T E
A S S E T M A N A G E M E N T
7

N E C S A A N N U A L R E P O R T 2 0 1 7 / 1 8 75 HUMAN RESOURCES & REAL ESTATE ASSET MANAGEMENT 7
The primary mandate of the Human Resources and REAM department is to provide strategic Human Resources support services that should enable Necsa to build organisational capabilities to achieve its strategic objectives and thereby deliver on its mandate.
From that perspective, the Human Resources strategy is derived from corporate strategy by interpreting the Human Resource implications of the strategic priorities and translating those into actionable Human Resources projects which are aligned to and support Necsa’s strategic objectives.
HR AND REAM REPORT
HR priorities for the year under review
The following high-level HR priorities were embarked on to create a platform for Necsa to achieve its strategic objectives:
• Implementation of career ladders;
• Developing and rolling out programmes for creating an awareness to facilitate effective implementation of talent management;
• Developing and implementing programmes to ensure a performance management culture is fully embedded within the organisation;
• Developing and rolling out of a group model in terms of which Necsa and its subsidiaries function within the context of a group;
• Transformation and representivity;
• Developing highly skilled people; and
• Collective bargaining outcome: - Minimum wages
- Leave benefits.
Workforce Planning Framework and Key Strategies
Necsa embarked on a campaign to inculcate a culture of ensuring the alignment of workforce planning with the organisation’s overall planning cycle in the form of a medium-term expenditure Framework (MTEF), thus en-suring that workforce planning is conducted as part of strategic planning to inform capacity requirements for the execution of the strategic priorities.
Employee Performance Management Framework
Performance management provides a framework for managing the performance of all employees within Necsa to ensure a fair, equitable and transparent process that instils a culture of high performance. To that end, the importance of
performance management was articulated in the workshops that were held across the organisation to ensure that the momentum is maintained.
Employee Wellness Programmes
Apart from being a business imperative due to the nature of its operations, Necsa’s approach to employee wellness is anchored on its belief that there is a direct correlation between productivity and the well-being of its employees. Accordingly, Necsa has adopted an integrated Employee Wellness Programme involving continuous medical sur-veillance on occupationally exposed workers against high risk exposures such as radiation, noise and chemicals, assisting employees to identify and resolve personal or work-related problems, providing emotional assistance and support interventions to employees.
During the year under review, Necsa organised health and wellness events such as Corporate Wellness Day to promote health and increase awareness on lifestyle conditions such as diabetes, hypertension and cholesterol and an HIV counselling and testing campaign during World AIDS Day. The company also ran a condom and reproductive health awareness week and a mental health awareness campaign.
Necsa has in place a comprehensive occupational hygiene monitoring programme to meet the requirements of the
Occupational Health and Safety Act, Act 85 of 1993.
Policy Development
To ensure alignment of its HR policies to relevant legisla-tion and its operational requirements, Necsa put in place a mechanism through which its policies are viewed on a regular basis.
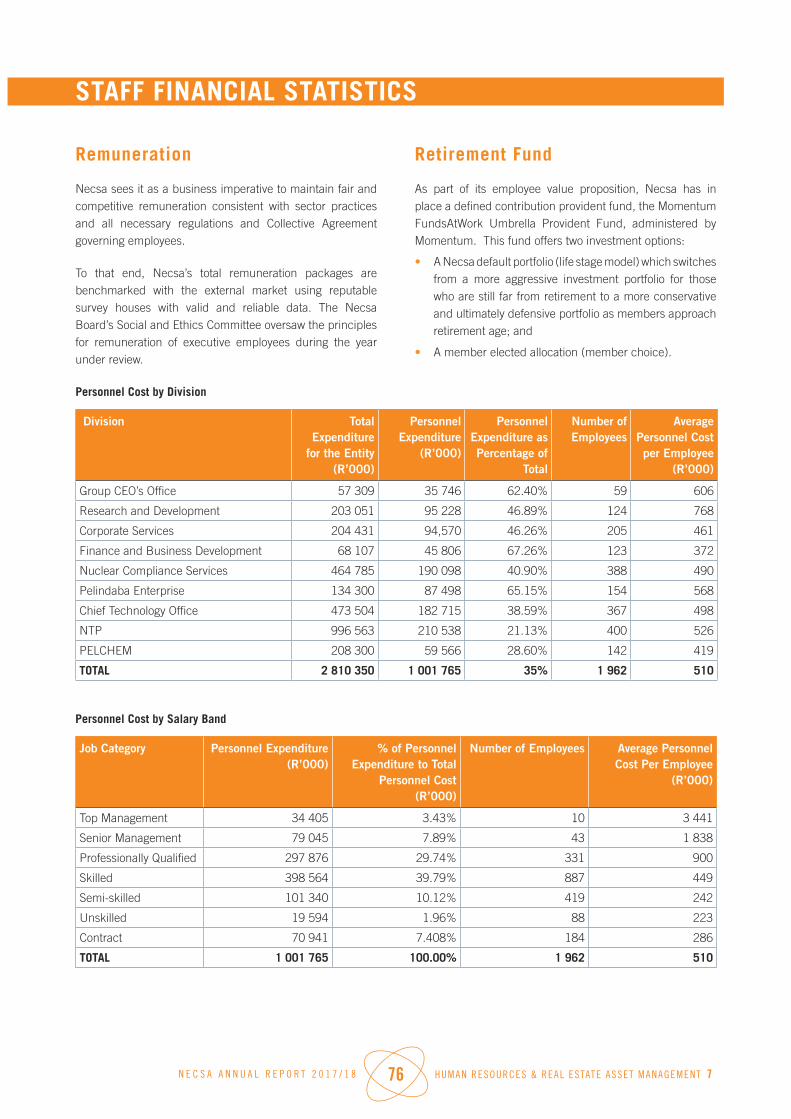
N E C S A A N N U A L R E P O R T 2 0 1 7 / 1 8 76 HUMAN RESOURCES & REAL ESTATE ASSET MANAGEMENT 7
STAFF FINANCIAL STATISTICS
Remuneration
Necsa sees it as a business imperative to maintain fair and competitive remuneration consistent with sector practices and all necessary regulations and Collective Agreement governing employees.
To that end, Necsa’s total remuneration packages are benchmarked with the external market using reputable survey houses with valid and reliable data. The Necsa Board’s Social and Ethics Committee oversaw the principles for remuneration of executive employees during the year under review.
Retirement Fund
As part of its employee value proposition, Necsa has in place a defined contribution provident fund, the Momentum FundsAtWork Umbrella Provident Fund, administered by Momentum. This fund offers two investment options:
• A Necsa default portfolio (life stage model) which switches from a more aggressive investment portfolio for those who are still far from retirement to a more conservative and ultimately defensive portfolio as members approach retirement age; and
• A member elected allocation (member choice).
Personnel Cost by Division
Division Total Expenditure
for the Entity (R’000)
Personnel Expenditure
(R’000)
Personnel Expenditure as Percentage of
Total
Number of Employees
Average Personnel Cost per Employee
(R’000)
Group CEO’s Office 57 309 35 746 62.40% 59 606
Research and Development 203 051 95 228 46.89% 124 768
Corporate Services 204 431 94,570 46.26% 205 461
Finance and Business Development 68 107 45 806 67.26% 123 372
Nuclear Compliance Services 464 785 190 098 40.90% 388 490
Pelindaba Enterprise 134 300 87 498 65.15% 154 568
Chief Technology Office 473 504 182 715 38.59% 367 498
NTP 996 563 210 538 21.13% 400 526
PELCHEM 208 300 59 566 28.60% 142 419
TOTAL 2 810 350 1 001 765 35% 1 962 510
Personnel Cost by Salary Band
Job Category Personnel Expenditure (R’000)
% of Personnel Expenditure to Total
Personnel Cost (R’000)
Number of Employees Average Personnel Cost Per Employee
(R’000)
Top Management 34 405 3.43% 10 3 441
Senior Management 79 045 7.89% 43 1 838
Professionally Qualified 297 876 29.74% 331 900
Skilled 398 564 39.79% 887 449
Semi-skilled 101 340 10.12% 419 242
Unskilled 19 594 1.96% 88 223
Contract 70 941 7.408% 184 286
TOTAL 1 001 765 100.00% 1 962 510

N E C S A A N N U A L R E P O R T 2 0 1 7 / 1 8 77 HUMAN RESOURCES & REAL ESTATE ASSET MANAGEMENT 7
Training Costs
Divisions / Business Unit /Subsidiaries Personnel Expenditure
(R’000)
Training Expenditure
(R000)
Training Expenditure
as a % of Personnel Cost
Number of Employees
Trained
Average Training Cost per Employee
(R)
Group CEO’s Office 45 806 89 0,19 59 1 508
Research and Development 35 746 395 1.11 124 3 185
Human Resources 87 498 594 0,68 205 2 896
Finance and Business Development 94 570 5 167 5.46 123 42 008
Nuclear Compliance Services 95 228 2 284 2.40 388 5 886
Pelindaba Enterprise 190 098 1 381 0,73 154 8 967
Chief Technology Office 182 715 1 162 0,64 367 3 166
NTP 210 538 3 810 1.81 400 9 525
Pelchem 59 566 450 1.76 142 3 169
TOTAL 1 001 765 15 332 1.53 1 962 7 815
The organisation had a total of 158 vacancies as at 31 March 2018. The process of filling all vacancies at senior management and management levels is underway.
Transformation and Representivity
Black employees now constitute 71.2% of Necsa Group workforce. Black technical staff as percentage of all technical staff increased to 61.5%, well in excess of the 55% target set.
Contributing factors:
• Targeted appointment resulted in 95% black new recruits.
• Natural attrition facilitated realisation of transformation objectives.
The percentage of females across race is growing steadily from 32.1% in the previous financial year to 34.2% this financial year.
Improved Working Conditions
Eighty-five cleaning staff, previously outsourced, were absorbed in Necsa, thereby obtaining improved job security and benefits such as pension and medical aid.
Insourcing of personnel further resulted in operational expenditure savings of around R 500 000.
The minimum wage for permanent employees is now R118 788.00 and employees now get equal pay for equal work.
Males get three (3) days paternity leave. Males that adopt children get three months leave for a child less than 7 years of age and one month leave for children 7 years and older.
Leave has been extended to contract workers. They get 27 days annual leave including six days discretionary leave.
A three-year, multi-collective agreement was signed. The signing of the Necsa Group bargaining and Consultative Forum Constitution paved the way for the 2018 to 2021
collective bargaining process.
Rewarding Innovators
In compliance with the IPR Act, an amount of R 100 080 was shared with two IP creators in relation to the licensing of C3F8 that resulted in a once off licence fee.More females appointed across Necsa Group
Mr Postma and Mr v d Westhuizen awarded for Innovation
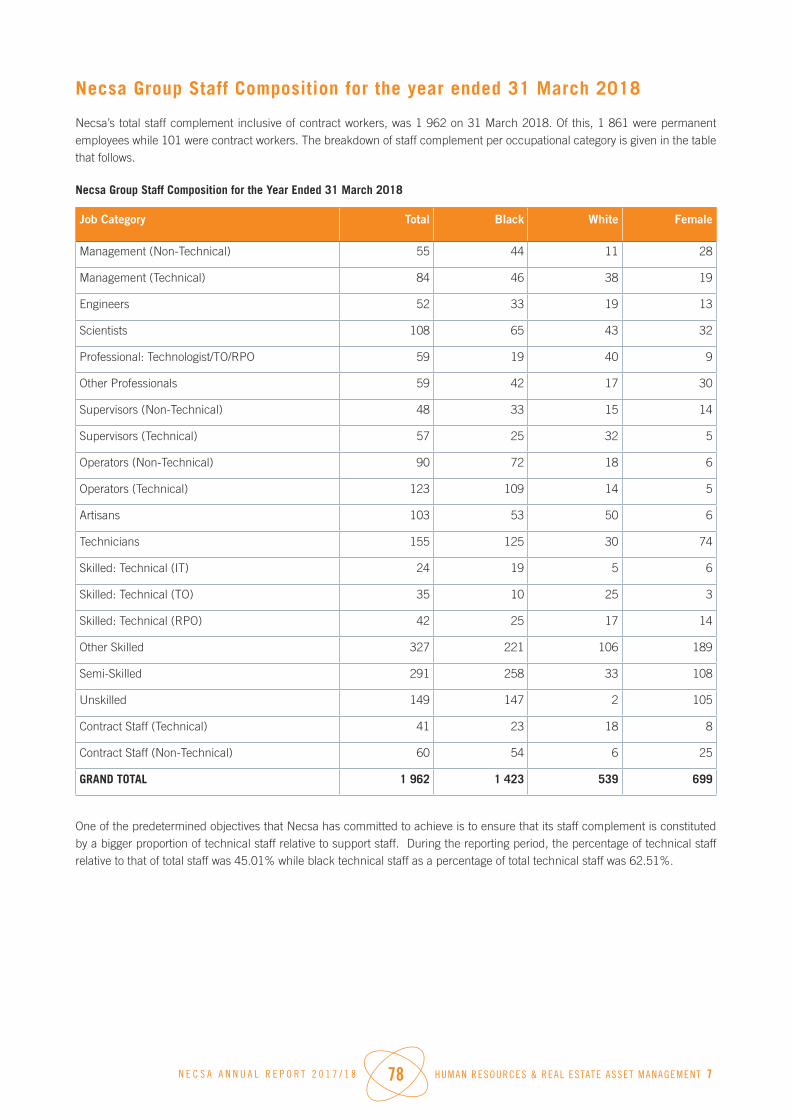
N E C S A A N N U A L R E P O R T 2 0 1 7 / 1 8 78 HUMAN RESOURCES & REAL ESTATE ASSET MANAGEMENT 7
Necsa Group Staff Composition for the year ended 31 March 2018
Necsa’s total staff complement inclusive of contract workers, was 1 962 on 31 March 2018. Of this, 1 861 were permanent employees while 101 were contract workers. The breakdown of staff complement per occupational category is given in the table that follows.
Necsa Group Staff Composition for the Year Ended 31 March 2018
Job Category Total Black White Female
Management (Non-Technical) 55 44 11 28
Management (Technical) 84 46 38 19
Engineers 52 33 19 13
Scientists 108 65 43 32
Professional: Technologist/TO/RPO 59 19 40 9
Other Professionals 59 42 17 30
Supervisors (Non-Technical) 48 33 15 14
Supervisors (Technical) 57 25 32 5
Operators (Non-Technical) 90 72 18 6
Operators (Technical) 123 109 14 5
Artisans 103 53 50 6
Technicians 155 125 30 74
Skilled: Technical (IT) 24 19 5 6
Skilled: Technical (TO) 35 10 25 3
Skilled: Technical (RPO) 42 25 17 14
Other Skilled 327 221 106 189
Semi-Skilled 291 258 33 108
Unskilled 149 147 2 105
Contract Staff (Technical) 41 23 18 8
Contract Staff (Non-Technical) 60 54 6 25
GRAND TOTAL 1 962 1 423 539 699
One of the predetermined objectives that Necsa has committed to achieve is to ensure that its staff complement is constituted by a bigger proportion of technical staff relative to support staff. During the reporting period, the percentage of technical staff relative to that of total staff was 45.01% while black technical staff as a percentage of total technical staff was 62.51%.

N E C S A A N N U A L R E P O R T 2 0 1 7 / 1 8 79 HUMAN RESOURCES & REAL ESTATE ASSET MANAGEMENT 7
STAFF SOCIAL STATISTICS
Employment and Vacancies
Job Category 2017/18Approved Posts
2017/18Employees
2017/18Vacancies
% Vacancies
Top Management 11 10 1 9.09
Senior Management 49 43 6 24.5
Professional qualified 367 331 36 9.81
Skilled 981 887 94 9.58
Semi-skilled 436 419 17 3.90
Unskilled 92 88 4 4.35
Subtotal 1 936 1 778 164 8.47
Contract - 184
GRAND TOTAL 1 936 1 962 164 8.47
Employment Changes
A total of 108 employees left the organisation through a combination of normal retirement, resignations, dismissals and deaths during the financial year. A total of 113 appointments were made, some of which were internal promotions. A total of 106 were from designated groups.
Changes in Employment
Job Category Designated Group Total Employees
Appointments Exits Appointments Exits
Management 8 16 15 22
Engineers 6 3 7 6
Scientists 6 4 7 7
Other Professionals 7 5 7 7
Supervisors 5 2 2 3
Operators 2 4 9 9
Artisans 1 5 2
Technicians 1 5 5 6
Skilled 9 18 31 32
Semi-Skilled 5 4 16 5
Unskilled 5 2 9 9
TOTAL 106 63 113 108
Staff Turnover in Critical Skills Categories
Job Category 2017/18 %
2016/17%
2015/16%
2014/15%
2013/14%
Management 1.17 0.62 0.12 0.42 4.93
Engineering and Science 0.71 0.26 0.65 0.77 9.90
Technical 1.33 0.31 0.30 4.02 19.0

N E C S A A N N U A L R E P O R T 2 0 1 7 / 1 8 80 HUMAN RESOURCES & REAL ESTATE ASSET MANAGEMENT 7
Reasons for Staff Leaving
Reason Number % of Total Number of Staff Leaving
Death 1 0,93
Resignation 67 62.04
Dismissal 4 3.70
Retirement 27 25.00
Ill health 1 0.93
Retrenchment 8 7.41
TOTAL 108 100
Labour Relations
Misconduct and Disciplinary Action
Nature of Disciplinary Action Number
Verbal Warning 1
Written Warning 1
Final Written warning 1
Dismissal 1
Resignation 2
Contract ended prior to the disciplinary 2
TOTAL 10
Disciplinary Hearings, Grievances and Sick Leave
Description 2017/18 2016/17 2015/16 2014/15 2013/14
Disciplinary Actions 10 6 27 34 46
Grievances Registered 23 24 186 24 14
Sick Leave (days per person per month) 0.63 0.69 0.64 0.65 0.71
Labour Union Membership
2017/18 2016/17 2015/16 2014/15 2013/14
Uni
onis
ed
Num
ber
Per
cent
age
Num
ber
Per
cent
age
Num
ber
Per
cent
age
Num
ber
Per
cent
age
Num
ber
Per
cent
age
Pelindaba Workers Union 300 23.96% 326 26.2% 341 27.72% 369 29.2% 390 31.5%
Solidarity 75 5.99% 81 6.5% 92 7.4% 114 9.0% 124 10.0%
National Education, Health and Allied Workers Union (NEHAWU)
694 55.43% 647 51.9% 606 49.26% 544 43.0% 469 37.9%
Sub-total 1 069 85.38% 1054 84.6 1 039 84.38% 983 81.3% 983 79.4%
Non-unionised 183 14.61% 191 15.52% 191 15.52% 236 18.7% 254 20.5%
TOTAL 1 252 99.99% 1245 99.99% 1 230 99.99% 1 263 99.99% 1 237 99.99%

N E C S A A N N U A L R E P O R T 2 0 1 7 / 1 8 81 HUMAN RESOURCES & REAL ESTATE ASSET MANAGEMENT 7
Employment Equity
In developing Necsa’s Employment Equity (EE) Plans, the Employee Assistance Programme (EAP) analysis was used to determine the degree of underrepresentation of the designated groups in our workforce profile. The EAP targets were used to set our numerical goals and targets in order to achieve an equitable and representative workforce.
Male representation relative to staff compliment is 67%. At top management level it is a staggering 72.7%, more than double the representation of women overall. While women in general are still underrepresented, there is however gradual movement in African females as seen in the table that follows.
Further scrutiny of the table shows that although black people collectively constitute 57.2% of senior management cadre, white males at 40.5% remained over-represented at this level in comparison with their EAP. Black males are gradually making ground and still outnumber females at the senior management level.
The table also contains workforce profile information in terms of race, gender and disability as at 31 March 2018. The first table contains information on all employees, including people with disabilities, and the second table only contains information on people with disabilities.
Necsa Group Employees, (including people with disabilities)
Occupational Levels
Male Female Foreign Nationals Total
A C I W A C I W Male Female
Top management 7 0 0 0 3 0 0 0 0 0 10
Senior management 14 1 4 14 9 0 0 1 0 0 43
Professionally qualified and experienced specialists and mid-management
98 5 10 108 44 4 10 41 9 2 331
Skilled technical and academically qualified workers, junior management, supervisors, foremen, and superintendents
317 22 4 212 222 5 8 94 0 3 887
Semi-skilled and discretionary decision making
271 10 1 20 91 7 0 19 0 0 419
Unskilled and defined decision making 42 0 0 2 43 0 0 1 0 0 88
TOTAL PERMANENT 749 38 19 356 412 16 18 156 12 2 1 778
Temporary employees 65 2 0 21 90 2 0 3 1 0 184
GRAND TOTAL 814 40 19 377 502 18 18 159 13 2 1 962
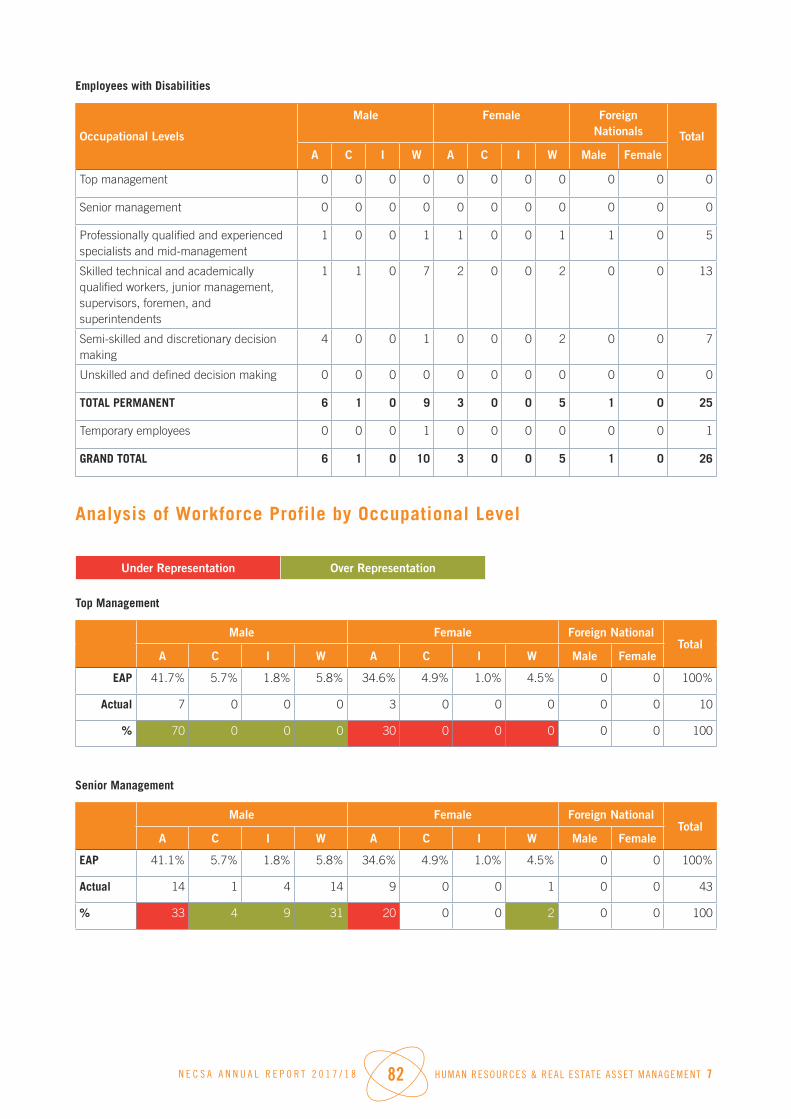
N E C S A A N N U A L R E P O R T 2 0 1 7 / 1 8 82 HUMAN RESOURCES & REAL ESTATE ASSET MANAGEMENT 7
Employees with Disabilities
Occupational Levels
Male Female Foreign Nationals Total
A C I W A C I W Male Female
Top management 0 0 0 0 0 0 0 0 0 0 0
Senior management 0 0 0 0 0 0 0 0 0 0 0
Professionally qualified and experienced specialists and mid-management
1 0 0 1 1 0 0 1 1 0 5
Skilled technical and academically qualified workers, junior management, supervisors, foremen, and superintendents
1 1 0 7 2 0 0 2 0 0 13
Semi-skilled and discretionary decision making
4 0 0 1 0 0 0 2 0 0 7
Unskilled and defined decision making 0 0 0 0 0 0 0 0 0 0 0
TOTAL PERMANENT 6 1 0 9 3 0 0 5 1 0 25
Temporary employees 0 0 0 1 0 0 0 0 0 0 1
GRAND TOTAL 6 1 0 10 3 0 0 5 1 0 26
Analysis of Workforce Profile by Occupational Level
Under Representation Over Representation
Top Management
Male Female Foreign NationalTotal
A C I W A C I W Male Female
EAP 41.7% 5.7% 1.8% 5.8% 34.6% 4.9% 1.0% 4.5% 0 0 100%
Actual 7 0 0 0 3 0 0 0 0 0 10
% 70 0 0 0 30 0 0 0 0 0 100
Senior Management
Male Female Foreign NationalTotal
A C I W A C I W Male Female
EAP 41.1% 5.7% 1.8% 5.8% 34.6% 4.9% 1.0% 4.5% 0 0 100%
Actual 14 1 4 14 9 0 0 1 0 0 43
% 33 4 9 31 20 0 0 2 0 0 100

N E C S A A N N U A L R E P O R T 2 0 1 7 / 1 8 83 HUMAN RESOURCES & REAL ESTATE ASSET MANAGEMENT 7
Professionally Qualified
Male Female Foreign NationalTotal
A C I W A C I W Male Female
EAP 41.7% 5.7% 1.8% 5.8% 34.6% 4.9% 1.0% 4.5% 0 0 100%
ACTUAL 98 5 10 108 44 4 10 41 9 2 331
% 30 2 3 33 13 1 3 12 2 0 100
Skilled Technicals
Male Female Foreign NationalTotal
A C I W A C I W Male Female
EAP 41.7% 5.7% 1.8% 5.8% 34.6% 4.9% 1.0% 4.5% 0 0 100%
Actual 317 22 4 212 222 5 8 94 3 887
% 36 3 1 24 25 1 1 11 0 0 100
Semi-Skilled
Male Female Foreign NationalTotal
A C I W A C I W Male Female
EAP 41.7% 5.7% 1.8% 5.8% 34.6% 4.9% 1.0% 4.5% 0 0 100%
Actual 271 10 1 20 91 7 19 0 0 419
% 65 1 0 5 22 2 0 5 0 0 100
Unskilled
Male Female Foreign NationalTotal
A C I W A C I W Male Female
EAP 41.7% 5.7% 1.8% 5.8% 34.6% 4.9% 1.0% 4.5% 0 0 100
Actual 42 0 0 2 43 1 0 0 88
% 49 0 0 2 48 0 0 1 0 0 100
People with Disabilities
Years 2015 2016 2017 2018
All employees 1819 2122 1887 1962
All people with disabilities 30 25 27 26
% 1.6 1.2 1.4 1.3

N E C S A A N N U A L R E P O R T 2 0 1 7 / 1 8 84 HUMAN RESOURCES & REAL ESTATE ASSET MANAGEMENT 7
STAFF DEVELOPMENT
During the 2017/18 financial year, a total of R2 060 152.61 was spent on the Study Assistance Scheme (SAS) to assist 142
Necsa staff in obtaining qualifications at various institutions of higher learning.
Employees on Study Assistance Scheme
DisciplineBlack Coloured Indian White
Male Female Male Female Male Female Male Female
B A Degree 6 2 0 0 0 1 0 0
B Com 3 6 0 0 0 0 1 0
B Tech 8 8 0 0 0 0 0 2
B Sc 1 1 0 0 0 0 0 0
D Com 0 1 0 0 0 0 0 0
Honours 1 3 1 0 0 0 0 1
LLB 0 3 0 0 0 0 0 0
M Tech 2 0 0 0 0 0 0 0
Masters 3 1 0 1 0 1 1 0
MBA 1 1 0 0 0 0 0 0
M Sc 1 2 0 0 0 0 1 0
National Diploma 29 24 1 1 0 0 2 2
PhD 11 5 0 0 1 0 1 1
TOTAL 66 57 2 2 1 2 6 6
Developing Highly Skilled People
Five young masters graduates returned from international universities in South Korea and Russia.
Employees from the Department of Energy, Necsa, NNR, iThemba Labs, Kouga Municipality, COEGA and Eskom (193) were sent to China for training in various nuclear areas of expertise.
Highly skilled Necsa employees hard at work

N E C S A A N N U A L R E P O R T 2 0 1 7 / 1 8 85 HUMAN RESOURCES & REAL ESTATE ASSET MANAGEMENT 7
The International Atomic Energy Agency IAEA and/or the USA Department of Energy (DOE, National Nuclear Security Administration) funded the participation of Necsa’s nuclear forensic scientists and technicians in the following events:
• the Necsa hosting of the regional training course in nuclear forensics to propagate for the establishment of an IAEA Southern African Regional Nuclear Forensics Centre of Excellence at Necsa.
• Nuclear forensic technician specialists training in nuclear forensics methodologies for member states with developing nuclear forensics capabilities at the JRC Institute of Transuranium Chemistry in Karlsruhe, Germany.
• Nuclear forensic scientists’ attendance of the technical meeting on nuclear forensics and cooperation with African states held at the IAEA headquarters in Vienna, Austria.
• Participation (alongside key national nuclear organisations) in the Galaxy Serpent version 3 (GSv3) tabletop exercise aimed at assisting nuclear countries to fast track the building and testing of national database libraries for the fingerprinting of nuclear materials origins.
• Nuclear forensic scientists’ attendance at the ITWG Global Initiative to Combat Nuclear Terrorism (GICNT) annual nuclear forensics expert’s consultancy meeting
on countering illicit nuclear trafficking hosted by the European Commission’s Joint Research Centre in Karlsruhe, Germany.
Necsa also secured a NRF/DST development grant for the nuclear forensics capacity building activities alongside Japan Atomic Energy Agency (JAEA). Execution of the Japan Science Promotion Society (JSPS)/NRF grant funded project aimed at the building of a prototype forensic database library and the validation of key forensic analysis methods has been delayed to 2018 due to the NRF/DST concern.
During the year under review, a number of students from higher educational institutions, two post-doctoral, 18 PhD, 17 MSc and 9 others (Hons and BTech) were assisted with their studies at Necsa. Two postdoctoral and six PhD level students from the NRF Professional Development Programme performed experimental studies at Necsa or at universities on Necsa projects, and were supervised by Necsa professionals. Six PhD/D Eng and 10 MSc/M Eng students were assisted at universities on DST/R&D programmes (i.e. AMI).
R&D experts continued to contribute strongly to capacity building activities in specialised areas in nuclear and radiation sciences with three extraordinary professors and three senior lecturers at NWU.
Necsa Internship Programme
Necsa embarked on training of interns funded and supported by CHIETA (Chemical Industries Education and Training Authority). For the year under review, a total of 33 young black graduates were appointed on contract to provide them the opportunity to gain workplace experience and thereby contributing to National Human Resources Development Strategy.
DisciplineBlack Coloured Indian White
Male Female Male Female Male Female Male Female
BSc (Electronics) 2 0 0 0 0 0 0 0
BSc (Physics & Electronics) 0 2 0 0 0 0 0 0
B Tech (Internal Audit) 0 1 0 0 0 0 0 0
BSc 1 1 0 0 0 0 0 0
BSc (Analytical Chemistry) 3 2 0 0 0 0 0 0
ND (Analytical Chemistry) 4 3 0 0 0 0 0 0
ND (Internal Audit) 0 2 0 0 0 0 0 0
ND (Information Technology) 6 3 0 0 0 0 0 0
ND (Management) 0 1 0 0 0 0 0 0
ND (Industrial Physics) 1 1 0 0 0 0 0 0
TOTAL 17 16 0 0 0 0 0 0
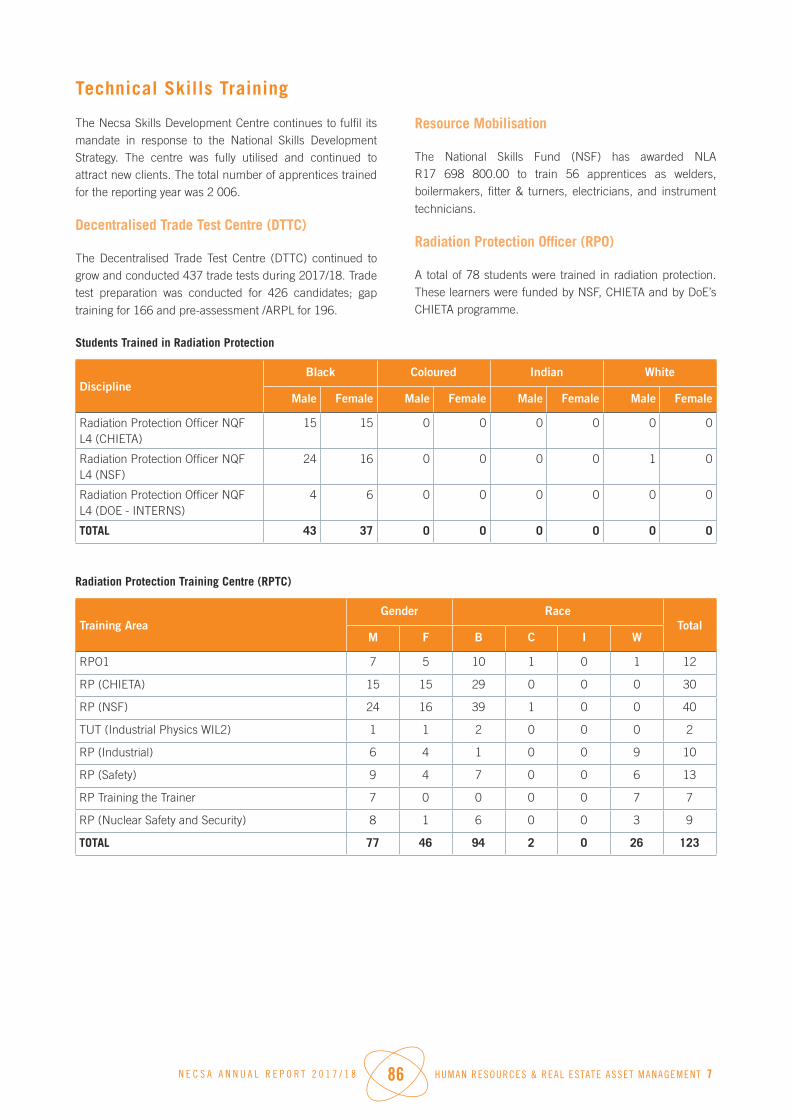
N E C S A A N N U A L R E P O R T 2 0 1 7 / 1 8 86 HUMAN RESOURCES & REAL ESTATE ASSET MANAGEMENT 7
Technical Skills Training
The Necsa Skills Development Centre continues to fulfil its mandate in response to the National Skills Development Strategy. The centre was fully utilised and continued to attract new clients. The total number of apprentices trained for the reporting year was 2 006.
Decentralised Trade Test Centre (DTTC)
The Decentralised Trade Test Centre (DTTC) continued to grow and conducted 437 trade tests during 2017/18. Trade test preparation was conducted for 426 candidates; gap
training for 166 and pre-assessment /ARPL for 196.
Resource Mobilisation
The National Skills Fund (NSF) has awarded NLA R17 698 800.00 to train 56 apprentices as welders, boilermakers, fitter & turners, electricians, and instrument
technicians.
Radiation Protection Officer (RPO)
A total of 78 students were trained in radiation protection. These learners were funded by NSF, CHIETA and by DoE’s CHIETA programme.
Students Trained in Radiation Protection
DisciplineBlack Coloured Indian White
Male Female Male Female Male Female Male Female
Radiation Protection Officer NQF L4 (CHIETA)
15 15 0 0 0 0 0 0
Radiation Protection Officer NQF L4 (NSF)
24 16 0 0 0 0 1 0
Radiation Protection Officer NQF L4 (DOE - INTERNS)
4 6 0 0 0 0 0 0
TOTAL 43 37 0 0 0 0 0 0
Radiation Protection Training Centre (RPTC)
Training AreaGender Race
TotalM F B C I W
RPO1 7 5 10 1 0 1 12
RP (CHIETA) 15 15 29 0 0 0 30
RP (NSF) 24 16 39 1 0 0 40
TUT (Industrial Physics WIL2) 1 1 2 0 0 0 2
RP (Industrial) 6 4 1 0 0 9 10
RP (Safety) 9 4 7 0 0 6 13
RP Training the Trainer 7 0 0 0 0 7 7
RP (Nuclear Safety and Security) 8 1 6 0 0 3 9
TOTAL 77 46 94 2 0 26 123

N E C S A A N N U A L R E P O R T 2 0 1 7 / 1 8 87 HUMAN RESOURCES & REAL ESTATE ASSET MANAGEMENT 7
Maths and Science Learner Support
Necsa had an agreement with Hofmeyr High School in Atteridgeville to provide supplementary lessons to 50 Grade 12 learners in Mathematics and Science. The programme, currently funded by CHIETA, also offers mentorship by Necsa volunteers for 10 months.
Learner support
DisciplineBlack Coloured Indian White
Male Female Male Female Male Female Male Female
Grade 12 – Maths & Science 26 0 0 0 0 0 0 0
Learner support programme 0 24 0 0 0 0 0 0
TOTAL 26 24 0 0 0 0 0 0
KEY HUMAN RESOURCES CHALLENGES
Recruiting young black professionals was the biggest HR challenge during the year under review. The challenge is exacerbated by the imperative to contain the salary bill and the low level of natural attrition.
Another challenge is that Necsa’s workforce is ageing. This calls for effective measures to mitigate institutio-
nal knowledge loss. To that end, it has become critical that a talent management framework is developed and implemented to attract, retain, and develop the young workforce that will take this organisation forward and meet transformational objectives.
Students at the Necsa Learning Academy using measuring equipment to test supply voltages

N E C S A A N N U A L R E P O R T 2 0 1 7 / 1 8 88 G O V E R N A N C E 8
G O V E R N A N C E
8

N E C S A A N N U A L R E P O R T 2 0 1 7 / 1 8 89 G O V E R N A N C E 8
ACCOUNTING AUTHORITY – NECSA BOARDIntroduction
The Necsa Board of Directors is the Accounting Authority as defined in terms of the Public Finance Management Act, No. 1 of 1999 (PFMA). The Board is appointed by the Minister of Energy (the Shareholder) in terms of Section 16 of the Nuclear Energy Act. Due regard is given to the ratio between independent and non-independent members to ensure objectivity in decision-making.
The Board is appointed for a renewable period of three years and undergoes a Necsa-specific induction process within six months of appointment. Appraisals of the Board and its committees were conducted.
Role of Board
As Accounting Authority, the Board is responsible for the application of corporate governance principles and the performance of the company. To this end, the Board reviews risk policy, annual budgets, business plans as well as corporate strategy.
Board Charter
The Nuclear Energy Act serves directly as the Necsa Board’s Charter. In terms of Section 16 of the Act “the Board must ensure that the goals of this Act are actively pursued and must exercise general control over the performance of the Corporation’s functions.”
The functions of Necsa are delineated in the Act under Section 13 on the Main Functions of Corporation and Section 14 on Ancillary powers and functions of Corporation. These relate to nuclear research and development, processing of nuclear materials, control of nuclear waste and compliance with the Republic’s international nuclear obligations.
Composition of Board
The Necsa Board consists of a chairperson, one executive and eight non-executive directors. An additional DoE repre-sentative was appointed to the Necsa Board with effect from 1 August 2017.
Dr KR KemmChairperson

N E C S A A N N U A L R E P O R T 2 0 1 7 / 1 8 90 G O V E R N A N C E 8
Mr GP TshelaneGroup Chief Executive Officer
Dr NT MagauNon-Executive Director
(Chairperson of Social and Ethics Committee)
Dr GJ DavidsNon-Executive Director
(Chairperson of Research and Development Committee)
Ms P BosmanNon-Executive Director
(Chairperson of Audit and Risk Committee)
Mr ENN NgcoboNon-Executive Director
Mr MPK TshivhaseNon-Executive Director
(Chairperson of Investment and Finance Committee)
Mr ZC NgidiNon-Executive Director
Ms RP MosiaNon-Executive Director
Mr MS SekgotaNon-Executive Director
(Chairperson of Nuclear Operations to Nuclear New Build Programme
Sub-Committee)
NECSA BOARD MEMBERS

N E C S A A N N U A L R E P O R T 2 0 1 7 / 1 8 91 G O V E R N A N C E 8
Details of Board Members for the Period 1 April 2017 to 31 March 2018
Members Age on 31 Mar 2018
Directorship on Other Boards
Date of Appointment
Term Date of Resignation/Expiry of Term
Qualifications
Executive Member
Mr GP TshelaneGroup Chief Executive Officer
55 - Nuclear Industry Association of South Africa (NIASA)
-�KINGS International Advisory Board
1 September 2012
2 Re - appointed 2nd Term 1 January 2017 – 31 December 2019
-�BSc Hons (Nuclear Physics), University of Witwatersrand;
-�BSc (Maths and Physics), University of Witwatersrand;
-�Executive Development Programme;
-�Certificate in Project Management;
-�Finance for Non-financial Managers, University of Witwatersrand
Independent Non-Executive Members
Dr KR KemmChairperson of the Board
68 -��Supreme Chess Trust-��Stratek Business Strategy Consultants
-��Silver Protea Nuclear Consortium Pty (Ltd)
-�Board of Advisors: Committee for a Constructive Tomorrow, Washington DC.
-�Board of Advisors: Go nuclear, Colorado USA
-�Board of Advisors: Environmentalists for Nuclear, Paris France
24 March 2016
1 3 year term expires 23 March 2019
-�BPhD (Nuclear Physics), University of KwaZulu-Natal
-��MSc, (Nuclear Physics), University of KwaZulu-Natal
-�BSc Hons (Physics), University of KwaZulu-Natal
-�BSc (Physics and Mathematics), University of KwaZulu-Natal;
Dr NT MagauChairperson of Social and Ethics Committee
65 -��Advisory Council member of the University of Cape Town Business School
-�Advisory member of the UP School of Management
-��NTP Radioisotopes Board -�Trustee of Bertha Gxowa Foundation
-�Dept of Water Izakhiwo Infundo Trust
24 March 2016
1 3 year term expires 23 March 2019
-�D.Ed, Harvard University;-�M.Ed, Rand Afrikaans University;
-��B.Ed, University of South Africa;
-�BA, University of the North.
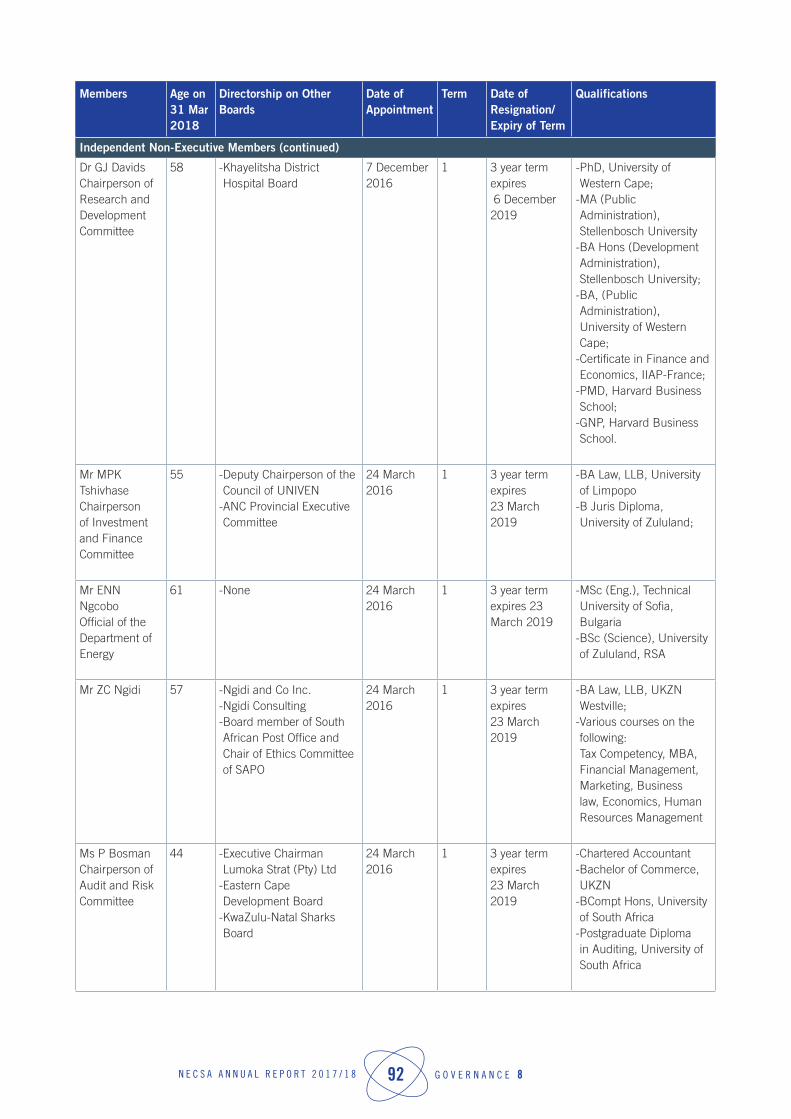
N E C S A A N N U A L R E P O R T 2 0 1 7 / 1 8 92 G O V E R N A N C E 8
Members Age on 31 Mar 2018
Directorship on Other Boards
Date of Appointment
Term Date of Resignation/Expiry of Term
Qualifications
Independent Non-Executive Members (continued)
Dr GJ DavidsChairperson of Research and Development Committee
58 -�Khayelitsha District Hospital Board
7 December 2016
1 3 year term expires 6 December 2019
-�PhD, University of Western Cape;
-�MA (Public Administration), Stellenbosch University
-�BA Hons (Development Administration), Stellenbosch University;
-�BA, (Public Administration), University of Western Cape;
-�Certificate in Finance and Economics, IIAP-France;
-�PMD, Harvard Business School;
-�GNP, Harvard Business School.
Mr MPK TshivhaseChairperson of Investment and Finance Committee
55 -�Deputy Chairperson of the Council of UNIVEN
-�ANC Provincial Executive Committee
24 March 2016
1 3 year term expires 23 March 2019
-��BA Law, LLB, University of Limpopo
-��B Juris Diploma, University of Zululand;
Mr ENN NgcoboOfficial of the Department of Energy
61 -�None 24 March 2016
1 3 year term expires 23 March 2019
-��MSc (Eng.), Technical University of Sofia, Bulgaria
-�BSc (Science), University of Zululand, RSA
Mr ZC Ngidi 57 -�Ngidi and Co Inc.-�Ngidi Consulting-�Board member of South African Post Office and Chair of Ethics Committee of SAPO
24 March 2016
1 3 year term expires 23 March 2019
-�BA Law, LLB, UKZN Westville;
-��Various courses on the following: Tax Competency, MBA, Financial Management, Marketing, Business law, Economics, Human Resources Management
Ms P BosmanChairperson of Audit and Risk Committee
44 -�Executive Chairman Lumoka Strat (Pty) Ltd
-��Eastern Cape Development Board
-�KwaZulu-Natal Sharks Board
24 March 2016
1 3 year term expires 23 March 2019
-�Chartered Accountant-��Bachelor of Commerce, UKZN
-��BCompt Hons, University of South Africa
-�Postgraduate Diploma in Auditing, University of South Africa

N E C S A A N N U A L R E P O R T 2 0 1 7 / 1 8 93 G O V E R N A N C E 8
Members Age on 31 Mar 2018
Directorship on Other Boards
Date of Appointment
Term Date of Resignation/Expiry of Term
Qualifications
Independent Non-Executive Members (continued)
Ms RP Mosia 50 -�The Bridge of Hope Wines-��Lemaj Investment-��Ekuseni Distribution
24 March 2016
1 3 year term expires 23 March 2019
-��MBL, UNISA-��BCom (Accounting), University of the North
-�Business Administration, Wits Graduate School of Business;
-��Criminal Justice in Auditing, UJ
-��BCTA (Bridging Certified Theory in Accounting), UJ
-�PG Higher Dip In Tax Law, University of Cape Town
Mr MS SekgotaChairperson of Nuclear Operations (Nuclear New Build Programme) Sub-Committee
39 None 7 December 2016
1 3 year term expires 6 December 2019
-�BCom Hons (Strategic Marketing) University of Limpopo
-��BCom (Business Management) University of Limpopo
Mr KP Maphoto 43 -�NNR Board’s Transformation and Development Committee(TDC)
-�Eskom and Necsa’s Emergency Planning, Steering and Oversight Committee(EPSOC)
-��Necsa Liability Coordination Committee (NLCC)
-��Nuclear Energy Sub-Working Group on Safety Legislation and Regulation(NESWG)under(NNEECC)
-�Nuclear Energy Sub-Working Group on Siting Environment and Communication.
-�Nuclear Energy Sub-Working Group on Fuel Cycle and Backend.
1 August 2017
1 3 year term expires 31 July 2020
-��MSc (Applied Environmental Nuclear Physics), University of Western Cape
-��BSc Hons (Physics), Former University of the North (University of Limpopo)
-�BSc (Physics and Chemistry) University of the North (University of Limpopo)
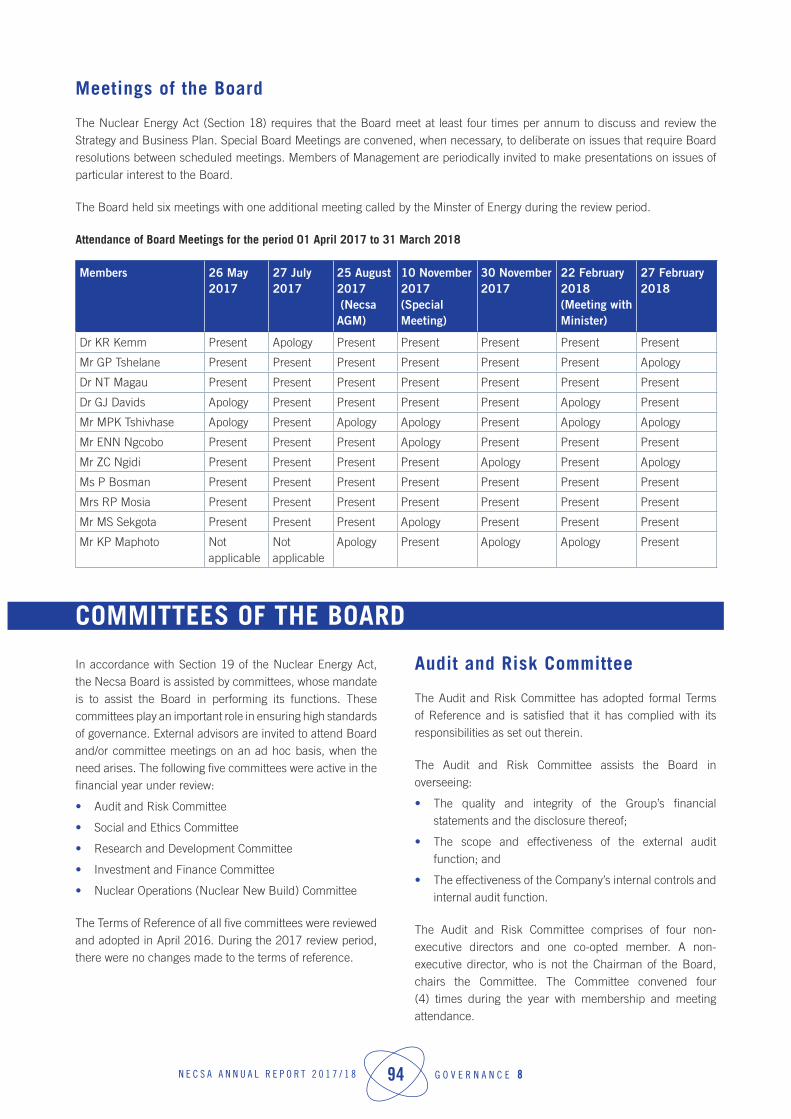
N E C S A A N N U A L R E P O R T 2 0 1 7 / 1 8 94 G O V E R N A N C E 8
Meetings of the Board
The Nuclear Energy Act (Section 18) requires that the Board meet at least four times per annum to discuss and review the Strategy and Business Plan. Special Board Meetings are convened, when necessary, to deliberate on issues that require Board resolutions between scheduled meetings. Members of Management are periodically invited to make presentations on issues of particular interest to the Board.
The Board held six meetings with one additional meeting called by the Minster of Energy during the review period.
Attendance of Board Meetings for the period 01 April 2017 to 31 March 2018
Members 26 May 2017
27 July 2017
25 August 2017 (Necsa AGM)
10 November2017(Special Meeting)
30 November 2017
22 February2018(Meeting with Minister)
27 February 2018
Dr KR Kemm Present Apology Present Present Present Present Present
Mr GP Tshelane Present Present Present Present Present Present Apology
Dr NT Magau Present Present Present Present Present Present Present
Dr GJ Davids Apology Present Present Present Present Apology Present
Mr MPK Tshivhase Apology Present Apology Apology Present Apology Apology
Mr ENN Ngcobo Present Present Present Apology Present Present Present
Mr ZC Ngidi Present Present Present Present Apology Present Apology
Ms P Bosman Present Present Present Present Present Present Present
Mrs RP Mosia Present Present Present Present Present Present Present
Mr MS Sekgota Present Present Present Apology Present Present Present
Mr KP Maphoto Not applicable
Not applicable
Apology Present Apology Apology Present
COMMITTEES OF THE BOARD
In accordance with Section 19 of the Nuclear Energy Act, the Necsa Board is assisted by committees, whose mandate is to assist the Board in performing its functions. These committees play an important role in ensuring high standards of governance. External advisors are invited to attend Board and/or committee meetings on an ad hoc basis, when the need arises. The following five committees were active in the financial year under review:
• Audit and Risk Committee
• Social and Ethics Committee
• Research and Development Committee
• Investment and Finance Committee
• Nuclear Operations (Nuclear New Build) Committee
The Terms of Reference of all five committees were reviewed and adopted in April 2016. During the 2017 review period, there were no changes made to the terms of reference.
Audit and Risk Committee
The Audit and Risk Committee has adopted formal Terms of Reference and is satisfied that it has complied with its responsibilities as set out therein.
The Audit and Risk Committee assists the Board in overseeing:
• The quality and integrity of the Group’s financial statements and the disclosure thereof;
• The scope and effectiveness of the external audit function; and
• The effectiveness of the Company’s internal controls and internal audit function.
The Audit and Risk Committee comprises of four non-executive directors and one co-opted member. A non-executive director, who is not the Chairman of the Board, chairs the Committee. The Committee convened four (4) times during the year with membership and meeting attendance.

N E C S A A N N U A L R E P O R T 2 0 1 7 / 1 8 95 G O V E R N A N C E 8
Meetings of the Audit and Risk Committee
Members 19 May 2017 21 July 2017 23 November 2017 21 February 2018
Ms P BosmanCommittee Chairperson
Apology Present Present Present
Mr GP Tshelane Apology Present Present Present
Mr ZC Ngidi Present Apology Apology Present
Mrs RP Mosia Present (Acting chair) Present Present Present
Mr NA MhlongoCo-opted Member
Apology Present Present Present
Mr MS Sekgota Present Present Present Present
Social and Ethics Committee
The Social and Ethics Committee comprises four non-executive directors chaired by a non-executive director who is not the Chairman of the Board.
This Committee was formally constituted in line with the provisions of regulation 43(5) read with section 72(4)-(10) of the Companies Act, Act 71 of 2008. The Committee has adopted formal Terms of Reference in line with these regulations.
The Committee’s responsibilities include:
• Monitoring the Company’s activities with regard to social and economic development, good corporate citizenship,
the environment, health and public safety, consumer relationships and labour relations;
• Drawing matters within the Committee’s mandate to the attention of the Board as the occasion requires; and
• Reporting to the shareholders at the Company’s annual general meeting on matters falling within its mandate.
The Committee holds sufficient scheduled meetings to discharge its duties as set out in its Terms of Reference, but subject to a minimum of three meetings per year. The Committee convened five (5) times during the period under review.
Meetings of the Social and Ethics Committee
Name 18 May 2017 18-19 May 2017 (Workshop)
20 July 2017 22 November 2017
20 February2018
Dr NT Magau Committee Chairperson Present Present Present Present Present
Mr GP Tshelane Present Present Present Present Present
Mr ENN Ngcobo Present Present Present Present Present
Ms P Bosman Present Present Apology Present Present
Dr GJ Davids Present Present Not applicable Present Present
Mr ZC Ngidi Apology Present Present Apology Present
Research and Development Committee
The Research and Development Committee’s Terms of Reference assigns it the following responsibilities:
• Make recommendations concerning: - Policy and implementation of Research, Development and Technology;
- Research and Development initiatives proposed by Management;
- Implementation of best practices;
- Potential opportunities in nuclear research and development;
- Capacity development and annual research budget; - External collaboration; and - Strategic management of Intellectual Property
• Monitoring: - Management of Research, Development and Nuclear Technology; and
- Progress in collaboration with other organisations.

N E C S A A N N U A L R E P O R T 2 0 1 7 / 1 8 96 G O V E R N A N C E 8
The Research and Development Committee comprises three non-executive directors and two co-opted members, chaired by a non-executive director who is not the Chairman of the Board, met four (4) times during the period under review.
Meetings of the Research and Development Committee
Member 23 May 2017 20 July 2017 22 November 2017 20 February 2018
Dr GJ DavidsCommittee Chairperson (Feb 2017)
Present Present Present Present
Mr MPK Tshivhase Present Apology Present Apology
Mr GP Tshelane Apology Present Present Present
Mr ENN Ngcobo Present Present Present Present
Mr KP Maphoto Not applicable Not applicable Apology Present
Dr Z Vilakazi Co-opted Member Present Present Present Apology
Investment and Finance Committee
The responsibilities of this Committee include:
• Investment policies;
• Reviewing the viability of business opportunities and/or cases;
• Reviewing the Necsa Group’s financial performance;
• Procedures to monitor compliance with investment policies by officers, employees and Necsa’s Investment Board’s agents;
• Approval of investment transactions;
• Monitoring the effectiveness of the investment policies;
• Considering and recommending approval by the Necsa Board of the Necsa Group Corporate Plan; and
• Such other matters as may be delegated to the Committee by the Board.
The four non-executive directors met four (4) times during the period under review. A non-executive director, who is not the Chairman of the Board, chaired the Committee.
Meetings of the Investment and Finance Committee
Member 19 May 2017 21 July 2017 23 November 2017 21 February 2018
Mr MPK TshivhaseCommittee Chairperson
Present Present Present Apology
Mr GP Tshelane Apology Present Present Present
Mr ZC Ngidi Present Apology Apology Present
Mrs RP Mosia Present Present Present Present
Mr MS Sekgota Present Present Present Present
Mr KP Maphoto Not applicable Not applicable Not applicable Present
Nuclear Operations (Nuclear New Build) Committee
The responsibilities of the Nuclear Operations Committee is to:
• assess the sustainability of the nuclear energy system, taking into account global scenarios and strategies;
• support the development of long-range national energy strategies, and report on technological and institutional innovations that are necessary to achieve sustainable nuclear power programmes for South Africa;
• look into opportunities and challenges posed by the national energy development plan;
• coordinate nuclear power planning, design and building operations;
• coordinate new construction energy modelling and commissioning standards;
• nuclear energy-related technical standards for new constructions; renovations and refurbishments;

N E C S A A N N U A L R E P O R T 2 0 1 7 / 1 8 97 G O V E R N A N C E 8
• identify nuclear energy efficient equipment and technologies;
• coordinate and cooperate between Necsa and other local and international bodies as well as other relevant stakeholders that share common goals with Necsa to help ensure the sustainable development of nuclear energy;
• develop and maintain a suite of tools that may be used to analyse and compare different design alternatives related to the nuclear energy concepts from the perspectives of: 1) economics and sustainability, 2) safety and reliability, and 3) proliferation resistance and security;
• develop nuclear power technological innovation and demonstration projects;
• educate the public;
• synergise with other Board Committees where it relates
to the Nuclear New Build Programme (i.e. procurement, funding, strategic business case for employment opportunities, environmental impact zoning, water permits, suite suitability, etc.)provide an accessible platform for management and staff within the business units of Necsa to participate in identifying, exploring and proposing a range of future nuclear power consideration and present these to the Board; and
• identify information gaps in respect of opportunities and provide guidance on national priorities.
The Nuclear Operations Committee comprises five non-executive directors and one executive director with a non-executive director, who is not the Chairman of the Board, chairing the Committee. They met three (3) times during the period under review.
Meetings of the Nuclear Operations Committee
Member 25 August 2017 21 November 2017 21 February 2018
Mr MS Sekgota Committee Chairperson Present Present Present
Dr KR Kemm Board Chairperson Present Present Apology
Mr GP Tshelane Present Apology Present
Mrs RP Mosia Present Present Present
Ms P Bosman Present Present Present
Dr GJ Davids Present Not applicable Not applicable
Mr KP Maphoto Not applicable Not applicable Present
Remuneration of Board Members
The remuneration of Necsa’s non-executive directors is determined and reviewed annually by the Minister of Energy in terms of the Nuclear Energy Act, No. 46 of 1999. In making her determination in this respect, the Minister also considers the relevant National Treasury Regulations and Framework on Remuneration of Non-executive Directors of state-owned entities.
Remuneration of Board Members
Member Fees Running Cost Company Contribution SDL
Company Contribution COIDA
Total
Non-executive Board members
Kemm KR (Dr) R353 901.56 R13 780.09 R969.83 R3 655.51 R372 306.99
Magau NT (Dr) R317 249.47 R0.00 R513.40 R3 109.91 R320 872.78
Mhlongo AN (Mr) R75 289.65 R0.00 R121.84 R737.99 R76 149.48
Tshivhase MPK (Mr) R317 249.47 R0.00 R438.28 R3 032.54 R320 720.29
Bosman P (Ms) R300 710.40 R0.00 R512.30 R3 108.78 R304 331.48
Ngcobo ENN (Mr) R0.00 R5 076.54 R34.98 R52.29 R5 163.81
Ngidi ZC (Mr) R343 799.39 R0.00 R672.39 R3 423.15 R347 894.93
Mosia RP (Ms) R268 509.74 R0.00 R550.55 R2 749.40 R271 809.69
Vilakazi Z (Prof) R75 289.65 R0.00 R121.84 R737.99 R76 149.48
Sekgota MS (Mr) R268 509.74 R0.00 R434.51 R2 632.17 R271 576.42
Davids GJ (Dr) R317 249.47 R0.00 R513.40 R3 109.91 R320 872.78

N E C S A A N N U A L R E P O R T 2 0 1 7 / 1 8 98 G O V E R N A N C E 8
EXECUTIVE MANAGEMENT COMMITTEE - EXCO
In terms of Sections 22 and 23 of the Nuclear Energy Act, the Group CEO must ensure that the functions of the Corporation in terms of the Act are carried out, report accordingly to the Board and furnish the Minister with an annual plan of action. As Accounting Officer of the Board, the Group CEO accounts for the Corporation’s finances.
The Group CEO is assisted by the Executive Management Committee (EXCO) for which Terms of Reference has been approved by the Board. The contract period for the Group CEO is three years while Divisional and Group Executives are contracted for five years with a one month notice of termination period.
EXCO advises the Group CEO on matters including implementation of policies, procedures and annual budgets. It ensures proper governance through the implementation of Corporate Strategy and Plans and the appointment of senior officials reporting directly to Divisional and Group Executives.
EXCO reports to the Board on Group performance, makes recommendations via EXCO committees aligned to the four Board Committees and recommends the integrated annual report for approval by the Board.
Composition of EXCO
The Executive Management Committee is chaired by the Group CEO. It is further composed of Divisional and Group Executives as well as the heads of Internal Audit, Strategy and Performance, Business Development, the Company Secretariat and Pelindaba Enterprise.
Necsa EXCO Members
Mr GP TshelaneGroup Chief Executive Officer
Mr ZG MyezaGroup Executive
(April 2014-August 2017)Finance and Business Development
Ms HNB KhumaloChief Financial Officer
(Sep 2017 to date)Finance DivisionGroup Executive
(Feb 2017 to Aug 2017)Corporate Services
Mr TJ TselaneChief Technology Officer
(Sep 2017 to date)Chief Technology Office
Divisional Executive (Apr 2014 to Aug 2017)
Operations

N E C S A A N N U A L R E P O R T 2 0 1 7 / 1 8 99 G O V E R N A N C E 8
Dr MS MaserumuleDivisional Executive
(Apr 2014 to Aug 2017)Research and Development
Mr BM MphahleleGroup Executive (Sep 2017 to date)Business Development & Innovation
Executive Manager (Nov 2015 to Aug 2017)Business Development
Mr MU RamatsuiGroup Executive (Sep 2017 to date)
Senior Executive Manager (Jan 2017 to Aug 2017)
Pelindaba Enterprise
Ms MA RaswesweGroup Executive (Jan 2017 to date)Nuclear Compliance and Services
Mr MA MondiGroup Executive (Sep 2017 to date)
Human Resources & Real Estate Asset Management
Senior Manager (Feb 2017 to Aug 2017)Corporate Services
Ms NF Tengimfene General Manager (Sep 2017 to date)
Senior Manager (May 2015 to Aug 2017)Corporate Communication & Stakeholder
Relations
Mr A MyoliChief Information Officer
(Jun 2012 to date)
Mr FAM DionizioActing General Manager
(Sep 2017 to date)Research and Technology Development
Mr VMG MalebanaChief Legal Advisor (Sept 2017 to date)
Mr U NathaGeneral Manager (Sep 2017 to date)
Acting Executive Manager (Jan 2017 to Aug 2017)
Strategy and Performance
Mr HJ ViljoenChief Audit Officer (Oct 2013 to date)
Mr FM MkhabelaChief Risk Officer (1 Jan 2018 to date)

N E C S A A N N U A L R E P O R T 2 0 1 7 / 1 8 100 G O V E R N A N C E 8
Standing EXCO Members for the 2017/18 Financial Year
Name Capacity Appointed to the Committee
Mr Phumzile Tshelane CEO September 2012 to date
Mr Zakes Myeza Group Executive: Finance and Business Development April 2014 to August 2017
Mr Ruby Ramatsui Group Executive: Pelindaba Enterprise January 2017 to date
Mr Thabo Tselane Chief Technology Officer: Chief Technology Office April 2014 to date
Ms Mosa Rasweswe Group Executive: Nuclear Compliance and Services January 2017 to date
Dr Motodi Maserumule Divisional Executive: R&D April 2014 to August 2017
Ms Hlengiwe Khumalo Group Executive: Corporate ServicesChief Financial Officer
February 2017 to August 2017September 2017 to date
Mr Monde Mondi Group Executive : HR & REAM September 2017 to date
Mr Umesh Natha General Manager: Strategy and Performance January 2017 to date
Mr Brian Mphahlele Group Executive: Business Development & Innovation November 2015 to date
Mr Vusi Malebana Chief Legal Adviser April 2013 to date
Mr Rico Viljoen Chief Audit Officer October 2013 to date
Mr Ayanda Myoli Chief Information Officer June 2012 to date
Ms Nikelwa Tengimfene General Manager: Corporate Communication & Stakeholder Relations
September 2017 to date
Mr Fortune Mkhabela Chief Risk Officer January 2018 to date
Mr Fabrizio Dionizio Acting General Manager September 2017 to date
The Executive Management Committee is mandated to hold sufficient meetings to discharge all its obligations subject to a minimum of one meeting per month. During the 2017/18 financial year the Committee met fortnightly, alternating between a strategic and performance focus.

N E C S A A N N U A L R E P O R T 2 0 1 7 / 1 8 101 G O V E R N A N C E 8
RISK MANAGEMENT
Enterprise-wide Risk Management has as principal objective
increasing the likelihood of Necsa achieving its objectives
by optimally balancing risk and reward. The methodology
and processes described below are aimed at ensuring
that significant business risks are systematically identified,
assessed and reduced to acceptable levels.
Risk Methodology
Group Risk Management follows the Risk Management
Framework of ISO 31000, the Committee of Sponsoring
Organisations (COSO) of the Treadway Commission, the
National Treasury Risk Management Framework and King
III, to ensure alignment with best practice.
The Necsa Group Risk Management Policy and Strategy
was approved by the Board in March 2015. The Strategy
outlines roles and responsibilities for risk identification,
assessment and management as well as the overall risk
management process. As a nuclear organisation operating
a Research Reactor, sustainability risks relating to safety,
security, regulatory compliance and commercial success of
subsidiaries are prioritised. Current, imminent and envisaged
risks that may threaten the long-term sustainability of the
Group are considered.
Necsa’s risk tolerance is set at a risk rating level of ≥16
(i.e. those risks with high impact and high likelihood of
occurrence). The company’s risk appetite has been defined
as “No risk may remain in the very high (unacceptable)
category (16≤ rating ≤25) for longer than two consecutive
quarters before being managed into a more acceptable
(lower) risk category (rating ≤15)”.
Risk Management Assurance
Assurance for the Risk Management Process is provided
through a series of interrelated processes which include
Divisional Risk Champions, the Group’s Internal Risk
Management Committee (IRMC), Internal Audit, the Audit
and Risk Committees of EXCO and the Board and ultimately
the Board of Directors.
The IRMC assists the Executive Management Committee
(EXCO) and the Board with implementation of the Risk
Management Policy and Strategy by developing processes
for risk identification and control. These processes involve
Risk Champions updating Divisional Risk Registers at
Management Committee meetings for amalgamation into
the Necsa Group Strategic Risk Register. The IRMC meets
on a quarterly basis to review the Necsa Group Strategic Risk
Register and progress with risk responses. Internal Audit
conducts a risk-based audit and assesses the effectiveness
of the risk management processes for assurance to both
EXCO and the Board.
The new Chief Risk Officer was appointed on 1 January 2018.
Strategic Group Risks
The top ten risks currently faced by the Group are
reviewed below.
Group Sustainability Risks
Liquidity Risk
The inability of Necsa to meet its obligations when they fall
due results from ineffective cash management within the
financial constraints faced by Necsa. Mitigation actions
include Budget manuals and guidelines are circulated to line
management, information sessions are held by decentralised
financial officers and GEs, the forecast is managed on a
monthly basis in order to identify areas where funding is
not utilised in terms of the approved budget, Delegations
of authority are issued in order to ensure that funding is
used appropriately. Complete Management Accounts are
provided to monthly EXCO for deliberation. Residual risk
rating remains at 25.
Pelindaba Enterprise Sales Targets
The risk of Pelindaba Enterprise not achieving its sales targets
impacts on its viability. In mitigation, a market research
study was completed. This information is being used to
compile a business model and plan. More competitive
pricing is required in quotes which necessitates finding a
solution to the high overhead cost structures. The capacity
of the project management office needs to be strengthened
and a productivity improvement programme implemented.
Residual risk rating is at 25.
Going Concern Status
Necsa’s Going Concern Status is crucial to its financial
sustainability as it determines its ability to fund operations and
strategic initiatives. To this end savings on variable costs are
being pursued, costs savings are negotiated with suppliers
and commercial focus to grow revenue is encouraged.

N E C S A A N N U A L R E P O R T 2 0 1 7 / 1 8 102 G O V E R N A N C E 8
Additional grant funding for R&D is being sought, borrowing from IDC for capital projects is being pursued, Pelchem’s Board is being engaged and long-term Cabinet commitment for Stage 2 Decommissioning and Decontamination funding is to be secured. The residual risk rating stands at 25.
NTP Dependence on One Dissolver Hot Cell
Dependence on a single unit for Mo-99 radiochemical production threatens sustained and reliable supply of products to customers. This is being mitigated by the refurbishment of Cell 19 for which the last hot commissioning run was conducted on 28 March 2017. The residual risk level is assessed at 20.
NTP Reliance on One Major Product (Mo-99)
Lack of product diversification makes NTP’s business excessively vulnerable to changes in the market for Mo-99. The product range is to be broadened with introduction of non-carrier Lu-177 Dotatate and Lu-177 PSMA. In addition, iThemba LABS investment is to be explored as well as a Radiopharmaceutical Market Growth Strategy. Residual risk rating stands at 20.
NPT Non-Adherence and non-compliance to safety and regulatory
The nuclear environment is heavily regulated, and any noncompliance may result in shutdown of production facility.
Mitigation actions include NTP safety procedures and documents are constantly monitored and a report indicating overdue documents is distributed twice monthly, Continuous staff training on all relevant policies, procedures and SOP’s, internal and external audits are performed. Residual risk level remains at 25.
NTP Inadequate Capacity to Handle High Density U-Residue
U-Residue if not handled appropriately will affect produc-tion process.
Mitigation action actions include hot commissioning of the U-residue removal from Cell 3 to Cell 6A (Welding) to Cell 6B (safeguards) and finally to Cell 2 for interim storage of the long term storage containers has continued and is in progress. Residual risk level remains at 25.
Low Plant Availability
Downtime and increasing maintenance costs at Pelchem can be attributed to ageing Infrastructure and equipment. An ageing management plan is being developed and imple-mented. Approval for an Industrial Development Corporation loan is being sought to help with plant maintenance. The residual risk level is assessed at 20.
Group Security of Supply Risks
Security of Supply of LEU Target Plates
Low Enriched Uranium (LEU) target plates are essential as irradiation targets in the production of Mo-99 in SAFARI-1 for NTP. Security of target plate supply is being ameliorated through recommendations from the formulated strategy including the current assessment of potential suppliers. The residual risk level is at 20.
Security of Supply of LEU Fuel Plates
Low Enriched Uranium (LEU) fuel plates are essential in the manufacturing of Fuel Elements and Control Rods for SAFARI-1. The security of supply risk is being addressed through a number of strategic interventions including diversifying suppliers by establishing partnerships and collaborations. The residual risk level is assessed at 20.
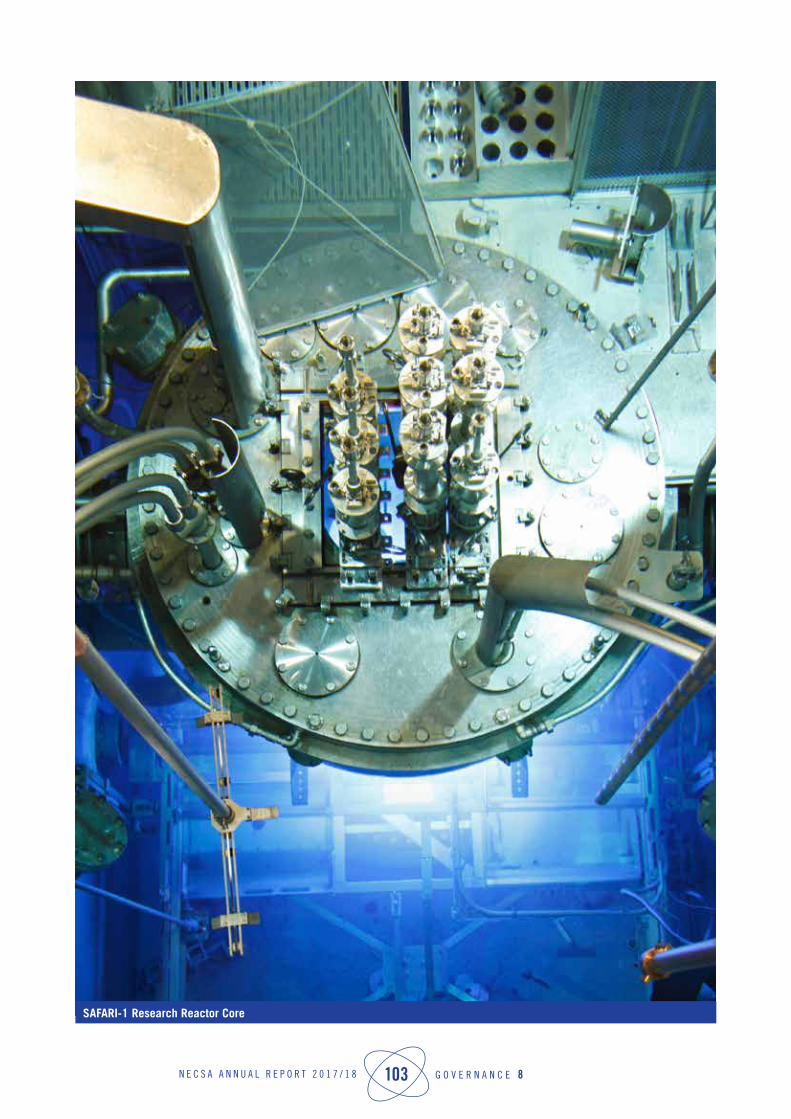
N E C S A A N N U A L R E P O R T 2 0 1 7 / 1 8 103 G O V E R N A N C E 8
SAFARI-1 Research Reactor Core

N E C S A A N N U A L R E P O R T 2 0 1 7 / 1 8 104 S U S T A I N A B I L I T Y R E P O R T 9
S U S T A I N A B I L I T Y
R E P O R T
9

N E C S A A N N U A L R E P O R T 2 0 1 7 / 1 8 105 S U S T A I N A B I L I T Y R E P O R T 9
The Necsa Group is committed to the goal of sustainable development to ensure that opportunities available to future generations are not compromised. To this end, the company’s economic, social and environmental impacts are considered below.
In each of the three domains, sustainability is examined in terms of the relevant capitals at the core of the International Integrated Reporting Framework and relevant performance indicators presented.
ECONOMIC SUSTAINABILITY
The following Integrated Reporting Capitals are directly linked to Economic Sustainability:
Necsa’s Financial Capital includes operational and capital grants from government, revenues from commercial ventures as well as debt financing. Necsa manages its Financial Capital through its Finance and Business Development Division, its two commercial subsidiaries NTP and Pelchem as well as the Pelindaba Enterprise Division as incubator of new business ventures. In addition, a Business Development Department resides in the Office of the CEO.
Financial Capital Indicators
Necsa Group 2013 2014 2015 2016 2017 2018
Necsa Corporate Sales R315m R332m R353m R382m R401m R388m
NTP Group Net Profit R137m R89m R69m R183m R196m R131m
Pelchem Group Net Profit (R36m) (R34m) (R18m) R29m (R36m) (R35m)
Group Bank Overdraft R15m R21m R66m R85m R124m R32m
Necsa’s Manufactured Capital includes its buildings, infrastructure, plant and equipment used in its operations. It is managed jointly by the Utilities and Facilities, Security Services and Corporate Finance departments as well as the respective facility operating units.
Manufactured Capital Indicators
Necsa Group 2013 2014 2015 2016 2017 2018
Group Property, Plant and Equipment
R972m R984m R1 042m R1 299m R1 348m R1 406m
Research Reactor Availability 305 days 302 days 300 days 303 days 298 days 299 days
Necsa’s Intellectual Capital includes the organisation’s stock of intellectual property, as well as the tacit knowledge embedded in systems and processes. Necsa manages its Intellectual capital through the Intellectual Property office in the Business Development and Innovation division and the Knowledge Management unit. The Research and Technology Development division generates new intellectual property.

N E C S A A N N U A L R E P O R T 2 0 1 7 / 1 8 106 S U S T A I N A B I L I T Y R E P O R T 9
Intellectual Capital Indicators
Necsa Group 2013 2014 2015 2016 2017 2018
Innovation Disclosures 17 17 18 13 15 10
Research Publications 34 33 34 55 43 45
Internationally Granted Patents 12 11 50 16 10 7
SOCIAL SUSTAINABILITY
Social Sustainability can be analysed in terms of Human as well as Social and Relationship Capitals:
Necsa’s Human Capital includes the vast educational qualifications of its staff and their nuclear industry experience as well as their motivation to innovate and collaborate. The Human Resources & REAM division in collaboration with the Necsa Learning Academy are dedicated to managing this capital.
Human Capital Indicators
Necsa Group 2013 2014 2015 2016 2017 2018
Staff Number 1 948 1 839 1 906 1 857 1 912 1 962
Percentage Technical Staff 48.8% 50.4% 50.1% 49.2% 47.8% 45.01%
Black Technical Staff as % of All Technical Staff
45.8% 48.7% 53.1% 56.0% 58.5% 61.51%
Trade Tests Conducted 232 435 467 450 304 437
Study Assistance Recipients 165 149 148 146 102 142
Necsa’s Social and Relationship Capital includes its relationships with key stakeholders such as Government, National Nuclear Regulator, Media, Customers and Business Partners. In addition, the social networks among its employees and the community around the Pelindaba site contributes to individual and collective well-being. Necsa manages this capital by means of its Corporate Communication and Stakeholder Relations department in collaboration with the departments taking responsibility for the indicators below.
Social and Relationship Capital Indicators
Necsa Group 2013 2014 2015 2016 2017 2018
Disabling Injury Incidence Rate 0.60 0.64 0.71 0.78 1.1 1.03
National Key Point Security Compliance Rating
98.1% 98.9% 99.0% 99.0% 98.7% 98.0 %
Non-Unionised Staff Percentage 23.8% 20.5% 18.7% 16% 15.3% 14.61%

N E C S A A N N U A L R E P O R T 2 0 1 7 / 1 8 107 S U S T A I N A B I L I T Y R E P O R T 9
ENVIRONMENTAL SUSTAINABILITY
The Natural Capital from the Integrated Reporting Framework can be analysed to examine Environmental Sustainability:
Necsa’s Natural Capital includes the abiotic factors on and around the Pelindaba site such as the land, air, aquifers, rivers and water bodies as well as attendant vegetation and animal life. Necsa’s Environmental Management group takes responsibility for environmental monitoring on the Pelindaba site and has a veterinarian on call to attend to fauna in need. The Nuclear Liability Management department performs ongoing Decommissioning and Decontamination while the Utilities and Facilities department manages water and electricity consumption. The Central Scrap Recovery unit manages redundant materials in compliance with safety and security requirements and utilises certified waste and paper recycling contractors.
Natural Capital Indicators
Necsa Group 2013 2014 2015 2016 2017 2018
Execution of Annual Decommissioning and Decontamination Plan
110% 104% 106% 90% 99% 122.8%
Public Dose Impact as % of Allowable Limit
3.8% 3.9% 2.5% 2.2% 2.2% 1.94%
Percentage of Permitted Effluent Released to Crocodile River
54% 58% 77% 43% 29% 20.5%
Percentage of Permitted Fluoride Emissions
22% 25% 25% 34% 12% 21%
Annual Electricity Usage 100 GW.h 86 GW.h 86 GW.h 86 GW.h 76 GW.h 67GW.h
Annual Water Usage 883 k.m3 907 k.m3 977 k.m3 1.064 k.m3 1.006 k.m3 *814.7 k.m3
* Water year is from October 2017 - September 2018
N E C S A A N N U A L R E P O R T 2 0 1 7 / 1 8 108 F I N A N C I A L R E P O R T 1 0
F I N A N C I A L
R E P O R T
10

N E C S A A N N U A L R E P O R T 2 0 1 7 / 1 8 109 F I N A N C I A L R E P O R T 1 0
TABLE OF CONTENTS
General Information 110
Director’s Responsibilities and Approval 111
Report of the Audit and Risk Committee 112
Directors’ Report 114
Independent Auditor’s Report 120
Consolidated Statement of Financial Position 127
Consolidated Statement of Comprehensive Income 130
Consolidated Statement of Changes in Equity 132
Consolidated Statement of Cash Flows 134
Accounting Policies 135
Notes to the Annual Financial Statements 152
LEVEL OF ASSURANCE
These Annual Financial Statements have been audited in compliance with the applicable requirements of the Companies Act of South Africa, (Act No. 71 of 2008).
Published
Tuesday 31 July 2018

N E C S A A N N U A L R E P O R T 2 0 1 7 / 1 8 110 F I N A N C I A L R E P O R T 1 0
GENERAL INFORMATION
Country of incorporation and domicile South Africa
Nature of business and principal activities
The South African Nuclear Energy Corporation SOC Limited is responsible for managing certain institutional obligations defined in the Nuclear Energy Act, No. 46 of 1999
Directors Dr KR Kemm (Chairperson) Mr GP Tshelane (Necsa CEO) Mr KP Maphoto Dr NT Magau Mrs RP Mosia Mr ENN Ngcobo Ms P Bosman Mr ZC Ngidi Mr MPK Tshivhase Mr MS Sekgota Dr GJ Davids Prof Z Vilakazi
Registered office Elias Motsoaledi Street Extension (Church Street West) R104 Pelindaba Brits Magisterial District, Madibeng Municipality North West Province 0240
Business address Elias Motsoaledi Street Extension (Church Street West) R104 Pelindaba Brits Magistrial District, Madibeng Municipality North West Province 0240
Postal address PO Box 582 Pretoria 0001
Shareholder Department of Energy
Auditor Auditor-General of South Africa Registered Auditors
Secretary FCGLA (Pty) Ltd
Company registration number 2000/003735/06
N E C S A A N N U A L R E P O R T 2 0 1 7 / 1 8 111 F I N A N C I A L R E P O R T 1 0
DIRECTORS' RESPONSIBILITIES AND APPROVAL
The directors are required in terms of the Companies Act of South Africa and the Public Finance Management Act No.1 of 1999 (PFMA) to maintain adequate accounting records and are responsible for the content and integrity of the Annual Financial Statements and related financial information included in this report. It is their responsibility to ensure that the Annual Financial Statements fairly present the state of affairs of the group and Company as at the end of the financial year and the results of its operations and cash flows for the year then ended, in conformity with International Financial Reporting Standards. The external auditor is engaged to express an independent opinion on the financial statements.
The Annual Financial Statements are prepared in accordance with International Financial Reporting Standards and are based upon appropriate accounting policies consistently applied and supported by reasonable and prudent judgement and estimates.
The directors acknowledge that they are ultimately responsible for the system of internal financial control established by the group and place considerable importance on maintaining a strong control environment. To enable the directors to meet these responsibilities, they set standards for internal control aimed at reducing the risk of error or loss in a cost effective manner. The standards include the proper delegation of responsibilities within a clearly defined framework, effective accounting procedures and adequate segregation of duties to ensure an acceptable level of risk. These controls are monitored throughout the group and all employees are required to maintain the highest ethical standards in ensuring the group’s business is conducted in a manner that in all reasonable circumstances is above reproach. The focus of risk management in the group is on identifying, assessing, managing and monitoring all known forms of risk across the group. While operating risk cannot be fully eliminated, the group endeavours to minimise it by ensuring that appropriate infrastructure, controls, systems and ethical behaviour are applied and managed within predetermined procedures and constraints.
The directors are of the opinion, based on the information and explanations given by management, that the system of internal control provides reasonable assurance that the financial records may be relied on for the preparation of the Annual Financial Statements. However, any system of internal financial control can provide only reasonable, and not absolute, assurance against material misstatement or loss.
The directors have reviewed the group’s cash flow forecast for the year to 31 March 2019 and, in light of this review and the current financial position, they are satisfied that the group has or had access to adequate resources to continue in operational existence for the foreseeable future.
The external auditor is responsible for independently auditing and reporting on the group's financial statements. The financial statements have been examined by the group's external auditor and their report is presented on pages 120 - 126.
The financial statements set out on pages 127 to 243, which have been prepared on the going concern basis, were approved by the directors on 30 June 2018 and were signed on their behalf by:
Dr KR Kemm (Chairperson)

N E C S A A N N U A L R E P O R T 2 0 1 7 / 1 8 112 F I N A N C I A L R E P O R T 1 0
We are pleased to present our report for the financial year ended 31 March 2018.
1. AUDIT AND RISK COMMITTEE TERMS OF REFERENCE
The Audit and Risk Committee has adopted formal terms of reference that have been approved by the Board of Directors. The Committee has conducted its affairs in compliance with its terms of reference and has discharged its responsibilities contained therein. The terms of reference are available on request.
2. AUDIT AND RISK COMMITTEE MEMBERS, MEETING ATTENDANCE AND QUALIFICATIONS
The Committee is independent and consists of four independent, Non- Executives Directors. It meets at least four times per year as per its terms of reference. Attendance of meetings, dates of appointments as well as qualifications of the members are included in the governance report.
3. ROLES AND RESPONSIBILITIES
3.1 Statutory Duties
The Committee's role and responsibilities include statutory duties as per the Companies Act, PFMA and further responsibilities assigned to it by the Board of Directors.
3.2 External Auditor Appointments and Independence
The Committee has satisfied itself that the external auditor was independent of the Group, as set out in the Companies Act, which includes consideration of conflicts of interest as prescribed by the Public Auditors Act (PAA). Requisite assurance was sought and provided by the external auditor that internal governance processes within the audit firm support and demonstrate its claims to independence.
The Committee, in consultation with executive management, agreed to the engagement letter, audit plan and budgeted audit fees for the 2018 financial year.
3.3 Financial Statements and Accounting Practices
The Committee has evaluated the Annual Financial Statements of the company and the Group for the year ended 31 March 2018 and based on the information provided to the Committee, considers that the Annual Financial Statements comply, in all material respects with the requirements of the Companies Act and the PFMA, and South African Statements of Generally Accepted Accounting Practice. The Committee concurs that the adoption of the going concern premise in the preparation of the Annual Financial Statements is appropriate. The Committee has recommended the adoption of the Annual Financial Statements and the Integrated Annual Report by the Board of Directors.
The Audit and Risk Committee has:
• Reviewed and discussed with the Auditor General and Accounting Authority the audited Annual Financial Statements;
• Reviewed the Auditor General's management letter and management responses;
• Reviewed changes in accounting policies and practices;• Reviewed significant adjustments resulting from the
audit; and• Reviewed and discussed with the Accounting Authority,
Performance Information submitted to the Auditor General.
3.4 Internal Financial Controls
The Committee is satisfied that internal controls and systems have been put in place and that these controls have functioned effectively during the period under review. The Committee has overseen a process by which internal audit has performed audits according to a risk based audit plan where the effectiveness of the risk management and internal controls were evaluated. The findings of these evaluations formed the basis for the Committee's recommendations in this regard to the Board of Directors, in order for the Board of Directors to report thereon. The Audit and Risk Committee is satisfied, based on the information and explanations given by management and the Internal Audit Department on the result of their audits that an adequate system of internal control is being maintained to:
REPORT OF THE AUDIT AND RISK COMMITTEE
N E C S A A N N U A L R E P O R T 2 0 1 7 / 1 8 113 F I N A N C I A L R E P O R T 1 0
• Reduce the entity's risk to an acceptable level;• Meet the business objectives of the organization;• Review changes in accounting policies and practices;• Ensure the organisation's assets are adequately
safeguarded; and• Ensure that the transactions undertaken are recorded in
the organisation's records accurately and timeously.
3.5 Going Concern
The Committee has reviewed management's assessment of the going concern status of the Group and has recommended to the Board of Directors that the Group is a going concern.
3.6 Internal Audit
The Committee is responsible for ensuring that the Group's Internal Audit is independent and has the necessary resources, standing and authority within the Group to enable it to discharge its duties. Furthermore, the Committee oversees cooperation between the internal and external auditors and serves as a link between the Board of Directors and these functions. The Committee considered and approved the internal audit charter. The internal audit function's annual audit plan and three year strategic plan were approved by the Committee.
The internal audit function reports administratively to the Chief Executive Officer and functionally to this Committee and is responsible for reviewing and providing assurance on the adequacy of the internal control environment across all of the Group's operations. The Internal Audit Manager has direct access to the Committee, primarily through its Chairperson.
From the various reports of the internal auditors, it was noted that no matters were reported that indicate any material
deficiencies in the systems of internal control. Risks that have been identified through various processes have been addressed.
3.7 Expertise and Experience of Chief Financial Officer and Finance Function
The Committee has satisfied itself that the Chief Financial Officer has appropriate expertise and experience. The Committee has considered, and has satisfied itself of the appropriateness of the expertise and the adequacy of resources of the finance function and experience of the senior members of management responsible for the financial function.
3.8 Governance of Risk
The Committee oversees the implementation of the policy and plan for risk management taking place by means of risk management systems and processes. The Committee is satisfied that appropriate and effective systems are in place for risk management.
3.9 Auditor General
The Committee accepts the audit opinion of the Auditor General on the Annual Financial Statements and recommends that the audited Annual Financial Statements be accepted and read together with the report of the Auditor General.
On behalf of the audit committee:
Ms P Bosman
Chairperson - Audit and Risk CommitteeTuesday, 31 July 2018
REPORT OF THE AUDIT AND RISK COMMITTEE (CONTINUED)

N E C S A A N N U A L R E P O R T 2 0 1 7 / 1 8 114 F I N A N C I A L R E P O R T 1 0
The directors have pleasure in submitting their report on the financial statements of The South African Nuclear Energy Corporation SOC Limited and its Group Companies for the year ended 31 March 2018.
1. INCORPORATION
The company was incorporated on Thursday, 24 February 2000 as a Schedule 2 public entity in terms of the PFMA and obtained its certificate to commence business on the same day.
2. REVIEW OF FINANCIAL RESULTS AND ACTIVITIES
Necsa derives its mandate from the Nuclear Energy Act, No. 46 of 1999 and the Minister of Energy (the Minister) to manage and operate certain of the Republic’s nuclear related functions and facilities.
Necsa has been assigned the responsibility for managing certain institutional obligations of the Republic as defined in the Act. The main functions of the Company are:
• To undertake and promote research and development in the field of nuclear energy and radiation sciences and technology and subject to the Safeguards agreement, to make these generally available;
• To process source material, special nuclear material and restricted material and to process and enrich source material and nuclear material; and
• To co-operate with any person or institution in matters falling within these functions subject to the approval of the minister.
Ancillary powers and functions may be granted to the Group:
• In connection with its main functions;• In order to create and utilise viable business opportunities
in commerce and industry; and• In order to undertake the development and/or exploitation
of nuclear technology or nuclear related technology.
With regard to its nuclear related activities Necsa is governed by Nuclear Installations Licences (NIL’s) issued by the National Nuclear Regulator (NNR) in terms of the Nuclear Regulator Act 47 of 1999.
The subsidiary companies in turn, have a mandate from Necsa to operate in a self-sustainable manner and to remain competitive in the industries within which they operate.
Full details of the financial position, results of operations and cash flows of the group are set out in these consolidated financial statements.
3. DIVIDENDS
No dividends were declared or paid to the shareholder in 201/18 and 2016/7. However, a R20 million dividend was declared in May 2018.
3.1. Accounting Standards
Necsa Group adopted International Financial Reporting Standards (IFRS) for the first time in 01 April 2018 as it was previously prepared under SA GAAP. The Annual Financial Statements (AFS) set out in this report have been prepared by management in accordance with IFRS and are based on appropriate accounting policies.
DIRECTORS' REPORT
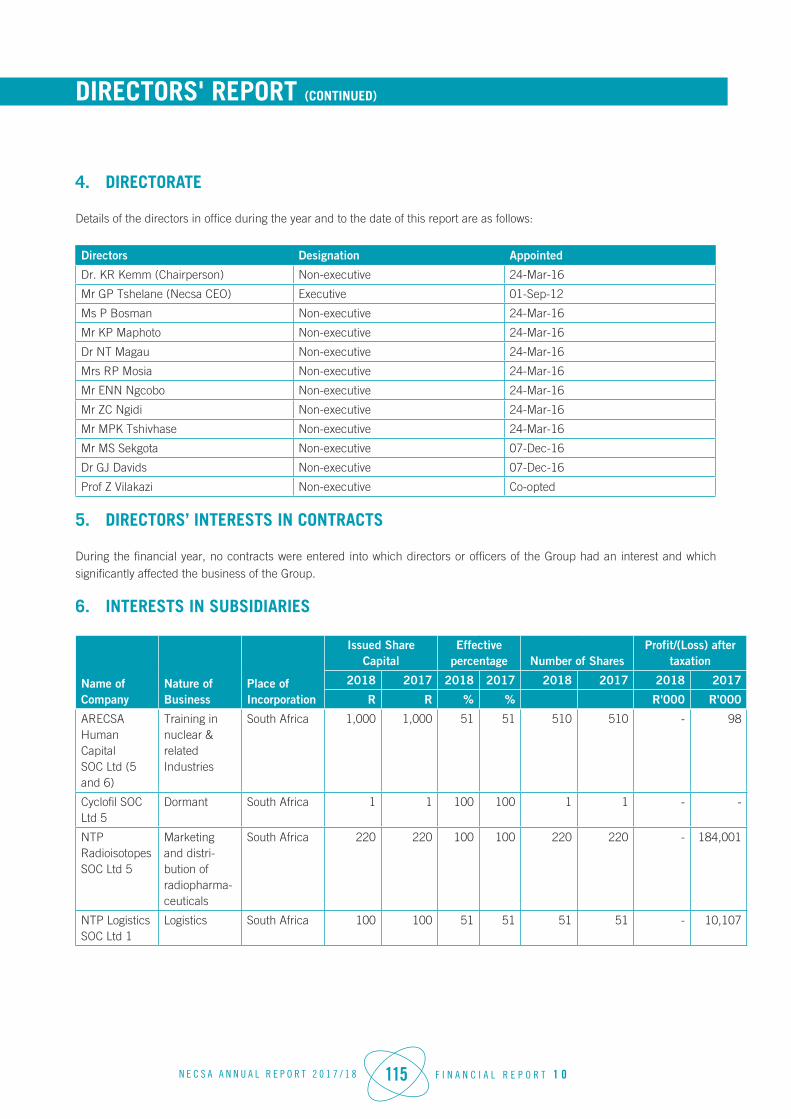
N E C S A A N N U A L R E P O R T 2 0 1 7 / 1 8 115 F I N A N C I A L R E P O R T 1 0
4. DIRECTORATE
Details of the directors in office during the year and to the date of this report are as follows:
Directors Designation Appointed
Dr. KR Kemm (Chairperson) Non-executive 24-Mar-16
Mr GP Tshelane (Necsa CEO) Executive 01-Sep-12
Ms P Bosman Non-executive 24-Mar-16
Mr KP Maphoto Non-executive 24-Mar-16
Dr NT Magau Non-executive 24-Mar-16
Mrs RP Mosia Non-executive 24-Mar-16
Mr ENN Ngcobo Non-executive 24-Mar-16
Mr ZC Ngidi Non-executive 24-Mar-16
Mr MPK Tshivhase Non-executive 24-Mar-16
Mr MS Sekgota Non-executive 07-Dec-16
Dr GJ Davids Non-executive 07-Dec-16
Prof Z Vilakazi Non-executive Co-opted
5. DIRECTORS’ INTERESTS IN CONTRACTS
During the financial year, no contracts were entered into which directors or officers of the Group had an interest and which significantly affected the business of the Group.
6. INTERESTS IN SUBSIDIARIES
Name of Company
Nature of Business
Place of Incorporation
Issued Share Capital
Effective percentage Number of Shares
Profit/(Loss) after taxation
2018 2017 2018 2017 2018 2017 2018 2017
R R % % R'000 R'000
ARECSA Human CapitalSOC Ltd (5 and 6)
Training in nuclear & relatedIndustries
South Africa 1,000 1,000 51 51 510 510 - 98
Cyclofil SOC Ltd 5
Dormant South Africa 1 1 100 100 1 1 - -
NTP Radioisotopes SOC Ltd 5
Marketing and distri-bution of radiopharma-ceuticals
South Africa 220 220 100 100 220 220 - 184,001
NTP Logistics SOC Ltd 1
Logistics South Africa 100 100 51 51 51 51 - 10,107
DIRECTORS' REPORT (CONTINUED)
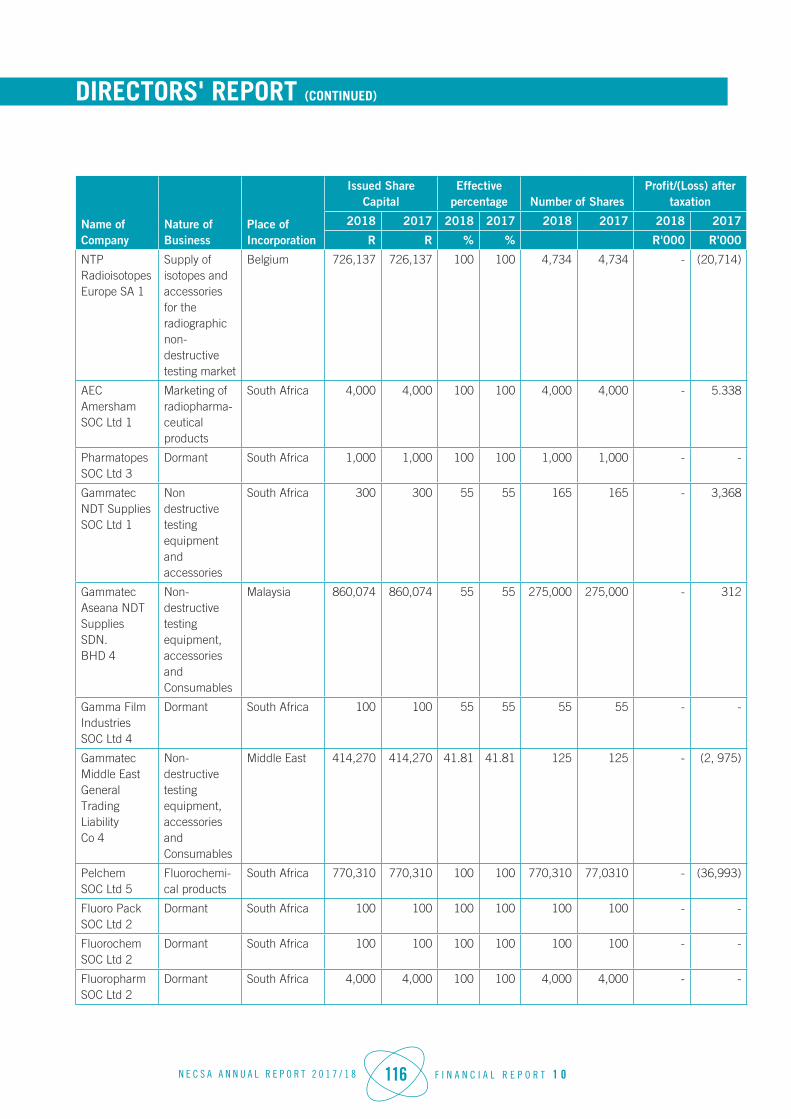
N E C S A A N N U A L R E P O R T 2 0 1 7 / 1 8 116 F I N A N C I A L R E P O R T 1 0
DIRECTORS' REPORT (CONTINUED)
Name of Company
Nature of Business
Place of Incorporation
Issued Share Capital
Effective percentage Number of Shares
Profit/(Loss) after taxation
2018 2017 2018 2017 2018 2017 2018 2017
R R % % R'000 R'000
NTP Radioisotopes Europe SA 1
Supply of isotopes and accessories for the radiographic non-destructive testing market
Belgium 726,137 726,137 100 100 4,734 4,734 - (20,714)
AEC Amersham SOC Ltd 1
Marketing of radiopharma-ceutical products
South Africa 4,000 4,000 100 100 4,000 4,000 - 5.338
Pharmatopes SOC Ltd 3
Dormant South Africa 1,000 1,000 100 100 1,000 1,000 - -
Gammatec NDT Supplies SOC Ltd 1
Non destructive testing equipment and accessories
South Africa 300 300 55 55 165 165 - 3,368
GammatecAseana NDT SuppliesSDN.BHD 4
Non-destructive testing equipment, accessories andConsumables
Malaysia 860,074 860,074 55 55 275,000 275,000 - 312
Gamma Film IndustriesSOC Ltd 4
Dormant South Africa 100 100 55 55 55 55 - -
Gammatec Middle EastGeneral Trading LiabilityCo 4
Non-destructive testing equipment, accessories andConsumables
Middle East 414,270 414,270 41.81 41.81 125 125 - (2, 975)
PelchemSOC Ltd 5
Fluorochemi-cal products
South Africa 770,310 770,310 100 100 770,310 77,0310 - (36,993)
Fluoro PackSOC Ltd 2
Dormant South Africa 100 100 100 100 100 100 - -
FluorochemSOC Ltd 2
Dormant South Africa 100 100 100 100 100 100 - -
FluoropharmSOC Ltd 2
Dormant South Africa 4,000 4,000 100 100 4,000 4,000 - -

N E C S A A N N U A L R E P O R T 2 0 1 7 / 1 8 117 F I N A N C I A L R E P O R T 1 0
DIRECTORS' REPORT (CONTINUED)
Name of Company
Nature of Business
Place of Incorporation
Issued Share Capital
Effective percentage Number of Shares
Profit/(Loss) after taxation
2018 2017 2018 2017 2018 2017 2018 2017
R R % % R'000 R'000
LimitedElectronicsSouth AfricaSOC Ltd 2
Manufac-turing and distribution of NitrogenTri-Fluoride
South Africa 1,000 1,000 100 100 1,000 1,000 - 7,195
1 Subsidiary of NTP Radioisotopes SOC Ltd2 Subsidiary of Pelchem SOC Ltd3 Subsidiary of AEC Amersham SOC Ltd4 Subsidiary of Gammatec NDT Supplies SOC Ltd5 Subsidiary of Necsa SOC Ltd6 The profit/(loss) after tax relates to interest earned on ARECSA’s bank account. ARECSA is almost wholly impaired.
Details of the Group’s investment in subsidiaries are set out in note 9.
7. INTEREST IN ASSOCIATES
Name of Company Nature of BusinessPlace of Incorporation
Issued Share Capital
Effective Percentage
Number of Shares
2018 2017 2018 2017 2018 2017
R R % %
Business Venture Exploration Investments No. 33 (Pty) Ltd 2
Dormant South Africa 3,840 3,840 41,61 41,61 - 1,598
Gamwave (Pty) Ltd (formerly Cyclotope) 3
Radiation of food sources South Africa 100 100 40 40 - 40
Oserix 1 Supply of isotopes and accessories for the radiographic non-destructive testing market
South Africa 582 582 13,75 13,75 - 80
Element 42 3 Dormant South Africa - - 50 50 - -
1 Associate of Gammatec NDT Supplies SOC Ltd. Gammatec NDT Supplies SOC Ltd holds 25% of Oserix issued share capital. NTP Radio Isotopes SOC Ltd holds 55% of Gammatec NDT Supplies SOC Ltd therefore resulting in the group having significant influence over the associate.
2 Associate of Necsa SOC Limited3 Associate of NTP Radioisotopes SOC Ltd
Details of the Group’s investment in associates are set out in note 10.
8. SHAREHOLDER
The Company’s sole shareholder is the State, represented by the Minister of Energy.

N E C S A A N N U A L R E P O R T 2 0 1 7 / 1 8 118 F I N A N C I A L R E P O R T 1 0
9. EVENTS AFTER THE REPORTING PERIOD
Non-Adjusting entry:
The NTP Board passed a resolution, on the 25 May 2018, to declare a dividend of R20 million to Necsa. As such, this was considered to be a non-adjusting entry and is not provided for on the annual financial statements of the Company and Group.
10. GOING CONCERN
The Annual Financial Statements (AFS) for 2017/18 have been prepared on the basis of accounting policies applicable to a going concern. According to the Conceptual Framework of Financial Reporting, the AFS are prepared using the underlying assumption that funds will be available to finance future financial obligations and that the realization of assets and settlement of liabilities, contingent obligations and commitments will occur in the ordinary course of business. Necsa is in a solvent position as its total assets exceeded its liabilities by R26.7 million as at 31 March 2018. However, due to liquidity challenges, Necsa had to utilise cash from investing activities to fund financial obligations for the period ending 31 March 2019.
Additional Dividend from NTP
The NTP Board declared an additional dividend of R20 million during May 2018.
DIRECTORS' REPORT (CONTINUED)
N E C S A A N N U A L R E P O R T 2 0 1 7 / 1 8 119 F I N A N C I A L R E P O R T 1 0
11. AUDITORS
The Auditor-General of South Africa continued in office as auditors for the company and its subsidiaries for 2018.
12. SECRETARY
The company secretary is FCGLA (Pty) Ltd.
Postal address PO Box 164 Carlswald 1685
Business address 105 Ninth Road Carlswald Midrand 1685
13. COMPLIANCE WITH LEGISLATION
The directors believe the Group has complied, in all material respects, with the provisions of the Companies Act, PFMA and the Nuclear Energy Act and other applicable legislation during the year under review.
DIRECTORS' REPORT (CONTINUED)

N E C S A A N N U A L R E P O R T 2 0 1 7 / 1 8 120 F I N A N C I A L R E P O R T 1 0
INDEPENDENT AUDITOR'S REPORT
Report on the audit of the consolidated and separate financial statements
DISCLAIMER OF OPINION
1. I was engaged to audit the consolidated and separate financial statements of the South African Nuclear Energy Corporation SOC Limited (the entity) and its subsidiaries (the group) set out on pages 127 to 243, which comprise the consolidated and separate statement of financial position as at 31 March 2018, the consolidated and separate statement of comprehensive income, statements of changes in equity and statements of cash flows for the year then ended, as well as the notes to the financial statements and a summary of significant accounting policies.
2. I do not express an opinion on the consolidated and separate financial statements of the South African Nuclear Energy Corporation. Because of the significance of the matters described in the basis for disclaimer of opinion section of my report, I have not been able to obtain sufficient appropriate audit evidence to provide a basis for an audit opinion on these consolidated and separate financial statements.
BASIS FOR DISCLAIMER OF OPINION
Preparation of the separate and consolidated financial statements
3. I was unable to obtain sufficient appropriate audit evidence that the accounting authority has fulfilled its responsibility for the preparation and fair presentation of the separate and consolidated financial statements in accordance with the International Financial Reporting Standards (IFRS), as written management representations letters in this respect were not provided. I was also unable to obtain written representations from the accounting authority that I had been provided with all relevant information and access to information as agreed in terms of the audit engagement, and that all transactions had been recorded and were reflected in the separate and consolidated financial statements. I could not determine the effect of the lack of such representations on the financial position
of the entity and the group at 31 March 2018 or the financial performance and cash flows for the year then ended.
Consolidated financial statements
4. I was unable to obtain sufficient appropriate audit evidence that the consolidated financial statements and the notes thereto have been properly prepared as required by IFRS 10, Consolidated Financial Statements, as the consolidation could not be substantiated with supporting workings that reconcile and agreed to the consolidated financial statements. Material differences were noted between the consolidated amounts and the amounts as per the audited trial balances resulting in an unreconciled overall difference of R 17 505 000. I was unable to audit the consolidation by alternative means. Consequently, I was unable to determine to which accounts such adjustments were necessary to the consolidated financial statements as a whole.
5. In addition, I was unable to obtain sufficient appropriate audit evidence for cost of sales, trade and other payables, provisions, inventory, cash and cash equivalent, revenue and trade and other receivables on the financial statement of Pelchem, due to a breakdown in the internal controls surrounding the accounting records at the subsidiary. The subsidiary did not have adequate systems of internal controls in place for the recording of all transactions and events and further could not reconcile the transactions and events to the financial statements. I could not confirm the subsidiary financial statement items by alternative means. Consequently, I was unable to determine whether any further adjustments to these financial statement items were necessary and the related impact thereof on the consolidated financial statement items as described below:
• Cost of sales stated at R1 177 610 000.• Trade and other payables stated at R200 400 000.• Provisions stated at R96 815 000.• Inventory stated at R278 749 000.• Cash and cash equivalents stated at R61 511 000.• Revenue stated at R2 251 307 000.• Trade and other receivables stated at R459 960 000.
N E C S A A N N U A L R E P O R T 2 0 1 7 / 1 8 121 F I N A N C I A L R E P O R T 1 0
Going concern for consolidated and separate financial statements
6. The entity’s current liabilities exceed its current assets by R 153 132 000 and the entity made a loss of R 132 992 000 during the current year with accumulated losses of R510 752 000 at year end. The entity has adverse liquidity ratios with cash deficits being forecast for the next financial year. Pelchem SOC Limited (Pelchem) a subsidiary, continued to make losses with an accumulated of R 207 944 000 (2017: R172 386 000) for the 2018 financial year end and has adverse solvency and liquidity ratios which is significantly dependent on Necsa. Note 42 does indicate multiple factors that I am unable to confirm or dispel whether it is appropriate to prepare the financial statements using the going concern basis of accounting for the entity and group as management did not provide me with sufficient appropriate audit evidence to support the going concern assumption.
New standards and interpretations
7. The entity and the group did not include the required information on the impact of the standards and interpretations of the IFRS reporting framework that have been issued but are not yet effective in the notes to the financial statements, as required by IAS 8, Accounting policies, changes in accounting estimates and errors and IAS 1. The following standards are effective for annual periods beginning on or after 1 January 2018: IFRS 15, Revenue from contracts with customers and IFRS 9 Financial Instruments.
Revenue and trade receivables
8. I was unable to obtain sufficient appropriate audit evidence that sales of goods, included in the revenue note 29 to the separate financial statements, were recognised in the correct financial year, as internal controls have not been established to ensure that all invoices are processed in the year the goods are delivered in accordance with International Accounting Standards (IAS) 18: Revenue, due to the status of the accounting records. I could not confirm revenue from sales of goods by alternative means. Consequently, I was unable to determine whether any adjustment was necessary to the revenue from sales of goods amount stated at R388 072 000 for the entity, the related impact thereof on R1 563 035 000 for the
Group respectively and trade receivables amount stated at R61 250 000 of the entity and the related impact on R459 960 000 for the Group, respectively, in the separate and consolidated financial statements. I therefore could not determine the impact on the separate loss and consolidated profit for the year as well as separate accumulated losses and consolidated accumulated earnings.
Investment in subsidiaries in separate financial statements
9. As disclosed in note 9 to the separate financial statements an amount of R115 010 000, being the trade receivable owing to the entity by Pelchem as at 31 December 2017 was converted to a further investment in Pelchem. The decision to convert the trade receivable in a further investment in a subsidiary took place after the financial year end of 31 March 2018 and was not related to conditions that existed as at 31 March 2018. This is therefore a non-adjusting event in terms of the requirements of IAS 10, events after the reporting period. Consequently, the separate gross investment in subsidiaries and separate impairment of investment in subsidiaries are overstated by R115 010 000 respectively.
10. In addition, I was unable to obtain sufficient appropriate audit evidence to confirm the impairment loss on the investment in Pelchem of R 23 048 000 included in note 9 to the financial statements due to limitations placed on the scope of my work. I was unable to confirm this by alternative means. Consequently, I was unable to determine whether any further adjustments were necessary to the investment in subsidiaries stated at R 243 749 000 in the separate financial statements.
Impairment of Property, Plant and Equipment
11. The entity, in recognising the impairment loss estimate for Property, Plant and Equipment, did not take into account all relevant information available as required by IAS 36: Impairment of Assets, about impairment indicators existing at the end of the period. I was unable to obtain sufficient appropriate audit evidence on the recoverable amount for the Capital Work-in-Progress amount that is reflected in Property, Plant and Equipment by alternative means. Consequently, I was unable to determine whether any adjustment was necessary to the Capital Work-
INDEPENDENT AUDITOR'S REPORT (CONTINUED)
N E C S A A N N U A L R E P O R T 2 0 1 7 / 1 8 122 F I N A N C I A L R E P O R T 1 0
INDEPENDENT AUDITOR'S REPORT (CONTINUED)
Progress that is reflected in Property, Plant and Equipment amount stated at R993 450 000 for the entity and R1 405 503 000 for the group in the separate and consolidated financial statements. I therefore could not determine the impact on the separate loss and consolidated profit for the year as well as separate accumulated losses and consolidated accumulated earnings.
Impairment of trade and other receivables
12. The entity did not estimate the impairment loss for trade and other receivables in accordance with the requirements of IAS 39: Financial Instruments – Recognition and Measurement. In recognising the impairment loss estimate for trade and other receivables, did not reverse the prior year impairment loss, resulting in the current year impairment loss being overstated by R 33 672 000. Consequently, trade and other receivables was understated and total expenditure was overstated by R 33 672 000 in the separate financial statements and accumulated loss are understated in the separate financial statement.
Stage 1 and 2 Decommission and Decontamination provision
13. The entity and the group did not calculate the stage 1 and 2 in accordance with the requirements of IAS 37: Provisions, Contingent Liabilities and Contingent Assets. In recognising the stage 1 and 2 of the Decommission and Decontamination provisions did not correctly account for the government grants received in the discounting calculation resulting in an understatement of the provisions of R 27 228 000. Consequently total expenditure was understated by R 27 228 000 in the consolidated and separate financial statements and accumulated loss are understated in the separate financial statement and accumulated earnings are overstated in the consolidated financial statement.
Irregular expenditure
14. The entity did not include irregular expenditure in the notes to the financial statements, as required by section 40(3)(i)/ 55(2)(b)(i) of the PFMA. This was due to payments made in contravention of the supply chain management requirements, which resulted in irregular expenditure of R29 943 803. In addition, I was unable to
obtain sufficient appropriate audit evidence to confirm the irregular expenditure included in the notes to the financial statements as sufficient appropriate audit evidence was not provided. I was unable to confirm this by alternative means. Consequently, I was unable to determine whether any further adjustments were necessary to the irregular expenditure stated at R Nil (2017: R Nil) in the financial statements.
EMPHASIS OF MATTERS
15. I draw attention to the matters below. My disclaimer of opinion is not further modified in respect of these matters.
Change in financial reporting framework
16. As disclosed in note 4, the consolidated and separate financial statements have been prepared in accordance with International Financial Reporting Standards (IFRS) for the first time.
Material impairment investment in subsidiaries
17. As disclosed in note 9 to the financial statements, material impairment of investment in subsidiaries of R133 962 000 was incurred.
RESPONSIBILITIES OF THE ACCOUNTING AUTHORITY FOR THE CONSOLIDATED AND SEPARATE FINANCIAL STATEMENTS
18. The board of directors, which constitutes the accounting authority is responsible for the preparation and fair presentation of the consolidated and separate financial statements in accordance with IFRS and the requirements of the PFMA and Companies Act, and for such internal control as the accounting authority determines is necessary to enable the preparation of consolidated and separate financial statements that are free from material misstatement, whether due to fraud or error.
19. In preparing the consolidated and separate financial statements, the accounting authority is responsible for assessing the entity’s and the group’s ability to continue as a going concern, disclosing, as applicable, matters relating to going concern and using the going concern basis of accounting unless the accounting authority either intends to liquidate the group and/or company or to cease operations, or has no realistic alternative but to do so.

N E C S A A N N U A L R E P O R T 2 0 1 7 / 1 8 123 F I N A N C I A L R E P O R T 1 0
AUDITOR-GENERAL’S RESPONSIBILITIES FOR THE AUDIT OF THE CONSOLIDATED AND SEPARATE FINANCIAL STATEMENTS
20. My responsibility is to conduct an audit of the consolidated and separate financial statements in accordance with the International Standards on Auditing and to issue an auditor’s report. However, because of the matters described in the basis for disclaimer of opinion section of this auditor’s report, I was unable to obtain sufficient appropriate audit evidence to provide a basis for an audit opinion on these consolidated and separate financial statements.
21. I am independent of the public entity in accordance with the International Ethics Standards Board for Accountants’ Code of ethics for professional accountants (IESBA code) and the ethical requirements that are relevant to my audit of the consolidated and separate financial statements in South Africa. I have fulfilled my other ethical responsibilities in accordance with these requirements and the IESBA code.
Report on the audit of the annual performance report
INTRODUCTION AND SCOPE
22. In accordance with the Public Audit Act of South Africa, 2004 (Act No. 25 of 2004) (PAA) and the general notice issued in terms thereof, I have a responsibility to report material findings on the reported performance information against predetermined objectives for selected objectives presented in the annual performance report. I performed procedures to identify findings but not to gather evidence to express assurance.
23. My procedures address the reported performance information, which must be based on the approved performance planning documents of the public entity. I have not evaluated the completeness and appropriateness of the performance indicators included in the planning documents. My procedures also did not extend to any disclosures or assertions relating to planned performance strategies and information in respect of future periods that may be included as part of the reported performance information. Accordingly, my findings do not extend to these matters.
24. I evaluated the usefulness and reliability of the reported performance information in accordance with the criteria developed from the performance management and reporting framework, as defined in the general notice, for the following selected objectives presented in the annual performance report of the public entity for the year ended 31 March 2018:
Objectives
Pages in the annual
performance report
Objective 1– Pelchem Group financials: Net profit after tax
28
Objective 2 – NTP Group financials: Net profit after tax
28
Objective 3 – SAFARI-1 Operation: Operational availability (days per year)
28
Objective 4 – D&D programme execution: Execution of Annual Plan of Action as approved by DoE
29
Objective 5 - Compliance to SHEQ, license and other regulatory requirements:• Disabling Injury Incidence Rate (DIIR)• Public dose impact (expressed as %
of NNR allowable limit)
30
Objective 6 – Necsa Corporate Financials: External sales (including Intra Group Sales)
30
25. I performed procedures to determine whether the reported performance information was properly presented and whether performance was consistent with the approved performance planning documents. I performed further procedures to determine whether the indicators and related targets were measurable and relevant, and assessed the reliability of the reported performance information to determine whether it was valid, accurate and complete.
26. The material findings in respect of the usefulness and reliability of the selected objectives are as follows:
INDEPENDENT AUDITOR'S REPORT (CONTINUED)

N E C S A A N N U A L R E P O R T 2 0 1 7 / 1 8 124 F I N A N C I A L R E P O R T 1 0
INDEPENDENT AUDITOR'S REPORT (CONTINUED)
Objective 1 – Pelchem Group financials: Net profit after tax
27. I was unable to obtain sufficient appropriate audit evidence for the reported achievement of the objective. This was due to limitations placed on the scope of my work. I was unable to confirm the reported achievement by alternative means. Consequently, I was unable to determine whether any adjustment was required to the achievement of R35.5 million loss as reported in the annual performance report.
Objective 2 – NTP Group financials: Net profit after tax
28. The achievement for target: Net profit after tax, reported in the annual performance report was R 97.2 million. However, the supporting evidence provided did not agree to the reported achievement and indicated an achievement of R 122.2 million.
Objective 3 – SAFARI-1 Operation: Operational availability (days per year)
29. I did not raise any material findings on the usefulness and reliability of the reported performance information for the Safari-1 Operation objective.
Objective 4 – D&D programme execution: Execution of Annual Plan of Action as approved by DoE
30. I was unable to obtain sufficient appropriate audit evidence that clearly defined the predetermined method of collecting information to be used when measuring the actual achievement for the indicator. This was due to a lack of proper systems and processes. I was unable to test whether the target was clearly defined by alternative means.
Objective 5 – Compliance to SHEQ, licence and other regulatory requirements
31. The achievement for target: Public dose impact (expressed as % of NNR allowable limit), reported in the annual performance report was 2.780%. However, the supporting evidence provided did not agree to the reported achievement and indicated an achievement of 1.938%.
Objective 6 – Necsa Corporate Financials: External sales (including Intra Group Sales)
32. I was unable to obtain sufficient appropriate audit evidence for the reported achievement of the objective. This was due to limitations placed on the scope of my work and I was unable to confirm the reported achievement by alternative means. Consequently, I was unable to determine whether any adjustment was required to the achievement of R362.5 million as reported in the annual performance report.
OTHER MATTERS
33. I draw attention to the matters below.
Achievement of planned targets
34. Refer to the annual performance report on pages 28 to 30 for information on the achievement of planned targets for the year and explanations provided for the under/ over achievement of a significant number of targets. This information should be considered in the context of the material findings on the usefulness and reliability of the reported performance information in paragraphs 28 to 30 of this report.
Report on the audit of compliance with legislation
INTRODUCTION AND SCOPE
35. In accordance with the PAA and the general notice issued in terms thereof, I have a responsibility to report material findings on the compliance of the public entity with specific matters in key legislation. I performed procedures to identify findings but not to gather evidence to express assurance.
36. The material findings on compliance with specific matters in key legislations are as follows:
Annual financial statements, performance and annual report
37. The consolidated and separate financial statements submitted for auditing were not prepared in accordance
N E C S A A N N U A L R E P O R T 2 0 1 7 / 1 8 125 F I N A N C I A L R E P O R T 1 0
INDEPENDENT AUDITOR'S REPORT (CONTINUED)
with the prescribed financial reporting framework and supported by full and proper records, as required by section 55(1) (b) of the PFMA.
38. The financial statements submitted for auditing were not supported by full and proper records, as required by section 55(1) (a) of the PFMA. Material misstatements identified by the auditors in the submitted financial statements were not adequately corrected and the supporting records could not be provided subsequently, which resulted in the consolidated and separate financial statements receiving a disclaimer of opinion.
Expenditure management
39. Effective and appropriate steps were not taken to prevent irregular expenditure, as required by section 51(1)(b)(ii) of the PFMA. As reported in the basis for the disclaimer of opinion, note 43 of the financial statements does not reflect the full extent of the irregular expenditure incurred.
Asset management
40. Significant shareholding in a company was acquired without approval by the executive authority, in contravention of section 54(2)(c) of the PFMA.
Revenue Management
41. Effective and appropriate steps were not taken to collect all revenue due, as required by section 51(1)(b)(i) of the PFMA.
Procurement and contract management
42. Goods, works or services were not procured through a procurement process which is fair, equitable, transparent and competitive, as required by section 51(1)(a)(iii) of the PFMA.
Other information
43. The accounting authority is responsible for the other information. The other information comprises the information included in the annual report which includes the Report of the Audit and Risk Committee, Directors’ Report and the Company Secretary’s Certificate as required by the Companies Act. The other information
does not include the consolidated and separate financial statements, the auditor’s report and those selected objectives presented in the annual performance report that have been specifically reported in this auditor’s report.
44. My disclaimer of opinion on the consolidated and separate financial statements and findings on the reported performance information and compliance with legislation do not cover the other information and I do not express an audit opinion or any form of assurance conclusion thereon.
45. In connection with my audit, my responsibility is to read the other information and, in doing so, consider whether the other information is materially inconsistent with the consolidated and separate financial statements and the selected objectives presented in the annual performance report, or my knowledge obtained in the audit, or otherwise appears to be materially misstated.
46. The other information I obtained prior to the date of this auditor’s report is the Director’s Report as required by the Companies Act of South Africa, and the report of the Audit and Risk Committee. The Company Secretary’s Certificate as required by the Companies Act of South Africa and the other information contained in the annual report is expected to be made available to me after 23 January 2019.
47. If, based on the work I have performed on the other information obtained prior to the date of this auditor’s report, I conclude that there is a material misstatement of this other information, I am required to report that fact. I have nothing to report in this regard.
48. After I receive and read the Company Secretary’s Certificate and annual report and if I conclude that there is a material misstatement, I am required to communicate the matter to those charged with governance and request that the other information be corrected. If the other information is not corrected, I may have to retract this auditor’s report and re-issue an amended report as appropriate. However, if it is corrected this will not be necessary.
N E C S A A N N U A L R E P O R T 2 0 1 7 / 1 8 126 F I N A N C I A L R E P O R T 1 0
Internal control deficiencies
49. I considered internal control relevant to my audit of the financial statements, reported performance information and compliance with applicable legislation; however, my objective was not to express any form of assurance on it. The matters reported below are limited to the significant internal control deficiencies that resulted in the basis for the disclaimer of opinion, the findings on the annual performance report and the findings on compliance with legislation included in this report.
Leadership
50. The accounting authority and management did not provide adequate and effective leadership based on a culture of honesty, ethical business practices and good governance, and protecting and enhancing the best interests of the entity.
51. Leadership did not adequately exercise oversight responsibility regarding financial and performance reporting and compliance as well as related internal controls.
52. There is inadequate monitoring on the implementation of action plans to address internal control deficiencies.
Financial and performance management
53. Management did not adequately implement proper record keeping in a timely manner to ensure that complete, relevant and accurate information is accessible and available to support financial and performance reporting.
54. Management did not adequately implement controls over daily and monthly processing and reconciling transactions.
55. Management did not prepare regular, accurate and complete financial and performance reports that are supported and evidenced by reliable information.
56. Management did not adequately review and monitor compliance with applicable legislation.
Governance
57. The public entity did not adequately implement appropriate risk management activities to ensure that a risk strategy to address the risks is developed and monitored.
58. Internal audit did not adequately identify internal control deficiencies and recommend corrective action.
59. The audit committee did not adequately monitor responses to risks and overseeing the effectiveness of the internal control environment, including financial and performance reporting and compliance with legislation.
Pretoria25 January 2019
INDEPENDENT AUDITOR'S REPORT (CONTINUED)

N E C S A A N N U A L R E P O R T 2 0 1 7 / 1 8 127 F I N A N C I A L R E P O R T 1 0
CONSOLIDATED AND SEPARATE STATEMENT OF FINANCIAL POSITION AS AT 31 MARCH 2018
Note(s)
Group Company
2018 2017 2016 2018 2017 2016
R '000 R '000 R '000 R '000 R '000 R '000
Assets
Non-Current Assets
Property, plant and equipment 6 1,405,503 1,348,288 1,298,751 993,450 1,027,060 1,004,001
Investment property 5 46,007 18,027 17,190 126,328 63,212 61,377
Goodwill 7 46,332 11,357 11,357 - - -
Intangible assets 8 37,219 10,284 10,860 - - -
Investments in subsidiaries 9 - - - 243,749 262,702 262,702
Investments in associates 10 148 2,405 2,405 2 2 2
Other financial assets 12 443,483 453,566 317,523 441,940 453,526 311,988
Deferred tax 13 19,509 30,283 26,565 - - -
Decommission and Decontaminate 44 3,166,102 2,727,063 2,789,448 3,166,102 2,727,063 2,789,448
Stage 1
Decommission and Decontaminate 44 186,921 152,941 195,312 186,921 152,941 195,312
Stage 2
Vaalputs After Care 45 3,766 4,142 4,519 3,766 4,142 4,519
5,354,990 4,758,356 4,673,930 5,162,258 4,690,648 4,629,349
Current Assets
Inventories 14 278,749 238,064 231,886 61,641 22,765 39,491
Loans to group companies 11 3,310 3,310 3,310 - 756 3,879
Trade and other receivables 15 459,960 198,360 309,551 61,250 147,701 186,242
Other financial assets 12 719,301 784,009 694,289 281,082 246,812 258,663
Prepayments 57,656 6,752 120,653 56,006 78 55,808
Current tax receivable 26,072 10,733 10,005 - - -
Cash and cash equivalents 16 61,511 99,697 104,704 15,012 37,232 19,391
1,606,559 1,340,925 1,474,398 474,991 455,344 563,474
Non-current assets of discontinued operations 17 - - 307 - - -
Total Assets 6,961,549 6,099,281 6,148,635 5,637,249 5,145,992 5,192,823

N E C S A A N N U A L R E P O R T 2 0 1 7 / 1 8 128 F I N A N C I A L R E P O R T 1 0
Note(s)
Group Company
2018 2017 2016 2018 2017 2016
R '000 R '000 R '000 R '000 R '000 R '000
Equity and Liabilities
Equity
Equity Attributable to Equity Holders of Parent
Share capital 18 2,205 2,205 2,205 2,205 2,205 2,205
Reserves 538,045 545,593 493,625 534,843 483,212 454,804
Accumulated Earnings/ (Loss) 598,154 503,963 511,051 (510,752) (396,489) (287,717)
1,138,404 1,051,761 1,006,881 26,296 88,928 169,292
Non-controlling interest 58,579 52,583 48,113 - - -
1,196,983 1,104,344 1,054,994 26,296 88,928 169,292
Liabilities
Non-Current Liabilities
Vaalputs After Care Liabilities 45 83,314 76,792 75,080 83,314 76,792 75,080
Other financial liabilities 19 4,405 5,475 6,986
Finance lease liabilities 20 1,555 3,549 5,543 1,494 2,690 3,126
Retirement benefit obligation 21 345,672 371,953 386,972 316,642 346,471 361,156
Deferred income 22 442,654 453,558 479,387 442,654 453,558 479,387
Deferred tax 13 259 - - - - -
Provisions 23 464,818 228,393 205,769 403,573 381,845 313,888
Investment contributions for future liabilities 46 38,285 43,153 40,549 38,285 35,653 33,049
Decommission and Decontaminate 44 530,766 449,951 450,308 530,766 449,951 450,308
Stage 2
Decommission and Decontaminate 44 3,166,102 2,727,063 2,789,448 3,166,102 2,727,063 2,789,448
Stage 1
5,077,830 4,359,887 4,440,042 4,982,830 4,474,023 4,505,442
Current Liabilities
Trade and other payables 24 200,400 81,186 276,379 81,383 127,084 139,612
Loans from group companies 11 - - - 58,969 - -
Loans from shareholders 1 - - - - -
Other financial liabilities 19 9,446 7,693 17,277 5,949 756 -
Finance lease liabilities 20 1,991 1,756 2,659 1,792 1,058 1,961
Operating lease liability - 15 16 - - -
CONSOLIDATED AND SEPARATE STATEMENT OF FINANCIAL POSITION AS AT 31 MARCH 2018 (CONTINUED)
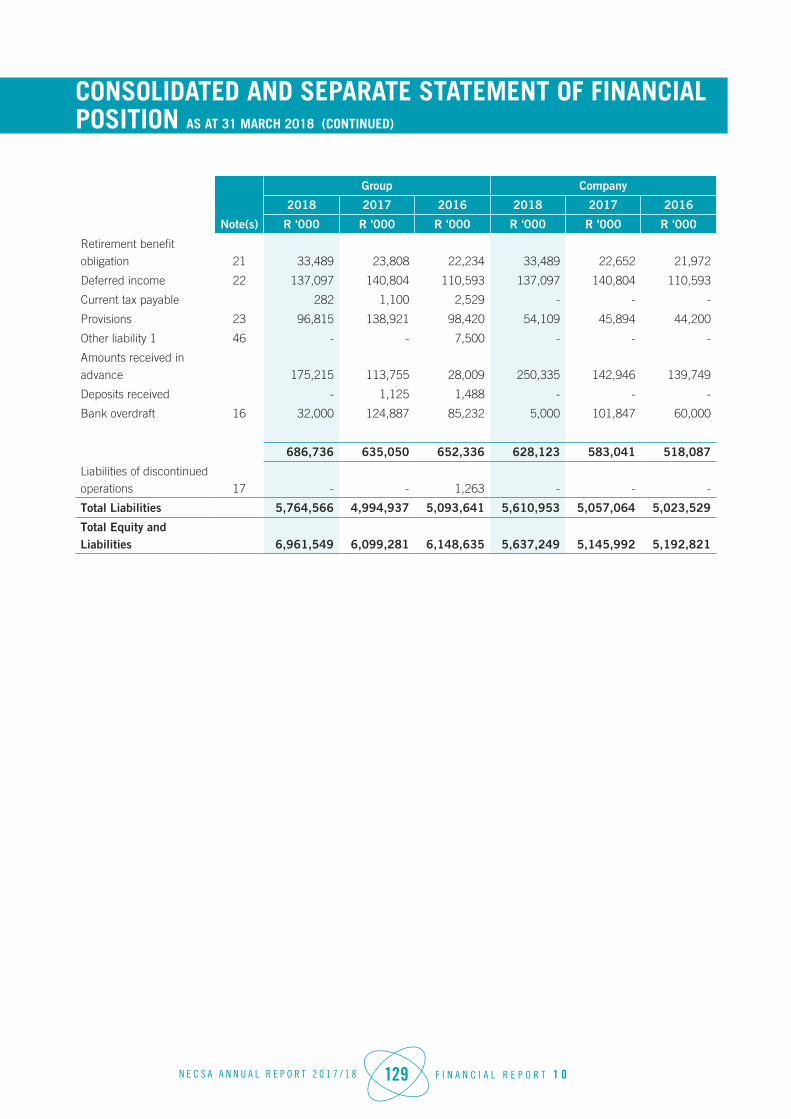
N E C S A A N N U A L R E P O R T 2 0 1 7 / 1 8 129 F I N A N C I A L R E P O R T 1 0
Note(s)
Group Company
2018 2017 2016 2018 2017 2016
R '000 R '000 R '000 R '000 R '000 R '000
Retirement benefit obligation 21 33,489 23,808 22,234 33,489 22,652 21,972
Deferred income 22 137,097 140,804 110,593 137,097 140,804 110,593
Current tax payable 282 1,100 2,529 - - -
Provisions 23 96,815 138,921 98,420 54,109 45,894 44,200
Other liability 1 46 - - 7,500 - - -
Amounts received in advance 175,215 113,755 28,009 250,335 142,946 139,749
Deposits received - 1,125 1,488 - - -
Bank overdraft 16 32,000 124,887 85,232 5,000 101,847 60,000
686,736 635,050 652,336 628,123 583,041 518,087
Liabilities of discontinued operations 17 - - 1,263 - - -
Total Liabilities 5,764,566 4,994,937 5,093,641 5,610,953 5,057,064 5,023,529
Total Equity and Liabilities 6,961,549 6,099,281 6,148,635 5,637,249 5,145,992 5,192,821
CONSOLIDATED AND SEPARATE STATEMENT OF FINANCIAL POSITION AS AT 31 MARCH 2018 (CONTINUED)

N E C S A A N N U A L R E P O R T 2 0 1 7 / 1 8 130 F I N A N C I A L R E P O R T 1 0
Note(s)
Group Company
2018 2017 2018 2017
R’000 R’000 R’000 R’000
Continuing operations
Revenue 29 2,251,307 2,189,360 1,072,447 955,277
Cost of sales 14 (1,177,610) (977,972) (257,454) (254,571)
Gross profit 1,073,697 1,211,388 814,993 700,706
Other income 115,684 88,707 60,419 16,669
Other operating expenses (986,039) (1,143,054) (820,179) (791,530)
Government Grant Income (Decommissioning and 44 236,052 264,857 236,052 264,857
Decontamination Stage 1)
Acceptance of Decommission and Decontamination Stage 1 44 (236,052) (264,858) (236,052) (264,857)
Administration and fees (127,283) (154,492) (185,802) (126,790)
Operating profit (loss) 30 76,059 2,548 (130,569) (200,945)
Investment income 31 320,046 321,248 364,764 313,920
Fair value adjustments 10,436 2,919 (121,136) 5,883
Finance costs 32 (267,550) (259,170) (246,051) (243,647)
Profit (loss) before taxation 138,991 67,545 (132,992) (124,789)
Taxation 33 (40,268) (96,603) - -
Profit (loss) from continuing operations 98,723 (29,058) (132,992) (124,789)
Discontinued operations
(Loss) profit from discontinued operations 17 (41) 130 - -
Profit (loss) for the year 98,682 (28,928) (132,992) (124,789)
Other comprehensive income:
Remeasurements on net defined benefit liability/asset 18,729 19,191 18,729 16,647
Gains on property revaluation 23,496 28,891 50,386 27,020
Exchange differences on translating foreign operations (32,289) 21,689 - -
Available-for-sale financial assets adjustments 1,245 1,388 1,245 1,388
Other comprehensive income for the year net of taxation 34 11,181 71,159 70,360 45,055
Total comprehensive income (loss) for the year 109,863 42,231 (62,632) (79,734)
Loss attributable to:
Owners of the parent 92,683 (35,087) (132,992) (124,789)
Non-controlling interest 5,999 6,159 - -
98,682 (28,928) (132,992) (124,789)
Loss attributable to:
Owners of the parent:
From continuing operations 92,724 (35,217) (132,992) (124,789)
From discontinued operations (41) 130 - -
92,683 (35,087) (132,992) (124,789)
CONSOLIDATED AND SEPARATE STATEMENT OF COMPREHENSIVE INCOME FOR THE YEAR ENDED 31 MARCH 2018

N E C S A A N N U A L R E P O R T 2 0 1 7 / 1 8 131 F I N A N C I A L R E P O R T 1 0
Note(s)
Group Company
2018 2017 2018 2017
R’000 R’000 R’000 R’000
Non-controlling interest:
From continuing operations 5,999 6,159 - -
Total comprehensive income (loss) attributable to:
Owners of the parent 103,864 36,072 (62,632) (79,734)
Non-controlling interest 5,999 6,159 - -
109,863 42,231 (62,632) (79,734)
CONSOLIDATED AND SEPARATE STATEMENT OF COMPREHENSIVE INCOME FOR THE YEAR ENDED 31 MARCH 2018 (CONTINUED)
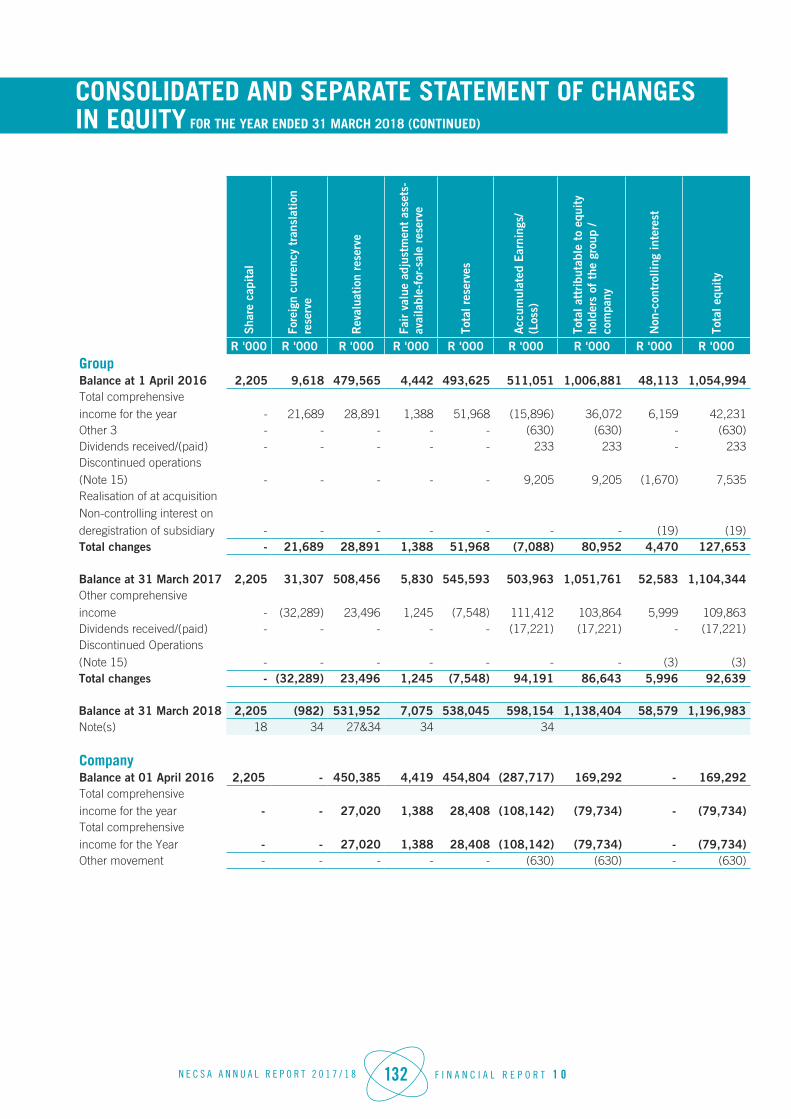
N E C S A A N N U A L R E P O R T 2 0 1 7 / 1 8 132 F I N A N C I A L R E P O R T 1 0
CONSOLIDATED AND SEPARATE STATEMENT OF CHANGES IN EQUITY FOR THE YEAR ENDED 31 MARCH 2018 (CONTINUED)
Sha
re c
apit
al
Fore
ign
curr
ency
tra
nsla
tion
re
serv
e
Rev
alua
tion
rese
rve
Fair
val
ue a
djus
tmen
t as
sets
-av
aila
ble-
for-
sale
res
erve
Tota
l res
erve
s
Acc
umul
ated
Ear
ning
s/
(Los
s)
Tota
l att
ribu
tabl
e to
equ
ity
hold
ers
of t
he g
roup
/ co
mpa
ny
Non
-con
trol
ling
inte
rest
Tota
l equ
ity
R '000 R '000 R '000 R '000 R '000 R '000 R '000 R '000 R '000
GroupBalance at 1 April 2016 2,205 9,618 479,565 4,442 493,625 511,051 1,006,881 48,113 1,054,994Total comprehensive income for the year - 21,689 28,891 1,388 51,968 (15,896) 36,072 6,159 42,231Other 3 - - - - - (630) (630) - (630)Dividends received/(paid) - - - - - 233 233 - 233Discontinued operations (Note 15) - - - - - 9,205 9,205 (1,670) 7,535Realisation of at acquisition Non-controlling interest on deregistration of subsidiary - - - - - - - (19) (19)Total changes - 21,689 28,891 1,388 51,968 (7,088) 80,952 4,470 127,653
Balance at 31 March 2017 2,205 31,307 508,456 5,830 545,593 503,963 1,051,761 52,583 1,104,344Other comprehensive income - (32,289) 23,496 1,245 (7,548) 111,412 103,864 5,999 109,863Dividends received/(paid) - - - - - (17,221) (17,221) - (17,221)Discontinued Operations (Note 15) - - - - - - - (3) (3)Total changes - (32,289) 23,496 1,245 (7,548) 94,191 86,643 5,996 92,639
Balance at 31 March 2018 2,205 (982) 531,952 7,075 538,045 598,154 1,138,404 58,579 1,196,983Note(s) 18 34 27&34 34 34
CompanyBalance at 01 April 2016 2,205 - 450,385 4,419 454,804 (287,717) 169,292 - 169,292Total comprehensive income for the year - - 27,020 1,388 28,408 (108,142) (79,734) - (79,734)Total comprehensive income for the Year - - 27,020 1,388 28,408 (108,142) (79,734) - (79,734)Other movement - - - - - (630) (630) - (630)
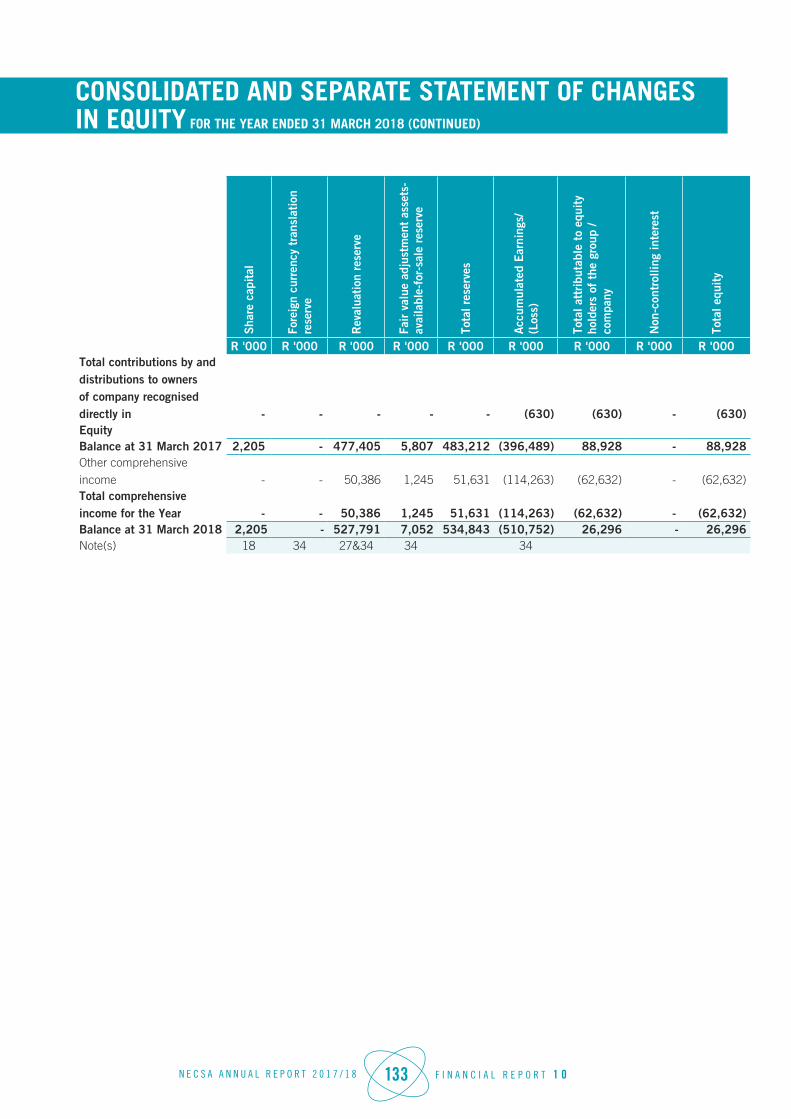
N E C S A A N N U A L R E P O R T 2 0 1 7 / 1 8 133 F I N A N C I A L R E P O R T 1 0
Sha
re c
apit
al
Fore
ign
curr
ency
tra
nsla
tion
re
serv
e
Rev
alua
tion
rese
rve
Fair
val
ue a
djus
tmen
t as
sets
-av
aila
ble-
for-
sale
res
erve
Tota
l res
erve
s
Acc
umul
ated
Ear
ning
s/
(Los
s)
Tota
l att
ribu
tabl
e to
equ
ity
hold
ers
of t
he g
roup
/ co
mpa
ny
Non
-con
trol
ling
inte
rest
Tota
l equ
ity
R '000 R '000 R '000 R '000 R '000 R '000 R '000 R '000 R '000Total contributions by and distributions to owners of company recognised directly in - - - - - (630) (630) - (630)EquityBalance at 31 March 2017 2,205 - 477,405 5,807 483,212 (396,489) 88,928 - 88,928Other comprehensive income - - 50,386 1,245 51,631 (114,263) (62,632) - (62,632)Total comprehensive income for the Year - - 50,386 1,245 51,631 (114,263) (62,632) - (62,632)Balance at 31 March 2018 2,205 - 527,791 7,052 534,843 (510,752) 26,296 - 26,296Note(s) 18 34 27&34 34 34
CONSOLIDATED AND SEPARATE STATEMENT OF CHANGES IN EQUITY FOR THE YEAR ENDED 31 MARCH 2018 (CONTINUED)
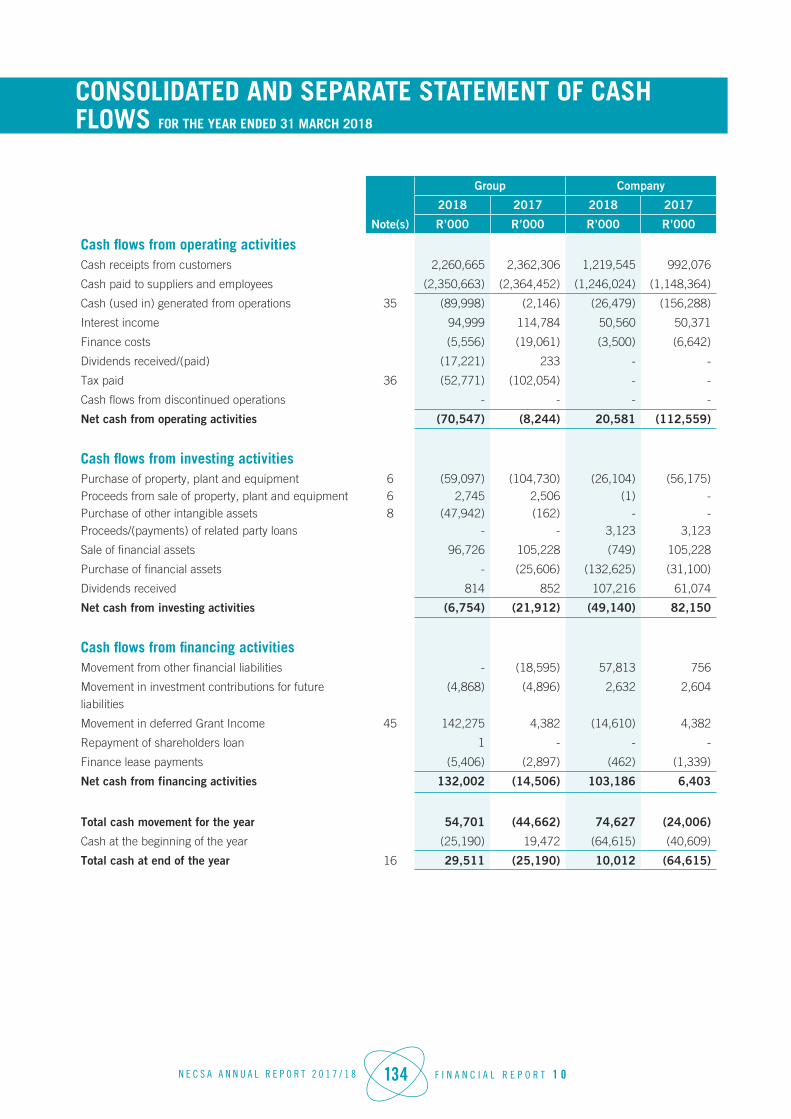
N E C S A A N N U A L R E P O R T 2 0 1 7 / 1 8 134 F I N A N C I A L R E P O R T 1 0
CONSOLIDATED AND SEPARATE STATEMENT OF CASH FLOWS FOR THE YEAR ENDED 31 MARCH 2018
Group Company
2018 2017 2018 2017
Note(s) R’000 R’000 R’000 R’000
Cash flows from operating activitiesCash receipts from customers 2,260,665 2,362,306 1,219,545 992,076
Cash paid to suppliers and employees (2,350,663) (2,364,452) (1,246,024) (1,148,364)
Cash (used in) generated from operations 35 (89,998) (2,146) (26,479) (156,288)
Interest income 94,999 114,784 50,560 50,371
Finance costs (5,556) (19,061) (3,500) (6,642)
Dividends received/(paid) (17,221) 233 - -
Tax paid 36 (52,771) (102,054) - -
Cash flows from discontinued operations - - - -
Net cash from operating activities (70,547) (8,244) 20,581 (112,559)
Cash flows from investing activitiesPurchase of property, plant and equipment Proceeds from sale of property, plant and equipment Purchase of other intangible assets Proceeds/(payments) of related party loans
668
(59,097)2,745
(47,942)-
(104,730)2,506(162)
-
(26,104)(1)
-3,123
(56,175)--
3,123
Sale of financial assets 96,726 105,228 (749) 105,228
Purchase of financial assets - (25,606) (132,625) (31,100)
Dividends received 814 852 107,216 61,074
Net cash from investing activities (6,754) (21,912) (49,140) 82,150
Cash flows from financing activitiesMovement from other financial liabilities - (18,595) 57,813 756
Movement in investment contributions for future liabilities
(4,868) (4,896) 2,632 2,604
Movement in deferred Grant Income 45 142,275 4,382 (14,610) 4,382
Repayment of shareholders loan 1 - - -
Finance lease payments (5,406) (2,897) (462) (1,339)
Net cash from financing activities 132,002 (14,506) 103,186 6,403
Total cash movement for the year 54,701 (44,662) 74,627 (24,006)
Cash at the beginning of the year (25,190) 19,472 (64,615) (40,609)
Total cash at end of the year 16 29,511 (25,190) 10,012 (64,615)

N E C S A A N N U A L R E P O R T 2 0 1 7 / 1 8 135 F I N A N C I A L R E P O R T 1 0
ACCOUNTING POLICIES
1. BASIS OF PREPARATION
Statement of compliance
The consolidated and separate Annual Financial Statements have been prepared in accordance with International Financial Reporting Standards("IFRS"), the requirements of the Public Finance Management Act of South Africa, 1999 (Act No.1 of 1999) (PFMA) and the Companies Act of South Africa, 2008( Act No 71 of 2008) (Companies Act). The Annual Financial Statements have been prepared on the historical cost basis except for certain properties and financial instruments that are measured at revalued amounts or fair values, as explained in the accounting policies below. Historical cost is generally based on the fair value of the consideration given in exchange for goods and services. These accounting policies are consistent with the previous period.
These financial statements, for the year ended 31 March 2018, are the first the Group has prepared in accordance with IFRS. For all periods up to and including the year ended 31 March 2017, the Group prepared its financial statements in accordance with SA GAAP. Refer to Note 4 for information on how the Group adopted IFRS.
Accordingly, the Group has prepared financial statements, which comply with IFRS applicable for periods ending on or after 31 March 2018, together with the comparative period data as at and for the year ended 31 March 2017, as described in the accounting policies.
Fair value is the price that would be received to sell an asset or paid to transfer a liability in an orderly transaction between market participants at the measurement date, regardless of whether that price is directly observable or estimated using another valuation technique. In estimating the fair value of an asset or a liability, the Group takes into account the characteristics of the asset or liability if market participants would take those characteristics into account when pricing the asset or liability at the measurement at the measurement date. Fair value for measurement and/or disclosure purpose in these consolidated financial statements is determined on such a basis, except for share-based payment transactions that are within the scope of IFRS 2, leasing transactions that are within the scope of IAS 17, and measurements that have some similarities to fair value but are not fair value, such as net realisable value in IAS 2 or value in use in IAS 36.
In addition, for financial reporting purposes, fair value measurements are categorised into Level 1, 2 or 3 based on the degree to which the inputs to the fair values measurements are observable and the significance of the inputs to the fair value measurements in its entirety, which are described as follows:• Level 1 Inputs are quoted prices (unadjusted) in active
markets for identical assets or liabilities that the entity can access at the measurement date;
• Level 2 Inputs are inputs, other than quoted prices included within Level 1, that are observable for the asset or liability, either directly or indirectly; and
• Level 3 inputs are observable inputs for the asset or liability.
In preparing these financial statements, the Group’s opening statement of financial position was prepared as at 1 April 2016, the Group’s date of transition to IFRS. Management has conducted a detailed analysis to identify gaps between SA GAAP and IFRS and have come to the conclusion that to a large extent, during the prior periods many of the accounting balances had already been accounted for in accordance with IFRS. However, the disclosures have been enhanced in the financial statements in order to ensure that the Group complies with IFRS.
In this regard no significant adjustments have been made by Group in restating its SA GAAP statement of financial position as at 1 April 2016 and its previously published SA GAAP financial statements as at and for the year ended 31 March 2017.
The principal accounting policies are set out below.
The draft annual financial statements are submitted to the Auditor General on 31 May of each year are final.
1.1 Consolidation
Basis of consolidation
The consolidated Annual Financial Statements incorporate the Annual Financial Statements of the Necsa and its subsidiaries. Control is achieved when Necsa or its Subsidiaries:• has power over the investee;• is exposed, or has rights, to variable returns from its
involvement with the investee; and• has the ability to use its power to affect its returns
N E C S A A N N U A L R E P O R T 2 0 1 7 / 1 8 136 F I N A N C I A L R E P O R T 1 0
ACCOUNTING POLICIES (CONTINUED)
When Necsa or its subsidiaries has less than a majority of the voting rights of an investee, it has power over the investee when the voting rights are sufficient to give it the practical ability to direct the relevant activities of the investee unilaterally. Necsa considers all relevant facts and circumstances in assessing whether or not Necsa or its subsidiaries' voting rights in an investee are sufficient to give power, including:• the size of the Company's holding of voting rights relative
to the size and dispersion of holdings of the other vote holders;
• potential voting rights held by the Company, other vote holders or other parties;
• rights arising from other contractual arrangements; and• any additional facts and circumstances that indicate that
the Company has, or does not have, the current ability to direct the relevant activities at the time that decisions need to be made, including voting patterns at previous shareholders' meetings.
Consolidation of a subsidiary begins when Necsa or its subsidiaries obtains control over the subsidiary and ceases when Necsa or its subsidiaries loses control of the subsidiary. Specifically, income and expenses of a subsidiary acquired or disposed of during the year are included in the consolidated statement of profit or loss and other comprehensive income from the date Necsa or its subsidiaries gains control until the date when Necsa or its subsidiaries ceases to control the subsidiary.
Profit or loss and each component of other comprehensive income are attributed to the owners of Necsa and to the non-controlling interests. Total comprehensive income of subsidiaries is attributed to the owners of the Necsa and to the non-controlling interests.
All intragroup assets and liabilities, equity, income, expenses and cash flows relating to transactions between members of the Group are eliminated in full on consolidation.
Investment in associates
An associate is an entity over which the group has significant influence and which is neither a subsidiary nor a joint venture. Significant influence is the power to participate in the financial and operating policy decisions of the investee but is not control or joint control over those policies.
The results, of assets and liabilities of associates are incorporated in these consolidated financial statements using the equity method of accounting, except when the investment is classified as held for sale, in which case it is accounted for in accordance with IFRS 5 Non-current Assets Held for Sale and Discontinued Operations. Under the equity method, an investment in an associate is initially recognised in the consolidated statement of financial position at cost and adjusted thereafter to recognise the Group's share of the profit or loss and other comprehensive income of the associate. When the Group's share of losses of an associate exceeds the Group's interest in that associate (which includes any long-term interests that, in substance, form part of the Group's net investment in the associate), the Group discontinues recognising its share of further losses. Additional losses are classified as liabilities when recognised, only to the extent that the Group has incurred legal or constructive obligations or made payments on behalf of the associate.
The requirements of IAS 39 are applied to determine whether it is necessary to recognise any impairment loss with respect to the Group’s investment in an associate. When necessary, the entire carrying amount of the investment (including goodwill) is tested for impairment in accordance with IAS 36 Impairment of Assets as a single asset by comparing its recoverable amount (higher of value in use and fair value less costs to sell) with its carrying amount. Any impairment loss recognised forms part of the carrying amount of the investment. Any reversal of that impairment loss is recognised in accordance with IAS 36 to the extent that the recoverable amount of the investment subsequently increases.
When a Group entity transacts with its associate, profits and losses resulting from the transactions with the associate are recognised in the Group's consolidated financial statements only to the extent of interests in the associate that are not related to the Group.
1.2 Investment property
Investment properties are properties held to earn rentals.
Investment property is initially recognised at cost. Transaction costs are included in the initial measurement.
Costs include costs incurred initially and costs incurred subsequently to add to, or to replace a part of, or service a property. If a replacement part is recognised in the carrying

N E C S A A N N U A L R E P O R T 2 0 1 7 / 1 8 137 F I N A N C I A L R E P O R T 1 0
amount of the investment property, the carrying amount of the replaced part is derecognised.
Fair value
Subsequent to initial measurement investment property is measured at fair value.
A gain or loss arising from a change in fair value is included in net profit or loss of the period in which it arises.
An investment property is derecognised upon disposal or when the investment property is permanently withdrawn from use and no future economic benefits are expected from the disposal. Any gain or loss arising on derecognition of the property (calculated as the difference between the net disposal proceeds and the carrying amount of the asset) is included in profit or loss in the period in which the property is derecognised.
1.3 Property, plant and equipment
Property, plant and equipment is initially measured at cost.
Costs include costs incurred initially to acquire or construct an item of property, plant and equipment and costs incurred subsequently to add to, replace part of, or service it. If a replacement cost is recognised in the carrying amount of an item of property, plant and equipment, the carrying amount of the replaced part is derecognised.
The initial estimate of the costs of dismantling and removing the item and restoring the site on which it is located is also included in the cost of property, plant and equipment, where the entity is obliged to incur such expenditure, and where the obligation arises as a result of acquiring the asset or using it for purposes other than the production of inventories.
Plant and equipment is stated at cost less accumulated depreciation and any impairment losses.
Land and buildings is carried at revalued amount, being the fair value at the date of revaluation less any subsequent accumulated depreciation and subsequent accumulated impairment losses.
Revaluations are performed with sufficient regularity such that the carrying amount does not differ materially from that
which would be determined using fair value as the end of the reporting period.
The frequency of revaluations depends upon the changes in fair values of the items of property, plant and equipment being revalued. Some items of property, plant and equipment experience significant and volatile changes in fair value, thus necessitating annual revaluation. Such frequent revaluations are unnecessary for items of property, plant and equipment with only insignificant changes in fair value. Instead, it may be necessary to revalue the item every three to five years.
When an item of property, plant and equipment is revalued, any accumulated depreciation at the date of the revaluation is eliminated against the gross carrying amount of the asset and the net amount restated to the revalued amount of the asset.
Any increase in an asset's carrying amount, as a result of a revaluation, is recognised to other comprehensive income and accumulated in the revaluation surplus in equity. The increase is recognised in profit or loss to the extent that it reverses a revaluation decrease of the same asset previously recognised in profit or loss.
Any increase in an asset's carrying amount, as a result of a revaluation, is recognised in profit or loss in the current period. The decrease is recognised in other comprehensive income to the extent of any credit balance existing in the revaluation surplus in respect of that asset. The decrease recognised in other comprehensive income reduces the amount accumulated in the revaluation surplus in equity.
The revaluation surplus in equity related to a specific item of property, plant and equipment is transferred directly to retained earnings when the asset is derecognised.
Property, plant and equipment is depreciated on the straight line basis over their expected useful lives to their estimated residual value.
The useful lives of items of property, plant and equipment have been assessed as follows:
Item Range of useful lives
Land Indefinite
Buildings 10 - 50 years
Plant 5 - 50 years
ACCOUNTING POLICIES (CONTINUED)

N E C S A A N N U A L R E P O R T 2 0 1 7 / 1 8 138 F I N A N C I A L R E P O R T 1 0
ACCOUNTING POLICIES (CONTINUED)
Item Range of useful lives
Furniture and fixtures 2 - 22 years
Motor vehicles and transport containers
2 - 26 years
Office equipment 2 - 22 years
IT equipment 2 - 22 years
Research facilities 2 - 22 years
Leasehold improvements 2 - 10 years
Machinery and equipment 2 - 22 years
Component spares 2 - 10 years
The residual value, useful life and depreciation method of each asset are reviewed at the end of each reporting period. If the expectations differ from previous estimates, the change is accounted for as a change in accounting estimate.
The depreciation charge for each period is recognised in profit or loss unless it is included in the carrying amount of another asset.
An item of property, plant and equipment is derecognised upon disposal or when no future economic benefits are expected to arise from the continued use of the asset.
The gain or loss arising from the derecognition of an item of property, plant and equipment is included in profit or loss when the item is derecognised. The gain or loss arising from the derecognition of an item of property, plant and equipment is determined as the difference between the net disposal proceeds, if any, and the carrying amount of the item.
Assets held under finance leases are depreciated over their expected useful lives on the same basis as owned assets. However, when there is no reasonable certainty that ownership will be obtained by the end of the lease term. Assets are depreciated over the shorter the lease term and their useful lives.
1.4 Intangible assets
An intangible asset is recognised when:• it is probable that the expected future economic benefits
that are attributable to the asset will flow to the entity; and• the cost of the asset can be measured reliably.
Intangible assets are initially recognised at cost.
Internally generated intangible assets - research and development expenditure
Expenditure on research (or on the research phase of an internal project) is recognised as an expense when it is incurred.
An intangible asset arising from development (or from the development phase of an internal project) is recognised when all of the following have been demonstrated:• the technical feasibility of completing the intangible asset
so that it will be available for use or sale.• the intention to complete the intangible asset and use or
sell it.• the ability to use or sell the intangible asset.• it will generate probable future economic benefits.• how the intangible asset will generate probable future
economic benefits.• the availability of adequate technical, financial and other
resources to complete the development and to use or sell the intangible asset.
• the ability to measure reliably the expenditure attributable to the intangible asset during its development.
The amount initially recognised for internally-generated intangible assets is the sum of the expenditure incurred from the date when the intangible asset first meets the recognition criteria listed above. Where no internally-generated intangible asset can be recognised, development expenditure is recognised in profit or loss in the period in which it is incurred.
Subsequent to initial recognition, internally-generated intangible assets are reported at cost less accumulated amortisation and accumulated impairment losses, on the same basis as intangible assets that are acquired separately.
An intangible asset is regarded as having an indefinite useful life when, based on all relevant factors, there is no foreseeable limit to the period over which the asset is expected to generate net cash inflows. Amortisation is not provided for these intangible assets, but they are tested for impairment annually and whenever there is an indication that the asset may be impaired. For all other intangible assets amortisation is provided on a straight-line basis over their useful life.

N E C S A A N N U A L R E P O R T 2 0 1 7 / 1 8 139 F I N A N C I A L R E P O R T 1 0
ACCOUNTING POLICIES (CONTINUED)
The amortisation period and the amortisation method for intangible assets are reviewed at the end of each reporting period.
Re-assessing the useful life of an intangible asset with a finite useful life after it was classified as indefinite is an indicator that the asset may be impaired. As a result the asset is tested for impairment and the remaining carrying amount is amortised over its useful life.
Internally generated brands, mastheads, publishing titles, customer lists and items similar in substance are not recognised as intangible assets.
Amortisation is provided to write down the intangible assets, on a straight line basis, to their residual values as follows:
Item Useful lives
Patents, trademarks and other rights
20 years
Computer software 3 years
1.5 Investments in subsidiaries
Company financial statements
In the company’s separate financial statements, investments in subsidiaries are carried at cost less any accumulated impairment.
The cost of an investment in a subsidiary is the aggregate of:• the fair value, at the date of exchange, of assets given,
liabilities incurred or assumed, and equity instruments issued by the company; plus
• any costs directly attributable to the purchase of the subsidiary.
1.6 Investments in associates
Company financial statements
An investment in an associate is carried at cost less any accumulated impairment.
1.7 Financial instruments
Classification
The group classifies financial assets and financial liabilities into the following categories:• Financial assets at fair value through profit or loss - held
for trading• Held-to-maturity investments• Loans and receivables• Available-for-sale financial assets• Financial liabilities at fair value through profit or loss - held
for trading• Financial liabilities measured at amortised cost
Classification depends on the purpose for which the financial instruments were obtained / incurred and takes place at initial recognition. Classification is re-assessed on an annual basis, except for derivatives and financial assets designated at fair value through profit or loss, which may not be classified out of the fair value through profit or loss category.
Initial recognition and measurement
Financial instruments are recognised initially when the group becomes a party to the contractual provisions of the instruments.
The group classifies financial instruments, or their component parts, on initial recognition as a financial asset, a financial liability or an equity instrument in accordance with the substance of the contractual arrangement.
Financial instruments are measured initially at fair value.
For financial instruments which are not at fair value through profit or loss, transaction costs are included in the initial measurement of the instrument.
Transaction costs on financial instruments at fair value through profit or loss are recognised in profit or loss.
Regular purchases and sales of investments are recognised on trade-date, i.e. the date on which the Group commits to purchase or sell the asset.

N E C S A A N N U A L R E P O R T 2 0 1 7 / 1 8 140 F I N A N C I A L R E P O R T 1 0
ACCOUNTING POLICIES (CONTINUED)
Subsequent measurement
Financial instruments at fair value through profit or loss are subsequently measured at fair value, with gains and losses arising from changes in fair value being included in profit or loss for the period.
Net gains or losses on the financial instruments at fair value through profit or loss excludes dividends and interest.
Dividend income is recognised in profit or loss as part of other income when the group's right to receive payment is established.
Loans and receivables are subsequently measured at amortised cost, using the effective interest method, less accumulated impairment losses.
Held-to-maturity investments are subsequently measured at amortised cost, using the effective interest method, less accumulated impairment losses.
Available-for-sale financial assets are subsequently measured at fair value. This excludes equity investments for which a fair value is not determinable, which are measured at cost less accumulated impairment losses.
Gains and losses arising from changes in fair value are recognised in other comprehensive income and accumulated in equity until the asset is disposed of or determined to be impaired. Interest on available-for-sale financial assets calculated using the effective interest method is recognised in profit or loss as part of other income. Dividends received on available-for-sale equity instruments are recognised in profit or loss as part of other income when the group's right to receive payment is established.
Changes in fair value of available-for-sale financial assets denominated in a foreign currency are analysed between translation differences resulting from changes in amortised cost and other changes in the carrying amount. Translation differences on monetary items are recognised in profit or loss, while translation differences on non-monetary items are recognised in other comprehensive income and accumulated in equity.
Financial liabilities at amortised cost are subsequently measured at amortised cost, using the effective interest method.
Fair value determination
The fair values of quoted investments are based on current bid prices. If the market for a financial asset is not active (and for unlisted securities), the group establishes fair value by using valuation techniques. These include the use of recent arm’s length transactions, reference to other instruments that are substantially the same, discounted cash flow analysis, and option pricing models making maximum use of market inputs and relying as little as possible on entity-specific inputs.
Impairment of financial assets
At each reporting date the group assesses all financial assets, other than those at fair value through profit or loss, to determine whether there is objective evidence that a financial asset or Group of financial assets has been impaired.
Financial assets are considered to be impaired when there is objective evidence that, as a result of one or more events that occurred after the initial recognition of the financial asset, the estimated future cash flows of the investment have been affected.
For amounts due to the group, significant financial difficulties of the debtor, probability that the debtor will enter bankruptcy and default of payments are all considered indicators of impairment.
In the case of equity securities classified as available -for-sale, a significant or prolonged decline in the fair value of the security below its cost is considered an indicator of impairment. For all other financial assets, objective evidence of impairment could include:• significant financial difficulty of the issuer or counterparty;
or• breach of contract, such as a default or delinquency in
interest or principal payments; or• it becoming probable that the borrower will enter
bankruptcy or financial re-organisation; or• the disappearance of an active market for that financial
asset because of financial difficulties.

N E C S A A N N U A L R E P O R T 2 0 1 7 / 1 8 141 F I N A N C I A L R E P O R T 1 0
ACCOUNTING POLICIES (CONTINUED)
For financial assets carried at amortised cost, the amount of the impairment loss recognised is the difference between the asset's carrying amount and the present value of estimated future cash flows, discounted at the financial asset's original effective interest rate.
For financial assets carried at cost, the amount of the impairment loss is measured as the difference between the asset's carrying amount and the present value of the estimated future cash flows discounted at the current market rate of return for a similar financial asset. Such impairment loss may not be reversed in subsequent periods.
The carrying amount of the financial asset is reduced by the impairment loss directly for all financial assets with the exception of trade receivables, where the carrying amount is reduced through the use of an allowance account. When a trade receivable is considered uncollectible, it is written off against the allowance account. Subsequent recoveries of amounts previously written off are credited against the allowance account. Changes in the carrying amount of the allowance account are recognised in profit or loss.
When an available-for-sale financial asset is considered to be impaired, cumulative gains or losses previously recognised in other comprehensive income are reclassified to profit or loss in the period.
For financial assets measured at amortised cost, if, in a subsequent period, the amount of the impairment loss decreases and the decrease can be related objectively to an event occurring after the impairment was recognised, the previously recognised impairment loss is reversed through profit or loss to the extent that the carrying amount of the investment at the date the impairment is reversed does not exceed what the amortised cost would have been had the impairment not been recognised.
In respect of available-for-sale equity securities, impairment losses previously recognised in profit or loss are not reversed through profit or loss. Any increase in fair value subsequent to an impairment loss is recognised in other comprehensive income and accumulated under the heading of investments revaluation reserve. In respect of available-for-sale debt securities, impairment losses are subsequently reversed through profit or loss if an increase in the fair value of the investment can be objectively related to an event occurring after the recognition of the impairment loss.
The group derecognises a financial asset only when the contractual rights to the cash flows from the asset expire, or when it transfers the financial asset and substantially all the risks and rewards of ownership of the asset to another entity. If the group neither transfers nor retains substantially all the risks and rewards of ownership and continues to control the transferred asset, the group recognises its retained interest in the asset and an associated liability for amounts it may have to pay. If the group retains substantially all the risks and rewards of ownership of a transferred financial asset, the group continues to recognise the financial asset and also recognises a collateralised borrowing for the proceeds received.
On derecognition of a financial asset in its entirety, the difference between the asset's carrying amount and the sum of the consideration received and receivable and the cumulative gain or loss that had been recognised in other comprehensive income and accumulated in equity is recognised in profit or loss.
On derecognition of a financial asset other than in its entirety (e.g. when the group retains an option to repurchase part of a transferred asset or retains a residual interest that does not result in the retention of substantially all the risks and rewards of ownership and the group retains control), the group allocates the previous carrying amount of the financial asset between the part it continues to recognise under continuing involvement, and the part it no longer recognises on the basis of the relative fair values of those parts on the date of the transfer. The difference between the carrying amount allocated to the part that is no longer recognised and the sum of the consideration received for the part no longer recognised and any cumulative gain or loss allocated to it that had been recognised in other comprehensive income is recognised in profit or loss. A cumulative gain or loss that had been recognised in other comprehensive income is allocated between the part that continues to be recognised and the part that is no longer recognised on the basis of the relative fair values of those parts.
Financial instruments designated as at fair value through profit or loss
These are financial assets held for trading. A financial asset is classified in this category if acquired principally for the purpose of selling in the short term. Assets in this category are classified as current assets if they are either held for trading or

N E C S A A N N U A L R E P O R T 2 0 1 7 / 1 8 142 F I N A N C I A L R E P O R T 1 0
ACCOUNTING POLICIES (CONTINUED)
are expected to be realised within 12 months of the statement of financial position date.
Gains or losses arising from changes in the fair value of the ‘financial assets at fair value through profit or loss’ category, are presented in the statement of comprehensive income in the period in which they arise. Dividend income from financial assets at fair value through profit or loss is recognised in the statement of comprehensive income as part of other income when the Group's right to receive payment is established.
Financial instruments designated as available-for-sale
Available-for-sale financial assets are non-derivatives that are either designated in this category or not classified in any of the other categories. They are included in non-current assets unless management intends to dispose of the investment within 12 months of the statement of financial position date.
Changes in the fair value of monetary securities classified as available-for-sale and non-monetary securities classified as available-for-sale are recognised in comprehensive income.
When securities classified as available -for- sale are sold or impaired, the accumulated fair value adjustments recognised in other comprehensive income are included in the statement of comprehensive income as ‘gains and losses from investment securities’. Interest on available-for-sale securities calculated using the effective interest method is recognised in the statement of comprehensive income. Dividends on available-for-sale equity instruments are recognised in the statement of comprehensive income when the company’s right to receive payments is established.
Loans to (from) group companies
These include loans to and from holding companies, fellow subsidiaries, subsidiaries, joint ventures and associates and are recognised initially at fair value plus direct transaction costs.
Loans to companies are classified as loans and receivables.
Loans from Group companies are classified as financial liabilities measured at amortised cost.
Loans to shareholders, directors, managers and employees
These financial assets are classified as loans and receivables.
Trade and other receivables
Trade receivables are measured at initial recognition at fair value, and are subsequently measured at amortised cost using the effective interest rate method. Appropriate allowances for estimated irrecoverable amounts are recognised in profit or loss when there is objective evidence that the asset is impaired. Significant financial difficulties of the debtor, probability that the debtor will enter bankruptcy or financial reorganisation, and default or delinquency in payments (more than 30 days overdue) are considered indicators that the trade receivable is impaired. The allowance recognised is measured as the difference between the asset’s carrying amount and the present value of estimated future cash flows discounted at the effective interest rate computed at initial recognition.
The carrying amount of the asset is reduced through the use of an allowance account, and the amount of the loss is recognised in profit or loss within operating expenses. When a trade receivable is uncollectible, it is written off against the allowance account for trade receivables. Subsequent recoveries of amounts previously written off are credited against operating expenses in profit or loss.
Trade and other receivables (excluding prepayments, deposits and VAT receivable) are classified as loans and receivables.
Trade and other payables
Trade payables are initially measured at fair value, and are subsequently measured at amortised cost, using the effective interest rate method.
Cash and cash equivalents
Cash and cash equivalents comprise cash on hand and demand deposits, and other short-term highly liquid investments that are readily convertible to a known amount of cash and are subject to an insignificant risk of changes in value. These are initially recognised at fair value and subsequently treated as loans and receivables.

N E C S A A N N U A L R E P O R T 2 0 1 7 / 1 8 143 F I N A N C I A L R E P O R T 1 0
ACCOUNTING POLICIES (CONTINUED)
Bank overdraft and borrowings
Bank overdrafts and borrowings are initially measured at fair value, and are subsequently measured at amortised cost, using the effective interest rate method. Any difference between the proceeds (net of transaction costs) and the settlement or redemption of borrowings is recognised over the term of the borrowings in accordance with the group’s accounting policy for borrowing costs.
Derivatives
Derivative financial instruments, which are not designated as hedging instruments, consisting of foreign exchange contracts and interest rate swaps, are initially measured at fair value on the contract date, and are re-measured to fair value at subsequent reporting dates.
Derivatives embedded in other financial instruments or other non-financial host contracts are treated as separate derivatives when their risks and characteristics are not closely related to those of the host contract and the host contract is not carried at fair value with unrealised gains or losses reported in profit or loss.
Changes in the fair value of derivative financial instruments are recognised in profit or loss as they arise.
Derivatives are classified as financial assets at fair value through profit or loss - held for trading.
The patents, trademarks and other rights relate to intellectual property internally generated by a subsidiary of the company, which is used in the purification of Fluorine.
Computer software has been specifically developed for Gammatec. Management has assessed that no impairment indicators exist as the subsidiary is generating healthy cash flows.
1.8 Tax
Current tax assets and liabilities
Current tax for current and prior periods is, to the extent unpaid, recognised as a liability. If the amount already paid in respect of current and prior periods exceeds the amount due for those periods, the excess is recognised as an asset.
Current tax liabilities (assets) for the current and prior periods are measured at the amount expected to be paid to (recovered from) the tax authorities, using the tax rates (and tax laws) that have been enacted or substantively enacted by the end of the reporting period.
The tax currently payable is based on taxable profit for the year. Taxable profit differs from profit as reported in the consolidated statement of comprehensive income because of items of income or expense that are taxable or deductible in other years and items that are never taxable or deductible. The Group's liability for current tax is calculated using tax rates that have been enacted or substantively enacted by the end of the reporting period.
Deferred tax assets and liabilities
A deferred tax liability is recognised for all taxable temporary differences, except to the extent that the deferred tax liability arises from:• the initial recognition of goodwill; or• the initial recognition of an asset or liability in a transaction
which:- is not a business combination; and- at the time of the transaction, affects neither
accounting profit nor taxable profit (tax loss).
A deferred tax liability is recognised for all taxable temporary differences associated with investments in subsidiaries, branches and associates, and interests in joint ventures, except to the extent that both of the following conditions are satisfied:• the parent, investor or venturer is able to control the
timing of the reversal of the temporary difference; and• it is probable that the temporary difference will not reverse
in the foreseeable future.
A deferred tax asset is recognised for all deductible temporary differences to the extent that it is probable that taxable profit will be available against which the deductible temporary difference can be utilised, unless the deferred tax asset arises from the initial recognition of an asset or liability in a transaction that:• is not a business combination; and• at the time of the transaction, affects neither accounting
profit nor taxable profit (tax loss).
N E C S A A N N U A L R E P O R T 2 0 1 7 / 1 8 144 F I N A N C I A L R E P O R T 1 0
ACCOUNTING POLICIES (CONTINUED)
A deferred tax asset is recognised for all deductible temporary differences arising from investments in subsidiaries, branches and associates, and interests in joint ventures, to the extent that it is probable that:• the temporary difference will reverse in the foreseeable
future; and• taxable profit will be available against which the temporary
difference can be utilised.
A deferred tax asset is recognised for the carry forward of unused tax losses and unused Dividends Withholding Tax credits to the extent that it is probable that future taxable profit will be available against which the unused tax losses and unused Dividends Withholding Tax credits can be utilised.
The carrying amount of deferred tax assets is reviewed at the end of each reporting period and reduced to the extent that it is no longer probable that sufficient taxable profits will be available to allow all or part of the asset to be recovered.
Deferred tax assets and liabilities are measured at the tax rates that are expected to apply to the period when the asset is realised or the liability is settled, based on tax rates (and tax laws) that have been enacted or substantively enacted by the end of the reporting period.
The measurement of deferred tax liabilities and assets reflects the tax consequences that would follow from the manner in which the Group expects, at the end of the reporting period, to recover or settle the carrying amount of its assets and liabilities.
1.9 Leases
Leases are classified as finance leases whenever the terms of the lease transfer substantially all the risks and rewards of ownership to the lessee. All other leases are classified as operating leases.
Finance leases – lessee
Finance leases are recognised as assets and liabilities in the statement of financial position at amounts equal to the fair value of the leased property or, if lower, the present value of the minimum lease payments. The corresponding liability to the lessor is included in the statement of financial position as a finance lease obligation.
The assets are depreciated over the useful life on a straight line basis consistent with the property, plant and equipment within the group.
The discount rate used in calculating the present value of the minimum lease payments is the interest rate implicit in the lease.
The lease payments are apportioned between the finance charge and reduction of the outstanding liability. The finance charge is allocated to each period during the lease term so as to produce a constant periodic rate on the remaining balance of the liability.
Operating leases - lessor
Operating lease income is recognised as an income on a straight-line basis over the lease term.
Initial direct costs incurred in negotiating and arranging operating leases are added to the carrying amount of the leased asset and recognised as an expense over the lease term on the same basis as the lease income.
Income for leases is disclosed under revenue in profit or loss.
Operating leases – lessee
Operating lease payments are recognised as an expense on a straight-line basis over the lease term except when another systematic basis is more representative of the time pattern in which economic benefits from the leased asset are consumed. The difference between the amounts recognised as an expense and the contractual payments is recognised as an operating lease asset. This liability is not discounted.
In the event that lease incentives are received to enter into operating leases, such incentives are recognised as a liability. The aggregate benefit of incentives is recognised as a reduction of rental expense on a straight-line basis, except where another systematic basis is more representative of the time pattern in which economic benefits from the leased asset are consumed.
Any contingent rents are expensed in the period they are incurred.
N E C S A A N N U A L R E P O R T 2 0 1 7 / 1 8 145 F I N A N C I A L R E P O R T 1 0
ACCOUNTING POLICIES (CONTINUED)
1.10 Inventories
Inventories are measured at the lower of cost and net realisable value.
Net realisable value represents the estimated selling price in the ordinary course of business less the estimated costs of completion and the estimated costs necessary to make the sale.
The cost of inventories comprises of all costs of purchase, costs of conversion and other costs incurred in bringing the inventories to their present location and condition.
The cost of inventories of items that are not ordinarily interchangeable and goods or services produced and segregated for specific projects is assigned using specific identification of the individual costs.
The cost of inventories is assigned using the weighted average cost formula. The same cost formula is used for all inventories having a similar nature and use to the entity.
When inventories are sold, the carrying amount of those inventories is recognised as an expense in the period in which the related revenue is recognised. The amount of any write-down of inventories to net realisable value and all losses of inventories are recognised as an expense in the period the write-down or loss occurs. The amount of any reversal of any write-down of inventories, arising from an increase in net realisable value, are recognised as a reduction in the amount of inventories recognised as an expense in the period in which the reversal occurs.
1.11 Non-current assets held for sale
Non-current assets and disposal groups are classified as held for sale if their carrying amount will be recovered through a sale transaction rather than through continuing use. This condition is regarded as met only when the sale is highly probable and the asset (or disposal group) is available for immediate sale in its present condition. Management must be committed to the sale, which should be expected to qualify for recognition as a completed sale within one year from the date of classification.
In the statement of comprehensive income, income and expenses from discontinued operations are reported
separately from income and expenses from continuing operations, down to the level of profit after taxes, even when the Group retains a non-controlling interest in the subsidiary after the sale. The resulting profit or loss (after taxes) is reported separately in the statement of comprehensive income as part of comprehensive income.
Non-current assets held for sale (or disposal group) are measured at the lower of its previous carrying amount and fair value less costs to sell.
A non-current asset is not depreciated (or amortised) while it is classified as held for sale, or while it is part of a disposal group classified as held for sale.
Interest and other expenses attributable to the liabilities of a disposal group classified as held for sale are recognised in profit or loss.
Any gain or loss on the remeasurement on a non-current asset classified as held for sale that does not meet the definition of a discontinued operation is included in profit or loss from continuing operations.
Any impairment loss is recognised for any initial or subsequent write-down of the asset to fair value less cost to sell.
A gain shall be recognised for any subsequent increase in fair value less costs to sell of the asset, but not in excess of the cumulative impairment loss that has been recognised previously.
1.12 Impairment of tangible and intangible assets other than goodwill
The group assesses at each end of the reporting period whether there is any indication that an asset may be impaired. If any such indication exists, the recoverable amount of the asset is estimated in order to determine the extent of the impairment loss (if any).
Irrespective of whether there is any indication of impairment, the group also:• tests intangible assets with an indefinite useful life or
intangible assets not yet available for use annually for impairment by comparing its carrying amount with its recoverable amount. This impairment test is performed during the annual period and at the same time every period.

N E C S A A N N U A L R E P O R T 2 0 1 7 / 1 8 146 F I N A N C I A L R E P O R T 1 0
ACCOUNTING POLICIES (CONTINUED)
• tests goodwill acquired in a business combination annually for impairment.
If it is not possible to estimate the recoverable amount of the individual asset, the recoverable amount of the cash-generating unit to which the asset belongs is determined.
The recoverable amount of an asset or a cash-generating unit is the higher of its fair value less costs to sell and its value in use.
In assessing value in use, the estimated future cash flows are discounted to their present value using a pre-tax discount rate that reflects current market assessments of the time value of money and the risks specific to the asset for which the estimates of future cash flows have not been adjusted.If the recoverable amount of an asset is less than its carrying amount, the carrying amount of the asset is reduced to its recoverable amount.
An impairment loss of assets carried at cost less any accumulated depreciation or amortisation is recognised immediately in profit or loss. Any impairment loss of a revalued asset is treated as a revaluation decrease.
Goodwill acquired in a business combination is, from the acquisition date, allocated to each of the cash-generating units, or groups of cash-generating units, that are expected to benefit from the synergies of the combination.
An impairment loss is recognised for cash-generating units if the recoverable amount of the unit is less than the carrying amount of the units. The impairment loss is allocated to reduce the carrying amount of the assets of the unit in the following order:• first, to reduce the carrying amount of any goodwill
allocated to the cash-generating unit and• then, to the other assets of the unit, pro rata on the basis
of the carrying amount of each asset in the unit.
The carrying amount of an asset included in a cash generating unit may not be reduced below the highest of (1) Its fair value less cost to sell; (2) Its value in use or (3) zero.
An entity assesses at each reporting date whether there is any indication that an impairment loss recognised in prior periods for assets other than goodwill may no longer exist or may have decreased. If any such indication exists, the recoverable amounts of those assets are estimated.
The increased carrying amount of an asset other than goodwill attributable to a reversal of an impairment loss does not exceed the carrying amount that would have been determined had no impairment loss been recognised for the asset in prior periods.
A reversal of an impairment loss of assets carried at cost less accumulated depreciation or amortisation other than goodwill is recognised immediately in profit or loss. Any reversal of an impairment loss of a revalued asset is treated as a revaluation increase.
1.13 Share capital and equity
An equity instrument is any contract that evidences a residual interest in the assets of an entity after deducting all of its liabilities.
Ordinary shares are classified as equity and measured at cost.
1.14 Employee benefits
Short-term employee benefits
The cost of short-term employee benefits, those payable within 12 months after the service is rendered, such as paid vacation leave and sick leave, bonuses, and non-monetary benefits such as medical care, are recognised in the period in which the service is rendered and are not discounted.
The expected cost of compensated absences is recognised as an expense as the employees render services that increase their entitlement or, in the case of non-accumulating absences, when the absence occurs.
The expected cost of profit sharing and bonus payments is recognised as an expense when there is a legal or constructive obligation to make such payments as a result of past performance.
Defined contribution plans
The companies operate a provident fund on behalf of its employees. The schemes are generally funded through payments to insurance companies or trustee-administered funds, determined by periodic actuarial calculations. A defined contribution plan is a plan under which the company pays fixed contributions into a separate entity. The company
N E C S A A N N U A L R E P O R T 2 0 1 7 / 1 8 147 F I N A N C I A L R E P O R T 1 0
ACCOUNTING POLICIES (CONTINUED)
has no legal or constructive obligations to pay further contributions if the fund does not hold sufficient assets to pay all employees the benefit relating to employee service in the current and prior periods.
Payments to defined contribution retirement benefit plans are charged as an expense as they fall due. Prepaid contributions are recognised as an asset to the extent that a cash refund or a reduction in the future payments is available.
Defined benefit plans
Some Group companies provide post-retirement healthcare benefits to their retirees. The entitlement to these benefits is usually conditional on the employee remaining in service up to retirement age and the completion of a minimum service period. For defined benefit plans the cost of providing the benefits is determined using the projected unit credit method.
Actuarial valuations are conducted on an annual basis by independent actuaries.
Consideration is given to any event that could impact the funds up to the end of the reporting period where the interim valuation is performed at an earlier date.
Past service costs are recognised immediately to the extent that the benefits are already vested, and are otherwise amortised on a straight line basis over the average period until the amended benefits become vested.
Actuarial gains and losses are recognised in the year in which they arise, in other comprehensive income.
Gains or losses on the curtailment or settlement of a defined benefit plan are recognised when the group is demonstrably committed to curtailment or settlement.
When it is virtually certain that another party will reimburse some or all of the expenditure required to settle a defined benefit obligation, the right to reimbursement is recognised as a separate asset. The asset is measured at fair value. In all other respects, the asset is treated in the same way as plan assets. In profit or loss, the expense relating to a defined benefit plan is presented as the net of the amount recognised for a reimbursement.
The amount recognised in the statement of financial position represents the present value of the defined benefit obligation as adjusted for unrecognised actuarial gains and losses and unrecognised past service costs, and reduces by the fair value of plan assets.
Any asset is limited to unrecognised actuarial losses and past service costs, plus the present value of available refunds and reduction in future contributions to the plan.
1.15 Provisions and contingencies
Provisions are recognised when:• the group has a present obligation as a result of a past
event;• it is probable that an outflow of resources embodying
economic benefits will be required to settle the obligation; and
• a reliable estimate can be made of the obligation.
The amount recognised as a provision is the best estimate of the consideration required to settle the present obligation at the end of the reporting period, taking into account the risks and uncertainties surrounding the obligation. When a provision is measured using the cash flows estimated to settle the present obligation, its carrying amount is the present value of those cash flows (where the effect of the time value of money is material).
Where some or all of the expenditure required to settle a provision is expected to be reimbursed by another party, the reimbursement shall be recognised when, and only when, it is virtually certain that reimbursement will be received if the entity settles the obligation. The reimbursement shall be treated as a separate asset. The amount recognised for the reimbursement shall not exceed the amount of the provision.
Provisions are not recognised for future operating losses.
Onerous contracts
If an entity has a contract that is onerous, the present obligation under the contract shall be recognised and measured as a provision.
An onerous contract is considered to exist where the Group has a contract under which the unavoidable costs of meeting the obligations under the contract exceed the economic

N E C S A A N N U A L R E P O R T 2 0 1 7 / 1 8 148 F I N A N C I A L R E P O R T 1 0
ACCOUNTING POLICIES (CONTINUED)
benefits expected to be received from the contract. Rental income relating to Pelchem has resulted in an onerous contract.
Contingent assets and liabilities
After their initial recognition contingent liabilities recognised in business combinations that are recognised separately are subsequently measured at the higher of:• the amount that would be recognised as a provision; and• the amount initially recognised less cumulative
amortisation.
Contingent assets and contingent liabilities are not recognised on the face of the Annual Financial Statements however they are disclosed in note 38 - Contingencies.
1.16 Government grants and deferred grant income
Government grants are recognised when there is reasonable assurance that:• the group will comply with the conditions attaching to
them; and• the grants will be received.
Government grants are recognised as income over the periods necessary to match them with the related costs that they are intended to compensate.
Specifically, government grants whose primary condition is that the Group should purchase, construct or otherwise acquire non-current assets are recognised as deferred revenue in the consolidated statement of financial position and transferred to profit or loss on a systematic and rational basis over the useful lives of the related assets.
A government grant that becomes receivable as compensation for expenses or losses already incurred or for the purpose of giving immediate financial support to the entity with no future related costs is recognised as income of the period in which it becomes receivable.
Government grants related to assets, including non-monetary grants at fair value, are presented in the statement of financial position by setting up the grant as deferred income.
Grants related to income are presented as a credit in the profit or loss (separately).
Repayment of a grant related to income is applied first against any un-amortised deferred credit set up in respect of the grant. To the extent that the repayment exceeds any such deferred credit, or where no deferred credit exists, the repayment is recognised immediately as an expense.
Repayment of a grant related to an asset is recorded by reducing the deferred income balance by the amount repayable. The cumulative additional depreciation that would have been recognised to date as an expense in the absence of the grant is recognised immediately as an expense.
1.17 Revenue
Revenue is measured at the fair value of the consideration received or receivable. Revenue is reduced for estimated customer returns, rebates and other similar allowances.
Revenue from the sale of goods is recognised when all the following conditions have been satisfied:• the group has transferred to the buyer the significant risks
and rewards of ownership of the goods;• the group retains neither continuing managerial
involvement to the degree usually associated with ownership nor effective control over the goods sold;
• the amount of revenue can be measured reliably;• it is probable that the economic benefits associated with
the transaction will flow to the group; and• the costs incurred or to be incurred in respect of the
transaction can be measured reliably.
When the outcome of a transaction involving the rendering
of services can be estimated reliably, revenue associated
with the transaction is recognised by reference to the stage
of completion of the transaction at the end of the reporting
period. The outcome of a transaction can be estimated
reliably when all the following conditions are satisfied:
• the amount of revenue can be measured reliably;
• it is probable that the economic benefits associated with
the transaction will flow to the group;
• the stage of completion of the transaction at the end of the
reporting period can be measured reliably; and
• the costs incurred for the transaction and the costs to
complete the transaction can be measured reliably.
When the outcome of the transaction involving the rendering of services cannot be estimated reliably, revenue is

N E C S A A N N U A L R E P O R T 2 0 1 7 / 1 8 149 F I N A N C I A L R E P O R T 1 0
ACCOUNTING POLICIES (CONTINUED)
recognised only to the extent of the expenses recognised that are recoverable.
Service revenue is recognised by reference to the stage of completion of the transaction at the end of the reporting period. Stage of completion is determined by services performed to date as a percentage of total services to be performed.
Contract revenue comprises:• the initial amount of revenue agreed in the contract; and• variations in contract work, claims and incentive
payments:- to the extent that it is probable that they will result in
revenue; and- they are capable of being reliably measured.
Interest income from a financial asset is recognised when it is probable that the economic benefits will flow to the Group and the amount of income can be measured reliably. Interest income is accrued on a time basis, by reference to the principal outstanding and at the effective interest rate applicable, which is the rate that exactly discounts estimated future cash receipts through the expected life of the financial asset to that asset's net carrying amount on initial recognition.
Dividends are recognised, in profit or loss, when the shareholder's right to receive payment has been established, provided that it is probable that the economic benefits will flow to the entity and that the amount of dividend income can be measured reliably.
Service fees included in the price of a product are recognised as revenue over the period during which the service is performed.
The company has applied the principles stipulated in Circular 09/2006.The application of this Circular is to consider the impact in accounting for extended payment terms to trade debtors and creditors. Where extended payment terms are granted, whether explicitly or implicitly, the effect of the time value of money should be taken into account wherever this is material, irrespective of other factors such as the cash selling prices of the goods.
The Group's policy for recognition of revenue from operating leases is described in accounting policy 1.9 above.
1.18 Construction contracts and receivables
When the outcome of a construction contract cannot be estimated reliably, revenue and costs are recognised by reference to the stage of completion of the contract activity at the end of the reporting period, measured based on the proportion of contract costs incurred for work performed to date relative to the estimated total contract costs, except where this would not be representative of the stage of completion. Variations in contract work, claims and incentive payments are included to the extent that the amount can be measured reliably and its receipt is considered probable.
When the outcome of a construction contract cannot be estimated reliably, contract revenue is recognised to the extent of contract costs incurred that it is probable will be recoverable. Contract costs are recognised as expenses in the period in which they are incurred.
When it is probable that total contract costs will exceed total contract revenue, the expected loss is recognised as an expense immediately.
When contract costs incurred to date plus recognised profits less recognised losses exceed progress billings, the surplus is shown as amounts due from customers for contract work. For contracts where progress billings exceed contract costs incurred to date plus recognised profits less recognised losses, the surplus is shown as the amounts due to customers for contract work. Amounts received before the related work is performed are included in the consolidated statement of financial position, as a liability, as advances received. Amounts billed for work performed but not yet paid by the customer are included in the consolidated statement of financial position under trade and other receivable.
Necsa does not enter into construction contracts greater than 12 months.
1.19 Cost of sales
When inventories are sold, the carrying amount of those inventories is recognised as an expense in the period in which the related revenue is recognised. The amount of any write-down of inventories to net realisable value and all losses of inventories are recognised as an expense in the period the write-down or loss occurs. The amount of any reversal of any write-down of inventories, arising from an increase in net
N E C S A A N N U A L R E P O R T 2 0 1 7 / 1 8 150 F I N A N C I A L R E P O R T 1 0
ACCOUNTING POLICIES (CONTINUED)
realisable value, is recognised as a reduction in the amount of inventories recognised as an expense in the period in which the reversal occurs.
The related cost of providing services recognised as revenue in the current period is included in cost of sales.
Contract costs comprise:• costs that relate directly to the specific contract;• costs that are attributable to contract activity in general
and can be allocated to the contract; and• such other costs as are specifically chargeable to the
customer under the terms of the contract.
1.20 Translation of foreign currencies
Functional and presentation currency
Items included in the financial statements of each of the group entities are measured using the currency of the primary economic environment in which the entity operates.
The consolidated financial statements are presented in Rand which is the group functional and presentation currency.
Foreign currency transactions
In preparing the financial statements of each individual Group entity, transactions in currencies other than the entity's functional currency (foreign currencies) are recognised at the rates of exchange prevailing at the dates of the transactions. At the end of each reporting period, monetary items denominated in foreign currencies are retranslated at the rates prevailing at that date. Non-monetary items carried at fair value that are denominated in foreign currencies are retranslated at the rates prevailing at the date when the fair value was determined. Non-monetary items that are measured in terms of historical cost in a foreign currency are not retranslated.
Exchange differences on monetary items are recognised in profit or loss in the period in which they arise except for:• exchange differences on foreign currency borrowings
relating to assets under construction for future productive use, which are included in the cost of those assets when they are regarded as an adjustment to interest costs on those foreign currency borrowings;
• exchange differences on transactions entered into in order to hedge certain foreign currency risks; and
Exchange differences arising on the settlement of monetary items or on translating monetary items at rates different from those at which they were translated on initial recognition during the period or in previous financial statements are recognised in profit or loss in the period in which they arise.
When a gain or loss on a non-monetary item is recognised to other comprehensive income and accumulated in equity, any exchange component of that gain or loss is recognised to other comprehensive income and accumulated in equity. When a gain or loss on a non-monetary item is recognised in profit or loss, any exchange component of that gain or loss is recognised in profit or loss.
Necsa is exposed to foreign currency translation risks relating to Euro, Malaysian Ringgit and Dirham currencies.
Necsa, NTP and Pelchem enter into FEC's for all procurement transactions over R300 000 and they enter into FEC contracts for exposure to income receivable.
Investments in subsidiaries, joint ventures and associates
For the purposes of presenting consolidated financial statements, the assets and liabilities of the Group's foreign operations are translated into Rands using exchange rates prevailing at the end of each reporting period. Income and expense items are translated at the average exchange rates for the period, unless exchange rates fluctuate significantly during that period, in which case the exchange rates at the dates of the transactions are used. Exchange differences arising, if any, are recognised in other comprehensive income and accumulated in equity (attributed to non-controlling interests as appropriate).
On the disposal of a foreign operation (i.e. a disposal of the Group's entire interest in a foreign operation, or a disposal involving loss of control over a subsidiary that includes a foreign operation, a disposal involving loss of joint control over a jointly controlled entity that includes a foreign operation, or a disposal involving loss of significant influence over an associate that includes a foreign operation), all of the exchange differences accumulated in equity in respect of that operation attributable to the owners of the Company are reclassified to profit or loss.

N E C S A A N N U A L R E P O R T 2 0 1 7 / 1 8 151 F I N A N C I A L R E P O R T 1 0
ACCOUNTING POLICIES (CONTINUED)
In the case of a partial disposal that does not result in the Group losing control over a subsidiary that includes a foreign operation, the proportionate share of accumulated exchange differences are re-attributed to non-controlling interests and are not recognised in profit or loss. For all other partial disposals (i.e. reductions in the Group's ownership interest in associates or jointly controlled entities that do not result in the Group losing significant influence or joint control), the proportionate share of the accumulated exchange differences is reclassified to profit or loss.
Goodwill and fair value adjustments on identifiable assets and liabilities acquired arising on the acquisition of a foreign operation are treated as assets and liabilities of the foreign operation and translated at the rate of exchange prevailing at the end of each reporting period. Exchange differences arising are recognised in equity.
1.21 Related Parties
The Group operates in an economic environment currently dominated by entities directly or indirectly owned by the South African Government. As a result of the constitutional independence of all three spheres of government in South Africa, only parties within the national sphere of government are considered to be related parties.
Key management is defined as being individuals with the authority and responsibility for planning, directing and controlling the activities of the entity. All individuals from the level of Chief Executive Officer up to the Board of Directors are regarded as key management.
Close family members of key management personnel are considered to be those family members who may be expected to influence or be influenced by key management individuals or other parties related to the entity.
1.22 Fruitless and wasteful, irregular and unauthorised expenditure
Fruitless and wasteful expenditure in terms of the Public Finance Management Act means expenditure which was made in vain and would have been avoided had reasonable care been exercised are recorded in the notes to the financial statements.
Irregular expenditure is recorded in the notes to the financial statements. The amount recorded in the notes are equal to the value of the irregular expenditure incurred unless it is impracticable to determine the value thereof.
Unauthorised expenditure, when confirmed, must be recorded in the Statement of Financial Position. The amount recorded must be equal to the overspending within the division or the expenditure incurred that was not in accordance with the purpose of the division.
1.23 Rounding
Unless otherwise stated all financial figures are rounded off to the nearest one thousand rands (R'000).
N E C S A A N N U A L R E P O R T 2 0 1 7 / 1 8 152 F I N A N C I A L R E P O R T 1 0
NOTES TO THE FINANCIAL STATEMENTS FOR THE YEAR ENDED 31 MARCH 2018
2. SIGNIFICANT JUDGEMENTS AND SOURCES OF ESTIMATION UNCERTAINTY
Significant judgement and estimates in assessing the impairment of Financial assets
Financial assets, other than those at FVPL, are assessed for indicators of impairment at the end of each reporting period. The Group uses significant judgement in determining whether financial assets are considered to be impaired when there is objective evidence that, as a result of one or more events that occurred after the initial recognition of the financial asset, the estimated future cash flows of the investment have been affected.
For Annual Financial Statements equity investments, a significant or prolonged decline in the fair value of the security below its cost is considered to be objective evidence of impairment. This determination requires significant judgement by Group.
For certain categories of financial assets, such as trade receivables, assets are assessed for impairment on a collective basis even if they were assessed not to be impaired individually. Objective evidence of impairment for a portfolio of receivables could include the Group's past experience of collecting payments, an increase in the number of delayed payments in the portfolio past the average credit period of 60 days, as well as observable changes in national or local economic conditions that correlate with default on receivable.
Allowance for slow moving, damaged and obsolete inventory
An allowance is made to write inventory down to the lower of cost or net realisable value. Management have made estimates of the selling price and direct cost to sell on certain inventory items. The write down is included in the operating profit note.
Fair value estimation
Some of the Group assets and liabilities are measured at fair value for financial reporting purposes. The Chief Financial Officer's determines appropriate valuation techniques based on the accounting standards.
The fair value of financial instruments traded in active markets (such as trading and available-for-sale securities) is based on quoted market prices at the end of the reporting period. The quoted market price used for financial assets held by the group is the current bid price.
The fair value of financial instruments that are not traded in an active market is determined by using valuation techniques. The group uses a variety of methods and makes assumptions that are based on market conditions existing at the end of each reporting period. Other techniques, such as estimated discounted cash flows, are used to determine fair value for the remaining financial instruments. The fair value of forward foreign exchange contracts is determined using quoted forward exchange rates at the end of the reporting period. In estimating the fair value of an asset or liability, the Group uses market observable data to the extent that it is available. Where level 1 inputs are not available, the Group engages valuers to establish the appropriate valuation techniques and inputs into the model.
The carrying value less impairment provision of trade receivables and payables are assumed to approximate their fair values. The fair value of financial liabilities for disclosure purposes is estimated by discounting the future contractual cash flows at the current market interest rate that is available to the group for similar financial instruments. The assumption is based on the management expectation that outstanding balances will be collected or paid within twelve months, therefore the time value of money will not have an impact as it is considered to be immaterial.
Information about valuation techniques inputs used in determining fair values of various assets and liabilities are disclosed in notes.
N E C S A A N N U A L R E P O R T 2 0 1 7 / 1 8 153 F I N A N C I A L R E P O R T 1 0
NOTES TO THE FINANCIAL STATEMENTS FOR THE YEAR ENDED 31 MARCH 2018 (CONTINUED)
Impairment testing of Goodwill and tangible assets
The recoverable amounts of cash-generating units and individual assets have been determined based on the higher of value-in-use calculations and fair values less costs to sell. These calculations require the use of estimates and assumptions. It is reasonably possible that an assumption may change which may then impact estimations and may then require a material adjustment to the carrying value of goodwill and tangible assets.
The group reviews and tests the carrying value of assets when events or changes in circumstances suggest that the carrying amount may not be recoverable. In addition, goodwill is tested on an annual basis for impairment. Assets are grouped at the lowest level for which identifiable cash flows are largely independent of cash flows of other assets and liabilities. If there are indications that impairment may have occurred, estimates are prepared of expected future cash flows for each group of assets. Expected future cash flows used to determine the value in use of goodwill and tangible assets are inherently uncertain and could materially change over time.
Provisions
Provisions are estimated by management based on the available information. Additional disclosure of these estimates are included in note 23 - Provisions.
Taxation
Judgement is required in determining the provision for income taxes due to the complexity of legislation. There are many transactions and calculations for which the ultimate tax determination is uncertain during the ordinary course of business. The group recognises liabilities for anticipated tax audit issues based on estimates of whether additional taxes will be due. Where the final tax outcome of these matters is different from the amounts that were initially recorded, such differences will impact the income tax and deferred tax provisions in the period in which such determination is made.
The group recognises the net future tax benefit related to deferred income tax assets to the extent that it is probable that the deductible temporary differences will reverse in the foreseeable future. Assessing the recoverability of deferred income tax assets requires the group to make significant estimates related to expectations of future taxable income. Estimates of future taxable income are based on forecast cash flows from operations and the application of existing tax laws in each jurisdiction. To the extent that future cash flows and taxable income differ significantly from estimates, the ability of the group to realise the net deferred tax assets recorded at the end of the reporting period could be impacted.
Useful lives and residual values of property, plant and equipment
The useful lives of assets are based on management's estimation. Management considers the following factors to determine the optimum useful life expectation for each of the individual items of property, plant and equipment.• Expected usage of the asset. Usage is assessed by reference to the assets expected capacity or physical output.• Expected physical wear and tear, which depends on operational factors such as the number of shifts for which the asset is to
be used and the repair and maintenance programme, and the care and maintenance of the asset while idle.• Technical or commercial obsolescence arising from changes or improvement in production or from a change in the market
demand for the product or service output of the asset.• Exit policy of the Company.
The estimation of residual value of assets is also based on management's judgement that the assets will be sold and what its condition will be like at the end of its useful life. For assets that incorporate both a tangible and intangible portion, management uses judgement to assess which element is more significant to determine whether it should be treated as property, plant and equipment or intangible assets.

N E C S A A N N U A L R E P O R T 2 0 1 7 / 1 8 154 F I N A N C I A L R E P O R T 1 0
NOTES TO THE FINANCIAL STATEMENTS FOR THE YEAR ENDED 31 MARCH 2018 (CONTINUED)
Post retirement benefit obligation
Judgement is required when recognizing and measuring the retirement benefit obligation of the Group and the Company. The obligation is valued by an independent actuary at each reporting date. The actuarial valuation method is used to value the obligation and the projected unit credit method is used. Future benefit values are projected using specific actuarial assumptions and the liability to in-service members is accrued over the expected working lifetime. The most significant of which are subsidy inflation, longevity, cash flow risk, changes in bond yields and CPI as well as further changes in legislation.
3. NEW STANDARDS AND INTERPRETATIONS
3.1 Standards and interpretations effective and adopted in the current year
In the current year, the group has adopted the following standards and interpretations that are effective for the current financial year and that are relevant to its operations:
Standard/ Interpretation:Effective date:Years beginning on or after
Expected impact:
• Amendments to IFRS 12: Annual Improvements to IFRS 2014 - 2016 cycle
• Amendments to IAS 7: Disclosure initiative
• Amendments to IAS 12: Recognition of Deferred Tax Assets for Unrealised Losses
01 January 2017
01 January 2017
01 January 2017
No expected impact
(2)
(3)
IAS 7 Cash Flow Statements (amendments)
(2) IAS 7 Cash Flow Statements (amendments) – effective for annual periods beginning on or after 1 January 2017. The amendments require disclosures that enable users of financial statements to evaluate changes in liabilities arising from financing activities, including both changes arising from cash flow and non-cash changes. The amendments are intended to provide information to help investors better understand changes in a company‘s debt. To satisfy the new disclosure requirements, the group intends to present a reconciliation between the opening and closing balances for liabilities with changes arising from financing activities.
IAS 12 Income Taxes (amendments)
(3) IAS 12 Income Taxes (amendments) – effective for annual periods beginning on or after 1 January 2017. The amendments clarify the accounting for deferred tax assets for unrealised losses on debt instruments measured at fair value. The group is assessing the potential impact of this amendment but does not expect that there will be a significant impact on its separate and consolidated financial statements.
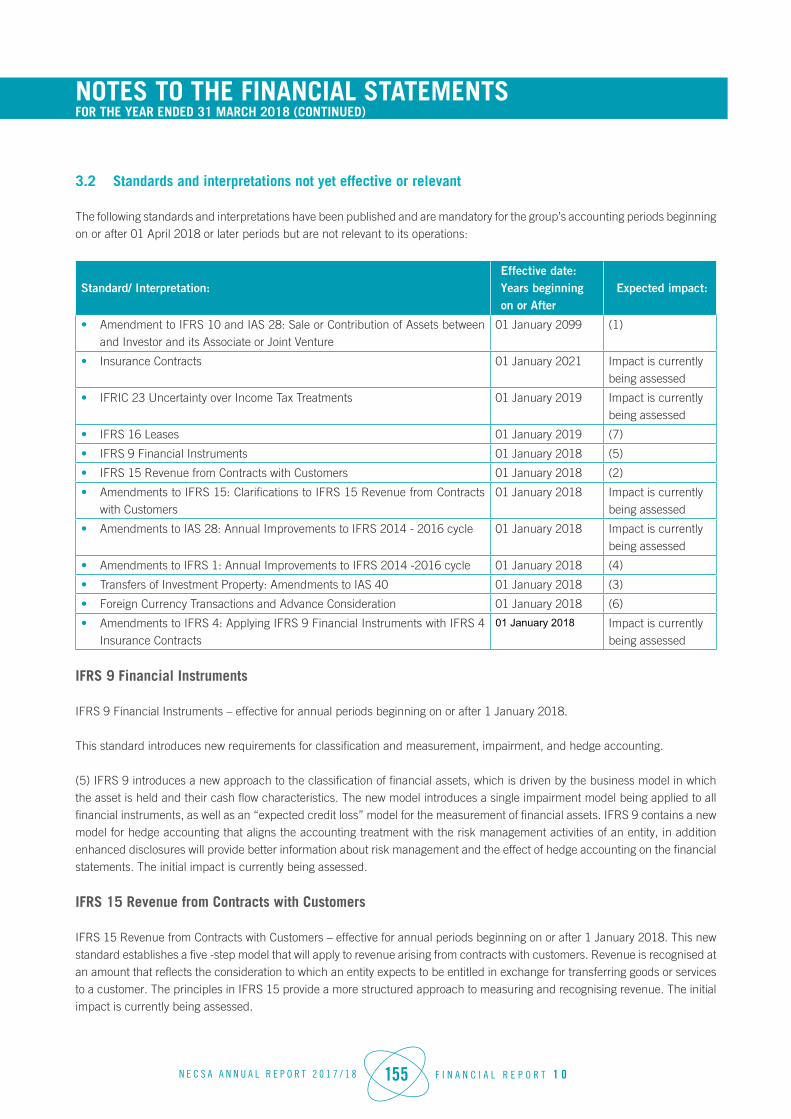
N E C S A A N N U A L R E P O R T 2 0 1 7 / 1 8 155 F I N A N C I A L R E P O R T 1 0
3.2 Standards and interpretations not yet effective or relevant
The following standards and interpretations have been published and are mandatory for the group’s accounting periods beginning on or after 01 April 2018 or later periods but are not relevant to its operations:
Standard/ Interpretation:Effective date:Years beginning on or After
Expected impact:
• Amendment to IFRS 10 and IAS 28: Sale or Contribution of Assets between and Investor and its Associate or Joint Venture
01 January 2099 (1)
• Insurance Contracts 01 January 2021 Impact is currently being assessed
• IFRIC 23 Uncertainty over Income Tax Treatments 01 January 2019 Impact is currently being assessed
• IFRS 16 Leases 01 January 2019 (7)
• IFRS 9 Financial Instruments 01 January 2018 (5)
• IFRS 15 Revenue from Contracts with Customers 01 January 2018 (2)
• Amendments to IFRS 15: Clarifications to IFRS 15 Revenue from Contracts with Customers
01 January 2018 Impact is currently being assessed
• Amendments to IAS 28: Annual Improvements to IFRS 2014 - 2016 cycle 01 January 2018 Impact is currently being assessed
• Amendments to IFRS 1: Annual Improvements to IFRS 2014 -2016 cycle 01 January 2018 (4)
• Transfers of Investment Property: Amendments to IAS 40 01 January 2018 (3)
• Foreign Currency Transactions and Advance Consideration 01 January 2018 (6)
• Amendments to IFRS 4: Applying IFRS 9 Financial Instruments with IFRS 4 Insurance Contracts
01 January 2018 Impact is currently being assessed
IFRS 9 Financial Instruments
IFRS 9 Financial Instruments – effective for annual periods beginning on or after 1 January 2018.
This standard introduces new requirements for classification and measurement, impairment, and hedge accounting.
(5) IFRS 9 introduces a new approach to the classification of financial assets, which is driven by the business model in which the asset is held and their cash flow characteristics. The new model introduces a single impairment model being applied to all financial instruments, as well as an “expected credit loss” model for the measurement of financial assets. IFRS 9 contains a new model for hedge accounting that aligns the accounting treatment with the risk management activities of an entity, in addition enhanced disclosures will provide better information about risk management and the effect of hedge accounting on the financial statements. The initial impact is currently being assessed.
IFRS 15 Revenue from Contracts with Customers
IFRS 15 Revenue from Contracts with Customers – effective for annual periods beginning on or after 1 January 2018. This new standard establishes a five -step model that will apply to revenue arising from contracts with customers. Revenue is recognised at an amount that reflects the consideration to which an entity expects to be entitled in exchange for transferring goods or services to a customer. The principles in IFRS 15 provide a more structured approach to measuring and recognising revenue. The initial impact is currently being assessed.
NOTES TO THE FINANCIAL STATEMENTS FOR THE YEAR ENDED 31 MARCH 2018 (CONTINUED)
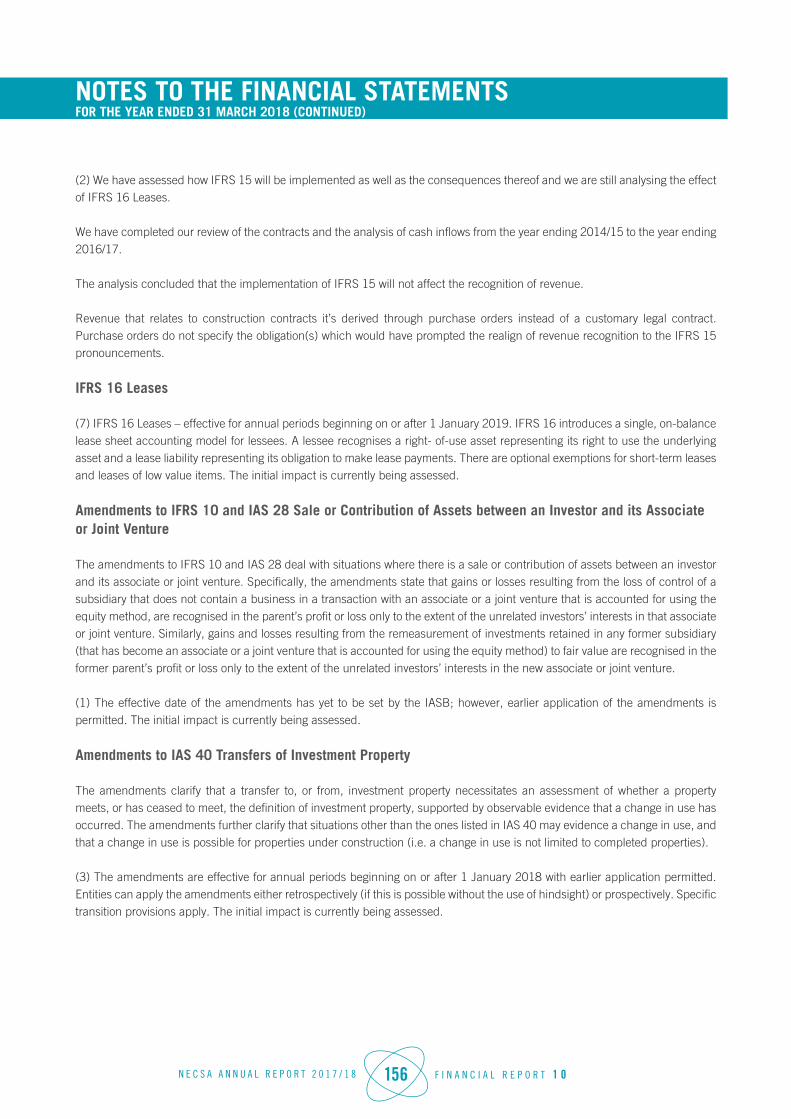
N E C S A A N N U A L R E P O R T 2 0 1 7 / 1 8 156 F I N A N C I A L R E P O R T 1 0
NOTES TO THE FINANCIAL STATEMENTS FOR THE YEAR ENDED 31 MARCH 2018 (CONTINUED)
(2) We have assessed how IFRS 15 will be implemented as well as the consequences thereof and we are still analysing the effect of IFRS 16 Leases.
We have completed our review of the contracts and the analysis of cash inflows from the year ending 2014/15 to the year ending 2016/17.
The analysis concluded that the implementation of IFRS 15 will not affect the recognition of revenue.
Revenue that relates to construction contracts it’s derived through purchase orders instead of a customary legal contract. Purchase orders do not specify the obligation(s) which would have prompted the realign of revenue recognition to the IFRS 15 pronouncements.
IFRS 16 Leases
(7) IFRS 16 Leases – effective for annual periods beginning on or after 1 January 2019. IFRS 16 introduces a single, on-balance lease sheet accounting model for lessees. A lessee recognises a right- of-use asset representing its right to use the underlying asset and a lease liability representing its obligation to make lease payments. There are optional exemptions for short-term leases and leases of low value items. The initial impact is currently being assessed.
Amendments to IFRS 10 and IAS 28 Sale or Contribution of Assets between an Investor and its Associate or Joint Venture
The amendments to IFRS 10 and IAS 28 deal with situations where there is a sale or contribution of assets between an investor and its associate or joint venture. Specifically, the amendments state that gains or losses resulting from the loss of control of a subsidiary that does not contain a business in a transaction with an associate or a joint venture that is accounted for using the equity method, are recognised in the parent’s profit or loss only to the extent of the unrelated investors’ interests in that associate or joint venture. Similarly, gains and losses resulting from the remeasurement of investments retained in any former subsidiary (that has become an associate or a joint venture that is accounted for using the equity method) to fair value are recognised in the former parent’s profit or loss only to the extent of the unrelated investors’ interests in the new associate or joint venture.
(1) The effective date of the amendments has yet to be set by the IASB; however, earlier application of the amendments is permitted. The initial impact is currently being assessed.
Amendments to IAS 40 Transfers of Investment Property
The amendments clarify that a transfer to, or from, investment property necessitates an assessment of whether a property meets, or has ceased to meet, the definition of investment property, supported by observable evidence that a change in use has occurred. The amendments further clarify that situations other than the ones listed in IAS 40 may evidence a change in use, and that a change in use is possible for properties under construction (i.e. a change in use is not limited to completed properties).
(3) The amendments are effective for annual periods beginning on or after 1 January 2018 with earlier application permitted. Entities can apply the amendments either retrospectively (if this is possible without the use of hindsight) or prospectively. Specific transition provisions apply. The initial impact is currently being assessed.

N E C S A A N N U A L R E P O R T 2 0 1 7 / 1 8 157 F I N A N C I A L R E P O R T 1 0
NOTES TO THE FINANCIAL STATEMENTS FOR THE YEAR ENDED 31 MARCH 2018 (CONTINUED)
Annual Improvements to IFRSs 2014 - 2016 Cycle
The Annual Improvements include amendments to IFRS 1 and IAS 28, which are not yet mandatorily effective for the Group. The package also includes amendments to IFRS 12, which is mandatorily effective for the Group in the current year.
The amendments to IAS 28 clarify that the option for a venture capital organisation and other similar entities to measure investments in associates and joint ventures at FVTPL is available separately for each associate or joint venture, and that election should be made at initial recognition of the associate or joint venture. In respect of the option for an entity that is not an investment entity (IE) to retain the fair value measurement applied by its associates and joint ventures that are IEs when applying the equity method, the amendments make a similar clarification that this choice is available for each IE associate or IE joint venture. The amendments apply retrospectively with earlier application permitted.
(4) Both the amendments to IFRS 1 and IAS 28 are effective for annual periods beginning on or after 1 January 2018. The initial impact is currently being assessed.
IFRIC 22 Foreign Currency Transactions and Advance Consideration
IFRIC 22 addresses how to determine the ‘date of transaction’ for the purpose of determining the exchange rate to use on initial recognition of an asset, expense or income, when consideration for that item has been paid or received in advance in a foreign currency which resulted in the recognition of a non-monetary asset or non-monetary liability (e.g. a non-refundable deposit or deferred revenue).
The Interpretation specifies that the date of transaction is the date on which the entity initially recognises the non -monetary asset or non-monetary liability arising from the payment or receipt of advance consideration. If there are multiple payments or receipts in advance, the Interpretation requires an entity to determine the date of transaction for each payment or receipt of advance consideration.
The Interpretation is effective for annual periods beginning on or after 1 January 2018 with earlier application permitted. Entities can apply the Interpretation either retrospectively or prospectively. Specific transition provisions apply to prospective application.
(6) The initial impact is currently being assessed.
4. FIRST-TIME ADOPTION OF INTERNATIONAL FINANCIAL REPORTING STANDARDS
These financial statements, for the year ended 31 March 2018, are the first the Group has prepared in accordance with IFRS. For periods up to and including the year ended 31 March 2017, the Group prepared its financial statements in accordance with SA GAAP.
Accordingly, the Group has prepared financial statements, which comply with IFRS applicable for periods ending on or after 31 March 2018, together with the comparative period data as at and for the year ended 31 March 2017, as described in the accounting policies.
In preparing these financial statements, the Group’s opening statement of financial position was prepared as at 1 April 2016, the Group’s date of transition to IFRS. Management has conducted a detailed analysis to identify gaps between SA GAAP and IFRS and have come to the conclusion that to a large extent, during the prior periods many of the accounting balances had already been accounted for in accordance with IFRS. However the disclosures have been enhanced in the financial statements in order to ensure that the Group complies with IFRS.

N E C S A A N N U A L R E P O R T 2 0 1 7 / 1 8 158 F I N A N C I A L R E P O R T 1 0
NOTES TO THE FINANCIAL STATEMENTS FOR THE YEAR ENDED 31 MARCH 2018 (CONTINUED)
In this regard no significant adjustments have been made by Group in restating its SA GAAP statement of financial position as at 1 April 2016 and its previously published SA GAAP financial statements as at and for the year ended 31 March 2017.
The date of transition was 1 April 2016 and the effect of the transition was as follows.
Group
Reconciliation of equity at 01 April 2016 (Date of transition to the new standards)
Note
As reported under previous
GAAPIFRS as at
1 April 2016
Assets Non-current assets
Property, plant and equipment 6 1,298,751 1,298,751
Investment property 5 17,190 17,190
Goodwill 7 11,357 11,357
Intangible assets 8 10,860 10,860
Investments in associates 9 2,405 2,405
Other financial assets 10 317,523 317,523
Deferred tax 12 26,565 26,565
Decommission and Decontaminate Stage 1 44 2,789,448 2,789,448
Decommission and Decontaminate Stage 2 195,312 195,312
Vaalputs After Care 4,519 4,519
4,673,930 4,673,930
Current assets
Inventories 14 231,886 231,886
Loans to group companies 11 3,310 3,310
Trade and other receivables 15 309,551 309,551
Other financial assets 12 694,289 694,289
Prepayments 120,653 120,653
Current tax receivable 10,005 10,005
Cash and cash equivalents 16 104,704 104,704
Non-current assets held for sale and assets of disposal groups 17 307 307
Total assets 6,148,635 6,148,635
Equity and liabilities
Equity
Share capital 18 2,205 2,205
Reserves 493,625 493,625
Accumulated Earnings/ (Loss) 511,051 511,051
Non-controlling interest 48,113 48,113
Total equity 1,054,994 1,054,994

N E C S A A N N U A L R E P O R T 2 0 1 7 / 1 8 159 F I N A N C I A L R E P O R T 1 0
NOTES TO THE FINANCIAL STATEMENTS FOR THE YEAR ENDED 31 MARCH 2018 (CONTINUED)
Note
As reported under previous
GAAPIFRS as at
1 April 2016
Non-current liabilities
Vaalputs After Care Liabilities 75,080 75,080
Other financial liabilities 19 6,986 6,986
Finance lease liabilities 20 5,543 5,543
Retirement benefit obligation 21 386,972 386,972
Deferred income 22 479,387 479,387
Provisions 23 205,769 205,769
Investment contributions for future liabilities 46 40,549 40,549
Decommission and Decontaminate Stage 2 450,308 450,308
Decommission and Decontaminate Stage 1 2,789,448 2,789,448
4,440,042 4,440,042
Current liabilities
Trade and other payables 24 276,379 276,379
Other financial liabilities 19 17,277 17,277
Finance lease liabilities 20 2,659 2,659
Operating lease liability 16 16
Retirement benefit obligation 21 22,234 22,234
Deferred income 22 110,593 110,593
Current tax payable 2,529 2,529
Provisions 23 98,420 98,420
Other liability 1 7,500 7,500
Amounts received in advance 28,009 28,009
Deposits received 1,488 1,488
Bank overdraft 16 85,232 85,232
652,336 652,336
Total liabilities 5,092,378 5,092,378
Liabilities of disposal groups 1,263 1,263
Total equity and liabilities 6,148,635 6,148,635

N E C S A A N N U A L R E P O R T 2 0 1 7 / 1 8 160 F I N A N C I A L R E P O R T 1 0
NOTES TO THE FINANCIAL STATEMENTS FOR THE YEAR ENDED 31 MARCH 2018 (CONTINUED)
Reconciliation of equity at 31 March 2017
Note
As reported under previous
GAAPIFRS as at
1 April 2017
Assets Non-current assets
Property, plant and equipment 6 1,348,288 1,348,288
Investment property 5 18,027 18,027
Goodwill 7 11,357 11,357
Intangible assets 8 10,284 10,284
Investments in associates 9 2,405 2,405
Other financial assets 10 453,566 453,566
Deferred tax 12 30,283 30,283
Decommission and Decontaminate Stage 1 44 2,727,063 2,727,063
Decommission and Decontaminate Stage 2 152,941 152,941
Vaalputs After Care 4,142 4,142
4,758,356 4,758,356
Current assets
Inventories 14 238,064 238,064
Loans to group companies 11 3,310 3,310
Trade and other receivables 15 198,360 198,360
Other financial assets 12 784,009 784,009
Prepayments 6,752 6,752
Current tax receivable 10,733 10,733
Cash and cash equivalents 16 99,697 99,697
1,340,925 1,340,925
Total assets 6,099,281 6,099,281
Equity and liabilities
Equity
Share capital 18 2,205 2,205
Reserves 545,593 545,593
Accumulated Earnings/ (Loss) 503,963 503,963
Non-controlling interest 52,583 52,583
Total equity 1,104,344 1,104,344
NOTES TO THE FINANCIAL STATEMENTS FOR THE YEAR ENDED 31 MARCH 2018 (CONTINUED)
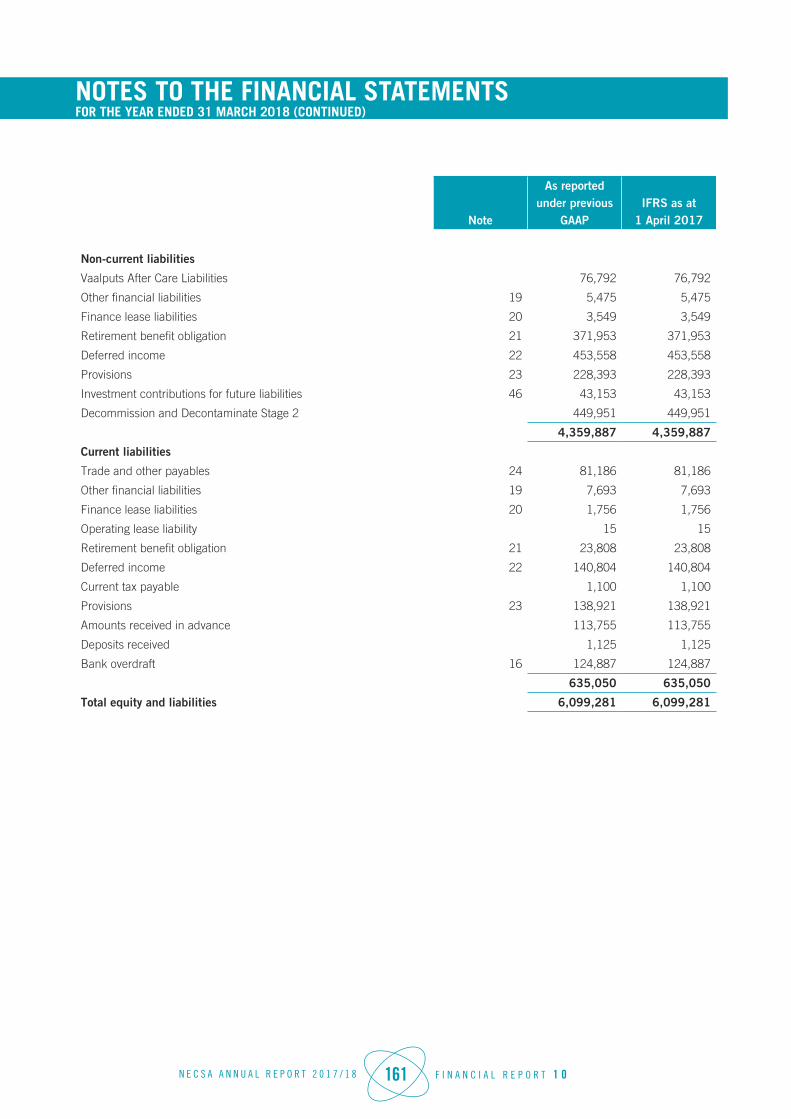
N E C S A A N N U A L R E P O R T 2 0 1 7 / 1 8 161 F I N A N C I A L R E P O R T 1 0
NOTES TO THE FINANCIAL STATEMENTS FOR THE YEAR ENDED 31 MARCH 2018 (CONTINUED)NOTES TO THE FINANCIAL STATEMENTS FOR THE YEAR ENDED 31 MARCH 2018 (CONTINUED)
Note
As reported under previous
GAAPIFRS as at
1 April 2017
Non-current liabilities
Vaalputs After Care Liabilities 76,792 76,792
Other financial liabilities 19 5,475 5,475
Finance lease liabilities 20 3,549 3,549
Retirement benefit obligation 21 371,953 371,953
Deferred income 22 453,558 453,558
Provisions 23 228,393 228,393
Investment contributions for future liabilities 46 43,153 43,153
Decommission and Decontaminate Stage 2 449,951 449,951
4,359,887 4,359,887
Current liabilities
Trade and other payables 24 81,186 81,186
Other financial liabilities 19 7,693 7,693
Finance lease liabilities 20 1,756 1,756
Operating lease liability 15 15
Retirement benefit obligation 21 23,808 23,808
Deferred income 22 140,804 140,804
Current tax payable 1,100 1,100
Provisions 23 138,921 138,921
Amounts received in advance 113,755 113,755
Deposits received 1,125 1,125
Bank overdraft 16 124,887 124,887
635,050 635,050
Total equity and liabilities 6,099,281 6,099,281

N E C S A A N N U A L R E P O R T 2 0 1 7 / 1 8 162 F I N A N C I A L R E P O R T 1 0
NOTES TO THE FINANCIAL STATEMENTS FOR THE YEAR ENDED 31 MARCH 2018 (CONTINUED)NOTES TO THE FINANCIAL STATEMENTS FOR THE YEAR ENDED 31 MARCH 2018 (CONTINUED)
Company
Reconciliation of equity at 01 April 2016 (Date of transition to the new standards)
Note
As reported under previous
GAAPIFRS as at
1 April 2017
Assets Non-current assets
Property, plant and equipment 6 1,004,001 1,004,001
Investment property 5 61,377 61,377
Investments in subsidiaries 262,702 262,702
Investments in associates 9 2 2
Other financial assets 10 311,988 311,988
Decommission and Decontaminate Stage 1 44 2,789,448 2,789,448
Decommission and Decontaminate Stage 2 195,312 195,312
Vaalputs After Care 4,519 4,519
4,629,349 4,629,349
Current assets
Inventories 14 39,491 39,491
Loans to group companies 11 3,879 3,879
Trade and other receivables 15 186,242 186,242
Other financial assets 12 258,663 258,663
Prepayments 55,808 55,808
Cash and cash equivalents 16 19,391 19,391
563,474 563,474
Total assets 5,192,823 5,192,823
Equity and liabilities
Equity
Share capital 18 2,205 2,205
Reserves 454,804 454,804
Accumulated Earnings/ (Loss) (287,717) (287,717)
Total equity 169,292 169,292
Non-current liabilities
Vaalputs After Care Liabilities 75,080 75,080
Finance lease liabilities 20 3,126 3,126
Retirement benefit obligation 21 361,156 361,156
Deferred income 22 479,387 479,387
Provisions 23 313,888 313,888
Investment contributions for future liabilities 46 33,049 33,049
Decommission and Decontaminate Stage 2 450,308 450,308
Decommission and Decontaminate Stage 1 2,789,448 2,789,448
4,505,442 4,505,442

N E C S A A N N U A L R E P O R T 2 0 1 7 / 1 8 163 F I N A N C I A L R E P O R T 1 0
NOTES TO THE FINANCIAL STATEMENTS FOR THE YEAR ENDED 31 MARCH 2018 (CONTINUED)NOTES TO THE FINANCIAL STATEMENTS FOR THE YEAR ENDED 31 MARCH 2018 (CONTINUED)
Note
As reported under previous
GAAPIFRS as at
1 April 2017
Current liabilities
Trade and other payables 24 139,612 139,612
Finance lease liabilities 20 1,961 1,961
Retirement benefit obligation 21 21,972 21,972
Deferred income 22 110,593 110,593
Provisions 23 44,200 44,200
Amounts received in advance 139,749 139,749
Bank overdraft 16 60,000 60,000
518,087 518,087
Total equity and liabilities 5,192,821 5,192,821

N E C S A A N N U A L R E P O R T 2 0 1 7 / 1 8 164 F I N A N C I A L R E P O R T 1 0
NOTES TO THE FINANCIAL STATEMENTS FOR THE YEAR ENDED 31 MARCH 2018 (CONTINUED)
Reconciliation of equity at 31 March 2017
Note
As reported under previous
GAAPIFRS as at
1 April 2017
Assets Non-current assets
Property, plant and equipment 6 1,027,060 1,027,060
Investment property 5 63,212 63,212
Investments in subsidiaries 262,702 262,702
Investments in associates 9 2 2
Other financial assets 10 453,526 453,526
Decommission and Decontaminate Stage 1 44 2,727,063 2,727,063
Decommission and Decontaminate Stage 2 152,941 152,941
Vaalputs After Care 4,142 4,142
4,690,648 4,690,648
Current assets
Inventories 14 22,765 22,765
Loans to group companies 11 756 756
Trade and other receivables 15 147,701 147,701
Other financial assets 12 246,812 246,812
Prepayments 78 78
Cash and cash equivalents 16 37,232 37,232
455,344 455,344
Total assets 5,145,992 5,145,992
Equity and liabilities
Equity
Share capital 18 2,205 2,205
Reserves 483,212 483,212
Accumulated Earnings/ (Loss) (396,489) (396,489)
Total equity 88,928 88,928
Non-current liabilities
Vaalputs After Care Liabilities 76,792 76,792
Finance lease liabilities 20 2,690 2,690
Retirement benefit obligation 21 346,471 346,471
Deferred income 22 453,558 453,558
Provisions 23 381,845 381,845
Investment contributions for future liabilities 46 35,653 35,653
Decommission and Decontaminate Stage 2 449,951 449,951
Decommission and Decontaminate Stage 1 2,727,063 2,727,063
4,474,023 4,474,023

N E C S A A N N U A L R E P O R T 2 0 1 7 / 1 8 165 F I N A N C I A L R E P O R T 1 0
NOTES TO THE FINANCIAL STATEMENTS FOR THE YEAR ENDED 31 MARCH 2018 (CONTINUED)
Note
As reported under previous
GAAPIFRS as at
1 April 2017
Current liabilities
Trade and other payables 24 127,084 127,084
Other financial liabilities 19 756 756
Finance lease liabilities 20 1,058 1,058
Retirement benefit obligation 21 22,652 22,652
Deferred income 22 140,804 140,804
Provisions 23 45,894 45,894
Amounts received in advance 142,946 142,946
Bank overdraft 16 101,847 101,847
583,041 583,041
Total equity and liabilities 5,145,992 5,145,992
5. INVESTMENT PROPERTY
Group
2018 2017
Cost / Valuation
Accumulated depreciation
Carrying value Cost / Valuation
Accumulated depreciation
Carrying value
R '000 R '000 R '000 R '000 R '000 R '000
Investment property 46,007 - 46,007 18,027 - 18,027
Group
2016
Cost / Valuation
Accumulated depreciation
Carrying value
R '000 R '000 R '000
Investment property 17,190 - 17,190
Company
2018 2017
Cost / Valuation
Accumulated depreciation
Carrying value Cost / Valuation
Accumulated depreciation
Carrying value
R '000 R '000 R '000 R '000 R '000 R '000
Investment property 126,328 - 126,328 63,212 - 63,212
Company 2016
Cost / Valuation
Accumulated depreciation
Carrying value
R '000 R '000 R '000
Investment property 61,377 - 61,377

N E C S A A N N U A L R E P O R T 2 0 1 7 / 1 8 166 F I N A N C I A L R E P O R T 1 0
NOTES TO THE FINANCIAL STATEMENTS FOR THE YEAR ENDED 31 MARCH 2018 (CONTINUED)
Reconciliation of investment property - Group - Year ended 31 March 2018
Opening balance
Transfers from Property, plant and equipment
Fair value adjustments Total
R '000 R '000 R '000 R '000
Investment property 18,027 27,989 (9) 46,007
Reconciliation of investment property - Group - Year ended 31 March 2017
Opening balance
Transfers from Property, plant and equipment
Other changes, Movements
Fair value adjustments Total
R '000 R '000 R '000 R '000 R '000
Investment property 17,190 (1,297) (784) 2,918 18,027
Reconciliation of investment property - Group - Year ended 31 March 2016
Opening balance
Transfers from Property, plant and equipment
Other changes, Movements
Fair value adjustments Total
R '000 R '000 R '000 R '000 R '000
Investment property 15,467 1,801 (1,265) 1,187 17,190
Reconciliation of investment property - Company -Year ended 31 March 2018
Opening balance
Transfers from Property, plant and equipment
Fair value adjustments Total
R '000 R '000 R '000 R '000
Investment property 63,212 61,756 1,360 126,328
Reconciliation of investment property - Company -Year ended 31 March 2017
Opening balance
Transfers from Property, plant and equipment
Other changes, Movements
Fair value adjustments Total
R '000 R '000 R '000 R '000 R '000
Investment property 61,377 (1,297) (2,751) 5,883 63,212

N E C S A A N N U A L R E P O R T 2 0 1 7 / 1 8 167 F I N A N C I A L R E P O R T 1 0
NOTES TO THE FINANCIAL STATEMENTS FOR THE YEAR ENDED 31 MARCH 2018 (CONTINUED)
Reconciliation of investment property - Company -Year ended 31 March 2016
Opening balance
Transfers from Property, plant and equipment
Other changes, movements
Fair value adjustments Total
Investment property 64,313 1,801 (3,157) (1,580) 61,377
Group Company
2018 2017 2016 2018 2017 2016
R '000 R '000 R '000 R '000 R '000 R '000
Fair value of investment properties 46,007 18,027 17,190 126,328 63,212 61,377
A register containing the information required by Regulation 25(3) of the Companies Regulations, 2011 is available for inspection at the registered office of the company.
Details of valuation
The fair value of the Group's investment property as at 31 March 2018 and 31 March 2017 has been arrived at on the basis of a valuation carried out on the respective dates by Mr M Fitchet from Knight Frank. Mr M Fitchet is a registered Professional Valuer in terms of section 19 of the Property Valuers Act, 2000. The valuers meet the requirements of RICS valuation - Professional standards VS 1.6, having sufficient current knowledge of the particular market and the skills to undertake the valuation completely.
Knight Frank is not a related party to the group and is independent.
The Investment (or Income) Approach to Valuation has been applied in terms of IFRS13. The valuation is made on the basis that the property’s Highest and Best Use would be for a mixed use industrial park providing facilities management for security, fire & safety as well as existing steam and compressed air services to tenants, including Necsa.
Gross rentals range from R12/m² for yard area to between R25-R32/m² for workshop/warehouse and R38-R40/m² for offices.
A special assumption is that the properties are not a National Key Point and is therefore capable of occupation and lease to 3rd parties.The Fair value was determined based on market research by way of enquiries with property practitioners active in the industrial property sector throughout Gauteng and elsewhere in South Africa. Other sources include windeed searches; web based research and the review of SAPOA and Rode property reports.
The valuers adopted the Income or Investment Approach to value for purposes of establishing fair value. The approach relies on value inputs including the application of market related rentals; the assessment of property expenses; consideration for future vacancies and the application of a market related capitalisation rate. There is also value in the surplus farm land value in existing use. In this regard, the valuers have been advised that development restriction exists which disallows housing township development to take place within a 5km radius of Necsa. The full farm falls within this radius. The capitalisation rate adopted is made by reference to the yield rates observed by the valuers for similar properties in the locality and adjusted based on the valuers' knowledge of factors specific to the respective properties.
There has been no change to the valuation technique during the year.
The group's investment property falls into level 2 of the fair value hierarchy.
There were no transfers between levels 1 and 2 during the year.
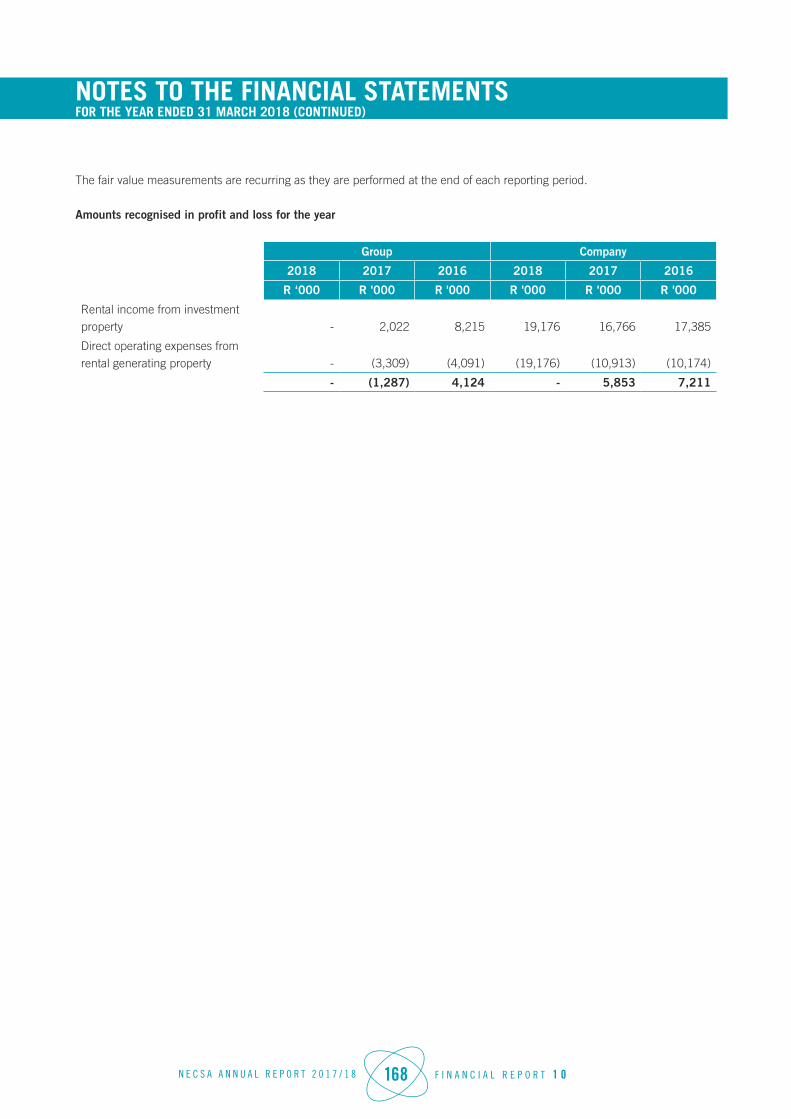
N E C S A A N N U A L R E P O R T 2 0 1 7 / 1 8 168 F I N A N C I A L R E P O R T 1 0
NOTES TO THE FINANCIAL STATEMENTS FOR THE YEAR ENDED 31 MARCH 2018 (CONTINUED)
The fair value measurements are recurring as they are performed at the end of each reporting period.
Amounts recognised in profit and loss for the year
Group Company
2018 2017 2016 2018 2017 2016
R ‘000 R '000 R '000 R '000 R '000 R '000
Rental income from investment property - 2,022 8,215 19,176 16,766 17,385
Direct operating expenses from rental generating property - (3,309) (4,091) (19,176) (10,913) (10,174)
- (1,287) 4,124 - 5,853 7,211

N E C S A A N N U A L R E P O R T 2 0 1 7 / 1 8 169 F I N A N C I A L R E P O R T 1 0
NOTES TO THE FINANCIAL STATEMENTS FOR THE YEAR ENDED 31 MARCH 2018 (CONTINUED)
6.
PROP
ERTY
, PLA
NT
AND
EQU
IPM
ENT
Grou
p
20
18
20
17
20
16
Cost / Valuation
Accumulated depreciation and Accumulated impairment (losses)/ reversals
Carrying value Cost / Valuation
Accumulated depreciation and Accumulated impairment (losses)/ reversals
Carrying value
Cost or revaluation
Accumulated depreciation and Accumulated impairment (losses)/ reversals
Carrying value
R '0
00
R '0
00R
'00
0R
'00
0R
'000
R '0
00
R '0
00
R '0
00R
'00
0
Com
pone
nt s
pare
s27
,839
(20,
104)
7,73
524
,286
(18,
480)
5,80
625
,489
(17,
710)
7,77
9
Fina
nce
leas
e as
sets
23,7
19(1
8,19
1)5,
528
29,7
51(2
3,44
4)6,
307
27,3
48(2
1,40
4)5,
944
Furn
iture
and
fixt
ures
21,0
76(1
5,82
3)5,
253
19,1
51(1
3,12
0)6,
031
19,3
62(1
1,20
6)8,
156
IT e
quip
men
t91
,220
(73,
236)
17,9
8488
,534
(66,
740)
21,7
9480
,731
(61,
672)
19,0
59
Land
and
bui
ldin
gs80
0,95
4(3
1,96
0)76
8,99
484
0,87
4(8
7,13
0)75
3,74
476
8,45
9(3
4,80
3)73
3,65
6
Leas
ehol
d im
prov
emen
ts19
5(1
85)
1019
5(9
3)10
219
5(7
8)11
7
Mac
hine
ry a
nd e
quip
men
t41
7,65
3(2
70,0
80)
147,
573
399,
059
(244
,177
)15
4,88
237
9,63
6(2
19,4
08)
160,
228
Mot
or v
ehic
les
and
tran
spor
t con
tain
ers
59,8
54(4
5,47
4)14
,380
59,0
36(3
4,98
7)24
,049
57,6
07(3
2,07
3)25
,534
Offi
ce e
quip
men
t13
,449
(11,
214)
2,23
517
,214
(14,
272)
2,94
217
,323
(14,
106)
3,21
7
Pla
nt59
7,48
3(1
87,5
77)
409,
906
546,
108
(199
,662
)34
6,44
649
7,05
3(1
81,9
84)
315,
069
Res
earc
h fa
cilit
ies
33,2
17(7
,312
)25
,905
32,7
14(6
,529
)26
,185
25,7
81(5
,789
)19
,992
Tota
l2
,08
6,6
59
(68
1,1
56
)1
,40
5,5
03
2,0
56
,92
2(7
08
,63
4)
1,3
48
,28
81
,89
8,9
84
(60
0,2
33
)1
,29
8,7
51
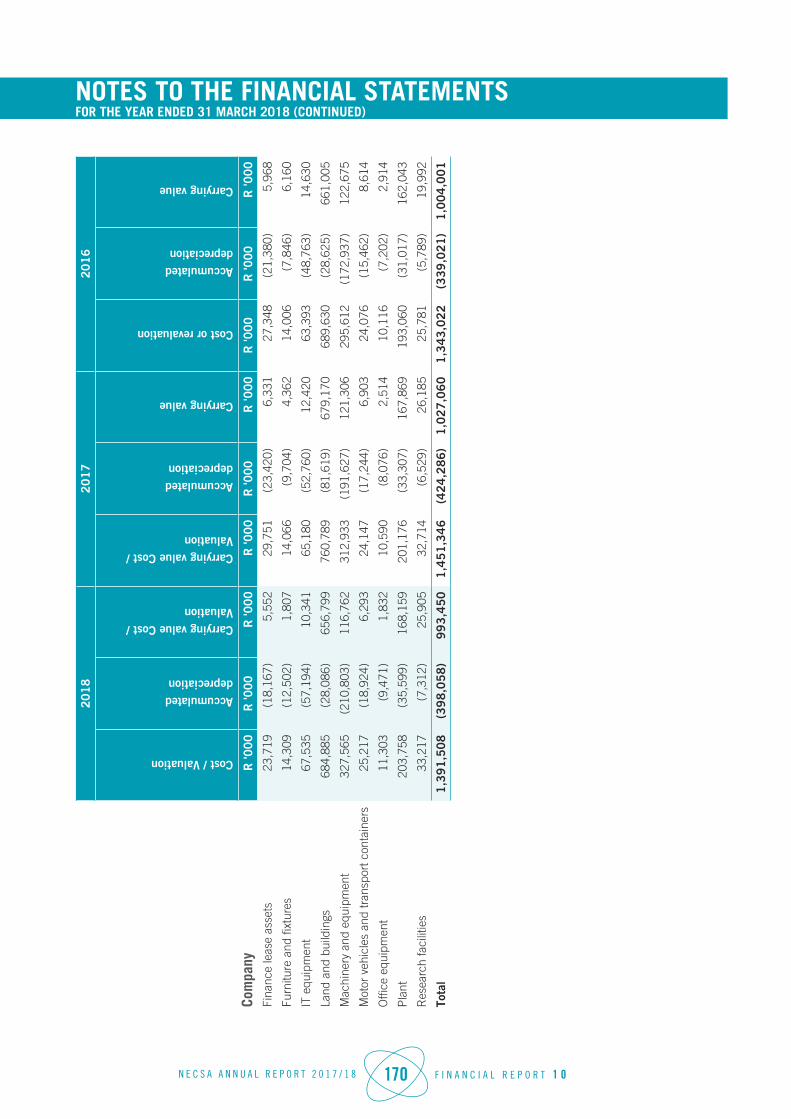
N E C S A A N N U A L R E P O R T 2 0 1 7 / 1 8 170 F I N A N C I A L R E P O R T 1 0
NOTES TO THE FINANCIAL STATEMENTS FOR THE YEAR ENDED 31 MARCH 2018 (CONTINUED)
Com
pany
20
18
20
17
20
16
Cost / Valuation
Accumulated depreciation
Carrying value Cost / Valuation
Carrying value Cost / Valuation
Accumulated depreciation
Carrying value
Cost or revaluation
Accumulated depreciation
Carrying value
R '0
00
R '0
00R
'00
0R
'00
0R
'000
R '0
00
R '0
00
R '0
00R
'00
0
Fina
nce
leas
e as
sets
23,7
19(1
8,16
7)5,
552
29,7
51(2
3,42
0)6,
331
27,3
48(2
1,38
0)5,
968
Furn
iture
and
fixt
ures
14,3
09(1
2,50
2)1,
807
14,0
66(9
,704
)4,
362
14,0
06(7
,846
)6,
160
IT e
quip
men
t67
,535
(57,
194)
10,3
4165
,180
(52,
760)
12,4
2063
,393
(48,
763)
14,6
30
Land
and
bui
ldin
gs68
4,88
5(2
8,08
6)65
6,79
976
0,78
9(8
1,61
9)67
9,17
068
9,63
0(2
8,62
5)66
1,00
5
Mac
hine
ry a
nd e
quip
men
t32
7,56
5(2
10,8
03)
116,
762
312,
933
(191
,627
)12
1,30
629
5,61
2(1
72,9
37)
122,
675
Mot
or v
ehic
les
and
tran
spor
t con
tain
ers
25,2
17(1
8,92
4)6,
293
24,1
47(1
7,24
4)6,
903
24,0
76(1
5,46
2)8,
614
Offi
ce e
quip
men
t11
,303
(9,4
71)
1,83
210
,590
(8,0
76)
2,51
410
,116
(7,2
02)
2,91
4
Pla
nt20
3,75
8(3
5,59
9)16
8,15
920
1,17
6(3
3,30
7)16
7,86
919
3,06
0(3
1,01
7)16
2,04
3
Res
earc
h fa
cilit
ies
33,2
17(7
,312
)25
,905
32,7
14(6
,529
)26
,185
25,7
81(5
,789
)19
,992
Tota
l1
,39
1,5
08
(39
8,0
58
)9
93
,45
01
,45
1,3
46
(42
4,2
86
)1
,02
7,0
60
1,3
43
,02
2(3
39
,02
1)
1,0
04
,00
1
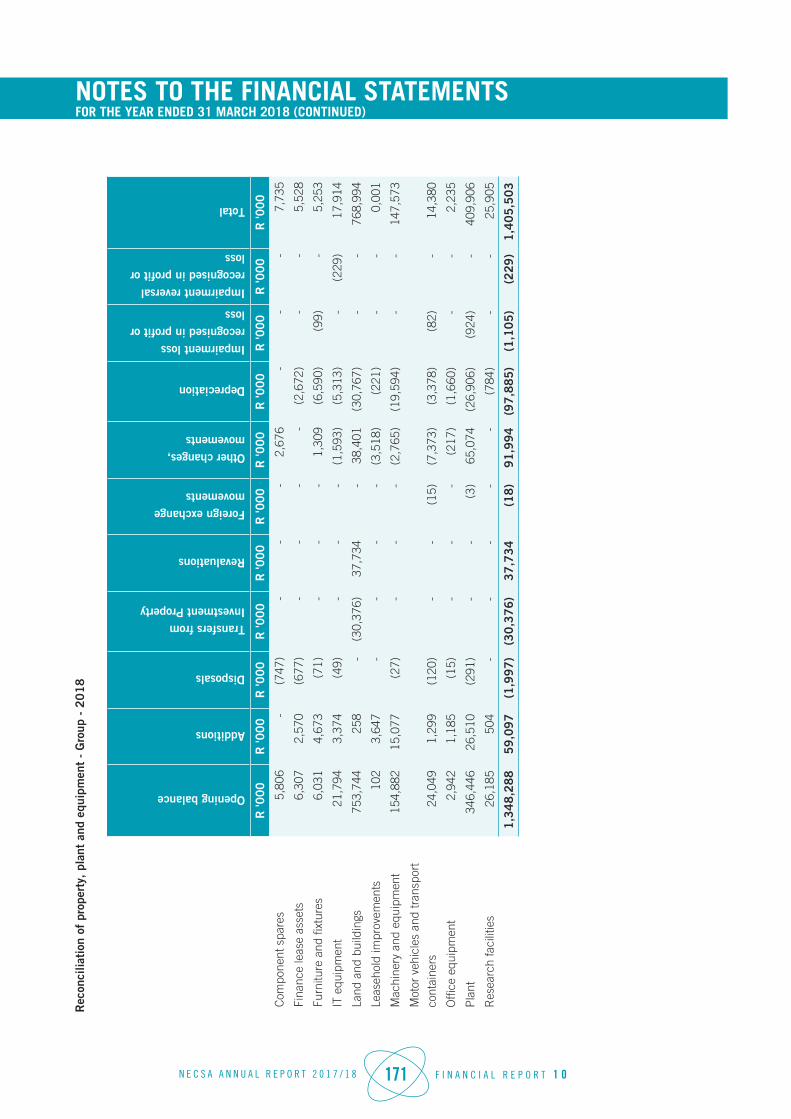
N E C S A A N N U A L R E P O R T 2 0 1 7 / 1 8 171 F I N A N C I A L R E P O R T 1 0
NOTES TO THE FINANCIAL STATEMENTS FOR THE YEAR ENDED 31 MARCH 2018 (CONTINUED)
Rec
onci
liati
on o
f pr
oper
ty, pl
ant
and
equi
pmen
t -
Gro
up -
20
18
Opening balance
Additions
Disposals
Transfers from Investment Property
Revaluations
Foreign exchange movements
Other changes, movements
Depreciation
Impairment loss recognised in profit or loss
Impairment reversal recognised in profit or loss
Total
R '0
00
R '0
00
R '0
00
R '0
00
R '0
00
R '0
00
R '0
00
R '0
00
R '0
00
R '0
00
R '0
00
Com
pone
nt s
pare
s5,
806
-(7
47)
--
-2,
676
--
-7,
735
Fina
nce
leas
e as
sets
6,30
72,
570
(677
)-
--
-(2
,672
)-
-5,
528
Furn
iture
and
fixt
ures
6,03
14,
673
(71)
--
-1,
309
(6,5
90)
(99)
-5,
253
IT e
quip
men
t21
,794
3,37
4(4
9)-
--
(1,5
93)
(5,3
13)
-(2
29)
17,9
14
Land
and
bui
ldin
gs75
3,74
425
8-
(30,
376)
37,7
34-
38,4
01(3
0,76
7)-
-76
8,99
4
Leas
ehol
d im
prov
emen
ts10
23,
647
--
--
(3,5
18)
(221
)-
-0,
001
Mac
hine
ry a
nd e
quip
men
t15
4,88
215
,077
(27)
--
-(2
,765
)(1
9,59
4)-
-14
7,57
3
Mot
or v
ehic
les
and
tran
spor
t co
ntai
ners
24,0
491,
299
(120
)-
-(1
5)(7
,373
)(3
,378
)(8
2)-
14,3
80
Offi
ce e
quip
men
t2,
942
1,18
5(1
5)-
--
(217
)(1
,660
)-
-2,
235
Pla
nt34
6,44
626
,510
(291
)-
-(3
)65
,074
(26,
906)
(924
)-
409,
906
Res
earc
h fa
cilit
ies
26,1
8550
4-
--
--
(784
)-
-25
,905
1,3
48
,28
85
9,0
97
(1,9
97
)(3
0,3
76
)3
7,7
34
(18
)9
1,9
94
(97
,88
5)
(1,1
05
)(2
29
)1
,40
5,5
03

N E C S A A N N U A L R E P O R T 2 0 1 7 / 1 8 172 F I N A N C I A L R E P O R T 1 0
NOTES TO THE FINANCIAL STATEMENTS FOR THE YEAR ENDED 31 MARCH 2018 (CONTINUED)
Rec
onci
liati
on o
f pr
oper
ty, pl
ant
and
equi
pmen
t -
Gro
up -
20
17
Opening balance
Additions
Disposals
Transfers to Investment Property
Revaluations
Foreign exchange movements
Other changes, movements
Depreciation
Impairment reversal/(loss) recognised in profit or loss
Total
R '0
00
R '0
00
R '0
00
R '0
00R
'00
0R
'00
0R
'000
R '0
00
R '0
00
R '0
00
Com
pone
nt s
pare
s7,
779
1,97
9-
--
-(3
,263
)(6
89)
-5,
806
Fina
nce
leas
e as
sets
5,94
42,
733
--
--
(306
)(2
,040
)-
6,30
7
Furn
iture
and
fixt
ures
8,15
67,
182
(53)
--
(25)
(4,8
69)
(4,3
43)
(17)
6,03
1
IT e
quip
men
t19
,059
3,48
1(9
6)-
-(6
)4,
727
(5,3
71)
-21
,794
Land
and
bui
ldin
gs73
3,65
615
,976
-1,
297
31,0
98-
714
(28,
997)
-75
3,74
4
Leas
ehol
d im
prov
emen
ts11
7-
--
--
(15)
--
102
Mac
hine
ry a
nd e
quip
men
t16
0,22
819
,303
(11)
--
-(3
,848
)(2
0,79
0)-
154,
882
Mot
or v
ehic
les
and
tran
spor
t co
ntai
ners
25,5
342,
838
(523
)-
-(1
5)(2
6)(3
,782
)23
24,0
49
Offi
ce e
quip
men
t3,
217
283
(1)
--
-47
3(1
,030
)-
2,94
2
Pla
nt31
5,06
944
,023
(357
)-
-(3
5)2,
836
(13,
778)
(1,3
36)
346,
446
Res
earc
h fa
cilit
ies
19,9
926,
932
--
--
1(7
40)
-26
,185
1,2
98
,75
11
04
,73
0(1
,04
1)
1,2
97
31
,09
8(8
1)
(3,5
76
)(8
1,5
60
)(1
,33
0)
1,3
48
,28
8
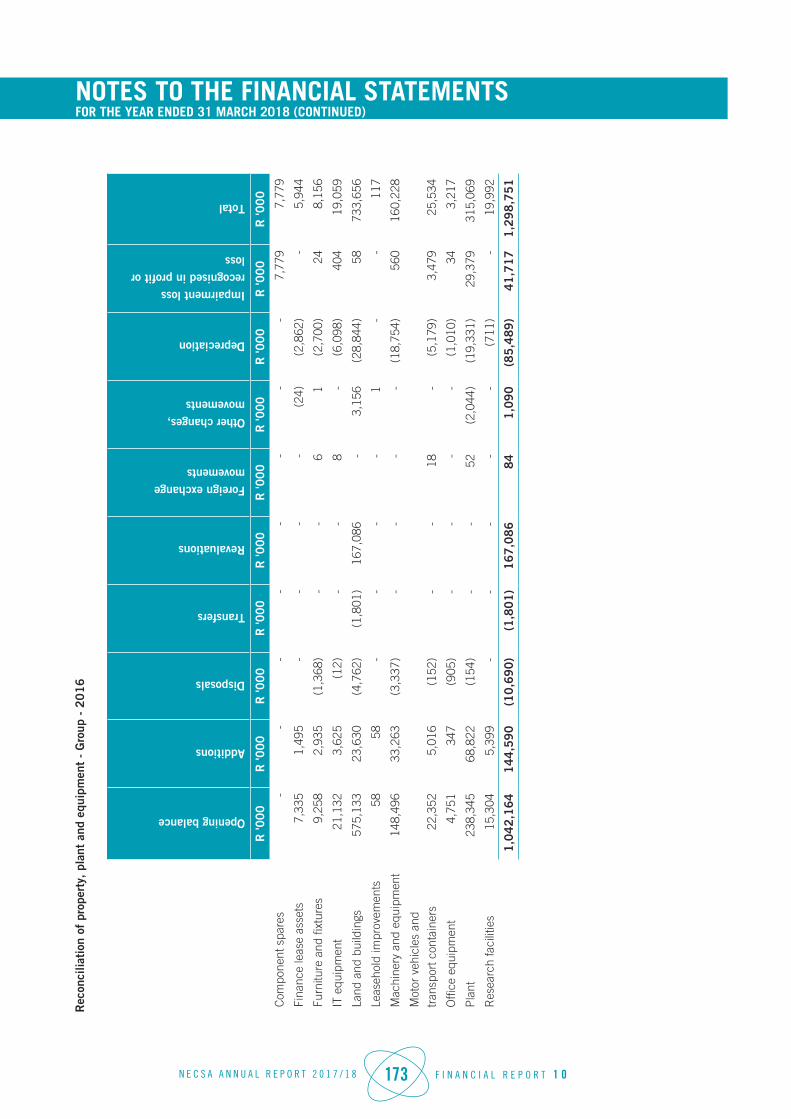
N E C S A A N N U A L R E P O R T 2 0 1 7 / 1 8 173 F I N A N C I A L R E P O R T 1 0
NOTES TO THE FINANCIAL STATEMENTS FOR THE YEAR ENDED 31 MARCH 2018 (CONTINUED)
Rec
onci
liati
on o
f pr
oper
ty, pl
ant
and
equi
pmen
t -
Gro
up -
20
16
Opening balance
Additions
Disposals
Transfers
Revaluations
Foreign exchange movements
Other changes, movements
Depreciation
Impairment loss recognised in profit or loss
Total
R '0
00
R '0
00
R '0
00
R '0
00R
'00
0R
'00
0R
'000
R '0
00
R '0
00
R '0
00
Com
pone
nt s
pare
s-
--
--
--
-7,
779
7,77
9
Fina
nce
leas
e as
sets
7,33
51,
495
--
--
(24)
(2,8
62)
-5,
944
Furn
iture
and
fixt
ures
9,25
82,
935
(1,3
68)
--
61
(2,7
00)
248,
156
IT e
quip
men
t21
,132
3,62
5(1
2)-
-8
-(6
,098
)40
419
,059
Land
and
bui
ldin
gs57
5,13
323
,630
(4,7
62)
(1,8
01)
167,
086
-3,
156
(28,
844)
5873
3,65
6
Leas
ehol
d im
prov
emen
ts58
58-
--
-1
--
117
Mac
hine
ry a
nd e
quip
men
t14
8,49
633
,263
(3,3
37)
--
--
(18,
754)
560
160,
228
Mot
or v
ehic
les
and
tran
spor
t con
tain
ers
22,3
525,
016
(152
)-
-18
-(5
,179
)3,
479
25,5
34
Offi
ce e
quip
men
t4,
751
347
(905
)-
--
-(1
,010
)34
3,21
7
Pla
nt23
8,34
568
,822
(154
)-
-52
(2,0
44)
(19,
331)
29,3
7931
5,06
9
Res
earc
h fa
cilit
ies
15,3
045,
399
--
--
-(7
11)
-19
,992
1,0
42
,16
41
44
,59
0(1
0,6
90
)(1
,80
1)
16
7,0
86
84
1,0
90
(85
,48
9)
41
,71
71
,29
8,7
51

N E C S A A N N U A L R E P O R T 2 0 1 7 / 1 8 174 F I N A N C I A L R E P O R T 1 0
NOTES TO THE FINANCIAL STATEMENTS FOR THE YEAR ENDED 31 MARCH 2018 (CONTINUED)
Rec
onci
liati
on o
f pr
oper
ty, pl
ant
and
equi
pmen
t -
Com
pany
- 2
01
8
Opening balance
Additions
Disposals
Transfers
Revaluations
Other changes, movements
Depreciation
Total
R '0
00
R '0
00
R '0
00
R '0
00
R '0
00
R '0
00
R '0
00
R '0
00
Fina
nce
leas
e as
sets
6,33
12,
570
(677
)-
--
(2,6
72)
5,55
2
Furn
iture
and
fixt
ures
4,36
225
4-
--
-(2
,809
)1,
807
IT e
quip
men
t12
,420
2,93
1(2
2)-
--
(4,9
88)
10,3
41
Land
and
bui
ldin
gs67
9,17
025
8-
(30,
376)
35,8
34-
(28,
087)
656,
799
Mac
hine
ry a
nd e
quip
men
t12
1,30
615
,077
(27)
--
-(1
9,59
4)11
6,76
2
Mot
or v
ehic
les
and
tran
spor
t con
tain
ers
6,90
31,
069
--
--
(1,6
79)
6,29
3
Offi
ce e
quip
men
t2,
514
859
--
--
(1,5
41)
1,83
2
Pla
nt16
7,86
92,
582
--
--
(2,2
92)
168,
159
Res
earc
h fa
cilit
ies
26,1
8550
4-
--
-(7
84)
25,9
05
1,0
27
,06
02
6,1
04
(72
6)
(30
,37
6)
35
,83
4-
(64
,44
6)
99
3,4
50
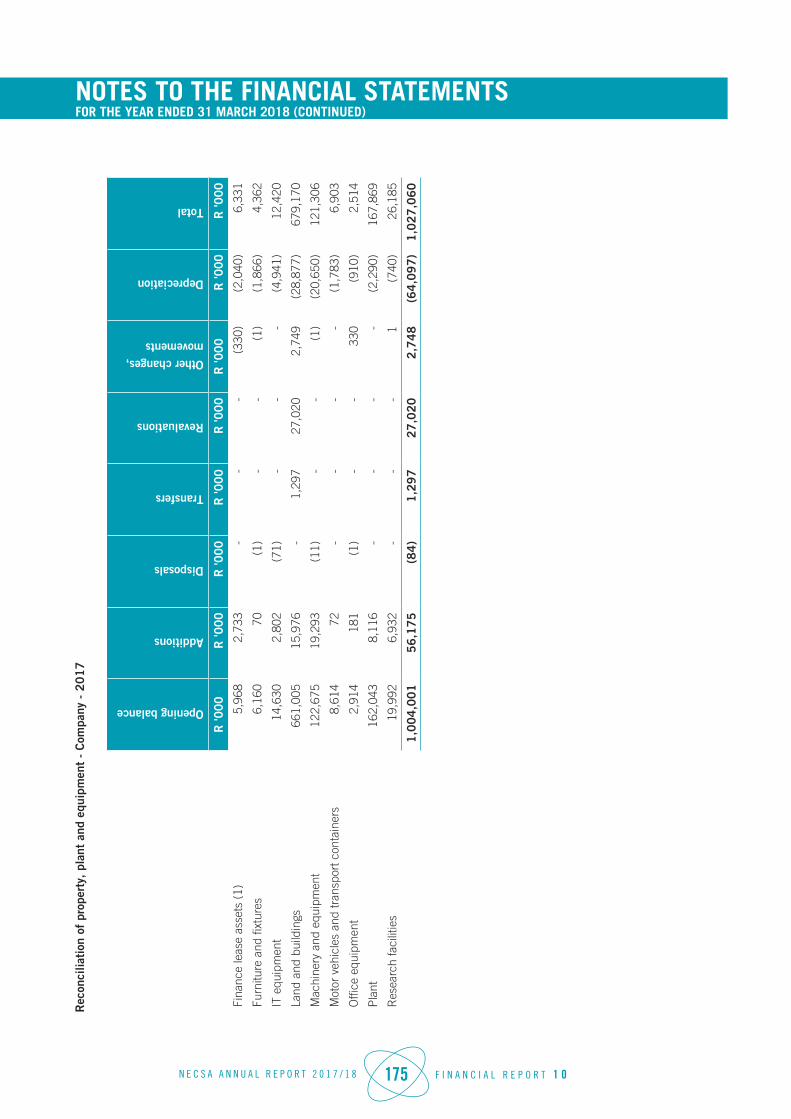
N E C S A A N N U A L R E P O R T 2 0 1 7 / 1 8 175 F I N A N C I A L R E P O R T 1 0
NOTES TO THE FINANCIAL STATEMENTS FOR THE YEAR ENDED 31 MARCH 2018 (CONTINUED)
Rec
onci
liati
on o
f pr
oper
ty, pl
ant
and
equi
pmen
t -
Com
pany
- 2
01
7
Opening balance
Additions
Disposals
Transfers
Revaluations
Other changes, movements
Depreciation
Total
R '0
00
R '0
00
R '0
00
R '0
00
R '0
00
R '0
00
R '0
00
R '0
00
Fina
nce
leas
e as
sets
(1)
5,96
82,
733
--
-(3
30)
(2,0
40)
6,33
1
Furn
iture
and
fixt
ures
6,16
070
(1)
--
(1)
(1,8
66)
4,36
2
IT e
quip
men
t14
,630
2,80
2(7
1)-
--
(4,9
41)
12,4
20
Land
and
bui
ldin
gs66
1,00
515
,976
-1,
297
27,0
202,
749
(28,
877)
679,
170
Mac
hine
ry a
nd e
quip
men
t12
2,67
519
,293
(11)
--
(1)
(20,
650)
121,
306
Mot
or v
ehic
les
and
tran
spor
t con
tain
ers
8,61
472
--
--
(1,7
83)
6,90
3
Offi
ce e
quip
men
t2,
914
181
(1)
--
330
(910
)2,
514
Pla
nt16
2,04
38,
116
--
--
(2,2
90)
167,
869
Res
earc
h fa
cilit
ies
19,9
926,
932
--
-1
(740
)26
,185
1,0
04
,00
15
6,1
75
(84
)1
,29
72
7,0
20
2,7
48
(64
,09
7)
1,0
27
,06
0

N E C S A A N N U A L R E P O R T 2 0 1 7 / 1 8 176 F I N A N C I A L R E P O R T 1 0
NOTES TO THE FINANCIAL STATEMENTS FOR THE YEAR ENDED 31 MARCH 2018 (CONTINUED)
Rec
onci
liati
on o
f pr
oper
ty, pl
ant
and
equi
pmen
t -
Com
pany
- 2
01
6
Opening balance
Additions
Disposals
Transfers
Revaluations
Other changes, movements
Depreciation
Total
R '0
00
R '0
00
R '0
00
R '0
00
R '0
00
R '0
00
R '0
00
R '0
00
Fina
nce
leas
e as
sets
7,33
51,
495
--
--
(2,8
62)
5,96
8
Furn
iture
and
fixt
ures
7,11
621
2-
--
-(1
,168
)6,
160
IT e
quip
men
t18
,511
1,83
3(1
2)-
--
(5,7
02)
14,6
30
Land
and
bui
ldin
gs50
0,88
420
,805
-(1
,801
)16
6,58
63,
156
(28,
625)
661,
005
Mac
hine
ry a
nd e
quip
men
t10
7,88
633
,263
--
--
(18,
474)
122,
675
Mot
or v
ehic
les
and
tran
spor
t con
tain
ers
8,84
11,
726
--
--
(1,9
53)
8,61
4
Offi
ce e
quip
men
t3,
665
133
(5)
--
-(8
79)
2,91
4
Pla
nt15
1,22
613
,109
--
--
(2,2
92)
162,
043
Res
earc
h fa
cilit
ies
15,3
045,
399
--
--
(711
)19
,992
82
0,7
68
77
,97
5(1
7)
(1,8
01
)1
66
,58
63
,15
6(6
2,6
66
)1
,00
4,0
01
(1)
Fina
nce
leas
es r
elat
e to
ele
ctro
nic
offic
e eq
uipm
ent a
nd m
otor
veh
icle
s.
Expe
nses
incu
rred
in th
e co
nstr
uctio
n of
pro
pert
y, p
lant
and
equ
ipm
ent i
tem
s ha
ve n
ot b
een
capi
talis
ed to
the
asse
ts.
All
clas
ses
of p
rope
rty,
pla
nt a
nd e
quip
men
t ite
ms
othe
r th
an la
nd a
nd b
uild
ings
hav
e be
en r
ecog
nise
d on
the
cost
mod
el.
Ple
dged
as
secu
rity
No
asse
ts h
ave
been
ple
dged
as
secu
rity
and
are
secu
red
by th
e le
ssor
's ti
tle to
the
leas
ed a
sset
s.

N E C S A A N N U A L R E P O R T 2 0 1 7 / 1 8 177 F I N A N C I A L R E P O R T 1 0
NOTES TO THE FINANCIAL STATEMENTS FOR THE YEAR ENDED 31 MARCH 2018 (CONTINUED)
Details of properties
Land and buildings consist of the following properties:
Necsa: Farm 567, Weldaba; Erf 1150, 1153, 1155 and 1156 . The properties were revalued as at 31 March 2017 by an independent valuator. Please refer to revaluation below.
Albertinia; Erf 4473 and 4474 Riverdale; Erf 1115, 1224, 1916, 1917, 1919, 1921, 1922, 1924, 1926, 1928 and 1929. These assets are measured at cost less accumulated depreciation.
Springbok; Farm 369 and 380 Vaalputs. The rest of the assets are measured at cost less accumulated depreciation.
Gammatec NDT: Portion 91 of Farm 601 Klipplaatdrif, Vereeniging. The property is encumbered as disclosed in note of Gammatec NDT Annual Financial Statements. The property was revalued as at 30 April 2017 by an independent valuer.
AEC Amersham: Erf 176, 100 Indianapolis Street, Kyalami. The property was revalued as at 31 March 2017 by an independent valuer.
The estimation of the useful lives of property, plant and equipment is based on historic performance as well as expectations about future use and therefore requires a significant degree of judgement to be applied by management. These depreciation rates represent management’s current best estimate of the useful lives of the assets.
Transfer of property, plant and equipment not only relates to investment property, but also include transfers to other asset classes.
The revaluation reserve may not be distributed to shareholders.
A register containing the information required by Regulation 25(3) of the Companies Regulations, 2011 is available for inspection at the registered office of the Company.
Depreciation rates
The depreciation methods and average useful lives of property, plant and equipment have been assessed as follows:
Land Straight line basis - years Indefinite
Buildings Straight line basis - years 10 - 50 years
Plant Straight line basis - years 5 - 50 years
Furniture and fixtures Straight line basis - years 2 - 22 years
Motor vehicles and transport containers Straight line basis - years 2 - 26 years
Office equipment Straight line basis - years 2 - 22 years
IT equipment Straight line basis - years 2 - 22 years
Research facilities Straight line basis - years 2 - 22 years
Leasehold improvements Straight line basis - years 2 - 10 years
Machinery and equipment Straight line basis - years 2 - 22 years
Component spares Straight line basis - years 2 - 10 years
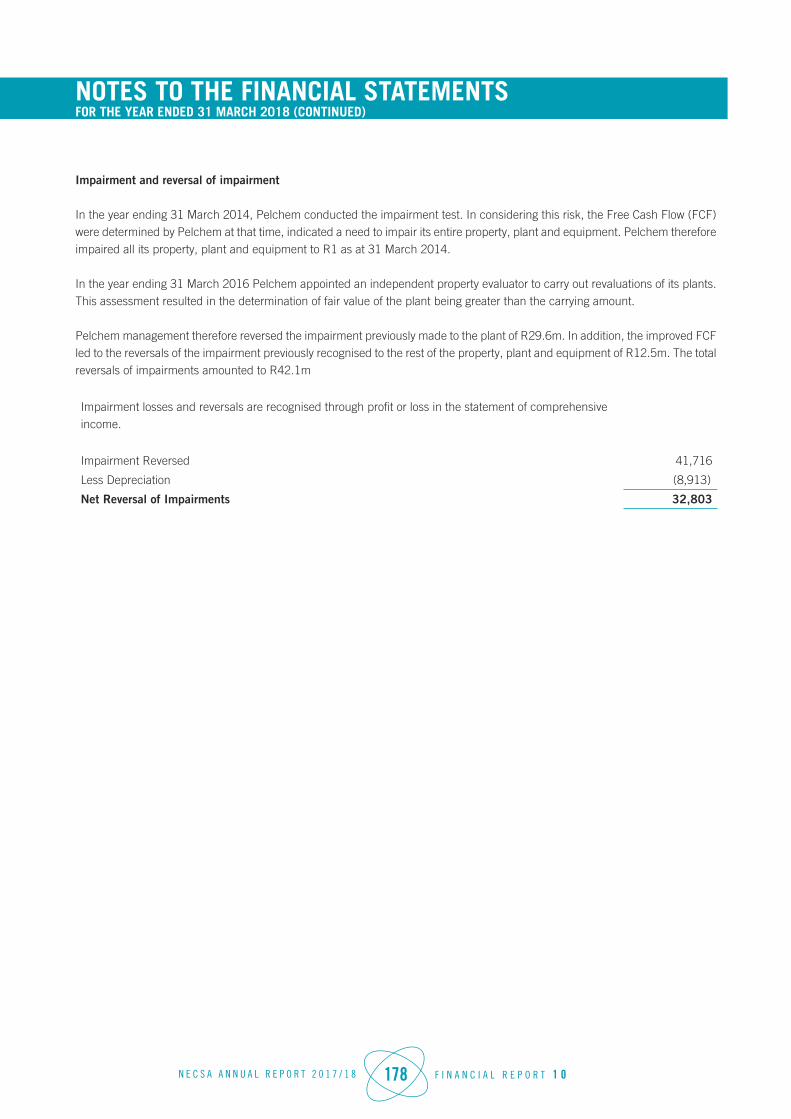
N E C S A A N N U A L R E P O R T 2 0 1 7 / 1 8 178 F I N A N C I A L R E P O R T 1 0
NOTES TO THE FINANCIAL STATEMENTS FOR THE YEAR ENDED 31 MARCH 2018 (CONTINUED)
Impairment and reversal of impairment
In the year ending 31 March 2014, Pelchem conducted the impairment test. In considering this risk, the Free Cash Flow (FCF) were determined by Pelchem at that time, indicated a need to impair its entire property, plant and equipment. Pelchem therefore impaired all its property, plant and equipment to R1 as at 31 March 2014.
In the year ending 31 March 2016 Pelchem appointed an independent property evaluator to carry out revaluations of its plants. This assessment resulted in the determination of fair value of the plant being greater than the carrying amount.
Pelchem management therefore reversed the impairment previously made to the plant of R29.6m. In addition, the improved FCF led to the reversals of the impairment previously recognised to the rest of the property, plant and equipment of R12.5m. The total reversals of impairments amounted to R42.1m
Impairment losses and reversals are recognised through profit or loss in the statement of comprehensive income.
Impairment Reversed 41,716
Less Depreciation (8,913)
Net Reversal of Impairments 32,803

N E C S A A N N U A L R E P O R T 2 0 1 7 / 1 8 179 F I N A N C I A L R E P O R T 1 0
NOTES TO THE FINANCIAL STATEMENTS FOR THE YEAR ENDED 31 MARCH 2018 (CONTINUED)
7.
GOOD
WIL
L
Grou
p
20
18
20
17
20
16
Cos
tA
ccum
ulat
ed
impa
irm
ent
Carr
ying
va
lue
Cos
tA
ccum
ulat
ed
impa
irm
ent
Carr
ying
va
lue
Cos
tA
ccum
ulat
ed
impa
irm
ent
Carr
ying
va
lue
R '0
00R
'00
0R
'000
R '0
00R
'000
R '0
00R
'00
0R
'000
R '0
00
Goo
dwill
66,4
17(2
0,08
5)46
,332
14,5
87(3
,230
)11
,357
14,5
87(3
,230
)11
,357
Goo
dwill
is
initi
ally
mea
sure
d at
cos
t, w
hich
rep
rese
nts
the
exce
ss o
f th
e pu
rcha
se p
rice
over
the
net
fai
r va
lue
of t
he i
dent
ifiab
le a
sset
s, l
iabi
litie
s an
d co
ntin
gent
lia
bilit
ies
whe
n th
e su
bsid
iary
was
acq
uire
d.
Goo
dwill
aro
se o
n th
e ac
quis
ition
of t
he fo
llow
ing
subs
idia
ries:
A 5
5% s
hare
hold
ing
in G
amm
atec
ND
T Su
pplie
s SO
C L
imite
d w
as a
cqui
red
on 1
Oct
ober
200
9 by
NTP
Rad
iois
otop
es S
OC
Lim
ited.
The
Gam
mat
ec G
roup
of c
ompa
nies
co
nsis
ts o
f six
com
pani
es lo
cate
d in
Sou
th A
fric
a, M
alay
sia,
the
Mid
dle
East
, Aus
tral
ia a
nd N
ew Z
eala
nd.
A 1
00%
sha
reho
ldin
g in
Pha
rmat
opes
SO
C L
imite
d w
as a
cqui
red
on 1
Jan
uary
200
9 by
AEC
Am
ersh
am S
OC
Lim
ited.
Goo
dwill
is t
este
d fo
r im
pairm
ent
on a
n an
nual
bas
is.
The
curr
ent
carr
ying
val
ue w
as d
eter
min
ed t
o be
low
er t
han
the
reco
vera
ble
amou
nt .
No
impa
irmen
t lo
ss w
as
reco
gnis
ed. W
e th
us in
dica
te th
at th
ere
is n
o im
pairm
ent o
f the
Car
ryin
g Va
lue
stat
ed in
the
AFS
for
Gam
mat
ec, N
TP R
adio
isot
opes
and
Nec
sa.
8.
INTA
NGI
BLE
ASSE
TS
Gro
up
20
18
20
17
20
16
Cos
t /
Valu
atio
nA
ccum
ulat
ed
amor
tisa
tion
Car
ryin
g va
lue
Cos
t /
Valu
atio
nA
ccum
ulat
ed
amor
tisa
tion
Car
ryin
g va
lue
Cos
t /
Valu
atio
nA
ccum
ulat
ed
amor
tisa
tion
Car
ryin
g va
lue
R '0
00
R '0
00
R '0
00
R '0
00
R '0
00R
'00
0R
'00
0R
'000
R '0
00
Com
pute
r so
ftwar
e2,
257
(1,3
12)
945
2,11
7(1
,154
)96
31,
998
(990
)1,
008
Inta
ngib
le a
sset
s un
der
deve
lopm
ent
--
-8,
847
-8,
847
8,84
7-
8,84
7
Pat
ents
, tra
dem
arks
and
ot
her
right
s12
4,28
3(8
8,00
9)36
,274
--
--
--
Pat
ents
, tra
dem
arks
and
ot
her
right
s-
--
2,03
9(1
,565
)47
42,
396
(1,3
91)
1,00
5
Tota
l1
26
,54
0(8
9,3
21
)3
7,2
19
13
,00
3(2
,71
9)
10
,28
41
3,2
41
(2,3
81
)1
0,8
60
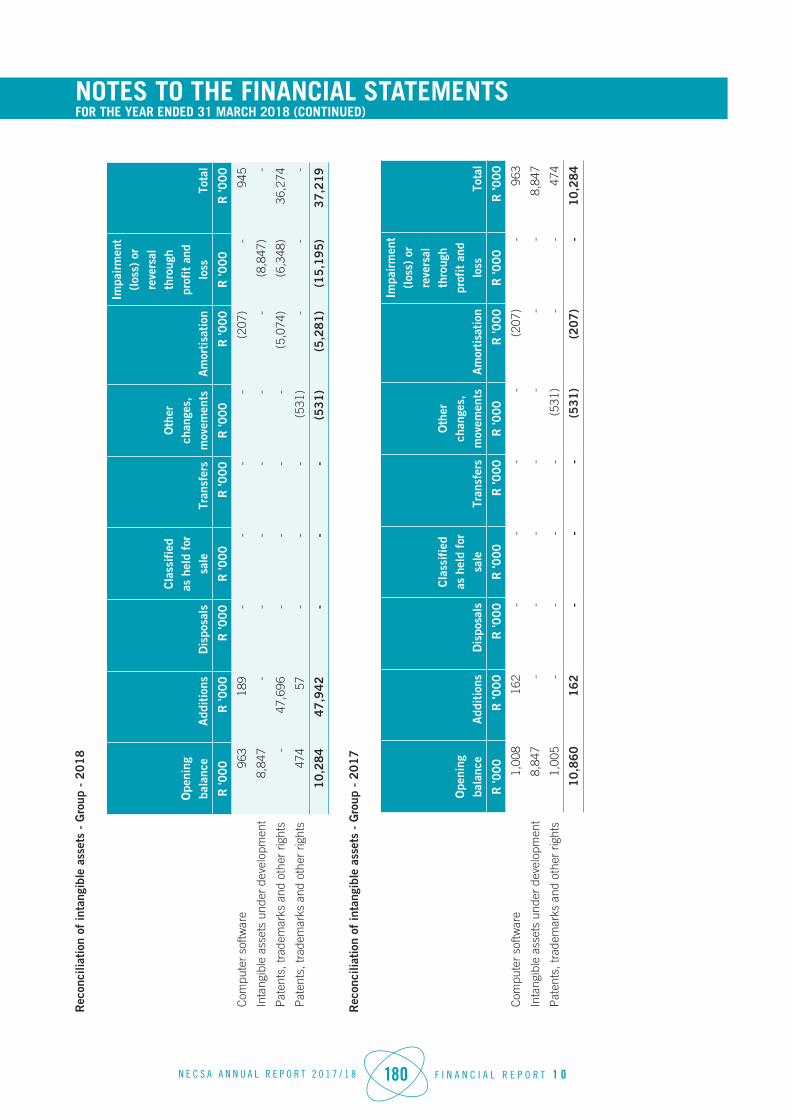
N E C S A A N N U A L R E P O R T 2 0 1 7 / 1 8 180 F I N A N C I A L R E P O R T 1 0
NOTES TO THE FINANCIAL STATEMENTS FOR THE YEAR ENDED 31 MARCH 2018 (CONTINUED)
Rec
onci
liati
on o
f in
tang
ible
ass
ets
- G
roup
- 2
01
8
Ope
ning
ba
lanc
eA
ddit
ions
Dis
posa
ls
Cla
ssif
ied
as h
eld
for
sale
Tran
sfer
s
Oth
er
chan
ges,
m
ovem
ents
Am
orti
sati
on
Impa
irm
ent
(los
s) o
r re
vers
al
thro
ugh
prof
it a
nd
loss
Tota
l
R '0
00R
'00
0R
'00
0R
'000
R '0
00
R '0
00R
'00
0R
'00
0R
'00
0
Com
pute
r so
ftwar
e96
318
9-
--
-(2
07)
-94
5
Inta
ngib
le a
sset
s un
der
deve
lopm
ent
8,84
7-
--
--
-(8
,847
)-
Pat
ents
, tra
dem
arks
and
oth
er r
ight
s-
47,6
96-
--
-(5
,074
)(6
,348
)36
,274
Pat
ents
, tra
dem
arks
and
oth
er r
ight
s47
457
--
-(5
31)
--
-
10
,28
44
7,9
42
--
-(5
31
)(5
,28
1)
(15
,19
5)
37
,21
9
Rec
onci
liati
on o
f in
tang
ible
ass
ets
- G
roup
- 2
01
7
Ope
ning
ba
lanc
eA
ddit
ions
Dis
posa
ls
Cla
ssif
ied
as h
eld
for
sale
Tran
sfer
s
Oth
er
chan
ges,
m
ovem
ents
Am
orti
sati
on
Impa
irm
ent
(los
s) o
r re
vers
al
thro
ugh
prof
it a
nd
loss
Tota
l
R '0
00R
'00
0R
'00
0R
'000
R '0
00
R '0
00R
'00
0R
'00
0R
'00
0
Com
pute
r so
ftwar
e1,
008
162
--
--
(207
)-
963
Inta
ngib
le a
sset
s un
der
deve
lopm
ent
8,84
7-
--
--
--
8,84
7
Pat
ents
, tra
dem
arks
and
oth
er r
ight
s1,
005
--
--
(531
)-
-47
4
10
,86
01
62
--
-(5
31
)(2
07
)-
10
,28
4

N E C S A A N N U A L R E P O R T 2 0 1 7 / 1 8 181 F I N A N C I A L R E P O R T 1 0
NOTES TO THE FINANCIAL STATEMENTS FOR THE YEAR ENDED 31 MARCH 2018 (CONTINUED)
Rec
onci
liati
on o
f in
tang
ible
ass
ets
- G
roup
- 2
01
6
Ope
ning
ba
lanc
eA
ddit
ions
Dis
posa
lsTr
ansf
ers
Fore
ign
exch
ange
m
ovem
ents
Am
orti
sati
on
Impa
irm
ent
(los
s) o
r re
vers
al
thro
ugh
prof
it
and
loss
Tota
l
R '0
00R
'000
R '0
00R
'000
R '0
00R
'000
R '0
00R
'000
Com
pute
r so
ftwar
e1,
177
46(1
6)(2
)5
(202
)-
1,00
8
Inta
ngib
le a
sset
s un
der
deve
lopm
ent
8,84
7-
--
--
-8,
847
Pat
ents
, tra
dem
arks
and
oth
er r
ight
s92
226
1-
--
(178
)-
1,00
5
10
,94
63
07
(16
)(2
)5
(38
0)
-1
0,8
60
Othe
r in
form
atio
n
Ther
e ar
e no
sig
nific
ant
inta
ngib
le a
sset
s co
ntro
lled
by t
he G
roup
but
not
rec
ogni
sed
as a
sset
s be
caus
e th
ey d
id n
ot m
eet
the
reco
gniti
on c
riter
ia in
thi
s St
anda
rd o
r be
caus
e th
ey w
ere
acqu
ired
or g
ener
ated
bef
ore
the
vers
ion
of IA
S 38
Inta
ngib
le A
sset
s is
sued
in 1
998
was
effe
ctiv
e.
Inta
ngib
le a
sset
s co
mpr
ise
com
pute
r sof
twar
e an
d in
telle
ctua
l pro
pert
y ge
nera
ted
inte
rnal
ly b
y a
subs
idia
ry o
f the
Com
pany
, whi
ch is
use
d in
the
purifi
catio
n of
Flu
orin
e.
The
follo
win
g us
eful
live
s ar
e us
ed in
the
cal
cula
tion
of
amor
tisa
tion
Item
Use
ful l
ives
Pat
ents
, tra
dem
arks
and
oth
er r
ight
s20
yea
rs
Com
pute
r so
ftwar
e3
year
s
The
com
pute
r so
ftwar
e w
as p
urch
ased
by
Gam
mat
ec fr
om N
ecsa
.
No
impa
irmen
t los
ses
have
bee
n re
cogn
ised
in th
e pe
riods
pre
sent
ed.
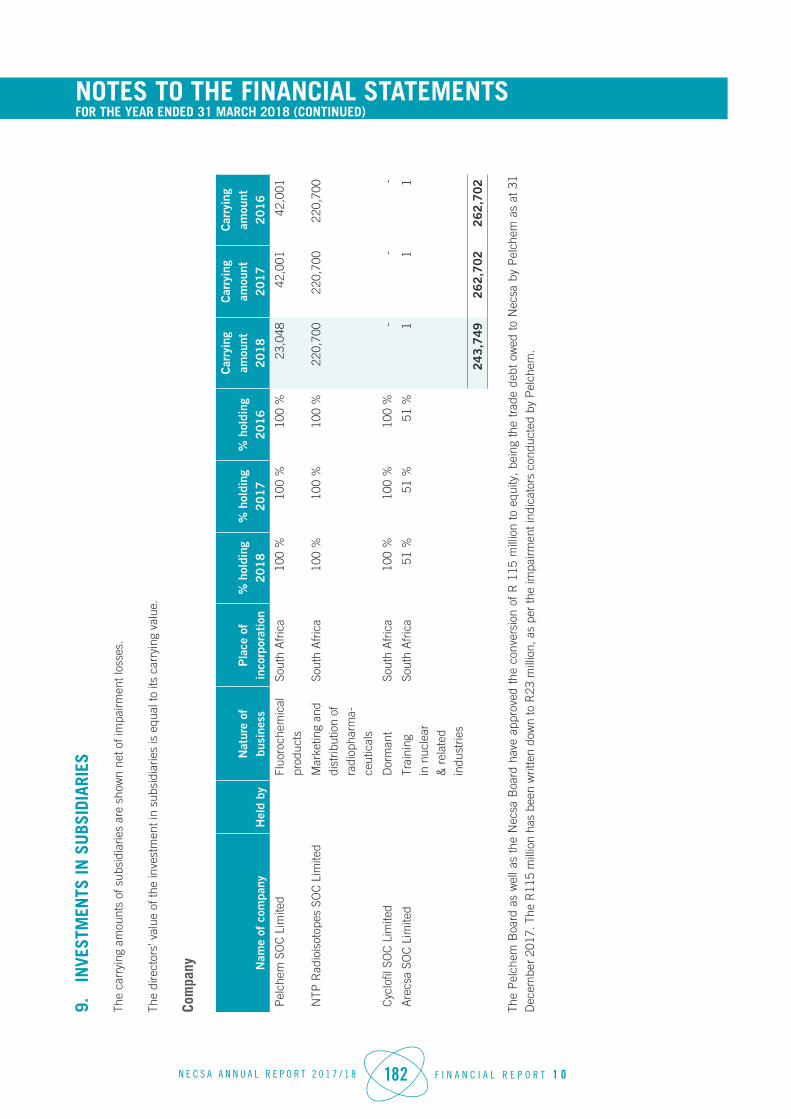
N E C S A A N N U A L R E P O R T 2 0 1 7 / 1 8 182 F I N A N C I A L R E P O R T 1 0
NOTES TO THE FINANCIAL STATEMENTS FOR THE YEAR ENDED 31 MARCH 2018 (CONTINUED)
9.
INVE
STM
ENTS
IN S
UBS
IDIA
RIES
The
carr
ying
am
ount
s of
sub
sidi
arie
s ar
e sh
own
net o
f im
pairm
ent l
osse
s.
The
dire
ctor
s’ v
alue
of t
he in
vest
men
t in
subs
idia
ries
is e
qual
to it
s ca
rryi
ng v
alue
.
Com
pany N
ame
of c
ompa
nyH
eld
byN
atur
e of
bu
sine
ssP
lace
of
inco
rpor
atio
n%
hol
ding
20
18
%
hol
ding
20
17
% h
oldi
ng2
01
6
Car
ryin
g am
ount
2
01
8
Car
ryin
g am
ount
2
01
7
Car
ryin
g am
ount
2
01
6
Pel
chem
SO
C L
imite
dFl
uoro
chem
ical
pr
oduc
tsSo
uth
Afr
ica
100
%10
0 %
100
%23
,048
42,0
0142
,001
NTP
Rad
iois
otop
es S
OC
Lim
ited
Mar
ketin
g an
d di
strib
utio
n of
ra
diop
harm
a-ce
utic
als
Sout
h A
fric
a10
0 %
100
%10
0 %
220,
700
220,
700
220,
700
Cyc
lofil
SO
C L
imite
dD
orm
ant
Sout
h A
fric
a10
0 %
100
%10
0 %
--
-
Are
csa
SOC
Lim
ited
Trai
ning
in
nuc
lear
&
rel
ated
in
dust
ries
Sout
h A
fric
a51
%51
%51
%1
11
24
3,7
49
26
2,7
02
26
2,7
02
The
Pel
chem
Boa
rd a
s w
ell a
s th
e N
ecsa
Boa
rd h
ave
appr
oved
the
con
vers
ion
of R
115
mill
ion
to e
quity
, be
ing
the
trad
e de
bt o
wed
to
Nec
sa b
y P
elch
em a
s at
31
Dec
embe
r 20
17. T
he R
115
mill
ion
has
been
writ
ten
dow
n to
R23
mill
ion,
as
per
the
impa
irmen
t ind
icat
ors
cond
ucte
d by
Pel
chem
.
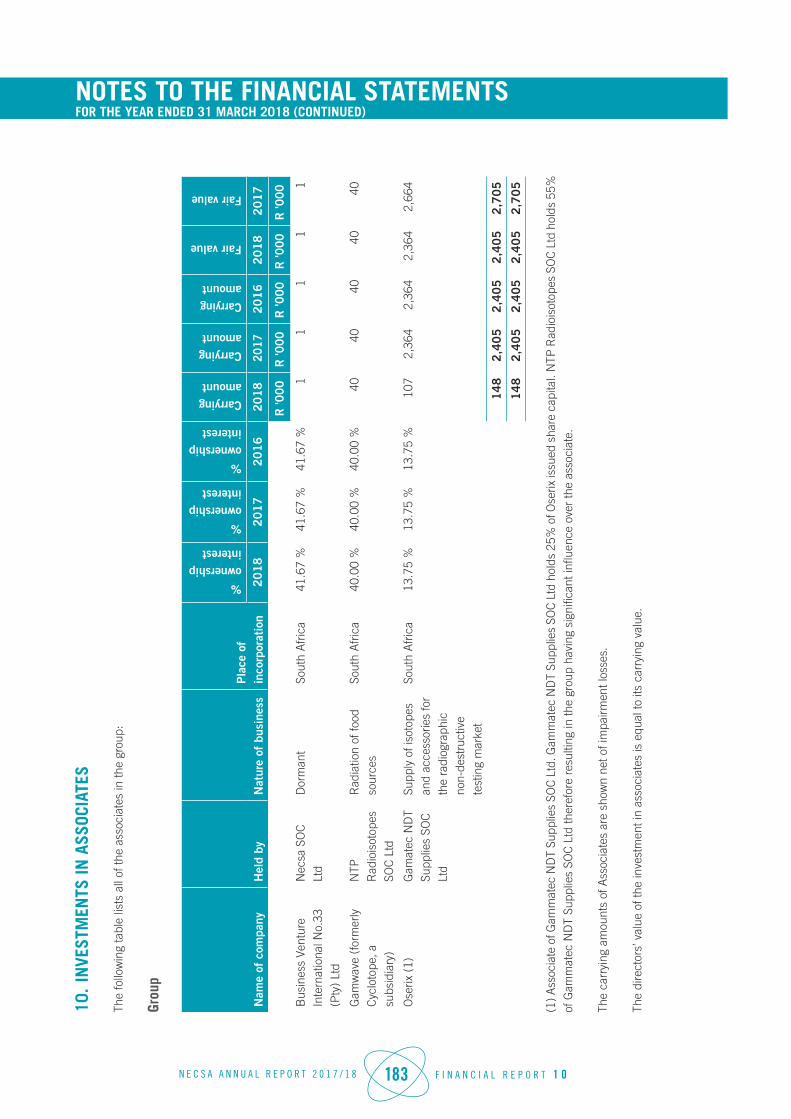
N E C S A A N N U A L R E P O R T 2 0 1 7 / 1 8 183 F I N A N C I A L R E P O R T 1 0
NOTES TO THE FINANCIAL STATEMENTS FOR THE YEAR ENDED 31 MARCH 2018 (CONTINUED)
10.
INVE
STM
ENTS
IN A
SSOC
IATE
S
The
follo
win
g ta
ble
lists
all
of th
e as
soci
ates
in th
e gr
oup:
Grou
p
Nam
e of
com
pany
Hel
d by
Nat
ure
of b
usin
ess
Pla
ce o
f in
corp
orat
ion
% ownership interest
% ownership interest
% ownership interest
Carrying amount
Carrying amount
Carrying amount
Fair value
Fair value
20
18
20
17
20
16
20
18
2017
20
16
20
18
20
17
R '0
00R
'000
R '0
00
R '0
00R
'000
Bus
ines
s Ve
ntur
e In
tern
atio
nal N
o.33
(P
ty)
Ltd
Nec
sa S
OC
Lt
dD
orm
ant
Sout
h A
fric
a41
.67
%41
.67
%41
.67
%1
11
11
Gam
wav
e (f
orm
erly
C
yclo
tope
, a
subs
idia
ry)
NTP
R
adio
isot
opes
SO
C L
td
Rad
iatio
n of
food
so
urce
sSo
uth
Afr
ica
40.0
0 %
40.0
0 %
40.0
0 %
4040
4040
40
Ose
rix (
1)G
amat
ec N
DT
Supp
lies
SOC
Lt
d
Supp
ly o
f iso
tope
s an
d ac
cess
orie
s fo
r th
e ra
diog
raph
ic
non-
dest
ruct
ive
test
ing
mar
ket
Sout
h A
fric
a13
.75
%13
.75
%13
.75
%10
72,
364
2,36
42,
364
2,66
4
14
82
,40
52
,40
52
,40
52
,70
5
14
82
,40
52
,40
52
,40
52
,70
5
(1) A
ssoc
iate
of G
amm
atec
ND
T Su
pplie
s SO
C L
td. G
amm
atec
ND
T Su
pplie
s SO
C L
td h
olds
25%
of O
serix
issu
ed s
hare
cap
ital.
NTP
Rad
iois
otop
es S
OC
Ltd
hol
ds 5
5%
of G
amm
atec
ND
T Su
pplie
s SO
C L
td th
eref
ore
resu
lting
in th
e gr
oup
havi
ng s
igni
fican
t infl
uenc
e ov
er th
e as
soci
ate.
The
carr
ying
am
ount
s of
Ass
ocia
tes
are
show
n ne
t of i
mpa
irmen
t los
ses.
The
dire
ctor
s’ v
alue
of t
he in
vest
men
t in
asso
ciat
es is
equ
al to
its
carr
ying
val
ue.
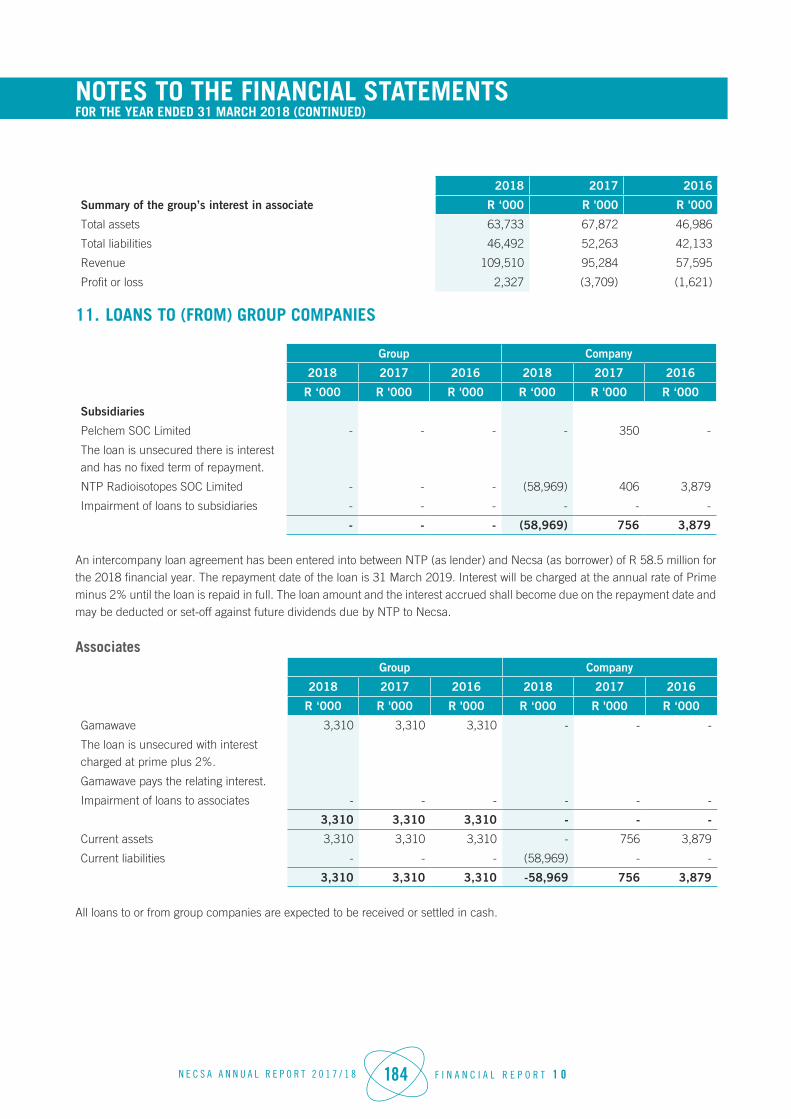
N E C S A A N N U A L R E P O R T 2 0 1 7 / 1 8 184 F I N A N C I A L R E P O R T 1 0
NOTES TO THE FINANCIAL STATEMENTS FOR THE YEAR ENDED 31 MARCH 2018 (CONTINUED)
2018 2017 2016
Summary of the group’s interest in associate R ‘000 R '000 R '000
Total assets 63,733 67,872 46,986
Total liabilities 46,492 52,263 42,133
Revenue 109,510 95,284 57,595
Profit or loss 2,327 (3,709) (1,621)
11. LOANS TO (FROM) GROUP COMPANIES
Group Company
2018 2017 2016 2018 2017 2016
R ‘000 R '000 R '000 R ‘000 R '000 R ‘000
Subsidiaries
Pelchem SOC Limited - - - - 350 -
The loan is unsecured there is interest and has no fixed term of repayment.
NTP Radioisotopes SOC Limited - - - (58,969) 406 3,879
Impairment of loans to subsidiaries - - - - - -
- - - (58,969) 756 3,879
An intercompany loan agreement has been entered into between NTP (as lender) and Necsa (as borrower) of R 58.5 million for the 2018 financial year. The repayment date of the loan is 31 March 2019. Interest will be charged at the annual rate of Prime minus 2% until the loan is repaid in full. The loan amount and the interest accrued shall become due on the repayment date and may be deducted or set-off against future dividends due by NTP to Necsa.
AssociatesGroup Company
2018 2017 2016 2018 2017 2016
R ‘000 R '000 R '000 R ‘000 R '000 R ‘000
Gamawave 3,310 3,310 3,310 - - -
The loan is unsecured with interest charged at prime plus 2%.
Gamawave pays the relating interest.
Impairment of loans to associates - - - - - -
3,310 3,310 3,310 - - -
Current assets 3,310 3,310 3,310 - 756 3,879
Current liabilities - - - (58,969) - -
3,310 3,310 3,310 -58,969 756 3,879
All loans to or from group companies are expected to be received or settled in cash.

N E C S A A N N U A L R E P O R T 2 0 1 7 / 1 8 185 F I N A N C I A L R E P O R T 1 0
NOTES TO THE FINANCIAL STATEMENTS FOR THE YEAR ENDED 31 MARCH 2018 (CONTINUED)
Credit quality of loans to group companies
The credit quality of loans to Group companies that are neither past due nor impaired can be assessed by reference to historical information about counterparty default rates, as external credit ratings are not available. Loans to Associates are considered medium high quality as no defaults occurred in the past. The loan to NTP Radioisotopes SOC Limited is considered high quality as no defaults occurred in the past, and NTP Radioisotopes SOC Limited has a strong financial position. The credit quality of the loan to Pelchem SOC Limited is considered medium to low due to the fact that Pelchem SOC Limited has an accumulated loss at year end and predicts a loss for the ensuing financial year.
Fair value of loans to and from group companiesGroup Company
2018 2017 2016 2018 2017 2016
R ‘000 R '000 R '000 R ‘000 R '000 R ‘000
Loans to group companies 3,310 3,310 3,310 (58,969) 756 3,879
The maximum exposure to credit risk at the reporting date is the fair value of each class of loan mentioned above. The Group does not hold any collateral as security.
12. OTHER FINANCIAL ASSETS
Group Company
2018 2017 2016 2018 2017 2016
R ‘000 R '000 R '000 R ‘000 R '000 R ‘000
At fair value through profit or loss - designated
Foreign-exchange contract asset 1,502 7 10,520 - - 5,018
Available-for-sale
Listed shares 1,569 1,303 1,568 1,528 1,270 1,535
Unit trusts 408,287 420,131 275,195 408,287 420,131 275,195
The decrease from the 2016 to 2017 year of assessment in the available for sale financial assets relates to R100m being used for security for the Nedbank overdraft loan
409,856 421,434 276,763 409,815 421,401 276,730
Short-term investments
Ring-fenced and 3rd party funds and other short term investments R100 million was used to pay Necsa’s financial obligations during the 2017/18 financial year. 703,414 768,122 679,302 265,195 230,925 243,676
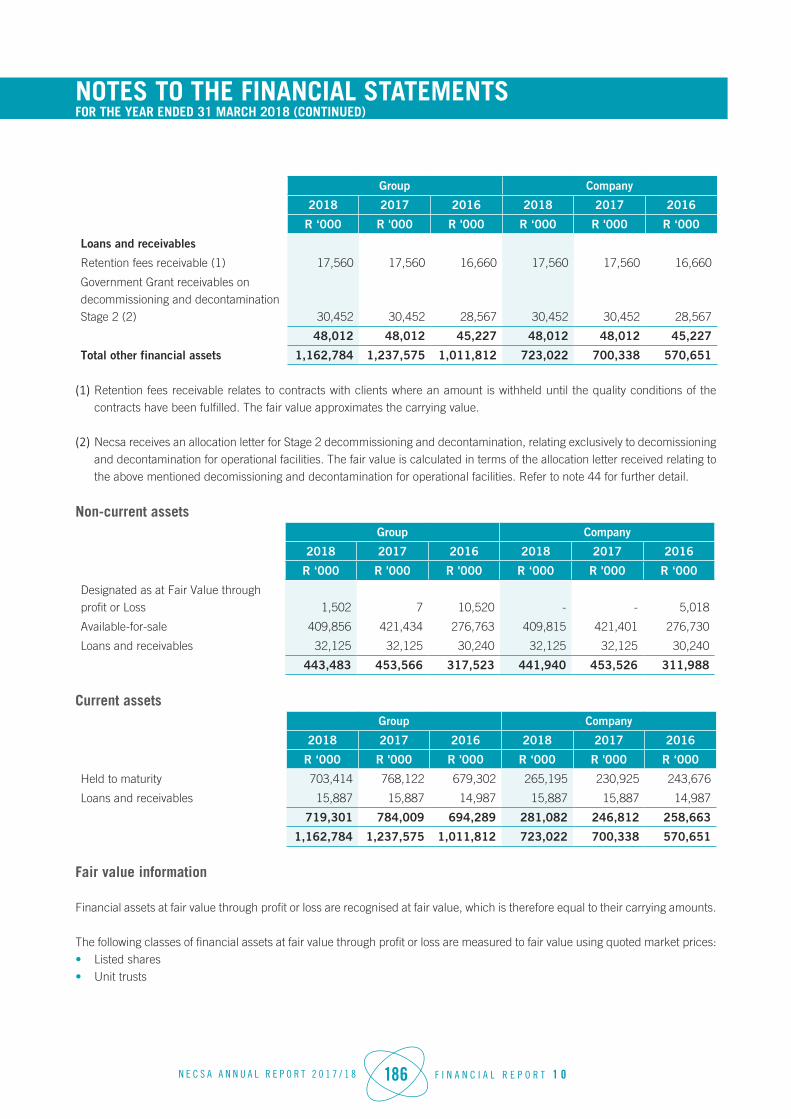
N E C S A A N N U A L R E P O R T 2 0 1 7 / 1 8 186 F I N A N C I A L R E P O R T 1 0
NOTES TO THE FINANCIAL STATEMENTS FOR THE YEAR ENDED 31 MARCH 2018 (CONTINUED)
Group Company
2018 2017 2016 2018 2017 2016
R ‘000 R '000 R '000 R ‘000 R '000 R ‘000
Loans and receivables
Retention fees receivable (1) 17,560 17,560 16,660 17,560 17,560 16,660
Government Grant receivables on decommissioning and decontamination Stage 2 (2) 30,452 30,452 28,567 30,452 30,452 28,567
48,012 48,012 45,227 48,012 48,012 45,227
Total other financial assets 1,162,784 1,237,575 1,011,812 723,022 700,338 570,651
(1) Retention fees receivable relates to contracts with clients where an amount is withheld until the quality conditions of the contracts have been fulfilled. The fair value approximates the carrying value.
(2) Necsa receives an allocation letter for Stage 2 decommissioning and decontamination, relating exclusively to decomissioning and decontamination for operational facilities. The fair value is calculated in terms of the allocation letter received relating to the above mentioned decomissioning and decontamination for operational facilities. Refer to note 44 for further detail.
Non-current assetsGroup Company
2018 2017 2016 2018 2017 2016
R ‘000 R '000 R '000 R ‘000 R '000 R ‘000
Designated as at Fair Value through profit or Loss 1,502 7 10,520 - - 5,018
Available-for-sale 409,856 421,434 276,763 409,815 421,401 276,730
Loans and receivables 32,125 32,125 30,240 32,125 32,125 30,240
443,483 453,566 317,523 441,940 453,526 311,988
Current assetsGroup Company
2018 2017 2016 2018 2017 2016
R ‘000 R '000 R '000 R ‘000 R '000 R ‘000
Held to maturity 703,414 768,122 679,302 265,195 230,925 243,676
Loans and receivables 15,887 15,887 14,987 15,887 15,887 14,987
719,301 784,009 694,289 281,082 246,812 258,663
1,162,784 1,237,575 1,011,812 723,022 700,338 570,651
Fair value information
Financial assets at fair value through profit or loss are recognised at fair value, which is therefore equal to their carrying amounts.
The following classes of financial assets at fair value through profit or loss are measured to fair value using quoted market prices:• Listed shares• Unit trusts

N E C S A A N N U A L R E P O R T 2 0 1 7 / 1 8 187 F I N A N C I A L R E P O R T 1 0
NOTES TO THE FINANCIAL STATEMENTS FOR THE YEAR ENDED 31 MARCH 2018 (CONTINUED)
Fair values are determined annually as at the end of the reporting period.
Fair value hierarchy of financial assets at fair value through profit or loss
For financial assets recognised at fair value, disclosure is required of a fair value hierarchy which reflects the significance of the inputs used to make the measurements.
Level 1Group Company
2018 2017 2016 2018 2017 2016
R ‘000 R '000 R '000 R ‘000 R '000 R ‘000
Sanlam - Ordinary shares - 86 88 - 53 54
Old Mutual - Ordinary shares - 1,217 1,480 - 1,217 1,480
Unit Trusts - Collective Investment 408,287 221,502 275,195 408,287 221,502 275,195
Schemes
408,287 222,805 276,763 408,287 222,772 276,729
13. DEFERRED TAX
Group Company
2018 2017 2016 2018 2017 2016
R ‘000 R '000 R '000 R ‘000 R '000 R ‘000
Deferred tax asset
Property, plant and equipment (296) (17,901) (18,075) - - -
Provisions, allowances and PRML liability 16,869 44,964 41,219 - - -
Fair value and IFRS adjustments 4,573 3,484 3,514 - - -
Prepayments - (264) (93) - - -
21,146 30,283 26,565 - - -
Reconciliation of deferred tax asset
At beginning of year 30,283 26,565 13,898 - - -
Reduction due to rate change 2,085 4,741 12,667 - - -
Increases (decrease) in tax loss available for set off against future taxable income - gross of valuation allowance (10,645) - - - - -
Taxable / (deductible) temporary difference movement on tangible fixed assets - (1,023) - - - -
Deferred tax asset of discontinued (45) - - - - -
Operations
Originating temporary differences on revaluation of property (532) - - - - -
21,146 30,283 26,565 - - -

N E C S A A N N U A L R E P O R T 2 0 1 7 / 1 8 188 F I N A N C I A L R E P O R T 1 0
NOTES TO THE FINANCIAL STATEMENTS FOR THE YEAR ENDED 31 MARCH 2018 (CONTINUED)
Group Company
2018 2017 2016 2018 2017 2016
R ‘000 R '000 R '000 R ‘000 R '000 R ‘000
Deferred tax liability
Reconciliation of deferred tax (liability)
At beginning of year - - (15) - - -
Reduction due to rate change - - 15 - - -
- - - -
The deferred tax assets and the deferred tax liability relate to income tax in the same jurisdiction, and the law allows net settlement. Therefore, they have been offset in the statement of financial position as follows:
Group Company
2018 2017 2016 2018 2017 2016
R ‘000 R '000 R '000 R ‘000 R '000 R ‘000
Deferred tax asset 19,509 29,909 25,686 - - -
Deferred tax liability (259) 374 879 - - -
Total net deferred tax asset 19,250 30,283 26,565 - - -
14. INVENTORIESGroup Company
2018 2017 2016 2018 2017 2016
R ‘000 R '000 R '000 R ‘000 R '000 R ‘000
Raw materials 36,605 29,884 27,229 - - -
Work in progress 26,013 (3,342) 19,989 25,130 (8,808) 10,089
Finished goods 27,261 39,296 51,417 - - 1,915
Life science products and equipment 5,691 3,922 5,072 - - -
Production supplies 916 20,623 21,203 - - -
Goods in transit 12,111 3,597 3,681 - - -
Consumables 182,368 165,325 124,098 39,193 33,267 28,918
290,965 259,305 252,689 64,323 24,459 40,922
Inventories (write-downs) (12,216) (21,241) (20,803) (2,682) (1,694) (1,431)
278,749 238,064 231,886 61,641 22,765 39,491
Carrying value of inventories carried at fair value less costs to sell 278,749 238,064 231,886 61,641 22,765 39,491
During the financial year end 31 March 2018 R 1,177,610 (2017: R 977,972) (2016: R 723 683) was recognised as an expense for the Company and R 257,454 (2017: R 236 160) (2016: R 146 739) for the Group.
Impaired amount of categories of inventory
Raw materials - 4,696 3,014 - - -
Finished goods 12,216 10,292 11,824 2,682 1,694 1,431
Production supplies - 6,253 5,965 - - -
12,216 21,241 20,803 2,682 1,694 1,431

N E C S A A N N U A L R E P O R T 2 0 1 7 / 1 8 189 F I N A N C I A L R E P O R T 1 0
NOTES TO THE FINANCIAL STATEMENTS FOR THE YEAR ENDED 31 MARCH 2018 (CONTINUED)
15. TRADE AND OTHER RECEIVABLES
Group Company
2018 2017 2016 2018 2017 2016
R ‘000 R '000 R '000 R ‘000 R '000 R ‘000
Financial Instruments
Trade receivables 385,692 77,032 240,176 10,644 83,641 65,576
Prepayments (if immaterial) 352 1,111 417 - - -
Deposits 42 38 38 - - -
Other receivable 58,366 75,261 46,289 50,606 64,060 120,666
Non-financial instruments
VAT 15,508 44,918 22,631 - - -
459,960 198,360 309,551 61,250 147,701 186,242
Trade and other receivables pledged as security
No trade and other receivables have been pledged as security.
Credit quality of trade and other receivables
Customer credit risk is managed by each business unit subject to the Group’s established policy, procedures and control relating to customer credit risk management. The credit quality of a customer is assessed based on an extensive credit rating scorecard and individual credit limits are defined in accordance with this assessment. Outstanding customer receivables are regularly monitored and any shipments to major customers are generally covered by letters of credit or other forms of credit insurance.
Group Company
2018 2017 2016 2018 2017 2016
R ‘000 R '000 R '000 R ‘000 R '000 R ‘000
Fair value of trade and other receivables
Trade and other receivables 459,960 197,209 309,091 61,250 147,700 186,241
Fair value of trade and other receivables has been determined using unobservable inputs (level 3).
Trade and other receivables are initially measured at fair value and are subsequently measured at amortised cost using the effective interest rate method.
Debtors have been reviewed on an individual basis and where extended payment terms were granted the effect of the time value of money has been taken into account. This was done to determine the finance portion granted. The carrying value of Trade and other receivables is reduced by an interest charge of R5 647 (2017: R2,461) and (2016: R1,445) to discount the carrying value to amortised cost for the Company and an interest charge of R 8769 (2017: R5,570) and (2016: R5,927) for the Group.
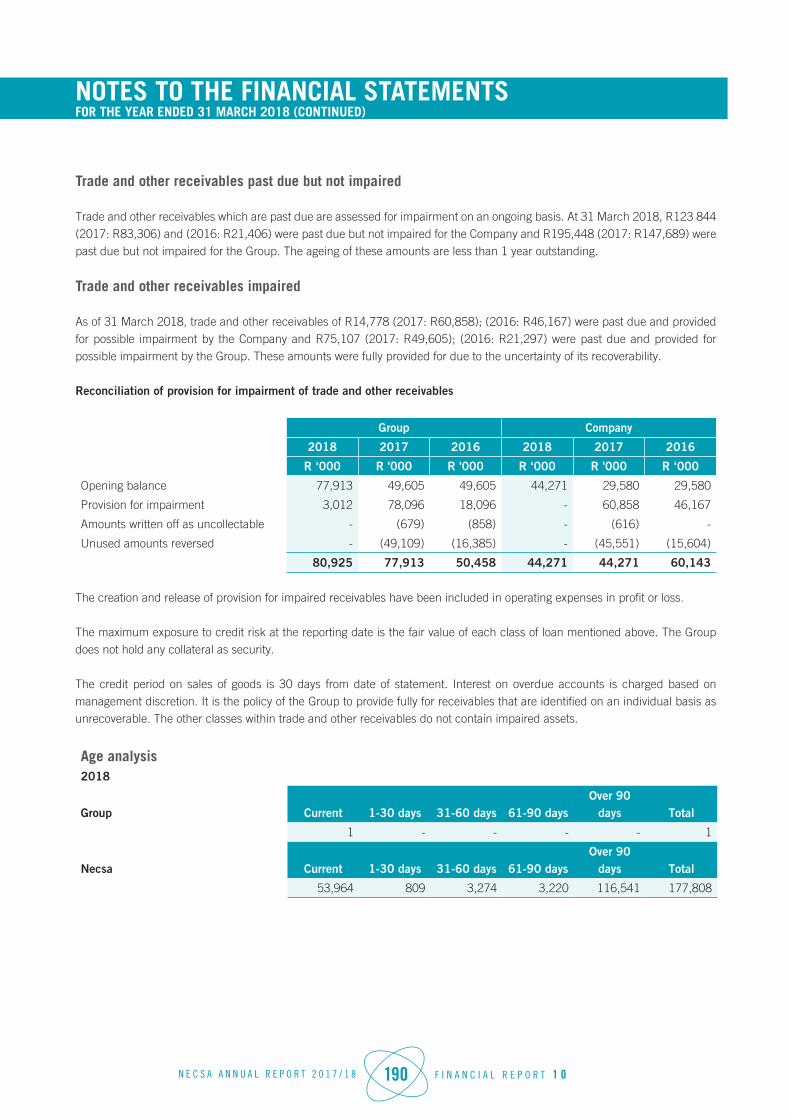
N E C S A A N N U A L R E P O R T 2 0 1 7 / 1 8 190 F I N A N C I A L R E P O R T 1 0
NOTES TO THE FINANCIAL STATEMENTS FOR THE YEAR ENDED 31 MARCH 2018 (CONTINUED)
Trade and other receivables past due but not impaired
Trade and other receivables which are past due are assessed for impairment on an ongoing basis. At 31 March 2018, R123 844 (2017: R83,306) and (2016: R21,406) were past due but not impaired for the Company and R195,448 (2017: R147,689) were past due but not impaired for the Group. The ageing of these amounts are less than 1 year outstanding.
Trade and other receivables impaired
As of 31 March 2018, trade and other receivables of R14,778 (2017: R60,858); (2016: R46,167) were past due and provided for possible impairment by the Company and R75,107 (2017: R49,605); (2016: R21,297) were past due and provided for possible impairment by the Group. These amounts were fully provided for due to the uncertainty of its recoverability.
Reconciliation of provision for impairment of trade and other receivables
Group Company
2018 2017 2016 2018 2017 2016
R ‘000 R '000 R '000 R ‘000 R '000 R ‘000
Opening balance 77,913 49,605 49,605 44,271 29,580 29,580
Provision for impairment 3,012 78,096 18,096 - 60,858 46,167
Amounts written off as uncollectable - (679) (858) - (616) -
Unused amounts reversed - (49,109) (16,385) - (45,551) (15,604)
80,925 77,913 50,458 44,271 44,271 60,143
The creation and release of provision for impaired receivables have been included in operating expenses in profit or loss.
The maximum exposure to credit risk at the reporting date is the fair value of each class of loan mentioned above. The Group does not hold any collateral as security.
The credit period on sales of goods is 30 days from date of statement. Interest on overdue accounts is charged based on management discretion. It is the policy of the Group to provide fully for receivables that are identified on an individual basis as unrecoverable. The other classes within trade and other receivables do not contain impaired assets.
Age analysis2018
Group Current 1-30 days 31-60 days 61-90 daysOver 90
days Total
1 - - - - 1
Necsa Current 1-30 days 31-60 days 61-90 daysOver 90
days Total
53,964 809 3,274 3,220 116,541 177,808

N E C S A A N N U A L R E P O R T 2 0 1 7 / 1 8 191 F I N A N C I A L R E P O R T 1 0
NOTES TO THE FINANCIAL STATEMENTS FOR THE YEAR ENDED 31 MARCH 2018 (CONTINUED)
16. CASH AND CASH EQUIVALENTS
Cash and cash equivalents consist of:
Group Company
2018 2017 2016 2018 2017 2016
R ‘000 R '000 R '000 R ‘000 R '000 R ‘000
Cash on hand 49 68 106 45 53 62
Bank balances 61,462 99,629 104,598 14,967 37,179 19,329
Bank overdraft (32,000) (124,887) (85,232) (5,000) (101,847) (60,000)
29,511 (25,190) 19,472 10,012 (64,615) (40,609)
Current assets 61,511 99,697 104,704 15,012 37,232 19,391
Current liabilities (1) (32,000) (124,887) (85,232) (5,000) (101,847) (60,000)
29,511 (25,190) 19,472 10,012 (64,615) (40,609)
(1) The current liabilities are made up as follows:
Current liabilities
Group Company
2018 2017 2016 2018 2017 2016
R ‘000 R '000 R '000 R ‘000 R '000 R ‘000
Gammatec - 3.000 5.226 - - -
Pelchem - 20.000 20.000 - - -
Necsa (1) - 101.000 60.000 - - -
- 124,000 85,226 - - -
Of the R10,012 cash in Necsa as per 2018, R 3.3 million relates to general Necsa activities, R270.3 million to ring-fenced activities and R23.1 million are cash held on behalf of third parties.
The Government of South Africa is irrevocably bound as surety and co-principal debtor to Nedbank (2017: Absa), (2016: Absa) with regard to the repayment of capital and payment of interest and any other charges in terms of the general short term banking facility of Necsa to the amount of R20 million (2017: R120 million), (2016: 60 million).
The R20 million undrawn facility is available for future operating activities and to settle capital commitments, without restriction.
(1) The Necsa bank overdraft has been classified as level 1 in the Fair Value Hierarchy, the main reason thereof is that all variables were known and agreed upfront. To fund the financial obligations relating to the fourth quarter of 2017/18 financial year, Necsa during December 2017 utilized R 5 million of the Overnight Loan Facility.

N E C S A A N N U A L R E P O R T 2 0 1 7 / 1 8 192 F I N A N C I A L R E P O R T 1 0
NOTES TO THE FINANCIAL STATEMENTS FOR THE YEAR ENDED 31 MARCH 2018 (CONTINUED)
Details of facilities
The Nedbank bank overdraft is secured, Necsa has signed suretyship for the R20 000 000 overdraft facility. The overdraft facility is reviewed once a year by Nedbank.There is no set repayment terms of the overdraft and interest is charged at prime less 1.5%. There are no restrictions on the realisability of any of the cash and cash equivalents. The credit quality of cash at bank and short term deposits, excluding cash on hand that are neither past due nor impaired can be assessed by reference to external credit ratings (if available) or historical information about counterparty default rates:
Group Company
2018 2017 2016 2018 2017 2016
R ‘000 R '000 R '000 R ‘000 R '000 R ‘000
Overnight loan facility 20,000 120,000 60,000 20,000 120,000 60,000
Asset based financing 8,000 8,000 8,000 8,000 8,000 8,000
Bills of exchange 100 100 100 - - -
CFC 2,000 2,000 1,500 - - -
Commitments regarding guarantees (foreign) - - 73 - - -
Commitments regarding guarantees (local) 11,300 11,300 12,300 - - -
Corporate credit card 300 300 300 - - -
FEC's 117,115 86,515 85,235 60,000 30,000 30,000
Fleet management service 145 145 145 - - -
Forex cancellation limit 750 750 750 - - -
Forex settlement limit 7,000 7,000 7,000 - - -
General short term banking facility 75,200 75,200 37,200 15,000 15,000 15,000
Guarantees by bank 11,300 11,300 11,300 - - -
Letter of credit 450 45,000 450 - - -
Medium term loan 433 967 1,100 - - -
Overdraft 11,600 15,600 13,600 - - -
Vehicle and asset finance 5,290 6,890 6,890 - - -
17. DISCONTINUED OPERATIONS
The Board of Lectromax and the Board of Gammatec NDT Supplies SOC Ltd resolved to discontinue all direct operations of Lectromax Australia (Pty) Ltd during the prior financial year. The assets and liabilities as at 31 March 2016 are set out below. The decision was made to discontinue operations due to lack of return and suitable profitable trading activities.
In the 2017 financial year, the property, plant and equipment has been sold at a loss on sale of R71, 671 and this has been recorded and included in the Loss from Discontinued Operations in the Consolidated Statement of Comprehensive Income.
All the trade receivables have been settled by the relevant customers during the current financial year. The loan from the shareholders and trade payables were settled or forgiveness provided.
Deregistration of Lectromax Australia (Pty) Ltd was submitted on 28 March 2017.
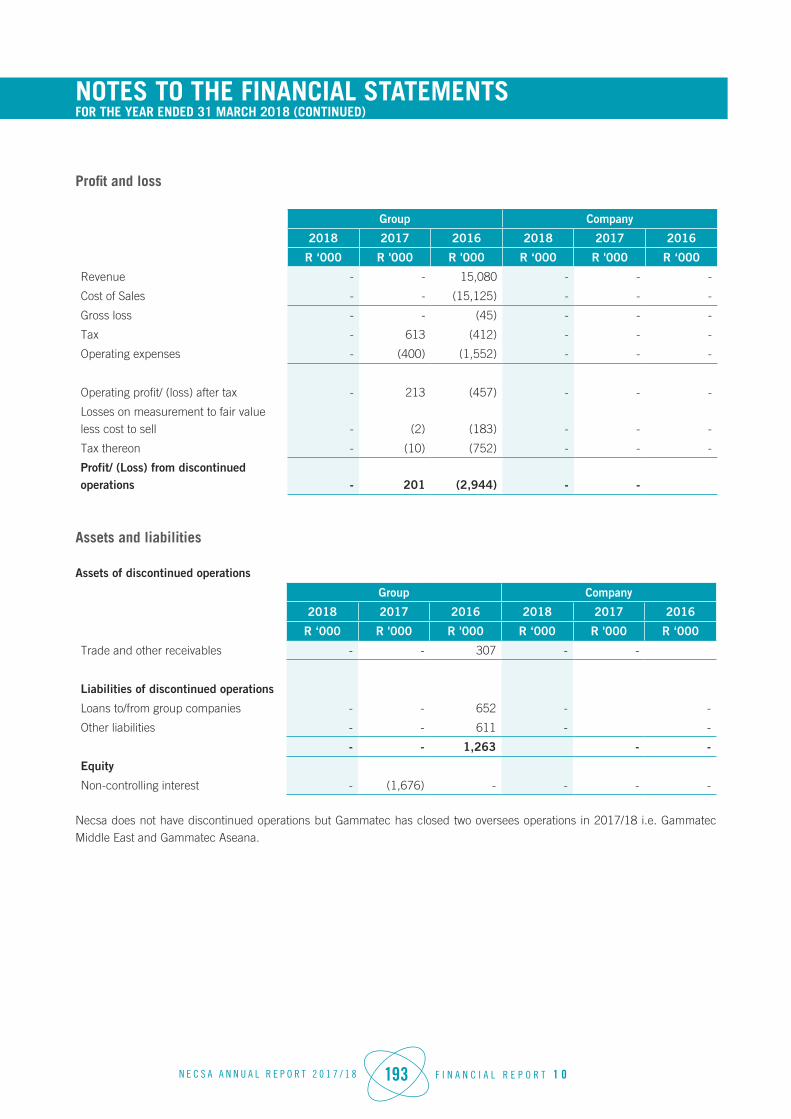
N E C S A A N N U A L R E P O R T 2 0 1 7 / 1 8 193 F I N A N C I A L R E P O R T 1 0
NOTES TO THE FINANCIAL STATEMENTS FOR THE YEAR ENDED 31 MARCH 2018 (CONTINUED)
Profit and loss
Group Company
2018 2017 2016 2018 2017 2016
R ‘000 R '000 R '000 R ‘000 R '000 R ‘000
Revenue - - 15,080 - - -
Cost of Sales - - (15,125) - - -
Gross loss - - (45) - - -
Tax - 613 (412) - - -
Operating expenses - (400) (1,552) - - -
Operating profit/ (loss) after tax - 213 (457) - - -
Losses on measurement to fair value less cost to sell - (2) (183) - - -
Tax thereon - (10) (752) - - -
Profit/ (Loss) from discontinued operations - 201 (2,944) - -
Assets and liabilities
Assets of discontinued operations
Group Company
2018 2017 2016 2018 2017 2016
R ‘000 R '000 R '000 R ‘000 R '000 R ‘000
Trade and other receivables - - 307 - -
Liabilities of discontinued operations
Loans to/from group companies - - 652 - -
Other liabilities - - 611 - -
- - 1,263 - -
Equity
Non-controlling interest - (1,676) - - - -
Necsa does not have discontinued operations but Gammatec has closed two oversees operations in 2017/18 i.e. Gammatec Middle East and Gammatec Aseana.

N E C S A A N N U A L R E P O R T 2 0 1 7 / 1 8 194 F I N A N C I A L R E P O R T 1 0
NOTES TO THE FINANCIAL STATEMENTS FOR THE YEAR ENDED 31 MARCH 2018 (CONTINUED)
18. SHARE CAPITAL
Group Company
2018 2017 2016 2018 2017 2016
R ‘000 R '000 R '000 R ‘000 R '000 R ‘000
Authorised
500,000,000 Ordinary shares of R1 each 500,000 500,000 500,000 500,000 500,000 500,000
There were no changes in authorised share capital.
Reconciliation of number of shares issued:
Reported as at 1 April 2017 2,205 2,205 2,205 2,205 2,205 2,205
Issued
Ordinary 2,205 2,205 2,205 2,205 2,205 2,205
19. OTHER FINANCIAL LIABILITIES
Group Company
2018 2017 2016 2018 2017 2016
R ‘000 R '000 R '000 R ‘000 R '000 R ‘000
At fair value through profit (loss) - designated
Cash Flow Hedge - - 15,058 - - -
Foreign exchange contract 7,861 5,474 - 5,949 756 -
7,861 5,474 15,058 5,949 756 -
Held at amortised cost
Standard Bank - Australia 233 633 1,033 - - -
Investment
The loan is unsecured, bears a fixed interest rate of 11.50% and is repayable in equal monthly instalments of R42,000. The amount is restricted to R2,500.
First National Bank - Mortgage The loan is secured by a first mortgage bond registered over land and buildings Portion 91 of Farm 601, Klipplaatdrif, Vereeniging (Note 4). Interest is charged at prime rate minus 1%. The bond is repayable in equal monthly instalments of R146. 7,109 9,280 10,391 - - -
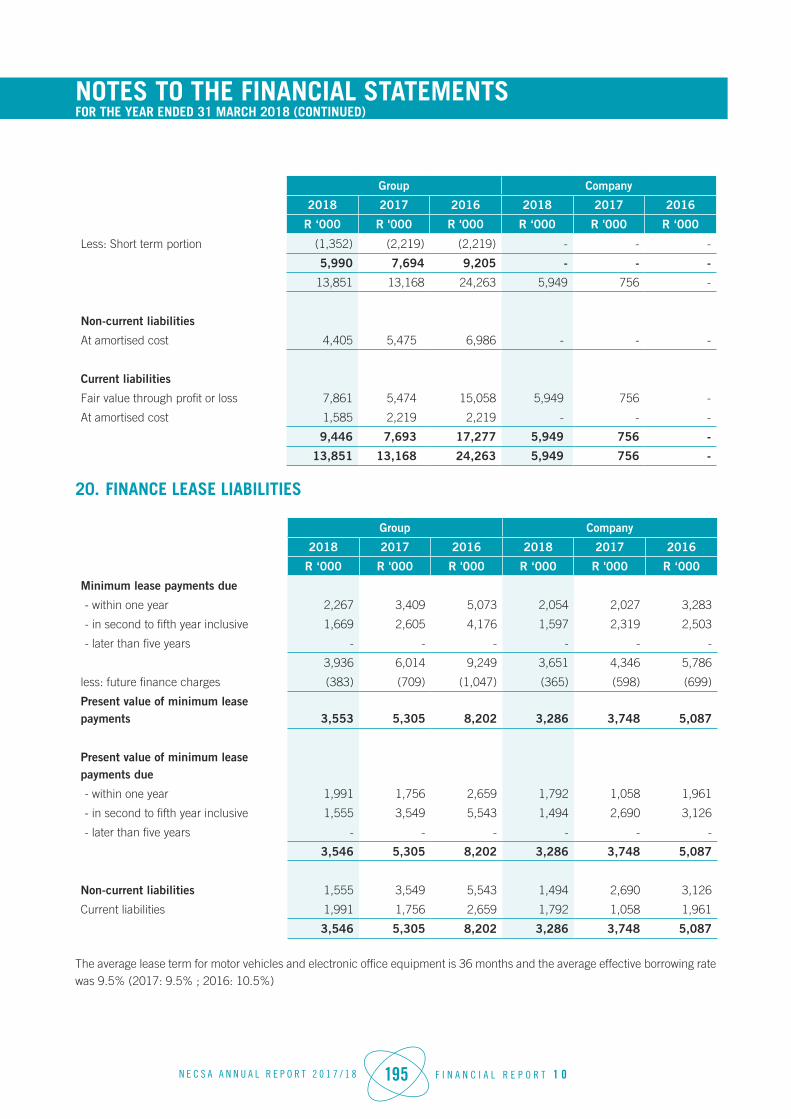
N E C S A A N N U A L R E P O R T 2 0 1 7 / 1 8 195 F I N A N C I A L R E P O R T 1 0
NOTES TO THE FINANCIAL STATEMENTS FOR THE YEAR ENDED 31 MARCH 2018 (CONTINUED)
Group Company
2018 2017 2016 2018 2017 2016
R ‘000 R '000 R '000 R ‘000 R '000 R ‘000
Less: Short term portion (1,352) (2,219) (2,219) - - -
5,990 7,694 9,205 - - -
13,851 13,168 24,263 5,949 756 -
Non-current liabilities
At amortised cost 4,405 5,475 6,986 - - -
Current liabilities
Fair value through profit or loss 7,861 5,474 15,058 5,949 756 -
At amortised cost 1,585 2,219 2,219 - - -
9,446 7,693 17,277 5,949 756 -
13,851 13,168 24,263 5,949 756 -
20. FINANCE LEASE LIABILITIES
Group Company
2018 2017 2016 2018 2017 2016
R ‘000 R '000 R '000 R ‘000 R '000 R ‘000
Minimum lease payments due
- within one year 2,267 3,409 5,073 2,054 2,027 3,283
- in second to fifth year inclusive 1,669 2,605 4,176 1,597 2,319 2,503
- later than five years - - - - - -
3,936 6,014 9,249 3,651 4,346 5,786
less: future finance charges (383) (709) (1,047) (365) (598) (699)
Present value of minimum lease payments 3,553 5,305 8,202 3,286 3,748 5,087
Present value of minimum lease payments due
- within one year 1,991 1,756 2,659 1,792 1,058 1,961
- in second to fifth year inclusive 1,555 3,549 5,543 1,494 2,690 3,126
- later than five years - - - - - -
3,546 5,305 8,202 3,286 3,748 5,087
Non-current liabilities 1,555 3,549 5,543 1,494 2,690 3,126
Current liabilities 1,991 1,756 2,659 1,792 1,058 1,961
3,546 5,305 8,202 3,286 3,748 5,087
The average lease term for motor vehicles and electronic office equipment is 36 months and the average effective borrowing rate was 9.5% (2017: 9.5% ; 2016: 10.5%)
N E C S A A N N U A L R E P O R T 2 0 1 7 / 1 8 196 F I N A N C I A L R E P O R T 1 0
NOTES TO THE FINANCIAL STATEMENTS FOR THE YEAR ENDED 31 MARCH 2018 (CONTINUED)
Interest rates are linked to prime at the contract date. All leases have fixed repayments and no arrangements have been entered into for contingent rent.
Necsa entered into a finance lease arrangement as lessee for the following:
Electronic office equipment - ownership transfers at the end of the lease term to Necsa and the lease term is for the major part of the economic life of the asset.
Motor vehicles leased from AVIS.
There are no unguaranteed residual values of assets leased under finance leases at the end of the reporting period.
The Group’s obligations under finance leases are secured by the lessor’s charge over the leased assets (refer to Note 6). The Lessor will at all times remain the owner of the vehicle and the vehicle may only be utilised for the rental period or any extended period. The pledging agreement does not impede the use or control over the assets.
21. RETIREMENT BENEFITS
The Company and its two major subsidiaries, NTP Radioisotopes and Pelchem, operate a provident fund scheme which is governed by the Pensions Fund Act No. 24 of 1956. The scheme is generally funded through payments to insurance companies or trustee administered funds, determined by periodic actuarial calculations. The Company has defined contribution plans established in 1994. These contribution plans are compulsory for every permanent employee employed in accordance with the conditions of employment, primarily by means of monthly contributions to the Necsa Retirement Fund. A defined contribution plan is a provident fund under which the Company pays fixed contributions into a separate entity. The Company has no legal or constructive obligations to pay further contributions if the fund does not hold sufficient assets to pay all employees the benefits relating to employee services in the current and prior periods. The contributions are recognised as an expense when they are due. Prepaid contributions are recognised as an asset to the extent that a cash refund or a reduction in the future payments is available.
The Necsa Retirement Fund is revalued by an independent Actuary on an annual basis. The last actuarial valuation was performed in April 2018 for the year ending 31 March 2018. The conclusion made in the latest actuarial valuation was that the Fund is currently in a good financial position and should remain so, based on the contribution rates payable in terms of the rules of the Fund, until the next actuarial valuation.
Defined benefit plan
Necsa and its two major subsidiaries, NTP Radioisotopes and Pelchem's post-employment health care liabilities consists of a commitment to pay a portion of the members’ post-employment medical scheme contributions. This liability is also generated in respect of dependents who are offered continued membership of the medical scheme on the death of the primary member. The schemes have been valued per individual entity namely Necsa, NTP Radioisotopes and Pelchem, which reflects the group figures. These schemes have been disclosed separately below.
Members employed before 1 September 2004 are entitled to a 100% subsidy of medical scheme contributions in retirement, provided they have been members of the medical scheme for at least 10 years. Should a member be on the medical scheme for less than 10 years at retirement, they will be entitled to a 10% subsidy for each year they were active on the medical scheme during employment at Necsa.

N E C S A A N N U A L R E P O R T 2 0 1 7 / 1 8 197 F I N A N C I A L R E P O R T 1 0
NOTES TO THE FINANCIAL STATEMENTS FOR THE YEAR ENDED 31 MARCH 2018 (CONTINUED)
Eligible members receive a Rand amount based on the Essential Core option’s contributions in 2005, increasing annually in line with consumer price inflation (‘CPI’). The Rand amounts for 2018 are R1,227 for a single member and R2,022 for a married member. The child dependent subsidy for 2018 is R513.
If a member qualifies to upgrade to a Comprehensive option as per the subsidy rules then Necsa will subsidise an additional Rand amount for the upgrade. The additional Rand amounts for members on the Classic Comprehensive option in 2018 are R685 for a single member and R1,244 for a married member. The additional Rand amounts for members on the Essential Comprehensive option in 2018 are R694 for a single member and R1,256 for a married member.
Members who do not qualify for an upgrade to a Comprehensive option or who do not belong to a Comprehensive option receive an additional Rand amount for the Medical Savings Account (MSA) contributions. The additional Rand amount for 2018 is R594 per member, irrespective of marital status.
Members who retired before 1 July 1990, referred to as the “Old 100% Group”, receive an additional Rand amount of R218 for 2017, irrespective of marital status.
Members who retired before 1 July 1990, referred to as the “Old 100% Group”, receive an additional Rand amount of R229 for 2018, irrespective of marital status. Dependents of eligible continuation members receive a subsidy before and after the death of the principal member.
Necsa and its two major subsidiaries, NTP Radioisotopes and Pelchem's subsidy of its current employees’ future post-employment medical scheme contributions and current pensioners’ medical scheme contributions presents certain risks to the Company, the most significant of which are summarised below. The majority of these risks mainly apply to the Pelchem group only.
Subsidy inflation The post-employment health care liability is linked to consumer price inflation. Higher consumer price inflation than expected will lead to higher liabilities.
Longevity The employer’s subsidy covers the post-employment medical scheme contributions in retirement until the main pensioner’s death. On the main pensioner’s death the subsidy will continue at a reduced level based on the contributions for the remaining dependants. The longevity risk is the risk that pensioners will live longer than expected. Possible contributing factors are medical advances, better health care and greater emphasis on following healthier lifestyles. This would lead to benefits being payable for longer than expected.
Cash flow risk The employer pays the subsidy amounts in respect of the pensioners either directly to the pensioner or to the medical aid. There is a risk to the employer that, due to unforeseen circumstances, funds may not be available at the time that they are required.
Changes in bond yields and CPI
A decrease in the bond yields used to determine the discount rate will increase the employer’s reported post- employment health care liability. An increase in CPI will result in a higher subsidy inflation assumption, which consequently will lead to a higher reported post- employment health care liability. High volatility in the above rates may lead to volatile balance sheet and income statement disclosures.
Future changes in legislation
The Government’s stated intention to implement a National Health Insurance system in the near future may lead to a requirement to provide some level of compensation to eligible members or to fund additional amounts into the system. Furthermore, changes in tax legislation affecting the subsidy may also pose a risk to both the employer and the recipients of the subsidy.

N E C S A A N N U A L R E P O R T 2 0 1 7 / 1 8 198 F I N A N C I A L R E P O R T 1 0
NOTES TO THE FINANCIAL STATEMENTS FOR THE YEAR ENDED 31 MARCH 2018 (CONTINUED)
Company developments:Necsa and its two major subsidiaries, NTP Radioisotopes and Pelchem purchased additional annuities with effect from 1 May 2016 to cater for new retirements since the previous purchase. In addition, contributions were also made towards the recurring premium contracts in place.
The most recent actuarial valuation of the plan assets and the present value of the defined benefit obligation were carried out at 31 March 2018 by Mr. Roy Gweshe, Fellow of the Institute of Actuaries of South Africa. The present value of the defined benefit obligation, and the related current service cost and past service cost, were measured using the projected unit credit method. MSS also undertook the previous valuation for Necsa and its two major subsidiaries, NTP Radioisotapes and Pelchem as at 31 March 2017.
MMI Specialised Solutions (‘MSS’) quantify the present value of post-employment health care liabilities in terms of IAS19 for:
a) Current continuation membersb) Future continuation members emanating from the current active medical scheme members employed by Necsa. In particular,
the funded status of the post-employment plan as at the valuation date will be determined and compared to the projected liability calculated as at 31 March 2017. An expense for the 2017/18 financial year will be derived and a projected expense for the forthcoming year will be calculated for budget purposes. The report complies with the relevant professional guidance from the Actuarial Society of South Africa as described in Advisory Practice Note APN301.
The principal assumptions used for the purposes of the actuarial valuations for Necsa and its two major subsidiaries, NTP Radioisotopes and Pelchem were as follows.
Valuation at
Economic assumptions: 2018 2017 2016
Discount rate (D) 8.90 % 9.90 % 10.10 %
Consumer Price Index (CPI)* 6.50 % 7.40 % 8.10 %
Subsidy contribution increase rate (H) 6.50 % 7.40 % 8.10 %
Net discount rate ((1+D)/(1+H)-1) 2.25 % 2.33 % 1.85 %
Expected return in Plan Assets 8.90 % 9.90 % 10.10 %
* This is the market expectation of long-term CPI.
We have estimated the total duration of the liability to be 12.5 years, based on the previous valuation results.
The rates derived are based on prevailing yields as at 31 March 2018. We used a convention of rounding the derived rates to the nearest 0.1%, similar to the previous valuation.
While it is essential that the assumptions are individually justifiable, it is the relative levels of the discount rate and health care cost inflation to one another that are important in the determination of the liability, rather than the nominal values.
Discount rateWe have derived the discount rate from the BEASSA zero-coupon yield curve. We used the spot rate on the nominal curve with duration equal to the rounded liability duration of 13.25 years to derive the discount rate of 9.90% per annum.

N E C S A A N N U A L R E P O R T 2 0 1 7 / 1 8 199 F I N A N C I A L R E P O R T 1 0
NOTES TO THE FINANCIAL STATEMENTS FOR THE YEAR ENDED 31 MARCH 2018 (CONTINUED)
Consumer price index inflationThe risk free market expectation of long -term Consumer Price Inflation (CPI) of 7.40% per annum was derived from the differential between the nominal yield curve and real yield curve at the same duration.
Subsidy contribution increase rateThe subsidy contribution increase rate was set at CPI.
Expected return on Plan AssetsThe expected return on Plan Assets was set at the discount rate.
Comparison to previous valuationThe financial assumptions have been set on a consistent basis with the previous year’s valuation.
Valuation at
2018 2017 2016
Demographic assumptions:
Expected retirement age (Males and females) 65.00 65.00 65.00
Family structure
Current valuation
Active members Pensioners
Age difference between husband and wife Actual ages used if available / Husband 4 years older than wife
Actual ages used
Proportion married Assumed 90% married at retirement
Actual marital status used
In valuing the death-in-service healthcare liability, it is necessary to make a number of additional assumptions. We assumed that the percentage married of active members increases from 0% at age 21 to 90% at age 45 and stays at 90% until retirement. We have assumed the following percentage married for valuing death-in-service healthcare liability.
Example at stated age Proportion married
21 0%
25 15%
30 34%
35 53%
40 71%
45+ 30%
We have assumed that pensioner’s children and orphans will be subsidised until the age of 21. We have not made any allowance for active members to have child dependants in retirement.
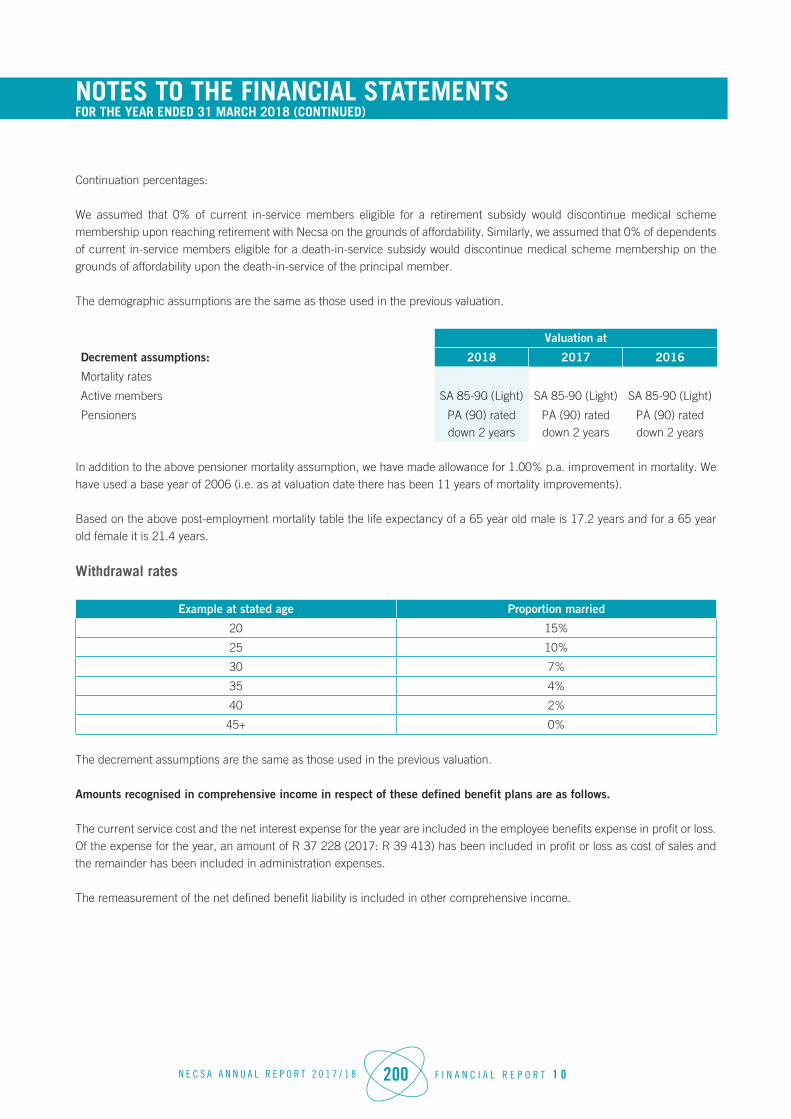
N E C S A A N N U A L R E P O R T 2 0 1 7 / 1 8 200 F I N A N C I A L R E P O R T 1 0
NOTES TO THE FINANCIAL STATEMENTS FOR THE YEAR ENDED 31 MARCH 2018 (CONTINUED)
Continuation percentages:
We assumed that 0% of current in-service members eligible for a retirement subsidy would discontinue medical scheme membership upon reaching retirement with Necsa on the grounds of affordability. Similarly, we assumed that 0% of dependents of current in-service members eligible for a death-in-service subsidy would discontinue medical scheme membership on the grounds of affordability upon the death-in-service of the principal member.
The demographic assumptions are the same as those used in the previous valuation.
Valuation at
Decrement assumptions: 2018 2017 2016
Mortality rates
Active members SA 85-90 (Light) SA 85-90 (Light) SA 85-90 (Light)
Pensioners PA (90) rated down 2 years
PA (90) rated down 2 years
PA (90) rated down 2 years
In addition to the above pensioner mortality assumption, we have made allowance for 1.00% p.a. improvement in mortality. We have used a base year of 2006 (i.e. as at valuation date there has been 11 years of mortality improvements).
Based on the above post-employment mortality table the life expectancy of a 65 year old male is 17.2 years and for a 65 year old female it is 21.4 years.
Withdrawal rates
Example at stated age Proportion married
20 15%
25 10%
30 7%
35 4%
40 2%
45+ 0%
The decrement assumptions are the same as those used in the previous valuation.
Amounts recognised in comprehensive income in respect of these defined benefit plans are as follows.
The current service cost and the net interest expense for the year are included in the employee benefits expense in profit or loss. Of the expense for the year, an amount of R 37 228 (2017: R 39 413) has been included in profit or loss as cost of sales and the remainder has been included in administration expenses.
The remeasurement of the net defined benefit liability is included in other comprehensive income.
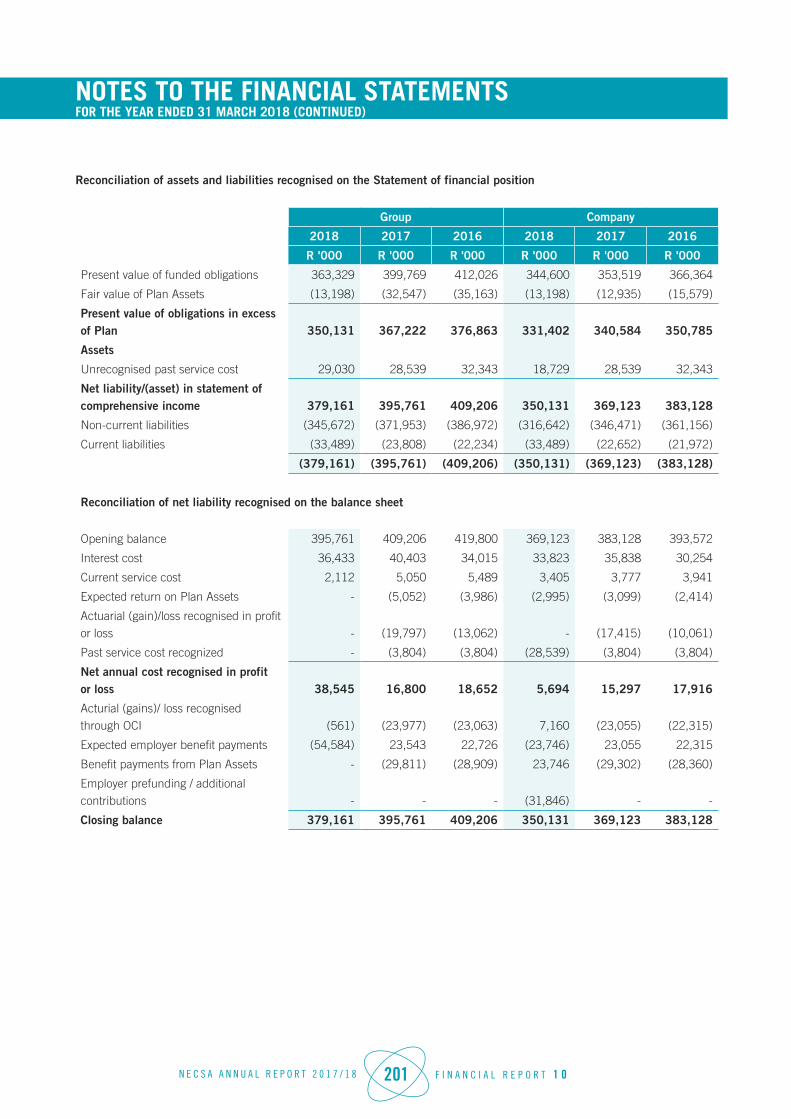
N E C S A A N N U A L R E P O R T 2 0 1 7 / 1 8 201 F I N A N C I A L R E P O R T 1 0
NOTES TO THE FINANCIAL STATEMENTS FOR THE YEAR ENDED 31 MARCH 2018 (CONTINUED)
Reconciliation of assets and liabilities recognised on the Statement of financial position
Group Company
2018 2017 2016 2018 2017 2016
R '000 R '000 R '000 R '000 R '000 R '000
Present value of funded obligations 363,329 399,769 412,026 344,600 353,519 366,364
Fair value of Plan Assets (13,198) (32,547) (35,163) (13,198) (12,935) (15,579)
Present value of obligations in excess of Plan 350,131 367,222 376,863 331,402 340,584 350,785
Assets
Unrecognised past service cost 29,030 28,539 32,343 18,729 28,539 32,343
Net liability/(asset) in statement of comprehensive income 379,161 395,761 409,206 350,131 369,123 383,128
Non-current liabilities (345,672) (371,953) (386,972) (316,642) (346,471) (361,156)
Current liabilities (33,489) (23,808) (22,234) (33,489) (22,652) (21,972)
(379,161) (395,761) (409,206) (350,131) (369,123) (383,128)
Reconciliation of net liability recognised on the balance sheet
Opening balance 395,761 409,206 419,800 369,123 383,128 393,572
Interest cost 36,433 40,403 34,015 33,823 35,838 30,254
Current service cost 2,112 5,050 5,489 3,405 3,777 3,941
Expected return on Plan Assets - (5,052) (3,986) (2,995) (3,099) (2,414)
Actuarial (gain)/loss recognised in profit or loss - (19,797) (13,062) - (17,415) (10,061)
Past service cost recognized - (3,804) (3,804) (28,539) (3,804) (3,804)
Net annual cost recognised in profit or loss 38,545 16,800 18,652 5,694 15,297 17,916
Acturial (gains)/ loss recognised through OCI (561) (23,977) (23,063) 7,160 (23,055) (22,315)
Expected employer benefit payments (54,584) 23,543 22,726 (23,746) 23,055 22,315
Benefit payments from Plan Assets - (29,811) (28,909) 23,746 (29,302) (28,360)
Employer prefunding / additional contributions - - - (31,846) - -
Closing balance 379,161 395,761 409,206 350,131 369,123 383,128

N E C S A A N N U A L R E P O R T 2 0 1 7 / 1 8 202 F I N A N C I A L R E P O R T 1 0
NOTES TO THE FINANCIAL STATEMENTS FOR THE YEAR ENDED 31 MARCH 2018 (CONTINUED)
Reconciliation of present value of obligations in excess of Plan Assets
Group Company
2018 2017 2016 2018 2017 2016
R '000 R '000 R '000 R '000 R '000 R '000
Opening balance 368,020 376,793 384,257 340,584 350,785 357,425
Interest cost 36,433 40,403 34,015 33,823 35,838 30,254
Current service cost - 5,050 5,489 3,405 3,777 3,941
Expected return on Plan Assets - (5,052) (3,986) (2,995) (3,099) (2,414)
Actuarial (gain)/ loss (7,721) (19,797) (13,062) 7,160 (17,415) (10,061)
Expected employer benefit payments from Plan Assets - 23,977 22,726 23,746 23,055 22,315
Expected employer benefit payments 4,112 (23,543) 23,063 (23,746) (23,055) (22,315)
Employer prefunding contributions (21,683) (29,811) 29,583 (31,846) (29,302) (28,360)
Current service cost 379,161 368,020 482,085 350,131 340,584 350,785
Reconciliation of unrecognised past service cost
Company
2018 2017 2016
R '000 R '000 R '000
Opening unrecognised past service cost 28,539 32,343 36,147
Past service cost arising - (3,804) (3,904)
Past service cost recognised (28,539) - -
Closing unrecognised past service cost - 28,539 32,243
Components of unrecognised past service cost at year end - - 3,804
Total unrecognised past service cost at year end - 28,539 36,047
Sensitivity analysis:
Company:The liability derived by this valuation is dependent on the assumptions set out above, which may or may not be borne out in practice. Variations from these assumptions will emerge in future years as experience gains or losses and will be recognised by Necsa in accordance with its accounting policies.
The valuation results are sensitive to changes in the underlying assumptions. The effects of varying these assumptions are illustrated below.
The sensitivity analyses are based on a change in an assumption while holding all other assumptions constant. In practice, this is unlikely to occur, and changes in some of the assumptions may be correlated. This is a limitation of a sensitivity analysis.
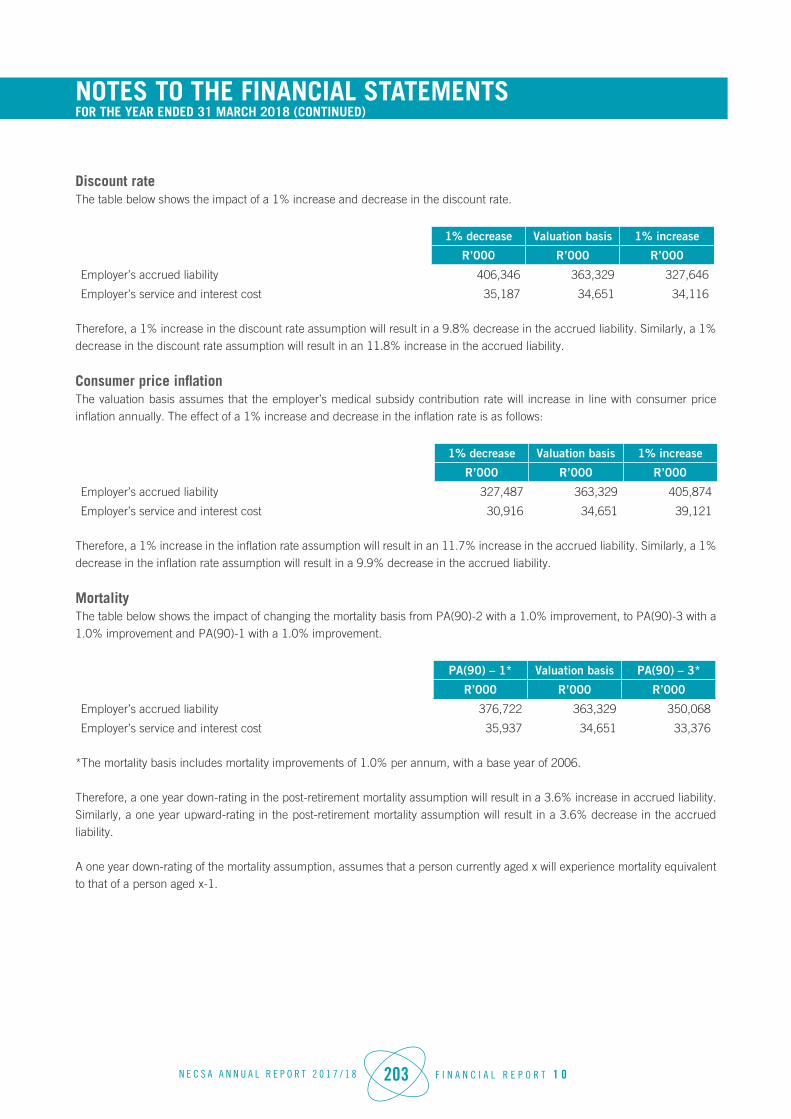
N E C S A A N N U A L R E P O R T 2 0 1 7 / 1 8 203 F I N A N C I A L R E P O R T 1 0
NOTES TO THE FINANCIAL STATEMENTS FOR THE YEAR ENDED 31 MARCH 2018 (CONTINUED)
Discount rateThe table below shows the impact of a 1% increase and decrease in the discount rate.
1% decrease Valuation basis 1% increase
R’000 R’000 R’000
Employer’s accrued liability 406,346 363,329 327,646
Employer’s service and interest cost 35,187 34,651 34,116
Therefore, a 1% increase in the discount rate assumption will result in a 9.8% decrease in the accrued liability. Similarly, a 1% decrease in the discount rate assumption will result in an 11.8% increase in the accrued liability.
Consumer price inflationThe valuation basis assumes that the employer’s medical subsidy contribution rate will increase in line with consumer price inflation annually. The effect of a 1% increase and decrease in the inflation rate is as follows:
1% decrease Valuation basis 1% increase
R’000 R’000 R’000
Employer’s accrued liability 327,487 363,329 405,874
Employer’s service and interest cost 30,916 34,651 39,121
Therefore, a 1% increase in the inflation rate assumption will result in an 11.7% increase in the accrued liability. Similarly, a 1% decrease in the inflation rate assumption will result in a 9.9% decrease in the accrued liability.
MortalityThe table below shows the impact of changing the mortality basis from PA(90)-2 with a 1.0% improvement, to PA(90)-3 with a 1.0% improvement and PA(90)-1 with a 1.0% improvement.
PA(90) – 1* Valuation basis PA(90) – 3*
R’000 R’000 R’000
Employer’s accrued liability 376,722 363,329 350,068
Employer’s service and interest cost 35,937 34,651 33,376
*The mortality basis includes mortality improvements of 1.0% per annum, with a base year of 2006.
Therefore, a one year down-rating in the post-retirement mortality assumption will result in a 3.6% increase in accrued liability. Similarly, a one year upward-rating in the post-retirement mortality assumption will result in a 3.6% decrease in the accrued liability.
A one year down-rating of the mortality assumption, assumes that a person currently aged x will experience mortality equivalent to that of a person aged x-1.

N E C S A A N N U A L R E P O R T 2 0 1 7 / 1 8 204 F I N A N C I A L R E P O R T 1 0
NOTES TO THE FINANCIAL STATEMENTS FOR THE YEAR ENDED 31 MARCH 2018 (CONTINUED)
Expected retirement ageThe table below shows the impact of a 1 year increase and decrease in the average retirement age assumption (which is the age that the liability is assumed to be fully accrued). The impact of reducing the average retirement age by two years is also shown in the table below. The average retirement age is assumed to be 65 years.
2 years younger 1 year younger Valuation basis 1 year older
R’000 R’000 R’000 R’000
Employer’s accrued liability - 369,817 363,329 356,834
Employer’s service and interest cost - 35,240 34,651 33,957
Therefore, an increase of 1 year in the average retirement age assumption will result in a 1.8% decrease in the accrued liability. Similarly, a decrease of 1 year in the average retirement age assumption will result in a 1.9% increase in the accrued liability. A reduction of 2 years in the average retirement age assumption will result in a 3.8% increase in the accrued liability.
Group:Discount rate
The table below shows the impact of a 1% increase and decrease in the discount rate.
1% decrease Valuation basis 1% increase
R’000 R’000 R’000
Employer’s accrued liability 465,311 413,739 371,256
Employer’s service and interest cost 41,022 40,092 39,214
Therefore, a 1% increase in the discount rate assumption will result in a 15.3% decrease in the accrued liability. Similarly, a 1% decrease in the discount rate assumption will result in a 19.6% increase in the accrued liability.
Consumer price inflationThe valuation basis assumes that the employer’s medical subsidy contribution rate will increase in line with consumer price inflation annually. The effect of a 1% increase and decrease in the inflation rate is as follows:
1% decrease Valuation basis 1% increase
R’000 R’000 R’000
Employer’s accrued liability 371,019 413,739 464,808
Employer’s service and interest cost 35,568 40,092 45,547
Therefore, a 1% increase in the inflation rate assumption will result in a 19.6% increase in the accrued liability. Similarly, a 1% decrease in the inflation rate assumption will result in a 15.5% decrease in the accrued liability.

N E C S A A N N U A L R E P O R T 2 0 1 7 / 1 8 205 F I N A N C I A L R E P O R T 1 0
NOTES TO THE FINANCIAL STATEMENTS FOR THE YEAR ENDED 31 MARCH 2018 (CONTINUED)
MortalityThe table below shows the impact of changing the mortality basis from PA(90)-2 with a 1.0% improvement, to PA(90)-3 with a 1.0% improvement and PA(90)-1 with a 1.0% improvement.
PA(90) – 1* Valuation basis PA(90) – 3*
R’000 R’000 R’000
Employer’s accrued liability 428,532 413,739 399,073
Employer’s service and interest cost 41,530 40,092 38,664*The mortality basis includes mortality improvements of 1.0% per annum, with a base year of 2006.
Therefore, a one year down-rating in the post-retirement mortality assumption will result in a 2.7% increase in accrued liability. Similarly, a one year upward-rating in the post-retirement mortality assumption will result in a 2.7% decrease in the accrued liability.
A one year down-rating of the mortality assumption, assumes that a person currently aged x will experience mortality equivalent to that of a person aged x-1.
Expected retirement ageThe table below shows the impact of a 1 year increase and decrease in the average retirement age assumption (which is the age that the liability is assumed to be fully accrued). The impact of reducing the average retirement age by two years is also shown in the table below. The average retirement age is assumed to be 65 years.
2 years younger1 year
youngerValuation
basis 1 year older
R’000 R’000 R’000 R’000
Employer’s accrued liability - 422,184 413,739 399,073
Employer’s service and interest cost - 40,902 40,092 39,214
Therefore, an increase of 1 year in the average retirement age assumption will result in a 4.7% decrease in the accrued liability. Similarly, a decrease of 1 year in the average retirement age assumption will result in a 5.0% increase in the accrued liability. A reduction of 2 years in the average retirement age assumption will result in a 10.2% increase in the accrued liability.
NTP RadioisotopesDiscount rate
The table below shows the impact of a 1% increase and decrease in the discount rate.
1% decrease Valuation basis 1% increase
R’000 R’000 R’000
Employer’s accrued liability 24,722 21,379 18,683
Employer’s service and interest cost 2,429 2,293 2,171
Therefore, a 1% increase in the discount rate assumption will result in a 12.9% decrease in the accrued liability. Similarly, a 1% decrease in the discount rate assumption will result in a 16.0% increase in the accrued liability.

N E C S A A N N U A L R E P O R T 2 0 1 7 / 1 8 206 F I N A N C I A L R E P O R T 1 0
NOTES TO THE FINANCIAL STATEMENTS FOR THE YEAR ENDED 31 MARCH 2018 (CONTINUED)
Consumer price inflationThe valuation basis assumes that the employer’s medical subsidy contribution rate will increase in line with consumer price inflation annually. The effect of a 1% increase and decrease in the inflation rate is as follows:
1% decrease Valuation basis 1% increase
R’000 R’000 R’000
Employer’s accrued liability 18,655 21,379 24,705
Employer’s service and interest cost 1,981 2,293 2,676
Therefore, a 1% increase in the inflation rate assumption will result in a 15.9% increase in the accrued liability. Similarly, a 1% decrease in the inflation rate assumption will result in a 13.0% decrease in the accrued liability.
MortalityThe table below shows the impact of changing the mortality basis from PA(90)-2 with a 1.0% improvement, to PA(90)-3 with a 1.0% improvement and PA(90)-1 with a 1.0% improvement.
PA(90) – 1* Valuation PA(90) – 3*
R’000 basis R’000 R’000
Employer’s accrued liability 22,009 21,379 20,748
Employer’s service and interest cost 2,361 2,293 2,224*The mortality basis includes mortality improvements of 1.0% per annum, with a base year of 2006.
Therefore, a one year down-rating in the post-retirement mortality assumption will result in a 2.9% increase in accrued liability. Similarly, a one year upward-rating in the post-retirement mortality assumption will result in a 2.9% decrease in the accrued liability.
A one year down-rating of the mortality assumption, assumes that a person currently aged x will experience mortality equivalent to that of a person aged x-1.
Expected retirement ageThe table below shows the impact of a 1 year increase and decrease in the average retirement age assumption (which is the age that the liability is assumed to be fully accrued). The impact of reducing the average retirement age by two years is also shown in the table below. The average retirement age is assumed to be 65 years.
2 years younger 1 year younger Valuation basis 1 year older
R’000 R’000 R’000 R’000
Employer’s accrued liability - 22,208 21,379 20,626
Employer’s service and interest cost - 2,373 2,293 2,193
Therefore, an increase of 1 year in the average retirement age assumption will result in a 3.5% decrease in the accrued liability. Similarly, a decrease of 1 year in the average retirement age assumption will result in a 3.9% increase in the accrued liability.
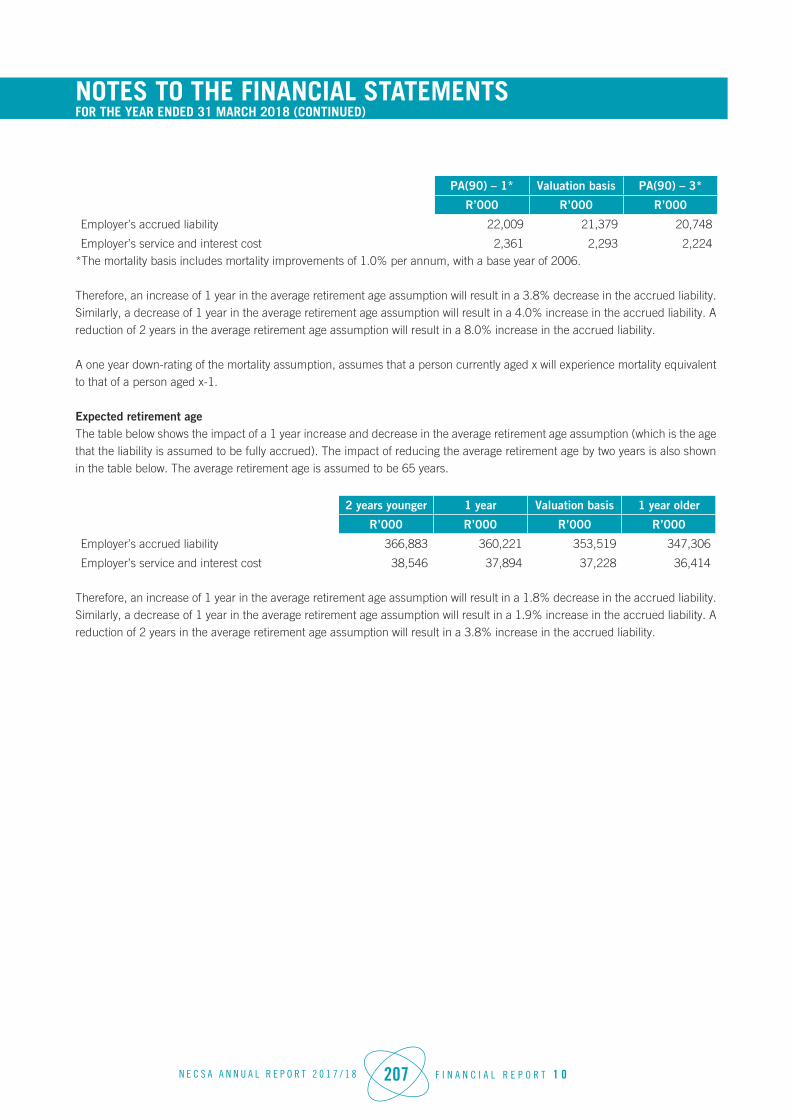
N E C S A A N N U A L R E P O R T 2 0 1 7 / 1 8 207 F I N A N C I A L R E P O R T 1 0
NOTES TO THE FINANCIAL STATEMENTS FOR THE YEAR ENDED 31 MARCH 2018 (CONTINUED)
PA(90) – 1* Valuation basis PA(90) – 3*
R’000 R’000 R’000
Employer’s accrued liability 22,009 21,379 20,748
Employer’s service and interest cost 2,361 2,293 2,224*The mortality basis includes mortality improvements of 1.0% per annum, with a base year of 2006.
Therefore, an increase of 1 year in the average retirement age assumption will result in a 3.8% decrease in the accrued liability. Similarly, a decrease of 1 year in the average retirement age assumption will result in a 4.0% increase in the accrued liability. A reduction of 2 years in the average retirement age assumption will result in a 8.0% increase in the accrued liability.
A one year down-rating of the mortality assumption, assumes that a person currently aged x will experience mortality equivalent to that of a person aged x-1.
Expected retirement ageThe table below shows the impact of a 1 year increase and decrease in the average retirement age assumption (which is the age that the liability is assumed to be fully accrued). The impact of reducing the average retirement age by two years is also shown in the table below. The average retirement age is assumed to be 65 years.
2 years younger 1 year Valuation basis 1 year older
R’000 R’000 R’000 R’000
Employer’s accrued liability 366,883 360,221 353,519 347,306
Employer’s service and interest cost 38,546 37,894 37,228 36,414
Therefore, an increase of 1 year in the average retirement age assumption will result in a 1.8% decrease in the accrued liability. Similarly, a decrease of 1 year in the average retirement age assumption will result in a 1.9% increase in the accrued liability. A reduction of 2 years in the average retirement age assumption will result in a 3.8% increase in the accrued liability.

N E C S A A N N U A L R E P O R T 2 0 1 7 / 1 8 208 F I N A N C I A L R E P O R T 1 0
NOTES TO THE FINANCIAL STATEMENTS FOR THE YEAR ENDED 31 MARCH 2018 (CONTINUED)
Fair valueCompany
Necsa purchased an insurance policy in the form of a company-owned annuity policy, which qualifies as a Plan Asset, effective as at 1 March 2011. Following this, five further policies were purchased with effective dates of 1 July 2012, 1 May 2013, 1 May 2014, 1 May 2015 and 1 May 2016.
As at 31 March 2018, the policy value of the Plan Asset provided by the insurer was R10,037.
The annuity portfolio is made up of a Growth Account and a Guaranteed Account. Increases are guaranteed at a minimum of CPI per annum. Funds may be transferred from the Growth Account to the Guaranteed Account annually to fund any increase in Employer Contributions in excess of the guaranteed annuities. Furthermore, the Growth Account is used for interim subsidies for new retirees until the annual annuity purchase.
31 March 2018 31 March 2017 31 March 2016
R’000 R’000 R’000
Guaranteed account 9,649 12,690 9,438
Growth account 388 452 542
Market value of Plan Asset 10,037 13,142 9,980
IAS 19 requires Plan Assets to be accounted for at fair value. To ensure comparability and consistency between the asset and liability valuation, the fair value of the Guaranteed Account was calculated as the present value of the liabilities (only for pensioners already on the Momentum annuity policy) using current valuation assumptions, less the present value of future outstanding premiums (after deducting administration costs, solvency and profit margins in the future premiums). For this, we have assumed admin costs of 2.7% and another 8% margin to cover solvency and profit margins. The fair value of the Growth Account was set at the market value.
The fair value of the Plan Asset is therefore set as follows:
31 March 2018 31 March 2017 31 March 2016
R’000 R’000 R’000
Guaranteed account - 15,127 12,393
Growth account - 452 542
Fair value of Plan Asset - 15,579 12,935
GroupPelchem:
We are not aware of any assets set aside for post-employment medical aid funding that qualify as Plan Assets in terms of the requirements of IAS19. As such we have ascribed a nil value to the fair value of Plan Assets.
NTP Radioisotopes:
NTP purchased an insurance policy in the form of a company owned annuity policy, which qualifies as a Plan Asset, effective as at 1 March 2011.
As at 31 March 2018, the policy value of the Plan Asset provided by the insurer was R21,688.

N E C S A A N N U A L R E P O R T 2 0 1 7 / 1 8 209 F I N A N C I A L R E P O R T 1 0
NOTES TO THE FINANCIAL STATEMENTS FOR THE YEAR ENDED 31 MARCH 2018 (CONTINUED)
The annuity portfolio is made up of a Growth Account and a Guaranteed Account. Increases are guaranteed at a minimum of CPI per annum. Funds are transferred from the Growth Account to the Guaranteed Account to fund the purchase of annuities for new retirees. The account may also be used to fund any increase in Employer Contributions in excess of the guaranteed annuities.
At the current and previous valuation date, the values of each of these accounts were as follows:
31 March 2018 31 March 2017 31 March 2016
R’000 R’000 R’000
Guaranteed account 10,257 8,008 10,667
Growth account 11,431 12,478 10,466
Market value of Plan Asset 21,688 20,486 21,133
IAS 19 requires Plan Assets to be accounted for at fair value. To ensure comparability and consistency between the asset and liability valuation, the fair value of the Guaranteed Account was calculated as the present value of the liabilities with increases at CPI using current valuation assumptions. The fair value of the Growth Account remains at market value (this was limited to the value of accrued liability as this also funds future service liabilities).
The fair value of the Plan Asset is therefore set as follows:
31 March 2018 31 March 2017 31 March 2016
R’000 R’000 R’000
Guaranteed account 14,560 19,584 19,612
Growth account 14,470 - -
Fair value of Plan Asset 29,030 19,584 19,612
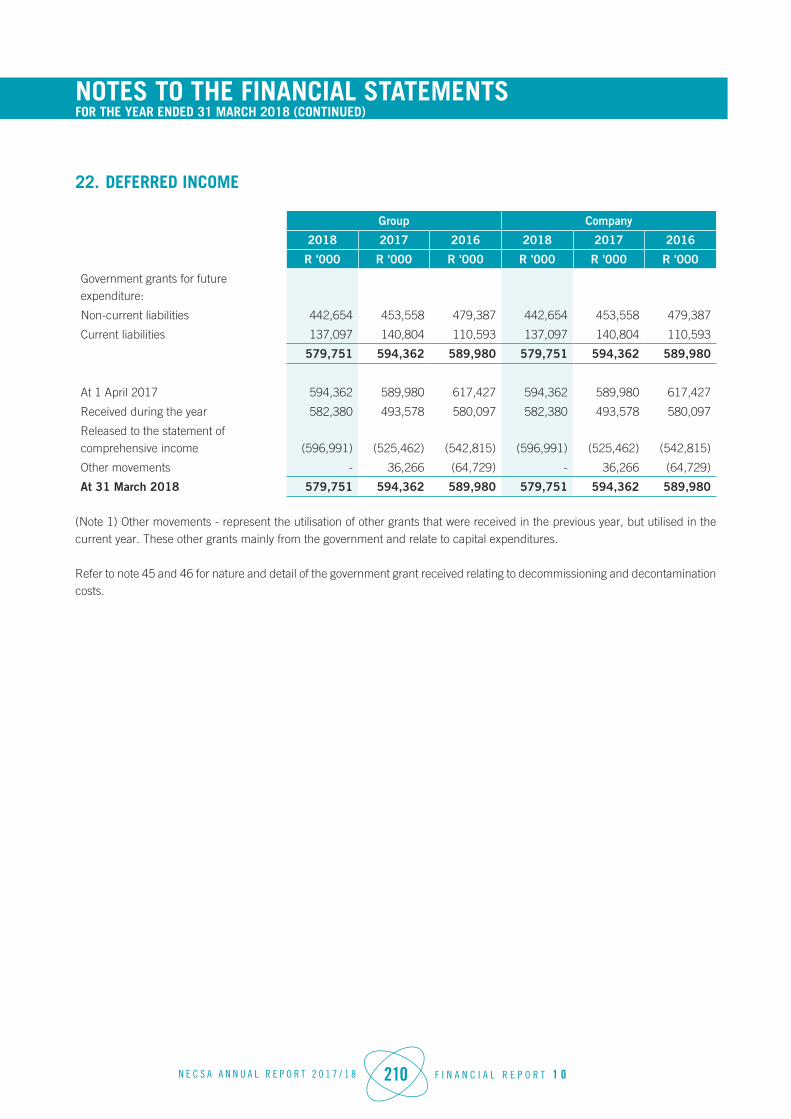
N E C S A A N N U A L R E P O R T 2 0 1 7 / 1 8 210 F I N A N C I A L R E P O R T 1 0
NOTES TO THE FINANCIAL STATEMENTS FOR THE YEAR ENDED 31 MARCH 2018 (CONTINUED)
22. DEFERRED INCOME
Group Company
2018 2017 2016 2018 2017 2016
R '000 R '000 R '000 R '000 R '000 R '000
Government grants for future expenditure:
Non-current liabilities 442,654 453,558 479,387 442,654 453,558 479,387
Current liabilities 137,097 140,804 110,593 137,097 140,804 110,593
579,751 594,362 589,980 579,751 594,362 589,980
At 1 April 2017 594,362 589,980 617,427 594,362 589,980 617,427
Received during the year 582,380 493,578 580,097 582,380 493,578 580,097
Released to the statement of comprehensive income (596,991) (525,462) (542,815) (596,991) (525,462) (542,815)
Other movements - 36,266 (64,729) - 36,266 (64,729)
At 31 March 2018 579,751 594,362 589,980 579,751 594,362 589,980
(Note 1) Other movements - represent the utilisation of other grants that were received in the previous year, but utilised in the current year. These other grants mainly from the government and relate to capital expenditures.
Refer to note 45 and 46 for nature and detail of the government grant received relating to decommissioning and decontamination costs.
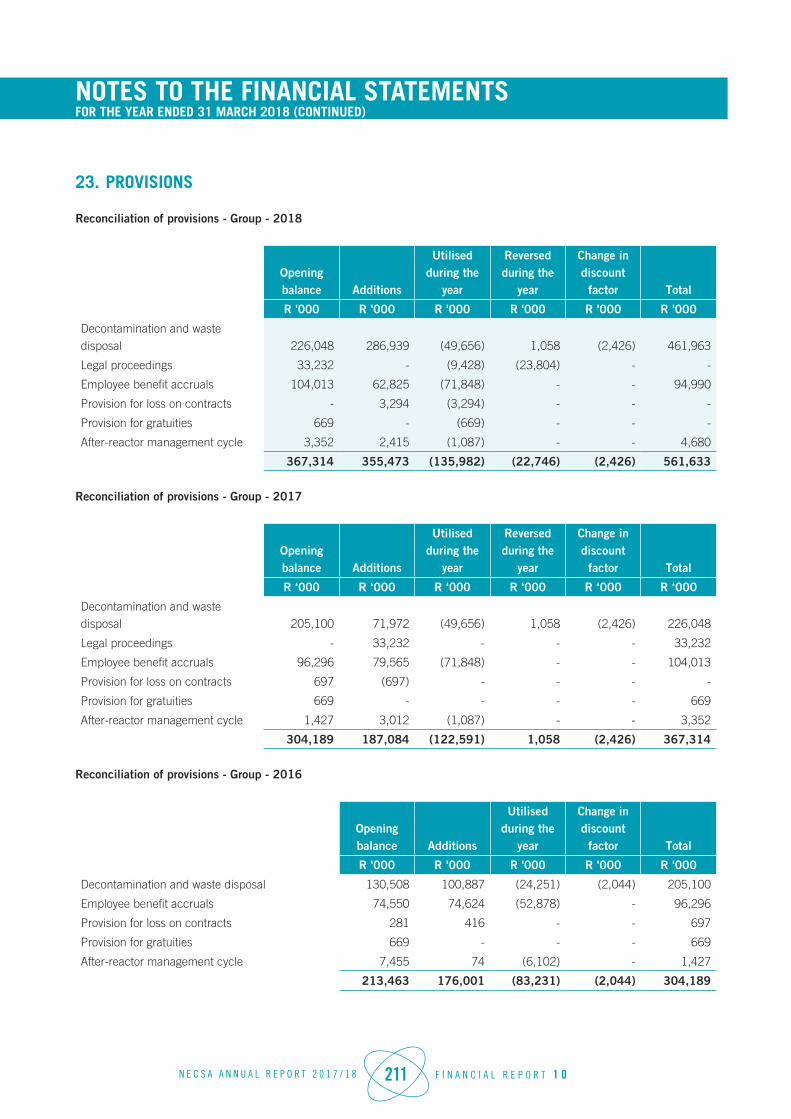
N E C S A A N N U A L R E P O R T 2 0 1 7 / 1 8 211 F I N A N C I A L R E P O R T 1 0
NOTES TO THE FINANCIAL STATEMENTS FOR THE YEAR ENDED 31 MARCH 2018 (CONTINUED)
23. PROVISIONS
Reconciliation of provisions - Group - 2018
Opening balance Additions
Utilised during the
year
Reversed during the
year
Change in discount
factor Total
R '000 R '000 R '000 R '000 R '000 R '000
Decontamination and waste disposal 226,048 286,939 (49,656) 1,058 (2,426) 461,963
Legal proceedings 33,232 - (9,428) (23,804) - -
Employee benefit accruals 104,013 62,825 (71,848) - - 94,990
Provision for loss on contracts - 3,294 (3,294) - - -
Provision for gratuities 669 - (669) - - -
After-reactor management cycle 3,352 2,415 (1,087) - - 4,680
367,314 355,473 (135,982) (22,746) (2,426) 561,633
Reconciliation of provisions - Group - 2017
Opening balance Additions
Utilised during the
year
Reversed during the
year
Change in discount
factor Total
R ‘000 R ‘000 R ‘000 R ‘000 R ‘000 R ‘000
Decontamination and waste disposal 205,100 71,972 (49,656) 1,058 (2,426) 226,048
Legal proceedings - 33,232 - - - 33,232
Employee benefit accruals 96,296 79,565 (71,848) - - 104,013
Provision for loss on contracts 697 (697) - - - -
Provision for gratuities 669 - - - - 669
After-reactor management cycle 1,427 3,012 (1,087) - - 3,352
304,189 187,084 (122,591) 1,058 (2,426) 367,314
Reconciliation of provisions - Group - 2016
Opening balance Additions
Utilised during the
year
Change in discount
factor Total
R '000 R '000 R '000 R '000 R '000
Decontamination and waste disposal 130,508 100,887 (24,251) (2,044) 205,100
Employee benefit accruals 74,550 74,624 (52,878) - 96,296
Provision for loss on contracts 281 416 - - 697
Provision for gratuities 669 - - - 669
After-reactor management cycle 7,455 74 (6,102) - 1,427
213,463 176,001 (83,231) (2,044) 304,189

N E C S A A N N U A L R E P O R T 2 0 1 7 / 1 8 212 F I N A N C I A L R E P O R T 1 0
NOTES TO THE FINANCIAL STATEMENTS FOR THE YEAR ENDED 31 MARCH 2018 (CONTINUED)
Reconciliation of provisions - Company - 2018
Opening balance Additions
Utilised during the
year
Reversed during the
year
Change in discount
factor Total
R '000 R '000 R '000 R '000 R '000 R '000
Decontamination and waste disposal 380,169 20,549 - - - 400,718
Employee benefit accruals 45,894 35,729 (27,514) - - 54,109
After-reactor management cycle 1,676 1,179 - - - 2,855
427,739 57,457 (27,514) - - 457,682
Reconciliation of provisions - Company - 2017
Opening balance Additions
Utilised during the
year
Reclassified during the
year
Change in discount
factor Total
R '000 R '000 R '000 R '000 R '000 R '000
Decontamination and waste disposal 313,888 66,281 - - - 380,169
Employee benefit accruals 43,503 29,905 (27,514) - - 45,894
Provision for loss on contracts 697 (697) - - - -
After-reactor management cycle - 1,676 - - - 1,676
358,088 97,165 (27,514) - - 427,739
Reconciliation of provisions - Company - 2016
Opening balance Additions
Utilised during the
year Total
R '000 R '000 R '000 R '000
Decontamination and waste disposal 269,800 44,088 - 313,888
Employee benefit accruals 42,281 33,168 (31,946) 43,503
Provision for loss on contracts 281 416 - 697
312,362 77,672 (31,946) 358,088

N E C S A A N N U A L R E P O R T 2 0 1 7 / 1 8 213 F I N A N C I A L R E P O R T 1 0
NOTES TO THE FINANCIAL STATEMENTS FOR THE YEAR ENDED 31 MARCH 2018 (CONTINUED)
Group Company
2018 2017 2016 2018 2017 2016
R '000 R '000 R '000 R '000 R '000 R '000
Non-current liabilities 464,818 228,393 205,769 403,573 381,845 313,888
Current liabilities 96,815 138,921 98,420 54,109 45,894 44,200
561,633 367,314 304,189 457,682 427,739 358,088
Provision for decontamination and waste disposal:
Provision is made for the decontamination of purely commercial plants and disposal of the resulting waste. The annual transfer is based on the latest available cost information. The Company was awarded a license from the National Nuclear Regulator to transport the waste to Vaalputs on 15 March 2011. The assessment methodology provides an estimate of the total cost associated with the decommissioning of commercial plants currently existing at Necsa to the point where they can be reused or released from regulatory control, and the total cost to manage (treat, condition, store and/or dispose) all the existing and future waste created by these activities. In order to estimate the cost and scheduling of the various decommissioning and waste management activities the following assumptions were made:
i) In view of the fact that the Necsa site will remain a licensed site for the foreseeable future, the decommissioning of facilities to the point of release from regulatory control is not necessarily regarded as the required endpoint, as that may depend on the potential future re-use of the nuclear facility.
ii) Only liabilities associated with existing facilities identified during the assessment cycle, and future facilities identified as essential for the discharge of these liabilities are included in the assessment.
iii) The following costs are included in the assessment:
The cost to decommission all facilities to the point where they can be released from regulatory control (the cost exclude future demolishing cost of buildings). Rehabilitation of the site was not included in the assessment, except in cases where this was considered to be the most viable option to achieve release from regulatory control.
A potential benefit (cost decrease) may be achieved as a result of technological progress in the fields of decommissioning and waste management. There are, however, many uncertainties that may impact the accuracy of cost estimates for discharging nuclear liabilities, mainly due to the long time periods over which the cost estimates must be done. Some of these uncertainties are listed below:
Non-technical aspects, such as socio-political factors and changes in laws or regulations in nuclear safety and waste management, are difficult to quantify in terms of impact on cost estimates.
Decommissioning cost for many projects occur some years in the future. The life time of some processes may also be extended resulting in the postponement of decommissioning activities and cost.
Future developments in the nuclear industry (up scaling or down scaling) may result in the reuse of contaminated or previously decommissioned facilities. Refer note 44 and 46 for further disclosure on the nature of Decommissioning and decontamination liability.
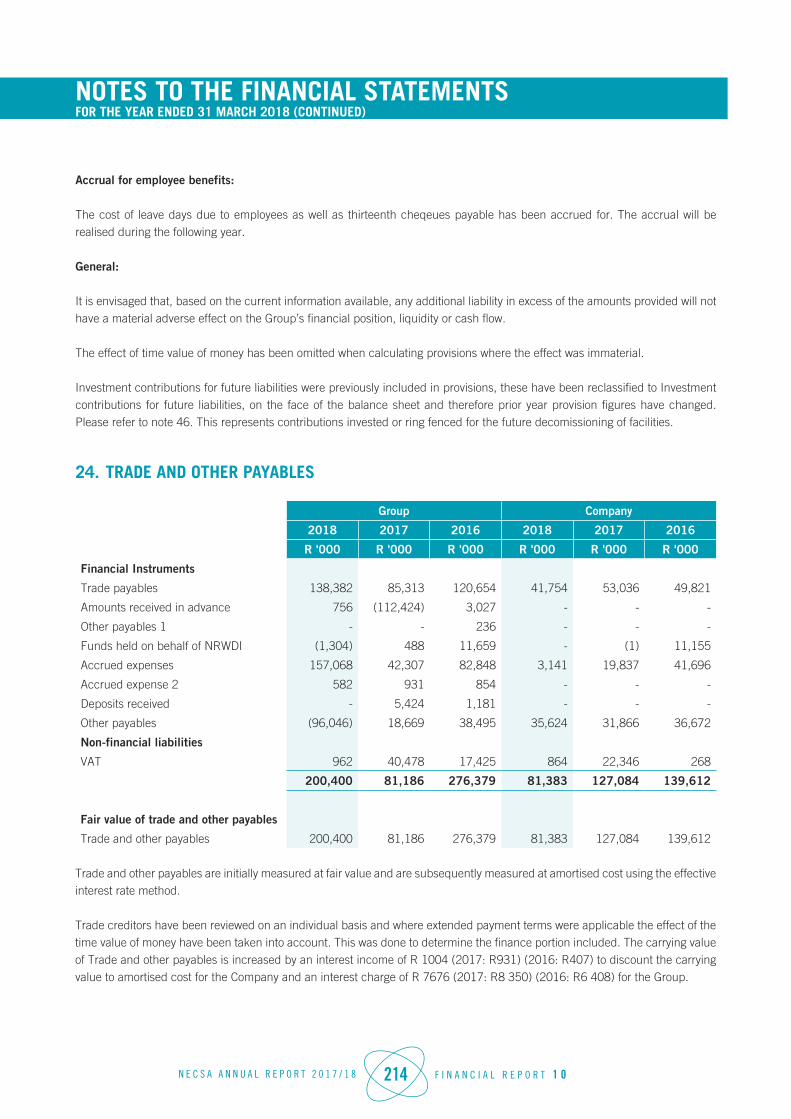
N E C S A A N N U A L R E P O R T 2 0 1 7 / 1 8 214 F I N A N C I A L R E P O R T 1 0
NOTES TO THE FINANCIAL STATEMENTS FOR THE YEAR ENDED 31 MARCH 2018 (CONTINUED)
Accrual for employee benefits:
The cost of leave days due to employees as well as thirteenth cheqeues payable has been accrued for. The accrual will be realised during the following year.
General:
It is envisaged that, based on the current information available, any additional liability in excess of the amounts provided will not have a material adverse effect on the Group’s financial position, liquidity or cash flow.
The effect of time value of money has been omitted when calculating provisions where the effect was immaterial.
Investment contributions for future liabilities were previously included in provisions, these have been reclassified to Investment contributions for future liabilities, on the face of the balance sheet and therefore prior year provision figures have changed. Please refer to note 46. This represents contributions invested or ring fenced for the future decomissioning of facilities.
24. TRADE AND OTHER PAYABLES
Group Company
2018 2017 2016 2018 2017 2016
R '000 R '000 R '000 R '000 R '000 R '000
Financial Instruments
Trade payables 138,382 85,313 120,654 41,754 53,036 49,821
Amounts received in advance 756 (112,424) 3,027 - - -
Other payables 1 - - 236 - - -
Funds held on behalf of NRWDI (1,304) 488 11,659 - (1) 11,155
Accrued expenses 157,068 42,307 82,848 3,141 19,837 41,696
Accrued expense 2 582 931 854 - - -
Deposits received - 5,424 1,181 - - -
Other payables (96,046) 18,669 38,495 35,624 31,866 36,672
Non-financial liabilities
VAT 962 40,478 17,425 864 22,346 268
200,400 81,186 276,379 81,383 127,084 139,612
Fair value of trade and other payables
Trade and other payables 200,400 81,186 276,379 81,383 127,084 139,612
Trade and other payables are initially measured at fair value and are subsequently measured at amortised cost using the effective interest rate method.
Trade creditors have been reviewed on an individual basis and where extended payment terms were applicable the effect of the time value of money have been taken into account. This was done to determine the finance portion included. The carrying value of Trade and other payables is increased by an interest income of R 1004 (2017: R931) (2016: R407) to discount the carrying value to amortised cost for the Company and an interest charge of R 7676 (2017: R8 350) (2016: R6 408) for the Group.

N E C S A A N N U A L R E P O R T 2 0 1 7 / 1 8 215 F I N A N C I A L R E P O R T 1 0
NOTES TO THE FINANCIAL STATEMENTS FOR THE YEAR ENDED 31 MARCH 2018 (CONTINUED)
The average credit period on purchases is between 30 and 60 days from date of statement. The Company and Group settle payments to creditors on average 30 days from receipt of the statements. Interest is sometimes charged on trade payables based on the payment policy of the Group. The Company and Group has financial risk management policies in place to ensure that all payables are paid within the credit timeframe.
25. FINANCIAL ASSETS BY CATEGORY
The accounting policies for financial instruments have been applied to the line items below:
Group - 2018
Loans and receivables
Fair value through
profit or loss -designated
Available-for-sale Total
R '000 R '000 R '000 R '000
Loans to (from) group companies 3,310 - - 3,310
Other financial assets 751,426 1,503 409,857 1,162,786
Cash and cash equivalents 61,512 - - 61,512
Trade and other receivables (excl. prepayments, deposits and VAT receivable) 540,556 - - 540,556
1,356,804 1,503 409,857 1,768,164
Group - 2017Loans and receivables Total
R '000 R '000
Loans to (from) group companies 3,310 3,310
Company - 2018Loans and receivables
Available-for-sale Total
R '000 R '000 R '000
Loans to (from) group companies (58,969) - (58,969)
Other financial assets 313,207 409,815 723,022
Cash and cash equivalents 15,012 - 15,012
Trade and other receivables (excl. prepayments, deposits and VAT receivable) 116,953 - 116,953
386,203 409,815 796,018
Company - 2017Loans and receivables
Available-for-sale Total
R '000 R '000 R '000
Loans to (from) group companies 756 - 756
Other financial assets 48,012 222,772 270,784
Trade and other receivables (excl. prepayments, deposits and VAT receivable) 208,453 - 208,453
257,221 222,772 479,993
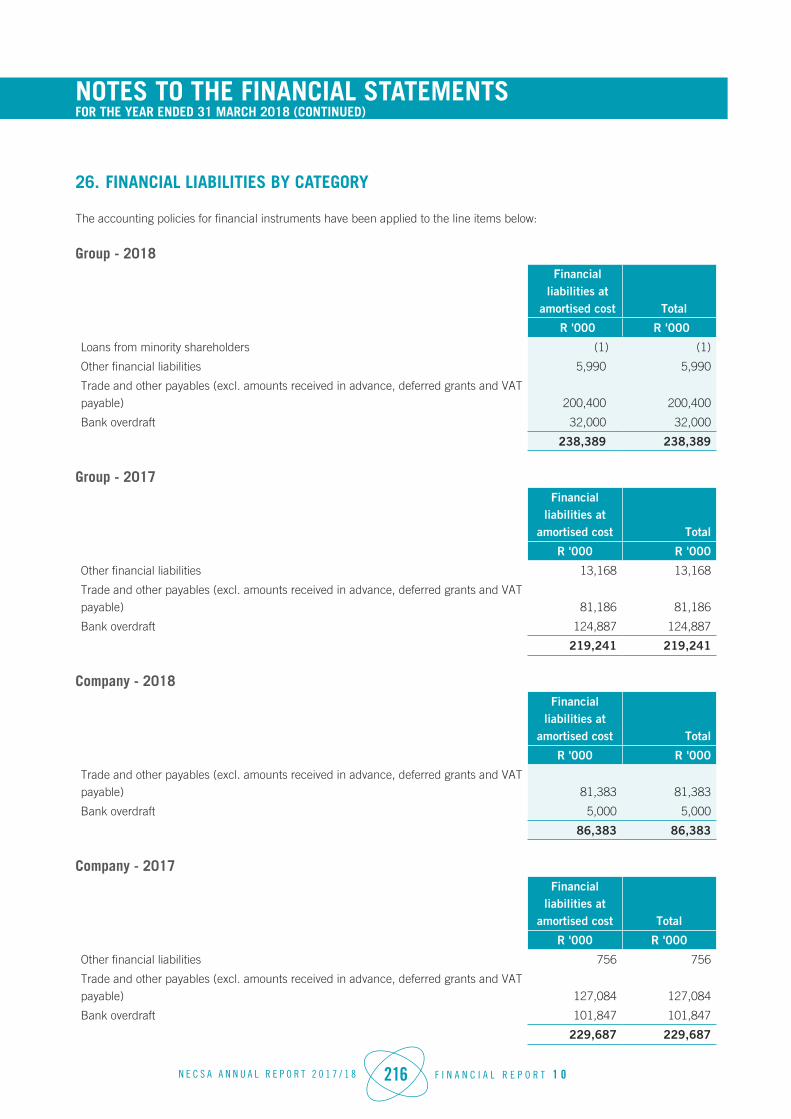
N E C S A A N N U A L R E P O R T 2 0 1 7 / 1 8 216 F I N A N C I A L R E P O R T 1 0
NOTES TO THE FINANCIAL STATEMENTS FOR THE YEAR ENDED 31 MARCH 2018 (CONTINUED)
26. FINANCIAL LIABILITIES BY CATEGORY
The accounting policies for financial instruments have been applied to the line items below:
Group - 2018Financial
liabilities at amortised cost Total
R '000 R '000
Loans from minority shareholders (1) (1)
Other financial liabilities 5,990 5,990
Trade and other payables (excl. amounts received in advance, deferred grants and VAT payable) 200,400 200,400
Bank overdraft 32,000 32,000
238,389 238,389
Group - 2017Financial
liabilities at amortised cost Total
R '000 R '000
Other financial liabilities 13,168 13,168
Trade and other payables (excl. amounts received in advance, deferred grants and VAT payable) 81,186 81,186
Bank overdraft 124,887 124,887
219,241 219,241
Company - 2018Financial
liabilities at amortised cost Total
R '000 R '000
Trade and other payables (excl. amounts received in advance, deferred grants and VAT payable) 81,383 81,383
Bank overdraft 5,000 5,000
86,383 86,383
Company - 2017Financial
liabilities at amortised cost Total
R '000 R '000
Other financial liabilities 756 756
Trade and other payables (excl. amounts received in advance, deferred grants and VAT payable) 127,084 127,084
Bank overdraft 101,847 101,847
229,687 229,687

N E C S A A N N U A L R E P O R T 2 0 1 7 / 1 8 217 F I N A N C I A L R E P O R T 1 0
NOTES TO THE FINANCIAL STATEMENTS FOR THE YEAR ENDED 31 MARCH 2018 (CONTINUED)
27. REVALUATION RESERVE
The revaluation reserve consists of fair value adjustments to the land and buildings of the Company and Group.
Group Company
2018 2017 2016 2018 2017 2016
R '000 R '000 R '000 R '000 R '000 R '000
Fair value adjustment to land and buildings 531,952 508,456 479,565 527,791 477,405 450,385
Necsa does not intend to sell their land and buildings before decommissioning and decontamination takes place. An exercise will need to be conducted to check the decommissioning and decontamination of the land and buildings. Refer to note 34 on further disclosure on the revaluation reserve.
28. FAIR VALUE ADJUSTMENT ASSETS-AVAILABLE-FOR-SALE RESERVE
The fair value adjustment assets-available-for- sale-reserve comprises all fair value adjustments on available for sale financial instruments. When an asset or liability is derecognised, the fair value adjustment relating to that asset or liability is transferred to profit or loss.
Group Company
2018 2017 2016 2018 2017 2016
R '000 R '000 R '000 R '000 R '000 R '000
Available for sale financial instruments 7,075 5,830 4,442 7,052 5,807 4,419
29. REVENUEGroup Company
2018 2017 2018 2017
R ‘000 R '000 R '000 R '000
Sale of goods 1,563,035 1,619,679 388,072 400,652
Construction contracts 30,026 6,445 30,026 6,445
Government grants 596,991 525,462 596,991 525,462
Other grants 61,255 37,774 57,358 22,718
2,251,307 2,189,360 1,072,447 955,277
The amount included in revenue arising from government grants is as follows:
Group Company
2018 2017 2018 2017
R ‘000 R '000 R '000 R '000
Operating activities 491,738 446,046 491,738 446,046
Decommissioning of strategic plants 73,473 61,691 73,473 61,691
LEU Fuel and conversion 21,344 8,418 21,344 8,418
Security 9,394 8,372 9,394 8,372
Deferred R&D Safari Grant Used 276 169 276 169
Deferred MTEF Grant utilised for Activities 766 766 766 766
596,991 525,462 596,991 525,462

N E C S A A N N U A L R E P O R T 2 0 1 7 / 1 8 218 F I N A N C I A L R E P O R T 1 0
NOTES TO THE FINANCIAL STATEMENTS FOR THE YEAR ENDED 31 MARCH 2018 (CONTINUED)
The government grant relating to operating activities is primarily utilised to fund research and development expenses, non-commercial overheads and supplementary activities as required by the Nuclear Energy Act, costs for discarding radioactive waste and for storage of irradiated nuclear fuel.
The South African Government has an obligation to discharge nuclear liabilities resulting from previous strategic nuclear programmes which includes decommissioning and decontamination of disused historic facilities. The Minister of Department of Energy is charged with this responsibility on behalf of government. A Nuclear Liabilities Management Plan (NLMP) was approved by cabinet in February 2007.
Necsa, as a statutory body created in terms of the Nuclear Energy Act (Act 46 of 1999) has been delegated with certain responsibilities in this regard. It annually receives funds to apply to the decommissioning and decontamination process in terms of the NLMP. Funds received by Necsa for this purpose and not utilised at year end are accounted for as deferred grants.
30. OPERATING PROFIT (LOSS)
Group Company
2018 2017 2018 2017
R '000 R '000 R '000 R '000
Operating profit (loss) for the year is stated after charging (crediting) the following, amongst others:
Income from subsidiaries (other than investment income)
Dividends - - 107,216 61,074
Interest 6 1,499 - -
6 1,499 107,216 61,074
Leases
Operating lease charges
Premises 468 1,314 150 138
Equipment 3,500 3,713 3,373 3,600
Lease rentals 45,303 47,423 45,037 42,481
49,271 52,450 48,560 46,219
Contingent rentals on operating leases
Operating lease 1 5,494 - - -
Total operating lease charges 54,765 52,450 48,560 46,219
Less: Operating lease charges included in cost of merchandise sold and inventories (5,494) - - -
Total operating lease charges expensed 49,271 52,450 48,560 46,219
Auditor's remuneration – external
Audit fees 8,029 9,942 5,824 5,353
Auditor's remuneration - internal 343 341 - -
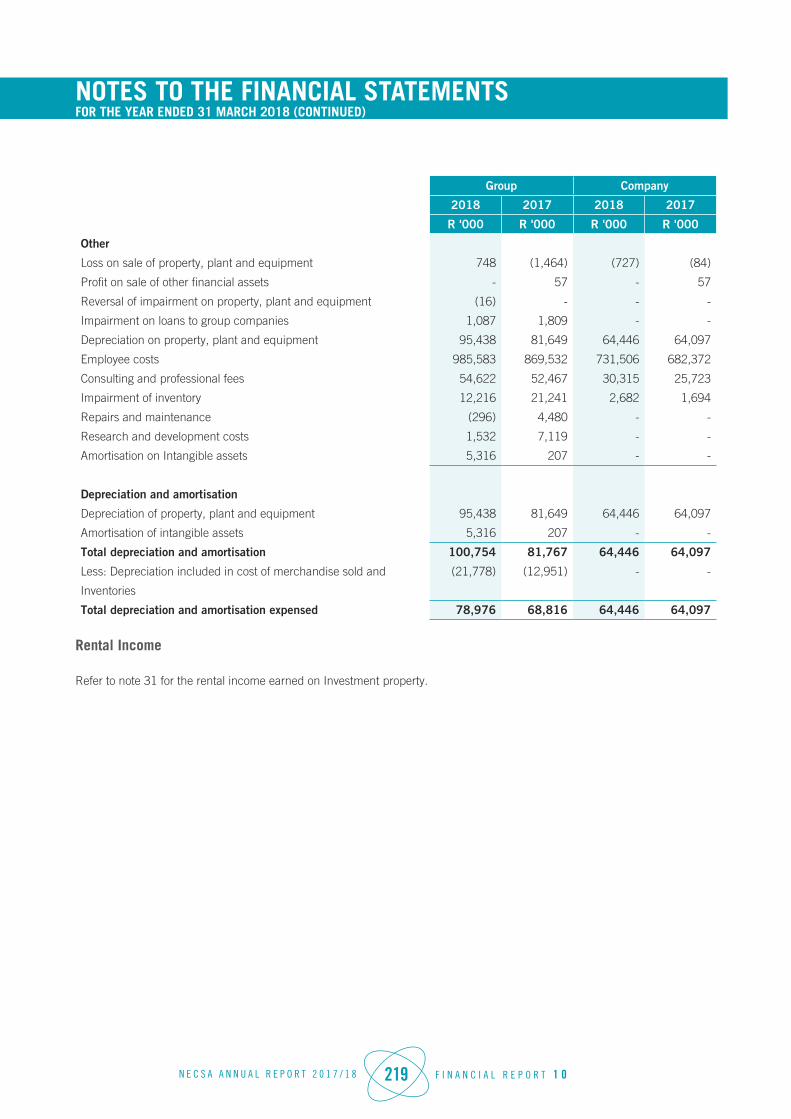
N E C S A A N N U A L R E P O R T 2 0 1 7 / 1 8 219 F I N A N C I A L R E P O R T 1 0
NOTES TO THE FINANCIAL STATEMENTS FOR THE YEAR ENDED 31 MARCH 2018 (CONTINUED)
Group Company
2018 2017 2018 2017
R '000 R '000 R '000 R '000
Other
Loss on sale of property, plant and equipment 748 (1,464) (727) (84)
Profit on sale of other financial assets - 57 - 57
Reversal of impairment on property, plant and equipment (16) - - -
Impairment on loans to group companies 1,087 1,809 - -
Depreciation on property, plant and equipment 95,438 81,649 64,446 64,097
Employee costs 985,583 869,532 731,506 682,372
Consulting and professional fees 54,622 52,467 30,315 25,723
Impairment of inventory 12,216 21,241 2,682 1,694
Repairs and maintenance (296) 4,480 - -
Research and development costs 1,532 7,119 - -
Amortisation on Intangible assets 5,316 207 - -
Depreciation and amortisation
Depreciation of property, plant and equipment 95,438 81,649 64,446 64,097
Amortisation of intangible assets 5,316 207 - -
Total depreciation and amortisation 100,754 81,767 64,446 64,097
Less: Depreciation included in cost of merchandise sold and (21,778) (12,951) - -
Inventories
Total depreciation and amortisation expensed 78,976 68,816 64,446 64,097
Rental Income
Refer to note 31 for the rental income earned on Investment property.

N E C S A A N N U A L R E P O R T 2 0 1 7 / 1 8 220 F I N A N C I A L R E P O R T 1 0
NOTES TO THE FINANCIAL STATEMENTS FOR THE YEAR ENDED 31 MARCH 2018 (CONTINUED)
31. INVESTMENT INCOME
Group Company
2018 2017 2018 2017
R '000 R '000 R '000 R '000
Dividend income
Subsidiaries - Local - - 107,216 61,074
Associates - Foreign - 14 - -
Listed investments - Local - Available for sale 814 838 - -
Total dividend income 814 852 107,216 61,074
Interest income
From investments in financial assets:
Bank 92,481 87,434 48,913 42,020
Interest charged on trade and other receivables 120 146 - -
Fair value adjustments 22,717 27,942 5,647 8,354
Stage 1 decommissioning and decontamination 203,039 202,570 202,988 202,472
Impaired financial assets - - - -
From loans to group and other related parties:
Subsidiaries 6 1,499 - -
Associates 869 805 - -
Total interest income 319,232 320,396 257,548 252,846
Total investment income 320,046 321,248 364,764 313,920
This relates imputed interest on debtors accounts.
This relates to interest charged on the Decommissioning & decontamination asset refer to note 44
Rental income
Finance lease contingent rental income - - - -
Operating lease rental income
Investment property 50,991 5,467 49,661 4,597
Contingent rental income - - - -
50,991 5,467 49,661 4,597
Necsa is a lessor in terms of an operating lease for buildings.
Necsa has no contingent rental

N E C S A A N N U A L R E P O R T 2 0 1 7 / 1 8 221 F I N A N C I A L R E P O R T 1 0
NOTES TO THE FINANCIAL STATEMENTS FOR THE YEAR ENDED 31 MARCH 2018 (CONTINUED)
32. FINANCE COSTS
Group Company
2018 2017 2018 2017
R '000 R '000 R '000 R '000
Group - 425 - -
Non-current borrowings 2 3 - -
Trade and other payables 1,123 3,399 1,118 3,028
Finance leases 514 718 423 478
Bank overdraft 3,916 1,574 - -
Interest expensed 240,835 236,541 242,551 237,006
Amortisation of held to maturity liabilities - 1,011 - -
Fair value adjustments (1) 21,160 15,499 1,959 3,135
Total finance costs 267,550 259,170 246,051 243,647
Necsa did not capitalise borrowing costs in the current or prior year presented.
(1) Fair adjustments relate to imputed interest.
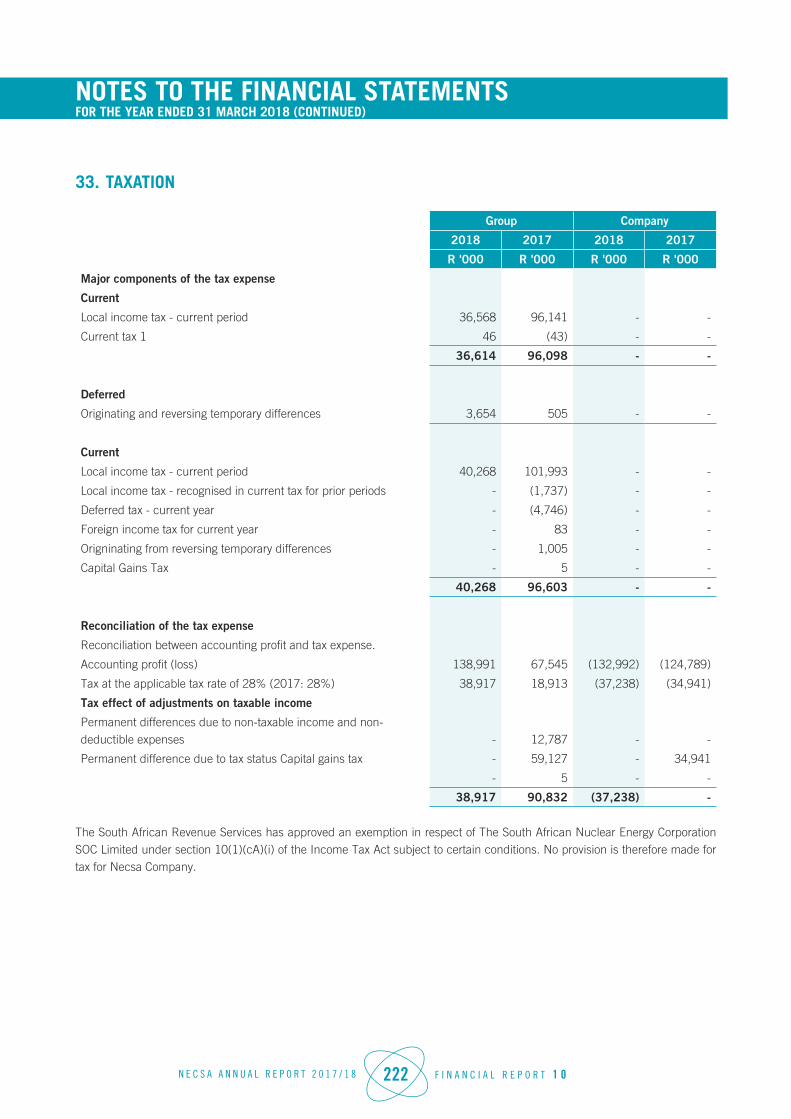
N E C S A A N N U A L R E P O R T 2 0 1 7 / 1 8 222 F I N A N C I A L R E P O R T 1 0
NOTES TO THE FINANCIAL STATEMENTS FOR THE YEAR ENDED 31 MARCH 2018 (CONTINUED)
33. TAXATION
Group Company
2018 2017 2018 2017
R '000 R '000 R '000 R '000
Major components of the tax expense
Current
Local income tax - current period 36,568 96,141 - -
Current tax 1 46 (43) - -
36,614 96,098 - -
Deferred
Originating and reversing temporary differences 3,654 505 - -
Current
Local income tax - current period 40,268 101,993 - -
Local income tax - recognised in current tax for prior periods - (1,737) - -
Deferred tax - current year - (4,746) - -
Foreign income tax for current year - 83 - -
Origninating from reversing temporary differences - 1,005 - -
Capital Gains Tax - 5 - -
40,268 96,603 - -
Reconciliation of the tax expense
Reconciliation between accounting profit and tax expense.
Accounting profit (loss) 138,991 67,545 (132,992) (124,789)
Tax at the applicable tax rate of 28% (2017: 28%) 38,917 18,913 (37,238) (34,941)
Tax effect of adjustments on taxable income
Permanent differences due to non-taxable income and non-deductible expenses - 12,787 - -
Permanent difference due to tax status Capital gains tax - 59,127 - 34,941
- 5 - -
38,917 90,832 (37,238) -
The South African Revenue Services has approved an exemption in respect of The South African Nuclear Energy Corporation SOC Limited under section 10(1)(cA)(i) of the Income Tax Act subject to certain conditions. No provision is therefore made for tax for Necsa Company.

N E C S A A N N U A L R E P O R T 2 0 1 7 / 1 8 223 F I N A N C I A L R E P O R T 1 0
NOTES TO THE FINANCIAL STATEMENTS FOR THE YEAR ENDED 31 MARCH 2018 (CONTINUED)
34. OTHER COMPREHENSIVE INCOME
Components of other comprehensive income - Group - 2018
Gross Tax Net
R '000 R '000 R '000
Items that will not be reclassified to profit (loss)
Remeasurements on net defined benefit liability/asset
Remeasurements on net defined benefit liability/asset 18,729 - 18,729
Movements on revaluation
Gains (losses) on property revaluation 23,496 - 23,496
Total items that will not be reclassified to profit (loss) 42,225 - 42,225
Items that may be reclassified to profit (loss)
Exchange differences on translating foreign operations
Exchange differences arising during the year (32,289) - (32,289)
Available-for-sale financial assets adjustments
Gains (losses) arising during the year 1,245 - 1,245
Total items that may be reclassified to profit (loss) (31,044) - (31,044)
Total 11,181 - 11,181
Components of other comprehensive income - Group - 2017
Gross Tax Net
R '000 R '000 R '000
Items that will not be reclassified to profit (loss)
Remeasurements on net defined benefit liability/asset
Remeasurements on net defined benefit liability/asset 19,191 - 19,191
Movements on revaluation
Gains (losses) on property revaluation 28,891 - 28,891
Total items that will not be reclassified to profit (loss) 48,082 - 48,082
Items that may be reclassified to profit (loss)
Exchange differences on translating foreign operations
Exchange differences arising during the year 21,689 - 21,689
Available-for-sale financial assets adjustments
Gains (losses) arising during the year 1,388 - 1,388
Total items that may be reclassified to profit (loss) 23,077 - 23,077
Total 71,159 - 71,159

N E C S A A N N U A L R E P O R T 2 0 1 7 / 1 8 224 F I N A N C I A L R E P O R T 1 0
NOTES TO THE FINANCIAL STATEMENTS FOR THE YEAR ENDED 31 MARCH 2018 (CONTINUED)
Components of other comprehensive income - Company - 2018
Gross Tax Net
R '000 R '000 R '000
Items that will not be reclassified to profit (loss)
Remeasurements on net defined benefit liability/asset
Remeasurements on net defined benefit liability/asset 18,729 - 18,729
Movements on revaluation
Gains (losses) on property revaluation 50,386 - 50,386
Total items that will not be reclassified to profit (loss) 69,115 - 69,115
Items that may be reclassified to profit (loss)
Available-for-sale financial assets adjustments
Gains (losses) arising during the year 1,245 - 1,245
Total 70,360 - 70,360
Components of other comprehensive income - Company - 2017
Gross Tax Net
R '000 R '000 R '000
Items that will not be reclassified to profit (loss)
Remeasurements on net defined benefit liability/asset
Remeasurements on net defined benefit liability/asset 16,647 - 16,647
Movements on revaluation
Gains (losses) on property revaluation 27,020 - 27,020
Total items that will not be reclassified to profit (loss) 43,667 - 43,667
Items that may be reclassified to profit (loss)
Available-for-sale financial assets adjustments
Gains (losses) arising during the year 1,388 - 1,388
Total 45,055 - 45,055
Revaluation reserve
The properties revaluation reserve arises on the revaluation of land and buildings. When revalued land or buildings are sold, the portion of the properties revaluation reserve that relates to that asset is transferred directly to retained earnings. Items of other comprehensive income included in the properties revaluation reserve will not be reclassified subsequently to profit or loss. Necsa does not intend to sell the land and buildings before the decommissioning and decontamination takes place. An exercise will need to be conducted in order to ensure that the decommissioning and decontamination takes place. Necsa shareholders will not distribute the revaluation reserve to shareholders.
N E C S A A N N U A L R E P O R T 2 0 1 7 / 1 8 225 F I N A N C I A L R E P O R T 1 0
NOTES TO THE FINANCIAL STATEMENTS FOR THE YEAR ENDED 31 MARCH 2018 (CONTINUED)
Foreign currency translation reserve
Exchange differences relating to the translation of the results and net assets of the Group's foreign operations from their functional currencies to the Group's presentation currency (i.e. Currency Units) are recognised directly in other comprehensive income and accumulated in the foreign currency translation reserve. Gains and losses on hedging instruments that are designated as hedging instruments for hedges of net investments in foreign operations are included in the foreign currency translation reserve. Exchange differences previously accumulated in the foreign currency translation reserve (in respect of translating both the net assets of foreign operations and hedges of foreign operations) are reclassified to profit or loss on the disposal of the foreign operation.
Available for sale financial assets and liabilities
Listed redeemable notes held by the Group that are traded in an active market are classified as AFS and are stated at fair value at the end of each reporting period. Changes in the carrying amount of AFS monetary financial assets relating to changes in foreign currency rates , interest income calculated using the effective interest method and dividends on AFS equity investments are recognised in profit or loss. Other changes in the carrying amount of available-for-sale financial assets are recognised in other comprehensive income and accumulated under the heading of investments revaluation reserve. When the investment is disposed of or is determined to be impaired, the cumulative gain or loss previously accumulated in the investments revaluation reserve is reclassified to profit or loss.

N E C S A A N N U A L R E P O R T 2 0 1 7 / 1 8 226 F I N A N C I A L R E P O R T 1 0
NOTES TO THE FINANCIAL STATEMENTS FOR THE YEAR ENDED 31 MARCH 2018 (CONTINUED)
35. CASH (USED IN) GENERATED FROM OPERATIONS
Group Company
2018 2017 2018 2017
R ‘000 R '000 R '000 R '000
Profit (loss) before taxation 138,991 67,545 (132,992) (124,789)
Adjustments for:
Depreciation 95,438 81,560 64,446 64,097
Amortisation 5,316 207 - -
Profit/ (Loss) on sale of assets (748) 1,464 727 84
Profit/(Loss) on sale of other financial assets - (57) - (57)
Losses (gains) on foreign exchange 11,112 10,001 6,174 7,078
Dividend income (814) (852) (107,216) (61,074)
Interest income (319,232) (320,396) (257,548) (252,846)
Finance costs 267,550 259,170 246,051 243,647
Fair value (gains) losses (10,436) (2,919) 121,136 (5,883)
Impairment losses and reversals 1,330 1,330 - -
Movements in retirement benefit assets and liabilities 2,129 (13,445) (263) (14,005)
Bad debts written off 1,735 11,231 - -
Amortisation: Decommissioning and decontamination 14,425 9,659 14,170 9,569
Movements in provisions 194,319 63,125 29,943 69,651
Discontinued operations (41) 130 - -
Other non-cash flow movements (320,549) (298,888) (61,128) (193,175)
Imputed interest - debtors (8,769) (5,471) (5,647) (2,461)
Imputed interest - creditors 7,676 8,350 1,004 931
Fair value adjustments on other financial assets (1,303) (1,325) (1,303) (1,325)
Movements in investment contributions for future liabilities 2,632 2,604 2,632 2,604
Loss on disposal of subsidiary - 17,981 - -
Changes in working capital:
Inventories (40,685) (6,178) (38,876) 16,726
Trade and other receivables (263,724) 108,937 86,451 38,541
Prepayments (50,904) 113,901 (55,928) 55,730
Trade and other payables 119,214 (83,985) (45,701) (12,528)
Amounts received in advance 61,460 (29,705) 107,389 3,197
Deposits received 3,880 3,880 - -
(89,998) (2,146) (26,479) (156,288)
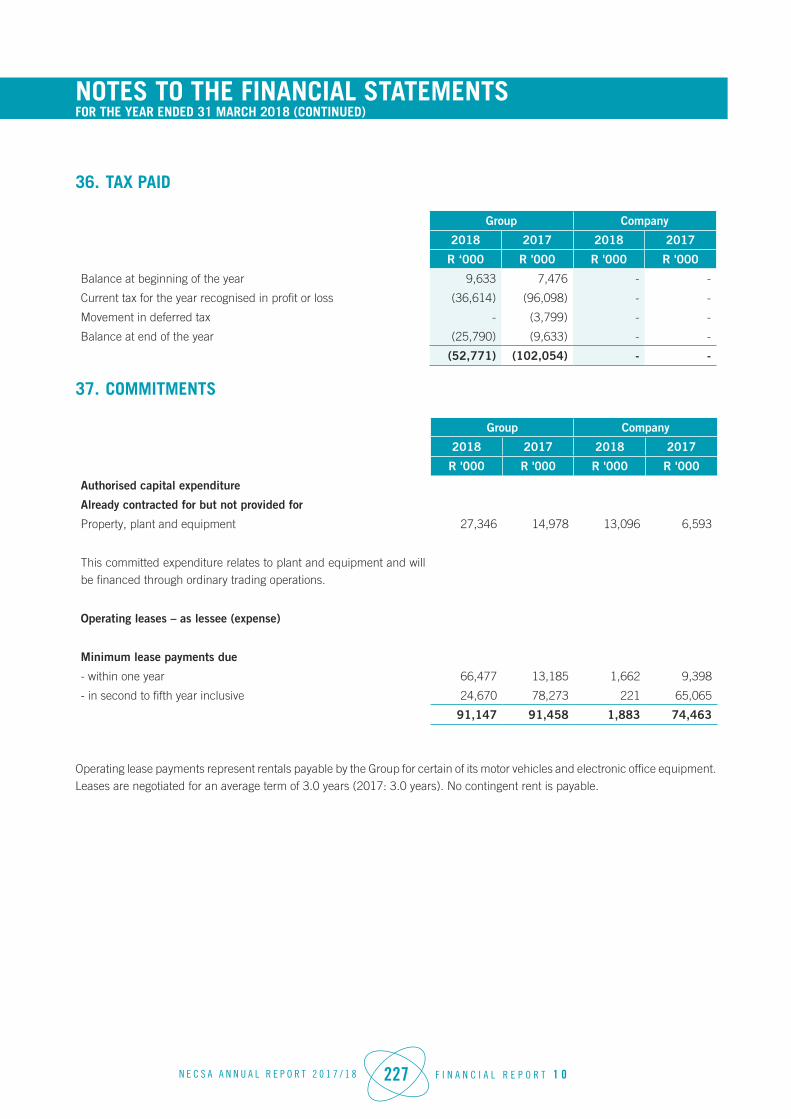
N E C S A A N N U A L R E P O R T 2 0 1 7 / 1 8 227 F I N A N C I A L R E P O R T 1 0
NOTES TO THE FINANCIAL STATEMENTS FOR THE YEAR ENDED 31 MARCH 2018 (CONTINUED)
36. TAX PAID
Group Company
2018 2017 2018 2017
R ‘000 R '000 R '000 R '000
Balance at beginning of the year 9,633 7,476 - -
Current tax for the year recognised in profit or loss (36,614) (96,098) - -
Movement in deferred tax - (3,799) - -
Balance at end of the year (25,790) (9,633) - -
(52,771) (102,054) - -
37. COMMITMENTS
Group Company
2018 2017 2018 2017
R '000 R '000 R '000 R '000
Authorised capital expenditure
Already contracted for but not provided for
Property, plant and equipment 27,346 14,978 13,096 6,593
This committed expenditure relates to plant and equipment and will be financed through ordinary trading operations.
Operating leases – as lessee (expense)
Minimum lease payments due
- within one year 66,477 13,185 1,662 9,398
- in second to fifth year inclusive 24,670 78,273 221 65,065
91,147 91,458 1,883 74,463
Operating lease payments represent rentals payable by the Group for certain of its motor vehicles and electronic office equipment. Leases are negotiated for an average term of 3.0 years (2017: 3.0 years). No contingent rent is payable.

N E C S A A N N U A L R E P O R T 2 0 1 7 / 1 8 228 F I N A N C I A L R E P O R T 1 0
NOTES TO THE FINANCIAL STATEMENTS FOR THE YEAR ENDED 31 MARCH 2018 (CONTINUED)
38. CONTINGENCIES
By their nature, contingencies will only be resolved when one or more future events occur or fail to occur. The assessment of such contingencies inherently involves the exercise of significant judgement and estimates of the outcome of future events.
Litigation and other judicial proceedings as a rule raise difficult and complex legal issues and are subject to uncertainties and complexities including, but not limited to, the facts and circumstances of each particular case, issues regarding the jurisdiction in which each suit is brought and differences in applicable law. Upon resolution of any pending legal matter, the Company may be forced to incur charges in excess of the presently established provisions and related insurance coverage. It is possible that the financial position, results of operations or cash flows of the Company could be materially affected by the unfavourable outcome of litigation.
Guarantees:
Guarantees of R866 (2017: R866) were issued to financial institutions as collateral security for housing loans granted by financial institutions to employees. Performance guarantees of R0 (2017: R0) were issued to ABSA Bank for a customer.
Legal claims:
Possible quantifiable legal obligations exists for the Group totaling an estimated R20, 255 (2017: R10, 000) in connection with disputes with delivery of goods, arrear rentals receivable, unfair labour practice, CCMA disputes and services rendered. These cases are currently being investigated by the Necsa Legal division.
Suretyship:
A limited deed of suretyship for an amount of up to R20, 000 (2017: R20, 000) has been given to Pelchem SOC Limited for a Nedbank facility. R14, 000 (2017: R14, 000) relates to an overnight facility and R6, 000 (2017: R6, 000) to an asset based finance.
Gammatec Middle East General Trading (LLC)
A material uncertainty exists on whether a subsidiary, Gammatec Middle East General Trading LLC, would be able to meet its obligations as they fall due, as this subsidiary’s liabilities exceed its fairly valued assets at the end of the reporting period. Gammatec NDT Supplies SOC Limited as a 76% shareholder of Gammatec Middle East General Trading LLC, has given a letter of support to the management and auditors of Gammatec Middle East General Trading LLC that it will provide an appropriate level of financial support to ensure that Gammatec Middle East general trading LLC is in a position to meet its financial liabilities and obligations as and when they fall due for at least a period of 18 months. The Gammatec Middle East General Trading LLC liabilities exceeded its assets with R9,129 at 31 March 2018.
NTP Radioisotopes SOC Limited
In May 2018, NTP Radioisotopes SOC Limited , a 100% owned subsidiary of Necsa, signed a suretyship agreement for the amount of R30 million for the IDC loan granted to Pelchem SOC Limited for bridging finance on condition that the current letter of support issued to Pelchem be withdrawn. Pelchem is a 100% owned subsidiary of Necsa SOC Limited. NTP has issued a guarantee of R30 million related to IDC.
Necsa has issued a suretyship of R20 million to Pelchem for overdraft facility, However, Nedbank has requested NTP to issue the guarantee in terms Pari Passu.

N E C S A A N N U A L R E P O R T 2 0 1 7 / 1 8 229 F I N A N C I A L R E P O R T 1 0
NOTES TO THE FINANCIAL STATEMENTS FOR THE YEAR ENDED 31 MARCH 2018 (CONTINUED)
39. RELATED PARTIES
Group Company2018 2017 2018 2017R '000 R '000 R '000 R '000
RelationshipsHolding entity Department of EnergySubsidiaries Refer to note 9Associates Refer to note 10National government All national government departments are regarded to be related parties
in accordance with circular 4 of 2005: Guidance on the term “State controlled entities” in the context of IAS 24 - Related Parties, issued by the South African Institute of Chartered Accountants. No transactions are implied simply by the nature of existence of the relationship between entities. All directors have given general declarations of interest in terms of the Companies Act.
Directors and members of key management Details of directors and key management remuneration paid are disclosed in note 40
The following is a summary of transactions with related parties during the year and balances due at year end National public entities
Services rendered - 1,077 - 1,077Services received - (40,423) - (40,423)Trade amount due (to)/ from - (10,157) - (10,100)
National Government DepartmentsServices rendered - 525,735 - 525,735
SubsidiariesServices rendered - - - 374,508Services received - - - (4,152)Dividends income - - - 61,074Loans to (from) subsidiaries - - - 756Trade amount due (to)/ from - - - 150,230
AssociatesServices rendered - 2,606 - -Services received - (10,180) - -Loans to/from associates - 3,310 - -Trade amount due (to)/ from - 1,760 - -
Compensation to directors and other key managementShort-term employee benefits 137,746 64,284 2,669 1,413
Necsa pays an amount of R25 000 per month to Dr KR Kemm (Chairperson of Necsa's Board) for a consultation fee for strategic planning from 1 April 2016.Trade amount due to/from subsidiaries are gross values reflected prior to provisions for bad debts.A provision for bad debts relating to Pelchem was raised R nil (2017 R65 million; 2016 R69 million).Trade debtors (Gammatec and NTP) have payment terms of 60 days. Pelchem trade debtors have payment terms of 120 days. The remaining accounts have payment terms of 30 days.
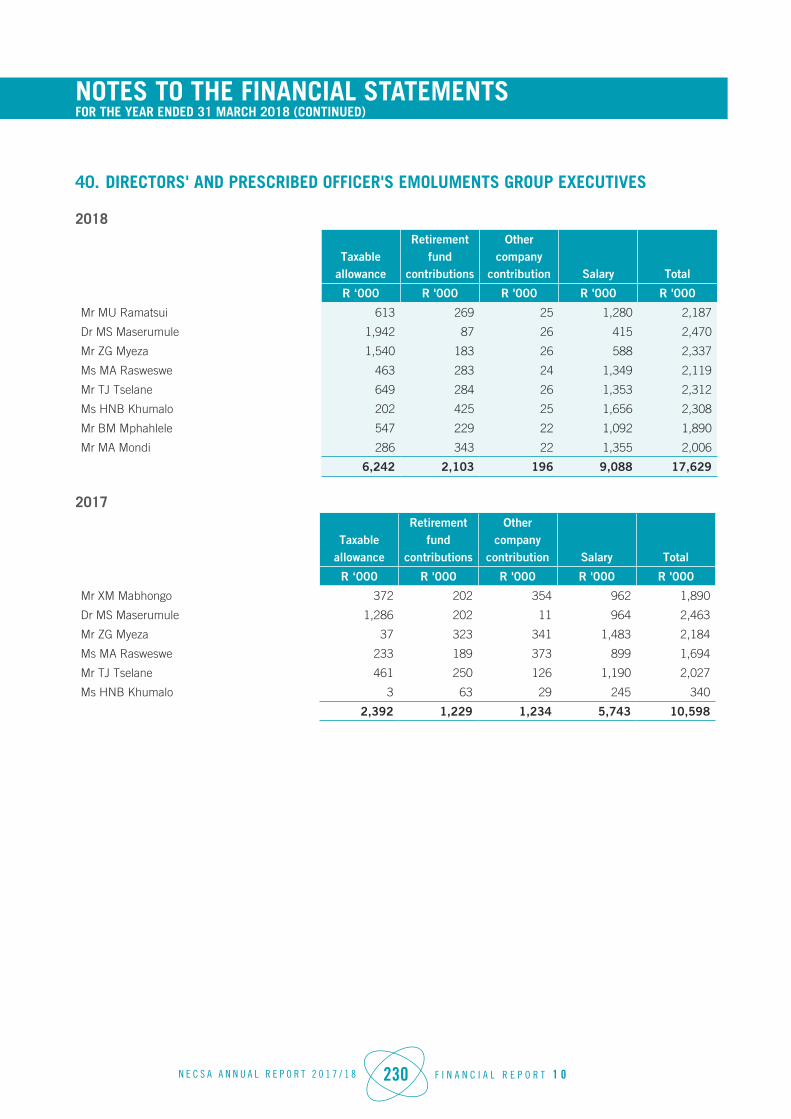
N E C S A A N N U A L R E P O R T 2 0 1 7 / 1 8 230 F I N A N C I A L R E P O R T 1 0
NOTES TO THE FINANCIAL STATEMENTS FOR THE YEAR ENDED 31 MARCH 2018 (CONTINUED)
40. DIRECTORS' AND PRESCRIBED OFFICER'S EMOLUMENTS GROUP EXECUTIVES
2018
Taxable allowance
Retirement fund
contributions
Other company
contribution Salary Total
R ‘000 R '000 R '000 R '000 R '000
Mr MU Ramatsui 613 269 25 1,280 2,187
Dr MS Maserumule 1,942 87 26 415 2,470
Mr ZG Myeza 1,540 183 26 588 2,337
Ms MA Rasweswe 463 283 24 1,349 2,119
Mr TJ Tselane 649 284 26 1,353 2,312
Ms HNB Khumalo 202 425 25 1,656 2,308
Mr BM Mphahlele 547 229 22 1,092 1,890
Mr MA Mondi 286 343 22 1,355 2,006
6,242 2,103 196 9,088 17,629
2017
Taxable allowance
Retirement fund
contributions
Other company
contribution Salary Total
R ‘000 R '000 R '000 R '000 R '000
Mr XM Mabhongo 372 202 354 962 1,890
Dr MS Maserumule 1,286 202 11 964 2,463
Mr ZG Myeza 37 323 341 1,483 2,184
Ms MA Rasweswe 233 189 373 899 1,694
Mr TJ Tselane 461 250 126 1,190 2,027
Ms HNB Khumalo 3 63 29 245 340
2,392 1,229 1,234 5,743 10,598

N E C S A A N N U A L R E P O R T 2 0 1 7 / 1 8 231 F I N A N C I A L R E P O R T 1 0
NOTES TO THE FINANCIAL STATEMENTS FOR THE YEAR ENDED 31 MARCH 2018 (CONTINUED)
Non-executive2018
Directors' fees Total
R '000 R '000
Dr NT Magau 321 321
Mr AN Mhlongo 76 76
Dr. KR Kemm (Chairperson) 372 372
Mrs RP Mosia 272 272
Mr ENN Ngcobo 5 5
Ms P Bosman 304 304
Mr ZC Ngidi 348 348
Mr MPK Tshivhase 321 321
Mr MS Sekgota 272 272
Dr GJ Davids 321 321
Prof Z Vilakazi 76 76
2,688 2,688
2017Executive Director 2018
Taxable allowance
Retirement Fund
Contribution
Other company
contributions Salary Total
R '000 R '000 R '000 R '000 R '000
Tshelane GP 1,486 196 47 2,380 4,109
2017
Taxable allowance
Retirement Fund
Contribution
Other company
contributions Salary Total
R '000 R '000 R '000 R '000 R '000
Tshelane GP 768 382 195 1,960 3,305
Details of service contracts
No director has a notice period in excess of one year and no director’s contract makes provision for predetermined compensation on termination exceeding one year’s salary and benefits in kind. No directors are proposed for election or re-election at the forthcoming annual general meeting. All the directors have a service contract.

N E C S A A N N U A L R E P O R T 2 0 1 7 / 1 8 232 F I N A N C I A L R E P O R T 1 0
NOTES TO THE FINANCIAL STATEMENTS FOR THE YEAR ENDED 31 MARCH 2018 (CONTINUED)
41. PRIOR PERIOD ERRORS
Intercompany dividends of R 12 963 million from NTP Radioisotopes (NTPR) were incorrectly eliminated in the prior year which resulted in consolidated dividend income reflected in the annual financial statements. The correction was effected in the current year against the Distributable Reserves that the NTP Radioisotopes uses to pay out dividends.
The prior year Statements of Changes in Equity has been restated to correctly reflect the Non-Controlling Interest, Foreign Currency Translation Reserve and Retained Earnings. There has been no Changes to Assets, Liabilities and Profit and Loss of the current or prior period.
The errors have been corrected retrospectively and resulted in adjustments as follows:
2017 2016 2015 2016
Consolidated Statement of Financial Position R'000 R'000 R'000 R’000
Inventory decreased - - 1 (1,786)
Inventory increased - - - 57
Tax asset increased - - - 1,729
Statement of comprehensive income
Cost of sales increased - (12,963) - -
42. GOING CONCERN
The Annual Financial Statements have been prepared on the basis of accounting policies applicable to a going concern. According to the Conceptual Framework of Financial Reporting, the financial statements are prepared using the underlying assumption that funds will be available to finance future operations and that the realisation of assets and settlement of liabilities, contingent obligations and commitments will occur in the ordinary course of business.
We draw attention to the fact that as at 31 March 2018, the company had accumulated losses of R510.752 million and that the company's total assets exceed its liabilities by R 26.296 million.
Subsequent to 31 March 2018 financial year closure, NTP declared an additional dividend of R20 million. The repayment date of a loan of 58.6 million to Necsa has been extended to 31 March 2021.
Necsa currently has an investment in NTP of R220 million that arose as a result of debt to equity conversion some years ago. Necsa has received advice on the extraction of a royalty payment iro the NTP IP which Necsa has retained the right for continuous improvement of. As such, the IP asset structuring has to be relooked into in consideration of benefits that must be derived by Necsa as the originator and NTP as the user.
Necsa instituted a strategic repositioning in response to curb losses going forward. The impact areas that will guide strategic focus includes the following:• Industrial applications;• Medical diagnostics and therapy• Materials beneficiation• Nuclear waste• Non-proliferation of Nuclear materials• Nuclear Manufacturing and• Clean Energy.

N E C S A A N N U A L R E P O R T 2 0 1 7 / 1 8 233 F I N A N C I A L R E P O R T 1 0
NOTES TO THE FINANCIAL STATEMENTS FOR THE YEAR ENDED 31 MARCH 2018 (CONTINUED)
The ability of the company to continue as a going concern is dependent on a number of factors. The most significant of these is growth of sales, government grant, containment of costs, and application for new grant fund for mandates that are unfunded and have to be executed.
43. PUBLIC FINANCE MANAGEMENT ACT
Group Company
2018 2017 2018 2017
R ‘000 R '000 R '000 R '000
Fruitless and wasteful expenditure:
Opening balance 506 1,295 459 604
Overpayments not recoverable 1 228 69 134 67
Recoveries made (5) (58) (5) (56)
Internal losses 2 - 65 - 65
Written off to the statement of comprehensive income (458) (865) (458) (221)
Fruitless and wasteful expenditure unresolved 271 506 130 459
Fruitless and wasteful expenditure:
Comments (including actions taken with regard to matters)
1 Disciplinary steps have been taken against staff to address the shortcoming.2 This matter is under investigation in order to identify the root cause and persons involved.
Criminal or disciplinary steps:
The irregular expenditure was investigated according to the treasury guidelines on irregular expenditure, upon investigation it was found that the state did not suffer any loss due to the transgression.
There were no material losses through criminal conduct or irregular expenditure. Therefore criminal steps are not applicable. Disciplinary steps have been taken were applicable.
Gifts, donations or sponsorships received:
Employees are allowed to receive gifts and courtesies. Gifts and courtesies received above R300 are recorded in a register and approved by the relevant manager. Gifts and courtesies received above R3,000 needs written permission from the Group Executive or CEO as appropriate.
Remissions or payments made as an act of grace:
There were no remissions or payments made as an act of grace.
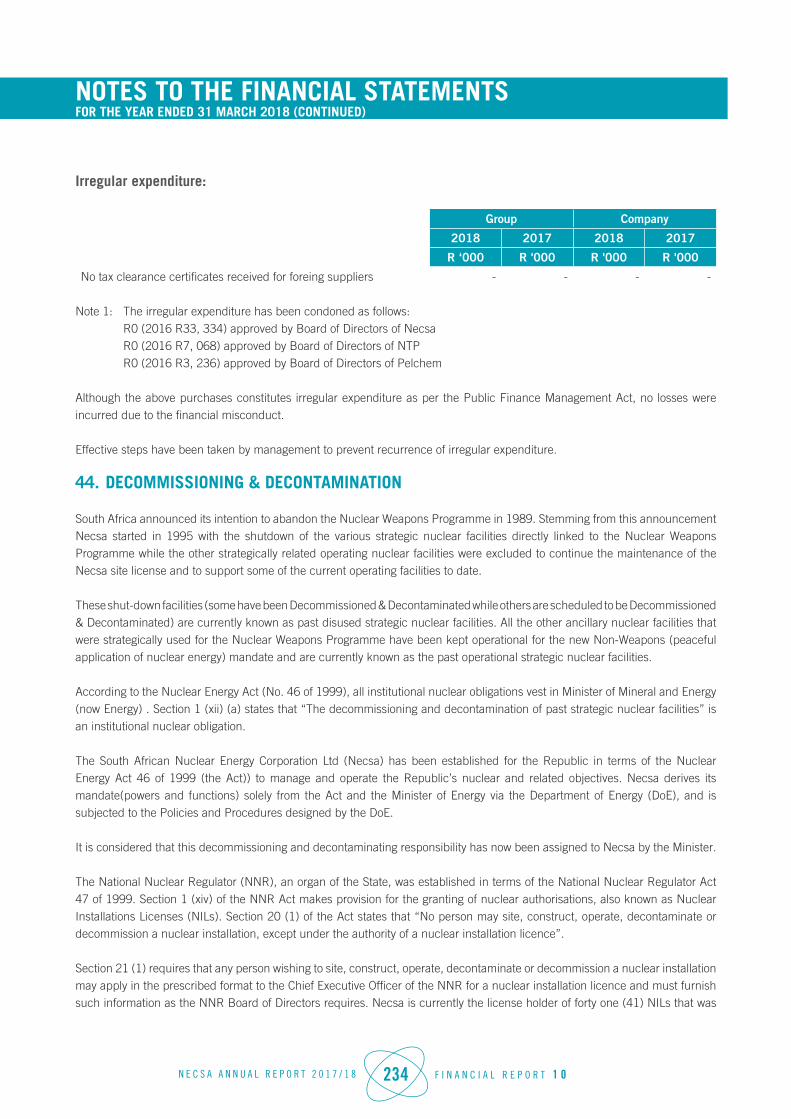
N E C S A A N N U A L R E P O R T 2 0 1 7 / 1 8 234 F I N A N C I A L R E P O R T 1 0
NOTES TO THE FINANCIAL STATEMENTS FOR THE YEAR ENDED 31 MARCH 2018 (CONTINUED)
Irregular expenditure:
Group Company
2018 2017 2018 2017
R ‘000 R '000 R '000 R '000
No tax clearance certificates received for foreing suppliers - - - -
Note 1: The irregular expenditure has been condoned as follows: R0 (2016 R33, 334) approved by Board of Directors of Necsa R0 (2016 R7, 068) approved by Board of Directors of NTP R0 (2016 R3, 236) approved by Board of Directors of Pelchem
Although the above purchases constitutes irregular expenditure as per the Public Finance Management Act, no losses were incurred due to the financial misconduct.
Effective steps have been taken by management to prevent recurrence of irregular expenditure.
44. DECOMMISSIONING & DECONTAMINATION
South Africa announced its intention to abandon the Nuclear Weapons Programme in 1989. Stemming from this announcement Necsa started in 1995 with the shutdown of the various strategic nuclear facilities directly linked to the Nuclear Weapons Programme while the other strategically related operating nuclear facilities were excluded to continue the maintenance of the Necsa site license and to support some of the current operating facilities to date.
These shut-down facilities (some have been Decommissioned & Decontaminated while others are scheduled to be Decommissioned & Decontaminated) are currently known as past disused strategic nuclear facilities. All the other ancillary nuclear facilities that were strategically used for the Nuclear Weapons Programme have been kept operational for the new Non-Weapons (peaceful application of nuclear energy) mandate and are currently known as the past operational strategic nuclear facilities.
According to the Nuclear Energy Act (No. 46 of 1999), all institutional nuclear obligations vest in Minister of Mineral and Energy (now Energy) . Section 1 (xii) (a) states that “The decommissioning and decontamination of past strategic nuclear facilities” is an institutional nuclear obligation.
The South African Nuclear Energy Corporation Ltd (Necsa) has been established for the Republic in terms of the Nuclear Energy Act 46 of 1999 (the Act)) to manage and operate the Republic’s nuclear and related objectives. Necsa derives its mandate(powers and functions) solely from the Act and the Minister of Energy via the Department of Energy (DoE), and is subjected to the Policies and Procedures designed by the DoE.
It is considered that this decommissioning and decontaminating responsibility has now been assigned to Necsa by the Minister.
The National Nuclear Regulator (NNR), an organ of the State, was established in terms of the National Nuclear Regulator Act 47 of 1999. Section 1 (xiv) of the NNR Act makes provision for the granting of nuclear authorisations, also known as Nuclear Installations Licenses (NILs). Section 20 (1) of the Act states that “No person may site, construct, operate, decontaminate or decommission a nuclear installation, except under the authority of a nuclear installation licence”.
Section 21 (1) requires that any person wishing to site, construct, operate, decontaminate or decommission a nuclear installation may apply in the prescribed format to the Chief Executive Officer of the NNR for a nuclear installation licence and must furnish such information as the NNR Board of Directors requires. Necsa is currently the license holder of forty one (41) NILs that was
N E C S A A N N U A L R E P O R T 2 0 1 7 / 1 8 235 F I N A N C I A L R E P O R T 1 0
NOTES TO THE FINANCIAL STATEMENTS FOR THE YEAR ENDED 31 MARCH 2018 (CONTINUED)
issued by the NNR. The NNR approved NILs issued to Necsa, govern all nuclear activities undertaken in the disused and operational nuclear facilities.
In 2000 Necsa was requested by the then Department of Minerals and Energy (DME) to quantify the total nuclear and related liability on the Pelindaba site arising from the nuclear weapons/strategic programme. Necsa then submitted to Cabinet, in April 2004, through the DoE, a Nuclear Liabilities Management Plan (NLMP). The NLMP differentiated between three stages of D&D, namely:• Stage 1- Disused Facilities;• Stage 2- Strategic Operational Nuclear Facilities (currently in use); and• Stage 3- HEU Spent Fuel.
In November 2005 Cabinet approved :
Funding of approximately R1 800 million (2004/5 Rand values) as reflected below:• The D&D of disused historical nuclear facilities (Stage 1) of the Nuclear Liabilities Management Plan (R1 526 million) and• Decommissioning and remediation of Thabana waste trenches & waste storage facilities, which were excluded from the
NLMP, R270 million.• The consolidation of nuclear liabilities management funding into a single ring-fenced budget;• That the DoE and the National Treasury work out a programme for the funding of R1 800million (in 2004/5 Rand values)
estimated to discharge the liability over a 28 years period.
In order to provide a monitoring mechanism for effective oversight of the implementation of the approved 2005 Cabinet resolutions, DoE issued a Policy Procedure on the Management of Nuclear Liabilities arising from Past Strategic Nuclear Facilities in May 2008. According to the policy procedure, Necsa must submit to DoE a formal reassessment of the liabilities every five years or at a shorter frequency if so required by the Minister. The initial methodology for reassessing the liabilities and any changes to the methodology thereafter must be agreed with the DoE prior to implementation.
The re-assessment takes in account the following and is subjected to international experts benchmarking and validation:• Review of variables and values used in the assessment model (e.g. interest rates, inflation rates, waste inventories, processing
cost, etc.)• Review assumptions made in the model.• Appropriateness of model used.• Adjustments due to liabilities discharged in previous years.
The assessed amount is adjusted for inflation annually until the next re-assessment. Since 2007/08 Necsa has been receiving annually ring-fenced grants from the State to discharge this liability on behalf of the DoE.
Stage 1 Liabilities
Until the 2013/14 financial year all the parties considered that the Decommissioning and Decontamination liability vested in the Minister and was recognised in the financial statements of the DoE; and Necsa was acting as an agent of the Minister with regard to D&D. A Senior Counsel opinion, obtained in March 2016, confirmed that the liability to Decommission and Decontaminate past strategic nuclear facilities rests with Necsa with regard to both disused and currently in use facilities; and that the State is obligated to fund these liabilities. The Minister has accepted this opinion and has transferred this liability as well as Cabinet’s approval to fund the Stage 1 liability to Necsa; to be recognised in Necsa”s financial statements as from the 2014/15 financial year.

N E C S A A N N U A L R E P O R T 2 0 1 7 / 1 8 236 F I N A N C I A L R E P O R T 1 0
NOTES TO THE FINANCIAL STATEMENTS FOR THE YEAR ENDED 31 MARCH 2018 (CONTINUED)
An independent international expert, Crossland Consulting Ltd, has confirmed that the assessment methodology used to determine the liability was in line with international best practice and that the amount was sound and reasonable.
After adjusting for inflation and the costs already incurred this liability has been determined to be R2 800 million as at 31 March 2016 and in terms of IAS 37 this liability is recognised as a provision (liability) and the State’s funding obligation, approved by Cabinet is recognised as an asset.
Disused facilities
• Cabinet approval was obtained for Stage 1 Decommissioning and decontamination facilities, therefore an asset has been recognised with the matching liability.
Group Company
2018 2017 2016 2018 2017 2016
R '000 R ‘000 R '000 R '000 R '000 R '000
Non-current assets
Decommissioning & decontamination - Stage 1 3,166,102 2,727,063 2,789,448 3,166,102 2,727,063 2,789,448
Non-current liabilities
Decommissioning & decontamination - Stage 1 (3,166,102) (2,727,063) (2,789,448) (3,166,102) (2,727,063) (2,789,448)
- - - - - -
Government grant income (Decommissioning & decontamination - Stage 1) 236,052 264,857 2,570,919 236,052 264,857 2,570,919
Acceptance of Decommissioning & decontamination - Stage 1 (236,052) (264,858) (2,570,919) (236,052) (264,857) (2,570,919)
- (1) - - - -
Opening Additions Utilised Reversed
Change in discount
factor Total
Assets 2,727,063 - - - - 2,727,063
Liabilities (2,727,063) - - - - (2,727,063)
- - - - -
Stage 2 Liabilities
The Stage 2 facilities are currently in operation and these facilities will only be Decommissioned and Decontaminated once operations cease. On the basis of the current capacities of these facilities it is estimated that they will be in use for at least the next 30 years, where after they will be Decommissioned and Decontaminated. However, based on international experience, it is considered that these facilities could be refurbished when needed to be used indefinitely.
Strategic Operational Nuclear Facilities currently in use
N E C S A A N N U A L R E P O R T 2 0 1 7 / 1 8 237 F I N A N C I A L R E P O R T 1 0
NOTES TO THE FINANCIAL STATEMENTS FOR THE YEAR ENDED 31 MARCH 2018 (CONTINUED)
44. DECOMMISSIONING & DECONTAMINATION (CONTINUED)
• The asset can only be recognised to the extent of the letter of grant (Medium Term Expenditure Framework) received from the shareholder (Department of Energy).
• The recognition of this liability has negatively impacted the Equity of the Company and the Group in the amount of R255 million in the 2015/16 financial year and a further charge of R 41 million in the 2016/17 financial year and RXX in the 2017/18 financial year. The recognition of this liability will have no impact on the Company’s and the Group’s future cash flows until 2030. Refer to 44 note for further discussion on the Company’s Decommission and Decontaminate obligations.
The Stage 2 facilities include the SAFARI-1 Reactor which NTP Radioisotopes SOC Ltd (NTP), a subsidiary of Necsa, is contracted to manage and operate. In terms of the manage and operate agreement NTP and Necsa will share the Decommissioning and Decontamination costs of SAFARI-1; and NTP will be charged based on the commercial utilisation of the SAFARI-1 by NTP. NTP’s contribution is ring-fenced and invested to be utilised when Decommissioning and Decontamination commences.
The Stage 2 Liability has been assessed on the basis of the same methodology as for Stage 1. The re-assessment will be done every 3 years and the assessed amount will be adjusted for inflation until the next re-assessment.
Senior Counsel’s opinion is that the State is obligated to fund these liabilities. The Minster has accepted this opinion. The asset can only be recognised to the extent of the letter of grant (Medium Term Expenditure Framework) received from the shareholder (Department of energy).
In the meantime the National Treasury has allocated funding in terms of the Medium Term Expenditure Framework as follows (Inclusive of VAT):• 2015/16: R 16.120 million (received)• 2016/17: R 17.086 million (received)• 2017/18: R 18.112 million (received)• 2018/19: R 19.162 million (committed)• 2019/20: R 20.235 million (committed)
These funds will be ring-fenced and invested to be utilised when Decomissioning and decontamination commences.
Assuming the current Medium Term Expenditure Framework contributions committed by the National Treasury (vat exclusive), escalated at average 6% CPI rate, and the investments earning interest at the current long term Government Bond rate of 9.4% as at July 2016, the full liability will be settled by 2037 after the last Medium Term Expenditure Framework contribution of R0.048 million, with future value of investment at R1,5 million .
Since the liabilty was transferred from the Department of Energy (Shareholder) to Necsa from the 2017 financial year, no reconciliation was performed for 2017. Management will include the movement schedule for 2017 financial year.
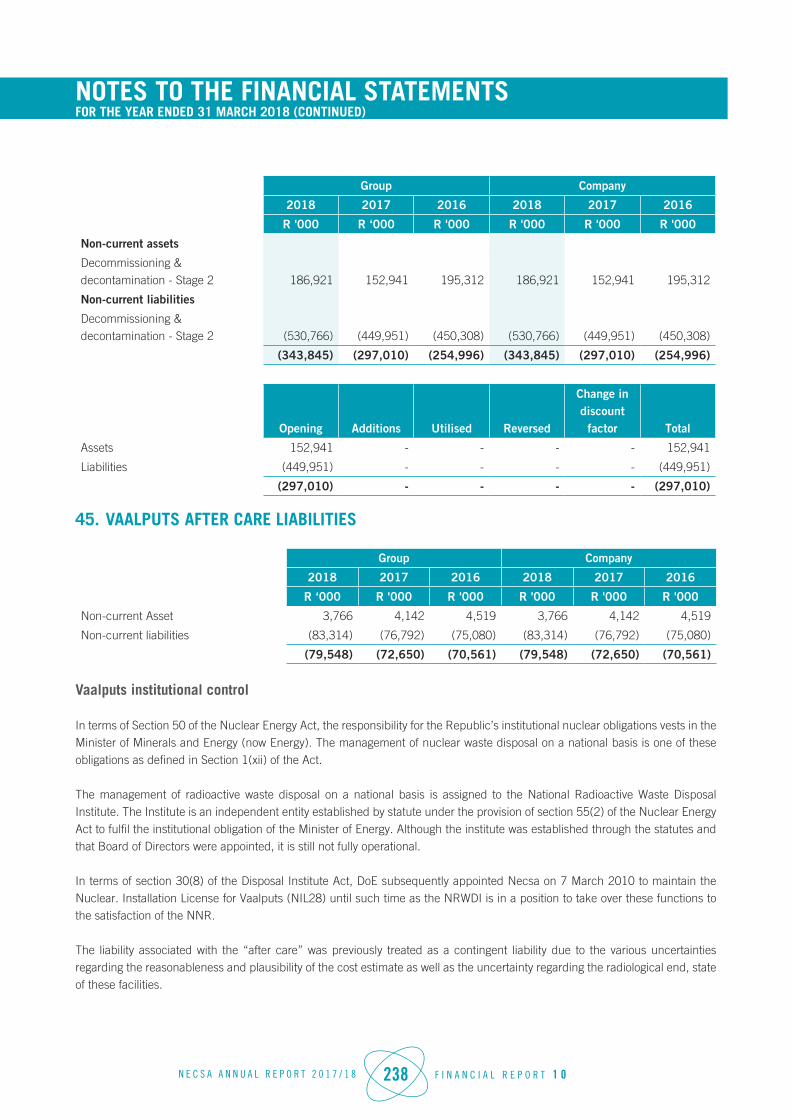
N E C S A A N N U A L R E P O R T 2 0 1 7 / 1 8 238 F I N A N C I A L R E P O R T 1 0
Group Company
2018 2017 2016 2018 2017 2016
R '000 R ‘000 R '000 R '000 R '000 R '000
Non-current assets
Decommissioning & decontamination - Stage 2 186,921 152,941 195,312 186,921 152,941 195,312
Non-current liabilities
Decommissioning & decontamination - Stage 2 (530,766) (449,951) (450,308) (530,766) (449,951) (450,308)
(343,845) (297,010) (254,996) (343,845) (297,010) (254,996)
Opening Additions Utilised Reversed
Change in discount
factor Total
Assets 152,941 - - - - 152,941
Liabilities (449,951) - - - - (449,951)
(297,010) - - - - (297,010)
45. VAALPUTS AFTER CARE LIABILITIES
Group Company
2018 2017 2016 2018 2017 2016
R ‘000 R '000 R '000 R '000 R '000 R '000
Non-current Asset 3,766 4,142 4,519 3,766 4,142 4,519
Non-current liabilities (83,314) (76,792) (75,080) (83,314) (76,792) (75,080)
(79,548) (72,650) (70,561) (79,548) (72,650) (70,561)
Vaalputs institutional control
In terms of Section 50 of the Nuclear Energy Act, the responsibility for the Republic’s institutional nuclear obligations vests in the Minister of Minerals and Energy (now Energy). The management of nuclear waste disposal on a national basis is one of these obligations as defined in Section 1(xii) of the Act.
The management of radioactive waste disposal on a national basis is assigned to the National Radioactive Waste Disposal Institute. The Institute is an independent entity established by statute under the provision of section 55(2) of the Nuclear Energy Act to fulfil the institutional obligation of the Minister of Energy. Although the institute was established through the statutes and that Board of Directors were appointed, it is still not fully operational.
In terms of section 30(8) of the Disposal Institute Act, DoE subsequently appointed Necsa on 7 March 2010 to maintain the Nuclear. Installation License for Vaalputs (NIL28) until such time as the NRWDI is in a position to take over these functions to the satisfaction of the NNR.
The liability associated with the “after care” was previously treated as a contingent liability due to the various uncertainties regarding the reasonableness and plausibility of the cost estimate as well as the uncertainty regarding the radiological end, state of these facilities.
NOTES TO THE FINANCIAL STATEMENTS FOR THE YEAR ENDED 31 MARCH 2018 (CONTINUED)
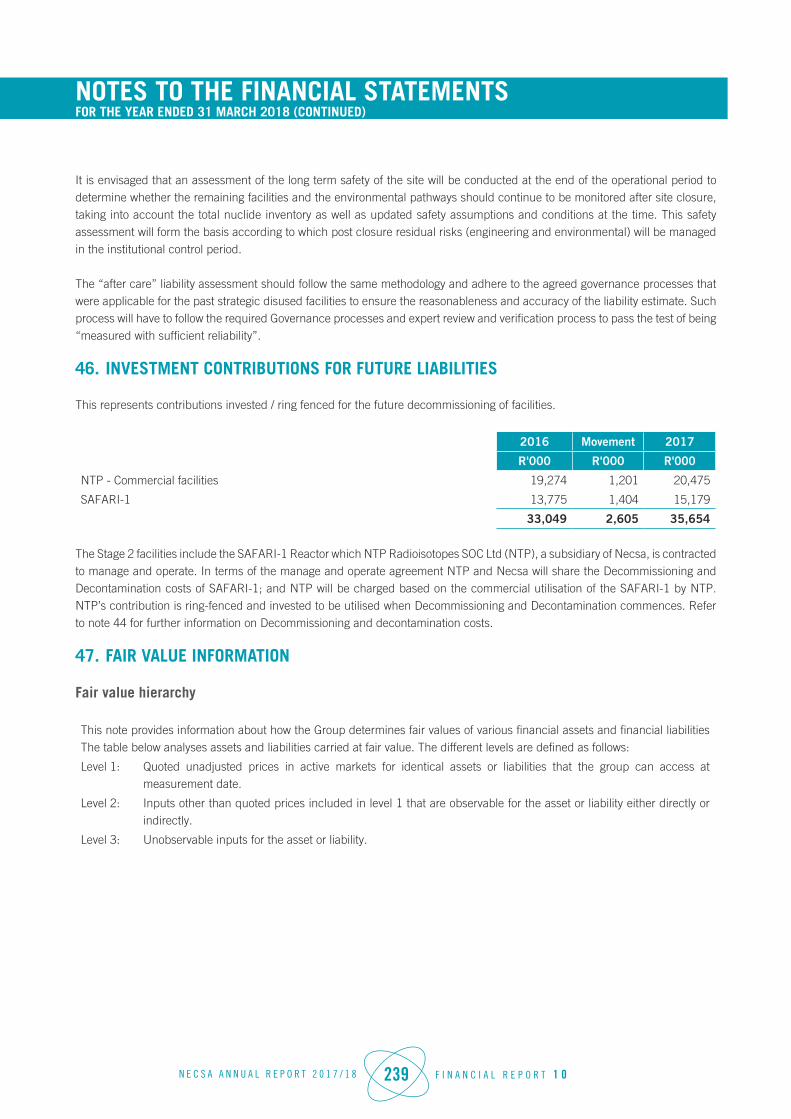
N E C S A A N N U A L R E P O R T 2 0 1 7 / 1 8 239 F I N A N C I A L R E P O R T 1 0
NOTES TO THE FINANCIAL STATEMENTS FOR THE YEAR ENDED 31 MARCH 2018 (CONTINUED)
It is envisaged that an assessment of the long term safety of the site will be conducted at the end of the operational period to determine whether the remaining facilities and the environmental pathways should continue to be monitored after site closure, taking into account the total nuclide inventory as well as updated safety assumptions and conditions at the time. This safety assessment will form the basis according to which post closure residual risks (engineering and environmental) will be managed in the institutional control period.
The “after care” liability assessment should follow the same methodology and adhere to the agreed governance processes that were applicable for the past strategic disused facilities to ensure the reasonableness and accuracy of the liability estimate. Such process will have to follow the required Governance processes and expert review and verification process to pass the test of being “measured with sufficient reliability”.
46. INVESTMENT CONTRIBUTIONS FOR FUTURE LIABILITIES
This represents contributions invested / ring fenced for the future decommissioning of facilities.
2016 Movement 2017
R'000 R'000 R'000
NTP - Commercial facilities 19,274 1,201 20,475
SAFARI-1 13,775 1,404 15,179
33,049 2,605 35,654
The Stage 2 facilities include the SAFARI-1 Reactor which NTP Radioisotopes SOC Ltd (NTP), a subsidiary of Necsa, is contracted to manage and operate. In terms of the manage and operate agreement NTP and Necsa will share the Decommissioning and Decontamination costs of SAFARI-1; and NTP will be charged based on the commercial utilisation of the SAFARI-1 by NTP. NTP’s contribution is ring-fenced and invested to be utilised when Decommissioning and Decontamination commences. Refer to note 44 for further information on Decommissioning and decontamination costs.
47. FAIR VALUE INFORMATION
Fair value hierarchy
This note provides information about how the Group determines fair values of various financial assets and financial liabilities The table below analyses assets and liabilities carried at fair value. The different levels are defined as follows:
Level 1: Quoted unadjusted prices in active markets for identical assets or liabilities that the group can access at measurement date.
Level 2: Inputs other than quoted prices included in level 1 that are observable for the asset or liability either directly or indirectly.
Level 3: Unobservable inputs for the asset or liability.
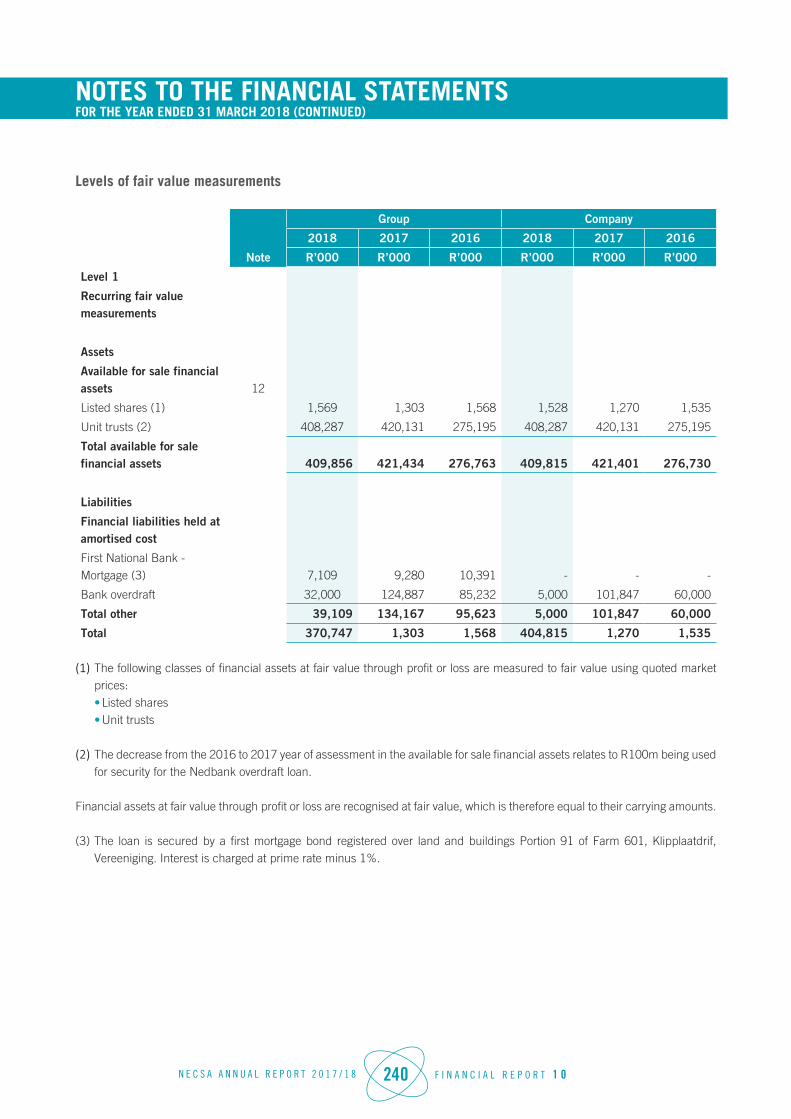
N E C S A A N N U A L R E P O R T 2 0 1 7 / 1 8 240 F I N A N C I A L R E P O R T 1 0
NOTES TO THE FINANCIAL STATEMENTS FOR THE YEAR ENDED 31 MARCH 2018 (CONTINUED)
Levels of fair value measurements
Group Company
2018 2017 2016 2018 2017 2016
Note R’000 R’000 R’000 R’000 R’000 R’000
Level 1
Recurring fair value measurements
Assets
Available for sale financial assets 12
Listed shares (1) 1,569 1,303 1,568 1,528 1,270 1,535
Unit trusts (2) 408,287 420,131 275,195 408,287 420,131 275,195
Total available for sale financial assets 409,856 421,434 276,763 409,815 421,401 276,730
Liabilities
Financial liabilities held at amortised cost
First National Bank - Mortgage (3) 7,109 9,280 10,391 - - -
Bank overdraft 32,000 124,887 85,232 5,000 101,847 60,000
Total other 39,109 134,167 95,623 5,000 101,847 60,000
Total 370,747 1,303 1,568 404,815 1,270 1,535
(1) The following classes of financial assets at fair value through profit or loss are measured to fair value using quoted market prices:• Listed shares• Unit trusts
(2) The decrease from the 2016 to 2017 year of assessment in the available for sale financial assets relates to R100m being used for security for the Nedbank overdraft loan.
Financial assets at fair value through profit or loss are recognised at fair value, which is therefore equal to their carrying amounts.
(3) The loan is secured by a first mortgage bond registered over land and buildings Portion 91 of Farm 601, Klipplaatdrif, Vereeniging. Interest is charged at prime rate minus 1%.

N E C S A A N N U A L R E P O R T 2 0 1 7 / 1 8 241 F I N A N C I A L R E P O R T 1 0
NOTES TO THE FINANCIAL STATEMENTS FOR THE YEAR ENDED 31 MARCH 2018 (CONTINUED)
Group Company
2018 2017 2016 2018 2017 2016
Note R’000 R’000 R’000 R’000 R’000 R’000
Level 2
Recurring fair value measurements
Assets
Investment in subsidiaries at fair value 9
NTP Radioisotopes SOC Ltd (1) 220,700 220,700 220,700 - - -
Cyclofil SOC Ltd - - - - - -
ARECSA SOC Ltd 1 1 1 - - -
Total available for sale financial assets 220,701 220,701 220,701 - - -
Investment in associates at fair value 10
Business Venture International No. 33 (Pty) Ltd 1 1 1 - - -
Gamwave (formaly Cyclotope, a subsidary) 40 40 40 - - -
Oserix 107 2,364 2,364 - - -
Total investments in associates at fair value 148 2,405 2,405 - - -
Liabilities
Financial liabilities held at amortised cost
Standard bank Australia investment (1) 233 633 1,033 - - -
Finance lease payables 3,546 5,305 8.202 3,286 3,748 5,087
Total other 3,779 5,938 9,235 3,286 3,748 5,087
Total 217,070 - - (3,289) - -
(1) The loan is unsecured, bears a fixed interest rate of 11.50% and is repayable in equal monthly instalments of R42,000. The amount is restricted to R2,500.
(2) Pelchem has obtained from the IDC in the prior financial year, a R30 000 000 loan in terms of their job fund programme. The Minister of Energy approved the borrowing from IDC on the 12 April 2013.The loan was fully utilized by 31 March 2014.These funds were used as working capital. The R30 000 0000 is repayable over 4 years starting 1 April 2014 at an interest rate of 5%. NTP Radioisotopes SOC Ltd have signed suretyship for the R30 000 000 should Pelchem not be in a position repay the loan.

N E C S A A N N U A L R E P O R T 2 0 1 7 / 1 8 242 F I N A N C I A L R E P O R T 1 0
NOTES TO THE FINANCIAL STATEMENTS FOR THE YEAR ENDED 31 MARCH 2018 (CONTINUED)
Group Company
2018 2017 2016 2018 2017 2016
Note(s) R’000 R’000 R’000 R’000 R’000 R’000
Level 3
Recurring fair value measurements
Assets
Total - - - - - -
Non recurring fair value measurements
Investments in subsidiaries (1)
Pelchem SOC Ltd 23,048 42,001 42,001 - - -
Total 23,048 42,001 42,001 - - -
There have been no Transfers of assets and liabilities within levels of the fair value hierarchy.
Reconciliation of assets and liabilities measured at level 3
All are recurring fair value measurements except Pelchem.
Note(s)Opening balance
Gains (losses) recognised in profit (loss)
Closing balance
Group - 2013AssetsInvestments in subsidiaries at fair valuePelchem SOC Ltd 9 1 - 1
Financial assets at fair value through profit (loss) - designated 12Foreign exchange contracts 1 - 1Cash flow hedge (1) 1 - 1Total financial assets at fair value through profit (loss) - designated 2 - 2
Financial assets -Loans and receivablesLoans and receivables - Government grant receivable 1 - 1Loans and receivables - Retention fees receivable (2) 1 - 1Loans to group companies - 3,310 3,310Trade and other receivables - 152,291 152,291Total Financial assets -Loans and receivables 2 155,601 155,603
Fianacial liabilities held at amortised costTrade and other paybles - (147,707) (147,707)Total 5 303,308 303,313
N E C S A A N N U A L R E P O R T 2 0 1 7 / 1 8 243 F I N A N C I A L R E P O R T 1 0
NOTES TO THE FINANCIAL STATEMENTS FOR THE YEAR ENDED 31 MARCH 2018 (CONTINUED)
(1) This relates to a once-off cash flow hedge that was entered into due to a long term inventory purchase contract. The Company no longer enters into cash flow hedge transactions.
(2) Retention fees receivable relates to contracts with clients where an amount is withheld until the quality conditions of the contract have been fulfilled. The fair value approximates the carrying value.
Necsa receives an allocation letter for Stage 2 decomissioning and decontamination, relating exclusively to decomissioning and decontamination for operational facilities. The fair value is calculated in terms of the allocation letter received relating to the above mentioned decomissioning and decontamination for operational facilities.
Highest and best use
All of the assets' in current use are the highest and best use.
48. EVENTS AFTER THE REPORTING PERIOD
Non-Adjusting entry:
The NTP Board passed a resolution, on the 25 May 2018, to declare a dividend of R20 million to Necsa. As such, this was considered to be a non-adjusting entry and is not provided for in the annual financial statements of the Company and Group.

11
K N O W L E D G E D I S S E M I N A T I O N
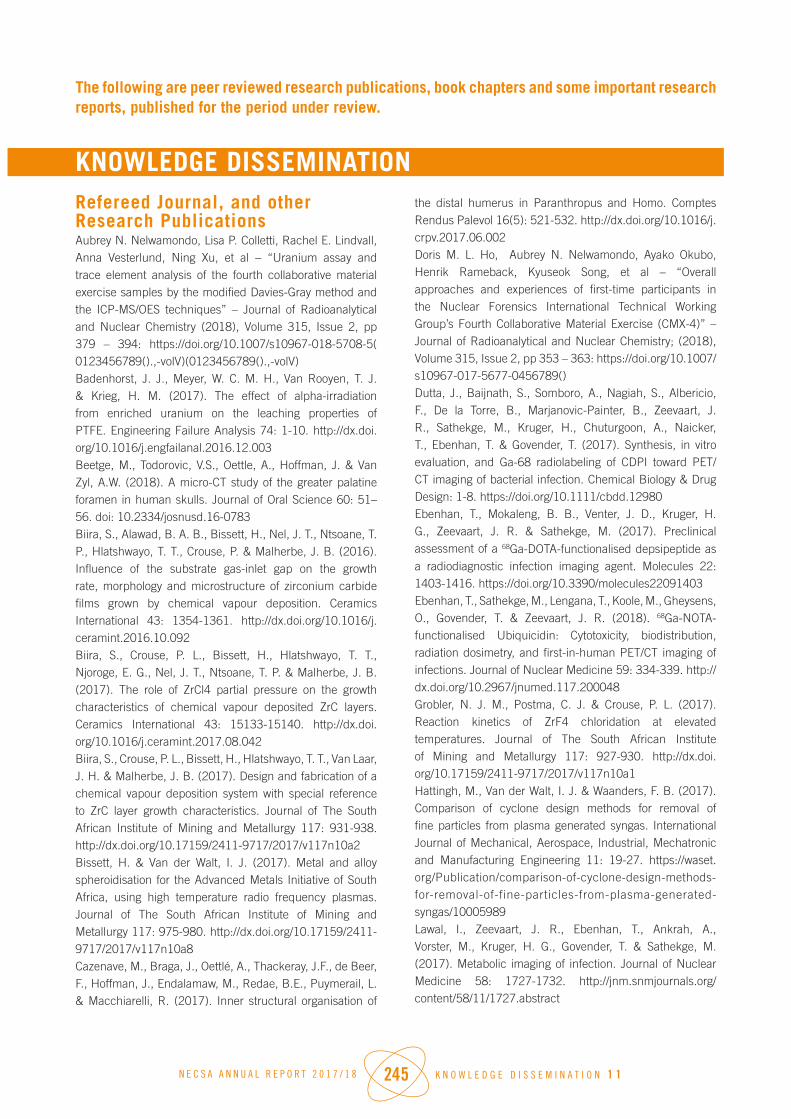
N E C S A A N N U A L R E P O R T 2 0 1 7 / 1 8 245 K N O W L E D G E D I S S E M I N A T I O N 1 1
The following are peer reviewed research publications, book chapters and some important research reports, published for the period under review.
KNOWLEDGE DISSEMINATIONRefereed Journal, and other Research PublicationsAubrey N. Nelwamondo, Lisa P. Colletti, Rachel E. Lindvall, Anna Vesterlund, Ning Xu, et al – “Uranium assay and trace element analysis of the fourth collaborative material exercise samples by the modified Davies-Gray method and the ICP-MS/OES techniques” – Journal of Radioanalytical and Nuclear Chemistry (2018), Volume 315, Issue 2, pp 379 – 394: https://doi.org/10.1007/s10967-018-5708-5( 0123456789().,-volV)(0123456789().,-volV)Badenhorst, J. J., Meyer, W. C. M. H., Van Rooyen, T. J. & Krieg, H. M. (2017). The effect of alpha-irradiation from enriched uranium on the leaching properties of PTFE. Engineering Failure Analysis 74: 1-10. http://dx.doi.org/10.1016/j.engfailanal.2016.12.003 Beetge, M., Todorovic, V.S., Oettle, A., Hoffman, J. & Van Zyl, A.W. (2018). A micro-CT study of the greater palatine foramen in human skulls. Journal of Oral Science 60: 51–56. doi: 10.2334/josnusd.16-0783 Biira, S., Alawad, B. A. B., Bissett, H., Nel, J. T., Ntsoane, T. P., Hlatshwayo, T. T., Crouse, P. & Malherbe, J. B. (2016). Influence of the substrate gas-inlet gap on the growth rate, morphology and microstructure of zirconium carbide films grown by chemical vapour deposition. Ceramics International 43: 1354-1361. http://dx.doi.org/10.1016/j.ceramint.2016.10.092Biira, S., Crouse, P. L., Bissett, H., Hlatshwayo, T. T., Njoroge, E. G., Nel, J. T., Ntsoane, T. P. & Malherbe, J. B. (2017). The role of ZrCl4 partial pressure on the growth characteristics of chemical vapour deposited ZrC layers. Ceramics International 43: 15133-15140. http://dx.doi.org/10.1016/j.ceramint.2017.08.042Biira, S., Crouse, P. L., Bissett, H., Hlatshwayo, T. T., Van Laar, J. H. & Malherbe, J. B. (2017). Design and fabrication of a chemical vapour deposition system with special reference to ZrC layer growth characteristics. Journal of The South African Institute of Mining and Metallurgy 117: 931-938. http://dx.doi.org/10.17159/2411-9717/2017/v117n10a2Bissett, H. & Van der Walt, I. J. (2017). Metal and alloy spheroidisation for the Advanced Metals Initiative of South Africa, using high temperature radio frequency plasmas. Journal of The South African Institute of Mining and Metallurgy 117: 975-980. http://dx.doi.org/10.17159/2411-9717/2017/v117n10a8Cazenave, M., Braga, J., Oettlé, A., Thackeray, J.F., de Beer, F., Hoffman, J., Endalamaw, M., Redae, B.E., Puymerail, L. & Macchiarelli, R. (2017). Inner structural organisation of
the distal humerus in Paranthropus and Homo. Comptes Rendus Palevol 16(5): 521-532. http://dx.doi.org/10.1016/j.crpv.2017.06.002Doris M. L. Ho, Aubrey N. Nelwamondo, Ayako Okubo, Henrik Rameback, Kyuseok Song, et al – “Overall approaches and experiences of first-time participants in the Nuclear Forensics International Technical Working Group’s Fourth Collaborative Material Exercise (CMX-4)” – Journal of Radioanalytical and Nuclear Chemistry; (2018), Volume 315, Issue 2, pp 353 – 363: https://doi.org/10.1007/s10967-017-5677-0456789()Dutta, J., Baijnath, S., Somboro, A., Nagiah, S., Albericio, F., De la Torre, B., Marjanovic-Painter, B., Zeevaart, J. R., Sathekge, M., Kruger, H., Chuturgoon, A., Naicker, T., Ebenhan, T. & Govender, T. (2017). Synthesis, in vitro evaluation, and Ga-68 radiolabeling of CDPI toward PET/CT imaging of bacterial infection. Chemical Biology & Drug Design: 1-8. https://doi.org/10.1111/cbdd.12980Ebenhan, T., Mokaleng, B. B., Venter, J. D., Kruger, H. G., Zeevaart, J. R. & Sathekge, M. (2017). Preclinical assessment of a 68Ga-DOTA-functionalised depsipeptide as a radiodiagnostic infection imaging agent. Molecules 22: 1403-1416. https://doi.org/10.3390/molecules22091403Ebenhan, T., Sathekge, M., Lengana, T., Koole, M., Gheysens, O., Govender, T. & Zeevaart, J. R. (2018). 68Ga-NOTA-functionalised Ubiquicidin: Cytotoxicity, biodistribution, radiation dosimetry, and first-in-human PET/CT imaging of infections. Journal of Nuclear Medicine 59: 334-339. http://dx.doi.org/10.2967/jnumed.117.200048Grobler, N. J. M., Postma, C. J. & Crouse, P. L. (2017). Reaction kinetics of ZrF4 chloridation at elevated temperatures. Journal of The South African Institute of Mining and Metallurgy 117: 927-930. http://dx.doi.org/10.17159/2411-9717/2017/v117n10a1Hattingh, M., Van der Walt, I. J. & Waanders, F. B. (2017). Comparison of cyclone design methods for removal of fine particles from plasma generated syngas. International Journal of Mechanical, Aerospace, Industrial, Mechatronic and Manufacturing Engineering 11: 19-27. https://waset.org/Publication/comparison-of-cyclone-design-methods-for-removal-of-fine-particles-from-plasma-generated-syngas/10005989 Lawal, I., Zeevaart, J. R., Ebenhan, T., Ankrah, A., Vorster, M., Kruger, H. G., Govender, T. & Sathekge, M. (2017). Metabolic imaging of infection. Journal of Nuclear Medicine 58: 1727-1732. http://jnm.snmjournals.org/content/58/11/1727.abstract

N E C S A A N N U A L R E P O R T 2 0 1 7 / 1 8 246 K N O W L E D G E D I S S E M I N A T I O N 1 1
Lengana, T., Van de Wiele, C., Lawal, I., Maes, A., Ebenhan, T., Boshomane, T., Zeevaart, J. R., Ankrah, A., Mokgoro, N., Vorster, M. & Sathekge, M. (2018). 68Ga-PSMA-HBED-CC PET/CT imaging in Black versus White South African patients with prostate carcinoma presenting with a low volume, androgen-dependent biochemical recurrence: a prospective study. Nuclear Medicine Communications 39: 179-185. https://journals.lww.com/nuclearmedicinecomm/Abstract/2018/02000/68Ga_PSMA_HBED_CC_PET_CT_imaging_in_Black_versus.12.aspxMaledi, N.B., Oladijo, O.P., Botef, I., Ntsoane, T.P., Madiseng, A, Moloisane, L. (2017). Cold spray parameters on the microstructures and residual stress of Zn coatings sprayed on mild steel. Surface and Coatings Technology 318: 106-113. https://doi.org/10.1016/j.surfcoat.2017.03.062Michael J. Kristo, Ross Williams, Amy M. Gaffney, Theresa M. Kayzar-Boggs, Kerri C. Schorzman, Petra Lagerkvist, Anna Vesterlund, Henrik Rameback, Aubrey N. Nelwamondo, Deon Kotze, et al – “The application of radiochronometry during the 4th collaborative materials exercise of the nuclear forensics international technical working group (ITWG)” – Journal of Radioanalytical and Nuclear Chemistry (2018), Volume 315, Issue 2, pp 425 – 434: https://doi.org/10.1007/s10967-017-5680-5Muchono B., Prinsloo A.R.E., Sheppard C.J., Venter A.M. & Liss K.D. (2017). Spin density wave behaviour in the (Cr98.4 Al1.6 )100-y Moy and (Cr100-x Alx)95 Mo5 alloy series. Journal of Physics: Conference Series 903: 012028. doi:10.1088/1742-6596/903/1/012028Muchono, B., Sheppard, C.J., Venter A.M. & Prinsloo, A.R.E. (2018). Thermal transport properties, magnetic susceptibility and neutron diffraction studies of the (Cr100-xAlx)95Mo5 alloy system. Physica B: Condensed Matter 537: 212-224. http://dx.doi.org/10.1016/j.physb.2018.02.018Muvhiiwa, R. F., Sempuga, B., Hildebrandt, D. & Van der Walt, I. J. (2018). Study of the effects of temperature on syngas composition from pyrolysis of wood pellets using a nitrogen plasma torch reactor. Journal of Analytical and Applied Pyrolysis 130: 159-168. https://doi.org/10.1016/j.jaap.2018.01.014Nete, M., Purcell, W. & Nel, J. T. (2017). Non-fluoride dissolution of tantalum and niobium oxides and their separation using ion exchange. Hydrometallurgy 173: 192-198. http://dx.doi.org/10.1016/j.hydromet.2017.08.018Padenko, E., Van Rooyen, L. J. & Karger-Kocsis, J. (2017). Transfer film formation in PTFE/oxyfluorinated graphene nanocomposites during dry sliding. Tribology Letters Article ID 36. http://dx.doi.org/10.1007/s11249-017-0821-0Pan, L., Dumoncel, J., de Beer, F., Hoffman, J., Thackeray, J.F., Duployer, B., Tenailleau, C. & Braga, J. (2017). Further morphological evidence on South African earliest Homo lower postcanine dentition: Enamel thickness and enamel dentine junction. American Journal of Physical Anthropology 96: 82-96. https://doi.org/10.1002/ajpa.23240
Postma, C. J., Lubbe, S. J. & Crouse, P. L. (2017). Selective sublimation/desublimation separation of ZrF4 and HfF4. Journal of The South African Institute of Mining and Metallurgy 117: 939-946. http://dx.doi.org/10.17159/2411-9717/2017/v117n10a3Potgieter, M., Barry, J. C., Van der Westhuisen, D. J. & Krieg, H. M. (2017). Recovery of uranium from nuclear conversion plant waste. Journal of The South African Institute of Mining and Metallurgy 117: 785-792. http://dx.doi.org/10.17159/2411-9717/2017/v117n8a9Rondahl, S.H., Pointurier, F., Ahlinder, L., Ramebäck, H., Marie, O., Ravat, B., Delaunay, F., Young, E., Blagojevic, N., Hester, J.R., Thorogood, G., Nelwamondo, A.N., Ntsoane, T.P., Roberts, S.K. & Holliday, K.S. (2018). Comparing results of X-ray diffraction, µ-Raman spectroscopy and neutron diffraction when identifying chemical phases in seized nuclear material, during a comparative nuclear forensics exercise. Journal of Radioanalytical and Nuclear Chemistry 315(2): 395–408. https://doi.org/10.1007/s10967-017-5666-3Sathekge, M., Lengana, T., Maes, A., Vorster, M., Zeevaart, J. R., Lawal, I., Ebenhan, T. & Van de Wiele, C. (2018). 68Ga-PSMA-11 PET/CT in primary staging of prostate carcinoma: preliminary results on differences between black and white South-Africans. European Journal of Nuclear Medicine and Molecular Imaging 45: 226-234. https://doi.org/10.1007/s00259-017-3852-8Schlünz, E.B., Bokov, P.M. & van Vuuren, J.H. (2018). Multiobjective in-core nuclear fuel management optimisation by means of a hyperheuristic. Swarm and Evolutionary Computation (Published online) https://doi.org/10.1016/j.swevo.2018.02.019 Sonopo, M. S., Pillay, A., Chibale, K., Marjanovic-Painter, B., Donini, C. & Zeevaart, J. R. (2016). Carbon-14 radiolabelling and tissue distribution evaluation of MMV390048. Journal of Labelled Compounds and Radiopharmaceuticals 59: 680-688. http://dx.doi.org/10.1002/jlcr.3445Stina Holmgren Rondahl, Fabien Pointurier, …Aubrey N. Nelwamondo, Tshepo P. Ntsoane, Sarah K. Roberts, Kiel S. Holliday – “Comparing results of X-ray diffraction, μ-Raman spectroscopy and neutron diffraction when identifying chemical phases in seized nuclear material, during a comparative nuclear forensics exercise” – Journal of Radioanalytical and Nuclear Chemistry (2018), Volume 315, Issue 2, pp 395–408: https://doi.org/10.1007/s10967-017-5666-3Van der Walt, I. J., Jansen, A. A. & Crouse, P.L. (2017). Plasma-assisted treatment of municipal solid waste: A scenario analysis. Plasma Chemistry and Plasma Processing 37: 763-782. https://doi.org/10.1007/s11090-017-9786-x Van Laar, J. H., Bissett, H., Barry, J. C., Van der Walt, I. J. & Crouse, P. (2017). Deposition of SiC/Si coatings in a microwave plasma-assisted spouted bed reactor. Journal of The European Ceramic Society 38: 1197-1209. https://doi.org/10.1016/j.jeurceramsoc.2017.10.030

N E C S A A N N U A L R E P O R T 2 0 1 7 / 1 8 247 K N O W L E D G E D I S S E M I N A T I O N 1 1
Book Chapters
Ebenhan, T., Wagener, C. C. P., Zeevaart, J. R., Bambarger, L. & Kalinda, A. (2017). Radiochemistry in imaging infections. In: Jain, S.K. (Ed). Imaging Infections: From bench to bedside, pp 77-131.
Hrabofski, M. & Van der Walt, I. J. (2018). Handbook of Thermal Sciences and Engineering: Chapter 8 Plasma waste destruction .
Selyshchev, P.A. & Bokov, P.M. (2018). Kinetics of annealing: Basic relationships and nonlinear effects. In: Archilla, J.F.R., Palmero, F., Lemos, M.C., Sánchez-Rey, B. & Casado-Pascual, J. (eds). Nonlinear Systems, Vol. 2: Nonlinear Phenomena in Biology, Optics and Condensed Matter, pp 283–314.
Other peer reviewed publications
de Beer, F., van der Merwe J-H. & Bessarabov, D. (2017). PEM water electrolysis: Preliminary investigations using neutron radiography. Physics Procedia 88:19-26. Proceedings of the ITMNR-8, Beijing, China, Sept 2016. doi:10.1016/j.phpro.2017.06.002
Gama, J. S., Barry, J. C. & Crouse, P. (2017). Selective removal of aluminium from both the cladding and the core of LEU fuel plate. Uranium 2017 International Conference, Swakopmund, Namibia, September 2017, Proceedings published by: The South African Institute of Mining and Metallurgy: 375-382
Makaringe, N. P., Van der Walt, I. J., Puts, G. J. & Crouse, P. L. (2017). TGA-FTIR characterisation of bamboo wood, Napier grass, pine wood and peach pips for gasification applications. Brazilian Journal of Thermal Analysis 6: 12-19. http://doi.org/10.18362/bjta.v6i1.8
Mastoroudes, M., Markgraaff, J. & Barry, J. C. (2017). Characterisation of ZrC with varying C/Zr ratios synthesised through a solution based process. AMI Precious Metals 2017, Polokwane, South Africa, October 2017, Proceedings published by: The South African Institute of Mining and Metallurgy S94: 19-30.
Mokgawa, J. L. & Lotter, S. J. (2017). The determination of rare earth elements in nuclear-grade zirconium by ICP-OES. AMI Precious Metals 2017, Polokwane, South Africa, October 2017, Proceedings published by: The South African Institute of Mining and Metallurgy: 13-18.
Nelwamondo, S. M. M., Meyer, W. C. M. H., Krieg, H. & Markgraaff, J. (2017). The development of a magnesium potassium phosphate geopolymer at different sintering temperature for stabilisation of uranium wastes. Uranium 2017 International Conference, Swakopmund, Namibia,
September 2017, Proceedings published by: The South African Institute of Mining and Metallurgy: 55-65.
Pargeter, J., Bam, L., de Beer F. & Lombard, M. (2018). Field and Technical Report, Microfocus X-Ray Tomography as a Method for Characterising Macro-Fractures on Quartz Backed Tools. South African Archaeological Bulletin 72(206): 148-155.
Potgieter, M., Barry, J. C., Van der Westhuizen, D. J. & Krieg, H. M. (2017). Effect of impurities on the selective extraction and recovery of uranium from nuclear conversion plant waste. Uranium 2017 International Conference, Swakopmund, Namibia, September 2017, Proceedings published by: The South African Institute of Mining and Metallurgy: 87-95.
Skolo, K. P., Barry, J. C. & Crouse, P. (2017). Batch adsorption studies of uranium onto Amberlite IRC-50 and Purolite A500 resins. Uranium 2017 International Conference, Swakopmund, Namibia, September 2017, Proceedings published by: The South African Institute of Mining and Metallurgy: 383-390.
Steyn, P. J., Zimolong, D. G. & Cilliers, A. C. (2017). Surrogate material selection for the set-up of zirconium alloy component manufacturing. AMI Precious Metals 2017, Polokwane, South Africa, October 2017, Proceedings published by: The South African Institute of Mining and Metallurgy S94: 73-84.
Van der Walt, B. & Bissett, H. (2018). Deposition of zirconium carbide layers using a plasma spraying method. AMI Precious Metals 2017, Polokwane, South Africa, October 2017, Proceedings published by: The South African Institute of Mining and Metallurgy: 33-45.
Substantive Scientific Reports for Contract Research Projects
Driver, C. H. S. & Zeevaart, J. R. (2017). Confidential client report for BGM Pharmaceuticals. Accepted by Martin Magwaza for BGM Pharmaceuticals.
Groenewald, S.A. (2017). Study into burnup modelling of the molybdenum rigs in SAFARI-1.
Groenewald, S.A., Adetula, B.A. & van Rooyen, T.J. (2017). Code V&V in support of RG-0016 compliance for nuclide inventory, source term and dose rate calculations.
Ngobeni, S. (2017). Confidential client report for NTP. Accepted by Gavin Ball for NTP.
Prinsloo, R.H. (2018). SAFARI-1 power peaking factor study.

N E C S A A N N U A L R E P O R T 2 0 1 7 / 1 8 248 K N O W L E D G E D I S S E M I N A T I O N 1 1
Prinsloo, R.H. & van Heerden, F.A. (2017). Development of an OSCAR-4 core follow calculational model for the HOR, in aid of verification and validation.
Sepini, L. C. (2017). Confidential client report for NTP. Accepted by Otto Knoesen for NTP.
Sonopo, M. S. (2017). Confidential client report for NTP. Accepted by Dr Otto Knoesen for NTP.
Stassen, E., Carstens, P. A. B., Venter, C. J. H., Goede, A., Badenhorst, J. J., Nelwamondo, S. M. M., Britton, M. T. S., Ntsoane, T. P., Thompson, J. C., Van Rooyen, L. J., Meyer, W. C. M. H. & Van der Merwe, R. (2017). Confidential client report for Argonne National Laboratory. Accepted by G Vandegrift on behalf of Argonne National Laboratory.
Van Heerden, F.A. (2017). OSCAR-4 reactivity calculations to support HOR pie analysis.
Van Rooyen, T.J. (2017). Activity and dose rate calculations for MEU and LEU target-plate solid residue in an LTS container.
Van Rooyen, T.J. (2017). Calculation of energy deposition rates and dose rates for an irradiated SAFARI-1 fuel element in the spent fuel transport cask.
Van Rooyen, T.J. (2017). Source-term and lead-cell shielding thickness requirement calculations for one irradiated fuel-pebble from a pebbled-bed type advance high-temperature reactor (AHTR).
Van Rooyen, T.J. (2018). ELIS_APP: A utility code to calculate isotopic compositions of mixtures of natural, terrestrial elements.
Van Rooyen, T.J. (2018). Development of calculational model for NTP Beatrice Type-B transport package.
Van Rooyen, T.J. (2018). Necsa Neutron Radiography (NRAD) collimator optimisation study.
Zamonsky, M. (2018). Activation of Y203 with MCNP.
Zamonsky, M. (2018). RG-0016 compliance of MCNP-5 to criticality and shielding calculations related to SAFARI-1. Et al.

RP59/2019ISBN: 978-0-621-47110-6
PO Box 582, Pretoria, 0001, South AfricaTel +27 12 305 4911
Design and Layout:www.blackmoon.co.za