MAY 2014
2014 M&A HoroscopeThe stars are aligned to bridge the $2 trillion M&A deficit

Published by Corporate Finance Advisory
For questions or further information, please contact:
Corporate Finance Advisory
Marc Zenner [email protected] (212) 834-4330
Ram Chivukula [email protected] (212) 622-5682

2014 M&A HOROSCOPE | 1
1. Are the stars aligned for M&A?Every time—including so far this year—a large M&A announcement follows another, commentators rush to proclaim the long-awaited arrival of an “M&A wave.” Reasonable predictions usually do come true often enough, and that appears to be the case now, when finally, conditions do seem ripe for more M&A. The post-crisis economic rebound appears to be gathering some strength, while credit and equity markets remain vibrant, with the cost of debt at historic lows and equity indices at new highs. Moreover, corporate balance sheets continue to be robust and fortress-like. This growth-friendly environment has fueled investor expectations. Indeed, shareholders are pressuring CEOs to deploy their firms’ extraordinary balance sheet flexibility to deliver greater equity-price growth. In this environment, a standing ovation from shareholders is increasingly the reaction to firms announcing strategic acquisitions, in sharp contrast to decades of poor investor response to acquisitive firms.1
M&A volumes have remained at levels typically seen only in less favorable periods despite the stars being aligned otherwise (Figure 1). The nominal amount of strategic U.S. M&A activity in 2013 was $563 billion.2 This level places it more than 10% below 2010’s post-crisis lows of $630 billion and at about half of the most recent peak of $1.2 trillion in 2006. On a market capitalization-adjusted basis, M&A activity in 2013 was $633 billion, down more than one-third from 2010 with an adjusted volume of $1.0 trillion.3 What explains this conundrum?
This report asks the following questions in an attempt to solve this M&A puzzle:
1 For further reading on positive acquirer market reactions, please see our September 2013 brief, “Seven pearls of wisdom from recent mega-cap M&A” or our December 2012 report, “Uncorking M&A: The 2013 vintage.” They are located at:
http://www.jpmorgan.com/directdoc/JPMorgan_CorporateFinanceAdvisory_WisdomFromMegacapMA.pdf and http://www.jpmorgan.com/directdoc/JPMorgan_CorporateFinanceAdvisory_MA.pdf, respectively 2 Strategic M&A volume is defined based on transactions greater than $500 million in which at least one of the two firms is U.S. based, excluding financial sponsor transactions
3 M&A volumes are linearly scaled, on a quarterly basis, by the value of the S&P 500 at the end of that quarter relative to the value of the index at the end of 2013. As an example, the nominal $630 billion in 2010 equates to $1.0 trillion on an adjusted basis
1. Do economic conditions, equity markets, credit markets and corporate balance sheets typically drive M&A waves?
2. Have we been in—and are we still in—an environment conducive to a vigorous M&A market?
3. How much M&A should we have experienced in this favorable economic climate that we have not, i.e., what is the M&A deficit?
4. What factors have prevented the release of the animal spirits so essential to hearty M&A appetites?
5. What are the key takeaways for CEOs and boards of directors?

2 | Corporate Finance Advisory
Figure 1
M&A volumes have yet to fully rebound in nominal or real terms
U.S. strategic M&A ($bn, annual)
EXECUTIVE TAKEAWAY
M&A volumes ebb and flow with economic and
financial conditions, leading to M&A waves.
Today’s economic and financial conditions have
been, and still are, consistent with a massive M&A
wave that we have yet to see. Will M&A activity
finally rise to its potential this year?
0
500
1,000
1,500
2,000
2,500
3,000
1995 1996 1997 1998 1999 2000 2001 2002 2003 2004 2005 2006 2007 2008 2009 2010 2011 2012 2013
Adjusted M&A (quarterly, per the S&P 500 Index)1
Nominal M&A
Hot period Hot period Cold period Cold period M&A deficit
Source: J.P. Morgan, BloombergNote: Strategic M&A defined as transactions greater than $500 million in which at least one of the two firms is U.S., excluding sponsor transactions1 Adjusted M&A rebased quarterly by S&P 500 market cap for period relative to 12/31/2013 S&P 500 market cap

2014 M&A HOROSCOPE | 3
2. Historic drivers of M&A activityA host of factors have traditionally been associated with hot versus cold M&A markets. These potential drivers of M&A activity fall into four categories: (1) Economic indicators, (2) Equity markets, (3) Credit markets and (4) Corporate balance sheets. For each set of variables, we examine the historical (1995–2009) statistical relationship between the indicators and M&A activity.4 We then use this historical relationship to predict what M&A would have been post-crisis had the traditional calculus persisted.
2.1 Economic indicatorsWe examine two economic indicators—disposable income growth and the Producers Manufacturing Index (PMI)—both of which are correlated with the U.S. economic cycle.5
As expected, these indicators are also correlated with M&A activity. For example, the PMI averaged 51.5 and 54.3 during the two active M&A periods, and 49.5 and 45.9 during the slow M&A periods (Figure 2). In the post-crisis period, however, the PMI averaged 54.1 with no commensurate jump in M&A activity.
Figure 2
Economic indicators
4 Based on regressions using quarterly data from 1995 to 20095 An indicator of the economic health of the manufacturing sector, the PMI is based on five major factors: new orders, inventory
levels, production, supplier deliveries and the employment environment. A PMI of more than 50 represents expansion of the manufacturing sector, compared to the previous month. A reading less than 50 represents a contraction, while a reading at 50 indicates no change
51.5 49.5
54.3
45.9
54.1 53.7
’95–’00 ’01–’03 ’04–’07 ’08–’09 ’10–'13 Q1 ’14
912
504
1,852
879
1,410 1,367 1,416 1,412
’95–’00 ’01–’03 ’04–’07 ’08–’09 ’10–’13 Q1 ’14
5.8% 4.8%
5.3%
1.7%
3.6% 3.3%
’95–’00 ’01–’03 ’04–’07 ’08–’09 ’10–’13 Q1 ’14
Disposable income growth Adjusted annual M&A ($bn)1
Producers Manufacturing Index (PMI)
Predicted M&A based on indicators2
Source: J.P. Morgan, Bloomberg, Dealogic, Bureau of Economic AnalysisNote: Averages of quarterly values shown for economic indicators1 Adjusted annual M&A defined as annualized average of quarterly adjusted values during the period (levels adjusted quarterly by S&P 500 market cap for period relative to 12/31/2013 S&P 500 market cap)
2 Predicted values estimated using a regression of adjusted quarterly M&A volumes on historical data
4 | Corporate Finance Advisory
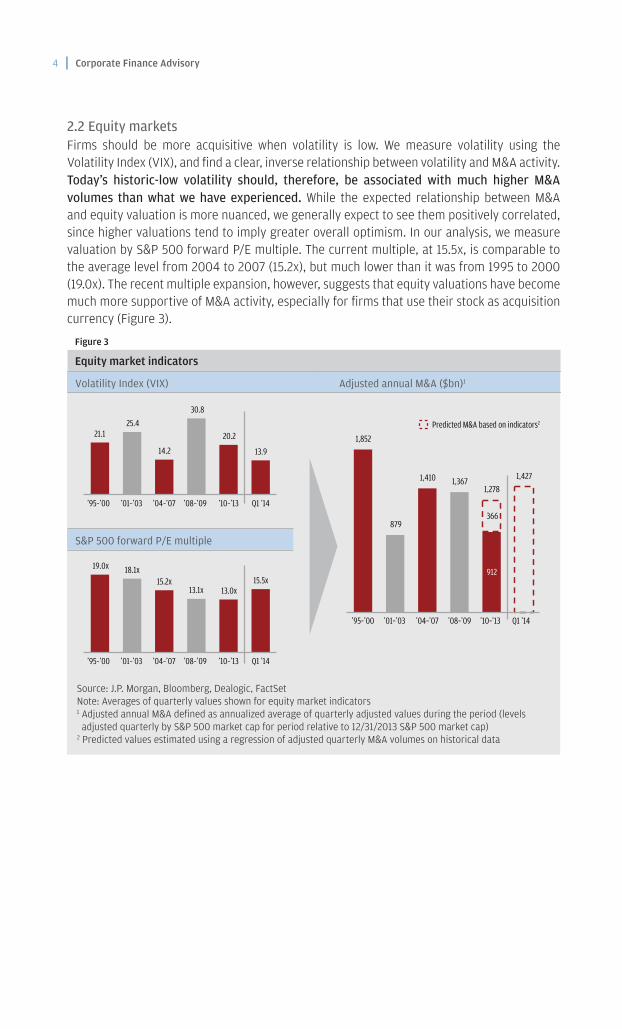
2.2 Equity marketsFirms should be more acquisitive when volatility is low. We measure volatility using the Volatility Index (VIX), and find a clear, inverse relationship between volatility and M&A activity. Today’s historic-low volatility should, therefore, be associated with much higher M&A volumes than what we have experienced. While the expected relationship between M&A and equity valuation is more nuanced, we generally expect to see them positively correlated, since higher valuations tend to imply greater overall optimism. In our analysis, we measure valuation by S&P 500 forward P/E multiple. The current multiple, at 15.5x, is comparable to the average level from 2004 to 2007 (15.2x), but much lower than it was from 1995 to 2000 (19.0x). The recent multiple expansion, however, suggests that equity valuations have become much more supportive of M&A activity, especially for firms that use their stock as acquisition currency (Figure 3).
Figure 3
Equity market indicators
19.0x 18.1x 15.2x
13.1x 13.0x 15.5x
’95–’00 ’01–’03 ’04–’07 ’08–’09 ’10–’13 Q1 ’14
21.1 25.4
14.2
30.8
20.2
13.9
’95–’00 ’01–’03 ’04–’07 ’08–’09 ’10–’13 Q1 ’14
912
366
1,852
879
1,410 1,367 1,278
1,427
’95–’00 ’01–’03 ’04–’07 ’08–’09 ’10–’13 Q1 ’14
Volatility Index (VIX) Adjusted annual M&A ($bn)1
S&P 500 forward P/E multiple
Predicted M&A based on indicators2
Source: J.P. Morgan, Bloomberg, Dealogic, FactSetNote: Averages of quarterly values shown for equity market indicators1 Adjusted annual M&A defined as annualized average of quarterly adjusted values during the period (levels adjusted quarterly by S&P 500 market cap for period relative to 12/31/2013 S&P 500 market cap)
2 Predicted values estimated using a regression of adjusted quarterly M&A volumes on historical data

2014 M&A HOROSCOPE | 5
2.3 Credit marketsLow spreads, in both the investment grade and high yield credit markets, are also indicative of benign capital markets. Indeed, during the M&A hot periods, investment grade spreads averaged 1.6% and 1.0%, below the 1.7% and the 3.3% of the cold periods. At 1.3% today, we are once more in a credit environment that should be conducive to increased M&A activity. High yield credit markets paint a picture even more supportive of M&A activity: The current high yield spread, 2.5%, is significantly lower than its averages of 3.5% and 4.5% during the two most recent hot M&A markets.
Figure 4
Credit market indicators
.
4.5%
7.0%
3.5%
9.8%
4.7%
2.5%
’95–’00 ’01–’03 ’04–’07 ’08–’09 ’10–’13 Q1 ’14
1.6% 1.7%
1.0%
3.3%
1.9% 1.3%
’95–’00 ’01–’03 ’04–’07 ’08–’09 ’10–’13 Q1 ’14
1,852
1,410 1,367 1,422 1,458
’95-’00 ’01-’03 ’04-’07 ’08-’09 ’10-’13 Q1 ’14
912
510
879
Investment grade spreads1 Adjusted annual M&A ($bn)3
High yield spreads2
Predicted M&A based on indicators4
Source: J.P. Morgan, Dealogic, BloombergNote: Averages of quarterly values shown for credit market indicators1 J.P. Morgan U.S. Liquid Index (JULI)2 J.P. Morgan U.S. High Yield Bond Index3 Adjusted annual M&A defined as annualized average of quarterly adjusted values during the period (levels
adjusted quarterly by S&P 500 market cap for period relative to 12/31/2013 S&P 500 market cap)4 Predicted values estimated using a regression of adjusted quarterly M&A volumes on historical data

6 | Corporate Finance Advisory
2.4 Balance sheetsBolstered by rising equity valuations and historically high cash balances, firms have organically delevered in recent years. As a result, today’s gross leverage levels, as measured relative to market capitalization, are in-line or lower than the levels of the two preceding M&A hot periods. In fact, on a net debt to EBITDA basis, firms have record-low leverage. Using this metric, leverage has been relatively flat over the last decade (Figure 5). It is significantly lower than its levels in the late 1990s, however, suggesting that firms have material financial flexibility to use the debt markets to execute large acquisitions.
Figure 5
Balance sheet indicators
35.5%
46.1%
28.7%
43.9%
33.8% 30.6%
’95–’00 ’01–’03 ’04–’07 ’08–’09 ’10–’13 Q1 ’14
912
460
1,852
879
1,410 1,367 1,373 1,431
’95–’00 ’01–’03 ’04–’07 ’08–’09 ’10–’13 Q1 ’14
2.0x 2.0x
1.4x 1.5x 1.2x 1.2x
’95–’00 ’01–’03 ’04–’07 ’08–’09 ’10–’13 Q1 ’14
Debt/market capitalization1 Adjusted annual M&A ($bn)3
Net debt/EBITDA2
Predicted M&A based on indicators4
Source: J.P. Morgan, Bloomberg, FactSetNote: Averages of quarterly values shown for corporate finance indicators1 Quarterly average during period of balance sheet debt/equity market capitalization for S&P 500 constituents (excluding Financials)
2 Quarterly average during period of total net debt/total EBITDA for S&P 500 constituents (excluding Financials)3 Adjusted annual M&A defined as annualized average of quarterly adjusted values during the period (levels adjusted
quarterly by S&P 500 market cap for period relative to 12/31/2013 S&P 500 market cap)4 Predicted values estimated using a regression of adjusted quarterly M&A volumes on historical data

2014 M&A HOROSCOPE | 7
2.5 All factors combinedWe estimate various regression models to explain quarterly M&A volumes since 1995. In particular, we estimate separate models for each series of M&A predictors, as well as a combined model relying on economic, equity, credit and balance sheet metrics. These models, as demonstrated in Figure 6, indicate a significant shortfall in M&A over the last four years. The annual-adjusted “M&A potential” from 2010 to 2013 was $1.3–$1.5 trillion, compared to its average “realized level” of $900 billion for the same period. This suggests an aggregate M&A deficit of approximately $2 trillion during the post-crisis period.
Per our analysis, however, all indicators currently point to an increase in M&A volume in the coming year. The various M&A predictors suggest a strategic U.S. M&A volume of $1.4–$1.6 trillion in 2014, roughly double the realized level in 2013. For now, we appear on pace to achieve this prediction: Strategic M&A activity in the U.S. in the first quarter of 2014 totaled $300 billion.
Figure 6
All indicators suggest that M&A activity is significantly below potential
Observed and predicted adjusted annual M&A volume1
EXECUTIVE TAKEAWAY
On a market capitalization-adjusted basis, there
was about $900 billion of strategic M&A per
year in the U.S. in the post-crisis period. These
numbers are about $500 billion short, annually,
of what we would have predicted based on their
historical relationships with economic, equity,
credit and balance sheet metrics. In other words,
there was a $1.5–$2.0 trillion M&A deficit over
the last four years. The same models also suggest
that the 2014 M&A volume should be roughly
$1.5 trillion, about twice its level in 2013.
Economic indicators (PMI, Disposable income)
Equity market indicators (S&P forward P/E, VIX)
Credit market indicators (IG spreads, HY spreads)
Balance sheet indicators (Debt/market cap, Net debt/EBITDA)
Economic, equity, credit and balance sheet indicators
Adjusted annual M&A ($bn)
2014 predicted M&A3 Annual M&A potential 2010–20132
1,416 1,412
1,278 1,427
1,422 1,458
1,373 1,431
1,496 1,593
0 200 400 600 800 1,000 1,200 1,400 1,600 1,800 2,000
Observed averageannual M&A (2010-2013)
($912bn)
Source: J.P. Morgan1 Observed based on adjusted annual M&A defined as annualized average of quarterly adjusted values during the period (levels adjusted quarterly by S&P 500 market cap for period relative to 12/31/2013 S&P 500 market cap); predicted values estimated using a regression of adjusted quarterly M&A volumes on historical data
2 Obtained by applying the regression coefficients to the average quarterly indicators in 2010–20133 Obtained by applying the regression coefficients to the average quarterly indicators in Q1 2014

8 | Corporate Finance Advisory
3. Factors that are uniquely favorable to M&A today3.1 Historic-low cost of debt, historic-high accretion When observers describe a favorable environment for M&A, they frequently mention the record-low cost of debt we have experienced over the last few years. Thanks to accommodating Federal Reserve policy, the cost of debt for both investment grade and non-investment grade borrowers has been as low as we have ever seen it. Many M&A transactions, therefore, appear value enhancing when viewed through the lens of EPS accretion, a measure often relied on in the context of M&A. From the charts in Figure 7, the implications are clear: Debt- and cash-financed acquisitions generate record EPS accretion today despite the recent run-up in equity values.
Surely, neither EPS accretion nor a low cost of debt alone is sufficient to drive M&A activity. Nor does a high cost of debt necessarily prevent M&A volumes from booming. For example, in the M&A hot period of the late 1990s, the cost of investment grade debt was 6.6% on average, significantly higher than it was in the cold periods of the early 2000s. But when all other factors are already favorable, a historic-low cost of debt financing should be beneficial…
Figure 7
Today’s low cost of debt financing makes M&A a particularly attractive proposition
Bond indices over time Illustrative EPS accretion of M&A3
(15%)
(10%)
(5%)
0%
5%
10%
15%
1995 1997 1999 2001 2003 2005 2007 2009 2011 2013
Debt-financed M&A Cash-financed M&A
9.7%
4.9%
0%
5%
10%
15%
20%
25%
1995 1997 1999 2001 2003 2005 2007 2009 2011 2013
IG1 HY2
Current: 2.3% Lower 9.4% of the time
Average: 4.6%v
Current: 5.4% Lower 1.4% of the time
Average: 9.6%
5.4%
2.3%
Source: Bloomberg, FactSet1 Based on the Barclays U.S. Aggregate Index, which has a modified duration of 5.66 years as of 5/15/20142 Based on the Barclays U.S. Corporate High Yield Index, which has a modified duration of 4.05 years as of 5/15/20143 Assumes acquisition of 10% of market capitalization, historical repurchase premiums for cash consideration
deals and a 35% marginal tax rate; assumes Bloomberg fair market value index cost of debt for BBB rated issuer; assumes three-month LIBOR as interest earned on cash; assumes no synergies from the transaction

2014 M&A HOROSCOPE | 9
3.2 Investors respond positively to acquirers announcing synergistic transactionsFor decades, target firms’ stock prices would jump at the announcement of an M&A transaction, whereas the acquirers’ stock prices would break even in cash transactions and, on average, suffer losses in stock transactions. Today, in a reversal of this long-established pattern, acquirers tend to gain at the announcement of a synergistic transaction. Whereas the market response still tends to be more favorable for cash transactions, many stock transactions now also receive investor approval. We have documented this trend in detail in two previous reports.6 Many expected the trend to be short-lived but, if anything, it appears to have strengthened since we first documented it (Figure 8).
Figure 8
Investors are now routinely rewarding acquirers
Median acquirer stock price reaction1
EXECUTIVE TAKEAWAY
Not only do the traditional M&A drivers indicate
much larger transaction volumes, but two unique
factors should also propel M&A to new highs
this year: (1) A record-low cost of debt financing,
which leads to remarkably material EPS accretion
from M&A) and (2) Equity investors who, for
the first time ever, are rewarding acquisitive
companies, including those usuing stock as
acquisition currency.
6 For further reading on positive acquirer market reactions, please see our September 2013 brief, “Seven pearls of wisdom from recent mega-cap M&A” or our December 2012 report, “Uncorking M&A: The 2013 vintage.” They are located at: http://www.jpmorgan.com/directdoc/JPMorgan_CorporateFinanceAdvisory_WisdomFromMegacapMA.pdf and http://www.jpmorgan.com/directdoc/JPMorgan_CorporateFinanceAdvisory_MA.pdf, respectively
One-day reaction Five-day reaction
(0.2%)
0.4% 0.7% 0.7%1.4%
(2.0%)
(0.4%)
0.4%1.0%
2.2% 1.7%
4.3%
(0.2%)(0.8%)
(3.0%)(2.0%)(1.0%)
0.0%1.0%2.0%3.0%4.0%5.0%
2008 2009 2010 2011 2012 2013 2014 Q1
Source: FactSet, company filings1 Excess return over S&P 500 returns times acquirer’s beta from unaffected date prior to announcement; includes acquisitions by U.S. buyers with minimum deal value of $500 million, % owned <20%, % acquired >80% and target >5% of the size of the acquirer

10 | Corporate Finance Advisory
4. Stock as an acquisition currency: Riding the wave of the buoyant equity market
Driven by the availability of debt at near record-low costs, the majority of the transactions during the post-recession period have been paid for with cash. The recent strength of the equity markets has, however, pushed firms to increasingly turn to equity as an acquisition currency (Figure 9). In the first quarter of 2014, 44% of announced acquisitions were fully paid for with equity. This is double the level in the previous M&A hot period (22% from 2004 to 2007), but slightly lower than the peaks seen during the late 1990s (52% from 1995 to 2000).
Nevertheless, we expect cash to continue to be an important component of financing as long as debt markets remain robust and deep, interest rates continue to be close to historic lows and balance sheets remain strong.
Figure 9
Method of financing across M&A waves
EXECUTIVE TAKEAWAY
In the M&A wave of the late 1990s, stock was the
primary acquisition currency. During the 2004–2007
wave, cash was the predominant source of M&A
financing, as it was immediately after the crisis. This
reliance on cash in the post-crisis period was expected
because of the historic-low cost of debt, depressed
stock values and strong balance sheets. This quarter,
however, stock has reemerged as a key source of
financing, with cash-only transactions at a low not
seen since the late 1990s.
52%
37%
22% 20% 19%
44%
21%
28%
22% 37%
27%
25%
26% 35%
57%
43% 54%
31%
0%
10%
20%
30%
40%
50%
60%
70%
80%
90%
100%
’95–’00 ’01–’03 ’04–’07 ’08–’09 ’10–’13 Q1 ’14
All stock Mix All cash
M&A volume by type of financing
Source: Dealogic; data includes only U.S. M&A and excludes all sponsor transactions

2014 M&A HOROSCOPE | 11
5. Using all the tools in the toolbox to create value with M&AToday’s deep capital markets and strong corporate balance sheets, coupled with the current low cost of debt and supportive equity investors, make being acquisitive a winning proposition. Despite these extremely favorable conditions (summarized in Figure 10), M&A might have been held back in the post-crisis period by the risk aversion of executives and boards. This sentiment will be a passing one, as corporations, pressured by investors with high expectations, retool themselves to capitalize on the current environment.
While all stars are aligned for acquisitions today, skies could darken. The projected rise in interest rates in the coming months, as the Fed tightens its monetary policy, will raise the cost of debt financing. Further, as M&A activity picks up from its post-crisis lows, the competition will nudge multiples and premiums upward. The combination of these factors may make M&A less attractive just as deal-making rebounds. Against this backdrop, firms that are first movers will reap the greatest rewards.
Figure 10
A historic time for M&A
Hist
oric
fact
ors
Hot M&A market Today
5. Cost of debt All over the map Historic lows
6. Investors reception to acquirers announcing strategic transactions
Neutral to negative Neutral to positive
Uniq
uely
favo
rabl
e fa
ctor
s
M&A catalyst Consistent with a hot market
1. Consumer and producer mood
Higher than average Higher than average
2. Favorable equity market conditions
Valuations higher than average and volatility lower
than average
Valuations higher than average and volatility lower
than average
3. Credit market conditions Spreads below average Spreads below average
4. Balance sheet strength Less levered than average Less levered than average

12 | Corporate Finance Advisory
The flurry of large transactions over the last few months shows that decision makers understand the uniqueness of the current environment. Unlike in the aftermath of the financial crisis, firms are now willing to consider all available tools:
• Using stock as part of the transaction consideration (see Figure 9)
• Making offers even if rebuffed by the target
• Re-domiciling to other jurisdictions to capitalize on tax synergies
• Teaming up with new partners to help convince reluctant targets
• Stretching the balance sheet and taking a ratings downgrade
• Executing complex asset sales to satisfy regulatory requirements
EXECUTIVE TAKEAWAY
Today’s market conditions are uniquely favorable to
M&A. Over time, however, higher costs of financing
and increased competition for targets may dampen the
returns from acquisitions. Firms have demonstrated in
recent months that they understand these dynamics by
pulling the trigger on once-in-a-lifetime opportunities
despite possible hurdles. To accomplish their strategic
objectives and maximize value, they are willing to use
all the tools in the toolbox.

This material is not a product of the Research Departments of J.P. Morgan Securities LLC (“JPMS”) and is not a research report. Unless otherwise specifically stated, any views or opinions expressed herein are solely those of the authors listed, and may differ from the views and opinions expressed by JPMS’s Research Departments or other departments or divisions of JPMS and its affiliates.
RESTRICTED DISTRIBUTION: Distribution of these materials is permitted to investment banking clients of J.P. Morgan, only, subject to approval by J.P. Morgan. These materials are for your personal use only. Any distribution, copy, reprints and/or forward to others is strictly prohibited. Information has been obtained from sources believed to be reliable but JPMorgan Chase & Co. or its affiliates and/or subsidiaries (collectively JPMorgan Chase & Co.) do not warrant its completeness or accuracy. Information herein constitutes our judgment as of the date of this material and is subject to change without notice.
This material is not intended as an offer or solicitation for the purchase or sale of any financial instrument. In no event shall J.P. Morgan be liable for any use by any party of, for any decision made or action taken by any party in reliance upon, or for any inaccuracies or errors in, or omissions from, the information contained herein and such information may not be relied upon by you in evaluating the merits of participating in any transaction.
IRS Circular 230 Disclosure: JPMorgan Chase & Co. and its affiliates do not provide tax advice. Accordingly, any discussion of U.S. tax matters contained herein (including any attachments) is not intended or written to be used, and cannot be used, in connection with the promotion, marketing or recommendation by anyone unaffiliated with JPMorgan Chase & Co. of any of the matters addressed herein or for the purpose of avoiding U.S. tax-related penalties.
J.P. Morgan is the marketing name for the investment banking activities of JPMorgan Chase Bank, N.A., JPMS (member, NYSE), J.P. Morgan PLC (authorized by the Prudential Regulation Authority and regulated by the Financial Conduct Authority and the Prudential Regulation Authority) and their investment banking affiliates.
Copyright 2014 JPMorgan Chase & Co. All rights reserved.
We would like to thank Doug Braunstein, Hernan Cristerna and Chris Ventresca for their invaluable comments and suggestions and, in particular, Doug Braunstein for providing the impetus to explore this topic. We also thank Stephen Berenson, Mark De Rocco, Noam Gilead, Nina Gnedin and Erik Oken for their feedback on this report and Jennifer Chan, Siobhan Dixon, Sarah Farmer and the Creative Services group for their help with the editorial process. We are particularly grateful to Rob Stuhr for his tireless contributions to the analytics in this report as well as for his invaluable insights.