Please note: 1) as a general rule, an asterisk in the data file indicates the data has been suppressed. 2) as a general rule, a blank in the data file indicates that the data item is not applicable to the school or the group. 3) district record has a dummy school code of 888. 4) DFG record has a dummy county code of 88, dummy district code of 8888, and dummy school code of 888. 5) state record has a dummy county code of 99, district code of 9999, and school code 999.
NEW JERSEY DEPARTMENT OF EDUCATION
2003 School Report Card Database File Layouts
February 2, 2004
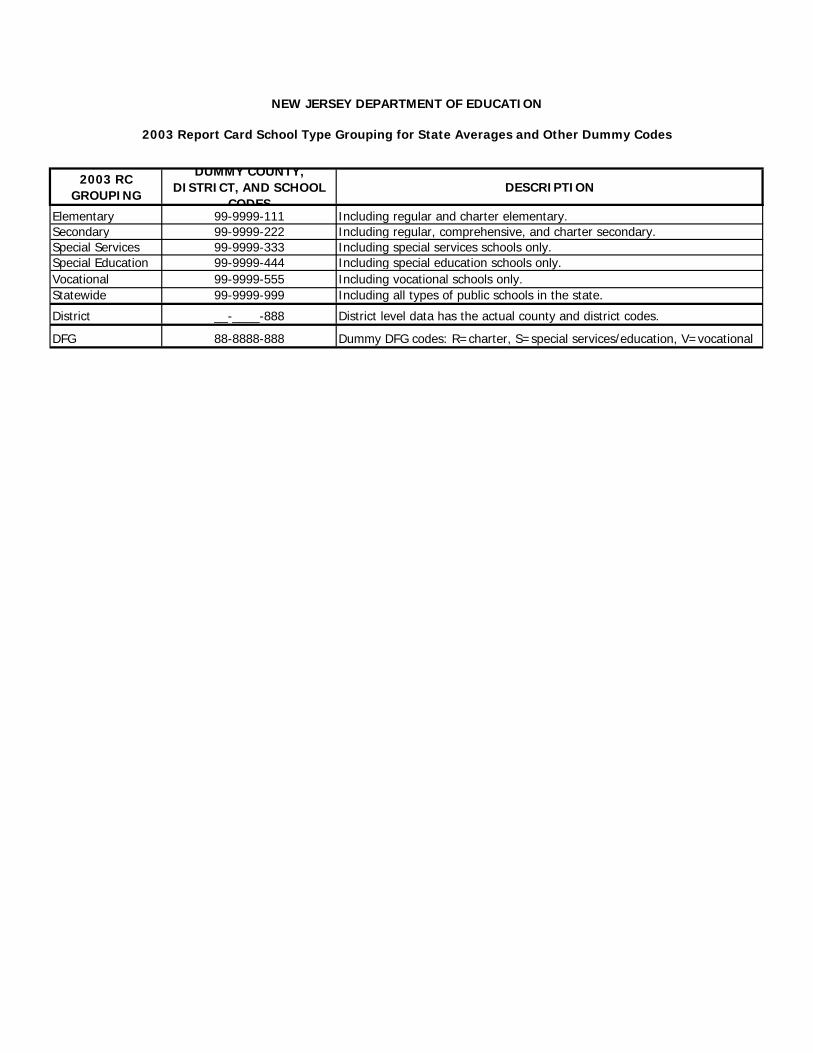
2003 RC GROUPING
DUMMY COUNTY, DISTRICT, AND SCHOOL
CODESDESCRIPTION
Elementary 99-9999-111 Including regular and charter elementary.Secondary 99-9999-222 Including regular, comprehensive, and charter secondary.Special Services 99-9999-333 Including special services schools only.Special Education 99-9999-444 Including special education schools only.Vocational 99-9999-555 Including vocational schools only.Statewide 99-9999-999 Including all types of public schools in the state.
District __-____-888 District level data has the actual county and district codes.
DFG 88-8888-888 Dummy DFG codes: R=charter, S=special services/education, V=vocational
NEW JERSEY DEPARTMENT OF EDUCATION
2003 Report Card School Type Grouping for State Averages and Other Dummy Codes

Table: SCH_HEADERContent: Contains School Identification Information, School Type Codes
Field Start End Width Type DescriptionCO_CODE 1 2 2 CHAR County codeDIST_CODE 3 6 4 CHAR District codeSCH_CODE 7 9 3 CHAR School codeCO_NAME 10 19 10 CHAR County nameDIS_NAME 20 44 25 CHAR District nameSCH_NAME 45 69 25 CHAR School nameSCH_TYPE 70 70 1 CHAR School type code used in the NJ DOE school headerDFG 71 72 2 CHAR District Factor Group
Key to the school type codes: C=Special services E=Elementary school H=Secondary school I=Comprehensive high school P=Special education T=Charter school elementary U=Charter school secondary V=Vocational school
Key to the dummy DFG codes: R=charter schools as a group S=special services/education schools as a group V=vocational schools as a group
NEW JERSEY DEPARTMENT OF EDUCATION2003 School Report Card Data Layout

Table: DIST_OPTYPEContent: Contains district operation type Information
Field Start End Width Type DescriptionCO_CODE 1 2 2 CHAR County codeDIST_CODE 3 6 4 CHAR District codeCO_NAME 7 16 10 CHAR County nameDIS_NAME 17 41 25 CHAR District nameOP_TYPE 42 66 25 CHAR District operation type
NEW JERSEY DEPARTMENT OF EDUCATION2003 School Report Card Data Layout

Table: CLASSIZEContent: Contains Average Class Size Data
Field Start End Width Type DescriptionCO_CODE 1 2 2 CHAR County codeDIST_CODE 3 6 4 CHAR District codeSCH_CODE 7 9 3 CHAR School codeLEVEL 10 10 1 CHAR S=School, T=StatePK 11 15 5 Alphanumeric, 1 decimal Pre-kindergartenKG 16 20 5 Alphanumeric, 1 decimal KindergartenG1 21 25 5 Alphanumeric, 1 decimal Grade 1G2 26 30 5 Alphanumeric, 1 decimal Grade 2G3 31 35 5 Alphanumeric, 1 decimal Grade 3G4 36 40 5 Alphanumeric, 1 decimal Grade 4G5 41 45 5 Alphanumeric, 1 decimal Grade 5G6 46 50 5 Alphanumeric, 1 decimal Grade 6G7 51 55 5 Alphanumeric, 1 decimal Grade 7G8 56 60 5 Alphanumeric, 1 decimal Grade 8G9 61 65 5 Alphanumeric, 1 decimal Grade 9G10 66 70 5 Alphanumeric, 1 decimal Grade 10G11 71 75 5 Alphanumeric, 1 decimal Grade 11G12 76 80 5 Alphanumeric, 1 decimal Grade 12SPED 81 85 5 Alphanumeric, 1 decimal Special Education - ungradedTOTAL 86 90 5 Alphanumeric, 1 decimal Total students
Note: Special education schools will only have data in the TOTAL field.
NEW JERSEY DEPARTMENT OF EDUCATION2003 School Report Card Data Layout

Table: ATTENDANCEContent: Contains Student Attendance Rates
Field Start End Width Type DescriptionCO_CODE 1 2 2 CHAR County code
DIST_CODE 3 6 4 CHAR District code
SCH_CODE 7 9 3 CHAR School code
YEAR 10 13 4 CHAR School year
LEVEL 14 14 1 CHAR S=School, T=State
PK 15 19 5 Alphanumeric, 1 decimal Pre-kindergarten (including half and full day)
KG 20 24 5 Alphanumeric, 1 decimal Kindergarten (including half and full day)
G1 25 29 5 Alphanumeric, 1 decimal Grade 1
G2 30 34 5 Alphanumeric, 1 decimal Grade 2
G3 35 39 5 Alphanumeric, 1 decimal Grade 3
G4 40 44 5 Alphanumeric, 1 decimal Grade 4
G5 45 49 5 Alphanumeric, 1 decimal Grade 5
G6 50 54 5 Alphanumeric, 1 decimal Grade 6
G7 55 59 5 Alphanumeric, 1 decimal Grade 7
G8 60 64 5 Alphanumeric, 1 decimal Grade 8
G9 65 69 5 Alphanumeric, 1 decimal Grade 9
G10 70 74 5 Alphanumeric, 1 decimal Grade 10
G11 75 79 5 Alphanumeric, 1 decimal Grade 11
G12 80 84 5 Alphanumeric, 1 decimal Grade 12
SPED 85 89 5 Alphanumeric, 1 decimal Special Education - ungraded
TOTAL 90 94 5 Alphanumeric, 1 decimal Total students
NEW JERSEY DEPARTMENT OF EDUCATION2003 School Report Card Data Layout

Table: DROPOUTContent: Contains Dropout Data
Field Start End Width Type DescriptionCO_CODE 1 2 2 CHAR County codeDIST_CODE 3 6 4 CHAR District codeSCH_CODE 7 9 3 CHAR School codeYEAR 10 13 4 CHAR School yearLEVEL 14 14 1 CHAR Level of data: S=school, T=stateWDRP 15 19 5 Alphanumeric, 1 decimal Dropout rate: White studentsBDRP 20 24 5 Alphanumeric, 1 decimal Dropout rate: Black studentsADRP 25 29 5 Alphanumeric, 1 decimal Dropout rate: Asian/P.I. StudentsNDRP 30 34 5 Alphanumeric, 1 decimal Dropout rate: American Indian/Alaska Native studentsHDRP 35 39 5 Alphanumeric, 1 decimal Dropout rate: Hispanic studentsMDRP 40 44 5 Alphanumeric, 1 decimal Dropout rate: Male studentsFDRP 45 49 5 Alphanumeric, 1 decimal Dropout rate: Female studentsSEDRP 50 54 5 Alphanumeric, 1 decimal Dropout rate: Students with disabilitiesLEDRP 55 59 5 Alphanumeric, 1 decimal Dropout rate: LEP studentsTOTDRP 60 64 5 Alphanumeric, 1 decimal Dropout rate: Total students
NEW JERSEY DEPARTMENT OF EDUCATION2003 School Report Card Data Layout
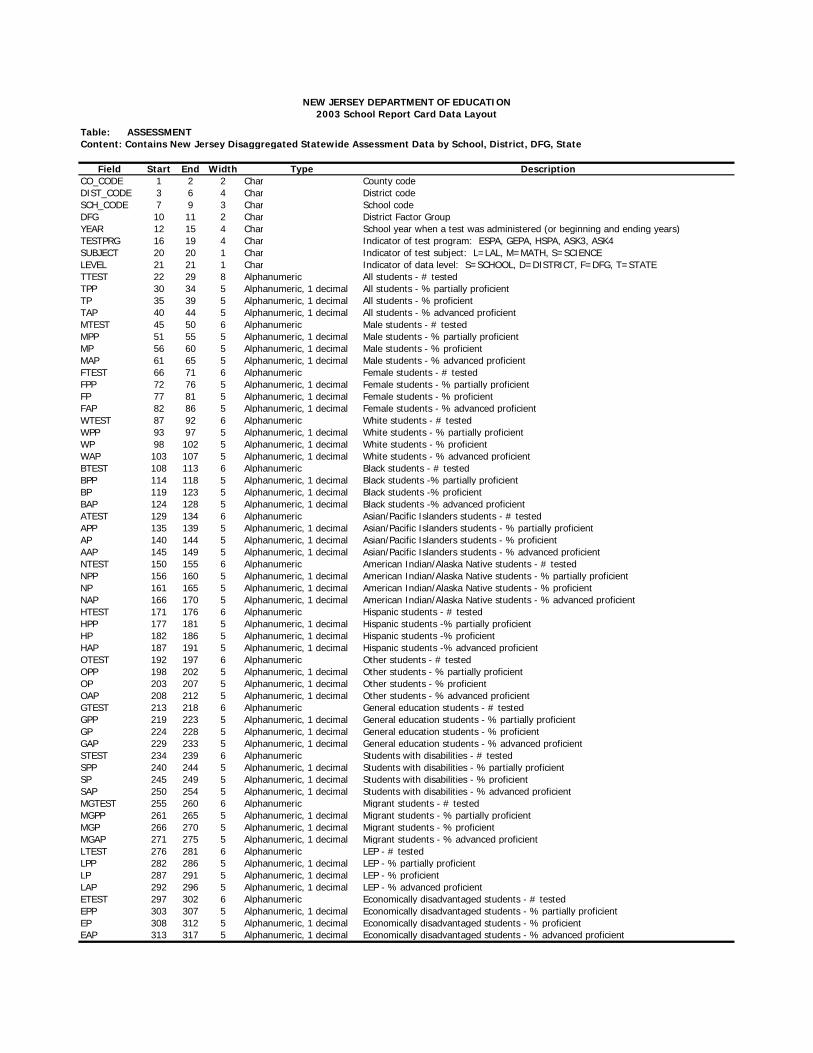
Table: ASSESSMENTContent: Contains New Jersey Disaggregated Statewide Assessment Data by School, District, DFG, State
Field Start End Width TypeCO_CODE 1 2 2 Char County codeDIST_CODE 3 6 4 Char District codeSCH_CODE 7 9 3 Char School codeDFG 10 11 2 Char District Factor GroupYEAR 12 15 4 Char School year when a test was administered (or beginning and ending years)TESTPRG 16 19 4 Char Indicator of test program: ESPA, GEPA, HSPA, ASK3, ASK4SUBJECT 20 20 1 Char Indicator of test subject: L=LAL, M=MATH, S=SCIENCELEVEL 21 21 1 Char Indicator of data level: S=SCHOOL, D=DISTRICT, F=DFG, T=STATETTEST 22 29 8 Alphanumeric All students - # testedTPP 30 34 5 Alphanumeric, 1 decimal All students - % partially proficientTP 35 39 5 Alphanumeric, 1 decimal All students - % proficientTAP 40 44 5 Alphanumeric, 1 decimal All students - % advanced proficientMTEST 45 50 6 Alphanumeric Male students - # testedMPP 51 55 5 Alphanumeric, 1 decimal Male students - % partially proficientMP 56 60 5 Alphanumeric, 1 decimal Male students - % proficientMAP 61 65 5 Alphanumeric, 1 decimal Male students - % advanced proficientFTEST 66 71 6 Alphanumeric Female students - # testedFPP 72 76 5 Alphanumeric, 1 decimal Female students - % partially proficientFP 77 81 5 Alphanumeric, 1 decimal Female students - % proficientFAP 82 86 5 Alphanumeric, 1 decimal Female students - % advanced proficientWTEST 87 92 6 Alphanumeric White students - # testedWPP 93 97 5 Alphanumeric, 1 decimal White students - % partially proficientWP 98 102 5 Alphanumeric, 1 decimal White students - % proficientWAP 103 107 5 Alphanumeric, 1 decimal White students - % advanced proficientBTEST 108 113 6 Alphanumeric Black students - # testedBPP 114 118 5 Alphanumeric, 1 decimal Black students -% partially proficientBP 119 123 5 Alphanumeric, 1 decimal Black students -% proficientBAP 124 128 5 Alphanumeric, 1 decimal Black students -% advanced proficientATEST 129 134 6 Alphanumeric Asian/Pacific Islanders students - # testedAPP 135 139 5 Alphanumeric, 1 decimal Asian/Pacific Islanders students - % partially proficientAP 140 144 5 Alphanumeric, 1 decimal Asian/Pacific Islanders students - % proficientAAP 145 149 5 Alphanumeric, 1 decimal Asian/Pacific Islanders students - % advanced proficientNTEST 150 155 6 Alphanumeric American Indian/Alaska Native students - # testedNPP 156 160 5 Alphanumeric, 1 decimal American Indian/Alaska Native students - % partially proficientNP 161 165 5 Alphanumeric, 1 decimal American Indian/Alaska Native students - % proficientNAP 166 170 5 Alphanumeric, 1 decimal American Indian/Alaska Native students - % advanced proficientHTEST 171 176 6 Alphanumeric Hispanic students - # testedHPP 177 181 5 Alphanumeric, 1 decimal Hispanic students -% partially proficientHP 182 186 5 Alphanumeric, 1 decimal Hispanic students -% proficientHAP 187 191 5 Alphanumeric, 1 decimal Hispanic students -% advanced proficientOTEST 192 197 6 Alphanumeric Other students - # testedOPP 198 202 5 Alphanumeric, 1 decimal Other students - % partially proficientOP 203 207 5 Alphanumeric, 1 decimal Other students - % proficientOAP 208 212 5 Alphanumeric, 1 decimal Other students - % advanced proficientGTEST 213 218 6 Alphanumeric General education students - # testedGPP 219 223 5 Alphanumeric, 1 decimal General education students - % partially proficientGP 224 228 5 Alphanumeric, 1 decimal General education students - % proficientGAP 229 233 5 Alphanumeric, 1 decimal General education students - % advanced proficientSTEST 234 239 6 Alphanumeric Students with disabilities - # testedSPP 240 244 5 Alphanumeric, 1 decimal Students with disabilities - % partially proficientSP 245 249 5 Alphanumeric, 1 decimal Students with disabilities - % proficientSAP 250 254 5 Alphanumeric, 1 decimal Students with disabilities - % advanced proficientMGTEST 255 260 6 Alphanumeric Migrant students - # testedMGPP 261 265 5 Alphanumeric, 1 decimal Migrant students - % partially proficientMGP 266 270 5 Alphanumeric, 1 decimal Migrant students - % proficientMGAP 271 275 5 Alphanumeric, 1 decimal Migrant students - % advanced proficientLTEST 276 281 6 Alphanumeric LEP - # testedLPP 282 286 5 Alphanumeric, 1 decimal LEP - % partially proficientLP 287 291 5 Alphanumeric, 1 decimal LEP - % proficientLAP 292 296 5 Alphanumeric, 1 decimal LEP - % advanced proficientETEST 297 302 6 Alphanumeric Economically disadvantaged students - # testedEPP 303 307 5 Alphanumeric, 1 decimal Economically disadvantaged students - % partially proficientEP 308 312 5 Alphanumeric, 1 decimal Economically disadvantaged students - % proficientEAP 313 317 5 Alphanumeric, 1 decimal Economically disadvantaged students - % advanced proficient
Description
NEW JERSEY DEPARTMENT OF EDUCATION2003 School Report Card Data Layout

Table: SCH_INFO1Content: Contains Single Year School Information Data
Field Start End Width TypeCO_CODE 1 2 2 Char County codeDIST_CODE 3 6 4 Char District codeSCH_CODE 7 9 3 Char School codeLEVEL 10 10 1 Char Data level: S=school, T=stateDISAB 11 16 6 Alphanumeric Percent of students with disabilities (IEP).SCHDAYH 17 18 2 Alphanumeric Length of school day (day session): hour.SCHDAYM 19 20 2 Alphanumeric Length of school day (day session): minute.FINSTIMH 21 22 2 Alphanumeric Instructional time for full time students: hourFINSTIMM 23 24 2 Alphanumeric Instructional time for full time students: minute.SINSTIMH 25 26 2 Alphanumeric Instructional time for share time students: hourSINSTIMM 27 28 2 Alphanumeric Instructional time for share time students: minute.
Description
NEW JERSEY DEPARTMENT OF EDUCATION2003 School Report Card Data Layout

Table: SCH_INFO2Content: Contains Multiple Year School Information Data
Field Start End Width Type
CO_CODE 1 2 2 Char County codeDIST_CODE 3 6 4 Char District codeSCH_CODE 7 9 3 Char School codeYEAR 10 13 4 Char School year for which the data was collected. Max 4 years in report card.LEVEL 14 14 1 Char Data level: S=school, T=stateSTMOB 15 20 6 Alphanumeric Student mobility rate.SUSPENS 21 26 6 Alphanumeric Student suspension rate.EXPULSN 27 32 6 Alphanumeric Student expulsion rate.SCRATIO 33 38 6 Alphanumeric Student computer ratio.CLSNET 39 44 6 Alphanumeric Internet connectivity - Classroom.LIBNET 45 50 6 Alphanumeric Internet connectivity - Library.LABNET 51 56 6 Alphanumeric Internet connectivity - Computer labs.ALLNET 57 62 6 Alphanumeric Internet connectivity - All locations.
Description
NEW JERSEY DEPARTMENT OF EDUCATION2003 School Report Card Data Layout

TABLE: STAFF_INFOCONTENT: CONTAINS STAFF INFORMATION DATA
FIELD START END WIDTH TYPECO_CODE 1 2 2 Char County codeDIST_CODE 3 6 4 Char District codeSCH_CODE 7 9 3 Char School codeYEAR 10 13 4 Char School year for which the data was collected. Max 4 years in report card.LEVEL 14 14 1 Char Data level: S=school, D=district, F=DFG, T=stateSFRATIO 45 50 6 Alphanumeric Student faculty ratio.FATTEND 51 56 6 Alphanumeric Faculty attendance rate.SARATIO 57 62 6 Alphanumeric Student administrator ratio.BABS 93 98 6 Alphanumeric Percent of faculty possessing BA/BS.MAMS 99 104 6 Alphanumeric Percent of faculty possessing MA/MS.PHDEDD 105 110 6 Alphanumeric Percent of faculty possessing PhD/EdD.LCONLY 111 116 6 Alphanumeric Percent of faculty possessing an occupational license or certification.LCDEG 117 122 6 Alphanumeric Percent of faculty possessing an license/certification and an academic degree.NBSTANDA 123 128 6 Alphanumeric National Board for Professional Teaching Standards - Number of applicants.NBSTANDC 129 134 6 Alphanumeric National Board for Professional Teaching Standards - Number of certified.
Note: LCONLY (possessing license/certification only) and LCDEG (possessing license/certification and academic degree) are not applicable to regular elementary, secondary schools.
NEW JERSEY DEPARTMENT OF EDUCATION2003 SCHOOL REPORT CARD DATA LAYOUT
DESCRIPTION

Table: LANGUAGEContent: Contains Language Diversity Data
Field Start End Width Type
CO_CODE 1 2 2 Char County codeDIST_CODE 3 6 4 Char District codeSCH_CODE 7 9 3 Char School codeLINE 10 10 1 Alphanumeric Line number to indicate a language. The 9th line has the % LEP LANGNAME 11 30 20 Alphanumeric Language nameLPCT 31 35 5 Alphanumeric Percent of language
NOTE: 1) This table contains one year data.
NEW JERSEY DEPARTMENT OF EDUCATIONRegular School Report Card Data Layout
Description

Table: ENR_REGContent: Contains Elementary, Secondary Enrollment Data Including Charter Schools
Field Start End Width TypeCO_CODE 1 2 2 Char County codeDIST_CODE 3 6 4 Char District codeSCH_CODE 7 9 3 Char School codeYEAR 10 13 4 Char School year for which the data was collected.PREKH 14 19 6 Alphanumeric Half day pre-kindergarten enrollment number.PREKF 20 25 6 Alphanumeric Full day pre-kindergarten enrollment number.KGH 26 31 6 Alphanumeric Half day kindergarten enrollment number.KGF 32 37 6 Alphanumeric Full day kindergarten enrollment number.G1 38 43 6 Alphanumeric Grade 1 enrollment number.G2 44 49 6 Alphanumeric Grade 2 enrollment number.G3 50 55 6 Alphanumeric Grade 3 enrollment number.G4 56 61 6 Alphanumeric Grade 4 enrollment number.G5 62 67 6 Alphanumeric Grade 5 enrollment number.G6 68 73 6 Alphanumeric Grade 6 enrollment number.G7 74 79 6 Alphanumeric Grade 7 enrollment number.G8 80 85 6 Alphanumeric Grade 8 enrollment number.G9 86 91 6 Alphanumeric Grade 9 enrollment number.G10 92 97 6 Alphanumeric Grade 10 enrollment number.G11 98 103 6 Alphanumeric Grade 11 enrollment number.G12 104 109 6 Alphanumeric Grade 12 enrollment number.SPED 110 115 6 Alphanumeric Special education enrollment number.TOTAL 116 121 6 Alphanumeric Total enrollment number.
NOTE: This table contains four year school level data.
Description
NEW JERSEY DEPARTMENT OF EDUCATION2003 School Report Card Data Layout

Table: ENR_SPESContent: Contains Special Education/services School Enrollment Data
Field Start End Width Type
CO_CODE 1 2 2 Char County codeDIST_CODE 3 6 4 Char District codeSCH_CODE 7 9 3 Char School codeYEAR 10 13 4 Char School year for which the data was collected.COGMILD 111 116 6 Alphanumeric Cognitive-mild student enrollment number.COGMOD 117 122 6 Alphanumeric Cognitive-moderate student enrollment number.LLD 123 128 6 Alphanumeric Learning and/or language disabilities student enrollment numberBEHDIS 129 134 6 Alphanumeric Behavioral disabilities student enrollment number.MULTDIS 135 140 6 Alphanumeric Multiple disabilities student enrollment numberAUDIMP 141 146 6 Alphanumeric Auditory impairments student enrollment numebr.VISIMP 147 152 6 Alphanumeric Visual impairments student enrollment number.AUTISM 153 158 6 Alphanumeric Autism student enrollment number.COGSEV 159 164 6 Alphanumeric Cognitive severe student enrollment number.FPRESCH 165 170 6 Alphanumeric Full day pre-school disability.HPRESCH 171 176 6 Alphanumeric Half dat pre-school disability.TOTAL 177 182 6 Alphanumeric Total student enrollment number.
NOTE: This table contains three year school level data using the 2000-01 new special ed. grade categories.
Description
NEW JERSEY DEPARTMENT OF EDUCATION2003 School Report Card Data Layout

Table: ENR_VOCContent: Contains Vocational School Enrollment Data
Field Start End Width TypeCO_CODE 1 2 2 Char County codeDIST_CODE 3 6 4 Char District codeSCH_CODE 7 9 3 Char School codeYEAR 10 13 4 Char School year for which the data was collected. FTG9 14 19 6 Alphanumeric Full time grade 9 student enrollment number.FTG10 20 25 6 Alphanumeric Full time grade 10 student enrollment number.FTG11 26 31 6 Alphanumeric Full time grade 11 student enrollment number.FTG12 32 37 6 Alphanumeric Full time grade 12 student enrollment number.FTSPED 38 43 6 Alphanumeric Full time special education student enrollment number.FTTOT 44 49 6 Alphanumeric Full time student total enrollment number.STG9 50 55 6 Alphanumeric Share time grade 9 student enrollment number.STG10 56 61 6 Alphanumeric Share time grade 10 student enrollment number.STG11 62 67 6 Alphanumeric Share time grade 11 student enrollment number.STG12 68 73 6 Alphanumeric Share time grade 12 student enrollment number.STSPED 74 79 6 Alphanumeric Share time special education student enrollment number.STTOT 80 85 6 Alphanumeric Share time student total enrollment number.
NOTE: This table contains 4 year school level data for vocational schools.
NEW JERSEY DEPARTMENT OF EDUCATION2003 School Report Card Data Layout
Description

Table: SATContent: Contains Scholastic Assessment Test Results
Field Start End Width TypeCO_CODE 1 2 2 Char County codeDIST_CODE 3 6 4 Char District codeSCH_CODE 7 9 3 Char School codeDFG 10 11 2 Char District Factor GroupYEAR 12 15 4 Char School year for which the data was collected. LEVEL 16 16 1 Char Data level: S=school, F=DFG, T=stateNTESTED 17 21 5 Alphanumeric Number of students taking the test.PTESTED 22 26 5 Alphanumeric Percent of students taking the test.MMEAN 27 29 3 Alphanumeric Mathematics average score.M25 30 32 3 Alphanumeric Mathematics 25th percentile score.M50 33 35 3 Alphanumeric Mathematics 50th percentile score.M75 36 38 3 Alphanumeric Mathematics 75th percentile score.VMEAN 39 41 3 Alphanumeric Verbal average score.V25 42 44 3 Alphanumeric Verbal 25th percentile score.V50 45 47 3 Alphanumeric Verbal 50th percentile score.V75 48 50 3 Alphanumeric Verbal 75th percentile score.
Description
NEW JERSEY DEPARTMENT OF EDUCATION2003 School Report Card Data Layout

Table: APContent: Contains Detailed School Level Advanced Placement Test Results
Field Start End Width TypeCO_CODE 1 2 2 Char County codeDIST_CODE 3 6 4 Char District codeSCH_CODE 7 9 3 Char School codeTEST 10 34 25 Alphanumeric AP test name.INCLASS 35 37 3 Alphanumeric Number of students enrolled in the AP class.TESTED 38 40 3 Alphanumeric Number of students taking the AP test.PCTGE3 41 45 5 Alphanumeric Number of students who scored 3 and above.
NOTE: Each school will have a record containing summary AP results, with TOTAL as the test name. See definition for detail.
NEW JERSEY DEPARTMENT OF EDUCATION2003 School Report Card Data Layout
Descrition

Table: AP_SUMContent: Contains 3 Years Summary Advanced Placement Test Results
Field Start End Width TypeCO_CODE 1 2 2 Char County codeDIST_CODE 3 6 4 Char District codeSCH_CODE 7 9 3 Char School codeYEAR 10 13 4 Char School yearLEVEL 14 14 1 Char Data level: S=school, T=statePCTEST 15 19 5 Alphanumeric Unduplicated # students taking AP as % of 11th and 12th graders.
NOTE:This table contains three year AP summary data at school and state level.
NEW JERSEY DEPARTMENT OF EDUCATION2003 School Report Card Data Layout
Description

Table: NOCTIContent: Contains NOCTI Job Readt Examination Results
Field Start End Width TypeCO_CODE 1 2 2 Char County codeDIST_CODE 3 6 4 Char District codeSCH_CODE 7 9 3 Char School codeEXAM 10 34 25 Alphanumeric Exam title.WRITTEN 35 37 3 Alphanumeric Number of students taking written test.PERFORM 38 40 3 Alphanumeric Number of students taking performance test.SCHW 41 45 5 Alphanumeric School average of the written examination.SCHP 46 50 5 Alphanumeric School average of the performance examination.STATEW 51 55 5 Alphanumeric State average of the written examination.STATEP 56 60 5 Alphanumeric State average of the performance examination.
NEW JERSEY DEPARTMENT OF EDUCATION2003 School Report Card Data Layout
Description

Table: GRADUATEContent: Contains Graduate Data
Field Start End Width TypeCO_CODE 1 2 2 Char County codeDIST_CODE 3 6 4 Char District codeSCH_CODE 7 9 3 Char School codeLEVEL 10 10 1 Char Data level: S=school, D=district, F=DFG, T=stateREGHSPA 11 15 5 Alphanumeric Percent of regular students graduated passed HSPA.ALLHSPA 16 20 5 Alphanumeric Percent of all students graduated passed HSPA.ALLSRA 21 25 5 Alphanumeric Percent of all students graduated via SRA process. LEPSRA 26 30 5 Alphanumeric Percent of students graduated via LEP SRA.EXEMPT 31 35 5 Alphanumeric Percent of students graduated via exempt from HSPA.
NOTE: This table contains one year graduation data.
Description
NEW JERSEY DEPARTMENT OF EDUCATION2003 School Report Card Data Layout

Table: POSTGRADContent: Contains Post Graduation Data
Field Start End Width TypeCO_CODE 1 2 2 Char County codeDIST_CODE 3 6 4 Char District codeSCH_CODE 7 9 3 Char School codeYEAR 10 13 4 Char School year for which the data was collected.LEVEL 14 14 1 Char Data level: S=school, T=statePCTGRAD 15 19 5 Alphanumeric Percent of students graduated/graduation rate - most recent school year.COLLEG4 20 24 5 Alphanumeric Percent of graduating seniors pursuing 4 year college/university.COLLEG2 25 29 5 Alphanumeric Percent of graduating seniors pursuing 2 year college/university.COLLEGO 30 34 5 Alphanumeric Percent of graduating seniors pursuing other college.POSTSEC 35 39 5 Alphanumeric Percent of graduating seniors pursuing other post-secondary school.MILITARY 40 44 5 Alphanumeric Percent of graduating senrios pursuing military service.FTEMP 45 49 5 Alphanumeric Percent of graduating seniors pursuing full-time employment.PTEMP 50 54 5 Alphanumeric Percent of graduating seniors pursuing part-time employment.UNEMP 55 59 5 Alphanumeric Percent of graduating seniors pursuing unemployed.OTHER 60 64 5 Alphanumeric Percent of graduating seniors pursuing other plan.STATUK 65 69 5 Alphanumeric Percent of graduating seniors whose post high school plan is unknown.UNDECIDE 70 74 5 Alphanumeric Percent of graduating seniors that had no decision on the plan.
NOTE: This table contains three year school level post graduation data plus a most current year school and statewide graduation rate.
Description
NEW JERSEY DEPARTMENT OF EDUCATION2003 School Report Card Data Layout
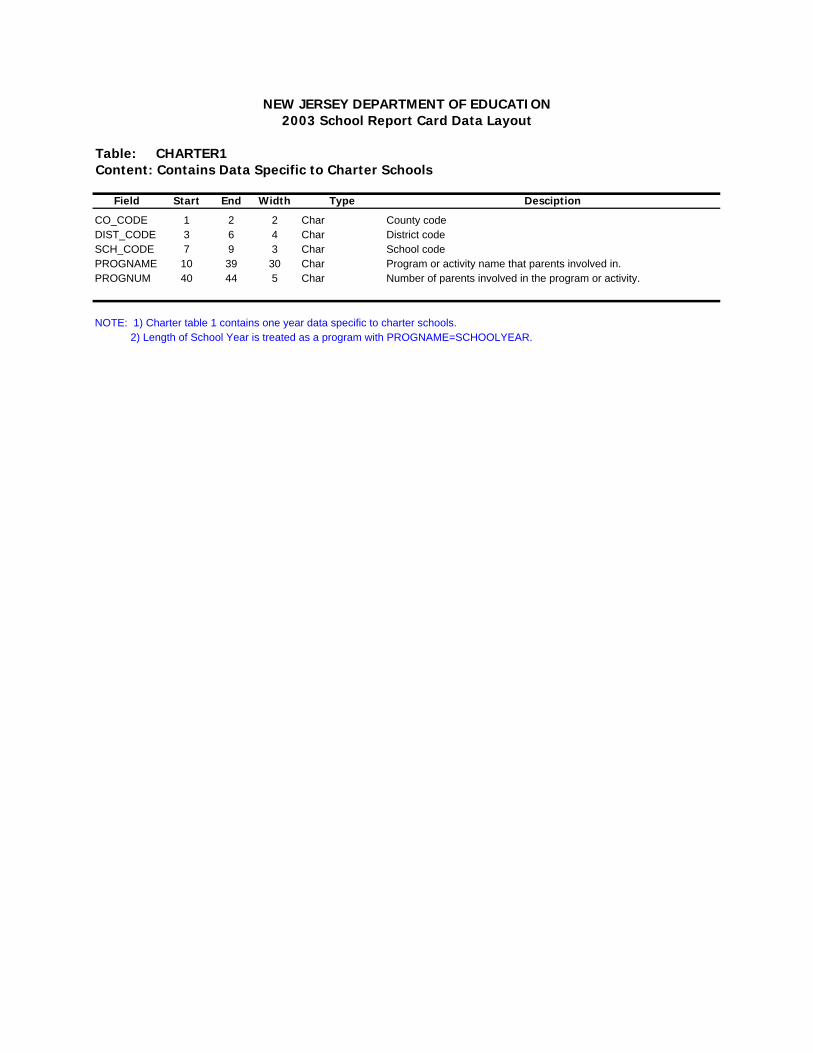
Table: CHARTER1Content: Contains Data Specific to Charter Schools
Field Start End Width Type
CO_CODE 1 2 2 Char County codeDIST_CODE 3 6 4 Char District codeSCH_CODE 7 9 3 Char School codePROGNAME 10 39 30 Char Program or activity name that parents involved in.PROGNUM 40 44 5 Char Number of parents involved in the program or activity.
NOTE: 1) Charter table 1 contains one year data specific to charter schools. 2) Length of School Year is treated as a program with PROGNAME=SCHOOLYEAR.
NEW JERSEY DEPARTMENT OF EDUCATION2003 School Report Card Data Layout
Desciption

Table: CHARTER2Content: Contains Data Specific to Charter Schools
Field Start End Width TypeCO_CODE 1 2 2 Char County codeDIST_CODE 3 6 4 Char District codeSCH_CODE 7 9 3 Char School codeYEAR 10 13 4 Char School year for which the data was collected.LEVEL 14 14 1 Char Data level: S=school, D=district (charters as a group in this case)TURNOVER 15 19 5 Alphanumeric Percent of faculty who entered or left the schoo during the school year.STPART 20 24 5 Alphanumeric Percent of students participating in before/after school programs/activities.WAIT 25 27 3 Numeric Number of students on the waiting list.CLSROOM 28 32 5 Numeric Number of classrooms in the school.
NOTE: Charter Table 2 contains three year data fields and two levels of data: school and charterwide.
Desciption
NEW JERSEY DEPARTMENT OF EDUCATION2003 School Report Card Data Layout

Table: FINANCEContent: Contains District Finance Data
Field Start End Width Type Section
CO_CODE 1 2 2 Char County codeDIST_CODE 3 6 4 Char District codeYEAR 7 10 4 Char School year for which the data was collected.LEVEL 11 11 1 Char Data level: D=district, T=stateLOCAL 12 16 5 Alphanumeric Revenues Percent of total revenues from local sources.STATE 17 21 5 Alphanumeric Revenues Percent of total revenues from state.FEDERAL 22 26 5 Alphanumeric Revenues Percent of total revenues from federal.OTHER 27 31 5 Alphanumeric Revenues Percent of total revenues from other sources.CL_SAL 32 35 5 Alphanumeric Per Pupil Expenditure Classroom - salaries and benefits.CL_SUP 36 40 5 Alphanumeric Per Pupil Expenditure Classroom - general supplies/textbooksCL_OTH 41 45 5 Alphanumeric Per Pupil Expenditure Classroom - purchased services and otherCL_TOT 46 50 5 Alphanumeric Per Pupil Expenditure Classroom - totalSS_SAL 51 55 5 Alphanumeric Per Pupil Expenditure Support services - salaries and benefits.SS_OTH 56 60 5 Alphanumeric Per Pupil Expenditure Support services - otherSS_TOT 61 65 5 Alphanumeric Per Pupil Expenditure Support services - total.AD_SAL 66 70 5 Alphanumeric Per Pupil Expenditure Administration - salaries and benefitsAD_OTH 71 75 5 Alphanumeric Per Pupil Expenditure Administration - otherAD_TOT 76 80 5 Alphanumeric Per Pupil Expenditure Administration - totalOP_SAL 81 85 5 Alphanumeric Per Pupil Expenditure Operations & maintenance of plant - salaries and benefitsOP_OTH 86 90 5 Alphanumeric Per Pupil Expenditure Operations & maintenance of plant - otherOP_TOT 91 95 5 Alphanumeric Per Pupil Expenditure Operations & maintenance of plant - totalFS_TOT 96 100 5 Alphanumeric Per Pupil Expenditure Total food services costs.EX_TOT 101 105 5 Alphanumeric Per Pupil Expenditure Total extracurricular costs.OTH_TOT 106 110 5 Alphanumeric Per Pupil Expenditure Total other costs.CC_TOT 111 115 5 Alphanumeric Per Pupil Expenditure Total comparative cost per pupil.TOTCOST 116 120 5 Alphanumeric Per Pupil Expenditure Total cost per pupil.
NEW JERSEY DEPARTMENT OF EDUCATION2003 School Report Card Data Layout
Description

Table: SALARYContent: Contains District Personnel and Salary Data
Field Start End Width Type Section
CO_CODE 1 2 2 Char County codeDIST_CODE 3 6 4 Char District codeYEAR 7 10 4 Char School year for which the data was collected. DADM 11 16 6 Alphanumeric Administrative and Faculty Personnel Average number of district administratorsSADM 17 22 6 Alphanumeric Administrative and Faculty Personnel Average number of state administratorsDSCH 23 28 6 Alphanumeric Administrative and Faculty Personnel Average number of schools in districtSSCH 29 34 6 Alphanumeric Administrative and Faculty Personnel Average number of schools in the stateDSTAD 35 40 6 Alphanumeric Administrative and Faculty Personnel Number of students per administrator in the districtSSTAD 41 46 6 Alphanumeric Administrative and Faculty Personnel Number of students per administrator in the stateDFACAD 47 52 6 Alphanumeric Administrative and Faculty Personnel Number of faculty per administrator in the districtSFACAD 53 58 6 Alphanumeric Administrative and Faculty Personnel Number of faculty per administrator in the stateDADSAL 59 64 6 Alphanumeric Median Salary & Years of Experience Administrator - Salary - DistrictSADSAL 65 70 6 Alphanumeric Median Salary & Years of Experience Adminstrator - Salary - State MedianDADEXP 71 76 6 Alphanumeric Median Salary & Years of Experience Administrator - Years of experience - DistrictSADEXP 77 82 6 Alphanumeric Median Salary & Years of Experience Administrator - Years of experience - State MedianDFACSAL 83 88 6 Alphanumeric Median Salary & Years of Experience Faculty - Salary - DistrictSFACSAL 89 94 6 Alphanumeric Median Salary & Years of Experience Faculty - Salary - State MedianDFACEXP 95 100 6 Alphanumeric Median Salary & Years of Experience Faculty - Years of Experience - DistrictSFACEXP 101 106 6 Alphanumeric Median Salary & Years of Experience Faculty - Years of Experience - State MedianDTCHSB 107 112 6 Alphanumeric Teacher Salaries and Benefits % for teachers salaries/benefits - District AverageSTCHSB 113 118 6 Alphanumeric Teacher Salaries and Benefits % for teachers salaries/benefits - State AverageDFACHNG 119 124 6 Alphanumeric Teacher Salaries and Benefits % Change - Increase/Decrease - District AverageSFACHNG 125 130 6 Alphanumeric Teacher Salaries and Benefits % Change - Increase/Decrease - State AverageDADMSB 131 136 6 Alphanumeric Administrative Salaries and Benefits % for administrative salaries/benefits - District AverageSADMSB 137 142 6 Alphanumeric Administrative Salaries and Benefits % for administrative salaries/benefits - State AverageDADMCHNG 143 148 6 Alphanumeric Administrative Salaries and Benefits % Change - Increase/Decrease - District AverageSADMCHNG 149 154 6 Alphanumeric Administrative Salaries and Benefits % Change - Increase/Decrease - State Average
Decription
NEW JERSEY DEPARTMENT OF EDUCATION2003 School Report Card Data Layout

Table: COMPVOCContent: Contains Program Completion Data for Vocational Education Schools
Field Start End Width Type
CO_CODE 1 2 2 Char County codeDIST_CODE 3 6 4 Char District codeSCH_CODE 7 9 3 Char School codeYEAR 10 13 4 Char School year for which the data was collected. Max 4 years in report card.FTG12 15 19 5 Alphanumeric Percent of full time Grade 12 students who graduated from vocational school.STG12 20 24 5 Alphanumeric Percent of share time Grade 12 students who graduated from vocational school.RETURN 25 29 5 Alphanumeric Percent of share time students who completed and returned to home school.POSTSEC 30 34 5 Alphanumeric Percent of post-secondary students who completed their programs.
NEW JERSEY DEPARTMENT OF EDUCATION2003 School Report Card Data Layout
Description

Table: VOCTESTContent: Contains Vocational Certification/Licensure Examination Results
Field Start End Width TypeCO_CODE 1 2 2 Char County codeDIST_CODE 3 6 4 Char District codeSCH_CODE 7 9 3 Char School codeTESTNAME 10 29 20 Char Test name.TESTNUM 30 34 5 Alphanumeric Number of students taking the test.TESTPCT 35 39 5 Alphanumeric Percent of students passing the test.
NOTE: This table contains the most current year school level data.
NEW JERSEY DEPARTMENT OF EDUCATION2003 School Report Card Data Layout
Description

Table: HQTIContent: Contains Highly Qualified Teacher Information
Field Start End Width TypeCO_CODE 1 2 2 Char County codeDIST_CODE 3 6 4 Char District codeYEAR 7 10 4 Char Data yearLEVEL 11 11 1 Char Data level: S=school, T=statePCTHQT 12 17 6 Alphanumeric Percent of teachers with emergency or conditional certificates
NOTE: 1) This table has two years data for 2003 report card - 2001-02 and 2002-03. 2) It has two levels of data: district and state. State level data is calculated by including every school with valid data. 3) State level data has the following dummy CD codes: co=99, dist=9999.
NEW JERSEY DEPARTMENT OF EDUCATION2003 School Report Card Data Layout
Description