2
Disclaimer
These materials have been prepared by PT Toba Bara Sejahtra (the “Company”).
These materials may contain statements that constitute forward-looking statements. These statements
include descriptions regarding the intent, belief or current expectations of the Company or its officers with
respect to the consolidated results of operations and financial condition of the Company. These statements
can be recognized by the use of words such as “expects,” “plan,” “will,” “estimates,” “projects,” “intends,” or
words of similar meaning. Such forward-looking statements are not guarantees of future performance and
involve risks and uncertainties, and actual results may differ from those in the forward-looking statements
as a result of various factors and assumptions. The Company has no obligation and does not undertake to
revise forward-looking statements to reflect future events or circumstances.
These materials are for information purposes only and do not constitute or form part of an offer, solicitation
or invitation of any offer to buy or subscribe for any securities of the Company, in any jurisdiction, nor
should it or any part of it form the basis of, or be relied upon in any connection with, any contract,
commitment or investment decision whatsoever. Any decision to purchase or subscribe for any securities
of the Company should be made after seeking appropriate professional advice.

3
Content
Financial Highlights
2
5
Corporate Profile & Updates
4
Investment Highlights & Growth Strategies
3 Business Overview & Updates
CSR & Environmental Highlights
1

4
Corporate Profile & Updates 1

5
ABN66.1%
IM15.7%
TMU18.2%
Toba specializes in thermal coal production and comprises three operating subsidiaries: Adimitra
Baratama Nusantara (ABN), Indomining (IM) and Trisensa Mineral Utama (TMU), which hold adjacent
concession areas located in East Kalimantan, Indonesia
Toba in Brief
• Substantial and diversified thermal coal
reserves and resources
oJORC-compliant proved and probable reserves of
147 MM tons and measured, indicated and
inferred resources of 236 MM tons
oCoal brands with calorific values ranging from
4,700 - 5,800 Kcal / kg GAR
ABN79.6%
IM15.0%
TMU5.4%
Reserves
%
• Strong growth profile
oProduced 5.2 MM tons of coal in 2011 and grew to
produce around 5.6 MM tons of coal in 2012
o Prime location provides the operational cost edge to
grow as a logistical & operational center for the area
oContinued exploration effort to increase our Reserves and
Resources. Current reserves only account for 52% of our
total area has been explored
Revenue (1)
%
EBITDA(1)
%
Resources %
Total: 147 MM Tonnes Total: US$ 425 MM Total: US$ 30 MM Total: 236 MM Tonnes
Note: (1) Last Twelve Month analysis ~ Revenue and EBITDA
ABN 73.7%
IM 21.8%
TMU 4.5%
ABN 76.0%
IM 19.6%
TMU 4.4%

6
Toba’s coal quality
is in mid-upper
range
Coal Specifications
Calorific Value GAR
Ash Sulphur
4,700 5,800
5,200 5,900
6,000 5,300
4,200 7,200
4,900 6,500
5,000 5,100
4,500 6,700
4,900 4,200
4,100 5,100
6,700 4,200
2,5% 12,0%
1,5% 2,0%
2,5% 3,3%
4,0% 5,5%
5,0% 5,5%
4,0% 8,0%
4,5% 13,0%
7,0% 11,5%
9,0% 2,0%
1,9% 10,9%
0,2% 1,4%
0,1% 0,2%
0,1% 0,1%
0,2% 2,0%
1,0% 0,6%
0,7% 0,5% 0,1%
1,5%
1,0% 0,7%
0,2% 0,5%
0,2% 1,0%
TOBA
TOBA TOBA
Source: Broker Reports

7
Notes:
1. Son of TS founder, Luhut B. Pandjaitan
2. Figures are rounded off
Ownership Structure
• 20-year Production
Operation Mining Permit
(“IUPOP”) expiring in
December 2029
• IUPOP was converted from
Kuasa Pertambangan
(“KP”) in 2009
• IUPOP expires in June 2013
• IUPOP was converted from KP in
2010
• IUPOP extension was completed
in March 2013 (First out of 2
extensions: in 2023, with tenor of
10 years each)
• 13-year IUPOP expires in December
2023
• IUPOP was converted from a KP in
2010
• Plantation permit expires in 2036
• 2,990 ha • 683 ha • 3,414 ha • 8,633 ha (Right to Use Land)
• Reserves: 117MT- JORC
• Resources: 156MT- JORC
• Reserve: 22 MT- JORC
• Resources: 37MT- JORC
• Reserves : 8 MT - JORC and
additional 7 MT of internal estimate
• Resources: 43 MT- JORC
• Planted Area: 2,896 ha
License
Area
Davit Togar Pandjaitan (1) PT Bara Makmur Abadi PT Toba Sejahtra (“TS”) Roby Budi Prakoso PT Sinergi Sukses Utama
71.8% 0.8% 6.2% 5.1%
PT Toba Bumi Energi (“TBE”)
99.99% (2)
99.99% (2)
3.6%
ABN Minorities
49.0%
51.00% 99.99% (2)
Public
12.5%
Reserve
90.00%
8
Majority Shareholder
Toba believes it benefits from Toba Sejahtra’s experience in the Indonesian coal sector as well as its
leadership and experience
Controlling Shareholder with Established Track Record… … Helmed by an Experienced Leader
• A privately owned group founded in 2004 with interests in energy
and plantations
• Its business segments are as follow:
– Energy: Owns 5 coal mining concessions through Toba and PT
Kutai Energi. All of TS' mines are characterized by low production
costs and favorable proximity to ports
– Oil & Gas: In the exploration phase of the 4,567 sq miles South
East Madura Block through subsidiary E&P company PT Energi
Mineral Langgeng
– Power Plant: Operates a 30 MW coal-fired power plant in Palu,
Central Sulawesi and is developing a 120 MW greenfield power
plant in Senipah, East Kalimantan
– Agribusiness: A 25% stake in a 12,000 ha palm oil plantation in
East Kalimantan
• General (Ret.) Luhut B. Pandjaitan is the key shareholder and
founder of Toba Sejahtra group. He is currently the chairman of TS
• Mr. Luhut had a long and illustrious career in the civic service
before turning to the commercial sector. Over the course of thirty
years in the Army Special Forces, Mr. Luhut rose to become a four-
star general
– In 1999, Mr. Luhut retired from the military service to serve as
Ambassador for the Republic of Indonesia to Singapore
– In 2000, he was appointed Minister of Industry and Trade of the
Republic of Indonesia
• Thereafter, Mr. Luhut applied his knowledge and leadership skills to
establish TS in 2004, building it from the ground up into a major
business group with interests in energy oil and gas, power and
agribusiness
9
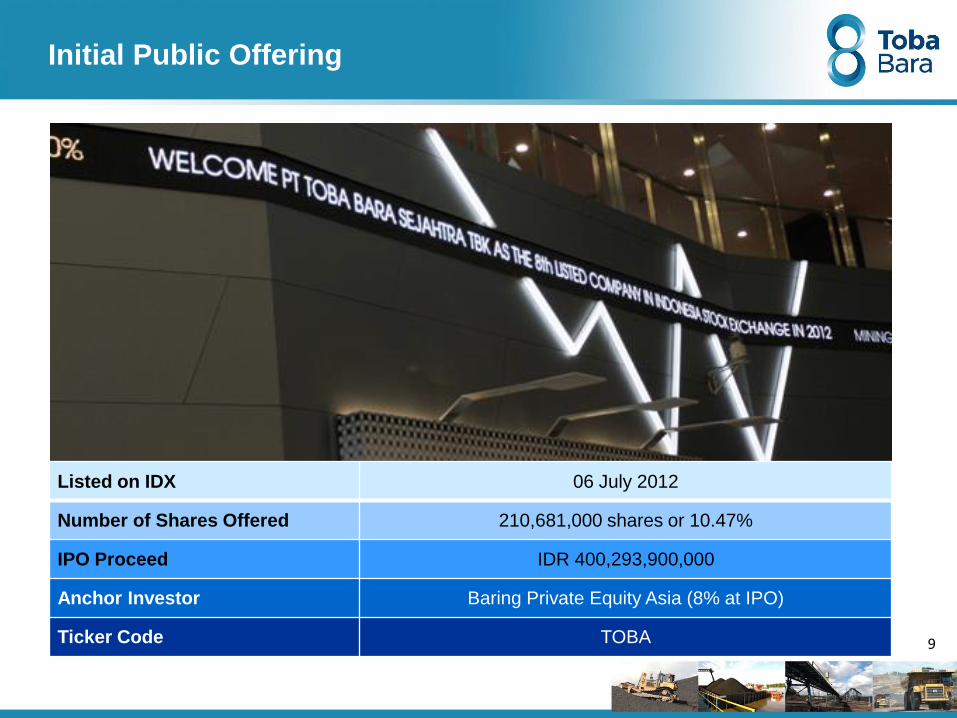
Initial Public Offering
Listed on IDX 06 July 2012
Number of Shares Offered 210,681,000 shares or 10.47%
IPO Proceed IDR 400,293,900,000
Anchor Investor Baring Private Equity Asia (8% at IPO)
Ticker Code TOBA
10
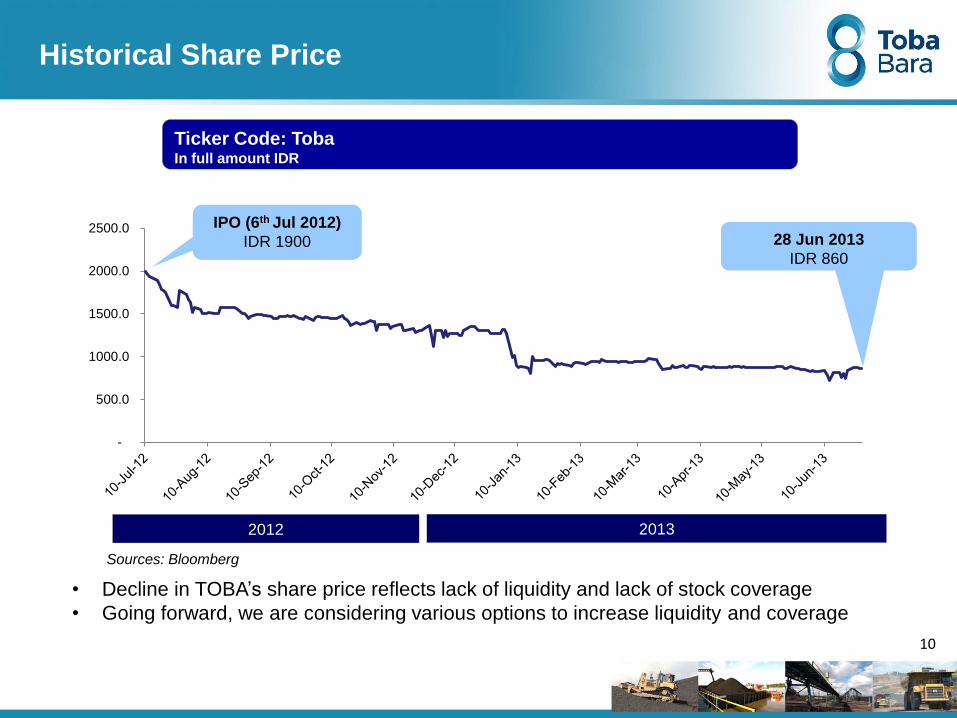
Ticker Code: Toba In full amount IDR
IPO (6th Jul 2012)
IDR 1900 28 Jun 2013
IDR 860
Historical Share Price
Sources: Bloomberg
• Decline in TOBA’s share price reflects lack of liquidity and lack of stock coverage
• Going forward, we are considering various options to increase liquidity and coverage
2012 2013
-
500.0
1000.0
1500.0
2000.0
2500.0

11
2007
• IM commenced
production
2011
• TMU commenced
production
• Toba production
hit 5m tons
2008
• ABN commenced
production
• Operational
adjustment due to
drop in coal
market
2010
• TS acquired the remaining share
for IM from minority shareholder
• Toba acquired 51.0% of ABN,
52.5% of TBE (IM’s shareholding
company) and 51.0% of TMU
• Toba production hit 4m tons
Key Milestones
Strong track record of acquisitions, development of greenfield mines, rapid production ramp-up and
experience to adjust operation in a down-market
2007 2008 2009 2010 2011 2012 2013
2012
• Toba acquired the minorities’ shares in TBE and TMU
• IPO/Listed on IDX, 6th July
2012
• Eliminated overlapping issues
with plantation company (PKU)
2009
• ABN & IM production
reached 2m tons
2013
• IM successfully
extended IUPOP
until 2023

12
Investment Highlights and Growth Strategies
Source: Company data
0.1
1.1
3.1 3.8
4.4
~ 6,5
0.7
0.9
0.9
1.4
1.0 0.0
0.3
0
1
2
3
4
5
6
7
2007 2008 2009 2010 2011 2012 2013
TMU Indomining ABN
13
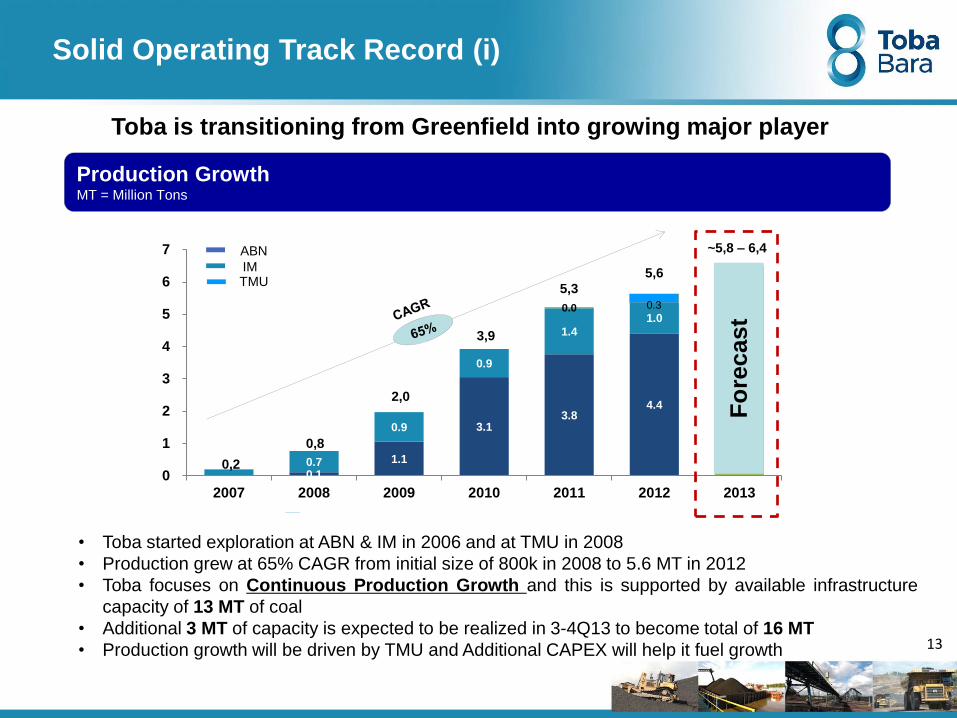
Solid Operating Track Record (i)
0,8
2,0
3,9
5,3
5,6
Production Growth MT = Million Tons
0,2
~5,8 – 6,4
Fo
recast
• Toba started exploration at ABN & IM in 2006 and at TMU in 2008
• Production grew at 65% CAGR from initial size of 800k in 2008 to 5.6 MT in 2012
• Toba focuses on Continuous Production Growth and this is supported by available infrastructure
capacity of 13 MT of coal
• Additional 3 MT of capacity is expected to be realized in 3-4Q13 to become total of 16 MT
• Production growth will be driven by TMU and Additional CAPEX will help it fuel growth
ABN
IM TMU
Toba is transitioning from Greenfield into growing major player
Fo
recast
0.3
14
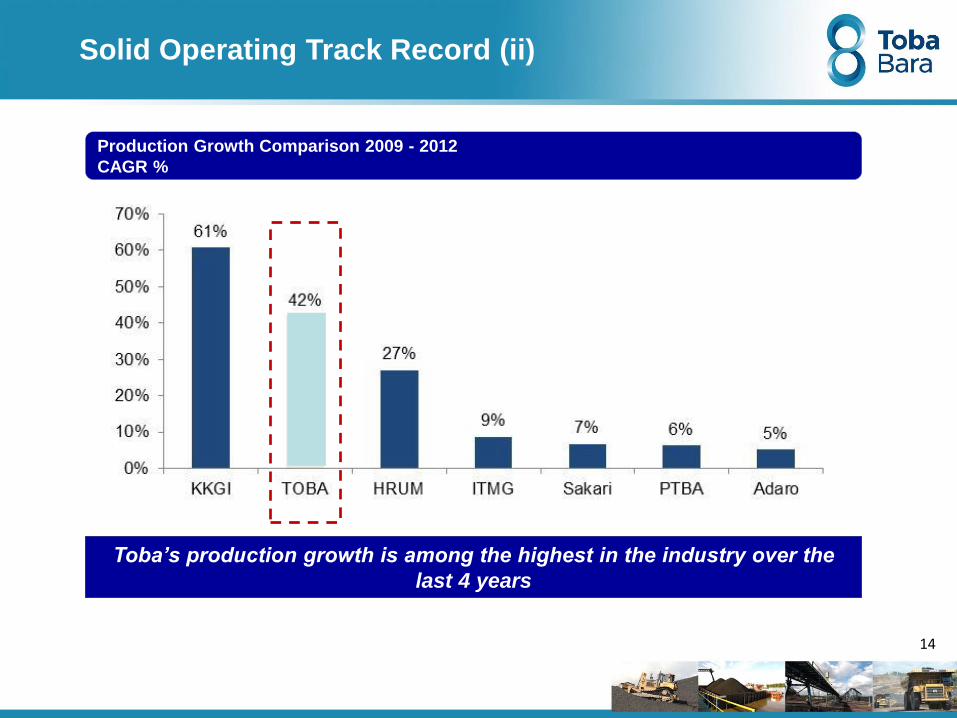
Toba’s production growth is among the highest in the industry over the
last 4 years
Production Growth Comparison 2009 - 2012
CAGR %
Solid Operating Track Record (ii)

15
Prime Location Gives Significant Advantage in Cost (i)
Samarinda
Mahakam River
Muara Jawa
Muara
Berau
Makassar Strait
Major City
Jetty
Transhipment Point
~55 km
(total ~120 km)
~65 km
kilometers
0 12 24 36 48
ABN
Kutai Energy
Adjacent
locations for all
3 mines
TMU ABN
IM
1
17km
ABN Jetty
IM Jetty
~ 5 km
Furthest pit to
jetty 25km | with
closest one ~5km
3 Major city is
less than 50
km
4
Close proximity
transhipment
point & jetty
2
Toba owns all infrastructures (coal processing plants, overland conveyors, and jetties),
giving significant operating leverage vs other concessions in surrounding areas
Prime Location
TMU - IM Hauling Road
Balikpapan
Jetty

16
Prime Location Gives Significant Advantage in Cost (ii)
Coal Chain Distance (a)
In km
Toba’s transportation costs are low due to its close proximity to the
Transhipment Point
Notes : (a) Weighted average distance based on respective production usage of each transportation facility (from pit to vessel)
(b) Represent ABN & IM only
Source : Broker Reports
(b)
90

29
47 45 39
71 67
0
10
20
30
40
50
60
70
80
2009 2012
Global Cash Cost Environment & Indonesia’s Position
Average cash cost prices have moved up by close to 50%...
Lowest
Median
Weighted average
US$/ton
Prod. Cash Cost by Country (Thermal Coal)
Cash Cost Curve in 2009
Cash Cost Curve in 2012
Global Cash Cost in 2012

18
Co
st
Red
ucti
on
Cost Reduction Initiatives
ABN
IM
TMU
SR (x)
Dump
Distance
(m)
2012A 2013F
SR
Dump
Distance
(m)
SR
Instrastruc
ture
(US$/ton)
15.3x
13.0x
14.9x
US$13/ton US$4 – 6 /ton
2,365
2,174
12 – 14x
1500 - 1800
9 – 11x
1800- 2100
9 – 10x
Potential Cost Saving
Up to US$8/ton
US$15 - 20 /ton
Up to US$8 /ton
19
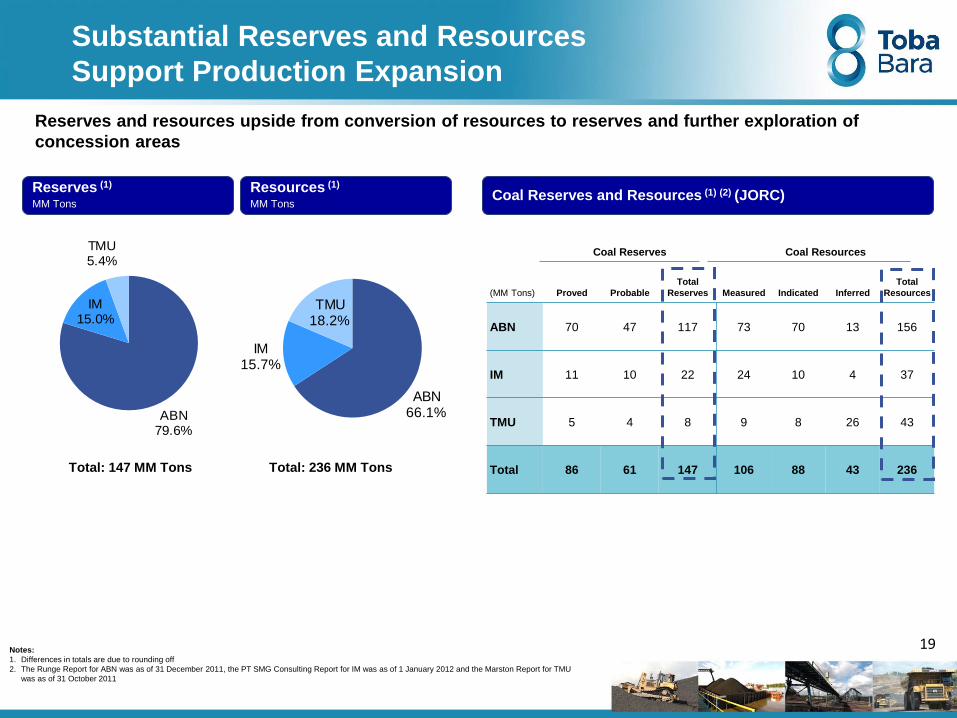
ABN66.1%
IM15.7%
TMU18.2%
Coal Reserves Coal Resources
(MM Tons) Proved Probable
Total
Reserves Measured Indicated Inferred
Total
Resources
ABN 70 47 117 73 70 13 156
IM 11 10 22 24 10 4 37
TMU 5 4 8 9 8 26 43
Total 86 61 147 106 88 43 236
Reserves and resources upside from conversion of resources to reserves and further exploration of
concession areas
Notes:
1. Differences in totals are due to rounding off
2. The Runge Report for ABN was as of 31 December 2011, the PT SMG Consulting Report for IM was as of 1 January 2012 and the Marston Report for TMU
was as of 31 October 2011
Total: 147 MM Tons Total: 236 MM Tons
Substantial Reserves and Resources
Support Production Expansion
Coal Reserves and Resources (1) (2) (JORC) Reserves (1)
MM Tons
Resources (1)
MM Tons
ABN79.6%
IM15.0%
TMU5.4%
Note: Areas already explored
20
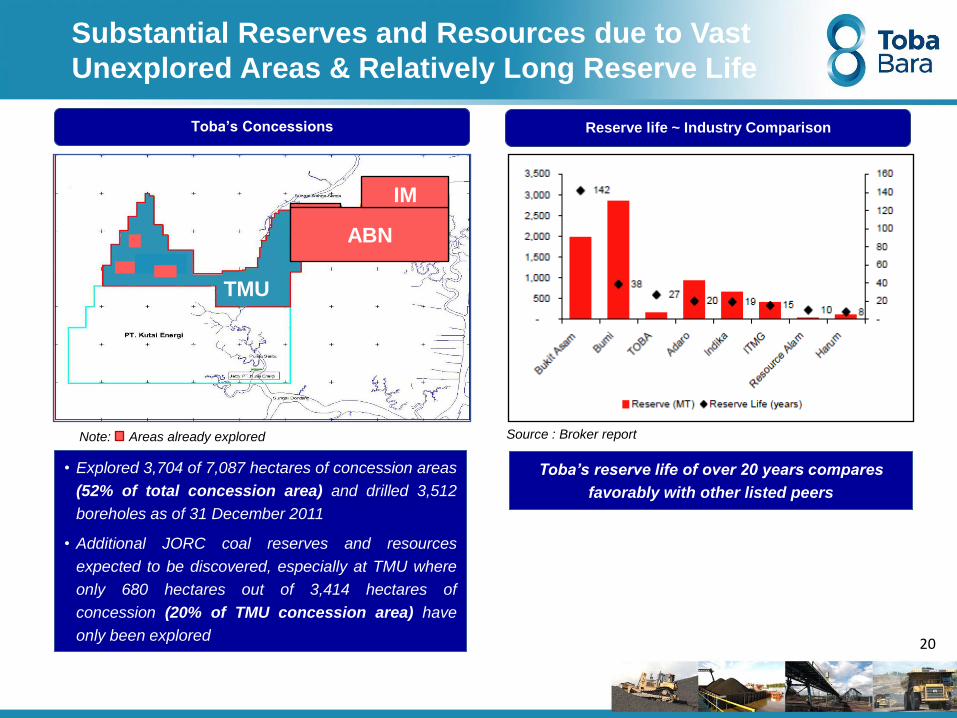
Substantial Reserves and Resources due to Vast
Unexplored Areas & Relatively Long Reserve Life
• Explored 3,704 of 7,087 hectares of concession areas
(52% of total concession area) and drilled 3,512
boreholes as of 31 December 2011
• Additional JORC coal reserves and resources
expected to be discovered, especially at TMU where
only 680 hectares out of 3,414 hectares of
concession (20% of TMU concession area) have
only been explored
TMU
Source : Broker report
Toba’s reserve life of over 20 years compares
favorably with other listed peers
Toba’s Concessions Reserve life ~ Industry Comparison
ABN
IM
TMU

21
Coal Market Update
Range-bound US$77 -95/ton
• Coal Prices have bounced back from high 70’s in 2Q 2013 and now on decline trend within
US$ 77-83/ton
• Going forward, prices are expected to trade within range-bound of US77-95/ton
Source: Newcastle Index
70
80
90
100
2012 2013
Changes in Forward Curve Newc Global Coal Index
Source: Global Coal
81.7 83.2 86.6 90.3 93.6
95.4 96.7 100.6
105.9 110.2
0
50
100
150
200
250
Q3'13 Q4'13 Cal-14 Cal-15 Cal-16
19-Jun-13 2-Jan-13
Coal Price Trend

22
Strong Relationships with Multinational Customers
Major Customers
DRAGON ENERGY GROUP
Major customers provide the stable
business support for Toba’s marketing…
… minimum marketing fees because Toba
handles our own marketing internally
Toba’s Marketing Operations
Central Marketing Operations of all 3
subsidiaries
Internally developed customer base
that allows Toba to have low marketing
costs
Balance mix of long term contracts,
short term and spot
Active participation in reputable
conference and trade shows to promote
Toba brand
Enhance marketing strategy to sell
directly to end-users

23
Sales by Destination
Our coal is distributed to
major countries in Asia:
- China
- Taiwan
- South Korea
- India Taiwan, 22.7%
India, 9.2%
China, 31.7%
South Korea, 9.9%
Vietnam, 3.1%
Japan, 0.2%
Hong Kong, 1.7%
Thailand, 1.2%
Others, 20.2%

24
Selling Price Analysis
NEWC Index dropped from Q1 to Q2 2013, while ASP increased over same period
25
Business Overview 3

26
Manage cash costs: Lower SR,
Shorten Dump Distance
Construct hauling road from
TMU to IM
Share current infrastructures :
CPP & Jetty & lower costs
Centralize fuel supply
Optimize sales through hedging
activities
Increase our reserves through
acquisition and exploration
Strategic Initiatives to Manage Changing Environment
Returning future
Profitability
Level
Strategic Initiatives / Response to Changing Coal Prices
1
2
3
4
5
6

27
Executions and Achievements so far… (I)
Manage Cash Cost: lower SR &
dump distance
OPERATION
Achievement Execution Initiative
Construct Hauling Road from
TMU to IM
Share Existing Infrastructure
Adjusted mine plan in 3Q12 and
lowered dump distance despite pre-
stripping in 1Q13 at ABN
Construction commenced end-2012
and was scheduled for completion in
2Q13
TMU commenced infra-sharing using
ABN’s road and IM’s CPP & Jetty
Provide Financing to IM
FINANCIAL
Optimize Sales through Hedging
Centralize Fuel Supply
Maximized current ideal capital structure
by using loan to finance new CPP
construction and land compensation
Made available hedging line with
notable financial institutions
Sourced constant bulk supply from
major fuel supplier to allow for good
monitoring of effective fuel usage
Secured 3-year US$ 15 mn term loan
from SCB at competitive lending rate
of LIBOR+3.6%
No hedging has been utilized. Sold
~70% of 2013 sales volume using fixed
pricing, and securing cash
prepayments
Cash cost is on track to be
lowered ~US$8/t by FY13
Hauling road was completed in
May 2013, ahead of schedule
TMU’s underwent significant
production ramp-up from 25K tons
in April 2013 to 72K in June 2013
Sourced supply at competitive
price, while continuing to seek
other sources with better pricing
In
Progress
In
Progress
In
Progress
Conduct Joint Mine Plan Maximizing extraction of ~2 MT of
high quality coal reserve with low SR
ABN & IM commenced joint-
border mining end-2012
In
Progress
Achievement Execution Initiative
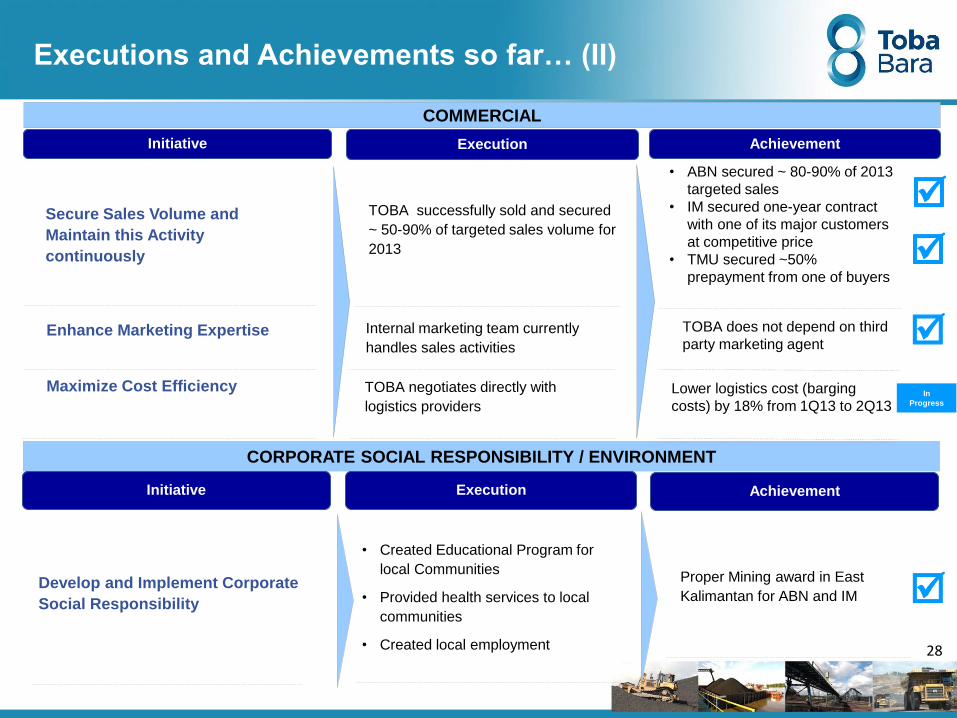
Executions and Achievements so far… (II)
Secure Sales Volume and
Maintain this Activity
continuously
COMMERCIAL
Achievement Execution Initiative
TOBA successfully sold and secured
~ 50-90% of targeted sales volume for
2013
Develop and Implement Corporate
Social Responsibility
CORPORATE SOCIAL RESPONSIBILITY / ENVIRONMENT
Achievement Execution Initiative
• Created Educational Program for
local Communities
• Provided health services to local
communities
• Created local employment
Proper Mining award in East
Kalimantan for ABN and IM
• ABN secured ~ 80-90% of 2013
targeted sales
• IM secured one-year contract
with one of its major customers
at competitive price
• TMU secured ~50%
prepayment from one of buyers
Enhance Marketing Expertise
TOBA negotiates directly with
logistics providers
Internal marketing team currently
handles sales activities
Maximize Cost Efficiency Lower logistics cost (barging
costs) by 18% from 1Q13 to 2Q13
TOBA does not depend on third
party marketing agent
In
Progress
28

…Next: Objectives in 2H 2013
COMMERCIAL
Execution Initiative
Develop and Implement Corporate
Social Responsibility
CORPORATE SOCIAL RESPONSIBILITY / ENVIRONMENT
Execution Initiative
Aiming to be eligible for “Proper” mining
awards for all three mines
Maximize Cost Efficiency Aiming to continue lowering logistics
cost i.e. by another 10-15%, resulting in
overall cost savings for full year of US$1/
ton, equivalent to 25% cost savings
Increase Cooperation and Internal
integration with Suppliers
Working together with contractors on
fleet management and supply parts
management with end-providers
Status
Still in negotiation. Expected to be
completed in 2H 2013
Expected to be completed in 2H 2013
Status
Expected to be achieved in 1Q14
29

30
Toba’s Milestone 2013
2007 2008 2009 2010 2011 2012
• Hauling Road TMU – IM
completed ahead of
schedule
• TMU Production ready
for ramp up to 80 - 100 K
tons/month
May’13 Sept’13
• New CPP at IM
expected to be
completed
• IM’s capacity
expected to increase
up to 6 MMTPA
Oct’13
• 2nd underpass in
ABN expected to
be completed
Apr’13
• TMU set up mine
operations in new
pit (block 4)
• Border-mining at
ABN & IM
commenced
Jan’13
• IM entered into
new Mining
Contract with
RPP for 5 years
Toba is on track in integrating its operation and infrastructure
capabilities
………..

31
Integration of three (3) mines
• Benchmarking and
sharing between
departments and
functions
• Optimize and
coordinate mine
planning and logistics
• Centrally coordinate
and streamline
corporate finance,
legal, human resource
and CSR functions
• Joint mine plan and
infrastructure sharing
1 Increase coal reserve
and resource
• Continue exploration
activities to increase
proven and probable
reserves as only 52%
has been explored to
JORC standard
• Consider opportunities
to acquire coal
concessions with
significant reserves
3 Strengthen existing
and develop new customer
relationships
• Supply a higher
proportion of sales
volume to end users,
while maintaining
relationships with
existing coal traders
• Target customers in
Japan, Taiwan, South
Korea, China, Vietnam
and Hong Kong, South
East Asia and India
4 Continue to focus on
health and safety, environmental track
record and commitment to CSR
• Maintain and enhance
high international
operating standards,
utilize automated
mining methods to
minimize accidents and
enhance safety
• Foster community ties
through development
programs as well as job
creation
5 Organically increase
coal production levels
• Expand coal production
through increased
production and mine
development activities
• Strengthen
relationships with third
party mining
contractors and work
closely with them to
improve their
productivity
2
Toba’s Business Strategies
Growing Reserves and Maintain Profitability at Different Cycles

Toba’s Operational Performance in 2Q 2013
Quarterly Production & Stripping Ratio (SR) Thousand Tons
Production Summary
1Q13 2Q13 Change Comment
Production
(Mn tons)
SR (x)
1.29 1.50
15.1 13.6
1.44 1.37 Sales volume in 1Q13 was slightly higher than in 2Q13
mainly due to inventory clearance accumulated from
4Q12
-4.9%
16.6%
-9.9%
Q-o-Q production in 2Q13 increased by 16.6%
resulting from completion of pre-stripping at ABN and
TMU
SR fell due to completion of pre-stripping at ABN
Sales
(Mn tons)
1,097 1,373 1,574 1,587 1,287 1,501
17.6x
16.6x
14.2x
12.1x
15.1x 13.6x
5x
10x
15x
20x
500
1,000
1,500
2,000
1Q 2012 2Q 2012 3Q 2012 4Q 2012 1Q2013 2Q2013
Production volume Stripping Ratio (SR)• Production volume of 2.8
MMT in 1H 2013 was 44%
of our FY 2013 production
target
• To achieve FY target of
5.8MT-6.4MT, TMU is
expected to be
instrumental in boosting
overall growth via
continued ramp-up

33
ABN Operational Performance
Production & Stripping Ratio Thousand Tons
Despite higher than anticipated rainfall delayed operational activities in 1H13,
ABN still managed to increase production by 7.6% from 1Q13 to 2Q13
ABN’s 2nd underpass is currently under construction and expected to be
completed by 4Q13 with aim to lower OB dump distance
At 14.2x SR, for every 100 meter-decrease in dump distance is expected to
reduce cost by~US$0.73/ton, contributing to ~US$ 4.3/ton in FOB cash cost
saving
Operational Advantage & Focus
Short coal hauling distance 4km
High Built Crusher Cap 10 mm ton/year
Barge Loading Jetty Loading Speed of up to
1,800 ton/hour
Under-pass:
Capitalizing on Infra Strength
1 2 3 4
ABN
Key Highlights
TMU
IM
PT Kutai Energi
884 1,078 1,224 1,225 925 995
17.6x 17.1x
14.7x
12.6x
16.6x 14.2x
5x
10x
15x
20x
500
1,000
1,500
1Q 2012 2Q 2012 3Q 2012 4Q 2012 1Q2013 2Q 2013
Production volume (mt) Stripping ratio
Dump
distance (m)2,492 2,461 1,978 1,723 1,719 1,864

34
IM Operational Performance
IM’s production in 2Q13 increased by 30% Q-o-Q, contributed by
higher production volume from border mining
On y-o-y basis, dump distance fell by ~1000m, decreased by 40%
At 13x SR, for every 100 meter-decrease in dump distance is
expected to reduce cost by~US$0.71/ton, contributing to ~US$
7.6/ton in FOB cash cost saving
Key Highlights
Production & Stripping Ratio Thousand Tons
Operational Advantage & Focus
Short coal
hauling dist. < 5km
CPP Ramp up to
6MM TPY
Conveyor for TMU
& Others
Cross Border
Mining with ABN
1 2 3 4
TMU
ABN
PT Kutai Energi
190 236 265 272 278 360
14.6x
14.5x
13.1x 9.7x
11.2x
12.7x
0x
5x
10x
15x
20x
0
250
500
1Q 2012 2Q 2012 3Q 2012 4Q 2012 1Q 2013 2Q 2013
Production volume (mt) Stripping ratio
Dump
distance (m)1,693 2,740 2,136 2,284 1,698 1,662
35
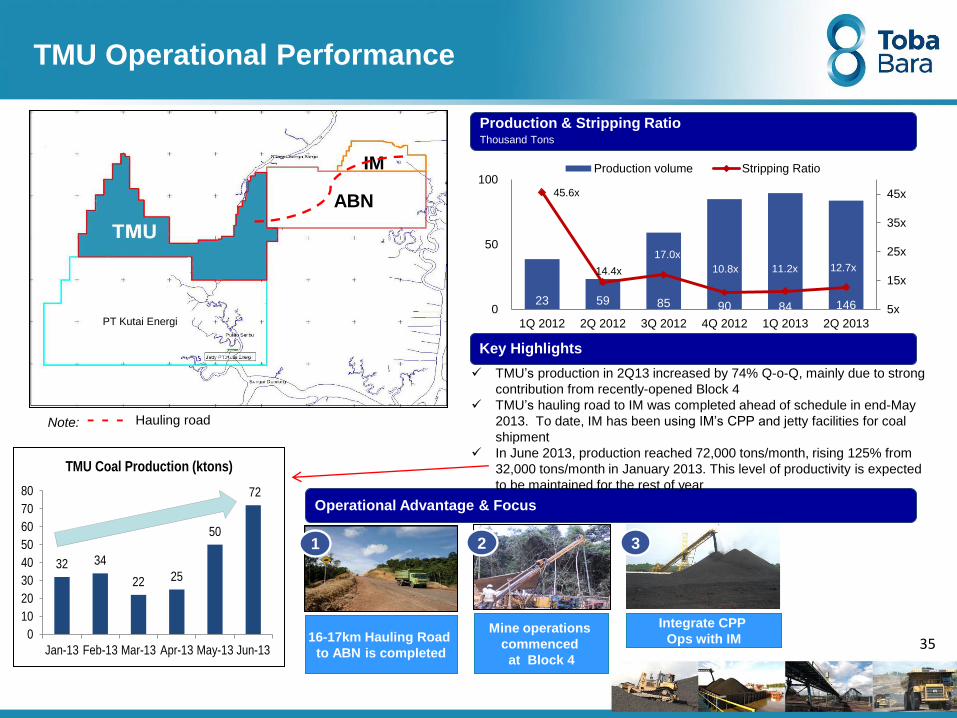
TMU Operational Performance
Key Highlights
Production & Stripping Ratio Thousand Tons
Operational Advantage & Focus
TMU’s production in 2Q13 increased by 74% Q-o-Q, mainly due to strong
contribution from recently-opened Block 4
TMU’s hauling road to IM was completed ahead of schedule in end-May
2013. To date, IM has been using IM’s CPP and jetty facilities for coal
shipment
In June 2013, production reached 72,000 tons/month, rising 125% from
32,000 tons/month in January 2013. This level of productivity is expected
to be maintained for the rest of year
16-17km Hauling Road
to ABN is completed
Integrate CPP
Ops with IM Mine operations
commenced
at Block 4
1 2 3
ABN
IM
PT Kutai Energi
Note: - - - Hauling road
23 59 85 90 84 146
45.6x
14.4x
17.0x
10.8x 11.2x 12.7x
5x
15x
25x
35x
45x
0
50
100
1Q 2012 2Q 2012 3Q 2012 4Q 2012 1Q 2013 2Q 2013
Production volume Stripping Ratio
32 34
22 25
50
72
0
10
20
30
40
50
60
70
80
Jan-13 Feb-13 Mar-13 Apr-13 May-13 Jun-13
TMU Coal Production (ktons)
36
Financial Highlights 4
37
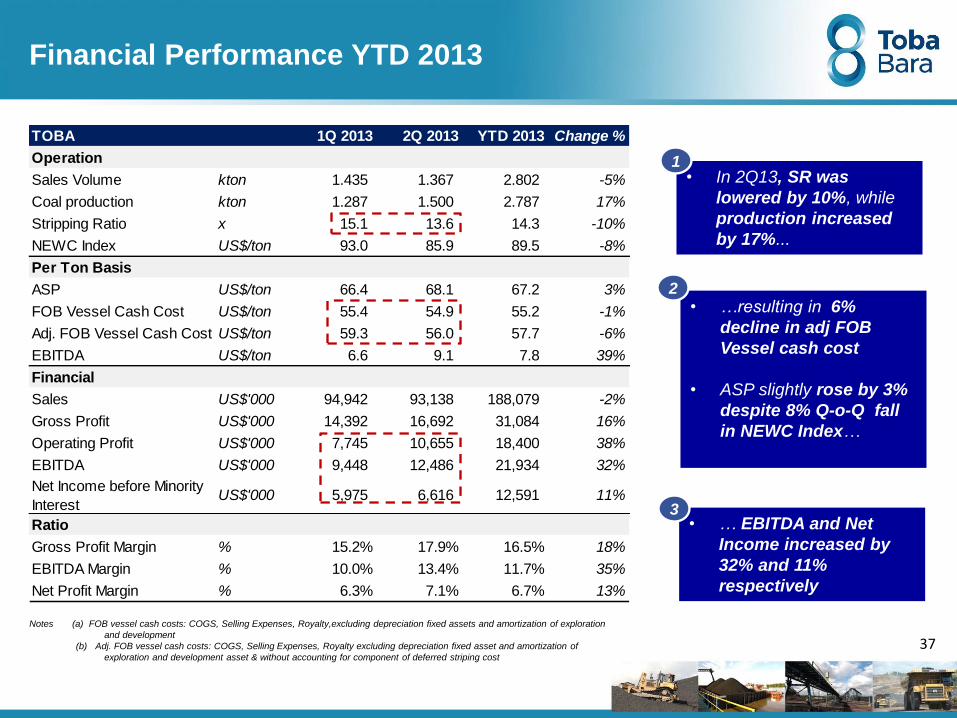
Financial Performance YTD 2013
• In 2Q13, SR was
lowered by 10%, while
production increased
by 17%...
• …resulting in 6%
decline in adj FOB
Vessel cash cost
• ASP slightly rose by 3%
despite 8% Q-o-Q fall
in NEWC Index…
Notes (a) FOB vessel cash costs: COGS, Selling Expenses, Royalty,excluding depreciation fixed assets and amortization of exploration
and development
(b) Adj. FOB vessel cash costs: COGS, Selling Expenses, Royalty excluding depreciation fixed asset and amortization of
exploration and development asset & without accounting for component of deferred striping cost
• … EBITDA and Net
Income increased by
32% and 11%
respectively
1
2
3
TOBA 1Q 2013 2Q 2013 YTD 2013 Change %
Operation
Sales Volume kton 1.435 1.367 2.802 -5%
Coal production kton 1.287 1.500 2.787 17%
Stripping Ratio x 15.1 13.6 14.3 -10%
NEWC Index US$/ton 93.0 85.9 89.5 -8%
Per Ton Basis
ASP US$/ton 66.4 68.1 67.2 3%
FOB Vessel Cash Cost US$/ton 55.4 54.9 55.2 -1%
Adj. FOB Vessel Cash Cost US$/ton 59.3 56.0 57.7 -6%
EBITDA US$/ton 6.6 9.1 7.8 39%
Financial
Sales US$'000 94,942 93,138 188,079 -2%
Gross Profit US$'000 14,392 16,692 31,084 16%
Operating Profit US$'000 7,745 10,655 18,400 38%
EBITDA US$'000 9,448 12,486 21,934 32%
Net Income before Minority
InterestUS$'000 5,975 6,616 12,591 11%
Ratio
Gross Profit Margin % 15.2% 17.9% 16.5% 18%
EBITDA Margin % 10.0% 13.4% 11.7% 35%
Net Profit Margin % 6.3% 7.1% 6.7% 13%

38
Financial Performance – 1H 2013 vs 1H 2012
Note (a) FOB vessel cash costs: COGS, Royalty, Selling Expenses excluding depreciation and
amortization
Coal production grew 13% (yoy)
driven by TMU and border mining
at IM
(a)
1H 2012 1H 2013 Change %
Operation
Sales Volume million ton 2.45 2.80 14.1
Coal Production million ton 2.47 2.79 13.0
Striping Ratio x 17.1 14.3 (16.4)
NEWC Index US$/ton 105.3 89.5 (15.0)
Financials
Sales US$ Million 202.86 188.10 (7.3%)
Gross Profit US$ Million 35.90 31.10 (13.4%)
Operating Profit US$ Million 25.11 17.82 (29.0%)
EBITDA US$ Million 27.63 21.92 (20.7%)
Net Income US$ Million 18.15 12.65 (30.3%)
Net Income after Minority US$ Million 9.73 6.61 (32.1%)
Interest
Ratio
Gross Profit Margin % 0.18 0.17 (6.6%)
EBITDA Margin % 0.14 0.12 (14.4%)
Net Profit Margin % 8.95 6.73 (24.8%)
Per Ton Basis
ASP US$/ton 82.6 67.2 (18.6%)
FOB Vessel Cash Cost US$/ton 67.6 55.0 (18.6%)
EBITDA declined 20.7%
attributable to 18.6% drop in ASP,
but compensated by lower
COGS and increased sales
volume
Toba’s 1H13 production achieved
44% of 2013 highest production
target of 6.4 million tons
FOB vessel cash cost slashed by
18.6% yoy mainly due to lower
SR and shortened dump
distance

39
Evolution of FOB Vessel Cash Cost
on Quarterly Basis
ABN
IM
1Q 2012 2Q 2012 3Q 2012 4Q 2012 2Q 2013
Adj. FOB vessel
cash cost (b) US$74/ton US$73/ton US$64/ton
US$66/ton US$64/ton US$49/ton
SR 17,6x 17,1x 14,7x 12,6x
14,6x 14,5x 13,1x 10,5x
14,2x
12,9x
US$56/ton
US$53/ton
US$51/ton
US$61/ton
Notes (a) FOB vessel cash costs: COGS, Selling Expenses, Royalty,excluding depreciation fixed assets and amortization of exploration and development
(b) Adj. FOB vessel cash costs: COGS, Selling Expenses, Royalty excluding depreciation fixed asset and amortization of exploration and development asset &
without accounting for component of deferred striping cost
FOB vessel
cash cost (a) US$65/ton US$68/ton US$61/ton US$57/ton US$56/ton
US$74/ton US$71/ton US$57/ton US$57/ton US$57/ton Adj. FOB vessel
cash cost (b)
SR
FOB vessel
cash cost (a)
TMU
Adj. FOB vessel
cash cost (b)
SR
FOB vessel
cash cost (a) US$76/ton US$69/ton US$64/ton
45,6x 14,4x 10,9x 10,8x 12,7x
US$42/ton US$66/ton
US$128/ton US$56/ton US$41/ton US$52/ton US$64/ton
1Q 2013
16,6x
11,3x
US$62/ton
US$57/ton
US$56/ton
US$55/ton
11,2x
US$44/ton
US$49/ton
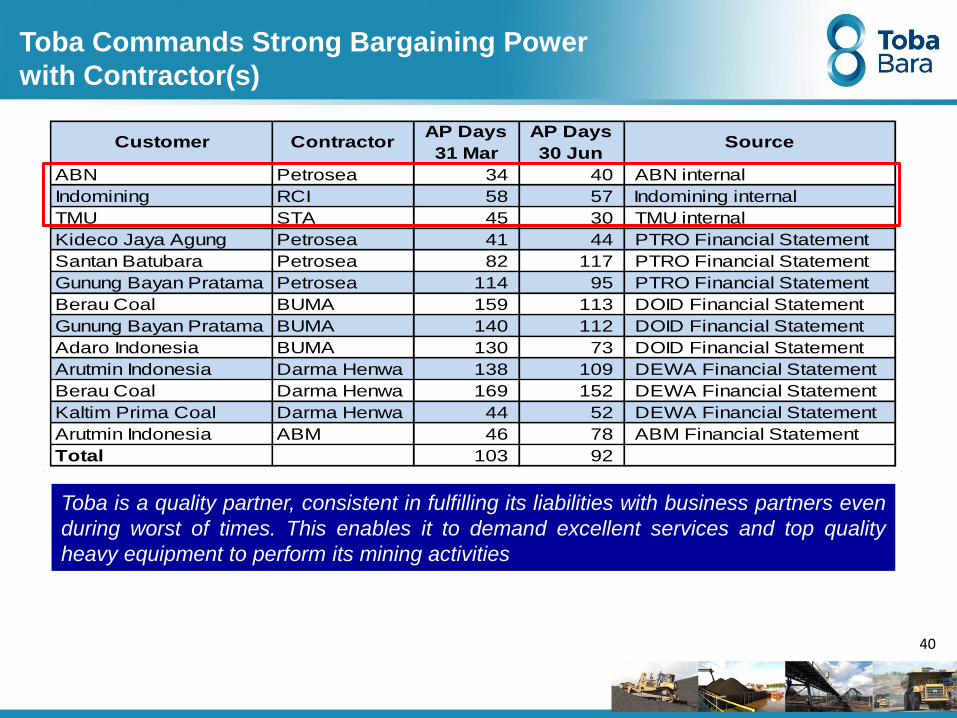
ABN Petrosea 34 40 ABN internal
Indomining RCI 58 57 Indomining internal
TMU STA 45 30 TMU internal
Kideco Jaya Agung Petrosea 41 44 PTRO Financial Statement
Santan Batubara Petrosea 82 117 PTRO Financial Statement
Gunung Bayan Pratama Petrosea 114 95 PTRO Financial Statement
Berau Coal BUMA 159 113 DOID Financial Statement
Gunung Bayan Pratama BUMA 140 112 DOID Financial Statement
Adaro Indonesia BUMA 130 73 DOID Financial Statement
Arutmin Indonesia Darma Henwa 138 109 DEWA Financial Statement
Berau Coal Darma Henwa 169 152 DEWA Financial Statement
Kaltim Prima Coal Darma Henwa 44 52 DEWA Financial Statement
Arutmin Indonesia ABM 46 78 ABM Financial Statement
Total 103 92
SourceAP Days
30 Jun Customer Contractor
AP Days
31 Mar
40
Toba Commands Strong Bargaining Power
with Contractor(s)
Toba is a quality partner, consistent in fulfilling its liabilities with business partners even
during worst of times. This enables it to demand excellent services and top quality
heavy equipment to perform its mining activities

41 Note (a) FOB Vessel Cash Costs exclude G&A, royalty, marketing fee, depreciation of fixed asset, and
amortization of exploration asset, while including deferred striping cost
Toba’s Cash Costs Comparisons
• ABN can operate in higher SR
relative to peers mainly due to
lower transportations costs from
location advantages
SR 16,6x 11,3x 7,2x 11,7x
FOB Vessel Cash Cost (a)
US$/ton
• The FOB Vessel Cash Cost
calculation excludes marketing
fees, in which HRUM and ITMG
paid significant amount
• ABN’s cash cost and SR was
high in 1Q 2013 mainly due to
pre-stripping activities in Pit 1
1Q 2013 Figures

42
Balance Sheet
• Total Assets as of June 2013
increased by 13% from December
2012
• Cash and cash equivalent rose by
47% compared to December 2012
• Shareholders Equity surged by 4%
from December 2012 to June 2013,
reflecting positive growth return
Balance Sheet US$’000
Despite decreasing trend in Coal index
price, we have successfully grown total
assets through stronger equity base
Dec-12 Mar-13 Jun-13 Movement
(Jun'13 - Dec'12)
Cash and cash equivalents 36,307 60,348 53,289 47%
Fixed Assets 34,053 35,678 41,337 21%
Others 191,166 187,232 199,681 4%
Total Assets 261,526 283,258 294,307 13%
Debt 49,033 43,352 55,804 14%
Other Liabilities 101,549 122,991 123,395 22%
Total Liabilities 150,582 166,343 179,199 19%
Shareholders Equity 110,944 116,915 115,108 4%
Total Net debt/Equity 44% 37% 48%
114
97
90
87
93
86
80
85
90
95
100
105
110
115
120
1Q 2012 2Q 2012 3Q 2012 4Q 2012 1 Q 2013 2Q 2013
NEWC Index Price (US$/tons)

34
16
39 36
60
53
35 35
44
49
43
56
0
10
20
30
40
50
60
70
1Q 2012 2Q 2012 3Q 2012 4Q 2012 1Q 2013 2Q 2013
Cash
Debt
43
Debt and Cash Position
Net Debt Position US$ Mn
2% 34% 6% 11% Net Cash 3% Net Debt to
Equity
Cash balance rose from US$16.5 mn in 2Q12 to US$53.3mn in 2Q13, causing net debt
position to improve from US$18.5mn in 2Q12 to US$3.0mn in 2Q13

Jun-12 Jun-13
Cash Generated from Operation 17,348 30,293
Income Tax Payment (37,284) (4,962)
Interest income/expenses (747) (791)
Cash flow from Operation (20,683) 24,540
Cash flow from Investment (108,205) 4,162
Cash flow from Financing 86,547 (11,304)
Movement in cash flow (42,341) 17,399
Change in Cash due to forex 257 (416.80)
Beginning Cash 58,573 36,307
Ending Cash 16,489 53,289
44
Strong Cash Flow Generation
• During current volatile coal market, Toba
opts to predominantly enter into fixed
pricing contracts with buyers and yet is
still able to secure sales on cash
prepayment basis at competitive pricing
• Positive cash position increased by
223% from US$ 16mn in 1H 2012 to US$
53mn in 1H 2013 mainly due to
prepayment and lower SR
Cash Flow Statements US$’000
Extraordinary transaction:
Significant CF from Investment
& Financing as a result of
minority restructuring
45
CSR & Environmental Highlights 5

46
• Toba is continuously developing and implementing its corporate social responsibility programs
– Creating educational opportunities for local communities including renovating schools, training teachers,
providing post-graduate educational assistance and creating a literacy program for adults and a scholarship
program for school-aged children
– Providing health services to the local communities
– Helping groups of farmers plant crops of vegetables and bamboo and assisting with land rehabilitation
– Creating local employment opportunities by sourcing some of the Company’s site workforce from the
neighboring areas
Helping Farmers Plant Crops Creating Educational Opportunities Providing Health Services
Toba is Committed to Being a Responsible
Corporate Citizen

2007 2008 2009 2010
2
0
1
1
Target
PROPER Mining Award in
ABN, IM, & TMU
47
Award and Recognition
ABN
East Kalimantan PROPER Green
Mining Award
2012 2014 2011
Ernst and Young
Social
Entrepreneur of
the Year 2011
2013
Indomining
East Kalimantan PROPER Blue
Mining Award
PT Toba Bara Sejahtra Ranks as one of Indonesia’s
Top 50 companies
!

48
Appendix

49
• Current production capacity (31 December 2012):
– Crusher: 10 MM tonnes p.a.
– Conveyor: 10 MM tonnes p.a.
• Produces two varieties of blended thermal coal
– ABN 52: Marketed CV(1) of 5,200 kcal / kg GAR
– ABN 55: Marketed CV of 5,500 kcal / kg GAR
– ABN 58 : Marketed CV of 5,800 kcal / kg GAR
• Substantially all of the owners of the land within ABN’s
concession area have been compensated and ABN has been
granted the exclusive right to mine those areas
• Area: 2,990 ha
• Location: Sanga-Sanga, Kutai Kartanegara, East Kalimantan
• Type of license: IUPOP
• Expiry date: 1 December 2029
• Commencement of production: September 2008
• 2012 production: 4.4 MM tonnes
• Mining consultant: PT Runge Indonesia
ABN: Coal Concession Overview
IM
TMU
ABN
Jetty ABN
Overview
Operations
Marketing
• Historically sold between 50%-100% of its annual production through
long-term (longer than 1 year) with coal trading companies
– The remainder were sold on the spot market
• Currently, IM sells coal to buyers based on fixed priced contracts up
to one year, backed with pre-determined cash prepayments
Note:
1. Calorific value

50
• Current production capacity (31 December 2012):
– Crusher: 3.0 MM tonnes p.a.
– Conveyor: 4.5 MM tonnes p.a.
• Produced one variety of blended thermal coal “Indomining”
with marketed CV(1) of 5,700 kcal / kg GAR in 2012
– May produce additional varieties of blended thermal coal in
the future
• Has compensated the majority all of the owners of the land
within its concession area for their land and has been granted
the exclusive right to mine those areas
• Area: 683 ha
• Location: Sanga-Sanga, Kutai Kartanegara, East Kalimantan
• Type of license: IUPOP
• Expiry date: IUPOP effective until 2023 and can be renewed for
another 10 years
• Production commencement: August 2007
• 2012 production: 1 MM tonnes
• Mining consultant: PT SMG Consultants
IM: Coal Concession Overview
IM
TMU
Overview
Operations
Marketing
• Historically sold approximately 50% of its annual production through
short-term (one year or shorter) contracts with coal trading companies
– Clients include Glencore, Flame, Peabody, Dragon, Aempire
• The remainder are sold on the spot market
• Currently, IM sells coal to buyers based on fixed priced contracts up to
one year, backed with pre-determined cash prepayments
IM
Jetty
Note:
1. Calorific value
ABN

51
• Current production capacity (31 December 2012):
– Crusher: 1.4 MM tons p.a.
• Produces one variety of blended thermal coal “Trisensa-
47”, with marketed CV(1) of 4,700 kcal / kg GAR
– May produce additional varieties of blended thermal
coal in the future
• Area: 3,414 ha
• Location: Loa Janan, Muara Jawa and Sanga-Sanga,
Kutai Kartanegara, East Kalimantan
• Type of license: IUPOP
• Expiry date: 14 December 2023
• Commencement of production: October 2011
• 2012 coal production: ~257,000 tons
• Mining consultant: Marston & Marston
TMU: Coal Concession Overview
Overview
Operations & Marketing
Note:
1. Calorific value
Kutai Energi haul
road and jetty
(17 km)
IM
ABN
TMU
Sungai Sangasanga
Sungai Dondang
Pulau Seribu
Jetty KE
Completed haul road
to ABN and IM (25 km)