1
Tutorial:
Causal Model Search
Richard Scheines
Carnegie Mellon University
Peter Spirtes, Clark Glymour, Joe Ramsey,
others
Goals
1) Convey rudiments of graphical causal models
2) Basic working knowledge of Tetrad IV
2

Tetrad: Complete Causal Modeling Tool
3

Tetrad
1) Main website: http://www.phil.cmu.edu/projects/tetrad/
2) Download: http://www.phil.cmu.edu/projects/tetrad/current.html
3) Data files:
www.phil.cmu.edu/projects/tetrad_download/download/workshop/Data
/
4) Download from Data directory:• tw.txt • Charity.txt• Optional:
• estimation1.tet, estimation2.tet• search1.tet, search2.tet, search3.tet 4

Outline
1) Motivation
2) Representing/Modeling Causal Systems
3) Estimation and Model fit
4) Causal Model Search
5
Statistical Causal Models: Goals
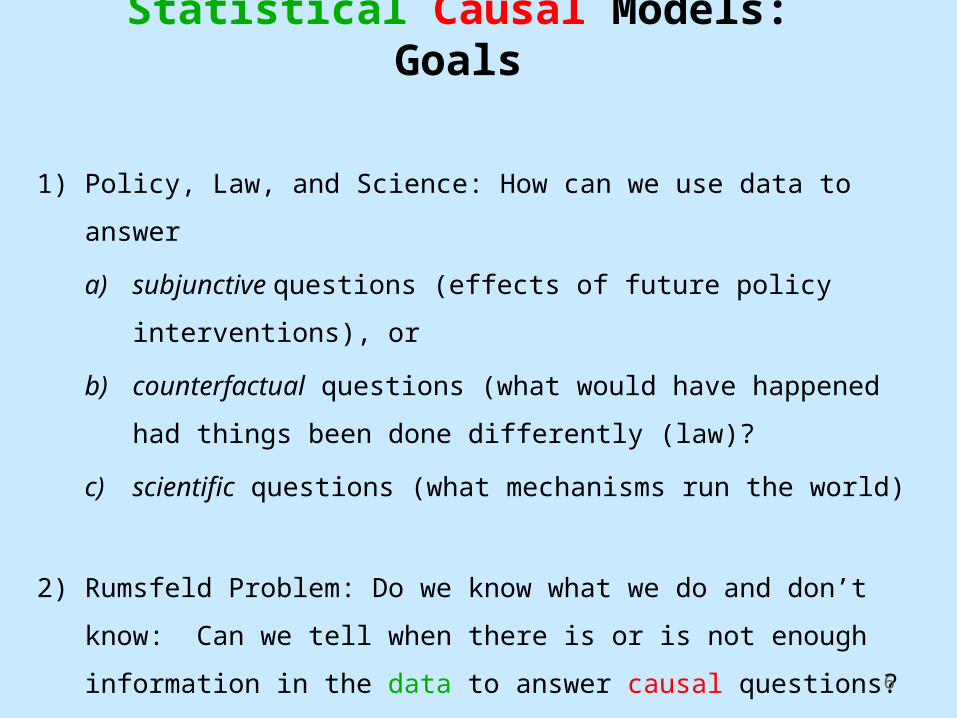
1) Policy, Law, and Science: How can we use data to answer
a) subjunctive questions (effects of future policy interventions), or
b) counterfactual questions (what would have happened had things
been done differently (law)?
c) scientific questions (what mechanisms run the world)
2) Rumsfeld Problem: Do we know what we do and don’t know: Can we
tell when there is or is not enough information in the data to answer
causal questions?
6

Causal Inference Requires More than Probability
In general: P(Y=y | X=x, Z=z) ≠ P(Y=y | Xset=x, Z=z)
Prediction from Observation ≠ Prediction from Intervention
P(Lung Cancer 1960 = y | Tar-stained fingers 1950 = no)
Causal Prediction vs. Statistical Prediction:
Non-experimental data(observational study)
Background Knowledge
P(Y,X,Z)
P(Y=y | X=x, Z=z)
Causal Structure
P(Y=y | Xset=x, Z=z)
≠ P(Lung Cancer 1960 = y | Tar-stained fingers 1950set = no)
7

Causal Search
8
Causal Search:
1. Find/compute all the causal models that are
indistinguishable given background knowledge and data
2. Represent features common to all such models
Multiple Regression is often the wrong tool for Causal Search:
Example: Foreign Investment & Democracy

9
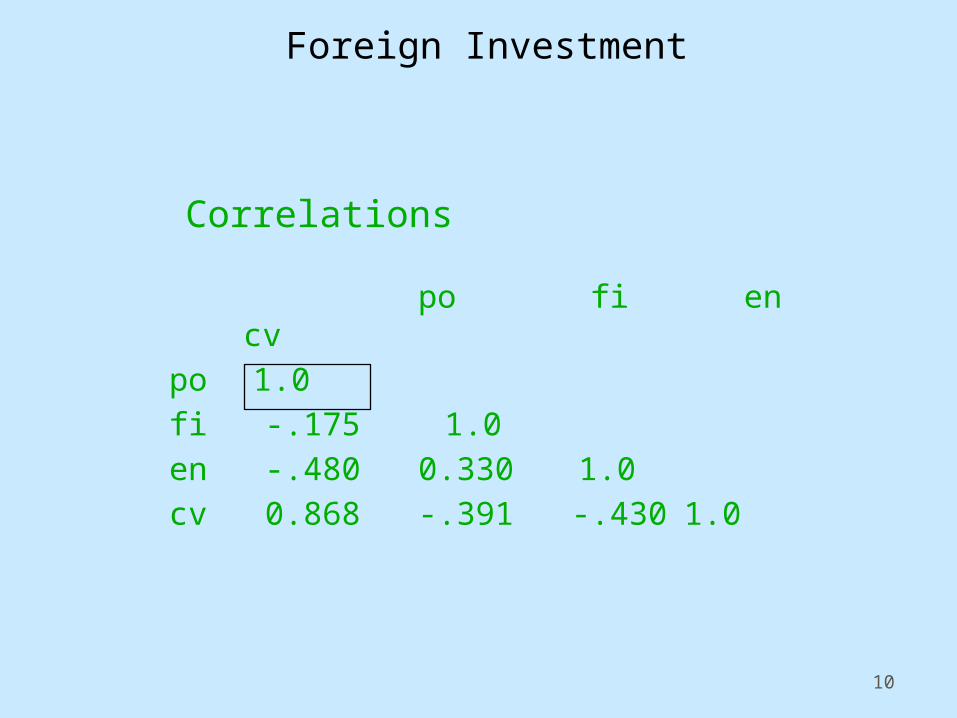
Foreign Investment
Does Foreign Investment in 3rd World Countries inhibit Democracy?
Timberlake, M. and Williams, K. (1984). Dependence, political exclusion, and government repression: Some cross-national evidence. American Sociological Review 49, 141-146.
N = 72
PO degree of political exclusivity
CV lack of civil liberties
EN energy consumption per capita (economic development)
FI level of foreign investment
10
Correlations
po fi en cv po 1.0fi -.175 1.0 en -.480 0.330 1.0 cv 0.868 -.391 -.430 1.0
Foreign Investment

11
Regression Results
po = .227*fi - .176*en + .880*cv
SE (.058) (.059) (.060)
t 3.941 -2.99 14.6
Interpretation: foreign investment increases political repression
Case Study: Foreign Investment

Alternatives
.217
FI
PO
CV En
Regression
.88 -.176
FI
PO
CV En
Tetrad - FCI
FI
PO
CV En
Fit: df=2, 2=0.12, p-value = .94
.31 -.23
.86 -.48
Case Study: Foreign Investment
There is no model with testable constraints (df > 0) that is not rejected by the data, in which FI has a positive effect on PO.

13
Tetrad Demo
1. Load tw.txt data
2. Estimate regression
3. Search for alternatives
4. Estimate alternative

14
Tetrad Hands-On
1. Load tw.txt data
2. Estimate regression

Outline
1) Motivation
2) Representing/Modeling Causal Systems
1) Causal Graphs
2) Standard Parametric Models
1) Bayes Nets
2) Structural Equation Models
3) Other Parametric Models
1) Generalized SEMs
2) Time Lag models
15
16
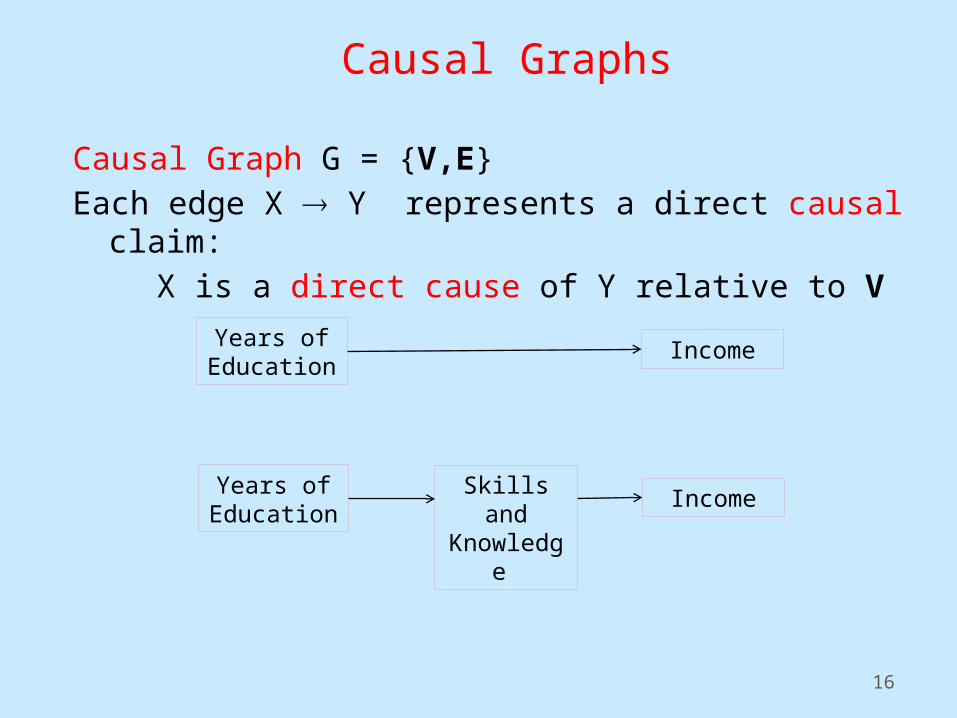
Causal Graph G = {V,E}
Each edge X Y represents a direct causal claim:
X is a direct cause of Y relative to V
Causal Graphs
Years of Education
Income
IncomeSkills and Knowledge
Years of Education

17
Causal Graphs
Not Cause Complete
Common Cause Complete
IncomeSkills and Knowledge
Years of Education
Omitteed Causes
Omitteed Common Causes
IncomeSkills and Knowledge
Years of Education

18
Sweaters On
Room Temperature
Pre-experimental SystemPost
Modeling Ideal Interventions
Interventions on the Effect

19
Modeling Ideal Interventions
SweatersOn
Room Temperature
Pre-experimental SystemPost
Interventions on the Cause
20
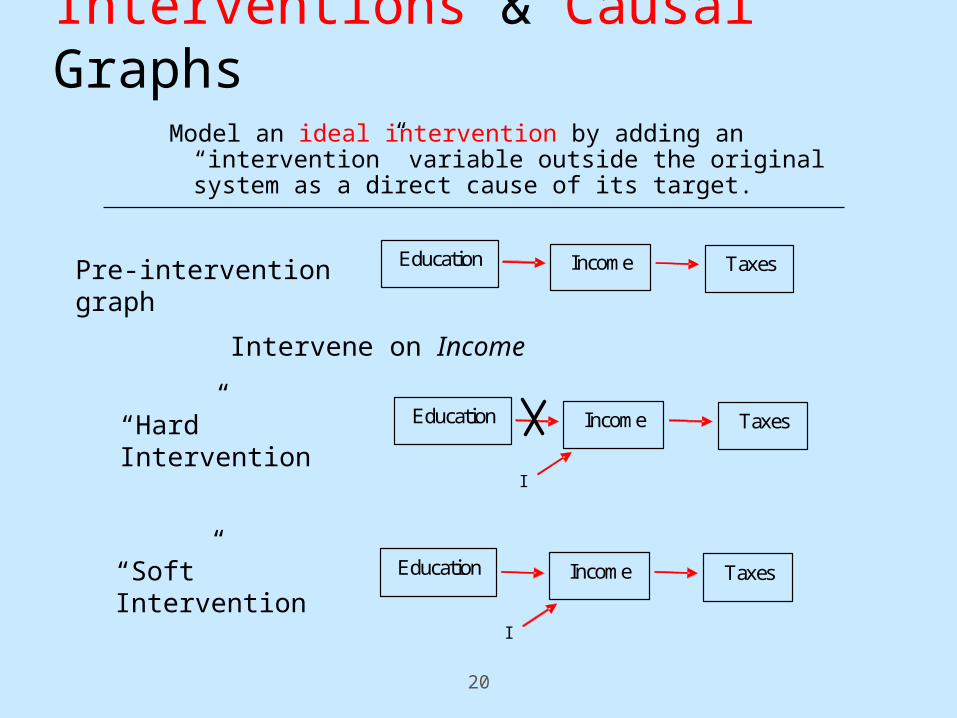
Interventions & Causal GraphsModel an ideal intervention by adding an “intervention” variable
outside the original system as a direct cause of its target.
Education Income Taxes Pre-intervention graph
Intervene on Income
“Soft” Intervention
Education Income Taxes
I
“Hard” Intervention
Education Income Taxes
I
21
Tetrad Demo & Hands-On
Build and Save an acyclic causal graph:
1) with 3 measured variables, no latents
2) with 5 variables, and at least 1 latent

22
Parametric Models
23
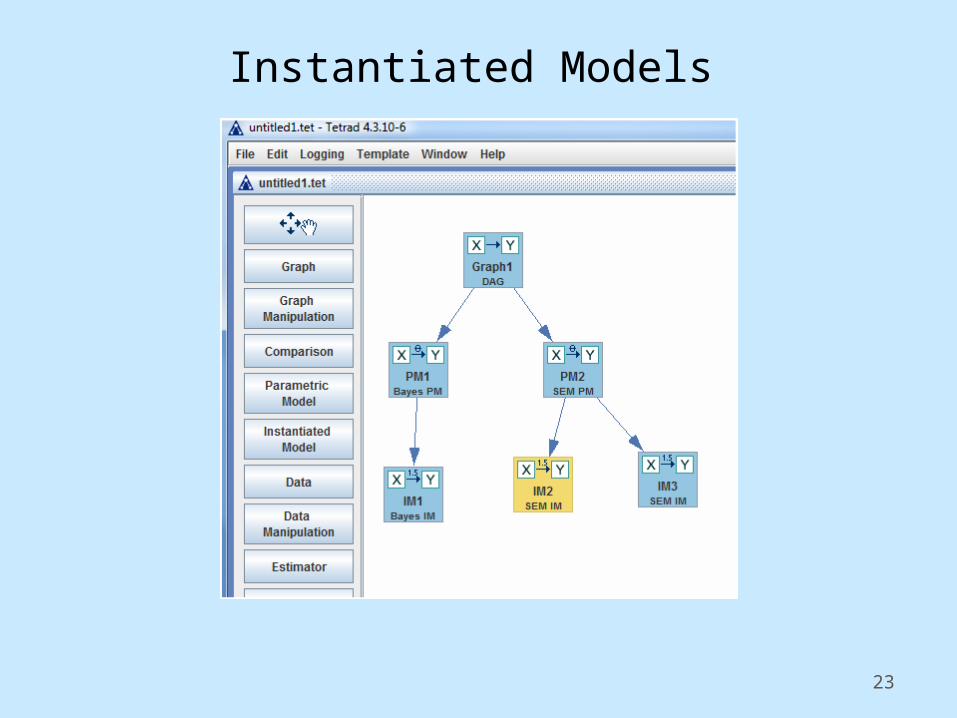
Instantiated Models
24
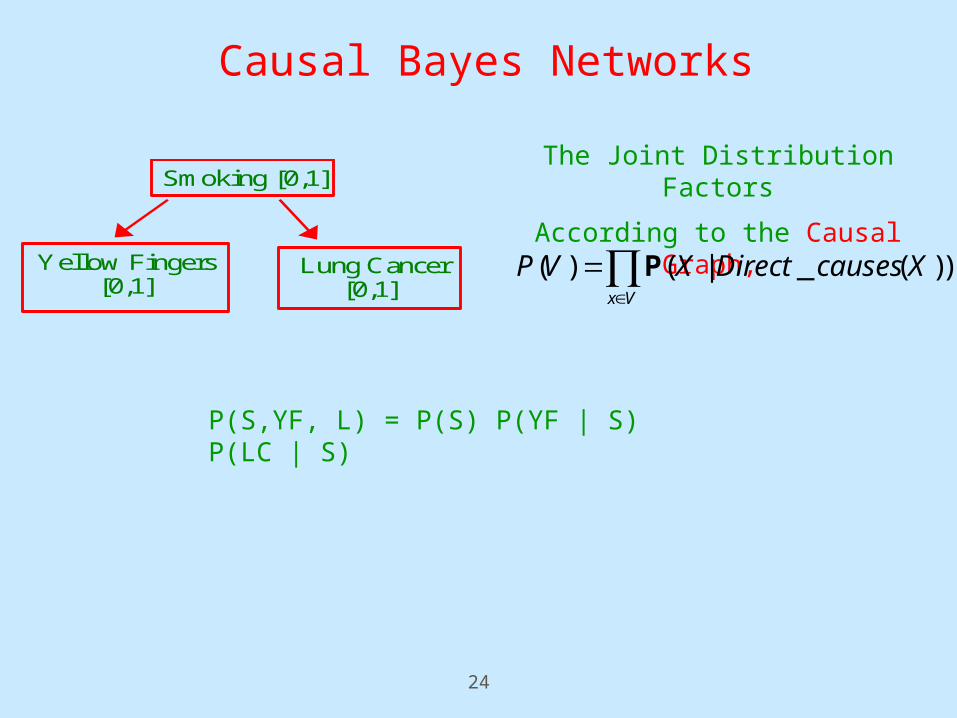
Causal Bayes Networks
Smoking [0,1]
Lung Cancer[0,1]
Yellow Fingers[0,1]
P(S,YF, L) = P(S) P(YF | S) P(LC | S)
The Joint Distribution Factors
According to the Causal Graph,
))(_|()(
Vx
XcausesDirectXVP P

25
Causal Bayes Networks
P(S = 0) = 1
P(S = 1) = 1 - 1
P(YF = 0 | S = 0) = 2 P(LC = 0 | S = 0) = 4
P(YF = 1 | S = 0) = 1- 2 P(LC = 1 | S = 0) = 1- 4
P(YF = 0 | S = 1) = 3 P(LC = 0 | S = 1) = 5
P(YF = 1 | S = 1) = 1- 3 P(LC = 1 | S = 1) = 1- 5
Smoking [0,1]
Lung Cancer[0,1]
Yellow Fingers[0,1]
P(S) P(YF | S) P(LC | S) = f()
The Joint Distribution Factors
According to the Causal Graph,
))(_|()(
Vx
XcausesDirectXVP P
All variables binary [0,1]: = {1, 2,3,4,5, }
26
Tetrad Demo & Hands-On
1) Attach a Bayes PM to your 3-variable graph
2) Define the Bayes PM (# and values of categories for each
variable)
3) Attach an IM to the Bayes PM
4) Fill in the Conditional Probability Tables.

27
Structural Equation Models
Structural EquationsFor each variable X V, an assignment equation:
X := fX(immediate-causes(X), eX)
Education
LongevityIncome
Causal Graph
Exogenous Distribution: Joint distribution over the exogenous vars : P(e)

28
Equations: Education := Education
Income :=Educationincome
Longevity :=EducationLongevit
y
Education
LongevityIncome
Causal Graph
Education
Income Longevity
1 2
Longevity Income
Education
Path diagram
Linear Structural Equation Models
E.g. (ed, Income,Income ) ~N(0,2)
2 diagonal,
- no variance is zero
Exogenous Distribution: P(ed, Income,Income )
- i≠j ei ej (pairwise independence)
- no variance is zero
Structural Equation Model:
V = BV + E
29
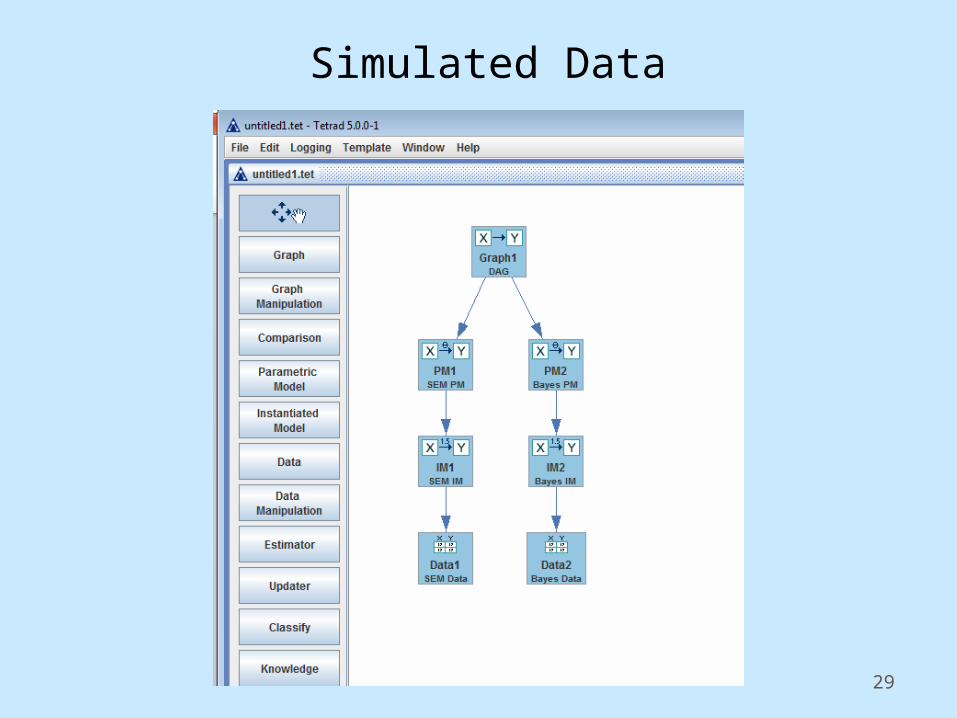
Simulated Data
30
Tetrad Demo & Hands-On
1) Attach a SEM PM to your 3-variable graph
2) Attach a SEM IM to the SEM PM
3) Change the coefficient values.
4) Simulate Data from both your SEM IM and your Bayes IM

Outline
1) Motivation
2) Representing/Modeling Causal Systems
3) Estimation and Model fit
4) Model Search
31

32
Estimation

33
Estimation
34
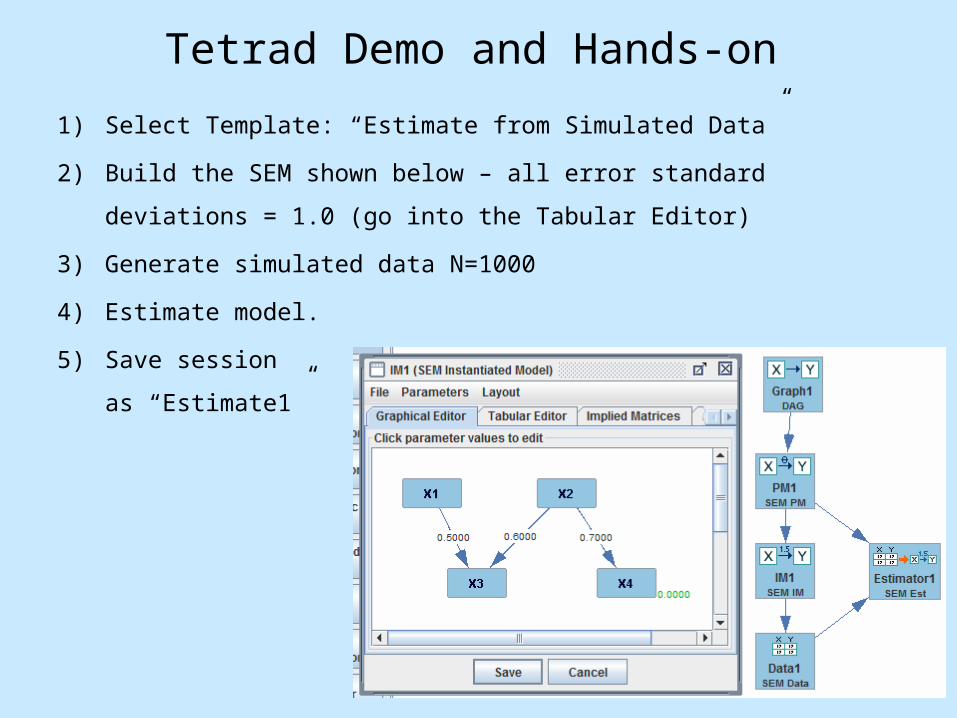
Tetrad Demo and Hands-on
1) Select Template: “Estimate from Simulated Data”
2) Build the SEM shown below – all error standard deviations = 1.0 (go into
the Tabular Editor)
3) Generate simulated data N=1000
4) Estimate model.
5) Save session
as “Estimate1”

35
Estimation
36
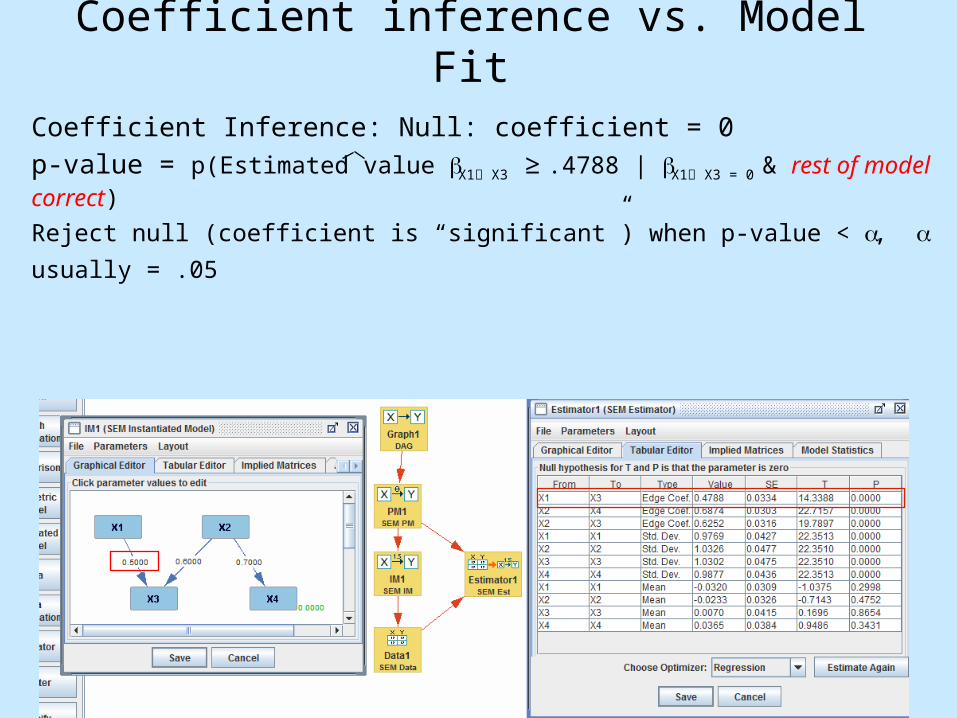
Coefficient inference vs. Model FitCoefficient Inference: Null: coefficient = 0
p-value = p(Estimated value bX1 X3 ≥ .4788 | bX1 X3 = 0 & rest of model correct)
Reject null (coefficient is “significant”) when p-value < a, a usually = .05
37
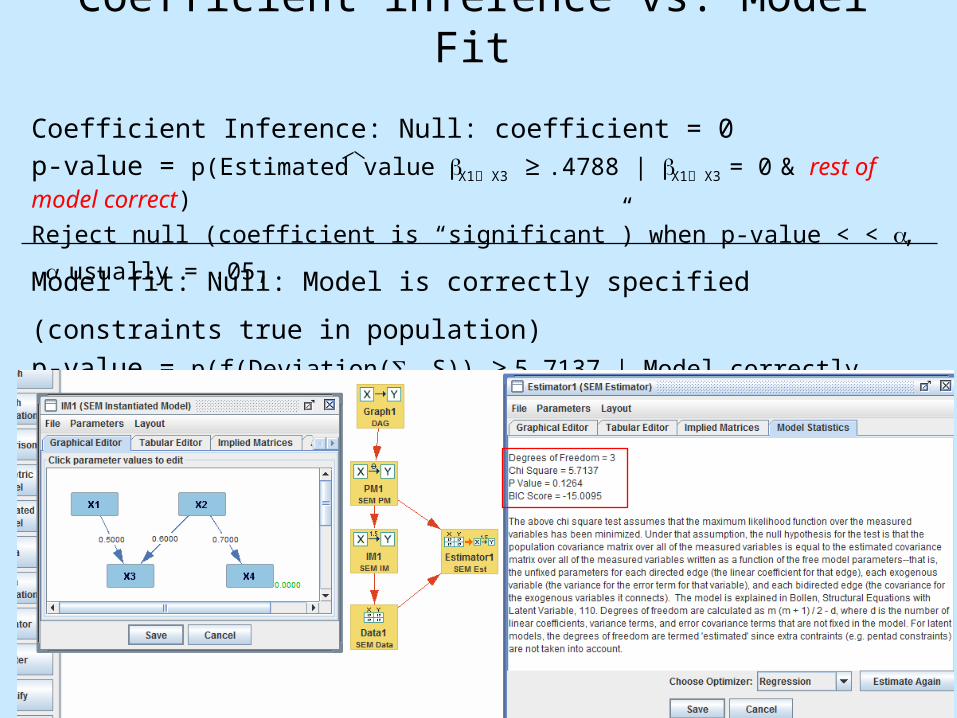
Coefficient inference vs. Model Fit
Coefficient Inference: Null: coefficient = 0
p-value = p(Estimated value bX1 X3 ≥ .4788 | bX1 X3 = 0 & rest of model correct)
Reject null (coefficient is “significant”) when p-value < < a, a usually = .05,
Model fit: Null: Model is correctly specified (constraints true in population)
p-value = p(f(Deviation(Sml,S)) ≥ 5.7137 | Model correctly specified)
38
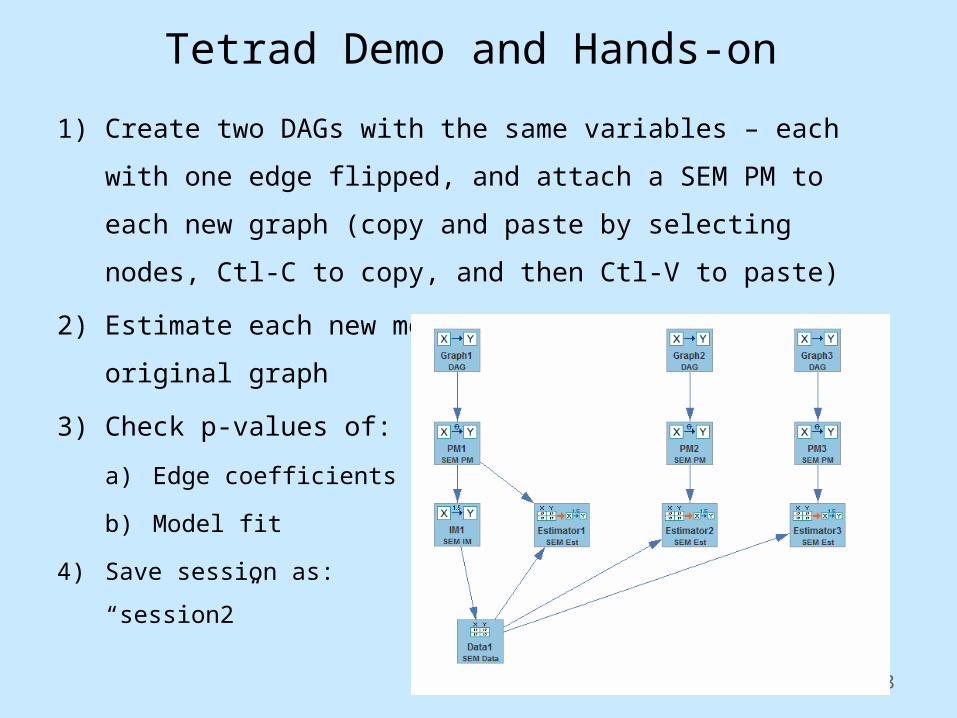
Tetrad Demo and Hands-on
1) Create two DAGs with the same variables – each with one edge
flipped, and attach a SEM PM to each new graph (copy and paste
by selecting nodes, Ctl-C to copy, and then Ctl-V to paste)
2) Estimate each new model on the data produced by original graph
3) Check p-values of:
a) Edge coefficients
b) Model fit
4) Save session as:
“session2”
39
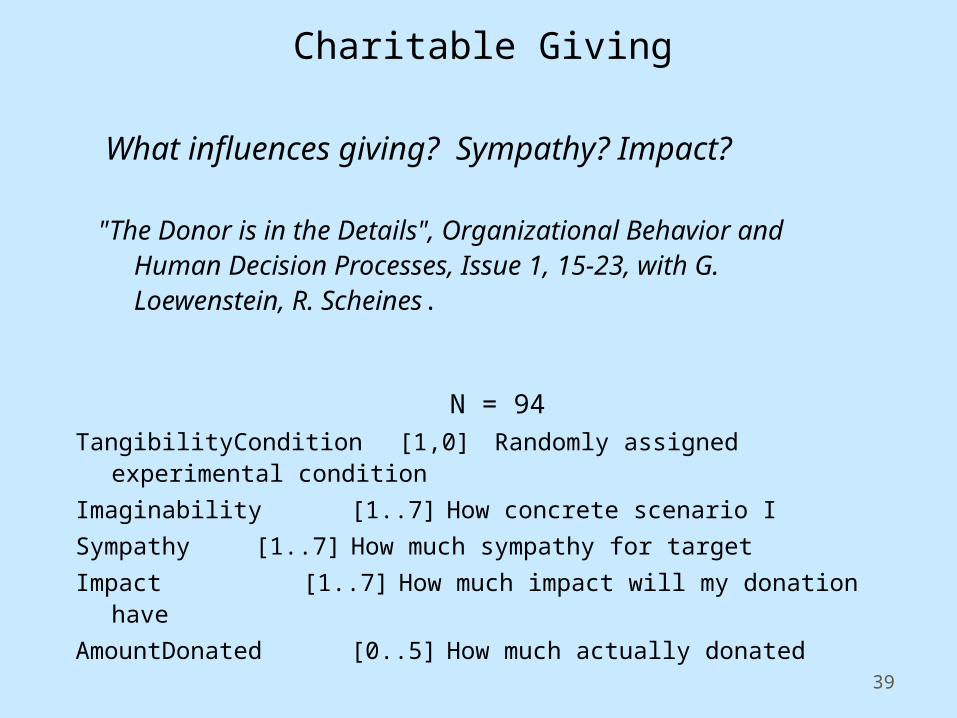
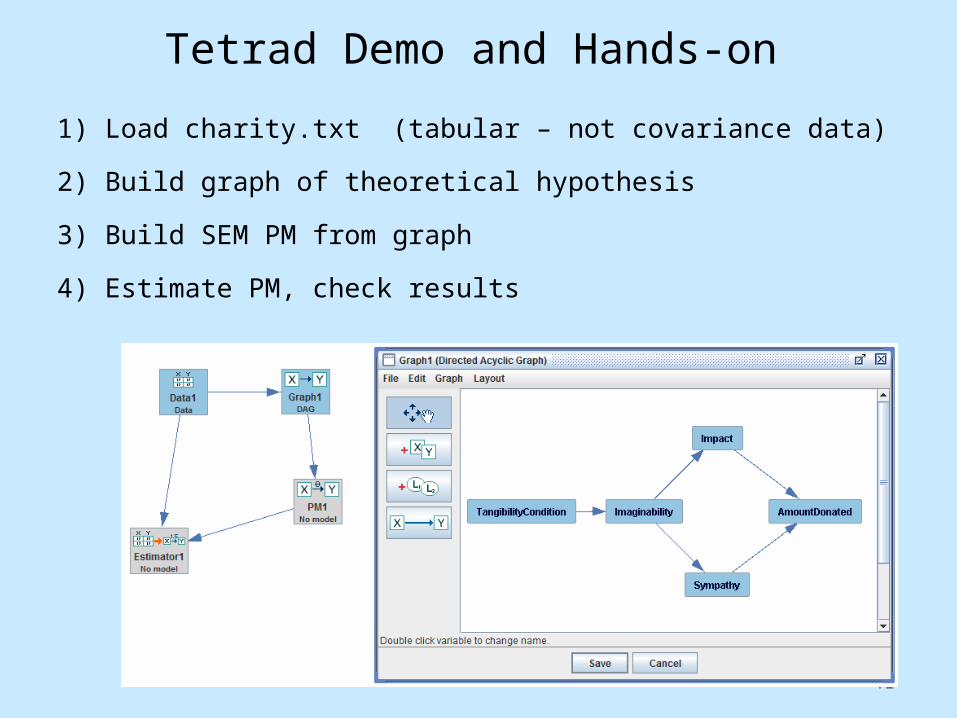
Charitable Giving
What influences giving? Sympathy? Impact?
"The Donor is in the Details", Organizational Behavior and Human Decision Processes, Issue 1, 15-23, with G. Loewenstein, R. Scheines.
N = 94TangibilityCondition [1,0] Randomly assigned experimental condition
Imaginability [1..7] How concrete scenario I
Sympathy [1..7] How much sympathy for target
Impact [1..7] How much impact will my donation have
AmountDonated [0..5] How much actually donated

Theoretical Hypothesis
40
Hypothesis 2
41
Tetrad Demo and Hands-on
1) Load charity.txt (tabular – not covariance data)
2) Build graph of theoretical hypothesis
3) Build SEM PM from graph
4) Estimate PM, check results

10 MinuteBreak
42

Outline
1) Motivation
2) Representing/Modeling Causal Systems
3) Estimation and Model fit
4) Model Search
1) Bridge Principles (Causal Graphs Probability Constraints):
a) Markov assumption
b) Faithfulness assumption
c) D-separation
2) Equivalence classes
3) Search
43

44
Constraint Based Search
Background Knowledge
e.g., X2 prior in time to X3
X3 | X2 X1
Statistical Constraints
Data
Statistical Inference
X2 X3 X1
Equivalence Class of Causal Graphs
X2 X3 X1
X2 X3 X1
Discovery Algorithm
Causal Markov Axiom (D-separation)
X1 _||_X2 | X3 means: P(X1, X2 | X3) = P(X1 | X3)P(X2 | X3)
X1 _||_ X2 means: P(X1, X2) = P(X1)P(X2)

45
Score Based Search
Background Knowledge
e.g., X2 prior in time to X3
Data
Model Score
X2 X3 X1
Equivalence Class of Causal Graphs
X2 X3 X1
X2 X3 X1
Equivalence Class of Causal Graphs
X2 X3 X1
X2 X3 X1
X2 X3 X1
Equivalence Class of Causal Graphs
X2 X3 X1

46
Independence Equivalence Classes:Patterns & PAGs
• Patterns (Verma and Pearl, 1990): graphical representation of d-separation equivalence among models with no latent common causes
• PAGs: (Richardson 1994) graphical representation of a d-separation equivalence class that includes models with latent common causes and sample selection bias that are d-separation equivalent over a set of measured variables X

47
Patterns
X2 X1
X2 X1
X2 X1
X4 X3
X2 X1
Possible Edges Example
48
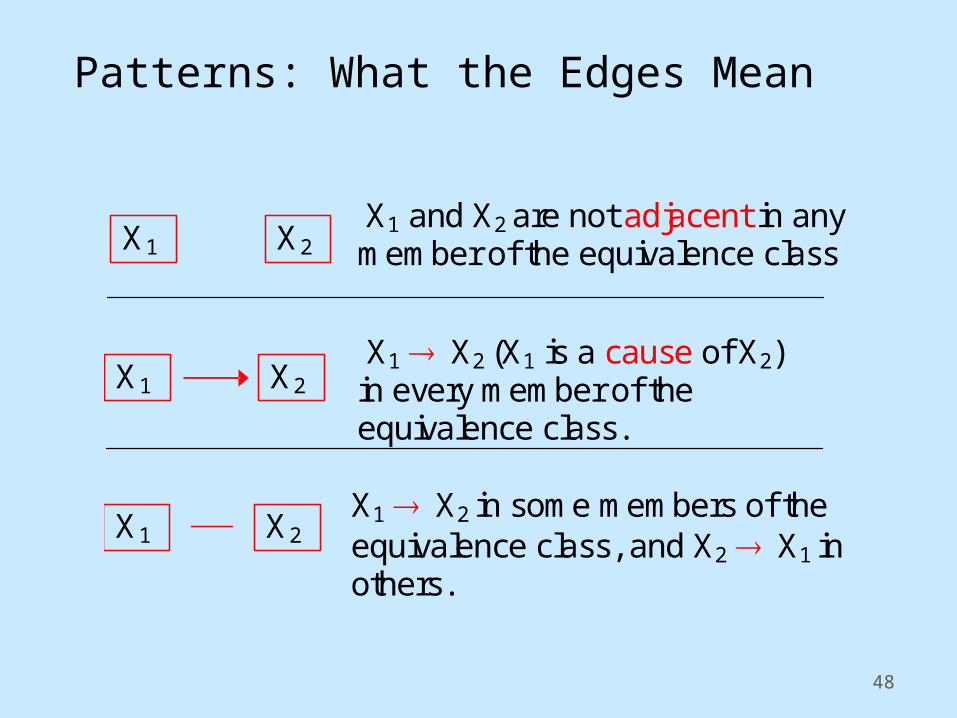
Patterns: What the Edges Mean
X2 X1
X2 X1 X1 X2 in some members of the equivalence class, and X2 X1 in others.
X1 X2 (X1 is a cause of X2) in every member of the equivalence class.
X2 X1 X1 and X2 are not adjacent in any member of the equivalence class

49
Patterns
X2
X4 X3
X1
X2
X4 X3
Represents
Pattern
X1 X2
X4 X3
X1

50
Tetrad Demo and Hands On
51
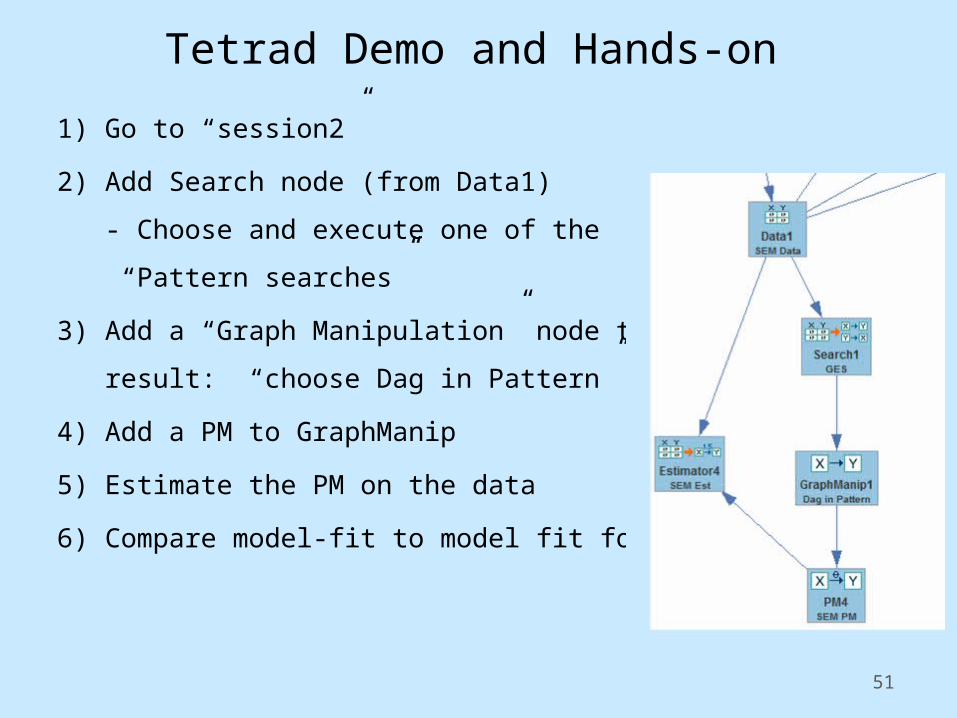
Tetrad Demo and Hands-on
1) Go to “session2”
2) Add Search node (from Data1)
- Choose and execute one of the
“Pattern searches”
3) Add a “Graph Manipulation” node to search
result: “choose Dag in Pattern”
4) Add a PM to GraphManip
5) Estimate the PM on the data
6) Compare model-fit to model fit for true model
52
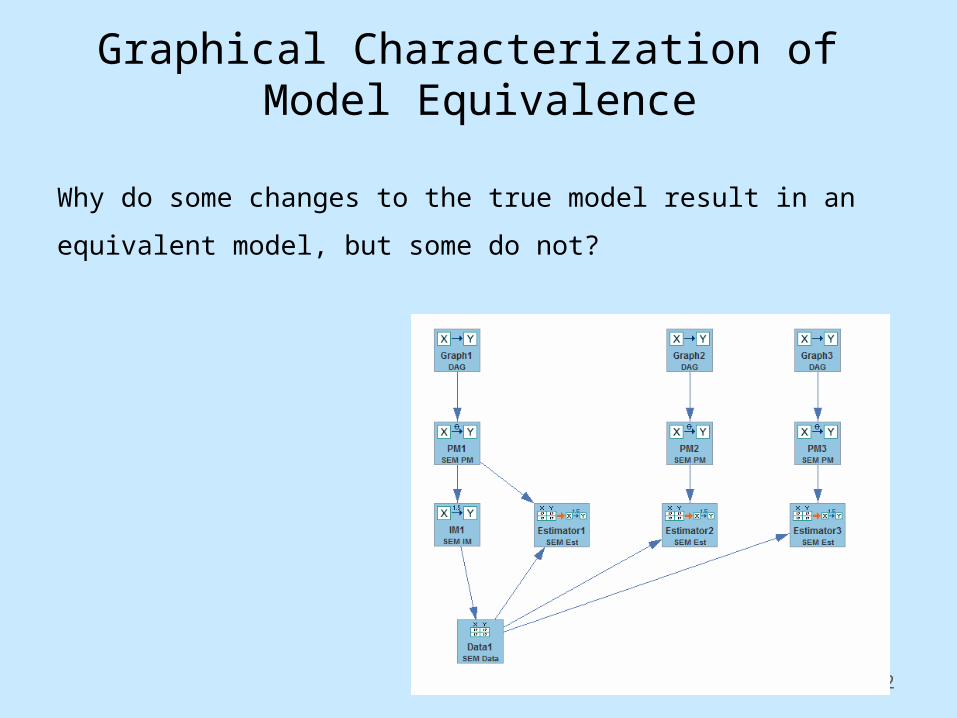
Graphical Characterization of Model Equivalence
Why do some changes to the true model result in an equivalent model,
but some do not?

53
D-separation Equivalence Theorem (Verma and Pearl, 1988)
Two acyclic graphs over the same set of variables are
d-separation equivalent iff they have:
• the same adjacencies
• the same unshielded colliders
d-separation/Independence Equivalence

54
Colliders
Y: Collider
Shielded Unshielded
X
Y
Z
X
Y
Z X
Y
Z
Y: Non-Collider X
Y
Z X
Y
ZX
Y
Z

55
Constraint Based Search
Background Knowledge
e.g., X2 prior in time to X3
X3 | X2 X1
Statistical Constraints
Data
Statistical Inference
X2 X3 X1
Equivalence Class of Causal Graphs
X2 X3 X1
X2 X3 X1
Discovery Algorithm
Causal Markov Axiom (D-separation)
X1 _||_X2 | X3 means: P(X1, X2 | X3) = P(X1 | X3)P(X2 | X3)
X1 _||_ X2 means: P(X1, X2) = P(X1)P(X2)

56
Backround KnowledgeTetrad Demo and Hands-on
1) Create new session
2) Select “Search from Simulated Data” from Template menu
3) Build graph below, PM, IM, and generate sample data N=1,000.
4) Execute PC search, a = .05

57
Backround KnowledgeTetrad Demo and Hands-on
1) Add “Knowledge” node – as below
2) Create “Tiers” as shown below.
3) Execute PC search again, a = .05
4) Compare results (Search2) to previous search (Search1)
58
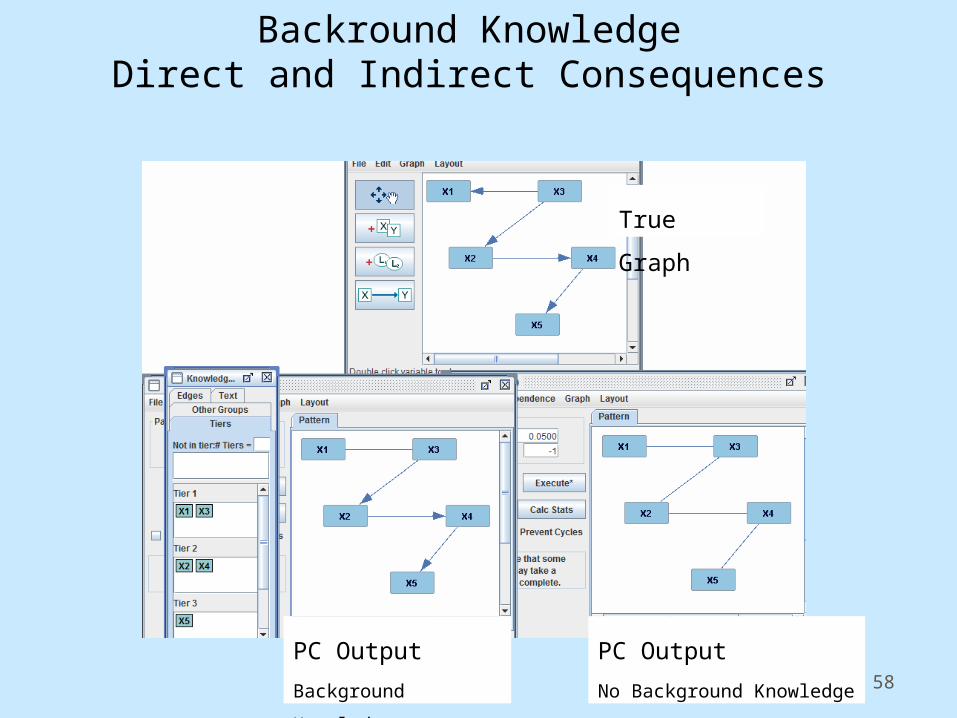
Backround KnowledgeDirect and Indirect Consequences
True Graph
PC Output
Background Knowledge
PC Output
No Background Knowledge
59
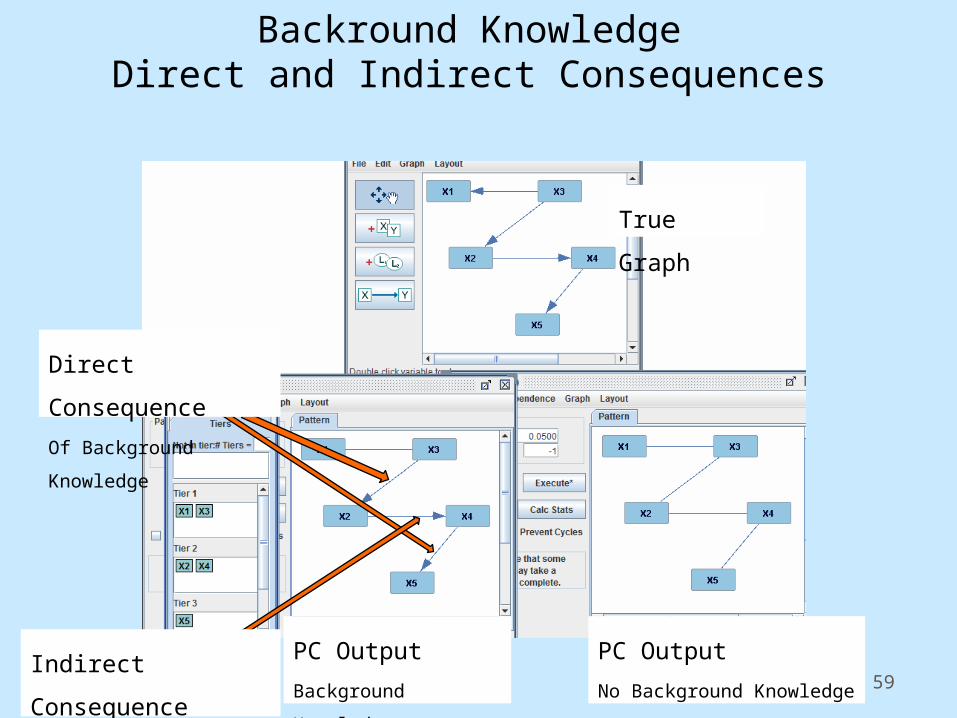
Backround KnowledgeDirect and Indirect Consequences
True Graph
PC Output
Background Knowledge
PC Output
No Background Knowledge
Direct Consequence
Of Background Knowledge
Indirect Consequence
Of Background Knowledge

60
Independence Equivalence Classes:Patterns & PAGs
• Patterns (Verma and Pearl, 1990): graphical representation of d-separation equivalence among models with no latent common causes
• PAGs: (Richardson 1994) graphical representation of a d-separation equivalence class that includes models with latent common causes and sample selection bias that are d-separation equivalent over a set of measured variables X
61
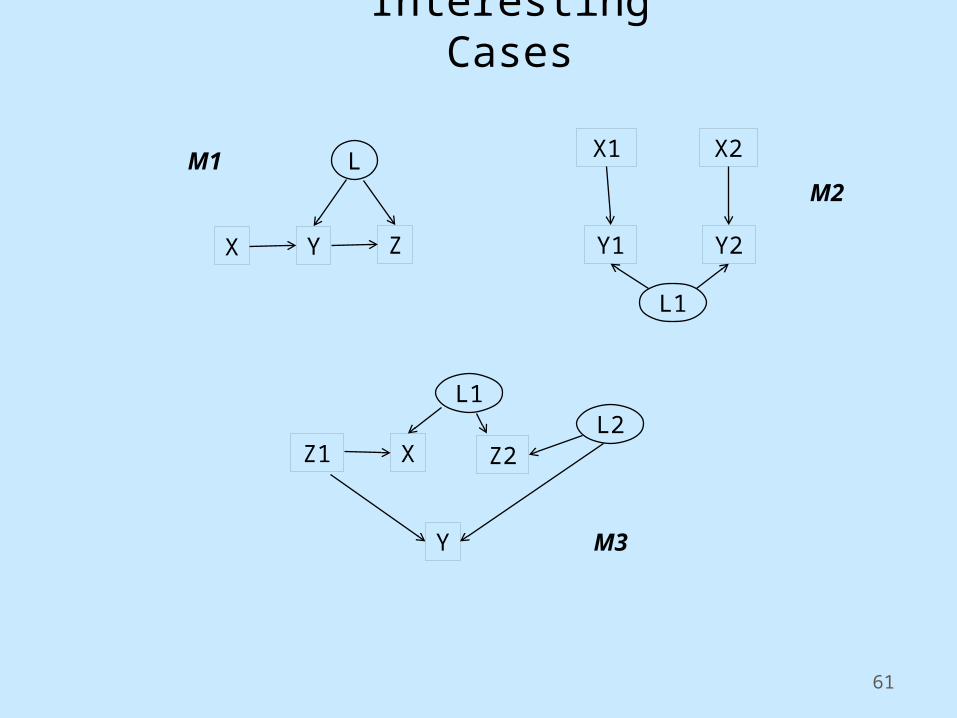
Interesting Cases
X Y Z
L
X
Y
Z2
L1
M1M2
M3
Z1L2
X1
Y2
L1
Y1
X2

62
PAGs: Partial Ancestral Graphs
X2
X3
X1
X2
X3
Represents
PAG
X1 X2
X3
X1
X2
X3
T1
X1
X2
X3
X1
etc.
T1
T1 T2

63
PAGs: Partial Ancestral Graphs
Z2
X
Z1
Z2
X3
Represents
PAG
Z1 Z2
X3
Z1
etc.
T1
Y
Y Y
Z2
X3
Z1 Z2
X3
Z1
T2
Y Y
T1
T1

64
PAGs: Partial Ancestral Graphs
X2 X1
X2 X1
X2 X1
X2 There is a latent commoncause of X1 and X2
No set d-separates X2 and X1
X1 is a cause of X2
X2 is not an ancestor of X1
X1
X2 X1 X1 and X2 are not adjacent
What PAG edges mean.

65
Tetrad Demo and Hands-on
1) Create new session
2) Select “Search from Simulated Data” from Template menu
3) Build graph below, SEM PM, IM, and generate sample data N=1,000.
4) Execute PC search, a = .05
5) Execute FCI search, a = .05
6) Estimate multiple regression,
Y as response,
Z1, X, Z2 as Predictors

66
Search Methods• Constraint Based Searches
• PC, FCI• Very fast – capable of handling >5,000 variables• Pointwise, but not uniformly consistent
• Scoring Searches• Scores: BIC, AIC, etc.• Search: Hill Climb, Genetic Alg., Simulated Annealing• Difficult to extend to latent variable models• Meek and Chickering Greedy Equivalence Class (GES)• Slower than constraint based searches – but now capable of 1,000 vars• Pointwise, but not uniformly consistent
• Latent Variable Psychometric Model Search• BPC, MIMbuild, etc.
• Linear non-Gaussian models (Lingam)• Models with cycles• And more!!!

67
Tetrad Demo and Hands-on
1) Load charity.txt (tabular – not covariance data)
2) Build graph of theoretical hypothesis
3) Build SEM PM from graph
4) Estimate PM, check results

68
Tetrad Demo and Hands-on
1) Create background knowledge: Tangibility exogenous (uncaused)
2) Search for models
3) Estimate one model from the output of search
4) Check model fit, check parameter estimates, esp. their sign

69
Thank You!

70
AdditionalSlides

71
1) Adjacency2) Orientation
Constraint-based Search

Constraint-based Search: Adjacency
1. X and Y are adjacent if they are dependent conditional on all subsets that don’t include them
2. X and Y are not adjacent if they are independent conditional on any subset that doesn’t include them

Search: Orientation
Patterns
Y Unshielded
X Y Z
X _||_ Z | YX _||_ Z | Y
Collider Non-Collider
X Y Z X Y Z
X Y Z
X Y Z
X Y Z
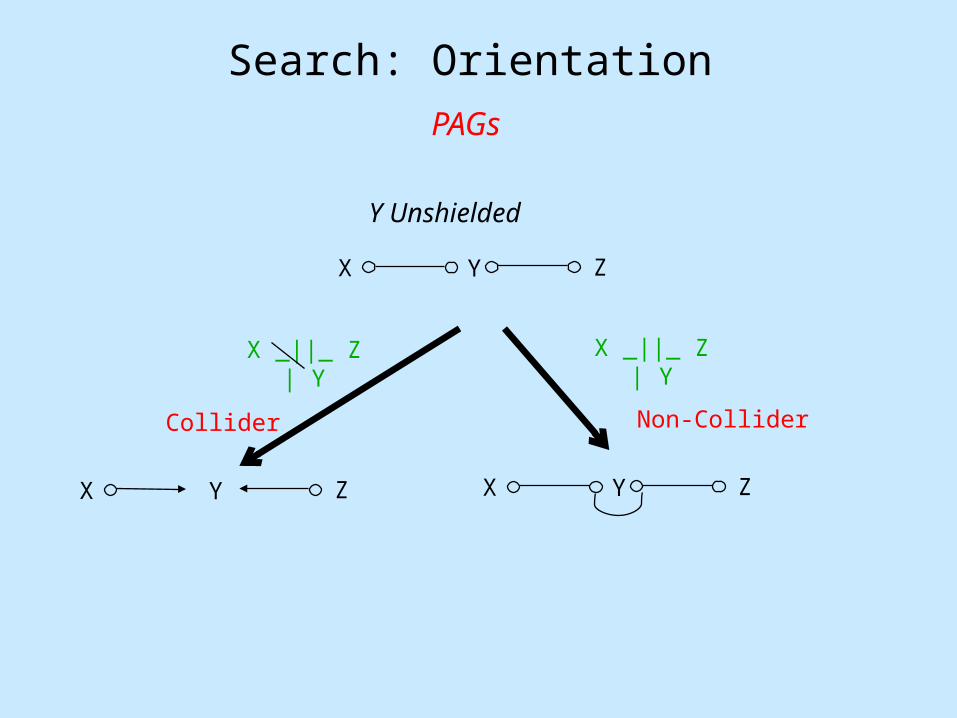
Search: Orientation
PAGs
Y Unshielded
X Y Z
X _||_ Z | YX _||_ Z | Y
Collider Non-Collider
X Y Z X Y Z

Search: Orientation
X3
X2
* X1
X1 X3 | X2
1) X1 - X2 adjacent, and into X2. 2) X2 - X3 adjacent 3) X1 - X3 not adjacent
No Yes
X3
X2
* X1 X3
X2
* X1
Test
Test Conditions
Away from Collider

X1
X2
X3 X4
Causal Graph
Independcies
Begin with:
From
X1
X2
X3 X4
X1 X2
X1 X4 {X3}
X2 X4 {X3}
X1
X2
X3 X4
X1
X2
X3 X4
X1
X2
X3 X4
From
From
X1 X2
X1 X4 {X3}
X2 X4 {X3}
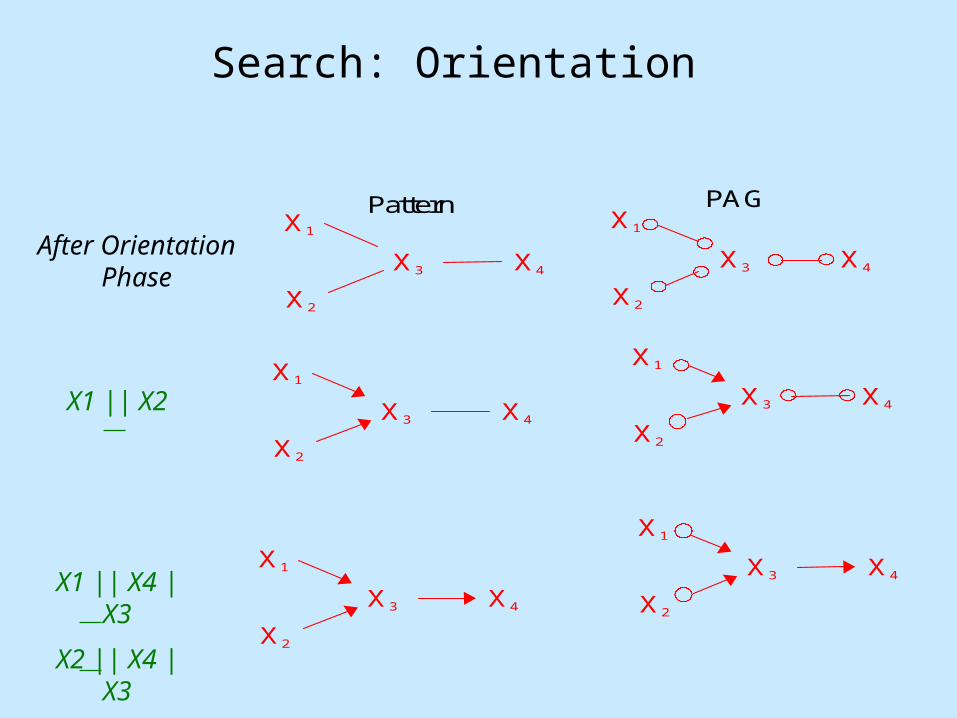
Search: Orientation
X4 X3
X2
X1
X4 X3
X2
X1
X4 X3
X2
X1
X4 X3
X2
X1
X4 X3
X2
X1
PAG Pattern
X4 X3
X2
X1
X1 || X2
X1 || X4 | X3
X2 || X4 | X3
After Orientation Phase

78
Bridge Principles: Acyclic Causal Graph over V Constraints on P(V)
Weak Causal Markov Assumption
V1,V2 causally disconnected V1 _||_ V2
V1 _||_ V2 P(V1,V2) = P(V1)P(V2)
V1,V2 causally disconnected
i. V1 not a cause of V2, and
ii. V2 not a cause of V1, and
iii. No common cause Z of V1 and V2
79
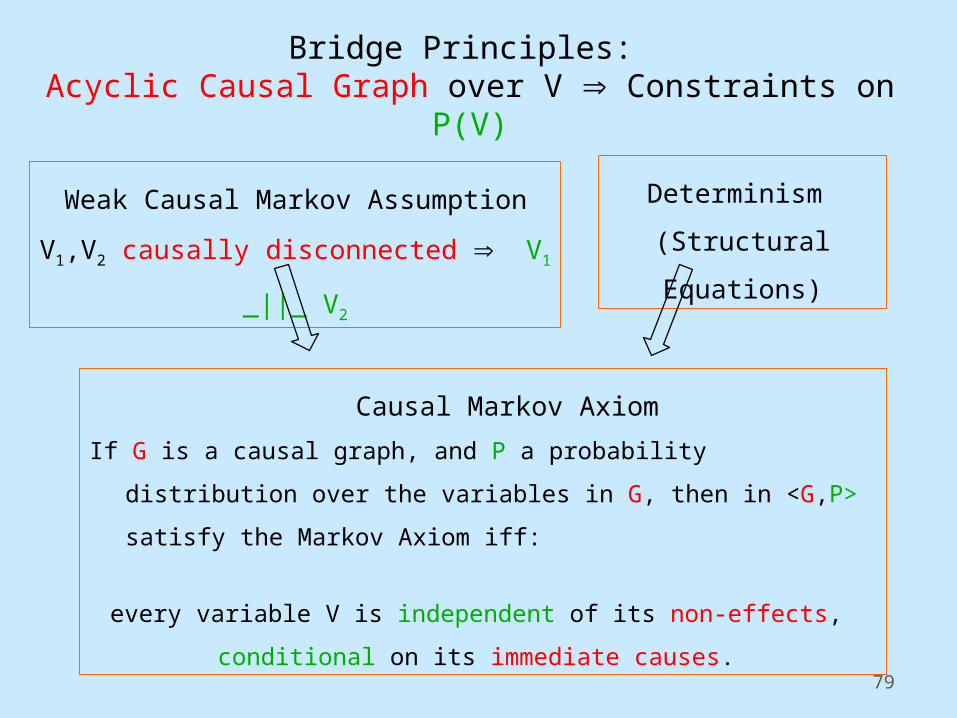
Bridge Principles: Acyclic Causal Graph over V Constraints on P(V)
Weak Causal Markov Assumption
V1,V2 causally disconnected V1 _||_ V2
Causal Markov Axiom
If G is a causal graph, and P a probability distribution over the variables in
G, then in <G,P> satisfy the Markov Axiom iff:
every variable V is independent of its non-effects,
conditional on its immediate causes.
Determinism
(Structural Equations)

80
Causal Markov Axiom Acyclicity
d-separation criterion
Independence OracleCausal Graph
Z X Y1
Z _||_ Y1 | X Z _||_ Y2 | X
Z _||_ Y1 | X,Y2 Z _||_ Y2 | X,Y1
Y1 _||_ Y2 | X Y1 _||_ Y2 | X,ZY2
Bridge Principles: Acyclic Causal Graph over V Constraints on P(V)
81
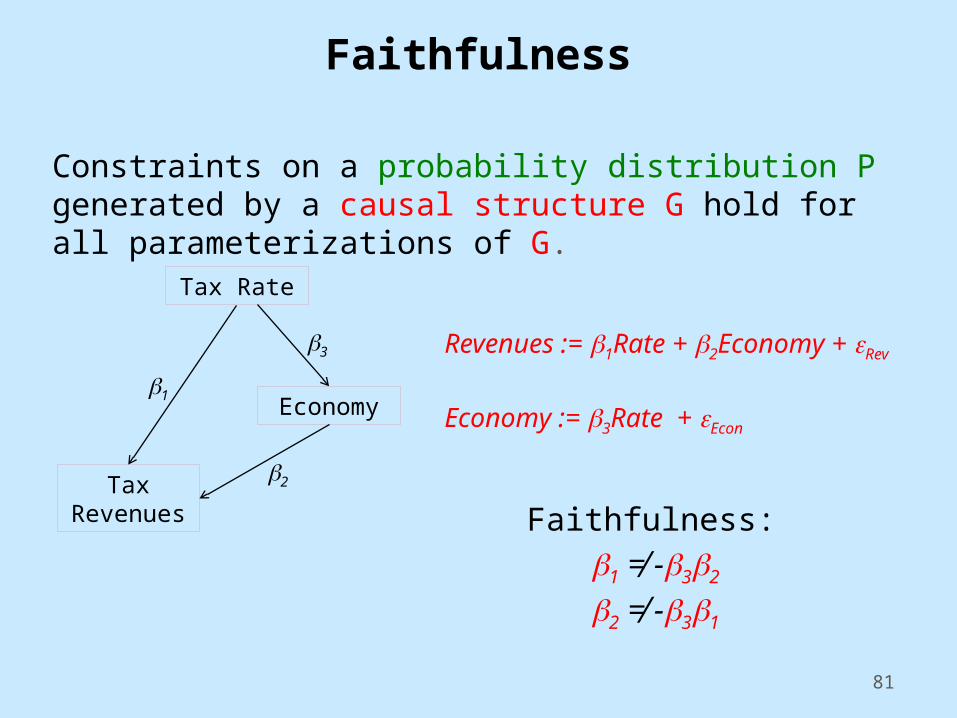
Faithfulness
Constraints on a probability distribution P generated by a causal structure G hold for all parameterizations of G.
Revenues := b1Rate + b2Economy + eRev
Economy := b3Rate + eEcon
Faithfulness:
b1 ≠ -b3b2
b2 ≠ -b3b1
Tax Rate
Economy
Tax Revenues
b1
b3
b2
82
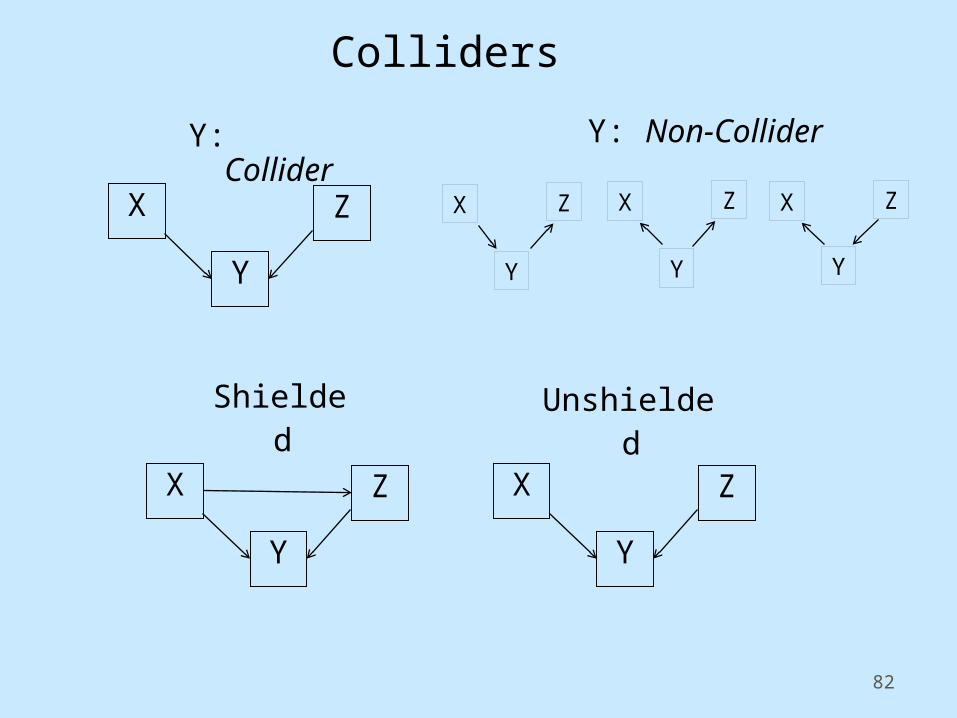
Colliders
Y: Collider
Shielded Unshielded
X
Y
Z
X
Y
Z X
Y
Z
Y: Non-Collider X
Y
Z X
Y
ZX
Y
Z
83
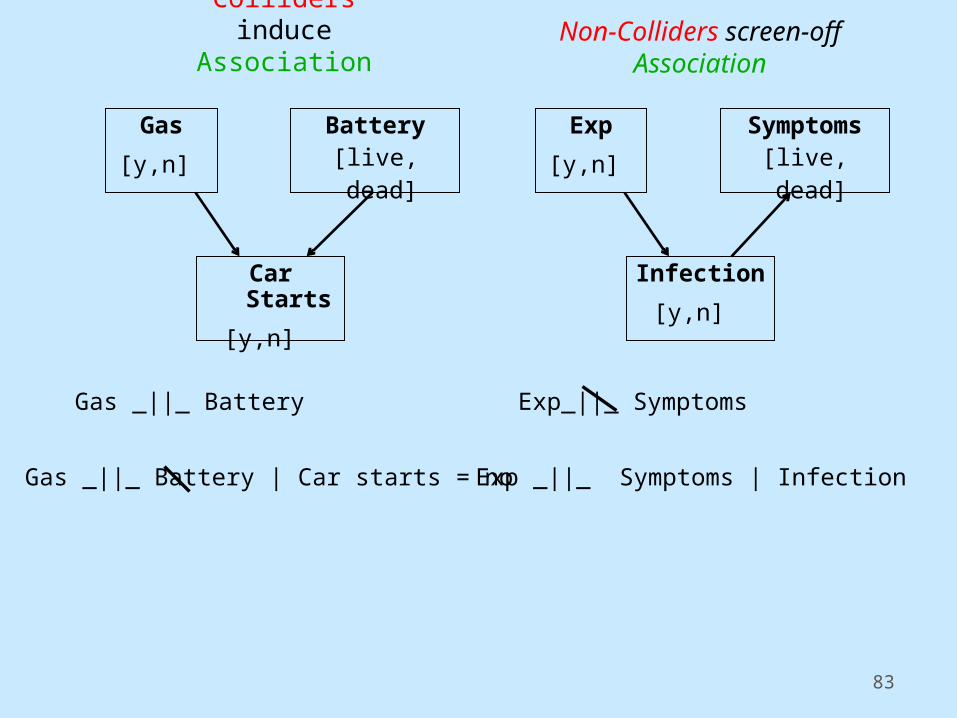
Colliders induce Association
Gas
[y,n] Battery
[live, dead]
Car Starts
[y,n]
Gas _||_ Battery
Gas _||_ Battery | Car starts = no
Exp
[y,n] Symptoms
[live, dead]
Infection
[y,n]
Exp_||_ Symptoms
Exp _||_ Symptoms | Infection
Non-Colliders screen-off Association

84
D-separationX is d-separated from Y by Z in G iffEvery undirected path between X and Y in G is inactive relative to Z
An undirected path is inactive relative to Z iffany node on the path is inactive relative to Z
A node N (on a path) is inactive relative to Z iffa) N is a non-collider in Z, orb) N is a collider that is not in Z,
and has no descendant in Z
X YZ1
Z2
V
W
Undirected Paths between X , Y:
1) X --> Z1 <-- W --> Y
2) X <-- V --> Y
A node N (on a path) is active relative to Z iffa) N is a non-collider not in Z, orb) N is a collider that is in Z,
or has a descendant in Z

85
D-separationX is d-separated from Y by Z in G iffEvery undirected path between X and Y in G is inactive relative to Z
An undirected path is inactive relative to Z iffany node on the path is inactive relative to Z
A node N is inactive relative to Z iffa) N is a non-collider in Z, orb) N is a collider that is not in Z,
and has no descendant in Z
X YZ1
Z2
V
W
Undirected Paths between X , Y:
1) X --> Z1 <-- W --> Y
2) X <-- V --> Y
X d-sep Y relative to Z = {V} ?
X d-sep Y relative to Z = {V, Z1 } ?
X d-sep Y relative to Z = {W, Z2 } ?
No
Yes
No
X d-sep Y relative to Z = ?
Yes

86
D-separation
X3 X2 X1
X3 and X1 d-sep by X2?
Yes: X3 _||_ X1 | X2
X3
T
X2 X1
X3 and X1 d-sep by X2?
No: X3 _||_ X1 | X2
87
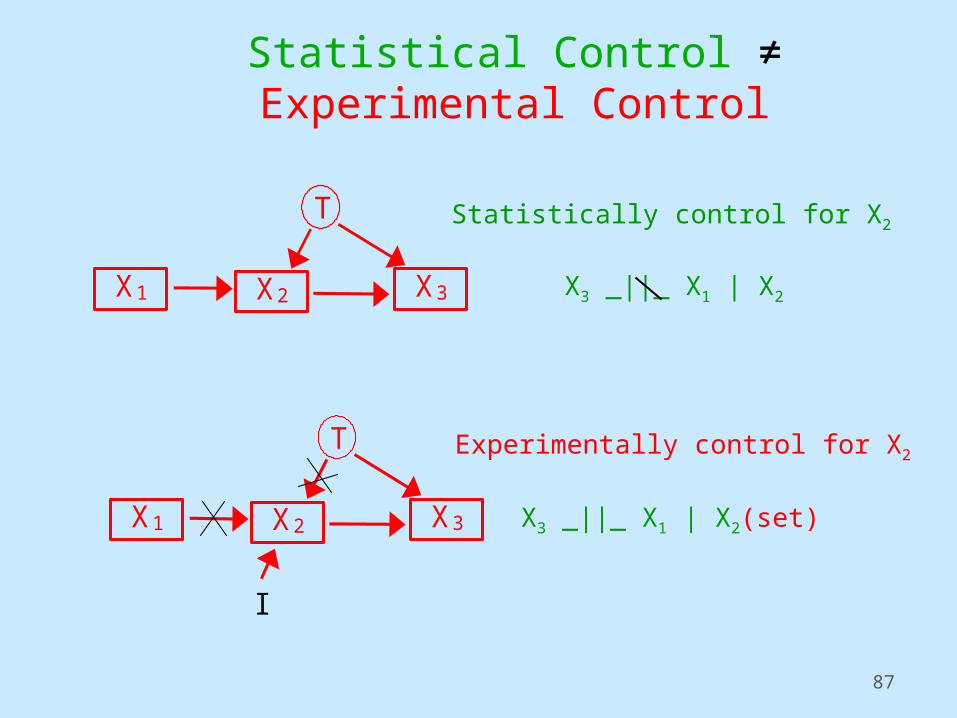
Statistical Control ≠ Experimental Control
X3
T
X2 X1
X3
T
X2 X1
I
X3 _||_ X1 | X2
X3 _||_ X1 | X2(set)
Statistically control for X2
Experimentally control for X2
88
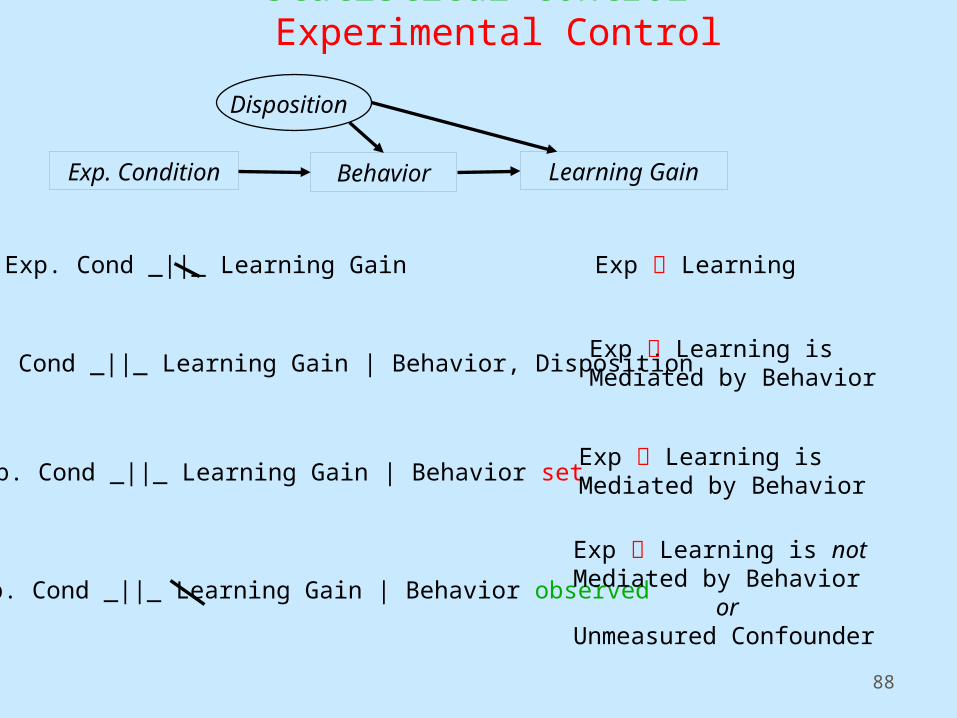
Statistical Control ≠ Experimental Control
Exp. Cond _||_ Learning Gain | Behavior, Disposition
Exp. Condition Behavior
Disposition
Learning Gain
Exp. Cond _||_ Learning Gain | Behavior set
Exp. Cond _||_ Learning Gain | Behavior observed
Exp. Cond _||_ Learning Gain Exp Learning
Exp Learning is Mediated by Behavior
Exp Learning is Mediated by Behavior
Exp Learning is not Mediated by Behavior
orUnmeasured Confounder
89
Regression &
Causal Inference

90
Regression & Causal Inference
2. So, identifiy and measure potential confounders Z:
a) prior to X,
b) associated with X,
c) associated with Y
Typical (non-experimental) strategy:1. Establish a prima facie case (X associated with Y)
3. Statistically adjust for Z (multiple regression)
X Y
Z
But, omitted variable bias
91
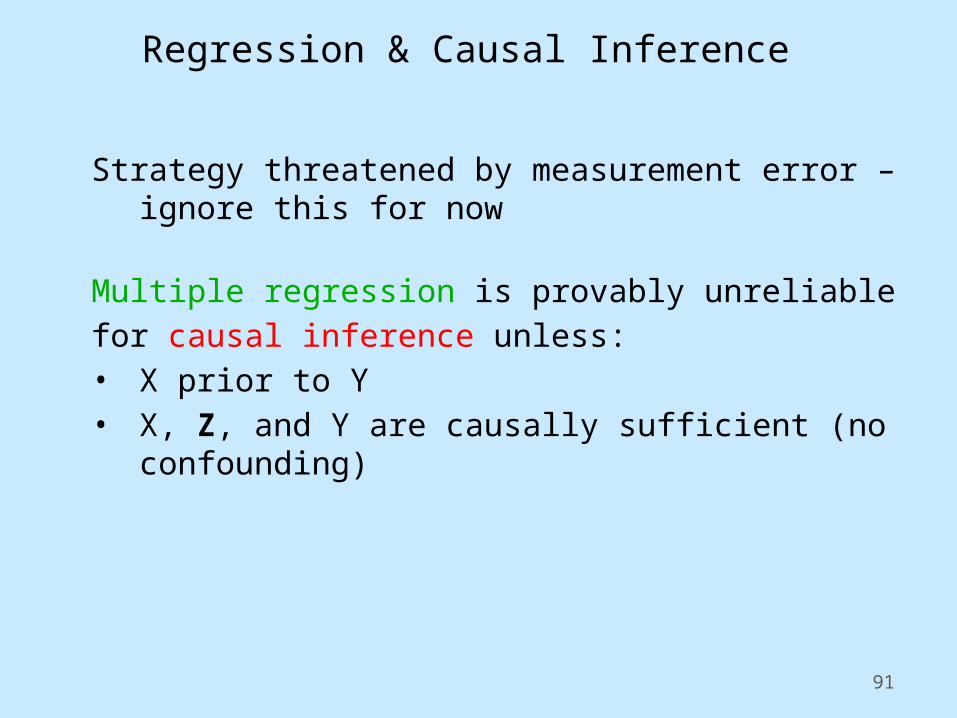
Regression & Causal Inference
Strategy threatened by measurement error – ignore this for now
Multiple regression is provably unreliable
for causal inference unless:• X prior to Y • X, Z, and Y are causally sufficient (no confounding)

X
Y
Z
X
Y
Z2 Z1
T1
T2
X
Y
Z
T2
T1
TruthRegression Y: outcome
X, Z, Explanatory Alternative?
bX = 0
bZ ≠ 0
bX ≠ 0
bZ ≠ 0
bX ≠ 0
bZ1 ≠ 0
bZ2 ≠ 0

93
Better Methods Exist
Causal Model Search (since 1988):
• Provably Reliable
• Provably Rumsfeld
Tetrad Demo


![[Clark Glymour] the Mind's Arrows Bayes Nets and (BookZZ.org)](https://static.cupdf.com/doc/110x72/55cf8f37550346703b9a0df2/clark-glymour-the-minds-arrows-bayes-nets-and-bookzzorg.jpg)