1 of 29© 2014 Pearson Education, Inc.
5ElasticityC H A P T E R O U T L I N EPrice Elasticity of Demand
Slope and Elasticity
Types of Elasticity
Calculating ElasticitiesCalculating Percentage Changes
Elasticity Is a Ratio of Percentages
The Midpoint Formula
Elasticity Changes Along a Straight-Line Demand Curve
Elasticity and Total Revenue
The Determinants of Demand ElasticityAvailability of Substitutes
The Importance of Being Unimportant
The Time Dimension
Other Important ElasticitiesIncome Elasticity of Demand
Cross-Price Elasticity of Demand
Elasticity of Supply
Looking Ahead
2 of 29© 2014 Pearson Education, Inc.
3 of 29© 2014 Pearson Education, Inc.
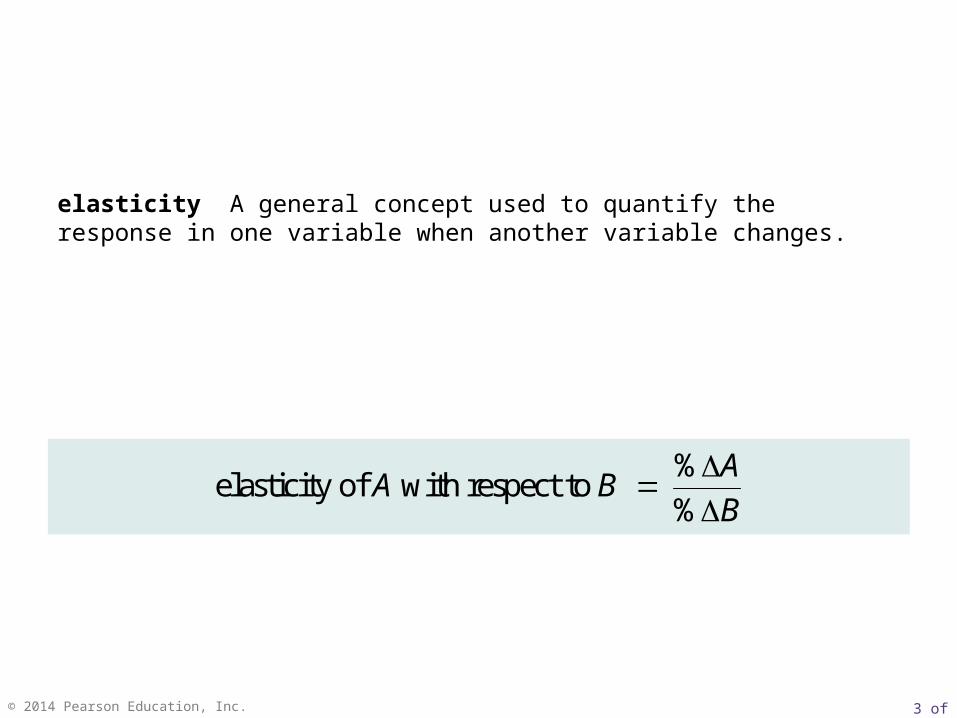
elasticity A general concept used to quantify the response in one variable when another variable changes.
%elasticity of with respect to
%
AA B
B
4 of 29© 2014 Pearson Education, Inc.
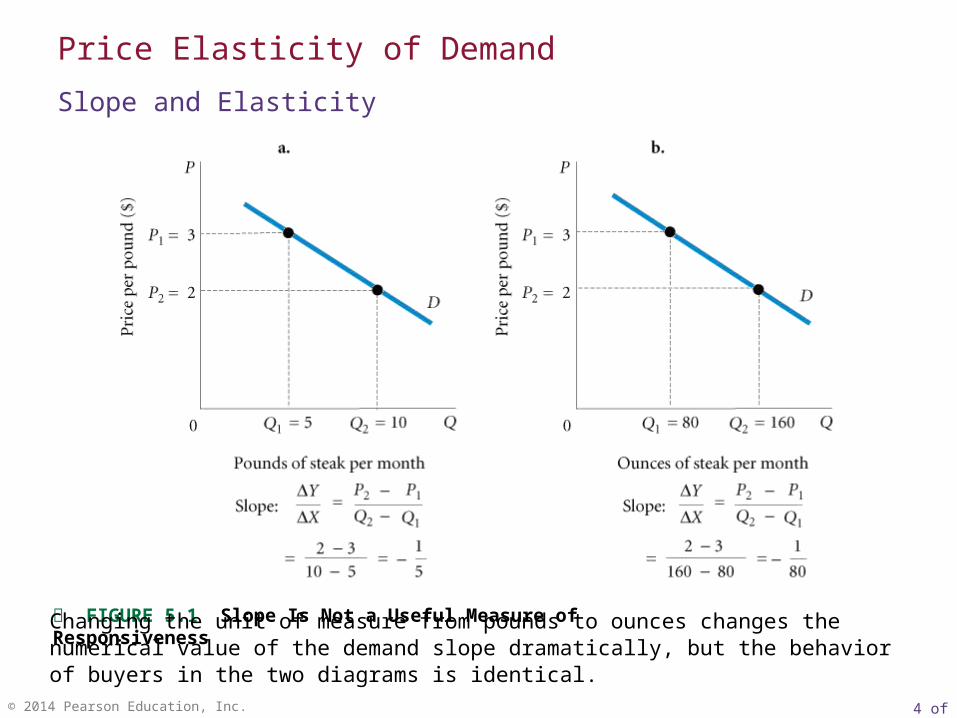
FIGURE 5.1 Slope Is Not a Useful Measure of Responsiveness
Changing the unit of measure from pounds to ounces changes the numerical value of the demand slope dramatically, but the behavior of buyers in the two diagrams is identical.
Price Elasticity of Demand
Slope and Elasticity
5 of 29© 2014 Pearson Education, Inc.
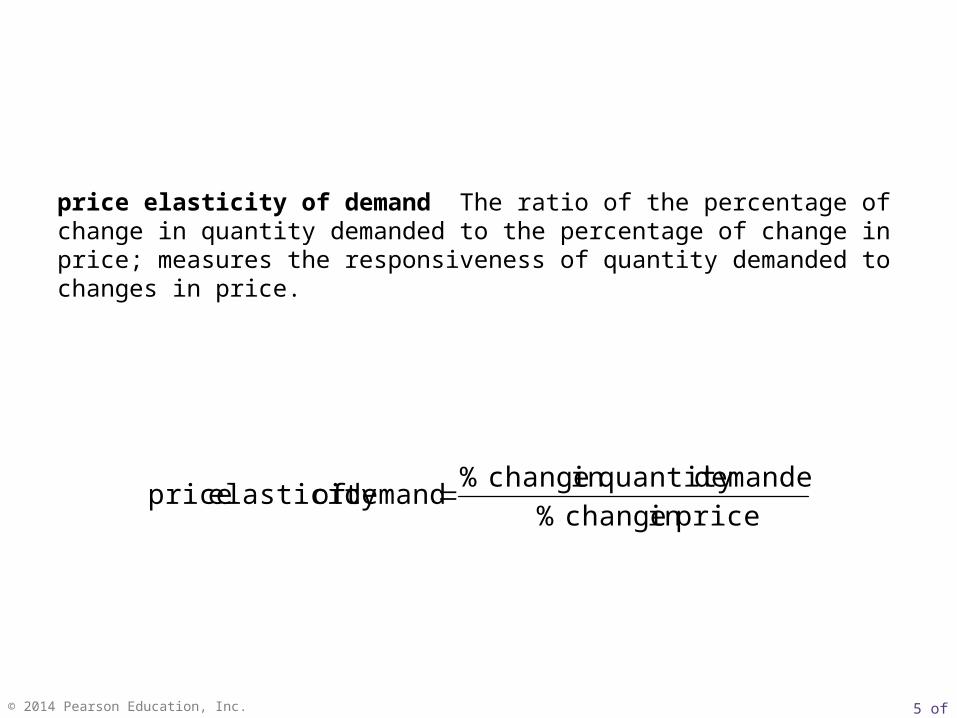
price elasticity of demand The ratio of the percentage of change in quantity demanded to the percentage of change in price; measures the responsiveness of quantity demanded to changes in price.
pricein change %
demandedquantity in change % demand of elasticity price
6 of 29© 2014 Pearson Education, Inc.
perfectly inelastic demand Demand in which quantity demanded does not respond at all to a change in price.
Types of Elasticity
perfectly elastic demand Demand in which quantity drops to zero at the slightest increase in price.
A good way to remember the difference between the two perfect elasticities is
7 of 29© 2014 Pearson Education, Inc.
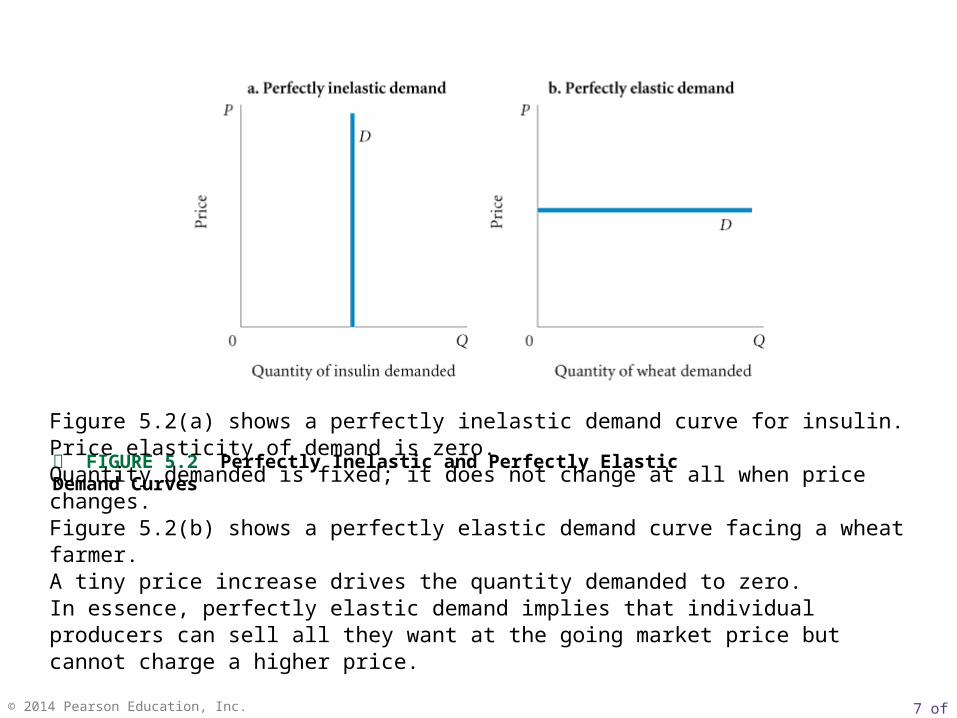
FIGURE 5.2 Perfectly Inelastic and Perfectly Elastic Demand Curves
Figure 5.2(a) shows a perfectly inelastic demand curve for insulin. Price elasticity of demand is zero. Quantity demanded is fixed; it does not change at all when price changes.Figure 5.2(b) shows a perfectly elastic demand curve facing a wheat farmer. A tiny price increase drives the quantity demanded to zero. In essence, perfectly elastic demand implies that individual producers can sell all they want at the going market price but cannot charge a higher price.
8 of 29© 2014 Pearson Education, Inc.
inelastic demand Demand that responds somewhat, but not a great deal, to changes in price. Inelastic demand always has a numerical value between zero and 1.
unitary elasticity A demand relationship in which the percentage change in quantity of a product demanded is the same as the percentage change in price in absolute value (a demand elasticity of 1).
elastic demand A demand relationship in which the percentage change in quantity demanded is larger than the percentage change in price in absolute value (a demand elasticity with an absolute value greater than 1).
You must be very careful about signs. Because it is generally understood that demand elasticities are negative (demand curves have a negative slope), they are often reported and discussed without the negative sign.
A warning:
9 of 29© 2014 Pearson Education, Inc.
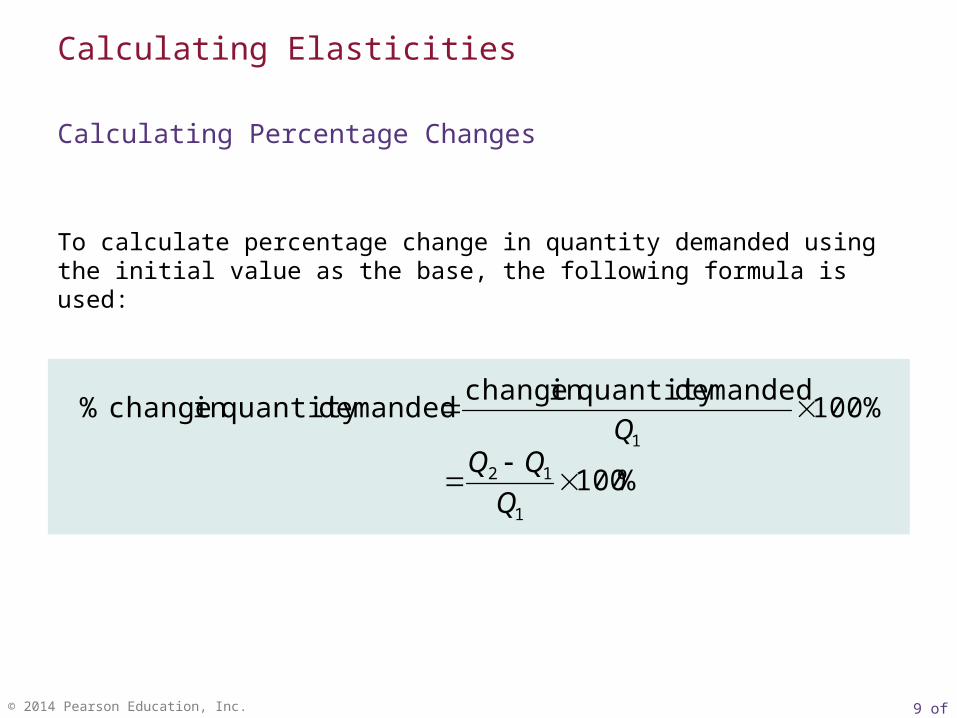
To calculate percentage change in quantity demanded using the initial value as the base, the following formula is used:
Calculating Elasticities
Calculating Percentage Changes
100%demandedquantity in change
demandedquantity in change %1
Q
%1001
12
Q
10 of 29© 2014 Pearson Education, Inc.
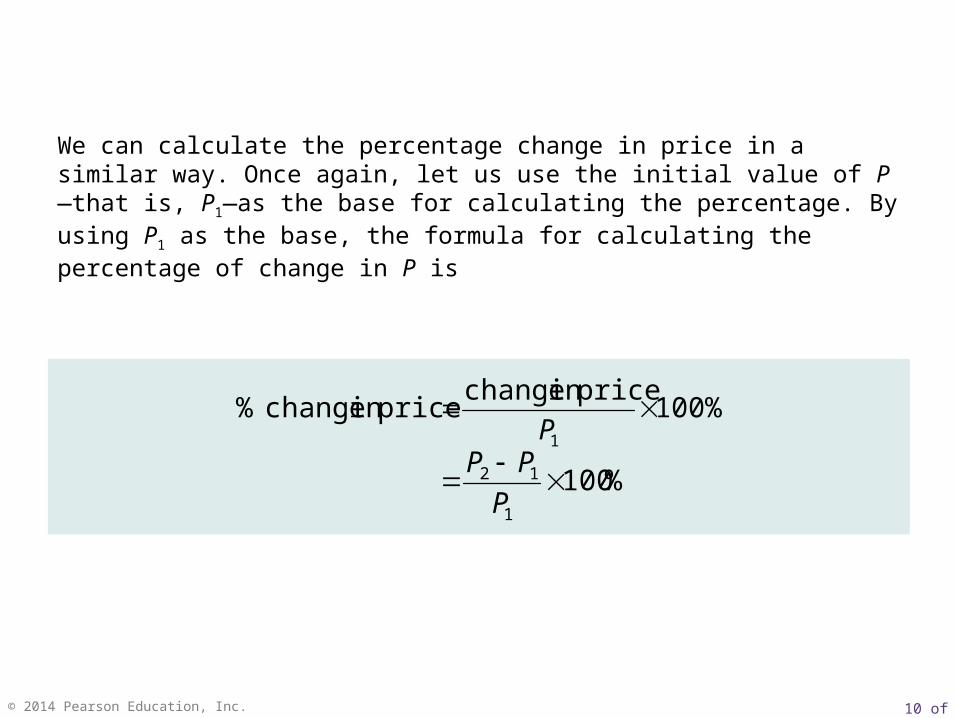
We can calculate the percentage change in price in a similar way. Once again, let us use the initial value of P—that is, P1—as the base for calculating the percentage. By using P1 as the base, the formula for calculating the percentage of change in P is
100%pricein change
pricein change %1
P
%1001
12
P
PP
11 of 29© 2014 Pearson Education, Inc.
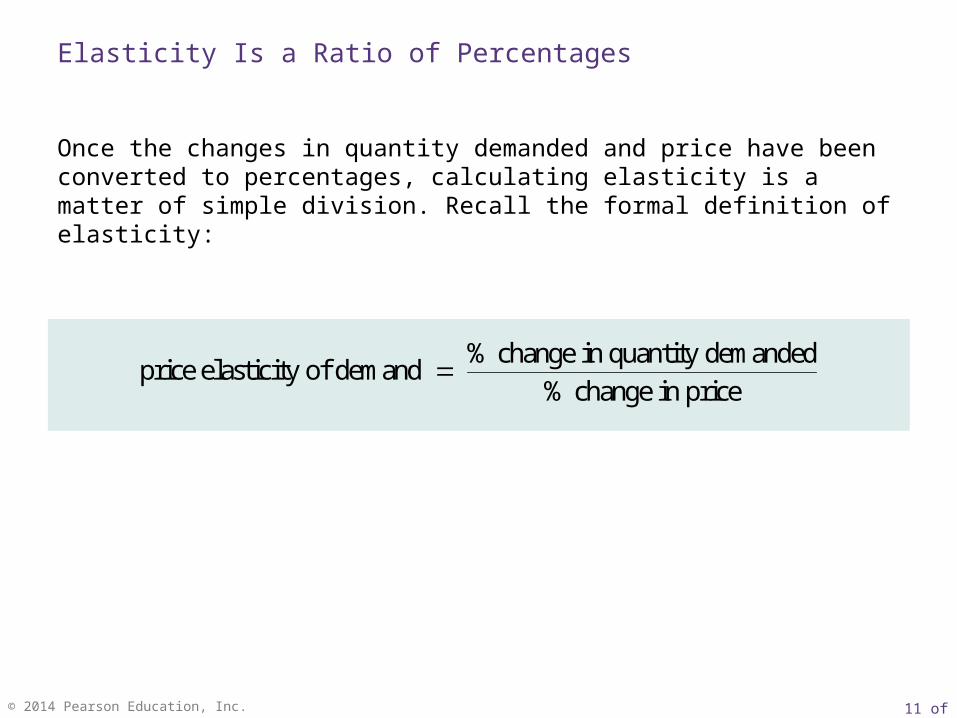
Once the changes in quantity demanded and price have been converted to percentages, calculating elasticity is a matter of simple division. Recall the formal definition of elasticity:
% change in quantity demandedprice elasticity of demand
% change in price
Elasticity Is a Ratio of Percentages
12 of 29© 2014 Pearson Education, Inc.
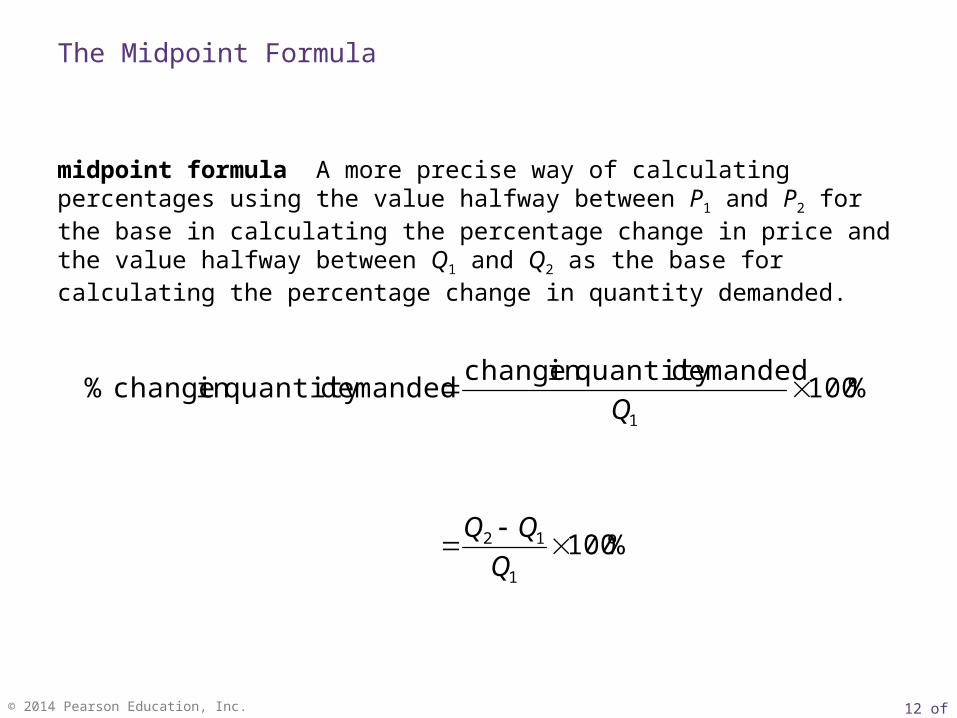
midpoint formula A more precise way of calculating percentages using the value halfway between P1 and P2 for the base in calculating the percentage change in price and the value halfway between Q1 and Q2 as the base for calculating the percentage change in quantity demanded.
The Midpoint Formula
%100demandedquantity in change
demandedquantity in change %1
Q
%100 1
12
Q
13 of 29© 2014 Pearson Education, Inc.
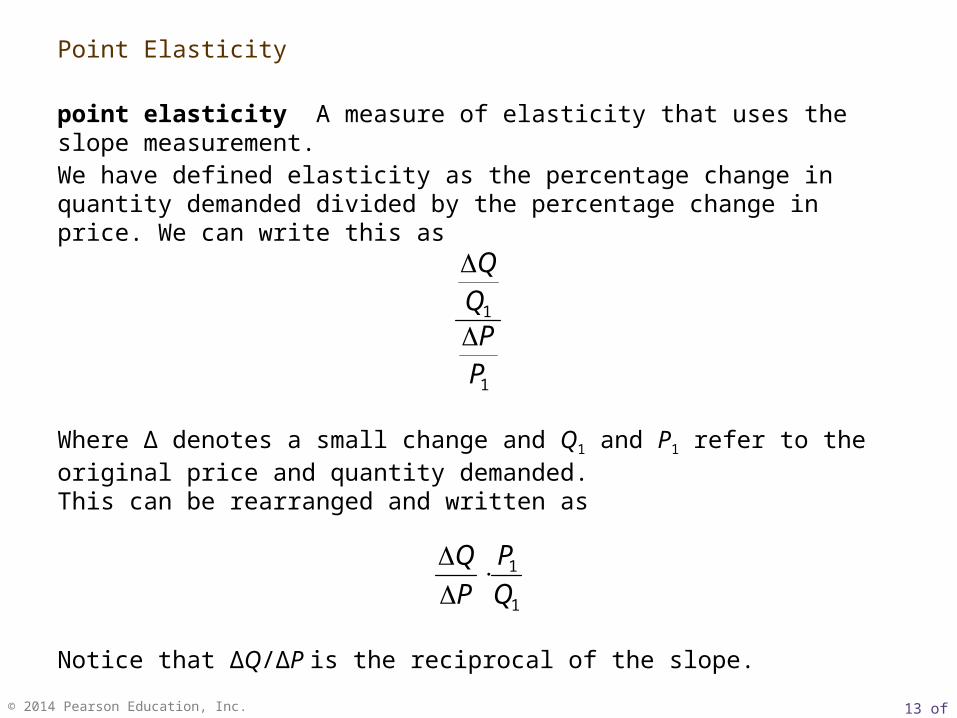
Point Elasticity
point elasticity A measure of elasticity that uses the slope measurement.
We have defined elasticity as the percentage change in quantity demanded divided by the percentage change in price. We can write this as
Where ∆ denotes a small change and Q1 and P1 refer to the original price and quantity demanded.This can be rearranged and written as
Notice that ∆Q/∆P is the reciprocal of the slope.
1
1
PPQQ
1
1
Q
P
P
Q
14 of 29© 2014 Pearson Education, Inc.
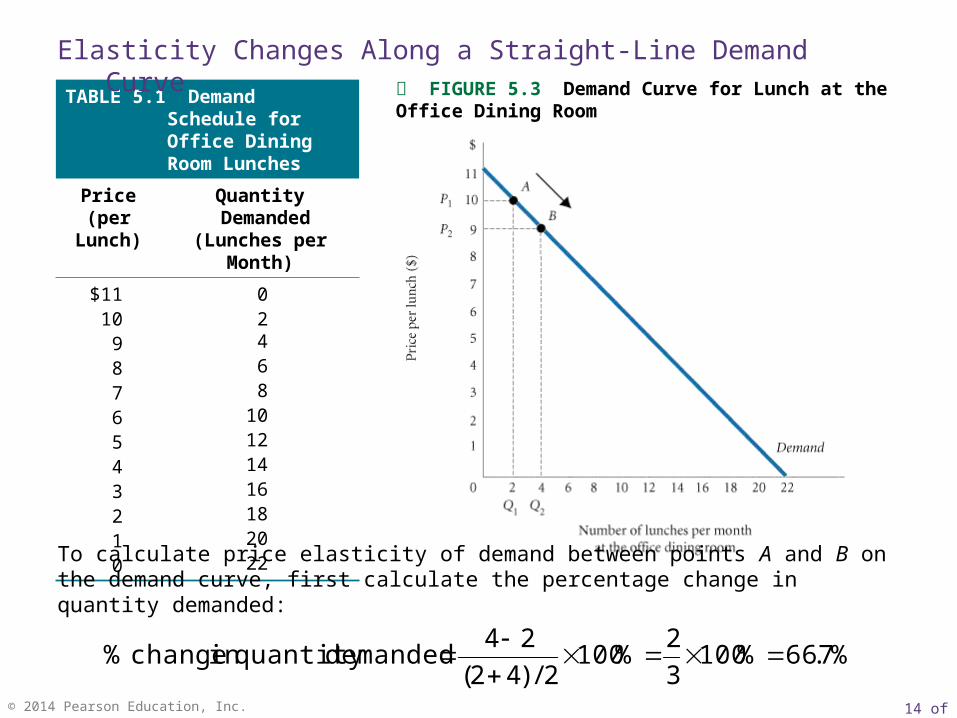
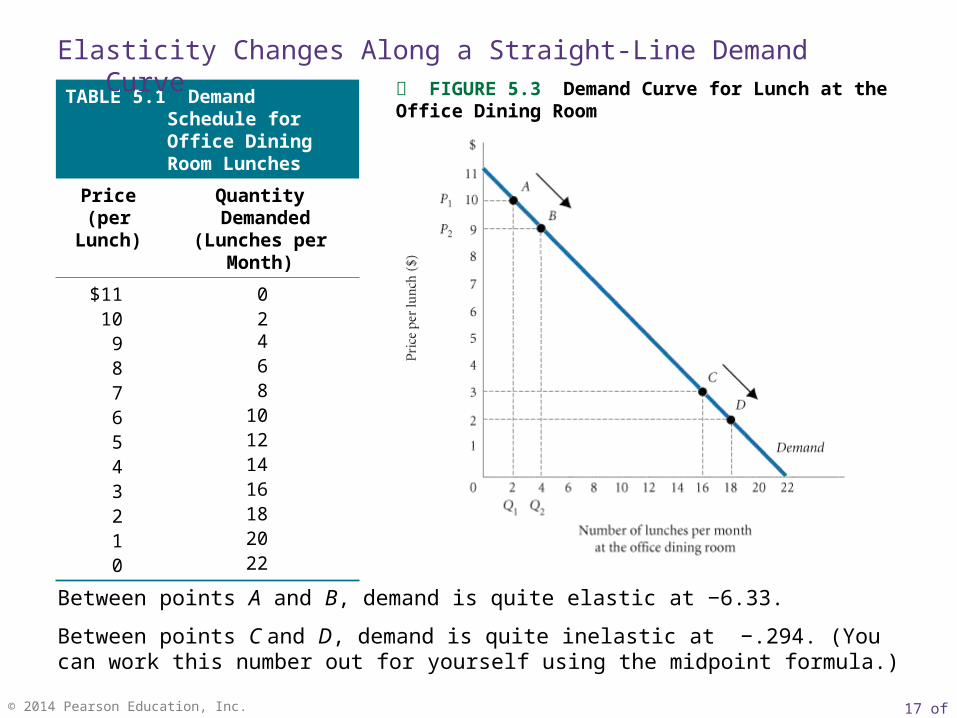
TABLE 5.1 Demand Schedule for Office Dining Room Lunches
Price(per
Lunch)
Quantity Demanded
(Lunches per Month)
$1110
9876543210
02468
10121416182022
FIGURE 5.3 Demand Curve for Lunch at the Office Dining Room
To calculate price elasticity of demand between points A and B on the demand curve, first calculate the percentage change in quantity demanded:
Elasticity Changes Along a Straight-Line Demand Curve
%7.66%1003
2%100
2/)42(
24demandedquantity in change %
15 of 29© 2014 Pearson Education, Inc.
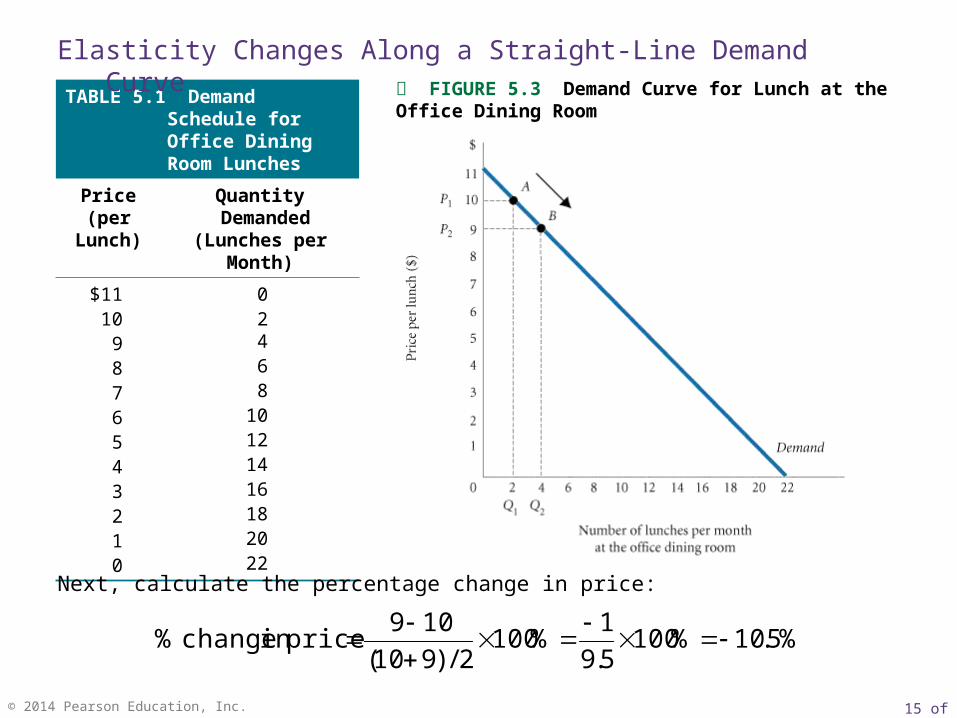
TABLE 5.1 Demand Schedule for Office Dining Room Lunches
Price(per
Lunch)
Quantity Demanded
(Lunches per Month)
$1110
9876543210
02468
10121416182022
FIGURE 5.3 Demand Curve for Lunch at the Office Dining Room
Next, calculate the percentage change in price:
%5.10%1005.9
1%100
2/)910(
109pricein change %
Elasticity Changes Along a Straight-Line Demand Curve
16 of 29© 2014 Pearson Education, Inc.
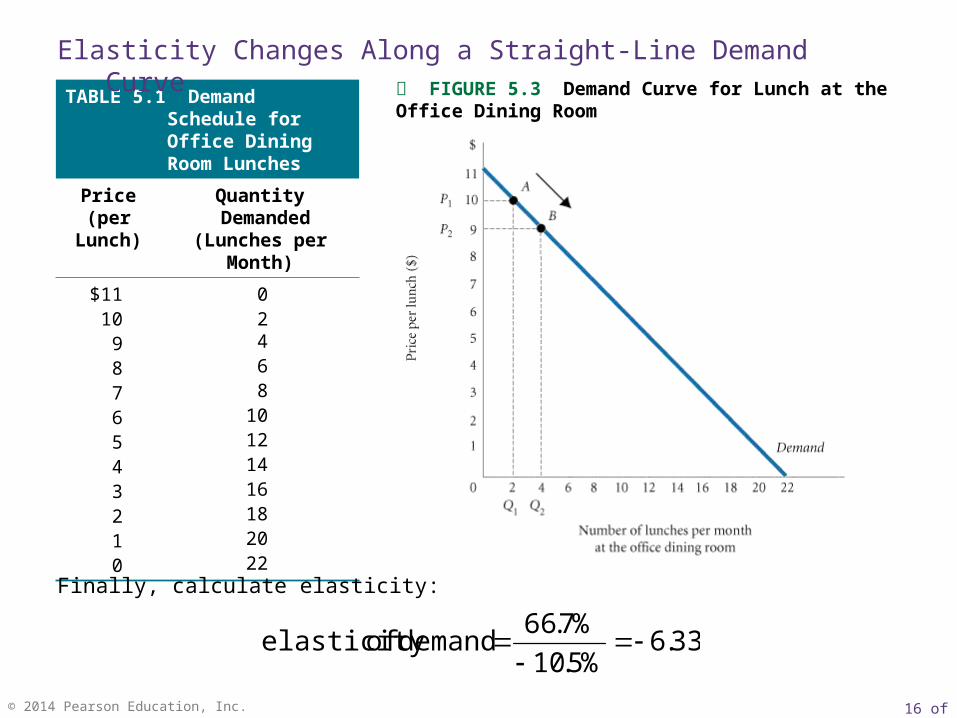
TABLE 5.1 Demand Schedule for Office Dining Room Lunches
Price(per
Lunch)
Quantity Demanded
(Lunches per Month)
$1110
9876543210
02468
10121416182022
FIGURE 5.3 Demand Curve for Lunch at the Office Dining Room
Finally, calculate elasticity:
33.6%5.10
%7.66demand of elasticity
Elasticity Changes Along a Straight-Line Demand Curve
17 of 29© 2014 Pearson Education, Inc.
TABLE 5.1 Demand Schedule for Office Dining Room Lunches
Price(per
Lunch)
Quantity Demanded
(Lunches per Month)
$1110
9876543210
02468
10121416182022
FIGURE 5.3 Demand Curve for Lunch at the Office Dining Room
Between points A and B, demand is quite elastic at −6.33.
Between points C and D, demand is quite inelastic at −.294. (You can work this number out for yourself using the midpoint formula.)
Elasticity Changes Along a Straight-Line Demand Curve
18 of 29© 2014 Pearson Education, Inc.
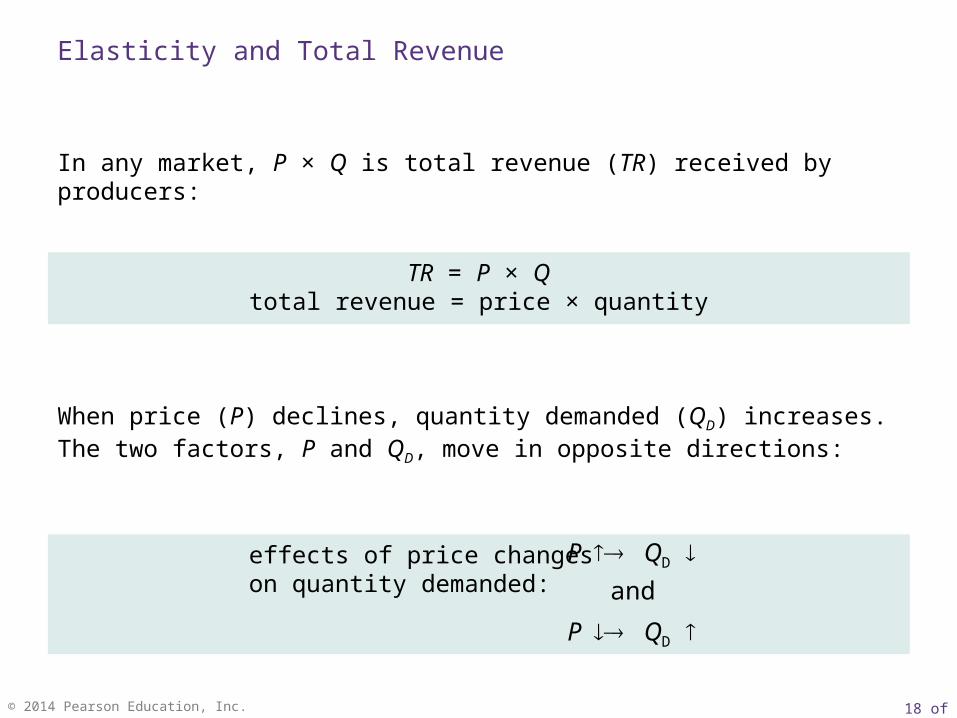
TR = P × Qtotal revenue = price × quantity
In any market, P × Q is total revenue (TR) received by producers:
When price (P) declines, quantity demanded (QD) increases. The two factors, P and QD, move in opposite directions:
effects of price changeson quantity demanded:
and
D
D
QP
QP
Elasticity and Total Revenue
19 of 29© 2014 Pearson Education, Inc.
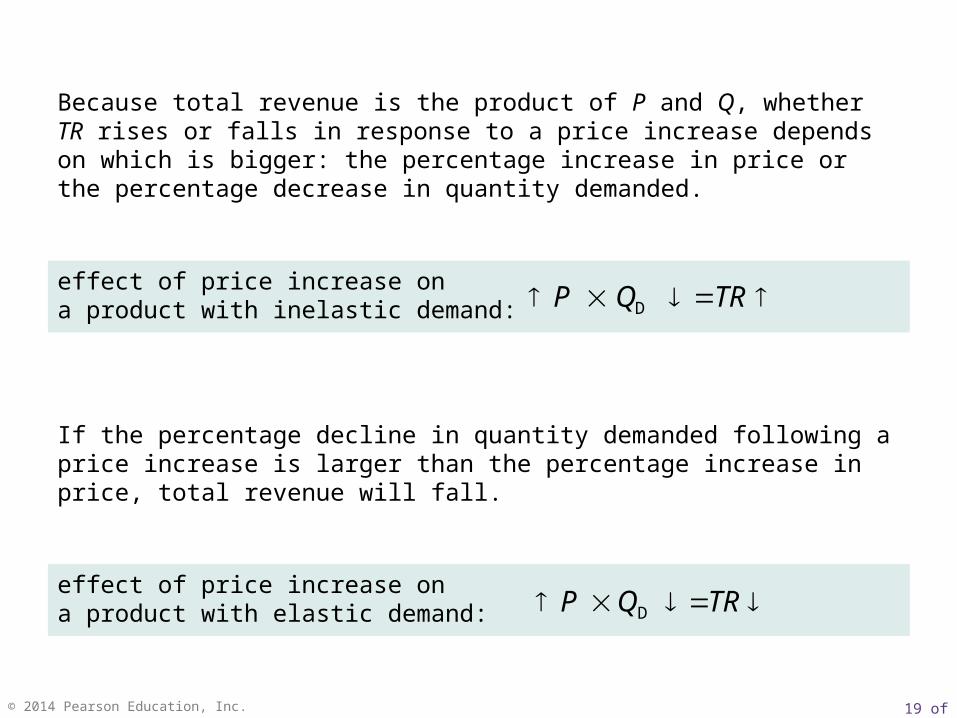
Because total revenue is the product of P and Q, whether TR rises or falls in response to a price increase depends on which is bigger: the percentage increase in price or the percentage decrease in quantity demanded.
If the percentage decline in quantity demanded following a price increase is larger than the percentage increase in price, total revenue will fall.
effect of price increase ona product with inelastic demand: D TRQP
effect of price increase ona product with elastic demand: D TRQP
20 of 29© 2014 Pearson Education, Inc.
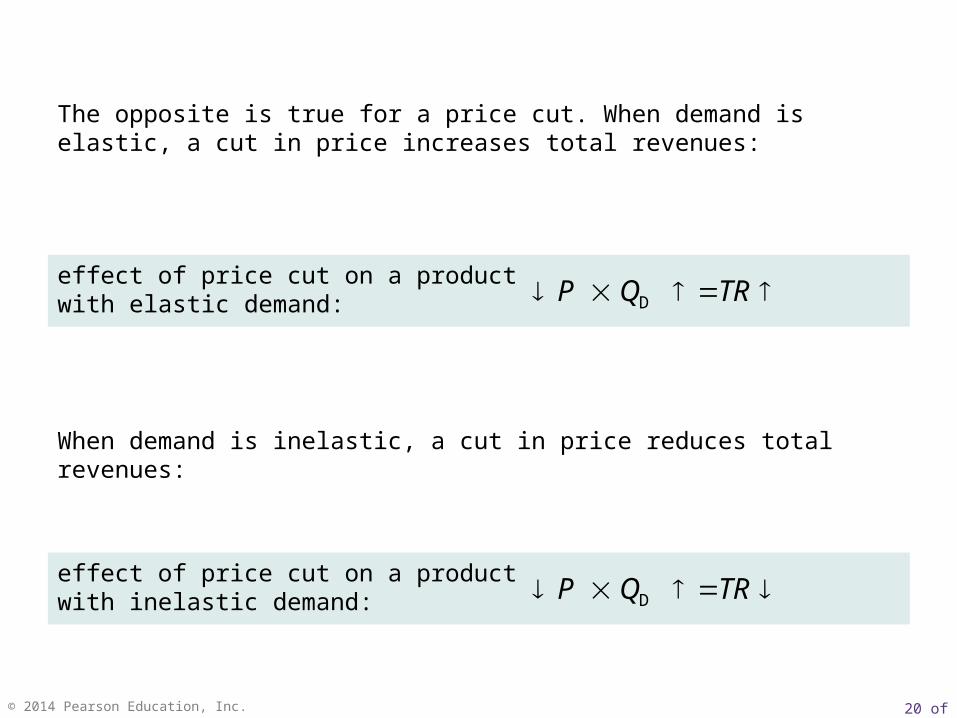
The opposite is true for a price cut. When demand is elastic, a cut in price increases total revenues:
When demand is inelastic, a cut in price reduces total revenues:
effect of price cut on a productwith elastic demand: D TRQP
effect of price cut on a productwith inelastic demand: D TRQP
21 of 29© 2014 Pearson Education, Inc.
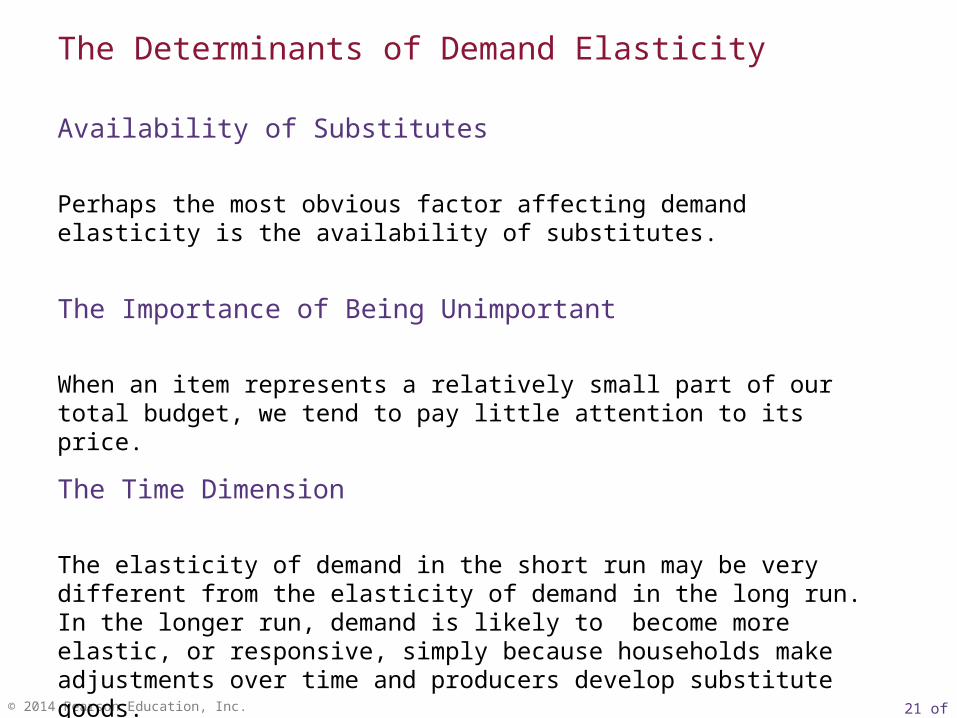
Perhaps the most obvious factor affecting demand elasticity is the availability of substitutes.
When an item represents a relatively small part of our total budget, we tend to pay little attention to its price.
The elasticity of demand in the short run may be very different from the elasticity of demand in the long run. In the longer run, demand is likely to become more elastic, or responsive, simply because households make adjustments over time and producers develop substitute goods.
The Determinants of Demand Elasticity
Availability of Substitutes
The Importance of Being Unimportant
The Time Dimension

22 of 29© 2014 Pearson Education, Inc.
Many people would argue that because more young people are new smokers and because they have less money than adults, their demand for cigarettes would be more elastic.
On the other hand, if peer pressure favors smoking, this could lower demand elasticity for youths.
Who Are the Elastic Smokers?
E C O N O M I C S I N P R A C T I C E
THINKING PRACTICALLY
1.Cigarette taxes help discourage smoking and also raise revenue for states.How does elasticity affect each of these?
THINKING PRACTICALLY
1.Cigarette taxes help discourage smoking and also raise revenue for states.How does elasticity affect each of these?
23 of 29© 2014 Pearson Education, Inc.
24 of 29© 2014 Pearson Education, Inc.
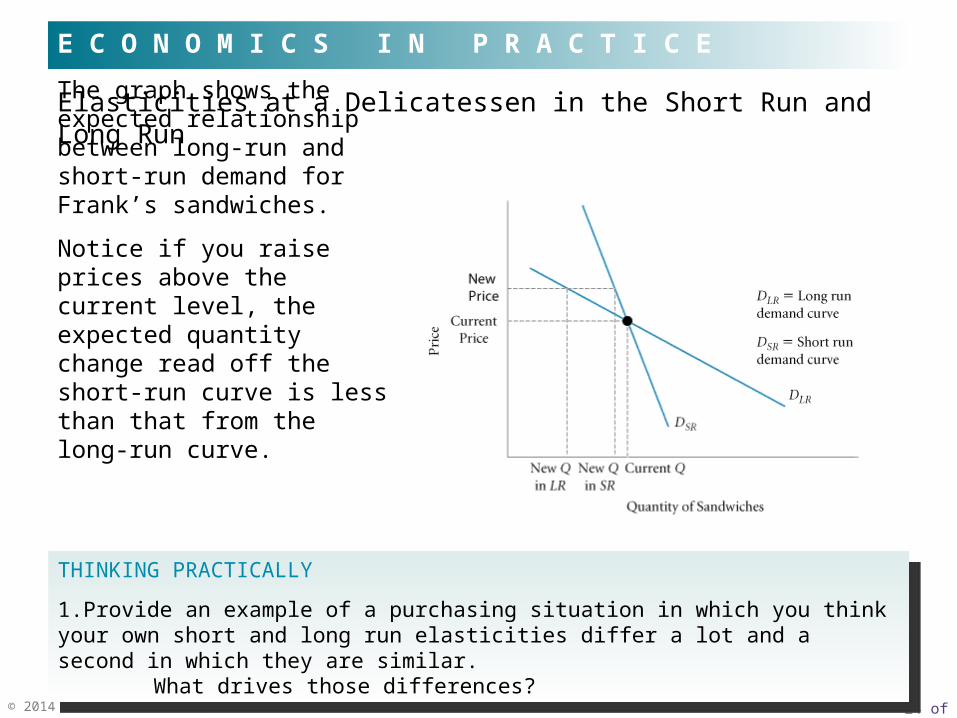
The graph shows the expected relationship between long-run and short-run demand for Frank’s sandwiches.
Notice if you raise prices above the current level, the expected quantity change read off the short-run curve is less than that from the long-run curve.
Elasticities at a Delicatessen in the Short Run and Long Run
E C O N O M I C S I N P R A C T I C E
THINKING PRACTICALLY
1.Provide an example of a purchasing situation in which you think your own short and long run elasticities differ a lot and a second in which they are similar.
What drives those differences?
THINKING PRACTICALLY
1.Provide an example of a purchasing situation in which you think your own short and long run elasticities differ a lot and a second in which they are similar.
What drives those differences?
25 of 29© 2014 Pearson Education, Inc.
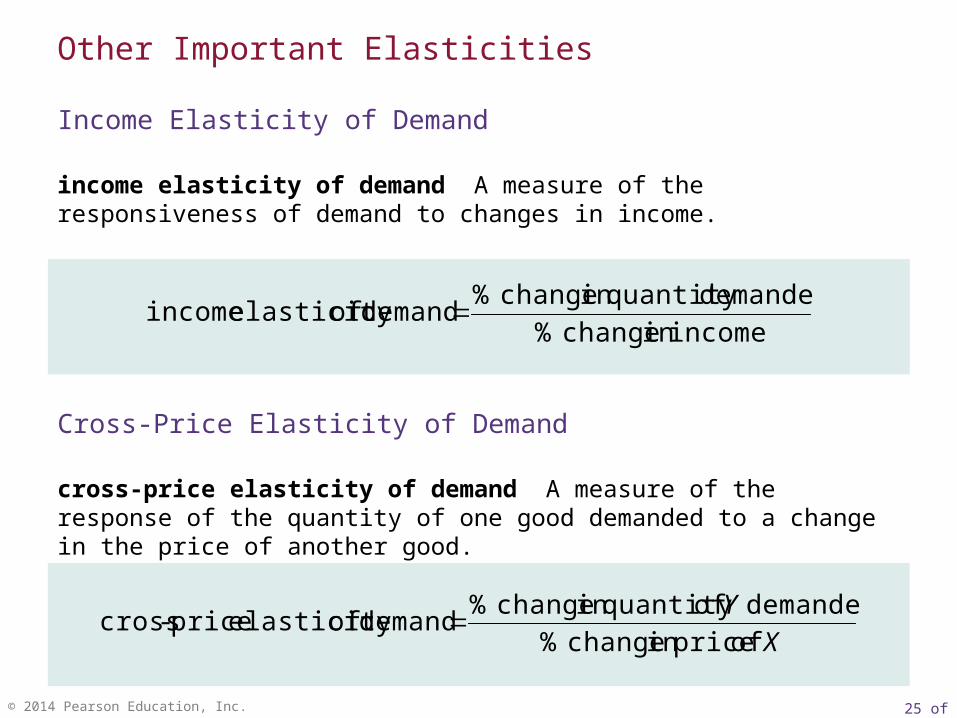
income elasticity of demand A measure of the responsiveness of demand to changes in income.
incomein change %
demandedquantity in change % demand of elasticity income
Other Important Elasticities
Income Elasticity of Demand
cross-price elasticity of demand A measure of the response of the quantity of one good demanded to a change in the price of another good.
X
Y
of pricein change %
demanded ofquantity in change % demand of elasticity price-cross
Cross-Price Elasticity of Demand
26 of 29© 2014 Pearson Education, Inc.
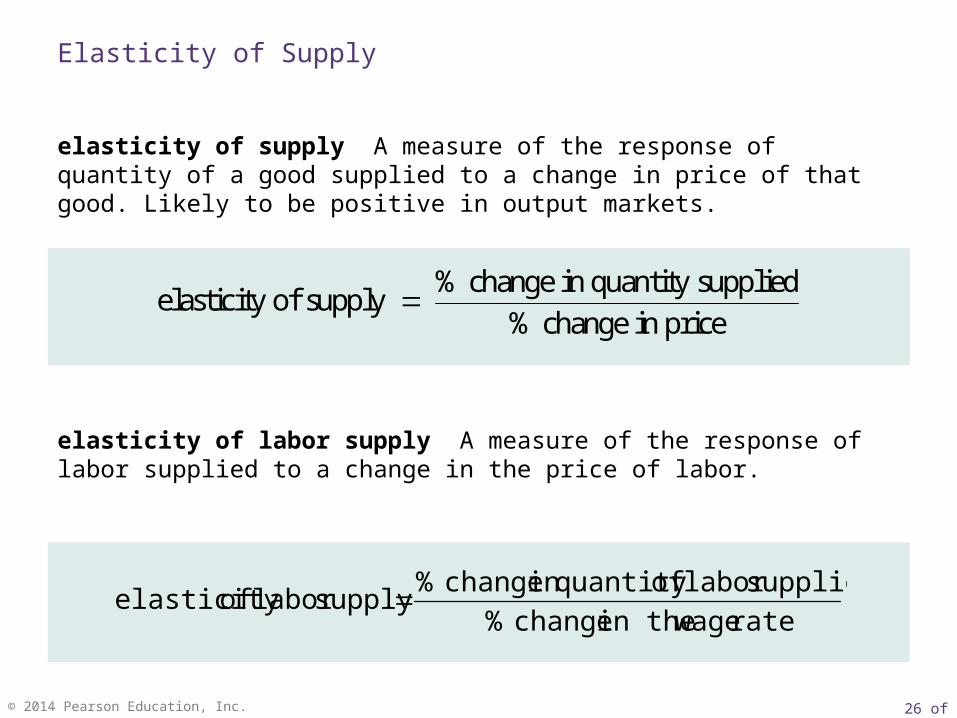
elasticity of supply A measure of the response of quantity of a good supplied to a change in price of that good. Likely to be positive in output markets.
% change in quantity suppliedelasticity of supply
% change in price
Elasticity of Supply
elasticity of labor supply A measure of the response of labor supplied to a change in the price of labor.
rate wagein the change %
suppliedlabor ofquantity in change % supply labor of elasticity
27 of 29© 2014 Pearson Education, Inc.
Looking Ahead
The purpose of this chapter was to convince you that measurement is important. If all we can say is that a change in one economic factor causes another to change, we cannot say whether the change is important or whether a particular policy is likely to work. The most commonly used tool of measurement is elasticity, and the term will recur as we explore economics in more depth.
We now return to the study of basic economics by looking in detail at household behavior. Recall that households demand goods and services in product markets but supply labor and savings in input or factor markets.
28 of 29© 2014 Pearson Education, Inc.
cross-price elasticity of demand
elastic demand
elasticity
elasticity of labor supply
elasticity of supply
income elasticity of demand
inelastic demand
midpoint formula
perfectly elastic demand
perfectly inelastic demand
point elasticity
price elasticity of demand
unitary elasticity
R E V I E W T E R M S A N D C O N C E P T S


![Topic 4 Elasticity - Trinity College, Dublin · PDF filePrice Elasticity of Demand ... Price Elasticity of Supply ... Microsoft PowerPoint - Topic 4 Elasticity [Compatibility Mode]](https://static.cupdf.com/doc/110x72/5ab680a27f8b9a6e1c8dc1e4/topic-4-elasticity-trinity-college-dublin-elasticity-of-demand-price-elasticity.jpg)