1
Environmental “footprint”: Land area required to provide for resource consumption & waste assimilation on a sustainable basis (Wackernagel et al.)
Cropland
Grazing LandFishing
ForestBuilt-up
Energy
0.0
2.0
4.0
6.0
8.0
10.0
12.0
14.0
61 66 71 76 81 86 91 96Year
Bill
ion
glo
ba
l he
ctar
es
0.00
0.20
0.40
0.60
0.80
1.00
1.20
Nu
mb
er
of
Ea
rth
s
Wackernagel et al., 2002
PopulationAssumedFootprint
Numberof Earths
1995 1995 1.31995 India 0.291995 Denmark 2.41995 USA 3.72 x 1995 Denmark 4.8
Wackernagel & Rees, 1996

2
The first industrial revolution
The second industrial revolutionResources scarce, people plentifulContext
Context Resources plentiful, people scarceResponse
Dramatic increases in
Resource consumption per capitaFraction of energy supply from non-sustainable sources (~0 to 80% higher)
Level of services (mobility, housing, dietary variety, information) desired
Labor productivity (output/person/hour); 100-fold higher
Population
Response
Dramatic increases inResource productivity (service/resource invested)Fraction of energy supply from sustainable resources
Population stabilization (appears to be happening)
The Next Industrial Revolution?*
*Hawkins, Lovins, and Lovins, “Natural Capitalism”

3 Sole Supply
SustainableResources
Sunlight
Wind
Ocean/hydro
Geothermal
Nuclear
Minerals
Food
HumanNeeds
EnergyMotors/Lights
Heat
Transport.
Materials
Organic
Inorganic
Primary Intermediates
Biomass
Electricity
Secondary Intermediates
Hydrogen
Animals
OrganicFuels
Batteries
Choices
Imagining a Sustainable World
The Environment
Water Soil Wildlife habitat/biodiversity
Air ClimateNutrientcycles

4
Hazard of driving with the low beams on
5
Prospects for Achieving Large Sustainability & Security Benefits via Biomass-Based Processes
Workshop on the Economic and EnvironmentalImpacts of Bio-Based Production
Chicago, IllinoisJune 8, 2004
Lee Lynd
Thayer School of EngineeringDartmouth College
• RBAEF Project
• Life cycle issues - a product non-specific framework for analyzing fossil fuel displacement
• Resource issues - matching the scale of challenges & solutions
• RBAEF Mature Technology Scenarios

6
The Role of Biomass in America’s Energy Future (RBAEF) Project
Multi-institutional• Dartmouth • Natural Resources Defense Council• Argonne National Lab • Michigan State University• National Renewable Energy Lab • Princeton • Union of Concerned Scientists • USDA Agricultural Research Service • University of Tennessee • Oak Ridge National Lab
Sponsors• Department of Energy • The Energy Foundation• National Commission on Energy Policy
ObjectivesIdentify & evaluate paths by which biomass can make a large contributionto future demand for energy services.
Determine what can be done to accelerate biomass energy use and in whattimeframe associated benefits can be realized.

7
The Role of Biomass in America’s Energy Future (RBAEF) Project…
Task Task 1. Biomass production a. Technology analysis b. Environmental evaluationTasks 2&3. Biomass power & biofuels a. Technology analysis b. Mobility chains c. Environmental evaluationTask 4. Coproduct analysis a. Technology analysis b. Environmental evaluationTask 5. Biomass Resource Sufficiency a. Sufficiency analysis b. Environmental evaluation
Task 6. Transition DynamicsTask 7. Policy Options & Evaluation a. Policy Development b. Policy Evaluation
Group Leader
Sandy McLaughlin (formerly of ORNL) Nathanael Greene, NRDC
Eric Larson, Princeton; Lee Lynd, Dartmouth Michael Wang, ANL Nathanael Greene, NRDC
Mark Laser, Dartmouth; Bruce Dale, MSU Nathanael Greene, NRDC
Lee Lynd, Dartmouth Nathanael Greene, NRDC
John Sheehan, NREL
Nathanael Greene, NRDC Nathanael Greene, NRDC
8
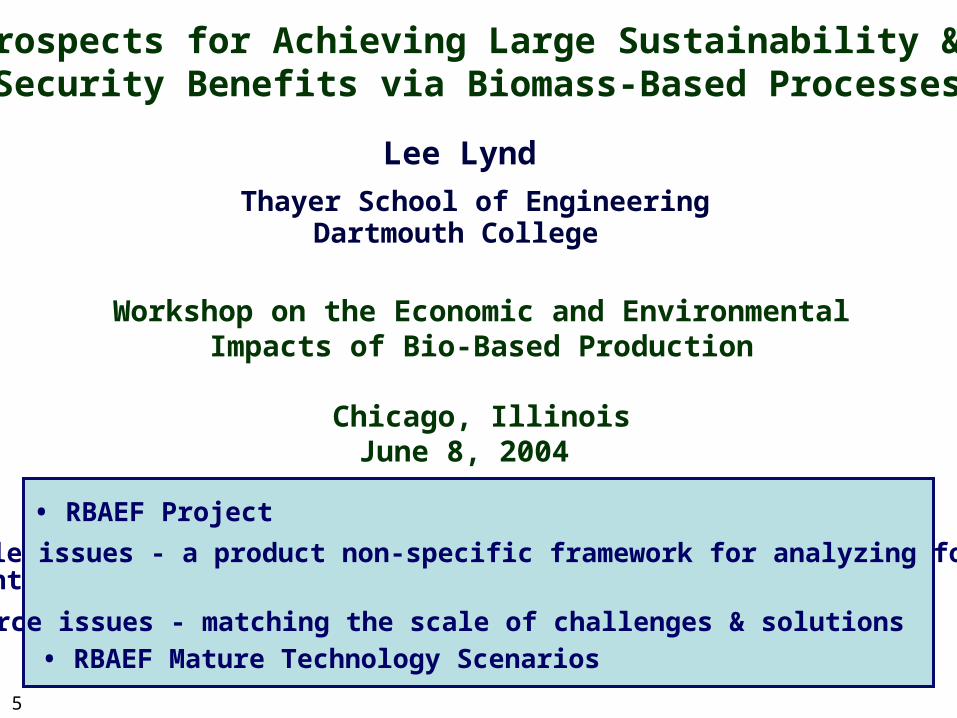
The Role of Biomass in America’s Energy Future (RBAEF) Project…
Distinguishing featuresBreadth of technologies (although not all) considered in a common framework.
Diversity of participants
• Technical
• Policy
• Environmental
Emphasis on mature technology
More important to know where we can get than where we are to evaluate
• The potential contribution of biomass to a sustainable world.
• Appropriate levels of research effort, policy intensity for biomass-based options.
Key Premise: Rational policy formulation is informed by a vision of what is possible.
Analysis of biomass energy within a framework that assumes innovation & change can happen.

9
Life Cycle Issues
€
Net Benefits (+or−) = BenefitsUnit Utilized
⎛
⎝
⎜ ⎜
⎞
⎠
⎟ ⎟ ×Units Utilized⎛
⎝ ⎜ ⎞
⎠
• Net fossil fuel displacement (kg FFE displaced/kg product)
< 0: no benefit
> 1: large benefits
One figure of merit
• Seek to develop a product non-specificframework to glean general insights
Whether large (per unit)fossil fuel displacement can be achieved
Upon what this depends
10
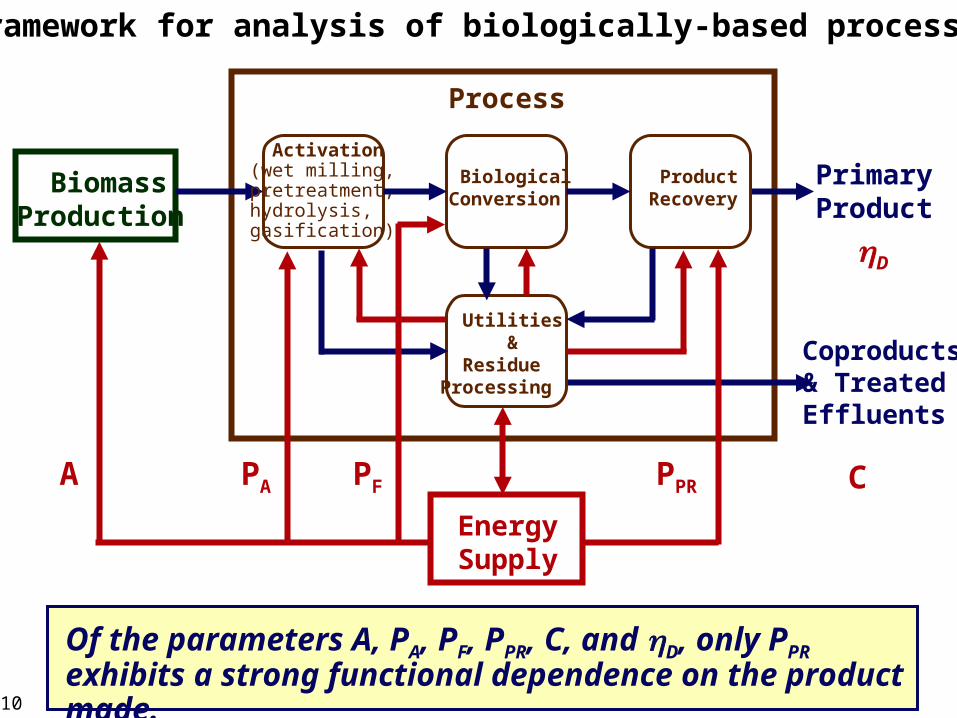
BiomassProduction
Process
PrimaryProduct
Coproducts& TreatedEffluents
Activation(wet milling,pretreatment,hydrolysis,gasification)
BiologicalConversion
ProductRecovery
Utilities & ResidueProcessing
EnergySupply
LCA Framework for analysis of biologically-based processes
A CPA PF PPR
D
Of the parameters A, PA, PF, PPR, C, and D, only PPR exhibits a strong functional dependence on the product made.
11
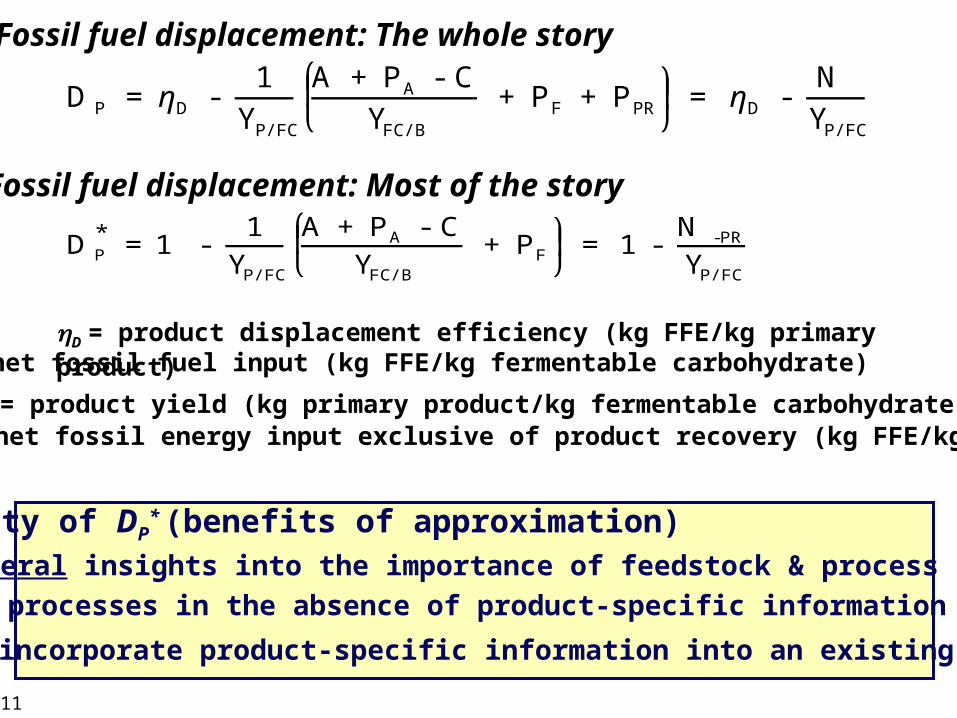
Utility of DP* (benefits of approximation)
Gain general insights into the importance of feedstock & process features
Fossil fuel displacement: The whole story
€
D P = ηD - 1
YP/FC
A + PA - CYFC/B
+ PF + PPR
⎛
⎝ ⎜ ⎞
⎠ ⎟ = ηD -
NYP/FC
D = product displacement efficiency (kg FFE/kg primary product)N = net fossil fuel input (kg FFE/kg fermentable carbohydrate)
YP/FC = product yield (kg primary product/kg fermentable carbohydrate)
Fossil fuel displacement: Most of the story
€
D P* = 1 -
1YP/FC
A + PA - CYFC/B
+ PF
⎛
⎝ ⎜ ⎞
⎠ ⎟ = 1 -
N -PR
YP/FC
N-PR = net fossil energy input exclusive of product recovery (kg FFE/kg FC)
Screen processes in the absence of product-specific information
Rapidly incorporate product-specific information into an existing rubric

12
Summary of Scenarios and Corresponding Parameter Values
Scenario
kg FFE/kg biomass (A, PA , C); kg FFE/kg FC (PF, N-PR)
A PA PF C N-PR
Corn 1. Aerobic, no residue utilization 0.0648 0.0943 0.238 0.0308 0.403 (0% stover used) 2. Aerobic, current rotation 0.0648 0.0943 0.238 0.119 0.280 (13% stover used) 3. Aerobic, high recovery 0.0648 0.0943 0.238 0.248 0.123 (46% stover used) 4. Anaerobic, no residue utilization 0.0648 0.0943 0.0527 0.0308 0.218 (0% stover used) 5. Anaerobic, current rotation 0.0648 0.0943 0.0527 0.119 0.104 (13% stover used) 6. Anaerobic, high recovery 0.0648 0.0943 0.0527 0.248 -0.062 (46% stover used)
Cellulosic
1. Aerobic, base case 0.0190 0 0.192 0.0849 0.0784 2. Aerobic, advanced 0.0190 0 0.192 0.114 0.0613 3. Anaerobic, base case 0.0190 0 0.0071 0.0849 -0.107
Lynd & Wang (JIE 04).
4. Anaerobic, advanced 0.0190 0 0.0071 0.114 -0.124

13
1. Aerobic, no stover utilization (0%)
2. Aerobic, current rotation (13%)
3. Aerobic, high recovery (46%)
4. Anaerobic, no stover utilization (0%)
5. Anaerobic, current rotation (13%)
6. Anaerobic, high recovery (46%)
1. Aerobic, base case 2. Aerobic, advanced
3. Anaerobic, base case
4. Anaerobic, advanced
-1.5
-1
-0.5
0
0.5
1
1.5
2
2.5
0 0.2 0.4 0.6 0.8 1
Dp*
or
Dp
(kg
FF
E/k
g p
rod
uct
)
12
3
4
5
6
-1.5
-1
-0.5
0
0.5
1
1.5
2
2.5
0 0.2 0.4 0.6 0.8 1YP/FC
1
4
3
2
PHA, D = 1, withproduct recovery
Corn Cellulosic
EtOH, D = 0.78, with product recovery
YP/FC
Numbers in parenthesis refer to % corn stover utilized

14
Fossil Fuel Displacement via Biologically-Based Processes (kg fossil fuel/kg product)
Fostered byFeedstock
Cellulosic
Corn with residue recovery and compatible harvest methods
Process
High product yield
Anaerobic rather than aerobic processing
Reasonable energy requirements for product recovery
Can be very high if most of these features are favorable
Can be zero or negative if most of these features are not favorable
Processes can be rapidly screened in the absence of detailed, product-specific analysis

15
Resource Issues
€
Net Benefits (+or−) = BenefitsUnit Utilized
⎛
⎝
⎜ ⎜
⎞
⎠
⎟ ⎟ ×Units Utilized⎛
⎝ ⎜ ⎞
⎠
• How big a role couldbiomass play in meeting these challenges?
Matching the scale of challenges & solutions
• Origin of sustainability & security challenges
What do we need to impact?
16
60
50
40
30
20
10
0
500
1,000
1,500
2,000
0
Ann
ual U
.S. C
onsu
mpt
ion
(mil
lion
s of
sho
rt to
ns)
(Qua
dril
lion
BT
U/y
r)
Fos
sil F
uel f
or E
lect
rici
ty1,
081
27
Ani
mal
Fee
d50
5
8 347
6L
umbe
r, P
ulp,
and
Ply
woo
d
68 2O
rgan
ic C
hem
ical
s an
d P
olym
ers
35 1A
nnua
l Gro
wth
in F
ossi
l Fue
ls
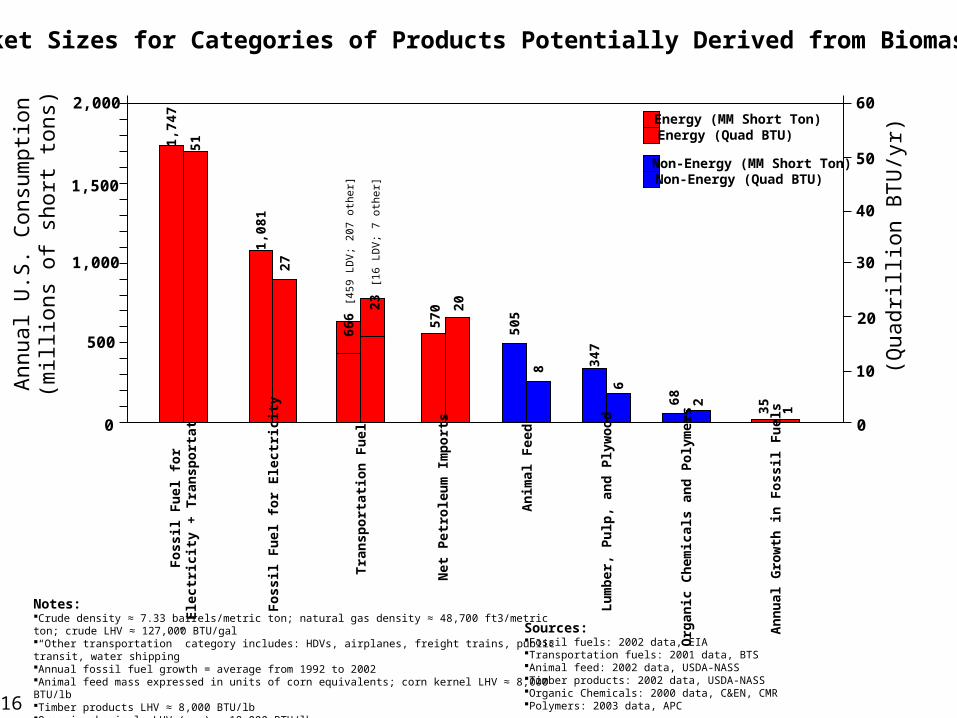
Market Sizes for Categories of Products Potentially Derived from Biomass
Fos
sil F
uel f
orE
lect
rici
ty +
Tra
nspo
rtat
ion
1,74
7
51
Energy (MM Short Ton)Energy (Quad BTU)
Non-Energy (MM Short Ton)Non-Energy (Quad BTU)
Notes:Crude density ≈ 7.33 barrels/metric ton; natural gas density ≈ 48,700 ft3/metric ton; crude LHV ≈ 127,000 BTU/gal“Other transportation” category includes: HDVs, airplanes, freight trains, public transit, water shippingAnnual fossil fuel growth = average from 1992 to 2002Animal feed mass expressed in units of corn equivalents; corn kernel LHV ≈ 8,000 BTU/lbTimber products LHV ≈ 8,000 BTU/lbOrganic chemicals LHV (ave) ≈ 18,000 BTU/lbPrimary organics include ethylene, propylene, methanol, benzene, toluene, 1,3-butadiene, and o-xylenePrimary organic chemicals used as polymer feedstock ≈ 46 MM ton/yr (assumes stoichiometric yields)
Sources:Fossil fuels: 2002 data, EIATransportation fuels: 2001 data, BTSAnimal feed: 2002 data, USDA-NASSTimber products: 2002 data, USDA-NASSOrganic Chemicals: 2000 data, C&EN, CMRPolymers: 2003 data, APC
Tra
nspo
rtat
ion
Fue
ls66
6 [4
59 L
DV
; 207
oth
er]
23 [1
6 L
DV
; 7 o
ther
]
Net
Pet
role
um I
mpo
rts
570 20

17
Biomass - A Credible Solution to Mega Challenges?
Our major sustainability & security challenges arise primarily from energy use
Sustainability: Fossil fuel utilization in all sectors
Security: Oil the dominant concern, transportation the dominant sector
If biomass is to play more than a minor role in responding to sustainability & security challenges, it must have a significant impact on energy utilization.
Case has not been articulated in any detail
Widely-accepted common wisdom: No. Not enough biomass/land
If this were to changeWould provide a rationale for shifting into a new gear.
18
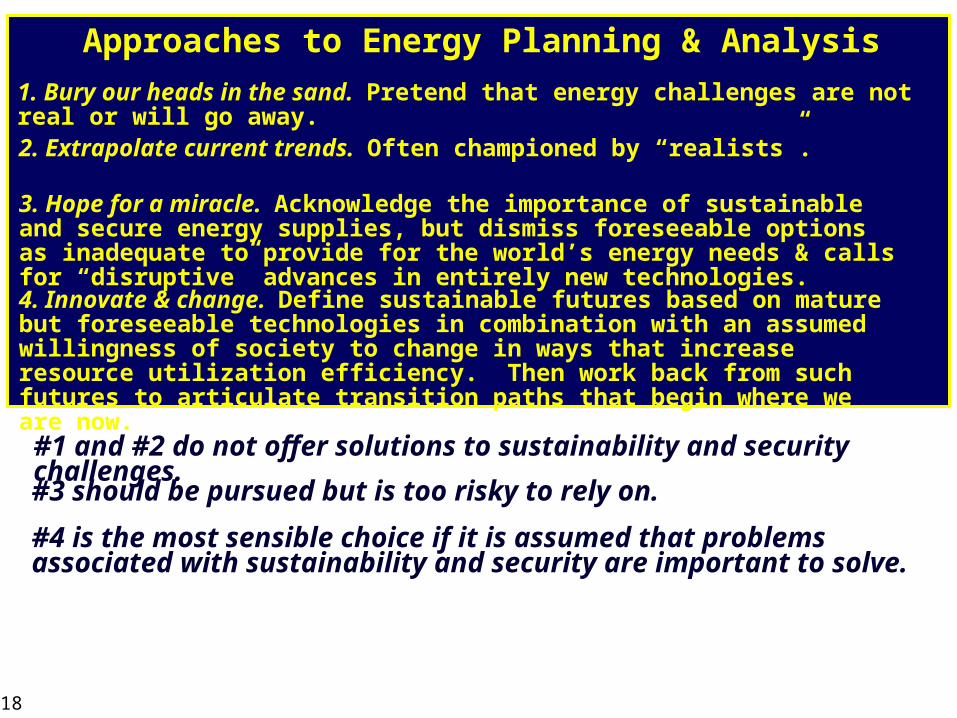
Approaches to Energy Planning & Analysis
1. Bury our heads in the sand. Pretend that energy challenges are not real or will go away.
2. Extrapolate current trends. Often championed by “realists”.
3. Hope for a miracle. Acknowledge the importance of sustainable and secure energy supplies, but dismiss foreseeable options as inadequate to provide for the world’s energy needs & calls for “disruptive” advances in entirely new technologies.
4. Innovate & change. Define sustainable futures based on mature but foreseeable technologies in combination with an assumed willingness of society to change in ways that increase resource utilization efficiency. Then work back from such futures to articulate transition paths that begin where we are now.
#4 is the most sensible choice if it is assumed that problems associated with sustainability and security are important to solve.
#1 and #2 do not offer solutions to sustainability and security challenges.
#3 should be pursued but is too risky to rely on.

19
How big a contribution could biomass make?
Radically different conclusions have been reached • Biomass becomes the largest energy source supporting humankind in the Renewables-Intensive Global Energy Scenario of Johanssen et al. (1993).
• Large scale biofuel production is not an alternative to the current use of oil and is not even an advisable option to cover a significant fraction of it (Giampetro et al., ‘97).
• To provide ethanol to replace all gasoline used in the [U.S] light-duty fleet, we estimate it would be necessary to process the biomass growing on 300 to 500 million acres. (Lave et al., 2002).
Key variables impacting availability of biomass for non-food uses
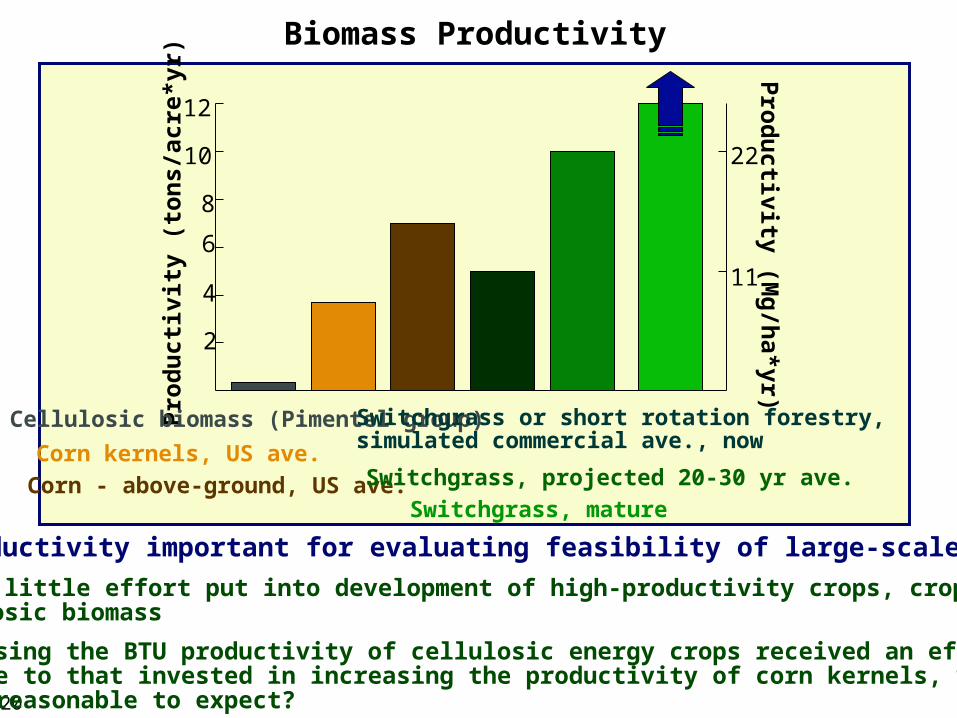
Biomass productivity (tons/acre*yr)
Vehicle efficiency (miles/gallon)
Land use
• Biomass will eventually provide over 90% of U.S. chemical and over 50% of U.S. fuel production (Biobased Industrial Products, NRC, 1999).
• Biomass share of world energy supply will equal that of oil in 2050 and be as large as any other resource (Kassler, Shell Petroleum Ltd, 1994).
Food production efficiency (calories, protein/acre)
Integrated production of feedstock production into existing activities (ag., forest products)
20
Pro
duct
ivit
y (t
ons/
acre
*yr) P
roductivity (Mg/ha*yr)
22
11
2
4
6
8
10
12
Cellulosic biomass (Pimentel group)
Corn kernels, US ave.
Corn - above-ground, US ave.
Switchgrass or short rotation forestry, simulated commercial ave., now
Switchgrass, projected 20-30 yr ave.
Biomass Productivity
Future productivity important for evaluating feasibility of large-scale bioenergy
Relatively little effort put into development of high-productivity crops, cropping systemsfor cellulosic biomass
If increasing the BTU productivity of cellulosic energy crops received an effortcomparable to that invested in increasing the productivity of corn kernels, what would be reasonable to expect?
Switchgrass, mature
21
0
20
40
60
80
100
120
140
160
1 2 3 4 5 6
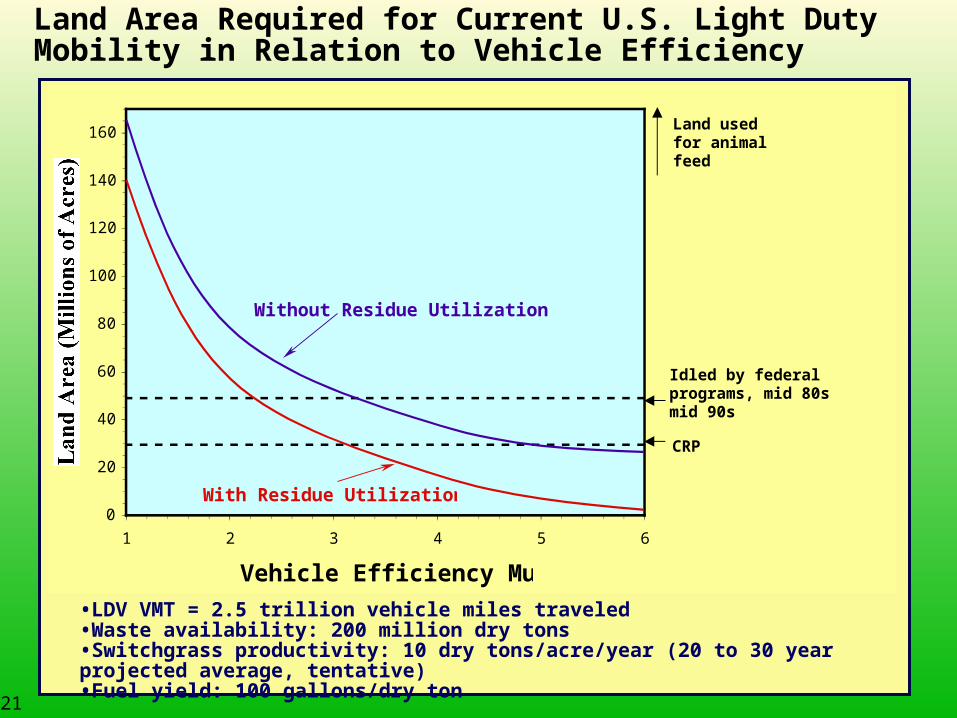
Vehicle Efficiency Multiplier
Land Area (Millions of Acres)
Without Residue Utilization
With Residue Utilization
Idled by federal programs, mid 80s-mid 90s
CRP
Land used for animal feed
•LDV VMT = 2.5 trillion vehicle miles traveled•Waste availability: 200 million dry tons •Switchgrass productivity: 10 dry tons/acre/year (20 to 30 year projected average, tentative)•Fuel yield: 100 gallons/dry ton
Land Area Required for Current U.S. Light Duty Mobility in Relation to Vehicle Efficiency

22
Scenario High efficiency vehicles compensate for…
Difficult to imagine a sustainable transportation sector without it
Biomass/fuel (several) Otherwise large land requirement
Renewable power/batteries Otherwise low travel radius
Renewable power/H2 Otherwise low travel radius
High Vehicle EfficiencyPossible (2020 estimates from Friedman, 2003)
Today: ‘04 Prius (mid-size), 56 mpg
By 2020, fuel savings > added vehicle cost (hybrids + advanced technology)
A fleet made up only of pickups, minivans, and SUVs could still reach 50 mpg.
Fleet average: 50 to 60 mpg.
DesirableDirect: Reduces GHG emissions, oil imports & depletion rate.Indirect: Increases the feasibility of alternatives to petroleum
Implicit in transportation scenarios featuring energy storage as H2

23
Food Production Efficiency: Some Observations
Strongly impacted by dietary trends - the amount and kind of meat consumed in particular.
Tremendous potential elasticity
Land to feed U.S. population in the most land-efficient way possible: ~ 20 million acres
Land currently used: > 400 million acres
Food production is usually assumed to remain static in analyses of the role of biomass as an energy source.
Farmers would rethink what they plant.
However, demand for cellulosic feedstocks due to cost-competitive processing technology would very likely result in large changes in food production.
Coproduction of processing feedstock and animal feed is one likely change.
A similar argument can be advanced for the forest products industry.

24
Integrated Production of Processing Feedstocks and Feed Protein
• Production of perennial grass could potentially produce the same amount of feed protein per acre while producing a large amount of feedstock for energy production
• Consumption of calories and protein by livestock 10x that by humans in the U.S.
• Requires readily foreseeable processing technology to recover feed protein
Switchgrass Protein Recovery/
(& Pretreatment)
Fuels/Chemicals
Feed ProteinConcept
0.40 – 0.450.36 (bean only)1.1 – 1.3Soybeans
0.4 – 1.2.08 -0.12 (early cut)5.0 – 10 Switchgrass
Protein Productivity(tons/acre/year)
Protein (Mass Fraction)
Mass Productivity(tons/acre/year)
Crop
Composition & productivity comparison
Processing
25
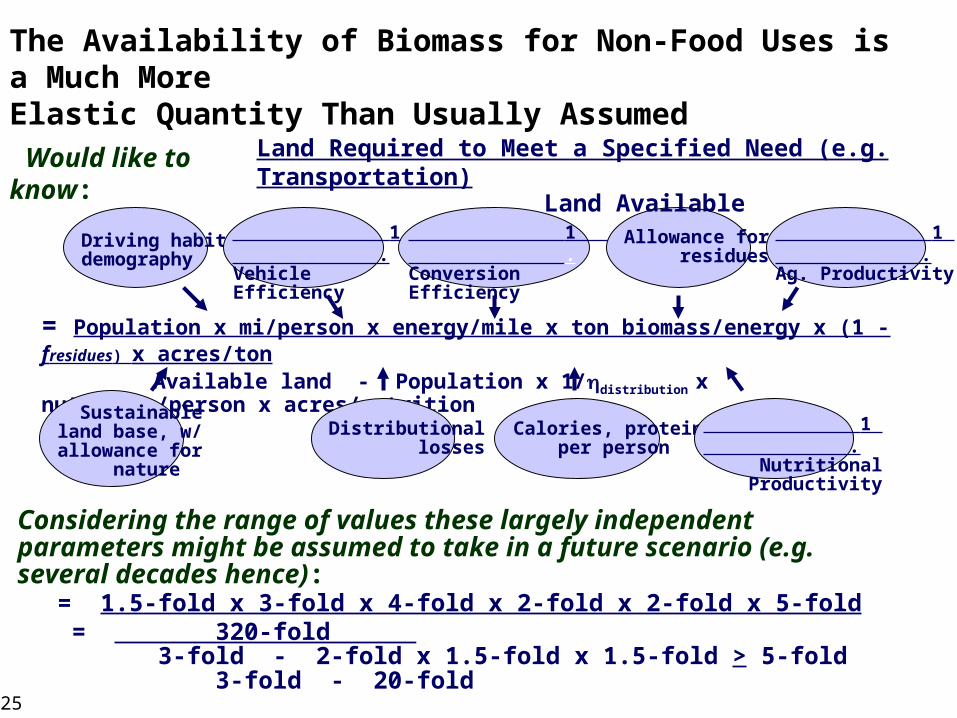
The Availability of Biomass for Non-Food Uses is a Much MoreElastic Quantity Than Usually Assumed
Would like to know:
= Population x mi/person x energy/mile x ton biomass/energy x (1 - fresidues) x acres/ton Available land - Population x 1/distribution x nutrition/person x acres/nutrition
Driving habits,demography
1 .Vehicle Efficiency
1 .Conversion Efficiency
Allowance for residues
1 .Ag. Productivity
Sustainableland base, w/allowance for nature
Distributional losses
Calories, protein per person
1 . Nutritional Productivity
Considering the range of values these largely independent parameters might be assumed to take in a future scenario (e.g. several decades hence):
Land Required to Meet a Specified Need (e.g. Transportation) Land Available
= 1.5-fold x 3-fold x 4-fold x 2-fold x 2-fold x 5-fold = 320-fold . 3-fold - 2-fold x 1.5-fold x 1.5-fold > 5-fold 3-fold - 20-fold
26
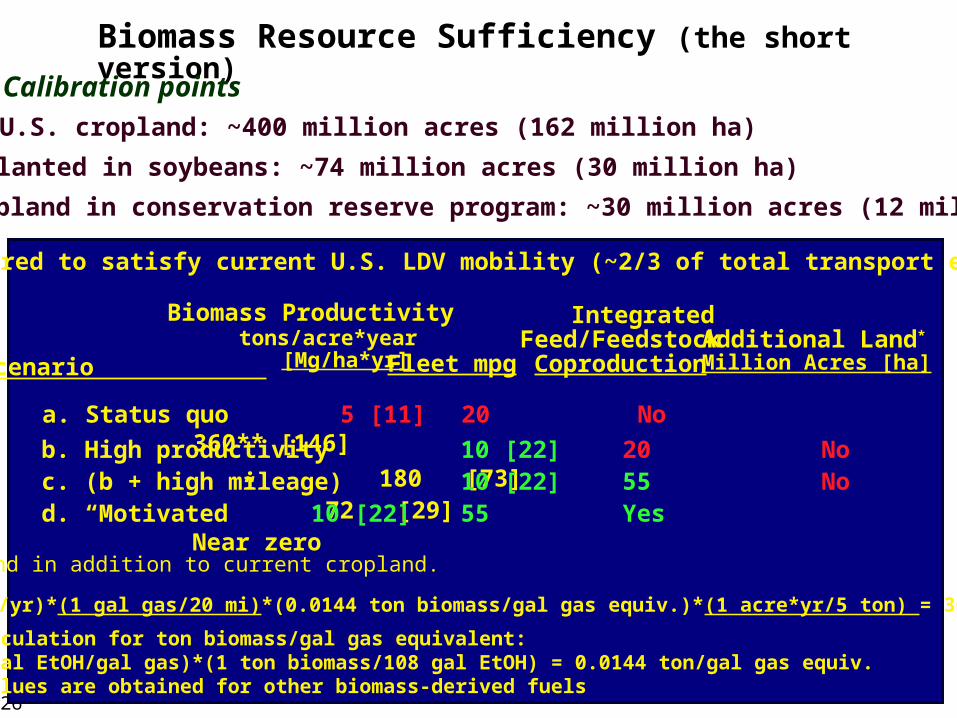
Land required to satisfy current U.S. LDV mobility (~2/3 of total transport energy)
Fleet mpg
Biomass Productivity tons/acre*year [Mg/ha*yr]
IntegratedFeed/Feedstock Coproduction
Additional Land*
Million Acres [ha]
a. Status quo 5 [11] 20 No 360** [146]
Scenario
* Land in addition to current cropland.
**(2.5x10¹² mi/yr)*(1 gal gas/20 mi)*(0.0144 ton biomass/gal gas equiv.)*(1 acre*yr/5 ton) = 360 x 106 acres
Sample calculation for ton biomass/gal gas equivalent: (1.55 gal EtOH/gal gas)*(1 ton biomass/108 gal EtOH) = 0.0144 ton/gal gas equiv.Similar values are obtained for other biomass-derived fuels
Biomass Resource Sufficiency (the short version)
Calibration points
Total U.S. cropland: ~400 million acres (162 million ha)
Land planted in soybeans: ~74 million acres (30 million ha)
Idled cropland in conservation reserve program: ~30 million acres (12 million ha)
b. High productivity 10 [22] 20 No 180 [73] c. (b + high mileage) 10 [22] 55 No 72 [29]d. “Motivated” 10 [22] 55 Yes Near zero
27
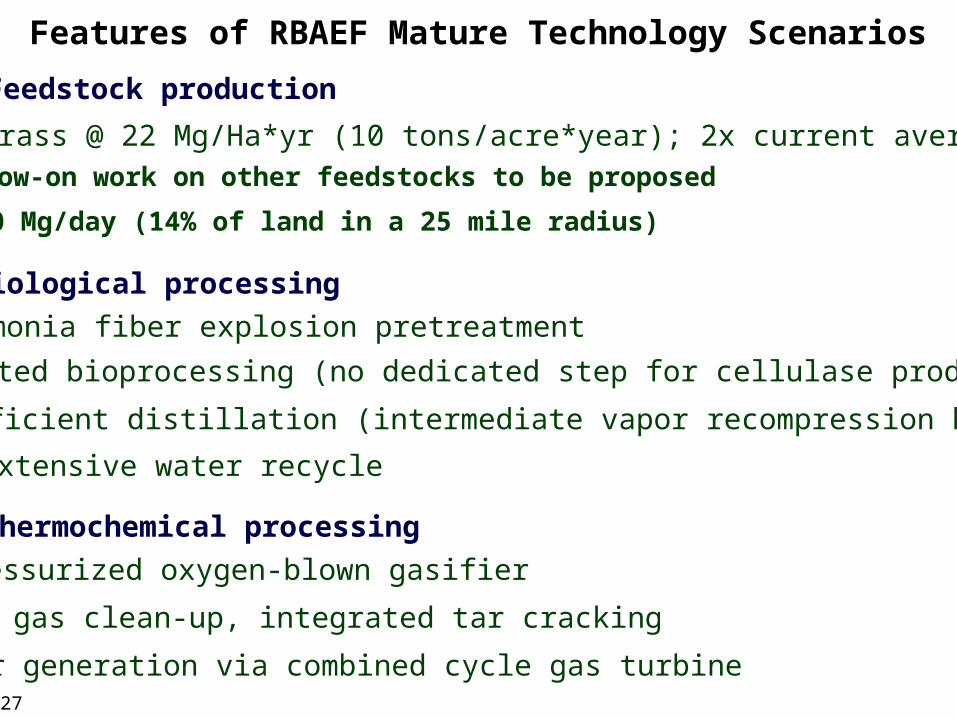
Features of RBAEF Mature Technology Scenarios
Feedstock production
Switchgrass @ 22 Mg/Ha*yr (10 tons/acre*year); 2x current average
5000 Mg/day (14% of land in a 25 mile radius)
Follow-on work on other feedstocks to be proposed
Biological processing
Ammonia fiber explosion pretreatment
Consolidated bioprocessing (no dedicated step for cellulase production)
Energy-efficient distillation (intermediate vapor recompression heat pumps)
Extensive water recycle
Thermochemical processing
Pressurized oxygen-blown gasifier
Warm gas clean-up, integrated tar cracking
Power generation via combined cycle gas turbine

28
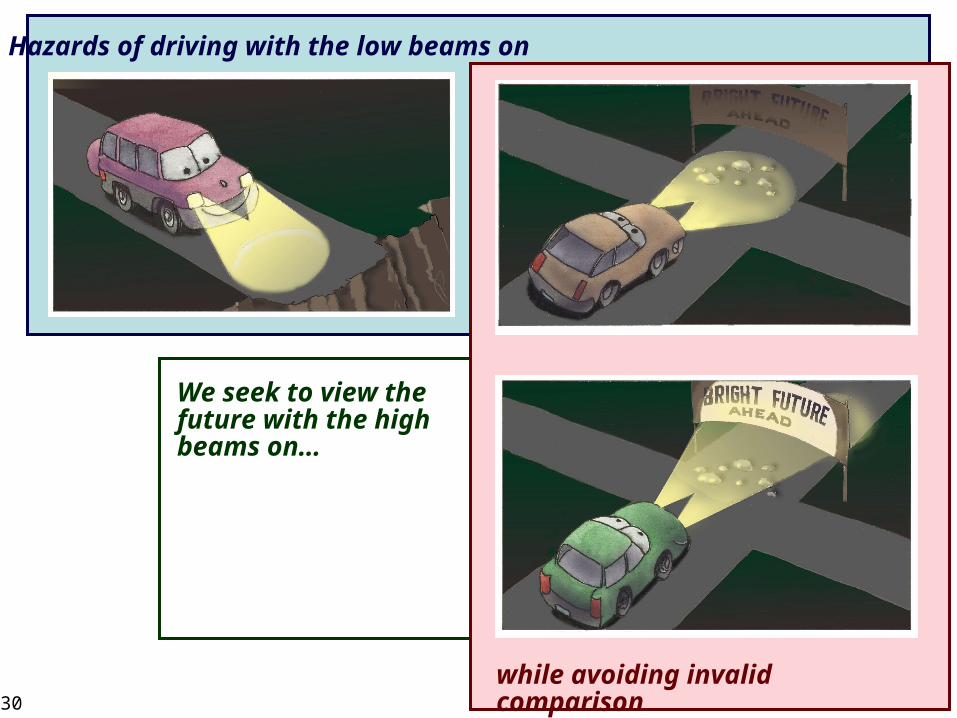
Hazards of driving with the low beams on

29
We seek to view the future with the high beams on…
Hazards of driving with the low beams on
30
We seek to view the future with the high beams on…
Hazards of driving with the low beams on
while avoiding invalid comparison
31
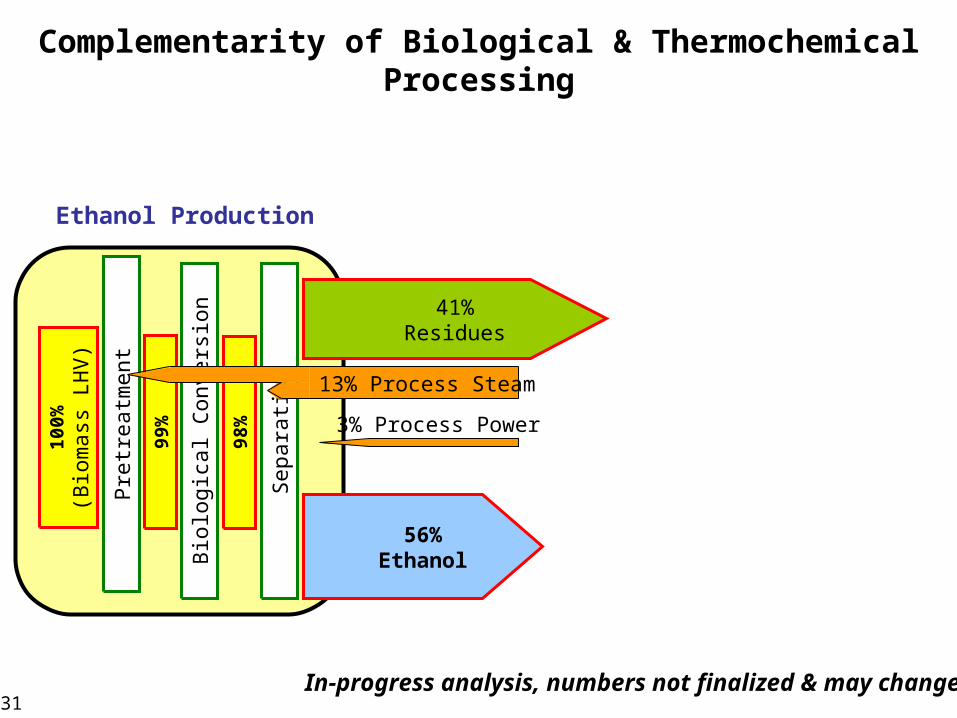
100%
(Bio
mas
s L
HV
)
Pre
trea
tmen
t
99%
Bio
logi
cal C
onve
rsio
n
98%
Sep
arat
ion
56%Ethanol
41%Residues
Complementarity of Biological & Thermochemical Processing
13% Process Steam
3% Process Power
Ethanol Production
In-progress analysis, numbers not finalized & may change.
32
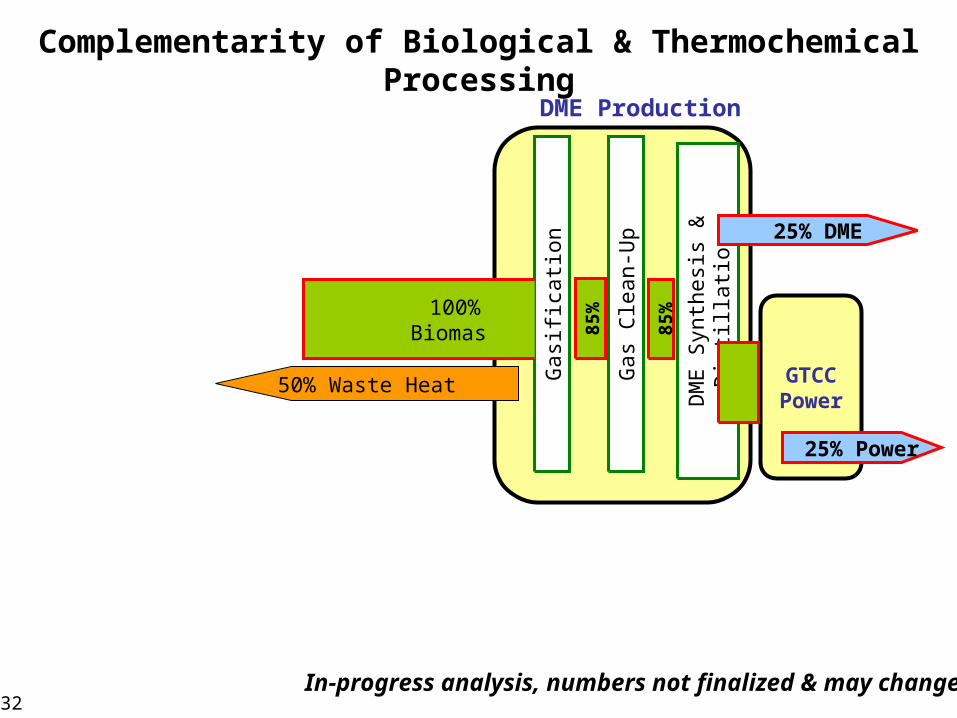
100%Biomass
Gas
ific
atio
n
Gas
Cle
an-U
p
DM
E S
ynth
esis
& D
isti
llat
ion
DME Production
85%
85%
25% DME
GTCCPower
25% Power
50% Waste Heat
Complementarity of Biological & Thermochemical Processing
In-progress analysis, numbers not finalized & may change.

33
100%
(Bio
mas
s L
HV
)
Pre
trea
tmen
t
99%
Bio
logi
cal C
onve
rsio
n
98%
Sep
arat
ion
56%Ethanol
41%Residues
13% Process Steam
Ethanol Production
3% Process Power
41%Residues
Gas
ific
atio
n
Gas
Cle
an-U
p
DM
E S
ynth
esis
& D
isti
llat
ion
DME Production
35%
35%
11% DME
GTCCPower
5% Power
Complementarity of Biological & Thermochemical Processing
In-progress analysis, numbers not finalized & may change.

34
Energy Input
Oil
Ref
inin
g
Energy O
utput
External Energy Input
Internal Energy Input
Energy Output
100%90%80%70%60%50%40%30%20%10%
0%10%20%30%40%50%
% o
f F
eed
stoc
k L
HV
Energy Output:Input Ratios Increase with Maturity
Cu
rren
t C
ellu
losi
c E
than
ol
Ad
v. E
than
ol (
B)/
Ste
am d
ryin
g/F
T f
uel
s
Cor
n E
than
ol
Ad
v. E
than
ol/
H2
Ad
v. E
than
ol (
A)/
Ran
kin
e P
ower
AFEXCBP
No evaporation
Ad
v. E
than
ol (
B)/
Ran
kin
e P
ower
IHOSRDistillation
Ad
v. E
than
ol (
B)/
GT
CC
Pow
er
GTCCPower
Ad
v. E
than
ol (
B)/
Ste
am d
ryin
g/G
TC
C
Integrated SteamDrying of Residue
In-progress analysis, numbers not finalized & may change.

35
Co-Production Process Efficiencies E
nerg
y Y
ield
(%
of
feed
stoc
k L
HV
)
10%
20%
30%
40%50%
60%
70%
80%
90%
100%
Ethanol
Electricity
TCF
Hydrogen
Power
50%
EtOH +Power
56%
18%
74%
FT liquids +Power
48%
4%
52%19%
EtOH +FT fuels
56%
75%
EtOH +H2
56%
24%
80%
60%
H2
Gasoline (38%)Diesel (21%)Jet Fuel (9%)Residual Fuel Oil (5%)Coke (4%)
Still Gas (4%)Liquefied Gases (3%)Chemical Feedstocks (2%)Other (2%)
88%
PetroleumRefining
Sources:Overall petroleum refinery efficiency: GM, ANL, BP, ExxonMobil, Shell, 2001.
Petroleum product yields: API
Product energy densities: EIA
In-progress analysis, numbers not finalized & may change.
56%
11%5%
72%
EtOH +DME
DME +Power
25%
25%
50%
36
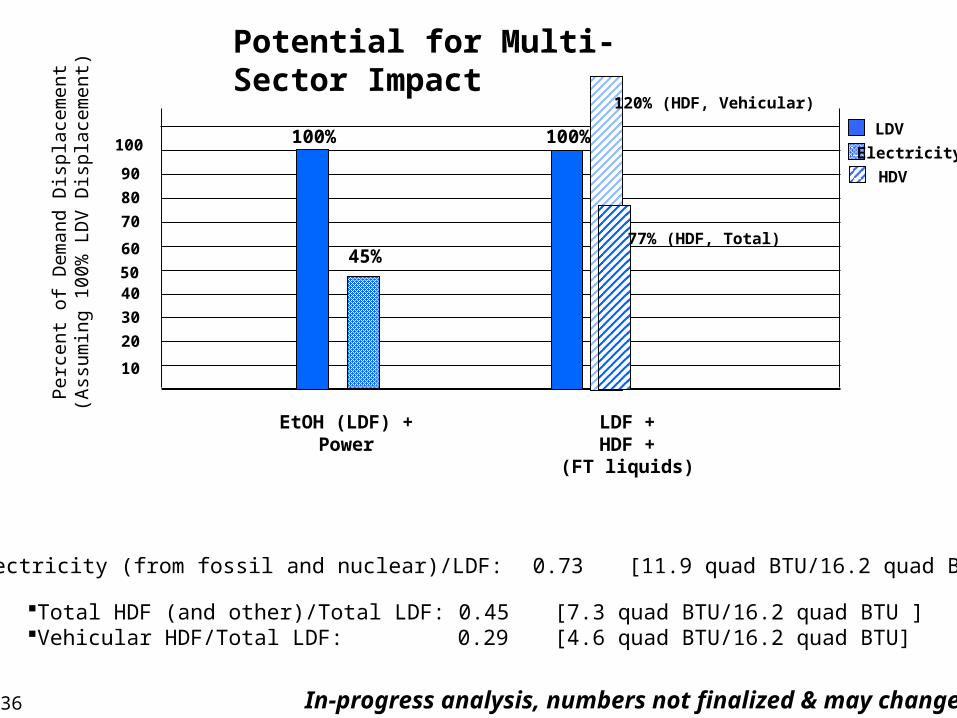
Potential for Multi-Sector ImpactP
erce
nt o
f D
eman
d D
ispl
acem
ent
(Ass
umin
g 10
0% L
DV
Dis
plac
emen
t)
10
20
30
4050
60
70
80
90
100
Total HDF (and other)/Total LDF: 0.45 [7.3 quad BTU/16.2 quad BTU ]Vehicular HDF/Total LDF: 0.29 [4.6 quad BTU/16.2 quad BTU]
LDF +HDF +
(FT liquids)
100%
77% (HDF, Total)
120% (HDF, Vehicular)
LDV
Electricity
HDV
EtOH (LDF) +Power
100%
45%
Electricity (from fossil and nuclear)/LDF: 0.73 [11.9 quad BTU/16.2 quad BTU ]
In-progress analysis, numbers not finalized & may change.

37
$500 $1,000 $1,500$0
Switchgrass (10 tpa 2-cut) $1,216
Switchgrass (10 tpa 1-cut) $936
Switchgrass (5 tpa 2-cut) $608
Switchgrass (5 tpa, 1-cut) $468
Corn + Stover $873
Corn $754
Soybeans $374
Oil ($0.27/lb, corn; $0.33/lb, soy)
Corn Gluten Feed ($0.03/lb)
Corn Gluten Meal ($0.12/lb)
Ethanol ($0.10/lb)
Protein ($0.33/lb)
Electricity ($0.04/kwh)
HFCS ($0.13/lb)
Dextrose ($0.20/lb)
Corn Starch ($0.13/lb)
Product Value ($/Acre)Crop Yield
(ton/acre)Corn 4.0
Corn Stover 2.0
Soybeans 1.1
SWG (base) 4.9
SWG (advanced) 9.8
Product Value per Acre
Notes:Switchgrass protein recovery assumed to be 80%2-cut switchgrass assumes 67% of total yield harvested in early cutCorn + stover scenario assumes 50% stover collectedEthanol price assumed to be $0.64/gallon (energy equivalent of gasoline at $1.00/gallon)
Sources:Corn yield: 2002 U.S. average, USDA-NASSCorn product yields: CRAHCFS, glucose, and dextrose prices: 2003 U.S. average, Milling & Baking NewsStarch, CGF, CGM prices: 2002 average, USDA Feed Situation and Outlook Yearbook, 2003Corn oil price: 2002 average, USDA Oil Crops Situation and Outlook, 2003Soybean yield: 2002 U.S. average, USDA—NASSSoy product yields: 2002 U.S. average, USDA Oil Crops Situation and Outlook, 2003Soy oil and protein prices: March 2004, Chicago Board of Trade In-progress analysis, numbers not finalized & may change.

38
Flows are tonnes of carbon per hectare per year Soil carbon: McLaughlin et al., 2002 Processing: In-progress RBAEF analysis
Conversion5.56
Soil Carbon Reservoir
1.0
Carbon cycle for switchgrass processing (carbon-poor soil, 30 year period)
End Use
2.47
Photosynthesis
6.56
Atmospheric CO2
Power
3.09
Ethanol 2.05
TCF 0.42
0.43
0.19Fossil Carbon Reservoir
2.08X
X
X
In-progress analysis, numbers not finalized, may change.
Soil(sequestered, 27%)
TCF(avoided, 11.5%)
Ethanol(avoided, 56.3%)
Power(avoided, 5.1%)

39
Finding Common Interest with the Environmental Community
The environmental community has generally been largely ambivalentrelative to biomass energy and biobased industrial products.
Two of the largest environmental advocacy organizations are involvedNatural Resources Defense Council - Nathanael Greene
Union of Concerned Scientists - Jason Mark
But is taking a close and fresh look, and revising their assessment…
“Cellulosic ethanol is at least as likely as hydrogen to be an energy carrier of choice for a sustainable transportation sector.”
Joint NRDC, UCS statement at the Feb. ‘04 public meeting of the RBAEF project
40
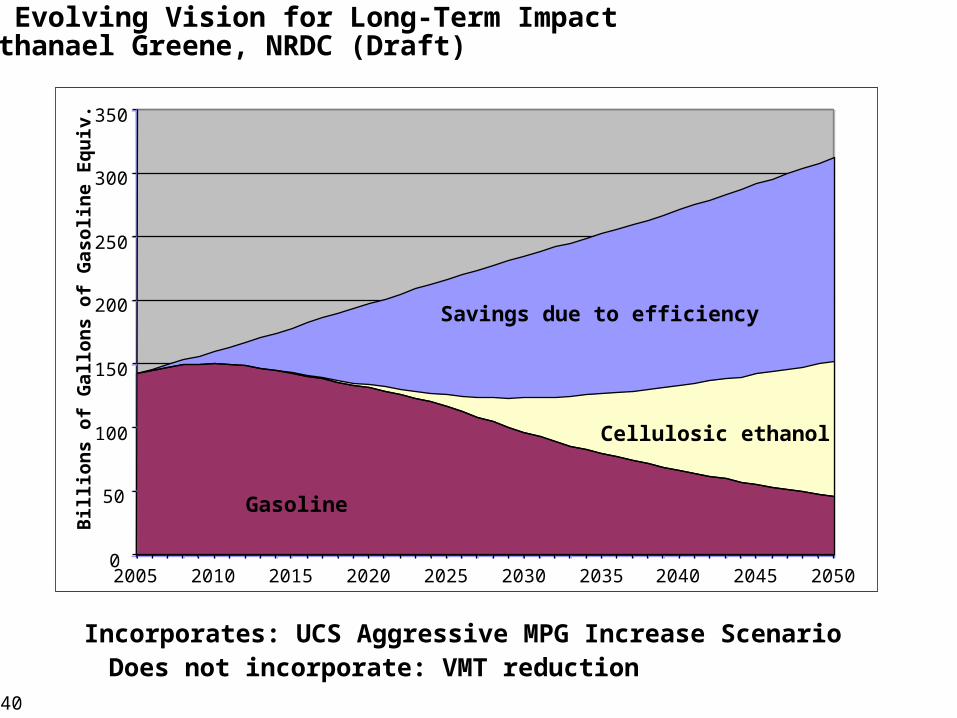
2005 2010 2015 2020 2025 2030 2035 2040 2045 20500
50
100
150
200
250
300
350
Bil
lio
ns
of
Gal
lon
s o
f G
aso
lin
e E
qu
iv.
Gasoline
Savings due to efficiency
Cellulosic ethanol
An Evolving Vision for Long-Term ImpactNathanael Greene, NRDC (Draft)
Incorporates: UCS Aggressive MPG Increase ScenarioDoes not incorporate: VMT reduction
41
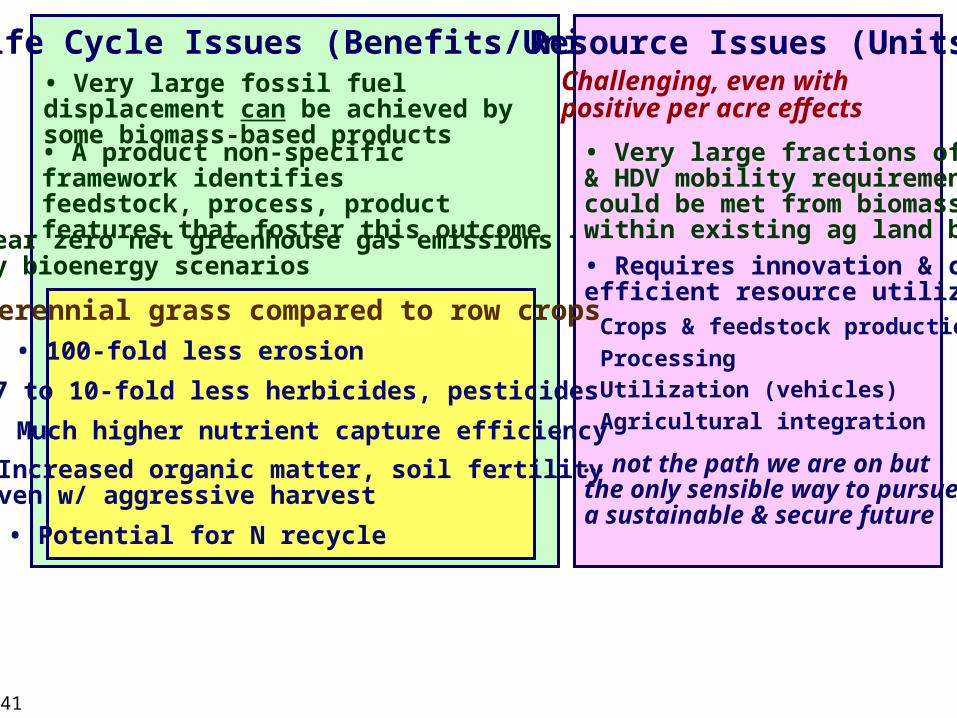
Life Cycle Issues (Benefits/Unit)• Very large fossil fuel displacement can be achieved by some biomass-based products
• A product non-specific framework identifiesfeedstock, process, product features that foster this outcome
• Near zero net greenhouse gas emissions formany bioenergy scenarios
Resource Issues (Units)Challenging, even with positive per acre effects
• 100-fold less erosion
Perennial grass compared to row crops
• 7 to 10-fold less herbicides, pesticides
• Much higher nutrient capture efficiency
• Increased organic matter, soil fertility even w/ aggressive harvest
• Potential for N recycle
• Very large fractions of LDV & HDV mobility requirementscould be met from biomasswithin existing ag land base
• Requires innovation & change,efficient resource utilization
Crops & feedstock production
ProcessingUtilization (vehicles)
Agricultural integration
… not the path we are on butthe only sensible way to pursuea sustainable & secure future