1
MASTER PROJECT
Cement Market in Peru
Carlos Ireijo Kanashiro
Master of Competition and Market Regulation 2011

2
Contents
1. Motivation ........................................................................................................................ 3
2. The product ....................................................................................................................... 4
3. Caracteristic of the demand ............................................................................................... 4
4. Characteristics of supply ................................................................................................... 5
4.1. Chain Cement Productive .......................................................................................... 5
4.1.1. Production Process ............................................................................................. 5
4.1.2. Distribution of the product ................................................................................. 7
4.2. Geographical Market of the Suppliers ........................................................................ 8
4.3. The firms and Groups behind ..................................................................................... 9
5. Determinants of market power of the cement suppliers .................................................... 10
5.1. Concentration: market share..................................................................................... 10
5.2. Transportation costs ................................................................................................. 15
5.3. Entry Barriers .......................................................................................................... 16
5.3.1 Capital Investments ................................................................................................ 16
5.3.2 Legal Barriers ......................................................................................................... 16
5.3.3 Trade Barriers ......................................................................................................... 17
5.3.4 Marketing and advertising costs .............................................................................. 17
5.4. Potential competition ............................................................................................... 18
5.5. Analysis of collusion: dynamic contexts................................................................... 18
6. Forms of competition in cement industry ......................................................................... 19
6.1. Horizontal Differentiation ........................................................................................ 19
6.2. Cournot competition: the choice of production capacity ........................................... 20
6.3. Price behavior (2000 – 2008) ................................................................................... 22
7. Conclusions..................................................................................................................... 24
8. References ...................................................................................................................... 26

3
Cement Market in Peru
1. Motivation
The cement market is a very important business in the construction industry. As many
studies conclude, its demand is very cyclical and highly correlated with the economic
cycles of growth. So, expansive cycles are signs of potential increases of cement orders
for new infrastructure in expanding economies and with that, the big ones of this
business. On the other hand, there are high fixed costs behind this product which makes
it costly to be provided by several suppliers. It might be reasonable, that just one
company provide the material in a geographical area. Nevertheless, that does not mean
that another company should not enter in this area to compete with the first one, but
certainly it would be hard for the last one to achieve the level of output of the first one
from the beginning. This is a clear entry barrier in the market, which is not easily
affordable.
So in this context, due the important sunk costs of entry faced by the firms, there is a
very concentrated market regarding to the supply and just a few ones that dominate
market within a geographical location; which is determined by transport costs of both,
raw material and the final product. However, as long as firms grow it is highly probable
that they make arrangements in order to grow and be each time more profitable either
by legal or even illegal ways. That is why this market could be a very interesting market
to study. With high entry or sunk costs, a homogeneity product, high transport costs,
inelastic demands, the market appears attractive to the dominant firms to collude or
make cartels in order to deter entry and have the highest possible return.

4
2. The product
The cement is a primary hydraulic binder (as well as plaster and lime) which mixed
with sand and water, allows the adhesion among different materials that will be fixed in
a solid product after drying. It is obtained by pulverizing the clinker, which in turn is
obtained by a calcined mixture of clay, sand and limestone that contain oxides of
calcium, silicon, aluminum and iron in measured amounts, and eventually you can add
uncalcined gypsum.
The cement can be classified into several types depending on its uses and its strength
and durability properties. The most commun is called Portland cement and its
production process is developed under the Peruvian technical standards ASTM C-150,
334,009.
Despite the existence of several types of cement, this is a fairly homogenous good with
limited space for differentiation. While there are various types of cement and the
substitution between them is feasible, is hardly replaceable by another good.
Another characteristic of cement is related to its perishability: given its sensitivity to
humidity, its quality can be kept intact for two months after its packaging (bagging) and
stored. This feature of the product eliminates any possibility of accumulating
inventories or stocks, since it is sold what it was produced.
3. Caracteristic of the demand
In general, there are three groups of cement buyers: the government (by procurement
projects), the great construction (private companies running big bulding projects) and
the self-construction (mainly households). The first two would explain about 40% of
cement demand, while the remaining 60% for self-construction.
As it is known the experts agree on qualify the cement demand as highly inelastic to the
price inasmuch as there is no close substitute in the short run1. So it is possible to
1 See Dumez and Jeunemaitre (2000), Rosenbaum and Sukharomana (2001), ABN-AMRO (2001).

5
consider inelastic almost 40% of the demand, but the part of self-construction could
have some degree of elasticity in the rural areas of the country that may use “quincha”
(a mixture of straw and mud). Morever it is important to note the sustained growth of
the local demand since the beginnings of the decade, which gave a total rate of growth
of 87.7% with a annual average rate of 6.9% between 2000 and 2008, which goes
together also with the valuable 8% of growth of the economy.
4. Characteristics of supply
4.1. Chain Cement Productive
There are three links or market segments that make up the production chain: input
supply, production and marketing and distribution.
Regarding the provision of inputs (clay and limestone), they are available in non-
metallic reserves. Peru has several no metal reserves which contain the essential inputs
for the manufacture of cement and are concentrated in three areas: north, center and
south (see Annex 1).
Currently there are seven companies producing cement also extract nonmetallic mineral,
each in a different area or region. It should be noted that extraction of the cement inputs
are not free and is regulated, as it is presented later in the document. In next section it is
focus more in the production and distribution links since they have more key costs of
this chain. The marketing and advertisement will be developed in part 5 of the report,
which treat about entry barriers.
4.1.1. Production Process
Cement production is done in several stages, but they can be classified into four: (i)
extraction, crushing and grinding of raw materials, (ii) homogenization and mixing of
raw materials, (iii) the clinker output by calcining the raw powder, and (iv)
pulverization of clinker and cement preparation. A more detailed description of the
process could be seen in the table below:

6
Table 1: Stage process for the production of cement(*)
(i) Mining, crushing and milling of raw materials: the
main raw materials of cement are limestone, clay and sand
which contain calcium silicates and aluminates and
additionally it can added iron ore and gypsum. These
materials are extracted from the soil in the quarry, near which is located processing plants. Once extracted raw
materials are crushed to convert them to smaller sizes and
suitable for mixed.
(ii) Homogenization and mixing of raw materials: in order
to have an appropriate composition of raw materials, its
proceeds to mix, and to obtain it uniformly it is possible
to use air currents (dry) or using water (wet).
(iii) Preparation of clinker: the homogenized mixture by dry
is transported to the furnaces where it is burned, the
product obtained is called clinker. Under the wet process,
the wet mixture is transported and delivered to the furnace
where it should be calcined at higher temperature (1500 º
C) in order to eliminate the water. This process is lengthy
and costly.
(iv) Spraying of clinker and cement preparation: after
obtaining the clinker, it is crushed and pulverized to make
cement. Depending on the type of cement quality and
choice available, you can add additives such as gypsum,
puzulana among others.
(*) BWS report (2005)
It should be noted that in Peru the manufacturing process of cement used is the dry
process, except for Cementos Sur and Cementos Selva companies, which use the semi-
wet and wet respectively. This is important in order to differentiate the production
process by the cost structures of the industry. The wet process involves higher costs as
long as it needs water in order to achieve the homogenization of the additives and after
that, the energy which allow to dry the wet mixture in furnaces with temperatures above
1500°C. The dry process is more efficient insofar water is no needed and it requires just
machinery grinding and shorter furnaces to expose the clinker to high temperatures but
under less time, which makes it efficiently also in the consume of energy.

7
4.1.2. Distribution of the product
After obtaining the cement, it is distributed packaged (paper bags) or bulk. The
marketing of cement bag is the most common and traditional. It is channeled through
hardware stores and commercial storage primarily self builder sector. However, due to
large-scale constructions, and consequently the need for greater volumes of cement,
there is a growing bulk supply, an arrangement which allows to have savings from
better management in the process of unloading and handling (avoidance of losses ) and
better storage conditions of cement (the risks of moisture damage are minimized).
Under this method, the cement is transported in tankers and is then stored in silos
specially equipped2. The bulk sale will be channeled mainly to major constructors and
to big industrial production of concrete (concrete mixers).
Chart No. 1 shows the cement market chain since the raw material extraction until its
distribution. In this sense, firms extract their raw materials and produce close to their
quarry. Also, the sector forward linkages with the distribution and production of
concrete segments such as bricks, pre-fabricated materials and ultimately the
construction of buildings and public works:
Chart 1. Production and Distribution Chain
2 Cement Producers Association (ASOCEM)

8
4.2. Geographical Market of the Suppliers
With independence of the physical characteristics of their products, the several cement
producers differ from each other regarding the geographic location of their plants, the
availability of their products and the services associated with the purchases to the
customers3.
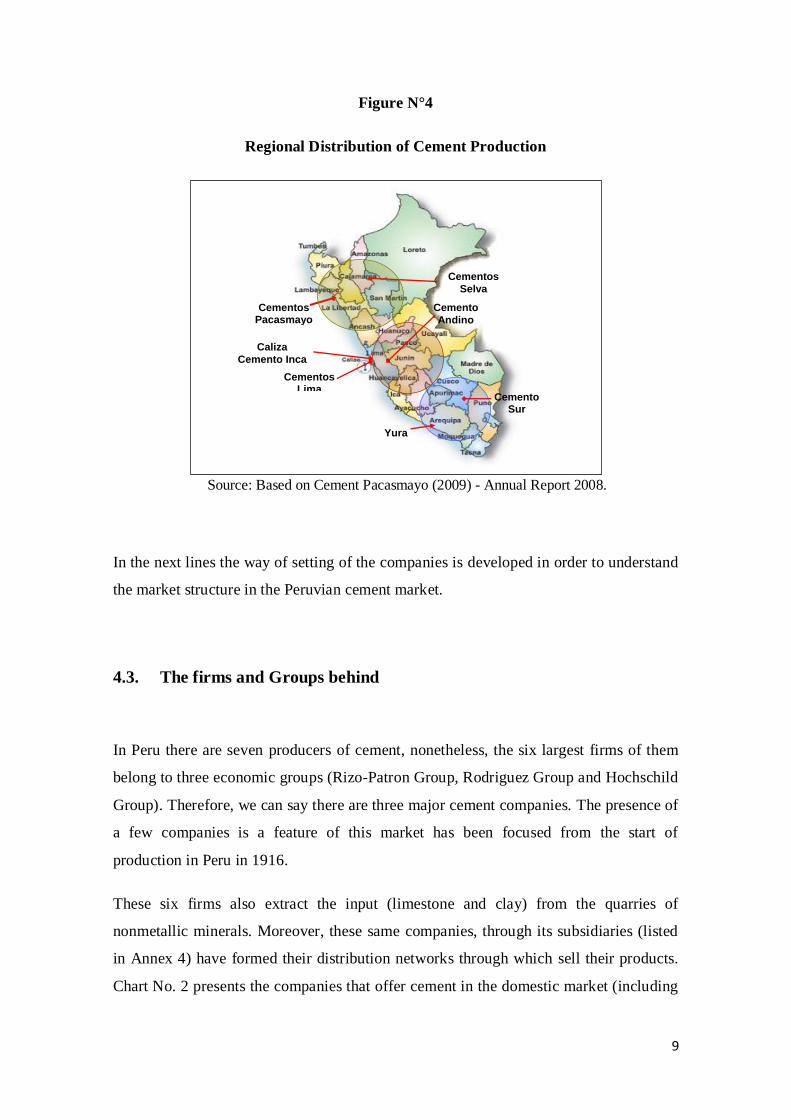
Due to the high costs of transport and distribution, firms rely on differentiation by
geographic location of plants in order to make consumer to choice the closest product
around. Figure N°4 shows graphically the location of production and market for each
case.
3 Nera Report. Static and dynamic competition in the cement industry: the case of the Philippines. 2002. P 5.
Notas: 1/ information of market share of 2007 sales.
2/ Information of the 2008 year. 3/ Pacasmayo Subsidiary Cements.
4/ Lima Cement Subsidiary. 5/ Information of Lima Cement and Andino Group, the Group with the higher market share.
6/ Referential information got it of BWS (2005) which estimate a market share of self construction sector between 60% and 70%.
Quarry
(Extraction of raw
materials:clay,sand
and limestone)
a) Raw material grinding
b) Mixing and
homogeneization
c) Output of calcined clinker
Clinker grinding and
packaging
Cement (sales)
(6.8 mill TM) 2/
Storage and
distribution
Industrial Canal (25%5/
)
Ironmonger canal (75%5/
)
- Modern canal (3%5)
(self-service stores)
- Traditional Canal (97%5)
(ironmonger and
ProgreSol red)
* Rizo-Patrón Group (Lima and
Andino Cements) - 59% 1/
* Hochschild Group ( Pacasmayo and Selva Cements) - 23%
1/
* Cementero Sur - Rodriguez
Banda Consortium –connected
to Gloria Group ( Yura Cements
and Sur) – 17.7% 1/
Imports
(221.6 TM) 2/
Large constructions [40% of demand] 6/
Estate (infraestructure, public works,
and housing programs).
Building industry (building houses,
malls, private infraestructure).
Little constructions [60% of demand] 6/
Selfconstruction (houses and
remodeling)
* Latin American
Trading (CEMEX)
*Progre-Sol Red (Lima
Center)
DINO and Dinoselva Iquitos SAC
3/
* Conchan Customs
warehouse and Lurin
Transports 4/
Manufacture of concrete and cement producs
(concrete, premixed, bricks, etc)
Exports
(62 TM) 2/
Local sales
(6.7 mill TM) 2/
Production
9
Figure N°4
Regional Distribution of Cement Production
Source: Based on Cement Pacasmayo (2009) - Annual Report 2008.
In the next lines the way of setting of the companies is developed in order to understand
the market structure in the Peruvian cement market.
4.3. The firms and Groups behind
In Peru there are seven producers of cement, nonetheless, the six largest firms of them
belong to three economic groups (Rizo-Patron Group, Rodriguez Group and Hochschild
Group). Therefore, we can say there are three major cement companies. The presence of
a few companies is a feature of this market has been focused from the start of
production in Peru in 1916.
These six firms also extract the input (limestone and clay) from the quarries of
nonmetallic minerals. Moreover, these same companies, through its subsidiaries (listed
in Annex 4) have formed their distribution networks through which sell their products.
Chart No. 2 presents the companies that offer cement in the domestic market (including
Cementos
Selva
Cementos Pacasmayo
Caliza
Cemento Inca
Cemento
Andino
Cementos Lima
Yura
Cemento Sur

10
importers of that good), showing its participation, product brands on the market,
installed capacity and some characteristics of its operation.
Chart N°2. Domestic producers in the market andareas of influence
1/ Year in which the company operates with such a name, previously did under the name of Compañía Peruana de Cementos Portland since 1916. 2/ In 1994 it was acquired by Grupo Gloria. 3/ Cemex's subsidiary in Peru which began operations in July 2009 and imports cement from Dominican Republic Source: Proceedings of the companies, INEI, ASOCEM
5. Determinants of market power of the cement suppliers
5.1. Concentration: market share
In general, the level of sales of cement firms showed an increasend trend over the period
2003-2008 (see Figure No. 1). It should be noted that in 2008 Cementos Yura,
Cementos Pacasmayo and Cementos Lima recorded growth sales of 95%, 92% and 90%
respectively, higher than the sales level reached by each of them five years ago in 2003.
Despite the fact that Cementos Selva and Cementos Sur showed a stable trend and even
slightly declining sales but just in the last year, without doubt is a profitable market
since the trend of growth is still sustainable along the time.
Economic
Group
Sales market
shares (2008)
Name of the
firmBrand
Start of
OperationsBase (plant) Zone of influence
Sales market
shares (2008)
Installed
capacity -
MT (2009)
Cementos
LimaSol y Atlas 1967 1/ Lima
(Atocongo)Center 42,6% 5.500.000
Cemeno
AndinoAndino 1956 Junín (Tarma) Center 18,5% 1.500.000
Cementos
PacasmayoPacasmayo 1949
Lima
(Pacasmayo-
La Libertad)
North 19,6% 1.925.000
Cementos
SelvaPacasmayo 1998
San Martín
(Rioja)North 2,3% 150.000
Cementos
YuraYura 19622/ Arequipa
(Yura)South 14,3% 1.800.000
Cementos
SurRumi 1965 Puno (Juliaca) South 1,8% 340.000
Familia Choy 0,9%Caliza
Cemento IncaCemento Inca 2007
Lima
(Chosica)Lima 0,9% n.d.
CEMEX 0,0%Latinamerican
Trading 3/ Quisqueya 2007Republica
Dominicana 3/ Lima 0,0% n.d.
Total National
Sales (MT) 5.878.055 100%
Rizo-Patrón 61,1%
Hochschild 21,8%
Gloria (Rodriguez
Banda)16,2%

11
Figure N°1: Total sales of cement by company
Source: INEI, Statistical Compendium 2008
In detail, the monthly evolution of cement sales shows not only the growing trend of
cement production for the aggregate by group, but also by the largest firms Cementos
Lima and Cemento Andino (Group Rizo-Patron) over the rest4. An additional firm, not
depicted in the figure, is Caliza Cementos Inca, which has a very small but slightly
increasing participation in cement sales in the center region of Peru. Its production plant
operates in Cajamarquilla (Chosica, Lima) since mid-2007 (see Figure No. 2).
Figure No. 2.
Monthly evolution of cement sales related by group of companies, in thousands of
TM (ene.2001-set.2009)
4 The joint production of these two companies exceeds the joint production of other four producers.
0
500 000
1 000 000
1 500 000
2 000 000
2 500 000
3 000 000
3 500 000
2003 2004 2005 2006 2007 2008
Cementos Lima Cementos Pacasmayo Cemento Andino
Yura S.A. Cemento Sur Cementos Selva

12
Source: INEI, 2008 Statistical Compendium and statistical database.
Chart No. 3 shows the distribution of cement sales per firm, by department in 2008. As
can be seen, taking the market share of the economic groups Hochschild (GH), Rizo-
Patron (GR), Rodríguez Banda (GRB), in at least 14 departments of 24 there is no
competition, but instead basically only one producer provides the good.
Chart No. 3.
Distribution of cement sales per company, by department (2008)
0
50
100
150
200
250
300
350
400
450
En
e-0
2
May-0
2
Sep
-02
En
e-0
3
May-0
3
Sep
-03
En
e-0
4
May-0
4
Sep
-04
En
e-0
5
May-0
5
Sep
-05
En
e-0
6
May-0
6
Sep
-06
En
e-0
7
May-0
7
Sep
-07
En
e-0
8
May-0
8
Sep
-08
En
e-0
9
May-0
9
Sep
-09
Mile
s d
e T
M
Cementos Lima y Andino Cementos Pacasmayo y Selva Cementos Yura y Sur Caliza Cemento Inca

13
Source: INEI (2008) and CUANTO (2008).
Rizo-Patron Group (GR) that serves the central area of Peru through its brands
Cementos Lima and Cementos Andino has about 60% of total national market; which is
explained by its total market share in Lima –almost 100%- that represents in turn the
43% of the total national market. The Hochschild Group, which operates in the north
through his brands Cementos Pacasmayo and Cementos Selva, and finally the
Rodríguez-Banda Group, which operates in the South with his firms Cementos Yura
and Cementos Sur, follow GR in size.
It can be seen that the hinterland of each producer differs one from each other, facing
very low competition (or non-competition) at regional level. This is explained by the
high entry costs in this industry, which also shows a strong vertical integration level of
firms. Besides, a highlighting factor is the transport costs for cement delivery, which
lead companies to sell their product close to its production plant avoiding the
competitive interaction as much as possible.
Indeed, the national cement market in Peru is highly concentrated as demostrated by the
evolution of the Herfindahl-Hirschman index, which has remained high (in average,
about 4500) since the 70's, as it could be seen below:
MTCementos
Lima
Cementos
Pacasmayo
Cemento
Andino
Yura
S.A.
Cement
o Sur
Cemento
s Selva
Caliza
Cemento
Inca
GR GH GRB CCI
Ay acucho 112 389 25 984 0 86 392 13 0 0 0 100,0% 0,0% 0,0% 0,0%
Huancav elica 37 809 82 0 37 727 0 0 0 0 100,0% 0,0% 0,0% 0,0%
Huánuco 99 486 4 631 0 92 515 0 0 0 2 340 100,0% 0,0% 0,0% 2,4%
Ica 314 805 309 405 0 32 5 368 0 0 0 98,3% 0,0% 1,7% 0,0%
Junín 395 809 115 0 395 694 0 0 0 0 100,0% 0,0% 0,0% 0,0%
Lima 2 785 080 2 312 318 0 415 099 0 0 0 57 662 97,9% 0,0% 0,0% 2,1%
Pasco 123 293 0 0 123 293 0 0 0 0 100,0% 0,0% 0,0% 0,0%
Ucay ali 45 213 1 788 0 43 425 0 0 0 0 100,0% 0,0% 0,0% 0,0%
Amazonas 30 528 0 15 052 0 0 0 15 476 0 0,0% 100,0% 0,0% 0,0%
Áncash 281 108 121 852 157 255 2 001 0 0 0 0 44,1% 55,9% 0,0% 0,0%
Cajamarca 157 443 329 157 114 0 0 0 0 0 0,2% 99,8% 0,0% 0,0%
La Libertad 449 956 937 449 019 0 0 0 0 0 0,2% 99,8% 0,0% 0,0%
Lambay eque 273 458 11 273 447 0 0 0 0 0 0,0% 100,0% 0,0% 0,0%
Loreto 54 777 22 077 0 31 347 0 0 1 353 0 97,5% 2,5% 0,0% 0,0%
Piura 240 428 3 393 237 035 0 0 0 0 0 1,4% 98,6% 0,0% 0,0%
San Martín 144 816 0 0 9 246 0 0 135 570 0 6,4% 93,6% 0,0% 0,0%
Tumbes 30 768 10 30 758 0 0 0 0 0 0,0% 100,0% 0,0% 0,0%
Apurímac 42 371 15 604 0 11 633 14 881 253 0 0 64,3% 0,0% 35,7% 0,0%
Arequipa 361 864 35 355 0 0 326 509 0 0 0 9,8% 0,0% 90,2% 0,0%
Cusco 258 287 967 0 862 256 458 0 0 0 0,7% 0,0% 99,3% 0,0%
Madre de Dios 56 786 0 0 0 882 55 904 0 0 0,0% 0,0% 100,0% 0,0%
Moquegua 51 979 1 803 0 0 50 176 0 0 0 3,5% 0,0% 96,5% 0,0%
Puno 256 265 2 651 0 0 185 752 67 862 0 0 1,0% 0,0% 99,0% 0,0%
Tacna 135 872 10 404 0 0 125 468 0 0 0 7,7% 0,0% 92,3% 0,0%
Total 6 740 590 2 869 716 1 319 680 1 249 268 965 507 124 019 152 399 60 002 61,1% 21,8% 16,2% 0,9%
Region
or AreaDepartment
Sales Firms (sales in MT) Market share of Group by Department
Ce
nte
rN
ort
hS
ou
th

14
Figure No. 3. HHI * Cement sales 1976 - 2008
(*) HHI <1000 indicates unconcentrated market, 1000 <HHI <1800 moderately concentrated market and HHI> 1800 indicates high market concentration. Source: Cement Producers Association. ASOCEM
Moreover, considering that the cement supply is bounded to the nearest geographical
area and that in scarce opportunities these companies compete each other in the same
geographic market, market concentration is much higher: at a disaggregated level, most
of the departments has only one supplier, situation that has been invariant during the
period 2003-2008 as it can be seen in Chart N°4. The evolution of the HHI over 8000
points (see shaded information), shows a very high regional concentration in almost all
cases:
Chart N°4. HHI(*)
Index constructed from the amount of sales by department (2003-2008)
0
1 000
2 000
3 000
4 000
5 000
6 000
1976
1977
1978
1979
1980
1981
1982
1983
1984
1985
1986
1987
1988
1989
1990
1991
1992
1993
1994
1995
1996
1997
1998
1999
2000
2001
2002
2003
2004
2005
2006
2007
2008
IHH
IHH Global Lineal (IHH Global)
Hig
h c
on
ce
ntr
atio
nlo
w/m
ed
ium
co
nce
ntr
ation

15
(*) HHI <1000 indicates unconcentrated market, 1000 <HHI <1800 moderately concentrated market and HHI> 1800 indicates high market concentration. Source: INEI, 2008 Statistical Compendium and statistical database.
5.2. Transportation costs
Due the relative perishability of the good and considering also his big weight, and given
the inadequate and lacking transport infrastructure in Peru, long distance transport
charge is expensive relative to its value5, making it a low tradeable good for far distant
markets, and therefore the distribution to closest market to the cement plants have to be
the priority.
It is worthy mentioning that cement is mainly transported by land, sea-transport would
not be an efficient option in Peru because of two reasons: (i) the high sensitivity of
cement to humidity – cement requires special treatment (humid protection) and careful
5 A brief survey of freight rates, transport cement to destinations such as Lima Madre de Dios
(South) or Tarapoto (north) can cost up to 34 suns per bag of cement (which has a price that hovers around 22 soles). This cost is reduced to closer destinations such as Arequipa and Trujillo, destinations, according to the surveyed companies, the cost amounts to S /. 7.65 per
bag of cement transported. (The poll was conducted Transport companies Cornejo, Santa Marta and Mega Transport SRL, the first week of December 2009).
2003 2004 2005 2006 2007 2008 Nº firms (2008)Group
Leader
Amazonas 10000 10000 10000 10000 10000 10000 1 GH
Áncash 6961 7441 8246 8908 5805 5071 2 GH
Apurímac 7145 6506 6680 6994 6303 5408 2 GRB
Arequipa 10000 9999 10000 9962 10000 8237 2 GRB
Ayacucho 9282 9884 9681 9882 9988 9998 2 GR
Cajamarca 9235 8215 10000 10000 10000 9958 1 GH
Cusco 9913 9998 9982 9900 9900 9859 2 GRB
Huancavelica 10000 10000 10000 10000 10000 10000 1 GR
Huánuco 10000 10000 10000 10000 10000 9541 1 GR
Ica 6693 7028 6600 7653 8135 9665 2 GR
Junín 10000 10000 10000 10000 10000 10000 1 GR
La Libertad 10000 10000 10000 10000 10000 9958 1 GH
Lambayeque 10000 10000 10000 10000 10000 9999 1 GH
Lima 9988 9998 9995 10000 10000 9594 2 GR
Loreto 5110 5005 5867 5394 5218 9518 2 GR
Madre de Dios 9715 10000 10000 10000 10000 10000 1 GRB
Moquegua 10000 10000 10000 10000 10000 9330 1 GRB
Pasco 10000 10000 10000 10000 10000 10000 1 GR
Piura 10000 10000 10000 10000 10000 9722 1 GH
Puno 10000 10000 10000 10000 10000 9795 1 GRB
San Martín 8820 8986 8949 8898 9274 8805 2 GH
Tacna 5725 5898 5914 5831 5813 8586 2 GRB
Tumbes 10000 0 0 0 0 9994 1 GH
Ucayali 10000 10000 10000 10000 10000 10000 1 GR
Total 4599 4617 4560 4429 4321 4473

16
cargo handling – that would imply higher costs and (ii) poor port infrastructure (outside
of Callao) that raises the costs of freight transport logistics.
5.3. Entry Barriers
5.3.1 Capital Investments
Mining concession
An important element to be considered in assessing the market entry of cement
is associated to the access to raw materials: limestone and gypsum deposits. As
seen in a previous section, the provision of inputs is very important to continue
the production process and is therefore an activity that also makes the production
of cement, thus showing a vertically integrated structure that is less expensive
and efficient. In Annex N°3 is detailed some basic compulsory rules stablish by
the state to explote operate according to law.
Capacity of plants
Regarding structural barriers, the market presents economies of scale and the
existence of high sunk costs that could be considered as entry barriers deterring
the initiation of operations of a potential competitor e.g. the overinvestment in
capacity. These sunk costs are associated with high investments in plants and the
implementation of purchasing of machinery as the one used for grinding and
cooking of raw materials and clinker. In addition, there are certain economies of
scope associated with favorable production of clinker (as the final) and plaster,
and then with the manufacture of concrete and pre-fabricated materials.
5.3.2 Legal Barriers
Although there are no strong legal barriers, however it should be noted that some
difficulties associated with the delay to obtaining permits, may eventually
happens due to the rate of time proceedings in public administration.

17
5.3.3 Trade Barriers
In the field of trade barriers, there would be no relevant barriers. There are
dumping duties applied only to white Portland cement, but not for the gray
Portland type which is the most traded.
5.3.4 Marketing and advertising costs
Marketing
Peruvian Cement companies are also directly involved in the distribution of their
product; this may be associated to lower transport costs and higher cargo care.
Implementing marketing campaing has been a common strategy of largest
companies to ensure selling their products. A more extended description of the
distribution strategy implemented for the largest firms could be seen in Annex 4.
Advertisement
Finally, among other strategic barriers may also be mentioned the advertising:
higher expenses in advertising by established firms could make it difficult or
more expensive the entry of new competitors.
The threat of entry by CEMEX to the Peruvian market has not only generated
reactions from established companies with greater investment in the expansion
of its installed capacity, but has also significantly impacted the way in which
companies approach to consumers. Two sales strategies have been remarkably
applied in this sector: (i) the formation and consolidation of distribution
networks, by which companies try to take a closer relationship with its
customers; and (ii) an intense advertising campaign to positioning the brand and
consumer loyalty.
The advertising strategy would not be innovative and rather common in the
Mexican market, where CEMEX has used it widely and aggressively, even by
sponsoring sports teams.
In parallel, Cementos Lima has been increasing spending in advertising spots in
different news media (newspapers, radio and TV) directed primarily to

18
strengthen its brand preference "Sol" in the segment of self construction, which
would be allocated 60% of cement produced. So, Cementos Lima spent an
amount of U.S. $ 436.3 thousand for advertising in different media during 2007,
and up to September 2008, this spending just on radio advertising arrived to $
360 thousand6.
5.4. Potential competition
With the booming construction market, the peruvian cement market is attractive,
encouraging the entry of new competitors. Upon arrival of CEMEX in 2007, in the next
years it would expect to come three new companies7:
Cementos Portland: company created by the partnership between World
Cement Group (Spanish investors) and the local investment group Portland
Cementos Otorongo: subsidiary of Cimentos of Portugal – CIMPOR
Cementos Interoceánicos8
5.5. Analysis of collusion: dynamic contexts
Regarding the dynamic determinants of the power market in this industry, a study of
Nera9 regarding the cements markets, identifies the followings factors related with the
market structure:
1) Concentration grade or number of firms
2) Type and frequency of competitive interaction
3) Cyclical position of the demand
4) Over / under capacity added in industry
5) Multimarket contact,etc
And also within the firms:
6 Gross basis IBOPE obtained. Idem.
7 BCRP (2008) Research Notes: Economic Activity, BCRP, Working Paper No. 62, September
2008. Available at: http://www.bcrp.gob.pe/docs/Publicaciones/Notas-Estudios/2008/Nota-Estudios-62-2008.pdf. 8 Newspaper Article "cements Interoceanic expect to compete with three brands," published
in the Economics Section of the newspaper El Comercio August 6, 2008. 9 Nera Report. Static and dynamic competition in the cement industry: the case of the
Philippines. 2002. P 50.

19
1) Capital cost
2) Ownership structure: degree of diversification, solvency and liquidity, etc.
According with this study, these indicators, which affects positively or negatively the
the discount factor, could reveal the conditions required for a sustainable collusion
practice.
Nevertheless in the case of the Peruvian market, the collusion would took part prior to
the price competition, as we see in the Chart N°3, since they would avoid the
competition within the same region through an anticompetitive practice of market
sharing, which is demostrated with the concentration by department. Thus this practice
overrides some kind of competitive interaction and also isolates the demand between
regions and rules out the importance of cyclical position of the demand. It worths to
note that through this practice it is also avoided the multimarket contact, that allows
price discrimination, which could be an important signal of competition.
Another important fact that will be well developed in the next section, is related to the
excess of capacity which owns each plant of the groups that would works as a
mechanism to deter off the competition price among the companies.
Regarding the lasts two dynamic determinants, about the internal factors of the
companies, the firms presents similar degree of integration and also similar financial
stability since all of them are Peruvian Groups, so it is posible to dismiss any kind of
advantage related this issue.
6. Forms of competition in cement industry
6.1. Horizontal Differentiation
So the cement market is characterized by an oligopolistic market structure where firms
produce a fairly homogenous good. As it was already demonstrated, the six largest
producers is differentiated by region or geographical zones according the location of its
plants, which were decided in the beginning of the Peruvian cement business.

20
Thus, there are three different geographical markets: northern, central and southern
region; each region is dominated by each of the three economic groups already
identified (Group Rizo-Patron Rodriguez Group and Grupo Hochschild-Banda).
6.2. Cournot competition: the choice of production capacity
Importants models as two steps ones proposed by Kreps and Scheinkman (1983) could
help to understand more these markets that in the first step firms choose capacity and
then prices in order to compete with prices over marginal costs. As these capacities
could be observed they may be used to build credible commitments10
.
Consequently, investment in machinery and expansion of idle capacity can be
considered as strategic barriers imposed by firms in the sector: the excess of capacity of
cement industry surpasses the 11 million tons according to 2009 estimates, which is
more than 50% domestic demand for that product (approximately 7 million tons in
2008). This feature would affect the market structure, since it can be adequately
supplied by existing firms.
In line with this, taking the ratio of total dispatch and total idle capacity as a proxy
indicator of the rate of capacity utilization (see Chart No. 5), we observe that out of
Cemento Andino and Cementos Selva the rest of companies produced using less than
70% of their total capacity, so one might think that recent investments in capacity
expansion are not only related to a growing demand needs, but also coincide with the
threat of entry of international firms like CEMEX.
10
Juan Jose Ganuza. Dynamic Games and Industrial Organization lectures. Barcelonagse.

21
Chart N° 5. Indicator of capacity utilization *
* Ratio between the amount of cement shipped
and idle capacity Source: ASOCEM & INEI
Excessive capacity can raise a barrier against the threat of price competition if it
reaches. Lately, companies such as Cementos Pacasmayo and Cementos Lima have
initiated major investment projects to expand their plants. The first had expanded its
capacity by 22% and the other would be investing to expand capacity by 52%. Yura
also planned to invest U.S. $ 500 million to double its installed capacity. Also, during
2007-2008 Cemento Andino, and especially, Cementos Sur increased its installed
capacity:
Chart N°6. Investments in Capacities by Cement Firms
Source: ASOCEM
On the other hand, the possession or control of a distribution network may also be
considered as a strategic behavior. On one hand, Cementos Pacasmayo through DINO
ensures its distribution network in the North, while in the center; Cementos Lima has
begun an aggressive acquisition strategy through affiliated retail network Progresol
Hardware since May 2008. Again, this activity could raise the entry costs and
discourage the entry of potential competitors.
Firm 2007 2008
C. Lima S.A. 57,1% 65,30%
C. Andino S.A. 97,4% 83,40%
C. Pacasmayo S.A. 63,5% 68,70%
C. Selva S.A. 95,0% 100%
Yura S.A. 51,6% 51,50%
C. Sur S.A. 46,4% 36,20%
Clinker Cement Clinker Cement Clinker Cement Clinker Cement
C. Lima S.A. 3.600.000 4.500.000 3.600.000 4.500.000 4.800.000 5.500.000 4.800.000 5.500.000
C. Andino S.A. 1.050.000 1.250.000 1.180.000 1.500.000 1.180.000 1.500.000 1.180.000 1.500.000
C. Pacasmayo
S.A.A. 1.100.000 1.925.000 1.175.000 1.925.000 1.175.000 1.925.000 1.175.000 2 925 000 1
C. Selva S.A. 120.000 150.000 120.000 150.000 120.000 150.000 120.000 150.000
Yura S.A. 590.000 1.800.000 590.000 1.800.000 1 190 000 2
1.800.000 1.190.000 1.800.000
C. Sur S.A. - 180.000 330.000 340 000 3
330.000 340.000 330.000 340.000
Firm
2007 2008 2009 2010

22
6.3. Price behavior (2000 – 2008)
In order to observe the evolution of the annual prices of the cement in the Peruvian
market across regions, and since there is not databases of cement prices by region, Chart
No.7 was made using the available information of Government Procurement collected
by the Electronic Government Procurement (SEACE) for the period ene.2005-set.2009.
As seen in the mentioned table, differences of the average prices accross regions were
found. In general, the South region has not only the highest average price but also
shows an increasing trend in comparison to the other regions. This can be explained due
to more difficulties for transporting the product in the South of Peru.
Chart N°7
Annual evolution of the average price of a bag of Portland Cement Type I, by
department and region (2005-set.2009)

23
Note: Average prices have been obtained from a unit-cost award for the purchase of bags (42.5 kg each) of Portland cement Type I by government agencies. Source: obtained from the base of the Electronic Procurement System (SEACE)
Again it is possible to identify the clear overlap between the geographical region and the
leading producer in each area (with the exception of Loreto, where although it belongs
to a northern region, is attended by the center leader producer).
It should be also noted that unlike what happens in the north and the south, in the center
there are more marked differences between prices by departments, taking the lowest
price in Lima and neighboring departments. In general, the price differences could be
explained by the distance and several difficulties in the access to farther areas that
finally increases the transportation costs and therefore makes prices higher.
Moreover, it is worthy noting that price series does not shows any kind of competiton
among regions since there are not overlaps inter groups departments, probably due to
anticompetitive practices such as market sharing, as shown above. This practice woul be
also confirmed by the absence of any discriminatory prices policy, which is usually
Zone o
regionGroup Leader Department 2005 2006 2007 2008 2009
Ayacucho 22,02 21,99 22,90 23,32 22,96
Huancavelica 20,71 21,01 20,84 21,29 21,32
Huánuco 19,10 20,39 19,51 19,83 21,03
Ica 15,55 18,76 18,66 18,23 17,40
Junín 18,37 18,27 18,52 18,59 18,62
Lima 18,23 18,59 17,67 17,97 17,93
Pasco 19,36 19,77 20,23 20,87 19,69
Ucayali 18,96 19,11 23,25 25,92 24,49
Average price central 18,95 19,26 19,89 20,13 20,35
Amazonas 19,57 20,78 21,75 24,32 25,79
Ancash 19,99 20,60 20,39 20,77 21,03
Cajamarca 20,38 21,85 21,52 21,82 21,88
La Libertad 17,88 19,85 20,04 20,96 21,36
Lambayeque 19,03 19,06 19,49 19,75 19,60
Piura 19,73 20,23 21,49 21,88 22,08
San Martín 18,84 20,47 20,52 21,32 21,44
Tumbes 21,00 21,27 22,25 22,08 -
Grupo Rizo-Patrón Loreto 18,93 20,00 26,10 25,46 23,91
Average price north 19,70 20,48 21,51 21,58 21,64
Apurimac 22,14 25,26 24,15 25,14 21,72
Arequipa 18,95 19,90 19,23 22,42 22,44
Cusco 20,82 22,92 24,37 26,00 24,73
Madre de Dios - 28,50 25,48 28,40 27,04
Moquegua 18,41 21,06 20,94 23,78 22,25
Puno 20,75 21,64 20,73 23,46 22,55
Tacna 18,20 20,21 20,90 23,99 21,96
Average price south 19,81 21,86 21,92 24,46 23,03
National average 19,48 20,53 21,11 22,06 21,67
Centro
Rizo-Patrón Group
(Cementos Lima y
Cemento Andino)
Norte
Hochschild Group
(Cementos
Pacasmayo y
Cemntos Selva)
Sur
Grupo Rodriguez
Banda
(Cementos Yura y
Cemento Sur)

24
used to expand their geographical markets. As it was noted before, prices in the
departments where the companies (economic groups in this case) locate their plants are
not higher than the rest of the cities in the same region, probably because of the absence
of the threat of a competitor.
7. Conclusions
The Peruvian Cement market is not different from the general cement markets. It is
caracterizated by a fairly homogeneous product with low space to differentiation by
physical characteristics. Facing a growing economy with an increasing demand for
construction and therefore for cement, firms bet to horizontal differentiation in order to
expand their market shares. There are six largest firms which belongs to just three
financial groups with virtually shares all the cement market in Peru. The firms
Cementos Lima and Cementos Pacasmayo which belongs to Rizo-Patrón Group, are the
two dominants firms in the North region of the country. While Cementos Pacasmayo
and Cementos Selva of the Hochschild Group are the two dominants firms in the Center
region and finally, Cementos Yura and Cementos Sur of the Gloria Group (Rodríguez
Banda Group) are dominants in the South region.
About the determinants of market power of the cement suppliers in this market, the
study found a highly concentrated market at national level by these six largest firms,
even more the strong concentration is not only obtained by region but also by
department since a HHI index applied in each department, which conform a region, is
dominate by a single firm in the majority of the cases. Furthermore it has been found a
very clear allocation of the regions by Group, since a single dominant Group has an
almost complete region of the country to serve.
Additionally high important costs of transport also increase the market power of each
firm in its local market, and even worse if the alternative by sea is not possible. The
entry barriers also encourage their market power since it is demostrated the presence of
important sunk costs along the vertically integrated chain production, which works as a
mechanism to deter entry like big capital investments, through considerable costs of
marketing and advertisement until the distribution strategy in the the final part of the

25
chain, but preventing of potential entry at the same time, notwithstanding the presence
of new competition already in the market, and more additional entrants expected in the
coming years.
Another important fact to understand the absence of any competition might be the
overinvestment in capacity as a strategic barrier, which could deter of a war price
between the firms. Furthermore, the price behavior reviewed of the period 2000 – 2008
shows the lack of any kind of discriminatory price policy that can reveal any strategy to
expand their market shares or hereby, competition itself. So based on all the
characteristics of this market and the indicators showed along this market research, it is
highly likely the presence of market sharing of regions in function of the geographical
locations of their plants, where there is no competitive interaction or multimarket
contact yet, in the majority of the departments and even worse at regional levels. But in
order to confirm the existence of the practice with greater certainty a survey of
information on each region would be useful to have incriminatory plus information of
the agents in order to fulfill also with concrete evidence, which leaves study materials to
be covered may be in future reports.

26
8. References
NERA (2002). Static and dynamic competition in the cement industry: the case of the
Philippines. 2002.
ARORA Ritu Raj y Runa SARKAR (s.f.) Detecting Cartels in the Indian cement
industry: An Analytical Framework, Industrial and Management Engineering
Department, IIT Kanpur.
APOYO&ASOCIADOS (2009a) Cementos Lima S.A, Empresas – Análisis de
Riesgo, Apoyo & Asociados, abril de 2009.
APOYO&ASOCIADOS (2009b) Cementos Pacasmayo S.A.A. (CPSAA),
Financiamiento Estructurado, Apoyo & Asociados, mayo de 2009.
APOYO&ASOCIADOS (2009c) Cemento Andino S.A.A., Empresas – Informe
Trimestral, Apoyo & Asociados, diciembre de 2009.
ASOCEM (1985) The Cement Industry Technology and Development, a document
drawn from the presentation by Mr. Manuel Gonzales de la Cotera, Executive
Director of Asocem the October 17, 1985. Cement Producers Association - Asocem.
ASOCEM (2009) Perú: General overview of the construction industry, Cement
Producers Association - Asocem, January 2009, Lima
AVALOS, M. y ACHATAN, C. (2004) Condiciones de competencia en el contexto
internacional Cemento, azúcar y fertilizantes en Centroamérica, Tecnológico de
Monterrey Documento de Trabajo, EGAP-2004-08, México DF.
BWS (2004) Reporte Empresarial: Cementos Pacasmayo S.A.A., Departamento de
Estudios Económicos, Banco Wiese Sudameris (ahora Scottiabank), mayo 2004,
Lima.
BWS (2005) La industria de cemento en el Perú: Favorables perspectivas de
crecimiento en el largo plazo, Departamento de Estudios Económicos, Banco
Wiese Sudameris (ahora Scottiabank), Lima.
CÁRDENAS, M., C. MEJÍA y F. GARCÍA (2007) La industria del Cemento,
Fedesarrollo, Documento de trabajo No. 33, Enero de 2007, Colombia.
CARRASCO, G. (2009) Informe elaborado para la Gerencia de Estudios
Económicos INDECOPI sobre la Industria de Cementos, Documento de consultoría,
Mimeo. Mayo 2009.
CEMENTOS LIMA (2009) Memoria Anual 2008, Cementos Limas S.A., Lima.

27
CLASS&ASOCIADOS (2009a) Fundamentos de clasificación de riesgo: Yura S.A.,
Class&Asociados Clasificadora de riesgo, Información a diciembre 2008, Lima.
CLASS&ASOCIADOS (2009b) Fundamentos de clasificación de riesgo: Cemento
Lima S.A., Class&Asociados Clasificadora de riesgo, Información a marzo 2009,
Lima.
DNP (s.f.) Cemento y sus aplicaciones, Departamento nacional de Planeación –
DNP.
EQULIBRIUM (2009) Cemento Andino S.A., Inforem de Clasificación, Equilibrium
Clasificadora de Riesgo, diciembre de 2009..
ICPC (2008) Evolución reciente del sector cementero en América Latina, Jefatura de
Investigaciones – Instituto Colombiano de Productores de Cemento, Julio de 2008,
Bogotá.
MINEM (2005) GUIAS MINERAS 2005 MINERIA NO METALICA, Dirección de
Promoción y Desarrollo Minero, Sub Sector Minería, Ministerio de Energía y Minas -
MINEM, julio 2005, Lima.
PROEXPORT (1999) Perfil de Mercado: Cemento en Chile, Proexport Colombia,
inteligencia de mercados, Bogotá.
RATING PCR (2009) Cementos Pacasmayo S.A.A., Rating PCR, mayo de 2009.
SCOTIABANK (2006) Reporte Empresarial: cementos Pacasmayo S.A.A.,
Departamento de Estudios Económicos, Banco Scotiabank, octubre de 2006, Lima.

28
ANNEX N˚ 1
Location of the non-metallic reservoirs in Peru

29
ANNEX N˚ 3
Some basic requirements established by the Peruvian government for the
exploitation of mines:
For quarrying nonmetallic requires a mining concession granted by the Peruvian
government. To this end, the holder must apply for such concession to the
Institute of Geology, Mining and Metallurgical INGEMMET (ex-National
Institute of Concessions and Mining Cadastre-INACC) through the filing of a
request the payment of Effective Law for the first year (which is equivalent to
USD 3.00 per acre requested that in case of small miners and artisanal miners
were reduced to USD 1.00 and USD 0.5 per hectare, respectively), and payment
of processing fee (equivalent to 10% of the UIT.) Once approved by the
INGEMMET, the Ministry of Energy and Mines (MINEM) makes public
assessment and the approval through a ministerial resolution.
Mining concessions grant the holder the right to exploration and exploitation of
mineral resources in the subsoil of the area granted. Such concessions may
include extensions 100 to 1,000 hectares in grid or set of adjacent grids by at
least one side.
Furthermore, the requests for areas designated for urban expansion goals must
also be approved by the provincial municipality under its jurisdiction with the
corresponding complementary technnical information.
For quarrying for building materials the right holder shall comply with the
requirements stipulated in the Ministerial Resolution No. 188-97-EM, which are
related to the limits of depth, height, length, volume and even time In order to
avoid damage to the ecosystem and the population.
The working of quarries to building materials the right holder shall comply with
the requirements stipulated in the Ministerial Resolution No. 188-97-EM, which
are related to the limits of depth, height, length, volume and even time In order
to avoid damage to the ecosystem and the population.

30
ANNEX N˚ 4
Cementos Pacasmayo
DINO and Dinoselva Iquitos are subsidiaries of Cementos Pacasmayo that are
responsible for distribution and marketing of building materials including cement.
DINO has 11 branches and 72 distribution partners. Supported by selling products
Pacasmayo, DINO offers through its dealers, other benefits to users in the form of
technical advice.
About 67% of total sales invoiced by DINO in 2008 are explained by the products
supplied by Cementos Pacasmayo. Different situation occurs with Dinoselva, where
92.5% of sales products offered come from other companies, and only 7.5%
corresponded to the products supplied by Cementos Selva.
In 2001, Dino was reported to the Free Competition Commission (CLC) for alleged
abuse of dominant position in the forms of price discrimination and tied sales by the
companies Warehouse Santa Beatriz SRL, SRL Eleodoro Ramos Quiroga Quiroga and
Trade SRL Piura market. After a market investigation, the CLC declared the complaint
to Dino unfounded because the company contracts were not coercive, since there was a
space before deciding to join or not, also did not show sales practices tied as the
products sold were related to general construction market, a sector that is dedicated to
the complaint.
By signing the affiliation agreement, Dino gives free use of its logo, provides the
member of the company's advertising material, commercial and technical supports and
offers special prices for the purchase of their products. The affiliate, on the other side,
undertakes to buy minimum amounts of products exclusively to Dino, serves as an
advertising medium Dino brand, and provides information on their amount of sales,
stocks and financial statements.
Cementos Pacasmayo has the following subsidiaries:
31
Cementos Selva SAC, responsible for the production of cement in the
northeastern part of Peru,
Distribuidora Norte Pacasmayo ERL (DINO) began operations in 1995 to sell
building materials. At the time, this distributor has 11 branches and a network of
70 distribution partners, covering 32 cities of Peru. Cementos Pacasmayo, also
has ready-mix plants in three northern cities (Pacasmayo, Trujillo and Piura) and
in the Jungle, plants used for the production of bricks for different uses (roof,
wall and floor)and also has six plants of concrete (Piura, Chiclayo, Cajamarca,
Pacasmayo, Trujillo and Chimbote each one with necessary equipment as units
concrete mixers and truck providers. Iquitos Dinoselva also involved in the
distribution and marketing of building materials (cement and products derived
from it).
Tinku Generation S.A.C constituted in April 2008 and is dedicated to project
development and investment, particularly in the energy sector, hydrocarbons,
infrastructure, transportation, and communications, among others. It has also
beendesigned to develop activities of generation, transmission and marketing of
electric power in general.
SA CORIANTA founded in 1994 dedicated to prospecting, exploration and
operation of concessions and mining rights in Peru, which provides raw
materials to CementosPacasmayo.
Cementos Lima
Cementos Lima commercializes its products in paper bags (42.5 kg bag) and bulk. The
type of distribution depends on the type of cement, Portland cement sold in bags (brands
and ATLAS SOL) and the rest (Portland cement type I, IP, II and type V) in bulk. It is
noteworthy that Type I Portland cement accounts for 75% of sales of the company, and
it is distributed through the channel hardware dealer using the modern form (self-service
stores) and the traditional mode (independent hardware stores and hardware stores
Progresol Network), modalities through which sold 3% and 97% of GDP, respectively.

32
Also, the Portland cements which are sold by the Industrial Canal are sold in bulk (by
the advantages in handling and efficiency of storage and use) to companies which
produce ready mixed concrete and other cement products.
By implementing Progresol Network Hardware Stores, Cementos Lima enhanced its
retail channel; Progresol currently has more than 120 independent subdistributors
dealers present in Lima (covering up to Casma on the north and Nazca on the south),
Ancash, Ica, Ayacucho and Apurimac departments who collectively consume the 50.2%
of the cement sold domestically.
By Red Progresol, Cementos Lima can ensure products for the consumers with the
exact weight (42.5 kg) and mantain direct contact with the representatives (owners). In
this sense, Cementos Lima asserts that the members of its distribution system can access
higher profit margins, to information systems and billing, and training the point of sale
for master builders and self builders. Also, to strengthen its presence, Cementos Lima
has implemented a sales commission system, which is granted whenever sales exceed a
certain number of sacks in a period of time. This mechanism encourages, in turn, the
hardware to implement their own sales strategies and expand its scope.
At the time, only the department of Lima (among the list of Hardware Stores available
in the directory of Yell Peru), it has been counted 132 establishments affiliated to
theRed Progresol, of whom 103 are located in Lima and distributed in 36 of its
43districts. With more than seven branches in San Martin de Porres, St. Juan
deLurigancho, La Victoria, San Juan de Miraflores and Villa María del Triunfo.
Cementos Lima has the following subsidiaries:
Concrete and Allied Investment SA-INVECO, who also owns UNICON, both
dedicated to the sale of concrete
Atocongo electrical generation, which provides electricity to Cementos Lima
Conchan Customs Warehouse which also provides storage services to the
cement factory
El Platanal Electric Company
Skanon Investments Inc. and through it to Drake Cement LLC, which operate in
the United States

33
Prefabricated Andean Peru SAC, where Cementos Lima owns 50% of the
shares.
Lurin Transport S.A and Conchán Naviera SA
Cementos Yura
Due to the announced entry of Cementos Otorongo (a subsidiary of Portugal Cimento
CIMPOR) and Cementos interoceanic the south - which would begin operations in 2010
and 2011 respectively, which together would produce 2.25 million MT per year (twice
what is currently Yura and Cementos Selva produced together) - Yura will invest U.S. $
500 million to double its current production capacity to attend growing domestic
demand and to export its product to Brazil through the Inter-Oceanic Highway, also the
economic group Rodriguez Banda (Gloria group), as well as Cementos Lima, has begun
its distribution network, "TO Build", a mechanism which seeks loyalty of customers and
retailers.
Through the system of distribution, the company's strategy has not only supported the
direct delivery of its product (ensuring freshness and quality), but seeks to retain
customers through the implementation of a system which gives them access to credit; to
do this the company has signed agreements with local banks in Arequipa and Cusco.
Through its network affiliation, the company also offers to the dealers the conditioning
of their locals and training in construction issues.
Yura Cements, which at the same time is a subsidiary of the Consorcio Cementero del
Sur and has the following companies in which hold a 93.77% and 99.98% respectively:
Cemento Sur SA (Cesur), founded in 1952 and dedicated to primarily at the
production and sale of cement and lime. This activity also includes the
extraction, processing and transport of metallic and nonmetallic minerals from
its quarries to its production plant in Puno.
34
Cachimayo INDUSTRIES S.A.C founded in 2002 and devoted primarily to
manufacturing and selling of various types of ammonium nitrate at its plant in
Cuzco.