DESIGN, FABRICATION AND EVALUATION OF 2D TO 3D NANOSTRUCTURED
CERAMIC/POLYMER COMPOSITES FOR ORTHOPEDIC REGENERATION AND
CONTROLLED DRUG DELIVERY
BY
HUINAN LIU
B.S., UNIVERSITY OF SCIENCE AND TECHNOLOGY BEIJING, 1997
M.S., UNIVERSITY OF SCIENCE AND TECHNOLOGY BEIJING, 2000
M.S., PURDUE UNIVERSITY, 2005
A DISSERTATION SUBMITTED IN PARTIAL FULFILLMENT OF THE
REQUIREMENTS FOR THE DEGREE OF DOCTOR OF PHILOSOPHY
IN THE BIOMEDICAL ENGINEERING
AWARDED JOINTLY BY
THE DIVISION OF ENGINEERING
AND
THE DIVISION OF BIOLOGY AND MEDICINE
AT BROWN UNIVERSITY
PROVIDENCE, RHODE ISLAND
MAY 2008

© Copyright 2008 by Huinan Liu

iii
This dissertation by Huinan Liu is accepted in its present form
by the Division of Engineering and the Division of Biology and Medicine
as satisfying the dissertation requirement for the degree of Doctor of Philoshopy.
Date Thomas J. Webster, Advisor
Date Jeffrey R. Morgan, Reader
Recommended to the Graduate Council
Date Edith Mathiowitz, Reader
Date G. Tayhas R. Palmore, Reader
Date Jeffrey M. Karp, Reader
Date Sheila Bonde, Dean of the Graduate School
Approved by the Graduate Council
iv
CURRICULUM VITAE
HUINAN LIU
EDUCATION Brown University, Providence, Rhode Island
Ph.D., Biomedical Engineering, May 2008
Purdue University, West Lafayette, Indiana M.S., Materials Science and Engineering, December 2005
University of Science and Technology Beijing (USTB), Beijing, China M.S., Materials Science and Engineering, March 2000 B.S., Diploma with First-class Honors, Major in Materials Science and Engineering and Minor in Scientific English Literature, July 1997
RESEARCH EXPERIENCE Brown University, Biomedical Engineering, Research Assistant, 2006-Present
Ph.D. Dissertation Project: Design, Fabrication and Evaluation of 2D to 3D Nanostructured Ceramic/Polymer Composites for Orthopedic Regeneration and Controlled Drug Delivery.
Advisor: Dr. Thomas J. Webster
Advisory Committee: Dr. Jeffrey R. Morgan, Dr. Edith Mathiowitz, Dr. G. Tayhas Palmore, and Dr. Jeffrey M. Karp (Harvard-MIT)
The main goal of my research is to create novel biomaterials and drug delivery systems with highly controlled nano-to-macro hierarchical structures that repair or replace damaged bone tissue and restore its normal biological functions. My research develops a multidisciplinary approach to assemble orthopedic tissue substitutes that can deliver structural, biological and mechanical signals to bone cells at the nano-scale and eventually heal damaged bone tissue at the macro-scale in a more effective way. This is accomplished by applying the concepts of nanotechnology, tissue engineering and controlled drug delivery into orthopedic systems to closely mimic natural bone in terms of its chemistry, nanostructure, biological organization and distinctive mechanical properties. Specific studies are listed as the following.
v
• Designed CAD models to build 3D nanophase ceramic/polymer composite scaffolds by a novel aerosol-based 3D printing technique.
• Characterized such nanocomposites and 3D scaffolds by Fourier transform infrared spectroscopy (FTIR), scanning electron microscopy (SEM), transmission electron microscopy (TEM), energy dispersive X-ray analysis (EDX), X-ray diffraction (XRD), X-ray photoelectron spectroscopy (XPS), atomic force microscopy (AFM) and etc.
• Investigated mechanical properties (such as elastic modulus, fracture behavior, compressive and tensile strength) of such nanocomposites in comparison to natural bone.
• Developed physical and chemical methods to load bone morphogenetic proteins (BMPs) and associated peptides into scaffolds for regulating cellular behavior and consequently treating various bone diseases.
• Conducted in vitro analysis to determine differentiation of human mesenchymal stem cells and functions of osteoblasts (bone forming cell) on the nanocomposite scaffolds. Fluorescence microscopy and confocal laser scanning microscopy were used to characterize cell adhesion and infiltration. Biochemical assays were used to characterize long-term cell functions.
• Studied drug loading efficiency and drug release rate related to degradation kinetics of materials.
Other Projects: • Investigated the relationship between biological properties and material
characteristics of nano-to-micron particulate calcium phosphates. • Studied in vitro cytocompatibility of novel machinable calcium
phosphate/lanthanum phosphate (LaPO4) composites for orthopedic applications.
• Characterized osteoblast interactions with calcium phosphate/barium titanate (BaTiO3) composites.
• Investigated osteoblast adhesion on calcium phosphates with various Ca/P ratios.
• Investigated osteoblast adhesion on nanograined hydroxyapatite/calcium titanate composites and tricalcium phosphate/calcium titanate composites.
Purdue University, Materials Science and Engineering, Research Assistant, 2003-2005
M.S. Thesis Project: Nanophase Titania/PLGA (Poly-Lactide-Co-Glycolide) Composites for Bone Tissue Engineering Applications.
General Research Institute for Nonferrous Metals at Beijing, China, Research Engineer, 2000-2003
• Studied microstructure and properties of orthopedic implant materials, mainly focused on titanium alloys.
• Simulated the processing of titanium alloys by the Finite Element Method (FEM).
vi
University of Science and Technology Beijing (USTB), Research Assistant, 1997-2000
• Developed the Expert System for the designing of extrusion dies. • Predicted the properties of microalloyed steel plates based on the artificial
neural network model. • Investigated functionally gradient materials, such as synthesis, process and
performance of stainless steel and zirconia composites.
RESEARCH INTERESTS Biomaterials, Ceramics, Polymers, Nanocomposites, Nano-to-micron 3D Fabrication, Rapid prototyping, Orthopedic prostheses, Vascular grafts, Neural implants, Health impacts of nanomaterials, Biomimetic tissue engineering, and Drug delivery systems for controlled tissue regeneration and disease treatment.
PUBLICATIONS Patent Application
• Liu H, Ergun C and Webster TJ. Novel Machinable Calcium Phosphate/Lanthanum Phosphate Composites for Orthopedic Application. Disclosed to Brown University, August 2007.
Book Chapters
• Liu H and Webster TJ. “Bioinspired Nanocomposites for Orthopedic Applications”, in Nanotechnology for the Regeneration of Hard and Soft Tissues, Webster TJ (ed), World Scientific, pp. 1-52, 2007.
• Liu H, Park G and Webster TJ. “Biocomposites”, in Encyclopedia of Biomaterials and Biomedical Engineering, Wnek G and Bowlin G (eds.), Marcel Dekker, Inc., pp. 1-17, 2006.
Journal Articles (Peer-reviewed)
• Liu H and Webster TJ. Nanomedicine for Implants: A Review of Studies and Necessary Experimental Tools. Biomaterials. 28(2): 354-369, 2007.
* Rated as ScienceDirect Top 25 Hottest Articles • Liu H, Yazici H, Ergun C and Webster TJ. An In Vitro Evaluation of the
Ca/P Ratio Factor in Cytocompatibility of Nano-to-Micron Particulate Calcium Phosphates for Bone Regeneration. Acta Biomaterialia. Accepted, 2007.
• Ergun C, Liu H and Webster TJ. Osteoblast Adhesion on Novel Machinable Calcium Phosphate/Lanthanum Phosphate Composites for Orthopedic Applications. Journal of Biomedical Materials Research. Accepted, 2007.
• Liu H and Webster TJ. The Promise of Aerosol Printed 3D Nanostructured Ceramic/Polymer Composites as Next Generation Orthopedic Tissue Engineering Scaffolds. Materials and Processes for Medical Devices. In press, 2007.
• Ergun C, Liu H, Webster TJ, Olcay E, Yilmaz S and Sahin FC. Increased Osteoblast Adhesion on Nanoparticulate Calcium Phosphates with Higher

vii
Ca/P Ratios. Journal of Biomedical Materials Research A. 85(1): 236-241, 2008.
• Ergun C, Liu H, Halloran JW and Webster TJ. Increased Osteoblast Adhesion on Nanograined Hydroxyapatite and Tricalcium Phosphate Containing Calcium Titanate”, Journal of Biomedical Materials Research. 80A(4): 990-997, 2007.
• Liu H, Slamovich EB and Webster TJ. Increased Osteoblast Functions among Nanophase Titania/Poly(lactide-co-glycolide) Composites of the Highest Nanometer Surface Roughness. Journal of Biomedical Materials Research. 78A(4): 798-807, 2006.
• Liu H, Slamovich EB and Webster TJ. Less Harmful Acidic Degradation of Poly(lactic-co-glycolic acid) Bone Tissue Engineering Scaffolds Through Titania Nanoparticle Addition. International Journal of Nanomedicine. 1(4): 541-545, 2006.
• Liu H, Slamovich EB and Webster TJ. Increased Osteoblast Functions on Nanophase Titania Dispersed in Poly-lactic-co-glycolic Acid Composites. Nanotechnology. 16(7): S601-608, 2005.
• Liu H, Slamovich EB and Webster TJ. Increased Osteoblast Functions on Poly-lactic-co-glycolic-acid with Highly Dispersed Nanophase Titania. Journal of Biomedical Nanotechnology. 1(1): 83-89, 2005.
• Palin E, Liu H, and Webster TJ. Mimicking the Nanofeatures of Bone Increases Bone-forming Cell Adhesion and Proliferation. Nanotechnology. 16(9): 1828-1835, 2005.
• Liu H and Xie J. Database System for Design of Extrusion Dies. Beijing Keji Daxue Xuebao/Journal of University of Science and Technology Beijing. 23(1): 63-72, 2001.
• Chen J, Xie J and Liu H. Extrusion Characteristics of Composite Powders of Stainless Steel and Zirconia. Beijing Keji Daxue Xuebao/Journal of University of Science and Technology Beijing. 19(6): 590-598, 1997.
Conference Proceedings
• Liu H and Webster TJ. Nano-Dispersed Particulate Ceramics in Poly-Lactide-Co-Glycolide Composites Improve Implantable Bone Substitute Properties. 2007 Materials Research Society Symposium Proceedings, Nanophase and Nanocomposite Materials. Boston, MA, November 2007.
• Liu H and Webster TJ. Nanostructured Titania/PLGA Composite Scaffolds Improve Cytocompatibility and Mechanical Strength for Better Bone Regeneration. 2007 AIChE Annual Meeting Proceeding. Salt Lake City, UT, November 2007.
• Liu H and Webster TJ. Favored Osteoblast Interactions with Aerosol Printed 3D Nano-to-Macro Hierarchical Architectures: The Promise of Nanocomposites as Orthopedic Prostheses. 2007 NSTI Nanotechnology Proceeding. Santa Clara, CA, May 2007.
• Liu H and Webster TJ. Ceramic/Polymer Nanocomposite Tissue Engineering Scaffolds for More Effective Orthopedic Applications: From 2D Surfaces to Novel 3D Architectures. 2006 Materials Research Society

viii
Symposium Proceedings, Biosurfaces and Biointerfaces. Boston, MA, November 2006.
• Liu H and Webster TJ. From Nano to Micro: Nanostructured Titania/PLGA Orthopedic Tissue Engineering Scaffolds Assembled by Three-dimensional Printing. 2006 AIChE Annual Meeting Proceeding. San Francisco, CA, November 2006.
• Liu H, Slamovich EB and Webster TJ. Less Harmful Acidic Degradation of Poly(lactic-co-glycolic acid) with Well-dispersed Titania Nanoparticle. 2006 NSTI Nanotechnology Proceeding. Boston, MA, May 2006.
• Liu H, Slamovich EB and Webster TJ. Surface Roughness Values Closer to Bone for Titania Nanoparticle/Poly-lactic-co-glycolic Acid (PLGA) Composites Increases Bone Cell Adhesion. 2005 Materials Research Society Symposium Proceedings, Vol. 873E, Biological and Bio-inspired Materials and Devices. San Francisco, CA, March 2005.
• Liu H, Slamovich EB and Webster TJ. Enhanced Osteoblast Functions on Nanophase Titania in Poly-lactic-co-glycolic Acid (PLGA) Composites. 2004 Materials Research Society Symposium Proceedings, Vol. 845, Nanoscale Materials Science in Biology and Medicine, pp. 315-320. Boston, MA, November 2004.
• Liu H, Slamovich EB and Webster TJ. Osteoblast Functions on Nanophase Titania in Poly-lactic-co-glycolic Acid (PLGA) Composites. 2004 AIChE Annual Meeting Proceeding, pp. 1271-1273. Austin, TX, November 2004.
• Liu H, Slamovich EB and Webster TJ. Improved Dispersion of Nanophase Titania in PLGA Enhances Osteoblast Adhesion. Ceramic Transactions, Ceramic Nanomaterials and Nanotechnology III - Proceedings of the 106th Annual Meeting of the American Ceramic Society, Vol. 159, pp. 247-255. Indianapolis, IN, April 2004.
PRESENTATIONS Podium Presentations
• Improved Mechanical Properties of Nanophase Titania/PLGA (Poly-Lactide-Co-Glycolide) Composites for Orthopedic Applications. 2008 34th Annual Northeast Bioengineering Conference, Providence, RI, April 2008.
• Nanostructured Titania/PLGA Composite Scaffolds Improve Cytocompatibility and Mechanical Strength for Better Bone Regeneration. 2007 AIChE Annual Meeting, Salt Lake City, UT, November 2007.
• Reduced Macrophage Functions On Nanomaterials. Presented on Dr. Thomas J Webster’s Behalf. 2007 BMES Annual Meeting, Los Angeles, CA, September 2007.
• Favored Osteoblast Interactions with Aerosol Printed 3D Nano-to-Macro Hierarchical Architectures: The Promise of Nanocomposites as Orthopedic Prostheses. 2007 NSTI Nanotechnology Conference, Santa Clara, CA, May 2007.

ix
• Three Dimensional Nanophase Ceramic/Polymer Composites for Bone Tissue Engineering. Northeast BMES 2007 Meeting, Stony Brook, NY, March 2007.
• Bio-inspired 2D to 3D Nanocomposite Scaffolds. Division of Biology and Medicine Seminar, Brown University, Providence, RI, March 2007.
• Novel Bio-nanocomposites for Orthopedic Applications. Invited, Graduate Materials Links (GML) Symposium on Interdisciplinary Graduate Research, Northeastern University, Boston, MA, February 2007.
• Nanophase Ceramic/Polymer Composites for More Effective Bone Regeneration: From 2D to 3D. Invited, Regional Bioengineering and Biotechnology Conference 2007, UMass Dartmouth, MA, February 2007.
• Polymer/Ceramic Nanocomposite Tissue Engineering Scaffolds for More Effective Orthopedic Applications. 2006 MRS Fall Meeting, Boston, MA, November 2006.
• From Nano to Micro: Nanostructured Titania/PLGA Orthopedic Tissue Engineering Scaffolds Assembled by Three-dimensional Printing. 2006 AIChE Annual Meeting, San Francisco, CA, November 2006.
• Ceramic/Polymer Nanocomposites for Orthopedic Applications. Invited, 2006 MS&T Meeting, Cincinnati, OH, October 2006.
• Nanomedicine for Increasing Tissue Growth. Invited. Presented on Dr. Thomas J Webster’s Behalf. 2006 MS&T Meeting, Cincinnati, OH, October 2006.
• Decreased Degradation of Poly(lactic-co-glycolic acid) Bone Tissue Engineering Scaffolds Through Titania Nanoparticle Addition. 2006 NSTI Nanotechnology Conference, Boston, MA, May 2006.
• Osteoblast Long-term Functions on Nanophase Ceramic/polymer Composites. School of Materials Engineering Seminar, Purdue University, West Lafayette, IN, June 2005.
• Nanophase Titania/Poly-lactic-co-glycolic acid (PLGA) Scaffolds for Bone Tissue Engineering Applications: Titania Dispersion and Osteoblast Response. 30th Society for Biomaterials Annual Meeting, Memphis, TN, April 2005.
• Mimicking the Surface Roughness of Bone in Titania Nanoparticle/Poly-lactic-co-glycolic acid (PLGA) Composites Increases Bone Cell Adhesion. 2005 MRS Spring Meeting, San Francisco, CA, March 2005.
• Osteoblast Adhesion on Nanophase Ceramic/Polymer Composites. School of Materials Engineering Seminar, Purdue University, West Lafayette, IN, February 2004.
Poster Presentations
• Nano-dispersed Particulate Ceramics in Poly-Lactide-Co-Glycolide Composites Improve Implantable Bone Substitute Properties. 2007 MRS Fall Meeting, Boston, MA, November 2007.
• Well Dispersed Nano-Titania in PLGA Composites Promote Bone Cell Functions and Mechanical Strength. 2007 BMES Annual Meeting, Los Angeles, CA, September 2007.

x
• Enhanced Osteoblast Function and Infiltration into Nanostructured Titania/Poly(lactide-co-glycolide) Aerosol 3D Printed Orthopedic Tissue Engineering Scaffolds. 32th Society for Biomaterials Annual Meeting, Chicago, IL, April 2007.
• Increased Osteoblast Adhesion on Nanograined Hydroxyapatite/Calcium Titanate and Tricalcium Phosphate/Calcium Titanate Composites. 2006 MRS Fall Meeting, Boston, MA, November 2006.
• PLGA/Titania Nanoparticle Composites for More Effective Orthopedic Applications. 2006 BMES Annual Meeting, Chicago, IL, October 2006.
• Nanophase Titania/PLGA (Poly-Lactide-co-Glycolide) Composites for Bone Tissue Engineering Applications. Methods in Bioengineering, Massachusetts Institute of Technology, Cambridge, MA, July 2006.
• Nanophase Titania/Poly(lactic-co-glycolic acid) Composites for Drug Delivery Applications. 2006 AAPS Annual Meeting, Boston, MA, June 2006.
• Degradation Kinetics of Poly(lactide-co-glycolide) Mediated by Titania Nanoparticles. 31th Society for Biomaterials Annual Meeting, Pittsburgh, PA, April 2006.
• Nanophase Titania/Poly-lactic-co-glycolic Acid (PLGA) Composites for Orthopedic Applications. 2005 Composites at Lake Louise, Lake Louise, Canada, October 2005.
• Nanophase Titania/PLGA (poly-lactide-co-glycolide) Composites for Bone Tissue Engineering Applications. 2005 Graduate Student Poster Competition, School of Materials Engineering, Purdue University, West Lafayette, IN, November 2005.
* Received First-prize Research Award. • Improved Osteoblast Functions on Nanophase Titania in PLGA Composites.
2004 BMES Annual Meeting, Philadelphia, PA, October 2004. • Improved Dispersion of Nanophase Titania in Polymer Composites
Enhance Osteoblast Adhesion. 106th ACerS Annual Meeting, Indianapolis, IN, April 2004.
• Improved Dispersion of Nanophase Titania in Polymer Composites Enhance Osteoblast Adhesion. 2004 Sigma Xi Graduate Student Poster Competition, Purdue University, West Lafayette, IN, February 2004.
* Received Second-prize Poster Award.
TEACHING EXPERIENCE Teaching Assistant Positions
• Transforming Society-Technology and Choices for the Future, Brown University, Providence, RI, Spring 2007.
Taught a guest lecture and led discussions on how to start research projects; developed the sample solutions for some homework problems; graded homework and exam problems.

xi
• Structure and Properties of Materials, Purdue University, West Lafayette, IN, Spring 2005.
Served as an instructor for 2 review sessions twice per week; held weekly office hours; designed and graded biweekly quizzes; graded weekly homework and exams.
• Materials Processing Laboratory, Purdue University, West Lafayette, IN, Spring 2004.
Prepared labs; gave lab introductions and demonstrations; helped students with their lab projects.
• Fundamentals of Database, USTB, Beijing, China, Spring 1999. Led a programming lab in Visual Foxpro; helped students debug code; graded programming assignments; helped students with the final project.
Pedagogical Training and Teaching Certificates
• Certificate III, Professional Development, The Harriet W. Sheridan Center for Teaching and Learning in Higher Education, Brown University, Providence, RI, 2007-2008.
• Certificate II, Classroom Tools, The Harriet W. Sheridan Center for Teaching and Learning in Higher Education, Brown University, Providence, RI, 2007-2008.
• Certificate I, Teaching Effectiveness, The Harriet W. Sheridan Center for Teaching and Learning in Higher Education, Brown University, Providence, RI, 2006-2007.
Teaching Consultation/Services
• Served as a teaching consultant for The Harriet W. Sheridan Center for Teaching and Learning in Higher Education, Brown University, Providence, RI, 2007-2008.
• Served as the Sheridan Center graduate liaison for the Division of Engineering, Brown University, Providence, RI, 2007-2008.
• Served on the graduate student panel for the WiSE (Women in Science and Engineering) program, Brown University, Providence, RI, 2007.
Advising
• Served as a research mentor for 3 undergraduate students, Purdue University, West Lafayette, IN, 2004-2005.
TEACHING INTERESTS Undergraduate-Level Courses: Structure and properties of materials, Thermodynamics, Tissue engineering, Cell biology and Physiology. Graduate-Level Courses: Advanced composite materials, Material characterization techniques, Biomaterials and Nanomedicine.
xii
OTHER ACADEMIC ACTIVITIES/SERVICES Professional Societies
• Member of MRS (Materials Research Society) • Member of ACerS (The American Ceramic Society) • Member of ASM (ASM International - Materials Information Society) • Member of TMS (The Minerals, Metals & Materials Society) • Member of AIST (Association for Iron & Steel Technology) • Member of BMES (Biomedical Engineering Society) • Member of AAPS (American Association of Pharmaceutical Scientists) • Member of AIChE (American Institute of Chemical Engineers)
Reviewer
• Reviewed manuscripts for Biomaterials, International Journal of Nanomedicine, and Journal of Biomedical Materials Research.
• Reviewed manuscripts for Proceedings of MRS Annual Spring and Fall Meeting.
Conferences
• Chaired Bioinstrumention II Track Session. 2008 34th Annual Northeast Bioengineering Conference, Providence, RI, April 2008.
• Symposium Assistant. 2007 MRS Fall Meeting, Boston, MA, November 2007.
• Chaired Undergraduate Platform Session IV: Tissue Engineering on Dr. Thomas J Webster’s Behalf. 2007 BMES Annual Meeting, Los Angeles, CA, September 2007.
• Chaired Nanostructured Scaffolds for Tissue Engineering Session on Dr. Thomas J Webster’s Behalf. 2006 AIChE Annual Meeting, San Francisco, CA, November 2006.
AWARDS AND HONORS
• Nominated as a Full Member of Sigma Xi (The Scientific Research Society), 2008
• First Place for Materials Engineering Graduate Student Association Research Competition, Purdue University, West Lafayette, IN, 2005.
• Member of Alpha Sigma Mu Honor Society (International Professional Honor Society For Materials Science and Engineering), Purdue University, West Lafayette, IN, 2003-2005.
• Second Place Poster Award for Sigma Xi Graduate Student Research Competition, Purdue University, West Lafayette, IN, 2004.
• Outstanding Graduate Student Scholarship, USTB, Beijing, 1998. • Excellent Graduate Award, First-class Honor issued by the Government, Beijing
Municipal Commission of Education, Beijing, 1997. • Excellent Bachelor Thesis Award, USTB, Beijing, 1997. • IET Outstanding Undergraduate Student Fellowship, USTB/IET Fund, Beijing,

xiii
1996. • Outstanding Undergraduate Student Scholarship, USTB, Beijing, 1993-1997.
LANGUAGES English, Chinese (native).
GRADUATE-LEVEL COURSES TAKEN AT PURDUE UNIVERSITY
• Microstructural Characterization Techniques • Powder Processing (Colloid Science and Ceramics) • Quantitative Analysis of Microstructure (Stereology) • Deposition Processing of Thin Films and Coatings • Phase Equilibria in Multicomponent Systems (Advanced Thermodynamics) • Scanning Electron Microscopy (SEM) Skills • Transmission Electron Microscopy (TEM) Skills • Energy Dispersive X-ray Micro Analysis (EDX) Skills • Steel: Classification and Properties for Application in Automobiles • Polymer Synthesis • Polymers in Pharmaceutical and Biomedical Systems • Statistics Methods for Biology • Atomic Force Microscopy (AFM) Skills
GRADUATE-LEVEL COURSES TAKEN AT BROWN UNIVERSITY
• Biomaterials • Small Wonders: The Science, Technology, and Health Impacts of Nanomaterials • Drug and Gene Delivery • Techniques in Molecular and Cell Science • Cell Physiology and Biophysics • Principles in Experimental Surgery

xiv
ACKNOWLEDGMENTS
Many people have contributed their support to this dissertation. Words are not
enough for me to express my gratitude heartily.
First and foremost, I would like to sincerely thank my advisor, Dr. Thomas J.
Webster, for his extensive support, encouragement, and enthusiastic guidance.
Professionally, his strong insight in science and technology has inspired me into this most
exciting interdisciplinary field, the development of novel biomaterials for treating
diseases. I have learned so much from him not only intellectually but also spiritually. I
really appreciate the time, training and caring that he invested in me throughout my
graduate studies, all of which made this dissertation possible.
I would also like to thank Dr. Jeffrey R. Morgan, Dr. Edith Mathiowitz, Dr. G.
Tayhas Palmore, and Dr. Jeffrey M. Karp (Harvard-MIT) for serving as valuable
members of my graduate committee and providing me helpful input and constructive
suggestions for this project. I highly appreciate their time, inspiring comments and
encouragements.
I am also very grateful to many people who assisted me to use various instruments
and/or share their experiences, including Senior Research Engineer Mr. Anthony W.
McCormick for his technical supports for using instruments in the Center for Advanced
Materials Research, Dr. Robbert Creton and Mr. Geoffrey Williams for their assistance
for using microscopes in the Leduc Bioimaging Facility, Dr. Michael Renn from
xv
Optomec, Inc. for his assistance with M3D® systems, and Dr. Christopher Bull, Mr. Brian
R. Corkum and Mr. Charlie Vickers for their assistance and supports for working in the
Joint Engineering and Physics Instrument Shop.
I would like to thank all my group members in Dr. Webster’s nanomedicine
laboratory for their supports and suggestions. I also appreciate great supports from
professors, graduate students and staff in the Division of Engineering and the Division of
Biology and Medicine during my past two years of graduate studies at Brown University.
I thank all my friends at Brown. They made my life at Brown more memorable.
I thank the National Science Foundation (NSF) for a Nanoscale Exploratory
Research Grant and the National Institutes of Health (NIH) for financial support.
I dedicate my greatest thankfulness to my beloved family, my parents, my
husband and my brother. My dearest husband, Dr. Dmytro V. Zagrebelnny, as my best
friend in life has provided the most important mental support for my graduate studies.
Without his love, support and motivation, I can not overcome all the difficulties I
encountered at Brown. My family encourages me to move forward and makes my life
meaningful and colorful. Without my family, I could not have pursued my dream and
fulfilled my passion for discovery and innovation in science and technology.

xvi
TABLE OF CONTENTS
Page
SIGNATURE PAGE ......................................................................................................... iii
CURRICULUM VITAE.................................................................................................... iv
ACKNOWLEDGMENTS ............................................................................................... xiv
TABLE OF CONTENTS................................................................................................. xvi
LIST OF TABLES.......................................................................................................... xxii
LIST OF FIGURES ....................................................................................................... xxiv
CHAPTER 1. INTRODUCTION ....................................................................................... 1
1.1. Increasing Demand for More Effective Orthopedic Prostheses .............................. 1 1.2. Problems with Current Bone Substitutes ................................................................. 4
1.2.1. Autografts ......................................................................................................... 4 1.2.2. Allografts and Xenografts................................................................................. 5 1.2.3. Metals and Metal Alloys................................................................................... 5
1.3. Basic Science of Bone ............................................................................................. 6 1.3.1. Bone as a Nano-Composite Material ................................................................ 7
1.3.1.1. Inorganic Phase.......................................................................................... 7 1.3.1.2. Organic Phase ............................................................................................ 8
1.3.2. Architecture, Microstructure and Mechanical Properties of Bone ................... 9 1.3.3. Bone Remodeling and Bone Cells .................................................................. 12
1.3.3.1. Osteoblasts ............................................................................................... 13 1.3.3.2. Osteocytes ................................................................................................ 15 1.3.3.3. Osteoclasts ............................................................................................... 15
1.4. Essential Requirements for Orthopedic Prostheses ............................................... 16 1.4.1. Considerations of Synthetic Material-Tissue Interfaces ................................. 17
1.4.1.1. Protein-Material Interactions ................................................................... 18

xvii
1.4.1.2. Protein-Mediated Cell Interactions with Surfaces ................................... 20 1.4.2. Desirable Properties of Synthetic Materials for Orthopedic Applications ..... 21
1.4.2.1. Biocompatibility ...................................................................................... 21 1.4.2.2. Biodegradability....................................................................................... 21 1.4.2.3. Mechanical Properties.............................................................................. 22 1.4.2.4. Surface Properties .................................................................................... 23 1.4.2.5. Osteoinductivity....................................................................................... 23 1.4.2.6. Interconnected 3D Structures................................................................... 24 1.4.2.7. Feasible Fabrication Techniques and Sterilizability ................................ 25
1.5. Suitable Orthopedic Materials ............................................................................... 25 1.5.1. Biodegradable Polymers ................................................................................. 26
1.5.1.1. PLGA as a Biodegradable Polymer ......................................................... 27 1.5.1.2. Other Biodegradable Polymers ................................................................ 33
1.5.2. Bioceramics..................................................................................................... 34 1.5.2.1. Titania ...................................................................................................... 34
1.5.2.1.1. Crystal Structure of Titania............................................................... 34 1.5.2.1.2. Chemical, Physical, Mechanical and Thermal Properties of Titania 36 1.5.2.1.3. Surface Properties of Titania ............................................................ 37 1.5.2.1.4. Medical Applications of Titania ....................................................... 38
1.5.2.2. Calcium Phosphates ................................................................................. 39 1.5.2.2.1. Crystal Structure of Hydroxyapatite ................................................. 39 1.5.2.2.2. Chemical, Physical, Mechanical and Biological Properties of HA .. 41
1.5.3. Bio-inspired Ceramic/Polymer Composites ................................................... 44 1.6. Nanostructured Biocomposites as Next-Generation Orthopedic Materials........... 46
1.6.1. Desirable Cell Interactions with Nanocomposites.......................................... 47 1.6.2. Rationale for Cell Interactions with Nanomaterials........................................ 49
1.6.2.1. Natural Tissue is Nanostructured............................................................. 49 1.6.2.2. Unique Surface Properties of Nanomaterials........................................... 50
1.6.3. Advantageous Mechanical Properties of Nanocomposites and Rationale...... 52 1.7. Hypothesis and Objectives..................................................................................... 53
CHAPTER 2. NANOSTRUCTURED 2D CERAMIC/POLYMER COMPOSITES: FROM MATERIAL CHARACTERISTICS TO OSTEOBLAST RESPONSES............ 57
2.1. Specific Problems and Aims.................................................................................. 57 2.2. Materials and Methods........................................................................................... 59
2.2.1. Materials Preparation ...................................................................................... 59 2.2.1.1. Nanophase Titania/PLGA Composites .................................................... 59 2.2.1.2. Control Materials ..................................................................................... 62
2.2.1.2.1. PLGA ................................................................................................ 62 2.2.1.2.2. Nanophase Titania Compacts ........................................................... 63
2.2.1.3. Reference Materials ................................................................................. 63 2.2.1.4. Sterilization of Materials.......................................................................... 64 2.2.1.5. Preparation of Bone Slices....................................................................... 64
2.2.2. Characterization Methods ............................................................................... 65 2.2.2.1. Scanning Electron Microscopy (SEM) and Quantitative Image Analysis65
xviii
2.2.2.2. Atomic Force Microscopy (AFM) and Characteristic Data Analysis ..... 65 2.2.3. In vitro Cytocompatibility Studies.................................................................. 67
2.2.3.1. Cell Culture.............................................................................................. 67 2.2.3.2. Osteoblast Adhesion ................................................................................ 67 2.2.3.3. Osteoblast Morphologies ......................................................................... 69 2.2.3.4. Osteoblast Long-term Functions.............................................................. 70
2.2.3.4.1. Total Protein Content........................................................................ 70 2.2.3.4.2. Total Collagen Content ..................................................................... 71 2.2.3.4.3. Alkaline Phosphatase Activity.......................................................... 72 2.2.3.4.4. Quantification of Calcium Deposition .............................................. 72
2.2.3.5. Acellular Calcium Deposition Studies..................................................... 73 2.2.4. In vitro Degradation Studies ........................................................................... 74 2.2.5. Statistical Analysis.......................................................................................... 74
2.3. Results.................................................................................................................... 75 2.3.1. Materials Characterization.............................................................................. 75
2.3.1.1. Surface Topography Determined by SEM............................................... 75 2.3.1.1.1. Nanophase Titania/PLGA Composites ............................................. 75 2.3.1.1.2. Control Materials .............................................................................. 76
2.3.1.2. Nanometer Surface Features Determined by AFM ................................. 78 2.3.2. In Vitro Cytocompatibility.............................................................................. 86
2.3.2.1. Osteoblast Adhesion ................................................................................ 86 2.3.2.2. Osteoblast Morphologies ......................................................................... 87 2.3.2.3. Osteoblast Long-term Functions.............................................................. 90
2.3.2.3.1. Synthesis of Total Protein................................................................. 90 2.3.2.3.2. Total Collagen Content ..................................................................... 91 2.3.2.3.3. Alkaline Phosphatase Activity.......................................................... 92 2.3.2.3.4. Extracellular Calcium Deposition..................................................... 94
2.3.2.4. Acellular Calcium Deposition.................................................................. 95 2.3.3. Evaluation of In Vitro Degradation................................................................. 96
2.4. Discussion ............................................................................................................ 100 2.4.1. Bio-inspired Nanophase Titania/PLGA Composites as Bone Substitutes.... 100 2.4.2. Dispersion of Nanophase Titania in PLGA Composites .............................. 102
2.4.2.1. Why Dispersion Is Necessary for Nanocomposites............................... 102 2.4.2.2. Mechanism of Agglomeration of Nanophase Titania Particles ............. 108 2.4.2.3. Dispersion of Nanophase Titania Particles in PLGA by Sonication ..... 110 2.4.2.4. Sedimentation of Nanophase Titania Particles ...................................... 113
2.4.3. Quantification of Essential Surface Properties ............................................. 114 2.4.4. Osteoblast Functions on Nanophase Titania/PLGA Composites ................. 117
2.4.4.1. Surface Roughness Influences Osteoblast Functions ............................ 118 2.4.4.2. Surface Area Influences Osteoblast Functions ...................................... 120
2.4.5. Degradation Behavior of Nanophase Titania/PLGA Composites ................ 121 2.4.6. Toxicity of Nanophase Titania/PLGA Composites ...................................... 124
2.4.6.1 Toxicity of PLGA and Its Degradation Products.................................... 124 2.4.6.2 Toxicity of Nano-Titania Particles.......................................................... 125
2.5. Conclusions.......................................................................................................... 126
xix
CHAPTER 3. OSTEOBLAST INTERACTIONS WITH NANOSTRUCTURED 3D CERAMIC/POLYMER COMPOSITES ........................................................................ 128
3.1. Scientific Challenges and Specific Aims............................................................. 128 3.1.1. Problems of Current 3D Fabrication Techniques ......................................... 129 3.1.2. Nanofabrication: A Novel Aerosol-Based 3D Printing ................................ 131
3.2. Materials and Methods......................................................................................... 134 3.2.1. Preparation of 3D Nanophase Titania/PLGA Scaffolds ............................... 134 3.2.2. Characterization of 3D Nanophase Titania/PLGA Scaffolds ....................... 137 3.2.3. In Vitro Osteoblast Interactions with 3D Nanophase Titania/PLGA Scaffolds................................................................................................................................. 137
3.3. Results and Discussions....................................................................................... 139 3.3.1. Well-Ordered 3D Nanophase Titania/PLGA Scaffolds................................ 139 3.3.2. Increased Osteoblast Interactions with 3D Printed Nanocomposites ........... 140
3.4. Conclusions.......................................................................................................... 142
CHAPTER 4. MECHANICAL PROPERTIES OF NANOPHASE CERAMIC/POLYMER COMPOSITES ........................................................................ 144
4.1. Problems and Specific Aims................................................................................ 144 4.2. Materials and Methods......................................................................................... 145
4.2.1. Material Preparation for Mechanical Tests................................................... 145 4.2.1.1. Specimens for Tensile and Compressive Tests...................................... 145
4.2.1.1.1. Nanophase Titania/PLGA Composites for Mechanical Tests ........ 145 4.2.1.1.2. Nanophase HA/PLGA Composites for Mechanical Tests.............. 146
4.2.1.2. Design of Casting Molds for Tensile Specimens................................... 148 4.2.3. Characterization of Materials Before Mechanical Tests............................... 149 4.2.4. Mechanical Tests: Tensile and Compressive Tests ...................................... 149 4.2.5. Fracture Analysis After Tensile Tests........................................................... 150 4.2.6. Statistical Analysis........................................................................................ 151
4.3. Results.................................................................................................................. 151 4.3.1. Material Characterization Before Mechanical Tests..................................... 151
4.3.1.1. Nanophase Titania/PLGA Composites Before Mechanical Tests ......... 151 4.3.1.2. Nanophase HA/PLGA Composites Before Mechanical Tests............... 153
4.3.2. Mechanical Properties................................................................................... 155 4.3.2.1. Mechanical Properties of Nanophase Titania/PLGA Composites......... 155 4.3.2.2. Mechanical Properties of Nanophase HA/PLGA Composites .............. 158
4.3.3. Fracture Analysis .......................................................................................... 162 4.3.3.1. Macroscopic View of Fractures ............................................................. 162 4.3.3.2. Microscopic View of Fractures.............................................................. 164
4.4. Discussion ............................................................................................................ 171 4.5. Conclusions.......................................................................................................... 173

xx
CHAPTER 5. NANOPHASE CERAMIC/POLYMER COMPOSITES AS CONTROLLED DRUG DELIVERY CARRIERS FOR TREATING BONE DISEASES......................................................................................................................................... 175
5.1. Problems and Specific Aims................................................................................ 175 5.2. Model Drug Carriers and Model Drugs ............................................................... 176
5.2.1. The Choice of Model Ceramics: Nano-titania vs. Nano-HA........................ 176 5.2.2. Bone Morphogenetic Proteins....................................................................... 177 5.2.3. BMP-Derived Short Peptides........................................................................ 179
5.3. Materials and Methods......................................................................................... 181 5.3.1. Material Preparation...................................................................................... 181
5.3.1.1. Synthesis of Nanocrystalline Hydroxyapatite........................................ 181 5.3.1.2. Design and Synthesis of the Model Peptide .......................................... 183 5.3.1.3. Peptide Loading onto Nanophase Ceramic/Polymer Composites ......... 184
5.3.1.3.1. Immobilization of Peptide Using Aminosilane Chemistry............. 184 5.3.1.3.2. Immobilization of Peptide Using Physical Adsorption Methods ... 186
5.3.1.4. Nanophase Hydroxyapatite-Peptide-PLGA Drug Delivery Systems .... 188 5.3.1.4.1. Preparation of Controls ................................................................... 189 5.3.1.4.2. Preparation of HA/PLGA Composites Loaded with Peptides........ 189
5.3.2. Characterization of Nano-HA/PLGA Composites Loaded with the Model Peptide..................................................................................................................... 191
5.3.2.1. Surface Characterization........................................................................ 191 5.3.2.2. CBQCA Assay ....................................................................................... 191
5.3.3. In Vitro Drug Release Profiles and Degradation of Drug Carriers............... 193 5.4. Results and Discussions....................................................................................... 193
5.4.1. Characterization of Drug Loading ................................................................ 193 5.4.1.1. Surface Characterization........................................................................ 193 5.4.1.2. CBQCA Assay ....................................................................................... 196
5.4.2. In Vitro Drug Release and Degradation of Drug Carriers ............................ 198 5.4.2.1. In Vitro Drug Release Profiles............................................................... 198 5.4.2.2. Degradation of Drug Carriers ................................................................ 202
5.5. Conclusions.......................................................................................................... 203
CHAPTER 6. CONCLUSTIONS AND PROPOSALS FOR FUTURE RESEARCH .. 205
6.1. Summary of Major Conclusions .......................................................................... 205 6.2. Key Criteria and Considerations for the Next Generation of Orthopedic Prostheses..................................................................................................................................... 207 6.3. Proposals for Future Research ............................................................................. 207
6.3.1. Building 3D Tissue Constructs at the Patient Bedside by Rapid Prototyping Techniques .............................................................................................................. 207 6.3.2. Controllable Drug-Carrying Implants for Treating Bone Diseases at Targeted sites ......................................................................................................................... 208 6.3.3. Stem Cell Differentiation on Nanocomposites Functionalized with Peptides................................................................................................................................. 208 6.3.4. Animal Models for Preclinical Evaluations of Tissue Substitutes................ 209

xxi
6.4. Challenges, Promises and Ultimate Dreams........................................................ 209
LIST OF REFERENCES................................................................................................ 212

xxii
LIST OF TABLES
Table Page
CHAPTER 1
Table 1. 1: Selected physical and mechanical properties of metal alloys that are currently used as bone replacements. ................................................................................................. 6
Table 1. 2: Relative density and mechanical properties of healthy human bone.............. 11
Table 1. 3: Types of tissue response to implanted materials ............................................ 18
Table 1. 4: Selected properties of materials used for bone repair..................................... 26
Table 1. 5: Mechanical properties of selected biodegradable polymers........................... 32
Table 1. 6: Typical physical and mechanical properties of titania ................................... 37
Table 1. 7: Physical and mechanical properties of HA in comparison with TCP. ........... 42
CHAPTER 2
Table 2. 1: Nanophase titania/PLGA composites, controls and references that were studied in this chapter. ...................................................................................................... 61
Table 2. 2: The temperature of composite suspensions before and after sonication. ....... 61
Table 2. 3: Surface area values of the substrates of interest compared to bone. AFM scan size is 5 μm × 5 μm........................................................................................................... 82
Table 2. 4: Surface area values of the substrates of interest compared to bone. AFM scan size is 1 μm × 1 μm........................................................................................................... 86

xxiii
CHAPTER 5
Table 5. 1: The detailed procedures that were followed for immobilization of the model peptide to nano-HA using aminosilane chemistry. ......................................................... 186
Table 5. 2: A summarized list of nano-HA-peptide-PLGA drug delivery systems, controls and references of interest to this study............................................................................ 188
Table 5. 3: The detailed procedures that were followed for preparing the HA_Pa_PLGA systems............................................................................................................................ 190
Table 5. 4: The detailed procedures that were followed for preparing the HA_Pd_PLGA systems............................................................................................................................ 190
Table 5. 5: The detailed procedures that were followed for preparing the HA_Ps_PLGA systems............................................................................................................................ 191
xxiv
LIST OF FIGURES
Figure Page
CHAPTER 1
Figure 1. 1: The number of people with bone diseases will increase as the population ages.. ................................................................................................................................... 2
Figure 1. 2: The number of new implantation surgeries and the number of revision surgeries have both gradually increased over the past decade............................................ 3
Figure 1. 3: Schematic structure of a human femur.......................................................... 10
Figure 1. 4: Schematic diagram of the coordinated bone cell functions that maintain homeostasis during bone remodeling................................................................................ 13
Figure 1. 5: Time course of osteoblast functions on a newly implanted biomaterial.. ..... 14
Figure 1. 6: Schematic representation of protein-mediated cell adhesion on biomaterial surfaces.. ........................................................................................................................... 19
Figure 1. 7: Synthesis of poly(DL-lactide-co-glycolide) (PLGA) and decomposition into respective acids by hydrolysis. ......................................................................................... 29
Figure 1. 8: Crystallographic unit cell of the three phases of titania.. .............................. 36
Figure 1. 9: Crystal structure of hydroxyapatite (HA) projected onto the (0001) plane (Hexagonal, a=0.942 nm and c=0.688 nm).. .................................................................... 40
Figure 1. 10: Generic formulation of apatite minerals, and potential substitutions in the three sub-lattices. .............................................................................................................. 41
Figure 1. 11: Diagram illustrating three scale levels of hierarchical structures of bone.. 50
Figure 1. 12: Diagram illustrating the multidisciplinary approach of this dissertation which will combine nanotechnology, tissue engineering and controlled drug delivery into orthopedic prosthetic design to promote healthy bone regeneration. ............................... 54

xxv
CHAPTER 2
Figure 2. 1: TEM image of nanophase titania powder. Magnification bar is 10 nm. ....... 59
Figure 2. 2: The schematic procedures for preparing nanophase titania/PLGA composites using a solvent-casting technique. .................................................................................... 62
Figure 2. 3: The schematic diagram of the experimental procedures followed for determining osteoblast adhesion. ...................................................................................... 68
Figure 2. 4: SEM micrographs of nanophase titania/PLGA composites: PTC25, PTC35, PTC45, and PTC70.. ......................................................................................................... 76
Figure 2. 5: SEM micrographs of control materials and natural bone: PLGA, TCG (green titania compacts), TCS (sintered titania compacts) and outer surface of bone................. 77
Figure 2. 6: SEM micrographs of inner surface of bone................................................... 77
Figure 2. 7: AFM micrographs of materials of interest: PTC25, PTC35, PTC45, and PTC70.. ............................................................................................................................. 79
Figure 2. 8: AFM micrographs of materials of interest: PLGA, TCG, TCS, and bone.... 80
Figure 2. 9: Surface roughness (root-mean-square) of PLGA, PTC25, PTC35, PTC45, PTC70, TCG, TCS, and natural bone.. ............................................................................. 81
Figure 2. 10: AFM micrographs of materials of interest: PTC25, PTC35, PTC45, and PTC70. Original scan size is 1 μm × 1 μm....................................................................... 83
Figure 2. 11: AFM micrographs of materials of interest: PLGA, TCG, TCS, and bone. Original scan size is 1 μm × 1 μm.. .................................................................................. 84
Figure 2. 12: Surface roughness (root-mean-square) of PLGA, PTC25, PTC35, PTC45, PTC70, TCG, TCS, and natural bone. AFM scan size is 1 μm × 1 μm. .......................... 85
Figure 2. 13: Osteoblast adhesion on PLGA, PTC25, PTC35, PTC45, PTC70, TCG, TCS, and reference: Glass.......................................................................................................... 87
Figure 2. 14: SEM micrographs of osteoblasts adhering on the materials of interest: PTC25, PTC35, PTC45, and PTC70. Incubation time is 4 hours. The average length of the major axis of typical adherent osteoblasts on the substrates of interest was shown below each micrograph.. ................................................................................................... 88
Figure 2. 15: SEM micrographs of osteoblasts adhering on the materials of interest: PLGA, TCG, and TCS. Incubation time is 4 hours. The average length of the major axis of typical adherent osteoblasts on the substrates of interest was shown below each micrograph.. ...................................................................................................................... 89

xxvi
Figure 2. 16: Total protein content in osteoblasts cultured on PLGA, PTC25, PTC35, PTC45, PTC70, TCG, TCS; and reference: Glass............................................................ 90
Figure 2. 17: Total collagen content in osteoblasts cultured on PLGA, PTC25, PTC35, PTC45, PTC70, TCG, TCS; and reference: Glass............................................................ 92
Figure 2. 18: Alkaline phosphatase activity in osteoblasts cultured on PLGA, PTC25, PTC35, PTC45, PTC70, TCG, TCS; and reference: Glass.. ............................................ 93
Figure 2. 19: Calcium deposited by osteoblasts cultured on PLGA, PTC25, PTC35, PTC45, PTC70, TCG, TCS; and reference: Glass............................................................ 94
Figure 2. 20: Acellular calcium precipitated on PLGA, PTC25, PTC35, PTC45, PTC70, TCG, TCS; and reference: Glass.. .................................................................................... 96
Figure 2. 21: Percent weight loss for PLGA, PTC25, PTC35, PTC45, PTC70, TCS, and Glass incubated in PBS under standard incubation conditions......................................... 97
Figure 2. 22: pH variation with incubation time for PLGA, PTC25, PTC35, PTC45, PTC70, TCS, and Glass incubated in PBS under standard incubation conditions.. ......... 99
Figure 2. 23: Schematic of theoretical microstructure of ceramic/polymer composites. (a) 12.7 vol. % of particles with 1000 nm diameters (4 particles within an area of 25 μm2); (b) 12.7 vol. % of particles with 100 nm diameters (404 particles within an area of 25 μm2); (c) 12.7 vol. % of particles with 50 nm diameters (1617 particles within an area of 25 μm2); and (d) 12.7 vol. % of particles with 30 nm diameters (4492 particles within an area of 25 μm2). .............................................................................................................. 106
Figure 2. 24: Schematic of the cross section of the atomic structure of an oxide showing (a) a dry surface, (b) a surface with physically adsorbed water and (c) a surface with chemically adsorbed water.............................................................................................. 109
Figure 2. 25: Diagrams illustrating (a) the mechanisms of PLGA degradation and (b) the mechanisms how ceramic particles influence PLGA degradation. ................................ 123
CHAPTER 3
Figure 3. 1: Illustration of the M3DTM system developed by OPTOMEC®. Left is the M3DTM system. Right is a close up of the deposition head and nozzle used to deposit nanophase ceramic/polymer composites in a controlled manner.. ................................. 132
Figure 3. 2: Diagram illustrating the basic principles of the aerosol-based 3D printing. (1) The well-dispersed nanocomposite suspensions are aerosolized in an atomizer (ultrasonic or pneumatic) to create a dense aerosol of tiny droplets. (2) The aerosol is carried by a gas to the deposition head. (3) The aerosol is focused by a second gas sheath in the deposition head and “sprayed” onto the deposition platform layer by layer. ................. 136

xxvii
Figure 3. 3: SEM micrograph of (a) 3D nanocomposite scaffolds, Bar=100 µm; (b) a magnified region of the 3D nanocomposite surface. ...................................................... 140
Figure 3. 4: (a) SEM micrograph of an osteoblast adhering on the nanocomposite surface, Bar=10 µm. (b) Confocal micrograph of osteoblasts adhering around pore structures of 3D printed nanocomposite scaffolds............................................................................... 141
Figure 3. 5: (a) The average number of osteoblasts adherent to pore structures. (b) The average number of osteoblasts adherent to the surfaces away from pores.. ................... 142
CHAPTER 4
Figure 4. 1: The tensile specimens of PLGA, PTCa and PTCd...................................... 146
Figure 4. 2: The tensile specimens of PLGA, PHAa and PHAd.. .................................. 148
Figure 4. 3: The casting mold for tensile specimens. ..................................................... 149
Figure 4. 4: The experimental setup for tensile tests.. .................................................... 150
Figure 4. 5: SEM micrographs of nanophase titania/PLGA composites: (a) the top surface of PTCa, (b) the bottom surface of PTCa, (c) the top surface of PTCd, and (d) the bottom surface of PTCd.. ............................................................................................................ 152
Figure 4. 6: SEM micrographs of particulate HA synthesized by the wet chemistry method............................................................................................................................. 153
Figure 4. 7: SEM micrographs of nanophase HA/PLGA composites: (a) the top surface of PHAa, (b) the bottom surface of PHAa, (c) the top surface of PHAd, and (d) the bottom surface of PHAd.............................................................................................................. 154
Figure 4. 8: The typical stress-strain curves of PLGA, PTCa and PTCd calculated from the load-extension data from tensile tests. ...................................................................... 156
Figure 4. 9: The tensile moduli of the materials of interest.. .......................................... 156
Figure 4. 10: The tensile strength at yield and the ultimate tensile strength (UTS) of the materials of interest......................................................................................................... 157
Figure 4. 11: The elongation at yield and the elongation at break for the materials of interest............................................................................................................................. 157
Figure 4. 12: The compressive moduli of the materials of interest.. .............................. 158
Figure 4. 13: The typical stress-strain curves of PLGA, PHAa and PHAd calculated from the load-extension data from tensile tests. ...................................................................... 159
xxviii
Figure 4. 14: The tensile moduli of the materials of interest.. ........................................ 159
Figure 4. 15: The tensile strength at yield and the ultimate tensile strength (UTS) of the materials of interest......................................................................................................... 160
Figure 4. 16: The elongation at yield and the elongation at break for the materials of interest............................................................................................................................. 161
Figure 4. 17: The compressive moduli of the materials of interest. ............................... 162
Figure 4. 18: Macroscopic fracture appearances of nanophase titania/PLGA composites, nanophase HA/PLGA composites and PLGA. ............................................................... 163
Figure 4. 19: Microscopic fracture appearances of PLGA after tensile tests. ................ 165
Figure 4. 20: Microscopic fracture appearances of PTCa (agglomerated nano-titania/PLGA composites) after tensile tests. The fracture cross-section is shown in (a). The top surfaces of PTCa near the fracture cross-section are shown in (b,c,d).............. 167
Figure 4. 21: Microscopic fracture appearances of PTCa (agglomerated nano-titania/PLGA composites) after tensile tests. The bottom surfaces of the PTCa near the fracture cross-sections..................................................................................................... 168
Figure 4. 22: Microscopic fracture appearances of PTCd (well-dispersed nano-titania/PLGA composites) after tensile tests. The fracture cross-section is shown in (a). The top surfaces of PTCd near the fracture cross-section are shown in (b,c,d). ............ 169
Figure 4. 23: Microscopic fracture appearances of PTCd (well-dispersed nano-titania/PLGA composites) after tensile tests. The bottom surfaces of the PTCd near the fracture cross-sections..................................................................................................... 170
CHAPTER 5
Figure 5. 1: Histology of rat calvaria after tantalum (Ta) scaffolds coated with either nano-HA or micron-HA which were implanted for 2 weeks.......................................... 177
Figure 5. 2: Short peptides derived from BMP-7 and their amino acid sequences.. ...... 181
Figure 5. 3: The schematic diagram illustrating HA synthesis by a wet chemistry precipitation method. ...................................................................................................... 183
Figure 5. 4: The schematic illustrations of the chemical structures and the reactions that were used to bond the model peptide to nano-HA particles.. ......................................... 185
Figure 5. 5: Schematic illustrations of loading DIF-7c by physical adsorption.. ........... 187

xxix
Figure 5. 6: The CBQCA reaction illustrates the transformation of the non-fluorescent CBQCA molecule into a fluorescent molecule when it reacts with amine groups in the presence of a cyanide catalyst......................................................................................... 192
Figure 5. 7: SEM images of the PLGA_P. Original magnification is 100 kX. .............. 194
Figure 5. 8: SEM images of the HA_Pa_PLGA.. ........................................................... 195
Figure 5. 9: SEM images of the HA_Ps_PLGA. ............................................................ 195
Figure 5. 10: The CBQCA analysis of nano-HA loaded with the model peptide DIF-7c by the chemical bonding method. Fluorescence images are: (a) nano-HA, (b) nano-HA after APTES treatment, (c) nano-HA after SMP reaction, and (d) nano-HA with the chemically attached peptide. ............................................................................................................. 197
Figure 5. 11: The CBQCA analysis of nano-HA loaded with the model peptide DIF-7c by the physical adsorption method. Fluorescence images are (a) the peptide, and (b) nano-HA with the physically attached peptide. ....................................................................... 198
Figure 5. 12: The amount of peptide DIF-7c released from the drug delivery systems of interest to this study. The peptide concentration in the collected supernatant was determined by MicroBCA assay (Pierce). (a) Peptide released from the controls: PLGA_P, HA_Pa, and HA_Ps. (b) Peptide released from the nanocomposites: HA_Pd_PLGA, HA_Pa_PLGA, and HA_Ps_PLGA.. ................................................... 200
Figure 5. 13: The total amount of peptide DIF-7c released from the drug delivery systems during 52 days of culture in vitro.................................................................................... 201
Figure 5. 14: The appearance of drug carriers after 30 and 52 days of culture in vitro. (a,b): after 30 days of culture. (c,d): after 52 days of culture. ........................................ 203
CHAPTER 6
Figure 6. 1: Schematic diagram illustrating an ideal situation of bone regeneration. Bone substituting materials will resorb after fulfilling their initial tasks, thus, ideally, nothing foreign left in these patients.. .......................................................................................... 211

1
CHAPTER 1. INTRODUCTION
1.1. Increasing Demand for More Effective Orthopedic Prostheses
Annually, an estimated 1.5 million individuals in the United States suffer from a
bone fracture caused by some form of bone disease [1]. It is projected that the prevalence
of bone diseases will increase significantly as the United States population ages, as
shown in Figure 1.1 [1,2]. The most adverse effects of bone diseases (such as osteopenia,
osteoporosis, bone cancer, etc.) relate to fractures. Osteoporosis is a leading underlying
cause of bone fracture which affects both males and females at all ages, although to
varying degrees. Other bone disorders, such as Paget’s disease, osteogenesis imperfecta,
rickets, and osteomalacia also have adverse influences on bone structure, strength, and
density, and subsequently lead to bone fractures.
Orthopedic prostheses are often required to repair or replace damaged bone tissue
due to various diseases, injuries and genetic malformations. In 2001, about 165,000 hip
joints and 326,000 knees were replaced in hospitals in the United States according to the
National Center for Health Statistics [3,4]. Health statistics also highlight that the number
of new implantation and revision surgeries have gradually increased over the past decade,
as shown in Figure 1.2 [3,4]. A majority of the patients who receive an orthopedic
implant may have to undergo several revision surgeries in their lifetime since the average
longevity of current orthopedic implants is only 10 to 15 years [ 5 ]. Direct care

2
expenditures for fractures, such as surgery and therapy, cost approximately 18 billion
dollars per year in the United States. Indirect costs, such as lost productivity for patients,
may add billions of dollars to this figure [1]. In the coming decades, these costs could
double or triple if surgical removal and revision surgery become necessary after
implantation when an orthopedic implant fails under physiological loading conditions.
Figure 1. 1: The number of people with bone diseases will increase as the population ages. (a) The number of people older than 65 in 2000 and 2050 in the United States. (b) The number of people with bone diseases in 2000 and 2020 in the United States. (Data obtained from [1,2]).
10.1
13.8
0
4
8
12
16
2000 2020
35
86
0
50
100
2000 2050
The
Num
ber o
f Peo
ple
Old
er T
han
65 (M
illio
ns)
The
Num
ber o
f Peo
ple
with
B
one
Dis
ease
s (M
illio
ns)
(a) (b)
Year Year
3
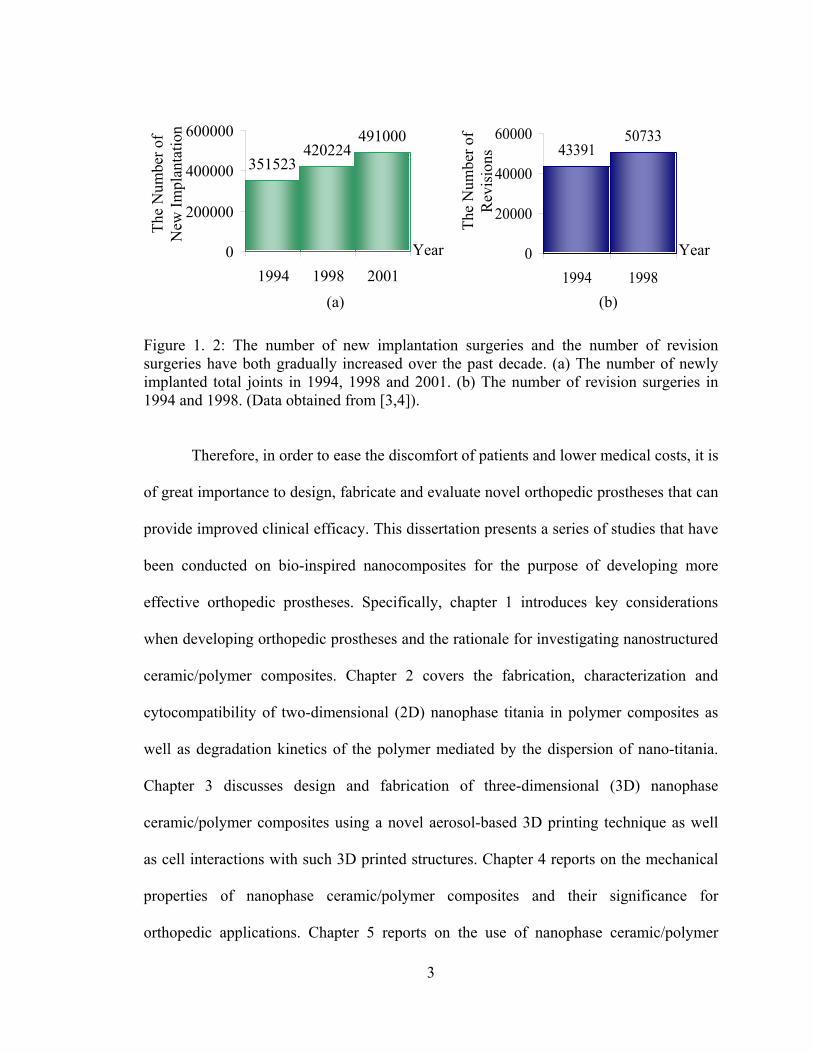
Figure 1. 2: The number of new implantation surgeries and the number of revision surgeries have both gradually increased over the past decade. (a) The number of newly implanted total joints in 1994, 1998 and 2001. (b) The number of revision surgeries in 1994 and 1998. (Data obtained from [3,4]).
Therefore, in order to ease the discomfort of patients and lower medical costs, it is
of great importance to design, fabricate and evaluate novel orthopedic prostheses that can
provide improved clinical efficacy. This dissertation presents a series of studies that have
been conducted on bio-inspired nanocomposites for the purpose of developing more
effective orthopedic prostheses. Specifically, chapter 1 introduces key considerations
when developing orthopedic prostheses and the rationale for investigating nanostructured
ceramic/polymer composites. Chapter 2 covers the fabrication, characterization and
cytocompatibility of two-dimensional (2D) nanophase titania in polymer composites as
well as degradation kinetics of the polymer mediated by the dispersion of nano-titania.
Chapter 3 discusses design and fabrication of three-dimensional (3D) nanophase
ceramic/polymer composites using a novel aerosol-based 3D printing technique as well
as cell interactions with such 3D printed structures. Chapter 4 reports on the mechanical
properties of nanophase ceramic/polymer composites and their significance for
orthopedic applications. Chapter 5 reports on the use of nanophase ceramic/polymer
The
Num
ber o
f R
evis
ions
Year
(a)
4339150733
0
20000
40000
60000
1994 1998
351523420224
491000
0
200000
400000
600000
1994 1998 2001
The
Num
ber o
f N
ew Im
plan
tatio
n
Year
(b)

4
composites for controlled drug delivery applications. Lastly, chapter 6 summarizes the
major conclusions drawn from these studies highlighted key design criteria for improving
orthopedic prostheses through nanotechnology, and proposals for future research.
1.2. Problems with Current Bone Substitutes
Traditionally, autografts, allografts, xenografts and metal implants have been used
to repair fractures and other bone defects. However, these substitutes are far from ideal as
each has its own specific problems and limitations [6].
1.2.1. Autografts
An autograft is the tissue removed from one portion of the skeleton and
transferred to another location in the same individual. It is commonly taken in the form of
cancellous bone from the patient’s iliac crest, but compact bone can be used as well [7].
Historically, autografts have been the gold standard for bone replacements for many
years because they provide osteogenic cells as well as essential osteoinductive factors
needed for bone healing and regeneration [8]. However, autografts are always associated
with donor shortage and donor site morbidity, which severely limit their applications. The
number of patients requiring a transplant far exceeds the available supply of donor tissue
[9]. Clearly, other bone substitutes are needed to reduce this deficit.

5
1.2.2. Allografts and Xenografts
An allograft is the tissue transplanted between genetically non-identical members
of the same species while a xenograft is the tissue transplanted between members of
different species. Clearly, allografts and xenografts have the risk of disease transmission
and, thus, may involve a severe immune response [10,11].
1.2.3. Metals and Metal Alloys
Due to the above stated issues with natural grafts, synthetic materials have been
the material of choice for the majority of orthopedic applications. Metals and metal alloys,
such as stainless steel, CoCrMo alloy and Ti6Al4V alloy, have been the dominant
materials used in orthopedics. However, the average longevity of current metal-based
orthopedic implants is only 10 to 15 years [5].
Implant loosening over time is the leading cause of clinical failure in the short
term, as a result of insufficient osteoblast (bone forming cell) functions and excessive
fibroblast (fibrous tissue forming cell) activities. Moreover, mismatches in the
mechanical properties of metallic implants and physiological bone result in “stress
shielding” problems in the long term according to Wolff’s law [12-14]. That is, the
implanted material shields healing bone from mechanical loading, resulting in necrosis of
the surrounding bone and subsequent implant loosening. Table 1.1 highlights some
physical and mechanical properties of metals which are currently used for bone
replacements. Obviously, metals have much higher density and mechanical properties
than actual bone. All these conditions generate clinical complications and necessitate

6
additional revision surgery. In addition, metallic implants are permanent and, thus, can
not be remodeled or replaced with time with healthy bone; this results in chronic clinical
problems (such as possible consistent inflammation and malnutrition of surrounding bone
tissue).
Table 1. 1: Selected physical and mechanical properties of metal alloys that are currently used as bone replacements. (Data obtained from [15]).
Metal alloys Density (g/cm3)
Elastic Modulus
(GPa)
Yield Strength (MPa)
Ultimate Tensile Strength (MPa)
Elongation (%)
Stainless Steel (316L Annealed) 8 193 172 485 40
CoCrMo
(F75 Cast) 8.3 220 450 655 8
Ti6Al4V 4.42 100 795 860 10
All of these clinical problems that are associated with natural grafts and metallic
implants emphasize a critical need for novel synthetic orthopedic prostheses that possess
similar structure, properties, and functions to physiological bone. In this manner, it is
important to first understand the composition, structure, and resulting properties of bone.
1.3. Basic Science of Bone
The skeleton is a remarkable organ that serves both a structural function
(providing mobility, support and protection for other internal organs) and a reservoir
function (e.g., as the storehouse for essential minerals). This section introduces the
7
chemistry, architecture, mechanical properties and physiological functions of natural
bone so as to closely mimic or match its composition, microstructure and properties using
synthetic materials.
1.3.1. Bone as a Nano-Composite Material
Natural bone is a composite material composed of organic compounds (mainly
collagen) reinforced with inorganic compounds (minerals). Apparently, the single
mineral phase of bone is too brittle and easy to break while the single collagen phase is
too soft and does not have mechanical stability (such as compression strength). The
composite chemistry of bone provides both strength and resilience so that the skeleton
can absorb energy when stressed without breaking. The detailed composition of bone
differs depending on species, age, dietary history, health status and anatomical location.
In general, however, the inorganic phase accounts for about 70% of the dry weight of
bone and the organic matrix makes up the remainder [16].
1.3.1.1. Inorganic Phase
The inorganic or mineral component of bone is primarily rod-like (20 to 80 nm
long and 2 to 5 nm in diameter) crystalline hydroxyapatite, Ca10(PO4)6(OH)2 or HA.
Small amounts of impurities which affect cellular functions may be present in the
mineralized HA matrix; for example, magnesium, strontium, sodium, or potassium ions
may replace calcium ions, carbonate may replace phosphate groups, whereas chloride and
fluoride may replace hydroxyl groups. Because the release of ions from the mineral phase
8
of the bone matrix controls cell-mediated functions, the presence of impurities may alter
certain physical properties of bone (such as solubility) and consequently important
biological aspects which are critical to normal bone function. For example, magnesium
present in the mineralized matrix may enhance cellular activity and promote the growth
of HA crystals and subsequent new bone formation [1].
1.3.1.2. Organic Phase
Approximately 90% of the organic phase of bone is Type I collagen; the
remaining 10% consists of noncollagenous proteins and ground substances. Type I
Collagen found in bone is synthesized by osteoblasts and is secreted as a triple helical
procollagen into the extracellular matrix, where collagen molecules are stabilized by
cross-linking of reactive aldehydes among the collagen chains. Generally, each of the 12
types of collagen found in body consists of 3 polypeptide chains composed of
approximately 1,000 amino acids each. Specifically, Type I collagen (molecular weight
139,000 Daltons) possesses 2 identical α1(I) chains and 1 unique α2 chain; this
configuration produces a fairly rigid linear molecule that is 300 nm long [17]. The linear
molecules (or fibers) of Type I collagen are grouped into triple helix bundles having a
periodicity of 67 nm, with gaps (called hole-zones) between the ends of the molecules
and pores between the sides of parallel molecules. The collagen fibers provide the
framework and architecture of bone, with the HA particles located between the fibers.
Noncollagenous proteins, for example, growth factors and cytokines (such as
insulin-like growth factors and osteogenic proteins), bone inductive proteins (such as
osteonectin, osteopontin, and osteocalcin), and extracellular matrix compounds (such as

9
bone sialoprotein, bone proteoglycans, and other phosphoproteins as well as proteolipids)
provide minor contributions to the overall weight of bone but have major contributions to
its biological functions. During new bone formation, noncollagenous proteins are
synthesized by osteoblasts, and mineral ions (such as calcium and phosphate) are
deposited into the hole-zones and pores of the collagen matrix to promote HA crystal
growth. The ground substance is formed from proteins, polysaccharides and
mucopolysaccharides which acts as a cement, filling the spaces between collagen fibers
and HA crystals.
In conclusion, bone itself is a nanostructured composite composed of nanometer-
sized HA well-dispersed in a mostly collagen matrix (Figure 1.3). Although the inorganic
and organic components of bone have structural and some regulatory functions, the
principal regulators of bone metabolism are bone cells which will be discussed in section
1.3.3.
1.3.2. Architecture, Microstructure and Mechanical Properties of Bone
Cancellous bone and compact bone are two of the most important naturally
occurring forms of bone, as shown in Figure 1.3. Cancellous bone (also called trabecular
or spongy bone) is characterized by a three-dimensional sponge-like branching lattice
structure with 50 to 90% porosity and large pores which are up to several millimeters in
diameter. Cancellous bone, primarily found at the epiphyses and metaphyses of both long
and cuboidal bones, approximates an isotropic material and is mainly subjected to
compression under physiological loading conditions. In contrast, compact bone (also

10
called cortical bone) is characterized by less than 30% porosity and is composed of small
pores up to 1 mm in diameter. Compact bone, primarily found at the diaphysis of long
bones (such as the femur and the tibia), is highly anisotropic with reinforcing structures
along its loading axis.
Figure 1. 3: Schematic structure of a human femur. (Adapted and redrawn from [18]).
Compact bone is usually more dense and, thus, stronger than cancellous bone.
The relative density and some mechanical properties of bone are shown in Table 1.2.
These properties also change with sex, age, dietary history, health status, and anatomical
locations. Diseased bone usually has lower density and weaker mechanical properties
than respective healthy bone.

11
Table 1. 2: Relative density and mechanical properties of healthy human bone. (Data obtained from [19-22]).
Property Cancellous Bone Compact Bone (Longitude)
Compact Bone (Transverse)
Relative Density 0.05-0.7 0.7-1.8
Elongation (%) 5-7 1-3
Elastic Modulus (GPa) 0.05-0.5 17-30 7-13
Ultimate Tensile Strength (MPa) 2-20 130-150 50-60
Compressive Strength (MPa) 2-12 100-230
Bending Strength
(in Ringer’s Solution) (MPa)
N/A 50-150
Fracture Toughness, KIC ( mMPa )
N/A 2-12
At the microstructural level, bone consists of two structures: woven and lamellae.
Woven bone is immature or a primitive form of bone and is normally found in the
metaphyseal region of growing bone as well as in fracture callus and diseased (such as
Pagetic) bone. Woven bone is composed of relatively disoriented coarse collagen fibers
and, thus, has isotropic characteristics. In contrast, lamellae bone is a more mature bone
that results from the remodeling of woven or previously existing bone. Lamellae bone is
highly organized and contains stress-oriented collagen fibers which results in anisotropic
properties with greatest strength parallel to the longitudinal axis of the collagen fibers.
Lamellae bone is formed into concentric rings (approximately 4-20 rings) called osteons
with a central blood supply called a Haversian system.

12
It is not only the complex architecture of natural bone that makes it difficult to
replace, but also its dynamic ability. Bone has the ability to regenerate when damaged
and also to remodel when the loading conditions change, for example, the mass of bone
mineral can be increased with exercise, making bones less likely to fracture [23 ].
Therefore, it is important to understand how bone cells coordinate functions during this
bone remodeling process.
1.3.3. Bone Remodeling and Bone Cells
Bone as a living organ can change in size, shape, position, and properties by its
remodeling process throughout its lifetime to respond to different kinds of stress
produced by physical activity or mechanical loads. The remodeling process involves the
removal of old bone and regeneration of new bone at the same site. Therefore, bone has
the capability of self-repairing under excessive mechanical stresses by activating the
remodeling process through the formation of a bone-modeling unit (BMU). This process
involves three major types of bone cells: osteoblasts (bone-forming cells), osteocytes
(bone-maintaining cells), and osteoclasts (bone-resorbing cells).
Bone remodeling continues throughout human life so that most of the adult
skeleton is replaced about every 10 years. Figure 1.4 depicts how bone cells cooperate in
the bone remodeling process. Osteoclasts are activated by growth factors, cytokines, and
proteins present in the bone matrix to resorb old bone. Osteoblasts are then activated by
growth factors (such as insulin-like growth factors I and II) secreted by osteoclasts and/or
osteocytes to deposit calcium-containing minerals. Osteocytes regulate new bone
formation by modulating osteoblast differentiation from non-calcium depositing to

13
calcium depositing cells through the secretion of growth factors (such as insulin-like
growth factor I and the tissue growth factor β ) [24].
Figure 1. 4: Schematic diagram of the coordinated bone cell functions that maintain homeostasis during bone remodeling. (Adapted and redrawn from [25]).
1.3.3.1. Osteoblasts
Osteoblasts are located on the periosteal and endosteal surfaces of bone with an
average diameter of 10 to 50 μm and contribute to new bone synthesis. Figure
1.5schematically describes the time course of osteoblast proliferation and differentiation
on a newly implanted biomaterial. After initial adhesion to the surface of an implant,
osteoblasts actively proliferate and express genes for Type I collagen, vitronectin, and
fibronectin [26]. At the end of proliferation, the extracellular matrix development and

14
maturation begin and osteoblasts start to differentiate from non-calcium to calcium
depositing cells. Alkaline phosphatase activity and mRNA expression for proteins (such
as osteopontin, and collagenase) increase tenfold [26]. As the mineralization process
begins and mineral nodules form, osteoblasts synthesize and deposit bone sialoprotein,
osteocalcin (a calcium-binding protein), and other matrix proteins. Osteocalcin interacts
with HA and is thought to mediate the coupling to bone resorption by osteoclasts and
bone formation by osteoblasts and/or osteocytes.
Figure 1. 5: Time course of osteoblast functions on a newly implanted biomaterial. (Adapted and redrawn from [26]).
Synthesis of : Type I collagen Vitronectin Fibronectin
Synthesis of : Osteopontin Alkaline Phosphatase Collagenase
0 12 21
Days in Culture
Synthesis of : Osteocalcin Bone Sialoprotein
PROLIFERATION AND
EXTRACELLULAR MATRIX
SYNTHESIS
OSTEOBLAST PROLIFERATION
EXTRACELLULAR MATRIX
DEVELOPMENT AND
MATURATION
EXTRACELLULAR MATRIX
MINERALIZATION
OSTEOBLAST DIFFERENTIATION

15
1.3.3.2. Osteocytes
Osteocytes are mature osteoblasts embedded in the mineralized bone matrix and
also contribute to new bone synthesis but to a lesser extent than osteoblasts. The principal
difference between osteocytes and osteoblasts is their relative location in bone.
Osteocytes are arranged concentrically around the central lumen of an osteon and in
between lamellae (Figure 1.3). Osteocytes possess extensive long branches with which
they establish contacts and communications with adjacent osteocytes through small
channels called canaliculi. Due to their three-dimensional distribution and
interconnecting structure, osteocytes are believed to be sensitive to physiological stress
and strain signals in bone tissue and help to mediate or balance (i) osteoblastic activity to
deposit new bone and (ii) osteoclastic activity to dissolve old bone.
1.3.3.3. Osteoclasts
Osteoclasts are derived from pluripotent cells of bone marrow and lie in the
regions of bone resorption in pits called Howship’s lacunae. Osteoclasts, primarily
responsible for bone resorption, are distinguished by their large size which is up to 100
μm in diameter and their multiple nuclei which could be up to 100 per cell. When
osteoclasts sweep across disrupted bone surfaces to dissolve bone, they first form ruffled
cell membrane edges to increases their total surface area of attachment onto the
resorptive surfaces. Then, osteoclasts produce tartrate-resistant acid phosphatase (also
know as TRAP) which results in the release of hydrogen ions through the carbonic
anhydrase system and subsequently decreases the pH of the local environment. The

16
lowered pH increases the solubility of HA crystals and the organic components of the
bone matrix are removed by acidic proteolytic digestion.
The remodeling process is vital for bone health, for a variety of reasons. First, the
remodeling process helps bone repair or replace small cracks or deformities in the areas
of cell damage resulted from repeated stresses. Second, remodeling maintains the
resilience of bone by replacing old, brittle bone with new regenerated bone. Third, the
remodeling is important for functions of the skeleton, providing storage space for calcium
and phosphorus. Specifically, the formation phase of remodeling can take up calcium and
phosphorus and replenish this storage space when mineral supplies are ample while the
resorption phase can supply these minerals to the other parts of body when needed.
Importantly, the extent of bone remodeling that occurs at an implant surface will
determine the fate of the prosthetic device. For example, loosening and failure of the
implant may result from either: (1) little or no remodeling in the bone surrounding an
implant, which may lead to malnourished juxtaposed bone, or (2) too much remodeling in
the bone surrounding an implant, which may lead to excessive bone resorption, or
osteolysis and eventual implant loosening.
1.4. Essential Requirements for Orthopedic Prostheses
Orthopedic prostheses must have a series of suitable properties for the purpose of
bone regeneration. The successful design of orthopedic prostheses involves
comprehensive considerations of macro-, micron- and nano-structural properties of the
prostheses and their interactions with natural tissue. Such properties affect not only cell
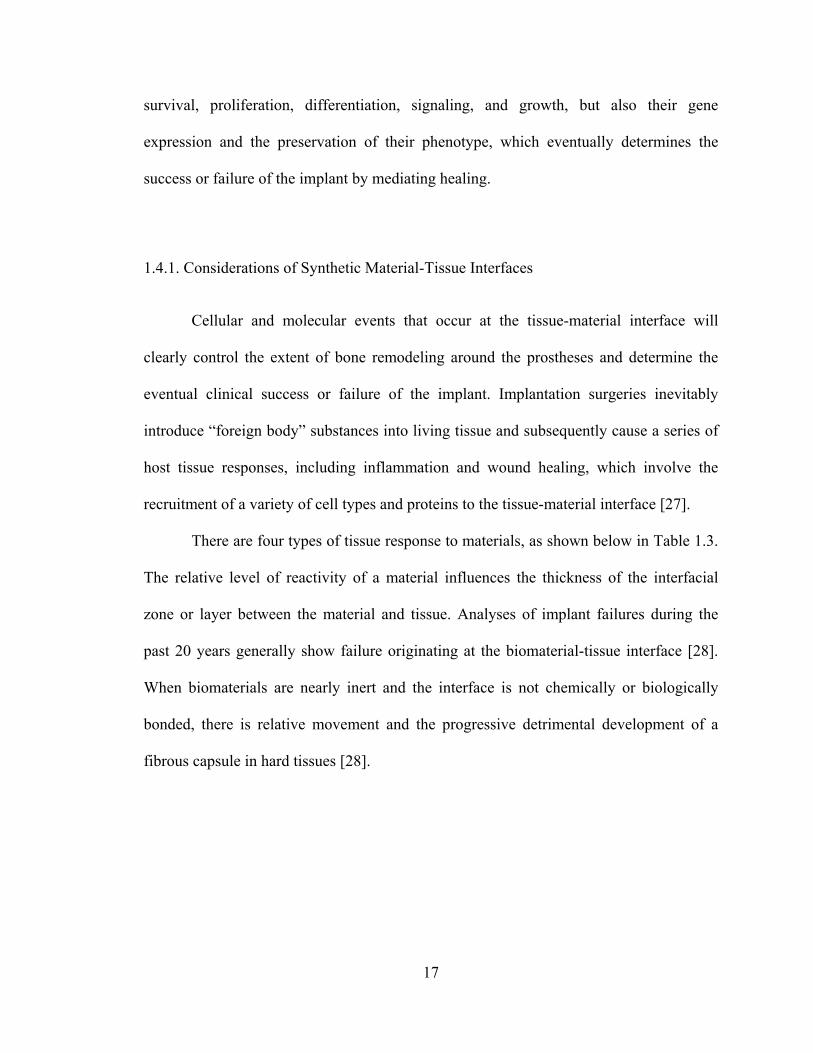
17
survival, proliferation, differentiation, signaling, and growth, but also their gene
expression and the preservation of their phenotype, which eventually determines the
success or failure of the implant by mediating healing.
1.4.1. Considerations of Synthetic Material-Tissue Interfaces
Cellular and molecular events that occur at the tissue-material interface will
clearly control the extent of bone remodeling around the prostheses and determine the
eventual clinical success or failure of the implant. Implantation surgeries inevitably
introduce “foreign body” substances into living tissue and subsequently cause a series of
host tissue responses, including inflammation and wound healing, which involve the
recruitment of a variety of cell types and proteins to the tissue-material interface [27].
There are four types of tissue response to materials, as shown below in Table 1.3.
The relative level of reactivity of a material influences the thickness of the interfacial
zone or layer between the material and tissue. Analyses of implant failures during the
past 20 years generally show failure originating at the biomaterial-tissue interface [28].
When biomaterials are nearly inert and the interface is not chemically or biologically
bonded, there is relative movement and the progressive detrimental development of a
fibrous capsule in hard tissues [28].
18
Table 1. 3: Types of tissue response to implanted materials. (Adapted and redrawn from [28]).
Implanted Materials Tissue Response
Toxic The surrounding tissue dies Nontoxic and biologically inactive (nearly inert)
A fibrous tissue of variable thickness forms
Nontoxic and biologically active (bioactive) An interfacial bond forms
Nontoxic and resorbable The surrounding tissue replaces it
However, such detrimental fibrous tissue formation can be avoided if certain
optimal chemistries are chosen. For example, for bone regeneration, initial protein-
mediated osteoblast adhesion to the surface of orthopedic materials is imperative for
subsequent new bone formation, leading to successful osseointegration. The initial
adsorption of proteins to material surfaces is important for cell adhesion.
1.4.1.1. Protein-Material Interactions
Before cells (such as osteoblasts) adhere to an implant surface, proteins will
adsorb onto the surface within milliseconds to potentially interact with select cell
membrane receptors, as shown in Figure 1.6 [17].
Accessibility of adhesive domains (such as specific amino acid sequences) of
adsorbed proteins may either enhance or inhibit subsequent cellular attachment.
Adsorption of particular proteins (such as vitronectin, fibronectin, and laminin) from
body fluids determines the subsequent adhesion and growth of specific desirable or
undesirable cells on the surface [17]. The type, concentration, conformation, and
bioactivity of plasma proteins adsorbed onto materials depend on surface chemistry,

19
hydrophilicity or hydrophobicity, charge, topography, roughness, and energy. For
example, maximum vitronectin adsorption was noted on hydrophilic surfaces with high
surface roughness [29,30]. Compared to rough surfaces, very smooth surfaces favor
fibroblast functions over osteoblast functions to subsequently result in fibrous tissue
formation called fibrosis, which should be avoided for a successful implant [31]. It has
also been reported that the adsorption of calcium on titanium surfaces enhanced binding
of select proteins since many proteins have calcium binding sites, but the adsorption of
other ions (such as magnesium) does not affect select protein adsorption [17].
Figure 1. 6: Schematic representation of protein-mediated cell adhesion on biomaterial surfaces. (Adapted and redrawn from [17]).
The strength of adhesion between the material surface and the adsorbed proteins
will determine if the proteins will remain adherent or be replaced by other proteins with a
higher affinity to the surface [32-34]. The adsorbed protein layer composition and
configuration then dictates what adhesive protein ligands will be exposed, thus,
Proteins (fibronectin, vitronectin, laminin, Type I collagen, etc.)
Integrin Receptors
Adhesive Peptide Sequence of Protein
Protein Adsorption
Cell Membrane
Cell

20
determining the cell adhesive nature of the surface [35,36]. Specifically, the Arginine-
Glycine-Aspartic Acid (RGD) peptide sequence present in vitronectin, fibronectin,
collagen, and laminin are known to promote the adhesion of several types of cells to
biomaterial surfaces [28].
1.4.1.2. Protein-Mediated Cell Interactions with Surfaces
Cells interact with their external environment through signals (specifically,
chemical, electrical, and mechanical) transmitted through the cell membrane. For this
reason, understanding cellular interactions with a biomaterial surface requires elucidation
of molecular processes that occur at the cell membrane-biomaterial interface. For
example, cellular adhesion, a prerequisite step for anchorage-dependent cell functions has
been well examined at the molecular level. Cell-binding regions of extracellular matrix
proteins (such as the RGD peptide sequence) and respective cell-membrane-intercalated
receptors have been identified as being among the most important mechanisms for cell
adhesion to substrates (Figure 1.6).
Initial bone cell interactions with a surface indicate material toxicity,
cytocompatibility, and eventually its potential to support new bone formation. Therefore,
nowadays, how the surface characteristics influence initial cellular activity (such as cell
adhesion, morphology, proliferation, and differentiation) in vitro attracts more and more
attention because it is relatively easy for in vitro cytocompatibility studies to eliminate a
wide range of extraneous factors to examine a specific cellular response as compared
with in vivo studies [37].

21
1.4.2. Desirable Properties of Synthetic Materials for Orthopedic Applications
When developing synthetic materials for orthopedic applications, the properties
highlighted in the following sections must be considered thoroughly because these
properties control, either directly or indirectly, the efficacy and destiny of bone
substitutes, critical for clinical success.
1.4.2.1. Biocompatibility
Orthopedic prostheses should be compatible to cells and be well integrated into
the host tissue without eliciting a severe immune response, cytotoxicity, or formation of
scar tissue [7]. Factors that determine cytocompatibility can be affected not only by
intrinsic chemistry of materials but also by techniques used for material synthesis and
fabrication. For example, residual chemicals involved in polymer processes (such as
organic solvents, initiators, stabilizers, cross-linking agents, catalysts, or unreacted
monomers) may leach out of implanted materials under physiological conditions.
Therefore, not only the intact biomaterial, but also any leachable components and
degradation products, must be biocompatible. Specifically, the release of acidic by-
products from some degradable materials may cause tissue necrosis or inflammation due
to a quick drop in local pH [38].
1.4.2.2. Biodegradability
The ideal orthopedic prostheses should be biodegradable and bioresorbable with a
controllable degradation and resorption rate to match cell/tissue growth in vitro and in
22
vivo. The degradation rate of the materials and the rate of new tissue formation must be
appropriately coupled to each other in such a way that by the time the injury site is totally
regenerated, the implant is totally degraded. The degradation rate of an implant can be
altered by many factors (such as its structure and the molecular weight of the component
materials). The structures in prostheses (such as surface-to-volume ratio, porosity, pore
size and shape) may also play important roles in degradation kinetics, as do dimensions
and geometries. The choice of implantation site, the amount of mechanical loading, and
the rate of metabolism of degradation products in vivo also influence the degradation time
of the implanted prostheses.
1.4.2.3. Mechanical Properties
Orthopedic prostheses should also have adequate mechanical properties to match
the intended site of implantation. In vitro, the scaffolds should have sufficient mechanical
strength to withstand hydrostatic pressures and to maintain spacing required for cell in-
growth and matrix production [39]. In vivo, because bone is always under physiological
stresses (such as compression, tension, torsion, and bending), the mechanical properties
of the implanted materials should closely match those of living bone so that early healing
of the injured site can be possible. If the mechanical strength of an implant is much
higher than bone, resulting stress-shielding effects will slow down bone healing. If the
mechanical strength of an implant is much lower than bone, obviously, it will break down
under load-bearing conditions.

23
1.4.2.4. Surface Properties
Orthopedic prostheses should have appropriate surfaces to favor cell attachment,
proliferation and differentiation. Surface properties, both chemical and topographical, can
control and affect bioactivity and osteoconductivity. Chemical properties are related to
the ability of proteins to initially adsorb and, subsequently, for cells to adhere to the
material surface. Topographical properties are of particular interest when
osteoconductivity is concerned. Osteoconduction is the process by which osteogenic cells
migrate to the surface of the scaffold through a fibrin clot, which is established
immediately after the material is implanted. This migration of osteogenic cells through
the clot will cause retraction of the temporary fibrin matrix. Hence, it is of the utmost
importance that the fibrin matrix is well secured to the implant, otherwise, when
osteogenic cells start to migrate, the fibrin will detach from the implant due to wound
contraction. As opposed to a smooth surface, it has been previously shown that a rough
surface will be able to imprison the fibrin matrix and hence facilitate the migration of
osteogenic cells to the implant surface [40,41].
1.4.2.5. Osteoinductivity
Osteoinduction is the process by which mesenchymal stem cells and pluripotent
osteoprogenitor cells are recruited to a bone healing site. These cells are then stimulated
to the osteogenic differentiation pathway. However, when the portion of bone that
requires regeneration is large, natural osteoinduction is not enough for accelerating bone
healing. Therefore, the orthopedic implant itself should be osteoinductive to promote
bone formation. Recombinant human bone morphogenetic proteins (rhBMPs), such as

24
rhBMP-2 and rhBMP-7, were found to be osteoinductive and capable of inducing new
bone formation. Recent research has demonstrated that combining rhBMPs with bone
scaffolds could significantly increase osteoinductivity of the scaffolds and hence promote
new bone growth and accelerate healing [42].
1.4.2.6. Interconnected 3D Structures
The ideal orthopedic prostheses should have 3D bone-like interconnected porous
structures with appropriate organization, porosity and scale to favor tissue integration and
vascularization, as well as support flow transportation of nutrients and metabolic waste.
Pore size is a very important factor because bone scaffolds with large void volume and
large surface-area-to-volume ratio maximize space to help cells, tissues, and blood
vessels penetrate. To attain a high surface area per unit volume, however, smaller pores
are preferable as long as the pore size is greater than the diameter of osteoblasts (typically,
10 μm). If the pores employed are too small, pore occlusion by the cells may happen.
This will prevent cellular penetration and neovascularization of the inner areas of bone
scaffolds. It is reported that interconnected larger pores facilitate diffusion and cell
migration within the scaffolds, improving nutrient supply and waste removal, and, thus,
increasing the viability of cells at the center of the scaffolds [38]. Currently, researchers
are still searching for the optimal pore size and shape for various bone tissue engineering
applications. It is also crucial to control the suitable porosity of scaffolds by adjusting
available fabrication techniques to match the porosity of true bone. Importantly, the
porosity, pore structures, and pore size affect the mechanical and biological properties of
scaffolds.
25
1.4.2.7. Feasible Fabrication Techniques and Sterilizability
Orthopedic prostheses should be fabricated reproducibly on a large scale using
versatile processing techniques for a variety of shapes and sizes to match bone defects in
patients. As with all implanted materials, bone substitutes must be easily sterilizable to
prevent infection. The method of sterilization, however, must not interfere with
bioactivity of biomaterials or alter their chemical composition, which could influence
their cytocompatibility or degradation properties.
Keeping these requirements in mind, several orthopedic materials for bone
regeneration will be further reviewed in section 1.5.
1.5. Suitable Orthopedic Materials
The selection of the most appropriate material to produce an orthopedic prosthesis
is a very important step towards the construction of a successful product. As mentioned,
the properties of constituent materials will determine, to a great extent, the properties of
the final implant. So far, a wide variety of natural and synthetic biomaterials, such as
polymers, ceramics, and a combination of them, have been studied for orthopedic and
dental applications. Table 1.4 highlights some physical and mechanical properties of
materials of particular interest for bone repair.
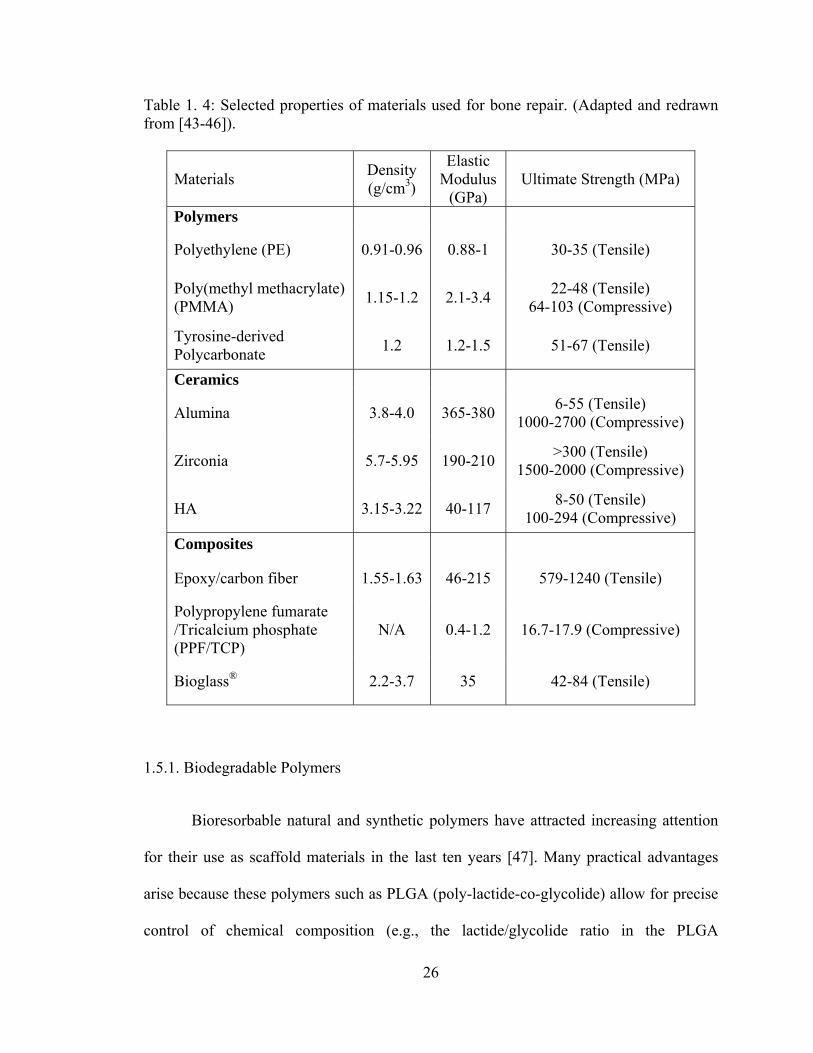
26
Table 1. 4: Selected properties of materials used for bone repair. (Adapted and redrawn from [43-46]).
Materials Density (g/cm3)
Elastic Modulus
(GPa) Ultimate Strength (MPa)
Polymers
Polyethylene (PE) 0.91-0.96 0.88-1 30-35 (Tensile)
Poly(methyl methacrylate) (PMMA) 1.15-1.2 2.1-3.4 22-48 (Tensile)
64-103 (Compressive)
Tyrosine-derived Polycarbonate 1.2 1.2-1.5 51-67 (Tensile)
Ceramics
Alumina 3.8-4.0 365-380 6-55 (Tensile) 1000-2700 (Compressive)
Zirconia 5.7-5.95 190-210 >300 (Tensile) 1500-2000 (Compressive)
HA 3.15-3.22 40-117 8-50 (Tensile) 100-294 (Compressive)
Composites
Epoxy/carbon fiber 1.55-1.63 46-215 579-1240 (Tensile)
Polypropylene fumarate /Tricalcium phosphate (PPF/TCP)
N/A 0.4-1.2 16.7-17.9 (Compressive)
Bioglass® 2.2-3.7 35 42-84 (Tensile)
1.5.1. Biodegradable Polymers
Bioresorbable natural and synthetic polymers have attracted increasing attention
for their use as scaffold materials in the last ten years [47]. Many practical advantages
arise because these polymers such as PLGA (poly-lactide-co-glycolide) allow for precise
control of chemical composition (e.g., the lactide/glycolide ratio in the PLGA

27
copolymers), crystallinity, molecular weight, molecular weight distribution, as well as
microstructure and macrostructure (including porosity) [48-50]. This allows adequate
control of bone scaffold properties (such as degradation rate and mechanical strength),
thus, creating optimal conditions for cell survival, proliferation, and subsequent tissue
formation. The degradation products of these polymers can be removed by natural
metabolic pathways.
1.5.1.1. PLGA as a Biodegradable Polymer
The most commonly used synthetic polymers are biodegradable aliphatic
polyesters. Poly(glycolic acid) (PGA, also called as polyglycolide), poly(lactic acid)
(PLA, also called as polylactide), and their copolymers poly(lactic-co-glycolic acid)
(PLGA, also called as poly-lactide-co-glycolide), as a family of aliphatic polyesters, are
some of the most popular scaffold polymers [51-53].
PLGA was originally developed for use in resorbable surgical sutures and
biodegradable drug delivery systems. These polymers (PLA, PGA, and PLGAs) are
approved by the U.S. Food and Drug Administration (FDA) for certain human clinical
applications. The first commercial suture, Dexon® (composed of poly-lactide-co-
glycolide), was available in 1970 and the first FDA-cleared drug product was the Lupron
Depot® drug-delivery system (TAP Pharmaceutical Products Inc.; Lake Forest, IL) which
was a controlled release device for the treatment of advanced prostate cancer that used
biodegradable microspheres of 75/25 weight ratio of lactide/glycolide to administer
leuprolide acetate over periods of time up to 4 months (replacing daily injections). Since
then there has been intensive development of medical devices composed of PGA, PLA,

28
and their copolymers [54]. The use of biodegradable polymers in orthopedic devices for
fixation of fractures of long bones was first clinically implemented in Finland in 1984
[55,56]. Since the 1990s, the applications of PLA, PGA, and PLGA in tissue engineering
have been extensively investigated [57].
DL-lactides and glycolides are polymerized via a cationic ring-opening reaction in
the presence of stannous octoate as a catalyst to form a random copolymer called
poly(DL-lactide-co-glycolide) or PLGA. A representative polymerization reaction is
shown in Figure 1.7. PLGA gradually degrades into the endogenous natural metabolites
lactic acid and glycolic acid by non-enzymatic hydrolysis of ester bonds in its backbone
[58,59]. The polymers that undergo hydrolytic cleavage tend to have more predictable
degradation rates in vivo than polymers whose degradation is mediated predominantly by
enzymes because the levels of enzymatic activity may vary widely not only among
different patients but also among different tissue sites in the same patient. But, the
availability of water is virtually constant in all soft/hard tissues and varies little from
patient to patient. The degradation products of PGA, PLA and PLGA are nontoxic,
natural metabolites, and are eventually eliminated from the body in the form of carbon
dioxide and water.

29
Figure 1. 7: Synthesis of poly(DL-lactide-co-glycolide) (PLGA) and decomposition into respective acids by hydrolysis.
The PLGA degradation process has been divided into three steps that begin at the
outer perimeter of the device and move gradually into the interior, followed by
catastrophic disintegration [60]. In step 1, water diffuses into the polymer and hydrolytic
random chain scission of ester bonds begins. In step 2, the molecular weight decreases
and low-molecular-weight oligomers in the inner part of the matrix begin to diffuse out of
CH3
O
O
O
OCH3
DL-Lactide
+ O
O
O
O
Glycolide
CH CHC C
O
O
O
O
CH3 CH3
m
CH2C C
O
O
O
O
n
CH2
m n
Hydrolysis
Poly(DL-lactide) Poly(glycolide)
Random Poly(DL-lactide-co-glycolide)
CH HO C
O CH3
OH CH2 C
O
OH HO+ Lactic Acid Glycolic Acid
Sn(II) Oct 115°C
30
the thinning outer layer. At this stage, an acidic environment is formed. When the
molecular weight of these oligomers is low enough to allow solubilization in the medium,
weight loss begins. In the final step 3, a polymer shell remains after the oligomers
solubilize and slow degradation of the shell takes place. PLGA usually degrades through
random scission mode under normal conditions (i.e. in water or phosphate buffer medium
of pH 7.4 at 37 °C). However, PLGA degrades through unzipping mode (chain-end
scission) under harsh conditions (such as high acidity, high temperature, or high energy
radiation) [61]. Clearly, this complex degradation process indicates the difficulties in
controlling the release rate.
The degradation rate of these polymers, such as PGA, PLA, and PLGA, can even
be tailored to satisfy the requirements from several weeks to several years by altering the
ratio of polylactic to polyglycolic acid, molecular weight, molecular weight distribution,
crystallinity, hydrophilicity, pH of the surrounding fluids, as well as specimen size,
geometry, porosity, surface properties and sterilization methods [62]. The degradation
rate becomes slower as the molecular weight becomes higher. The lower the crystallinity
is, the higher the chance of penetration of water molecules to initiate hydrolysis of the
chains. Gamma irradiation used for sterilization at doses of 2-3 Mrad can result in
significant backbone degradation since aliphatic polymers are sensitive to radiation
damage. These materials are usually sterilized by exposure to ethylene oxide.
Unfortunately, the use of ethylene oxide gas represents a serious safety hazard as well as
potentially leaving residual traces in the polymeric devices. They must be degassed for
extended periods of time.

31
Polymer crystallinity is a measure of the alignment of polymeric chains along
each other. The presence of bulky side groups, branches and freely mobile atoms (like
oxygen in the backbone bonds) adversely influences the alignment of neighboring chains
and, thus, crystallinity. Because lactic acid has a chiral center, PLA can exist in four
stereoisomeric forms, poly(L-lactic acid), poly(D-lactic acid), meso-poly(DL-lactic acid),
and the racemic mixture of poly(L-lactic acid) and poly(D-lactic acid). Steroregular
poly(L-lactic acid) is semicrystalline, while the racemic poly(DL-lactic acid) is
amorphous.
In the same conditions, hydrophilic PGA degrades faster in aqueous solutions (or
in vivo) than the hydrophobic PLA because the adsorption of water molecules is higher
into the chain of the former polymer, although the ester bonds in each have about the
same chemical reactivity towards water. The extra methyl group in the PLA repeating
unit (compared with PGA) makes it more hydrophobic, reduces the molecular affinity to
water, and, thus, leads to a slower hydrolysis rate. Therefore, it seems that the higher the
glycolic acid content, the faster the degradation rate. However, the lifetime of PLGA is
shorter at a PLA/PGA ratio of 50/50 [63], because the more crystalline domains of PGA
form as the amount of glycolic acid in the copolymer increases. In the crystalline state,
the polymer chains are densely packed and organized to resist the penetration of water.
Consequently, polymer backbone hydrolysis tends to only occur at the surface of the
crystalline regions, which takes a much longer time than hydrolysis in an amorphous
polymer or in an amorphous region of a semicrystalline polymer.

32
The mechanical properties of biodegradable polymers depend on their chemical
structure, crystallinity, molecular weight, or molecular orientation. Table 1.5 highlights
the mechanical properties of selected biodegradable polymers [18,21,64,65].
Table 1. 5: Mechanical properties of selected biodegradable polymers. (Data obtained from [18,21,64,65]).
Polymers Elastic
Modulus (GPa)
Tensile Strength (MPa)
Ultimate Elongation (%)
PGA (polyglycolide) >6.9 >68.9 15-20
PLLA (semicrystalline) 2.4-4.2 55.2-82.7 5-10
PDLLA (amorphous) 1.4-2.8 27.6-41.4 3-10
PLGA 1.4-2.08 41.4-55.2 3-10
PCL (poly(ε-caprolactone)) 0.21-0.34 20.7-34.5 300-500
Clearly, degradation leads to a loss of mechanical properties and an increase in
crystallinity as a result of content loss. PGA loses mechanical integrity between two and
four weeks while PLA takes many months or even years to lose mechanical integrity in
vitro or in vivo [66,67]. The amorphous regions of semicrystalline polymers are subjected
to degradation earlier than the crystalline regions, leading to an increase in crystallinity.
The heterogeneity index (HI, Mw/Mn), an indicator of molecular weight distribution,
increases upon PLGA degradation, indicating a faster decrease in Mn (number average
molecular weight) in comparison to a decrease in Mw (weight average molecular weight).

33
1.5.1.2. Other Biodegradable Polymers
There are other aliphatic polyesters, such as poly(ε-caprolactone) (PCL), which
has been studied for bone tissue engineering applications [68 ]. PCL degrades at a
significantly slower rate than PLA, PGA, and PLGA [69-71]. A slow degradation rate
makes PCL less attractive for general tissue engineering applications, but more attractive
for long-term implants and controlled drug release applications. PCL-based copolymers
have recently been synthesized to improve degradation properties [72]. Poly(propylene
fumarate) (PPF) is also an important synthetic biodegradable polymer and can degrade
through hydrolysis of the ester bonds similar to glycolide and lactide polymers [73]. The
mechanical properties of PPF can vary greatly depending on the synthesis method and the
cross-linking agents used [74].
Naturally derived polymers, such as collagen, have also been used for bone
regeneration [75-77]. Collagen is a fibrous protein and a major natural extracellular
matrix component. On the one hand, collagen (as the most popular natural polymer for
tissue regeneration by far) has very attractive biological properties (such as
biocompatibility) desirable for bone regeneration; on the other hand, there are concerns
over collagen because of poor handling and poor mechanical properties to support bone
loading requirements. Denatured collagen (gelatin) has also been processed into porous
materials for bone tissue repair [78 - 80 ]. To increase the strength of these natural
materials, they are often combined with ceramics [81].

34
1.5.2. Bioceramics
The main advantage of using ceramics lies in their high cytocompatibility with
bone cells. For orthopedic applications, alumina, zirconia, titania, and calcium
phosphates (such as calcium tetraphosphate (Ca4P2O9), tricalcium phosphate (TCP,
Ca3(PO4)2), hydroxyapatite (HA, Ca10(PO4)6(OH)2) and its derivatives, as well as their
combinations) are the most common types of bioceramics that have been used to
facilitate bone tissue regeneration [82,83]. These ceramics are widely considered to be
osteoconductive because their surface properties support osteoblast adhesion, growth, and
differentiation and are also reported to be osteoinductive as a result of their capacity to
bind and concentrate bone morphogenetic proteins (BMPs) in vivo [84]. Moreover,
selected ceramics, such as HA and TCP, can react with physiological fluids and form
tenacious bonds to hard and soft tissues through cellular activity, thus, classifying them
as “bioactive” [ 85 , 86 ]. In this dissertation, titania and calcium phosphate-based
bioceramics were chosen as model ceramics. Therefore, their structure, properties, and
medical applications will be discussed in the following sections.
1.5.2.1. Titania
1.5.2.1.1. Crystal Structure of Titania
Titania, also called titanium dioxide, has four possible phases: amorphous, the
metastable crystalline forms of brookite and anatase, and the high temperature stable
phase rutile. The control of titania crystal structure is important because each of the four
possible phases possesses vastly different properties. Both anatase and rutile crystallize in
the tetragonal system and are produced commercially, while brookite in the rhombic

35
system is rare, difficult to produce, and has no technological importance identified so far.
Transformation from amorphous to anatase requires sintering temperatures near 300 ºC.
Above 700 °C, the monotropic conversion of anatase to rutile takes place rapidly.
Therefore, rutile is the most thermally stable although anatase is also stable over long
time periods below its phase transformation temperature.
However, when manufacturing temperatures are high (such as above 1000 °C),
the oxygen partial pressure increases continuously as oxygen is liberated and
consequently lower oxides of titanium (such as TiO) can be formed. This is accompanied
by changes in color and electrical conductivity. Above 400 °C, a significant yellow color
develops, caused by thermal expansion of the lattice; this is reversible.
In all three titania crystal structures, one titanium atom in the lattice is surrounded
octahedrally by six oxygen atoms, while each oxygen atom is surrounded by three
titanium atoms in a trigonal arrangement. The three structures correspond to different
manners of linking the octahedral at their corners and edges, as shown in Figure 1.8
[87,88]. In rutile, the structure is based on octahedrons of titanium oxide which shares
two edges of the octahedron with other octahedrons and forms chains. It is the chains
themselves which are arranged into a four-fold symmetry. In anatase, the octahedrons
share four edges hence the four fold axis. Rutile has the most compact atomic structure
and, thus, has the highest density and hardness.

36
Figure 1. 8: Crystallographic unit cell of the three phases of titania. Green (light) balls represent titanium cations while red (dark) balls represent oxygen anions. (Adapted and redrawn from [87,88]).
1.5.2.1.2. Chemical, Physical, Mechanical and Thermal Properties of Titania
Both the anatase and rutile phase of titania are chemically very stable and resist
various atmospheric contaminants (such as sulfur dioxide, carbon dioxide, and hydrogen
sulfide). Under normal conditions, they are not readily reduced, oxidized, or attacked by
most inorganic and organic reagents. Titania dissolves slightly in bases, hydrofluoric acid,
and hot concentrated sulfuric acid. Therefore, titania is stable and nontoxic, making it
medically preferred due to its chemical inertness [89].
Physical and mechanical properties of anatase and rutile are summarized in Table
1.6 [90,91]. The temperature for which these values are valid is room temperature.
Anatase Rutile Brookite
Ti
O

37
Table 1. 6: Typical physical and mechanical properties of titania. (Data obtained from [90,91]) Properties Anatase Rutile
Crystal System Tetragonal Tetragonal
Lattice Constants
a (nm) 0.3785 0.4593
c (nm) 0.9514 0.2959
Theoretical Density (kg/m3) 3.89×10³ 4.26×10³
Melting Point (°C) Convert to rutile 1830-1850
Boiling Point (°C) Convert to rutile 2500
Hardness, Mohs Scale 5.5-6 7-7.5
Vickers Hardness (GPa) N/A 7-11
Poisson’s Ratio N/A 0.27
Young’s Modulus (GPa) N/A 283
Shear Modulus (GPa) N/A 90
Modulus of Rupture (MPa) N/A 140
Transverse Rupture Strength (MPa) N/A 69-103
Compressive Strength (MPa) N/A 680
Fracture Toughness, KIC (MPa·m0.5) N/A 2.5
Thermal Expansion (K-1) N/A 9.4 ×10⁻⁶
Thermal Conductivity (W·m-1·K-1) N/A 11.7
1.5.2.1.3. Surface Properties of Titania
Usually, the surface of titania is saturated by coordinatively bonded water, which
then forms hydroxyl ions. Depending on the type of bonding of the hydroxyl groups to
titanium, these groups possess acidic or basic character. The surface of titania is, thus,
always polar. The surface covering of hydroxyl groups has a decisive influence on
dispersibility of titania particles because adsorbed water vapor promotes the sticking of

38
powders to surfaces and agglomeration of powders. Heating above the boiling point of
water is required to remove the adsorbed water completely.
1.5.2.1.4. Medical Applications of Titania
Oxidized layers (mainly titania) spontaneously form on traditional titanium
orthopedic implant surfaces when exposed to air, water or other media (except under
certain artificial conditions like ultra-high vacuum). Titania on the surface improves the
stability (corrosion resistance) and biocompatibility of implants and is often used as
coatings on implants. For example, the bioactivity of a titania coating can be easily
improved by inducing deposition of apatite in Kokubo’s simulated body fluid (SBF) [92].
The enhanced bioactivity of both titania and titania with grown apatite is attributed to
both the epitaxial effect and the abundant Ti-OH group on their surfaces [92]. Selective
adsorption of vitronectin (a protein known to mediate osteoblast adhesion) to titania
surfaces was observed to be more than on an unoxidized titanium sufaces [ 93 ].
Anodization of titanium implants to create titania also improved osteoblast adhesion
leading to more new bone formation around the implant [94].
Moreover, it has been reported that (i) titania coated implants enhance osteoblast-
like cell proliferation and alkaline phosphatase activity in vitro as compared to uncoated
pure titanium implants and (ii) a sol-gel derived titania coating stimulated the immediate
contact with connective tissue in vivo whereas the titanium controls formed a gap and an
extensive fibrous capsule at the implant-tissue interface [95,96]. It has also been reported
that osteoblast adhesion increased with increasing crystallinity, while differentiation was

39
stimulated more on anatase than on rutile [97]. Very few studies, however, have been
conducted on titania as a component of biocomposites for orthopedic applications.
1.5.2.2. Calcium Phosphates
Calcium phosphate-based bioceramics have received great attention as bone
substitutes due to their chemical similarity to natural bone, their bioactivity and
promising applications for less invasive orthopedic surgeries [ 98 ]. Importantly, the
stability, reactivity, degradability, mechanical properties and biological properties of
calcium phosphates depend to a great extent on their ratios of calcium (Ca) to
phosphorous (P) [99-102]. The Ca/P ratios of calcium phosphates in bulk or in coatings
vary according to which of the following phases are present: alpha and beta-tricalcium
phosphate (TCP, β-Ca3(PO4)2), tetracalcium phosphate, octacalcium phosphate, and
hydroxyapatite (HA or Ca10(PO4)6(OH)2). Among these phases, pure crystalline HA is
known to be the most stable and strongest phase [103]. HA is one of the most used
calcium phosphates in the fabrication of orthopedic implants.
1.5.2.2.1. Crystal Structure of Hydroxyapatite
The crystal structure of HA is hexagonal rhombic with lattice constants of
a=0.942 nm and c=0.688 nm, as shown in Figure 1.9 [104-107]. This unit cell can be
arranged along a preferred orientation due to its hexagonal symmetry, which contributes
to the anisotropic properties of natural bone. The ideal Ca/P molar ratio in stoichiometric
HA is 1/0.6 ≈ 1.67. However, no biological HA shows a stoichiometric Ca/P ratio. For
example, in bone and dental enamel, the crystallinity of HA is low and natural HA is

40
often doped with other ions, such as K+, Na+, Mg2+, and Zn2+, substituting for the Ca2+
ions [108]. HA has the ability to accept compositional variations through exchange of
ions in its three sub-lattices, as shown in Figure 1.10. Therefore, HA can be modified and
developed in response to the requirements of specific applications.
Figure 1. 9: Crystal structure of hydroxyapatite (HA) projected onto the (0001) plane (Hexagonal, a=0.942 nm and c=0.688 nm). (Adapted and redrawn from [107]).
The crystallinity of HA has a remarkable physiological meaning for skeletal
systems. The more crystalline the HA becomes, the more difficult ions interchange and
bone grows [109]. The less crystalline HA allows faster bone growth because its non-
stoichiometric structure can store necessary elements through substitution. These
elements facilitate bone regeneration carried out by osteoblasts. It has been reported that
HA doped with zinc and magnesium promoted responses of osteoblasts and, in
consequence, new bone formation [110].
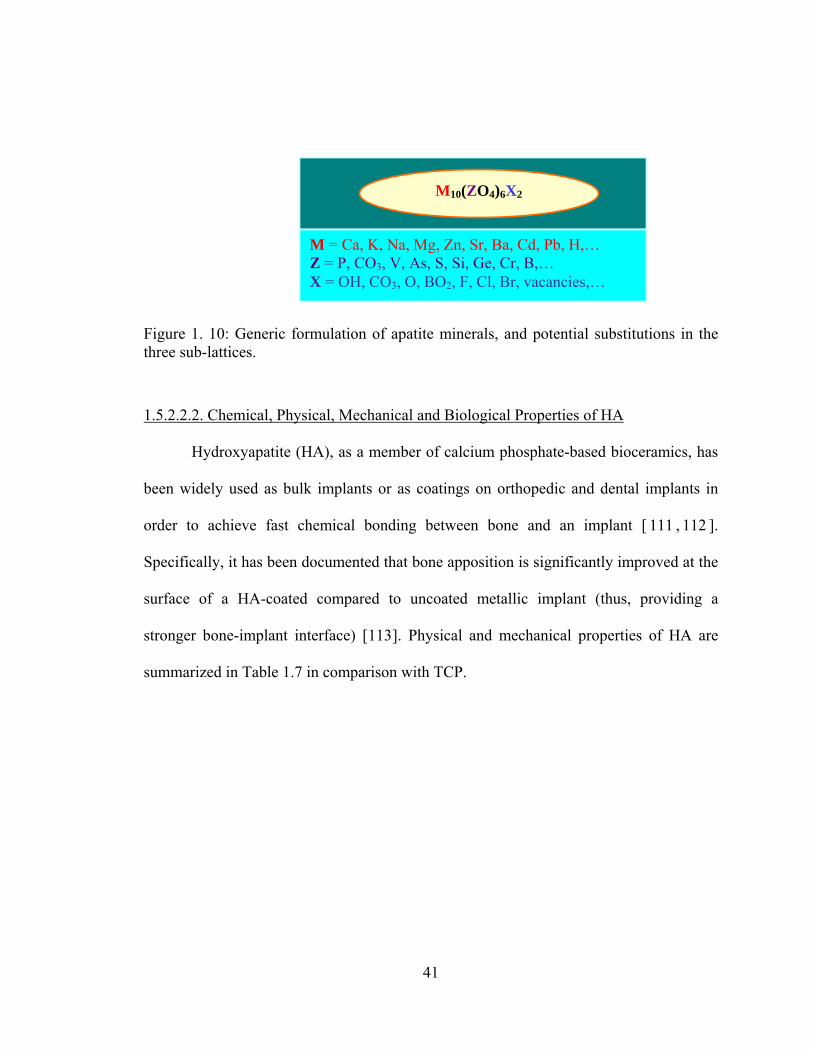
41
Figure 1. 10: Generic formulation of apatite minerals, and potential substitutions in the three sub-lattices.
1.5.2.2.2. Chemical, Physical, Mechanical and Biological Properties of HA
Hydroxyapatite (HA), as a member of calcium phosphate-based bioceramics, has
been widely used as bulk implants or as coatings on orthopedic and dental implants in
order to achieve fast chemical bonding between bone and an implant [ 111 , 112 ].
Specifically, it has been documented that bone apposition is significantly improved at the
surface of a HA-coated compared to uncoated metallic implant (thus, providing a
stronger bone-implant interface) [113]. Physical and mechanical properties of HA are
summarized in Table 1.7 in comparison with TCP.
M10(ZO4)6X2
M = Ca, K, Na, Mg, Zn, Sr, Ba, Cd, Pb, H,… Z = P, CO3, V, As, S, Si, Ge, Cr, B,… X = OH, CO3, O, BO2, F, Cl, Br, vacancies,…
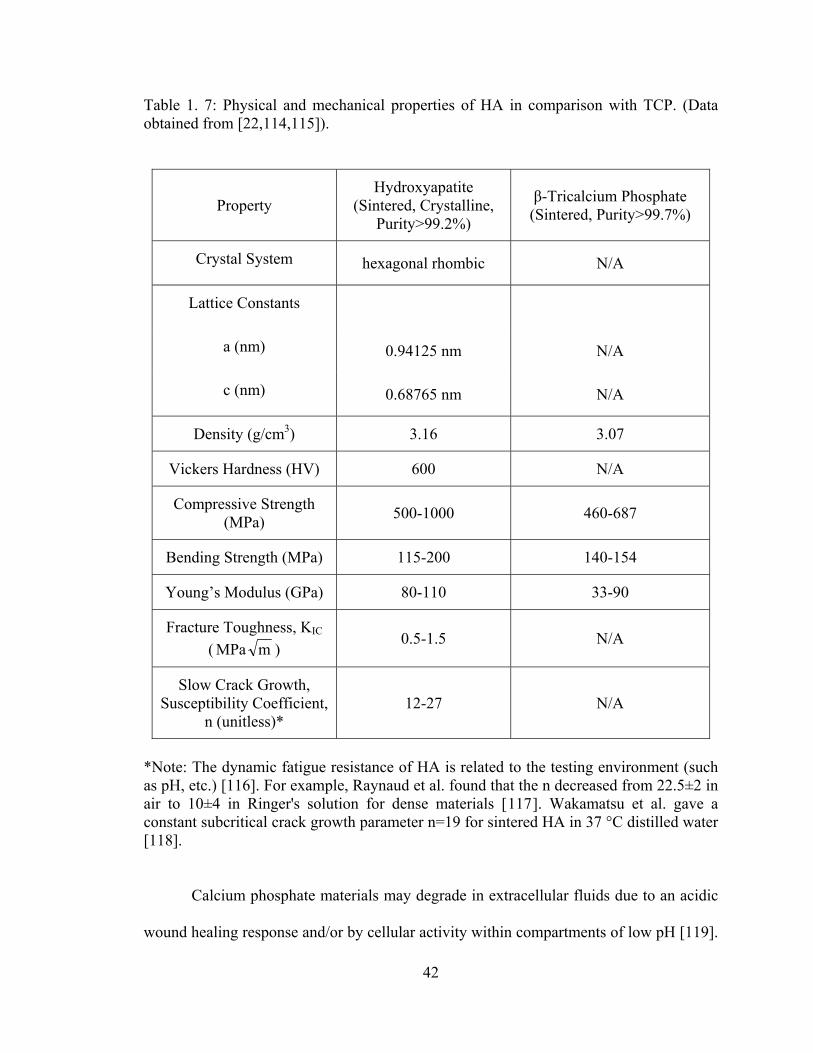
42
Table 1. 7: Physical and mechanical properties of HA in comparison with TCP. (Data obtained from [22,114,115]).
Property Hydroxyapatite
(Sintered, Crystalline, Purity>99.2%)
β-Tricalcium Phosphate (Sintered, Purity>99.7%)
Crystal System hexagonal rhombic N/A
Lattice Constants
a (nm) 0.94125 nm N/A
c (nm) 0.68765 nm N/A
Density (g/cm3) 3.16 3.07
Vickers Hardness (HV) 600 N/A
Compressive Strength (MPa) 500-1000 460-687
Bending Strength (MPa) 115-200 140-154
Young’s Modulus (GPa) 80-110 33-90
Fracture Toughness, KIC ( mMPa )
0.5-1.5 N/A
Slow Crack Growth, Susceptibility Coefficient,
n (unitless)* 12-27 N/A
*Note: The dynamic fatigue resistance of HA is related to the testing environment (such as pH, etc.) [116]. For example, Raynaud et al. found that the n decreased from 22.5±2 in air to 10±4 in Ringer's solution for dense materials [117]. Wakamatsu et al. gave a constant subcritical crack growth parameter n=19 for sintered HA in 37 °C distilled water [118].
Calcium phosphate materials may degrade in extracellular fluids due to an acidic
wound healing response and/or by cellular activity within compartments of low pH [119].

43
As mentioned, the long term stability of calcium phosphate derived materials depends to
a great extent on their Ca/P ratios. The lower the Ca/P ratio is, the larger are the acidity
and solubility of calcium phosphates. For Ca/P<1, both acidity and solubility are
extremely high; both parameters decrease substantially for Ca/P ratios close to 1.67
(stoichiometric HA) [120]. Moreover, less crystalline phases of calcium phosphates (such
as TCP) degrade much faster than the crystalline phase HA [121]. In addition, the
dopents found naturally in HA dramatically change its properties. It is known that the
bone regeneration rate depends on presence of certain elements that are released during
the resorption of calcium phosphates, besides several other factors such as porosity,
composition, and solubility of materials. For instance, small amounts of strontium, zinc
or silicates stimulate the action of osteoblasts [109].
In addition to intentionally designing calcium phosphate materials to be more
biodegradable or more stable, there are several unintentional cases that may lead to a lack
of purity in the produced HA phase. For example, many coating processes lead to bulk or
localized Ca/P ratios that can deviate from the standard HA stoichiometric value of 1.67.
Calcium oxide (CaO) can be induced from either thermal decomposition [122] or from
intentional additions for improving thermal stability [123]. Tricalcium phosphate is
another common product of thermal decomposition that may occur during HA coating
processes.
The main advantages of using bioceramics in orthopedic applications include high
cytocompatibility with bone cells and possibly biodegradability leading to bone ingrowth.
However, when used alone as a single phase material, they are inherently brittle, difficult
to process into complex shapes and can not match the mechanical properties of true bone.

44
For example, the fracture toughness of HA (0.5-1.5 mMPa ) is much lower than that of
the cortical bone (2-12 mMPa ) [ 124 - 126 ]. Therefore, bioceramics should be
considered as major components of biocomposites for bone regeneration.
1.5.3. Bio-inspired Ceramic/Polymer Composites
Ceramic/polymer composites have been considered as the third-generation
orthopedic biomaterials due to their closer-matched properties with natural bone
compared to first (metals or metal alloys) and second generation (ceramics) bone
substitute materials [98]. The design of ceramic/polymer composites offers an
exceptional approach to combine the advantages of bioactive, strong ceramics and
biodegradable, flexible polymers to optimize physical, mechanical, and biological
properties of scaffolds for bone regeneration. In the past few years, the development of
ceramic/polymer composites as orthopedic materials has attracted more and more
attention [49,127,128].
First, in ceramic/polymer composites, osteoblast functions can be enhanced from
better cell seeding and growth environments due to improved osteoconductivity
properties provided by the bioactive ceramic phase [129-133]. For example, Ma et al.
prepared highly porous PLA/HA composite scaffolds with a thermal-induced phase
separation technique and demonstrated that osteoblast survival percentages and
proliferation rates in the PLA/HA scaffolds were higher than in the pure PLA scaffolds
[133].

45
Second, ceramic particles (such as Bioglass®, HA and TCP) used as inclusions in
biodegradable polyesters can provide a pH buffering effect at the polymer surface and
tailor the desired degradation and resorption kinetics of the polymer matrix; thus,
preventing acceleration of polymer degradation, avoiding the formation of an unfavorable
environment for cells, and reducing side-effects (such as inflammation) from acidic
degradation by-products [49].
Third, the stiffer particulate ceramic phase in polymer composites is important for
improving mechanical properties of implants [134-137]. Specifically, Thomson et al.
demonstrated that the compressive yield strength increased from 0.95 ± 0.11 MPa for
PLGA foams to 2.82 ± 0.63 MPa for foams with PLGA/HA fiber weight ratios of 7/6
[128]. Moreover, Marra et al. reported that the Young’s modulus increased from 2.5 ±0.7
MPa to 12.5 ±3.2 MPa when 10 wt. % HA was incorporated into a PCL/PLGA blend
with a weight ratio of 10/90 [130]. Wei et al. have also demonstrated that the
compressive modulus of HA/PLA scaffolds increased with HA content [6]. Specifically,
the modulus increased from 4.3 MPa for the plain PLA scaffolds to 8.3 MPa when the
weight ratio of HA to PLA was 50/50 [6].
Most importantly, ceramic/polymer composites can be formulated to mimic many
aspects of natural bone. As mentioned, natural bone is a nanostructured composite
composed of a polymer matrix (mainly collagen) reinforced with nanometer-sized
ceramic particles (mainly carbonated HA). Recent research in this field suggests that
better osteoconductivity would be achieved if synthetic materials were fabricated to
resemble bone in terms of its microstructure [ 138 , 139 ]. For example, Du et al.
synthesized HA/collagen composites with a porous microstructure similar to bone and

46
these materials promoted the deposition of a new bone matrix. Furthermore, they showed
that osteoblasts within this biologically-inspired composite eventually acquired a three-
dimensional polygonal shape that integrated with juxtaposed bone fragments [138,139].
Therefore, it is clear that one approach for the design of next generation orthopedic
prostheses is to further closely mimic bone from the structural perspective.
1.6. Nanostructured Biocomposites as Next-Generation Orthopedic Materials
It has been reported that the response of host organisms (including at the protein
and cellular level) to nanomaterials is different than that to conventional (micron-scale)
materials and the remarkable recognition capabilities of cells and biomolecules when
combined with the unique properties of nanomaterials can lead to novel tissue substitutes
and controlled drug delivery systems with significantly improved performances [140].
Nanomaterials typically have basic structural units less than 100 nm in at least one
dimension and for that reason, have significantly improved mechanical, electrical
magnetic, catalytic, optical and biological properties compared to conventional
formulations of the same materials [ 141 - 144 ]. Although nanomaterials have
revolutionized numerous other fields, the question has been raised concerning how the
nanomaterials can benefit orthopedic medicine. Therefore, it is important to elucidate the
promise that nanostructured biocomposites can bring into the field of bone regeneration.
47
1.6.1. Desirable Cell Interactions with Nanocomposites
The rationale for the growing impact of nanotechnology in medicine is that
biological systems are inherently composed of nanoscale building blocks and
pathophysiological processes always involve interactions at the molecular or cellular
level.
In orthopedics, particularly, the dependence of osteoblast adhesion on
nanomaterials was first reported in 1999 [145]. Specifically, alumina with grain sizes
between 49 and 67 nm and titania with grain sizes between 32 and 56 nm promoted
osteoblast adhesion compared to their respective micron-grained materials. Further
investigations of these nanoceramics (alumina, titania, hydroxyapatite) demonstrated that
in vitro osteoblast proliferation and long term functions (as measured by intracellular and
extracellular matrix protein synthesis such as collagen and alkaline phosphatase, and
calcium-containing mineral deposition) were enhanced on ceramics with grain sizes less
than 100 nm [146]. In addition to osteoblast functions, enhanced osteoclast (bone-
resorbing cell) functions were also observed on nanophase ceramics compared to
conventional ceramics. For example, osteoclast synthesis of tartrate-resistant acid
phosphatase (TRAP) and subsequent formation of resorption pits were up to two times
greater on nanophase HA compared to conventional HA [147]. Coordinated functions of
osteoblasts and osteoclasts are critical for the formation and maintenance of healthy new
bone [148]. Therefore, the results of promoted functions of osteoblasts coupled with
greater functions of osteoclasts could ensure healthy remodeling of juxtaposed bone
formed at the surfaces of nanophase ceramics. Moreover, decreased functions of
competitive cells, such as fibroblasts (cells that contribute to fibrous encapsulation and

48
callus formation events that may lead to implant loosening and subsequent failure), were
observed on nanophase ceramics compared to conventional ceramics [149]. Specifically,
the ratio of osteoblast to fibroblast adhesion increased from 1:1 on conventional alumina
to 3:1 on nanophase alumina [149]. In fact, decreasing alumina grain size from 167 to 24
nm increased osteoblast adhesion 51% and at the same time decreased fibroblast adhesion
235% after 4 hours [145].
Nanophase ceramics have demonstrated desirable interactions with the select cells.
As mentioned, however, ceramics are inherently brittle, difficult to process into complex
shapes required for orthopedic applications and can not match the mechanical properties
of true bone for load-bearing when they are used alone, because natural bone is
composed of both malleable organic components (mainly type I collagen) and stiff
inorganic components (HA). Nanophase ceramic/polymer composites combine the
advantages of strong, bioactive ceramics and flexible, biodegradable polymers to
optimize their physicochemical, biological and mechanical properties for bone
regeneration. Moreover, nanophase ceramics in polymer composites can mimic the
nanostructure and associated properties of bone and can potentially be combined with
bone morphogenetic proteins (BMPs) to further control new bone growth.
Previous studies have also determined bone cell functions on nanophase
ceramic/polymer composites with various ceramic/polymer ratios [150,151]. Specifically,
composites of PLGA combined separately with 30 wt.% nanophase alumina, titania and
HA showed the greatest osteoblast responses [150]. Moreover, up to three times more
osteoblasts adhered to PLGA composites when 30 wt.% nanophase titania was
incorporated compared to 30 wt.% conventional titania. Fibroblasts, as competitive cells

49
to osteoblasts, also deserve some attention. As mentioned, fibroblast functions decreased
on nanophase compared to conventional ceramics (alumina, titania and HA), as well as
on PLGA with nanoscale surface features compared to conventional PLGA [149,152].
1.6.2. Rationale for Cell Interactions with Nanomaterials
From these studies concerning the degree to which the select cells interact with
nanomaterials, it is important to further understand the mechanisms as to why
nanomaterials demonstrate unique biological properties.
1.6.2.1. Natural Tissue is Nanostructured
One straightforward explanation lies in the fact that natural tissues and associated
extracellular matrices are composed of nanostructured materials. Natural bone is a good
example of a nanostructured composite material. There are three scale levels of
hierarchical structures in bone: (i) the nanostructure (a few nanometers to a few hundred
nanometers), including non-collageneous organic proteins, fibrillar collagen and
embedded mineral (HA) crystals; (ii) the microstructure (from 1 to 500 micrometers),
including lamellae, osteons and Haversian systems; and (iii) the macrostructure,
including cancellous and cortical bone [137]. These three levels of oriented structures
assemble into heterogeneous and anisotropic bone, as shown in Figure 1.11.
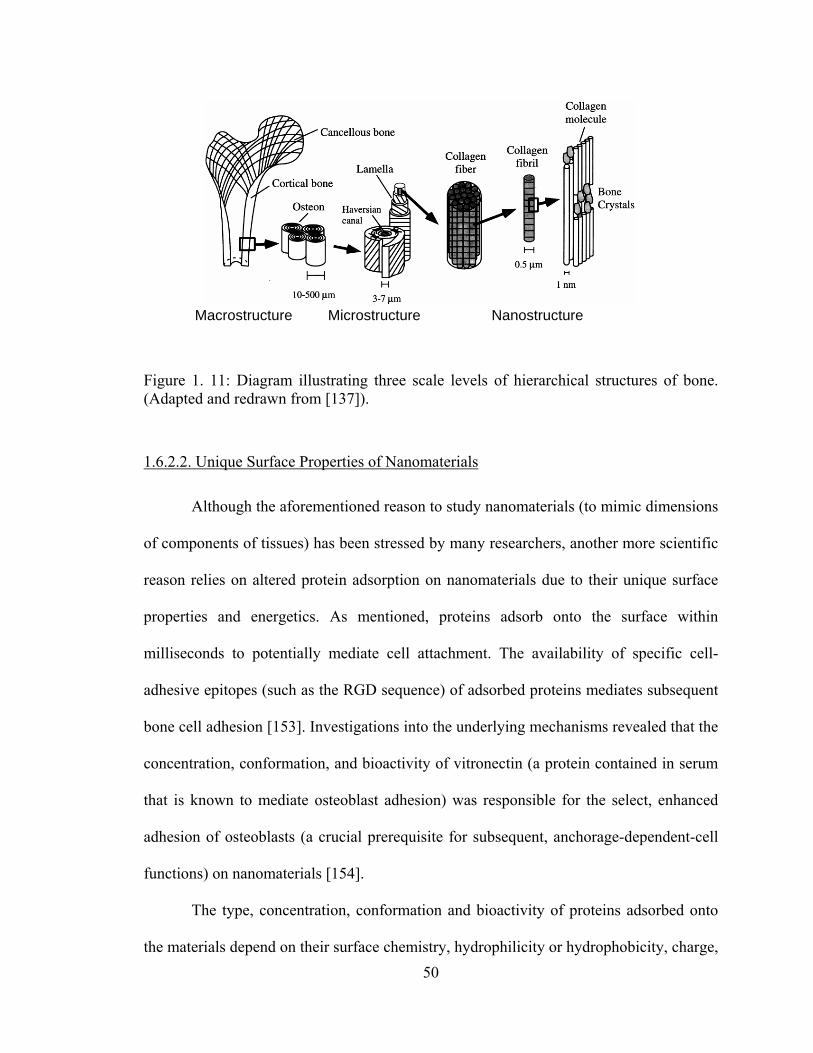
50
Figure 1. 11: Diagram illustrating three scale levels of hierarchical structures of bone. (Adapted and redrawn from [137]).
1.6.2.2. Unique Surface Properties of Nanomaterials
Although the aforementioned reason to study nanomaterials (to mimic dimensions
of components of tissues) has been stressed by many researchers, another more scientific
reason relies on altered protein adsorption on nanomaterials due to their unique surface
properties and energetics. As mentioned, proteins adsorb onto the surface within
milliseconds to potentially mediate cell attachment. The availability of specific cell-
adhesive epitopes (such as the RGD sequence) of adsorbed proteins mediates subsequent
bone cell adhesion [153]. Investigations into the underlying mechanisms revealed that the
concentration, conformation, and bioactivity of vitronectin (a protein contained in serum
that is known to mediate osteoblast adhesion) was responsible for the select, enhanced
adhesion of osteoblasts (a crucial prerequisite for subsequent, anchorage-dependent-cell
functions) on nanomaterials [154].
The type, concentration, conformation and bioactivity of proteins adsorbed onto
the materials depend on their surface chemistry, hydrophilicity or hydrophobicity, charge,
Macrostructure Microstructure Nanostructure

51
topography, roughness, and energetics [155-159]. Nanomaterials have higher surface
areas, higher surface roughness, higher portions of surface defects (edge/corner sites and
grain boundaries) resulting from both decreased grain size and decreased diameter of
surface pores. Moreover, nanophase ceramics possess enhanced surface wettability due to
greater surface roughness and greater numbers of grain boundaries on their surfaces. All
these unusual properties affect their interactions with proteins since all proteins are
nanoscale entities. For example, vitronectin has a linear structure 15 nm in length and is
preferentially adsorbed to the small defects (pores) on the nanomaterials, such as 0.98 nm
pores present on nanophase titania compacts [154].
Moreover, increased surface areas and nanoscale surface features on
nanomaterials can expose more available sites for proteins to interact with and, thus, alter
the amount of protein adhesion as well as protein conformation that are crucial for
subsequent cellular interactions. Miller et al. examined fibronectin interactions with
nanomaterials with various nanoscale surface features under an atomic force microscope
(AFM) and visualized for the first time how proteins respond differently to surface
feature scales [140,160]. Specifically, fibronectin (5 µg/mL) adsorbed to PLGA surface
with 500 nm spherical bumps showed little to no interconnectivity between fibronectin
molecules; fibronectin (5 µg/mL) adsorbed to PLGA surface with 100 nm spherical
bumps showed well-spread fibronectin molecules with a highest degree of
interconnectivity leading to a network masking of the underlying PLGA nanometer
surface features [160].
It has been reported that nanophase ceramics (alumina, titania, HA) significantly
promoted specific protein adsorption (vitronectin and fibronectin) compared to the

52
respective conventional ceramics [161]. Specifically, adsorption of vitronectin was 10%
greater on nanophase compared to conventional alumina [154]. Furthermore, protein
conformation plays a critical role in mediating subsequent cell interactions. Increased
unfolding of vitronectin adsorbed on nanophase ceramics compared to conventional
ceramics was also observed [154]. Vitronectin unfolding further promoted the availability
of specific cell-adhesive epitopes (RGD sequence) for subsequent enhanced osteoblast
adhesion [154]. Moreover, increased protein adsorption was also observed on
nanocomposites, specifically, when nano-HA rather than micron-HA was introduced to
poly(L-lactic acid) (PLLA) [6].
1.6.3. Advantageous Mechanical Properties of Nanocomposites and Rationale
Ceramic/polymer nanocomposites may be synthesized to possess hardness,
bending, compressive and tensile strengths that are higher than conventional composites
but are more similar to physiological bone. Indeed, greater mechanical properties have
been reported for polymer composites with a reduction in ceramic grain size into the
nanometer range [162]. For example, McManus et al. reported that the bending moduli of
composites of PLA with 40 and 50 wt.% nanophase (<100 nm) alumina, titania and HA
were significantly greater than respective composite formulations with conventional
coarser grained ceramics [162]. Specifically, compared to a bending modulus of 60 ±3
MPa for plain PLA and 870 ±30 MPa for conventional titania/PLA composites with a
weight ratio of 50/50, the bending modulus of nanophase titania/PLA composites with a
weight ratio of 50/50 was 1960 ±250 MPa [162].
53
Mechanical deformation theory indicates that as grain size is reduced, high-
volume fraction of interfacial regions compared to bulk materials leads to increased
deformation by grain-boundary sliding and short-range diffusion-healing events, thus,
increased ductility in nanocrystalline ceramics may be observed.
1.7. Hypothesis and Objectives
It has been mentioned previously that traditional bone substitutes (autografts,
allografts, xenografts and metallic implants) do not meet increasing clinical demands as a
result of either limited sources of natural grafts or short implantable lifetimes (10-15
years) of current synthetic implants [163]. Therefore, the long term objective of this study
is to develop a new approach to design and fabricate orthopedic implant systems that heal
damaged bone tissue in a natural and more effective way. This will be accomplished by
combining nanotechnology, tissue engineering and controlled drug delivery into
orthopedic prostheses to closely mimic natural bone in terms of its chemistry, highly
ordered nano-to-macro hierarchical structures and associated physicochemical,
mechanical and nanoscale surface properties (Figure 1.12).
The specific hypothesis behind this proposed research is that the chemistry and
special surface properties (topography, surface area and surface roughness) of
ceramic/polymer nanocomposites as well as bone-like three dimensional (3D) structures
built from the nanocomposites will enhance the initial adhesion, long-term functions and
infiltration of bone cells. The success of such prostheses for bone regeneration can be
further ensured by incorporating bone morphogenetic proteins (BMPs) and controlling
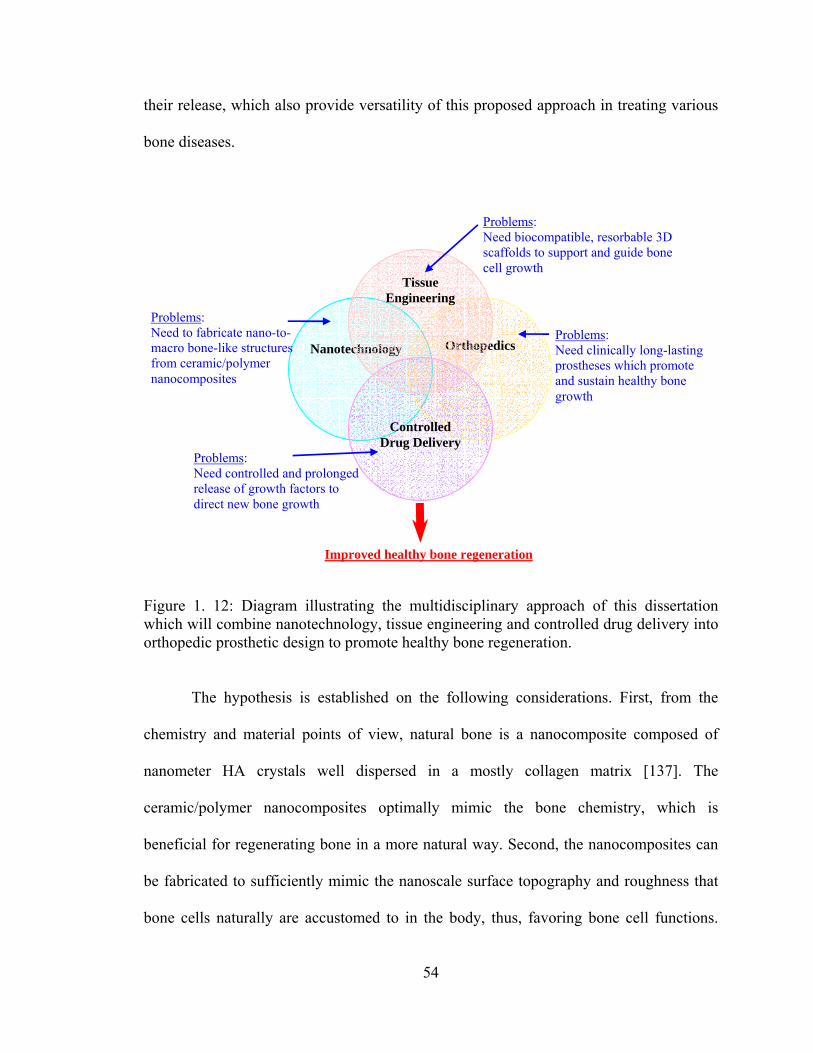
54
their release, which also provide versatility of this proposed approach in treating various
bone diseases.
Figure 1. 12: Diagram illustrating the multidisciplinary approach of this dissertation which will combine nanotechnology, tissue engineering and controlled drug delivery into orthopedic prosthetic design to promote healthy bone regeneration.
The hypothesis is established on the following considerations. First, from the
chemistry and material points of view, natural bone is a nanocomposite composed of
nanometer HA crystals well dispersed in a mostly collagen matrix [137]. The
ceramic/polymer nanocomposites optimally mimic the bone chemistry, which is
beneficial for regenerating bone in a more natural way. Second, the nanocomposites can
be fabricated to sufficiently mimic the nanoscale surface topography and roughness that
bone cells naturally are accustomed to in the body, thus, favoring bone cell functions.
Nanotechnology
Orthopedics
Improved healthy bone regeneration
Problems: Need to fabricate nano-to-macro bone-like structures from ceramic/polymer nanocomposites
Problems: Need clinically long-lasting prostheses which promote and sustain healthy bone growth
Controlled
Drug Delivery
Tissue Engineering
Problems: Need biocompatible, resorbable 3D scaffolds to support and guide bone cell growth
Problems: Need controlled and prolonged release of growth factors to direct new bone growth
55
Third, from the clinical perspective, the main reason for failure of current metallic bone
substitutes lies in a lack of osseointegration (that is, insufficient juxtaposed bone growth
at the bone-implant interface) which leads to early and intermediate loosening of implants
[164-166]. Thus, the interactions of implants with cells, especially osteoblasts and
mesenchymal stem cells, are key considerations for orthopedic implant systems. Fourth,
combining BMPs into the nanocomposites provides an extra control over cell functions
and orientation on the nanocomposites because BMP-2 and BMP-7 (also called
osteogenic protein-1), for example, are growth factors that induce the differentiation of
mesenchymal stem cells and osteoprogenitor cells into osteoblasts [167-168169170];
induce bone tissue formation; influence the bone pattern formation [167-170]; and are
chemotactic for osteoblasts [171] (that is, the characteristic movement or orientation of
osteoblasts in response to a BMP-2 or BMP-7 concentration gradient) [172,173].
Lastly, natural bone assembles its 3D hierachical structure from nanoscale
building blocks. Currently, however, it is a scientific challenge to manipulate nanoscale
structures and integrate them into macro architectures and systems while preserving their
nanoscale structures and components within the fabricated macro-scale assemblies. Novel
3D fabrication techniques are highly needed to assemble such nanomaterial building
blocks to create macro bone-like structures that can be used clinically. For these reasons,
it is believed that the proposed novel aerosol-based 3D printing will accomplish an
important role towards treating damaged bone.
The specific aims of this project are designed to assess cell interactions with 2D
and 3D nanocomposites that have attractive bone-like surface properties and hierarchical
architectures and also to control the delivery of BMPs using such nanocomposites for

56
more effective bone regeneration. These specific aims will be addressed in Chapter 2 (2D
nanocomposites), Chapter 3 (3D nanocomposites), and Chapter 5 (nanocomposites as
controlled drug delivery carriers). In addition to these perspectives, Chapter 4 will
address the nanocomposites in terms of their mechanical properties necessary for
orthopedic applications. Accomplishing these specific aims will provide the foundation to
assess the ability of nanostructured ceramic/polymer composites to promote and direct
bone cell functions to heal and reestablish normal physiological bone function.
57
CHAPTER 2. NANOSTRUCTURED 2D CERAMIC/POLYMER COMPOSITES:
FROM MATERIAL CHARACTERISTICS TO OSTEOBLAST RESPONSES
2.1. Specific Problems and Aims
One of the key factors that influence properties of polymer composite materials is
the dispersion status of ceramics. Even when the chemistry, phase composition, and
crystal structures of the ceramic component are kept the same in a composite material, its
final properties may vary significantly depending on ceramic dispersion (agglomeration).
This is important since considering bone at the nanostructural level, HA crystals are
located specifically in discrete spaces within collagen fibrils and this unique architectural
dispersion and arrangement grant natural bone distinctive biological and mechanical
properties such that no synthetic materials have yet ever fully mimicked [98]. The
dispersion of ceramics in polymers is definitely one of the most important issues for all of
composite engineering. No literature studies, however, have addressed the relationship
between ceramic dispersion in polymer composites and their resulting biological
properties (particularly for orthopedic applications).
Agglomeration significantly increases as ceramic particle sizes decrease into the
nanometer regime and as the percentage of a ceramic phase increases to more than 2 wt%
in a polymer matrix. Therefore, the objective of the studies to be presented in this chapter
was to disperse nanophase ceramics in polymers and compare biological properties of

58
well-dispersed to agglomerated nanocomposites. A 30/70 ceramic/polymer weight ratio
was chosen since previous studies have demonstrated that this ratio is optimal for
osteoblast adhesion [150]. Both nanophase ceramics and single phase polymers were
used as controls.
In this study, PLGA (poly-lactide-co-glycolide) was chosen as the model polymer
since it is biodegradable, widely utilized in tissue engineering applications, and has been
approved by the FDA for certain human clinical applications. Nanophase titania was
utilized as the model ceramic since it is readily formed at the surfaces of the current
widely-used titanium orthopedic implants and has excellent cytocompatibility properties
as shown in previous studies [146]. Sonication was controlled and used at low to high
powers to achieve various dispersion states of nanophase titania in PLGA composites and
to imitate the nano-sized surface features of bone. The resulting surface characteristics
(such as topography, surface area and surface roughness) of the composites were studied
by scanning electron microscopy (SEM) and atomic force microscopy (AFM), and were
compared to natural bone. The objective of the in vitro study was to investigate osteoblast
adhesion and subsequent long-term functions (such as total protein synthesis, total
collagen synthesis, alkaline phosphatase activity and calcium deposition) on nanophase
titania/PLGA composites with nano-dispersion or micron-agglomeration. The
relationship between osteoblast functions and the surface properties of the titania/PLGA
composites were also addressed to aid in understanding cell-material interactions.
Moreover, the degradation behavior of nanophase titania/PLGA composites was
investigated to provide a fundamental guideline for tailoring PLGA degradation kinetics
in the composites, which is necessary for optimizing bone regeneration and drug delivery.

59
2.2. Materials and Methods
2.2.1. Materials Preparation
2.2.1.1. Nanophase Titania/PLGA Composites
PLGA (poly-lactide-co-glycolide) pellets (50/50 wt.% poly(DL-lactide/glycolide);
molecular weight: 100,000-120,000 g/mol; intrinsic viscosity: 66-80 cm3/g;
polydispersity: 1.8; density: 1.34 g/cm3; glass transition temperature Tg: 45-50 °C) were
purchased from Polysciences, Inc. (Warrington, PA).
Nanophase titania powder (Nanotek®) was purchased from Nanophase
Technologies Corporation (Romeoville, IL). The purity of the titania powder was 99.5+%,
the particle size was 32 nm which was calculated from BET adsorption measurements,
the particle morphology was nearly spherical as shown in the TEM image (Figure 2.1),
and the crystalline phase was 80% anatase/20% rutile [174]. Bulk and true density of this
titania powder were 0.25 g/cm3 and 3.96 g/cm3, respectively.
Figure 2. 1: TEM image of nanophase titania powder. Magnification bar is 10 nm.
60
PLGA pellets were dissolved in chloroform (Mallinckrodt Technical) at 40 °C in
a water bath for 40 minutes. Nanophase titania powder was then added to the PLGA
solution to give a 30/70 ceramic/polymer weight ratio.
The composite mixture was sonicated using a W-380 sonicator (Heat System –
Ultrasonics, Inc.) with its tip immersed in the mixture. The output power settings of
sonicator were from 118.75 W to 332.5 W, as shown in Table 2.1. The W-380 sonicator
permits the application of ultrasonic energy to the suspensions on a pulsed basis. In this
study, the pulse width was set at 60% of the duty cycle out of 1 second cycle time. This
intermittent operation permits high intensity sonication while avoiding heat build-up in
the processed suspensions. The temperature of composite mixture was monitored before
and after sonication using a thermometer (VWR) placed 10 mm below the tip of the
ultrasonic horn where the temperature was the highest in the composite mixture, as
shown in Table 2.2.
After sonication, the suspension was cast into a Teflon petri dish (Chemware®, 50
mm diameter ×15 mm height, Cole-Parmer Instrument Company, Vernon Hills, IL)
evaporated in air at room temperature for 24 hours and dried in an air vacuum chamber at
room temperature for 48 hours. The schematic procedure is shown in Figure 2.2. Finally,
the composite films (0.5 mm in thickness) were cut into 1 cm × 1 cm squares for material
characterization and cell functional studies [175].

61
Table 2. 1: Nanophase titania/PLGA composites, controls and references that were studied in this chapter.
Materials Parameters
PLGA Pure PLGA, control
PTC25 PLGA/titania composites sonicated at 118.75 W for 10 minutes
PTC35 PLGA/titania composites sonicated at 166.25 W for 10 minutes
PTC45 PLGA/titania composites sonicated at 213.75 W for 10 minutes
PTC70 PLGA/titania composites sonicated at 332.5 W for 10 minutes
TCG Green titania compacts, control
TCS Sintered titania compacts, control
Glass Etched in 1 N NaOH, reference
Table 2. 2: The temperature of composite suspensions before and after sonication.
Temperature (°C) Samples
Before sonication After 10-minnute sonication
PTC25 25 31
PTC35 25 36
PTC45 25 40
PTC70 25 47

62
Figure 2. 2: The schematic procedures for preparing nanophase titania/PLGA composites using a solvent-casting technique.
2.2.1.2. Control Materials
PLGA films as well as green (non-sintered) and sintered titania compacts were
prepared as described below and were used as control materials.
2.2.1.2.1. PLGA
For polymer films, PLGA pellets were dissolved in chloroform at 40 °C in a water
bath for 40 minutes, cast into a Teflon petri dish, evaporated in air at room temperature
for 24 hours and dried in an air vacuum chamber at room temperature for 48 hours. The

63
films (0.3 mm in thickness) were then cut into 1 cm × 1 cm squares for use in material
characterization and cell experiments.
2.2.1.2.2. Nanophase Titania Compacts
Green titania disks were prepared by dry pressing nanophase titania powders
(obtained as described above) in a tool-steel die via a uniaxial pressing cycle from 0.6 to
3 GPa over a 10 minute period into pellets of 0.8 mm in thickness. The green compacts
were then heated in air at a rate of 10 °C/minute from room temperature to a final
temperature of 600 °C, sintered at 600 °C for 2 hours and were cooled down at the same
rate as the heating rate. These compacts were termed as sintered titania. Previous studies
have demonstrated no grain growth and phase transformation when titania was sintered
under these conditions [146].
2.2.1.3. Reference Materials
Borosilicate glass coverslips (Fisher Scientific; 1 cm in diameter) were used as
reference materials for all of the in vitro experiments according to standard protocols
[175]. The glass coverslips were degreased by soaking in acetone (Mallinckrodt) for 10
minutes, sonicating in acetone (Mallickrodt) for 10 minutes, soaking in 70% enthanol
(AAPER) for 10 minutes, and sonicating in ethanol for 10 minutes. Lastly, the coverslips
were etched in 1 N NaOH for 1 hour at room temperature. For use in in vitro cell
experiments, glass coverslips were then rinsed thoroughly with deionized (DI) water and
dried in an oven at about 65 °C for 1 hour.

64
All the substrates used in the cell experiments were previously summarized in
Table 2.1.
2.2.1.4. Sterilization of Materials
Composite samples and PLGA controls were sterilized by soaking in 70% ethanol
for 30 minutes and were dried completely before performing experiments with cells.
Titania compacts were sterilized by exposing them to UV light for 1 hour on each side.
Glass references were sterilized in a steam autoclave at 120 °C for 30 minutes.
2.2.1.5. Preparation of Bone Slices
Devitalized porcine femurs were dissected in an effort to compare surface
properties of the nanophase titania/PLGA composites sonicated at different powers to
natural bone. For this purpose, the diaphyses of the porcine femurs were purchased from
a supermarket (Wal-Mart) and were cut into slices (1 cm × 1 cm × 1 mm) using a
handsaw. Bone slices were then degreased and ultrasonically cleaned of adhering tissue
and marrow in acetone according to established lab protocols [176]. The outer uncut
surface of bone slices were characterized using a scanning electron microscope (SEM)
and an atomic force microscope (AFM) as described in the next section.

65
2.2.2. Characterization Methods
2.2.2.1. Scanning Electron Microscopy (SEM) and Quantitative Image Analysis
Surface topography of the nanophase titania/PLGA composites (prepared as
described in section 2.2.1) were characterized according to standard scanning electron
microscopy techniques using a JEOL JSM-840 Scanning Electron Microscope at a 5 kV
accelerating voltage and 3×10-11 Amp probe current. Substrates were sputter-coated with
a thin layer of gold-palladium using a Hummer I Sputter Coater (Technics) in a 100
millitorr vacuum argon environment for 3 minutes with 0.01 Amp of current. SEM
images taken at 15 kX magnifications were used to determine differences in the
topography. Quantitative image analysis methods were used to determine titania coverage
on the surface of the nanocomposites [102].
2.2.2.2. Atomic Force Microscopy (AFM) and Characteristic Data Analysis
Atomic force microscopy (AFM) can be used as a powerful tool to gain a better
understanding of the surface of materials on scales from μm to nm or even down to
atomic resolution. AFM produces topographical data by scanning a sharp tip, situated at
the end of a microscopic cantilever, over a surface. The advantage of using AFM for
surface characterization is that the measurements could cover many orders of magnitude
of length scales and acquire three-dimensional data in a digital format which allows
extensive mathematical analyses of the data.
In this study, AFM was used to characterize the three-dimensional surface
features as well as surface roughness and surface area of the materials of interest to the

66
present study. Specifically, height images of each sample were collected according to
established tapping mode techniques using a MultimodeTM SPM (Digital Instruments Inc.,
Santa Barbara, CA). The typical tip (NSC15, Mikromasch) curvature radius of the probe
used in the present study was less than 10 nm. The measurements were conducted in
ambient air using a scan rate of 1 Hz and 256 scanning lines. The scan field of view was
5 μm × 5 μm. The resulting height images were analyzed using Nanoscope imaging
software.
Z values (or heights) were used in calculating the substrate surface area in a 25
μm2 scanned area. The surface area was found using the following equation:
A = l×b (2.1)
where l was the length traveled by the AFM tip over 256 scanning lines and b was
the width of 256 scanned lines.
Root mean square (RMS) surface roughness values (nm) were calculated using
height information from AFM scans captured on an area of 25 μm2. The imaging
software uses the following equation 2.2 to compute surface roughness for a three-
dimensional N×N pixel image:
N
ZZ
R
N
iavei
q
∑=
−
= 1
2)(
(2.2)
where Rq was the rms surface roughness (standard deviation of height), Zave was
the average of the Z values (or heights) within the given scanning area, Zi was the Z value
of current pixel, and N was the number of pixel points within the given area of samples.

67
All surface roughness values and surface area data were collected from five
different 5 μm × 5 μm AFM scan spots. The average RMS surface roughness and surface
area value were calculated.
In addition, height images of each sample were also collected from five different
1 μm × 1 μm AFM scan spots using the same procedures described above. The average
RMS surface roughness and surface area values were calculated based on 1 μm × 1 μm
AFM scans.
2.2.3. In vitro Cytocompatibility Studies
2.2.3.1. Cell Culture
Human osteoblasts (bone-forming cells; CRL-11372 American Type Culture
Collection) were cultured in Dulbecco’s modified Eagle’s medium (DMEM; GIBCO,
Grand Island, NY) supplemented with 10% fetal bovine serum (FBS; Hyclone) and 1%
penicillin/streptomycin (P/S; Hyclone) under standard cell culture conditions, that is, a
sterile, 37 °C, humidified, 5% CO2/95% air environment. Cells at population numbers 6-
9 were used in the experiments without further characterization.
2.2.3.2. Osteoblast Adhesion
Figure 2.3 illustrates the experimental procedures used to determine osteoblast
adhesion on the substrates. All sterilized substrates listed in Table 2.1 were placed in 12-
well tissue culture plates (Corning, New York) and were rinsed three times with sterilized
phosphate buffered saline (PBS; a solution containing 8 g NaCl, 0.2 g KCl, 1.5 g

68
Na2HPO4, and 0.2 g KH2PO4 in a 1000 ml of DI water adjusted to a pH of 7.4; all
chemicals from Sigma).
Figure 2. 3: The schematic diagram of the experimental procedures followed for determining osteoblast adhesion.
Osteoblasts were seeded at a concentration of 2500 cells/cm2 onto the substrates
of interest in 2 ml of DMEM supplemented with 10% FBS and 1% P/S and were then
incubated under standard cell culture conditions for 4 hours. After that time period, non-
adherent cells were removed by rinsing with PBS and adherent cells were then fixed with
formaldehyde (Fisher Scientific, Pittsburgh, PA) and stained with Hoechst 33258 dye
(Sigma); the cell nuclei were, thus, visualized and counted under a fluorescence
microscope (Leica, excitation wavelength 365 nm and emission wavelength 400 nm).

69
Cell counts were expressed as the average number of cells on eight random fields per
substrate.
All experiments were run in triplicate and repeated at three separate times. Cell
adhesion was evaluated based on the mean number of adherent cells.
2.2.3.3. Osteoblast Morphologies
Osteoblast morphologies on the composites and the controls were observed using
a JEOL JSM-840 Scanning Electron Microscope. For this purpose, after the 4 hour
adhesion test, adherent osteoblasts on the substrates were fixed with 2 % glutaraldehyde
(Electron Microscopy Sciences) in 0.1 M cacodylate (pH 7.4; Electron Microscopy
Sciences) for 30 minutes at 4 °C. After washing with cacodylate buffer, the cells were
secondarily fixed with 1 % osmium tetraoxide (Electron Microscopy Sciences) in 0.1 M
cacodylate (pH 7.4) for 30 minutes at 4 °C. The cells were dehydrated through a series of
ethanol solutions (from 30, 50, 70, 90, to 100 %; AAPER) and were finally dried by
critical point drying (CPD; LADD Research Industries). Specifically, the specimens were
immersed in liquid CO2 until there was a complete exchange of liquid CO2 for the
ethanol in the specimens. The specimens were then heated above 34 °C under 7.6 MPa
where all liquid CO2 was converted to gaseous CO2 and the specimens were dry. Before
imaging, all the specimens were sputter-coated with a thin layer of gold-palladium using
a Hummer I Sputter Coater (Technics) in a 100 millitorr vacuum argon environment for 3
minutes with 0.01 Amp of current. Cell morphologies were imaged using a 5 kV
accelerating voltage, and a 3×10-11 Amp probe current. Magnifications varied according
to the distribution of cells on the substrates.

70
2.2.3.4. Osteoblast Long-term Functions
Osteoblasts were seeded at a density of 100,000 cells/cm2 onto the substrates of
interest and were cultured in DMEM supplemented with 10% FBS, 1% P/S, 50 μg/ml L-
ascorbic acid (Sigma) and 10 mM β–glycerophosphate (Sigma) under standard cell
culture conditions for 7, 14, and 21 days. Cell culture media was changed every other day
during the osteoblast long-term function experiments. At the end of the prescribed time
periods, the substrates were first rinsed three times with 50 mM Tris-buffered saline
(TBS; a solution consisting of 8.77 g NaCl, 6.61g Tris-HCl, and 0.97 g Tris Base in a
1000 ml of DI water adjusted to a pH of 7.4; all chemicals from Sigma). Then, the
osteoblasts were lysed using distilled water and three freeze-thaw cycles to determine
total protein content, total collagen content and alkaline phosphatase activity in the
supernatant according to standard protocols as described below.
2.2.3.4.1. Total Protein Content
Total protein content in the cell lysates was determined using a commercial
Coomassie PlusTM --- The Better Bradford Assay Kit (Pierce Biotechnology, Inc.)
following manufacturer’s instructions. For this purpose, aliquots of each protein-
containing, distilled water supernatant of cell lysates were mixed with a Coomassie
PlusTM Reagent in a 96-well microplate and incubated for 10 minutes at room
temperature. Light absorbance of these samples was measured at 595 nm on a
spectrophotometer (Spectra MAX 190; Molecular Devices). Total intracellular protein
synthesized by osteoblasts cultured on the substrates of interest to the present study was
determined from a standard curve of absorbance versus known concentrations of albumin

71
run in parallel with experimental samples. The total intracellular proteins synthesized by
osteoblasts were normalized by substrate surface area and expressed as μg/cm2. All
experiments were run in triplicate and repeated at three separate times.
2.2.3.4.2. Total Collagen Content
Cell lysates were prepared as described above. Collagen is main organic
component of bone. To test this, aliquots of the distilled water supernatant were dried
onto a 96-well microplate through incubating at 37 °C for i) 16 hours and for ii) 24 hours
in the presence of a desiccant (W.A. Hamond Drierite Company). Thereafter, the
microplate was rinsed three times with distilled water, 1 minute per wash and 200 μL per
well. Then 100 μL of a 0.1% Sirius Red stain (Sirius Red powder in picric acid; Sigma)
was dispensed into each well and incubated for 1 hour at room temperature. After that,
the microplate was washed five times with 200 μL of 0.01 M HCl (Mallinckrodt
Technical) for 10 seconds per wash to remove the unbound stain. The collagen bound
stain was then washed with 200 μL of 0.1 M NaOH for 5 minutes for desorption. The
eluted stain was then mixed several times into a multichannel pipette and was placed into
a second microplate. Finally, absorbance was read at 540 nm in a spectrophotometer
(Spectra MAX 190; Molecular Devices). A standard curve was plotted as known
concentrations of collagen run parallel with experimental samples versus absorbance at
540 nm and the collagen content of the samples were calculated from this curve. Total
collagen content was normalized by substrate area and expressed as mg/cm2.

72
2.2.3.4.3. Alkaline Phosphatase Activity
Alkaline phosphatase is an enzyme whose production signifies increased
osteoblast differentiation to calcium depositing cells [177]. An Alkaline Phosphatase
Assay Kit, a commercial kit from Upstate Cell Signaling Solutions, was used to assay
alkaline phosphatase activity in the cell lysates prepared as described above. For this
purpose, aliquots of the distilled water supernatants of cell lysates were mixed with 5 μL
NiCl2, 5 μL BSA, 5 μL phosphopeptide solution in the wells of a microplate. Then, the
reaction was incubated for 15 minutes at 37 °C. Alkaline phosphatase activity was
detected by the addition of 100 μl Malachite Green solution. The assay was read with
blank and standards by a spectrophotometer (Spectra MAX 190; Molecular Devices) at
650 nm. Alkaline phosphatase activity was calculated by comparing absorbance values to
a standard curve of absorbance versus known concentrations of potassium phosphate
monobasic run in parallel with experimental samples. One unit of activity was equivalent
to 1 nmol p-Nitrophenyl phosphate (pNPP) hydrolyzed per minute. The activity was
normalized by substrate area and expressed as nanomoles of converted pNPP/min/cm2.
2.2.3.4.4. Quantification of Calcium Deposition
Lastly, the ultimate indicator of osteoblast differentiation (calcium deposition)
was determined in this study. For this purpose, after the cells were lysed and removed,
the substrates of interest (and remaining calcium-containing mineral deposited on them)
were treated with 0.6 N HCl (Mallinckrodt Technical) at 37 °C overnight. After the
prescribed time period, the amount of calcium present in the acidic supernatant was
quantified using a commercially available kit (Sigma) and following the manufacturer’s

73
instructions. Light absorbance of the samples was measured at 575 nm using a
spectrophotometer (Spectra MAX 190; Molecular Devices). Total calcium was calculated
from standard curves of absorbance versus known concentrations of calcium standards
(Sigma) run in parallel with the experimental samples. Calcium concentration values
were normalized by substrate area and expressed as μg/cm2. All experiments were run in
triplicate and repeated at three separate times.
2.2.3.5. Acellular Calcium Deposition Studies
Not only can calcium be deposited by osteoblasts, but it may also precipitate from
surrounding cell culture media. To determine this, all the substrates of interest to the
present study were incubated in DMEM supplemented with 10% FBS, 1% P/S, 50 μg/ml
L-ascorbic acid (Sigma) and 10 mM β–glycerophosphate (Sigma) under standard cell
culture conditions for 7, 14, and 21 days. Cell culture media was changed every other day
during these acellular calcium deposition experiments. At the end of the prescribed time
periods, the substrates were rinsed three times with 50 mM Tris-buffered saline (TBS; a
solution consisting of 8.77 g NaCl, 6.61g Tris-HCl, and 0.97 g Tris Base in a 1000 ml of
DI water adjusted to a pH of 7.4; all chemicals from Sigma). The substrates of interest
and remaining calcium-containing mineral deposited on them from DMEM were then
treated with 0.6 N HCl (Mallinckrodt Technical) at 37 °C overnight. After the prescribed
time period, the amount of calcium present in the acidic supernatant was quantified using
a commercially available kit (Sigma) and following the manufacturer’s instructions.
Light absorbance of the samples was measured at 575 nm using a spectrophotometer
(Spectra MAX 190; Molecular Devices). Total calcium was calculated from standard

74
curves of absorbance versus known concentrations of calcium standards (Sigma) run in
parallel with the experimental samples. Calcium concentration values were normalized
by substrate area and expressed as μg/cm2. All experiments were run in triplicate and
repeated at three separate times.
2.2.4. In vitro Degradation Studies
For ceramic/polymer composite degradation experiments, initial dry substrates of
interest were weighed (W0) and sterilized. Then, all the substrates were immersed into 3
mL of PBS (along with blank PBS as a reference) and were incubated under standard cell
culture conditions. After 21, 28, and 35 days, specimens were removed from PBS,
abundantly rinsed with DI water to remove the soluble inorganic salt, and dried in an air
vacuum chamber at room temperature for 48 hours to reach constant mass. At each time
point, samples were weighed (Wt) and the percentage of weight loss (%WL) with respect
to incubation time was calculated according to equation (2.3).
100%W
)W(W%WL
0
t0 ×−
= (2.3)
At least three samples of each kind were measured and the results averaged. The
pH of the supernatant buffer was monitored three times a week during the experiment.
2.2.5. Statistical Analysis
Numerical data were analyzed using standard analysis of variance (ANOVA)
techniques; statistical significance was considered at p<0.05. All data analyzed by

75
ANOVA were from experiments run in triplicate and repeated at least three separate
times.
2.3. Results
2.3.1. Materials Characterization
2.3.1.1. Surface Topography Determined by SEM
2.3.1.1.1. Nanophase Titania/PLGA Composites
Titania particles of different agglomeration sizes were visible on the surface of the
composites, as shown in Figure 2.4. Scanning electron micrographs suggest that the
distribution of ceramic particles was different on the surface of the composite scaffolds
depending on the sonication power utilized; specifically, there were more titania particles
on the surface of each scaffold after sonication with higher power. Finer titania particles
were also observed on the surface with increasing sonication powers. That is, larger
ceramic agglomerations tended to break into smaller particles in the polymer solution
after higher powers of sonication. Because of this, the amount of surface area occupied
by titania increased on the surface of the composite scaffolds with higher sonication
powers. Specifically, 10.6%, 10.2%, and 10.1% compared to 5.7% of the surface area
occupied was titania on PTC70, PTC45, PTC30 and PTC25 composites, respectively. At
higher sonication powers, titania particles became smaller and were more evenly
dispersed in the PLGA matrix. However, there were no significant differences in terms of
titania surface coverage for PTC45 and PTC70 compared to PTC35.

76
Figure 2. 4: SEM micrographs of nanophase titania/PLGA composites: PTC25, PTC35, PTC45, and PTC70. Original magnification: 15 kX; magnification bars: 1 µm.
2.3.1.1.2. Control Materials
Pure PLGA and titania compacts (both green and sintered) are shown in Figure
2.5. It can be seen that the surface of PLGA was rather smooth while the surface of
titania compacts were more rough and, thus, more similar to the surface structure of
natural bone. Figure 2.5 shows outer surface of natural bone. Figure 2.6 shows inner
surface of natural bone. Clearly, the inner surface of natural bone has more porous
structures for nutrient and waste transportation.
PTC25
PTC45
PTC35
PTC70

77
Figure 2. 5: SEM micrographs of control materials and natural bone: PLGA, TCG (green titania compacts), TCS (sintered titania compacts) and outer surface of bone. Original magnification: 15 kX; magnification bars: 1 µm.
Figure 2. 6: SEM micrographs of inner surface of bone. (a) Original magnification: 2500 X, magnification bar: 10 µm. (b) Original magnification: 15 kX, magnification bar: 1 µm.
TCG
PLGA
TCS
Bone
(b)(a)
78
2.3.1.2. Nanometer Surface Features Determined by AFM
Atomic force microscopy results demonstrated that all the titania/PLGA
composites fabricated at different sonication powers had nanometer scale surface
roughness from 20 nm to 120 nm according to 5 µm × 5 µm AFM scans. AFM images
confirmed SEM results that the dispersion of ceramic particles improved on the surface
of the composites when higher sonication powers were utilized (Figure 2.7) and that the
surface of PLGA was rather smooth while the surface of titania compacts were more
rough and, thus, more similar to the structure of natural bone (Figure 2.8).

79
Figure 2. 7: AFM micrographs of materials of interest: PTC25, PTC35, PTC45, and PTC70. Original scan size is 5 μm × 5 μm. Data Z-scale is 300 nm.
PTC25 PTC35
PTC45 PTC70
1 2
34
5(μm)
1 2
34
5(μm)
12
3 4
5(μm)
12
3 4
5(μm)

80
Figure 2. 8: AFM micrographs of materials of interest: PLGA, TCG, TCS, and bone. Original scan size is 5 μm × 5 μm. Data Z-scale is 300 nm.
Moreover, the surface roughness of all the substrates compared to natural bone
was plotted in Figure 2.9. Results showed that: (i) the surface roughness of all the
composites was significantly greater than PLGA, (ii) the surface roughness of the titania
compacts were significantly greater than all the composites, and (iii) the surface
roughness of PTC35 was significantly greater than PTC25, PTC45 and PTC70. However,
PLGA1
2 3
45
(μm)
TCG 1
2 3
45
(μm)
TCS
Bone
12
3 4
5(μm)
54
3 2
1
(μm)

81
there was no significant difference in surface roughness between titania compacts and
natural bone. Importantly, the composite with the surface roughness values closest to
bone was PTC35.
Figure 2. 9: Surface roughness (root-mean-square) of PLGA, PTC25, PTC35, PTC45, PTC70, TCG, TCS, and natural bone. Values are mean ± SEM; n=5; *p < 0.05 compared to PLGA; **p < 0.05 compared to all the composites; ***p < 0.05 compared to PTC25, PTC45 and PTC70. AFM scan size is 5 μm × 5 μm.
Results from AFM surface analysis also provided quantitative evidence of the
surface area of substrates of interest compared to natural bone, as shown in Table 2.3.
The surface area of all the composites was significantly greater than PLGA, and the
surface area of the titania compacts were significantly greater than all the composites.
*
*
*
*** **
**
***
Surf
ace
Rou
ghne
ss (R
oot M
ean
Squa
re, n
m)
0
20
40
60
80
100
120
140
PLGA PTC25 PTC35 PTC45 PTC70 TCG TCS Bone

82
Table 2. 3: Surface area values of the substrates of interest compared to bone. Values are mean ± SEM; n = 3; *p < 0.05 compared to PLGA; #p < 0.05 compared to all the composites. AFM scan size is 5 μm × 5 μm.
Samples Average Surface Area
(μm2 per unit of scanned area [25 μm2])
PLGA 25.0401 ± 0.0250
PTC25 25.1135 ± 0.0005*
PTC35 25.3437 ± 0.0208*
PTC45 25.5063 ± 0.0301*
PTC70 25.3384 ± 0.0231*
TCG 51.1387 ± 7.0515* #
TCS 41.1670 ± 7.9951* #
Bone 29.2762 ± 1.6143* #
In addition, AFM results from 1 μm × 1 μm scans demonstrated very similar
trends as AFM results from 5 μm × 5 μm scans. AFM images from 1 μm × 1 μm scans
were shown in Figure 2.10 and Figure 2.11. The average RMS surface roughness and
surface area were calculated from 1 μm × 1 μm AFM scans, as shown in Figure 2.12 and
Table 2.4.

83
Figure 2. 10: AFM micrographs of materials of interest: PTC25, PTC35, PTC45, and PTC70. Original scan size is 1 μm × 1 μm. Data Z-scale is 200 nm.
1
0.2 0.4
0.60.8
PTC45 0.2
0.40.6
0.81(μm)
PTC70
PTC25 0.2 0.4
0.60.8
1
(μm)
(μm) (μm)
0.2 0.4
0.6 0.8
1
PTC35

84
Figure 2. 11: AFM micrographs of materials of interest: PLGA, TCG, TCS, and bone. Original scan size is 1 μm × 1 μm. Data Z-scale is 200 nm.
PLGA
TCG TCS
Bone
0.2
0.80.6
0.4
(μm)1
(μm)
0.2 0.4
0.6 0.8
1
(μm)
10.8
0.6 0.4
0.2
1
0.2 0.4
0.60.8
(μm)

85
Figure 2. 12: Surface roughness (root-mean-square) of PLGA, PTC25, PTC35, PTC45, PTC70, TCG, TCS, and natural bone. Values are mean ± SEM; n=5; *p < 0.05 compared to PLGA; **p < 0.05 compared to all the composites; ***p < 0.05 compared to PTC25. AFM scan size is 1 μm × 1 μm.
*
*
*
***
**
**
***
Surf
ace
Rou
ghne
ss (R
oot M
ean
Squa
re, n
m)
0
10
20
30
40
50
60
70
PLGA PTC25 PTC35 PTC45 PTC70 TCG TCS Bone
* *

86
Table 2. 4: Surface area values of the substrates of interest compared to bone. Values are mean ± SEM; n = 3; *p < 0.05 compared to PLGA; #p < 0.05 compared to all the composites. AFM scan size is 1 μm × 1 μm.
Samples Average Surface Area
(μm2 per unit of scanned area [1 μm2])
PLGA 1.0047 ± 0.0020
PTC25 1.0040 ± 0.0004
PTC35 1.0333 ± 0.0023*
PTC45 1.0467 ± 0.0072*
PTC70 1.0288 ± 0.0071*
TCG 1.7813 ± 0.1827* #
TCS 1.6900 ± 0.0468* #
Bone 1.3078 ± 0.0542* #
2.3.2. In Vitro Cytocompatibility
2.3.2.1. Osteoblast Adhesion
Adhesion is a critical initial step for the interaction between osteoblasts and
materials. Results showed that osteoblast adhesion was significantly greater on the TCG
and TCS than all the composites, as shown in Figure 2.13. Moreover, osteoblast adhesion
was significantly greater on all the composites than on PLGA. Most importantly,
osteoblast adhesion was significantly greater on the PTC35 than on the PTC25, PTC45
and PTC70 composites. Osteoblast adhesion was not significantly different between the
TCG and TCS.

87
Figure 2. 13: Osteoblast adhesion on PLGA, PTC25, PTC35, PTC45, PTC70, TCG, TCS, and reference: Glass. Values are mean ± SEM; N = 3; *p < 0.05 compared to PLGA; **p < 0.05 compared to PTC25; ***p < 0.05 compared to all the composites.
2.3.2.2. Osteoblast Morphologies
The typical morphologies of adherent osteoblasts on the substrates of interest after
a 4-hour incubation time are presented in Figures 2.14 and 2.15. The average length of
the major axis of typical adherent osteoblasts on the substrates of interest was measured,
as shown in Figure 2.14 and 2.15.
0
500
1000
1500
2000
2500
PLGA PTC25 PTC35 PTC45 PTC70 TCG TCS Glass
Cel
l Den
sity
(cel
ls/c
m2 )
*
**
***
*
***
*
*
**
**
**
*
*
*
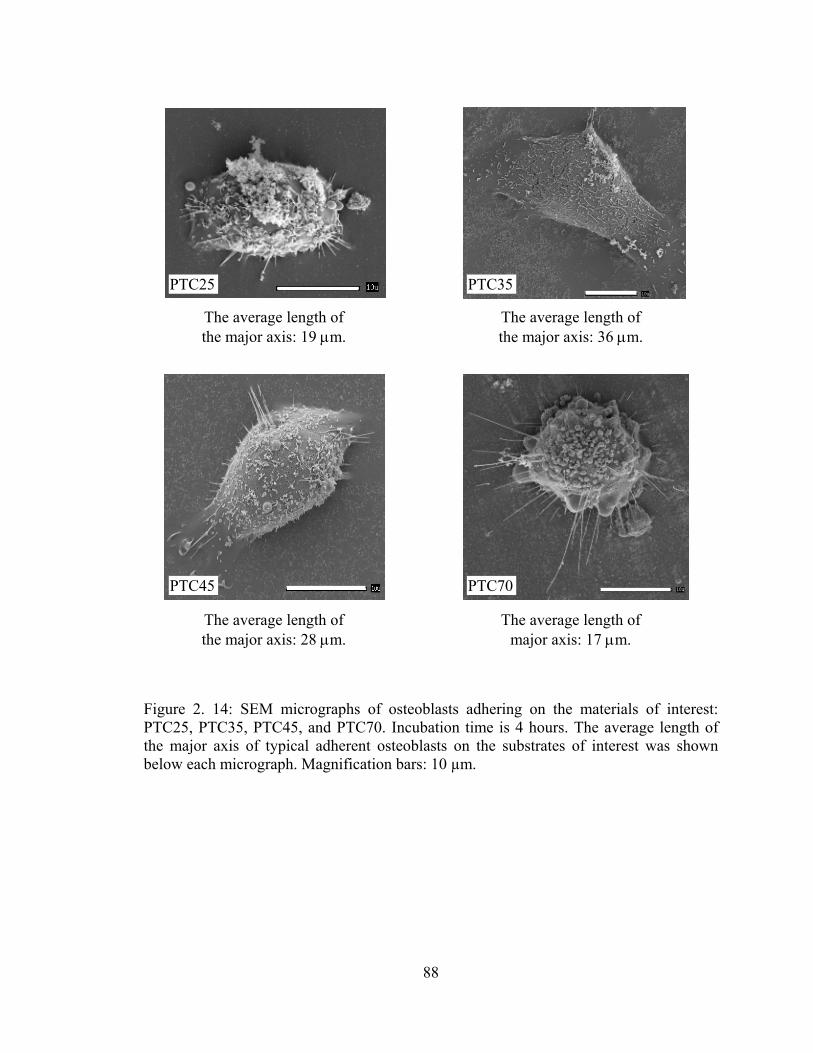
88
Figure 2. 14: SEM micrographs of osteoblasts adhering on the materials of interest: PTC25, PTC35, PTC45, and PTC70. Incubation time is 4 hours. The average length of the major axis of typical adherent osteoblasts on the substrates of interest was shown below each micrograph. Magnification bars: 10 µm.
The average length of the major axis: 36 μm.
PTC25 PTC35
PTC45 PTC70
The average length of the major axis: 19 μm.
The average length of the major axis: 28 μm.
The average length of major axis: 17 μm.

89
Figure 2. 15: SEM micrographs of osteoblasts adhering on the materials of interest: PLGA, TCG, and TCS. Incubation time is 4 hours. The average length of the major axis of typical adherent osteoblasts on the substrates of interest was shown below each micrograph. Magnification bars: 10 µm.
Osteoblasts on TCG and TCS possessed their typical very flat polygonal shape. In
contrast, less spread osteoblasts were observed on PLGA and PTC70 substrates.
Generally, osteoblasts were more spread on TCG and TCS than on any composite and
PLGA. Osteoblasts on the composites were better spread than that on PLGA.
TCG TCS
PLGA
The average length of the major axis: 33 μm.
The average length of the major axis: 34 μm.
The average length of the major axis: 14 μm.

90
2.3.2.3. Osteoblast Long-term Functions
2.3.2.3.1. Synthesis of Total Protein
There were detectable amounts of total proteins secreted by osteoblasts on all
substrates after 7, 14 and 21 days of culture (Figure 2.16).
Figure 2. 16: Total protein content in osteoblasts cultured on PLGA, PTC25, PTC35, PTC45, PTC70, TCG, TCS; and reference: Glass. Values are mean ± SEM; N = 3; *p < 0.05 compared to PTC25, PT35, PT45, PTC70, and PLGA at respective days. #p < 0.05 compared to the respective substrates at 7 days.
Generally, total protein content increased with longer time periods of culture.
Specifically, total protein content increased significantly on the PTC 35 and TCG after 14
and 21 days of culture compared to 7 days of culture while total protein content on all the
other composites (PTC25, PTC45, and PTC70) and PLGA did not increase significantly
after 14 and 21 days of culture compared to 7 days of culture.
0
20
40
60
80
100
120
140
160
180
200
PLGA PTC25 PTC35 PTC45 PTC70 TCG TCS Glass
Days=7Days=14Days=21
Tota
l Pro
tein
Con
tent
(μg/
cm2 ) *
*
*
*
*
* *
*
*
##
##
#

91
Importantly, total protein content was significantly greater on TCG and TCS than
that on all the composites and PLGA after respective 7, 14, and 21 days of culture. In
contrast, the total protein content was not significantly different between TCG and TCS
substrates after respective 7, 14, and 21 days of culture. After 7 days of culture, total
protein content was not significantly different among all the composites and PLGA.
However, total protein content was significantly greater on PTC35 than all the other
composites and PLGA after 14 days of culture. There was no statistical difference of total
protein content detected among all the composites and PLGA after 21 days of culture.
2.3.2.3.2. Total Collagen Content
There were detectable amounts of total collagen synthesized by osteoblasts on all
substrates after 7, 14 and 21 days of culture (Figure 2.17). Generally, total collagen
synthesis by osteoblasts increased with longer time periods of culture. For example, total
collagen content increased significantly on all the substrates after 21 days of culture
compared to 7 days of culture.
After 7 days of culture, total collagen synthesis was significantly greater on TCG
and TCS than on all the composites and PLGA; significantly greater on PTC35 than on
the other composites and PLGA. After 14 days of culture, total collagen synthesis was
significantly greater on TCG and TCS than on all the composites and PLGA;
significantly greater on PTC35 than on PTC45 and PLGA. After 21 days of culture, total
collagen synthesis was significantly greater on TCG and TCS than on all the composites
and PLGA; significantly greater on PTC35, PTC45 and PTC70 than on PLGA and
PTC25; not significantly different between PTC35, PTC45 and PTC70; not significantly

92
different between the TCG and TCS; and not significantly different between PTC25 and
PLGA.
Figure 2. 17: Total collagen content in osteoblasts cultured on PLGA, PTC25, PTC35, PTC45, PTC70, TCG, TCS; and reference: Glass. Values are mean ± SEM; N = 3; *p < 0.05 compared to PLGA at respective days; **p < 0.05 compared to PTC25 at respective days; ***p < 0.05 compared to all the composites at respective days; #p < 0.05 compared to PTC45 at respective days.
2.3.2.3.3. Alkaline Phosphatase Activity
There were detectable amounts of alkaline phosphatase synthesized by osteoblasts
on all the substrates after 7, 14 and 21 days of culture (Figure 2.18). Generally, alkaline
phosphatase activity increased with longer time periods of osteoblast culture. Specifically,
alkaline phosphatase activity increased significantly on all the substrates after 21 days of
culture compared to 7 days of culture.
0
0.1
0.2
0.3
0.4
0.5
0.6
0.7
0.8
PLGA PTC25 PTC35 PTC45 PTC70 TCG TCS Glass
Days=7Days=14Days=21
Tota
l Col
lage
n C
once
ntra
tion
(mg/
cm2 )
*
*
* *
*
****
******
**
****
* ** *
*
* *
* **
***
**** **
**
** **
** ******* ******
***
*** ***
# #

93
Figure 2. 18: Alkaline phosphatase activity in osteoblasts cultured on PLGA, PTC25, PTC35, PTC45, PTC70, TCG, TCS; and reference: Glass. Values are mean ± SEM; N = 3; *p < 0.05 compared to PLGA at respective days; **p < 0.05 compared to all the composites at respective days; ***p < 0.05 compared to PTC70 at respective days; #p < 0.05 compared to PTC45 at respective days.
After 7 days of culture, alkaline phosphatase activity was significantly greater on
TCG and TCS than on all the composites; significantly greater on all the composites than
on PLGA; and not significantly different among all the composites. After 14 days of
culture, alkaline phosphatase activity was significantly greater on TCG and TCS than on
all the composites; significantly greater on all the composites than on PLGA; and
significantly greater on PTC35 than on PTC45 and PTC70. After 21 days of culture,
alkaline phosphatase activity was significantly greater on TCG and TCS than on all the
composites; significantly greater on all the composites (twice more) than on PLGA; and
significantly greater on PTC35 than on PTC70. Alkaline phosphatase was not
significantly different between TCG and TCS at respective 7, 14 and 21 days of culture.
0
5
10
15
20
25
PLGA PTC25 PTC35 PTC45 PTC70 TCG TCS Glass
Days=7Days=14Days=21
Alk
alin
e Ph
osph
atas
e A
ctiv
ity
(nm
ol p
-nitr
ophe
nol/m
in/c
m2 )
* **
*
* ***
**
***
** *
*
** * *
** **
**
** ****
***#
*

94
2.3.2.3.4. Extracellular Calcium Deposition
There were detectable amounts of calcium deposited by osteoblasts on all the
composites, PLGA, TCG, TCS and glass after 7, 14 and 21 days of culture (Figure 2.19).
There were significantly greater amounts of calcium deposited by osteoblasts on all the
composites and titania compacts at 21 than at 7 and 14 days of culture. However, calcium
deposited on PLGA and glass did not increase at 21 days of culture compared to at 7 and
14 days of culture.
Figure 2. 19: Calcium deposited by osteoblasts cultured on PLGA, PTC25, PTC35, PTC45, PTC70, TCG, TCS; and reference: Glass. Values are mean ± SEM; n = 3; *p < 0.05 compared to PLGA at respective days; **p < 0.05 compared to all the composites at respective days; ***p < 0.05 compared to PTC70 at respective days.
After respective 7, 14, and 21 days of culture, calcium deposition was
significantly greater on TCG and TCS than on all the composites and PLGA. There was
no significantly different calcium deposition by osteoblasts between TCG and TCS at any
0
50
100
150
200
250
300
350
PLGA PTC25 PTC35 PTC45 PTC70 TCG TCS Glass
Days=7Days=14Days=21
Cal
cium
Con
cent
ratio
n (μ
g/cm
2 )
* ***
* *** **
*******
*
*
*
*
**
**
**
**

95
time period. After 7 days of culture, only very small amounts of calcium deposited on the
composites and PLGA and, thus, statistical difference was not detected. After 14 days of
culture, calcium concentration was significantly greater on PTC35 than on the other
composites and PLGA. After 21 days of culture, the amount of calcium was significantly
greater on all the composites than on PLGA. Importantly, the amount of calcium
deposited by osteoblasts was significantly greater on PTC35 than on PTC70 after 21 days
of culture.
2.3.2.4. Acellular Calcium Deposition
Acellular calcium precipitated on all the composites, PLGA, TCG, TCS and glass
after 7, 14 and 21 days of culture (Figure 2.20). There were significantly greater amounts
of calcium precipitated on all the composites and titania compacts at 21 than at 7 days of
culture. However, calcium precipitated on PLGA and glass did not increase at 21 days of
culture compared to at 7 and 14 days of culture.
After respective 7, 14, and 21 days of culture, acellular calcium precipitation was
significantly greater on TCG and TCS than on all the composites and PLGA. There was
no significantly different calcium precipitation between TCG and TCS at any time period.
After 7 days of culture, the amount of acellular calcium precipitated was significantly
greater on PTC35 and PTC45 than that on PTC25, PTC70 and PLGA; not significantly
different between PTC35 and PTC45; and not significantly different between PTC25 and
PLGA. After 14 days of culture, the amount of acellular calcium precipitated was
significantly greater on all the composites than that on PLGA and not significantly
different among the composites. After 21 days of culture, the amount of acellular calcium
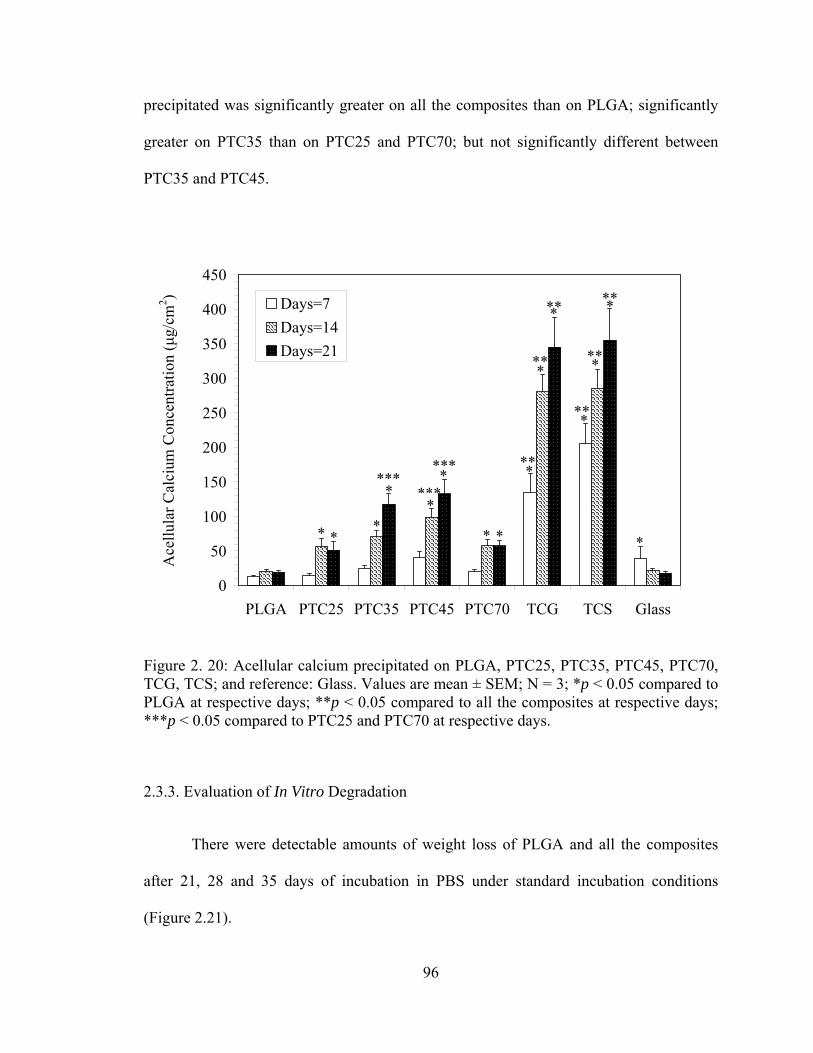
96
precipitated was significantly greater on all the composites than on PLGA; significantly
greater on PTC35 than on PTC25 and PTC70; but not significantly different between
PTC35 and PTC45.
Figure 2. 20: Acellular calcium precipitated on PLGA, PTC25, PTC35, PTC45, PTC70, TCG, TCS; and reference: Glass. Values are mean ± SEM; N = 3; *p < 0.05 compared to PLGA at respective days; **p < 0.05 compared to all the composites at respective days; ***p < 0.05 compared to PTC25 and PTC70 at respective days.
2.3.3. Evaluation of In Vitro Degradation
There were detectable amounts of weight loss of PLGA and all the composites
after 21, 28 and 35 days of incubation in PBS under standard incubation conditions
(Figure 2.21).
0
50
100
150
200
250
300
350
400
450
PLGA PTC25 PTC35 PTC45 PTC70 TCG TCS Glass
Days=7Days=14Days=21
*
**
*
* *** **
******
Ace
llula
r Cal
cium
Con
cent
ratio
n (μ
g/cm
2 )
*
*
** **
*
* *** **
**
**
***

97
Figure 2. 21: Percent weight loss for PLGA, PTC25, PTC35, PTC45, PTC70, TCS, and Glass incubated in PBS under standard incubation conditions. Values are mean ± SEM; N = 3; *p < 0.05 compared to PLGA at respective days; #p < 0.05 compared to all the composites at all days; **p < 0.05 compared to PTC25 at respective days.
The percentage of weight loss of pure PLGA was the greatest among all the
substrates incubated at respective days. As expected, no weight loss was observed on
titania compacts and glass. Among all the composites, the weight loss of PTC25 was
greater than the others at 35 days of incubation. This indicated that the dispersion status
of nanophase titania in PLGA played an important role in decreasing the degradation rate
of these nano-composite.
Moreover, the buffering effect of titania particles towards PLGA weight loss was
more significant after longer time periods of incubation, which correlated to the pH
buffering effect of titania particles, as shown in Figure 2.22. Specifically, the pH drop
Wei
ght L
oss (
%)
*****
***
***
# #
** **
0
10
20
30
40
50
60
70
80
90
100
PLGA PTC25 PTC35 PTC45 PTC70 TCS Glass
Days=21Days=28Days=35
# # # #
98
was less than 16% for all the composites during the first 21 days of incubation while it
was 19% for pure PLGA. During 22 to 35 days of incubation, the pH drop was faster than
the first 3 weeks of incubation. Specifically, the pH drop was 70% for pure PLGA after
35 days of incubation while it was 68% for PTC25, 56% for PTC35, and only 43% for
PTC70.

99
Figure 2. 22: pH variation with incubation time for PLGA, PTC25, PTC35, PTC45, PTC70, TCS, and Glass incubated in PBS under standard incubation conditions. Values are mean ± SEM; N = 3. The SEM bars were not shown in this figure for the purpose of clarity.
Incubation Time (days)
pH V
alue
2.0
3.0
4.0
5.0
6.0
7.0
8.0
0 5 10 15 20 25 30 35 40
PTC 25PTC 35PTC 45PTC 70PLGATCS

100
2.4. Discussion
2.4.1. Bio-inspired Nanophase Titania/PLGA Composites as Bone Substitutes
Compared to metals, metal alloys (such as titanium and titanium alloys) and
conventional ceramics (grain sizes greater than 100 nm), nanophase ceramics (such as
titania) have improved cytocompatibility properties [145,146]. In the present study, the
improved cytocompatibility of nanophase titania was documented by greater osteoblast
adhesion, synthesis of alkaline phosphatase, and calcium mineral deposition over PLGA
[175]. However, practically, ceramics are inherently brittle and difficult to deform into
complex shapes with acceptable mechanical properties for load-bearing orthopedic
applications when they are used alone.
Therefore, nanophase titania/PLGA composites (as formulated in the present
study) offer an opportunity to take advantage of the great cytocompatibility properties of
nanophase titania with improved malleability properties due to the addition of a polymer.
In addition, through the use of PLGA, the composite may degrade as new bone grows,
thus allowing for increased interlocking strength and a potentially higher degree of
implant success. Moreover, nano-sized titania particles used as inclusions in
biodegradable PLGA can provide a pH buffering effect to the polymer and to tailor the
degradation kinetics of the PLGA matrix.
As mentioned, natural bone is composed of nanostructured constituent such as
Type I collagen, HA crystals, and proteins. Thus, it stands to reason that cells are
naturally exposed to nanostructured surface features in the body. Previous studies
conducted by our research group provided evidence that greater weight percentages of

101
nanophase titania in PLGA scaffolds increased functions of osteoblasts (such as adhesion,
alkaline phosphatase activity and calcium deposition) when many material properties
(such as chemistry, crystallinity, and crystal phase) were kept constant in comparison
scaffolds [178]. Specifically, for example, nanophase titania/PLGA composites with a
30/70 weight percent ratio demonstrated greater osteoblast functions than nanophase
titania/PLGA composites with a 20/80 weight percent ratio and conventional
titania/PLGA composites with a 30/70 weight percent ratio [178]. Therefore, in this study,
nanophase titania/PLGA composites with a 30/70 weight percent were chosen since the
30/70 weight percent ratio was proven to be optimal for osteoblast functions.
However, when titania particles decrease into the nanometer regime and the
amount of titania particles in PLGA increases, the tendency for particle agglomeration is
dramatically higher and may consequently counteract the advantages of adding
nanophase titania to PLGA in the first place. The strong tendency for nanoparticles to
agglomerate could result in unevenly distributed nanoparticles and subsequently
inhomogeneous modification of the properties of polymer matrix; clearly, the mechanical
and biological properties of nano-composites will depend irregularly on the amount of
titania loaded. Therefore, it is important to study and discuss the dispersion behavior of
nanophase titania in PLGA and its influence on subsequent cell functions.
102
2.4.2. Dispersion of Nanophase Titania in PLGA Composites
2.4.2.1. Why Dispersion Is Necessary for Nanocomposites
Nanocomposites represent a new prospective branch in the field of conventional
ceramic/polymer composites for orthopedic applications. It has been shown that an
overall enhancement of composite properties can be achieved under certain conditions by
the addition of nanoparticles instead of conventional micron-sized particles. For example,
Zhang et al. reported that tensile strength, percent elongation, and tear strength of EPDM
(ethylene-propylene-diene monomer) rubber composites reinforced with 40 wt.%
magnesium hydroxide (Mg(OH)2) particles increased significantly as the particle size
decreased. Specifically, when the average particle size of Mg(OH)2 decreased from 2 μm
to 50 nm, the tensile strength increased from 3 MPa to 10 MPa; the percent elongation
increased from 280% to 430%; the tear strength increased from 15 KPa to 35 KPa [179].
This is likely to be the combined result of the stress concentration effect becoming
negligible as the size of particles approach that of the molecules and a synergistic effect
yet unknown becoming dominant at the nanometer scale.
Furthermore, the presence of nanoparticles provides improvements in other
properties as well (such as scratch resistance, erosion resistance, wear resistance, and fire
resistance) [180]. For example, it was reported that the scratch indentation of titania-filled
epoxy composites decreased from 60 μm to 30 μm when the filled titania particle size
decreased from 0.24 μm to 32 nm [181]. However, these positive effects of adding
nanoparticles into a polymer do not appear simultaneously, but rather depend on the
dispersion state and microstructure of nanoparticles in polymer matrix. Most importantly,
when the microstructural homogeneity of the nanocomposites improves, their mechanical
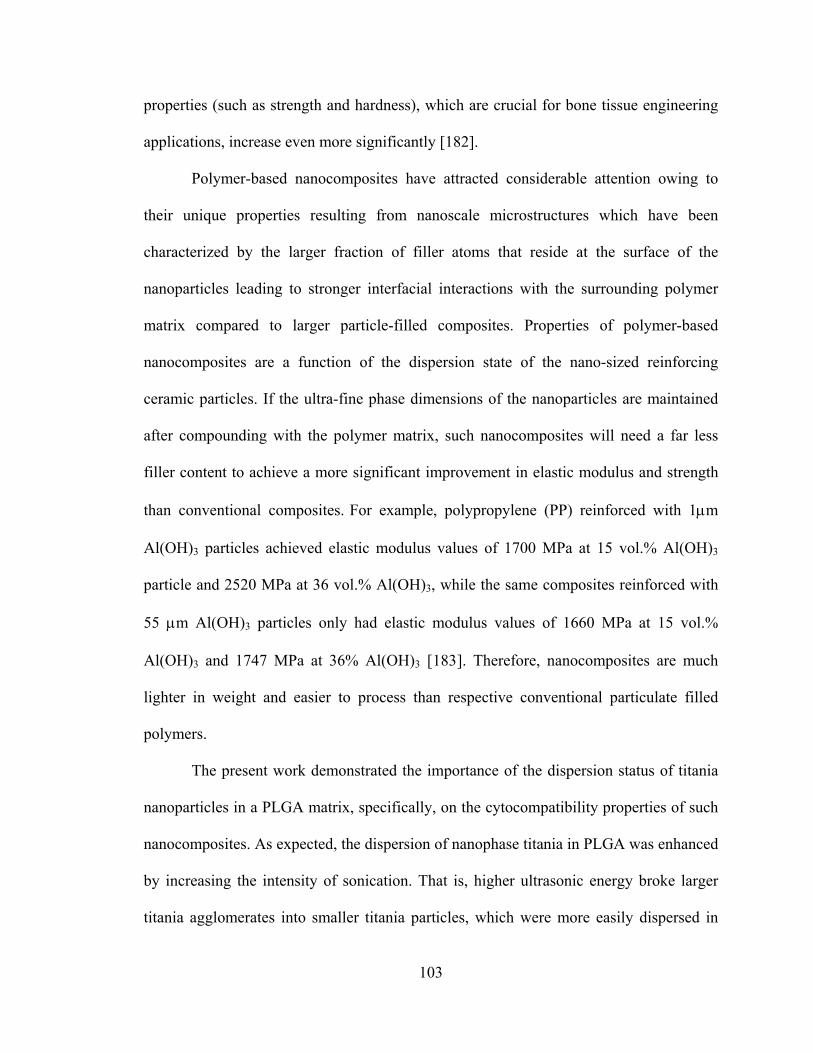
103
properties (such as strength and hardness), which are crucial for bone tissue engineering
applications, increase even more significantly [182].
Polymer-based nanocomposites have attracted considerable attention owing to
their unique properties resulting from nanoscale microstructures which have been
characterized by the larger fraction of filler atoms that reside at the surface of the
nanoparticles leading to stronger interfacial interactions with the surrounding polymer
matrix compared to larger particle-filled composites. Properties of polymer-based
nanocomposites are a function of the dispersion state of the nano-sized reinforcing
ceramic particles. If the ultra-fine phase dimensions of the nanoparticles are maintained
after compounding with the polymer matrix, such nanocomposites will need a far less
filler content to achieve a more significant improvement in elastic modulus and strength
than conventional composites. For example, polypropylene (PP) reinforced with 1μm
Al(OH)3 particles achieved elastic modulus values of 1700 MPa at 15 vol.% Al(OH)3
particle and 2520 MPa at 36 vol.% Al(OH)3, while the same composites reinforced with
55 μm Al(OH)3 particles only had elastic modulus values of 1660 MPa at 15 vol.%
Al(OH)3 and 1747 MPa at 36% Al(OH)3 [183]. Therefore, nanocomposites are much
lighter in weight and easier to process than respective conventional particulate filled
polymers.
The present work demonstrated the importance of the dispersion status of titania
nanoparticles in a PLGA matrix, specifically, on the cytocompatibility properties of such
nanocomposites. As expected, the dispersion of nanophase titania in PLGA was enhanced
by increasing the intensity of sonication. That is, higher ultrasonic energy broke larger
titania agglomerates into smaller titania particles, which were more easily dispersed in

104
PLGA suspensions, and subsequently remained on the surface of the nanocomposites
after the solvent (chloroform) evaporated. The composites (such as PTC35 or the
composite sonicated at 166.25 W) with greater amounts of nanophase titania on the
surface promoted greater osteoblast adhesion and long-term functions (such as alkaline
phosphatase activity and calcium-containing mineral deposition).
As previously mentioned, nanophase titania/PLGA composites with a 30/70 of
weight percent ratio were chosen as model composites in this study. The volume
percentage of nanophase titania in PLGA was calculated according to the equation 4.1.
PLGA
PLGA
titania
titaniatitania
titania
titania
ρW
ρW
ρW
V+
= (4.1)
Vtitania is the volume fraction of titania in PLGA, which was calculated as 12.7
vol.%. Wtitania is the weight fraction of titania, which was 0.30; WPLGA is the weight
fraction of PLGA, which was 0.70; ρtitania is the theoretical density of titania with an
80/20 anatase/rutile phase content, which was 3.96 g/cm3; ρPLGA is the density of PLGA,
which was 1.34 g/ cm3.
Since the predominant feature of nanoparticles lies in their ultra-fine dimension, a
large fraction of the filler atoms can reside at the interface and can lead to a strong
interfacial interaction [184], but only if the nanoparticles are well dispersed on the
nanometer level into the surrounding polymer matrix. As the interfacial structure plays a
critical role in determining the properties of composites, nanocomposites coupled with a
great number of interfaces could be expected to provide unusual properties, and the

105
shortcomings induced by the heterogeneity of conventional (or micron) particle filled
composites would also be avoided [182].
The microstructural appearance of 12.7 vol. % particles of different sizes
dispersed in a polymer matrix was sketched in Figure 2.23. Consequently, the so-called
nanoparticle filled polymers sometimes contain a number of loose clusters of particles
and exhibit properties even worse than conventional particle/polymer systems.

106
Figure 2. 23: Schematic of theoretical microstructure of ceramic/polymer composites. (a) 12.7 vol. % of particles with 1000 nm diameters (4 particles within an area of 25 μm2); (b) 12.7 vol. % of particles with 100 nm diameters (404 particles within an area of 25 μm2); (c) 12.7 vol. % of particles with 50 nm diameters (1617 particles within an area of 25 μm2); and (d) 12.7 vol. % of particles with 30 nm diameters (4492 particles within an area of 25 μm2).
When nanophase titania particles are incorporated into PLGA, the mechanical
properties (such as bending modulus) of the composites increased from 500 ± 60 MPa to
1470 ± 90 MPa, especially if a rather uniform dispersion of the nanoparticles exists [162].
This implies, on the one hand, that titania nanoparticles can effectively improve polymer
properties more than conventional micron titania particles. On the other hand, when the
5 μm
5 μ
m
32 x Magnification
(c) (d)
(a) (b)

107
nanoparticles are unevenly dispersed in the matrix, the nanocomposites serve as
composites filled with micrometer-sized agglomerate fillers, in which crack-initiation and
coalescence occur more easily in the particulate-rich phases. In such studies, the presence
of powder agglomeration caused a remarkable change in the powder-packing structure
[185]. In addition, the agglomerated particles in a suspension caused an increase in
viscosity at a given shear rate. Irregular powder packing reduces the volume fraction of
free flowing solvents because the solvent is entrapped within the agglomerates and, thus,
reduces the evaporation rate of solvent, and even results in the remainder of the organic
solvent in the final product [186].
However, very few studies have been presented to date concerning the
relationship between the microstructural details determined by the dispersion status of
nanoparticles in a polymer matrix and subsequent biological properties of such bulk
nanocomposites. This is very surprising, since this is a topic which has both a
fundamental and applied significance for the development of nanocomposites for tissue
engineering applications. Therefore, the objective of the present in vitro work focused on
the performance of composites with identical species and the same amount of the
reinforcing components, but with a different dispersion status. In particular, the effects of
the dispersion status on the biological behavior of nanophase titania/PLGA composites
were studied, so as to provide knowledge for an optimum material preparation for
orthopedic applications. Dispersion status of nanophase titania/PLGA biocomposites can
manipulate surface features of such nanocomposites, such as surface roughness and
surface area, which consequently influence in vitro cell responses.

108
2.4.2.2. Mechanism of Agglomeration of Nanophase Titania Particles
Groups of particles that are relatively weakly bonded together by physical bonds
may behave as fragile, larger pseudo-particles called soft agglomerates. If particles are
strongly bonded together by chemical bonds, the larger particle is not as easily dispersed
and is referred to as aggregate or hard agglomerate. In soft agglomerates of non-magnetic
powder, the weak physical bonds may be Van der Waals forces, electrostatic attraction,
or capillary adhesion forces. Electrostatic forces occur because of surface-adsorbed ions
or because of the transfer of electrons between particles in regions of contact.
Electrostatic and Van der Waals forces produce relatively fragile agglomerates. However,
even these fragile agglomerates can impede the flow of nanocomposite suspensions and
cause an uneven distribution of properties of nanocomposites.
Usually, the surface oxide of particles (such as titania) tend to adsorb water
molecules from the atmosphere physically or chemically. Evidence of surface adsorption
of water is provided by infrared adsorption studies, heats of immersion, and the thermal
behavior of the adsorption-desorption kinetics [187]. Reactions of the type:
physical adsorption MO(surface) + H2O → MO ⎯ H2O(surface) (4.2)
and
chemical adsorption MO(surface) + H2O → 2MOH(surface) (4.3)
have been suggested (see Figure 2.24) [187]. M represents a metal atom. The polar
hydroxyl (−OH) groups may cause the surface to attract and physically adsorb other
molecules, thus, having a crucial effect on the agglomeration of titania particles.
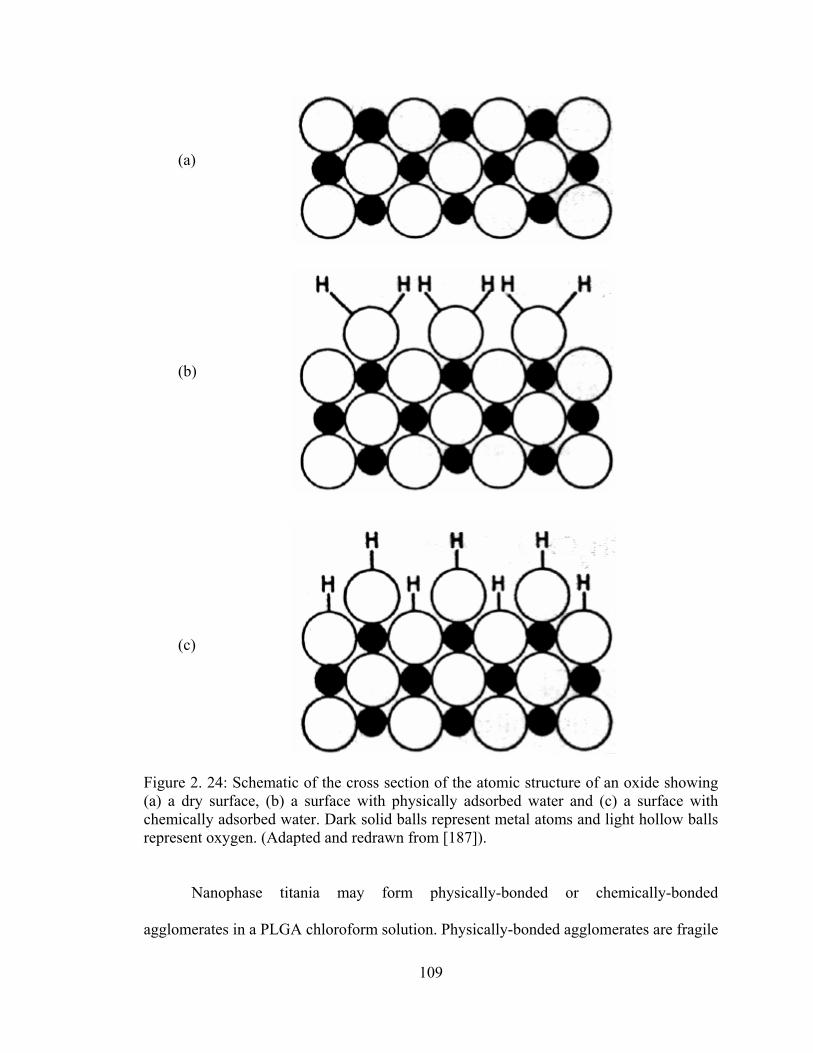
109
Figure 2. 24: Schematic of the cross section of the atomic structure of an oxide showing (a) a dry surface, (b) a surface with physically adsorbed water and (c) a surface with chemically adsorbed water. Dark solid balls represent metal atoms and light hollow balls represent oxygen. (Adapted and redrawn from [187]).
Nanophase titania may form physically-bonded or chemically-bonded
agglomerates in a PLGA chloroform solution. Physically-bonded agglomerates are fragile
(a)
(c)
(b)

110
and easier to break while chemically-bonded agglomerates are more difficult to break.
Therefore, an absolutely homogeneous dispersion of nanophase titania particles in a
PLGA matrix is a very difficult task due to the existence of chemical bonding. Sonication
at different powers was utilized in this study to break down soft agglomerates and to
produce nanostructured composites. The significant improvement in dispersion status of
nanophase titania in PLGA composites is beneficial for the miscibility of particle/matrix,
even though the particles could not be completely dispersed in the form of primary
nanoparticles in the polymer matrix.
2.4.2.3. Dispersion of Nanophase Titania Particles in PLGA by Sonication
In order to take full advantages of the benefits mentioned above, a technique to
uniformly disperse the nanophase titania particles in the PLGA was required. For non-
medical applications, such as electronic systems, surfactants have been usually used to
stabilize the dispersion of ceramic particles in polymer-based composites and optimize
the electrical properties of the composites. For example, Rao et al. reported that block
copolymer surfactants (i.e. polystyrene-b-epoxy modified polybutadiene) could improve
the BaTiO3 particle (average diameter 65 nm) dispersion in epoxy composites and, thus,
increased the dielectric constant of the composites from 10 to 42 with 40 vol.% BaTiO3
particle loading, which allowed the composites to achieve a higher dielectric constant at
relatively lower ceramic loading level for embedded capacitor applications [ 188 ].
However, for biomedical applications, cytocompatibility of surfactants has to be
considered and tested. Unfortunately, so far, common surfactants widely used in
structural, mechanical and electrical systems are either cytotoxic or have adverse

111
influences on cytocompatibility properties. Furthermore, even if biocompatible
surfactants were found, they are still not a good choice for dispersion of very fine
nanoparticles for bone tissue engineering applications because bone substitutes are
exposed to mechanical loading conditions. Adding the surfactants decreases packing
density of the particles and, thus, impairs mechanical properties of ceramic/polymer
composites.
Sonication has been found to be effective for submicron and nano-powders which
are hard to disperse by other methods [189-191]. It is generally believed that sonication
helps to improve the dispersion status of nanoparticles and consequently the homogeneity
of composites microstructure. For example, it was reported that 1.5 to 3.0 wt.% spherical
silicon carbide (SiC) nanoparticles 29 nm in diameter were dispersed into a SC-15 resin
using a sonicator (Sonics Vibra Cell Ultrasonic Liquid Processor) at 55% of the
amplitude for about 30 minutes and the dispersion of the nanoparticles was visually
observed to be uniform [192]. It was also demonstrated that uniform incorporation of
SnO2 nanoparticles into polyethylene oxide (PEO)-LiClO4 composites was achieved by
sonication and conductivity of such nanocomposites improved due to better dispersion
[193]. Nano nickel particles that were dispersed into polycarbosilane (PC) by sonication,
and then mixed with SiC fibers demonstrated better mechanical properties and
continuous controllable resistivity [194]. However, in all these studies, single-power
sonicators were used and, that is, the sonication powers were not controlled.
Sonication involves the formation and collapse of cavities that produce local high
velocity jets and pressure gradients. The resulting mechanical forces on the aggregated
particles are strong enough to break up the weakly bonded particles, such as those joined

112
by the Van der Waals forces. In the present study, the dispersion quality looked
acceptable immediately after sonication (whether at high or low powers) according to
visual observations and there were no visibly clear phase separations. During solvent
evaporation, however, particle sedimentation was observed on samples sonicated at low
powers.
It was observed that the best dispersion stability was achieved at a sonication
period of 10 minutes. Most aggregates were broken in the early stage of sonication and
the dispersion quality did not improve that much after 10 minutes. If sonication was set as
longer than 10 minutes, the temperature would rise up so that chloroform would have
evaporated during sonication. Subsequently, the composite mixture would become too
thick to flow and could not be cast into the mold. Similar events were reported by Park et
al. that 4 vol.% iron oxide (Fe3O4) particles with an average diameter of approximately
26 nm were sonicated in resin solutions at a power of 400 W for 5, 11, and 20 minutes
and the best particle dispersion quality was obtained at a sonication time of 11 minutes
[195].
In the present study, initially, nanoparticles formed agglomerates because of the
Van der Waals forces between them. During sonication, agglomerates broke up and
titania particles were surrounded by the polymer molecules. Although these separated
particles tried to re-agglomerate after sonication because of the Van der Waals forces,
they could not form direct contact with one another because individual titania particles
were still separated by the intervening polymer molecules. That is, once the particles
were separated by sonication, steric equilibrium was achieved. It is, thus, easy to
maintain a dispersed state until all the solvent was removed by evaporation. As expected,

113
it was clearly shown that the improved dispersion was achieved under higher sonication
power in Figures 2.4 and 2.7. That is, higher ultrasonic energy broke large titania
agglomerates into smaller titania particles, which were more easily dispersed in PLGA
suspensions and took longer time for sedimentation (as will be discussed in next section
2.4.2.4), and consequently increased the coverage of titania on the surface of the
composites. Although sonication was effective, it was also determined to be rather
difficult to achieve a completely uniform dispersion of nanoscale particles due to the
presence of hard agglomerates.
2.4.2.4. Sedimentation of Nanophase Titania Particles
After sonication, the composite mixture was cast into a Teflon petri dish and
chloroform was allowed to evaporate in air at room temperature. It was observed that
chloroform evaporated and the composites solidified within 6 hours after casting. The
time (t) for titania particles to settle to a height (H) could be estimated using Stokes
equation (4.4) if the composite mixture was assumed as a Newtonian fluid with laminar
flow.
gD
HtLp
L⋅−⋅
⋅=
)(
182 ρρ
η (4.4)
ηL is the viscosity of the suspension, approximated by the viscosity of chloroform
at room temperature, which was 5.63×10⁻⁴ kg·m-1·s-1. D is the titania particle size. ρp is
density of titania particle. ρL is the density of suspension, approximated by the density of
chloroform, which was 1.48×10³ kg·m-3. g is the acceleration due to gravity, which was
9.8 m/s-2. t is the time that it would take titania particles with a diameter of D to settle
114
down a height H in suspension L. H is the height of the composite suspension after
casting into the petri dish, estimated by the equation
mmAVH 4
)2
50(
80002≈==
π (4.5)
V is the volume of the composite suspension; A is surface area of the petri dish used in
this study.
According to the Stokes equation, if the particle size was 200 nm, it would take
12 hours for titania particles to settle down. If the particle size was 100 nm, it would take
47 hours for titania particles to settle down. If the particle size was 50 nm, it would take
188 hours (7.8 days) for titania particles to settle down. Smaller particles will take even
longer time to settle down, which is much longer than the evaporation time of chloroform.
Therefore, theoretically, the evaporation process of chloroform was much faster than the
sedimentation process of titania particles which were smaller than 300 nm.
2.4.3. Quantification of Essential Surface Properties
Of particular importance to the present study is how the nanometer surface
features of nanophase titania/PLGA composites controlled by sonication at different
powers influenced osteoblast adhesion and their long-term functions. As in all of the
present studies, it was an important objective of the present study to elucidate various
properties of nanophase composites that promoted osteoblast functions. In all materials,
there are several possibilities: surface roughness, surface area, chemistry, degree of
crystallinity, crystal phase, and so on. The present study was carefully designed to control
as many of these properties as possible and evaluate only the consequences of changing
115
the degree of titania dispersion status and subsequent topographical structure which
influence surface properties (such as surface roughness and surface area). Moreover, for
the first time, surface roughness and surface area of natural bone were measured to
compare with the nanocomposites of interest to the present study.
Not surprisingly, AFM results showed that sonication significantly increased the
RMS (root mean square) roughness values of the surfaces of the nanocomposites.
Actually, from the SEM pictures in Figure 2.4, it can be seen that when sonication power
increased and subsequently improved the dispersion of nanophase titania particles, the
surface microstructure became more uniform which was closer to the microstructure of
natural bone since nano-HA crystals are uniformly dispersed in a collagen matrix in
natural bone, as shown in Figure 2.5 and 2.6.
Besides directly imaging surfaces, surface structures can also be quantified by
several fundamental parameters, for example, RMS roughness defined previously in
equation 2.2, a measure of the deviation in height above or below some reference point;
Ra, a measure of the arithmetic average of the absolute height of all pixels; or Rp-v, a
measure of the maximum peak-to-valley height. All of these parameters may be used to
characterize the surface roughness, but the RMS value is the most commonly used for the
analysis of AFM data. The advantage of RMS is not only its simplicity, but also in terms
of statistical significance. Since it is the standard deviation of the height, it describes the
spread of the height distribution about the mean value. Because the surfaces in this study
were produced by a method with some degree of spatial randomness, they were expected
to exhibit Gaussian or near-Gaussian height distributions, suggesting that RMS is an
appropriate description of roughness.

116
Obviously, RMS roughness values alone are not sufficient to describe 3-D surface
features. The most apparent limitation of RMS (also Ra and Rp-v) for describing surfaces
is a lack of spatial information. A single roughness value provides no insight into the
width or spacing of surface features, and roughness for surfaces with different spatial
variations of features that may be identical [ 196 - 198 ]. Fortunately, this could be
compensated by measuring surface area at the same time, which provides spatial
information of surface features. Generally, the parameters used for quantifying surface
features such as surface area and surface roughness are dependent on the scan size, the
size of the image in relation to the largest feature size, and the type of post-processing
performed on the image data. It should be noted that the scan area was 25 μm2 and 1 μm2
in this study and the measurements of surface area and roughness were based on five
randomly selected areas.
It is also important to be aware that roughness analysis can be biased by AFM
imaging artifacts. For example, it is unlikely that the sample is exactly perpendicular to
the tip; therefore, AFM images usually have some planar artifact (sample tilt) that is not
representative of the surface. Roughness measured with this artifact intact is an
overestimate, while improper removal of the artifact will also result in misrepresentation.
Therefore, in this study only linear plane fitting and flattening (no higher-order fits) were
used for all the surfaces so as to achieve comparable results among samples. The issue of
the effect of probe tip radius and geometry on limited spatial resolution and image
artifacts has also been considered extensively by researchers [199,200].

117
These parameters (such as surface area and roughness) discussed above influence
protein adsorption, osteoblast adhesion and long-term functions which will be discussed
in the following section.
2.4.4. Osteoblast Functions on Nanophase Titania/PLGA Composites
The development of bone-implant interfaces depends on the direct interactions of
osteoblasts with the biomaterial. Osteoblast adhesion and long-term functions are
therefore essential for bone–biomaterial interactions. Early in vitro studies of osteoblast-
biomaterial interaction were more concentrated with the effect of diverse materials rather
than any surface properties on cell adhesion, proliferation and differentiation [201].
However, it is now understood that the surface properties of biomaterials play a critical
role in the establishment of cell-biomaterial interfaces. In vitro cytocompatibility studies
are increasingly concerned with the influence of surface topography and consequent
adsorption of proteins on cell attachment and proliferation [202-204].
As mentioned, the dispersion of nanophase titania in PLGA was enhanced by
increasing the intensity of sonication. A key objective of this study was to determine the
influence of nanophase titania dispersed in PLGA by sonication at various powers on
osteoblast functions. The composites (such as PTC35) with greater amounts of nanophase
titania dispersed on their surface promoted greater osteoblast adhesion and long-term
functions (such as alkaline phosphatase activity and calcium-containing mineral
deposition). Thus, as demonstrated in SEM pictures, osteoblast functions may have been
enhanced simply because more titania was present on the surfaces of composites under
high power sonication and osteoblasts preferred titania over PLGA. However, when the

118
sonication power increased to higher than 166.25 W (35% maximum power), although
the titania coverage on the composites was about the same, osteoblast functions (such as
adhesion) decreased.
It is intriguing to consider why osteoblast adhesion and long-term functions were
different on the nanophase titania/PLGA composites which had the same percentage of
nanophase titania but were prepared using different sonication powers and, thus, had
various surface properties (such as various nanometer scale roughness).
2.4.4.1. Surface Roughness Influences Osteoblast Functions
In this light, it is important to mention that previous studies have shown that
protein interactions are much different on surfaces with nanometer compared to
conventional roughness. Specifically, the adsorption of vitronectin has been reported to
be much greater on nanophase compared to conventional titania although both titania in
comparison had the same chemistry [161]. Moreover, exposure of select epitopes that
mediate osteoblast adhesion (such as RGD) was greater when vitronectin was adsorbed
on nanometer compared to conventional ceramics [161]. The same events may be
happening here. That is, since PTC35 possessed the highest nanometer scale surface
roughness among all the composites, the present results suggest that osteoblast adhesion
and long-term functions may be closely related to surface roughness of titania/PLGA
composites.
Nanophase titania compacts, nanocomposites, and PLGA used in this study had
nanometer scale surface roughness from 20 nm to 120 nm according to 5 μm × 5 μm
AFM scans. Interestingly, PTC35 had nanometer surface roughness values closer to

119
natural bone compared to any other composite formulated here. The composite PTC35
with nanometer surface roughness values almost double that of PTC70, allowed for better
cell adhesion, alkaline phosphatase activity and greater calcium mineral deposition. That
is, when sonication power increased, titania agglomerates decreased to finer particles,
which promoted titania coverage on the surface of composites and subsequently
enhanced nanometer surface roughness; greater osteoblast adhesion and long-term
functions on the PTC35 composite, thus, resulted. However, when the sonication power
was greater than 166.25 W (PTC35), titania coverage on the composite surface did not
significantly further increase. But the surface roughness measured at 5 μm × 5 μm AFM
scans actually decreased because very fine titania particles tended to smoothen the
surface of the composites; decreased osteoblast adhesion and long-term functions for the
PTC70 (compared to PTC35), thus, resulted.
Cell morphology is an essential regulator for cell adhesion and proliferation.
Studies have demonstrated that well spread cells divide at a higher rate than those cells
with a rounded shape [205]. In the present study, more well spread osteoblasts were
observed on the titania compacts than PLGA and the composites; more well spread
osteoblasts were observed on PTC35 than the other composites and PLGA.
Therefore, roughness definitely had a significant positive effect on the greater
osteoblast adhesion and longer-term functions since some well-dispersed titania/PLGA
composites had the same surface composition in the present study.
Clearly, initial events during cell-biomaterials interactions, such as cell adhesion,
affect longer-term functions (such as proliferation, synthesis of proteins and calcium
mineral deposition). In the present study, enhanced synthesis of alkaline phosphatase and

120
deposition of calcium-containing mineral was observed on the titania/PLGA composites
which increased osteoblast adhesion the most (PTC35). Thus, it is unclear at this time
whether enhanced osteoblast long-term functions resulted simply from more cells
adhering in the first place or whether those adherent osteoblasts differentiated at a faster
rate. A much higher seeding density (100,000 cells/cm2) was used for longer-term
experiments than that for adhesion (2500 cells/cm2) which may have compensated the
influence of initial osteoblast adhesion on longer-term functions; that is, the number of
initial adherent cells on the surface may not make a considerable difference as time goes.
Further studies will be needed to determine the exact mechanism by which the nanophase
titania/PLGA composites with the highest nanometer surface roughness (PTC35)
promoted osteoblast functions.
2.4.4.2. Surface Area Influences Osteoblast Functions
Another explanation for promoted osteoblast functions may be greater surface
area. Previous studies have shown that, compared with larger grain size titania compacts,
nanophase titania had about 35% more surface area for cell adhesion [206]. The results
from this study also demonstrated that osteoblast adhesion, collagen synthesis, alkaline
phosphatase synthesis, and calcium deposition were greater on the composites with
higher surface area. However, when normalized to this increased surface area, osteoblast
adhesion, proliferation, and deposition of calcium-containing mineral were still enhanced
on nanometer compared to conventional bulk titania [206]. This indicates that increased
surface area was not the only contributing factor to greater osteoblast functions on
nanophase titania compacts.

121
In this study, acellular calcium deposition on nanophase titania/PLGA composites
and PLGA and titania controls depended on the surface area of the materials since they
followed very similar trend if comparing the data shown in Table 2.3 and Figure 2.20.
2.4.5. Degradation Behavior of Nanophase Titania/PLGA Composites
As mentioned, PLGA can degrade with random chain scission by ester hydrolysis
in a process auto-catalyzed by the generation of carboxylic acid end groups, and ceramic
particles used as inclusions in PLGA can tailor the degradation kinetics of the polymer
matrix and prevent acceleration of polymer degradation. Zhang et al. reported that adding
HA particles into PLGA (50/50 PLA/PGA) could decrease the degradation rate of PLGA
and buffering pH drop during the degradation process [207]. Maquet et al. demonstrated
that the degradation kinetics of PLGA (75/25 PLA/PGA) was delayed by the presence of
Bioglass® and the molecular weight of PLGA decreased in a slower rate in the presence
of Bioglass® [208]. However, the influence of nanophase titania and its dispersion status
on the degradation kinetics of PLGA have not been completed so far. This study provided
the first evidence that nanophase titania present in PLGA can improve the structural
stability and mediate the degradation behavior of PLGA.
Moreover, it is important to understand the mechanisms of PLGA degradation
mediated by ceramic particles. Surprisingly, this issue has not been thoroughly addressed
in the literature [207,208]. In this study, therefore, how the presence of ceramic particles
influences PLGA degradation in the composites was speculated and illustrated in Figure
2.25. Initially, ceramic particles interfere with the diffusion of water molecules into the
polymer chains, which decrease the probability of hydrolysis and, thus, decrease the

122
PLGA degradation rate. At a later stage of PLGA degradation, ceramic particles interfere
with the diffusion of the intermediate degradation products (oligomers) out into the
surrounding media, which slow down the pH drop in the media and, thus, further
decrease the PLGA degradation rate.

123
Figure 2. 25: Diagrams illustrating (a) the mechanisms of PLGA degradation and (b) the mechanisms how ceramic particles influence PLGA degradation.
(a) Diagram illustrating the mechanisms of PLGA degradation.
(b) Diagram illustrating the mechanisms of PLGA degradation mediated by ceramic particles.
Ceramic Particles

124
More importantly, nanophase titania/PLGA composites demonstrated much less
weight loss than pure PLGA at 21, 28, and 35 days of incubation. Specifically, the weight
loss of PTC35, PTC45 and PTC70 was approximately 20% less than pure PLGA at 21
days of incubation; 30% less than pure PLGA at 28 days of incubation; and 50% less than
pure PLGA at 35 days of incubation. This buffering effect of titania particles in weight
loss is more significant after longer time periods of incubation, which is correlated to the
pH buffering effect of titania particles. The buffering effect of titania particles on pH is
significant at the later stage of the degradation, that is, after 21 days of incubation. Less
acidic degradation of PLGA is less harmful to surrounding bone cells.
It is also important to note that the weight loss of PTC25 was very close to PLGA,
and even no statistical significance between them was observed. This indicated that the
dispersion status of nanophase titania in PLGA certainly played an important role in the
degradation behavior of the nanocomposites.
2.4.6. Toxicity of Nanophase Titania/PLGA Composites
2.4.6.1 Toxicity of PLGA and Its Degradation Products
PLGA has been proven to be a successful biodegradable polymer for biomedical
applications because there is very minimal systemic toxicity associated with PLGA
[209,210]. For example, Basarkar et al. evaluated in vitro toxicity of PLGA nanoparticles
(mean particles size: 740-1000 nm) in human embryonic kidney (HEK293) cells (ATCC,
CRL-1573) using a commercial MTT assay. It was reported that PLGA nanoparticles
were non-toxic at concentrations of 2.5-50 μg per well in 100 μL media after 24 hours of

125
culture and average cell viabilities were more than 90% of the control (not treated with
PLGA nanoparticles). Furthermore, PLGA undergoes hydrolysis in the body to produce
lactic acid and glycolic acid, which are normal by-products of various physiological
metabolic pathways and are removed from the body through citric acid cycle (also known
as tricarboxylic acid cycle or the Krebs cycle) [209]. In aerobic organisms, the citric acid
cycle is a metabolic pathway that is involved in the chemical conversion of carbohydrates,
fats and proteins into carbon dioxide and water to generate usable energy. The
degradation products of PLGA are neutralized and eventually eliminated from the body
with the urine. Therefore, once PLGA completely degrades, nothing foreign will be left
in the body.
2.4.6.2 Toxicity of Nano-Titania Particles
Well-dispersed titania nanoparticles in the PLGA composites decreased the
PLGA degradation rate, reduced the rapid pH drop induced by lactic acid and glycolic
acid (intermediate degradation products of PLGA), and provided the composites with
longer periods of mechanical integrity for bone regeneration. As mentioned, PLGA
degradation rate could be tailored to match new bone growth rate. When new bone grows
faster than PLGA degrades, titania nanoparticles could be incorporated into new bone
matrix through bone mineralization process. Even if small amounts of nano-titania
particles were detached from the composites due to PLGA degradation, these small
amounts of nano-titania particles should not affect osteoblast viability [ 211 , 212 ].
Specifically, it was reported that the number of viable osteoblasts when cultured with
1000 μg/mL of nano-titania particles for 2 or 6 hours was similar to the cell cultures
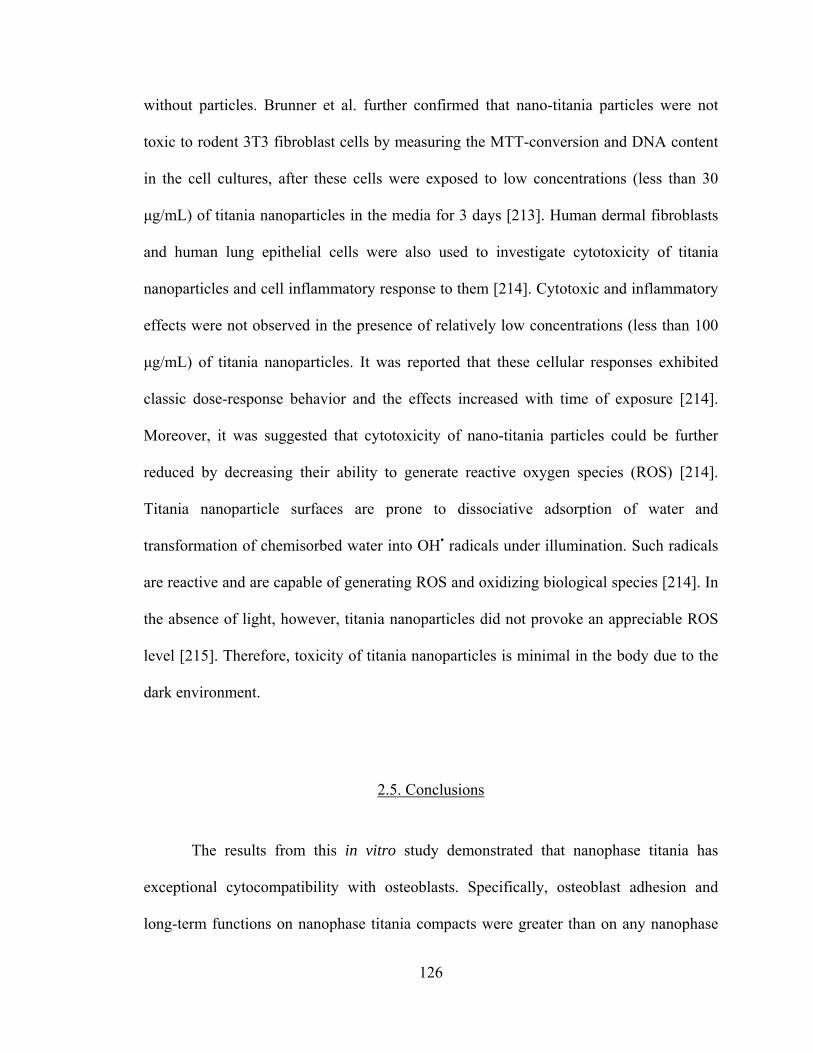
126
without particles. Brunner et al. further confirmed that nano-titania particles were not
toxic to rodent 3T3 fibroblast cells by measuring the MTT-conversion and DNA content
in the cell cultures, after these cells were exposed to low concentrations (less than 30
μg/mL) of titania nanoparticles in the media for 3 days [213]. Human dermal fibroblasts
and human lung epithelial cells were also used to investigate cytotoxicity of titania
nanoparticles and cell inflammatory response to them [214]. Cytotoxic and inflammatory
effects were not observed in the presence of relatively low concentrations (less than 100
μg/mL) of titania nanoparticles. It was reported that these cellular responses exhibited
classic dose-response behavior and the effects increased with time of exposure [214].
Moreover, it was suggested that cytotoxicity of nano-titania particles could be further
reduced by decreasing their ability to generate reactive oxygen species (ROS) [214].
Titania nanoparticle surfaces are prone to dissociative adsorption of water and
transformation of chemisorbed water into OH• radicals under illumination. Such radicals
are reactive and are capable of generating ROS and oxidizing biological species [214]. In
the absence of light, however, titania nanoparticles did not provoke an appreciable ROS
level [215]. Therefore, toxicity of titania nanoparticles is minimal in the body due to the
dark environment.
2.5. Conclusions
The results from this in vitro study demonstrated that nanophase titania has
exceptional cytocompatibility with osteoblasts. Specifically, osteoblast adhesion and
long-term functions on nanophase titania compacts were greater than on any nanophase

127
titania/PLGA composite. Moreover, PLGA when combined with nanophase titania
allowed for better osteoblast adhesion, collagen synthesis, alkaline phosphatase activity,
and calcium mineral deposition than what occurred for pure PLGA. It demonstrated for
the first time that the nanophase titania/PLGA composites with the closest surface
roughness to natural bone at the nanoscale (provided by well-dispersed titania
nanoparticles in PLGA) promoted osteoblast adhesion and calcium deposition the most.
Among the composites, when considering all data together, PTC35, enhanced osteoblast
functions the most.
Nanophase titania in PLGA composites also provided better degradation kinetics
which favors cell survival and enhanced functions.
In conclusion, this study suggests that nanophase titania/PLGA composites with
proper dispersion status have excellent cytocompatibility properties crucial in designing
better orthopedic materials for bone regeneration. In order to take full advantage of the
nanophase titania/PLGA composites, however, adjusting dispersion of titania and
mimicking the surface properties of natural bone (such as surface roughness) are key
considerations.

128
CHAPTER 3. OSTEOBLAST INTERACTIONS WITH NANOSTRUCTURED 3D
CERAMIC/POLYMER COMPOSITES
3.1. Scientific Challenges and Specific Aims
Chapter 2 demonstrated that nanoscale surface features provided by well-
dispersed nanophase titania in PLGA composites promoted osteoblast adhesion and long-
term functions (such as alkaline phosphatase activity and calcium-containing mineral
deposition). However, to date, relatively few advantages of the macro assembly of
nanocomposites composed of nanophase ceramics and degradable polymers have been
incorporated into the orthopedic clinical arena due to the limited availability and
flexibility of traditional 3D fabrication techniques for nanocomposites. The challenge lies
in how to integrate nanoscale structures or components in a cost-effective, scalable and
repeatable way into macro architectures while preserving their nano-features.
A successful synthetic orthopedic prosthesis requires a hierarchical internal
structure with interconnecting pores for nutrition transportation, cell infiltration and
vascularization as well as nanoscale surface features favorable for cell attachment and
long-term functions. This Chapter, therefore, focuses on further mimicking bone by
building 3D structures from titania/PLGA nanocomposites because, similarly, natural
bone assembles its 3D hierarchical architecture from nanostructured building blocks. The
objective of this study was to test the effectiveness of a novel aerosol-based 3D printing

129
technique for nanocomposite fabrication and in vitro cytocompatibility (such as
osteoblast adhesion and infiltration into these 3D printed nanocomposite scaffolds).
3.1.1. Problems of Current 3D Fabrication Techniques
Solvent-casting/porogen-leaching (SC/PL) techniques have been widely used to
fabricate 3D porous polymer scaffolds for tissue engineering applications. Salt is the
most commonly used porogen because it is easily available and very easy to handle.
Briefly, this technique involves producing a suspension of polymers or ceramic/polymer
composites in a solvent. Salt particles are ground and sieved into small particles and
those of the desired size (most researchers use 100-200 µm range particles) are
transferred into a mold. A polymer or composite suspension is then cast into the salt-
filled mold. The solvent is then removed by evaporation in air and/or in vacuum. After
the evaporation of the solvent, the salt crystals are leached away by immersion in water to
form a porous structure. In this technique, the pore size can be controlled by the size of
the porogen particles and the porosity can be controlled by the amount of porogen added
into the polymer or composite suspension. However, solvent-casting/porogen-leaching
techniques have two main disadvantages. First, certain critical variables such as pore
shape and inter-pore openings are still not well controlled in this technique. Second, if
nanophase ceramic particles were used to make nanocomposite scaffolds in this
technique, nanoparticles may interfere with the porogen leaching process, which will
result in residual porogen particles in the final tissue engineering products, and, thus,
have adverse effects on their cytocompatibility.

130
Another technique, called phase separation and emulsion freeze drying, has been
developed based on the thermodynamic principle for the fabrication of 3D porous
polymer scaffolds [216-217]. This technique involves liquid-liquid phase separation and
solid-liquid phase separation. Liquid-liquid phase separation was mainly used for
preparing polymer scaffolds. Solid-liquid phase separation, also called emulsion freeze
drying, could be applied to both polymers and composites. Briefly, this technique could
be achieved by lowering the temperature to induce solvent crystallization from a polymer
or composite suspension (solid phase formation in a liquid phase). After the removal of
the solvent crystals (sublimation or solvent exchange), the space originally taken by the
solvent crystals becomes pores. For example, Liu et al. used this technique to prepare
collagen/hydroxyapatite composite scaffolds [218]. Specifically, hydroxyapatite powder
was added into a collagen solution, and homogenized by a speed stirrer. The mixture was
then poured onto petri dishes, and rapidly transferred into a refrigerator at -30 °C to
solidify the mixture and induce solid-liquid phase separation. The solidified mixture was
maintained at that temperature for 2 hours, and then lyophilized for 2 days. The final
collagen/hydroxyapatite scaffolds were porous with three-dimensional interconnected
fiber microstructure and demonstrated an uneven pore size from 50 to 150 μm. Although
this technique is advantageous as it does not require a porogen and an extra
washing/leaching step, the phase diagrams of the polymer-solvent or composite-solvent
systems must be fully characterized which would significantly increase the difficulties in
controlling the process especially when composites are involved. Moreover, the pores
formed using phase separation techniques usually have irregular shapes, have diameters

131
on the order of a few to tens or hundreds of microns and are often not uniformly
distributed.
One of the common shortcomings of these traditional fabrication technologies
(such as solvent-casting/porogen-leaching and phase separation) is the lack of precise
control of the 3D internal and external nano-architecture of the final products especially
when a second phase (ceramic nanoparticles) is involved [219,220]. This is not desirable
since osteoblasts prefer well-ordered structures rather than random structures [221-224].
Moreover, these traditional techniques can not produce scalable consistent results for
clinical applications.
3.1.2. Nanofabrication: A Novel Aerosol-Based 3D Printing
A novel aerosol-based 3D printing technique (Maskless Mesoscale Materials
DepositionTM or M3DTM system) developed by OPTOMEC® provides a great promise in
breaking through these difficulties associated with traditional fabrication techniques.
Here it is proposed to use the M3DTM system to build desired 3D bone-like macro
structures to take full advantage of nanocomposites for orthopedic applications (Figure
3.1). One direct and simple reason is that natural bone, similarly, assembles its 3D macro
hierarchical structures from nanostructured building blocks (nano-HA and collagen)
(Figure 1.11.).

132
Figure 3. 1: Illustration of the M3DTM system developed by OPTOMEC®. Left is the M3DTM system. Right is a close up of the deposition head and nozzle used to deposit nanophase ceramic/polymer composites in a controlled manner. Bar=100 µm. (Adapted and redrawn from [225]).
The M3DTM system offers great promise towards its applications in the next
generation of nanocomposite orthopedic implant systems due to many more scientific
reasons, especially when considering the following benefits offered by its special features.
First, the M3DTM system is capable of producing complex-shaped scaffolds with well-
controlled 3D architectures and internal pore structures layer-by-layer from pre-designed
CAD models. This technique makes it possible to directly assemble bone substitutes with
a variety of shapes and sizes to match bone defects in the patients based on their medical
information from computer-aided tomography (CT) and/or magnetic resonance imaging
(MRI) (that can be translated into CAD models). Second, the M3DTM system can deposit
a wide variety of materials, including any materials that can be suspended in liquid
(metals, ceramics, polymers, composites and biological materials), on virtually any 2D
planar surfaces or 3D non-planar substrates. The ability to deposit materials on a 3D non-
Magnified Region of Deposition Head
Magnified Nozzle

133
planar substrate is made possible by the relatively high (more than 5 mm) standoff point
of the deposition head and long focal length of the material beam exiting the nozzle.
There is no physical contact between the nozzle and the substrate and therefore
conformal writing can be achieved. Third, the M3DTM system follows an additive
(bottom-up) manufacture that does not need tooling, masks or any porogens, thus,
offering a cost-effective high resolution deposition in contrast to traditional subtractive
(top-down) methods. Fourth, the M3DTM system provides a scalable and repeatable 3D
nanofabrication technique that has the ability to deposit materials at speeds up to 1 mm3/s
with a feature resolution down to 10 µm in line width and 50-100 nm in thickness (single
layer deposition) [226]. The M3DTM system is also capable of depositing a single layer as
high as 5 microns for a larger scale of applications [226]. Fifth, the M3DTM system offers
low temperature processing [ 227 ], which is particularly beneficial for fabricating
nanomaterials because it helps prevent grain growth typically induced by high
temperature sintering.
The major challenges of using this 3D printing technique lie on designing CAD
(computer-aided design) models for bone-like structures, dispersion of nanophase
ceramics in the polymer solutions and controlling rheological properties of
nanocomposite suspensions for optimal aerosolization. Sonication at controlled powers is
necessary to disperse nanophase ceramics in polymer composites. Various
ceramic/polymer/solvent ratios have to be manipulated to obtain stable suspensions,
critical for maximizing 3D printing efficiency. Many factors (size and shape of
nanoparticles, dispersion/agglomeration of nanoparticles, volume fraction, steric
repulsion, Brownian motion, electrostatic forces, hydrodynamic forces) affect stability of

134
suspensions. Measuring the rheology of a suspension offers an indication of the colloidal
state, which is important for determining its processing behavior for 3D printing. A
rheometer can be used to measure viscosity as a function of shear rate to determine non-
Newtonian flow behavior, thus, determining dispersion/agglomeration as well as shear
thining or thicking of the nanocomposite suspensions of interest.
3.2. Materials and Methods
3.2.1. Preparation of 3D Nanophase Titania/PLGA Scaffolds
PLGA (poly-lactide-co-glycolide) pellets (50/50 wt.% poly(DL-lactide/glycolide);
molecular weight: 100,000-120,000 g/mol) were purchased from Polysciences, Inc.
(Warrington, PA). Nanophase titania powder (Nanotek®) was purchased from Nanophase
Technologies Corporation (Romeoville, IL). The purity of the titania powder was 99.5+%,
the particle size was 32 nm which was calculated from BET adsorption measurements,
the particle morphology was nearly spherical as shown in the TEM image (Figure 2.1),
and the crystalline phase was 80% anatase/20% rutile [175].
PLGA pellets were dissolved in chloroform (Sigma-Aldrich) at 40 °C in a water
bath for 40 minutes. Nanophase titania was then well dispersed in PLGA solutions by
controlled sonication using a S-250D Branson® Digital Sonifier (Branson, Inc., Danbury,
CT) with its tip immersed in the mixture. This sonifier permits the application of
ultrasonic energy to the suspensions on a pulsed basis. In this study, the intensity was set
at 400 W and the pulse width was set as 60% of the duty cycle out of 1 second cycle time.
This intermittent operation permits high intensity sonication while avoiding heat build-up

135
in the processed suspensions. The weight ratio of nano-titania/PLGA in the composites
was 30/70.
As a first attempt to further mimick bone in its 3D architecture, a novel aerosol-
based 3D printing technique was used to build 3D structures from titania/PLGA
nanocomposites. The M3DTM system was developed by OPTOMEC®. This technique
uses aerodynamic focusing of aerosol streams for the high-resolution deposition of
chemical precursor solutions or colloidal suspensions. The M3DTM system consists of 3
basic modules, as shown in Figure 3.2. (i) An aerosol (mist) generation module for
atomizing material suspensions. A dense aerosol of tiny droplets is generated using an
ultrasonic transducer (for suspensions with a viscosity of less than 10 cP) or a pneumatic
atomizer (for suspensions with a viscosity of 10-1000 cP) [228]. (ii) A flow guidance
module for carrying and focusing the aerosol. An annular and co-axial flow of the aerosol
stream is carried by a gas flow to the deposition head and focused by a second gas sheath
in the deposition head through a nozzle towards the deposition platform. The M3DTM
flow guidance head is capable of focusing an aerosol stream to as small as a tenth of the
size of the nozzle orifice for higher resolution structures. (iii) A CAD module (in-flight
processing) for controlling the pattern of the aerosol droplets. The deposition is driven by
a CAD model that is pre-written into a standard .DFX file. Patterning is accomplished by
a computer-driven deposition platform or by translating the flow guidance head while the
deposition platform remains fixed.

136
Figure 3. 2: Diagram illustrating the basic principles of the aerosol-based 3D printing. (1) The well-dispersed nanocomposite suspensions are aerosolized in an atomizer (ultrasonic or pneumatic) to create a dense aerosol of tiny droplets. (2) The aerosol is carried by a gas to the deposition head. (3) The aerosol is focused by a second gas sheath in the deposition head and “sprayed” onto the deposition platform layer by layer. (Adapted and redrawn from [225]).
The suspension of well dispersed nano-titania in PLGA composites was
aerosolized in the M3DTM ultrasonic atomizer to create a dense aerosol of tiny droplets;
the aerosol was carried by a gas to the deposition head and focused by a second gas flow
within the deposition head; and finally the resulting high velocity stream was “sprayed”
onto the substrate layer by layer according to pre-designed CAD (computer-aided design)
models (Figure 3.2). The final 3D nanocomposite scaffolds were 1 cm × 1 cm squares
with a thickness of 0.5 mm.
The 3D printed nanocomposite scaffolds were dried in air at room temperature for
24 hours and dried in an air vacuum chamber at room temperature for 48 hours. These 3D
1
3
Ultrasonic Atomizer
Size Sorter
Pneumatic Atomizer
1’
Deposition Platform
2

137
composites were sterilized by soaking in 70% ethanol for 30 minutes and were dried
completely before performing experiments with cells.
3.2.2. Characterization of 3D Nanophase Titania/PLGA Scaffolds
Field emission scanning electron microscopy (FESEM) was used to characterize
the nano-to-micron structure and surface features of these 3D scaffolds. Surface
topographies and 3D structures of the 3D printed nanophase titania/PLGA composites
were characterized according to standard scanning electron microscopy techniques using
a LEO 1530 Field Emission Scanning Electron Microscope (FESEM) at a 5 kV
accelerating voltage and 3×10-11 Amp probe current.. Substrates were sputter-coated with
a thin layer of gold-palladium using a Hummer I Sputter Coater (Technics) in a 100
millitorr vacuum argon environment for 3 minutes with 0.01 Amp of current. The areal
analysis technique was used to quantitatively measure the pore size and porosity. SEM
images taken at 60 kX magnifications were used to determine nanophase titania
dispersion in PLGA.
3.2.3. In Vitro Osteoblast Interactions with 3D Nanophase Titania/PLGA Scaffolds
Human osteoblasts (bone-forming cells; CRL-11372 American Type Culture
Collection) were cultured in Dulbecco’s modified Eagle’s medium (DMEM; GIBCO,
Grand Island, NY) supplemented with 10% fetal bovine serum (FBS; Hyclone) and 1%
penicillin/streptomycin (P/S; Hyclone) under standard cell culture conditions, that is, a

138
sterile, 37 °C, humidified, 5% CO2/95% air environment. Cells at passage numbers 5-6
were used in the experiments.
All sterilized scaffolds were placed in tissue culture plates (Corning, New York)
and were rinsed three times with sterilized phosphate buffered saline (PBS). Osteoblasts
were seeded at a concentration of 3500 cells/cm2 onto the substrates of interest in 2 ml
DMEM supplemented with 10% FBS and 1% P/S and were then incubated under
standard cell culture conditions for 4 hours. After that time period, non-adherent cells
were removed by rinsing with PBS and adherent cells were then stained with DAPI
nucleic acid stain (Invitrogen).
Confocal laser scanning microscopy was used to evaluate osteoblast attachment
on the surface and infiltration into the porous structures. The cell nuclei were visualized
and counted under a Leica TCS SP2 AOBS spectral confocal microscope (excitation
wavelength 358 nm and emission wavelength 461 nm). Two detection channels were
used in this study: one was for imaging fluorescence from stained cells and another one
was for collecting bright field images of scaffolds. Leica’s confocal software (LCS
version 2.5) was used for 3D-scanning image acquisition and 3D reconstruction. Cell
counts were expressed as the number of cells adherent around the pores and adherent on
the surfaces away from the pores by averaging twenty fields of view. All experiments
were run in triplicate. Numerical data were analyzed using Student t test; statistical
significance was considered at p<0.05.
Osteoblasts morphologies on the composite scaffolds were observed using a LEO
1530 FESEM. For this purpose, after the 4 hour adhesion test, adherent osteoblasts on the
substrates were fixed with 2 % glutaraldehyde (Electron Microscopy Sciences) in 0.1 M

139
cacodylate (pH 7.4; Electron Microscopy Sciences) for 30 minutes at 4 °C. After washing
with cacodylate buffer, the cells were secondarily fixed with 1 % osmium tetraoxide
(Electron Microscopy Sciences) in 0.1 M cacodylate (pH 7.4) for 30 minutes at 4 °C. The
cells were dehydrated through a series of ethanol solutions (from 30, 50, 70, 90, to 100 %;
AAPER) and were then critical point dried (CPD; LADD Research Industries). All the
specimens were sputter-coated with a thin layer of gold-palladium using a Hummer I
Sputter Coater (Technics) in a 100 millitorr vacuum argon environment for 3 minutes
with 0.01 Amp of current.
3.3. Results and Discussions
3.3.1. Well-Ordered 3D Nanophase Titania/PLGA Scaffolds
The 3D printed nanophase titania/PLGA composite scaffolds had well-ordered 3D
structures as designed (Figure 3.3a). The SEM results demonstrated that the printed nano
3D scaffolds have a well-controlled, repeatable inner structure and, moreover, possessed
uniformly dispersed titania nanoparticles which provided for nanoscale surface features
throughout the PLGA matrix. The pores had a cubic shape and pore sizes were controlled
at 100 μm. The porosity was 32% according to the areal analysis. As mentioned, the pore
size, shape and percentage can be precisely controlled by pre-designed CAD models
using this aerosol based 3D printing technique.
The architecture of these 3D scaffolds was significantly different from that
formed from porogen leaching or phase separation techniques which produce randomly
packed pores. Clearly, the uncontrolled, random pore structures cause a lack of
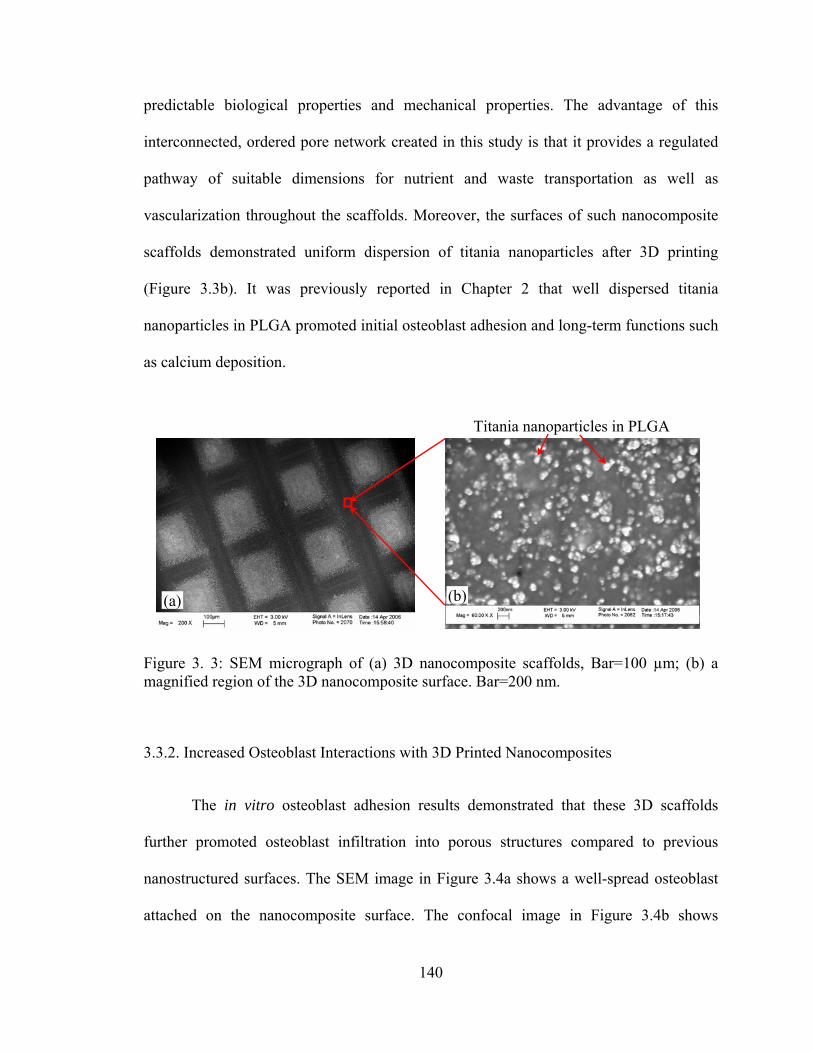
140
predictable biological properties and mechanical properties. The advantage of this
interconnected, ordered pore network created in this study is that it provides a regulated
pathway of suitable dimensions for nutrient and waste transportation as well as
vascularization throughout the scaffolds. Moreover, the surfaces of such nanocomposite
scaffolds demonstrated uniform dispersion of titania nanoparticles after 3D printing
(Figure 3.3b). It was previously reported in Chapter 2 that well dispersed titania
nanoparticles in PLGA promoted initial osteoblast adhesion and long-term functions such
as calcium deposition.
Figure 3. 3: SEM micrograph of (a) 3D nanocomposite scaffolds, Bar=100 µm; (b) a magnified region of the 3D nanocomposite surface. Bar=200 nm.
3.3.2. Increased Osteoblast Interactions with 3D Printed Nanocomposites
The in vitro osteoblast adhesion results demonstrated that these 3D scaffolds
further promoted osteoblast infiltration into porous structures compared to previous
nanostructured surfaces. The SEM image in Figure 3.4a shows a well-spread osteoblast
attached on the nanocomposite surface. The confocal image in Figure 3.4b shows
Titania nanoparticles in PLGA
(a) (b)

141
enhanced osteoblast adhesion on pore structures of such 3D printed nanocomposite
scaffolds. The results demonstrated that osteoblasts preferred the nanoscale roughness of
the pore walls over that of the outer surface of the 3D nano-scaffolds. Thus, this study
suggests that these novel 3D nano-scaffolds consisting of nanophase titania/PLGA
composites created via the 3D printing technique are very promising for more effective
orthopedic tissue engineering applications.
Figure 3. 4: (a) SEM micrograph of an osteoblast adhering on the nanocomposite surface, Bar=10 µm. (b) Confocal micrograph of osteoblasts adhering around pore structures of 3D printed nanocomposite scaffolds. Bar=150 µm.
Quantitative results demonstrated that osteoblast infiltration onto the pore
structures was 4.2 times greater than osteoblast adhesion onto the rest of scaffold surfaces,
as shown in Figure 3.5. Increased osteoblast infiltration into 3D porous structures is a
crucial prerequisite for enhancing subsequent new bone ingrowth.
Cells
(a) (b)

142
Figure 3. 5: (a) The average number of osteoblasts adherent to pore structures. (b) The average number of osteoblasts adherent to the surfaces away from pores. Values are mean ± SD; n = 3; *p < 0.05 compared to (b).
3.4. Conclusions
Results of this study have evaluated a means of fabricating a hierarchical macro-
structure from ceramic/polymer nanocomposites that can mimic properties of natural
bone, thus, providing a new material and approach for more effective orthopedic
applications. The aerosol-based 3D printing technique produced well-ordered bone-like
structures and preserved nano-dispersion of ceramic in polymer composites. The 3D
printed nanocomposites promoted bone cell infiltrations and subsequent bone ingrowth.
Considering these exciting results, future work is needed to focus on
understanding cell interactions with various nanostructured 3D patterns and determining
the mechanisms for improved osteoblast functions and infiltration on these 3D
nanocomposite scaffolds. The mechanisms of cell-material interactions can be
*
Cel
l Den
sity
(cel
ls/c
m2 )
(a) In pores (b) On surfaces 0
500
1000
1500
2000
2500

143
determined by selective and competitive protein adsorption. This will provide a
fundamental mechanism explaining protein mediated cellular behavior on the 3D printed
nanocomposites.

144
CHAPTER 4. MECHANICAL PROPERTIES OF NANOPHASE
CERAMIC/POLYMER COMPOSITES
4.1. Problems and Specific Aims
Previous chapters demonstrated that well-dispersed nano-particulate titania in
poly-lactide-co-glycolide (PLGA) composites promoted osteoblast (bone-forming cell)
adhesion and long-term functions (such as collagen synthesis and calcium-containing
mineral deposition) compared to pure PLGA and more agglomerated titania in PLGA
composites. The controlled dispersion of titania nanoparticles in PLGA also furthered
decreased the weight loss of bone scaffolds, reduced harmful acidic pH changes during
PLGA degradation, and prolonged the mechanical integrity of the scaffolds. It is
intriguing and necessary to examine mechanical properties of such nanocomposites for
orthopedic applications.
Mismatches in the mechanical properties of metallic implants and physiological
bone result in stress-shielding problems [162]. Metallic materials widely used in
orthopedic applications have much stronger mechanical properties (such as elastic
modulus) than natural bone, which can weaken the newly formed bone interface due to
stress-shielding. Because natural bone is under continuous physiological stresses (such as
compression, tension, torsion, and/or bending), the mechanical properties of orthopedic
implant materials should closely match those of living bone. This is necessary to

145
minimize stress and strain imbalances during physiological loading conditions which will
lead to implant failure.
The objective of the present study, therefore, was to characterize the mechanical
properties of PLGA with well-dispersed nanophase titania. The dispersion of titania in
PLGA was controlled by sonication and was characterized by field emission scanning
electron microscopy and image analysis techniques. For this purpose, two major stresses
(compression and tension) that natural bone experiences under physiological loading
conditions were characterized using an Instron Material Testing System.
4.2. Materials and Methods
4.2.1. Material Preparation for Mechanical Tests
4.2.1.1. Specimens for Tensile and Compressive Tests
4.2.1.1.1. Nanophase Titania/PLGA Composites for Mechanical Tests
PLGA (50/50 wt.% poly(dl-lactide/glycolide); Polysciences) was dissolved in an
organic solvent and titania nanoparticles (Nanophase Technologies) were added into the
PLGA solution to provide a 70/30 polymer/ceramic weight ratio. The composite mixture
was then processed using a Misonix 3000 sonicator (Misonix, Inc.) with its microtip
immersed in the mixture. After sonication, the composite suspension was cast into a
Teflon mold that was specially designed for dog-bone shaped tensile specimens,
evaporated in air at room temperature for 24 hours and dried in an air vacuum chamber at
room temperature for 48 hours. The design of the casting mold for tensile specimens will
be described in the later section 4.2.1.2. The dispersion status of final composite scaffolds

146
was controlled by sonication settings. These PLGA/titania composites (PTC) were
termed as PTCa (a=agglomerated) and PTCd (d=dispersed) according to their titania
dispersion states. PLGA was used as a control and was prepared by the solvent-casting
technique described above except that no ceramics were added. These mold-cast tensile
specimens had the same dimension (Figure 4.1). The gage length was 25 mm; the gage
width was 10 mm; and the thickness was 0.5 mm. Similar procedures were used to
prepare the specimens for compressive tests except that the casting mold was for
compressive specimens with a circular shape. The gage diameter of compressive
specimens was 10 mm and the thickness was 0.5 mm.
Figure 4. 1: The tensile specimens of PLGA, PTCa and PTCd. The gage length x width x thickness = 25 x 10 x 0.5 mm.
4.2.1.1.2. Nanophase HA/PLGA Composites for Mechanical Tests
Nanophase HA was synthesized using a wet chemistry precipitation method by
mixing solutions of calcium nitrate and ammonium phosphate in an alkaline pH region
[229]. Specifically, a 1 M calcium nitrate solution and a 0.6 M ammonium phosphate
solution were prepared by dissolving their respective solid state powders in deionized (DI)
water separately. The produced ammonium phosphate solution was mixed with DI water
PLGA
PTCa
PTCd

147
which was adjusted to pH 10 by ammonium hydride. The pre-made 1 M calcium nitrate
solution was then added into the mixture of ammonium phosphate and ammonium
hydride at a rate of 3.6 ml/min. Precipitation occurred as soon as the calcium nitrate was
added. Chemically, the HA precipitation occurred through the reaction [4.1]:
10Ca(NO3)2+6(NH4)2HPO4+8NH4OH = Ca10(PO4)6(OH)2+6H2O+20NH4NO3 [4.1]
Precipitation continued for 10 minutes at room temperature with constant stirring.
The supernatant was collected, centrifuged (Eppendorf centrifuge, Model 5810 R) to
reduce 75% of the solution volume and placed into to a 125 ml Teflon liner (Parr
Instrument). The Teflon liner was sealed tightly in a Parr acid digestion bomb (Parr
Instrument) and treated hydrothermally at 200 °C for 20 hours to obtain nanocrystalline
HA. The hydrothermal treatment demonstrated a great advantage to prepare a
stoichiometric, ultrafine HA powder with a homogeneous shape and size distribution due
to higher applied pressures than atmospheric [230,231]. After the hydrothermal treatment,
nano-HA particles were rinsed with DI water and dried in an oven at 80 °C for 12 hours.
PLGA (50/50 wt.% poly(dl-lactide/glycolide); Polysciences) was dissolved in an
organic solvent and synthesized HA nanoparticles were added into the PLGA solution to
provide a 30/70 ceramic/polymer weight ratio. The composite mixture was then
processed using a Misonix 3000 sonicator (Misonix, Inc.) with its microtip immersed in
the mixture. After sonication, the composite suspension was cast into a Teflon mold that
was specially designed for dog-bone shaped tensile specimens, evaporated in air at room
temperature for 24 hours and dried in an air vacuum chamber at room temperature for 48
hours. The design of the casting mold for tensile specimens will be described in the later

148
section 4.2.1.2. The dispersion status of final composite scaffolds was controlled by
sonication settings. These HA/PLGA composites (PHA) were termed as PHAa
(a=agglomerated) and PHAd (d=dispersed) according to their HA dispersion states.
PLGA was used as a control and was prepared by the solvent-casting technique described
above except that no ceramics were added. These mold-cast tensile specimens had the
same dimension (Figure 4.2). The gage length was 25 mm; the gage width was 10 mm;
and the thickness was 0.5 mm. Similar procedures were used to prepare the specimens for
compressive tests except that the casting mold was for compressive specimens with a
circular shape. The gage diameter of compressive specimens was 10 mm and the
thickness was 0.5 mm.
Figure 4. 2: The tensile specimens of PLGA, PHAa and PHAd. The gage length x width x thickness = 25 x 10 x 0.5 mm.
4.2.1.2. Design of Casting Molds for Tensile Specimens
The casting molds for tensile specimens were designed based on ASTM
(American Society for Testing and Materials) standards D638, D882, D3039, and ISO
PLGA
PHAa
PHAd

149
(International Organization for Standardization) standard 37 [232-237]. Figure 4.3 shows
an example of casting molds for preparing tensile specimens.
Figure 4. 3: The casting mold for tensile specimens. The gage length was designed as 25 mm; the gage width was designed as 10 mm; and the depth was designed as 10 mm.
4.2.3. Characterization of Materials Before Mechanical Tests
Surface properties of the titania/PLGA nanocomposites and HA/PLGA
nanocomposites were characterized before mechanical tests using a Field Emission
Scanning Electron Microscope (FESEM, LEO 1530) at a 3 kV accelerating voltage. The
nanocomposites and PLGA were sputter-coated with a thin layer of gold-palladium, using
a Hummer I Sputter Coater (Technics) in a 100 mTorr vacuum argon environment for 3
min at 10 mA of current.
4.2.4. Mechanical Tests: Tensile and Compressive Tests
All composites and PLGA were subjected to tensile and compressive tests using
an Instron 5882 mechanical testing system (Figure 4.4). A 50 kN load cell was used to
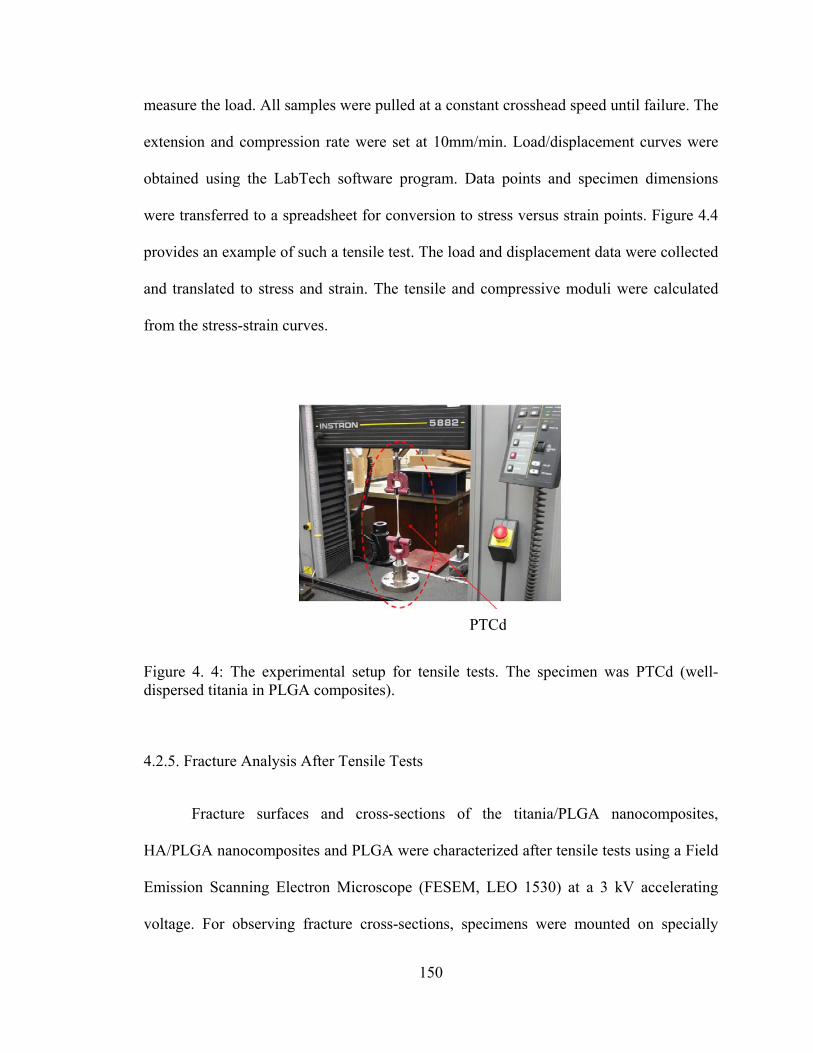
150
measure the load. All samples were pulled at a constant crosshead speed until failure. The
extension and compression rate were set at 10mm/min. Load/displacement curves were
obtained using the LabTech software program. Data points and specimen dimensions
were transferred to a spreadsheet for conversion to stress versus strain points. Figure 4.4
provides an example of such a tensile test. The load and displacement data were collected
and translated to stress and strain. The tensile and compressive moduli were calculated
from the stress-strain curves.
Figure 4. 4: The experimental setup for tensile tests. The specimen was PTCd (well-dispersed titania in PLGA composites).
4.2.5. Fracture Analysis After Tensile Tests
Fracture surfaces and cross-sections of the titania/PLGA nanocomposites,
HA/PLGA nanocomposites and PLGA were characterized after tensile tests using a Field
Emission Scanning Electron Microscope (FESEM, LEO 1530) at a 3 kV accelerating
voltage. For observing fracture cross-sections, specimens were mounted on specially
PTCd

151
designed 45°/90° holders. The nanocomposites and PLGA were sputter-coated with a
thin layer of gold-palladium, using a Hummer I Sputter Coater (Technics) in a 100 mTorr
vacuum argon environment for 3 min with 10 mA of current.
4.2.6. Statistical Analysis
All mechanical tests were repeated three times (3 specimens each time) for each
type of specimens. Numerical data were analyzed using standard analysis of variance
(ANOVA) techniques and standard pair-wised comparison tests; statistical significance
was considered at p<0.05.
4.3. Results
4.3.1. Material Characterization Before Mechanical Tests
4.3.1.1. Nanophase Titania/PLGA Composites Before Mechanical Tests
Scanning electron micrographs suggest that the distribution of nano-titania
particles was much different in the PTCa and PTCd samples although both of them had
the same weight percentage of titania (that is, 30 wt.%) in PLGA, as shown in Figure 4.5.
Specifically, there were less titania particles on the top surface of PTCa than PTCd
because the agglomerates larger than 100 nm descended faster than the solvent
evaporation rate according to the established Stoke’s Equation. The amount of surface
area occupied by titania increased on the top surface of PTCd (10.1%, Figure 4.5c)
compared to PTCa (5.7%, Figure 4.5a) because the solvent evaporation was much faster

152
than the sedimentation of well-dispersed titania particles less than 100 nm. Moreover, for
the PTCa, the top surface was much different from the bottom surface, which indicates
the difference in the distribution of nano-titania agglomerates. More agglomerates
concentrated on the bottom side of PTCa. For the PTCd, however, there was no
significant difference between its top and bottom surfaces.
Figure 4. 5: SEM micrographs of nanophase titania/PLGA composites: (a) the top surface of PTCa, (b) the bottom surface of PTCa, (c) the top surface of PTCd, and (d) the bottom surface of PTCd. Magnification bars: 1 µm.
(a) (b)
(c) (d)
153
4.3.1.2. Nanophase HA/PLGA Composites Before Mechanical Tests
Nanophase HA synthesized by the wet chemistry method demonstrated a relative
uniform particle size, as shown in Figure 4.6. The linear image analysis results
demonstrated that the nano-HA had an average particle size of 36 nm.
Figure 4. 6: SEM micrographs of particulate HA synthesized by the wet chemistry method. Original magnification is 100 kX, scale bar is 200 nm.
Scanning electron micrographs suggest that the distribution of nano-HA particles
was much different in the PHAa and PHAd samples although both of them had the same
weight percentage of HA (that is, 30 wt.%) in PLGA, as shown in Figure 4.7. Specifically,
there were less HA particles on the top surface of PHAa than PHAd because the
agglomerates larger than 100 nm descended faster than the solvent evaporation rate
according to the established Stoke’s Equation. The amount of surface area occupied by
HA increased on the top surface of PHAd (11.2%, Figure 4.7c) compared to PHAa (7.1%,
Figure 4.7a) because the solvent evaporation was much faster than the sedimentation of
well-dispersed HA particles less than 100 nm. Moreover, for the PHAa, the top surface
was much different from the bottom surface, which provided evidence of the difference

154
in the distribution of nano-HA agglomerates. More agglomerates concentrated on the
bottom side of PHAa. For the PHAd, however, there was no significant difference
between its top and bottom surfaces.
Figure 4. 7: SEM micrographs of nanophase HA/PLGA composites: (a) the top surface of PHAa, (b) the bottom surface of PHAa, (c) the top surface of PHAd, and (d) the bottom surface of PHAd. Original magnification is 50 kX for (a,b) and 100 kX for (c,d). Magnification bars are 200 nm for (a,b,c) and 100 nm for (d).
(a) (b)
(c) (d)
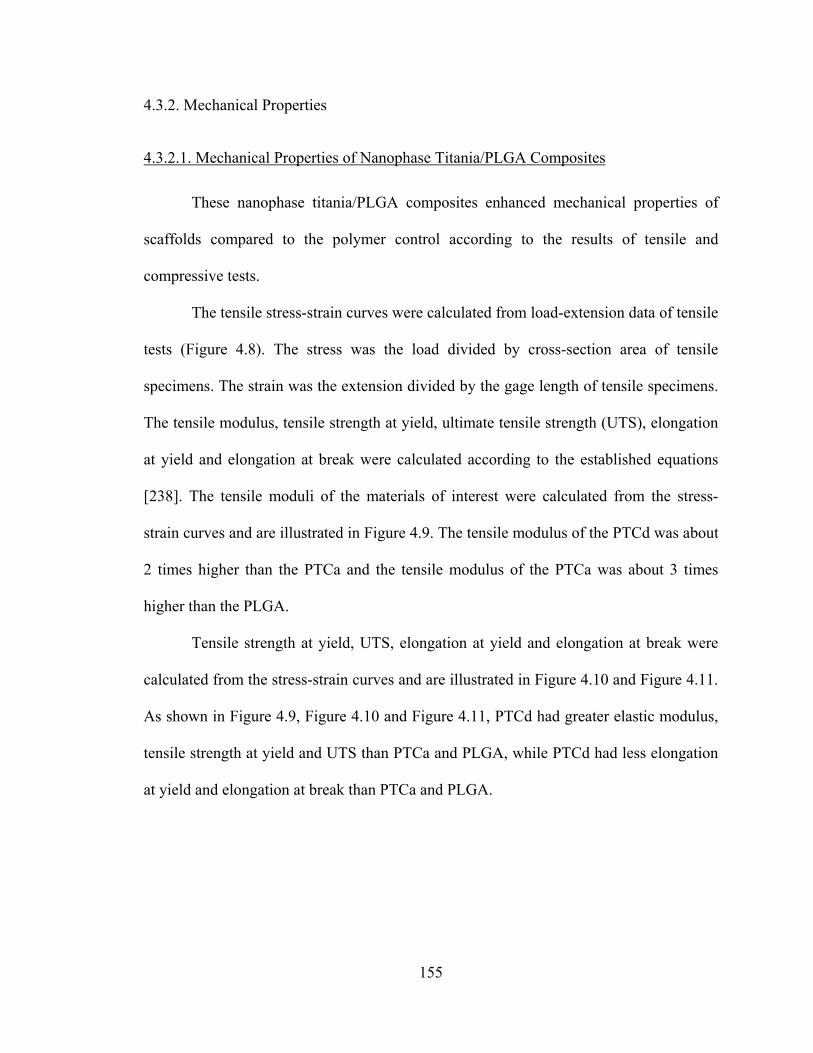
155
4.3.2. Mechanical Properties
4.3.2.1. Mechanical Properties of Nanophase Titania/PLGA Composites
These nanophase titania/PLGA composites enhanced mechanical properties of
scaffolds compared to the polymer control according to the results of tensile and
compressive tests.
The tensile stress-strain curves were calculated from load-extension data of tensile
tests (Figure 4.8). The stress was the load divided by cross-section area of tensile
specimens. The strain was the extension divided by the gage length of tensile specimens.
The tensile modulus, tensile strength at yield, ultimate tensile strength (UTS), elongation
at yield and elongation at break were calculated according to the established equations
[238]. The tensile moduli of the materials of interest were calculated from the stress-
strain curves and are illustrated in Figure 4.9. The tensile modulus of the PTCd was about
2 times higher than the PTCa and the tensile modulus of the PTCa was about 3 times
higher than the PLGA.
Tensile strength at yield, UTS, elongation at yield and elongation at break were
calculated from the stress-strain curves and are illustrated in Figure 4.10 and Figure 4.11.
As shown in Figure 4.9, Figure 4.10 and Figure 4.11, PTCd had greater elastic modulus,
tensile strength at yield and UTS than PTCa and PLGA, while PTCd had less elongation
at yield and elongation at break than PTCa and PLGA.

156
Figure 4. 8: The typical stress-strain curves of PLGA, PTCa and PTCd calculated from the load-extension data from tensile tests.
Figure 4. 9: The tensile moduli of the materials of interest. Values are mean ± SEM; n = 3; *p < 0.05 compared to PLGA; and **p < 0.05 compared to PTCa.
0
0.05
0.1
0.15
0.2
0.25
0.3
0 2 4 6 8 10 12 14
PLGA PTCa PTCd
Stre
ss (σ
, MPa
)
Strain (ε, unitless)
0
1
2
3
PLGA PTCa PTCd
*
**
Tens
ile M
odul
i (M
Pa)

157
Figure 4. 10: The tensile strength at yield and the ultimate tensile strength (UTS) of the materials of interest. Values are mean ± SEM; n = 3; *p < 0.05 compared to PLGA; and **p < 0.05 compared to PTCa.
Figure 4. 11: The elongation at yield and the elongation at break for the materials of interest. Values are mean ± SEM; n = 3; *p < 0.05 compared to PLGA; and **p < 0.05 compared to PTCa.
The compressive moduli were calculated from the data of compressive tests and
are shown in Figure 4.12. The compressive modulus of the PTCd was about 2 times
higher than the PTCa and the compressive modulus of the PTCa was about 2 times higher
0.0
0.1
0.2
0.3
0.4
0.5
PLGA PTCa PTCd0.0
5.0
10.0
15.0
PLGA PTCa PTCd
Elon
gatio
n
Elon
gatio
n
(a) Elongation at Yield (b) Elongation at Break
* **
* **
Tens
ile S
treng
th (M
Pa)
0.0
0.1
0.2
0.3
PLGA PTCa PTCd
Tensile Strength at YieldUTS
***
*
**
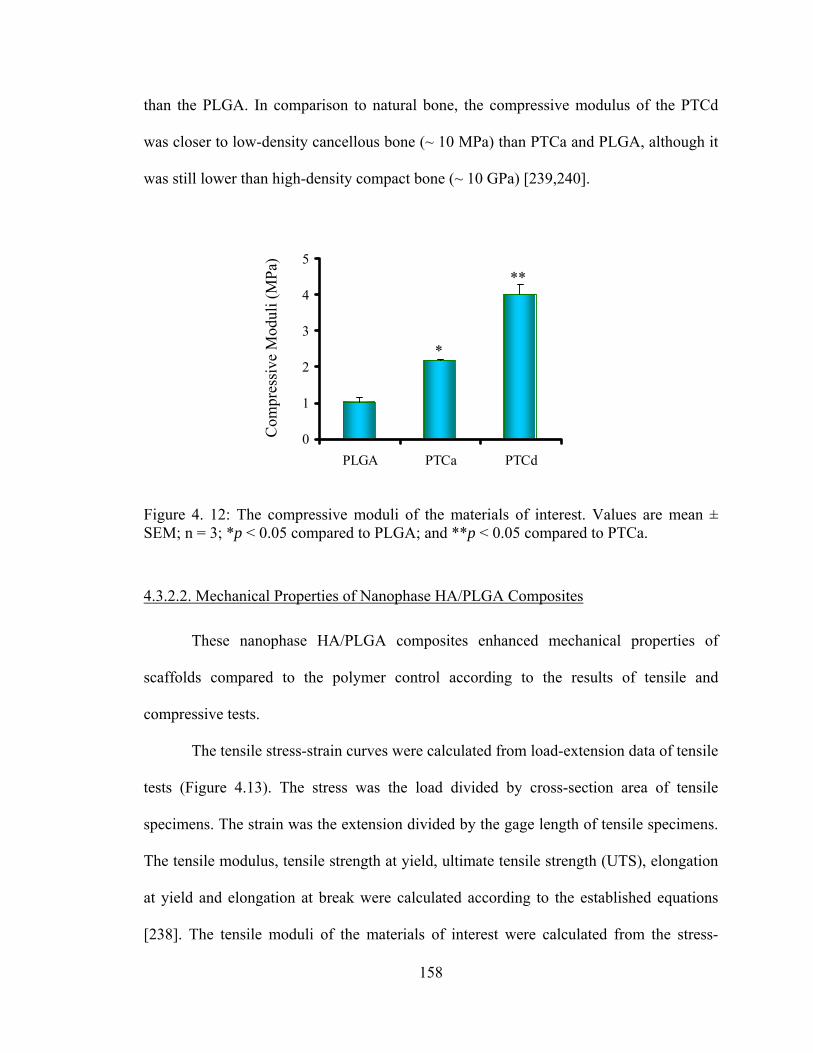
158
than the PLGA. In comparison to natural bone, the compressive modulus of the PTCd
was closer to low-density cancellous bone (~ 10 MPa) than PTCa and PLGA, although it
was still lower than high-density compact bone (~ 10 GPa) [239,240].
Figure 4. 12: The compressive moduli of the materials of interest. Values are mean ± SEM; n = 3; *p < 0.05 compared to PLGA; and **p < 0.05 compared to PTCa.
4.3.2.2. Mechanical Properties of Nanophase HA/PLGA Composites
These nanophase HA/PLGA composites enhanced mechanical properties of
scaffolds compared to the polymer control according to the results of tensile and
compressive tests.
The tensile stress-strain curves were calculated from load-extension data of tensile
tests (Figure 4.13). The stress was the load divided by cross-section area of tensile
specimens. The strain was the extension divided by the gage length of tensile specimens.
The tensile modulus, tensile strength at yield, ultimate tensile strength (UTS), elongation
at yield and elongation at break were calculated according to the established equations
[238]. The tensile moduli of the materials of interest were calculated from the stress-
0
1
2
3
4
5
PLGA PTCa PTCd
Com
pres
sive
Mod
uli (
MPa
)
*
**

159
strain curves and are illustrated in Figure 4.14. The tensile moduli of the PHAd and
PHAa were greater than the PLGA.
Figure 4. 13: The typical stress-strain curves of PLGA, PHAa and PHAd calculated from the load-extension data from tensile tests.
Figure 4. 14: The tensile moduli of the materials of interest. Values are mean ± SEM; n = 3; *p < 0.05 compared to PLGA.
02468
1012141618
PLGA PHAa PHAd
Tens
ile M
odul
i (M
Pa)
*
*
0
0.2
0.4
0.6
0.8
1
1.2
1.4
0 2 4 6 8 10 12 14
PLGA PHAa PHAd
0
0.2
0.4
0.6
0.8
1
1.2
1.4
0 0.5 1 1.5 2 2.5
PLGA PHAa PHAd
Stre
ss (σ
, MPa
)
Strain (ε, unitless)
Magnified this region

160
Tensile strength at yield, UTS, elongation at yield and elongation at break were
calculated from the stress-strain curves and are illustrated in Figure 4.15 and Figure 4.16.
As shown in Figure 4.14, Figure 4.15 and Figure 4.16, PHAa and PHAd had greater
elastic modulus, tensile strength at yield and UTS than the PLGA, while PHAa and
PHAd had less elongation at yield and elongation at break than the PLGA.
Figure 4. 15: The tensile strength at yield and the ultimate tensile strength (UTS) of the materials of interest. Values are mean ± SEM; n = 3; *p < 0.05 compared to PLGA.
Tens
ile S
treng
th (M
Pa) *
*
*
*
0.0
0.5
1.0
1.5
2.0
PLGA PHAa PHAd
Tensile Strength at YieldUTS
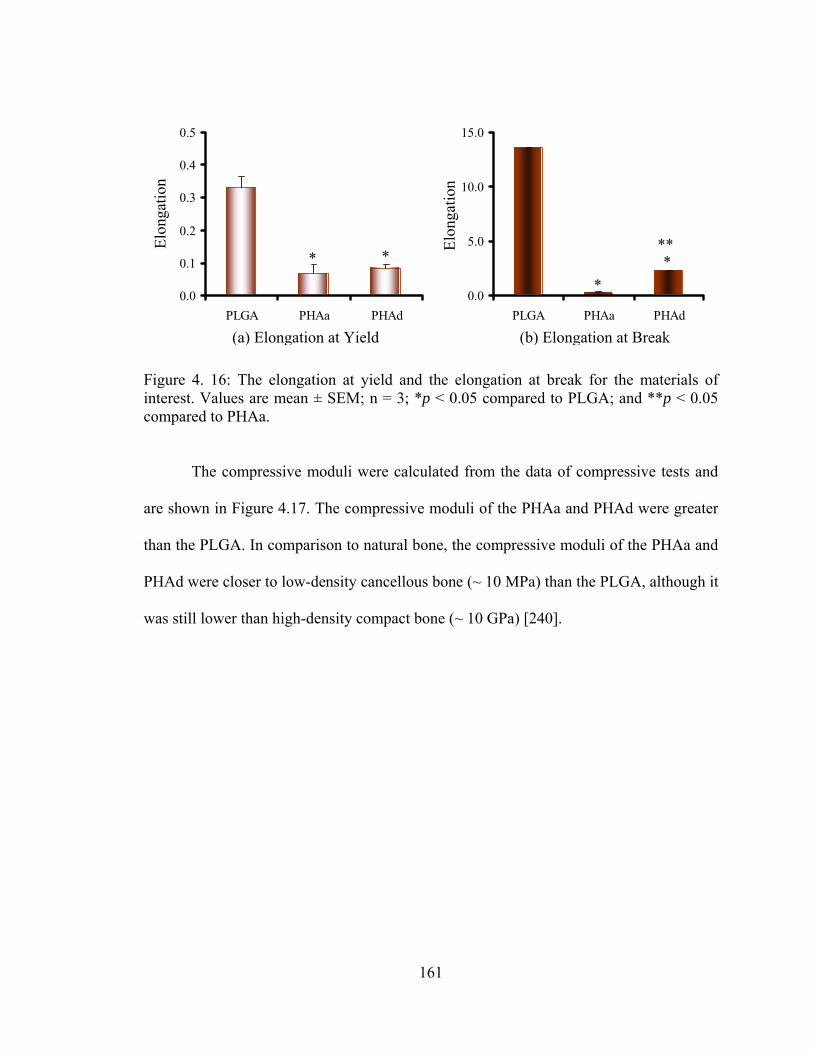
161
Figure 4. 16: The elongation at yield and the elongation at break for the materials of interest. Values are mean ± SEM; n = 3; *p < 0.05 compared to PLGA; and **p < 0.05 compared to PHAa.
The compressive moduli were calculated from the data of compressive tests and
are shown in Figure 4.17. The compressive moduli of the PHAa and PHAd were greater
than the PLGA. In comparison to natural bone, the compressive moduli of the PHAa and
PHAd were closer to low-density cancellous bone (~ 10 MPa) than the PLGA, although it
was still lower than high-density compact bone (~ 10 GPa) [240].
0.0
0.1
0.2
0.3
0.4
0.5
PLGA PHAa PHAd0.0
5.0
10.0
15.0
PLGA PHAa PHAd
Elon
gatio
n
Elon
gatio
n
(a) Elongation at Yield (b) Elongation at Break
*
*
* ***
162
Figure 4. 17: The compressive moduli of the materials of interest. Values are mean ± SEM; n = 3; *p < 0.05 compared to PLGA.
4.3.3. Fracture Analysis
4.3.3.1. Macroscopic View of Fractures
The stress-strain behaviors were different with nanophase titania/PLGA
composites, nanophase HA/PLGA composites and single-phase PLGA, as shown in
previous Figures 4.8 and 4.13. The stress-strain relations of nanophase ceramic/PLGA
composites demonstrated an initial linear and following nonlinear deformation until
fracture. The differences in tensile behaviors clearly influenced the fracture appearances
of the nanocomposites. Macroscopic fracture appearances of the nanocomposites and
PLGA control are shown in Figure 4.18. The fracture surfaces of the nano-HA/PLGA
composites appeared more brittle compared to nano-titania/PLGA composites and PLGA.
This difference in fracture surfaces clearly demonstrated that variations in the ceramic
0
2
4
6
8
10
12
14
PLGA PHAa PHAd
Com
pres
sive
Mod
uli (
MPa
) *
*

163
phases (titania or HA) and their dispersion states in the polymer matrix caused different
fracture behaviors and effectively altered the mechanical performance of the composites.
Figure 4. 18: Macroscopic fracture appearances of nanophase titania/PLGA composites, nanophase HA/PLGA composites and PLGA.
(a) PLGA
(b) PTCa
(c) PTCd
(d) PHAa
(e) PHAd

164
4.3.3.2. Microscopic View of Fractures
The fracture sites of the tensile specimens were visualized using a FESEM. Figure
4.19 shows representative microscopic appearances of the PLGA fracture surfaces after
tensile tests. The river-like bands appeared in Figure 4.19 (a,c,d) were termed as “splay”
or “sliver streak”. These silver streaks were very different from microcracks that
appeared in Figure 4.19 (b,d) and nanopores that appeared in Figure 4.19 (e,f) due to their
unique characteristics. First, the silver streaks still contained 30-50 vol. % of polymers
while there were no polymers inside the microcracks or the nanopores. Second, these
silver streaks maintained certain strength compared to the microcracks and the nanopores.
Third, the silver streaks were reversible while the microcracks and nanopores were
irreversible. The silver streaks could be reduced or even removed under the compressive
stress or heat (Temperature above Tg). Moreover, the density and refractive index of the
splay region decreased compared to the original non-deformed polymers due to the void
formation. The formation of silver streaks and the derived branches was associated with
the tensile stress concentration and the dislocations. When the volume gain induced by
the extension along the direction of the load could not compensate the volume loss due to
the contraction along the direction perpendicular to the load, the silver streaks and voids
would begin to form. The orientation of the silver streaks was perpendicular to the
direction of load, as shown in Figure 4.19.

165
Figure 4. 19: Microscopic fracture appearances of PLGA after tensile tests. Original magnifications are 1 kX for (a,b), 5 kX for (c,d) and 50 kX for (e,f). Magnification bars are 10 μm for (a,b), 2 μm for (c,d) and 200 nm for (e,f). F shows the direction of the load.
Figure 4.20 and Figure 4.21 show representative microscopic fracture
appearances of the PTCa (agglomerated nano-titania/PLGA composites) after tensile tests.
(d)
(a) (b)
(c)
(e) (f)
F
F
Silver Streak Microcrack
Nanopore

166
Figure 4.20(a) shows the fracture cross-section of the PTCa. Figure 4.20(b,c,d) shows the
top surfaces of PTCa near the fracture cross-section. Figure 4.21 shows the bottom
surfaces of the PTCa near the fracture cross-sections. The debonding of ceramic phases
from the polymer matrix was evident for PTCa, as shown in Figure 4.21 (b,c,d). The
silver streaks were observed on the top surface in Figure 4.20(b). The microcracks and
nanopores were observed on the top surfaces in Figure 4.20(d). The crack tip initiation
and propagation were observed, as shown in Figure 4.20(c).
Figure 4.22 and Figure 4.23 show representative microscopic fracture
appearances of the PTCd (well dispersed nano-titania/PLGA composites) after tensile
tests. Figure 4.22(a) shows the fracture cross-section of the PTCd. Figure 4.22(b,c,d)
shows the top surfaces of PTCd near the fracture cross-section. Figure 4.23 shows the
bottom surfaces of the PTCd near the fracture cross-sections. The debonding of ceramic
phases from the polymer matrix was also observed for PTCd, as shown in Figure
4.22(b,c). The silver streaks, however, were not observed on the top surface of PTCd.
The microcracks and nanopores were present on the top surfaces in Figure 4.22(b,d). The
crack tip initiation, propagation and branching were observed, as shown in Figure 4.22(d)
and 4.23(a).

167
Figure 4. 20: Microscopic fracture appearances of PTCa (agglomerated nano-titania/PLGA composites) after tensile tests. The fracture cross-section is shown in (a). The top surfaces of PTCa near the fracture cross-section are shown in (b,c,d). Original magnifications are 1 kX for (a), 5 kX for (b), 20 kX for (c) and 50 kX for (d). Magnification bars are 10 μm for (a), 2 μm for (b), 1 μm for (c) and 200 nm for (d). F shows the direction of the load.
(a)
(c)
(b)
(d)
F
F
Silver Streak Microcrack Nanopore
Crack Growth Crack Tip
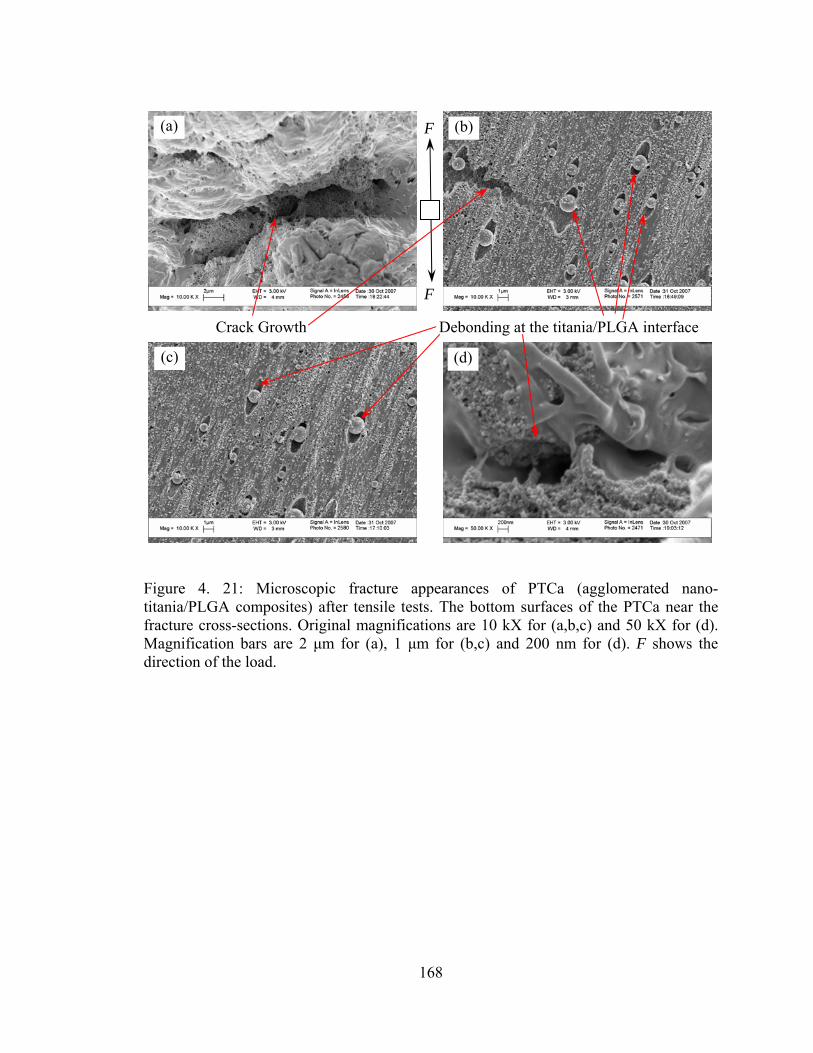
168
Figure 4. 21: Microscopic fracture appearances of PTCa (agglomerated nano-titania/PLGA composites) after tensile tests. The bottom surfaces of the PTCa near the fracture cross-sections. Original magnifications are 10 kX for (a,b,c) and 50 kX for (d). Magnification bars are 2 μm for (a), 1 μm for (b,c) and 200 nm for (d). F shows the direction of the load.
(a)
(c)
(b)
(d)
Crack Growth Debonding at the titania/PLGA interface
F
F

169
Figure 4. 22: Microscopic fracture appearances of PTCd (well-dispersed nano-titania/PLGA composites) after tensile tests. The fracture cross-section is shown in (a). The top surfaces of PTCd near the fracture cross-section are shown in (b,c,d). Original magnifications are 400 X for (a) and 50 kX for (b,c,d). Magnification bars are 100 μm for (a) and 200 nm for (b,c,d).
(a)
(c)
(b)
(d)
Debonding at the titania/PLGA interface Nanopore
Crack Growth

170
Figure 4. 23: Microscopic fracture appearances of PTCd (well-dispersed nano-titania/PLGA composites) after tensile tests. The bottom surfaces of the PTCd near the fracture cross-sections. Original magnifications are 20 kX for (a), 50 kX for (b,c) and 100 kX for (d). Magnification bars are 1 μm for (a) and 200 nm for (b,c,d).
Microcracks and nanopores were observed on both well-dispersed and
agglomerated nanophase titania in PLGA composites. However, the amount of
microcracks and the size of microcracks were different on PTCa and PTCd. The cracks
propagated along the interfaces of the ceramic and the polymer matrix. There were also
instances when the crack did not initiate at the interface, but at the polymer phase (Figure
4.20d). In these rare cases, it is speculated that the high local stress concentrations were
created due to poor distribution of ceramic particles.
(a)
(c)
(b)
(d)
Crack Growth Debonding at the titania/PLGA interface Crack Tip
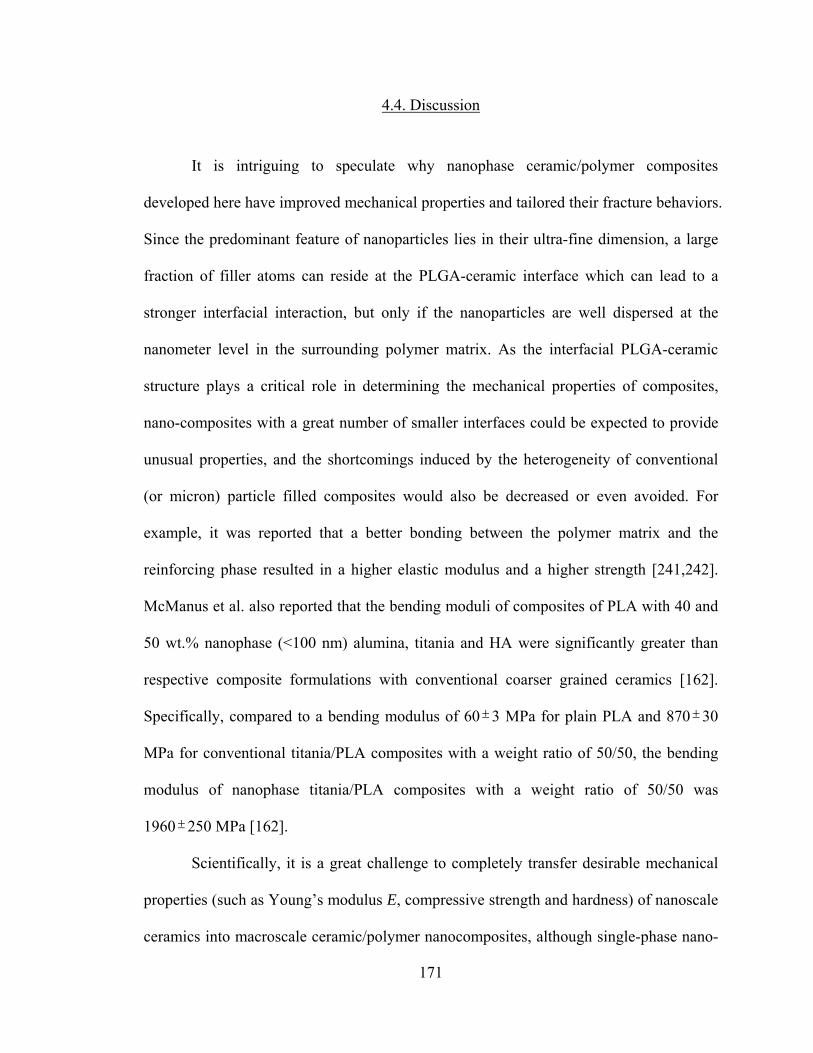
171
4.4. Discussion
It is intriguing to speculate why nanophase ceramic/polymer composites
developed here have improved mechanical properties and tailored their fracture behaviors.
Since the predominant feature of nanoparticles lies in their ultra-fine dimension, a large
fraction of filler atoms can reside at the PLGA-ceramic interface which can lead to a
stronger interfacial interaction, but only if the nanoparticles are well dispersed at the
nanometer level in the surrounding polymer matrix. As the interfacial PLGA-ceramic
structure plays a critical role in determining the mechanical properties of composites,
nano-composites with a great number of smaller interfaces could be expected to provide
unusual properties, and the shortcomings induced by the heterogeneity of conventional
(or micron) particle filled composites would also be decreased or even avoided. For
example, it was reported that a better bonding between the polymer matrix and the
reinforcing phase resulted in a higher elastic modulus and a higher strength [241,242].
McManus et al. also reported that the bending moduli of composites of PLA with 40 and
50 wt.% nanophase (<100 nm) alumina, titania and HA were significantly greater than
respective composite formulations with conventional coarser grained ceramics [162].
Specifically, compared to a bending modulus of 60 ±3 MPa for plain PLA and 870 ±30
MPa for conventional titania/PLA composites with a weight ratio of 50/50, the bending
modulus of nanophase titania/PLA composites with a weight ratio of 50/50 was
1960 ±250 MPa [162].
Scientifically, it is a great challenge to completely transfer desirable mechanical
properties (such as Young’s modulus E, compressive strength and hardness) of nanoscale
ceramics into macroscale ceramic/polymer nanocomposites, although single-phase nano-

172
ceramics possess exceptional compressive strength, stiffness and hardness. Mechanical
properties of nanoparticle-filled polymer composites have been significantly improved
compared to conventional larger particle-filled polymer composites, but they are still far
below the expected theoretical and experimental values determined by the individual
nanoscale building blocks, except at a very low volume fraction of the reinforcing phase
[243-246]. Non-ideal mechanical properties of ceramic/polymer composites are largely
related to the difficulties in achieving well-dispersed large volume fractions of the
reinforcing nano-ceramics in polymer composites and a lack of nanostructural control in
the composites. As mentioned, nanoparticles have a strong tendency to agglomerate in
the composites, especially when they took up more than 2 wt.% of the composites. Nano-
ceramics are, thus, very difficult to be incorporated homogeneously, individually into the
polymer, as completely dispersed ceramics rather than intercalated structures. Moreover,
it is also important to control an effective load transfer from the polymeric matrix to the
nanoscale components and understand mechanical interactions of the two constituents at
the nanoscale.
For loading-bearing orthopedic applications, it is important to produce a
nanocomposite with mechanical properties closer to the theoretical values. The
approaches include controlling spatial distribution and orientation of nanoparticles in a
polymer matrix at the nanoscale, and retaining this order at the macroscale. For example,
Podsiadlo et al. assembled a homogeneous, optically transparent clay (montmorillonite,
MTM)/polymer (poly(vinyl alcohol), PVA) nanocomposite with planar orientation of the
alumosilicate nanosheets using a bottom-up layer-by-layer (LBL) assembly process. The
tensile strength (UTS) of these multilayer MTM/PVA composites reached 400±40 MPa

173
and the Young’s modulus reached 106±11 GPa, one order of magnitude greater than that
of PVA. This was contributed to the nanoscale dimension of the inorganic MTM phase,
and the nearly perfect orientation and fine dispersion of the MTM nanoplatelets. A highly
effective load transfer between nanosheets and the polymer was, thus, achieved by
combining highly ordered nanoscale building blocks with dense covalent and hydrogen
bonding that stiffened the polymer chains. The greater mechanical properties of
PVA/MTM nanocomposites were resulted from several mechanisms at the nanoscale.
The degree of structural organization (afforded by the LBL process) of the clay platelets
in the composite maximizes the number of polymer/MTM interactions and constrains the
polymer-chain motion, which resulted in a highly efficient load transfer between the
polymer phase and the stiff MTM platelets.
All these theories and postulations discussed above can be applied to nanophase
ceramic/polymer composites to promote their mechanical properties for load-bearing
orthopedic applications.
4.5. Conclusions
The dispersion of ceramic nanoparticles (titania or HA) in PLGA promoted
mechanical properties of orthopedic materials as compared to the PLGA and the
agglomerated ceramic/PLGA composites. For example, well-dispersed nano-
titania/PLGA composites promoted the tensile modulus, tensile strength at yield, ultimate
tensile strength and compressive modulus as compared to PLGA and the more
agglomerated nano-titania/PLGA composites. As expected, nano-HA/PLGA
174
nanocomposites also demonstrated greater tensile modulus, tensile strength and
compressive modulus than the PLGA. Although the well-dispersed nano-HA/PLGA
composites (PHAd) had a slightly lower tensile modulus, tensile strength and
compressive modulus compared to PHAa, PHAd presented a much better ductility
(greater elongation at yield and greater elongation at break) than PHAa.
In conclusion, when collectively considering these results, the combination of the
ductile PLGA with a strong and biocompatible well-dispersed nano-ceramic phase can be
very promising for customizing mechanical properties of next generation orthopedic
prostheses. Therefore, coupled with prior studies demonstrating greater osteoblast
functions, the combination of PLGA with nano-ceramics may provide better candidate
materials for more effective orthopedic applications, from both biological and mechanical
perspectives.
175
CHAPTER 5. NANOPHASE CERAMIC/POLYMER COMPOSITES AS
CONTROLLED DRUG DELIVERY CARRIERS FOR TREATING BONE DISEASES
5.1. Problems and Specific Aims
Pharmaceutical agents are often required to stimulate new bone formation for the
treatment of bone injuries or diseases (such as osteoporosis). However, there are several
problems associated with current drug delivery methods. First, conventional systemic
administration of these agents can not effectively reach targeted sites and, thus, they can
cause non-specific bone formation in areas not affected by injury or disease. Second,
even if intentionally delivered or implanted locally to the damaged bone tissue, these
agents tend to rapidly diffuse into adjacent tissues due to weak physical bonding to their
drug carriers, which limits their potential to promote prolonged bone formation in
targeted areas of bone. Therefore, this study explored chemical bonding methods for
immobilizing bone morphogenetic proteins (BMPs) to nanophase hydroxyapatite (nano-
HA) to improve local bone growth and interfacial bonding strength to juxtaposed bone.
Moreover, the use of nano-HA could increase protein loading efficiency considering that
nano-HA has much larger surface area and much more exposed reaction sites for
chemical bonding. For this purpose, nano-HA was synthesized by wet chemistry
precipitation followed by hydrothermal treatment to gain control over desirable grain
sizes and crystallinities. BMPs were chemically bonded to nano-HA through amino-

176
silane chemistry. Nano-HA/BMP conjugates were then dispersed in poly(lactide-co-
glycolide) (PLGA) solutions to create an implantable scaffold by a solvent-casting
technique. These scaffolds were characterized for drug loading efficiency and in vitro
drug release profiles.
5.2. Model Drug Carriers and Model Drugs
5.2.1. The Choice of Model Ceramics: Nano-titania vs. Nano-HA
Previous in vitro studies reported the great potential of nanophase
ceramic/polymer composites for orthopedic applications, particularly using nano-titania
as a model ceramic. This chapter, however, will mainly focus on nanophase calcium
phosphates and their derivatives such as nano-HA as model ceramics considering their
advantages in controlled drug delivery applications [247,248]. Formulations of various
phases of calcium phosphates will offer different chemical structure, density, crystallinity
and subsequent properties of degradation, critical for serving as good carriers for BMPs
and their derivatives [249]. Moreover, increased new bone formation has been observed
on nano-HA compared to micron-HA coated scaffolds when implanted into rat calvarial
bone [140,250], as shown in Figure 5.1. Enhanced new bone infiltration can be clearly
seen as early as two weeks on the nano-HA coated tantalum scaffolds compared to
micron-HA coated and uncoated tantalum scaffolds. Such results provided evidence of
the promising translation of in vitro cell functions to in vivo bone growth.

177
Figure 5. 1: Histology of rat calvaria after tantalum (Ta) scaffolds coated with either nano-HA or micron-HA which were implanted for 2 weeks. Red shows new bone infiltration which occurred in greater amounts on nano-HA coated Ta than either micron-HA coated Ta or uncoated Ta. (Adapted and redrawn from [140]).
In summary, these preliminary studies rationalized desirable properties of the
nanocomposites in vitro and in vivo for better new bone regeneration. The objective of
this chapter is to further expand the advantages of the nanocomposites by delivering
BMPs or its derived peptides more efficiently to promote bone growth.
5.2.2. Bone Morphogenetic Proteins
Bone morphogenetic proteins, especially recombinant human bone morphogenetic
protein-2 (or rhBMP-2) and BMP-7 (osteogenic protein-1), have the ability to induce new
Uncoated Ta Scaffolds
Nano-HA Coated Ta (high magnification) Micron-HA Coated Ta
Nano-HA Coated Ta (low magnification)
New bone
New bone

178
bone formation [251,252]. It has been reported that rhBMP-2 is an osseoinductive protein
that could effectively induce new host bone regeneration by guiding the modulation and
differentiation of mesenchymal cells into bone forming cells [252,253]. Improved bone
repair using rhBMP-2 was observed in the rat tibia, rabbit calvarium, dog mandible, and
sheep tibia [254-258]. For example, rhBMP-2 could be adsorbed onto porous HA to
enhance the osseointegration of implanted HA to the skull of adult white rabbits [259]. It
was observed that rhBMP-2 increased the percentage of bone filling into microporous
HA scaffolds compared to respective scaffolds without rhBMP-2 [ 260 ]. Moreover,
rhBMP-2 mechanically strengthened HA implants as early as 4 weeks due to the induced
faster healing. Specifically, when the initial fracture loads of HA scaffolds were 100 N,
the strength of HA scaffolds combined with rhBMP-2 reached 650 N at 4 weeks and 800
N at 8 weeks, but the facture load of HA implants without rhBMP-2 did not increase until
8 weeks after implantation [261]. Enhancing mechanical strength in an earlier stage
allows patients to exert loading earlier after implantation, which could further accelerate
the healing process [262]. In addition to all of these advantages, rhBMP-2 has recently
received clearance from the Food and Drug Administration (FDA) for the specific
clinical use.
However, these studies also exposed two problems with the current delivery
systems for BMPs: low loading efficiency and lack of controlled drug release [263].
Recent studies demonstrated that a desired drug release profile could be achieved by
controlling the fabrication method of nanocomposite-drug conjugates [264]. It has been
demonstrated that when the enzyme (glucocerebrosidase) was pre-adsorbed onto
nanophase calcium phosphate powders prior to dispersing in alginate, the initial burst of

179
drug release was significantly reduced and a slower prolonged release was achieved [264].
Nano-HA as a carrier for BMPs could be beneficial for a prolonged drug release
compared to conventional (or micron) HA. Although the proposed drugs and carrier
materials are different here, it is still very likely to achieve similar results for nano-HA
with BMP growth factors dispersed in PLGA systems due to the same mechanism.
5.2.3. BMP-Derived Short Peptides
BMPs are the most potent growth factors for enhancing bone formation.
Especially, BMP-2 and BMP-7 (osteogenic protein-1) promotes the formation and
regeneration of bone and cartilage [265-267]. A single BMP, currently either BMP-2 or
BMP-7, is usually chosen when bone regeneration is desired. However, when these
BMPs are used in higher order mammals (such as human beings), a pharmacological dose
rather than a physiological dosage has to be administrated because the efficacy of the
BMPs is still dependent on the recruitment of local cells, additional BMPs, and other
growth factors [268]. In higher order mammals, the BMPs need to be present in the
targeted sites for a longer period of time in order to achieve desirable pharmaceutical
effects. On the contrary, clinical studies demonstrated that they often quickly diffuse
away from the currently used carriers before inducing a local effect [268]. Additionally,
the number of progenitor cells that are responsive to BMPs may be more limited in the
higher order mammals and human beings, particularly under clinical circumstances (such
as non-unions and predominantly elderly patients) [268]. The amount of implanted
protein exceeds by far the normal physiological concentration of this protein in the
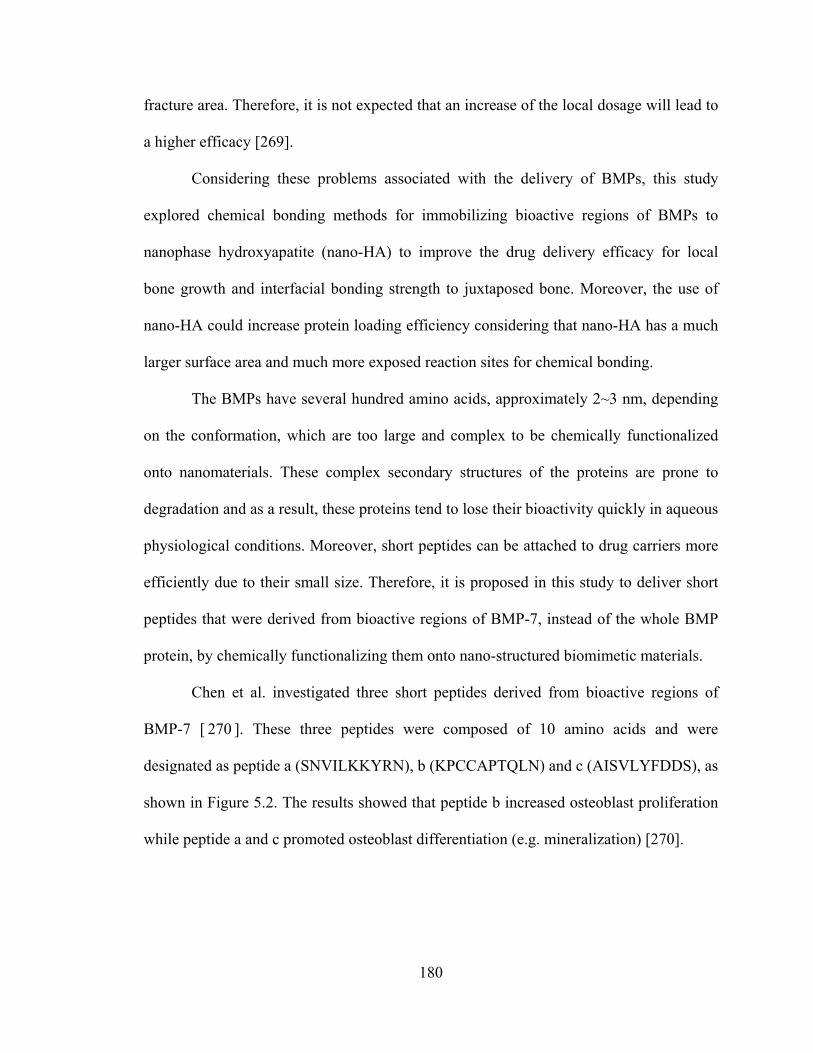
180
fracture area. Therefore, it is not expected that an increase of the local dosage will lead to
a higher efficacy [269].
Considering these problems associated with the delivery of BMPs, this study
explored chemical bonding methods for immobilizing bioactive regions of BMPs to
nanophase hydroxyapatite (nano-HA) to improve the drug delivery efficacy for local
bone growth and interfacial bonding strength to juxtaposed bone. Moreover, the use of
nano-HA could increase protein loading efficiency considering that nano-HA has a much
larger surface area and much more exposed reaction sites for chemical bonding.
The BMPs have several hundred amino acids, approximately 2~3 nm, depending
on the conformation, which are too large and complex to be chemically functionalized
onto nanomaterials. These complex secondary structures of the proteins are prone to
degradation and as a result, these proteins tend to lose their bioactivity quickly in aqueous
physiological conditions. Moreover, short peptides can be attached to drug carriers more
efficiently due to their small size. Therefore, it is proposed in this study to deliver short
peptides that were derived from bioactive regions of BMP-7, instead of the whole BMP
protein, by chemically functionalizing them onto nano-structured biomimetic materials.
Chen et al. investigated three short peptides derived from bioactive regions of
BMP-7 [ 270 ]. These three peptides were composed of 10 amino acids and were
designated as peptide a (SNVILKKYRN), b (KPCCAPTQLN) and c (AISVLYFDDS), as
shown in Figure 5.2. The results showed that peptide b increased osteoblast proliferation
while peptide a and c promoted osteoblast differentiation (e.g. mineralization) [270].

181
Figure 5. 2: Short peptides derived from BMP-7 and their amino acid sequences. (Adapted and redrawn from [270]).
In this study, peptide c was chosen and slightly modified as the model peptide for
studying drug loading efficiency and long-term drug release, thus, promoting bone
mineralization and healing. Combining BMP-7 short peptides with nano-HA/PLGA
composites may provide a promising solution for designing and fabricating more
effective nanotechnology-derived orthopedic implants that are capable of delivering
growth factors in a controlled, tunable fashion.
5.3. Materials and Methods
5.3.1. Material Preparation
5.3.1.1. Synthesis of Nanocrystalline Hydroxyapatite
Nanophase HA was synthesized using a wet chemistry precipitation method by
mixing solutions of calcium nitrate and ammonium phosphate in an alkaline pH region
[229]. Specifically, a 1 M calcium nitrate solution and a 0.6 M ammonium phosphate
solution were prepared by dissolving their respective solid state powders in deionized (DI)

182
water separately. The produced ammonium phosphate solution was mixed with DI water
which had been adjusted to pH 10 by ammonium hydride. The pre-made 1 M calcium
nitrate solution was then added into the mixture of ammonium phosphate and ammonium
hydride at a rate of 3.6 ml/min. Precipitation occurred as soon as the calcium nitrate was
added. Chemically, the HA precipitation occurred through the reaction [5.1]:
10Ca(NO3)2+6(NH4)2HPO4+8NH4OH = Ca10(PO4)6(OH)2+6H2O+20NH4NO3 [5.1]
Precipitation continued for 10 minutes at room temperature with constant stirring.
The supernatant was collected, centrifuged (Eppendorf centrifuge, Model 5810 R) to
reduce 75% of the solution volume and placed into to a 125 ml Teflon liner (Parr
Instrument). The Teflon liner was sealed tightly in a Parr acid digestion bomb 4748 (Parr
Instrument) and treated hydrothermally at 200 °C for 20 hours to obtain nanocrystalline
HA. The hydrothermal treatment has a great advantage to prepare a stoichiometric,
ultrafine HA powder with a homogeneous shape and size distribution due to higher
applied pressures than atmospheric [230,231]. After the hydrothermal treatment, nano-
HA particles were rinsed with DI water and dried in an oven at 80 °C for 12 hours. Figure
5.2 shows the schematic procedures of HA synthesis followed in this study.

183
Figure 5. 3: The schematic diagram illustrating HA synthesis by a wet chemistry precipitation method.
5.3.1.2. Design and Synthesis of the Model Peptide
The peptide c (AISVLYFDDS) was further modified at its N-terminal with a
cysteine-containing spacer to ease chemical conjugation onto the nano-HA particles using
aminosilane chemistry followed by a maleimide cross-linker molecule. In this study, the
peptide with a 12 amino-acid sequence of CKAISVLYFDDS was used as the model
peptide and termed as DIF-7c.
The peptide DIF-7c was obtained as carboxyl terminal acids to more than 98.2%
purity according to the HPLC profile provided by the manufacturer (GenScript
Corporation, USA). The molecular weight of the peptide DIF-7c was 1360.56 g/mol.
Water
(NH4)2HPO4
(NH4)2HPO4 Solution
Add NH4OH until pH=11-12
Stir
Water
Ca(NO3)2
Ca(NO3)2Solution
Add NH4OH until pH=11-12
(NH4)2HPO4 Solution
Stir
AddCa(NO3)2 Solution
3.6 ml/min
Precipitates
Wash
Filter
Hydrothermal treatment
at 200 °C for 20 hours
HA
Centrifuge
HA
Wash
DryCharacterization
XRD
SEM
Water
(NH4)2HPO4
(NH4)2HPO4 Solution
Add NH4OH until pH=11-12
Stir
Water
Ca(NO3)2
Ca(NO3)2Solution
Add NH4OH until pH=11-12
(NH4)2HPO4 Solution
Stir
AddCa(NO3)2 Solution
3.6 ml/min
Precipitates
Wash
Filter
Hydrothermal treatment
at 200 °C for 20 hours
HA
Centrifuge
HAHA
Wash
DryCharacterization
XRD
SEM

184
5.3.1.3. Peptide Loading onto Nanophase Ceramic/Polymer Composites
As mentioned, the difficulties of drug delivery lie in the efficient loading and
controlled release. In this study, two types of loading methods were used and compared
for efficacy: chemical bonding and physical adsorption.
5.3.1.3.1. Immobilization of Peptide Using Aminosilane Chemistry
For chemical bonding, nano-HA was functionalized through aminosilane
chemistry under dry conditions to avoid surface contamination and, thus, ensure stability
of the peptide, as shown in Figure 5.4 [271,272]. First, nano-HA was silanized in 3-
aminopropyltriethoxysilane (APTES; Sigma 440140) in anhydrous hexane (Sigma
296090). Second, for substituting a hetero-bifunctional cross-linker for the terminal
amine, the silanized nano-HA was coupled with N-succinimidyl-3-maleimido propionate
(SMP; also called 3-Maleimidopropionic acid N-hydroxysuccinimide ester, Sigma
358657) in anhydrous N,N-dimethylformamide (DMF; Sigma 494488). Third, the
peptide DIF-7c was immobilized onto nano-HA in anhydrous DMF through a reaction
between the outer maleimide group with the thiol group of cysteine present in the
terminal of DIF-7c. The nano-HA and model peptide conjugates that were bonded using
aminosilane chemistry were termed as HA_Ps.

185
Figure 5. 4: The schematic illustrations of the chemical structures and the reactions that were used to bond the model peptide to nano-HA particles. (Adapted and redrawn from [271]).
Experimentally, immobilization of the peptide DIF-7c to HA nanoparticles was
performed according to the following procedure, as shown in Table 5.1. To note, all these
procedures were carefully carried out under dry conditions.
Nano-HA Silanized HA
DMF
Peptide
APTES
Hexane
SMP
DMF
Nano-HA and Peptide Conjugates
APTES SMP CKAISVLYFDDS
Peptide DIF-7c
Cysteine
Thiol

186
Table 5. 1: The detailed procedures that were followed for immobilization of the model peptide to nano-HA using aminosilane chemistry.
(1) HA nanoparticles were dried and degassed at 40 °C in vacuum (10-5 Torr) for 24 hours.
(2) HA nanoparticles were rinsed with anhydrous hexane using a vortex (Fisher Scientific) and a centrifuge (Eppendorf centrifuge, Model 5810 R).
(3) HA nanoparticles were silanized by immersing in a solution of APTES (10 vol.%) in anhydrous hexane at 40 °C for 24 hours under continuous stirring.
(4) After silanization, HA nanoparticles were rinsed with hexane for 3 times and dried at 40 °C in vacuum (10-5 Torr) for 24 hours.
(5) Silanized HA nanoparticles were coupled with SMP (0.01 M) in DMF at 40 °C for 24 hours under continuous stirring.
(6) After SMP attachment, HA nanoparticles were rinsed with DMF for 3 times and dried at 40 °C in vacuum (10-5 Torr) for 24 hours.
(7) The model peptide DIF-7c was immobilized onto HA nanoparticles in anhydrous DMF (1mM) at 40 °C for 24 hours under continuous stirring.
(8) The functionalized HA nanoparticles were rinsed 3 times with DMF followed by 3 washes with DI water
(9) The HA-peptide conjugates (termed HA_Ps) were dried and degassed at 40 °C in vacuum (10-5 Torr) for 24 hours.
5.3.1.3.2. Immobilization of Peptide Using Physical Adsorption Methods
For physical adsorption, two possible ways were investigated in this study: (a) the
peptide DIF-7c was pre-adsorbed to nano-HA particles and then was dispersed in PLGA
solution, and (b) nano-HA and the peptide DIF-7c was dispersed individually in PLGA
solution, as shown in Figure 5.5.
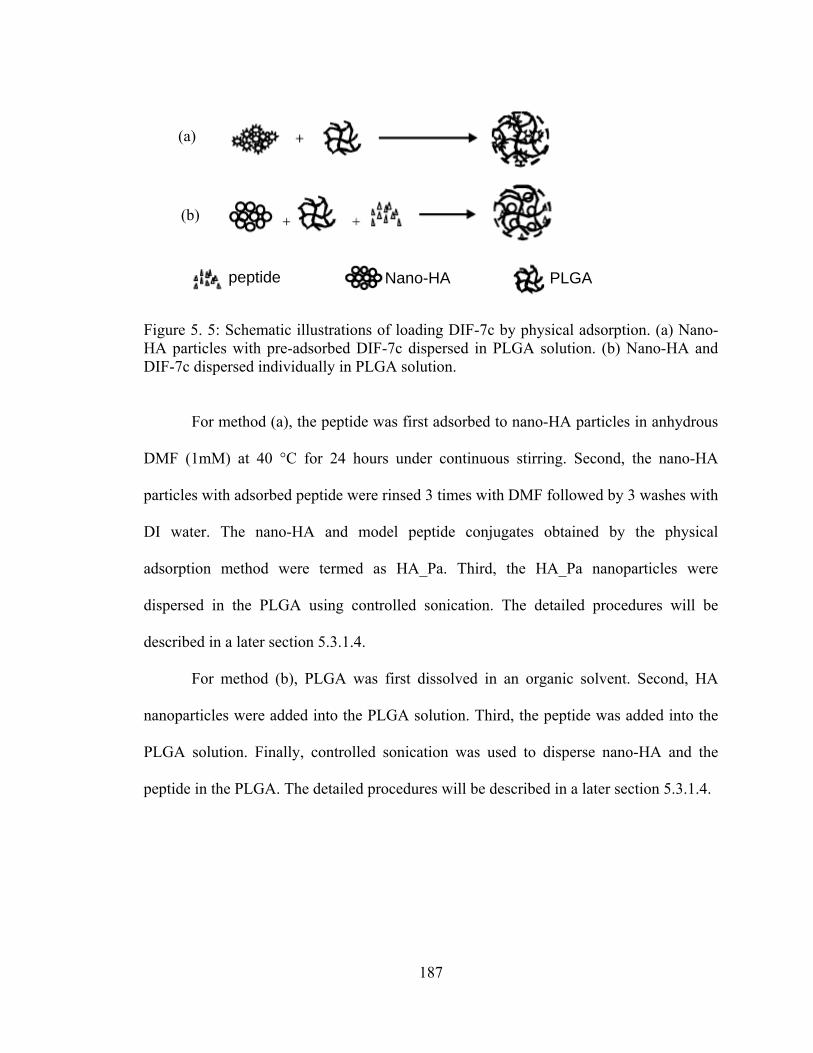
187
Figure 5. 5: Schematic illustrations of loading DIF-7c by physical adsorption. (a) Nano-HA particles with pre-adsorbed DIF-7c dispersed in PLGA solution. (b) Nano-HA and DIF-7c dispersed individually in PLGA solution.
For method (a), the peptide was first adsorbed to nano-HA particles in anhydrous
DMF (1mM) at 40 °C for 24 hours under continuous stirring. Second, the nano-HA
particles with adsorbed peptide were rinsed 3 times with DMF followed by 3 washes with
DI water. The nano-HA and model peptide conjugates obtained by the physical
adsorption method were termed as HA_Pa. Third, the HA_Pa nanoparticles were
dispersed in the PLGA using controlled sonication. The detailed procedures will be
described in a later section 5.3.1.4.
For method (b), PLGA was first dissolved in an organic solvent. Second, HA
nanoparticles were added into the PLGA solution. Third, the peptide was added into the
PLGA solution. Finally, controlled sonication was used to disperse nano-HA and the
peptide in the PLGA. The detailed procedures will be described in a later section 5.3.1.4.
PLGA
(a)
(b)
peptide Nano-HA
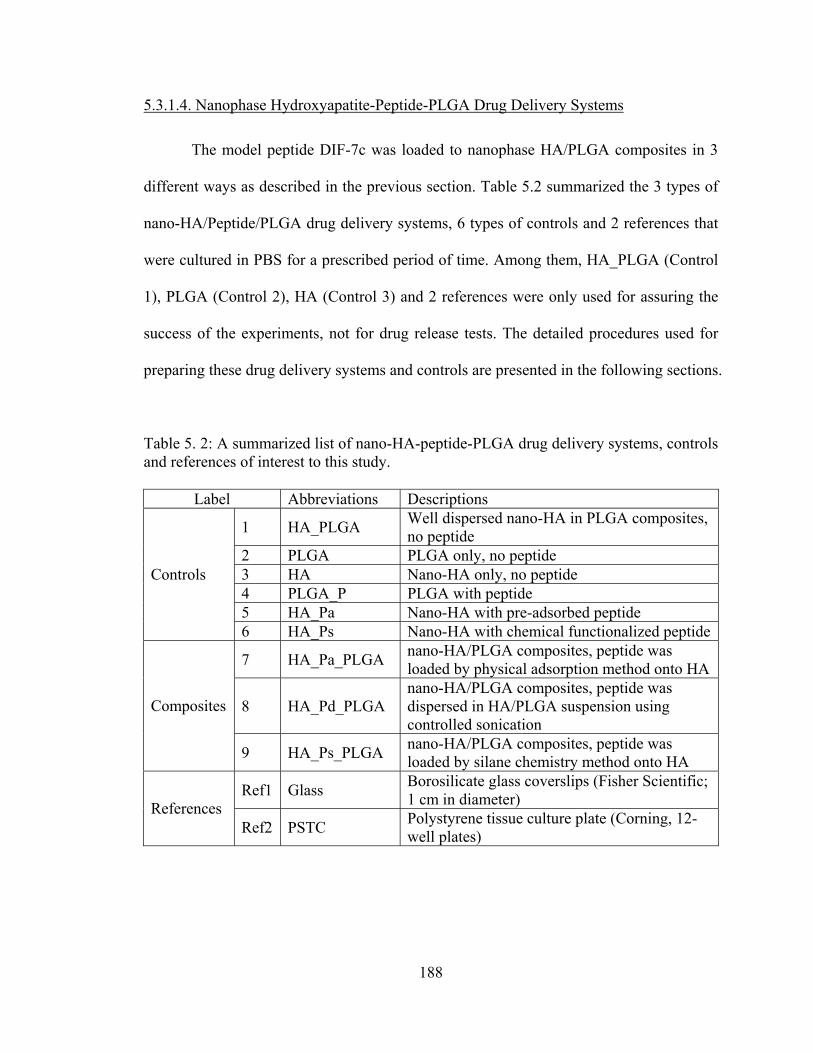
188
5.3.1.4. Nanophase Hydroxyapatite-Peptide-PLGA Drug Delivery Systems
The model peptide DIF-7c was loaded to nanophase HA/PLGA composites in 3
different ways as described in the previous section. Table 5.2 summarized the 3 types of
nano-HA/Peptide/PLGA drug delivery systems, 6 types of controls and 2 references that
were cultured in PBS for a prescribed period of time. Among them, HA_PLGA (Control
1), PLGA (Control 2), HA (Control 3) and 2 references were only used for assuring the
success of the experiments, not for drug release tests. The detailed procedures used for
preparing these drug delivery systems and controls are presented in the following sections.
Table 5. 2: A summarized list of nano-HA-peptide-PLGA drug delivery systems, controls and references of interest to this study.
Label Abbreviations Descriptions
1 HA_PLGA Well dispersed nano-HA in PLGA composites, no peptide
2 PLGA PLGA only, no peptide 3 HA Nano-HA only, no peptide 4 PLGA_P PLGA with peptide 5 HA_Pa Nano-HA with pre-adsorbed peptide
Controls
6 HA_Ps Nano-HA with chemical functionalized peptide
7 HA_Pa_PLGA nano-HA/PLGA composites, peptide was loaded by physical adsorption method onto HA
8 HA_Pd_PLGA nano-HA/PLGA composites, peptide was dispersed in HA/PLGA suspension using controlled sonication
Composites
9 HA_Ps_PLGA nano-HA/PLGA composites, peptide was loaded by silane chemistry method onto HA
Ref1 Glass Borosilicate glass coverslips (Fisher Scientific; 1 cm in diameter) References
Ref2 PSTC Polystyrene tissue culture plate (Corning, 12-well plates)

189
5.3.1.4.1. Preparation of Controls
PLGA with the peptide (control 2) and PLGA without the peptide (control 3)
were used as polymer controls. For the PLGA (control 3), PLGA pellets (50/50 wt.%
poly(DL-lactide/glycolide, Polysciences, Inc., Warrington, PA) were dissolved in
chloroform at 40 °C in a water bath for 40 minutes, cast into a Teflon petri dish,
evaporated in air at room temperature for 24 hours, and dried in an air vacuum chamber
at room temperature for 48 hours. For the PLGA_P (control 2), 1.5 mg peptide was added
into PLGA solution after PLGA was dissolved in chloroform at 40 °C. These PLGA
films (0.3 mm in thickness) were then cut into 1 cm × 1 cm squares for use in material
characterizations and in vitro studies.
For the HA/PLGA (control 1), nanocrystalline HA (synthesized in 5.3.1.1.,
average particle size 36 nm) was added into the PLGA solution to give a 30/70
ceramic/polymer weight ratio. The composite mixture was sonicated using a Misonix
3000 sonicator (Misonix, Inc.) with its microtip immersed in the mixture. After
sonication, the composite suspension was cast into a Teflon dish, evaporated in air at
room temperature for 24 hours, and dried in an air vacuum chamber at room temperature
for 48 hours. The nano-HA/PLGA specimens were cut into 1 cm × 1 cm squares for use
in material characterizations and in vitro studies.
HA, HA_Pa and HA_Ps were used as ceramic controls.
5.3.1.4.2. Preparation of HA/PLGA Composites Loaded with Peptides
The peptide DIF-7c was loaded to HA/PLGA composites by 3 methods, one was
through chemical bonding, the other two were through physical bonding. Experimentally,

190
the HA_Pa_PLGA systems were prepared according to the procedures listed in Table 5.3.
The HA_Pd_PLGA systems were prepared according to the procedures listed in Table
5.4. The HA_Ps_PLGA systems were prepared according to the procedures listed in
Table 5.5.
Table 5. 3: The detailed procedures that were followed for preparing the HA_Pa_PLGA systems.
(1) PLGA was dissolved in chloroform at 40 °C in a water bath for 40 minutes.
(2) HA_Pa nanoparticles were added into PLGA solution. The weight ratio of HA_Pa to PLGA was 30/70.
(3) The mixture was sonicated for 10 min at controlled powers to achieve a uniform dispersion of HA_Pa in PLGA.
(4) After sonication, the mixture was cast into a Teflon mold, evaporated in air at room temperature for 24 hours, and dried in an air vacuum chamber at room temperature for 48 hours.
Table 5. 4: The detailed procedures that were followed for preparing the HA_Pd_PLGA systems.
(1) PLGA was dissolved in chloroform at 40 °C in a water bath for 40 minutes.
(2) HA nanoparticles were added into PLGA solution.
(3) The peptide was added into PLGA solution. The weight ratio of (HA+peptide) to PLGA was 30/70.
(4) The mixture was sonicated for 10 min at controlled powers to achieve a uniform dispersion of HA and peptide in PLGA.
(5) After sonication, the mixture was cast into a Teflon mold, evaporated in air at room temperature for 24 hours, and dried in an air vacuum chamber at room temperature for 48 hours.
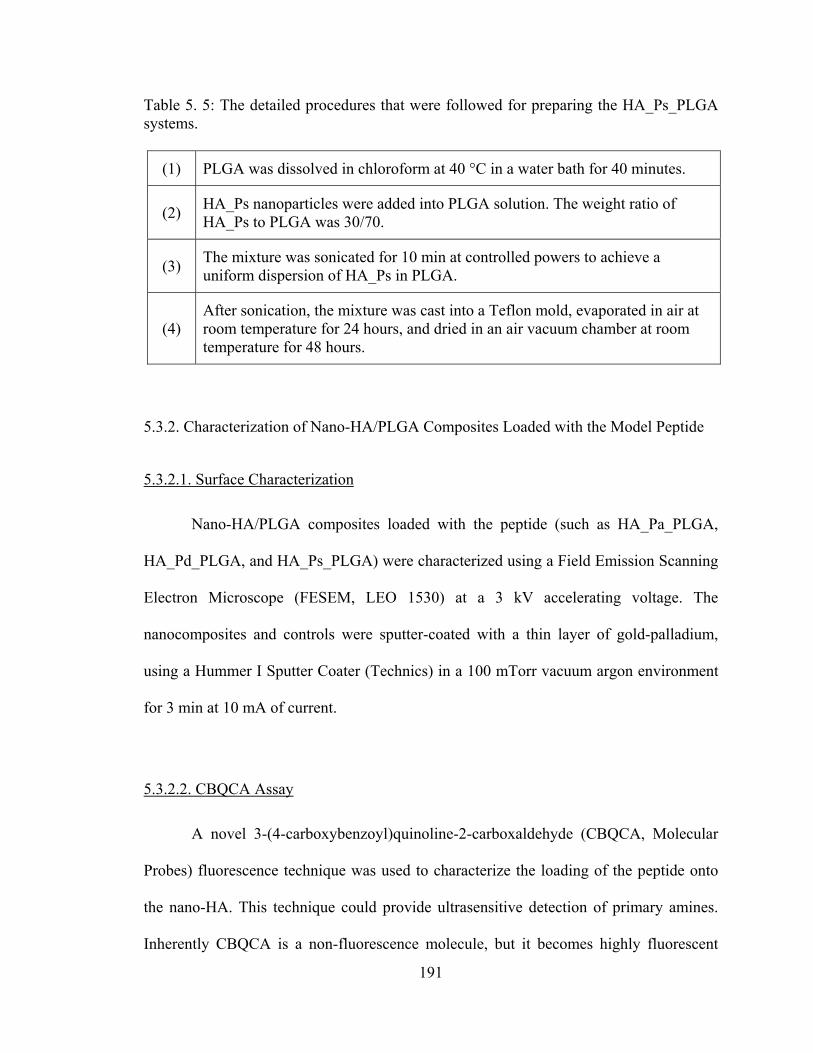
191
Table 5. 5: The detailed procedures that were followed for preparing the HA_Ps_PLGA systems.
(1) PLGA was dissolved in chloroform at 40 °C in a water bath for 40 minutes.
(2) HA_Ps nanoparticles were added into PLGA solution. The weight ratio of HA_Ps to PLGA was 30/70.
(3) The mixture was sonicated for 10 min at controlled powers to achieve a uniform dispersion of HA_Ps in PLGA.
(4) After sonication, the mixture was cast into a Teflon mold, evaporated in air at room temperature for 24 hours, and dried in an air vacuum chamber at room temperature for 48 hours.
5.3.2. Characterization of Nano-HA/PLGA Composites Loaded with the Model Peptide
5.3.2.1. Surface Characterization
Nano-HA/PLGA composites loaded with the peptide (such as HA_Pa_PLGA,
HA_Pd_PLGA, and HA_Ps_PLGA) were characterized using a Field Emission Scanning
Electron Microscope (FESEM, LEO 1530) at a 3 kV accelerating voltage. The
nanocomposites and controls were sputter-coated with a thin layer of gold-palladium,
using a Hummer I Sputter Coater (Technics) in a 100 mTorr vacuum argon environment
for 3 min at 10 mA of current.
5.3.2.2. CBQCA Assay
A novel 3-(4-carboxybenzoyl)quinoline-2-carboxaldehyde (CBQCA, Molecular
Probes) fluorescence technique was used to characterize the loading of the peptide onto
the nano-HA. This technique could provide ultrasensitive detection of primary amines.
Inherently CBQCA is a non-fluorescence molecule, but it becomes highly fluorescent

192
upon reaction with amine groups in the presence of cyanide molecules, as shown in
Figure 5.6 [273]. CBQCA reacts specifically with primary amines to form conjugates that
are highly fluorescent and the sensitivity of detection of CBQCA conjugates could reach
the attomole range (10-18 moles).
Figure 5. 6: The CBQCA reaction illustrates the transformation of the non-fluorescent CBQCA molecule into a fluorescent molecule when it reacts with amine groups in the presence of a cyanide catalyst.
CBQCA reagent solutions were prepared by dissolving the CBQCA (MW = 305.3
g/mol) in dimethylsulfoxide (DMSO, Sigma D2650) (10 mM). Potassium cyanide (KCN,
MW = 65.1, Sigma 60178) was dissolved in DI water to give a 10mM working solution.
Nano-HA particles with or without the peptide were exposed to CBQCA and potassium
cyanide working solutions for 2 hours at room temperature. These Nano-HA particles
were then carefully transferred onto a glass cover slip using a micropipette and visualized
under a fluorescence microscope (LEICA DM5500B upright fluoresence microscope).
Images were obtained using Image Pro software.
Non-Fluorescence Fluorescence

193
5.3.3. In Vitro Drug Release Profiles and Degradation of Drug Carriers
In vitro nano-HA/PLGA degradation and the peptide release kinetics were studied
in PBS (pH=7.4). All samples of interest were incubated in PBS under standard cell
culture conditions for 52 days. After 1, 3, 5, 7, 30, and 52 days, the supernatants were
collected and analyzed. The appearance of specimen integrity was monitored and used to
estimate the speed of degradation. The peptide release from scaffolds into culture
solution was determined using a micro-BCA assay (Pierce). Briefly, the peptide DIF-7c
standards were prepared by a serial dilution and the working reagent was mixed
according to the established protocol [274]. Each standard and unknown sample were
aliquoted in 150 μL into a microplate well and mixed thoroughly with the working
reagent on a plate shaker for 30 seconds. The reactions were incubated at 37 °C for 2
hours. The microplates were cooled to room temperature and read the absorbance at 562
nm using a spectrophotometer (SpectraMax® 340 PC, Molecular Devices). A standard
curve was generated by plotting the average Blank-corrected 562 nm reading for each
peptide standard versus its concentration in μg/mL. The peptide concentration in the
supernatants was calculated according to the standard curve.
5.4. Results and Discussions
5.4.1. Characterization of Drug Loading
5.4.1.1. Surface Characterization
Scanning electron micrographs suggest that the PLGA_P maintained a very
smooth surface similar to the PLGA, as shown in Figure 5.7. The top and bottom surfaces

194
of the HA_Pa_PLGA scaffolds demonstrated that the HA_Pa nanoparticles were well
dispersed in the polymer matrix, as shown in Figure 5.8. The HA_Pd_PLGA scaffolds
had similar surfaces to the HA_Pa_PLGA (Images not shown). Scanning electron
micrographs of the HA_Ps_PLGA demonstrated that HA_Ps nanoparticles had a finer
dispersion in the polymer matrix compared to the HA_Pa_PLGA and HA_Pd_PLGA
scaffolds, as shown in Figure 5.9. In general, the distribution of nano-HA particles was
uniform in these drug delivery systems after controlled sonication, whether these HA
nanoparticles were functionalized chemically or physically.
Figure 5. 7: SEM images of the PLGA_P. Original magnification is 100 kX. Magnification bar is 100 nm.

195
Figure 5. 8: SEM images of the HA_Pa_PLGA. Original magnifications are 50 kX for (a) and 100 kX for (b). Magnification bars are 200 nm.
Figure 5. 9: SEM images of the HA_Ps_PLGA. Original magnifications are 100 kX for (a,b) and 200 kX for (c,d). Magnification bars are 200 nm for (a,c,d) and 100 nm for (b).
(a) (b)
(c) (d)
(a) (b)

196
5.4.1.2. CBQCA Assay
The results of the CBQCA assay demonstrated the success of loading the peptide
to nano-HA both chemically and physically, as shown in Figure 5.10 and Figure 5.11. In
Figure 5. 10, nano-HA with chemically loaded peptide produced very good fluorescence
(Figure 5. 10d), which indicated the successful attachment of the peptide to nano-HA.
Moreover, in the absence of the CBQCA, APTES treated nano-HA did not fluorescence
(image not shown). In contrast, in the presence of CBQCA, APTES treated nano-HA did
fluorescence (Figure 5. 10b). Nano-HA after SMP reaction did not fluorescence (Figure 5.
10c), indicating that the amine groups were completely covered by the SMP. The nano-
HA (without peptide) control did not show fluorescence (Figure 5. 10a), which provided
evidence that the CBQCA did not react with HA and only reacted with the amino groups.
In Figure 5.11b, nano-HA with physically loaded peptide (HA_Pa) produced detectable
fluorescence at the same exposure conditions, although its signal strength was much
weaker than that of nano-HA with chemically attached peptide (HA_Ps) as shown in
Figure 5.10d. Figure 5.11a further confirmed the presence of fluorescence after CBQCA
reacted with the peptide DIF-7c under the conditions defined in the CBQCA assay.
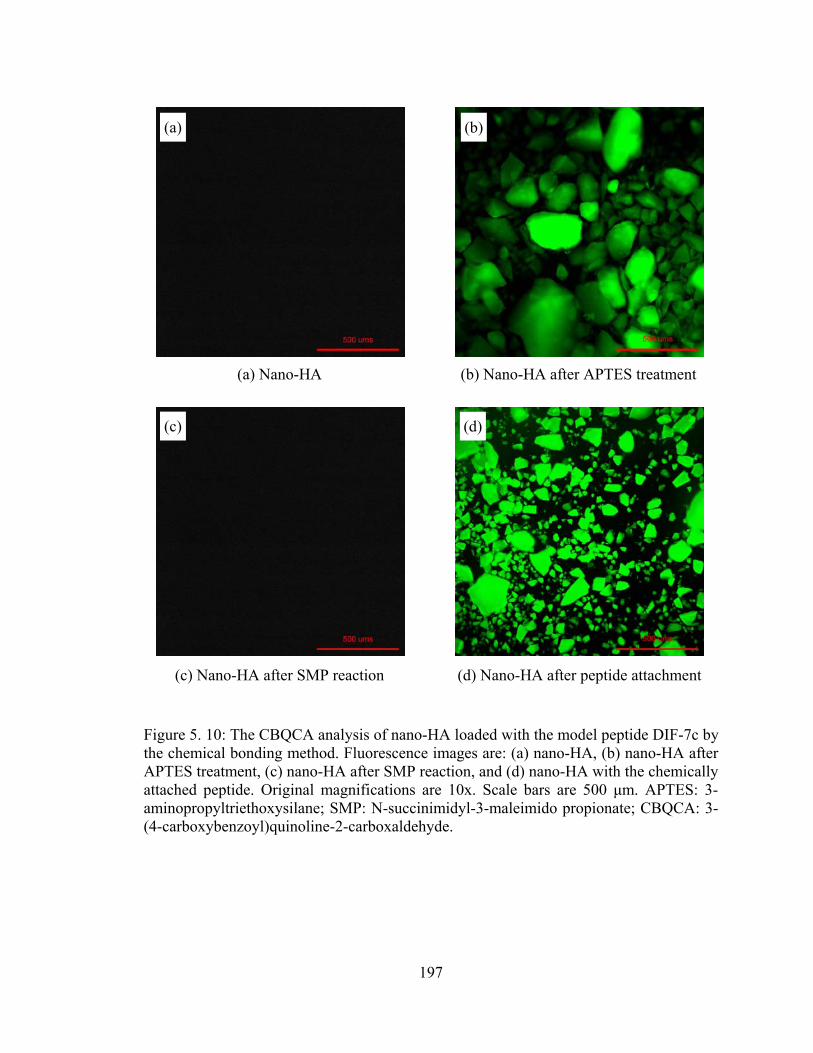
197
Figure 5. 10: The CBQCA analysis of nano-HA loaded with the model peptide DIF-7c by the chemical bonding method. Fluorescence images are: (a) nano-HA, (b) nano-HA after APTES treatment, (c) nano-HA after SMP reaction, and (d) nano-HA with the chemically attached peptide. Original magnifications are 10x. Scale bars are 500 μm. APTES: 3-aminopropyltriethoxysilane; SMP: N-succinimidyl-3-maleimido propionate; CBQCA: 3-(4-carboxybenzoyl)quinoline-2-carboxaldehyde.
(a) (b)
(c) (d)
(a) Nano-HA (b) Nano-HA after APTES treatment
(c) Nano-HA after SMP reaction (d) Nano-HA after peptide attachment

198
Figure 5. 11: The CBQCA analysis of nano-HA loaded with the model peptide DIF-7c by the physical adsorption method. Fluorescence images are (a) the peptide, and (b) nano-HA with the physically attached peptide. Original magnifications are 10x. Scale bars are 500 μm.
5.4.2. In Vitro Drug Release and Degradation of Drug Carriers
5.4.2.1. In Vitro Drug Release Profiles
A series of drug therapies are usually necessary after orthopedic surgeries to
prevent either infection or inflammation or to induce appropriate natural tissue
integration with the implants. Currently, drugs (such as antibiotics, anti-inflammatory
drugs and bone growth factors) are typically administered either orally or intravenously.
These routes of drug delivery often result in limited bioavailability, thus, requiring high
dosages for drugs to be effective at the site of implantation. The ideal situation is
delivering drugs directly at the interface of the implant and tissue. In other words, drug
carrying implants that are capable of controlled drug release may provide a promising
approach for treating bone diseases at targeted sites.
(a) (b)
(a) The model peptide DIF-7c (b) Nano-HA with the adsorbed peptide
199
The release of peptide DIF-7c in vitro was studied for up to 52 days, as shown in
Figure 5.12. In Figure 5.12(a), the single phase drug carriers, including PLGA_P, HA_Pa,
HA_Ps, all demonstrated one-phase release, although the major release happened at
different time points for the HA carrier and the PLGA carrier. Specifically, the HA
carrier (HA_Pa and HA_Ps) started the peptide release at day 1, while the PLGA carrier
did not release any peptide until day 7. At day 30, the HA carrier stopped the peptide
release, while the PLGA carrier showed evidence of peptide release. At day 52, the
PLGA carrier continuously showed peptide release, while HA carrier did not release any
peptide. The HA carrier demonstrated continuous peptide release from day 1 to 7. From
day 1 to day 7, the total amount of peptide released by the HA_Ps was greater than the
HA_Pa. It was speculated that the HA_Ps had higher peptide loading efficiency
compared to the HA_Pa. That is, chemical functionalization permitted more peptide to be
attached onto nano-HA compared to physical adsorption when the same peptide/HA ratio
was used. The higher fluorescence intensity of the HA_Ps (Figure 5.10d) compared to the
HA_Pa (Figure 5.11b) under the same exposure conditions also provided evidence for the
higher peptide loading efficiency. In Figure 5.12(b), the composite drug carriers,
including HA_Pd_PGA, HA_Pa_PLGA, and HA_Ps_PLGA, all demonstrated two-phase
release. At phase I (from day 1 to 7), the HA_Ps_PGA demonstrated continuous peptide
release, while the HA_Pa_PLGA and the HA_Pd_PLGA stopped releasing at day 5 and
day 7. At phase II, the HA_Ps_PLGA demonstrated increased peptide release from day
30 to 52, while the HA_Pa_PLGA demonstrated decreased release from day 30 to 52.
The HA_Pd_PLGA did not show any release at day 30, but showed peptide release at day
52.

200
Figure 5. 12: The amount of peptide DIF-7c released from the drug delivery systems of interest to this study. The peptide concentration in the collected supernatant was determined by MicroBCA assay (Pierce). (a) Peptide released from the controls: PLGA_P, HA_Pa, and HA_Ps. (b) Peptide released from the nanocomposites: HA_Pd_PLGA, HA_Pa_PLGA, and HA_Ps_PLGA. Values are mean ± SEM; N=3. For each type of drug carriers, the amount of peptide released at the prescribed time points are significant different from one another, p<0.05, N=3.
0
20
40
60
80
100
1 3 5 7 30 52
PLGA_PHA_PaHA_Ps
0
20
40
60
80
100
1 3 5 7 30 52
HA_Pd_PLGAHA_Pa_PLGAHA_Ps_PLGA
(a)
(b)
Time (Days)
Time (Days)
The
Am
ount
of P
eptid
e R
elea
sed
(μg/
mL)
Th
e A
mou
nt o
f Pep
tide
Rel
ease
d (μ
g/m
L)
Phase I Phase II

201
Figure 5.13 summarized the total amount of peptide released from the various
drug delivery systems during 52 days of culture in vitro. Among the single phase drug
carriers, the total peptide released from the HA_Ps was the highest; the HA_Pa was the
second; and the PLGA_P was the lowest. Among the composite drug carriers, the total
peptide released from the HA_Ps_PLGA was the highest; the HA_Pa_PLGA was the
second; and the HA_Pd_PLGA was the lowest.
Figure 5. 13: The total amount of peptide DIF-7c released from the drug delivery systems during 52 days of culture in vitro. Values are mean ± SEM; N=3. *p < 0.05 compared to PLGA_P and HA_Pa; **p < 0.05 compared to HA_Pd_PLGA and HA_Pa_PLGA; +p < 0.05 compared to PLGA_P; and ++p < 0.05 compared to HA_Pd_PLGA.
Clearly, both drug carriers and drug loading methods played important roles in the
drug release profiles. The drug carriers studied in this chapter provided a wide range of
drug release profiles, from one-phase release to two-phase release. These results provided
0
50
100
150
200
250
300
PLGA_P
HA_Pa
HA_Ps
HA_Pd_
PLGA
HA_Pa_
PLGA
HA_Ps_P
LGA
The
Tota
l Am
ount
of P
eptid
e R
elea
sed
Dur
ing
52 D
ays (μg
/mL)
* **
+++

202
important information for designing the drug carriers and drug loading methods for
different biological applications. For example, if one application requires a short-term
release (such as antibiotics release in a short time after surgeries), the single phase
carriers such as HA_Ps or HA_Pa would be a good choice. If another application (such as
growth factors for promoting bone regeneration) requires a long-term release,
HA_Ps_PLGA would be a better choice. When selecting a drug carrier and a drug
loading method, all the biological factors and characteristics of drug release should be
considered and balanced for an optimal match with the appropriate orthopedic application.
5.4.2.2. Degradation of Drug Carriers
As reported in Chapter 2 that titania nanoparticles mediated PLGA degradation,
nano-HA had similar effects on PLGA degradation. Moreover, the drug release profiles
are related to the degradation kinetics of the nanocomposites and types of bonding
formed between drug and carrier. Figure 5.14 showed the appearance of the drug carriers
after 30 and 52 days of culture in PBS under standard cell culture conditions. In Figure
5.14(a), after 30 days, HA_PLGA maintained their integrity, while PLGA and PLGA_P
lost their integrity and shape. In Figure 5.14(b), after 30 days, HA_Ps_PLGA maintained
their integrity, while HA_Pa_PLGA and HA_Pd_PLGA showed apparent degradation
trace around the specimens. In Figure 5.14(c), after 52 days, HA_PLGA, PLGA and
PLGA_P completely degraded. In Figure 5.14(d), after 52 days, HA_Pd_PLGA had less
than 10% of scaffolds left; HA_Pa_PLGA significantly shrank 50-60% and lost their
original shape; and HA_Ps_PLGA shrank less than 20% and maintained their shape and
integrity.

203
Figure 5. 14: The appearance of drug carriers after 30 and 52 days of culture in vitro. (a,b): after 30 days of culture. (c,d): after 52 days of culture.
5.5. Conclusions
Results of this chapter demonstrated a wide range of drug release profiles
achieved by using various drug carriers and drug loading methods. The drug loading
efficiency are also related to the drug carriers and the loading methods. Single phase drug
carriers (such as HA_Pa, HA_Ps and PLGA) provided one-phase release profiles. The
nanocomposite drug carriers demonstrated two-phase release profiles. Importantly, a
PLGA_P
(a)
(c) (d)
(b)
HA_PLGA PLGA
PSTC HA_Pd_PLGA
HA_Pa_PLGA HA_Ps_PLGA
Glass

204
prolonged peptide release (up to 52 days) was achieved on the HA_Ps_PLGA drug
delivery systems.
The drug carriers and the drug loading methods are very important factors that
should be considered when designing the next generation of drug carrying orthopedic
prostheses for various clinical applications. The appropriate drug carriers and drug
loading methods should be carefully chosen for specific applications. Results of this
chapter presented a useful guideline for designing more effective, controlled drug
delivery systems.

205
CHAPTER 6. CONCLUSTIONS AND PROPOSALS FOR FUTURE RESEARCH
6.1. Summary of Major Conclusions
This dissertation provided valuable information for designing and developing
nanostructured ceramic/polymer composites as next generation orthopedic prostheses for
more effective bone tissue regeneration.
Surface properties (such as topography, surface roughness and surface area) of
nanostructured 2D titania/PLGA composites were successfully controlled by low- to
high-power sonications and consequent dispersion states of nano-titania in PLGA
composites. The results demonstrated a strong correlation between the surface properties
of nanostructured composites and the in vitro osteoblast responses. Osteoblast adhesion
and long-term functions (such as collagen synthesis, alkaline phosphatase activity, and
calcium-containing mineral deposition) significantly increased on well-dispersed nano-
titania in PLGA composites compared to single-phase PLGA and agglomerated nano-
titania in PLGA composites. Moreover, well-dispersed nano-titania in PLGA composites
decreased the harmful acidic pH changes of PLGA as it degrades, reduced weight loss of
the nanocomposites, and prolonged the mechanical integrity of the nanocomposites
necessary for matching bone growth.
Not only were surface properties investigated for bone cell functions, but also 3D
structures built from nano-titania/PLGA composites. The aerosol-based 3D printing

206
technique produced well-ordered bone-like structures and successfully preserved nano-
dispersion of ceramic in the final polymer composites, critical for optimizing bone cell
functions. The results demonstrated that the 3D printed nanostructured titania/PLGA
composites promoted bone cell infiltrations and subsequent bone ingrowth.
From the perspective of mechanical properties, well-dispersed ceramic
nanoparticles (titania or HA) in PLGA composites promoted mechanical properties as
compared to the PLGA and the agglomerated ceramic/PLGA composites. Specifically,
well-dispersed nano-titania/PLGA composites promoted the tensile modulus, tensile
strength at yield, ultimate tensile strength and compressive modulus as compared to
PLGA and the more agglomerated nano-titania/PLGA composites. Nano-HA/PLGA
nanocomposites also demonstrated greater tensile modulus, tensile strength and
compressive modulus than the PLGA. Moreover, well-dispersed nano-HA in PLGA
composites demonstrated a greater ductility than the more agglomerated nano-HA/PLGA
composites.
Finally, nanophase ceramic/polymer composites were explored for controlled
drug delivery applications. The results demonstrated a wide range of drug release profiles
achieved by using various drug carriers and drug loading methods. The drug loading
efficiency are also related to the drug carriers and the loading methods. Single phase drug
carriers (such as HA_Pa, HA_Ps and PLGA) provided one-phase release profiles.
Specifically, HA_Pa or HA_Ps provided an early stage release while PLGA offered a
later stage release. All of the nanocomposite drug carriers demonstrated two-phase
release profiles. Importantly, a prolonged peptide release (up to 52 days) was achieved on
the HA_Ps_PLGA drug delivery systems.

207
6.2. Key Criteria and Considerations for the Next Generation of Orthopedic Prostheses
(1) Surface properties: It is necessary to create more bone-like nanostructured
surfaces in terms of topography, feature size, surface roughness, surface area, and etc.
(2) 3D structures: It is critical to produce more bone-like 3D hierarchical
structures using novel nanofabrication techniques.
(3) Degradation properties: It is crucial to design materials with a tunable
degradation rate to match the rate of bone regeneration.
(4) Mechanical properties: It is essential to mimic mechanical properties of bone
for load-bearing situations.
(5) Controlled drug delivery: It is important to design drug-carrying implants to
deliver necessary drugs to targeted sites at a desirable rate to facilitate bone healing.
6.3. Proposals for Future Research
6.3.1. Building 3D Tissue Constructs at the Patient Bedside by Rapid Prototyping
Techniques
Previous studies in Chapter 3 demonstrated the feasibility of fabricating 3D
nanocomposite scaffolds using an aerosol-based 3D printing technique. This 3D printing
technique should be continuously investigated to build 3D tissue constructs that have
tissue-like hierarchical inner architectures and outer structures of tissue defects. Future
research should concentrate on designing CAD models for various tissue types, printing
such structures, developing techniques that can potentially be used at the patient bedside

208
just before implantation, and investigating 3D interactions of such constructs with
differentiated cell types (such as osteoblast, chondrocyte, endothelial cells, etc.) as well
as stem cells.
6.3.2. Controllable Drug-Carrying Implants for Treating Bone Diseases at Targeted sites
The research goal is to conjugate bone substituting materials with bone
morphogenetic proteins (BMPs), BMP-derived peptides and, for the future, other agents
(such as antibiotics and anti-inflammatory drugs) to treat bone diseases (such as
osteoporosis, osteomalacia, osteosarcoma, etc.) and promote bone healing. Drug-loading
efficiency, drug release kinetics, and capability of targeting specific sites, are key
problems that greatly influence the effectiveness of drugs. Therefore, future studies
should focus on developing more effective drug delivery methods (such as combining
current discoveries in this dissertation with magnetic nanoparticles) for enhancing drug-
loading efficiency and prolonging drug release at targeted sites. Proteins, peptides, and
anti-inflammatory agents (such as dexamethasone), among others, should be used as
model drug molecules. In vitro drug release should be investigated using established
tissue culture techniques and biochemical assays.
6.3.3. Stem Cell Differentiation on Nanocomposites Functionalized with Peptides
Previous studies in Chapter 5 demonstrated the success in functionalizing
nanophase ceramic/polymer composites with a model peptide. Future research should
also investigate the differentiation of mesenchymal stem cells (MSCs) in response to such

209
nanocomposites functionalized with short peptides since their differentiation to bone cells
plays a crucial role in the success of bone regeneration. The short peptides can be
specially designed or derived from growth factors that favor MSCs differentiating into
osteoblasts or chondrocytes for various orthopedic applications. Future work should
investigate the factors and mechanisms controlling the differentiation of mesenchymal
stem cells in vitro. The long range goal of this proposed research should be to develop
methods to direct the differentiation or development of stem cells along specific cell
lineages to yield replacement cells for clinical use.
6.3.4. Animal Models for Preclinical Evaluations of Tissue Substitutes
It is necessary to develop animal models for testing tissue substitutes in vivo
before clinical trials. Since this dissertation included in vitro studies, it is clear that in
vivo drug release of some of the most promising materials here and their in vivo tissue
integration should be conducted. Different animal models are needed for different
orthopedic applications. For example, rabbit fracture models could be developed for
testing low load-bearing bone substitutes. However, for large high load-bearing implant
systems, sheep models should be developed.
6.4. Challenges, Promises and Ultimate Dreams
In this dissertation, nanostructured 2D to 3D ceramic/polymer composites have
been designed, fabricated and evaluated for the goal of developing more effective

210
orthopedic prostheses with suitable biological and mechanical properties for bone
regeneration and the capability of delivering drugs to the tissue-implant interface in a
more controlled fashion. This dissertation has demonstrated how 2D surface properties
(such as surface roughness and area) and well-ordered 3D structures can be controlled
through the manipulation of fabrication techniques (such as sonication and 3D printing);
how bone cells interact with these 2D to 3D nanostructures; how mechanical properties
of these nanophase ceramic/polymer composites can be optimized through controlling the
dispersion of nanophase ceramics in the polymer matrix; and how these nanocomposites
can be used as drug carriers to achieve prolonged two-phase drug release profiles through
regulating several variables (such as chemical or physical drug loading methods and
degradation kinetics of drug carriers).
The potential undoubtedly exists to refine nanophase ceramic/polymer composites
for the ultimate goal---replacing diseased or injured bone in a natural way, as shown in
Figure 6.1. Figure 6.1 illustrates an ideal situation. That is, bone substitutes provide the
appropriate support for the cells to proliferate and differentiate; their internal 3D
structures allow for proper diffusion of oxygen and nutrients to cells as well as proper
diffusion of waste from the cells; and their external architectures define the final shapes
of newly regenerated bone. The eventual goal is to return full biological, physiological
and mechanical functionality to a damaged bone tissue.
Over the past decade, it has been realized by researchers that the ideal situation
illustrated in Figure 6.1 is truly difficult and challenging to achieve, but seemingly still
very promising. The need for bone replacement will continuously increase as the
population ages. This dissertation has revealed many factors that influence bone

211
regeneration and the complexity of ideal bone replacement; and it is still believed that
this is an exciting and incredible research avenue.
Figure 6. 1: Schematic diagram illustrating an ideal situation of bone regeneration. Bone substituting materials will resorb after fulfilling their initial tasks, thus, ideally, nothing foreign left in these patients. (Adapted and redrawn from [275]).
A femur bone with a missing section is held in place with braces
Inserted bone substitutes with bone growth factors and other necessary drugs
The scaffold is slowly infiltrated by newly regenerated bone
The scaffold is ultimately completely replaced with new bone
The cells have their own blood supply
The femur bone has healed naturally
212
LIST OF REFERENCES
1 Bone Health and Osteoporosis: A Report of the Surgeon General. Rockville, MD : U.S. Department of Health and Human Services, Public Health Service, Office of the Surgeon General. pp. 68-70, 2004.
2 U.S. Interim Projections by Age, Sex, Race, and Hispanic Origin. Washington (DC): U.S. Census Bureau, Population Division, Populations Projection Branch. 2004. Also available at http://www.census.gov/ipc/www/usinterimproj/.
3 Wright TM, Goodman SB. Implant wear in total joint replacement: clinical and biologic issues, material and design considerations. American Academy of Orthopaedic Surgeons. pp. 3-11, 2001.
4 Bren L, Joint replacement: an inside look. FDA Consumer, 38(2), March-April 2004. Also available at http://www.fda.gov/fdac/features/2004/204_joints.html
5 Webster TJ. Nanophase ceramics as improved bone tissue engineering materials. American Ceramic Society Bulletin. 82(6): 23-28; 2003.
6 Wei G, Ma PX. Structure and properties of nano-hydroxyapatite/polymer composite scaffolds for bone tissue engineering. Biomaterials, 25(19): 4749-4757; 2004.
7 Salgado AJ, Coutinho OP, Reis RL. Bone tissue engineering: state of the art and future trends. Macromolecular Bioscience. 4(8): 743-765; 2004.
8 Stevenson S. Enhancement of fracture healing with autogenous and allogeneic bone grafts. Clinical Orthopaedics and Related Research. 355(Suppl): S239-246, 1998.
9 Saltzman WM. Tissue Engineering. New York : Oxford University Press, pp. 6-7, 2004.
10 Marra KG, Szem JW, Kumta PN, DiMilla PA, Weiss L.E. In vitro analysis of biodegradable polymer blend/hydroxyapatite composites for bone tissue engineering. Journal of Biomedical Materials Research. 47(3): 324-335; 1999.
11 Nather A, Biology of Healing of Large Deep-Frozen Cortical Bone Allografts, in “Bone Biology and Healing”, (Phillips, G.O., Ed.), pp. 50-65, 2003.

213
12 Frost HM. Wolff's Law and bone's structural adaptations to mechanical usage: an overview for clinicians. Angle Orthodontist. 64(3): 175-188; 1994.
13 Prendergast PJ, Huiskes R. The biomechanics of Wolff's law: recent advances. Irish Journal of Medical Sciences. 164(2): 152-154; 1995.
14 Chamay A, Tschantz P. Mechanical influences in bone remodeling. Experimental research on Wolff's law. Journal of Biomechanics 5(2): 173-180; 1972.
15 Park JB, Bronzino JD. Biomaterials: Principles and Applications, Boca Raton, FL : CRC Press, pp. 1-20, 2003.
16 Kaplan FS, Hayes WC, Keaveny TM, Boskey A, Einhorn TA, Iannotti JP. Form and Function of Bone, in “Orthopaedic Basic Science” (Simon, S.R., Ed.), Columbus, OH : American Academy of Orthopaedic Surgeons. pp. 127-185, 1994.
17 Webster TJ. Nanophase Ceramics: The Future Orthopedic and Dental Implant Material, in “Advances in Chemical Engineering Volume 27: Nanostructured Materials” (Ying, J.Y., Ed.), San Diego, CA : Academic Press, pp. 126-160, 2001.
18 Bronzino JD. The Biomedical Engineering Handbook, Boca Raton, FL : CRC Press, pp. 274-706, 2000.
19 Black J, Hastings G. Handbook of Biomaterial Properties, New York : Chapman & Hall, pp. 3-21, 1998.
20 Fung YC, Biomechanics: Mechanical Properties of Living Tissues, New York: Springer-Verlag, pp. 500-519, 1993.
21 Boccaccini AR, Blaker JJ. Bioactive composite materials for tissue engineering scaffolds. Expert Review of Medical Devices. 2(3): 303-317; 2005.
22 Hench LL. Bioceramics. Journal of the American Ceramic Society. 81(7): 1705-1728; 1998.
23 Guyton AC. Textbook of Medical Physiology. Philadelphia: Saunders, pp. 868-881, 1991.
24 Trippel SB. Potential role of insulinlike growth factors in fracture healing. Clinical Orthopaedics and Related Research. 355S: S301-313; 1998.
25 Marin BR, Burr DB. Structure Function and Adaptation of Compact Bone, New York : Raven Press, pp. 106-107, 1989.
26 Stein GS, Lian JB. Molecular mechanisms mediating proliferation/differentiation interrelationships during progressive development of osteoblast phenotype. Endocrine Reviews. 14(4): 424-442; 1993.

214
27 Korkusuz P, Korkusuz F. Hard Tissue-Biomaterial Interactions, in “Biomaterials in Orthopedics”, (Yaszemski MJ et al., Ed.), New York : Marcel Dekker, pp. 1-40, 2004.
28 Hench LL, Best S. Ceramics, Glasses, and Glass-Ceramics, in “Biomaterials Science: an Introduction to Materials in Medicine”, (Ratner BD Ed.), Amsterdam : Boston : Elsevier Academic Press, pp. 153-170, 2004.
29 Lopes MA, Monteiro FJ, Santos JD, Serro AP, Saramago B. Hydrophobicity, surface tension, and zeta potential measurements of glass-reinforced hydroxyapatite composites. Journal of Biomedical Materials Research. 45(4): 370-375; 1999.
30 Degasne I, Basle MF, Demais V, Hure G, Lesourd M, Grolleau B, Mercier L, Chappard D. Effects of roughness, fibronectin and vitronectin on attachment, spreading, and proliferation of human osteoblast-like cells (Saos-2) on titanium surfaces. Calcified Tissue Internatioal. 64(6): 499-507; 1999.
31 Litsky AS, Spector M. Biomaterials, in “Orthopaedic Basic Science” (Simon, S.R., Ed.), Columbus, OH : American Academy of Orthopaedic Surgeons, pp. 447-486, 1994.
32 Horbett TA. Principles underlying the role of adsorbed plasma proteins in blood interactions with foreign materials. Cardiovascular Pathology. 2 (supplement): 137S-148S; 1993.
33 Horbett TA. The role of adsorbed adhesion proteins in cellular recognition of biomaterials. BMES Bulletin: Biomedical Engineering Society Newsletter. 23(2): 5-9; 1999.
34 Jenney CR, Anderson JM. Adsorbed serum proteins responsible for surface dependent human macrophage behavior. Journal of Biomedical Materials Research. 49(4): 435-447; 2000.
35 Anderson JM, DeFife KM, McNally AK, Collier TO, Jenney CR. Monocyte, macrophage and foreign body giant cell interactions with molecularly engineered surfaces. Journal of Materials Science: Materials in Medicine. 10(10-11): 579-588; 1999.
36 Jenney CR, Anderson JM. Adsorbed IgG: A potent adhesive substrate for human macrophages. Journal of Biomedical Materials Research. 50(3): 281-290; 2000.
37 Bren L, English L, Fogarty J, Policoro R, Zsidi A, Vance J, Drelich J, White C, Donahue S, Istephanous N, Rohly K. Effect of surface characteristics of metallic biomaterials on interaction with osteoblast cells. 7th World Biomaterials Congress Transactions, Sydney, Australia, pp. 1121, May 17-21, 2004.
38 Temenoff JS, Steinbis ES, Mikos AG. Biodegradable Scaffolds, in “Orthopedic Tissue Engineering: Basic Science and Practice” (Goldberg, V.M., and Caplan, A.I., Ed.), New York : Marcel Dekker, pp. 77-95, 2004.
215
39 Leong KF, Cheah CM, Chua CK. Solid freeform fabrication of three-dimensional scaffolds for engineering replacement tissues and organs. Biomaterials. 24(13): 2363-2378; 2003.
40 Davies JE. In vitro modeling of the bone/implant interface. The Anatomical Record, 245(2): 426-445; 1996.
41 Albrektsson T, Johansson C. Osteoinduction, osteoconduction and osseointegration. European Spine Journal. 10(Supply 2): S96-101; 2001.
42 Kirker-Head CA. Potential applications and delivery strategies for bone morphogenetic proteins. Advanced Drug Delivery Reviews. 43(1): 65-92; 2000.
43 Silver FH. Biomaterials Medical Devices and Tissue Engineering: An Integrated Approach, New York : Chapman & Hall, pp. 4-29, 1994.
44 Park JB, Bronzino JD. Biomaterials: Principles and Applications, Boca Raton, FL : CRC Press, pp. 20-77, 2003.
45 Reis RL, Cohn D. Polymer Based Systems on Tissue Engineering, Replacement and Regeneration, Boston : Kluwer Academic Publishers, pp.69-92,130, 2001.
46 Porter BD, Oldham JB, He SL, Zobitz ME, Payne RG, An KN, Currier BL, Mikos AG, Yaszemski MJ. Mechanical properties of a biodegradable bone regeneration scaffold. Transactions of the ASME. Journal of Biomechanical Engineering. 122(3): 286-288; 2000.
47 Agrawal CM, Ray RB. Biodegradable polymeric scaffolds for musculoskeletal tissue engineering. Journal of Biomedical Materials Research. 55(2): 141-150; 2001.
48 Thomson RC, Mikos AG, Beahm E, Lemon JC, Satterfield WC, Aufdemorte TB, Miller MJ. Guided tissue fabrication from periosteum using preformed biodegradable polymer scaffolds. Biomaterials. 20(21): 2007-2018; 1999.
49 Boccaccini AR, Maquet V. Bioresorbable and bioactive polymer/bioglass® composites with tailored pore structure for tissue engineering applications. Composites Science and Technology. 63(16): 2417-2429; 2003.
50 Liu X, Ma PX. Polymeric scaffolds for bone tissue engineering. Annals of Biomedical Engineering. 32(3): 477-486; 2004.
51 Chen VJ, Ma PX. Nano-fibrous poly(L-lactic acid) scaffolds with interconnected spherical macropores. Biomaterials. 25(11): 2065-2073; 2004.
52 Karp JM, Shoichet MS, Davies JE. Bone formation on two-dimensional poly(DL-lactide-co-glycolide) (PLGA) films and three-dimensional PLGA tissue engineering scaffolds in vitro. Journal of Biomedical Materials Research - Part A. 64(2): 388-396; 2003.

216
53 Liu X, Ma PX. Polymeric scaffolds for bone tissue engineering. Annals of Biomedical Engineering. 32(3): 477-486; 2004.
54 Gilding DK, Reed AM. Biodegradable polymers for use in surgery---polyglycolic/poly(lactic acid) homo- and copolymers: 1. Polymer. 20(12): 1459-1464; 1979.
55 Rokkanen P, Bostman O, Vainionpaa S, Vihtonen K, Tormala P, Laiho J, Kilpikari J, Tamminmaki M. Biodegradable implants in fracture fixation: early results of treatment of fractures of the ankle. Lancet. 1(8443): 1422-1424; 1985.
56 Waris E, Konttinen YT, Ashammakhi N, Suuronen R, Santavirta S. Bioabsorbable fixation devices in trauma and bone surgery: current clinical standing. Expert Review of Medical Devices. 1(2): 229-240; 2004.
57 Gunatillake PA, Adhikari R. Biodegradable synthetic polymers for tissue engineering. European Cells and Materials. 5: 1-16; 2003.
58 Kohn J, Abramson S, Langer R. Bioresorbable and Bioerodible Materials, in “Biomaterials Science: an Introduction to Materials in Medicine”, (Ratner, B.D., Ed.), Amsterdam : Boston : Elsevier Academic Press, pp. 115-126, 2004.
59 Cooper SL, Visser SA, Hergenrother RW, Lamba NMK. Polymers, in “Biomaterials Science: an Introduction to Materials in Medicine”, (Ratner BD, Ed.). Amsterdam : Boston : Elsevier Academic Press, pp. 67-79, 2004.
60 Hasirci V. Biodegradable Biomedical Polymers: Review of Degradation Of and In Vivo Response to Polylactides and Polyhydroxyalkanoates, in “Biomaterials and Bioengineering Handbook” (Wise, D.L., Ed.), New York : Marcel Dekker, pp.141-155, 2000.
61 Shih C. A graphical method for the determination of the mode of hydrolysis of biodegradable polymers. Pharmaceutical Research. 12(12): 2036-2060; 1995.
62 Taddei P, Monti P, Simoni R. Vibrational and thermal study on the in vitro and in vivo degradation of a poly(lactic acid)-based bioabsorbable periodontal membrane. Journal of Materials Science: Materials in Medicine. 13(5): 469-475; 2002.
63 Park JB, Bronzino JD. Biomaterials: Principles and Applications. Boca Raton, FL : CRC Press, pp. 99-103, 2003.
64 Barbucci R. Integrated Biomaterials Science, New York : Kluwer Academic/Plenum Publishers, pp. 189-689, 2002.
65 Yang S, Leong KF, Du Z, Chua CK. The design of scaffolds for use in tissue engineering. Part 1. traditional factors. Tissue Engineering. 7(6): 679-689; 2001.

217
66 Ma PX, Langer R. Degradation, structure and properties of fibrous nonwoven poly(glycolic acid) scaffolds for tissue engineering. Materials Research Society Symposium - Proceedings, Polymers in Medicine and Pharmacy. 394: 99-104; 1995.
67 Zhang R, Ma PX. Degradation behavior of porous poly(α-hydroxy acids)/hydroxyapatite composite scaffolds. Polymer Preprints, published by Division of Polymer Chemistry Inc. and American Chemical Society. 41(2): 1618-1619; 2000.
68 Ciapetti G, Ambrosio L, Savarino L, Granchi D, Cenni E, Baldini N, Pagani S, Guizzardi S, Causa F, Giunti A. Osteoblast growth and function in porous poly ε-caprolactone matrices for bone repair: a preliminary study. Biomaterials. 24(21): 3815-3824; 2003.
69 Pitt CG, Chasalow FI, Hibionada YM, Klimas DM, Schindler A. Aliphatic polyesters. I. the degradation of poly(ε-caprolactone) in vivo. Journal of Applied Polymer Science. 26(11): 3779-3787; 1981.
70 Pitt CG, Gratzl MM, Kimmel GL, Surles J, Schindler A. Aliphatic polyesters II. the degradation of poly(DL-lactide), poly(ε-caprolactone), and their copolymers in vivo. Biomaterials. 2(4): 215-220; 1981.
71 Dunn AS, Campbell PG, Marra KG. The Influence of polymer blend composition on the degradation of polymer/hydroxyapatite biomaterial. Journal of Materials Science: Materials in Medicine. 12(8): 673-677; 2001.
72 Lin W. Comparison of thermal characteristics and degradation properties of ε-caprolactone copolymers. Journal of Biomedical Materials Research. 47: 420-423, 1999.
73 Fisher JP, Vehof JWM, Dean D, Van der Waerden JPCM, Holland TA, Mikos AG, Jansen JA. Soft and hard tissue response to photo crosslinked poly(propylene fumarate) scaffolds in a rabbit model. Journal of Biomedical Materials Research. 59(3): 547-556; 2002.
74 Temenoff JS, Mikos AG. Injectable biodegradable materials for orthopedic tissue engineering. Biomaterials. 21(23): 2405-2412; 2000.
75 Rodrigues CVM, Serricella P, Linhares ABR, Guerdes RM, Borojevic R, Rossi MA, Duarte MEL, Farina M. Characterization of a bovine collagen-hydroxyapatite composite scaffold for bone tissue engineering. Biomaterials. 24(27): 4987-4997; 2003.
76 Dunn MG, Bellincampi LD, Tria AJ, Zawadsky JP. Preliminary development of a collagen-PLA composite for ACL reconstruction. Journal of Applied Polymer Science. 63(11): 1423-1428; 1997.
77 Liao SS, Cui FZ, Zhu Y. Osteoblasts adherence and migration through three-dimensional porous mineralized collagen based composite: nHAC/PLA. Journal of Bioactive and Compatible Polymers. 19(2): 117-130, 2004.

218
78 Ren L, Tsuru K, Hayakawa S, Osaka A. Novel approach to fabricate porous gelatin-siloxane hybrids for bone tissue engineering. Biomaterials. 23(24): 4765-4773; 2002.
79 Yin Y, Ye F, Cui J, Zhang F, Li X, Yao K. Preparation and characterization of macroporous chitosan-gelatin/β-tricalcium phosphate composite scaffolds for bone tissue engineering. Journal of Biomedical Materials Research - Part A. 67(3): 844-855; 2003.
80 Zhao F, Yin Y, Lu WW, Leong JC, Zhang W, Zhang J, Zhang M, Yao K. Preparation and histological evaluation of biomimetic three-dimensional hydroxyapatite/chitosan-gelatin network composite scaffolds. Biomaterials. 23(15): 3227-3234; 2002.
81 Lawson AC, Czernuszka JT. Collagen-calcium phosphate composites. Proceedings of the Institution of Mechanical Engineers, Part H: Journal of Engineering in Medicine. 212(H6): 413-425; 1998.
82 Tadic D, Epple M. A thorough physicochemical characterisation of 14 calcium phosphate-based bone substitution materials in comparison to natural bone. Biomaterials. 25(6): 987-994; 2004.
83 Ramay HRR, Zhang M. Biphasic calcium phosphate nanocomposite porous scaffolds for load-bearing bone tissue engineering. Biomaterials. 25(21): 5171-5180; 2004.
84 LeGeros RZ, Lin S, Rohanizadeh R, Mijares D, Legeros JP. Biphasic calcium phosphate bioceramics: preparation, properties and applications. Journal of Materials Science: Materials in Medicine. 14(3): 201-209; 2003.
85 Hench LL, Polak JM. Third-generation biomedical materials. Science. 295(5557): 1014-1017; 2002.
86 Ducheyne P, de Groot K. In vivo surface activity of a hydroxyapatite alveolar bone substitute. Journal of Biomedical Materials Research. 15(3): 441-445; 1981.
87 Elvers B, Hawkins S, Schulz G. Photography to Plastics, Processing, in “Ullmann’s Encyclopedia of Industrial Chemistry”, (Gerhartz,W., Ed.), A20, Weinheim, Federal Republic of Germany ; Deerfield Beach, FL, USA : VCH, pp. 271-272, 1985.
88 Brunette DM, Tengvall P, Textor M, Thomson P. Titanium in Medicine: Material Science, Surface Science, Engineering, Biological Responses and Medical Applications, New York : Springer-Verlag, pp. 171-230, 2001.
89 Kroschwitz JI. Kirk-Othmer Encyclopedia of Chemical Technology, Volume 19, New York : A Wiley-Interscience Publication, pp. 12-13, 1991.
90 Brook RJ. Concise Encyclopedia of Advanced Ceramic Materials, Oxford : Pergamon Press; Cambridge, MA : MIT Press, pp. 486-487, 1991.
91 Gerhartz W. Ceramics to Chlorohydrins, in “Ullmann’s Encyclopedia of Industrial Chemistry”, (Gerhartz W, Ed.), A6, pp. 36-37, 1985.

219
92 Wu JM, Hayakawa S, Tsuru K, Osaka A. Low-temperature preparation of anatase and rutile layers on titanium substrates and their ability to induce in vitro apatite deposition. Journal of the American Ceramic Society. 87(9): 1635-1642; 2004.
93 Kothari S, Hatton PV, Douglas CWI. Protein adsorption to titania surfaces. Journal of Materials Science: Materials in Medicine. 6(12): 695-698; 1995.
94 Yao C, Slamovich EB, Webster TJ. Titanium nanosurface modification by anodization for orthopedic applications. Materials Research Society Symposium Proceedings, 845, Nanoscale Materials Science in Biology and Medicine. pp. 215-220, 2005.
95 Kim HW, Koh YH, Li LH, Lee S, Kim HE. Hydroxyapatite coating on titanium substrate with titania buffer layer processed by sol-gel method. Biomaterials. 25(13): 2533-2538; 2004.
96 Sami A, Paldan H, Peltola T, Narhi T, Jokinen M, Linden M. Use of sol-gel-derived titania coating for direct soft tissue attachment. Journal of Biomedical Materials Research-Part A. 70(2): 169-178; 2004.
97 Shin D, Arps JH, Sylvia VL, Dean DD. Osteoblast response to changes in titanium oxide nanostructure and morphology. The IADR/AADR/CADR 83rd Annual Meeting, Baltimore, MA, 2005. Also available at http://iadr.confex.com/iadr/2005Balt/techprogram/abstract_62911.htm
98 Traykova T, Aparicio C, Ginebra MP,, Planell JA. Bioceramics as nanomaterials. Nanomedicine. 1(1): 91-106; 2006.
99 Ramay HR, Zhang M. Biphasic calcium phosphate nanocomposite porous scaffolds for load-bearing bone tissue engineering. Biomaterials. 25(21): 5171-5180; 2004.
100 Fernández E, Gil FJ, Best SM, Ginebra MP, Driessens FC, Planell JA. Improvement of the mechanical properties of new calcium phosphate bone cements in the CaHPO4-alpha-Ca3(PO4)2 system: compressive strength and microstructural development. Journal of Biomedical Materials Research. 41(4): 560-567; 1998.
101 Wang H, Lee JK, Moursi A, Lannutti JJ. Ca/P ratio effects on the degradation of hydroxyapatite in vitro. Journal of Biomedical Materials Research-Part A. 67(2): 599-608; 2003.
102 Ergun C, Liu H, Webster TJ, Olcay E, Yılmaz S, Sahin FC. Increased osteoblast adhesion on nanoparticulate calcium phosphates with higher Ca/P ratios. Journal of Biomedical Materials Research-Part A. 2007 Aug 9; [Epub ahead of print]
103 Jarcho M, Bolen CH, Thomas MB, Bobick J, Kay JF, Doremus RH. Hydroxylapaptite synthesis and characterization in dense polycrystalline form. Journal of Materials Science. 11(11): 2027-2035; 1976.
220
104 Kay MI, Young RA, Posner AS. Crystal structure of hydroxyapatite. Nature. 204: 1050-1052; 1964.
105 Narasaraju TSB, Phebe DE. Review: some physicochemical aspects of hydroxyapatite. Journal of Materials Science. 31: 1-21; 1996.
106 Bhat SV. Biomaterials. Boston: Kluwer Academic Publishers/Norosa Publishing House, pp. 39-176, 2002.
107 Ivanova TI, Frank-Kamenetskaya OV, Kol'tsov A B, Ugolkov VL. Crystal structure of calcium-deficient carbonated hydroxyapatite. thermal decomposition. Journal of Solid State Chemistry. 160(2): 340-349; 2001.
108 Mayer I, Featherstone JDB. Dissolution studies of Zn-containing carbonated hydroxyapatite. Journal of Crystal Growth. 219(1): 98-101(4); 2000.
109 Vallet-Regí M, González-Calbet JM. Calcium phosphates as substitution of bone tissues. Progress in Solid State Chemistry. 32(1-2): 1-31; 2004.
110 Webster TJ, Ergun C, Doremus RH, Bizios R. Hydroxylapatite with substituted magnesium, zinc, cadmium, and yttrium. II. Mechanisms of osteoblast adhesion. Journal of Biomedical Materials Research. 59(2):312-317; 2002.
111 Kay JF. Bioactive surface coatings: cause for encouragement and caution. J Oral Implantol. 14(1): 43-54; 1988.
112 Doremus RH. Review: Bioceramics. Journal of Materials Science. 27: 285-297; 1992.
113 Stewart M, Welter JF, Goldberg VM. Effect of hydroxyapatite/tricalcium-phosphate coating on osseointegration of plasma-sprayed titanium alloy implants. Journal of Biomedical Materials Research. 69A(1): 1-10; 2004.
114 http://www.geocities.com/ctas61/IMAGEL84.JPG
115 Benaqqa C, Chevalier J, Saädaoui M, Fantozzi G. Slow crack growth behaviour of hydroxyapatite ceramics. Biomaterials. 26(31): 6106-6112; 2005.
116 Pinto MM, Cesar PF, Rosa V, Yoshimura HN. Influence of pH on slow crack growth of dental porcelains. Dent Mater. 2007 Nov 13, [Epub ahead of print].
117 Muralithran G, Ramesh S. The effect of sintering on the properties of hydroxyapatite. Ceramics International. 26: 221-230; 2000.
118 Kruzic JJ, Cannon RM, Ritchie RO. Crack size effects on cyclic and monotonic crack growth in polycristalline alumina: quantification of the role of grain bridging. Journal of the American Ceramic Society. 87(1): 93-103; 2004.

221
119 Hench LL, Splinter RJ, Allen WC, Greenlee TK. Bonding mechanisms at the interface of ceramic prosthetic materials. Journal of Biomedical Materials Research. 5(6): 117-141; 1971.
120 Aoki H. Medical applications of hydroxyapatite. Tokyo, St. Louis: Ishikayu Euro America Inc; 1994.
121 Klein CP, Driessen AA, de Groot K, van den Hooff A. Biodegradation behavior of various calcium phosphate materials in bone tissue. Journal of Biomedical Materials Research. 17(5): 769-784; 1983.
122 Cihlar J, Buchal A, Trunec M. Kinetics of thermal decomposition of hydroxyapatite bioceramics. Journal of Materials Science. 34(24): 6121-6131; 1999.
123 Tampieri A, Celotti G, Sprio S, Mingazzini C. Characteristics of synthetic hydroxyapatites and attempts to improve their thermal stability. Materials Chemistry and Physics. 64(1): 54-61; 2000.
124 Dalby MJ, Di Silvio L, Harper EJ, Bonfield W. Initial interaction of osteoblasts with the surface of a hydroxyapatite-poly(methylmethacrylate) cement. Biomaterials. 22(13): 1739-1747; 2001.
125 Wang X, Shen X, Li X, Agrawal CM. Age-related changes in the collagen network and toughness of bone.Bone. 31(1): 1-7; 2002.
126 Wang X, Li X, Shen X, Agrawal CM. Age-related changes of noncalcified collagen in human cortical bone. Annals of Biomedical Engineering. 31(11): 1365-1371; 2003.
127 Hutmacher DW. Scaffolds in tissue engineering bone and cartilage. Biomaterials. 21(24): 2529-2543; 2000.
128 Thomson RC, Yaszemski MJ, Powers JM, Mikos AG. Hydroxyapatite fiber reinforced poly(α-hydroxy ester) foams for bone regeneration. Biomaterials. 19(21): 1935-1943; 1998.
129 Boccaccini AR, Roether JA, Hench LL, Maquet V, Jerome R. A composite approach to tissue engineering. Ceramic Engineering and Science Proceedings. 23(4): 805-816; 2002.
130 Marra KG, Szem JW, Kumta PN, DiMilla PA, Weiss LE. In vitro analysis of biodegradable polymer blend/hydroxyapatite composites for bone tissue engineering. Journal of Biomedical Materials Research. 47(3): 324-335; 1999.
131 Kalita S, Finley J, Bose S, Hosick H, Bandyopadhyay A. Development of porous polymer-ceramic composites as bone grafts. Materials Research Society Symposium Proceedings. 726: 91-96; 2002.

222
132 Blaker JJ, Gough JE, Maquet V, Notingher I, Boccaccini AR. In vitro evaluation of novel bioactive composites based on bioglass®-filled polylactide foams for bone tissue engineering scaffolds. Journal of Biomedical Materials Research-Part A. 67(4): 1401-1411; 2003.
133 Ma PX, Zhang R, Xiao G, Franceschi R. Engineering new bone tissue in vitro on highly porous poly(α-hydroxyl acids)/hydroxyapatite composite scaffolds. Journal of Biomedical Materials Research. 54(2): 284-293; 2001.
134 Kasuga T, Ota Y, Nogami M, Abe Y. Preparation and mechanical properties of polylactic acid composites containing hydroxyapatite fibers. Biomaterials. 22(1): 19-23; 2001.
135 Navarro M, Ginebra MP, Planell JA, Zeppetelli S, Ambrosio L. Development and cell response of a new biodegradable composite scaffold for guided bone regeneration. Journal of Materials Science: Materials in Medicine. 15(4): 419-422; 2004.
136 Khan YM, Katti DS, Laurencin CT. Novel polymer-synthesized ceramic composite-based system for bone repair: an in vitro evaluation. Journal of Biomedical Materials Research - Part A. 69(4): 728-737; 2004.
137 Rho JY, Kuhn-Spearing L, Zioupos P, Mechanical properties and the hierarchical structure of bone. Medical Engineering & Physics. 20(2): 92-102; 1998.
138 Du C, Cui FZ, Zhu XD, de Groot K. Three-dimensional nano-HAP/collagen matrix loading with osteogenic cells in organ culture. Journal of Biomedical Materials Research. 44(4): 407-415; 1999.
139 Du C, Cui FZ, Feng QL, Zhu XD, de Groot, K. Tissue response to nano-hydroxyapatite/collagen composite implants in marrow cavity. Journal of Biomedical Materials Research. 42(4): 540-548; 1998.
140 Liu H, Webster TJ. Nanomedicine for implants: A review of studies and necessary experimental tools. Biomaterials 28(2): 354-369, Epub ahead of print, Oct 12; 2006.
141 Qin XY, Kim JG, Lee JS. Synthesis and magnetic properties of nanostructured γ-Ni-Fe alloys. Nanostructured Materials. 11(2): 259-270; 1999.
142 Li P, Miser DE, Rabiei S, Yadav RT, Hajaligol MR. The removal of carbon monoxide by iron oxide nanoparticles. Applied Catalysis B: Environmental. 43(2): 151-162; 2003.
143 Surowiak Z, Osinska K, Czekaj D. Structure and physical properties of nano-structured Pb(Zr0.5Ti0.5)O3 piezoceramics. Proceedings of SPIE-The International Society for Optical Engineering. 4413: 163-168; 2001.

223
144 Goldberg M, Langer R, Jia X. Nanostructured materials for applications in drug delivery and tissue engineering. Journal of Biomaterials Science, Polymer Edition. 18(3): 241-268; 2007.
145 Webster TJ, Siegel RW, Bizios R. Osteoblast adhesion on nanophase ceramics. Biomaterials 20(13): 1221-1227; 1999.
146 Webster TJ, Ergun C, Doremus RH, Siegel RW. Enhanced functions of osteoblasts on nanophase ceramics. Biomaterials. 21(17): 1803-1810; 2000.
147 Webster TJ, Ergun C, Siegel RW, Bizios R. Enhanced functions of osteoclast-like cells on nanophase ceramics. Biomaterials. 22(11): 1327-1333; 2001.
148 Marin BR, Burr DB. Structure Function and Adaptation of Compact Bone. Raven Press. New York. pp. 106-107, 1989.
149 Webster TJ, Siegel RW, Bizios R. Enhanced surface and mechanical properties of nanophase ceramics to achieve orthopaedic/dental implant efficacy. Key Engineering Materials. 192-195: 321-324, 2001.
150 Kay S, Thapa A, Haberstroh KM, Webster TJ. Nanostructured polymer/nanophase ceramic composites enhance osteoblast and chondrocyte adhesion. Tissue Engineering. 8(5): 753-761; 2002.
151 Dulgar Tulloch AJ, Bizios R, Siegel RW. Nanophase alumina/poly(L-lactic acid) composite scaffolds for biomedical applications. Materials Research Society Symposium Proceedings. 740: 161-166; 2003.
152 Vance RJ, Miller DC, Thapa A, Haberstroh KM, Webster TJ. Decreased fibroblast cell density on chemically degraded poly-lactic-co-glycolic acid, polyurethane, and polycaprolactone. Biomaterials. 25(11): 2095-2103; 2004.
153 Ruoslahti E, Pierschbacher MD. New perspectives in cell adhesion: RGD and integrins. Science. 238(4826): 491-497; 1987.
154 Webster TJ, Schadler LS, Siegel RW, Bizios R. Mechanisms of enhanced osteoblast adhesion on nanophase alumina involve vitronectin. Tissue Engineering. 7(3): 291-302; 2001.
155 Lopes MA, Monteiro FJ, Santos JD, Serro AP, Saramago B. Hydrophobicity, surface tension, and zeta potential measurements of glass-reinforced hydroxyapatite composites. Journal of Biomedical Materials Research. 45(4): 370-375; 1999.
156 Webster TJ, Siegel RW, Bizios R. Nanoceramic surface roughness enhances osteoblast and osteoclast functions for improved orthopaedic/dental implant efficacy. Scripta Materialia. 44(8-9): 1639-1642; 2001.

224
157 Yamasaki H, Sakai H. Osteogenic response to porous hydroxyapatite ceramics under the skin of dogs. Biomaterials. 13(5): 308-312; 1992.
158 Yuan H, Kurashina K, de Bruijin JD, Li Y, de Grout K, Zhang X. A preliminary study on osteoinduction of two kinds of calcium phosphate ceramics. Biomaterials. 20(19): 1799-1806; 1999.
159 Degasne I, Basle MF, Demais V, Hure G, Lesourd M, Grolleau B, Mercier L, Chappard D. Effects of roughness, fibronectin and vitronectin on attachment, spreading, and proliferation of human osteoblast-like cells (Saos-2) on titanium surfaces. Calcified Tissue International. 64(6): 499-507; 1999.
160 Miller DC, Haberstroh KM, Webster TJ. PLGA nanometer surface features manipulate fibronectin interactions for improved vascular cell adhesion. Journal of Biomedical Materials Research A. 81(3): 678-684; 2007.
161 Webster TJ, Ergun C, Doremus RH, Siegel RW, Bizios R. Specific proteins mediate enhanced osteoblast adhesion on nanophase ceramics. Journal of Biomedical Materials Research. 51(3): 475-483, 2000.
162 McManus AJ, Doremus RH, Siegel RW, Bizios R. Evaluation of cytocompatibility and bending modulus of nanoceramic/polymer composites. Journal of Biomedical Materials Research. 72A(1): 98-106; 2005.
163 Webster TJ. Nanophase ceramics as improved bone tissue engineering materials. American Ceramic Society Bulletin. 82(6): 23-28, 2003.
164 Long M, Rack HJ. Titanium alloys in total joint replacement—a materials science perspective. Biomaterials. 19(18): 1621-1639, 1998.
165 Albrektsson T, Jacobsson M. Bone-metal interface in osseointegration. J Prosthet Dent. 57(5): 597-607; 1987.
166 Petrie TA, Raynor JE, Reyes CD, Burns KL, Collard DM, García AJ. The effect of integrin-specific bioactive coatings on tissue healing and implant osseointegration. Biomaterials. 29(19): 2849-2857, 2008.
167 Lieberman JR, Daluiski A, Einhorn TA. The role of growth factors in the repair of bone: Biology and clinical applications. The Journal of Bone and Joint Surgery. American Volume. 84A(6): 1032-1044; 2002.
168 Friedlaender GE, Perry CR, Cole JD, Cook SD, Cierny G, Muschler GF, Zych GA, Calhoun JH, LaForte AJ, Yin S. The Journal of Bone and Joint Surgery. American Volume. 83A: 151; 2001.
169 Baylink DJ, Finkelman RD, Mohan S. Growth factors to stimulate bone formation. The Journal of Bone and Mineral Research. 8(Suppl 2): S565-572; 1993.

225
170 Reddi AH, Cunningham NS. Initiation and promotion of bone differentiation by bone morphogenetic proteins. The Journal of Bone and Mineral Research. 8(Suppl 2): S499-502; 1993.
171 Croucher PI, Russell GG. Growth Factors, In: Seibel MJ, Robins SP, Bilezikian JP (eds.), Dynamics of Bone and Cartilage Metabolism. Academic Press. San Diego, CA. pp. 83-95, 1999.
172 Reddi AH. Role of morphogenetic proteins in skeletal tissue engineering and regeneration. Nature Biotechnology. 16(3): 247-252; 1998.
173 Reddi AH. BMPs: Actions in flesh and bone. Nature Medicine. 3(8): 837-839; 1997.
174 http://www.nanophase.com/catalog/
175 Liu H, Slamovich EB, Webster TJ. Increased osteoblast functions on poly-lactic-co-glycolic-acid with highly dispersed nanophase titania. Journal of Biomedical Nanotechnology. 1(1): 83-89; 2005.
176 Webster TJ, Ergun C, Doremus RH, Siegel RW, Bizios R. Enhanced osteoclast like-cell functions on nanophase ceramics. Annals of Biomedical Engineering. 28(Suppl 1): S-15; 2000.
177 Chim H, Ong JL, Schantz JT, Hutmacher DW, Agrawal CM. Efficiency of glow discharge gas plasma treatment as a surface modification process for three-dimensional poly(D,L-lactide) scaffolds. Journal of Biomedical Materials Research-Part A. 65(3): 327-335; 2003.
178 Smith TA, Webster TJ. Bio-nanotechnology: Increased functions of osteoblasts on nano-structured polymer composites. 7th World Biomaterials Congress Transactions, Sydney, Australia, pp. 1345, May 17-21 2004.
179 Zhang Q, Tian M, Wu Y, Lin G, Zhang L. Effect of particle size on the properties of Mg(OH)2-filled rubber composites. Journal of Applied Polymer Science. 94(6): 2341-2346, 2004.
180 Gilman JW. Flammability and thermal stability studies of polymer layered-silicate (clay) nanocomposites. Applied Clay Science. 15(1): 31-49; 1999.
181 Ng CB, Schadler LS, Siegel RW. Synthesis and mechanical properties of TiO2-epoxy nanocomposites. Nanostructured Materials, 12(1): 507-510; 1999.
182 Rong MZ, Zhang MQ, Zheng YX, Zeng HM, Walter R, Friedrich K. Structure-property relationships of irradiation grafted nano-inorganic particle filled polypropylene composites. Polymer. 42(1): 167-183; 2001.

226
183 Dubnikova IL, Berezina SM, Antonov AV. Effect of rigid particle size on the toughness of filled polypropylene. Journal of Applied Polymer Science. 94(5): 1917-1926, 2004.
184 Roy R. Purposive Design of Nanocomposites: Entire Class of New Materials, in “Ceramic Microstructures ’86 : Role of Interfaces”, (Pask JA and Evans AG, Eds.), Materials Science Research, 21, New York : Plenum Press, Proceedings of the 22nd University Conference on Ceramics, and the International Materials Symposium, held July 28-31, 1986, at the University of California, Berkeley, Berkeley, California, pp.25-32, 1986.
185 Wu RY, Wei WJ. Dispersive and rheological properties of Mg-PSZ feedstocks for precision powder injection molding. Journal of Ceramic Processing Research. 5(3): 274-280; 2004.
186 Doroszkowski A, LambourneJ R. A viscometric technique for determining the layer thickness of polymer adsorbed on titanium dioxide. Journal of Colloid and Interface Science. 26(2): 214-221; 1968.
187 Reed JS. Principles of Ceramics Processing, Second Edition. New York : John Wiley and Sons, pp.140-142, 1995.
188 Rao Y, Takahashi A, Wong CP. Di-block copolymer surfactant study to optimize filler dispersion in high dielectric constant polymer-ceramic composite. Composites Part A (Applied Science and Manufacturing). 34A(11): 1113-1116; 2003.
189 Johnson DW, Nitti DJ. High purity reactive alumina powders. II. Particle size and agglomeration study. American Ceramic Society Bulletin. 51(12): 896-900; 1972.
190 Shoh A. Industrial Applications of Ultrasound, in “Ultrasound: Its Chemical, Physical, and Biological Effects” (Suslick KS, Ed.). New York : VCH Publishers, pp. 97-122, 1988.
191 Dooher J, Lippman R, Marrone T, Pohle H, Wright D. Ultrasonic disintegration of particles. Ultrasonics Symposium Proceedings. Phoenix, pp. 11-16, 1977.
192 Chisholm N, Mahfuz H, Rangari V, Rodgers R, Jeelani S. Synthesis and mechanical characterization of carbon/epoxy composites reinforced with SiC nano particles. 2004 NSTI Nanotechnology Conference and Trade Show, NSTI Nanotech 2004, 3, pp. 302-307, 2004.
193 Xiong H, Zhao K, Zhao X, Wang Y, Chen J. Elucidating the conductivity enhancement effect of nano-sized SnO2 fillers in the hybrid polymer electrolyte PEO-SnO2-LiClO4. Solid State Ionics. 159(1-2): 89-95; 2003.
194 Wang J, Song Y, Feng C. Mixed silicon carbide fiber and microwave-absorbing properties. Cailiao Gongcheng/Journal of Materials Engineering. (5): 41-43; 1998.

227
195 Park SS, Bernet N, De La Roche S, Hahn HT. Processing of iron oxide-epoxy vinyl ester nanocomposites. Journal of Composite Materials. 37(5): 465-476; 2003.
196 Spanos L, Irene EA. Investigation of roughened silicon surfaces using fractal analysis. I. Two-dimensional variation method. Journal of Vacuum Science & Technology A (Vacuum, Surfaces, and Films). 12(5): 2646-2652; 1994.
197 Spanos L, Liu Q, Irene EA, Zettler T, Hornung B, Wortman JJ. Investigation of roughened silicon surfaces using fractal analysis. II. Chemical etching, rapid thermal chemical vapor deposition, and thermal oxidation. Journal of Vacuum Science & Technology A (Vacuum, Surfaces, and Films). 12(5): 2653-2661; 1994.
198 Kiely JD, Bonnell DA. Quantification of topographic structure by scanning probe microscopy. Journal of Vacuum Science & Technology B: Microelectronics Processing and Phenomena. 15(4): 1483-1493; 1997.
199 Villarrubia JS. Morphological estimation of tip geometry for scanned probe microscopy. Surface Science. 321(3): 287-300; 1994.
200 Reiss G, Vancea J, Wittmann H, Zweck J, Hoffmann H. Scanning tunneling microscopy on rough surfaces: Tip-shape-limited resolution. Journal of Applied Physics. 67(3): 1156-1159; 1990.
201 Vrouwenvelder WCA, Groot CG, de Groot K. Histological and biochemical evaluation of osteoblasts cultured on bioactive glass, hydroxyapatite, titanium alloy, and stainless steel. Journal of Biomedical Materials Research. 27(4): 465-475; 1993.
202 Miller DC, Thapa A, Haberstroh KM, Webster TJ. Enhanced functions of cells on polymers with nanostructured surfaces. Conference Proceedings-Annual International Conference of the IEEE Engineering in Medicine and Biology, Houston, TX, 1, pp. 755-756, 2002.
203 Martin JY, Schwartz Z, Hummert TW, Schraub DM, Simpson J, Lankford J, Dean DD, Cochran DL, Boyan BD. Effects of titanium surface roughness on proliferation, differentiation, and protein synthesis of human osteoblast-like cells (MG63). Journal of Biomedical Materials Research. 29(3): 389-401; 1995.
204 Schwartz Z, Hummert TW, Cochran DL, Simpson J, Dean DD, Boyan BD. Surface roughness modulates the local production of growth factors and cytokines by osteoblast-like MG-63 cells. Journal of Biomedical Materials Research. 32(1): 55-63; 1996.
205 Folkman J, Moscona A. Role of cell shape in growth control. Nature. 273(5661): 345-349; 1978.
206 Webster TJ, Smith TA. Increased osteoblast function on PLGA composites containing nanophase titania. Journal of Biomedical Materials Research. 74(4): 677-686; 2005.

228
207 Zhang R, Ma PX. Degradation behavior of porous poly (α-hydroxy acid)/hydroxyapatite composite scaffolds. Polymer Preprints. 41(2): 1618-1619; 2000.
208 Maquet V, Boccaccini AR, Pravata L, Notingher I, Jerome R. Porous poly(alpha -hydroxyacid)/Bioglass® composite scaffolds for bone tissue engineering. I: preparation and in vitro characterization. Biomaterials. 25(18): 4185-4194; 2004.
209 Shive MS, Anderson JM. Biodegradation and biocompatibility of PLA and PLGA microspheres. Advanced Drug Delivery Reviews. 28(1): 5-24; 1997.
210 Basarkar A, Devineni D, Palaniappan R, Singh J. Preparation, characterization, cytotoxicity and transfection efficiency of poly(DL-lactide-co-glycolide) and poly(DL-lactic acid) cationic nanoparticles for controlled delivery of plasmid DNA. International Journal of Pharmaceutics. 343(1-2): 247-254; 2007.
211 Gutwein LG, Webster TJ. Increased viable osteoblast density in the presence of nanophase compared to conventional alumina and titania particles. Biomaterials. 25(18): 4175-4183; 2004
212 Yamamoto A, Honma R, Sumita M, Hanawa T. Cytotoxicity evaluation of ceramic particles of different sizes and shapes. Journal of Biomedical Materials Research-Part A. 68(2): 244-256; 2004.
213 Brunner TJ, Wick P, Manser P, Spohn P, Grass RN, Limbach LK, Bruinink A, Stark WJ. In vitro cytotoxicity of oxide nanoparticles: comparison to asbestos, silica, and the effect of particle solubility. Environmental Science & Technology. 40(14): 4374-4381; 2006.
214 Sayes CM, Wahi R, Kurian PA, Liu Y, West JL, Ausman KD, Warheit DB, Colvin VL. Correlating nanoscale titania structure with toxicity: a cytotoxicity and inflammatory response study with human dermal fibroblasts and human lung epithelial cells. Toxicological Sciences. 92(1): 174-185; 2006.
215 Limbach LK, Wick P, Manser P, Grass RN, Bruinink A, Stark WJ. Exposure of engineered nanoparticles to human lung epithelial cells: influence of chemical composition and catalytic activity on oxidative stress. Environmental Science & Technology. 41(11): 4158-4163; 2007.
216 Whang K, Thomas CH, Healy KE, Nuber G. Novel method to fabricate bioabsorbable scaffolds. Polymer. 36(4): 837-842; 1995.
217 Nam YS, Park TG. Porous biodegradable polymeric scaffolds prepared by thermally induced phase separation. Journal of Biomedical Materials Research. 47(1): 8-17; 1996.
218 Liu L, Zhang L, Ren B, Wang F, Zhang Q. Preparation and characterization of collagen-hydroxyapatite composite used for bone tissue engineering scaffold. Artificial Cells, Blood Substitutes, and Biotechnology. 31(4): 435-448; 2003.

229
219 Ma PX, Choi JW. Biodegradable polymer scaffolds with well-defined interconnected spherical pore network. Tissue Engineering. 7(1): 23-33; 2001.
220 Ma PX, Zhang R, Xiao G, Franceschi R. Engineering new bone tissue in vitro on highly porous poly(alpha-hydroxyl acids)/hydroxyapatite composite scaffolds. Journal of Biomedical Materials Research. 54(2): 284-293; 2001.
221 Badami AS, Kreke MR, Thompson MS, Riffle JS, Goldstein AS. Effect of fiber diameter on spreading, proliferation, and differentiation of osteoblastic cells on electrospun poly(lactic acid) substrates. Biomaterials. 27(4): 596-606; 2006.
222 Matsuzaka K, Walboomers XF, de Ruijter JE, Jansen JA. The effect of poly-L-lactic acid with parallel surface micro groove on osteoblast-like cells in vitro. Biomaterials. 20(14): 1293-1301; 1999.
223 Chehroudi B, McDonnell D, Brunette DM. Effects of micromachined surfaces on formation of bonelike tissue on subcutaneous implants as assessed by radiography and computer image processing. Journal of Biomedical Materials Research. 34(3): 279-290; 1997.
224 Wieland M, Textor M, Chehroudi B, Brunette DM. Synergistic interaction of topographic features in the production of bone-like nodules on Ti surfaces by rat osteoblasts. Biomaterials. 26(10): 1119-1130; 2005.
225 M3DTM 300 system specification. Proprietary Document of OPTOMEC®. 2006.
226 Hedges M, Kardos M, King B, Renn M. 3D direct writing via M3DTM. Proprietary Document of OPTOMEC®. 2006.
227 Potential applications of M3DTM in biotechnology: on its way to market. Proprietary Document of OPTOMEC®. 2005.
228 Carter M, Colvin J, Sears J. Characterization of conductive inks deposited with Maskless Mesoscale Material DepositionTM (M3DTM). Proprietary Document of OPTOMEC®. 2006.
229 Sato M, Sambito MA, Aslani A, Kalkhoran NM, Slamovich EB, Webster TJ. Increased osteoblast functions on undoped and yttrium-doped nanocrystalline hydroxyapatite coatings on titanium. Biomaterials 27(11): 2358-2369; 2006.
230 Ioku K, Yoshimura M. Stoichiometric apatite fine single crystals by hydrothermal synthesis. Phosphorus Research Bulletin. 1: 15-20; 1991.
231 Somiya S, Ioku K, Yoshimura M. Hydrothermal synthesis and characterization of fine apatite crystals. Materials Science Forum. 34-36(1): 371-378; 1988.
232 Holloway L. Polymer Composites for Civil and Structural Engineering . Published London, New York : Blackie Academic. 1993.
230
233 Daniel IM. Editor. Conference on Composite Materials: Testing and Design. (6th : 1981 : Phoenix, AZ.)
Composite Materials : Testing and Design (sixth conference). A conference / sponsored by ASTM Committee D-30 on High Modulus Fibers and Their Composites, Phoenix, AZ, 12-13 May, 1981 ; Published Philadelphia, PA.: ASTM. 1982.
234 ISO 37 Rubber, vulcanized or thermoplastic -- Determination of tensile stress-strain properties.
235 ASTM D3039 Tensile Properties of Polymer Matrix Composite.
236 ASTM D638 Tensile Properties of Plastics.
237 ASTM D882 Tensile Properties of Thin Plastic Sheeting.
238 Callister WD. Materials Science and Engineering: An Introduction. 7th Edition. Univ. of Utah. ISBN: 978-0-471-73696-7. 2007.
239 Fung YC. Biomechanics: Mechanical Properties of Living Tissues. New York: Springer-Verlag, pp. 500-519, 1993.
240 Swartz DE, Wittenberg RH, Shea M, White AA III, Hayes WC. Physical and mechanical properties of calf lumbosacral trabecular bone. Journal of Biomechanics. 24(11): 1059-1068; 1991.
241 Charvet JL, Cordes JA, Alexander H. Mechanical and fracture behavior of a fiber-reinforced bioabsorbable material for orthopaedic applications. Journal of Materials Science: Materials in Medicine. 11(2): 101-109; 2000.
242 Mamiya T, Kagawa Y, Shioji Y, Sato M, Yamamura T. Tensile fracture behavior and strength of surface-Modified SiTiCO fiber SiC-matrix minicomposites fabricated by the PIP process. Journal of the American Ceramic Society. 83(2): 433-435; 2000.
243 Podsiadlo P, Kaushik AK, Arruda EM, Waas AM, Shim BS, Xu JD, Nandivada H, Pumplin BG, Lahann J, Ramamoorthy A, Kotov NA. Ultrastrong and stiff layered polymer nanocomposites. Science. 318(5847): 80-83; 2007.
244 Treacy MMJ, Ebbesen TW, Gibson JM. Exceptionally high Young's modulus observed for individual carbon nanotubes. Nature. 381(6584): 678-680; 1996.
245 Yu MF, Lourie O, Dyer MJ, Moloni K, Kelly TF, Ruoff RS. Strength and breaking mechanism of multiwalled carbon nanotubes under tensile load. Science. 287(5453): 637-640; 2000.
246 Mack JJ, Viculis LM, Ali A, Luoh R, Yang GL, Hahn HT, Ko FK, Kaner RB. Graphite nanoplatelet reinforcement of electrospun polyacrylonitrile nanofibers. Advanced Materials. 17(1): 77-80; 2005.

231
247 Koempel JA, Patt BS, O'Grady K, Wozney J, Toriumi DM. Effect of recombinant human bone morphogenetic protein-2 on the integration of porous hydroxyapatite implants with bone. Journal of Biomedical Materials Research. 41(3): 359-363; 1998.
248 Li P. Biomimetic nano-apatite coating capable of promoting bone ingrowth. Journal of Biomedical Materials Research. 66A(1): 79-85; 2003.
249 Alam MI, Asahina I, Ohmamiuda K, Takahashi K, Yokota S, Enomoto S. Evaluation of ceramics composed of different hydroxyapatite to tricalcium phosphate ratios as carriers for rhBMP-2. Biomaterials 22(12): 1643-1651; 2001.
250 Balasundaram G, Webster TJ. Nanotechnology and biomaterials for orthopedic medical applications. Nanomedicine. 1(2):169-176; 2006.
251 Wozney JM, Rosen V, Celeste AJ, Mitsock LM, Whitters MJ, Kritz RW, Hewick RM, Wang EA. Novel regulators of bone formation: Molecular clones and activity. Science 242(4885): 1528-1534; 1988.
252 Wang EA, Rosen V, D'Alessandro JS, Bauduy M, Cordes P, Harada T, Israel DI, Hewick RM, Kerns KM, LaPan P, Luxenberg DP, Mcquaid D, Moutsatsos IK, Nove J, Wozney JM. Recombinant human bone morphogenetic protein induces bone formation. Proceedings of the National Academy of Sciences USA. 87(6): 2220-2224; 1990.
253 Yamaguchi A, Katagiri T, Ikeda T, Wozney JM, Rosen V, Wang EA, Kahn AJ, Suda T, Yoshiki S. Recombinant human bone morphogenetic protein-2 stimulates osteoblastic maturation and inhibits myogenic differentiation in vitro. The Journal of Cell Biology. 113(3): 681-687, 1991.
254 Yasko AW, Lane JM, Fellinger EJ, Rosen V, Wozney JM, Wang EA. The healing of segmental bone defects, induced by recombinant human bone morphogenetic protein (rhBMP-2). A radiographic, histological, and biomedical study in rats. The Journal of Bone and Joint Surgery. American volume. 74A(5): 659-670; 1992.
255 Miller TA, Ishida K, Kobayashi M, Wollman JS, Turk AE, Holmes RE. The induction of bone by an osteogenic protein and the conduction of bone by porous hydroxyapatite: A laboratory study in the rabbit. Plastic and Reconstructive Surgery. 87(1): 87-95; 1991.
256 Toriumi DM, Kotler HS, Luxenberg DP, Holtrop ME, Wang EA. Mandibular reconstruction with a recombinant bone-inducing factor: Functional, histologic, and biomechanical evaluation. Archives of Otolaryngology--Head & Neck Surgery. 117(10): 1101-1112; 1991.
257 Gerhart TN, Kirker-Head CA, Kriz MJ, Holtrop ME, Hennig GE, Hipp J, Schelling SH, Wang EA. Healing of segmental femoral defects in sheep using recombinant human bone morphogenetic protein. Clinical Orthopaedics and Related Research. 293: 317-326; 1993.

232
258 Aebli N, Stich H, Schawalder P, Theis JC, Krebs J. Effects of bone morphogenetic protein-2 and hyaluronic acid on the osseointegration of hydroxyapatite-coated implants: An experimental study in sheep. Journal of Biomedical Materials Research. 73A(3): 295-302; 2005.
259 Koempel JA, Patt BS, O'Grady K, Wozney J, Toriumi DM. Effect of recombinant human bone morphogenetic protein-2 on the integration of porous hydroxyapatite implants with bone. Journal of Biomedical Materials Research. 41(3): 359-363; 1998.
260 Dellinger JG, Eurell JA C, Jamison RD. Bone response to 3D periodic hydroxyapatite scaffolds with and without tailored microporosity to deliver bone morphogenetic protein 2. Journal of Biomedical Materials Research. 76A(2): 366-376; 2006.
261 Kaito T, Myoui A, Takaoka K, Saito N, Nishikawa M, Tamai N, Ohgushi H, Yoshikawa H. Potentiation of the activity of bone morphogenetic protein-2 in bone regeneration by a PLA-PEG/hydroxyapatite composite. Biomaterials. 26(1): 73-79; 2005.
262 Chao EY, Inoue N, Elias JJ, Aro H. Enhancement of fracture healing by mechanical and surgical intervention. Clinical Orthopaedics and Related Research. 355(Suppl): S163-178; 1998.
263 Minamide A, Kawakami M, Hashizume H, Sakata R, Tamaki T. Evaluation of carriers of bone morphogenetic protein for spinal fusion. Spine 26(8): 933-939; 2001.
264 Ribeiro CC, Barrias CC, Barbosa MA. Calcium phosphate-alginate microspheres as enzyme delivery matrices. Biomaterials 25(18): 4363-4373; 2004.
265 Bishop GB, Einhorn TA. Current and future clinical applications of bone morphogenetic proteins in orthopaedic trauma surgery. International Orthopaedics 31(6): 721-727; 2007.
266 White AP, Vaccaro AR, Hall JA, et al. Clinical applications of BMP-7/OP-1 in fractures, nonunions and spinal fusion. International Orthopaedics 31(6): 735-741; 2007.
267 Chubinskaya S, Hurtig M, Rueger DC. OP-1/BMP-7 in cartilage repair. International Orthopaedics 31(6): 773-781; 2007.
268 Gautschi OP, Frey SP, Zellweger R. Bone morphogenetic proteins in clinical applications. ANZ Journal of Surgery. 77 (8): 626-631; 2007.
269 Pecina M, Giltaij LR, Vukicevic S. Orthopaedic applications of osteogenic protein-1 (BMP-7). International Orthopaedics. 25: 203-208; 2001.
270 Chen Y, Webster TJ. Simple Structure, Easily Functionalized and Controlled Release Bioactive BMP-7 Short Peptides for Orthopaedic Applications. Journal of Oral Implantology, in press.
233
271 Hong HG; Jiang M; Sligar SG; Bohn PW. Cysteine-specific surface tethering of genetically engineered cytochromes for fabrication of metalloprotein nanostructures. Langmuir. 10(1): 153-158; 1994.
272 Balasundaram G, Sato M, Webster TJ. Using hydroxyapatite nanoparticles and decreased crystallinity to promote osteoblast adhesion similar to functionalizing with RGD. Biomaterials. 27(14): 2798-2805; 2006.
273 Liu JP, Shirota O, Novotny M. Capillary electrophoresis of amino sugars with laser-induced fluorescence detection. Analytical Chemistry. 63(5): 413-417; 1991.
274 Instructions for Micro BCATM Protein Assay Kit. Pierce. Also available at http://www.piercenet.com/files/0412dh5.pdf.
275 Mooney DJ, Mikos AG. Growing new organs. Scientific American. 280(4): 60-65; 1999.