Masaryk University Faculty of Economics and Administration Field of Study: Business management ERP SYSTEM, NEW TRENDS, PROCESSES OF SYSTEM SELECTION, SALES, IMPLEMENTATION AND SUPPORT ERP systém, nové tendence, proces výběru, prodeje, implementace a údržby Diploma thesis Thesis supervisor: Author: Ing. Jaromír Skorkovský, CSc. Bc. David DURANTI Brno, 2014

Welcome message from author
This document is posted to help you gain knowledge. Please leave a comment to let me know what you think about it! Share it to your friends and learn new things together.
Transcript

Masaryk Universi ty
Faculty of Economics and Administration
Field of Study: Business management
ERP SYSTEM, NEW TRENDS, PROCESSES OF
SYSTEM SELECTION, SALES,
IMPLEMENTATION AND SUPPORT
ERP systém, nové tendence, proces výběru, prodeje,
implementace a údržby
Diploma thesis
Thesis supervisor: Author:
Ing. Jaromír Skorkovský, CSc. Bc. David DURANTI
Brno, 2014

Name and surname of author: Bc. David Duranti
Ti t le of the diploma thesis : ERP system, new trends, processes of
system selection, sales, implementation
and support
Ti t le of the diploma thesis in Czech: ERP systém, nové tendence, proces
výběru, prodeje, implementace a údržby
Academic department : Business management
Thesis supervisor: Ing. Jaromír Skorkovský, CSc.
Dissertat ion year : 2014
Annotation
Subject of the thesis “ERP system, new trends, processes of system selection, sales, implementation
and support” is analysis of providing ERP as a Service which is compared to the predominant
on-premise model. In the theoretical part, the technology of cloud computing, ERP system
and the implementation process are described. In the practical part of the thesis analysis of the
vertical solutions "PrintVis cloud" for the printing industry is conducted. This solution is
compared to traditional on-premise variants of the same product.
Anotace
Předmětem diplomové práce „ERP systém, nové tendence, proces výběru, prodeje, implementace a
údržby“ je analýza poskytování ERP systému jako služby a srovnání se současně
převládajícím „on-premise“ modelem. V teoretické části práce je představena technologie
cloud computing, ERP systém a proces implementace. V praktické části práce je analyzováno
vertikální řešení „PrintVis in cloud“ pro polygrafický průmysl. Toto řešení je srovnáno
s tradiční „on-premise“ variantou stejného produktu.
Keywords
ERP, cloud computing, on-premise, SaaS, IaaS, PrintVis, MS Dynamics NAV 2013,
Implementation of an ERP system.
Klíčová slova
ERP, cloud computing, on-premise, SaaS, IaaS, PrintVis, MS Dynamics NAV 2013,
Implementace ERP systému.

Declaration
Hereby I declare that I disposed the Diploma Thesis “ERP system, new trends, processes of system
selection, sales, implementation and support” by myself under the supervision of Ing. Jaromír
Skorkovský, CSc. and that I stated all the used literary resources and other scientific sources according
to legislation, internal regulations of Masaryk University and internal management acts of Masaryk
University and the Faculty of Economics and Administration.
In Brno 14th May 2014
Si gna t ur e o f t he au t ho r

Acknowledgement
Here I would like to express my gratitude to my supervisor Ing. Jaromír Skorkovský Csc., for valuable
comments and expert advice, which contributed to the development of this thesis. In addition, I would
like to thank companies NAVERTICA a.s., ARDAN S.r.l. and NovaVision A/S for their time,
information and provided opportunity to participate on cloud pilot projects without which this thesis
couldn’t be conducted.

TABLE OF CONTENTS
INTRODUCTION ................................................................................................................................ 13
THEORETICAL PART ...................................................................................................................... 13
1 CLOUD COMPUTING ................................................................................................................ 16
1.1 ESSENTIAL CHARACTERISTICS ................................................................................................. 16 1.2 SERVICE DELIVERY MODELS .................................................................................................... 17
1.2.1 Software as a service (SaaS) ............................................................................................ 17 1.2.2 Infrastructure as a service (IaaS) ..................................................................................... 18 1.2.3 Platform as a service (PaaS) ............................................................................................ 18
1.3 DEPLOYMENT MODELS ............................................................................................................ 18 1.3.1 Private cloud .................................................................................................................... 18 1.3.2 Community cloud .............................................................................................................. 18 1.3.3 Public cloud ...................................................................................................................... 18 1.3.4 Hybrid cloud ..................................................................................................................... 18
1.4 SUBSCRIPTION PRICING MODELS ............................................................................................. 19 1.4.1 Pay as you go ................................................................................................................... 19 1.4.2 Pay per user ..................................................................................................................... 19
1.5 ECONOMICS OF THE CLOUD ..................................................................................................... 19 1.5.1 Supply-side savings .......................................................................................................... 20 1.5.2 Demand-side aggregation ................................................................................................ 21 1.5.3 Multitenant efficiency ....................................................................................................... 21 1.5.4 Overall impact .................................................................................................................. 22
2 ERP ................................................................................................................................................ 24
2.1 EVOLUTION OF ERP ................................................................................................................. 24 2.2 ERP DELIVERY MODELS .......................................................................................................... 25
2.2.1 On-premise ERP ............................................................................................................... 26 2.2.2 Cloud ERP ........................................................................................................................ 26 2.2.3 Hosted ERP ...................................................................................................................... 26
2.3 PROCESS OF SALE AND SELECTION .......................................................................................... 26 2.3.1 Buying decision making.................................................................................................... 26 2.3.2 Customer lock-in .............................................................................................................. 27 2.3.3 Marketing ......................................................................................................................... 28 2.3.4 Try-it-Buy-it model ........................................................................................................... 29
2.4 PROCESS OF IMPLEMENTATION ................................................................................................ 30 2.4.1 Critical success factors .................................................................................................... 30 2.4.2 Knowledge management................................................................................................... 31 2.4.3 Cloud ERP implementation .............................................................................................. 32
2.5 PROCESS OF MAINTENANCE ..................................................................................................... 33 2.5.1 Maintenance tasks ............................................................................................................ 33 2.5.2 Cloud ERP maintenance .................................................................................................. 34
PRACTICAL PART ............................................................................................................................ 36
3 PRESENTATION OF THE COMPANIES AND PARTNER MODEL .................................. 36
3.1 PARTNER MODEL ..................................................................................................................... 36 3.1.1 NAVERTICA ..................................................................................................................... 37 3.1.2 NovaVision Software ........................................................................................................ 37 3.1.3 ARDAN ............................................................................................................................. 38
4 MICROSOT DYNAMICS NAV 2013 ......................................................................................... 39

4.1 FOCUSED ON CLOUD ................................................................................................................ 39 4.1.1 Rapid implementations .................................................................................................... 41 4.1.2 Multitenancy in MS NAV R2 2013 ................................................................................... 41 4.1.3 Customizations ................................................................................................................. 43 4.1.4 Licensing .......................................................................................................................... 43
4.2 PRINTVIS 2013 ...................................................................................................................... 44 4.2.1 Licensing .......................................................................................................................... 45
4.3 PRINTVIS 2013 IN CLOUD ...................................................................................................... 46 4.3.1 Accelerated Sales Process ............................................................................................... 47 4.3.2 Accelerated Implementation Process ............................................................................... 49
4.4 WINDOWS AZURE .................................................................................................................... 50 4.4.1 Interface ........................................................................................................................... 51 4.4.2 Pricing examples .............................................................................................................. 52 4.4.3 Comparison with on-premise ........................................................................................... 53
5 MARKET ANALYSIS ................................................................................................................. 55
5.1 GLOBAL ERP MARKET ............................................................................................................ 55 5.1.1 Cloud-born players .......................................................................................................... 56 5.1.2 ERP delivery models ........................................................................................................ 58
5.2 NEW TRENDS IN ERP ............................................................................................................... 60 5.3 ERP MARKET IN SOUTH AFRICA ............................................................................................. 62
5.3.1 Cloud computing .............................................................................................................. 63 5.4 ERP MARKET IN THE CZECH REPUBLIC .................................................................................. 64
5.4.1 IT service spending .......................................................................................................... 64 5.4.2 Current ERP market ........................................................................................................ 64 5.4.3 EU cloud computing incentives ....................................................................................... 65 5.4.4 Printing industry .............................................................................................................. 65
6 SWOT ANALYSIS ....................................................................................................................... 68
6.1 CUSTOMER’S PERSPECTIVE ..................................................................................................... 68 6.1.1 Strengths .......................................................................................................................... 68 6.1.2 Weaknesses ...................................................................................................................... 69 6.1.3 Opportunities ................................................................................................................... 70 6.1.4 Threats ............................................................................................................................. 70 6.1.5 Customer’s perspective evaluation .................................................................................. 72
6.2 VENDOR’S PERSPECTIVE ......................................................................................................... 73 6.2.1 Strengths .......................................................................................................................... 73 6.2.2 Weaknesses ...................................................................................................................... 73 6.2.3 Opportunities ................................................................................................................... 74 6.2.4 Threats ............................................................................................................................. 74 6.2.5 Vendor’s perspective evaluation ...................................................................................... 75
7 CASE STUDY ............................................................................................................................... 76
7.1 PROJECT OVERVIEW ................................................................................................................ 76 7.1.1 Model Company ............................................................................................................... 76 7.1.2 Model assumptions and limitations ................................................................................. 76
7.2 TCO FOR PRINTVIS 2013 ........................................................................................................ 77 7.2.1 Up-front costs .................................................................................................................. 78 7.2.2 Divestment costs .............................................................................................................. 80 7.2.3 Operational costs ............................................................................................................. 81 7.2.4 Comparison ...................................................................................................................... 82 7.2.5 Discounted cash flow model ............................................................................................ 84
7.3 PROPOSED SOLUTION AND NOTICE TO THE RESULTING CONTEXT .......................................... 85

SUMMARY, CONCLUSIONS AND FUTURE RESEARCH ......................................................... 87
PROPOSED MEASURES ................................................................................................................... 90
REFERENCES ..................................................................................................................................... 91
LIFT OF PICTURES ........................................................................................................................... 96
LIST OF TABLES ............................................................................................................................... 96
LIST OF FIGURES ............................................................................................................................. 97
LIST OF ACRONYMS ....................................................................................................................... 97
LIST OF APENDICES ........................................................................................................................ 99


9
INTRODUCTION
Enterprise resource planning (ERP) is a core business application practically for every single medium
and large enterprise. This market segment is becoming extremely saturated, thus prompt vendors
to look for new opportunities. ERP systems are becoming no longer a fancy solution only for large
businesses; smaller companies also want a piece of the action. On the other hand due to its costs,
complexity and inflexibility, ERP still remains out of reach for most of them.
One of the current biggest phenomenon, which seems to address these obstacles and pushing barriers
of business applications further is cloud computing. This technology is still emerging and walking
on its cutting edge might be challenging and risky but at the same time highly lucrative
as Gartner (2011) says: “There is always a risk of adapting the technology too soon, but there is
also a risk, perhaps a bigger risk, of adapting the technology too late.” It looks like newly cloud
adopters have achieved tremendous growth during the past five years focusing on the unpenetrated
SME segment. Today’s major ERP companies are seeing this transition and they also want to join
the “cloud-run”. Nevertheless adopting the cloud approach means rethink the whole ERP business
and alternating established selection, selling, implementation, and maintenance processes.
This thesis research focuses on the ERP in cloud approach which is compared with the traditional
on-premise model. For the practical application the “Microsoft Dynamics NAV 2013 in cloud”
with a vertical solution “PrintVis in cloud” for printing industry will be chosen. These products are
Microsoft’s respond to the paradigm shifting towards cloud ERP, and both were released just recently.
Motivation for this thesis research is the newness and unexplored nature of the subject. This thesis is
dedicated for ERP implementation partners and clients who are looking to adopt the ERP in cloud with
the particular focus on printing industry. The main goal of this thesis is to describe the changes
in the selection, selling, implementation and maintenance processes with the application on the above
mentioned ERP system. Furthermore, outline the benefits and drawbacks of the ERP in cloud
and the potential market segment. Research questions and hypothesis are determined as following:
Q1: “What are the estimated costs and time of implementation of the cloud solution in comparison
with on-premise model?”
Q2: “Could the cloud solution of PrintVis be the future for the printing industry? Main
benchmarks are estimated number and size of possible clients feasible for this solution,
other metrics will be outlined in the thesis.”
H1: “PrintVis in cloud solution implementation project can reduce up to 30% of both customer’s
budget and implementation time.”

10
H2: “For companies in the printing industry below fifty employees considering an ERP adoption
PrintVis in cloud represents a better solution than on-premise PrintVis in the horizon of ten years.
Metrics will be outlined in the thesis.”
Structure of the thesis
The theoretical part is subdivided into two chapters. First chapter defines the cloud computing.
During last decade there was no clear and widely accepted definition of Clouds in the literature that
should help to determine the areas of research and explore new application domains for the usage
of the Clouds. National Institute of Standards and Technology (NIST) novel comprehensive definition
released in 2011 should be now accepted as a way for standardization of cloud services for both
providers and consumers. The first chapter is also dedicated to the underlying economics of cloud
computing examined by Microsoft. The second chapter focuses on the ERP, its evolution through
time, delivery models, and the changes linked with the cloud approach in selection, selling,
implementation, and maintenance processes.
The practical part is subdivided into five chapters, covering thus chapters 3-7. The third chapter
describes the companies involved in this thesis research, presenting the interrelation between them
with focus on NAVERTICA which is the main recipient of this thesis research. The fourth chapter
describes the MS Dynamics NAV 2013 and PrintVis 2013 with the weight given on the cloud
approach. In the end of this chapter, the Windows Azure cloud platform is described. The fifth chapter
is dedicated to the market analysis. Firstly, the global ERP market is analyzed, new trends are outlined
and then NAVERTICA’s strategic markets – South Africa and Czech Republic are analyzed in more
detail. In the end of the chapter a quick financial analysis of the printing industry in Czech Republic is
conducted. The sixth chapter consist in a SWOT analysis of the cloud ERP solution from both
customer’s and vendor’s perspective. In the final chapter a case study is conducted. The case study is
based on an actual implementation of PrintVis for a NAVERTICA’s client. The implementation was
delivered as on-premise, in our case study we reengineer this project as cloud-based and build
a comparison model.
Data Collection
The literature review is conducted mainly from recent articles and complementary data are collected
directly from Microsoft and NovaVision, as no unifying literature on this subject was found
both in Czech and international resources. The relation between key terms is discussed
with consultants in NAVERTICA.
Due to explorative nature of the subject, semi-structured interviews are chosen as this enables
also refining the questions and answers, if needed. Validity of interview data can be verified
from complementary data sources and interviews can be used for exploring relationships
of phenomena and for creation of new hypothesis (Regnell, 2011, p. 16).
11
The target group of interviewees is employees in the companies NAVERTICA, NovaVision,
and ARDAN. Within this group heterogeneous respondents who would offer a different perspective
on the cloud solution are spotted. Interviews are adjusted for each respondent based on his role
in an implementation project of an ERP solution. All the respondents have deep understanding of ERP
business. Interviews for NovaVision aims on the cloud solution of PrintVis which they started
to implement through pilot campaigns since April, 2013. Example of the interviews question can be
found in the Appendix G. The series of interviews will be conducted over a long period starting
with my internship in ARDAN in July – November. Afterwards interviews will continue until April,
2014.
Table 1: Respondents overview
Respondent Role Company
Guido Codini Project manager, Consultant ARDAN
Kit Tomshøj Salesperson NovaVision
Jörg Hüner Senior Consultant NovaVision
Tomáš Miklík Consultant NAVERTICA
František Vymazal Project manager, Consultant NAVERTICA
Petr Turek Salesperson NAVERTICA
Source: author

12
THEORETICAL PART
1 CLOUD COMPUTING
Cloud systems are hardware-based services offering compute, network and storage capacity where
hardware management is highly abstracted from the buyer, buyers incur infrastructure costs as variable
OPEX and infrastructure capacity is highly elastic (Forrest, 2009, p. 12). Cloud computing represent
nowadays one of the most important trends in ICT and IS technologies (Basl, 2011, p. 45).
In the hype period of cloud computing software vendors were often advertising their solutions
as cloud-based without actually meeting the criteria which a cloud solution requires. The expectations
were high and cloud was more of a fuzz word which stood for a cutting edge technology. Cloud
computing wasn’t standardized and there were many different definitions available in the literature
often contradicting each other. Apart from the technological innovation cloud computing is linked
with new business model that need to be understand. Vendors that haven’t understood this model can’t
perceive nor provide the benefits of cloud computing and they put the entire concept in a bad light.
CEO of NetSuite, which is a cloud-born ERP company, claims: “There are real clouds and fake
clouds. The fake clouds are people who are taking existing technology and saying, ‘We can host it for
you, and that’s the cloud’” (Nelson, 2010). The cloud computing was standardized in 2011
by the National Institute of Standards and Technology (NIST).
1.1 Essential characteristics
NIST (2011) defines five essential characteristics that must embrace a system to be qualified
as a cloud solution. There characteristics are:
• On-demand self-service: A consumer can unilaterally provision computing capabilities,
such as server time and network storage, as needed automatically without requiring human
interaction with each service provider.
• Broad network access: Capabilities are available over the network and accessed through
standard mechanisms that promote use by heterogeneous thin or thick client platforms
(e.g., mobile phones, tablets, laptops, and workstations).
• Resource pooling: The provider’s computing resources are pooled to serve multiple
consumers using a multitenant model, with different physical and virtual resources
dynamically assigned and reassigned according to consumer demand. There is a sense
of location independence in that the customer generally has no control or knowledge
over the exact location of the provided resources but may be able to specify location
at a higher level of abstraction (e.g., country, state, or datacenter). Examples of resources
include storage, processing, memory, and network bandwidth.
• Rapid elasticity: Capabilities can be elastically provisioned and released, in some cases
automatically, to scale rapidly outward and inward commensurate with demand.
To the consumer, the capabilities available for provisioning often appear to be unlimited and
can be appropriated in any quantity at any time.
13
• Measured service: Cloud systems automatically control and optimize resource use
by leveraging a metering capability 1 at some level of abstraction appropriate to the type
of service (e.g., storage, processing, bandwidth, and active user accounts). Resource usage can
be monitored, controlled, and reported, providing transparency for both the provider
and consumer of the utilized service.
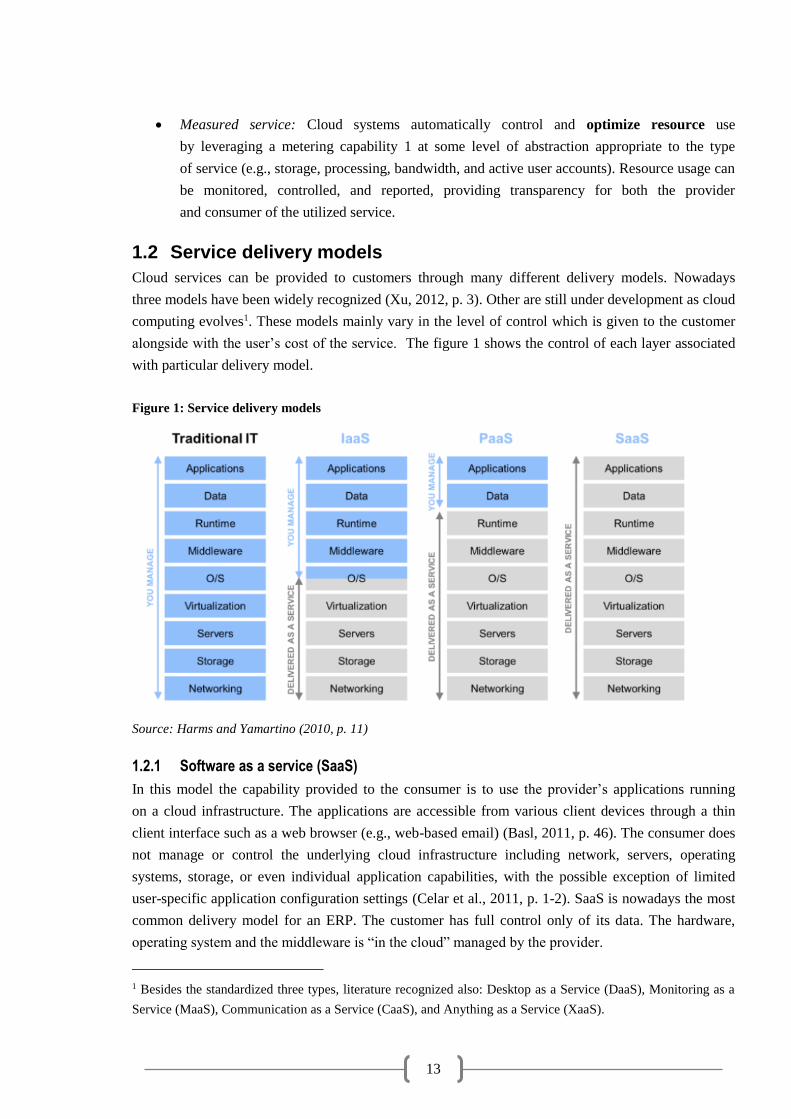
1.2 Service delivery models
Cloud services can be provided to customers through many different delivery models. Nowadays
three models have been widely recognized (Xu, 2012, p. 3). Other are still under development as cloud
computing evolves1. These models mainly vary in the level of control which is given to the customer
alongside with the user’s cost of the service. The figure 1 shows the control of each layer associated
with particular delivery model.
Figure 1: Service delivery models
Source: Harms and Yamartino (2010, p. 11)
1.2.1 Software as a service (SaaS)
In this model the capability provided to the consumer is to use the provider’s applications running
on a cloud infrastructure. The applications are accessible from various client devices through a thin
client interface such as a web browser (e.g., web-based email) (Basl, 2011, p. 46). The consumer does
not manage or control the underlying cloud infrastructure including network, servers, operating
systems, storage, or even individual application capabilities, with the possible exception of limited
user-specific application configuration settings (Celar et al., 2011, p. 1-2). SaaS is nowadays the most
common delivery model for an ERP. The customer has full control only of its data. The hardware,
operating system and the middleware is “in the cloud” managed by the provider.
1 Besides the standardized three types, literature recognized also: Desktop as a Service (DaaS), Monitoring as a
Service (MaaS), Communication as a Service (CaaS), and Anything as a Service (XaaS).

14
1.2.2 Infrastructure as a service (IaaS)
In this model the capability provided to the consumer is to provision processing, storage, networks,
and other fundamental computing resources where the consumer is able to deploy and run arbitrary
software, which can include operating systems and applications. The consumer does not manage
or control the underlying cloud infrastructure but has control over operating systems; storage,
deployed applications, and possibly limited control of select networking components (e.g., host
firewalls) (Celar et al., 2011, p. 1-2). Infrastructure as a service is also used in the ERP in cloud
solution as an underlying platform, where the system is deployed e.g. Windows Azure. This type of
delivery model offers bigger possibilities in terms of management for the customer. He can control its
data, middleware and also the operating system.
1.2.3 Platform as a service (PaaS)
This type of service is nowadays not used in the ERP in cloud solutions. In this model the capability
provided to the consumer is to deploy onto the cloud infrastructure consumer-created or acquired
applications created using programming languages and tools supported by the provider. The consumer
does not manage or control the underlying cloud infrastructure including network, servers, operating
systems, or storage, but has control over the deployed applications and possibly application hosting
environment configurations (Celar et al., 2011, p. 1-2).
1.3 Deployment models
Deployment models differentiate between where the underlying cloud computing hardware is placed
and which part of data are shared between users.
1.3.1 Private cloud
In the private cloud data and processes are handled as a one to one. Private clouds don’t share the
application, thus significantly undermine the multitenancy condition. The multitenancy occurs only on
a hardware level by resource pooling in a data centers. Private clouds can be used
for deploying an ERP system. In this case, the ERP can be customized at the cost of multitenancy.
This approach is nowadays typical for LE that chooses a cloud service.
1.3.2 Public cloud
The public cloud services are offered via the internet; the supplier provides a control mechanism for its
users only. Public cloud is the only deployment model that satisfies all the conditions for cloud
and brings all the benefits and drawbacks of cloud computing. This model is most common for the
ERP solutions, where the application is shared across a large number of clients.
1.3.3 Hybrid cloud
Hybrid cloud is a combination of a public cloud interacting with a private one.
1.3.4 Community cloud
Community cloud is controlled and used by a group of organizations that share the same interests.

15
1.4 Subscription pricing models
Cloud computing applications are sold under “new” pricing models which enables the flexibility
of these solutions. The most common models include “pay-as-you-go”, “pay-per-user”.
1.4.1 Pay as you go
In this model the customer pays only when he uses the service per a given unit e.g. per time,
per gigabyte, per processor time etc. This model associates directly provided cloud resources
with the customer usage of the service.
1.4.2 Pay per user
In this model the customer pays a fixed price per user per a given time unit (mostly month).
This model is less flexible but on the other hand the customer knows in advance how much he is going
to pay for any period of time. For example NetSuite CRM price begins at 79 USD per month
for users2. These models can be combined with each other and also combined with a fixed price.
For example a price of a cloud ERP can figure in a fixed price for implementation + price per user
accessing the service + price per computing power consumed.
1.5 Economics of the cloud
In this chapter we will outline economic efficiency of the cloud. “Underlying economics have a much
stronger impact on the direction and speed of disruption as technological challenges are resolved
or overcome through the rapid innovation we have grown accustomed to” (Harms and Yamartino,
2010, p. 3).
Cheaper technology is high likely to be adopted over time. For example we can look at a shift
from the mainframe terminal model to the client/server model during 1989 to 1995. This technology
shift could be considered as an equally big shift, from an architectural perspective, as cloud computing
is today (Höllwarth, 2012, p. 46-47). Figure 2 shows the adoption curve within the period 1989-1995
Figure 2: Adoption curve of a client/server model
Source: “How convention shapes our market” longitudinal survey, Shana Greenstein (1997)
2 According to publicly available pricelist in 2012. Source: http://www.erpsoftware-news.com/2012/10/netsuite-
pricing-.html
16
From the figure 2 we can see that the “Mainframe Only” approach have dropped from over 75%
to less than 25% within 15 years. The technology that was initially viewed as a “toy” technology
gradually replaced the mainframe model (Harms and Yamartino, 2010, p.3). A similar shift then
happened later with emergence of server virtualization. Several concerns from security issues to a
vendor lock-in raised and yet underlying economics of 20 to 30 percent savings3 compelled vendors to
overcome these concerns, and adoption quickly accelerated. Table 2 shows the technological and
economic aspects and related business model of the three above mentioned approaches.
Table 2: Cloud opportunity
Technology Economic Business Model
Mainframe Centralized compute and
storage
Optimized for efficiency
because of the high cost
High up-front costs for
hardware and software
Client/Server PCs and servers for
distributed compute,
storage, etc.
Optimized for agility
because of the low cost
Perpetual license for OS
and application software
Cloud Large DCs, ability to
scale, resource pooling,
broad network access
Optimized for efficiency
and elastic demand
Ability to pay as you go,
and only for what you use
Source: Author based on Harms and Yamartino (2010, p. 3)
The cost savings of the cloud are all about economies of scale. In economic terms, economies of scale
refers to the situation in where the cost of producing an additional unit of output (i.e., the marginal
cost) of a product (i.e., a good or service) decreases as the volume of output (i.e., the scale
of production) increases (Oza, 2012, s. 2). The economies of scale for the cloud can be divided in three
separate areas, which are supply-side savings, demand-side aggregation and multitenancy efficiency.
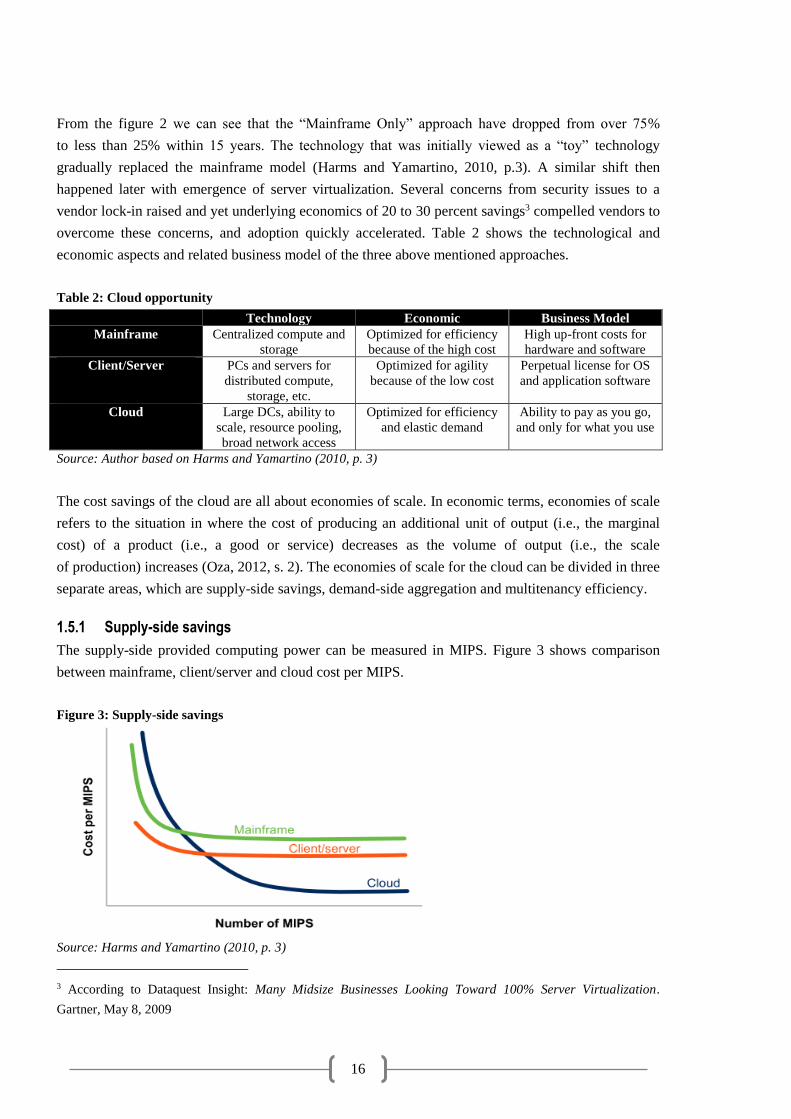
1.5.1 Supply-side savings
The supply-side provided computing power can be measured in MIPS. Figure 3 shows comparison
between mainframe, client/server and cloud cost per MIPS.
Figure 3: Supply-side savings
Source: Harms and Yamartino (2010, p. 3)
3 According to Dataquest Insight: Many Midsize Businesses Looking Toward 100% Server Virtualization.
Gartner, May 8, 2009

17
Reasons for the supply-side economies of scale are lower cost of electricity; lower infrastructure
labors costs and buying power of large DCs. Cloud computing is directly associated with Large DCs
because the computing power can be delivered anywhere via the internet.
The cost of electricity represents 15-20% of Total Cost of Ownership (TCO). Large DCs can pay less
than one-fourth of the national average electricity rate through bulk purchase agreements4.
The cloud service is provided through internet, thus the data center can take advantage of geographical
variability in electricity rates.
Infrastructure labor costs drops significantly at any scale due to “on demand self-service” character
of the cloud computing. While a single system administrator can service approximately 140 servers
in a traditional enterprise, in a cloud DC it would be thousands of servers. In closing infrastructure
deals operators of Large DC can get discounts up to 30 percent over smaller buyers thanks to their
buying power (Harms and Yamartino, 2010, p. 4).
1.5.2 Demand-side aggregation
The overall cost of IT is determined not only by the cost of capacity, but also by the degree to which
the capacity is efficiently utilized. In a non-virtualized data center, where each workload typically runs
on its own physical server the utilization has been extremely low around 5 to 10 percent.5 This low
level of utilization is a consequence of highly variable over time workloads which often demand large
amounts of resources in one minute and virtually none the next. The high variability arises from
service utilization randomness, time-of-day patterns, uncertain growth patterns etc.
A key economic advantage of the cloud computing is its ability to address variability in resource
utilization. By pooling resources, variability is diversified away, evening out utilization patterns.
The larger the pool of resources, the smoother the aggregate demand profile, the higher the overall
utilization rate, and the cheaper and more efficiently the IT organization can meet its end-user
demands (Harms and Yamartino, 2010, p. 8).
1.5.3 Multitenant efficiency
The previously described supply-side and demand-side economies of scale can be also achieved
to a certain extend by using virtualization and server hosting. But there is another important source
of economies of scale that can be harnessed only in true cloud multitenant architecture.
4 Source: U.S. Energy Information Administration (July 2010) and Microsoft. While the average U.S.
commercial rate is 10.15 cents per kilowatt hour, some locations offer power for as little as 2.2 cents per kilowatt
hour.
5 Based on: The Economics of Virtualization: Moving Toward an Application-Based Cost Model, IDC,
November 2009
18
In this type of architecture, customers share the application. This brings substantial economies of scale
in the maintenance process thanks to amortization of fixed costs over a large number of customers.
In a single-tenant instance, each customer has to pay for its own application management (i.e. labor
associated with update and upgrade management, incident resolution etc.). In a multitenant
architecture this application management is shared bringing overhead costs per tenant to zero (Harms
and Yamartino, 2010, p. 10).
Application can be entirely multitenant or they can achieve partial multi-tenancy by leveraging shared
services provided by the cloud platforms. The greater the use of such shared services,
the greater the application will benefit from these multitenant economies of scale (Harms
and Yamartino, 2010, p. 10).
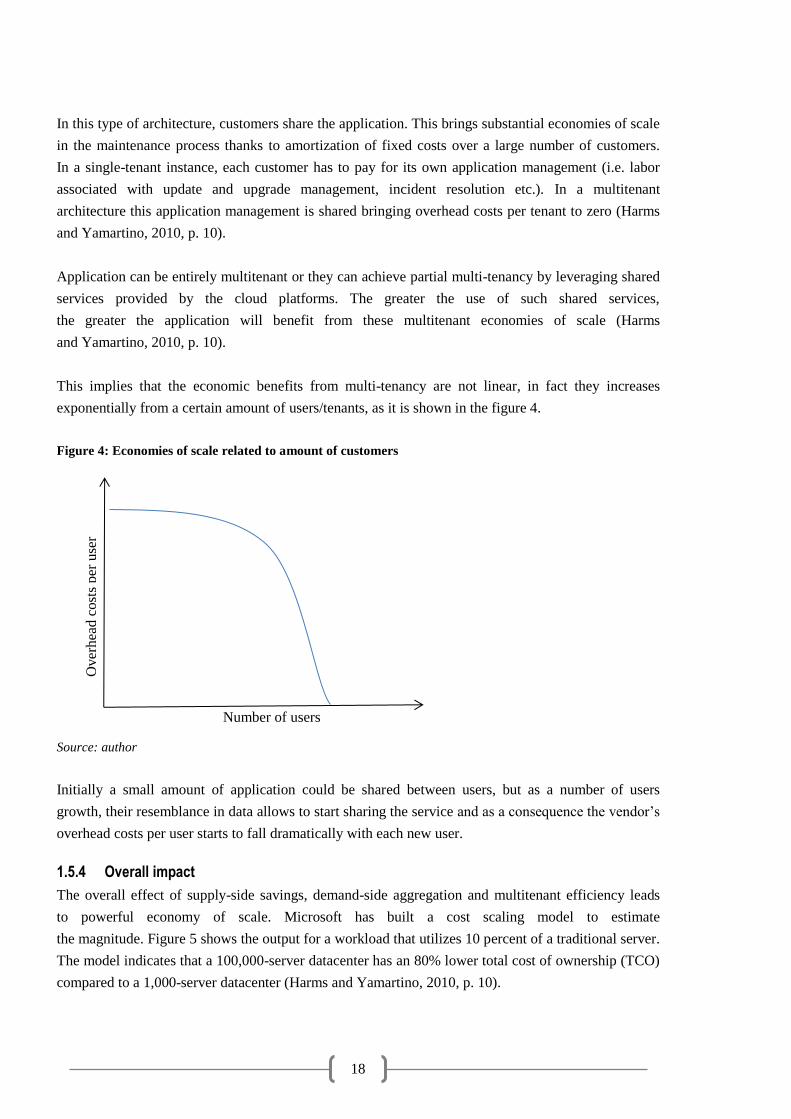
This implies that the economic benefits from multi-tenancy are not linear, in fact they increases
exponentially from a certain amount of users/tenants, as it is shown in the figure 4.
Figure 4: Economies of scale related to amount of customers
Source: author
Initially a small amount of application could be shared between users, but as a number of users
growth, their resemblance in data allows to start sharing the service and as a consequence the vendor’s
overhead costs per user starts to fall dramatically with each new user.
1.5.4 Overall impact
The overall effect of supply-side savings, demand-side aggregation and multitenant efficiency leads
to powerful economy of scale. Microsoft has built a cost scaling model to estimate
the magnitude. Figure 5 shows the output for a workload that utilizes 10 percent of a traditional server.
The model indicates that a 100,000-server datacenter has an 80% lower total cost of ownership (TCO)
compared to a 1,000-server datacenter (Harms and Yamartino, 2010, p. 10).
Number of users
Over
hea
d c
ost
s per
use
r

19
Figure 5: Total cost of ownership in the cloud
Source: Harms and Yamartino (2010, p. 10)
Microsoft’s partners argue that renting a cloud infrastructure from a third party, for example Windows
Azure, can’t drive profits to them (Miklík, 2014). The above figure shows that this is actually not
the case. Large data centers provide economies of scale up to 80% of Total Cost of Ownership (TCO),
thus delivering profit to themselves, partners and customers.

20
2 ERP
There are many definitions of ERP systems in the literature; moreover the definition has been
changing alongside with the evolution of ERP systems. Klaus el al. (2000, 141) have summarized
more than 100 articles related to ERP systems and defined ERP from three perspectives:
“First, and most obviously, ERP is a commodity, a product in the form of computer software. Second,
and fundamentally, ERP can be seen as a development objective of mapping all processes and data
of an enterprise into a comprehensive integrative structure. Third, ERP can be seen as the key element
of an infrastructure that delivers a solution to business.”
2.1 Evolution of ERP
In the early days of business applications most organization designed, developed and implemented
own in-house computing systems. These were legacy systems based on programing languages such
as COBOL, ALTGOL and FORTRAN (Liaquat and Hossain, 2002, p. 4). In 1960 IBM have
developed the first software for material requirement planning – MRP (Vymětal, 2010, p.26). Besides
General Ledger, MRP was the first off-the-shelf business application (Orlicky, 1975, p. 37). MRP
supported the bill-of-materials across all products and parts in one or more plants. Furthermore, this
solution contained bill-of-materials processors (demand-based planning) and forecasting algorithms
(Klaus et al., 2000, p.144). From technological perspective MRPs ran on mainframes, thus requiring
huge upfront investments.
Many other companies started to build their own MRP solutions. SAP, Oracle and Infor were born
in 1970s. Under the pressure of these companies development of MRP accelerated significantly
and in the late 1970s, Material Requirement Planning evolved into Manufacturing Resource Planning
– MRP II (Vymětal, 2010, p.26). Production planning became much more complex and accurate, as it
is shown in figure 6.
Figure 6: Production planning within MRP II
Source: author based on (Klaus et al., 2000, p. 145)
In the late 1980s the MRP II approach was extended in order to include all business-administrative
and technical functions of a company, although integration of these functions remained an issue.
The late MRP II systems included shop floor, distribution management, project management, finance,
human resource and engineering, thus becoming already very close to what is known as today’s ERP
(Liaquat and Hossain, 2002, p. 4). The ERP term started to appear in the literature.
21
In 1992 SAP R/3 system was released, which was the first integrated ERP. This started a new stage
as marketplace gained considerable momentum after 1995 accompanied by strong ERP coverage
in the trade press (Klaus et al., 2000, p. 152). From technological perspective ERP systems started
to run on a client/server architecture model lowering significantly hardware costs, thus allowing
medium enterprises to afford these solutions.
After 1995 vendors started adding more modules and functionality to their core modules giving birth
to the “extended ERP” or ERP II. Basl (2008) defines ERP II to cover following areas (above the
standard ERP):
• Supply Chain Management (SCM),
• Customer Relationship Management (CRM), and
• Business Intelligence (BI)
The core difference is the Business Intelligence functionality which combines data gathering, data
storage and knowledge management with analysis to provide input to the decision process (Negash
and Gray, 2008, p. 175).
Cloud computing is considered to be a next step in the history of enterprise software e.g. Luoma
and Nyberg (2011, p. 3-4); Gartner (2012) and others. Despite the idea of cloud computing is rather
old, first ERP systems started to occur in the New Millennium. These first pioneer solutions were
provided by „Application service providers” and they were basically hosted solutions. The cloud
computing took off in the mid-2000s and during a very turbulent era many under radar ERP solutions
were born. The “cloud-run” started after the economic crisis of 2008 for two reasons.
Firstly, the restricted loan policy, which took place, has frozen large investment in on-premise ERP.
Secondly, the saturation of the LE market has prompt ERP vendors to look for new opportunities.
New cloud born players such as NetSuite and Salesforce have gone through an astonishing period of
growth during 2009-2014. This didn’t remain unheeded by the major three ERP players (SAP, Oracle,
Microsoft), which have responded to the market demand releasing own cloud solutions of their on-
premise ERPs during the period 2011-2013.
2.2 ERP delivery models
The response of existing players gives ERP customers today a range of deployment options. They can
choose on-premise ERP, hosted ERP, cloud-enabled ERP, or a hybrid deployment of any of them.
The varied responses by traditional ERP providers to the threat from new cloud-only ERP vendors
have created market uncertainty (Scavo et al., 2012).

22
2.2.1 On-premise ERP
On-premise ERP solutions are usually sold via a license model. The software is then loaded onto
servers and computers in-house. The enterprise controls the infrastructure and platforms. Furthermore,
the enterprise handles and absorbs the costs of maintaining the servers and the space they require,
as well as disaster recovery (Fesak et al., 2012, p. 2).
2.2.2 Cloud ERP
Cloud ERP systems are sold via a subscription pricing model, see chapter 1.4 and delivered
to the customer via SaaS. Cloud computing essentially enables an outsourcing arrangement
of the IT department, where enterprise software is hosted on a SaaS vendor’s or third party
infrastructure and rented to a customer at a fraction of the costs compared with on-premise solutions
(Faasen et al., 2013, p. 36). Cloud-based ERP solutions appear to provide a number of benefits related
to sizable cost savings, competitive advantage enhancements, and flexibility of the solution.
Many authors agree on the unwillingness of SMEs to adopt on-premise ERP software due to the high
up-front costs and risk involved (Buonanno et al., 2005, p. 420) and for example Forrest (2009, p. 20)
claims: “Cloud offerings are very cost effective for SME primarily because of the subscription based
pricing schemes that typically re-quire significantly lower upfront investments”.
2.2.3 Hosted ERP
Hosted ERP systems are a hybrid solution where a customer rents the hardware from the vendor and
lease the license. The ERP is delivered in a private cloud, thus with a limited multitenancy efficiency.
This solution was provided in early 2000s by Application service provider (ASP).
2.3 Process of sale and selection
Nowhere is the buying experience changing more than in the software industry. In order to sell cloud
ERP to SMEs a whole new business model is required. The following chapter will describe the impact
of cloud ERP on customer’s perception of the service, buying decision making and service marketing.
2.3.1 Buying decision making
Large IT sales transaction between a vendor and its customer are the result of negotiations based
on a common understanding of several parameters (Brill, 2013, s.2). The basic relationship
is captured in the figure 7.

23
Figure 7: Information and the Commercial Negotiation
Source: Brill (2013, p.2)
Both the vendor and the customer have imperfect and mutually influenced assessments
of the negotiation based on their perception of the highly complex parameters involved. The customer
makes a buying decision based on the six parameters of commercial negotiation outlined
in the figure 7. “Use-cases & Future growth” usually plays the highest role (Brill, 2013, p.2).
Traditional on-premise selling model consists in a series of presentations called demos where the sales
team does its best to make a prospect6 understand how the system handles his typical business cases.
While prospects get a demonstration of the product capabilities, they usually don’t have opportunity
to get hands-on experience with the product.
Reducing the risk of limited knowledge of the product is one of the biggest advantages of the cloud
solution. According to Domergue (2009) when selling cloud solutions the real value is unveiled
to the customer. Since cloud solutions are available through internet, there is no need to install
the system in customer’s facilities and the customer can try the solution with demo data online.
This typical SaaS sales process often leads to an initial sale of only few seats. This is certainly
a drawback for a vendor, but a small initial sale implies a relatively low initial price, which minimizes
the requirements for drawn-out evaluations of return on investment. Moreover if the system proofs its
real value, it will inevitably acquire more users within an organization (Chappell, 2012, p.11).
2.3.2 Customer lock-in
Customer lock in is a common phenomenon in ERP business because of large investment needed,
information asymmetry and high switching costs. The customer buys the product without actually
knowing if the solution will meet his expectations. On the other hand the vendor’s interest is to sell
the product no matter what. Once the solution is live high switching costs keeps the customer locked
6 In the ERP business a potential customer is referred as prospect.
"The Deal"
Vendor
Commercial Negotiation
•Expected vs. Actual budget
•Competitive information
•Use-cases & Future growth
•Licensing & Pricing rules
•Complete Purchase History
•Assets in the IT Environment
Customer
24
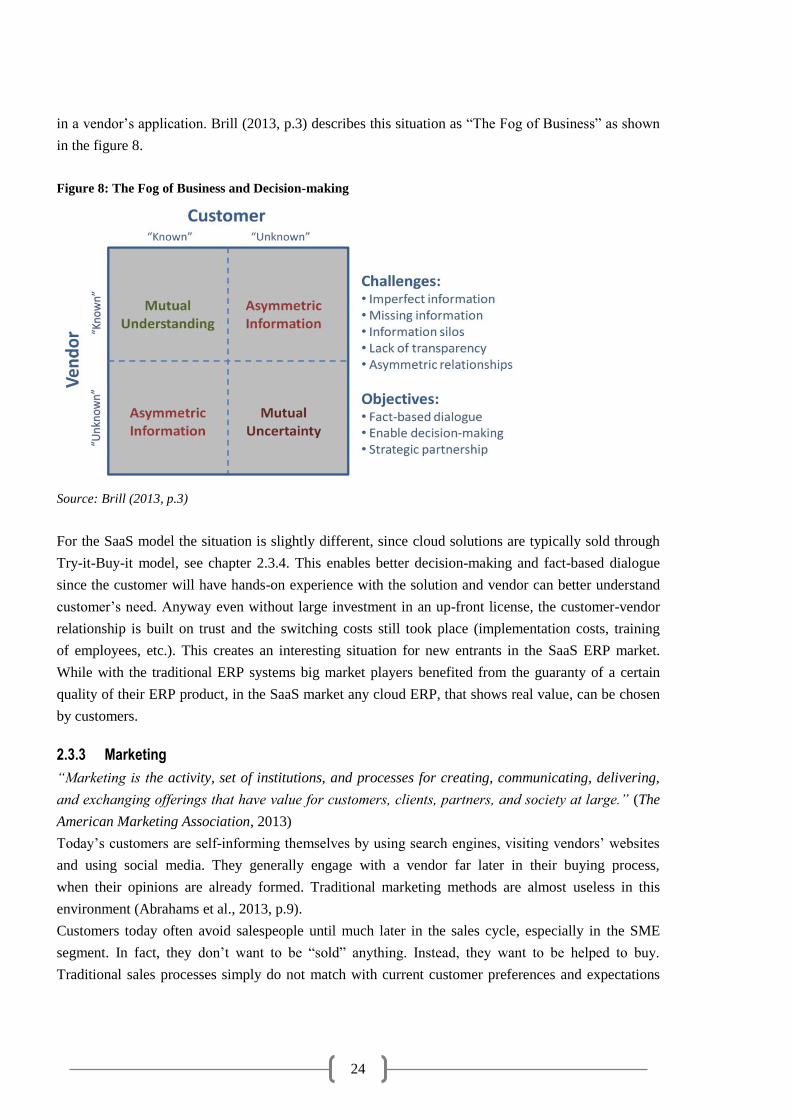
in a vendor’s application. Brill (2013, p.3) describes this situation as “The Fog of Business” as shown
in the figure 8.
Figure 8: The Fog of Business and Decision-making
Source: Brill (2013, p.3)
For the SaaS model the situation is slightly different, since cloud solutions are typically sold through
Try-it-Buy-it model, see chapter 2.3.4. This enables better decision-making and fact-based dialogue
since the customer will have hands-on experience with the solution and vendor can better understand
customer’s need. Anyway even without large investment in an up-front license, the customer-vendor
relationship is built on trust and the switching costs still took place (implementation costs, training
of employees, etc.). This creates an interesting situation for new entrants in the SaaS ERP market.
While with the traditional ERP systems big market players benefited from the guaranty of a certain
quality of their ERP product, in the SaaS market any cloud ERP, that shows real value, can be chosen
by customers.
2.3.3 Marketing
“Marketing is the activity, set of institutions, and processes for creating, communicating, delivering,
and exchanging offerings that have value for customers, clients, partners, and society at large.” (The
American Marketing Association, 2013)
Today’s customers are self-informing themselves by using search engines, visiting vendors’ websites
and using social media. They generally engage with a vendor far later in their buying process,
when their opinions are already formed. Traditional marketing methods are almost useless in this
environment (Abrahams et al., 2013, p.9).
Customers today often avoid salespeople until much later in the sales cycle, especially in the SME
segment. In fact, they don’t want to be “sold” anything. Instead, they want to be helped to buy.
Traditional sales processes simply do not match with current customer preferences and expectations

25
(Abrahams et al., 2013, p.9). The engagement point of on-premise compared to cloud (SaaS) is shown
in the figure 9.
Figure 9: Buying cycle evolution
Source: Chappell (2012, p.11)
Internet has become a key element in software business, and it is crucial for the marketing strategy
of software firms throughout the business cycle. Areas that have been affected by internet include
for example promotion, sales, payments, downloading the product, after-sale services, updates,
and monitoring accounts. Internet is especially potential marketing medium for smaller software firms,
because it can help them to better compete with larger competitors (Hu and McNaughton, 2011,
p. 107).
2.3.4 Try-it-Buy-it model
The line between Sales and Marketing is blurred for Cloud ERP partly because of the Try-it-Buy-it
model. The whole idea is rooted in providing the software to the customer before he buys it
for a limited time period or with limited functionality. Customer is than more willing to buy
the product, since he has perceived its real value.
The concept is not entirely new, proprietary packaged software was and still is commonly offered
as shareware, trial ware which is based on the same concept. Offering ERP systems via this model was
unthinkable before cloud computing. This approach was immediately adopted by cloud-born ERP
players like NetSuite, Salesforce and others7.
For example NetSuite offers a “test drive”8 of their ERP for a trial period of 14 days. The customer has
to do an online registration where he specifies basic details of his company. Afterwards he gets the
access to a demo company tailored to the industry segment he specified. He is also assisted by a
specialized consultant. Furthermore he gets the access to the manual which guides him through the
“test drive”.
7 Already many partners started to offer Dynamics NAV in cloud; these partners use the Try-it-Buy-it model. For
example: http://www.saasplaza.nl/dynamics-nav-azure-cloud.html
8 Source: http://www.trajectoryinc.com/ns_evaluationsales.html

26
2.4 Process of implementation
Process of implementation of an ERP is the most critical, as well as, the most resource consuming
phase of the project (Haddara and Zach, 2011, p.4). LI et al. (2006) divides the ERP implementation
process into six stages: initiation, adoption, adaptation, acceptance, routinization and infusion.
Microsoft has developed a similar six stage methodology called “Sure Step” for its ERP systems,
which can be seen in the figure 10.
Figure 10: Implementation project stages
Source: author based on Microsoft’s “Sure Step” methodology
The diagnostic phase defines the project scope and project plan, initial training is given
to the customer. In the analysis phase business processes are identified and document at high level.
Main goal of the design phase is conduct a fit/gap analysis9 and re-engineer business processes
in order to match them with the ERP system. The output of design phase and therefore the targeted
functionality of the ERP system have to be agreed and signed with the customer. In the development
phase all the programming work is conducted, this includes mainly customization of the ERP system.
This phase includes also data migration. This is usually also the most time-consuming phase
of the implementation project. In the deployment phase the ERP system is installed and configured.
Beside installation, configuration and feature deployment, the phase focuses on testing at system level.
When the system is ready to go live the implementation enters the operation phase. Here additional
training and support is given to the customer.
The whole implementation process is accompanied with workshops, trainings, project current state
evaluation etc. The Sure Step methodology is very specific in particular tasks that are related
to the project. This standardization is critical to make the project plan and management effective
and therefore the whole implementation process smoother.
The Sure Step methodology recognizes “Rapid Implementation” which is applicable for the cloud
solutions. The Rapid Implementation skips the Analysis, Design and Development phases because it
delivers a packaged business specific solution with minimal or no customizations. This solution is
applicable for the environment where customer’s business processes are not considered as complex
and the vendor is already familiar with the main business process specific to the industry.
2.4.1 Critical success factors
Despite the standardization, implementation projects still fail to meet the budget and buyer’s
expectations in most of the cases (Austin et al., 2003, p.3), also 2014 ERP Report (2014, p.11),
9 The analysis consists in identifying whether the present system fits the requirements, and if any such gaps are
identified, they are recorded in a prescribed format.
Diagnostic Analysis Design Development Deployment Operation

27
and 2013 ERP Report (2013, p. 13). This is due to the variability within ERP implementation projects
which makes them hard to standardize and forecast possible obstacles in the implementation project.
Various authors have offered many sets of critical success factor for the implementation phase
of an ERP system. LEYH and CRENZE (2010, p.229-230) have conducted a research over 185
relevant papers and identified top three following critical success factors:
- Project management
- User training
- Top management support.
Implementation of a cloud ERP in small enterprises differs from an on-premise implementation
mainly in the second identified success factor which is the “user training”. In cloud the training is
conducted mostly online and via e-learning materials. This “Do-it-yourself” approach is crucial
to keep the low budget, however it loads a lot of critical tasks on the customer-side. Krishnamurti
(2014) claims that key people in small enterprises are already overloaded with work thus collaborating
on the ERP implementation is always challenging.
2.4.2 Knowledge management
Knowledge management has been identified as one of the most important critical success factors in
ERP implementation (LI et al., 2006), (Deng and Bian, 2008). The implementation project length,
therefore cost, is deeply influenced by the experience build from previous implementations. LI et al.
(2006, p. 167) quotes in their research of the impact of KM on ERP implementation: “Although
realizing ERP is an implementation process, it is also a process of knowledge creation,
storage/retrieval, transfer and application from the knowledge management perspectives.”
Despite recognizing KM as significant factor during ERP implementation the magnitude of the impact
remains uncertain. Figure 11 shows the possible impact of knowledge accumulated during
implementations based on Li et al (2006) research.
Figure 11: Impact of knowledge accumulation on costs of the implementation
Source: author based on Li et al. (2006).
Number of implementations
Co
st r
educt
ion [
%]

28
Figure 12 shows that in the first implementation, there is a lot of to be learned. The diagnostic and
analysis phase together with workshops eats-up for a big slice of the budget. Every implementation
consists in learning customer’s and industry’s specific business processes, in order to do the best setup
of the ERP system. Vendors than use this know-how in future implementations, this is also referred as
“building best practices”. When the partner has build-up a lot of experience with the solution, the
impact of the knowledge accumulated from one additional implementation is nearly zero. According
to Miklík (2014) the initial effect could be around 20-30% of cost reduction per implementation. This
also depends on the company’s knowledge management system, especially how the knowledge is
stored.
Cloud ERP systems enable much higher level of knowledge building-up since they are focused
on high volumes, more implementations imply greater knowledge accumulation. The standardization
in the cloud is also easier. As a consequence costs of cloud implementations will fall more rapidly
than in the case of on-premise implementations and they will be also easier to forecast. On the other
hand the knowledge is an also a prerequisite in the cloud. In order to conduct a rapid implementation
significant knowledge about the business processes specific for the industry are necessary.
2.4.3 Cloud ERP implementation
Microsoft emphasized that in order to offer to a customer additional value of the Cloud-based solution,
the implementation must be far faster. All aspects of the implementation must be streamlined
significantly, as the hereinafter graphic illustrates, for the following reasons (Abrahams et al., 2013,
p.32):
1. User training becomes self-serve and web-based. Overall, better product design also drives
down the need for training.
2. Reporting becomes more “packaged”, and the need for custom reporting declines as result.
3. Configuration and setup is Cloud-based, “templatized” and automated.
The figure 12 above shows a comparison of tasks affected during the implementation process of a
cloud solution.
29
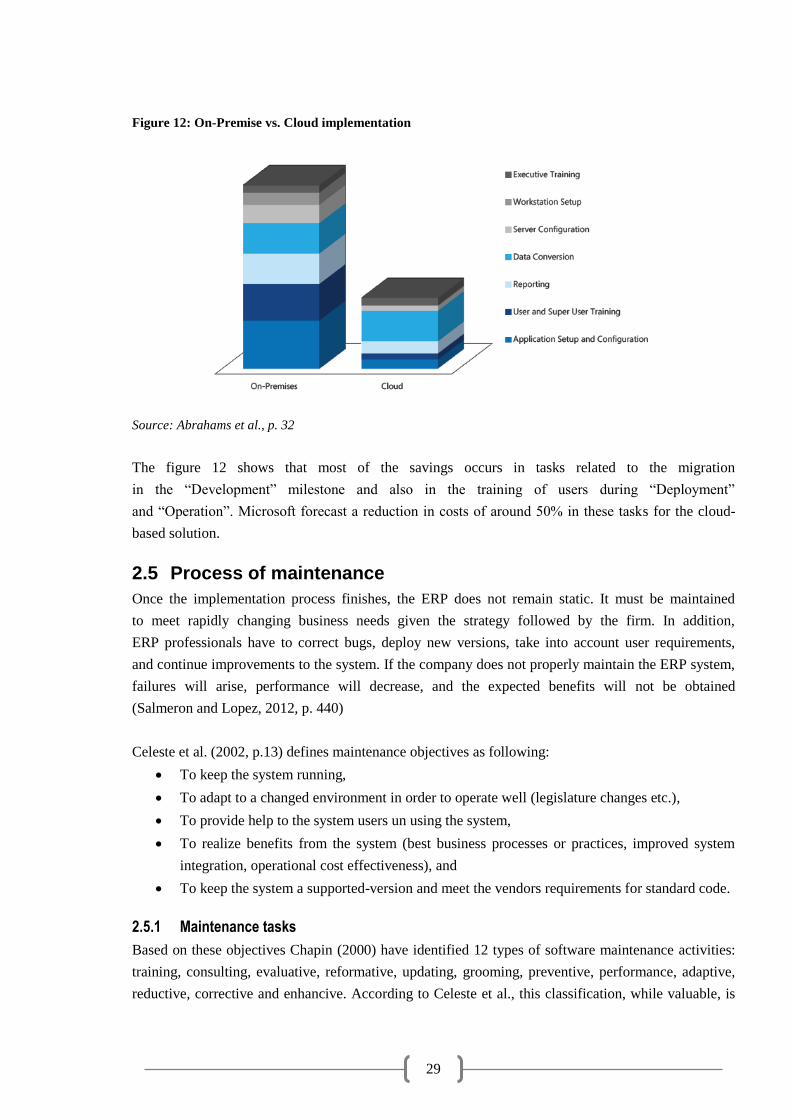
Figure 12: On-Premise vs. Cloud implementation
Source: Abrahams et al., p. 32
The figure 12 shows that most of the savings occurs in tasks related to the migration
in the “Development” milestone and also in the training of users during “Deployment”
and “Operation”. Microsoft forecast a reduction in costs of around 50% in these tasks for the cloud-
based solution.
2.5 Process of maintenance
Once the implementation process finishes, the ERP does not remain static. It must be maintained
to meet rapidly changing business needs given the strategy followed by the firm. In addition,
ERP professionals have to correct bugs, deploy new versions, take into account user requirements,
and continue improvements to the system. If the company does not properly maintain the ERP system,
failures will arise, performance will decrease, and the expected benefits will not be obtained
(Salmeron and Lopez, 2012, p. 440)
Celeste et al. (2002, p.13) defines maintenance objectives as following:
• To keep the system running,
• To adapt to a changed environment in order to operate well (legislature changes etc.),
• To provide help to the system users un using the system,
• To realize benefits from the system (best business processes or practices, improved system
integration, operational cost effectiveness), and
• To keep the system a supported-version and meet the vendors requirements for standard code.
2.5.1 Maintenance tasks
Based on these objectives Chapin (2000) have identified 12 types of software maintenance activities:
training, consulting, evaluative, reformative, updating, grooming, preventive, performance, adaptive,
reductive, corrective and enhancive. According to Celeste et al., this classification, while valuable, is

30
believed to be deficient in an ERP context because it does not consider the benefit of doing
maintenance. Celeste et al. (2002, p.14) then defines activities and their initiators in an ERP Customer-
Vendor relationship. These are outlined in table 3.
Table 3: Activities in ERP maintenance
Activity Initiator
Implementing internal change-requests ERP-using organization’s system users and IT staff
Responding or handling user-support requests ERP-using organization’s system users
Upgrading to new versions/releases Vendor
Performing patches Vendor
Source: author based on Celeste et al, p. 14
Implementing internal change-requests entail changes to the system properties such as data
dictionary, programs, screens, user interfaces, and/or documentation. These comprise data correction,
adaptation to the external environment, and enhancement of the existing functionality, and additional
functionality.
Responding or handling user-support requests is usually related to software system training, and
consultation on the system usage and functionality. In a case study conducted by Celeste et al., this
accounted for 59% of total maintenance effort10.
Upgrading to new versions/releases occurs usually over a longer period of 3-5 years and its costs are
strongly based on the complexity of the system. The complexity is reported to be a function
of the system size, system age, quality of the original system, the amount of maintenance done
previously, and software development practices (Banker et al., 1989, p. 254). The biggest factor
in the maintenance complexity is the amount of customization done during implementation and post-
implementation (Banker et al., 1989, p. 255). Customizations slow the whole maintenance efficiency
because each modification may cause extra effort in impact analysis, and re-testing the whole system
(Celeste et al., 2002, p.14). Therefore maintenance costs are increasing over time. Consequently this
may result in situations where the upgrade costs exceeds costs of a implementing a solution from
scratch.
Performing patches comprise following areas: Fixing bugs that are found in the standard code,
Adapting the ERP system to conform to a changed environment, such as Government regulations,
and Keeping the existing system up to the vendor’s standard version. These activities usually accounts
for the smallest part of maintenance.
2.5.2 Cloud ERP maintenance
Many authors11 claim that maintenance of a cloud ERP solution is much cheaper. The reasons behind
consider mainly energy, infrastructure and upgrade costs. Infrastructure and energy costs are moved
10 The percentage based on a single case study a single SAP implementation, therefore cannot be adopted as
wide-applicable.

31
from the customer-side to the vendor-side and upgrade costs are shared across a large amount
of customers due to multitenancy. Taking into account the economics of scale because of falling
overhead costs per customer outlined in chapter 1.5.3, the impact of cost savings in the maintenance
process is significantly bigger than in the selling, selection or implementation process.
From the vendor’s revenue perspective the cloud solution is also interesting. ERP maintenance is
an important source of incomes. A report (Jaconson, 2007) indicates that this revenue represent
around 36 percent of total ERP revenues. Cloud maintenance consists almost solely of training and
support services which have nowadays the highest profit margin around 70-80% among all
maintenance tasks described.12 Therefore despite having much lower amount of revenues, the profit
may look very promising for the cloud. Codini (2013) says that: “Cloud enables the true consultancy
potential of the ERP vendor, which should be the ultimate target of every ERP consulting company”.
In other words cloud delivers packaged know-how.
11 According to literature research done by Fesak (2012) 12 NetSuite profit margin on maintenance in 2012-2013.

32
PRACTICAL PART
3 PRESENTATION OF THE COMPANIES AND PARTNER
MODEL
3.1 Partner model
Microsoft Dynamics products are sold through partners all over the world. Partners act like Value
Added Resellers (VARs). Kelly (2012, s. 205) defines VARs as “partners who adds services that
an ISV cannot or do not wish to provide, such as an additional line of support, or support in the native
language.” In Microsoft VAR model, VAR handles the sales process; provide additional know-how
and localization of the product. They also provide professional services to help customers use
the product or integrate in into their existing systems i.e. customizations. The risk and revenues are
shared between Microsoft and its partners.
Complex add-ons or vertical solution can be developed by a third-party entity, which is basically
a company that develops a software build on some Microsoft Dynamics solution e.g. MS Dynamics
NAV. These companies act like Independent Software Vendors (ISVs). Gartner (2013) defines ISVs
as “a company whose primary function is to distribute software.” These ISVs sells the vertical solution
independently from Microsoft.
This research is a result of cooperation with NovaVision - the ISV selling the PrintVis solution and
both NAVERTICA and ARDAN which are Microsoft’s and NovaVision’s VARs. The relation
between these companies is shown in the figure 13. ARDAN was chosen to contribute to this research
because of extensive experience with the PrintVis solution and company strategy shift towards selling
PrintVis in cloud.
Figure 13: Partner model
Source: author
Figure 14 shows the cooperation between Microsoft, the ISV partner, and VARs partners. NovaVision
have to pay a commission for developing a vertical-solution based on MS Dynamics NAV and for
33
reselling licenses. NAVERTICA (or ARDAN) have to pay for reselling licenses of MS Dynamics
NAV and the vertical solution to NovaVision.13 Other costs involve maintenance fees.
3.1.1 NAVERTICA
NAVERTICA a.s. has been involved in the development and implementation of ERP systems since
1990 (previously under the name, FUTURE Engineering). NAVERTICA are headquartered in the
Czech Republic, with offices in Prague, Brno as well as in Bratislava, Slovakia. Additionally, the
company has a presence in Southern Africa with NAVERTICA SA, a daughter company with offices
in Johannesburg, South Africa.
NAVERTICA has continually fulfilled the requirements necessary to obtain Microsoft Gold Certified
Partner status since 2002 and was awarded many times as Microsoft Dynamics President’s Club.
NAVERTICA specialized in ERP and CRM solutions based on Microsoft Dynamics. In addition to
this, they manage a division, that is dedicated to the delivery of solutions such as intranet and
customer portals based on Microsoft SharePoint and also provides consultation services in the area
of integrated management systems (ISO 9001, ISO 14001, ISO 27001, etc.), with the former often
serving as an essential step in the delivery of a complex ERP or SW system.
Years of experience in the engineering has provided the know-how to deliver substantial added value
alongside ERP and SW systems. This added value is often higher than the value of the supplied system
and hence NAVERTICA commitment is to deliver “A Better Bottom Line” for the customer14.
In cooperation with partners NAVERTICA have developed and implemented Vertical Solutions for
the following segments:
• Service management
• Property management
• Rental and leasing management
• Health care
• Retail optical
• Government sector
• Manufacturing
• Engineering
• Printing industry
• Steel service and processing
• Material cutting/allocations
3.1.2 NovaVision Software
NovaVision Software A/S was founded in 1997 with goal to create an ultimate IT solution for printing
industry. The vision was also, to create a piece of software that could be implemented without many
13 Prior to NAV 2013, the VAR had to buy separately the standard MS Dynamics NAV from Microsoft
and the vertical solution from the ISV. 14 Source: navertica.com

34
customizations and thereby securing upgradeability for our customers.15 NovaVision choose to build-
up the solution on Microsoft Dynamics NAV which had proven to be the best possible platform to
obtain this goal. NovaVision has more than 250 customers around the globe with 30 partners
representing more than 40 countries.
3.1.3 ARDAN
ARDAN is a consulting company based in Milan, founded in 2010 as part of group “Gruppo i3”. The
company specializes itself on printing industry within the SME area. ARDAN provides practical and
innovative solutions, able to respond to the information, organizational, managerial and technological
need of a company. ARDAN implements “PrintVis” based on MS Dynamics NAV or “Print &
Packaging” based on MS Dynamics AX. ARDAN has around 20 clients, of which many companies
represent the biggest market players in the Italian and European printing industry.
15 Source: NovaVision profile presentation for partners available:
http://www.printviswiki.com/w/images/8/88/NovaVision_Profile_Presentation.ppt

35
4 MICROSOT DYNAMICS NAV 2013
“ERP systems are like wine: they get better with age” (ROYS and BABIC, 2008, p. 7). Microsoft
Dynamics NAV 2013 is the latest product of the Dynamics NAV family for small and midsize
businesses. It features new Office 2013 looking interface, closer integration with other Microsoft’s
products such as SharePoint, Outlook and Excel and better Business Intelligence. The Role-Tailored
client, which was firstly introduced in the Microsoft Dynamics NAV 2009 as an addition
to the “Classic” client has now murdered his older brother. Role-Tailored client offers a different
interface of the ERP system based on user’s assigned role. The user interface hides the complexity
of the system away from the users. This helps users to see only the relevant part of the ERP for them.
A real change has been done beneath the surface in the new three-tiered architecture
(ROYS and BABIC, 2008, p. 8). This goes far beyond the subject of this thesis, thus shortly put the
three-tiered is a precondition to have a scalable system that handles more users, internal departments
or even companies. With the three-tiered architecture it is also possible to expose any part
of the system as a Web service on the internet The NAV 2013 features a full web client, which has
been connected to the three-tier architecture. This is essential for having “a true cloud” architecture.
Together with other changes this made MS Dynamics NAV 2013 a first cloud-enabled Dynamics’
family product. Other features of this release are outlined in the picture 1 below.
Picture 1: Microsoft Dynamics NAV 2013 features
Source: Microsoft
4.1 Focused on cloud
The Cloud means both substantial opportunity and the requirement to change. The emphasis on cloud
computing in the market today has been on deployment to the cloud to reduce costs. This is
an opportunity to re-imagine business applications that deliver rich experiences with services,
36
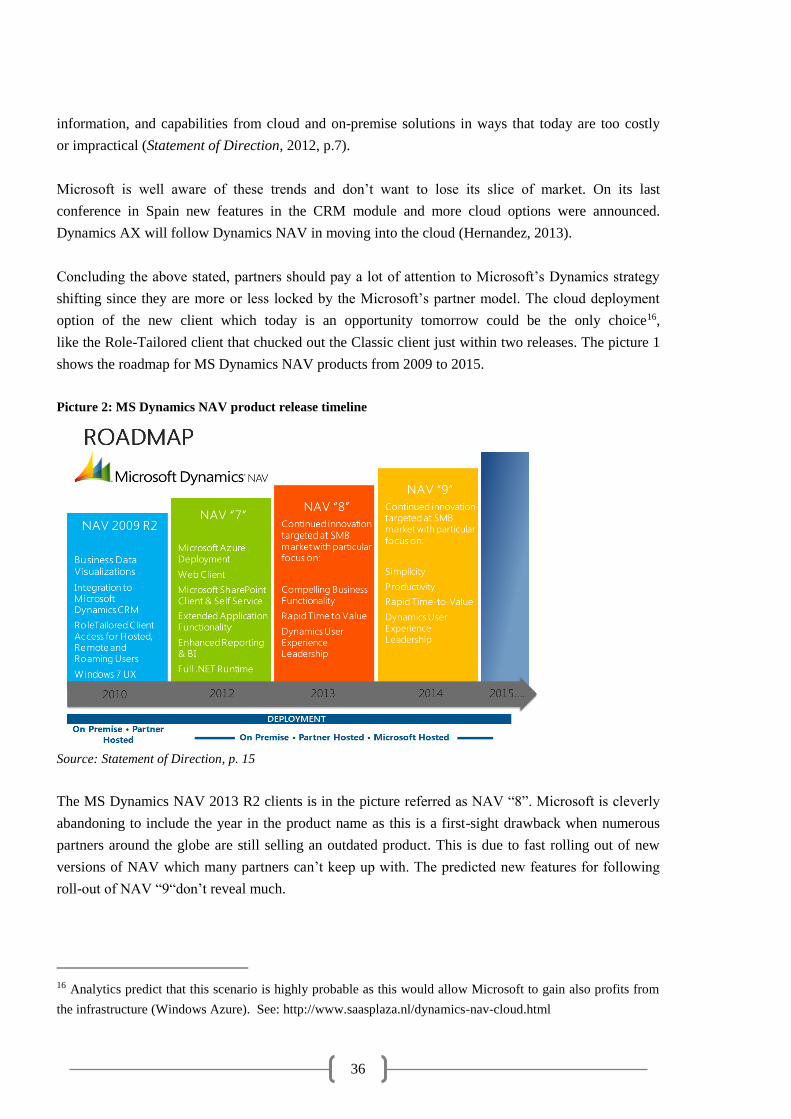
information, and capabilities from cloud and on-premise solutions in ways that today are too costly
or impractical (Statement of Direction, 2012, p.7).
Microsoft is well aware of these trends and don’t want to lose its slice of market. On its last
conference in Spain new features in the CRM module and more cloud options were announced.
Dynamics AX will follow Dynamics NAV in moving into the cloud (Hernandez, 2013).
Concluding the above stated, partners should pay a lot of attention to Microsoft’s Dynamics strategy
shifting since they are more or less locked by the Microsoft’s partner model. The cloud deployment
option of the new client which today is an opportunity tomorrow could be the only choice16,
like the Role-Tailored client that chucked out the Classic client just within two releases. The picture 1
shows the roadmap for MS Dynamics NAV products from 2009 to 2015.
Picture 2: MS Dynamics NAV product release timeline
Source: Statement of Direction, p. 15
The MS Dynamics NAV 2013 R2 clients is in the picture referred as NAV “8”. Microsoft is cleverly
abandoning to include the year in the product name as this is a first-sight drawback when numerous
partners around the globe are still selling an outdated product. This is due to fast rolling out of new
versions of NAV which many partners can’t keep up with. The predicted new features for following
roll-out of NAV “9“don’t reveal much.
16 Analytics predict that this scenario is highly probable as this would allow Microsoft to gain also profits from
the infrastructure (Windows Azure). See: http://www.saasplaza.nl/dynamics-nav-cloud.html

37
4.1.1 Rapid implementations
Rapid implementations are among the targets of Dynamics NAV. The situation for the three major
market players (SAP, Oracle, Microsoft) is shown in figure 14.
Figure 14: Average Time to Implementation (Planned vs. Actual)
Source: Clash of the Titans 2014, p. 10
Average implementations of a MS Dynamics solution (both Microsoft Dynamics AX and Microsoft
Dynamics NAV) have taken 12.5 months for the year 2013. Although Dynamics solution has beaten
its competitors, the number is less impressive when considering the market segment17 and a second
look on the planned vs actual project duration doesn’t give many points either. In this discipline, SAP
projects have the shortest overrun time-wise (2.5 months).
To fight back MS Dynamics NAV 2013 have developed a new RapidStart tool in order to make
the data migration phase, thus the whole implementation process, quicker and provide a better
overview. RapidStart Services for Microsoft Dynamics NAV helps reduce implementation time
by automating and simplifying the recurrent processes in an implementation project. RapidStart
Services for Microsoft Dynamics NAV quickly configures core application setup data to meet specific
business needs using tailored templates. The templates are provided by Microsoft and are extended
and enriched by partners, to share best practices and solutions within the Microsoft Dynamics NAV
ecosystem (Microsoft, 2012, p. 6)
4.1.2 Multitenancy in MS NAV R2 2013
In a standard single-tenant model each company has its own computer or virtual machine that hosts
the Microsoft Dynamics NAV web server instance, Microsoft Dynamics NAV Server instance,
and Microsoft Dynamics NAV database. Companies or instances do not share resources
(Microsoft, 2013a). Figure 15 shows the single-tenant model typical for on-premise implementations.
17 MS Dynamics NAV solutions targets SME companies and MS Dynamics AX, which targets large enterprises,
have only small market penetration. On the other hand SAP and Oracle major markets are large enterprises.
1617,5
8,5
18,5
22,5
12,5
0
5
10
15
20
25
SAP Oracle Microsoft Dynamics
Planned (months)
Actual (months)

38
Figure 15: Single Server Instance
Source: Microsoft (2013a)
With the multitenant deployment architecture introduced in Microsoft Dynamics NAV 2013 R2,
a single application is used by two or more companies that store their data in separate databases.
This makes maintenance of the solution easier (Microsoft, 2013b).
The traditional NAV database has been split into two: one for the application data and one
for the customer data. Every customer has its own customer database containing tables like Sales
Header, Windows Login, and Windows Access Control etc. This configuration is shown
in the figure 16.
Figure 16: Multitenant architecture
Source: Microsoft (2013a)
With this configuration, companies share a Microsoft Dynamics NAV Server instance and application
database, but have their own business database. The application database contains tables
and information that describe the Microsoft Dynamics NAV application and is not specific
to companies. The business database, which is referred to as a tenant, stores business data that is

39
specific to the company (Microsoft, 2013a). This configuration is essential to exploit full benefits of
the cloud solution.
4.1.3 Customizations
Customization is the ability to modify the system to fit customer needs. One of the arguments in favor
of a Microsoft-based ERP platform is the widespread availability of people who can customize
the system (Cox, 2009, p.22). On the other hand in the maintenance process, we have demonstrated
that customizations are inefficient. Gartner (2014), as a world’s leading IT research and advisory
company, claim in their research that: “any heavily customized ERP system will soon become
obsolete... Many business executives are nowadays concerned about the lack of flexibility in their
business application portfolio”.
On the other hand business stakeholders still want the same qualities from the ERP system, but now
they assume that these qualities will be present in any software solution, and their requirements have
switched to the twin concerns of lowering IT costs and seeking increased flexibility (Gartner, 2014).
This need can be satisfied only by selling already highly tailored solutions specific to an industry.
Customizations are now acceptable only when they can be applied to a wide-range of customers.
These wide applicable customizations are afterwards packaged as add-ons and lead to a highly tailored
solution.
Many consultants will discourage this approach claiming it impossible to achieve thus defending
customization as a profit-driver for the vendor. Gartner (2014) claims that this conviction is a
consequence of 15 years of customization era where vendors secured themselves a prosperous future
by utilizing lucrative continuous service contracts that went beyond implementation into extensive
customizations.
Example of highly tailored solution is PrintVis 2013, which when combined with local add-ons can be
used without heavy customizations. ARDAN have managed by implementing this solution to drive
down the number of customization from over 300 to 17 in their upgrade from a previous PrintVis
release (Codini, 2013).
4.1.4 Licensing
License costs made up for almost fifty percent when talking about on-premise NAV implementations
with a reasonable level of customization.18 The cost of a license has to be usually paid upfront
but many providers offer “a leasing”, where customers pay a monthly fee and after he has paid all
the repayments, he owns the license. When choosing an on-premise license a customer buys the rights
to use the software forever and install it on their own server wherever that may be hosted on vendors’
18 The level of customization plays a significant role in the total implementation price; “reasonable” in this case
means that the customization costs will not exceed 10% of the total implementation budget

40
servers which are then rented to the customer. Many vendors claim that this is the cloud, even though
this solution has nothing to do with it.
For NAV 2013, Microsoft have opted for the title “Perpetual Licensing”, this is a bit confusing since
previous license models were also perpetual; however, it does the job of differentiating on premise
and subscription based (cloud) solutions which are packed under the title “Subscription Licensing”.
When choosing a subscription license a customer buys the rights to use the software for a limited
period when he is paying the subscription and deployment occurs on a cloud enabled server which is
chosen by the vendor. Table 4 summarized the license options described in the paragraph above.
Table 4: License options
License type Payment basis Right to usage Deployed
Perpetual Paid upfront Forever On-site
Hosted
Leasing Forever On-site
Hosted
Subscription Monthly subscription Paying period Hosted in cloud
Source: author
Basically both of these models works by deciding on the functionality required then adding
the number of users. For NAV 2013 Microsoft has also changed the licensing of the functionality
which is now adapted to the role based user-type structure. NAV now defines two types of users listed
as “Full user” and “Limited user”. Full user has write and read access to every object in the system.
Limited user has limited write access but unlimited read access of the objects. The price of a limited
user is around 17% of a full user.19
4.2 PRINTVIS 2013
PrintVis is a comprehensive standard ERP/MIS vertical product for the printing industry developed
by a small Danish company NovaVision A/S founded in 1997. Since then Nova Vision’s main goal
was to create an ultimate ERP solution for the printing industry. PrintVis is built on and certified
for Microsoft Dynamics NAV. Since MS Dynamics NAV is a highly customizable ERP platform
designed for firms involved in distribution and manufacturing, it is ideal core to build a print company
on. NovaVision claims that their system PrintVis will fulfill the most advanced needs for all the tasks
and processes in the administration and production of prepress, press and postpress. PrintVis can be
adapted to client’s specific needs. PrintVis is marketed, sold and implemented globally by a network
of highly skilled partners over the globe (PrintVis, 1997-2014).
PrintVis handles printing, newspapers, flexo print, packaging, book production, magazine and
publication manufacturing, large format printing and commercial print (PrintVis, 1997-2014).
Modules within PrintVis include estimating, planning, production, e-commerce specific to the printing
industry. Other modules like finance, stock management, human resources, supply chain management,
19 The price varies based on the number of objects to which the user has the write access.

41
fixed asset management are “taken” from the standard MS Dynamics NAV solution. The firm can
always choose which module they are going to use and this vary the price of the final product/service.
According to discussion with consultants,20 PrintVis competitive advantage lies, besides the benefits
of the MS Dynamics NAV, mainly in the high level of detail provided, especially the imposition,
which shows how the various part of the order are placed on the printed paper. Since the paper
consumption is the main KPI for the printing industry this feature is a significant competitive
advantage. Another advantage is the JDF21 capability. PrintVis fulfill the standards of JDF which
allows machines to communicate directly with the ERP system. Picture 3 shows the interface of
PrintVis with the imposition.
Picture 3: Job details with imposition
Source: author
4.2.1 Licensing
PrintVis 2013 has derived its three basic user types from the MS Dynamics 2013 limited and full user
types, as it is shown in the figure 17.
20 Interview with Codini (2013).
21 Job Definition Format (JDF) is a technical standard being developed by the graphic arts industry to facilitate
cross-vendor workflow implementations of the application domain.

42
Figure 17: PrintVis user types
Source: author
The table 5 shows the functionality of the above three PrintVis user types.
Table 5: PrintVis user types
PrintVis full user PrintVis Remote Salesman User PrintVis Registration User
This user type is needed for all
users that need full access to all
NAV functionality, to create G/L
entries and administrate PrintVis
by using the setup.
This user type is perfect for
office staff and estimator as
well as the outside sales force,
which can monitor orders on
the go.
This user type covers the typical
functionality needed for shop floor
machine operators, shipping clerks
and warehouse workers.
• Comprehensive Estimating
Tools
• Total Order Management
• Purchasing and Invoicing
• Create Cases, Quotes and
Orders
• Run Sales Reports
• Create/Maintain
Customers
• Print Job Tickets
• Production Plan Overview
• Time
Registration/Documentation
• Materials Documentation
• Status Updates Report to Admin
Source: author
4.3 PRINTVIS 2013 in cloud
PrintVis in cloud was released in December 2012. In fact, NovaVision was among the first
of Microsoft’s partners to shifts its vertical solution “up in the clouds” - almost immediately after
Microsoft released Microsoft Dynamics NAV 2013 which was the first cloud-enabled Dynamics
solution.22 NovaVision also achieved an important triumph in being the first to deploy a cloud solution
on Windows Azure platform.23
NovaVision offers two basic options of how the partner can sell and implement PrintVis in cloud:
The standard way where the implementation partner has the possibility to buy the subscription licenses
at 50% of the end-user price, quoted in table 22 of the case study, and charge for the implementation
and deployment on an IaaS platform or much more fixed “package implementation” consisting
22 On February 4th 2013, the print broker company Production Facilities from Copenhagen, Denmark, went live
on their new PrintVisCloud solution.
23 On May 1st the first PV customer went live on Azure. In fact, this is the first in the world NAV on Azure to go
live
Full user PV Full user
Limited user
PV Remote Salesman user
PV Registration user

43
in selling the solution through “Accelerated Sales Process” and implementing it on Windows Azure
through “Accelerated implementation process”.
4.3.1 Accelerated Sales Process
This process is used for selling the PrintVis in cloud solution below 120 implementation days.
The Accelerated sales process complies with the current changes in the sale and selection process
outlined in chapter 2.3. This process is derived from the Microsoft’s campaign for MS Dynamics
NAV 2013 called “Road to Repeatability”. The underground philosophy is a “Five Call Close”
and online approach. In online meetings an extensive emphasis is put on mutual understanding
in order to avoid mutual uncertainty described in the chapter 2.3.1. The table 6 outlines several key
messages from today’s customer perception of the ERP selection and selling process and proposed
impact on partner’s way of selling the solution. NovaVision already adopted this strategy
for the PrintVis 2013 in cloud.
Table 6: Road to Repeatability
Key message Partner impact
ERP projects are always rooted in emotionally charged
business challenges.
Partners must understand the 4-6 primary business
drivers that force/compel prospects to upgrade their
core business system.
Prospects will find you online long before you find them
and want to understand your solution before they engage.
Partners must position themselves to be “found” by
potential prospects, through SEO, SEM and active
online presence.
Prospects will look to their social networks such as
linkedin.com and online communities for guidance and
validation before they reach out to vendors.
Be active in targeting prospects ‘online
communities.
Prospects will remain anonymous through much (up to
65%) of their buying process.
Speed of response and adding value early in the
engagement experience is critical to creating
differentiation and compressing the sales cycle.
Prospects often know more about their industry
challenges, and potential solutions than many sales
professionals.
Identify the business challenge driving the initiative
through intelligent discovery and introduce
vertically relevant information that is new to the
prospect.
Operational project leads are often reluctant to engage
their executives in the discovery process.
Respectfully handle objections by focusing on how
the project lead benefits by changing his or her
mindset
Misunderstandings can easily take place during the
discovery process.
Send solution specific e-mails to validate prospects
business challenges and impacts.
Create positive emotional bias early in the sales cycle by
showing how your solution solves one of the prospect’s
primary project driver.
Understand and listen for the 4-6 change drivers and
have pre-configured 5-10 minute demos prepared for
remote delivery.
Direct BANT24 qualification and poor listening skills
undermine trusts and disclosure.
Exercise a customer-centric discovery process (what,
how, why) to effectively profile a lead/opportunity.
To prospects, most software applications look very
similar, if not identical. Capital preservation and speed
can be as important as solution functionality.
Configure concise industry specific solution demos
and offer solutions that are available on a
subscription basis that can be deployed quickly.
24 BANT = Budget, Authority (to purchase), Need and Timeframe. It is widely used by sales teams all over the
world. Its premise is simple, “if sales people discover the following four pieces of information, they are more
likely to succeed in winning the deal.”

44
Most sales professionals e-mail proposals with no insight
into prospect’s objections and concerns and wait for a
response.
Configure and deliver a 6-8 slide proposal
presentation to project stakeholders via webcasts,
and then deliberately ask for commitment.
Prospects want a smooth buying experience and to
complete their transaction as soon as they have made
their decision.
Simplify contracts to as few pages as possible and
make in easy to execute signatures digitally.
Source: Road to Repeatability (2013)
The accelerated sales process is built to address the above mentioned key messages and as it was
already mention consist in five calls (meetings). The following three phases are recognized.
Phase I – Qualify (1st and 2nd phone call)
The majority of the heavy lifting and positioning is completed during Qualify; which effectively
compresses the first three phases of a traditional complex sales model. Coming out of this phase 1 the
sales professional will have:
• validated the opportunity meets pre-defined “accelerated” criteria
• qualified the prospect based on layer 1 (BANT) and layer II (solution/partner specific criteria)
• secured an understanding of the selection process and selection criteria
• aligned the prospect’s buying process with the partners selling process
• secured access to the BDM (business decision maker)
• delivered a 15 – 20 minute buy-in demo
• confirmed the desired solutions set and fit to partner offering
• determined proof activities required to move to contracting
• validated all of the above through a mutual alignment/action plan
Phase II – Proof (3rd and 4th phone call)
The Proof phase focuses exclusively on providing the comfort required to proceed to contract
and surfacing, then handling all outstanding objections. The primary Proof activities are:
• Satisfying outstanding technical concerns
• Educating and demonstrating to a broader stakeholder group
• Managing a trial process (Buy-It-Try-It model, see chapter 2.3.4)
• Aligning the prospect with a recommended close plan
Exit criteria for the Proof phase are the elimination of all outstanding objections and agreement
to proceed to submitting a proposal. Goal in this phase:
• Align business challenges with solution capabilities
• Validate capabilities
• Remove the barriers to commitment
Phase III – Close (5th phone call)
The Close phase focuses exclusively on the mechanics of handling hidden or unconscious objections
and mechanically closing the transaction. The primary Close activities are:
• Developing and presenting a proposal
• Handling outstanding objections
• Contract execution (ask for the order)

45
Exit criteria for the Close phase are contract execution and a successful hand off to delivery. Microsoft
claims that total average time spend on the buying cycle before closing the deal is 6 hours and 15
minutes on 5 calls (Road to Repeatability, 2013). In comparison traditional sales and selection process
for a project of 200 implementation days involves around 150-160 hours on 20-30 meetings and more
than 50 telephone calls (Turek, 2014). We must notice that the Accelerated Sales Process is applicable
only on projects below 120 implementation days (Tomshøj, 2014) which will follow the accelerated
implementation process.
Extensive focuses on social network marketing, building-up online help and become an expert on the
solution are other key messages outlined from the table 6. The partner can generate leads through
PrintVis cloud website (cloud.printvis.com) or through own marketing.
In order to become a cloud partner a participation in a cloud campaign is required. The campaign
consists in a series of meetings and homework where partners are taught how to generate leads in
cloud, the accelerated sales and implementation process and the translation of the website in
corresponding language is made.
4.3.2 Accelerated Implementation Process
Cloud PrintVis is deployed following a standardized implementation project. This project plan is
designed for “small” projects deployed on Windows Azure, which saves time with setting-up,
delivering and testing the architecture. This combination of SaaS and IaaS shortens “Time to Value”
of the implementation.
The budget for an implementation is fixed and depends on the region. For Czech Republic it will be an
equitant of 7 500 EUR which all goes to the partner. The project plan for the implementation package
consists in 10 man-days + 2 days follow-ups. This translated to man-hours accounts for a total of 88
Mh, which are distributed between the Finance Consultant, Printing Consultant and Customer’s
“homework” for Bookkeeper and Printing resource. Detailed project plan can be found in the
Appendix B. Table 7 describes resources needed for the implementation.
Table 7: Implementation package
VENDOR CUSTOMER
Task Finance
consultant
Printing
consultant
Printing
resource
homework
Bookkeeper
homework
ClickOnce deployment on Azure 0.5 0 0 0
RapidStart setup 4 7 0 0
Excel sheets for migration 2 2 7 15
Test, learn and change cycle 3 4 10 2
5 reports changes 2 2 0 0
GoLive & Follow-ups 5 11 0 0
16 support calls 4 4 0 0
Total implementation [Mh] 20.5 30 17 17
Source: author
46
Table 7 contains tasks included in the implementation package and estimated man-hours.25 Estimated
man-hours are based on NovaVision practice and are valid for partners who have extensive knowledge
of the solution. The customer is charged only for the time on the vendor’s side. As you can,
the implementation time from the vendor’s side accounts for a total of 50.5 Mh. From the customer’s
side a lot of effort is required, totally 34 man-hours, where probably a lot of support from the vendor’s
side will be needed, thus the worst-case scenario can lead up to 84.5 Mh invoiced. NovaVision is
comparing this cloud implementation to a model implementation of on-premise solution, where based
on their practice a similar implementation would take from 13 to 16 man-days, a total of 104-128 Mh.
This represents a 19-34% of average decrease in time-budget from the vendor perspective
in the implementation process.
In order to complete the implementation within the outlined fixed budget a lot of effort from both
partner and customer side is required. A consultant from NAVERTICA claims: “I can only imagine
this online approach if we had someone who has extensive knowledge of the solution who would
nimbly react to customers’ needs and do the right setups during the implementation” (Miklík, 2014).
Another key success factor is the willingness of customer to take this leap of faith in doing everything
online. According to Hünner this was one of the hardest things during their cloud implementations.
NovaVision is also prepared to cooperate with partners, who want to join the ‘cloud-run’ in order
to improve the mutual knowledge on this solution (Hünner, 2014). Together with partners,
NovaVision have already achieved four successful implementation of this solution. NovaVision has
also developed a database of self-training videos for end-users, the complete structure can be found in
the Appendix E. Each session takes 90 minutes. Live online training with consultants are also
available for 450/900 EUR half/full day.
4.4 Windows Azure
Windows Azure is the IaaS platform build by Microsoft which offers almost unlimited scalable
computing power where client pays based on the computing power consumed per time unit. This
enables true cloud efficiency, faster deployment and faster return on investments.26 Table 8 outlines
key values of PrintVis deployed on Windows Azure.
Table 8: NAV on Windows Azure key values
Key value Description
Increased flexibility and lower total cost of
ownership
Easily scale infrastructure up or down as needed to
meet business needs. Never worry about running out
of resources, or paying for overcapacity. Examples of
peak usage times include holiday shopping season,
month/year
25 A man-hour is the amount of work performed by the average worker in one hour. It is commonly used in
project management for estimation of the total amount of uninterrupted labor required to perform a task. 26 Source: http://community.dynamics.com/dynamicbusiness/b/theedge/archive/2013/06/18/microsoft-dynamics-
partner-abakion-expect-to-gain-25-in-revenue-through-hosting-on-windows-azure.aspx

47
end close, and so on. Replace infrastructure, hardware,
and IT management costs with highly efficient
automated processes in Windows Azure.
Receive detailed usage reports and only pay for the
computing resources you use each month. Refocus IT
resources from managing infrastructure to working on
strategic projects.
Accelerated deployment
Get up and running in hours instead of weeks by
removing the need to scope, purchase, deploy, and test
infrastructure
Anywhere access Securely access your business data in the cloud from
anywhere at any time using the Microsoft Dynamics
NAV Web client on virtually any device.
Enterprise-grade infrastructure and support
99.95% availability guarantee when working with two
or more instances in availability set. 24x7 global
support from Microsoft experts. Robust security,
backup and privacy controls enabled by Windows
Azure running in geographically dispersed datacenters
that comply with key industry standards, such as
ISO/IEC 27001:2005.
Source: Microsoft (2014)
4.4.1 Interface
The Windows Azure interface is web-based and user-friendly. MS Dynamics NAV can be installed
just with few clicks or by running a simple script, which allows automation of the whole deployment
process. The picture 4 shows the installation of Microsoft Dynamics NAV in Windows Azure
environment.
Picture 4: Windows Azure MS NAV 2013 deployment
Source: Microsoft Dynamics NAV 2013 R2 available in the Windows Azure Portal under MSDN
subscription (2014)
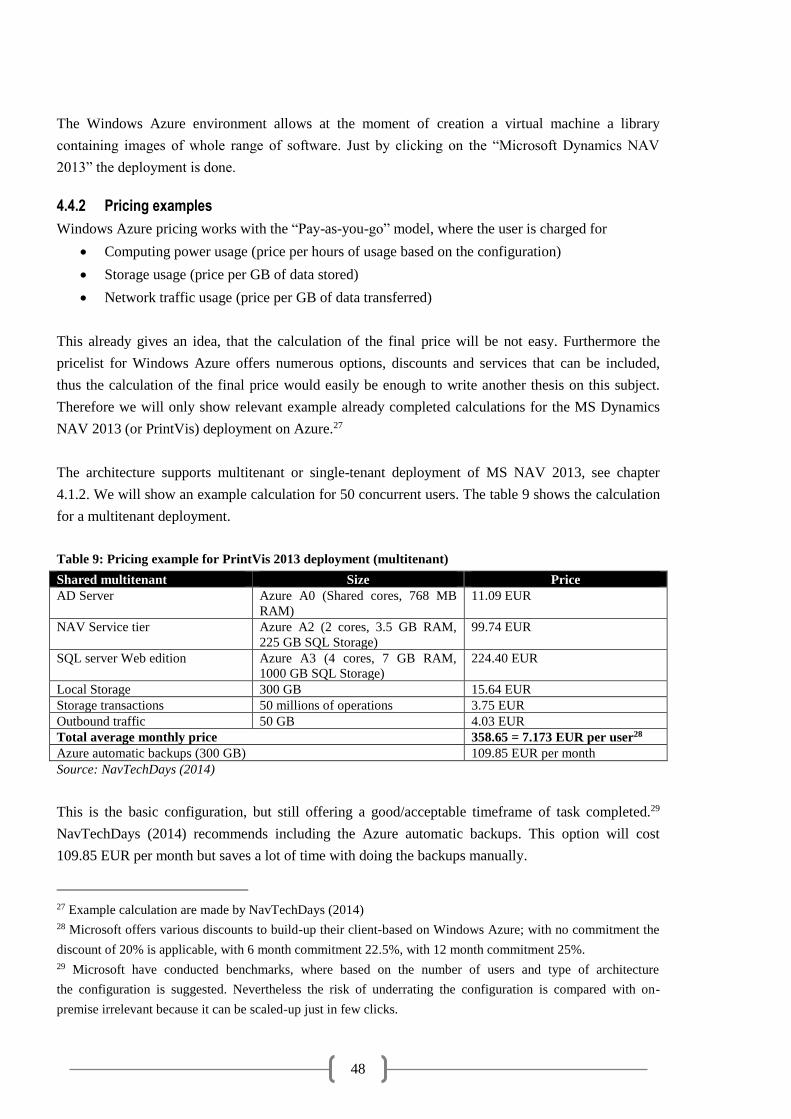
48
The Windows Azure environment allows at the moment of creation a virtual machine a library
containing images of whole range of software. Just by clicking on the “Microsoft Dynamics NAV
2013” the deployment is done.
4.4.2 Pricing examples
Windows Azure pricing works with the “Pay-as-you-go” model, where the user is charged for
• Computing power usage (price per hours of usage based on the configuration)
• Storage usage (price per GB of data stored)
• Network traffic usage (price per GB of data transferred)
This already gives an idea, that the calculation of the final price will be not easy. Furthermore the
pricelist for Windows Azure offers numerous options, discounts and services that can be included,
thus the calculation of the final price would easily be enough to write another thesis on this subject.
Therefore we will only show relevant example already completed calculations for the MS Dynamics
NAV 2013 (or PrintVis) deployment on Azure.27
The architecture supports multitenant or single-tenant deployment of MS NAV 2013, see chapter
4.1.2. We will show an example calculation for 50 concurrent users. The table 9 shows the calculation
for a multitenant deployment.
Table 9: Pricing example for PrintVis 2013 deployment (multitenant)
Shared multitenant Size Price
AD Server Azure A0 (Shared cores, 768 MB
RAM)
11.09 EUR
NAV Service tier Azure A2 (2 cores, 3.5 GB RAM,
225 GB SQL Storage)
99.74 EUR
SQL server Web edition Azure A3 (4 cores, 7 GB RAM,
1000 GB SQL Storage)
224.40 EUR
Local Storage 300 GB 15.64 EUR
Storage transactions 50 millions of operations 3.75 EUR
Outbound traffic 50 GB 4.03 EUR
Total average monthly price 358.65 = 7.173 EUR per user28
Azure automatic backups (300 GB) 109.85 EUR per month
Source: NavTechDays (2014)
This is the basic configuration, but still offering a good/acceptable timeframe of task completed.29
NavTechDays (2014) recommends including the Azure automatic backups. This option will cost
109.85 EUR per month but saves a lot of time with doing the backups manually.
27 Example calculation are made by NavTechDays (2014)
28 Microsoft offers various discounts to build-up their client-based on Windows Azure; with no commitment the
discount of 20% is applicable, with 6 month commitment 22.5%, with 12 month commitment 25%.
29 Microsoft have conducted benchmarks, where based on the number of users and type of architecture
the configuration is suggested. Nevertheless the risk of underrating the configuration is compared with on-
premise irrelevant because it can be scaled-up just in few clicks.

49
Now we will consider a single-tenant architecture for 8 clients (tenants) (each has own NAV tier), but
they are sharing one SQL server. Each client has the tier designed for 50 concurrent users. The table
10 shows the price calculation for this scenario.
Table 10: Pricing example for PrintVis 2013 deployment (single-tenant)
Shared 8-tenants Size Price
AD Server Azure A0 (Shared cores, 768 MB
RAM)
11.09 EUR
SQL server Web edition Azure A3 (4 cores, 7 GB RAM,
1000 GB SQL Storage)
224.40 EUR
Local Storage 300 GB 15.64 EUR
Storage transactions 50 millions of operations 3.75 EUR
Outbound traffic 50 GB 4.03 EUR
Monthly price for dedicated NAV tier (50 users) 258.91 / 50 = 5.178 EUR per user
Shared SQL Server Azure A2 (2 cores, 3.5 GB RAM,
225 GB SQL Storage)
99.74 / 8 = 12.468 EUR per client
Total average monthly price per client per user 17.65 EUR
Source: NavTechDays (2014)
As you can see from the table, the cost of this deployment has more than doubled. This is an example
of how multitenancy efficiency drives down the total costs. Nevertheless, in cases where multitenancy
cannot be applied (required customizations) or desired this approach can be used. We must also notice
that the calculation for “single-tenant” architecture would vary based on the number of clients sharing
the SQL server.
4.4.3 Comparison with on-premise
We can compare the above Windows Azure pricing with the hardware required for an on-premise
implementation for 50 concurrent users. Such implementation would require a server costing 27 308
EUR30 and yearly costs of 7 300 EUR31. The yearly costs for a multitenant Windows Azure
deployment will be 4 304 EUR and 10 590 EUR for a single-tenant Windows Azure deployment. The
figure 18 shows the comparison of the three above described deployment options.
30 Calculated as following: Server costs for an on-premise implementation for 25 concurrent users = 3 603 EUR
* 2 + Software costs = 10 051 * 2 = 20 102 EUR = 27 308 EUR. 31 Yearly operating costs are from the case study see chapter 7.2.3. Electricity costs are 1.5 the amount for a 25
concurrent and server administration costs are equal because we do not suppose more work for 50 users than
in case of 25 users.

50
Figure 18: Windows Azure costs (multi/single tenant) compared to on-premise
Source: author
The efficiency of multi-tenancy overcome the two other deployment options. This magnitude of
savings is compliance with the theory outlined in chapter 1.5.4. The single-tenant architecture reaches
a break-even point with on-premise in the eighth year. The model is simplified because does not incur
upgrade costs for on-premise hardware and the clients stations both for cloud and on-premise are left
out. Furthermore the software for on-premise includes additional applications which we did not
include for Windows Azure. NavTechDays (2014) claims, that all of their new clients since 2013 have
chosen the Windows Azure deployment (at the moment still single-tenant) instead of hosted or on-
premise.
0
20000
40000
60000
80000
100000
120000
140000
160000
180000
Year
0
Year
1
Year
2
Year
3
Year
4
Year
5
Year
6
Year
7
Year
8
Year
9
Year
10
Year
11
Year
12
Year
13
Year
14
Year
15
Co
st [
EUR
]
Years
On-premise
Windows Azure(multitenant)
Windows Azure (single-tenant)

51
5 MARKET ANALYSIS
In order to quantify the potential market for the PrintVis in cloud solution we will analyze the current
situation in the ERP market globally and locally. We will forecast future growth in the segment and
analyze new trends in the market. Furthermore we will conduct a simplified financial analysis of the
printing industry in Czech Republic.
5.1 Global ERP market
To better visualize current situation on the global ERP market we will be using the Boston Matrix
originally developed by Bruce D. Henderson for the Boston Consulting Group in 1970. The Boston
Matrix classifies a firm’s products according to their Relative market share and Market growth.
These products are then classified according the following key.
Figure 19: Boston matrix
Source: McDonald (2011, p. 173)
The somewhat picturesque labels to each of the four categories of products give some indication of the
prospects for product in each quadrant according the table 11. A company should invest the cash
surplus generated by Cash Cows to the Stars and some selected Question Marks.
Table 11: Products classifications
Classification Definition
Question
Marks
(Babies)
Products which have not yet achieved a dominant market position and thus a high cash flow,
or perhaps They once had such position but have slipped back. They will be a high user of
cash because they are in a growth market
Stars Products which are probably a newish and has achieved a high market share and which are
probably more or less self-financing in cash terms.
Cash cows
These products are leaders in markets where there is little additional growth, but a lot of
stability. These are excellent generators of cash and tend to use little because of the state of
the market
Doggies
These products often have little future and can be a cash drain on the company. While it is
possible that such products are necessary to support more successful products, they are
probably candidates for divestment.
Source: author based on McDonald (2011, p. 173-174)
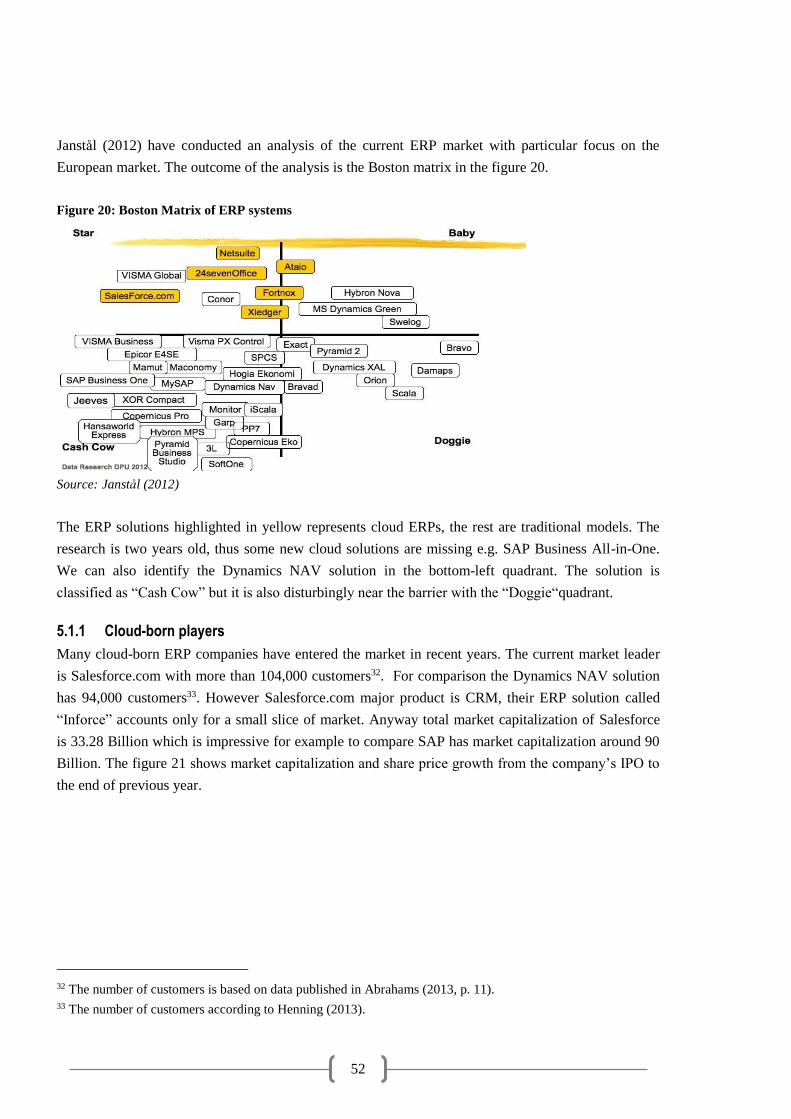
52
Janstål (2012) have conducted an analysis of the current ERP market with particular focus on the
European market. The outcome of the analysis is the Boston matrix in the figure 20.
Figure 20: Boston Matrix of ERP systems
Source: Janstål (2012)
The ERP solutions highlighted in yellow represents cloud ERPs, the rest are traditional models. The
research is two years old, thus some new cloud solutions are missing e.g. SAP Business All-in-One.
We can also identify the Dynamics NAV solution in the bottom-left quadrant. The solution is
classified as “Cash Cow” but it is also disturbingly near the barrier with the “Doggie“quadrant.
5.1.1 Cloud-born players
Many cloud-born ERP companies have entered the market in recent years. The current market leader
is Salesforce.com with more than 104,000 customers32. For comparison the Dynamics NAV solution
has 94,000 customers33. However Salesforce.com major product is CRM, their ERP solution called
“Inforce” accounts only for a small slice of market. Anyway total market capitalization of Salesforce
is 33.28 Billion which is impressive for example to compare SAP has market capitalization around 90
Billion. The figure 21 shows market capitalization and share price growth from the company’s IPO to
the end of previous year.
32 The number of customers is based on data published in Abrahams (2013, p. 11).
33 The number of customers according to Henning (2013).

53
Figure 21: Salesforce.com shares price
Source: finance.google.com
The second big player, much more relevant competitor, which specializes strictly on ERP solutions
running in cloud is NetSuite Inc. Company has around 7,200 customers mainly in the United States
but it is also penetrating the APAC and EMEA market the figure 22 shows market capitalization and
share price growth from the company’s IPO to the end of previous year. Furthermore, NetSuite is
positioning its ERP system against Microsoft Dynamics Solutions thus driving customers away from
Microsoft.34
Figure 22: NetSuite Inc. shares price
Source: finance.google.com
The shares have grown by 163.21% in the period from December 28, 2007 to Dec 31, 2013. Current
market capitalization is around 7.69 Billion. As you can see from figures of both companies, the
growth is astonishing, but Microsoft claims: “As impressive as the success of these players is, it is
really only the tip of the iceberg. There are also numerous new entrants in virtually every market
worldwide that operate largely ‘under the radar’ and are privately held“(Abrahams, 2013, p. 11).
34 Source: http://www.netsuite.com/portal/press/releases/nlpr04-09-13.shtml

54
5.1.2 ERP delivery models
Panorama Consulting Solutions conducts every year an independent research of the ERP global
markets. The survey examines more than 150 companies, which are currently running an ERP
implementation project or have implemented an ERP in the recent year. Last research also shows the
ratio of “Cloud”, “On-premise” and “Other” delivery models. There is a misconception where delivery
models are divided to “SaaS” and “Cloud” separately, for purpose of this thesis these two categories
has been merged. Cloud implementations include hosted implementations which are typical for fake
clouds. The confusion between various models goes even further in previous researches which makes
then impossible to do a y-o-y comparison. The figure 23 shows the market share of various delivery
models.
Figure 23: Service delivery models
Source: Panorama Consulting Solutions (2013, p. 9)
Unsurprisingly the on-premise model with 61% is dominant on the market, but Cloud and SaaS
delivery models accounted for an impressive 26%. The rest is left to “Other” and this category is not
further specified. This part probably accounts for hybrid implementations. The research (Panorama
Consulting Solutions, 2013, p.9) also pointed out that despite the growing market share; companies are
still reluctant to adopt this solution. The figure 24 shows the most common reason for doing so.
61%
26%
13%
On-Premise
Cloud, SaaS
Other
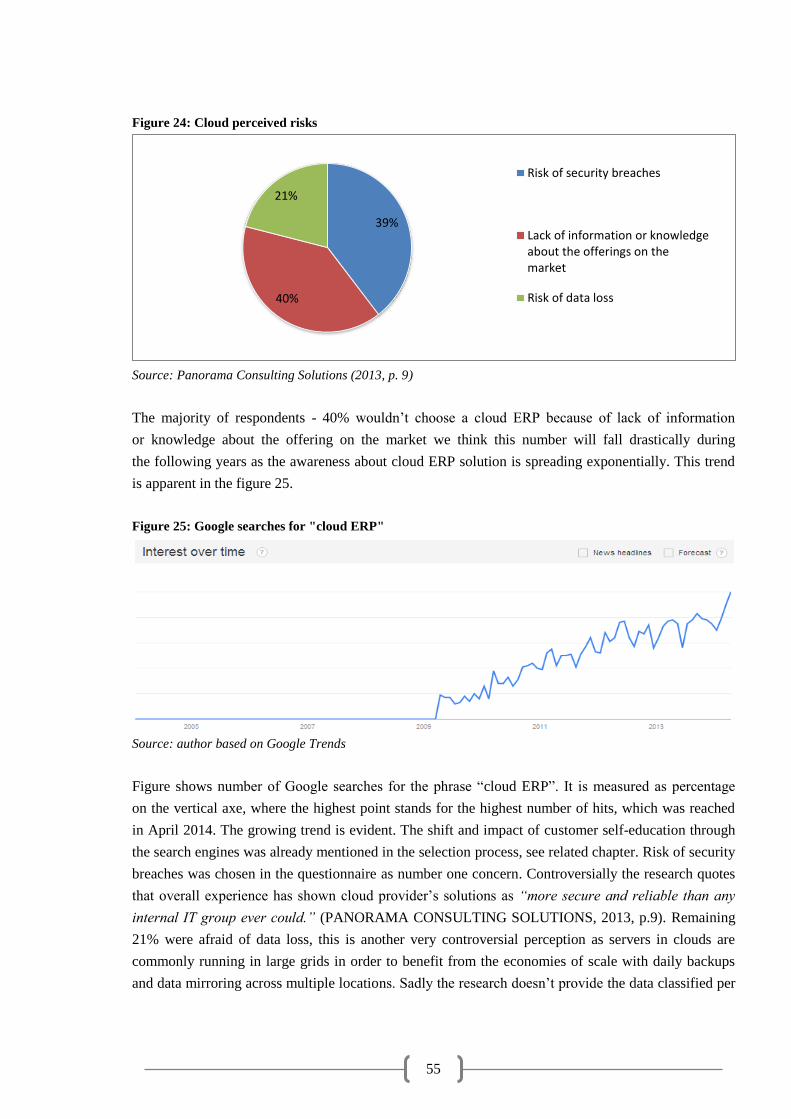
55
Figure 24: Cloud perceived risks
Source: Panorama Consulting Solutions (2013, p. 9)
The majority of respondents - 40% wouldn’t choose a cloud ERP because of lack of information
or knowledge about the offering on the market we think this number will fall drastically during
the following years as the awareness about cloud ERP solution is spreading exponentially. This trend
is apparent in the figure 25.
Figure 25: Google searches for "cloud ERP"
Source: author based on Google Trends
Figure shows number of Google searches for the phrase “cloud ERP”. It is measured as percentage
on the vertical axe, where the highest point stands for the highest number of hits, which was reached
in April 2014. The growing trend is evident. The shift and impact of customer self-education through
the search engines was already mentioned in the selection process, see related chapter. Risk of security
breaches was chosen in the questionnaire as number one concern. Controversially the research quotes
that overall experience has shown cloud provider’s solutions as “more secure and reliable than any
internal IT group ever could.” (PANORAMA CONSULTING SOLUTIONS, 2013, p.9). Remaining
21% were afraid of data loss, this is another very controversial perception as servers in clouds are
commonly running in large grids in order to benefit from the economies of scale with daily backups
and data mirroring across multiple locations. Sadly the research doesn’t provide the data classified per
39%
40%
21%
Risk of security breaches
Lack of information or knowledgeabout the offerings on themarket
Risk of data loss

56
company-size. However, the survey shows the structure of the sample of respondents by number of
users, which is shown in the figure 26.
Figure 26: Number of Named users
Source: Panorama Consulting Solutions (2013, p. 4)
The “Named user” stands for a user that access the ERP system under its own login name and
password. For the cloud solutions the most interesting is the 26% for the group 1-30 named users,
because the penetration within the small implementation is generally higher for cloud ERP solution.
With the increasing number of uses, the total amount paid in subscription fees starts to overcome the
up-front savings and the long-term TCO for cloud ERP rises significantly.
5.2 New trends in ERP
In order to distinguish viable technologies from the buzz a professional and objective view on the
market is needed. A world leading IT consultancy company Gartner conducts yearly a study of the IT
market and builds a curve called the “hype cycle”35. The hype cycle measures the maturity
and adoption rate of technologies and applications (Basl, 2011, p.28). Furthermore it measures how
these technologies are potentially relevant to solving real business problems and exploiting new
opportunities (Gartner, 2004). The Hype Cycle distinguishes following five stages:
Technology Trigger: A potential technology breakthrough kicks things off. Early proof-of-concept
stories and media interest trigger significant publicity. Often no usable products exist and commercial
viability is unproven.
Peak of Inflated Expectations: Early publicity produces a number of success stories—often
accompanied by scores of failures. Some companies take action; many do not.
35 Similar analysis conducts also G. Moore (2008), which uses the term „chasm“, instead of hype.
26%
22%
18%
7%
11%
16% 1-30
31-100
101-250
251-500
501-1000
1000+

57
Trough of Disillusionment: Interest wanes as experiments and implementations fail to deliver.
Producers of the technology shake out or fail. Investments continue only if the surviving providers
improve their products to the satisfaction of early adopters.
Slope of Enlightenment: More instances of how the technology can benefit the enterprise start
to crystallize and become more widely understood. Second- and third-generation products appear from
technology providers. More enterprises fund pilots; conservative companies remain cautious.
Plateau of Productivity: Mainstream adoption starts to take off. Criteria for assessing provider
viability are more clearly defined. The technology’s broad market applicability and relevance are
clearly paying off.
Gartner also forecasts “Years to Mainstream Adoption” which indicates how many years are needed
before the technology reaches the last stage – Plateau of Productivity. Figure 27 shows the Hype cycle
for ERP systems and related technology.
Figure 27: Hype cycle for ERP 2012
Source: Gartner (2012)
For our research are particularly relevant “Cloud ERP for Small or Midsize Businesses” which are
currently almost at the peak of inflated expectations with five to ten years to mainstream adoption.
Another relevant term is “Cloud ERP for Large Enterprises” with five to ten years to mainstream
adoption which has just started to climb along the curve.

58
According to Gartner the adoption rate for SME is still very slow with market penetration from 1 to 5
percent. The cloud is particularly popular for administrative ERP, but remains less prevalent
for manufacturing due to lack of cloud ERP solutions for this segment, complexity and security
concerns. Gartner also confirms that adoption of cloud ERP will remain ahead for SME rather than in
Large Enterprises (Gartner, 2012).
We must keep in mind that the research quoted above is two years old and the situation in the cloud
ERP market is now quite different as many ERP vendors have released their cloud solutions in the last
two years e.g. Dynamics NAV. More recent research from Gartner is restricted only for the paying
audience, but fragments from newer researches can be found in related articles where Gartner have
made the following previsions (Gartner, 2014), (Gartner. 2013):
• By 2018, at least 30 percent of service-centric companies will move the majority of their ERP
applications to the cloud.
• The use of cloud computing is growing, and by 2016 this growth will increase to become
the bulk of new IT spend. The 2016 will be a defining year for cloud as private cloud begins to
give way to hybrid cloud and nearly half of large enterprises will have hybrid cloud
deployments by the end of 2017.
• The concept of a single ERP suite that meets all of an enterprise's needs is dead, and has been
replaced by a hybrid ERP approach that combines cloud point solutions with a smaller "core"
of on-premises ERP function.
5.3 ERP market in South Africa
South Africa (SA) is one of the strategic markets for NAVERTICA. In order to analyze the SA ERP
market we will be using currently researches of the local IT market with a forecast for next 5 years
conducted by BMI (2013b) and AMR Research (2007).
According to AMR Research (2007), emerging markets such as Brazil, Russia, India, China and South
Africa (BRICS) will be the major area of growth for future ERP markets and the majority of the
companies would be SMEs.
Other research (Faasen et al., 2013, p. 42) outlines lack of control and vendor trust as a dominating
factor in the SA environment. Additionally BMI reports two major risks in the local market which are
lack of access to credit: “Lack of access to credit remains a significant barrier to IT investments by
smaller firms, as they are generally regarded by lenders as a greater risk” (Business Monitor
International, 2013b, p. 49). Furthermore continuing electricity hikes have a negative effect on the
market. In early 2013, The National Energy Regulator of South Africa (NERSA) granted power utility
Eskoman 8% average increase per annum over the next five years. This is in addition to the more than
170% increase seen over the past five years (Business Monitor International, 2013b, p. 43).

59
These two last risks specified can be partially overcome with cloud computing due to low upfront
investments, increased energy efficiency and elastic pricing.
5.3.1 Cloud computing
In South Africa cloud computing deployments are positioned to be the dominant delivery mechanism
for enterprise software, where on-site deployments have little legacy. We expect new cloud computing
offerings and increased competition in the SaaS market to fuel further demand from end-users to
utilize this technology. Another factor driving growth is the weakening economy, with organizations
adopting SaaS as they look for innovative ways to reduce costs, as well as for better and more
effective deployment of IT resource (Business Monitor International, 2013b, p. 39).
Although lack of reliable bandwidth, has proven being challenging in these markets. However the
broadband connection has improved greatly in the last years. Table 12 shows the Internet access
historical and forecast data for SA.
Table 12: Internet access - Historical Data and Forecasts South Africa
2010 2011 2012 2013e 2014f 2015f 2016f 2017f
No. of internet users (‘000) 6500 15500 21250 24491 26913 28137 28829 29262
No. of internet users/100 inhabitants 13.1 30.9 41.9 47.9 52.1 53.9 54.7 55.0
e/f = BMI estimate/forecast. Source: BMI (2013b)
A major leap can be seen from the table; penetration has jumped from 13.1 to 41.9 during the period
2010-2012 due to large investment into infrastructure including new submarine, growth of wireless
network as well as optical-fiber networks. The heated up market is forcing major local broadband
providers such as Telekom, Neotel, Vodacom and MTN to lower the prices. Cloud service providers
are seeing this and in order to meet the demand, many datacenters facilities are currently under
construction. BMI forecasts that at the end of 2017 the penetration will reach 55%
ERP remains the most popular enterprise software application with South African businesses, with a
growing number of them now using this tool. Vendors have reported excellent growth in SAP
implementations. SAP recently launched a referral program in South Africa aimed at SAP partners and
non-partners. The program pays about 5% of the value of a software license deal, after the deal is
closed. Municipal and local authorities are also starting to implement cloud services. In 2011, the IP
EXPO survey found that 46% of South African large businesses had already introduced some form of
cloud computing. This share was projected to be close to 60% by 2013 (Business Monitor
International, 2013b, p. 40-60).
According to a study conducted by Lamb (2011) research possibilities of Green IT to overcome
energy hikes and power outages. Green IT or ICT sustainability is a concept which include designing,
manufacturing, using, and disposing of computers, servers, and associated subsystems effectively with
minimal or no impact on the environment. The study suggests that clouds have great promise at data
centers not historically tightly governed and managed.

60
The concept was born after the economic crisis in 2008-2009 (Basl, 2011, p. 48). The ICT around the
globe consumes around 153 TWh which represents 1% of global energy consumption and the
consumption doubles every five years. Cloud computing lowers greatly ecological impact of the
hardware, since less hardware is required, the hardware last longer in professional datacenters and it is
used efficiently in terms of performance and energy consumption.
5.4 ERP Market in the Czech Republic
In order to analyze the local ERP market we will be using currently last available research of the IT
market in the Czech Republic with a forecast for next 5 years conducted by The Business Monitor
International (BMI). BMI is a leading, independent provider of proprietary data, analysis, ratings,
rankings and forecasts covering 195 countries and 24 industry sectors.
5.4.1 IT service spending
The research forecast flat real GDP growth in 2013, while private final consumption will decline
by 1%. Total spending on IT services in the period 2010-2017 is described in the table 13.
Table 13: Czech Republic IT services spending
2010 2011 2012 2013f 2014f 2015f 2016f 2017f
IT services spending [CZKmn] 29,033 30,349 31,096 32,201 33,755 35,888 38,187 40,441
f = BMI estimate/forecast. Source: BMI (2013b)
The medium-term outlook predicts faster growth as the economic environment improves, and forecast
CAGR36 of 5.86% 2013 to 2017m with the market increase to 40,441.
5.4.2 Current ERP market
According to the research the ERP market is a relatively mature in the whole CEE region, and demand
for enterprise software is saturated in some large business segments. Many larger organizations
already have an ERP system and these accounts are now more about upgrades for an installed based
and maintenances. This caused a slowdown in new clients’ acquisition and shifted vendor’s attention
to new areas. Demand is still strong with potential growth for areas like customer relationship
management (CRM) and business intelligence. The growth is also forecasted for the exporters
such as pharmaceutical and discrete manufacturing that need enterprise software in order to compete
on the global market.
The report confirms that the demand for ERP in the SME is rising. Many vendors are launching
slimmed-down versions of their software for smaller companies. The enterprise software market is
dominated by market leader SAP, followed by MS Dynamics and Helios. Together, these three players
have more than two-thirds of the market. The strongest growth for these major players now comes
from the SME segment. After 10 years of fairly strong investment by larger Czech manufacturing
36 Calculated as 𝐶𝐴𝐺𝑅 = (𝐸𝑛𝑑𝑖𝑛𝑔 𝑣𝑎𝑙𝑢𝑒
𝐵𝑒𝑔𝑖𝑛𝑖𝑛𝑔 𝑣𝑎𝑙𝑢𝑒)
(1
# 𝑜𝑓 𝑦𝑒𝑎𝑟𝑠)
− 1 = (40,441
32,201)
1
4− 1 = 0.0586

61
companies in ERP and other enterprise solutions, the market is approaching saturation in some
verticals (Business Monitor International, 2013a, p. 41).
5.4.3 EU cloud computing incentives
Local cloud computing market is growing fast and its popularity is spreading beyond the initial core
application area of CRM. According to the research spending on cloud services was estimated to grow
by around one-third in 2012.
In September 2012, the European Commission adopted a strategy for “Unleashing the Potential
of Cloud Computing in Europe”. The strategy outlines actions to deliver a net gain of 2.5 million new
European jobs, and an annual boost of €160 billion to the European Union GDP (around 1%),
by 2020. The strategy consists mainly in 3 key actions (European Commission, 2012a):
1. Standardization and certification of the cloud services in order to enhance trust,
2. Safe and Fair Contract Terms and Conditions, and
3. Promoting a common cloud services for public sector
Other support of this technology through grants is also anticipated. This could have huge impact
on the cloud ERP market, since nowadays many companies are using EU grants to finance ERP
implementations.
A survey conducted by Aspectio Research (2011) found out that almost 70% of SMEs in the Czech
Republic had never hear of cloud computing and only 25% knew the correct meaning of the term.
This implies the objectives for marketing ERP cloud solutions.
Table 14: Internet access - Historical Data and Forecasts Czech Republic
2010 2011 2012 2013e 2014f 2015f 2016f 2017f
No. of internet users (‘000) 7,225 7,743 7,995 8,158 8,350 8,535 8,711 8,879
No. of internet users/100 inhabitants 68.5 73.0 75.0 76.2 77.7 79.2 80.6 81.9
e/f = BMI estimate/forecast. Source: BMI (2013b), OECD, EC, ITU
When evaluating the potential market for the cloud computing technology, access to the broadband
internet connection must be taken into account. According to the research the number of internet users
will rise to 8.88mn by end-2017, with 81.9% penetration (Business Monitor International, 2013a, p.
20). This is certainly a positive outcome for technologies such as cloud computing which are delivered
through the internet
5.4.4 Printing industry
As a manufacturing sector, the printing industry processes and reproduces texts and images in print A
definition of the different operations in the sector can distinguish three phases; prepress - the
preparation of printing, press - the printing proper, and postpress - completion task (Printing Industry -
Czech Tradition in Whirl of New Technologies, 2011, p. 24). Short delivery time, accurate cost

62
calculation, product variety, material planning, and process sequence optimization – these are the key
factors to which printing industries are facing every day.
According to the classification CZ-NACE 18.137 printing industry includes processing the information
into tangible products such as newspapers, books, magazines, mercantile and packaging. This market
represents only 0.6% of the overall Czech manufacturing sector (MPO, 2012) and it’s under constant
pressure by the wide-spread of technologies such as in online newspaper, e-book readers etc.
Nevertheless the number of printed books is still growing, but with diminishing margins. The only
sector which remains unaffected is the packaging segment. Table 15 shows the number of printing
companies in the Czech Republic across the reporting period 2006-2012.
Table 15: Number of printing companies in the Czech Republic
2006 2007 2008 2009 2010 2011 2012
Number of printing companies 7 873 8 908 9 008 8 996 8 785 7 977 7 800
Source: MPO (2012)
The table shows that, the number of printing companies had hit its peak in 2008 and has been falling
since. According to MPO, the majority of printing industries are micro and small enterprises. The
figure 28 shows sector y-o-y change38 in productivity, sales and Added Value (VA)39, compared to the
whole manufacturing industry in the period 2006-2012.
Figure 28: Financial indicators for printing industry (Sales and Added Value)
Source: author based on MPO (2012)
37 The Statistical Classification of Economic Activities in the European Community
38 A method of evaluating two or more measured events to compare the results at one time period with those
from another time period (or series of time periods), on annualized basis i.e. ∆𝑦 =𝑣𝑎𝑙𝑢𝑒 𝑖𝑛 𝑦𝑒𝑎𝑟 𝑦
𝑣𝑎𝑙𝑢𝑒 𝑖𝑛 𝑦𝑒𝑎𝑟 𝑦−1∗ 100
39 Value added is calculated as 𝑉𝐴 = 𝑆𝑎𝑙𝑒𝑠 𝑝𝑟𝑖𝑐𝑒 − 𝑃𝑟𝑜𝑑𝑢𝑐𝑡𝑖𝑜𝑛 𝑐𝑜𝑠𝑡𝑠
80859095
100105110115120125
[%]
Sales
Sales CZ-NACE 18.1
Sales manufacturing industry
80859095
100105110115120125
[%]
Added Value
Added Value CZ-NACE 18.1
Added Value manufacturing industry

63
In the reporting period we can observe a significant drop in Sales and consequently Added Value
in the year 2009 when the financial crisis hit the Czech market. The recovery was significantly slower
for the printing industry than for the rest of the manufacturing industry. In the end of the period, we
can see a convergence of the printing and whole manufacturing industry. The following two charts
in figure 29 shows productivity measured as added value per employ and gross operating margin
measured as added value minus labor costs.
Figure 29: Financial indicators for printing industry (Productivity and Gross operating margin)
Source: author based on MPO (2012)
On the other hand the productivity, of the printing industry remains stable during the period with a
slight drop in last two years. This was caused mainly by a drop in number of employees, which have
fallen by 11.2% during the period. Gross operating margin have fluctuated significantly during the
period. We can observe a downgrade trend for the printing industry which is certainly not good.
Falling gross margin drives the need to cutting costs in general this means accurate estimation of every
product, this should be feasible with a good ERP/BI solutions. On the other hand the above stated
financial situation doesn’t allow companies in this sector to invest large amount of money in IT
solutions.
80859095
100105110115120125
[%]
Productivity
Productivity CZ-NACE 18.1
Productivity manufracturing industry
80859095
100105110115120125
[%]
Gross operating margin
Gross operating surplus CZ-NACE 18.1
Gross operating surplus manufracturingindustry

64
6 SWOT ANALYSIS
SWOT analysis is based on the analysis of the internal environment in the context of external
environment. SWOT analysis distinguishes Strengths, Weaknesses, Threats, and Opportunities
(Myšík, 2010, p. 10). In order to be able to understand the benefits and drawbacks of a cloud ERP
compared with traditional on-premise ERP a SWOT analysis for the customer and the vendor
perspective was conducted. The analysis was based on literature research and interviews with
consultants of the PrintVis solution but in a large extent is applicable on any cloud-based ERP.
6.1 Customer’s perspective
We start with the customer’s perspective. Outcomes from this perspective are useful for the vendor
in order to target main strengths and opportunities of the cloud solution and be prepared to argument
against the weaknesses and threats.
6.1.1 Strengths
S1: Lower upfront costs
Cloud computing substantially reduces the capital expenses incurred by an enterprise in order
to implement an ERP system (Marston et al., 2011, p.185). Customers pay for the solution based
on a “pay-as-you-go” or “pay-per-user” model. Customers perceive all the costs as OPEX instead
of CAPEX. This benefit is applicable for public and hybrid clouds but with a limited extent to private
clouds due to the character of the service, see chapter 1.3. This benefit is also diminished
for companies that have recently acquired new hardware for running their business applications thus
the age of the hardware must be taken into consideration.
S2: Lower and predictable operating costs
The OPEX is lower when applying the Total Cost of Ownership model because of cuts of personnel,
electricity costs, and other IT staff costs and efforts. The OPEX and also TCO are strictly linear
for the cloud ERPs. This benefit is applicable mainly for SMEs due to small IT departments which can
be outsourced to the cloud.
S3: Rapid implementation
As was mentioned in chapter 2.4, cloud ERP implementation is always faster, thus cheaper and takes
fewer risks.
S4: Scalability
Scalability is without doubt the biggest advantage of a cloud-based ERP. Resource poling and rapid
elasticity are outlined in the five main characteristic of cloud computing. This enables faster time
to market (Marston et al., 2011, p.178), strategic flexibility and improved competitiveness. Customers
pay only for the computing power he uses, and in case he needs more he doesn’t have to buy more
servers. As was mentioned in chapter 1.5.2 the amount of utilization of the computing power
for in-house servers is below 5% in 90% of their up-time. This feature is reported as a possible
advantage that is particularly relevant for SMEs (Fesak et al., 2012, p. 6).
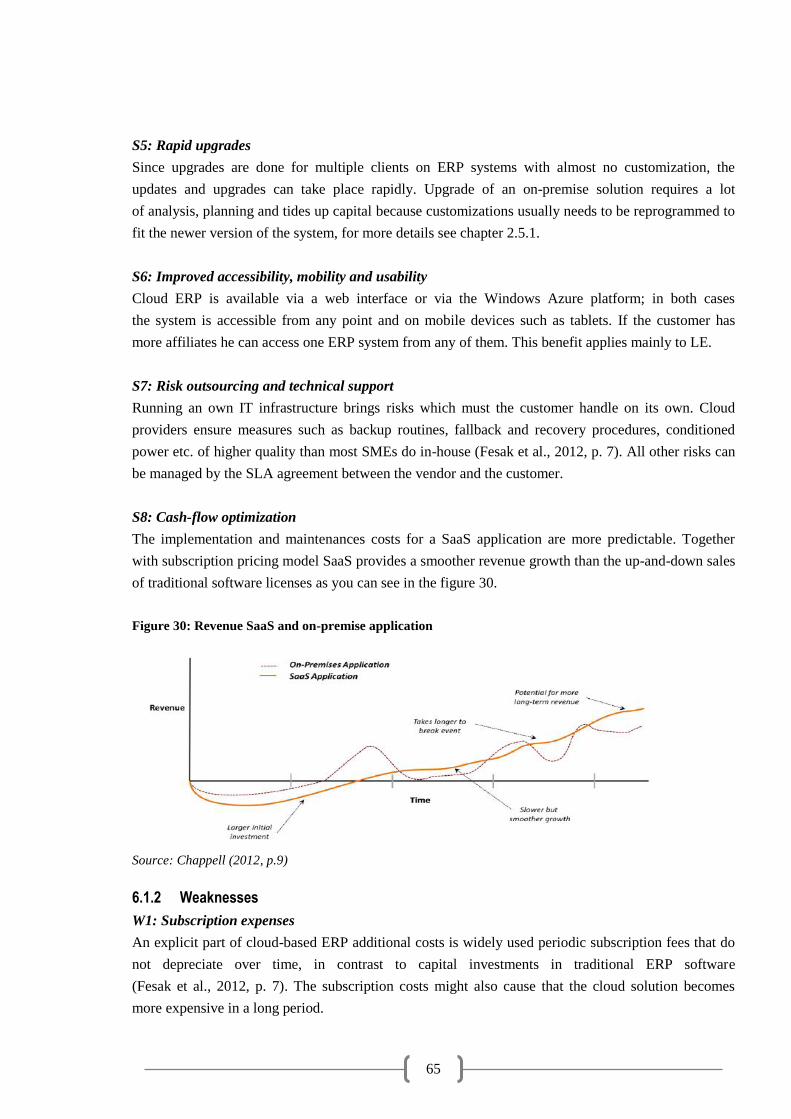
65
S5: Rapid upgrades
Since upgrades are done for multiple clients on ERP systems with almost no customization, the
updates and upgrades can take place rapidly. Upgrade of an on-premise solution requires a lot
of analysis, planning and tides up capital because customizations usually needs to be reprogrammed to
fit the newer version of the system, for more details see chapter 2.5.1.
S6: Improved accessibility, mobility and usability
Cloud ERP is available via a web interface or via the Windows Azure platform; in both cases
the system is accessible from any point and on mobile devices such as tablets. If the customer has
more affiliates he can access one ERP system from any of them. This benefit applies mainly to LE.
S7: Risk outsourcing and technical support
Running an own IT infrastructure brings risks which must the customer handle on its own. Cloud
providers ensure measures such as backup routines, fallback and recovery procedures, conditioned
power etc. of higher quality than most SMEs do in-house (Fesak et al., 2012, p. 7). All other risks can
be managed by the SLA agreement between the vendor and the customer.
S8: Cash-flow optimization
The implementation and maintenances costs for a SaaS application are more predictable. Together
with subscription pricing model SaaS provides a smoother revenue growth than the up-and-down sales
of traditional software licenses as you can see in the figure 30.
Figure 30: Revenue SaaS and on-premise application
Source: Chappell (2012, p.9)
6.1.2 Weaknesses
W1: Subscription expenses
An explicit part of cloud-based ERP additional costs is widely used periodic subscription fees that do
not depreciate over time, in contrast to capital investments in traditional ERP software
(Fesak et al., 2012, p. 7). The subscription costs might also cause that the cloud solution becomes
more expensive in a long period.

66
W2: Customization limitations
Customizations in a cloud ERP are almost impossible from the definition of cloud computing, see
chapter 1.1 and 3.2.3. The only possibility to bypass this limitation is when using private cloud.
W3: Dependency on the service provider.
Dependency on the provider of the service means that the customer is willing to outsource his critical
business application to a vendor. Increased dependency is furthermore enforced by the absence or
reducement of IT staff that is not need when running ERP in cloud.
W4: Obligation to upgrade
Customers are obligate to automatic upgrades even if they are fully satisfied with the current version
and doesn’t need or want an upgrade. For example they are used to the old interface of the ERP
system. Automatic upgrades are derived from the multitenant architecture, see chapter 2.5.2
6.1.3 Opportunities
O1: Independency on internal human resources and their fluctuation
Outsourcing the service makes the company independent on internal IT experts and their fluctuation.
O2: Access to last available technology with potential growth
Cloud computing ERP systems and other cloud business applications are among newborn solutions
which offer the latest technology and functionality. On-premise solutions are in many cases still build
on the core that has been developed more than 20 years ago with the rise of the ERP era. This is valid
for cloud solutions that were developed.
6.1.4 Threats
T1: Performance and outage risks
The performance of the ERP system is highly dependent on the bandwidth. The cloud ERP system is
always subjected to an outage risk. In other words cloud doesn’t mean fail-safe (Byrne, 2009, p. 40).
T2: Security risks
Security and confidentiality risks are among the most reported and top concerned risks for any
software running in the cloud. Many resources e.g. Marston et al. (2011, p.178) outlines this risk also
valid for the ERP in cloud solution. According to discussions with many consultants of the PrintVis
vertical solution (Hünner, 2014) and (Fesak et al., 2012, p. 8-10) this risk is very controversial.
A company that chooses not to use an in-house developed ERP system is in any cases handing its
sensitive data over to the ERP solution provider. The provider of the ERP solution has the access
to the client’s entire database as long as the contract is in force. This is both valid for the on-premise
and cloud model. On the other hand there is another perceptible risk for cloud solution. According
to Talbot (2010, p.38-40) whenever your data runs via the Internet, there is an increased threat that
someone could hack into your database and abuse of your sensitive data. Customer could also perceive
these risks as a psychological barrier, see related chapter. Despite the above mentioned we found this

67
risk negligible for the PrintVis cloud solution as Microsoft have strong architecture standards for the
cloud architecture that should minimize the risk of a potential invasion.
T3: Psychological barriers
One of the current biggest threats according to discussion with consultants is the customer attitude
to the ERP system. The first barrier perceived by customers is the concept of ownership. People are
taught that it’s good to own things. Moreover when customers invest money in such a fundamental
product for running their business they want to have it fully under their control.
So why rent when you can own? From a short term cash-flow perspective, the biggest advantage is
that renting ties up less capital. Business can invest their money saved on the ERP system elsewhere.
A printing company can for example invest into new machines in order to boost their production
output. Some small businesses can’t even afford to own a fancy ERP system. From a long term view
there are several factors to put into account, like the number of users and size of the company.
Security issues are another big psychological barrier. This was already mentioned above but not from
a psychological point of view. Customers are scared to have their entire business “online”. They are
scared that their data will be stolen by hackers and we think that in a certain way rightfully. We will be
witnesses of many hackers’ attacks on cloud-based applications in the early future as the technology
becomes more widespread and stealing valuable sensitive data will become an attractive goal.
However, big cloud providers such as Microsoft, IBM, Amazon, Salesforce, SAP etc. should have
their clouds encrypted and well-secured. Anyway hackers’ attacks on the less secured cloud solutions
will undermine the cloud credibility in general. In conclusion according to Symantec most sensitive
data frauds are committed by own employees who have access to company’s data.
Last but not least is the fear of change. People generally don’t like changes, change is uncomfortable.
This applies both for customers and vendors. The software has been sold for more than 60 years as a
product. You can either choose to shift and potentially grow with the cloud solution or to defend the
on-premise business against cloud solutions.
T4: Vendor bankruptcy risk
The customers are also scared because of possible vendor insolvency that may cause him to bankrupt,
thus they lose the access to their ERP system. Hünner (2014) have claimed that all PrintVis customers
running in cloud have raised this concern. However, in case of PrintVis in cloud the solution runs
on Windows Azure, thus on Microsoft’s datacenter. The Service-level agreement40 in this case assures
that a customer can obtain data directly from Microsoft, which is unlikely to go bankruptcy.
40 A service-level agreement (SLA) is a part of a service contract where a service is formally defined.
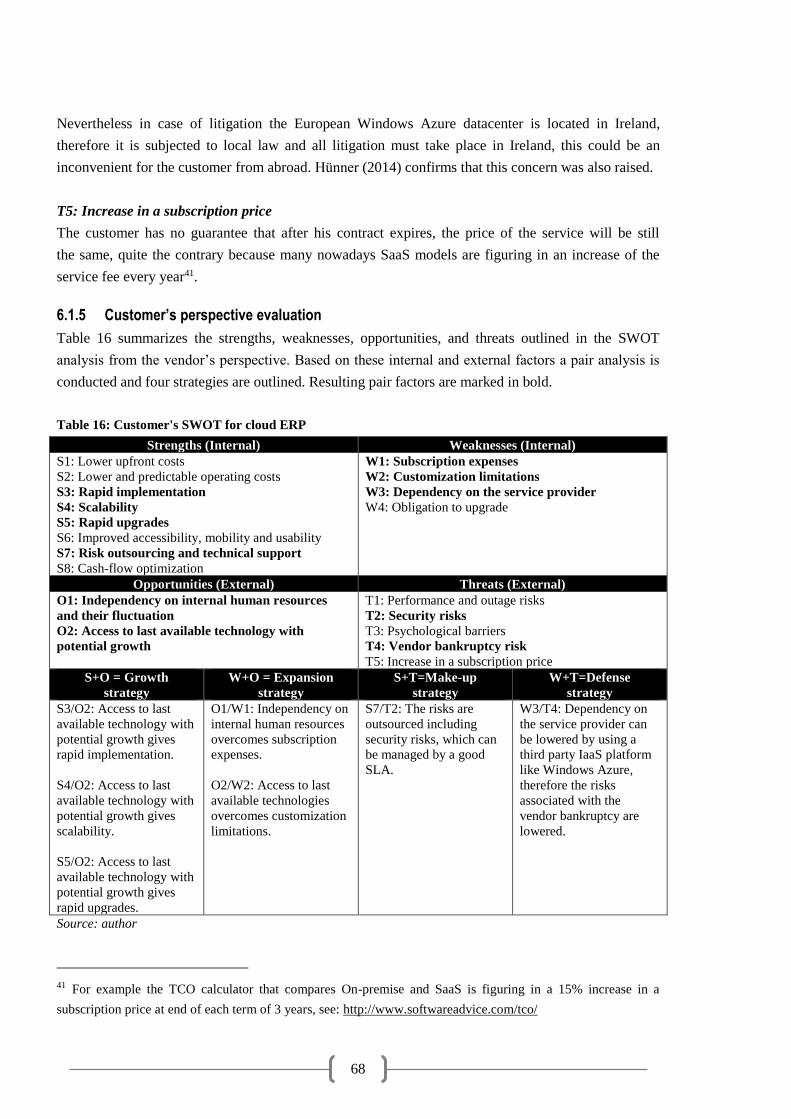
68
Nevertheless in case of litigation the European Windows Azure datacenter is located in Ireland,
therefore it is subjected to local law and all litigation must take place in Ireland, this could be an
inconvenient for the customer from abroad. Hünner (2014) confirms that this concern was also raised.
T5: Increase in a subscription price
The customer has no guarantee that after his contract expires, the price of the service will be still
the same, quite the contrary because many nowadays SaaS models are figuring in an increase of the
service fee every year41.
6.1.5 Customer’s perspective evaluation
Table 16 summarizes the strengths, weaknesses, opportunities, and threats outlined in the SWOT
analysis from the vendor’s perspective. Based on these internal and external factors a pair analysis is
conducted and four strategies are outlined. Resulting pair factors are marked in bold.
Table 16: Customer's SWOT for cloud ERP
Strengths (Internal) Weaknesses (Internal)
S1: Lower upfront costs
S2: Lower and predictable operating costs
S3: Rapid implementation
S4: Scalability
S5: Rapid upgrades
S6: Improved accessibility, mobility and usability
S7: Risk outsourcing and technical support
S8: Cash-flow optimization
W1: Subscription expenses
W2: Customization limitations
W3: Dependency on the service provider
W4: Obligation to upgrade
Opportunities (External) Threats (External)
O1: Independency on internal human resources
and their fluctuation
O2: Access to last available technology with
potential growth
T1: Performance and outage risks
T2: Security risks
T3: Psychological barriers
T4: Vendor bankruptcy risk
T5: Increase in a subscription price
S+O = Growth
strategy
W+O = Expansion
strategy
S+T=Make-up
strategy
W+T=Defense
strategy
S3/O2: Access to last
available technology with
potential growth gives
rapid implementation.
S4/O2: Access to last
available technology with
potential growth gives
scalability.
S5/O2: Access to last
available technology with
potential growth gives
rapid upgrades.
O1/W1: Independency on
internal human resources
overcomes subscription
expenses.
O2/W2: Access to last
available technologies
overcomes customization
limitations.
S7/T2: The risks are
outsourced including
security risks, which can
be managed by a good
SLA.
W3/T4: Dependency on
the service provider can
be lowered by using a
third party IaaS platform
like Windows Azure,
therefore the risks
associated with the
vendor bankruptcy are
lowered.
Source: author
41 For example the TCO calculator that compares On-premise and SaaS is figuring in a 15% increase in a
subscription price at end of each term of 3 years, see: http://www.softwareadvice.com/tco/

69
6.2 Vendor’s perspective
The SWOT analysis from the vendor’s perspective, offers factors to be taken into consideration when
making the strategic decision whether migrate the ERP system to the cloud, or choose a defensive
strategy to stay with on-premise.
6.2.1 Strengths
S1: Regular source of income
The subscription payment represents a regular source of income which has a positive impact on cash-
flow planning. The on-premise has usually a big income linked with the license purchase, investment
in architecture and implementation project, following income comes from maintenance which is not
even mandatory and depends on the type of contract. Usually the contracts are closed for a time period
of 1-3 years after which the customer can withdraw. Other support to the customer is highly gusty and
unforeseeable for the vendor.
S2: Economies of Scale
Cloud ERPs enables economies of scale due to multitenancy and takes effect mostly in the
maintenance process. That means the more cloud implementation a vendor does the cheaper is
maintenance per tenant, see chapter 2.5.2. These economies of scale do not occur for on-premise
solution because every client needs dedicated application management.
S3: Flexible solution
Vendor offers a highly scalable solution that can react to a changing demand due to economic cycles
and also satisfy a much larger audience.
S4: Rapid implementation
Rapid and repeatable implementations enable high volume selling. Vendor’s capacities are freed up
more quickly and the efficiency of implementations increases significantly.
S5: Pure consultancy
ERP in cloud means selling packaged know-how. This enables the true consultancy potential of the
ERP vendor, the consultancy services are linked with much higher profit margins than IT software
development.
6.2.2 Weaknesses
W1: Initial investment in the infrastructure
The vendor usually needs to build-up the infrastructure like the server with large bandwidth that will
be used for providing cloud services, or choose a hosting partner were the ERP system will be
deployed. In case of PrintVis in cloud the recommendation is to use Windows Azure platform that is
cloud-ready, doesn’t require any investment and partners can manage to obtain good deals from
Microsoft (Hünner, 2014).

70
W2: Need to adopt a new business model
The cloud ERP is a fundamental change in the way ERP systems are sold, implemented and
maintained; see chapter 2. The vendor has to make a prior investment in training and build-up practice
with the solution.
6.2.3 Opportunities
O1: Build better best-practices
More rapid implementations imply building better best-practices; see chapter 2.4.2.
O2: Low market saturation
The saturation among the cloud ERP market is currently very low. The cloud ERP market is still
growing in double digits numbers; with growth rate from 20-30% In comparison with the sluggish
growth rate of 2.2% of the worldwide ERP market (Columbus, 2013).
O3: Diversify portfolio of services
The vendor can diversify the portfolio of services adding the cloud ERP as a delivery model. This will
target new customers especially from the SME area.
O4: Lower costs of maintenance
Due to multitenancy the vendor can achieve lower overhead costs related to maintenance and upgrade
of the solutions as the cloud customer-base growths. See chapter 2.5.2.
O5: Target global customers
The cloud ERP allows targeting global customers since the service is delivered almost entirely online.
Despite the vendor might not be familiar with abroad accounting standards and legislature for the
finance management, he can still sell other modules of the ERP.
O6: Cloud computing gives knowledge
The application that runs in cloud can be monitored by the vendor in order to have a feedback from
customers about how the users operate system’s particular functionality. Consequently vendors can
understand how to make their solutions better for future users. Neither MS Dynamics NAV
nor PrintVis offers nowadays this kind of feedback algorithm, but this could be just a matter of time.
6.2.4 Threats
T1: Global competition
The market of cloud ERP is a global market, similarly as the vendor can target global customers,
the competition can do the same with his local market.
T2: Poor customer-base
If the vendor doesn’t succeed in selling the cloud-based ERP, the economies of scale associated with
cloud solutions won’t take place and the initial investment in re-designing the business model might
not return.
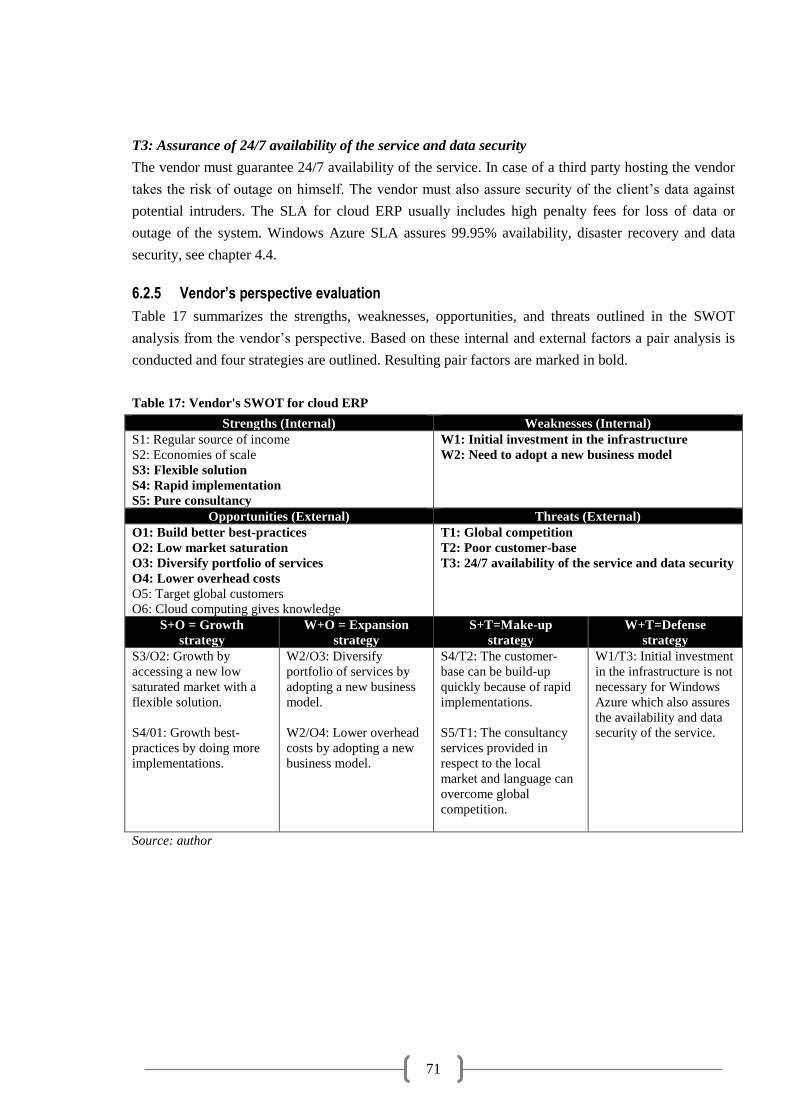
71
T3: Assurance of 24/7 availability of the service and data security
The vendor must guarantee 24/7 availability of the service. In case of a third party hosting the vendor
takes the risk of outage on himself. The vendor must also assure security of the client’s data against
potential intruders. The SLA for cloud ERP usually includes high penalty fees for loss of data or
outage of the system. Windows Azure SLA assures 99.95% availability, disaster recovery and data
security, see chapter 4.4.
6.2.5 Vendor’s perspective evaluation
Table 17 summarizes the strengths, weaknesses, opportunities, and threats outlined in the SWOT
analysis from the vendor’s perspective. Based on these internal and external factors a pair analysis is
conducted and four strategies are outlined. Resulting pair factors are marked in bold.
Table 17: Vendor's SWOT for cloud ERP
Strengths (Internal) Weaknesses (Internal)
S1: Regular source of income
S2: Economies of scale
S3: Flexible solution
S4: Rapid implementation
S5: Pure consultancy
W1: Initial investment in the infrastructure
W2: Need to adopt a new business model
Opportunities (External) Threats (External)
O1: Build better best-practices
O2: Low market saturation
O3: Diversify portfolio of services
O4: Lower overhead costs
O5: Target global customers
O6: Cloud computing gives knowledge
T1: Global competition
T2: Poor customer-base
T3: 24/7 availability of the service and data security
S+O = Growth
strategy
W+O = Expansion
strategy
S+T=Make-up
strategy
W+T=Defense
strategy
S3/O2: Growth by
accessing a new low
saturated market with a
flexible solution.
S4/01: Growth best-
practices by doing more
implementations.
W2/O3: Diversify
portfolio of services by
adopting a new business
model.
W2/O4: Lower overhead
costs by adopting a new
business model.
S4/T2: The customer-
base can be build-up
quickly because of rapid
implementations.
S5/T1: The consultancy
services provided in
respect to the local
market and language can
overcome global
competition.
W1/T3: Initial investment
in the infrastructure is not
necessary for Windows
Azure which also assures
the availability and data
security of the service.
Source: author
72
7 CASE STUDY
The case study was built on figures from a confidential service-level agreement (SLA) between the
vendor and the customer.

73
SUMMARY, CONCLUSIONS AND FUTURE RESEARCH
Purpose of this thesis was to define the ERP running in cloud and therefore sold as a service, compare
this solution with the traditional on-premise approach, analyze the current ERP market and quantify
possible benefits and drawbacks for both customers and vendors.
In the theory part the ERP running in cloud was defined. This has proved challenging since there is
almost none unifying literature on this subject. Various literatures consider separately Cloud
Computing and ERP. Therefore to define these concepts various recent articles were used. Key
concepts of the Cloud Computing and ERP and their relations were defined in chapter 1 and 2.
Particular contribution to the subject is the sub-chapter 1.5, where economics of cloud computing was
outlined. Chapter 2 also included the impact of cloud computing on the Sales, Selection,
Implementation, and Maintenance process of an ERP. This chapter was based on assumptions outlined
in a Microsoft cloud “guide” and assumptions were discussed with consultants. Another obstacle was
the inconsistency between various resources in key concepts and time, for example the interchanging
of terms SaaS and Cloud Computing is a common phenomenon in literature before 2011,
when the cloud computing was standardized.
The practical part begins with the chapter 3, where the partner model and companies involved
in this thesis are presented. In chapter 4 the new cloud enabled release of Dynamics NAV 2013 and
vertical solution for the printing industry PrintVis 2013 was introduced. The chapter contains the
description of cloud key characteristics defined in chapter 1 and the impact on sales and
implementation process described in chapter 2. Particular contribution is the sub-chapter 4.4, where
the Windows Azure platform was described. The last part of this chapter defines Windows Azure
platform as IaaS.
In chapter 5 the market analysis of cloud ERP was conducted, examining new market players, current
market trends using the Gartner’s hype cycle and a separate analysis of NAVERTICA’s strategic
markets for PrintVis was conducted. In the last part of this chapter a quick financial analysis
of the Czech printing industry was made. Chapter 6 was dedicated to a SWOT analysis of cloud ERP
from both customer’s and vendor’s perspective.
Last chapter was dedicated to a case study of an on-premise implementation of PrintVis from which
a two scenario model was derived. In the first scenario the implementation was conducted
as on-premise and in the second as cloud. These scenarios were compared in term of costs
and break-even point.
Goal of this thesis was to answer research questions and hypothesis outlined in the introduction.
The research question Q1: “What are the estimated costs and time of implementation of the cloud
solution in comparison with on-premise model?” can be answered together with the hypothesis H1.
74
The overall hypothesis H1: “PrintVis in cloud solution implementation project can reduce up to 30%
of implementation time and therefore customer’s ERP budget.” can be separated for evaluation
in two sub-hypothesis H1a, H1b.
H1a: “PrintVis in cloud solution implementation project can reduce up to 30% of implementation
time”.
H1b: “PrintVis in cloud solution implementation project can reduce up to 30% of customer’s budget”.
Despite the theory outlined in chapters 2.4 suggests significant time savings and rapid implementation.
Findings from our case study from the chapter 7.3 did not support this argument and therefore we have
to rejects the sub-hypothesis H1a. The cloud ERP lowers the time-budget because time-consuming
tasks like training are moved on the customer’s side. This “Do-It-Yourself” approach lowers
the project price, but at the same time increases the risks due to the possible backfiring of the self-
learning processes. The quality of self-learning materials is also in question and future PrintVis users
might not understand the solution properly.
The second sub-hypothesis H1b hypothesis is supported by the findings from our case study.
The overall up-front costs fall by 57.78%. This is a fundamental condition in order to achieve market
penetration in the unsaturated SME segment due to their limited resources.
In comprehensive evaluation, we must therefore reject the overall H2 hypothesis due to rejection
of the H2a. But we must notice that our study is limited to a single case implementation of the PrintVis
solution, which is only the second implementation of this solution of the NAVERTICA holding.
Evaluation of this hypothesis would require a multiple-case analysis from more experienced
NovaVision partners. Hünner (2014) claims that reduction outlined in the H2 hypothesis can be easily
achieved with more customers, due to multitenancy efficiency, falling overhead costs per customer
and knowledge accumulation. Despite we have outlined in chapter 2.4 and 1.5.2 the importance
of these three factors, their magnitude still remains undiscovered and cannot be measured on a single
case. Therefore the rejection of H1 based on a single case cannot be generalized to a large extent
and future research on more case studies within companies that have numerous implementations
of this solution is required.
In order to evaluate the hypothesis H2: “PrintVis in cloud for companies in the printing industry below
fifty employees represents a better solution than on-premise PrintVis in the horizon of ten years.
Metrics will be outlined in the thesis” we will consider besides hard metrics from the case study also
the outcomes from the SWOT analysis in chapter 6. The case study demonstrated that the TCO for a
decision period of ten years is lower for the cloud solution by 2.45% without discounting and 12.5%
using a discounted cash flow model. The cloud solution has numerous advantages - immediate
scalability, predictable costs, and easy upgrades without additional expenditures are particularly
relevant for SME. Adding these benefits to the metrics from the case study supports
the H2 hypothesis.

75
Q2: “Could the cloud solution of PrintVis ne the future for the printing industry? Main benchmarks
are estimated number and size of possible clients feasible for this solution.”
To answer this question we must look in the chapter 5 where we have analyzed the global ERP market
and chapter 6 where a SWOT analysis was conducted. The global demand shift towards cloud
computing ERP systems was acknowledged by multiple resources. Using the Gartner’s hype cycle we
have outlined that the first shift will occur within the period of 5 years and will take place firstly
in the SME sector where the saturation of ERP systems is generally low due to limited resources.
In the outlook from 5-10 years the shift will also take place within the LEs where the main reasons
for choosing the cloud ERP solution will be the global accessibility, and maintenance efficiency
of one data center compared with many in-house servers.
In order to estimate the number and size of the possible market for this solution respectfully
with NAVERTICA strategic markets we have conducted a separate marketing analysis for Czech
Republic and South Africa.
The ERP market in the Czech Republic is already saturated for the LEs and the new demand is coming
from the SME area. The investments into new IT technologies will be staidly rising by the rate
of 5.86% in the period 2013-2017. IT spending on cloud services is estimated to growth by 33% solely
in 2012. The Czech cloud ERP market could also potentially benefit from Europe-wide regulations
for data security and the incentive program “Unleashing the Potential of Cloud Computing
in Europe”. The global and European regulation will play a crucial role in the local cloud computing
market, since according to Turek (2014) the majority of customers are concerned about the data
security in cloud. This is rooted in biases about the Cloud Computing flourished by the poor
knowledge of this technology among local businesses. We have noticed that the data security
of a service, deployed on a reliable IaaS platform like Windows Azure, is actually higher
than any in-house deployment. Additionally, the cloud ERP was found as more convenient for smaller
projects42 within the unsaturated SME segment.
The ERP market in the South Africa, as in other emerging economies, remains unsaturated. The cloud
computing have suffered from an unreliable broadband connectivity. Nevertheless the broadband
connectivity improved by 30% solely in the period 2010-2012, which have stimulated the demand
for cloud computing ERP. The cloud computing is particularly important for the local market because
it enables green ICT, which addresses the local electricity price hikes due to limited energy resources.
The limitation of this thesis research is the absence of data for conducting a multiple-case analysis
with focus on the maintenance process. Despite the case study have outlined some cost benefits of the
cloud solution, these benefits are not of such magnitude as outlined in the theoretical part and would
not explain the major shift towards cloud ERP which is currently happening on global markets.
42 NovaVision defines smaller projects as a project under 120 mans-days.

76
PROPOSED MEASURES
Confidential content

77
REFERENCES AUSTIN R., COTTELEER, M., ESCALLE, C., (2003) Enterprise Resource Planning: Technology Note,
Harward Business School Publising, March, pp 1-8
BANKER, R.D., DATAR, S.M., ZWEIG, D., 1989. In: Software Complexity and Maintainability. International Conference on Information Systems, New York, pp. 247–255.
BASL, Josef. Inovace podnikových informačních systémů: podpora konkurenceschopnosti podniků. 1. vyd. Praha: Professional Publishing, 2011, 150 s. ISBN 9788074310454.
BASL, Josef. Podnikové informační systémy: podnik v informační společnosti. 2., výrazně přeprac. a rozš. vyd. Praha: Grada, 2008, 283 s. Management v informační společnosti. ISBN 978-80-247-2279-5.
CHAPIN, N., 2000. Software maintenance types––a fresh view. In:International Conference on Software Maintenance, San Jose, Carlifornia. IEEE Computer Society, Los Alamitos, CA, pp. 247–251
COX, Barney. Crimsonwing PrintVis. London: Haymarket Business Publications Ltd., 2009. Printweek.
HÖLLWARTH, Tobias. Cloud migration. Engl.-language ed., 2., rev. ed. Heidelberg: mitp, 2012. ISBN 9783826692246.
KELLY, Allan. Business patterns for software developers. Wiley, 2012. ISBN 11-199-9924-3.
LIAQUAT HOSSAIN, Jon David Patrick. Enterprise resource planning global opportunities and challenges. Hershey, PA: Idea Group Pub, 2002. ISBN 978-159-1400-257.
MCDONALD, Malcolm a Hugh WILSON. Marketing plans: how to prepare them, how to use them. 7th ed. Chichester, West Sussex, U.K.: Wiley, 2011, xvi, 573 p. ISBN 04-706-6997-7.
MYŠÍK, Jiří. Hodnocení efektů při zavedení nebo inovaci informačního systému
ORLICKY, Joseph. Material requirements planning: the new way of life in production and inventory management. New York: McGraw-Hill, 1975, xx, 292 p. ISBN 00-704-7708-6.
REGNELL, Björn, and WEERD, Inge. Software Business Second International Conference, ICSOB 2011, Brussels, Belgium, June 8-10, 2011. Proceedings. 1., st Edition. Berlin, Heidelberg, 2011. ISBN 978-364-2215-445.
ROYS, David and Vjekoslav BABIĆ. Implementing Microsoft Dynamics NAV 2009: explore the new features of Microsoft Dynamics NAV 2009, and implement the solution your business needs. Birmingham, U.K.: Packt Publishing Ltd., 2008, x, 527 p.
v podniku. Vyd. 1. Ostrava: Key Publishing, 2010. 55 s. ISBN 9788087255421
VYMĚTAL, Dominik. Podnikové informační systémy - ERP: the new way of life in production and inventory management. Vyd. 1. Karviná: Slezská univerzita v Opavě, 2010, 134 s. ISBN 978-807-2486-182.
ELECTRONIC ARTICLES
ABRAHAMS, Terrence, Bill TATTAN, Jeff EDWARDS and Dana WILLMER. Microsoft Dynamics Cloud Partner Profitability Guide [online]. 2013 [cit. 2014-02-20]. Available: https://partner.microsoft.com/download/global/40162698
AMR RESEARCH. ERP Providers Serving the Midmarket [online]. 2007 [cit. 2014-03-29]. Available:
http://www.oracle.com/corporate/analyst/reports/ent_apps/mm/erp-providers-serving-
midmarket.pdf
BRILL, Ron and GUSTAFSON, Jeff. Re-Imagining the Vendor-Customer Relationship: Sales-enablement via Asset Management [online]. 2013 [cit. 2014-02-02]. Available:http://www.slideshare.net/mjgusta2/reimagining-the-vendorcustomer-relationship-via-asset-management-23483526

78
BUONANNO, G., P. FAVERIO, F. PIGNI a A. RAVARINI. Factors affecting ERP system adoption: A comparative analysis between SMEs and large companies. Journal of enterprise information management [online]. 2005, vol. 18, issue 4 [cit. 2014-05-02].
BUSINESS MONITOR INTERNATIONAL Czech Republic information technology report Q1 2014 [online]. BMI, 2013a [cit. 2014-03-29]. ISSN 1750502X. Available: http://search.proquest.com/docview/1458679139?accountid=16531
BUSINESS MONITOR INTERNATIONAL South Africa information technology report Q1 2014 [online]. BMI, 2013b [cit. 2014-03-29]. ISSN 1750516X. Available: http://search.proquest.com/docview/1458679139?accountid=16531
BYRNE, Tony. Clouding Over. EContent [online]. 2009, vol. 32, issue 3, s. 37-37 [cit. 2014-04-01].
CELAR, Stipe, Zeljko SEREMET and Mili TURIC. CLOUD COMPUTING: DEFINITION, CHARACTERISTICS, SERVICES AND MODELS. Annals of DAAAM, Proceedings. [online]. 2011 [cit. 2014-02-02]. p. 1-2.
CELESTE, Pui, Guy G GABLE and Taizan CHAN. An ERP-client benefit-oriented maintenance taxonomy. The Journal of systems and software [online]. 2002, vol. 64, issue 2, s. 87-109 [cit. 2014-04-26].
CHAPIN, N. Software maintenance types-a fresh view. Proceedings International Conference on Software Maintenance ICSM-94 [online]. IEEE Comput. Soc. Press, 2000, s. 247-252 [cit. 2014-04-26]. DOI: 10.1109/ICSM.2000.883056. Available: http://ieeexplore.ieee.org/lpdocs/epic03/wrapper.htm?arnumber=883056
CHAPPELL, David. How SaaS changes an ISV's business [online]. 2012 [cit. 2014-02-20]. Available:http://www.davidchappell.com/writing/white_papers/How_SaaS_Changes_an_ISVs_Business--Chappell_v1.0.pdf
COLUMBUS, Louis. 2013 ERP Market Share Update: SAP Solidifies Market Leadership. Forbes [online]. 2013 [cit. 2014-04-04]. Available: http://www.forbes.com/sites/louiscolumbus/2013/05/12/2013-erp-market-share-update-sap-solidifies-market-leadership/
DOMERGUE, Doug. SaaS: Value based Selling [online]. 2009 [cit. 2014-02-02]. Available: http://www.prudentcloud.com/saas/saas-value-based-selling-03082009
EUROPEAN COMISSION. SBA Fact Sheet 2012 Czech Republic [online]. 2012b [cit. 2014-04-29]. Available: http://ec.europa.eu/enterprise/policies/sme/facts-figures-analysis/performance-review/files/countries-sheets/2012/czechrepublic_en.pdf
EUROPEAN COMISSION. Unleashing the Potential of Cloud Computing in Europe [online]. 2012a [cit. 2014-04-29]. Available: http://eur-lex.europa.eu/LexUriServ/LexUriServ.do?uri=COM:2012:0529:FIN:EN:PDF
FAASEN, Julian, Lisa F. SEYMOUR a Joachim SCHULER. SaaS ERP Adoption Intent: Explaining the
South African SME Perspective. [online]. s. 35 [cit. 2014-04-29]. DOI: 10.1007/978-3-642-36611-
6_3. Available: http://link.springer.com/10.1007/978-3-642-36611-6_3
FORREST, Will. Clearing the air on cloud computing [online]. 2009 [cit. 2013-10-20]. Available: http://www.isaca.org/Groups/Professional-English/cloud-computing/GroupDocuments/McKinsey_Cloud%20matters.pdf
HADDARA, M and O ZACH. ERP Systems in SMEs: A Literature Review. 2011 44th Hawaii International Conference on System Sciences [online]. IEEE, 2011, s. 1-10 [cit. 2014-03-26]. DOI: 10.1109/HICSS.2011.191. Available: http://ieeexplore.ieee.org/lpdocs/epic03/wrapper.htm?arnumber=5718924
HARMS, Rolf and YAMARTINO Michael. The Economics of the Cloud. [online]. 2010 [cit. 2013-10-09]. Available: http://www.microsoft.com/en-us/news/presskits/cloud/docs/the-economics-of-the-cloud.pdf
HU, Shuangzeng and Rod B. MCNAUGHTON. Online Distribution of Packaged Software. s. 98. DOI: 10.1007/978-3-642-21544-5_9. Available: http://link.springer.com/10.1007/978-3-642-21544-5_9
79
LAMB, J. Green IT and use of private cloud computing in South Africa. 2011 8th International Conference [online]. IEEE, 2011, s. 1-6 [cit. 2014-04-29]. DOI: 10.1109/CEWIT.2011.6135875. Available: http://ieeexplore.ieee.org/lpdocs/epic03/wrapper.htm?arnumber=6135875
LEYH, Christian and Lars CRENZE. ERP System Implementations vs. IT Projects: Comparison of Critical Success Factors. [online]. s. 223 [cit. 2014-04-26]. DOI: 10.1007/978-3-642-36611-6_20. Available: http://link.springer.com/10.1007/978-3-642-36611-6_20
LI, Yuan, Xiu Wu LIAO and Hong Zhen LEI. A knowledge management system for ERP implementation. Systems Research and Behavioral Science [online]. 2006, vol. 23, issue 2, s. 157-168 [cit. 2014-03-26]. DOI: 10.1002/sres.751. Available: http://doi.wiley.com/10.1002/sres.751
LUOMA, Eetu and NYBERG, Timo, Four scenarios for adoption of cloud computing in China. ECIS 2011 [cit. 2014-04-04]. Proceedings.Paper 123.Available: http://aisel.aisnet.org/ecis2011/123
MARSTON, Sean, Zhi LI, Subhajyoti BANDYOPADHYAY, Juheng ZHANG a Anand GHALSASI. Cloud computing — The business perspective. Decision Support Systems. 2011, vol. 51, issue 1, s. 176-189. DOI: 10.1016/j.dss.2010.12.006. Available: http://linkinghub.elsevier.com/retrieve/pii/S0167923610002393
NEGASH, Solomon and Paul GRAY. Business Intelligence. Handbook on Decision Support Systems 2 [online]. Berlin, Heidelberg: Springer Berlin Heidelberg, 2008, s. 175 [cit. 2014-04-25]. DOI: 10.1007/978-3-540-48716-6_9. Available: http://link.springer.com/10.1007/978-3-540-48716-6_9
OZA, Nilay. What cloud users (SaaS PROVIDERS) should know about diseconomies of
Printing Industry -- Czech Tradition in Whirl of New Technologies. Czech Business and Trade [online]. 2011, 1/2, s. 24-24 [cit. 2014-04-29]. Available: http://content.epnet.com/ContentServer.asp?T=P& P=AN& K=60685442& EbscoContent=dGJyMNLr40SeqLc4v%2BbwOLCmr0yeprNSsq64S7KWxWXS& ContentCustomer=dGJyMPGuskuvrrVQuePfgeyx%2BEu3q64A& D=bth
SALMERON, Jose L. and Cristina LOPEZ. Forecasting Risk Impact on ERP Maintenance with Augmented Fuzzy Cognitive Maps. IEEE Transactions on Software Engineering [online]. 2012, vol. 38, issue 2, s. 439-452 [cit. 2014-04-26]. DOI: 10.1109/TSE.2011.8. Available: http://ieeexplore.ieee.org/lpdocs/epic03/wrapper.htm?arnumber=5680917.
scale? [online]. University of Helsinki, 2012 [cit. 2014-02-02]. Available: http://www.cloudsw.org/under-review/1bcc547d-aa01-4558-9cea-247c4b1eca3a/file_initial_version
SCAVO, F., NEWTON, B. & LONGWELL, M. Choosing between cloud and hosted ERP, and why it matters. 2012. Computer Economics Report . Vol. 34 No. 8. Available: http://www.computereconomics.com/article.cfm?id=1727
TALBOT, David. Security in the Ether. Technology review [online]. 2010, vol. 113, issue 1 [cit. 2014-04-01].
The NIST Definition of Cloud Computing [online]. 2011 [cit. 2013-10-09]. Available: http://csrc.nist.gov/publications/nistpubs/800-145/SP800-145.pdf
XU X. From cloud computing to cloud manufacturing [online]. Robot Comput Integr Manuf (2011), doi:10.1016/j.rcim.2011.07.002
OTHER
ASPECTIO RESEARCH. Google: čeští podnikatelé nevědí, co je cloud [online]. 2011 [cit. 2014-04-
29]. Available: http://businessworld.cz/aktuality/google-cesti-podnikatele-nevedi-co-je-cloud-
8309
CODINI, Guido. Personal interview. Milan. 2013-17-07 FESAK, Alexander, Jiaqi DUAN, Parwiz FAKER a Tim STUART. BENEFITS AND DRAWBACKS OF
CLOUD-BASED VERSUS TRADITIONAL ERP SYSTEMS. Tilburg, 2012. Dissertation. Tilburg University.
GARTNER, IT Glossary 2013 [cit. 2014-03-27]. Available: http://www.gartner.com/it-glossary/var-
value-added-reseller/

80
GARTNER. Understanding Gartner's Hype Cycles [online]. 2011 [cit. 2014-04-20]. Available:
http://www.gartner.com/id=1748018
GARTNER. Gartner Says By 2016, the Impact of Cloud and Emergence of Postmodern ERP Will
Relegate Highly Customized ERP Systems to "Legacy" Status [online]. 2014 [cit. 2014-03-27].
Available: http://www.gartner.com/newsroom/id/2658415
GARTNER. Gartner Says Cloud Computing Will Become the Bulk of New IT Spend by 2016 [online].
2013 [cit. 2014-03-27]. Available: http://www.gartner.com/newsroom/id/2613015
GARTNER. Hype Cycle for ERP 2012 [online]. 2012 [cit. 2014-03-27]. Available:
z: http://www.avanade.com/Documents/Resources/hype-cycle-for-erp-2012.pdf
GARTNER. Hype Cycle Research Methodology [online]. 2004 [cit. 2014-04-20].
Available: http://www.gartner.com/technology/research/methodologies/hype-cycle.jsp
HERNANDEZ, Pedro. Microsoft Details Dynamics CRM, ERP Progress [online]. 2013 [cit. 2014-03-26]. Available: http://www.eweek.com/enterprise-apps/microsoft-details-dynamics-crm-erp-progess.html
HÜNNER, Jorg. Personal GoToMeeting interview. Brno. 2014-02-04 JACONSON, S., SHEPERD, J., D'AQUILA M. and CARTER, C. The Enterprise Resource Planning
Spending Report 2006-2011. [online] AMR Research, 2007 [cit. 2014-02-03]. Available: http:/www.amrresearch.com
JANSTÅL, Sören. ERP Boston Matrix [online]. 2012 [cit. 2014-03-27].
Available: http://www.dpu.se/boston_e.html
KRISHNAMURTI, Ramaswamy. Risks in implementing ERP for an SME [online]. 2014 [cit. 2014-04-20]. Available: http://www.linkedin.com/groups/Risks-in-implementing-ERP-SME-141170.S.5859139757606449155?view=&item=5859139757606449155&type=member&gid=141170&trk=eml-b2_anet_digest-null-5-null&ut=24ClSLTdkZi6c1
LUND, Henning. NAV is the biggest piece of the Dynamics cake [online]. 2013 [cit. 2014-03-27].
Available:http://www.partnerpowerinternational.com/blog/now-confirmed-nav-is-the-biggest-
piece-of-the-dynamics-cake/
Microsoft Dynamics NAV 2013 R2 available in the Windows Azure Portal under MSDN subscription [online]. 2014 [cit. 2014-02-04]. Available: http://blogs.msdn.com/b/nav/archive/2014/02/21/microsoft-dynamics-nav-2013-r2-available-in-the-windows-azure-portal-under-msdn-subscription.aspx
MICROSOFT. Microsoft Dynamics NAV 2013 R2 on Windows Azure. 2014 [cit. 2014-02-04]. Available: http://blogs.msdn.com/b/nav/archive/2014/02/21/microsoft-dynamics-nav-2013-r2-available-in-the-windows-azure-portal-under-msdn-subscription.aspx
MICROSOFT. Migrating to Multitenancy [online]. 2013b [cit. 2014-04-27].
Available: http://msdn.microsoft.com/en-us/library/dn271673(v=nav.71).aspx
MICROSOFT. Scaling the Microsoft Dynamics NAV Network Topology [online]. 2013a [cit. 2014-03-
27]. Available: http://msdn.microsoft.com/en-us/library/dn271671(v=nav.71).aspx
MICROSOFT. Using RapidStart Services for Microsoft Dynamics NAV and the Microsoft Dynamics
Sure Step Methodology [online]. 2012 [cit. 2014-04-27]. Available:
https://mbs.microsoft.com/downloads/partner/nav/usingrapidstartservicesmsdnavmsdsurestep
methodologywhitepaper.docx
MIKLÍK, Tomáš. Personal interview. Brno. 2014-02-04 MPO Analýza vývoje ekonomiky ČR za rok 2012 [online], 2012 [cit. 2014-02-04]. Available:
http://download.mpo.cz/get/48686/54874/601806/priloha001.pdf NAVTECHDAYS, NAVTechDays2013 Dynamics NAV on Azure How to get started Field Experiences
Microsoft 2014, Published: 2013-11-11 [cit. 2014-04-26]. Available: http://www.youtube.com/watch?v=IWZxlfdgcuk
NELSON, Zack. interview on CRN. [online] 2010 [cit. 2013-10-15]. Transcript available: http://www.crn.com.au/News/235363,netsuite-ceo-warns-resellers-of-fake-clouds.aspx
PANORAMA CONSULTING SOLUTIONS. 2011 ERP REPORT [online]. 2011 [cit. 2014-02-26]. Available: http://panorama-consulting.com/resource-center/2011-erp-report/

81
PANORAMA CONSULTING SOLUTIONS. 2012 ERP REPORT [online]. 2012 [cit. 2014-02-26]. Available: http://panorama-consulting.com/resource-center/2012-erp-report/
PANORAMA CONSULTING SOLUTIONS. 2013 ERP REPORT [online]. 2013 [cit. 2014-02-26]. Available: http://panorama-consulting.com/resource-center/2013-erp-report/
PANORAMA CONSULTING SOLUTIONS. 2014 ERP REPORT [online]. 2014 [cit. 2014-02-26]. Available: http://panorama-consulting.com/resource-center/2014-erp-report/
PANORAMA CONSULTING SOLUTIONS. Clash of the titans 2014 [online]. 2014 [cit. 2014-02-26]. Available: http://panorama-consulting.com/resource-center/clash-of-the-titans-2014-sap-vs-oracle-vs-microsoft-dynamics/
PrintVis [online]. NovaVision, © 1997-2014 [cit. 2014-04-27]. Available: http://printvis.com/?p=PrintVis
Road to Repeatability [online]. Published: 2013-09-13 [cit. 2014-04-26] http://onedrive.live.com/?cid=CAB24A070D0D03BE&id=CAB24A070D0D03BE%21128&v=3&authkey=%21ANy6NZLCvuT4AmQ
Statement of Direction: Product strategy and roadmap for Microsoft Dynamics NAV [online]. 2012 [cit. 2014-03-26]. Available:http://www.advania.is/library/Files/Hugb-og-Lausnir/Microsoft-NAV/Statement%20of%20Direction%20for%20NAV.pdf
The American Marketing Association [online]. 2013 [cit. 2014-03-26]. Available: https://www.ama.org/AboutAMA/Pages/Definition-of-Marketing.aspx
TOMSHØJ, Kit. My first RapidStart with NAV2013 and PrintVisCloud [online], 2013 [cit. 2014-02-04]. Available: http://cloud.printvis.com/my-first-rapidstart-with-nav2013-and-printviscloud/
VYMAZAL, František. Personal interview. Brno. 2014-03-04
82
LIFT OF PICTURES
Picture 1: Microsoft Dynamics NAV 2013 features .............................................................................. 35
Picture 2: MS Dynamics NAV product release timeline ....................................................................... 36
Picture 3: Job details with imposition .................................................................................................... 41
Picture 4: Windows Azure MS NAV 2013 deployment........................................................................ 47
LIST OF TABLES
Table 1: Respondents overview ............................................................................................................. 15
Table 2: Cloud opportunity .................................................................................................................... 20
Table 3: Activities in ERP maintenance ................................................................................................ 34
Table 4: License options ........................................................................................................................ 44
Table 5: PrintVis user types ................................................................................................................... 46
Table 6: Road to Repeatability .............................................................................................................. 47
Table 7: Implementation package .......................................................................................................... 49
Table 8: NAV on Windows Azure key values ...................................................................................... 50
Table 9: Pricing example for PrintVis 2013 deployment (multitenant) ................................................ 52
Table 10: Pricing example for PrintVis 2013 deployment (single-tenant) ............................................ 53
Table 11: Products classifications ......................................................................................................... 55
Table 12: Internet access - Historical Data and Forecasts South Africa................................................ 63
Table 13: Czech Republic IT services spending .................................................................................... 64
Table 14: Internet access - Historical Data and Forecasts Czech Republic ........................................... 65
Table 15: Number of printing companies in the Czech Republic .......................................................... 66
Table 16: Customer's SWOT for cloud ERP ......................................................................................... 68
Table 17: Vendor's SWOT for cloud ERP ............................................................................................. 71
Table 18: Model assumptions ................................................................................................................ 77
Table 19: Project tasks analysis ............................................................................................................. 78
Table 20: Server and client station costs ............................................................................................... 79
Table 21: Model company license pricing on-premise .......................................................................... 79
Table 22: Model company monthly subscription in cloud .................................................................... 81
Table 23: Comparing on-premise and cloud PrintVis TCO for 10 years .............................................. 82
Table 24: TCO Break-even point On-premise vs. Cloud ...................................................................... 83
Table 25: Net Present Value .................................................................................................................. 85

LIST OF FIGURES
Figure 1: Service delivery models.......................................................................................................... 17
Figure 2: Adoption curve of a client/server model ................................................................................ 19
Figure 3: Supply-side savings ................................................................................................................ 20
Figure 4: Economies of scale related to amount of customers ............................................................... 22
Figure 5: Total cost of ownership in the cloud ...................................................................................... 23
Figure 6: Production planning within MRP II ....................................................................................... 24
Figure 7: Information and the Commercial Negotiation ........................................................................ 27
Figure 8: The Fog of Business and Decision-making ............................................................................ 28
Figure 9: Buying cycle evolution ........................................................................................................... 29
Figure 10: Implementation project stages .............................................................................................. 30
Figure 11: Impact of knowledge accumulation on costs of the implementation .................................... 31
Figure 12: On-Premise vs. Cloud implementation ................................................................................. 33
Figure 13: Partner model ........................................................................................................................ 36
Figure 14: Average Time to Implementation (Planned vs. Actual) ....................................................... 41
Figure 15: Single Server Instance .......................................................................................................... 42
Figure 16: Multitenant architecture ........................................................................................................ 42
Figure 17: PrintVis user types ................................................................................................................ 46
Figure 18: Windows Azure costs (multi/single tenant) compared to on-premise .................................. 54
Figure 20: Boston matrix ....................................................................................................................... 55
Figure 20: Boston Matrix of ERP systems ............................................................................................. 56
Figure 21: Salesforce.com shares price .................................................................................................. 57
Figure 22: NetSuite Inc. shares price ..................................................................................................... 57
Figure 23: Service delivery models ........................................................................................................ 58
Figure 24: Cloud perceived risks ........................................................................................................... 59
Figure 25: Google searches for "cloud ERP" ......................................................................................... 59
Figure 26: Number of Named users ....................................................................................................... 60
Figure 27: Hype cycle for ERP 2012 ..................................................................................................... 61
Figure 28: Financial indicators for printing industry (Sales and Added Value) .................................... 66
Figure 29: Financial indicators for printing industry (Productivity and Gross operating margin) ........ 67
Figure 30: Revenue SaaS and on-premise application ........................................................................... 69
Figure 31: On-Premise vs. Cloud break-even point ............................................................................... 84
LIST OF ACRONYMS
APAC – Asia-Pacific
ASP – Application Service Provider
BANT – Budget, Authority (to purchase), Need and Timeframe
BI – Business Intelligence
BMI – Business Monitor International

BRICS – Acronym for Brazil, Russia, India, China and South Africa
BRL – Business Ready Licensing
CEE – Central and Eastern Europe
CRM – Customer relationship management
DC – Data Center
EMEA - Europe, the Middle East and Africa
ERP – Enterprise resource planning
EU – European Union
HW – Hardware
IaaS – Infrastructure as a Service
ICT – Information and Communication Technologies
IPO – Initial Public Offering
IS – Information System
ISV – Independent Software Vendor
JDF – Job Definition Format
KM – Knowledge Management
KPI – Key Performance Indicator
LE – Large Enterprise
MBP – Module Based Pricing
Mh – Man-hour
MIPS – Million Instructions Per Second
MPO – Ministry of Industry and Trade
MRP – Material Requirements Planning
MRP II – Manufacturing Resource Planning
MS – Microsoft
NAV – Microsoft Dynamics NAV
OPEX – Operating Expenses
PaaS – Platform as a Service
SA – South Africa
SaaS – Software as a Service
SCM – Supply Chain Management
SME – Small and Medium Enterprises
SLA – Service-level agreement
SW – Software
TCO – Total cost of Ownership
TWh – Terawatt hours
VAR – Value Added Reseller

LIST OF APENDICES
Appendix A – Financial Analysis of CZ-NACE 18.1
Appendix B – Accelerated Implementation Process Project Plan
Appendix C – Example Server Configuration (25 Concurrent users)
Appendix D – PrintVis implementation project plan
Appendix E – Online training for PrintVis 2013
Appendix F – Net Present Value
Appendix G – Example of interview with NovaVision

APPENDIX A: FINANCIAL ANALYSIS OF CZ-NACE 18.1
Sales
Year Sales CZ-NACE 18.1 [CZK]
ΔSales CZ-NACE 18.1[%]
Sales manufacturing industry [CZK]
ΔSales manufacturing industry [%]
2006 37 708 347 Kč 100.0 3 029 353 956 Kč 100.0
2007 40 084 885 Kč 106.3 3 317 853 476 Kč 109.5
2008 41 138 592 Kč 102.6 3 271 606 761 Kč 98.6
2009 37 396 263 Kč 90.9 2 738 224 010 Kč 83.7
2010 36 945 304 Kč 98.8 3 048 245 454 Kč 111.3
2011 35 098 632 Kč 95.0 3 299 037 641 Kč 108.2
2012 33 643 731 Kč 95.9 3 390 420 676 Kč 102.8
Added Value
Year Added Value CZ-NACE 18.1 [CZK]
ΔAdded Value CZ-NACE 18.1 [%]
Added Value manufacturing industry
[CZK]
ΔAdded Value manufacturing industry [%]
2006 12 065 174 Kč 100.0 754 989 335 Kč 100.0
2007 12 088 820 Kč 100.2 812 965 759 Kč 107.7
2008 12 738 675 Kč 105.4 775 017 614 Kč 95.3
2009 11 602 173 Kč 91.1 666 867 397 Kč 86.0
2010 11 425 443 Kč 98.5 729 358 869 Kč 109.4
2011 10 704 511 Kč 93.7 769 142 333 Kč 105.5
2012 10 341 114 Kč 96.6 777 552 413 Kč 101.1
Productivity
Year Productivity CZ-NACE 18.1 [CZK]
ΔProductivity CZ-NACE 18.1 [%]
Productivity manufacturing industry
[CZK]
ΔProductivity manufacturing industry [%]
2006 628 252 Kč 100.0 631 168 Kč 100.0
2007 633 131 Kč 100.8 663 720 Kč 105.2
2008 657 802 Kč 103.9 634 437 Kč 95.6
2009 674 231 Kč 102.5 625 465 Kč 98.6
2010 687 232 Kč 101.9 700 978 Kč 112.1
2011 662 981 Kč 96.5 722 542 Kč 103.1
2012 644 283 Kč 97.2 731 756 Kč 101.3
Gross operating surplus
Year Gross operating surplus CZ-NACE
18.1 [CZK]
ΔGross operating surplus CZ-NACE
18.1 [%]
Gross operating surplus manufacturing industry
[CZK]
ΔGross operating surplus manufacturing industry [%]
2006 6 051 210 Kč 100.0 381 118 503 Kč 100.0
2007 5 509 233 Kč 91.0 401 276 260 Kč 105.3
2008 5 802 704 Kč 105.3 332 480 419 Kč 82.9
2009 5 322 214 Kč 91.7 271 856 599 Kč 81.8
2010 5 237 893 Kč 98.4 328 007 762 Kč 120.7
2011 4 530 982 Kč 86.5 346 429 189 Kč 105.6
2012 4 212 548 Kč 93.0 341 372 865 Kč 98.5

APPENDIX B: ACCELERATED IMPLEMENTATION PROCESS PROJECT PLAN
Confidential content

APPENDIX C: EXAMPLE SERVER CONFIGURATION (25 CONCURRENT USERS)
Confidential content

APPENDIX D: PRINTVIS IMPLEMENTATION PROJECT PLAN
Confidential content

APPENDIX E: ONLINE TRAININGS FOR PRINTVIS 2013
The structure of the training session is as following.
• Workflow training (3 sessions)
o Training Session W1: Case Flow, Views and Adaptations
o Training Session W2: Case Documents and Folders
o Training Session W3: Job Costing
• Estimation training (8 sessions)
o Training Session E1: Estimation, Tool Box Overview
o Training Session E2: Making Quotes with PrintVis
o Training Session E3: Estimation, Deep Dive
o Training Session E4: Sub-Contracting and Job Ticket Description
o Training Session E5: Estimation Wizard Setup
o Training Session E6: Sales Orders and Finished Goods Templates
o Training Session E7: Customer Finished Goods
o Training Session E8: Price Concepts and Price Lists for Customers
• Scheduling training (3 sessions)
o Training Session S1: Scheduling and Planning Setup
o Training Session S2: Getting Started on Production Plan Scheduler
o Training Session S3: EQ Plan Gantt Board Setup
• Finance training (8 sessions)
o F1: Basic Finance Setup
o F2: Sales and Purchase Invoicing
o F3: Old orders, Customers and Vendors
o F4: Posting Journals, Application and Reminders
o F5: Budgeting, Month-End and Year-End Closing
o F6: Stock Count and Inventory Value
o F7: Import of Own General Ledger
o F8: Items, Item types and Item setup

APPENDIX F: NET PRESENT VALUE
On-premise Cloud Cost benefit of
cloud Year PVi NPVi PVi NPVi
0. -167 176 EUR -167 176 EUR -70 589 EUR -70 589 EUR 57.78%
1. -14 899 EUR -182 074 EUR -26 271 EUR -96 860 EUR 46.80%
2. -13 795 EUR -195 869 EUR -24 325 EUR -121 184 EUR 38.13%
3. -20 027 EUR -215 897 EUR -22 523 EUR -143 707 EUR 33.44%
4. -11 827 EUR -227 724 EUR -20 855 EUR -164 562 EUR 27.74%
5. -16 835 EUR -244 559 EUR -21 639 EUR -186 201 EUR 23.86%
6. -15 898 EUR -260 457 EUR -17 879 EUR -204 080 EUR 21.65%
7. -9 389 EUR -269 846 EUR -16 555 EUR -220 635 EUR 18.24%
8. -8 693 EUR -278 539 EUR -15 329 EUR -235 964 EUR 15.29%
9. -12 621 EUR -291 160 EUR -14 193 EUR -250 157 EUR 14.08%
10. -9 455 EUR -300 615 EUR -13 934 EUR -264 091 EUR 12.15%
11.
year
-6 901 EUR -307 516 EUR -12 168 EUR -276 260 EUR 10,16%
12.
year
-10 019 EUR -317 535 EUR -11 267 EUR -287 527 EUR 9,45%
13.
year
-5 916 EUR -323 451 EUR -10 432 EUR -297 959 EUR 7,88%
14.
year
-5 478 EUR -328 929 EUR -9 660 EUR -307 619 EUR 6,48%
15.
year
-8 635 EUR -337 564 EUR -9 214 EUR -316 833 EUR 6,14%
16.
year
-4 697 EUR -342 260 EUR -8 282 EUR -325 114 EUR 5,01%
17.
year
-4 349 EUR -346 609 EUR -7 668 EUR -332 783 EUR 3,99%
18.
year
-6 313 EUR -352 923 EUR -7 100 EUR -339 883 EUR 3,69%
19.
year
-3 728 EUR -356 651 EUR -6 574 EUR -346 457 EUR 2,86%
20.
year
-3 684 EUR -360 335 EUR -6 179 EUR -352 636 EUR 2,14%
21.
year
-5 012 EUR -365 347 EUR -5 636 EUR -358 272 EUR 1,94%
22.
year
-2 960 EUR -368 307 EUR -5 219 EUR -363 491 EUR 1,31%
23.
year
-2 740 EUR -371 047 EUR -4 832 EUR -368 323 EUR 0,73%
24.
year
-3 979 EUR -375 026 EUR -4 474 EUR -372 798 EUR 0,59%
25.
year
-2 428 EUR -377 454 EUR -4 174 EUR -376 972 EUR 0,13%
26.
year
-2 175 EUR -379 629 EUR -3 836 EUR -380 808 EUR -0,31%
APPENDIX G: EXAMPLE OF AN INTERVIEW WITH NOVAVISION

1. How many new customers on the cloud solution have you added? Compare it with number of
sold on-premise licenses in the same period.
2. What partners are implementing cloud solution of PrintVis?
3. Why is the implementation period for PrintVis cheaper/shorter in cloud?
a. HW setting up
b. Multitenant architecture?
c. Can you/some partner give me an example project plan (GANTT) for a Cloud
project?
4. How many of the prospects undertaking the demo then buys the cloud solution (Cloud
solutions should show better its real value, so the acceptance rate is supposed to be higher)?
5. What is the customer knowledge about cloud solutions, do they ask for this solution?
6. Is the margin on current cloud projects for cloud solutions higher, if not do you forecast a
growth in the early future (I presume cloud PrintVis still represents a change of business
which require additional resources to invest in learning and understanding the solution –
management of change)?
7. Can you tell, what are the major differences in the sales process for PrintVis in cloud?
a. Accelerated sales process (Road to Repeatability)?
b. Online selling via web page?
i. I know that you track traffic on your website any positive trends discovered?
ii. What is the success rate of selling PrintVis online?
Related Documents