Visual Learning Company 1-800-453-8481 25 Union Street www.visuallearningco.com Brandon, Vermont Editors: Brian A. Jerome, Ph.D. Stephanie Zak Jerome Assistant Editor: Louise Marrier Graphics: Dean Ladago Fred Thodal Your Science Fair Project Teacher’s Guide Middle School

Welcome message from author
This document is posted to help you gain knowledge. Please leave a comment to let me know what you think about it! Share it to your friends and learn new things together.
Transcript
Visual Learning Company 1-800-453-848125 Union Streetwww.visuallearningco.com Brandon, Vermont
Editors:Brian A. Jerome, Ph.D.Stephanie Zak Jerome
Assistant Editor:Louise Marrier
Graphics:Dean Ladago
Fred Thodal
Your Science Fair Project
Teacher’s GuideMiddle School
2Visual Learning Company 1-800-453-8481 www.visuallearningco.com
Your Science Fair ProjectYour Science Fair Project
3
Use and Copyright
The purchase of this video program entitles the user the right to reproduce or duplicate, in whole or in part, this teacher’s guide and the blackline master handouts for the purpose of teaching in conjunction with this video, Your Science Fair Project. The right is restricted only for use with this video program. Any reproduction or duplication, in whole or in part, of this guide and student masters for any purpose other than for use with this video program is prohibited.
The video and this teacher’s guide are the exclusive property of the copyright holder. Copying, transmitting or reproducing in any form, or by any means, without prior written permission from the copyright holder is prohibited (Title 17, U.S. Code Sections 501 and 506).
Copyright © 2005
ISBN 1-59234-109-8
2 3
Your Science Fair Project
Visual Learning Company1-800-453-8481www.visuallearningco.com
Table of ContentsPage
A Message From Our Company
National Standards Correlations
Student Learning Objectives
Assessment
Introducing the Video
Video Viewing Suggestions
Video Script
Student Assessments and Activities
Answers to Student Assessments
Answers to Student Activities
Assessment and Student Activity Masters
5
6
7
8
9
9
10
16
17
18
19
4Visual Learning Company 1-800-453-8481 www.visuallearningco.com
Your Science Fair ProjectYour Science Fair Project
5
Viewing Clearances
The video and accompanying teacher’s guide are for instructional use only. In showing these programs, no admission charges are to be incurred. The programs are to be utilized in face-to-face classroom instructional settings, library settings, or similar instructional settings.
Duplication rights are available, but must be negotiated with theVisual Learning Company.
Television, cable or satellite rights are also available, but must be negotiated with the Visual Learning Company.
Closed circuit rights are available, and are defi ned as the use of the program beyond a single classroom but within a single campus. Institutions wishing to utilize the program in multiple campuses must purchase the multiple campus version of the program, available at a slightly higher fee.
Discounts may be granted to institutions interested in purchasing programs in large quantities. These discounts may be negotiated with the Visual Learning Company.
4 5
Your Science Fair Project
Visual Learning Company1-800-453-8481www.visuallearningco.com
A Message from our Company. . .Dear Educator:
Thank you for your interest in the educational videos produced by the Visual Learning Company. We are a Vermont-based, family owned and operated business specializing in the production of quality educational science videos and materials.
We have a long family tradition of education. Our grandmothers graduated from normal school in the 1920’s to become teachers. Brian’s mother was an elementary teacher and guidance counselor, and his father was a high school teacher and superintendent. This family tradition inspired Brian to become a science teacher, and to earn a Ph.D. in education, and led Stephanie to work on science educational programs at NASA.
In developing this video, accompanying teacher’s guide, and student activities, our goal is to provide educators with the highest quality materials, thus enabling students to be successful. In this era of more demanding standards and assessment requirements, supplementary materials need to be curricular and standards based - this is what we do!
Our videos and accompanying materials focus on the key concepts and vocabulary required by national and state standards and goals. It is our mission to help students meet these goals and standards, while experiencing the joy and thrill of science.
Sincerely,
Brian and Stephanie Jerome
6Visual Learning Company 1-800-453-8481 www.visuallearningco.com
Your Science Fair ProjectYour Science Fair Project
7
National Standards CorrelationsNational Science Education Standards (Content standards: 5-8, National Academy of Sciences, c. 1996)
Benchmarks for Science Literacy (Project 2061 – AAAS, c. 1993)
Science as Inquiry (Content Standard A) - Abilities necessary to do scientifi c inquiry.
• Identify questions that can be answered through scientifi c inquiry.
• Design and conduct a scientifi c investigation.
• Use appropriate tools and techniques to gather, analyze, and interpret data.
• Develop descriptions, explanations, predictions, and models using evidence.
• Recognize and analyze alternative explanations and predictions.
• Communicate scientifi c procedures and explanations.
• Know why it is important in science to keep honest, clear, and accurate records.
• Know that hypotheses are valuable, even if they turn out not to be true, if they lead to fruitful investigations.
Habits of Mind - Values and Attitudes (12A)
By the end of the 8th grade, students should be able to:
6 7
Your Science Fair Project
Visual Learning Company1-800-453-8481www.visuallearningco.com
Student Learning ObjectivesUpon viewing the video and completing the enclosed student activities, students will be able to do the following:
• Explain that the scientifi c method is a systematic approach to solving problems.
• State and describe each of the steps in the scientifi c method including: Statement of question or problem Gather information State hypothesis Test hypothesis Collect data State the conclusion
• Design a science fair project based on the scientifi c method.
• Choose a science fair project topic based on their individual interest.
• Safely plan and execute a science project with appropriate safety equipment.
• Explain the characteristics of a well thought out and carefully planned science fair project.
• Communicate the results of a science project.
• Create the fi nal product of a science fair project illustrating the steps in the scientifi c method including statement of problem, hypothesis, experiment, data, conclusion, and any other important information.
8Visual Learning Company 1-800-453-8481 www.visuallearningco.com
Your Science Fair ProjectYour Science Fair Project
9
Assessment
Preliminary Assessment:The Preliminary Assessment, provided in the Student Masters section, is an assessment tool designed to gain an understanding of students’ pre-existing knowledge. It can also be used as a benchmark upon which to assess student progress based on the objectives stated on the previous pages.
Video Review:The Video Review, provided in the Student Masters section, can be used as an assessment tool or as a student activity. There are two main parts. The fi rst part contains questions that can be answered during the video. The second series of ten questions consists of a video quiz to be answered at the conclusion of the video.
Post Assessment:The Post Assessment, provided in the Student Masters section, can be utilized as an assessment tool following completion of the video and student activities. The results of the Post Assessment can be compared against the results of the Preliminary Assessment to evaluate student progress.
8 9
Your Science Fair Project
Visual Learning Company1-800-453-8481www.visuallearningco.com
Introducing the Video
Video Viewing SuggestionsThe student Master “Video Review” is provided for distribution to students. You may choose to have your students complete this Master while viewing the program or to do so upon its conclusion.
The program is approximately twenty minutes in length and includes a ten question video quiz. Answers are not provided to the Video Quiz on the video, but are included in this teacher’s guide. You may choose to grade student quizzes as an assessment tool or to review the answers in class.
The video is content-rich with numerous vocabulary words. For this reason you may want to periodically stop the video to review and discuss new terminology and concepts.
Before showing students the program, introduce students to the scientifi c method. An interesting way to introduce students to the scientifi c method is to propose problems or questions to them. Possible questions they might want to answer include: 1. Which breakfast cereal has the greatest nutritional value? 2. What shampoo produces the most lather? 3. What skateboard design works best? 4. What rock band has the most bass in its music?
Have students list some of their own questions they would like to answer using the scientifi c method. Next, have each student write down their own question that could be answered using the scientifi c method. Tell students to pay close attention to the video so that after the program they will be able to describe how they can answer their question using the scientifi c method.
10Visual Learning Company 1-800-453-8481 www.visuallearningco.com
Your Science Fair ProjectYour Science Fair Project
11
Video Script: Your Science Fair Project1. Suppose you planned to go to the beach on a hot, sunny day.2. You were looking forward to swimming in the ocean and sitting in the sun, but you
were worried about getting a sunburn.3. How would you go about choosing the right sunscreen lotion?4. Or, suppose your family wanted to fi gure out what gasoline would help your car to
get the best gas mileage. 5. Or, how would you go about trying to fi gure out the best temperature and cooking
time for pasta. 6. These are not easy things to fi gure out, but we attempt to answer questions like
these everyday.7. These problems can be solved using a specifi c process, called the scientifi c method.8. Scientists use the scientifi c method to help them answer puzzling questions.9. The scientifi c method also plays a key role in creating a great science fair project.
10. During the next few minutes we are going to take an in-depth look at the scientifi c method.
11. And we are going to explore some ways you can design, complete, and display your science fair project.
12. Graphic Transition- The Scientifi c Method13. Throughout the world, tens of thousands of scientists are studying scores of different
problems from...14. ...environmental pollution,...15. ...to the development of new medicines,...16. ...to the nature of undersea volcanoes. 17. Even though scientists and researchers are studying many different topics,
problems, and questions, they all have one thing in common.18. You Decide! What do scientists have in common?19. Scientists and researchers use a distinct process called the scientifi c method to help
answer questions. 20. The scientifi c method is a systematic approach to solving problems.21. There are a number of important steps in the scientifi c method. Let us take a look at
these steps.22. Graphic Transition- Steps in the Scientifi c Method23. The fi rst step in the scientifi c method focuses on the question or problem at hand.24. Let us take a look at a food most of us enjoy eating-popcorn.25. Say we want to fi gure out how the temperature at which popcorn is stored infl uences
how well it pops.26. This can be stated as a question: How does the storage temperature of
microwavable popcorn affect how well it pops?
10 11
Your Science Fair Project
Visual Learning Company1-800-453-8481www.visuallearningco.com
27. The next step in the scientifi c method involves gathering information.28. We may want to learn more about how popcorn pops, how a microwave oven
operates, and how to measure the volume of popcorn.29. Scientists often spend a great deal of time reading about a problem and gathering
information before moving on to the next step in the scientifi c method.30. This next step involves forming a hypothesis. A hypothesis is a prediction that can
be tested.31. A hypothesis for our experiment with popcorn might be: Popcorn stored in a cold
place does not pop as well as popcorn stored in a warm place. 32. The next step in the scientifi c method involves testing the hypothesis. We can test
the hypothesis by performing an experiment.33. In the experiment let us place the packet of microwavable popcorn in three different
temperature environments: the freezer, the refrigerator, and on the kitchen shelf.34. After 24 hours we will heat each packet in the microwave for exactly the same
amount of time.35. At the end of the time interval, the amount of popcorn in each packet is measured.36. The next step in the scientifi c method involves collecting data. Data consists of
observations gathered by our senses. Data may be in the form of words, numbers, or even pictures.
37. In this experiment our data consists of the amount of popcorn popped from the packets stored at different temperatures.
38. It is important that data be carefully recorded.39. Data can be graphed and analyzed in order to identify patterns and relationships. 40. We can see from the data that the popcorn stored in the freezer produced the least
amount of popcorn. The popcorn stored in the refrigerator popped more and the popcorn stored on the counter popped the most.
41. The next step in the scientifi c method is stating a conclusion.42. Stating a conclusion involves exploring a logical answer to a question or problem
based on observations and data.43. For example, we can conclude that the popcorn stored in a cold temperature does
not pop as well as popcorn stored at warmer temperatures.44. We therefore can accept our hypothesis which stated that popcorn stored in cold
places does not pop as well as popcorn stored in warmer places.45. Scientists often write up the results of their work in the form of articles which are
published in magazines and journals.46. Generally speaking, this is how knowledge is created using the scientifi c method.
Script (cont)
12Visual Learning Company 1-800-453-8481 www.visuallearningco.com
Your Science Fair ProjectYour Science Fair Project
13
Script (cont.)47. Graphic Transition- What Will You Learn From a Science Fair Project?48. Most often science projects are presented at a school science fair and the science
fair projects can vary widely.49. In many cases science projects are judged, and awards may be presented.50. While this can be fun, the most important thing to realize is that working on a
science fair project is a learning process.51. In this process you get to experience the thrill and excitement real scientists
experience in their work. 52. While working on your science project you will learn things that will stick with you for
years to come. 53. So keep in mind that it is not that important to receive the top prize at your science
fair. But, what is important is that you enjoy the process of working on the project and give it your best effort.
54. Graphic Transition-Choosing a Project Topic 55. There are literally thousands of different science fair project topics to choose from. 56. In fact, there are so many possibilities, it is often diffi cult to narrow it down to just
one.57. It is important to choose a topic that interests you.58. If you are interested in sports, then choose a topic which focuses on an aspect of
the sport you love.59. For example, if you like baseball, you might want to answer the question: what type
of bat; aluminum or wood, hits the ball farther?60. Or, if you are interested in food you might want to do a study on the nutritional value
of different vegetables.61. Or, let us say you live near the ocean and you want to know why freshwater ponds
freeze before ocean bays do.62. Graphic Transition-The Next Steps 63. The next step in your science fair project is to gather information that relates to your
question or your problem.64. To gather more information you might visit a variety of locations near the ocean to
see what similarities and differences you observe 65. You might want to see if these two different bodies of water differ in size, how the
wind hits them differently, or if there are any apparent differences in their water chemistry.
66. You may want to read about your topic by going to the library and doing some research.
67. You want to gather as much information as possible to help you create a reasonable and testable hypothesis.
12 13
Your Science Fair Project
Visual Learning Company1-800-453-8481www.visuallearningco.com
Script (cont.)68. Forming a good hypothesis is a very important step in your science project.69. The hypothesis to our problem could be stated as follows: Seawater freezes at a
lower temperature because it contains salt.70. Let us now see how we can go about testing this hypothesis.71. Graphic Transition-Testing a Hypothesis72. Experiments are commonly conducted to test a hypothesis.73. However, there are several things you need to do before starting an experiment.74. You need to develop a plan for your experiment. Discuss your plan with your
teacher.75. Write down your plan in a notebook or write it down on a piece of paper and store it
in a folder labeled “Science Fair Project.”76. Make a list of materials you will need.77. And, decide where you will do the experiment whether it be in your kitchen,
basement, or garage.78. Discuss any safety concerns with your teacher. You may need to wear protective
goggles, gloves, or wear a lab apron.79. In our project we need to design an experiment which rules out every factor, except
the presence of salt, as the cause of the different freezing points.80. Let us take two containers and pour equal amounts of water into each container.81. We will place salt in just one container. Salt is what we call the variable. 82. It is a good idea to test a single variable at a time.83. In an effort to eliminate the possibility of unknown variables interfering with the
results it is important to have a control experiment.84. You Compare! How does the control setup compare to the setup with salt?85. The control experiment is set up exactly like the setup containing the variable, but
the control does not contain the variable.86. In this experiment the control part of the experiment does not contain the variable
of salt.87. But, it does contain the same amount of water, and undergoes the same decrease
in temperature as the saltwater.88. Let us try our experiment.89. Graphic Transition – The Importance of Data!90. Conducting your experiment, recording and analyzing data are some of the most
interesting aspects of your science project.91. Before you even start your experiment, think about the kind of data you will be
recording and how you will organize that data.92. One of the best things to do is to neatly create a data table in your notebook.93. Remember, a data table has a title, as well as labels for each column.
14Visual Learning Company 1-800-453-8481 www.visuallearningco.com
Your Science Fair ProjectYour Science Fair Project
15
Script (cont.)94. Let us put the containers with thermometers in the freezer and record the
temperature every fi ve minutes.95. In recording data it is very important to record it as accurately, precisely, and neatly
as possible.96. Following data collection it is important to analyze the data. Data analysis includes
looking for patterns and relationships in the data.97. One way to do this is to graph data.98. The graph of our data looks like this with temperature on the left axis and time in
minutes on the bottom axis.99. The red line represents the salt water and the blue line represents the freshwater.
100. You Compare! How do the two lines in the graph differ?101. As you can see, as time progresses, the red line representing saltwater falls below
the blue line for freshwater.102. Let us now think about what the data is telling us.103. Graphic transition – Drawing Conclusions104. The fi nal step in the scientifi c method is to make conclusions.105. The data shows that the container with salt froze at a lower temperature.106. Therefore, we can conclude that freshwater freezes at a higher temperature than
saltwater.107. The hypothesis stated that seawater freezes at a lower temperature because it
contains salt.108. Therefore, we can accept our hypothesis that the saltwater froze at a lower
temperature than the freshwater.109. Graphic Transition – Displaying Your Science Fair Project110. Now that you have completed the steps in the scientifi c method of your project it is
necessary to communicate your results.111. Your teacher may encourage you to follow a specifi c format for presenting your
project.112. A fold out display board is often used to post the various steps you went through
in your project starting with the stated problem or question right through to the conclusion.
113. Neatly write or print out the parts of your project and place them on your display board.
114. Remember, that correct spelling and grammar are essential.115. Try to illustrate your data with graphs, charts, pictures, or photographs.116. You may even want to display some of the actual things you experimented with.117. Remember, no matter how good a job you did on your science project, if it is not
displayed neatly, correctly, and with enthusiasm, it won’t refl ect what a good job you did.
14 15
Your Science Fair Project
Visual Learning Company1-800-453-8481www.visuallearningco.com
Script (cont.)118. It is also important that you practice explaining your project, as you might have to
discuss your project with the judges.119. Graphic Transition – Summing Up120. During the past few minutes we looked at the important steps in the scientifi c
method. 121. We discussed how the scientifi c method should be incorporated into your science
fair project.122. The importance of safety and planning was addressed,…123. …as was the need to take accurate and neat notes.124. Finally, we discussed some helpful hints on how to communicate your results and
display your science fair project.125. Enjoy going through the scientifi c method in working on your science project.
Learn as much as you can and give it your best effort.126. Hopefully, the experience will give you an appreciation for the fascinating process
of scientifi c discovery.127. Graphic Transition – Video Assessment
Fill in the correct word to complete the sentence. Good luck and let us get started! 1. The scientifi c ______ is a systematic approach to solving problems. 2. A ______ is a prediction that can be tested. 3. _______ are often conducted to test a hypothesis. 4. ______ consists of observations gathered by our senses. 5. Data ______ involves looking for trends or relationships. 6. A ________ involves stating an answer to a question. 7. The basis for a science project is the ______ method. 8. Choose a project topic that ______ you. 9. Always keep ______ in mind to avoid injuries.
10. A ______ is a good way to display data.
Answers are on page 17.
16Visual Learning Company 1-800-453-8481 www.visuallearningco.com
Your Science Fair ProjectYour Science Fair Project
17
Student Assessments and ActivitiesAssessment Masters:
• Preliminary Assessment
• Video Review
• Post Assessment
Student Activity Masters:
• The Scientifi c Method
• Science Fair Count Down!
• Suggestions for Your Display
• Hints for a Successful Science Fair Project
• Vocabulary of Your Science Fair Project
16 17
Your Science Fair Project
Visual Learning Company1-800-453-8481www.visuallearningco.com
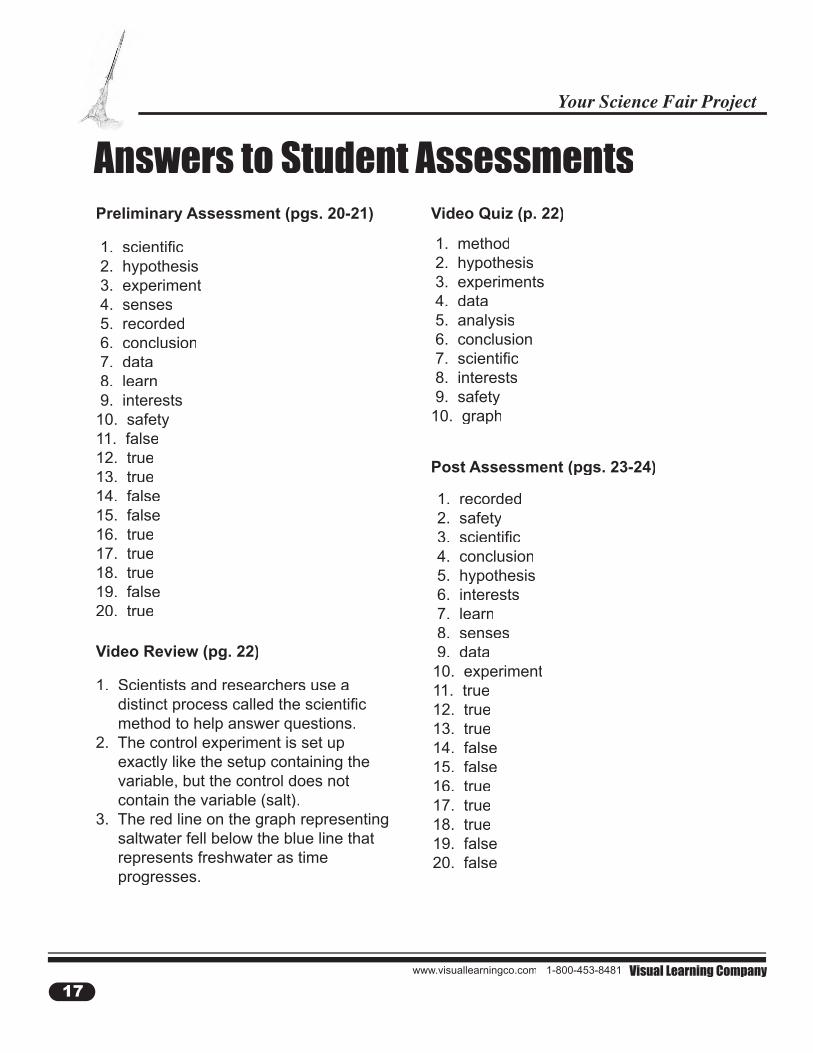
Answers to Student AssessmentsPreliminary Assessment (pgs. 20-21)
Video Review (pg. 22)
Post Assessment (pgs. 23-24)
Video Quiz (p. 22)
1. method 2. hypothesis 3. experiments 4. data 5. analysis 6. conclusion 7. scientifi c 8. interests 9. safety10. graph
1. Scientists and researchers use a distinct process called the scientifi c method to help answer questions.2. The control experiment is set up exactly like the setup containing the variable, but the control does not contain the variable (salt).3. The red line on the graph representing saltwater fell below the blue line that represents freshwater as time progresses.
1. scientifi c 2. hypothesis 3. experiment 4. senses 5. recorded 6. conclusion 7. data 8. learn 9. interests10. safety11. false12. true13. true14. false15. false16. true17. true18. true19. false20. true
1. recorded 2. safety 3. scientifi c 4. conclusion 5. hypothesis 6. interests 7. learn 8. senses 9. data10. experiment11. true12. true13. true14. false15. false16. true17. true18. true19. false20. false
18Visual Learning Company 1-800-453-8481 www.visuallearningco.com
Your Science Fair ProjectYour Science Fair Project
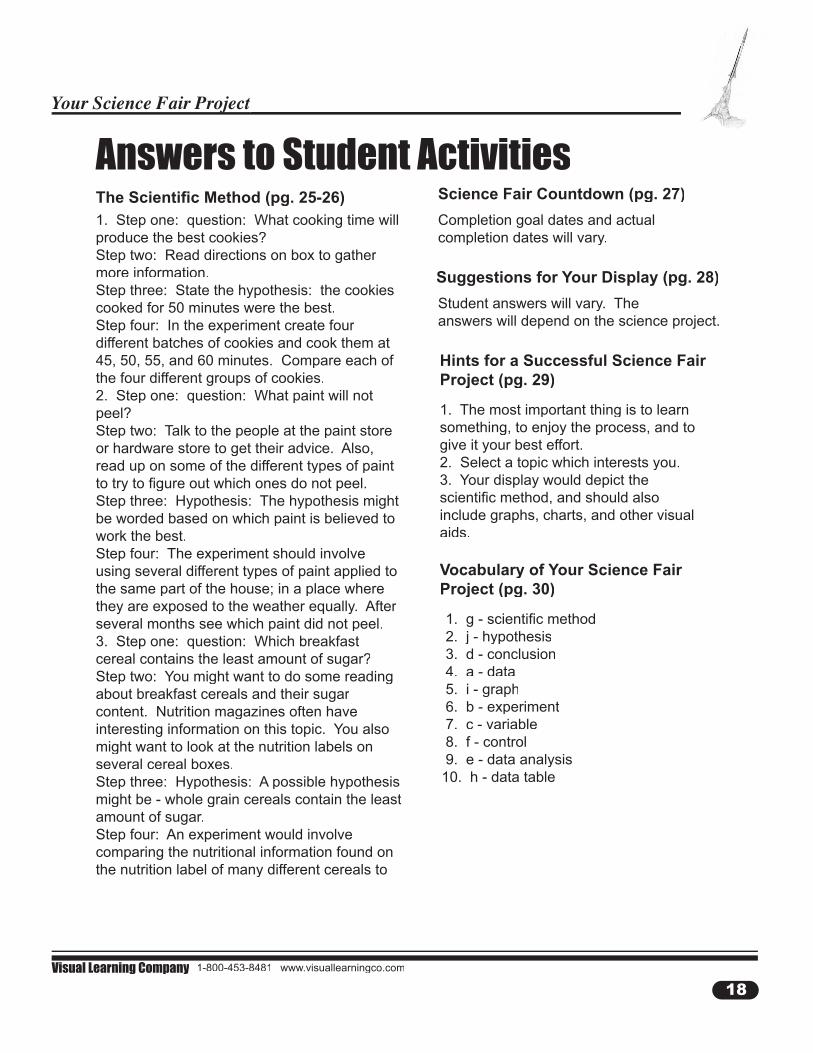
Answers to Student ActivitiesThe Scientifi c Method (pg. 25-26) Science Fair Countdown (pg. 27)
Completion goal dates and actual completion dates will vary.
Suggestions for Your Display (pg. 28)
Student answers will vary. The answers will depend on the science project.
Hints for a Successful Science Fair Project (pg. 29)
1. The most important thing is to learn something, to enjoy the process, and to give it your best effort.2. Select a topic which interests you.3. Your display would depict the scientifi c method, and should also include graphs, charts, and other visual aids.
Vocabulary of Your Science Fair Project (pg. 30)
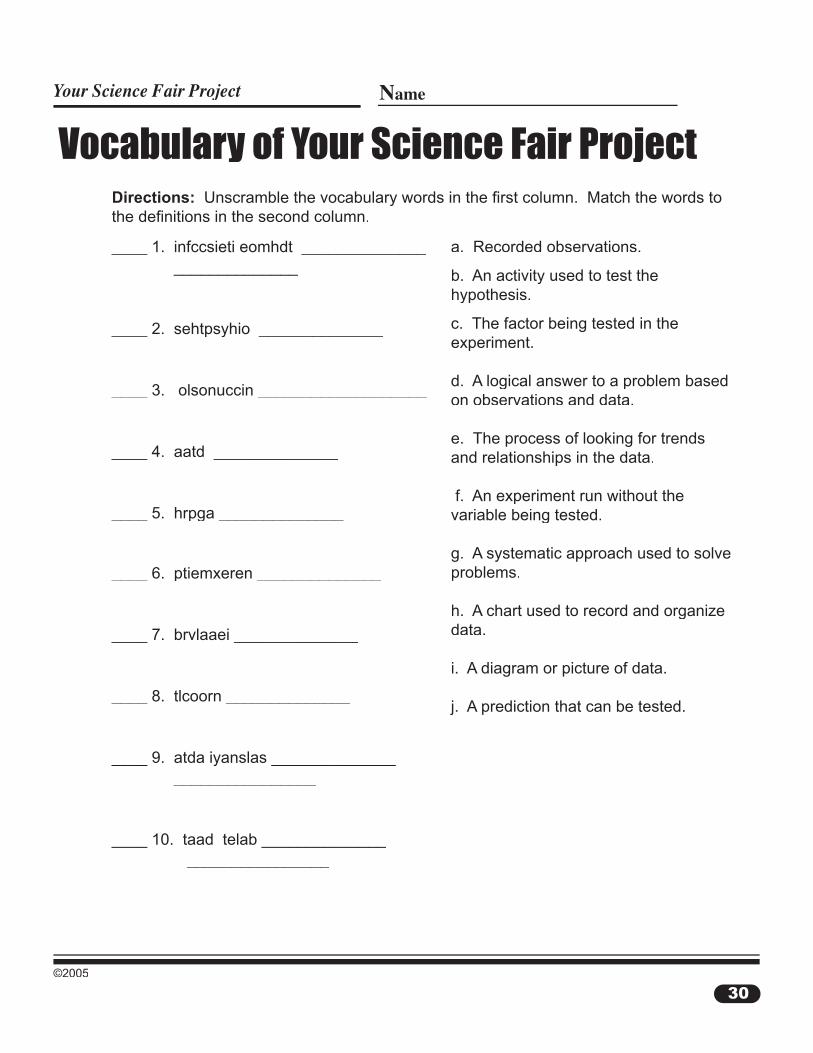
1. g - scientifi c method 2. j - hypothesis 3. d - conclusion 4. a - data 5. i - graph 6. b - experiment 7. c - variable 8. f - control 9. e - data analysis10. h - data table
1. Step one: question: What cooking time will produce the best cookies?Step two: Read directions on box to gather more information.Step three: State the hypothesis: the cookies cooked for 50 minutes were the best.Step four: In the experiment create four different batches of cookies and cook them at 45, 50, 55, and 60 minutes. Compare each of the four different groups of cookies.2. Step one: question: What paint will not peel?Step two: Talk to the people at the paint store or hardware store to get their advice. Also, read up on some of the different types of paint to try to fi gure out which ones do not peel.Step three: Hypothesis: The hypothesis might be worded based on which paint is believed to work the best.Step four: The experiment should involve using several different types of paint applied to the same part of the house; in a place where they are exposed to the weather equally. After several months see which paint did not peel.3. Step one: question: Which breakfast cereal contains the least amount of sugar?Step two: You might want to do some reading about breakfast cereals and their sugar content. Nutrition magazines often have interesting information on this topic. You also might want to look at the nutrition labels on several cereal boxes.Step three: Hypothesis: A possible hypothesis might be - whole grain cereals contain the least amount of sugar.Step four: An experiment would involve comparing the nutritional information found on the nutrition label of many different cereals to
18
Assessment and Student
Activity Masters
20©2005
NameYour Science Fair Project
21
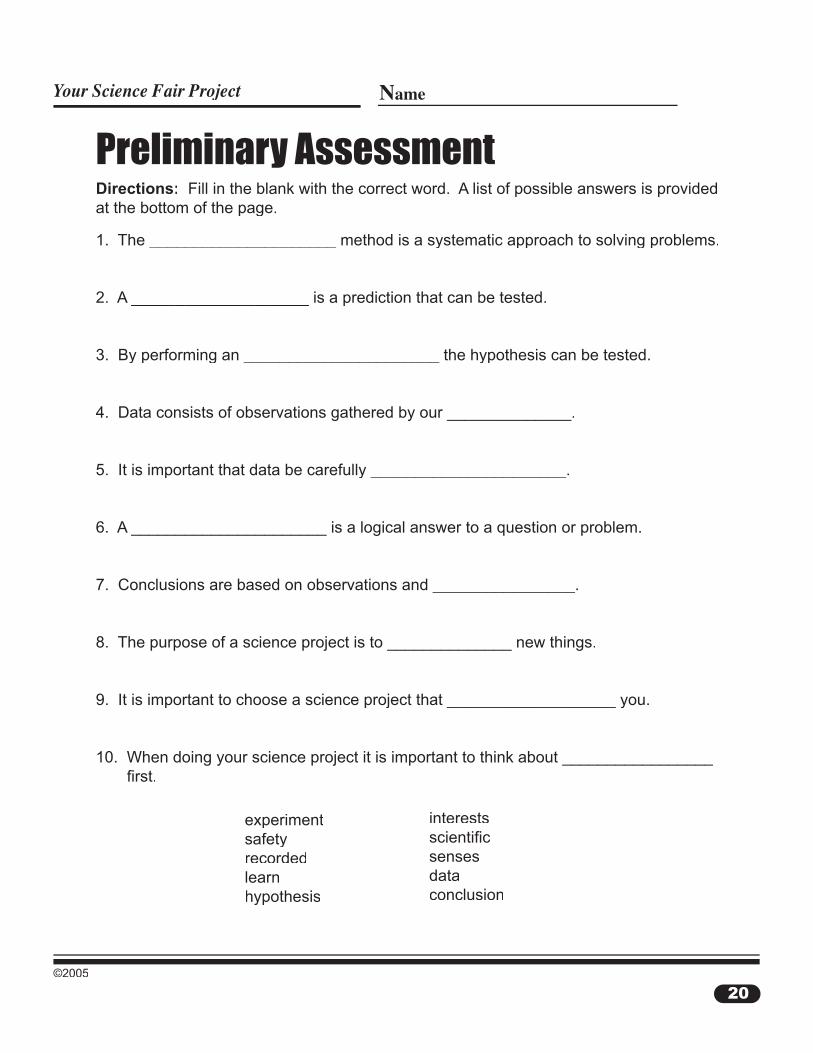
Directions: Fill in the blank with the correct word. A list of possible answers is provided at the bottom of the page.
Preliminary Assessment
1. The _____________________ method is a systematic approach to solving problems.
2. A ____________________ is a prediction that can be tested.
3. By performing an ______________________ the hypothesis can be tested.
4. Data consists of observations gathered by our ______________.
5. It is important that data be carefully ______________________.
6. A ______________________ is a logical answer to a question or problem.
7. Conclusions are based on observations and ________________.
8. The purpose of a science project is to ______________ new things.
9. It is important to choose a science project that ___________________ you.
10. When doing your science project it is important to think about _________________ fi rst.
experimentsafetyrecordedlearnhypothesis
interestsscientifi csensesdataconclusion
20 21©2005
NameYour Science Fair Project
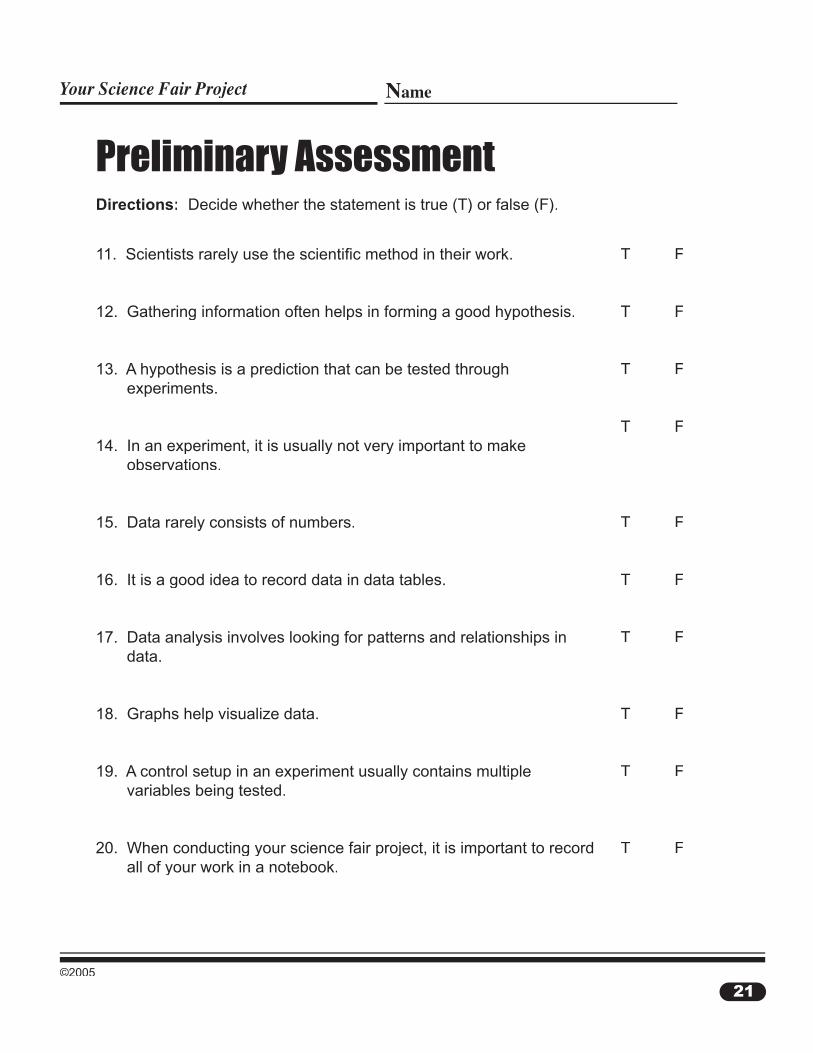
Directions: Decide whether the statement is true (T) or false (F).
Preliminary Assessment
11. Scientists rarely use the scientifi c method in their work.
12. Gathering information often helps in forming a good hypothesis.
13. A hypothesis is a prediction that can be tested through experiments.
14. In an experiment, it is usually not very important to make observations.
15. Data rarely consists of numbers.
16. It is a good idea to record data in data tables.
17. Data analysis involves looking for patterns and relationships in data.
18. Graphs help visualize data.
19. A control setup in an experiment usually contains multiple variables being tested.
20. When conducting your science fair project, it is important to record all of your work in a notebook.
T F
T F
T F
T F
T F
T F
T F
T F
T F
T F
22©2005
NameYour Science Fair Project
23
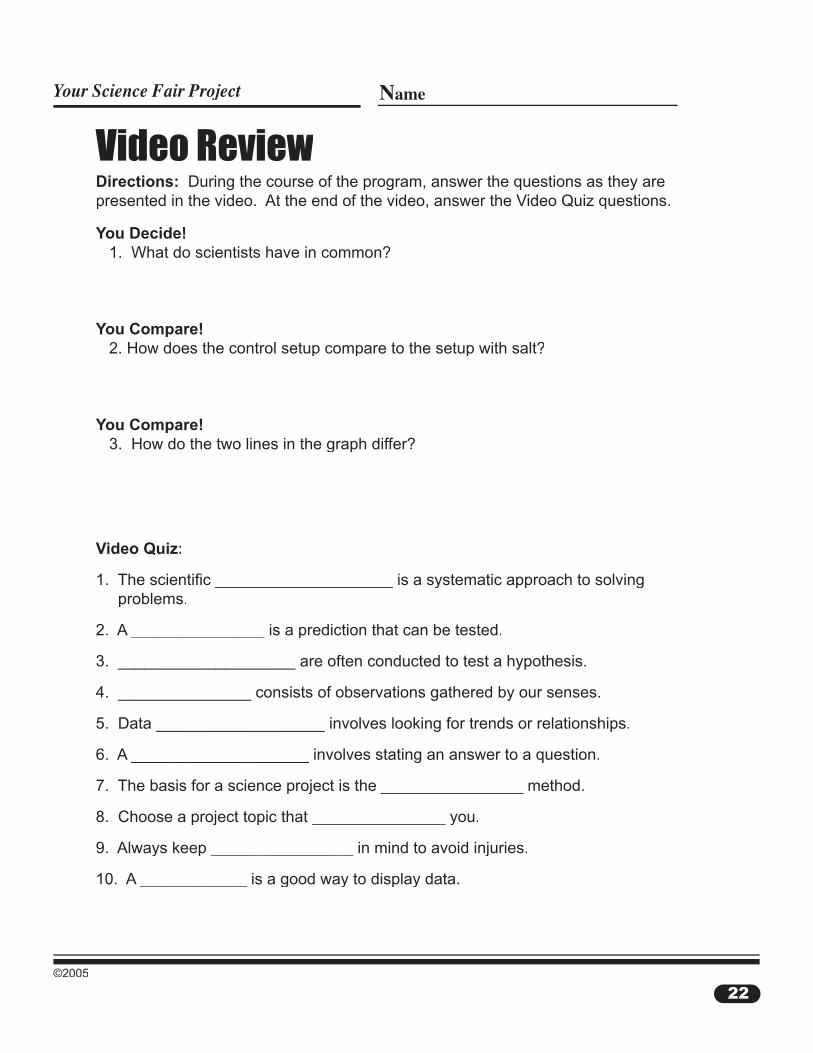
Video ReviewDirections: During the course of the program, answer the questions as they are presented in the video. At the end of the video, answer the Video Quiz questions.
You Decide! 1. What do scientists have in common?
You Compare! 2. How does the control setup compare to the setup with salt?
You Compare! 3. How do the two lines in the graph differ?
Video Quiz:
1. The scientifi c ____________________ is a systematic approach to solving problems.
2. A _______________ is a prediction that can be tested.
3. ____________________ are often conducted to test a hypothesis.
4. _______________ consists of observations gathered by our senses.
5. Data ___________________ involves looking for trends or relationships.
6. A ____________________ involves stating an answer to a question.
7. The basis for a science project is the ________________ method.
8. Choose a project topic that _______________ you.
9. Always keep ________________ in mind to avoid injuries.
10. A ____________ is a good way to display data.
22 23©2005
NameYour Science Fair Project
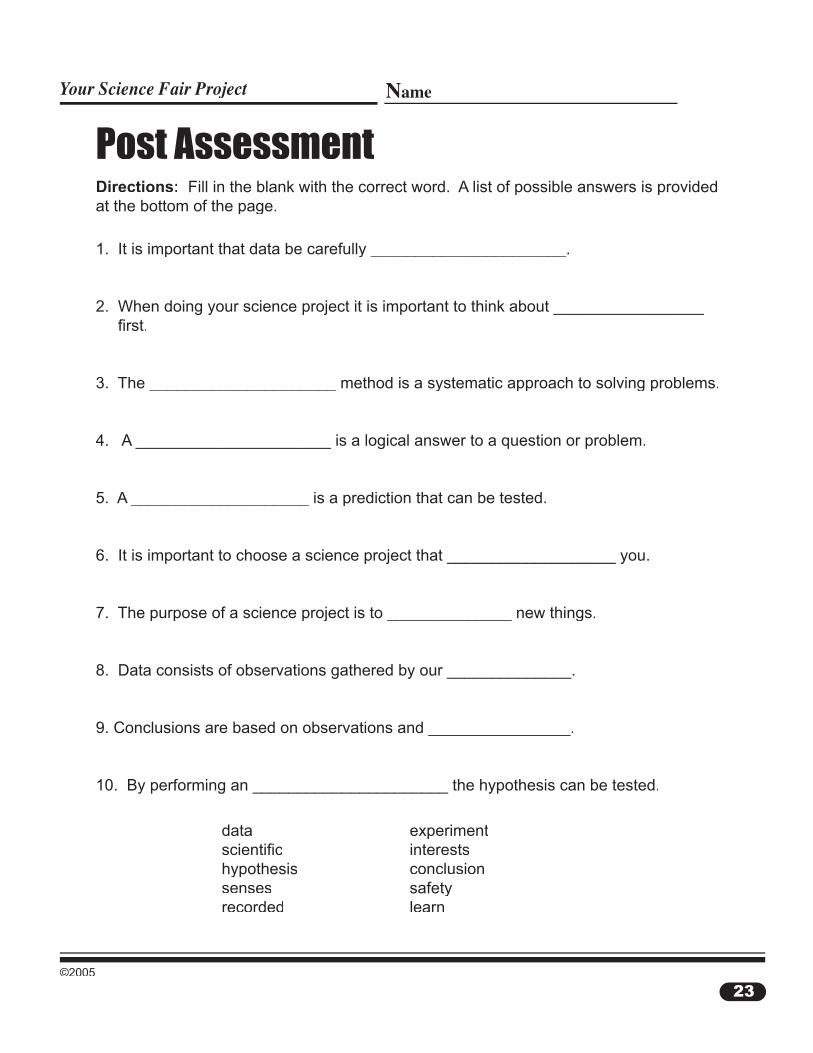
Post AssessmentDirections: Fill in the blank with the correct word. A list of possible answers is provided at the bottom of the page.
1. It is important that data be carefully ______________________.
2. When doing your science project it is important to think about _________________ fi rst.
3. The _____________________ method is a systematic approach to solving problems.
4. A ______________________ is a logical answer to a question or problem.
5. A ____________________ is a prediction that can be tested.
6. It is important to choose a science project that ___________________ you.
7. The purpose of a science project is to ______________ new things.
8. Data consists of observations gathered by our ______________.
9. Conclusions are based on observations and ________________.
10. By performing an ______________________ the hypothesis can be tested.
datascientifi chypothesissensesrecorded
experimentinterestsconclusionsafetylearn
24©2005
NameYour Science Fair Project
25
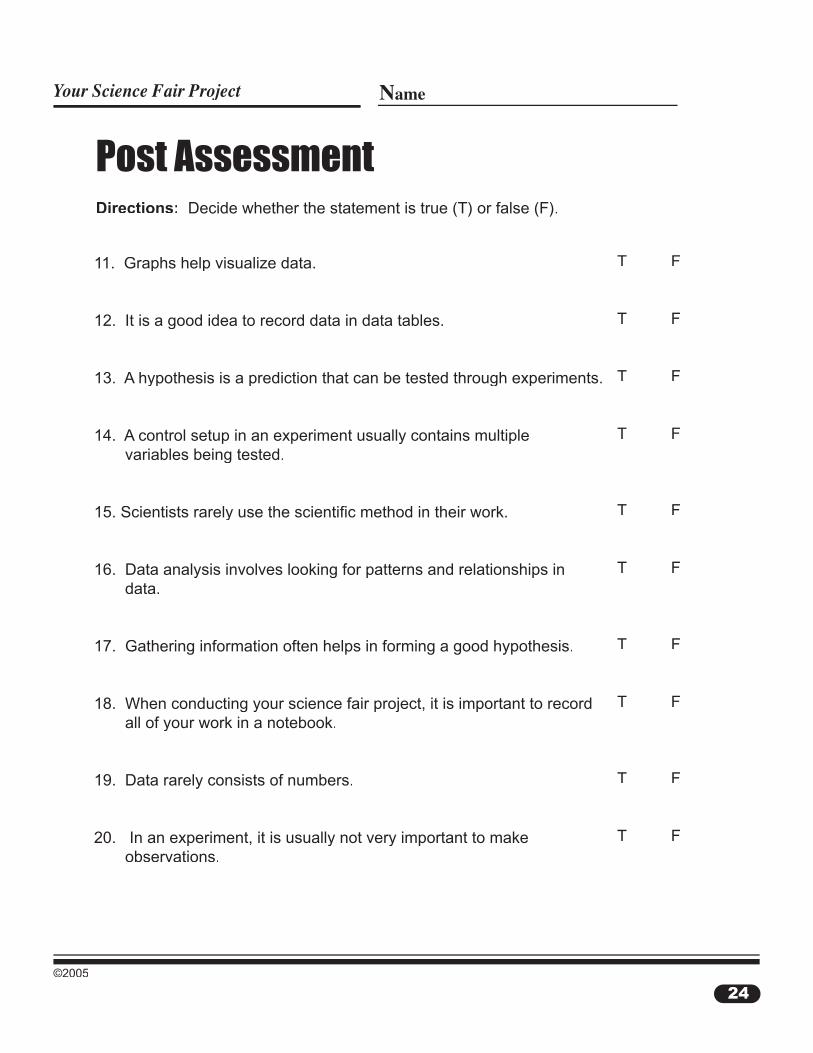
Post AssessmentDirections: Decide whether the statement is true (T) or false (F).
11. Graphs help visualize data.
12. It is a good idea to record data in data tables.
13. A hypothesis is a prediction that can be tested through experiments.
14. A control setup in an experiment usually contains multiple variables being tested.
15. Scientists rarely use the scientifi c method in their work.
16. Data analysis involves looking for patterns and relationships in data.
17. Gathering information often helps in forming a good hypothesis.
18. When conducting your science fair project, it is important to record all of your work in a notebook.
19. Data rarely consists of numbers.
20. In an experiment, it is usually not very important to make observations.
T F
T F
T F
T F
T F
T F
T F
T F
T F
T F
24 25©2005
NameYour Science Fair Project
The Scientifi c MethodBackground: Have you ever wondered how scientists go about their work? What tools do they use, how do they make new discoveries, and how do they go about answering hard-to-solve questions and problems? There is no single answer to these questions. But, one strategy most scientists use at one time or another is the scientifi c method. The scientifi c method is a systematic approach to solving problems.
There are a number of steps in the scientifi c method. Let us take a minute to discuss each step:
1. The fi rst step in the scientifi c method focuses on forming a question or stating the problem at hand. 2. The next step in the scientifi c method involves gathering information. Scientists often spend a lot of time reading and learning about the question in which they are interested. This helps them with the next step - creating a hypothesis. 3. A hypothesis is a prediction that can be tested. A hypothesis can also be looked at as a proposed solution to a problem. 4. After forming a hypothesis it is necessary to test it. This is most often done by performing experiments. Scientists often spend a great deal of time designing experiments, as well as conducting experiments. In many cases experiments are repeated many times, and even redesigned and conducted again. While conducting experiments, scientists carry out another step in the scientifi c method - collecting data.5. As you know, data consists of recorded observations gathered by our senses. Data may be in the form of words, numbers, or even pictures. Scientists often spend time analyzing data during which they try to identify patterns and relationships in the data.6. The fi nal step in the scientifi c method involves stating a conclusion. Stating a conclusion involves exploring a logical answer to the question or problem stated earlier. The conclusion is based on observations and data gathered in the experiment.
Scientists commonly communicate the results of their work in magazines and journals. This enables others to learn about their results. Generally speaking, this is how knowledge is created using the scientifi c method.
Activity: Following are three different puzzling scientifi c problems. Read each problem and think about it for a couple of minutes. Then complete the fi rst four steps in the scientifi c method.
26©2005
NameYour Science Fair Project
27
The Scientifi c Method cont.1. You just made a batch of chocolate chip cookies for some friends, but the cookies came out very hard. You are not sure why the cookies came out hard. The recipe said to cook them for 45 to 60 minutes. You cooked them for 60 minutes. How could you use the scientifi c method to try to bake cookies that are not hard?
2. Last summer you painted your friend’s house. The following spring you noticed that the paint peeled in many places. You have a hunch you need to try a couple of different kinds of paint to see which one will not peel. Describe how you would use the scientifi c method to fi gure out which paint is the best.
3. On your last visit to the dentist you found out you had a cavity. The dentist suggested you try not to eat cereals containing a lot of sugar. Describe how you would use the scientifi c method to fi nd a breakfast cereal that does not contain a lot of sugar.
26 27©2005
NameYour Science Fair Project
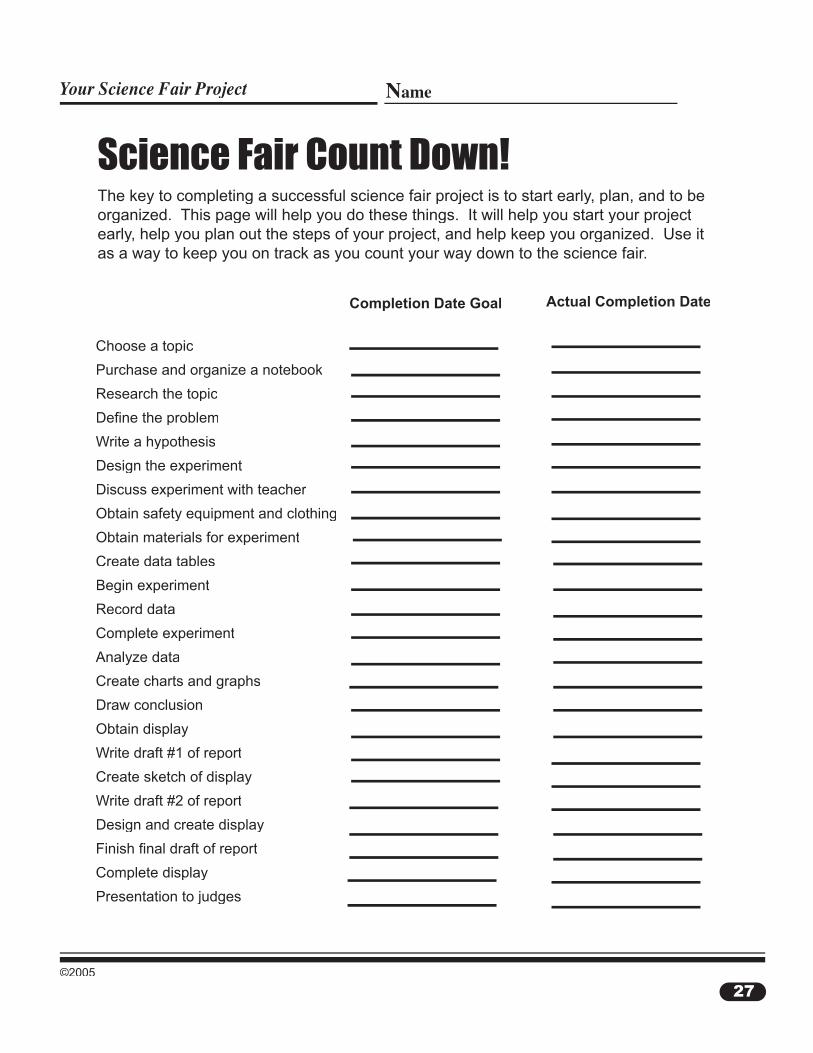
Science Fair Count Down!The key to completing a successful science fair project is to start early, plan, and to be organized. This page will help you do these things. It will help you start your project early, help you plan out the steps of your project, and help keep you organized. Use it as a way to keep you on track as you count your way down to the science fair.
Choose a topic
Purchase and organize a notebook
Research the topic
Defi ne the problem
Write a hypothesis
Design the experiment
Discuss experiment with teacher
Obtain safety equipment and clothing
Obtain materials for experiment
Create data tables
Begin experiment
Record data
Complete experiment
Analyze data
Create charts and graphs
Draw conclusion
Obtain display
Write draft #1 of report
Create sketch of display
Write draft #2 of report
Design and create display
Finish fi nal draft of report
Complete display
Presentation to judges
Completion Date Goal Actual Completion Date
28©2005
NameYour Science Fair Project
29
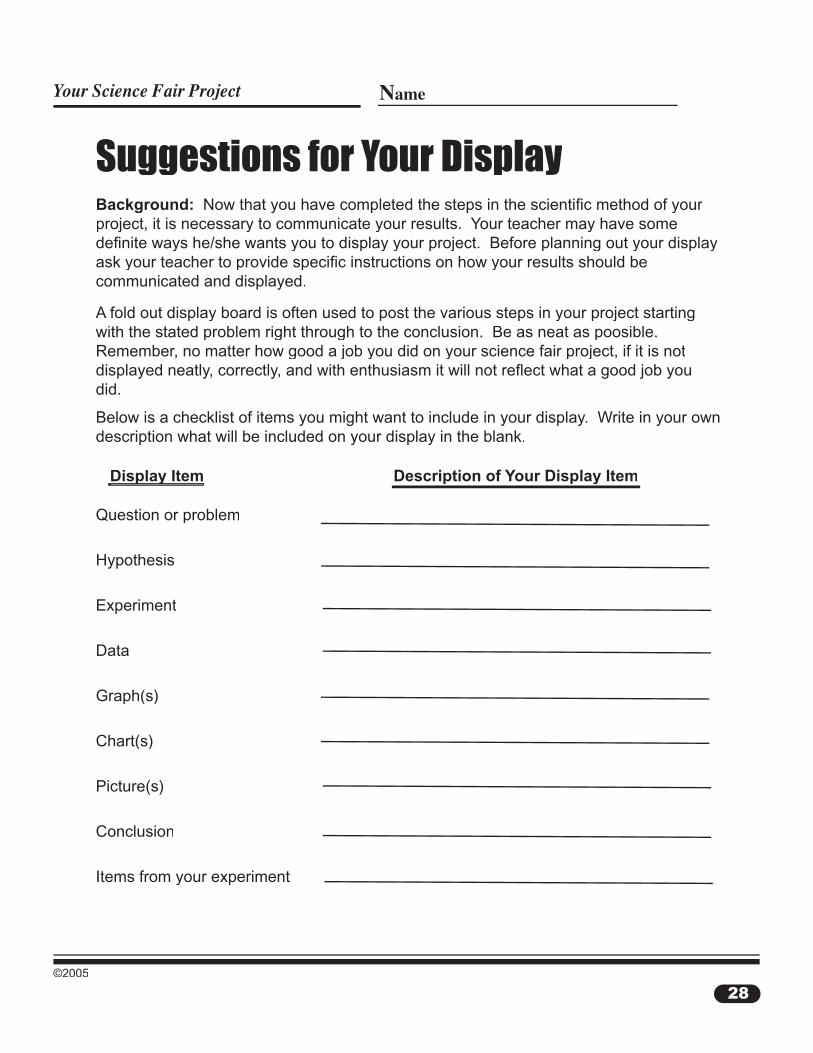
Suggestions for Your DisplayBackground: Now that you have completed the steps in the scientifi c method of your project, it is necessary to communicate your results. Your teacher may have some defi nite ways he/she wants you to display your project. Before planning out your display ask your teacher to provide specifi c instructions on how your results should be communicated and displayed.
A fold out display board is often used to post the various steps in your project starting with the stated problem right through to the conclusion. Be as neat as poosible. Remember, no matter how good a job you did on your science fair project, if it is not displayed neatly, correctly, and with enthusiasm it will not refl ect what a good job you did.
Below is a checklist of items you might want to include in your display. Write in your own description what will be included on your display in the blank.
Display Item Description of Your Display Item
Question or problem
Hypothesis
Experiment
Data
Graph(s)
Chart(s)
Picture(s)
Conclusion
Items from your experiment
Display Item
28 29©2005
NameYour Science Fair Project
Hints for a Successful Science Fair ProjectIt is common for science projects to be presented at school science fairs. Perhaps your school has a science fair. In many cases, science projects are judged and awards may be presented. While this can be fun, the most important thing to realize is that working on a science fair project is a learning process. In this process you get to experience the thrill real scientists experience in their work. So, keep in mind that it is not that important to receive the top prize at your science fair. But, what is important is that you enjoy the process of working on the project, and give it your best effort.
Following are a number of general hints to help you create a successful science project, and to help you enjoy the process.
1. Choose a topic that interests you. 2. Start your project early. 3. Create a work schedule with dates as deadlines. 4. Try your hardest to show original thinking in your project. 5. Document all of your project in a notebook. 6. Use the scientifi c method in designing and executing your project. 7. Use safe science practices, and always think about safety fi rst. 8. Create a display that is well organized, neat, and attractive. 9. Include appropriate visual aids such as graphs, charts, and materials used in your experiment.10. Calmly present your project to judges in an organized and confi dent manner. (practice your presentation).
Questions:
1. What is the most important thing you should get out of a science project?
2. How should you go about selecting a topic?
3. What should be in your display?
30©2005
NameYour Science Fair Project
Vocabulary of Your Science Fair ProjectDirections: Unscramble the vocabulary words in the fi rst column. Match the words to the defi nitions in the second column.
____ 1. infccsieti eomhdt ______________ ______________
____ 2. sehtpsyhio ______________
____ 3. olsonuccin ___________________
____ 4. aatd ______________
____ 5. hrpga ______________
____ 6. ptiemxeren ______________
____ 7. brvlaaei ______________
____ 8. tlcoorn ______________
____ 9. atda iyanslas ______________ ________________
____ 10. taad telab ______________ ________________
a. Recorded observations.
b. An activity used to test the hypothesis.
c. The factor being tested in the experiment. d. A logical answer to a problem based on observations and data. e. The process of looking for trends and relationships in the data. f. An experiment run without the variable being tested. g. A systematic approach used to solve problems.
h. A chart used to record and organize data. i. A diagram or picture of data.
j. A prediction that can be tested.
Related Documents