YOLLA 4 T/L1 OFFSHORE BASS BASIN WELL COMPLETION REPORT INTERPRETIVE DATA D.M. Brooks, K. Bierbrauer, J. Parvar Origin Energy Resources Ltd 339 Coronation Drive MILTON QLD 4064 Australia MAY 2005 Chief Geologist Chief Geophysicist Subsurface Manager BassGas Distribution List:

Welcome message from author
This document is posted to help you gain knowledge. Please leave a comment to let me know what you think about it! Share it to your friends and learn new things together.
Transcript
YOLLA 4
T/L1 OFFSHORE BASS BASIN
WELL COMPLETION REPORT INTERPRETIVE DATA
D.M. Brooks, K. Bierbrauer, J. Parvar Origin Energy Resources Ltd 339 Coronation Drive MILTON QLD 4064 Australia MAY 2005
Chief Geologist
Chief Geophysicist
Subsurface Manager BassGas
Distribution List:
Contents 1. WELL INDEX SHEET ........................................................... 1 2. WELL SUMMARY ............................................................... 3 3. WELL RESULTS................................................................. 5
3.1 Hydrocarbons Encountered........................................... 5 3.2 Stratigraphy ............................................................ 6 3.3 Reservoir Evaluation .................................................15
3.3.1 Petrophysical Summary ............................................... 15 3.3.2 Core Analysis Summary................................................ 17 3.3.3 Facies Interpretation .................................................. 19
3.4 Hydrocarbon Source Evaluation ....................................20 3.4.1 Maturation ................................................................ 20 3.4.2 Source Rock and Hydrocarbon Evaluation ........................ 21
3.5 MDT Pressure Data Interpretation .................................23 3.6 Production Testing Interpretation Results........................23
4. GEOPHYSICAL DISCUSSION..................................................24 4.1 Seismic Data ...........................................................24 4.2 Structure ...............................................................24 4.3 VSP and Well tie ......................................................24 4.4 Actual versus Predicted Depths ....................................27
5. GEOLOGICAL DISCUSSION...................................................28 5.1 Exploration History ...................................................28 5.2 Regional Geology .....................................................28
5.2.1 Structure .................................................................. 28 5.2.2 Stratigraphy .............................................................. 29
5.3 Contributions to Geological Concepts and Conclusions.........30 6. REFERENCES...................................................................32 APPENDIX 1: PETROPHYSICS REPORT
APPENDIX 2: MDT REPORT APPENDIX 3: PRODUCTION TESTING INTERPRETATION REPORT
(A) Test Interpretation
(B) Sand Production
APPENDIX 4: GEOCHEMISTRY REPORT APPENDIX 5: VITRINITE REFLECTANCE REPORT APPENDIX 6: PALYNOLOGY REPORT
APPENDIX 7: PETROLOGY REPORT APPENDIX 8: CORE INTERPRETATION APPENDIX 9: SPECIAL CORE ANALYSIS APPENDIX 10: FMI INTERPRETATION REPORT ENCLOSURE 1: COMPOSITE LOG
Origin Energy Resources Ltd ABN 66 007 845 338 Commercial-in-Confidence Exploration Division Ref: S:\T-RL1 (YOLLA)\Yolla 4 WCR\Interpretive\Yolla 4 Interpretive Data WCR.docc 1/32
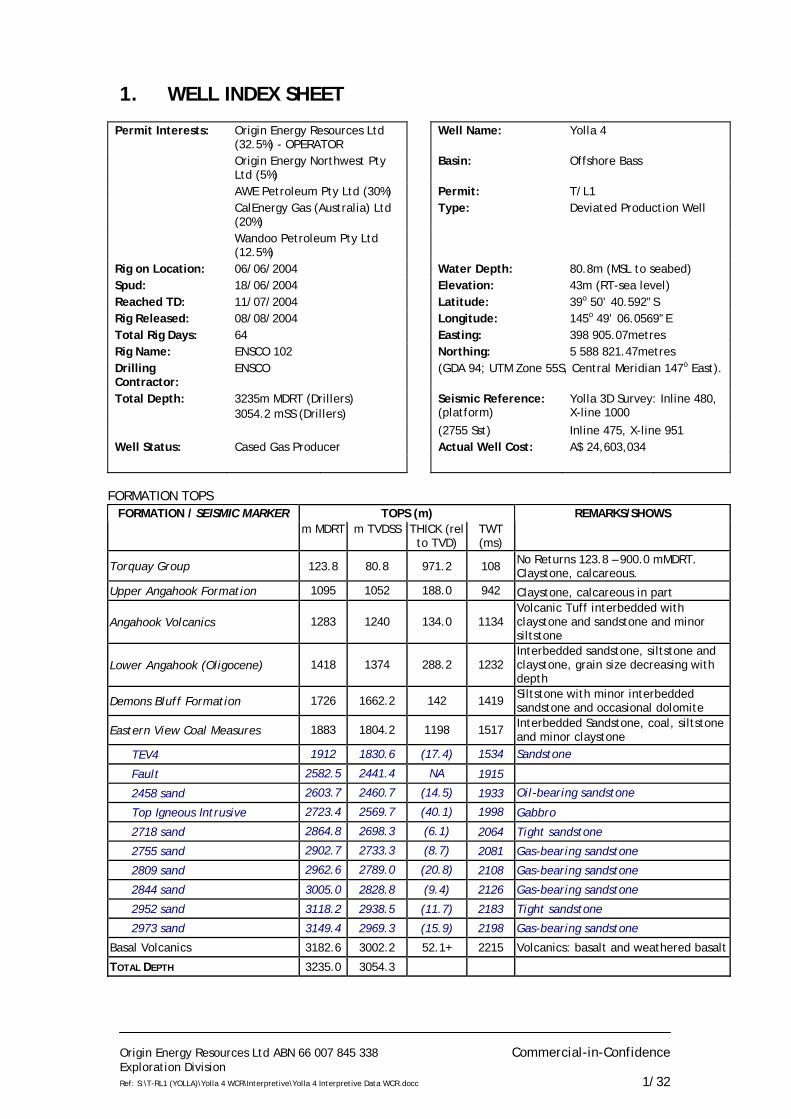
1. WELL INDEX SHEET
Permit Interests: Origin Energy Resources Ltd (32.5%) - OPERATOR
Well Name: Yolla 4
Origin Energy Northwest Pty Ltd (5%)
Basin: Offshore Bass
AWE Petroleum Pty Ltd (30%) Permit: T/L1 CalEnergy Gas (Australia) Ltd
(20%) Type: Deviated Production Well
Wandoo Petroleum Pty Ltd (12.5%)
Rig on Location: 06/06/2004 Water Depth: 80.8m (MSL to seabed) Spud: 18/06/2004 Elevation: 43m (RT-sea level) Reached TD: 11/07/2004 Latitude: 39o 50’ 40.592”S Rig Released: 08/08/2004 Longitude: 145o 49’ 06.0569”E Total Rig Days: 64 Easting: 398 905.07metres Rig Name: ENSCO 102 Northing: 5 588 821.47metres Drilling Contractor:
ENSCO (GDA 94; UTM Zone 55S, Central Meridian 147o East).
Total Depth: 3235m MDRT (Drillers) 3054.2 mSS (Drillers)
Seismic Reference: (platform)
Yolla 3D Survey: Inline 480, X-line 1000
(2755 Sst) Inline 475, X-line 951 Well Status: Cased Gas Producer Actual Well Cost: A$ 24,603,034
FORMATION TOPS
TOPS (m) FORMATION / SEISMIC MARKER m MDRT m TVDSS THICK (rel
to TVD) TWT (ms)
REMARKS/SHOWS
Torquay Group 123.8 80.8 971.2 108 No Returns 123.8 – 900.0 mMDRT. Claystone, calcareous.
Upper Angahook Formation 1095 1052 188.0 942 Claystone, calcareous in part
Angahook Volcanics 1283 1240 134.0 1134 Volcanic Tuff interbedded with claystone and sandstone and minor siltstone
Lower Angahook (Oligocene) 1418 1374 288.2 1232 Interbedded sandstone, siltstone and claystone, grain size decreasing with depth
Demons Bluff Formation 1726 1662.2 142 1419 Siltstone with minor interbedded sandstone and occasional dolomite
Eastern View Coal Measures 1883 1804.2 1198 1517 Interbedded Sandstone, coal, siltstone and minor claystone
TEV4 1912 1830.6 (17.4) 1534 Sandstone
Fault 2582.5 2441.4 NA 1915
2458 sand 2603.7 2460.7 (14.5) 1933 Oil-bearing sandstone
Top Igneous Intrusive 2723.4 2569.7 (40.1) 1998 Gabbro
2718 sand 2864.8 2698.3 (6.1) 2064 Tight sandstone
2755 sand 2902.7 2733.3 (8.7) 2081 Gas-bearing sandstone
2809 sand 2962.6 2789.0 (20.8) 2108 Gas-bearing sandstone
2844 sand 3005.0 2828.8 (9.4) 2126 Gas-bearing sandstone
2952 sand 3118.2 2938.5 (11.7) 2183 Tight sandstone
2973 sand 3149.4 2969.3 (15.9) 2198 Gas-bearing sandstone
Basal Volcanics 3182.6 3002.2 52.1+ 2215 Volcanics: basalt and weathered basalt
TOTAL DEPTH 3235.0 3054.3
Origin Energy Resources Ltd ABN 66 007 845 338 Commercial-in-Confidence Exploration Division Ref: S:\T-RL1 (YOLLA)\Yolla 4 WCR\Interpretive\Yolla 4 Interpretive Data WCR.docc 2/32
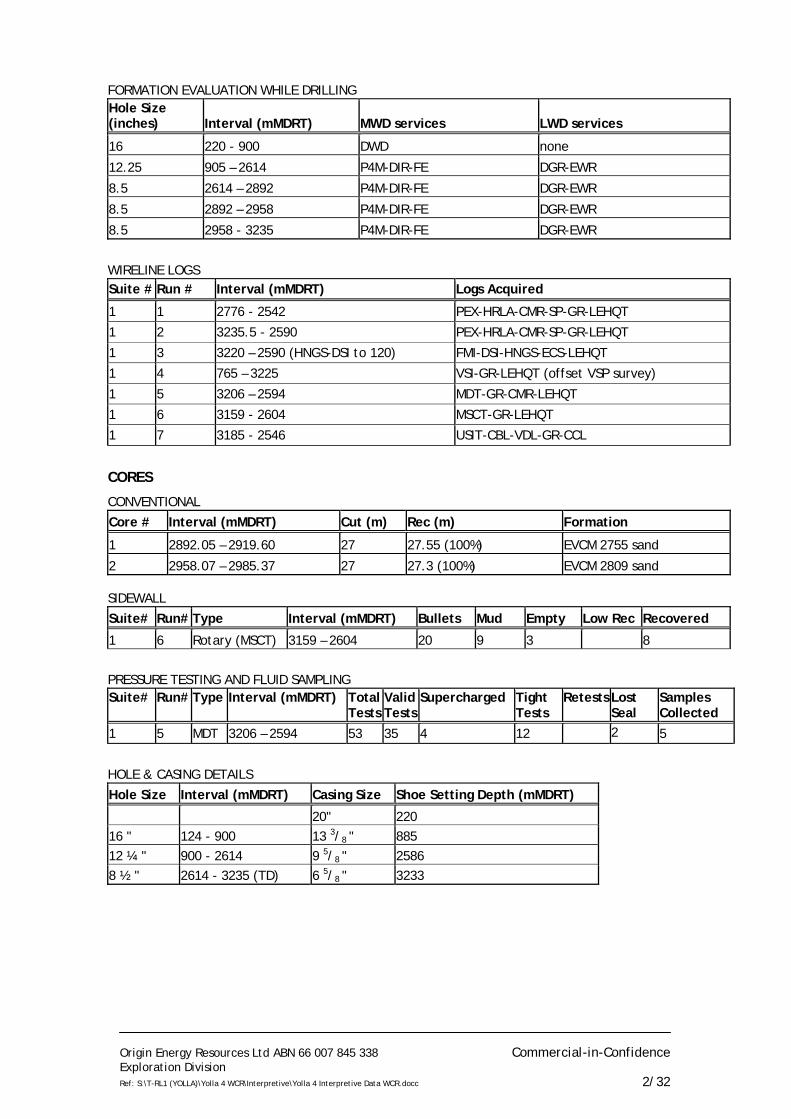
FORMATION EVALUATION WHILE DRILLING Hole Size (inches) Interval (mMDRT) MWD services LWD services
16 220 - 900 DWD none
12.25 905 – 2614 P4M-DIR-FE DGR-EWR
8.5 2614 – 2892 P4M-DIR-FE DGR-EWR
8.5 2892 – 2958 P4M-DIR-FE DGR-EWR
8.5 2958 - 3235 P4M-DIR-FE DGR-EWR
WIRELINE LOGS Suite # Run # Interval (mMDRT) Logs Acquired
1 1 2776 - 2542 PEX-HRLA-CMR-SP-GR-LEHQT
1 2 3235.5 - 2590 PEX-HRLA-CMR-SP-GR-LEHQT
1 3 3220 – 2590 (HNGS-DSI to 120) FMI-DSI-HNGS-ECS-LEHQT
1 4 765 – 3225 VSI-GR-LEHQT (offset VSP survey)
1 5 3206 – 2594 MDT-GR-CMR-LEHQT
1 6 3159 - 2604 MSCT-GR-LEHQT
1 7 3185 - 2546 USIT-CBL-VDL-GR-CCL
CORES
CONVENTIONAL
Core # Interval (mMDRT) Cut (m) Rec (m) Formation
1 2892.05 – 2919.60 27 27.55 (100%) EVCM 2755 sand
2 2958.07 – 2985.37 27 27.3 (100%) EVCM 2809 sand
SIDEWALL
Suite# Run# Type Interval (mMDRT) Bullets Mud Empty Low Rec Recovered
1 6 Rotary (MSCT) 3159 – 2604 20 9 3 8
PRESSURE TESTING AND FLUID SAMPLING Suite# Run# Type Interval (mMDRT) Total
Tests Valid Tests
Supercharged Tight Tests
Retests Lost Seal
Samples Collected
1 5 MDT 3206 – 2594 53 35 4 12 2 5
HOLE & CASING DETAILS
Hole Size Interval (mMDRT) Casing Size Shoe Setting Depth (mMDRT)
20" 220 16 " 124 - 900 13 3/8 " 885 12 ¼ " 900 - 2614 9 5/8 " 2586 8 ½ " 2614 - 3235 (TD) 6 5/8 " 3233
Origin Energy Resources Ltd ABN 66 007 845 338 Commercial-in-Confidence Exploration Division Ref: S:\T-RL1 (YOLLA)\Yolla 4 WCR\Interpretive\Yolla 4 Interpretive Data WCR.docc 3/32
2. WELL SUMMARY
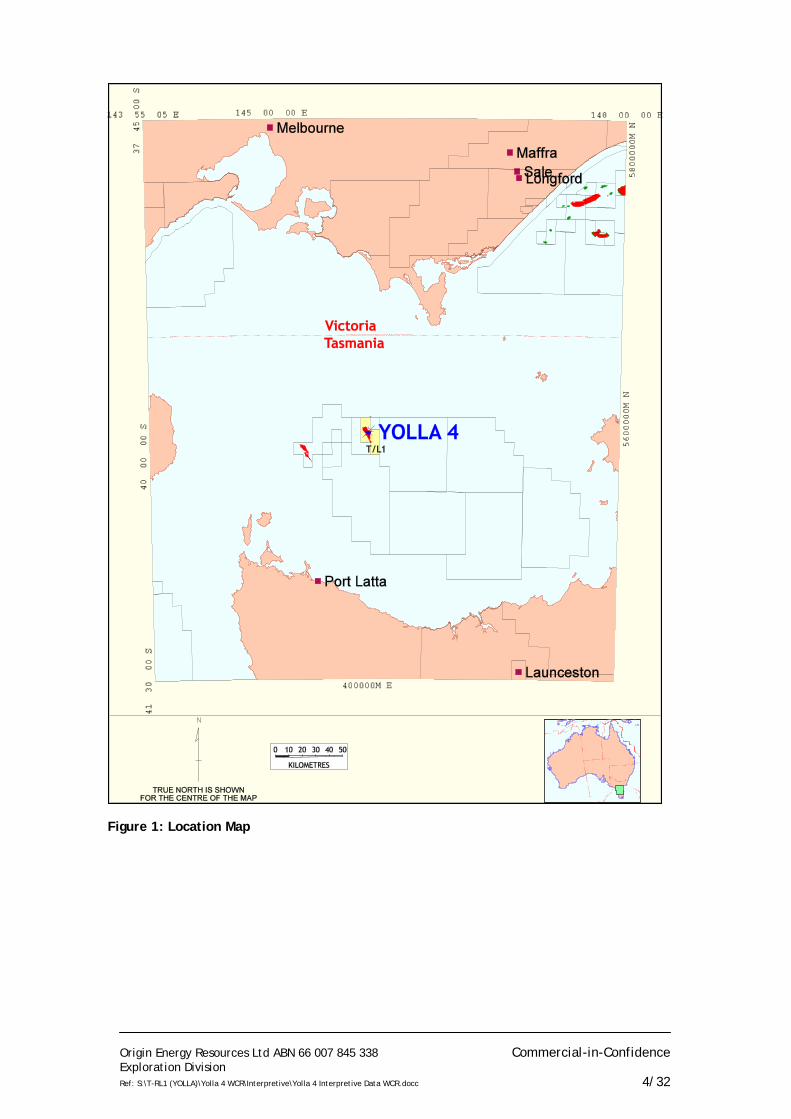
Yolla 4 was drilled as a deviated development well in the northern part of the Yolla Gas Field in the offshore Bass Basin, Tasmania within Production Licence T/L1. The well is located approximately 120 kilometres offshore from Tasmania and 200 kilometres south south-east of Melbourne, Victoria (Figure 1). The well was drilled using the ENSCO 102 jack up drilling rig, which was temporarily cantilevered over the top of the Yolla A permanent production platform. The well was directionally drilled in a southerly direction from the platform. Yolla 4 targeted the sandstone reservoirs of the Eastern View Coal Measures (EVCM) previously intersected and evaluated in Yolla 1 and Yolla 2. The well was designed to intersect the top Eastern View Coal Measures (EVCM) 1290m NNE of Yolla 2 and the top of the 2809 gas reservoir (intra-EVCM) 940m NNE of Yolla 2. Yolla 4 spudded on the 18th June 2004. Primary objectives within the Paleocene, termed 2718, 2755, 2809 and 2973 sand units, were intersected close to prognosed depth. Surprisingly the 2718 sand was found to be water wet. All other objectives were production tested and flowed gas and condensate. An unpredicted oil zone was encountered higher in the EVCM, termed 2458 sand unit which flowed oil on test. The well reached total depth of 3235mRT (3054.25mTVDSS) on 11th July 2004. Following production testing, the rig was released to Yolla 3 on 8th August 2004. On 30th September 2004, after the Yolla 3 operations were completed, the rig skidded back to the Yolla 4 well bore. This was to determine the source of a leakage down hole and undertake further testing of the 2809 sand unit to obtain uncontaminated samples. This retesting was necessary as the analysis of the original samples collected from Yolla 4 were spurious due to leakage of hydrocarbons from the 2973 sand mixing with the hydrocarbons produced from the shallower gas zones. After successfully completing these objectives the rig was then released on 16th October 2004 to the T/18P joint venture to drill Trefoil 1.
Origin Energy Resources Ltd ABN 66 007 845 338 Commercial-in-Confidence Exploration Division Ref: S:\T-RL1 (YOLLA)\Yolla 4 WCR\Interpretive\Yolla 4 Interpretive Data WCR.docc 4/32
Figure 1: Location Map
Origin Energy Resources Ltd ABN 66 007 845 338 Commercial-in-Confidence Exploration Division Ref: S:\T-RL1 (YOLLA)\Yolla 4 WCR\Interpretive\Yolla 4 Interpretive Data WCR.docc 5/32
3. WELL RESULTS 3.1 Hydrocarbons Encountered
In this section 3.1, all depths of shows described while drilling are referenced to driller’s depths. Mudlog gas readings commenced from 900mRT. Background gas readings in Yolla 4 remained fairly steady down to the base of the Miocene section of the upper Angahook Formation (total gas range 4 – 38 units). No significant gas peaks were recorded and no fluorescence was observed.
The first sandstone in the well was intersected at a depth of 1315mRT,
within the Miocene age Angahook volcanics. At this depth a gas peak of 221 units, including up to C5, was recorded. Gas readings dropped to background levels (average 12 units total gas) below 1322mRT.
Throughout the remainder of the Angahook Formation and the underlying
Demons Bluff Formation, background gas readings steadily increased from average 20 units to 60 units, with very minor gas peaks recorded within sandstone interbeds at 1396mRT (49 units), 1501mRT (57 units) and 1526mRT (48 units).
Immediately upon entering the Eastern View Coal Measures gas readings
climbed sharply to a total gas peak of 173 units at 1908mRT. Trace fluorescence was noted between 1908mRT and 1914mRT. The fluorescence is described as very dull, pinpoint, dark yellow, no direct cut, no crush cut and no residue ring. The well is interpreted to have encountered the basal 3m of the oil column which was discovered in Yolla 1. The OWC for this accumulation is at –1831mTVDSS.
Gas readings reduced to high background levels averaging 79 units between
1912mRT to 1938mRT. Total gas remained at background levels averaging between 6 and 43 units from 1938mRT to 2602mRT, except for peaks at coal beds. The most significant peaks associated with coals are 158 units at 2318mRT, 125 units at 2375mRT, 109 units at 2406mRT, 184 units at 2481mRT, 354 units at 2595mRT.
At 2602mRT total gas readings rose to 364 units accompanied by significant
increase in gas wetness ratio and direct 70% fluorescence in sandstone cuttings. The fluorescence is bright, even, light green, no direct cut, very slow bleeding crush cut, bright, light green patchy residue ring. This sandstone was subsequently tested with MDT samples and production tested. The sandstone interval 2603.7 to 2619.6mRT (-2460.7 to 2475.2mTVDSS) is interpreted to be oil-bearing with 2.5 metres of net pay. No OWC is interpreted from the pressure data however a water sample was obtained at 2614.5mRT. This oil-bearing sand is referred to as the 2458 sand (2458mTVDSS being the drillers depth at which the top of the sand was encountered in Yolla 4).
Below the small oil zone, gas readings remained at background levels from 5 to 61 units from 2614mRT to 2894mRT. Gas peaks associated with coals were encountered at 2657mRT (121 units) and 2663mRT (139 units). Fluorescence was noted at 3 intervals:
2614 to 2630mRT – 50% fluorescence in sandstone aggregates, bright yellow,
moderately fast, even crush cut, bright green, bleeding direct cut and a thin pale green residue.
Origin Energy Resources Ltd ABN 66 007 845 338 Commercial-in-Confidence Exploration Division Ref: S:\T-RL1 (YOLLA)\Yolla 4 WCR\Interpretive\Yolla 4 Interpretive Data WCR.docc 6/32
2652 to 2658mRT – trace fluorescence in sandstone cuttings, dull yellow, no direct cut, no crush cut, trace broken pale cream residue ring.
2860 to 2883mRT – trace fluorescence, dim yellow, trace to very slow direct and crush cut, dim cream broken film residue.
At 2894mRT the 2755 sand (gas zone) was intersected and total gas readings
rose to 390 units, dropping to background levels at 2909mRT. Within core #1 taken in the 2755 sand, fluorescence between 2895mRT to 2907.8mRT is described as 5 to 90% dull to bright green, no to very slow direct cut, very slow to no crush cut, dull to bright cream broken film residue. Log analysis, MDT and production test results indicate a 7.6m net gas column was intersected with the GWC at 3009.0mRT (-2832.0mTVDSS).
Between the 2755 sand and the 2809 sand (2909 to 2958mRT), gas levels
generally remained at background levels between 4 and 12 units, except for a peak of 30 units at 2946mRT within a tight sandstone.
The 2809 sand (gas zone) was cored (core #2 2958 to 2985.4mRT) and had average total gas readings of 446 units and fluorescence occurred intermittently between 2958 and 2981mRT. The fluorescence was trace to nil, dull to bright green, patchy, no direct cut, very slow to trace crush cut, dull white cream residue ring. Log analysis, MDT and production test results indicate a 20.8m net gas column was intersected with the GWC at 3266.2mRT (-2826.5mTVDSS).
Below the 2809 sand, from 2985.4 to 3130mRT total gas levels within the
predominantly siltstone and claystone interval remained at 8 to 22 units. One small sandstone unit (termed the 2844 zone) contained a gas peak of 94 units between 3003 to 3006mRT.
The 2952 sand was intersected from 3118 to 3130mRT where gas peaked at 207 units. Background gas readings remained relatively high (30 to 77 units) from 3120mRT to the top of the 2973 gas zone at 3145mRT.
The 2973 sand (gas zone) exhibited high gas peaks up to 258 units between
3145 and 3164mRT. Log analysis, MDT and production test results indicate a 9.8 meter net gas column was intersected in this well with the GWC interpreted at 3170.3mRT (-2990.0mTVDSS).
From the base of the 2973 sand to total depth, total gas readings remained low averaging between 5 and 6 units.
3.2 Stratigraphy
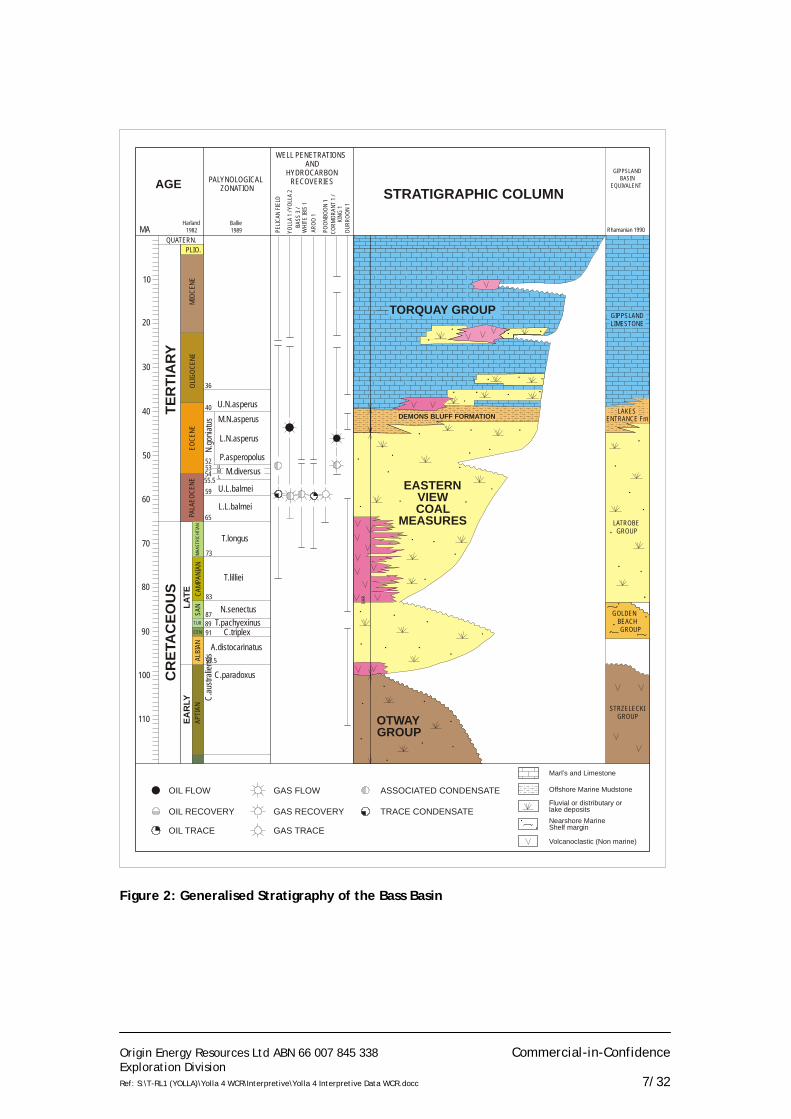
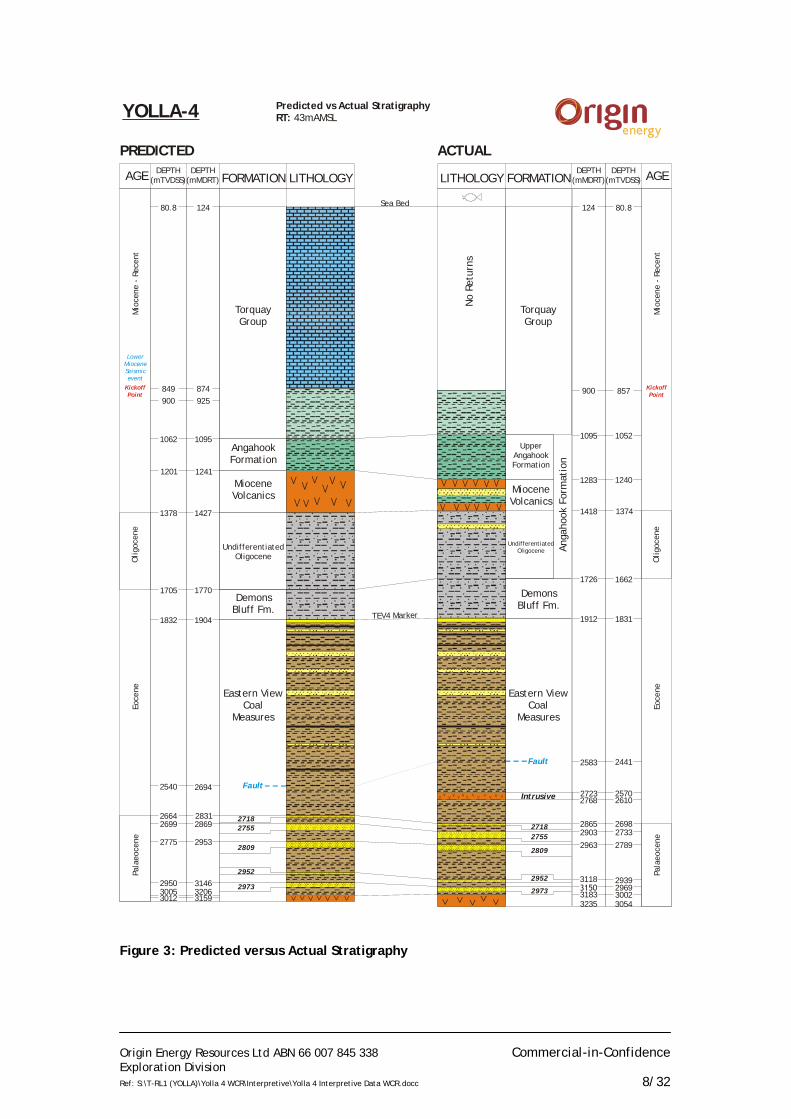
A generalised stratigraphy of the Bass Basin is illustrated in Figure 2. Figure 3 contains a comparison between the pre-drill prognosis and actual stratigraphy encountered at Yolla 4. A further report by Dr Roger Morgan (Morgan Palaeo Associates) on the age and palaeo-environment of 15 cuttings samples is included in Appendix 6. This report also contains maturity data derived from the spore colour index method.
Lithological descriptions from ditch cuttings, sidewall core and
conventional core (see Appendices 1, 2 and 3, Yolla 4 Well Completion Report Volume 1, Basic Data), together with the MWD and wireline log interpretation (Appendix 1, this volume), provide the basis for the stratigraphic breakdown in the Composite Well Log (Enclosure 1). All thicknesses quoted are referenced to TVDSS depths.
Origin Energy Resources Ltd ABN 66 007 845 338 Commercial-in-Confidence Exploration Division Ref: S:\T-RL1 (YOLLA)\Yolla 4 WCR\Interpretive\Yolla 4 Interpretive Data WCR.docc 7/32
10
20
30
40
50
60
70
80
90
100
110
QUATERN.
AGE
PELIC
AN F
IELD
AROO
1
POON
BOON
1
EAR
LYLA
TE
C.au
strali
ensis
C.paradoxus
A.distocarinatusC.triplex
T.pachyexinusN.senectus
T.longus
P.asperopolus
MA
STRATIGRAPHIC COLUMN
OIL FLOW
OIL RECOVERY
OIL TRACE
GAS FLOW
GAS RECOVERY
GAS TRACE
ASSOCIATED CONDENSATE
TRACE CONDENSATE
CR
ETA
CEO
US
TER
TIA
RY
PLIO.
MIOC
ENE
CEN
TUR
SAN
PALA
EOCE
NEEO
CENE
OLIG
OCEN
E
L.L.balmei
U.L.balmei
M.diversusUML
U.N.asperusM.N.asperus
L.N.asperus
36
40
52535455.559
65
73
83
878991
97.5
Harland1982
Ballie1989
WELL PENETRATIONSAND
HYDROCARBONRECOVERIESPALYNOLOGICAL
ZONATION
Rhamanian 1990
GIPPSLANDBASIN
EQUIVALENT
N.go
niatus
TORQUAY GROUP
DURR
OON
1
STRZELECKIGROUP
GIPPSLANDLIMESTONE
LAKESENTRANCE Fm
OTWAYGROUP
APTI
ANAL
BIAN
CAMP
ANIA
N
BAR
MAAS
TRIC
HTIA
N LATROBEGROUP
GOLDEN BEACH
GROUP
DEMONS BLUFF FORMATION
EASTERNVIEWCOAL
MEASURES
T.lilliei
BASS
3 /
WHI
TE IB
IS 1
CORM
ORAN
T 1 /
KING
1
Marl’s and Limestone
Offshore Marine Mudstone
Fluvial or distributary orlake deposits
Volcanoclastic (Non marine)
Nearshore MarineShelf margin
YOLL
A 1 /
YOL
LA 2
Figure 2: Generalised Stratigraphy of the Bass Basin
Origin Energy Resources Ltd ABN 66 007 845 338 Commercial-in-Confidence Exploration Division Ref: S:\T-RL1 (YOLLA)\Yolla 4 WCR\Interpretive\Yolla 4 Interpretive Data WCR.docc 8/32
80.8
849900
1705
MioceneVolcanics
TorquayGroup
Pala
eoce
neEo
cene
Olig
ocen
eM
ioce
ne -
Rec
ent
DEPTH(mTVDSS)AGE FORMATION LITHOLOGY
YOLLA-4 Predicted vs Actual StratigraphyRT: 43mAMSL
PREDICTED ACTUAL
LowerMioceneSeismicevent
1201
1062AngahookFormation
Undifferentiated Oligocene
DemonsBluff Fm.
Eastern ViewCoal
Measures
27182755
Fault
2952
2973
V
V
V
1378
2664
3012
1832
3005
Figure 3: Yolla-4 Predicted Versus Actual Stratigraphy
2809
KickoffPoint
DEPTH(mMDRT)
124
874925
1095
1241
1427
1770
1904
2831
32063159
2694
Pala
eoce
neEo
cene
Olig
ocen
eM
ioce
ne -
Rec
ent
KickoffPoint
AGEDEPTH(mTVDSS)
DEPTH(mMDRT)LITHOLOGY FORMATION
80.8
857
1052
1831
1374
1240
1662
2698
3054
2441
3002
124
900
1095
1283
1418
1726
1912
2583
V
V
V MioceneVolcanics
TorquayGroup
UpperAngahookFormation
Undifferentiated Oligocene
DemonsBluff Fm.
TEV4 Marker
Eastern ViewCoal
Measures
27182755
Fault
2952
2973
2809
3146
2953
2869 2865
31833235
3118
2963
2903 2733
2789
29392969
No
Retu
rns
2723 2570
Anga
hook
For
mat
ion
26102768V V Intrusive 2540
2950
2775
2699
Sea Bed
Figure 3: Predicted versus Actual Stratigraphy
Origin Energy Resources Ltd ABN 66 007 845 338 Commercial-in-Confidence Exploration Division Ref: S:\T-RL1 (YOLLA)\Yolla 4 WCR\Interpretive\Yolla 4 Interpretive Data WCR.docc 9/32
Torquay Group (123.8 to 1095.0mRT, 80.8 to 1052.0mTVDSS)
The Torquay Group in Yolla 4 is approximately 971.2 mTVD thick. The unit is interpreted to be deposited under shallow marine conditions and can be seismically divided into two upper units separated by a prominent seismic marker called the ‘Lower Miocene Seismic event’. This event separates the Pliocene to Miocene mainly calcareous dominated lithology from the underlying Miocene age claystone. The third and lowermost unit of the group is the Angahook Formation, which itself can be divided into 3 sub-units.
Returns were established from 900mRT therefore lithology above this depth
is assumed to be similar to the offset well Yolla 1. In Yolla 1 the top portion of the Torquay Group consists of a bioclastic limestone. This upper limestone section comprises white to mid-grey, coarse- to fine-grained unconsolidated bioclastic calcarenite to calcirudite composed of friable and loosely cemented skeletal debris consisting of pelecypods, bryozoans, foraminifera and gastropods. The fragment size decreases with depth with biocalcirudites grading to biocalcarenites and calcarenites and finally calcilutites. Quartz grains appear in the lower portion of the limestone interval. There is a general increase in the proportion of clay in silt towards the base of this interval.
The lower portion of the Torquay Group is described in Yolla 4 as olive grey
to green grey and light to medium grey, off white, soft to very soft, dispersive to sub-blocky, up to 20% calcareous, with trace amounts of: silt, fossil fragments, forams, shell fragments, carbonaceous matter and disseminated pyrite.
Angahook Formation (1095.0 to 1726.0mRT, 1052.0 to 1662.2mTVDSS)
Overall the thickness of the Miocene to Oligocene Angahook Formation in Yolla 4 is 610.2mTVD. This unit is distinctive from the overlying upper units of the Torquay Group due to reworking and presence of volcanics and sediments proximal to centres of Miocene volcanism (Lennon et al, 1999).
Upper Angahook Formation (1095.0 to 1283.0mRT, 1052.0 to 1240.0mTVDSS)
In Yolla 4 the upper part of the Angahook Formation consists of claystone
which is light olive grey to light to medium grey, off white, loose to very soft, sub-blocky to dispersive, is up to 7% calcareous and contains traces of silt, very fine sand, carbonaceous grains, siderite and lithic grains. The basal interval from 1244mRT – 1283mRT also contains a second claystone lithology which consists of off white to rare red brown, very soft to dispersive clays with a rare slight tuffaceous texture.
The log response through this interval is a fairly uniform GR and resistivity response with a slight decrease in GR from the top of the unit to the base suggesting a gradual fining upward trend in grainsize. The mudlog shows a minor but consistent increase in gas and wet gas from the top to the base.
Angahook Volcanics
(1283.0 to 1418.0mRT, 1240.0 to 1374.0mTVDSS)
The volcanic-rich interval within the Angahook Formation in Yolla 4 is described as interbedded volcanic tuff, claystone, sandstone and minor

Origin Energy Resources Ltd ABN 66 007 845 338 Commercial-in-Confidence Exploration Division Ref: S:\T-RL1 (YOLLA)\Yolla 4 WCR\Interpretive\Yolla 4 Interpretive Data WCR.docc 10/32
siltstone. The top of the unit is distinctive on logs due to the gamma-ray (GR) response of the tuffs compared to the overlying claystone. The top of the unit is picked on a thin very high GR response (4 m drilled thickness in Yolla 4) which is immediately underlain by a thicker low GR (15 m drilled thickness in Yolla 4). Both of these features are correlatable to Yolla 1 and Yolla 3. The tuff is assumed to be sourced from the Miocene volcano which is evident on seismic and located just to the north of the Yolla Field.
The volcanic tuff is blue-grey in colour, soft, sub-blocky to amorphous, with
tuffaceous texture in part with a predominantly silt to very fine sand size quartz and glassy ground mass, commonly the tuff is weathered to claystone. The claystone is light brown grey to light medium grey colour, very soft, dispersive containing 10% calcareous grains and trace of pyrite. The sandstone grains are clear to translucent, loose to rare soft small aggregates consisting of 40% very fine grains, 50% fine grain and 10% medium grain size which are moderately sorted, subrounded to occasionally rounded, sub-elongate to sub-spherical, weak siliceous cement and 3% tuff matrix and inferred 20% intergranular porosity. The siltstone which is only described in the base of the unit between 1370 – 1418mRT is medium to light grey, soft, sub-blocky and contains 10% calcareous grains and 10% clay, 20% very fine sand and 10% fine sand size grains, 3% glauconite and trace siderite.
The Angahook Volcanics unit lies within the spore-pollen zone upper
P.tuberculatus (lower Miocene). Spores and pollens are subordinate to dinoflagellates indicating a marine depositional environment ranging from shelfal at the base to offshore higher up in the interval suggesting a gradational deepening of water depth upwards in the stratigraphy.
Undifferentiated Oligocene (1418.0 to 1726.0mRT, 1374.0 to 1662.2mTVDSS)
The remaining basal interval of the Angahook Formation is a clastic
dominated marine unit of interbedded sandstone, siltstone and claystone, within increasing percentage of siltstone and decreasing sand content down hole.
An apparent increase in sandiness from the GR response, compared to the
overlying unit, characterises the top of this interval. There is a gradual decrease in grain size down hole. The overall GR and resistivity log responses (from the LWD tools) is fairly bland.
Siltstone is the dominant lithology in this interval and consists of light to
medium grey colour, very soft to soft, sub-blocky, 10-15% calcareous grains, 5-10% clay, 50% silt, 20% very fine sand size grains and 0-10% fine sand grains, weak calcareous cement, up to 3% glauconite grains, 0 – 3% lithics and trace siderite. The sandstone is light grey, off-white to light brown, very soft to soft, sub-blocky fracture, with 5% calcareous grains, 5- 0% clay size grains, 10-30% silt, 40% very fine sand, 0-20% fine sand and 0-10% medium sand size grains, well to poorly sorted, sub-angular to angular, sub-spherical grains with a weak calcareous cement weakly argillaceous matrix in part and accessories are 0 3% glauconite, 0-5% lithics, trace pyrite and 3-5% intergranular porosity. The claystone interbeds are light grey to olive green coloured, very soft, dispersive, and is made up of 5-30% calcareous grains, 50-60% clay, 10-30% silt and 5 – 10% very fine sand grains and trace glauconite.
The one sample analysed for palynology within this sub-formation is
assigned to the lower P. tuberculatus spore-pollen zone (Oligocene), or
Origin Energy Resources Ltd ABN 66 007 845 338 Commercial-in-Confidence Exploration Division Ref: S:\T-RL1 (YOLLA)\Yolla 4 WCR\Interpretive\Yolla 4 Interpretive Data WCR.docc 11/32
could be as old as N. asperus. Spore and pollens are dominant and diverse compared to scarce low diversity dinoflagellates suggesting a very nearshore marine depositional environment.
Demons Bluff Formation
(1726.0 to 1883.0mRT, 1662.2 to 1804.2mTVDSS)
The Demons Bluff Formation lithology is dominated by siltstone within minor interbedded sandstone and claystone and trace dolomite. This formation forms a thick regional seal over the EVCM.
The GR logs at the top of the unit show a distinct baseline shift indicating a reduction in overall grainsize compared to the Angahook Formation. The LWD GR and resistivity log responses throughout the interval are very uniform.
The siltstone is medium grey to dark grey-brown, soft to firm, sub-blocky with 0 – 5% calcareous grains, 20-30% clay, 50-60% silt, 5-15% very fine sand, 0 – 10% fine sand size grains with trace mica and trace carbonaceous matter. The sandstone consists of medium to light brown grains and dark grey coloured clasts, firm, sub-blocky made up of 5% clay, 15% silt, 50% very fine sand and 30% fine sand, moderately sorted, sub-angular, sub-elongate, siliceous cement with moderate strength, 5% calcite and 5% visual intergranular porosity. The claystone interbeds are silty, light grey coloured, very soft, dispersive, 5% calcareous grains, 60% clay, 30% silt, 5% very fine sand. The minor dolomite is described as medium brown, firm to moderately hard, angular, sharp fragments.
Near to top of the Demons Bluff Formation, one cuttings sample was examined for spore-pollen age assignment. Very few diagnostic palynomorophs were recovered from the sample and an uncertain zonation of N. asperus is assigned. Marginal marine depositional conditions are interpreted due to the rare dinoflagellates compared to the dominant and diverse spores and pollen present.
Eastern View Coal Measures (1883.0 to 3182.6mRT, 1804.2 to 3002.2mTVDSS)
The Eastern View Coal Measures (EVCM) is a very thick succession of non-marine fluvio-lacustrine deposits at the base to nearshore and marginal marine sediments at the top of the formation. Younger volcanic related intrusives are also present within this formation. The formation ranges in age from Eocene to Paleocene in Yolla 4.
The formation can be split into 3 broad lithological units. The top unit dated as Middle to Late Eocene, based on the presence of the middle to lower N.asperus spore pollen zone, is sandstone-rich and is interpreted to be deposited in a marginal marine to near-shore marine environment. The middle unit is a highly thinly interbedded coal, siltstone and minor sandstone and is Early Eocene as it includes the P.asperopolus (from Yolla 1 data) to middle M.diversus spore pollen zones. These sediments are interpreted to have been deposited in a nearshore marine to non-marine lacustrine/lagoonal settings. The basal interval is dominated by thick beds of siltstone and sandstone and was deposited in a dominantly fluvial setting with minor nearshore or marginal marine influence. The age of these sequences is Early Eocene to Paleocene, as they span the spore-pollen zones lower M.diversus to lower L.balmei.
Origin Energy Resources Ltd ABN 66 007 845 338 Commercial-in-Confidence Exploration Division Ref: S:\T-RL1 (YOLLA)\Yolla 4 WCR\Interpretive\Yolla 4 Interpretive Data WCR.docc 12/32
The topmost unit of the EVCM occurs between 1883.0 to 2182mRT in Yolla 4. As soon as the top of the EVCM is penetrated the GR log shows increasing grainsize accompanied by increase in gas readings. These both increase over the next 30 m (relative to TVDSS thickness), though the lithology is still dominantly siltstone with increasing fine sandstone appearing. The TEV4 unit (informal name) heralds the topmost sandstone of the EVCM in Yolla 1. This interval is dominated by sandstone within interbedded siltstone, and minor thin coal beds appearing near the base of the unit. The sandstone is medium brown to light brown grey, light green to off-white, clear to translucent, loose to soft, sub-blocky, composed of 20-30% clay, 0-30% silt, 0 – 70% very fine sand grains, 0 – 30% fine sand and 0 – 40% medium sand grains, 0 – 40% coarse sand grains, 0 – 20% very coarse sand grain size, which are poorly to well sorted, sub-rounded, sub spherical to sub-elongate, weakly argillaceous and weak silica cement, occasionally strongly pyrite cemented, trace carbonaceous grains and trace to 20% intergranular visual porosity. The interbedded siltstone is medium brown to brownish grey to black-grey to black-brown to white-brown, very soft to soft – friable, sub-blocky to sub-fissile, with trace calcareous grains, consisting of 10-50% clay, 40 – 70% silt and trace 30% very fine sand grains, and traces of pyrite, mica and carbonaceous grains. The coals are described as black, firm to friable, brittle, blocky, vitreous to sub-vitreous, sub-conchoidal to hackly fracture.
The middle EVCM unit occurs between 2182 to 2723mRT. This portion of the EVCM is composed of thinly bedded siltstone, coals, sandstone and minor claystone. The siltstones intersected are sandy in part, off-white to light brown to speckled black and becoming medium to dark brown and dark grey to grey with depth, moderately hard to very soft, sub-fissile to blocky, composed of 0 – 40% clay, 40 – 100% silt, trace – 20% very fine sand grains, 0 – 10% fine sand grains with traces of argillaceous matrix and micro mica and up to 5% carbonaceous grains and up to 15% carbonaceous laminae. The coals are black to dark brown, friable to firm, brittle, sub-vitreous to vitreous, blocky, sub-conchoidal to hackly fracture with trace argillaceous matter and silt. The sandstones are described as off-white to clear to light brown, translucent, loose to soft and composed of 0 – 40% clay, 5-10% silt, 15-80% very fine sand, trace – 40% fine sand, 10 – 60% medium sand, 0-20% coarse sand grains, very poorly to well sorted, rounded to sub-angular, sub-spherical to sub-elongate, and trace to 30% weak argillaceous or kaolinite matrix weak, trace rarely weak calcareous cement, fossils and carbonaceous grains and 3-20% intergranular visual porosity.
A normal fault was intersected in the well at an interpreted depth of 2582.5mRT, based on wireline log correlation with the other Yolla Field wells. Approximately 40 to 50 metres of section appear to be missing due to crossing from the downthrown side of the fault to the up-thrown side of the fault. This fault was predicted pre-drill from seismic interpretation but came in approximately 100m shallower than predicted.
An oil-bearing sand was encountered from 2603.7 – 2619.7mRT. This sand is informally named the 2458 sand. The lithology was determined by petrological analysis of two MSCT’s taken within this sand (Appendix 7) and is described as thinly laminated, well sorted very fine grained quartz arenites. The quartz grains are angular to subrounded. One sample contains abundant siderite with probable very high grain density. The thin laminae include fine organic fragments /stringers and compacted mica flakes. The minor lithics present (1.7 – 3.0%) are all low-grade metasedimentary rock fragments. Clays are mostly authigenic kaolin with very minor illite. Mica is a common accessory. Quartz overgrowths are minor having been inhibited by the presence of siderite and authigenic kaolin. Reservoir quality is poor in the 2 MSCT’s examined with less than 2% total visual porosity.
Origin Energy Resources Ltd ABN 66 007 845 338 Commercial-in-Confidence Exploration Division Ref: S:\T-RL1 (YOLLA)\Yolla 4 WCR\Interpretive\Yolla 4 Interpretive Data WCR.docc 13/32
At the base of this middle section, from 2723.4 – 2767.7mRT, a thick igneous sill has intruded into the sediment pile. The intrusive is a dolerite/gabbro described in Yolla 4 as mottled white green, speckled black, soft to firm occasionally hard, medium to coarse crystal size, common quartz, biotite, plagioclase, black to green pyroxene, calcareous, commonly altered to clay with a chloritic ground mass.
Below the intrusive, the lowermost portion of the EVCM was intersected between 2767.7 – 3182.6mRT. This interval is dominated by thickly bedded siltstones and sandstones, minor claystone and rare coal. This section contains the primary targets of the well which are the gas-bearing reservoirs of the Yolla Field known as the 2755, 2809 and 2973 sands. The 2755 and 2809 sands were almost entirely cored in Yolla 4. Detailed descriptions of these cores can be found in Appendix 8.
Above each of the reservoir zones are thick siltstone units which are providing top seal over the gas pay. The siltstones are described as light to medium to dark grey to grey black, brownish grey, soft to hard, blocky to sub-fissile, composed of 10-30% clay, 50-90% silt, 0-40% very fine sand grains and 0 – 5% fine sand grains with traces of dolomite, micro mica and pyrite, occasionally very carbonaceous.
The first sand unit encountered in this interval is the 2718 sand. This sand is 6.1m thick (relative to TVD) in Yolla 4 was present between 2864.8 to 2871.4mRT. The sand had previously been interpreted as gas-bearing in Yolla 1, but is clearly water saturated in Yolla 4 based on wireline log and MDT data. The interval is interpreted from the wireline logs to have 4.2 mMD of net sand with an average porosity of 17.7%. The sandstone is described as light greyish yellow, soft to firm, sub-blocky consisting of 10% clay, 10% silt, 50% very fine sand and 30% fine sand grains which are moderately sorted, sub-angular, sub-elongate to sub-spherical and weakly cemented with silica and weak argillaceous matrix (10 – 20% of total cuttings) 3% visual intergranular porosity.
The next major sand unit to be drilled was the 2755 sand between 2902.7 – 2912.1mRT. This gas-bearing sand was fully cored and consisted of mainly sandstone with minor siltstone and coal. The sandstone colour varies from pale cream to light to medium brown with clear to translucent grains and is moderately hard to friable, composed of 20% silt, 40% very fine sand, 40% fine sand, moderately sorted, sub-angular, sub-spherical, moderately strong argillaceous cement, silty in part with 5 – 15% visual intergranular porosity. Two core plugs within this sand were selected for petrological analysis (Appendix 7). One sample, taken in a low permeability interval, is a very fine grained quartzarenite with little intergranular porosity mainly due to authigenic kaolin filling pore space along with minor quartz overgrowths and compacted siderite grains. The other sample, taken in a high permeability zone is a much coarser quartzarenite, being upper medium grain size and more quartzose. Most porosity reduction is due to quartz overgrowths with minor kaolin formation and physical compaction. Core analysis through the sand (not including the non-net intervals at the top and base of the core) had average measured porosity of 17.3% (range 2.0 – 23.1%) and average permeability of 853 mD (range 0.41 – 4616mD. Detailed core description (Appendix 8) of the 2755 sand interprets the overall facies as alluvial to lacustrine with sheetflood deposition dominant. The top half of the sand is thin bedded and deposited in a lacustrine fan-delta shoreline within a transgressive systems tract. The basal half of the sand is thick bedded and may have been deposited in an alluvial fan/fan delta within a lowstand systems tract. The overlying siltstone and coal was probably deposited within a coastal plain environment. The basal section of core is
Origin Energy Resources Ltd ABN 66 007 845 338 Commercial-in-Confidence Exploration Division Ref: S:\T-RL1 (YOLLA)\Yolla 4 WCR\Interpretive\Yolla 4 Interpretive Data WCR.docc 14/32
siltstone and mudstone dominated and is interpreted as back barrier lagoon facies with coastal mire/vegetation mats to progradational lacustrine sheetflood fan delta facies.
The 2809 gas-charged sand is the third sand body encountered in this section and is present between 2962.6 – 2984.8mRT with a vertical thickness of 20.8m. Core #2 covered the entire gas column. The sands in this interval are described as light to medium brown and light brownish grey to medium grey, firm to moderately hard comprising occasional clay matrix (0 – 20%), trace 30% silt, 5-40% very fine sand, 10-70% fine sand grain size, 10-30% medium sand, trace – 30% coarse sand, 20% very coarse sand and trace granule size grains, which is mainly very poorly to moderately sorted, well sorted at the base, sub-angular and sub-spherical to sub-elongate grains with moderate to strong siliceous and weak to moderately strong argillaceous cement, 10 – 20% visual intergranular porosity, decreasing to 3% at the base of the sand. Two thin sections from core plugs which represented end members in the permeability measured within the 2809 sand were submitted for petrological analysis (Appendix 7). The low permeability sample is a well sorted fine grained sublitharenite containing thin siderite and heavy mineral laminae. Authigenic kaolin has almost completely filled available pore space. The high permeability sandstone is an upper coarse grain size quartzarenite that has undergone severe grain contact dissolution. Further porosity reduction is due to minor quartz overgrowths and patchy kaolin matrix. Framework grains are commonly rimmed by bitumen which has inhibited quartz overgrowth cementation leading to very high porosity and permeability. Core analysis results show an average measured porosity of 17.3% (range 0.5 – 23.1%) and average permeability of 337 mD (range 0.05 – 2121mD). The interpretive core description (Appendix 8) places most of the sand as deposited within a sheetflood dominated alluvial fan/fan delta facies. The basal 5m section of the core is slightly finer grained and is interpreted as deposited within a prograding lacustrine wave-influenced shoreline.
Below the 2809 sand, 2 poorly developed coarsening upward sequences are present and these both culminate in 2 thin sand units at the top. They have been correlated with the 2844 sand unit in Yolla 1. In Yolla 4 the 2844 sand is gas-bearing and was intersected from 3005.0 – 3014.9mRT. The sand unit is mainly tight and is interpreted to contain of 1.3 metres of net-pay only.
The 2844 sand unit consist of white, clear to translucent grains, loose to soft, 20% fine sand, 40% medium sand, 30% coarse sand and 10% very coarse sand, poorly sorted, angular, elongate, weak siliceous cement and 20% visual intergranular porosity.
A very thick siltstone with minor claystone is present between the 2844 sand unit and the deepest sandstone units in the well. The unit is very argillaceous and silty with 30% very fine sand and 10% fine sand grains, well sorted, sub-rounded, sub-spherical, weak argillaceous cement with trace carbonaceous grains and trace visual intergranular porosity. The claystone is light grey, soft, dispersive, composed of 50% clay, 30% silt and 20% very fine sand.
The lowermost sandstone intervals in Yolla 4 are termed the 2952 and the 2973 sands. The 2952 sand is interpreted to be tight and water saturated and was intersected between 3118.3 to 3130.1mRT in Yolla 4 and is 11.7m thick (referenced to TVD). This sand is off-white to light brown, moderately hard, sub-blocky comprising 15% clay, 5% silt, 40% very fine sand, 40% fine sand and trace of medium sand size grains. The sand is well sorted and grains are sub-angular and sub-spherical with moderately hard argillaceous matrix with trace carbonaceous matter and 5% visual intergranular porosity.
Origin Energy Resources Ltd ABN 66 007 845 338 Commercial-in-Confidence Exploration Division Ref: S:\T-RL1 (YOLLA)\Yolla 4 WCR\Interpretive\Yolla 4 Interpretive Data WCR.docc 15/32
The 2973 sand is the deepest gas-bearing unit in Yolla 4. It is 15.7m thick (referenced to TVD) and occurs between 3149.4 – 3165.4mRT in the well. The sands of this interval are off-white to light brown, soft, sub-blocky composed of 10% clay, 20% very fine sand, 30% fine sand and 40% medium sand grains which are moderately sorted, sub-angular and sub-spherical with weak argillaceous cement and 10% visual intergranular porosity.
Below the gas-bearing zones in the well, the basal 17m of the EVCM consists of interbedded argillaceous very fine sandstone and siltstone. The sandstone is off-white to light brown, firm, sub-blocky comprising 30% clay, 60% very fine sand and 10% fine sand which is well sorted, sub-angular and sub-spherical grains with a moderately to strong argillaceous cement and up to 5% visual intergranular porosity.
Basal Volcanics (3182.6 to 3235.0mRT, 3002.2 to 3054.3mTVDSS)
Between the base of the EVCM and total depth in Yolla 4 a basalt sequence was drilled. The basalt varied from relatively fresh to extremely altered, probably due to weathering. The age of the basalts is interpreted to be Late Cretaceous or Early Paleocene.
The weathered basalt is described as off-white to very light brown mottled, occasionally pale yellowish brown, firm, blocky, very fine groundmass, rare weathered feldspar and pyroxene, trace indistinct flow structure, commonly weathered to clay, trace black obsidian. The unaltered basalt is dark greenish black, reddish brown to purple grey, very common olivine to 70% occasionally weathered, minor pyroxene, occasional red/brown ground mass, common free calcite, rare indistinct flow structure.
Within the basalt are some minor interbedded sandstone and siltstone. The
sandstone is light brown to light grey, firm, sub-blocky consisting of 30% clay, 60% very fine sand and 10% fine grained sand which is well sorted, sub-angular and sub spherical grains with a moderate strength argillaceous matrix and up to 25% kaolinite and 5% intergranular visual porosity. The siltstone is medium to dark grey, moderately hard, sub-fissile and composed of 30% clay, 40% silt, 30% very fine sand, trace fine sand grains and trace carbonaceous matter.
3.3 Reservoir Evaluation
3.3.1 Petrophysical Summary
A comprehensive petrophysical review was conducted to assess the reservoir quality and hydrocarbon saturation of all zones which displayed good hydrocarbon shows while drilling (Appendix 1). These zones were concentrated in the Eastern View Coal Measures (EVCM) but included one zone within the Angahook Formation. The study entailed an analysis of all available lithological data, core samples and MDT and production test data. Full diameter cores were acquired through the entire section of the 2755 and 2809 sandstone and have been analysed to determine RCA and SCAL properties which were then used to calibrate the log analysis. A summary of the log analysis is presented in Table 1. The results through the main gas reservoirs in the EVCM are summarized below:
The 2718 sand (2864.8 – 2871.4mRT) is good quality sandstone, but water bearing at Yolla-4. The interval is interpreted from the wireline logs to have 4.2 mMD of net sand with an average porosity of 17.7% and
Origin Energy Resources Ltd ABN 66 007 845 338 Commercial-in-Confidence Exploration Division Ref: S:\T-RL1 (YOLLA)\Yolla 4 WCR\Interpretive\Yolla 4 Interpretive Data WCR.docc 16/32
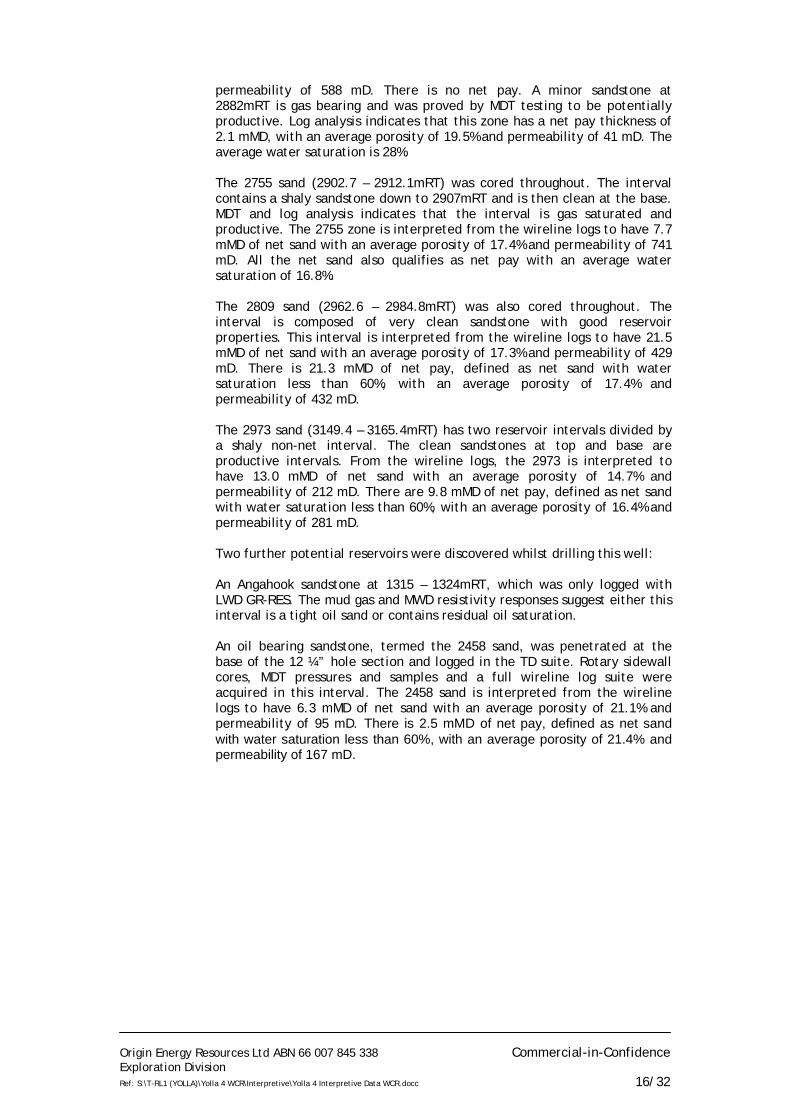
permeability of 588 mD. There is no net pay. A minor sandstone at 2882mRT is gas bearing and was proved by MDT testing to be potentially productive. Log analysis indicates that this zone has a net pay thickness of 2.1 mMD, with an average porosity of 19.5% and permeability of 41 mD. The average water saturation is 28%.
The 2755 sand (2902.7 – 2912.1mRT) was cored throughout. The interval contains a shaly sandstone down to 2907mRT and is then clean at the base. MDT and log analysis indicates that the interval is gas saturated and productive. The 2755 zone is interpreted from the wireline logs to have 7.7 mMD of net sand with an average porosity of 17.4% and permeability of 741 mD. All the net sand also qualifies as net pay with an average water saturation of 16.8%.
The 2809 sand (2962.6 – 2984.8mRT) was also cored throughout. The interval is composed of very clean sandstone with good reservoir properties. This interval is interpreted from the wireline logs to have 21.5 mMD of net sand with an average porosity of 17.3% and permeability of 429 mD. There is 21.3 mMD of net pay, defined as net sand with water saturation less than 60%, with an average porosity of 17.4% and permeability of 432 mD.
The 2973 sand (3149.4 – 3165.4mRT) has two reservoir intervals divided by a shaly non-net interval. The clean sandstones at top and base are productive intervals. From the wireline logs, the 2973 is interpreted to have 13.0 mMD of net sand with an average porosity of 14.7% and permeability of 212 mD. There are 9.8 mMD of net pay, defined as net sand with water saturation less than 60%, with an average porosity of 16.4% and permeability of 281 mD.
Two further potential reservoirs were discovered whilst drilling this well:
An Angahook sandstone at 1315 – 1324mRT, which was only logged with LWD GR-RES. The mud gas and MWD resistivity responses suggest either this interval is a tight oil sand or contains residual oil saturation.
An oil bearing sandstone, termed the 2458 sand, was penetrated at the base of the 12 ¼” hole section and logged in the TD suite. Rotary sidewall cores, MDT pressures and samples and a full wireline log suite were acquired in this interval. The 2458 sand is interpreted from the wireline logs to have 6.3 mMD of net sand with an average porosity of 21.1% and permeability of 95 mD. There is 2.5 mMD of net pay, defined as net sand with water saturation less than 60%, with an average porosity of 21.4% and permeability of 167 mD.
Origin Energy Resources Ltd ABN 66 007 845 338 Commercial-in-Confidence Exploration Division Ref: S:\T-RL1 (YOLLA)\Yolla 4 WCR\Interpretive\Yolla 4 Interpretive Data WCR.docc 17/32
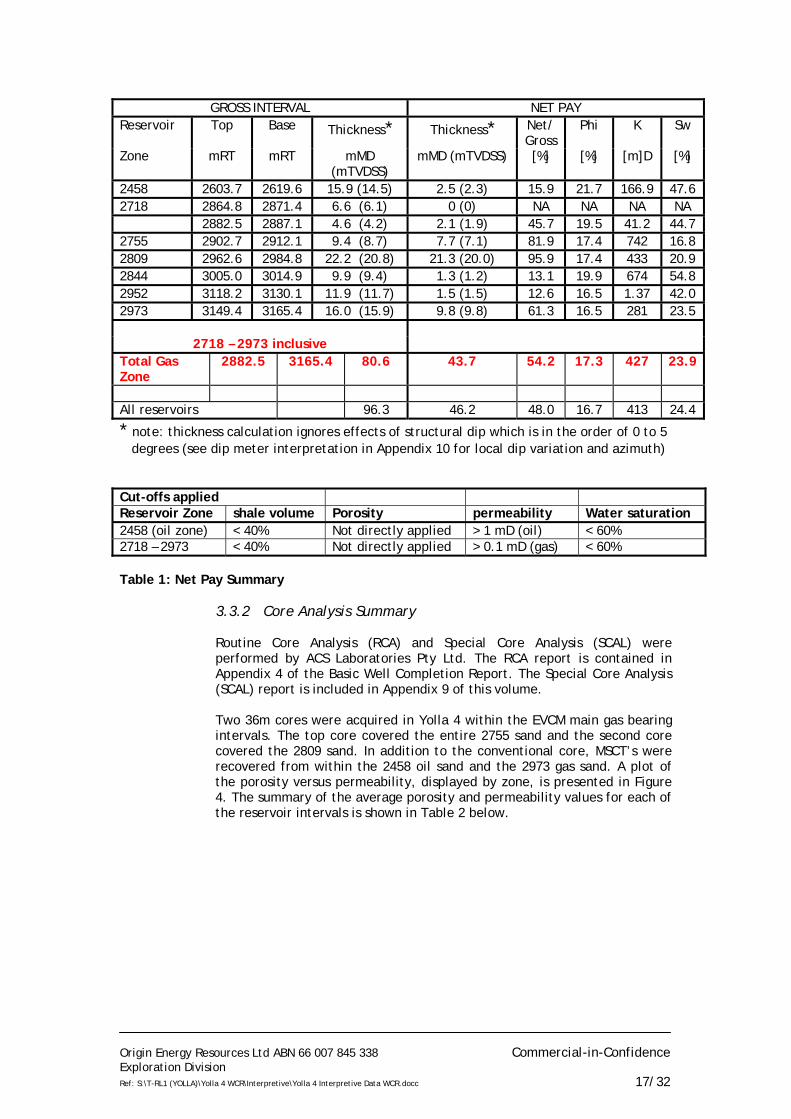
GROSS INTERVAL NET PAY
Reservoir Top Base Thickness* Thickness* Net/ Gross
Phi K Sw
Zone mRT mRT mMD (mTVDSS)
mMD (mTVDSS) [%] [%] [m]D [%]
2458 2603.7 2619.6 15.9 (14.5) 2.5 (2.3) 15.9 21.7 166.9 47.6 2718 2864.8 2871.4 6.6 (6.1) 0 (0) NA NA NA NA 2882.5 2887.1 4.6 (4.2) 2.1 (1.9) 45.7 19.5 41.2 44.7 2755 2902.7 2912.1 9.4 (8.7) 7.7 (7.1) 81.9 17.4 742 16.8 2809 2962.6 2984.8 22.2 (20.8) 21.3 (20.0) 95.9 17.4 433 20.9 2844 3005.0 3014.9 9.9 (9.4) 1.3 (1.2) 13.1 19.9 674 54.8 2952 3118.2 3130.1 11.9 (11.7) 1.5 (1.5) 12.6 16.5 1.37 42.0 2973 3149.4 3165.4 16.0 (15.9) 9.8 (9.8) 61.3 16.5 281 23.5
2718 – 2973 inclusive Total Gas Zone
2882.5 3165.4 80.6 43.7 54.2 17.3 427 23.9
All reservoirs 96.3 46.2 48.0 16.7 413 24.4
* note: thickness calculation ignores effects of structural dip which is in the order of 0 to 5 degrees (see dip meter interpretation in Appendix 10 for local dip variation and azimuth) Cut-offs applied Reservoir Zone shale volume Porosity permeability Water saturation 2458 (oil zone) < 40% Not directly applied > 1 mD (oil) < 60% 2718 – 2973 < 40% Not directly applied > 0.1 mD (gas) < 60% Table 1: Net Pay Summary
3.3.2 Core Analysis Summary
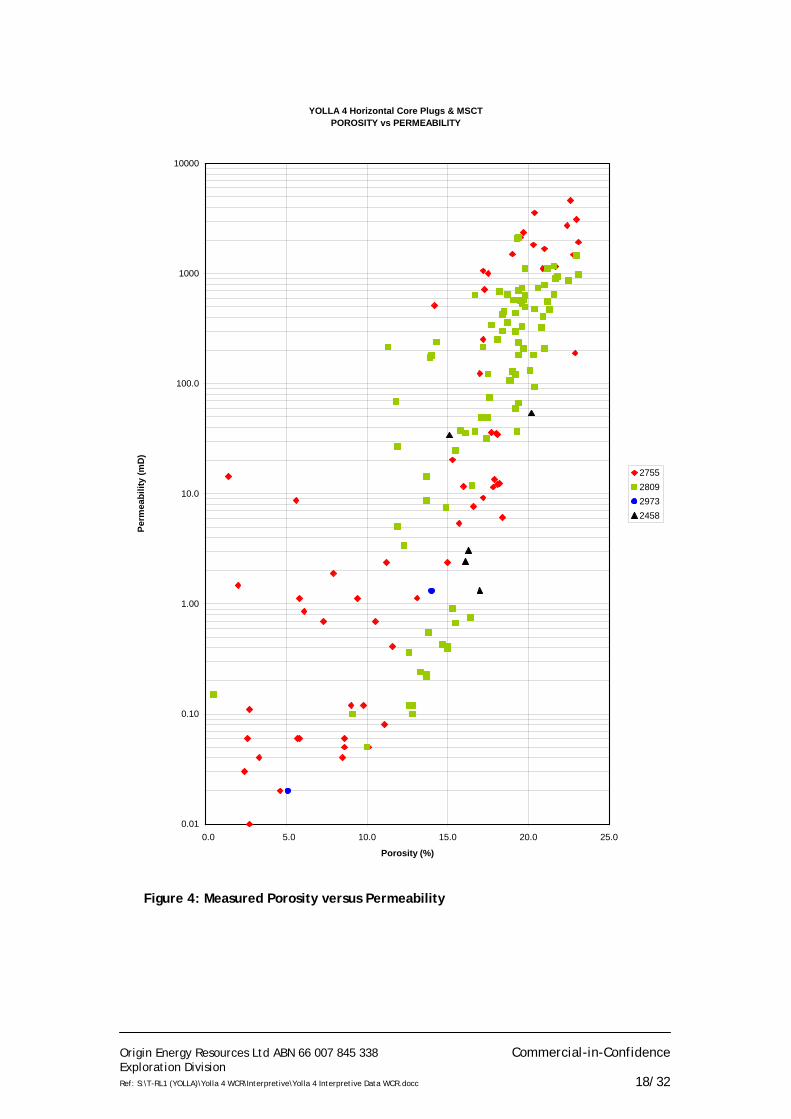
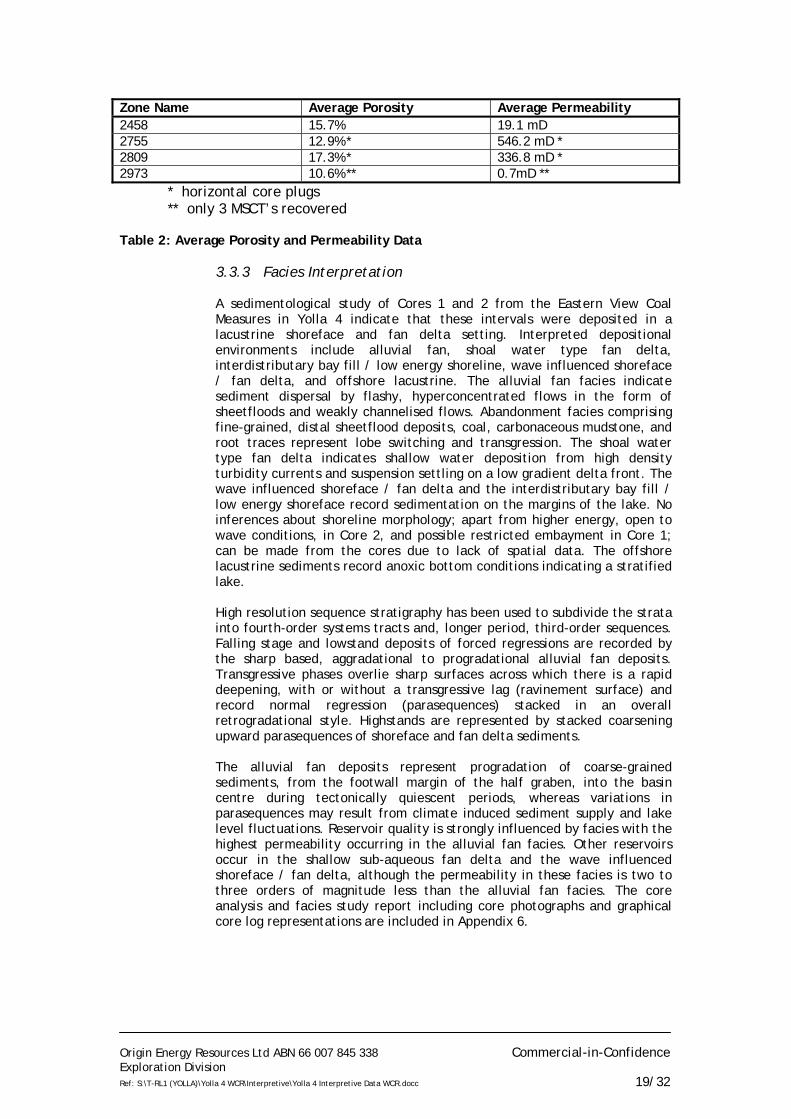
Routine Core Analysis (RCA) and Special Core Analysis (SCAL) were performed by ACS Laboratories Pty Ltd. The RCA report is contained in Appendix 4 of the Basic Well Completion Report. The Special Core Analysis (SCAL) report is included in Appendix 9 of this volume. Two 36m cores were acquired in Yolla 4 within the EVCM main gas bearing intervals. The top core covered the entire 2755 sand and the second core covered the 2809 sand. In addition to the conventional core, MSCT’s were recovered from within the 2458 oil sand and the 2973 gas sand. A plot of the porosity versus permeability, displayed by zone, is presented in Figure 4. The summary of the average porosity and permeability values for each of the reservoir intervals is shown in Table 2 below.
Origin Energy Resources Ltd ABN 66 007 845 338 Commercial-in-Confidence Exploration Division Ref: S:\T-RL1 (YOLLA)\Yolla 4 WCR\Interpretive\Yolla 4 Interpretive Data WCR.docc 18/32
YOLLA 4 Horizontal Core Plugs & MSCTPOROSITY vs PERMEABILITY
0.01
0.10
1.00
10.0
100.0
1000
10000
0.0 5.0 10.0 15.0 20.0 25.0
Porosity (%)
Perm
eabi
lity
(mD
)
2755280929732458
Figure 4: Measured Porosity versus Permeability
Origin Energy Resources Ltd ABN 66 007 845 338 Commercial-in-Confidence Exploration Division Ref: S:\T-RL1 (YOLLA)\Yolla 4 WCR\Interpretive\Yolla 4 Interpretive Data WCR.docc 19/32
Zone Name Average Porosity Average Permeability 2458 15.7% 19.1 mD 2755 12.9% * 546.2 mD * 2809 17.3% * 336.8 mD * 2973 10.6% ** 0.7mD **
* horizontal core plugs ** only 3 MSCT’s recovered
Table 2: Average Porosity and Permeability Data
3.3.3 Facies Interpretation A sedimentological study of Cores 1 and 2 from the Eastern View Coal Measures in Yolla 4 indicate that these intervals were deposited in a lacustrine shoreface and fan delta setting. Interpreted depositional environments include alluvial fan, shoal water type fan delta, interdistributary bay fill / low energy shoreline, wave influenced shoreface / fan delta, and offshore lacustrine. The alluvial fan facies indicate sediment dispersal by flashy, hyperconcentrated flows in the form of sheetfloods and weakly channelised flows. Abandonment facies comprising fine-grained, distal sheetflood deposits, coal, carbonaceous mudstone, and root traces represent lobe switching and transgression. The shoal water type fan delta indicates shallow water deposition from high density turbidity currents and suspension settling on a low gradient delta front. The wave influenced shoreface / fan delta and the interdistributary bay fill / low energy shoreface record sedimentation on the margins of the lake. No inferences about shoreline morphology; apart from higher energy, open to wave conditions, in Core 2, and possible restricted embayment in Core 1; can be made from the cores due to lack of spatial data. The offshore lacustrine sediments record anoxic bottom conditions indicating a stratified lake. High resolution sequence stratigraphy has been used to subdivide the strata into fourth-order systems tracts and, longer period, third-order sequences. Falling stage and lowstand deposits of forced regressions are recorded by the sharp based, aggradational to progradational alluvial fan deposits. Transgressive phases overlie sharp surfaces across which there is a rapid deepening, with or without a transgressive lag (ravinement surface) and record normal regression (parasequences) stacked in an overall retrogradational style. Highstands are represented by stacked coarsening upward parasequences of shoreface and fan delta sediments. The alluvial fan deposits represent progradation of coarse-grained sediments, from the footwall margin of the half graben, into the basin centre during tectonically quiescent periods, whereas variations in parasequences may result from climate induced sediment supply and lake level fluctuations. Reservoir quality is strongly influenced by facies with the highest permeability occurring in the alluvial fan facies. Other reservoirs occur in the shallow sub-aqueous fan delta and the wave influenced shoreface / fan delta, although the permeability in these facies is two to three orders of magnitude less than the alluvial fan facies. The core analysis and facies study report including core photographs and graphical core log representations are included in Appendix 6.
Origin Energy Resources Ltd ABN 66 007 845 338 Commercial-in-Confidence Exploration Division Ref: S:\T-RL1 (YOLLA)\Yolla 4 WCR\Interpretive\Yolla 4 Interpretive Data WCR.docc 20/32
3.4 Hydrocarbon Source Evaluation
3.4.1 Maturation
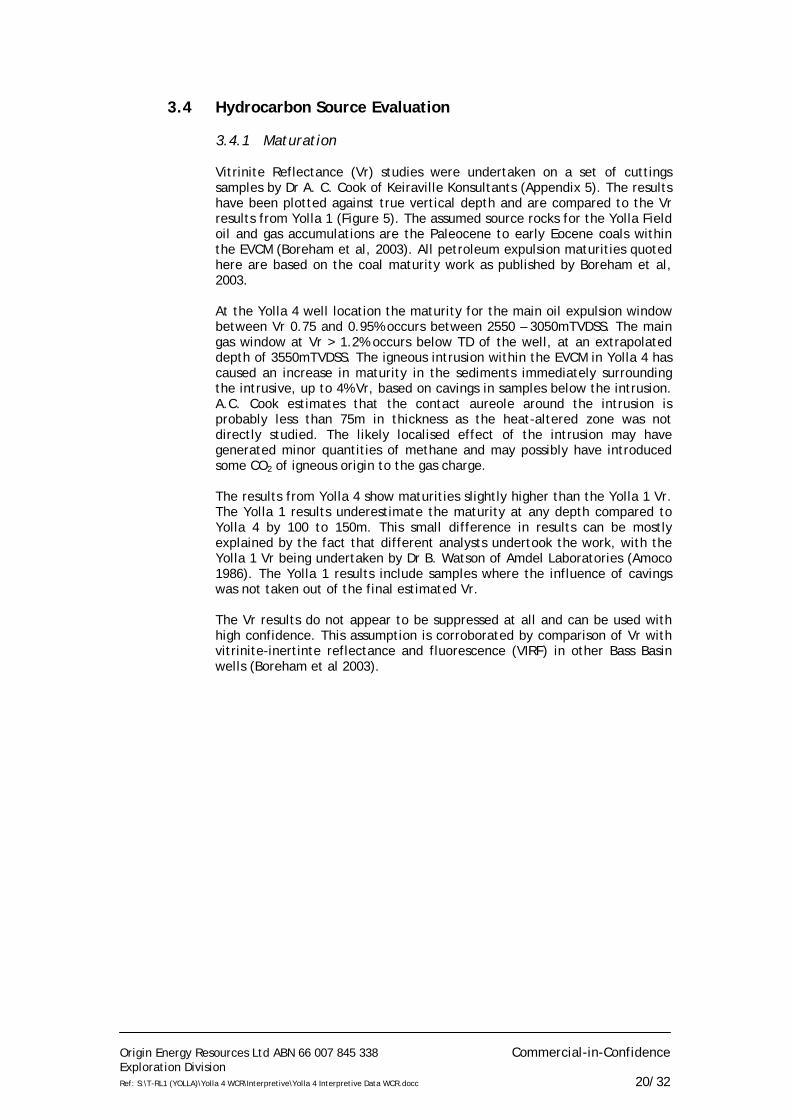
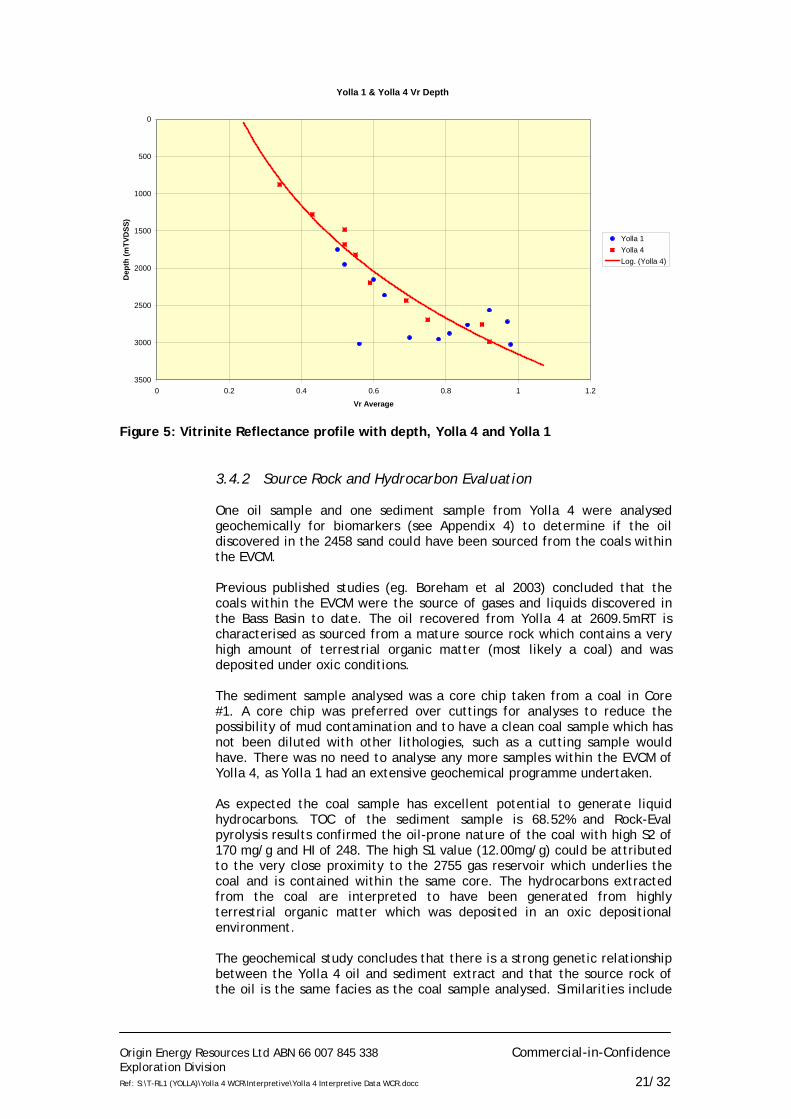
Vitrinite Reflectance (Vr) studies were undertaken on a set of cuttings samples by Dr A. C. Cook of Keiraville Konsultants (Appendix 5). The results have been plotted against true vertical depth and are compared to the Vr results from Yolla 1 (Figure 5). The assumed source rocks for the Yolla Field oil and gas accumulations are the Paleocene to early Eocene coals within the EVCM (Boreham et al, 2003). All petroleum expulsion maturities quoted here are based on the coal maturity work as published by Boreham et al, 2003. At the Yolla 4 well location the maturity for the main oil expulsion window between Vr 0.75 and 0.95% occurs between 2550 – 3050mTVDSS. The main gas window at Vr > 1.2% occurs below TD of the well, at an extrapolated depth of 3550mTVDSS. The igneous intrusion within the EVCM in Yolla 4 has caused an increase in maturity in the sediments immediately surrounding the intrusive, up to 4% Vr, based on cavings in samples below the intrusion. A.C. Cook estimates that the contact aureole around the intrusion is probably less than 75m in thickness as the heat-altered zone was not directly studied. The likely localised effect of the intrusion may have generated minor quantities of methane and may possibly have introduced some CO2 of igneous origin to the gas charge. The results from Yolla 4 show maturities slightly higher than the Yolla 1 Vr. The Yolla 1 results underestimate the maturity at any depth compared to Yolla 4 by 100 to 150m. This small difference in results can be mostly explained by the fact that different analysts undertook the work, with the Yolla 1 Vr being undertaken by Dr B. Watson of Amdel Laboratories (Amoco 1986). The Yolla 1 results include samples where the influence of cavings was not taken out of the final estimated Vr. The Vr results do not appear to be suppressed at all and can be used with high confidence. This assumption is corroborated by comparison of Vr with vitrinite-inertinte reflectance and fluorescence (VIRF) in other Bass Basin wells (Boreham et al 2003).
Origin Energy Resources Ltd ABN 66 007 845 338 Commercial-in-Confidence Exploration Division Ref: S:\T-RL1 (YOLLA)\Yolla 4 WCR\Interpretive\Yolla 4 Interpretive Data WCR.docc 21/32
Yolla 1 & Yolla 4 Vr Depth
0
500
1000
1500
2000
2500
3000
35000 0.2 0.4 0.6 0.8 1 1.2
Vr Average
Dep
th (m
TVD
SS)
Yolla 1Yolla 4Log. (Yolla 4)
Figure 5: Vitrinite Reflectance profile with depth, Yolla 4 and Yolla 1
3.4.2 Source Rock and Hydrocarbon Evaluation
One oil sample and one sediment sample from Yolla 4 were analysed geochemically for biomarkers (see Appendix 4) to determine if the oil discovered in the 2458 sand could have been sourced from the coals within the EVCM. Previous published studies (eg. Boreham et al 2003) concluded that the coals within the EVCM were the source of gases and liquids discovered in the Bass Basin to date. The oil recovered from Yolla 4 at 2609.5mRT is characterised as sourced from a mature source rock which contains a very high amount of terrestrial organic matter (most likely a coal) and was deposited under oxic conditions. The sediment sample analysed was a core chip taken from a coal in Core #1. A core chip was preferred over cuttings for analyses to reduce the possibility of mud contamination and to have a clean coal sample which has not been diluted with other lithologies, such as a cutting sample would have. There was no need to analyse any more samples within the EVCM of Yolla 4, as Yolla 1 had an extensive geochemical programme undertaken. As expected the coal sample has excellent potential to generate liquid hydrocarbons. TOC of the sediment sample is 68.52% and Rock-Eval pyrolysis results confirmed the oil-prone nature of the coal with high S2 of 170 mg/g and HI of 248. The high S1 value (12.00mg/g) could be attributed to the very close proximity to the 2755 gas reservoir which underlies the coal and is contained within the same core. The hydrocarbons extracted from the coal are interpreted to have been generated from highly terrestrial organic matter which was deposited in an oxic depositional environment.
The geochemical study concludes that there is a strong genetic relationship between the Yolla 4 oil and sediment extract and that the source rock of the oil is the same facies as the coal sample analysed. Similarities include
Origin Energy Resources Ltd ABN 66 007 845 338 Commercial-in-Confidence Exploration Division Ref: S:\T-RL1 (YOLLA)\Yolla 4 WCR\Interpretive\Yolla 4 Interpretive Data WCR.docc 22/32
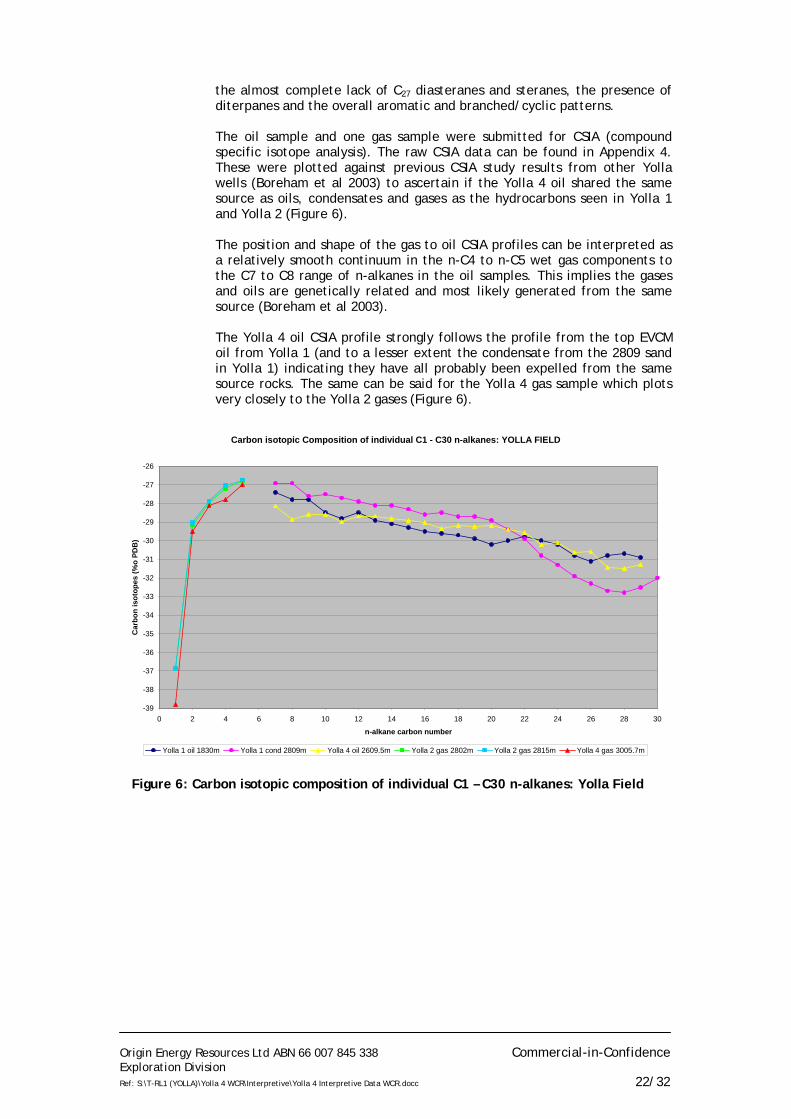
the almost complete lack of C27 diasteranes and steranes, the presence of diterpanes and the overall aromatic and branched/cyclic patterns. The oil sample and one gas sample were submitted for CSIA (compound specific isotope analysis). The raw CSIA data can be found in Appendix 4. These were plotted against previous CSIA study results from other Yolla wells (Boreham et al 2003) to ascertain if the Yolla 4 oil shared the same source as oils, condensates and gases as the hydrocarbons seen in Yolla 1 and Yolla 2 (Figure 6). The position and shape of the gas to oil CSIA profiles can be interpreted as a relatively smooth continuum in the n-C4 to n-C5 wet gas components to the C7 to C8 range of n-alkanes in the oil samples. This implies the gases and oils are genetically related and most likely generated from the same source (Boreham et al 2003). The Yolla 4 oil CSIA profile strongly follows the profile from the top EVCM oil from Yolla 1 (and to a lesser extent the condensate from the 2809 sand in Yolla 1) indicating they have all probably been expelled from the same source rocks. The same can be said for the Yolla 4 gas sample which plots very closely to the Yolla 2 gases (Figure 6).
Carbon isotopic Composition of individual C1 - C30 n-alkanes: YOLLA FIELD
-39
-38
-37
-36
-35
-34
-33
-32
-31
-30
-29
-28
-27
-26
0 2 4 6 8 10 12 14 16 18 20 22 24 26 28 30
n-alkane carbon number
Car
bon
isot
opes
(%o
PDB
)
Yolla 1 oil 1830m Yolla 1 cond 2809m Yolla 4 oil 2609.5m Yolla 2 gas 2802m Yolla 2 gas 2815m Yolla 4 gas 3005.7m
Figure 6: Carbon isotopic composition of individual C1 – C30 n-alkanes: Yolla Field
Origin Energy Resources Ltd ABN 66 007 845 338 Commercial-in-Confidence Exploration Division Ref: S:\T-RL1 (YOLLA)\Yolla 4 WCR\Interpretive\Yolla 4 Interpretive Data WCR.docc 23/32
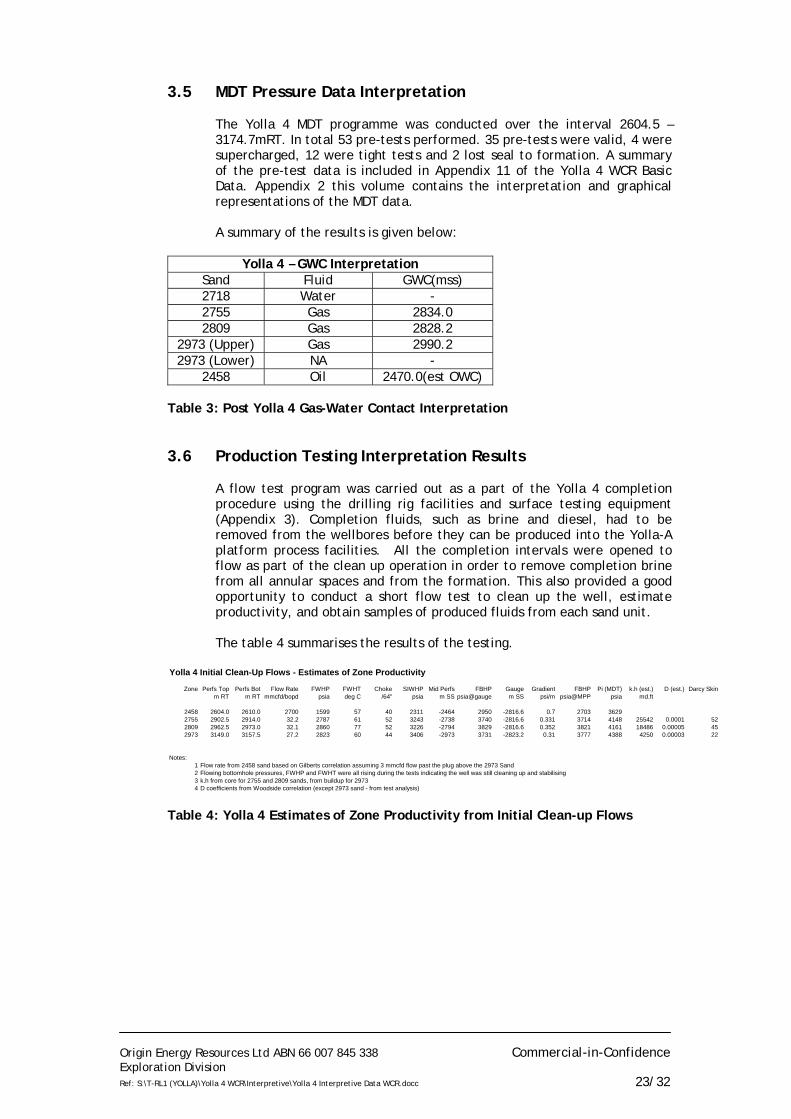
3.5 MDT Pressure Data Interpretation The Yolla 4 MDT programme was conducted over the interval 2604.5 – 3174.7mRT. In total 53 pre-tests performed. 35 pre-tests were valid, 4 were supercharged, 12 were tight tests and 2 lost seal to formation. A summary of the pre-test data is included in Appendix 11 of the Yolla 4 WCR Basic Data. Appendix 2 this volume contains the interpretation and graphical representations of the MDT data.
A summary of the results is given below:
Yolla 4 – GWC Interpretation
Sand Fluid GWC(mss) 2718 Water - 2755 Gas 2834.0 2809 Gas 2828.2
2973 (Upper) Gas 2990.2 2973 (Lower) NA -
2458 Oil 2470.0(est OWC) Table 3: Post Yolla 4 Gas-Water Contact Interpretation
3.6 Production Testing Interpretation Results A flow test program was carried out as a part of the Yolla 4 completion procedure using the drilling rig facilities and surface testing equipment (Appendix 3). Completion fluids, such as brine and diesel, had to be removed from the wellbores before they can be produced into the Yolla-A platform process facilities. All the completion intervals were opened to flow as part of the clean up operation in order to remove completion brine from all annular spaces and from the formation. This also provided a good opportunity to conduct a short flow test to clean up the well, estimate productivity, and obtain samples of produced fluids from each sand unit.
The table 4 summarises the results of the testing.
Yolla 4 Initial Clean-Up Flows - Estimates of Zone Productivity
Zone Perfs Top Perfs Bot Flow Rate FWHP FWHT Choke SIWHP Mid Perfs FBHP Gauge Gradient FBHP Pi (MDT) k.h (est.) D (est.) Darcy Skinm RT m RT mmcfd/bopd psia deg C /64" psia m SS psia@gauge m SS psi/m psia@MPP psia md.ft
2458 2604.0 2610.0 2700 1599 57 40 2311 -2464 2950 -2816.6 0.7 2703 36292755 2902.5 2914.0 32.2 2787 61 52 3243 -2738 3740 -2816.6 0.331 3714 4148 25542 0.0001 522809 2962.5 2973.0 32.1 2860 77 52 3226 -2794 3829 -2816.6 0.352 3821 4161 18486 0.00005 452973 3149.0 3157.5 27.2 2823 60 44 3406 -2973 3731 -2823.2 0.31 3777 4388 4250 0.00003 22
Notes:1 Flow rate from 2458 sand based on Gilberts correlation assuming 3 mmcfd flow past the plug above the 2973 Sand 2 Flowing bottomhole pressures, FWHP and FWHT were all rising during the tests indicating the well was still cleaning up and stabilising3 k.h from core for 2755 and 2809 sands, from buildup for 29734 D coefficients from Woodside correlation (except 2973 sand - from test analysis)
Table 4: Yolla 4 Estimates of Zone Productivity from Initial Clean-up Flows
Origin Energy Resources Ltd ABN 66 007 845 338 Commercial-in-Confidence Exploration Division Ref: S:\T-RL1 (YOLLA)\Yolla 4 WCR\Interpretive\Yolla 4 Interpretive Data WCR.docc 24/32
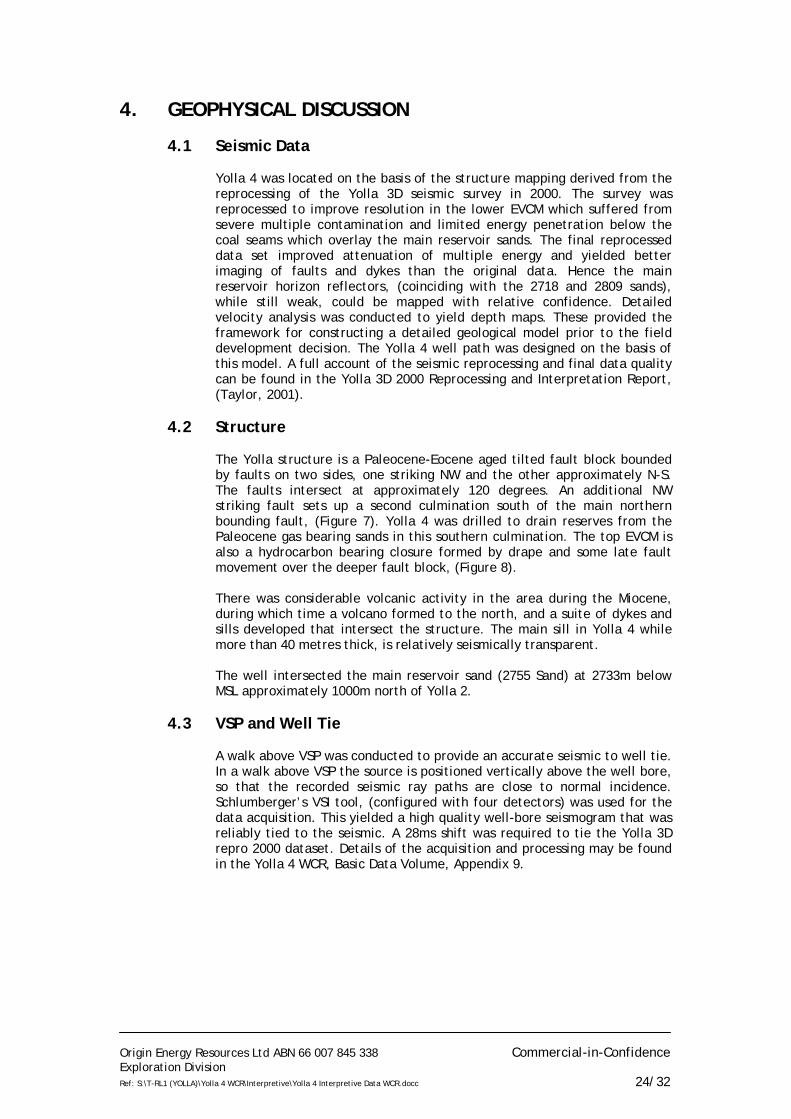
4. GEOPHYSICAL DISCUSSION 4.1 Seismic Data
Yolla 4 was located on the basis of the structure mapping derived from the reprocessing of the Yolla 3D seismic survey in 2000. The survey was reprocessed to improve resolution in the lower EVCM which suffered from severe multiple contamination and limited energy penetration below the coal seams which overlay the main reservoir sands. The final reprocessed data set improved attenuation of multiple energy and yielded better imaging of faults and dykes than the original data. Hence the main reservoir horizon reflectors, (coinciding with the 2718 and 2809 sands), while still weak, could be mapped with relative confidence. Detailed velocity analysis was conducted to yield depth maps. These provided the framework for constructing a detailed geological model prior to the field development decision. The Yolla 4 well path was designed on the basis of this model. A full account of the seismic reprocessing and final data quality can be found in the Yolla 3D 2000 Reprocessing and Interpretation Report, (Taylor, 2001).
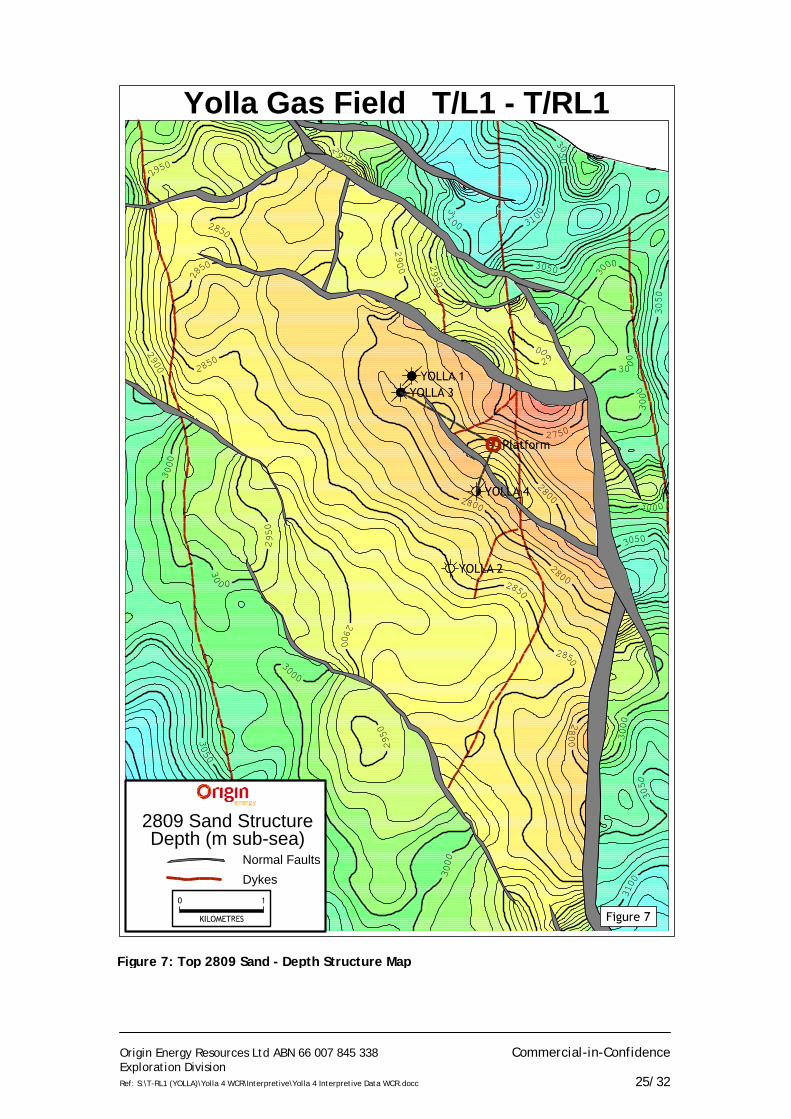
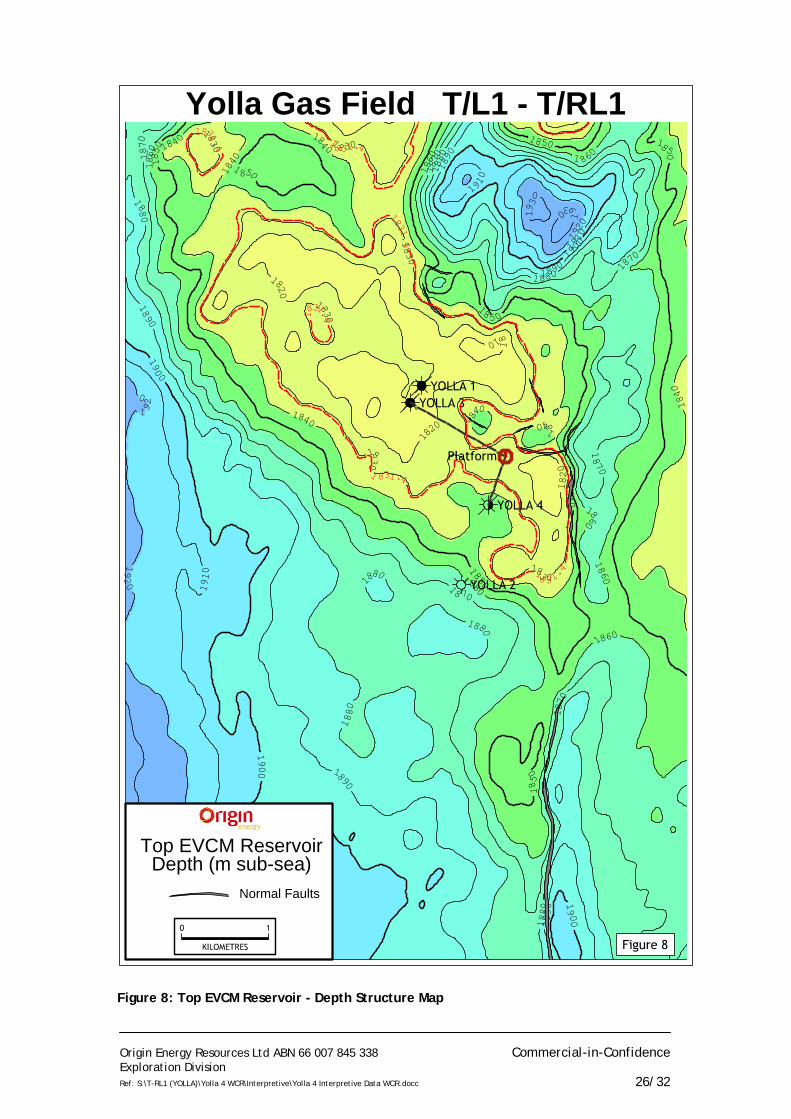
4.2 Structure
The Yolla structure is a Paleocene-Eocene aged tilted fault block bounded by faults on two sides, one striking NW and the other approximately N-S. The faults intersect at approximately 120 degrees. An additional NW striking fault sets up a second culmination south of the main northern bounding fault, (Figure 7). Yolla 4 was drilled to drain reserves from the Paleocene gas bearing sands in this southern culmination. The top EVCM is also a hydrocarbon bearing closure formed by drape and some late fault movement over the deeper fault block, (Figure 8). There was considerable volcanic activity in the area during the Miocene, during which time a volcano formed to the north, and a suite of dykes and sills developed that intersect the structure. The main sill in Yolla 4 while more than 40 metres thick, is relatively seismically transparent. The well intersected the main reservoir sand (2755 Sand) at 2733m below MSL approximately 1000m north of Yolla 2.
4.3 VSP and Well Tie
A walk above VSP was conducted to provide an accurate seismic to well tie. In a walk above VSP the source is positioned vertically above the well bore, so that the recorded seismic ray paths are close to normal incidence. Schlumberger’s VSI tool, (configured with four detectors) was used for the data acquisition. This yielded a high quality well-bore seismogram that was reliably tied to the seismic. A 28ms shift was required to tie the Yolla 3D repro 2000 dataset. Details of the acquisition and processing may be found in the Yolla 4 WCR, Basic Data Volume, Appendix 9.
Origin Energy Resources Ltd ABN 66 007 845 338 Commercial-in-Confidence Exploration Division Ref: S:\T-RL1 (YOLLA)\Yolla 4 WCR\Interpretive\Yolla 4 Interpretive Data WCR.docc 25/32
Yolla Gas Field T/L1 - T/RL1
2750
00
82
2800
0082
2800
2850
0582
2850
28
50
0582
00
9 2
0092
29
00
00
922
950
29
50
2950
2950
29 50
0003
0003
3000
300 0
0003
3000
300
0
3000
30
00
050
3
05 0 3
050
3
0503
0503
3050
3050
001
3
3100
00
13
3100
05
13
Normal FaultsDykes
2809 Sand StructureDepth (m sub-sea)
Figure 7: Top 2809 Sand - Depth Structure Map
Origin Energy Resources Ltd ABN 66 007 845 338 Commercial-in-Confidence Exploration Division Ref: S:\T-RL1 (YOLLA)\Yolla 4 WCR\Interpretive\Yolla 4 Interpretive Data WCR.docc 26/32
Yolla Gas Field T/L1 - T/RL1
1810
182
0
1820
1820
18 30
183 0
038
1
1830
0381
0381 1840
1840
0481
0 481
18
40
0481
1840
0481058 1
18500581
1850 1850
185
00581
0681
1 860
1860
0681
06810681
1860
07 8 1
18 70
1870
078
1
1870
0781
1880
0881
1880
0881
0881
1880
0881
1890
1890
1890
1890
0981
1900
1900
009
1
190
0
019
1
191
0
1910
1910
19
20
02
91
1 92
0
1920
193
0
1930
0
391
Normal Faults
Top EVCM ReservoirDepth (m sub-sea)
18 31.4
18 31.4
4.1
381
1 831.44.
1381
4.1381
Figure 8: Top EVCM Reservoir - Depth Structure Map
Origin Energy Resources Ltd ABN 66 007 845 338 Commercial-in-Confidence Exploration Division Ref: S:\T-RL1 (YOLLA)\Yolla 4 WCR\Interpretive\Yolla 4 Interpretive Data WCR.docc 27/32
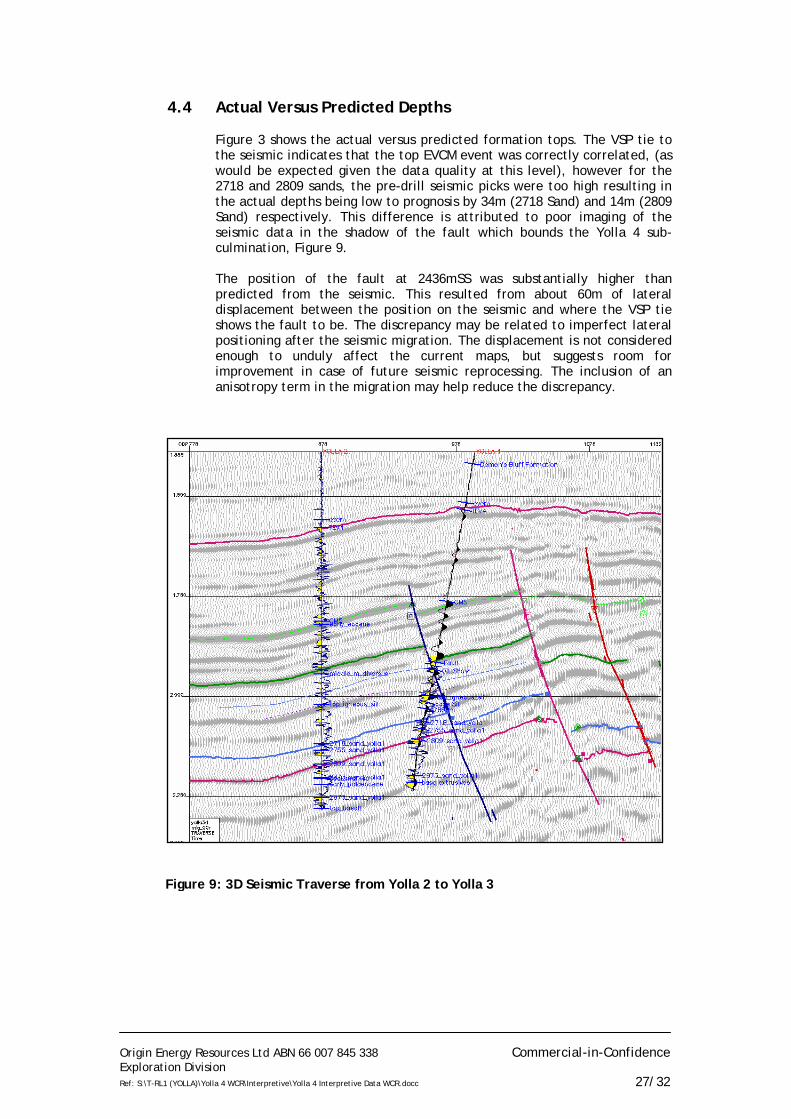
4.4 Actual Versus Predicted Depths
Figure 3 shows the actual versus predicted formation tops. The VSP tie to the seismic indicates that the top EVCM event was correctly correlated, (as would be expected given the data quality at this level), however for the 2718 and 2809 sands, the pre-drill seismic picks were too high resulting in the actual depths being low to prognosis by 34m (2718 Sand) and 14m (2809 Sand) respectively. This difference is attributed to poor imaging of the seismic data in the shadow of the fault which bounds the Yolla 4 sub-culmination, Figure 9. The position of the fault at 2436mSS was substantially higher than predicted from the seismic. This resulted from about 60m of lateral displacement between the position on the seismic and where the VSP tie shows the fault to be. The discrepancy may be related to imperfect lateral positioning after the seismic migration. The displacement is not considered enough to unduly affect the current maps, but suggests room for improvement in case of future seismic reprocessing. The inclusion of an anisotropy term in the migration may help reduce the discrepancy.
Figure 9: 3D Seismic Traverse from Yolla 2 to Yolla 3
Origin Energy Resources Ltd ABN 66 007 845 338 Commercial-in-Confidence Exploration Division Ref: S:\T-RL1 (YOLLA)\Yolla 4 WCR\Interpretive\Yolla 4 Interpretive Data WCR.docc 28/32
5. GEOLOGICAL DISCUSSION 5.1 Exploration History
The Yolla Gas Field is a large northwest-southeast trending fault bounded structure which has been compartmentalised by major faults. Two wells have been previously drilled in the Yolla Field. Yolla-1 was drilled in June 1985 by AMOCO Ltd and encountered gas in both the Intra-Eastern View Coal Measures (EVCM) between 2700m and 3000mRT, and also in the Upper-EVCM at approximately 1830mRT. Gas Pay was encountered in 5 separate zones within the Intra-EVCM, and these provide the main reserves for the BassGas development. DST 1 in Yolla-1 tested gas and liquids from the 2809 Sand of the Intra-EVCM at rates of up to 425 000 m3/day and 92 kl/day respectively (15.1 mmscfd and 580 bcpd). Yolla-1 was suspended for possible future re-entry. A 3D seismic survey was acquired over the Yolla Field in mid 1994 with the aim of enabling accurate depth mapping for the purpose of reserves estimation and appraisal/development planning. These data were subsequently reprocessed in early 2000. Updated depth maps were produced in December 2000 and January 2001 and form the basis for the latest field review and basis for the development plan issued in September 2002. The Yolla-2 appraisal well was drilled in April and May 1998. The well was drilled 2.35km SSE of Yolla-1, and approximately 45m down-dip at the intra-EVCM reservoir level. The well demonstrated good correlation to the sands intersected in Yolla-1, although many were intersected below the gas-water contact due to the low structural location of the well. Pressure data allowed confident interpretation of GWC levels in the different Intra-EVCM units. Yolla-2 was plugged and abandoned.
5.2 Regional Geology
5.2.1 Structure
The Bass Basin is located offshore in south-eastern Australia between Victoria and Tasmania. It is one of a series of sedimentary basins that were formed in response to rifting during the Late Jurassic to Early Cretaceous between Australia and Antarctica (Williamson et al, 1987). The Bass Basin covers approximately 65,000 km2 and water depths range from 30 to 90 m. The Bass Basin is a failed intra-cratonic rift basin with structural features which highlight three separate phases of evolution: 1) initial northeast-southwest extension during the early Cretaceous, 2) Late Cretaceous to Pliocene thermal subsidence and 3) Miocene compression. The rifting created a series of northwest-southeast oriented grabens offset by associated east-west wrench movement. The Pelican, Yolla and Cormorant Troughs comprise the major depocentres in the Bass Basin (Fig. 3). The Yolla Field is located on the flank of the Yolla and Cormorant Troughs. These depocentres are fault-bounded half-grabens that progressively developed via growth faulting during the active rifting and thermal subsidence phases of basin evolution. The dominant structural trend in the basin is northwest-southeast, highlighted by the orientation of the major faults and troughs.
Origin Energy Resources Ltd ABN 66 007 845 338 Commercial-in-Confidence Exploration Division Ref: S:\T-RL1 (YOLLA)\Yolla 4 WCR\Interpretive\Yolla 4 Interpretive Data WCR.docc 29/32
5.2.2 Stratigraphy
The stratigraphic succession in the Bass Basin comprises sediments ranging in age from Early Cretaceous to Recent (Figure 2) The Early Cretaceous Otway Group rests unconformably on pre-rift Palaeozoic black shales and quartzites and consists of clastic, volcaniclastic, fluvial and deltaic sediments ranging from coarse-grained sandstone to shale and coal. The Otway Group was deposited as a very thick sequence of sediments (C.australiensis to C.paradoxus) that have been intersected in the Bass Basin at only one locale, Durroon-1, in the extreme southeast. Localised uplift and erosion then occurred on the basin margins as the initial rifting phase subsided (Middle Cretaceous). The Otway Drift phase then began along the southern margin of Australia, which was largely contemporaneous with the start of the Tasman Rifting event on the eastern edge of the southern margin. This recommenced rifting in the Bass Basin, which resulted in deposition of the prospective Early Cretaceous to Late Eocene Eastern View Coal Measures (EVCM) which comprise a thick succession of sandstone, siltstone, shale and coal, deposited primarily within fluvial, deltaic and lacustrine depositional environments. Seismic data suggests that the EVCM is over 4000m thick in the Troughs. The EVCM thins markedly towards the basin margins and exhibits both onlap onto basement and erosional truncation. In a broad sense, the EVCM can be divided into three sequences separated by erosional unconformities. The middle sequence was penetrated in Bass-1 and Yolla-1 and –2 and contains the major gas accumulations in the Yolla Field. This sequence is bounded at the base by the N. senectus unconformity and at the top by the upper M. diversus unconformity. The Lower Eastern View Coal Measures (EVCM) depositional sequence was deposited from Cenomanian to Santonian times (A.distocrinatus to N.senectus). These units have only been intersected in Durroon-1 in the southeast of the Bass Basin and are equivalent to the Golden Beach Group in the Gippsland Basin. An angular unconformity is identified over localised highs on the basin margins at the top of the N.senectus zone. The boundary is marked in places by significant extrusive volcanism, similar to that observed in the Gippsland Basin. This event signals the termination of Tasman rifting, which was followed by sea floor spreading in conjunction with the already active drift in the Otway region. During this time, thermal subsidence dominated throughout the basin and thick, ubiquitous deposition of the Late Cretaceous to Paleocene Lower EVCM occurred (T.lillei to Lower M.diversus / P.asperopolus). The Late Cretaceous sediments are restricted mainly to the basin depocentres and axial reaches where accommodation space was sufficient for deposition and subsequent preservation. The section is missing on the basin margins due to sediment bypass. The Paleocene section is extensive throughout with the greatest thickness of sediments in the basin depocentres and significant thinning towards the basin flanks, as a result of both condensing of the section and basement onlap. The Late Cretaceous/Paleocene Lower EVCM has been intersected in numerous wells in the basin, identifying it as a continuos sequence of late low stand sediments grading through a transgressive systems tract and finally capped by high stand sediments. Environments are gradational both laterally and temporally from alluvial through fluvio-deltaic and nearshore
Origin Energy Resources Ltd ABN 66 007 845 338 Commercial-in-Confidence Exploration Division Ref: S:\T-RL1 (YOLLA)\Yolla 4 WCR\Interpretive\Yolla 4 Interpretive Data WCR.docc 30/32
to deeper restricted lacustrine. Primary sediment input to the basin was from the southeast with minor localised input also deposited transversely from the flanks of the troughs. Extensive coal measures dominate the sedimentary sequence in the southeast of the basin (Pelican Trough) with increasingly thicker homogeneous shale units occurring through the Yolla and Cormorant Troughs. The top of the Lower EVCM is identified by localised uplift and inversion of the pre-existing sedimentary sequence, caused by mild regional compression. The effects of this uplift are variable with the degree of erosion extending from the Mid M.diversus through to the P.asperopolus in places. The Eocene upper EVCM (Mid M.diversus / P.asperopolus to Mid N.asperus) was then deposited under a regime of slower subsidence, resulting in more widespread, highly variable facies development. Fluctuating conditions of alluvial, fluvio-deltaic and shallow marine processes resulted with more extensive deposition of coal measure sediments. A regional marine transgression then occurred, resulting in the basin-wide deposition of the Demons Bluff, the base of which is marked by a locally very thick transgressive sand. Conformably overlying the EVCM is the Late Eocene Demon’s Bluff Formation. Lithologically this unit consists of a basal sequence of fine-grained carbonaceous shale and siltstone deposited in an open marine environment. The unit has an average thickness over the basin of approximately 120 m, but thins toward the basin margins. The Demon’s Bluff Formation provides a regional top seal to hydrocarbons reservoired in the top-most sandstone units of the EVCM as demonstrated in Yolla-1. The Demon’s Bluff Formation is overlain by the Late Eocene to Pliocene age Torquay Group which broadly consists of a basal sequence of marls and calcareous shales which grade upwards into a succession of bioclastic limestones. The Torquay Group signifies continual deposition under pervasive marine conditions. The Torquay Group is punctuated in places by episodes of minor uplift and/or erosion accompanied by varying effects of volcanism. Large-scale extrusives (volcanoes) are observable on the seismic data with extensive sill and dyke networks also resulting from these events (Yolla-1, Cormorant-1 and Aroo-1).
5.3 Contributions to Geological Concepts and Conclusions
Two new potential reservoirs were discovered whilst drilling this well.
• A sandstone within the Angahook Formation at 1315 – 1324mRT, which was only logged with LWD GR-RES. The mud gas response suggests either tight oil sands or residual oil saturation.
• An oil bearing sandstone in the Intra-EVCM at 2603mRT (called the 2458
sand) was penetrated at the base of the 12 ¼” hole section and logged in the TD suite. Rotary sidewall cores, MDT pressures and samples and a full wireline log suite were acquired in this interval. Geochemical analysis of the oil indicates this oil is very similar to the oil previously discovered at the top of the EVCM (within the TEV4 sand) and is probably from the same source rock. This discovery opens up a new oil play within the intra-EVCM which previously had been primarily targeted for gas.
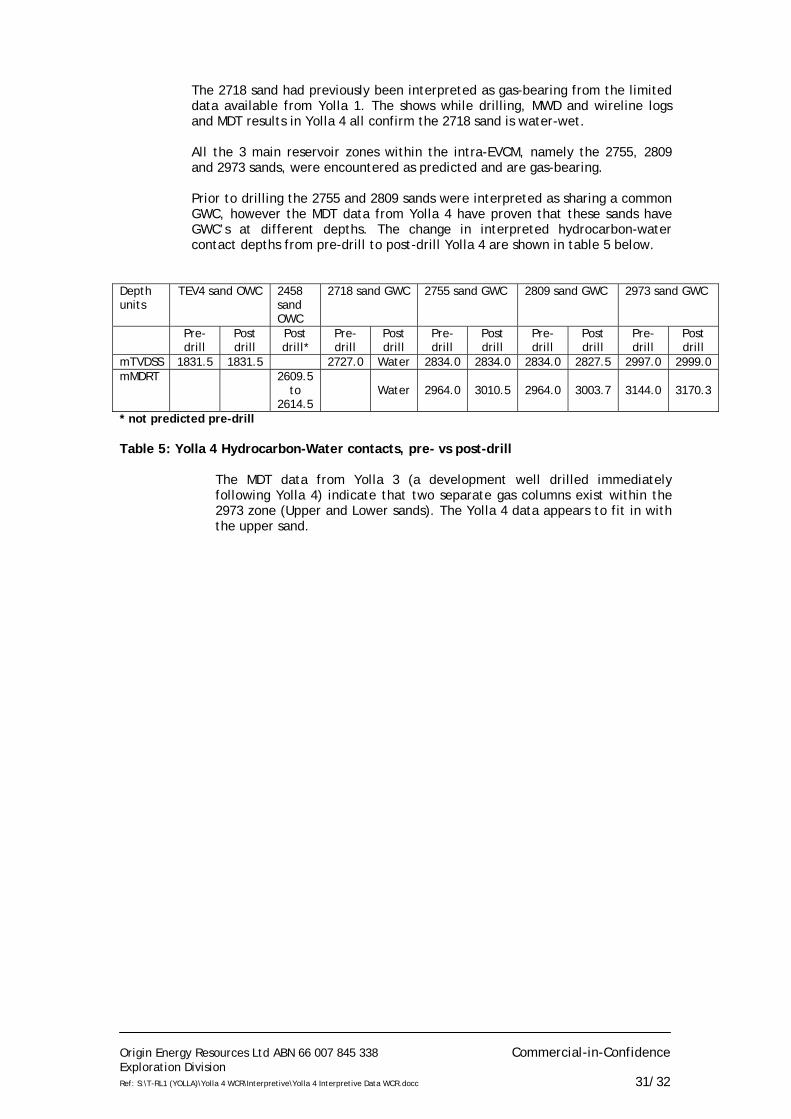
Origin Energy Resources Ltd ABN 66 007 845 338 Commercial-in-Confidence Exploration Division Ref: S:\T-RL1 (YOLLA)\Yolla 4 WCR\Interpretive\Yolla 4 Interpretive Data WCR.docc 31/32
The 2718 sand had previously been interpreted as gas-bearing from the limited data available from Yolla 1. The shows while drilling, MWD and wireline logs and MDT results in Yolla 4 all confirm the 2718 sand is water-wet. All the 3 main reservoir zones within the intra-EVCM, namely the 2755, 2809 and 2973 sands, were encountered as predicted and are gas-bearing. Prior to drilling the 2755 and 2809 sands were interpreted as sharing a common GWC, however the MDT data from Yolla 4 have proven that these sands have GWC’s at different depths. The change in interpreted hydrocarbon-water contact depths from pre-drill to post-drill Yolla 4 are shown in table 5 below.
Depth units
TEV4 sand OWC 2458 sand OWC
2718 sand GWC 2755 sand GWC 2809 sand GWC 2973 sand GWC
Pre-drill
Post drill
Post drill*
Pre-drill
Post drill
Pre-drill
Post drill
Pre-drill
Post drill
Pre-drill
Post drill
mTVDSS 1831.5 1831.5 2727.0 Water 2834.0 2834.0 2834.0 2827.5 2997.0 2999.0 mMDRT
2609.5
to 2614.5
Water 2964.0 3010.5 2964.0 3003.7 3144.0 3170.3
* not predicted pre-drill Table 5: Yolla 4 Hydrocarbon-Water contacts, pre- vs post-drill
The MDT data from Yolla 3 (a development well drilled immediately following Yolla 4) indicate that two separate gas columns exist within the 2973 zone (Upper and Lower sands). The Yolla 4 data appears to fit in with the upper sand.
Origin Energy Resources Ltd ABN 66 007 845 338 Commercial-in-Confidence Exploration Division Ref: S:\T-RL1 (YOLLA)\Yolla 4 WCR\Interpretive\Yolla 4 Interpretive Data WCR.docc 32/32
6. REFERENCES Amoco Australia Petroleum Company, 1986 – Yolla 1 Final Well Report, Volume 1 – Geology, Appendix 9, Part 2: Vitrinite reflectance Determinations and Organic Petrology Boreham, C.J., Blevin, J.E., Radlinski, A.P. and Trigg, K.R., 2003 – Coal as a source of oil and gas: A case study from the Bass Basin, Australia. APPEA Journal 43 (1) 117-148 Lennon, R.G., Suttill, R.J., Guthrie, D.A. and Waldron, A.R., 1999 - The renewed search for oil and gas in the Bass Basin: Results of Yolla 2 and White Ibis 1. APPEA Journal 39 (1) 248 – 262. Taylor, R., 2001 - Yolla 3D 2000 Reprocessing and Interpretation Report, Origin Energy Resources Ltd, unpublished report. Williamson, P.E., Pigram, C.J., Colwell, J.B., Scherl, A.S., Lockwood, K.L. and Branson, J.C., 1987 – Review of stratigraphy, structure and hydrocarbon potential of Bass Basin, Australia. AAPG Bulletin V.71, No.3, 253-280

Origin Energy Resources Ltd ABN 66 007 845 338 Commercial-in-Confidence Greenfields Division Ref: W:\Complete Reports\BASS\Yolla\Yolla 4\Interpretive\Yolla4InterpretativeDataWCR with appendix headers.docc
AAPPPPEENNDDIIXX 11:: PPEETTRROOPPHHYYSSIICCSS RREEPPOORRTT
ORIGIN ENERGY RESOURCES LIMITED YOLLA-4 PETROPHYSICAL REVIEW, TR/L1, BASS BASIN
1
TRL/1, BASS BASIN, TASMANIA
YOLLA - 4 PETROPHYSICAL INTERPRETATION
EASTERN VIEW COAL MEASURES 2590 – 3235 mRT
FINAL
Origin Energy Resources Limited Second Floor, South Tower, John Oxley Centre
339 Coronation Drive MILTON QLD 4064
Andy Hall, December 2004
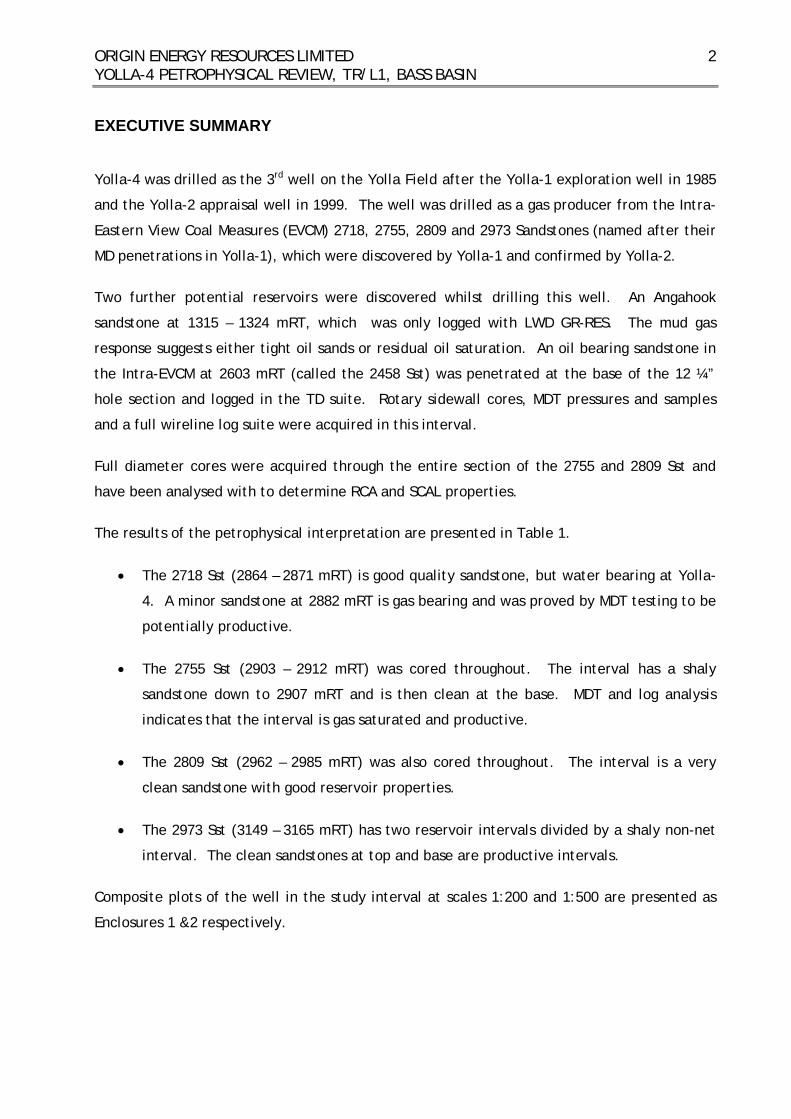
ORIGIN ENERGY RESOURCES LIMITED YOLLA-4 PETROPHYSICAL REVIEW, TR/L1, BASS BASIN
2
EXECUTIVE SUMMARY Yolla-4 was drilled as the 3rd well on the Yolla Field after the Yolla-1 exploration well in 1985
and the Yolla-2 appraisal well in 1999. The well was drilled as a gas producer from the Intra-
Eastern View Coal Measures (EVCM) 2718, 2755, 2809 and 2973 Sandstones (named after their
MD penetrations in Yolla-1), which were discovered by Yolla-1 and confirmed by Yolla-2.
Two further potential reservoirs were discovered whilst drilling this well. An Angahook
sandstone at 1315 – 1324 mRT, which was only logged with LWD GR-RES. The mud gas
response suggests either tight oil sands or residual oil saturation. An oil bearing sandstone in
the Intra-EVCM at 2603 mRT (called the 2458 Sst) was penetrated at the base of the 12 ¼”
hole section and logged in the TD suite. Rotary sidewall cores, MDT pressures and samples
and a full wireline log suite were acquired in this interval.
Full diameter cores were acquired through the entire section of the 2755 and 2809 Sst and
have been analysed with to determine RCA and SCAL properties.
The results of the petrophysical interpretation are presented in Table 1.
• The 2718 Sst (2864 – 2871 mRT) is good quality sandstone, but water bearing at Yolla-
4. A minor sandstone at 2882 mRT is gas bearing and was proved by MDT testing to be
potentially productive.
• The 2755 Sst (2903 – 2912 mRT) was cored throughout. The interval has a shaly
sandstone down to 2907 mRT and is then clean at the base. MDT and log analysis
indicates that the interval is gas saturated and productive.
• The 2809 Sst (2962 – 2985 mRT) was also cored throughout. The interval is a very
clean sandstone with good reservoir properties.
• The 2973 Sst (3149 – 3165 mRT) has two reservoir intervals divided by a shaly non-net
interval. The clean sandstones at top and base are productive intervals.
Composite plots of the well in the study interval at scales 1:200 and 1:500 are presented as
Enclosures 1 &2 respectively.
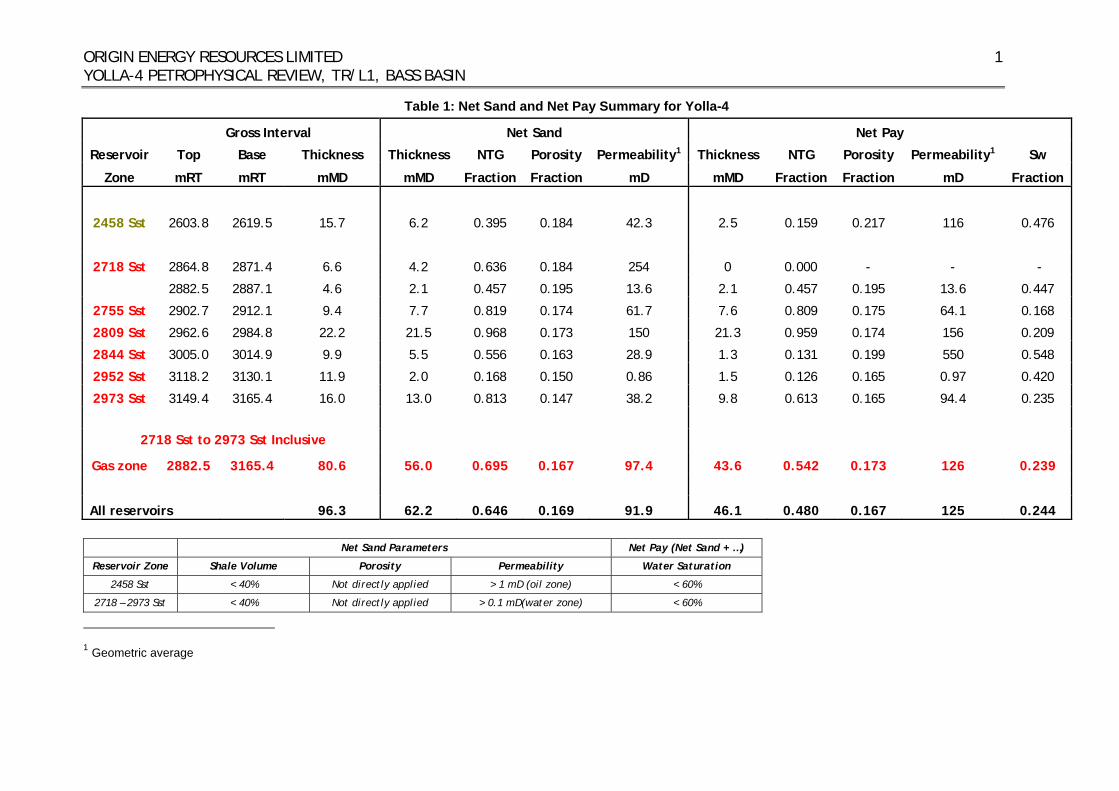
ORIGIN ENERGY RESOURCES LIMITED YOLLA-4 PETROPHYSICAL REVIEW, TR/L1, BASS BASIN
1
Table 1: Net Sand and Net Pay Summary for Yolla-4
Gross Interval Net Sand Net Pay
Reservoir Top Base Thickness Thickness NTG Porosity Permeability1 Thickness NTG Porosity Permeability1 Sw
Zone mRT mRT mMD mMD Fraction Fraction mD mMD Fraction Fraction mD Fraction
2458 Sst 2603.8 2619.5 15.7 6.2 0.395 0.184 42.3 2.5 0.159 0.217 116 0.476
2718 Sst 2864.8 2871.4 6.6 4.2 0.636 0.184 254 0 0.000 - - -
2882.5 2887.1 4.6 2.1 0.457 0.195 13.6 2.1 0.457 0.195 13.6 0.447
2755 Sst 2902.7 2912.1 9.4 7.7 0.819 0.174 61.7 7.6 0.809 0.175 64.1 0.168
2809 Sst 2962.6 2984.8 22.2 21.5 0.968 0.173 150 21.3 0.959 0.174 156 0.209
2844 Sst 3005.0 3014.9 9.9 5.5 0.556 0.163 28.9 1.3 0.131 0.199 550 0.548
2952 Sst 3118.2 3130.1 11.9 2.0 0.168 0.150 0.86 1.5 0.126 0.165 0.97 0.420
2973 Sst 3149.4 3165.4 16.0 13.0 0.813 0.147 38.2 9.8 0.613 0.165 94.4 0.235
2718 Sst to 2973 Sst Inclusive
Gas zone 2882.5 3165.4 80.6 56.0 0.695 0.167 97.4 43.6 0.542 0.173 126 0.239
All reservoirs 96.3 62.2 0.646 0.169 91.9 46.1 0.480 0.167 125 0.244
Net Sand Parameters Net Pay (Net Sand + …)
Reservoir Zone Shale Volume Porosity Permeability Water Saturation
2458 Sst < 40% Not directly applied > 1 mD (oil zone) < 60%
2718 – 2973 Sst < 40% Not directly applied > 0.1 mD(water zone) < 60%
1 Geometric average
ORIGIN ENERGY RESOURCES LIMITED YOLLA-4 PETROPHYSICAL REVIEW, TR/L1, BASS BASIN
1
TABLE OF CONTENTS
EXECUTIVE SUMMARY................................................................................... 2
BOREHOLE DATA......................................................................................... 3
Hole / Casing Diameters ............................................................................... 3
Hole Deviation ............................................................................................ 3
Drilling Mud Properties .................................................................................. 3
Borehole Temperatures ................................................................................. 4
DATA AVAILABILITY ..................................................................................... 7
Logging While Drilling (LWD) Data..................................................................... 7
Wireline Log Data ........................................................................................ 7
Core Data.................................................................................................. 8
Petrology / Shows....................................................................................... 10
LOG ANALYSIS METHODOLOGY ......................................................................15
Shale Determination .................................................................................... 15
Porosity ................................................................................................... 15
Water Saturation ........................................................................................ 17
Permeability ............................................................................................. 18
Net Sand and Net Pay Cut-offs........................................................................ 18
INTERPRETATION RESULTS ...........................................................................25
Angahook Sandstone (1315 – 1324 mRT)............................................................. 25
2458 Sst (2603 – 2619 mRT)............................................................................ 25
2718 Sst (2865 – 2871 mRT)............................................................................ 27
2755 Sst (2902 – 2912 mRT)............................................................................ 27
2809 Sst (2962 – 2985 mRT)............................................................................ 28
2844 Sst (3005 – 3015 mRT)............................................................................ 28
2952 Sst (3118 – 3130 mRT)............................................................................ 28
2973 Sst (3149 – 3165 mRT)............................................................................ 28
REFERENCES.............................................................................................40
ORIGIN ENERGY RESOURCES LIMITED YOLLA-4 PETROPHYSICAL REVIEW, TR/L1, BASS BASIN
2
Figures Figure 1: Plan View of the Yolla-4 Well Deviation ...................................................... 5
Figure 2: Cross-section View of the Yolla-4 Well ....................................................... 5
Figure 3: Horner temperature Plot for the TD Logging Suite at Yolla-4............................. 6
Figure 4: Core Plug Spacing In Yolla-4 Cores #1 and #2...............................................13
Figure 5: Overburden Porosity vs Ambient Porosity From Yolla-4 Cores #1 and #2 ..............14
Figure 6: Overburden Permeability vs Ambient Permeability From Yolla-4 Cores #1 and #2 ...14
Figure 7: Histogram of CGR from the 2809 Sst .........................................................19
Figure 8: Core Porosity / Density Log Correlation for the 2809 Sst .................................20
Figure 9: Core Porosity / Density Log Correlation for the 2755 Sst .................................21
Figure 10: Pickett Plot for the 2458 Sst in Yolla-4.....................................................22
Figure 11: Pickett Plot for the 2718 Sst in Yolla-4.....................................................22
Figure 12: Overburden Corrected Porosity / Permeability Trend for Yolla-4 Cores #1 & #2....23
Figure 13: Ratio of Rt to Rxo Plotted against Permeability in the 2809 Sst .......................23
Figure 14: Ratio of Rt to Rxo Plotted against Permeability in the 2755 Sst .......................24
Figure 15: Mud and LWD Logs section Across the Angahook Sandstone ............................30
Figure 16: 2458 Sst MSCT Porosity / Permeability .....................................................31
Figure 17: Pressure Profile through the 2458 Sst ......................................................31
Figure 18: 2458 Sst Reservoir .............................................................................32
Figure 19: 2718 Sst Interval ...............................................................................33
Figure 20: 2755 Sst Reservoir .............................................................................34
Figure 21: 2755 and 2809 Sst Reservoir MDT Pressure Data Analysis ...............................35
Figure 22: 2809 Sst Reservoir .............................................................................36
Figure 23: Log Section Across the 2844 Sst .............................................................37
Figure 24: MDT Pressure Profile for the 2973 Sst in Yolla-4..........................................38
Figure 25: Log Section through the 2952 and 2973 Sst................................................39
Enclosures
1. Yolla-4 EVCM (2600 – 3200 mRT) Petrophysical summary plot 1 : 200
2. Yolla-4 EVCM (2600 – 3200 mRT) Petrophysical summary plot 1 : 500
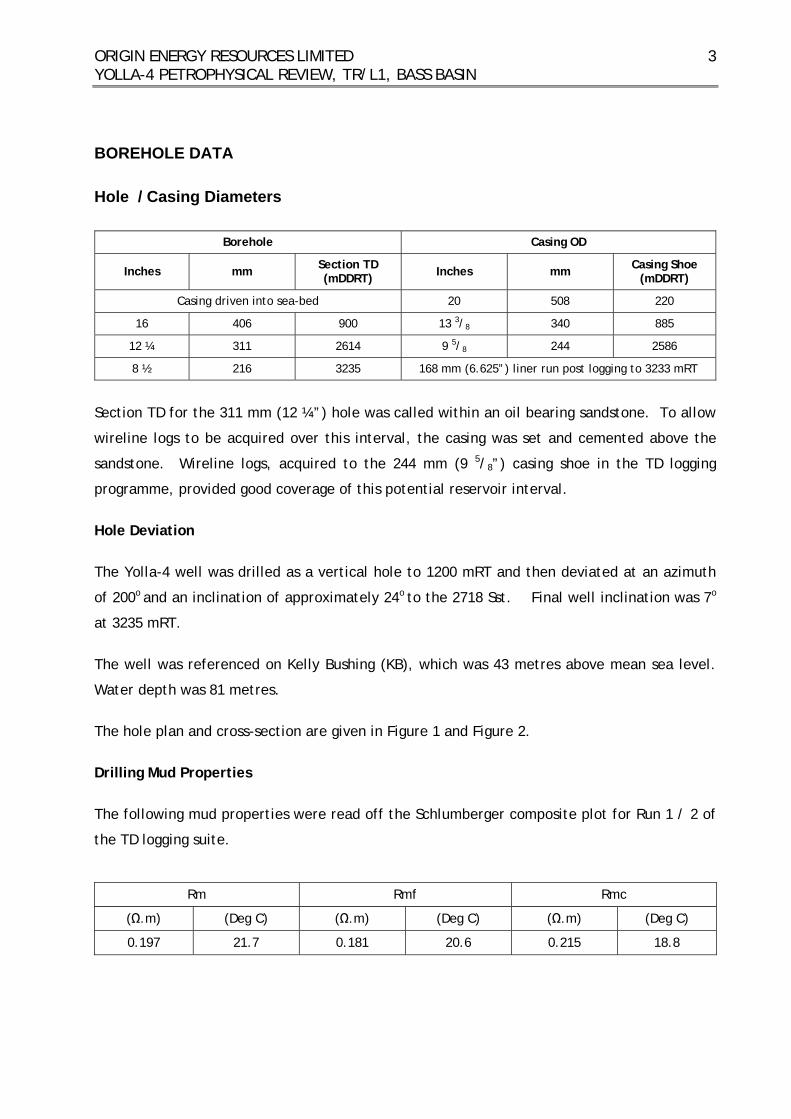
ORIGIN ENERGY RESOURCES LIMITED YOLLA-4 PETROPHYSICAL REVIEW, TR/L1, BASS BASIN
3
BOREHOLE DATA
Hole / Casing Diameters
Borehole Casing OD
Inches mm Section TD (mDDRT) Inches mm Casing Shoe
(mDDRT)
Casing driven into sea-bed 20 508 220
16 406 900 13 3/8 340 885
12 ¼ 311 2614 9 5/8 244 2586
8 ½ 216 3235 168 mm (6.625”) liner run post logging to 3233 mRT
Section TD for the 311 mm (12 ¼”) hole was called within an oil bearing sandstone. To allow
wireline logs to be acquired over this interval, the casing was set and cemented above the
sandstone. Wireline logs, acquired to the 244 mm (9 5/8”) casing shoe in the TD logging
programme, provided good coverage of this potential reservoir interval.
Hole Deviation
The Yolla-4 well was drilled as a vertical hole to 1200 mRT and then deviated at an azimuth
of 200o and an inclination of approximately 24o to the 2718 Sst. Final well inclination was 7o
at 3235 mRT.
The well was referenced on Kelly Bushing (KB), which was 43 metres above mean sea level.
Water depth was 81 metres.
The hole plan and cross-section are given in Figure 1 and Figure 2.
Drilling Mud Properties
The following mud properties were read off the Schlumberger composite plot for Run 1 / 2 of
the TD logging suite.
Rm Rmf Rmc
(Ω.m) (Deg C) (Ω.m) (Deg C) (Ω.m) (Deg C)
0.197 21.7 0.181 20.6 0.215 18.8

ORIGIN ENERGY RESOURCES LIMITED YOLLA-4 PETROPHYSICAL REVIEW, TR/L1, BASS BASIN
4
Borehole Temperatures
Bottom hole temperature (BHT) was measured in each of the logging runs. The temperature
range was from 126oC in Run 1 / 2 to 149.5oC (corrected to logging TD) in Run 1 / 6. The
Horner plot suggests a corrected BHT of 162.9oC, equivalent to a temperature gradient of
49.1oCkm-1, assuming a sea bed temperature of 10oC (Figure 3).
The temperature from Run 1 / 2 PEX-CMR-HRLA-GR (126oC at 3235.5 mRT) was used in the
petrophysical analysis.
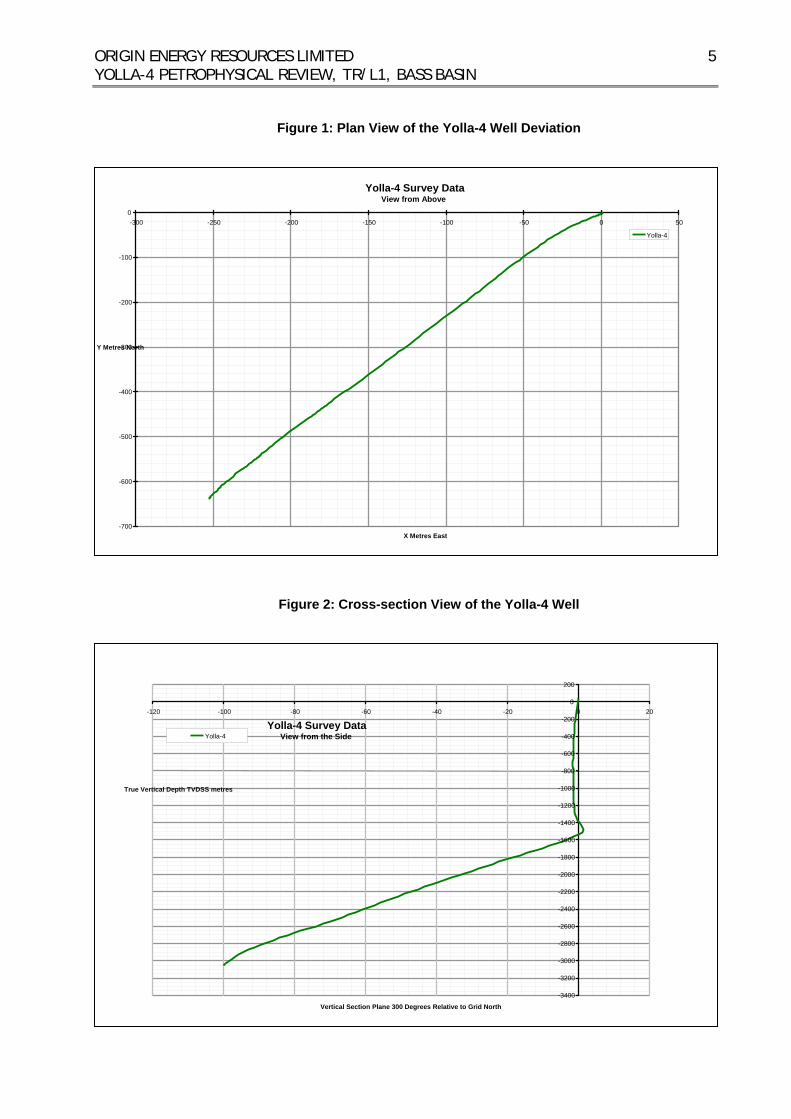
ORIGIN ENERGY RESOURCES LIMITED YOLLA-4 PETROPHYSICAL REVIEW, TR/L1, BASS BASIN
5
Figure 1: Plan View of the Yolla-4 Well Deviation
Yolla-4 Survey DataView from Above
0 -300 -250 -200 0 -150 -100 -50 50
Yolla-4
-100
-200
-300 Y Metres North
-400
-500
-600
-700 X Metres East
Figure 2: Cross-section View of the Yolla-4 Well
Yolla-4 Survey DataView from the Side
-3400 -3200 -3000 -2800 -2600 -2400 -2200 -2000 -1800 -1600 -1400 -1200 -1000 -800 -600 -400 -200 0
0 200
-120 -100 -80 20 -60 -40 -20
Yolla-4
True Vertical Depth TVDSS metres
Vertical Section Plane 300 Degrees Relative to Grid North
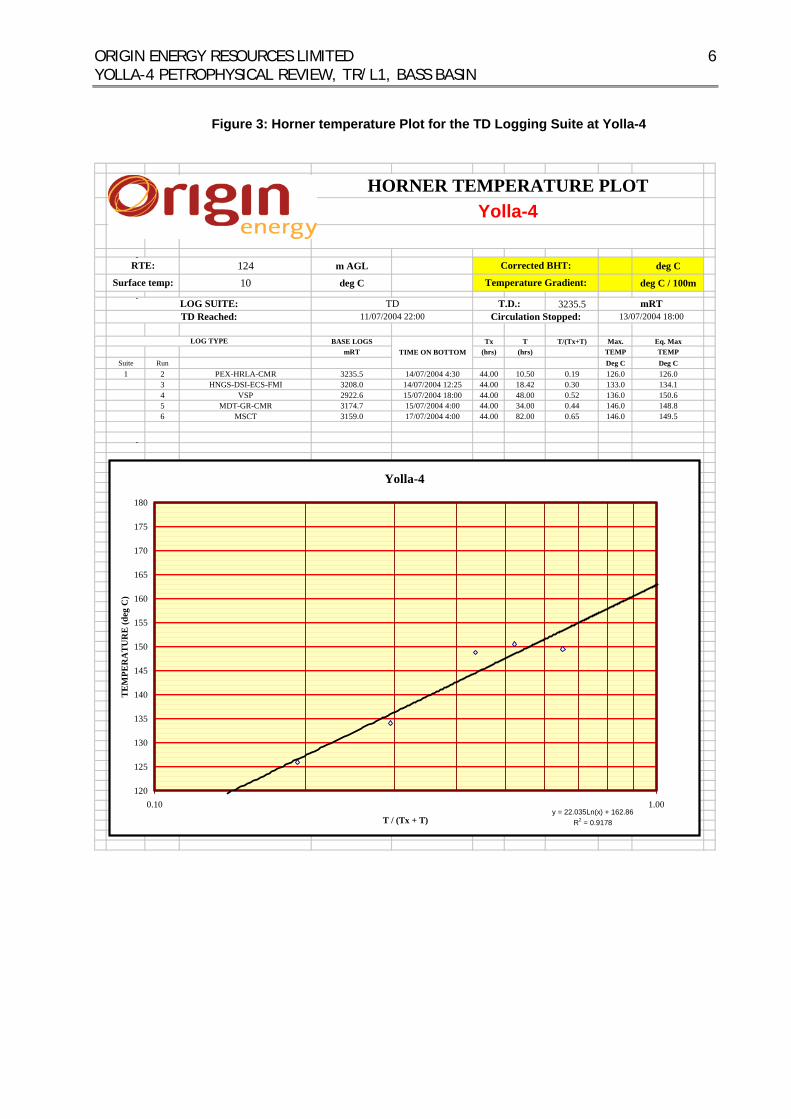
ORIGIN ENERGY RESOURCES LIMITED YOLLA-4 PETROPHYSICAL REVIEW, TR/L1, BASS BASIN
6
Figure 3: Horner temperature Plot for the TD Logging Suite at Yolla-4
124 m AGL deg C
10 deg C deg C / 100m
3235.5
BASE LOGS Tx T T/(Tx+T) Max. Eq. MaxmRT (hrs) (hrs) TEMP TEMP
Suite Run Deg C Deg C1 2 PEX-HRLA-CMR 3235.5 14/07/2004 4:30 44.00 10.50 0.19 126.0 126.0
3 HNGS-DSI-ECS-FMI 3208.0 14/07/2004 12:25 44.00 18.42 0.30 133.0 134.14 VSP 2922.6 15/07/2004 18:00 44.00 48.00 0.52 136.0 150.65 MDT-GR-CMR 3174.7 15/07/2004 4:00 44.00 34.00 0.44 146.0 148.86 MSCT 3159.0 17/07/2004 4:00 44.00 82.00 0.65 146.0 149.5
LOG TYPETIME ON BOTTOM
mRTTD Reached: 11/07/2004 22:00 Circulation Stopped: 13/07/2004 18:00
Surface temp: Temperature Gradient:
LOG SUITE: TD T.D.:
HORNER TEMPERATURE PLOTYolla-4
RTE: Corrected BHT:
Yolla-4
y = 22.035Ln(x) + 162.86R2 = 0.9178
120
125
130
135
140
145
150
155
160
165
170
175
180
0.10 1.00
T / (Tx + T)
TE
MPE
RA
TU
RE
(deg
C)
ORIGIN ENERGY RESOURCES LIMITED YOLLA-4 PETROPHYSICAL REVIEW, TR/L1, BASS BASIN
7
DATA AVAILABILITY
Logging While Drilling (LWD) Data
LWD GR and resistivity were acquired by Sperry Sun from the 340 mm (13 3/8”) casing shoe at
885 mRT to final TD at 3235 mRT.
The 311 mm (12 ¼”) section was drilled in one bit run. LWD logging comprised the dual
gamma ray (DGR) and four-phase Electromagnetic Resistivity (EWR-P4) tool. This yielded the
Smoothed Gamma ray log (SGRC) and the micro, shallow, medium and deep resistivity curves
(SEXP, SESP, SEMP and SEDP respectively). At the end of the section, the potential reservoir
section between 1310 – 1340 mRT was relogged with the gamma ray and SEXP / SEDP curves
to obtain an invasion profile.
The 216 mm (8 ½”) section was drilled in 3 bit runs, due to core being taken in the reservoirs.
The section was logged throughout with the DGR – EWR-P4 tools. The cored sections were
wiped with the tools when drilling recommenced after coring.
Wireline Log Data
Wireline data was acquired by Schlumberger over the section from the 244 mm (9 5/8”) casing
to TD (Table 2).
In the first wireline logging run (Run 1 / 1 : PEX-CMR–HRLA), the tools would not pass below
2776 mRT and so only the section between 2776 mRT and the casing shoe at 2590 mRT was
logged. Schlumberger could not follow their normal depth correction procedure and the
depths were tied to the LWD data and do not conform to the final depth datum for the well.
After reconfiguring the tool string, the PEX-CMR-HRLA was rerun (Run 1 / 2) over the interval
between TD and the 244 mm (9 5/8”) casing shoe. Upon reaching TD, the CMR failed to
calibrate and would have had to be taken up hole for recalibration. If this had been done,
the bottom hole temperature (BHT) would have exceeded the working limit for the PEX.
Consequently, no CMR data was acquired in this run.
HNGS-DSI-ECS-FMI was acquired in Run 1 / 3 between TD and the 244 mm (9 5/8”) casing shoe
without any significant problems. Sonic and gamma ray logs were acquired through casing
from the 244 mm (9 5/8”) casing shoe to 116 mRT.
ORIGIN ENERGY RESOURCES LIMITED YOLLA-4 PETROPHYSICAL REVIEW, TR/L1, BASS BASIN
8
VSP data was acquired in Run 1 / 4 from 3225 mRT to 1205 mRT at 20 metre intervals.
Between 1200 - 770 mRT, VSP data was acquired, but could not be used for time-depth
processing as the formation first arrivals could not be distinguished from casing ringing.
Run 1 / 5 was planned to acquire MDT pressures and fluid samples from the reservoirs. Due to
it’s failure earlier in the logging programme, the CMR was also included in this run. CMR data
was acquired without problems from 2576 – 3231 mRT. The MDT was used to acquire 52
pre-test pressure points and four 450 cc samples. One further sample was attempted, but the
chamber failed to open. The samples were taken in a sandstone (at 3006 mRT) immediately
beneath the 2809 Sst, the 2718 Sst water zone and in the 2458 Sst (2 samples).
Twenty-five MSCT plugs were planned to be acquired in Run 1 / 6. After failing with 3 cores
in the 2973 Sst, the tool was pulled back to casing and recalibrated. Twenty further cores
were cut, but only eight were accepted, six in the 2458 Sst and two in the 2973 Sst.
Core Data
Two 27 metre cores were acquired in Yolla-4.
Core #1 was taken in the 2755 Sst between 2892 - 2919.5 mDDRT with 100% recovery.
Comparison of the core GR to wireline logs suggests that the core depths were 5.9 metres
high of the wireline depth datum for the well.
• 259 probe permeability measurements were acquired
• 86 plugs were cut. 61 were used to measure horizontal permeability, 21 were used for
vertical permeability. 4 were unusable.
• 21 overburden porosities and permeabilities were measured using an overburden
pressure of 5000 psi.
• SCAL was calculated on 5 plugs with varying porosity and permeability
Core #2 was taken in the 2809 Sst between 2958 – 2985 mDDRT with 100% recovery.
Comparison of the core GR to wireline logs suggests that the core depths were 4.2 metres
high of the wireline depth datum for the well.
• 252 probe permeability measurements were acquired
ORIGIN ENERGY RESOURCES LIMITED YOLLA-4 PETROPHYSICAL REVIEW, TR/L1, BASS BASIN
9
• 117 plugs were cut. 91 were used to measure horizontal permeability, 26 were used
for vertical permeability.
• 31 overburden porosities and permeabilities were measured using an overburden
pressure of 5000 psi.
• SCAL was calculated on 5 plugs with varying porosity and permeability
Core plugs were planned to be sampled regularly every 0.30 metres to attempt to avoid
biasing the data distribution. The core quality (fracturing etc) influenced the plugs taken.
The spacing of the horizontal core plugs (Figure 4) illustrates that the data has been sampled
in a relatively unbiased manner. Core #1 was shalier, and regular core plugs were harder to
obtain. The lower, shaly section of core #1 was not sampled.
Overburden (OB) porosity and permeability were plotted from the two cores (Figure 5). This
suggests that the compaction correction is very similar for both cores. The following
equations were used to correct the ambient properties to down hole properties for cores #1
and #2. One apparently spurious point (ambient permeability = 2121 mD, OB permeability =
1369 mD) was removed from the core #2 distribution
OB Porosity = Ambient Porosity * 0.935
OB Permeability = Ambient Permeability * 0.833
Archie ‘m’ for Core #1 and #2 is calculated from the SCAL data to be 1.777 (average of 10
points) with no appreciable difference between the data from the two cores. The equivalent
shaly sand ‘m*’ is 1.785.
The Cation Exchange Capacity (CEC) was calculated from the same 10 cores. In Core #1 (2755
Sst), the average CEC (uncrushed) is 0.10 meq/100g, which translates to a Clay Qv of 0.01
meq/cm3. In Core #2 (2809 Sst), the average CEC (uncrushed) is 0.18 meq/100g, which
translates to a Clay Qv of 0.02 meq/cm3.
Ambient porosity and permeability were measured on 6 rotary sidewall core plugs from the
2458 Sst.
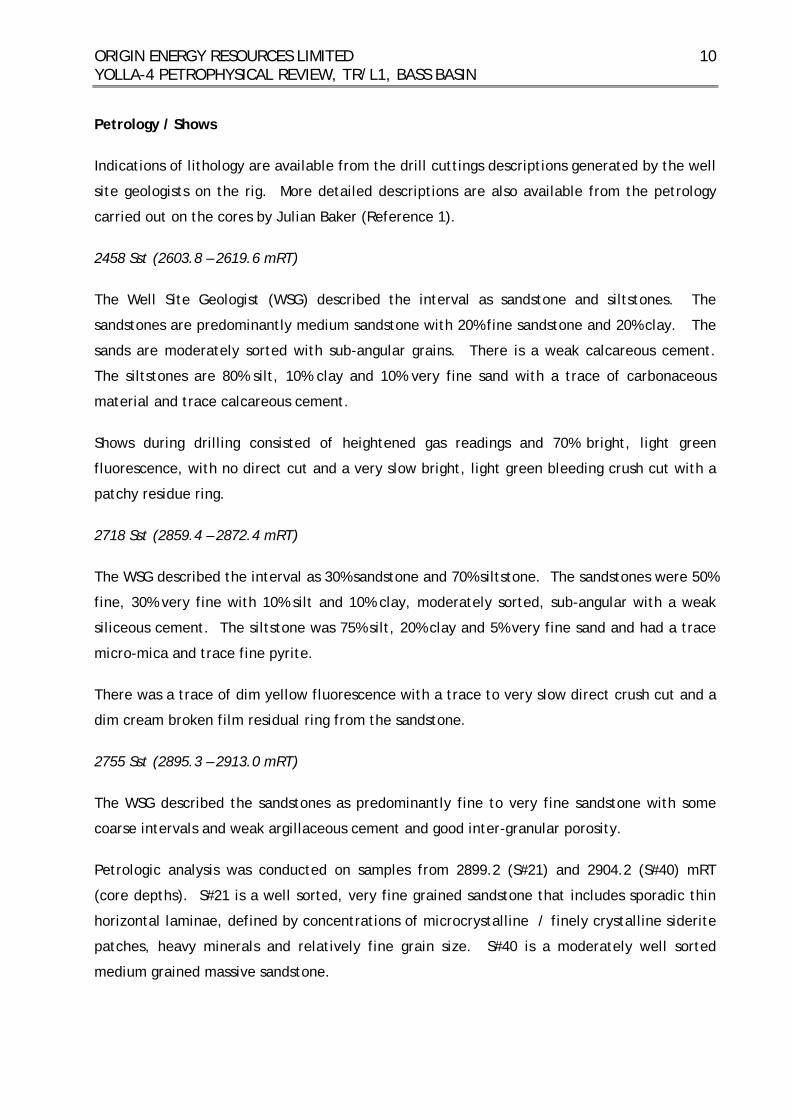
ORIGIN ENERGY RESOURCES LIMITED YOLLA-4 PETROPHYSICAL REVIEW, TR/L1, BASS BASIN
10
Petrology / Shows
Indications of lithology are available from the drill cuttings descriptions generated by the well
site geologists on the rig. More detailed descriptions are also available from the petrology
carried out on the cores by Julian Baker (Reference 1).
2458 Sst (2603.8 – 2619.6 mRT)
The Well Site Geologist (WSG) described the interval as sandstone and siltstones. The
sandstones are predominantly medium sandstone with 20% fine sandstone and 20% clay. The
sands are moderately sorted with sub-angular grains. There is a weak calcareous cement.
The siltstones are 80% silt, 10% clay and 10% very fine sand with a trace of carbonaceous
material and trace calcareous cement.
Shows during drilling consisted of heightened gas readings and 70% bright, light green
fluorescence, with no direct cut and a very slow bright, light green bleeding crush cut with a
patchy residue ring.
2718 Sst (2859.4 – 2872.4 mRT)
The WSG described the interval as 30% sandstone and 70% siltstone. The sandstones were 50%
fine, 30% very fine with 10% silt and 10% clay, moderately sorted, sub-angular with a weak
siliceous cement. The siltstone was 75% silt, 20% clay and 5% very fine sand and had a trace
micro-mica and trace fine pyrite.
There was a trace of dim yellow fluorescence with a trace to very slow direct crush cut and a
dim cream broken film residual ring from the sandstone.
2755 Sst (2895.3 – 2913.0 mRT)
The WSG described the sandstones as predominantly fine to very fine sandstone with some
coarse intervals and weak argillaceous cement and good inter-granular porosity.
Petrologic analysis was conducted on samples from 2899.2 (S#21) and 2904.2 (S#40) mRT
(core depths). S#21 is a well sorted, very fine grained sandstone that includes sporadic thin
horizontal laminae, defined by concentrations of microcrystalline / finely crystalline siderite
patches, heavy minerals and relatively fine grain size. S#40 is a moderately well sorted
medium grained massive sandstone.
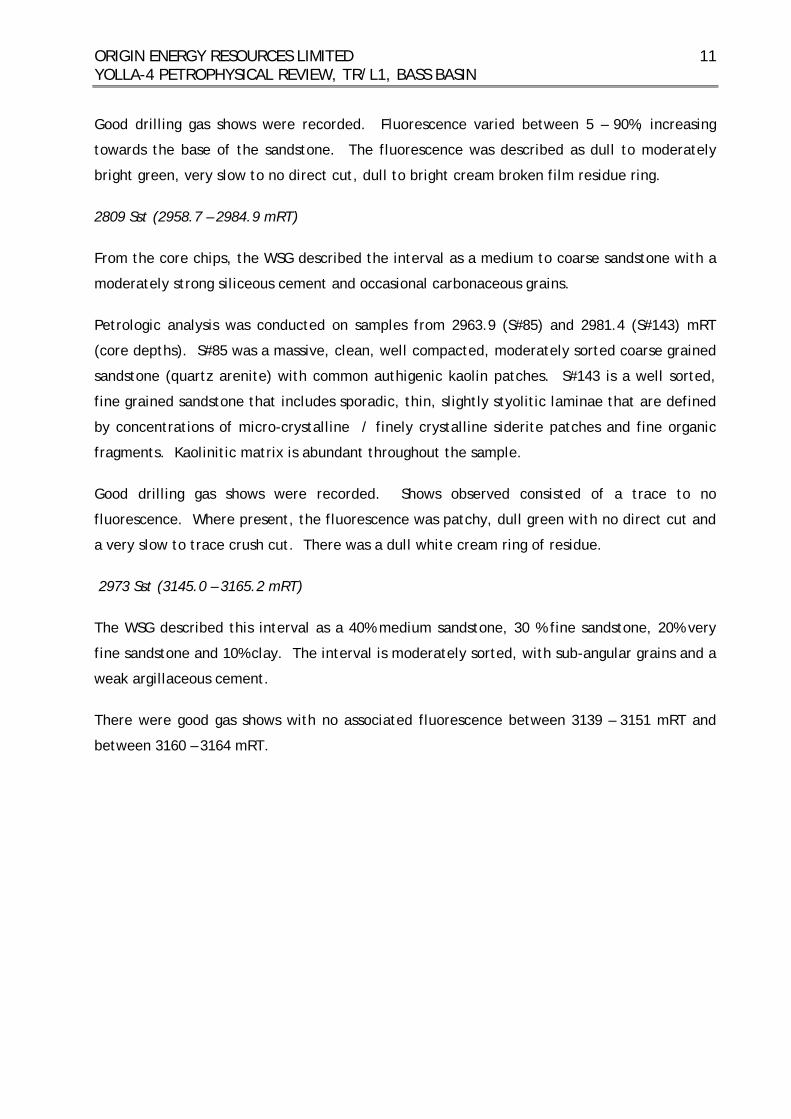
ORIGIN ENERGY RESOURCES LIMITED YOLLA-4 PETROPHYSICAL REVIEW, TR/L1, BASS BASIN
11
Good drilling gas shows were recorded. Fluorescence varied between 5 – 90%, increasing
towards the base of the sandstone. The fluorescence was described as dull to moderately
bright green, very slow to no direct cut, dull to bright cream broken film residue ring.
2809 Sst (2958.7 – 2984.9 mRT)
From the core chips, the WSG described the interval as a medium to coarse sandstone with a
moderately strong siliceous cement and occasional carbonaceous grains.
Petrologic analysis was conducted on samples from 2963.9 (S#85) and 2981.4 (S#143) mRT
(core depths). S#85 was a massive, clean, well compacted, moderately sorted coarse grained
sandstone (quartz arenite) with common authigenic kaolin patches. S#143 is a well sorted,
fine grained sandstone that includes sporadic, thin, slightly styolitic laminae that are defined
by concentrations of micro-crystalline / finely crystalline siderite patches and fine organic
fragments. Kaolinitic matrix is abundant throughout the sample.
Good drilling gas shows were recorded. Shows observed consisted of a trace to no
fluorescence. Where present, the fluorescence was patchy, dull green with no direct cut and
a very slow to trace crush cut. There was a dull white cream ring of residue.
2973 Sst (3145.0 – 3165.2 mRT)
The WSG described this interval as a 40% medium sandstone, 30 % fine sandstone, 20% very
fine sandstone and 10% clay. The interval is moderately sorted, with sub-angular grains and a
weak argillaceous cement.
There were good gas shows with no associated fluorescence between 3139 – 3151 mRT and
between 3160 – 3164 mRT.
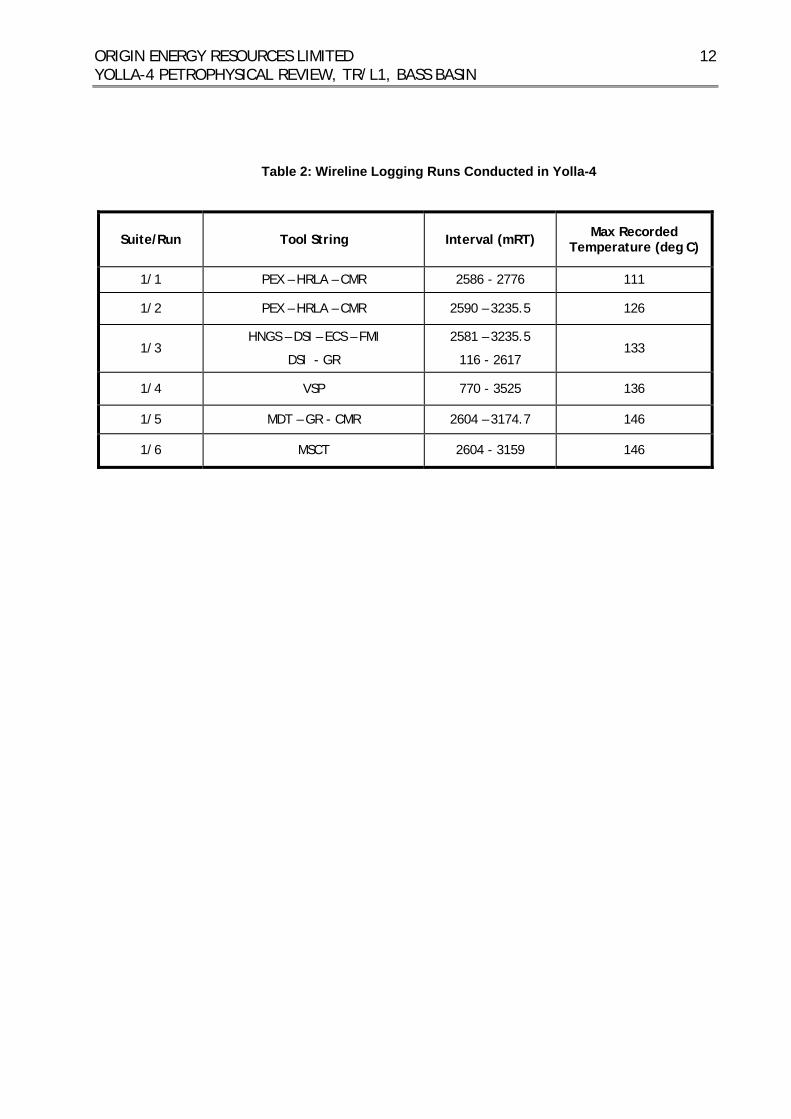
ORIGIN ENERGY RESOURCES LIMITED YOLLA-4 PETROPHYSICAL REVIEW, TR/L1, BASS BASIN
12
Table 2: Wireline Logging Runs Conducted in Yolla-4
Suite/Run Tool String Interval (mRT) Max Recorded Temperature (deg C)
1/1 PEX – HRLA – CMR 2586 - 2776 111
1/2 PEX – HRLA – CMR 2590 – 3235.5 126
1/3 HNGS – DSI – ECS – FMI
DSI - GR
2581 – 3235.5
116 - 2617 133
1/4 VSP 770 - 3525 136
1/5 MDT – GR - CMR 2604 – 3174.7 146
1/6 MSCT 2604 - 3159 146
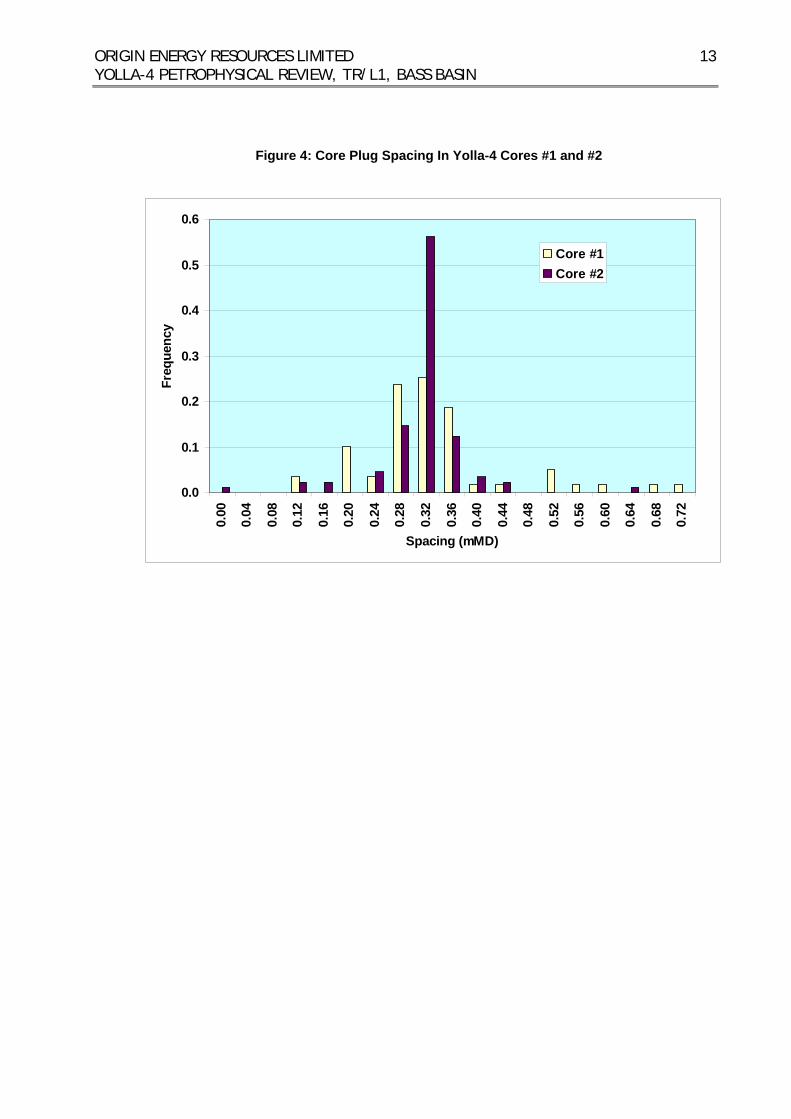
ORIGIN ENERGY RESOURCES LIMITED YOLLA-4 PETROPHYSICAL REVIEW, TR/L1, BASS BASIN
13
Figure 4: Core Plug Spacing In Yolla-4 Cores #1 and #2
0.0
0.1
0.2
0.3
0.4
0.5
0.60.
00
0.04
0.08
0.12
0.16
0.20
0.24
0.28
0.32
0.36
0.40
0.44
0.48
0.52
0.56
0.60
0.64
0.68
0.72
Spacing (mMD)
Freq
uenc
y
Core #1Core #2
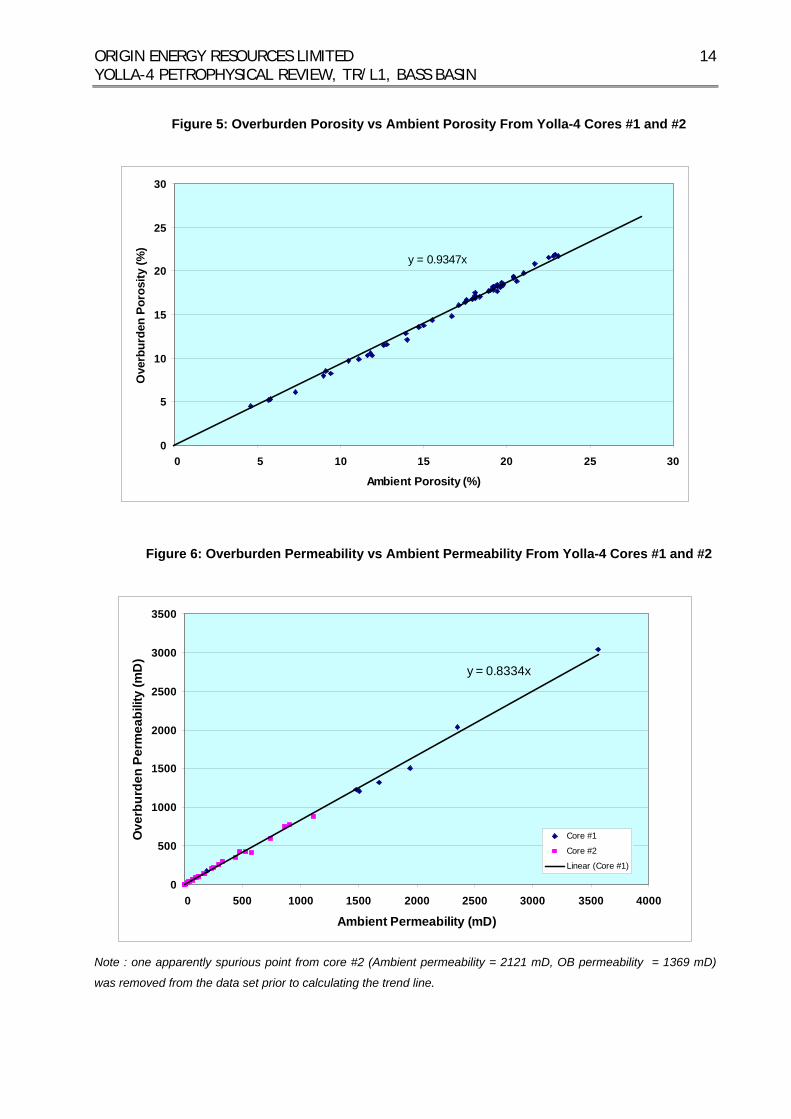
ORIGIN ENERGY RESOURCES LIMITED YOLLA-4 PETROPHYSICAL REVIEW, TR/L1, BASS BASIN
14
Figure 5: Overburden Porosity vs Ambient Porosity From Yolla-4 Cores #1 and #2
y = 0.9347x
0
5
10
15
20
25
30
0 5 10 15 20 25 30
Ambient Porosity (%)
Ove
rbur
den
Poro
sity
(%)
Figure 6: Overburden Permeability vs Ambient Permeability From Yolla-4 Cores #1 and #2
y = 0.8334x
0
500
1000
1500
2000
2500
3000
3500
0 500 1000 1500 2000 2500 3000 3500 4000
Ambient Permeability (mD)
Ove
rbur
den
Perm
eabi
lity
(mD
)
Core #1
Core #2
Linear (Core #1)
Note : one apparently spurious point from core #2 (Ambient permeability = 2121 mD, OB permeability = 1369 mD)
was removed from the data set prior to calculating the trend line.
ORIGIN ENERGY RESOURCES LIMITED YOLLA-4 PETROPHYSICAL REVIEW, TR/L1, BASS BASIN
15
LOG ANALYSIS METHODOLOGY
The parameters for the different intervals in the well are given in Appendix A.
Shale Determination
Shale Volume
Shale volume (VSHGR) was determined from the CGR curve (spectral GR minus the effect of
Uranium) and a linear interpolation between GRCLEAN and GRSHALE. GRCLEAN and GRSHALE were
chosen as the mode of the HCGR distribution through the 2809 Sst (13 API) and the peak of
the shale distribution (83 API) in the CGR distribution through the entire study interval (Figure
7).
Shale volume from neutron-density (VSHND) was also calculated. The agreement between
VSHND and VSHGR was excellent in most areas.
The minimum of VSHGR and VSHND was taken to be the true shale volume.
Porosity
Porosity was determined from a combination of the CMR, density and neutron logs. An
excellent agreement was obtained between the different tools for measuring porosity (sonic,
CMR, density and neutron).
Density porosity was used in the determination of permeability (which was used to derive net
sand thickness) and for the average net sand porosity.
Density
The density log was used with the core data in the 2755 and 2809 Sst to generate a core /
wireline correlation.
The average grain density from core analysis in the 2809 Sst is 2.663 gcm-3. Cross-plotting
core porosity and the density log and using the core derived grain density as a fixed point at
porosity = 0%, yields a value for the fluid density to honour average core porosity (Figure 8).
The required fluid density for the 2809 Sst is 0.629 gcm-3.
ORIGIN ENERGY RESOURCES LIMITED YOLLA-4 PETROPHYSICAL REVIEW, TR/L1, BASS BASIN
16
There is more variation in facies in the 2755 Sst. For the purposes of the core to log
correlation, the core can be divided into three intervals (Figure 9). The fluid density is the
density required to correlate the core porosity and density logs and not necessarily the actual
pore fluid density.
Top (mRT) Base (mRT) Grain Density (gcm-3) Fluid Density (gcm-3)
2900.0 2907.7 2.694 1.023
2907.7 2912.0 2.686 0.421
2912.0 2926.0 2.715 1.404
The ECS tool yields a matrix density curve (RHGE) that gives similar grain density averages
across the cored interval to the core data. This was used as the matrix density throughout
the interpreted interval.
The fluid density for the gas bearing 2809 Sst (0.605 gcm-3) was also used in the 2973 Sst
porosity determination.
Neutron Density
Neutron-density porosity was determined using the ECS matrix density curve and the
parameters given in Appendix A. Prior to determining the porosity, the neutron log was
converted to a sandstone matrix and shale corrected.
CMR
CMR porosity (TCMR) is the most accurately determined porosity in formations where the
hydrogen index (HI) of the pore fluid can be assumed to be 1.0 (i.e. water or oil bearing
formations). In gas bearing formations, the CMR under-reads the effective porosity by the
ratio of the HI of the gas to that of water. The bound fluid volume is assumed to be water
bearing, even in a gas zone, and is read correctly.
CO2 in the formation has no hydrogen and will, therefore, not be read as porosity by CMR.
The oxygen present will also increase the relaxation time of the hydrogen proton, making the
pores appear smaller than they actually are.
Due to the factors above, the CMR was not directly used in the porosity analysis for this well.
ORIGIN ENERGY RESOURCES LIMITED YOLLA-4 PETROPHYSICAL REVIEW, TR/L1, BASS BASIN
17
Water Saturation
Formation Water Resistivity
Two MDT water samples were taken in Yolla-4 in the 2718 Sst and the 2458 Sst. Both of these
are either mud filtrate or heavily contaminated with filtrate.
Three samples (all completion brine) were taken during the production test on the 2973 Sst.
A further four samples were taken from the 2755 Sst production test and three from the 2809
Sst. These were all very fresh water and were attributed to water of condensation from the
gas stream. Hence, none of the samples gathered in Yolla-4 are considered representative of
the formation water.
Water resistivity was determined for the reservoirs either from Pickett Plots in Yolla-4 (basal
section of the 2458 Sst (Figure 10) and the 2718 Sst (Figure 11)). Formation water resistivity
for the other reservoirs was estimated from Yolla-2 as the sands are below the GWC there.
Estimation of formation water resistivity for the 2755 Sst is more difficult as the reservoir is
gas bearing at Yolla-2. The values used in the interpretation are given below.
Reservoir Conditions
Standard Conditions Salinity Quality Well Rw
determined in
Sandstone (ohm.m) (oC) (ohm.m at 25oC)
Yolla-4 2458 Sst 0.17 102.3 0.453 12,340 Good (Figure 10)
Yolla-4 2718 Sst 0.24 112.1 0.689 7,870 Good (Figure 11)
Yolla-2 2755 Sst As for the 2809 Sst
Yolla-2 2809 Sst 0.17 106.5 0.468 11,910 Good
Yolla-2 2952 Sst 0.14 111.6 0.401 14,082 Reasonable
Yolla-2 2973 Sst 0.25 112.5 0.720 7,510 Good
Water Saturation Determination
Water saturation was calculated using the Archie and Waxman Smits equations. Since the
CEC is very low (0.10 meq/100g and 0.18 meq/100g for cores #1 and #2 respectively), the
equations yield a very similar answer.
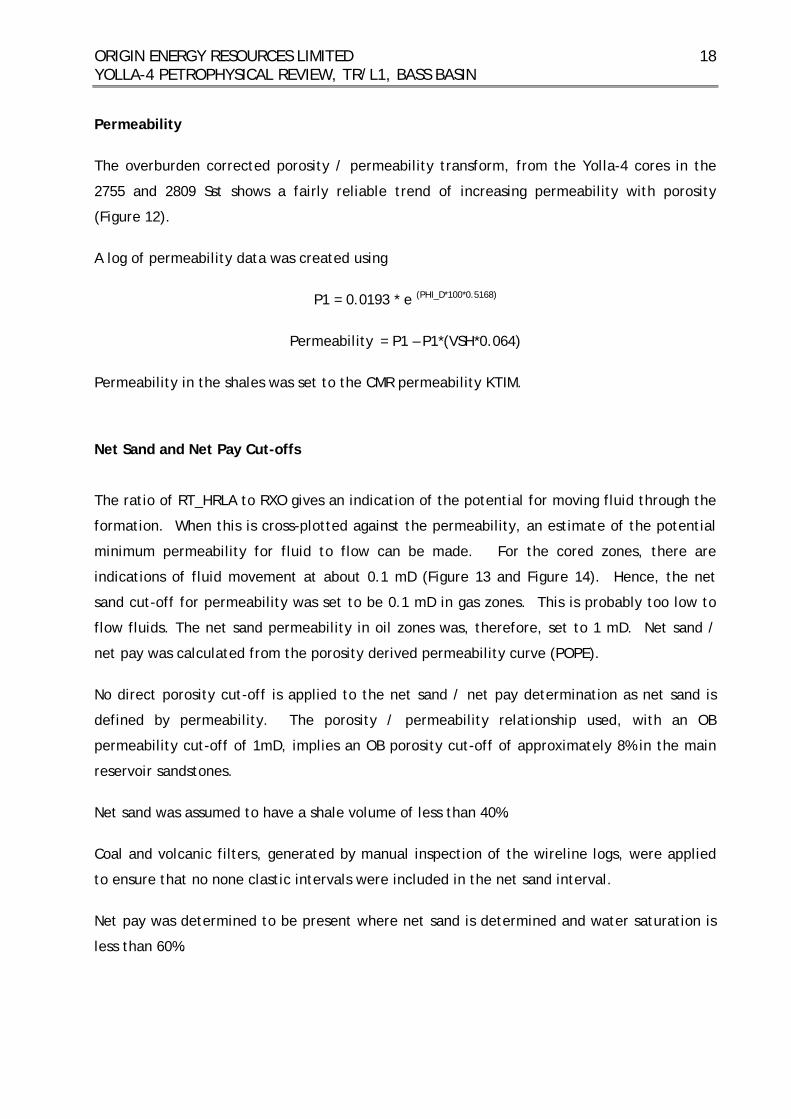
ORIGIN ENERGY RESOURCES LIMITED YOLLA-4 PETROPHYSICAL REVIEW, TR/L1, BASS BASIN
18
Permeability
The overburden corrected porosity / permeability transform, from the Yolla-4 cores in the
2755 and 2809 Sst shows a fairly reliable trend of increasing permeability with porosity
(Figure 12).
A log of permeability data was created using
P1 = 0.0193 * e (PHI_D*100*0.5168)
Permeability = P1 – P1*(VSH*0.064)
Permeability in the shales was set to the CMR permeability KTIM.
Net Sand and Net Pay Cut-offs
The ratio of RT_HRLA to RXO gives an indication of the potential for moving fluid through the
formation. When this is cross-plotted against the permeability, an estimate of the potential
minimum permeability for fluid to flow can be made. For the cored zones, there are
indications of fluid movement at about 0.1 mD (Figure 13 and Figure 14). Hence, the net
sand cut-off for permeability was set to be 0.1 mD in gas zones. This is probably too low to
flow fluids. The net sand permeability in oil zones was, therefore, set to 1 mD. Net sand /
net pay was calculated from the porosity derived permeability curve (POPE).
No direct porosity cut-off is applied to the net sand / net pay determination as net sand is
defined by permeability. The porosity / permeability relationship used, with an OB
permeability cut-off of 1mD, implies an OB porosity cut-off of approximately 8% in the main
reservoir sandstones.
Net sand was assumed to have a shale volume of less than 40%.
Coal and volcanic filters, generated by manual inspection of the wireline logs, were applied
to ensure that no none clastic intervals were included in the net sand interval.
Net pay was determined to be present where net sand is determined and water saturation is
less than 60%.
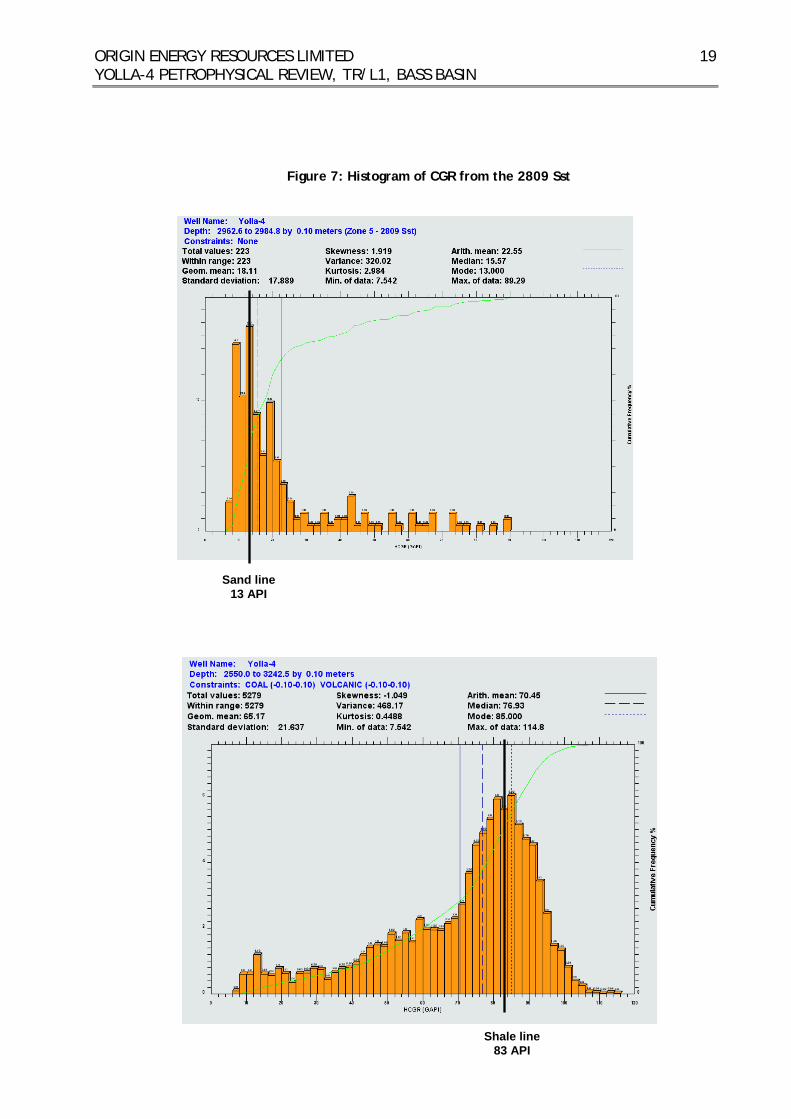
ORIGIN ENERGY RESOURCES LIMITED YOLLA-4 PETROPHYSICAL REVIEW, TR/L1, BASS BASIN
19
Figure 7: Histogram of CGR from the 2809 Sst
Sand line 13 API
Shale line83 API
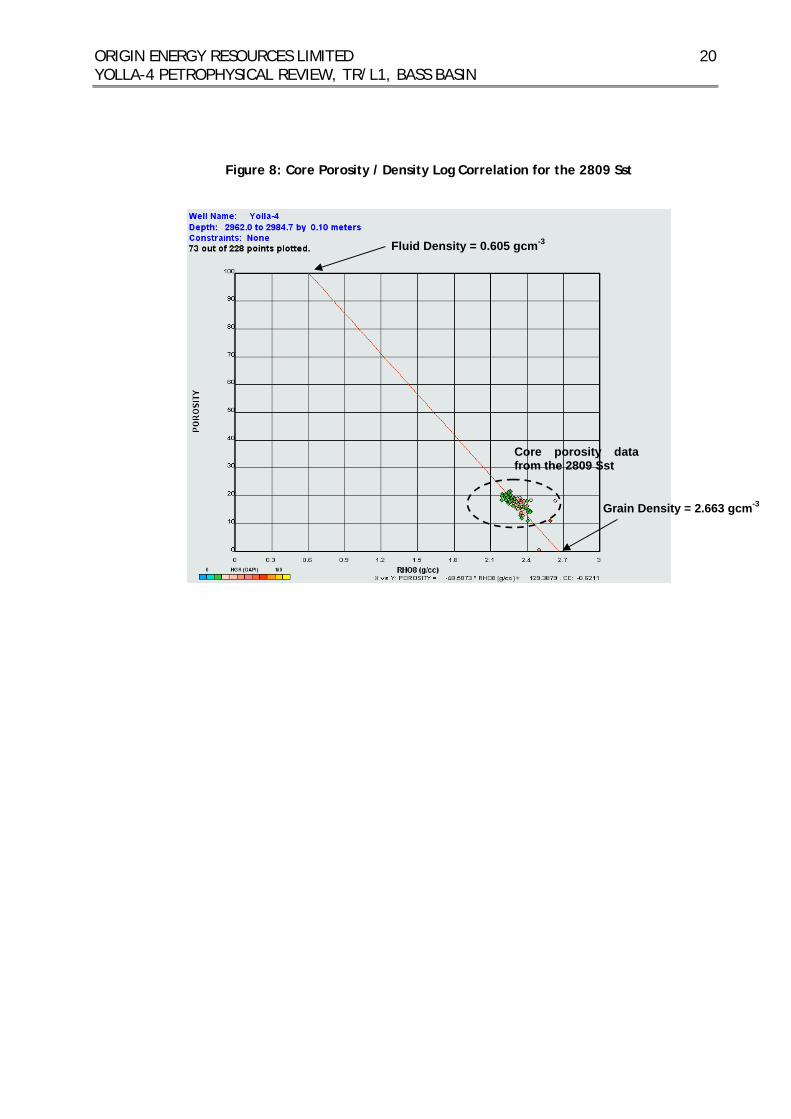
ORIGIN ENERGY RESOURCES LIMITED YOLLA-4 PETROPHYSICAL REVIEW, TR/L1, BASS BASIN
20
Figure 8: Core Porosity / Density Log Correlation for the 2809 Sst
Fluid Density = 0.605 gcm-3
Core porosity data from the 2809 Sst
Grain Density = 2.663 gcm-3
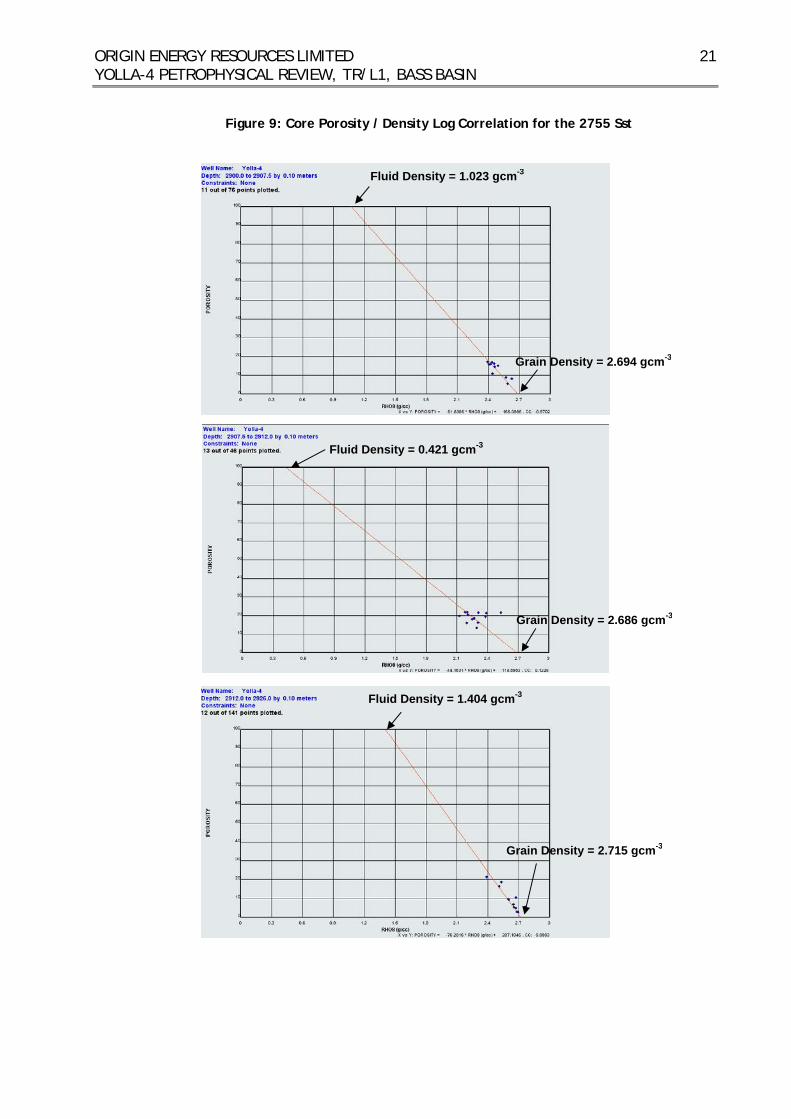
ORIGIN ENERGY RESOURCES LIMITED YOLLA-4 PETROPHYSICAL REVIEW, TR/L1, BASS BASIN
21
Figure 9: Core Porosity / Density Log Correlation for the 2755 Sst
Fluid Density = 1.023 gcm-3
Grain Density = 2.694 gcm-3
Fluid Density = 0.421 gcm-3
Grain Density = 2.686 gcm-3
Fluid Density = 1.404 gcm-3
Grain Density = 2.715 gcm-3
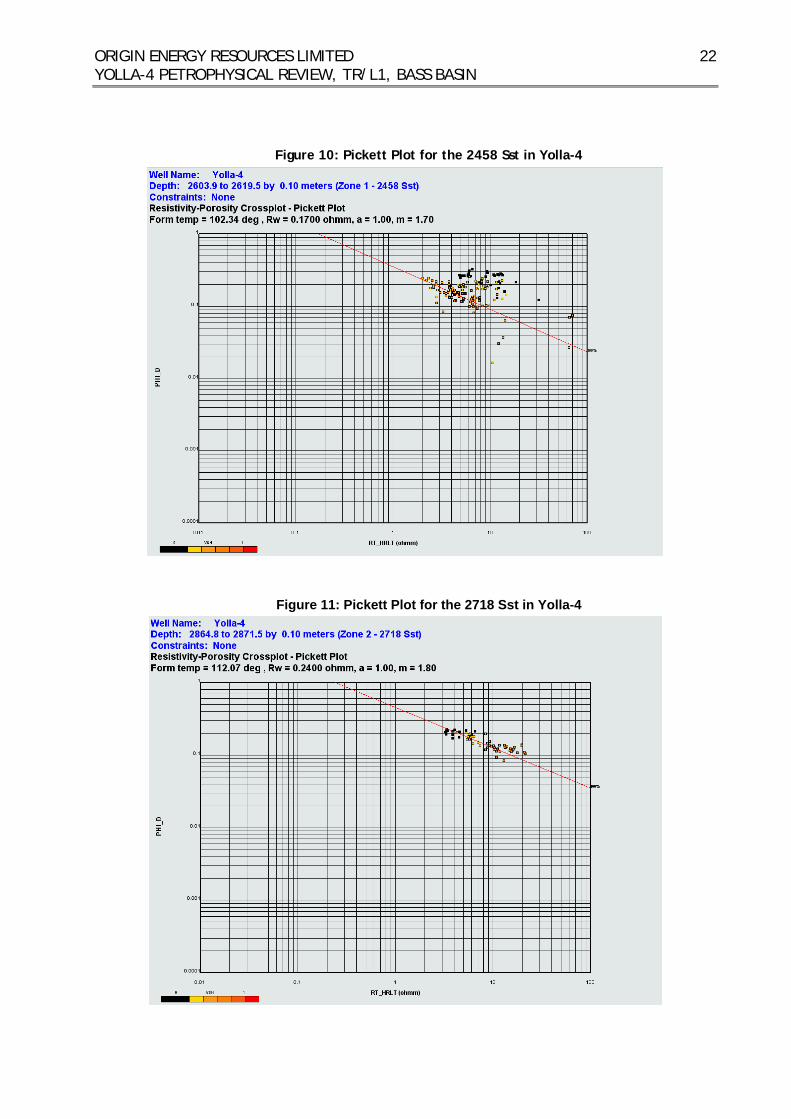
ORIGIN ENERGY RESOURCES LIMITED YOLLA-4 PETROPHYSICAL REVIEW, TR/L1, BASS BASIN
22
Figure 10: Pickett Plot for the 2458 Sst in Yolla-4
Figure 11: Pickett Plot for the 2718 Sst in Yolla-4
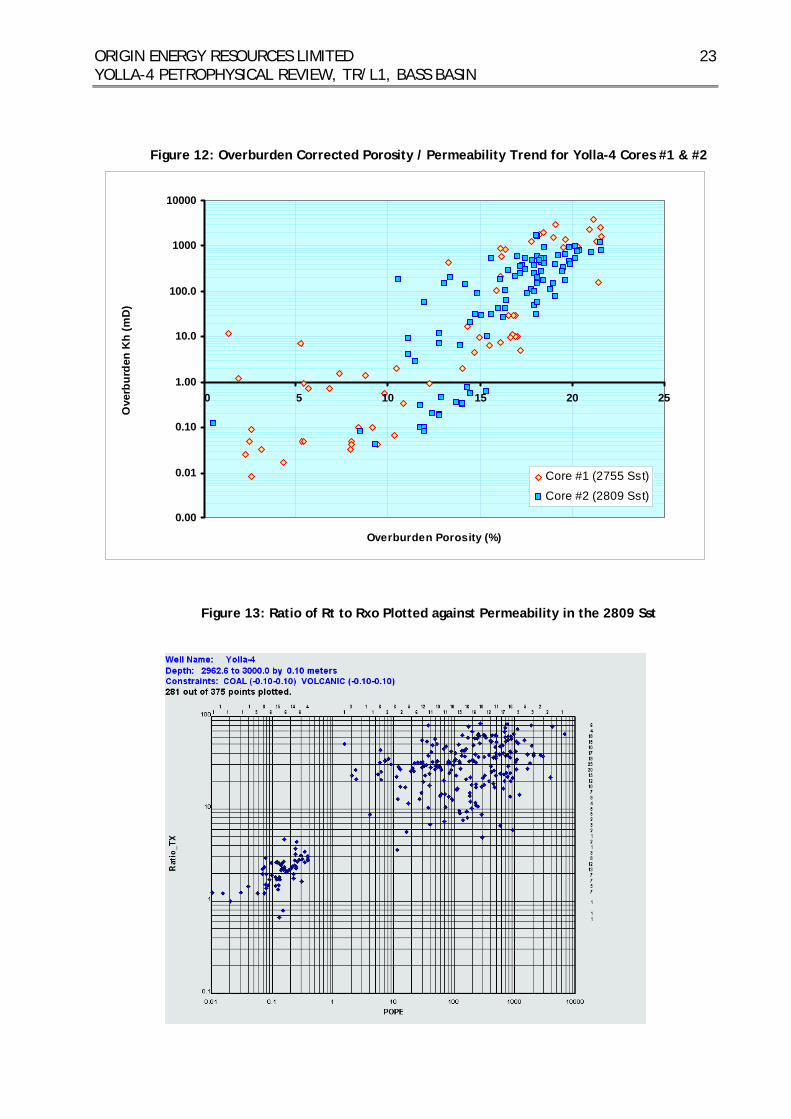
ORIGIN ENERGY RESOURCES LIMITED YOLLA-4 PETROPHYSICAL REVIEW, TR/L1, BASS BASIN
23
Figure 12: Overburden Corrected Porosity / Permeability Trend for Yolla-4 Cores #1 & #2
0.00
0.01
0.10
1.00
10.0
100.0
1000
10000
0 5 10 15 20 25
Overburden Porosity (%)
Ove
rbur
den
Kh
(mD
)
Core #1 (2755 Sst)
Core #2 (2809 Sst)
Figure 13: Ratio of Rt to Rxo Plotted against Permeability in the 2809 Sst
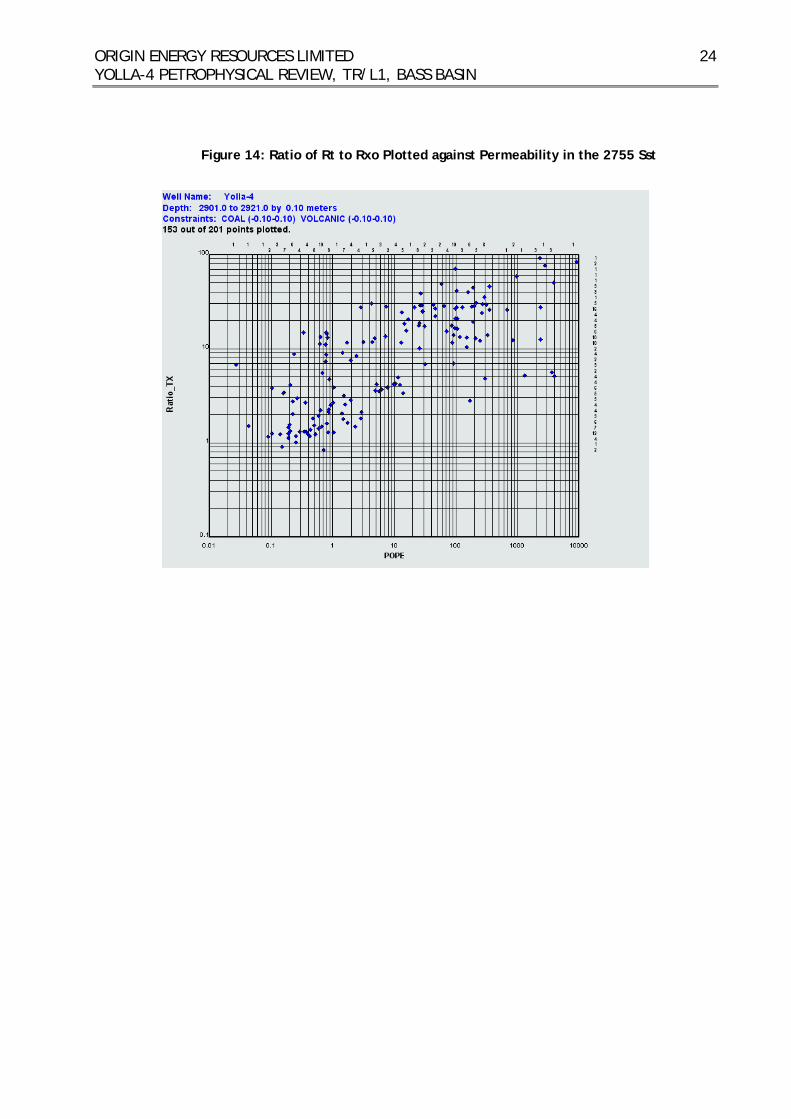
ORIGIN ENERGY RESOURCES LIMITED YOLLA-4 PETROPHYSICAL REVIEW, TR/L1, BASS BASIN
24
Figure 14: Ratio of Rt to Rxo Plotted against Permeability in the 2755 Sst
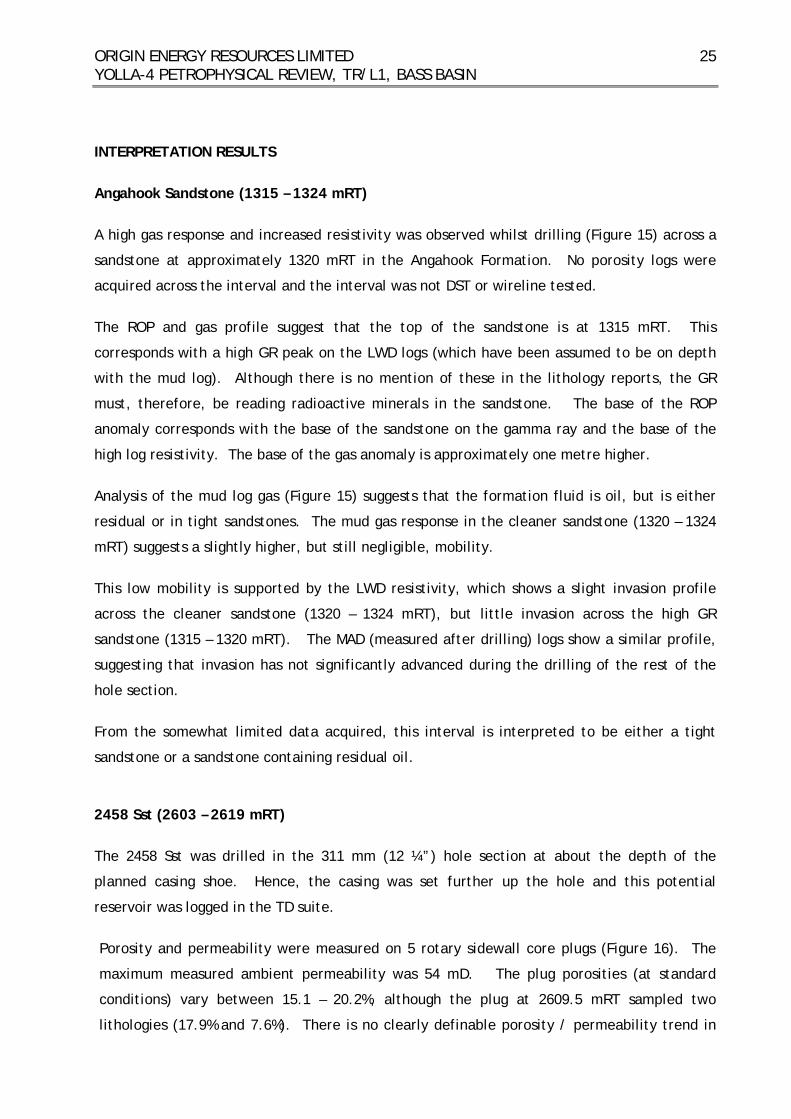
ORIGIN ENERGY RESOURCES LIMITED YOLLA-4 PETROPHYSICAL REVIEW, TR/L1, BASS BASIN
25
INTERPRETATION RESULTS
Angahook Sandstone (1315 – 1324 mRT)
A high gas response and increased resistivity was observed whilst drilling (Figure 15) across a
sandstone at approximately 1320 mRT in the Angahook Formation. No porosity logs were
acquired across the interval and the interval was not DST or wireline tested.
The ROP and gas profile suggest that the top of the sandstone is at 1315 mRT. This
corresponds with a high GR peak on the LWD logs (which have been assumed to be on depth
with the mud log). Although there is no mention of these in the lithology reports, the GR
must, therefore, be reading radioactive minerals in the sandstone. The base of the ROP
anomaly corresponds with the base of the sandstone on the gamma ray and the base of the
high log resistivity. The base of the gas anomaly is approximately one metre higher.
Analysis of the mud log gas (Figure 15) suggests that the formation fluid is oil, but is either
residual or in tight sandstones. The mud gas response in the cleaner sandstone (1320 – 1324
mRT) suggests a slightly higher, but still negligible, mobility.
This low mobility is supported by the LWD resistivity, which shows a slight invasion profile
across the cleaner sandstone (1320 – 1324 mRT), but little invasion across the high GR
sandstone (1315 – 1320 mRT). The MAD (measured after drilling) logs show a similar profile,
suggesting that invasion has not significantly advanced during the drilling of the rest of the
hole section.
From the somewhat limited data acquired, this interval is interpreted to be either a tight
sandstone or a sandstone containing residual oil.
2458 Sst (2603 – 2619 mRT)
The 2458 Sst was drilled in the 311 mm (12 ¼”) hole section at about the depth of the
planned casing shoe. Hence, the casing was set further up the hole and this potential
reservoir was logged in the TD suite.
Porosity and permeability were measured on 5 rotary sidewall core plugs (Figure 16). The
maximum measured ambient permeability was 54 mD. The plug porosities (at standard
conditions) vary between 15.1 – 20.2%, although the plug at 2609.5 mRT sampled two
lithologies (17.9% and 7.6%). There is no clearly definable porosity / permeability trend in
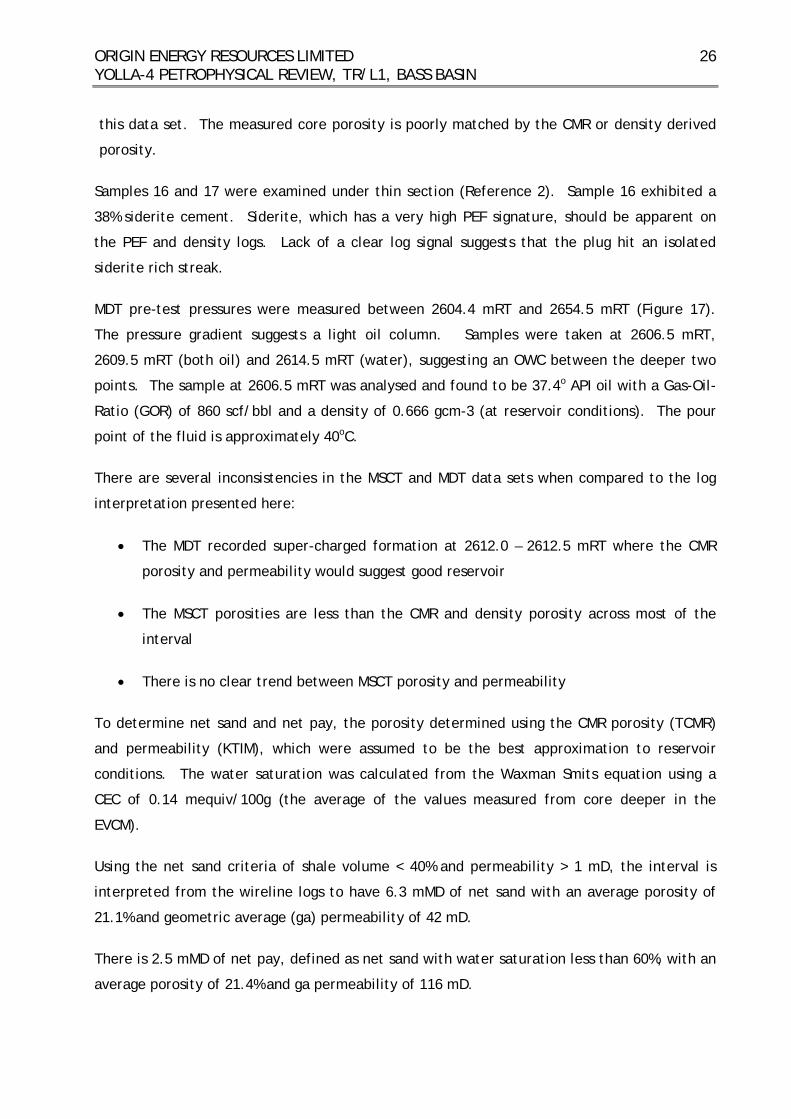
ORIGIN ENERGY RESOURCES LIMITED YOLLA-4 PETROPHYSICAL REVIEW, TR/L1, BASS BASIN
26
this data set. The measured core porosity is poorly matched by the CMR or density derived
porosity.
Samples 16 and 17 were examined under thin section (Reference 2). Sample 16 exhibited a
38% siderite cement. Siderite, which has a very high PEF signature, should be apparent on
the PEF and density logs. Lack of a clear log signal suggests that the plug hit an isolated
siderite rich streak.
MDT pre-test pressures were measured between 2604.4 mRT and 2654.5 mRT (Figure 17).
The pressure gradient suggests a light oil column. Samples were taken at 2606.5 mRT,
2609.5 mRT (both oil) and 2614.5 mRT (water), suggesting an OWC between the deeper two
points. The sample at 2606.5 mRT was analysed and found to be 37.4o API oil with a Gas-Oil-
Ratio (GOR) of 860 scf/bbl and a density of 0.666 gcm-3 (at reservoir conditions). The pour
point of the fluid is approximately 40oC.
There are several inconsistencies in the MSCT and MDT data sets when compared to the log
interpretation presented here:
• The MDT recorded super-charged formation at 2612.0 – 2612.5 mRT where the CMR
porosity and permeability would suggest good reservoir
• The MSCT porosities are less than the CMR and density porosity across most of the
interval
• There is no clear trend between MSCT porosity and permeability
To determine net sand and net pay, the porosity determined using the CMR porosity (TCMR)
and permeability (KTIM), which were assumed to be the best approximation to reservoir
conditions. The water saturation was calculated from the Waxman Smits equation using a
CEC of 0.14 mequiv/100g (the average of the values measured from core deeper in the
EVCM).
Using the net sand criteria of shale volume < 40% and permeability > 1 mD, the interval is
interpreted from the wireline logs to have 6.3 mMD of net sand with an average porosity of
21.1% and geometric average (ga) permeability of 42 mD.
There is 2.5 mMD of net pay, defined as net sand with water saturation less than 60%, with an
average porosity of 21.4% and ga permeability of 116 mD.
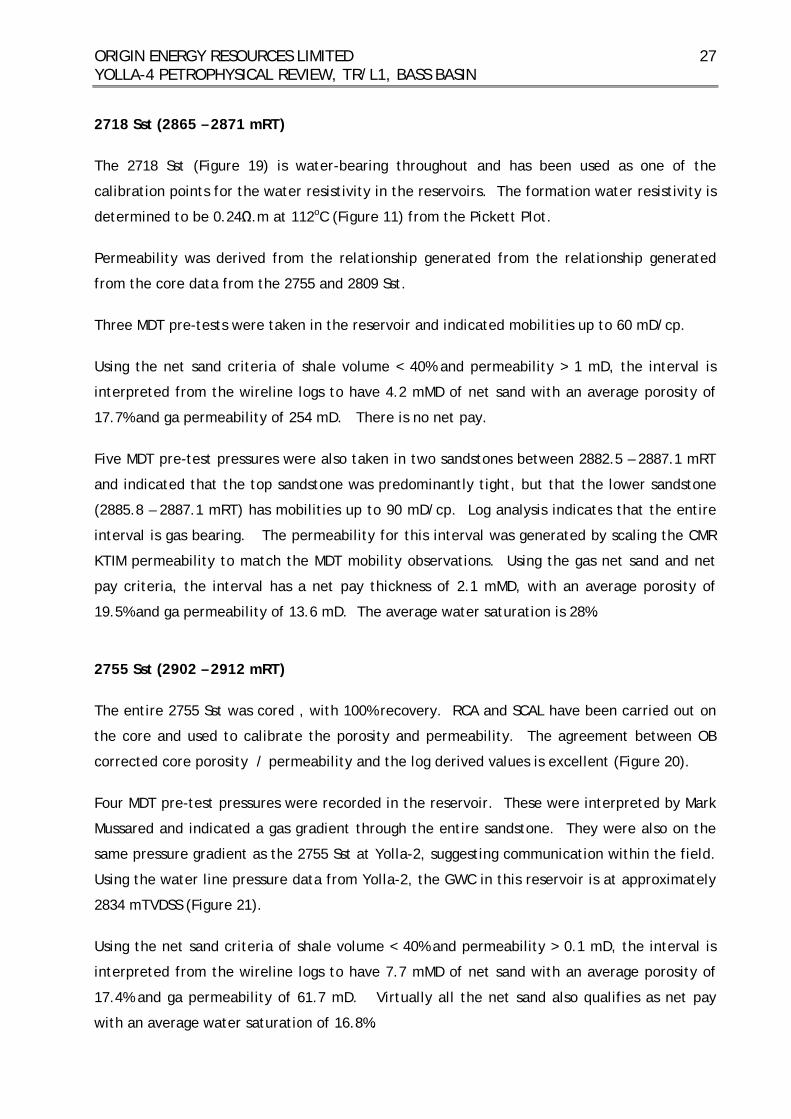
ORIGIN ENERGY RESOURCES LIMITED YOLLA-4 PETROPHYSICAL REVIEW, TR/L1, BASS BASIN
27
2718 Sst (2865 – 2871 mRT)
The 2718 Sst (Figure 19) is water-bearing throughout and has been used as one of the
calibration points for the water resistivity in the reservoirs. The formation water resistivity is
determined to be 0.24Ω.m at 112oC (Figure 11) from the Pickett Plot.
Permeability was derived from the relationship generated from the relationship generated
from the core data from the 2755 and 2809 Sst.
Three MDT pre-tests were taken in the reservoir and indicated mobilities up to 60 mD/cp.
Using the net sand criteria of shale volume < 40% and permeability > 1 mD, the interval is
interpreted from the wireline logs to have 4.2 mMD of net sand with an average porosity of
17.7% and ga permeability of 254 mD. There is no net pay.
Five MDT pre-test pressures were also taken in two sandstones between 2882.5 – 2887.1 mRT
and indicated that the top sandstone was predominantly tight, but that the lower sandstone
(2885.8 – 2887.1 mRT) has mobilities up to 90 mD/cp. Log analysis indicates that the entire
interval is gas bearing. The permeability for this interval was generated by scaling the CMR
KTIM permeability to match the MDT mobility observations. Using the gas net sand and net
pay criteria, the interval has a net pay thickness of 2.1 mMD, with an average porosity of
19.5% and ga permeability of 13.6 mD. The average water saturation is 28%.
2755 Sst (2902 – 2912 mRT)
The entire 2755 Sst was cored , with 100% recovery. RCA and SCAL have been carried out on
the core and used to calibrate the porosity and permeability. The agreement between OB
corrected core porosity / permeability and the log derived values is excellent (Figure 20).
Four MDT pre-test pressures were recorded in the reservoir. These were interpreted by Mark
Mussared and indicated a gas gradient through the entire sandstone. They were also on the
same pressure gradient as the 2755 Sst at Yolla-2, suggesting communication within the field.
Using the water line pressure data from Yolla-2, the GWC in this reservoir is at approximately
2834 mTVDSS (Figure 21).
Using the net sand criteria of shale volume < 40% and permeability > 0.1 mD, the interval is
interpreted from the wireline logs to have 7.7 mMD of net sand with an average porosity of
17.4% and ga permeability of 61.7 mD. Virtually all the net sand also qualifies as net pay
with an average water saturation of 16.8%.
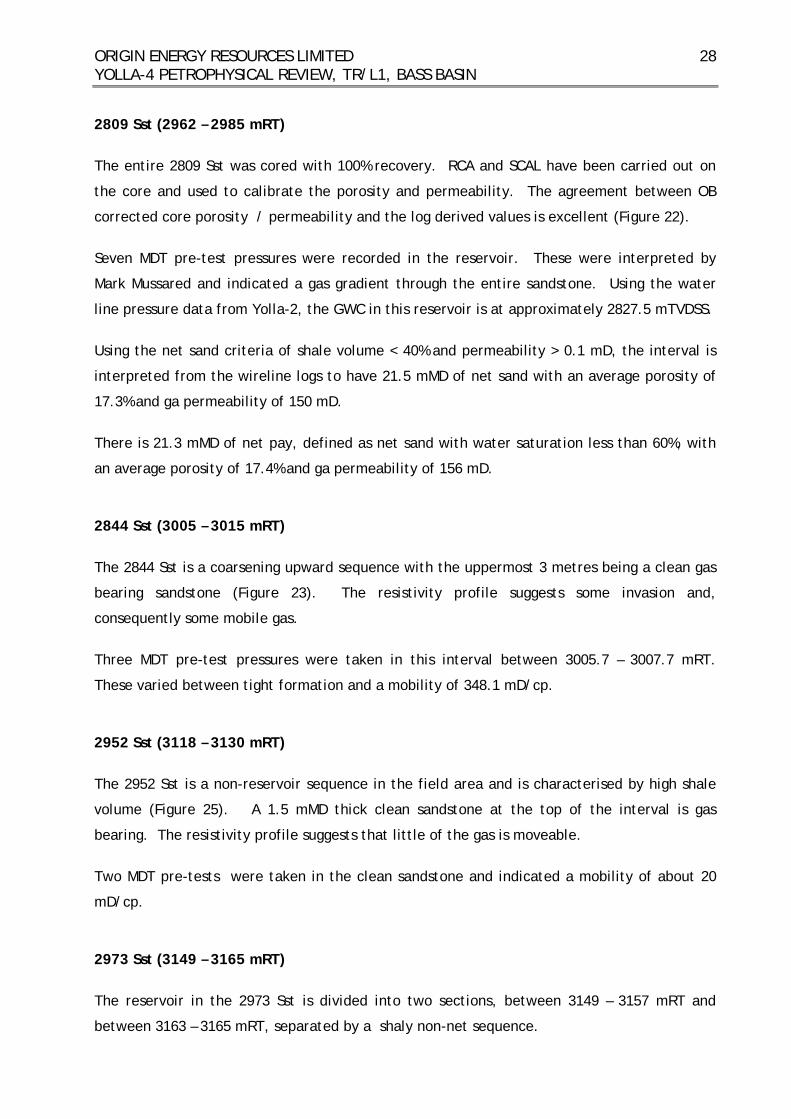
ORIGIN ENERGY RESOURCES LIMITED YOLLA-4 PETROPHYSICAL REVIEW, TR/L1, BASS BASIN
28
2809 Sst (2962 – 2985 mRT)
The entire 2809 Sst was cored with 100% recovery. RCA and SCAL have been carried out on
the core and used to calibrate the porosity and permeability. The agreement between OB
corrected core porosity / permeability and the log derived values is excellent (Figure 22).
Seven MDT pre-test pressures were recorded in the reservoir. These were interpreted by
Mark Mussared and indicated a gas gradient through the entire sandstone. Using the water
line pressure data from Yolla-2, the GWC in this reservoir is at approximately 2827.5 mTVDSS.
Using the net sand criteria of shale volume < 40% and permeability > 0.1 mD, the interval is
interpreted from the wireline logs to have 21.5 mMD of net sand with an average porosity of
17.3% and ga permeability of 150 mD.
There is 21.3 mMD of net pay, defined as net sand with water saturation less than 60%, with
an average porosity of 17.4% and ga permeability of 156 mD.
2844 Sst (3005 – 3015 mRT)
The 2844 Sst is a coarsening upward sequence with the uppermost 3 metres being a clean gas
bearing sandstone (Figure 23). The resistivity profile suggests some invasion and,
consequently some mobile gas.
Three MDT pre-test pressures were taken in this interval between 3005.7 – 3007.7 mRT.
These varied between tight formation and a mobility of 348.1 mD/cp.
2952 Sst (3118 – 3130 mRT)
The 2952 Sst is a non-reservoir sequence in the field area and is characterised by high shale
volume (Figure 25). A 1.5 mMD thick clean sandstone at the top of the interval is gas
bearing. The resistivity profile suggests that little of the gas is moveable.
Two MDT pre-tests were taken in the clean sandstone and indicated a mobility of about 20
mD/cp.
2973 Sst (3149 – 3165 mRT)
The reservoir in the 2973 Sst is divided into two sections, between 3149 – 3157 mRT and
between 3163 – 3165 mRT, separated by a shaly non-net sequence.
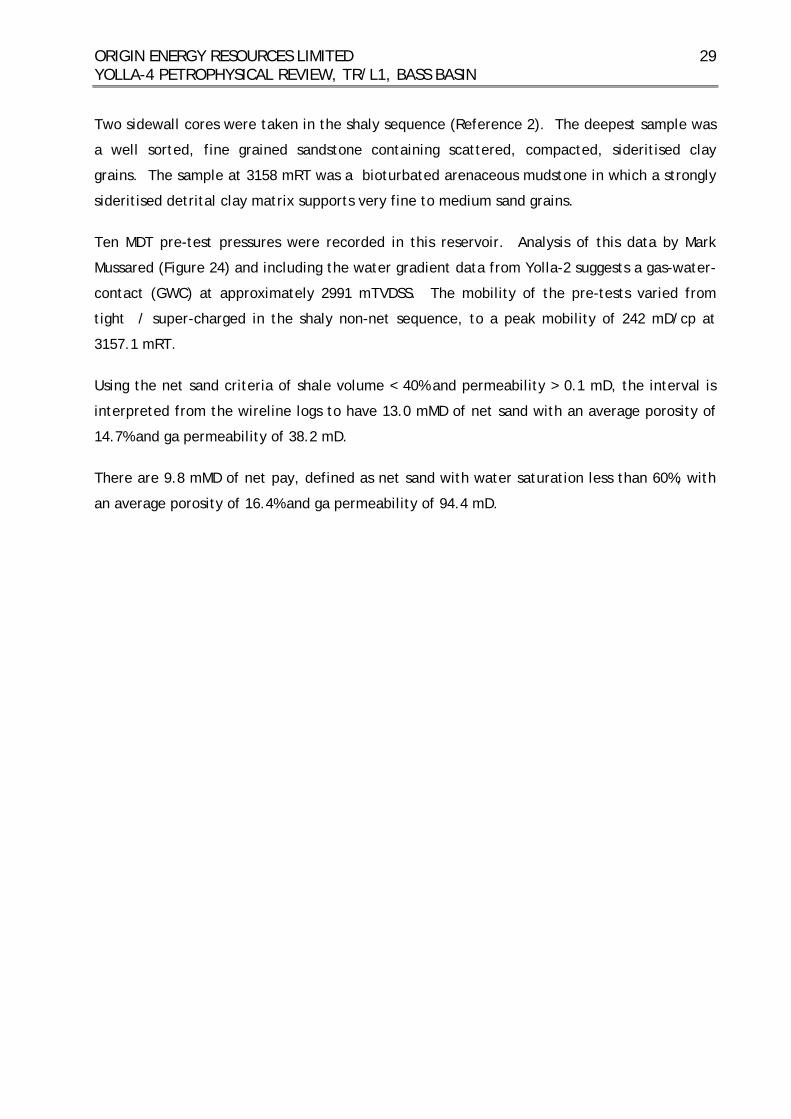
ORIGIN ENERGY RESOURCES LIMITED YOLLA-4 PETROPHYSICAL REVIEW, TR/L1, BASS BASIN
29
Two sidewall cores were taken in the shaly sequence (Reference 2). The deepest sample was
a well sorted, fine grained sandstone containing scattered, compacted, sideritised clay
grains. The sample at 3158 mRT was a bioturbated arenaceous mudstone in which a strongly
sideritised detrital clay matrix supports very fine to medium sand grains.
Ten MDT pre-test pressures were recorded in this reservoir. Analysis of this data by Mark
Mussared (Figure 24) and including the water gradient data from Yolla-2 suggests a gas-water-
contact (GWC) at approximately 2991 mTVDSS. The mobility of the pre-tests varied from
tight / super-charged in the shaly non-net sequence, to a peak mobility of 242 mD/cp at
3157.1 mRT.
Using the net sand criteria of shale volume < 40% and permeability > 0.1 mD, the interval is
interpreted from the wireline logs to have 13.0 mMD of net sand with an average porosity of
14.7% and ga permeability of 38.2 mD.
There are 9.8 mMD of net pay, defined as net sand with water saturation less than 60%, with
an average porosity of 16.4% and ga permeability of 94.4 mD.
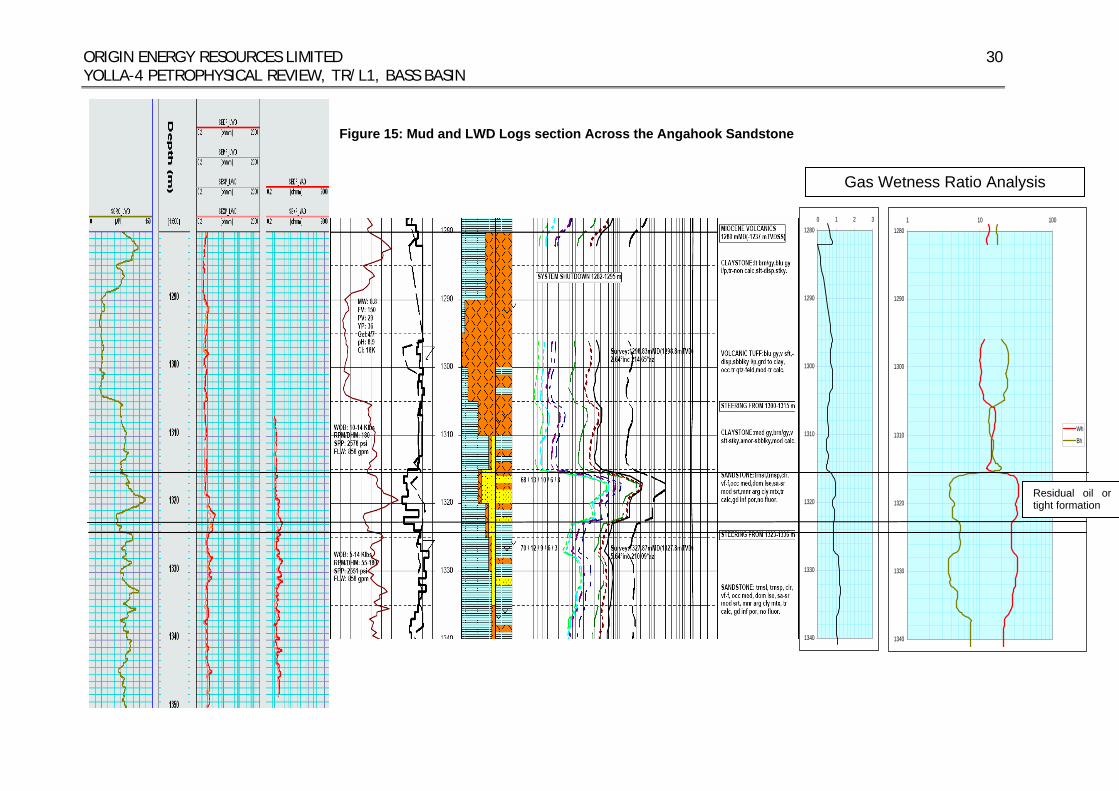
ORIGIN ENERGY RESOURCES LIMITED YOLLA-4 PETROPHYSICAL REVIEW, TR/L1, BASS BASIN
30
Figure 15: Mud and LWD Logs section Across the Angahook Sandstone
Measured after
drilling Measured during
drilling
1280
1290
1300
1310
1320
1330
1340
0 1 2 31280
1290
1300
1310
1320
1330
1340
1 10 100
Wh
Bh
Residual oil or tight formation
Gas Wetness Ratio Analysis
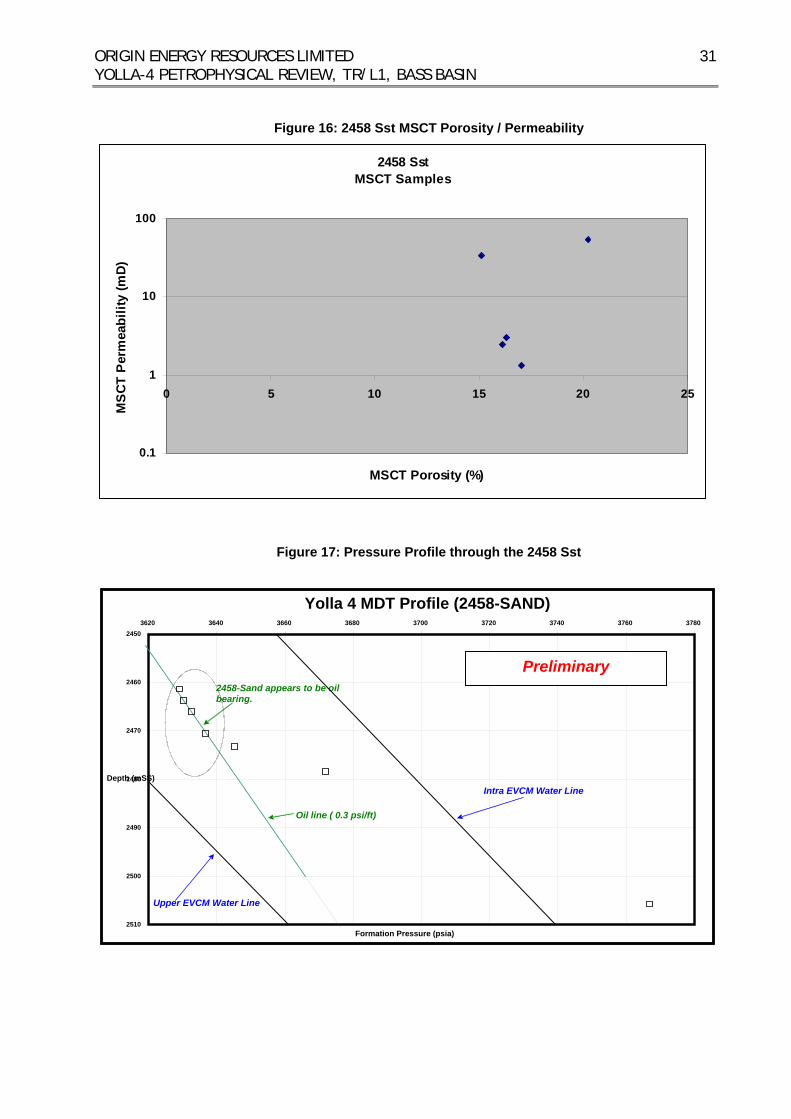
ORIGIN ENERGY RESOURCES LIMITED YOLLA-4 PETROPHYSICAL REVIEW, TR/L1, BASS BASIN
31
Figure 16: 2458 Sst MSCT Porosity / Permeability
2458 Sst MSCT Samples
0.1
1
10
100
0 5 10 15 20 25
MSCT Porosity (%)
MS
CT P
erm
eabi
lity
(mD
)
Figure 17: Pressure Profile through the 2458 Sst
Yolla 4 MDT Profile (2458-SAND)2450
3620 3640 3660 3740 3760 3680 3700 3720 3780
2460
2470
2480 Depth (mSS)
2490
2500
2510 Formation Pressure (psia)
Intra EVCM Water Line
Upper EVCM Water Line
2458-Sand appears to be oil bearing.
Oil line ( 0.3 psi/ft)
Preliminary
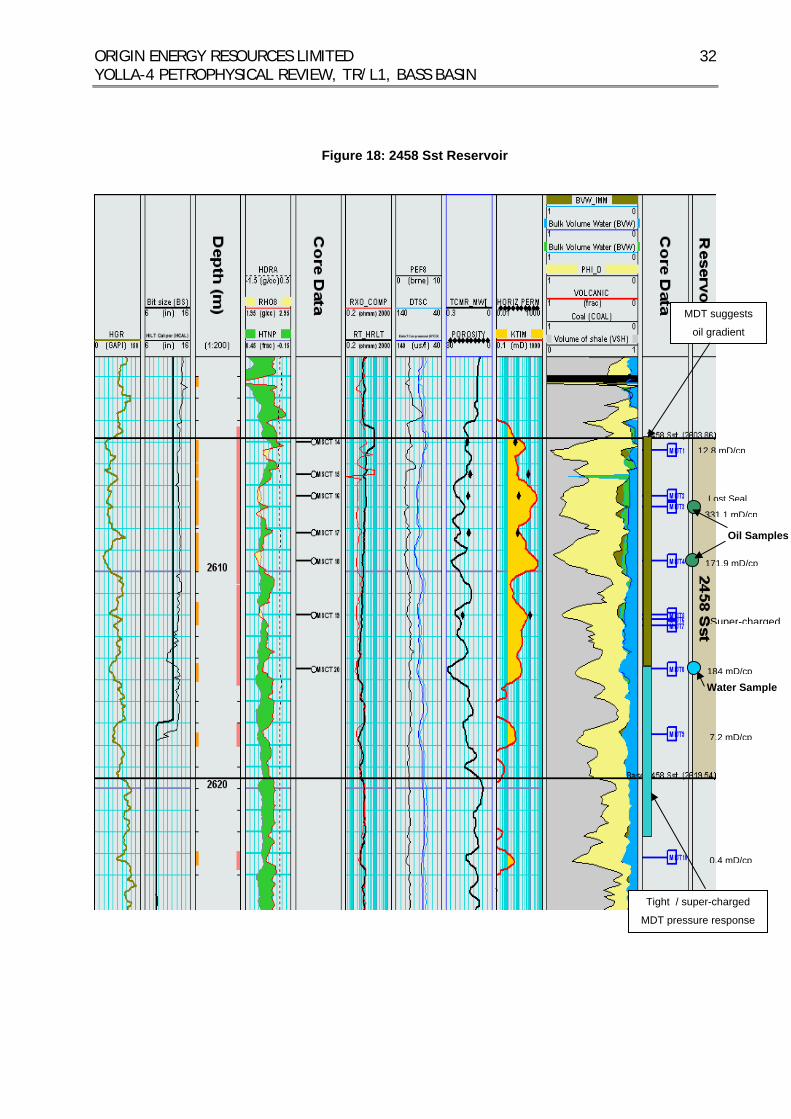
ORIGIN ENERGY RESOURCES LIMITED YOLLA-4 PETROPHYSICAL REVIEW, TR/L1, BASS BASIN
32
Figure 18: 2458 Sst Reservoir
Super-charged
12.8 mD/cp
171.9 mD/cp
Lost Seal
331.1 mD/cp
MDT suggests
oil gradient
Oil Samples
0.4 mD/cp
7.2 mD/cp
184 mD/cp
Water Sample
Tight / super-charged
MDT pressure response
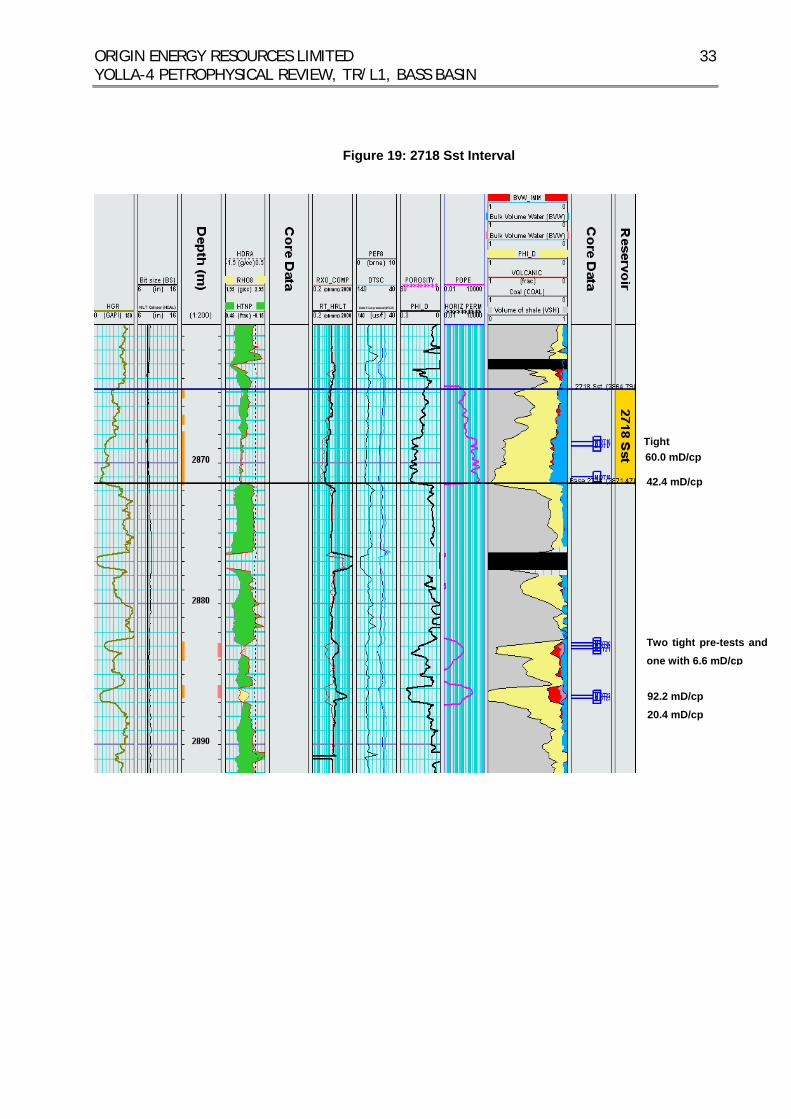
ORIGIN ENERGY RESOURCES LIMITED YOLLA-4 PETROPHYSICAL REVIEW, TR/L1, BASS BASIN
33
Figure 19: 2718 Sst Interval
Tight 60.0 mD/cp
42.4 mD/cp
Two tight pre-tests and one with 6.6 mD/cp
92.2 mD/cp 20.4 mD/cp
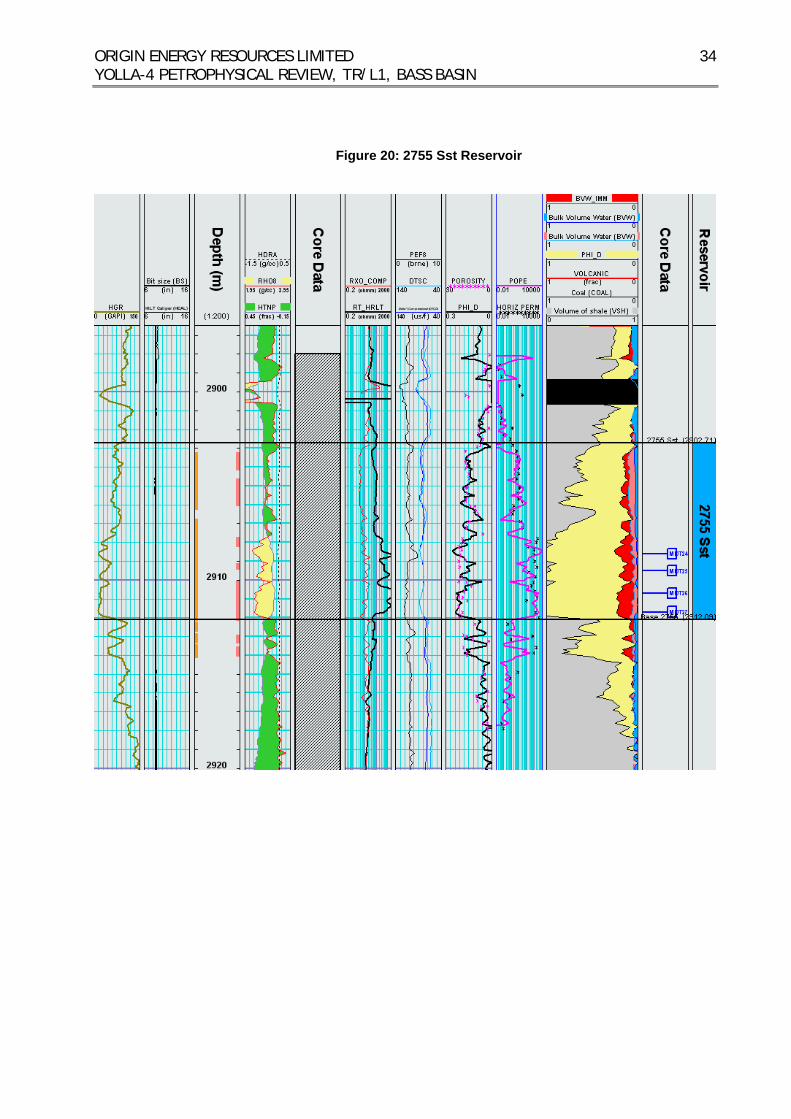
ORIGIN ENERGY RESOURCES LIMITED YOLLA-4 PETROPHYSICAL REVIEW, TR/L1, BASS BASIN
34
Figure 20: 2755 Sst Reservoir
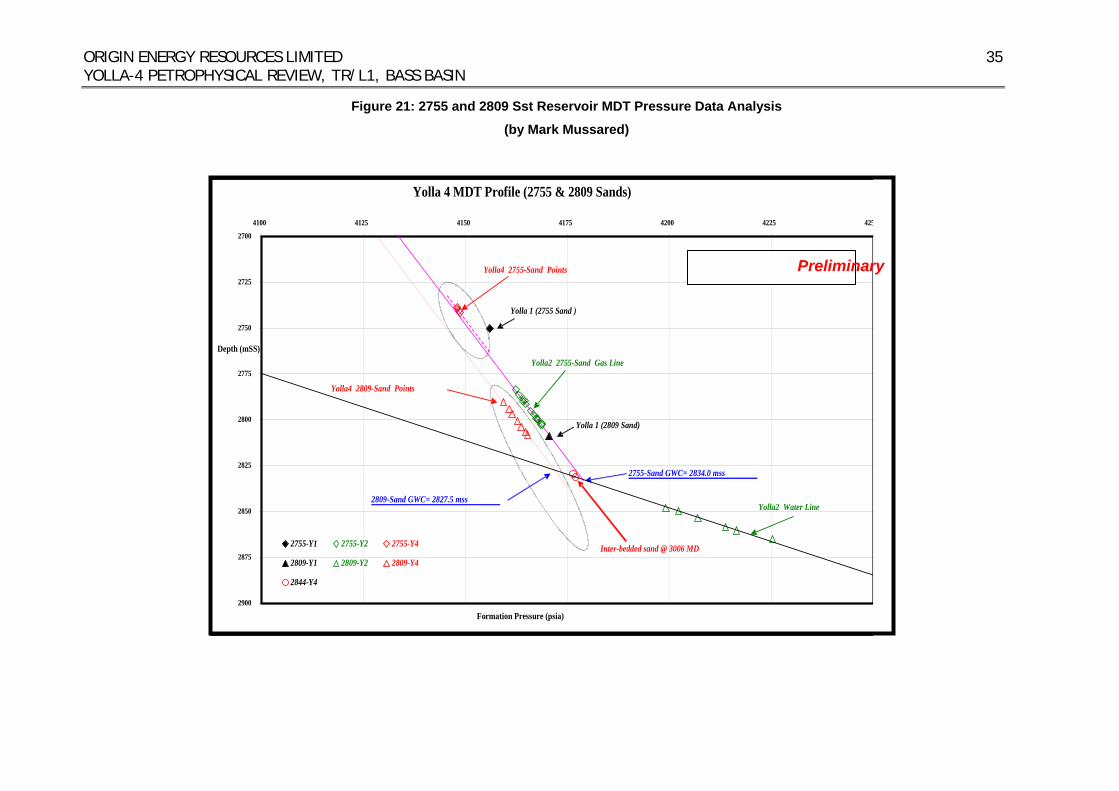
ORIGIN ENERGY RESOURCES LIMITED YOLLA-4 PETROPHYSICAL REVIEW, TR/L1, BASS BASIN
35
Figure 21: 2755 and 2809 Sst Reservoir MDT Pressure Data Analysis
(by Mark Mussared)
Yolla 4 MDT Profile (2755 & 2809 Sands)
2700
2725
2750
2775
2800
2825
2850
2875
2900
4100 4125 4150 4175 4200 4225 425
Formation Pressure (psia)
Depth (mSS)
2755-Y1 2755-Y2 2755-Y4
2809-Y1 2809-Y2 2809-Y4
2844-Y4
2809-Sand GWC= 2827.5 mss
Yolla4 2809-Sand Points
2755-Sand GWC= 2834.0 mss
Yolla4 2755-Sand Points
Yolla2 2755-Sand Gas Line
Yolla 1 (2755 Sand )
Yolla 1 (2809 Sand)
Inter-bedded sand @ 3006 MD
Yolla2 Water Line
Preliminary
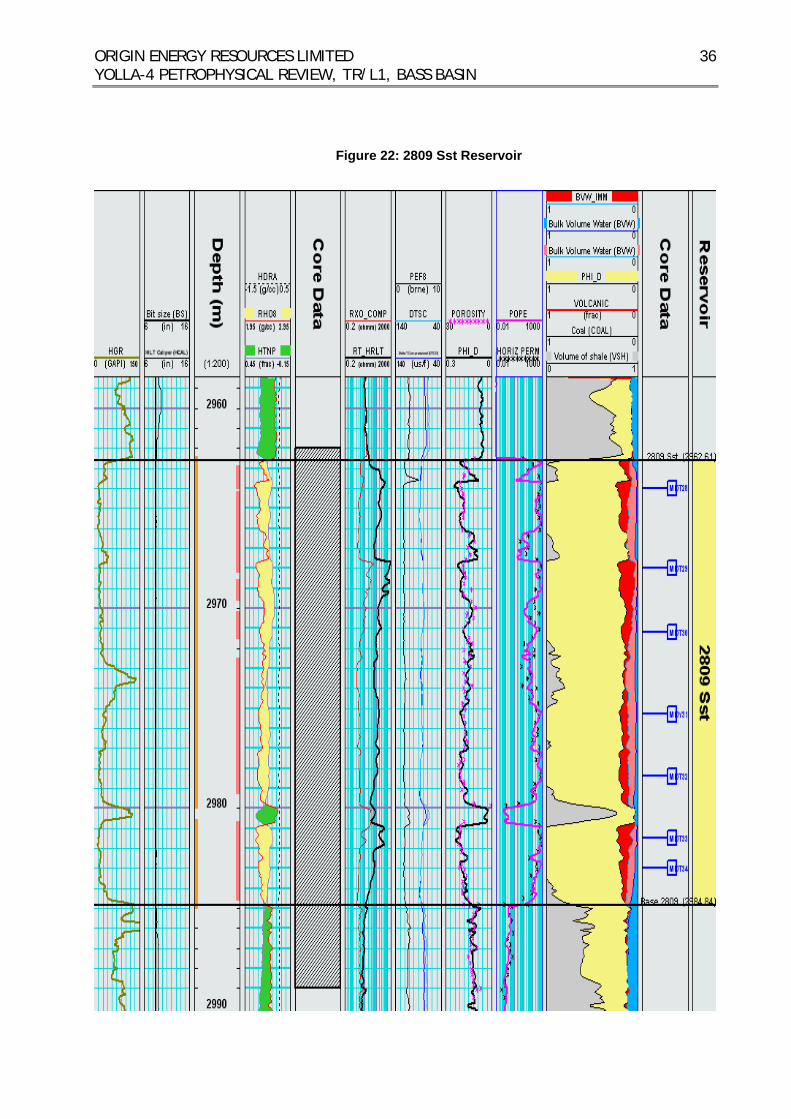
ORIGIN ENERGY RESOURCES LIMITED YOLLA-4 PETROPHYSICAL REVIEW, TR/L1, BASS BASIN
36
Figure 22: 2809 Sst Reservoir
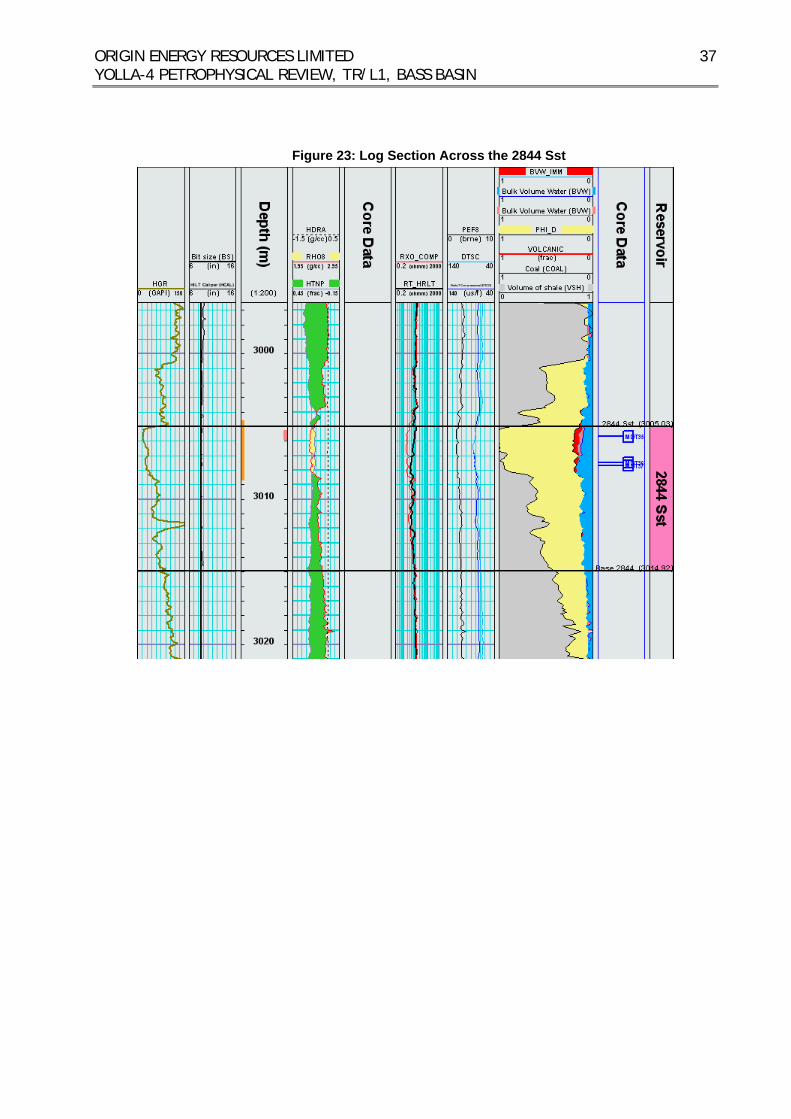
ORIGIN ENERGY RESOURCES LIMITED YOLLA-4 PETROPHYSICAL REVIEW, TR/L1, BASS BASIN
37
Figure 23: Log Section Across the 2844 Sst
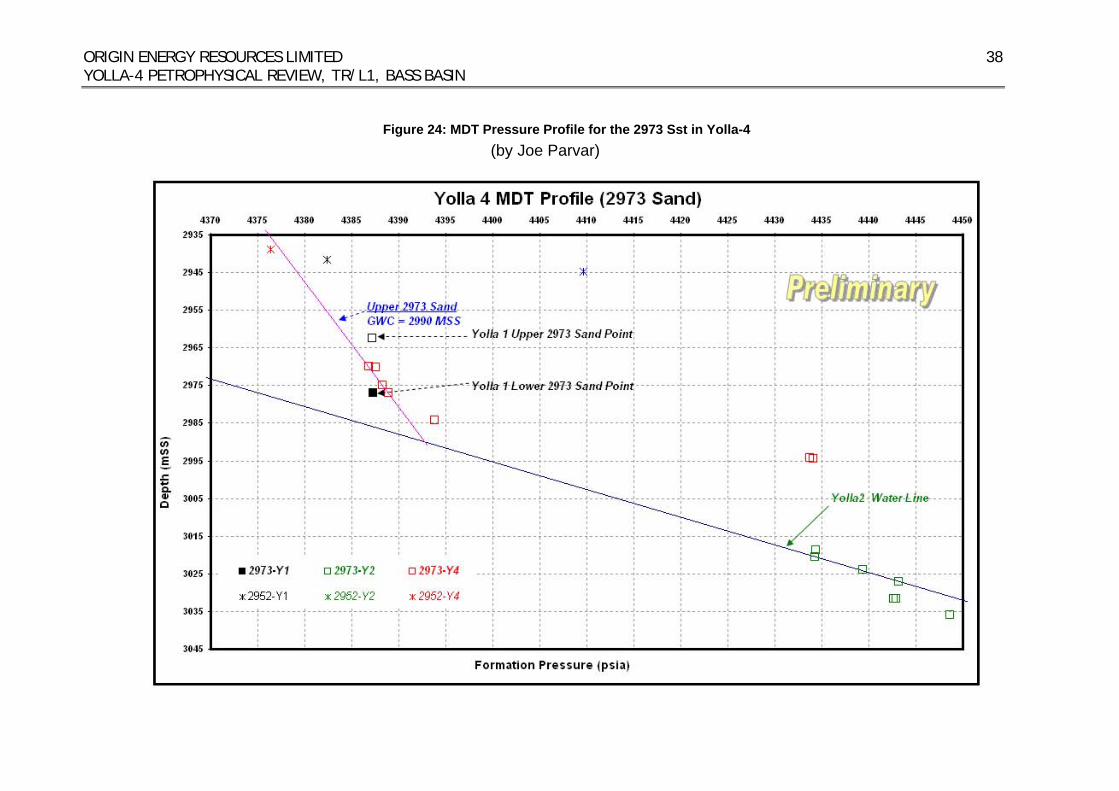
ORIGIN ENERGY RESOURCES LIMITED YOLLA-4 PETROPHYSICAL REVIEW, TR/L1, BASS BASIN
38
Figure 24: MDT Pressure Profile for the 2973 Sst in Yolla-4 (by Joe Parvar)
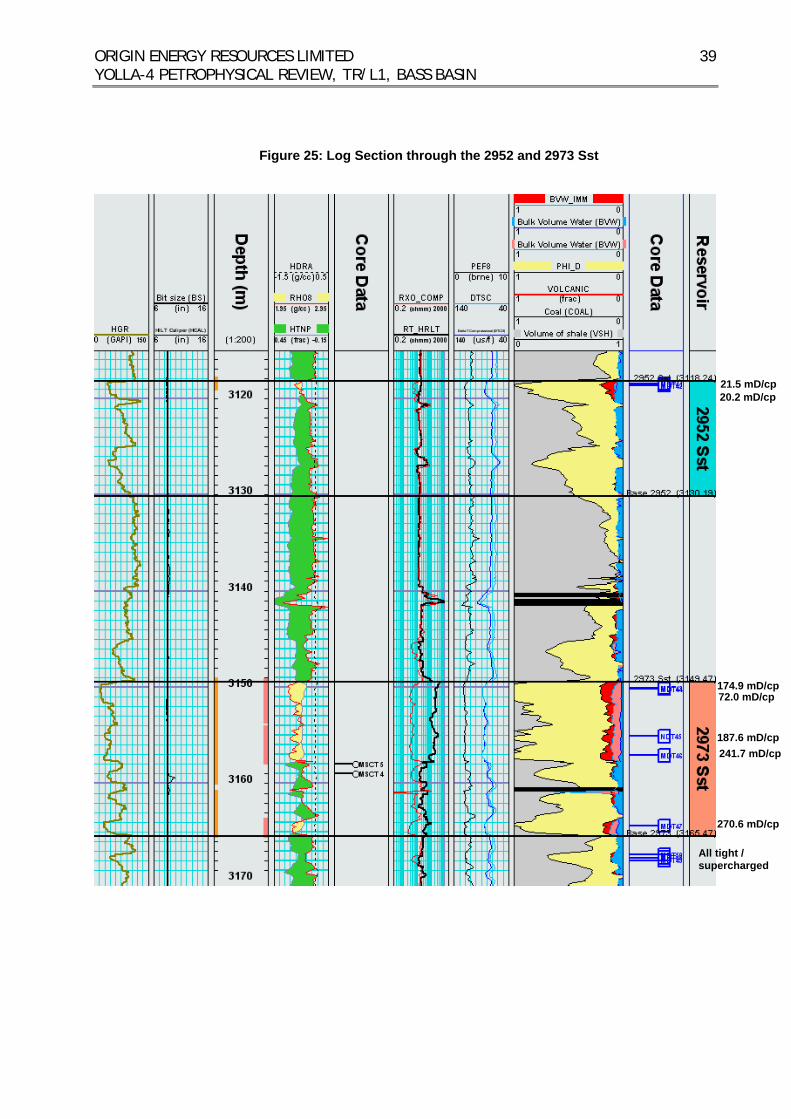
ORIGIN ENERGY RESOURCES LIMITED YOLLA-4 PETROPHYSICAL REVIEW, TR/L1, BASS BASIN
39
Figure 25: Log Section through the 2952 and 2973 Sst
21.5 mD/cp 20.2 mD/cp
174.9 mD/cp 72.0 mD/cp
187.6 mD/cp 241.7 mD/cp
270.6 mD/cp
All tight / supercharged

ORIGIN ENERGY RESOURCES LIMITED YOLLA-4 PETROPHYSICAL REVIEW, TR/L1, BASS BASIN
40
REFERENCES
1. Baker J.C. (2004) Petrology, Diagenesis and Reservoir Quality of Core Samples From
Yolla-4
2. Baker J.C. (2004) Petrology, Diagenesis and Reservoir Quality of MSCT Samples From
Yolla-4
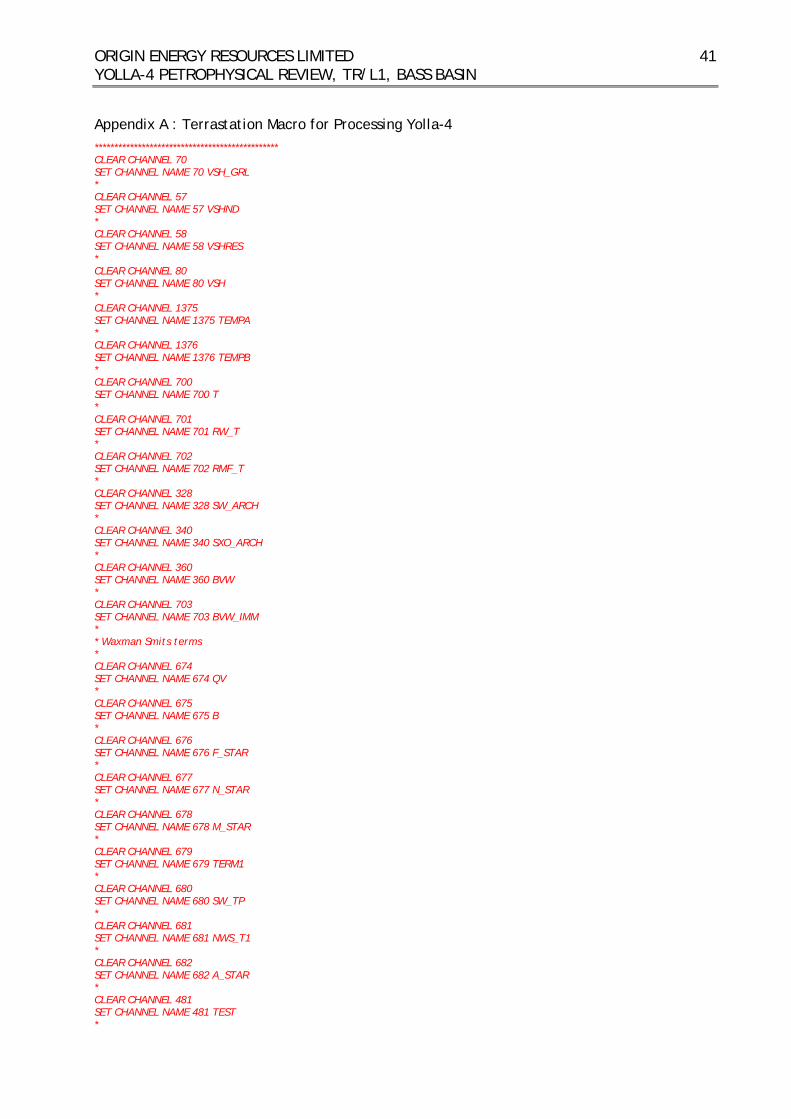
ORIGIN ENERGY RESOURCES LIMITED YOLLA-4 PETROPHYSICAL REVIEW, TR/L1, BASS BASIN
41
Appendix A : Terrastation Macro for Processing Yolla-4 *********************************************** CLEAR CHANNEL 70 SET CHANNEL NAME 70 VSH_GRL * CLEAR CHANNEL 57 SET CHANNEL NAME 57 VSHND * CLEAR CHANNEL 58 SET CHANNEL NAME 58 VSHRES * CLEAR CHANNEL 80 SET CHANNEL NAME 80 VSH * CLEAR CHANNEL 1375 SET CHANNEL NAME 1375 TEMPA * CLEAR CHANNEL 1376 SET CHANNEL NAME 1376 TEMPB * CLEAR CHANNEL 700 SET CHANNEL NAME 700 T * CLEAR CHANNEL 701 SET CHANNEL NAME 701 RW_T * CLEAR CHANNEL 702 SET CHANNEL NAME 702 RMF_T * CLEAR CHANNEL 328 SET CHANNEL NAME 328 SW_ARCH * CLEAR CHANNEL 340 SET CHANNEL NAME 340 SXO_ARCH * CLEAR CHANNEL 360 SET CHANNEL NAME 360 BVW * CLEAR CHANNEL 703 SET CHANNEL NAME 703 BVW_IMM * * Waxman Smits terms * CLEAR CHANNEL 674 SET CHANNEL NAME 674 QV * CLEAR CHANNEL 675 SET CHANNEL NAME 675 B * CLEAR CHANNEL 676 SET CHANNEL NAME 676 F_STAR * CLEAR CHANNEL 677 SET CHANNEL NAME 677 N_STAR * CLEAR CHANNEL 678 SET CHANNEL NAME 678 M_STAR * CLEAR CHANNEL 679 SET CHANNEL NAME 679 TERM1 * CLEAR CHANNEL 680 SET CHANNEL NAME 680 SW_TP * CLEAR CHANNEL 681 SET CHANNEL NAME 681 NWS_T1 * CLEAR CHANNEL 682 SET CHANNEL NAME 682 A_STAR * CLEAR CHANNEL 481 SET CHANNEL NAME 481 TEST *
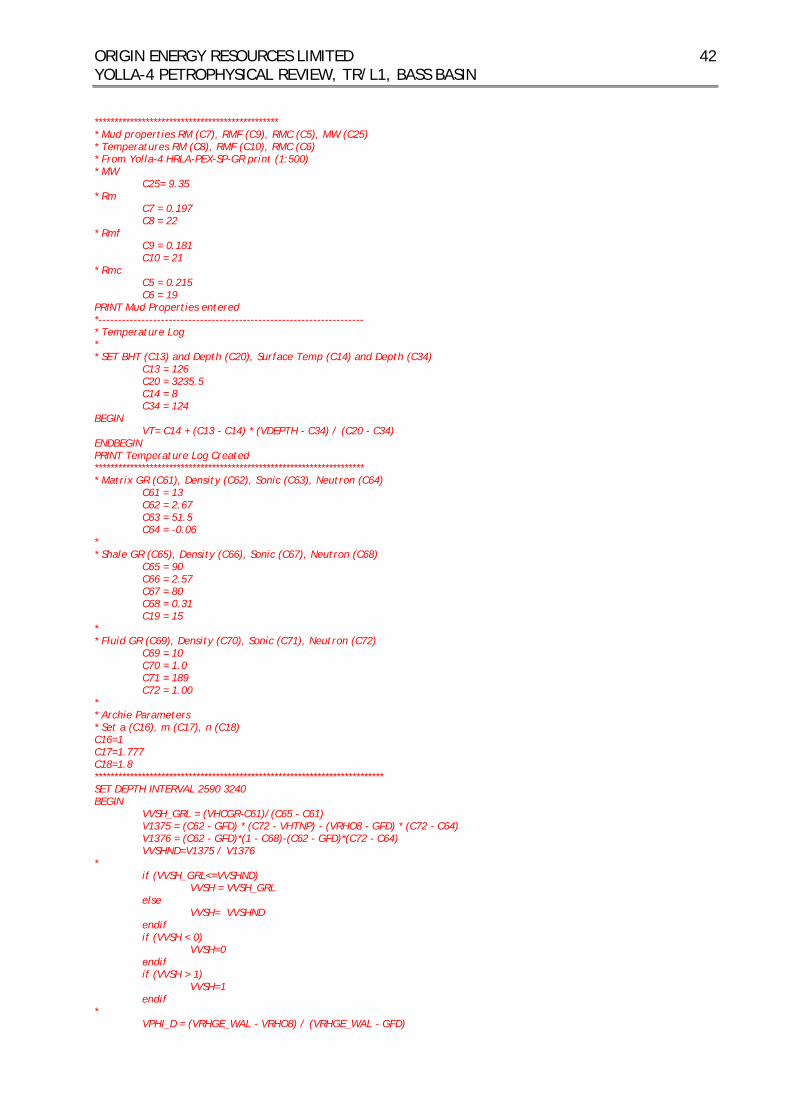
ORIGIN ENERGY RESOURCES LIMITED YOLLA-4 PETROPHYSICAL REVIEW, TR/L1, BASS BASIN
42
*********************************************** * Mud properties RM (C7), RMF (C9), RMC (C5), MW (C25) * Temperatures RM (C8), RMF (C10), RMC (C6) * From Yolla-4 HRLA-PEX-SP-GR print (1:500) * MW C25= 9.35 * Rm C7 = 0.197 C8 = 22 * Rmf C9 = 0.181 C10 = 21 * Rmc C5 = 0.215 C6 = 19 PRINT Mud Properties entered *-------------------------------------------------------------------- * Temperature Log * * SET BHT (C13) and Depth (C20), Surface Temp (C14) and Depth (C34) C13 = 126 C20 = 3235.5 C14 = 8 C34 = 124 BEGIN VT= C14 + (C13 - C14) * (VDEPTH - C34) / (C20 - C34) ENDBEGIN PRINT Temperature Log Created ********************************************************************* * Matrix GR (C61), Density (C62), Sonic (C63), Neutron (C64) C61 = 13 C62 = 2.67 C63 = 51.5 C64 = -0.06 * * Shale GR (C65), Density (C66), Sonic (C67), Neutron (C68) C65 = 90 C66 = 2.57 C67 = 80 C68 = 0.31 C19 = 15 * * Fluid GR (C69), Density (C70), Sonic (C71), Neutron (C72) C69 = 10 C70 = 1.0 C71 = 189 C72 = 1.00 * * Archie Parameters * Set a (C16), m (C17), n (C18) C16=1 C17=1.777 C18=1.8 ************************************************************************** SET DEPTH INTERVAL 2590 3240 BEGIN VVSH_GRL = (VHCGR-C61)/(C65 - C61) V1375 = (C62 - GFD) * (C72 - VHTNP) - (VRHO8 - GFD) * (C72 - C64) V1376 = (C62 - GFD)*(1 - C68)-(C62 - GFD)*(C72 - C64) VVSHND=V1375 / V1376 * if (VVSH_GRL<=VVSHND) VVSH = VVSH_GRL else VVSH= VVSHND endif if (VVSH < 0) VVSH=0 endif if (VVSH > 1) VVSH=1 endif * VPHI_D = (VRHGE_WAL - VRHO8) / (VRHGE_WAL - GFD)
ORIGIN ENERGY RESOURCES LIMITED YOLLA-4 PETROPHYSICAL REVIEW, TR/L1, BASS BASIN
43
VNPSC = VHTNP_SS - VVSH * (0.41 - 0.06) VPHI_ND = @SQT((VPHI_D^2 + VNPSC^2) / 2) VDTSC = VDTCO - VVSH * 10 VPHI_S = (VDTSC - 53) / (231 - 53) * * Water saturation * Rw and Rmf correction * VRW_T = GRW * (GTRW + 21.5) / (VT + 21.5) VRMF_T = C9 * (C10 + 21.5) / (VT + 21.5) * * Archie Water saturation VSW_ARCH = ((C16/VPHI_D^C17)*(VRW_T/VRT_HRLT))^(1/C18) VSXO_ARCH = ((C16/VPHI_D^C17)*(VRM_HRLT/VRXO_COMP))^(1/C18) if (VSW_ARCH > 1) VSW_ARCH = 1 endif if (VSXO_ARCH < VSW_ARCH) VSXO_ARCH = VSW_ARCH endif * * Calculate BVW VBVW=VSW_ARCH*VPHI_D VBVW_IMM=VSXO_ARCH*VPHI_D * * Coal and volcanic correction of porosity if (VCOAL = 1) VPHI_D=0 VPHI_ND=0 VPHI_S=0 endif if (VVOLCANICS = 1) VPHI_D=0 VPHI_ND=0 VPHI_S=0 endif * * Waxman Smits water Saturation * QV = CEC * RHOG * (1-PORO) / (100* PORO) VQV= GCEC * GGD * (1 - VPHI_D) / (100 * VPHI_D) * * B = (0.225 * T - 1.28 + 0.0004059*T^2) / 1+Rw^1.23*(0.045T-0.27) VB=(0.225*VT-1.28+0.0004059*VT^2)/(1+VRW_T^1.23*(0.045*VT-0.27)) * * F* = F (1+Rw*B*Qv) VF_STAR=(C16/VPHI_D^C17)*(1+VRW_T*VB*VQV) * * m* = m - LOG10(1+RwBQv)/LOG10(PORO) VM_STAR=C17-@LOG10(1+VRW_T*VB*VQV)/@LOG10(VPHI_D) * * a* = F* * PORO^m* VA_STAR = VF_STAR * VPHI_D ^ VM_STAR * VTERM1=((VA_STAR*VRW_T)/(VRT_HRLT*VPHI_D^VM_STAR)) * VSW_TP=VSW_ARCH VNWS_T1=1+VRW_T*VB*VQV C47=0 :LOOP C47=C47+1 if (C47>20) OUTPUT NUMBER 10 3 VDEPTH OUTPUT TEXT Did not converge PRINT OUTPUT GOTO ENDLOOP endif if (SW_TP = 1) VN_STAR=C18 else VN_STAR=C18*((1+((VRW_T*VB*VQV)/VSW_TP))/(VNWS_T1)) endif VSW_WS = ( VTERM1 * (1/(1+((VRW_T*VB*VQV)/VSW_TP))))^(1/VN_STAR) VTEST=@ABS(VSW_WS-VSW_TP) *
ORIGIN ENERGY RESOURCES LIMITED YOLLA-4 PETROPHYSICAL REVIEW, TR/L1, BASS BASIN
44
if (VTEST < 0.01) GOTO ENDLOOP else VSW_TP=VSW_WS GOTO LOOP endif :ENDLOOP * ENDBEGIN * * Permeability * BEGIN VPOPE = (0.0193*@EXP((VPHI_D*100)*0.5168)) VPOPE = VPOPE-((0.0193*@EXP((VPHI_D*100)*0.5168))*(VVSH*0.064)) ENDBEGIN SET DEPTH INTERVAL 2590 2864.5 BEGIN VPOPE = VKTIM ENDBEGIN SET DEPTH INTERVAL 2871.5 2898 BEGIN VPOPE = VKTIM ENDBEGIN SET DEPTH INTERVAL 2882.5 2885.8 BEGIN VPOPE = VKTIM*10 ENDBEGIN SET DEPTH INTERVAL 2885.8 2887.1 BEGIN VPOPE = VKTIM*200 ENDBEGIN SET DEPTH INTERVAL 2917.8 2962.4 BEGIN VPOPE = VKTIM ENDBEGIN SET DEPTH INTERVAL 2984.9 3004.8 BEGIN VPOPE = VKTIM ENDBEGIN SET DEPTH INTERVAL 3008.6 3149 BEGIN VPOPE = VKTIM ENDBEGIN SET DEPTH INTERVAL 3165.3 3240 BEGIN VPOPE = VKTIM ENDBEGIN SET DEPTH INTERVAL 3165.3 3240 BEGIN VPOPE = VKTIM ENDBEGIN SET DEPTH INTERVAL 3165.3 3240 BEGIN VPOPE = VKTIM ENDBEGIN SET DEPTH INTERVAL 2901 2907.7 BEGIN VPOPE = 0.0923*VPOPE ENDBEGIN SET DEPTH INTERVAL 2901 2907.7 BEGIN VPOPE = 1.32*VPOPE ENDBEGIN STATUS HEADINGS STATUS VSH_GRL STATUS VSHND STATUS VSH STATUS PHI_D STATUS PHI_ND STATUS PHI_S STATUS POPE

ORIGIN ENERGY RESOURCES LIMITED YOLLA-4 PETROPHYSICAL REVIEW, TR/L1, BASS BASIN
ENCLOSURE 1 Petrophysical summary plot
EVCM (2600 – 3200 mRT) (1:200)

ORIGIN ENERGY RESOURCES LIMITED YOLLA-4 PETROPHYSICAL REVIEW, TR/L1, BASS BASIN
ENCLOSURE 2 Petrophysical summary plot
EVCM (2600 – 3200 mRT) (1:500)
Yolla-4
Permit: TRL/1, Bass Basin, Tasmania
Latitude : 39 50’ 40.5920’ S
Longtitude : 145 49’ 06.0569’ E
Easting : 398905.07
Northing : 5588821.47
Datum : Rotary table (RT)
RTE: 43.0 m
Bit Size: 8.5 in
Rm: 0.197 ohmm at: 22.0 degC
Rmf: 0.181 ohmm at: 21.0 degC
Rmc: 0.215 ohmm at: 19.0 degC
Plot created on: 10/Dec/04 at: 12:11:52
TD (logs): 3242.5 m
BHT: 126.0 degC
Vertical Scale 1:500 m
Interpreter : Andy Hall
HGR0 150 (GAPI)
Bit size (BS)6 16 (in)
HILT Caliper (HCAL)6 16 (in)
(1:500)
Depth (m
)
2600
2610
2620
2630
2640
2650
2660
2670
2680
2690
2700
2710
2720
2730
2740
2750
2760
2770
2780
2790
2800
2810
2820
2830
2840
2850
2860
2870
2880
2890
2900
2910
2920
2930
2940
2950
2960
2970
2980
2990
3000
3010
3020
3030
3040
3050
3060
3070
3080
3090
3100
3110
3120
3130
3140
3150
3160
3170
3180
3190
3200
3210
3220
3230
3240
HTNP0.45 -0.15 (frac)
RHO81.95 2.95 (g/cc)
HDRA-1.5 0.5 (g/cc)
Delta-T Compressional (DTCO)140 40 (us/f)
PEF80 10 (brne)
RLA00.2 2000 (ohmm)
RLA10.2 2000 (ohmm)
RLA20.2 2000 (ohmm)
RLA30.2 2000 (ohmm)
RLA40.2 2000 (ohmm)
RLA50.2 2000 (ohmm)
RXO80.2 2000 (ohmm)
RT_HRLT0.2 2000 (ohmm)
RM_HRLT0.2 2000 (ohmm)
PHI_D0.3 0
POROSITY30 0
HORIZ PERM0.01 10000
POPE0.01 10000
SW_ARCH0 1
SXO_ARCH0 1
Volume of shale (VSH)0 1
PHI_D1 0
Bulk Volume Water (BVW)1 0
BVW_IMM1 0
Bulk Volume Water (BVW)1 0
Coal (COAL)1 0
VOLCANIC1 0 (frac)
Core D
ata
Core 1
Core 2
MSCT 14MSCT 15MSCT 16MSCT 17MSCT 18
MSCT 19
MSCT 20
MSCT 5MSCT 4
MD
T P
oints
1
23
4
567
8
9
10
111213
1415
1617
18
192021
2223
24252627
28
29
30
31
32
3334
353637a
37383940
4142
4344
45
46
47
484950
5152
2458
Sst
2718
Sst
2755
Sst
2809
Sst
2844
Sst
2952
Sst
2973
Sst
Reservoir
Base 2755 (2912.09)
Volcanics (3182.53)
2718 Sst (2864.79)
2755 Sst (2902.71)
2952 Sst (3118.24)
2809 Sst (2962.61)
Base 2844 (3014.92)
Base 2809 (2984.84)
Base 2952 (3130.19)
2844 Sst (3005.03)
2458 Sst (2603.86)
Base 2458 Sst (2619.54)
2973 Sst (3149.19)
Base 2973 (3165.47)
Base_2718Sst (2871.55)

Origin Energy Resources Ltd ABN 66 007 845 338 Commercial-in-Confidence Greenfields Division Ref: W:\Complete Reports\BASS\Yolla\Yolla 4\Interpretive\Yolla4InterpretativeDataWCR with appendix headers.docc
AAPPPPEENNDDIIXX 22:: MMDDTT RREEPPOORRTT
YOLLA 4
MDT INTERPRETATION
JANUARY 2005
DATE OF SURVEY: 15/7/2004
A Schlumberger MDT tool with pump out module, resistivity tool, optical analyser, quartz and strain gauges was used to obtain pressure data and collects reservoir fluid samples from Yolla 4. The tool was also fitted with 6x450cc sample chambers. The Yolla 4 MDT program was conducted over the interval 2604.5 to 3174.7 mRT on 15/07/2004 and 16/07/2004. A total of 53 pre-tests were attempted of which 35 tests were valid, 4 were supercharged, 12 were tight tests and two lost seal to formation. A summary of the pre-test data is included in Appendix 11 of the Yolla 4 WCR Basic Data. A total of 6 samples ware attempted, with all 6 samples successfully recovered. The descriptions of these samples are as follows. 3 x 450 CC Oil samples from 2458 Sand (2X2609.5 mRT & 2609.5 mRT) 1 x 450 CC Water sample from 2458 Sand (2614.5 mRT) 1 X 450 CC Water sample from 2718 Sand (2871 mRT) 1 X 450 CC Gas sample from 2844 Sand (3005.7 mRT) The fluid composition and analysis of these samples are included in Appendix 19 of the Yolla 4 WCR Basic Data. Meanwhile the pump out sub with optical fluid analyser (OFA) was used to identify the reservoir fluid at 3118.5 mRT (2952 Sand) and 3174.8 mRT as summarised below. OFA at 3174.8 mRT …..(tight) OFA at 3118.5 mRT (2952 Sand) Verified Gas trace water (21 minutes) The interpretation of the MDT data is presented in figures 4 to 8 while figures 1 to 3 demonstrate the data validation process (quality check). Figure1 shows the initial mud hydrostatic pressure recorded by the quartz
gauge. The data indicates a slope of 0.483 psi/ft equivalent to a mud density of 9.3 ppg at the down hole condition.
Figure2 illustrates the difference between the initial and final mud
hydrostatic pressures recorded by the quartz gauge. As shown in this plot this variance is very close to zero (+/- 0.5psi).
Figure3 shows the difference between reservoir pressure recorded by the
quartz and strain gauges. As shown in this plot this variance is very close to zero (+/- 1psi).
Figure4 shows the pressure vs. depth plot of all the zones within the Intra-
EVCM (excluding 2458). A water line with a gradient of 0.415 psi/ft, based on the Yolla 2 RFT data, was established for the Intra-EVCM
sands (with the exception of 2718 Sand which appears to be water saturated and has a separate water line).
Figure5 shows the MDT profile for the 2718 Sand. The MDT data indicates
that this zone is water saturated at the Yolla 4 location. A MDT sample taken at 2871 mRT recovered formation water confirming this result. The single Yolla1 RFT point, from which a gas column has been inferred in the past, could have been supercharged (it was later confirmed by the Yolla3 MDT data).
The 2718 Sand has a separate water line which indicates that this zone is not connected to the hydrodynamic system of the main Intra-EVCM sands.
Figure6 Illustrates the pressure vs. depth profile for the 2755 and 2809
sands. The plot shows that these two sands have separate gas water contacts. A gas line with a gradient of 0.105 psi/ft (consistent with the measured gas density) fitted through the Yolla4 data points defines a GWC of 2834.0 mss. Also a gas line with a gradient of 0.109 psi/ft (based on the measured gas density) plotted through the Yolla4 2809 Sand MDT data gives a GWC of 2828.2 mss. The fluid samples taken from these sands during production test (and also Yolla 3 MDT sampling) indicate that the associated reservoir fluids have different gas densities consistent with the gradients used in this interpretation.
As shown in this plot the Yolla 2 MDT points do not lie on the Yolla-4
trend and are offset by approximately 1.1 psi (or 3.2 metres). This variance is thought to be due to imprecision in the Yolla-4 depth measurements (the Yolla 3 data backs up this theory).
The only two points from the Yolla-1 2755 and 2809 sands (from
which gas columns have been defined in the past) are both offset by approximately 4 psi. This offset is likely to be a gauge error in the 1985 Yolla-1 measurements.
Figure7 Shows the MDT profile for the 2973 Sand. A gas line with a gradient
of 0.097 psi/ft (consistent with the measured gas density) fitted through the Yolla-4 2973 Upper Sand data points defines a GWC of 2990.2 mss with the water line from Yolla-2.
A preliminary interpretation of the MDT data of the second
development well (Yolla-3) indicates that there are two separate gas columns (Upper and Lower sands) within the 2973 zone. The Yolla-4 data appears to fit in with the upper sand.
The only point from Yolla-1 2973 Upper Sand (there is also one point
related to the Lower Sand) is offset by approximately 3.0 psi which is likely due to a gauge error in the 1985 data.
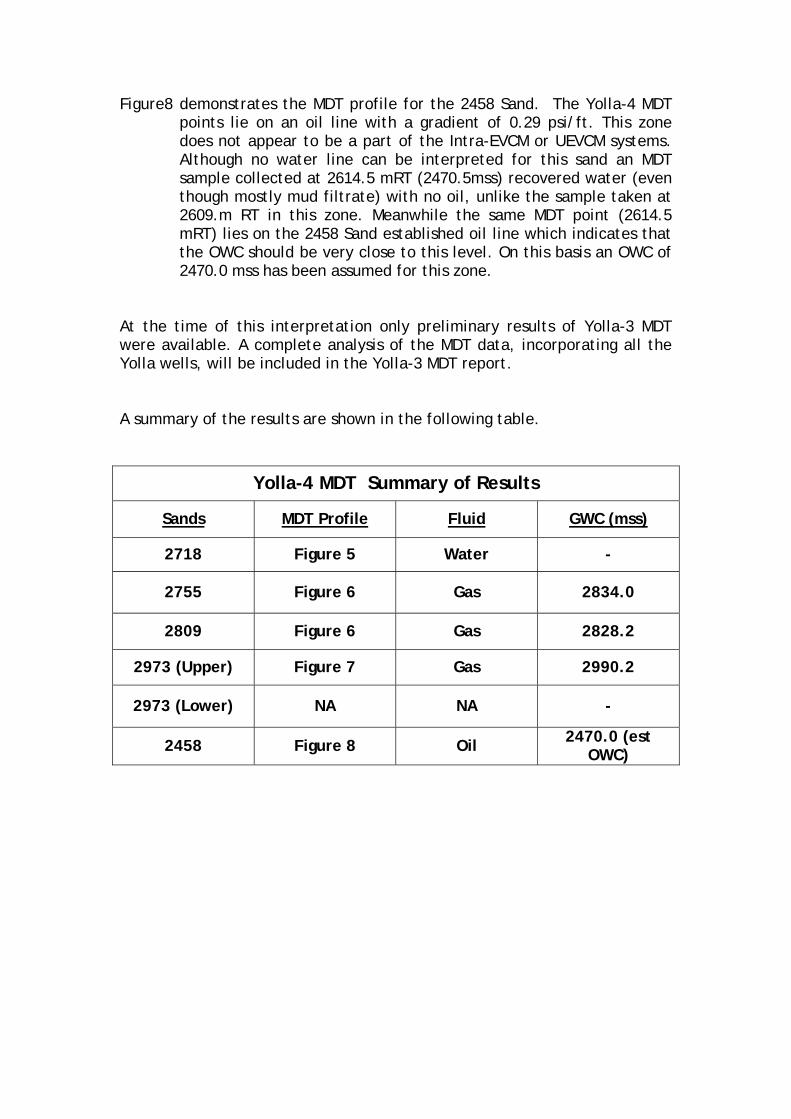
Figure8 demonstrates the MDT profile for the 2458 Sand. The Yolla-4 MDT points lie on an oil line with a gradient of 0.29 psi/ft. This zone does not appear to be a part of the Intra-EVCM or UEVCM systems. Although no water line can be interpreted for this sand an MDT sample collected at 2614.5 mRT (2470.5mss) recovered water (even though mostly mud filtrate) with no oil, unlike the sample taken at 2609.m RT in this zone. Meanwhile the same MDT point (2614.5 mRT) lies on the 2458 Sand established oil line which indicates that the OWC should be very close to this level. On this basis an OWC of 2470.0 mss has been assumed for this zone.
At the time of this interpretation only preliminary results of Yolla-3 MDT were available. A complete analysis of the MDT data, incorporating all the Yolla wells, will be included in the Yolla-3 MDT report. A summary of the results are shown in the following table.
Yolla-4 MDT Summary of Results
Sands MDT Profile Fluid GWC (mss)
2718 Figure 5 Water -
2755 Figure 6 Gas 2834.0
2809 Figure 6 Gas 2828.2
2973 (Upper) Figure 7 Gas 2990.2
2973 (Lower) NA NA -
2458 Figure 8 Oil 2470.0 (est OWC)
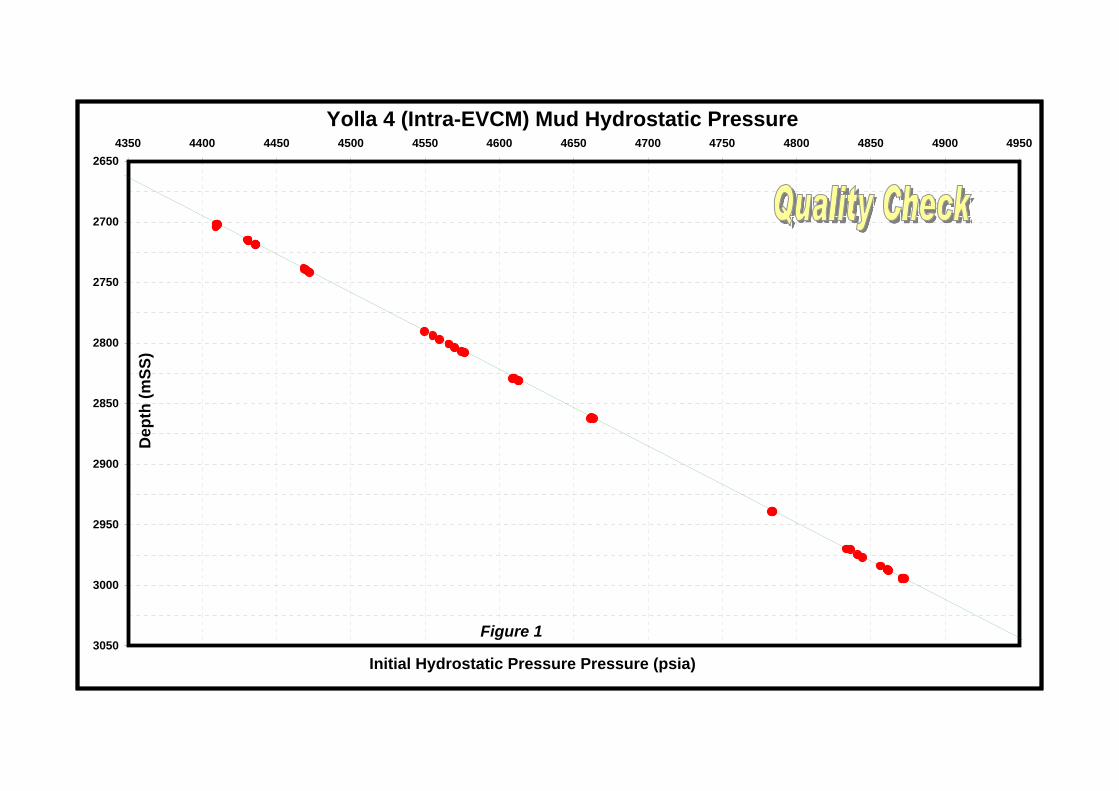
Yolla 4 (Intra-EVCM) Mud Hydrostatic Pressure
2650
2700
2750
2800
2850
2900
2950
3000
3050
4350 4400 4450 4500 4550 4600 4650 4700 4750 4800 4850 4900 4950
Initial Hydrostatic Pressure Pressure (psia)
Dep
th (m
SS)
Figure 1
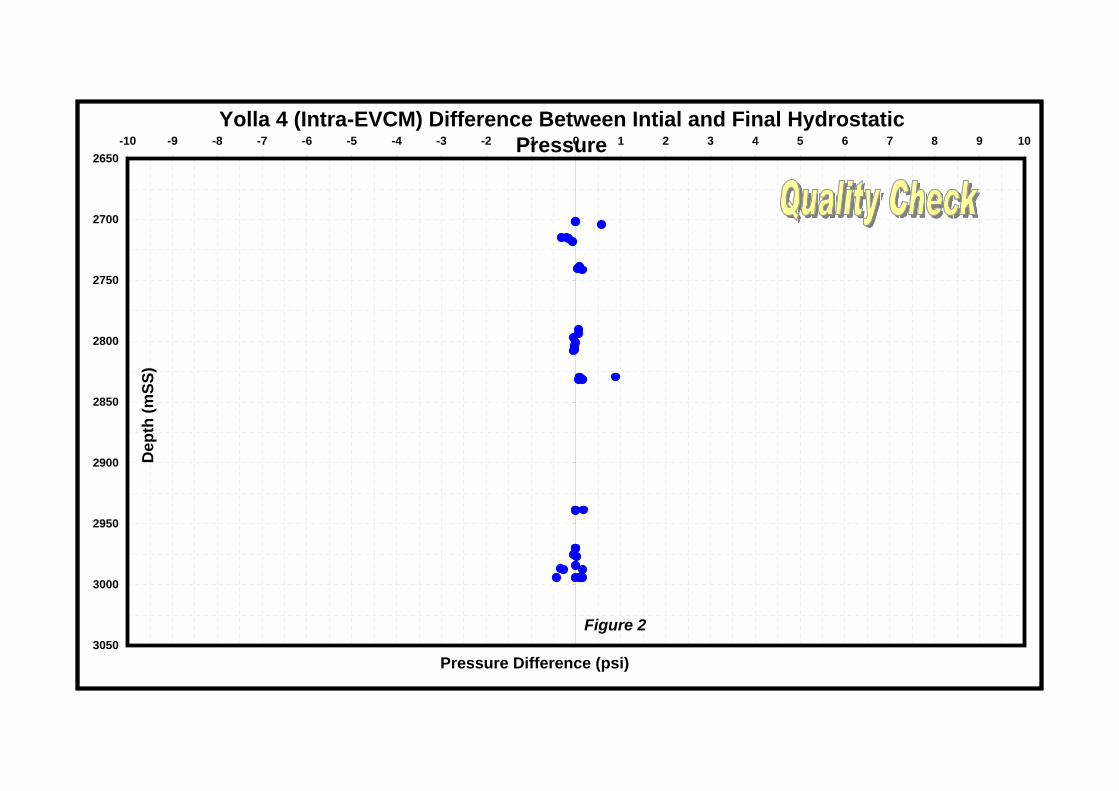
Yolla 4 (Intra-EVCM) Difference Between Intial and Final Hydrostatic Pressure
2650
2700
2750
2800
2850
2900
2950
3000
3050
-10 -9 -8 -7 -6 -5 -4 -3 -2 -1 0 1 2 3 4 5 6 7 8 9 10
Pressure Difference (psi)
Dep
th (m
SS)
Figure 2
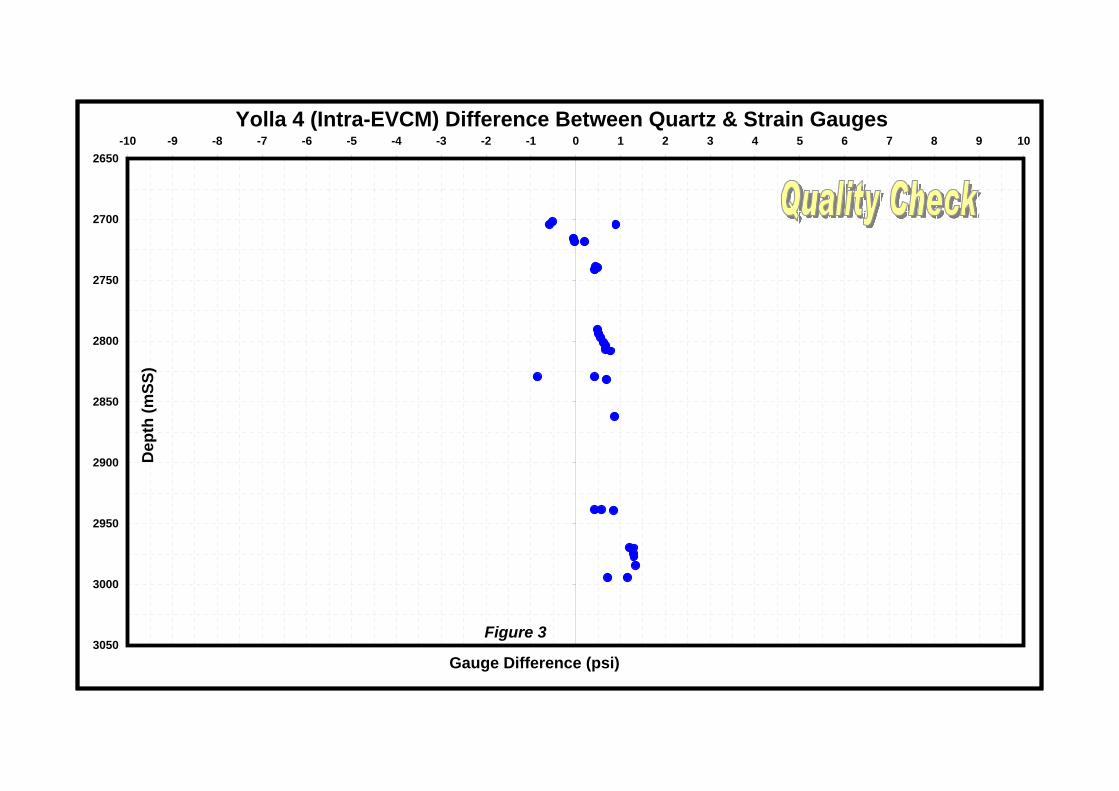
Yolla 4 (Intra-EVCM) Difference Between Quartz & Strain Gauges2650
2700
2750
2800
2850
2900
2950
3000
3050
-10 -9 -8 -7 -6 -5 -4 -3 -2 -1 0 1 2 3 4 5 6 7 8 9 10
Gauge Difference (psi)
Dep
th (m
SS)
Figure 3
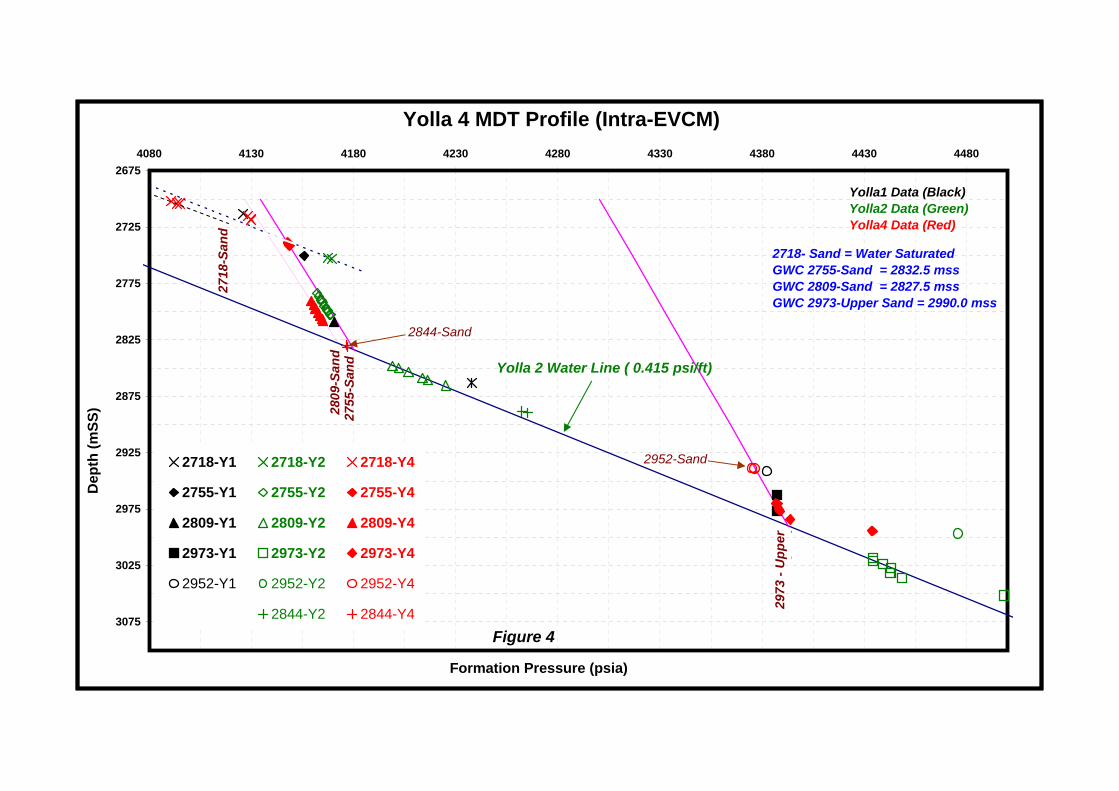
Yolla 4 MDT Profile (Intra-EVCM)
2675
2725
2775
2825
2875
2925
2975
3025
3075
4080 4130 4180 4230 4280 4330 4380 4430 4480
Formation Pressure (psia)
Dep
th (m
SS)
2718-Y1 2718-Y2 2718-Y4
2755-Y1 2755-Y2 2755-Y4
2809-Y1 2809-Y2 2809-Y4
2973-Y1 2973-Y2 2973-Y4
2952-Y1 2952-Y2 2952-Y4
----------- 2844-Y2 2844-Y4
Yolla1 Data (Black)Yolla2 Data (Green)Yolla4 Data (Red)
2718- Sand = Water SaturatedGWC 2755-Sand = 2832.5 mss GWC 2809-Sand = 2827.5 mss GWC 2973-Upper Sand = 2990.0 mss
2718
-San
d
2755
-San
d28
09-S
and
2973
- U
pper
S
d
2952-Sand
2844-Sand
Figure 4
Yolla 2 Water Line ( 0.415 psi/ft)
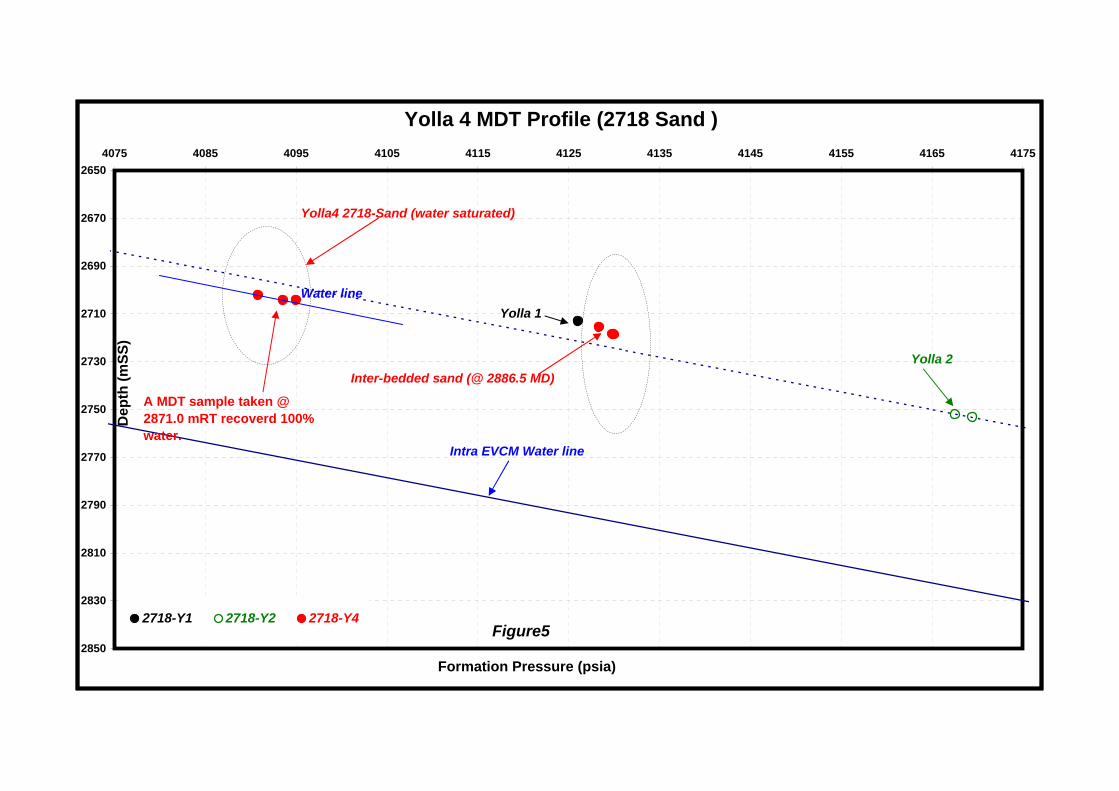
Yolla 4 MDT Profile (2718 Sand )
2650
2670
2690
2710
2730
2750
2770
2790
2810
2830
2850
4075 4085 4095 4105 4115 4125 4135 4145 4155 4165 4175
Formation Pressure (psia)
Dep
th (m
SS)
2718-Y1 2718-Y2 2718-Y4
Yolla 2
Yolla4 2718-Sand (water saturated)
Intra EVCM Water line
Yolla 1
Inter-bedded sand (@ 2886.5 MD)
Water line
Figure5
A MDT sample taken @ 2871.0 mRT recoverd 100% water.
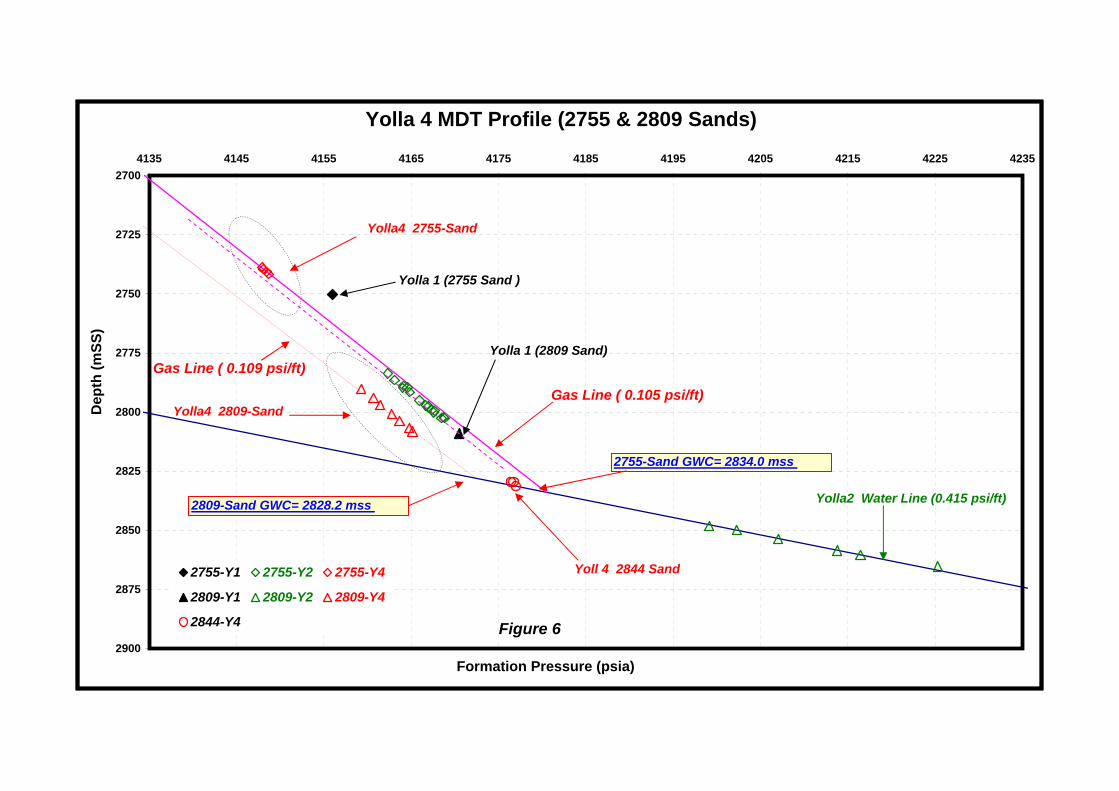
Yolla 4 MDT Profile (2755 & 2809 Sands)
2700
2725
2750
2775
2800
2825
2850
2875
2900
4135 4145 4155 4165 4175 4185 4195 4205 4215 4225 4235
Formation Pressure (psia)
Dep
th (m
SS)
2755-Y1 2755-Y2 2755-Y4
2809-Y1 2809-Y2 2809-Y4
2844-Y4
2809-Sand GWC= 2828.2 mss
Yolla4 2809-Sand
2755-Sand GWC= 2834.0 mss
Yolla4 2755-Sand
Yolla 1 (2755 Sand )
Yolla 1 (2809 Sand)
Yoll 4 2844 Sand
Yolla2 Water Line (0.415 psi/ft)
Figure 6
Gas Line ( 0.105 psi/ft)
Gas Line ( 0.109 psi/ft)
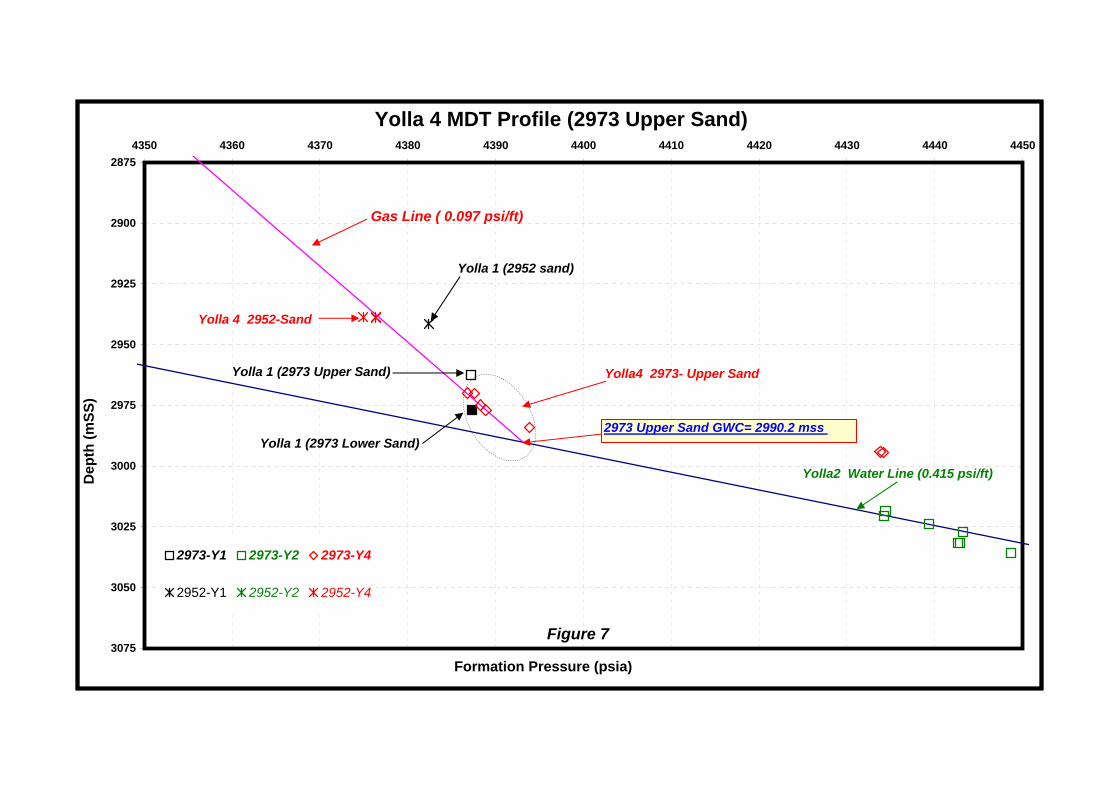
Yolla 4 MDT Profile (2973 Upper Sand)
2875
2900
2925
2950
2975
3000
3025
3050
3075
4350 4360 4370 4380 4390 4400 4410 4420 4430 4440 4450
Formation Pressure (psia)
Dep
th (m
SS)
2973-Y1 2973-Y2 2973-Y4
2952-Y1 2952-Y2 2952-Y4
Yolla 4 2952-Sand
2973 Upper Sand GWC= 2990.2 mss
Yolla4 2973- Upper Sand Yolla 1 (2973 Upper Sand)
Yolla 1 (2952 sand)
Yolla2 Water Line (0.415 psi/ft)
Figure 7
Gas Line ( 0.097 psi/ft)
Yolla 1 (2973 Lower Sand)
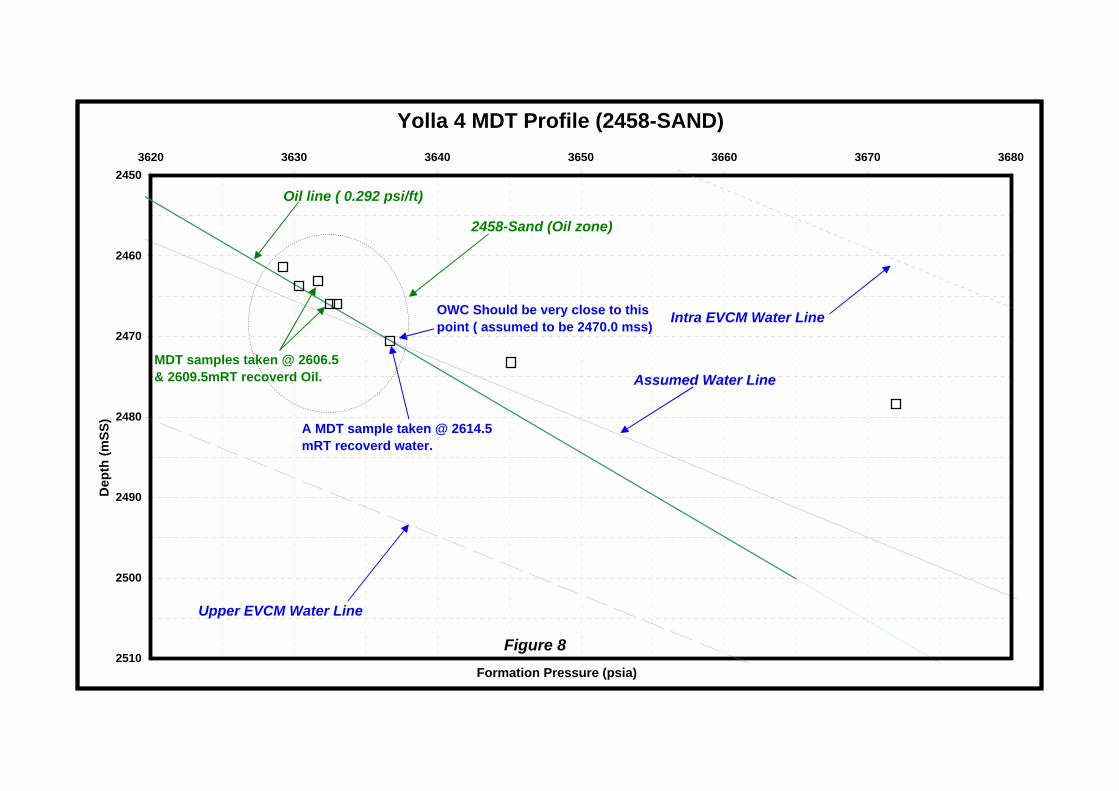
Yolla 4 MDT Profile (2458-SAND)
2450
2460
2470
2480
2490
2500
2510
3620 3630 3640 3650 3660 3670 3680
Formation Pressure (psia)
Dep
th (m
SS)
Intra EVCM Water Line
Upper EVCM Water Line
2458-Sand (Oil zone)
Oil line ( 0.292 psi/ft)
Figure 8
A MDT sample taken @ 2614.5 mRT recoverd water.
MDT samples taken @ 2606.5 & 2609.5mRT recoverd Oil. Assumed Water Line
OWC Should be very close to this point ( assumed to be 2470.0 mss)
Origin Energy Resources Ltd ABN 66 007 845 338 Commercial-in-Confidence Greenfields Division Ref: W:\Complete Reports\BASS\Yolla\Yolla 4\Interpretive\Yolla 4 Interpretive Data WCR.docc
AAPPPPEENNDDIIXX 33:: PPRROODDUUCCTTIIOONN TTEESSTTIINNGG IINNTTEERRPPRREETTAATTIIOONN RREEPPOORRTTSS

Origin Energy Resources Ltd ABN 66 007 845 338 Commercial-in-Confidence Greenfields Division Ref: W:\Complete Reports\BASS\Yolla\Yolla 4\Interpretive\Yolla 4 Interpretive Data WCR.docc
(A) Test Interpretation
Yolla 4 Initial Clean-Up Flow Tests – Interpretation Report Introduction As part of the completion procedure, the Yolla 4 well was flowed from each zone to clean up the well, estimate productivity, and obtain samples of produced fluids. Table 1 summarises the results of the testing by completion zone and the sections below describe the operational sequence, and the main test results and interpretations. Surface production testing operations were carried out by Schlumberger (WCR Basic Data Appendix 16), surface sampling was carried out by Petrolab, the downhole gauges were provided by Halliburton (WCR Basic Data Appendix 16) and programme preparation and technical supervision of testing operations was provided by AWT . Operational Summary The comments below summarise the testing operations in the sequence they were carried out – further details are available in the Schlumberger test report, and the bottomhole and surface data plots are included in the figures and the Saphir report attached to this document.
1. Commingled initial flow: Following completion of the well, the surface equipment was set up and tested and the liquid meter calibrated to the surge tank. The sliding sleeves were opened over the 2809 and 2755 Sands with little pressure response and when the 2458 Sand SSD was opened the THP built up to 631 psia. On 28 July 2004 at 7:43 the well was opened up to the surge tank and beaned up to 24/64” choke. The well FTHP dropped to 18 psia over a 30 minute period and the well returned 9 bbls of the diesel cushion. The well was shut-in at the choke manifold, the SSD’s over the 3 zones were closed, and a gradient survey was run. The low flow rates apparent from the well response are believed to be the result of plugging of the perforations by the completion brine fluid loss agent (sized salt) and inadequate drawdown being available to clear the perforations.
2. Test of the 2973 Sand: At 15:30 on 29 July, the 2973 sand was perforated with 6m of 2 1/8” Enerjet guns from 3149 – 3155m RT and the well immediately opened on 24/64” choke. The well unloaded the diesel cushion with gas to surface at 17:07 with a FTHP of 2554 psia. The well was shut-in, the spent guns pulled and a second 6m 2 1/8” Enerjet gun was run in. After opening the well at 22:53 on 20/64” choke, the second gun was fired from 3151.5 – 3157.5m RT at 00:07 on 30 July with a small response on the FTHP (2534 to 2583 psia). The well was shut-in and the guns pulled, and the Halliburton memory pressure gauges run in and set in the RN nipple in the tail pipe (approx gauge depth 2999m RT = -2832.2m SS). At 9:34 the well was opened on a series of increasing chokes up to 56/64”. Metering through the test separator started at 13:03 with a steady flow rate of 27.2 mmcfd on 44/64” choke with FTHP 2823 psia and FTHT 60 deg C. The measured CGR was reasonably steady at 11 stb/mmscf with 3-4 bbls/mmscf of condensed water. The rates on the higher chokes were not metered, but the FTHP on 56/64” choke was stable at 2542 psia. The well was shut in at the choke manifold at 17:22 with THP building to 3398 psia in 8 minutes, and the gauges were retrieved.
3. Commingled flows with 2973 Sand: A series of flows of the 2809, 2755, and 2458 sands, each commingled in turn with the 2973 sand, were run over the period 19:30 on 30 July to 11:22 on 31 July 2004. (A plug was not run above the 2973 sand to let the higher zones clean up without risking debris falling on the plug.). During these flows, bottomhole pressure gauges were not run and surface flow rates were not metered. The 2809 Sand SSD was opened and the 2809/2973 Sands flowed for 53 minutes mainly on the final choke setting of 43/64” with an FTHP of about 3030 psia. The well was SI and the 2809 SSD was closed and the 2755 SSD was opened. The 2755/2973 Sands were flowed for 106 minutes mainly on the final choke setting of 44/64” with a rising FTHP of up to 3105 psia. The FTHP’s were higher during the commingled flows of the 2809 and 2755 sands, than for the 2973 Sand alone, indicates that the upper zones were probably contributing to flow. The well was SI, the 2755 SSD closed and the 2458 SSD was opened. The 2458/2973 Sands were flowed for 77 minutes mainly on the final choke setting of 46/64” with a final FTHP of 2842 psia.
4. Test of the 2755 Sand: The 2458 SSD was closed and a plug was run in hole to attempt to set in the RN nipple to isolate the 2973 sand. Problems were encountered with the plug being left in the R nipple and needing to be fished. The plug was re-run and set in the RN nipple below the bottom packer. The plug was tested by bleeding off 1000 psi from the tubing and the test was accepted, though the wellhead
pressure was rising at about 2 psi/minute. Subsequent diagnostics (see Step 9 below) confirmed a leak past the plug. It should therefore be noted that the test results reported below are likely to be affected by a small proportion of the flow having come from the 2973 Sand. The 2755 SSD was opened and the WHP jumped up by 630 psi to 3144 psia. Production from the 2755 Sand was started at 16:32 on 1 August and the well was gradually beaned up to 40/64” choke. The well was SI at 17:40 to run in and hang off the pressure gauges in the bottommost sliding sleeve (below the bottom packer) with the sensing point at approximately 2992m RT (-2816.6m SS). The well was re-opened at 19:25 and gradually beaned up to 58/64” choke before beaning back to 52/64” choke. Production on 52/64” choke was metered via the test separator between 22:45 and 1:15 on 2 August 2004. The flow rate was steady at 32.2 mmcfd with a CGR of 20 stb/mmscf and 3-4 bbls/mmscf of condensed water, at an FTHP of 2787 psia and FTHT of 61 deg C.
5. Test of the 2458 Sand: The 2755 SSD was closed and the 2458 SSD was opened with SITHP then gradually falling from 3202 psia to 2984 psia. The 2458 sand was opened to production at 05:04 on 2 August 2004 and gradually beaned up to 40/64” choke. Oil arrived at surface in 67 minutes and the FTHP rose to stabilise at 1599 psia with FTHT of 59 deg C (the high FTHP is believed to be the result of the leaking plug above the 2973 Sand). The well was not flowed through the test separator to avoid potential problems with wax buildup. The well was shut-in at 09:11. The estimated leak rate past the 2973 plug was ~3 mmcfd based on the flow rate and drawdown using data from the flow in step 7 below. Using Gilbert’s correlation, the estimated flow rate from the 2458 sand is about 2700 stb/d.
6. Commingled flow of the 2458 and 2809 Sands: A shifting tool was RIH to open the 2809 SSD for a commingled flow to clear out the oil from the tubing. At that time the SITHP was 2311 psia and gradually rising. The was well flowed on various chokes starting from 16/64” to 48/64” before finishing on 32/64” choke with an FTHP of 1689 psia. Review of the surface and FBHP data showed that the 2809 SSD was probably not open.
7. Attempted test of the 2809 Sand: The 2458 SSD was closed and the well opened at 13:00 on 2 August 2004. The FTHP pressure gradually fell from 2653 psia to 882 psia on 44/64” choke, with the well slugging oil and gas. Comparing the FTHP and FBHP indicated the well was flowing mostly gas at a rate of 6 – 8 mmcfd. The well was shut in at 15:11 and a slickline tool was RIH to check the 2809 sleeve and open the 2755 sleeve. On checking the 2809 sleeve there was a sudden jump in THP and the tool was blown up the hole and could not be pulled past 2940m RT. This result indicates that the gas produced earlier had probably come mainly via the leaking plug, rather than from the 2809 Sand. Fishing operations were conducted over the next 4 days resulting in eventual recovery of the fish.
8. Test of the 2809 Sand: The well was opened up at 20:41 on 6 August 2004 and gradually beaned up to 54/64” choke before settling back to 52/64” for the main 3 hour flow period through the test separator. The flow rate was stable at 32.1 mmcfd with a CGR of 24.5 stb/mmscf, and 3-4 bbls/mmscf of condensed water, with a final FTHP of 2860 psia and FTHT of 77 deg C. The well was shut in at 04:24 on 7 August 2004.
9. Post test activities: The 2809 SSD was closed, the tubing pressure was bled down and the well observed. The tubing pressure built up from 350 psia to 1244 psia in 21 minutes, confirming a leak. A number of diagnostics were run to identify the leak before setting another plug and moving the rig to Yolla 3. Further pressure data analysis and diagnostics, including a PLT log, showed that the plug in the RN nipple (above the 2973 Sand) was leaking. Anomalously high bottomhole SI pressures recorded after the 2755 and 2809 flow tests confirmed communication with the higher pressured 2973 sand. Therefore, the leak had probably been ongoing throughout the individual flow tests of the 2755, 2458 and 2809 sands.
Well Test Data Interpretation Table 1 summarises the well test data including estimates of well productivity. It should be noted that the flow tests of the zones above the 2973 Sand were affected by the leak across the plug in the RN nipple – the 2973 sand is estimated to have contributed of the order of 1 – 8 mmcfd to the flow from the higher zones, depending on the drawdown. The flow rates and calculated skin factors in Table 1 are not corrected for the leak rate due to uncertainty regarding their magnitude (the correction would lower the zonal flow rates and increase the estimated skin). Conversely, the FBHP data showed that the zones were still cleaning up at the end of the drawdown phase (rising FBHP), indicating that the skin factors would fall with continued production. It should also be noted that the condensate rates reported from the gas zone clean-up flows appear to be significantly too low. This was confirmed by MDT and production test sampling of the same zones in Yolla 3.

A thorough audit of the gas and condensate metering in Yolla 4 was carried out (Reference ?) and it was concluded that the surface metering was reasonably accurate. The lower than expected condensate rates are believed mainly the result of liquid carryover in the gas stream exiting the test separator (although the separator was operated within its stated capacity), and also due in part from the lower CGR 2973 Sand contributing to the later flows. It is recommended that the recombined reservoir gas compositions estimated from the Yolla 4 tests not be used. The buildup for the 2973 Sand flow test was analysed and approximate estimates of permeability and skin factor were made (see the attached Saphir report). None of the other tests had usable buildup data due to a combination of short buildups, surface operations affecting the SIBHP and the impact of the 2973 plug leak. Figures 1 - 6 show the bottomhole and surface pressure and temperature data for the entire test sequence and for the individual zone tests.
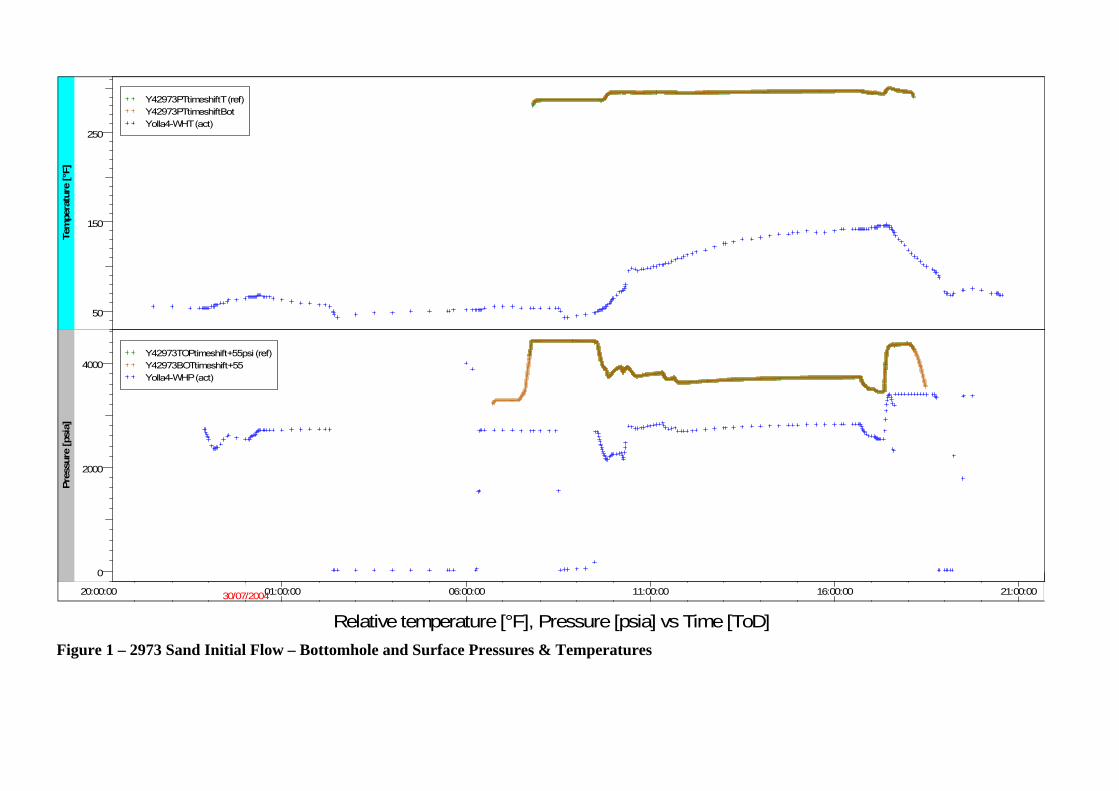
50
150
250
Y42973PTtimeshiftT (ref)Y42973PTtimeshiftBotYolla4-WHT (act)
Tem
pera
ture
[°F]
0
2000
4000Y42973TOPtimeshift+55psi (ref)Y42973BOTtimeshift+55Yolla4-WHP (act)
Pres
sure
[psi
a]
20:00:00 01:00:00 06:00:00 11:00:00 16:00:00 21:00:0030/07/2004
Relative temperature [°F], Pressure [psia] vs Time [ToD]Figure 1 – 2973 Sand Initial Flow – Bottomhole and Surface Pressures & Temperatures
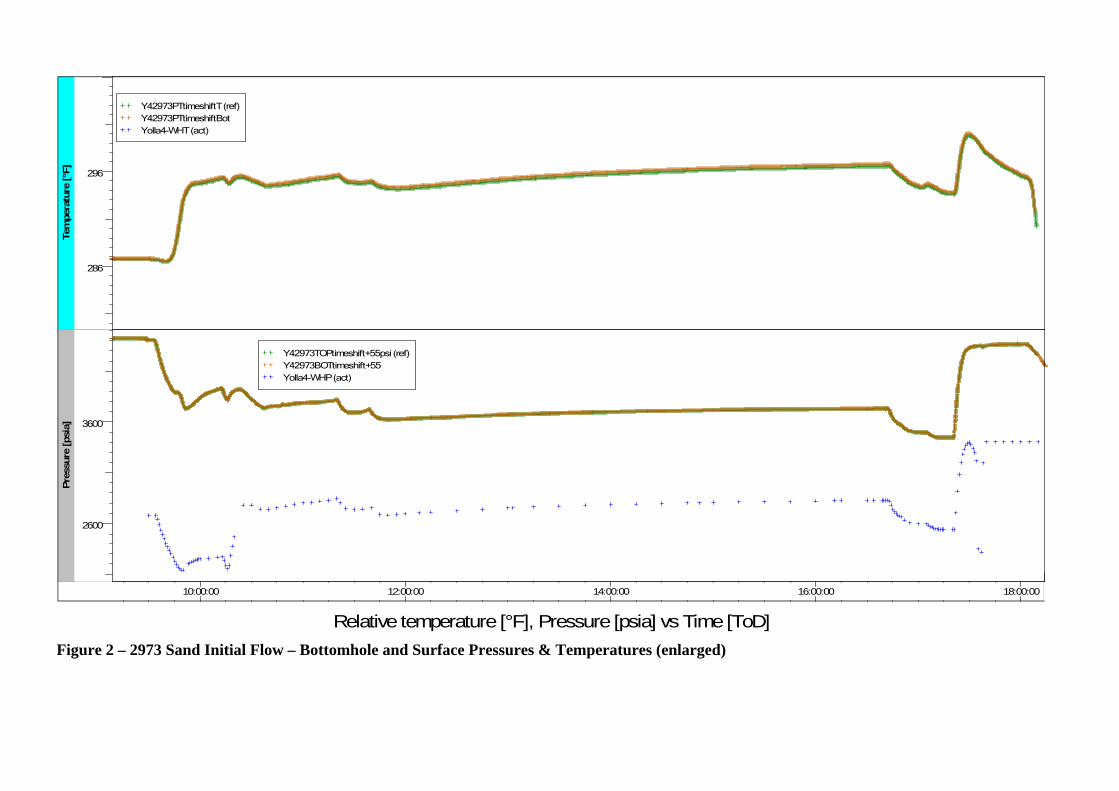
286
296
Y42973PTtimeshiftT (ref)Y42973PTtimeshiftBotYolla4-WHT (act)
Tem
pera
ture
[°F]
2600
3600
Y42973TOPtimeshift+55psi (ref)Y42973BOTtimeshift+55Yolla4-WHP (act)
Pres
sure
[psi
a]
10:00:00 12:00:00 14:00:00 16:00:00 18:00:00
Relative temperature [°F], Pressure [psia] vs Time [ToD]
Figure 2 – 2973 Sand Initial Flow – Bottomhole and Surface Pressures & Temperatures (enlarged)
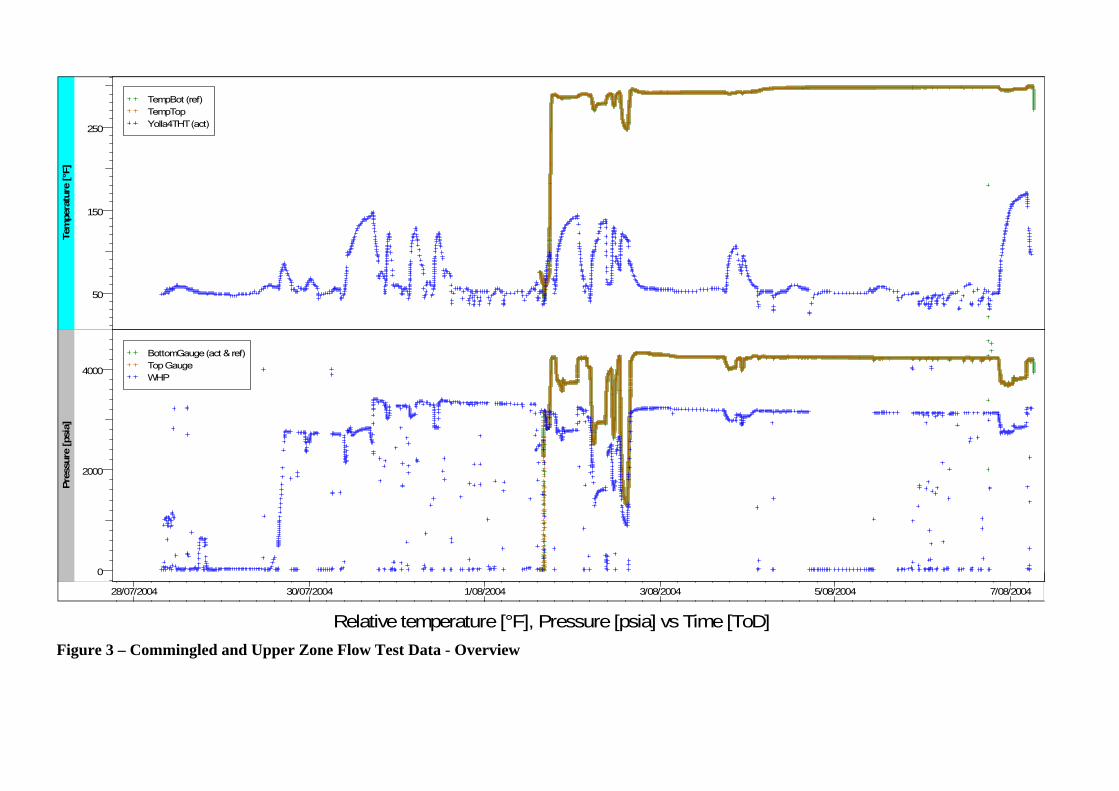
50
150
250
TempBot (ref)TempTopYolla4THT (act)
Tem
pera
ture
[°F]
0
2000
4000
BottomGauge (act & ref)Top GaugeWHP
Pres
sure
[psi
a]
28/07/2004 30/07/2004 1/08/2004 3/08/2004 5/08/2004 7/08/2004
Relative temperature [°F], Pressure [psia] vs Time [ToD]
Figure 3 – Commingled and Upper Zone Flow Test Data - Overview
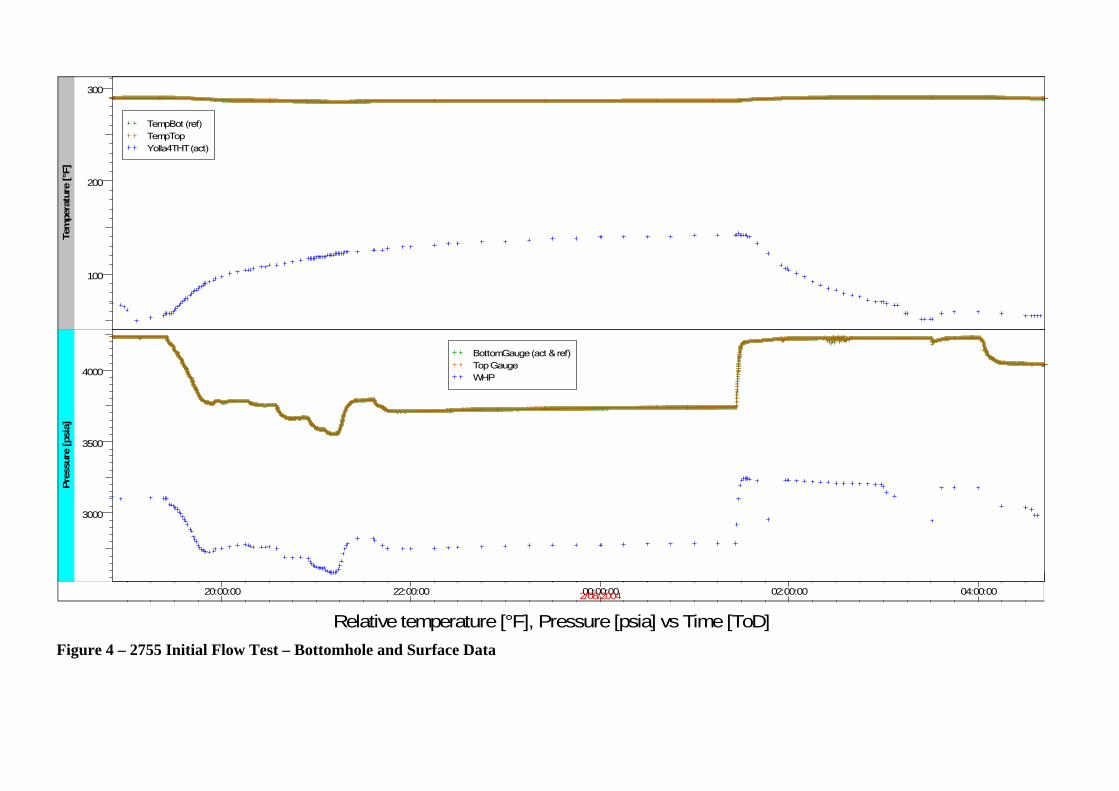
100
200
300
TempBot (ref)TempTopYolla4THT (act)
Tem
pera
ture
[°F]
3000
3500
4000
BottomGauge (act & ref)Top GaugeWHP
Pres
sure
[psi
a]
20:00:00 22:00:00 00:00:00 02:00:00 04:00:002/08/2004
Relative temperature [°F], Pressure [psia] vs Time [ToD]
Figure 4 – 2755 Initial Flow Test – Bottomhole and Surface Data
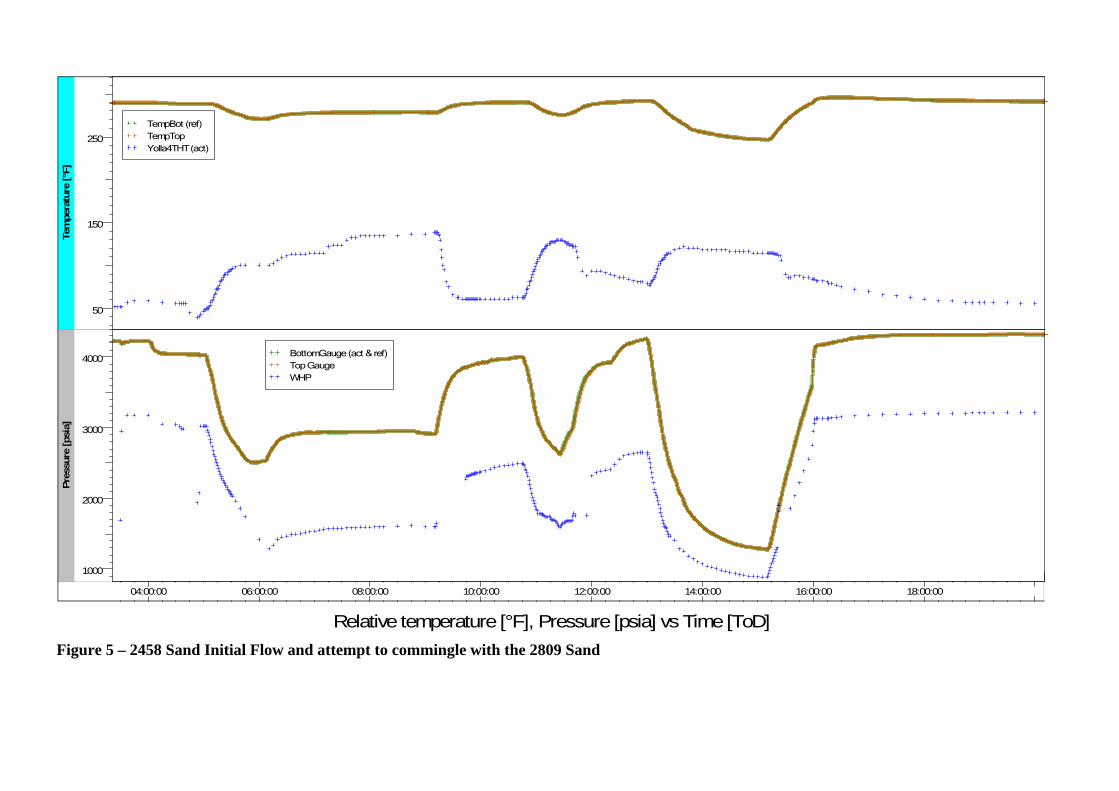
50
150
250TempBot (ref)TempTopYolla4THT (act)
Tem
pera
ture
[°F]
1000
2000
3000
4000 BottomGauge (act & ref)Top GaugeWHP
Pres
sure
[psi
a]
04:00:00 06:00:00 08:00:00 10:00:00 12:00:00 14:00:00 16:00:00 18:00:00
Relative temperature [°F], Pressure [psia] vs Time [ToD]
Figure 5 – 2458 Sand Initial Flow and attempt to commingle with the 2809 Sand
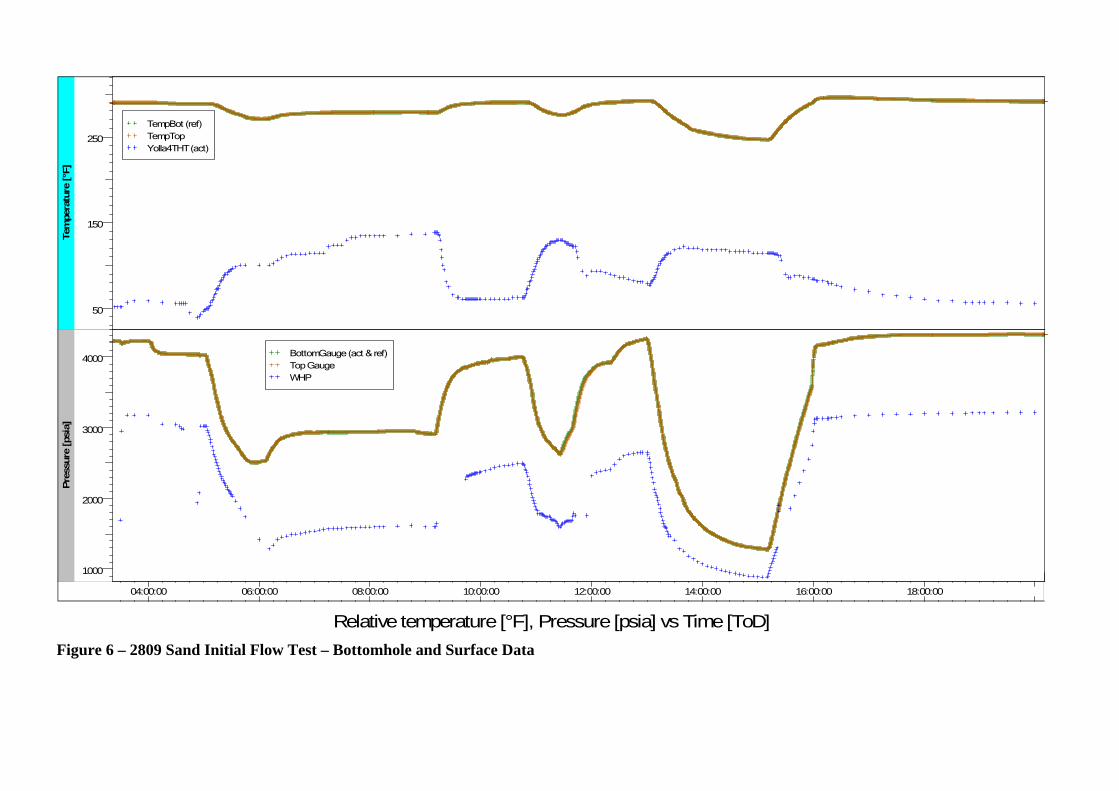
50
150
250TempBot (ref)TempTopYolla4THT (act)
Tem
pera
ture
[°F]
1000
2000
3000
4000 BottomGauge (act & ref)Top GaugeWHP
Pres
sure
[psi
a]
04:00:00 06:00:00 08:00:00 10:00:00 12:00:00 14:00:00 16:00:00 18:00:00
Relative temperature [°F], Pressure [psia] vs Time [ToD]Figure 6 – 2809 Sand Initial Flow Test – Bottomhole and Surface Data
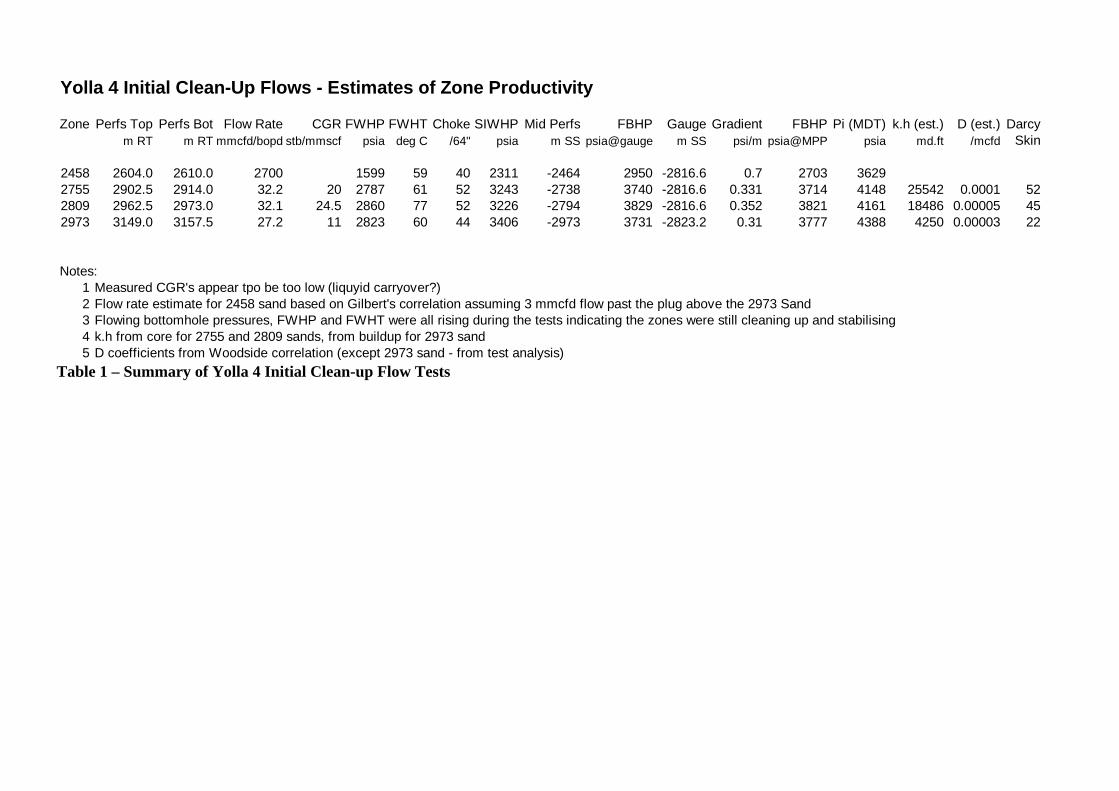
Yolla 4 Initial Clean-Up Flows - Estimates of Zone Productivity
Zone Perfs Top Perfs Bot Flow Rate CGR FWHP FWHT Choke SIWHP Mid Perfs FBHP Gauge Gradient FBHP Pi (MDT) k.h (est.) D (est.) Darcym RT m RT mmcfd/bopd stb/mmscf psia deg C /64" psia m SS psia@gauge m SS psi/m psia@MPP psia md.ft /mcfd Skin
2458 2604.0 2610.0 2700 1599 59 40 2311 -2464 2950 -2816.6 0.7 2703 36292755 2902.5 2914.0 32.2 20 2787 61 52 3243 -2738 3740 -2816.6 0.331 3714 4148 25542 0.0001 522809 2962.5 2973.0 32.1 24.5 2860 77 52 3226 -2794 3829 -2816.6 0.352 3821 4161 18486 0.00005 452973 3149.0 3157.5 27.2 11 2823 60 44 3406 -2973 3731 -2823.2 0.31 3777 4388 4250 0.00003 22
Notes:1 Measured CGR's appear tpo be too low (liquyid carryover?) 2 Flow rate estimate for 2458 sand based on Gilbert's correlation assuming 3 mmcfd flow past the plug above the 2973 Sand 3 Flowing bottomhole pressures, FWHP and FWHT were all rising during the tests indicating the zones were still cleaning up and stabilising4 k.h from core for 2755 and 2809 sands, from buildup for 2973 sand5 D coefficients from Woodside correlation (except 2973 sand - from test analysis)
Table 1 – Summary of Yolla 4 Initial Clean-up Flow Tests
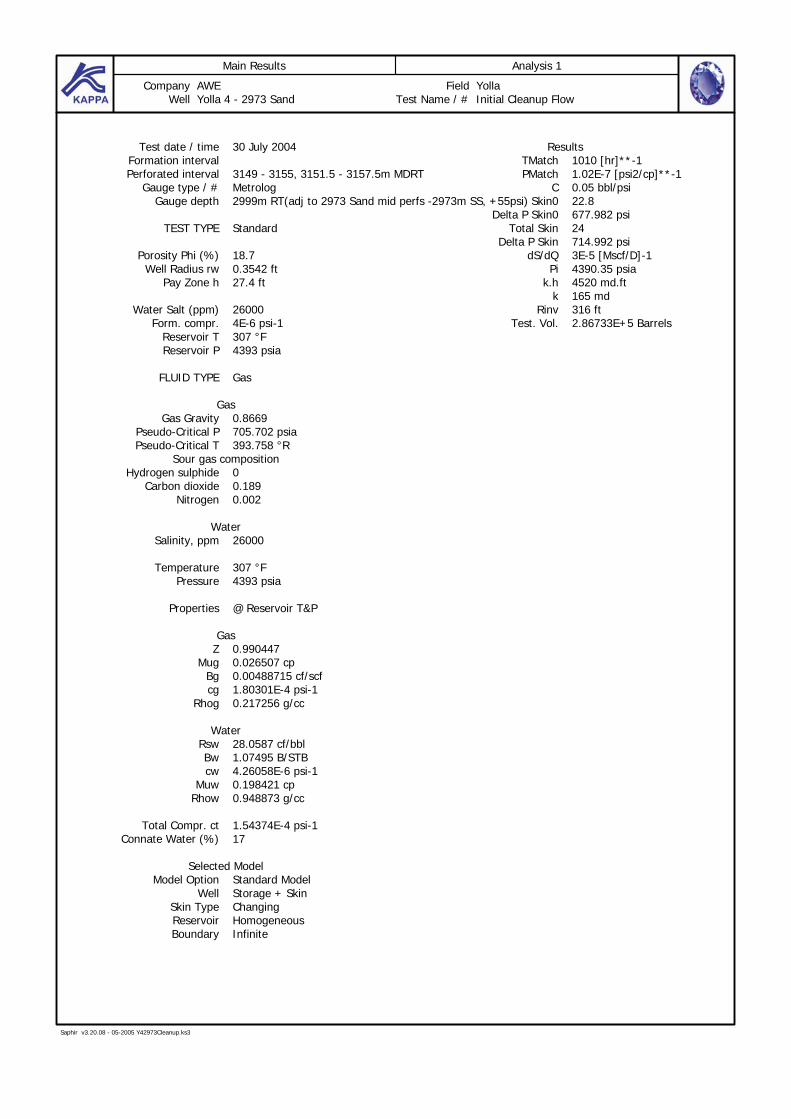
Main Results Analysis 1
Company AWE Field YollaWell Yolla 4 - 2973 Sand Test Name / # Initial Cleanup Flow
Saphir v3.20.08 - 05-2005 Y42973Cleanup.ks3
Test date / time 30 July 2004Formation intervalPerforated interval 3149 - 3155, 3151.5 - 3157.5m MDRT
Gauge type / # MetrologGauge depth 2999m RT(adj to 2973 Sand mid perfs -2973m SS, +55psi)
TEST TYPE Standard
Porosity Phi (%) 18.7 Well Radius rw 0.3542 ft
Pay Zone h 27.4 ft
Water Salt (ppm) 26000 Form. compr. 4E-6 psi-1
Reservoir T 307 °FReservoir P 4393 psia
FLUID TYPE Gas
GasGas Gravity 0.8669
Pseudo-Critical P 705.702 psiaPseudo-Critical T 393.758 °R
Sour gas compositionHydrogen sulphide 0
Carbon dioxide 0.189 Nitrogen 0.002
WaterSalinity, ppm 26000
Temperature 307 °FPressure 4393 psia
Properties @ Reservoir T&P
GasZ 0.990447
Mug 0.026507 cpBg 0.00488715 cf/scfcg 1.80301E-4 psi-1
Rhog 0.217256 g/cc
WaterRsw 28.0587 cf/bblBw 1.07495 B/STBcw 4.26058E-6 psi-1
Muw 0.198421 cpRhow 0.948873 g/cc
Total Compr. ct 1.54374E-4 psi-1Connate Water (%) 17
Selected ModelModel Option Standard Model
Well Storage + SkinSkin Type ChangingReservoir HomogeneousBoundary Infinite
ResultsTMatch 1010 [hr]**-1PMatch 1.02E-7 [psi2/cp]**-1
C 0.05 bbl/psiSkin0 22.8
Delta P Skin0 677.982 psiTotal Skin 24
Delta P Skin 714.992 psidS/dQ 3E-5 [Mscf/D]-1
Pi 4390.35 psiak.h 4520 md.ft
k 165 mdRinv 316 ft
Test. Vol. 2.86733E+5 Barrels

Comments Analysis 1
Company AWE Field YollaWell Yolla 4 - 2973 Sand Test Name / # Initial Cleanup Flow
Saphir v3.20.08 - 05-2005 Y42973Cleanup.ks3
Measured gauge pressures were adjusted to the 2973 Sand mid perfs (-2973m SS) by adding 55psi (the gauges were at 2999m RT or -2823.2m SS). The pressure gauge data was also time shifted to align the bottomhole gauges with the surface gauges and operational summary. The two downhole gauges gave good quality data. Petrophysical data used was from A. Hall Email of 7 April 2005 and fluid properties were based on correlations using the Yolla-3 MDT sample compoition from the 2973 sand.
The post flow shut-in at the choke manifold was of very short duration and affected by a small leak after 15 minutes of shut-in. The buildup was mainly afterflow with only a very short radial flow period, so parameters can only be estimated roughly. Estimated permeability-thickness is 4520 md.ft and the skin was 23. The non-darcy D coefficient was difficult to estimate as the well was cleaning up throughout the flow and only one flow was measured (the rest were estimated from the choke size and FTHP). However, it appears to be small.
The estimated initial reservoir pressure at MPP (4390 psia) was consistent with the MDT data (4388 psia at -2973m SS) but there is uncertainty re the gauge to mid perforations correction. The maximum temperature recorded (just after shut-in) was 302 deg F but had probably not built up fully and reservoir temperature is likely to be a few degrees higher.
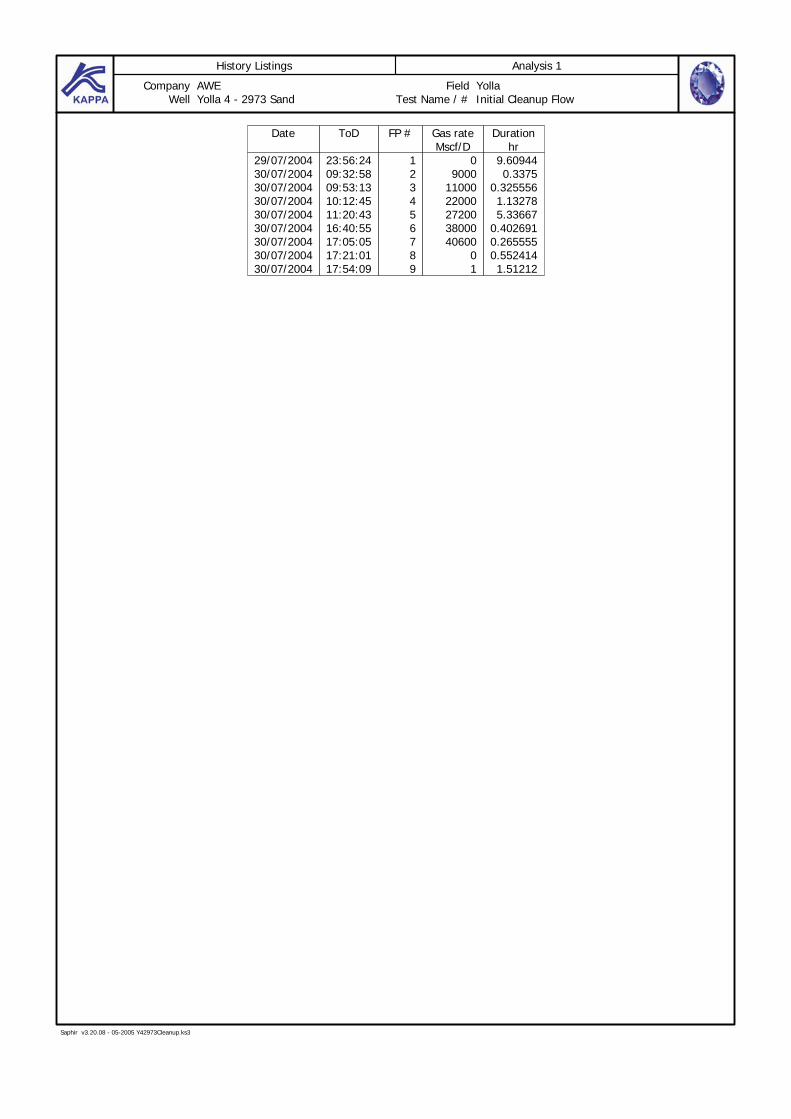
History Listings Analysis 1
Company AWE Field YollaWell Yolla 4 - 2973 Sand Test Name / # Initial Cleanup Flow
Saphir v3.20.08 - 05-2005 Y42973Cleanup.ks3
Date ToD FP # Gas rate Duration Mscf/D hr
29/07/2004 23:56:24 1 0 9.6094430/07/2004 09:32:58 2 9000 0.337530/07/2004 09:53:13 3 11000 0.32555630/07/2004 10:12:45 4 22000 1.1327830/07/2004 11:20:43 5 27200 5.3366730/07/2004 16:40:55 6 38000 0.40269130/07/2004 17:05:05 7 40600 0.26555530/07/2004 17:21:01 8 0 0.55241430/07/2004 17:54:09 9 1 1.51212
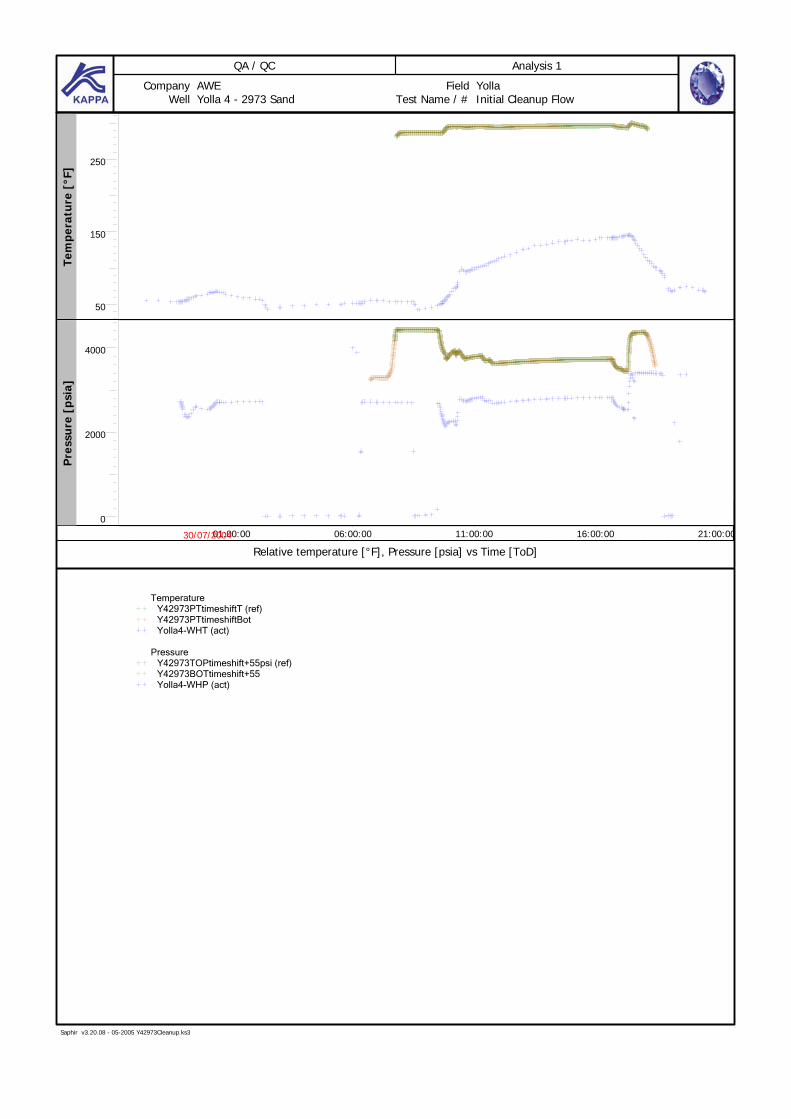
QA / QC Analysis 1
Company AWE Field YollaWell Yolla 4 - 2973 Sand Test Name / # Initial Cleanup Flow
Saphir v3.20.08 - 05-2005 Y42973Cleanup.ks3
Temperature
Y42973PTtimeshiftT (ref)Y42973PTtimeshiftBotYolla4-WHT (act)
Pressure
Y42973TOPtimeshift+55psi (ref)Y42973BOTtimeshift+55Yolla4-WHP (act)
50
150
250
Tem
pera
ture
[°F
]
0
2000
4000
Pre
ssu
re [
psia
]
01:00:00 06:00:00 11:00:00 16:00:00 21:00:0030/07/2004
Relative temperature [°F], Pressure [psia] vs Time [ToD]
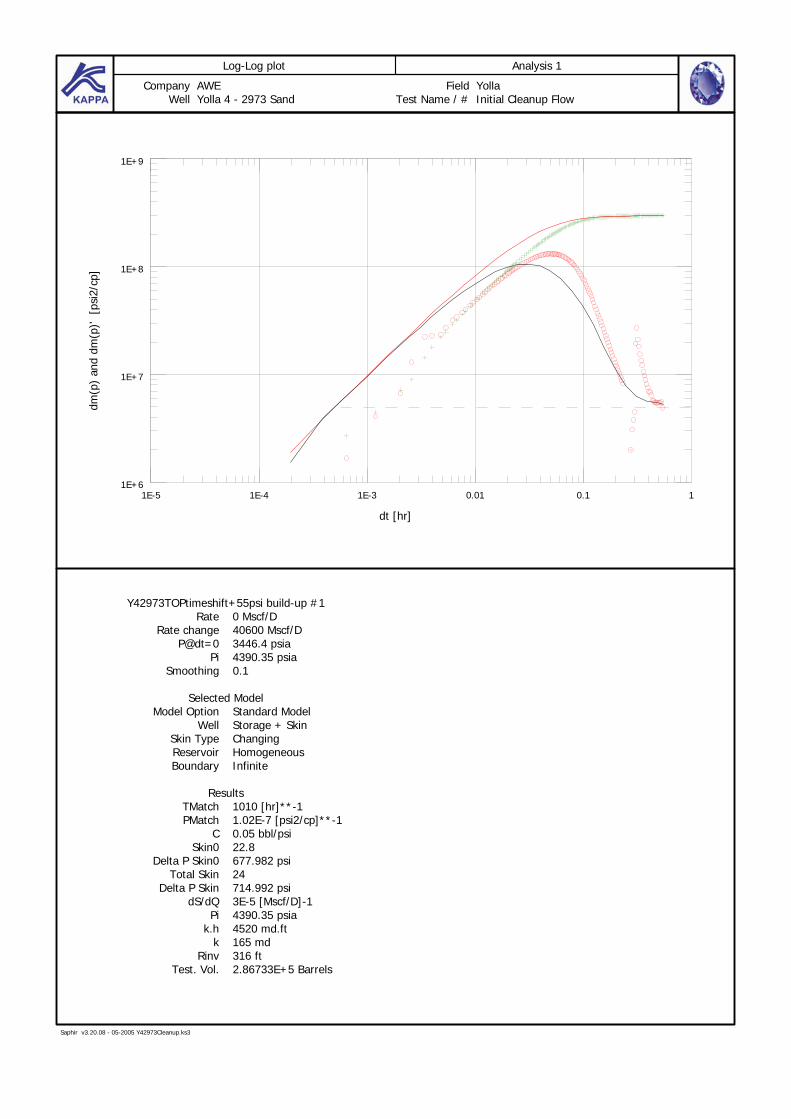
Log-Log plot Analysis 1
Company AWE Field YollaWell Yolla 4 - 2973 Sand Test Name / # Initial Cleanup Flow
Saphir v3.20.08 - 05-2005 Y42973Cleanup.ks3
Y42973TOPtimeshift+55psi build-up #1Rate 0 Mscf/D
Rate change 40600 Mscf/DP@dt=0 3446.4 psia
Pi 4390.35 psiaSmoothing 0.1
Selected ModelModel Option Standard Model
Well Storage + SkinSkin Type ChangingReservoir HomogeneousBoundary Infinite
ResultsTMatch 1010 [hr]**-1PMatch 1.02E-7 [psi2/cp]**-1
C 0.05 bbl/psiSkin0 22.8
Delta P Skin0 677.982 psiTotal Skin 24
Delta P Skin 714.992 psidS/dQ 3E-5 [Mscf/D]-1
Pi 4390.35 psiak.h 4520 md.ft
k 165 mdRinv 316 ft
Test. Vol. 2.86733E+5 Barrels
1E-5 1E-4 1E-3 0.01 0.1 11E+6
1E+7
1E+8
1E+9
dm(p
) an
d dm
(p)'
[ps
i2/c
p]
dt [hr]
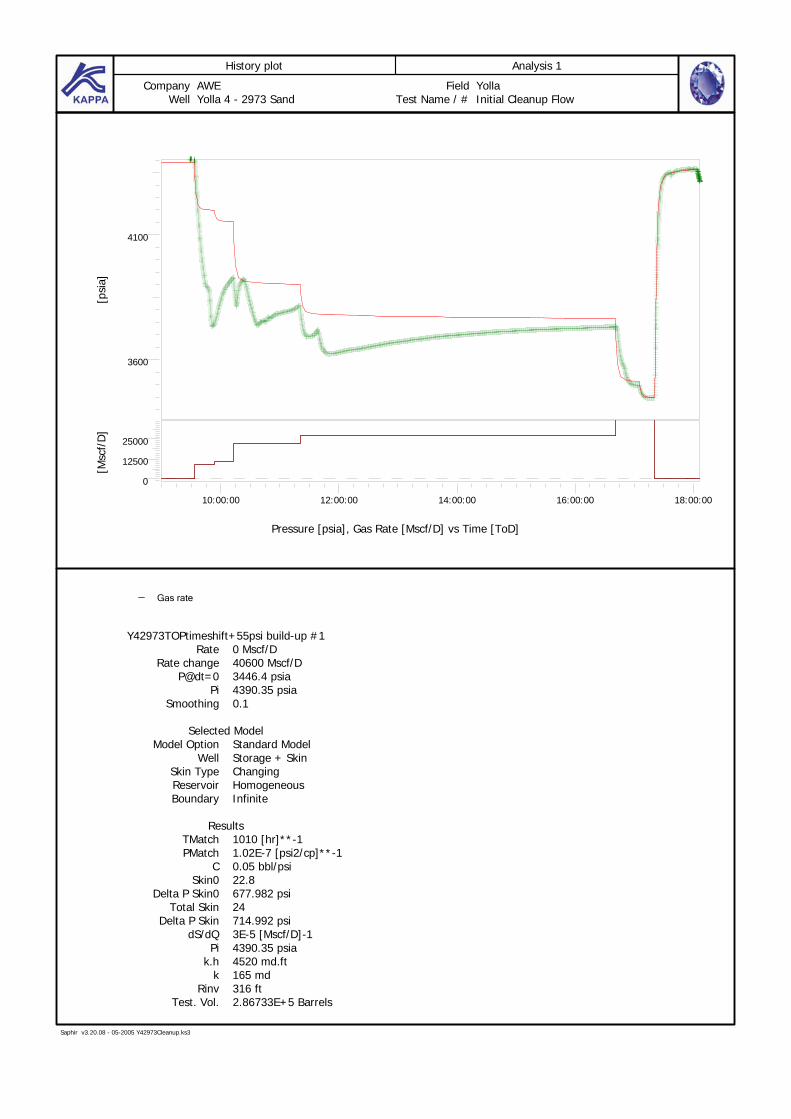
History plot Analysis 1
Company AWE Field YollaWell Yolla 4 - 2973 Sand Test Name / # Initial Cleanup Flow
Saphir v3.20.08 - 05-2005 Y42973Cleanup.ks3
Gas rate
Y42973TOPtimeshift+55psi build-up #1Rate 0 Mscf/D
Rate change 40600 Mscf/DP@dt=0 3446.4 psia
Pi 4390.35 psiaSmoothing 0.1
Selected ModelModel Option Standard Model
Well Storage + SkinSkin Type ChangingReservoir HomogeneousBoundary Infinite
ResultsTMatch 1010 [hr]**-1PMatch 1.02E-7 [psi2/cp]**-1
C 0.05 bbl/psiSkin0 22.8
Delta P Skin0 677.982 psiTotal Skin 24
Delta P Skin 714.992 psidS/dQ 3E-5 [Mscf/D]-1
Pi 4390.35 psiak.h 4520 md.ft
k 165 mdRinv 316 ft
Test. Vol. 2.86733E+5 Barrels
3600
4100
[psi
a]
10:00:00 12:00:00 14:00:00 16:00:00 18:00:00
0
12500
25000
[Msc
f/D
]
Pressure [psia], Gas Rate [Mscf/D] vs Time [ToD]
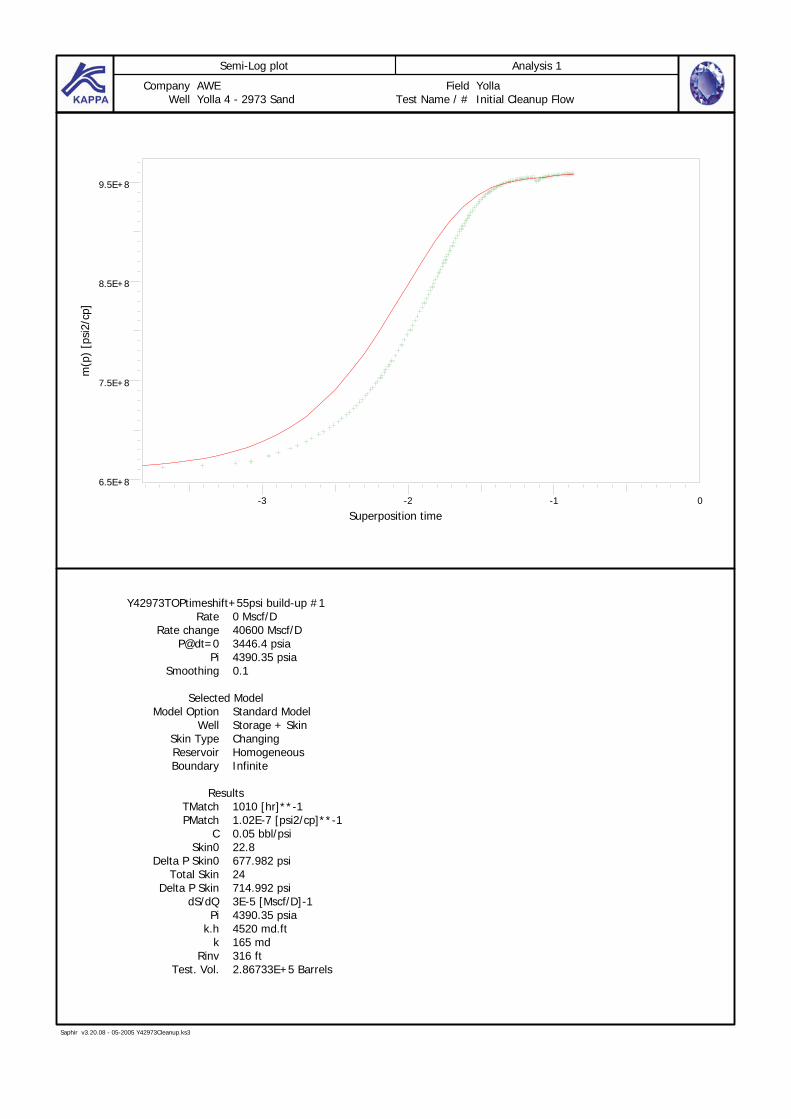
Semi-Log plot Analysis 1
Company AWE Field YollaWell Yolla 4 - 2973 Sand Test Name / # Initial Cleanup Flow
Saphir v3.20.08 - 05-2005 Y42973Cleanup.ks3
Y42973TOPtimeshift+55psi build-up #1Rate 0 Mscf/D
Rate change 40600 Mscf/DP@dt=0 3446.4 psia
Pi 4390.35 psiaSmoothing 0.1
Selected ModelModel Option Standard Model
Well Storage + SkinSkin Type ChangingReservoir HomogeneousBoundary Infinite
ResultsTMatch 1010 [hr]**-1PMatch 1.02E-7 [psi2/cp]**-1
C 0.05 bbl/psiSkin0 22.8
Delta P Skin0 677.982 psiTotal Skin 24
Delta P Skin 714.992 psidS/dQ 3E-5 [Mscf/D]-1
Pi 4390.35 psiak.h 4520 md.ft
k 165 mdRinv 316 ft
Test. Vol. 2.86733E+5 Barrels
-3 -2 -1 0
6.5E+8
7.5E+8
8.5E+8
9.5E+8
m(p
) [p
si2/
cp]
Superposition time

Origin Energy Resources Ltd ABN 66 007 845 338 Commercial-in-Confidence Greenfields Division Ref: W:\Complete Reports\BASS\Yolla\Yolla 4\Interpretive\Yolla 4 Interpretive Data WCR.docc
(B) Sand Production
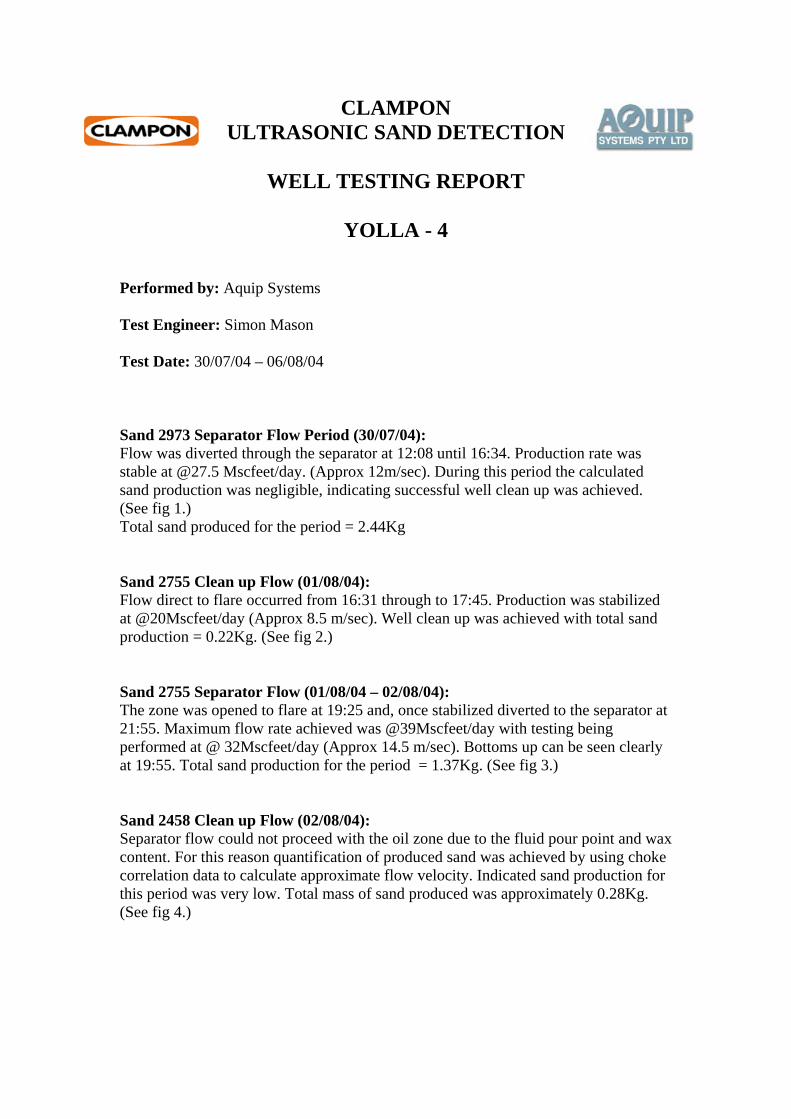
CLAMPON ULTRASONIC SAND DETECTION
WELL TESTING REPORT
YOLLA - 4
Performed by: Aquip Systems Test Engineer: Simon Mason Test Date: 30/07/04 – 06/08/04 Sand 2973 Separator Flow Period (30/07/04): Flow was diverted through the separator at 12:08 until 16:34. Production rate was stable at @27.5 Mscfeet/day. (Approx 12m/sec). During this period the calculated sand production was negligible, indicating successful well clean up was achieved. (See fig 1.) Total sand produced for the period = 2.44Kg Sand 2755 Clean up Flow (01/08/04): Flow direct to flare occurred from 16:31 through to 17:45. Production was stabilized at @20Mscfeet/day (Approx 8.5 m/sec). Well clean up was achieved with total sand production = 0.22Kg. (See fig 2.) Sand 2755 Separator Flow (01/08/04 – 02/08/04): The zone was opened to flare at 19:25 and, once stabilized diverted to the separator at 21:55. Maximum flow rate achieved was @39Mscfeet/day with testing being performed at @ 32Mscfeet/day (Approx 14.5 m/sec). Bottoms up can be seen clearly at 19:55. Total sand production for the period = 1.37Kg. (See fig 3.) Sand 2458 Clean up Flow (02/08/04): Separator flow could not proceed with the oil zone due to the fluid pour point and wax content. For this reason quantification of produced sand was achieved by using choke correlation data to calculate approximate flow velocity. Indicated sand production for this period was very low. Total mass of sand produced was approximately 0.28Kg. (See fig 4.)

Sand 2809 Clean up Flow (06/08/04): Clean up flow commenced at 20:41. The maximum achieved flow rate was @35Mscfeet/day (Approx 16m/sec) with an increased level of water production in a slug regime, hence the increased sensor raw values. The data shows initial high levels of slugging with a declining trend. Sand production for this period totaled 3.14Kg. (See fig 5.) Sand 2809 Separator Flow (07/08/04): Following the clean up flow this zone was not shut in prior to diverting flow to the separator at 01:20. The decreasing trend in sensor raw value continued through the period with very little sand being produced. The well was shut in at 04:24. Total sand mass detected was 0.16Kg
Tel: 08 9472 0122 Fax: 08 9472 5122
4/5 Brodie Hall Drive Bentley WA 6102
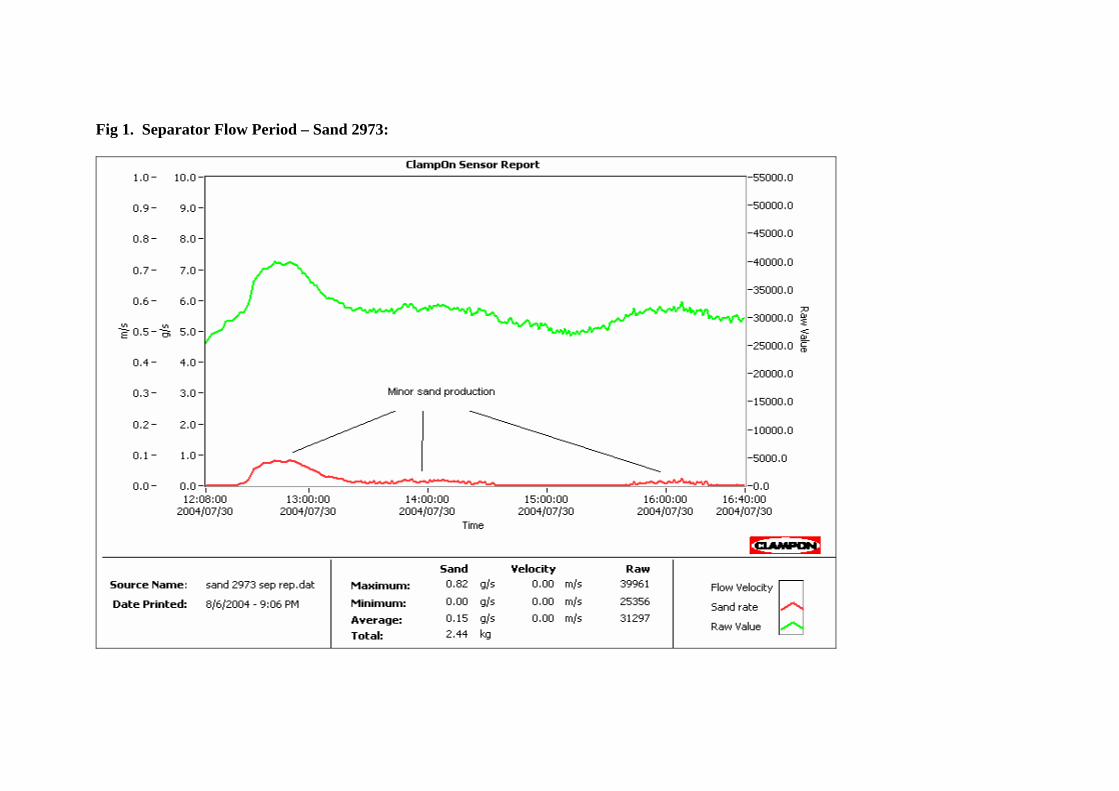
Fig 1. Separator Flow Period – Sand 2973:
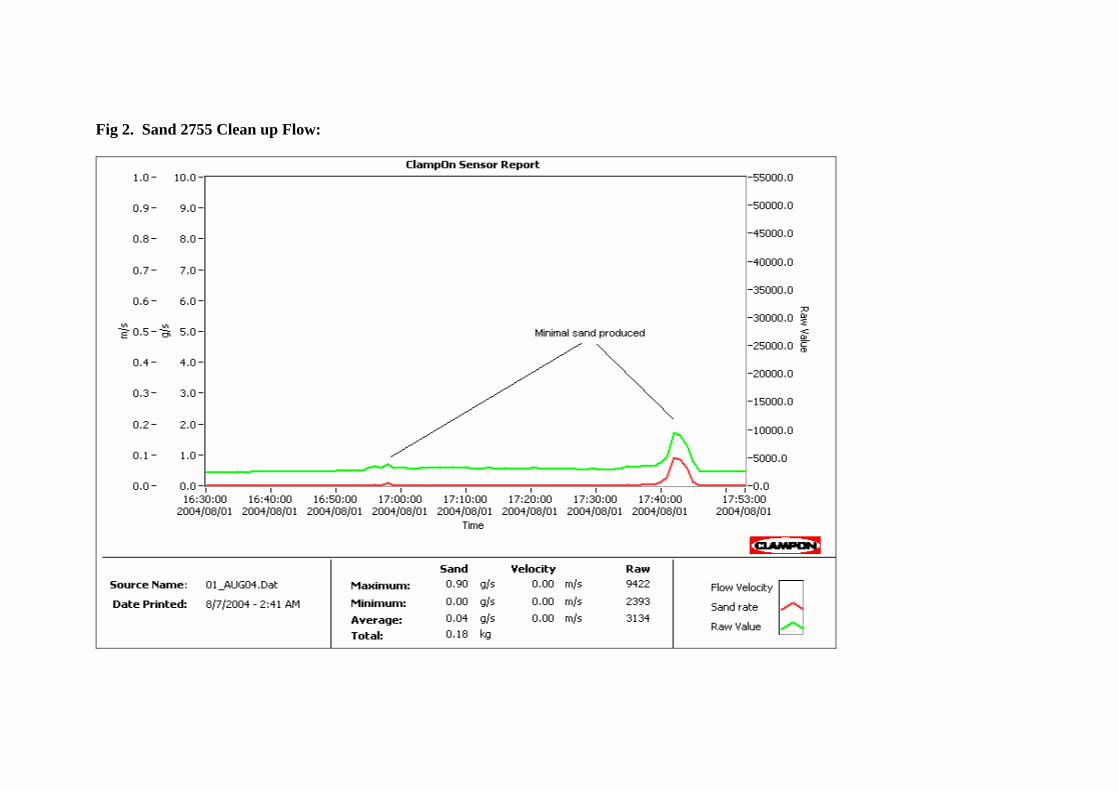
Fig 2. Sand 2755 Clean up Flow:
Fig 3. Sand 2755 Separator Flow:
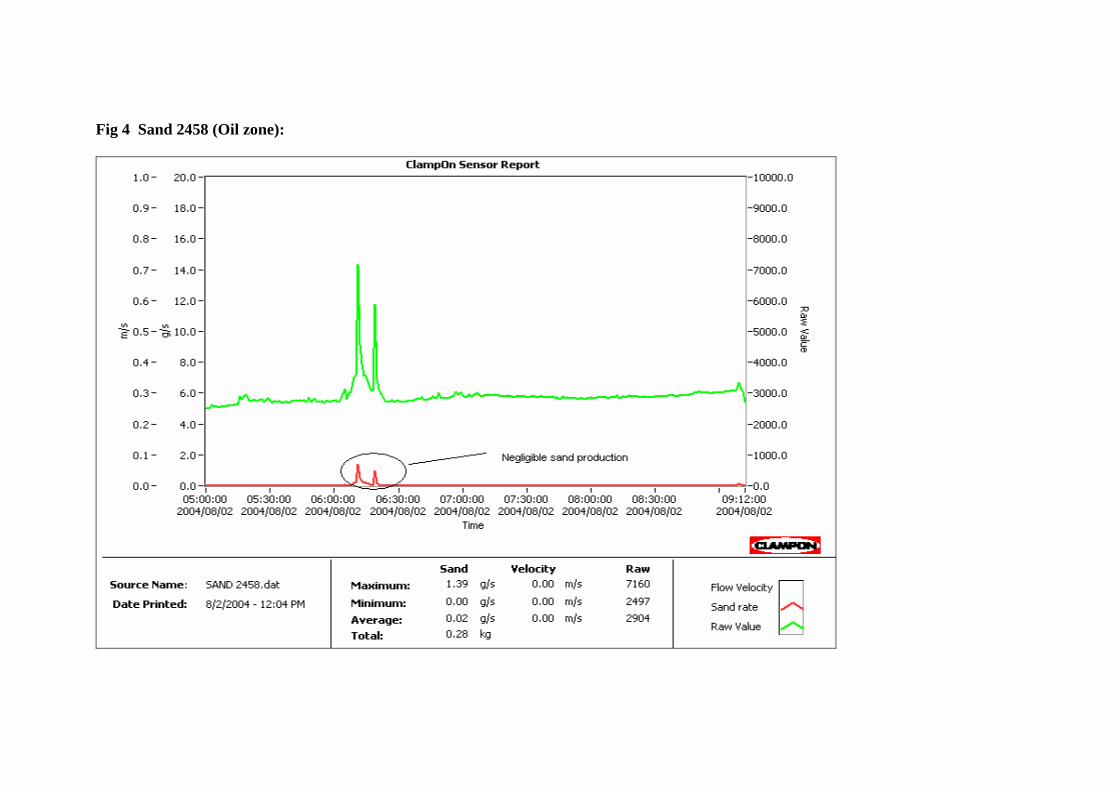
Fig 4 Sand 2458 (Oil zone):
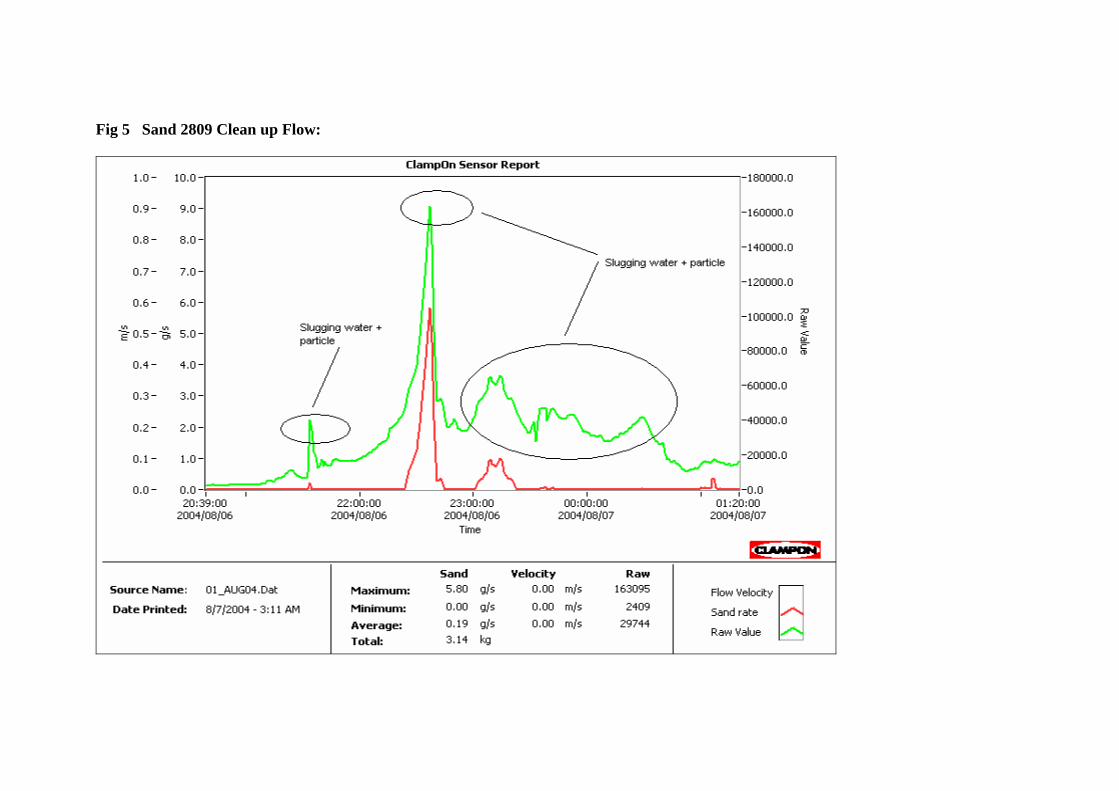
Fig 5 Sand 2809 Clean up Flow:
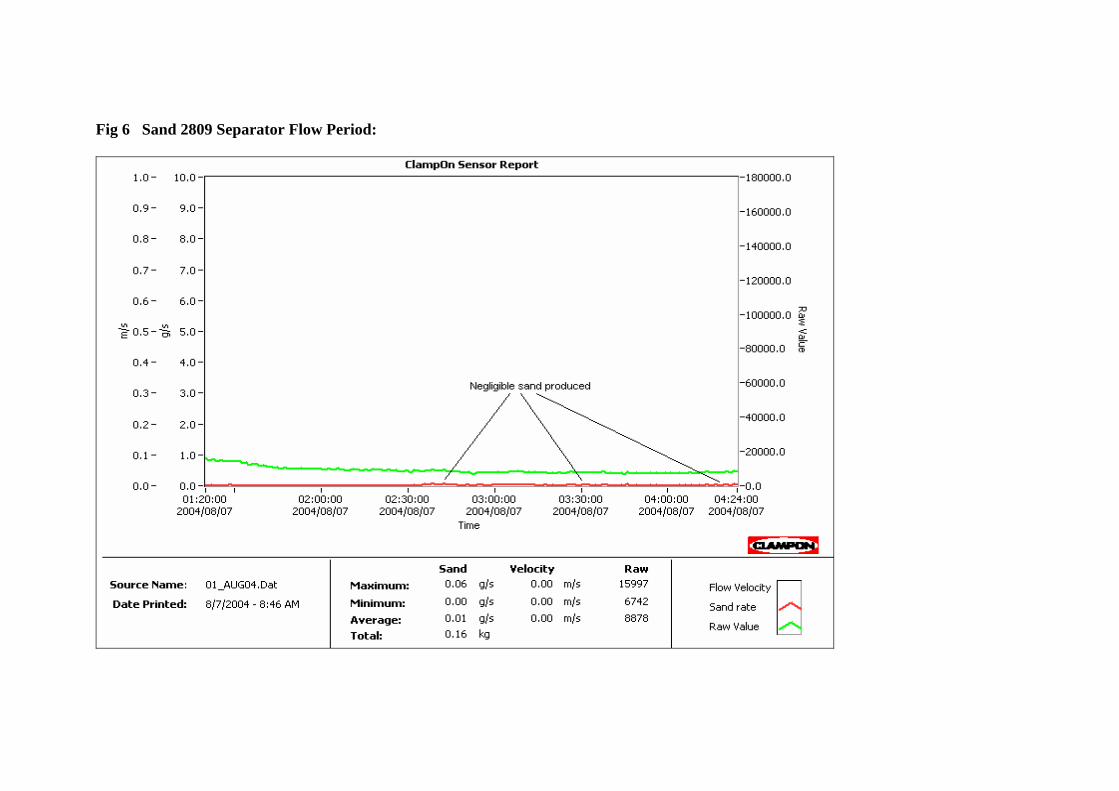
Fig 6 Sand 2809 Separator Flow Period:

Origin Energy Resources Ltd ABN 66 007 845 338 Commercial-in-Confidence Greenfields Division Ref: W:\Complete Reports\BASS\Yolla\Yolla 4\Interpretive\Yolla4InterpretativeDataWCR with appendix headers.docc
AAPPPPEENNDDIIXX 44:: GGEEOOCCHHEEMMIISSTTRRYY RREEPPOORRTT
HYDROCARBONCHARACTERISATION
STUDY
YOLLA-4
Prepared by:Christine West
Prepared for:Origin Energy December 2004
PPPRRROOOFFFEEESSSSSSIIIOOONNNAAALLL OOOPPPIIINNNIIIOOONNN
Page 2 of 13
GR3443A_Yolla-4.doc
GEOTECHNICAL SERVICES PTY LTD
EXECUTIVE SUMMARY
Oil
The Yolla-4 oil sample from 2609.5m depth is characterised as mature and is believed to be
sourced from highly terrestrial (most likely coaly) organic matter deposited under oxic
conditions.
Sediment
TOC/Rock-Eval pyrolysis data characterise the sediment from 2894.0m as very mature and
as having excellent potential to generate liquid hydrocarbons. The hydrocarbons extracted
from this sediment are believed to be sourced from highly terrestrial organic matter deposited
in an oxic depositional environment. The overall maturity assessment is marginal to
moderate, with the branched/cyclic data suggesting moderate maturity, and the aromatic data
suggesting marginal to moderate maturity.
Correlation
Overall, it is believed that a genetic relationship between the sediment extract and the oil
exists, ie that the source rock of the facies analysed is the likely source of the oil.

Page 3 of 13
GR3443A_Yolla-4.doc
GEOTECHNICAL SERVICES PTY LTD
HYDROCARBON CHARACTERISATION STUDY
YOLLA-4
TABLE OF CONTENTS
Page Number
1 INTRODUCTION 4
2 ANALYTICAL PROCEDURES 5
2.1 OIL SAMPLE 5
2.2 SEDIMENT SAMPLE 5
2.3 GAS SAMPLE 5
3 RESULTS AND INTERPRETATION 6
3.1 OIL SAMPLE 6
3.2 SEDIMENT SAMPLE 8
3.3 CORRELATION OF OIL AND SEDIMENT EXTRACT 9
4 CONCLUSION 10
5 REFERENCES 11
APPENDIX A: DATA AND TABLES
APPENDIX B: THEORY AND METHODS
Page 4 of 13
GR3443A_Yolla-4.doc
GEOTECHNICAL SERVICES PTY LTD
1 INTRODUCTION
One core sample (2894m) and one oil sample (2609.5m) from Yolla-4, drilled by Origin
Energy, were submitted for geochemical analyses.
The purpose of this report is to characterise the hydrocarbons in terms of source, maturity
and depositional environment, and to correlate the oil and sediment extract.
One hardcopy and one electronic copy of this report have been sent to Deidre Brooks at
Origin Energy. Any queries related to it may be directed to Christine West or Dr Birgitta
Hartung-Kagi at Geotechnical Services Pty Ltd.
All data and information are proprietary to Origin Energy and regarded as highly confidential
by all Geotech personnel.
Geotechnical Services has endeavoured to use techniques and equipment to achieve results
and information as accurately as it possibly can. However, such equipment and techniques
are not necessarily perfect. Therefore, Geotechnical Services shall not be held responsible or
liable for the results of any actions taken on the basis of the information contained in this
document. Moreover, this report should not be the sole reference when considering issues
that may have commercial implications.
Page 5 of 13
GR3443A_Yolla-4.doc
GEOTECHNICAL SERVICES PTY LTD
2 ANALYTICAL PROCEDURES
2.1 OIL SAMPLE
An oil sample labelled 2609.5m ex MPSR-1695 was submitted for geochemical analyses,
starting with whole oil GC-MS and followed by liquid chromatographic separation. The
saturate and aromatic fractions obtained were submitted for GC-MS analysis. The saturate
fraction was subsequently treated with ZSM5 sieves in order to remove the n-alkanes, and
the branched/cyclic fraction remaining was analysed by GC-MS.
A sub-sample of the oil was also submitted for CSIA (compound specific isotope analysis).
These data are included but not interpreted in this report.
2.2 SEDIMENT SAMPLE
A sediment from 2894m was submitted for source rock assessment, ie TOC and Rock-Eval
pyrolysis. The sample was solvent extracted and the extracted sediment was submitted for
pyrolysis-GC.
The extract obtained from the sediment was analysed by GC-MS and was then submitted for
liquid chromatographic separation in order to separate the saturate, aromatic and NSO
fractions. The saturate and aromatic fractions obtained were submitted for GC-MS analysis.
The saturate fraction was subsequently treated with ZSM5 sieves in order to remove the n-
alkanes, and the branched/cyclic fraction remaining was analysed by GC-MS.
2.3 GAS SAMPLE
A gas sample labelled 3005.7m ex MPSR-0066 was submitted for CSIA analysis. These data
are given, but not interpreted, in this report.
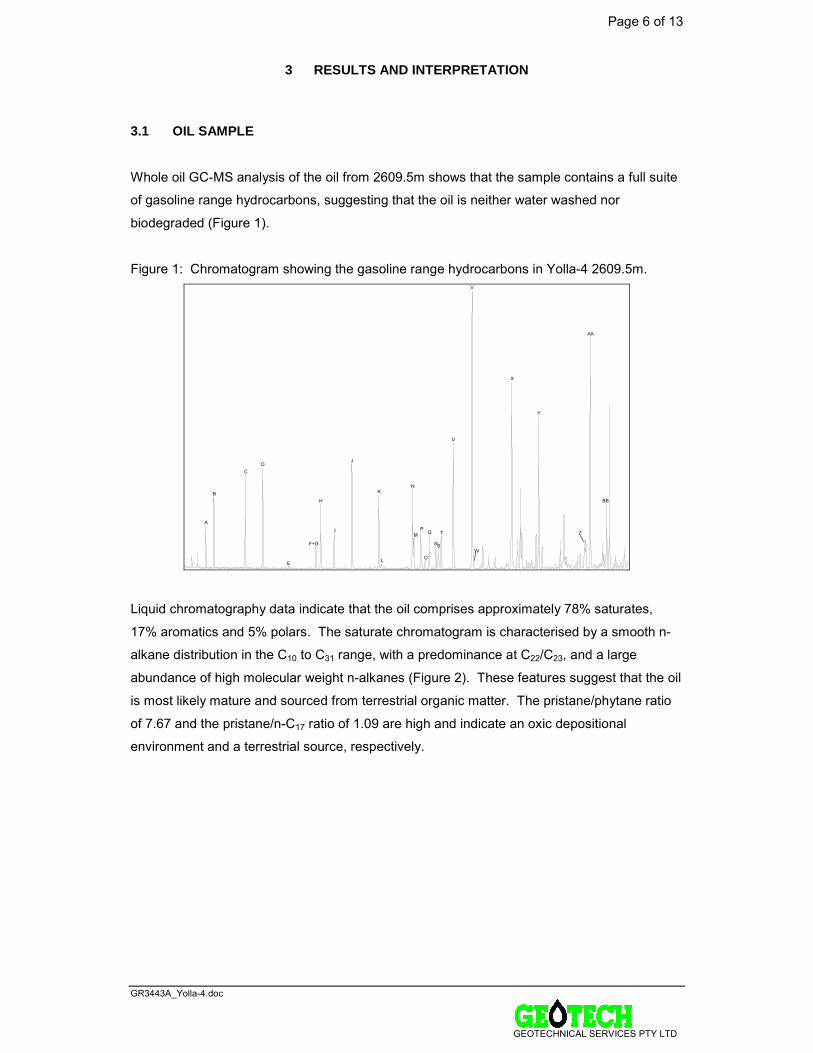
Page 6 of 13
GR3443A_Yolla-4.doc
GEOTECHNICAL SERVICES PTY LTD
3 RESULTS AND INTERPRETATION
3.1 OIL SAMPLE
Whole oil GC-MS analysis of the oil from 2609.5m shows that the sample contains a full suite
of gasoline range hydrocarbons, suggesting that the oil is neither water washed nor
biodegraded (Figure 1).
Figure 1: Chromatogram showing the gasoline range hydrocarbons in Yolla-4 2609.5m.
H
I
J
K
L
N
P Q T
U
V
X
Y
Z
AA
BB
C
B
A
D
OE
F+G RS
M
W
Liquid chromatography data indicate that the oil comprises approximately 78% saturates,
17% aromatics and 5% polars. The saturate chromatogram is characterised by a smooth n-
alkane distribution in the C10 to C31 range, with a predominance at C22/C23, and a large
abundance of high molecular weight n-alkanes (Figure 2). These features suggest that the oil
is most likely mature and sourced from terrestrial organic matter. The pristane/phytane ratio
of 7.67 and the pristane/n-C17 ratio of 1.09 are high and indicate an oxic depositional
environment and a terrestrial source, respectively.
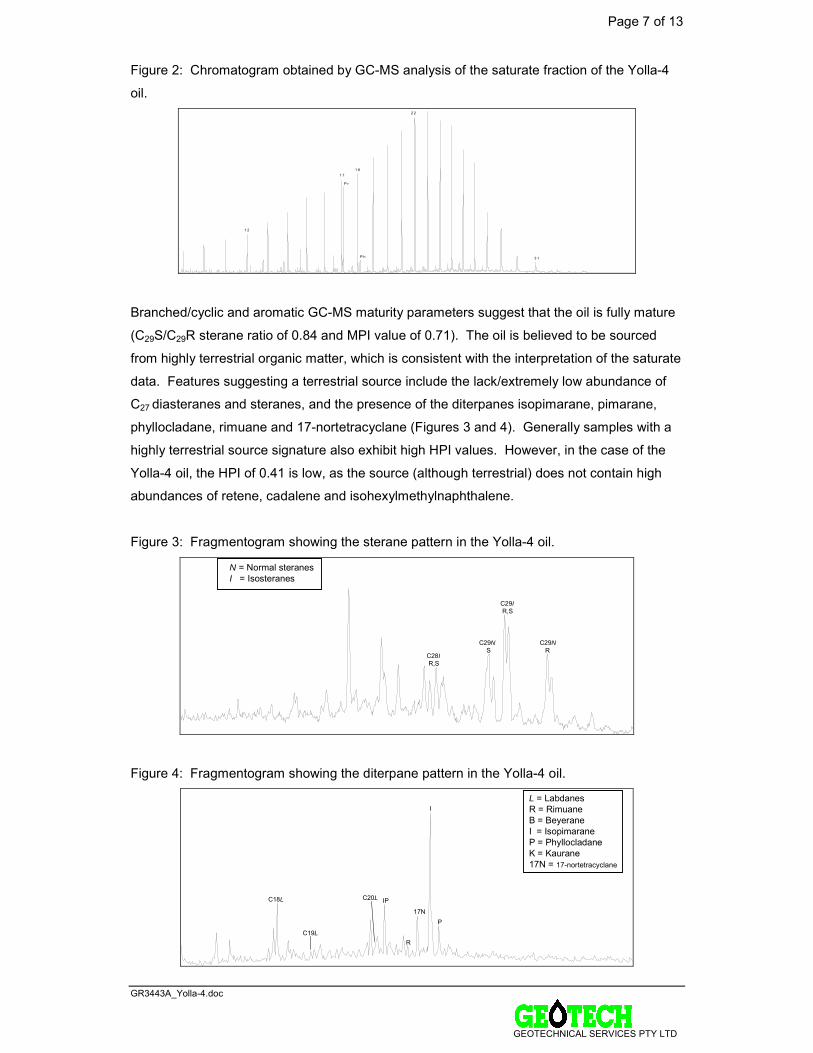
Page 7 of 13
GR3443A_Yolla-4.doc
GEOTECHNICAL SERVICES PTY LTD
Figure 2: Chromatogram obtained by GC-MS analysis of the saturate fraction of the Yolla-4
oil.
1 2
1 7
2 2
1 8
3 1
P r
P h
Branched/cyclic and aromatic GC-MS maturity parameters suggest that the oil is fully mature
(C29S/C29R sterane ratio of 0.84 and MPI value of 0.71). The oil is believed to be sourced
from highly terrestrial organic matter, which is consistent with the interpretation of the saturate
data. Features suggesting a terrestrial source include the lack/extremely low abundance of
C27 diasteranes and steranes, and the presence of the diterpanes isopimarane, pimarane,
phyllocladane, rimuane and 17-nortetracyclane (Figures 3 and 4). Generally samples with a
highly terrestrial source signature also exhibit high HPI values. However, in the case of the
Yolla-4 oil, the HPI of 0.41 is low, as the source (although terrestrial) does not contain high
abundances of retene, cadalene and isohexylmethylnaphthalene.
Figure 3: Fragmentogram showing the sterane pattern in the Yolla-4 oil.
N = Normal steranesI = Isosteranes
C28I R,S
C29N S
C29I R,S
C29N R
Figure 4: Fragmentogram showing the diterpane pattern in the Yolla-4 oil.
L = LabdanesR = RimuaneB = BeyeraneI = IsopimaraneP = PhyllocladaneK = Kaurane17N = 17-nortetracyclane
C19L
C18L C20L IP
R
17N
I
P
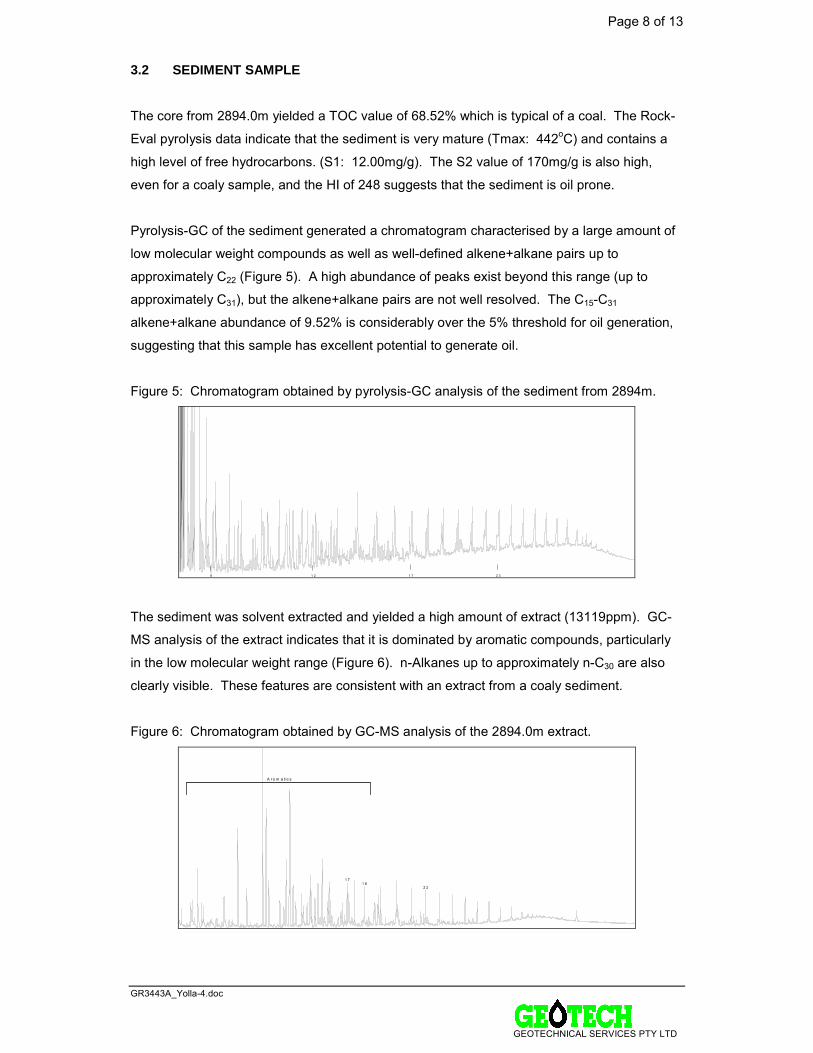
Page 8 of 13
GR3443A_Yolla-4.doc
GEOTECHNICAL SERVICES PTY LTD
3.2 SEDIMENT SAMPLE
The core from 2894.0m yielded a TOC value of 68.52% which is typical of a coal. The Rock-
Eval pyrolysis data indicate that the sediment is very mature (Tmax: 442oC) and contains a
high level of free hydrocarbons. (S1: 12.00mg/g). The S2 value of 170mg/g is also high,
even for a coaly sample, and the HI of 248 suggests that the sediment is oil prone.
Pyrolysis-GC of the sediment generated a chromatogram characterised by a large amount of
low molecular weight compounds as well as well-defined alkene+alkane pairs up to
approximately C22 (Figure 5). A high abundance of peaks exist beyond this range (up to
approximately C31), but the alkene+alkane pairs are not well resolved. The C15-C31
alkene+alkane abundance of 9.52% is considerably over the 5% threshold for oil generation,
suggesting that this sample has excellent potential to generate oil.
Figure 5: Chromatogram obtained by pyrolysis-GC analysis of the sediment from 2894m.
1 28 1 7 2 3
The sediment was solvent extracted and yielded a high amount of extract (13119ppm). GC-
MS analysis of the extract indicates that it is dominated by aromatic compounds, particularly
in the low molecular weight range (Figure 6). n-Alkanes up to approximately n-C30 are also
clearly visible. These features are consistent with an extract from a coaly sediment.
Figure 6: Chromatogram obtained by GC-MS analysis of the 2894.0m extract.
2 2
1 71 8
A r o m a t ic s
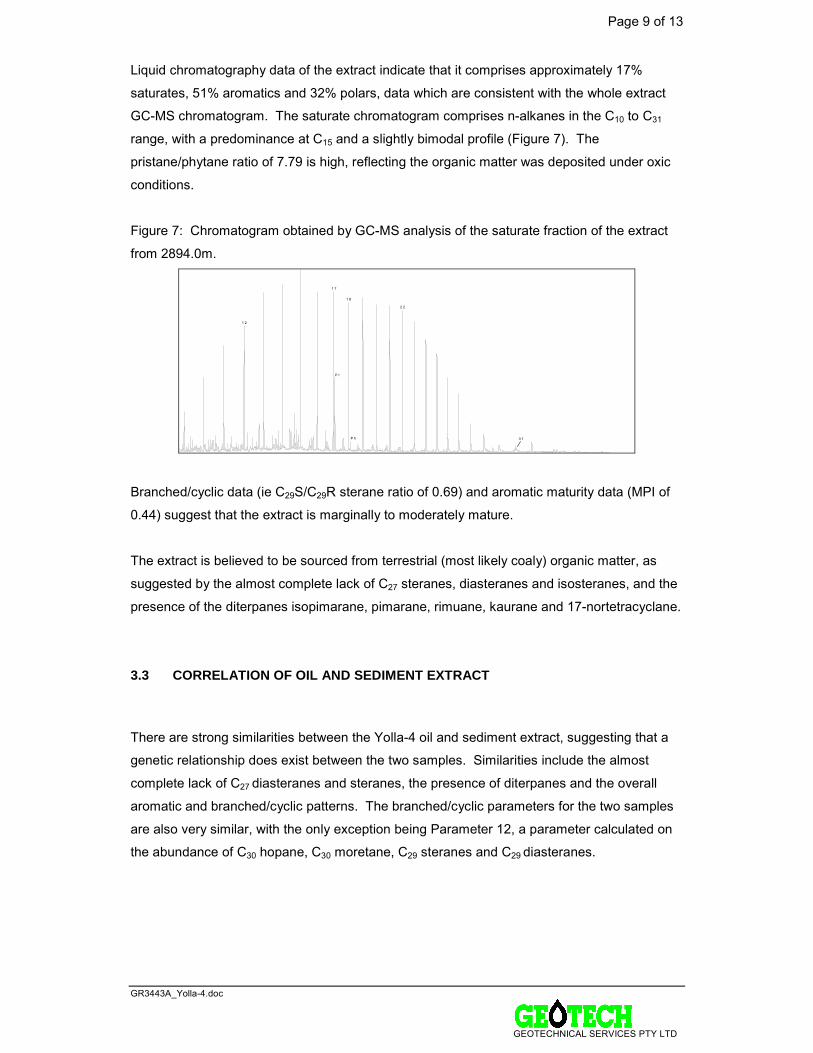
Page 9 of 13
GR3443A_Yolla-4.doc
GEOTECHNICAL SERVICES PTY LTD
Liquid chromatography data of the extract indicate that it comprises approximately 17%
saturates, 51% aromatics and 32% polars, data which are consistent with the whole extract
GC-MS chromatogram. The saturate chromatogram comprises n-alkanes in the C10 to C31
range, with a predominance at C15 and a slightly bimodal profile (Figure 7). The
pristane/phytane ratio of 7.79 is high, reflecting the organic matter was deposited under oxic
conditions.
Figure 7: Chromatogram obtained by GC-MS analysis of the saturate fraction of the extract
from 2894.0m.
1 2
1 7
2 2
1 8
3 1
P r
P h
Branched/cyclic data (ie C29S/C29R sterane ratio of 0.69) and aromatic maturity data (MPI of
0.44) suggest that the extract is marginally to moderately mature.
The extract is believed to be sourced from terrestrial (most likely coaly) organic matter, as
suggested by the almost complete lack of C27 steranes, diasteranes and isosteranes, and the
presence of the diterpanes isopimarane, pimarane, rimuane, kaurane and 17-nortetracyclane.
3.3 CORRELATION OF OIL AND SEDIMENT EXTRACT
There are strong similarities between the Yolla-4 oil and sediment extract, suggesting that a
genetic relationship does exist between the two samples. Similarities include the almost
complete lack of C27 diasteranes and steranes, the presence of diterpanes and the overall
aromatic and branched/cyclic patterns. The branched/cyclic parameters for the two samples
are also very similar, with the only exception being Parameter 12, a parameter calculated on
the abundance of C30 hopane, C30 moretane, C29 steranes and C29 diasteranes.
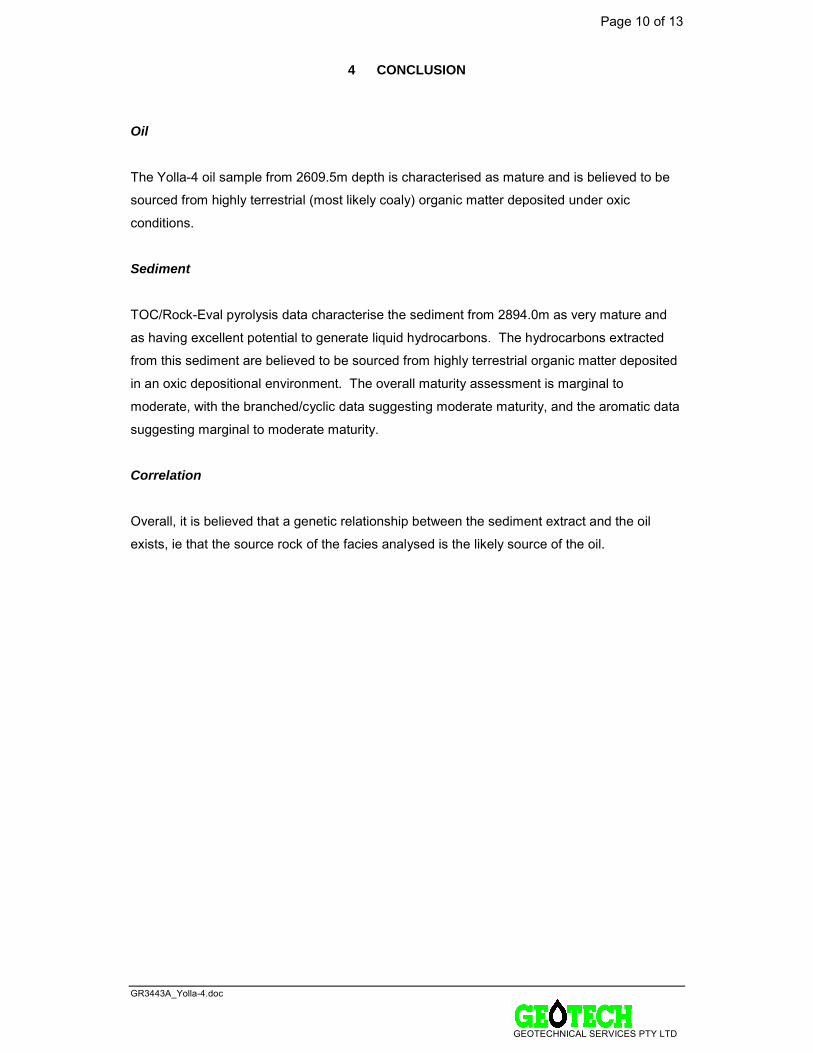
Page 10 of 13
GR3443A_Yolla-4.doc
GEOTECHNICAL SERVICES PTY LTD
4 CONCLUSION
Oil
The Yolla-4 oil sample from 2609.5m depth is characterised as mature and is believed to be
sourced from highly terrestrial (most likely coaly) organic matter deposited under oxic
conditions.
Sediment
TOC/Rock-Eval pyrolysis data characterise the sediment from 2894.0m as very mature and
as having excellent potential to generate liquid hydrocarbons. The hydrocarbons extracted
from this sediment are believed to be sourced from highly terrestrial organic matter deposited
in an oxic depositional environment. The overall maturity assessment is marginal to
moderate, with the branched/cyclic data suggesting moderate maturity, and the aromatic data
suggesting marginal to moderate maturity.
Correlation
Overall, it is believed that a genetic relationship between the sediment extract and the oil
exists, ie that the source rock of the facies analysed is the likely source of the oil.
Page 11 of 13
GR3443A_Yolla-4.doc
GEOTECHNICAL SERVICES PTY LTD
5 REFERENCES
van Aarssen, B.G.K., Alexander, R. and Kagi, R.I. (2000) Reconstructing the geological
history of Australian crude oils using aromatic hydrocarbons. The APPEA Journal, 283-292.
Alexander, R., Kagi, R.I., Rowland, S.J., Sheppard, P.N. and Chirila, T.V. (1985) The effects
of thermal maturity on distributions of dimethylnaphthalenes and trimethylnaphthalenes in
some Ancient sediments and petroleums. Geochimica et Cosmochimica Acta 49, 385-395.
Huang, W.-Y. and Meinschein, W.G. (1979) Sterols as ecological indicators. Geochimica et
Cosmochimica Acta 43, 739-745.
Hunt, J.M. (1979) Petroleum Geochemistry and Geology. San Francisco: W.H. Freeman.
Peters, K.E. and Moldowan, J.M., 1993 –The Biomarker Guide - Interpreting molecular fossils
in petroleum and ancient sediments. Prentice Hall, Englewood Cliffs, New Jersey 07632.
Radke, M. and Welte, D.H., 1983 – The methylphenanthrene index (MPI). A maturity
parameter based on aromatic hydrocarbons. Advances in Org. Geochem., 1981. J. Wiley and
Sons, New York, 504-512.
Thompson, K.F.M., 1983 – Classification and thermal history of petroleum based on light
hydrocarbons. Geochim. Cosmochim. Acta. 47, 303-316.
Tissot, B.P. and Welte, D.H., 1984 – Petroleum formation and Occurrence. Springer-Verlag,
Berlin.
van Aarssen, B.G.K., Bastow, T.P., Alexander, R and Kagi, R.I., 1999 – Distributions of
methylated naphthalenes in crude oils: indicators of maturity, biodegradation and mixing. Org.
Geochem. 30, 1213-1227.
Volkman, J.K., Alexander, R., Kagi, R.I., Rowland, S.J. and Sheppard, P.N., 1984 –
Biodegradation of aromatic hydrocarbons in crude oils from the Barrow Sub-basin of Western
Australia. Org. Geochem. 6, 619-632.

GR3443A_Yolla-4.doc
GEOTECHNICAL SERVICES PTY LTD
APPENDIX A
DATA AND TABLES
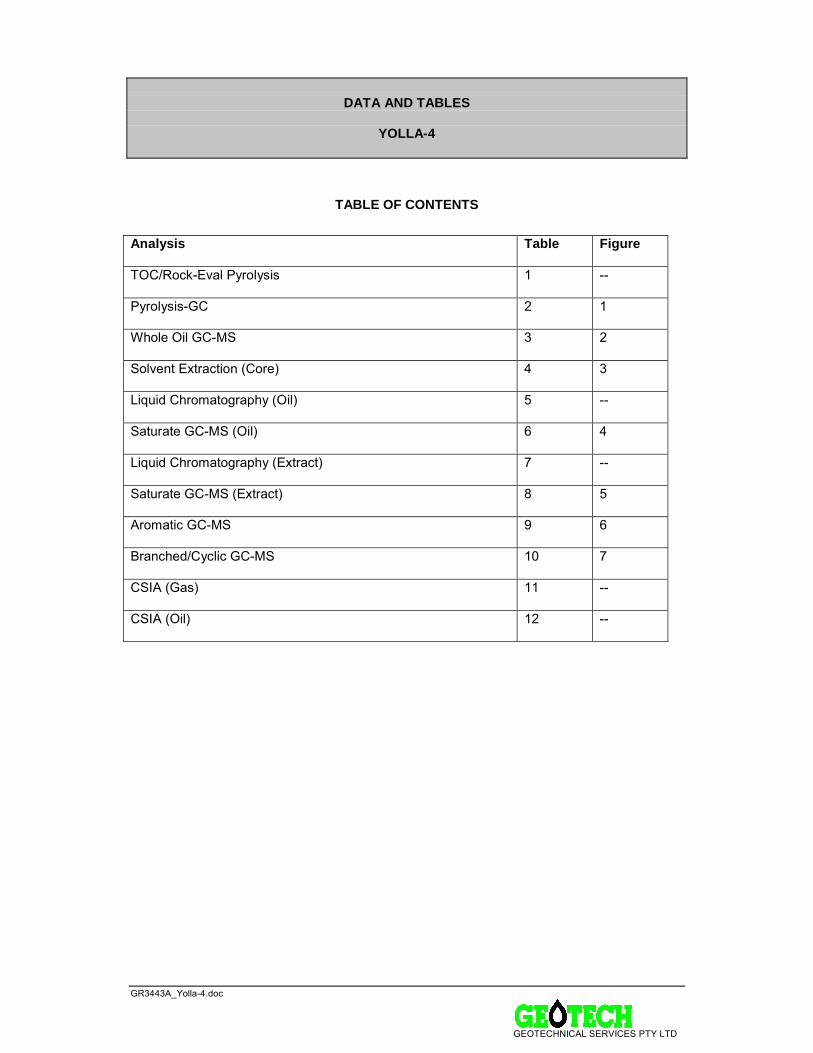
GR3443A_Yolla-4.doc
GEOTECHNICAL SERVICES PTY LTD
DATA AND TABLES
YOLLA-4
TABLE OF CONTENTS
Analysis Table Figure
TOC/Rock-Eval Pyrolysis 1 --
Pyrolysis-GC 2 1
Whole Oil GC-MS 3 2
Solvent Extraction (Core) 4 3
Liquid Chromatography (Oil) 5 --
Saturate GC-MS (Oil) 6 4
Liquid Chromatography (Extract) 7 --
Saturate GC-MS (Extract) 8 5
Aromatic GC-MS 9 6
Branched/Cyclic GC-MS 10 7
CSIA (Gas) 11 --
CSIA (Oil) 12 --

TABLE 1
ANALYSIS OF ORGANIC MATTER BY ROCK-EVAL PYROLYSIS
YOLLA-4
Depth (m) Tmax S1 S2 S3 S1+S2 S2/S3 PI TOC HI OI2894.0 Core 442 12.00 170.20 21.60 182.20 7.88 0.07 68.52 248 32
A TMAX value is not reported if the S2 is <0.2mg/g
TMAX = Max. temperature S2 (oC) S1 = Volatile hydrocarbons (HC) (mg/g rock) S2 = HC generating potential (mg/g rock)
S1+S2 = Potential yield (mg/g rock) S3 = Organic carbon dioxide (mg/g rock) PI = Production index
OI = Oxygen Index TOC = Total organic carbon (wt % of rock) HI = Hydrogen index
nd = no data GEOTECHNICAL SERVICES PTY LTD
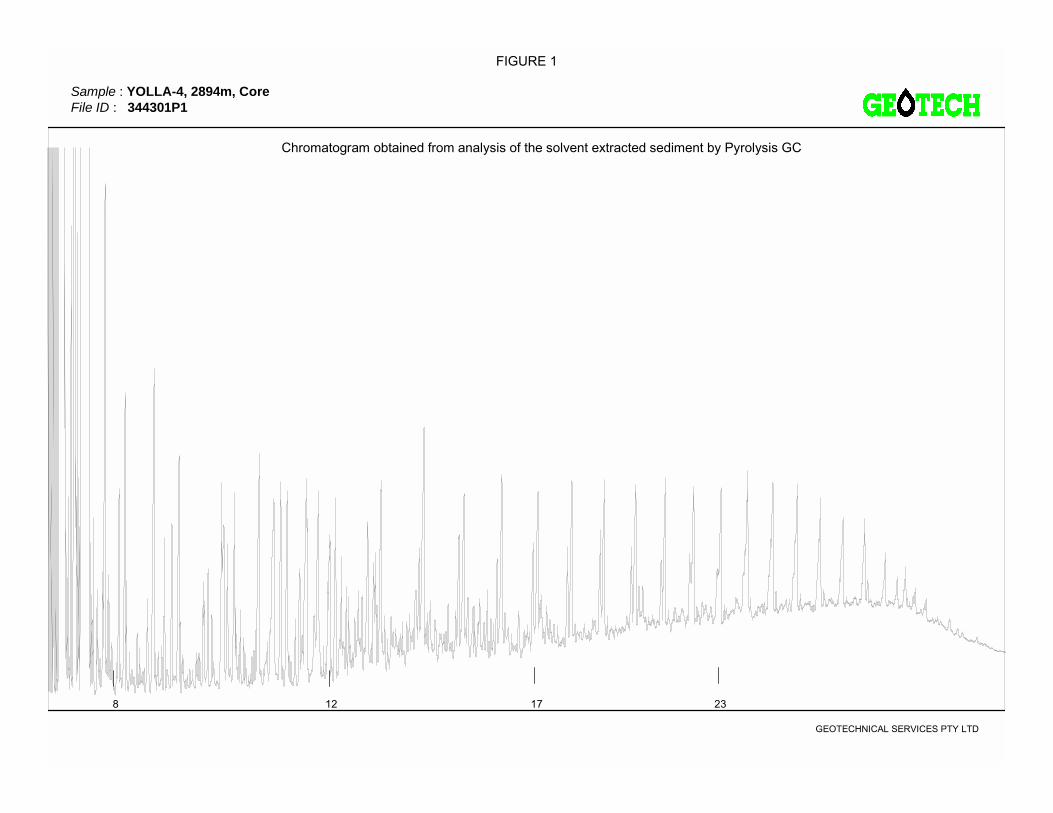
FIGURE 1
GEOTECHNICAL SERVICES PTY LTD
Chromatogram obtained from analysis of the solvent extracted sediment by Pyrolysis GC
Sample : YOLLA-4, 2894m, CoreFile ID : 344301P1
128 17 23
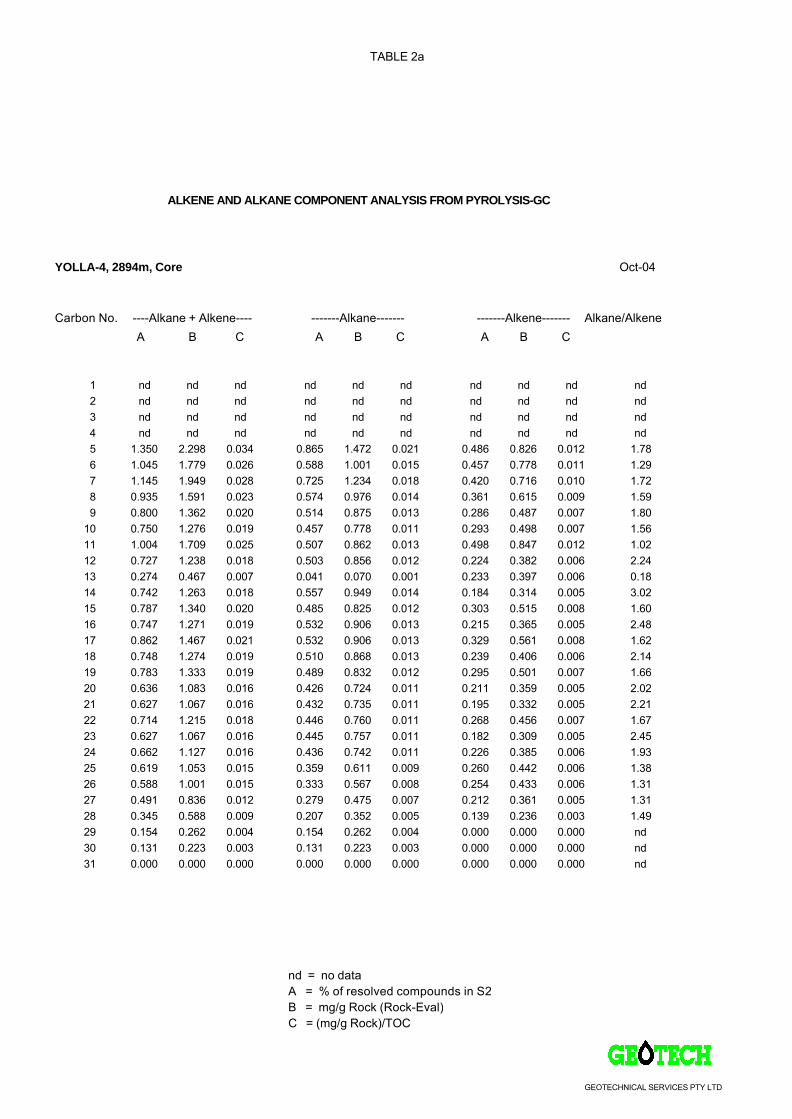
TABLE 2a
ALKENE AND ALKANE COMPONENT ANALYSIS FROM PYROLYSIS-GC
YOLLA-4, 2894m, Core Oct-04
Carbon No. ----Alkane + Alkene---- -------Alkane------- -------Alkene------- Alkane/AlkeneA B C A B C A B C
1 nd nd nd nd nd nd nd nd nd nd2 nd nd nd nd nd nd nd nd nd nd3 nd nd nd nd nd nd nd nd nd nd4 nd nd nd nd nd nd nd nd nd nd5 1.350 2.298 0.034 0.865 1.472 0.021 0.486 0.826 0.012 1.786 1.045 1.779 0.026 0.588 1.001 0.015 0.457 0.778 0.011 1.297 1.145 1.949 0.028 0.725 1.234 0.018 0.420 0.716 0.010 1.728 0.935 1.591 0.023 0.574 0.976 0.014 0.361 0.615 0.009 1.599 0.800 1.362 0.020 0.514 0.875 0.013 0.286 0.487 0.007 1.80
10 0.750 1.276 0.019 0.457 0.778 0.011 0.293 0.498 0.007 1.5611 1.004 1.709 0.025 0.507 0.862 0.013 0.498 0.847 0.012 1.0212 0.727 1.238 0.018 0.503 0.856 0.012 0.224 0.382 0.006 2.2413 0.274 0.467 0.007 0.041 0.070 0.001 0.233 0.397 0.006 0.1814 0.742 1.263 0.018 0.557 0.949 0.014 0.184 0.314 0.005 3.0215 0.787 1.340 0.020 0.485 0.825 0.012 0.303 0.515 0.008 1.6016 0.747 1.271 0.019 0.532 0.906 0.013 0.215 0.365 0.005 2.4817 0.862 1.467 0.021 0.532 0.906 0.013 0.329 0.561 0.008 1.6218 0.748 1.274 0.019 0.510 0.868 0.013 0.239 0.406 0.006 2.1419 0.783 1.333 0.019 0.489 0.832 0.012 0.295 0.501 0.007 1.6620 0.636 1.083 0.016 0.426 0.724 0.011 0.211 0.359 0.005 2.0221 0.627 1.067 0.016 0.432 0.735 0.011 0.195 0.332 0.005 2.2122 0.714 1.215 0.018 0.446 0.760 0.011 0.268 0.456 0.007 1.6723 0.627 1.067 0.016 0.445 0.757 0.011 0.182 0.309 0.005 2.4524 0.662 1.127 0.016 0.436 0.742 0.011 0.226 0.385 0.006 1.9325 0.619 1.053 0.015 0.359 0.611 0.009 0.260 0.442 0.006 1.3826 0.588 1.001 0.015 0.333 0.567 0.008 0.254 0.433 0.006 1.3127 0.491 0.836 0.012 0.279 0.475 0.007 0.212 0.361 0.005 1.3128 0.345 0.588 0.009 0.207 0.352 0.005 0.139 0.236 0.003 1.4929 0.154 0.262 0.004 0.154 0.262 0.004 0.000 0.000 0.000 nd30 0.131 0.223 0.003 0.131 0.223 0.003 0.000 0.000 0.000 nd31 0.000 0.000 0.000 0.000 0.000 0.000 0.000 0.000 0.000 nd
nd = no dataA = % of resolved compounds in S2B = mg/g Rock (Rock-Eval)C = (mg/g Rock)/TOC
GEOTECHNICAL SERVICES PTY LTD
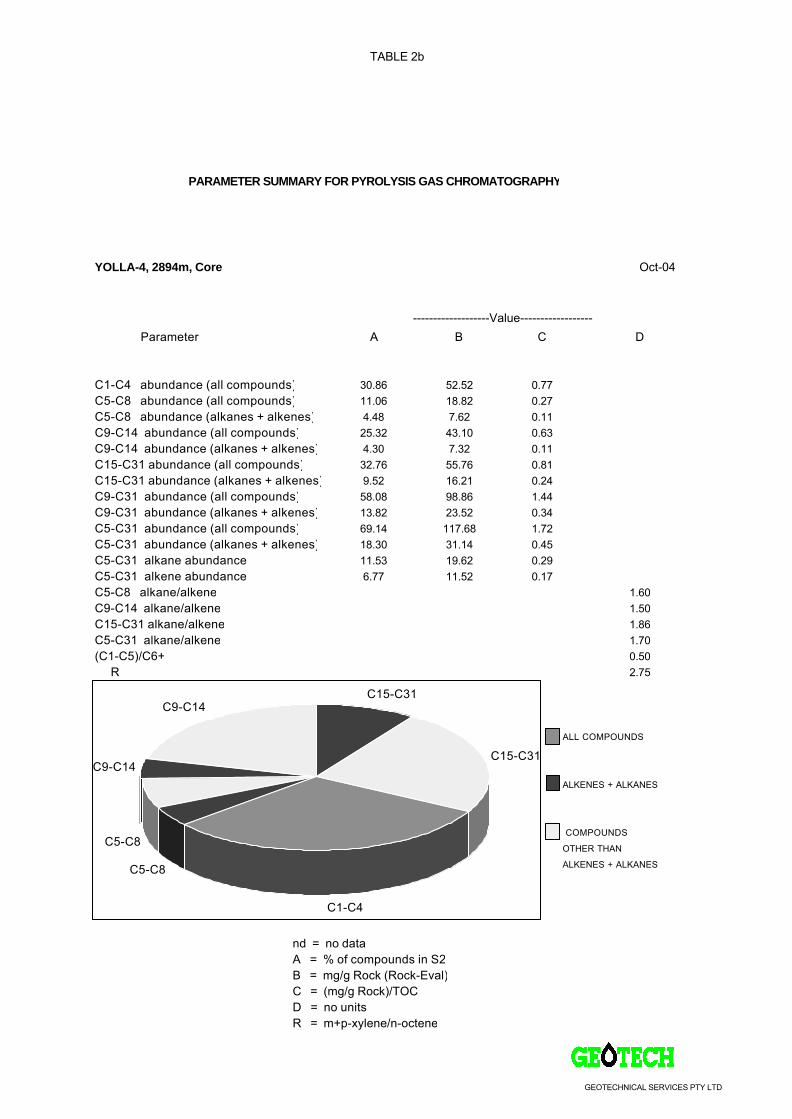
TABLE 2b
PARAMETER SUMMARY FOR PYROLYSIS GAS CHROMATOGRAPHY
YOLLA-4, 2894m, Core Oct-04
-------------------Value------------------Parameter A B C D
C1-C4 abundance (all compounds) 30.86 52.52 0.77C5-C8 abundance (all compounds) 11.06 18.82 0.27C5-C8 abundance (alkanes + alkenes) 4.48 7.62 0.11C9-C14 abundance (all compounds) 25.32 43.10 0.63C9-C14 abundance (alkanes + alkenes) 4.30 7.32 0.11C15-C31 abundance (all compounds) 32.76 55.76 0.81C15-C31 abundance (alkanes + alkenes) 9.52 16.21 0.24C9-C31 abundance (all compounds) 58.08 98.86 1.44C9-C31 abundance (alkanes + alkenes) 13.82 23.52 0.34C5-C31 abundance (all compounds) 69.14 117.68 1.72C5-C31 abundance (alkanes + alkenes) 18.30 31.14 0.45C5-C31 alkane abundance 11.53 19.62 0.29C5-C31 alkene abundance 6.77 11.52 0.17C5-C8 alkane/alkene 1.60C9-C14 alkane/alkene 1.50C15-C31 alkane/alkene 1.86C5-C31 alkane/alkene 1.70(C1-C5)/C6+ 0.50
R 2.75
ALL COMPOUNDS
ALKENES + ALKANES
COMPOUNDS
OTHER THAN
ALKENES + ALKANES
nd = no data A = % of compounds in S2 B = mg/g Rock (Rock-Eval) C = (mg/g Rock)/TOC D = no units R = m+p-xylene/n-octene
C15-C31
C15-C31
C1-C4
C5-C8
C5-C8
C9-C14
C9-C14
GEOTECHNICAL SERVICES PTY LTD
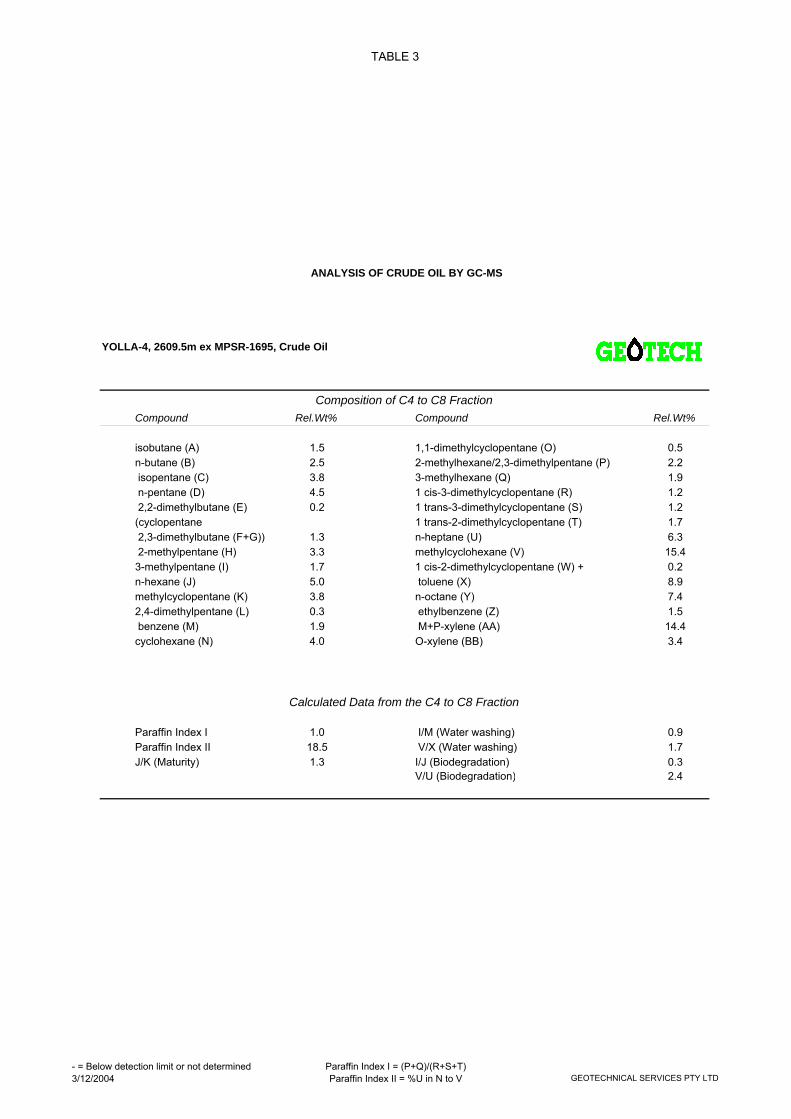
TABLE 3
YOLLA-4, 2609.5m ex MPSR-1695, Crude Oil
Compound Rel.Wt% Compound Rel.Wt%
isobutane (A) 1.5 1,1-dimethylcyclopentane (O) 0.5n-butane (B) 2.5 2-methylhexane/2,3-dimethylpentane (P) 2.2 isopentane (C) 3.8 3-methylhexane (Q) 1.9 n-pentane (D) 4.5 1 cis-3-dimethylcyclopentane (R) 1.2 2,2-dimethylbutane (E) 0.2 1 trans-3-dimethylcyclopentane (S) 1.2(cyclopentane 1 trans-2-dimethylcyclopentane (T) 1.7 2,3-dimethylbutane (F+G)) 1.3 n-heptane (U) 6.3 2-methylpentane (H) 3.3 methylcyclohexane (V) 15.43-methylpentane (I) 1.7 1 cis-2-dimethylcyclopentane (W) + 0.2n-hexane (J) 5.0 toluene (X) 8.9methylcyclopentane (K) 3.8 n-octane (Y) 7.42,4-dimethylpentane (L) 0.3 ethylbenzene (Z) 1.5 benzene (M) 1.9 M+P-xylene (AA) 14.4cyclohexane (N) 4.0 O-xylene (BB) 3.4
Paraffin Index I 1.0 I/M (Water washing) 0.9Paraffin Index II 18.5 V/X (Water washing) 1.7J/K (Maturity) 1.3 I/J (Biodegradation) 0.3
V/U (Biodegradation) 2.4
Composition of C4 to C8 Fraction
Calculated Data from the C4 to C8 Fraction
ANALYSIS OF CRUDE OIL BY GC-MS
- = Below detection limit or not determined 3/12/2004
Paraffin Index I = (P+Q)/(R+S+T)Paraffin Index II = %U in N to V GEOTECHNICAL SERVICES PTY LTD
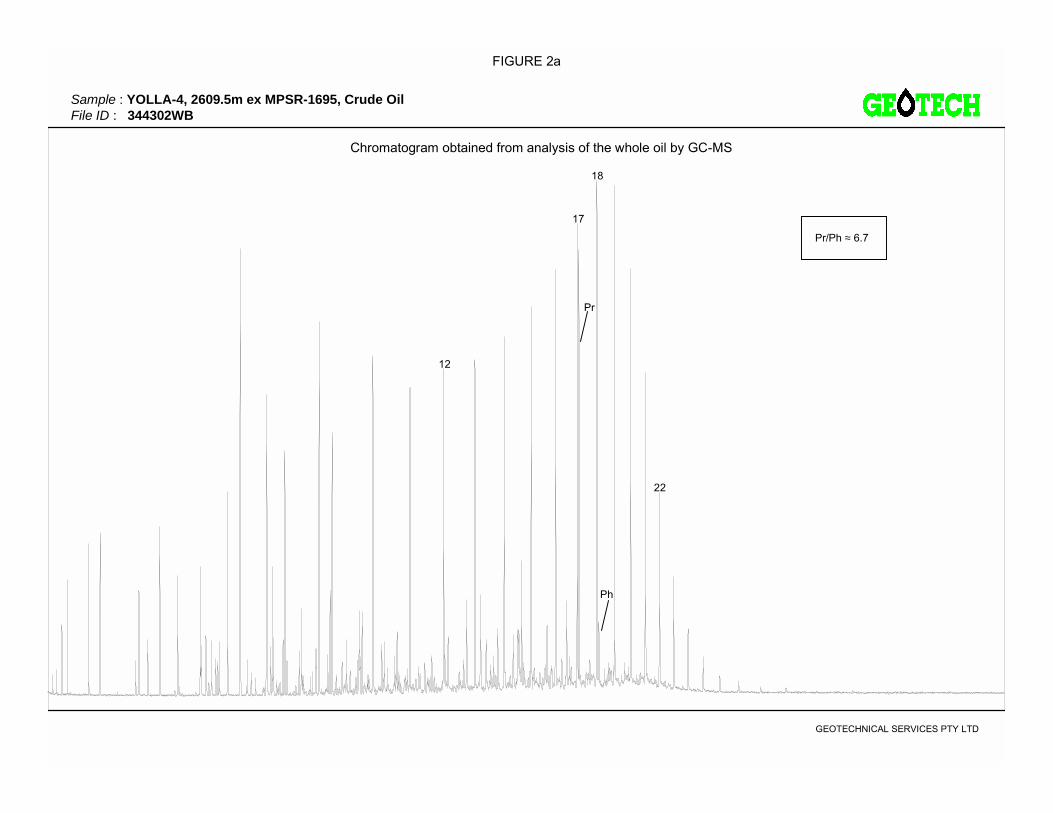
FIGURE 2a
GEOTECHNICAL SERVICES PTY LTD
Chromatogram obtained from analysis of the whole oil by GC-MS
Sample : YOLLA-4, 2609.5m ex MPSR-1695, Crude OilFile ID : 344302WB
Pr/Ph ≈ 6.7
12
Pr
17
18
Ph
22
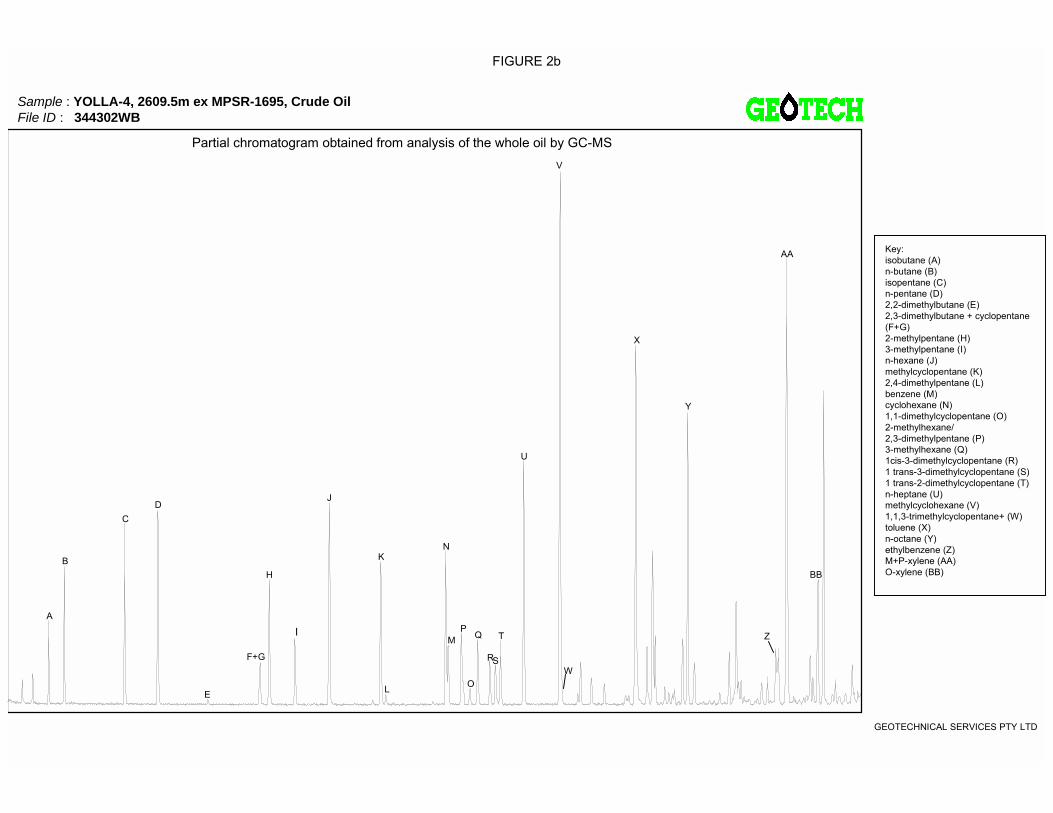
FIGURE 2b
GEOTECHNICAL SERVICES PTY LTD
Partial chromatogram obtained from analysis of the whole oil by GC-MS
H
I
J
K
L
N
PQ T
U
V
X
Y
Z
AA
BB
C
B
A
D
Sample : YOLLA-4, 2609.5m ex MPSR-1695, Crude OilFile ID : 344302WB
OE
F+G RS
Key:isobutane (A)n-butane (B)isopentane (C)n-pentane (D)2,2-dimethylbutane (E)2,3-dimethylbutane + cyclopentane(F+G)2-methylpentane (H)3-methylpentane (I)n-hexane (J)methylcyclopentane (K)2,4-dimethylpentane (L)benzene (M)cyclohexane (N)1,1-dimethylcyclopentane (O)2-methylhexane/2,3-dimethylpentane (P)3-methylhexane (Q)1cis-3-dimethylcyclopentane (R)1 trans-3-dimethylcyclopentane (S)1 trans-2-dimethylcyclopentane (T)n-heptane (U)methylcyclohexane (V)1,1,3-trimethylcyclopentane+ (W)toluene (X)n-octane (Y)ethylbenzene (Z)M+P-xylene (AA)O-xylene (BB)
M
W

TABLE 4
SOLVENT EXTRACTION DATA
YOLLA-4
Weight of Total Extract Total ExtractDEPTH Sample Type Material Extd. (g) (mg) (ppm)
2894.0m Core 5.1 67.3 13119
nd = no data3/12/2004 GEOTECHNICAL SERVICES PTY LTD
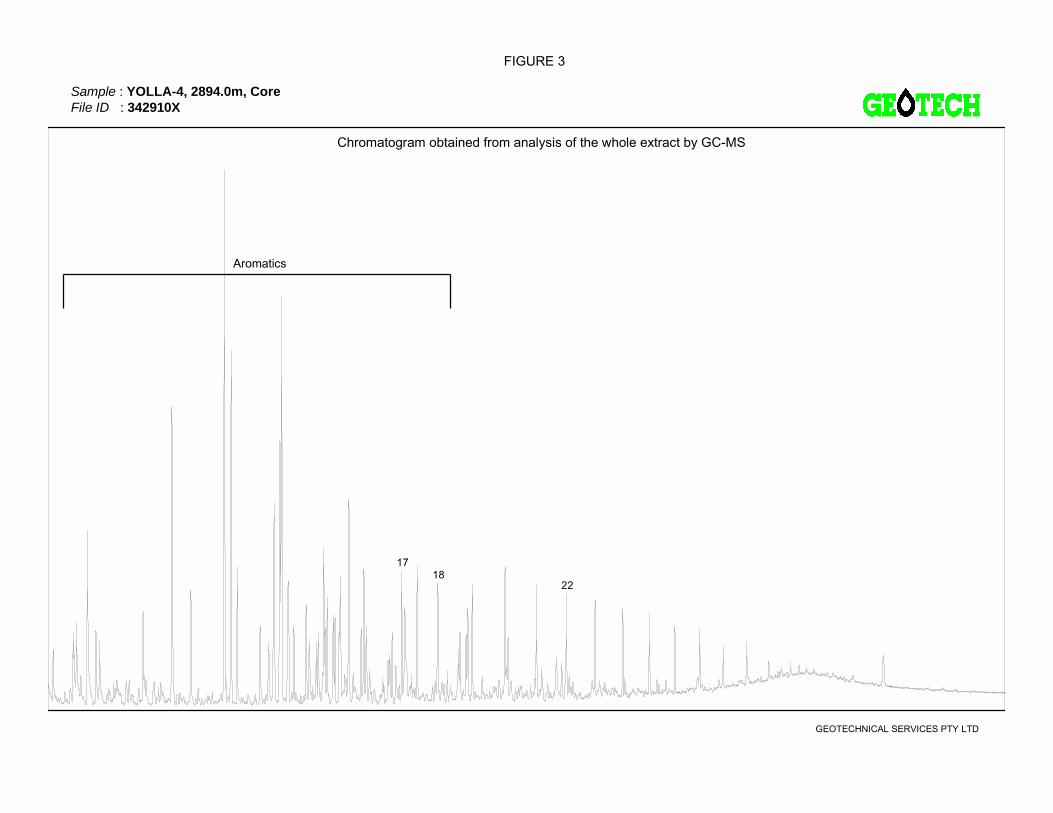
FIGURE 3
GEOTECHNICAL SERVICES PTY LTD
Chromatogram obtained from analysis of the whole extract by GC-MS
Sample : YOLLA-4, 2894.0m, Core File ID : 342910X
22
1718
Aromatics

TABLE 5
YOLLA-4
Yields (%) and Selected Ratios
------Hydrocarbons------ ------Non-hydrocarbons------ Sats Asph. HC___ ____ _____DEPTH Sample Type Sats Aros HC's NSOs Asph. Non HC's Aros NSO Non HC
2609.5m, ex MPSR-1695 Crude Oil 77.6 17.1 94.7 5.3 nd 5.3 4.5 nd 17.8
LIQUID CHROMATOGRAPHY DATAOIL
3/12/2004nd = no data GEOTECHNICAL SERVICES PTY LTD
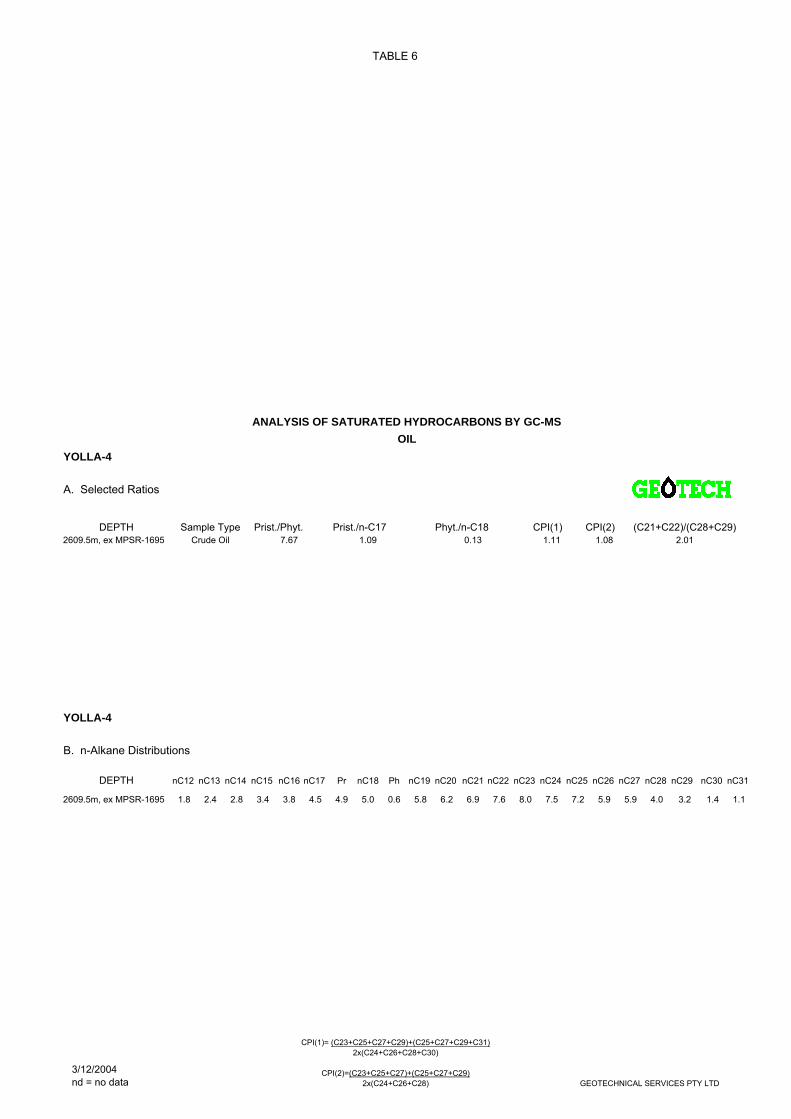
TABLE 6
YOLLA-4
A. Selected Ratios
DEPTH Sample Type Prist./Phyt. Prist./n-C17 Phyt./n-C18 CPI(1) CPI(2) (C21+C22)/(C28+C29)2609.5m, ex MPSR-1695 Crude Oil 7.67 1.09 0.13 1.11 1.08 2.01
YOLLA-4
B. n-Alkane Distributions
DEPTH nC12 nC13 nC14 nC15 nC16 nC17 Pr nC18 Ph nC19 nC20 nC21 nC22 nC23 nC24 nC25 nC26 nC27 nC28 nC29 nC30 nC31
2609.5m, ex MPSR-1695 1.8 2.4 2.8 3.4 3.8 4.5 4.9 5.0 0.6 5.8 6.2 6.9 7.6 8.0 7.5 7.2 5.9 5.9 4.0 3.2 1.4 1.1
ANALYSIS OF SATURATED HYDROCARBONS BY GC-MSOIL
3/12/2004nd = no data
CPI(1)= (C23+C25+C27+C29)+(C25+C27+C29+C31)2x(C24+C26+C28+C30)
CPI(2)=(C23+C25+C27)+(C25+C27+C29)2x(C24+C26+C28) GEOTECHNICAL SERVICES PTY LTD
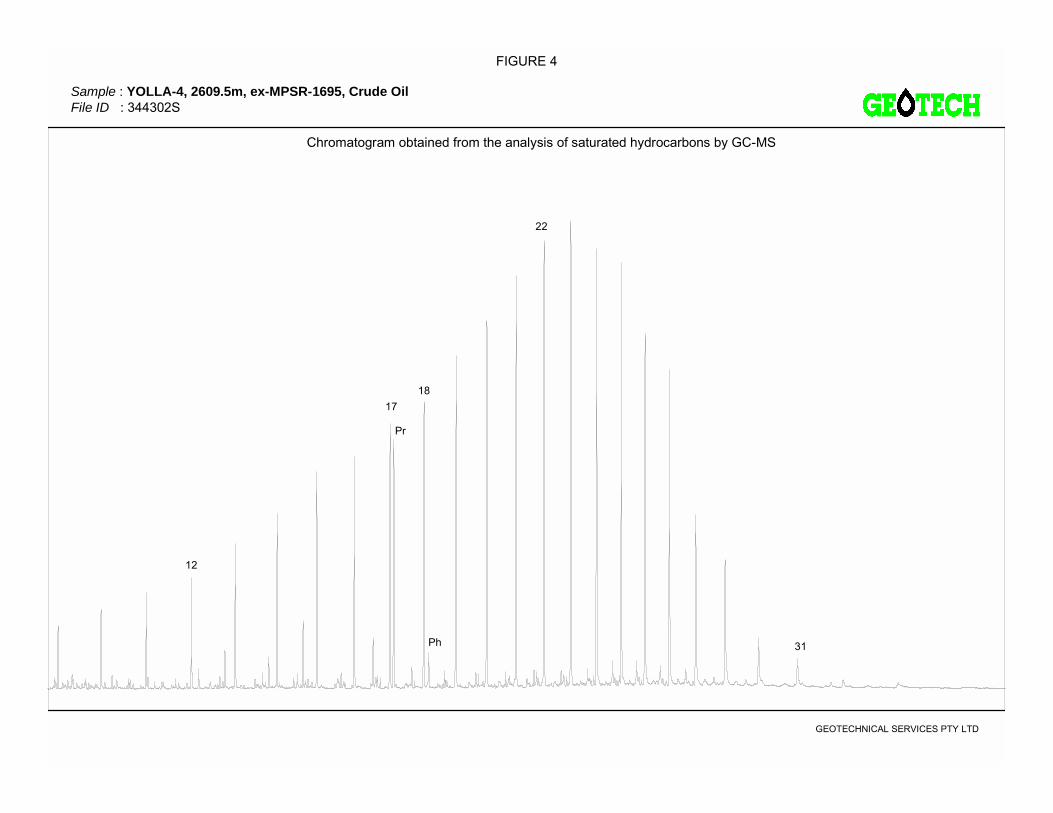
FIGURE 4
GEOTECHNICAL SERVICES PTY LTD
Chromatogram obtained from the analysis of saturated hydrocarbons by GC-MS
Sample : YOLLA-4, 2609.5m, ex-MPSR-1695, Crude OilFile ID : 344302S
12
17
22
18
31
Pr
Ph

TABLE 7
LIQUID CHROMATOGRAPHY DATAEXTRACT
YOLLA-4
A. Yields (ppm)
-------Hydrocarbons------- ------Non-hydrocarbons------ LossDEPTH Sample Type Sats Aros HC's NSOs Asph. Non HC's on column
2894.0m Core 1696 5244 6940 3275 nd 3275 2904
YOLLA-4
B. Yields (%) and Selected Ratios
------Hydrocarbons------ ------Non-hydrocarbons------ Sats Asph. HC____ _____ _______DEPTH Sample Type Sats Aros HC's NSOs Asph. Non HC's Aros NSO Non HC
2894.0m Core 16.6 51.3 68 32.1 nd 32 0.3 nd 2.1
3/12/2004nd = no data GEOTECHNICAL SERVICES PTY LTD
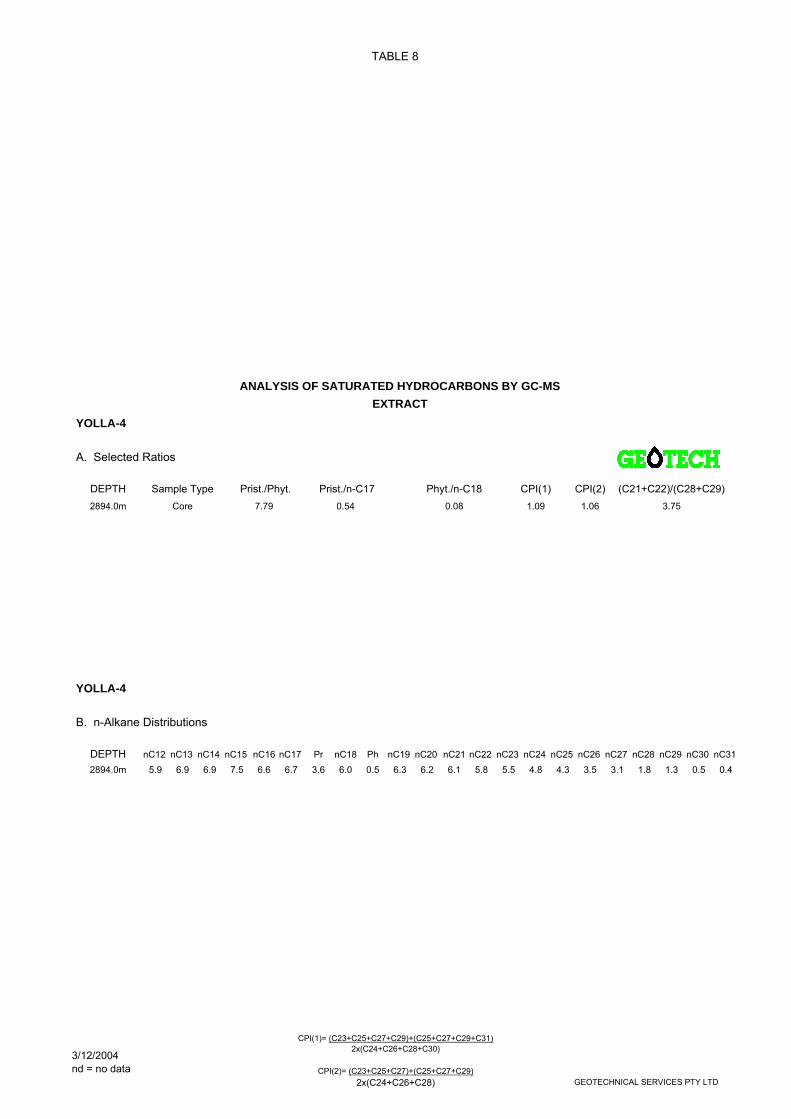
TABLE 8
ANALYSIS OF SATURATED HYDROCARBONS BY GC-MSEXTRACT
YOLLA-4
A. Selected Ratios
DEPTH Sample Type Prist./Phyt. Prist./n-C17 Phyt./n-C18 CPI(1) CPI(2) (C21+C22)/(C28+C29)2894.0m Core 7.79 0.54 0.08 1.09 1.06 3.75
YOLLA-4
B. n-Alkane Distributions
DEPTH nC12 nC13 nC14 nC15 nC16 nC17 Pr nC18 Ph nC19 nC20 nC21 nC22 nC23 nC24 nC25 nC26 nC27 nC28 nC29 nC30 nC312894.0m 5.9 6.9 6.9 7.5 6.6 6.7 3.6 6.0 0.5 6.3 6.2 6.1 5.8 5.5 4.8 4.3 3.5 3.1 1.8 1.3 0.5 0.4
3/12/2004nd = no data
CPI(1)= (C23+C25+C27+C29)+(C25+C27+C29+C31)2x(C24+C26+C28+C30)
CPI(2)= (C23+C25+C27)+(C25+C27+C29)2x(C24+C26+C28) GEOTECHNICAL SERVICES PTY LTD
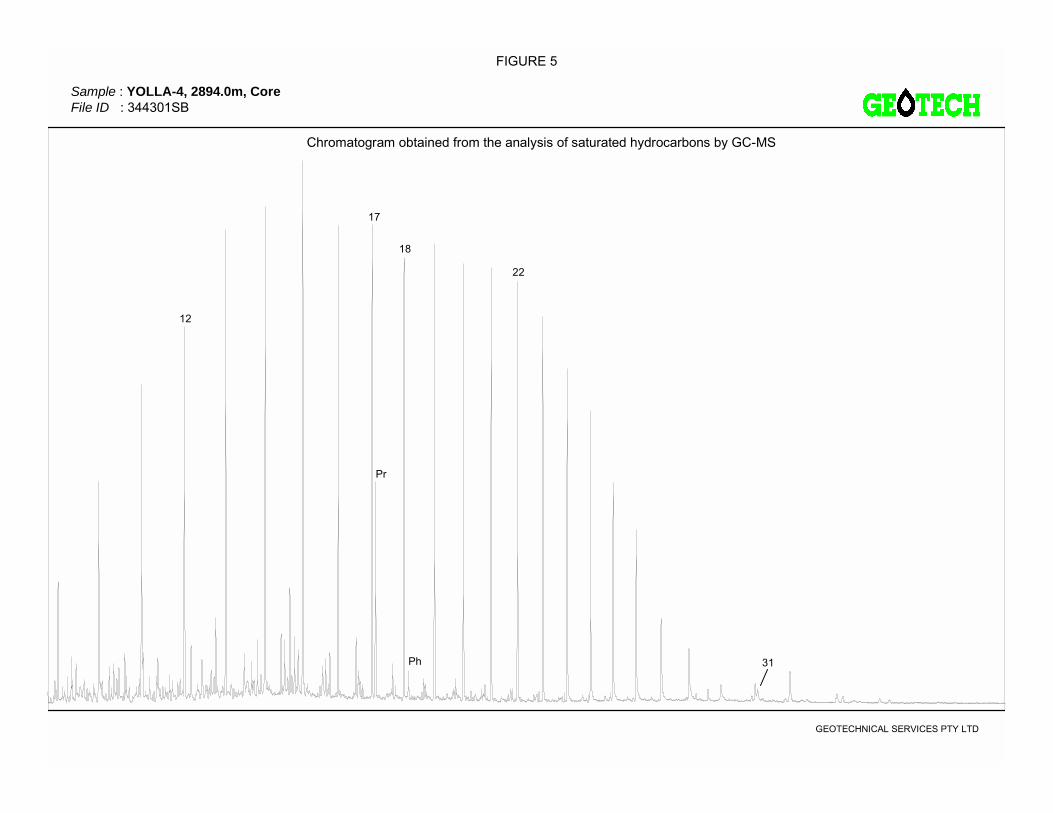
FIGURE 5
GEOTECHNICAL SERVICES PTY LTD
Chromatogram obtained from the analysis of saturated hydrocarbons by GC-MS
Sample : YOLLA-4, 2894.0m, CoreFile ID : 344301SB
12
17
22
18
31
Pr
Ph
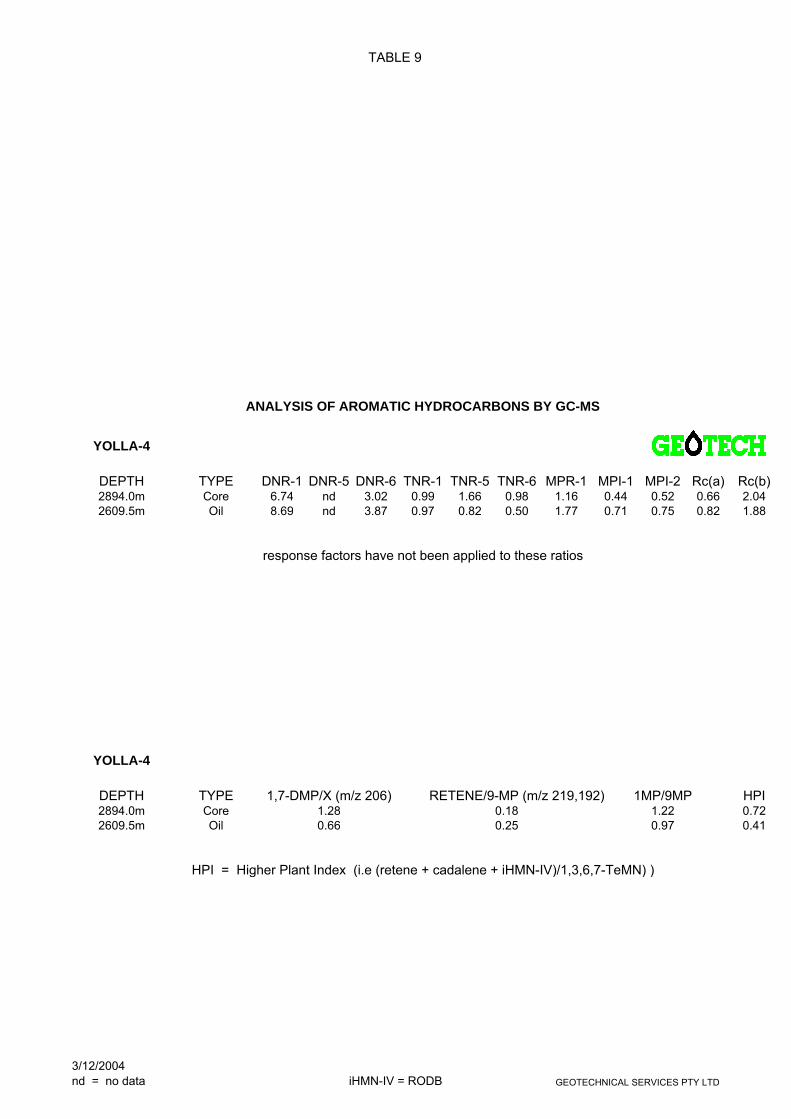
TABLE 9
ANALYSIS OF AROMATIC HYDROCARBONS BY GC-MS
YOLLA-4
DEPTH TYPE DNR-1 DNR-5 DNR-6 TNR-1 TNR-5 TNR-6 MPR-1 MPI-1 MPI-2 Rc(a) Rc(b)2894.0m Core 6.74 nd 3.02 0.99 1.66 0.98 1.16 0.44 0.52 0.66 2.042609.5m Oil 8.69 nd 3.87 0.97 0.82 0.50 1.77 0.71 0.75 0.82 1.88
response factors have not been applied to these ratios
YOLLA-4
DEPTH TYPE 1,7-DMP/X (m/z 206) RETENE/9-MP (m/z 219,192) 1MP/9MP HPI2894.0m Core 1.28 0.18 1.22 0.722609.5m Oil 0.66 0.25 0.97 0.41
HPI = Higher Plant Index (i.e (retene + cadalene + iHMN-IV)/1,3,6,7-TeMN) )
3/12/2004nd = no data iHMN-IV = RODB GEOTECHNICAL SERVICES PTY LTD
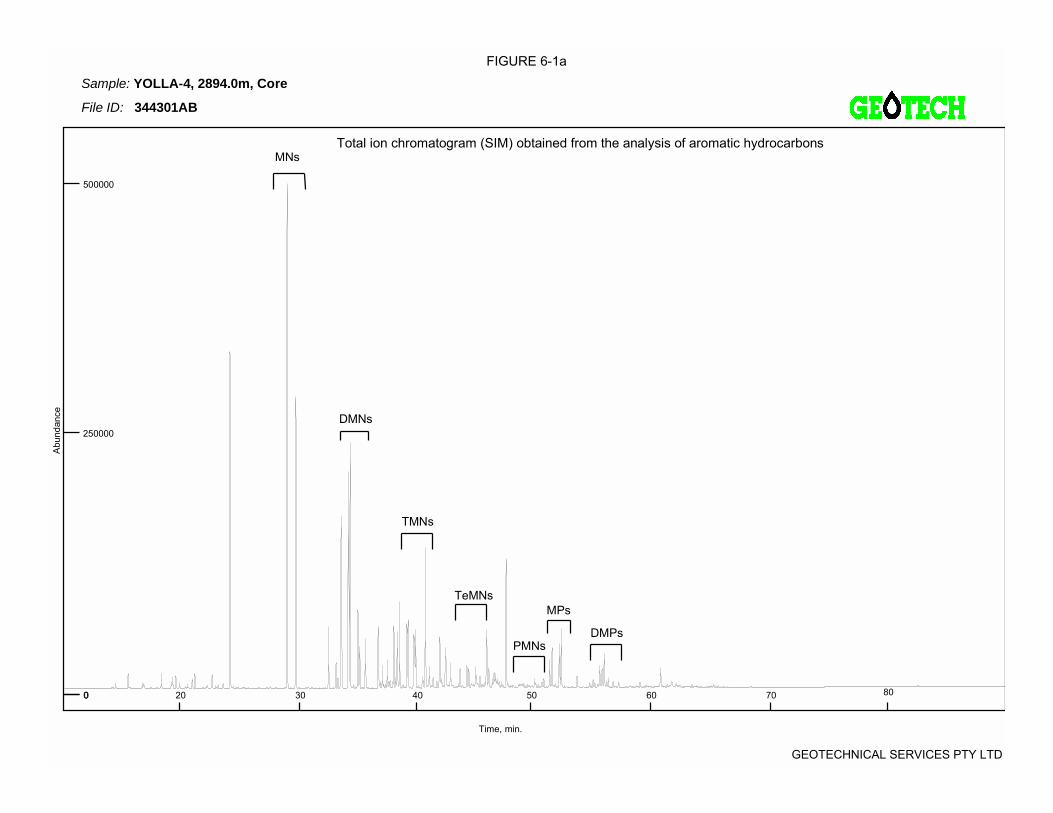
FIGURE 6-1a
GEOTECHNICAL SERVICES PTY LTD
Abu
nda n
ce
500000
0
250000
Time, min.
0 20 8040 605030 70
Total ion chromatogram (SIM) obtained from the analysis of aromatic hydrocarbons
Sample: YOLLA-4, 2894.0m, Core
File ID: 344301AB
PMNs
MNs
TMNs
TeMNs
DMPs
MPs
DMNs
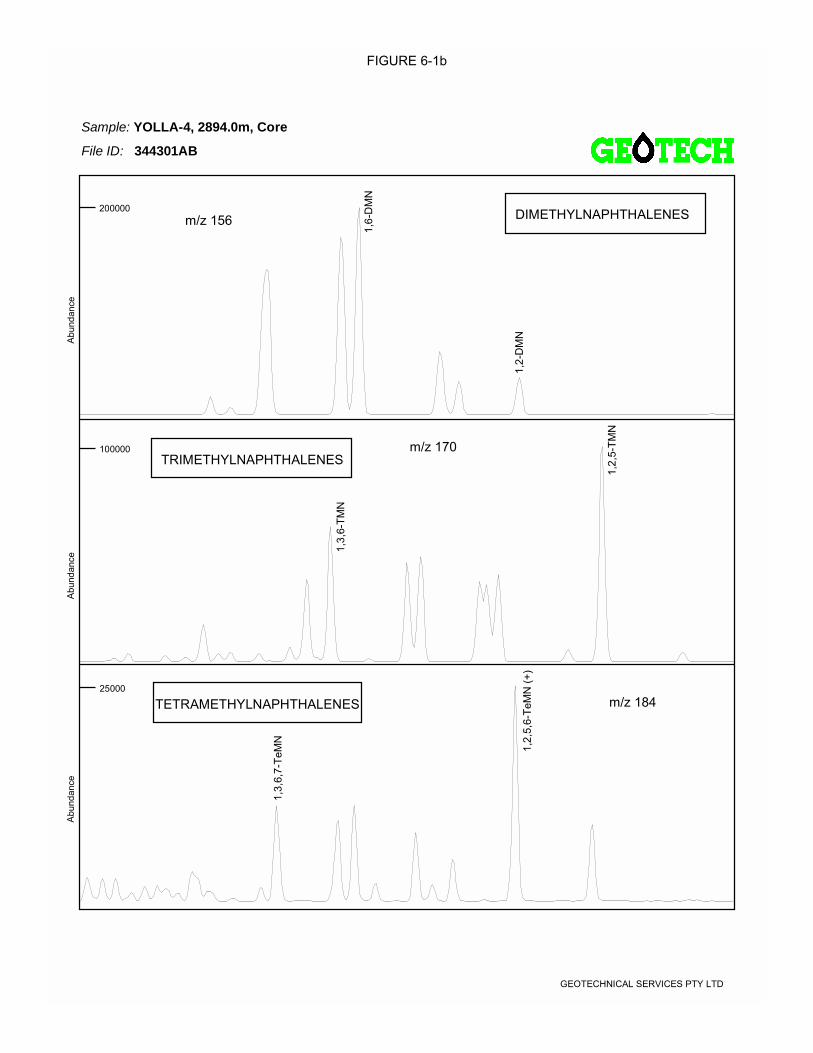
FIGURE 6-1b
GEOTECHNICAL SERVICES PTY LTD
TETRAMETHYLNAPHTHALENES
Abu
nda n
ce
200000
25000
100000
Abu
nda n
ceA
b und
a nce
m/z 184
1,2,
5,6-
TeM
N (+
)
1,3,
6,7-
TeM
N
TRIMETHYLNAPHTHALENESm/z 170
1,2,
5-TM
N
1,3,
6-TM
N
m/z 156 DIMETHYLNAPHTHALENES
1,2-
DM
N
1,6-
DM
N
Sample: YOLLA-4, 2894.0m, Core
File ID: 344301AB
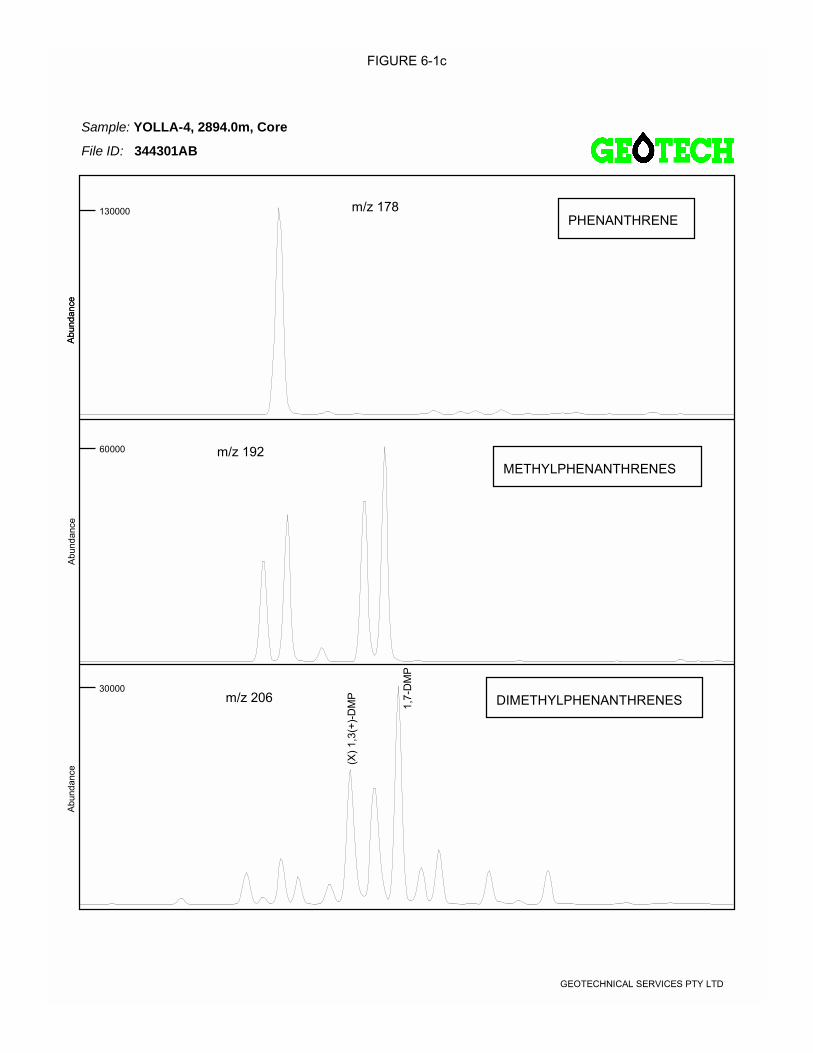
FIGURE 6-1c
GEOTECHNICAL SERVICES PTY LTD
Abu
nda n
ceA
b und
a nce
m/z 206
m/z 178PHENANTHRENE
m/z 192METHYLPHENANTHRENES
DIMETHYLPHENANTHRENES
Abu
nda n
ce
130000
30000
60000
Abu
nda n
ce
1,7-
DM
P
(X) 1
,3(+
)-DM
P
Sample: YOLLA-4, 2894.0m, Core
File ID: 344301AB
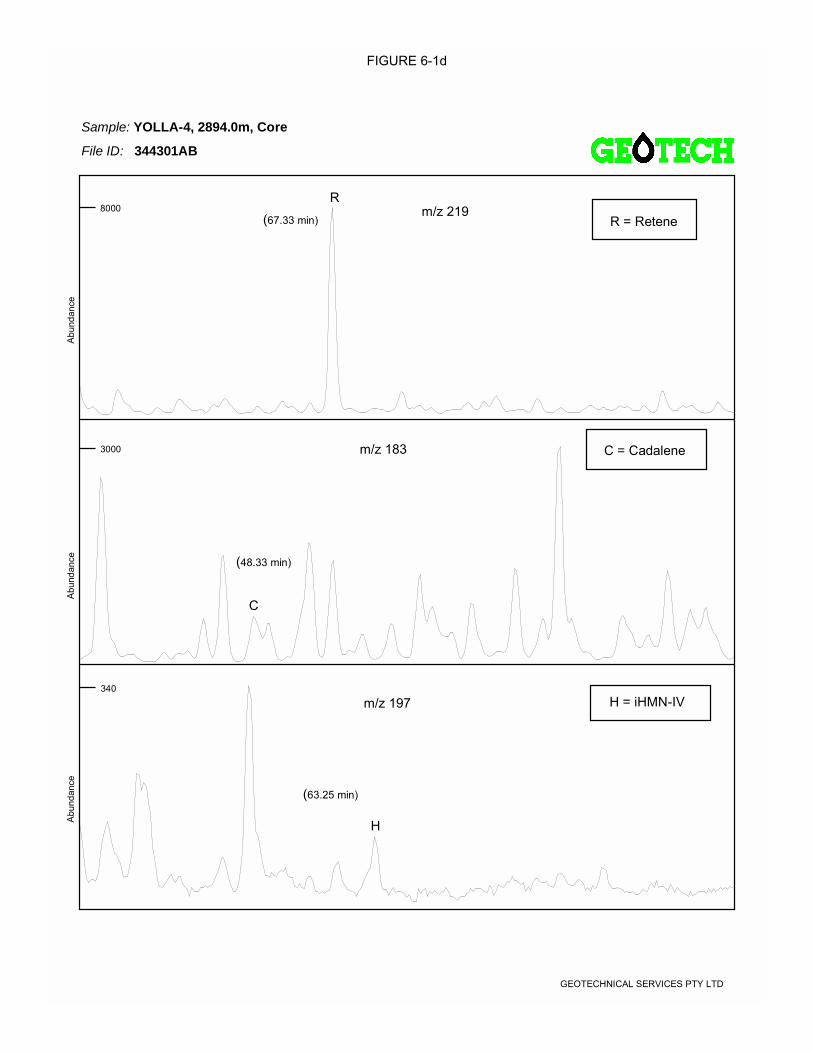
FIGURE 6-1d
GEOTECHNICAL SERVICES PTY LTD
m/z 219
m/z 197
m/z 183 C = Cadalene
H = iHMN-IV
R = Retene
Abu
nda n
ce
8000
340
3000
Abu
nda n
ceA
b und
a nce
(63.25 min)
H
(48.33 min)
C
(67.33 min)
R
Sample: YOLLA-4, 2894.0m, Core
File ID: 344301AB
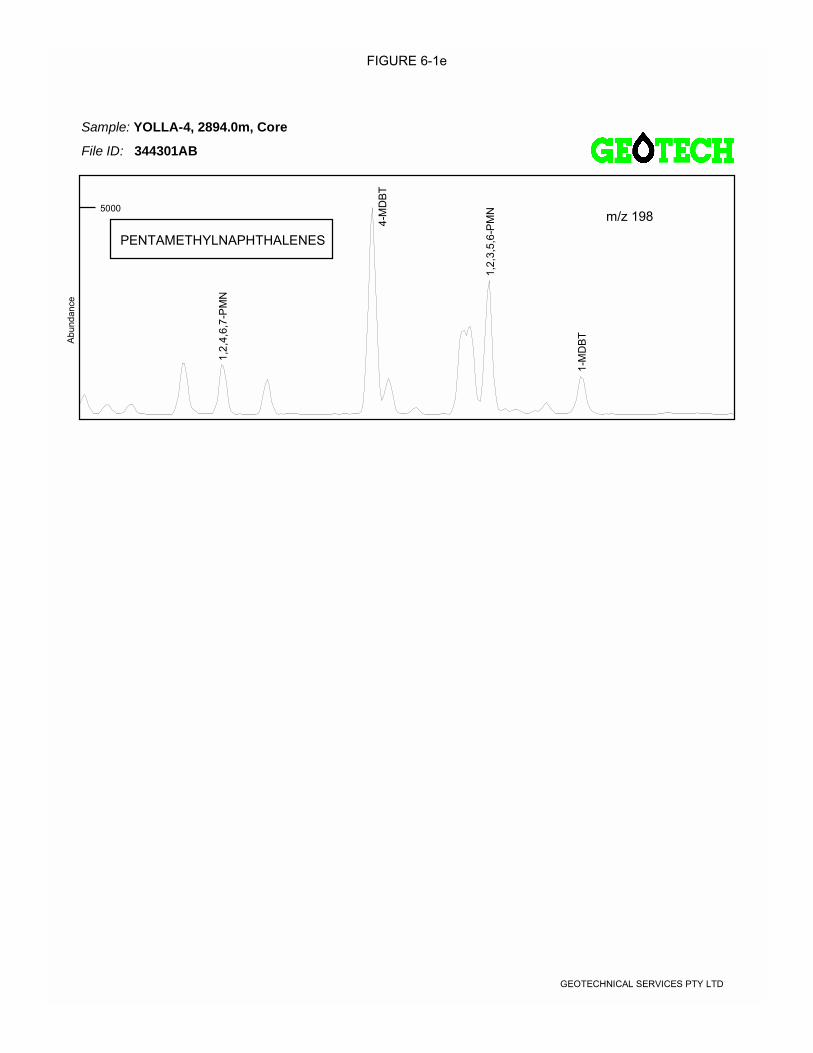
FIGURE 6-1e
GEOTECHNICAL SERVICES PTY LTD
Abu
nda n
ce
5000
PENTAMETHYLNAPHTHALENES
m/z 1981,
2,4,
6,7-
PM
N
1-M
DBT
1,2,
3,5,
6-P
MN
4-M
DBT
Sample: YOLLA-4, 2894.0m, Core
File ID: 344301AB
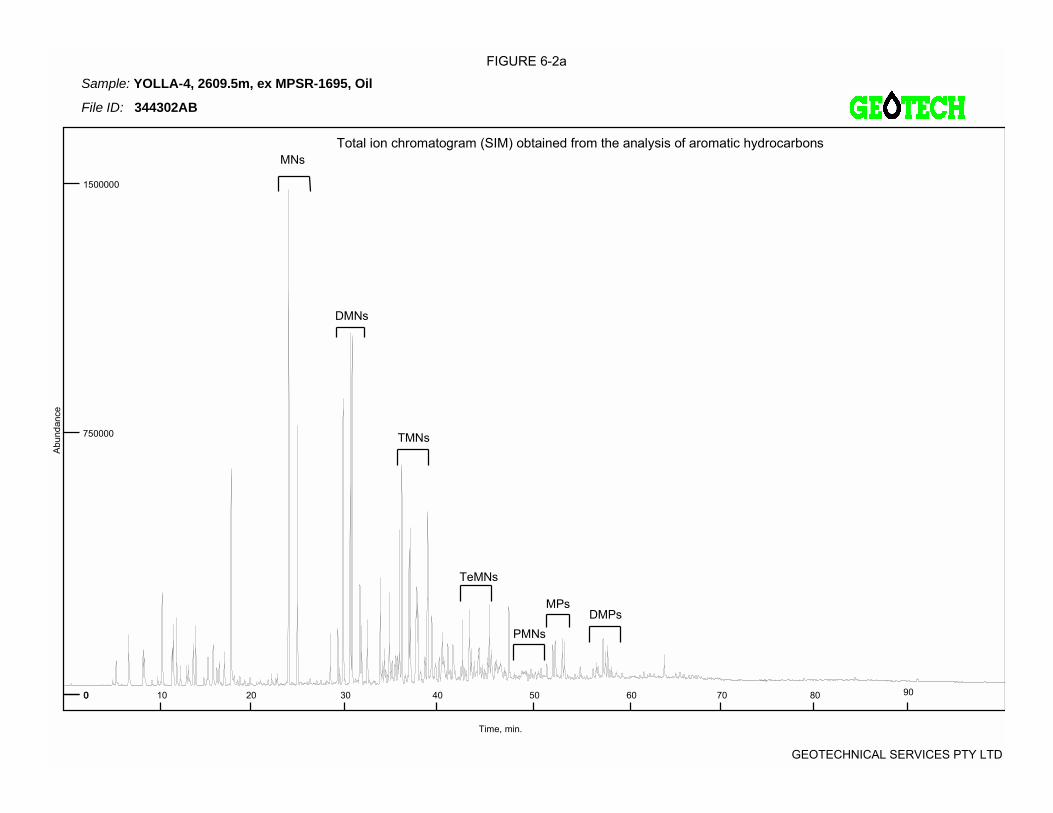
FIGURE 6-2a
GEOTECHNICAL SERVICES PTY LTD
Abu
nda n
ce
1500000
750000
Time, min.
Total ion chromatogram (SIM) obtained from the analysis of aromatic hydrocarbons
Sample: YOLLA-4, 2609.5m, ex MPSR-1695, Oil
File ID: 344302AB
PMNs
MNs
TMNs
TeMNs
DMPsMPs
DMNs
00 10 9040 605030 8020 70
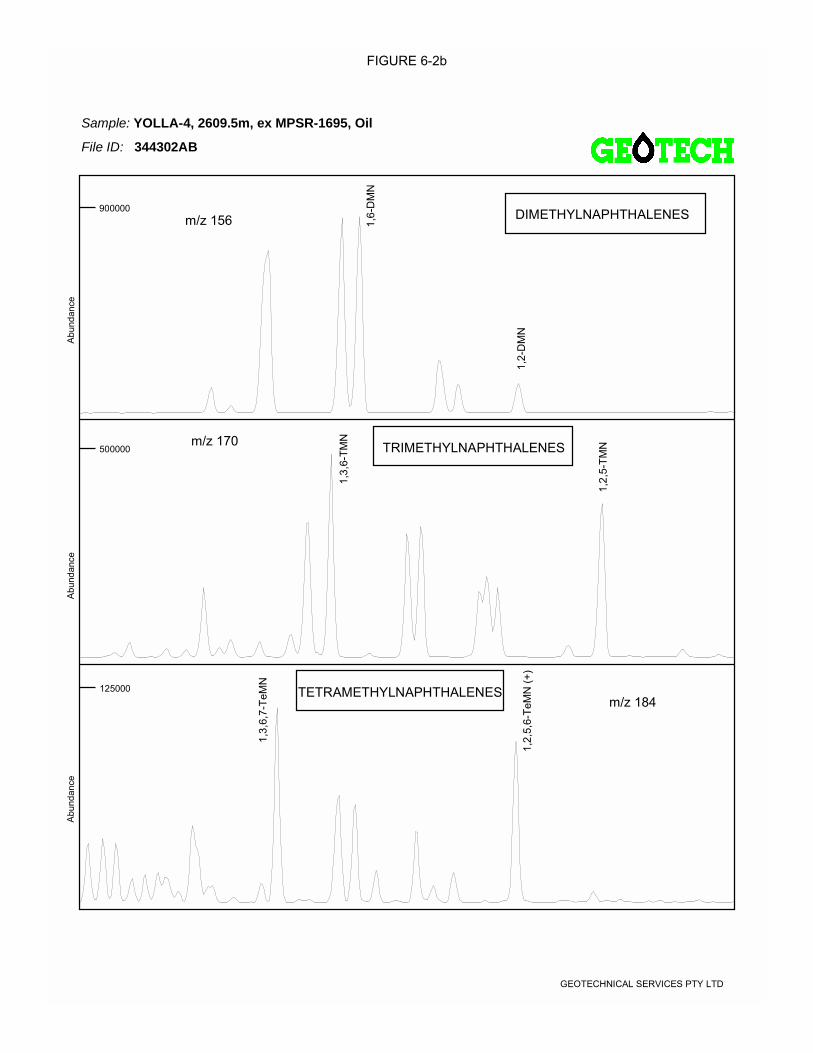
FIGURE 6-2b
GEOTECHNICAL SERVICES PTY LTD
TETRAMETHYLNAPHTHALENES
Abu
nda n
ce
900000
125000
500000
Abu
nda n
ceA
b und
a nce
m/z 184
1,2,
5,6-
TeM
N (+
)
1,3,
6,7-
TeM
N
TRIMETHYLNAPHTHALENESm/z 170
1,2,
5-TM
N
1,3,
6-TM
N
m/z 156 DIMETHYLNAPHTHALENES
1,2-
DM
N
1,6-
DM
N
Sample: YOLLA-4, 2609.5m, ex MPSR-1695, Oil
File ID: 344302AB
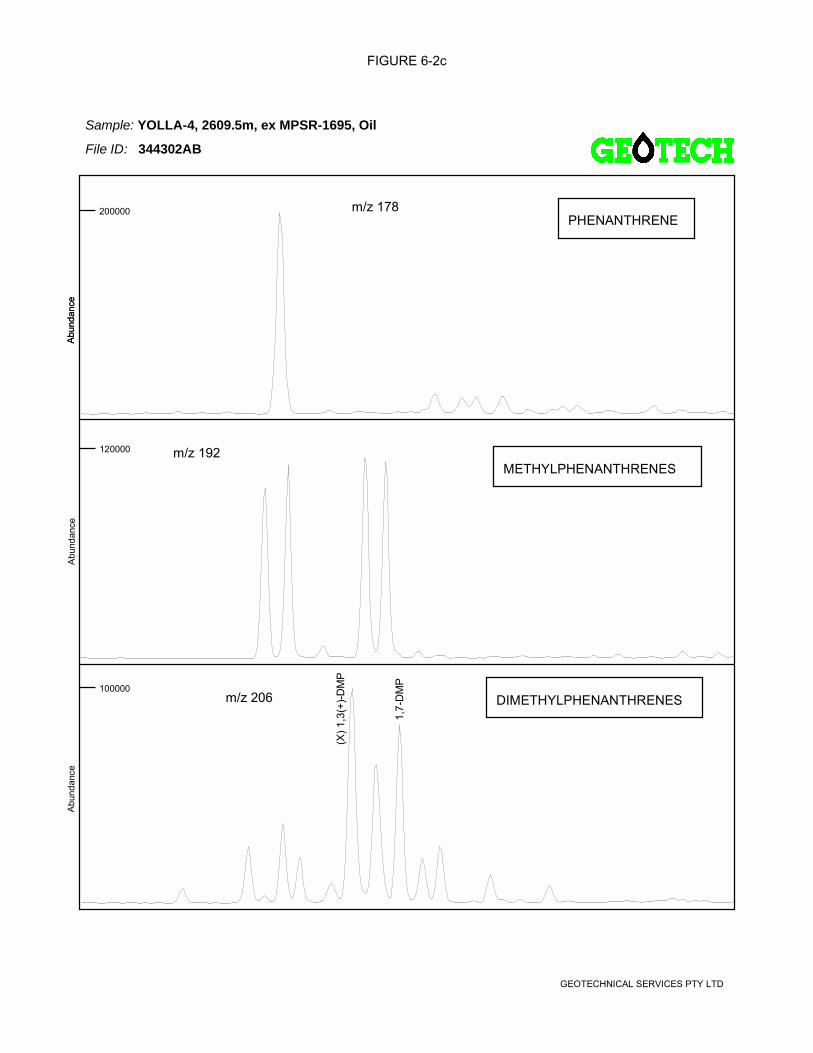
FIGURE 6-2c
GEOTECHNICAL SERVICES PTY LTD
Abu
nda n
ceA
b und
a nce
m/z 206
m/z 178PHENANTHRENE
m/z 192METHYLPHENANTHRENES
DIMETHYLPHENANTHRENES
Abu
nda n
ce
200000
100000
120000
Abu
nda n
ce
1,7-
DM
P
(X) 1
,3(+
)-DM
P
Sample: YOLLA-4, 2609.5m, ex MPSR-1695, Oil
File ID: 344302AB
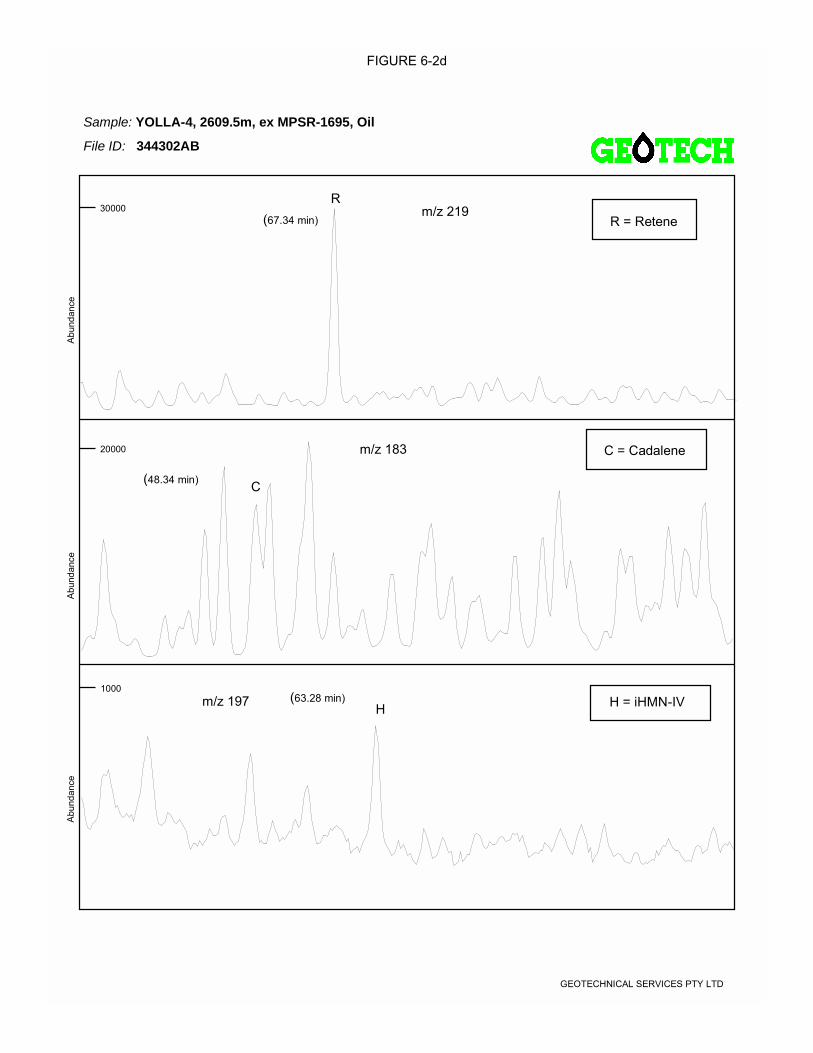
FIGURE 6-2d
GEOTECHNICAL SERVICES PTY LTD
m/z 219
m/z 197
m/z 183 C = Cadalene
H = iHMN-IV
R = Retene
Abu
nda n
ce
30000
1000
20000
Abu
nda n
ceA
b und
a nce
(63.28 min)H
(48.34 min) C
(67.34 min)
R
Sample: YOLLA-4, 2609.5m, ex MPSR-1695, Oil
File ID: 344302AB
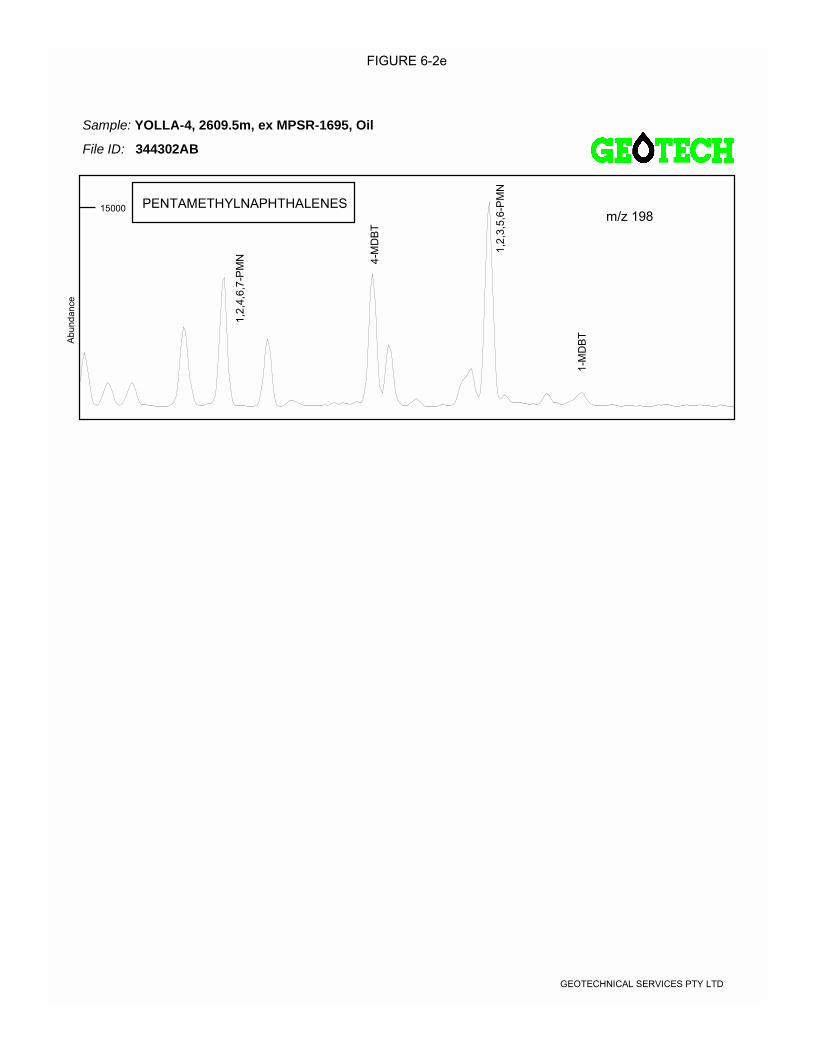
FIGURE 6-2e
GEOTECHNICAL SERVICES PTY LTD
Abu
nda n
ce
15000 PENTAMETHYLNAPHTHALENESm/z 198
1,2,
4,6,
7-P
MN
1-M
DBT
1,2,
3,5,
6-P
MN
4-M
DBT
Sample: YOLLA-4, 2609.5m, ex MPSR-1695, Oil
File ID: 344302AB
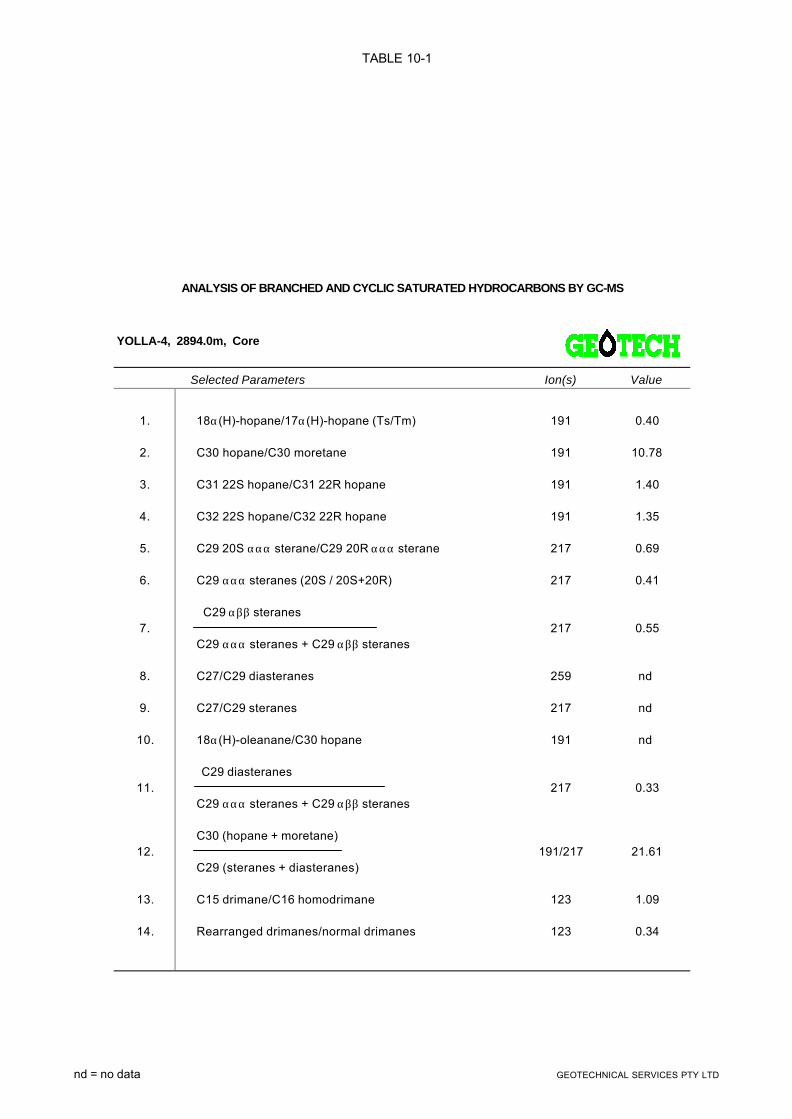
TABLE 10-1
YOLLA-4, 2894.0m, Core
Selected Parameters Ion(s) Value
1. 18α(H)-hopane/17α(H)-hopane (Ts/Tm) 191 0.40
2. C30 hopane/C30 moretane 191 10.78
3. C31 22S hopane/C31 22R hopane 191 1.40
4. C32 22S hopane/C32 22R hopane 191 1.35
5. C29 20S ααα sterane/C29 20R ααα sterane 217 0.69
6. C29 ααα steranes (20S / 20S+20R) 217 0.41
C29 αββ steranes 7. 217 0.55
C29 ααα steranes + C29 αββ steranes
8. C27/C29 diasteranes 259 nd
9. C27/C29 steranes 217 nd
10. 18α(H)-oleanane/C30 hopane 191 nd
C29 diasteranes 11. 217 0.33
C29 ααα steranes + C29 αββ steranes
C30 (hopane + moretane) 12. 191/217 21.61
C29 (steranes + diasteranes)
13. C15 drimane/C16 homodrimane 123 1.09
14. Rearranged drimanes/normal drimanes 123 0.34
ANALYSIS OF BRANCHED AND CYCLIC SATURATED HYDROCARBONS BY GC-MS
nd = no data GEOTECHNICAL SERVICES PTY LTD
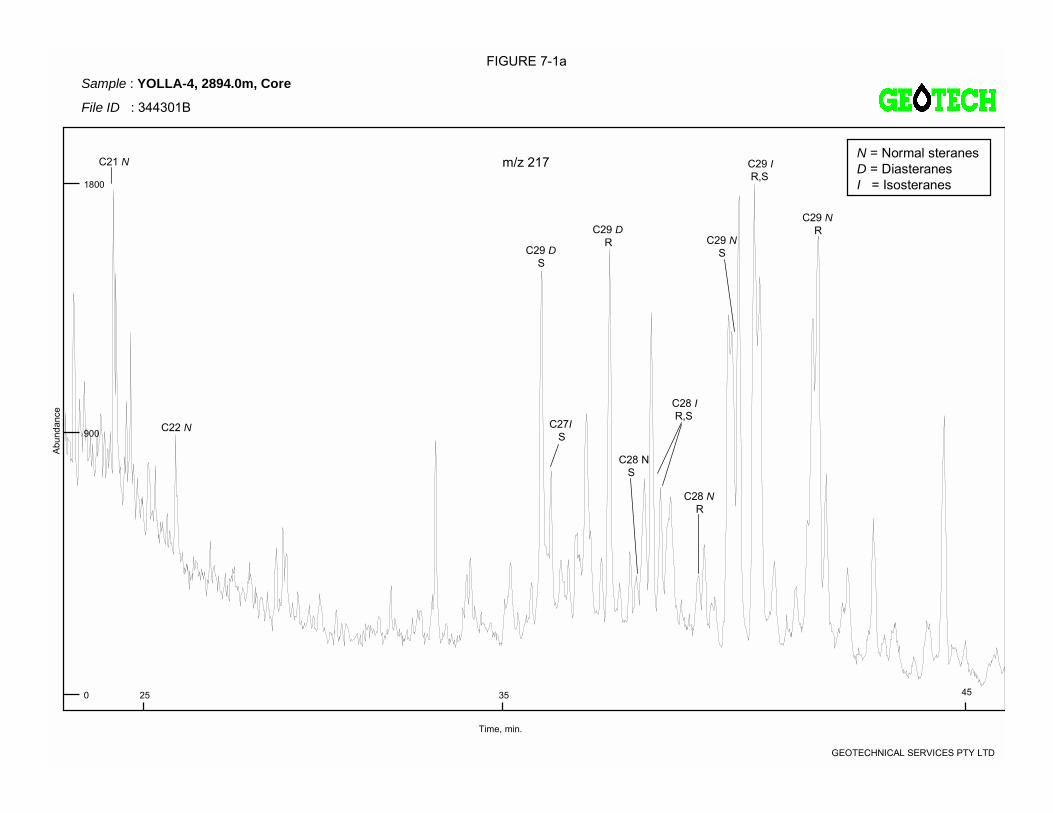
FIGURE 7-1a
GEOTECHNICAL SERVICES PTY LTD
m/z 217
25 35 45
Time, min.
Abu
nda n
ce
1800
0
Sample : YOLLA-4, 2894.0m, Core
File ID : 344301B
900
N = Normal steranesD = DiasteranesI = Isosteranes
C22 N
C21 N
C29 D R
C29 D S
C28 I R,S
C29 I R,S
C27I S
C28 N R
C29 N R
C29 N S
C28 N S
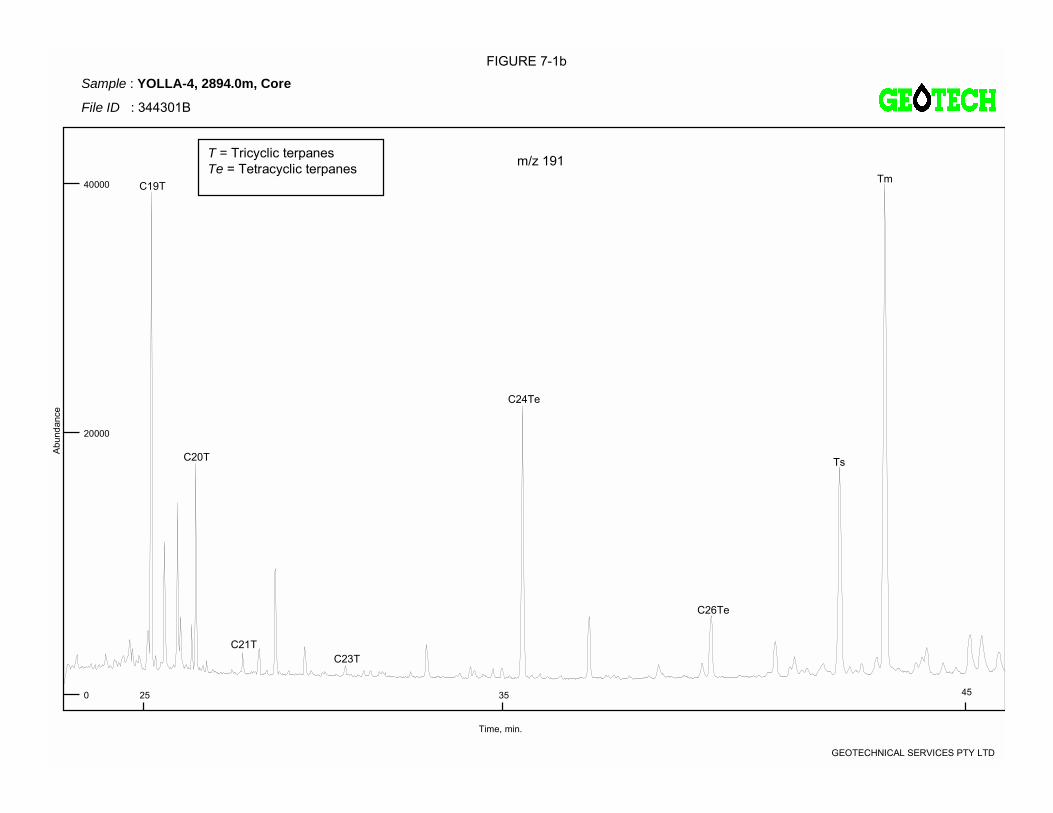
FIGURE 7-1b
GEOTECHNICAL SERVICES PTY LTD
m/z 191
25 35 45
Time, min.
Abu
nda n
ce
40000
0
20000
T = Tricyclic terpanesTe = Tetracyclic terpanes
C20T
C19T
C21TC23T
C26Te
C24Te
Ts
Tm
Sample : YOLLA-4, 2894.0m, Core
File ID : 344301B

FIGURE 7-1c
GEOTECHNICAL SERVICES PTY LTD
m/z 217
25 35 45
Time, min.
Abu
nda n
ce
1800
0
Sample : YOLLA-4, 2894.0m, Core
File ID : 344301B
900
N = Normal steranesD = DiasteranesI = Isosteranes
C22 N
C21 N
C29 D R
C29 D S
C28 I R,S
C29 I R,S
C27I S
C28 N R
C29 N R
C29 N S
C28 N S
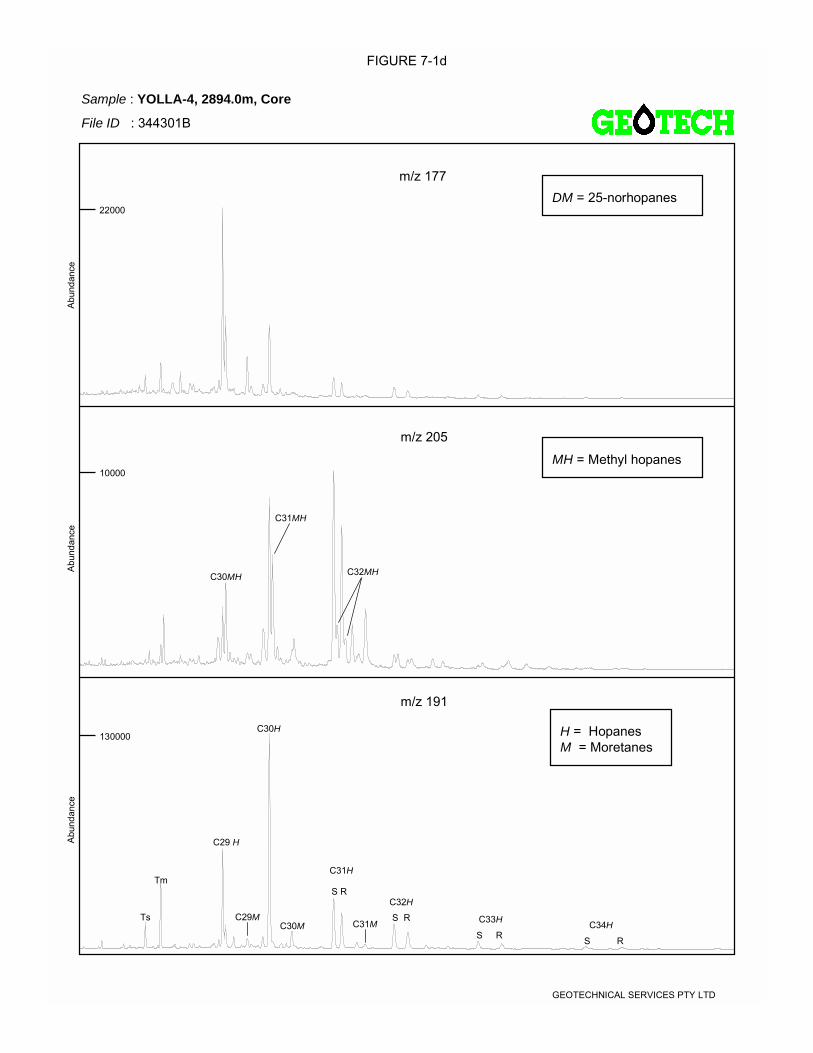
FIGURE 7-1d
GEOTECHNICAL SERVICES PTY LTD
m/z 177
m/z 191
m/z 205
DM = 25-norhopanes
Ts
Tm
C30H
C29 H
C29MC30M
MH = Methyl hopanes
C30MH
C31MH
Ab u
nda n
ceA
b und
a nce
Ab u
nda n
ce
22000
10000
130000 H = HopanesM = Moretanes
C31H
S RC32H
S R C34H
S R
C32MH
C33H
S RC31M
Sample : YOLLA-4, 2894.0m, Core
File ID : 344301B
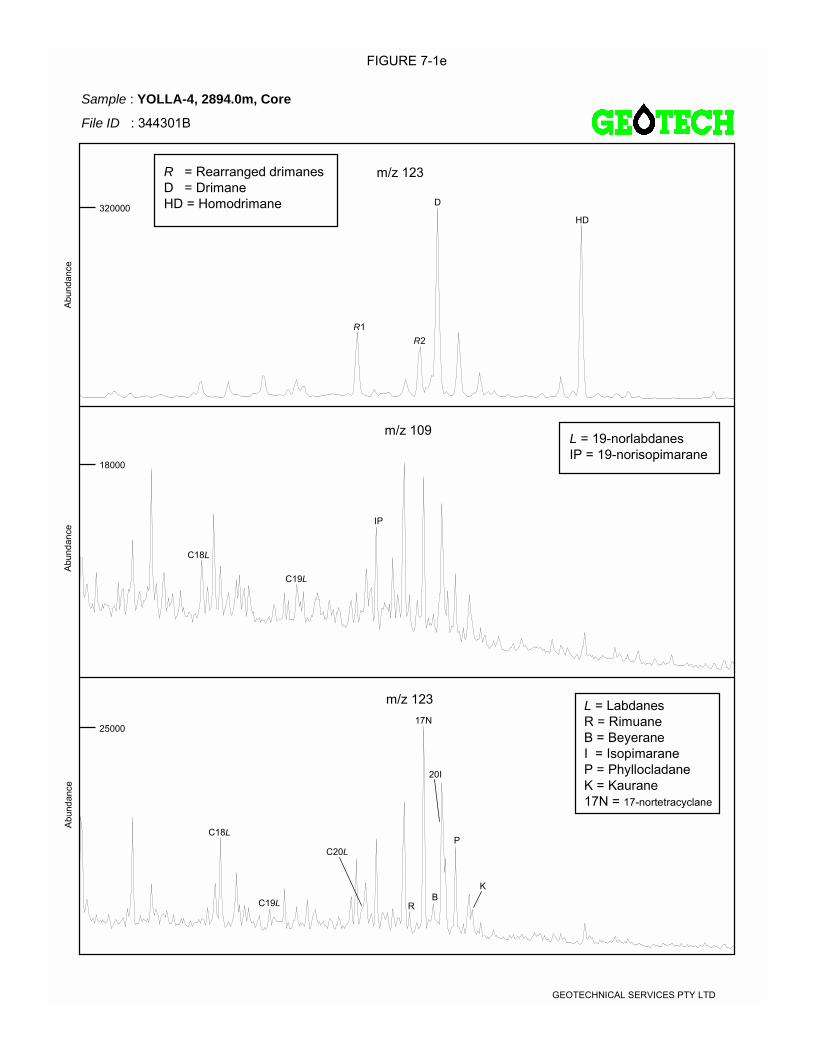
FIGURE 7-1e
GEOTECHNICAL SERVICES PTY LTD
m/z 123
m/z 123
m/z 109
R1R2
D
HD
L = 19-norlabdanesIP = 19-norisopimarane
L = LabdanesR = RimuaneB = BeyeraneI = IsopimaraneP = PhyllocladaneK = Kaurane17N = 17-nortetracyclane
C19L
C18L
C20L
C18L
C19L
R = Rearranged drimanesD = DrimaneHD = Homodrimane
Abu
nda n
ceA
b und
a nce
Ab u
nda n
ce
320000
18000
25000
Sample : YOLLA-4, 2894.0m, Core
File ID : 344301B
BK
P
20I
17N
IP
R
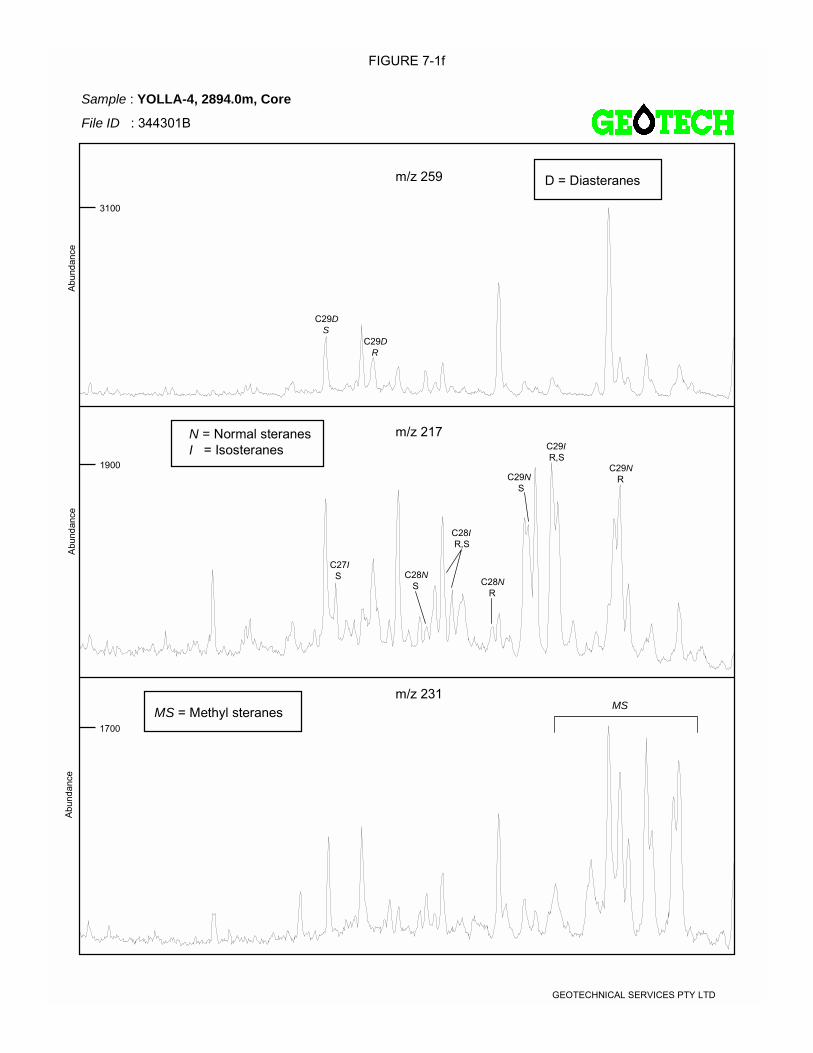
FIGURE 7-1f
GEOTECHNICAL SERVICES PTY LTD
m/z 259
m/z 231
m/z 217
MS = Methyl steranes MS
D = Diasteranes
Abu
nda n
ceA
b und
a nce
Ab u
nda n
ce
3100
1900
1700
N = Normal steranesI = Isosteranes
C29D S
C29D R
C27I S C28N
S
C28I R,S
C28N R
C29N S
C29I R,S
C29N R
Sample : YOLLA-4, 2894.0m, Core
File ID : 344301B
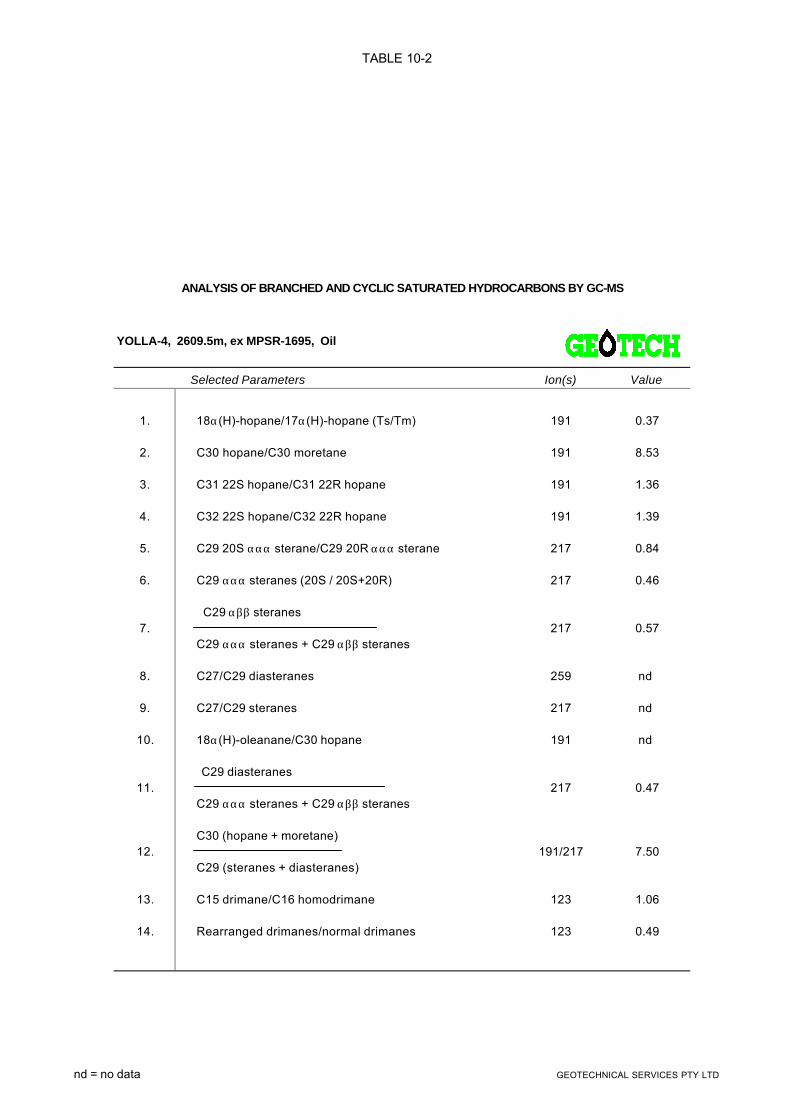
TABLE 10-2
YOLLA-4, 2609.5m, ex MPSR-1695, Oil
Selected Parameters Ion(s) Value
1. 18α(H)-hopane/17α(H)-hopane (Ts/Tm) 191 0.37
2. C30 hopane/C30 moretane 191 8.53
3. C31 22S hopane/C31 22R hopane 191 1.36
4. C32 22S hopane/C32 22R hopane 191 1.39
5. C29 20S ααα sterane/C29 20R ααα sterane 217 0.84
6. C29 ααα steranes (20S / 20S+20R) 217 0.46
C29 αββ steranes 7. 217 0.57
C29 ααα steranes + C29 αββ steranes
8. C27/C29 diasteranes 259 nd
9. C27/C29 steranes 217 nd
10. 18α(H)-oleanane/C30 hopane 191 nd
C29 diasteranes 11. 217 0.47
C29 ααα steranes + C29 αββ steranes
C30 (hopane + moretane) 12. 191/217 7.50
C29 (steranes + diasteranes)
13. C15 drimane/C16 homodrimane 123 1.06
14. Rearranged drimanes/normal drimanes 123 0.49
ANALYSIS OF BRANCHED AND CYCLIC SATURATED HYDROCARBONS BY GC-MS
nd = no data GEOTECHNICAL SERVICES PTY LTD

FIGURE 7-2a
GEOTECHNICAL SERVICES PTY LTD
m/z 217
25 35 45
Time, min.
Abu
nda n
ce
4000
0
Sample : YOLLA-4, 2609.5m, ex MPSR-1695, Crude Oil
File ID : 344302BB
2000
N = Normal steranesD = DiasteranesI = Isosteranes
C22 N
C21 N
C29 D R
C29 D S
C28 I R,S
C29 I R,S
C29 N R
C29 N S
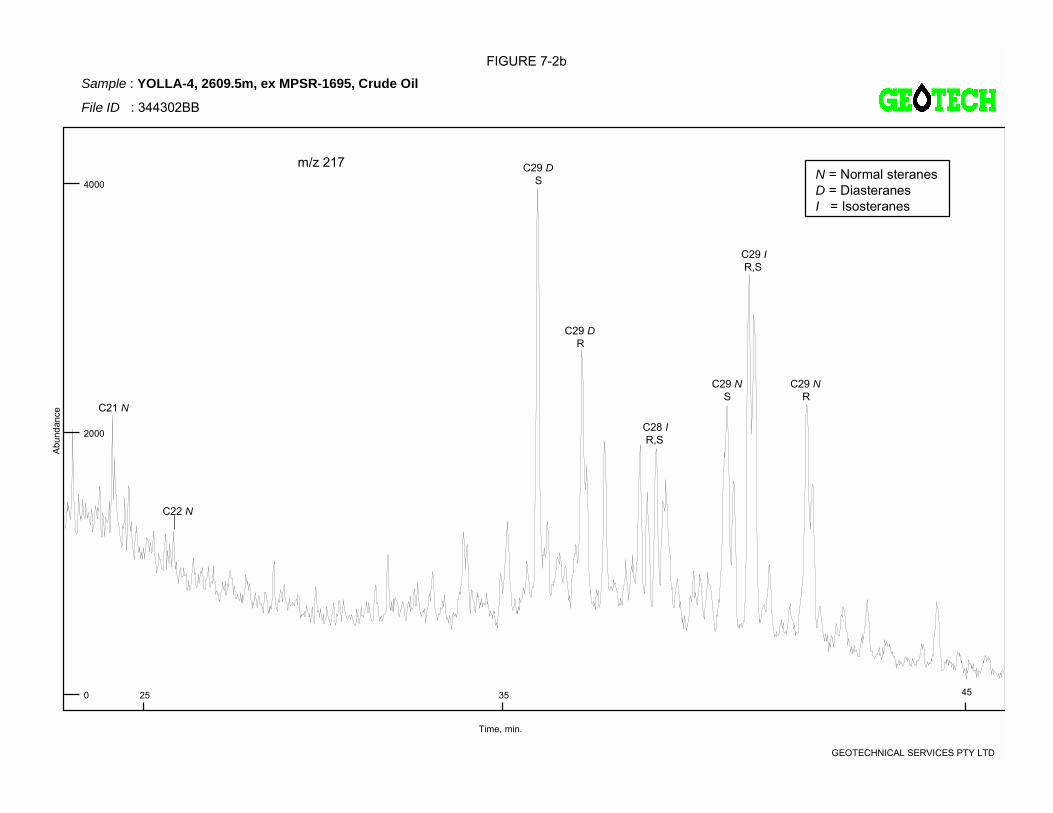
FIGURE 7-2b
GEOTECHNICAL SERVICES PTY LTD
m/z 217
25 35 45
Time, min.
Abu
nda n
ce
4000
0
Sample : YOLLA-4, 2609.5m, ex MPSR-1695, Crude Oil
File ID : 344302BB
2000
N = Normal steranesD = DiasteranesI = Isosteranes
C22 N
C21 N
C29 D R
C29 D S
C28 I R,S
C29 I R,S
C29 N R
C29 N S
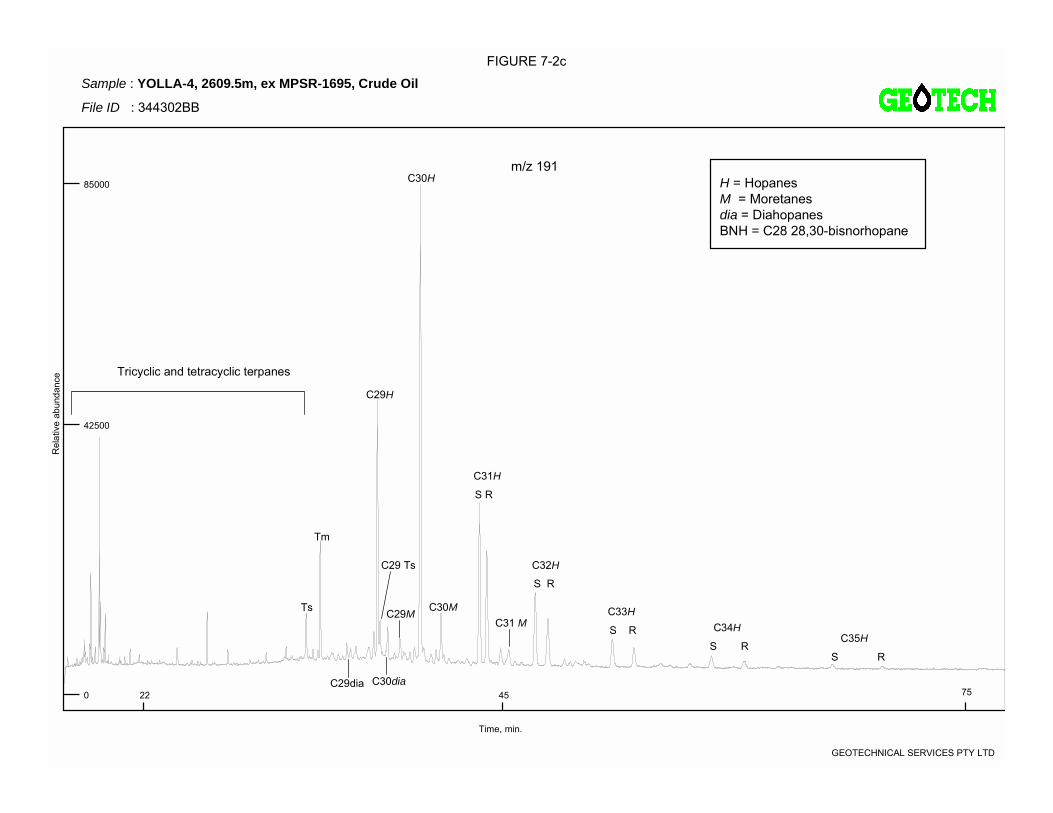
FIGURE 7-2c
GEOTECHNICAL SERVICES PTY LTD
22 45 75
Time, min.
Rel
ativ
e ab
unda
nce
85000
0
m/z 191
Tricyclic and tetracyclic terpanes
42500
Ts
Tm
C30H
C29H
C29M C30MC31 M
C29 Ts
C29dia C30dia
H = HopanesM = Moretanesdia = DiahopanesBNH = C28 28,30-bisnorhopane
C31H
S R
C32H
S R
C33H
S R C34H
S R C35H
S R
Sample : YOLLA-4, 2609.5m, ex MPSR-1695, Crude Oil
File ID : 344302BB

FIGURE 7-2d
GEOTECHNICAL SERVICES PTY LTD
m/z 177
m/z 191
m/z 205
DM = 25-norhopanes
Ts
Tm
C30H
C29 H
C29MC30M
MH = Methyl hopanes
C30MH
C31MH
Ab u
nda n
ceA
b und
a nce
Ab u
nda n
ce
19000
9000
85000 H = HopanesM = Moretanes
C31H
S R
C32H
S R C34H
S R
C32MH
C33H
S RC31M
Sample : YOLLA-4, 2609.5m, ex MPSR-1695, Crude Oil
File ID : 344302BB
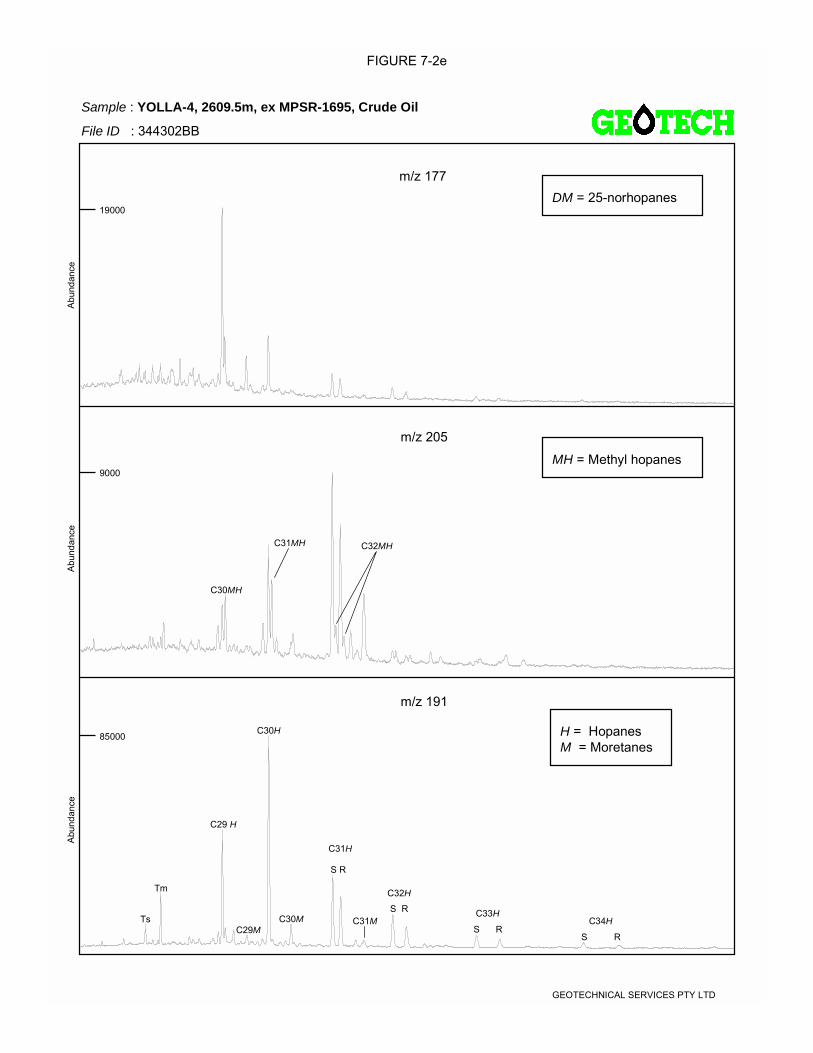
FIGURE 7-2e
GEOTECHNICAL SERVICES PTY LTD
m/z 177
m/z 191
m/z 205
DM = 25-norhopanes
Ts
Tm
C30H
C29 H
C29MC30M
MH = Methyl hopanes
C30MH
C31MH
Ab u
nda n
ceA
b und
a nce
Ab u
nda n
ce
19000
9000
85000 H = HopanesM = Moretanes
C31H
S R
C32H
S R C34H
S R
C32MH
C33H
S RC31M
Sample : YOLLA-4, 2609.5m, ex MPSR-1695, Crude Oil
File ID : 344302BB
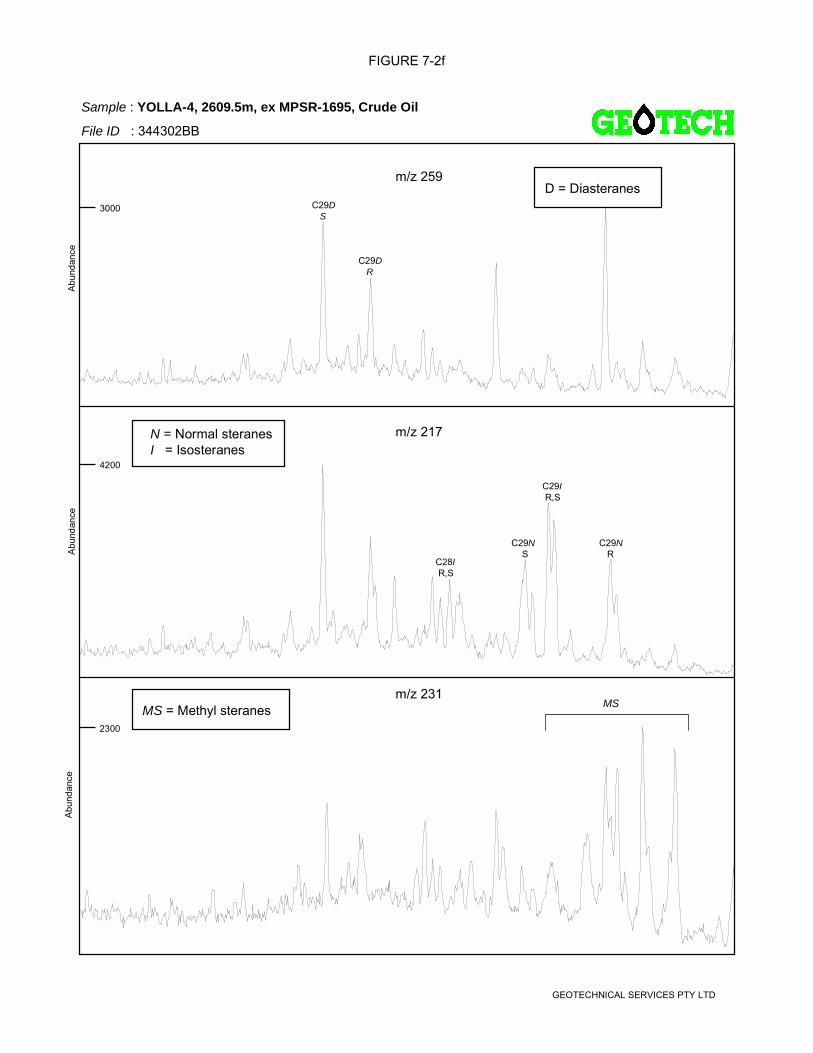
FIGURE 7-2f
GEOTECHNICAL SERVICES PTY LTD
m/z 259
m/z 231
m/z 217
MS = Methyl steranes MS
D = Diasteranes
Abu
nda n
ceA
b und
a nce
Ab u
nda n
ce
3000
4200
2300
N = Normal steranesI = Isosteranes
C29D S
C29D R
C28I R,S
C29N S
C29I R,S
C29N R
Sample : YOLLA-4, 2609.5m, ex MPSR-1695, Crude Oil
File ID : 344302BB

TABLE 11
YOLLA-4, 3005.7m, Gas
Compound δ13 C SD Misc. Informationmethane -38.8 0.05ethane -29.5 0.01
propane -28.1 0.10i-butane -28.7 0.04n-butane -27.8 0.12i-pentane -27.5 0.01n-pentane -27.0 0.13
CO2 -8.1 0.01
* Misc. Information : indicates if the abundance of the compound is lowand therefore the value calculated less reliable
COMPOUND SPECIFIC ISOTOPE ANALYSIS (GC-IRMS)
3/12/2004nd = not detected
Units: o/oo PDB(per mil International Standard Peedee Belemnite)
GEOTECHNICAL SERVICES PTY LTD
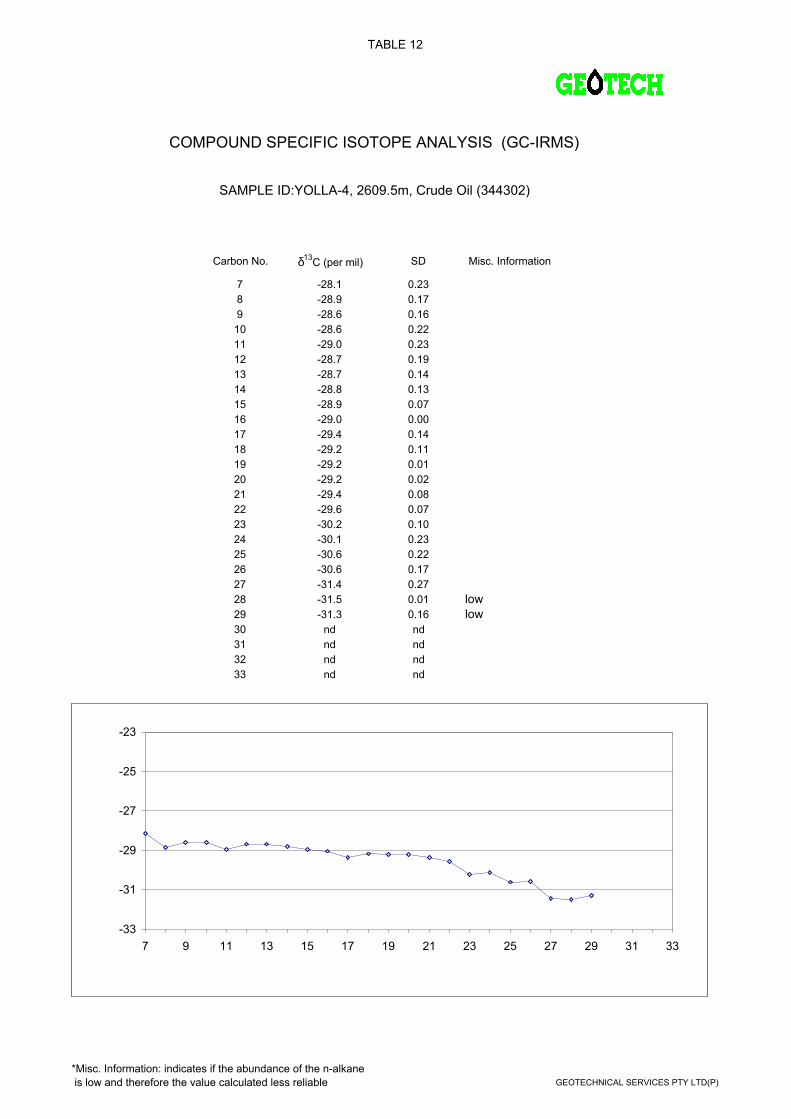
TABLE 12
Carbon No. δ13C (per mil) SD Misc. Information
7 -28.1 0.238 -28.9 0.179 -28.6 0.1610 -28.6 0.2211 -29.0 0.2312 -28.7 0.1913 -28.7 0.1414 -28.8 0.1315 -28.9 0.0716 -29.0 0.0017 -29.4 0.1418 -29.2 0.1119 -29.2 0.0120 -29.2 0.0221 -29.4 0.0822 -29.6 0.0723 -30.2 0.1024 -30.1 0.2325 -30.6 0.2226 -30.6 0.1727 -31.4 0.2728 -31.5 0.01 low29 -31.3 0.16 low30 nd nd31 nd nd32 nd nd33 nd nd
SAMPLE ID:YOLLA-4, 2609.5m, Crude Oil (344302)
COMPOUND SPECIFIC ISOTOPE ANALYSIS (GC-IRMS)
-33
-31
-29
-27
-25
-23
7 9 11 13 15 17 19 21 23 25 27 29 31 33
*Misc. Information: indicates if the abundance of the n-alkane is low and therefore the value calculated less reliable GEOTECHNICAL SERVICES PTY LTD(P)

GEOTECHNICAL SERVICES PTY LTD
APPENDIX B
THEORY AND METHODS

Page 1 of 20
gd003.v2-Aug02
GEOTECHNICAL SERVICES PTY LTD
PETROLEUM GEOCHEMISTRY 1.0 INTRODUCTION Petroleum geochemistry is primarily concerned with the application of organic chemistry to samples of geological interest in hydrocarbon exploration. Analyses can be carried out on cuttings, sidewall cores, conventional cores, relatively unweathered outcrop samples and fluid hydrocarbons (oil, condensate, gas). Source rock evaluation is best performed on sidewall cores, since cuttings are more susceptible to contamination from both cavings and organic additives in the mud system. In petroleum geochemical studies it is vitally important for the geochemist/geologist to be aware of the type of mud additives used and the stage at which they are used during the drilling program. Any anomalous results must be carefully considered in conjunction with mud system records. Petroleum geochemistry in exploration is applied for three major purposes: 1. Identification of richness, maturity and type of kerogen in (a large number of) whole
rock samples by screening analyses. 2. Semi-detailed characterisation of kerogen in sediments from selected source
intervals, to determine maturity, source type and genetic potential. 3. Detailed characterisation of petroleum fluids (extracts, oils and condensates) by
assessment of thermal maturity, source type and depositional environment to enable oil-to-oil and oil-to-source rock correlation studies.
Page 2 of 20
gd003.v2-Aug02
GEOTECHNICAL SERVICES PTY LTD
2.0 THEORY & METHODS Samples are analysed according to the scheme illustrated in Figure 1 which shows the order and type of analysis for both screening and detailed tests. 2.1 Screening Analyses of Whole Rock Samples 2.1.1 Headspace/Cuttings Gas Analysis The headspace sample is usually provided in a sealed tin can which holds both
cuttings and water to approximately three quarters capacity. This allows the volatile hydrocarbons to diffuse easily into an appreciable headspace.
The gas is taken into a syringe through a silicone seal on the lid of the container and
analysed by packed column gas chromatography using the following conditions: Instrument: Shimadzu GC-8APF Column: 6'x 1/8" Chromosorb 102 Injector/Detector Temperature: 120oC Column Temperature: 110oC Carrier Gas: Nitrogen Cuttings gas analysis is performed in the same manner but on samples which do not
liberate volatile gases readily. These sediments are subjected to very vigorous agitation prior to sampling.
Values are given as volume of gas per million volumes of sediment (ppm) for each
hydrocarbon (methane, ethane, propane, iso- and n-butane), as composite values including C5-C7, and as ratios.
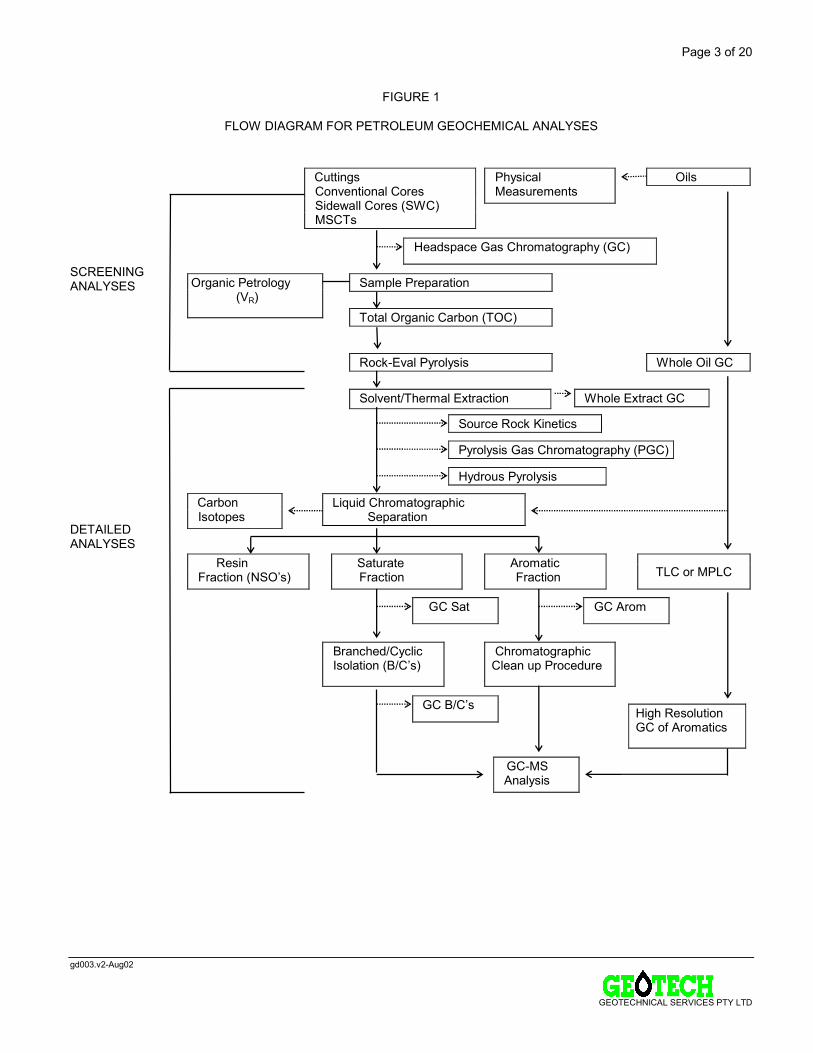
Page 3 of 20
gd003.v2-Aug02
GEOTECHNICAL SERVICES PTY LTD
FIGURE 1
FLOW DIAGRAM FOR PETROLEUM GEOCHEMICAL ANALYSES
SCREENING ANALYSES
DETAILED ANALYSES
Cuttings Conventional Cores Sidewall Cores (SWC) MSCTs
Physical Measurements
Oils
Headspace Gas Chromatography (GC)
Organic Petrology (VR)
Sample Preparation
Total Organic Carbon (TOC)
Rock-Eval Pyrolysis Whole Oil GC
Solvent/Thermal Extraction Whole Extract GC
Source Rock Kinetics
Pyrolysis Gas Chromatography (PGC)
Hydrous Pyrolysis
Liquid Chromatographic Separation
Carbon Isotopes
Resin Fraction (NSOs)
Saturate Fraction
Aromatic Fraction
TLC or MPLC
GC Sat GC Arom
Branched/Cyclic Isolation (B/Cs)
Chromatographic Clean up Procedure
GC B/Cs High Resolution GC of Aromatics
GC-MS Analysis
Page 4 of 20
gd003.v2-Aug02
GEOTECHNICAL SERVICES PTY LTD
Headspace/cuttings gas analyses are used as a screening technique to identify zones of significant gas generation and out-of-place gas (Letran et al, 1974). The classification for gas content is listed below:
Total gas content Description (C1;C2-C4; or C5-C7) 10 -100ppm very lean - lean 100-1,000 lean - moderate 1,000-10,000 moderate - rich 10,000-100,000 rich - very rich The abundance of C2-C4 components (wet gas) is used to locate the zone of oil generation,
since wet gas is commonly associated with petroleum (Fuex, 1977). It is important to ensure that the gases analysed are not of a biogenic origin, so an anti-
bacterial agent must be added to the cuttings when they are stored in water. 2.1.2 Sample Preparation Depending on drilling mud content, cuttings samples may be water washed before they are air
dried, picked free of contaminants and cavings, and then crushed to 0.1mm using a ring pulveriser.
Sidewall cores are freed of mud cake and other visible contaminants, sampled according to
homogeneity, air dried and hand crushed to 0.1mm grain size. Conventional core and outcrop samples are inspected for visible contaminants and crushed to
1/8" chips using a jaw crusher. After air drying, the chips are crushed with a ring pulveriser to small particle size (0.1mm).
Petroleum aqueous mixtures are separated into oil and water/mud fractions by decanting off
the oil layer and producing a clean separation by gently centrifuging the oil. If separation by this method is not effective, the petroleum is solvent extracted.
Page 5 of 20
gd003.v2-Aug02
GEOTECHNICAL SERVICES PTY LTD
2.1.3 Total Organic Carbon(TOC) The TOC value is determined on crushed sediment. The minimum sample requirement is one
gram, however, results may be obtained from as little as 0.2mg in very rich samples. Carbonate minerals are first removed by acid digest (HCl) and the remaining sample heated to 1700oC (Leco Induction Furnace) in an atmosphere of pure oxygen. The CO2 produced is measured with an infra-red detector, and values calculated according to standard calibration.
TOC is expressed as % of rock and is used as a screening procedure to classify source rock
richness: Classification Clastics Carbonates Poor 0.00 - 0.50 0.00 - 0.25 Fair 0.50 - 1.00 0.25 - 0.50 Good 1.00 - 2.00 0.50 - 1.00 Very Good 2.00 - 4.00 1.00 - 2.00 Excellent > 4.00 > 2.00 2.1.4 Rock-Eval Pyrolysis Although a preliminary source rock classification is made using TOC data, a more accurate
assessment of organic source type and maturity is possible by Rock-Eval pyrolysis. Two types of Rock-Eval analyses are offered: "one run" which involves pyrolysis of the crushed but otherwise untreated sediment and "two run" which involves pyrolysis of both the crushed, untreated sediment and the decarbonated sediment. The "two run" method provides more accurate S3 values that the "one run" method. S1 and S2 values are of the same accuracy in both methods.
The method requires 0.4g of sample material, although reliable results can often be obtained
from smaller amounts. The crushed sediment is heated in an inert atmosphere of helium over a programmed
temperature range. Hydrocarbons present in the free or adsorbed state (S1) are thermally distilled at 300oC and
measured by a flame ionisation detector (FID). Hydrocarbons are then cracked from the kerogen (S2) during a temperature ramp from 300o to 550oC and also measured by FID. CO2 released during the kerogen cracking process (S3) is trapped and subsequently measured by a thermal conductivity detector.
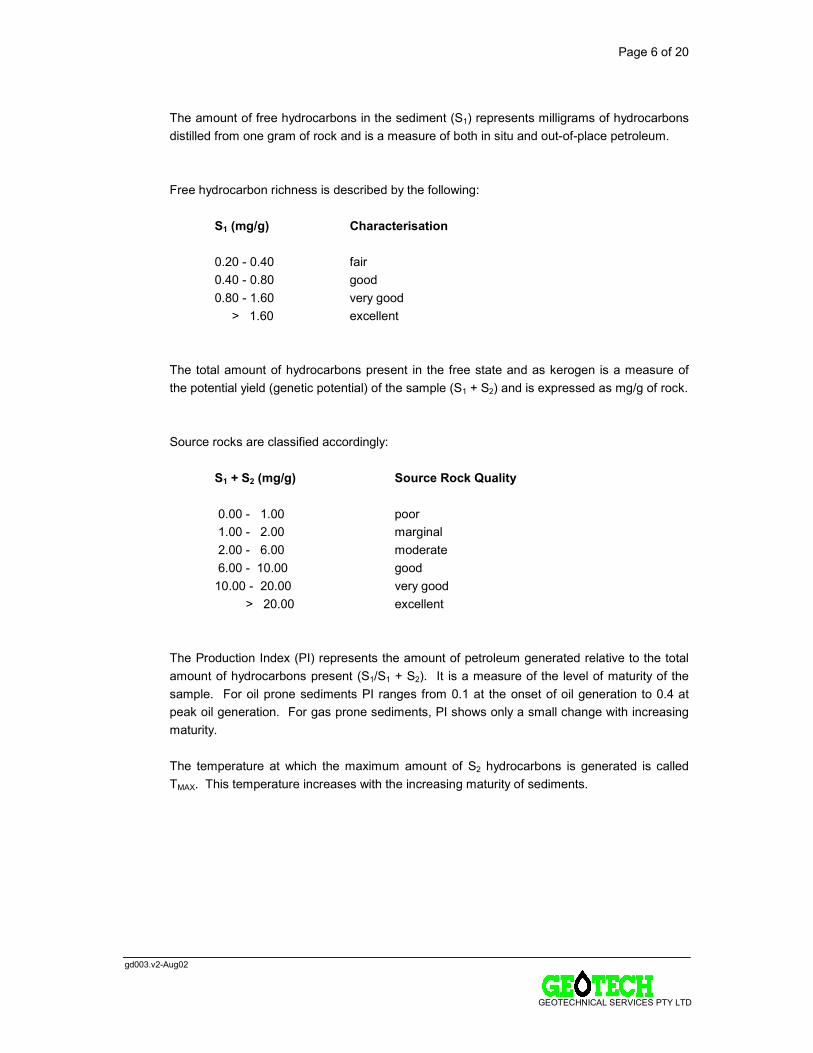
Page 6 of 20
gd003.v2-Aug02
GEOTECHNICAL SERVICES PTY LTD
The amount of free hydrocarbons in the sediment (S1) represents milligrams of hydrocarbons
distilled from one gram of rock and is a measure of both in situ and out-of-place petroleum. Free hydrocarbon richness is described by the following: S1 (mg/g) Characterisation
0.20 - 0.40 fair 0.40 - 0.80 good 0.80 - 1.60 very good > 1.60 excellent
The total amount of hydrocarbons present in the free state and as kerogen is a measure of
the potential yield (genetic potential) of the sample (S1 + S2) and is expressed as mg/g of rock. Source rocks are classified accordingly: S1 + S2 (mg/g) Source Rock Quality 0.00 - 1.00 poor 1.00 - 2.00 marginal 2.00 - 6.00 moderate 6.00 - 10.00 good 10.00 - 20.00 very good > 20.00 excellent The Production Index (PI) represents the amount of petroleum generated relative to the total
amount of hydrocarbons present (S1/S1 + S2). It is a measure of the level of maturity of the sample. For oil prone sediments PI ranges from 0.1 at the onset of oil generation to 0.4 at peak oil generation. For gas prone sediments, PI shows only a small change with increasing maturity.
The temperature at which the maximum amount of S2 hydrocarbons is generated is called
TMAX. This temperature increases with the increasing maturity of sediments.
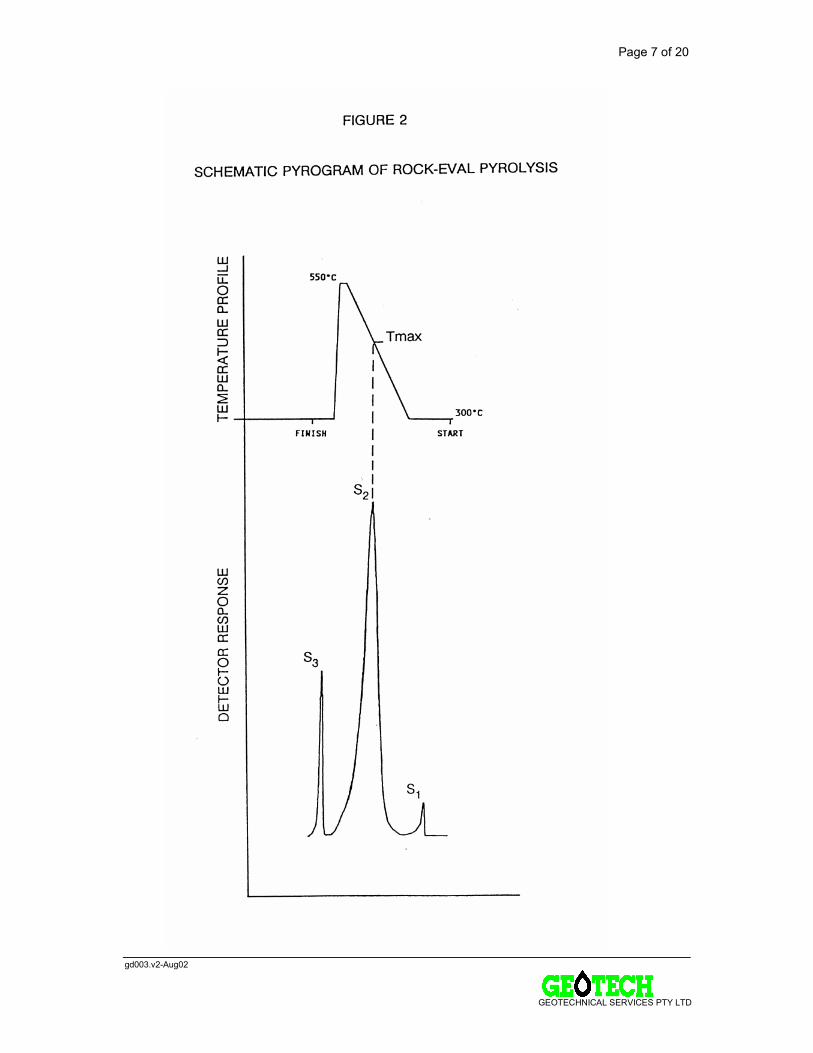
Page 7 of 20
gd003.v2-Aug02
GEOTECHNICAL SERVICES PTY LTD
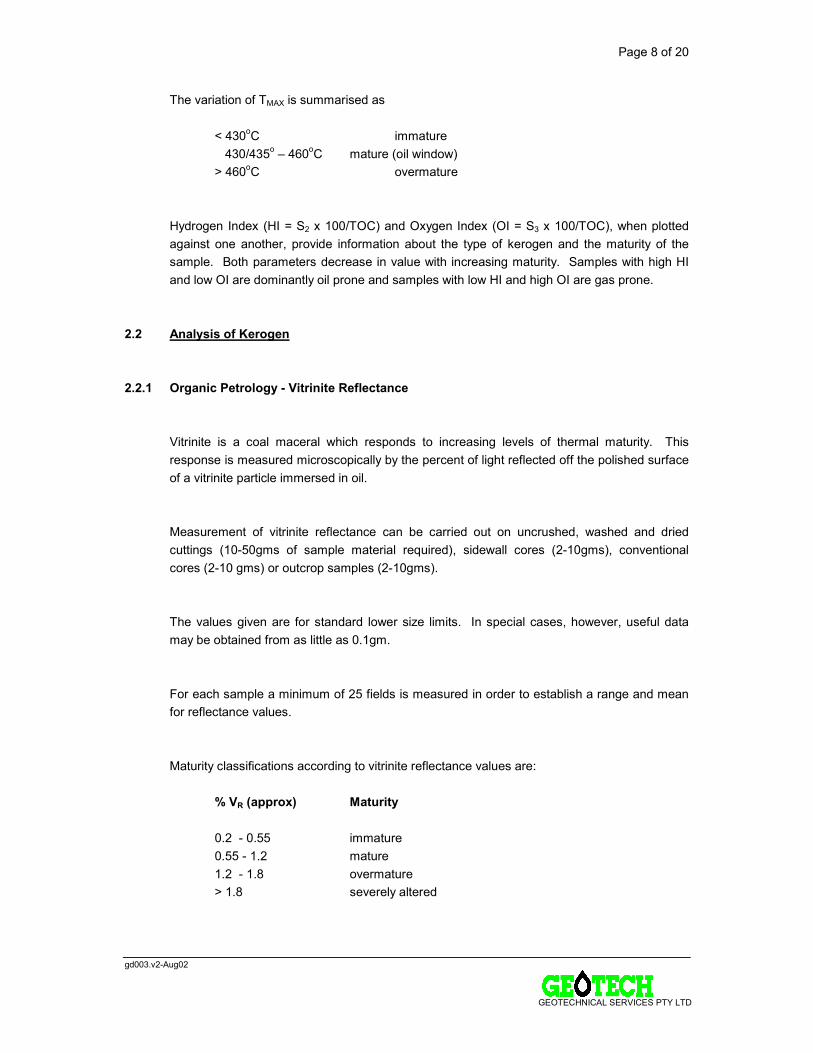
Page 8 of 20
gd003.v2-Aug02
GEOTECHNICAL SERVICES PTY LTD
The variation of TMAX is summarised as < 430oC immature 430/435o 460oC mature (oil window) > 460oC overmature Hydrogen Index (HI = S2 x 100/TOC) and Oxygen Index (OI = S3 x 100/TOC), when plotted
against one another, provide information about the type of kerogen and the maturity of the sample. Both parameters decrease in value with increasing maturity. Samples with high HI and low OI are dominantly oil prone and samples with low HI and high OI are gas prone.
2.2 Analysis of Kerogen 2.2.1 Organic Petrology - Vitrinite Reflectance Vitrinite is a coal maceral which responds to increasing levels of thermal maturity. This
response is measured microscopically by the percent of light reflected off the polished surface of a vitrinite particle immersed in oil.
Measurement of vitrinite reflectance can be carried out on uncrushed, washed and dried
cuttings (10-50gms of sample material required), sidewall cores (2-10gms), conventional cores (2-10 gms) or outcrop samples (2-10gms).
The values given are for standard lower size limits. In special cases, however, useful data
may be obtained from as little as 0.1gm. For each sample a minimum of 25 fields is measured in order to establish a range and mean
for reflectance values. Maturity classifications according to vitrinite reflectance values are: % VR (approx) Maturity 0.2 - 0.55 immature 0.55 - 1.2 mature 1.2 - 1.8 overmature > 1.8 severely altered
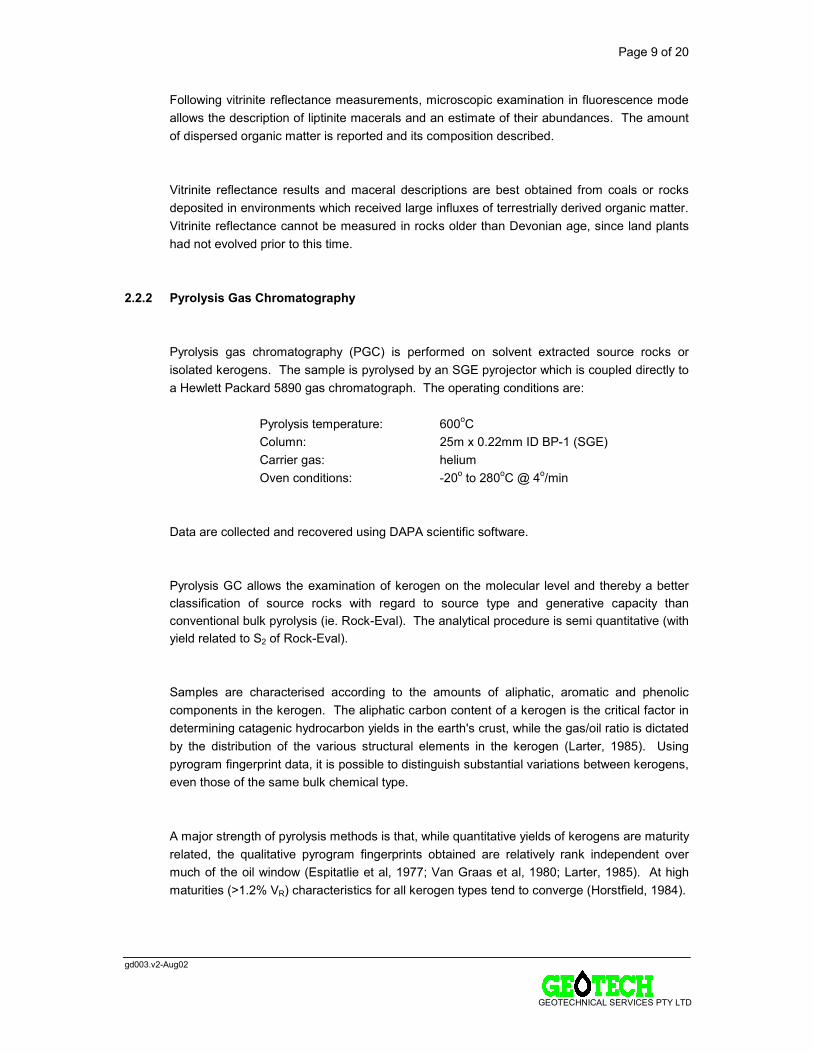
Page 9 of 20
gd003.v2-Aug02
GEOTECHNICAL SERVICES PTY LTD
Following vitrinite reflectance measurements, microscopic examination in fluorescence mode allows the description of liptinite macerals and an estimate of their abundances. The amount of dispersed organic matter is reported and its composition described.
Vitrinite reflectance results and maceral descriptions are best obtained from coals or rocks
deposited in environments which received large influxes of terrestrially derived organic matter. Vitrinite reflectance cannot be measured in rocks older than Devonian age, since land plants had not evolved prior to this time.
2.2.2 Pyrolysis Gas Chromatography Pyrolysis gas chromatography (PGC) is performed on solvent extracted source rocks or
isolated kerogens. The sample is pyrolysed by an SGE pyrojector which is coupled directly to a Hewlett Packard 5890 gas chromatograph. The operating conditions are:
Pyrolysis temperature: 600oC Column: 25m x 0.22mm ID BP-1 (SGE) Carrier gas: helium Oven conditions: -20o to 280oC @ 4o/min Data are collected and recovered using DAPA scientific software. Pyrolysis GC allows the examination of kerogen on the molecular level and thereby a better
classification of source rocks with regard to source type and generative capacity than conventional bulk pyrolysis (ie. Rock-Eval). The analytical procedure is semi quantitative (with yield related to S2 of Rock-Eval).
Samples are characterised according to the amounts of aliphatic, aromatic and phenolic components in the kerogen. The aliphatic carbon content of a kerogen is the critical factor in determining catagenic hydrocarbon yields in the earth's crust, while the gas/oil ratio is dictated by the distribution of the various structural elements in the kerogen (Larter, 1985). Using pyrogram fingerprint data, it is possible to distinguish substantial variations between kerogens, even those of the same bulk chemical type.
A major strength of pyrolysis methods is that, while quantitative yields of kerogens are maturity
related, the qualitative pyrogram fingerprints obtained are relatively rank independent over much of the oil window (Espitatlie et al, 1977; Van Graas et al, 1980; Larter, 1985). At high maturities (>1.2% VR) characteristics for all kerogen types tend to converge (Horstfield, 1984).
Page 10 of 20
gd003.v2-Aug02
GEOTECHNICAL SERVICES PTY LTD
Data are presented by percentage and mg/g of individual substances as well as groups of compounds.
Significant parameters are:
(C1 C5)/C6 + abundance gas/oil ratio
C9 C31 (alkenes + alkanes) oil yield
Type Index R: aromaticity
(Larter & Douglas 1979, Larter and Senftle, 1985).
2.3 Detailed Analyses of Petroleum Fluids 2.3.1 Solvent Extraction of Sediment The finely crushed sample (up to 100g) is extracted with dichloromethane (300mL) using
sonic vibration. After Buchner flask filtration, the filtrate is re-vibrated with activated copper powder (1g) to remove elemental sulphur. The extractable organic matter (EOM) is afforded by further filtration and fractional distillation of the solvent.
Source rock richness based upon EOM is classified accordingly: Yield ppm Poor < 500 Fair/Good 500 - 2000 Very Good 2000 - 4000 Excellent >4000
Page 11 of 20
gd003.v2-Aug02
GEOTECHNICAL SERVICES PTY LTD
2.3.2 Liquid Chromatographic Separation Sediment extracts, crude oil and condensate samples are separated into fractions
corresponding to three structural types: saturated hydrocarbons (SAT) aromatic hydrocarbons (AROM) resins plus ashphaltenes (NSO) This separation is achieved by liquid column chromatography using activated silicic acid
adsorbent and eluting solvents of varying polarity. Saturated, aromatic and NSO concentrates are recovered by fractional distillation/evaporation of the solvent and quantitative transfer to a small vial.
The amount of hydrocarbons (SAT plus AROM) can be used to classify source rock richness
and the amount of saturates to classify oil source potential, according to the following criteria: Classification ppm HC ppm SAT Poor 0 - 300 0 - 200 Fair 300 - 600 200 - 400 Good 600 - 1200 400 - 800 Very Good 1200 - 2400 800 - 1600 Excellent >2400 >1600 The composition of the extracts can also provide information about their levels of maturity
and/or source type (LeTran et. al., 1974; Philippi, 1974). Generally, marine extracts have relatively low concentrations of saturated and NSO compounds at low levels of maturity, but these concentrations increase with increasing maturation. Terrestrially derived organic matter often has a low level of saturates and large amount of aromatic and NSO compounds, irrespective of the level of maturity.
Specific ratios are measured from solvent extraction and liquid chromatography data which
give an indication of source type and maturity. EOM (mg)/TOC(g) can be used as a maturation indicator when plotted against depth for a given sedimentary sequence. Generally an EOM/TOC value of >100 indicates high maturity. If such a sample has a SAT (mg)/TOC(g) ratio <20, it is likely that the organic matter is gas prone. A value for SAT (mg)/TOC (g) >40 suggests an oil prone source type.
Page 12 of 20
gd003.v2-Aug02
GEOTECHNICAL SERVICES PTY LTD
2.3.3 Capillary Gas Chromatography (GC) C12+ gas chromatography is most commonly carried out on saturate fractions, but in certain
instances it is used to examine whole extracts/oils, aromatic or branched/cyclic fractions. It is also used as a tool to identify contamination. The analyses are performed under the following conditions:
Instruments: Hewlett Packard 5890 Gas Chromatography Injector: SGE 0CI-3 on column Column: 25m x 0.2mm ID BP-1 Injector Temp: 280oC Detector Temp: 320oC Column Temp: 45oC to 280oC at 4o/min Carrier Gas: Hydrogen Data are collected using an IBM compatible PC and DAPA scientific software. 2.3.3.1 C12+ Saturate Gas Chromatography Saturate GC results provide information pertaining to source type, maturity and depositional
environment. The n-alkane distribution from n-C12 to n-C31 is determined from the area under the peaks
representing each of these n-alkanes. The profile can yield information about maturity and source type and is quantified in the C21 + C22/C28 + C29 ratio and Carbon Preference Indices (CPI 1 and 2).
Carbon preference indices: - are approximately 1 for marine samples, regardless of maturity - decrease from 20--> 1 for terrestrial samples as maturity increases The C21 + C22/C28 + C29 ratio is generally >1.5 for aquatic source material and <1.2 for
terrestrial organic matter, however, the values increase with maturity.
wt%)C + C + C + (C x 2 wt%)C + C + C + (C + wt%)C + C + C + (C
= (1) CPI30282624
3129272529272523
wt%)C C (C x 2 wt%)C C (C wt%)C C (C (2) CPI
282624
292725272523
+++++++=
Page 13 of 20
gd003.v2-Aug02
GEOTECHNICAL SERVICES PTY LTD
Pristane/phytane (Pr/Ph) ratios can indicate depositional environments: . <3.0 - relatively reducing depositional environments; . 3.0-4.5 - mixed (reducing/oxidising) environments; . >4.5 - relatively oxidising depositional environments. 2.3.3.2 C1 C31 Whole Oil Gas Chromatography This analytical method is applied to oil and condensate samples. It provides a picture of the
whole oil up to n-C31 and allows quantitation of components with more than 4 carbon atoms. Several parameters are measured which illustrate changes in the degree of biodegradation and water washing in the reservoir. Because these measurements are performed on very volatile components in the oil, care should be taken during sampling, transportation and storage of the fluid to minimise evaporation.
Whole oil analytical conditions are listed below: Instrument: Shimadzu GC-9A Column: 25m x 0.2mm ID BP-1 Injector/Detector Temperature: 290oC Column Temperature: -20oC to 280oC at 4o/min Carrier Gas: hydrogen 2.3.4 Carbon Isotope Analysis This measurement is normally carried out on one or more of the following mixtures: topped oil,
saturate fraction, aromatic fraction, NSO fraction. The organic matter is combusted in oxygen to produce carbon dioxide which is purified and transferred to an isotope mass spectrometer. The carbon isotope ratio (δC13/δC12) is measured and compared to an international standard (the Peedee Belemnite Limestone - PDB).
Carbon isotope analysis is most commonly used to identify the source of methane according
to the following criteria (Fuex 1977): δδδδ13C o/oo PDB Source -75 to -55 Biogenic methane -58 to -40 Methane associated with oil -40 to -25 Thermal methane
Page 14 of 20
gd003.v2-Aug02
GEOTECHNICAL SERVICES PTY LTD
Source rock-crude oil correlations have been attempted by observing the change in δ13C values of components of oils and rocks (Stahl 1977). Source rock extracts are usually isotopically heavier than the corresponding crude oil but are lighter than the asphaltenes of the oil and the kerogen of the rock (Hunt 1979). It has also been observed that marine organic carbon is generally isotopically heavier than contemporaneous terrestrial organic carbon (Tissot & Welte 1978). However, it should be noted that increasing maturity and biodegradation produce a shift toward heavier isotope values.
2.3.5 Gas Chromatography - Mass Spectrometry (GC/MS) GC/MS analysis is normally performed on the branched and cyclic alkane fraction and/or the
aromatic fraction of oils, condensates and sediment extracts. The specific fraction is first isolated and then injected into a gas chromatograph which is linked in series with a mass spectrometer. As compounds are eluted from the chromatography column they are bombarded with high energy electrons. This causes them to fragment into a number of ions each with a molecular weight less than that of the parent molecule. Individual compounds give a characteristic fragmentation pattern (mass spectrum), the major ions of which are presented in a series of mass fragmentograms [ie. plots of ion concentration against GC retention time].
GC/MS analysis can be carried out using one of the following modes of operation: (i) Acquire mode - in which all ions (within a broad range) in each mass spectrum are
memorised by the data system. (ii) Selective Ion Monitoring (SIM) mode - in which only selected ions of interest are
memorised by the data system. 2.3.5.1 GC/MS Analysis of Branched/Cyclic Alkanes The group of compounds to be analysed is first isolated from the saturate fraction by refluxing
the sample with activated 5Ä molecular sieves in cyclohexane for 24 hours. Branched/ cyclic alkanes, including alkylcyclohexanes, are recovered from the solvent by fractional distillation.
For condensates, and samples where information about alkylcyclochexanes is not required,
the saturate fraction is passed through a small column packed with silicalite adsorbent. The branched/cyclic alkanes are recovered from the eluting solvent by fractional distillation.
Analysis is carried out in the SIM mode with a total of 33 ions being recorded over different
time spans.
Page 15 of 20
gd003.v2-Aug02
GEOTECHNICAL SERVICES PTY LTD
Operating conditions are: Instrument: 5987HP GC mass spec data system Column: 60m x 0.25mm ID cross linked methyl-silicone DB-1 (J&W)
column of 0.25 micron film thickness connected directly to the ion source
Injector: OCI-3(SGE) Carrier gas: hydrogen Oven Conditions: 50o to 274oC at 8o /min 274o to 280oC at 1o /min EM Voltage: 2,000 - 2,300V Electron Energy: 70eV Source temperature: 250oC GC/MS mass fragmentograms are examined for particular 'biomarker' compounds which can
be related to biological precursors. These allow the characterisation of petroleum with regard to thermal maturity, source, depositional environment and biodegradation.
The significance of selected parameters from branched/cyclic GC/MS analysis is outlined over
the page. 1. 18αααα (H)-hopane/17αααα (H)-hopane (Ts/Tm) Maturity indicator. The ratio of 18α (H) trisnorhopane to 17α (H) trisnorhopane increases
exponentially with increasing maturity from approximately 0.2 at the onset to approximately 1.0 at the peak of oil generation, ie. Tm decreases with maturity. This parameter is not reliable in very immature samples.
2. C30 hopane/C30 moretane Maturity indicator. The conversion of C30 17β, 21β hopane to 17β, 21α moretane is maturity
dependent. Values increase from approximately 2.5 at the onset of oil generation to approximately 10. Once the hopane/moretane ratio has reached 10, no further changes occur. A value of 10 is believed to represent a maturity stage just after the onset of oil generation and hopane/moretane ratios are therefore useful mainly as indicators of immaturity in a qualitative sense.
Page 16 of 20
gd003.v2-Aug02
GEOTECHNICAL SERVICES PTY LTD
3&4. C31 and C32 22S/22R hopanes Maturity indicator. An equilibrium between the biological R- and the geological S-
configuration occurs on mild thermal maturation. A ratio of S:R = 60:40, ie, a value of 1.5, characterises this equilibrium which occurs before the onset of oil generation. The C32 hopane pair is often more reliable for this purpose since co-elution sometimes affects the C31 ratio.
5. C2920S αααααααααααα/C2920Rαααααααααααα steranes Maturity indicator. Upon maturation, the biologically produced 20R sterioisomer is diminished
relative to the 20S form and a stabilisation is reached at approximately 55% 20R and 45% 20S compounds. VR equivalents are approximately 0.45% for a 20S/20R value of 0.2 and 0.8% for a 20S/20R value of 0.75. This parameter is most useful between maturity ranges equivalent to 0.4% to 1.0 VR.
6. C2920S αααααααααααααααα /C2920R αααααααααααα+ C2920S αααααααααααα steranes Maturity indicator. This ratio is a different way of expressing the relative abundance of the
biological 20R to the geological 20S normal sterane (see parameter 5). Expressed as a percentage, a value of about 25% indicates the onset of oil generation, and of about 50% the peak of oil generation.
7. C29 ααααββββββββ /C29 αααααααααααα + C29 ααααββββββββ steranes Maturity indicator. The αα form is produced biologically. Its abundance diminishes upon
maturation until a mixture of 65% ββ(iso) steranes and 35% αα (normal) steranes is reached, which is equivalent to approximately 0.9% VR.
8&9. C27/C29 diasteranes and steranes Source indicator. It has been suggested that marine phytoplankton is characterised by a
dominance of C27 steranes and diasteranes whereas a preponderance of C29 compounds indicates strong terrestrial contributions. Values smaller than 0.85 for C27/C29 diasterane and sterane ratios are believed to be indicative for terrestrial organic matter, values between 0.85 and 1.43 for mixed organic material, and values greater than 1.43 for an input of predominantly marine organic matter.
Page 17 of 20
gd003.v2-Aug02
GEOTECHNICAL SERVICES PTY LTD
It has been suggested, however, that marine sediments can also contain a predominance of C29 steranes, so the above rules have to be applied with caution. Any simplistic interpretation of C27/C29 steranes and diasteranes can be dangerous and the interpretation of these data should be consistent with other geological evidence.
10. 18αααα (H) - oleanane/C30 hopane
Source indicator. Oleanane is a triterpenoid compound which has often been reported from deltaic sediments of Late Cretaceous to Tertiary age. It is thought to be derived from certain angiosperms which developed in the late Cretaceous. If the 18α (H) - oleanane/C30 hopane ratio is below 10, no significant proportions of oleanane are present. At higher values, it can be used as indicator for a reducing environment during deposition of land plant-derived organic matter.
11. C29 diasteranes/C29 αααααααααααα steranes + C29 ααααββββ steranes Source indicator. This parameter is used to characterise the oxidity of depositional
environments. High values (up to 10) indicate oxic conditions, low values (down to 0.1) indicate reducing environments.
12. C30 (hopanes + moretanes)/C29 (steranes + diasteranes) Source indicator. Triterpanes are believed to be of prokariotic (bacterial) origin, whereas
steranes are derived from eukariotic organisms. This ratio reflects the preservation of primary organic matter derived from eukariots, relative to growth and preservation of bacteria in the sediment after deposition.
13. C15 drimane/C16 homodrimane Drimanes and homodrimanes are ubiquitous compounds most likely derived from microbial
activity in sediments. The C15 drimane/C16 homodrimane ratio is a useful parameter for correlation purposes in the low molecular weight region, especially for condensates which lack most conventional biomarkers. Drimanes are also useful to assess the degree of biodegradation as the removal of C15 to C16 bicyclics characterises an extensive level of biodegradation.
Page 18 of 20
gd003.v2-Aug02
GEOTECHNICAL SERVICES PTY LTD
14. Rearranged/normal drimanes Like parameter 13, this ratio can be used for correlation purposes in samples without
conventional biomarkers, and to assess levels of biodegradation. 2.3.5.2 GC/MS Analysis of Aromatics The aromatic fraction or the oil to be analysed is first subjected to thin layer chromatography
(TLC) or medium pressure liquid chromatography (MPLC), depending upon the analytical requirements.
1. Di- and tri- nuclear aromatic compounds are isolated by TLC. To effect this
separation, the sample is applied to an alumina coated glass plate (0.6mm thickness). The plate is developed with hexane and the required band located using short wavelength UV light. The fraction is recovered by extraction and fractional distillation.
This aromatic fraction may be analysed by GC-FID, but GC/MS is recommended
because of possible co-elution problems during GC.
Samples are analysed by GC/MS in the acquire mode scanning from 50 to 450 atomic mass units (amu).
Analytical conditions are: Instrument: HP5970 MSD Column: 60m x 0.25mm ID, 0.25 micron film thickness, 5%
phenylmethyl silicone column DB-5 (J&W) connected directly to the ion source
Injector: automatic on-column Carrier Gas: helium Oven Conditions: 70°C for 1 min
70°C --> 300°C at 3°/min Data collection commences at 10 mins Mass spectrometry Em Voltage 1500 - 1800V Electron Energy 70eV Mass fragmentograms are presented for alkylbiphenyls, alkylnaphthalenes, alkylfluorenes and
alkylphenanthrenes from a comprehensive data base. Aromatic compounds provide valuable information concerning thermal maturity since they can be applied outside the dynamic range
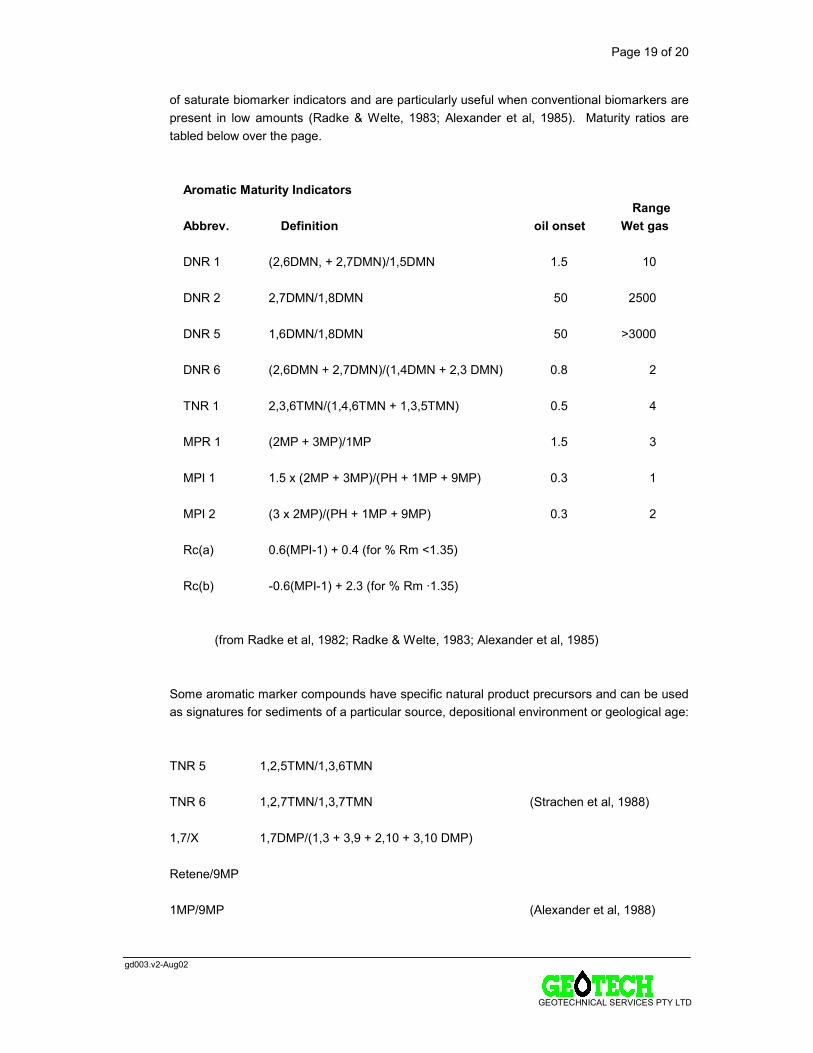
Page 19 of 20
gd003.v2-Aug02
GEOTECHNICAL SERVICES PTY LTD
of saturate biomarker indicators and are particularly useful when conventional biomarkers are present in low amounts (Radke & Welte, 1983; Alexander et al, 1985). Maturity ratios are tabled below over the page.
Aromatic Maturity Indicators Range Abbrev. Definition oil onset Wet gas DNR 1 (2,6DMN, + 2,7DMN)/1,5DMN 1.5 10 DNR 2 2,7DMN/1,8DMN 50 2500 DNR 5 1,6DMN/1,8DMN 50 >3000 DNR 6 (2,6DMN + 2,7DMN)/(1,4DMN + 2,3 DMN) 0.8 2 TNR 1 2,3,6TMN/(1,4,6TMN + 1,3,5TMN) 0.5 4 MPR 1 (2MP + 3MP)/1MP 1.5 3 MPI 1 1.5 x (2MP + 3MP)/(PH + 1MP + 9MP) 0.3 1 MPI 2 (3 x 2MP)/(PH + 1MP + 9MP) 0.3 2 Rc(a) 0.6(MPI-1) + 0.4 (for % Rm <1.35) Rc(b) -0.6(MPI-1) + 2.3 (for % Rm ·1.35) (from Radke et al, 1982; Radke & Welte, 1983; Alexander et al, 1985) Some aromatic marker compounds have specific natural product precursors and can be used
as signatures for sediments of a particular source, depositional environment or geological age: TNR 5 1,2,5TMN/1,3,6TMN TNR 6 1,2,7TMN/1,3,7TMN (Strachen et al, 1988) 1,7/X 1,7DMP/(1,3 + 3,9 + 2,10 + 3,10 DMP) Retene/9MP 1MP/9MP (Alexander et al, 1988)

Page 20 of 20
gd003.v2-Aug02
GEOTECHNICAL SERVICES PTY LTD
2. Mono- and triaromatic steranes are analysed by GC/MS under the same analytical conditions as used for di- and tri-nuclear aromatics. However, isolation of this fraction is performed by MPLC. To achieve this, the saturate plus aromatic mixture is injected onto a Merck Si60 column. The separation is monitored with a refractive index detector for saturates and a UV absorbance detector for aromatics.
As aromatic steranes are generally present in low abundances, especially in oils,
samples are analysed in the SIM mode and 16 ions are recorded.
The conversion of monoaromatic steranes to triaromatic steranes and the dimethylation of triaromatic steranes in sediments are considered to be maturity dependent (Mackenzie et al, 1981; Mackenzie, 1984). The triaromatic sterane maturity indicator should, however, not be applied to crude oils because migration effects appear to selectively deplete the triaromatic steranes.

Origin Energy Resources Ltd ABN 66 007 845 338 Commercial-in-Confidence Greenfields Division Ref: W:\Complete Reports\BASS\Yolla\Yolla 4\Interpretive\Yolla4InterpretativeDataWCR with appendix headers.docc
AAPPPPEENNDDIIXX 55:: VVIITTRRIINNIITTEE RREEFFLLEECCTTAANNCCEE RREEPPOORRTT
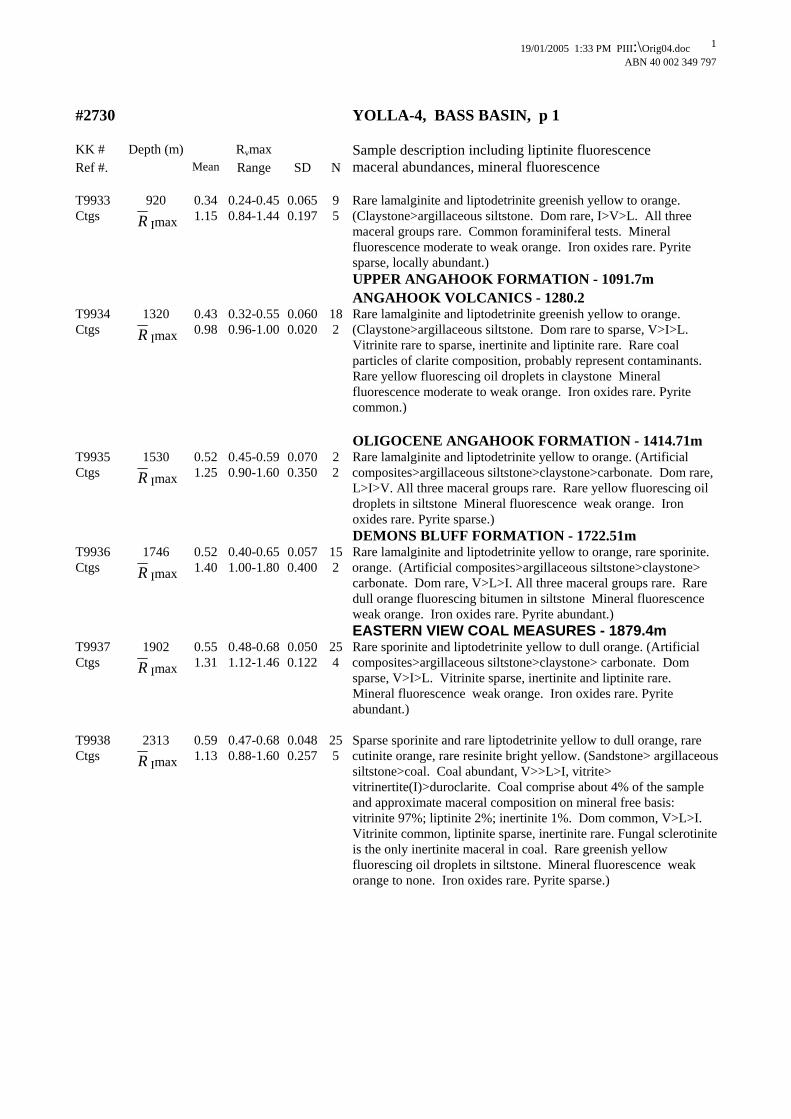
19/01/2005 1:33 PM PIII:\Orig04.doc ABN 40 002 349 797
1
#2730 YOLLA-4, BASS BASIN, p 1 KK # Depth (m) Rvmax Sample description including liptinite fluorescence Ref #. Mean Range SD N maceral abundances, mineral fluorescence T9933 920 0.34 0.24-0.45 0.065 9 Rare lamalginite and liptodetrinite greenish yellow to orange. Ctgs R Imax 1.15 0.84-1.44 0.197 5 (Claystone>argillaceous siltstone. Dom rare, I>V>L. All three
maceral groups rare. Common foraminiferal tests. Mineral fluorescence moderate to weak orange. Iron oxides rare. Pyrite sparse, locally abundant.)
UPPER ANGAHOOK FORMATION - 1091.7m ANGAHOOK VOLCANICS - 1280.2 T9934 1320 0.43 0.32-0.55 0.060 18 Rare lamalginite and liptodetrinite greenish yellow to orange. Ctgs R Imax 0.98 0.96-1.00 0.020 2 (Claystone>argillaceous siltstone. Dom rare to sparse, V>I>L.
Vitrinite rare to sparse, inertinite and liptinite rare. Rare coal particles of clarite composition, probably represent contaminants. Rare yellow fluorescing oil droplets in claystone Mineral fluorescence moderate to weak orange. Iron oxides rare. Pyrite common.)
OLIGOCENE ANGAHOOK FORMATION - 1414.71m T9935 1530 0.52 0.45-0.59 0.070 2 Rare lamalginite and liptodetrinite yellow to orange. (Artificial Ctgs R Imax 1.25 0.90-1.60 0.350 2 composites>argillaceous siltstone>claystone>carbonate. Dom rare,
L>I>V. All three maceral groups rare. Rare yellow fluorescing oil droplets in siltstone Mineral fluorescence weak orange. Iron oxides rare. Pyrite sparse.)
DEMONS BLUFF FORMATION - 1722.51m T9936 1746 0.52 0.40-0.65 0.057 15 Rare lamalginite and liptodetrinite yellow to orange, rare sporinite. Ctgs R Imax 1.40 1.00-1.80 0.400 2 orange. (Artificial composites>argillaceous siltstone>claystone>
carbonate. Dom rare, V>L>I. All three maceral groups rare. Rare dull orange fluorescing bitumen in siltstone Mineral fluorescence weak orange. Iron oxides rare. Pyrite abundant.)
EASTERN VIEW COAL MEASURES - 1879.4m T9937 1902 0.55 0.48-0.68 0.050 25 Rare sporinite and liptodetrinite yellow to dull orange. (Artificial Ctgs R Imax 1.31 1.12-1.46 0.122 4 composites>argillaceous siltstone>claystone> carbonate. Dom
sparse, V>I>L. Vitrinite sparse, inertinite and liptinite rare. Mineral fluorescence weak orange. Iron oxides rare. Pyrite abundant.)
T9938 2313 0.59 0.47-0.68 0.048 25 Sparse sporinite and rare liptodetrinite yellow to dull orange, rare Ctgs R Imax 1.13 0.88-1.60 0.257 5 cutinite orange, rare resinite bright yellow. (Sandstone> argillaceous
siltstone>coal. Coal abundant, V>>L>I, vitrite> vitrinertite(I)>duroclarite. Coal comprise about 4% of the sample and approximate maceral composition on mineral free basis: vitrinite 97%; liptinite 2%; inertinite 1%. Dom common, V>L>I. Vitrinite common, liptinite sparse, inertinite rare. Fungal sclerotinite is the only inertinite maceral in coal. Rare greenish yellow fluorescing oil droplets in siltstone. Mineral fluorescence weak orange to none. Iron oxides rare. Pyrite sparse.)
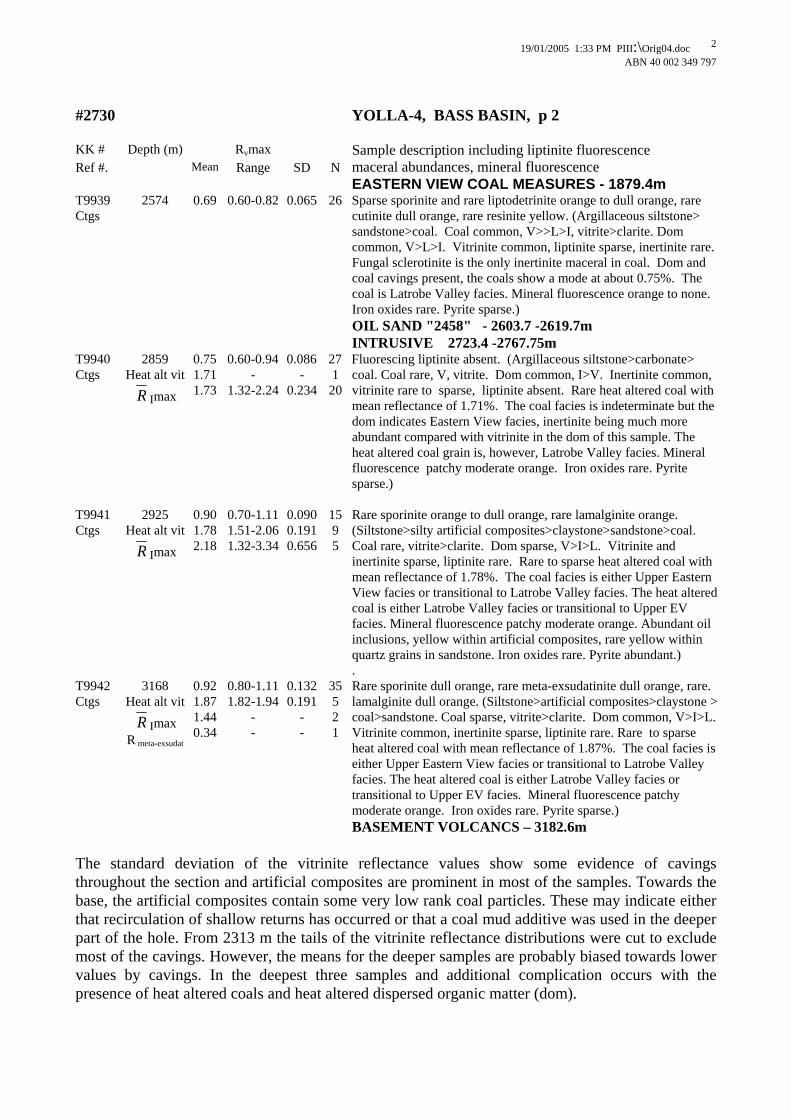
19/01/2005 1:33 PM PIII:\Orig04.doc ABN 40 002 349 797
2
#2730 YOLLA-4, BASS BASIN, p 2 KK # Depth (m) Rvmax Sample description including liptinite fluorescence Ref #. Mean Range SD N maceral abundances, mineral fluorescence EASTERN VIEW COAL MEASURES - 1879.4m T9939 2574 0.69 0.60-0.82 0.065 26 Sparse sporinite and rare liptodetrinite orange to dull orange, rare Ctgs cutinite dull orange, rare resinite yellow. (Argillaceous siltstone>
sandstone>coal. Coal common, V>>L>I, vitrite>clarite. Dom common, V>L>I. Vitrinite common, liptinite sparse, inertinite rare. Fungal sclerotinite is the only inertinite maceral in coal. Dom and coal cavings present, the coals show a mode at about 0.75%. The coal is Latrobe Valley facies. Mineral fluorescence orange to none. Iron oxides rare. Pyrite sparse.)
OIL SAND "2458" - 2603.7 -2619.7m INTRUSIVE 2723.4 -2767.75m T9940 2859 0.75 0.60-0.94 0.086 27 Fluorescing liptinite absent. (Argillaceous siltstone>carbonate> Ctgs Heat alt vit
R Imax 1.71 1.73
- 1.32-2.24
- 0.234
1 20
coal. Coal rare, V, vitrite. Dom common, I>V. Inertinite common, vitrinite rare to sparse, liptinite absent. Rare heat altered coal with mean reflectance of 1.71%. The coal facies is indeterminate but the dom indicates Eastern View facies, inertinite being much more abundant compared with vitrinite in the dom of this sample. The heat altered coal grain is, however, Latrobe Valley facies. Mineral fluorescence patchy moderate orange. Iron oxides rare. Pyrite sparse.)
T9941 2925 0.90 0.70-1.11 0.090 15 Rare sporinite orange to dull orange, rare lamalginite orange. Ctgs Heat alt vit
R Imax 1.78 2.18
1.51-2.06 1.32-3.34
0.191 0.656
9 5
(Siltstone>silty artificial composites>claystone>sandstone>coal. Coal rare, vitrite>clarite. Dom sparse, V>I>L. Vitrinite and inertinite sparse, liptinite rare. Rare to sparse heat altered coal with mean reflectance of 1.78%. The coal facies is either Upper Eastern View facies or transitional to Latrobe Valley facies. The heat altered coal is either Latrobe Valley facies or transitional to Upper EV facies. Mineral fluorescence patchy moderate orange. Abundant oil inclusions, yellow within artificial composites, rare yellow within quartz grains in sandstone. Iron oxides rare. Pyrite abundant.)
. T9942 3168 0.92 0.80-1.11 0.132 35 Rare sporinite dull orange, rare meta-exsudatinite dull orange, rare. Ctgs Heat alt vit
R Imax R meta-exsudat
1.87 1.44 0.34
1.82-1.94 - -
0.191- -
5 2 1
lamalginite dull orange. (Siltstone>artificial composites>claystone > coal>sandstone. Coal sparse, vitrite>clarite. Dom common, V>I>L. Vitrinite common, inertinite sparse, liptinite rare. Rare to sparse heat altered coal with mean reflectance of 1.87%. The coal facies is either Upper Eastern View facies or transitional to Latrobe Valley facies. The heat altered coal is either Latrobe Valley facies or transitional to Upper EV facies. Mineral fluorescence patchy moderate orange. Iron oxides rare. Pyrite sparse.)
BASEMENT VOLCANCS – 3182.6m The standard deviation of the vitrinite reflectance values show some evidence of cavings throughout the section and artificial composites are prominent in most of the samples. Towards the base, the artificial composites contain some very low rank coal particles. These may indicate either that recirculation of shallow returns has occurred or that a coal mud additive was used in the deeper part of the hole. From 2313 m the tails of the vitrinite reflectance distributions were cut to exclude most of the cavings. However, the means for the deeper samples are probably biased towards lower values by cavings. In the deepest three samples and additional complication occurs with the presence of heat altered coals and heat altered dispersed organic matter (dom).
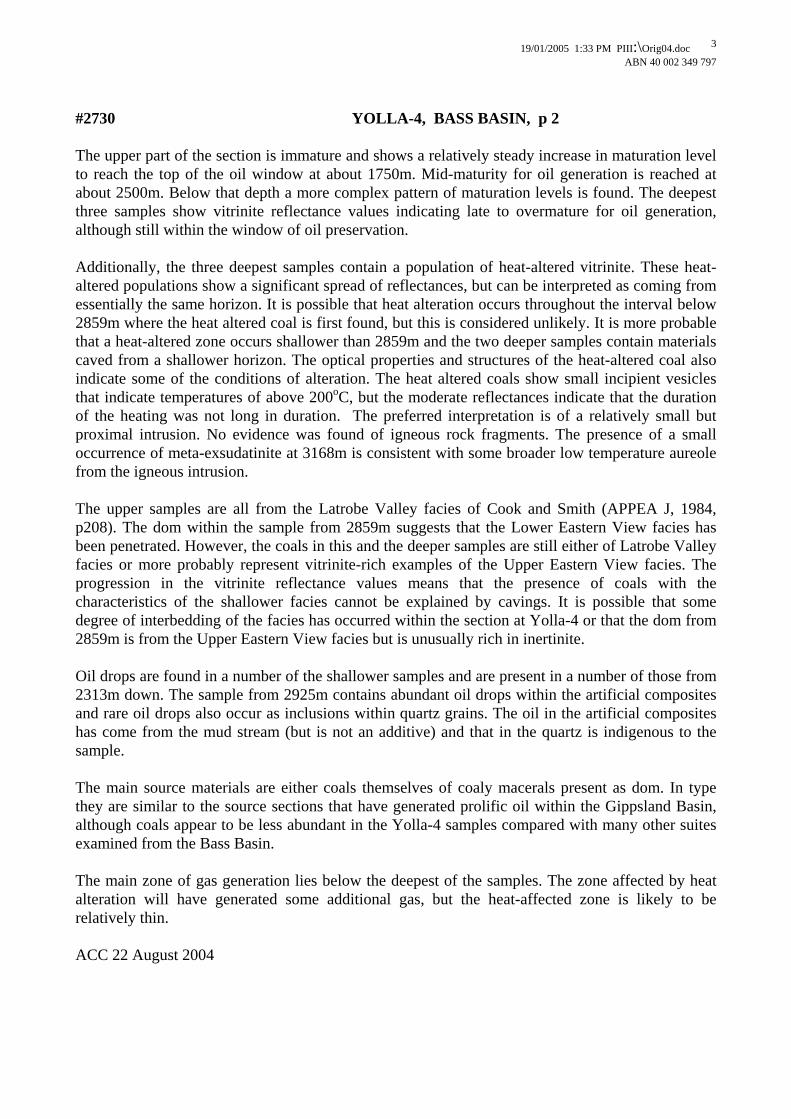
19/01/2005 1:33 PM PIII:\Orig04.doc ABN 40 002 349 797
3
#2730 YOLLA-4, BASS BASIN, p 2 The upper part of the section is immature and shows a relatively steady increase in maturation level to reach the top of the oil window at about 1750m. Mid-maturity for oil generation is reached at about 2500m. Below that depth a more complex pattern of maturation levels is found. The deepest three samples show vitrinite reflectance values indicating late to overmature for oil generation, although still within the window of oil preservation. Additionally, the three deepest samples contain a population of heat-altered vitrinite. These heat-altered populations show a significant spread of reflectances, but can be interpreted as coming from essentially the same horizon. It is possible that heat alteration occurs throughout the interval below 2859m where the heat altered coal is first found, but this is considered unlikely. It is more probable that a heat-altered zone occurs shallower than 2859m and the two deeper samples contain materials caved from a shallower horizon. The optical properties and structures of the heat-altered coal also indicate some of the conditions of alteration. The heat altered coals show small incipient vesicles that indicate temperatures of above 200oC, but the moderate reflectances indicate that the duration of the heating was not long in duration. The preferred interpretation is of a relatively small but proximal intrusion. No evidence was found of igneous rock fragments. The presence of a small occurrence of meta-exsudatinite at 3168m is consistent with some broader low temperature aureole from the igneous intrusion. The upper samples are all from the Latrobe Valley facies of Cook and Smith (APPEA J, 1984, p208). The dom within the sample from 2859m suggests that the Lower Eastern View facies has been penetrated. However, the coals in this and the deeper samples are still either of Latrobe Valley facies or more probably represent vitrinite-rich examples of the Upper Eastern View facies. The progression in the vitrinite reflectance values means that the presence of coals with the characteristics of the shallower facies cannot be explained by cavings. It is possible that some degree of interbedding of the facies has occurred within the section at Yolla-4 or that the dom from 2859m is from the Upper Eastern View facies but is unusually rich in inertinite. Oil drops are found in a number of the shallower samples and are present in a number of those from 2313m down. The sample from 2925m contains abundant oil drops within the artificial composites and rare oil drops also occur as inclusions within quartz grains. The oil in the artificial composites has come from the mud stream (but is not an additive) and that in the quartz is indigenous to the sample. The main source materials are either coals themselves of coaly macerals present as dom. In type they are similar to the source sections that have generated prolific oil within the Gippsland Basin, although coals appear to be less abundant in the Yolla-4 samples compared with many other suites examined from the Bass Basin. The main zone of gas generation lies below the deepest of the samples. The zone affected by heat alteration will have generated some additional gas, but the heat-affected zone is likely to be relatively thin. ACC 22 August 2004
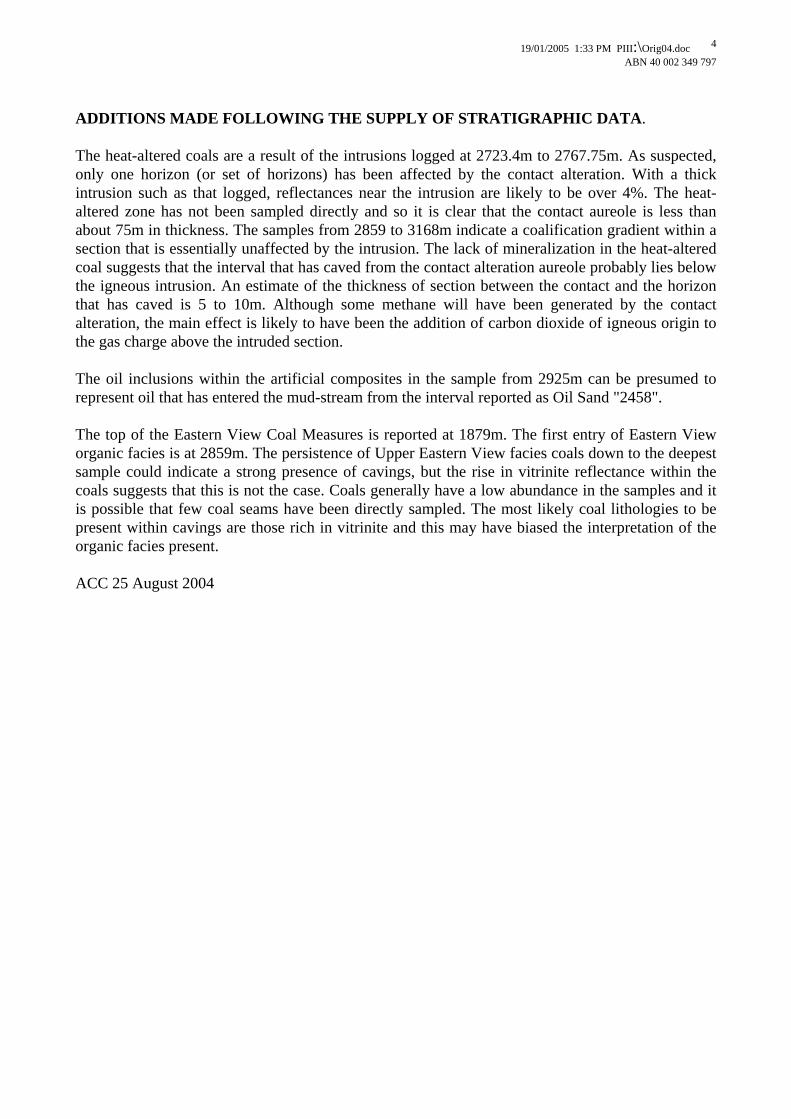
19/01/2005 1:33 PM PIII:\Orig04.doc ABN 40 002 349 797
4
ADDITIONS MADE FOLLOWING THE SUPPLY OF STRATIGRAPHIC DATA. The heat-altered coals are a result of the intrusions logged at 2723.4m to 2767.75m. As suspected, only one horizon (or set of horizons) has been affected by the contact alteration. With a thick intrusion such as that logged, reflectances near the intrusion are likely to be over 4%. The heat-altered zone has not been sampled directly and so it is clear that the contact aureole is less than about 75m in thickness. The samples from 2859 to 3168m indicate a coalification gradient within a section that is essentially unaffected by the intrusion. The lack of mineralization in the heat-altered coal suggests that the interval that has caved from the contact alteration aureole probably lies below the igneous intrusion. An estimate of the thickness of section between the contact and the horizon that has caved is 5 to 10m. Although some methane will have been generated by the contact alteration, the main effect is likely to have been the addition of carbon dioxide of igneous origin to the gas charge above the intruded section. The oil inclusions within the artificial composites in the sample from 2925m can be presumed to represent oil that has entered the mud-stream from the interval reported as Oil Sand "2458". The top of the Eastern View Coal Measures is reported at 1879m. The first entry of Eastern View organic facies is at 2859m. The persistence of Upper Eastern View facies coals down to the deepest sample could indicate a strong presence of cavings, but the rise in vitrinite reflectance within the coals suggests that this is not the case. Coals generally have a low abundance in the samples and it is possible that few coal seams have been directly sampled. The most likely coal lithologies to be present within cavings are those rich in vitrinite and this may have biased the interpretation of the organic facies present. ACC 25 August 2004
HISTOGRAMS FOR YOLLA-4
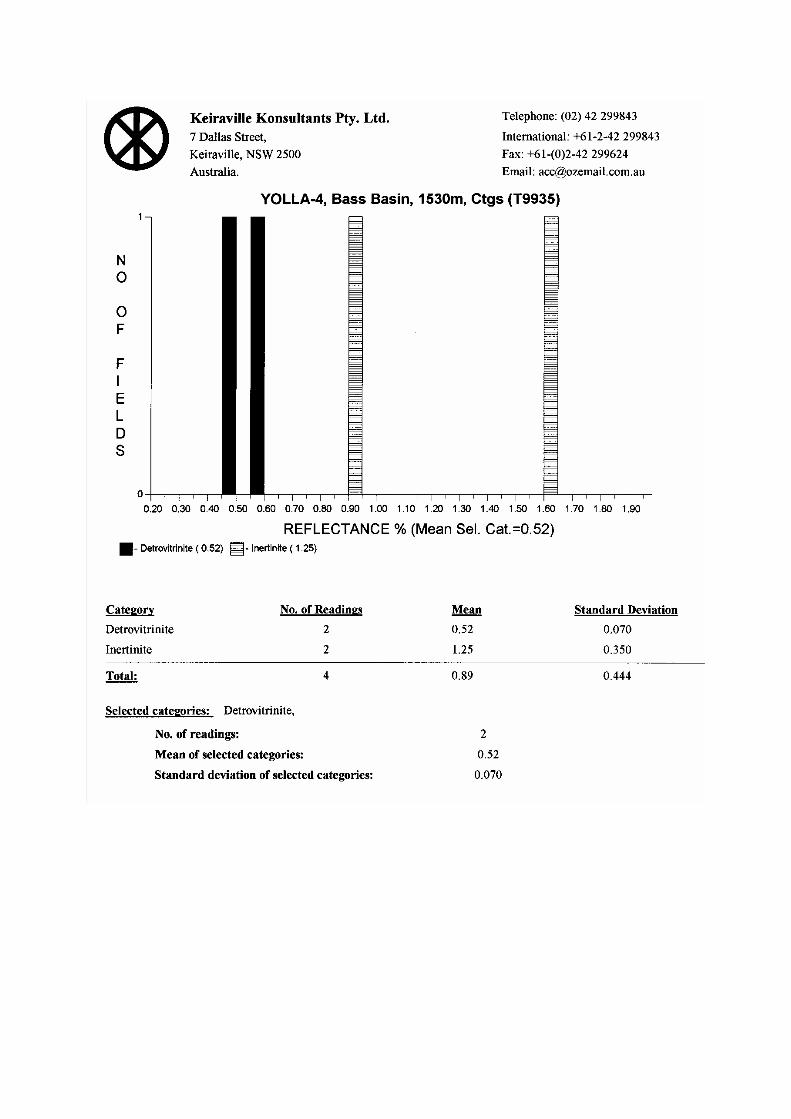
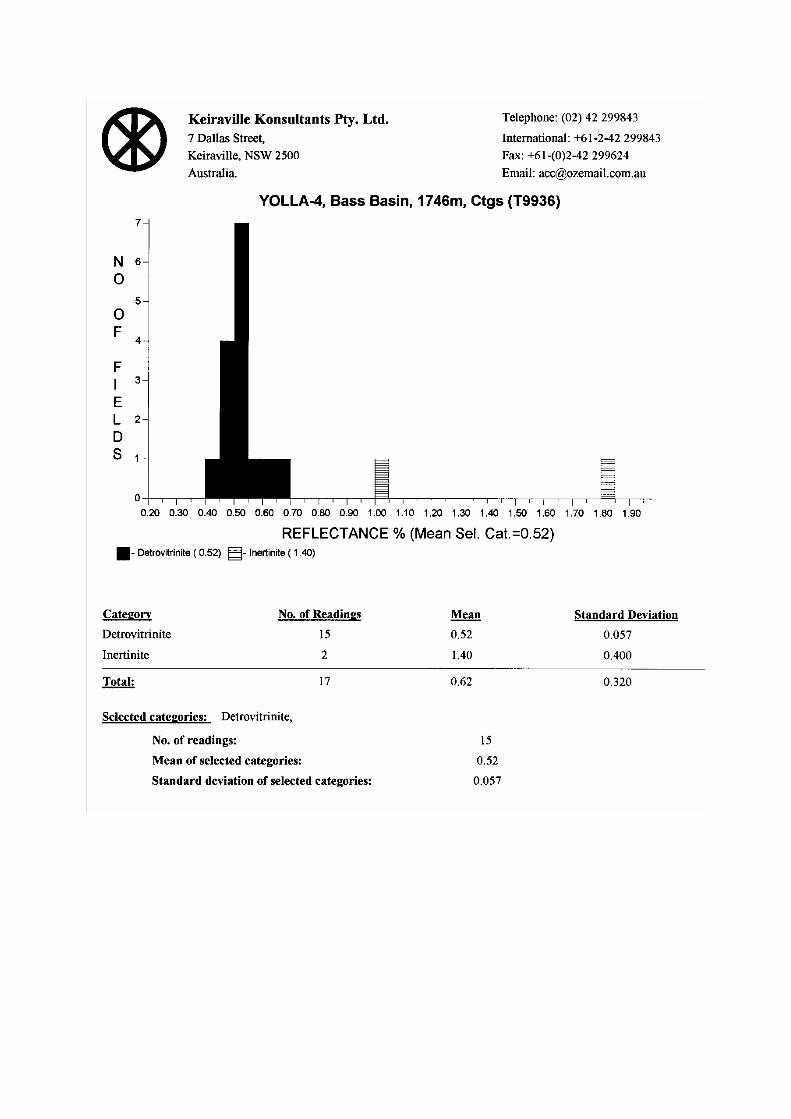
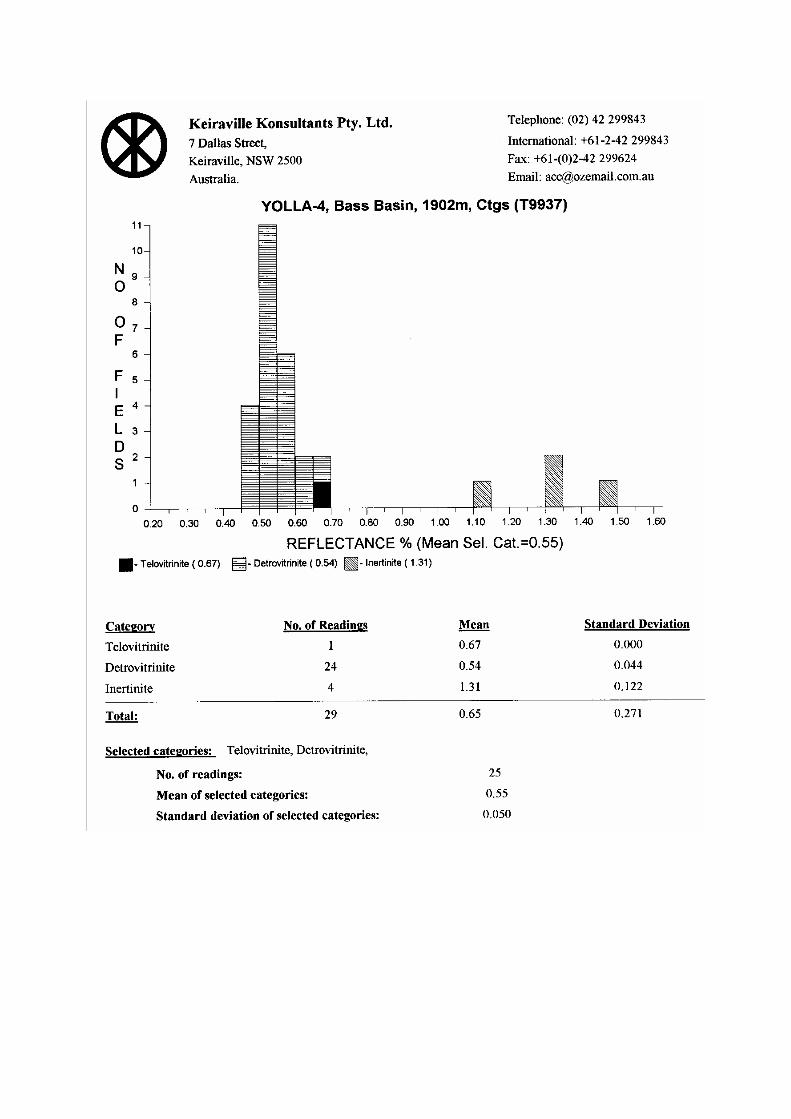
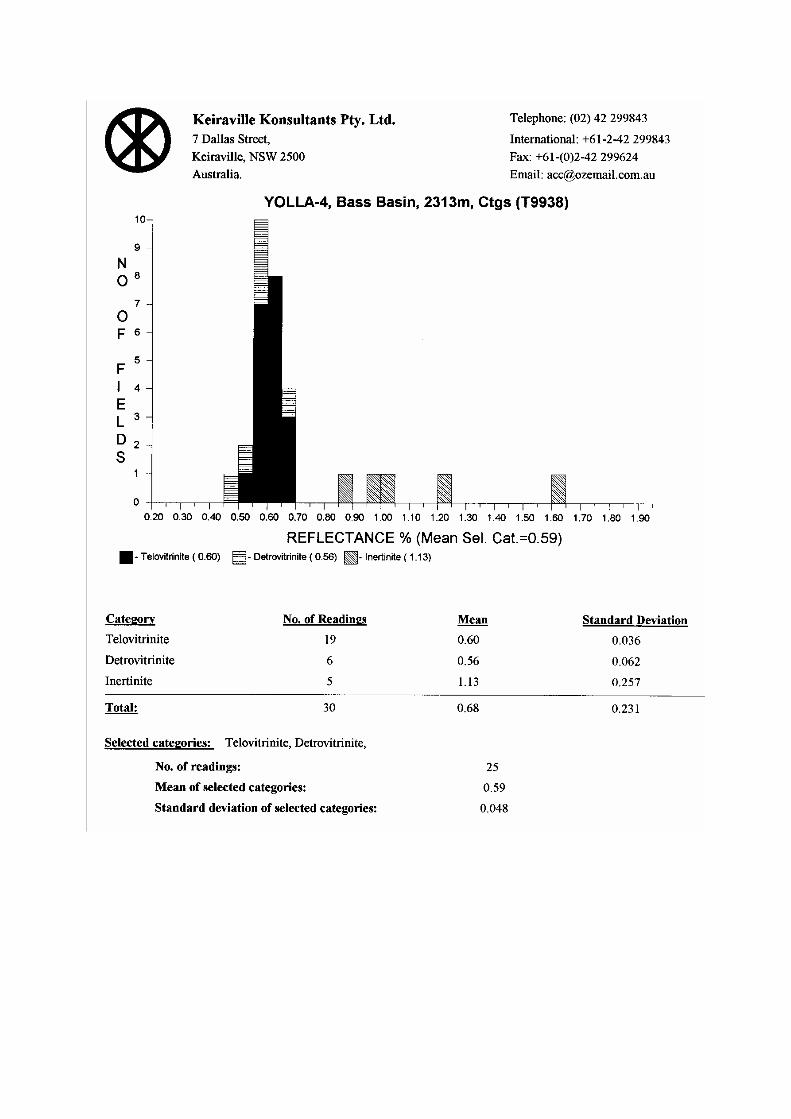
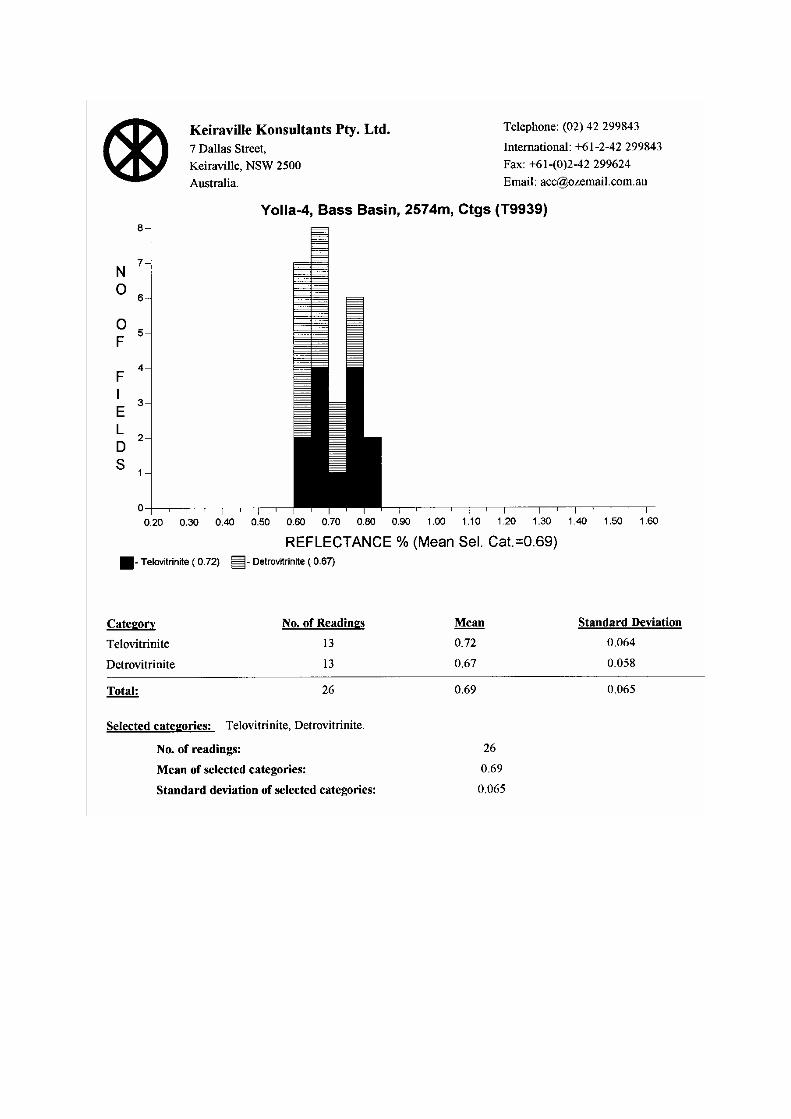
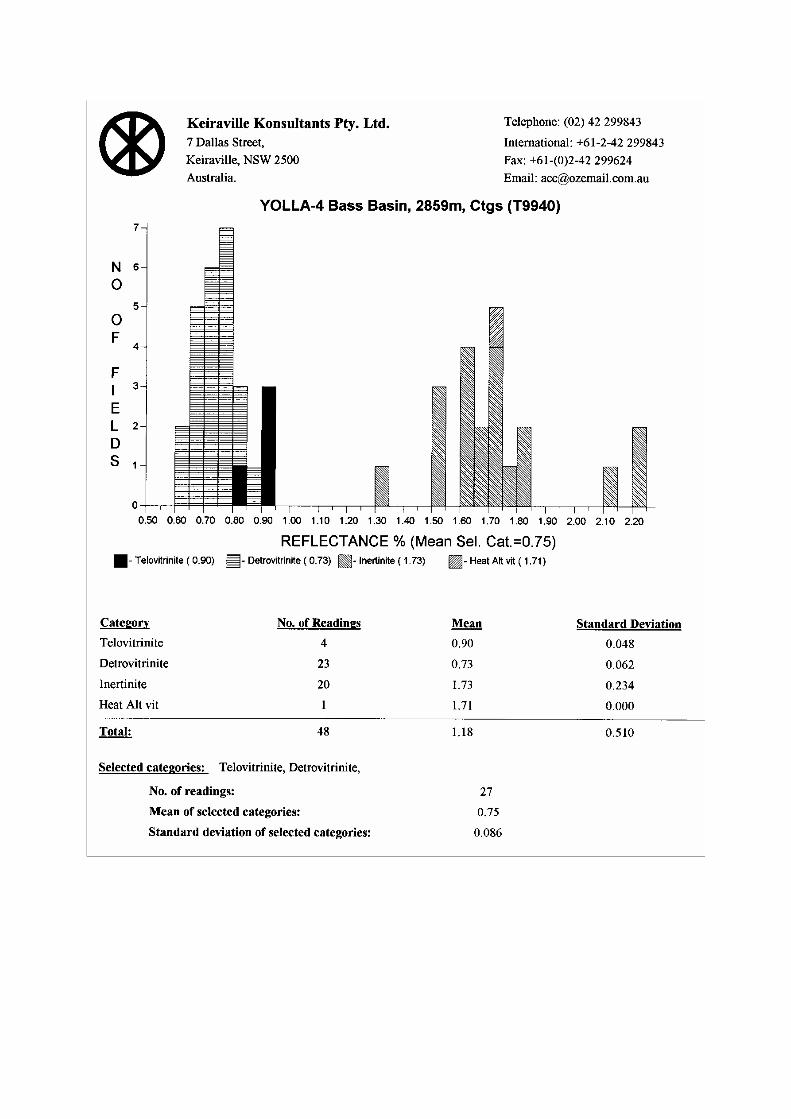
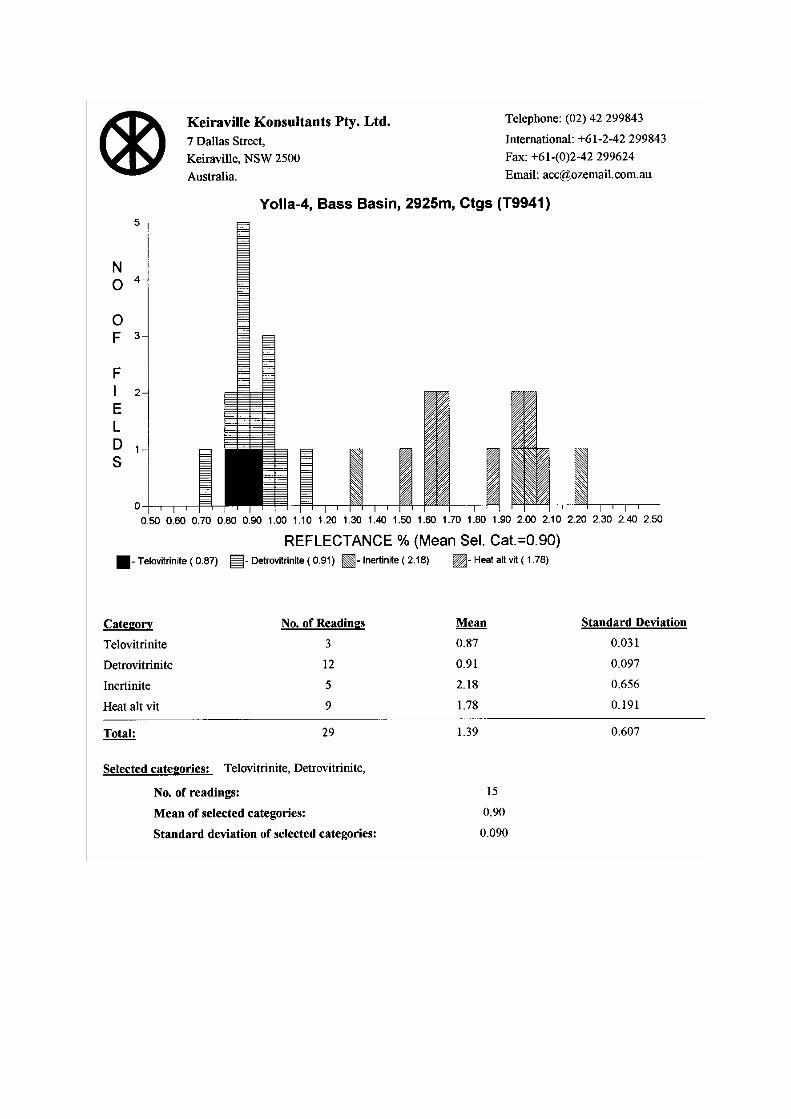
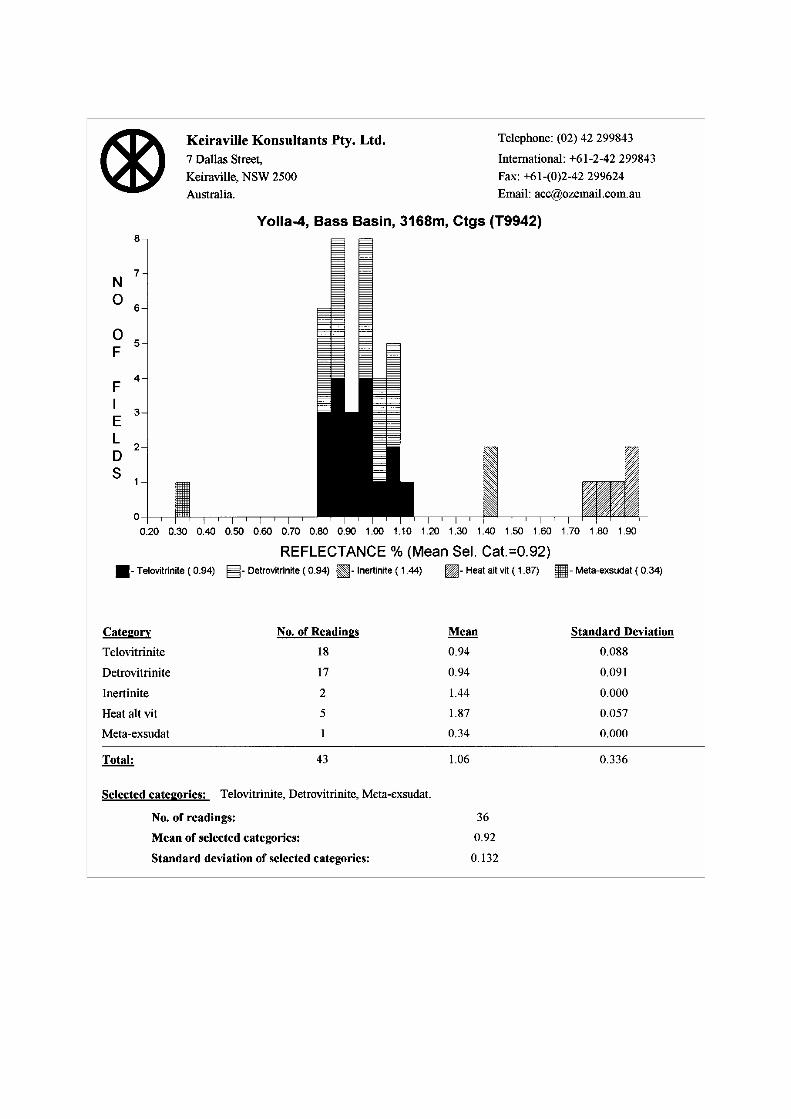

19/01/2005 1:38 PM Ori04vrw.doc
1
MISCELLANEOUS SAMPLES - YOLLA -4
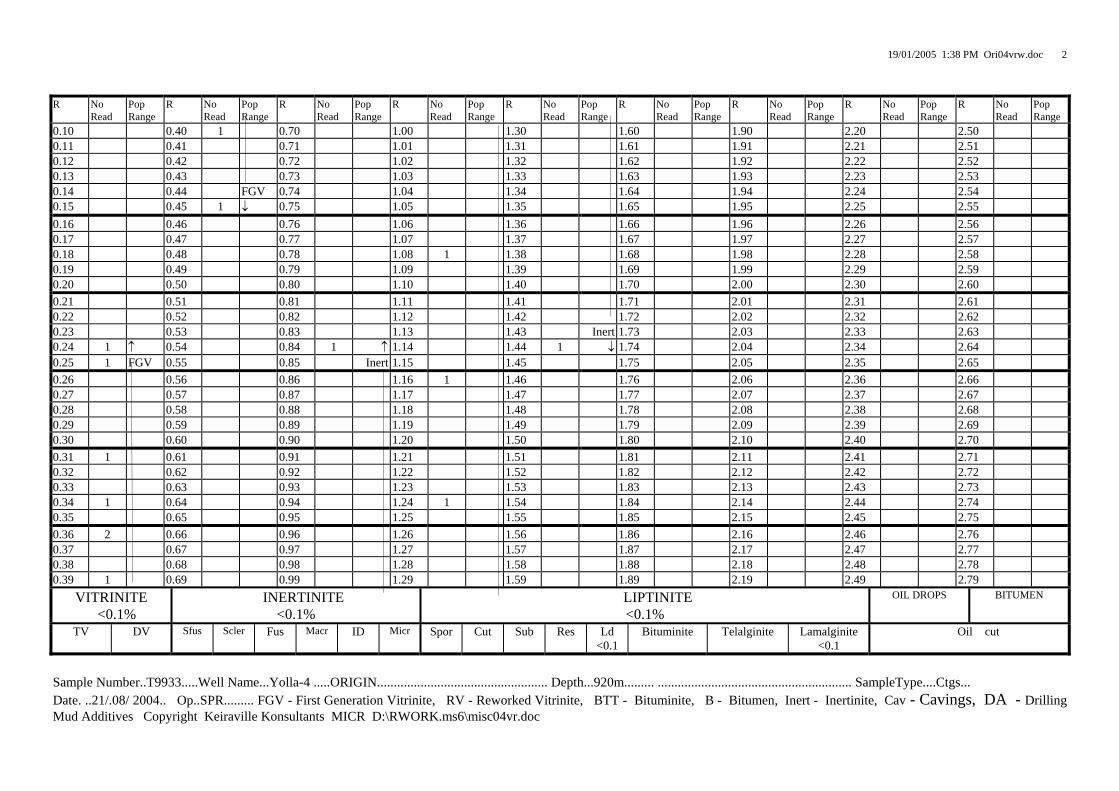
19/01/2005 1:38 PM Ori04vrw.doc
2
R No
Read Pop Range
R No Read
Pop Range
R No Read
Pop Range
R No Read
Pop Range
R No Read
Pop Range
R No Read
Pop Range
R No Read
Pop Range
R No Read
Pop Range
R No Read
Pop Range
0.10 0.40 1 0.70 1.00 1.30 1.60 1.90 2.20 2.50 0.11 0.41 0.71 1.01 1.31 1.61 1.91 2.21 2.51 0.12 0.42 0.72 1.02 1.32 1.62 1.92 2.22 2.52 0.13 0.43 0.73 1.03 1.33 1.63 1.93 2.23 2.53 0.14 0.44 FGV 0.74 1.04 1.34 1.64 1.94 2.24 2.54 0.15 0.45 1 ↓ 0.75 1.05 1.35 1.65 1.95 2.25 2.55 0.16 0.46 0.76 1.06 1.36 1.66 1.96 2.26 2.56 0.17 0.47 0.77 1.07 1.37 1.67 1.97 2.27 2.57 0.18 0.48 0.78 1.08 1 1.38 1.68 1.98 2.28 2.58 0.19 0.49 0.79 1.09 1.39 1.69 1.99 2.29 2.59 0.20 0.50 0.80 1.10 1.40 1.70 2.00 2.30 2.60 0.21 0.51 0.81 1.11 1.41 1.71 2.01 2.31 2.61 0.22 0.52 0.82 1.12 1.42 1.72 2.02 2.32 2.62 0.23 0.53 0.83 1.13 1.43 Inert 1.73 2.03 2.33 2.63 0.24 1 ↑ 0.54 0.84 1 ↑ 1.14 1.44 1 ↓ 1.74 2.04 2.34 2.64 0.25 1 FGV 0.55 0.85 Inert 1.15 1.45 1.75 2.05 2.35 2.65 0.26 0.56 0.86 1.16 1 1.46 1.76 2.06 2.36 2.66 0.27 0.57 0.87 1.17 1.47 1.77 2.07 2.37 2.67 0.28 0.58 0.88 1.18 1.48 1.78 2.08 2.38 2.68 0.29 0.59 0.89 1.19 1.49 1.79 2.09 2.39 2.69 0.30 0.60 0.90 1.20 1.50 1.80 2.10 2.40 2.70 0.31 1 0.61 0.91 1.21 1.51 1.81 2.11 2.41 2.71 0.32 0.62 0.92 1.22 1.52 1.82 2.12 2.42 2.72 0.33 0.63 0.93 1.23 1.53 1.83 2.13 2.43 2.73 0.34 1 0.64 0.94 1.24 1 1.54 1.84 2.14 2.44 2.74 0.35 0.65 0.95 1.25 1.55 1.85 2.15 2.45 2.75 0.36 2 0.66 0.96 1.26 1.56 1.86 2.16 2.46 2.76 0.37 0.67 0.97 1.27 1.57 1.87 2.17 2.47 2.77 0.38 0.68 0.98 1.28 1.58 1.88 2.18 2.48 2.78 0.39 1 0.69 0.99 1.29 1.59 1.89 2.19 2.49 2.79
VITRINITE <0.1%
INERTINITE <0.1%
LIPTINITE <0.1%
OIL DROPS
BITUMEN
TV
DV Sfus Scler Fus Macr ID Micr
Spor
Cut
Sub
Res
Ld <0.1
Bituminite
Telalginite
Lamalginite <0.1
Oil cut
Sample Number..T9933.....Well Name...Yolla-4 .....ORIGIN................................................... Depth...920m......... .......................................................... SampleType....Ctgs... Date. ..21/.08/ 2004.. Op..SPR......... FGV - First Generation Vitrinite, RV - Reworked Vitrinite, BTT - Bituminite, B - Bitumen, Inert - Inertinite, Cav - Cavings, DA - Drilling Mud Additives Copyright Keiraville Konsultants MICR D:\RWORK.ms6\misc04vr.doc
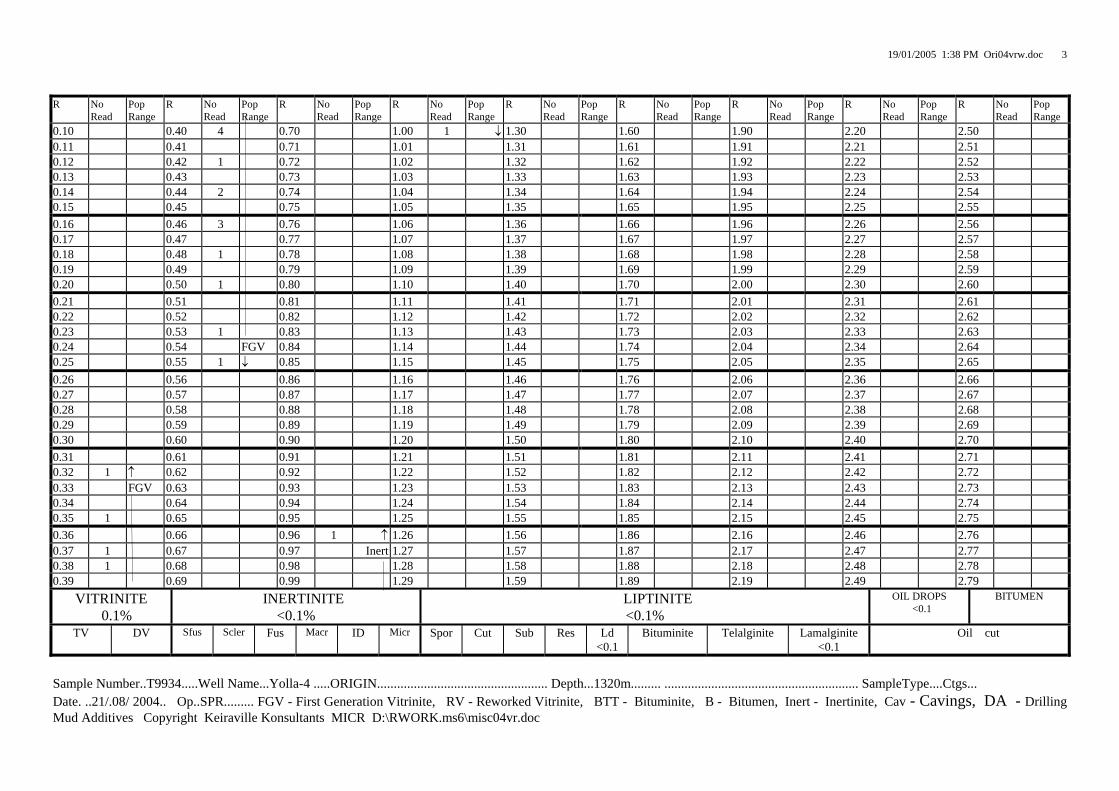
19/01/2005 1:38 PM Ori04vrw.doc
3
R No
Read Pop Range
R No Read
Pop Range
R No Read
Pop Range
R No Read
Pop Range
R No Read
Pop Range
R No Read
Pop Range
R No Read
Pop Range
R No Read
Pop Range
R No Read
Pop Range
0.10 0.40 4 0.70 1.00 1 ↓ 1.30 1.60 1.90 2.20 2.50 0.11 0.41 0.71 1.01 1.31 1.61 1.91 2.21 2.51 0.12 0.42 1 0.72 1.02 1.32 1.62 1.92 2.22 2.52 0.13 0.43 0.73 1.03 1.33 1.63 1.93 2.23 2.53 0.14 0.44 2 0.74 1.04 1.34 1.64 1.94 2.24 2.54 0.15 0.45 0.75 1.05 1.35 1.65 1.95 2.25 2.55 0.16 0.46 3 0.76 1.06 1.36 1.66 1.96 2.26 2.56 0.17 0.47 0.77 1.07 1.37 1.67 1.97 2.27 2.57 0.18 0.48 1 0.78 1.08 1.38 1.68 1.98 2.28 2.58 0.19 0.49 0.79 1.09 1.39 1.69 1.99 2.29 2.59 0.20 0.50 1 0.80 1.10 1.40 1.70 2.00 2.30 2.60 0.21 0.51 0.81 1.11 1.41 1.71 2.01 2.31 2.61 0.22 0.52 0.82 1.12 1.42 1.72 2.02 2.32 2.62 0.23 0.53 1 0.83 1.13 1.43 1.73 2.03 2.33 2.63 0.24 0.54 FGV 0.84 1.14 1.44 1.74 2.04 2.34 2.64 0.25 0.55 1 ↓ 0.85 1.15 1.45 1.75 2.05 2.35 2.65 0.26 0.56 0.86 1.16 1.46 1.76 2.06 2.36 2.66 0.27 0.57 0.87 1.17 1.47 1.77 2.07 2.37 2.67 0.28 0.58 0.88 1.18 1.48 1.78 2.08 2.38 2.68 0.29 0.59 0.89 1.19 1.49 1.79 2.09 2.39 2.69 0.30 0.60 0.90 1.20 1.50 1.80 2.10 2.40 2.70 0.31 0.61 0.91 1.21 1.51 1.81 2.11 2.41 2.71 0.32 1 ↑ 0.62 0.92 1.22 1.52 1.82 2.12 2.42 2.72 0.33 FGV 0.63 0.93 1.23 1.53 1.83 2.13 2.43 2.73 0.34 0.64 0.94 1.24 1.54 1.84 2.14 2.44 2.74 0.35 1 0.65 0.95 1.25 1.55 1.85 2.15 2.45 2.75 0.36 0.66 0.96 1 ↑ 1.26 1.56 1.86 2.16 2.46 2.76 0.37 1 0.67 0.97 Inert 1.27 1.57 1.87 2.17 2.47 2.77 0.38 1 0.68 0.98 1.28 1.58 1.88 2.18 2.48 2.78 0.39 0.69 0.99 1.29 1.59 1.89 2.19 2.49 2.79
VITRINITE 0.1%
INERTINITE <0.1%
LIPTINITE <0.1%
OIL DROPS <0.1
BITUMEN
TV
DV Sfus Scler Fus Macr ID Micr
Spor
Cut
Sub
Res
Ld <0.1
Bituminite
Telalginite
Lamalginite <0.1
Oil cut
Sample Number..T9934.....Well Name...Yolla-4 .....ORIGIN................................................... Depth...1320m......... .......................................................... SampleType....Ctgs... Date. ..21/.08/ 2004.. Op..SPR......... FGV - First Generation Vitrinite, RV - Reworked Vitrinite, BTT - Bituminite, B - Bitumen, Inert - Inertinite, Cav - Cavings, DA - Drilling Mud Additives Copyright Keiraville Konsultants MICR D:\RWORK.ms6\misc04vr.doc
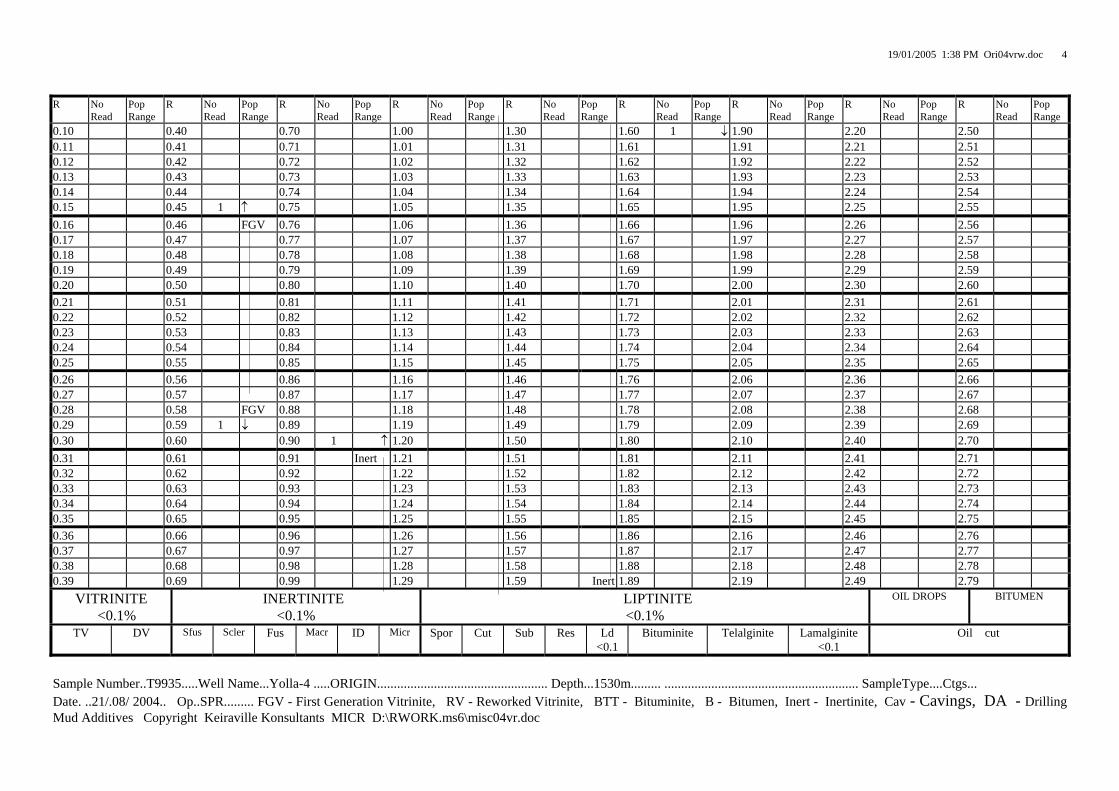
19/01/2005 1:38 PM Ori04vrw.doc
4
R No
Read Pop Range
R No Read
Pop Range
R No Read
Pop Range
R No Read
Pop Range
R No Read
Pop Range
R No Read
Pop Range
R No Read
Pop Range
R No Read
Pop Range
R No Read
Pop Range
0.10 0.40 0.70 1.00 1.30 1.60 1 ↓ 1.90 2.20 2.50 0.11 0.41 0.71 1.01 1.31 1.61 1.91 2.21 2.51 0.12 0.42 0.72 1.02 1.32 1.62 1.92 2.22 2.52 0.13 0.43 0.73 1.03 1.33 1.63 1.93 2.23 2.53 0.14 0.44 0.74 1.04 1.34 1.64 1.94 2.24 2.54 0.15 0.45 1 ↑ 0.75 1.05 1.35 1.65 1.95 2.25 2.55 0.16 0.46 FGV 0.76 1.06 1.36 1.66 1.96 2.26 2.56 0.17 0.47 0.77 1.07 1.37 1.67 1.97 2.27 2.57 0.18 0.48 0.78 1.08 1.38 1.68 1.98 2.28 2.58 0.19 0.49 0.79 1.09 1.39 1.69 1.99 2.29 2.59 0.20 0.50 0.80 1.10 1.40 1.70 2.00 2.30 2.60 0.21 0.51 0.81 1.11 1.41 1.71 2.01 2.31 2.61 0.22 0.52 0.82 1.12 1.42 1.72 2.02 2.32 2.62 0.23 0.53 0.83 1.13 1.43 1.73 2.03 2.33 2.63 0.24 0.54 0.84 1.14 1.44 1.74 2.04 2.34 2.64 0.25 0.55 0.85 1.15 1.45 1.75 2.05 2.35 2.65 0.26 0.56 0.86 1.16 1.46 1.76 2.06 2.36 2.66 0.27 0.57 0.87 1.17 1.47 1.77 2.07 2.37 2.67 0.28 0.58 FGV 0.88 1.18 1.48 1.78 2.08 2.38 2.68 0.29 0.59 1 ↓ 0.89 1.19 1.49 1.79 2.09 2.39 2.69 0.30 0.60 0.90 1 ↑ 1.20 1.50 1.80 2.10 2.40 2.70 0.31 0.61 0.91 Inert 1.21 1.51 1.81 2.11 2.41 2.71 0.32 0.62 0.92 1.22 1.52 1.82 2.12 2.42 2.72 0.33 0.63 0.93 1.23 1.53 1.83 2.13 2.43 2.73 0.34 0.64 0.94 1.24 1.54 1.84 2.14 2.44 2.74 0.35 0.65 0.95 1.25 1.55 1.85 2.15 2.45 2.75 0.36 0.66 0.96 1.26 1.56 1.86 2.16 2.46 2.76 0.37 0.67 0.97 1.27 1.57 1.87 2.17 2.47 2.77 0.38 0.68 0.98 1.28 1.58 1.88 2.18 2.48 2.78 0.39 0.69 0.99 1.29 1.59 Inert 1.89 2.19 2.49 2.79
VITRINITE <0.1%
INERTINITE <0.1%
LIPTINITE <0.1%
OIL DROPS
BITUMEN
TV
DV Sfus Scler Fus Macr ID Micr
Spor
Cut
Sub
Res
Ld <0.1
Bituminite
Telalginite
Lamalginite <0.1
Oil cut
Sample Number..T9935.....Well Name...Yolla-4 .....ORIGIN................................................... Depth...1530m......... .......................................................... SampleType....Ctgs... Date. ..21/.08/ 2004.. Op..SPR......... FGV - First Generation Vitrinite, RV - Reworked Vitrinite, BTT - Bituminite, B - Bitumen, Inert - Inertinite, Cav - Cavings, DA - Drilling Mud Additives Copyright Keiraville Konsultants MICR D:\RWORK.ms6\misc04vr.doc
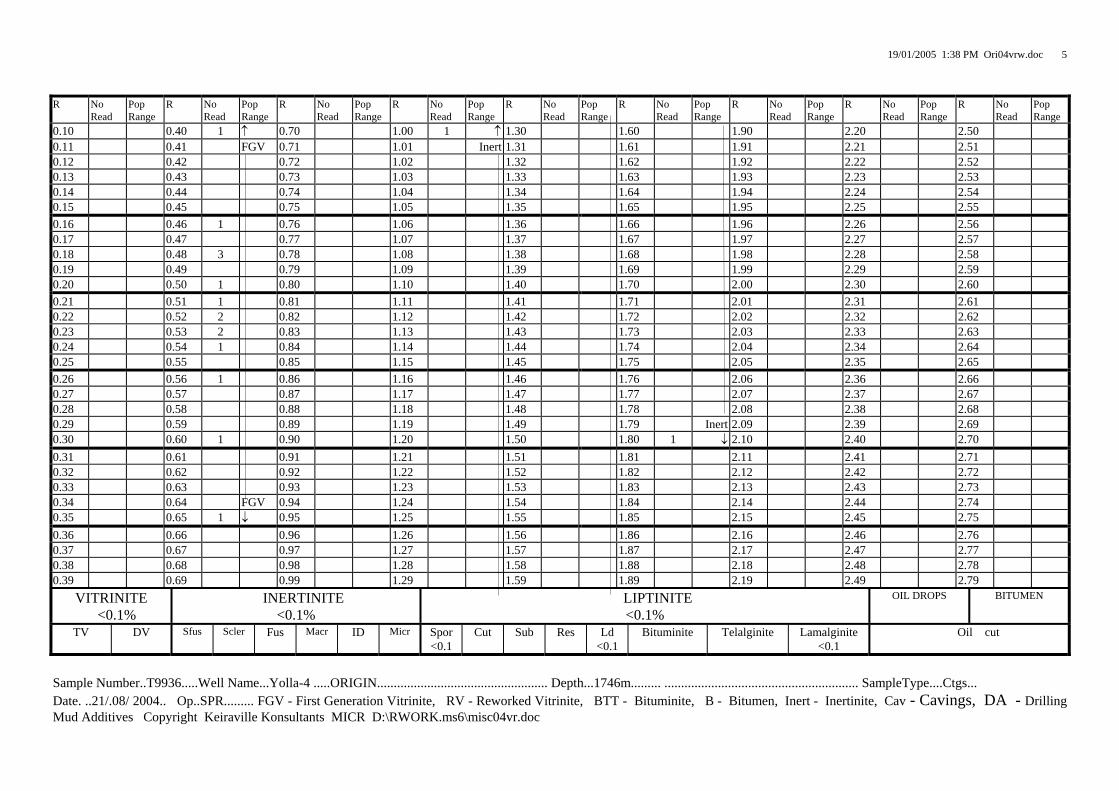
19/01/2005 1:38 PM Ori04vrw.doc
5
R No
Read Pop Range
R No Read
Pop Range
R No Read
Pop Range
R No Read
Pop Range
R No Read
Pop Range
R No Read
Pop Range
R No Read
Pop Range
R No Read
Pop Range
R No Read
Pop Range
0.10 0.40 1 ↑ 0.70 1.00 1 ↑ 1.30 1.60 1.90 2.20 2.50 0.11 0.41 FGV 0.71 1.01 Inert 1.31 1.61 1.91 2.21 2.51 0.12 0.42 0.72 1.02 1.32 1.62 1.92 2.22 2.52 0.13 0.43 0.73 1.03 1.33 1.63 1.93 2.23 2.53 0.14 0.44 0.74 1.04 1.34 1.64 1.94 2.24 2.54 0.15 0.45 0.75 1.05 1.35 1.65 1.95 2.25 2.55 0.16 0.46 1 0.76 1.06 1.36 1.66 1.96 2.26 2.56 0.17 0.47 0.77 1.07 1.37 1.67 1.97 2.27 2.57 0.18 0.48 3 0.78 1.08 1.38 1.68 1.98 2.28 2.58 0.19 0.49 0.79 1.09 1.39 1.69 1.99 2.29 2.59 0.20 0.50 1 0.80 1.10 1.40 1.70 2.00 2.30 2.60 0.21 0.51 1 0.81 1.11 1.41 1.71 2.01 2.31 2.61 0.22 0.52 2 0.82 1.12 1.42 1.72 2.02 2.32 2.62 0.23 0.53 2 0.83 1.13 1.43 1.73 2.03 2.33 2.63 0.24 0.54 1 0.84 1.14 1.44 1.74 2.04 2.34 2.64 0.25 0.55 0.85 1.15 1.45 1.75 2.05 2.35 2.65 0.26 0.56 1 0.86 1.16 1.46 1.76 2.06 2.36 2.66 0.27 0.57 0.87 1.17 1.47 1.77 2.07 2.37 2.67 0.28 0.58 0.88 1.18 1.48 1.78 2.08 2.38 2.68 0.29 0.59 0.89 1.19 1.49 1.79 Inert 2.09 2.39 2.69 0.30 0.60 1 0.90 1.20 1.50 1.80 1 ↓ 2.10 2.40 2.70 0.31 0.61 0.91 1.21 1.51 1.81 2.11 2.41 2.71 0.32 0.62 0.92 1.22 1.52 1.82 2.12 2.42 2.72 0.33 0.63 0.93 1.23 1.53 1.83 2.13 2.43 2.73 0.34 0.64 FGV 0.94 1.24 1.54 1.84 2.14 2.44 2.74 0.35 0.65 1 ↓ 0.95 1.25 1.55 1.85 2.15 2.45 2.75 0.36 0.66 0.96 1.26 1.56 1.86 2.16 2.46 2.76 0.37 0.67 0.97 1.27 1.57 1.87 2.17 2.47 2.77 0.38 0.68 0.98 1.28 1.58 1.88 2.18 2.48 2.78 0.39 0.69 0.99 1.29 1.59 1.89 2.19 2.49 2.79
VITRINITE <0.1%
INERTINITE <0.1%
LIPTINITE <0.1%
OIL DROPS
BITUMEN
TV
DV Sfus Scler Fus Macr ID Micr
Spor <0.1
Cut
Sub
Res
Ld <0.1
Bituminite
Telalginite
Lamalginite <0.1
Oil cut
Sample Number..T9936.....Well Name...Yolla-4 .....ORIGIN................................................... Depth...1746m......... .......................................................... SampleType....Ctgs... Date. ..21/.08/ 2004.. Op..SPR......... FGV - First Generation Vitrinite, RV - Reworked Vitrinite, BTT - Bituminite, B - Bitumen, Inert - Inertinite, Cav - Cavings, DA - Drilling Mud Additives Copyright Keiraville Konsultants MICR D:\RWORK.ms6\misc04vr.doc
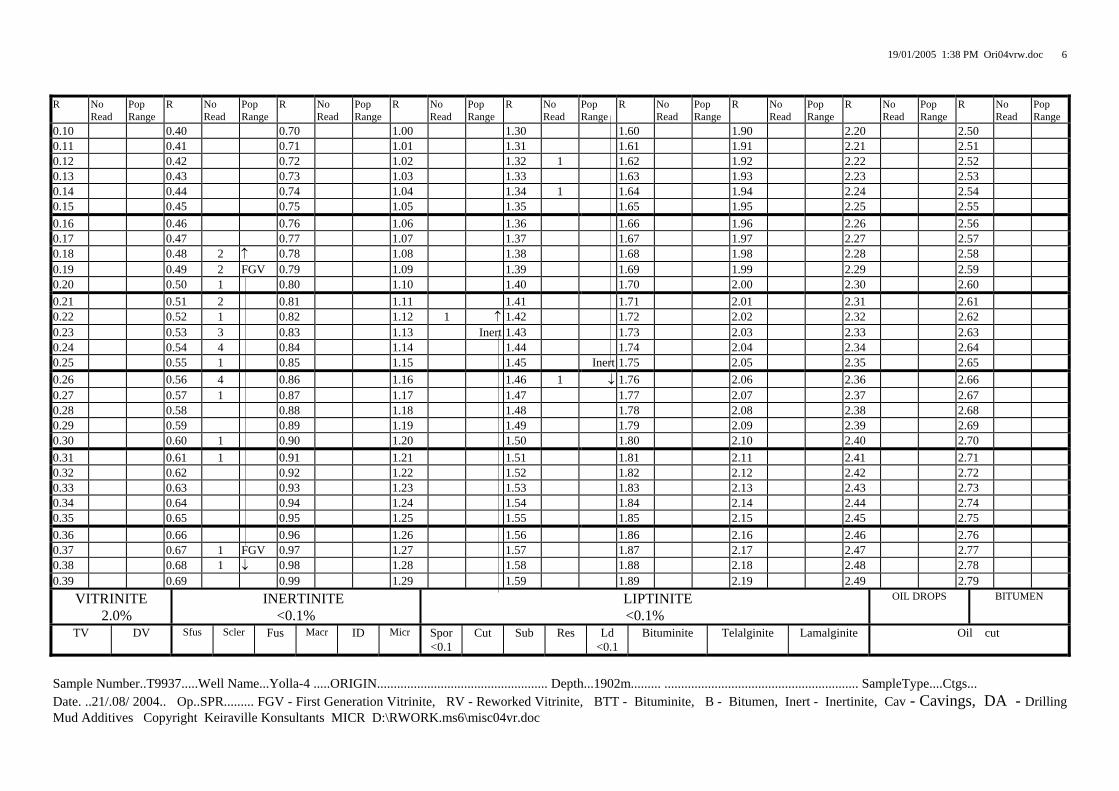
19/01/2005 1:38 PM Ori04vrw.doc
6
R No
Read Pop Range
R No Read
Pop Range
R No Read
Pop Range
R No Read
Pop Range
R No Read
Pop Range
R No Read
Pop Range
R No Read
Pop Range
R No Read
Pop Range
R No Read
Pop Range
0.10 0.40 0.70 1.00 1.30 1.60 1.90 2.20 2.50 0.11 0.41 0.71 1.01 1.31 1.61 1.91 2.21 2.51 0.12 0.42 0.72 1.02 1.32 1 1.62 1.92 2.22 2.52 0.13 0.43 0.73 1.03 1.33 1.63 1.93 2.23 2.53 0.14 0.44 0.74 1.04 1.34 1 1.64 1.94 2.24 2.54 0.15 0.45 0.75 1.05 1.35 1.65 1.95 2.25 2.55 0.16 0.46 0.76 1.06 1.36 1.66 1.96 2.26 2.56 0.17 0.47 0.77 1.07 1.37 1.67 1.97 2.27 2.57 0.18 0.48 2 ↑ 0.78 1.08 1.38 1.68 1.98 2.28 2.58 0.19 0.49 2 FGV 0.79 1.09 1.39 1.69 1.99 2.29 2.59 0.20 0.50 1 0.80 1.10 1.40 1.70 2.00 2.30 2.60 0.21 0.51 2 0.81 1.11 1.41 1.71 2.01 2.31 2.61 0.22 0.52 1 0.82 1.12 1 ↑ 1.42 1.72 2.02 2.32 2.62 0.23 0.53 3 0.83 1.13 Inert 1.43 1.73 2.03 2.33 2.63 0.24 0.54 4 0.84 1.14 1.44 1.74 2.04 2.34 2.64 0.25 0.55 1 0.85 1.15 1.45 Inert 1.75 2.05 2.35 2.65 0.26 0.56 4 0.86 1.16 1.46 1 ↓ 1.76 2.06 2.36 2.66 0.27 0.57 1 0.87 1.17 1.47 1.77 2.07 2.37 2.67 0.28 0.58 0.88 1.18 1.48 1.78 2.08 2.38 2.68 0.29 0.59 0.89 1.19 1.49 1.79 2.09 2.39 2.69 0.30 0.60 1 0.90 1.20 1.50 1.80 2.10 2.40 2.70 0.31 0.61 1 0.91 1.21 1.51 1.81 2.11 2.41 2.71 0.32 0.62 0.92 1.22 1.52 1.82 2.12 2.42 2.72 0.33 0.63 0.93 1.23 1.53 1.83 2.13 2.43 2.73 0.34 0.64 0.94 1.24 1.54 1.84 2.14 2.44 2.74 0.35 0.65 0.95 1.25 1.55 1.85 2.15 2.45 2.75 0.36 0.66 0.96 1.26 1.56 1.86 2.16 2.46 2.76 0.37 0.67 1 FGV 0.97 1.27 1.57 1.87 2.17 2.47 2.77 0.38 0.68 1 ↓ 0.98 1.28 1.58 1.88 2.18 2.48 2.78 0.39 0.69 0.99 1.29 1.59 1.89 2.19 2.49 2.79
VITRINITE 2.0%
INERTINITE <0.1%
LIPTINITE <0.1%
OIL DROPS
BITUMEN
TV
DV Sfus Scler Fus Macr ID Micr
Spor <0.1
Cut
Sub
Res
Ld <0.1
Bituminite
Telalginite
Lamalginite
Oil cut
Sample Number..T9937.....Well Name...Yolla-4 .....ORIGIN................................................... Depth...1902m......... .......................................................... SampleType....Ctgs... Date. ..21/.08/ 2004.. Op..SPR......... FGV - First Generation Vitrinite, RV - Reworked Vitrinite, BTT - Bituminite, B - Bitumen, Inert - Inertinite, Cav - Cavings, DA - Drilling Mud Additives Copyright Keiraville Konsultants MICR D:\RWORK.ms6\misc04vr.doc
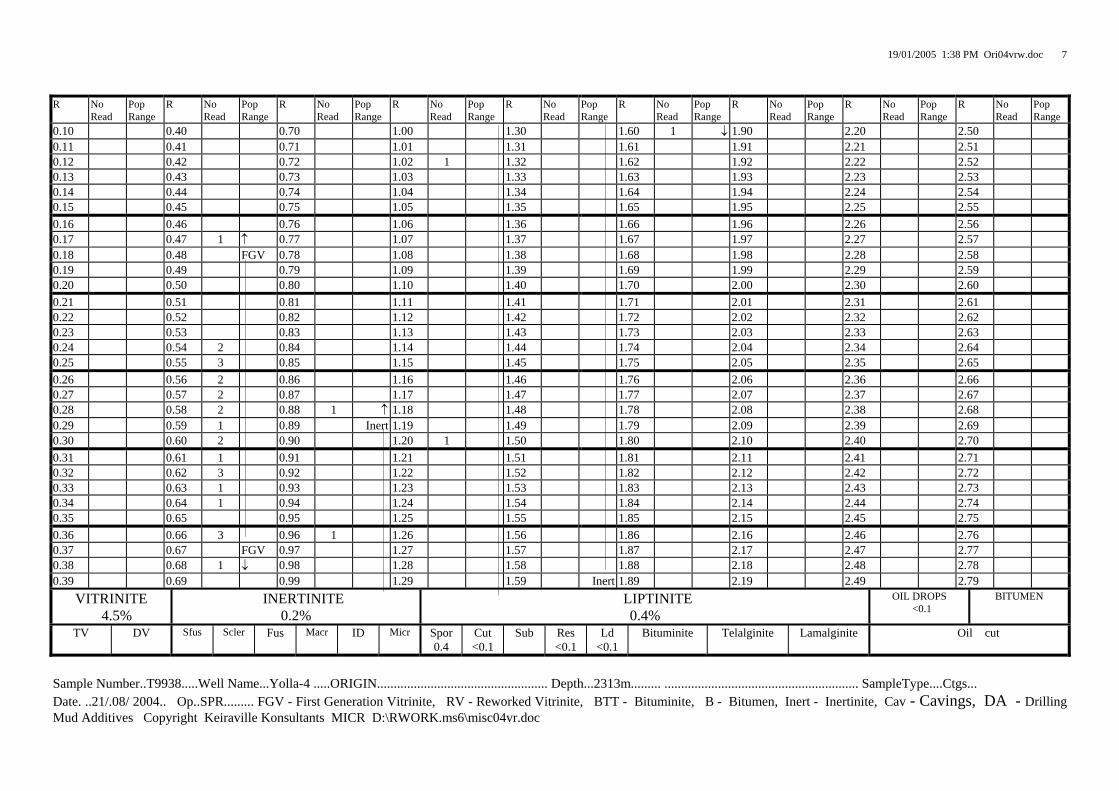
19/01/2005 1:38 PM Ori04vrw.doc
7
R No
Read Pop Range
R No Read
Pop Range
R No Read
Pop Range
R No Read
Pop Range
R No Read
Pop Range
R No Read
Pop Range
R No Read
Pop Range
R No Read
Pop Range
R No Read
Pop Range
0.10 0.40 0.70 1.00 1.30 1.60 1 ↓ 1.90 2.20 2.50 0.11 0.41 0.71 1.01 1.31 1.61 1.91 2.21 2.51 0.12 0.42 0.72 1.02 1 1.32 1.62 1.92 2.22 2.52 0.13 0.43 0.73 1.03 1.33 1.63 1.93 2.23 2.53 0.14 0.44 0.74 1.04 1.34 1.64 1.94 2.24 2.54 0.15 0.45 0.75 1.05 1.35 1.65 1.95 2.25 2.55 0.16 0.46 0.76 1.06 1.36 1.66 1.96 2.26 2.56 0.17 0.47 1 ↑ 0.77 1.07 1.37 1.67 1.97 2.27 2.57 0.18 0.48 FGV 0.78 1.08 1.38 1.68 1.98 2.28 2.58 0.19 0.49 0.79 1.09 1.39 1.69 1.99 2.29 2.59 0.20 0.50 0.80 1.10 1.40 1.70 2.00 2.30 2.60 0.21 0.51 0.81 1.11 1.41 1.71 2.01 2.31 2.61 0.22 0.52 0.82 1.12 1.42 1.72 2.02 2.32 2.62 0.23 0.53 0.83 1.13 1.43 1.73 2.03 2.33 2.63 0.24 0.54 2 0.84 1.14 1.44 1.74 2.04 2.34 2.64 0.25 0.55 3 0.85 1.15 1.45 1.75 2.05 2.35 2.65 0.26 0.56 2 0.86 1.16 1.46 1.76 2.06 2.36 2.66 0.27 0.57 2 0.87 1.17 1.47 1.77 2.07 2.37 2.67 0.28 0.58 2 0.88 1 ↑ 1.18 1.48 1.78 2.08 2.38 2.68 0.29 0.59 1 0.89 Inert 1.19 1.49 1.79 2.09 2.39 2.69 0.30 0.60 2 0.90 1.20 1 1.50 1.80 2.10 2.40 2.70 0.31 0.61 1 0.91 1.21 1.51 1.81 2.11 2.41 2.71 0.32 0.62 3 0.92 1.22 1.52 1.82 2.12 2.42 2.72 0.33 0.63 1 0.93 1.23 1.53 1.83 2.13 2.43 2.73 0.34 0.64 1 0.94 1.24 1.54 1.84 2.14 2.44 2.74 0.35 0.65 0.95 1.25 1.55 1.85 2.15 2.45 2.75 0.36 0.66 3 0.96 1 1.26 1.56 1.86 2.16 2.46 2.76 0.37 0.67 FGV 0.97 1.27 1.57 1.87 2.17 2.47 2.77 0.38 0.68 1 ↓ 0.98 1.28 1.58 1.88 2.18 2.48 2.78 0.39 0.69 0.99 1.29 1.59 Inert 1.89 2.19 2.49 2.79
VITRINITE 4.5%
INERTINITE 0.2%
LIPTINITE 0.4%
OIL DROPS <0.1
BITUMEN
TV
DV Sfus Scler Fus Macr ID Micr
Spor 0.4
Cut <0.1
Sub
Res <0.1
Ld <0.1
Bituminite
Telalginite
Lamalginite
Oil cut
Sample Number..T9938.....Well Name...Yolla-4 .....ORIGIN................................................... Depth...2313m......... .......................................................... SampleType....Ctgs... Date. ..21/.08/ 2004.. Op..SPR......... FGV - First Generation Vitrinite, RV - Reworked Vitrinite, BTT - Bituminite, B - Bitumen, Inert - Inertinite, Cav - Cavings, DA - Drilling Mud Additives Copyright Keiraville Konsultants MICR D:\RWORK.ms6\misc04vr.doc
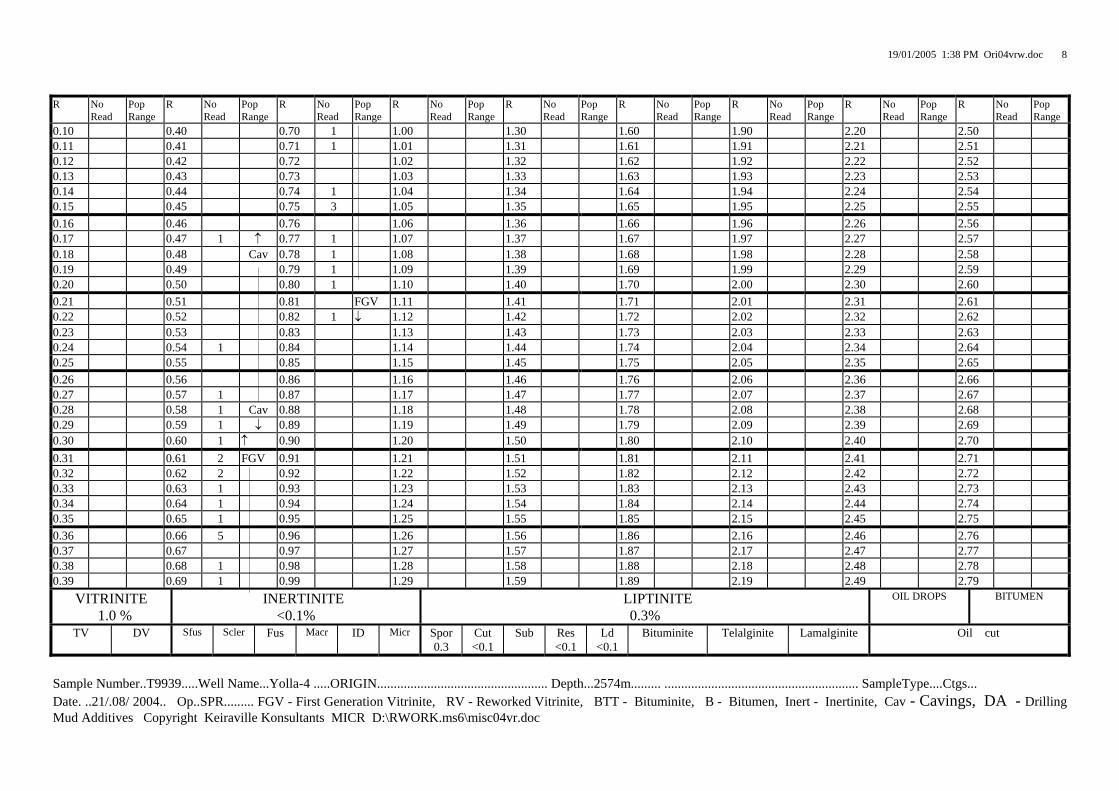
19/01/2005 1:38 PM Ori04vrw.doc
8
R No
Read Pop Range
R No Read
Pop Range
R No Read
Pop Range
R No Read
Pop Range
R No Read
Pop Range
R No Read
Pop Range
R No Read
Pop Range
R No Read
Pop Range
R No Read
Pop Range
0.10 0.40 0.70 1 1.00 1.30 1.60 1.90 2.20 2.50 0.11 0.41 0.71 1 1.01 1.31 1.61 1.91 2.21 2.51 0.12 0.42 0.72 1.02 1.32 1.62 1.92 2.22 2.52 0.13 0.43 0.73 1.03 1.33 1.63 1.93 2.23 2.53 0.14 0.44 0.74 1 1.04 1.34 1.64 1.94 2.24 2.54 0.15 0.45 0.75 3 1.05 1.35 1.65 1.95 2.25 2.55 0.16 0.46 0.76 1.06 1.36 1.66 1.96 2.26 2.56 0.17 0.47 1 ↑ 0.77 1 1.07 1.37 1.67 1.97 2.27 2.57 0.18 0.48 Cav 0.78 1 1.08 1.38 1.68 1.98 2.28 2.58 0.19 0.49 0.79 1 1.09 1.39 1.69 1.99 2.29 2.59 0.20 0.50 0.80 1 1.10 1.40 1.70 2.00 2.30 2.60 0.21 0.51 0.81 FGV 1.11 1.41 1.71 2.01 2.31 2.61 0.22 0.52 0.82 1 ↓ 1.12 1.42 1.72 2.02 2.32 2.62 0.23 0.53 0.83 1.13 1.43 1.73 2.03 2.33 2.63 0.24 0.54 1 0.84 1.14 1.44 1.74 2.04 2.34 2.64 0.25 0.55 0.85 1.15 1.45 1.75 2.05 2.35 2.65 0.26 0.56 0.86 1.16 1.46 1.76 2.06 2.36 2.66 0.27 0.57 1 0.87 1.17 1.47 1.77 2.07 2.37 2.67 0.28 0.58 1 Cav 0.88 1.18 1.48 1.78 2.08 2.38 2.68 0.29 0.59 1 ↓ 0.89 1.19 1.49 1.79 2.09 2.39 2.69 0.30 0.60 1 ↑ 0.90 1.20 1.50 1.80 2.10 2.40 2.70 0.31 0.61 2 FGV 0.91 1.21 1.51 1.81 2.11 2.41 2.71 0.32 0.62 2 0.92 1.22 1.52 1.82 2.12 2.42 2.72 0.33 0.63 1 0.93 1.23 1.53 1.83 2.13 2.43 2.73 0.34 0.64 1 0.94 1.24 1.54 1.84 2.14 2.44 2.74 0.35 0.65 1 0.95 1.25 1.55 1.85 2.15 2.45 2.75 0.36 0.66 5 0.96 1.26 1.56 1.86 2.16 2.46 2.76 0.37 0.67 0.97 1.27 1.57 1.87 2.17 2.47 2.77 0.38 0.68 1 0.98 1.28 1.58 1.88 2.18 2.48 2.78 0.39 0.69 1 0.99 1.29 1.59 1.89 2.19 2.49 2.79
VITRINITE 1.0 %
INERTINITE <0.1%
LIPTINITE 0.3%
OIL DROPS
BITUMEN
TV
DV Sfus Scler Fus Macr ID Micr
Spor 0.3
Cut <0.1
Sub
Res <0.1
Ld <0.1
Bituminite
Telalginite
Lamalginite
Oil cut
Sample Number..T9939.....Well Name...Yolla-4 .....ORIGIN................................................... Depth...2574m......... .......................................................... SampleType....Ctgs... Date. ..21/.08/ 2004.. Op..SPR......... FGV - First Generation Vitrinite, RV - Reworked Vitrinite, BTT - Bituminite, B - Bitumen, Inert - Inertinite, Cav - Cavings, DA - Drilling Mud Additives Copyright Keiraville Konsultants MICR D:\RWORK.ms6\misc04vr.doc
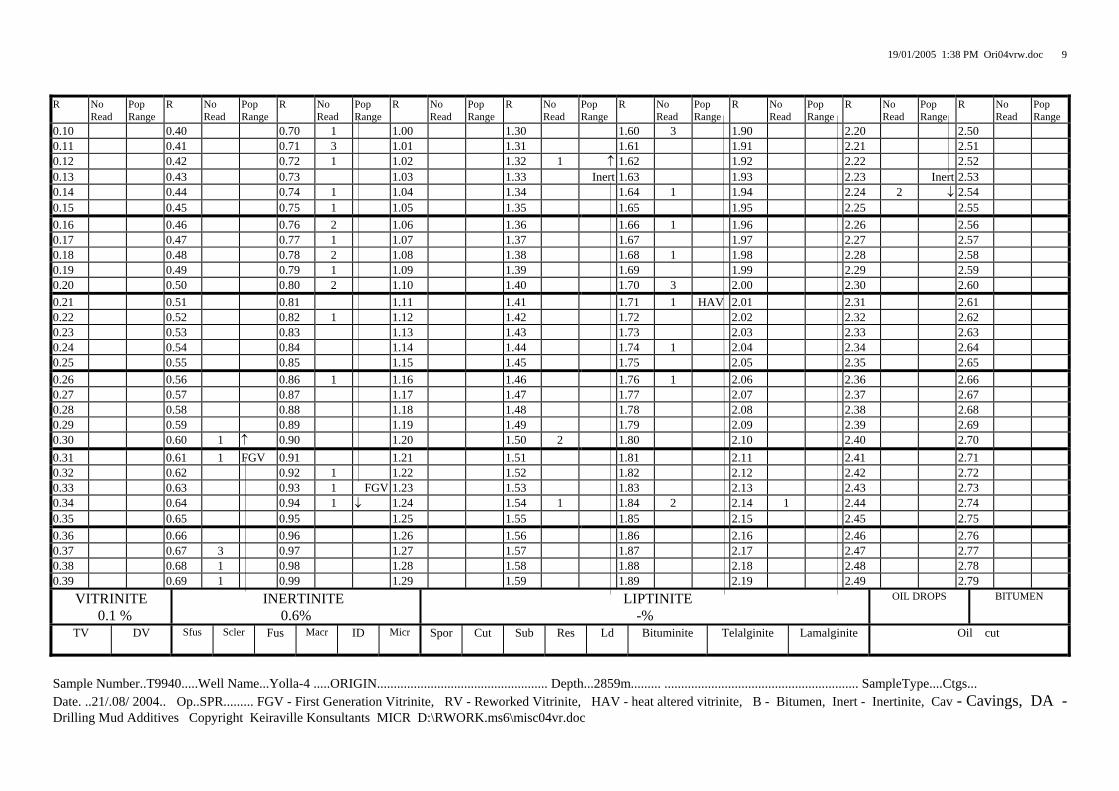
19/01/2005 1:38 PM Ori04vrw.doc
9
R No
Read Pop Range
R No Read
Pop Range
R No Read
Pop Range
R No Read
Pop Range
R No Read
Pop Range
R No Read
Pop Range
R No Read
Pop Range
R No Read
Pop Range
R No Read
Pop Range
0.10 0.40 0.70 1 1.00 1.30 1.60 3 1.90 2.20 2.50 0.11 0.41 0.71 3 1.01 1.31 1.61 1.91 2.21 2.51 0.12 0.42 0.72 1 1.02 1.32 1 ↑ 1.62 1.92 2.22 2.52 0.13 0.43 0.73 1.03 1.33 Inert 1.63 1.93 2.23 Inert 2.53 0.14 0.44 0.74 1 1.04 1.34 1.64 1 1.94 2.24 2 ↓ 2.54 0.15 0.45 0.75 1 1.05 1.35 1.65 1.95 2.25 2.55 0.16 0.46 0.76 2 1.06 1.36 1.66 1 1.96 2.26 2.56 0.17 0.47 0.77 1 1.07 1.37 1.67 1.97 2.27 2.57 0.18 0.48 0.78 2 1.08 1.38 1.68 1 1.98 2.28 2.58 0.19 0.49 0.79 1 1.09 1.39 1.69 1.99 2.29 2.59 0.20 0.50 0.80 2 1.10 1.40 1.70 3 2.00 2.30 2.60 0.21 0.51 0.81 1.11 1.41 1.71 1 HAV 2.01 2.31 2.61 0.22 0.52 0.82 1 1.12 1.42 1.72 2.02 2.32 2.62 0.23 0.53 0.83 1.13 1.43 1.73 2.03 2.33 2.63 0.24 0.54 0.84 1.14 1.44 1.74 1 2.04 2.34 2.64 0.25 0.55 0.85 1.15 1.45 1.75 2.05 2.35 2.65 0.26 0.56 0.86 1 1.16 1.46 1.76 1 2.06 2.36 2.66 0.27 0.57 0.87 1.17 1.47 1.77 2.07 2.37 2.67 0.28 0.58 0.88 1.18 1.48 1.78 2.08 2.38 2.68 0.29 0.59 0.89 1.19 1.49 1.79 2.09 2.39 2.69 0.30 0.60 1 ↑ 0.90 1.20 1.50 2 1.80 2.10 2.40 2.70 0.31 0.61 1 FGV 0.91 1.21 1.51 1.81 2.11 2.41 2.71 0.32 0.62 0.92 1 1.22 1.52 1.82 2.12 2.42 2.72 0.33 0.63 0.93 1 FGV 1.23 1.53 1.83 2.13 2.43 2.73 0.34 0.64 0.94 1 ↓ 1.24 1.54 1 1.84 2 2.14 1 2.44 2.74 0.35 0.65 0.95 1.25 1.55 1.85 2.15 2.45 2.75 0.36 0.66 0.96 1.26 1.56 1.86 2.16 2.46 2.76 0.37 0.67 3 0.97 1.27 1.57 1.87 2.17 2.47 2.77 0.38 0.68 1 0.98 1.28 1.58 1.88 2.18 2.48 2.78 0.39 0.69 1 0.99 1.29 1.59 1.89 2.19 2.49 2.79
VITRINITE 0.1 %
INERTINITE 0.6%
LIPTINITE -%
OIL DROPS
BITUMEN
TV
DV Sfus Scler Fus Macr ID Micr
Spor
Cut
Sub
Res
Ld
Bituminite
Telalginite
Lamalginite
Oil cut
Sample Number..T9940.....Well Name...Yolla-4 .....ORIGIN................................................... Depth...2859m......... .......................................................... SampleType....Ctgs... Date. ..21/.08/ 2004.. Op..SPR......... FGV - First Generation Vitrinite, RV - Reworked Vitrinite, HAV - heat altered vitrinite, B - Bitumen, Inert - Inertinite, Cav - Cavings, DA - Drilling Mud Additives Copyright Keiraville Konsultants MICR D:\RWORK.ms6\misc04vr.doc
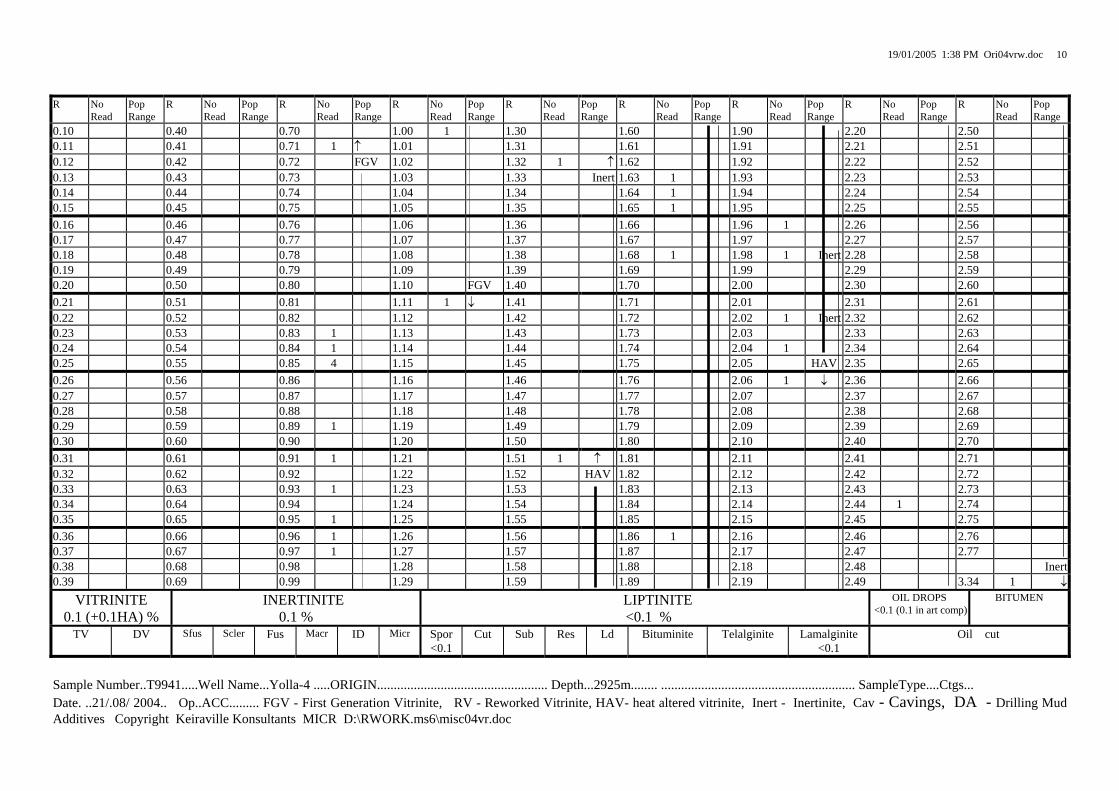
19/01/2005 1:38 PM Ori04vrw.doc
10
R No
Read Pop Range
R No Read
Pop Range
R No Read
Pop Range
R No Read
Pop Range
R No Read
Pop Range
R No Read
Pop Range
R No Read
Pop Range
R No Read
Pop Range
R No Read
Pop Range
0.10 0.40 0.70 1.00 1 1.30 1.60 1.90 2.20 2.50 0.11 0.41 0.71 1 ↑ 1.01 1.31 1.61 1.91 2.21 2.51 0.12 0.42 0.72 FGV 1.02 1.32 1 ↑ 1.62 1.92 2.22 2.52 0.13 0.43 0.73 1.03 1.33 Inert 1.63 1 1.93 2.23 2.53 0.14 0.44 0.74 1.04 1.34 1.64 1 1.94 2.24 2.54 0.15 0.45 0.75 1.05 1.35 1.65 1 1.95 2.25 2.55 0.16 0.46 0.76 1.06 1.36 1.66 1.96 1 2.26 2.56 0.17 0.47 0.77 1.07 1.37 1.67 1.97 2.27 2.57 0.18 0.48 0.78 1.08 1.38 1.68 1 1.98 1 Inert 2.28 2.58 0.19 0.49 0.79 1.09 1.39 1.69 1.99 2.29 2.59 0.20 0.50 0.80 1.10 FGV 1.40 1.70 2.00 2.30 2.60 0.21 0.51 0.81 1.11 1 ↓ 1.41 1.71 2.01 2.31 2.61 0.22 0.52 0.82 1.12 1.42 1.72 2.02 1 Inert 2.32 2.62 0.23 0.53 0.83 1 1.13 1.43 1.73 2.03 2.33 2.63 0.24 0.54 0.84 1 1.14 1.44 1.74 2.04 1 2.34 2.64 0.25 0.55 0.85 4 1.15 1.45 1.75 2.05 HAV 2.35 2.65 0.26 0.56 0.86 1.16 1.46 1.76 2.06 1 ↓ 2.36 2.66 0.27 0.57 0.87 1.17 1.47 1.77 2.07 2.37 2.67 0.28 0.58 0.88 1.18 1.48 1.78 2.08 2.38 2.68 0.29 0.59 0.89 1 1.19 1.49 1.79 2.09 2.39 2.69 0.30 0.60 0.90 1.20 1.50 1.80 2.10 2.40 2.70 0.31 0.61 0.91 1 1.21 1.51 1 ↑ 1.81 2.11 2.41 2.71 0.32 0.62 0.92 1.22 1.52 HAV 1.82 2.12 2.42 2.72 0.33 0.63 0.93 1 1.23 1.53 1.83 2.13 2.43 2.73 0.34 0.64 0.94 1.24 1.54 1.84 2.14 2.44 1 2.74 0.35 0.65 0.95 1 1.25 1.55 1.85 2.15 2.45 2.75 0.36 0.66 0.96 1 1.26 1.56 1.86 1 2.16 2.46 2.76 0.37 0.67 0.97 1 1.27 1.57 1.87 2.17 2.47 2.77 0.38 0.68 0.98 1.28 1.58 1.88 2.18 2.48 Inert 0.39 0.69 0.99 1.29 1.59 1.89 2.19 2.49 3.34 1 ↓
VITRINITE 0.1 (+0.1HA) %
INERTINITE 0.1 %
LIPTINITE <0.1 %
OIL DROPS <0.1 (0.1 in art comp)
BITUMEN
TV
DV Sfus Scler Fus Macr ID Micr
Spor <0.1
Cut
Sub
Res
Ld
Bituminite
Telalginite
Lamalginite <0.1
Oil cut
Sample Number..T9941.....Well Name...Yolla-4 .....ORIGIN................................................... Depth...2925m........ .......................................................... SampleType....Ctgs... Date. ..21/.08/ 2004.. Op..ACC......... FGV - First Generation Vitrinite, RV - Reworked Vitrinite, HAV- heat altered vitrinite, Inert - Inertinite, Cav - Cavings, DA - Drilling Mud Additives Copyright Keiraville Konsultants MICR D:\RWORK.ms6\misc04vr.doc
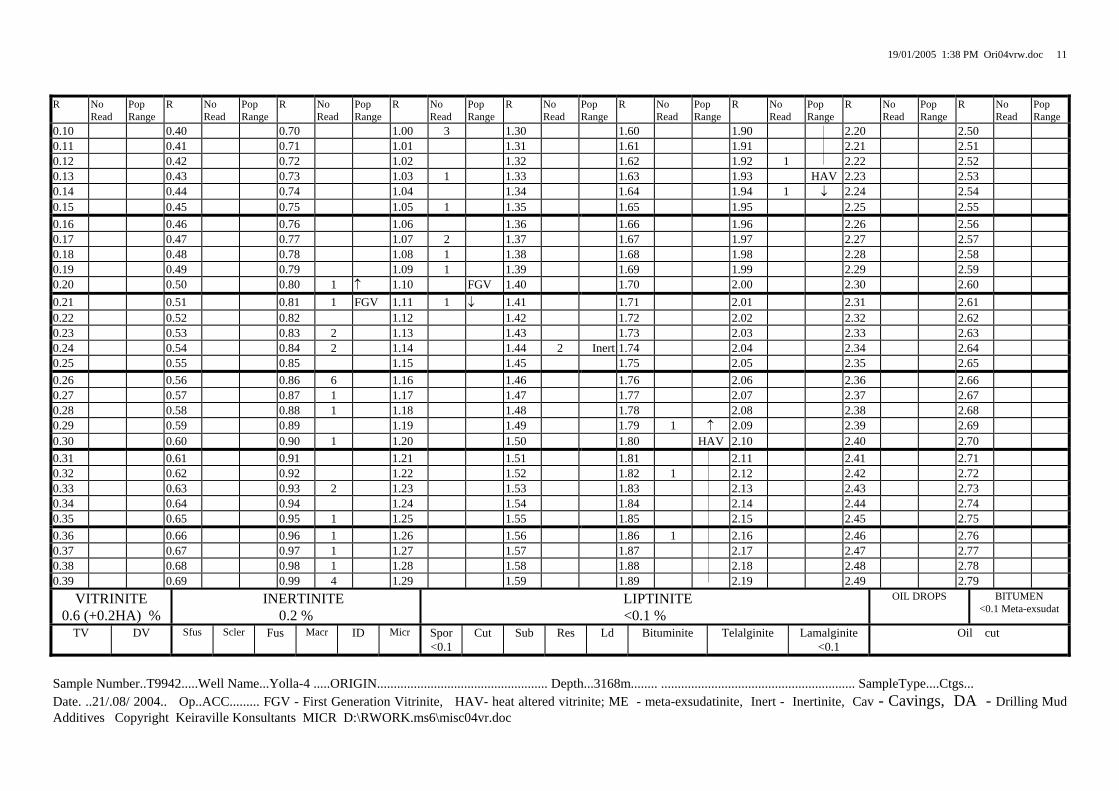
19/01/2005 1:38 PM Ori04vrw.doc
11
R No
Read Pop Range
R No Read
Pop Range
R No Read
Pop Range
R No Read
Pop Range
R No Read
Pop Range
R No Read
Pop Range
R No Read
Pop Range
R No Read
Pop Range
R No Read
Pop Range
0.10 0.40 0.70 1.00 3 1.30 1.60 1.90 2.20 2.50 0.11 0.41 0.71 1.01 1.31 1.61 1.91 2.21 2.51 0.12 0.42 0.72 1.02 1.32 1.62 1.92 1 2.22 2.52 0.13 0.43 0.73 1.03 1 1.33 1.63 1.93 HAV 2.23 2.53 0.14 0.44 0.74 1.04 1.34 1.64 1.94 1 ↓ 2.24 2.54 0.15 0.45 0.75 1.05 1 1.35 1.65 1.95 2.25 2.55 0.16 0.46 0.76 1.06 1.36 1.66 1.96 2.26 2.56 0.17 0.47 0.77 1.07 2 1.37 1.67 1.97 2.27 2.57 0.18 0.48 0.78 1.08 1 1.38 1.68 1.98 2.28 2.58 0.19 0.49 0.79 1.09 1 1.39 1.69 1.99 2.29 2.59 0.20 0.50 0.80 1 ↑ 1.10 FGV 1.40 1.70 2.00 2.30 2.60 0.21 0.51 0.81 1 FGV 1.11 1 ↓ 1.41 1.71 2.01 2.31 2.61 0.22 0.52 0.82 1.12 1.42 1.72 2.02 2.32 2.62 0.23 0.53 0.83 2 1.13 1.43 1.73 2.03 2.33 2.63 0.24 0.54 0.84 2 1.14 1.44 2 Inert 1.74 2.04 2.34 2.64 0.25 0.55 0.85 1.15 1.45 1.75 2.05 2.35 2.65 0.26 0.56 0.86 6 1.16 1.46 1.76 2.06 2.36 2.66 0.27 0.57 0.87 1 1.17 1.47 1.77 2.07 2.37 2.67 0.28 0.58 0.88 1 1.18 1.48 1.78 2.08 2.38 2.68 0.29 0.59 0.89 1.19 1.49 1.79 1 ↑ 2.09 2.39 2.69 0.30 0.60 0.90 1 1.20 1.50 1.80 HAV 2.10 2.40 2.70 0.31 0.61 0.91 1.21 1.51 1.81 2.11 2.41 2.71 0.32 0.62 0.92 1.22 1.52 1.82 1 2.12 2.42 2.72 0.33 0.63 0.93 2 1.23 1.53 1.83 2.13 2.43 2.73 0.34 0.64 0.94 1.24 1.54 1.84 2.14 2.44 2.74 0.35 0.65 0.95 1 1.25 1.55 1.85 2.15 2.45 2.75 0.36 0.66 0.96 1 1.26 1.56 1.86 1 2.16 2.46 2.76 0.37 0.67 0.97 1 1.27 1.57 1.87 2.17 2.47 2.77 0.38 0.68 0.98 1 1.28 1.58 1.88 2.18 2.48 2.78 0.39 0.69 0.99 4 1.29 1.59 1.89 2.19 2.49 2.79
VITRINITE 0.6 (+0.2HA) %
INERTINITE 0.2 %
LIPTINITE <0.1 %
OIL DROPS
BITUMEN <0.1 Meta-exsudat
TV
DV Sfus Scler Fus Macr ID Micr
Spor <0.1
Cut
Sub
Res
Ld
Bituminite
Telalginite
Lamalginite <0.1
Oil cut
Sample Number..T9942.....Well Name...Yolla-4 .....ORIGIN................................................... Depth...3168m........ .......................................................... SampleType....Ctgs... Date. ..21/.08/ 2004.. Op..ACC......... FGV - First Generation Vitrinite, HAV- heat altered vitrinite; ME - meta-exsudatinite, Inert - Inertinite, Cav - Cavings, DA - Drilling Mud Additives Copyright Keiraville Konsultants MICR D:\RWORK.ms6\misc04vr.doc
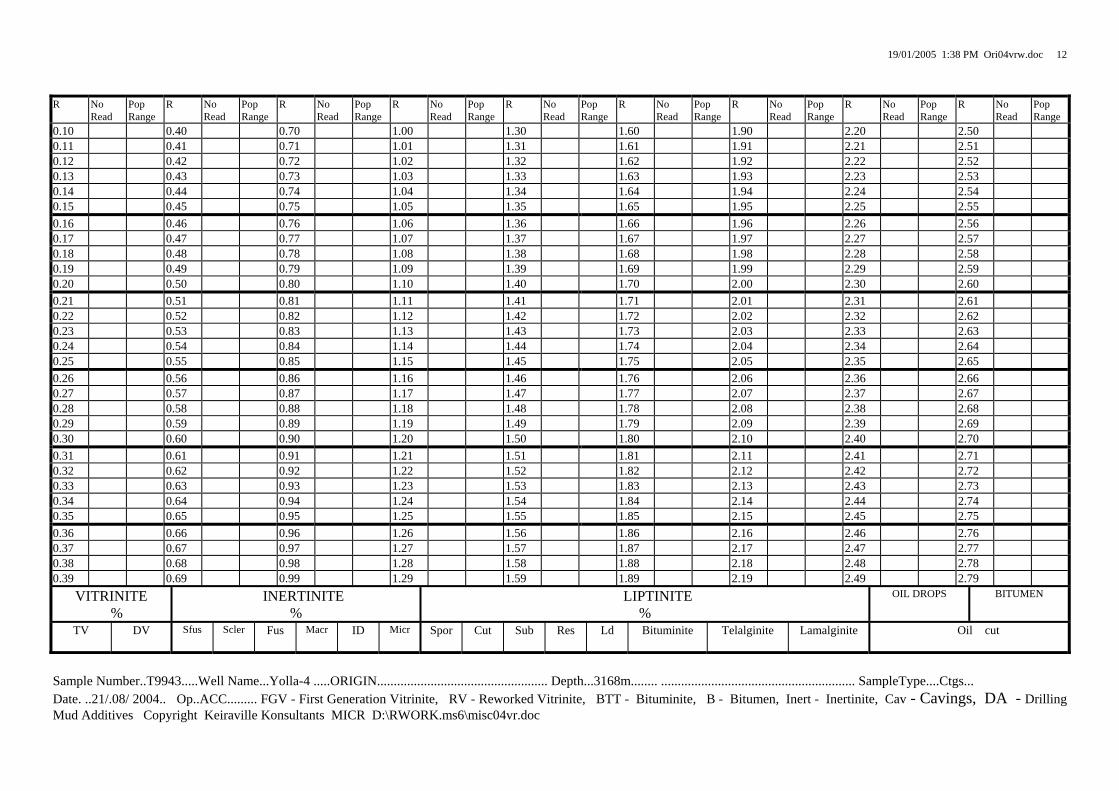
19/01/2005 1:38 PM Ori04vrw.doc
12
R No
Read Pop Range
R No Read
Pop Range
R No Read
Pop Range
R No Read
Pop Range
R No Read
Pop Range
R No Read
Pop Range
R No Read
Pop Range
R No Read
Pop Range
R No Read
Pop Range
0.10 0.40 0.70 1.00 1.30 1.60 1.90 2.20 2.50 0.11 0.41 0.71 1.01 1.31 1.61 1.91 2.21 2.51 0.12 0.42 0.72 1.02 1.32 1.62 1.92 2.22 2.52 0.13 0.43 0.73 1.03 1.33 1.63 1.93 2.23 2.53 0.14 0.44 0.74 1.04 1.34 1.64 1.94 2.24 2.54 0.15 0.45 0.75 1.05 1.35 1.65 1.95 2.25 2.55 0.16 0.46 0.76 1.06 1.36 1.66 1.96 2.26 2.56 0.17 0.47 0.77 1.07 1.37 1.67 1.97 2.27 2.57 0.18 0.48 0.78 1.08 1.38 1.68 1.98 2.28 2.58 0.19 0.49 0.79 1.09 1.39 1.69 1.99 2.29 2.59 0.20 0.50 0.80 1.10 1.40 1.70 2.00 2.30 2.60 0.21 0.51 0.81 1.11 1.41 1.71 2.01 2.31 2.61 0.22 0.52 0.82 1.12 1.42 1.72 2.02 2.32 2.62 0.23 0.53 0.83 1.13 1.43 1.73 2.03 2.33 2.63 0.24 0.54 0.84 1.14 1.44 1.74 2.04 2.34 2.64 0.25 0.55 0.85 1.15 1.45 1.75 2.05 2.35 2.65 0.26 0.56 0.86 1.16 1.46 1.76 2.06 2.36 2.66 0.27 0.57 0.87 1.17 1.47 1.77 2.07 2.37 2.67 0.28 0.58 0.88 1.18 1.48 1.78 2.08 2.38 2.68 0.29 0.59 0.89 1.19 1.49 1.79 2.09 2.39 2.69 0.30 0.60 0.90 1.20 1.50 1.80 2.10 2.40 2.70 0.31 0.61 0.91 1.21 1.51 1.81 2.11 2.41 2.71 0.32 0.62 0.92 1.22 1.52 1.82 2.12 2.42 2.72 0.33 0.63 0.93 1.23 1.53 1.83 2.13 2.43 2.73 0.34 0.64 0.94 1.24 1.54 1.84 2.14 2.44 2.74 0.35 0.65 0.95 1.25 1.55 1.85 2.15 2.45 2.75 0.36 0.66 0.96 1.26 1.56 1.86 2.16 2.46 2.76 0.37 0.67 0.97 1.27 1.57 1.87 2.17 2.47 2.77 0.38 0.68 0.98 1.28 1.58 1.88 2.18 2.48 2.78 0.39 0.69 0.99 1.29 1.59 1.89 2.19 2.49 2.79
VITRINITE %
INERTINITE %
LIPTINITE %
OIL DROPS
BITUMEN
TV
DV Sfus Scler Fus Macr ID Micr
Spor
Cut
Sub
Res
Ld
Bituminite
Telalginite
Lamalginite
Oil cut
Sample Number..T9943.....Well Name...Yolla-4 .....ORIGIN................................................... Depth...3168m........ .......................................................... SampleType....Ctgs... Date. ..21/.08/ 2004.. Op..ACC......... FGV - First Generation Vitrinite, RV - Reworked Vitrinite, BTT - Bituminite, B - Bitumen, Inert - Inertinite, Cav - Cavings, DA - Drilling Mud Additives Copyright Keiraville Konsultants MICR D:\RWORK.ms6\misc04vr.doc
Origin Energy Resources Ltd ABN 66 007 845 338 Commercial-in-Confidence Greenfields Division Ref: W:\Complete Reports\BASS\Yolla\Yolla 4\Interpretive\Yolla4InterpretativeDataWCR with appendix headers.docc
AAPPPPEENNDDIIXX 66:: PPAALLYYNNOOLLOOGGYY RREEPPOORRTT
PALYNOLOGY OF
YOLLA-4
BASS BASIN, AUSTRALIA
by
ROGER MORGAN
Prepared for ORIGIN ENERGY October 2004
REF: BAS.YOLLA-4 REPORT
2
PALYNOLOGY OF
YOLLA-4
BASS BASIN, AUSTRALIA
CONTENTS PAGE 1 SUMMARY 3 2 INTRODUCTION 4 3 PALYNOSTRATIGRAPHY 8 4 REFERENCES 13 Table 1 Individual Sample Summary, Yolla-4 Figure 1 Tertiary Zonation Scheme (Partridge 1976) Figure 2 Maturity Profile, Yolla-4 Enclosure 1 Species distribution chart
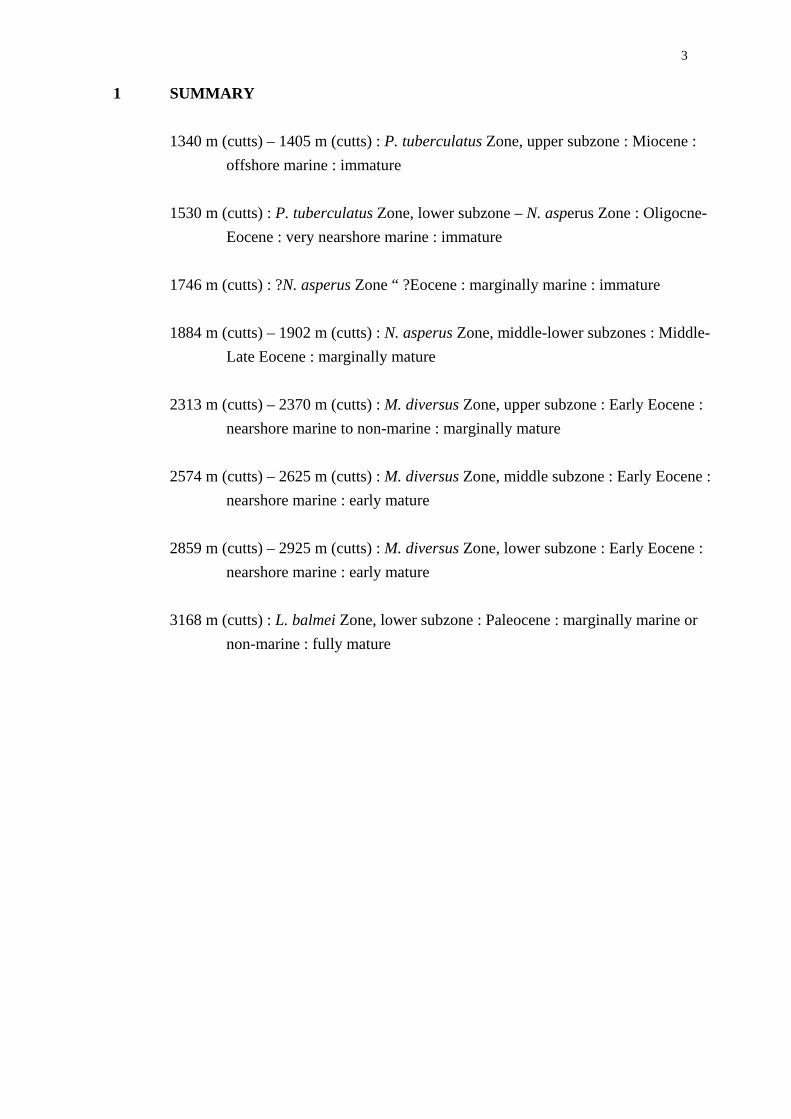
3
1 SUMMARY
1340 m (cutts) – 1405 m (cutts) : P. tuberculatus Zone, upper subzone : Miocene : offshore marine : immature
1530 m (cutts) : P. tuberculatus Zone, lower subzone – N. asperus Zone : Oligocne-
Eocene : very nearshore marine : immature 1746 m (cutts) : ?N. asperus Zone “ ?Eocene : marginally marine : immature 1884 m (cutts) – 1902 m (cutts) : N. asperus Zone, middle-lower subzones : Middle-
Late Eocene : marginally mature 2313 m (cutts) – 2370 m (cutts) : M. diversus Zone, upper subzone : Early Eocene :
nearshore marine to non-marine : marginally mature 2574 m (cutts) – 2625 m (cutts) : M. diversus Zone, middle subzone : Early Eocene :
nearshore marine : early mature 2859 m (cutts) – 2925 m (cutts) : M. diversus Zone, lower subzone : Early Eocene :
nearshore marine : early mature 3168 m (cutts) : L. balmei Zone, lower subzone : Paleocene : marginally marine or
non-marine : fully mature
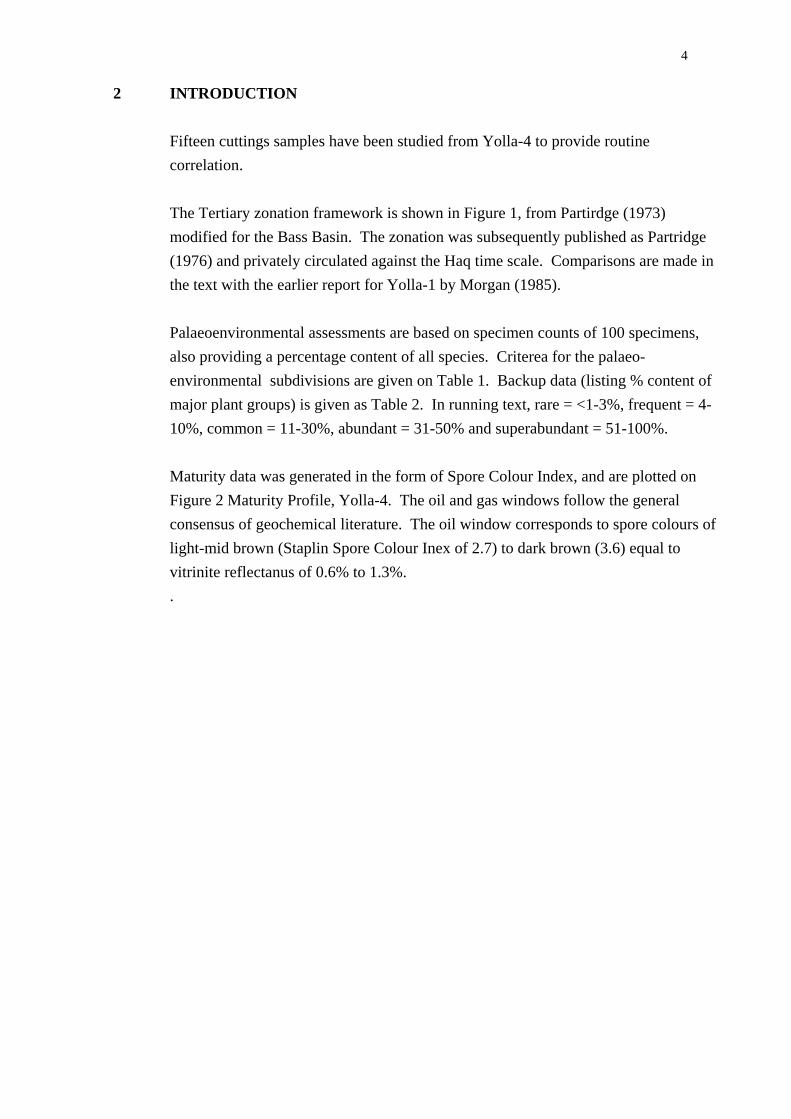
4
2 INTRODUCTION
Fifteen cuttings samples have been studied from Yolla-4 to provide routine correlation. The Tertiary zonation framework is shown in Figure 1, from Partirdge (1973) modified for the Bass Basin. The zonation was subsequently published as Partridge (1976) and privately circulated against the Haq time scale. Comparisons are made in the text with the earlier report for Yolla-1 by Morgan (1985). Palaeoenvironmental assessments are based on specimen counts of 100 specimens, also providing a percentage content of all species. Criterea for the palaeo-environmental subdivisions are given on Table 1. Backup data (listing % content of major plant groups) is given as Table 2. In running text, rare = <1-3%, frequent = 4-10%, common = 11-30%, abundant = 31-50% and superabundant = 51-100%. Maturity data was generated in the form of Spore Colour Index, and are plotted on Figure 2 Maturity Profile, Yolla-4. The oil and gas windows follow the general consensus of geochemical literature. The oil window corresponds to spore colours of light-mid brown (Staplin Spore Colour Inex of 2.7) to dark brown (3.6) equal to vitrinite reflectanus of 0.6% to 1.3%. .
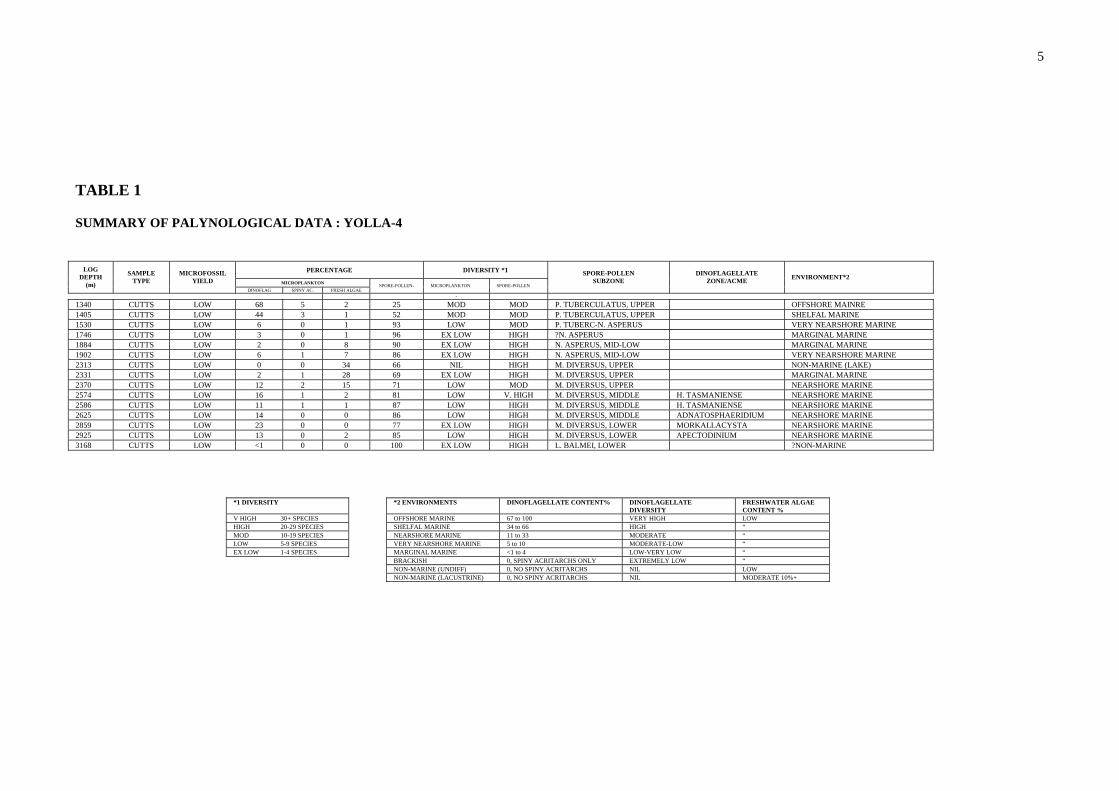
5
TABLE 1 SUMMARY OF PALYNOLOGICAL DATA : YOLLA-4
PERCENTAGE DIVERSITY *1
MICROPLANKTON
LOG DEPTH
(m)
SAMPLE TYPE
MICROFOSSIL YIELD
DINOFLAG SPINY AC. FRESH ALGAE SPORE-POLLEN- MICROPLANKTON SPORE-POLLEN
SPORE-POLLEN SUBZONE
DINOFLAGELLATE ZONE/ACME ENVIRONMENT*2
-
1340 CUTTS LOW 68 5 2 25 MOD MOD P. TUBERCULATUS, UPPER OFFSHORE MAINRE 1405 CUTTS LOW 44 3 1 52 MOD MOD P. TUBERCULATUS, UPPER SHELFAL MARINE 1530 CUTTS LOW 6 0 1 93 LOW MOD P. TUBERC-N. ASPERUS VERY NEARSHORE MARINE 1746 CUTTS LOW 3 0 1 96 EX LOW HIGH ?N. ASPERUS MARGINAL MARINE 1884 CUTTS LOW 2 0 8 90 EX LOW HIGH N. ASPERUS, MID-LOW MARGINAL MARINE 1902 CUTTS LOW 6 1 7 86 EX LOW HIGH N. ASPERUS, MID-LOW VERY NEARSHORE MARINE 2313 CUTTS LOW 0 0 34 66 NIL HIGH M. DIVERSUS, UPPER NON-MARINE (LAKE) 2331 CUTTS LOW 2 1 28 69 EX LOW HIGH M. DIVERSUS, UPPER MARGINAL MARINE 2370 CUTTS LOW 12 2 15 71 LOW MOD M. DIVERSUS, UPPER NEARSHORE MARINE 2574 CUTTS LOW 16 1 2 81 LOW V. HIGH M. DIVERSUS, MIDDLE H. TASMANIENSE NEARSHORE MARINE 2586 CUTTS LOW 11 1 1 87 LOW HIGH M. DIVERSUS, MIDDLE H. TASMANIENSE NEARSHORE MARINE 2625 CUTTS LOW 14 0 0 86 LOW HIGH M. DIVERSUS, MIDDLE ADNATOSPHAERIDIUM NEARSHORE MARINE 2859 CUTTS LOW 23 0 0 77 EX LOW HIGH M. DIVERSUS, LOWER MORKALLACYSTA NEARSHORE MARINE 2925 CUTTS LOW 13 0 2 85 LOW HIGH M. DIVERSUS, LOWER APECTODINIUM NEARSHORE MARINE 3168 CUTTS LOW <1 0 0 100 EX LOW HIGH L. BALMEI, LOWER ?NON-MARINE *1 DIVERSITY *2 ENVIRONMENTS DINOFLAGELLATE CONTENT% DINOFLAGELLATE
DIVERSITY FRESHWATER ALGAE CONTENT %
V HIGH 30+ SPECIES OFFSHORE MARINE 67 to 100 VERY HIGH LOW HIGH 20-29 SPECIES SHELFAL MARINE 34 to 66 HIGH “ MOD 10-19 SPECIES NEARSHORE MARINE 11 to 33 MODERATE “ LOW 5-9 SPECIES VERY NEARSHORE MARINE 5 to 10 MODERATE-LOW “ EX LOW 1-4 SPECIES MARGINAL MARINE <1 to 4 LOW-VERY LOW “ BRACKISH 0, SPINY ACRITARCHS ONLY EXTREMELY LOW “ NON-MARINE (UNDIFF) 0, NO SPINY ACRITARCHS NIL LOW NON-MARINE (LACUSTRINE) 0, NO SPINY ACRITARCHS NIL MODERATE 10%+
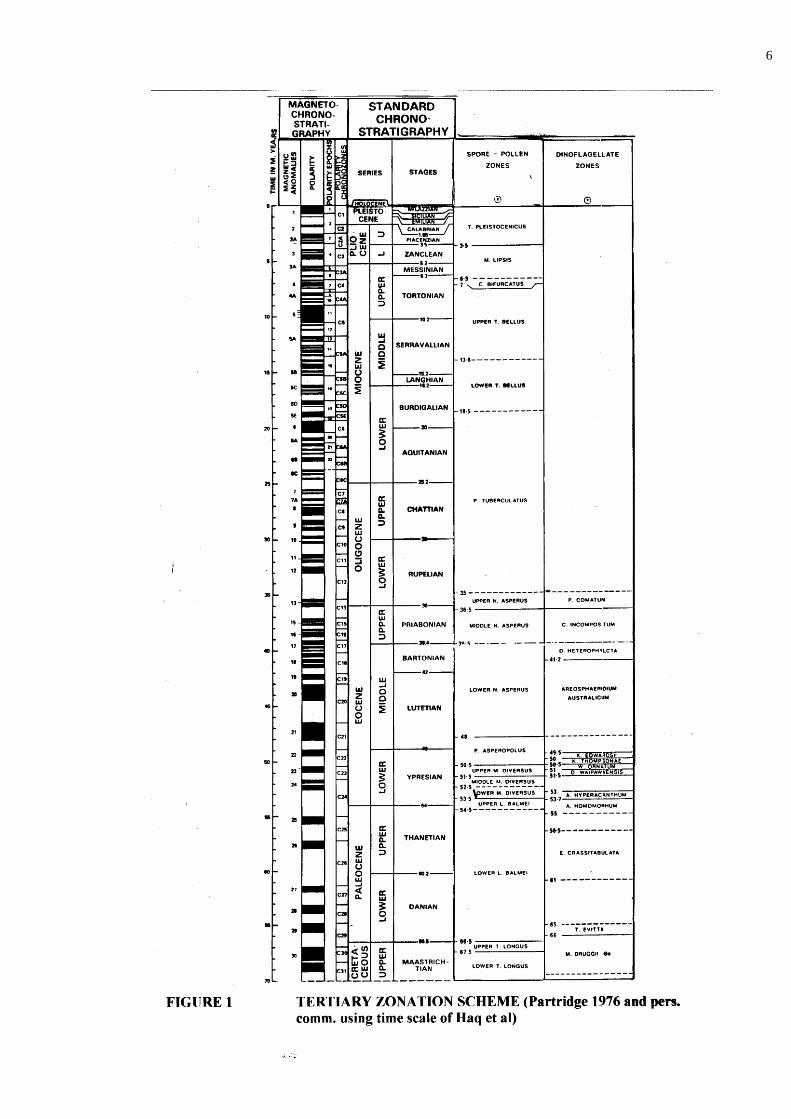
6
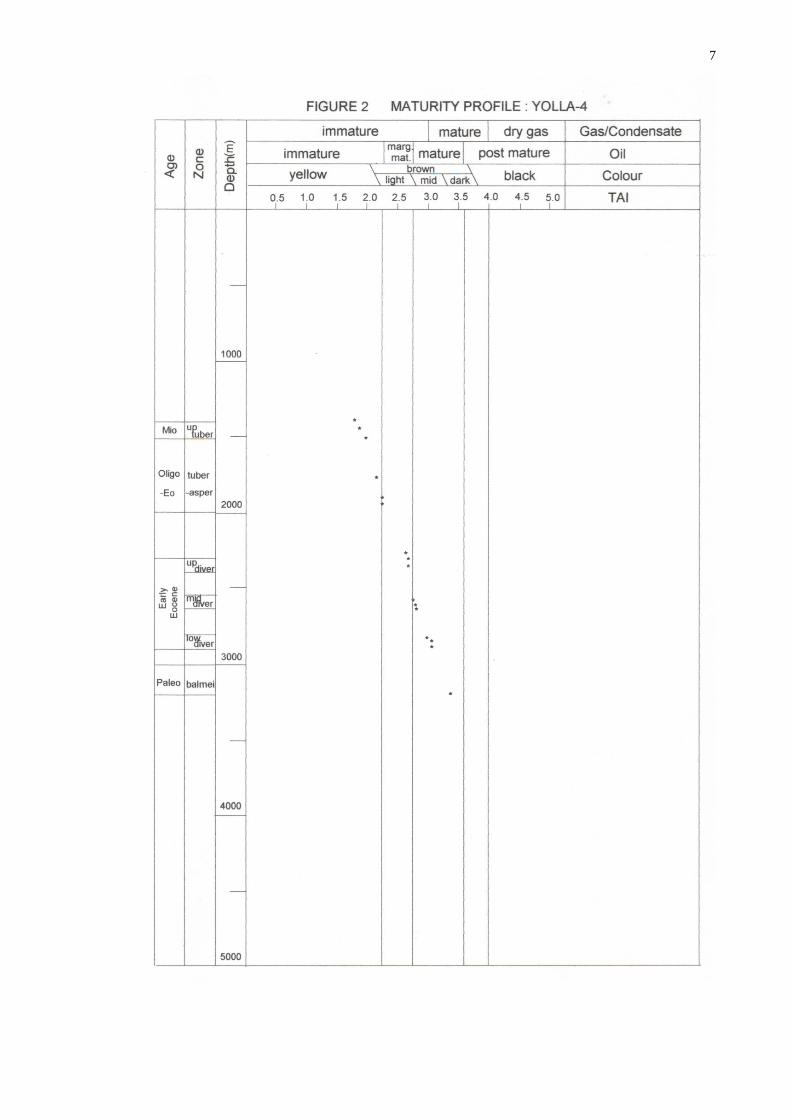
7
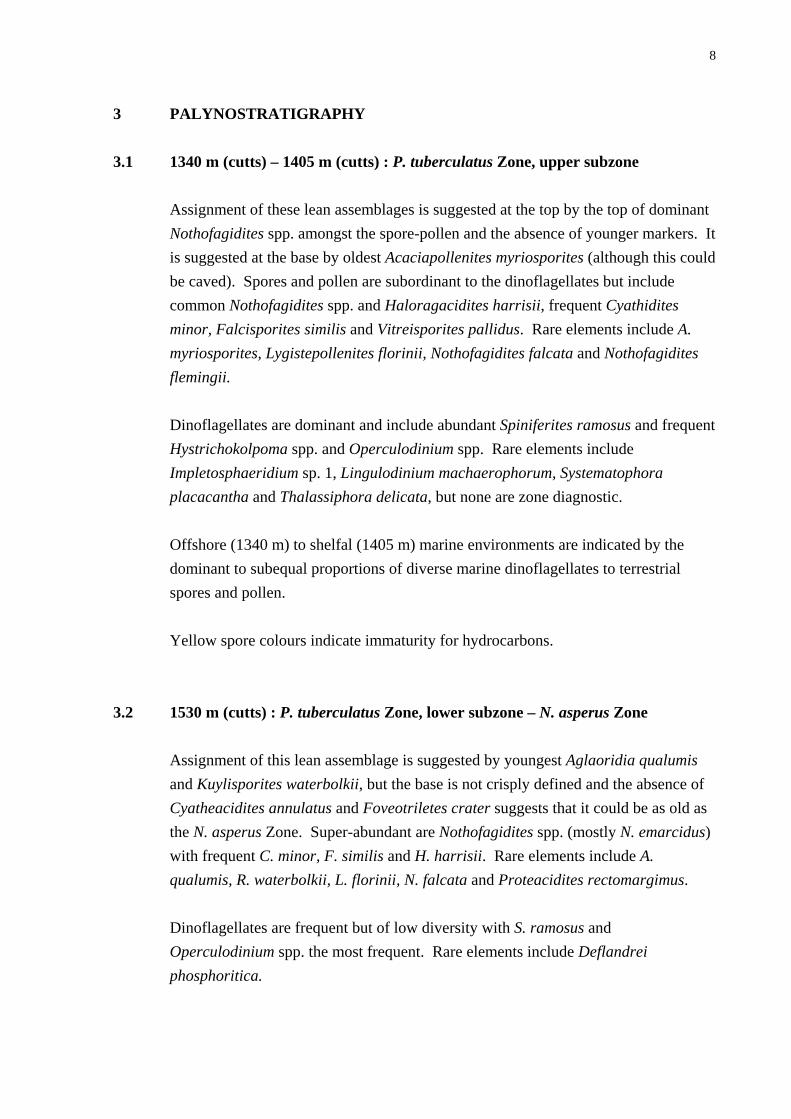
8
3 PALYNOSTRATIGRAPHY 3.1 1340 m (cutts) – 1405 m (cutts) : P. tuberculatus Zone, upper subzone
Assignment of these lean assemblages is suggested at the top by the top of dominant Nothofagidites spp. amongst the spore-pollen and the absence of younger markers. It is suggested at the base by oldest Acaciapollenites myriosporites (although this could be caved). Spores and pollen are subordinant to the dinoflagellates but include common Nothofagidites spp. and Haloragacidites harrisii, frequent Cyathidites minor, Falcisporites similis and Vitreisporites pallidus. Rare elements include A. myriosporites, Lygistepollenites florinii, Nothofagidites falcata and Nothofagidites flemingii. Dinoflagellates are dominant and include abundant Spiniferites ramosus and frequent Hystrichokolpoma spp. and Operculodinium spp. Rare elements include Impletosphaeridium sp. 1, Lingulodinium machaerophorum, Systematophora placacantha and Thalassiphora delicata, but none are zone diagnostic. Offshore (1340 m) to shelfal (1405 m) marine environments are indicated by the dominant to subequal proportions of diverse marine dinoflagellates to terrestrial spores and pollen. Yellow spore colours indicate immaturity for hydrocarbons.
3.2 1530 m (cutts) : P. tuberculatus Zone, lower subzone – N. asperus Zone
Assignment of this lean assemblage is suggested by youngest Aglaoridia qualumis and Kuylisporites waterbolkii, but the base is not crisply defined and the absence of Cyatheacidites annulatus and Foveotriletes crater suggests that it could be as old as the N. asperus Zone. Super-abundant are Nothofagidites spp. (mostly N. emarcidus) with frequent C. minor, F. similis and H. harrisii. Rare elements include A. qualumis, R. waterbolkii, L. florinii, N. falcata and Proteacidites rectomargimus. Dinoflagellates are frequent but of low diversity with S. ramosus and Operculodinium spp. the most frequent. Rare elements include Deflandrei phosphoritica.
9
Very nearshore marine environments are indicated by the scarce low diversity dinoflagellates amongst the dominant and diverse spores and pollen. Yellow spore colours indicate immaturity for hydrocarbons.
3.3 1746 m (cutts) :?N. asperus Zone
Assignment is uncertain as relatively few palynomorphs were seen amongst the dominant plant debris (mostly inertinite and amorphous organic matter (AOM)). Amongst the spores and pollen, abundant is N. emarcidus with common C. minor and Phyllocladidites mawsonii and frequent Cyathidites australis, F. similis, H. harrisii and Nothofagidites deminutus. Rare elements include Malvacipollis subtilis, N. flemingii, P. rectomarginus and Verrucosisporites kopukuensis. Dinoflagellates are extremely rare and not age diagnostic. Marginal marine environments are indicated by the rare low diversity dinoflagellates amongst the dominant and diverse spores and pollen. Yellow spore colours indicate immaturity for hydrocarbons.
3.4 1884 m (cutts) – 1902 m (cutts) : N. asperus Zone, middle-lower subzones Assignment is indicated at the top by youngest Proteacidites pachypolus and at the base by oldest dominant Nothofagidites spp. Common are N. emarcidus with frequent C. australis, C. minor, F. similis, H. harrisii, Osmundacidites wellmanii and Vitreisporites pallidus. Rare elements include M. subtilis, N. flemingii, Periporopollenites vesicus, Proteacidites incurvatus, P. grandis, P. pachypolus and Stereisporites punctatus. Dinoflagellates are frequent but include rare S. placacantha, consistent with the spore-pollen assignment. Very nearshore (1902 m) to marginal marine (1884 m) environments are indicated by the minor low diversity dinoflagellates amongst the dominant and highly diverse spores and pollen.
10
Light brown spore colours indicate marginal maturity for oil but immaturity for gas/condensate.
3.5 2313 m (cutts) – 2370 m (cutts) : M. diversus Zone, upper subzone
Assignment is indicated at the top by youngest Myrtaceidites tenuis and Proteacidites ornatus without younger markers, and at the base on oldest M. tenuis. Proteacidites asperopolus was not seen and suggests that the P. asperopolus Zone is unsampled. Common is H. harrisii with frequent Proteacidites spp. Rare elements include Beaupreadites verrucosus, M. subtilis, M. tenuis, Polycolpites esobolteus, P. grandis, P. ornatus, Proteacidites leightonii, Proteacidites tuberculiformis and Triporopollenites ambiguus. Dinoflagellates are absent at 2313 m, rare at 2331 m and frequent at 2370 m, but not age diagnostic. Environments are very nearshore to non-marine as indicated by the minor to absent dinoflagellates, and the dominant and diverse spores and pollen. Light to mid brown spore colours indicate marginal maturity for oil.
3.6 2574 m (cutts) – 2625 m (cutts) : M. diversus Zone, middle subzone Assignment is indicated at the top by youngest Peninsulapollis gillii and the absence of younger markers and at the base by oldest P. ornatus and P. tuberculiformis, supported at 2586 m by oldest T. ambiguus. Common are H. harrisii and C. minor with frequent Araucariacites australis, Dilwynites granulatus, F. similis, N. emarcidus, Proteacidites spp. and V. pallidus. Rare elements include Intratriporopollenites notabilis, P. grandis, P. ornatus, P. tuberculiformis, P. incurvatus, T. ambiguus and P. gillii. Dinoflagellates include Homotriblium tasmaniense at 2574 m and 2586 m but this is usually associated with the P. asperopolus and upper M. diversus Zones and is seen in Yolla-1 at 2282-2417 m in the upper M. diversus Zone. At 2586 m and 2625 m, Adnatosphaeridium sp. occurs and was seen in Yolla-1 at 2417-2471 m in the upper M. diversus and middle M. diversus Zone. The dinoflagellates are thus approximately compatible but do suggest that some of this interval might belong to the upper rather than middle M. diversus Zone. On the other hand, the
11
dinoflagellates may be partly caved. At 2574 m and 2586 m, S. ramosus and H. tasmaniense are frequent with rare Muratodinium fimbriatum and Apectodinium quinquelatum. At 2625 m, Adnatosphaeridium sp. is frequent with rare M. fimbriatum and Apectodinium homomorphum. Nearshore marine environments are indicated by the dominant and diverse spores and pollen and less numerous low diversity dinoflagellates. Mid brown spore colours indicate early maturity for oil and early marginal maturity for gas/condensate. Some black spores at 2574 m suggest reworking or vulcanicity during deposition.
3.7 2859 m (cutts) – 2925 m (cutts) : M. diversus Zone, lower subzone Assignment is indicated at the top by the absence of younger markers, and at the base by P. grandis without older markers. Common are F. similis and C. minor with frequent A. australis, D. granulatus and V. pallidus. Rare elements include M. subtilis, N. flemingii, P. grandis, P. gillii and a single Polycolpites langstonii at 2925 m. Dinoflagellates include Morkallacysta sp., common at 2859 m and rare at 2925 m. This is consistent with Yolla-1 where Morkallacysta sp. was common at 2711-2731 m in the lower M. diversus Zone. At 2925 m, Apectodinium spp. are frequent, a feature seen in Yolla-1 at 2783 m. Rare elements include Adnatosphaeridium sp. (probably caved) and M. fimbriatum. Apectodinium hyperacanthum occurs in both samples. Nearshore marine environments are indicated by the dominant and diverse spores and pollen and the less numerous low diversity dinoflagellates. Mid brown spore colours indicate early maturity for oil and early marginal maturity for gas/condensate.

12
3.8 3168 m (cutts) : L. balmei Zone, lower subzone
Assignment is indicated by youngest Gambierina rudata and Lygistepollenites balmei without older markers. The lower subzone is indicated by the absence of the upper subzone markers seen in Yolla-1. Abundant is F. similis with common D. granulatus and frequent C. minor, M. antarcticus, N. emarcidus, P. mawsonii, P. microsaccatus and V. pallidus. Rare elements include Cyathidites gigantis, G. rudata, L. balmei and Nothofagidites endurus. Dinoflagellates are extremely scarce and include only Morkallacysta sp. which may be caved. Environments are marginally marine or freshwater, depending on the significance of Morkallacysta sp. which has been suggested to be a freshwater dinoflagellate. Totally dominant and diverse are the spores and pollen. Dark brown spore colours indicate full maturity for oil and marginal maturity for gas/condensate.

13
4 REFERENCES
Morgan, R.P., (1985) Palynology of Amoco Yolla-1, Bass Basin, Australia unpubl rept for Amoco Australia
Partridge, A D (1973) Revision of the spore-pollen zonation in the Bass Basin, Esso
unpubl. palaeo. rept. 1973/4 Partridge, A D (1976) The geological expression of eustacy in the Early Tertiary of
the Gippsland Basin Aust. Pet. Explor. Assoc., J, 16:73-79
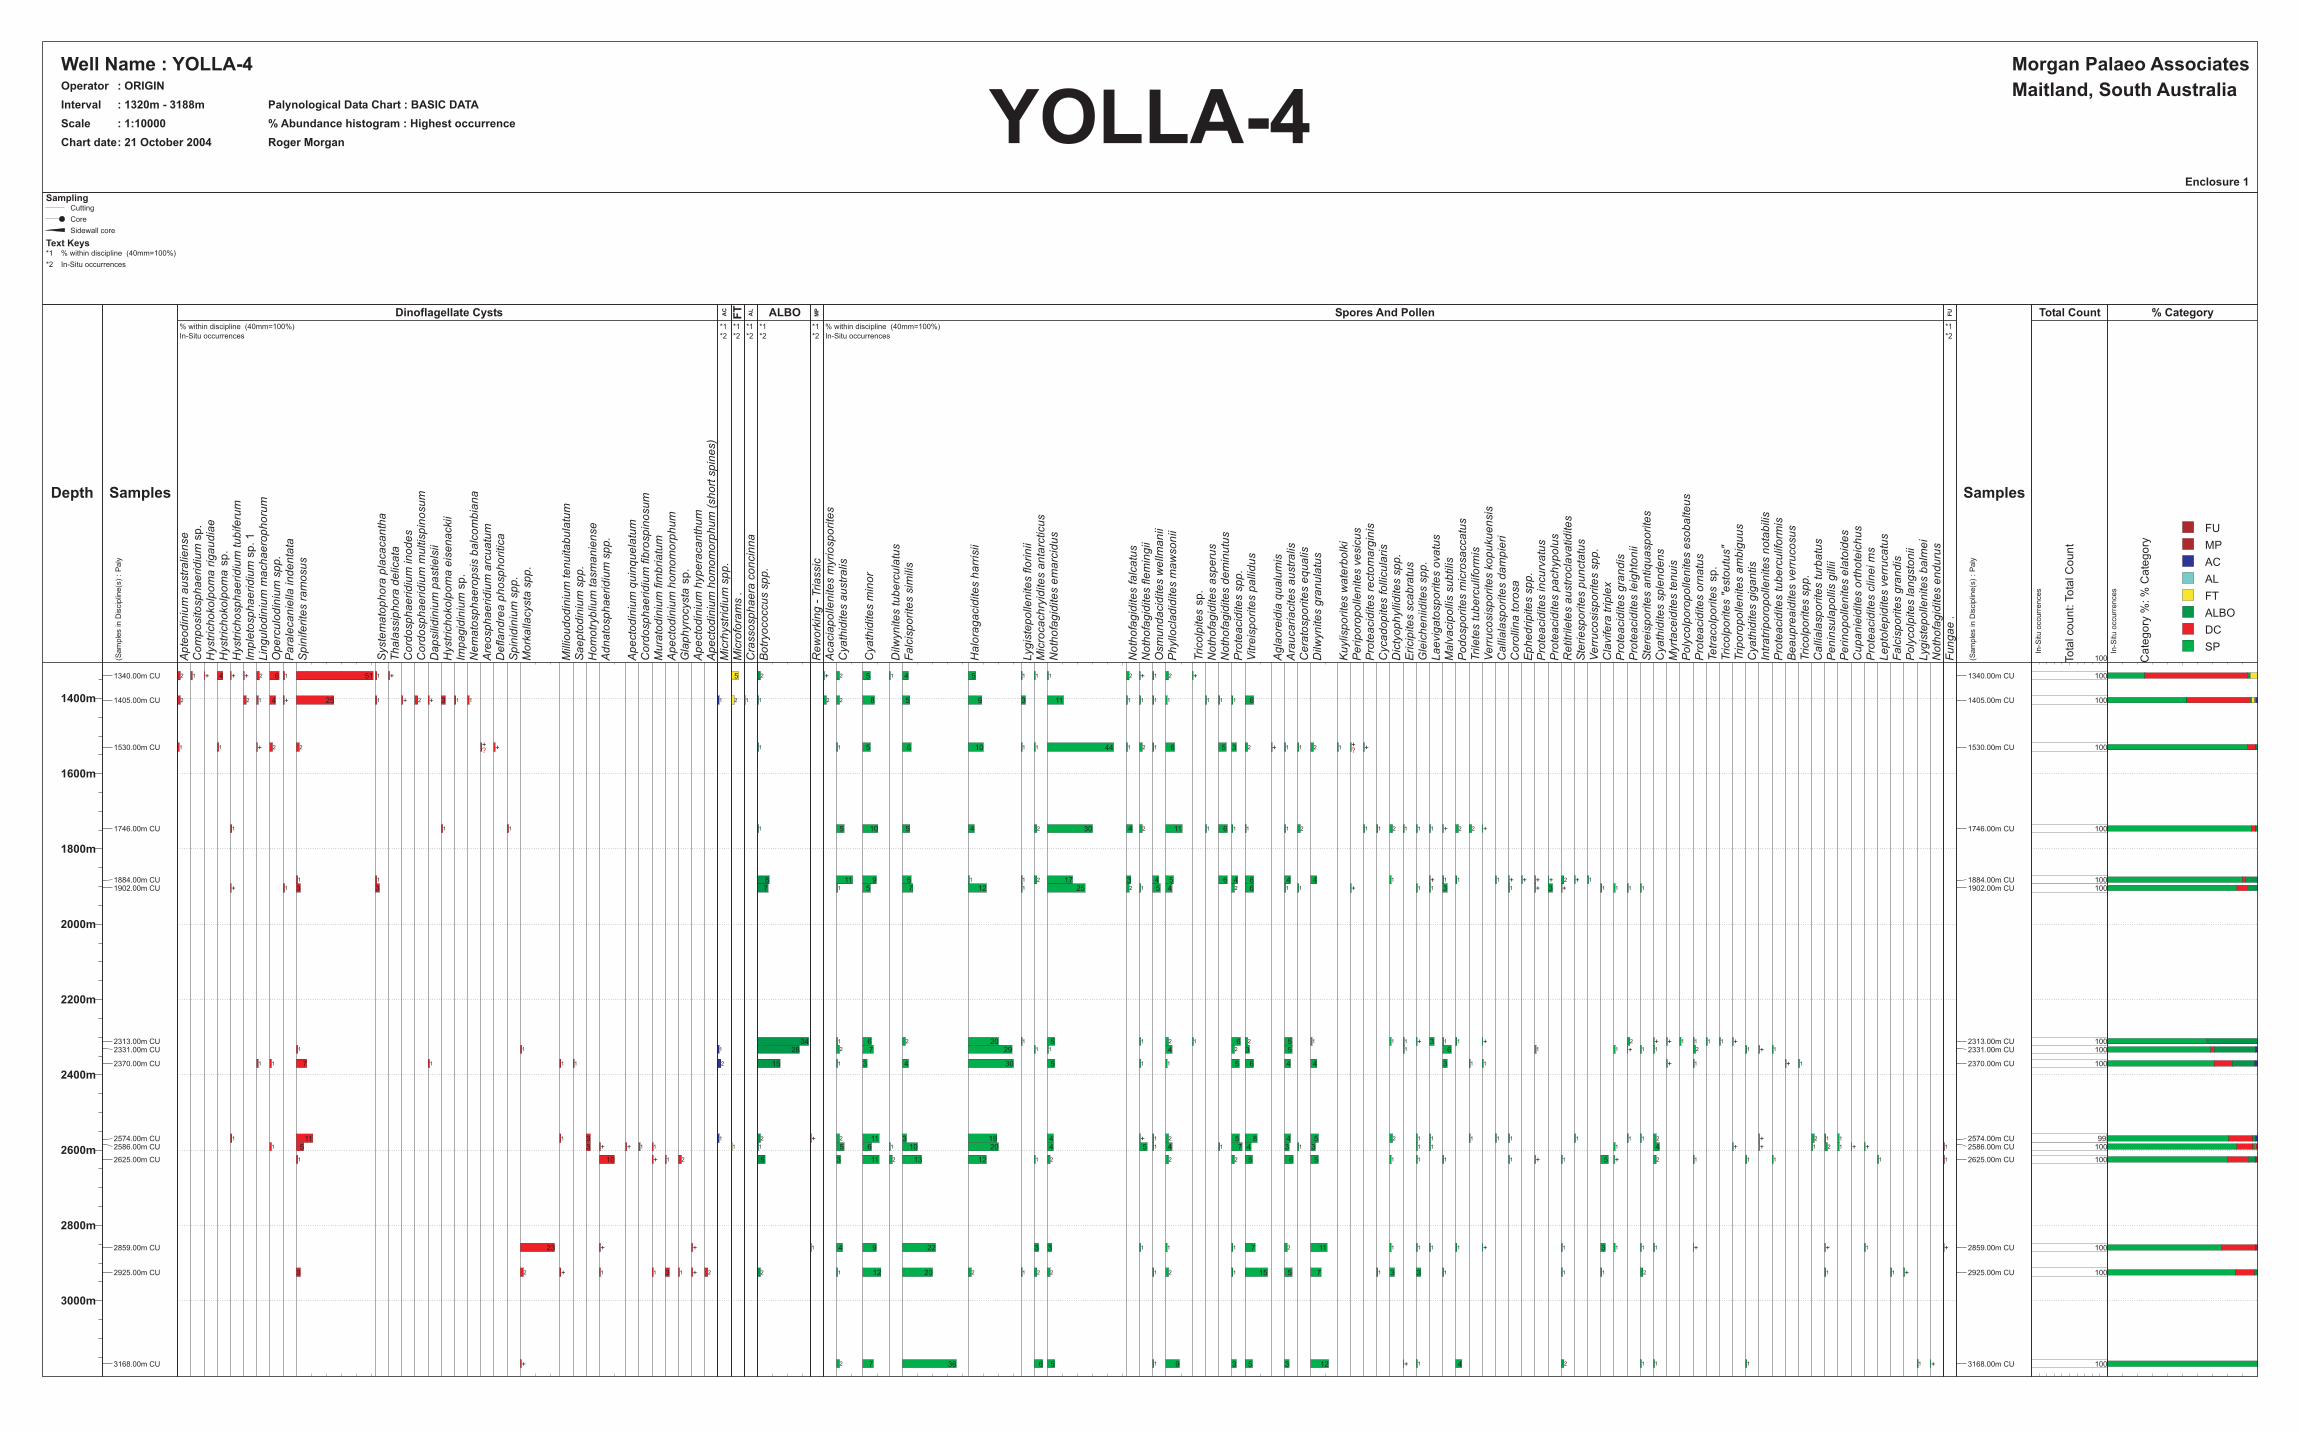
Depth
1400m
1600m
1800m
2000m
2200m
2400m
2600m
2800m
3000m
Well Name : YOLLA-4Operator : ORIGIN
Interval : 1320m - 3188m Palynological Data Chart : BASIC DATA
Scale : 1:10000 % Abundance histogram : Highest occurrence YOLLA-4Chart date: 21 October 2004 Roger Morgan
Enclosure 1
Morgan Palaeo Associates
Maitland, South Australia
Samples
(Sam
ple
sin
Dis
cip
line(s
):
Paly
1340.00m CU
1405.00m CU
1530.00m CU
1746.00m CU
1884.00m CU1902.00m CU
2313.00m CU2331.00m CU
2370.00m CU
2574.00m CU2586.00m CU
2625.00m CU
2859.00m CU
2925.00m CU
3168.00m CU
% within discipline (40mm=100%)
In-Situ occurrences
Ap
teo
din
ium
au
str
alie
nse
Co
mp
osito
sp
ha
eri
diu
msp
.H
ystr
ich
oko
lpo
ma
rig
au
dia
eH
ystr
ich
oko
lpo
ma
sp
.H
ystr
ich
osp
ha
eri
diu
mtu
bife
rum
Imp
leto
sp
ha
eri
diu
msp
.1
Lin
gu
lod
iniu
mm
ach
ae
rop
ho
rum
Op
erc
ulo
din
ium
sp
p.
Pa
rale
ca
nie
llain
de
nta
taS
pin
ife
rite
sra
mo
su
s
Syste
ma
top
ho
rap
laca
ca
nth
aT
ha
lassip
ho
rad
elic
ata
Co
rdo
sp
ha
eri
diu
min
od
es
Co
rdo
sp
ha
eri
diu
mm
ultis
pin
osu
mD
ap
sili
din
ium
pa
stie
lsii
Hystr
ich
oko
lpo
ma
eis
en
ackii
Imp
ag
idin
ium
sp
.N
em
ato
sp
ha
ero
psis
ba
lco
mb
ian
aA
reo
sp
ha
eri
diu
ma
rcu
atu
mD
efla
nd
rea
ph
osp
ho
ritica
Sp
inid
iniu
msp
p.
Mo
rka
llacysta
sp
p.
Mill
iou
do
din
ium
ten
uita
bu
latu
mS
ae
pto
din
ium
sp
p.
Ho
mo
tryb
lium
tasm
an
ien
se
Ad
na
tosp
ha
eri
diu
msp
p.
Ap
ecto
din
ium
qu
inq
ue
latu
mC
ord
osp
ha
eri
diu
mfib
rosp
ino
su
mM
ura
tod
iniu
mfim
bri
atu
mA
pe
cto
din
ium
ho
mo
mo
rph
um
Gla
ph
yro
cysta
sp
.A
pe
cto
din
ium
hyp
era
ca
nth
um
Ap
ecto
din
ium
ho
mo
mo
rph
um
(sh
ort
sp
ine
s)
2 1 + 4 + + 2 6 1 51 1 +
2 2 1 4 + 25 1 + 2 + 3 1 1
1 1 + 2 2 +? +
1 1 1
1 1
+ 1 3 3
1 1
1 1 7 1 1 1
1 11 1 31 5 3 + + 1 1
1 10 + 1 2
23 + +
3 2 + 1 1 3 1 + 2
+
Dinoflagellate Cysts*1
*2
Mic
rhystr
idiu
msp
p.
1
1
2
1
AC
*1
*2
Mic
rofo
ram
s.
5
2
1
FT
*1
*2
Cra
sso
sp
ha
era
co
ncin
na
1
AL
*1
*2
Bo
tryo
co
ccu
ssp
p.
2
1
1
1
87
3428
15
2
1
5
2
ALBO*1
*2
Re
wo
rkin
g-
Tri
assic
+
1
MP
% within discipline (40mm=100%)
In-Situ occurrences
Aca
cia
po
llen
ite
sm
yri
osp
ori
tes
Cya
thid
ite
sa
ustr
alis
Cya
thid
ite
sm
ino
r
Dilw
yn
ite
stu
be
rcu
latu
sF
alc
isp
ori
tes
sim
ilis
Ha
lora
ga
cid
ite
sh
arr
isii
Lyg
iste
po
llen
ite
sflo
rin
iiM
icro
ca
ch
ryid
ite
sa
nta
rcticu
sN
oth
ofa
gid
ite
se
ma
rcid
us
No
tho
fag
idite
sfa
lca
tus
No
tho
fag
idite
sfle
min
gii
Osm
un
da
cid
ite
sw
ellm
an
iiP
hyllo
cla
did
ite
sm
aw
so
nii
Tri
co
lpite
ssp
.N
oth
ofa
gid
ite
sa
sp
eru
sN
oth
ofa
gid
ite
sd
em
inu
tus
Pro
tea
cid
ite
ssp
p.
Vitre
isp
ori
tes
pa
llid
us
Ag
lao
reid
iaq
ua
lum
isA
rau
ca
ria
cite
sa
ustr
alis
Ce
rato
sp
ori
tes
eq
ua
lisD
ilwyn
ite
sg
ran
ula
tus
Ku
ylis
po
rite
sw
ate
rbo
lki
Pe
rip
oro
po
llen
ite
sve
sic
us
Pro
tea
cid
ite
sre
cto
ma
rgin
isC
yca
do
pite
sfo
llicu
lari
sD
icty
op
hylli
dite
ssp
p.
Eri
cip
ite
ssca
bra
tus
Gle
ich
en
iidite
ssp
p.
La
evig
ato
sp
ori
tes
ova
tus
Ma
lva
cip
olli
ssu
btilis
Po
do
sp
ori
tes
mic
rosa
cca
tus
Tri
lete
stu
be
rcu
lifo
rmis
Ve
rru
co
sis
po
rite
sko
pu
ku
en
sis
Ca
llia
lasp
ori
tes
da
mp
ieri
Co
rolli
na
toro
sa
Ep
he
dri
pite
ssp
p.
Pro
tea
cid
ite
sin
cu
rva
tus
Pro
tea
cid
ite
sp
ach
yp
olu
sR
etitr
ilete
sa
ustr
ocla
va
tid
ite
sS
teri
esp
ori
tes
pu
ncta
tus
Ve
rru
co
sis
po
rite
ssp
p.
Cla
vife
ratr
iple
xP
rote
acid
ite
sg
ran
dis
Pro
tea
cid
ite
sle
igh
ton
iiS
tere
isp
ori
tes
an
tiq
ua
sp
ori
tes
Cya
thid
ite
ssp
len
de
ns
Myrt
ace
idite
ste
nu
isP
oly
co
lpo
rop
olle
nite
se
so
ba
lte
us
Pro
tea
cid
ite
so
rna
tus
Te
tra
co
lpo
rite
ssp
.Tri
co
lpo
rite
s"e
sto
utu
s"
Tri
po
rop
olle
nite
sa
mb
igu
us
Cya
thid
ite
sg
iga
ntis
Intr
atr
ipo
rop
olle
nite
sn
ota
bili
sP
rote
acid
ite
stu
be
rcu
lifo
rmis
Be
au
pre
aid
ite
sve
rru
co
su
sTri
co
lpo
rite
ssp
p.
Ca
llia
lasp
ori
tes
turb
atu
sP
en
insu
lap
olli
sg
illii
Pe
rin
op
olle
nite
se
lato
ide
sC
up
an
ieid
ite
so
rth
ote
ich
us
Pro
tea
cid
ite
sclin
eim
sL
ep
tole
pid
ite
sve
rru
ca
tus
Fa
lcis
po
rite
sg
ran
dis
Po
lyco
lpite
sla
ng
sto
nii
Lyg
iste
po
llen
ite
sb
alm
ei
No
tho
fag
idite
se
nd
uru
s
+ 2 5 1 4 5 1 1 1 2 + 1 2 +
2 2 8 5 9 3 11 1 1 1 1 1 1 1 6
1 5 6 10 1 1 44 1 2 1 6 5 3 2 + 1 1 2 1 +? +
5 10 5 4 2 30 4 2 11 1 6 1 1 1 2 1 1 2 1 1 1 + 2 2 +
11 9 6 1 1 2 17 3 4 5 6 4 6 4 4 1 + 1 1 1 + + + + 2 + 1
1 5 7 12 1 25 2 1 5 4 2 6 1 1 + 1 1 3 1 + 3 + 1 1 1 1
1 6 2 20 1 5 1 2 1 6 2 5 1 1 1 + 3 1 1 + 2 + + 1 1 1 1 +2 7 29 1 1 4 2 3 5 1 6 1 1 + 1 1 2 1 + 1
1 3 4 30 5 1 1 5 6 4 4 3 1 1 + 1 + 1
2 11 3 19 4 + 1 2 5 8 4 5 2 1 1 1 1 1 1 1 1 2 + 2 1 1
5 6 1 10 20 4 5 1 4 1 7 4 3 1 3 1 1 1 4 + + 1 2 1 + +
3 11 2 13 12 1 2 2 2 5 6 5 1 1 1 1 + 1 5 + 2 1 1 1 1
4 9 22 3 3 1 1 1 7 2 11 1 1 1 1 + 1 3 1 1 1 + + 1
1 12 20 2 1 2 2 1 2 1 15 5 7 1 3 3 1 1 1 2 1 1 +
2 7 36 6 5 1 9 3 5 3 12 + 1 4 2 1 1 1 1 +
Spores And Pollen*1
*2
Fu
ng
ae
.
1
1
+
FU
Samples
(Sam
ple
sin
Dis
cip
line(s
):
Paly
1340.00m CU
1405.00m CU
1530.00m CU
1746.00m CU
1884.00m CU1902.00m CU
2313.00m CU2331.00m CU
2370.00m CU
2574.00m CU2586.00m CU
2625.00m CU
2859.00m CU
2925.00m CU
3168.00m CU
To
talco
un
t:To
talC
ou
nt
100
In-S
itu
occurr
ences
100
100
100
100
100100
100100
100
99100
100
100
100
100
Total Count
Ca
teg
ory
%:%
Ca
teg
ory
In-S
itu
occurr
ences
SP
DC
ALBO
FT
AL
AC
MP
FU
% Category
SamplingCutting
Core
Sidewall core
Text Keys*1 % within discipline (40mm=100%)
*2 In-Situ occurrences
Origin Energy Resources Ltd ABN 66 007 845 338 Commercial-in-Confidence Greenfields Division Ref: W:\Complete Reports\BASS\Yolla\Yolla 4\Interpretive\Yolla4InterpretativeDataWCR with appendix headers.docc
AAPPPPEENNDDIIXX 77:: PPEETTRROOLLOOGGYY RREEPPOORRTT
RESERVOIR SOLUTIONS PTY LTD LEVEL 2, 2 PARK RD, MILTON, 4064, QLD
PO BOX 2098, MILTON, 4064, QLD ABN 27 088 995 073
________________________________________________________________________
Julian C. Baker PhD
A report to: Origin Energy Resources Ltd 339 Coronation Drive
Milton QLD 4064 15 October, 2004
PETROLOGY, DIAGENESIS AND RESERVOIR QUALITY OF MSCT SAMPLES FROM YOLLA-4
C O N T E N T S
Page
EXECUTIVE SUMMARY ........................................................................................................ 1
1. INTRODUCTION ........................................................................................................... 2
2. ANALYTICAL PROGRAM
2.1 THIN-SECTION ANALYSIS ...................................................................................... 2
2.2 X-RAY DIFFRACTION ANALYSIS ........................................................................... 2
2.3 SCANNING ELECTRON MICROSCOPY ..................................................................... 2
3. TEXTURE ..................................................................................................................... 3
4. THIN-SECTION COMPOSITION
4.1 FRAMEWORK GRAINS ......................................................................................... 3
4.2 CLAYS................................................................................................................. 6
4.3 CEMENTS ............................................................................................................ 6
4.4 VISIBLE POROSITY .............................................................................................. 6
5. X-RAY DIFFRACTION ANALYSES ............................................................................... 7
6. DIAGENESIS ................................................................................................................. 7
7. RESERVOIR QUALITY.................................................................................................. 9
8. SUMMARY AND CONCLUSIONS .................................................................................. 10

C O N T E N T S cont. Page
FIGURES
FIGURE 1. QFR COMPOSITION ...................................................................... 5
TABLES
TABLE 1. THIN-SECTION ANALYSES.......................................................... 4
TABLE 2. BULK-ROCK XRD ANALYSES .................................................... 8
TABLE 3. FINE-FRACTION CLAY MINERALOGY ................................... 8
APPENDICES
APPENDIX 1. X-RAY DIFFRACTOGRAMS
APPENDIX 2. PHOTOMICROGRAPHS
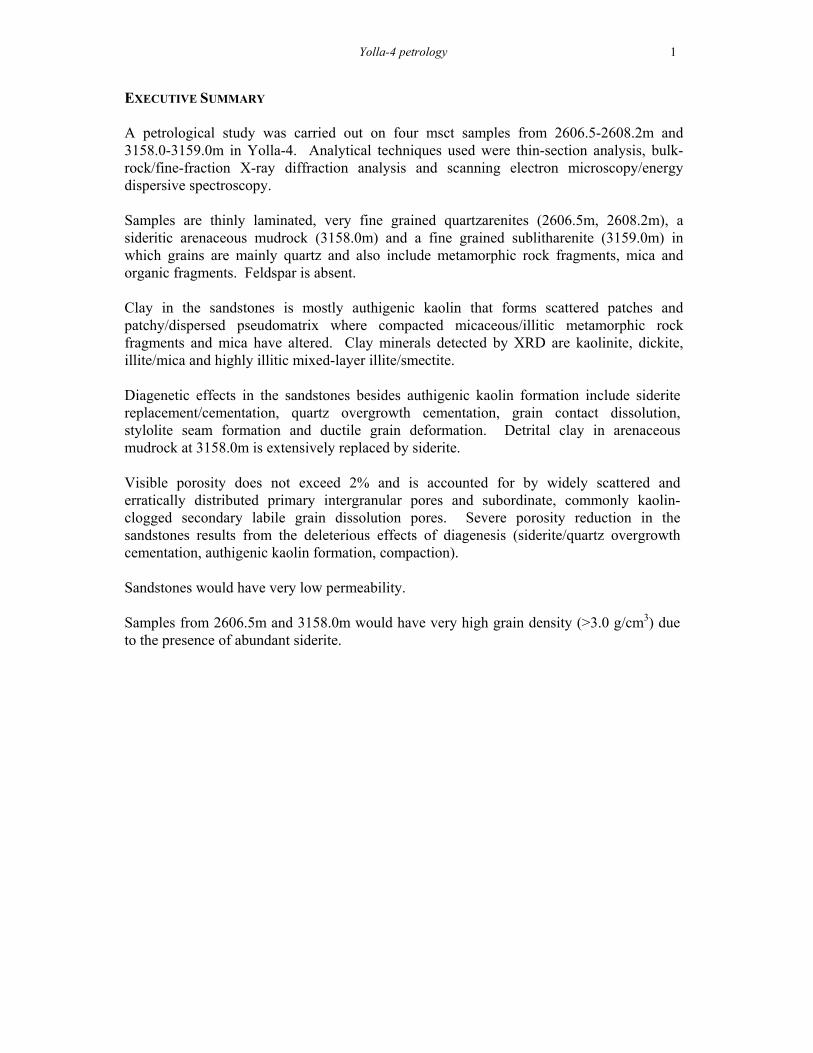
Yolla-4 petrology
1
EXECUTIVE SUMMARY A petrological study was carried out on four msct samples from 2606.5-2608.2m and 3158.0-3159.0m in Yolla-4. Analytical techniques used were thin-section analysis, bulk-rock/fine-fraction X-ray diffraction analysis and scanning electron microscopy/energy dispersive spectroscopy. Samples are thinly laminated, very fine grained quartzarenites (2606.5m, 2608.2m), a sideritic arenaceous mudrock (3158.0m) and a fine grained sublitharenite (3159.0m) in which grains are mainly quartz and also include metamorphic rock fragments, mica and organic fragments. Feldspar is absent. Clay in the sandstones is mostly authigenic kaolin that forms scattered patches and patchy/dispersed pseudomatrix where compacted micaceous/illitic metamorphic rock fragments and mica have altered. Clay minerals detected by XRD are kaolinite, dickite, illite/mica and highly illitic mixed-layer illite/smectite. Diagenetic effects in the sandstones besides authigenic kaolin formation include siderite replacement/cementation, quartz overgrowth cementation, grain contact dissolution, stylolite seam formation and ductile grain deformation. Detrital clay in arenaceous mudrock at 3158.0m is extensively replaced by siderite. Visible porosity does not exceed 2% and is accounted for by widely scattered and erratically distributed primary intergranular pores and subordinate, commonly kaolin-clogged secondary labile grain dissolution pores. Severe porosity reduction in the sandstones results from the deleterious effects of diagenesis (siderite/quartz overgrowth cementation, authigenic kaolin formation, compaction). Sandstones would have very low permeability. Samples from 2606.5m and 3158.0m would have very high grain density (>3.0 g/cm3) due to the presence of abundant siderite.
Yolla-4 petrology
2
1. INTRODUCTION A petrological study was carried out on four msct samples from 2606.5-2608.2m (#16, #17) and 3158.0-3159.0m (#10, #9) (log depths) in Yolla-4 in order to provide information on mineralogy, diagenetic effects and controls on reservoir quality. The study complements an earlier petrological study of core samples from Yolla-4 (2899.2-2981.4m) by Baker (2004).
2. ANALYTICAL PROGRAM 2.1 THIN-SECTION ANALYSIS Thin-sections were cut in kerosene, impregnated with blue-dyed epoxy resin to aid porosity recognition, and stained with sodium cobaltinitrite to aid feldspar identification. Mineral composition and visible porosity were determined by a count of 400 points, and mean quartz grain size and sorting were estimated in thin-section with the aid of an eyepiece graticule. Photomicrographs were taken of each thin-section to illustrate texture, composition, clay distribution, diagenetic effects and porosity. 2.2 X-RAY DIFFRACTION ANALYSIS Bulk-rock X-ray diffraction (XRD) analysis was carried out on each sample in order to quantify mineral abundance. The XRD analysis used a finely ground whole rock powder sample and the SIROQUANT processing technique was used to calculate mineral abundance. XRD analysis was carried out on the fine fraction of each sample in order to precisely determine clay mineralogy. The fine fraction was separated from each sample by disaggregation and settling in distilled water and was air dried on glass discs to produce oriented specimens for XRD analysis. Samples were analysed in air dried condition and also following treatment with ethylene glycol. 2.3 SCANNING ELECTRON MICROSCOPY Scanning electron microscopy (SEM) was carried out on two samples (#16, 2606.5m; #9, 3159.0m) in order to provide information on clay distribution, diagenetic effects and porosity characteristics. Analyses were done on freshly exposed surfaces that had been thoroughly washed in shellite to remove any volatile hydrocarbons. Energy dispersive spectroscopy (EDS) was used to determine the elemental composition of authigenic minerals.
Yolla-4 petrology
3
3. TEXTURE Lithology and texture are given in Table 1. The top two samples (#16, 2606.5m; #17, 2608.2m) are thinly laminated, well sorted, very fine grained sandstones with a mean grain size of 0.09mm and 0.12mm. Laminae in #16 are defined by concentrations of sideritised clay grains and fine organic fragments/stringers, whereas laminae in #17, which are stylolitic, are defined by concentrations of strongly compacted mica flakes and fine organic fragments. The deepest sample (#9, 3159.0m) is a well compacted, well sorted, fine grained sandstone with a mean grain size of 0.16mm and in which there are scattered, compacted, medium to coarse sand-sized sideritised clay grains. Sample #10 (3158.0m) is a bioturbated arenaceous mudrock in which strongly sideritised detrital clay matrix supports irregularly-distributed (due to burrowing), moderately-well sorted, very fine to medium sand-sized siliciclastic grains. Ignoring quartz overgrowths and the effects of grain contact dissolution, most quartz grains are angular to subrounded. 4. THIN-SECTION COMPOSITION Thin-section composition is given in Table 1, sandstone QFR composition is plotted in Figure 1, and annotated photomicrographs are presented in Appendix 2. The arenaceous mudrock (#10, 3158.0m) consists mainly of detrital clay matrix that is extensively replaced by finely-crystalline siderite. Grains in the mudrock have the same composition as those in the sandstones (see below). The mudrock is not discussed further in this section. 4.1 FRAMEWORK GRAINS The top two sandstones (#16, 2606.5m; #17, 2608.2m) are quartzarenites (Q96F0R4 mean), whereas the deepest sandstone (#9, 3159.0m) is a sublitharenite (Q88F0R12). Framework grains are mainly quartz and also include metamorphic rock fragments, mica and organic fragments. Total detrital quartz content is variable (39.3-61.6%), reflecting wide differences in siderite content. Quartz is mainly monocrystalline. Polycrystalline quartz includes metaquartzite and recrystallised metamorphic quartz with aligned mica inclusions. Quartz grains are enveloped by well-developed quartz overgrowths where adjacent intergranular spaces are not filled by clay or siderite. Total rock fragment content is 1.7-3.0% in the top two sandstones (#16, 2606.5m; #17, 2608.2m) and is 7.6% in the deepest sandstone (#9, 3159.0m). Lithic grains are almost entirely quartzose/micaceous/illitic, low-grade metasedimentary rock fragments (quartz/mica schist, mica/illite-bearing quartzite, metasandstone, metasiltstone, meta-argillite) and also include silicified volcanic rock fragments.
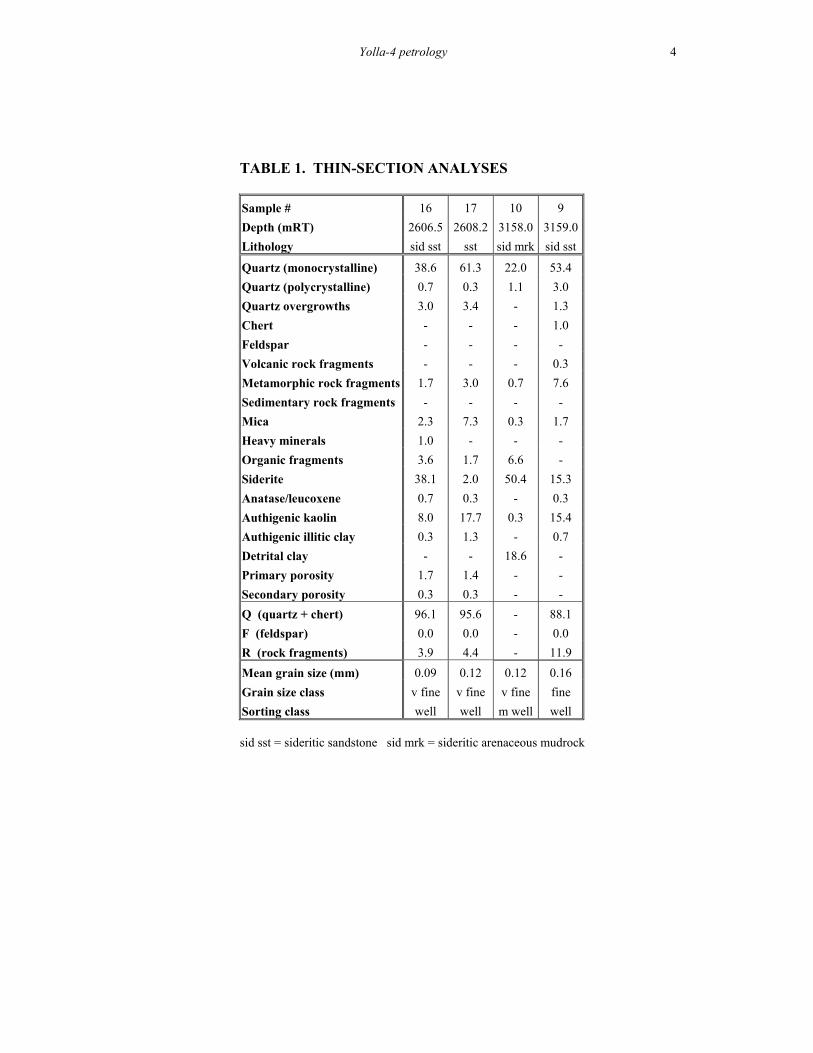
Yolla-4 petrology
4
TABLE 1. THIN-SECTION ANALYSES
Sample # 16 17 10 9 Depth (mRT) 2606.5 2608.2 3158.0 3159.0 Lithology sid sst sst sid mrk sid sst
Quartz (monocrystalline) 38.6 61.3 22.0 53.4 Quartz (polycrystalline) 0.7 0.3 1.1 3.0 Quartz overgrowths 3.0 3.4 - 1.3 Chert - - - 1.0 Feldspar - - - - Volcanic rock fragments - - - 0.3 Metamorphic rock fragments 1.7 3.0 0.7 7.6 Sedimentary rock fragments - - - - Mica 2.3 7.3 0.3 1.7 Heavy minerals 1.0 - - - Organic fragments 3.6 1.7 6.6 - Siderite 38.1 2.0 50.4 15.3 Anatase/leucoxene 0.7 0.3 - 0.3 Authigenic kaolin 8.0 17.7 0.3 15.4 Authigenic illitic clay 0.3 1.3 - 0.7 Detrital clay - - 18.6 - Primary porosity 1.7 1.4 - - Secondary porosity 0.3 0.3 - - Q (quartz + chert) 96.1 95.6 - 88.1 F (feldspar) 0.0 0.0 - 0.0 R (rock fragments) 3.9 4.4 - 11.9 Mean grain size (mm) 0.09 0.12 0.12 0.16 Grain size class v fine v fine v fine fine Sorting class well well m well well sid sst = sideritic sandstone sid mrk = sideritic arenaceous mudrock
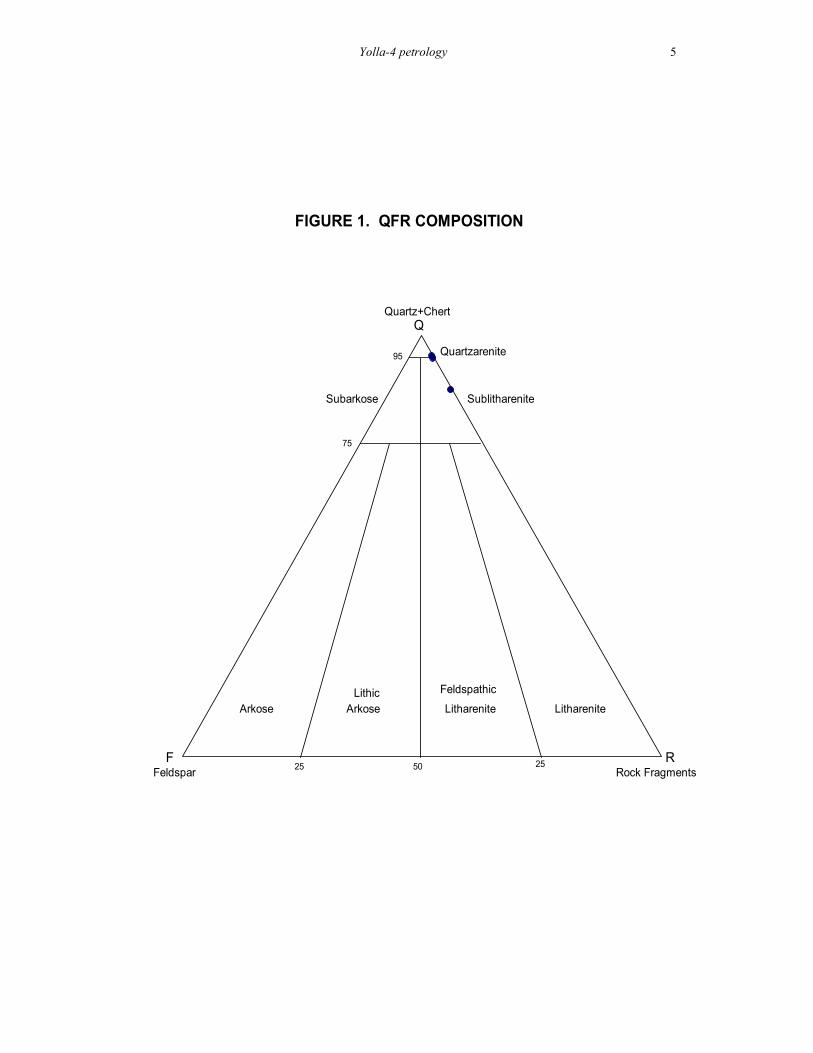
Yolla-4 petrology
5
Q
F R
Quartz+Chert
Feldspar Rock Fragments
Quartzarenite
SublithareniteSubarkose
ArkoseLithic
Arkose
Feldspathic
Litharenite Litharenite
95
75
50 2525
FIGURE 1. QFR COMPOSITION
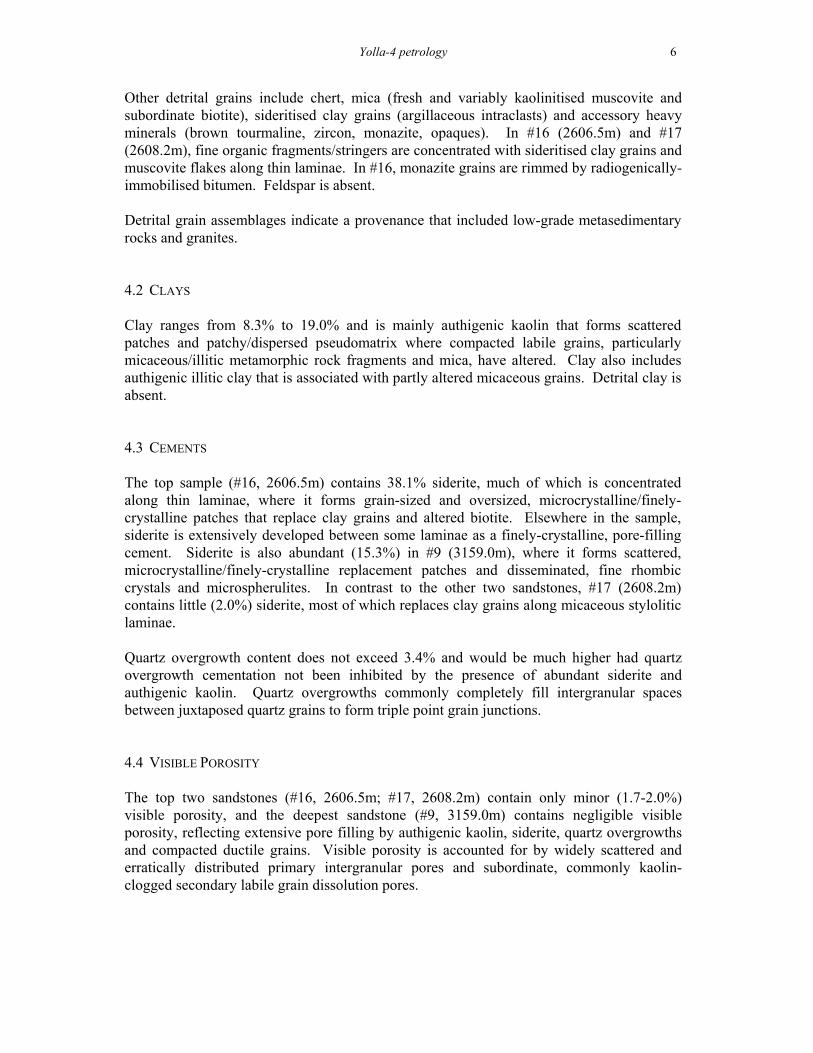
Yolla-4 petrology
6
Other detrital grains include chert, mica (fresh and variably kaolinitised muscovite and subordinate biotite), sideritised clay grains (argillaceous intraclasts) and accessory heavy minerals (brown tourmaline, zircon, monazite, opaques). In #16 (2606.5m) and #17 (2608.2m), fine organic fragments/stringers are concentrated with sideritised clay grains and muscovite flakes along thin laminae. In #16, monazite grains are rimmed by radiogenically-immobilised bitumen. Feldspar is absent. Detrital grain assemblages indicate a provenance that included low-grade metasedimentary rocks and granites. 4.2 CLAYS Clay ranges from 8.3% to 19.0% and is mainly authigenic kaolin that forms scattered patches and patchy/dispersed pseudomatrix where compacted labile grains, particularly micaceous/illitic metamorphic rock fragments and mica, have altered. Clay also includes authigenic illitic clay that is associated with partly altered micaceous grains. Detrital clay is absent. 4.3 CEMENTS The top sample (#16, 2606.5m) contains 38.1% siderite, much of which is concentrated along thin laminae, where it forms grain-sized and oversized, microcrystalline/finely-crystalline patches that replace clay grains and altered biotite. Elsewhere in the sample, siderite is extensively developed between some laminae as a finely-crystalline, pore-filling cement. Siderite is also abundant (15.3%) in #9 (3159.0m), where it forms scattered, microcrystalline/finely-crystalline replacement patches and disseminated, fine rhombic crystals and microspherulites. In contrast to the other two sandstones, #17 (2608.2m) contains little (2.0%) siderite, most of which replaces clay grains along micaceous stylolitic laminae. Quartz overgrowth content does not exceed 3.4% and would be much higher had quartz overgrowth cementation not been inhibited by the presence of abundant siderite and authigenic kaolin. Quartz overgrowths commonly completely fill intergranular spaces between juxtaposed quartz grains to form triple point grain junctions. 4.4 VISIBLE POROSITY The top two sandstones (#16, 2606.5m; #17, 2608.2m) contain only minor (1.7-2.0%) visible porosity, and the deepest sandstone (#9, 3159.0m) contains negligible visible porosity, reflecting extensive pore filling by authigenic kaolin, siderite, quartz overgrowths and compacted ductile grains. Visible porosity is accounted for by widely scattered and erratically distributed primary intergranular pores and subordinate, commonly kaolin-clogged secondary labile grain dissolution pores.
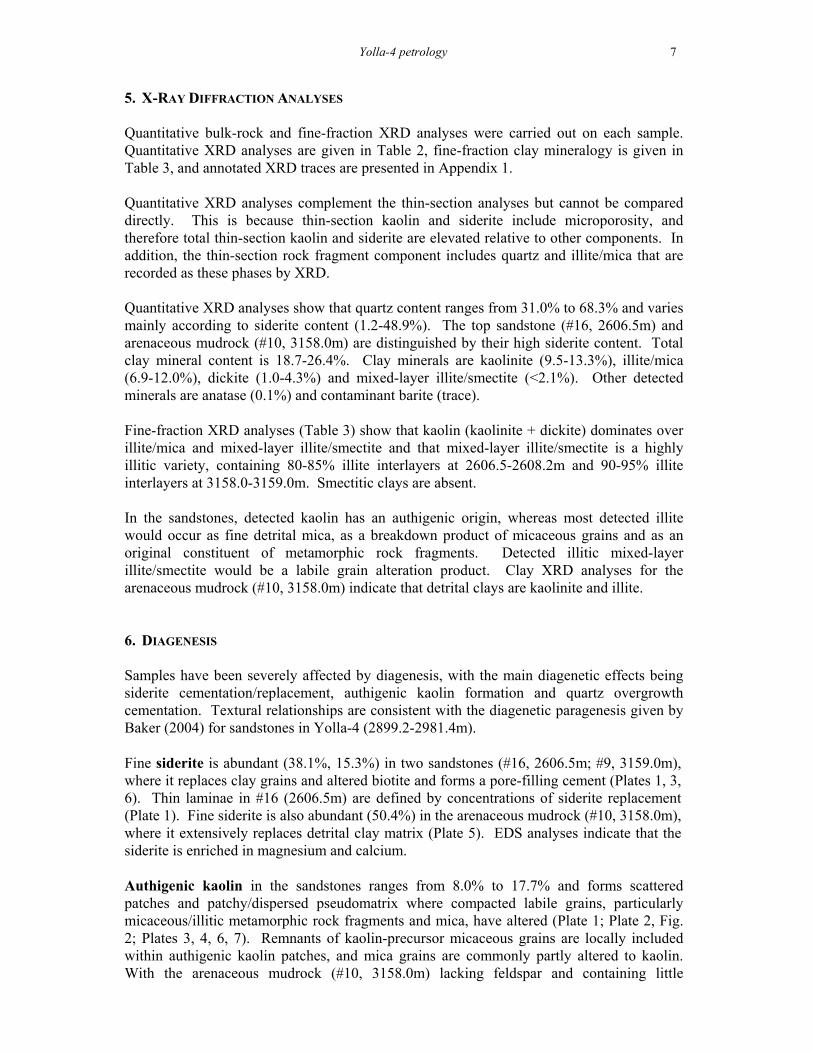
Yolla-4 petrology
7
5. X-RAY DIFFRACTION ANALYSES Quantitative bulk-rock and fine-fraction XRD analyses were carried out on each sample. Quantitative XRD analyses are given in Table 2, fine-fraction clay mineralogy is given in Table 3, and annotated XRD traces are presented in Appendix 1. Quantitative XRD analyses complement the thin-section analyses but cannot be compared directly. This is because thin-section kaolin and siderite include microporosity, and therefore total thin-section kaolin and siderite are elevated relative to other components. In addition, the thin-section rock fragment component includes quartz and illite/mica that are recorded as these phases by XRD. Quantitative XRD analyses show that quartz content ranges from 31.0% to 68.3% and varies mainly according to siderite content (1.2-48.9%). The top sandstone (#16, 2606.5m) and arenaceous mudrock (#10, 3158.0m) are distinguished by their high siderite content. Total clay mineral content is 18.7-26.4%. Clay minerals are kaolinite (9.5-13.3%), illite/mica (6.9-12.0%), dickite (1.0-4.3%) and mixed-layer illite/smectite (<2.1%). Other detected minerals are anatase (0.1%) and contaminant barite (trace). Fine-fraction XRD analyses (Table 3) show that kaolin (kaolinite + dickite) dominates over illite/mica and mixed-layer illite/smectite and that mixed-layer illite/smectite is a highly illitic variety, containing 80-85% illite interlayers at 2606.5-2608.2m and 90-95% illite interlayers at 3158.0-3159.0m. Smectitic clays are absent. In the sandstones, detected kaolin has an authigenic origin, whereas most detected illite would occur as fine detrital mica, as a breakdown product of micaceous grains and as an original constituent of metamorphic rock fragments. Detected illitic mixed-layer illite/smectite would be a labile grain alteration product. Clay XRD analyses for the arenaceous mudrock (#10, 3158.0m) indicate that detrital clays are kaolinite and illite. 6. DIAGENESIS Samples have been severely affected by diagenesis, with the main diagenetic effects being siderite cementation/replacement, authigenic kaolin formation and quartz overgrowth cementation. Textural relationships are consistent with the diagenetic paragenesis given by Baker (2004) for sandstones in Yolla-4 (2899.2-2981.4m). Fine siderite is abundant (38.1%, 15.3%) in two sandstones (#16, 2606.5m; #9, 3159.0m), where it replaces clay grains and altered biotite and forms a pore-filling cement (Plates 1, 3, 6). Thin laminae in #16 (2606.5m) are defined by concentrations of siderite replacement (Plate 1). Fine siderite is also abundant (50.4%) in the arenaceous mudrock (#10, 3158.0m), where it extensively replaces detrital clay matrix (Plate 5). EDS analyses indicate that the siderite is enriched in magnesium and calcium. Authigenic kaolin in the sandstones ranges from 8.0% to 17.7% and forms scattered patches and patchy/dispersed pseudomatrix where compacted labile grains, particularly micaceous/illitic metamorphic rock fragments and mica, have altered (Plate 1; Plate 2, Fig. 2; Plates 3, 4, 6, 7). Remnants of kaolin-precursor micaceous grains are locally included within authigenic kaolin patches, and mica grains are commonly partly altered to kaolin. With the arenaceous mudrock (#10, 3158.0m) lacking feldspar and containing little
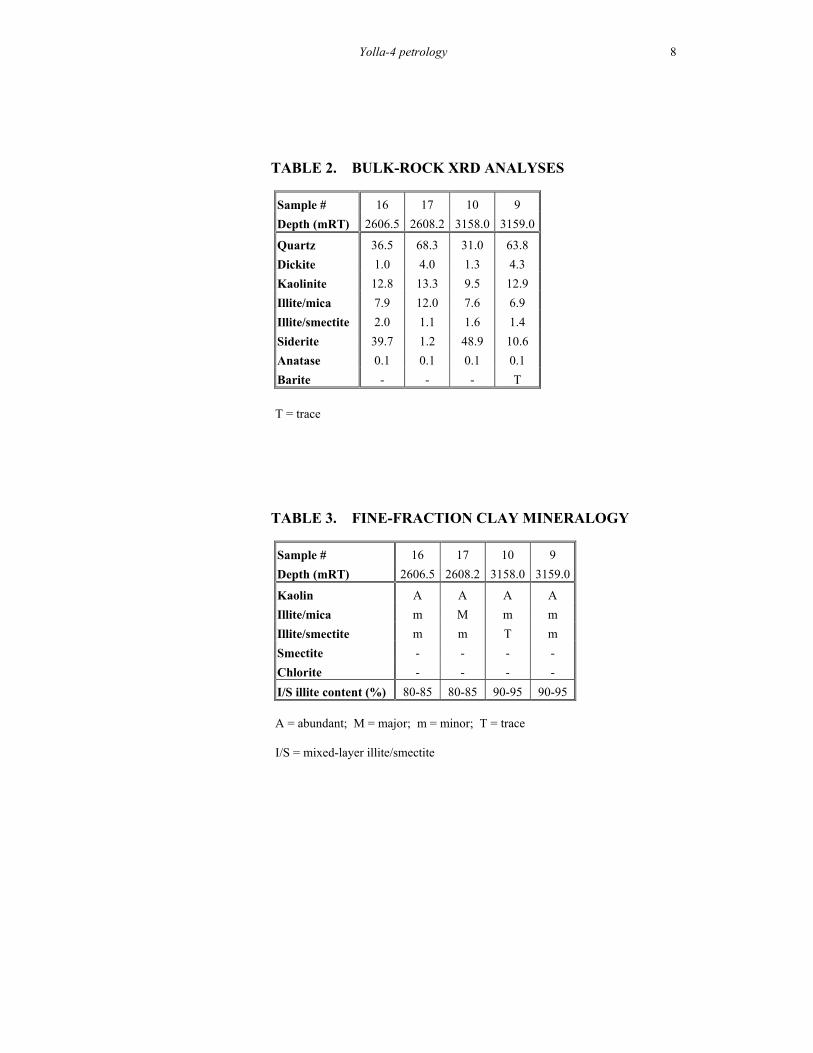
Yolla-4 petrology
8
TABLE 2. BULK-ROCK XRD ANALYSES
Sample # 16 17 10 9 Depth (mRT) 2606.5 2608.2 3158.0 3159.0
Quartz 36.5 68.3 31.0 63.8 Dickite 1.0 4.0 1.3 4.3 Kaolinite 12.8 13.3 9.5 12.9 Illite/mica 7.9 12.0 7.6 6.9 Illite/smectite 2.0 1.1 1.6 1.4 Siderite 39.7 1.2 48.9 10.6 Anatase 0.1 0.1 0.1 0.1 Barite - - - T
T = trace
TABLE 3. FINE-FRACTION CLAY MINERALOGY
Sample # 16 17 10 9 Depth (mRT) 2606.5 2608.2 3158.0 3159.0
Kaolin A A A A Illite/mica m M m m Illite/smectite m m T m Smectite - - - - Chlorite - - - - I/S illite content (%) 80-85 80-85 90-95 90-95
A = abundant; M = major; m = minor; T = trace I/S = mixed-layer illite/smectite
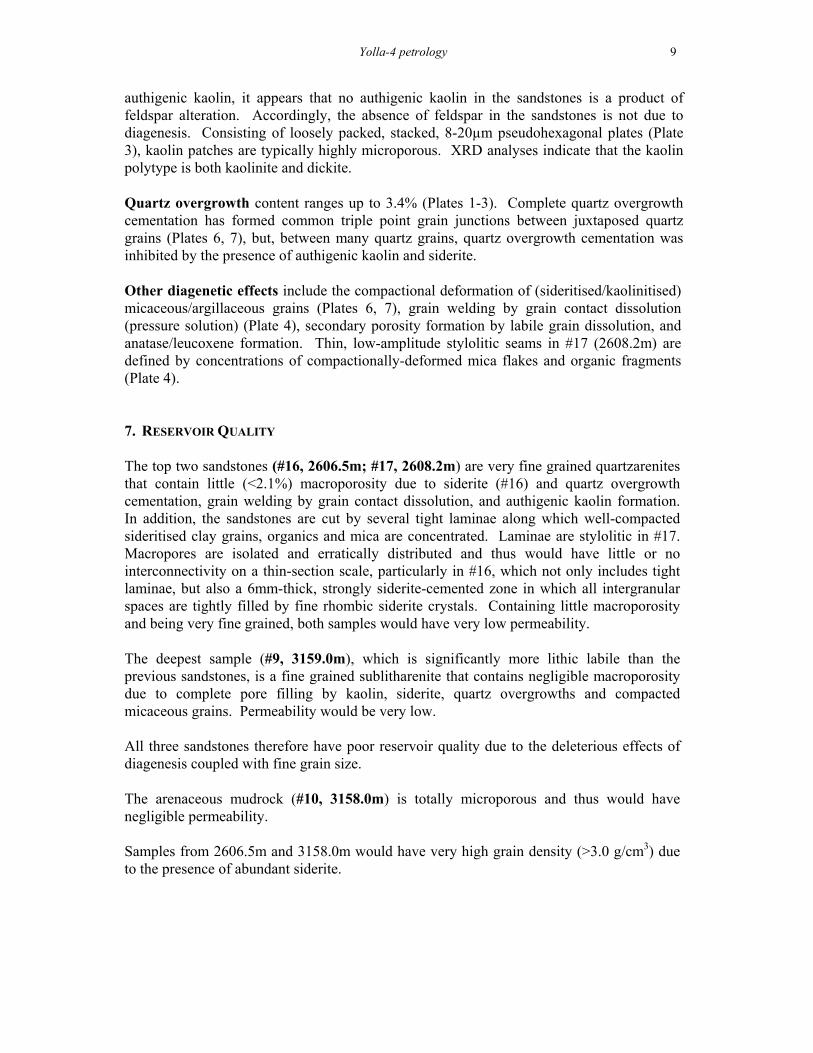
Yolla-4 petrology
9
authigenic kaolin, it appears that no authigenic kaolin in the sandstones is a product of feldspar alteration. Accordingly, the absence of feldspar in the sandstones is not due to diagenesis. Consisting of loosely packed, stacked, 8-20µm pseudohexagonal plates (Plate 3), kaolin patches are typically highly microporous. XRD analyses indicate that the kaolin polytype is both kaolinite and dickite. Quartz overgrowth content ranges up to 3.4% (Plates 1-3). Complete quartz overgrowth cementation has formed common triple point grain junctions between juxtaposed quartz grains (Plates 6, 7), but, between many quartz grains, quartz overgrowth cementation was inhibited by the presence of authigenic kaolin and siderite. Other diagenetic effects include the compactional deformation of (sideritised/kaolinitised) micaceous/argillaceous grains (Plates 6, 7), grain welding by grain contact dissolution (pressure solution) (Plate 4), secondary porosity formation by labile grain dissolution, and anatase/leucoxene formation. Thin, low-amplitude stylolitic seams in #17 (2608.2m) are defined by concentrations of compactionally-deformed mica flakes and organic fragments (Plate 4). 7. RESERVOIR QUALITY The top two sandstones (#16, 2606.5m; #17, 2608.2m) are very fine grained quartzarenites that contain little (<2.1%) macroporosity due to siderite (#16) and quartz overgrowth cementation, grain welding by grain contact dissolution, and authigenic kaolin formation. In addition, the sandstones are cut by several tight laminae along which well-compacted sideritised clay grains, organics and mica are concentrated. Laminae are stylolitic in #17. Macropores are isolated and erratically distributed and thus would have little or no interconnectivity on a thin-section scale, particularly in #16, which not only includes tight laminae, but also a 6mm-thick, strongly siderite-cemented zone in which all intergranular spaces are tightly filled by fine rhombic siderite crystals. Containing little macroporosity and being very fine grained, both samples would have very low permeability. The deepest sample (#9, 3159.0m), which is significantly more lithic labile than the previous sandstones, is a fine grained sublitharenite that contains negligible macroporosity due to complete pore filling by kaolin, siderite, quartz overgrowths and compacted micaceous grains. Permeability would be very low. All three sandstones therefore have poor reservoir quality due to the deleterious effects of diagenesis coupled with fine grain size. The arenaceous mudrock (#10, 3158.0m) is totally microporous and thus would have negligible permeability. Samples from 2606.5m and 3158.0m would have very high grain density (>3.0 g/cm3) due to the presence of abundant siderite.

Yolla-4 petrology
10
8. SUMMARY AND CONCLUSIONS • Samples from 2606.5-2608.2m and 3158.0-3159.0m in Yolla-4 are thinly laminated,
very fine grained quartzarenites (#16, #17), a sideritic arenaceous mudrock (#10) and a fine grained sublitharenite (#9) in which grains are mainly quartz and also include metamorphic rock fragments, mica and organic fragments. Feldspar is absent.
• Clay in the sandstones is mostly authigenic kaolin that forms scattered patches and
patchy/dispersed pseudomatrix where compacted micaceous/illitic metamorphic rock fragments and mica have altered.
• XRD analyses indicate that clay minerals are kaolin (kaolinite, dickite), illite/mica
and highly illitic mixed-layer illite/smectite.
• Diagenetic effects in the sandstones besides authigenic kaolin formation include siderite replacement/cementation (particularly in #16 and #9), quartz overgrowth cementation, grain contact dissolution, stylolite seam formation (#17) and ductile grain deformation (particularly in #9). Detrital clay in the arenaceous mudrock (#10) is extensively replaced by siderite.
• Visible porosity does not exceed 2% and is accounted for by widely scattered and
erratically distributed primary intergranular pores and subordinate, commonly kaolin-clogged secondary labile grain dissolution pores. Severe porosity reduction in the sandstones results from the deleterious effects of diagenesis (siderite/quartz overgrowth cementation, authigenic kaolin formation, compaction).
• Sandstones would have very low permeability.
• Samples from 2606.5m and 3158.0m would have very high grain density (>3.0
g/cm3) due to the presence of abundant siderite.

Yolla-4 petrology
11
REFERENCES Baker, J.C., 2004, Petrology, diagenesis and reservoir quality of core samples from Yolla-4.
Report to Origin Energy Resources Ltd.
APPENDIX 1.
X-RAY DIFFRACTOGRAMS
Key to abbreviations:
A = anatase
Ba = contaminant barite
D = dickite
I = illite/mica
I/S = illitic mixed-layer illite/smectite
K = kaolinite
Q = quartz
S = siderite
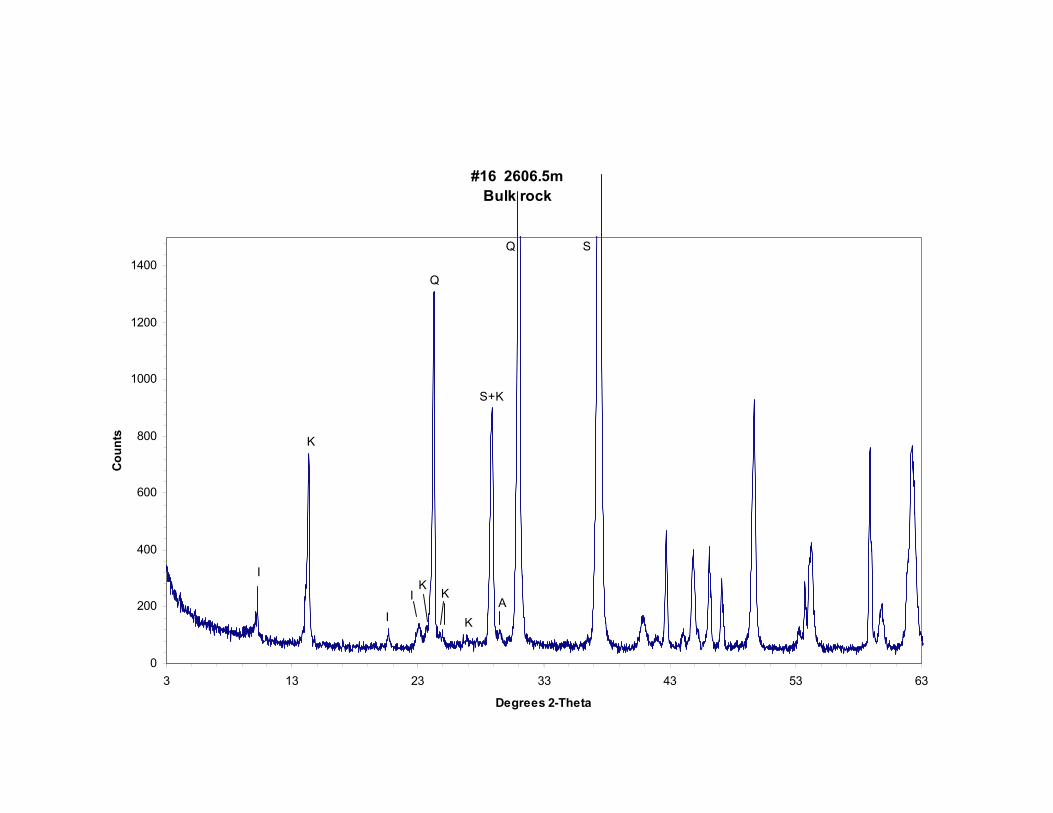
#16 2606.5m Bulk rock
0
200
400
600
800
1000
1200
1400
3 13 23 33 43 53 63
Degrees 2-Theta
Cou
nts
Q
Q
S+K
I
K
K K
I K A
S
I
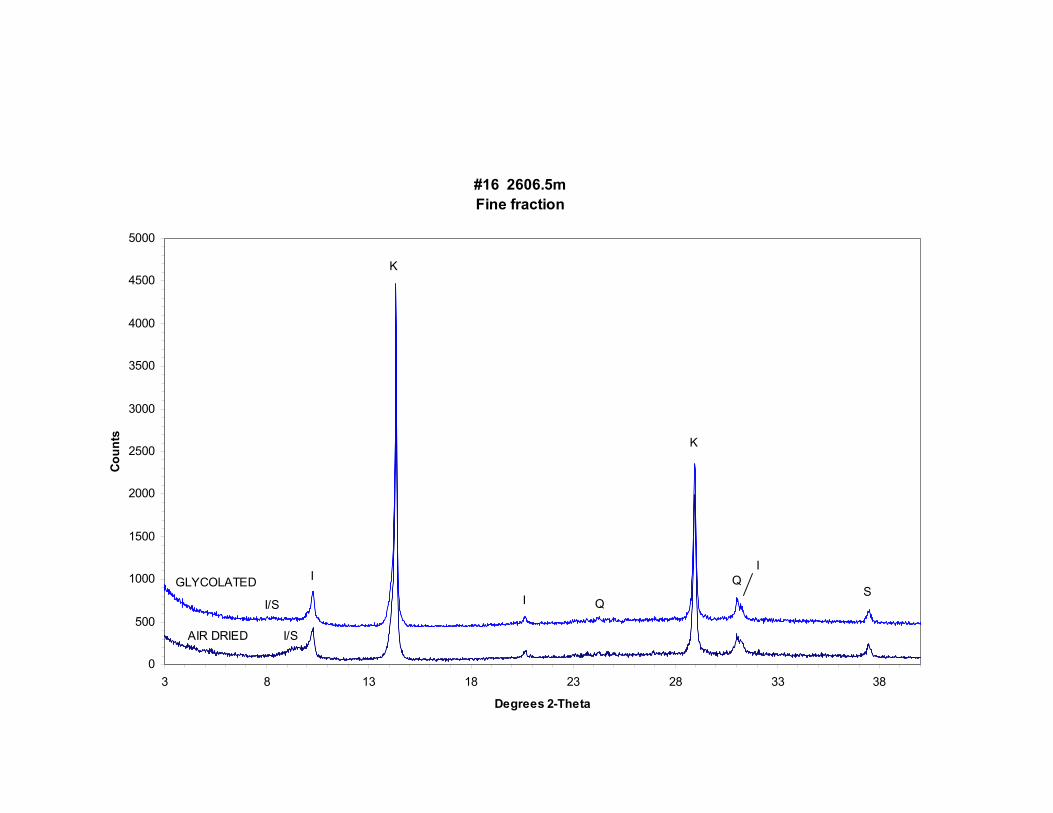
#16 2606.5m Fine fraction
0
500
1000
1500
2000
2500
3000
3500
4000
4500
5000
3 8 13 18 23 28 33 38
Degrees 2-Theta
Cou
nts
AIR DRIED
GLYCOLATED Q
I Q
K
K
S I
I
I/S
I/S
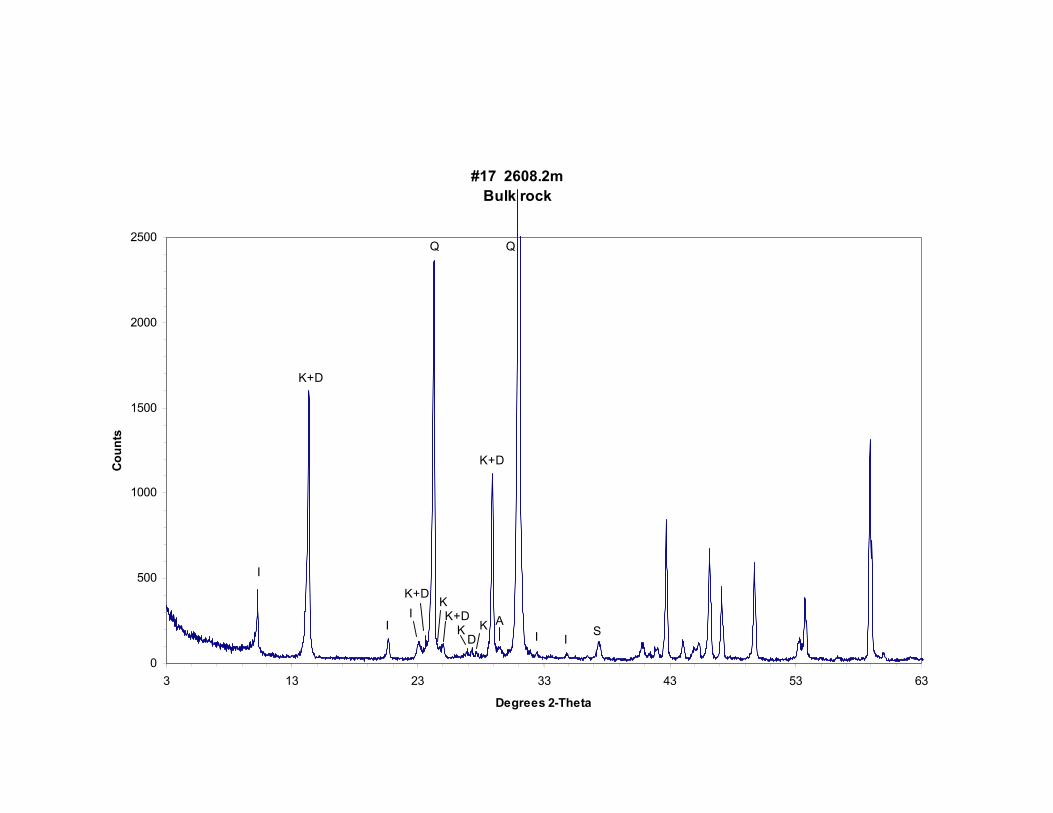
#17 2608.2m Bulk rock
0
500
1000
1500
2000
2500
3 13 23 33 43 53 63
Degrees 2-Theta
Cou
nts
Q Q
I
K+D
K+D K
I K+D A I
K KD
K+D
SII
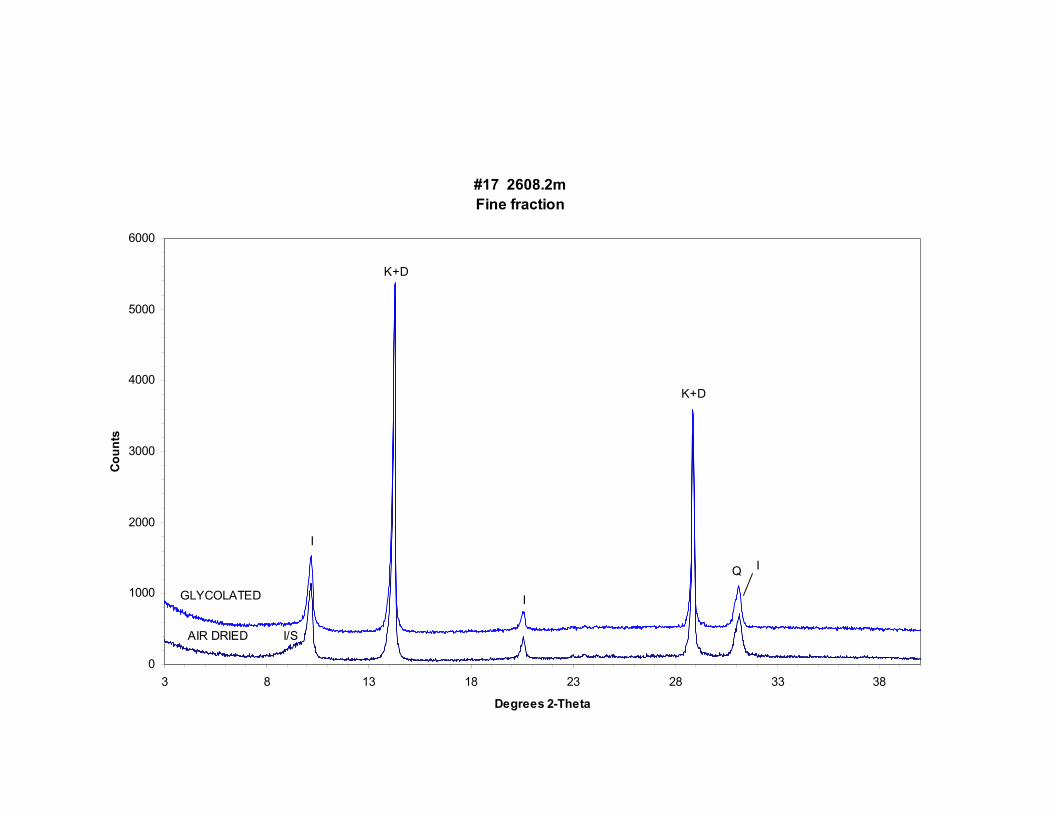
#17 2608.2m Fine fraction
0
1000
2000
3000
4000
5000
6000
3 8 13 18 23 28 33 38
Degrees 2-Theta
Cou
nts
AIR DRIED
GLYCOLATED
I
Q
K+D
K+D
I
I
I/S
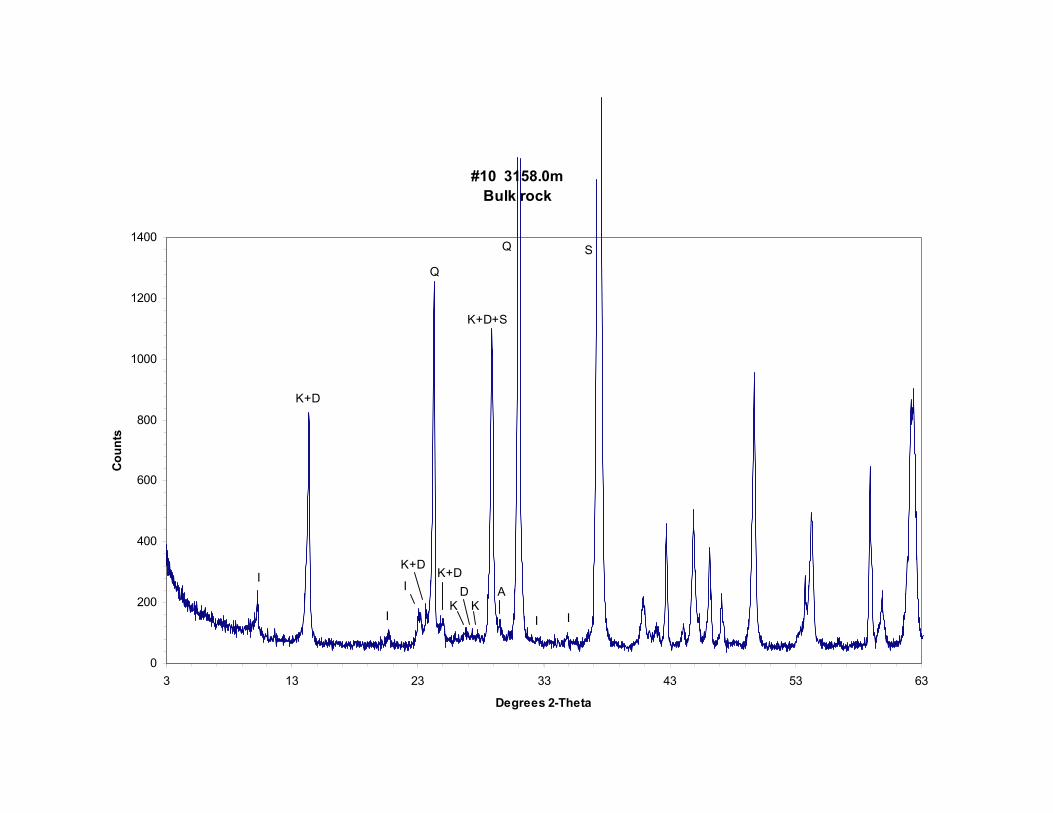
#10 3158.0m Bulk rock
0
200
400
600
800
1000
1200
1400
3 13 23 33 43 53 63
Degrees 2-Theta
Cou
nts
Q
Q
I
K+D
K+D
K I
D A I K
K+D+S
S
K+D
II
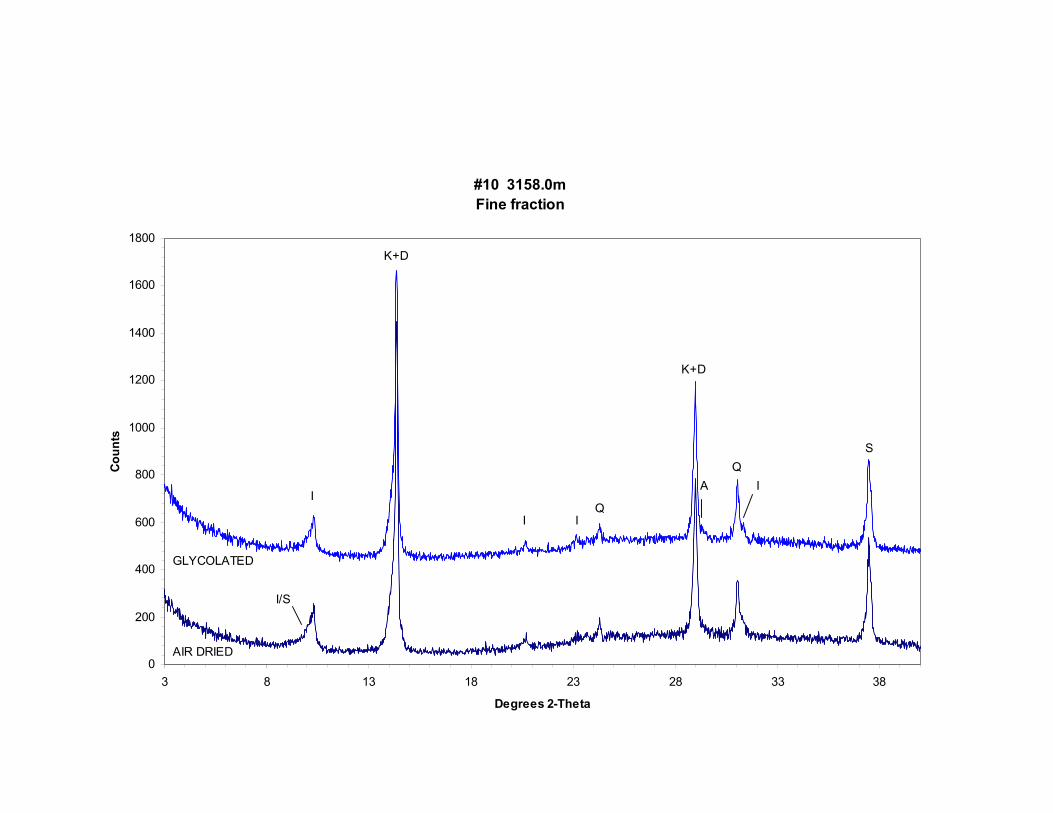
#10 3158.0m Fine fraction
0
200
400
600
800
1000
1200
1400
1600
1800
3 8 13 18 23 28 33 38
Degrees 2-Theta
Cou
nts
AIR DRIED
GLYCOLATED
I
Q
K+D
K+D
I
I
Q
S
I/S
I
A
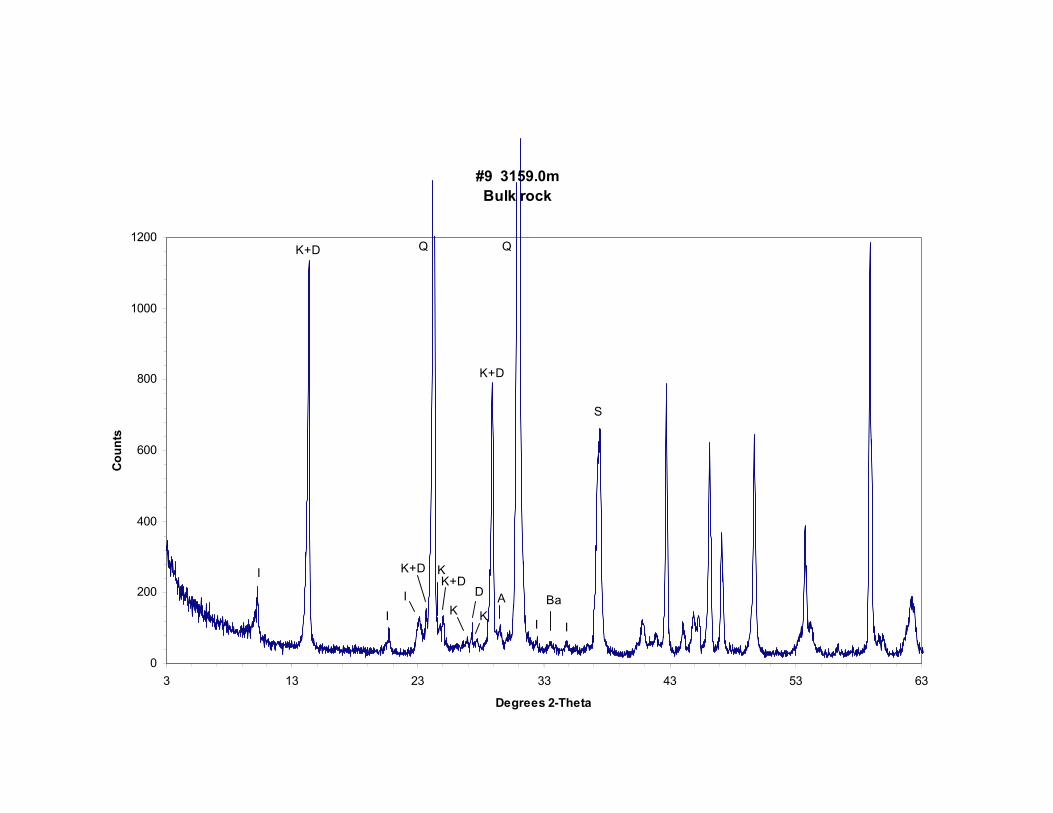
#9 3159.0m Bulk rock
0
200
400
600
800
1000
1200
3 13 23 33 43 53 63
Degrees 2-Theta
Cou
nts
Q Q
I
K+D
K+D
K I
D A I
K+D
S
KK+D
KII
Ba
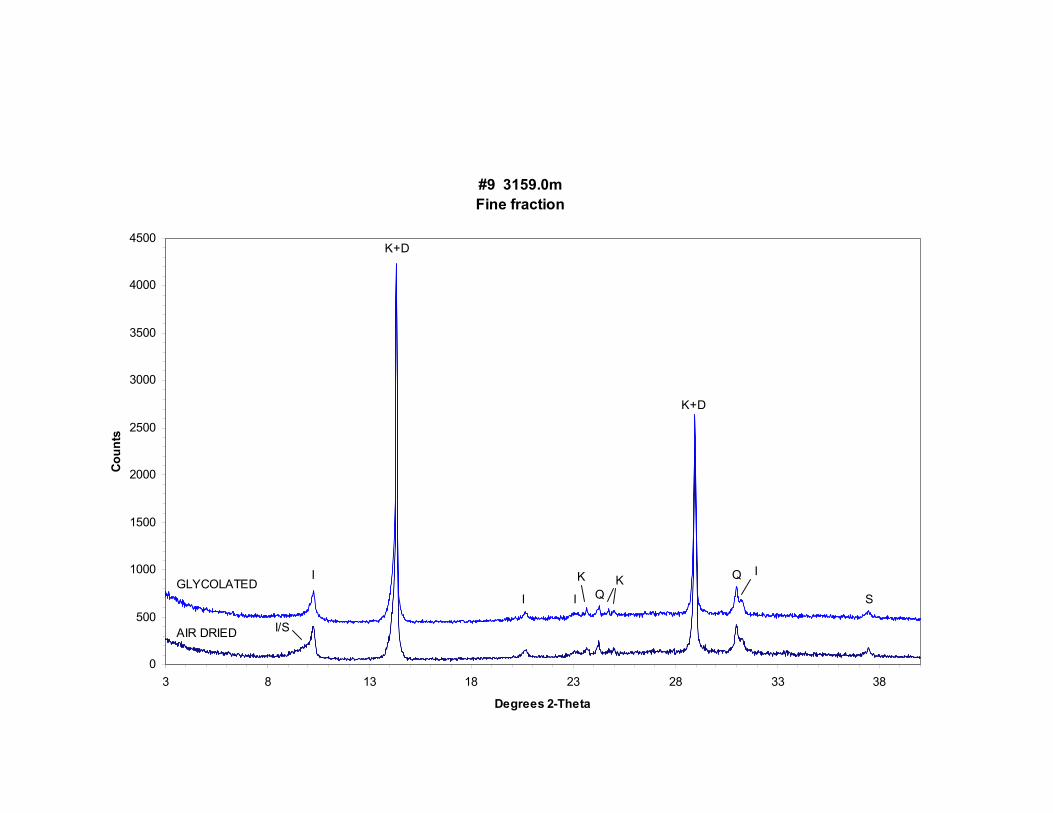
#9 3159.0m Fine fraction
0
500
1000
1500
2000
2500
3000
3500
4000
4500
3 8 13 18 23 28 33 38
Degrees 2-Theta
Cou
nts
AIR DRIED
GLYCOLATED I Q
K+D
K+D
I
I
Q S
I/S
I
K K

APPENDIX 2.
PHOTOMICROGRAPHS
Key to plates
Sample Depth Plate # (m) # 16 2606.5 1, 2*, 3* 17 2608.2 4 10 3158.0 5 9 3159.0 6, 7*
* SEM micrograph
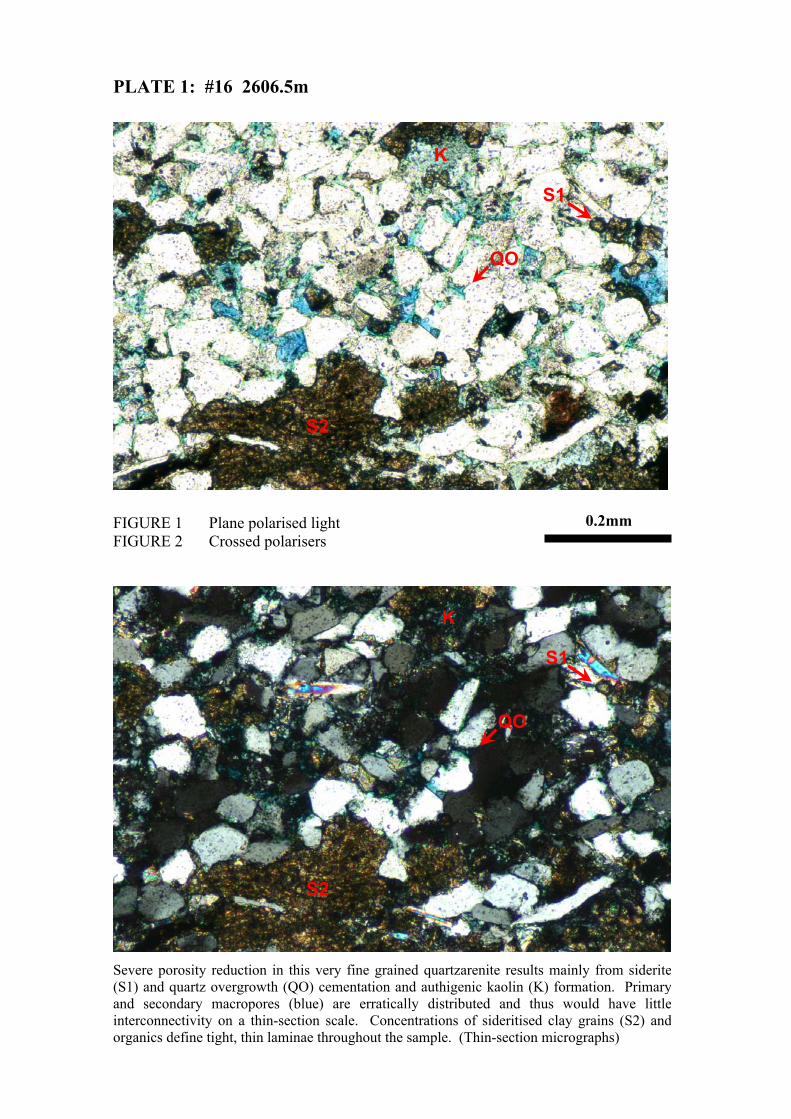
PLATE 1: #16 2606.5m
FIGURE 1 Plane polarised light FIGURE 2 Crossed polarisers
Severe porosity reduction in this very fine grained quartzarenite results mainly from siderite(S1) and quartz overgrowth (QO) cementation and authigenic kaolin (K) formation. Primaryand secondary macropores (blue) are erratically distributed and thus would have littleinterconnectivity on a thin-section scale. Concentrations of sideritised clay grains (S2) andorganics define tight, thin laminae throughout the sample. (Thin-section micrographs)
K
S1
S2
QO
QO
S1
S2
K
0.2mm
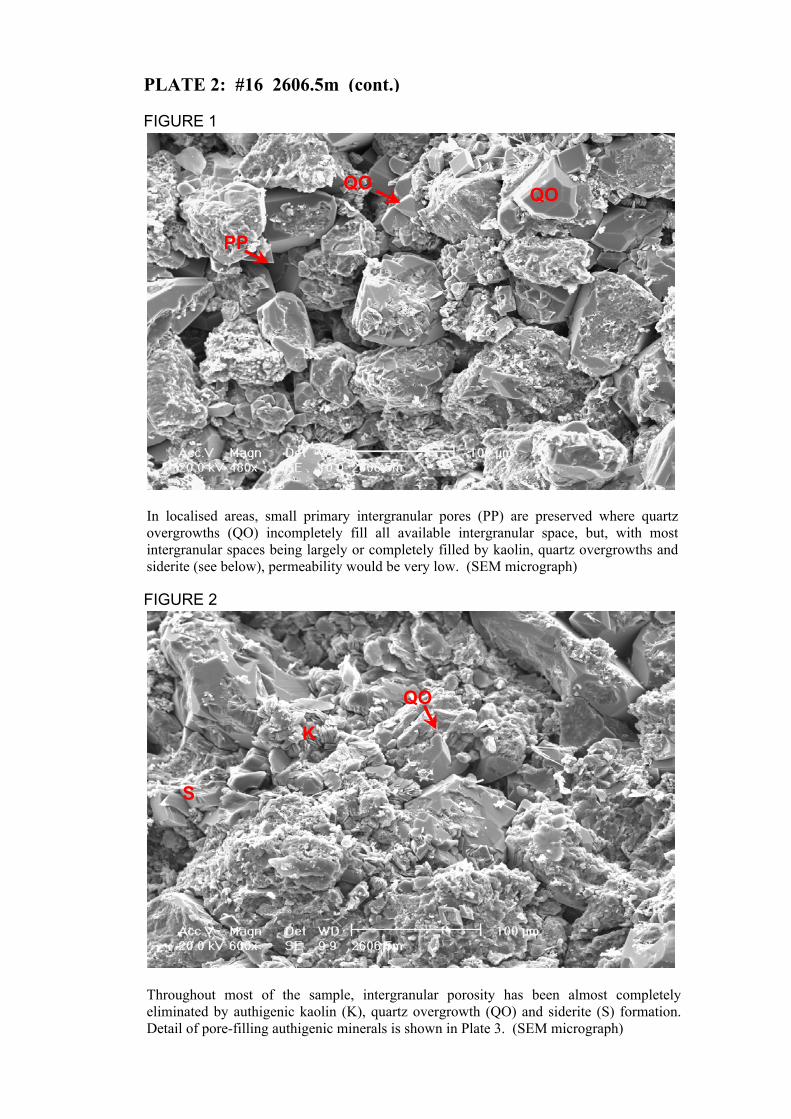
In localised areas, small primary intergranular pores (PP) are preserved where quartz overgrowths (QO) incompletely fill all available intergranular space, but, with most intergranular spaces being largely or completely filled by kaolin, quartz overgrowths and siderite (see below), permeability would be very low. (SEM micrograph)
100µm
Q
Q
Throughout most of the sample, intergranular porosity has been almost completely eliminated by authigenic kaolin (K), quartz overgrowth (QO) and siderite (S) formation. Detail of pore-filling authigenic minerals is shown in Plate 3. (SEM micrograph)
FIGURE 1
FIGURE 2
PLATE 2: #16 2606.5m (cont.)
QO
PP
QO
K
QO
S
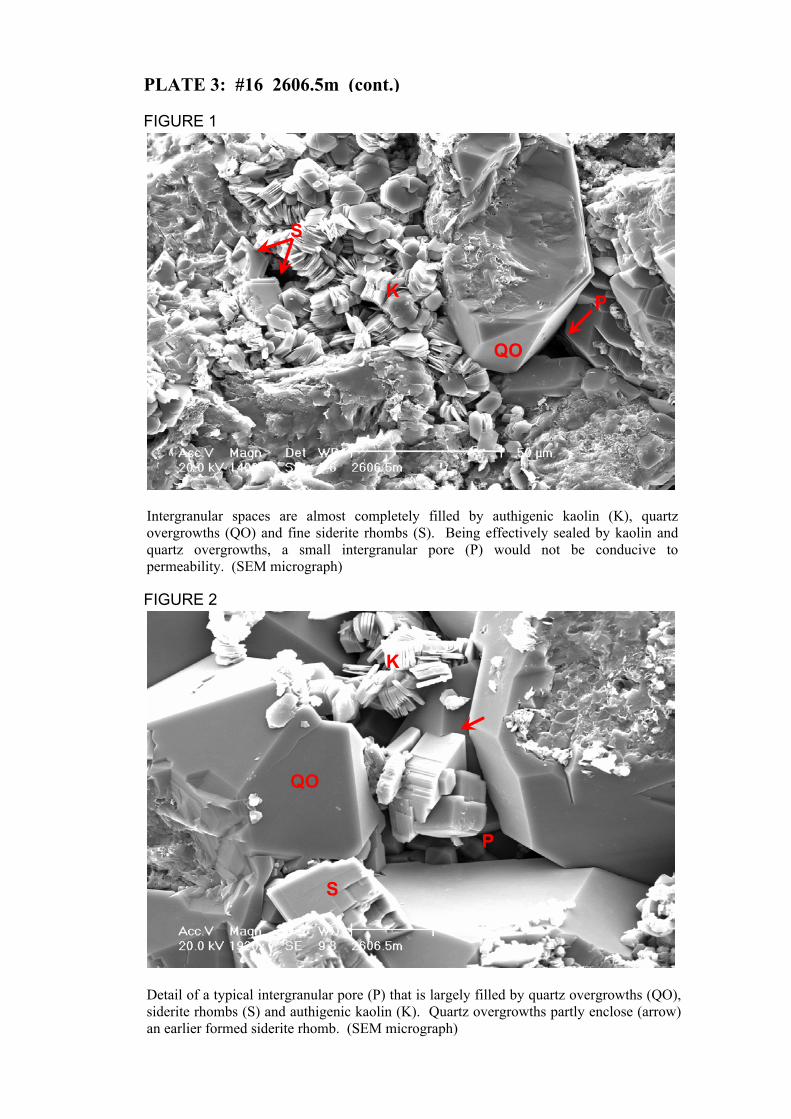
Intergranular spaces are almost completely filled by authigenic kaolin (K), quartz overgrowths (QO) and fine siderite rhombs (S). Being effectively sealed by kaolin and quartz overgrowths, a small intergranular pore (P) would not be conducive to permeability. (SEM micrograph)
100µm
Q
Q
Detail of a typical intergranular pore (P) that is largely filled by quartz overgrowths (QO), siderite rhombs (S) and authigenic kaolin (K). Quartz overgrowths partly enclose (arrow) an earlier formed siderite rhomb. (SEM micrograph)
FIGURE 1
FIGURE 2
PLATE 3: #16 2606.5m (cont.)
S
QO
K
K
P
QO
S
P
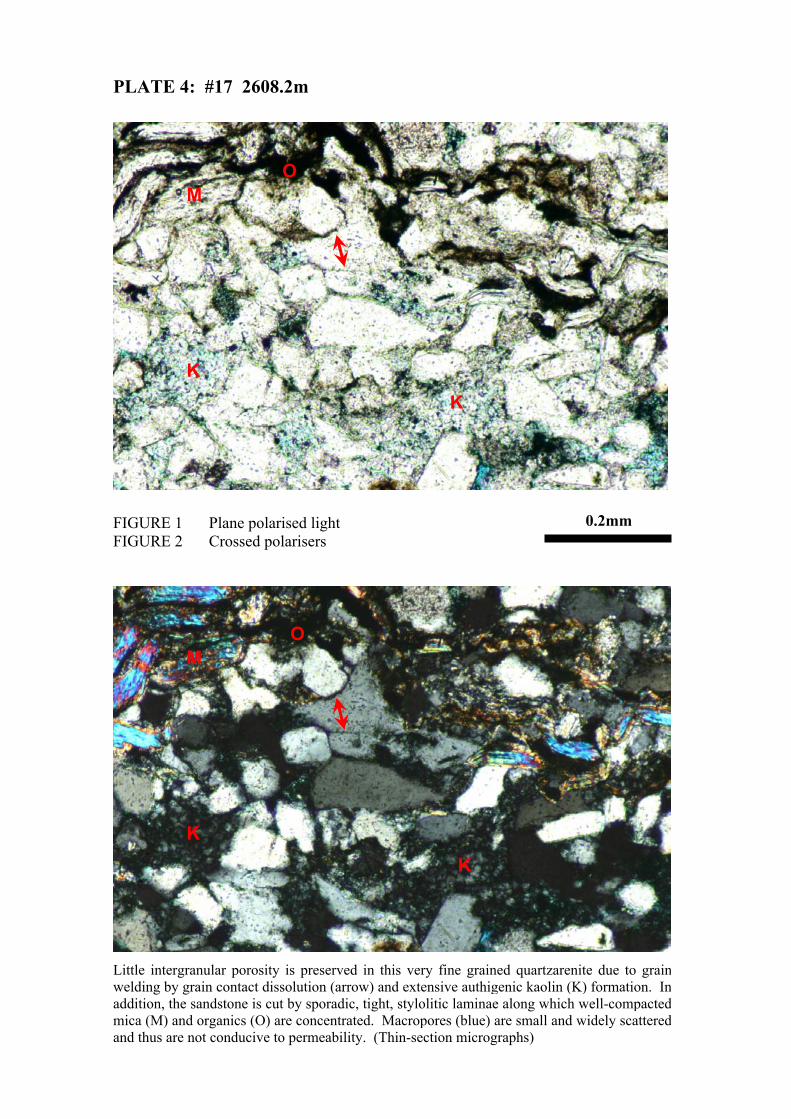
PLATE 4: #17 2608.2m
FIGURE 1 Plane polarised light FIGURE 2 Crossed polarisers
Little intergranular porosity is preserved in this very fine grained quartzarenite due to grainwelding by grain contact dissolution (arrow) and extensive authigenic kaolin (K) formation. Inaddition, the sandstone is cut by sporadic, tight, stylolitic laminae along which well-compactedmica (M) and organics (O) are concentrated. Macropores (blue) are small and widely scatteredand thus are not conducive to permeability. (Thin-section micrographs)
M O
K
K
M O
K
K
0.2mm
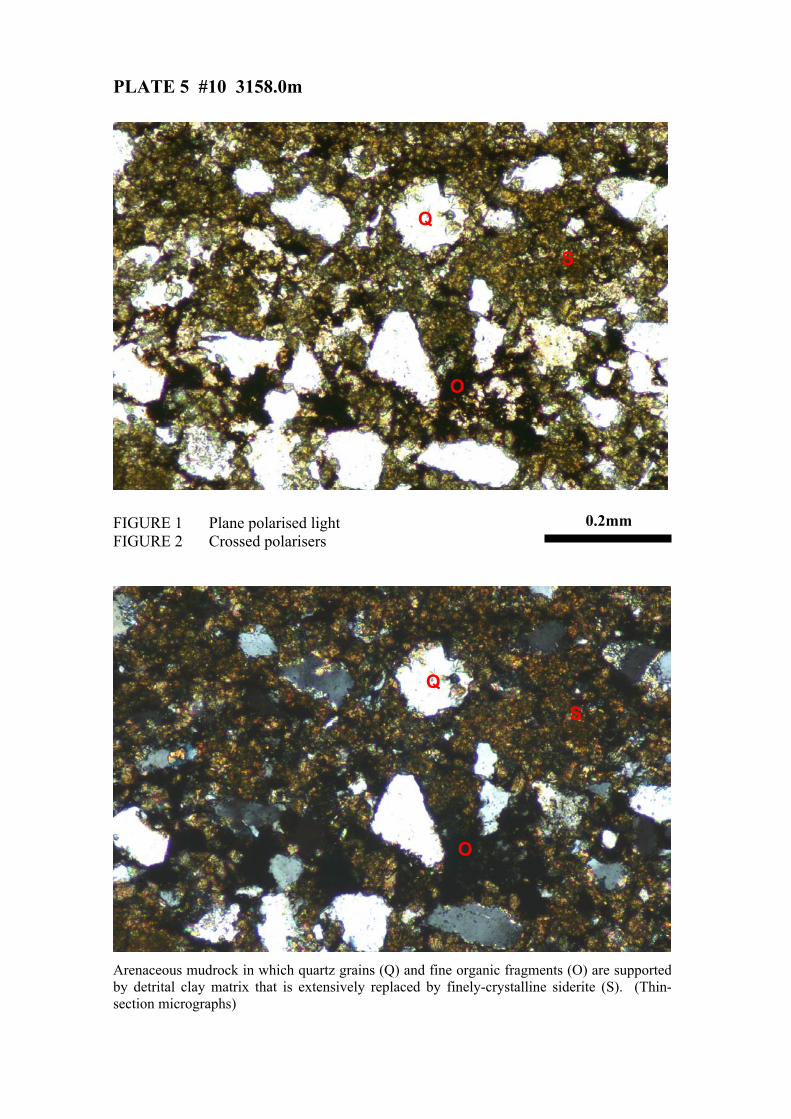
PLATE 5 #10 3158.0m
FIGURE 1 Plane polarised light FIGURE 2 Crossed polarisers
Arenaceous mudrock in which quartz grains (Q) and fine organic fragments (O) are supportedby detrital clay matrix that is extensively replaced by finely-crystalline siderite (S). (Thin-section micrographs)
Q
S
O
S
Q
O
0.2mm
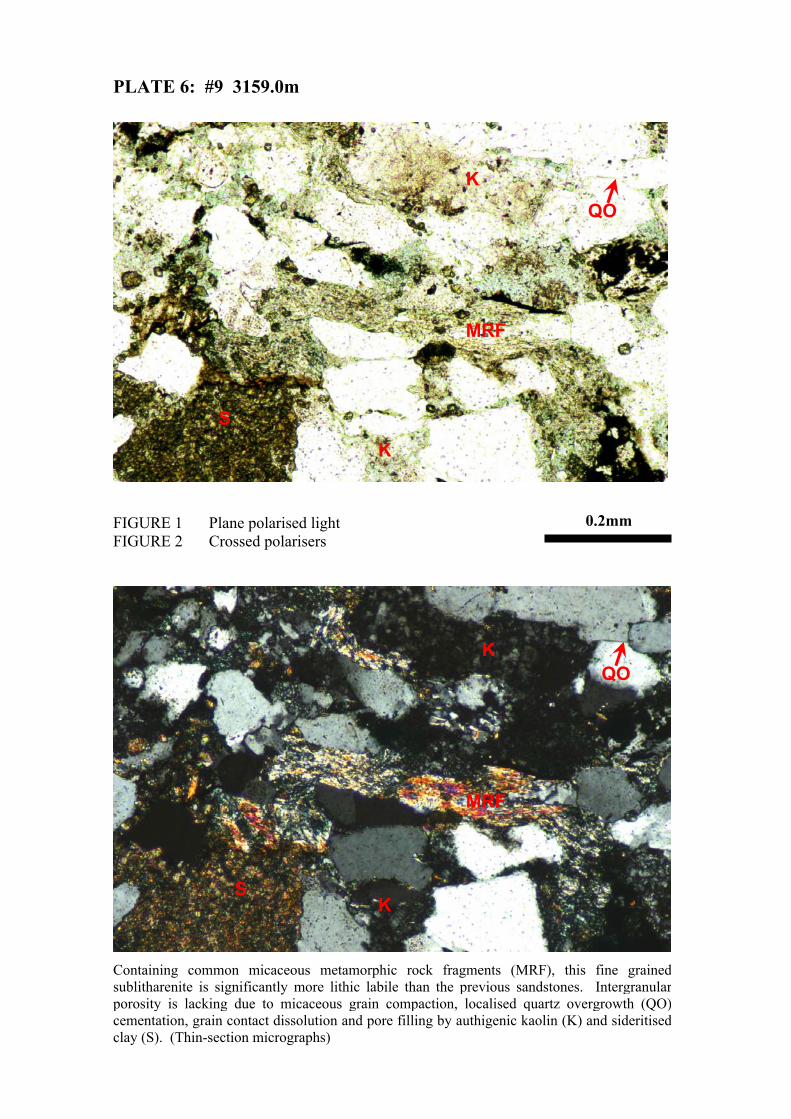
PLATE 6: #9 3159.0m
FIGURE 1 Plane polarised light FIGURE 2 Crossed polarisers
Containing common micaceous metamorphic rock fragments (MRF), this fine grainedsublitharenite is significantly more lithic labile than the previous sandstones. Intergranularporosity is lacking due to micaceous grain compaction, localised quartz overgrowth (QO)cementation, grain contact dissolution and pore filling by authigenic kaolin (K) and sideritisedclay (S). (Thin-section micrographs)
K QO
S
MRF
K
MRF
K
QO
S
K
0.2mm
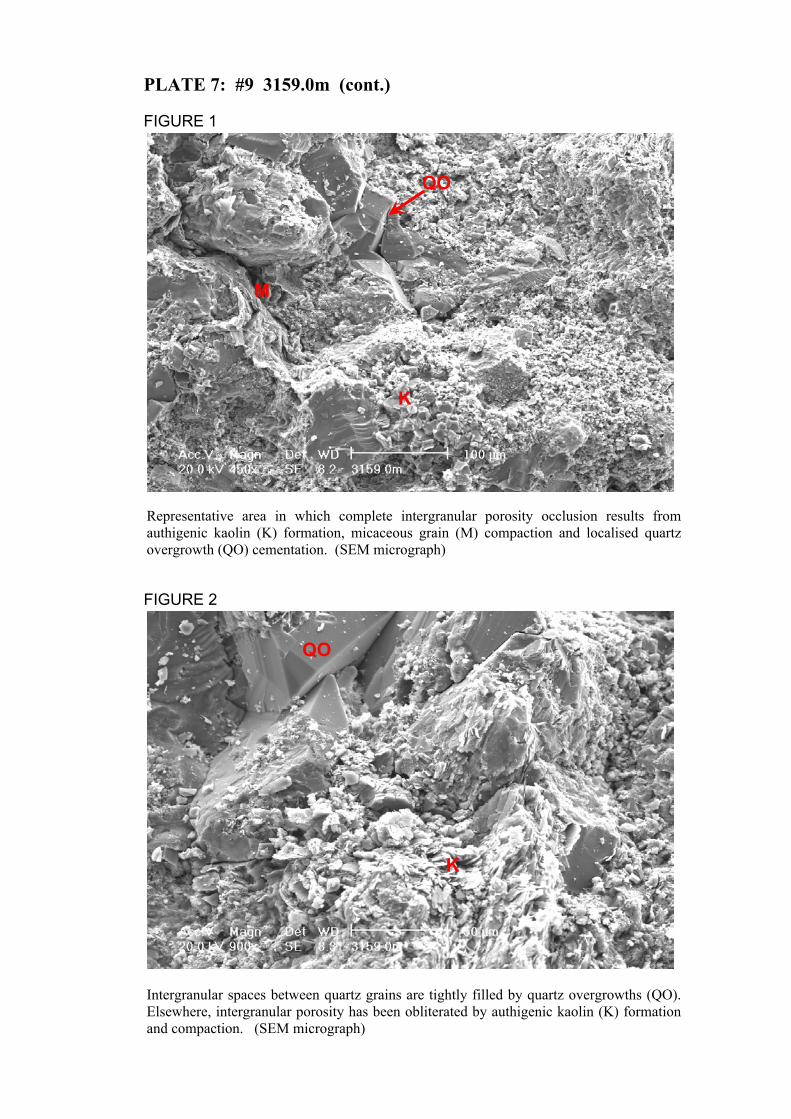
Representative area in which complete intergranular porosity occlusion results from authigenic kaolin (K) formation, micaceous grain (M) compaction and localised quartz overgrowth (QO) cementation. (SEM micrograph)
100µm
Q
Q
Intergranular spaces between quartz grains are tightly filled by quartz overgrowths (QO). Elsewhere, intergranular porosity has been obliterated by authigenic kaolin (K) formation and compaction. (SEM micrograph)
FIGURE 1
FIGURE 2
PLATE 7: #9 3159.0m (cont.)
M
K
QO
QO
K
Origin Energy Resources Ltd ABN 66 007 845 338 Commercial-in-Confidence Greenfields Division Ref: W:\Complete Reports\BASS\Yolla\Yolla 4\Interpretive\Yolla4InterpretativeDataWCR with appendix headers.docc
AAPPPPEENNDDIIXX 88:: CCOORREE IINNTTEERRPPRREETTAATTIIOONN
Origin Energy Yolla 4 Core Description Report ______________________________________________________________________________
1
Yolla 4
Core Description Report
T/L1 BASS BASIN
December 2004
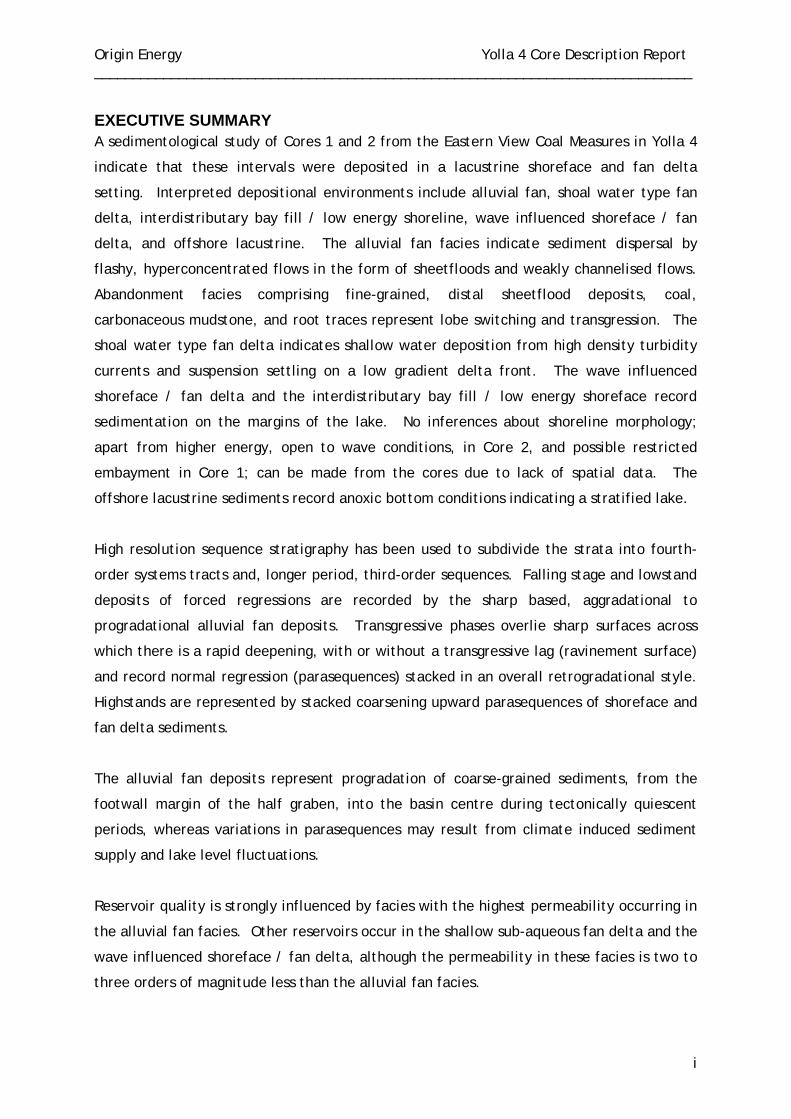
Origin Energy Yolla 4 Core Description Report ______________________________________________________________________________
i
EXECUTIVE SUMMARY A sedimentological study of Cores 1 and 2 from the Eastern View Coal Measures in Yolla 4
indicate that these intervals were deposited in a lacustrine shoreface and fan delta
setting. Interpreted depositional environments include alluvial fan, shoal water type fan
delta, interdistributary bay fill / low energy shoreline, wave influenced shoreface / fan
delta, and offshore lacustrine. The alluvial fan facies indicate sediment dispersal by
flashy, hyperconcentrated flows in the form of sheetfloods and weakly channelised flows.
Abandonment facies comprising fine-grained, distal sheetflood deposits, coal,
carbonaceous mudstone, and root traces represent lobe switching and transgression. The
shoal water type fan delta indicates shallow water deposition from high density turbidity
currents and suspension settling on a low gradient delta front. The wave influenced
shoreface / fan delta and the interdistributary bay fill / low energy shoreface record
sedimentation on the margins of the lake. No inferences about shoreline morphology;
apart from higher energy, open to wave conditions, in Core 2, and possible restricted
embayment in Core 1; can be made from the cores due to lack of spatial data. The
offshore lacustrine sediments record anoxic bottom conditions indicating a stratified lake.
High resolution sequence stratigraphy has been used to subdivide the strata into fourth-
order systems tracts and, longer period, third-order sequences. Falling stage and lowstand
deposits of forced regressions are recorded by the sharp based, aggradational to
progradational alluvial fan deposits. Transgressive phases overlie sharp surfaces across
which there is a rapid deepening, with or without a transgressive lag (ravinement surface)
and record normal regression (parasequences) stacked in an overall retrogradational style.
Highstands are represented by stacked coarsening upward parasequences of shoreface and
fan delta sediments.
The alluvial fan deposits represent progradation of coarse-grained sediments, from the
footwall margin of the half graben, into the basin centre during tectonically quiescent
periods, whereas variations in parasequences may result from climate induced sediment
supply and lake level fluctuations.
Reservoir quality is strongly influenced by facies with the highest permeability occurring in
the alluvial fan facies. Other reservoirs occur in the shallow sub-aqueous fan delta and the
wave influenced shoreface / fan delta, although the permeability in these facies is two to
three orders of magnitude less than the alluvial fan facies.
Origin Energy Yolla 4 Core Description Report ______________________________________________________________________________
ii
TABLE OF CONTENTS
Executive summary ..........................................................................i
INTRODUCTION ...............................................................................1
Overview ............................................................................................ 1
Objectives........................................................................................... 1
Methodology ........................................................................................ 2
SEDIMENTOLOGY.............................................................................2
Facies A – Massive mudstone .................................................................. 5 Facies B – Laminated mudstone ............................................................... 5 Facies C – Sub-aqueous hyperpycnal flow ................................................... 6 Facies D – Coarsening upward sand sequence............................................... 8 Facies E – Interbedded sand and mud, rare coal .......................................... 10 Facies F – Graded beds of stratified sand .................................................. 11 Facies G – Gravel and gravel sand beds..................................................... 12 Facies H – Graded sand beds.................................................................. 13 Facies I – Interbedded, massive to laminated sand and mud............................ 14
Facies Associations and depositional model ......................................... 16
Alluvial fan facies association................................................................ 16 Shoal water type fan delta facies association............................................. 16 Interdistributary bay fill / low energy shoreface......................................... 17 Wave influenced shoreface / fan delta..................................................... 17 Offshore lacustrine / restricted marine.................................................... 17
SEQUENCE STRATIGRAPHY............................................................... 17
Stratal surfaces ................................................................................. 18 Sequence stratigraphic model................................................................ 19
RESERVOIR QUALITY ...................................................................... 21
REFERENCES ................................................................................ 22
APPENDIX 1 Interpreted Core Photographs ENCLOSURE 1 Core 1 – EVCM ENCLOSURE 2 Core 2 – EVCM
Origin Energy Yolla 4 Core Description Report ______________________________________________________________________________
1
INTRODUCTION
Overview Two cores totalling 54.9 m were described in detail from Yolla-4. A recovery of 100 % was
achieved in both cores. All depths refer to drillers depth unless otherwise stated. The
following intervals were cored (Table 1):
Table 1: Core intervals in Yolla-4. There is a 6 m depth shift between drillers depth and
loggers depth.
The cores were taken in the Eastern View Coal Measures in the 2755 Sand (Core 1) and the
2809 Sand (Core 2) and these intervals constitute the upper two reservoir intervals of the
Yolla Field. This is the first core data for these reservoirs and allows detailed
sedimentological and sequence stratigraphic interpretation of the depositional
environments that can then be used to form facies models for the Yolla Field to assist in
the reservoir modelling.
Objectives
The main objectives of the core description were the following:
1 Provide a detailed description of the cored intervals
2 Determine lithofacies and ichnofacies
3 Interpret depositional environment
4 Describe sedimentary sequences and key stratal surfaces present within the core
5 Describe the reservoir potential
Core Depth Interval Recovery
1 2892.05 – 2919.6 m 100 %
2 2958.07 – 2985.4 m 100 %
Origin Energy Yolla 4 Core Description Report ______________________________________________________________________________
2
Methodology
Cores were logged at 1:20 scale. Grainsize, colour, composition, physical sedimentary
structures, macro palaeontology, ichnology (including Bioturbation index) were recorded.
Bioturbation index (BI) records the intensity of bioturbation within a unit on a scale of 1 to
6. Where 1 indicates sparse bioturbation and disturbance of primary physical sedimentary
structures and 6 indicates complete reworking of sediment and removal of all evidence of
original sedimentary structures. Other ichnology characteristics including community
succession resulting from environmental modification as the habitat becomes less suitable;
and tiering in which bioturbation is vertically partitioned, resulting from vertical zoning of
physical, chemical and biological parameters.
SEDIMENTOLOGY The cored intervals can be subdivided into four fourth-order sequences on the basis of
parasequence staking patterns. The sequences are characterised by facies assemblages
that represent particular depositional environments. Nine sedimentary facies have been
distinguished in the cored intervals. Not all facies are present in one cored interval. The
facies, labelled A through I, range from gravel to mud, and some of the finer-grained
facies also include thin coals. Most of these facies are compound units and their
component lithofacies are listed in Table 2. A summary of the main features of the facies
is in Table 3. Interpreted core photographs are included in Appendix 1.
Origin Energy Yolla 4 Core Description Report ______________________________________________________________________________
3
Table 2. Component lithofacies of sedimentary facies from cored intervals in Yolla 4.
Based on Miall, 1996; Martins-Neto, 1996; and Benvenuti, 2003
Lithofacies Main descriptive characteristics
(sediment texture and structure)
Gch
Massive, clast supported, moderately sorted, sub-angular to
sub-rounded gravel with crude normal grading and
stratification
Sl1 Planar parallel stratified / low angle laminated, medium- to
coarse-grained sand
Sl2 Planar parallel stratified / low angle laminated, very fine- to
medium-grained sand
Sr1 Ripple cross laminated, medium- to coarse-grained sand
Sr2 Ripple cross laminated, very fine- to medium-grained sand
Sg Horizontally stratified, fine- to coarse-grained sands with
normal grading
Sw Wavy, undulatory fine- to medium grained sands with possible
hummocky cross stratification
Slr Planar parallel stratified / low angle laminated, very fine- to
medium-grained sand, plant detritus and/or root traces
Sm1 Massive, very fine-grained sand with plant detritus
Sm2 Massive, medium- to coarse-grained sand with scattered
gravel and/or mudstone rip up clasts
St Small scale, trough cross stratified medium- to coarse-grained
sand
Fm Massive mudstone, siderite cemented bands
Fl Laminated mudstone with linsen lamination and thin cross
laminated silty sand or very fine-grained sand
Fmr Massive mudstone with plant debris and/or root traces
C Carbonaceous mudstone/coal
Origin Energy Yolla 4 Core Description Report ______________________________________________________________________________
4
Table 2. Summary of the main features of the sedimentary facies in Yolla 4 Core 1 and 2.
Facies Main features Inferred depositional process Depositional environment
A
Thick bedded Fm, lack
of bioturbation
Suspension settling below
storm wave base. Siderite and
lack of bioturbation implies
anoxic conditions.
Offshore lacustrine /
restricted marine.
B
Fl, Sg often contains
slumped intervals of
sand and mud
Combination of suspension
settling with sporadic low
density turbidity currents.
Slumped intervals due to
gravity loading
Deeper water; below storm
wave base sedimentation
with “event” beds on
prodelta.
C
Graded beds of Sm2,
Sg, Sr1, Fl
Sub-aqueous hyperpycnal flow Sub-aqueous portion (shoal
water type delta front) of
fan delta
D
Coarsening upward
sequence of Sw, Sr1,
Sl2, St, rare
bioturbation
Combination of upper and
lower flow regime,
unidirectional and oscillatory
currents
Middle to upper shoreface
deposition on wave
influenced shoreface / fan
delta
E
Composite sequence of
Sr1, Sw, Sl2,Sm1, Fl,
C, rare bioturbation
Low energy deposition with
periodic storm events in
shallow sub-aqueous setting,
grades into muddy marsh
environment
Shallow interdistributary bay
fill / low energy shoreline
overlain by prograding
muddy marsh.
F
Graded beds of Sl1,
Sr2, Sm2, rare St
Sub-aerial low-concentration
unconfined flow, St may
indicate confined flow
Distal sub-aerial sand skirt
facies.
G
Graded beds of Gch,
Sm2, rare Sr2
Supercritical flow forming
antidune bed forms. Gravel is
transported as bedload and
sand represents migration of
antidunes.
Distal sub-aerial portion of
alluvial fan – sheetflood
couplets
H
Graded beds of Sl2,
Sr1, Sm2, Sg, Fl
Sub-aqueous hyperpycnal flow Sub-aqueous portion
(nearshore – foreshore) of
shoal water type delta front.
I
Beds of Sl2, Slr, Sm1,
Fmr, Fm, C
Combination of sheetflood and
suspension settling in shallow
sub-aqueous to sub-aerial
setting. Coal development
reflects minimal clastic input.
Vegetated distal portion /
abandoned fan lobe with
intermittent sheetflood
deposition
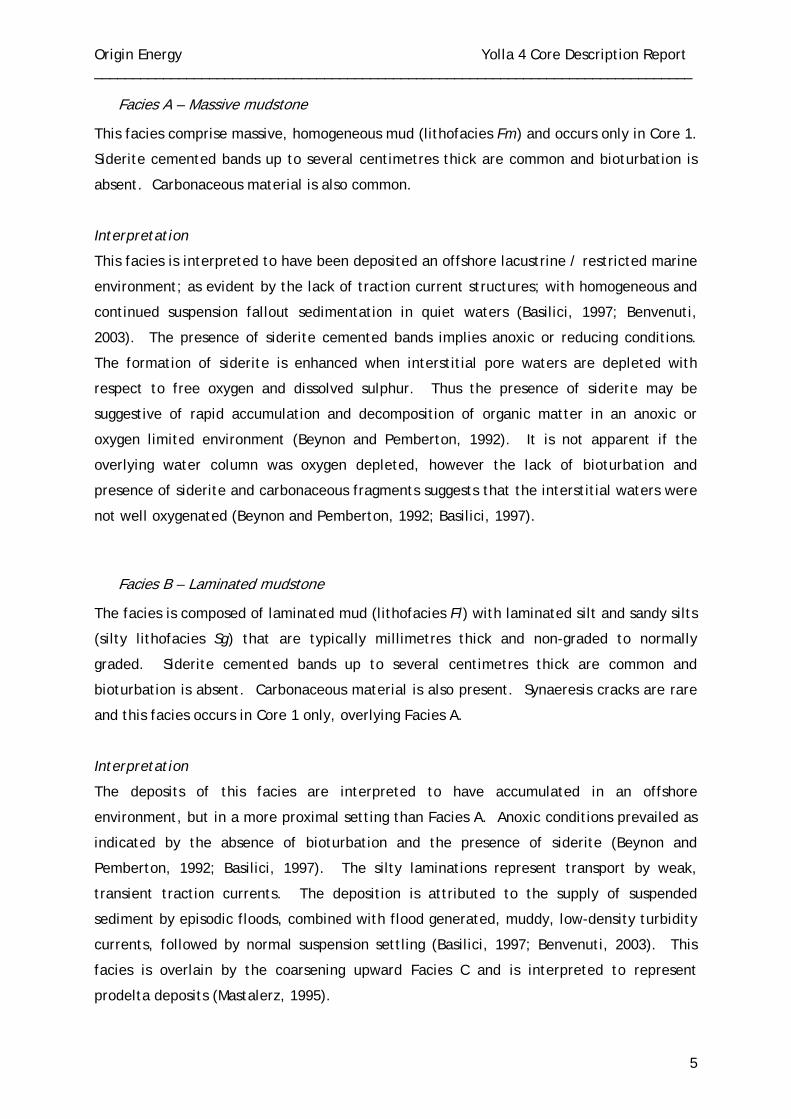
Origin Energy Yolla 4 Core Description Report ______________________________________________________________________________
5
Facies A – Massive mudstone
This facies comprise massive, homogeneous mud (lithofacies Fm) and occurs only in Core 1.
Siderite cemented bands up to several centimetres thick are common and bioturbation is
absent. Carbonaceous material is also common.
Interpretation
This facies is interpreted to have been deposited an offshore lacustrine / restricted marine
environment; as evident by the lack of traction current structures; with homogeneous and
continued suspension fallout sedimentation in quiet waters (Basilici, 1997; Benvenuti,
2003). The presence of siderite cemented bands implies anoxic or reducing conditions.
The formation of siderite is enhanced when interstitial pore waters are depleted with
respect to free oxygen and dissolved sulphur. Thus the presence of siderite may be
suggestive of rapid accumulation and decomposition of organic matter in an anoxic or
oxygen limited environment (Beynon and Pemberton, 1992). It is not apparent if the
overlying water column was oxygen depleted, however the lack of bioturbation and
presence of siderite and carbonaceous fragments suggests that the interstitial waters were
not well oxygenated (Beynon and Pemberton, 1992; Basilici, 1997).
Facies B – Laminated mudstone
The facies is composed of laminated mud (lithofacies Fl) with laminated silt and sandy silts
(silty lithofacies Sg) that are typically millimetres thick and non-graded to normally
graded. Siderite cemented bands up to several centimetres thick are common and
bioturbation is absent. Carbonaceous material is also present. Synaeresis cracks are rare
and this facies occurs in Core 1 only, overlying Facies A.
Interpretation
The deposits of this facies are interpreted to have accumulated in an offshore
environment, but in a more proximal setting than Facies A. Anoxic conditions prevailed as
indicated by the absence of bioturbation and the presence of siderite (Beynon and
Pemberton, 1992; Basilici, 1997). The silty laminations represent transport by weak,
transient traction currents. The deposition is attributed to the supply of suspended
sediment by episodic floods, combined with flood generated, muddy, low-density turbidity
currents, followed by normal suspension settling (Basilici, 1997; Benvenuti, 2003). This
facies is overlain by the coarsening upward Facies C and is interpreted to represent
prodelta deposits (Mastalerz, 1995).
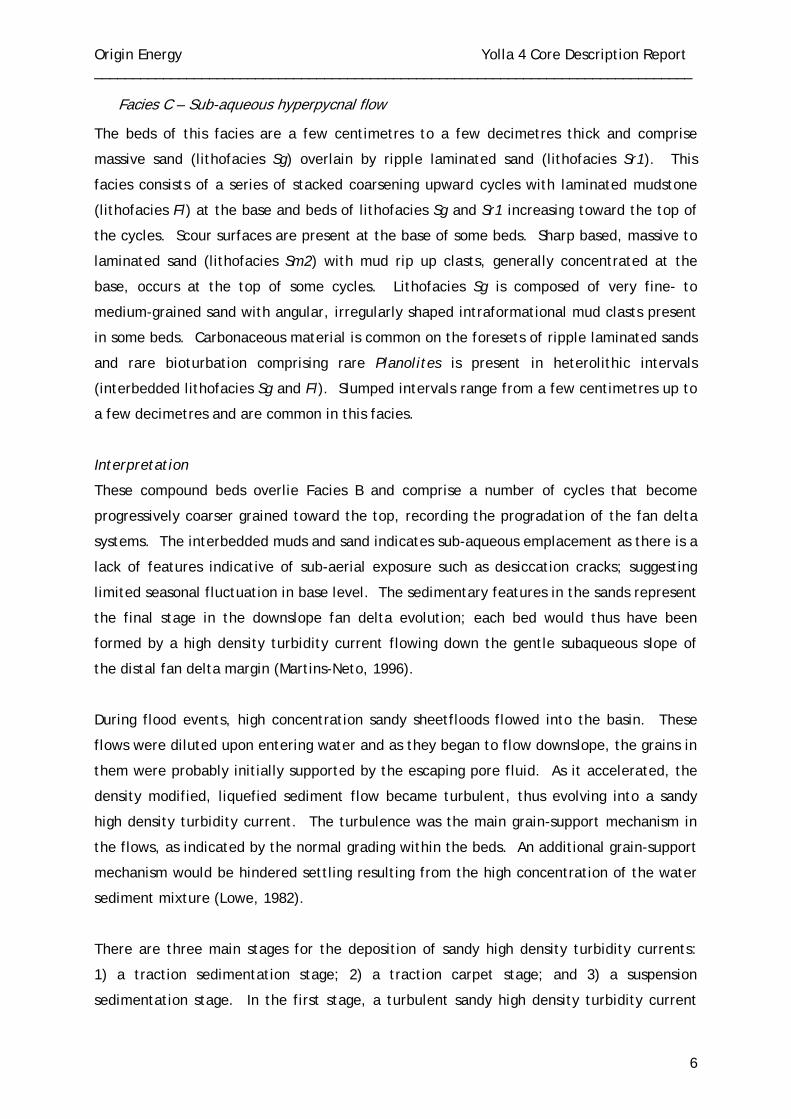
Origin Energy Yolla 4 Core Description Report ______________________________________________________________________________
6
Facies C – Sub-aqueous hyperpycnal flow
The beds of this facies are a few centimetres to a few decimetres thick and comprise
massive sand (lithofacies Sg) overlain by ripple laminated sand (lithofacies Sr1). This
facies consists of a series of stacked coarsening upward cycles with laminated mudstone
(lithofacies Fl) at the base and beds of lithofacies Sg and Sr1 increasing toward the top of
the cycles. Scour surfaces are present at the base of some beds. Sharp based, massive to
laminated sand (lithofacies Sm2) with mud rip up clasts, generally concentrated at the
base, occurs at the top of some cycles. Lithofacies Sg is composed of very fine- to
medium-grained sand with angular, irregularly shaped intraformational mud clasts present
in some beds. Carbonaceous material is common on the foresets of ripple laminated sands
and rare bioturbation comprising rare Planolites is present in heterolithic intervals
(interbedded lithofacies Sg and Fl). Slumped intervals range from a few centimetres up to
a few decimetres and are common in this facies.
Interpretation
These compound beds overlie Facies B and comprise a number of cycles that become
progressively coarser grained toward the top, recording the progradation of the fan delta
systems. The interbedded muds and sand indicates sub-aqueous emplacement as there is a
lack of features indicative of sub-aerial exposure such as desiccation cracks; suggesting
limited seasonal fluctuation in base level. The sedimentary features in the sands represent
the final stage in the downslope fan delta evolution; each bed would thus have been
formed by a high density turbidity current flowing down the gentle subaqueous slope of
the distal fan delta margin (Martins-Neto, 1996).
During flood events, high concentration sandy sheetfloods flowed into the basin. These
flows were diluted upon entering water and as they began to flow downslope, the grains in
them were probably initially supported by the escaping pore fluid. As it accelerated, the
density modified, liquefied sediment flow became turbulent, thus evolving into a sandy
high density turbidity current. The turbulence was the main grain-support mechanism in
the flows, as indicated by the normal grading within the beds. An additional grain-support
mechanism would be hindered settling resulting from the high concentration of the water
sediment mixture (Lowe, 1982).
There are three main stages for the deposition of sandy high density turbidity currents:
1) a traction sedimentation stage; 2) a traction carpet stage; and 3) a suspension
sedimentation stage. In the first stage, a turbulent sandy high density turbidity current
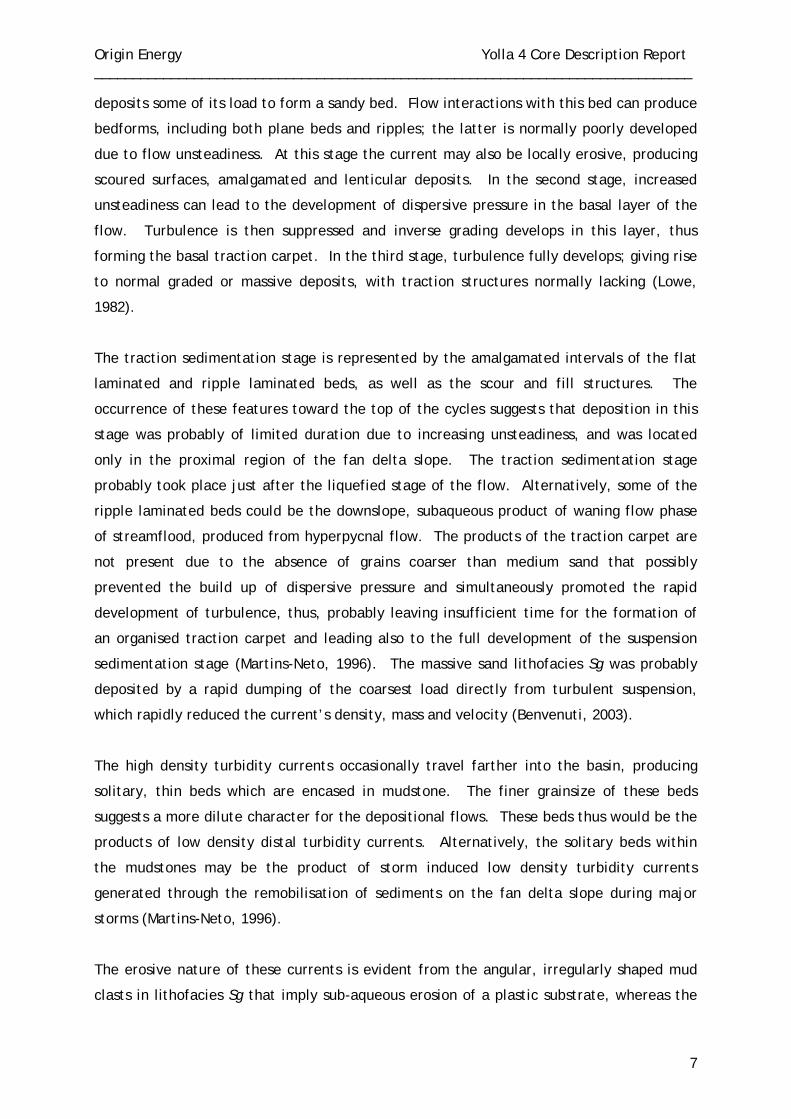
Origin Energy Yolla 4 Core Description Report ______________________________________________________________________________
7
deposits some of its load to form a sandy bed. Flow interactions with this bed can produce
bedforms, including both plane beds and ripples; the latter is normally poorly developed
due to flow unsteadiness. At this stage the current may also be locally erosive, producing
scoured surfaces, amalgamated and lenticular deposits. In the second stage, increased
unsteadiness can lead to the development of dispersive pressure in the basal layer of the
flow. Turbulence is then suppressed and inverse grading develops in this layer, thus
forming the basal traction carpet. In the third stage, turbulence fully develops; giving rise
to normal graded or massive deposits, with traction structures normally lacking (Lowe,
1982).
The traction sedimentation stage is represented by the amalgamated intervals of the flat
laminated and ripple laminated beds, as well as the scour and fill structures. The
occurrence of these features toward the top of the cycles suggests that deposition in this
stage was probably of limited duration due to increasing unsteadiness, and was located
only in the proximal region of the fan delta slope. The traction sedimentation stage
probably took place just after the liquefied stage of the flow. Alternatively, some of the
ripple laminated beds could be the downslope, subaqueous product of waning flow phase
of streamflood, produced from hyperpycnal flow. The products of the traction carpet are
not present due to the absence of grains coarser than medium sand that possibly
prevented the build up of dispersive pressure and simultaneously promoted the rapid
development of turbulence, thus, probably leaving insufficient time for the formation of
an organised traction carpet and leading also to the full development of the suspension
sedimentation stage (Martins-Neto, 1996). The massive sand lithofacies Sg was probably
deposited by a rapid dumping of the coarsest load directly from turbulent suspension,
which rapidly reduced the current’s density, mass and velocity (Benvenuti, 2003).
The high density turbidity currents occasionally travel farther into the basin, producing
solitary, thin beds which are encased in mudstone. The finer grainsize of these beds
suggests a more dilute character for the depositional flows. These beds thus would be the
products of low density distal turbidity currents. Alternatively, the solitary beds within
the mudstones may be the product of storm induced low density turbidity currents
generated through the remobilisation of sediments on the fan delta slope during major
storms (Martins-Neto, 1996).
The erosive nature of these currents is evident from the angular, irregularly shaped mud
clasts in lithofacies Sg that imply sub-aqueous erosion of a plastic substrate, whereas the
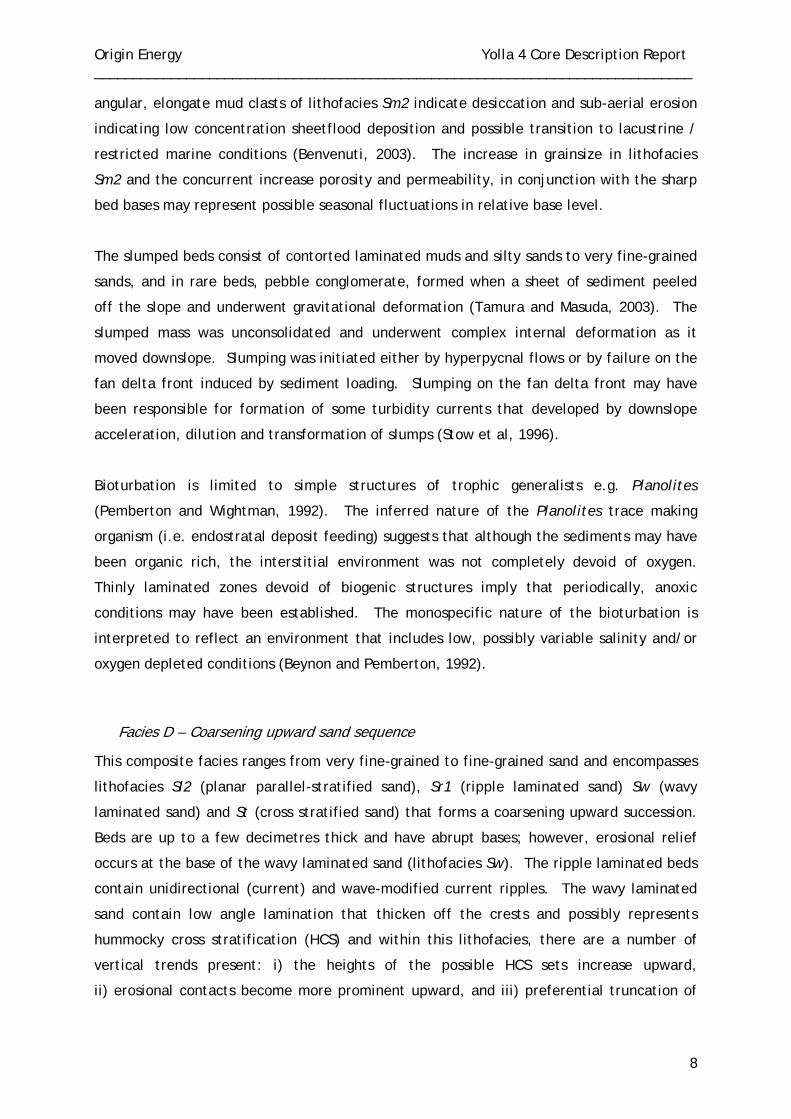
Origin Energy Yolla 4 Core Description Report ______________________________________________________________________________
8
angular, elongate mud clasts of lithofacies Sm2 indicate desiccation and sub-aerial erosion
indicating low concentration sheetflood deposition and possible transition to lacustrine /
restricted marine conditions (Benvenuti, 2003). The increase in grainsize in lithofacies
Sm2 and the concurrent increase porosity and permeability, in conjunction with the sharp
bed bases may represent possible seasonal fluctuations in relative base level.
The slumped beds consist of contorted laminated muds and silty sands to very fine-grained
sands, and in rare beds, pebble conglomerate, formed when a sheet of sediment peeled
off the slope and underwent gravitational deformation (Tamura and Masuda, 2003). The
slumped mass was unconsolidated and underwent complex internal deformation as it
moved downslope. Slumping was initiated either by hyperpycnal flows or by failure on the
fan delta front induced by sediment loading. Slumping on the fan delta front may have
been responsible for formation of some turbidity currents that developed by downslope
acceleration, dilution and transformation of slumps (Stow et al, 1996).
Bioturbation is limited to simple structures of trophic generalists e.g. Planolites
(Pemberton and Wightman, 1992). The inferred nature of the Planolites trace making
organism (i.e. endostratal deposit feeding) suggests that although the sediments may have
been organic rich, the interstitial environment was not completely devoid of oxygen.
Thinly laminated zones devoid of biogenic structures imply that periodically, anoxic
conditions may have been established. The monospecific nature of the bioturbation is
interpreted to reflect an environment that includes low, possibly variable salinity and/or
oxygen depleted conditions (Beynon and Pemberton, 1992).
Facies D – Coarsening upward sand sequence
This composite facies ranges from very fine-grained to fine-grained sand and encompasses
lithofacies Sl2 (planar parallel-stratified sand), Sr1 (ripple laminated sand) Sw (wavy
laminated sand) and St (cross stratified sand) that forms a coarsening upward succession.
Beds are up to a few decimetres thick and have abrupt bases; however, erosional relief
occurs at the base of the wavy laminated sand (lithofacies Sw). The ripple laminated beds
contain unidirectional (current) and wave-modified current ripples. The wavy laminated
sand contain low angle lamination that thicken off the crests and possibly represents
hummocky cross stratification (HCS) and within this lithofacies, there are a number of
vertical trends present: i) the heights of the possible HCS sets increase upward,
ii) erosional contacts become more prominent upward, and iii) preferential truncation of
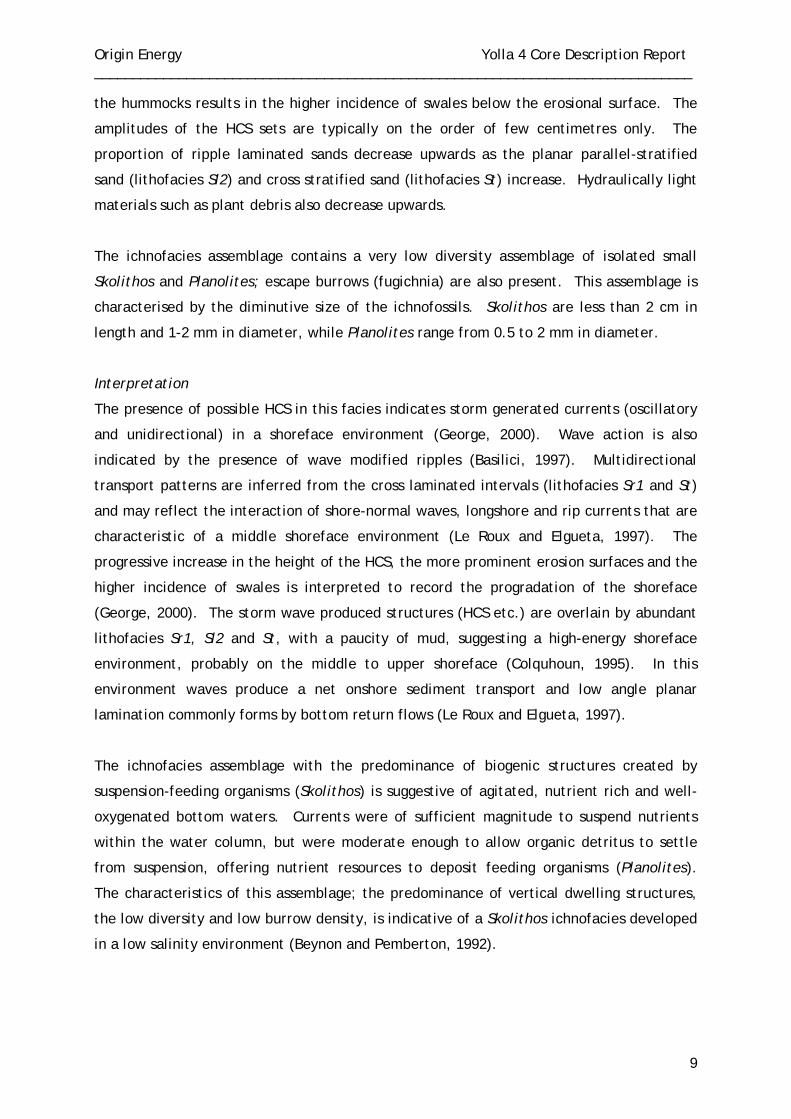
Origin Energy Yolla 4 Core Description Report ______________________________________________________________________________
9
the hummocks results in the higher incidence of swales below the erosional surface. The
amplitudes of the HCS sets are typically on the order of few centimetres only. The
proportion of ripple laminated sands decrease upwards as the planar parallel-stratified
sand (lithofacies Sl2) and cross stratified sand (lithofacies St) increase. Hydraulically light
materials such as plant debris also decrease upwards.
The ichnofacies assemblage contains a very low diversity assemblage of isolated small
Skolithos and Planolites; escape burrows (fugichnia) are also present. This assemblage is
characterised by the diminutive size of the ichnofossils. Skolithos are less than 2 cm in
length and 1-2 mm in diameter, while Planolites range from 0.5 to 2 mm in diameter.
Interpretation
The presence of possible HCS in this facies indicates storm generated currents (oscillatory
and unidirectional) in a shoreface environment (George, 2000). Wave action is also
indicated by the presence of wave modified ripples (Basilici, 1997). Multidirectional
transport patterns are inferred from the cross laminated intervals (lithofacies Sr1 and St)
and may reflect the interaction of shore-normal waves, longshore and rip currents that are
characteristic of a middle shoreface environment (Le Roux and Elgueta, 1997). The
progressive increase in the height of the HCS, the more prominent erosion surfaces and the
higher incidence of swales is interpreted to record the progradation of the shoreface
(George, 2000). The storm wave produced structures (HCS etc.) are overlain by abundant
lithofacies Sr1, Sl2 and St, with a paucity of mud, suggesting a high-energy shoreface
environment, probably on the middle to upper shoreface (Colquhoun, 1995). In this
environment waves produce a net onshore sediment transport and low angle planar
lamination commonly forms by bottom return flows (Le Roux and Elgueta, 1997).
The ichnofacies assemblage with the predominance of biogenic structures created by
suspension-feeding organisms (Skolithos) is suggestive of agitated, nutrient rich and well-
oxygenated bottom waters. Currents were of sufficient magnitude to suspend nutrients
within the water column, but were moderate enough to allow organic detritus to settle
from suspension, offering nutrient resources to deposit feeding organisms (Planolites).
The characteristics of this assemblage; the predominance of vertical dwelling structures,
the low diversity and low burrow density, is indicative of a Skolithos ichnofacies developed
in a low salinity environment (Beynon and Pemberton, 1992).
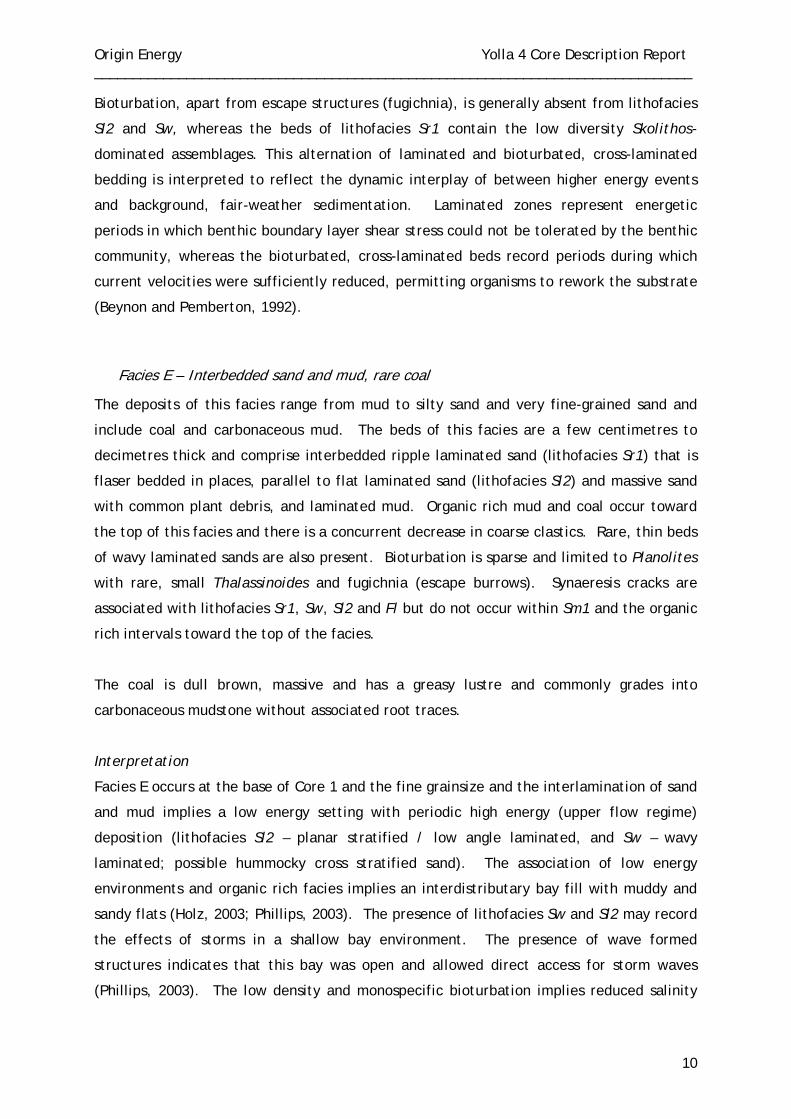
Origin Energy Yolla 4 Core Description Report ______________________________________________________________________________
10
Bioturbation, apart from escape structures (fugichnia), is generally absent from lithofacies
Sl2 and Sw, whereas the beds of lithofacies Sr1 contain the low diversity Skolithos-
dominated assemblages. This alternation of laminated and bioturbated, cross-laminated
bedding is interpreted to reflect the dynamic interplay of between higher energy events
and background, fair-weather sedimentation. Laminated zones represent energetic
periods in which benthic boundary layer shear stress could not be tolerated by the benthic
community, whereas the bioturbated, cross-laminated beds record periods during which
current velocities were sufficiently reduced, permitting organisms to rework the substrate
(Beynon and Pemberton, 1992).
Facies E – Interbedded sand and mud, rare coal
The deposits of this facies range from mud to silty sand and very fine-grained sand and
include coal and carbonaceous mud. The beds of this facies are a few centimetres to
decimetres thick and comprise interbedded ripple laminated sand (lithofacies Sr1) that is
flaser bedded in places, parallel to flat laminated sand (lithofacies Sl2) and massive sand
with common plant debris, and laminated mud. Organic rich mud and coal occur toward
the top of this facies and there is a concurrent decrease in coarse clastics. Rare, thin beds
of wavy laminated sands are also present. Bioturbation is sparse and limited to Planolites
with rare, small Thalassinoides and fugichnia (escape burrows). Synaeresis cracks are
associated with lithofacies Sr1, Sw, Sl2 and Fl but do not occur within Sm1 and the organic
rich intervals toward the top of the facies.
The coal is dull brown, massive and has a greasy lustre and commonly grades into
carbonaceous mudstone without associated root traces.
Interpretation
Facies E occurs at the base of Core 1 and the fine grainsize and the interlamination of sand
and mud implies a low energy setting with periodic high energy (upper flow regime)
deposition (lithofacies Sl2 – planar stratified / low angle laminated, and Sw – wavy
laminated; possible hummocky cross stratified sand). The association of low energy
environments and organic rich facies implies an interdistributary bay fill with muddy and
sandy flats (Holz, 2003; Phillips, 2003). The presence of lithofacies Sw and Sl2 may record
the effects of storms in a shallow bay environment. The presence of wave formed
structures indicates that this bay was open and allowed direct access for storm waves
(Phillips, 2003). The low density and monospecific bioturbation implies reduced salinity
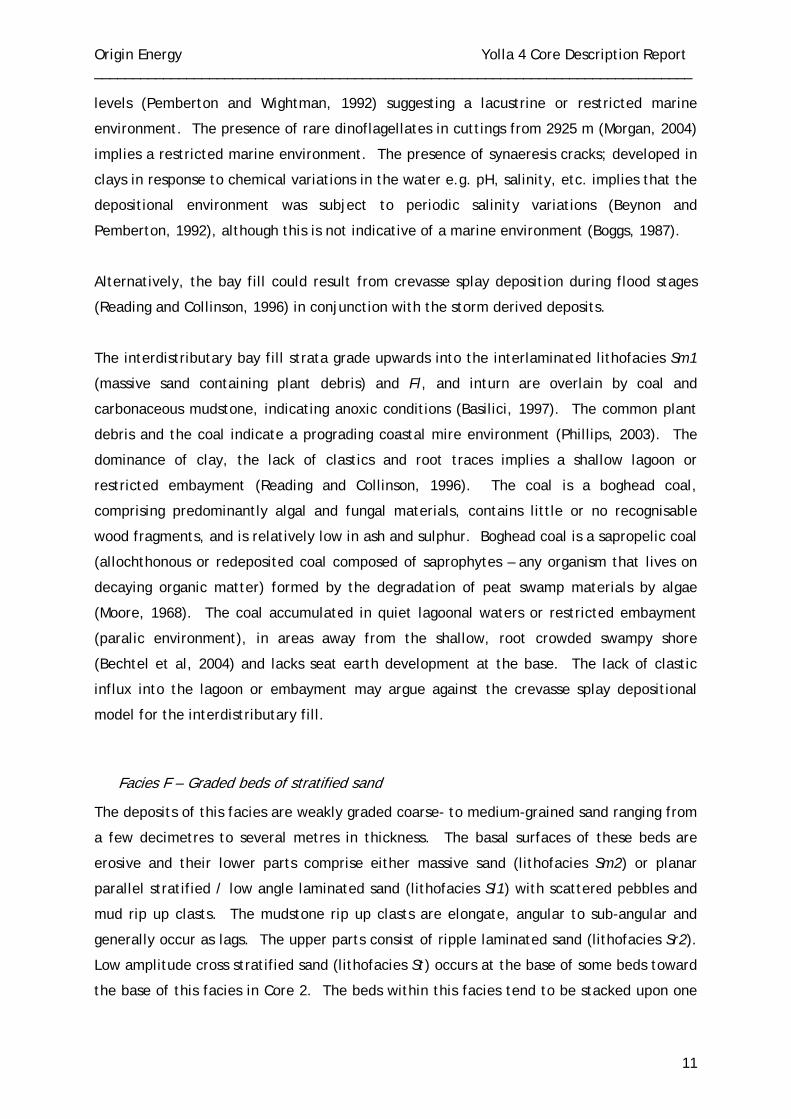
Origin Energy Yolla 4 Core Description Report ______________________________________________________________________________
11
levels (Pemberton and Wightman, 1992) suggesting a lacustrine or restricted marine
environment. The presence of rare dinoflagellates in cuttings from 2925 m (Morgan, 2004)
implies a restricted marine environment. The presence of synaeresis cracks; developed in
clays in response to chemical variations in the water e.g. pH, salinity, etc. implies that the
depositional environment was subject to periodic salinity variations (Beynon and
Pemberton, 1992), although this is not indicative of a marine environment (Boggs, 1987).
Alternatively, the bay fill could result from crevasse splay deposition during flood stages
(Reading and Collinson, 1996) in conjunction with the storm derived deposits.
The interdistributary bay fill strata grade upwards into the interlaminated lithofacies Sm1
(massive sand containing plant debris) and Fl, and inturn are overlain by coal and
carbonaceous mudstone, indicating anoxic conditions (Basilici, 1997). The common plant
debris and the coal indicate a prograding coastal mire environment (Phillips, 2003). The
dominance of clay, the lack of clastics and root traces implies a shallow lagoon or
restricted embayment (Reading and Collinson, 1996). The coal is a boghead coal,
comprising predominantly algal and fungal materials, contains little or no recognisable
wood fragments, and is relatively low in ash and sulphur. Boghead coal is a sapropelic coal
(allochthonous or redeposited coal composed of saprophytes – any organism that lives on
decaying organic matter) formed by the degradation of peat swamp materials by algae
(Moore, 1968). The coal accumulated in quiet lagoonal waters or restricted embayment
(paralic environment), in areas away from the shallow, root crowded swampy shore
(Bechtel et al, 2004) and lacks seat earth development at the base. The lack of clastic
influx into the lagoon or embayment may argue against the crevasse splay depositional
model for the interdistributary fill.
Facies F – Graded beds of stratified sand
The deposits of this facies are weakly graded coarse- to medium-grained sand ranging from
a few decimetres to several metres in thickness. The basal surfaces of these beds are
erosive and their lower parts comprise either massive sand (lithofacies Sm2) or planar
parallel stratified / low angle laminated sand (lithofacies Sl1) with scattered pebbles and
mud rip up clasts. The mudstone rip up clasts are elongate, angular to sub-angular and
generally occur as lags. The upper parts consist of ripple laminated sand (lithofacies Sr2).
Low amplitude cross stratified sand (lithofacies St) occurs at the base of some beds toward
the base of this facies in Core 2. The beds within this facies tend to be stacked upon one
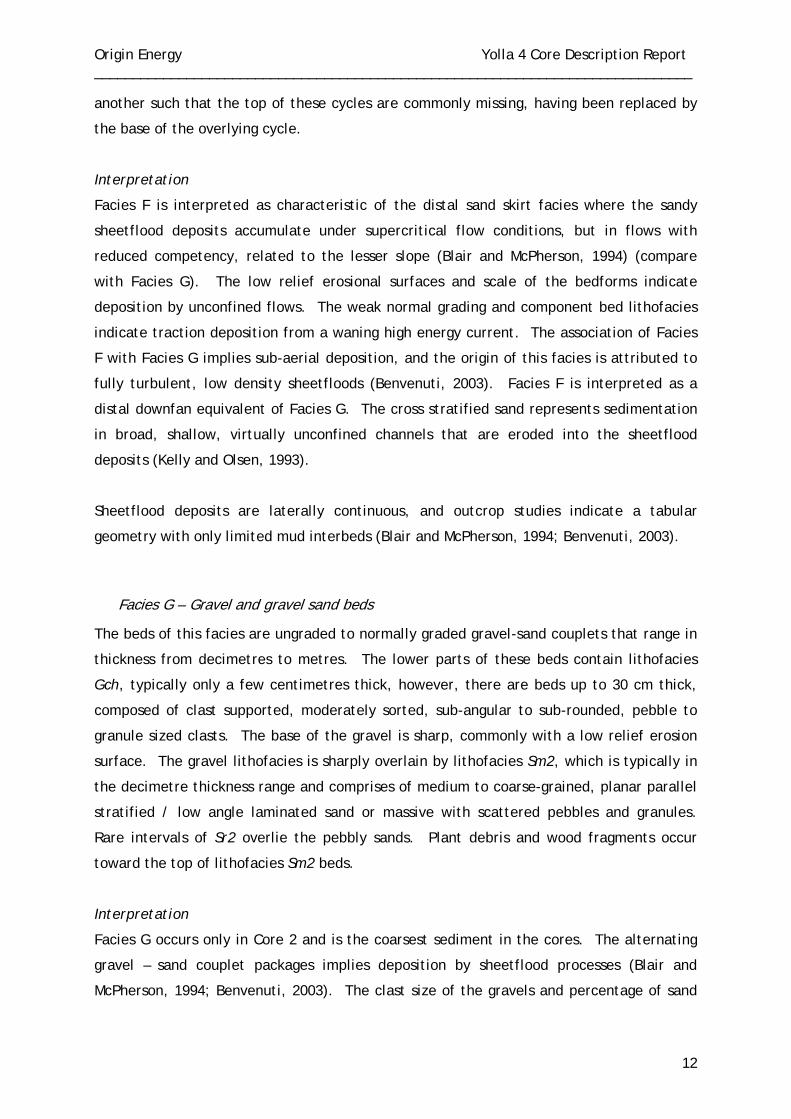
Origin Energy Yolla 4 Core Description Report ______________________________________________________________________________
12
another such that the top of these cycles are commonly missing, having been replaced by
the base of the overlying cycle.
Interpretation
Facies F is interpreted as characteristic of the distal sand skirt facies where the sandy
sheetflood deposits accumulate under supercritical flow conditions, but in flows with
reduced competency, related to the lesser slope (Blair and McPherson, 1994) (compare
with Facies G). The low relief erosional surfaces and scale of the bedforms indicate
deposition by unconfined flows. The weak normal grading and component bed lithofacies
indicate traction deposition from a waning high energy current. The association of Facies
F with Facies G implies sub-aerial deposition, and the origin of this facies is attributed to
fully turbulent, low density sheetfloods (Benvenuti, 2003). Facies F is interpreted as a
distal downfan equivalent of Facies G. The cross stratified sand represents sedimentation
in broad, shallow, virtually unconfined channels that are eroded into the sheetflood
deposits (Kelly and Olsen, 1993).
Sheetflood deposits are laterally continuous, and outcrop studies indicate a tabular
geometry with only limited mud interbeds (Blair and McPherson, 1994; Benvenuti, 2003).
Facies G – Gravel and gravel sand beds
The beds of this facies are ungraded to normally graded gravel-sand couplets that range in
thickness from decimetres to metres. The lower parts of these beds contain lithofacies
Gch, typically only a few centimetres thick, however, there are beds up to 30 cm thick,
composed of clast supported, moderately sorted, sub-angular to sub-rounded, pebble to
granule sized clasts. The base of the gravel is sharp, commonly with a low relief erosion
surface. The gravel lithofacies is sharply overlain by lithofacies Sm2, which is typically in
the decimetre thickness range and comprises of medium to coarse-grained, planar parallel
stratified / low angle laminated sand or massive with scattered pebbles and granules.
Rare intervals of Sr2 overlie the pebbly sands. Plant debris and wood fragments occur
toward the top of lithofacies Sm2 beds.
Interpretation
Facies G occurs only in Core 2 and is the coarsest sediment in the cores. The alternating
gravel – sand couplet packages implies deposition by sheetflood processes (Blair and
McPherson, 1994; Benvenuti, 2003). The clast size of the gravels and percentage of sand
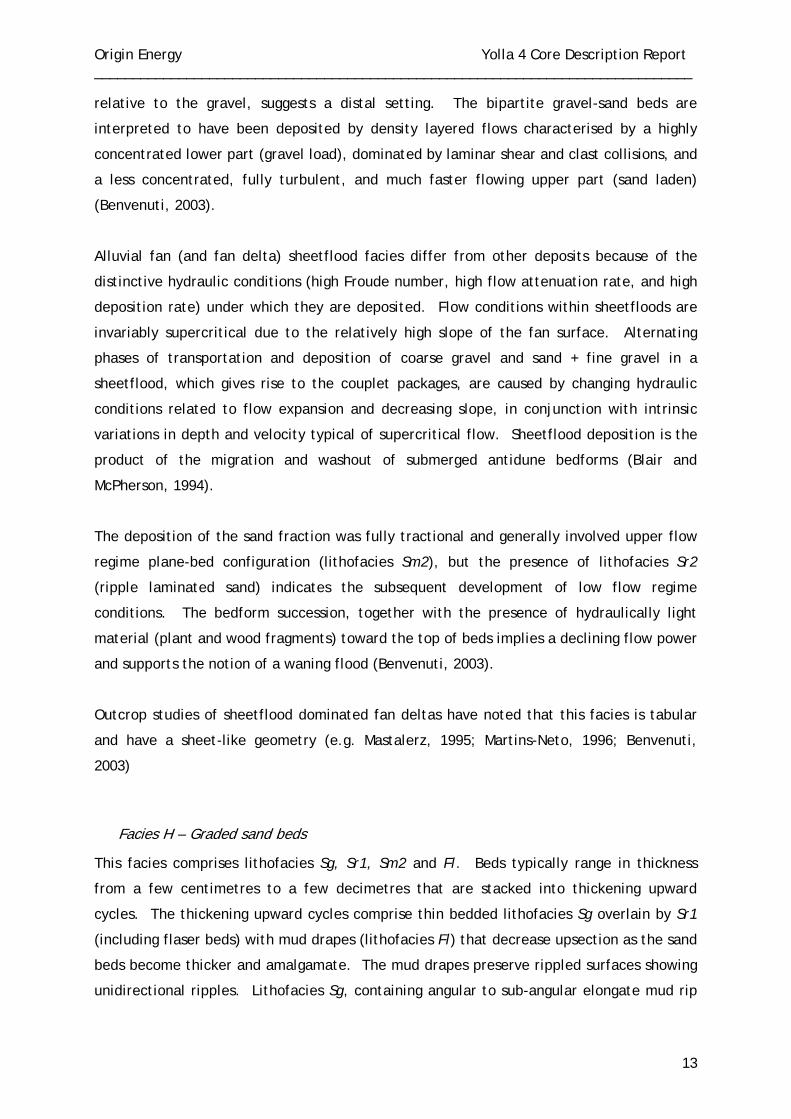
Origin Energy Yolla 4 Core Description Report ______________________________________________________________________________
13
relative to the gravel, suggests a distal setting. The bipartite gravel-sand beds are
interpreted to have been deposited by density layered flows characterised by a highly
concentrated lower part (gravel load), dominated by laminar shear and clast collisions, and
a less concentrated, fully turbulent, and much faster flowing upper part (sand laden)
(Benvenuti, 2003).
Alluvial fan (and fan delta) sheetflood facies differ from other deposits because of the
distinctive hydraulic conditions (high Froude number, high flow attenuation rate, and high
deposition rate) under which they are deposited. Flow conditions within sheetfloods are
invariably supercritical due to the relatively high slope of the fan surface. Alternating
phases of transportation and deposition of coarse gravel and sand + fine gravel in a
sheetflood, which gives rise to the couplet packages, are caused by changing hydraulic
conditions related to flow expansion and decreasing slope, in conjunction with intrinsic
variations in depth and velocity typical of supercritical flow. Sheetflood deposition is the
product of the migration and washout of submerged antidune bedforms (Blair and
McPherson, 1994).
The deposition of the sand fraction was fully tractional and generally involved upper flow
regime plane-bed configuration (lithofacies Sm2), but the presence of lithofacies Sr2
(ripple laminated sand) indicates the subsequent development of low flow regime
conditions. The bedform succession, together with the presence of hydraulically light
material (plant and wood fragments) toward the top of beds implies a declining flow power
and supports the notion of a waning flood (Benvenuti, 2003).
Outcrop studies of sheetflood dominated fan deltas have noted that this facies is tabular
and have a sheet-like geometry (e.g. Mastalerz, 1995; Martins-Neto, 1996; Benvenuti,
2003)
Facies H – Graded sand beds
This facies comprises lithofacies Sg, Sr1, Sm2 and Fl. Beds typically range in thickness
from a few centimetres to a few decimetres that are stacked into thickening upward
cycles. The thickening upward cycles comprise thin bedded lithofacies Sg overlain by Sr1
(including flaser beds) with mud drapes (lithofacies Fl) that decrease upsection as the sand
beds become thicker and amalgamate. The mud drapes preserve rippled surfaces showing
unidirectional ripples. Lithofacies Sg, containing angular to sub-angular elongate mud rip
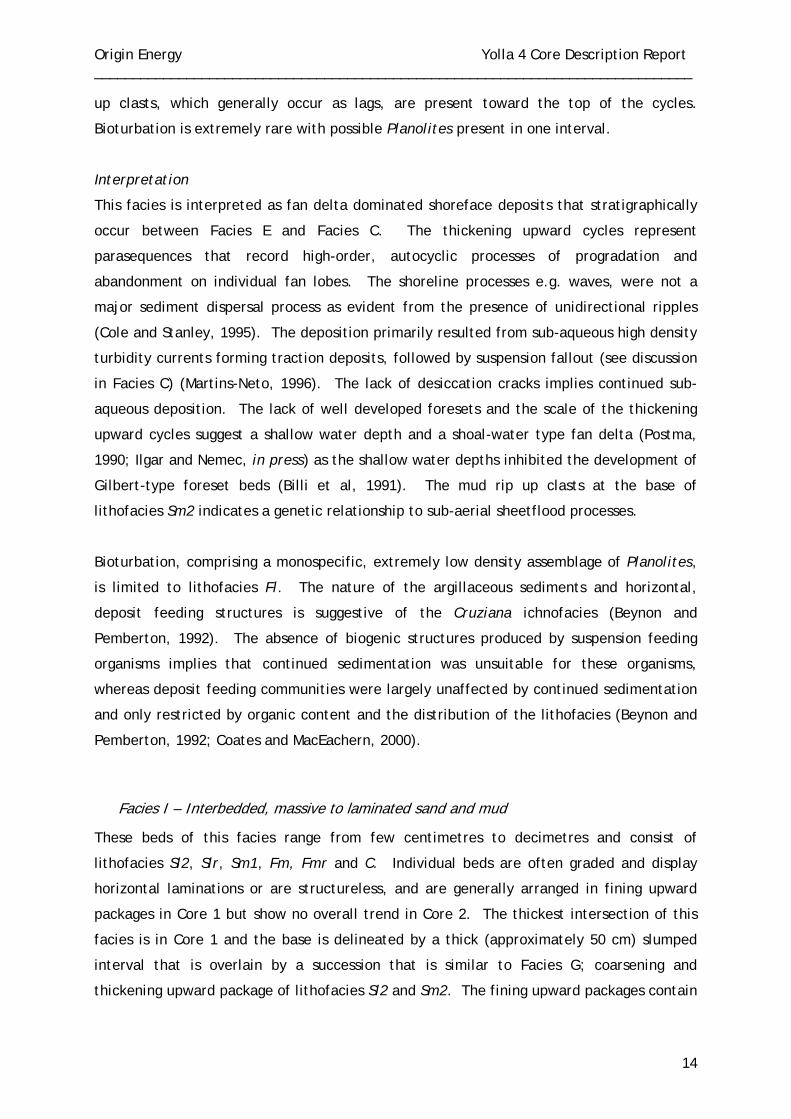
Origin Energy Yolla 4 Core Description Report ______________________________________________________________________________
14
up clasts, which generally occur as lags, are present toward the top of the cycles.
Bioturbation is extremely rare with possible Planolites present in one interval.
Interpretation
This facies is interpreted as fan delta dominated shoreface deposits that stratigraphically
occur between Facies E and Facies C. The thickening upward cycles represent
parasequences that record high-order, autocyclic processes of progradation and
abandonment on individual fan lobes. The shoreline processes e.g. waves, were not a
major sediment dispersal process as evident from the presence of unidirectional ripples
(Cole and Stanley, 1995). The deposition primarily resulted from sub-aqueous high density
turbidity currents forming traction deposits, followed by suspension fallout (see discussion
in Facies C) (Martins-Neto, 1996). The lack of desiccation cracks implies continued sub-
aqueous deposition. The lack of well developed foresets and the scale of the thickening
upward cycles suggest a shallow water depth and a shoal-water type fan delta (Postma,
1990; Ilgar and Nemec, in press) as the shallow water depths inhibited the development of
Gilbert-type foreset beds (Billi et al, 1991). The mud rip up clasts at the base of
lithofacies Sm2 indicates a genetic relationship to sub-aerial sheetflood processes.
Bioturbation, comprising a monospecific, extremely low density assemblage of Planolites,
is limited to lithofacies Fl. The nature of the argillaceous sediments and horizontal,
deposit feeding structures is suggestive of the Cruziana ichnofacies (Beynon and
Pemberton, 1992). The absence of biogenic structures produced by suspension feeding
organisms implies that continued sedimentation was unsuitable for these organisms,
whereas deposit feeding communities were largely unaffected by continued sedimentation
and only restricted by organic content and the distribution of the lithofacies (Beynon and
Pemberton, 1992; Coates and MacEachern, 2000).
Facies I – Interbedded, massive to laminated sand and mud
These beds of this facies range from few centimetres to decimetres and consist of
lithofacies Sl2, Slr, Sm1, Fm, Fmr and C. Individual beds are often graded and display
horizontal laminations or are structureless, and are generally arranged in fining upward
packages in Core 1 but show no overall trend in Core 2. The thickest intersection of this
facies is in Core 1 and the base is delineated by a thick (approximately 50 cm) slumped
interval that is overlain by a succession that is similar to Facies G; coarsening and
thickening upward package of lithofacies Sl2 and Sm2. The fining upward packages contain
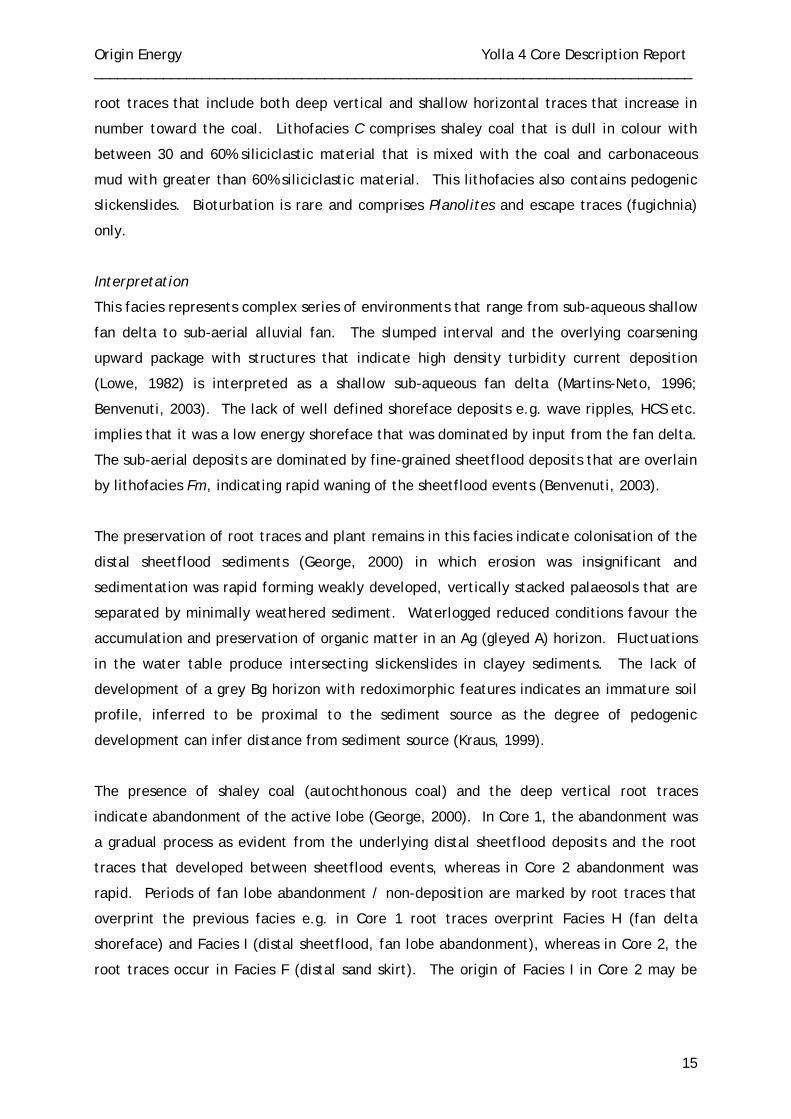
Origin Energy Yolla 4 Core Description Report ______________________________________________________________________________
15
root traces that include both deep vertical and shallow horizontal traces that increase in
number toward the coal. Lithofacies C comprises shaley coal that is dull in colour with
between 30 and 60% siliciclastic material that is mixed with the coal and carbonaceous
mud with greater than 60% siliciclastic material. This lithofacies also contains pedogenic
slickenslides. Bioturbation is rare and comprises Planolites and escape traces (fugichnia)
only.
Interpretation
This facies represents complex series of environments that range from sub-aqueous shallow
fan delta to sub-aerial alluvial fan. The slumped interval and the overlying coarsening
upward package with structures that indicate high density turbidity current deposition
(Lowe, 1982) is interpreted as a shallow sub-aqueous fan delta (Martins-Neto, 1996;
Benvenuti, 2003). The lack of well defined shoreface deposits e.g. wave ripples, HCS etc.
implies that it was a low energy shoreface that was dominated by input from the fan delta.
The sub-aerial deposits are dominated by fine-grained sheetflood deposits that are overlain
by lithofacies Fm, indicating rapid waning of the sheetflood events (Benvenuti, 2003).
The preservation of root traces and plant remains in this facies indicate colonisation of the
distal sheetflood sediments (George, 2000) in which erosion was insignificant and
sedimentation was rapid forming weakly developed, vertically stacked palaeosols that are
separated by minimally weathered sediment. Waterlogged reduced conditions favour the
accumulation and preservation of organic matter in an Ag (gleyed A) horizon. Fluctuations
in the water table produce intersecting slickenslides in clayey sediments. The lack of
development of a grey Bg horizon with redoximorphic features indicates an immature soil
profile, inferred to be proximal to the sediment source as the degree of pedogenic
development can infer distance from sediment source (Kraus, 1999).
The presence of shaley coal (autochthonous coal) and the deep vertical root traces
indicate abandonment of the active lobe (George, 2000). In Core 1, the abandonment was
a gradual process as evident from the underlying distal sheetflood deposits and the root
traces that developed between sheetflood events, whereas in Core 2 abandonment was
rapid. Periods of fan lobe abandonment / non-deposition are marked by root traces that
overprint the previous facies e.g. in Core 1 root traces overprint Facies H (fan delta
shoreface) and Facies I (distal sheetflood, fan lobe abandonment), whereas in Core 2, the
root traces occur in Facies F (distal sand skirt). The origin of Facies I in Core 2 may be
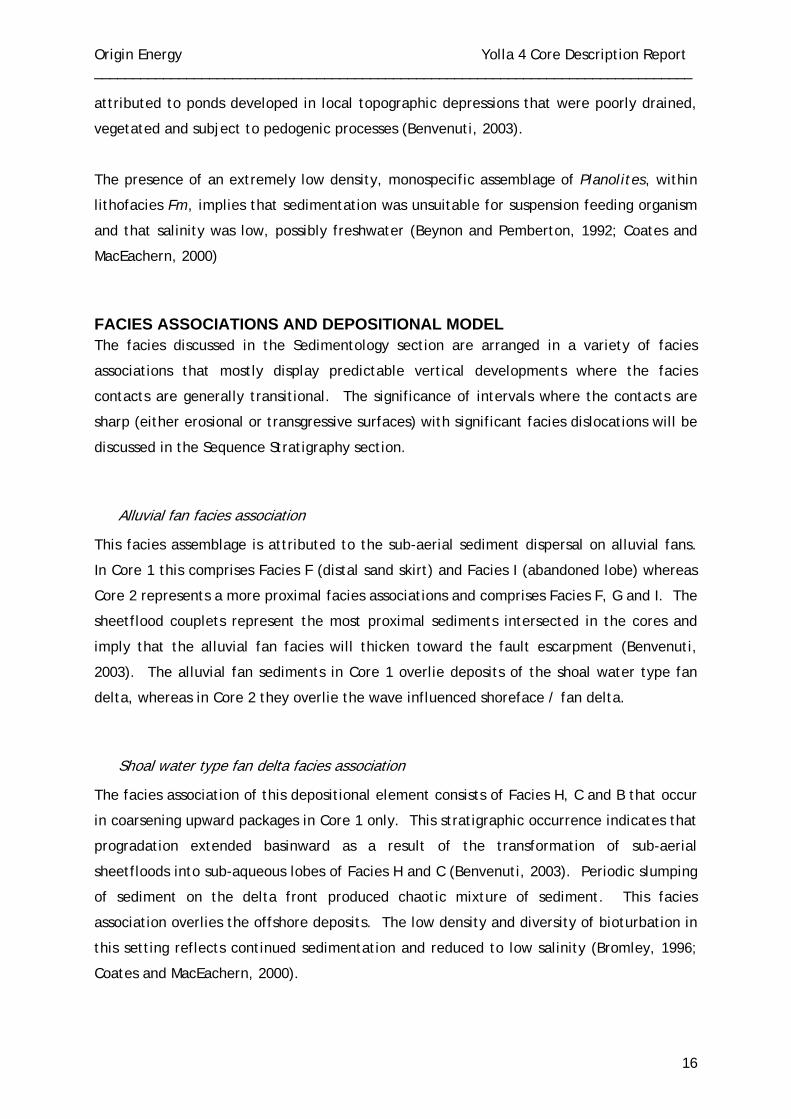
Origin Energy Yolla 4 Core Description Report ______________________________________________________________________________
16
attributed to ponds developed in local topographic depressions that were poorly drained,
vegetated and subject to pedogenic processes (Benvenuti, 2003).
The presence of an extremely low density, monospecific assemblage of Planolites, within
lithofacies Fm, implies that sedimentation was unsuitable for suspension feeding organism
and that salinity was low, possibly freshwater (Beynon and Pemberton, 1992; Coates and
MacEachern, 2000)
FACIES ASSOCIATIONS AND DEPOSITIONAL MODEL The facies discussed in the Sedimentology section are arranged in a variety of facies
associations that mostly display predictable vertical developments where the facies
contacts are generally transitional. The significance of intervals where the contacts are
sharp (either erosional or transgressive surfaces) with significant facies dislocations will be
discussed in the Sequence Stratigraphy section.
Alluvial fan facies association
This facies assemblage is attributed to the sub-aerial sediment dispersal on alluvial fans.
In Core 1 this comprises Facies F (distal sand skirt) and Facies I (abandoned lobe) whereas
Core 2 represents a more proximal facies associations and comprises Facies F, G and I. The
sheetflood couplets represent the most proximal sediments intersected in the cores and
imply that the alluvial fan facies will thicken toward the fault escarpment (Benvenuti,
2003). The alluvial fan sediments in Core 1 overlie deposits of the shoal water type fan
delta, whereas in Core 2 they overlie the wave influenced shoreface / fan delta.
Shoal water type fan delta facies association
The facies association of this depositional element consists of Facies H, C and B that occur
in coarsening upward packages in Core 1 only. This stratigraphic occurrence indicates that
progradation extended basinward as a result of the transformation of sub-aerial
sheetfloods into sub-aqueous lobes of Facies H and C (Benvenuti, 2003). Periodic slumping
of sediment on the delta front produced chaotic mixture of sediment. This facies
association overlies the offshore deposits. The low density and diversity of bioturbation in
this setting reflects continued sedimentation and reduced to low salinity (Bromley, 1996;
Coates and MacEachern, 2000).
Origin Energy Yolla 4 Core Description Report ______________________________________________________________________________
17
Interdistributary bay fill / low energy shoreface
This facies (Facies E) occurs at the base of Core 1 and is an incomplete sequence of
coarsening, then fining upward sediments that record the infilling of an interdistributary
bay and the development of a stagnant lagoonal environment (Phillips, 2003). The low
diversity of bioturbation implies low or reduced salinities, which is common in this type of
setting (Pemberton and Wightman, 1992; Beynon and Pemberton, 1992; Bromley, 1996).
Wave influenced shoreface / fan delta
This facies comprises the middle to upper shoreface of a wave influenced shoreface / fan
delta. This facies occurs at the base of Core 2 and the lower shoreface deposits are not
present in the core. The decrease in storm wave structures (HCS), the increase in fair-
weather structures and increasing grainsize toward the top of the facies indicates
progradation of the shoreline. The low diversity, low density and vertical orientation of
the bioturbation are indicative of high levels of wave or current energy (Bromley, 1996).
Offshore lacustrine / restricted marine
This facies underlies the shoal water type fan delta and comprises massive mud with
siderite cemented bands, plant debris and a lack of bioturbation that is indicative of
anoxic conditions (Bromley, 1996). The lack of high diversity bioturbation in well
oxygenated zones e.g. wave influenced shoreface / fan delta and shoal water type fan
delta implies that salinity was low and only allowed the presence of trophic generalists
(Planolites, Skolithos etc.) indicating a lacustrine environment is the most likely
interpretation for this setting (Bromley, 1996).
SEQUENCE STRATIGRAPHY The stratigraphic record can be subdivided into various scales or orders of cycles, resulting
from cyclical variations in sediment supply and relative base level change, on the basis of
the periodicities. These cycles occur at different time scales, forming a hierarchy of
sequences at differing frequencies and, therefore, longer period sequences contain several
shorter period, higher frequency sequences. In this nested periodicity, the longer period
sequences influence the stratal patterns within the higher frequency sequences; this is a
function of their position within the longer period sequence. The high resolution sequence
stratigraphic approach to the analysis sedimentary successions focuses attention on key
Origin Energy Yolla 4 Core Description Report ______________________________________________________________________________
18
stratal surfaces, facies dislocations and parasequence stacking patterns within the context
of relative base level changes.
Stratal surfaces
Key stratal surfaces identified in the cores include sequence boundaries (SB), transgressive
surfaces (TS), flooding surfaces (FS) and maximum flooding surfaces (MFS). The diagnostic
features of these surfaces are described below.
Sequence boundaries (SB)
These surfaces are developed at the base of alluvial fan facies and are characterised by an
increase in grainsize, increase in bed thickness and a change in parasequence set stacking
patterns, and often by a thin lag of mud rip up clasts or quartz pebbles. From core it is
difficult to determine the degree of erosional relief associated with these surfaces. In
Core 1, the SB separates the alluvial fan facies association from the shoal water type fan
delta, whereas in Core 2, the SB occurs between the alluvial fan and wave influenced
shoreface / fan delta. The facies dislocations indicate a basinward shift in facies
associated with a relative base level fall. There are different orders of SB present and are
associated with the different orders (scales) of cycles. The SB associated with the high-
order cycles possibly result from high frequency, possibly climatically driven relative base
level falls, whereas the lower-order SB result from tectonic episodes (Plint et al, 1992).
Transgressive surface (TS)
These surfaces occur only in the fourth- and third-order sequences at the top of the
alluvial fan facies association and are characterised by a change in parasequence set
stacking patterns. TS result from an increase in the accommodation rate relative to
sediment supply. In Core 1 the TS is marked by a rapid change in grainsize and bed
thickness, and separates the alluvial fan facies association from the shoal water type fan
delta. In Core 2 the TS occurs at the top of the core and is marked by a pebble to granule
lag (ravinement surface), overlain by mud that possibly represents an offshore
environment.
Origin Energy Yolla 4 Core Description Report ______________________________________________________________________________
19
Flooding surfaces (FS) and maximum flooding surfaces (MFS)
Flooding surfaces are stratigraphic horizons across which prominent increases in water
depths can be detected without evidence for significant erosion. These surfaces are best
developed in Core 1 and are marked by abrupt contacts between facies e.g. lagoonal
sediments overlain by offshore sediments, and alluvial fan sediments, including root
traces, overlain by sub-aqueous fan delta deposits.
Maximum flooding surfaces record the maximum transgression and are commonly
associated with mud dominated intervals predominantly deposited by suspension setting.
As with SB there are differing orders of MFS, with only a high-order MFS present within the
offshore sediments in Core 1.
Sequence stratigraphic model
The cored intervals are biased toward the reservoir intervals (alluvial fan, fan delta and
shoreface) and these environments are developed in a predictable sequence stratigraphic
framework.
Changes in relative base level, driven by allogenic processes (e.g. tectonics, climate
change etc.) had a pronounced effect on the autocyclic, shoreface and fan delta
depositional model. Relative base level falls within this setting caused forced regressions,
in which alluvial fan sediments to be superimposed onto shoreface and fan delta
environments. The lack of incised channel deposits implies a low gradient shoreface / fan
delta that, when exposed, allowed the alluvial fan to prograde basinward. The alluvial fan
sediments represent the lowstand systems tract (LST).
Subsequent rises in relative base level resulted in the flooding of the alluvial fan. In Core
2, the pebble lags at the top of the alluvial fan marks a transgressive ravinement surface,
whereas in Core 1, the lower energy conditions did not permit reworking during the
drowning of the fan and there is no ravinement surface. The increase in accommodation
relative to sediment supply as evident from a change in stacking patterns across this
surface implies a transgressive systems tract (TST) with episodic normal regressions. Only
the basal portion of the TST, incorporating the shallow fan delta and lobe abandonment
facies, is present in Core 1.
Origin Energy Yolla 4 Core Description Report ______________________________________________________________________________
20
The transition from the TST to the highstand systems tract (HST) at the maximum flooding
surface has not been intersected in core. The stacked progradational parasequences of
the HST occur at the base of both cores and comprise shoreface and fan delta sediments
that underlie the sequence boundaries.
Sequence development is generally controlled by the relationship between accommodation
and sediment supply, which, in lacustrine settings, is controlled by climate and tectonics.
If climate changes from drier to more humid conditions, there is an increase in both the
lake water volume and the sediment yield, whereas a reverse climatic change will similarly
reduce both. A rise in lake level thus tends to be accompanied by an increase in sediment
supply, whereas a fall is accompanied by a supply decline. Furthermore, a lake responds
to atmospheric changes in both precipitation and evaporation, whereas fluvial systems
respond chiefly to the former. A climatically forced regression thus tends to be non-
depositional, amounting to shoreface emergence, whereas a transgression may be
countered by the coeval increase in sediment yield and stream discharge (delta growth),
while being rapid and possibly non-depositional along a non-deltaic shoreline (Ilgar and
Nemec, in press).
The lowering of the basin floor by tectonic subsidence, even if rapid, may have little
effect on the lake water depth, because – unlike a marine basin – the subsidence is alone
cannot change the basin’s water volume. However, the subsidence in a lacustrine basin
means lowering of the base level and has a direct effect on streams. Furthermore, the
limited water volume and relatively small depth render lakes highly sensitive to changes in
basin floor configuration. Asymmetrical subsidence can tilt the basin floor and make the
water mass shift laterally, causing rapid regression (emergence) at one coast and coeval
transgression at the other. Syndepositional faulting can form intrabasinal ridges and
depressions, or can split the lake-hosting graben into narrower compartments and thus
partition the water mass or displace it by draining (Ilgar and Nemec, in press).
Tectonically induced cycles occur at a longer time scale than climatic cycles (typically 23
to 400 ka) and the periods of tectonic activity are represented by intervals of fine-grained
sedimentation, whereas the coarse-grained sediments reflect tectonically quiescent
periods when sediment dispersal processes have had time to adjust to the tectonic
subsidence (Blair and Bilodeau, 1988).
With the limited cored intervals, it is unlikely that a definitive cause for the sequences
present can be determined apart from some general points. The alluvial fans probably
Origin Energy Yolla 4 Core Description Report ______________________________________________________________________________
21
represent tectonically quiescent periods in which coarse-grained sediment derived from
the footwall prograded into the basin. The periods of tectonic activity are most likely
represented by the thick intervals of mud (2780 – 2860 m KB and 3050 – 3110 m KB) that
have not been cored. The parasequences present may indicate climatic variation
controlling the sediment supply and lake level.
RESERVOIR QUALITY Reservoir quality is strongly facies dependent with the alluvial fan facies association in the
lowstand systems tract having the highest permeability, reflecting the higher depositional
energy associated with sheetflood deposition. The shallow sub-aqueous fan delta (Facies
H) in Core 1 has permeability values (1 – 20 mD) two orders of magnitude less than the
alluvial fan facies association (40 – 2000 mD). The difference in permeability possibly
results from the depositional process; upper flow regime traction currents on the alluvial
fan and sub-aqueous high density turbidity current on the fan delta. The wave influenced
shoreface / fan delta deposits provide a third reservoir interval, however, the permeability
is low and varied, ranging from 0.1 to 5 mD, possibly reflecting the fine grainsize and
degree of sorting. Graphic core logs for Cores 1 and 2 (Enclosures 1 and 2) show the
porosity and permeability data from plugs and the probe permeameter for comparison with
the sedimentological log.
Origin Energy Yolla 4 Core Description Report ______________________________________________________________________________
22
REFERENCES
Basilici, G. 1997. Sedimentary facies in an extension and deep-lacustrine depositional
system: the Pliocene Tiberino Basin, Central Italy. Sedimentary Geology, 109, 73-
94.
Bechtal, A., Markic, M., Sachsenhofer, R.F., Jelen, B., Gratzer, R., Lücke, A. and
Püttmann. W., 2004. Palaeoenvironment of the upper Oligocene Trbovlje coal
seam (Slovenia). International Journal of Coal Geology, 57, 23-48.
Benvenuti, M., 2003. Facies analysis and tectonic significance of lacustrine fan-deltaic
successions in the Pliocene-Pleistocene Mugello Basin, Central Italy. Sedimentary
Geology 157, 197-234.
Beynon, B.M. and Pemberton, S.G., 1992. Ichnological signature of a brackish water
deposit: an example from the Lower Cretaceous Grand Rapids Formation, Cold
Lake Oil Sands area, Alberta. In: Pemberton, S.G., ed: Applications of Ichnology
to Petroleum Exploration: A Core Workshop. Society for Sedimentary Geology,
Tulsa, 199-221.
Billi, P., Magi, M. and Sagri, M., 1991. Pleistocene lacustrine fan delta deposits of the
Valdarno Basin, Italy. Journal of Sedimentary Petrology, 61, No. 2, 280-290.
Blair, T.C. and Bilodeau, W.L., 1988. Development of tectonic cyclothems in rift, pull-
apart, and foreland basins: Sedimentary response to episodic tectonism.
Geology, 16, 517-520.
Blair, T.C. and McPherson J.G., 1994. Alluvial fans and their natural distinction from rivers
based on morphology, hydraulic processes, sedimentary processes, and facies
assemblages. Journal of Sedimentary Research, A64, 3, 450-489.
Boggs, S. Jr. 1987. Principles of Sedimentology and Stratigraphy. Macmillian Publishing
Company, New York, 784p.
Bromley, R.G. 1996. Trace Fossils: Biology, taphonomy and applications. Chapman and
Hall, London, 361p
Origin Energy Yolla 4 Core Description Report ______________________________________________________________________________
23
Coates, L. and MacEachern, J.A., 2000. Differentiating river- and wave-dominated deltas
from shorefaces: examples from the Cretaceous Western Interior Seaway,
Alberta, Canada. http://www.cseg.ca/conferences/2000/443.pdf.
Cole, R.B. and Stanley, R.G. 1995. Middle Tertiary extension recorded by lacustrine fan-
delta deposits, Plush Ranch Basin, Western Transverse Ranges, California. Journal
of Sedimentary Research, B65, 455-468.
Colquhoun, G.P. 1995. Siliciclastic sedimentation on a storm- and tide-influenced shelf and
shoreline: the Early Devonian Roxburgh Formation, NE Lachlan Fold Belt,
southeastern Australia. Sedimentary Geology, 97, 69-98.
George, G.T., 2000. Characterisation and high resolution and sequence stratigraphy of
storm-dominated braid delta and shoreface sequences from the Basal Grit Group
(Namurian) of the South Wales Variscan peripheral foreland basin. Marine and
Petroleum Geology, 17, 445-475.
Holz, M. 2003. Sequence stratigraphy of a lagoonal estuarine system – an example from
the lower Permian Rio Bonito Formation, Paraná Basin, Brazil. Sedimentary
Geology, 162, 305-331.
Ilgar, A. and Nemec, W. in press. Early Miocene lacustrine deposits and sequence
stratigraphy of the Ermenek Basin, Central Taurides, Turkey. Sedimentary
Geology.
Kelly, S.B., and Olsen, H.O., 1993. Terminal fans – a review with reference to Devonian
examples. Sedimentary Geology, 85, 339-374.
Kraus, M.J., 1999. Paleosols in clastic sedimentary rocks: their geologic applications.
Earth Science Reviews, 47, 41-70.
Le Roux, J.P. and Elgueta, S. 1997. Paralic parasequences associated with Eocene sea-level
oscillations in an active margin setting: Trihueco Formation of the Arauco Basin,
Chile. Sedimentary Geology, 110, 257-276.
Origin Energy Yolla 4 Core Description Report ______________________________________________________________________________
24
Lowe, D.R., 1982. Sediment gravity flows: II Depositional models with special reference to
the deposits of high density turbidity currents. Journal of Sedimentary Petrology,
52, 279-297.
Martins-Neto, M.A., 1996. Lacustrine fan-deltaic sedimentation in a Proterozoic rift basin:
the Sopa-Brumadinhp Tectonosequence, southeastern Brazil. Sedimentary
Geology, 106, 65-96.
Mastalerz, K., 1995. Deposits of high-density turbidity currents on fan-delta slopes: an
example from the upper Visean Szczawno Formation, Intrasudetic Basin, Poland.
Sedimentary Geology, 98, 121-146.
Miall, A.D., 1996. The Geology of Fluvial Deposits; Sedimentary Facies, Basin Analysis and
Petroleum Geology. Springer-Verlag, New York. 582p.
Moore, J.R., 1968. Cannel coals, bogheads and oil shales. In: Murchison, D., and Westoll,
T.S. eds. Coal and Coal Bearing Strata. Oliver & Boyd, Edinburgh, 19-29.
Morgan, R., 2004. Palynology of Yolla 4 Bass Basin, Australia. Unpublished report for Origin
Energy.
Pemberton, S.G. and Wightman, D.M., 1992. Ichnological characteristics of brackish water
deposits. In: Pemberton, S.G. ed. Applications of Ichnology to Petroleum
Exploration: A Core Workshop. Society for Sedimentary Geology, Tulsa, pp141-
167.
Phillips, R.L., 2003. Depositional environments and processes in Upper Cretaceous
nonmarine and marine sediments, Ocean Point dinosaur locality, North Slope,
Alaska. Cretaceous Research, 24, 499-523.
Plint, A.G., Eyles, N., Eyles, C.H. and Walker, R.G. 1992. Control of Sea Level Change. In
Walker, R.G. and James, N.P. eds, Facies Models: Response to Sea Level Change.
Geological Association of Canada, 15-26.
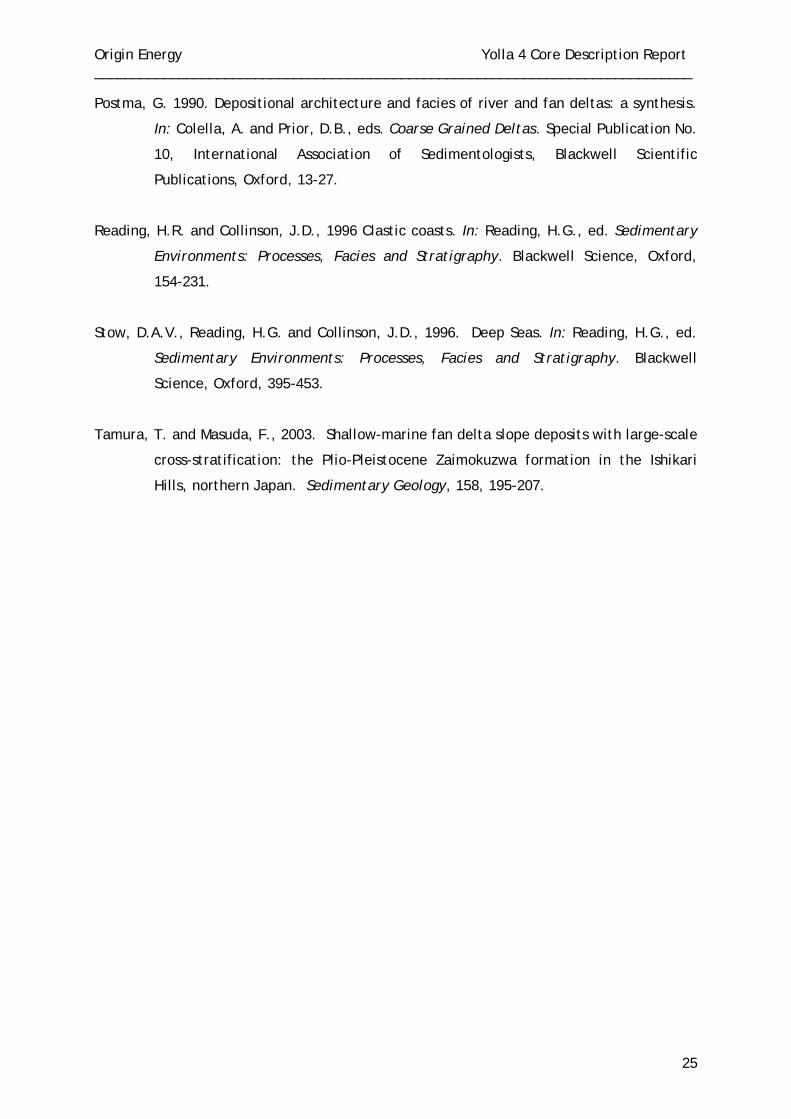
Origin Energy Yolla 4 Core Description Report ______________________________________________________________________________
25
Postma, G. 1990. Depositional architecture and facies of river and fan deltas: a synthesis.
In: Colella, A. and Prior, D.B., eds. Coarse Grained Deltas. Special Publication No.
10, International Association of Sedimentologists, Blackwell Scientific
Publications, Oxford, 13-27.
Reading, H.R. and Collinson, J.D., 1996 Clastic coasts. In: Reading, H.G., ed. Sedimentary
Environments: Processes, Facies and Stratigraphy. Blackwell Science, Oxford,
154-231.
Stow, D.A.V., Reading, H.G. and Collinson, J.D., 1996. Deep Seas. In: Reading, H.G., ed.
Sedimentary Environments: Processes, Facies and Stratigraphy. Blackwell
Science, Oxford, 395-453.
Tamura, T. and Masuda, F., 2003. Shallow-marine fan delta slope deposits with large-scale
cross-stratification: the Plio-Pleistocene Zaimokuzwa formation in the Ishikari
Hills, northern Japan. Sedimentary Geology, 158, 195-207.

Origin Energy Yolla 4 Core Description Report ______________________________________________________________________________
APPENDIX 1
YOLLA 4 INTERPRETED CORE PHOTOGRAPHS
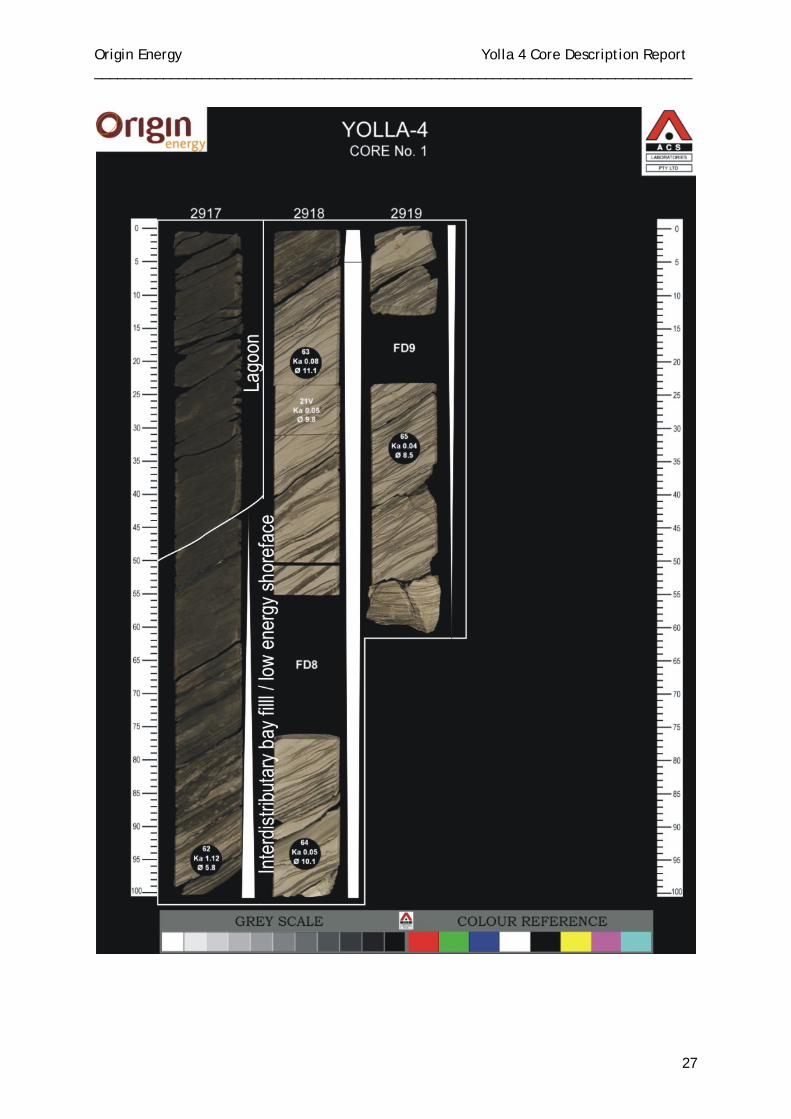
Origin Energy Yolla 4 Core Description Report ______________________________________________________________________________
27
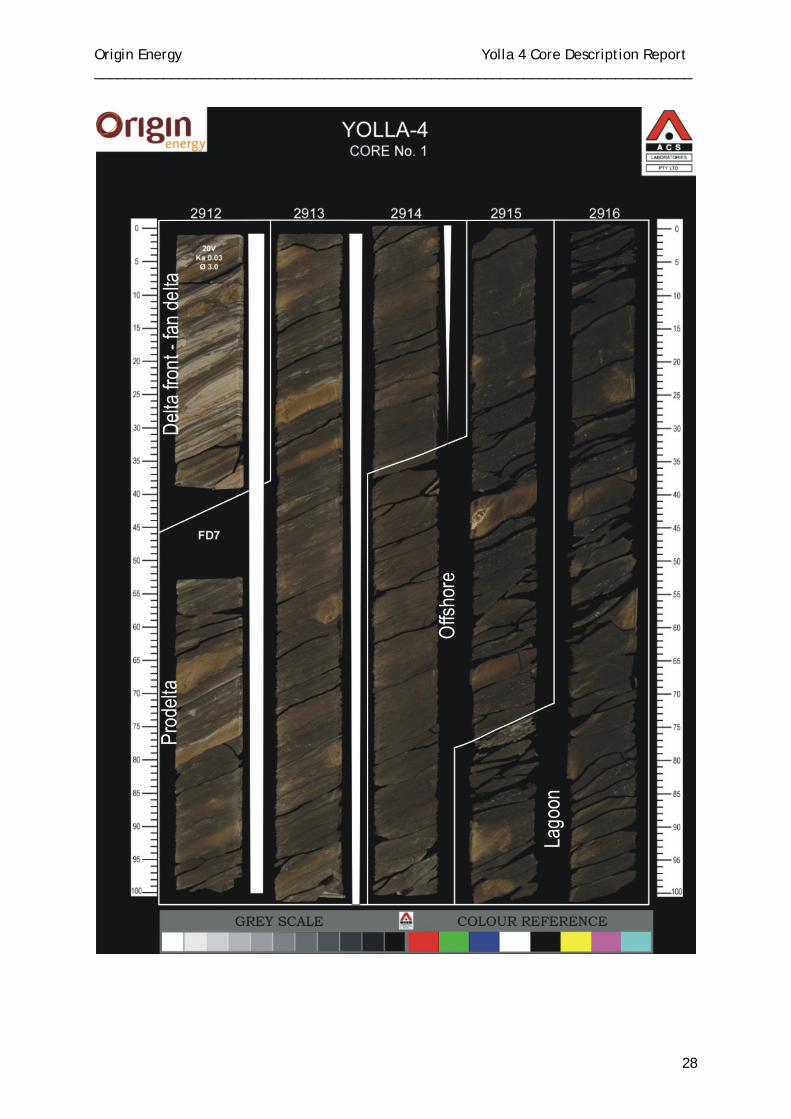
Origin Energy Yolla 4 Core Description Report ______________________________________________________________________________
28
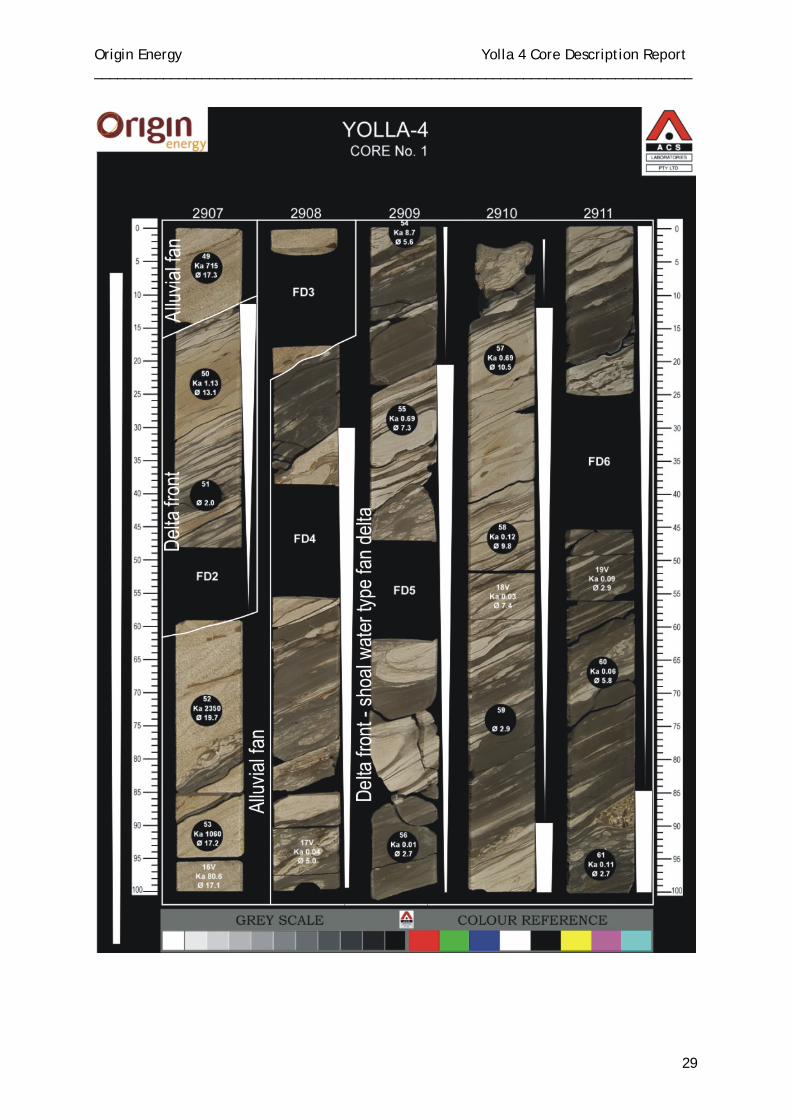
Origin Energy Yolla 4 Core Description Report ______________________________________________________________________________
29
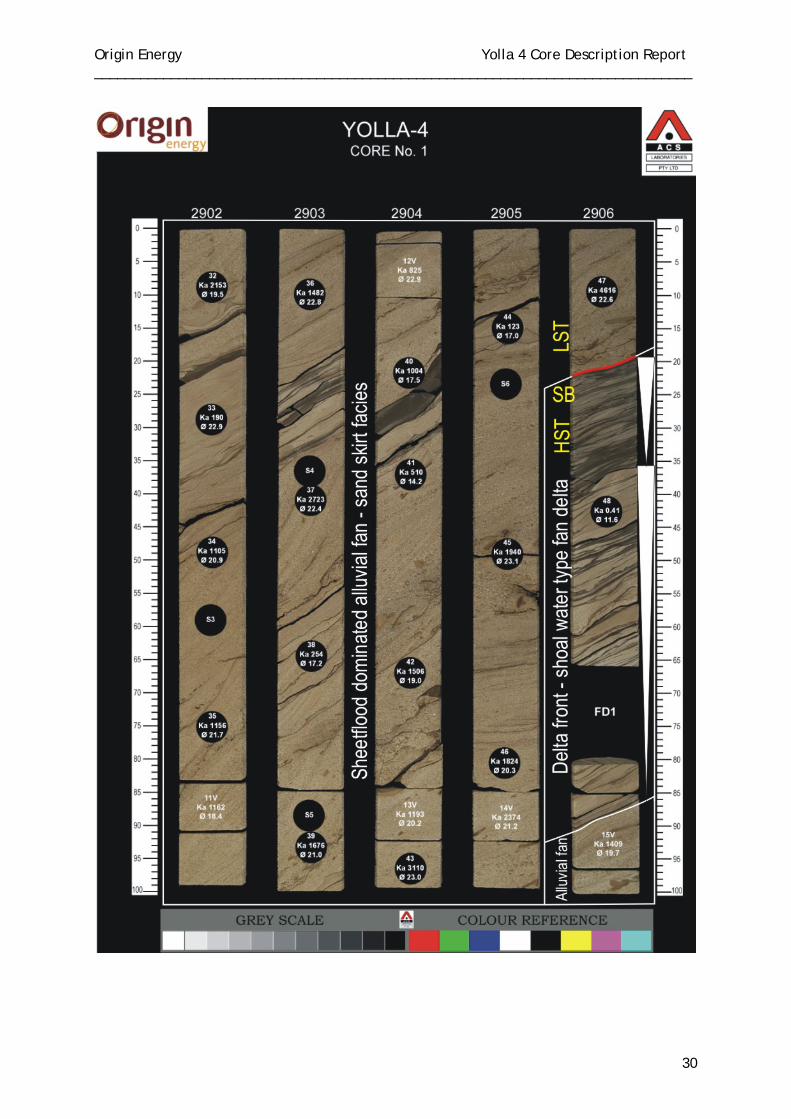
Origin Energy Yolla 4 Core Description Report ______________________________________________________________________________
30
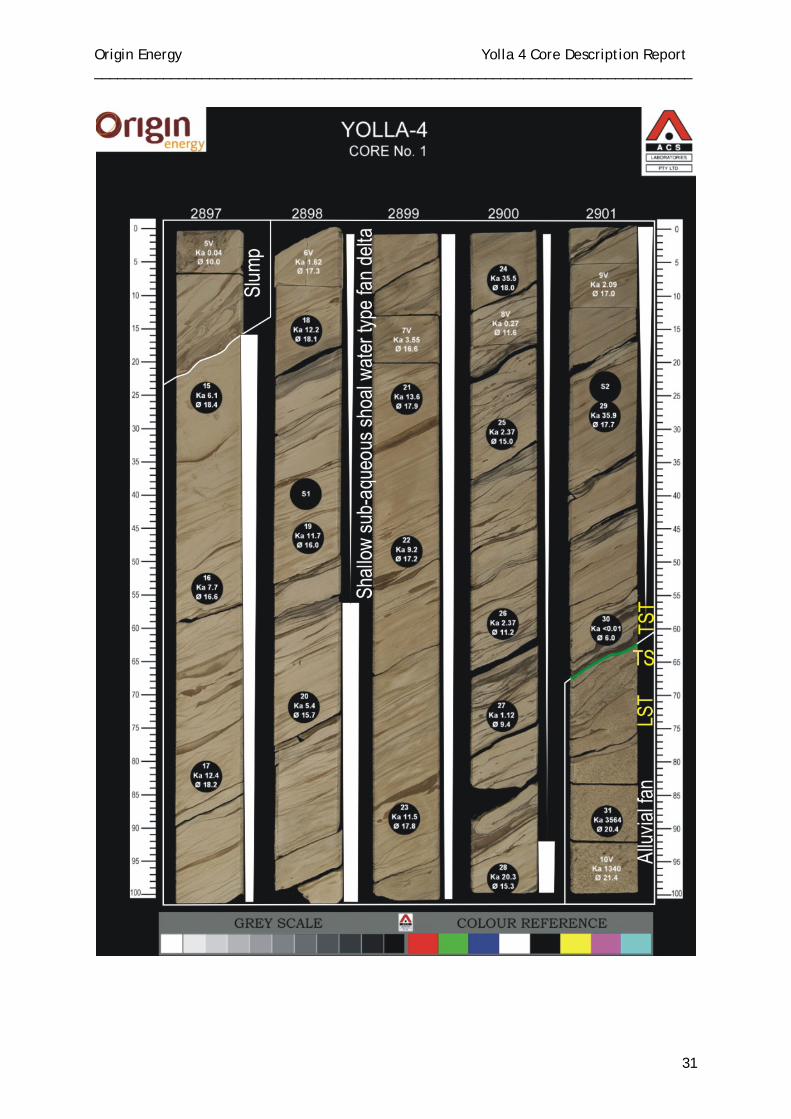
Origin Energy Yolla 4 Core Description Report ______________________________________________________________________________
31
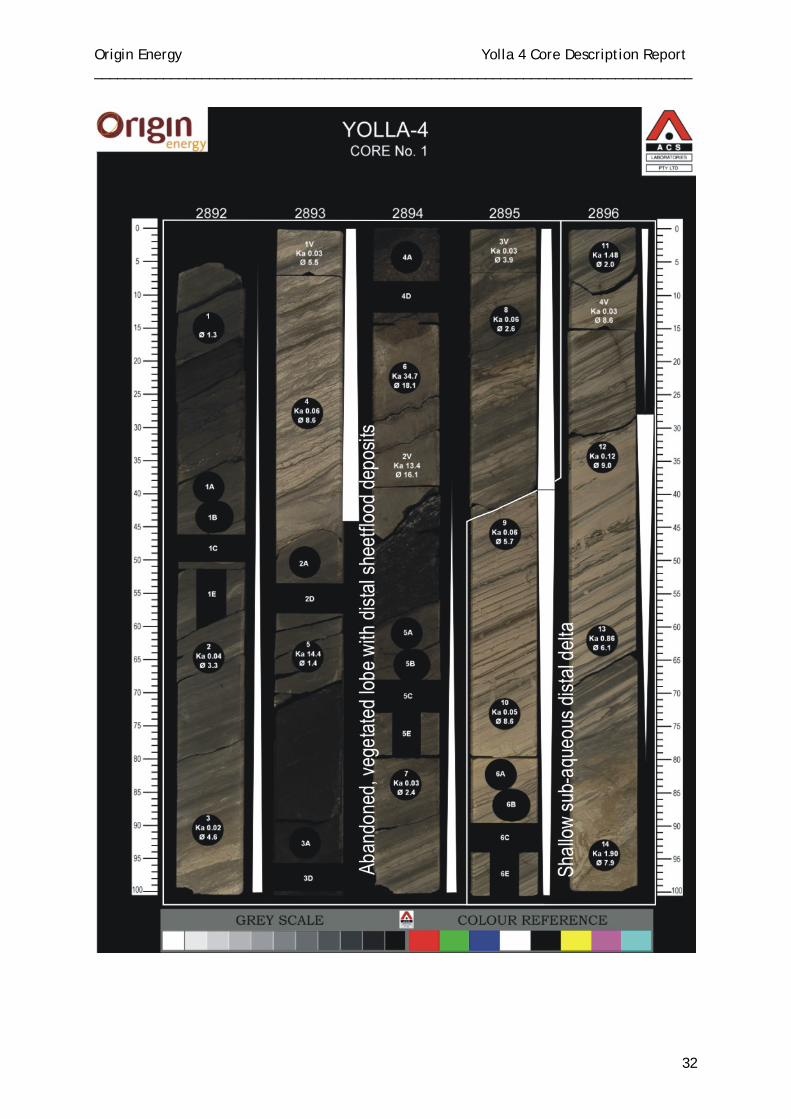
Origin Energy Yolla 4 Core Description Report ______________________________________________________________________________
32
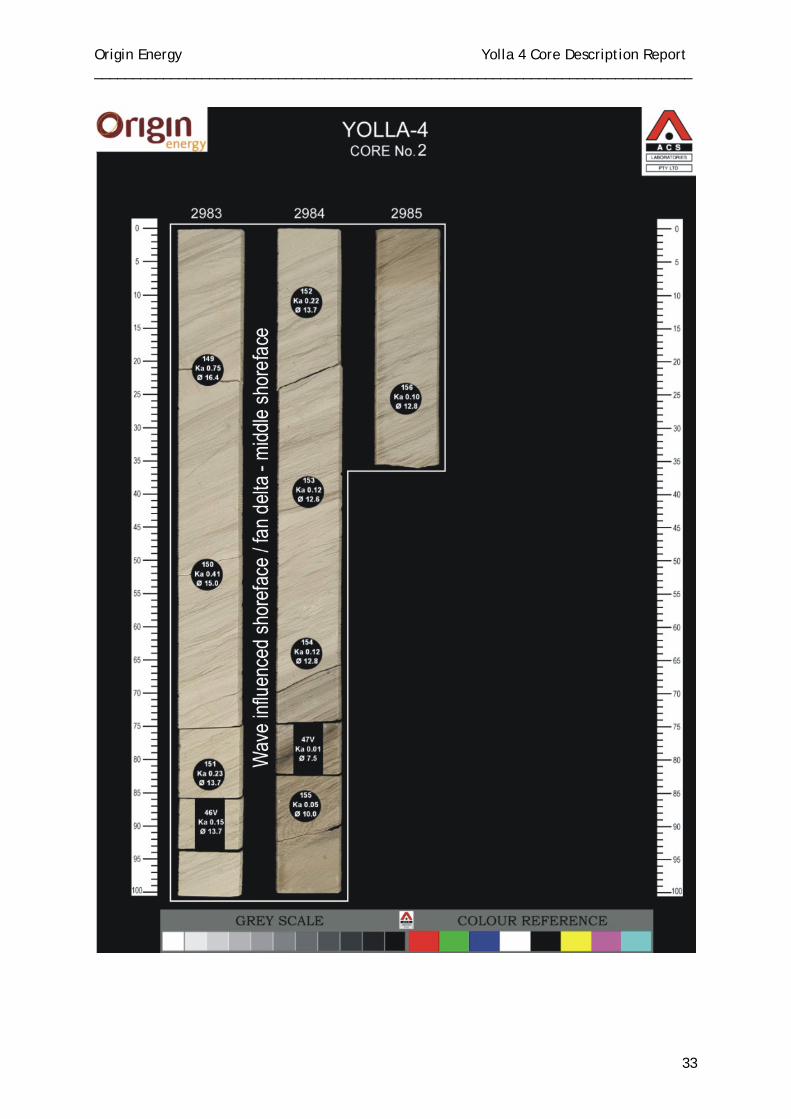
Origin Energy Yolla 4 Core Description Report ______________________________________________________________________________
33
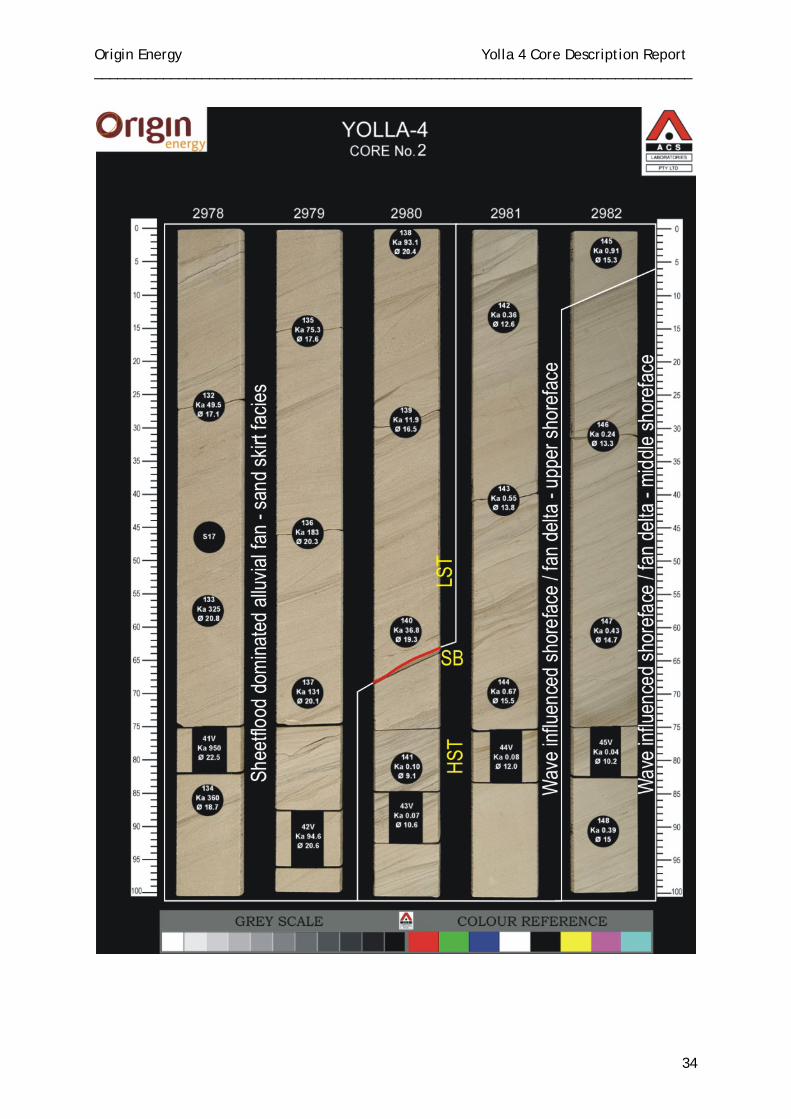
Origin Energy Yolla 4 Core Description Report ______________________________________________________________________________
34
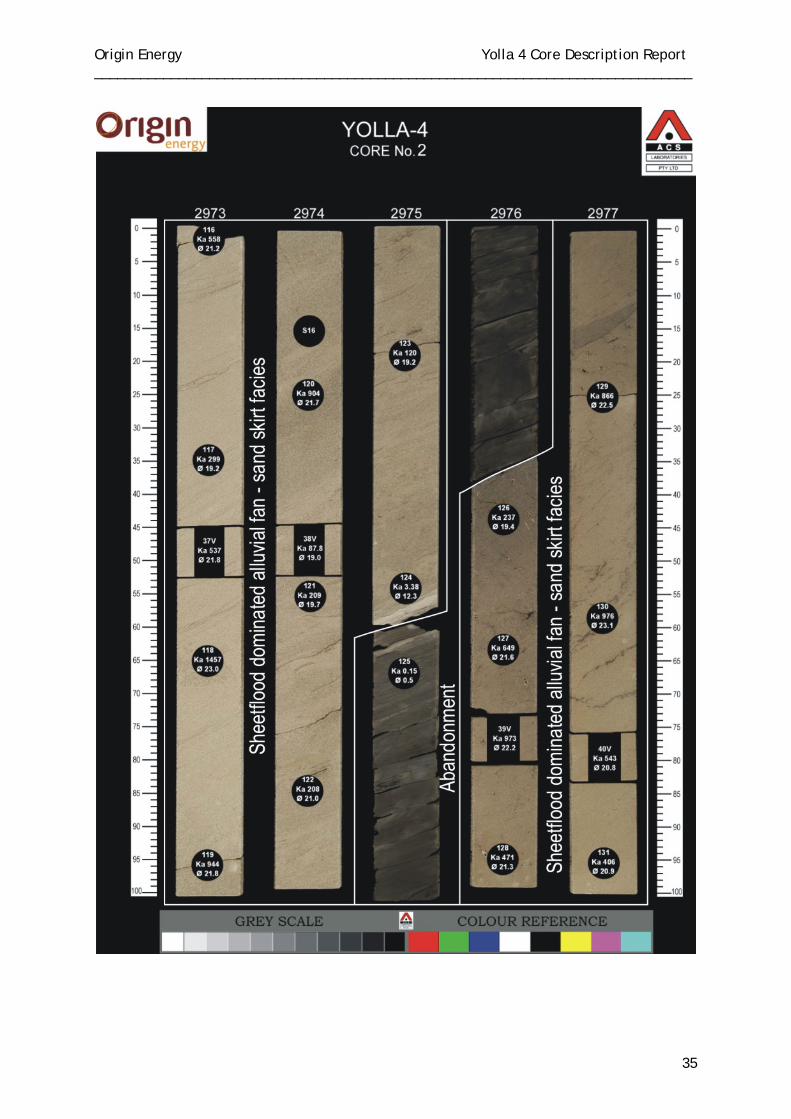
Origin Energy Yolla 4 Core Description Report ______________________________________________________________________________
35
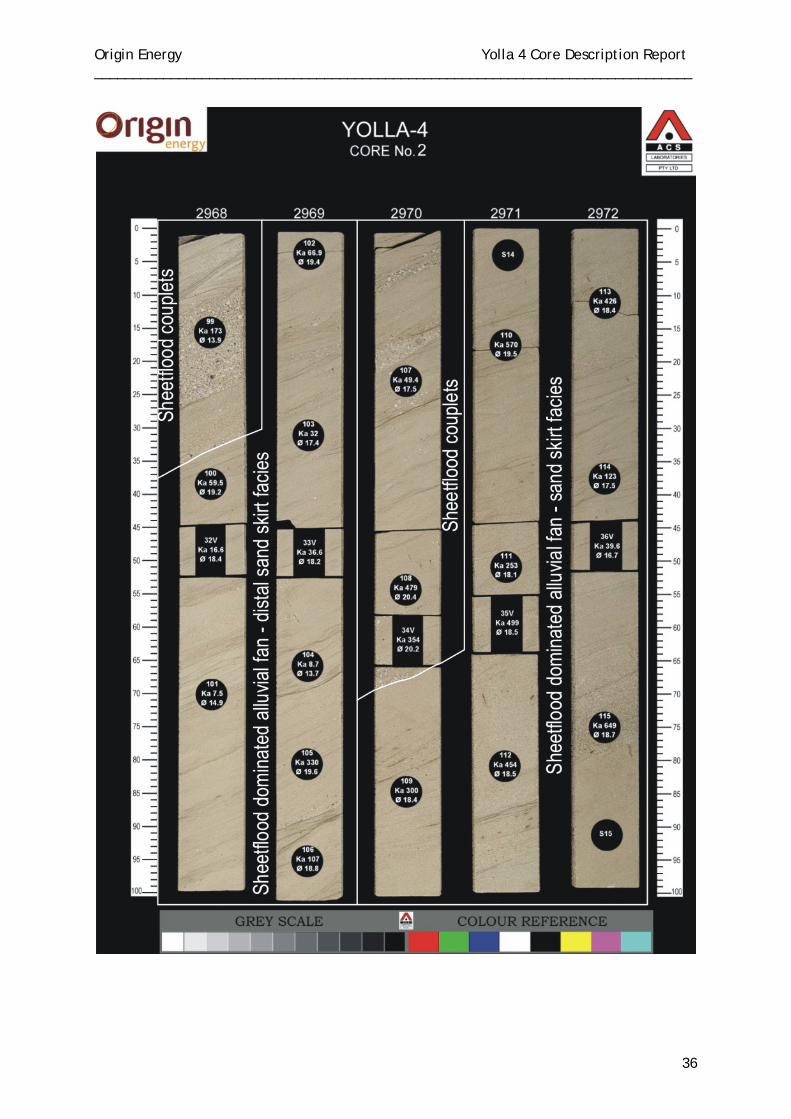
Origin Energy Yolla 4 Core Description Report ______________________________________________________________________________
36
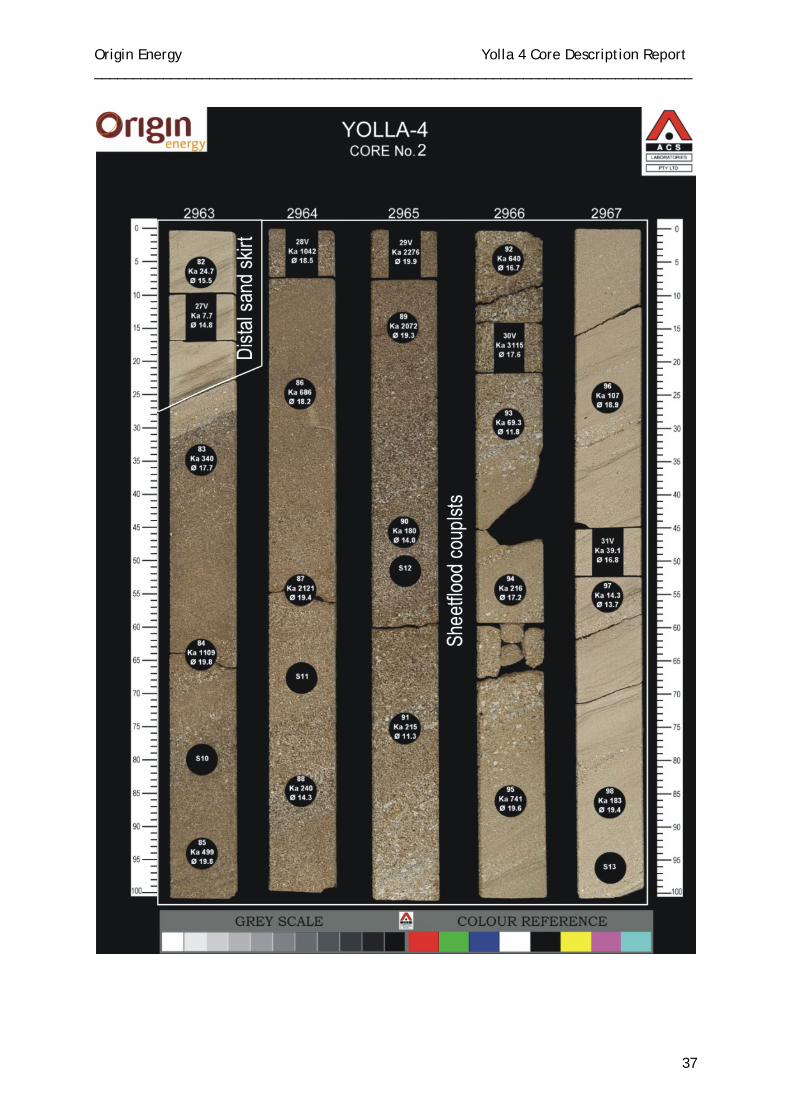
Origin Energy Yolla 4 Core Description Report ______________________________________________________________________________
37
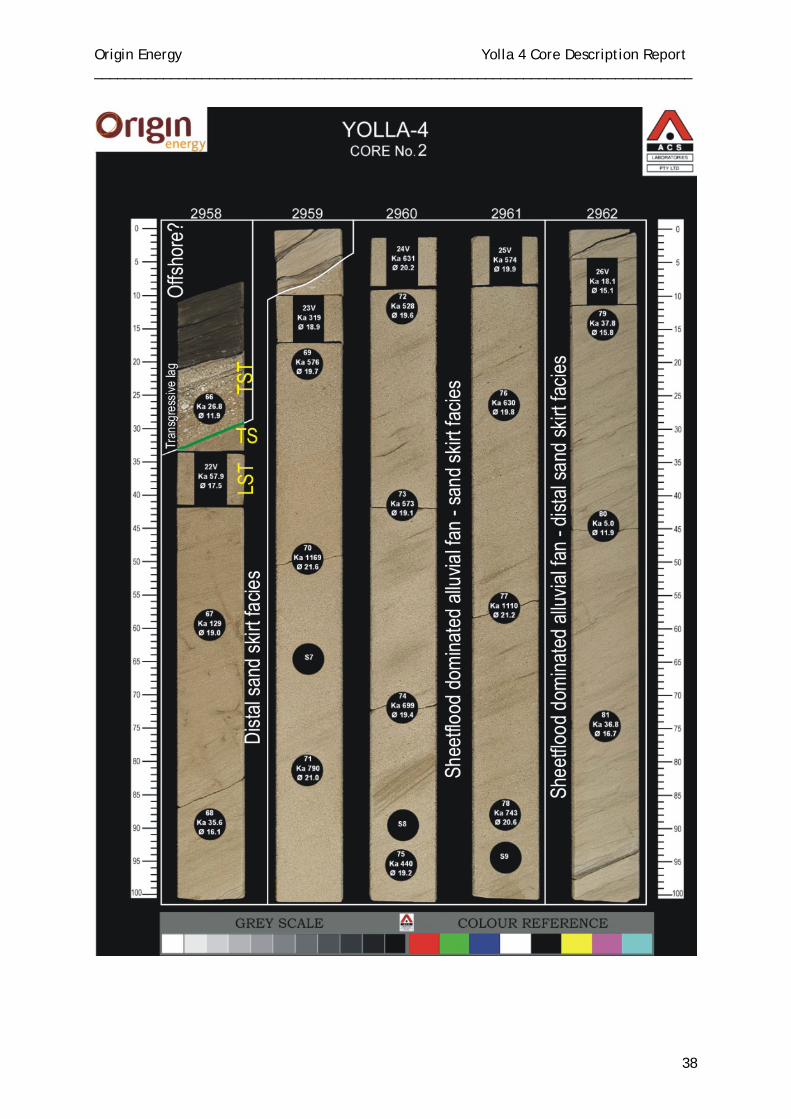
Origin Energy Yolla 4 Core Description Report ______________________________________________________________________________
38

Origin Energy Yolla 4 Core Description Report ______________________________________________________________________________
ENCLOSURE 1
YOLLA 4 CORE 1 – EVCM
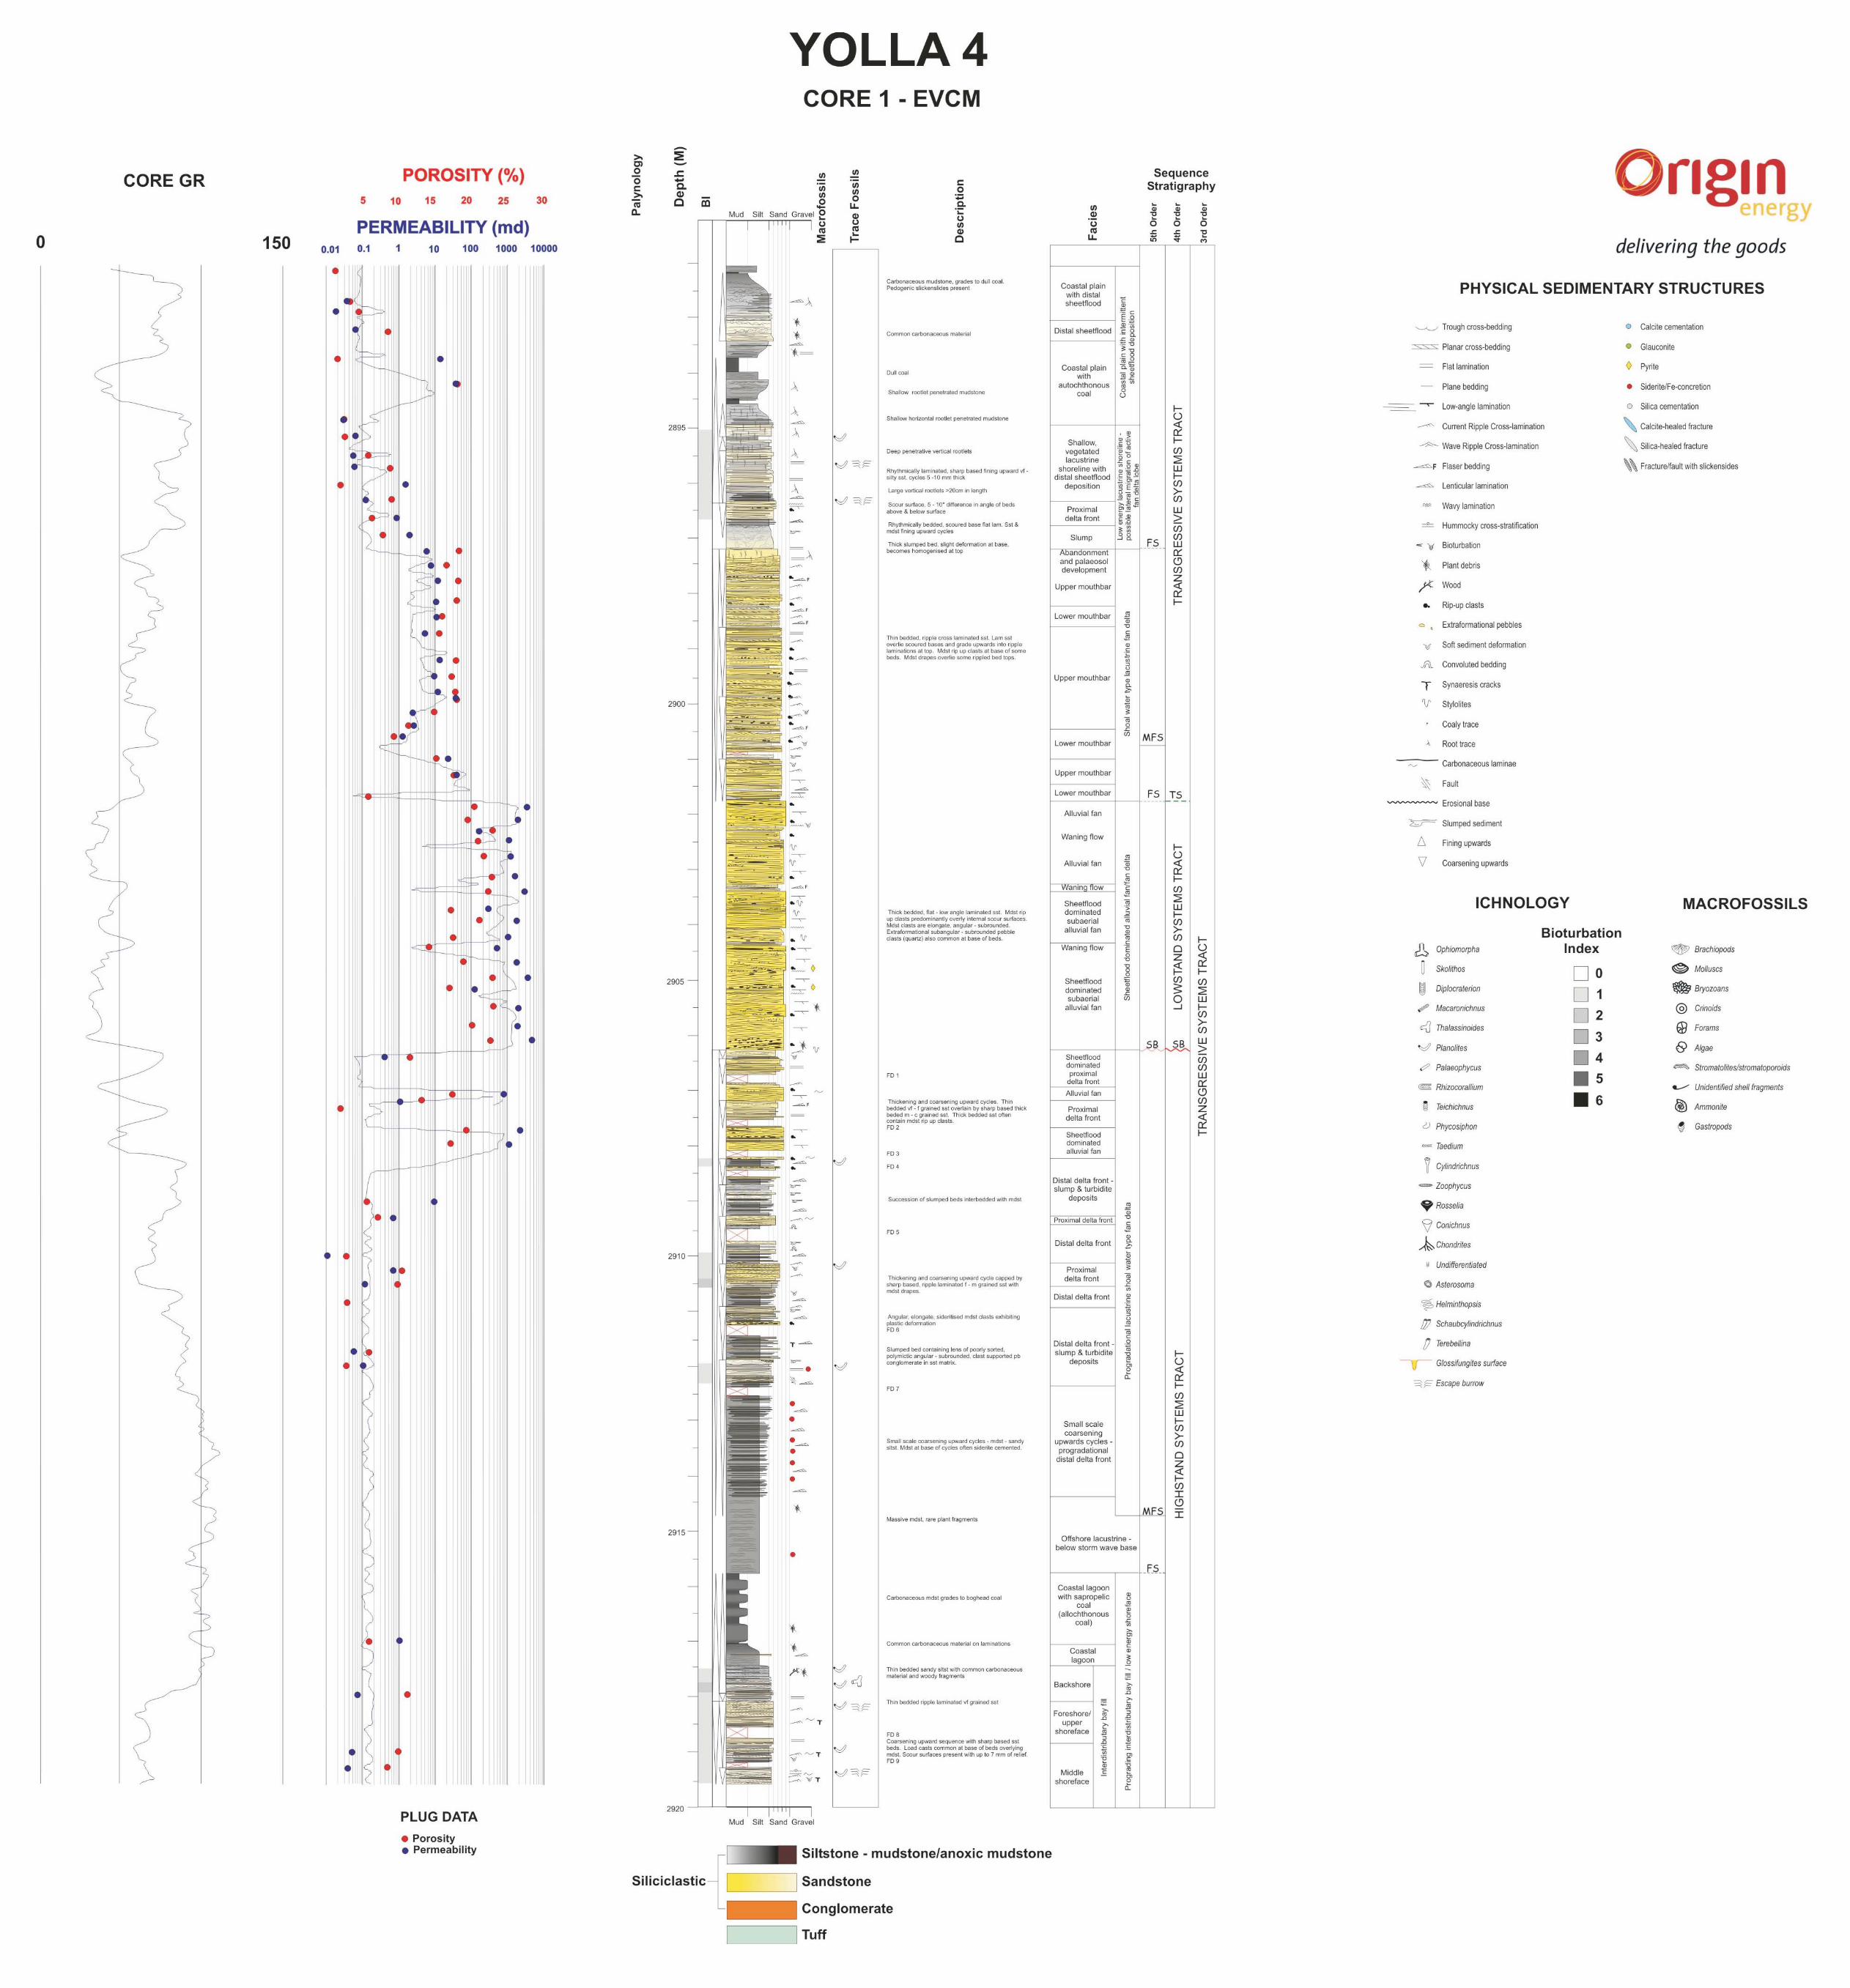

Origin Energy Yolla 4 Core Description Report ______________________________________________________________________________
ENCLOSURE 2
YOLLA 4 CORE 2 - EVCM
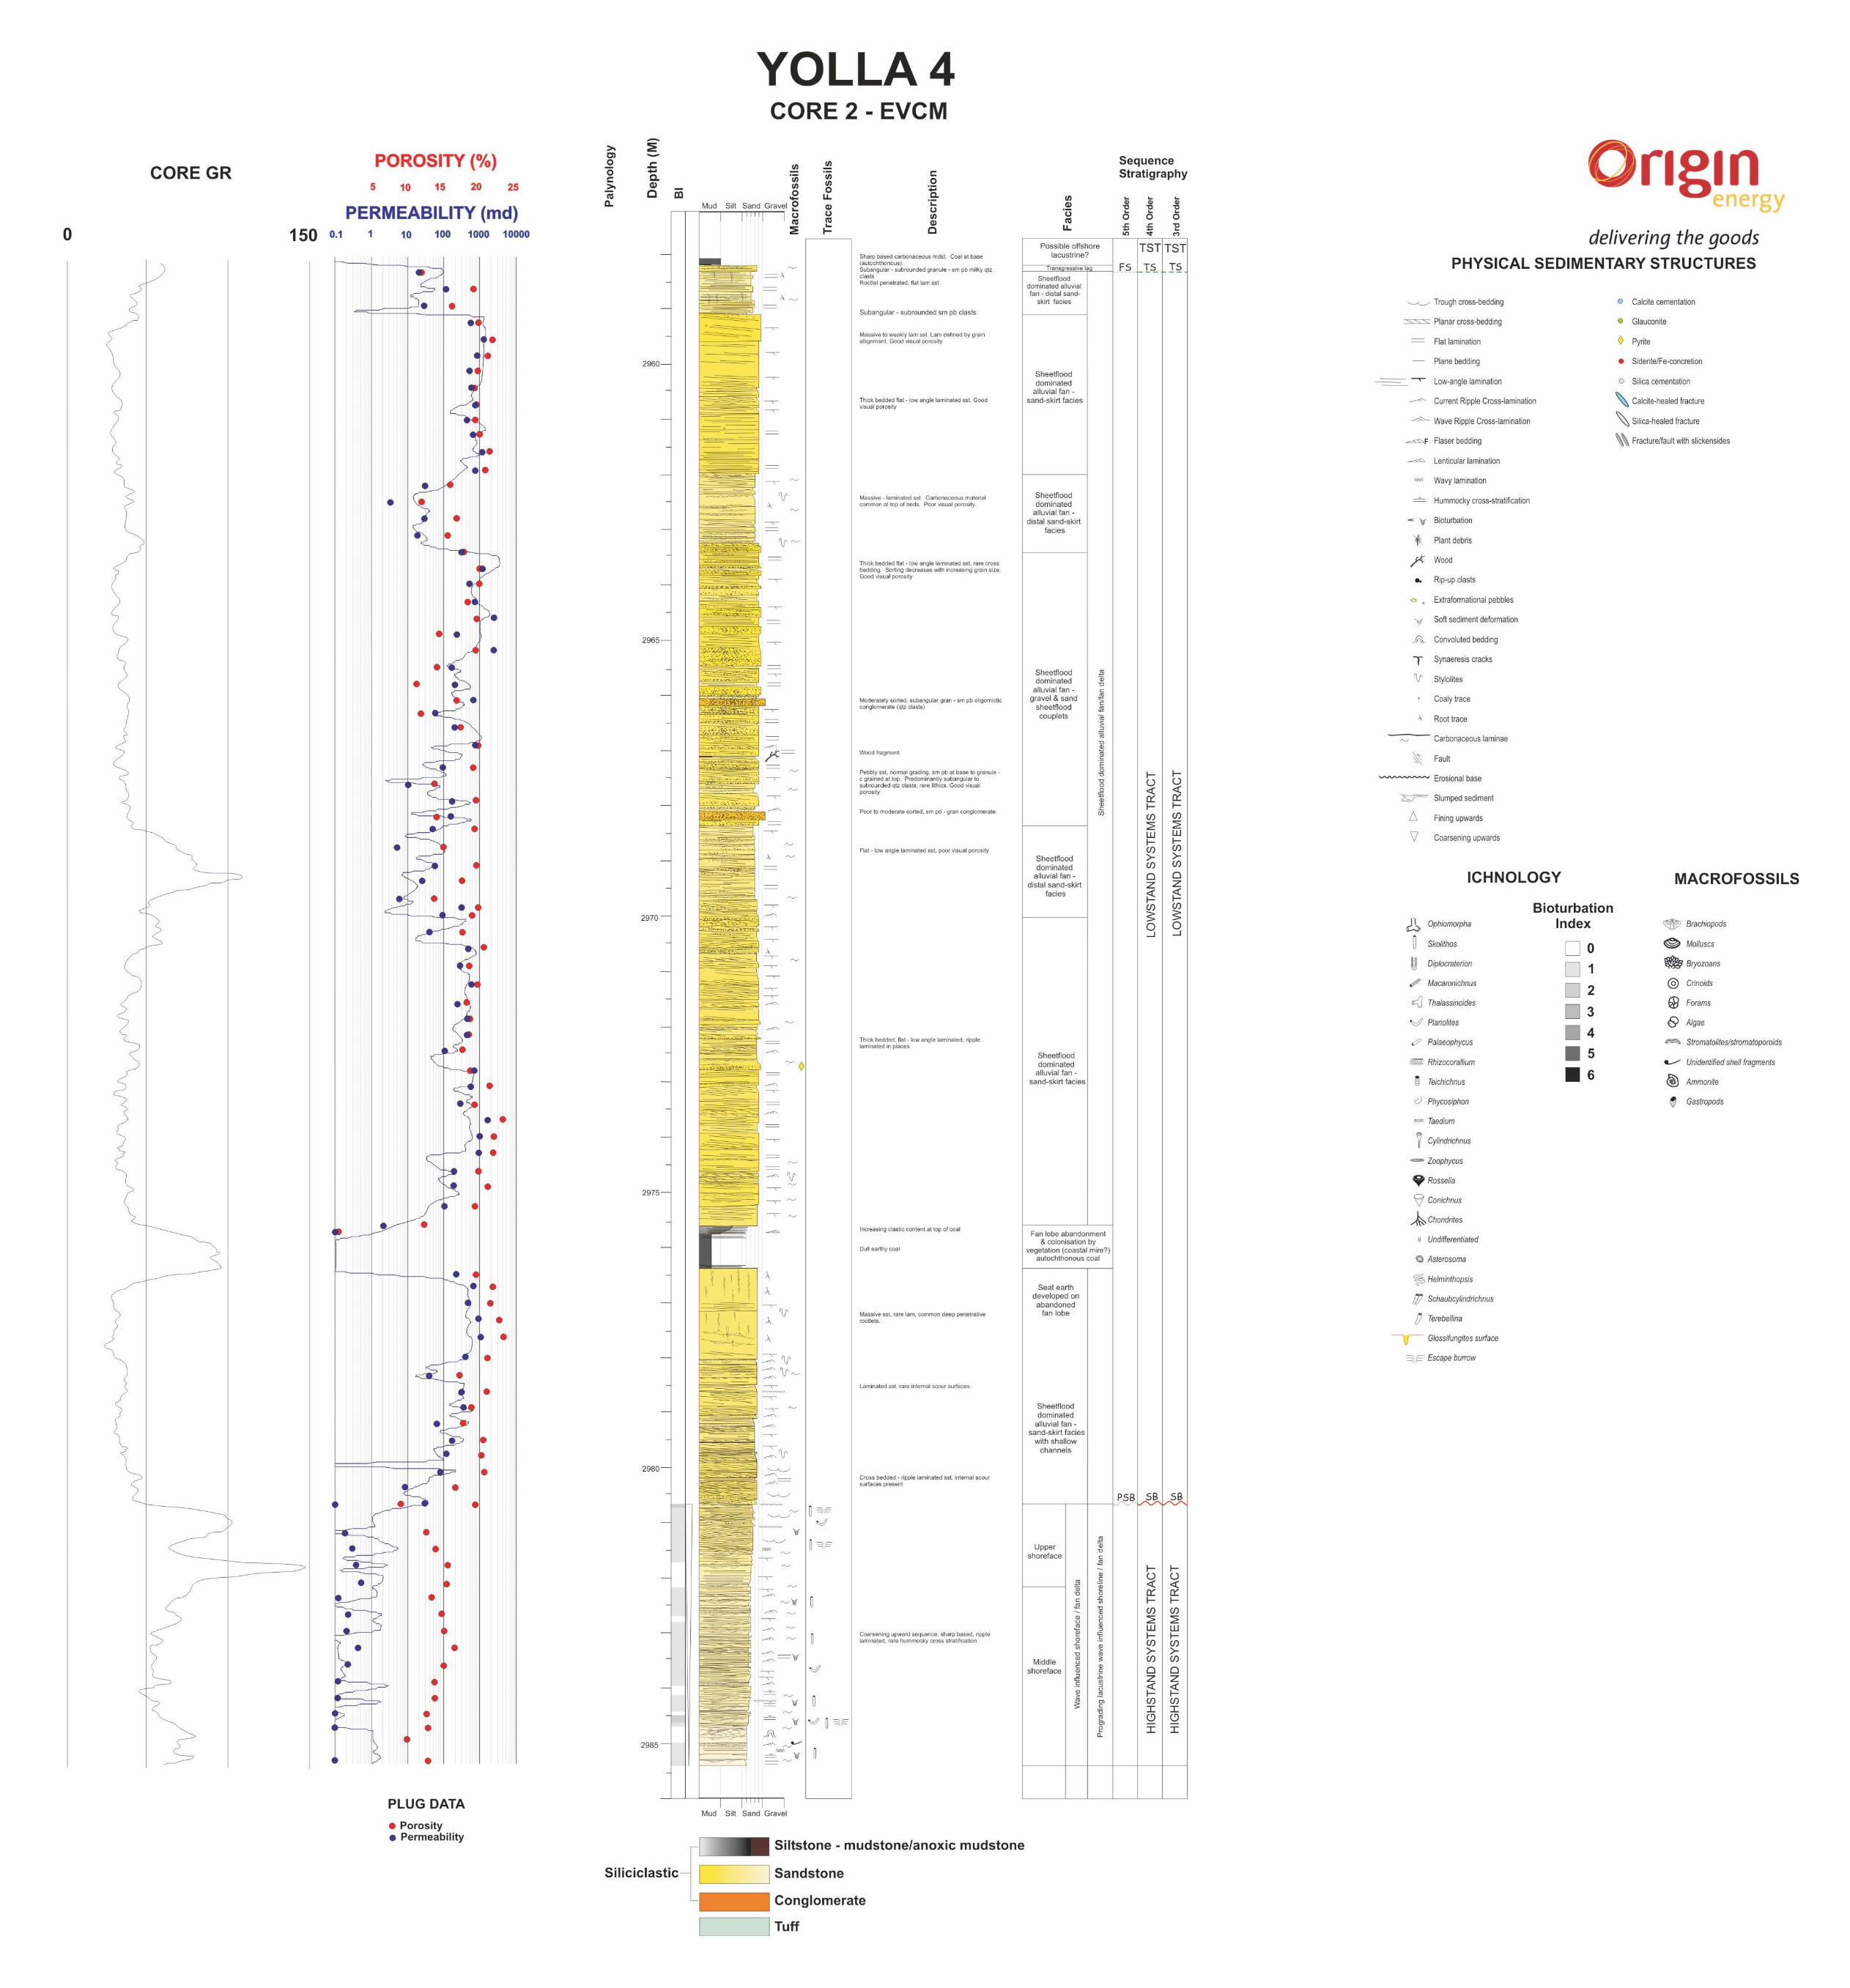
Origin Energy Resources Ltd ABN 66 007 845 338 Commercial-in-Confidence Greenfields Division Ref: W:\Complete Reports\BASS\Yolla\Yolla 4\Interpretive\Yolla4InterpretativeDataWCR with appendix headers.docc
AAPPPPEENNDDIIXX 99:: SSPPEECCIIAALL CCOORREE AANNAALLYYSSIISS
A C SLABORATORIES
PTY LTD
SPECIAL CORE ANALYSIS FINAL REPORT
of
YOLLA-4
for
ORIGIN ENERGY RESOURCES LIMITED
by
ACS LABORATORIES PTY LTD
Head 8 Cox Road, Windsor Qld 4030, Australia ACS Laboratories Pty Ltd Office: : 61 7 3357 1133 Facsimile: 61 7 3357 1100 ABN: 81 008 273 005 E-mail: [email protected]
A C SLABORATORIES
PTY LTD 31 January, 2005 Origin Energy Resources Limited Origin Energy Resources Limited Level 6 1st Floor, John Oxley Centre 1 King William Street 339 Coronation Drive ADELAIDE SA 5000 MILTON QLD 4064 Attention: Joe Parver Attention: Andy Hall
FINAL REPORT: 0475-08 CLIENT REFERENCE: O4641 MATERIAL: Core Plugs LOCALITY: Yolla-4 WORK REQUIRED: Special Core Analysis Please direct technical enquiries regarding this work to the signatories below under whose supervision the work was carried out. KEVIN H FLYNN General Manager ACS Laboratories Pty Ltd shall not be liable or responsible for any loss, cost, damages or expenses incurred by the client, or any other person or company, resulting from any information or interpretation given in this report. In no case shall ACS Laboratories Pty Ltd be responsible for consequential damages including, but not limited to, lost profits, damages for failure to meet deadlines and lost production arising from this report.
0475-08 Yolla-4 ACS Laboratories Pty Ltd ABN: 81 008 273 005
CONTENTS CHAPTERS PAGE 1. INTRODUCTION .................................................................................................. 1 2. SUMMARY OF TEST PROGRAM ..................................................................... 3 3. SAMPLE PREPARATION AND BASE PARAMETER DETERMINATIONS
3.1 Test and Calculation Procedures 3.1.1 CT Scanning .................................................................................... 7 3.1.2 Base Parameters ............................................................................. 7 3.1.3 Sample Saturation .......................................................................... 9
3.2 Test Results ................................................................................................. 10 4. ELECTRICAL PROPERTIES AND CAPILLARY PRESSURE
4.1 Test and Calculation Procedures 4.1.1 Formation Resistivity Factor ....................................................... 14 4.1.2 Formation Resistivity Index and Capillary Pressure ................ 15 4.1.3 Capillary Pressure ........................................................................ 16 4.1.4 Cation Exchange Capacity .......................................................... 16
4.2 Test Results 4.2.1 Formation Factor .......................................................................... 18 4.2.2 Resistivity Index ........................................................................... 20 4.2.3 Capillary Pressure ........................................................................ 32 4.2.4 Cation Exchange Capacity .......................................................... 56 4.2.5 Summary ....................................................................................... 58
5. RESIDUAL GAS
5.1 Test and Calculation Procedures 5.1.1 Permeability to Air at Residual Water Saturation .................... 62 5.1.2 Waterflood .................................................................................... 62
5.2 Test Results ................................................................................................. 63 APPENDICES I. FLUID PROPERTIES II. EQUIPMENT SCHEMATICS III. ABBREVIATIONS

0475-08 Yolla-4 ACS Laboratories Pty Ltd 1 ABN: 81 008 273 005
CHAPTER 1
INTRODUCTION
0475-08 Yolla-4 ACS Laboratories Pty Ltd 2 ABN: 81 008 273 005
1. INTRODUCTION This final report presents the results from a special core analysis study of the Yolla-4
core. The samples utilized were 1½ inch diameter core plugs originally drilled for a routine core analysis study (performed by ACS Laboratories) on the same well. Following discussions between Origin Energy Resources Limited and ACS Laboratories representatives, the test program was refined to that presented in summary format in Chapter 2 of this report. The subsequent chapters encompass descriptions of procedures and test results. The Appendices include ancillary information pertinent to the study.
0475-08 Yolla-4 ACS Laboratories Pty Ltd 3 ABN: 81 008 273 005
CHAPTER 2
SUMMARY OF TEST PROGRAM
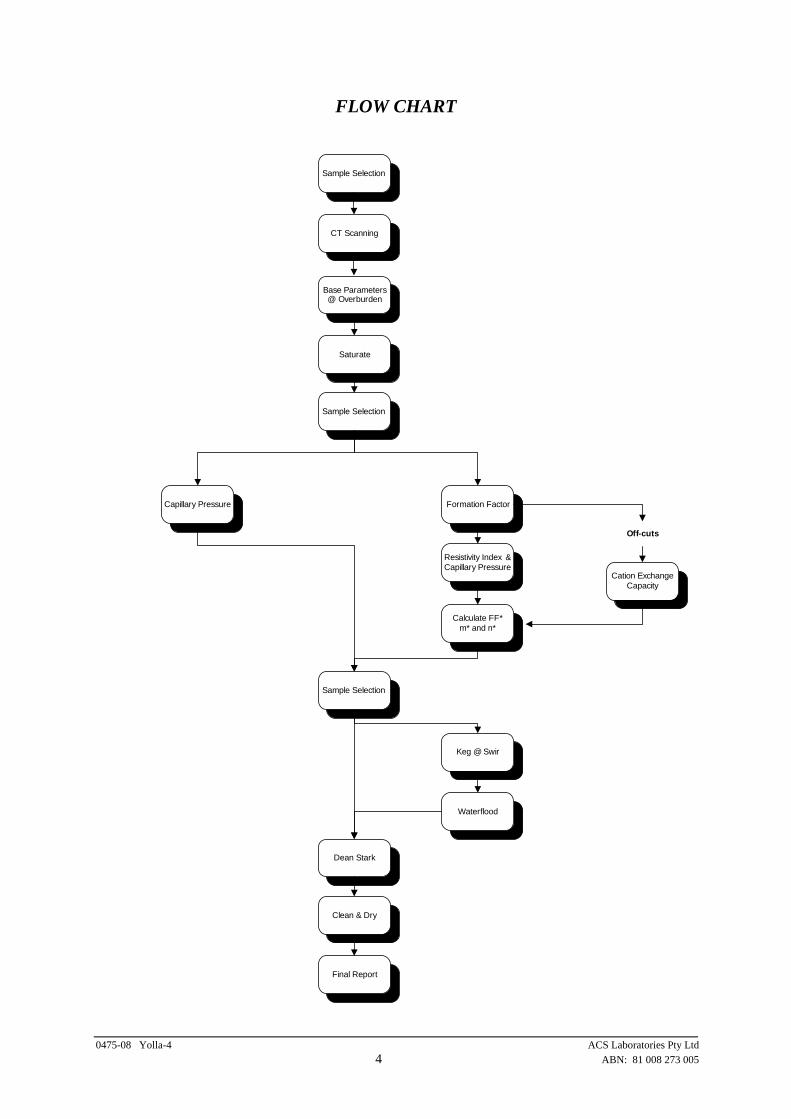
FLOW CHART
Sample Selection
CT Scanning
Base Parameters@ Overburden
Saturate
Sample Selection
Capillary Pressure Formation Factor
Resistivity Index &Capillary Pressure
Cation ExchangeCapacity
Off-cuts
Calculate FF*m* and n*
Sample Selection
Keg @ Swir
Waterflood
Dean Stark
Clean & Dry
Final Report
0475-08 Yolla-4 ACS Laboratories Pty Ltd 4 ABN: 81 008 273 005
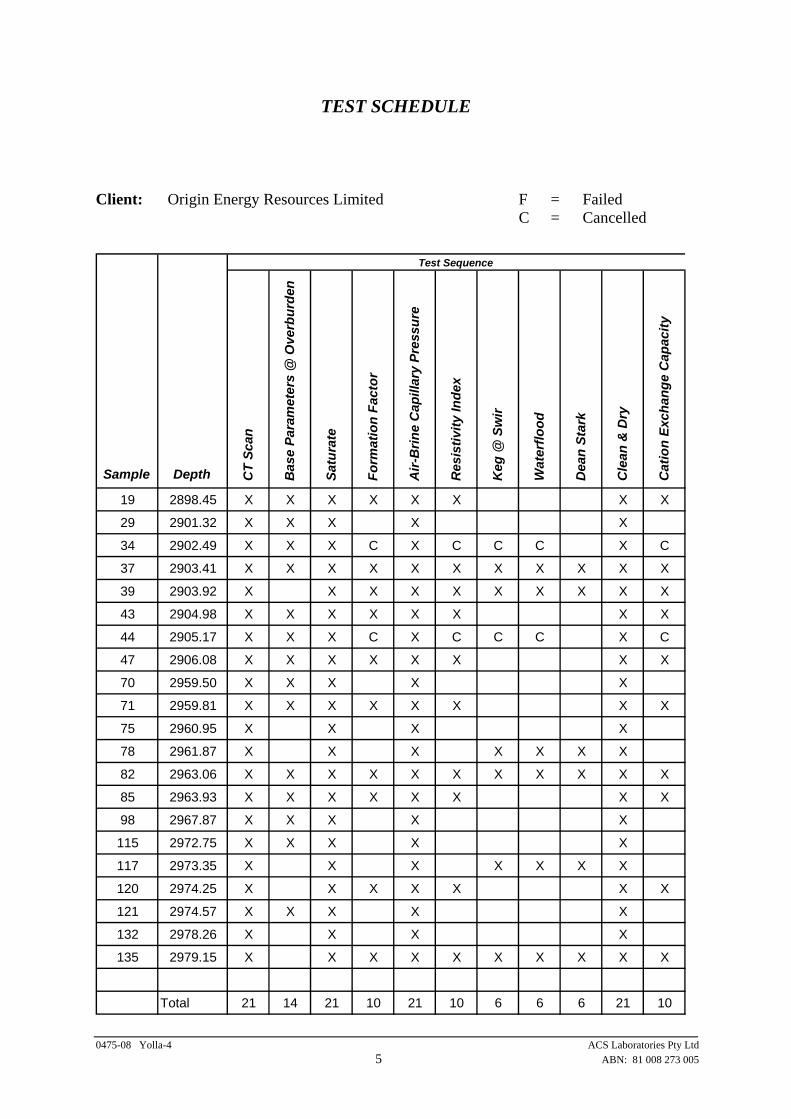
TEST SCHEDULE Client: Origin Energy Resources Limited F = Failed C = Cancelled
Test Sequence
Sample Depth CT
Scan
Bas
e Pa
ram
eter
s @
Ove
rbur
den
Satu
rate
Form
atio
n Fa
ctor
Air-
Brin
e C
apill
ary
Pres
sure
Res
istiv
ity In
dex
Keg
@ S
wir
Wat
erflo
od
Dea
n St
ark
Cle
an &
Dry
Cat
ion
Exch
ange
Cap
acity
19 2898.45 X X X X X X X X
29 2901.32 X X X X X
34 2902.49 X X X C X C C C X C
37 2903.41 X X X X X X X X X X X
39 2903.92 X X X X X X X X X X
43 2904.98 X X X X X X X X
44 2905.17 X X X C X C C C X C
47 2906.08 X X X X X X X X
70 2959.50 X X X X X
71 2959.81 X X X X X X X X
75 2960.95 X X X X
78 2961.87 X X X X X X X
82 2963.06 X X X X X X X X X X X
85 2963.93 X X X X X X X X
98 2967.87 X X X X X
115 2972.75 X X X X X
117 2973.35 X X X X X X X
120 2974.25 X X X X X X X
121 2974.57 X X X X X
132 2978.26 X X X X
135 2979.15 X X X X X X X X X X
Total 21 14 21 10 21 10 6 6 6 21 10
0475-08 Yolla-4 ACS Laboratories Pty Ltd 5 ABN: 81 008 273 005
0475-08 Yolla-4 ACS Laboratories Pty Ltd 6 ABN: 81 008 273 005
CHAPTER 3
SAMPLE PREPARATION AND BASE PARAMETER DETERMINATIONS
3.1 Test and Calculation Procedures
0475-08 Yolla-4 ACS Laboratories Pty Ltd 7 ABN: 81 008 273 005
3. SAMPLE PREPARATION AND BASE PARAMETER DETERMINATIONS 3.1 Test and Calculation Procedures 3.1.1 CT Scanning
CT Scanning was undertaken in order that internal inhomogeneities and/or drilling fluid invasion zones may be noted. Typical inhomogeneities may be clasts, bedding sedimentary structures, cementation, fractures and any other discontinuities that may not be readily visible to the naked eye. The principle of CT Scanning and its applications is presented by Hove et al, 1987 and Wellington and Vinegar, 1987. CT Scanners generate cross-sectional image slices through the sample by revolving an X-ray tube around the sample and obtaining projections at many different angles (Appendix I). From these image slices, a cross-sectional image was reconstructed by a back projection algorithm in the scanner's computer. Prior to analysis, an arbitrary orientation line was inscribed onto the sample using a marker to facilitate subsequent re-orientation. The sample was placed vertically within the scanner, with the orientation arrow left to right, and a longitudinal section image obtained. The sample was then rotated through exactly 90o to the initial orientation, and another section image recorded. These two images are labelled '0' and '90' on the prints. All images were reported in a separate report sent on 31 August 2004. 3.1.2 Base Parameters All ambient base parameters were performed during the routine core analysis study. Porosity Porosity was determined in two stages. Initially each sample was placed in a sealed matrix cup. Helium held at 100 psi reference pressure was then introduced to the cup. From the resultant pressure drop the unknown grain volume was determined using Boyle's Law.
P1 V1 = P2 V2
⇒ P1 Vr = P2 (Vr + Vc + Vl - Vg)
where P1 = initial pressure (psig) Vr = reference cell volume (cm3) Vc = matrix cup volume (cm3) Vl = line volume (cm3) Vg = grain volume (cm3) P2 = final pressure (psig)
and ρ = WtVg
where ρ = grain density (g/cm3) Wt = weight of sample (g) Vg = grain volume (cm3)
The samples were then placed into individual thick walled rubber sleeves and the assembly loaded into a hydrostatic cell. With an ambient pressure (400 psi) applied to the sample, helium held at 100 psi reference pressure was released into the samples pore volume. The resultant pressure drop was used to determine pore volume at ambient. The confining pressure was then increased to the overburden pressure of 5000 psi and the resultant change in internal pore pressure was monitored and used to determine pore volume at overburden conditions.
Vb = Vp + Vg
Ambient Porosity % = VpVb
x 100
Overburden Porosity % = Vp VpVb Vp
x−−
∆∆
100
where Vp = ambient pore volume (cm3) Vb = ambient bulk volume (cm3) Vg = grain volume (cm3) ∆Vp = change in pore volume (cm3)
Permeability to Air The samples were placed into a hydrostatic cell (Appendix II) with an ambient confining pressure of 400 psi applied. The confining pressure was used to prevent bypassing of air around the sample when the measurement was made. In order to determine permeability a known air pressure was applied to the upstream face of each sample, creating a flow of air through the core plug. Air permeability for each core sample was calculated using Darcy's Law through knowledge of the upstream pressure, flow rate, viscosity of air and sample dimensions.
Ka = 2000
12
22
. . . .( ).
BP q LP P A
µ−
0475-08 Yolla-4 ACS Laboratories Pty Ltd 8 ABN: 81 008 273 005
0475-08 Yolla-4 ACS Laboratories Pty Ltd 9 ABN: 81 008 273 005
where Ka = air permeability (milliDarcy's) BP = barometric pressure (atmospheres) µ = gas viscosity (cP) q = flow rate (cm3/s) L = sample length (cm) P1 = upstream pressure (atmospheres) P2 = downstream pressure (atmospheres) A = sample cross sectional area (cm2)
The confining pressure was then increased to the overburden pressure of 5000 psi and the above procedure repeated to give permeability at overburden conditions. 3.1.3 Sample Saturation The selected samples were initially vacuum saturated with 26000 ppm NaCl equivalent brine (Appendix I) followed by pressure saturation at 2000 psi for a minimum of 12 hours. To determine complete saturation, the saturations were determined by mass balance and compared with that of porosimetry. In all cases the samples were deemed suitable to proceed with the test program.
0475-08 Yolla-4 ACS Laboratories Pty Ltd 10 ABN: 81 008 273 005
CHAPTER 3
SAMPLE PREPARATION AND BASE PARAMETER DETERMINATIONS
3.2 Test Results
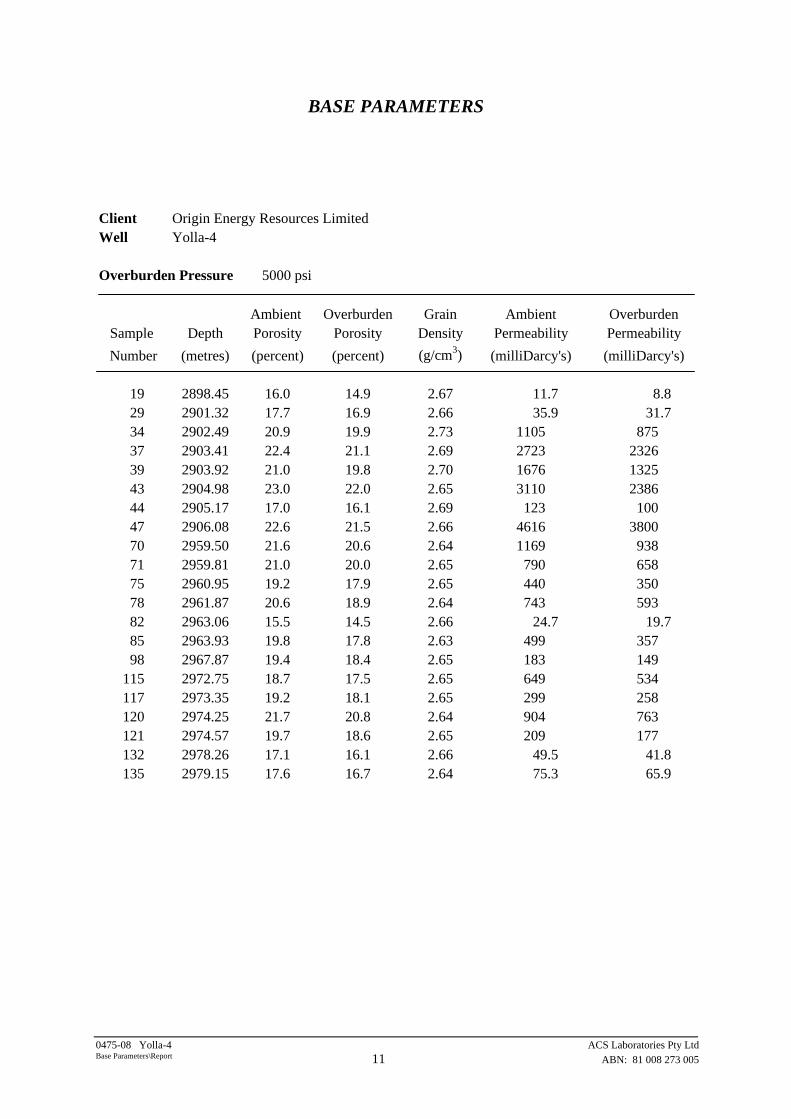
BASE PARAMETERS Client Origin Energy Resources LimitedWell Yolla-4
Overburden Pressure 5000 psi
Ambient Overburden Grain Ambient OverburdenSample Depth Porosity Porosity Density Permeability PermeabilityNumber (metres) (percent) (percent) (g/cm3) (milliDarcy's) (milliDarcy's)
19 2898.45 16.0 14.9 2.67 11.7 8.829 2901.32 17.7 16.9 2.66 35.9 31.734 2902.49 20.9 19.9 2.73 1105 87537 2903.41 22.4 21.1 2.69 2723 232639 2903.92 21.0 19.8 2.70 1676 132543 2904.98 23.0 22.0 2.65 3110 238644 2905.17 17.0 16.1 2.69 123 10047 2906.08 22.6 21.5 2.66 4616 380070 2959.50 21.6 20.6 2.64 1169 93871 2959.81 21.0 20.0 2.65 790 65875 2960.95 19.2 17.9 2.65 440 35078 2961.87 20.6 18.9 2.64 743 59382 2963.06 15.5 14.5 2.66 24.7 19.785 2963.93 19.8 17.8 2.63 499 35798 2967.87 19.4 18.4 2.65 183 149
115 2972.75 18.7 17.5 2.65 649 534117 2973.35 19.2 18.1 2.65 299 258120 2974.25 21.7 20.8 2.64 904 763121 2974.57 19.7 18.6 2.65 209 177132 2978.26 17.1 16.1 2.66 49.5 41.8135 2979.15 17.6 16.7 2.64 75.3 65.9
0475-08 Yolla-4 ACS Laboratories Pty Ltd 11 ABN: 81 008 273 005 Base Parameters\Report
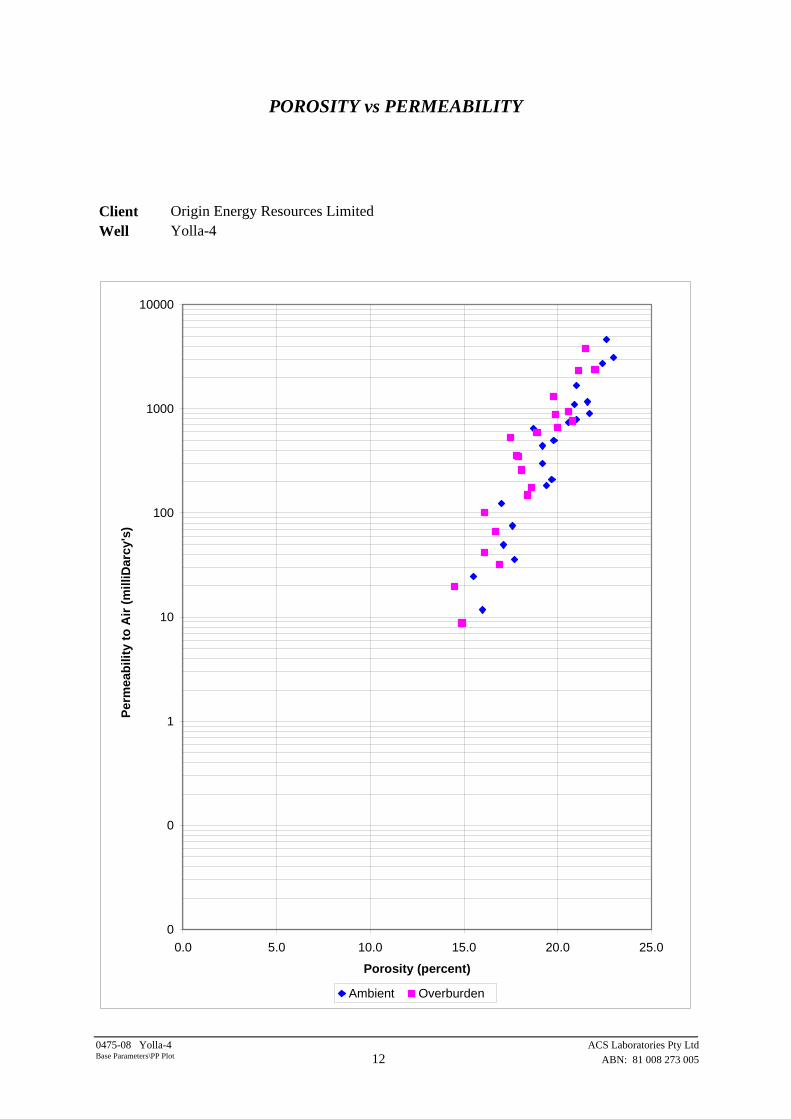
POROSITY vs PERMEABILITY Client Origin Energy Resources LimitedWell Yolla-4
0
0
1
10
100
1000
10000
0.0 5.0 10.0 15.0 20.0 25.0
Porosity (percent)
Perm
eabi
lity
to A
ir (m
illiD
arcy
's)
.
Ambient Overburden
0475-08 Yolla-4 ACS Laboratories Pty Ltd
12 ABN: 81 008 273 005 Base Parameters\PP Plot

0475-08 Yolla-4 ACS Laboratories Pty Ltd 13 ABN: 81 008 273 005
CHAPTER 4
ELECTRICAL PROPERTIES AND CAPILLARY PRESSURE
4.1 Test and Calculation Procedures
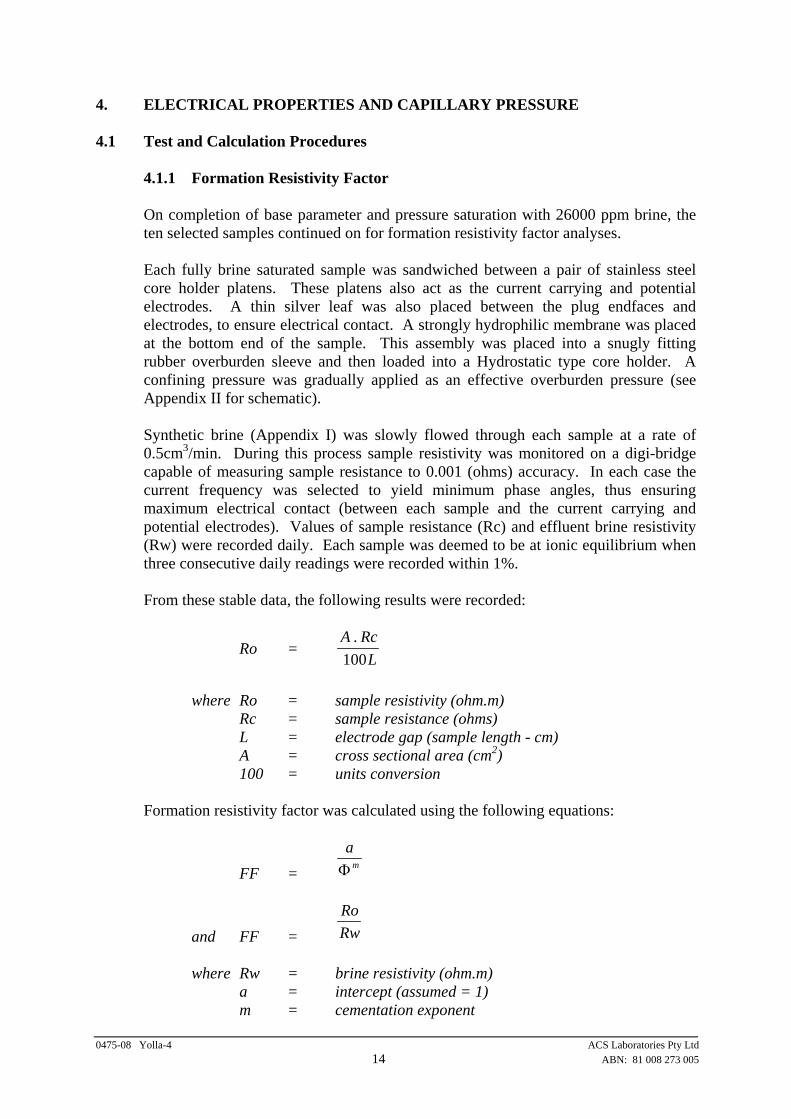
4. ELECTRICAL PROPERTIES AND CAPILLARY PRESSURE 4.1 Test and Calculation Procedures
4.1.1 Formation Resistivity Factor On completion of base parameter and pressure saturation with 26000 ppm brine, the ten selected samples continued on for formation resistivity factor analyses. Each fully brine saturated sample was sandwiched between a pair of stainless steel core holder platens. These platens also act as the current carrying and potential electrodes. A thin silver leaf was also placed between the plug endfaces and electrodes, to ensure electrical contact. A strongly hydrophilic membrane was placed at the bottom end of the sample. This assembly was placed into a snugly fitting rubber overburden sleeve and then loaded into a Hydrostatic type core holder. A confining pressure was gradually applied as an effective overburden pressure (see Appendix II for schematic). Synthetic brine (Appendix I) was slowly flowed through each sample at a rate of 0.5cm3/min. During this process sample resistivity was monitored on a digi-bridge capable of measuring sample resistance to 0.001 (ohms) accuracy. In each case the current frequency was selected to yield minimum phase angles, thus ensuring maximum electrical contact (between each sample and the current carrying and potential electrodes). Values of sample resistance (Rc) and effluent brine resistivity (Rw) were recorded daily. Each sample was deemed to be at ionic equilibrium when three consecutive daily readings were recorded within 1%. From these stable data, the following results were recorded:
Ro = A Rc
L.
100
where Ro = sample resistivity (ohm.m)
Rc = sample resistance (ohms) L = electrode gap (sample length - cm) A = cross sectional area (cm2) 100 = units conversion Formation resistivity factor was calculated using the following equations:
FF =
amΦ
and FF =
RoRw
where Rw = brine resistivity (ohm.m) a = intercept (assumed = 1) m = cementation exponent
0475-08 Yolla-4 ACS Laboratories Pty Ltd 14 ABN: 81 008 273 005
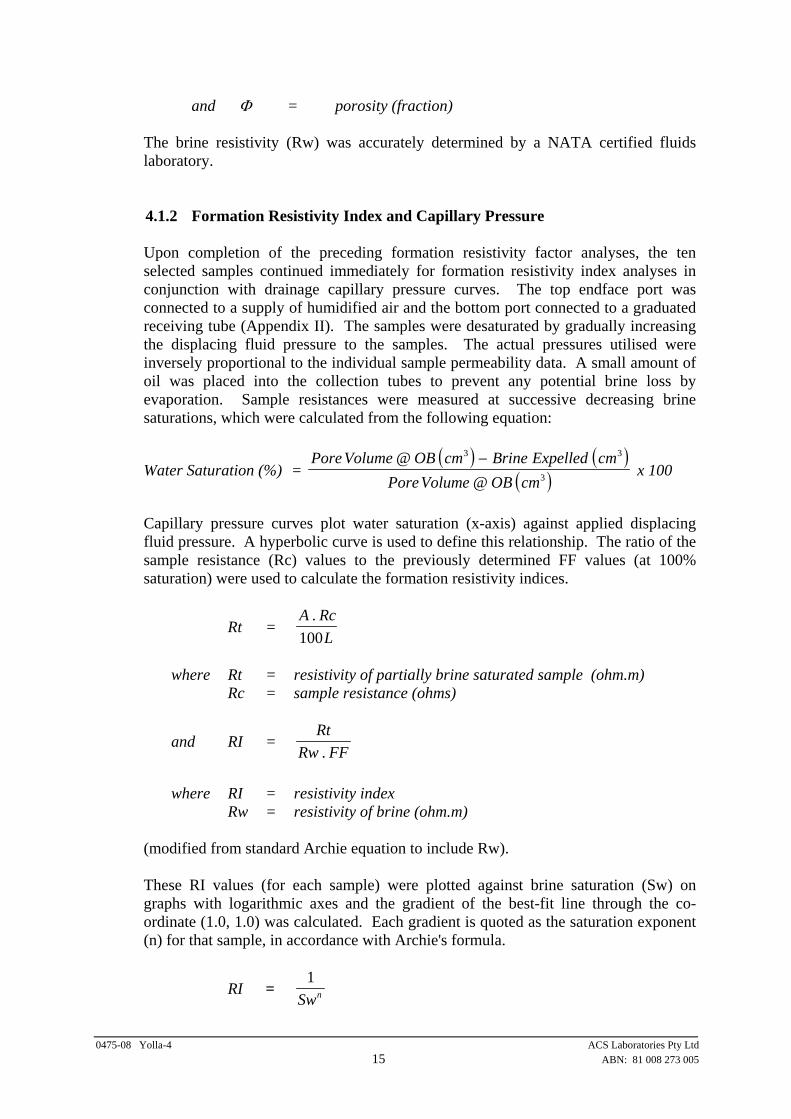
and Φ = porosity (fraction) The brine resistivity (Rw) was accurately determined by a NATA certified fluids laboratory. 4.1.2 Formation Resistivity Index and Capillary Pressure Upon completion of the preceding formation resistivity factor analyses, the ten selected samples continued immediately for formation resistivity index analyses in conjunction with drainage capillary pressure curves. The top endface port was connected to a supply of humidified air and the bottom port connected to a graduated receiving tube (Appendix II). The samples were desaturated by gradually increasing the displacing fluid pressure to the samples. The actual pressures utilised were inversely proportional to the individual sample permeability data. A small amount of oil was placed into the collection tubes to prevent any potential brine loss by evaporation. Sample resistances were measured at successive decreasing brine saturations, which were calculated from the following equation:
Water Saturation (%) = ( ) (
( ))Pore Volume OB cm Brine Expelled cm
PoreVolume OB cm@
@
3 3
3
− x 100
Capillary pressure curves plot water saturation (x-axis) against applied displacing fluid pressure. A hyperbolic curve is used to define this relationship. The ratio of the sample resistance (Rc) values to the previously determined FF values (at 100% saturation) were used to calculate the formation resistivity indices.
Rt = A Rc
L.
100
where Rt = resistivity of partially brine saturated sample (ohm.m) Rc = sample resistance (ohms)
and RI = Rt
Rw FF.
where RI = resistivity index Rw = resistivity of brine (ohm.m)
(modified from standard Archie equation to include Rw). These RI values (for each sample) were plotted against brine saturation (Sw) on graphs with logarithmic axes and the gradient of the best-fit line through the co-ordinate (1.0, 1.0) was calculated. Each gradient is quoted as the saturation exponent (n) for that sample, in accordance with Archie's formula.
RI = 1
Swn
0475-08 Yolla-4 ACS Laboratories Pty Ltd 15 ABN: 81 008 273 005

4.1.3 Capillary Pressure Eleven samples were selected for air-brine capillary pressure. Each fully brine saturated sample was sandwiched between a pair of stainless steel core holder platens with a strongly hydrophilic membrane at the bottom end of the sample. This assembly was placed into a snugly fitting rubber overburden sleeve and loaded into a hydrostatic type core holder and an overburden pressure of 5000 psi applied. The top endface port was connected to a supply of humidified air and the bottom port connected to a graduated receiving tube (Appendix II). The samples were desaturated by gradually increasing the displacing fluid pressure to the samples. The actual pressures utilised were inversely proportional to the individual sample permeability data. A small amount of oil was placed into the collection tubes to prevent any potential brine loss by evaporation. Sample resistances were measured at successive decreasing brine saturations, which were calculated from the following equation:
1003
33
x)cm(OB@VolumePore
)cm(ExpelledBrine)cm(OB@VolumePore(%)SaturationWater −=
Capillary pressure curves plot water saturation (x-axis) against applied displacing fluid pressure. A hyperbolic curve is used to define this relationship. 4.1.4 Cation Exchange Capacity Cation exchange capacity was determined on approximately 5 grams of sample (off-cuts) using the wet chemistry method. The samples were first washed with an ammonium chloride solution to exchange ions with the available clay cations. An exchange reagent was then washed through the sample and the resultant solution titrated. Where a smaller sample is used the limit of detection becomes greater and a minimum value is reported. Values of exchangeable cations (theoretical minimum of zero) present in the samples are reported as milliequivalents per 100 grams of dry sample (meq/100 g). Values of Qv have been calculated using the following equation:
Qv = CEC ( )1
100− ΦΦ
ρ
where ρ = grain density (g/cm3)
Φ = porosity (fraction) Qv = volume concentration of clay exchange cations (meq/cm3 pore space) CEC = cation exchange capacity (meq/100 g dry sample) Based on these CEC/Qv data, values of shaly sand equivalent formation factor (FF*), cementation factor (m*) and saturation exponent (n*) were calculated using the following equations:
0475-08 Yolla-4 ACS Laboratories Pty Ltd 16 ABN: 81 008 273 005

FF* = FF B Qv Rw. ( . . )1 +
m* = log *
logFF
− Φ
n* = log
. .. . /
log
log
11
++
⎡
⎣⎢
⎤
⎦⎥ −
Rw B QvRw B Qv Sw
FRI
Sw
where1 B = )27.0..045.0(.1.0004059.0.225.028.1
23.1
2
−+−+−
TRwTT
FF = formation resistivity factor
FF* = shaly sand equivalent formation resistivity factor m* = shaly sand equivalent cementation factor Φ = porosity (fraction) n* = shaly sand equivalent saturation exponent Rw = brine resistivity (ohm.m @ 25oC) T = temperature of 25°C B = equivalent conductance of clay exchange cations Qv = volume concentration of clay exchange cations Sw = final saturation (fraction) FRI = resistivity index @ saturation Sw
1 Juhasz, I., 1981, Normalized Q, - the key to shaly sand evaluation using the Waxman-Smits equation in the absence of core data,
paper Z, in 22nd Annual Logging Symposium Transactions: Society of Professional Well Log Analysts, 36p.
0475-08 Yolla-4 ACS Laboratories Pty Ltd
17 ABN: 81 008 273 005

0475-08 Yolla-4 ACS Laboratories Pty Ltd 18 ABN: 81 008 273 005
CHAPTER 4
ELECTRICAL PROPERTIES AND CAPILLARY PRESSURE
4.2 Test Results
4.2.1 Formation Factor
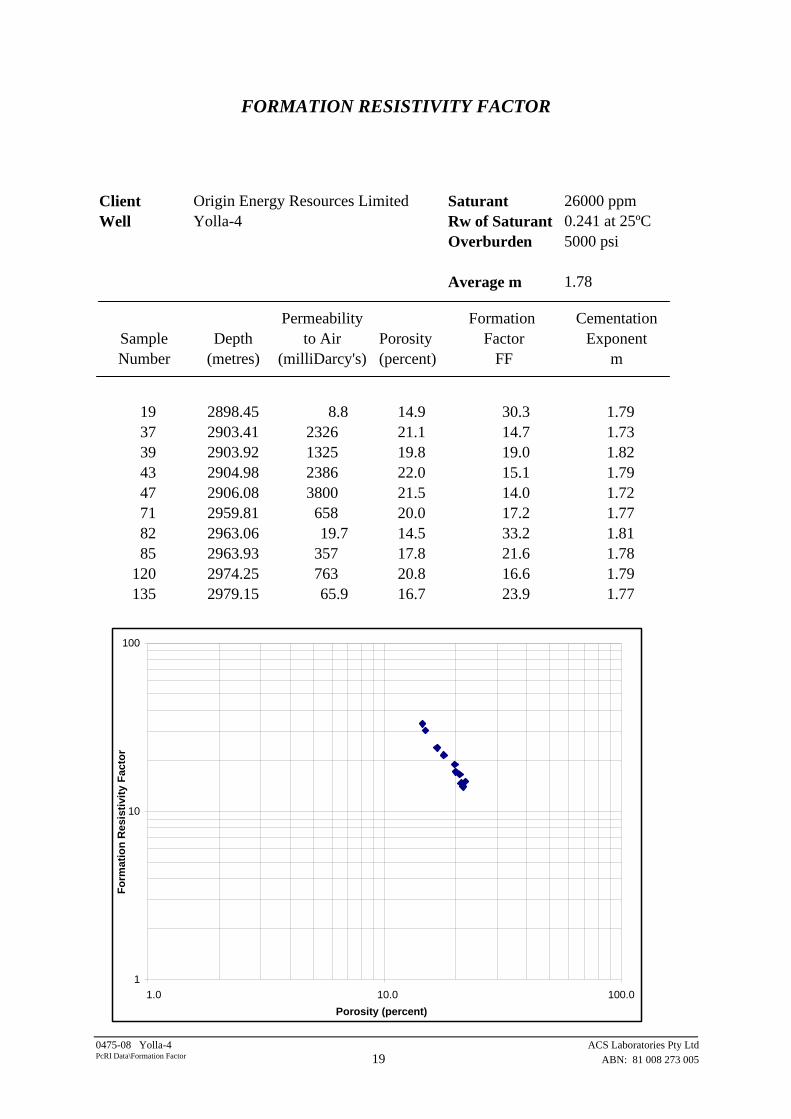
FORMATION RESISTIVITY FACTOR Client Origin Energy Resources Limited Saturant 26000 ppmWell Yolla-4 Rw of Saturant 0.241 at 25ºC
Overburden 5000 psi
Average m 1.78
Permeability Formation CementationSample Depth to Air Porosity Factor ExponentNumber (metres) (milliDarcy's) (percent) FF m
19 2898.45 8.8 14.9 30.3 1.7937 2903.41 2326 21.1 14.7 1.7339 2903.92 1325 19.8 19.0 1.8243 2904.98 2386 22.0 15.1 1.7947 2906.08 3800 21.5 14.0 1.7271 2959.81 658 20.0 17.2 1.7782 2963.06 19.7 14.5 33.2 1.8185 2963.93 357 17.8 21.6 1.78
120 2974.25 763 20.8 16.6 1.79135 2979.15 65.9 16.7 23.9 1.77
1
10
100
1.0 10.0 100.0Porosity (percent)..
Form
atio
n R
esis
tivity
Fac
tor
....
0475-08 Yolla-4 ACS Laboratories Pty Ltd
19 ABN: 81 008 273 005 PcRI Data\Formation Factor

0475-08 Yolla-4 ACS Laboratories Pty Ltd 20 ABN: 81 008 273 005
CHAPTER 4
ELECTRICAL PROPERTIES AND CAPILLARY PRESSURE
4.2 Test Results
4.2.2 Resistivity Index
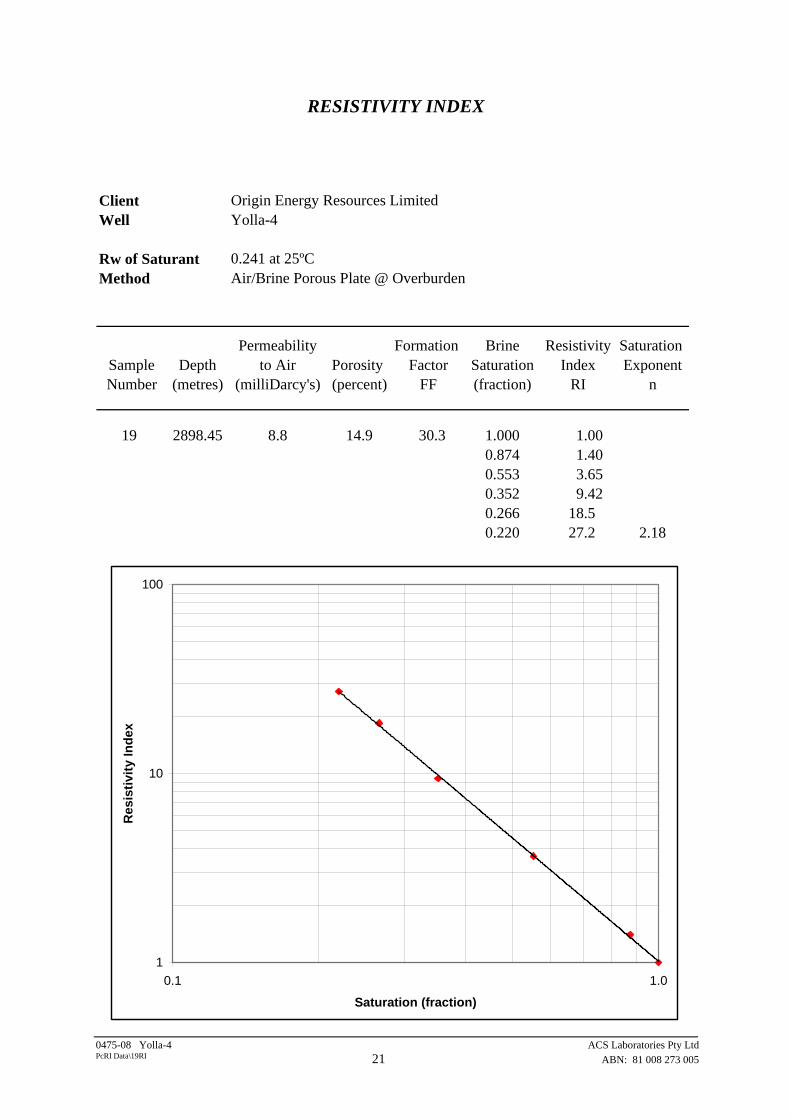
RESISTIVITY INDEX Client Origin Energy Resources LimitedWell Yolla-4
Rw of Saturant 0.241 at 25ºCMethod Air/Brine Porous Plate @ Overburden
Permeability Formation Brine Resistivity Saturation Sample Depth to Air Porosity Factor Saturation Index ExponentNumber (metres) (milliDarcy's) (percent) FF (fraction) RI n
19 2898.45 8.8 14.9 30.3 1.000 1.000.874 1.400.553 3.650.352 9.420.266 18.50.220 27.2 2.18
1
10
100
0.1 1.0
Saturation (fraction)
Res
istiv
ity In
dex
0475-08 Yolla-4 ACS Laboratories Pty Ltd
21 ABN: 81 008 273 005 PcRI Data\19RI
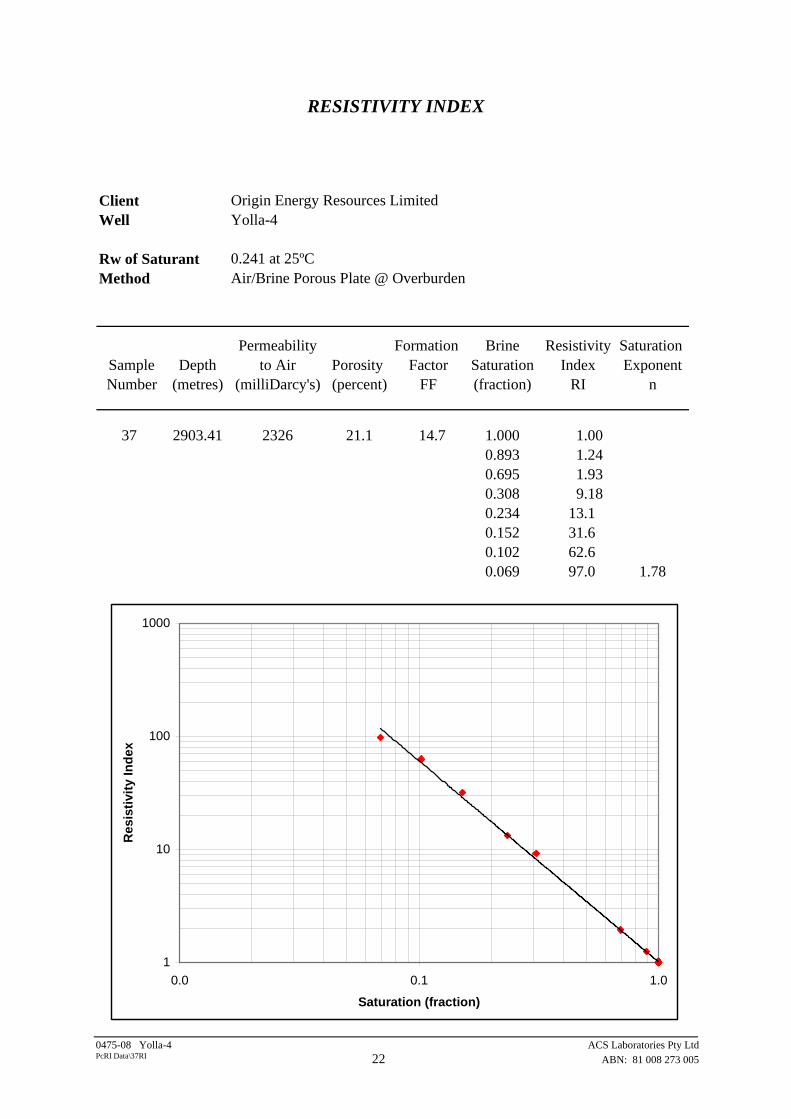
RESISTIVITY INDEX Client Origin Energy Resources LimitedWell Yolla-4
Rw of Saturant 0.241 at 25ºCMethod Air/Brine Porous Plate @ Overburden
Permeability Formation Brine Resistivity Saturation Sample Depth to Air Porosity Factor Saturation Index ExponentNumber (metres) (milliDarcy's) (percent) FF (fraction) RI n
37 2903.41 2326 21.1 14.7 1.000 1.000.893 1.240.695 1.930.308 9.180.234 13.10.152 31.60.102 62.60.069 97.0 1.78
1
10
100
1000
0.0 0.1 1.0
Saturation (fraction)
Res
istiv
ity In
dex
0475-08 Yolla-4 ACS Laboratories Pty Ltd
22 ABN: 81 008 273 005 PcRI Data\37RI
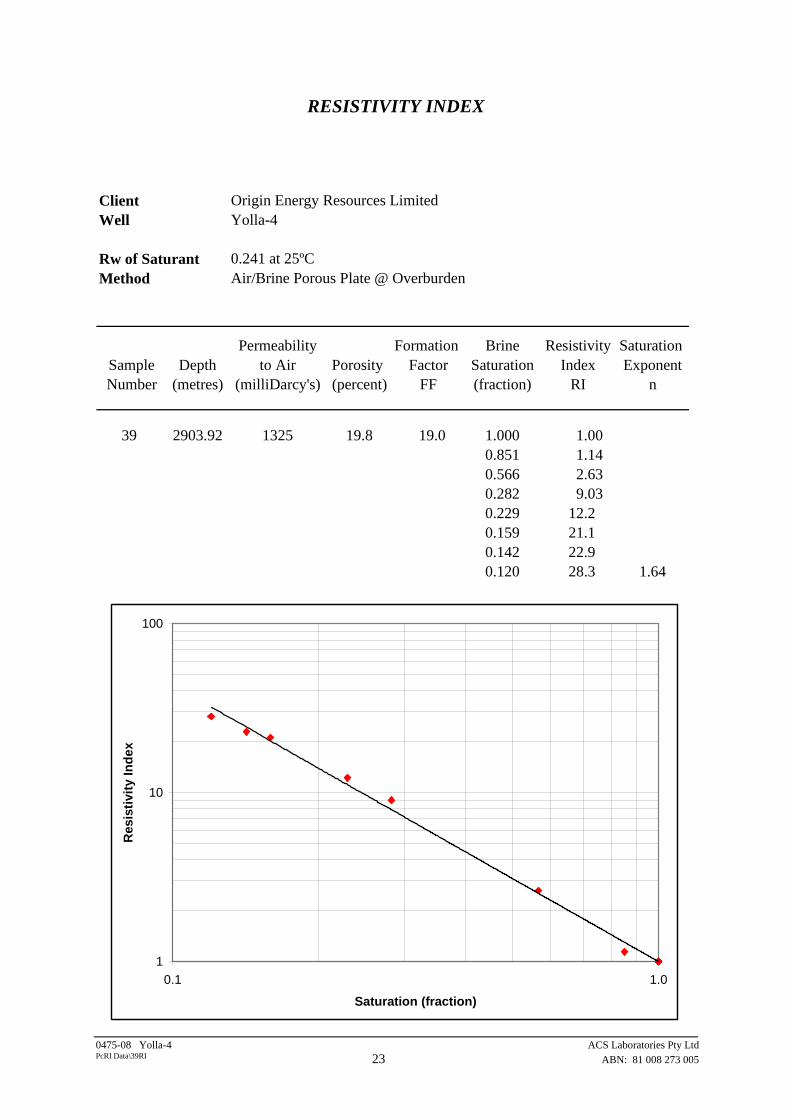
RESISTIVITY INDEX Client Origin Energy Resources LimitedWell Yolla-4
Rw of Saturant 0.241 at 25ºCMethod Air/Brine Porous Plate @ Overburden
Permeability Formation Brine Resistivity Saturation Sample Depth to Air Porosity Factor Saturation Index ExponentNumber (metres) (milliDarcy's) (percent) FF (fraction) RI n
39 2903.92 1325 19.8 19.0 1.000 1.000.851 1.140.566 2.630.282 9.030.229 12.20.159 21.10.142 22.90.120 28.3 1.64
1
10
100
0.1 1.0
Saturation (fraction)
Res
istiv
ity In
dex
0475-08 Yolla-4 ACS Laboratories Pty Ltd
23 ABN: 81 008 273 005 PcRI Data\39RI
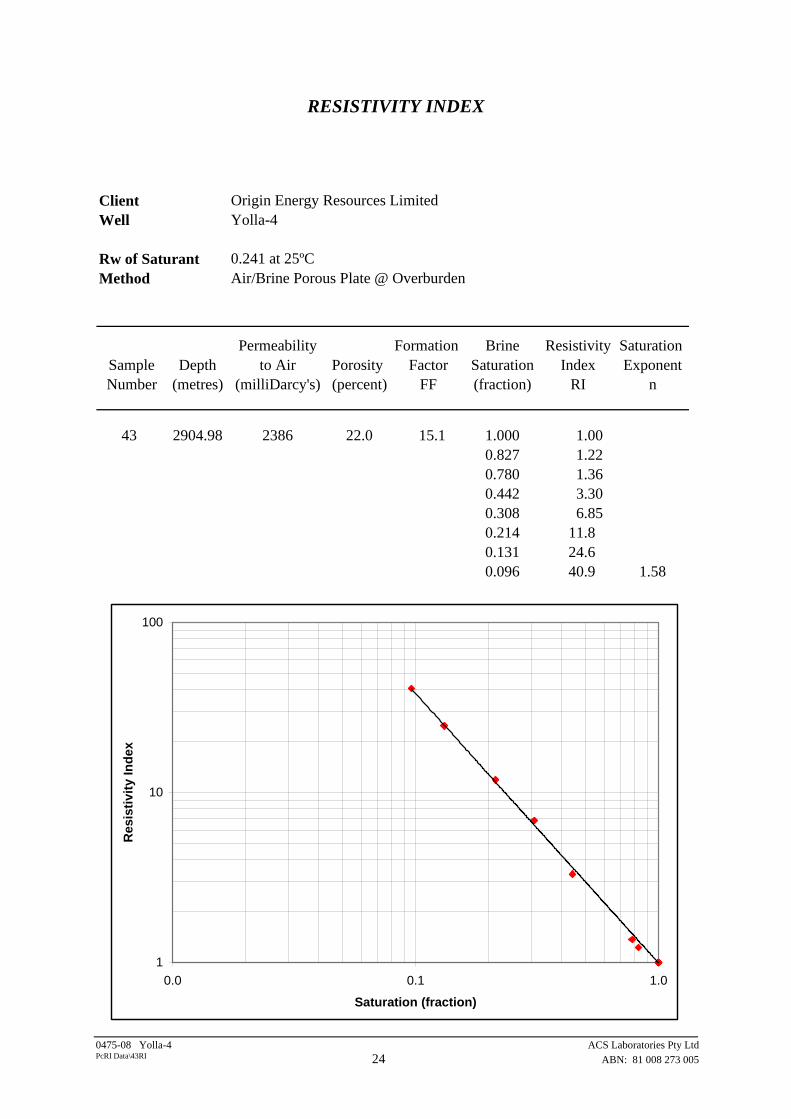
RESISTIVITY INDEX Client Origin Energy Resources LimitedWell Yolla-4
Rw of Saturant 0.241 at 25ºCMethod Air/Brine Porous Plate @ Overburden
Permeability Formation Brine Resistivity Saturation Sample Depth to Air Porosity Factor Saturation Index ExponentNumber (metres) (milliDarcy's) (percent) FF (fraction) RI n
43 2904.98 2386 22.0 15.1 1.000 1.000.827 1.220.780 1.360.442 3.300.308 6.850.214 11.80.131 24.60.096 40.9 1.58
1
10
100
0.0 0.1 1.0
Saturation (fraction)
Res
istiv
ity In
dex
0475-08 Yolla-4 ACS Laboratories Pty Ltd
24 ABN: 81 008 273 005 PcRI Data\43RI
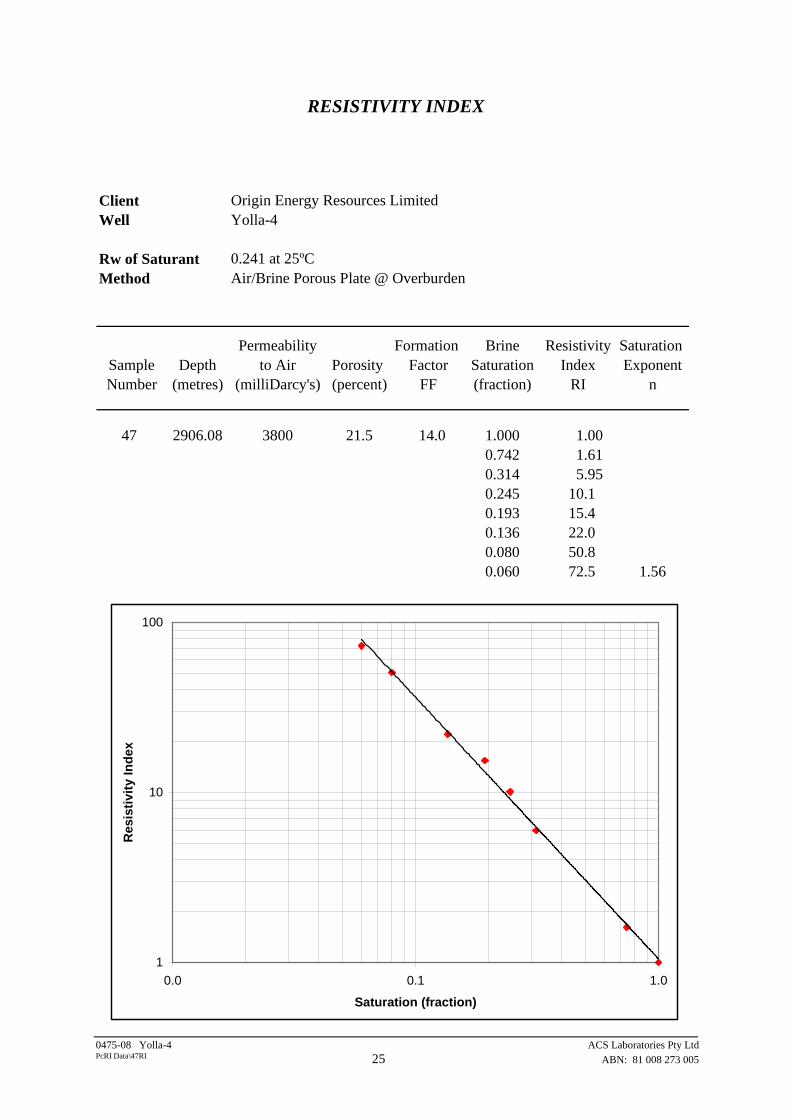
RESISTIVITY INDEX Client Origin Energy Resources LimitedWell Yolla-4
Rw of Saturant 0.241 at 25ºCMethod Air/Brine Porous Plate @ Overburden
Permeability Formation Brine Resistivity Saturation Sample Depth to Air Porosity Factor Saturation Index ExponentNumber (metres) (milliDarcy's) (percent) FF (fraction) RI n
47 2906.08 3800 21.5 14.0 1.000 1.000.742 1.610.314 5.950.245 10.10.193 15.40.136 22.00.080 50.80.060 72.5 1.56
1
10
100
0.0 0.1 1.0
Saturation (fraction)
Res
istiv
ity In
dex
0475-08 Yolla-4 ACS Laboratories Pty Ltd
25 ABN: 81 008 273 005 PcRI Data\47RI
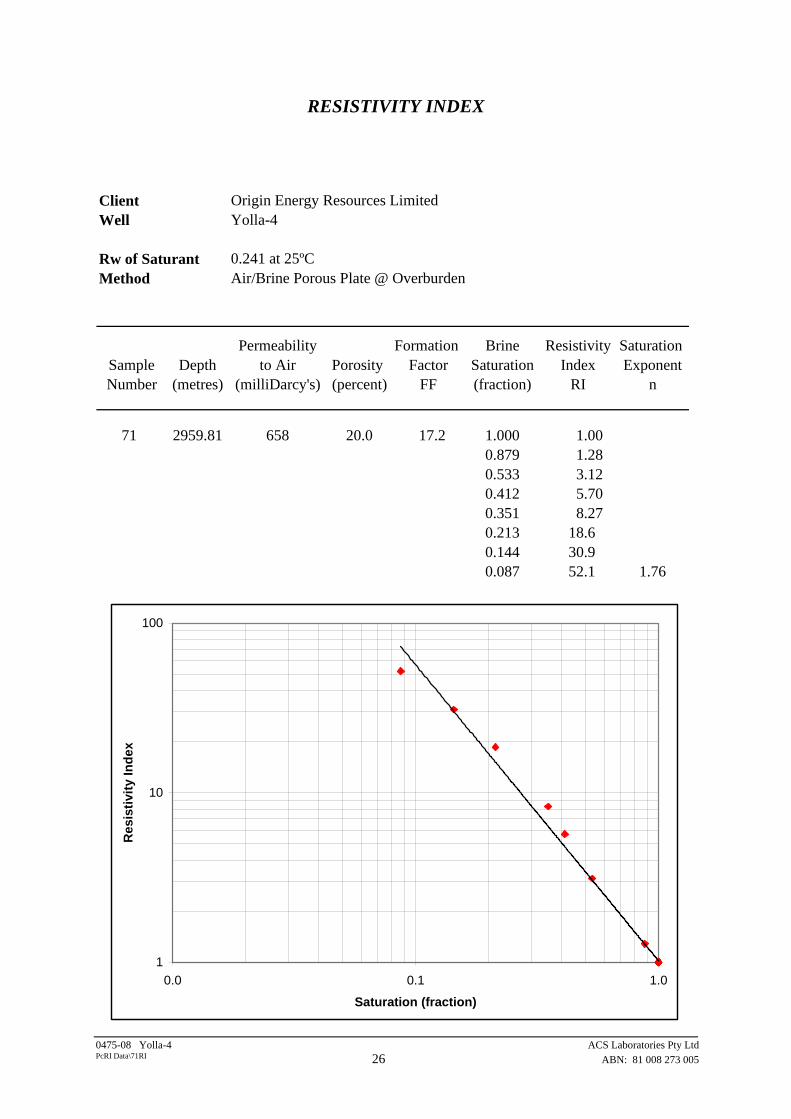
RESISTIVITY INDEX Client Origin Energy Resources LimitedWell Yolla-4
Rw of Saturant 0.241 at 25ºCMethod Air/Brine Porous Plate @ Overburden
Permeability Formation Brine Resistivity Saturation Sample Depth to Air Porosity Factor Saturation Index ExponentNumber (metres) (milliDarcy's) (percent) FF (fraction) RI n
71 2959.81 658 20.0 17.2 1.000 1.000.879 1.280.533 3.120.412 5.700.351 8.270.213 18.60.144 30.90.087 52.1 1.76
1
10
100
0.0 0.1 1.0
Saturation (fraction)
Res
istiv
ity In
dex
0475-08 Yolla-4 ACS Laboratories Pty Ltd
26 ABN: 81 008 273 005 PcRI Data\71RI
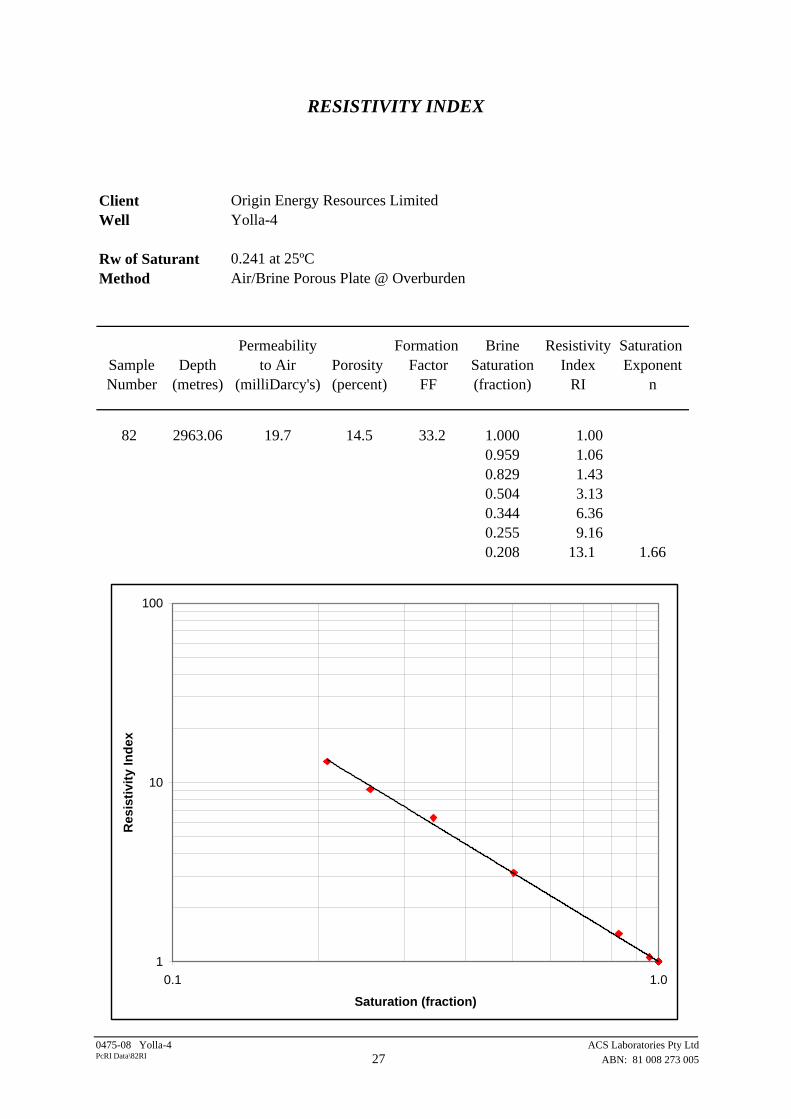
RESISTIVITY INDEX Client Origin Energy Resources LimitedWell Yolla-4
Rw of Saturant 0.241 at 25ºCMethod Air/Brine Porous Plate @ Overburden
Permeability Formation Brine Resistivity Saturation Sample Depth to Air Porosity Factor Saturation Index ExponentNumber (metres) (milliDarcy's) (percent) FF (fraction) RI n
82 2963.06 19.7 14.5 33.2 1.000 1.000.959 1.060.829 1.430.504 3.130.344 6.360.255 9.160.208 13.1 1.66
1
10
100
0.1 1.0
Saturation (fraction)
Res
istiv
ity In
dex
0475-08 Yolla-4 ACS Laboratories Pty Ltd
27 ABN: 81 008 273 005 PcRI Data\82RI
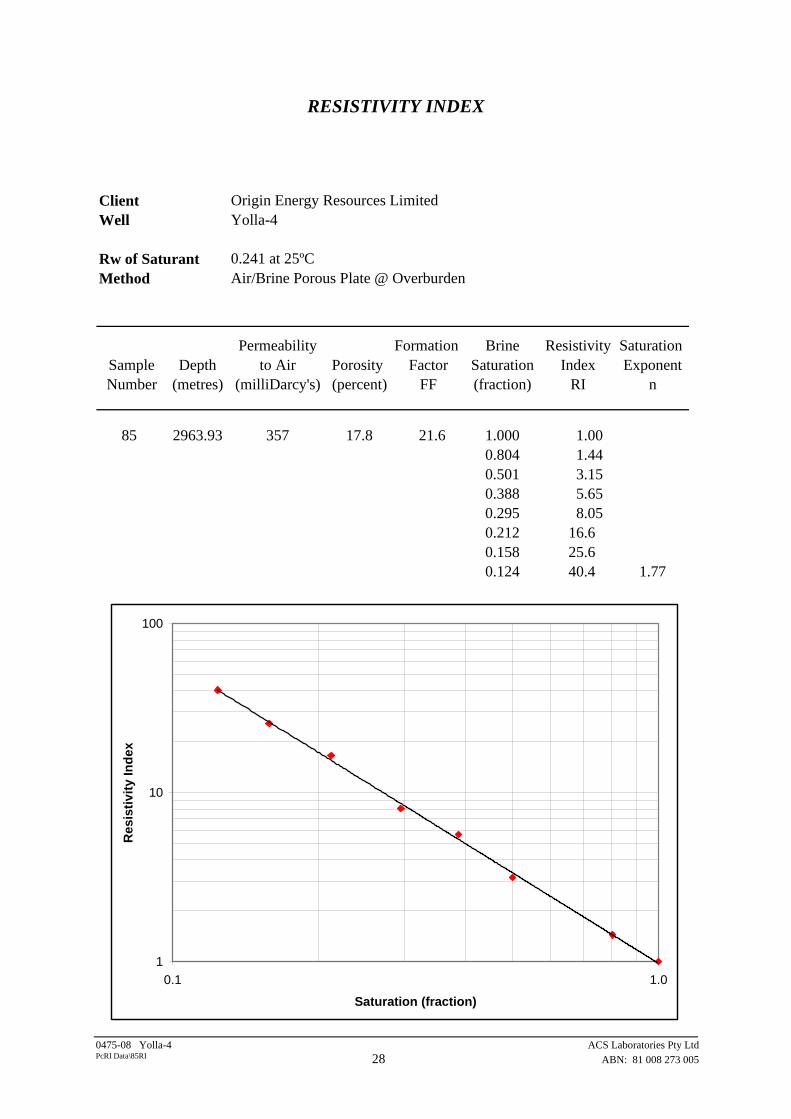
RESISTIVITY INDEX Client Origin Energy Resources LimitedWell Yolla-4
Rw of Saturant 0.241 at 25ºCMethod Air/Brine Porous Plate @ Overburden
Permeability Formation Brine Resistivity Saturation Sample Depth to Air Porosity Factor Saturation Index ExponentNumber (metres) (milliDarcy's) (percent) FF (fraction) RI n
85 2963.93 357 17.8 21.6 1.000 1.000.804 1.440.501 3.150.388 5.650.295 8.05 0.212 16.60.158 25.60.124 40.4 1.77
1
10
100
0.1 1.0
Saturation (fraction)
Res
istiv
ity In
dex
0475-08 Yolla-4 ACS Laboratories Pty Ltd
28 ABN: 81 008 273 005 PcRI Data\85RI
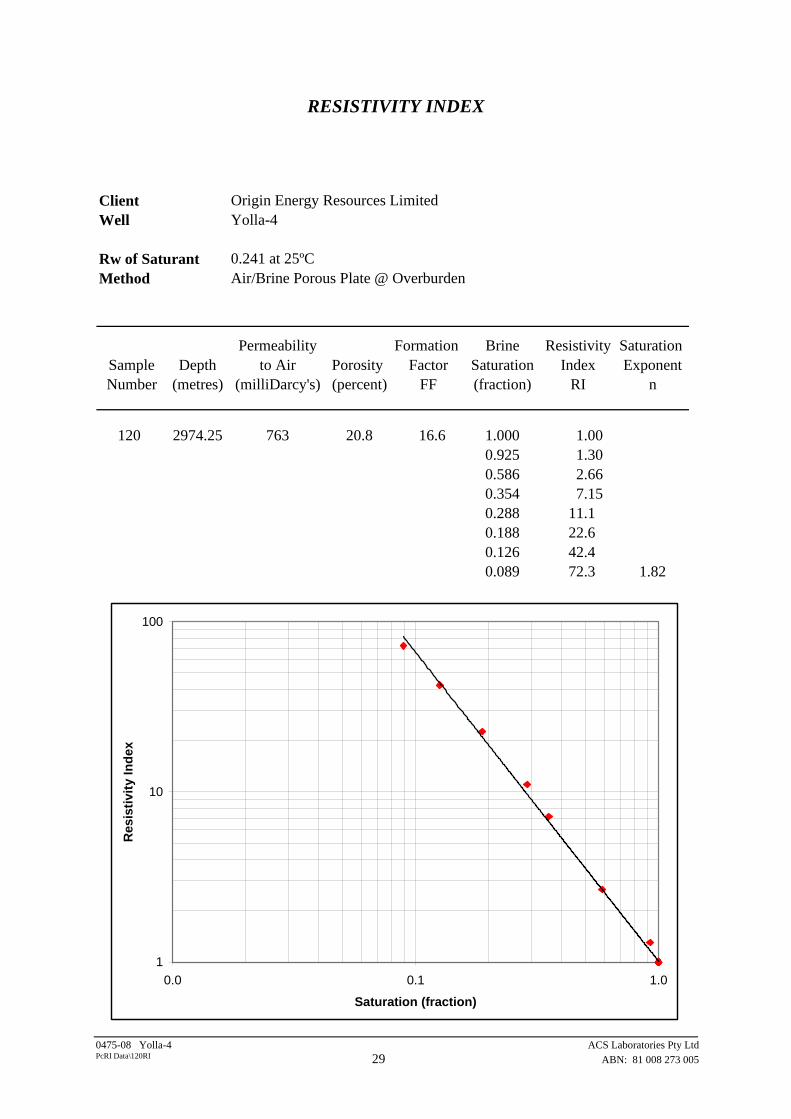
RESISTIVITY INDEX Client Origin Energy Resources LimitedWell Yolla-4
Rw of Saturant 0.241 at 25ºCMethod Air/Brine Porous Plate @ Overburden
Permeability Formation Brine Resistivity Saturation Sample Depth to Air Porosity Factor Saturation Index ExponentNumber (metres) (milliDarcy's) (percent) FF (fraction) RI n
120 2974.25 763 20.8 16.6 1.000 1.000.925 1.300.586 2.660.354 7.150.288 11.10.188 22.60.126 42.40.089 72.3 1.82
1
10
100
0.0 0.1 1.0
Saturation (fraction)
Res
istiv
ity In
dex
0475-08 Yolla-4 ACS Laboratories Pty Ltd
29 ABN: 81 008 273 005 PcRI Data\120RI
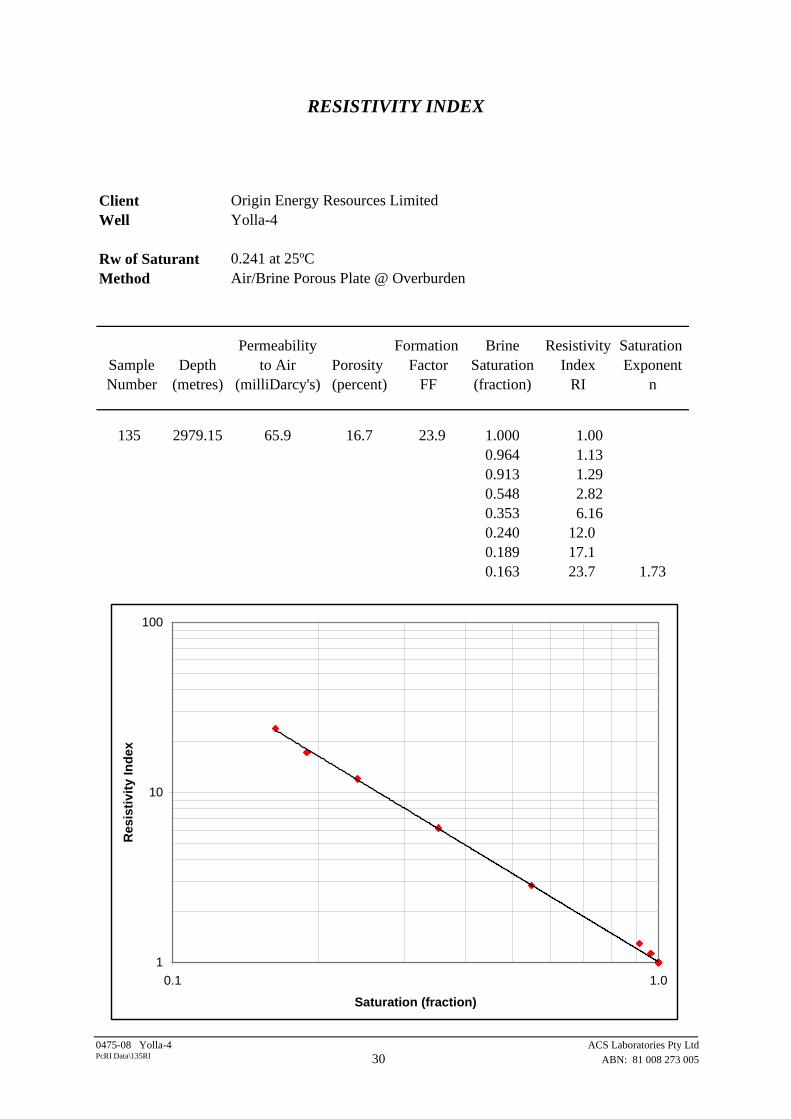
RESISTIVITY INDEX Client Origin Energy Resources LimitedWell Yolla-4
Rw of Saturant 0.241 at 25ºCMethod Air/Brine Porous Plate @ Overburden
Permeability Formation Brine Resistivity Saturation Sample Depth to Air Porosity Factor Saturation Index ExponentNumber (metres) (milliDarcy's) (percent) FF (fraction) RI n
135 2979.15 65.9 16.7 23.9 1.000 1.000.964 1.130.913 1.290.548 2.820.353 6.160.240 12.00.189 17.10.163 23.7 1.73
1
10
100
0.1 1.0
Saturation (fraction)
Res
istiv
ity In
dex
0475-08 Yolla-4 ACS Laboratories Pty Ltd
30 ABN: 81 008 273 005 PcRI Data\135RI
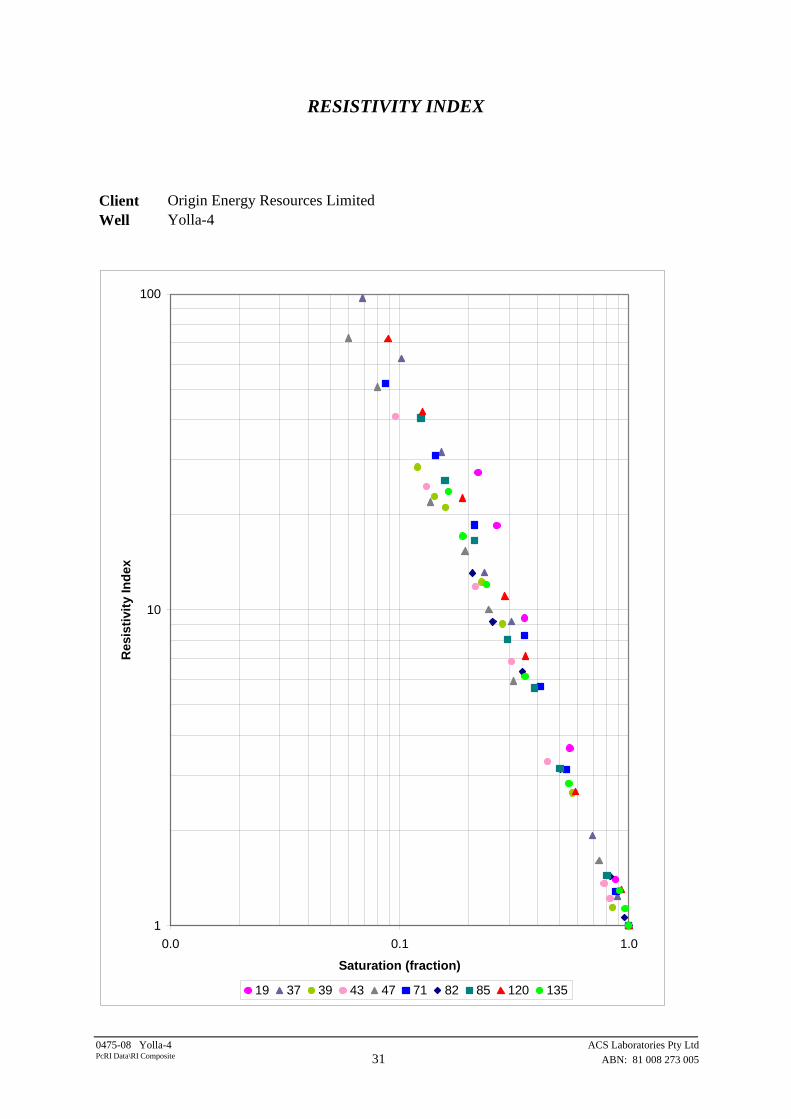
RESISTIVITY INDEX Client Origin Energy Resources LimitedWell Yolla-4
1
10
100
0.0 0.1 1.0
Saturation (fraction)
Res
istiv
ity In
dex
19 37 39 43 47 71 82 85 120 135
0475-08 Yolla-4 ACS Laboratories Pty Ltd
31 ABN: 81 008 273 005 PcRI Data\RI Composite

0475-08 Yolla-4 ACS Laboratories Pty Ltd 32 ABN: 81 008 273 005
CHAPTER 4
ELECTRICAL PROPERTIES AND CAPILLARY PRESSURE
4.2 Test Results
4.2.3 Capillary Pressure
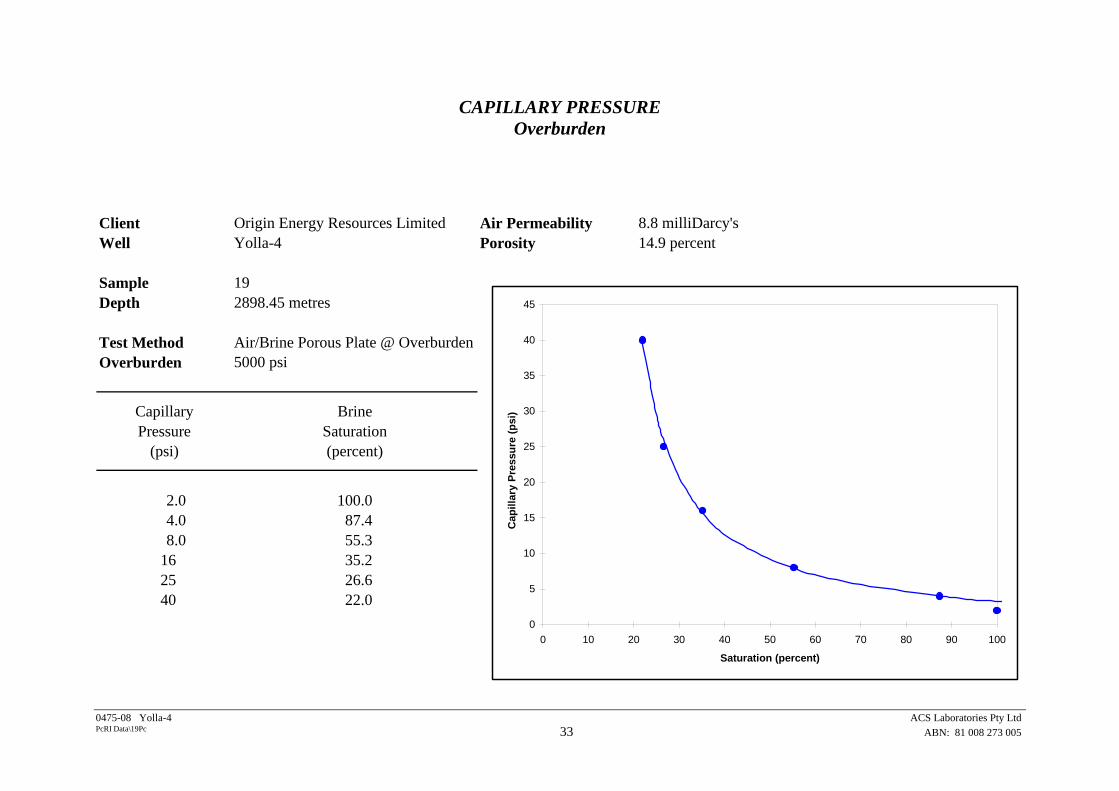
CAPILLARY PRESSURE Overburden
Client Origin Energy Resources Limited Air Permeability 8.8 milliDarcy'sWell Yolla-4 Porosity 14.9 percent
Sample 19Depth 2898.45 metres
Test Method Air/Brine Porous Plate @ OverburdenOverburden 5000 psi
Capillary BrinePressure Saturation
(psi) (percent)
2.0 100.04.0 87.48.0 55.3
16 35.225 26.640 22.0
0
5
10
15
20
25
30
35
40
45
0 10 20 30 40 50 60 70 80 90 100
Saturation (percent)
Cap
illar
y Pr
essu
re (p
si)
..
0475-08 Yolla-4 ACS Laboratories Pty Ltd 33 ABN: 81 008 273 005 PcRI Data\19Pc
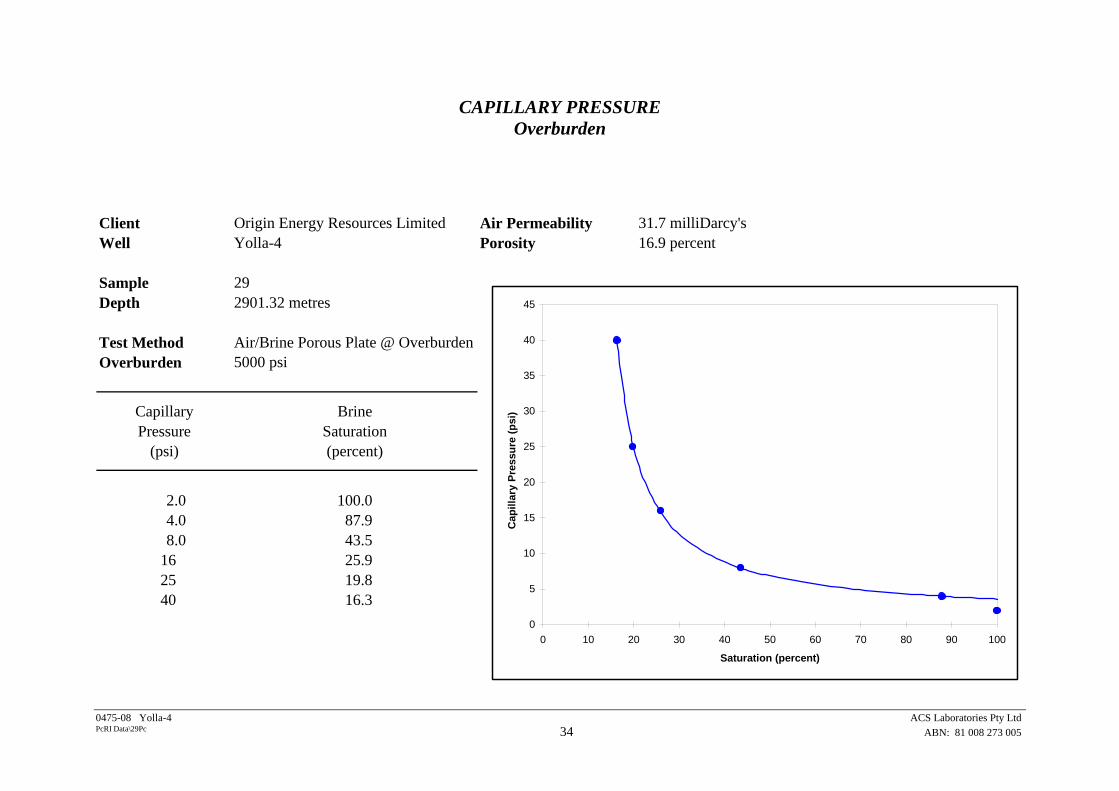
CAPILLARY PRESSURE Overburden
Client Origin Energy Resources Limited Air Permeability 31.7 milliDarcy'sWell Yolla-4 Porosity 16.9 percent
Sample 29Depth 2901.32 metres
Test Method Air/Brine Porous Plate @ OverburdenOverburden 5000 psi
Capillary BrinePressure Saturation
(psi) (percent)
2.0 100.04.0 87.98.0 43.5
16 25.925 19.840 16.3
0
5
10
15
20
25
30
35
40
45
0 10 20 30 40 50 60 70 80 90 100
Saturation (percent)
Cap
illar
y Pr
essu
re (p
si)
..
0475-08 Yolla-4 ACS Laboratories Pty Ltd 34 ABN: 81 008 273 005 PcRI Data\29Pc
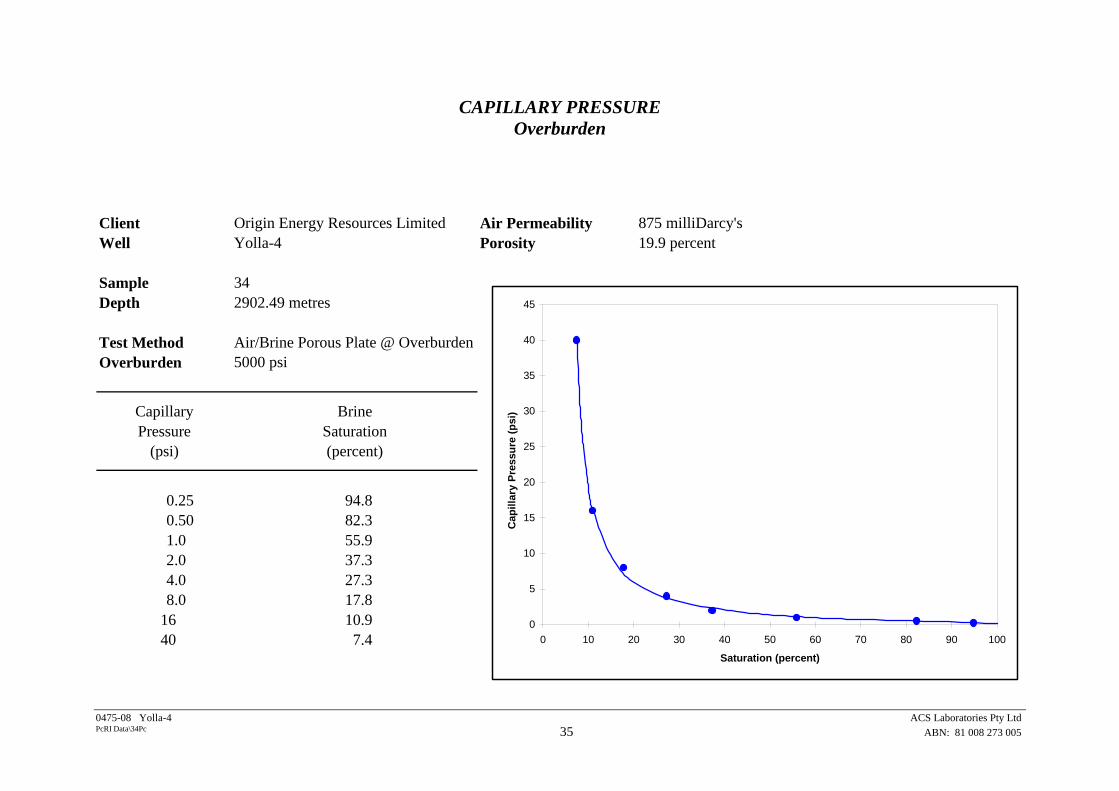
CAPILLARY PRESSURE Overburden
Client Origin Energy Resources Limited Air Permeability 875 milliDarcy'sWell Yolla-4 Porosity 19.9 percent
Sample 34Depth 2902.49 metres
Test Method Air/Brine Porous Plate @ OverburdenOverburden 5000 psi
Capillary BrinePressure Saturation
(psi) (percent)
0.25 94.80.50 82.31.0 55.92.0 37.34.0 27.38.0 17.8
16 10.940 7.4
0
5
10
15
20
25
30
35
40
45
0 10 20 30 40 50 60 70 80 90 100
Saturation (percent)
Cap
illar
y Pr
essu
re (p
si)
..
0475-08 Yolla-4 ACS Laboratories Pty Ltd 35 ABN: 81 008 273 005 PcRI Data\34Pc
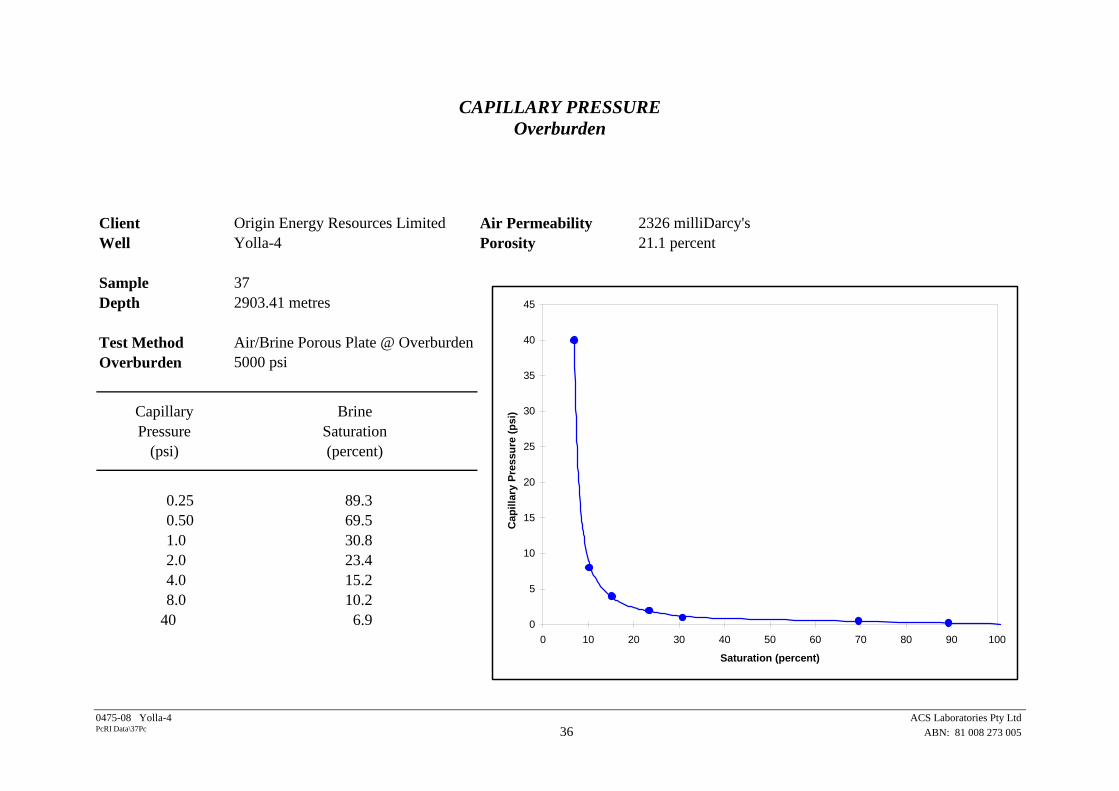
CAPILLARY PRESSURE Overburden
Client Origin Energy Resources Limited Air Permeability 2326 milliDarcy'sWell Yolla-4 Porosity 21.1 percent
Sample 37Depth 2903.41 metres
Test Method Air/Brine Porous Plate @ OverburdenOverburden 5000 psi
Capillary BrinePressure Saturation
(psi) (percent)
0.25 89.30.50 69.51.0 30.82.0 23.44.0 15.28.0 10.2
40 6.9 0
5
10
15
20
25
30
35
40
45
0 10 20 30 40 50 60 70 80 90 100
Saturation (percent)
Cap
illar
y Pr
essu
re (p
si)
..
0475-08 Yolla-4 ACS Laboratories Pty Ltd 36 ABN: 81 008 273 005 PcRI Data\37Pc

CAPILLARY PRESSURE Overburden
Client Origin Energy Resources Limited Air Permeability 1325 milliDarcy'sWell Yolla-4 Porosity 19.8 percent
Sample 39Depth 2903.92 metres
Test Method Air/Brine Porous Plate @ OverburdenOverburden 5000 psi
Capillary BrinePressure Saturation
(psi) (percent)
0.50 85.11.0 56.62.0 28.24.0 22.98.0 15.9
16 14.240 12.0 0
5
10
15
20
25
30
35
40
45
0 10 20 30 40 50 60 70 80 90 100
Saturation (percent)
Cap
illar
y Pr
essu
re (p
si)
..
0475-08 Yolla-4 ACS Laboratories Pty Ltd 37 ABN: 81 008 273 005 PcRI Data\39Pc

CAPILLARY PRESSURE Overburden
Client Origin Energy Resources Limited Air Permeability 2386 milliDarcy'sWell Yolla-4 Porosity 22.0 percent
Sample 43Depth 2904.98 metres
Test Method Air/Brine Porous Plate @ OverburdenOverburden 5000 psi
Capillary BrinePressure Saturation
(psi) (percent)
0.25 82.70.50 78.01.0 44.22.0 30.84.0 21.4
16 13.140 9.6 0
5
10
15
20
25
30
35
40
45
0 10 20 30 40 50 60 70 80 90 100
Saturation (percent)
Cap
illar
y Pr
essu
re (p
si)
..
0475-08 Yolla-4 ACS Laboratories Pty Ltd 38 ABN: 81 008 273 005 PcRI Data\43Pc
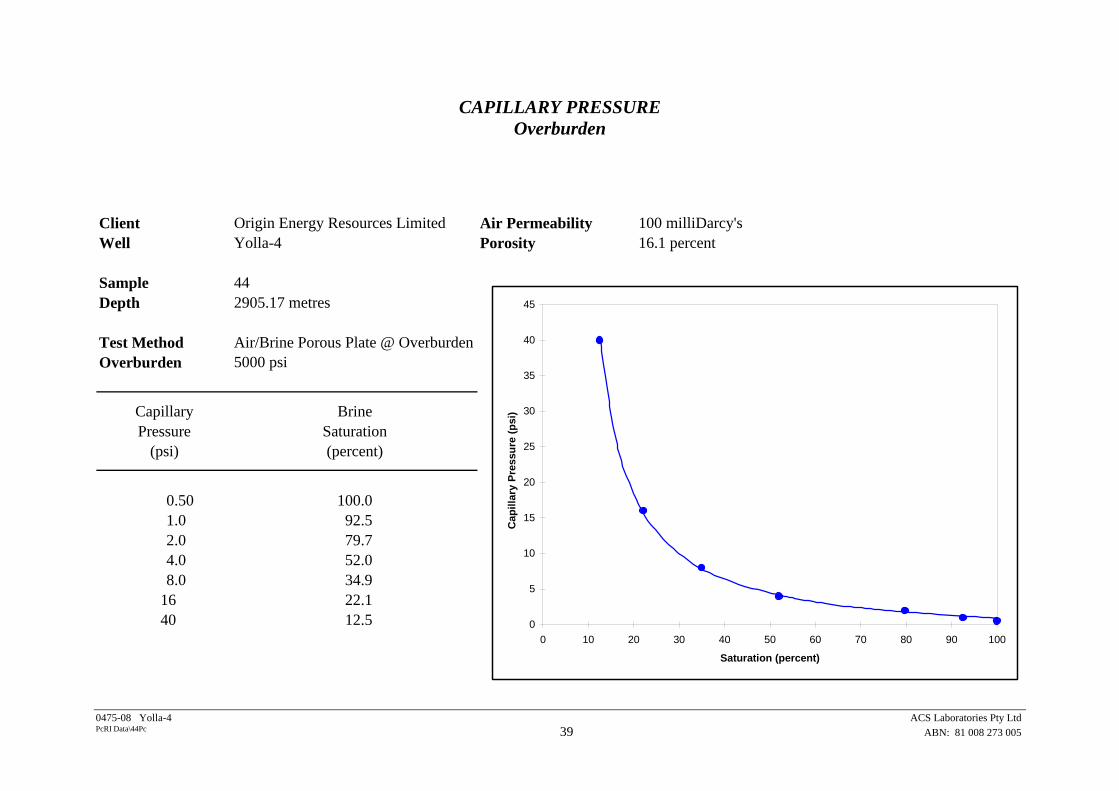
CAPILLARY PRESSURE Overburden
Client Origin Energy Resources Limited Air Permeability 100 milliDarcy'sWell Yolla-4 Porosity 16.1 percent
Sample 44Depth 2905.17 metres
Test Method Air/Brine Porous Plate @ OverburdenOverburden 5000 psi
Capillary BrinePressure Saturation
(psi) (percent)
0.50 100.01.0 92.52.0 79.74.0 52.08.0 34.9
16 22.140 12.5 0
5
10
15
20
25
30
35
40
45
0 10 20 30 40 50 60 70 80 90 100
Saturation (percent)
Cap
illar
y Pr
essu
re (p
si)
..
0475-08 Yolla-4 ACS Laboratories Pty Ltd 39 ABN: 81 008 273 005 PcRI Data\44Pc
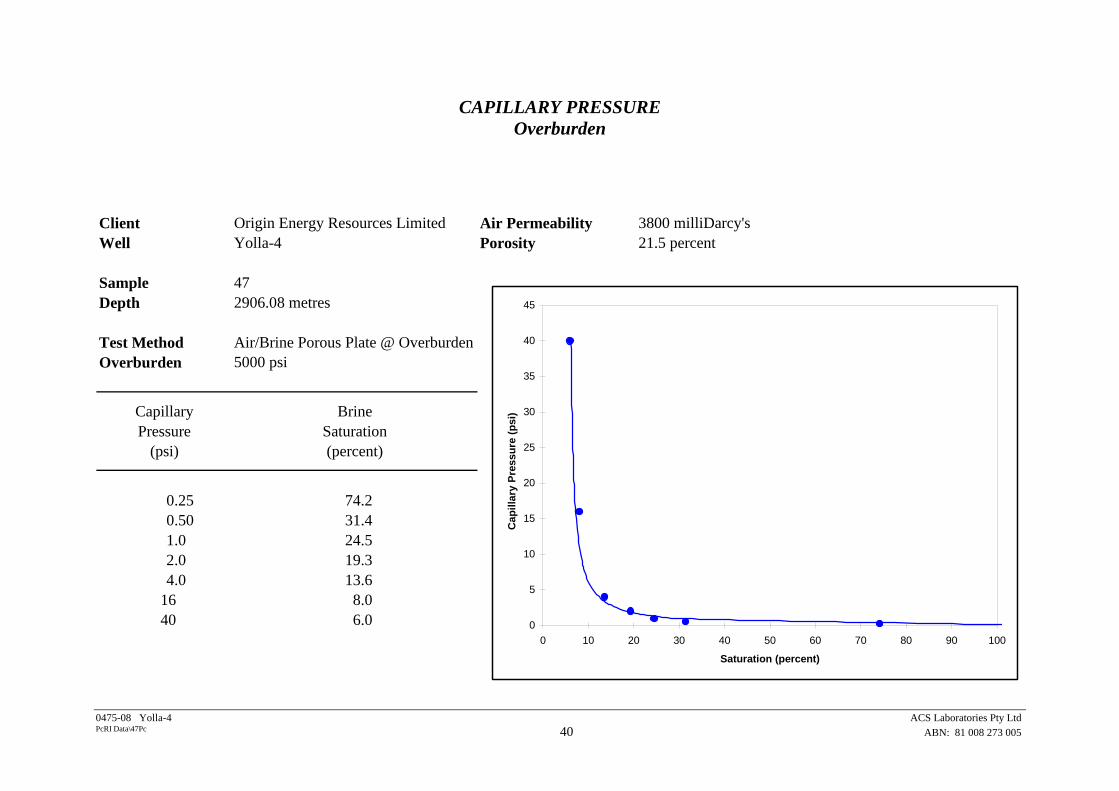
CAPILLARY PRESSURE Overburden
Client Origin Energy Resources Limited Air Permeability 3800 milliDarcy'sWell Yolla-4 Porosity 21.5 percent
Sample 47Depth 2906.08 metres
Test Method Air/Brine Porous Plate @ OverburdenOverburden 5000 psi
Capillary BrinePressure Saturation
(psi) (percent)
0.25 74.20.50 31.41.0 24.52.0 19.34.0 13.6
16 8.040 6.0 0
5
10
15
20
25
30
35
40
45
0 10 20 30 40 50 60 70 80 90 100
Saturation (percent)
Cap
illar
y Pr
essu
re (p
si)
..
0475-08 Yolla-4 ACS Laboratories Pty Ltd 40 ABN: 81 008 273 005 PcRI Data\47Pc
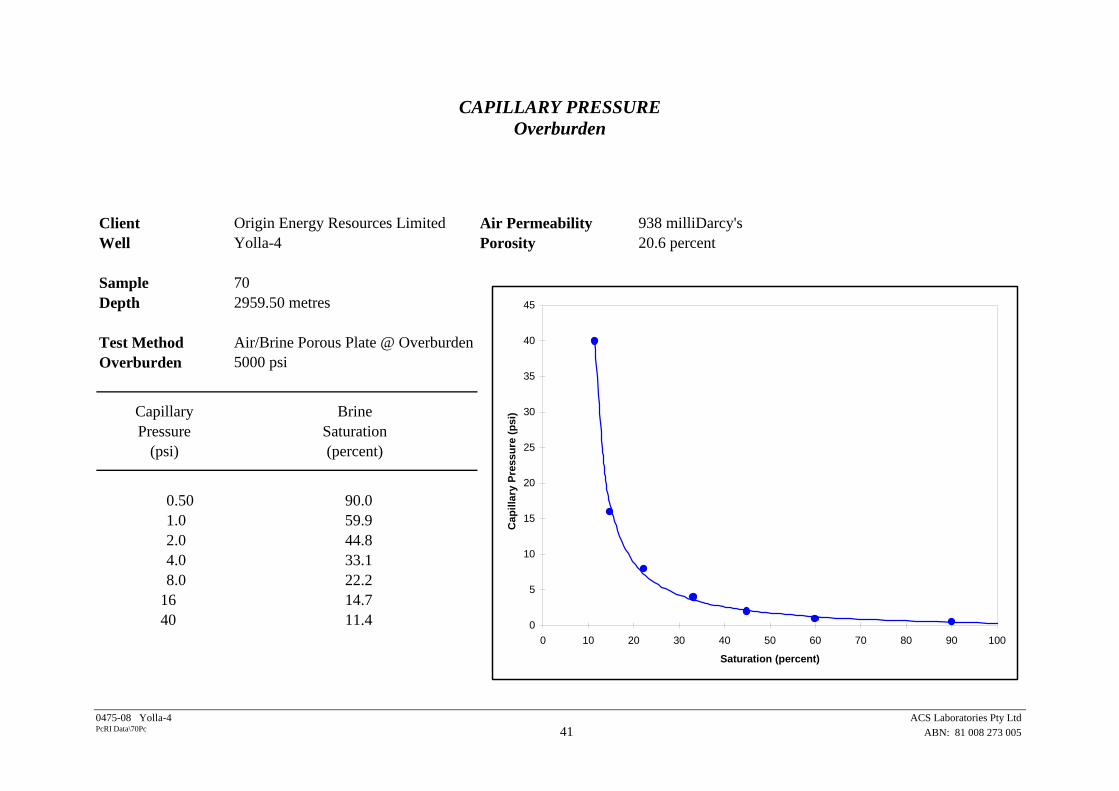
CAPILLARY PRESSURE Overburden
Client Origin Energy Resources Limited Air Permeability 938 milliDarcy'sWell Yolla-4 Porosity 20.6 percent
Sample 70Depth 2959.50 metres
Test Method Air/Brine Porous Plate @ OverburdenOverburden 5000 psi
Capillary BrinePressure Saturation
(psi) (percent)
0.50 90.01.0 59.92.0 44.84.0 33.18.0 22.2
16 14.740 11.4 0
5
10
15
20
25
30
35
40
45
0 10 20 30 40 50 60 70 80 90 100
Saturation (percent)
Cap
illar
y Pr
essu
re (p
si)
..
0475-08 Yolla-4 ACS Laboratories Pty Ltd 41 ABN: 81 008 273 005 PcRI Data\70Pc

CAPILLARY PRESSURE Overburden
Client Origin Energy Resources Limited Air Permeability 658 milliDarcy'sWell Yolla-4 Porosity 20.0 percent
Sample 71Depth 2959.81 metres
Test Method Air/Brine Porous Plate @ OverburdenOverburden 5000 psi
Capillary BrinePressure Saturation
(psi) (percent)
0.50 87.91.0 53.32.0 41.24.0 35.18.0 21.3
16 14.440 8.7 0
5
10
15
20
25
30
35
40
45
0 10 20 30 40 50 60 70 80 90 100
Saturation (percent)
Cap
illar
y Pr
essu
re (p
si)
..
0475-08 Yolla-4 ACS Laboratories Pty Ltd 42 ABN: 81 008 273 005 PcRI Data\71Pc

CAPILLARY PRESSURE Overburden
Client Origin Energy Resources Limited Air Permeability 350 milliDarcy'sWell Yolla-4 Porosity 17.9 percent
Sample 75Depth 2960.95 metres
Test Method Air/Brine Porous Plate @ OverburdenOverburden 5000 psi
Capillary BrinePressure Saturation
(psi) (percent)
0.25 96.10.50 89.31.0 65.12.0 51.54.0 35.18.0 21.5
40 9.8 0
5
10
15
20
25
30
35
40
45
0 10 20 30 40 50 60 70 80 90 100
Saturation (percent)
Cap
illar
y Pr
essu
re (p
si)
..
0475-08 Yolla-4 ACS Laboratories Pty Ltd 43 ABN: 81 008 273 005 PcRI Data\75Pc

CAPILLARY PRESSURE Overburden
Client Origin Energy Resources Limited Air Permeability 593 milliDarcy'sWell Yolla-4 Porosity 18.9 percent
Sample 78Depth 2961.87 metres
Test Method Air/Brine Porous Plate @ OverburdenOverburden 5000 psi
Capillary BrinePressure Saturation
(psi) (percent)
0.25 93.10.50 77.81.0 52.92.0 42.34.0 33.58.0 22.9
40 11.8 0
5
10
15
20
25
30
35
40
45
0 10 20 30 40 50 60 70 80 90 100
Saturation (percent)
Cap
illar
y Pr
essu
re (p
si)
..
0475-08 Yolla-4 ACS Laboratories Pty Ltd 44 ABN: 81 008 273 005 PcRI Data\78Pc
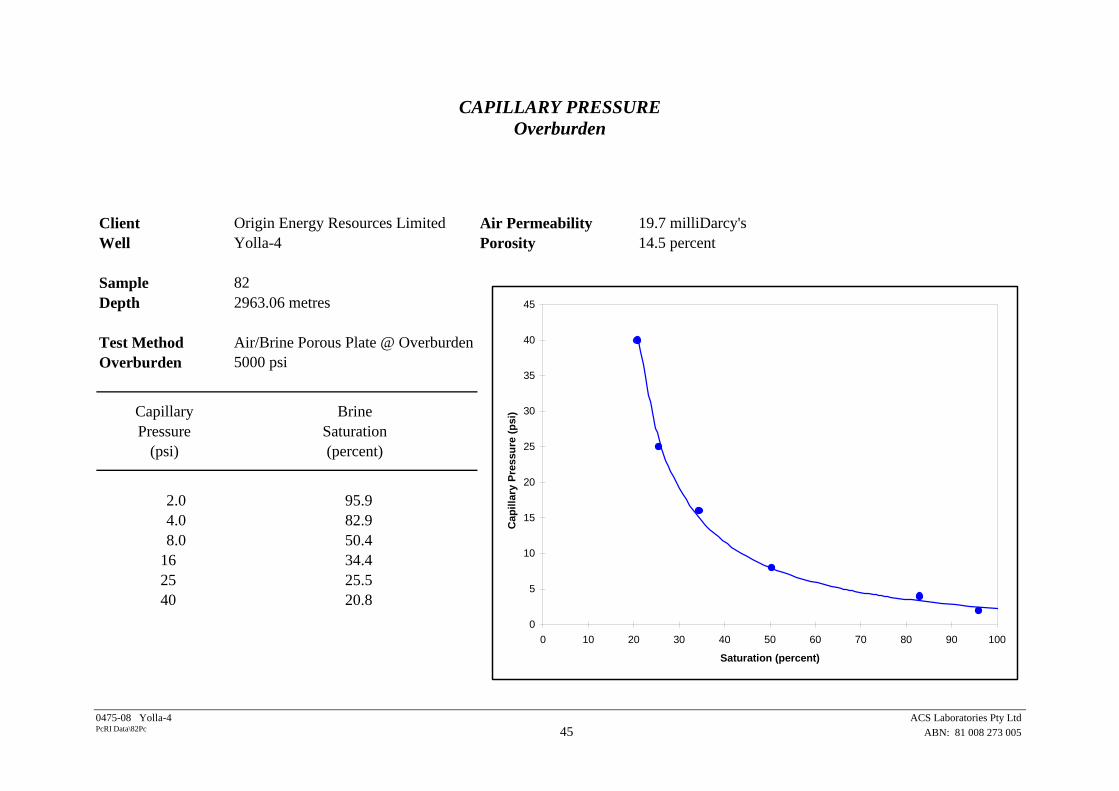
CAPILLARY PRESSURE Overburden
Client Origin Energy Resources Limited Air Permeability 19.7 milliDarcy'sWell Yolla-4 Porosity 14.5 percent
Sample 82Depth 2963.06 metres
Test Method Air/Brine Porous Plate @ OverburdenOverburden 5000 psi
Capillary BrinePressure Saturation
(psi) (percent)
2.0 95.94.0 82.98.0 50.4
16 34.425 25.540 20.8
0
5
10
15
20
25
30
35
40
45
0 10 20 30 40 50 60 70 80 90 100
Saturation (percent)
Cap
illar
y Pr
essu
re (p
si)
..
0475-08 Yolla-4 ACS Laboratories Pty Ltd 45 ABN: 81 008 273 005 PcRI Data\82Pc

CAPILLARY PRESSURE Overburden
Client Origin Energy Resources Limited Air Permeability 357 milliDarcy'sWell Yolla-4 Porosity 17.8 percent
Sample 85Depth 2963.93 metres
Test Method Air/Brine Porous Plate @ OverburdenOverburden 5000 psi
Capillary BrinePressure Saturation
(psi) (percent)
0.50 80.41.0 50.12.0 38.84.0 29.58.0 21.2
16 15.840 12.4 0
5
10
15
20
25
30
35
40
45
0 10 20 30 40 50 60 70 80 90 100
Saturation (percent)
Cap
illar
y Pr
essu
re (p
si)
..
0475-08 Yolla-4 ACS Laboratories Pty Ltd 46 ABN: 81 008 273 005 PcRI Data\85Pc

CAPILLARY PRESSURE Overburden
Client Origin Energy Resources Limited Air Permeability 149 milliDarcy'sWell Yolla-4 Porosity 18.4 percent
Sample 98Depth 2967.87 metres
Test Method Air/Brine Porous Plate @ OverburdenOverburden 5000 psi
Capillary BrinePressure Saturation
(psi) (percent)
1.0 97.22.0 68.74.0 53.28.0 34.3
16 22.425 16.340 12.1 0
5
10
15
20
25
30
35
40
45
0 10 20 30 40 50 60 70 80 90 100
Saturation (percent)
Cap
illar
y Pr
essu
re (p
si)
..
0475-08 Yolla-4 ACS Laboratories Pty Ltd 47 ABN: 81 008 273 005 PcRI Data\98Pc

CAPILLARY PRESSURE Overburden
Client Origin Energy Resources Limited Air Permeability 534 milliDarcy'sWell Yolla-4 Porosity 17.5 percent
Sample 115Depth 2972.75 metres
Test Method Air/Brine Porous Plate @ OverburdenOverburden 5000 psi
Capillary BrinePressure Saturation
(psi) (percent)
0.50 96.21.0 71.72.0 57.04.0 40.58.0 26.7
16 15.340 8.3 0
5
10
15
20
25
30
35
40
45
0 10 20 30 40 50 60 70 80 90 100
Saturation (percent)
Cap
illar
y Pr
essu
re (p
si)
..
0475-08 Yolla-4 ACS Laboratories Pty Ltd 48 ABN: 81 008 273 005 PcRI Data\115Pc

CAPILLARY PRESSURE Overburden
Client Origin Energy Resources Limited Air Permeability 258 milliDarcy'sWell Yolla-4 Porosity 18.1 percent
Sample 117Depth 2973.35 metres
Test Method Air/Brine Porous Plate @ OverburdenOverburden 5000 psi
Capillary BrinePressure Saturation
(psi) (percent)
0.25 97.10.50 88.61.0 65.82.0 43.44.0 34.48.0 22.0
40 12.5 0
5
10
15
20
25
30
35
40
45
0 10 20 30 40 50 60 70 80 90 100
Saturation (percent)
Cap
illar
y Pr
essu
re (p
si)
..
0475-08 Yolla-4 ACS Laboratories Pty Ltd 49 ABN: 81 008 273 005 PcRI Data\117Pc
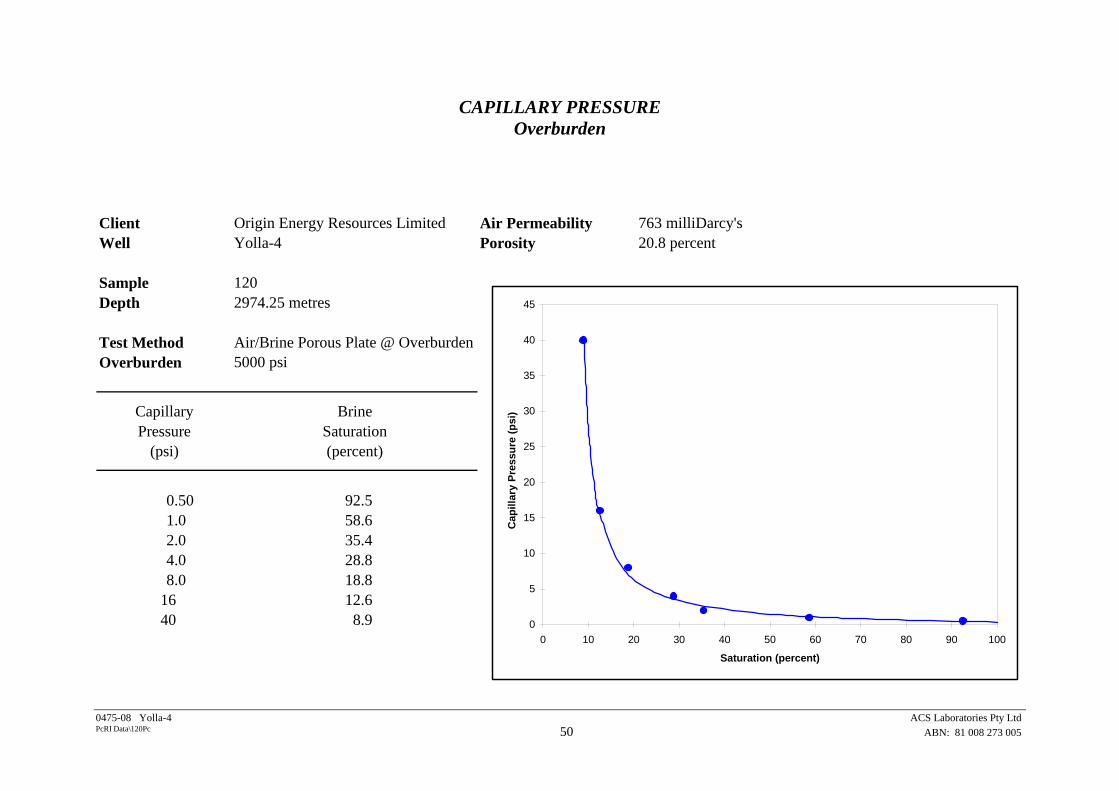
CAPILLARY PRESSURE Overburden
Client Origin Energy Resources Limited Air Permeability 763 milliDarcy'sWell Yolla-4 Porosity 20.8 percent
Sample 120Depth 2974.25 metres
Test Method Air/Brine Porous Plate @ OverburdenOverburden 5000 psi
Capillary BrinePressure Saturation
(psi) (percent)
0.50 92.51.0 58.62.0 35.44.0 28.88.0 18.8
16 12.640 8.9 0
5
10
15
20
25
30
35
40
45
0 10 20 30 40 50 60 70 80 90 100
Saturation (percent)
Cap
illar
y Pr
essu
re (p
si)
..
0475-08 Yolla-4 ACS Laboratories Pty Ltd 50 ABN: 81 008 273 005 PcRI Data\120Pc
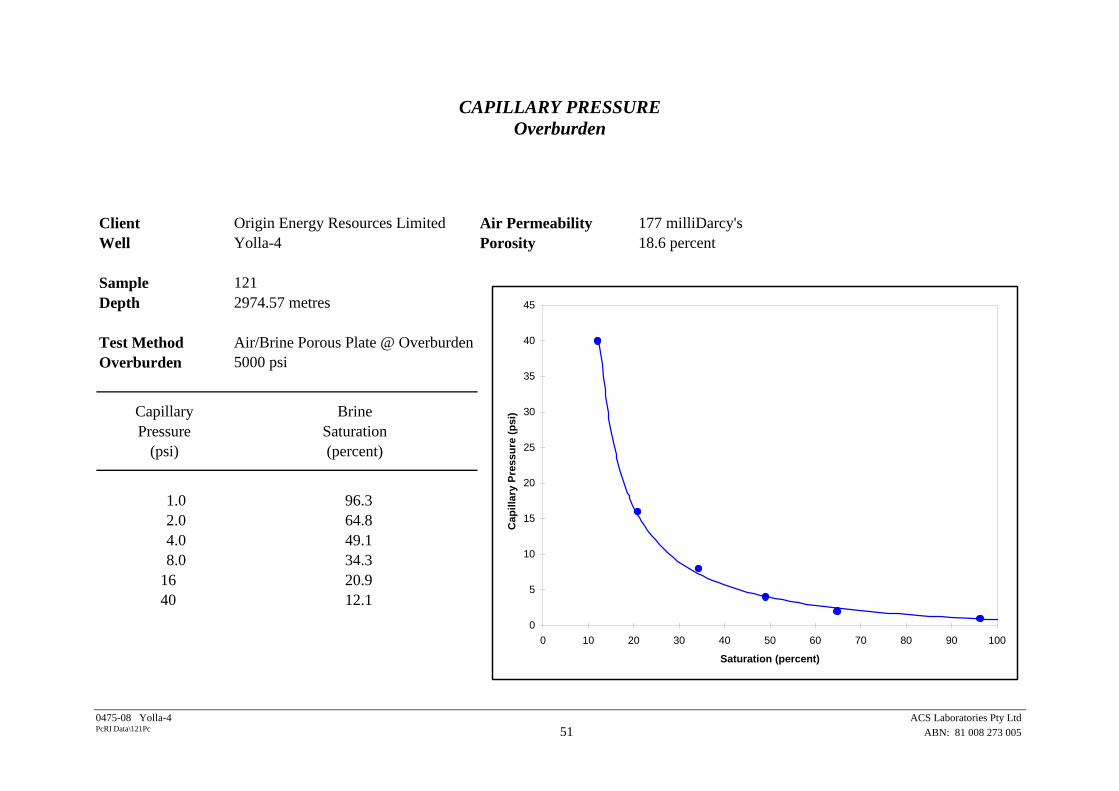
CAPILLARY PRESSURE Overburden
Client Origin Energy Resources Limited Air Permeability 177 milliDarcy'sWell Yolla-4 Porosity 18.6 percent
Sample 121Depth 2974.57 metres
Test Method Air/Brine Porous Plate @ OverburdenOverburden 5000 psi
Capillary BrinePressure Saturation
(psi) (percent)
1.0 96.32.0 64.84.0 49.18.0 34.3
16 20.940 12.1
0
5
10
15
20
25
30
35
40
45
0 10 20 30 40 50 60 70 80 90 100
Saturation (percent)
Cap
illar
y Pr
essu
re (p
si)
..
0475-08 Yolla-4 ACS Laboratories Pty Ltd 51 ABN: 81 008 273 005 PcRI Data\121Pc
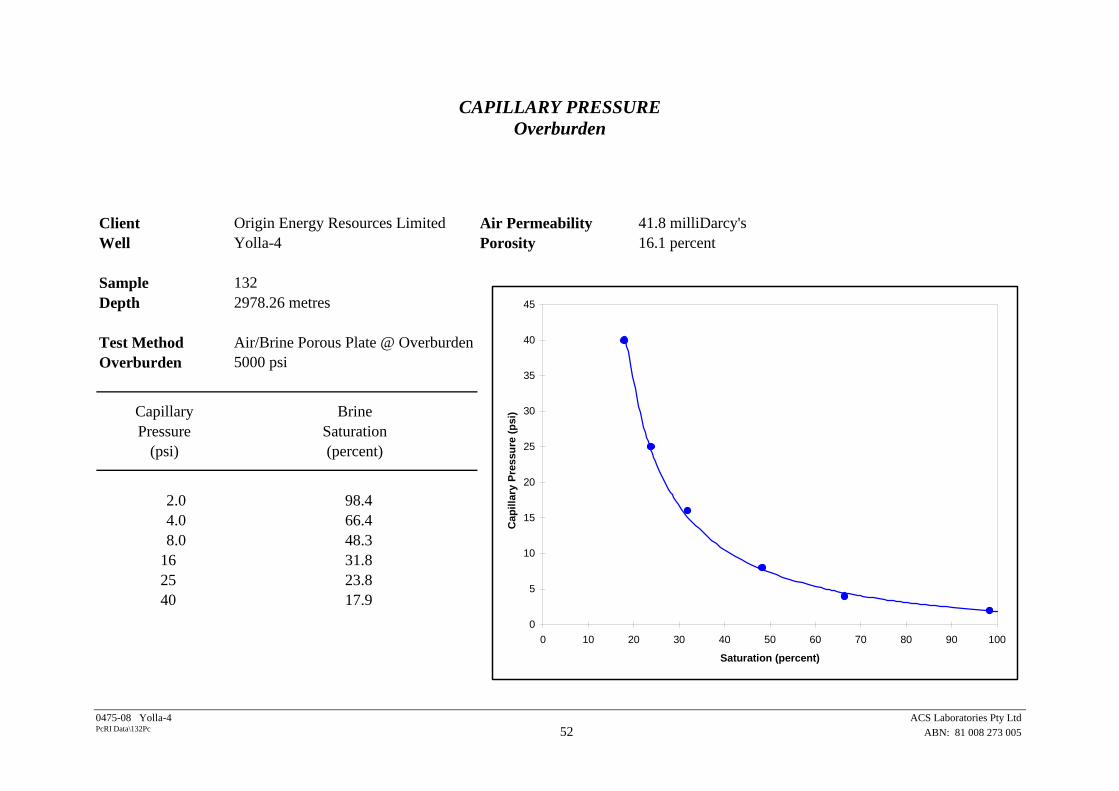
CAPILLARY PRESSURE Overburden
Client Origin Energy Resources Limited Air Permeability 41.8 milliDarcy'sWell Yolla-4 Porosity 16.1 percent
Sample 132Depth 2978.26 metres
Test Method Air/Brine Porous Plate @ OverburdenOverburden 5000 psi
Capillary BrinePressure Saturation
(psi) (percent)
2.0 98.44.0 66.48.0 48.3
16 31.825 23.840 17.9
0
5
10
15
20
25
30
35
40
45
0 10 20 30 40 50 60 70 80 90 100
Saturation (percent)
Cap
illar
y Pr
essu
re (p
si)
..
0475-08 Yolla-4 ACS Laboratories Pty Ltd 52 ABN: 81 008 273 005 PcRI Data\132Pc

CAPILLARY PRESSURE Overburden
Client Origin Energy Resources Limited Air Permeability 65.9 milliDarcy'sWell Yolla-4 Porosity 16.7 percent
Sample 135Depth 2979.15 metres
Test Method Air/Brine Porous Plate @ OverburdenOverburden 5000 psi
Capillary BrinePressure Saturation
(psi) (percent)
1.0 96.42.0 91.34.0 54.88.0 35.3
16 24.025 18.940 16.3 0
5
10
15
20
25
30
35
40
45
0 10 20 30 40 50 60 70 80 90 100
Saturation (percent)
Cap
illar
y Pr
essu
re (p
si)
..
0475-08 Yolla-4 ACS Laboratories Pty Ltd
53 ABN: 81 008 273 005 PcRI Data\135Pc
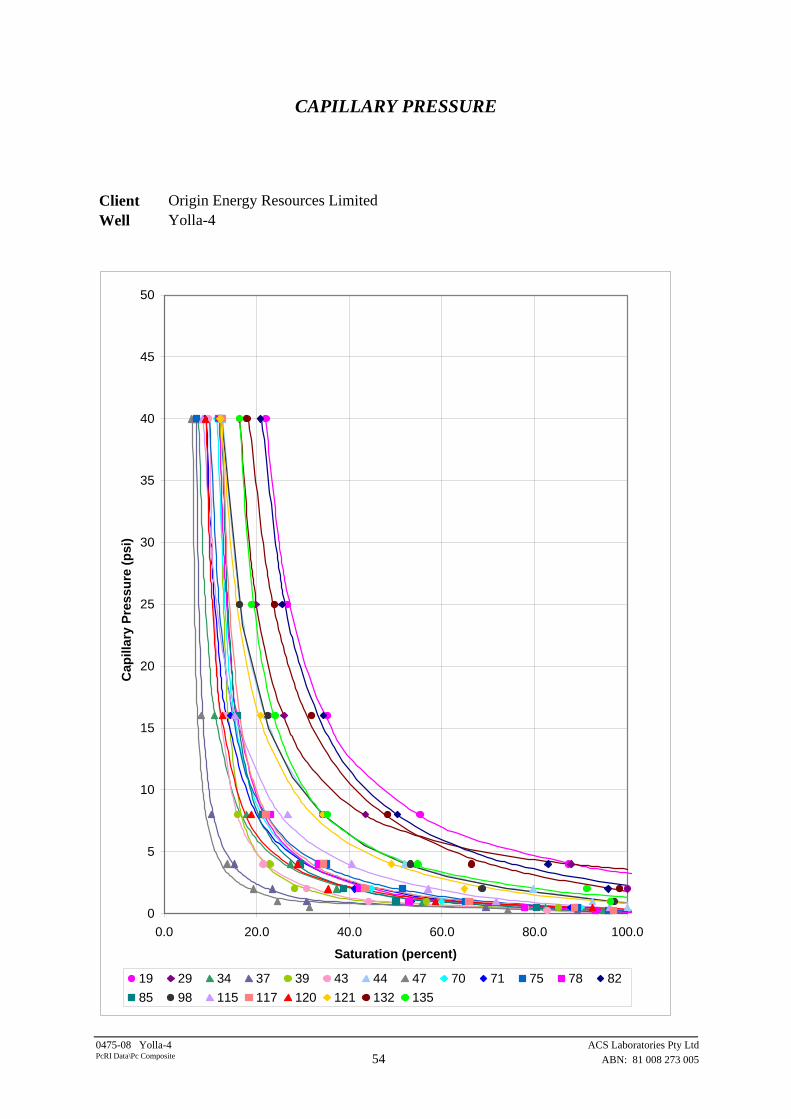
CAPILLARY PRESSURE Client Origin Energy Resources LimitedWell Yolla-4
0
5
10
15
20
25
30
35
40
45
50
0.0 20.0 40.0 60.0 80.0 100.0
Saturation (percent)
Cap
illar
y Pr
essu
re (p
si)
.
19 29 34 37 39 43 44 47 70 71 75 78 8285 98 115 117 120 121 132 135
0475-08 Yolla-4 ACS Laboratories Pty Ltd
54 ABN: 81 008 273 005 PcRI Data\Pc Composite
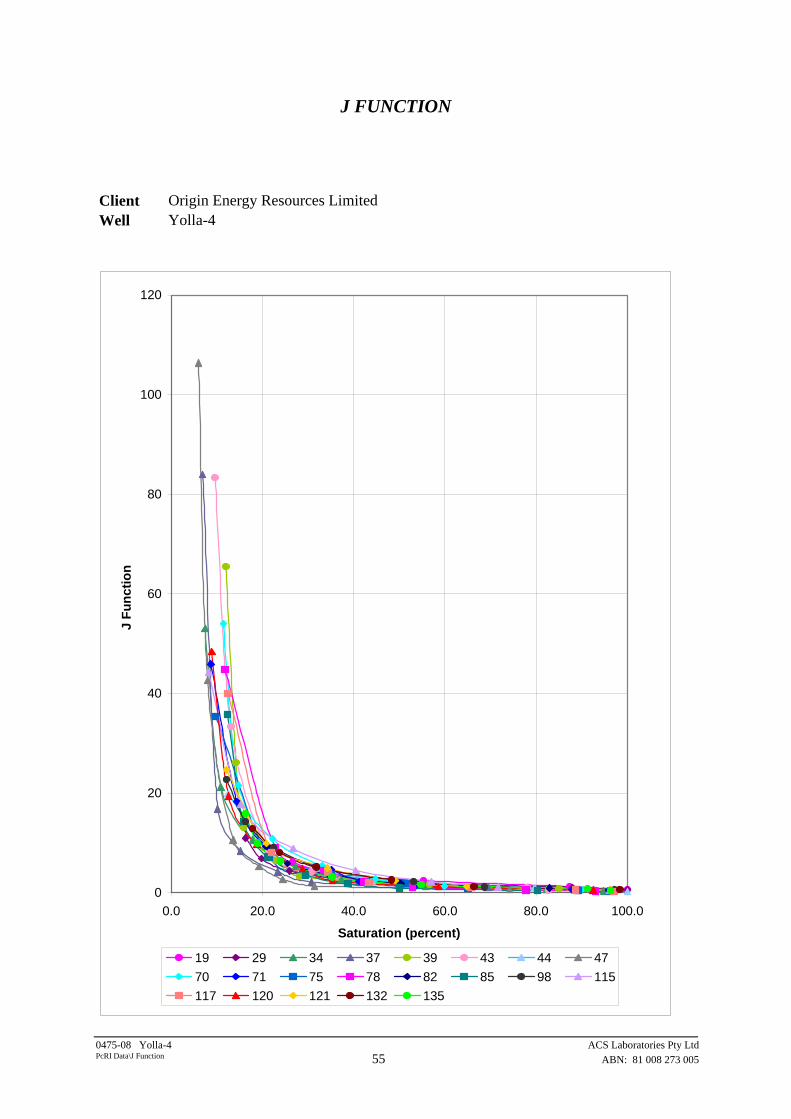
J FUNCTION Client Origin Energy Resources LimitedWell Yolla-4
0
20
40
60
80
100
120
0.0 20.0 40.0 60.0 80.0 100.0
Saturation (percent)
J Fu
nctio
n .
19 29 34 37 39 43 44 4770 71 75 78 82 85 98 115117 120 121 132 135
0475-08 Yolla-4 ACS Laboratories Pty Ltd
55 ABN: 81 008 273 005 PcRI Data\J Function
0475-08 Yolla-4 ACS Laboratories Pty Ltd 56 ABN: 81 008 273 005
CHAPTER 4
ELECTRICAL PROPERTIES AND CAPILLARY PRESSURE
4.2 Test Results
4.2.4 Cation Exchange Capacity
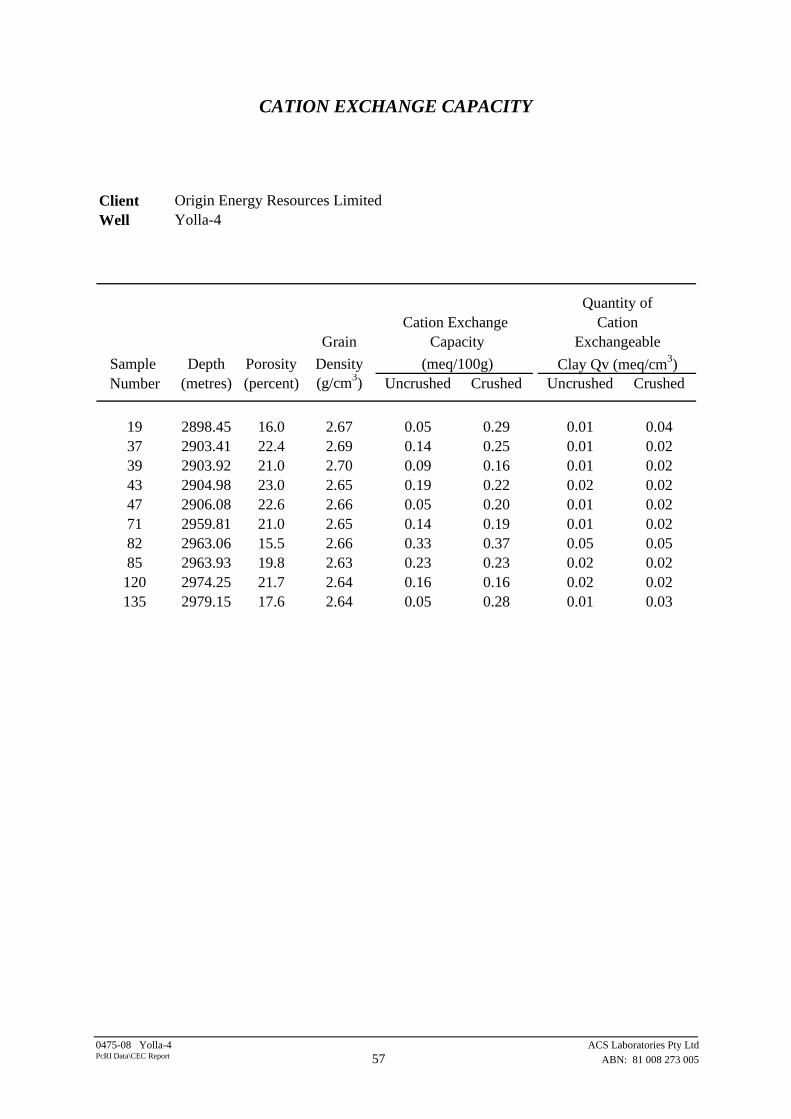
CATION EXCHANGE CAPACITY Client Origin Energy Resources LimitedWell Yolla-4
Quantity ofCation Exchange Cation
Grain Capacity ExchangeableSample Depth Porosity Density (meq/100g) Clay Qv (meq/cm3)Number (metres) (percent) (g/cm3) Uncrushed Crushed Uncrushed Crushed
19 2898.45 16.0 2.67 0.05 0.29 0.01 0.0437 2903.41 22.4 2.69 0.14 0.25 0.01 0.0239 2903.92 21.0 2.70 0.09 0.16 0.01 0.0243 2904.98 23.0 2.65 0.19 0.22 0.02 0.0247 2906.08 22.6 2.66 0.05 0.20 0.01 0.0271 2959.81 21.0 2.65 0.14 0.19 0.01 0.0282 2963.06 15.5 2.66 0.33 0.37 0.05 0.0585 2963.93 19.8 2.63 0.23 0.23 0.02 0.02120 2974.25 21.7 2.64 0.16 0.16 0.02 0.02135 2979.15 17.6 2.64 0.05 0.28 0.01 0.03
0475-08 Yolla-4 ACS Laboratories Pty Ltd 57 ABN: 81 008 273 005 PcRI Data\CEC Report
0475-08 Yolla-4 ACS Laboratories Pty Ltd 58 ABN: 81 008 273 005
CHAPTER 4
ELECTRICAL PROPERTIES AND CAPILLARY PRESSURE
4.2 Test Results
4.2.5 Summary
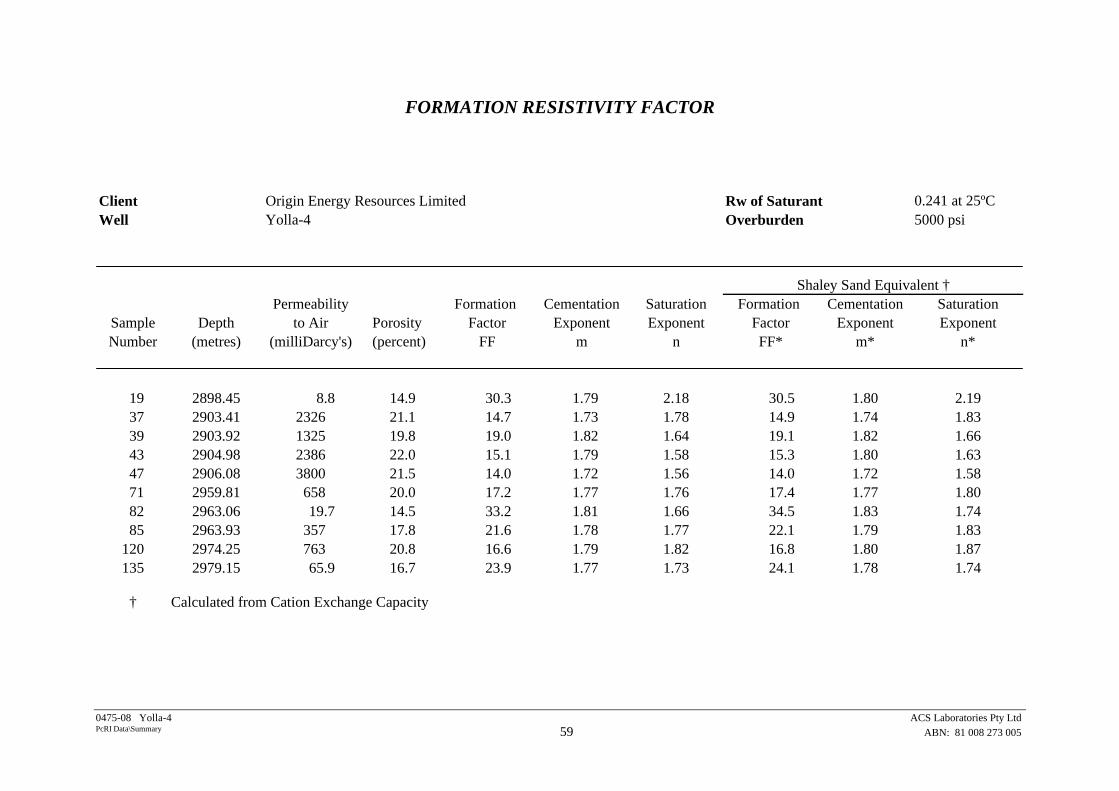
FORMATION RESISTIVITY FACTOR Client Origin Energy Resources Limited Rw of Saturant 0.241 at 25ºCWell Yolla-4 Overburden 5000 psi
Permeability Formation Cementation Saturation Formation Cementation SaturationSample Depth to Air Porosity Factor Exponent Exponent Factor Exponent ExponentNumber (metres) (milliDarcy's) (percent) FF m n FF* m* n*
19 2898.45 8.8 14.9 30.3 1.79 2.18 30.5 1.80 2.1937 2903.41 2326 21.1 14.7 1.73 1.78 14.9 1.74 1.8339 2903.92 1325 19.8 19.0 1.82 1.64 19.1 1.82 1.6643 2904.98 2386 22.0 15.1 1.79 1.58 15.3 1.80 1.6347 2906.08 3800 21.5 14.0 1.72 1.56 14.0 1.72 1.5871 2959.81 658 20.0 17.2 1.77 1.76 17.4 1.77 1.8082 2963.06 19.7 14.5 33.2 1.81 1.66 34.5 1.83 1.7485 2963.93 357 17.8 21.6 1.78 1.77 22.1 1.79 1.83
120 2974.25 763 20.8 16.6 1.79 1.82 16.8 1.80 1.87135 2979.15 65.9 16.7 23.9 1.77 1.73 24.1 1.78 1.74
† Calculated from Cation Exchange Capacity
Shaley Sand Equivalent †
0475-08 Yolla-4 ACS Laboratories Pty Ltd 59 ABN: 81 008 273 005 PcRI Data\Summary
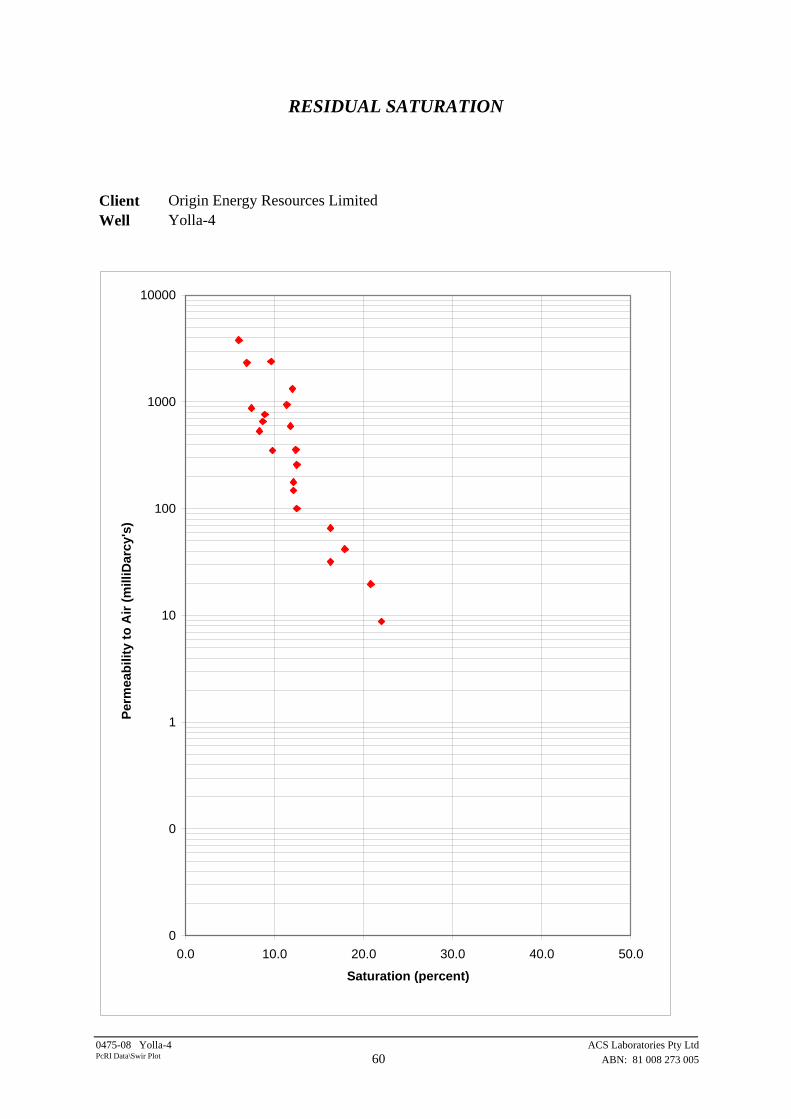
RESIDUAL SATURATION Client Origin Energy Resources LimitedWell Yolla-4
0
0
1
10
100
1000
10000
0.0 10.0 20.0 30.0 40.0 50.0
Saturation (percent)
Perm
eabi
lity
to A
ir (m
illiD
arcy
's)
.
0475-08 Yolla-4 ACS Laboratories Pty Ltd 60 ABN: 81 008 273 005 PcRI Data\Swir Plot
0475-08 Yolla-4 ACS Laboratories Pty Ltd 61 ABN: 81 008 273 005
CHAPTER 5
RESIDUAL GAS
5.1 Test and Calculation Procedures
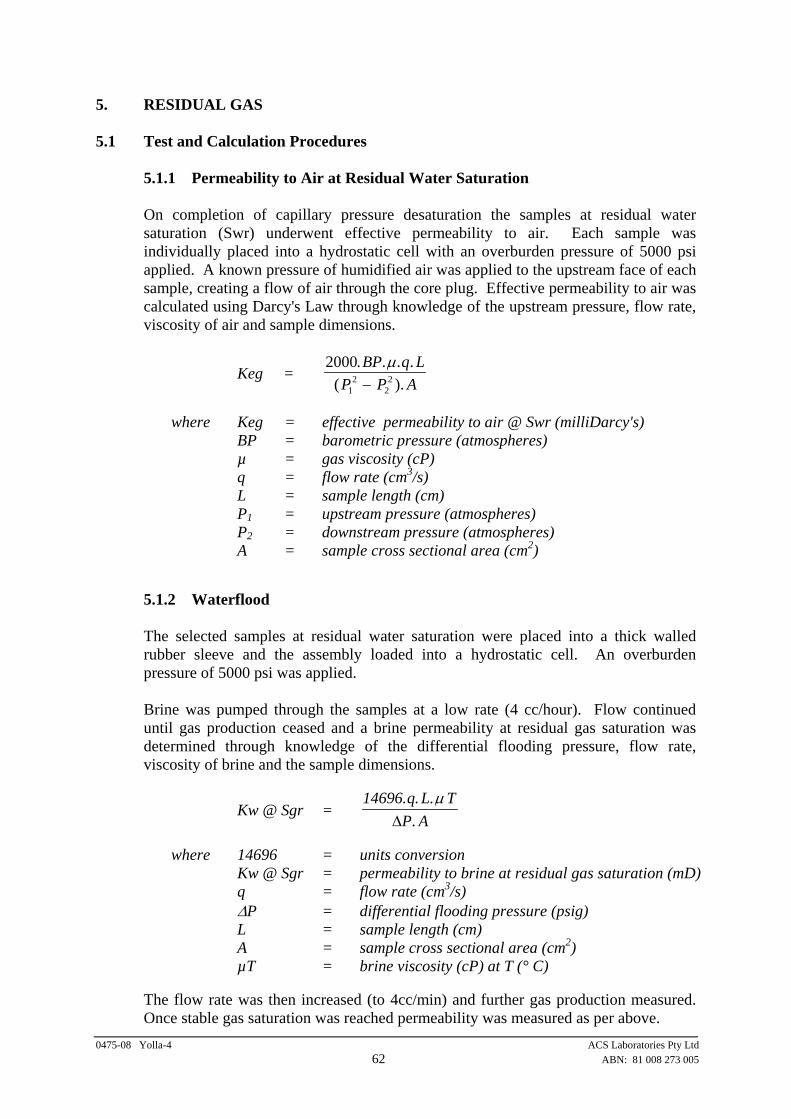
5. RESIDUAL GAS 5.1 Test and Calculation Procedures
5.1.1 Permeability to Air at Residual Water Saturation On completion of capillary pressure desaturation the samples at residual water saturation (Swr) underwent effective permeability to air. Each sample was individually placed into a hydrostatic cell with an overburden pressure of 5000 psi applied. A known pressure of humidified air was applied to the upstream face of each sample, creating a flow of air through the core plug. Effective permeability to air was calculated using Darcy's Law through knowledge of the upstream pressure, flow rate, viscosity of air and sample dimensions.
Keg = 2000
12
22
. . . .( ).
BP q LP P A
µ−
where Keg = effective permeability to air @ Swr (milliDarcy's)
BP = barometric pressure (atmospheres) µ = gas viscosity (cP) q = flow rate (cm3/s) L = sample length (cm) P1 = upstream pressure (atmospheres) P2 = downstream pressure (atmospheres) A = sample cross sectional area (cm2)
5.1.2 Waterflood The selected samples at residual water saturation were placed into a thick walled rubber sleeve and the assembly loaded into a hydrostatic cell. An overburden pressure of 5000 psi was applied. Brine was pumped through the samples at a low rate (4 cc/hour). Flow continued until gas production ceased and a brine permeability at residual gas saturation was determined through knowledge of the differential flooding pressure, flow rate, viscosity of brine and the sample dimensions.
Kw @ Sgr = 14696.q.L. T
. Aµ
∆P
where 14696 = units conversion
Kw @ Sgr = permeability to brine at residual gas saturation (mD) q = flow rate (cm3/s) ∆P = differential flooding pressure (psig) L = sample length (cm) A = sample cross sectional area (cm2) µT = brine viscosity (cP) at T (° C)
The flow rate was then increased (to 4cc/min) and further gas production measured. Once stable gas saturation was reached permeability was measured as per above.
0475-08 Yolla-4 ACS Laboratories Pty Ltd 62 ABN: 81 008 273 005
0475-08 Yolla-4 ACS Laboratories Pty Ltd 63 ABN: 81 008 273 005
COMMENTS: It was noted that the absolute permeability to air is very close to the permeability @ irreducible/initial water saturation. In theory the Kg @ Swi should be lower than the absolute Ka. However it was noted at the time that these results did not always follow expected trends: Samples 37, 39 and 78 the Kg is effectively equal to the Ka Samples 80 and 117 follow the expected trend Ka>Kg Sample 135 is atypical Kg>Ka. This was noted at the time, and checks were made to confirm the data was correct. In fact additional samples (ex-Pc/RI samples that weren’t scheduled for waterfloods) were run and the same erratic trends were noted. Whilst it is unusual it is not unique – we have seen this phenomenon before. For samples 37, 39 and 78 as noted above Kg effectively is the same as the Ka. This is acceptable in the higher permeable samples. The residual brine saturation is in the smaller pores that are not effectively or significantly contributing to the overall permeability. Sample 135 is indeed atypical though. As an aside to this issue at the recent Society of Core Analysts Symposium in October last year a paper was presented that highlighted a similar effect. The paper is “Mobilisation of Trapped Gas from below the Gas-Water Contact” ref SCA2004-29 by Andrew Cable et al, quote as follows: “The effective gas permeability at Swi was higher than the absolute gas permeability which maybe a result of a ‘lubrication effect’. Additional (independent) laboratory analysis undertaken on this core also reported similar permeability ‘anomalies’. Published papers describing similar effects have also been identified for reference. ACS makes no warranty as to the “lubrication effect” – however the concept of Swi in smaller pore throats that basically do not effectively contribute to the overall permeability, is much more readily acceptable. Sample 135 is currently drying after being cleaned post all analyses. We will repeat the “original” Ka to see if the actual permeability of this sample has changed since the Ka was first determined. The absolute Ka for Sample 135 was repeated post analysis. The value was the analysis was repeated by two different technicians with consistent results. This is in effect the same as the Kg at Swi, consistent with the other samples.
0475-08 Yolla-4 ACS Laboratories Pty Ltd 64 ABN: 81 008 273 005
CHAPTER 5
RESIDUAL GAS
5.2 Test Results
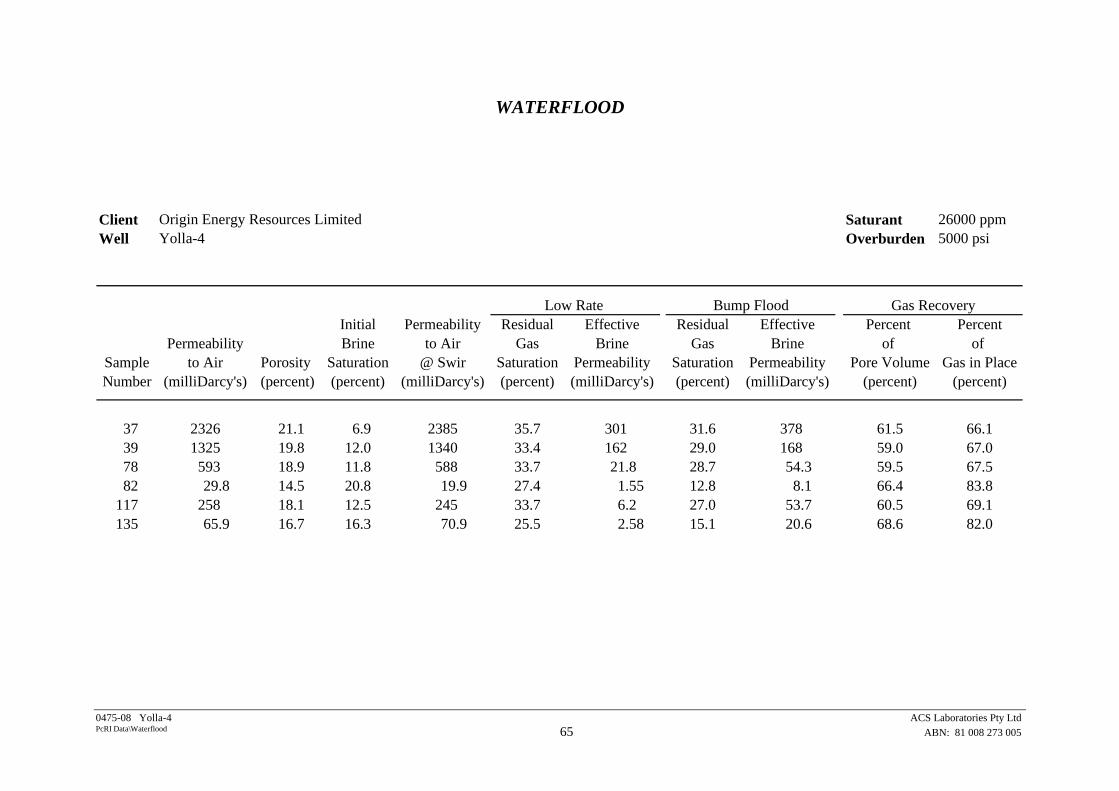
WATERFLOOD Client Origin Energy Resources Limited Saturant 26000 ppmWell Yolla-4 Overburden 5000 psi
Initial Permeability Residual Effective Residual Effective Percent PercentPermeability Brine to Air Gas Brine Gas Brine of of
Sample to Air Porosity Saturation @ Swir Saturation Permeability Saturation Permeability Pore Volume Gas in PlaceNumber (milliDarcy's) (percent) (percent) (milliDarcy's) (percent) (milliDarcy's) (percent) (milliDarcy's) (percent) (percent)
37 2326 21.1 6.9 2385 35.7 301 31.6 378 61.5 66.139 1325 19.8 12.0 1340 33.4 162 29.0 168 59.0 67.078 593 18.9 11.8 588 33.7 21.8 28.7 54.3 59.5 67.582 29.8 14.5 20.8 19.9 27.4 1.55 12.8 8.1 66.4 83.8
117 258 18.1 12.5 245 33.7 6.2 27.0 53.7 60.5 69.1135 65.9 16.7 16.3 70.9 25.5 2.58 15.1 20.6 68.6 82.0
Low Rate Bump Flood Gas Recovery
0475-08 Yolla-4 ACS Laboratories Pty Ltd 65 ABN: 81 008 273 005 PcRI Data\Waterflood
0475-08 Yolla-4 ACS Laboratories Pty Ltd ABN: 81 008 273 005
APPENDIX I
FLUID PROPERTIES
0475-08 Yolla-4 ACS Laboratories Pty Ltd ABN: 81 008 273 005
FLUID PROPERTIES
Brine 26000 ppm NaCl equivalent Density = 1.023 g/cm3 @ 25°C Resistivity = 0.241 ohm.m @ 25°C Viscosity = 1.011 cP @ 25°C

0475-08 Yolla-4 ACS Laboratories Pty Ltd ABN: 81 008 273 005
APPENDIX II
EQUIPMENT SCHEMATICS
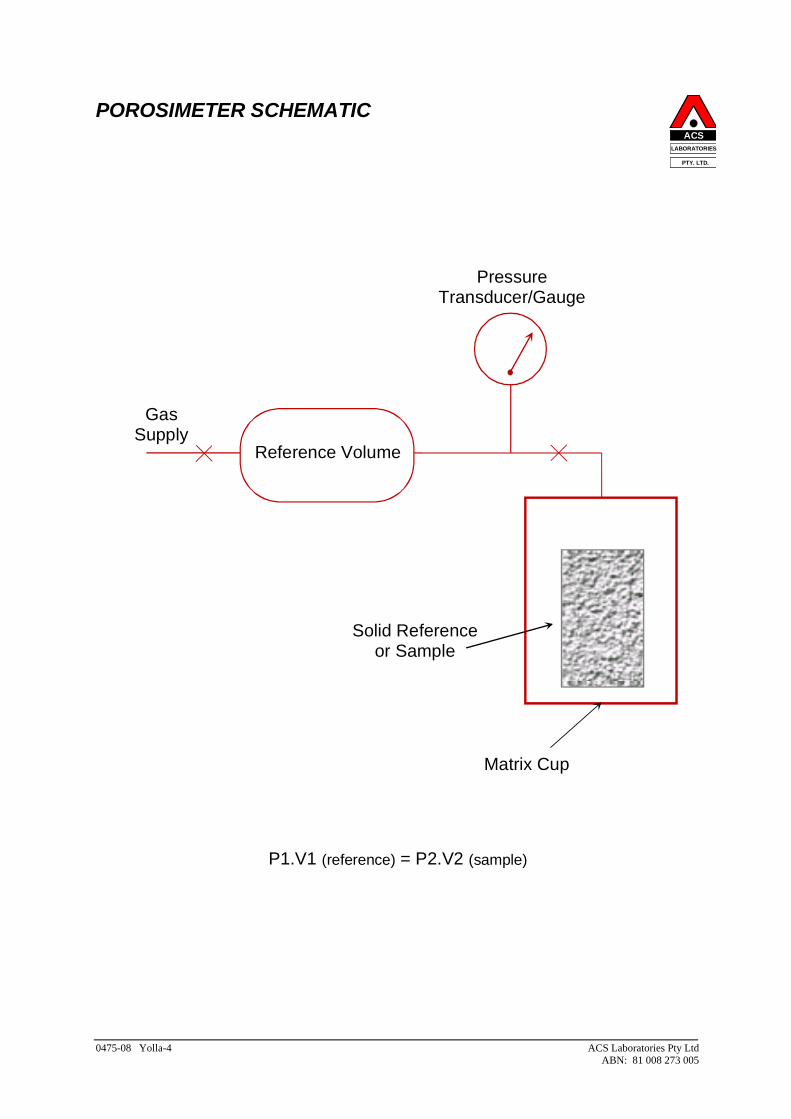
ACSLABORATORIES
PTY. LTD.
POROSIMETER SCHEMATIC
GasSupply
Reference Volume
PressureTransducer/Gauge
Solid Referenceor Sample
P1.V1 (reference) = P2.V2 (sample)
Matrix Cup
0475-08 Yolla-4 ACS Laboratories Pty Ltd ABN: 81 008 273 005
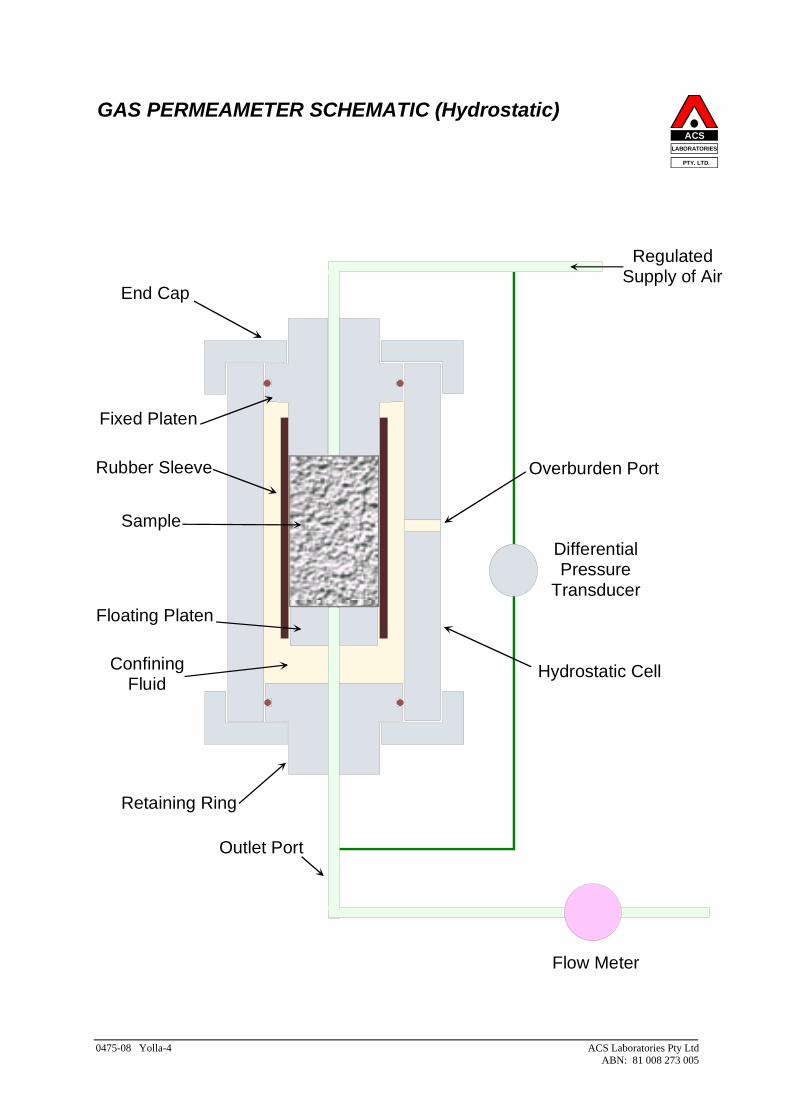
ACSLABORATORIES
PTY. LTD.
GAS PERMEAMETER SCHEMATIC (Hydrostatic)
Regulated Supply of Air
DifferentialPressure
Transducer
Flow Meter
End Cap
Fixed Platen
Sample
Floating Platen
Rubber Sleeve Overburden Port
ConfiningFluid
Retaining Ring
Outlet Port
Hydrostatic Cell
0475-08 Yolla-4 ACS Laboratories Pty Ltd ABN: 81 008 273 005
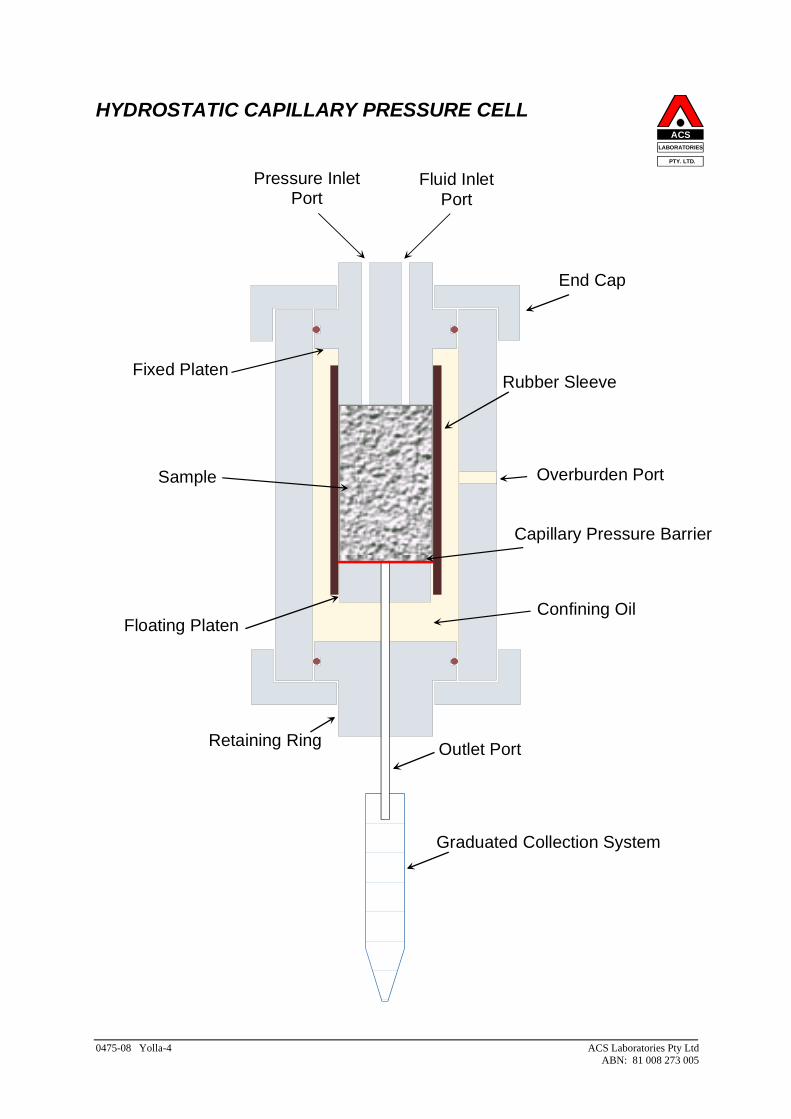
ACSLABORATORIES
PTY. LTD.
HYDROSTATIC CAPILLARY PRESSURE CELL
Pressure InletPort
Fluid InletPort
End Cap
Fixed Platen
Sample
Floating Platen
Rubber Sleeve
Overburden Port
Confining Oil
Retaining Ring Outlet Port
Capillary Pressure Barrier
Graduated Collection System
0475-08 Yolla-4 ACS Laboratories Pty Ltd ABN: 81 008 273 005

ACSLABORATORIES
PTY. LTD.
CT SCANNER SCHEMATIC
Rotation Scan 90o
Rotation Scan 135o
Rotation Scan 45o
0o 180o
X-RayTube Broad Fan
Beam
Detector Array
Direction ofRotation
Sample
0475-08 Yolla-4 ACS Laboratories Pty Ltd ABN: 81 008 273 005
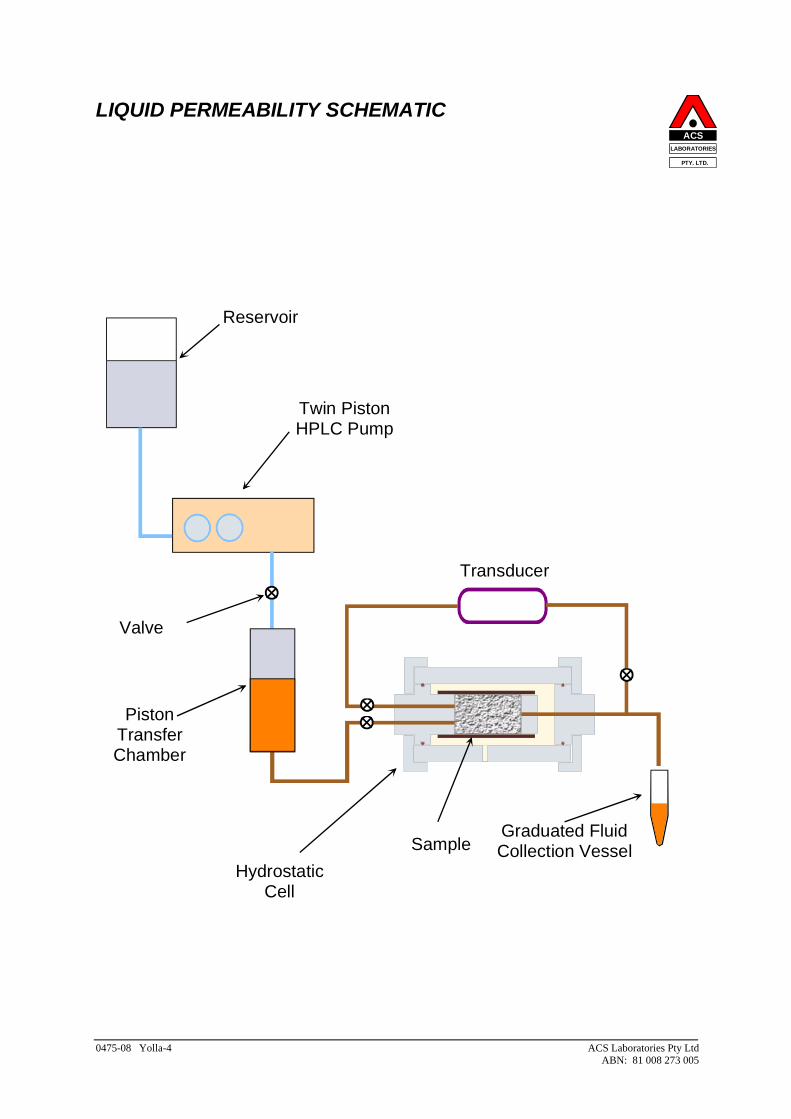
ACSLABORATORIES
PTY. LTD.
LIQUID PERMEABILITY SCHEMATIC
Reservoir
Twin PistonHPLC Pump
PistonTransferChamber
Transducer
Graduated FluidCollection VesselSample
Valve
HydrostaticCell
0475-08 Yolla-4 ACS Laboratories Pty Ltd ABN: 81 008 273 005
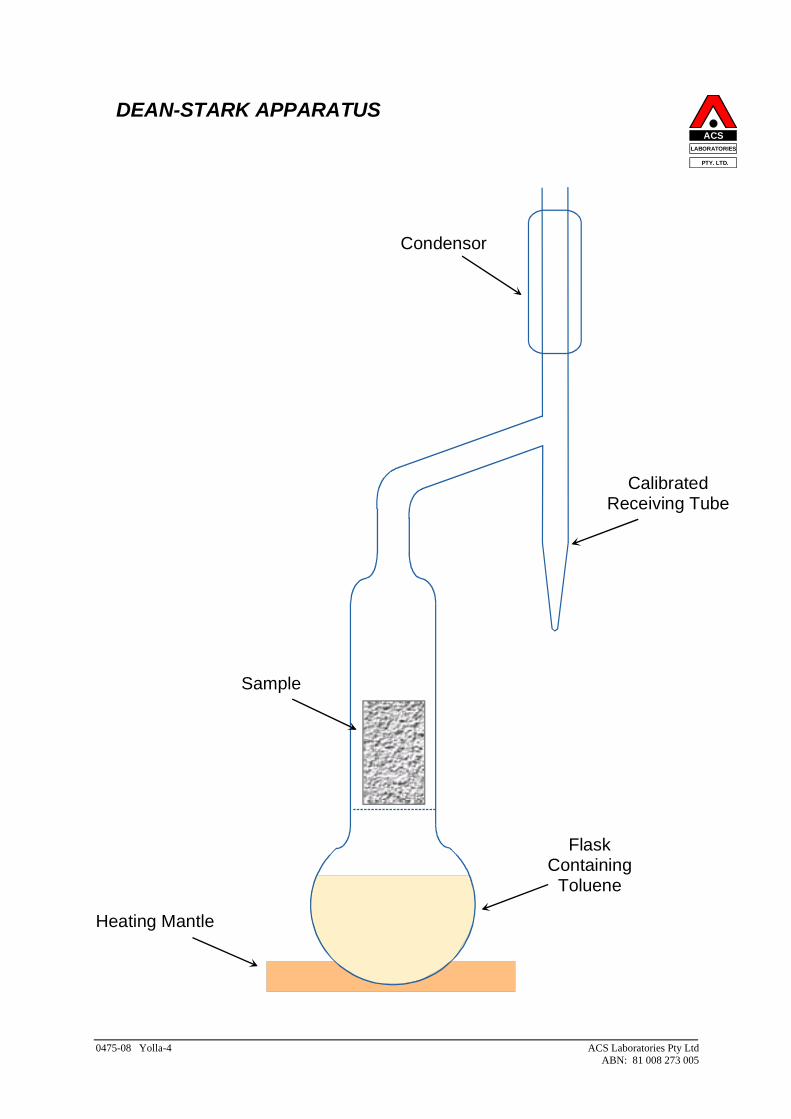
ACSLABORATORIES
PTY. LTD.
DEAN-STARK APPARATUS
Condensor
Sample
CalibratedReceiving Tube
Heating Mantle
FlaskContaining
Toluene
0475-08 Yolla-4 ACS Laboratories Pty Ltd ABN: 81 008 273 005

0475-08 Yolla-4 ACS Laboratories Pty Ltd ABN: 81 008 273 005
APPENDIX III
ABBREVIATIONS
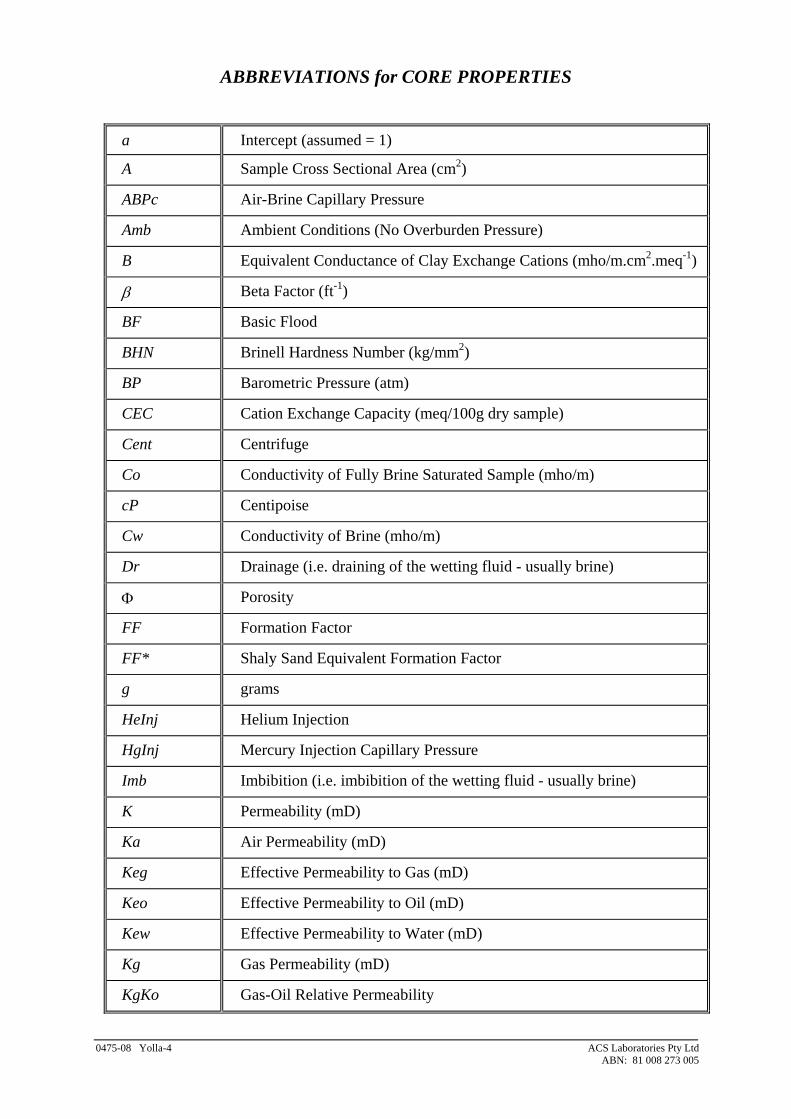
0475-08 Yolla-4 ACS Laboratories Pty Ltd ABN: 81 008 273 005
ABBREVIATIONS for CORE PROPERTIES
a Intercept (assumed = 1)
A Sample Cross Sectional Area (cm2)
ABPc Air-Brine Capillary Pressure
Amb Ambient Conditions (No Overburden Pressure)
B Equivalent Conductance of Clay Exchange Cations (mho/m.cm2.meq-1)
β Beta Factor (ft-1)
BF Basic Flood
BHN Brinell Hardness Number (kg/mm2)
BP Barometric Pressure (atm)
CEC Cation Exchange Capacity (meq/100g dry sample)
Cent Centrifuge
Co Conductivity of Fully Brine Saturated Sample (mho/m)
cP Centipoise
Cw Conductivity of Brine (mho/m)
Dr Drainage (i.e. draining of the wetting fluid - usually brine)
Φ Porosity
FF Formation Factor
FF* Shaly Sand Equivalent Formation Factor
g grams
HeInj Helium Injection
HgInj Mercury Injection Capillary Pressure
Imb Imbibition (i.e. imbibition of the wetting fluid - usually brine)
K Permeability (mD)
Ka Air Permeability (mD)
Keg Effective Permeability to Gas (mD)
Keo Effective Permeability to Oil (mD)
Kew Effective Permeability to Water (mD)
Kg Gas Permeability (mD)
KgKo Gas-Oil Relative Permeability
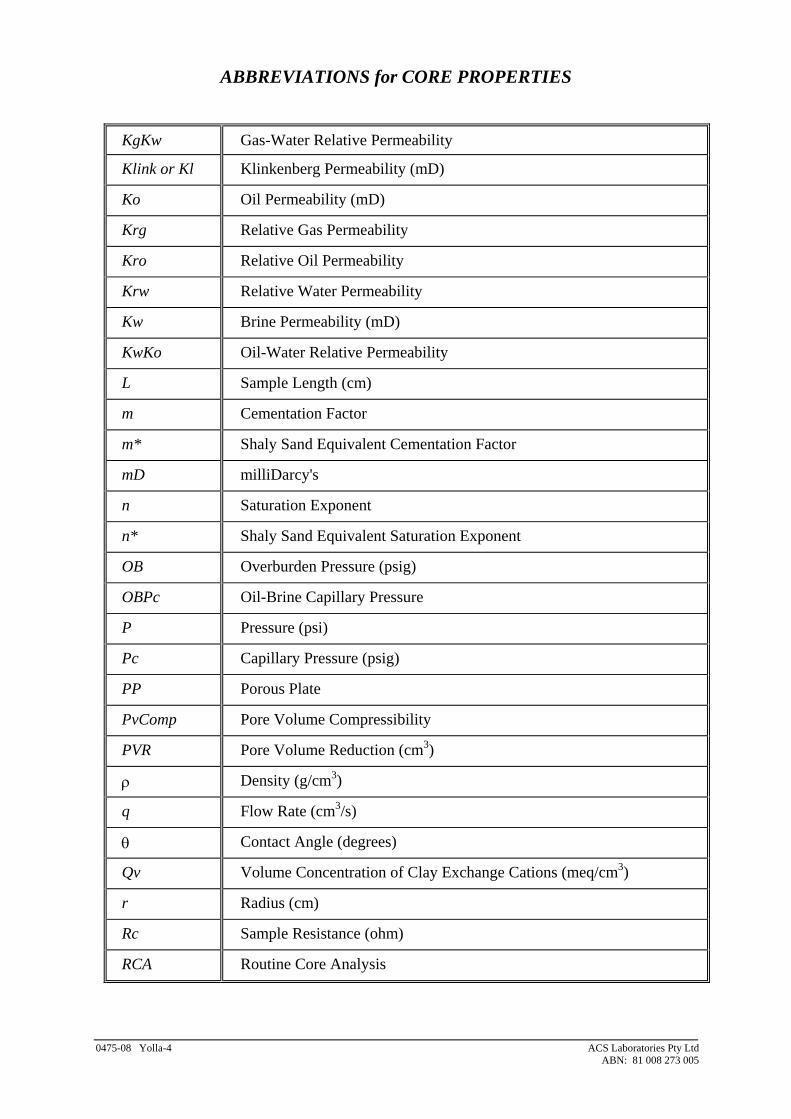
0475-08 Yolla-4 ACS Laboratories Pty Ltd ABN: 81 008 273 005
ABBREVIATIONS for CORE PROPERTIES
KgKw Gas-Water Relative Permeability
Klink or Kl Klinkenberg Permeability (mD)
Ko Oil Permeability (mD)
Krg Relative Gas Permeability
Kro Relative Oil Permeability
Krw Relative Water Permeability
Kw Brine Permeability (mD)
KwKo Oil-Water Relative Permeability
L Sample Length (cm)
m Cementation Factor
m* Shaly Sand Equivalent Cementation Factor
mD milliDarcy's
n Saturation Exponent
n* Shaly Sand Equivalent Saturation Exponent
OB Overburden Pressure (psig)
OBPc Oil-Brine Capillary Pressure
P Pressure (psi)
Pc Capillary Pressure (psig)
PP Porous Plate
PvComp Pore Volume Compressibility
PVR Pore Volume Reduction (cm3)
ρ Density (g/cm3)
q Flow Rate (cm3/s)
θ Contact Angle (degrees)
Qv Volume Concentration of Clay Exchange Cations (meq/cm3)
r Radius (cm)
Rc Sample Resistance (ohm)
RCA Routine Core Analysis
0475-08 Yolla-4 ACS Laboratories Pty Ltd ABN: 81 008 273 005
ABBREVIATIONS for CORE PROPERTIES
ResCon Reservoir Conditions
RI Resistivity Index
RICP Resistivity Index & Capillary Pressure
Ro Resistivity of Fully Brine Saturated Sample (ohm.m)
Rt Resistivity of Partially Saturated Sample (ohm.m)
Rw Resistivity of Brine (ohm.m)
S Saturation
s Seconds
SCA Special Core Analysis
Sg Gas Saturation
Sgr Residual Gas Saturation
SngPt Single Point
So Oil Saturation
Sor Irreducible Oil Saturation (or Residual Oil Saturation)
SS Steady State
Sw Brine Saturation
Swi Initial Water Saturation
Swir Irreducible Water Saturation
Swr Residual Water Saturation
T Temperature (oC)
USS Unsteady State
µ Viscosity (cP)
Vb Bulk Volume (cm3)
Vg Grain Volume (cm3)
Vp Pore Volume (cm3)
ω Angular Velocity (rad/s)
Wett Wettability
Wt Weight (g)

A C SLABORATORIES
PTY LTD
CT SCAN REPORT
of
YOLLA-4
for
ORIGIN ENERGY RESOURCES LIMITED
by
ACS LABORATORIES PTY LTD
Head 8 Cox Road, Windsor Qld 4030, Australia ACS Laboratories Pty Ltd Office: : 61 7 3357 1133 Facsimile: 61 7 3357 1100 ABN: 81 008 273 005 E-mail: [email protected]
A C SLABORATORIES
PTY LTD 30 August, 2004 Origin Energy Resources Limited Origin Energy Resources Limited Level 6 GPO Box 148 1 King William Street BRISBANE QLD 4001 ADELAIDE SA 5000 Attention: Joe Parver Attention: Andy Hall
CT SCAN REPORT: 0475-08 MATERIAL: Core Plugs LOCALITY: Yolla-4 WORK REQUIRED: CT Scanning Please direct technical enquiries regarding this work to the signatories below under whose supervision the work was carried out. KEVIN H FLYNN General Manager ACS Laboratories Pty Ltd shall not be liable or responsible for any loss, cost, damages or expenses incurred by the client, or any other person or company, resulting from any information or interpretation given in this report. In no case shall ACS Laboratories Pty Ltd be responsible for consequential damages including, but not limited to, lost profits, damages for failure to meet deadlines and lost production arising from this report.

0475-08 Yolla-4 (CT Scanning) ACS Laboratories Pty Ltd ABN: 81 008 273 005
CONTENTS CHAPTERS PAGE 1. INTRODUCTION ................................................................................................... 1 2. CT SCANNING PROCEDURE ............................................................................. 3 3. CT SCANNING IMAGES ...................................................................................... 5 APPENDICES I. CT SCANNER SCHEMATIC

0475-08 Yolla-4 (CT Scanning) ACS Laboratories Pty Ltd 1 ABN: 81 008 273 005
CHAPTER 1
INTRODUCTION

0475-08 Yolla-4 (CT Scanning) ACS Laboratories Pty Ltd 2 ABN: 81 008 273 005
1. INTRODUCTION
This report presents images of plugs selected for analyses as part of Origin Energy Resources Limited Yolla-4 special core analysis study. CT scanning images have been digitally superimposed onto single pages (for easier comparison) in Chapter 3 of this report.

0475-08 Yolla-4 (CT Scanning) ACS Laboratories Pty Ltd 3 ABN: 81 008 273 005
CHAPTER 2
CT SCANNING PROCEDURE
0475-08 Yolla-4 (CT Scanning) ACS Laboratories Pty Ltd 4 ABN: 81 008 273 005
2. CT SCANNING PROCEDURE
CT Scanning was undertaken in order that internal inhomogeneities and/or drilling fluid invasion zones may be noted. Typical inhomogeneities may be clasts, bedding sedimentary structures, cementation, fractures and any other discontinuities that may not be readily visible to the naked eye. The principle of CT Scanning and its applications is presented by Hove et al, 1987 and Wellington and Vinegar, 1987. CT Scanners generate cross-sectional image slices through the sample by revolving an X-ray tube around the sample and obtaining projections at many different angles (Appendix I). From these image slices, a cross-sectional image was reconstructed by a back projection algorithm in the scanner's computer. As the samples were frozen at time of scanning we were unable to place orientation lines on the plugs. The sample was placed vertically within the scanner and a longitudinal section image obtained. The sample was then rotated through exactly 90o and another section image recorded. These two images are labelled '0' and '90' on the prints.
0475-08 Yolla-4 (CT Scanning) ACS Laboratories Pty Ltd 5 ABN: 81 008 273 005
CHAPTER 3
CT SCANNING IMAGES
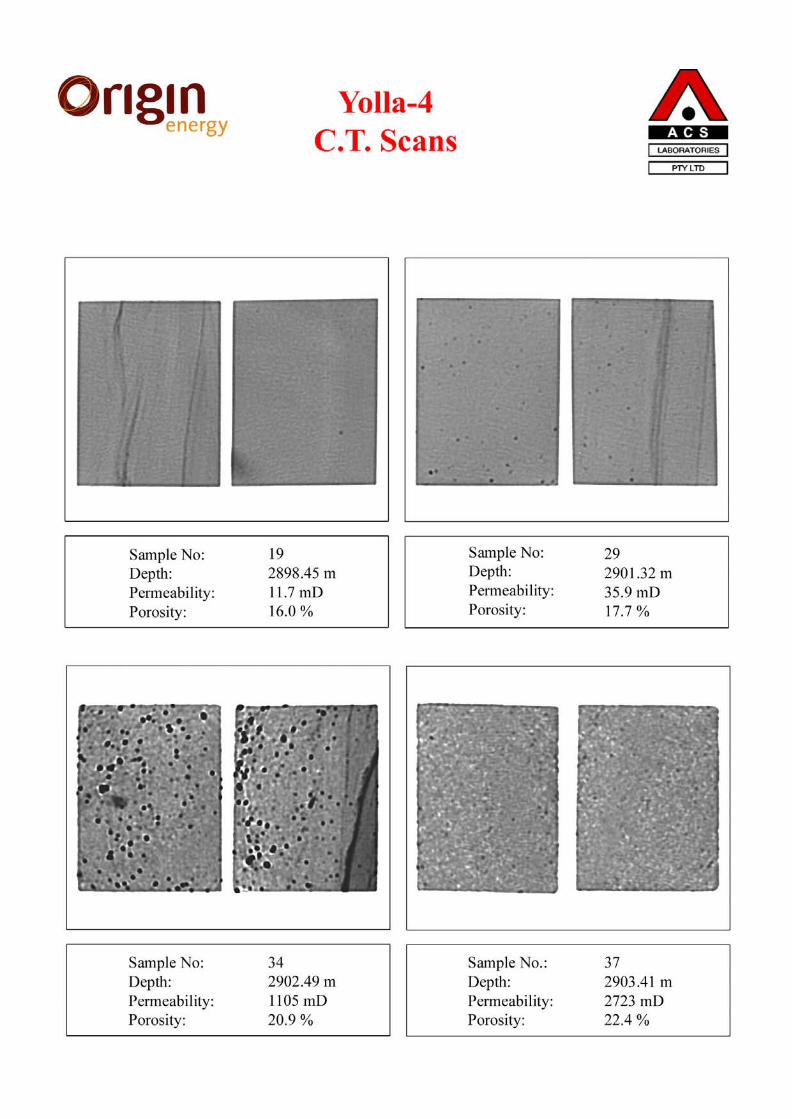
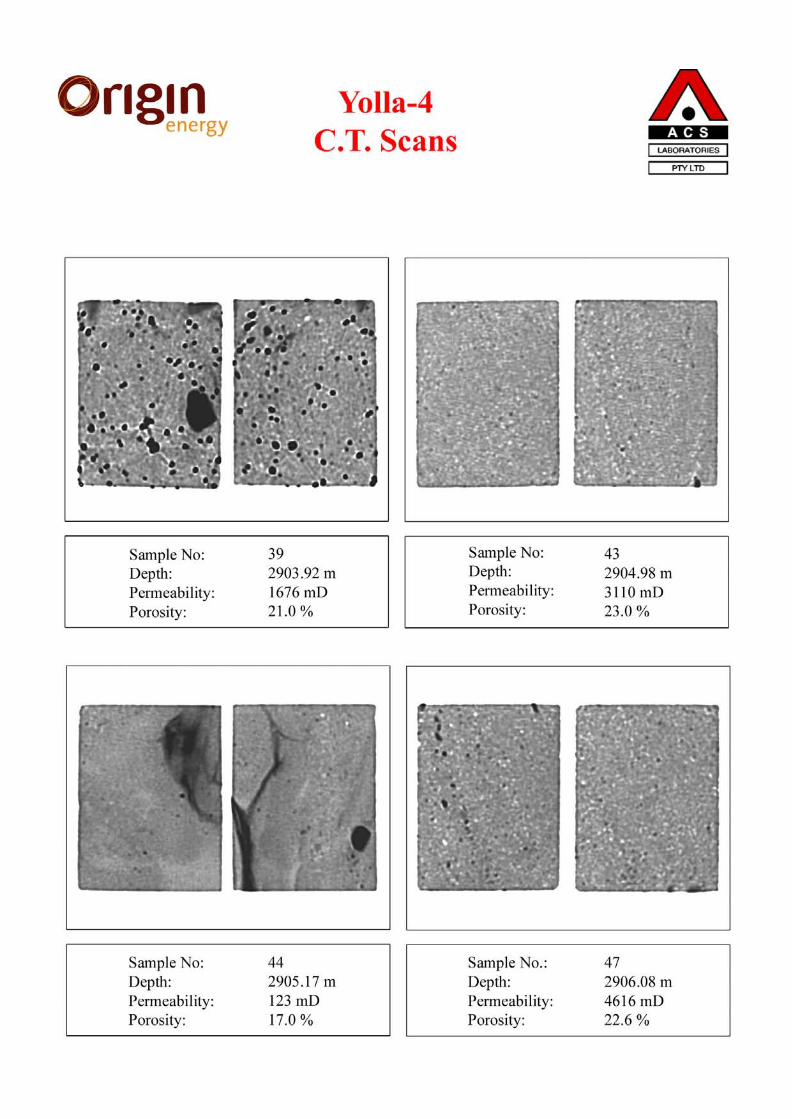
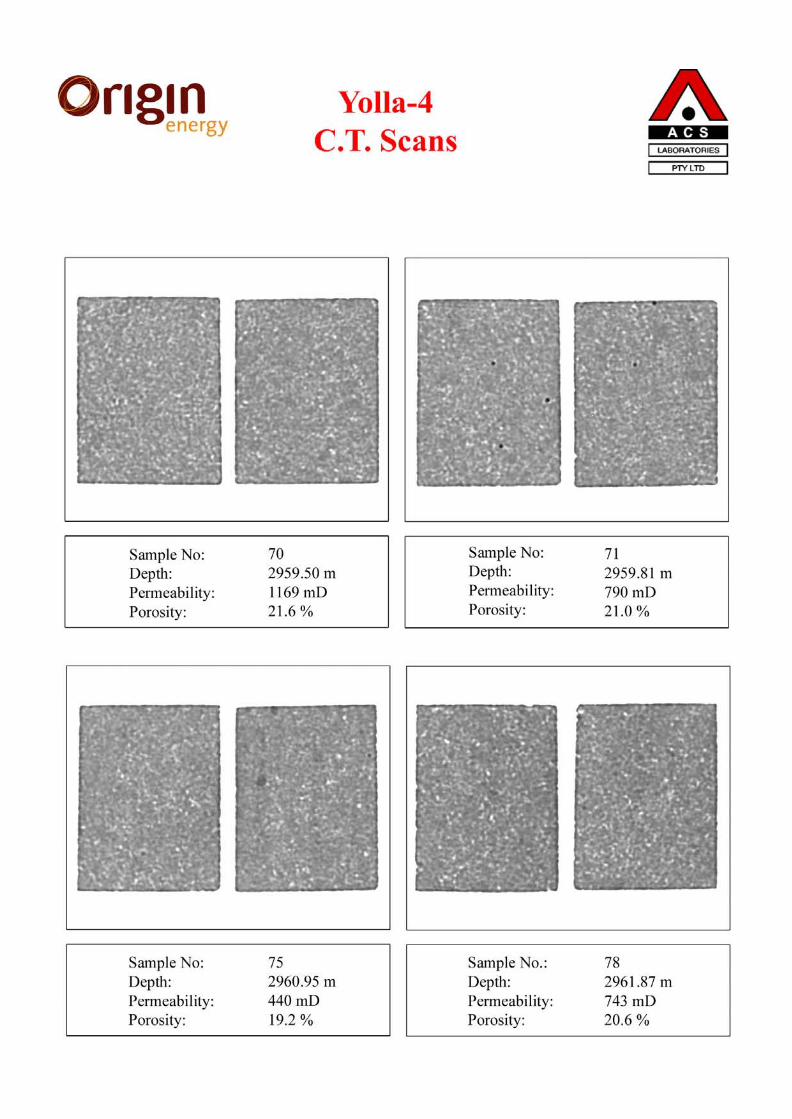
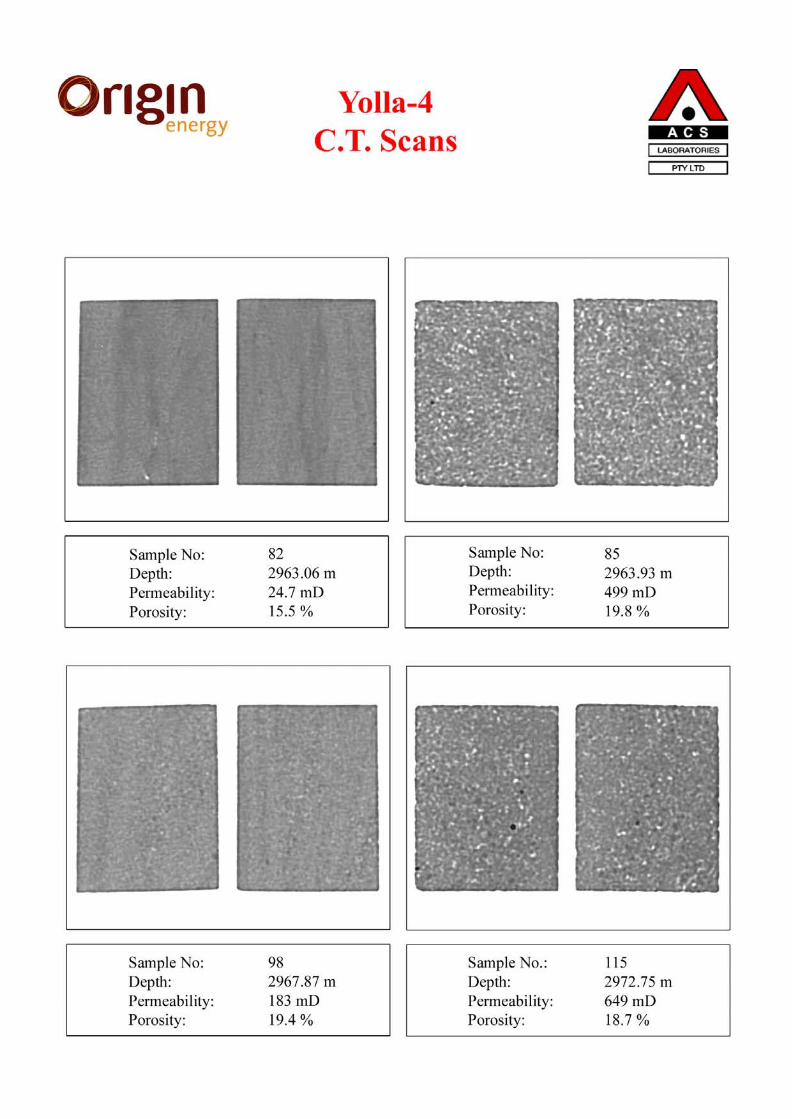
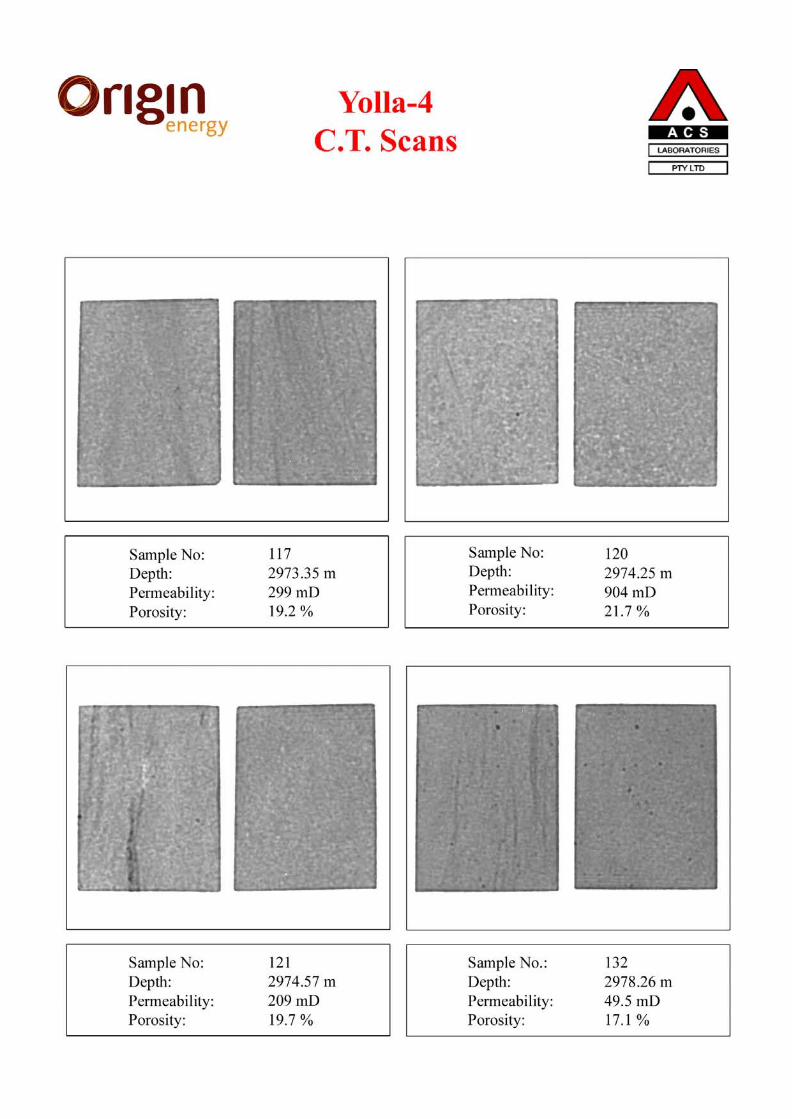


0475-08 Yolla-4 (CT Scanning) ACS Laboratories Pty Ltd ABN: 81 008 273 005
APPENDIX 1
CT SCANNER SCHEMATIC
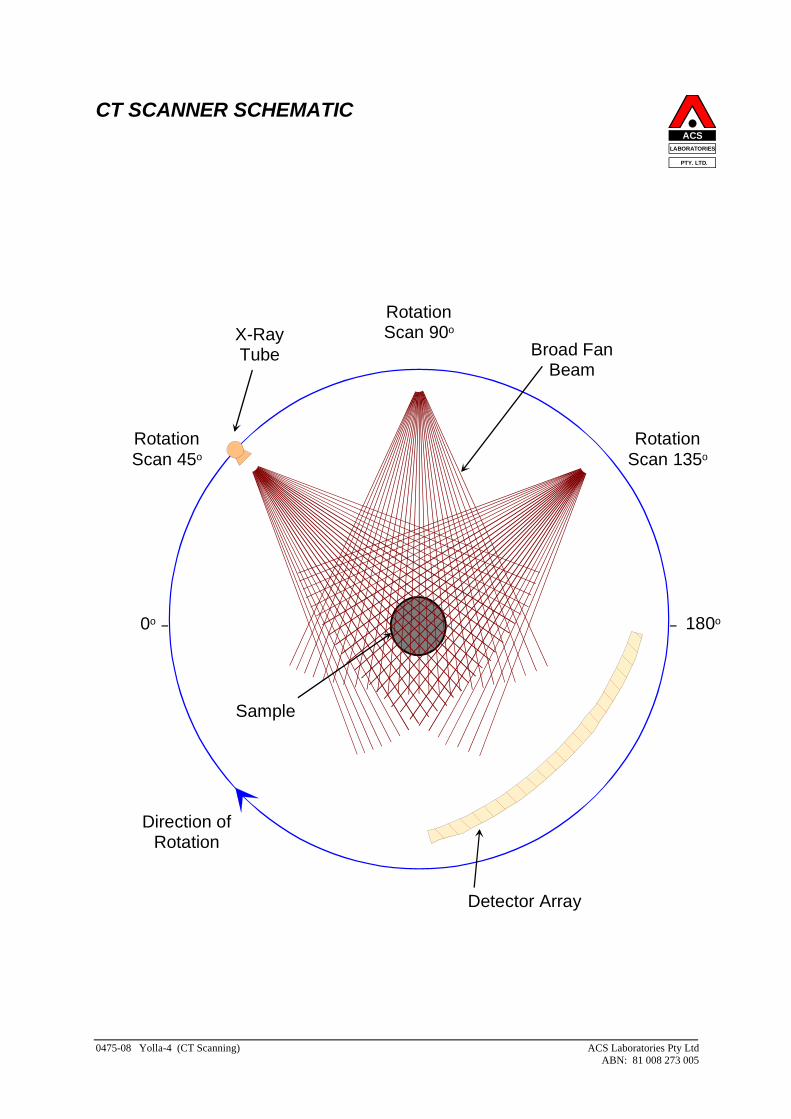
ACSLABORATORIES
PTY. LTD.
CT SCANNER SCHEMATIC
Rotation Scan 90o
Rotation Scan 135o
Rotation Scan 45o
0o 180o
X-RayTube Broad Fan
Beam
Detector Array
Direction ofRotation
Sample
0475-08 Yolla-4 (CT Scanning) ACS Laboratories Pty Ltd ABN: 81 008 273 005
Origin Energy Resources Ltd ABN 66 007 845 338 Commercial-in-Confidence Greenfields Division Ref: W:\Complete Reports\BASS\Yolla\Yolla 4\Interpretive\Yolla4InterpretativeDataWCR with appendix headers.docc
AAPPPPEENNDDIIXX 1100:: FFMMII IINNTTEERRPPRREETTAATTIIOONN RREEPPOORRTT
Yolla 4
Formation Micro-Imager (FMI) Interpretation Report
T/L1 BASS BASIN
December 2004
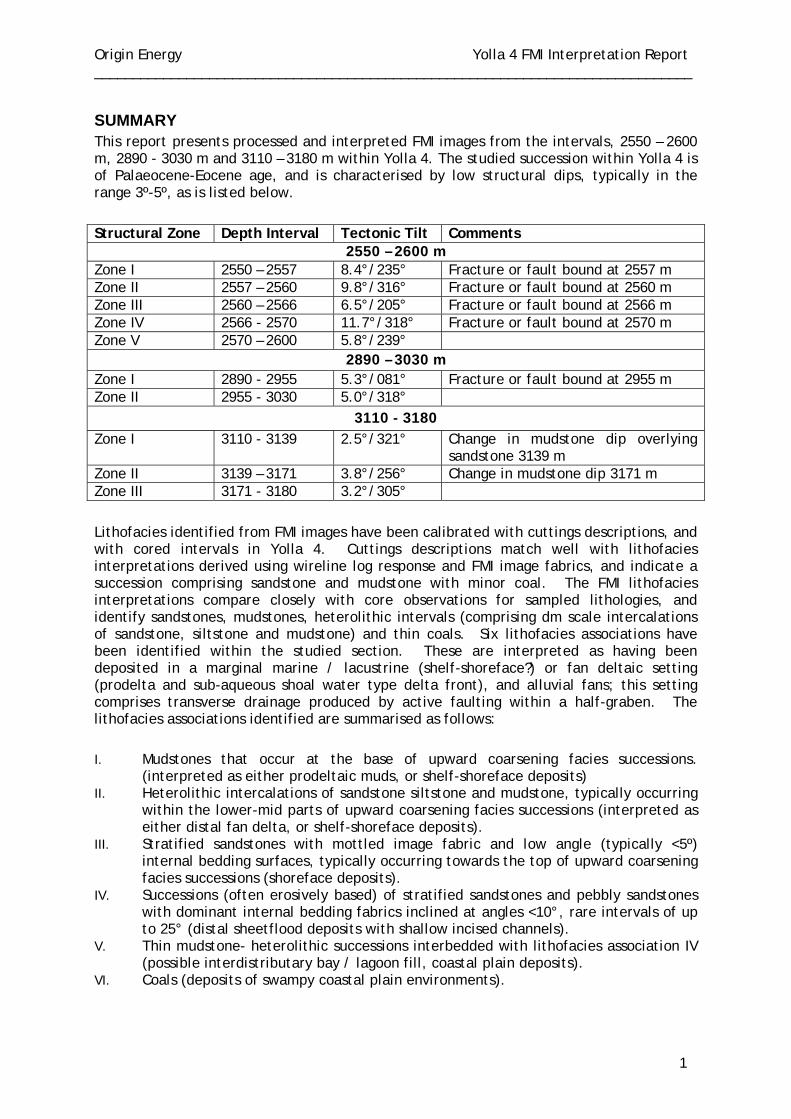
Origin Energy Yolla 4 FMI Interpretation Report ______________________________________________________________________________
1
SUMMARY This report presents processed and interpreted FMI images from the intervals, 2550 – 2600 m, 2890 - 3030 m and 3110 – 3180 m within Yolla 4. The studied succession within Yolla 4 is of Palaeocene-Eocene age, and is characterised by low structural dips, typically in the range 3º-5º, as is listed below.
Structural Zone Depth Interval Tectonic Tilt Comments 2550 – 2600 m
Zone I 2550 – 2557 8.4°/235° Fracture or fault bound at 2557 m Zone II 2557 – 2560 9.8°/316° Fracture or fault bound at 2560 m Zone III 2560 – 2566 6.5°/205° Fracture or fault bound at 2566 m Zone IV 2566 - 2570 11.7°/318° Fracture or fault bound at 2570 m Zone V 2570 – 2600 5.8°/239°
2890 – 3030 m Zone I 2890 - 2955 5.3°/081° Fracture or fault bound at 2955 m Zone II 2955 - 3030 5.0°/318°
3110 - 3180 Zone I 3110 - 3139 2.5°/321° Change in mudstone dip overlying
sandstone 3139 m Zone II 3139 – 3171 3.8°/256° Change in mudstone dip 3171 m Zone III 3171 - 3180 3.2°/305°
Lithofacies identified from FMI images have been calibrated with cuttings descriptions, and with cored intervals in Yolla 4. Cuttings descriptions match well with lithofacies interpretations derived using wireline log response and FMI image fabrics, and indicate a succession comprising sandstone and mudstone with minor coal. The FMI lithofacies interpretations compare closely with core observations for sampled lithologies, and identify sandstones, mudstones, heterolithic intervals (comprising dm scale intercalations of sandstone, siltstone and mudstone) and thin coals. Six lithofacies associations have been identified within the studied section. These are interpreted as having been deposited in a marginal marine / lacustrine (shelf-shoreface?) or fan deltaic setting (prodelta and sub-aqueous shoal water type delta front), and alluvial fans; this setting comprises transverse drainage produced by active faulting within a half-graben. The lithofacies associations identified are summarised as follows:
I. Mudstones that occur at the base of upward coarsening facies successions. (interpreted as either prodeltaic muds, or shelf-shoreface deposits)
II. Heterolithic intercalations of sandstone siltstone and mudstone, typically occurring within the lower-mid parts of upward coarsening facies successions (interpreted as either distal fan delta, or shelf-shoreface deposits).
III. Stratified sandstones with mottled image fabric and low angle (typically <5º) internal bedding surfaces, typically occurring towards the top of upward coarsening facies successions (shoreface deposits).
IV. Successions (often erosively based) of stratified sandstones and pebbly sandstones with dominant internal bedding fabrics inclined at angles <10°, rare intervals of up to 25° (distal sheetflood deposits with shallow incised channels).
V. Thin mudstone- heterolithic successions interbedded with lithofacies association IV (possible interdistributary bay / lagoon fill, coastal plain deposits).
VI. Coals (deposits of swampy coastal plain environments).
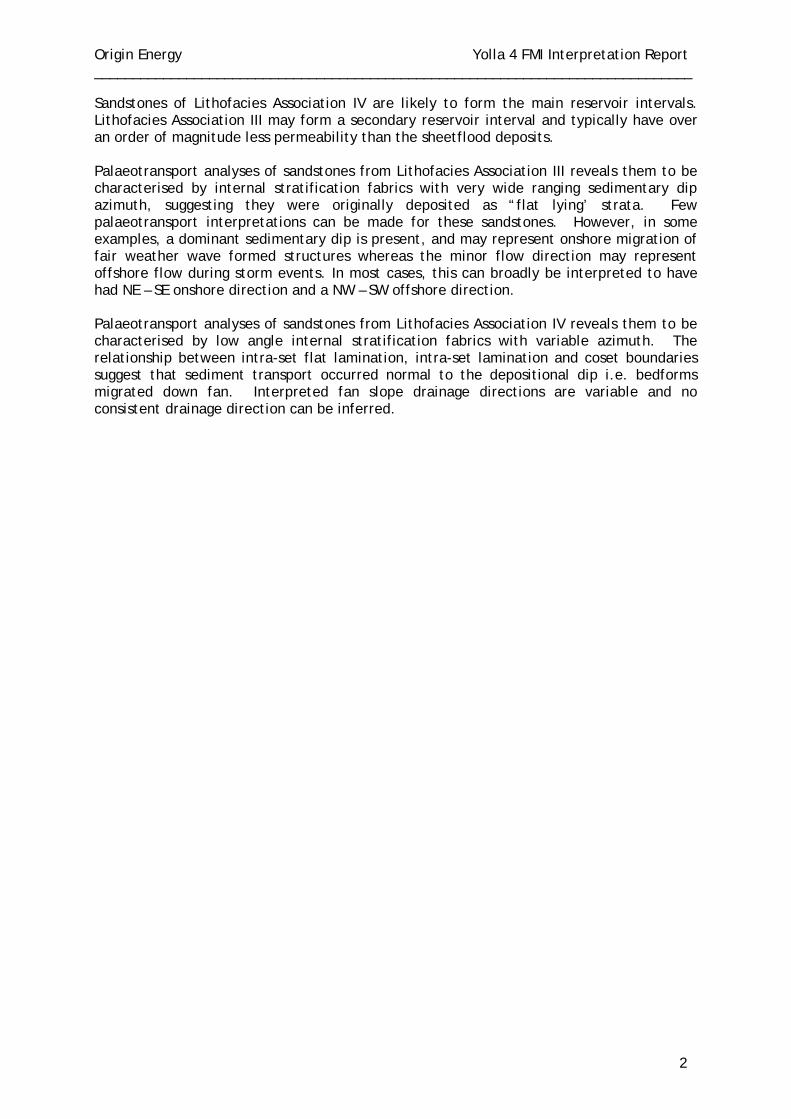
Origin Energy Yolla 4 FMI Interpretation Report ______________________________________________________________________________
2
Sandstones of Lithofacies Association IV are likely to form the main reservoir intervals. Lithofacies Association III may form a secondary reservoir interval and typically have over an order of magnitude less permeability than the sheetflood deposits. Palaeotransport analyses of sandstones from Lithofacies Association III reveals them to be characterised by internal stratification fabrics with very wide ranging sedimentary dip azimuth, suggesting they were originally deposited as “flat lying’ strata. Few palaeotransport interpretations can be made for these sandstones. However, in some examples, a dominant sedimentary dip is present, and may represent onshore migration of fair weather wave formed structures whereas the minor flow direction may represent offshore flow during storm events. In most cases, this can broadly be interpreted to have had NE – SE onshore direction and a NW – SW offshore direction. Palaeotransport analyses of sandstones from Lithofacies Association IV reveals them to be characterised by low angle internal stratification fabrics with variable azimuth. The relationship between intra-set flat lamination, intra-set lamination and coset boundaries suggest that sediment transport occurred normal to the depositional dip i.e. bedforms migrated down fan. Interpreted fan slope drainage directions are variable and no consistent drainage direction can be inferred.
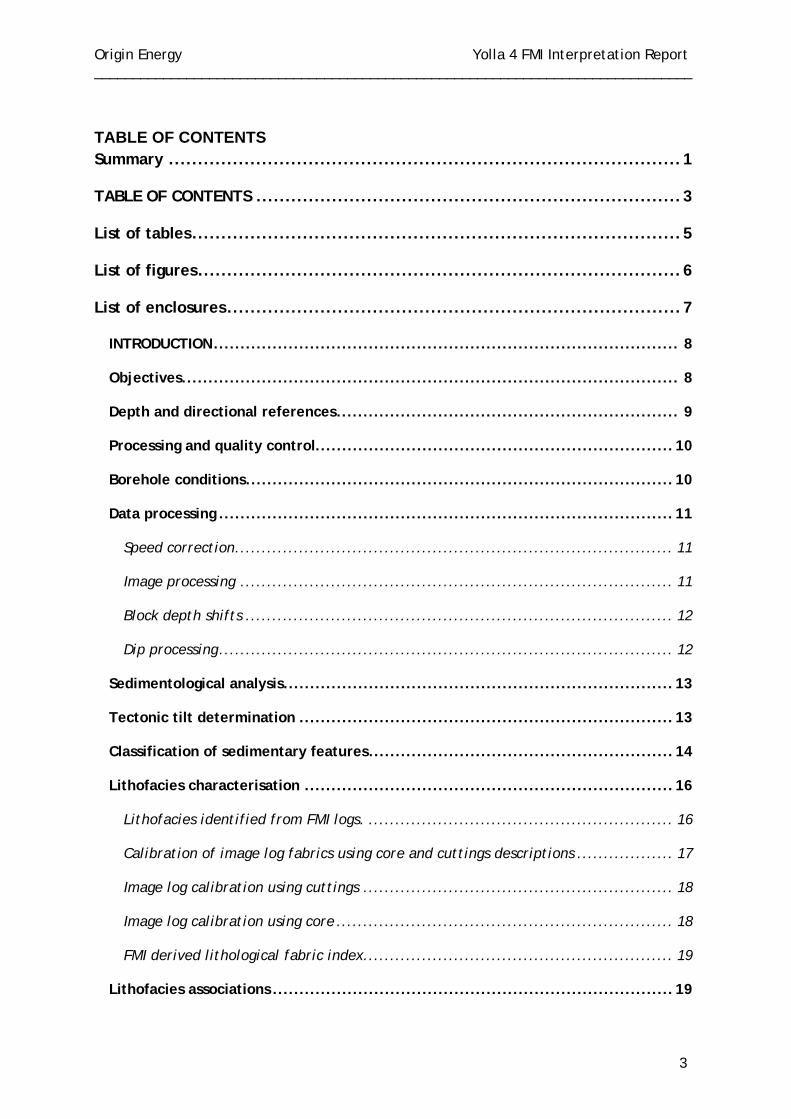
Origin Energy Yolla 4 FMI Interpretation Report ______________________________________________________________________________
3
TABLE OF CONTENTS Summary ........................................................................................1
TABLE OF CONTENTS .........................................................................3
List of tables....................................................................................5
List of figures...................................................................................6
List of enclosures..............................................................................7
INTRODUCTION....................................................................................... 8
Objectives............................................................................................. 8
Depth and directional references................................................................ 9
Processing and quality control...................................................................10
Borehole conditions................................................................................10
Data processing .....................................................................................11
Speed correction.................................................................................. 11
Image processing ................................................................................. 11
Block depth shifts ................................................................................ 12
Dip processing..................................................................................... 12
Sedimentological analysis.........................................................................13
Tectonic tilt determination ......................................................................13
Classification of sedimentary features.........................................................14
Lithofacies characterisation .....................................................................16
Lithofacies identified from FMI logs. ......................................................... 16
Calibration of image log fabrics using core and cuttings descriptions .................. 17
Image log calibration using cuttings .......................................................... 18
Image log calibration using core ............................................................... 18
FMI derived lithological fabric index.......................................................... 19
Lithofacies associations ...........................................................................19
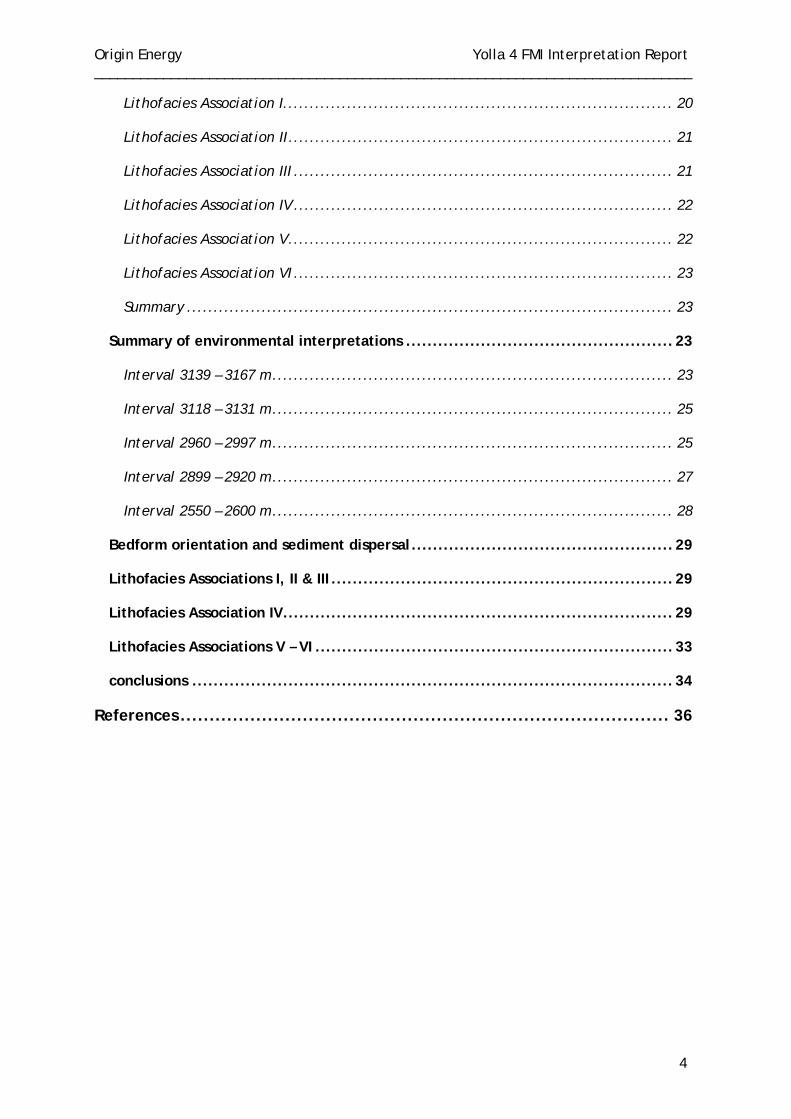
Origin Energy Yolla 4 FMI Interpretation Report ______________________________________________________________________________
4
Lithofacies Association I......................................................................... 20
Lithofacies Association II........................................................................ 21
Lithofacies Association III ....................................................................... 21
Lithofacies Association IV ....................................................................... 22
Lithofacies Association V........................................................................ 22
Lithofacies Association VI ....................................................................... 23
Summary ........................................................................................... 23
Summary of environmental interpretations ..................................................23
Interval 3139 – 3167 m........................................................................... 23
Interval 3118 – 3131 m........................................................................... 25
Interval 2960 – 2997 m........................................................................... 25
Interval 2899 – 2920 m........................................................................... 27
Interval 2550 – 2600 m........................................................................... 28
Bedform orientation and sediment dispersal .................................................29
Lithofacies Associations I, II & III ................................................................29
Lithofacies Association IV.........................................................................29
Lithofacies Associations V – VI ...................................................................33
conclusions ..........................................................................................34
References .................................................................................... 36
Origin Energy Yolla 4 FMI Interpretation Report ______________________________________________________________________________
5
LIST OF TABLES Table 1 Summary of well details, study objectives and the data set used for this analysis. Table 2 Summary of hole conditions through the study intervals in Yolla 4 Table 3 Tectonic tilt summary of Yolla 4 Table 4 Classification of surfaces identified from FMI images Table 5 Lithofacies identified from FMI images within the study intervals Table 6 Simple fabric index (applied to sandstone lithofacies) based upon mnemonics
scheme used for FMI interpretation of. lithofacies. Note the fabric index may approximate to a bioturbation index within sandstone lithologies free of granular-pebbly detritus
Table 7 Summary of deposits in the interval 3139 – 3167 m Table 8 Summary of deposits in the interval 3118 – 3131 m Table 9 Summary of deposits in the interval 2960 – 2997 m Classification of surfaces
identified from FMI images Table 10 Summary of deposits in the interval 2899 – 2920 m Table 11 Summary of deposits in the interval 2550 – 2600 m Table 12 Characteristics of Type I verses Type II alluvial fans (Blair and McPherson, 1994) Table 13 Bedding orientations, sheetflood deposits within the interval 3160 – 3149 m Table 14 Bedding orientations, sheetflood deposits within the interval 2985 – 2962 m Table 15 Bedding orientation, sheetflood deposits within the interval 2912 – 2903 m
Origin Energy Yolla 4 FMI Interpretation Report ______________________________________________________________________________
6
LIST OF FIGURES Figure 1 Cumulative automatic, manual and muds and hets, dip azimuth plots for studied
section (2550 – 2600 m). Figure 2 Cumulative automatic, manual and mud hets dip azimuth plots for the studied
section (2890 – 3180 m) Figure 3 Example of coal (lithofacies VI) in interval 2596 – 2599 m Figure 4 Dip categories used in this study Figure 5 FMI Image through well laminated mudstone (lithofacies Ml) Figure 6 FMI image through dm-scale heterolithic sst-mudstone lithofacies with well
developed lamination fabric (Hl) 3144 – 3145 m, 3145.5 – 3146.5 m and 3147 – 3149 m; and less well developed fabric (Hm) 3145 – 3145.5 and 3146.5 – 3147 m.
Figure 7 FMI image illustrating well laminated sandstone Sl with thin mottled sandstone
with vague lamination Sm(Sl) 2908.5 – 2909 m. Figure 8 FMI image illustrating sandstone with coarse scale mottled fabric, Scm. Core
calibration reveals that this lithofacies comprise pebble conglomerate and pebbly sandstone.
Figure 9 FMI image illustrating sandstone with fine scale mottled fabric with weak
lamination, Sm(Sl). Note conductive high angle fracture. Figure 10 Cumulative dip azimuth plot for the interval 2890 – 2920m. ISSf and ISS intraset
surfaces (flat) are shown with structural dip removed. ISSf surfaces are dominant and large changes in azimuth are associated with these nearly flat lying structures. HETS and MUD surfaces only, occur above 3151 m.
Figure 11 Cumulative dip azimuth plot for the interval 2960 – 2997 m. ISSf and ISS
intraset surfaces (flat) are shown with structural dip removed. ISSf surfaces are dominant and large changes in azimuth are associated with these nearly flat lying structures.
Figure 12 Cumulative dip azimuth plot for the interval 3139 – 3167 m. ISSf and ISS
intraset surfaces (flat) are shown with structural dip removed. ISSf surfaces are dominant and large changes in azimuth are associated with these nearly flat lying structures.
Origin Energy Yolla 4 FMI Interpretation Report ______________________________________________________________________________
7
LIST OF ENCLOSURES Scale Enclosure 1 Quality control plot of FMI log, 2550 – 2600 m
1:250
Enclosure 2 Quality control plot of FMI log, 2885 – 3190 m
1:500
Enclosure 3 Overview structural summary log, 2550 – 2600 m
1:250
Enclosure 4 Overview structural summary log, 2890 – 3190 m
1:500
Enclosure 5 Data overview plot, 2550 – 2600 m
1:200
Enclosure 6 Data overview plot, 2890 – 3180 m
1:200
Enclosure 7 Sedimentological summary plot, 2890 – 2920 m
1:100
Enclosure 8 Sedimentological summary plot, 2960 – 3030 m
1:100
Enclosure 9 Sedimentological summary plot, 3115 – 3170 m
1:100
Enclosure 10 Core composite plot, 2895 – 2930 m
1:20
Enclosure 11 Core composite plot, 2960 – 3000 m 1:20
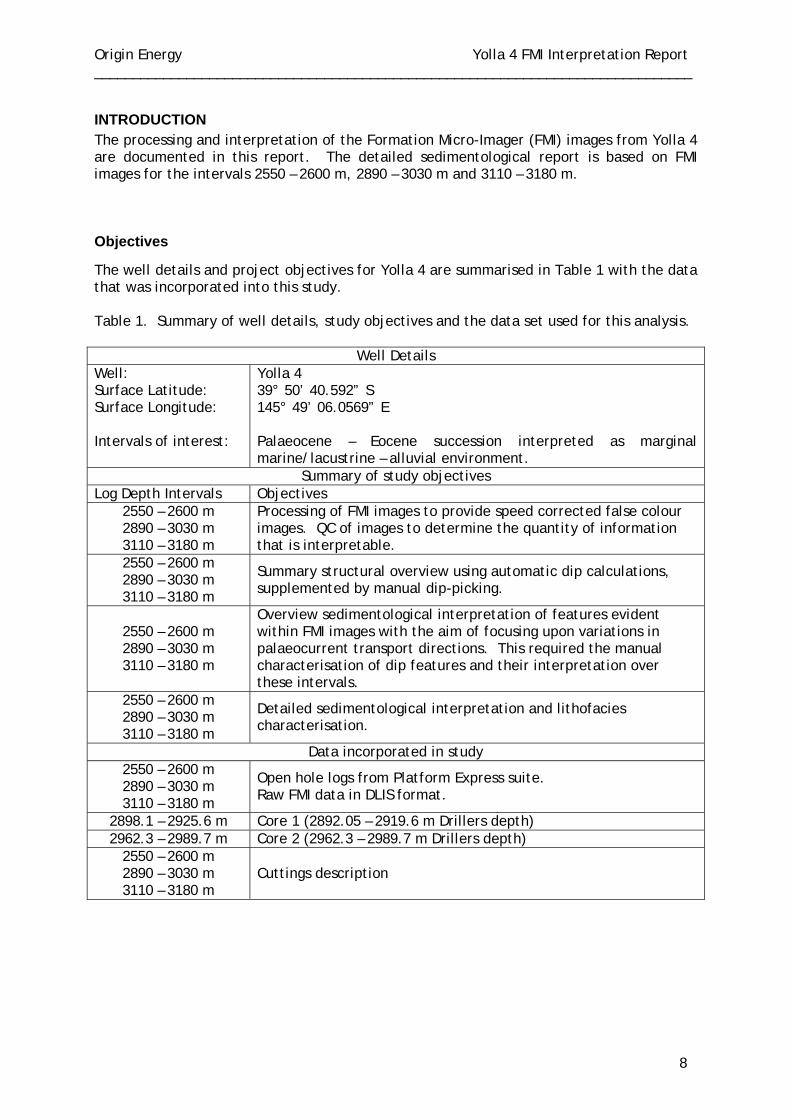
Origin Energy Yolla 4 FMI Interpretation Report ______________________________________________________________________________
8
INTRODUCTION The processing and interpretation of the Formation Micro-Imager (FMI) images from Yolla 4 are documented in this report. The detailed sedimentological report is based on FMI images for the intervals 2550 – 2600 m, 2890 – 3030 m and 3110 – 3180 m.
Objectives
The well details and project objectives for Yolla 4 are summarised in Table 1 with the data that was incorporated into this study. Table 1. Summary of well details, study objectives and the data set used for this analysis.
Well Details Well: Surface Latitude: Surface Longitude: Intervals of interest:
Yolla 4 39° 50’ 40.592” S 145° 49’ 06.0569” E Palaeocene – Eocene succession interpreted as marginal marine/lacustrine – alluvial environment.
Summary of study objectives Log Depth Intervals Objectives
2550 – 2600 m 2890 – 3030 m 3110 – 3180 m
Processing of FMI images to provide speed corrected false colour images. QC of images to determine the quantity of information that is interpretable.
2550 – 2600 m 2890 – 3030 m 3110 – 3180 m
Summary structural overview using automatic dip calculations, supplemented by manual dip-picking.
2550 – 2600 m 2890 – 3030 m 3110 – 3180 m
Overview sedimentological interpretation of features evident within FMI images with the aim of focusing upon variations in palaeocurrent transport directions. This required the manual characterisation of dip features and their interpretation over these intervals.
2550 – 2600 m 2890 – 3030 m 3110 – 3180 m
Detailed sedimentological interpretation and lithofacies characterisation.
Data incorporated in study 2550 – 2600 m 2890 – 3030 m 3110 – 3180 m
Open hole logs from Platform Express suite. Raw FMI data in DLIS format.
2898.1 – 2925.6 m Core 1 (2892.05 – 2919.6 m Drillers depth) 2962.3 – 2989.7 m Core 2 (2962.3 – 2989.7 m Drillers depth)
2550 – 2600 m 2890 – 3030 m 3110 – 3180 m
Cuttings description

Origin Energy Yolla 4 FMI Interpretation Report ______________________________________________________________________________
9
Depth and directional references
Unless otherwise mentioned, all depths in this report reference log depths. Orientation data is referenced using the standard convention of dip/dip azimuth. For example, 3°/313° indicates a dip of 3° (measured from the horizontal) towards 313° (referenced clockwise from north). Borehole orientation data follows a convention of deviation/azimuth of deviation. For example, 2°/300° indicates an 2° deviation from the vertical towards 300° (SW).
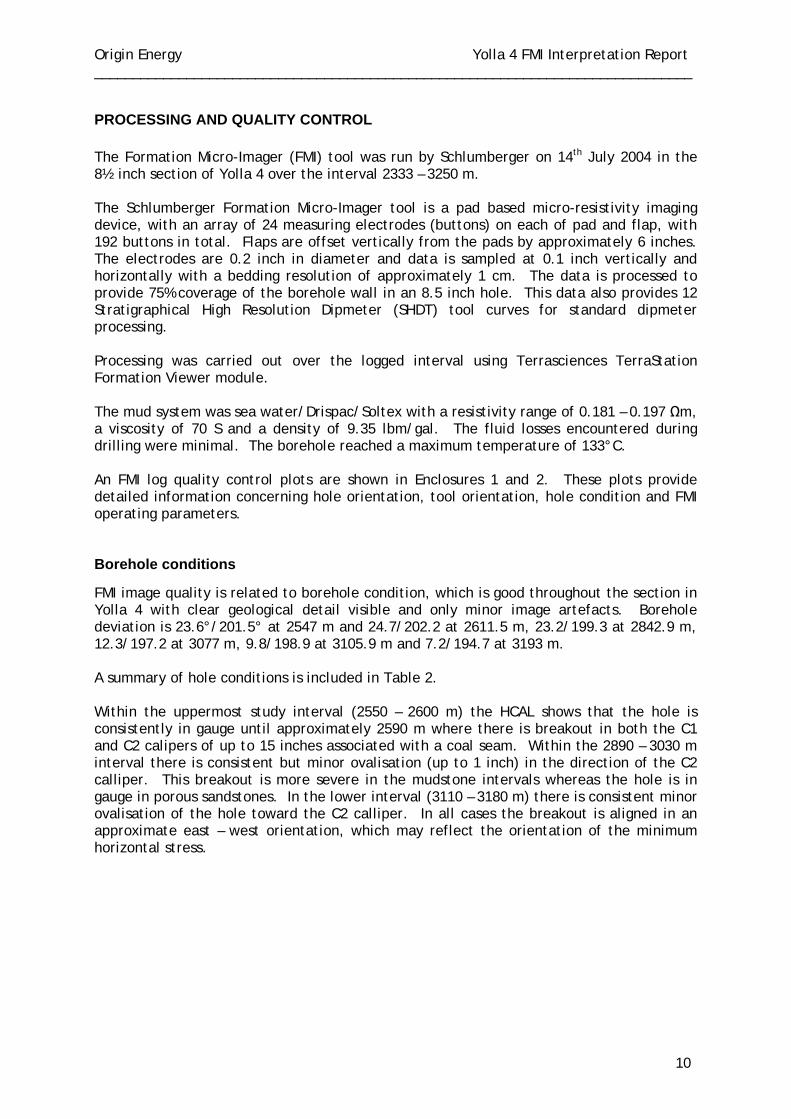
Origin Energy Yolla 4 FMI Interpretation Report ______________________________________________________________________________
10
PROCESSING AND QUALITY CONTROL The Formation Micro-Imager (FMI) tool was run by Schlumberger on 14th July 2004 in the 8½ inch section of Yolla 4 over the interval 2333 – 3250 m. The Schlumberger Formation Micro-Imager tool is a pad based micro-resistivity imaging device, with an array of 24 measuring electrodes (buttons) on each of pad and flap, with 192 buttons in total. Flaps are offset vertically from the pads by approximately 6 inches. The electrodes are 0.2 inch in diameter and data is sampled at 0.1 inch vertically and horizontally with a bedding resolution of approximately 1 cm. The data is processed to provide 75% coverage of the borehole wall in an 8.5 inch hole. This data also provides 12 Stratigraphical High Resolution Dipmeter (SHDT) tool curves for standard dipmeter processing. Processing was carried out over the logged interval using Terrasciences TerraStation Formation Viewer module. The mud system was sea water/Drispac/Soltex with a resistivity range of 0.181 – 0.197 Ωm, a viscosity of 70 S and a density of 9.35 lbm/gal. The fluid losses encountered during drilling were minimal. The borehole reached a maximum temperature of 133°C. An FMI log quality control plots are shown in Enclosures 1 and 2. These plots provide detailed information concerning hole orientation, tool orientation, hole condition and FMI operating parameters.
Borehole conditions
FMI image quality is related to borehole condition, which is good throughout the section in Yolla 4 with clear geological detail visible and only minor image artefacts. Borehole deviation is 23.6°/201.5° at 2547 m and 24.7/202.2 at 2611.5 m, 23.2/199.3 at 2842.9 m, 12.3/197.2 at 3077 m, 9.8/198.9 at 3105.9 m and 7.2/194.7 at 3193 m. A summary of hole conditions is included in Table 2. Within the uppermost study interval (2550 – 2600 m) the HCAL shows that the hole is consistently in gauge until approximately 2590 m where there is breakout in both the C1 and C2 calipers of up to 15 inches associated with a coal seam. Within the 2890 – 3030 m interval there is consistent but minor ovalisation (up to 1 inch) in the direction of the C2 calliper. This breakout is more severe in the mudstone intervals whereas the hole is in gauge in porous sandstones. In the lower interval (3110 – 3180 m) there is consistent minor ovalisation of the hole toward the C2 calliper. In all cases the breakout is aligned in an approximate east – west orientation, which may reflect the orientation of the minimum horizontal stress.
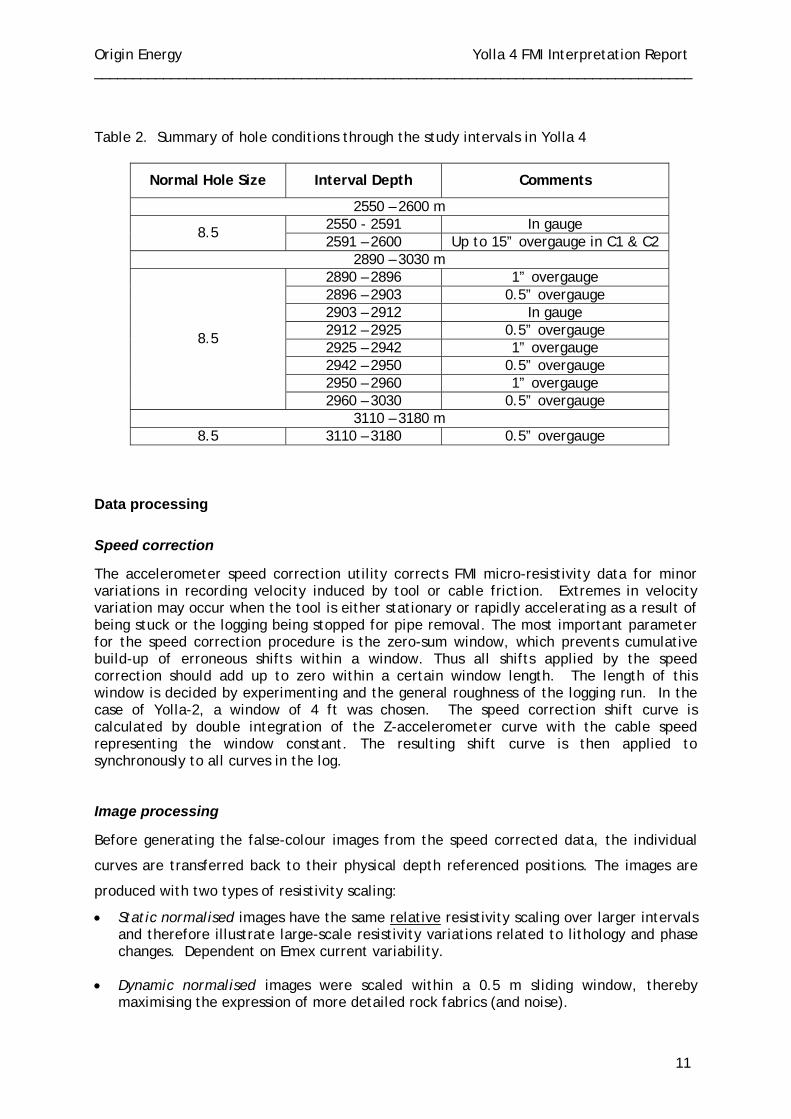
Origin Energy Yolla 4 FMI Interpretation Report ______________________________________________________________________________
11
Table 2. Summary of hole conditions through the study intervals in Yolla 4
Normal Hole Size Interval Depth Comments
2550 – 2600 m 2550 - 2591 In gauge 8.5 2591 – 2600 Up to 15” overgauge in C1 & C2
2890 – 3030 m 2890 – 2896 1” overgauge 2896 – 2903 0.5” overgauge 2903 – 2912 In gauge 2912 – 2925 0.5” overgauge 2925 – 2942 1” overgauge 2942 – 2950 0.5” overgauge 2950 – 2960 1” overgauge
8.5
2960 – 3030 0.5” overgauge 3110 – 3180 m
8.5 3110 – 3180 0.5” overgauge
Data processing
Speed correction
The accelerometer speed correction utility corrects FMI micro-resistivity data for minor variations in recording velocity induced by tool or cable friction. Extremes in velocity variation may occur when the tool is either stationary or rapidly accelerating as a result of being stuck or the logging being stopped for pipe removal. The most important parameter for the speed correction procedure is the zero-sum window, which prevents cumulative build-up of erroneous shifts within a window. Thus all shifts applied by the speed correction should add up to zero within a certain window length. The length of this window is decided by experimenting and the general roughness of the logging run. In the case of Yolla-2, a window of 4 ft was chosen. The speed correction shift curve is calculated by double integration of the Z-accelerometer curve with the cable speed representing the window constant. The resulting shift curve is then applied to synchronously to all curves in the log.
Image processing
Before generating the false-colour images from the speed corrected data, the individual
curves are transferred back to their physical depth referenced positions. The images are
produced with two types of resistivity scaling:
• Static normalised images have the same relative resistivity scaling over larger intervals and therefore illustrate large-scale resistivity variations related to lithology and phase changes. Dependent on Emex current variability.
• Dynamic normalised images were scaled within a 0.5 m sliding window, thereby maximising the expression of more detailed rock fabrics (and noise).
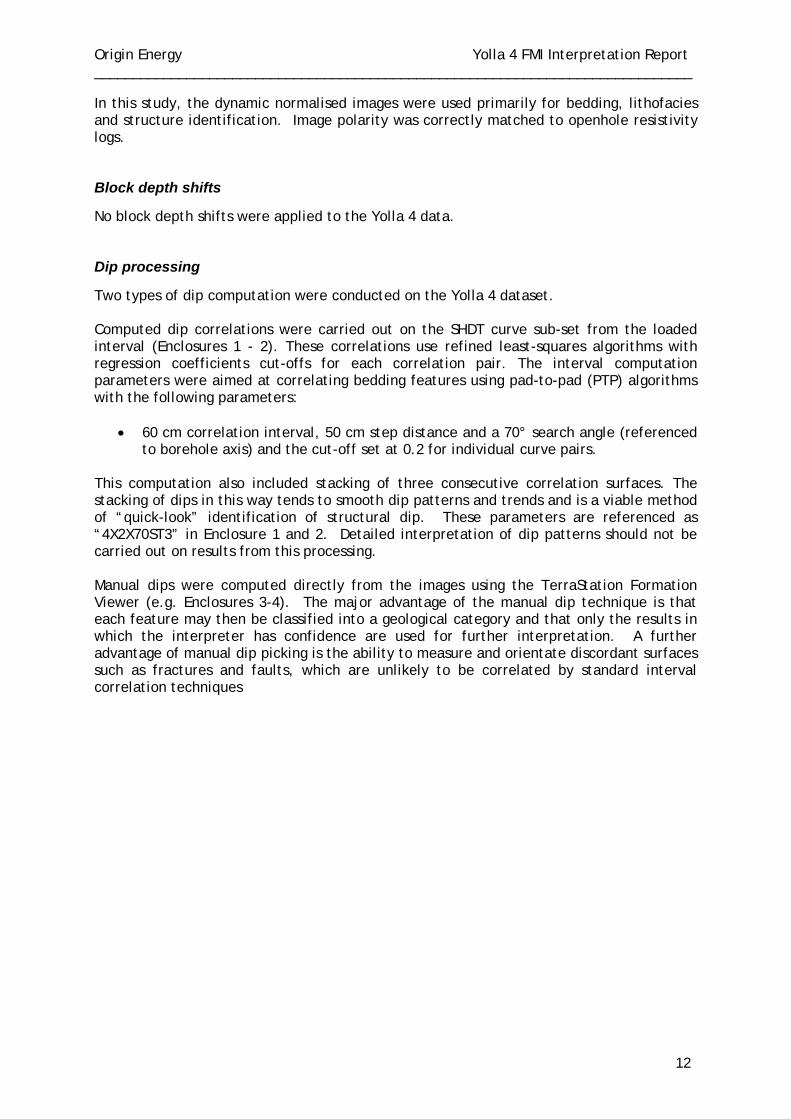
Origin Energy Yolla 4 FMI Interpretation Report ______________________________________________________________________________
12
In this study, the dynamic normalised images were used primarily for bedding, lithofacies and structure identification. Image polarity was correctly matched to openhole resistivity logs.
Block depth shifts
No block depth shifts were applied to the Yolla 4 data.
Dip processing
Two types of dip computation were conducted on the Yolla 4 dataset. Computed dip correlations were carried out on the SHDT curve sub-set from the loaded interval (Enclosures 1 - 2). These correlations use refined least-squares algorithms with regression coefficients cut-offs for each correlation pair. The interval computation parameters were aimed at correlating bedding features using pad-to-pad (PTP) algorithms with the following parameters:
• 60 cm correlation interval, 50 cm step distance and a 70° search angle (referenced to borehole axis) and the cut-off set at 0.2 for individual curve pairs.
This computation also included stacking of three consecutive correlation surfaces. The stacking of dips in this way tends to smooth dip patterns and trends and is a viable method of “quick-look” identification of structural dip. These parameters are referenced as “4X2X70ST3” in Enclosure 1 and 2. Detailed interpretation of dip patterns should not be carried out on results from this processing. Manual dips were computed directly from the images using the TerraStation Formation Viewer (e.g. Enclosures 3-4). The major advantage of the manual dip technique is that each feature may then be classified into a geological category and that only the results in which the interpreter has confidence are used for further interpretation. A further advantage of manual dip picking is the ability to measure and orientate discordant surfaces such as fractures and faults, which are unlikely to be correlated by standard interval correlation techniques
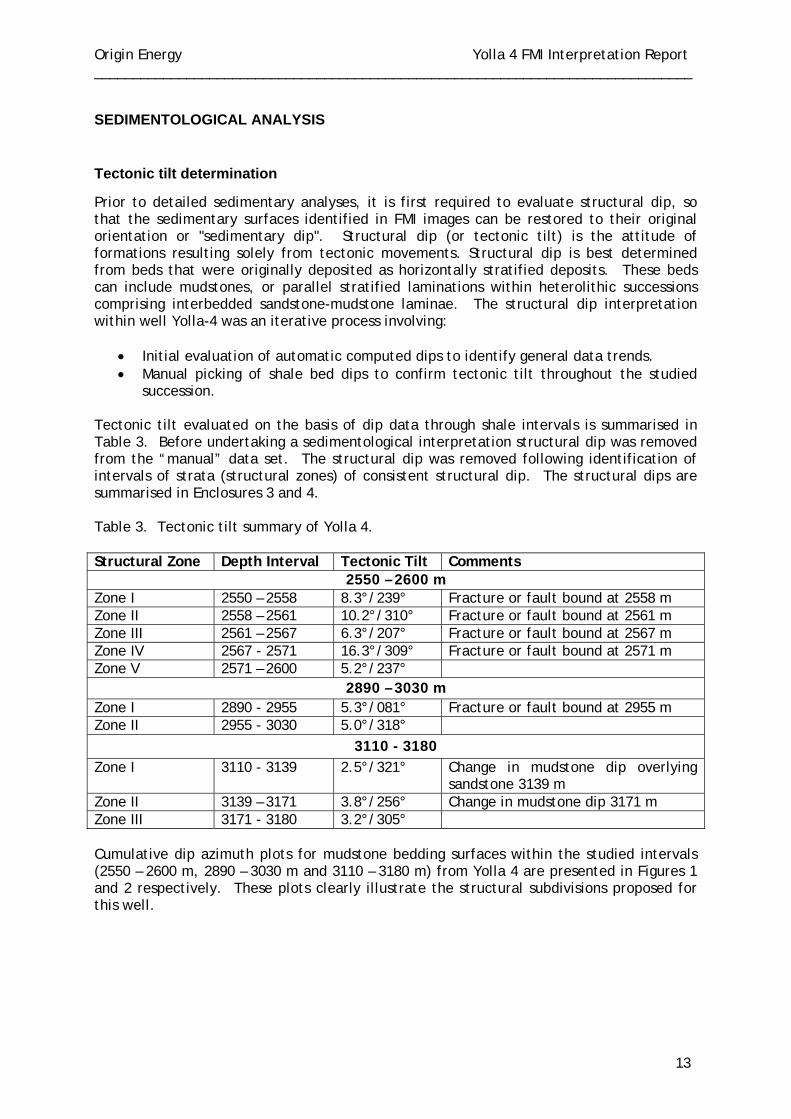
Origin Energy Yolla 4 FMI Interpretation Report ______________________________________________________________________________
13
SEDIMENTOLOGICAL ANALYSIS
Tectonic tilt determination
Prior to detailed sedimentary analyses, it is first required to evaluate structural dip, so that the sedimentary surfaces identified in FMI images can be restored to their original orientation or "sedimentary dip". Structural dip (or tectonic tilt) is the attitude of formations resulting solely from tectonic movements. Structural dip is best determined from beds that were originally deposited as horizontally stratified deposits. These beds can include mudstones, or parallel stratified laminations within heterolithic successions comprising interbedded sandstone-mudstone laminae. The structural dip interpretation within well Yolla-4 was an iterative process involving:
• Initial evaluation of automatic computed dips to identify general data trends. • Manual picking of shale bed dips to confirm tectonic tilt throughout the studied
succession.
Tectonic tilt evaluated on the basis of dip data through shale intervals is summarised in Table 3. Before undertaking a sedimentological interpretation structural dip was removed from the “manual” data set. The structural dip was removed following identification of intervals of strata (structural zones) of consistent structural dip. The structural dips are summarised in Enclosures 3 and 4. Table 3. Tectonic tilt summary of Yolla 4. Structural Zone Depth Interval Tectonic Tilt Comments
2550 – 2600 m Zone I 2550 – 2558 8.3°/239° Fracture or fault bound at 2558 m Zone II 2558 – 2561 10.2°/310° Fracture or fault bound at 2561 m Zone III 2561 – 2567 6.3°/207° Fracture or fault bound at 2567 m Zone IV 2567 - 2571 16.3°/309° Fracture or fault bound at 2571 m Zone V 2571 – 2600 5.2°/237°
2890 – 3030 m Zone I 2890 - 2955 5.3°/081° Fracture or fault bound at 2955 m Zone II 2955 - 3030 5.0°/318°
3110 - 3180 Zone I 3110 - 3139 2.5°/321° Change in mudstone dip overlying
sandstone 3139 m Zone II 3139 – 3171 3.8°/256° Change in mudstone dip 3171 m Zone III 3171 - 3180 3.2°/305° Cumulative dip azimuth plots for mudstone bedding surfaces within the studied intervals (2550 – 2600 m, 2890 – 3030 m and 3110 – 3180 m) from Yolla 4 are presented in Figures 1 and 2 respectively. These plots clearly illustrate the structural subdivisions proposed for this well.
Origin Energy Yolla 4 FMI Interpretation Report ______________________________________________________________________________
14
Classification of sedimentary features
Classification of sedimentary surfaces recognised from borehole image logs is a 3 stage iterative process involving:
• First pass dip picking. This phase of feature identification is carried out in conjunction with examination of wireline logs, and results in a simple 2-fold sub-division of dip features into mudstone and "others".
• Structural dip is removed from the data set using a workstation based stereographic technique to provide sedimentary dips.
• Sedimentary dips are re-classified in the workstation environment. Wireline logs are used to drive lithofacies interpretation. Sedimentary dips within sandstone lithologies are characterised using a hierarchical scheme depending upon their dip and orientation.
The hierarchical scheme applied to Yolla 4 is illustrated in Figure 3 and Table 4 below, and sedimentary dips for the studied intervals 2890 - 3030 m and 3110 - 3180 m are indicated in Enclosures 7 – 9.
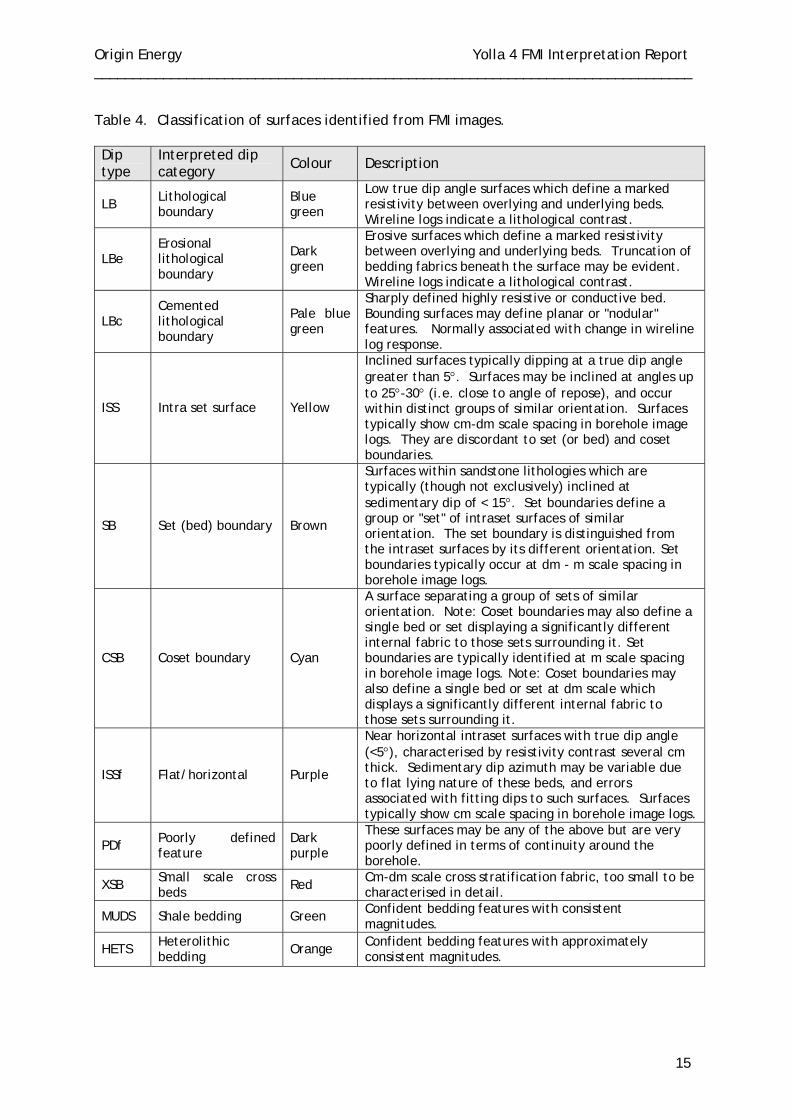
Origin Energy Yolla 4 FMI Interpretation Report ______________________________________________________________________________
15
Table 4. Classification of surfaces identified from FMI images. Dip type
Interpreted dip category Colour Description
LB Lithological boundary
Blue green
Low true dip angle surfaces which define a marked resistivity between overlying and underlying beds. Wireline logs indicate a lithological contrast.
LBe Erosional lithological boundary
Dark green
Erosive surfaces which define a marked resistivity between overlying and underlying beds. Truncation of bedding fabrics beneath the surface may be evident. Wireline logs indicate a lithological contrast.
LBc Cemented lithological boundary
Pale blue green
Sharply defined highly resistive or conductive bed. Bounding surfaces may define planar or "nodular" features. Normally associated with change in wireline log response.
ISS Intra set surface Yellow
Inclined surfaces typically dipping at a true dip angle greater than 5°. Surfaces may be inclined at angles up to 25°-30° (i.e. close to angle of repose), and occur within distinct groups of similar orientation. Surfaces typically show cm-dm scale spacing in borehole image logs. They are discordant to set (or bed) and coset boundaries.
SB Set (bed) boundary Brown
Surfaces within sandstone lithologies which are typically (though not exclusively) inclined at sedimentary dip of < 15°. Set boundaries define a group or "set" of intraset surfaces of similar orientation. The set boundary is distinguished from the intraset surfaces by its different orientation. Set boundaries typically occur at dm - m scale spacing in borehole image logs.
CSB Coset boundary Cyan
A surface separating a group of sets of similar orientation. Note: Coset boundaries may also define a single bed or set displaying a significantly different internal fabric to those sets surrounding it. Set boundaries are typically identified at m scale spacing in borehole image logs. Note: Coset boundaries may also define a single bed or set at dm scale which displays a significantly different internal fabric to those sets surrounding it.
ISSf Flat/horizontal Purple
Near horizontal intraset surfaces with true dip angle (<5°), characterised by resistivity contrast several cm thick. Sedimentary dip azimuth may be variable due to flat lying nature of these beds, and errors associated with fitting dips to such surfaces. Surfaces typically show cm scale spacing in borehole image logs.
PDf Poorly defined feature
Dark purple
These surfaces may be any of the above but are very poorly defined in terms of continuity around the borehole.
XSB Small scale cross beds Red Cm-dm scale cross stratification fabric, too small to be
characterised in detail.
MUDS Shale bedding Green Confident bedding features with consistent magnitudes.
HETS Heterolithic bedding Orange Confident bedding features with approximately
consistent magnitudes.
Origin Energy Yolla 4 FMI Interpretation Report ______________________________________________________________________________
16
Lithofacies characterisation
Lithofacies identification was first carried out using FMI images in conjunction with openhole log suites. The FMI interpretations were then calibrated against data from the cored intervals (Core 1 2898.1 – 2925.6 and Core 2 2962.3 – 2989.7 m). In this way, the initial FMI interpretations were not influenced by preconceptions gained from having seen the core, and an understanding of likely interpretation confidence was obtained.
Lithofacies identified from FMI logs.
The sedimentological interpretation of FMI images and dipmeter data were carried out with the aid of gamma ray, density, neutron porosity and sonic logs. Lithofacies were interpreted on the basis of variations in wireline log response in conjunction with fabrics observed in FMI images (Table 5). During interpretation, cuttings descriptions were also used to help provide a guide to lithology, but were found to have only moderate depth resolution (i.e. matching of cuttings description to log /response) due to dispersion of cuttings during circulation of drilling muds. Four broad lithofacies were interpreted as being present, i.e. sandstones, mudstones, finely inter-bedded heterolithic successions and coals. Heterolithic successions comprise centimetre-decimetre scale interbedded sandstone, siltstone and mudstone beds. Coals formed a minor lithofacies within the study intervals, and are clearly recognisable by their low density, high porosity and high resistivity log response (Figure 4). Lithofacies types were classified according to a simple scheme using mnemonics based upon interpreted lithology and contained fabric, the latter being determined from borehole image log and associated dip data. Examples of identified lithofacies are summarised below in Table 5.
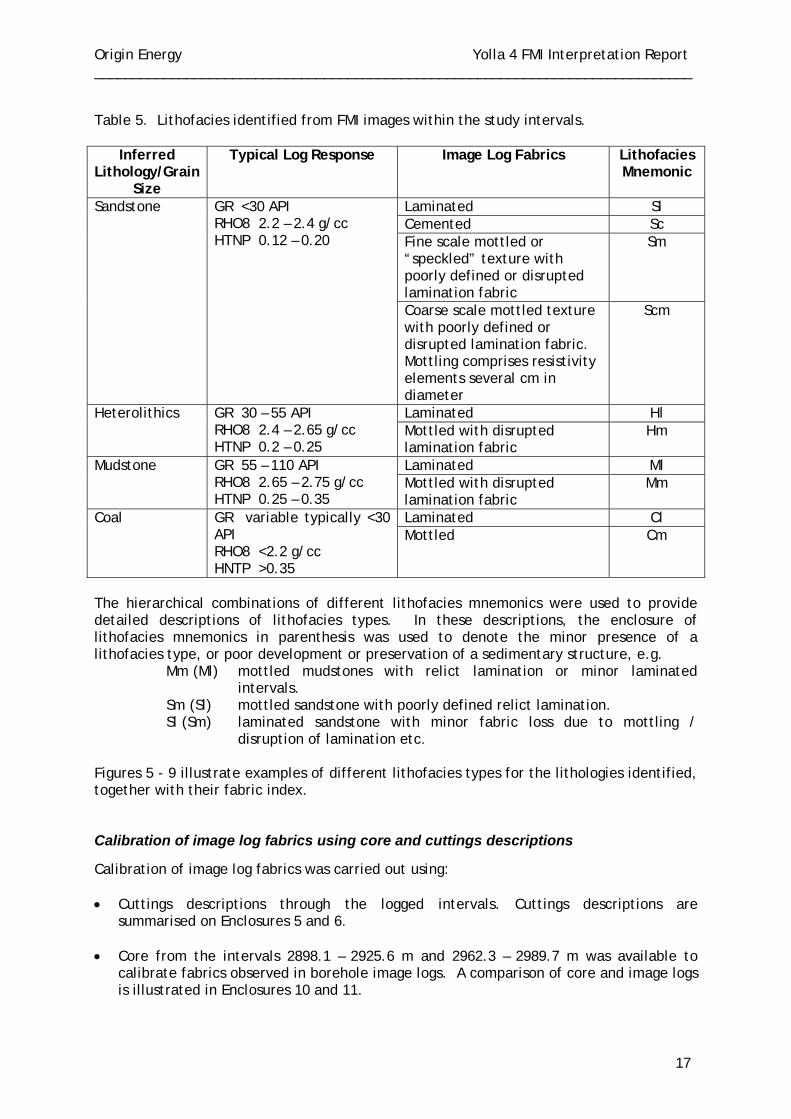
Origin Energy Yolla 4 FMI Interpretation Report ______________________________________________________________________________
17
Table 5. Lithofacies identified from FMI images within the study intervals.
Inferred Lithology/Grain
Size
Typical Log Response Image Log Fabrics Lithofacies Mnemonic
Laminated Sl Cemented Sc Fine scale mottled or “speckled” texture with poorly defined or disrupted lamination fabric
Sm
Sandstone GR <30 API RHO8 2.2 – 2.4 g/cc HTNP 0.12 – 0.20
Coarse scale mottled texture with poorly defined or disrupted lamination fabric. Mottling comprises resistivity elements several cm in diameter
Scm
Laminated Hl Heterolithics GR 30 – 55 API RHO8 2.4 – 2.65 g/cc HTNP 0.2 – 0.25
Mottled with disrupted lamination fabric
Hm
Laminated Ml Mudstone GR 55 – 110 API RHO8 2.65 – 2.75 g/cc HTNP 0.25 – 0.35
Mottled with disrupted lamination fabric
Mm
Laminated Cl Coal GR variable typically <30 API RHO8 <2.2 g/cc HNTP >0.35
Mottled Cm
The hierarchical combinations of different lithofacies mnemonics were used to provide detailed descriptions of lithofacies types. In these descriptions, the enclosure of lithofacies mnemonics in parenthesis was used to denote the minor presence of a lithofacies type, or poor development or preservation of a sedimentary structure, e.g.
Mm (Ml) mottled mudstones with relict lamination or minor laminated intervals.
Sm (Sl) mottled sandstone with poorly defined relict lamination. Sl (Sm) laminated sandstone with minor fabric loss due to mottling /
disruption of lamination etc. Figures 5 - 9 illustrate examples of different lithofacies types for the lithologies identified, together with their fabric index.
Calibration of image log fabrics using core and cuttings descriptions
Calibration of image log fabrics was carried out using: • Cuttings descriptions through the logged intervals. Cuttings descriptions are
summarised on Enclosures 5 and 6. • Core from the intervals 2898.1 – 2925.6 m and 2962.3 – 2989.7 m was available to
calibrate fabrics observed in borehole image logs. A comparison of core and image logs is illustrated in Enclosures 10 and 11.
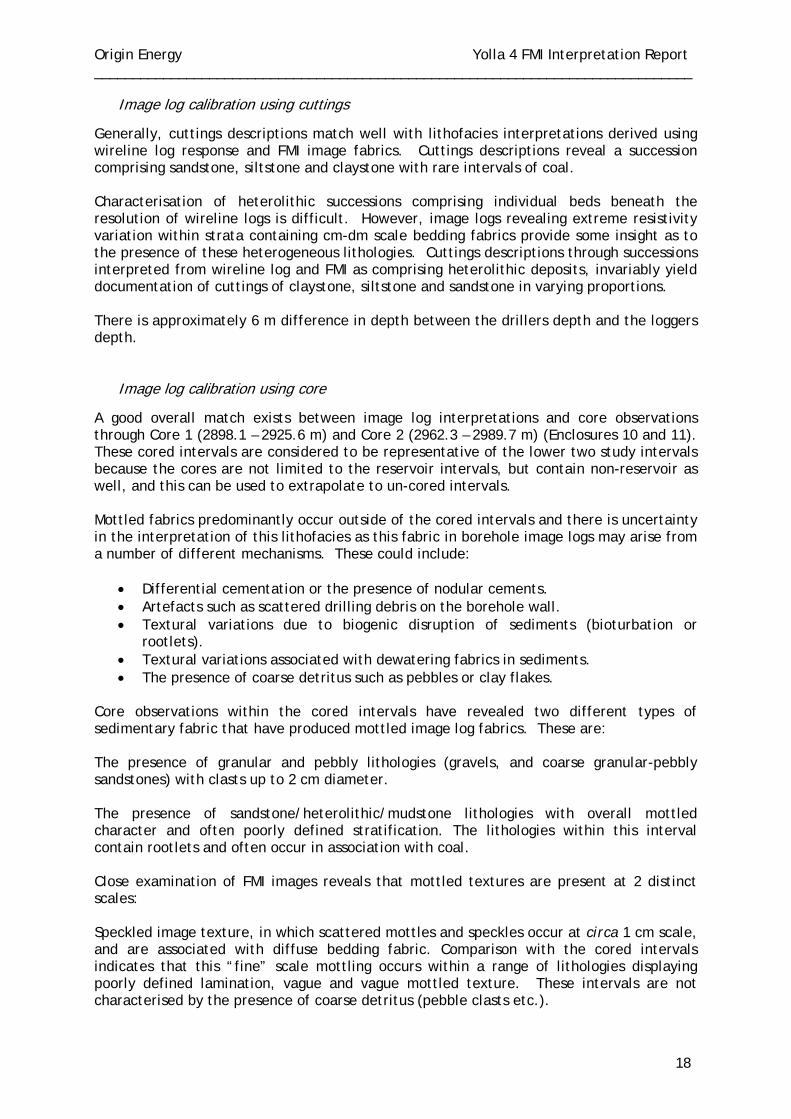
Origin Energy Yolla 4 FMI Interpretation Report ______________________________________________________________________________
18
Image log calibration using cuttings
Generally, cuttings descriptions match well with lithofacies interpretations derived using wireline log response and FMI image fabrics. Cuttings descriptions reveal a succession comprising sandstone, siltstone and claystone with rare intervals of coal. Characterisation of heterolithic successions comprising individual beds beneath the resolution of wireline logs is difficult. However, image logs revealing extreme resistivity variation within strata containing cm-dm scale bedding fabrics provide some insight as to the presence of these heterogeneous lithologies. Cuttings descriptions through successions interpreted from wireline log and FMI as comprising heterolithic deposits, invariably yield documentation of cuttings of claystone, siltstone and sandstone in varying proportions. There is approximately 6 m difference in depth between the drillers depth and the loggers depth.
Image log calibration using core
A good overall match exists between image log interpretations and core observations through Core 1 (2898.1 – 2925.6 m) and Core 2 (2962.3 – 2989.7 m) (Enclosures 10 and 11). These cored intervals are considered to be representative of the lower two study intervals because the cores are not limited to the reservoir intervals, but contain non-reservoir as well, and this can be used to extrapolate to un-cored intervals. Mottled fabrics predominantly occur outside of the cored intervals and there is uncertainty in the interpretation of this lithofacies as this fabric in borehole image logs may arise from a number of different mechanisms. These could include:
• Differential cementation or the presence of nodular cements. • Artefacts such as scattered drilling debris on the borehole wall. • Textural variations due to biogenic disruption of sediments (bioturbation or
rootlets). • Textural variations associated with dewatering fabrics in sediments. • The presence of coarse detritus such as pebbles or clay flakes.
Core observations within the cored intervals have revealed two different types of sedimentary fabric that have produced mottled image log fabrics. These are: The presence of granular and pebbly lithologies (gravels, and coarse granular-pebbly sandstones) with clasts up to 2 cm diameter. The presence of sandstone/heterolithic/mudstone lithologies with overall mottled character and often poorly defined stratification. The lithologies within this interval contain rootlets and often occur in association with coal. Close examination of FMI images reveals that mottled textures are present at 2 distinct scales: Speckled image texture, in which scattered mottles and speckles occur at circa 1 cm scale, and are associated with diffuse bedding fabric. Comparison with the cored intervals indicates that this “fine” scale mottling occurs within a range of lithologies displaying poorly defined lamination, vague and vague mottled texture. These intervals are not characterised by the presence of coarse detritus (pebble clasts etc.).
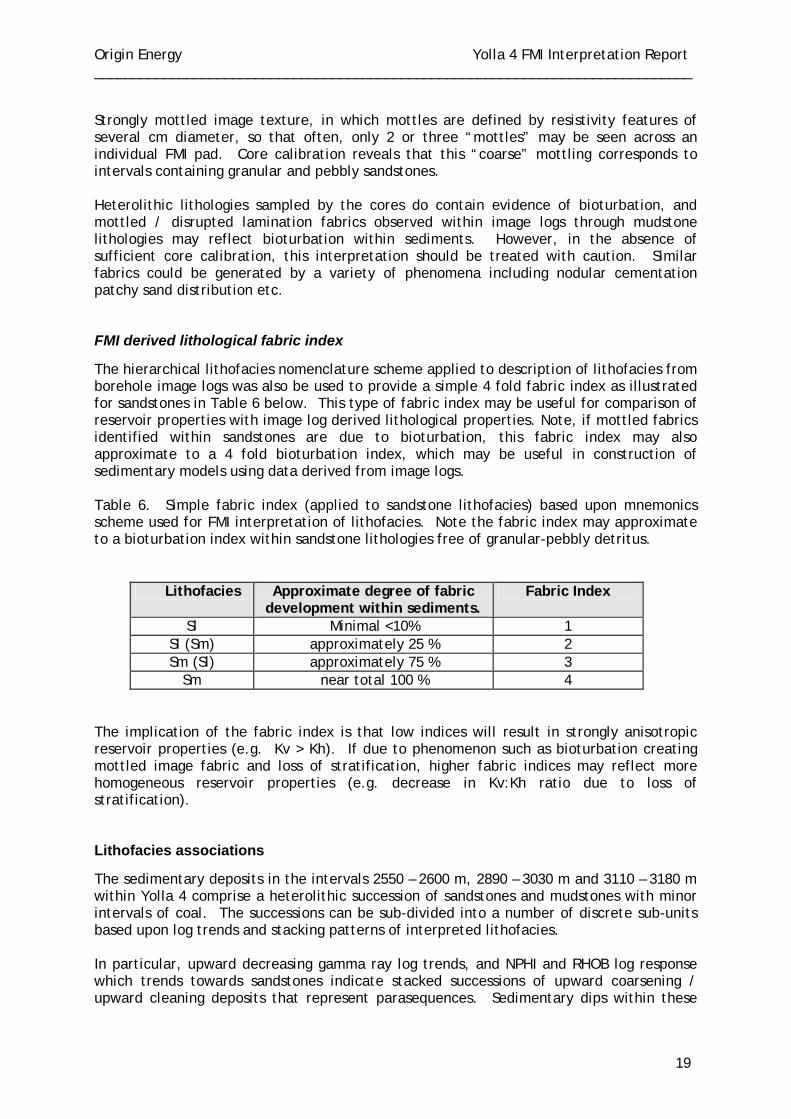
Origin Energy Yolla 4 FMI Interpretation Report ______________________________________________________________________________
19
Strongly mottled image texture, in which mottles are defined by resistivity features of several cm diameter, so that often, only 2 or three “mottles” may be seen across an individual FMI pad. Core calibration reveals that this “coarse” mottling corresponds to intervals containing granular and pebbly sandstones. Heterolithic lithologies sampled by the cores do contain evidence of bioturbation, and mottled / disrupted lamination fabrics observed within image logs through mudstone lithologies may reflect bioturbation within sediments. However, in the absence of sufficient core calibration, this interpretation should be treated with caution. Similar fabrics could be generated by a variety of phenomena including nodular cementation patchy sand distribution etc.
FMI derived lithological fabric index
The hierarchical lithofacies nomenclature scheme applied to description of lithofacies from borehole image logs was also be used to provide a simple 4 fold fabric index as illustrated for sandstones in Table 6 below. This type of fabric index may be useful for comparison of reservoir properties with image log derived lithological properties. Note, if mottled fabrics identified within sandstones are due to bioturbation, this fabric index may also approximate to a 4 fold bioturbation index, which may be useful in construction of sedimentary models using data derived from image logs. Table 6. Simple fabric index (applied to sandstone lithofacies) based upon mnemonics scheme used for FMI interpretation of lithofacies. Note the fabric index may approximate to a bioturbation index within sandstone lithologies free of granular-pebbly detritus.
Lithofacies Approximate degree of fabric development within sediments.
Fabric Index
Sl Minimal <10% 1 Sl (Sm) approximately 25 % 2 Sm (Sl) approximately 75 % 3
Sm near total 100 % 4 The implication of the fabric index is that low indices will result in strongly anisotropic reservoir properties (e.g. Kv > Kh). If due to phenomenon such as bioturbation creating mottled image fabric and loss of stratification, higher fabric indices may reflect more homogeneous reservoir properties (e.g. decrease in Kv:Kh ratio due to loss of stratification).
Lithofacies associations
The sedimentary deposits in the intervals 2550 – 2600 m, 2890 – 3030 m and 3110 – 3180 m within Yolla 4 comprise a heterolithic succession of sandstones and mudstones with minor intervals of coal. The successions can be sub-divided into a number of discrete sub-units based upon log trends and stacking patterns of interpreted lithofacies. In particular, upward decreasing gamma ray log trends, and NPHI and RHOB log response which trends towards sandstones indicate stacked successions of upward coarsening / upward cleaning deposits that represent parasequences. Sedimentary dips within these
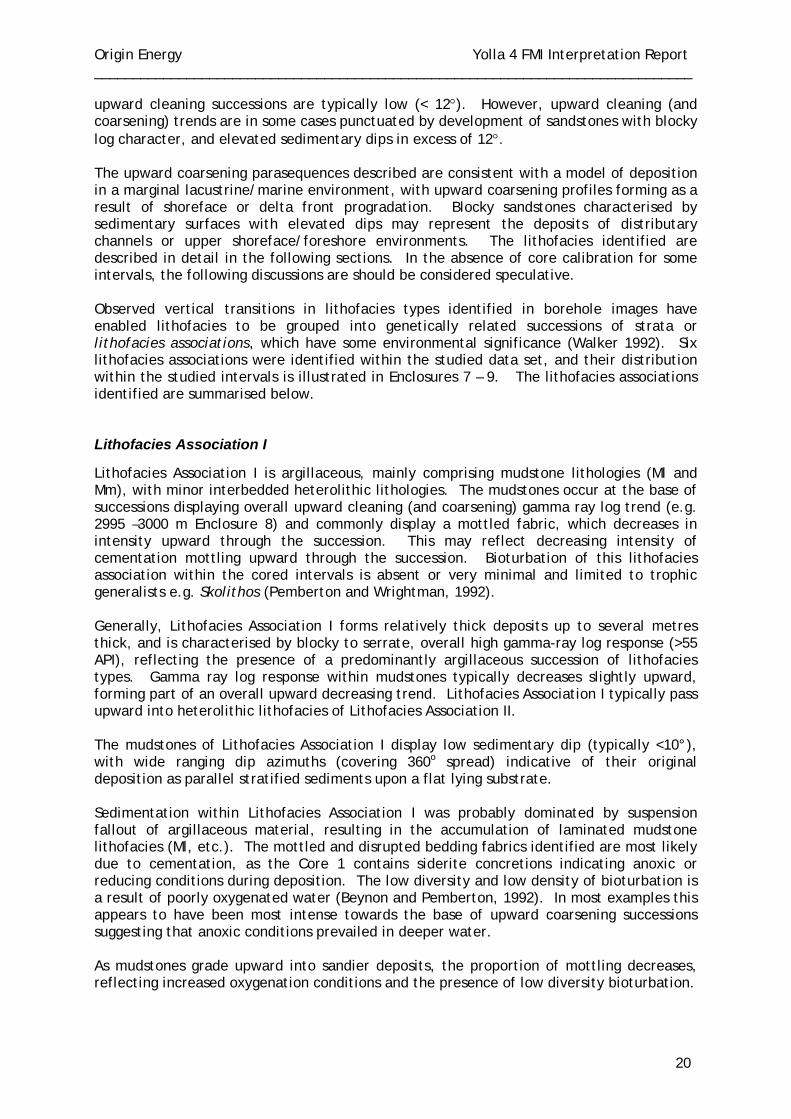
Origin Energy Yolla 4 FMI Interpretation Report ______________________________________________________________________________
20
upward cleaning successions are typically low (< 12°). However, upward cleaning (and coarsening) trends are in some cases punctuated by development of sandstones with blocky log character, and elevated sedimentary dips in excess of 12°. The upward coarsening parasequences described are consistent with a model of deposition in a marginal lacustrine/marine environment, with upward coarsening profiles forming as a result of shoreface or delta front progradation. Blocky sandstones characterised by sedimentary surfaces with elevated dips may represent the deposits of distributary channels or upper shoreface/foreshore environments. The lithofacies identified are described in detail in the following sections. In the absence of core calibration for some intervals, the following discussions are should be considered speculative. Observed vertical transitions in lithofacies types identified in borehole images have enabled lithofacies to be grouped into genetically related successions of strata or lithofacies associations, which have some environmental significance (Walker 1992). Six lithofacies associations were identified within the studied data set, and their distribution within the studied intervals is illustrated in Enclosures 7 – 9. The lithofacies associations identified are summarised below.
Lithofacies Association I
Lithofacies Association I is argillaceous, mainly comprising mudstone lithologies (Ml and Mm), with minor interbedded heterolithic lithologies. The mudstones occur at the base of successions displaying overall upward cleaning (and coarsening) gamma ray log trend (e.g. 2995 –3000 m Enclosure 8) and commonly display a mottled fabric, which decreases in intensity upward through the succession. This may reflect decreasing intensity of cementation mottling upward through the succession. Bioturbation of this lithofacies association within the cored intervals is absent or very minimal and limited to trophic generalists e.g. Skolithos (Pemberton and Wrightman, 1992). Generally, Lithofacies Association I forms relatively thick deposits up to several metres thick, and is characterised by blocky to serrate, overall high gamma-ray log response (>55 API), reflecting the presence of a predominantly argillaceous succession of lithofacies types. Gamma ray log response within mudstones typically decreases slightly upward, forming part of an overall upward decreasing trend. Lithofacies Association I typically pass upward into heterolithic lithofacies of Lithofacies Association II. The mudstones of Lithofacies Association I display low sedimentary dip (typically <10°), with wide ranging dip azimuths (covering 360o spread) indicative of their original deposition as parallel stratified sediments upon a flat lying substrate. Sedimentation within Lithofacies Association I was probably dominated by suspension fallout of argillaceous material, resulting in the accumulation of laminated mudstone lithofacies (Ml, etc.). The mottled and disrupted bedding fabrics identified are most likely due to cementation, as the Core 1 contains siderite concretions indicating anoxic or reducing conditions during deposition. The low diversity and low density of bioturbation is a result of poorly oxygenated water (Beynon and Pemberton, 1992). In most examples this appears to have been most intense towards the base of upward coarsening successions suggesting that anoxic conditions prevailed in deeper water. As mudstones grade upward into sandier deposits, the proportion of mottling decreases, reflecting increased oxygenation conditions and the presence of low diversity bioturbation.
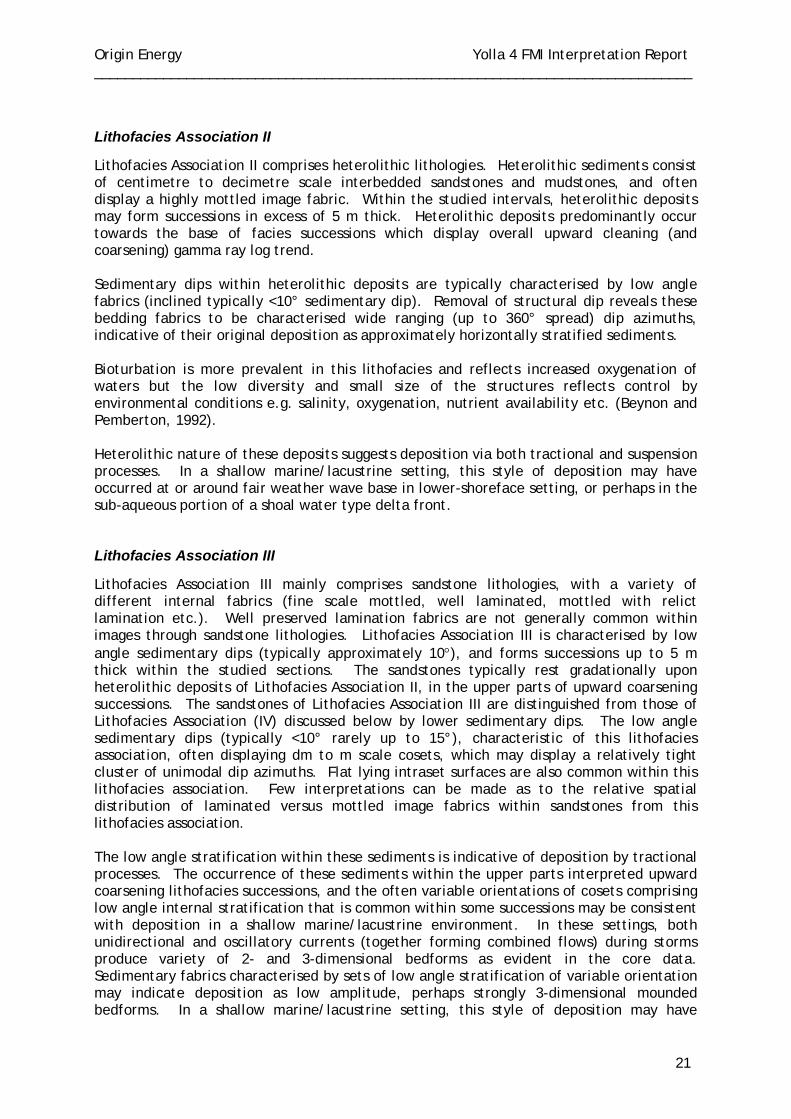
Origin Energy Yolla 4 FMI Interpretation Report ______________________________________________________________________________
21
Lithofacies Association II
Lithofacies Association II comprises heterolithic lithologies. Heterolithic sediments consist of centimetre to decimetre scale interbedded sandstones and mudstones, and often display a highly mottled image fabric. Within the studied intervals, heterolithic deposits may form successions in excess of 5 m thick. Heterolithic deposits predominantly occur towards the base of facies successions which display overall upward cleaning (and coarsening) gamma ray log trend. Sedimentary dips within heterolithic deposits are typically characterised by low angle fabrics (inclined typically <10° sedimentary dip). Removal of structural dip reveals these bedding fabrics to be characterised wide ranging (up to 360° spread) dip azimuths, indicative of their original deposition as approximately horizontally stratified sediments. Bioturbation is more prevalent in this lithofacies and reflects increased oxygenation of waters but the low diversity and small size of the structures reflects control by environmental conditions e.g. salinity, oxygenation, nutrient availability etc. (Beynon and Pemberton, 1992). Heterolithic nature of these deposits suggests deposition via both tractional and suspension processes. In a shallow marine/lacustrine setting, this style of deposition may have occurred at or around fair weather wave base in lower-shoreface setting, or perhaps in the sub-aqueous portion of a shoal water type delta front.
Lithofacies Association III
Lithofacies Association III mainly comprises sandstone lithologies, with a variety of different internal fabrics (fine scale mottled, well laminated, mottled with relict lamination etc.). Well preserved lamination fabrics are not generally common within images through sandstone lithologies. Lithofacies Association III is characterised by low angle sedimentary dips (typically approximately 10°), and forms successions up to 5 m thick within the studied sections. The sandstones typically rest gradationally upon heterolithic deposits of Lithofacies Association II, in the upper parts of upward coarsening successions. The sandstones of Lithofacies Association III are distinguished from those of Lithofacies Association (IV) discussed below by lower sedimentary dips. The low angle sedimentary dips (typically <10° rarely up to 15°), characteristic of this lithofacies association, often displaying dm to m scale cosets, which may display a relatively tight cluster of unimodal dip azimuths. Flat lying intraset surfaces are also common within this lithofacies association. Few interpretations can be made as to the relative spatial distribution of laminated versus mottled image fabrics within sandstones from this lithofacies association. The low angle stratification within these sediments is indicative of deposition by tractional processes. The occurrence of these sediments within the upper parts interpreted upward coarsening lithofacies successions, and the often variable orientations of cosets comprising low angle internal stratification that is common within some successions may be consistent with deposition in a shallow marine/lacustrine environment. In these settings, both unidirectional and oscillatory currents (together forming combined flows) during storms produce variety of 2- and 3-dimensional bedforms as evident in the core data. Sedimentary fabrics characterised by sets of low angle stratification of variable orientation may indicate deposition as low amplitude, perhaps strongly 3-dimensional mounded bedforms. In a shallow marine/lacustrine setting, this style of deposition may have
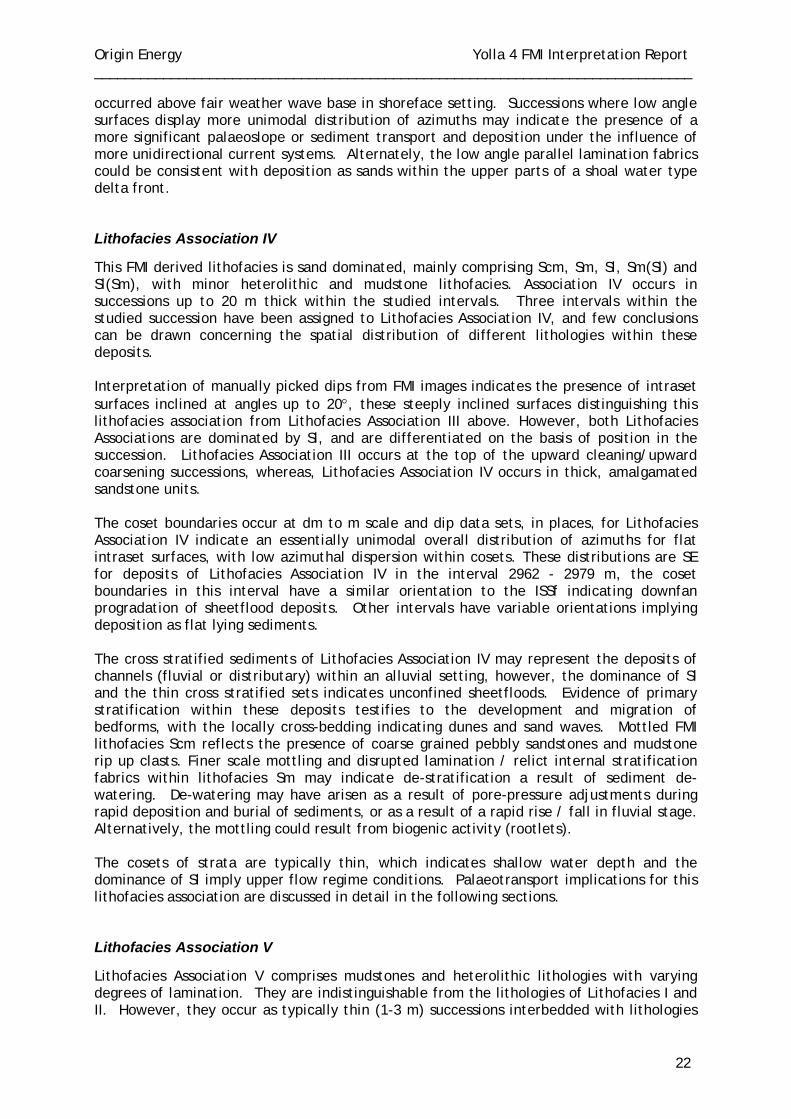
Origin Energy Yolla 4 FMI Interpretation Report ______________________________________________________________________________
22
occurred above fair weather wave base in shoreface setting. Successions where low angle surfaces display more unimodal distribution of azimuths may indicate the presence of a more significant palaeoslope or sediment transport and deposition under the influence of more unidirectional current systems. Alternately, the low angle parallel lamination fabrics could be consistent with deposition as sands within the upper parts of a shoal water type delta front.
Lithofacies Association IV
This FMI derived lithofacies is sand dominated, mainly comprising Scm, Sm, Sl, Sm(Sl) and Sl(Sm), with minor heterolithic and mudstone lithofacies. Association IV occurs in successions up to 20 m thick within the studied intervals. Three intervals within the studied succession have been assigned to Lithofacies Association IV, and few conclusions can be drawn concerning the spatial distribution of different lithologies within these deposits. Interpretation of manually picked dips from FMI images indicates the presence of intraset surfaces inclined at angles up to 20°, these steeply inclined surfaces distinguishing this lithofacies association from Lithofacies Association III above. However, both Lithofacies Associations are dominated by Sl, and are differentiated on the basis of position in the succession. Lithofacies Association III occurs at the top of the upward cleaning/upward coarsening successions, whereas, Lithofacies Association IV occurs in thick, amalgamated sandstone units. The coset boundaries occur at dm to m scale and dip data sets, in places, for Lithofacies Association IV indicate an essentially unimodal overall distribution of azimuths for flat intraset surfaces, with low azimuthal dispersion within cosets. These distributions are SE for deposits of Lithofacies Association IV in the interval 2962 - 2979 m, the coset boundaries in this interval have a similar orientation to the ISSf indicating downfan progradation of sheetflood deposits. Other intervals have variable orientations implying deposition as flat lying sediments. The cross stratified sediments of Lithofacies Association IV may represent the deposits of channels (fluvial or distributary) within an alluvial setting, however, the dominance of Sl and the thin cross stratified sets indicates unconfined sheetfloods. Evidence of primary stratification within these deposits testifies to the development and migration of bedforms, with the locally cross-bedding indicating dunes and sand waves. Mottled FMI lithofacies Scm reflects the presence of coarse grained pebbly sandstones and mudstone rip up clasts. Finer scale mottling and disrupted lamination / relict internal stratification fabrics within lithofacies Sm may indicate de-stratification a result of sediment de-watering. De-watering may have arisen as a result of pore-pressure adjustments during rapid deposition and burial of sediments, or as a result of a rapid rise / fall in fluvial stage. Alternatively, the mottling could result from biogenic activity (rootlets). The cosets of strata are typically thin, which indicates shallow water depth and the dominance of Sl imply upper flow regime conditions. Palaeotransport implications for this lithofacies association are discussed in detail in the following sections.
Lithofacies Association V
Lithofacies Association V comprises mudstones and heterolithic lithologies with varying degrees of lamination. They are indistinguishable from the lithologies of Lithofacies I and II. However, they occur as typically thin (1-3 m) successions interbedded with lithologies
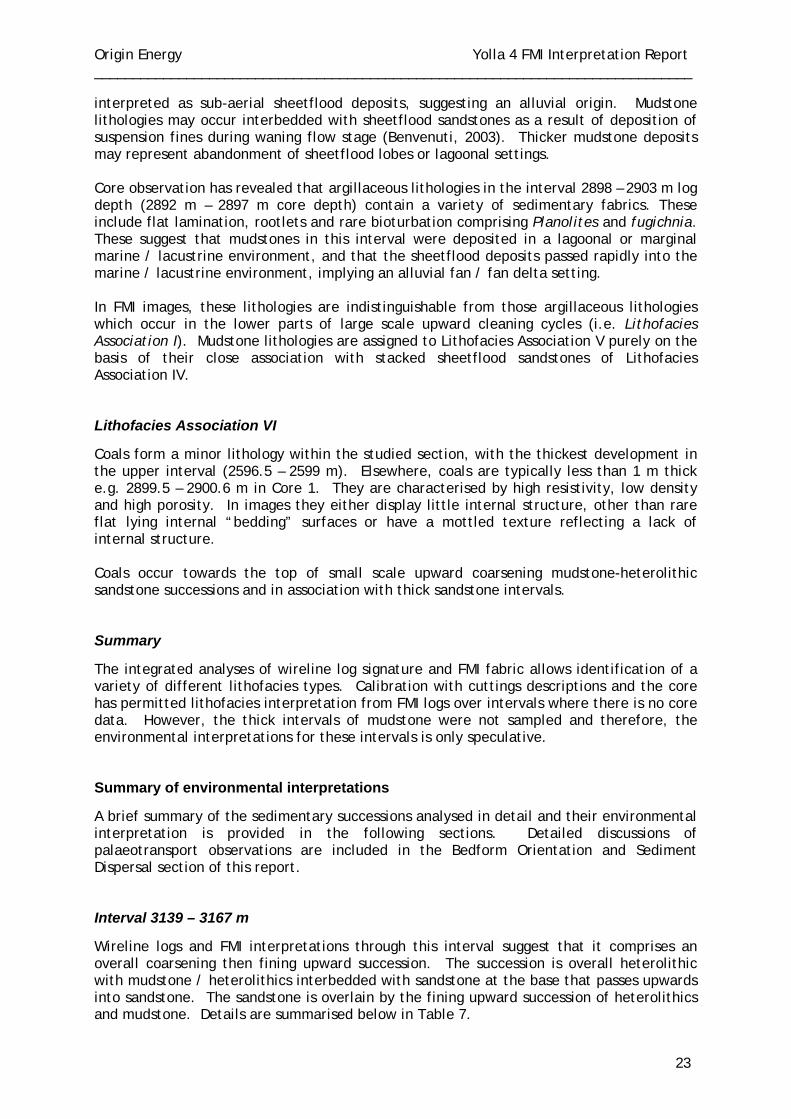
Origin Energy Yolla 4 FMI Interpretation Report ______________________________________________________________________________
23
interpreted as sub-aerial sheetflood deposits, suggesting an alluvial origin. Mudstone lithologies may occur interbedded with sheetflood sandstones as a result of deposition of suspension fines during waning flow stage (Benvenuti, 2003). Thicker mudstone deposits may represent abandonment of sheetflood lobes or lagoonal settings. Core observation has revealed that argillaceous lithologies in the interval 2898 – 2903 m log depth (2892 m – 2897 m core depth) contain a variety of sedimentary fabrics. These include flat lamination, rootlets and rare bioturbation comprising Planolites and fugichnia. These suggest that mudstones in this interval were deposited in a lagoonal or marginal marine / lacustrine environment, and that the sheetflood deposits passed rapidly into the marine / lacustrine environment, implying an alluvial fan / fan delta setting. In FMI images, these lithologies are indistinguishable from those argillaceous lithologies which occur in the lower parts of large scale upward cleaning cycles (i.e. Lithofacies Association I). Mudstone lithologies are assigned to Lithofacies Association V purely on the basis of their close association with stacked sheetflood sandstones of Lithofacies Association IV.
Lithofacies Association VI
Coals form a minor lithology within the studied section, with the thickest development in the upper interval (2596.5 – 2599 m). Elsewhere, coals are typically less than 1 m thick e.g. 2899.5 – 2900.6 m in Core 1. They are characterised by high resistivity, low density and high porosity. In images they either display little internal structure, other than rare flat lying internal “bedding” surfaces or have a mottled texture reflecting a lack of internal structure. Coals occur towards the top of small scale upward coarsening mudstone-heterolithic sandstone successions and in association with thick sandstone intervals.
Summary
The integrated analyses of wireline log signature and FMI fabric allows identification of a variety of different lithofacies types. Calibration with cuttings descriptions and the core has permitted lithofacies interpretation from FMI logs over intervals where there is no core data. However, the thick intervals of mudstone were not sampled and therefore, the environmental interpretations for these intervals is only speculative.
Summary of environmental interpretations
A brief summary of the sedimentary successions analysed in detail and their environmental interpretation is provided in the following sections. Detailed discussions of palaeotransport observations are included in the Bedform Orientation and Sediment Dispersal section of this report.
Interval 3139 – 3167 m
Wireline logs and FMI interpretations through this interval suggest that it comprises an overall coarsening then fining upward succession. The succession is overall heterolithic with mudstone / heterolithics interbedded with sandstone at the base that passes upwards into sandstone. The sandstone is overlain by the fining upward succession of heterolithics and mudstone. Details are summarised below in Table 7.
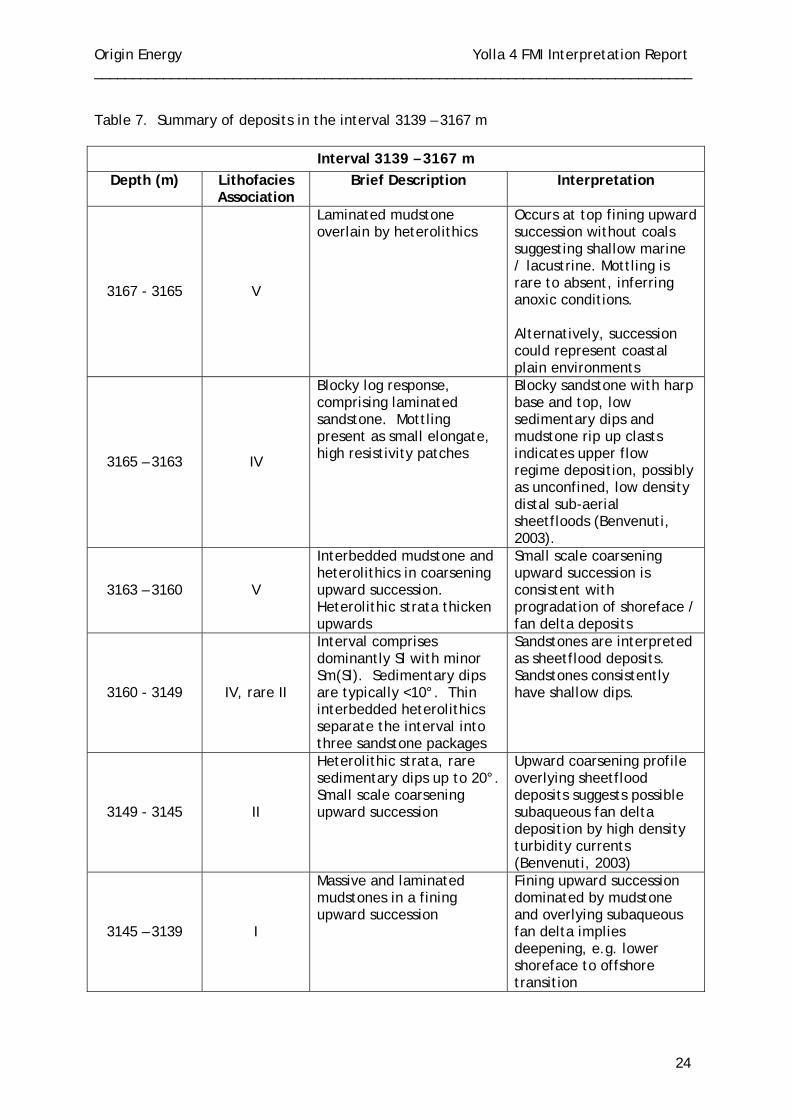
Origin Energy Yolla 4 FMI Interpretation Report ______________________________________________________________________________
24
Table 7. Summary of deposits in the interval 3139 – 3167 m
Interval 3139 – 3167 m Depth (m) Lithofacies
Association Brief Description Interpretation
3167 - 3165 V
Laminated mudstone overlain by heterolithics
Occurs at top fining upward succession without coals suggesting shallow marine / lacustrine. Mottling is rare to absent, inferring anoxic conditions. Alternatively, succession could represent coastal plain environments
3165 – 3163 IV
Blocky log response, comprising laminated sandstone. Mottling present as small elongate, high resistivity patches
Blocky sandstone with harp base and top, low sedimentary dips and mudstone rip up clasts indicates upper flow regime deposition, possibly as unconfined, low density distal sub-aerial sheetfloods (Benvenuti, 2003).
3163 – 3160 V
Interbedded mudstone and heterolithics in coarsening upward succession. Heterolithic strata thicken upwards
Small scale coarsening upward succession is consistent with progradation of shoreface / fan delta deposits
3160 - 3149 IV, rare II
Interval comprises dominantly Sl with minor Sm(Sl). Sedimentary dips are typically <10°. Thin interbedded heterolithics separate the interval into three sandstone packages
Sandstones are interpreted as sheetflood deposits. Sandstones consistently have shallow dips.
3149 - 3145 II
Heterolithic strata, rare sedimentary dips up to 20°. Small scale coarsening upward succession
Upward coarsening profile overlying sheetflood deposits suggests possible subaqueous fan delta deposition by high density turbidity currents (Benvenuti, 2003)
3145 – 3139 I
Massive and laminated mudstones in a fining upward succession
Fining upward succession dominated by mudstone and overlying subaqueous fan delta implies deepening, e.g. lower shoreface to offshore transition
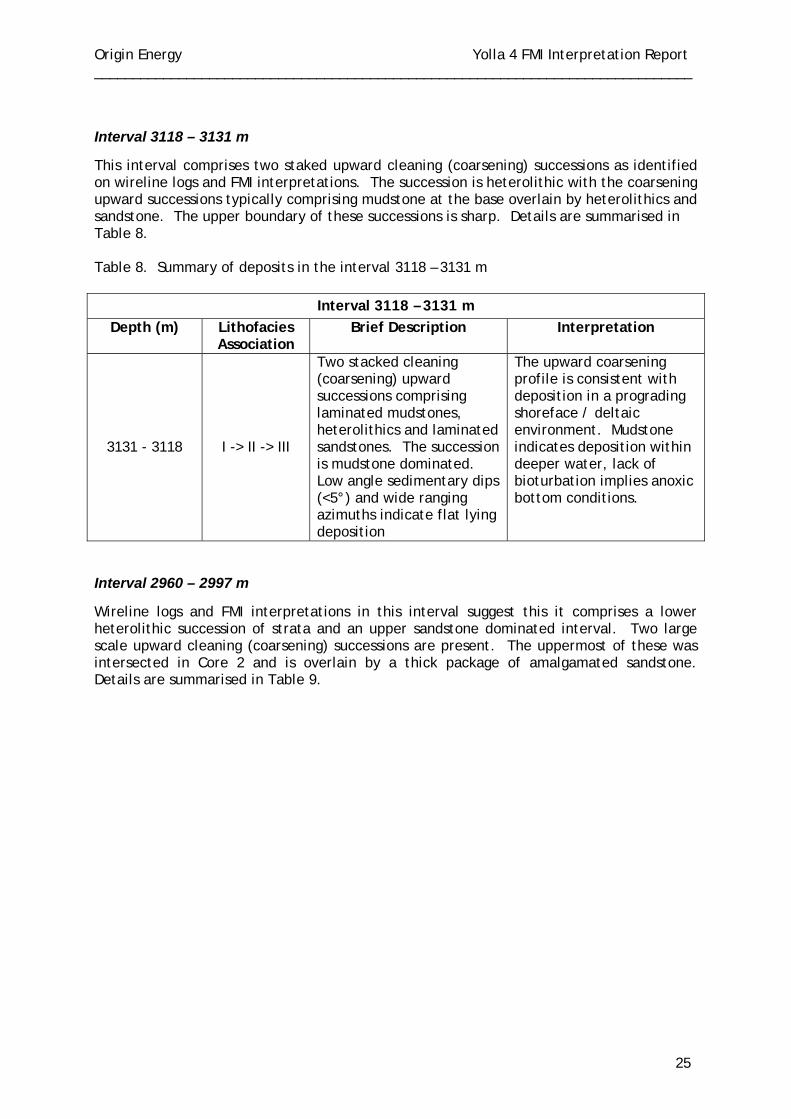
Origin Energy Yolla 4 FMI Interpretation Report ______________________________________________________________________________
25
Interval 3118 – 3131 m
This interval comprises two staked upward cleaning (coarsening) successions as identified on wireline logs and FMI interpretations. The succession is heterolithic with the coarsening upward successions typically comprising mudstone at the base overlain by heterolithics and sandstone. The upper boundary of these successions is sharp. Details are summarised in Table 8. Table 8. Summary of deposits in the interval 3118 – 3131 m
Interval 3118 – 3131 m Depth (m) Lithofacies
Association Brief Description Interpretation
3131 - 3118 I -> II -> III
Two stacked cleaning (coarsening) upward successions comprising laminated mudstones, heterolithics and laminated sandstones. The succession is mudstone dominated. Low angle sedimentary dips (<5°) and wide ranging azimuths indicate flat lying deposition
The upward coarsening profile is consistent with deposition in a prograding shoreface / deltaic environment. Mudstone indicates deposition within deeper water, lack of bioturbation implies anoxic bottom conditions.
Interval 2960 – 2997 m
Wireline logs and FMI interpretations in this interval suggest this it comprises a lower heterolithic succession of strata and an upper sandstone dominated interval. Two large scale upward cleaning (coarsening) successions are present. The uppermost of these was intersected in Core 2 and is overlain by a thick package of amalgamated sandstone. Details are summarised in Table 9.
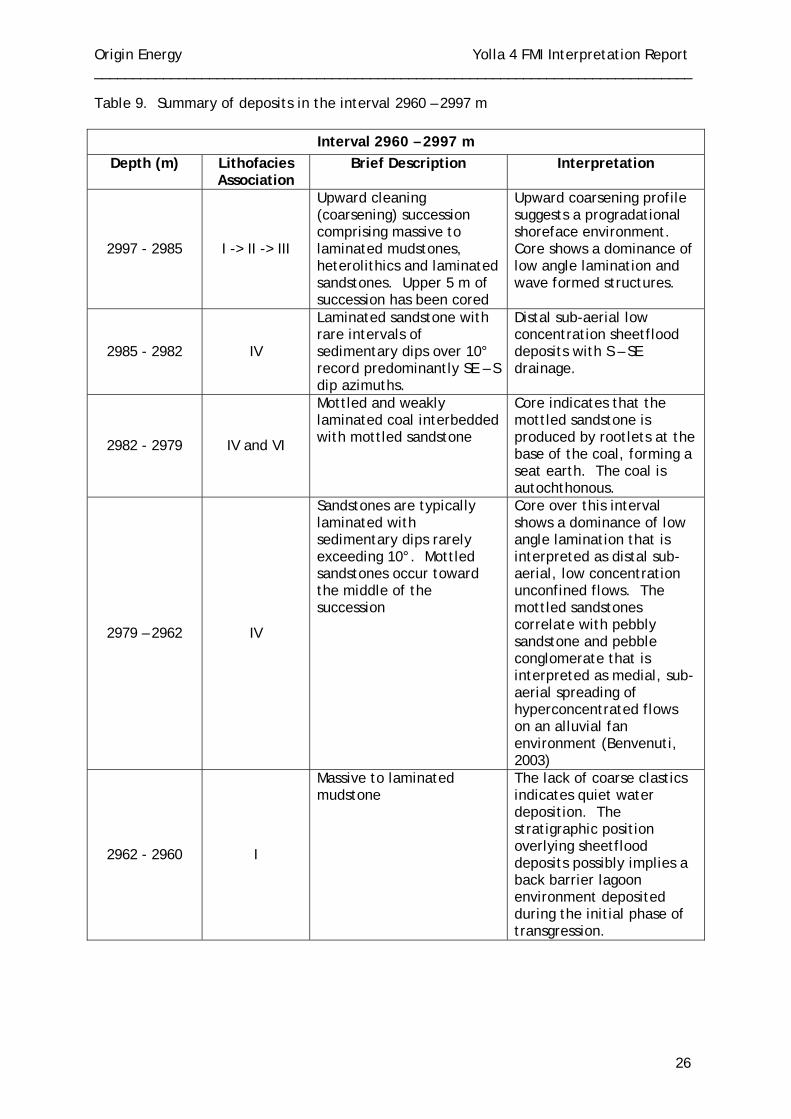
Origin Energy Yolla 4 FMI Interpretation Report ______________________________________________________________________________
26
Table 9. Summary of deposits in the interval 2960 – 2997 m
Interval 2960 – 2997 m Depth (m) Lithofacies
Association Brief Description Interpretation
2997 - 2985 I -> II -> III
Upward cleaning (coarsening) succession comprising massive to laminated mudstones, heterolithics and laminated sandstones. Upper 5 m of succession has been cored
Upward coarsening profile suggests a progradational shoreface environment. Core shows a dominance of low angle lamination and wave formed structures.
2985 - 2982 IV
Laminated sandstone with rare intervals of sedimentary dips over 10° record predominantly SE – S dip azimuths.
Distal sub-aerial low concentration sheetflood deposits with S – SE drainage.
2982 - 2979 IV and VI
Mottled and weakly laminated coal interbedded with mottled sandstone
Core indicates that the mottled sandstone is produced by rootlets at the base of the coal, forming a seat earth. The coal is autochthonous.
2979 – 2962 IV
Sandstones are typically laminated with sedimentary dips rarely exceeding 10°. Mottled sandstones occur toward the middle of the succession
Core over this interval shows a dominance of low angle lamination that is interpreted as distal sub-aerial, low concentration unconfined flows. The mottled sandstones correlate with pebbly sandstone and pebble conglomerate that is interpreted as medial, sub-aerial spreading of hyperconcentrated flows on an alluvial fan environment (Benvenuti, 2003)
2962 - 2960 I
Massive to laminated mudstone
The lack of coarse clastics indicates quiet water deposition. The stratigraphic position overlying sheetflood deposits possibly implies a back barrier lagoon environment deposited during the initial phase of transgression.
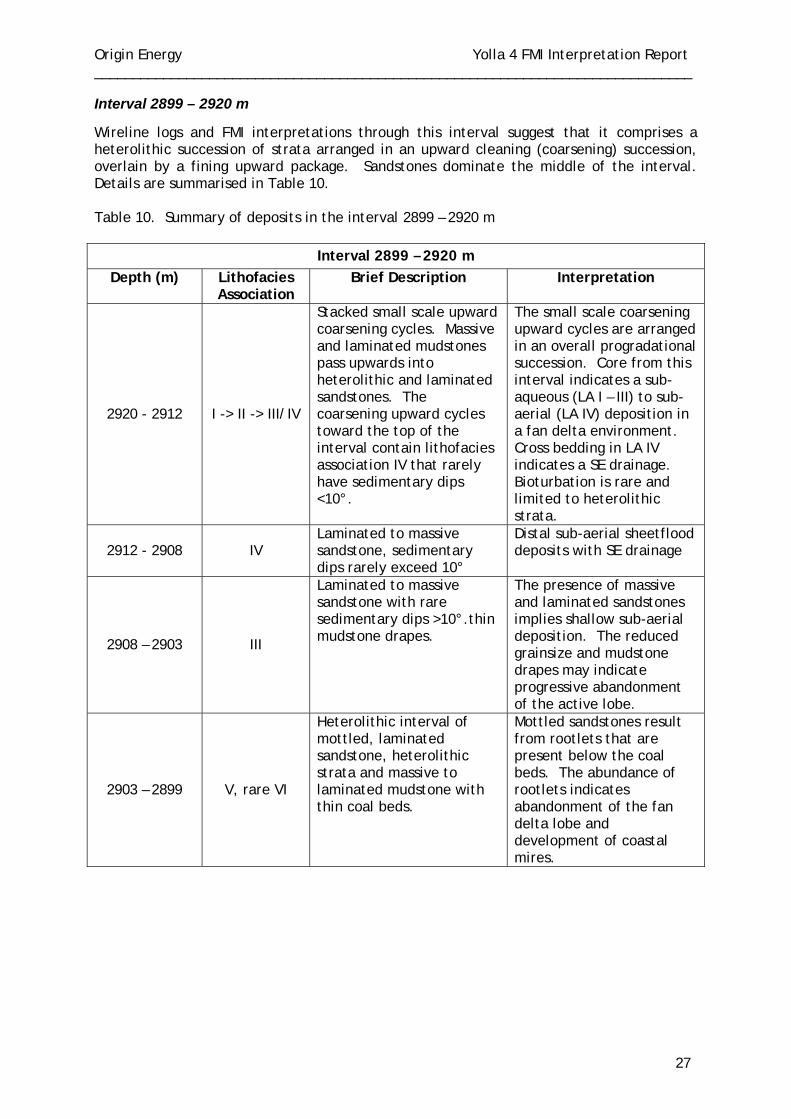
Origin Energy Yolla 4 FMI Interpretation Report ______________________________________________________________________________
27
Interval 2899 – 2920 m
Wireline logs and FMI interpretations through this interval suggest that it comprises a heterolithic succession of strata arranged in an upward cleaning (coarsening) succession, overlain by a fining upward package. Sandstones dominate the middle of the interval. Details are summarised in Table 10. Table 10. Summary of deposits in the interval 2899 – 2920 m
Interval 2899 – 2920 m Depth (m) Lithofacies
Association Brief Description Interpretation
2920 - 2912 I -> II -> III/IV
Stacked small scale upward coarsening cycles. Massive and laminated mudstones pass upwards into heterolithic and laminated sandstones. The coarsening upward cycles toward the top of the interval contain lithofacies association IV that rarely have sedimentary dips <10°.
The small scale coarsening upward cycles are arranged in an overall progradational succession. Core from this interval indicates a sub-aqueous (LA I – III) to sub-aerial (LA IV) deposition in a fan delta environment. Cross bedding in LA IV indicates a SE drainage. Bioturbation is rare and limited to heterolithic strata.
2912 - 2908 IV Laminated to massive sandstone, sedimentary dips rarely exceed 10°
Distal sub-aerial sheetflood deposits with SE drainage
2908 – 2903 III
Laminated to massive sandstone with rare sedimentary dips >10°.thin mudstone drapes.
The presence of massive and laminated sandstones implies shallow sub-aerial deposition. The reduced grainsize and mudstone drapes may indicate progressive abandonment of the active lobe.
2903 – 2899 V, rare VI
Heterolithic interval of mottled, laminated sandstone, heterolithic strata and massive to laminated mudstone with thin coal beds.
Mottled sandstones result from rootlets that are present below the coal beds. The abundance of rootlets indicates abandonment of the fan delta lobe and development of coastal mires.
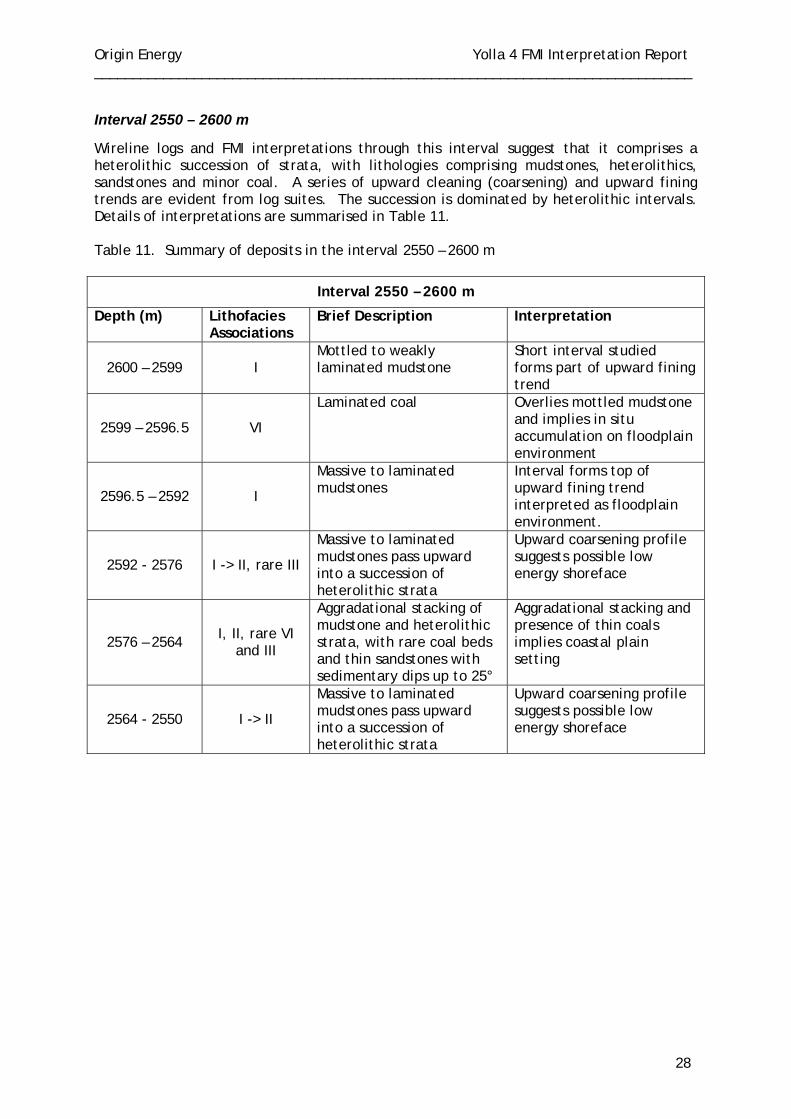
Origin Energy Yolla 4 FMI Interpretation Report ______________________________________________________________________________
28
Interval 2550 – 2600 m
Wireline logs and FMI interpretations through this interval suggest that it comprises a heterolithic succession of strata, with lithologies comprising mudstones, heterolithics, sandstones and minor coal. A series of upward cleaning (coarsening) and upward fining trends are evident from log suites. The succession is dominated by heterolithic intervals. Details of interpretations are summarised in Table 11. Table 11. Summary of deposits in the interval 2550 – 2600 m
Interval 2550 – 2600 m
Depth (m) Lithofacies Associations
Brief Description Interpretation
2600 – 2599 I Mottled to weakly laminated mudstone
Short interval studied forms part of upward fining trend
2599 – 2596.5 VI
Laminated coal Overlies mottled mudstone and implies in situ accumulation on floodplain environment
2596.5 – 2592 I
Massive to laminated mudstones
Interval forms top of upward fining trend interpreted as floodplain environment.
2592 - 2576 I -> II, rare III
Massive to laminated mudstones pass upward into a succession of heterolithic strata
Upward coarsening profile suggests possible low energy shoreface
2576 – 2564 I, II, rare VI and III
Aggradational stacking of mudstone and heterolithic strata, with rare coal beds and thin sandstones with sedimentary dips up to 25°
Aggradational stacking and presence of thin coals implies coastal plain setting
2564 - 2550 I -> II
Massive to laminated mudstones pass upward into a succession of heterolithic strata
Upward coarsening profile suggests possible low energy shoreface
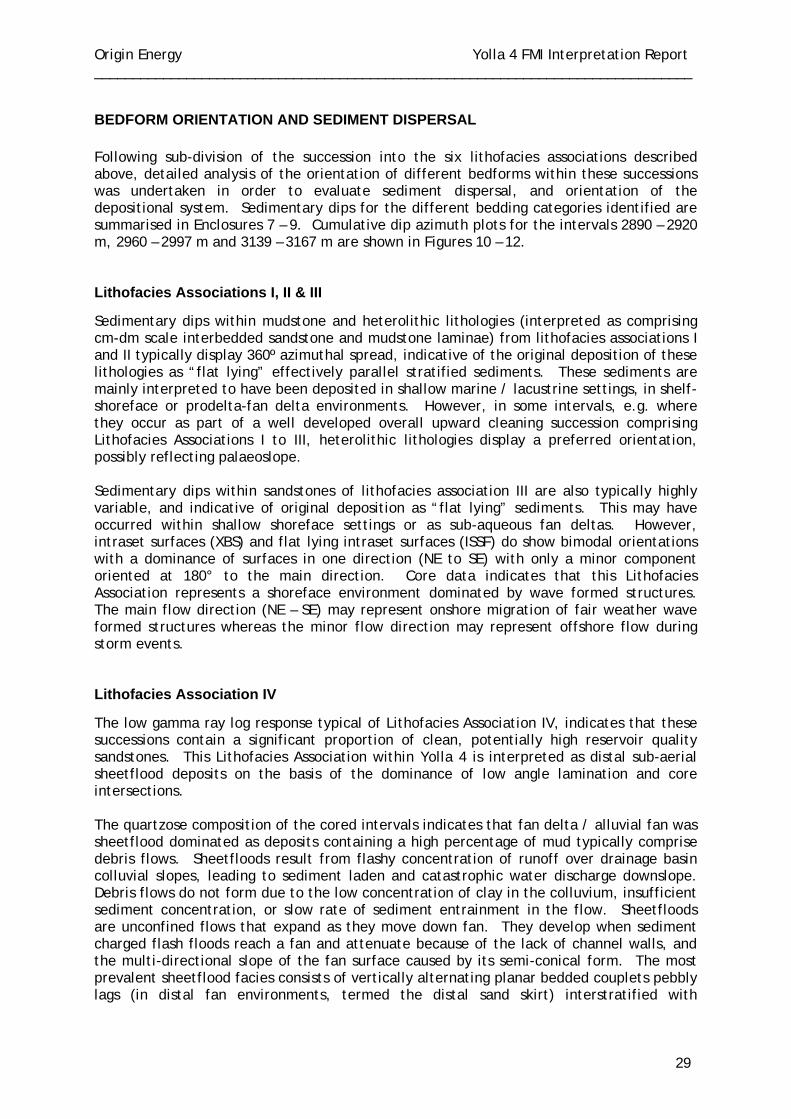
Origin Energy Yolla 4 FMI Interpretation Report ______________________________________________________________________________
29
BEDFORM ORIENTATION AND SEDIMENT DISPERSAL Following sub-division of the succession into the six lithofacies associations described above, detailed analysis of the orientation of different bedforms within these successions was undertaken in order to evaluate sediment dispersal, and orientation of the depositional system. Sedimentary dips for the different bedding categories identified are summarised in Enclosures 7 – 9. Cumulative dip azimuth plots for the intervals 2890 – 2920 m, 2960 – 2997 m and 3139 – 3167 m are shown in Figures 10 – 12.
Lithofacies Associations I, II & III
Sedimentary dips within mudstone and heterolithic lithologies (interpreted as comprising cm-dm scale interbedded sandstone and mudstone laminae) from lithofacies associations I and II typically display 360º azimuthal spread, indicative of the original deposition of these lithologies as “flat lying” effectively parallel stratified sediments. These sediments are mainly interpreted to have been deposited in shallow marine / lacustrine settings, in shelf-shoreface or prodelta-fan delta environments. However, in some intervals, e.g. where they occur as part of a well developed overall upward cleaning succession comprising Lithofacies Associations I to III, heterolithic lithologies display a preferred orientation, possibly reflecting palaeoslope. Sedimentary dips within sandstones of lithofacies association III are also typically highly variable, and indicative of original deposition as “flat lying” sediments. This may have occurred within shallow shoreface settings or as sub-aqueous fan deltas. However, intraset surfaces (XBS) and flat lying intraset surfaces (ISSF) do show bimodal orientations with a dominance of surfaces in one direction (NE to SE) with only a minor component oriented at 180° to the main direction. Core data indicates that this Lithofacies Association represents a shoreface environment dominated by wave formed structures. The main flow direction (NE – SE) may represent onshore migration of fair weather wave formed structures whereas the minor flow direction may represent offshore flow during storm events.
Lithofacies Association IV
The low gamma ray log response typical of Lithofacies Association IV, indicates that these successions contain a significant proportion of clean, potentially high reservoir quality sandstones. This Lithofacies Association within Yolla 4 is interpreted as distal sub-aerial sheetflood deposits on the basis of the dominance of low angle lamination and core intersections. The quartzose composition of the cored intervals indicates that fan delta / alluvial fan was sheetflood dominated as deposits containing a high percentage of mud typically comprise debris flows. Sheetfloods result from flashy concentration of runoff over drainage basin colluvial slopes, leading to sediment laden and catastrophic water discharge downslope. Debris flows do not form due to the low concentration of clay in the colluvium, insufficient sediment concentration, or slow rate of sediment entrainment in the flow. Sheetfloods are unconfined flows that expand as they move down fan. They develop when sediment charged flash floods reach a fan and attenuate because of the lack of channel walls, and the multi-directional slope of the fan surface caused by its semi-conical form. The most prevalent sheetflood facies consists of vertically alternating planar bedded couplets pebbly lags (in distal fan environments, termed the distal sand skirt) interstratified with
Origin Energy Yolla 4 FMI Interpretation Report ______________________________________________________________________________
30
laminated sandstone. The planar bedded sets have distally decreasing slopes of 2 - 8° parallel to the fan surface, that produce a concave profile (Blair and McPherson, 1994). Debris flows are initiated by two mechanisms, the most common involves transformation of a disintegration of a colluvial slide into a debris flow by entrainment of air and water through the jostling, deformation and loss of particle individuality as it moves downslope. This transformation requires the presence of water in the colluvium, and is therefore most apt to occur during or immediately after excessive precipitation. The second initiation mechanism occurs where fast moving water intersects a drainage basin slope mantled by abundant sediment. The ensuing reaction, in which the water dissipates its energy by dispersing clasts through mixing, can result in rapid entrainment of sediment, air and water to produce a debris flow. Debris flow dominated alluvial fans have constant slopes with values between 5 and 15° (Blair and McPherson, 1994). See Table 12 for the characteristics of debris flow (Type I) and sheetflood dominated (Type II) alluvial fans. The high porosity, permeability; as evident from the core data; and connectivity of permeable units have major implications for volumetrics and production strategies. The main intervals of sheetflood deposits assigned to lithofacies association IV have been identified within the intervals studied in detail. The main intervals of sheetflood deposits occur: 3160 – 3149 m 2985 – 2962 m 2912 – 2903 m The orientation of bedding surfaces within these intervals are summarised in Tables 13 – 15 below.
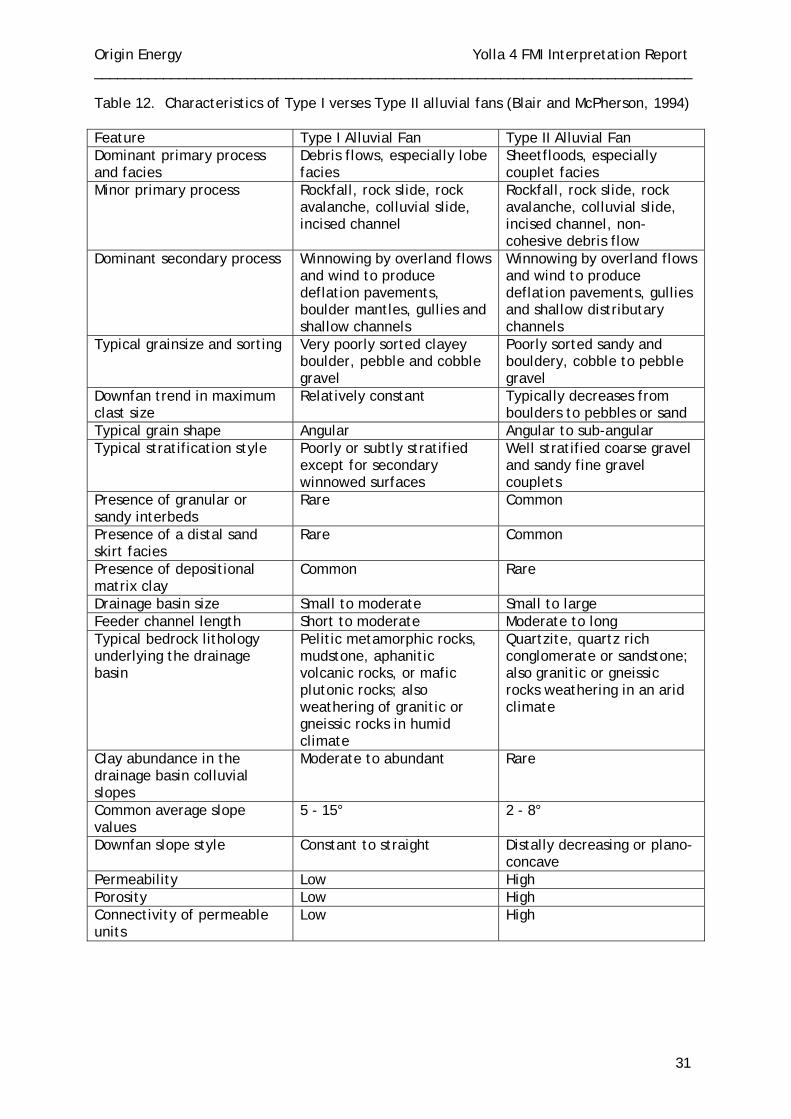
Origin Energy Yolla 4 FMI Interpretation Report ______________________________________________________________________________
31
Table 12. Characteristics of Type I verses Type II alluvial fans (Blair and McPherson, 1994) Feature Type I Alluvial Fan Type II Alluvial Fan Dominant primary process and facies
Debris flows, especially lobe facies
Sheetfloods, especially couplet facies
Minor primary process Rockfall, rock slide, rock avalanche, colluvial slide, incised channel
Rockfall, rock slide, rock avalanche, colluvial slide, incised channel, non-cohesive debris flow
Dominant secondary process Winnowing by overland flows and wind to produce deflation pavements, boulder mantles, gullies and shallow channels
Winnowing by overland flows and wind to produce deflation pavements, gullies and shallow distributary channels
Typical grainsize and sorting Very poorly sorted clayey boulder, pebble and cobble gravel
Poorly sorted sandy and bouldery, cobble to pebble gravel
Downfan trend in maximum clast size
Relatively constant Typically decreases from boulders to pebbles or sand
Typical grain shape Angular Angular to sub-angular Typical stratification style Poorly or subtly stratified
except for secondary winnowed surfaces
Well stratified coarse gravel and sandy fine gravel couplets
Presence of granular or sandy interbeds
Rare Common
Presence of a distal sand skirt facies
Rare Common
Presence of depositional matrix clay
Common Rare
Drainage basin size Small to moderate Small to large Feeder channel length Short to moderate Moderate to long Typical bedrock lithology underlying the drainage basin
Pelitic metamorphic rocks, mudstone, aphanitic volcanic rocks, or mafic plutonic rocks; also weathering of granitic or gneissic rocks in humid climate
Quartzite, quartz rich conglomerate or sandstone; also granitic or gneissic rocks weathering in an arid climate
Clay abundance in the drainage basin colluvial slopes
Moderate to abundant Rare
Common average slope values
5 - 15° 2 - 8°
Downfan slope style Constant to straight Distally decreasing or plano-concave
Permeability Low High Porosity Low High Connectivity of permeable units
Low High
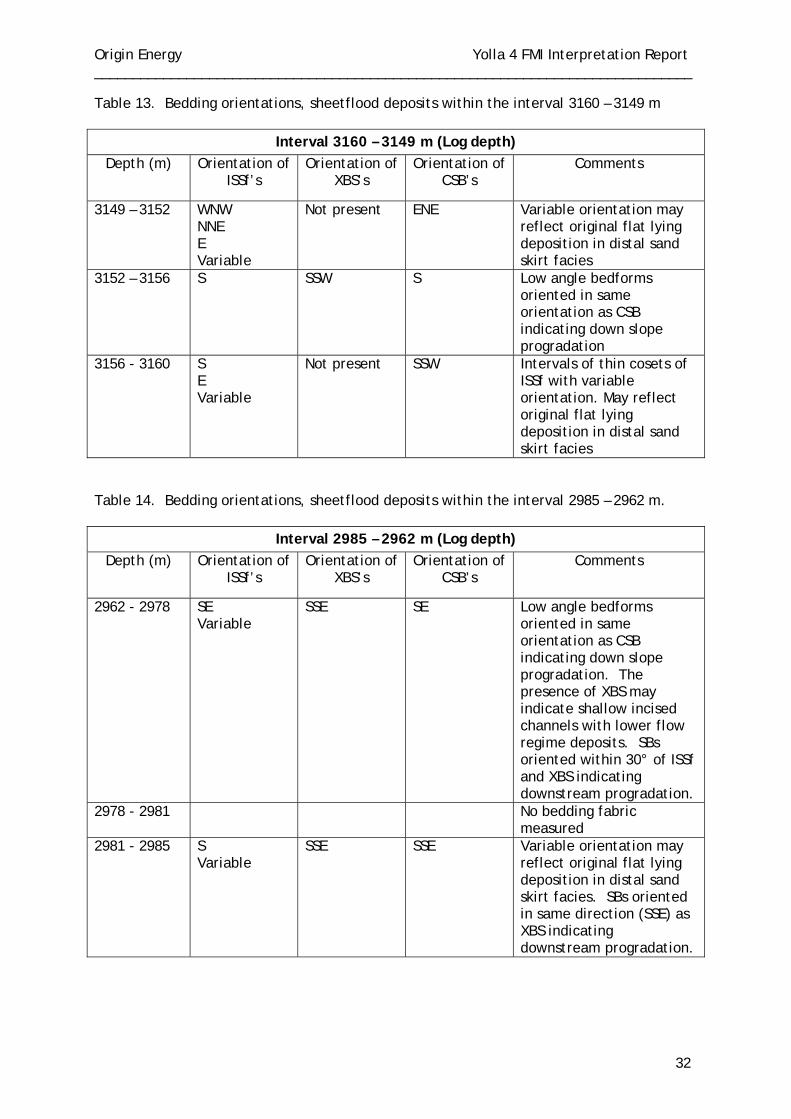
Origin Energy Yolla 4 FMI Interpretation Report ______________________________________________________________________________
32
Table 13. Bedding orientations, sheetflood deposits within the interval 3160 – 3149 m
Interval 3160 – 3149 m (Log depth) Depth (m) Orientation of
ISSf’s Orientation of
XBS’s Orientation of
CSB’s Comments
3149 – 3152 WNW NNE E Variable
Not present ENE Variable orientation may reflect original flat lying deposition in distal sand skirt facies
3152 – 3156 S SSW S Low angle bedforms oriented in same orientation as CSB indicating down slope progradation
3156 - 3160 S E Variable
Not present SSW Intervals of thin cosets of ISSf with variable orientation. May reflect original flat lying deposition in distal sand skirt facies
Table 14. Bedding orientations, sheetflood deposits within the interval 2985 – 2962 m.
Interval 2985 – 2962 m (Log depth) Depth (m) Orientation of
ISSf’s Orientation of
XBS’s Orientation of
CSB’s Comments
2962 - 2978 SE Variable
SSE SE Low angle bedforms oriented in same orientation as CSB indicating down slope progradation. The presence of XBS may indicate shallow incised channels with lower flow regime deposits. SBs oriented within 30° of ISSf and XBS indicating downstream progradation.
2978 - 2981 No bedding fabric measured
2981 - 2985 S Variable
SSE SSE Variable orientation may reflect original flat lying deposition in distal sand skirt facies. SBs oriented in same direction (SSE) as XBS indicating downstream progradation.
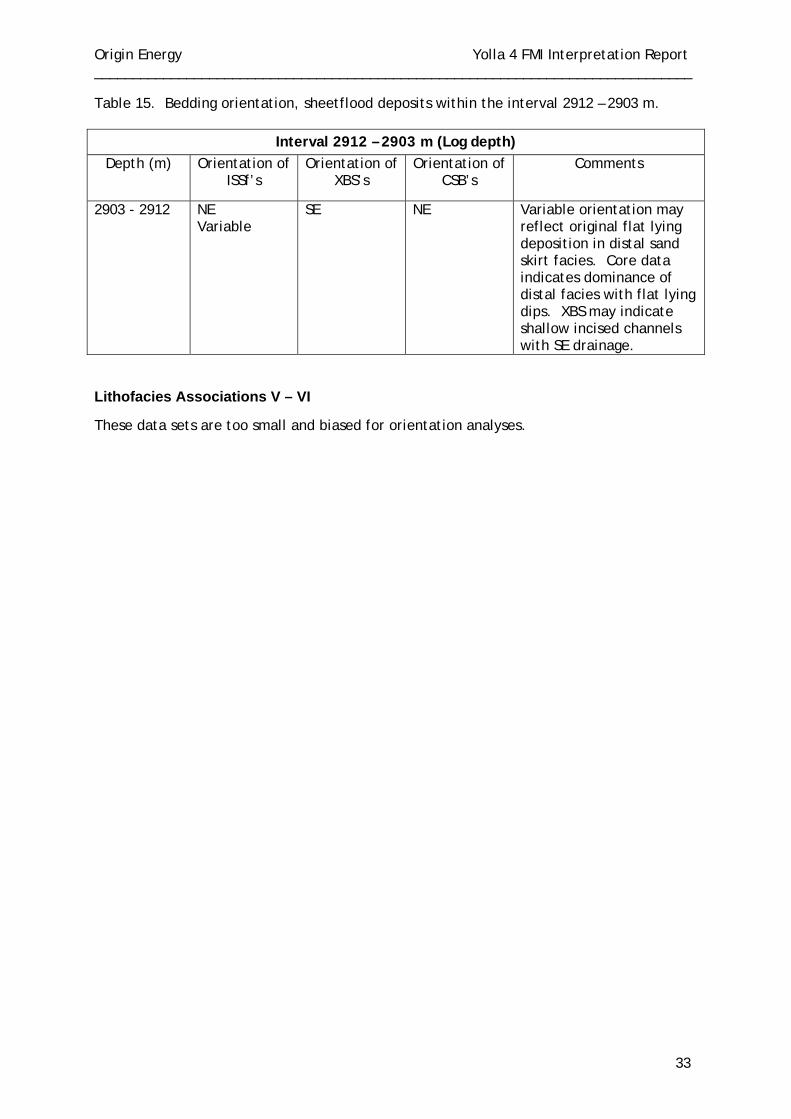
Origin Energy Yolla 4 FMI Interpretation Report ______________________________________________________________________________
33
Table 15. Bedding orientation, sheetflood deposits within the interval 2912 – 2903 m.
Interval 2912 – 2903 m (Log depth) Depth (m) Orientation of
ISSf’s Orientation of
XBS’s Orientation of
CSB’s Comments
2903 - 2912 NE Variable
SE NE Variable orientation may reflect original flat lying deposition in distal sand skirt facies. Core data indicates dominance of distal facies with flat lying dips. XBS may indicate shallow incised channels with SE drainage.
Lithofacies Associations V – VI
These data sets are too small and biased for orientation analyses.
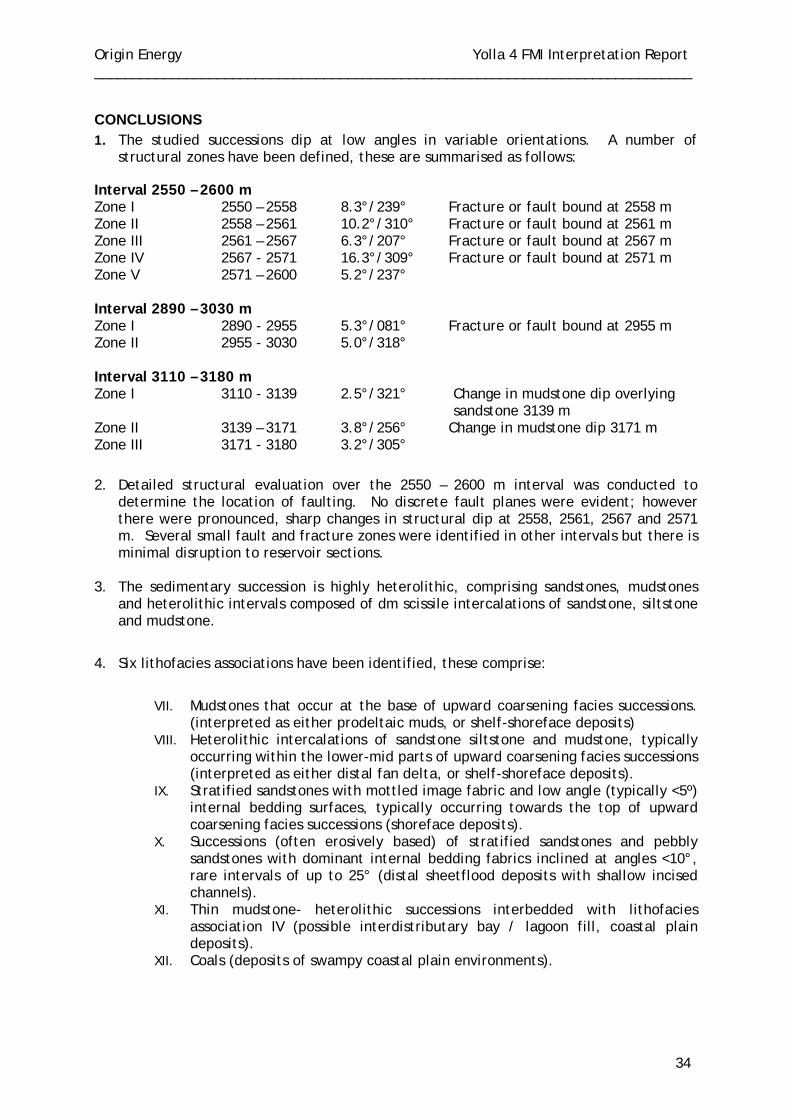
Origin Energy Yolla 4 FMI Interpretation Report ______________________________________________________________________________
34
CONCLUSIONS 1. The studied successions dip at low angles in variable orientations. A number of
structural zones have been defined, these are summarised as follows:
Interval 2550 – 2600 m Zone I 2550 – 2558 8.3°/239° Fracture or fault bound at 2558 m Zone II 2558 – 2561 10.2°/310° Fracture or fault bound at 2561 m Zone III 2561 – 2567 6.3°/207° Fracture or fault bound at 2567 m Zone IV 2567 - 2571 16.3°/309° Fracture or fault bound at 2571 m Zone V 2571 – 2600 5.2°/237° Interval 2890 – 3030 m Zone I 2890 - 2955 5.3°/081° Fracture or fault bound at 2955 m Zone II 2955 - 3030 5.0°/318° Interval 3110 – 3180 m Zone I 3110 - 3139 2.5°/321° Change in mudstone dip overlying
sandstone 3139 m Zone II 3139 – 3171 3.8°/256° Change in mudstone dip 3171 m Zone III 3171 - 3180 3.2°/305°
2. Detailed structural evaluation over the 2550 – 2600 m interval was conducted to determine the location of faulting. No discrete fault planes were evident; however there were pronounced, sharp changes in structural dip at 2558, 2561, 2567 and 2571 m. Several small fault and fracture zones were identified in other intervals but there is minimal disruption to reservoir sections.
3. The sedimentary succession is highly heterolithic, comprising sandstones, mudstones
and heterolithic intervals composed of dm scissile intercalations of sandstone, siltstone and mudstone.
4. Six lithofacies associations have been identified, these comprise:
VII. Mudstones that occur at the base of upward coarsening facies successions. (interpreted as either prodeltaic muds, or shelf-shoreface deposits)
VIII. Heterolithic intercalations of sandstone siltstone and mudstone, typically occurring within the lower-mid parts of upward coarsening facies successions (interpreted as either distal fan delta, or shelf-shoreface deposits).
IX. Stratified sandstones with mottled image fabric and low angle (typically <5º) internal bedding surfaces, typically occurring towards the top of upward coarsening facies successions (shoreface deposits).
X. Successions (often erosively based) of stratified sandstones and pebbly sandstones with dominant internal bedding fabrics inclined at angles <10°, rare intervals of up to 25° (distal sheetflood deposits with shallow incised channels).
XI. Thin mudstone- heterolithic successions interbedded with lithofacies association IV (possible interdistributary bay / lagoon fill, coastal plain deposits).
XII. Coals (deposits of swampy coastal plain environments).
Origin Energy Yolla 4 FMI Interpretation Report ______________________________________________________________________________
35
5. Sandstones of Lithofacies Association IV are likely to form the main reservoir intervals. Lithofacies Association III may form a secondary reservoir interval and typically have over an order of magnitude less permeability than the sheetflood deposits.
6. Palaeotransport analyses of sandstones from Lithofacies Association III reveals them to be characterised by internal stratification fabrics with very wide ranging sedimentary dip azimuth, suggesting they were originally deposited as “flat lying’ strata. Few palaeotransport interpretations can be made for these sandstones. However, in some examples, a dominant sedimentary dip is present, and may represent onshore migration of fair weather wave formed structures whereas the minor flow direction may represent offshore flow during storm events. In most cases, this can broadly be interpreted to have had NE – SE onshore direction and a NW – SW offshore direction.
7. Palaeotransport analyses of sandstones from Lithofacies Association IV reveals them to
be characterised by low angle internal stratification fabrics with variable azimuth. The relationship between intra-set flat lamination, intra-set lamination and coset boundaries suggest that sediment transport occurred normal to the depositional dip i.e. bedforms migrated down fan. Interpreted fan slope drainage directions are variable and no consistent drainage direction can be inferred.
8. In the absence of a detailed core calibration over the 3167 – 3139 m interval,
environmental interpretations are highly subjective. However, observed lithofacies stacking patterns do appear to be consistent with an interpretation of deposition of strata within a marginal marine / lacustrine fan deltaic setting.
Origin Energy Yolla 4 FMI Interpretation Report ______________________________________________________________________________
36
REFERENCES Benvenuti, M., 2003. Facies analysis and tectonic significance of lacustrine fan-deltaic
successions in the Pliocene-Pleistocene Mugello Basin, Central Italy. Sedimentary Geology, 157, 197-234.
Beynon, B.M. and Pemberton, S.G. 1992. Ichnological signature of a brackish water
deposit: an example from the Lower Cretaceous Grand Rapids Formation, Cold Lake Oil Sands area, Alberta. In: Pemberton, S.G. ed: Applications of Ichnology to Petroleum Exploration: A Core Workshop. Society for Sedimentary Geology, Tulsa, 199-221.
Blair, T.C. and McPherson, J.G., 1994. Alluvial fans and their natural distinction from
rivers based on morphology, hydraulic processes, sedimentary processes and facies assemblages. Journal of Sedimentary Research, 64, 450-489.
Pemberton S.G. and Wightman, D.M. 1992. Ichnological characteristics of brackish water
deposits. In: Pemberton, S.G. ed: Applications of Ichnology to Petroleum Exploration: A Core Workshop. Society for Sedimentary Geology, Tulsa, 141-167.
Walker, R.G. 1992. Facies models. In: Walker, R.G. and James, N.P. eds. Facies Models:
Response to Sea Level Change, Geological Association of Canada, Newfoundland, 1-14.
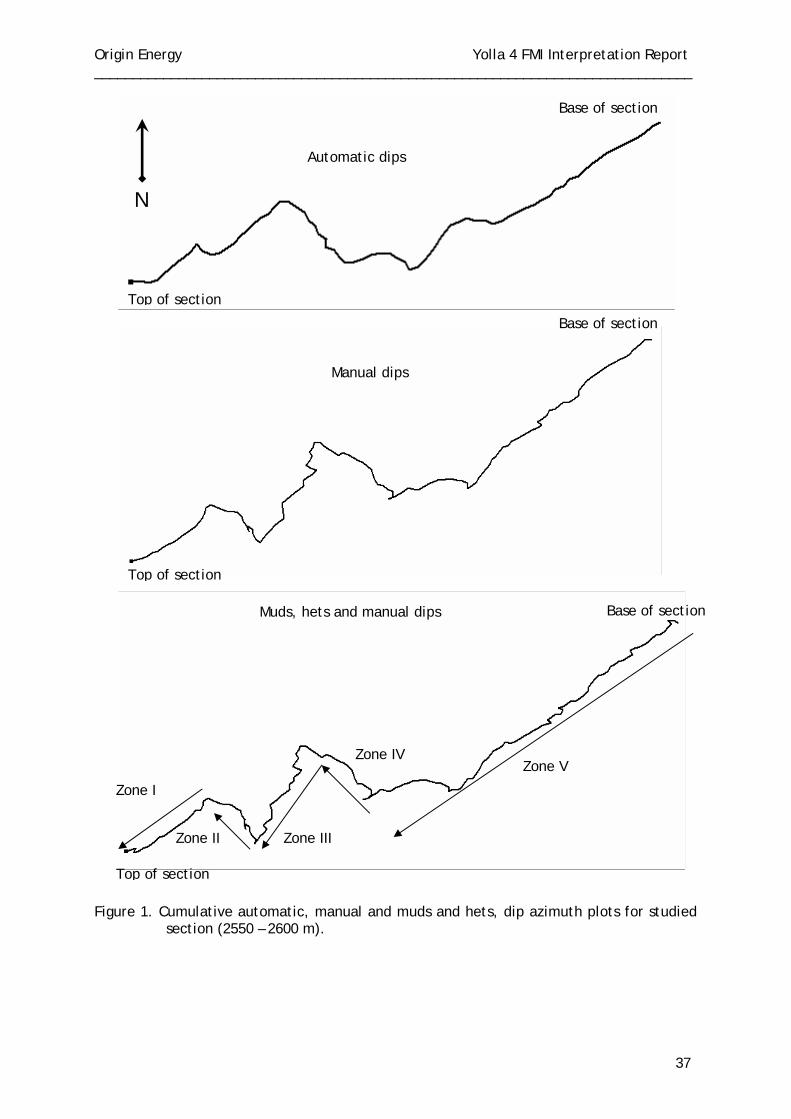
Origin Energy Yolla 4 FMI Interpretation Report ______________________________________________________________________________
37
Figure 1. Cumulative automatic, manual and muds and hets, dip azimuth plots for studied
section (2550 – 2600 m).
Muds, hets and manual dips
Manual dips
Automatic dips
Zone III
Zone V Zone IV
Zone I
N
Base of section
Top of section
Base of section
Top of section
Base of section
Top of section
Zone II
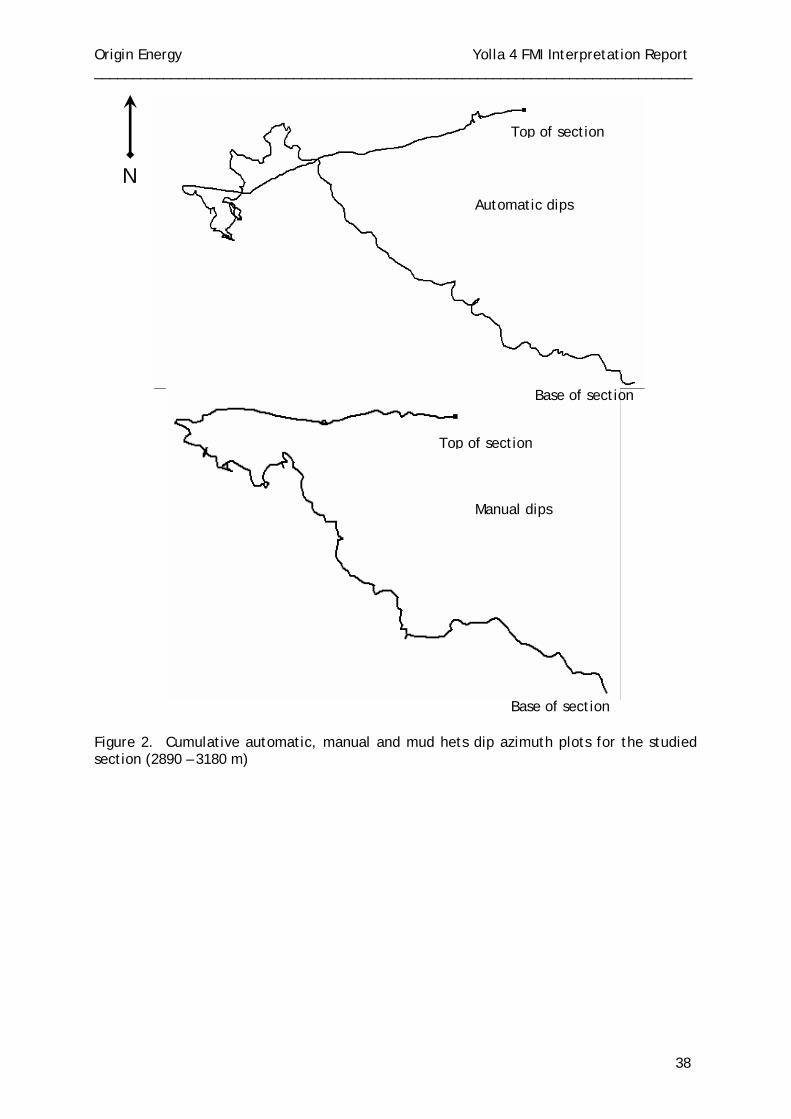
Origin Energy Yolla 4 FMI Interpretation Report ______________________________________________________________________________
38
Figure 2. Cumulative automatic, manual and mud hets dip azimuth plots for the studied section (2890 – 3180 m)
Automatic dips
Manual dips
N
Top of section
Base of section
Top of section
Base of section
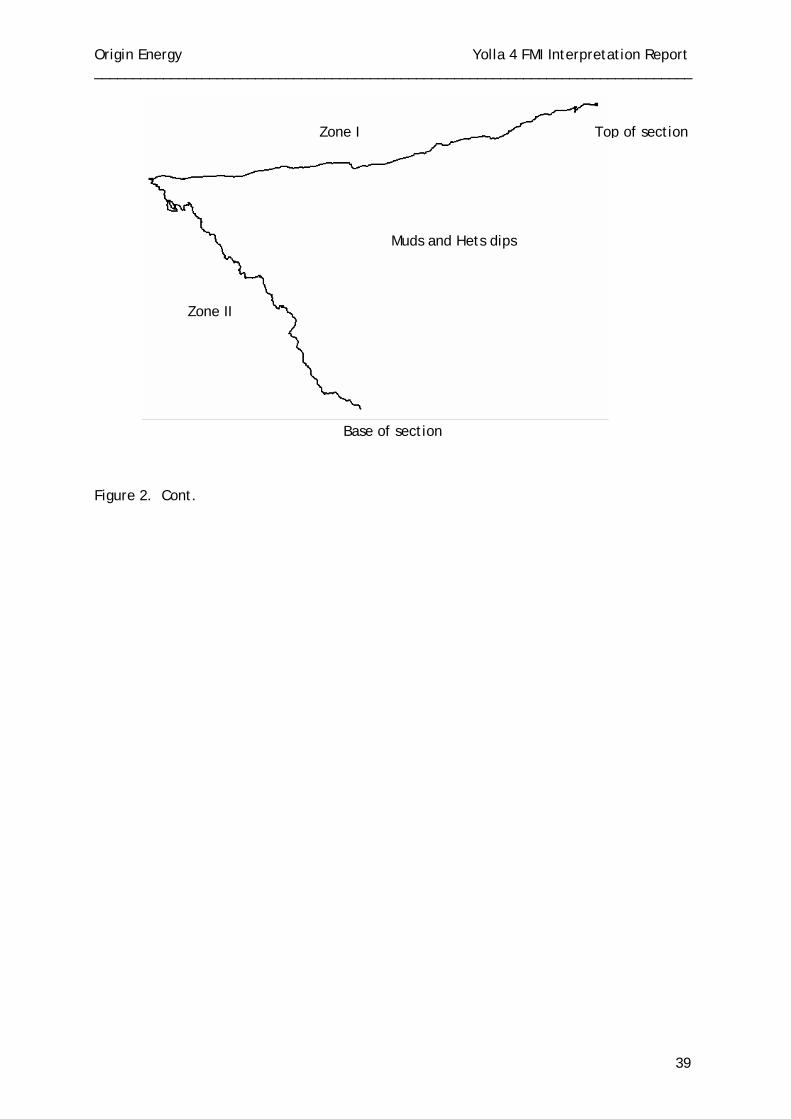
Origin Energy Yolla 4 FMI Interpretation Report ______________________________________________________________________________
39
Figure 2. Cont.
Muds and Hets dips
Zone II
Zone I
Base of section
Top of section
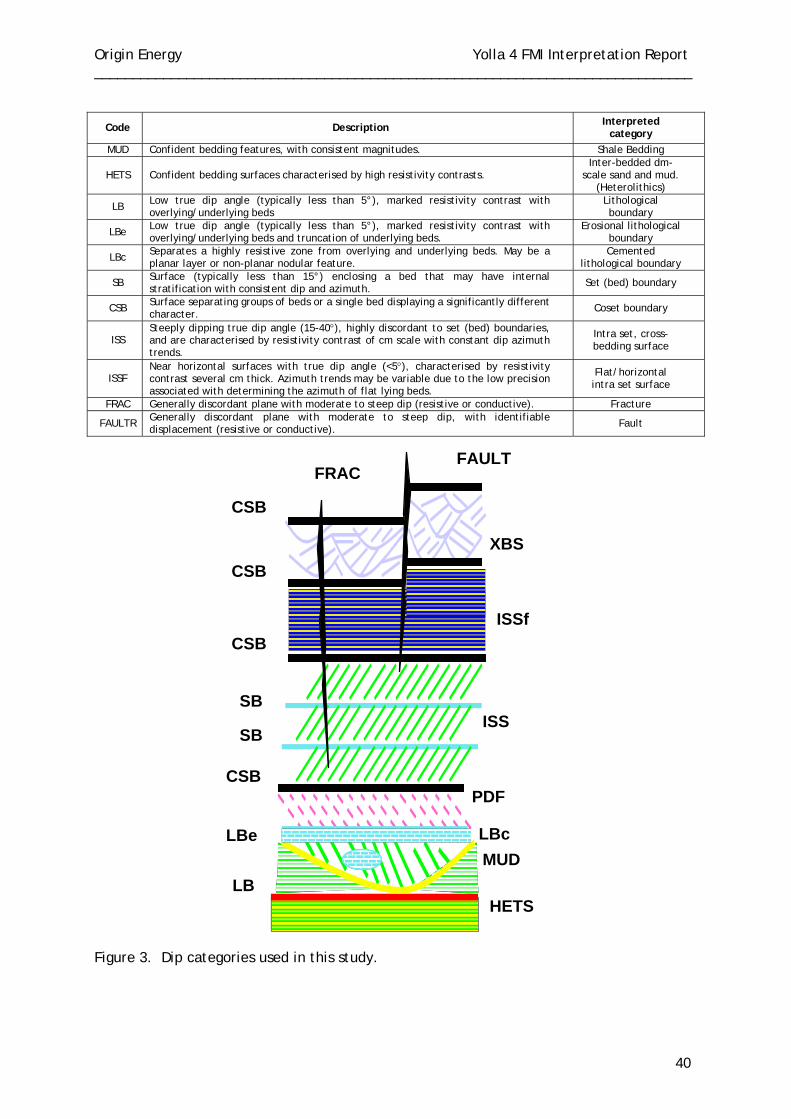
Origin Energy Yolla 4 FMI Interpretation Report ______________________________________________________________________________
40
Code Description Interpreted category
MUD Confident bedding features, with consistent magnitudes. Shale Bedding
HETS Confident bedding surfaces characterised by high resistivity contrasts. Inter-bedded dm-
scale sand and mud. (Heterolithics)
LB Low true dip angle (typically less than 5°), marked resistivity contrast with overlying/underlying beds
Lithological boundary
LBe Low true dip angle (typically less than 5°), marked resistivity contrast with overlying/underlying beds and truncation of underlying beds.
Erosional lithological boundary
LBc Separates a highly resistive zone from overlying and underlying beds. May be a planar layer or non-planar nodular feature.
Cemented lithological boundary
SB Surface (typically less than 15°) enclosing a bed that may have internal stratification with consistent dip and azimuth. Set (bed) boundary
CSB Surface separating groups of beds or a single bed displaying a significantly different character. Coset boundary
ISS Steeply dipping true dip angle (15-40°), highly discordant to set (bed) boundaries, and are characterised by resistivity contrast of cm scale with constant dip azimuth trends.
Intra set, cross-bedding surface
ISSF Near horizontal surfaces with true dip angle (<5°), characterised by resistivity contrast several cm thick. Azimuth trends may be variable due to the low precision associated with determining the azimuth of flat lying beds.
Flat/horizontal intra set surface
FRAC Generally discordant plane with moderate to steep dip (resistive or conductive). Fracture
FAULTR Generally discordant plane with moderate to steep dip, with identifiable displacement (resistive or conductive). Fault
Figure 3. Dip categories used in this study.
FRAC
LBe
CSB
CSB
SB
SB
CSB
CSB
LB
XBS
ISSf
ISS
MUD
HETS
LBc
FAULT
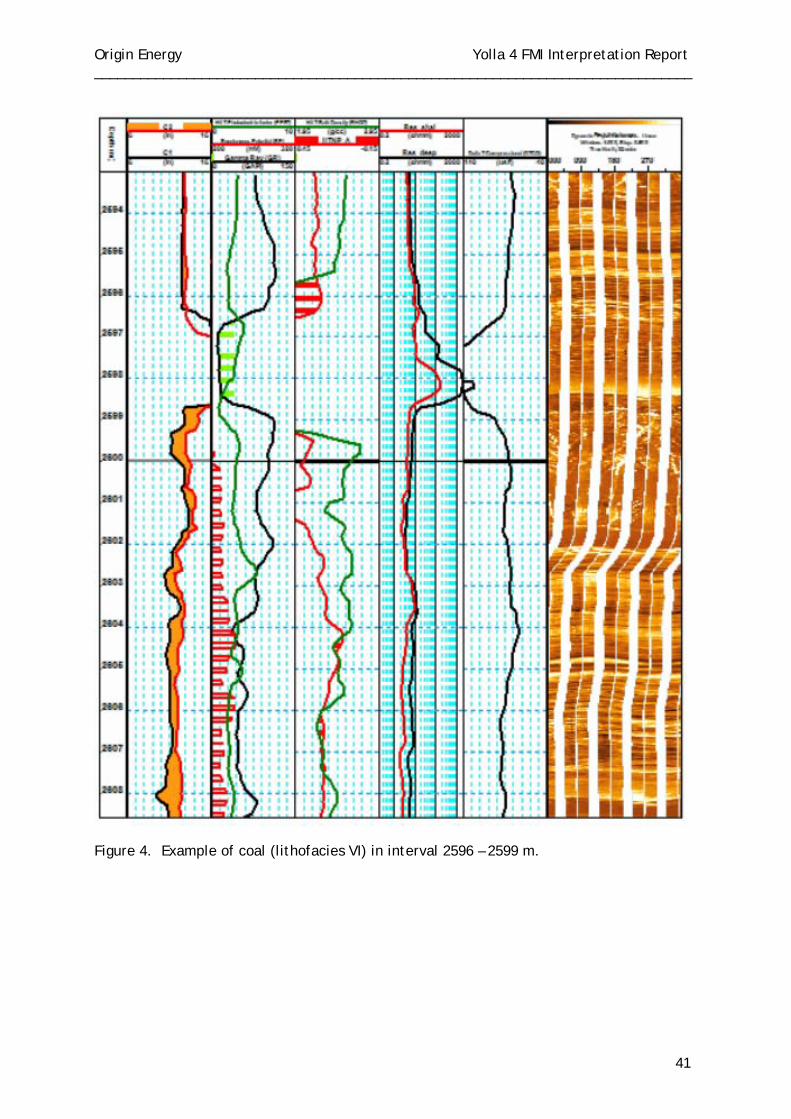
Origin Energy Yolla 4 FMI Interpretation Report ______________________________________________________________________________
41
Figure 4. Example of coal (lithofacies VI) in interval 2596 – 2599 m.
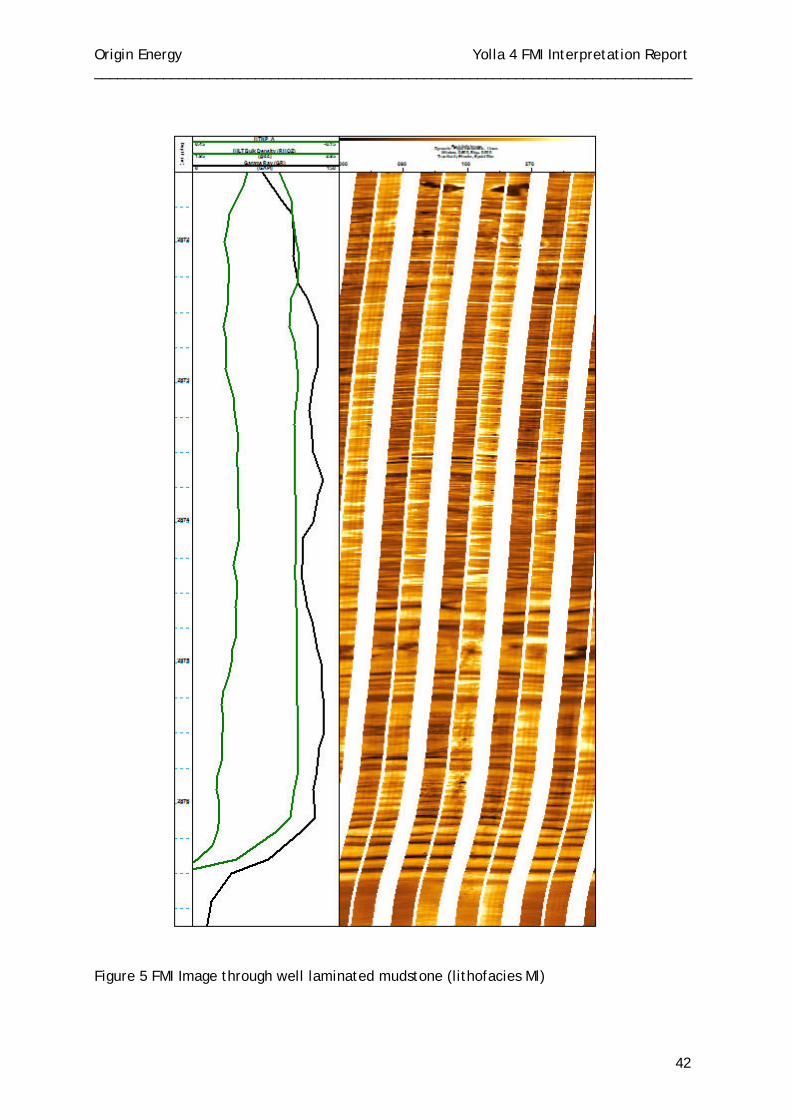
Origin Energy Yolla 4 FMI Interpretation Report ______________________________________________________________________________
42
Figure 5 FMI Image through well laminated mudstone (lithofacies Ml)
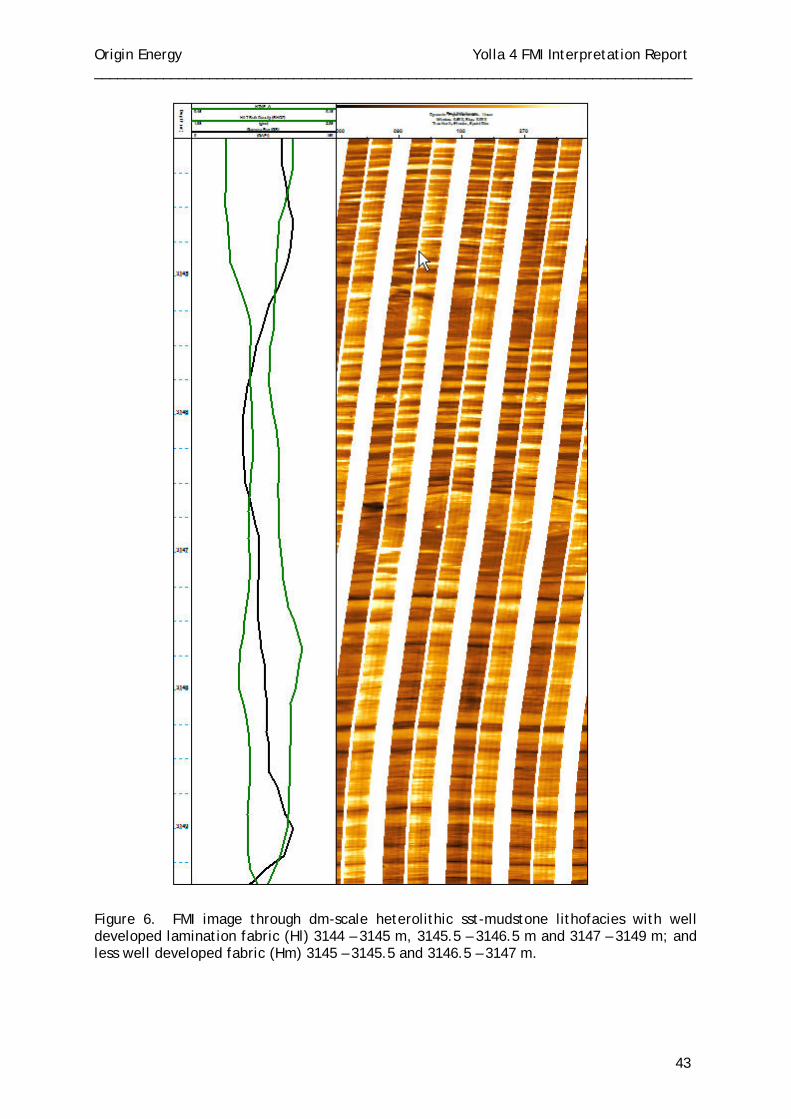
Origin Energy Yolla 4 FMI Interpretation Report ______________________________________________________________________________
43
Figure 6. FMI image through dm-scale heterolithic sst-mudstone lithofacies with well developed lamination fabric (Hl) 3144 – 3145 m, 3145.5 – 3146.5 m and 3147 – 3149 m; and less well developed fabric (Hm) 3145 – 3145.5 and 3146.5 – 3147 m.
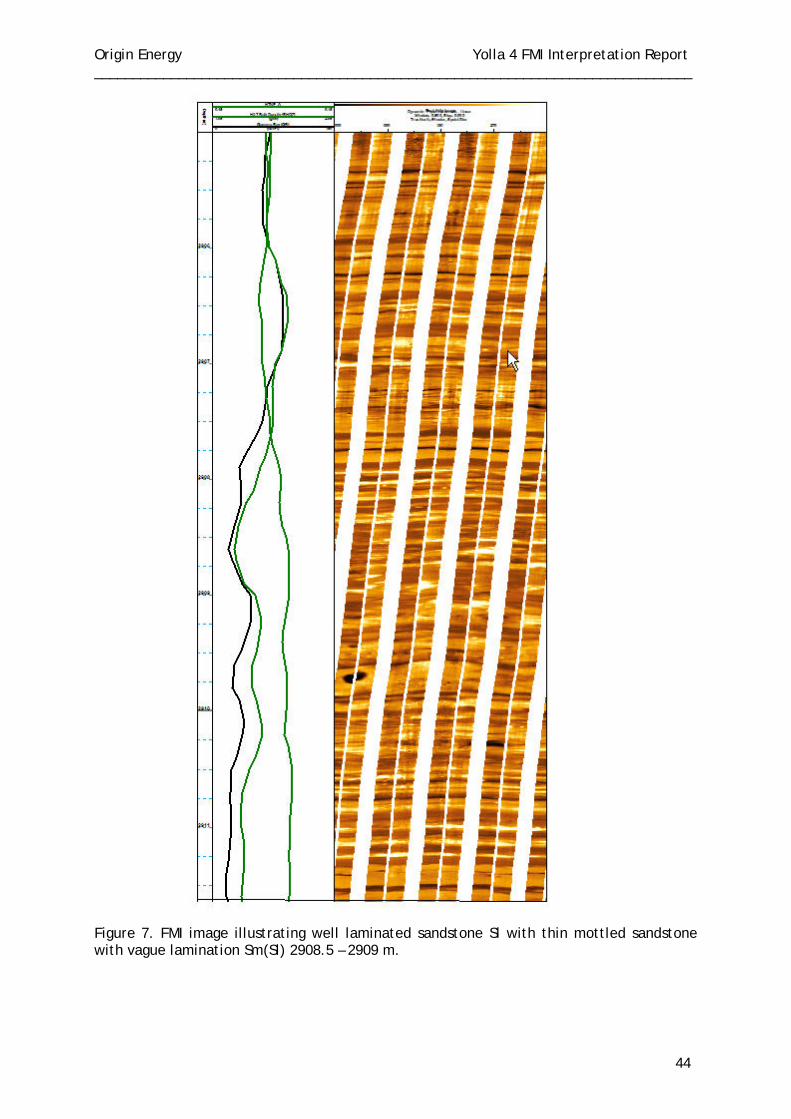
Origin Energy Yolla 4 FMI Interpretation Report ______________________________________________________________________________
44
Figure 7. FMI image illustrating well laminated sandstone Sl with thin mottled sandstone with vague lamination Sm(Sl) 2908.5 – 2909 m.
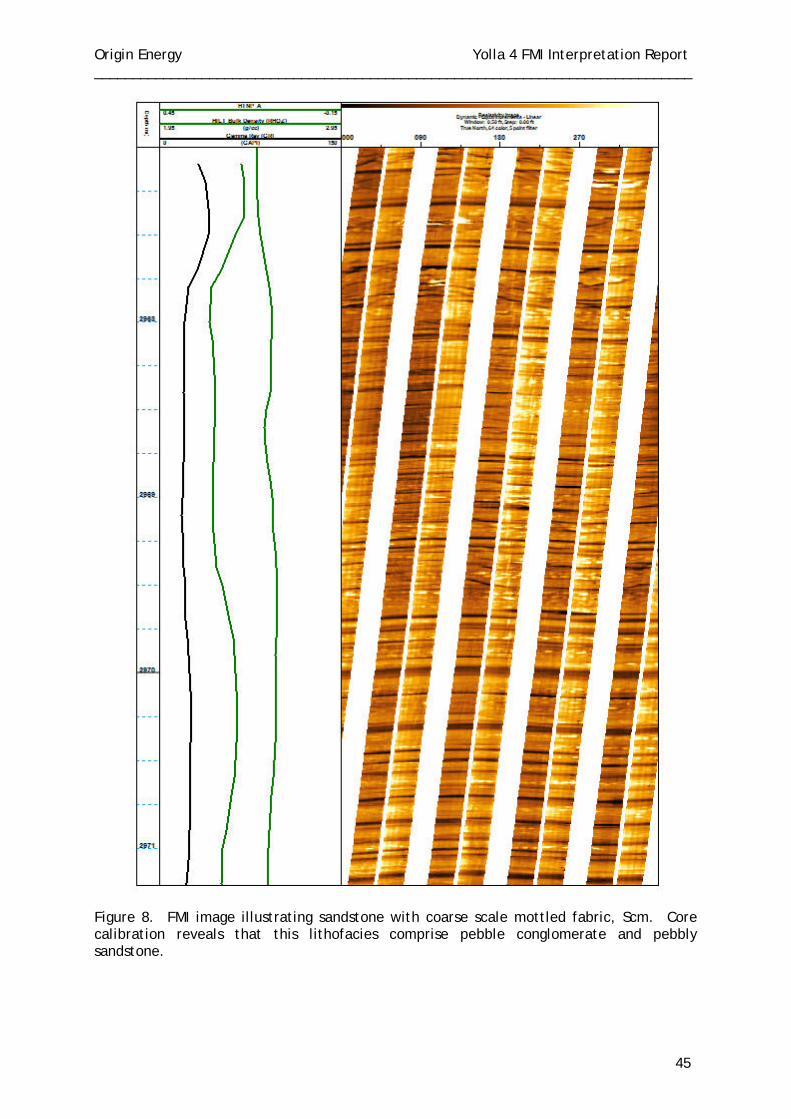
Origin Energy Yolla 4 FMI Interpretation Report ______________________________________________________________________________
45
Figure 8. FMI image illustrating sandstone with coarse scale mottled fabric, Scm. Core calibration reveals that this lithofacies comprise pebble conglomerate and pebbly sandstone.
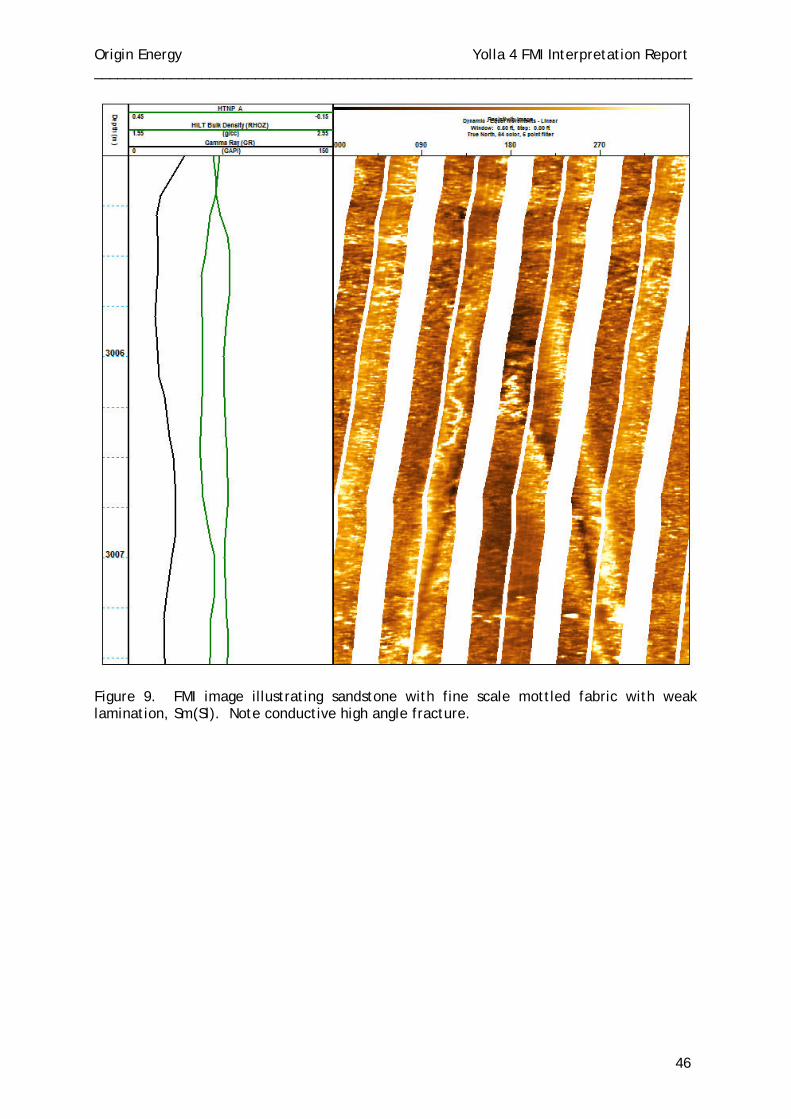
Origin Energy Yolla 4 FMI Interpretation Report ______________________________________________________________________________
46
Figure 9. FMI image illustrating sandstone with fine scale mottled fabric with weak lamination, Sm(Sl). Note conductive high angle fracture.
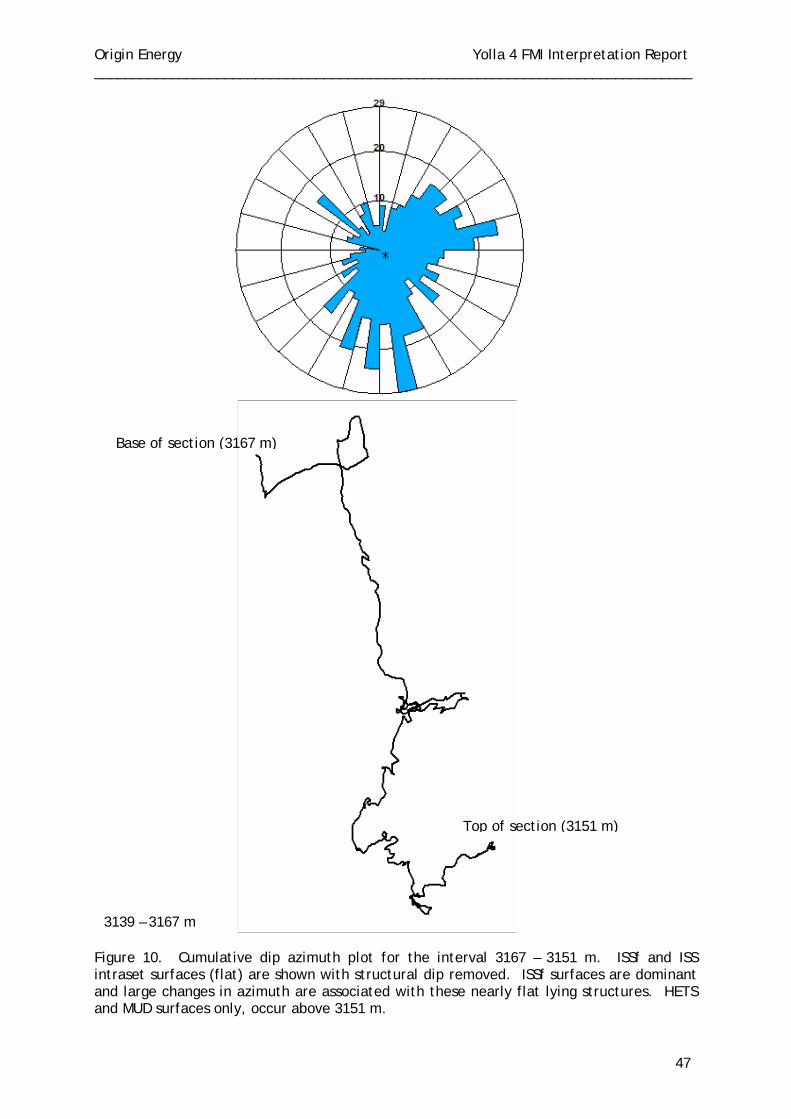
Origin Energy Yolla 4 FMI Interpretation Report ______________________________________________________________________________
47
Figure 10. Cumulative dip azimuth plot for the interval 3167 – 3151 m. ISSf and ISS intraset surfaces (flat) are shown with structural dip removed. ISSf surfaces are dominant and large changes in azimuth are associated with these nearly flat lying structures. HETS and MUD surfaces only, occur above 3151 m.
Base of section (3167 m)
Top of section (3151 m)
3139 – 3167 m
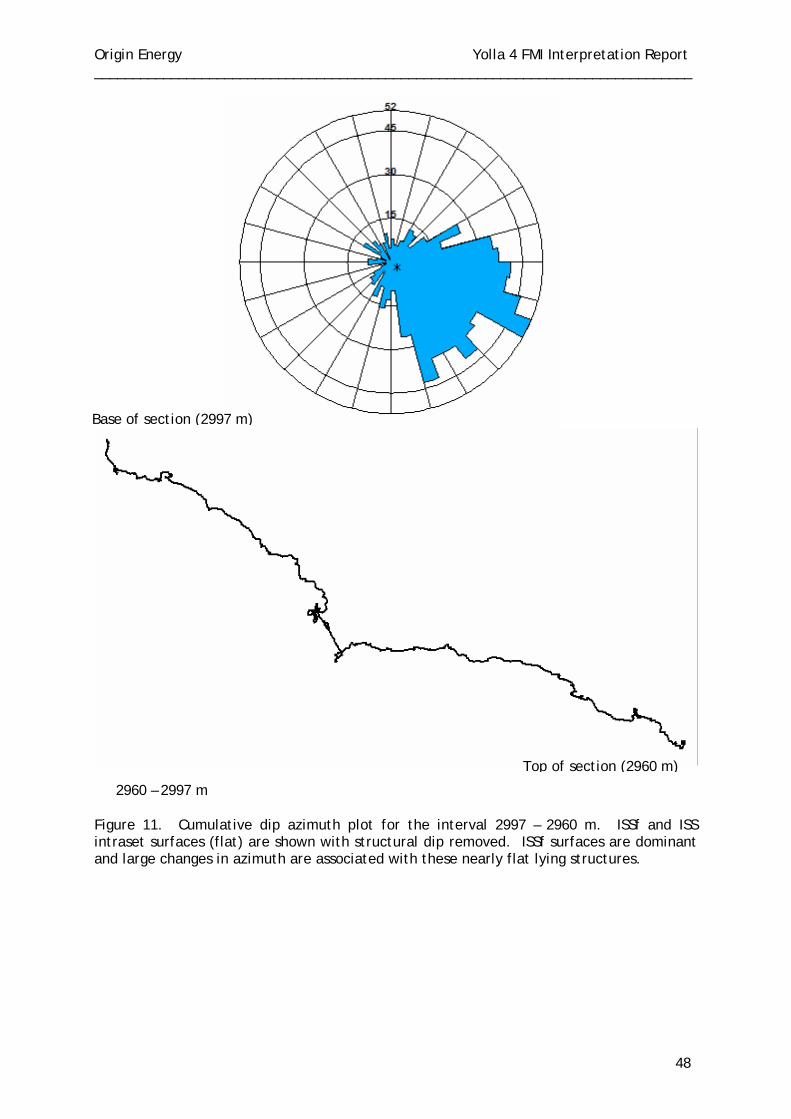
Origin Energy Yolla 4 FMI Interpretation Report ______________________________________________________________________________
48
Figure 11. Cumulative dip azimuth plot for the interval 2997 – 2960 m. ISSf and ISS intraset surfaces (flat) are shown with structural dip removed. ISSf surfaces are dominant and large changes in azimuth are associated with these nearly flat lying structures.
Base of section (2997 m)
Top of section (2960 m)
2960 – 2997 m
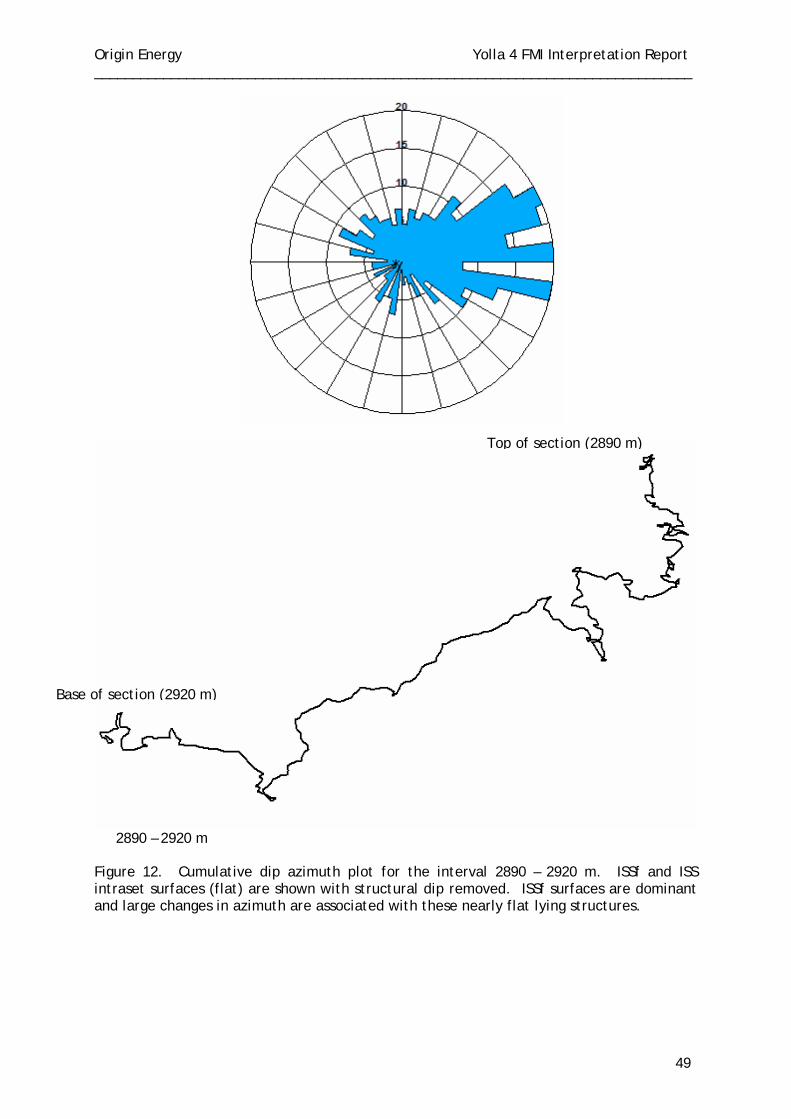
Origin Energy Yolla 4 FMI Interpretation Report ______________________________________________________________________________
49
Figure 12. Cumulative dip azimuth plot for the interval 2890 – 2920 m. ISSf and ISS intraset surfaces (flat) are shown with structural dip removed. ISSf surfaces are dominant and large changes in azimuth are associated with these nearly flat lying structures.
Base of section (2920 m)
Top of section (2890 m)
2890 – 2920 m
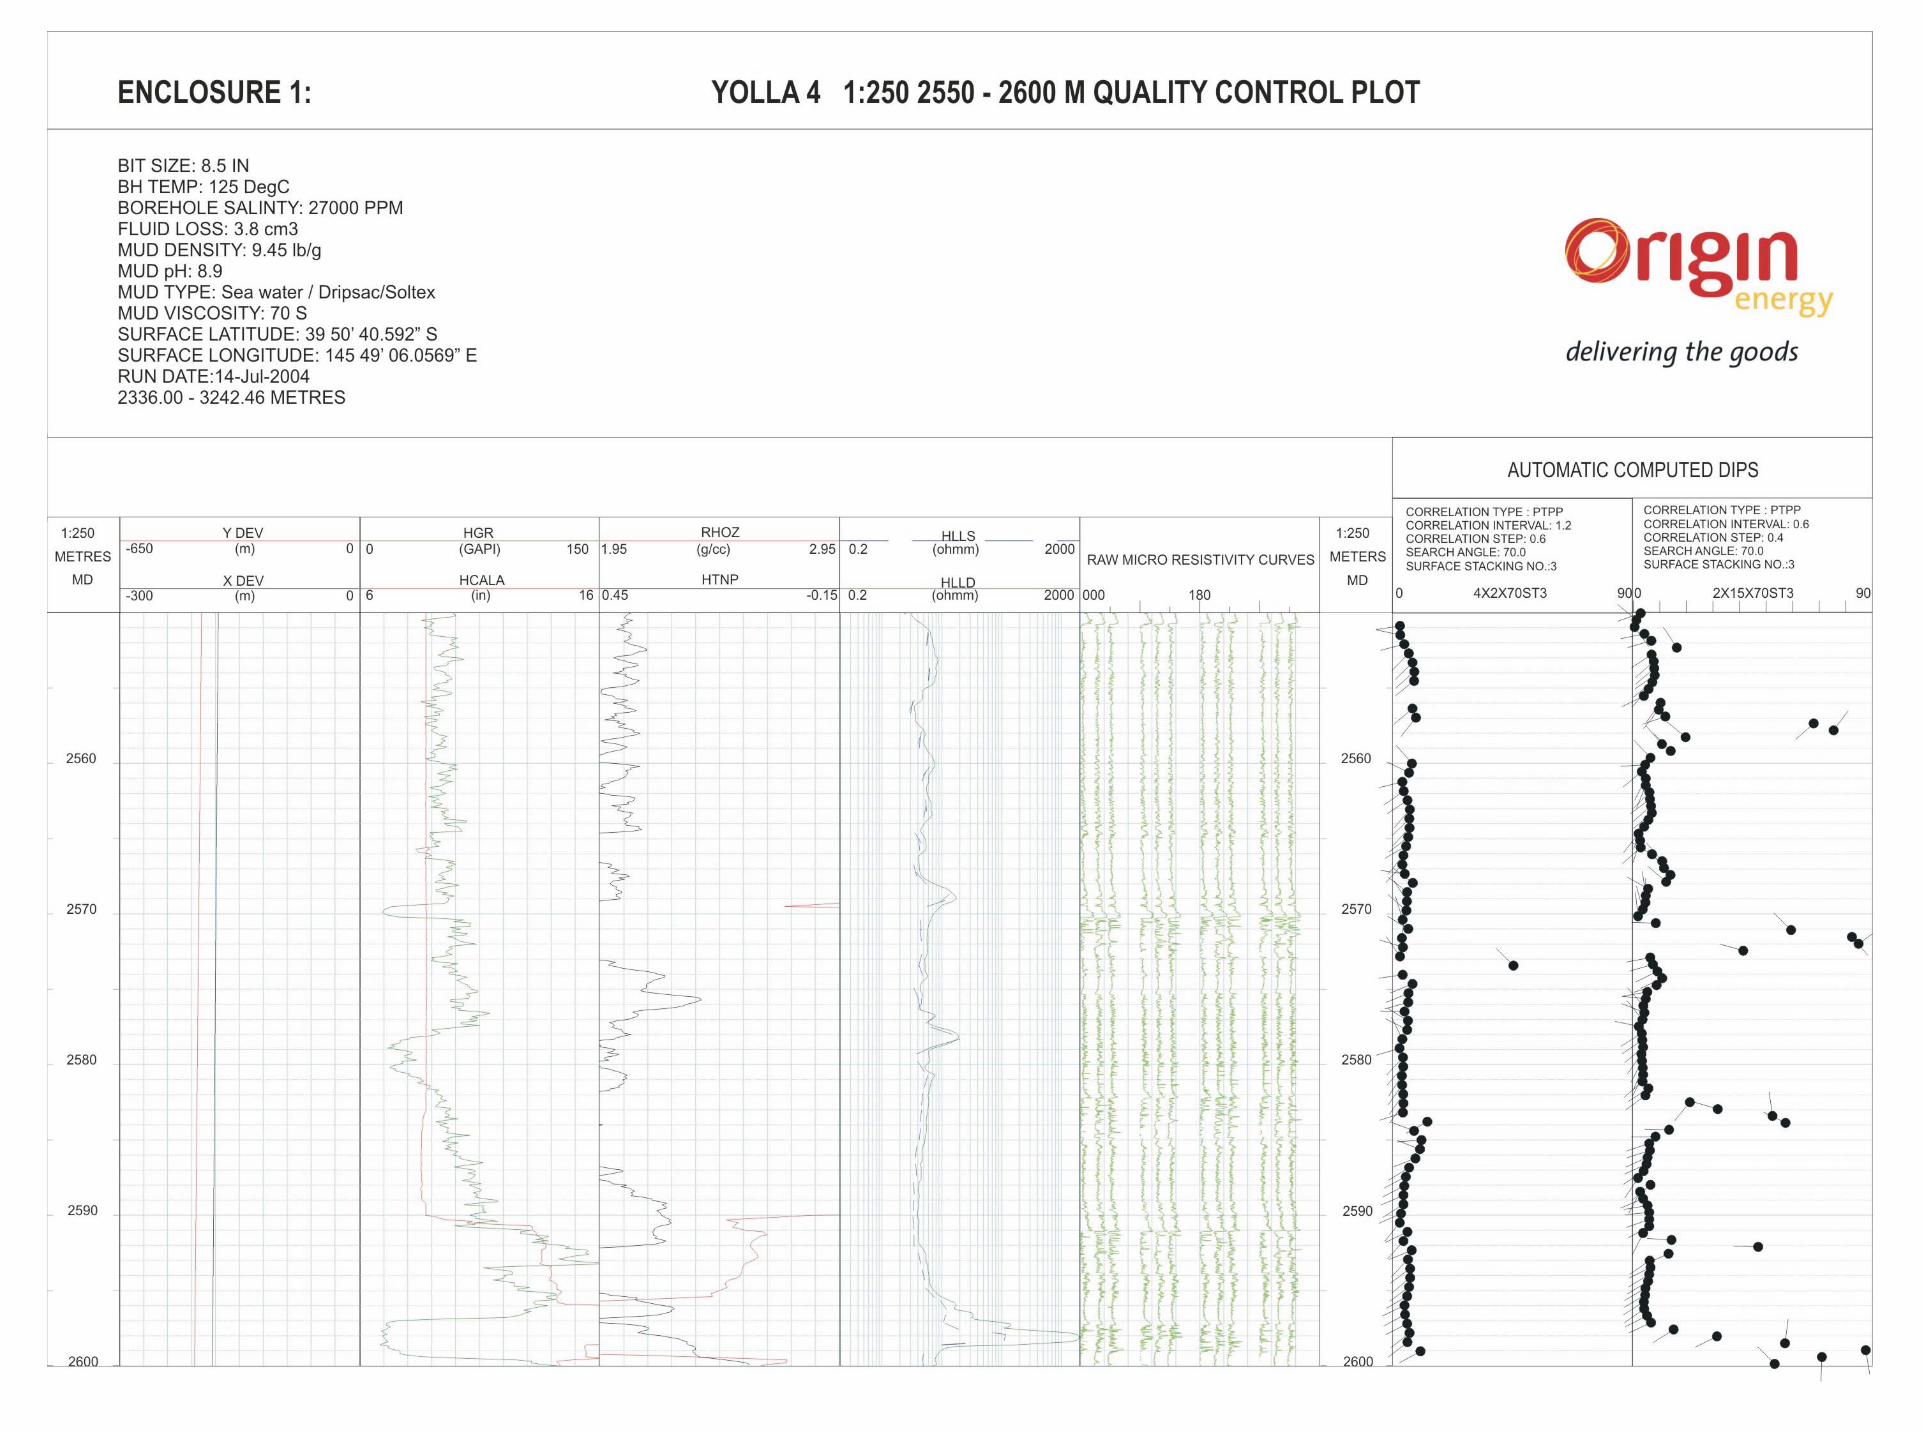
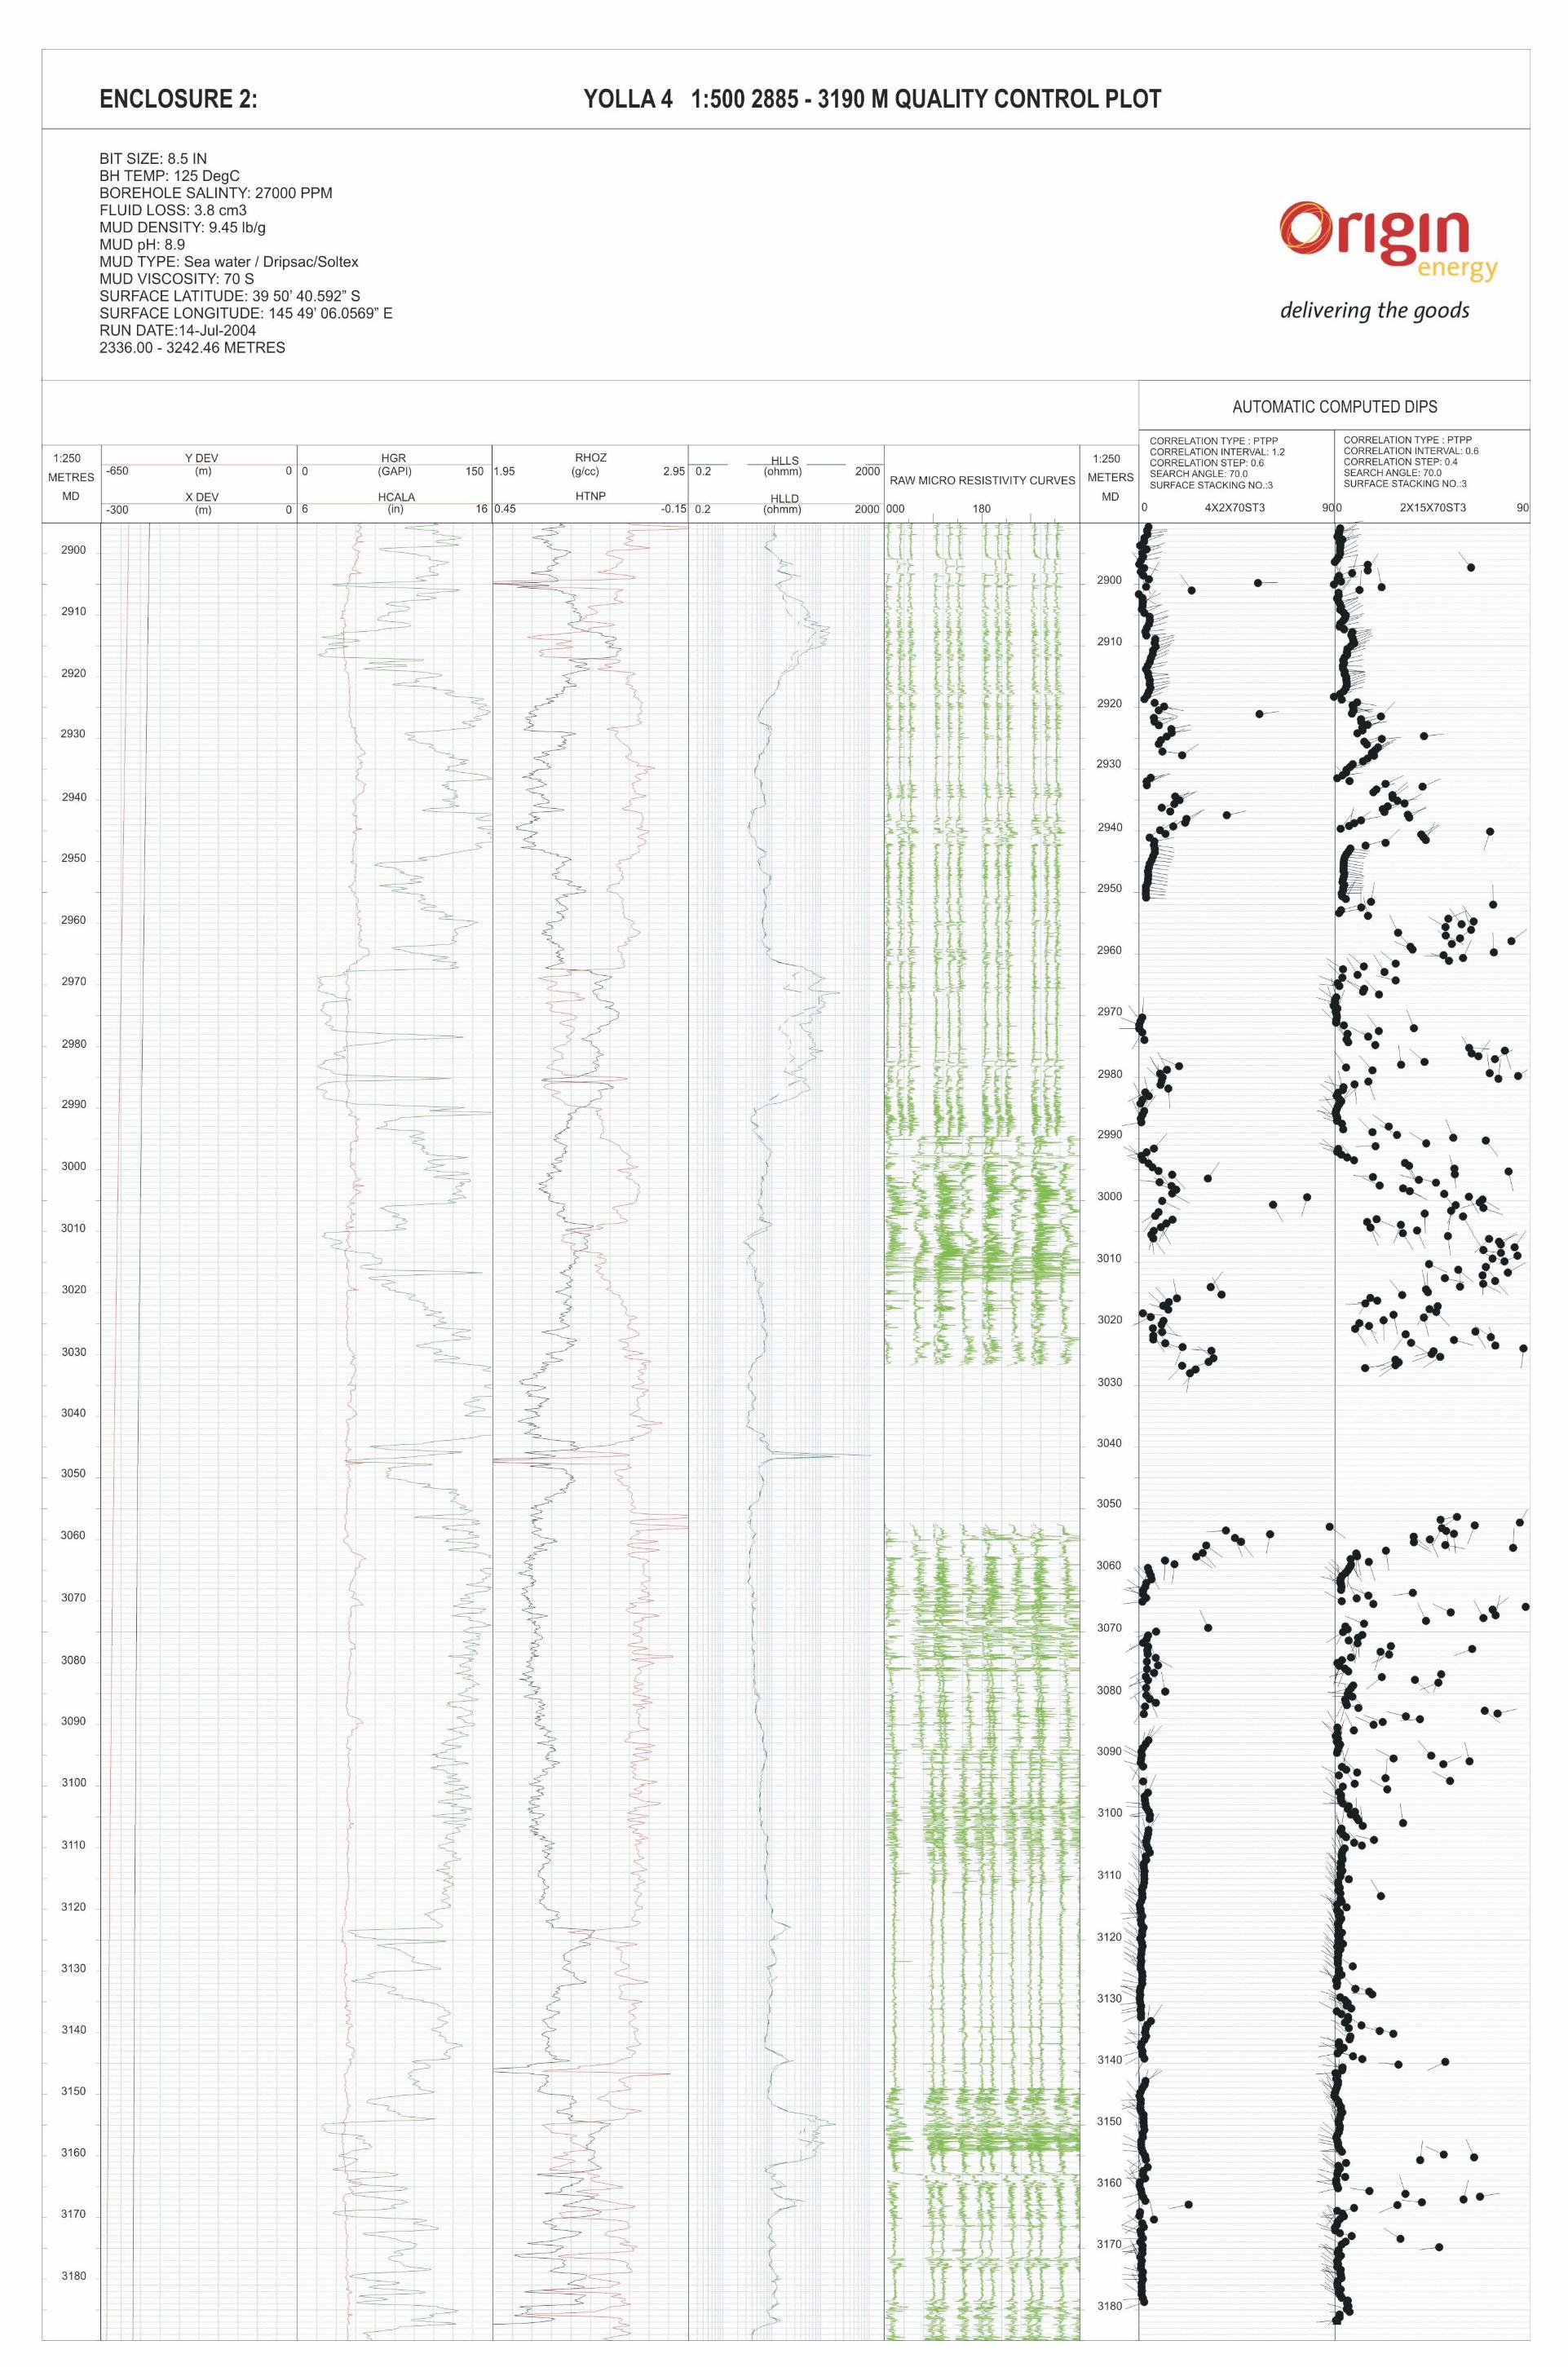
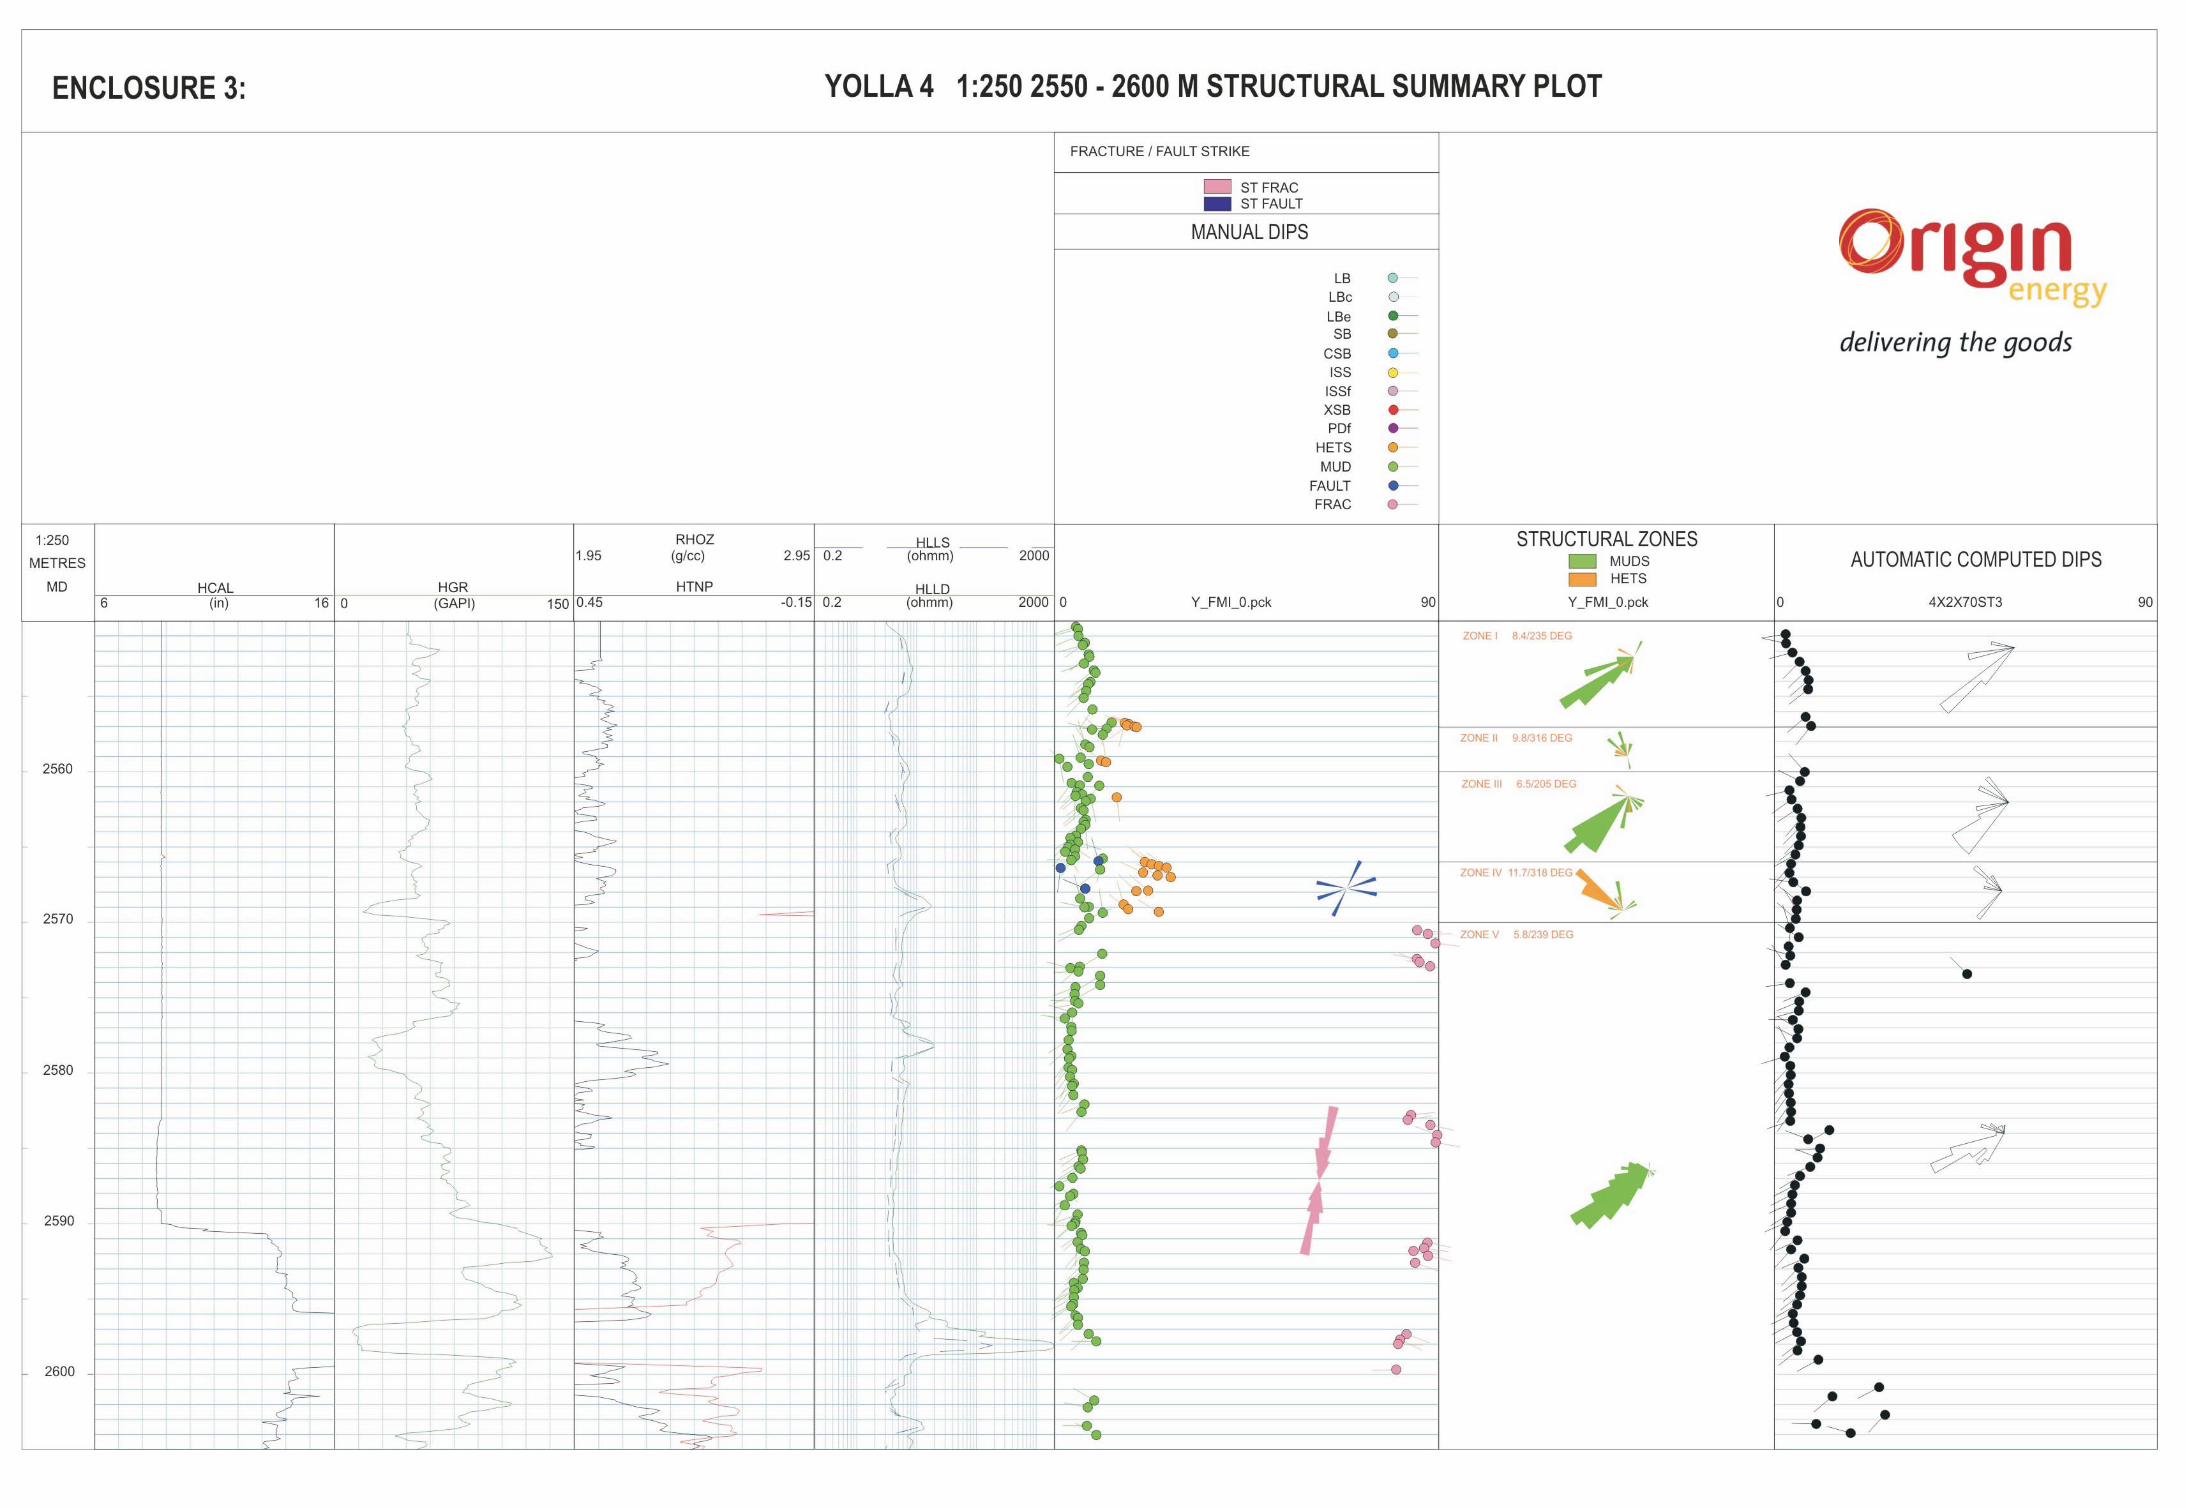
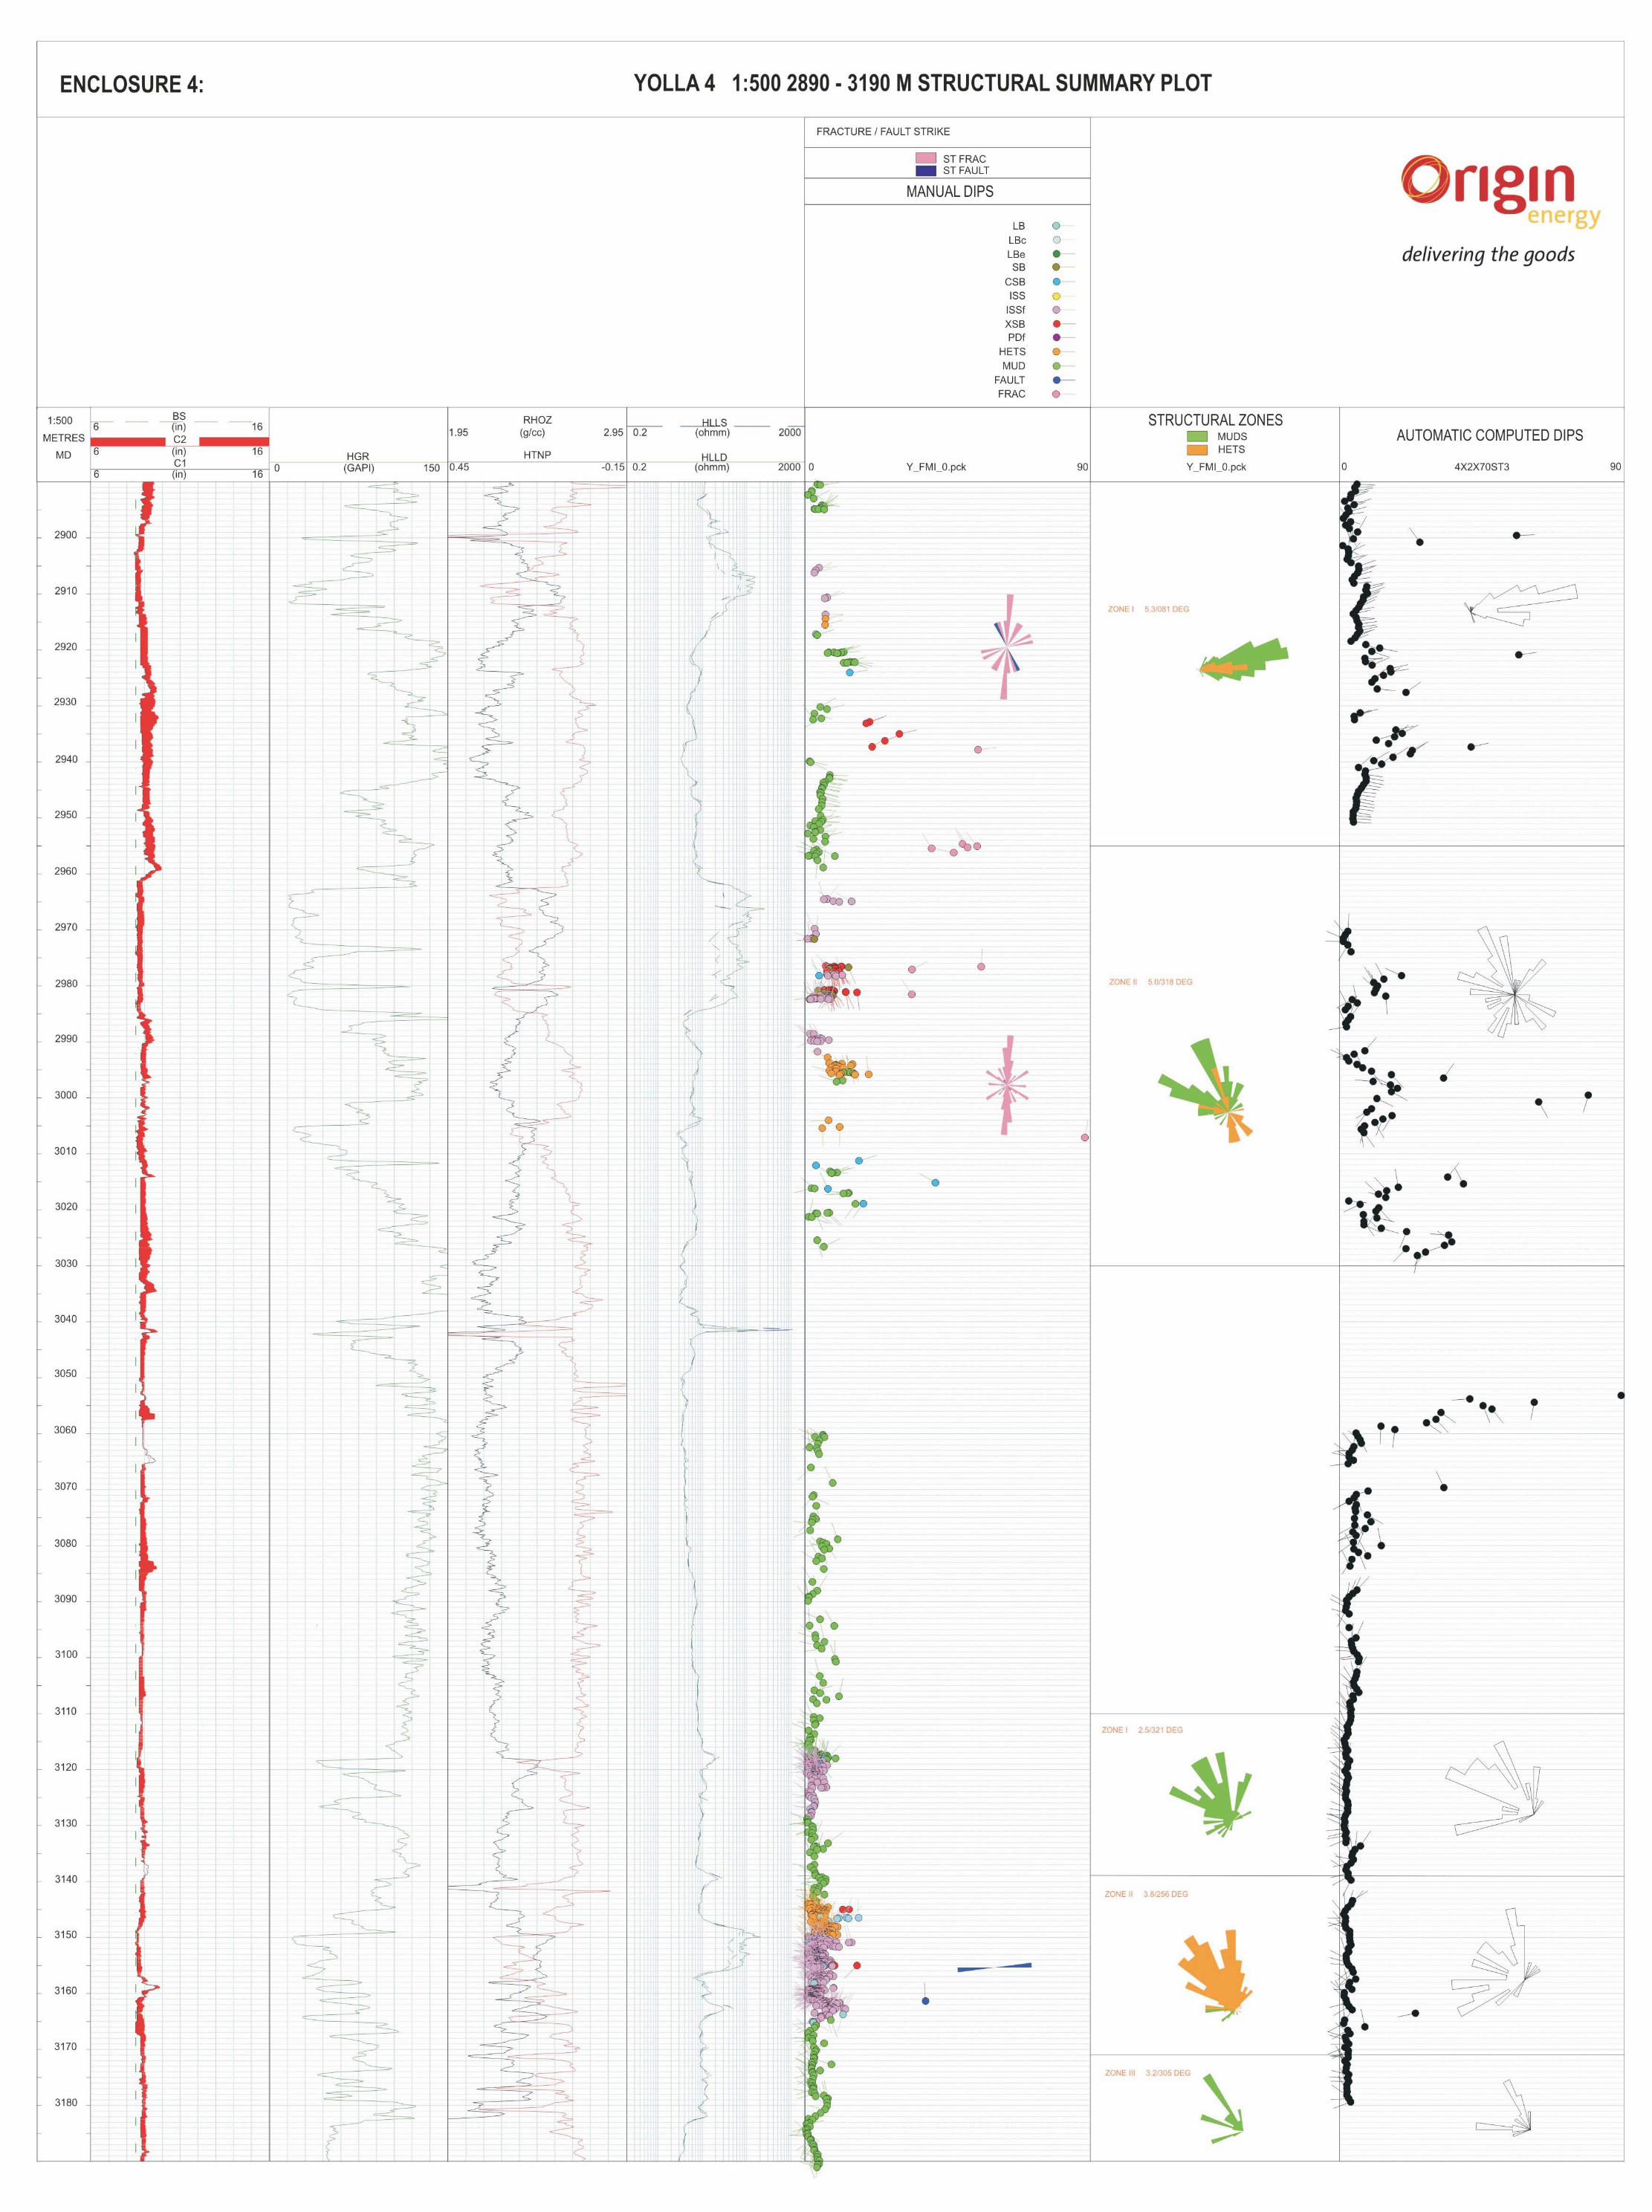
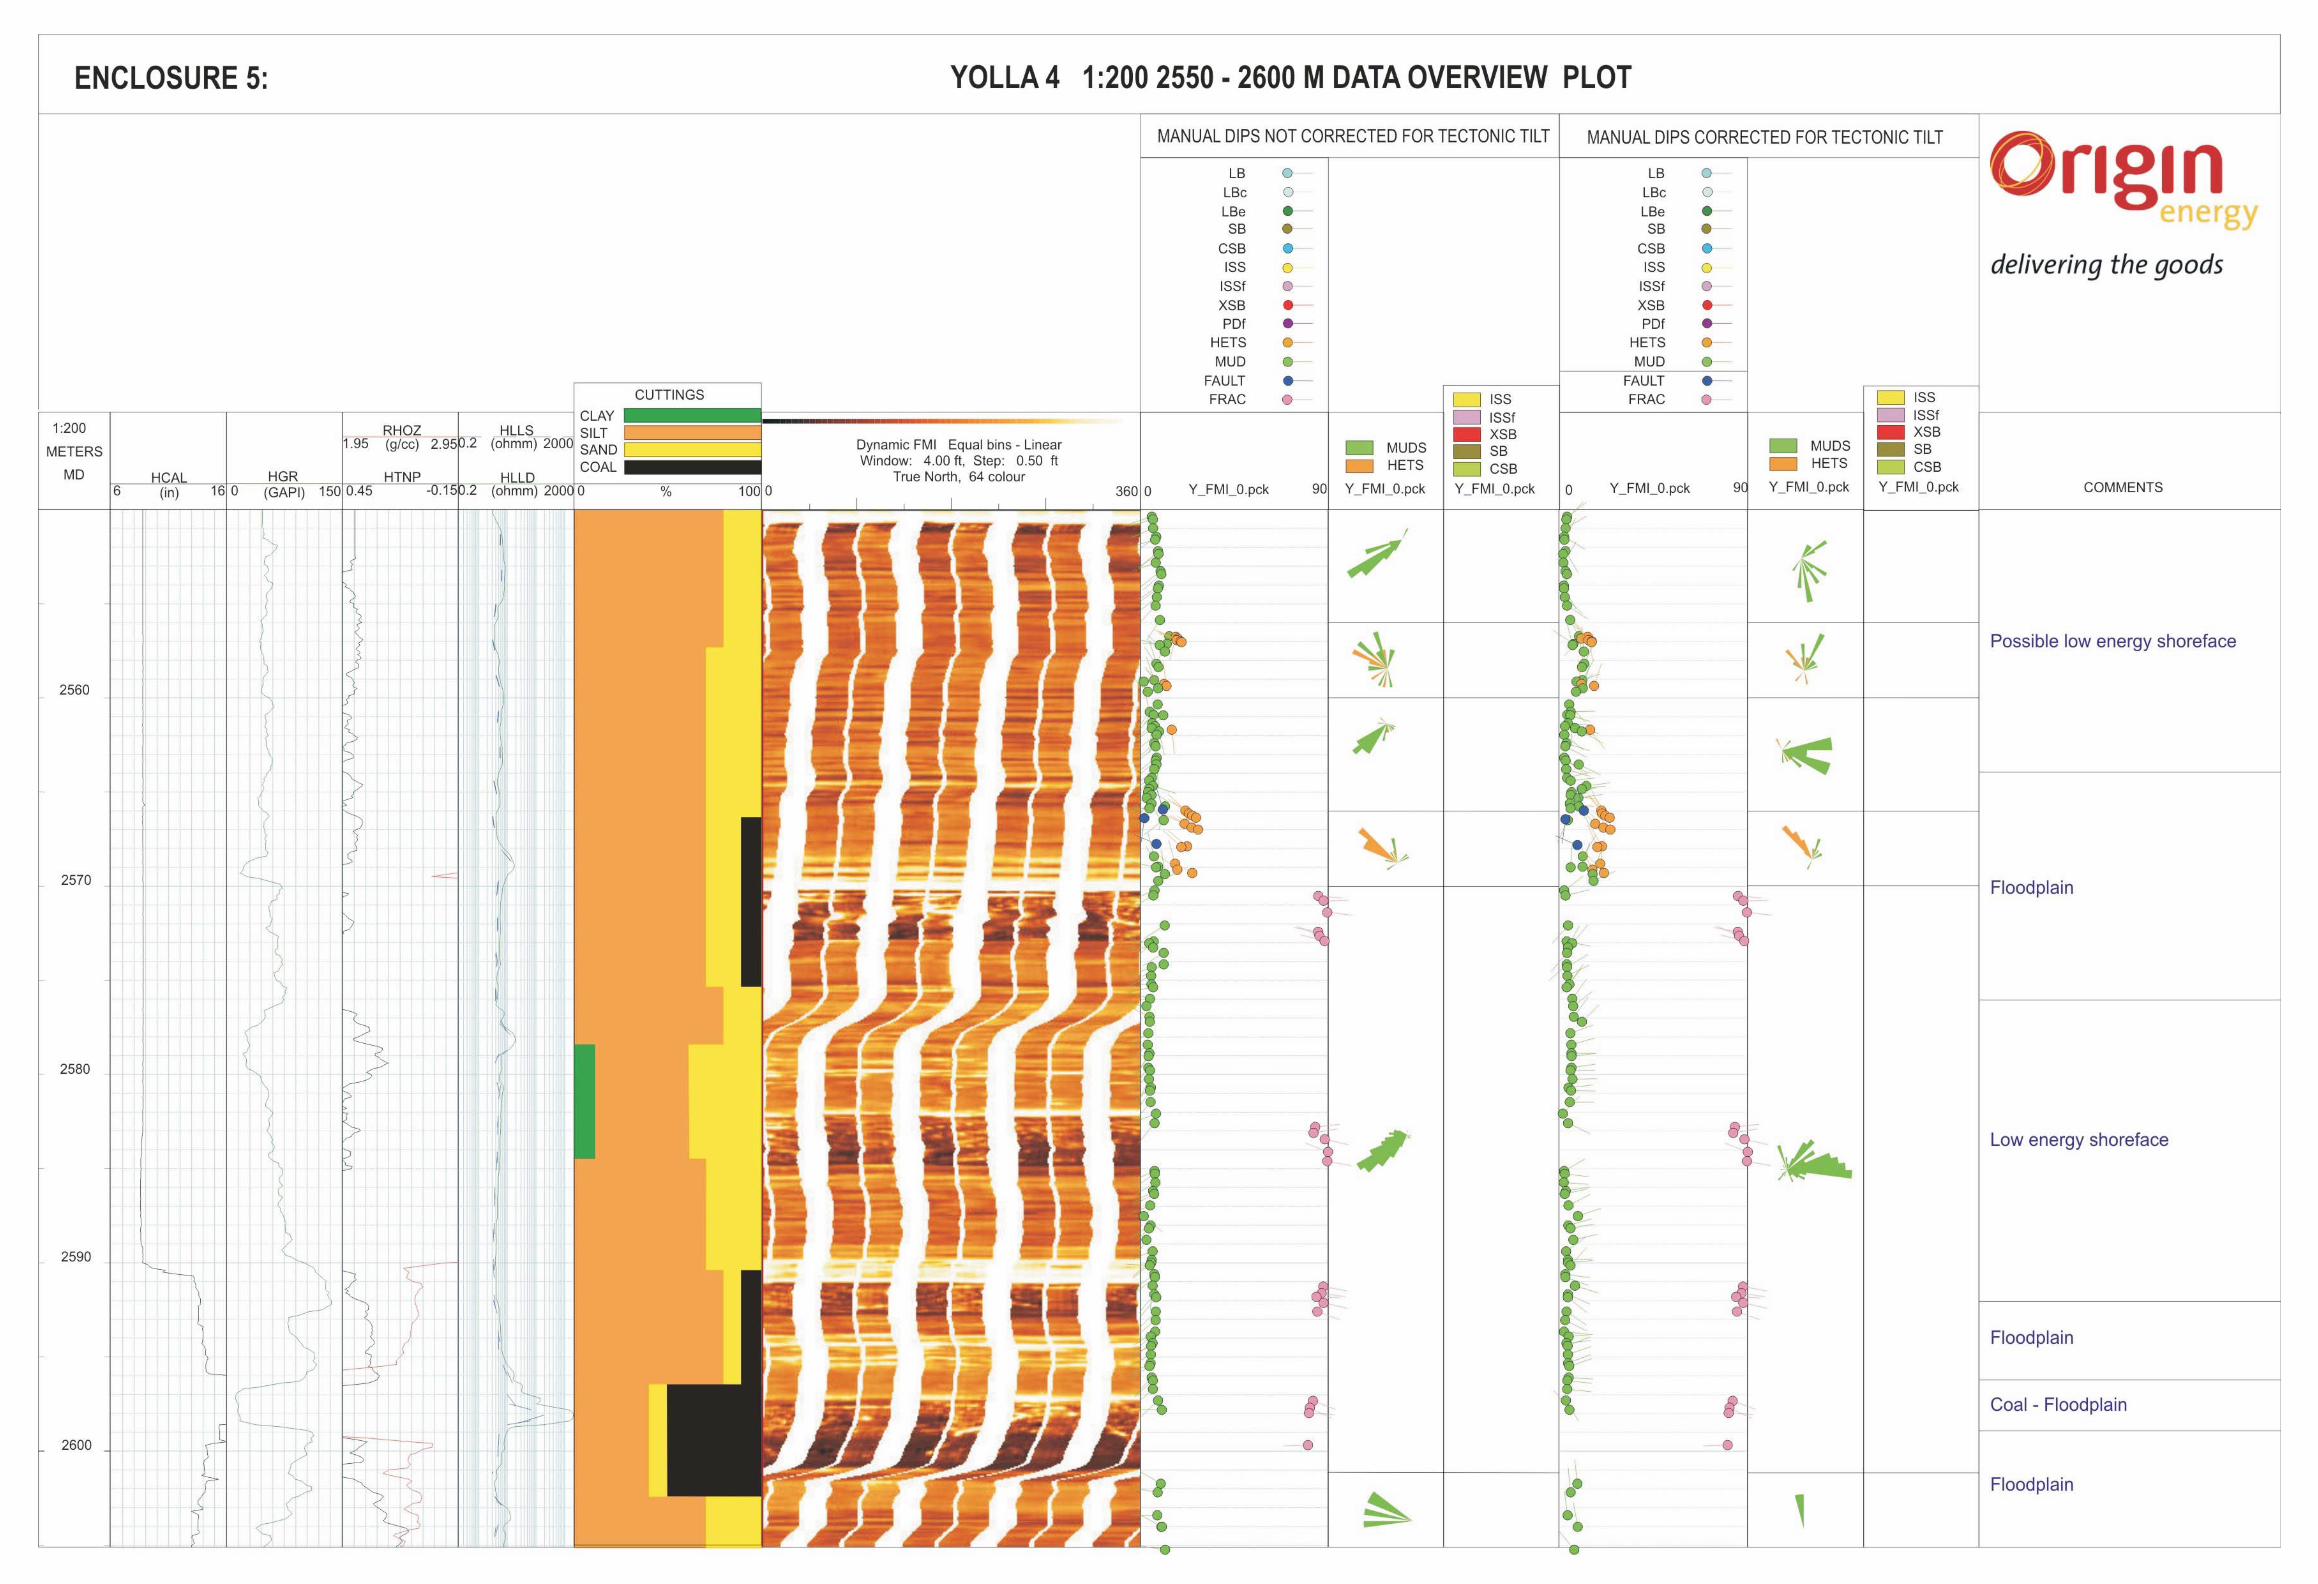
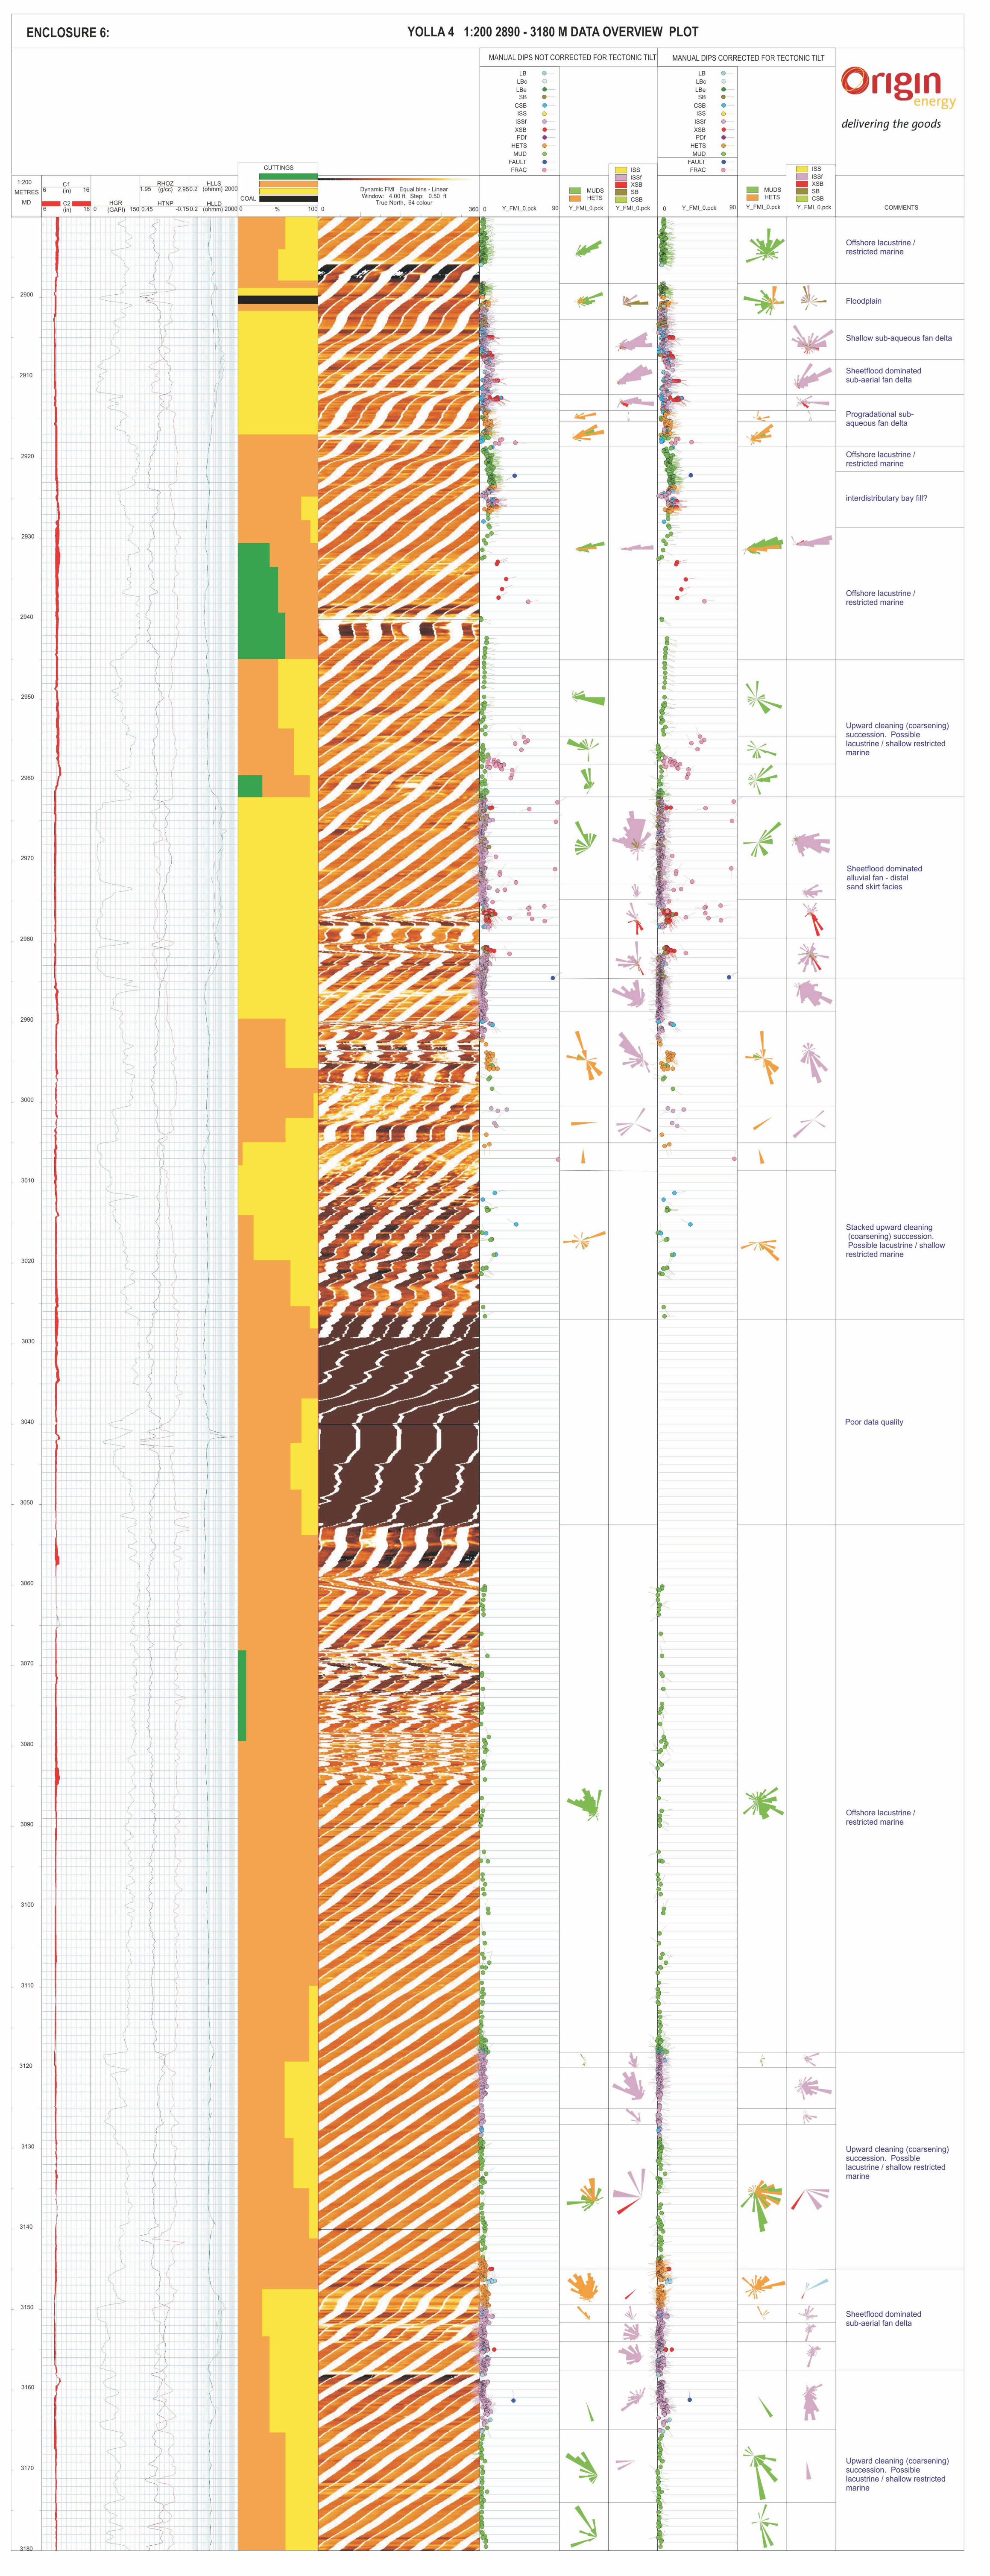
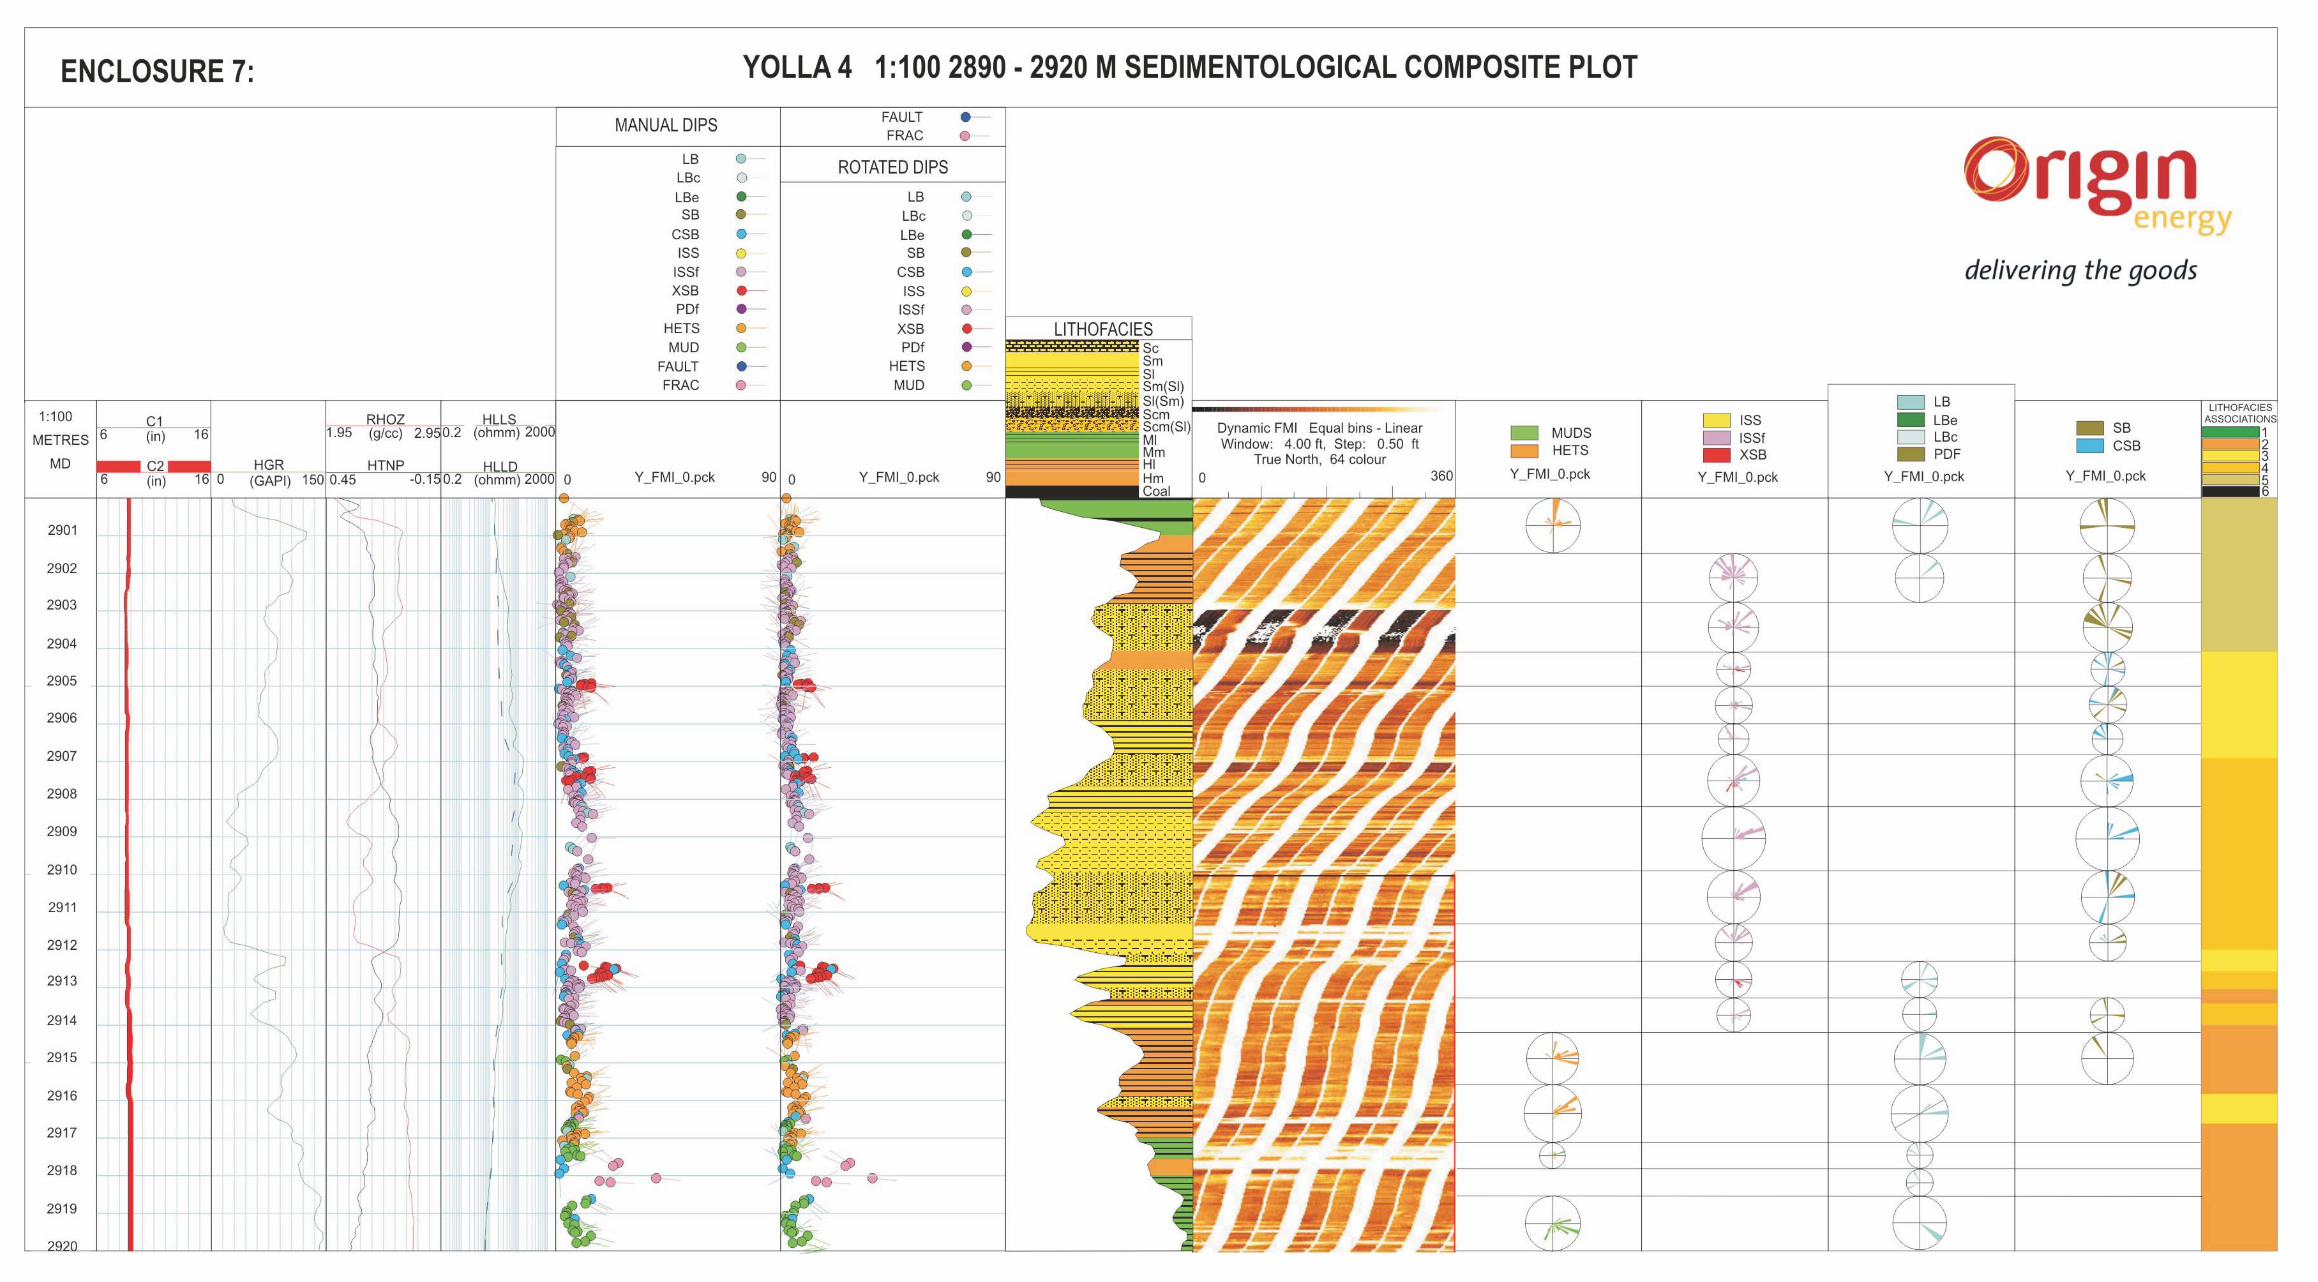
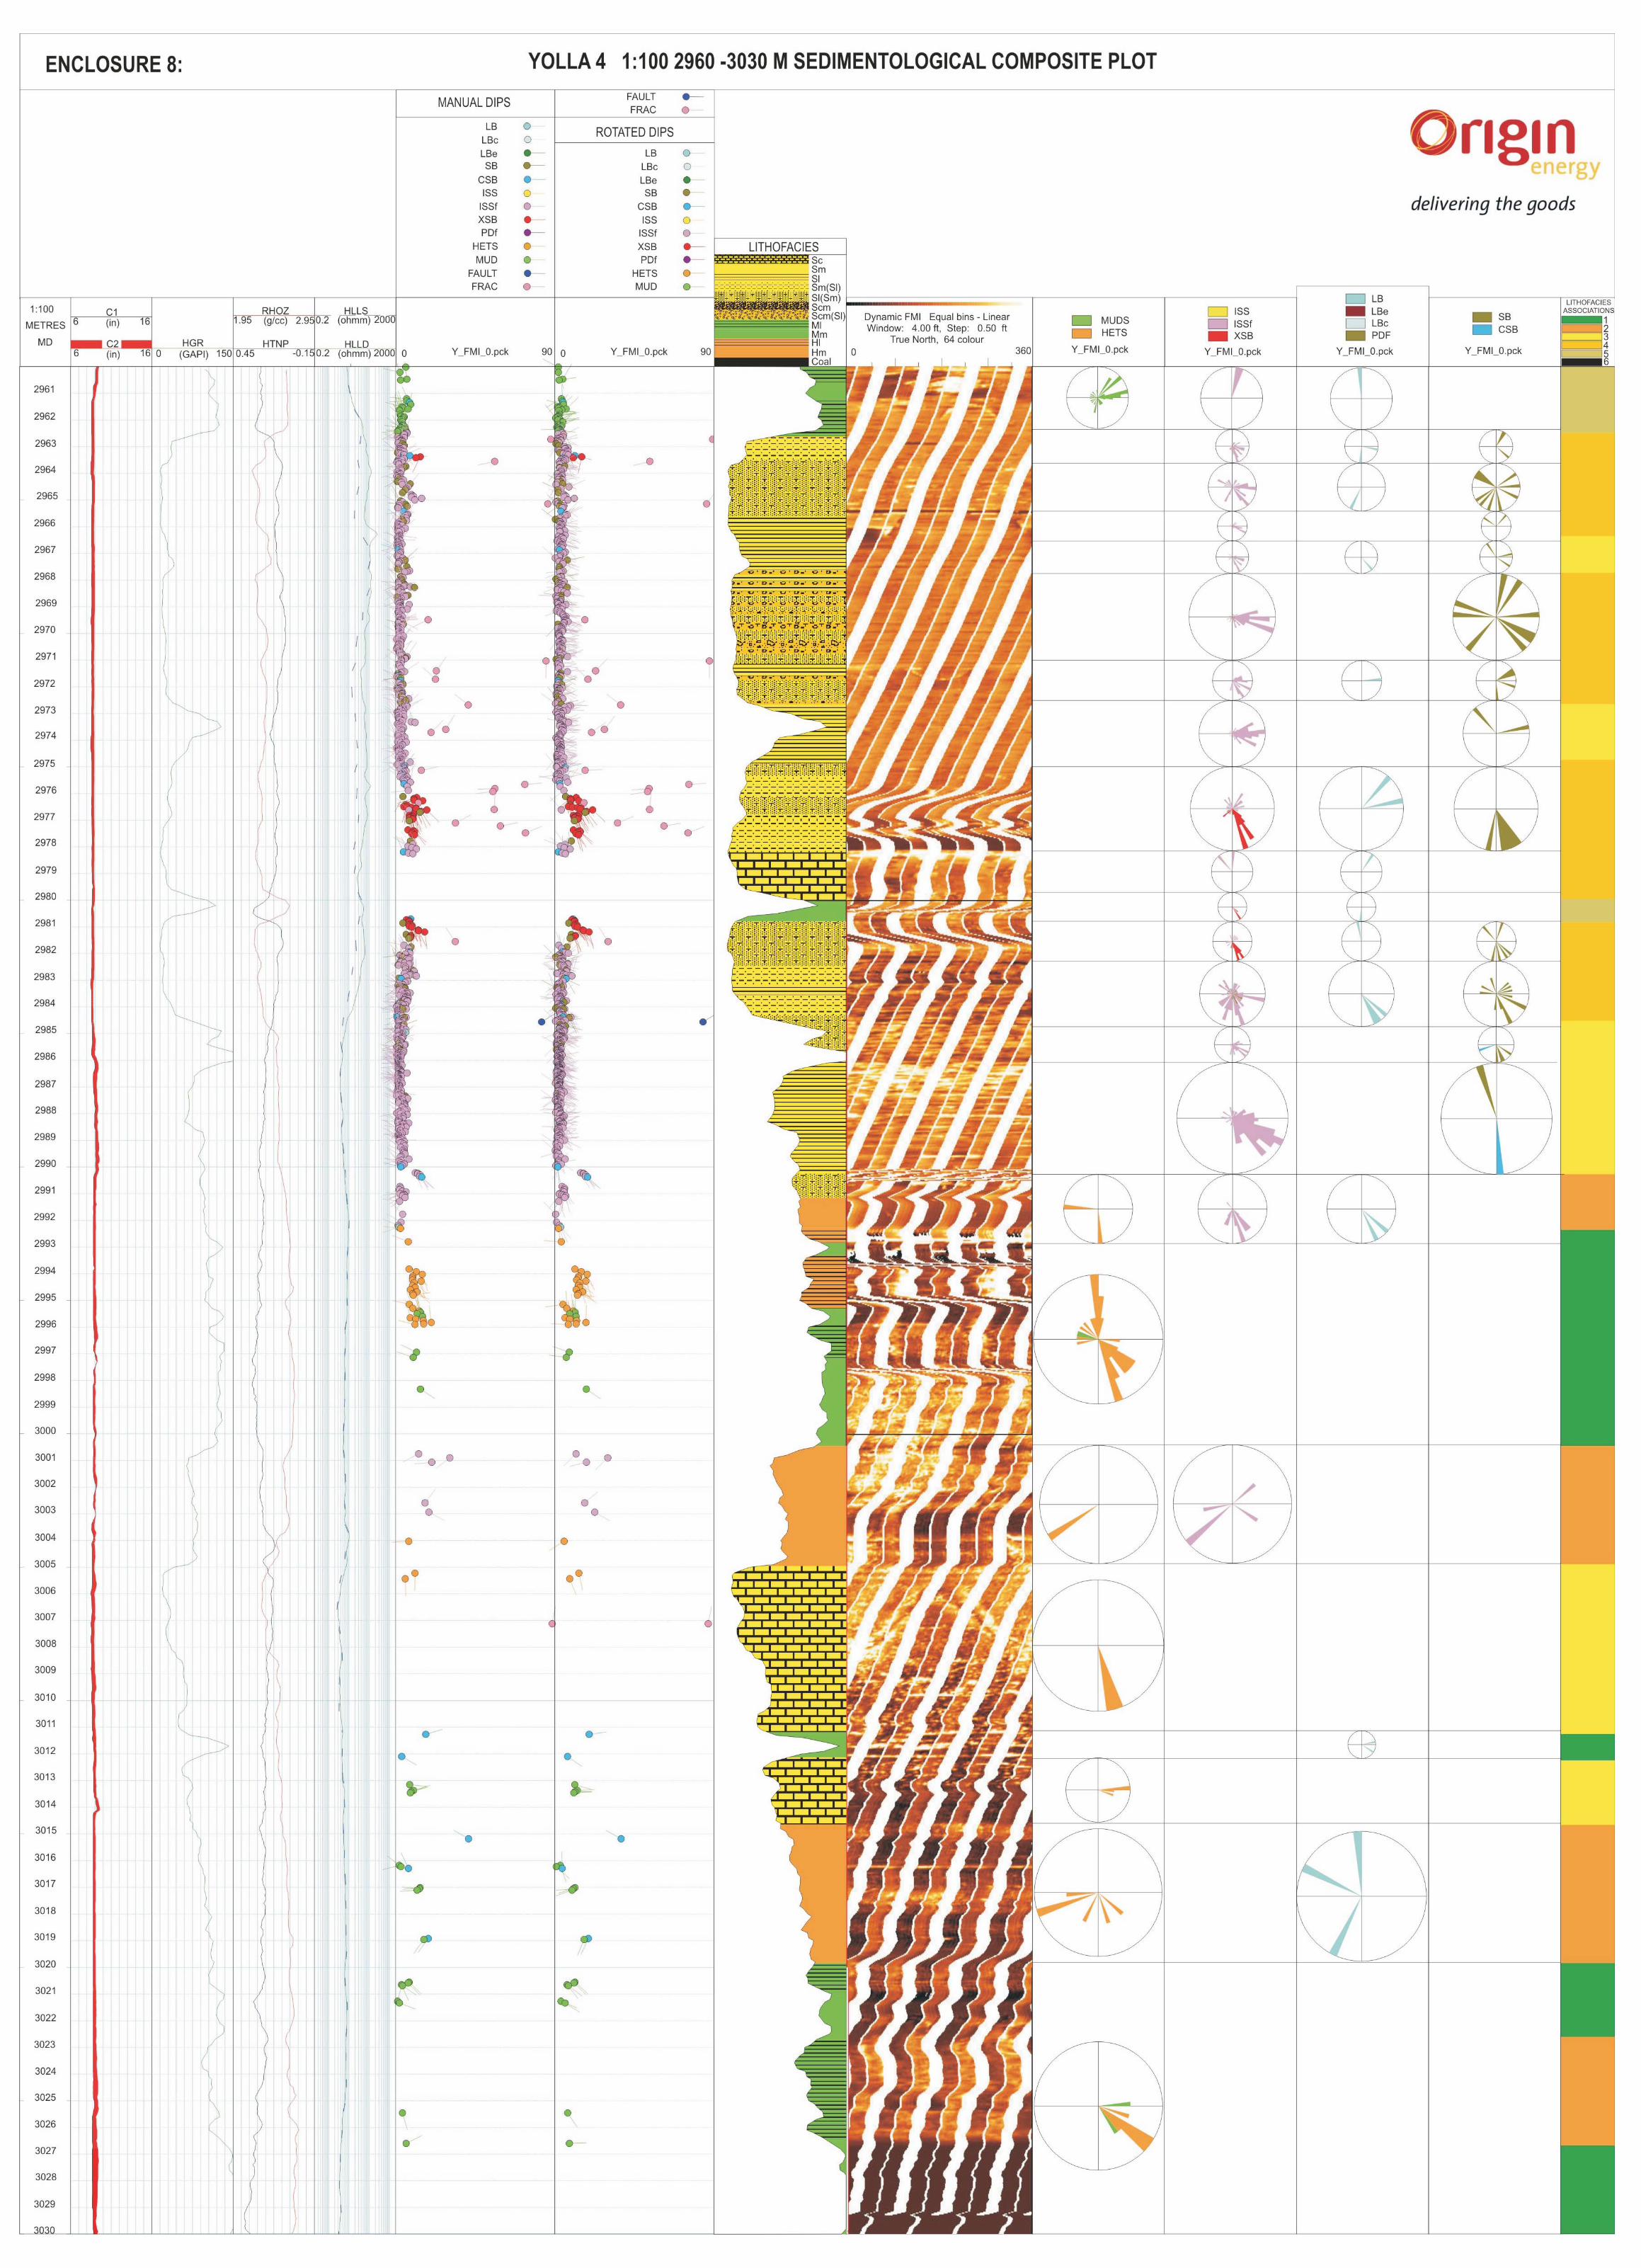
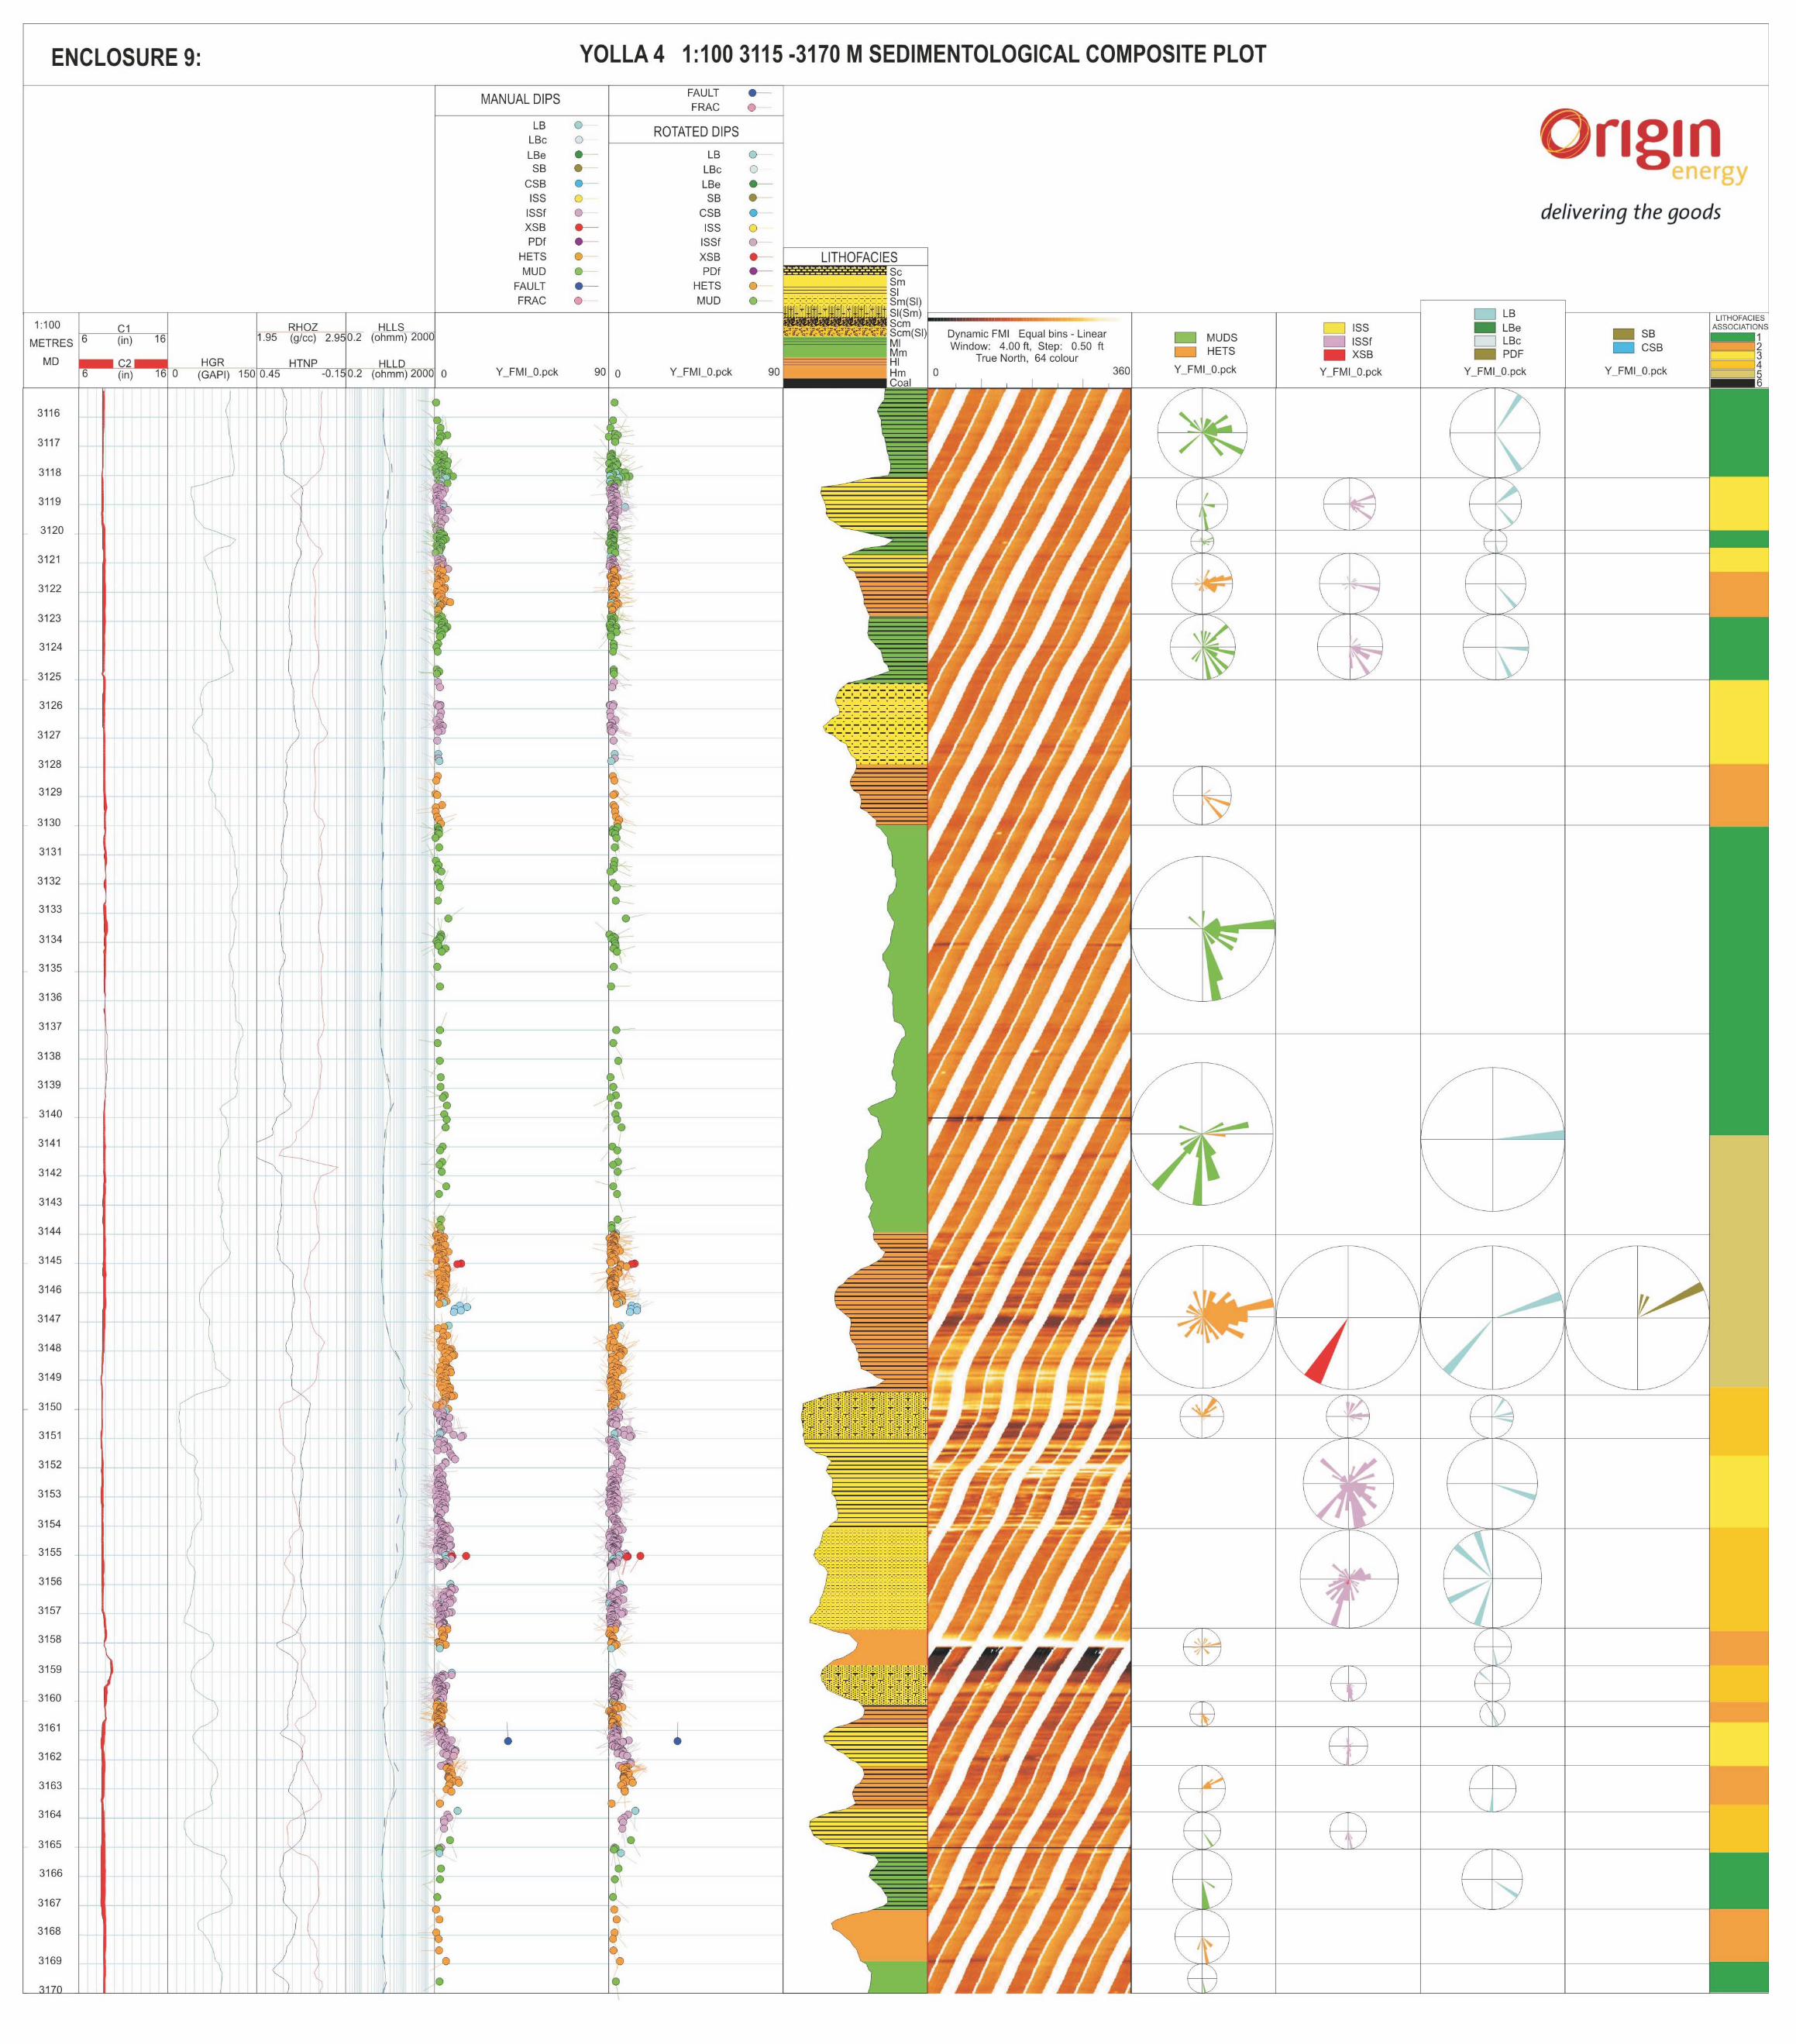
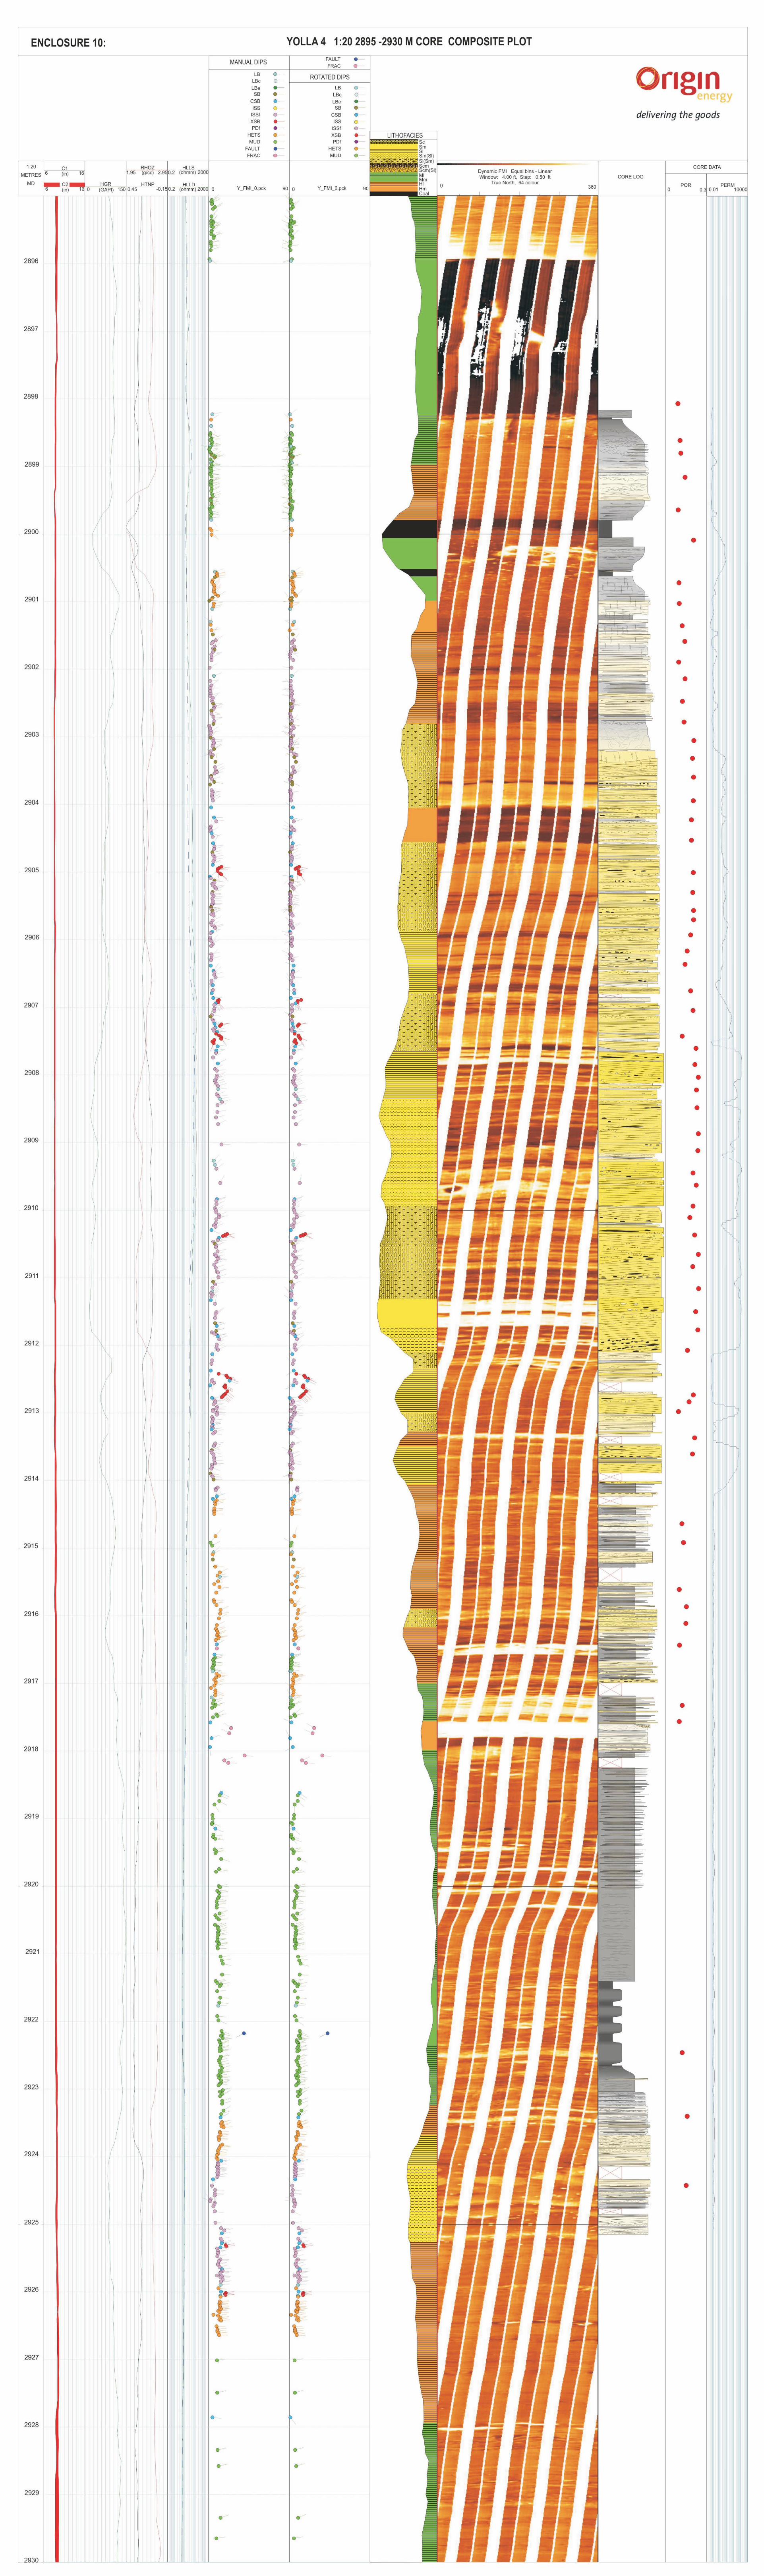
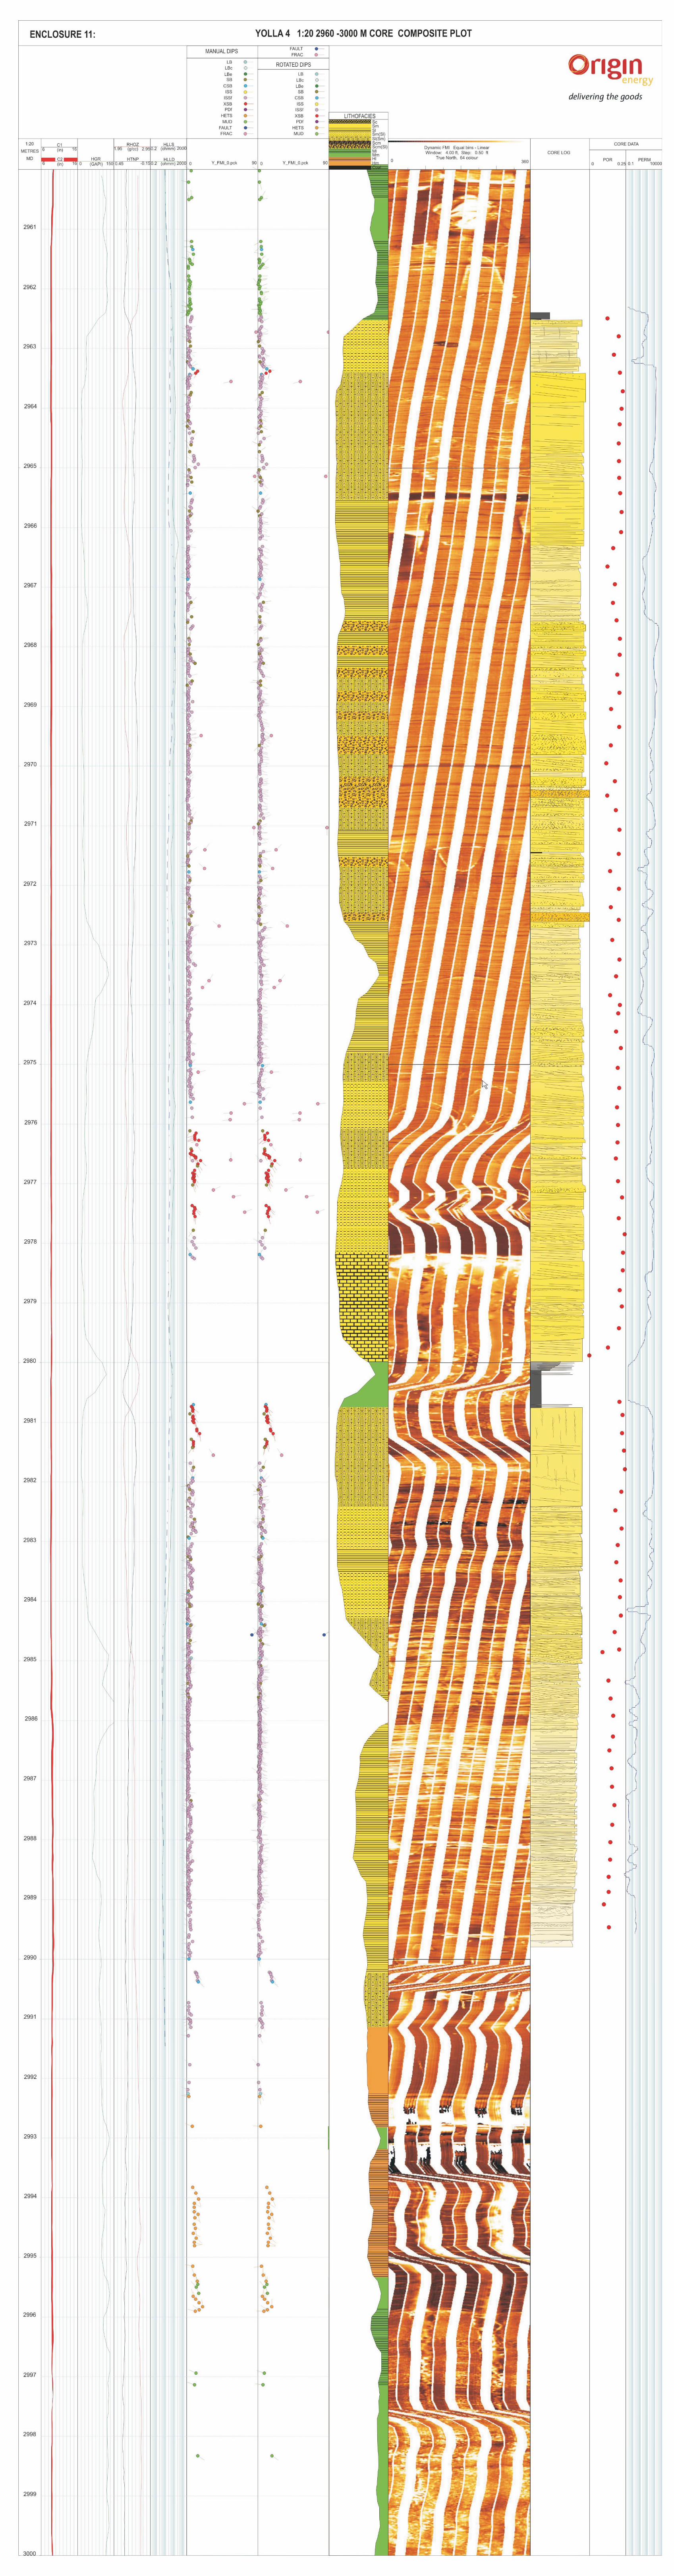
Origin Energy Resources Ltd ABN 66 007 845 338 Commercial-in-Confidence Greenfields Division Ref: W:\Complete Reports\BASS\Yolla\Yolla 4\Interpretive\Yolla 4 Interpretive Data WCR.docc
EENNCCLLOOSSUURREE 11:: CCOOMMPPOOSSIITTEE LLOOGG
Related Documents