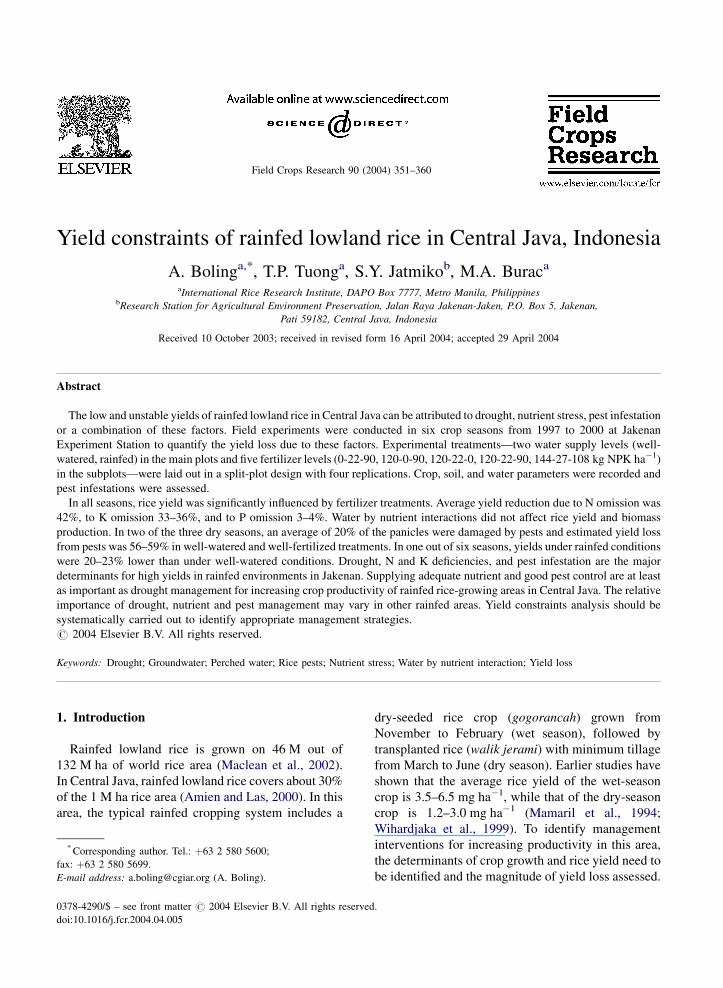
Yield constraints of rainfed lowland rice in Central Java, Indonesia A. Boling a,* , T.P. Tuong a , S.Y. Jatmiko b , M.A. Burac a a International Rice Research Institute, DAPO Box 7777, Metro Manila, Philippines b Research Station for Agricultural Environment Preservation, Jalan Raya Jakenan-Jaken, P.O. Box 5, Jakenan, Pati 59182, Central Java, Indonesia Received 10 October 2003; received in revised form 16 April 2004; accepted 29 April 2004 Abstract The low and unstable yields of rainfed lowland rice in Central Java can be attributed to drought, nutrient stress, pest infestation or a combination of these factors. Field experiments were conducted in six crop seasons from 1997 to 2000 at Jakenan Experiment Station to quantify the yield loss due to these factors. Experimental treatments—two water supply levels (well- watered, rainfed) in the main plots and five fertilizer levels (0-22-90, 120-0-90, 120-22-0, 120-22-90, 144-27-108 kg NPK ha 1 ) in the subplots—were laid out in a split-plot design with four replications. Crop, soil, and water parameters were recorded and pest infestations were assessed. In all seasons, rice yield was significantly influenced by fertilizer treatments. Average yield reduction due to N omission was 42%, to K omission 33–36%, and to P omission 3–4%. Water by nutrient interactions did not affect rice yield and biomass production. In two of the three dry seasons, an average of 20% of the panicles were damaged by pests and estimated yield loss from pests was 56–59% in well-watered and well-fertilized treatments. In one out of six seasons, yields under rainfed conditions were 20–23% lower than under well-watered conditions. Drought, N and K deficiencies, and pest infestation are the major determinants for high yields in rainfed environments in Jakenan. Supplying adequate nutrient and good pest control are at least as important as drought management for increasing crop productivity of rainfed rice-growing areas in Central Java. The relative importance of drought, nutrient and pest management may vary in other rainfed areas. Yield constraints analysis should be systematically carried out to identify appropriate management strategies. # 2004 Elsevier B.V. All rights reserved. Keywords: Drought; Groundwater; Perched water; Rice pests; Nutrient stress; Water by nutrient interaction; Yield loss 1. Introduction Rainfed lowland rice is grown on 46 M out of 132 M ha of world rice area (Maclean et al., 2002). In Central Java, rainfed lowland rice covers about 30% of the 1 M ha rice area (Amien and Las, 2000). In this area, the typical rainfed cropping system includes a dry-seeded rice crop (gogorancah) grown from November to February (wet season), followed by transplanted rice (walik jerami) with minimum tillage from March to June (dry season). Earlier studies have shown that the average rice yield of the wet-season crop is 3.5–6.5 mg ha 1 , while that of the dry-season crop is 1.2–3.0 mg ha 1 (Mamaril et al., 1994; Wihardjaka et al., 1999). To identify management interventions for increasing productivity in this area, the determinants of crop growth and rice yield need to be identified and the magnitude of yield loss assessed. Field Crops Research 90 (2004) 351–360 * Corresponding author. Tel.: þ63 2 580 5600; fax: þ63 2 580 5699. E-mail address: [email protected] (A. Boling). 0378-4290/$ – see front matter # 2004 Elsevier B.V. All rights reserved. doi:10.1016/j.fcr.2004.04.005

Welcome message from author
This document is posted to help you gain knowledge. Please leave a comment to let me know what you think about it! Share it to your friends and learn new things together.
Transcript
Yield constraints of rainfed lowland rice in Central Java, Indonesia
A. Bolinga,*, T.P. Tuonga, S.Y. Jatmikob, M.A. Buraca
aInternational Rice Research Institute, DAPO Box 7777, Metro Manila, PhilippinesbResearch Station for Agricultural Environment Preservation, Jalan Raya Jakenan-Jaken, P.O. Box 5, Jakenan,
Pati 59182, Central Java, Indonesia
Received 10 October 2003; received in revised form 16 April 2004; accepted 29 April 2004
Abstract
The low and unstable yields of rainfed lowland rice in Central Java can be attributed to drought, nutrient stress, pest infestation
or a combination of these factors. Field experiments were conducted in six crop seasons from 1997 to 2000 at Jakenan
Experiment Station to quantify the yield loss due to these factors. Experimental treatments—two water supply levels (well-
watered, rainfed) in the main plots and five fertilizer levels (0-22-90, 120-0-90, 120-22-0, 120-22-90, 144-27-108 kg NPK ha�1)
in the subplots—were laid out in a split-plot design with four replications. Crop, soil, and water parameters were recorded and
pest infestations were assessed.
In all seasons, rice yield was significantly influenced by fertilizer treatments. Average yield reduction due to N omission was
42%, to K omission 33–36%, and to P omission 3–4%. Water by nutrient interactions did not affect rice yield and biomass
production. In two of the three dry seasons, an average of 20% of the panicles were damaged by pests and estimated yield loss
from pests was 56–59% in well-watered and well-fertilized treatments. In one out of six seasons, yields under rainfed conditions
were 20–23% lower than under well-watered conditions. Drought, N and K deficiencies, and pest infestation are the major
determinants for high yields in rainfed environments in Jakenan. Supplying adequate nutrient and good pest control are at least
as important as drought management for increasing crop productivity of rainfed rice-growing areas in Central Java. The relative
importance of drought, nutrient and pest management may vary in other rainfed areas. Yield constraints analysis should be
systematically carried out to identify appropriate management strategies.
# 2004 Elsevier B.V. All rights reserved.
Keywords: Drought; Groundwater; Perched water; Rice pests; Nutrient stress; Water by nutrient interaction; Yield loss
1. Introduction
Rainfed lowland rice is grown on 46 M out of
132 M ha of world rice area (Maclean et al., 2002).
In Central Java, rainfed lowland rice covers about 30%
of the 1 M ha rice area (Amien and Las, 2000). In this
area, the typical rainfed cropping system includes a
dry-seeded rice crop (gogorancah) grown from
November to February (wet season), followed by
transplanted rice (walik jerami) with minimum tillage
from March to June (dry season). Earlier studies have
shown that the average rice yield of the wet-season
crop is 3.5–6.5 mg ha�1, while that of the dry-season
crop is 1.2–3.0 mg ha�1 (Mamaril et al., 1994;
Wihardjaka et al., 1999). To identify management
interventions for increasing productivity in this area,
the determinants of crop growth and rice yield need to
be identified and the magnitude of yield loss assessed.
Field Crops Research 90 (2004) 351–360
* Corresponding author. Tel.: þ63 2 580 5600;
fax: þ63 2 580 5699.
E-mail address: [email protected] (A. Boling).
0378-4290/$ – see front matter # 2004 Elsevier B.V. All rights reserved.
doi:10.1016/j.fcr.2004.04.005
The low and unstable rainfed rice yields can be
attributed to drought, nutrient stress, pest infestations,
or a combination of these factors. Field experiments
have shown that yield reduction due to drought ranges
from 8% in Indonesia (Setyanto et al., 2000) to 50% in
Thailand (Fukai et al., 1998). Simulation studies have
indicated an average of 30% yield loss due to drought
in rainfed lowland rice in Thailand (Jongdee et al.,
1997).
Many rainfed lowland rice areas have low soil
fertility (Fukai et al., 1999; Wade et al., 1998). Field
experiments have shown that most soils in Thailand
are characterized by limited supplies of N and P (Fukai
et al., 1999), while soils in Indonesia are low in
available K (Mamaril et al., 1995; Wihardjaka et al.,
1999). Extensive research in various countries has
demonstrated the importance of an adequate N-supply
to increase grain yields in rainfed lowland areas (Wade
et al., 1999). For Indonesia, the magnitude of yield
increase by applying N, P, and K is yet to be deter-
mined.
In India, average yield loss from rice pests was 28%
(Savary et al., 1997). Pest infestation, nutrient stress,
drought, and their interactions can occur simulta-
neously in rainfed systems (Khunthasuvon et al.,
1998; Wade et al., 1999). There is a need to study
the simultaneous yield-reducing effects of nutrient and
water deficiencies and the incidence of rice pests in
rainfed lowland areas.
In this study, field experiments were conducted in
six crop seasons from December 1997 to May 2000 in
Central Java to determine the yield losses of rainfed
rice caused by interactive effects of drought and
nutrient stress, also taking into account the incidence
of rice pests.
2. Materials and methods
2.1. Site description
The field experiments were conducted at Jakenan
Experiment Station (68450S, 1118100E, 7 m above sea
level), representative for about 150,000 ha of rainfed
lowland areas in Central Java (Mamaril et al., 1995).
The landscape is undulating and the soil is Tropaqualf.
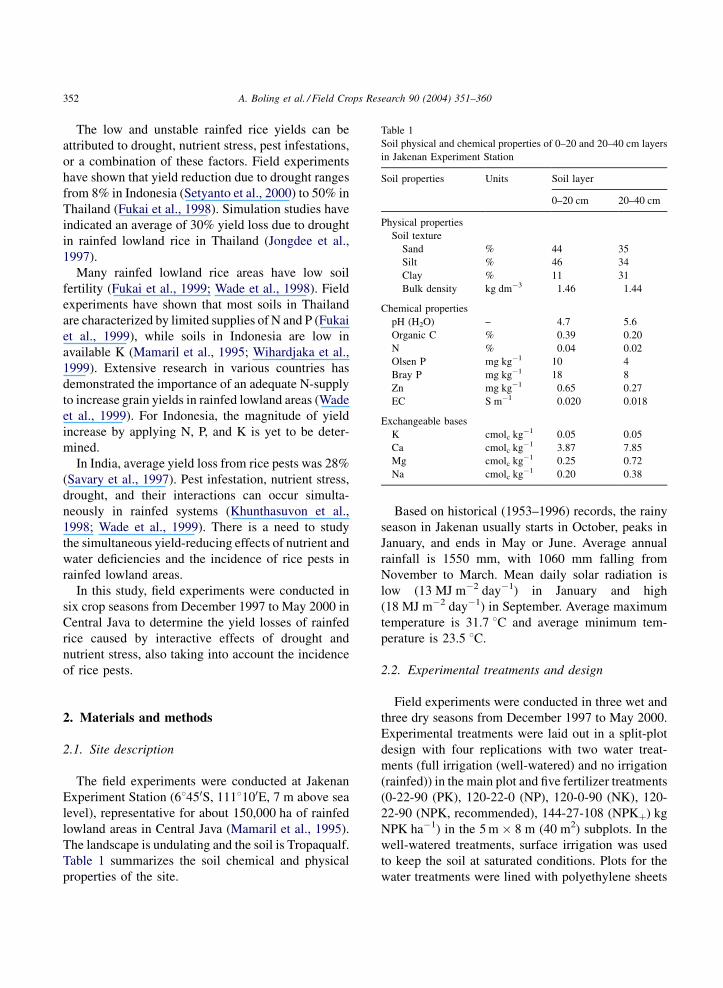
Table 1 summarizes the soil chemical and physical
properties of the site.
Based on historical (1953–1996) records, the rainy
season in Jakenan usually starts in October, peaks in
January, and ends in May or June. Average annual
rainfall is 1550 mm, with 1060 mm falling from
November to March. Mean daily solar radiation is
low (13 MJ m�2 day�1) in January and high
(18 MJ m�2 day�1) in September. Average maximum
temperature is 31.7 8C and average minimum tem-
perature is 23.5 8C.
2.2. Experimental treatments and design
Field experiments were conducted in three wet and
three dry seasons from December 1997 to May 2000.
Experimental treatments were laid out in a split-plot
design with four replications with two water treat-
ments (full irrigation (well-watered) and no irrigation
(rainfed)) in the main plot and five fertilizer treatments
(0-22-90 (PK), 120-22-0 (NP), 120-0-90 (NK), 120-
22-90 (NPK, recommended), 144-27-108 (NPKþ) kg
NPK ha�1) in the 5 m � 8 m (40 m2) subplots. In the
well-watered treatments, surface irrigation was used
to keep the soil at saturated conditions. Plots for the
water treatments were lined with polyethylene sheets
Table 1
Soil physical and chemical properties of 0–20 and 20–40 cm layers
in Jakenan Experiment Station
Soil properties Units Soil layer
0–20 cm 20–40 cm
Physical properties
Soil texture
Sand % 44 35
Silt % 46 34
Clay % 11 31
Bulk density kg dm�3 1.46 1.44
Chemical properties
pH (H2O) – 4.7 5.6
Organic C % 0.39 0.20
N % 0.04 0.02
Olsen P mg kg�1 10 4
Bray P mg kg�1 18 8
Zn mg kg�1 0.65 0.27
EC S m�1 0.020 0.018
Exchangeable bases
K cmolc kg�1 0.05 0.05
Ca cmolc kg�1 3.87 7.85
Mg cmolc kg�1 0.25 0.72
Na cmolc kg�1 0.20 0.38
352 A. Boling et al. / Field Crops Research 90 (2004) 351–360
up to 80 cm depth to minimize subsurface lateral
water flow.
The recommended fertilizer (NPK) and well-
watered treatments served as a control. The difference
in yields of the well-watered treatment and the rainfed
treatment was used to estimate production loss caused
by possible water deficits. Similarly, the yield differ-
ence between the NPK fertilizer treatment and the
nutrient omission treatments (PK, NP, NK) was used
to determine the production loss caused by elemental
N, K, and P deficiency, respectively. A high fertilizer
dose (NPKþ) was used to assess the effects of the
common farmers’ practice of fertilizer inputs exceed-
ing the recommendations.
2.3. Cultural practices
For all crop seasons, rice cultivar IR64 was planted.
For the wet seasons, land preparation started at the onset
of the rainy season. All plots were hoed twice manually
to 30 cm depth, followed by dry land plowing and
harrowing. Five dry rice seeds were dibbled in holes
at 15 cm � 15 cm spacing. After complete emergence,
the plants were thinned down to three plants per hill. For
the dry seasons, hoeing took place right after the harvest
of the wet-season crop. Plots were left fallow under
submerged or wet conditions for a week, then harrowed
by animal to level the nonpuddled fields and to incor-
porate basal fertilizer. Three 15- to 21-day-old seedlings
were transplanted per hill at 15 cm � 15 cm spacing.
Table 2 summarizes the planting (seeding or transplant-
ing) and harvest dates for the six crop seasons.
Micronutrients that included 5 kg Zn ha�1 and
20 kg S ha�1 were applied in all plots. Fertilizers were
applied in three splits: (1) basal—1/4 N, all P, 1/2 K,
all S, and all Zn; (2) at maximum tillering—1/2 N and
1/2 K; (3) at panicle initiation (PI)—1/4 N. For dry-
season crops, basal fertilizer was applied before trans-
planting. For wet-season crops, basal N was top-
dressed at 14 days after emergence (DAE) of the
dry seeded crop. The date of fertilizer application in
rainfed plots varied within �7 days around the pre-
determined dates depending on the occurrence of
rainfall to saturate the fields. The farmers’ practices
of hand weeding and pesticide spraying were used to
minimize pest damage.
2.4. Plant sampling and nutrient uptake
Dates of emergence, PI, flowering, and physiologi-
cal maturity were recorded. At physiological maturity,
22 hills (0.50 m2) were sampled from each subplot for
leaf blade, culm and leaf sheath, and panicle dry
weights, nutrient (N, P, K) concentrations, and yield
components (panicle density, spikelet number per
panicle, % of filled spikelets, 1000-grain weight).
Rice yield was determined from 6 m2 sampling area.
Plant N was determined using Kjeldahl digestion
(Varley, 1966). The digest was analyzed for nitrogen
as indo-phenol blue in the Technicon AutoAnalyzer II
(Technicon Instruments Corporation, 1977). P was
determined colorimetrically as reduced phosphomo-
lybdate at 625 m (Chapman and Pratt, 1961; Jackson,
1958; Jones and Case, 1990) using the Technicon
AutoAnalyzer II. K was determined by soaking with
1N HCl and subsequent analysis of the filtrate
(Yoshida et al., 1976) using Atomic Absorption Spec-
trophotometry.
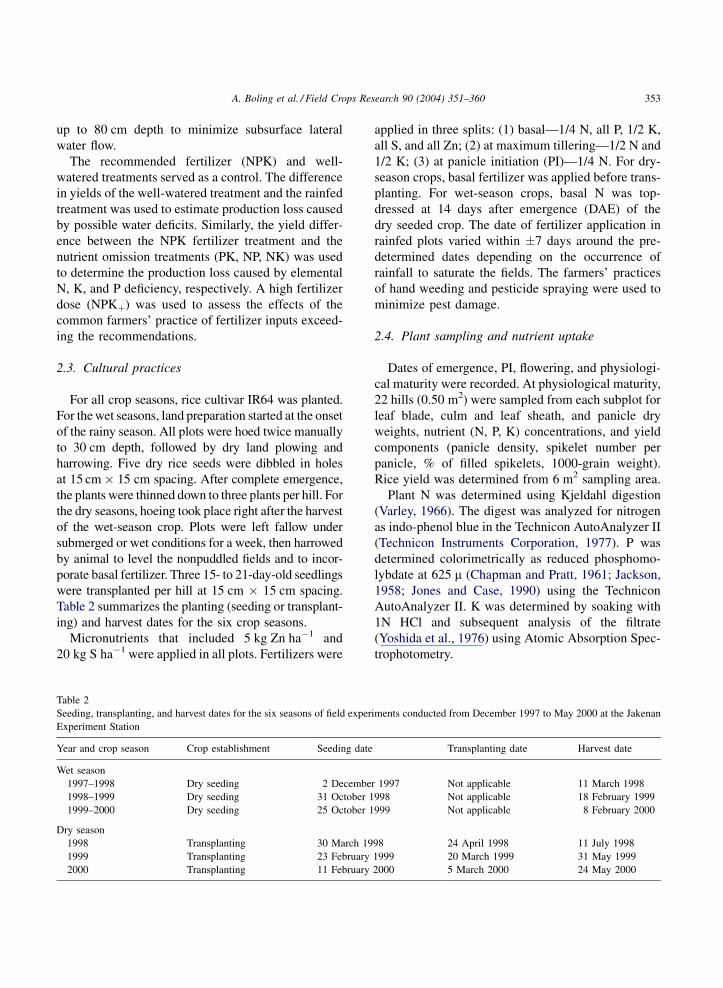
Table 2
Seeding, transplanting, and harvest dates for the six seasons of field experiments conducted from December 1997 to May 2000 at the Jakenan
Experiment Station
Year and crop season Crop establishment Seeding date Transplanting date Harvest date
Wet season
1997–1998 Dry seeding 2 December 1997 Not applicable 11 March 1998
1998–1999 Dry seeding 31 October 1998 Not applicable 18 February 1999
1999–2000 Dry seeding 25 October 1999 Not applicable 8 February 2000
Dry season
1998 Transplanting 30 March 1998 24 April 1998 11 July 1998
1999 Transplanting 23 February 1999 20 March 1999 31 May 1999
2000 Transplanting 11 February 2000 5 March 2000 24 May 2000
A. Boling et al. / Field Crops Research 90 (2004) 351–360 353
2.5. Water and weather records
Field water depth was measured daily in 40 cm-
long, 5 cm-diameter PVC tubes installed in each
subplot to 25 cm below the soil surface. The bottom
22 cm of the tubes was perforated with 3 mm-dia-
meter holes at 2 cm intervals. Groundwater table depth
was measured daily in each main plot of rainfed
treatments, using 5 cm-diameter, 150 cm-long PVC
tubes, similarly perforated in the bottom 75 cm length,
installed to a depth of 100 cm below the soil surface.
In the absence of standing water in the rainfed plots,
soil water potentials were measured daily from tensi-
ometers installed at 5-, 10-, and 20 cm depth.
Daily rainfall, solar radiation, maximum and mini-
mum temperature, relative humidity, and wind speed
were measured at the Jakenan weather station.
2.6. Pest monitoring
In the 1997–1998 wet season, any panicle damage
caused by pests was not recorded. From the 1998 dry
season onward, the proportion of panicle damage was
recorded at physiological maturity, following visible
pest incidence.
Insect species were identified using a combination
of sweepnet and random sampling of plant hills from
crop establishment to harvest. For adult insects, 10
sweeps of the sweepnet in a 40 m2 area were taken
thrice a week from 8:00 to 11:00 a.m. Similarly, 10
hills in a 40 m2 area were randomly sampled thrice a
week to identify immature insects.
Plant height and color and lesions in the leaf blade
and sheath were monitored in 10-hill samples for
disease symptoms. The organisms were identified
using the standard procedure for identifying rice pests
(International Rice Research Institute, 1983).
2.7. Data analysis
Rice biomass, yield, and yield components were
analyzed with standard split-plot analysis of variance
techniques. When the analysis of variance showed
significant differences among treatments, Duncan’s
multiple range test (DMRT) was used for pair-wise
comparison.
In pest-free conditions, grain yields for well-
watered NPK treatments were considered ‘‘poten-
tial’’. Under potential production situations, water
and nutrients are non-limiting so rice growth and
yield are determined by weather conditions and crop
genetic characteristics only. In seasons that are
affected by pests, the crop growth and yield of rice
cultivar IR64 in well-watered NPK treatments were
simulated using an ecophysiological model,
ORYZA2000 (Bouman et al., 2001). This model
was extensively evaluated for potential production
situations in Jakenan (Boling et al., 2004) and in
other areas (Kropff et al., 1994; Matthews et al.,
1995). Yield losses due to drought, nutrient stress,
and pests were estimated using the difference
between potential and actual yields.
Exceedance probability of rainfall was estimated
using the rank-order method (Doorenbos and Pruitt,
1977). In this method, rainfall was assumed to follow
normal distribution. Cumulative rainfall amount for
two crop periods (November–February and March–
June) were calculated from 1953 to 1996. For each
period, the cumulative rainfall records were arranged
in decreasing order. Each record was assigned a
ranking number (m) and a corresponding probability
level (P(m)):
PðmÞ ¼ 100m
n þ 1
where n is the number of records.
3. Results and discussion
3.1. Rice pests and their effects on rice yield
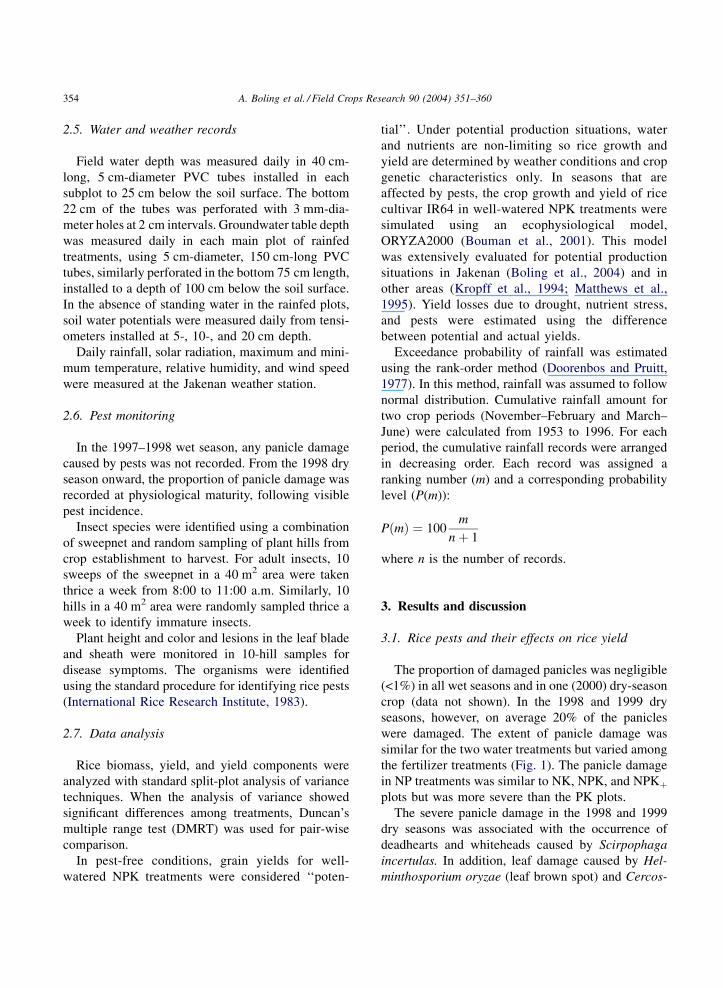
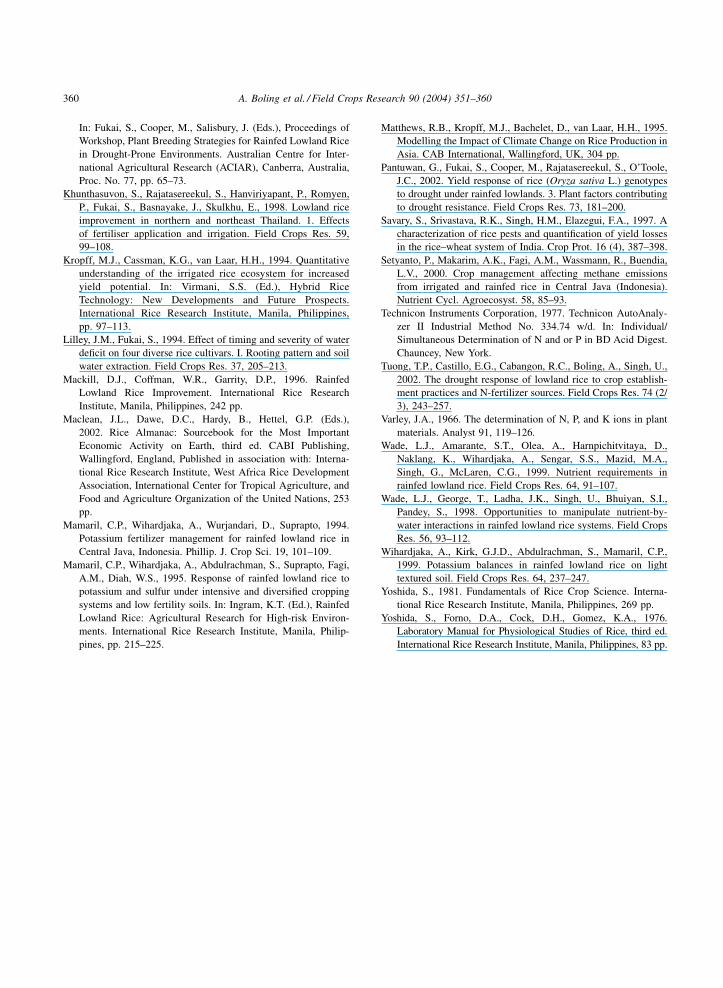
The proportion of damaged panicles was negligible
(<1%) in all wet seasons and in one (2000) dry-season
crop (data not shown). In the 1998 and 1999 dry
seasons, however, on average 20% of the panicles
were damaged. The extent of panicle damage was
similar for the two water treatments but varied among
the fertilizer treatments (Fig. 1). The panicle damage
in NP treatments was similar to NK, NPK, and NPKþplots but was more severe than the PK plots.
The severe panicle damage in the 1998 and 1999
dry seasons was associated with the occurrence of
deadhearts and whiteheads caused by Scirpophaga
incertulas. In addition, leaf damage caused by Hel-
minthosporium oryzae (leaf brown spot) and Cercos-
354 A. Boling et al. / Field Crops Research 90 (2004) 351–360
pora oryzae Miyake (narrow brown leaf spot) also
occurred.
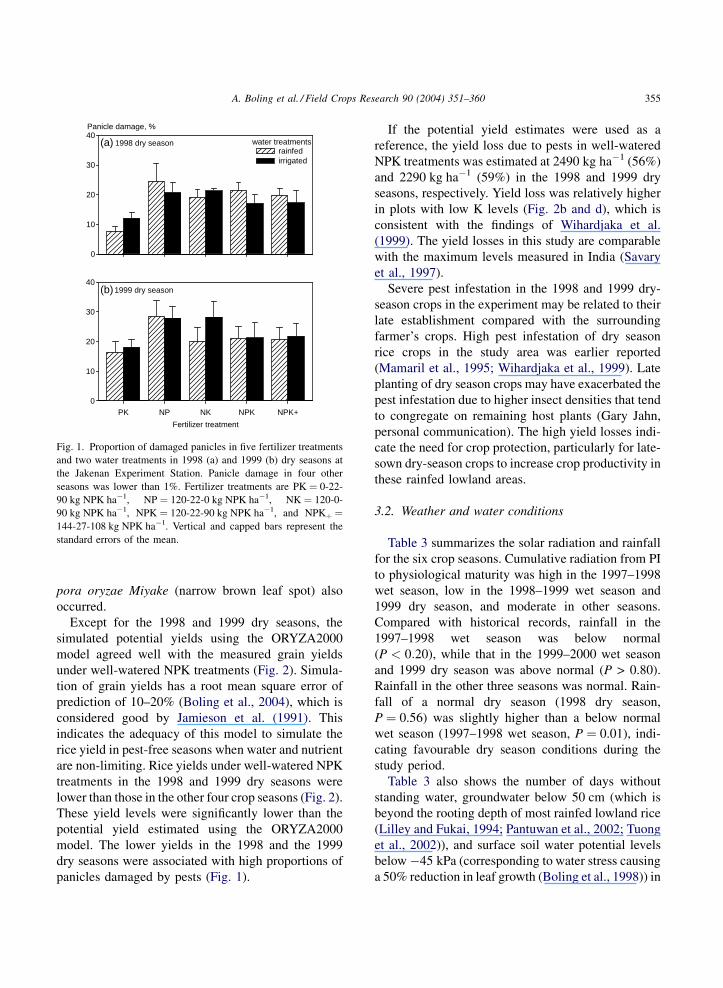
Except for the 1998 and 1999 dry seasons, the
simulated potential yields using the ORYZA2000
model agreed well with the measured grain yields
under well-watered NPK treatments (Fig. 2). Simula-
tion of grain yields has a root mean square error of
prediction of 10–20% (Boling et al., 2004), which is
considered good by Jamieson et al. (1991). This
indicates the adequacy of this model to simulate the
rice yield in pest-free seasons when water and nutrient
are non-limiting. Rice yields under well-watered NPK
treatments in the 1998 and 1999 dry seasons were
lower than those in the other four crop seasons (Fig. 2).
These yield levels were significantly lower than the
potential yield estimated using the ORYZA2000
model. The lower yields in the 1998 and the 1999
dry seasons were associated with high proportions of
panicles damaged by pests (Fig. 1).
If the potential yield estimates were used as a
reference, the yield loss due to pests in well-watered
NPK treatments was estimated at 2490 kg ha�1 (56%)
and 2290 kg ha�1 (59%) in the 1998 and 1999 dry
seasons, respectively. Yield loss was relatively higher
in plots with low K levels (Fig. 2b and d), which is
consistent with the findings of Wihardjaka et al.
(1999). The yield losses in this study are comparable
with the maximum levels measured in India (Savary
et al., 1997).
Severe pest infestation in the 1998 and 1999 dry-
season crops in the experiment may be related to their
late establishment compared with the surrounding
farmer’s crops. High pest infestation of dry season
rice crops in the study area was earlier reported
(Mamaril et al., 1995; Wihardjaka et al., 1999). Late
planting of dry season crops may have exacerbated the
pest infestation due to higher insect densities that tend
to congregate on remaining host plants (Gary Jahn,
personal communication). The high yield losses indi-
cate the need for crop protection, particularly for late-
sown dry-season crops to increase crop productivity in
these rainfed lowland areas.
3.2. Weather and water conditions
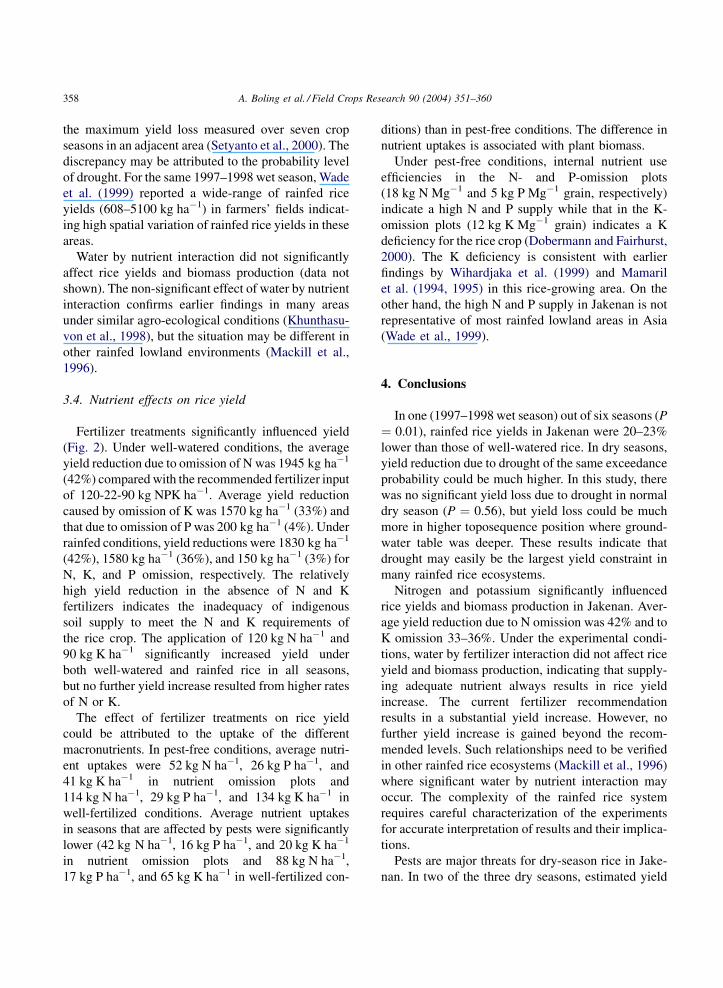
Table 3 summarizes the solar radiation and rainfall
for the six crop seasons. Cumulative radiation from PI
to physiological maturity was high in the 1997–1998
wet season, low in the 1998–1999 wet season and
1999 dry season, and moderate in other seasons.
Compared with historical records, rainfall in the
1997–1998 wet season was below normal
(P < 0:20), while that in the 1999–2000 wet season
and 1999 dry season was above normal (P > 0.80).
Rainfall in the other three seasons was normal. Rain-
fall of a normal dry season (1998 dry season,
P ¼ 0.56) was slightly higher than a below normal
wet season (1997–1998 wet season, P ¼ 0.01), indi-
cating favourable dry season conditions during the
study period.
Table 3 also shows the number of days without
standing water, groundwater below 50 cm (which is
beyond the rooting depth of most rainfed lowland rice
(Lilley and Fukai, 1994; Pantuwan et al., 2002; Tuong
et al., 2002)), and surface soil water potential levels
below �45 kPa (corresponding to water stress causing
a 50% reduction in leaf growth (Boling et al., 1998)) in
1998 dry season
Panicle damage, %
0
10
20
30
40
1999 dry season
Fertilizer treatment
PK NP NK NPK NPK+0
10
20
30
40
rainfedirrigated
water treatments(a)
(b)
Fig. 1. Proportion of damaged panicles in five fertilizer treatments
and two water treatments in 1998 (a) and 1999 (b) dry seasons at
the Jakenan Experiment Station. Panicle damage in four other
seasons was lower than 1%. Fertilizer treatments are PK ¼ 0-22-
90 kg NPK ha�1, NP ¼ 120-22-0 kg NPK ha�1, NK ¼ 120-0-
90 kg NPK ha�1, NPK ¼ 120-22-90 kg NPK ha�1, and NPKþ ¼144-27-108 kg NPK ha�1. Vertical and capped bars represent the
standard errors of the mean.
A. Boling et al. / Field Crops Research 90 (2004) 351–360 355
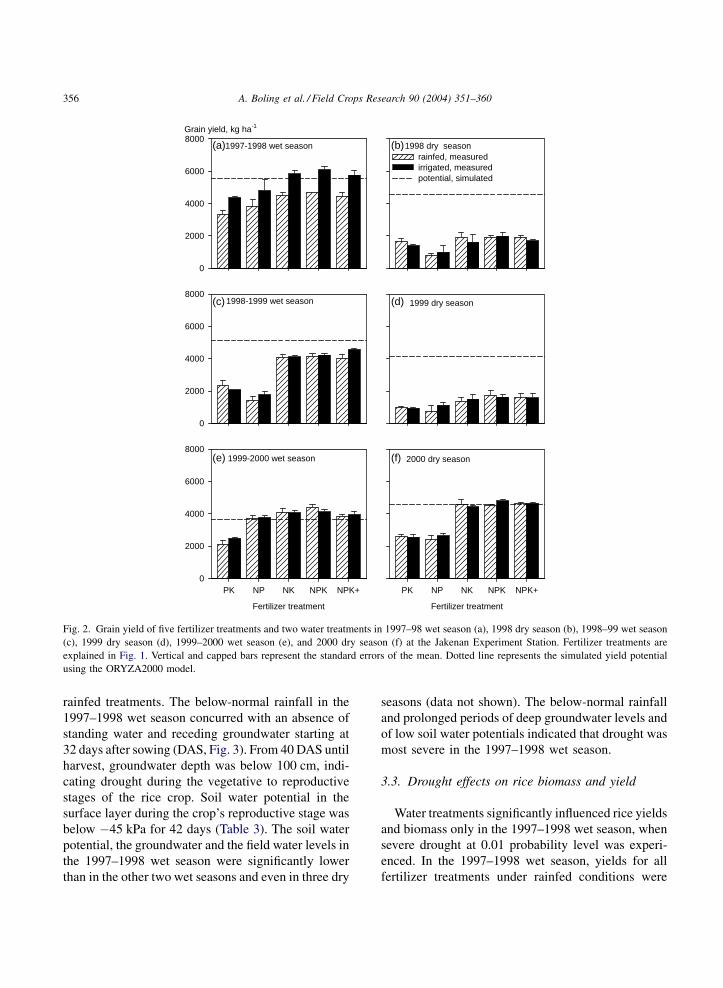
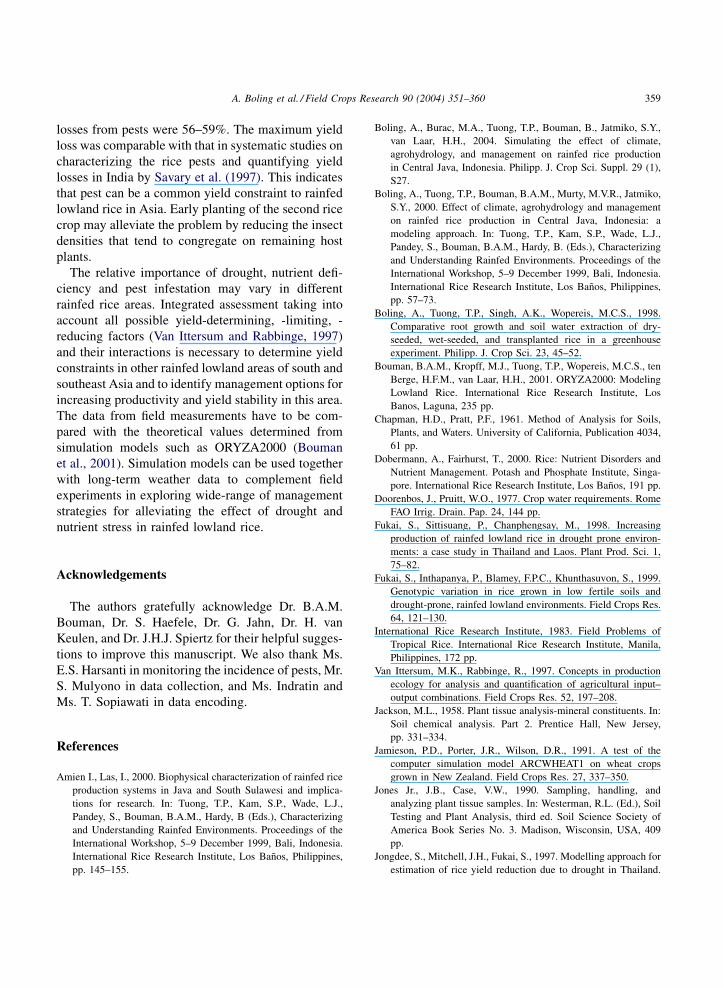
rainfed treatments. The below-normal rainfall in the
1997–1998 wet season concurred with an absence of
standing water and receding groundwater starting at
32 days after sowing (DAS, Fig. 3). From 40 DAS until
harvest, groundwater depth was below 100 cm, indi-
cating drought during the vegetative to reproductive
stages of the rice crop. Soil water potential in the
surface layer during the crop’s reproductive stage was
below �45 kPa for 42 days (Table 3). The soil water
potential, the groundwater and the field water levels in
the 1997–1998 wet season were significantly lower
than in the other two wet seasons and even in three dry
seasons (data not shown). The below-normal rainfall
and prolonged periods of deep groundwater levels and
of low soil water potentials indicated that drought was
most severe in the 1997–1998 wet season.
3.3. Drought effects on rice biomass and yield
Water treatments significantly influenced rice yields
and biomass only in the 1997–1998 wet season, when
severe drought at 0.01 probability level was experi-
enced. In the 1997–1998 wet season, yields for all
fertilizer treatments under rainfed conditions were
(a) (b) 1997-1998 wet season
Grain yield, kg ha-1
0
2000
4000
6000
8000
rainfed, measuredirrigated, measuredpotential, simulated
0
2000
4000
6000
8000 1999 dry season
1999-2000 wet season
Fertilizer treatment
PK NP NK NPK NPK+0
2000
4000
6000
8000 2000 dry season
Fertilizer treatment
PK NP NK NPK NPK+
1998 dry season
1998-1999 wet season(c) (d)
(e) (f)
Fig. 2. Grain yield of five fertilizer treatments and two water treatments in 1997–98 wet season (a), 1998 dry season (b), 1998–99 wet season
(c), 1999 dry season (d), 1999–2000 wet season (e), and 2000 dry season (f) at the Jakenan Experiment Station. Fertilizer treatments are
explained in Fig. 1. Vertical and capped bars represent the standard errors of the mean. Dotted line represents the simulated yield potential
using the ORYZA2000 model.
356 A. Boling et al. / Field Crops Research 90 (2004) 351–360
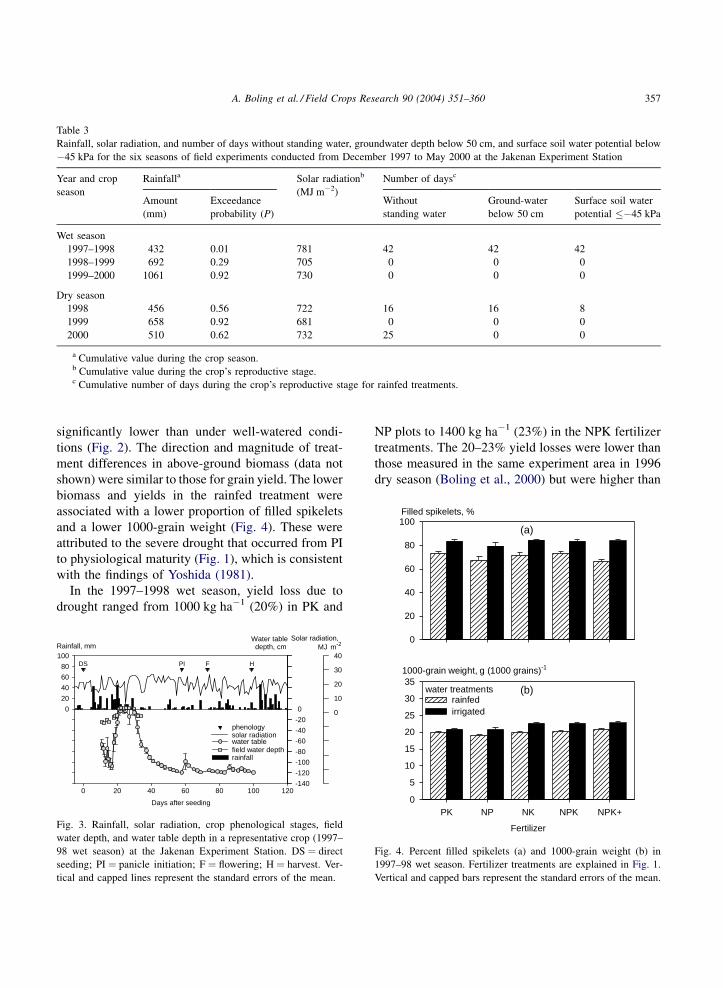
significantly lower than under well-watered condi-
tions (Fig. 2). The direction and magnitude of treat-
ment differences in above-ground biomass (data not
shown) were similar to those for grain yield. The lower
biomass and yields in the rainfed treatment were
associated with a lower proportion of filled spikelets
and a lower 1000-grain weight (Fig. 4). These were
attributed to the severe drought that occurred from PI
to physiological maturity (Fig. 1), which is consistent
with the findings of Yoshida (1981).
In the 1997–1998 wet season, yield loss due to
drought ranged from 1000 kg ha�1 (20%) in PK and
NP plots to 1400 kg ha�1 (23%) in the NPK fertilizer
treatments. The 20–23% yield losses were lower than
those measured in the same experiment area in 1996
dry season (Boling et al., 2000) but were higher than
Table 3
Rainfall, solar radiation, and number of days without standing water, groundwater depth below 50 cm, and surface soil water potential below
�45 kPa for the six seasons of field experiments conducted from December 1997 to May 2000 at the Jakenan Experiment Station
Year and crop
season
Rainfalla Solar radiationb
(MJ m�2)
Number of daysc
Amount
(mm)
Exceedance
probability (P)
Without
standing water
Ground-water
below 50 cm
Surface soil water
potential �45 kPa
Wet season
1997–1998 432 0.01 781 42 42 42
1998–1999 692 0.29 705 0 0 0
1999–2000 1061 0.92 730 0 0 0
Dry season
1998 456 0.56 722 16 16 8
1999 658 0.92 681 0 0 0
2000 510 0.62 732 25 0 0
a Cumulative value during the crop season.b Cumulative value during the crop’s reproductive stage.c Cumulative number of days during the crop’s reproductive stage for rainfed treatments.
Days after seeding
0 20 40 60 80 100 120
Rainfall, mm
0
20
40
60
80
100
Solar radiation,MJ m-2
0
10
20
30
40
Water table depth, cm
-140
-120
-100
-80
-60
-40
-20
0
DS PI F H
rainfall
solar radiationwater tablefield water depth
phenology
Fig. 3. Rainfall, solar radiation, crop phenological stages, field
water depth, and water table depth in a representative crop (1997–
98 wet season) at the Jakenan Experiment Station. DS ¼ direct
seeding; PI ¼ panicle initiation; F ¼ flowering; H ¼ harvest. Ver-
tical and capped lines represent the standard errors of the mean.
Fertilizer
PK NP NK NPK NPK+
1000-grain weight, g (1000 grains)-1
0
5
10
15
20
25
30
35
Filled spikelets, %
0
20
40
60
80
100
rainfedirrigated
water treatments
(a)
(b)
Fig. 4. Percent filled spikelets (a) and 1000-grain weight (b) in
1997–98 wet season. Fertilizer treatments are explained in Fig. 1.
Vertical and capped bars represent the standard errors of the mean.
A. Boling et al. / Field Crops Research 90 (2004) 351–360 357
the maximum yield loss measured over seven crop
seasons in an adjacent area (Setyanto et al., 2000). The
discrepancy may be attributed to the probability level
of drought. For the same 1997–1998 wet season, Wade
et al. (1999) reported a wide-range of rainfed rice
yields (608–5100 kg ha�1) in farmers’ fields indicat-
ing high spatial variation of rainfed rice yields in these
areas.
Water by nutrient interaction did not significantly
affect rice yields and biomass production (data not
shown). The non-significant effect of water by nutrient
interaction confirms earlier findings in many areas
under similar agro-ecological conditions (Khunthasu-
von et al., 1998), but the situation may be different in
other rainfed lowland environments (Mackill et al.,
1996).
3.4. Nutrient effects on rice yield
Fertilizer treatments significantly influenced yield
(Fig. 2). Under well-watered conditions, the average
yield reduction due to omission of N was 1945 kg ha�1
(42%) compared with the recommended fertilizer input
of 120-22-90 kg NPK ha�1. Average yield reduction
caused by omission of K was 1570 kg ha�1 (33%) and
that due to omission of P was 200 kg ha�1 (4%). Under
rainfed conditions, yield reductions were 1830 kg ha�1
(42%), 1580 kg ha�1 (36%), and 150 kg ha�1 (3%) for
N, K, and P omission, respectively. The relatively
high yield reduction in the absence of N and K
fertilizers indicates the inadequacy of indigenous
soil supply to meet the N and K requirements of
the rice crop. The application of 120 kg N ha�1 and
90 kg K ha�1 significantly increased yield under
both well-watered and rainfed rice in all seasons,
but no further yield increase resulted from higher rates
of N or K.
The effect of fertilizer treatments on rice yield
could be attributed to the uptake of the different
macronutrients. In pest-free conditions, average nutri-
ent uptakes were 52 kg N ha�1, 26 kg P ha�1, and
41 kg K ha�1 in nutrient omission plots and
114 kg N ha�1, 29 kg P ha�1, and 134 kg K ha�1 in
well-fertilized conditions. Average nutrient uptakes
in seasons that are affected by pests were significantly
lower (42 kg N ha�1, 16 kg P ha�1, and 20 kg K ha�1
in nutrient omission plots and 88 kg N ha�1,
17 kg P ha�1, and 65 kg K ha�1 in well-fertilized con-
ditions) than in pest-free conditions. The difference in
nutrient uptakes is associated with plant biomass.
Under pest-free conditions, internal nutrient use
efficiencies in the N- and P-omission plots
(18 kg N Mg�1 and 5 kg P Mg�1 grain, respectively)
indicate a high N and P supply while that in the K-
omission plots (12 kg K Mg�1 grain) indicates a K
deficiency for the rice crop (Dobermann and Fairhurst,
2000). The K deficiency is consistent with earlier
findings by Wihardjaka et al. (1999) and Mamaril
et al. (1994, 1995) in this rice-growing area. On the
other hand, the high N and P supply in Jakenan is not
representative of most rainfed lowland areas in Asia
(Wade et al., 1999).
4. Conclusions
In one (1997–1998 wet season) out of six seasons (P
¼ 0.01), rainfed rice yields in Jakenan were 20–23%
lower than those of well-watered rice. In dry seasons,
yield reduction due to drought of the same exceedance
probability could be much higher. In this study, there
was no significant yield loss due to drought in normal
dry season (P ¼ 0.56), but yield loss could be much
more in higher toposequence position where ground-
water table was deeper. These results indicate that
drought may easily be the largest yield constraint in
many rainfed rice ecosystems.
Nitrogen and potassium significantly influenced
rice yields and biomass production in Jakenan. Aver-
age yield reduction due to N omission was 42% and to
K omission 33–36%. Under the experimental condi-
tions, water by fertilizer interaction did not affect rice
yield and biomass production, indicating that supply-
ing adequate nutrient always results in rice yield
increase. The current fertilizer recommendation
results in a substantial yield increase. However, no
further yield increase is gained beyond the recom-
mended levels. Such relationships need to be verified
in other rainfed rice ecosystems (Mackill et al., 1996)
where significant water by nutrient interaction may
occur. The complexity of the rainfed rice system
requires careful characterization of the experiments
for accurate interpretation of results and their implica-
tions.
Pests are major threats for dry-season rice in Jake-
nan. In two of the three dry seasons, estimated yield
358 A. Boling et al. / Field Crops Research 90 (2004) 351–360
losses from pests were 56–59%. The maximum yield
loss was comparable with that in systematic studies on
characterizing the rice pests and quantifying yield
losses in India by Savary et al. (1997). This indicates
that pest can be a common yield constraint to rainfed
lowland rice in Asia. Early planting of the second rice
crop may alleviate the problem by reducing the insect
densities that tend to congregate on remaining host
plants.
The relative importance of drought, nutrient defi-
ciency and pest infestation may vary in different
rainfed rice areas. Integrated assessment taking into
account all possible yield-determining, -limiting, -
reducing factors (Van Ittersum and Rabbinge, 1997)
and their interactions is necessary to determine yield
constraints in other rainfed lowland areas of south and
southeast Asia and to identify management options for
increasing productivity and yield stability in this area.
The data from field measurements have to be com-
pared with the theoretical values determined from
simulation models such as ORYZA2000 (Bouman
et al., 2001). Simulation models can be used together
with long-term weather data to complement field
experiments in exploring wide-range of management
strategies for alleviating the effect of drought and
nutrient stress in rainfed lowland rice.
Acknowledgements
The authors gratefully acknowledge Dr. B.A.M.
Bouman, Dr. S. Haefele, Dr. G. Jahn, Dr. H. van
Keulen, and Dr. J.H.J. Spiertz for their helpful sugges-
tions to improve this manuscript. We also thank Ms.
E.S. Harsanti in monitoring the incidence of pests, Mr.
S. Mulyono in data collection, and Ms. Indratin and
Ms. T. Sopiawati in data encoding.
References
Amien I., Las, I., 2000. Biophysical characterization of rainfed rice
production systems in Java and South Sulawesi and implica-
tions for research. In: Tuong, T.P., Kam, S.P., Wade, L.J.,
Pandey, S., Bouman, B.A.M., Hardy, B (Eds.), Characterizing
and Understanding Rainfed Environments. Proceedings of the
International Workshop, 5–9 December 1999, Bali, Indonesia.
International Rice Research Institute, Los Banos, Philippines,
pp. 145–155.
Boling, A., Burac, M.A., Tuong, T.P., Bouman, B., Jatmiko, S.Y.,
van Laar, H.H., 2004. Simulating the effect of climate,
agrohydrology, and management on rainfed rice production
in Central Java, Indonesia. Philipp. J. Crop Sci. Suppl. 29 (1),
S27.
Boling, A., Tuong, T.P., Bouman, B.A.M., Murty, M.V.R., Jatmiko,
S.Y., 2000. Effect of climate, agrohydrology and management
on rainfed rice production in Central Java, Indonesia: a
modeling approach. In: Tuong, T.P., Kam, S.P., Wade, L.J.,
Pandey, S., Bouman, B.A.M., Hardy, B. (Eds.), Characterizing
and Understanding Rainfed Environments. Proceedings of the
International Workshop, 5–9 December 1999, Bali, Indonesia.
International Rice Research Institute, Los Banos, Philippines,
pp. 57–73.
Boling, A., Tuong, T.P., Singh, A.K., Wopereis, M.C.S., 1998.
Comparative root growth and soil water extraction of dry-
seeded, wet-seeded, and transplanted rice in a greenhouse
experiment. Philipp. J. Crop Sci. 23, 45–52.
Bouman, B.A.M., Kropff, M.J., Tuong, T.P., Wopereis, M.C.S., ten
Berge, H.F.M., van Laar, H.H., 2001. ORYZA2000: Modeling
Lowland Rice. International Rice Research Institute, Los
Banos, Laguna, 235 pp.
Chapman, H.D., Pratt, P.F., 1961. Method of Analysis for Soils,
Plants, and Waters. University of California, Publication 4034,
61 pp.
Dobermann, A., Fairhurst, T., 2000. Rice: Nutrient Disorders and
Nutrient Management. Potash and Phosphate Institute, Singa-
pore. International Rice Research Institute, Los Banos, 191 pp.
Doorenbos, J., Pruitt, W.O., 1977. Crop water requirements. Rome
FAO Irrig. Drain. Pap. 24, 144 pp.
Fukai, S., Sittisuang, P., Chanphengsay, M., 1998. Increasing
production of rainfed lowland rice in drought prone environ-
ments: a case study in Thailand and Laos. Plant Prod. Sci. 1,
75–82.
Fukai, S., Inthapanya, P., Blamey, F.P.C., Khunthasuvon, S., 1999.
Genotypic variation in rice grown in low fertile soils and
drought-prone, rainfed lowland environments. Field Crops Res.
64, 121–130.
International Rice Research Institute, 1983. Field Problems of
Tropical Rice. International Rice Research Institute, Manila,
Philippines, 172 pp.
Van Ittersum, M.K., Rabbinge, R., 1997. Concepts in production
ecology for analysis and quantification of agricultural input–
output combinations. Field Crops Res. 52, 197–208.
Jackson, M.L., 1958. Plant tissue analysis-mineral constituents. In:
Soil chemical analysis. Part 2. Prentice Hall, New Jersey,
pp. 331–334.
Jamieson, P.D., Porter, J.R., Wilson, D.R., 1991. A test of the
computer simulation model ARCWHEAT1 on wheat crops
grown in New Zealand. Field Crops Res. 27, 337–350.
Jones Jr., J.B., Case, V.W., 1990. Sampling, handling, and
analyzing plant tissue samples. In: Westerman, R.L. (Ed.), Soil
Testing and Plant Analysis, third ed. Soil Science Society of
America Book Series No. 3. Madison, Wisconsin, USA, 409
pp.
Jongdee, S., Mitchell, J.H., Fukai, S., 1997. Modelling approach for
estimation of rice yield reduction due to drought in Thailand.
A. Boling et al. / Field Crops Research 90 (2004) 351–360 359
In: Fukai, S., Cooper, M., Salisbury, J. (Eds.), Proceedings of
Workshop, Plant Breeding Strategies for Rainfed Lowland Rice
in Drought-Prone Environments. Australian Centre for Inter-
national Agricultural Research (ACIAR), Canberra, Australia,
Proc. No. 77, pp. 65–73.
Khunthasuvon, S., Rajatasereekul, S., Hanviriyapant, P., Romyen,
P., Fukai, S., Basnayake, J., Skulkhu, E., 1998. Lowland rice
improvement in northern and northeast Thailand. 1. Effects
of fertiliser application and irrigation. Field Crops Res. 59,
99–108.
Kropff, M.J., Cassman, K.G., van Laar, H.H., 1994. Quantitative
understanding of the irrigated rice ecosystem for increased
yield potential. In: Virmani, S.S. (Ed.), Hybrid Rice
Technology: New Developments and Future Prospects.
International Rice Research Institute, Manila, Philippines,
pp. 97–113.
Lilley, J.M., Fukai, S., 1994. Effect of timing and severity of water
deficit on four diverse rice cultivars. I. Rooting pattern and soil
water extraction. Field Crops Res. 37, 205–213.
Mackill, D.J., Coffman, W.R., Garrity, D.P., 1996. Rainfed
Lowland Rice Improvement. International Rice Research
Institute, Manila, Philippines, 242 pp.
Maclean, J.L., Dawe, D.C., Hardy, B., Hettel, G.P. (Eds.),
2002. Rice Almanac: Sourcebook for the Most Important
Economic Activity on Earth, third ed. CABI Publishing,
Wallingford, England, Published in association with: Interna-
tional Rice Research Institute, West Africa Rice Development
Association, International Center for Tropical Agriculture, and
Food and Agriculture Organization of the United Nations, 253
pp.
Mamaril, C.P., Wihardjaka, A., Wurjandari, D., Suprapto, 1994.
Potassium fertilizer management for rainfed lowland rice in
Central Java, Indonesia. Phillip. J. Crop Sci. 19, 101–109.
Mamaril, C.P., Wihardjaka, A., Abdulrachman, S., Suprapto, Fagi,
A.M., Diah, W.S., 1995. Response of rainfed lowland rice to
potassium and sulfur under intensive and diversified cropping
systems and low fertility soils. In: Ingram, K.T. (Ed.), Rainfed
Lowland Rice: Agricultural Research for High-risk Environ-
ments. International Rice Research Institute, Manila, Philip-
pines, pp. 215–225.
Matthews, R.B., Kropff, M.J., Bachelet, D., van Laar, H.H., 1995.
Modelling the Impact of Climate Change on Rice Production in
Asia. CAB International, Wallingford, UK, 304 pp.
Pantuwan, G., Fukai, S., Cooper, M., Rajatasereekul, S., O’Toole,
J.C., 2002. Yield response of rice (Oryza sativa L.) genotypes
to drought under rainfed lowlands. 3. Plant factors contributing
to drought resistance. Field Crops Res. 73, 181–200.
Savary, S., Srivastava, R.K., Singh, H.M., Elazegui, F.A., 1997. A
characterization of rice pests and quantification of yield losses
in the rice–wheat system of India. Crop Prot. 16 (4), 387–398.
Setyanto, P., Makarim, A.K., Fagi, A.M., Wassmann, R., Buendia,
L.V., 2000. Crop management affecting methane emissions
from irrigated and rainfed rice in Central Java (Indonesia).
Nutrient Cycl. Agroecosyst. 58, 85–93.
Technicon Instruments Corporation, 1977. Technicon AutoAnaly-
zer II Industrial Method No. 334.74 w/d. In: Individual/
Simultaneous Determination of N and or P in BD Acid Digest.
Chauncey, New York.
Tuong, T.P., Castillo, E.G., Cabangon, R.C., Boling, A., Singh, U.,
2002. The drought response of lowland rice to crop establish-
ment practices and N-fertilizer sources. Field Crops Res. 74 (2/
3), 243–257.
Varley, J.A., 1966. The determination of N, P, and K ions in plant
materials. Analyst 91, 119–126.
Wade, L.J., Amarante, S.T., Olea, A., Harnpichitvitaya, D.,
Naklang, K., Wihardjaka, A., Sengar, S.S., Mazid, M.A.,
Singh, G., McLaren, C.G., 1999. Nutrient requirements in
rainfed lowland rice. Field Crops Res. 64, 91–107.
Wade, L.J., George, T., Ladha, J.K., Singh, U., Bhuiyan, S.I.,
Pandey, S., 1998. Opportunities to manipulate nutrient-by-
water interactions in rainfed lowland rice systems. Field Crops
Res. 56, 93–112.
Wihardjaka, A., Kirk, G.J.D., Abdulrachman, S., Mamaril, C.P.,
1999. Potassium balances in rainfed lowland rice on light
textured soil. Field Crops Res. 64, 237–247.
Yoshida, S., 1981. Fundamentals of Rice Crop Science. Interna-
tional Rice Research Institute, Manila, Philippines, 269 pp.
Yoshida, S., Forno, D.A., Cock, D.H., Gomez, K.A., 1976.
Laboratory Manual for Physiological Studies of Rice, third ed.
International Rice Research Institute, Manila, Philippines, 83 pp.
360 A. Boling et al. / Field Crops Research 90 (2004) 351–360
Related Documents