New England University Transportation Center 77 Massachusetts Avenue, E40-279 Cambridge, MA 02139 utc.mit.edu Grant Number: DTRT13-G-UTC31 Project Title: Humanizing Travel: Investigating the User Identification of, Attitude towards and Preference for Dynamic Ridesharing Services Project Number: Project End Date: Submission Date: MITR25-18 8/31/2017 12/03/2017 Principal Investigator: Jinhua Zhao Title: Associate Professor University: MIT Email: [email protected] Phone: 617-254-7594 Co-Principal Investigator: Title: University: Email: Phone: Year 25 Final Report The contents of this report reflect the views of the authors, who are responsible for the facts and the accuracy of the information presented herein. This document is disseminated under the sponsorship of the Department of Transportation, University Transportation Centers Program, in the interest of information exchange. The U.S. Government assumes no liability for the contents or the use thereof. The New England University Transportation Center is a consortium of 5 universities funded by the U.S. Department of Transportation, University Transportation Centers Program. Members of the consortium are MIT, the University of Connecticut, the University of Maine, the University of Massachusetts, and Harvard University. MIT is the lead university.

Welcome message from author
This document is posted to help you gain knowledge. Please leave a comment to let me know what you think about it! Share it to your friends and learn new things together.
Transcript
New England University Transportation Center
77 Massachusetts Avenue, E40-279 Cambridge, MA 02139
utc.mit.edu
Grant Number: DTRT13-G-UTC31
Project Title:
Humanizing Travel: Investigating the User Identification of, Attitude towards and Preference for
Dynamic Ridesharing Services Project Number: Project End Date: Submission Date:
MITR25-18 8/31/2017 12/03/2017
Principal Investigator:
Jinhua Zhao
Title: Associate Professor
University: MIT
Email: [email protected]
Phone: 617-254-7594
Co-Principal Investigator:
Title:
University:
Email:
Phone:
Year 25 Final Report
The contents of this report reflect the views of the authors, who are responsible for the facts and the accuracy of the information
presented herein. This document is disseminated under the sponsorship of the Department of Transportation, University Transportation Centers Program, in the interest of information exchange. The U.S. Government assumes no liability for the contents or the use thereof.
The New England University Transportation Center is a consortium of 5 universities funded by the U.S. Department of Transportation,
University Transportation Centers Program. Members of the consortium are MIT, the University of Connecticut, the University of Maine, the University of Massachusetts, and Harvard University. MIT is the lead university.
2
The project has proceeded in three phases: the impact of e-hailing on the stakeholder relationship in taxi industry, user identification of and attitude toward dynamic ridesourcing services, and the social aspects of dynamic ridesharing. Each of them is summarized below in its own section following the structure of abstract, introduction, discussion, and the reference to the more detailed report. Phase 1: Humanizing Travel: How E-hail Apps Transform Stakeholder Relationships in the U.S. Taxi Industry Abstract
Motivated by the void in research on the qualitative impact on the for-hire transportation sector, this paper examines the influence of taxi-hailing mobile apps (e-hailing) on the U.S. taxi industry, particularly their disruption of stakeholder relationships in large-city markets. We interviewed industry stakeholders in New York, San Francisco, and Boston, and analyzed data using MAXQDA. We conclude that e-hailing can enhance accountability for drivers and passengers, enable more sophisticated third-party management of interactions, humanize previously impersonal relationships, and reduce rent-seeking behaviors of taxi dispatchers. These findings help broaden the thinking on evaluating new smartphone technologies beyond the traditionally-assessed efficiency benefits.
Introduction
When the rapid rise of smartphones and On-Demand Economy meets urban transportation, the union produces a powerful possibility to transform the nature of traveling. Efficiency benefits of the increasingly popular taxi-hailing and ridesharing apps have already been acknowledged (1, 2) – reduction of search time, convenience for passengers, and higher income for drivers. What is less talked about – but carrying no less weight – is the apps’ ability to change relationships among stakeholders, power dynamics, and user experiences within the for-hire transportation industry.
The U.S. taxicabs industry offers a fitting laboratory for examining such potential impacts. The emergence of taxi-hailing (e-hail) apps around 2010 is preceded by over 100 years of taxi presence in many cities, thus enabling a before-and-after look into the apps’ effects on the industry. Further, e-hail represents one of the biggest innovations in the slow-changing taxi sector. The industry is heavily regulated, with many of its fundamentals – such as the medallion system – dating back to the 1930s (3). Technology adoption also advances slowly – GPS replaced two-way radios as the dominant dispatch system only in the last decade. This rare instance of change thus presents an opportune motivation for inquiry, looking for ways that new technology could uproot some of the most entrenched relationship dynamics in the service industry.
Now is also a critical time to study the taxi industry as it stands at a crossroad. Taxis serve an important niche and constitutes a considerable modal share of urban mobility. According to the most recent (October 2003) National Household Travel Survey, 12% of
3
Americans used a taxi or limousine service in the month prior, comparable to 13% for public transit (4). As the Millennials gravitate towards an urban, less driving-dependent lifestyle (5), future demand for for-hire services will most likely increase. At the same time, this exact mobile hailing technology has given rise to the so-called “transportation network companies” (TNCs). By connecting passengers with drivers using their personal, non-commercial vehicles, companies such as UberX, Lyft, and Sidecar have imposed serious competition to the taxi industry (6). Taxi drivers have reported noticeable declines in rides and income. San Francisco, for example, has recently experienced for the first time a shortage of taxi drivers – many of whom having switched to driving for ridesharing companies (7). One comparative advantage of these ridesharing services is their emphasis on user experience – particularly the driver-passenger rapport – at the center of their offerings. It thus begs the question of whether the U.S. taxi industry could also innovate itself out of the brewing crisis with such new technology. Could e-hail disrupt the relationship dynamics and enhance the quality of taxi services for customers as well as work environment for drivers?
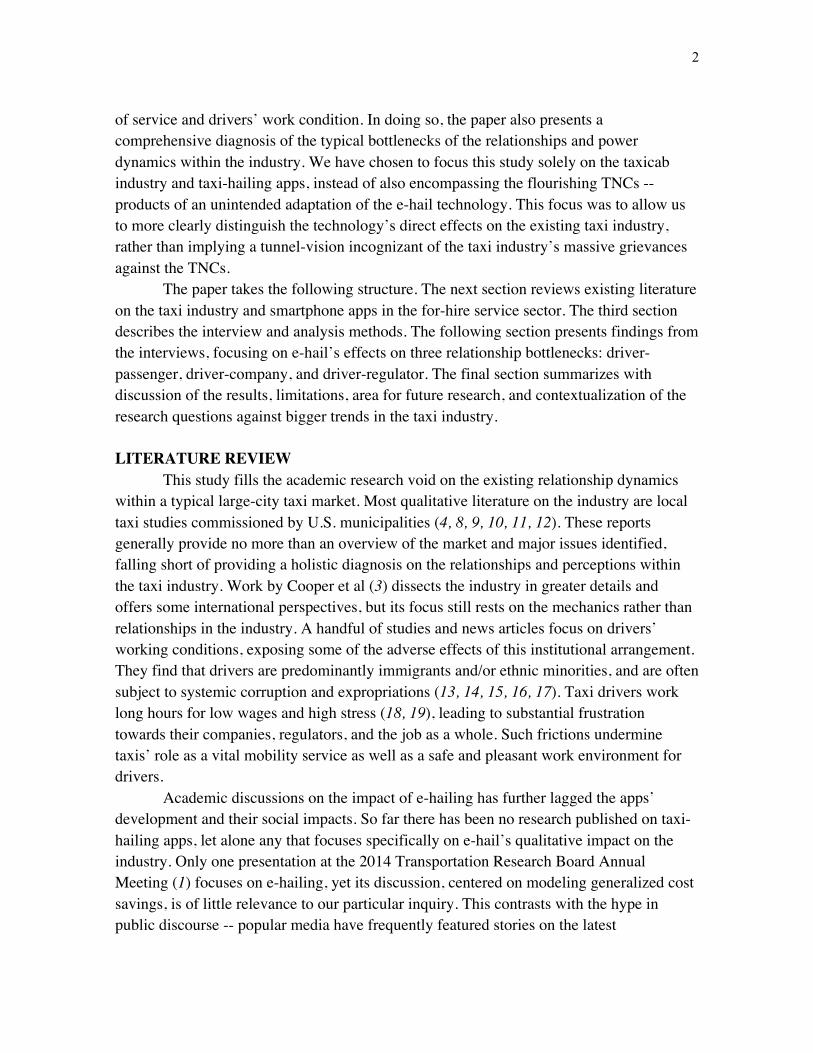
Culminating six months of in-depth interviews with key industry stakeholders in three major cities, this paper examines the potential effects of e-hail apps on stakeholder relationships in the taxi industry, illustrating their consequential implications on the quality of service and drivers’ work condition. In doing so, the paper also presents a comprehensive diagnosis of the typical bottlenecks of the relationships and power dynamics within the industry. We have chosen to focus this study solely on the taxicab industry and taxi-hailing apps, instead of also encompassing the flourishing TNCs -- products of an unintended adaptation of the e-hail technology. This focus was to allow us to more clearly distinguish the technology’s direct effects on the existing taxi industry, rather than implying a tunnel-vision incognizant of the taxi industry’s massive grievances against the TNCs.
Discussion
The interviews suggest that, of the stakeholder relationship bottlenecks within the taxi industry, e-hail apps have the biggest potential to improve passenger-driver and driver-dispatcher interactions. E-hailing has been shown to enhance accountability and sense of safety for drivers and passengers, enable more sophisticated third-party management of interactions while humanizing previously impersonal relationships, and reduce rent-seeking behaviors of taxi dispatchers. Although no two interviewees have identified identical factors or paths of change, virtually all of them provide one or more ways in which e-hailing has had a positive influence.
Nonetheless, the disparities in opinions on the specific path of change – for instance, the exact app mechanism(s) that humanizes the driver-passenger relationship – reflect the diverse nature of individual experiences in a very heterogeneous industry. One key lesson learned from this study is the impossibility of generalizing the relationships for the entire rider and driver populations, even in a specific taxi market. Indeed, in a city with over 50,000 drivers and 175 million rides per year such as New York City (7), every single driver, passenger, and their interactions are to some extent unique. For drivers, their perception of the relationships and effects of e-hail apps may vary depending on factors such as their years of experience, ethnic and
4
linguistic background, nature of their permit (e.g., driver-operator vs. shift driver), and their own personalities and preferences; for passengers, age, gender, profession, and reason for taking the taxi may be important. Of course, for both groups, their reception to new technology likely play a major role, as interviewees who express greater enthusiasm for e-hail also tend to be more affirmative of the apps’ impact on the industry. Such variance in experiences on both customer and provider sides is not unique to the taxi market, as it is prevalent in many other service industries as well.
In enriching the academic discussion on the fast-emerging for-hire transportation apps, this study’s findings bear significant implications to regulators, taxi companies, and e-hail app developers. Though e-hailing’s efficiency benefits are evident, safety and privacy concerns over a related service -- transportation networking companies (TNC) -- have engendered much controversy and debate. Taxi regulators across the country have been debating the fate of e-hailing – whether to allow it, regulate it, or promote it. E-hail’s positive effects on the deep-rooted problems in the taxi industry suggest identifying opportunities to leverage new technology to improve regulatory processes and build better institutions that would foster a more humanizing, service-oriented taxi industry. Certain municipalities, such as Los Angeles, are now starting to mandate their taxis to sign onto e-hailing to make the services more attractive and competitive (24). The study’s benefits for taxi companies are telling as well: e-hailing can improve the ride experience for drivers as well as passengers, mitigate corruption in dispatcher services, and potentially serve as a tool for communicating with and engaging the drivers. Though commercial e-hail apps are designed to maximize profit, the human impact discussed in this paper can still help developers refine their apps and lobby for policy changes.
As an exploratory and benchmarking inquiry, this phase of research reveals that e-hailing indeed induces qualitative effects in a typical taxi market. To test the significance or magnitude of these impacts would require larger-scale, quantitative surveys. As this study examines only relationships among existing stakeholders, another direction of future research would be to broaden the scope to include relationships involving new stakeholders and entire neighborhoods. A number of drivers interviewed reveal that e-hail has made them more willing to go to peripheries of the city – such as the outer boroughs of New York City -- as they now feel more confident about being able to pick up a passenger on their way back to the city core. In effect, the apps are bringing drivers into neighborhoods traditionally under-served by taxis or other modes of public transportation, hence changing the communities’ relationships with taxi services, people’s activity and mobility choices, and the neighborhoods’ accessibility. This observation is remarkable, for it implies that e-hail may be able to change people’s activities and transportation modes – changes that are conventionally hard to motivate without changing land use development patterns (such as transit-oriented development).
While this study focuses solely on taxi-hailing apps, it would be remiss to not acknowledge its place in context of the rise of the transportation networking companies (TNCs). Since these so-called “ridesharing” services are technically a form of e-hailing, the line between these two types of for-hire apps is becoming increasingly blurred. We often found it necessary to

5
go to great length to clarify the topic of this study for the interviewees. Even with such clarifications, in interviews with drivers and regulators, it was almost impossible for the conversation to not stray to the topic of TNCs. This reflects the fact that TNCs have become a dominant concern for many stakeholders in the taxi industry. With their innovative yet simple business models and the emphasis on user experience, the TNCs starkly juxtapose the inefficiencies and resistance to change in the traditional taxi industry, eroding both the taxi driver and customer bases in many cities. Though the effects of e-hail apps can potentially improve the drivers’ working condition by breaking down some of the coercive and abusing power relationships, the rise of the TNCs may likely confound or offset some of these benefits.
In fact, this new trend has not only rendered the taxi industry – but also e-hail app companies -- in a state of flux. In October 2014, Hailo, the most popular taxi e-hail apps, announced its ceasing of operations in North America due to competition from the ultra on-demand TNCs. This latest development seems to cast doubt on the potential for the taxi industry to renew itself with aid of technological innovation, but, under a different light, the taxi service is in fact one of the earliest on-demand sectors. Whether the taxi industry will retain its current form in the future or morph into a very different look, the message is clear – even the most deep-rooted relationship paradigms can be disrupted and innovated.
Full report
This phase of the project has been published as Corinna Li and Jinhua Zhao (2015) Humanizing Travel: How E-hail Apps Transform Stakeholder Relationships in the U.S. Taxi Industry, Transportation Research Board 94th Annual Meeting Compendium of Papers (No. 15-1133). Please see more details at https://trid.trb.org/View/1336738.
6
Phase II: User Identification of and Attitude Toward Dynamic Ridesourcing Services Abstract
Media coverage of ridesourcing services such as Uber and Lyft has described a rivalry between new technology and the established taxi industry. Individual users and non-users of ridesourcing may have more nuanced perspectives, but policymakers have had little guidance on how to best represent these interests. This study uses a standardized questionnaire distributed across the United States by an online survey company to understand individual attitudes toward Uber, Lyft, and ridesourcing technology in general. The survey asks respondents if they identify as users or non-users of ridesourcing, why or why not, how they rank Uber and Lyft among their other travel modes, and their attitudes toward the companies and toward the technology in general, among other questions. The survey returned 394 completed questionnaires from the most populous 15 metropolitan statistical areas in the U.S. with a response rate of 27%. Analysis of the results includes descriptive statistics, bivariate correlation analyses of relationships between variables, and logistic regressions to identify factors that impact user identification and attitude. The findings indicate that about 70% of respondents use some form of ridesourcing, mostly for special-purpose trips such as avoiding driving while intoxicated and getting to and from the airport. There are relationships between transportation needs and user identification and attitude, but demographics are the best predictor of user identification, which in turn predicts attitude, which can predict individuals’ policy preferences. The study suggests potential for policymakers to leverage constituent perspectives to change aspects of ridesourcing that have low public approval. Introduction
Recent years have ushered in innovation in the mobility industry, both in technological advancements and with new business models. A bevy of transportation services from private cars to commuter buses have become available on-demand thanks to the expansion of smartphone apps and online-enabled platforms. This paper focuses on ridesourcing, the model that allows individuals to request a ride through a smartphone application and get connected to a nearby driver within minutes. As a direct competitor to the taxi industry and a new technology, ridesourcing has faced criticism and concern for skirting established regulations. Yet it has grown increasingly popular as a mobility choice across the United States. Two frameworks provide context for this emerging shift: the urban mobility revolution, and the so-called sharing economy.
The urban mobility revolution resides at the confluence of the smart cities movement, innovation in autonomous vehicles, vehicle electrification and interconnectedness, and the advent of new mobility services (1, 2). These new mobility services might more accurately be called new models for accessing traditional forms of mobility, and range from car-sharing to ridesourcing. The convenience and cost savings associated with these alternative means of accessing mobility has made many of them competitors to traditional modes and providers (e.g. the car rental and taxi industries).
Occurring alongside this revolution is a phenomenon widely known as the sharing economy, which refers to the market for sharing, trading, or renting goods and services from person to person rather than through traditional ownership or centralized institutions. A key component is the use of online platforms to link excess supply to demand, granting temporary access to
7
underutilized or idle assets (3, 4). Popular examples of sharing economy companies include Uber, Airbnb, and TaskRabbit, which provide access to underutilized vehicle space, apartment space, and labor, respectively. Some scholars argue that the sharing economy should more accurately be called an access economy or platform economy (5, 6). This distinction and other topics of disagreement are discussed in 1.3 The ridesourcing debate.
As the two preeminent ridesourcing companies in the U.S., Uber and Lyft, expanded their operations from 2012 to the present, regulators and the public have demonstrated a wide variety of responses ranging from protesting and banning their operations to enacting policies that legitimize the services and regulate for consumer protection. These responses have changed over time and have yet to coalesce into a unified approach, indicating a need for more independent studies of individuals’ use and perceptions of ridesourcing. Popular media has provided a platform for debating the taxi controversy and, more recently, potential social and environmental impacts of ridesourcing, but academic literature is beginning to emerge that engages these ideas with greater analytic rigor (7). This paper aims to address the lack of evidence available for policymaking and bolster the growing body of literature by posing two questions: 1) Who uses ridesourcing and why? 2) How does an individual’s use impact their attitude toward ridesourcing and whether or not they identify as a user?
The first question both offers insight for regulators who have until now relied on popular media and biased data from Uber and Lyft, and responds to previous literature that poses similar questions about the role of ridesourcing in today’s suite of mobility options (7). The second question seeks to identify the relationships between nature of use and self-identification as a user or non-user, as well as tease out any distinctions between attitudes toward ride-sourcing technology and the companies that employ it. Discussion
Uber and Lyft represent innovation in the way people access mobility. The platform used to connect riders and drivers distinguishes these companies from taxi providers, and thereby called regulatory requirements into question in their first years of operation. State and local regulatory agencies have since responded to the growing mobility shift engendered by Uber and Lyft, but through exploratory and dynamic processes that have not yet coalesced into a typical or national-level strategy. Policymaking is influenced by media coverage, personal experiences, emerging literature, and occasional local studies, but ridesourcing companies still maintain a significant asymmetry of information that allows them to control much of what we know about how and why people use their services. Given the potential social impacts—both positive and negative—of ridesourcing on urban mobility patterns, it is imperative to determine the legitimate role of government in managing this new model and the evolving economy of which it is a part.
The nationally-distributed survey showed how and why people use Uber and Lyft (or not), and what they think about the two companies. Demographic characteristics are among the best predictors of whether or not someone identifies as a user, and user identification in turn influence attitude. Respondents tended to be younger, better educated, and higher earning than the average population. 69% of respondents identified as users of ridesourcing and 31% identified as non-users. Ridesourcing is used primarily for special purpose trips, like avoiding driving while intoxicated and getting to or from the airport. 6% percentage of respondents identified an ethical opposition that prevented them from using ridesourcing, but many more said the driver-as-contractor issue made them want to use Uber or Lyft less. According to public perception, Uber is ridesourcing technology. People responded almost identically to the questions about their attitude toward ridesourcing technology and toward Uber. Uber offers a stand-in term for the
8
sharing or access economy, as suggested by “the Uber-ization of Everything” (41). People generally call for their cities to support the ridesourcing services, but the specific recommendations vary—roughly equal splits between regulating, doing nothing and forming partnerships with Uber and Lyft. Limitations and future research
This survey was not representative of individual metropolitan area populations and can therefore only support interpretations of national trends. Policymakers might need to conduct similar studies locally to reach meaningful conclusions for specific metropolitan areas. In attempting to take the temperature of the American public about adoption of ridesourcing, the questionnaire covered a variety of topics with limited investigation into implications for policy. Future research should explore the regulatory implications associated with acting on the findings outlined above, as well as delving deeper into some of the topics not addressed by this survey such as informal labor and accessibility concerns. Researchers and policymakers alike may benefit from a study that proposes specific policy responses to the population from two or three target cities with distinct regulatory styles. Analyzing the reactions to these proposals would offer direction for policymaking in the future. Full report
This phase of the project has been published as Margo Darwes and Jinhua Zhao (2017) User Identification of and Attitude Toward Dynamic Ridesourcing Services, Transportation Research Board 96th Annual Meeting Compendium of Papers [No. 17-04418]. Please see more details at https://trid.trb.org/View/1438734.
9
Phase III: To Share Or Not To Share: Investigating The Social Aspects Of Dynamic Ridesharing ABSTRACT
Transportation Network Companies (TNCs) have recently introduced shared ride versions of their ordinary services, such as UberPool or Lyft Line. The concept is simple: passengers pay less in fares for an incremental increase in time spent picking up and dropping off other riders. This paper focuses on the social and behavioral considerations of shared rides, which have not been explored as thoroughly as time and cost trade-offs in transportation. A survey of TNC users conducted through Mechanical Turk in June and July of 2016 with 997 respondents across the United States found that: (i) users of dynamic ridesharing services report that social interactions are relevant to mode choice, although not as much as traditional factors such as time and cost; (ii) overall, the possibility of having a negative social interaction is more of a deterrent than the potential of having a positive social interaction is an incentive to using dynamic ridesharing; (iii) there is evidence that a substantial number of riders harbor feelings of prejudice towards passengers of different social class and race, and these passengers are much more likely to prefer having more information about potential future passengers; (iv) that most dynamic ridesharing users are motivated to use it due to its ease and speed compared to walking and public transportation; and (v) that safety in dynamic ridesharing is an important issue, especially for women, many of whom report feeling unsafe and prefer to be matched with passengers of the same sex. Introduction
Uber and Lyft, two Transportation Network Companies (TNCs), have recently introduced carpool versions of their services in many cities throughout the world. The concept of this service is simple: passengers save money in exchange for the time lost while taking a longer route, as might be required to pick up or drop off other passengers. Therefore, if it is often assumed that the decision to use this service is based on this exchange of time for money, the only factors that would be relevant for understanding the behavior of potential users.
Another characteristic of these shared ride alternatives is that users accept to share the backseat of a car, a private and intimate space in private rides, with unknown fellow passengers. How users perceive the social dimensions of sharing time and space with strangers is still unclear. Some passengers may positively value the opportunity to interact with new people, while others may consider these interactions inconvenient, unsafe, or even as an experience during which they are subject to discrimination from fellow passengers.
Given the rapid spread of this service known as dynamic ridesharing, our research questions focused on investigating whether people perceive it as having positive or negative utility with respect to its social aspects, what influences those perceptions, and how they compare with traditional factors like time and cost. In order to better understand the social dimensions of dynamic ridesharing services, we designed a survey to explore how people of different ages, genders, sociodemographic backgrounds, travel behaviors, and personalities use and experience the social aspects of ridesharing, and what types of social interventions might make them more or less likely to use the service.
This research is relevant from at least three perspectives. First, it could inform policy, communication tactics to riders, and capabilities to facilitate interaction between passengers.
10
Second, the approaches proposed here could be considered when analyzing or modeling travel mode choices made by individuals. Finally, other modes could also benefit from the methodology developed, as they also have social dimensions that can affect decisions made by their users. Conclusions
In an era when the use of ridesharing apps is becoming increasingly common and urban populations are growing rapidly, ridesharing poses a tremendous opportunity to move people from place to place in a more efficient, less congestion-inducing, less expensive, and more environmentally conscious manner.
Our study set out determine to what degree people perceive dynamic ridesharing as having positive or negative utility with respect to its social aspects, what influences those perceptions, and how they compare with traditional factors, such as time and cost. Our investigation revealed that a person’s perception of the social aspects, both positive and negative, is a factor that can both motivate and deter the use of shared rides, while personality and demographic characteristics mattered less than previous literature had suggested in determining a person’s willingness to rideshare.
Among some of its more significant findings, the survey revealed that: (i) users of dynamic ridesharing services report that social interactions, such as the possibility to have a networking opportunity or to have a good conversation with the fellow passenger, are relevant, but not as much as traditional factors such as time and cost; (ii) overall, the possibility of having a negative social interaction, such as being paired with an unpleasant passenger, appears to be more of a deterrent than the potential of having a positive social interaction is an incentive to using dynamic ridesharing; (iii) that there is evidence that a substantial number of riders harbor feelings of prejudice towards passengers of different social class and race, and these passengers are much more likely to prefer having more information about potential future passengers before matching through the application; (iv) that most dynamic ridesharing users are motivated to use it by its ease, speed, and comfortability compared to walking and public transportation; and (v) that safety in shared rides is an important issue, especially for women, many of whom report feeling unsafe and prefer to be matched with passengers of the same gender.
This study shows that while social motivations for using dynamic ridesharing are relevant, they matter less than factors such as time and costs. However, the study does not quantitatively determine the magnitude of the effect of social aspects on mode choice. The survey was not designed to request respondents to compare trip alternatives (which would allow us to build a mode choice model), but to assess a wider range of aspects (social and non-social) of dynamic ridesharing which would not be measured in a traditional stated preference survey.
Future research seeking to expand upon this study would do well to further investigate some of its findings. An implicit bias test, for example, might reveal that even more passengers hold feelings of prejudice than were discovered in this anonymous survey. Deeper examination of what makes the potential for negative social interactions more influential to riders’ perceptions of the service than positive ones would also be of value.
Dynamic ridesharing promises to be an increasingly prevalent mode of transportation in the future. Understanding the ways in which shared ride passengers interact with each other socially and how they perceive these social interactions will be valuable information for
11
policymakers and TNC strategists alike. We hope that the results discussed here will serve as a starting point for future study and modification of ridesharing services. Full report
This phase of the project has been published as Javier Morales Sarriera, German Escovar Alvarez, Kelly Blynn, Andrew Aylesbury, Tim Scully and Jinhua Zhao (2017) To Share or Not to Share: Investigating the Social Aspects of Dynamic Ridesharing, Transportation Research Record: Journal of the Transportation Research Board, (2605), 109-117. Please see more details at http://trrjournalonline.trb.org/doi/10.3141/2605-11
0
Humanizing Travel: How E-hail Apps Transform
Stakeholder Relationships in the U.S. Taxi Industry
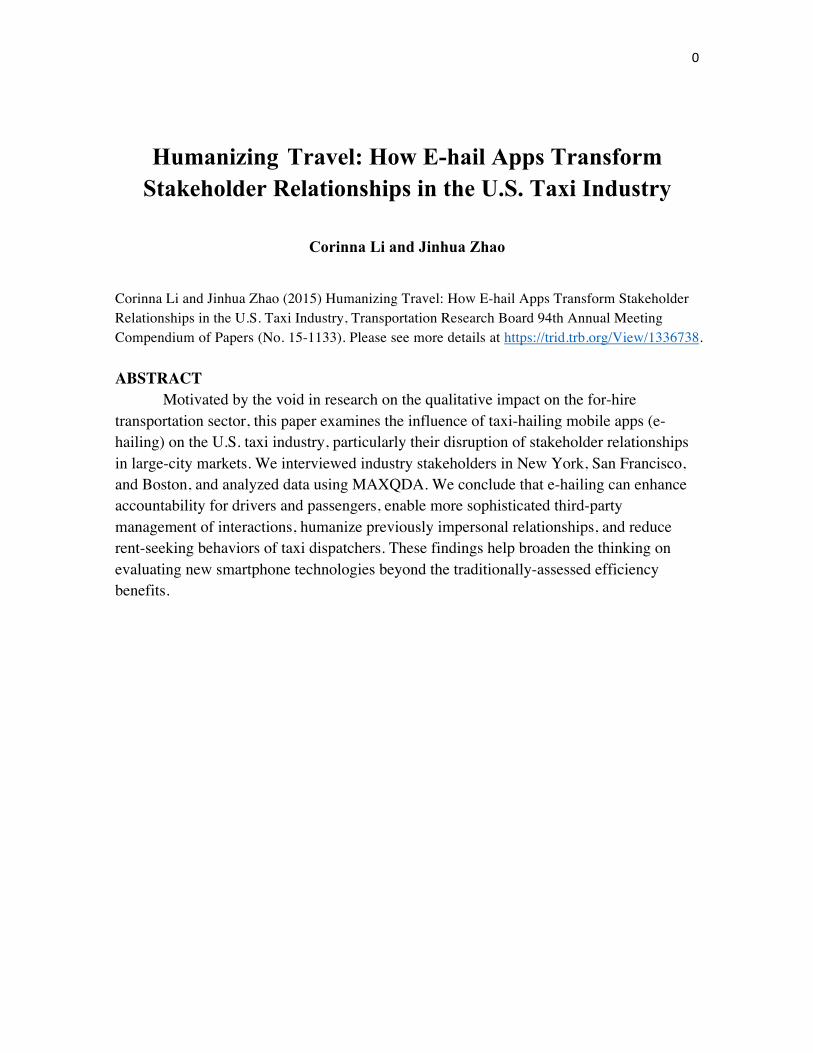
Corinna Li and Jinhua Zhao
Corinna Li and Jinhua Zhao (2015) Humanizing Travel: How E-hail Apps Transform Stakeholder Relationships in the U.S. Taxi Industry, Transportation Research Board 94th Annual Meeting Compendium of Papers (No. 15-1133). Please see more details at https://trid.trb.org/View/1336738. ABSTRACT
Motivated by the void in research on the qualitative impact on the for-hire transportation sector, this paper examines the influence of taxi-hailing mobile apps (e-hailing) on the U.S. taxi industry, particularly their disruption of stakeholder relationships in large-city markets. We interviewed industry stakeholders in New York, San Francisco, and Boston, and analyzed data using MAXQDA. We conclude that e-hailing can enhance accountability for drivers and passengers, enable more sophisticated third-party management of interactions, humanize previously impersonal relationships, and reduce rent-seeking behaviors of taxi dispatchers. These findings help broaden the thinking on evaluating new smartphone technologies beyond the traditionally-assessed efficiency benefits.
1
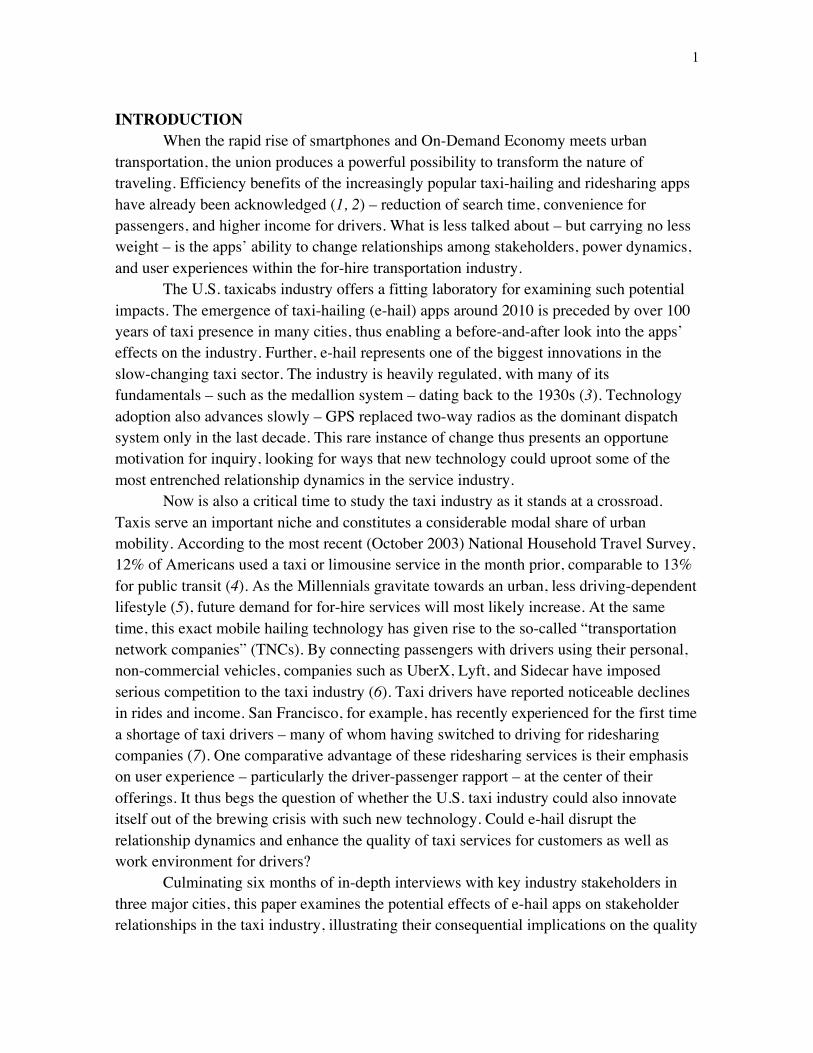
INTRODUCTION When the rapid rise of smartphones and On-Demand Economy meets urban
transportation, the union produces a powerful possibility to transform the nature of traveling. Efficiency benefits of the increasingly popular taxi-hailing and ridesharing apps have already been acknowledged (1, 2) – reduction of search time, convenience for passengers, and higher income for drivers. What is less talked about – but carrying no less weight – is the apps’ ability to change relationships among stakeholders, power dynamics, and user experiences within the for-hire transportation industry.
The U.S. taxicabs industry offers a fitting laboratory for examining such potential impacts. The emergence of taxi-hailing (e-hail) apps around 2010 is preceded by over 100 years of taxi presence in many cities, thus enabling a before-and-after look into the apps’ effects on the industry. Further, e-hail represents one of the biggest innovations in the slow-changing taxi sector. The industry is heavily regulated, with many of its fundamentals – such as the medallion system – dating back to the 1930s (3). Technology adoption also advances slowly – GPS replaced two-way radios as the dominant dispatch system only in the last decade. This rare instance of change thus presents an opportune motivation for inquiry, looking for ways that new technology could uproot some of the most entrenched relationship dynamics in the service industry.
Now is also a critical time to study the taxi industry as it stands at a crossroad. Taxis serve an important niche and constitutes a considerable modal share of urban mobility. According to the most recent (October 2003) National Household Travel Survey, 12% of Americans used a taxi or limousine service in the month prior, comparable to 13% for public transit (4). As the Millennials gravitate towards an urban, less driving-dependent lifestyle (5), future demand for for-hire services will most likely increase. At the same time, this exact mobile hailing technology has given rise to the so-called “transportation network companies” (TNCs). By connecting passengers with drivers using their personal, non-commercial vehicles, companies such as UberX, Lyft, and Sidecar have imposed serious competition to the taxi industry (6). Taxi drivers have reported noticeable declines in rides and income. San Francisco, for example, has recently experienced for the first time a shortage of taxi drivers – many of whom having switched to driving for ridesharing companies (7). One comparative advantage of these ridesharing services is their emphasis on user experience – particularly the driver-passenger rapport – at the center of their offerings. It thus begs the question of whether the U.S. taxi industry could also innovate itself out of the brewing crisis with such new technology. Could e-hail disrupt the relationship dynamics and enhance the quality of taxi services for customers as well as work environment for drivers?
Culminating six months of in-depth interviews with key industry stakeholders in three major cities, this paper examines the potential effects of e-hail apps on stakeholder relationships in the taxi industry, illustrating their consequential implications on the quality
2
of service and drivers’ work condition. In doing so, the paper also presents a comprehensive diagnosis of the typical bottlenecks of the relationships and power dynamics within the industry. We have chosen to focus this study solely on the taxicab industry and taxi-hailing apps, instead of also encompassing the flourishing TNCs -- products of an unintended adaptation of the e-hail technology. This focus was to allow us to more clearly distinguish the technology’s direct effects on the existing taxi industry, rather than implying a tunnel-vision incognizant of the taxi industry’s massive grievances against the TNCs.
The paper takes the following structure. The next section reviews existing literature on the taxi industry and smartphone apps in the for-hire service sector. The third section describes the interview and analysis methods. The following section presents findings from the interviews, focusing on e-hail’s effects on three relationship bottlenecks: driver-passenger, driver-company, and driver-regulator. The final section summarizes with discussion of the results, limitations, area for future research, and contextualization of the research questions against bigger trends in the taxi industry.
LITERATURE REVIEW
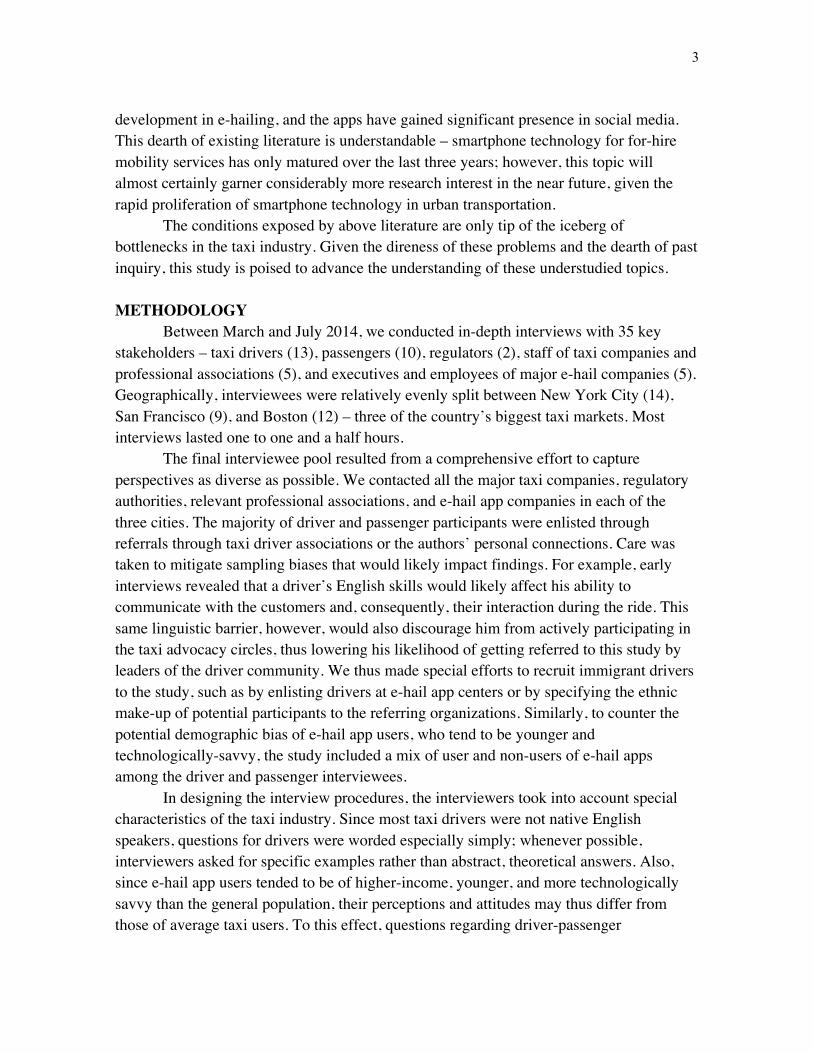
This study fills the academic research void on the existing relationship dynamics within a typical large-city taxi market. Most qualitative literature on the industry are local taxi studies commissioned by U.S. municipalities (4, 8, 9, 10, 11, 12). These reports generally provide no more than an overview of the market and major issues identified, falling short of providing a holistic diagnosis on the relationships and perceptions within the taxi industry. Work by Cooper et al (3) dissects the industry in greater details and offers some international perspectives, but its focus still rests on the mechanics rather than relationships in the industry. A handful of studies and news articles focus on drivers’ working conditions, exposing some of the adverse effects of this institutional arrangement. They find that drivers are predominantly immigrants and/or ethnic minorities, and are often subject to systemic corruption and expropriations (13, 14, 15, 16, 17). Taxi drivers work long hours for low wages and high stress (18, 19), leading to substantial frustration towards their companies, regulators, and the job as a whole. Such frictions undermine taxis’ role as a vital mobility service as well as a safe and pleasant work environment for drivers.
Academic discussions on the impact of e-hailing has further lagged the apps’ development and their social impacts. So far there has been no research published on taxi-hailing apps, let alone any that focuses specifically on e-hail’s qualitative impact on the industry. Only one presentation at the 2014 Transportation Research Board Annual Meeting (1) focuses on e-hailing, yet its discussion, centered on modeling generalized cost savings, is of little relevance to our particular inquiry. This contrasts with the hype in public discourse -- popular media have frequently featured stories on the latest
3
development in e-hailing, and the apps have gained significant presence in social media. This dearth of existing literature is understandable – smartphone technology for for-hire mobility services has only matured over the last three years; however, this topic will almost certainly garner considerably more research interest in the near future, given the rapid proliferation of smartphone technology in urban transportation.
The conditions exposed by above literature are only tip of the iceberg of bottlenecks in the taxi industry. Given the direness of these problems and the dearth of past inquiry, this study is poised to advance the understanding of these understudied topics. METHODOLOGY
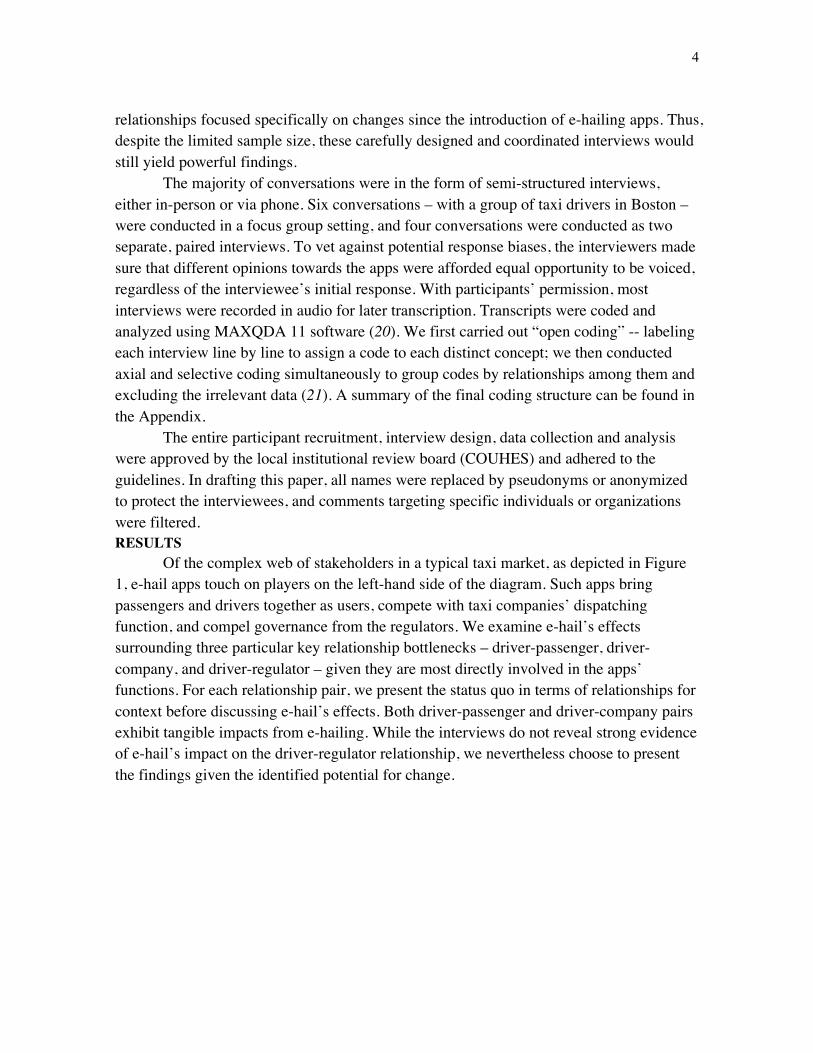
Between March and July 2014, we conducted in-depth interviews with 35 key stakeholders – taxi drivers (13), passengers (10), regulators (2), staff of taxi companies and professional associations (5), and executives and employees of major e-hail companies (5). Geographically, interviewees were relatively evenly split between New York City (14), San Francisco (9), and Boston (12) – three of the country’s biggest taxi markets. Most interviews lasted one to one and a half hours.
The final interviewee pool resulted from a comprehensive effort to capture perspectives as diverse as possible. We contacted all the major taxi companies, regulatory authorities, relevant professional associations, and e-hail app companies in each of the three cities. The majority of driver and passenger participants were enlisted through referrals through taxi driver associations or the authors’ personal connections. Care was taken to mitigate sampling biases that would likely impact findings. For example, early interviews revealed that a driver’s English skills would likely affect his ability to communicate with the customers and, consequently, their interaction during the ride. This same linguistic barrier, however, would also discourage him from actively participating in the taxi advocacy circles, thus lowering his likelihood of getting referred to this study by leaders of the driver community. We thus made special efforts to recruit immigrant drivers to the study, such as by enlisting drivers at e-hail app centers or by specifying the ethnic make-up of potential participants to the referring organizations. Similarly, to counter the potential demographic bias of e-hail app users, who tend to be younger and technologically-savvy, the study included a mix of user and non-users of e-hail apps among the driver and passenger interviewees.
In designing the interview procedures, the interviewers took into account special characteristics of the taxi industry. Since most taxi drivers were not native English speakers, questions for drivers were worded especially simply; whenever possible, interviewers asked for specific examples rather than abstract, theoretical answers. Also, since e-hail app users tended to be of higher-income, younger, and more technologically savvy than the general population, their perceptions and attitudes may thus differ from those of average taxi users. To this effect, questions regarding driver-passenger
4
relationships focused specifically on changes since the introduction of e-hailing apps. Thus, despite the limited sample size, these carefully designed and coordinated interviews would still yield powerful findings.
The majority of conversations were in the form of semi-structured interviews, either in-person or via phone. Six conversations – with a group of taxi drivers in Boston – were conducted in a focus group setting, and four conversations were conducted as two separate, paired interviews. To vet against potential response biases, the interviewers made sure that different opinions towards the apps were afforded equal opportunity to be voiced, regardless of the interviewee’s initial response. With participants’ permission, most interviews were recorded in audio for later transcription. Transcripts were coded and analyzed using MAXQDA 11 software (20). We first carried out “open coding” -- labeling each interview line by line to assign a code to each distinct concept; we then conducted axial and selective coding simultaneously to group codes by relationships among them and excluding the irrelevant data (21). A summary of the final coding structure can be found in the Appendix.
The entire participant recruitment, interview design, data collection and analysis were approved by the local institutional review board (COUHES) and adhered to the guidelines. In drafting this paper, all names were replaced by pseudonyms or anonymized to protect the interviewees, and comments targeting specific individuals or organizations were filtered. RESULTS
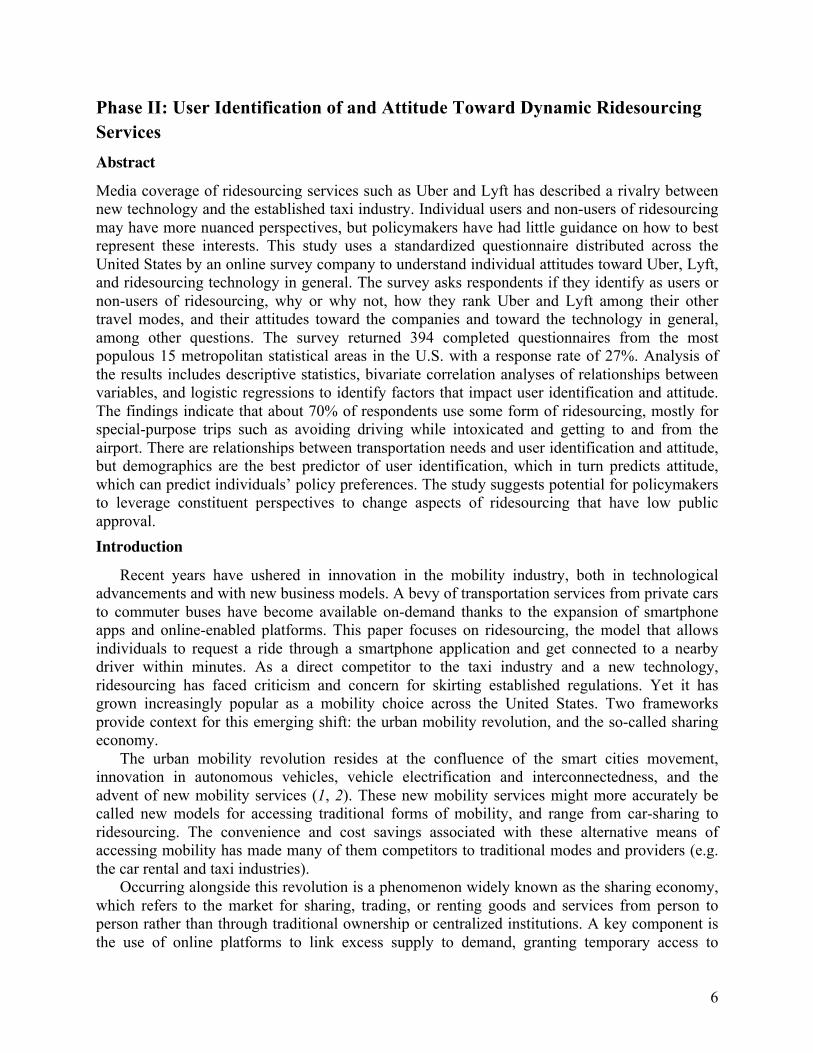
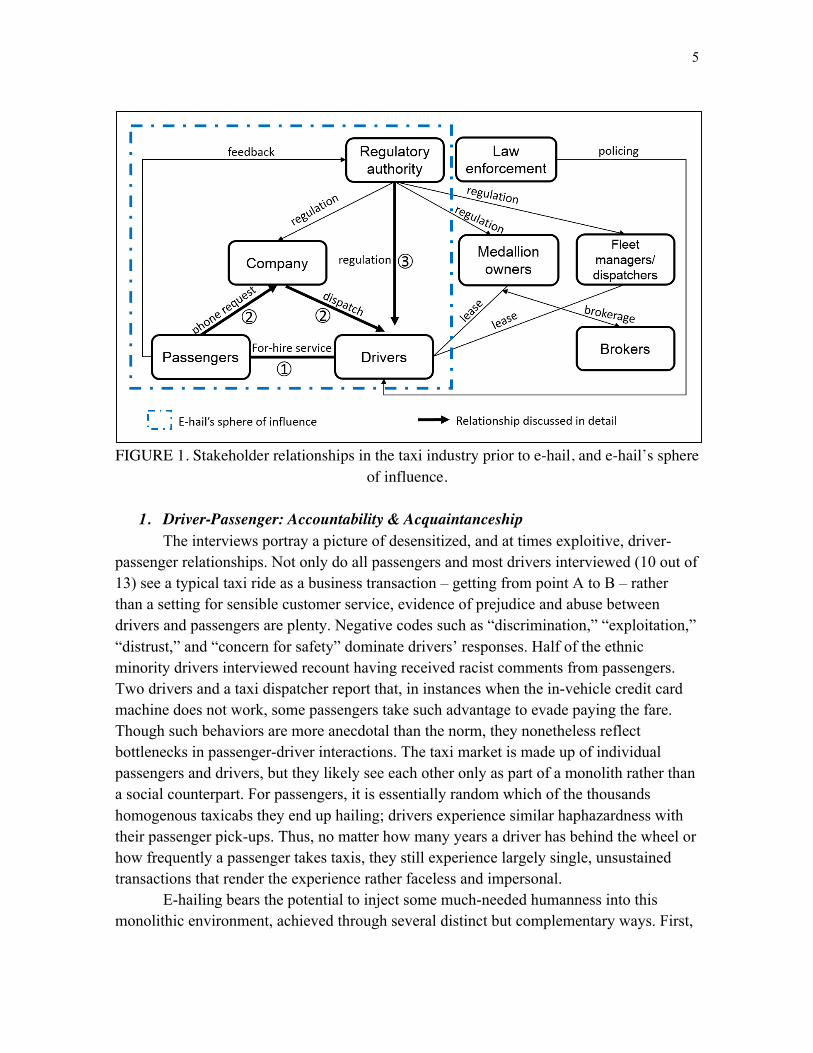
Of the complex web of stakeholders in a typical taxi market, as depicted in Figure 1, e-hail apps touch on players on the left-hand side of the diagram. Such apps bring passengers and drivers together as users, compete with taxi companies’ dispatching function, and compel governance from the regulators. We examine e-hail’s effects surrounding three particular key relationship bottlenecks – driver-passenger, driver-company, and driver-regulator – given they are most directly involved in the apps’ functions. For each relationship pair, we present the status quo in terms of relationships for context before discussing e-hail’s effects. Both driver-passenger and driver-company pairs exhibit tangible impacts from e-hailing. While the interviews do not reveal strong evidence of e-hail’s impact on the driver-regulator relationship, we nevertheless choose to present the findings given the identified potential for change.
5
FIGURE 1. Stakeholder relationships in the taxi industry prior to e-hail, and e-hail’s sphere
of influence.
1. Driver-Passenger: Accountability & Acquaintanceship The interviews portray a picture of desensitized, and at times exploitive, driver-
passenger relationships. Not only do all passengers and most drivers interviewed (10 out of 13) see a typical taxi ride as a business transaction – getting from point A to B – rather than a setting for sensible customer service, evidence of prejudice and abuse between drivers and passengers are plenty. Negative codes such as “discrimination,” “exploitation,” “distrust,” and “concern for safety” dominate drivers’ responses. Half of the ethnic minority drivers interviewed recount having received racist comments from passengers. Two drivers and a taxi dispatcher report that, in instances when the in-vehicle credit card machine does not work, some passengers take such advantage to evade paying the fare. Though such behaviors are more anecdotal than the norm, they nonetheless reflect bottlenecks in passenger-driver interactions. The taxi market is made up of individual passengers and drivers, but they likely see each other only as part of a monolith rather than a social counterpart. For passengers, it is essentially random which of the thousands homogenous taxicabs they end up hailing; drivers experience similar haphazardness with their passenger pick-ups. Thus, no matter how many years a driver has behind the wheel or how frequently a passenger takes taxis, they still experience largely single, unsustained transactions that render the experience rather faceless and impersonal.
E-hailing bears the potential to inject some much-needed humanness into this monolithic environment, achieved through several distinct but complementary ways. First,
6
it brings added assurance for drivers by mandating all passenger users to have a valid credit card on file. Considering that drivers are giving rides to essentially complete strangers, their top preoccupations, according to drivers interviewed, are their personal safety and getting paid at the end of the ride. The linking of a credit card and automatic electronic payment unprecedentedly assuage both concerns at once. Drivers know that they will receive the payment at the end and that passengers, given the electronic trail, are less likely to pose a threat to them. Driver participants overwhelmingly express their appreciation for these benefits, as represented by New York driver Mike’s words below:
“You have a direct connection to [the passengers] because the company has their credit card number and knows who they are. It's just a different relationship…I've been involved with drug deals where people would flag you down and take you up to Washington Heights, and ask you to wait outside the building. Then they come running out with whatever they are buying, and they want to go back downtown. You are not going to get that so much with e-hails, because there's too much of an electronic trail…I had a friend of mine pick up this guy [who] had robbed a bank. You just know a guy robbing a bank isn't going to e-hail you...”
This “different relationship” described by Mike is, in other words, a new layer of comfort in the driver-passenger interaction. Knowing that they are sharing a ride with non-threatening passengers and that payment is guaranteed, drivers may be relieved of their mental preoccupations and instead focus on their service during the ride.
Second, the profile and rating mechanisms in most e-hail apps further bolster perception of accountability. Each passenger and driver is pegged to an account and a profile. While passengers have always been able to provide feedback on the drivers to the regulating agency, e-hail apps level the playing field by allowing both the front and back seats to rate and comment on each other. Apps such as Hailo, Uber, and Flywheel require passenger and drivers to rate each other, out of five stars, at the end of every ride. Interviews with app developers confirm that these ratings are carefully monitored – a rating of one or two stars will likely prompt an inquiry from the app’s customer service team; consistently low ratings will result in a ban from the app. Each user’s aggregate ratings then becomes embedded and featured in his or her profile. This rating system is the mechanism most commented on by drivers. One New York driver says:
“It feels more secure to know that passengers will have a record. I’ve got their data – if anything goes bad, I can complain [by giving them a bad rating]. Because of this, passengers usually don’t do anything bad.”
For another driver, such assurance has changed his driving mentality and behavior. As he recalls:
“I pick up anybody [who uses e-hail], since I know this passenger can’t do anything bad. Everything is on record -- the credit card, his account, and such.”
7
Third, relationships between passengers and drivers are now managed with a new level of sophistication. In the old days, passengers’ calls or letters to the regulator or taxi companies – mostly negative – were the sole feedback available; in contrast, the mandatory rating step for both driver and passenger e-hail users at the end of each ride, brings feedback generation to an entirely new level. In the words one manager at Uber in New York:
“It’s a whole different scale of feedback. Nobody calls the Taxi and Limousine Commission every single time they get out of a taxi – that'd be millions of trips a day, and there's no way that they will ever collect those feedback. [At Uber,] we collect that automatically; we aggregate it; we send it to drivers. I think there's just a different ball game than what happened before in terms of quality and accountability.”
With comprehensive captures of both positive and negative reviews, e-hail companies are able to actively monitor feedback and control quality of users. While the profile and rating mechanisms string disjoint taxi trips into repeated interactions and give individuals reputations to uphold, the penalties imposed by e-hail companies further reinforce long-run incentive for good behaviors. This is akin to the game theory concept of “repeated games,” – players who face repeated interactions cooperate where they otherwise would not (22, 23) – except that e-hail’s record of ratings alone is sufficient to incentivize users to be better behave, without requiring the same driver-passenger pair each time. As previously mentioned, when either a driver or passenger receives a one- or two-star rating, he or she would receive a call from the app company staff to inquire about the situation; if the cause is found to be pernicious, the company may suspend or ban people from using the app. In contrast, positive feedback received from passengers may be shared with the specific drivers and even the broader driver community. Although this “carrot and stick” policy does not always guarantee excellent behaviors, it provides both sides with tangible incentives to keep up good behaviors, effectively maintaining some level of quality assurance within the system.
With e-hail companies becoming mediators between passengers and drivers, conflict resolution can become more high-touch and gentle. With dedicated staff for passenger and driver support, e-hail companies can quickly investigate reported incidents, reach out to the affected parties, educate, and seek reconciliation. A Hailo manager in Boston tells us:
“When customers call us about drivers cancelling, we can look it up in the system and tell the drivers: ‘hey, you accepted this job in our system and [then] cancelled on the customer, we reserve the right to no longer give you that opportunity to have these jobs.’ Drivers generally react in a positive way and say ‘I get it; I'll do better.’ Sometimes we would offer credits to those customers to have them try us again. So
8
customers get an actual resolution and the driver gets a second chance – even if it’s to our financial detriment, but that's the nature of customer service business.”
Such interventions and placation, albeit performed out of business profit considerations, lubricate the driver-passenger relationship. It thus seems fitting that members of Hailo’s customer support team call themselves “playing the psychologist’s role” in the interviews.
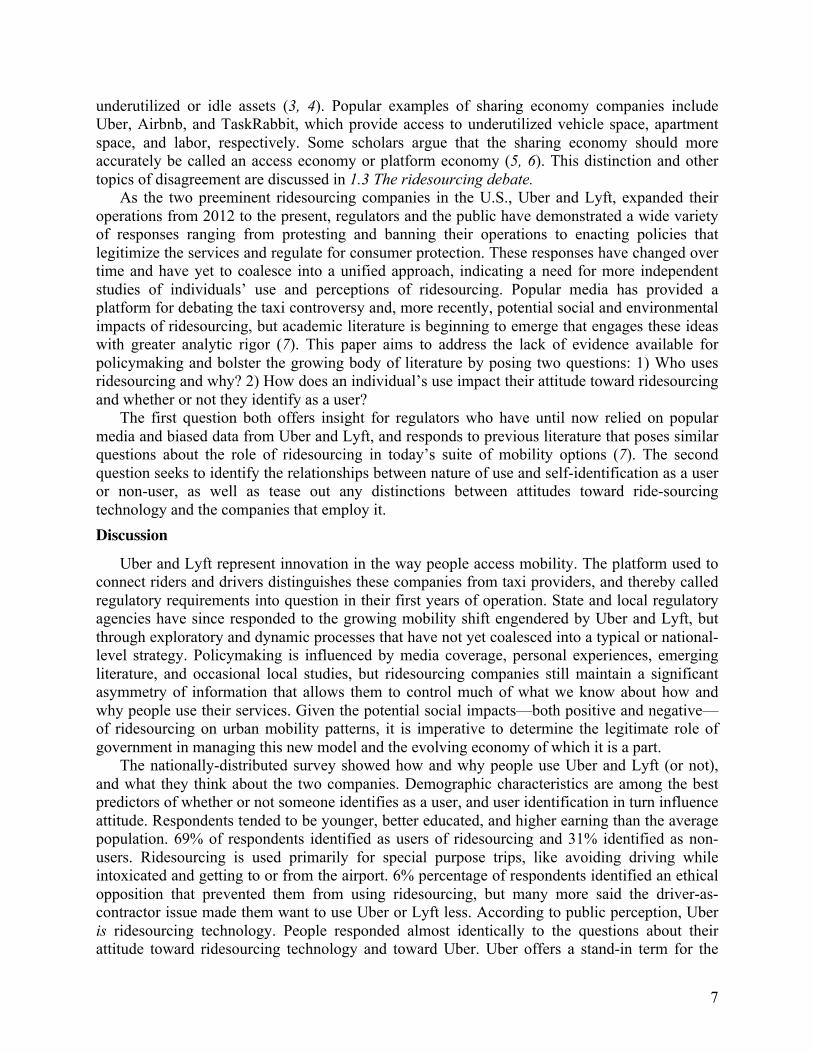
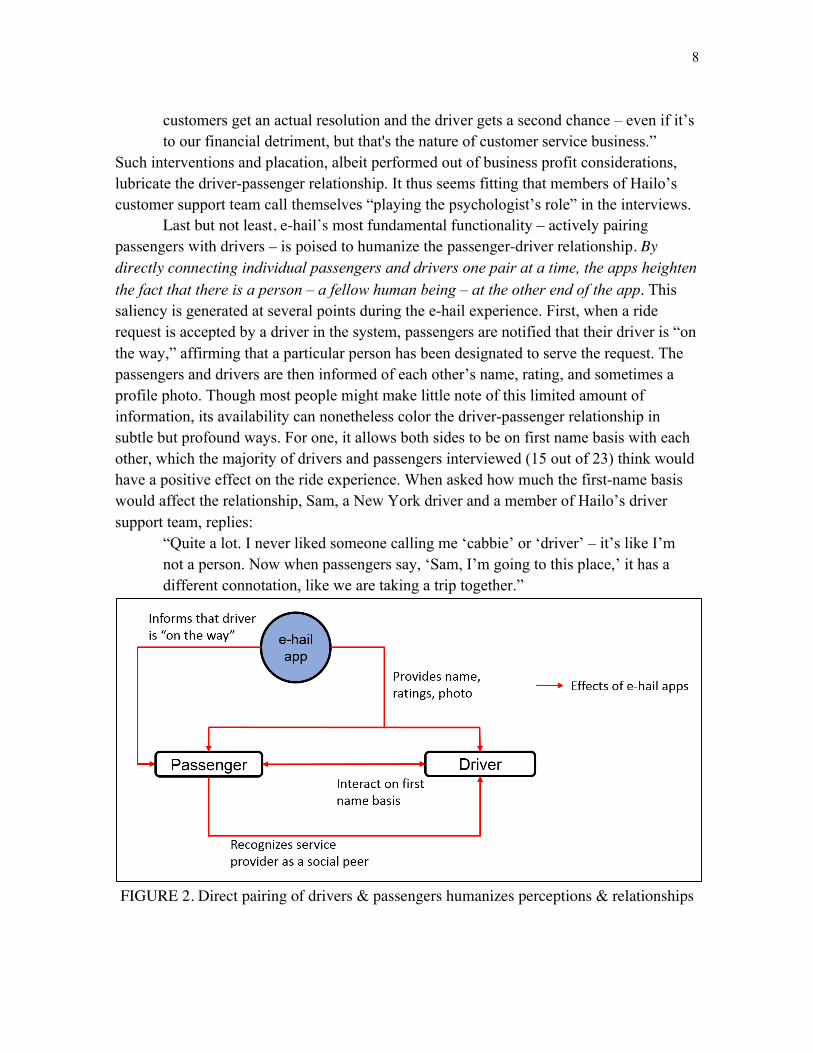
Last but not least, e-hail’s most fundamental functionality – actively pairing passengers with drivers – is poised to humanize the passenger-driver relationship. By directly connecting individual passengers and drivers one pair at a time, the apps heighten the fact that there is a person – a fellow human being – at the other end of the app. This saliency is generated at several points during the e-hail experience. First, when a ride request is accepted by a driver in the system, passengers are notified that their driver is “on the way,” affirming that a particular person has been designated to serve the request. The passengers and drivers are then informed of each other’s name, rating, and sometimes a profile photo. Though most people might make little note of this limited amount of information, its availability can nonetheless color the driver-passenger relationship in subtle but profound ways. For one, it allows both sides to be on first name basis with each other, which the majority of drivers and passengers interviewed (15 out of 23) think would have a positive effect on the ride experience. When asked how much the first-name basis would affect the relationship, Sam, a New York driver and a member of Hailo’s driver support team, replies:
“Quite a lot. I never liked someone calling me ‘cabbie’ or ‘driver’ – it’s like I’m not a person. Now when passengers say, ‘Sam, I’m going to this place,’ it has a different connotation, like we are taking a trip together.”
FIGURE 2. Direct pairing of drivers & passengers humanizes perceptions & relationships
9
It should be noted that this enhanced sense of acquaintanceship between drivers and passengers does not necessarily imply more intimate interactions. Indeed, while none of the drivers nor passengers interviewed report e-hailing eliciting more conversations, the changes in perception and attitude nevertheless affect relationships and power dynamics. Susie, a Bostonian passenger, speaks about the perceptional subtleties:
“[Even though] I don’t think it necessarily makes the driving experience more personal – every interaction has the potential to be very plain, just like a business transaction – when the app gives you the driver's first name, it humanizes the driver. When I see their name, their car, and their personal detail, I do register ‘oh, this person is coming to pick me up,’ unlike some anonymous taxi.”
Likewise, San Francisco driver Gabriel remarks:
“… [Having a name and profile] makes the service a little more pleasant, in the sense that even though it's a complete stranger getting into the car, it's an identifiable stranger.” (Emphasis added)
This quote demonstrates precisely the power of perceptions and feelings – though e-hail’s pairing of drivers and passengers is just as random as before, the lessened anonymity makes the experience feel less random. These perceptional differences, while subtle, demonstrate their ability to sufficiently influence the passenger-driver relationship during the ride. Driver-Company: Limited Empowerment
In addition to a wave on the street, taxi passengers and drivers in San Francisco and Boston can be connected via dispatch services provided by individual taxi companies. The lack of a fair, centralized taxi request dispatch system ranks among top complaints from drivers, especially those in San Francisco. While this flaw leads to unreliability of dispatch service and frustrations for passengers, it impact drivers more significantly in the form of rent-seeking behaviors from dispatchers. San Francisco driver Gabriel says:
“Corruption is really easy. Because [when] the calls come in, somebody has to take that call. Some of the computerized systems handle calls automatically, but generally speaking, there's an order scheduler that takes the call. The minute that somebody says they are going to the airport [i.e. a profitable trip], that call doesn't necessarily find its way into the computer system. It may be dispatched privately. Even in the computerized systems, dispatchers have methods of directing specific calls to specific drivers. There might be a good reason for that under certain circumstances, but it could also be abused.” The introduction of e-hailing can disrupt this rent-seeking paradigm. When a
passenger submits a request via the app, the algorithm automatically sends it to the nearest available e-hail-equipped driver. By taking human processing out of the system, the apps

10
deny dispatchers the ability to extort drivers for “good jobs,” making dispatch fairer and drivers feeling less oppressed. In the words of San Francisco driver Isaac:
“[The centralized dispatch environment enabled by e-hail] will take power out of the companies. Power creates corruption -- when you give a [dispatcher] a chance to make $100,000 a year by extorting money from other guys, he's going to do it…So you take power from him -- that's where you break the ring of corruption.”
In this view, the lack of centralized dispatch is not only an operational inefficiency, but it also enables perverse incentives and poisons the work environment. By bypassing the archaic dispatchers and creating an automated platform, e-hail apps democratizes the playing field and reduces drivers' risk of abuse. There are, however, limits to e-hailing’s capacity to level the playing field. Interviews reveal that e-hailing exerts little influence on curtailing rent-seeking behaviors from the myriad of other players in the industry. This is largely because the technology cannot change drivers’ status as independent contractors, the most fundamental cause of such expropriations. Virtually without exception, nearly every driver, regulator, and professional association and e-hail company staff interviewed identifies drivers’ independent contractor status as the top problem in terms of power dynamics in the industry. Drivers are the most emotional critics of this condition -- vast majority of drivers interviewed (Boston: 6/6, San Francisco: 3/3, New York: 2/4) recount instances of mistreatment and corruption. Issac, a San Francisco taxi driver, explains:
“I’ve paid tens of thousands of dollars in bribes over the years. Everything is a commodity….You want to get your cab fixed? You have to pay to bribe someone [at the garage] to look at the car. To get a [good shift], you have to pay. You get into the airport, you have to pay $5 [to bribe the dispatcher]. Everybody had their hand in the pocket of every driver. It's a horribly corrupt, disgusting business.”
Such corruption is also endemic in many places beyond the company garages. A former San Francisco regulator interviewed recounts the arrest of a member of the taxi police department for allegedly taking bribes to allow people with high criminal records to pass through taxi school. Former drivers who now work for e-hail companies describe hotel doormen asking for bribes in exchange for airport trips and police issuing tickets unfairly to taxi drivers.
These expropriating conditions predicate in large part on the drivers’ lack of organizing and bargaining power. As independent contractors, taxi workers are unable to unionize; the disadvantage at labor talk tables is compounded by the disempowered nature of the largely immigrant workforce with little political clout. These two characteristics create fertile grounds for corruption and coercion. As another San Francisco driver says:
“I've got no retirement, no benefit, no health insurance provided through the company….Cab drivers have really no ability [to do something] because they are contractors to the industry. Companies pretty much dictate the terms.”
11
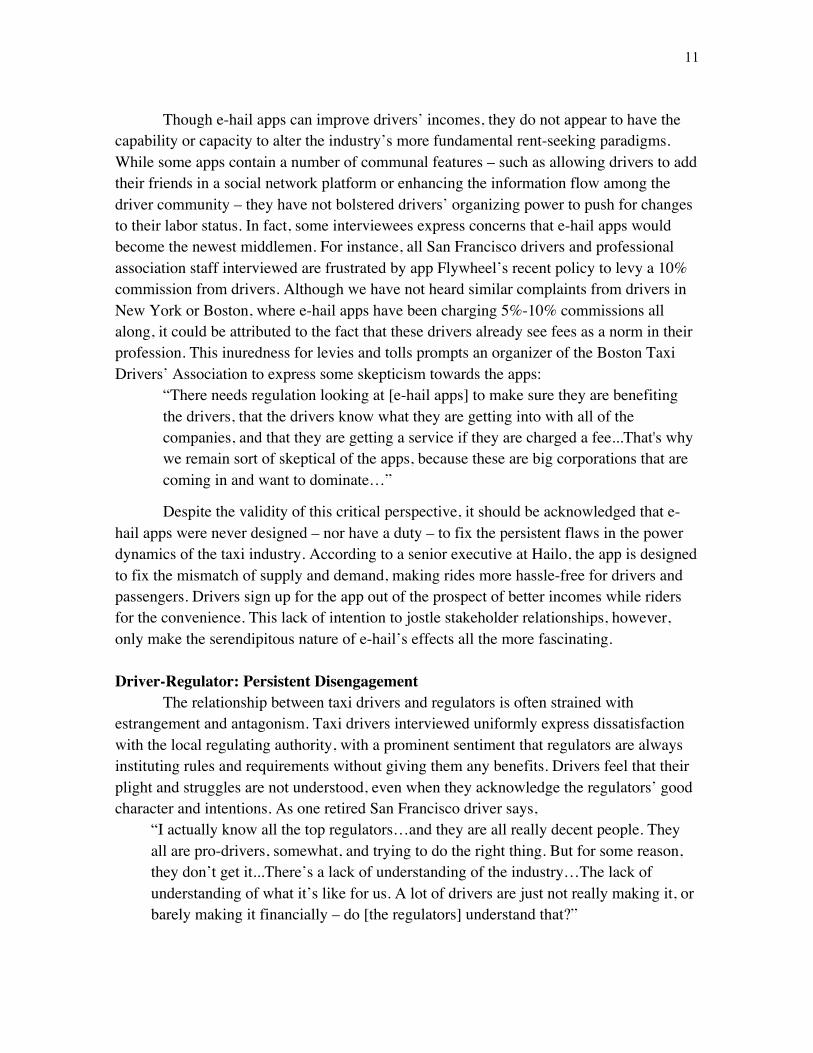
Though e-hail apps can improve drivers’ incomes, they do not appear to have the capability or capacity to alter the industry’s more fundamental rent-seeking paradigms. While some apps contain a number of communal features – such as allowing drivers to add their friends in a social network platform or enhancing the information flow among the driver community – they have not bolstered drivers’ organizing power to push for changes to their labor status. In fact, some interviewees express concerns that e-hail apps would become the newest middlemen. For instance, all San Francisco drivers and professional association staff interviewed are frustrated by app Flywheel’s recent policy to levy a 10% commission from drivers. Although we have not heard similar complaints from drivers in New York or Boston, where e-hail apps have been charging 5%-10% commissions all along, it could be attributed to the fact that these drivers already see fees as a norm in their profession. This inuredness for levies and tolls prompts an organizer of the Boston Taxi Drivers’ Association to express some skepticism towards the apps:
“There needs regulation looking at [e-hail apps] to make sure they are benefiting the drivers, that the drivers know what they are getting into with all of the companies, and that they are getting a service if they are charged a fee...That's why we remain sort of skeptical of the apps, because these are big corporations that are coming in and want to dominate…”
Despite the validity of this critical perspective, it should be acknowledged that e-hail apps were never designed – nor have a duty – to fix the persistent flaws in the power dynamics of the taxi industry. According to a senior executive at Hailo, the app is designed to fix the mismatch of supply and demand, making rides more hassle-free for drivers and passengers. Drivers sign up for the app out of the prospect of better incomes while riders for the convenience. This lack of intention to jostle stakeholder relationships, however, only make the serendipitous nature of e-hail’s effects all the more fascinating. Driver-Regulator: Persistent Disengagement
The relationship between taxi drivers and regulators is often strained with estrangement and antagonism. Taxi drivers interviewed uniformly express dissatisfaction with the local regulating authority, with a prominent sentiment that regulators are always instituting rules and requirements without giving them any benefits. Drivers feel that their plight and struggles are not understood, even when they acknowledge the regulators’ good character and intentions. As one retired San Francisco driver says,
“I actually know all the top regulators…and they are all really decent people. They all are pro-drivers, somewhat, and trying to do the right thing. But for some reason, they don’t get it...There’s a lack of understanding of the industry…The lack of understanding of what it’s like for us. A lot of drivers are just not really making it, or barely making it financially – do [the regulators] understand that?”
12
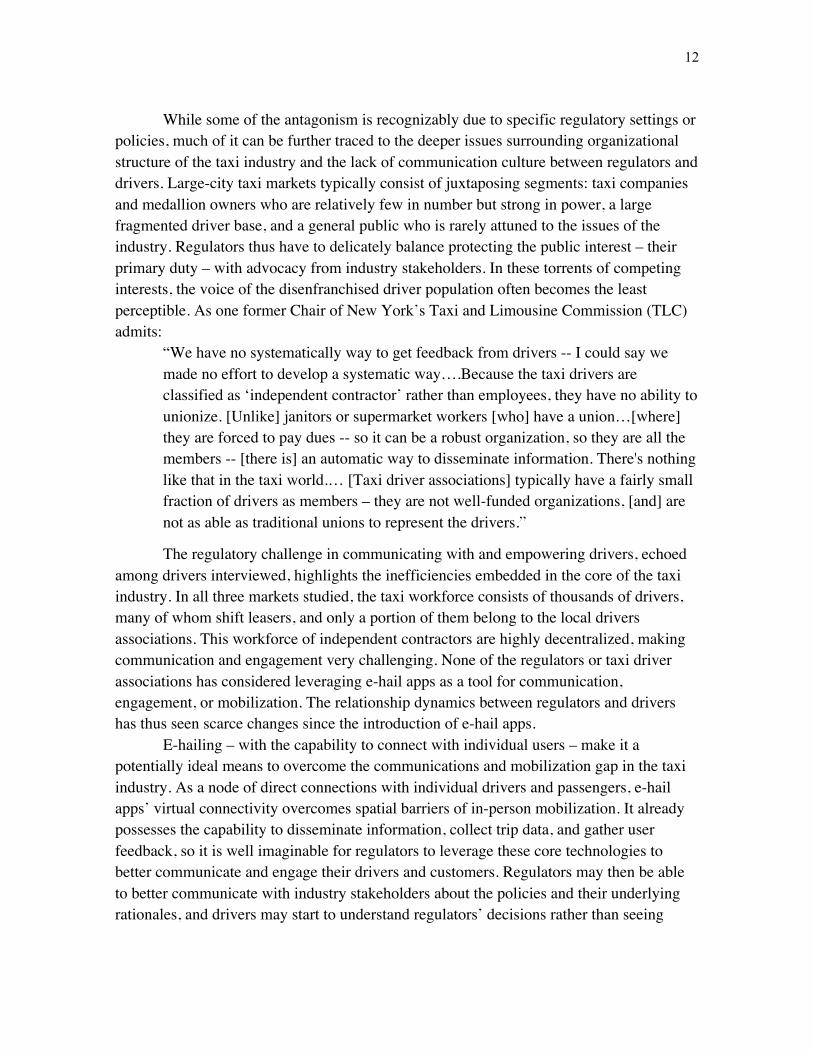
While some of the antagonism is recognizably due to specific regulatory settings or policies, much of it can be further traced to the deeper issues surrounding organizational structure of the taxi industry and the lack of communication culture between regulators and drivers. Large-city taxi markets typically consist of juxtaposing segments: taxi companies and medallion owners who are relatively few in number but strong in power, a large fragmented driver base, and a general public who is rarely attuned to the issues of the industry. Regulators thus have to delicately balance protecting the public interest – their primary duty – with advocacy from industry stakeholders. In these torrents of competing interests, the voice of the disenfranchised driver population often becomes the least perceptible. As one former Chair of New York’s Taxi and Limousine Commission (TLC) admits:
“We have no systematically way to get feedback from drivers -- I could say we made no effort to develop a systematic way….Because the taxi drivers are classified as ‘independent contractor’ rather than employees, they have no ability to unionize. [Unlike] janitors or supermarket workers [who] have a union…[where] they are forced to pay dues -- so it can be a robust organization, so they are all the members -- [there is] an automatic way to disseminate information. There's nothing like that in the taxi world.… [Taxi driver associations] typically have a fairly small fraction of drivers as members – they are not well-funded organizations, [and] are not as able as traditional unions to represent the drivers.”
The regulatory challenge in communicating with and empowering drivers, echoed among drivers interviewed, highlights the inefficiencies embedded in the core of the taxi industry. In all three markets studied, the taxi workforce consists of thousands of drivers, many of whom shift leasers, and only a portion of them belong to the local drivers associations. This workforce of independent contractors are highly decentralized, making communication and engagement very challenging. None of the regulators or taxi driver associations has considered leveraging e-hail apps as a tool for communication, engagement, or mobilization. The relationship dynamics between regulators and drivers has thus seen scarce changes since the introduction of e-hail apps.
E-hailing – with the capability to connect with individual users – make it a potentially ideal means to overcome the communications and mobilization gap in the taxi industry. As a node of direct connections with individual drivers and passengers, e-hail apps’ virtual connectivity overcomes spatial barriers of in-person mobilization. It already possesses the capability to disseminate information, collect trip data, and gather user feedback, so it is well imaginable for regulators to leverage these core technologies to better communicate and engage their drivers and customers. Regulators may then be able to better communicate with industry stakeholders about the policies and their underlying rationales, and drivers may start to understand regulators’ decisions rather than seeing
13
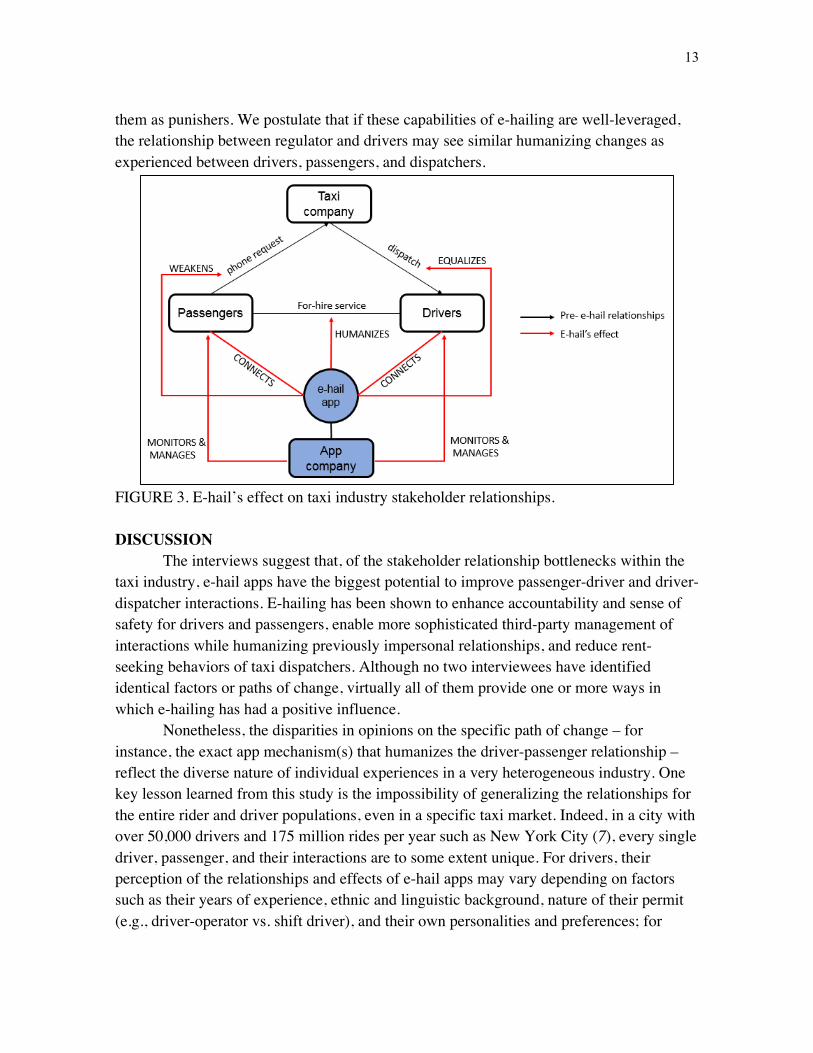
them as punishers. We postulate that if these capabilities of e-hailing are well-leveraged, the relationship between regulator and drivers may see similar humanizing changes as experienced between drivers, passengers, and dispatchers.
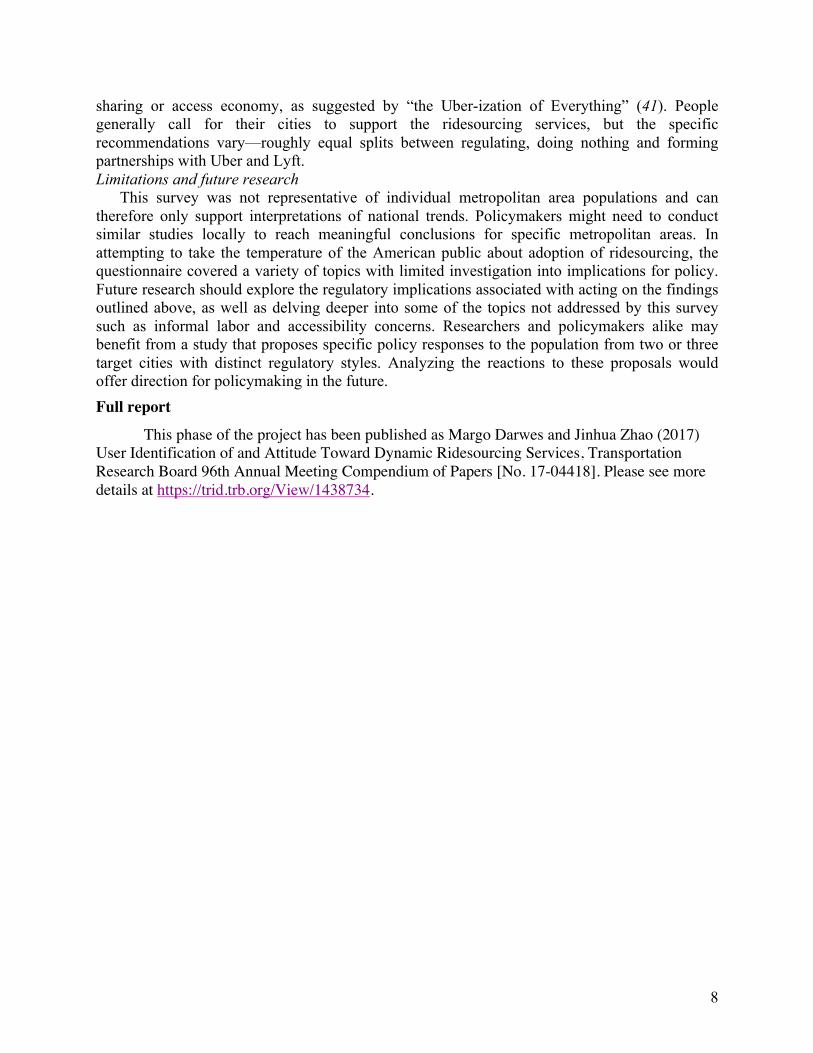
FIGURE 3. E-hail’s effect on taxi industry stakeholder relationships. DISCUSSION
The interviews suggest that, of the stakeholder relationship bottlenecks within the taxi industry, e-hail apps have the biggest potential to improve passenger-driver and driver-dispatcher interactions. E-hailing has been shown to enhance accountability and sense of safety for drivers and passengers, enable more sophisticated third-party management of interactions while humanizing previously impersonal relationships, and reduce rent-seeking behaviors of taxi dispatchers. Although no two interviewees have identified identical factors or paths of change, virtually all of them provide one or more ways in which e-hailing has had a positive influence.
Nonetheless, the disparities in opinions on the specific path of change – for instance, the exact app mechanism(s) that humanizes the driver-passenger relationship – reflect the diverse nature of individual experiences in a very heterogeneous industry. One key lesson learned from this study is the impossibility of generalizing the relationships for the entire rider and driver populations, even in a specific taxi market. Indeed, in a city with over 50,000 drivers and 175 million rides per year such as New York City (7), every single driver, passenger, and their interactions are to some extent unique. For drivers, their perception of the relationships and effects of e-hail apps may vary depending on factors such as their years of experience, ethnic and linguistic background, nature of their permit (e.g., driver-operator vs. shift driver), and their own personalities and preferences; for
14
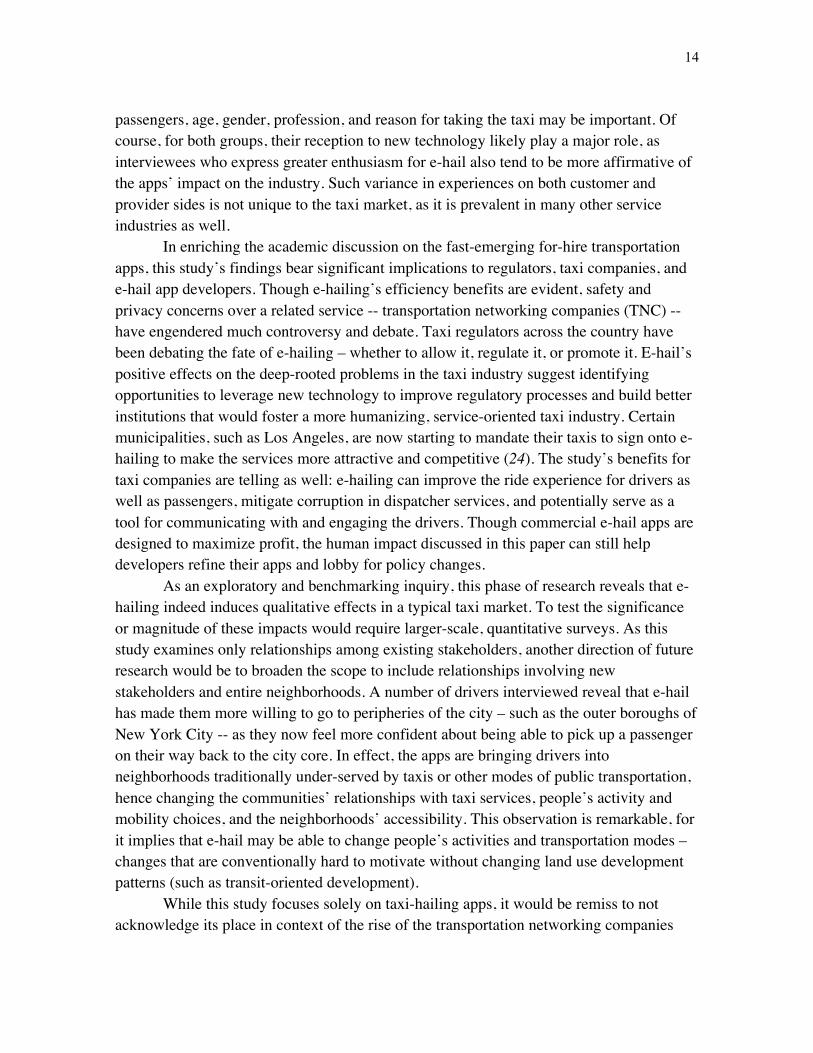
passengers, age, gender, profession, and reason for taking the taxi may be important. Of course, for both groups, their reception to new technology likely play a major role, as interviewees who express greater enthusiasm for e-hail also tend to be more affirmative of the apps’ impact on the industry. Such variance in experiences on both customer and provider sides is not unique to the taxi market, as it is prevalent in many other service industries as well.
In enriching the academic discussion on the fast-emerging for-hire transportation apps, this study’s findings bear significant implications to regulators, taxi companies, and e-hail app developers. Though e-hailing’s efficiency benefits are evident, safety and privacy concerns over a related service -- transportation networking companies (TNC) -- have engendered much controversy and debate. Taxi regulators across the country have been debating the fate of e-hailing – whether to allow it, regulate it, or promote it. E-hail’s positive effects on the deep-rooted problems in the taxi industry suggest identifying opportunities to leverage new technology to improve regulatory processes and build better institutions that would foster a more humanizing, service-oriented taxi industry. Certain municipalities, such as Los Angeles, are now starting to mandate their taxis to sign onto e-hailing to make the services more attractive and competitive (24). The study’s benefits for taxi companies are telling as well: e-hailing can improve the ride experience for drivers as well as passengers, mitigate corruption in dispatcher services, and potentially serve as a tool for communicating with and engaging the drivers. Though commercial e-hail apps are designed to maximize profit, the human impact discussed in this paper can still help developers refine their apps and lobby for policy changes.
As an exploratory and benchmarking inquiry, this phase of research reveals that e-hailing indeed induces qualitative effects in a typical taxi market. To test the significance or magnitude of these impacts would require larger-scale, quantitative surveys. As this study examines only relationships among existing stakeholders, another direction of future research would be to broaden the scope to include relationships involving new stakeholders and entire neighborhoods. A number of drivers interviewed reveal that e-hail has made them more willing to go to peripheries of the city – such as the outer boroughs of New York City -- as they now feel more confident about being able to pick up a passenger on their way back to the city core. In effect, the apps are bringing drivers into neighborhoods traditionally under-served by taxis or other modes of public transportation, hence changing the communities’ relationships with taxi services, people’s activity and mobility choices, and the neighborhoods’ accessibility. This observation is remarkable, for it implies that e-hail may be able to change people’s activities and transportation modes – changes that are conventionally hard to motivate without changing land use development patterns (such as transit-oriented development).
While this study focuses solely on taxi-hailing apps, it would be remiss to not acknowledge its place in context of the rise of the transportation networking companies
15
(TNCs). Since these so-called “ridesharing” services are technically a form of e-hailing, the line between these two types of for-hire apps is becoming increasingly blurred. We often found it necessary to go to great length to clarify the topic of this study for the interviewees. Even with such clarifications, in interviews with drivers and regulators, it was almost impossible for the conversation to not stray to the topic of TNCs. This reflects the fact that TNCs have become a dominant concern for many stakeholders in the taxi industry. With their innovative yet simple business models and the emphasis on user experience, the TNCs starkly juxtapose the inefficiencies and resistance to change in the traditional taxi industry, eroding both the taxi driver and customer bases in many cities. Though the effects of e-hail apps can potentially improve the drivers’ working condition by breaking down some of the coercive and abusing power relationships, the rise of the TNCs may likely confound or offset some of these benefits.
In fact, this new trend has not only rendered the taxi industry – but also e-hail app companies -- in a state of flux. In October 2014, Hailo, the most popular taxi e-hail apps, announced its ceasing of operations in North America due to competition from the ultra on-demand TNCs. This latest development seems to cast doubt on the potential for the taxi industry to renew itself with aid of technological innovation, but, under a different light, the taxi service is in fact one of the earliest on-demand sectors. Whether the taxi industry will retain its current form in the future or morph into a very different look, the message is clear – even the most deep-rooted relationship paradigms can be disrupted and innovated.
16
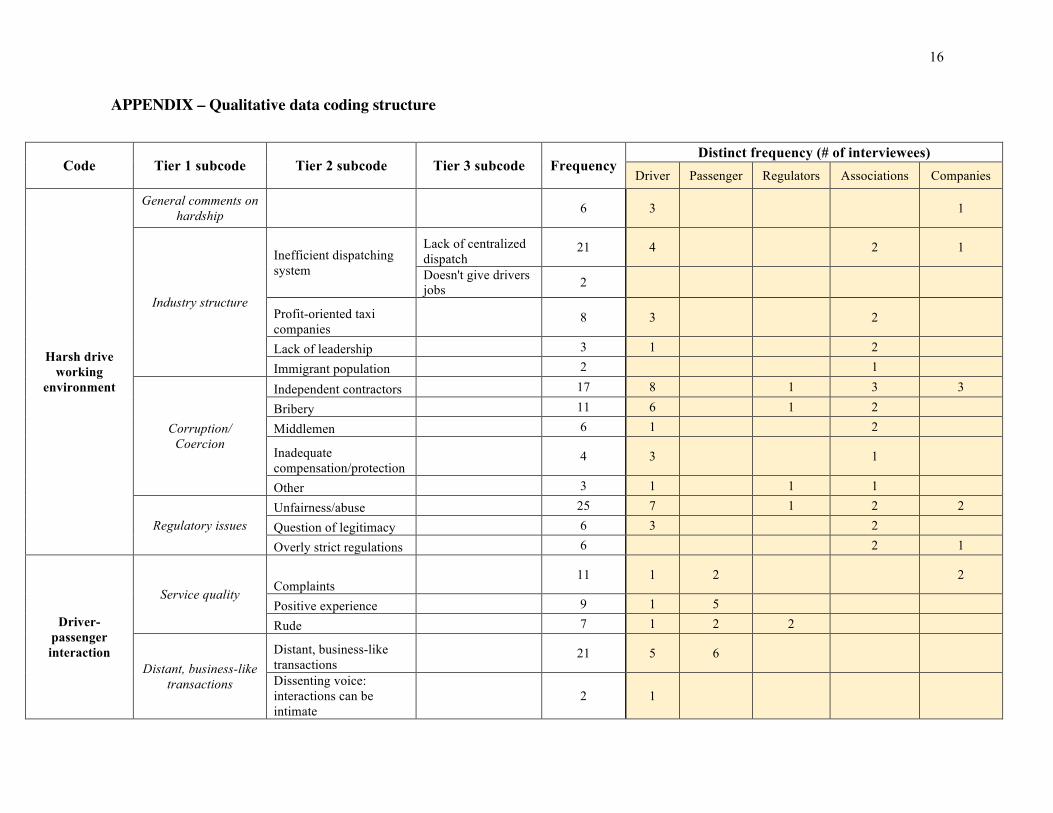
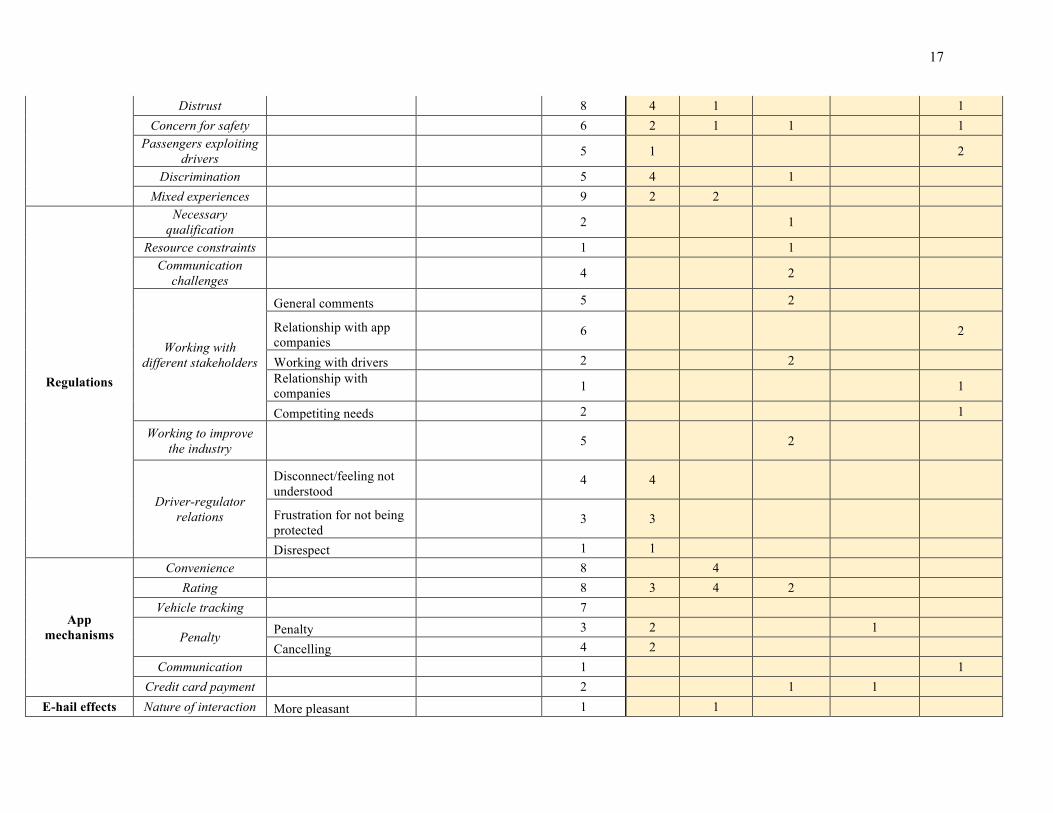
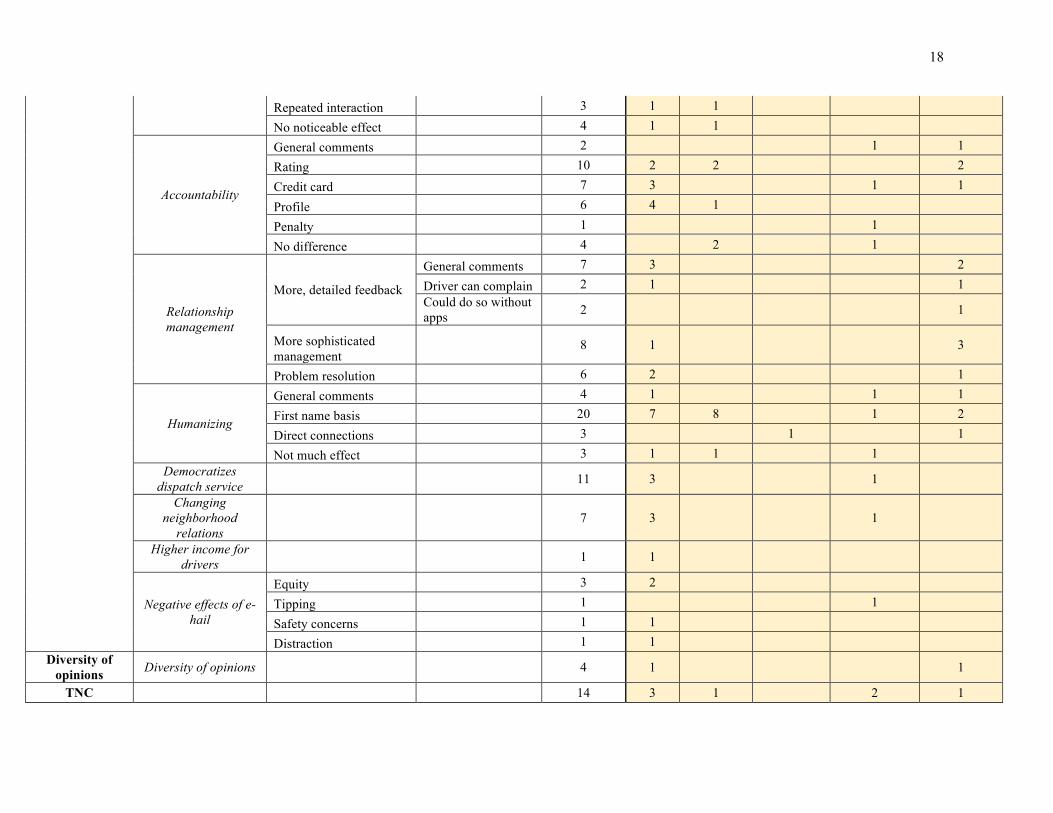
APPENDIX – Qualitative data coding structure
Code Tier 1 subcode Tier 2 subcode Tier 3 subcode Frequency Distinct frequency (# of interviewees)
Driver Passenger Regulators Associations Companies
Harsh drive working
environment
General comments on hardship
6 3 1
Industry structure
Inefficient dispatching system
Lack of centralized dispatch
21 4 2 1
Doesn't give drivers jobs 2
Profit-oriented taxi companies
8 3 2
Lack of leadership 3 1 2
Immigrant population 2 1
Corruption/ Coercion
Independent contractors 17 8 1 3 3
Bribery 11 6 1 2
Middlemen 6 1 2
Inadequate compensation/protection
4 3 1
Other 3 1 1 1
Regulatory issues Unfairness/abuse 25 7 1 2 2
Question of legitimacy 6 3 2
Overly strict regulations 6 2 1
Driver-passenger interaction
Service quality Complaints 11 1 2 2
Positive experience 9 1 5
Rude 7 1 2 2
Distant, business-like transactions
Distant, business-like transactions
21 5 6
Dissenting voice: interactions can be intimate
2 1
17
Distrust 8 4 1 1 Concern for safety 6 2 1 1 1
Passengers exploiting drivers 5 1 2
Discrimination 5 4 1 Mixed experiences 9 2 2
Regulations
Necessary qualification 2 1
Resource constraints 1 1 Communication
challenges 4 2
Working with different stakeholders
General comments 5 2
Relationship with app companies
6 2
Working with drivers 2 2 Relationship with companies 1 1
Competiting needs 2 1
Working to improve the industry
5 2
Driver-regulator relations
Disconnect/feeling not understood
4 4
Frustration for not being protected
3 3
Disrespect 1 1
App mechanisms
Convenience 8 4 Rating 8 3 4 2
Vehicle tracking 7
Penalty Penalty 3 2 1
Cancelling 4 2 Communication 1 1
Credit card payment 2 1 1 E-hail effects Nature of interaction More pleasant 1 1
18
Repeated interaction 3 1 1
No noticeable effect 4 1 1
Accountability
General comments 2 1 1
Rating 10 2 2 2
Credit card 7 3 1 1
Profile 6 4 1
Penalty 1 1
No difference 4 2 1
Relationship management
More, detailed feedback
General comments 7 3 2
Driver can complain 2 1 1 Could do so without apps 2 1
More sophisticated management
8 1 3
Problem resolution 6 2 1
Humanizing
General comments 4 1 1 1
First name basis 20 7 8 1 2
Direct connections 3 1 1
Not much effect 3 1 1 1 Democratizes
dispatch service 11 3 1
Changing neighborhood
relations 7 3 1
Higher income for drivers 1 1
Negative effects of e-hail
Equity 3 2
Tipping 1 1
Safety concerns 1 1
Distraction 1 1 Diversity of
opinions Diversity of opinions 4 1 1
TNC 14 3 1 2 1
19
REFERENCES 1. San Francisco Municipal Transportation Agency. Best Practices Studies of Taxi Regulations – Taxi User
Surveys. Hara Associates and Corey, Canapary & Galanis, March 2013. http://www.sfmta.com/sites/default/files/Draft%20SF%20UserSurvey%2055%20WEB%20version04042013.pdf
2. “Omnibus Household Survey.” Bureau of Transportation Statistics. October 2003. Accessed April 16, 2014. https://www.rita.dot.gov/bts/sites/rita.dot.gov.bts/files/subject_areas/omnibus_surveys/household_survey/2003/october/index.html
3. Li, Ye, Tian Xia, and Hui Dan. 2014. "The Impact on Taxi Industry of Taxi-Calling Mobile Apps in Shanghai." Paper presented at Transportation Research Board 93rd Annual Meeting, Washington D.C., January 2014. http://trid.trb.org/view.aspx?id=1289065
4. San Francisco Municipal Transportation Agency. Best Practices Studies of Taxi Regulations – Managing Taxi Supply. Hara Associates and Corey, Canapary & Galanis, 2013. http://www.sfmta.com/sites/default/files/Draft%20SF%20UserSurvey%2055%20WEB%20version04042013.pdf
5. Taxi 07: Roads Forward. New York: Design Trust for Public Space and the New York City Taxi & Limousine Commission (TLC), 2007. http://www.nyc.gov/html/tlc/downloads/pdf/taxi_book.pdf
6. City of Boston. Taxi Consultant Report. Boston: Nelson\Nygaard, 2013. http://www.cityofboston.gov/mayor/pdfs/bostaxiconsultant.pdf
7. 2014 Taxicab Factbook. New York: The New York City Taxi & Limousine Commission (TLC), 2014. http://www.nyc.gov/html/tlc/downloads/pdf/2014_taxicab_fact_book.pdf
8. Mundy, Ray. Houston Taxi Study. Houston: Tennessee Transportation & Logistics Foundation, 2014. https://www.houstontx.gov/ara/regaffairs/Houston_Taxi_Study_Results_20140120.pdf
9. Cooper, James, Ray Mundy, and John Nelson. Taxi!: Urban Economies and the Social and Transport Impacts of the Taxicab. Farnham, England: Ashgate, 2010.
10. Flegenheimer, Matt. “American-Born Cabbies Are a Vanishing Breed in New York.” New York Times, February 9, 2014. http://www.nytimes.com/2014/02/10/nyregion/american-born-cabbies-a-vanishing-breed-in-city.html
11. Leavitt, Jacqueline, Gary Blasi. The Los Angeles Taxi Workers Alliance (UCTC Research Paper No. 893). University of California Transportation Center, 2009. http://www.uctc.net/papers/893.pdf
12. Bruno, Roberto. Driven Into Poverty: A Comprehensive Study of the Chicago Taxicab Industry. Report II: Violence. Chicago: University of Illinois at Chicago, School of Labor and Employment Relations, 2009. http://www.ler.illinois.edu/labor/images/Violence_Report-_Final_Draft.pdf
13. “For cab drivers, risk and reward are a mismatch.” The Boston Globe, April 2, 2013. 14. “For Boston cabbies, a losing battle against the numbers.” The Boston Globe, March 31 2013. 15. Bruno, Roberto. Driven Into Poverty: A Comprehensive Study of the Chicago Taxicab Industry. Report I:
Income. Chicago: University of Illinois at Chicago, School of Labor and Employment Relations, 2009. http://www.ler.illinois.edu/labor/images/Taxi_Income_Report_-_Final_Copy.pdf
16. Blasi, Gary, and Jacqueline Leavitt. Driving Poor: Taxi Drivers and the Regulation of the Taxi Industry in Los Angeles. Los Angeles: Institute for Research on Labor and Employment, 2006.
17. Mailath, George Joseph, and Larry Samuelson. Repeated Games and Reputations: Long-run Relationships. Oxford: Oxford University Press, 2006.
18. Andreoni, James, and John H. Miller. "Rational Cooperation in the Finitely Repeated Prisoner's Dilemma: Experimental Evidence." The Economic Journal, 1993, 570. http://www.jstor.org/stable/2234532
20
19. Dutzik, Tony, Jeff Inglis, and Phineas Baxandall. Millennials in Motion: Changing Travel Habits of Young Americans and the Implications for Public Policy. U.S. PIRG Education Fund, Frontier Group, October 2014.
20. Barro, Josh. “Under Pressure From Uber, Taxi Medallion Prices Are Plummeting.” New York Times, November 27, 2014. http://www.nytimes.com/2014/11/28/upshot/under-pressure-from-uber-taxi-medallion-prices-are-plummeting.html?abt=0002&abg=0
21. MAXQDA Reference Manual. http://www.maxqda.com/download/manuals/max11_manual_eng.pdf 22. Strauss, Anselm, and Juliet M. Corbin. Basics of qualitative research: Grounded theory procedures and techniques.
Sage Publications, Inc, 1990. 23. New York City E-hail Pilot Program Final Report. New York City Taxi & Limousine Commission (TLC), January
28, 2015. http://www.nyc.gov/html/tlc/downloads/pdf/ehail_q5_report_final.pdf 24. Gross, Benjamin. “Los Angeles Taxis Will Have a Mandatory App Starting in August.” Curbed. January 16, 2015.
http://la.curbed.com/archives/2015/01/los_angeles_taxis_will_have_a_mandatory_app_starting_in_august.php
1
User Identification of and Attitude Toward Dynamic Ridesourcing Services 1 2 3 4Margo Dawes 5Department of Urban Studies and Planning 6Massachusetts Institute of Technology 777 Massachusetts Avenue, Cambridge, MA 02139, USA. 8Tel: 301-712-5013, email:[email protected] 9 10Jinhua Zhao, corresponding author 11Department of Urban Studies and Planning 12Massachusetts Institute of Technology 1377 Massachusetts Avenue, Cambridge, MA 02139, USA. 14Tel: 617-324-7594, email: [email protected] 16Total word count: 5875 + 8 tables and figures = 7875 17 18Submitted Aug 1, 2016 19 20 21 22
2
ABSTRACT 1 2Media coverage of ridesourcing services such as Uber and Lyft has described a rivalry between new 3technology and the established taxi industry. Individual users and non-users of ridesourcing may have more 4nuanced perspectives, but policymakers have had little guidance on how to best represent these interests. 5This study uses a standardized questionnaire distributed across the United States by an online survey 6company to understand individual attitudes toward Uber, Lyft, and ridesourcing technology in general. The 7survey asks respondents if they identify as users or non-users of ridesourcing, why or why not, how they 8rank Uber and Lyft among their other travel modes, and their attitudes toward the companies and toward 9the technology in general, among other questions. The survey returned 394 completed questionnaires from 10the most populous 15 metropolitan statistical areas in the U.S. with a response rate of 27%. Analysis of the 11results includes descriptive statistics, bivariate correlation analyses of relationships between variables, and 12logistic regressions to identify factors that impact user identification and attitude. The findings indicate that 13about 70% of respondents use some form of ridesourcing, mostly for special-purpose trips such as avoiding 14driving while intoxicated and getting to and from the airport. There are relationships between transportation 15needs and user identification and attitude, but demographics are the best predictor of user identification, 16which in turn predicts attitude, which can predict individuals’ policy preferences. The study suggests 17potential for policymakers to leverage constituent perspectives to change aspects of ridesourcing that have 18low public approval. 19 20Keywords: Ridesourcing, user identification, public attitude, Transportation Network Companies (TNCs) 21 22
3
1. Introduction 1
Recent years have ushered in innovation in the mobility industry, both in technological advancements 2and with new business models. A bevy of transportation services from private cars to commuter buses have 3become available on-demand thanks to the expansion of smartphone apps and online-enabled platforms. 4This paper focuses on ridesourcing, the model that allows individuals to request a ride through a smartphone 5application and get connected to a nearby driver within minutes. As a direct competitor to the taxi industry 6and a new technology, ridesourcing has faced criticism and concern for skirting established regulations. 7Yet it has grown increasingly popular as a mobility choice across the United States. Two frameworks 8provide context for this emerging shift: the urban mobility revolution, and the so-called sharing economy. 9
The urban mobility revolution resides at the confluence of the smart cities movement, innovation in 10autonomous vehicles, vehicle electrification and interconnectedness, and the advent of new mobility 11services (1, 2). These new mobility services might more accurately be called new models for accessing 12traditional forms of mobility, and range from car-sharing to ridesourcing. The convenience and cost savings 13associated with these alternative means of accessing mobility has made many of them competitors to 14traditional modes and providers (e.g. the car rental and taxi industries). 15
Occurring alongside this revolution is a phenomenon widely known as the sharing economy, which 16refers to the market for sharing, trading, or renting goods and services from person to person rather than 17through traditional ownership or centralized institutions. A key component is the use of online platforms to 18link excess supply to demand, granting temporary access to underutilized or idle assets (3, 4). Popular 19examples of sharing economy companies include Uber, Airbnb, and TaskRabbit, which provide access to 20underutilized vehicle space, apartment space, and labor, respectively. Some scholars argue that the sharing 21economy should more accurately be called an access economy or platform economy (5, 6). This distinction 22and other topics of disagreement are discussed in 1.3 The ridesourcing debate. 23
As the two preeminent ridesourcing companies in the U.S., Uber and Lyft, expanded their operations 24from 2012 to the present, regulators and the public have demonstrated a wide variety of responses ranging 25from protesting and banning their operations to enacting policies that legitimize the services and regulate 26for consumer protection. These responses have changed over time and have yet to coalesce into a unified 27approach, indicating a need for more independent studies of individuals’ use and perceptions of 28ridesourcing. Popular media has provided a platform for debating the taxi controversy and, more recently, 29potential social and environmental impacts of ridesourcing, but academic literature is beginning to emerge 30that engages these ideas with greater analytic rigor (7). This paper aims to address the lack of evidence 31available for policymaking and bolster the growing body of literature by posing two questions: 1) Who uses 32ridesourcing and why? 2) How does an individual’s use impact their attitude toward ridesourcing and 33whether or not they identify as a user? 34
The first question both offers insight for regulators who have until now relied on popular media and 35biased data from Uber and Lyft, and responds to previous literature that poses similar questions about the 36role of ridesourcing in today’s suite of mobility options (7). The second question seeks to identify the 37relationships between nature of use and self-identification as a user or non-user, as well as tease out any 38distinctions between attitudes toward ride-sourcing technology and the companies that employ it. 39
The paper begins by introducing Uber and Lyft in the context of the growth of ridesourcing in the U.S. 40and by reviewing relevant literature. It then describes the study methodology and the univariate and 41bivariate results of the survey. It concludes with a discussion of the key findings and recommendations for 42future research. 43
1.1 Background 44
The ridesourcing business model allows individuals seeking a ride to be connected to nearby drivers 45through a smartphone application. The application facilitates the entire transaction, including real-time 46vehicle location information, GPS-enabled navigation, automatic payment, and a driver-passenger rating 47
4
system, among other features. The model relies primarily on drivers who don’t have commercial vehicle 1licenses and who use their own vehicles to provide service on a part-time basis (7). 2
Uber and Lyft are currently the two major companies that offer ridesourcing services in the U.S. They 3are referred to as Transportation Network Companies, or TNCs, in most recent regulations, but refer to 4themselves as ridesharing services. This paper takes the stance that the companies’ carpooling services, 5UberPool and Lyft Line, are ridesharing, but that their original and primary services, UberX and Lyft, are 6not. Because drivers provide rides to individuals that they would not otherwise make, the primary function 7served by Uber and Lyft should be called ridesourcing, not ridesharing.1 8
At its inception in 2010, Uber operated an on-demand black car service. Facing competition from taxi 9alternatives, Lyft and Sidecar—founded in 2012 and 2011, respectively—Uber expanded its model to 10include a comparably affordable ridesourcing service (8). In the last six years, Uber has expanded to offer 11service in over 400 cities globally, working with hundreds of thousands of drivers to provide rides for 12millions of passengers. Lyft has a much smaller valuation than Uber—$5.5 billion compared to Uber’s 13$62.5 billion (9)—and operates only within the U.S., but it is Uber’s most serious domestic competitor. 14While Lyft is less widely used than Uber, it presents itself as a friendlier alternative, which may contribute 15to its enduring competitiveness (Lyft’s slogan is “Your friend with a car” and Uber’s is “Everyone’s private 16driver”) (10, 11). Internationally, Uber faces competition from similar regionally-focused companies, such 17as Didi Chuxing in China, Ola in India, Grab in Southeast Asia, and Cabify in Spain and Latin America. 18While no other ridesourcing company alone can yet challenge Uber on the global stage, Lyft, Did, Ola, and 19Grab announced in late 2015 that they would form an alliance to share riders across continents (12, 13). 20This alliance went online in April 2016 and will allow users to book cabs from the local app when traveling 21(14). 22
1.2 Related literature 23
While literature on the use, benefits, and costs of ridesourcing is nascent, decades of research on the 24taxi industry provide some insight and context for its success. 25
From the hackney carriages of early 17th-century Europe, taxis evolved alongside private vehicle 26advancements until the automobile reached wide distribution in the early 20th century. By the early 1920s, 27few American cities had established any sort of regulation for private taxicabs (15). However, as individuals 28gained enough wealth to start taxi companies, and then as the Great Depression motivated the search for 29alternative forms of employment, oversupply became the first problem cities tried to address with regulation 30(16, 15). In addition to exacerbating congestion, the surplus led new market entries to undercut standard 31fares, leading to rate wars in cities nationwide (15, 17). As new drivers and vehicles continued to flood the 32market, newspapers and public officials demand-ed stricter regulation of the taxi industry (16, 18). In the 33decades following the Great Depression, cities established entry restrictions, medallion limitations, driver 34and vehicle licensing requirements, and fixed fare structures, nearly all of which went unchanged until the 35United States’ widespread industry deregulation in the 1970s and 1980s (15, 18). After the taxi industry 36experienced its own wave of deregulation—which had ideological motivations and was intended to lower 37fares, improve services, and expand coverage to poorly served neighborhoods—almost all cities re-38regulated their taxi industries due to the failure of deregulation to produce the expected results (16, 19, 20). 39
In the process of this regulatory way-finding, the taxi industry has become entrenched in the American 40economy, but in the last two decades it has been protected mainly by the regulations designed to keep 41competitors at bay. By arguing that taxi regulations are inapplicable because they do not own any cars or 42employ any drivers, Uber and Lyft were able to enter the market of private for-hire transportation without 43becoming subject to the operational restrictions imposed on taxis. This circumvention, combined with the 44companies’ widely cited efficiency improvements, enabled Uber and Lyft to pose serious competition to 45the established taxi industry, igniting a controversy between taxi drivers and these companies that came to 46be known as disruptors. The popular media has capitalized on this controversy in its coverage of the 47
1 Other literature refers to the same services as e-hailing, ride-hailing, and on-demand for-hire vehicles.
5
evolution of Uber and Lyft (18, 26, 31), but some authors argue that this focus is too narrow, and leaves 1more pressing questions about vehicle use and ownership out of the discussion (7). 2
1.3 The ridesourcing debate 3
Ridesourcing as a model has numerous potential impacts, not just for the incumbent taxi industry, but 4for potential users of for-hire transportation, for the people contracted as drivers by these companies, and 5for society as a whole. These impacts may be positive or negative, and are only beginning to be understood 6as new studies are published on specific questions. For now, the literature largely frames the debate by 7enumerating the potential costs and benefits and identifying areas for future study. 8
Reflecting the fixation of ridesourcing as a direct competitor to the taxi industry, many authors cite the 9efficiency gains of ridesourcing companies over the services offered by taxis and livery vehicles, 10particularly in gains of reduced wait times and lowered search costs (7, 21). Some emerging literature 11argues that potential benefits include potential earnings for drivers, potential savings for consumers, 12resource conservation for urban space previously reserved for parking, reduction of car ownership, and 13supplementation of public transit (22, 21, 23). However, citing the dearth of conclusive literature on the 14measurable benefits of ridesourcing, many authors use literature on taxis, ridesharing, and paratransit as a 15stand-in, which allows for further claims that ridesourcing could constitute an integral component of a city’s 16public transit and mobility network if planners and regulators recognize its potential (24, 15, 25). 17
In contrast, other authors suggest ride-sourcing may actually compete with transit, increase overall 18VMT and urban congestion, and enable companies to employ droves of con-tractors and part-time workers, 19thereby bypassing the need to offer full-time benefits (24, 26, 6, 21). Ridesourcing may also endanger 20consumer safety, enable implicit bias between drivers and passengers, and exclude those who don’t have 21access to smartphones (e.g. the low-income and elderly) (7, 21). Public safety is a popular topic, with the 22public voicing concerns along multiple axes: driver safety and sobriety, vehicle maintenance and insurance, 23and criminal background checks (27, 21, 28). 24
Echoing the sentiments of popular media, much recent literature refers to Uber and Lyft as industry 25disruptors, suggesting that they pose a threat to industries operating under existing regulations, which 26include not only the taxi industry and public transit, but the private car industry as well (29, 6, 30). Critics 27of this disruption point not to the economic decline of an industry in general, but to the disparate impacts 28felt by taxi drivers, who used to be able to make a livelihood out of driving (15, 31, 18). Sup-porters, 29however, argue that industry disruption is a form of innovation that may mitigate the inefficiencies of taxi 30licensing and sustain long-term economic growth (32, 21). 31
Weighing in on components of this larger debate, a number of local studies and case studies have been 32conducted by private consultants and academics. These studies include investigations into congestion (33); 33service to low-income neighborhoods in Los Angeles (34); motivations of and benefits for drivers (35, 36); 34trip-specific comparisons of taxis, transit, and ridesourcing in San Francisco (7); and annual travel surveys 35and references in public opinion polls (37, 38). While these studies have a role in informing research and 36policymaking, only the San Francisco case study contributes meaningfully to the body of academic 37literature, and only the national tracking poll offers a glimpse of trends observable outside individual cities. 38Still unrepresented or underrepresented in the literature is independent research on the use of ridesourcing 39and its costs and benefits, the constituent perspective, and mechanisms for direct translation of findings to 40policy. This paper will not fill all of those gaps, but it will offer new information on public opinion at a 41national level, including connections to policy, while remaining unaffiliated with either Uber or Lyft. 42
2. Methodology 43
The data collection method was an online self-administered survey hosted and distributed by Qualtrics, 44a private research survey company. Responses were collected between March 17 and March 19, 2016. The 45study targeted adults living in the top 15 metropolitan statistical areas by population in the U.S., and sought 46a sample size of 385 to be representative of the adult U.S. population with 95% confidence and a margin of 47error of 5%. As a methodology, the nationally-distributed survey was preferable compared to more detailed 48
6
qualitative methods such as semi-structured interviews due to its ability to capture the perceptions of the 1general public (as opposed to policymakers or opinionated commentators). 2
Qualtrics recruits participants through partner-ships with external organizations and programs known 3as “panels.” Respondents join panels through apps, online games, and rewards programs, and exchange 4participation in surveys for cash or reward point incentives. Of the respondents who initiate the survey, 5only “good completes” are included in the final sample size and compensated for completion. To qualify 6as “good completes,” respondents must make it to the end of the survey and pass the attention checks, 7careful completion checks, and speeding checks embedded in the survey by Qualtrics. Qualtrics reported a 827% response rate, indicating that 1,463 individuals viewed the recruitment message. 673 people initiated 9the survey before 394 “good completes” were recorded and the survey closed. 10
The 32-question survey asked respondents to identify as users or non-users of Uber and Lyft; to give 11their reasoning for using or not using either service, primary trip purposes, and frequency of use; to rank 12their regular mode choices; to describe their attitudes toward Uber, Lyft, and ridesourcing technology in 13general; and to share their opinion on how their city should respond to Uber and Lyft. It also asked 14respondents to share basic demographics. 15
The analysis method includes descriptive statistics of the survey results, bivariate correlation analysis 16of the independent and dependent variables, and logistic regressions used to discern which variables had 17directional and predictive relationships with user identification and attitude. 18
3. Results 19 20
3.1 Respondent demographics 21
Survey respondents were generally younger, better educated, and more represented by women than the 22average population of urban adults in the United States (see Table 1). Individuals between the ages of 18 23and 24 were overrepresented (as were the 25-34 and 35-44 age groups, but to a much lesser degree). 24Respondents were also slightly wealthier than the average population, but about as white. The disparities 25may be influenced by the sampling method: individuals who completed the survey may be more computer-26savvy than the average urban adult, which could impact age, education, and income data. These findings 27support the evidence presented by Rayle et al. that ridesourcing serves a younger, wealthier population (7). 28
The breakdown of respondents by U.S. Census region is as follows: 110 (27.9%) were from the 29Northeast, 109 (27.7%) were from the South, 96 (24.4%) were from the West, and 79 (20.1%) were from 30the Midwest. 31
Based on the population densities associated with home zip code, 56% of respondents live in urban 32areas, while 26% live in suburban areas, and 18% live in areas classified as rural, despite identifying as 33residents of a nearby metropolitan area. Respondents live between 3.3 and 156.8 miles from the center of 34the nearest metropolitan area, with an average distance from center of 32.1 miles and a standard deviation 35of 24.7 miles. 183 respondents (46%) reported living and working in the same zip code, leaving 204 36respondents (52%) who reported different zip codes for their home and work addresses, implying some 37form of a regular commute. 38
39Table 1: Demographics of survey respondents compared to adult population of the 15 aggregated 40metropolitan areas41
Survey Results US Census, 2010
Responses Percent Gender a Female 237 60% 51% Male 155 39% 49% Prefer not to answer 2 1%

7
n 394 100% 100% Age a 18-24 91 23% 10% 25-34 112 28% 14% 35-44 84 21% 14% 45-54 60 15% 15% 55+ 45 11% 23% Prefer not to answer 2 1% n 394 100% Race and/or Ethnicity a Native American or Alaska Native 0 0% 1% Asian or Pacific Islander 23 6% 9% Hispanic or Latino/a 51 13% 26% Black or African American 57 15% 16% White 242 61% 62% Multiple races and/or ethnicities 14 4% 3% Prefer not to answer 7 2% n 394 100% Education b High school (incl. GED) or less 77 20% 42% Some college 97 25% 21% 2-year degree 52 13% 8% 4-year degree 97 25% 18% Professional degree 63 16% 11% Doctorate 6 2% n/a Prefer not to answer 2 1% n 394 100% 100% Household Income b Less than $25 K 49 12% 23% $25-49 K 85 22% 24% $50-74 K 93 24% 18% $75-99 K 58 15% 12% $100-124 K 31 8%
13% $125-149 K 23 6% $150-174 K 13 3%
5% $175-199 K 9 2% $200 K + 12 3% 5% Prefer not to answer 21 5% n 394 100% 100% Sources: a U.S. Census Bureau, 2010 Census. b 2010-2014 ACS 5-Year Estimates. Note. Education and income census data represent the U.S. population as a whole. Different collection techniques for U.S. Census data and survey data account for apparent discrepancy in the Hispanic or Latino/a category. Age percentages reported by U.S. Census do not add to 100 because categorization excludes minors.
3.2 User identification 1
When asked to describe how they identify, 32% of respondents identified as a user of both Uber and 2Lyft, 35% identified as a user of Uber only, only 1% identified as a user of Lyft only, and 31% identified 3
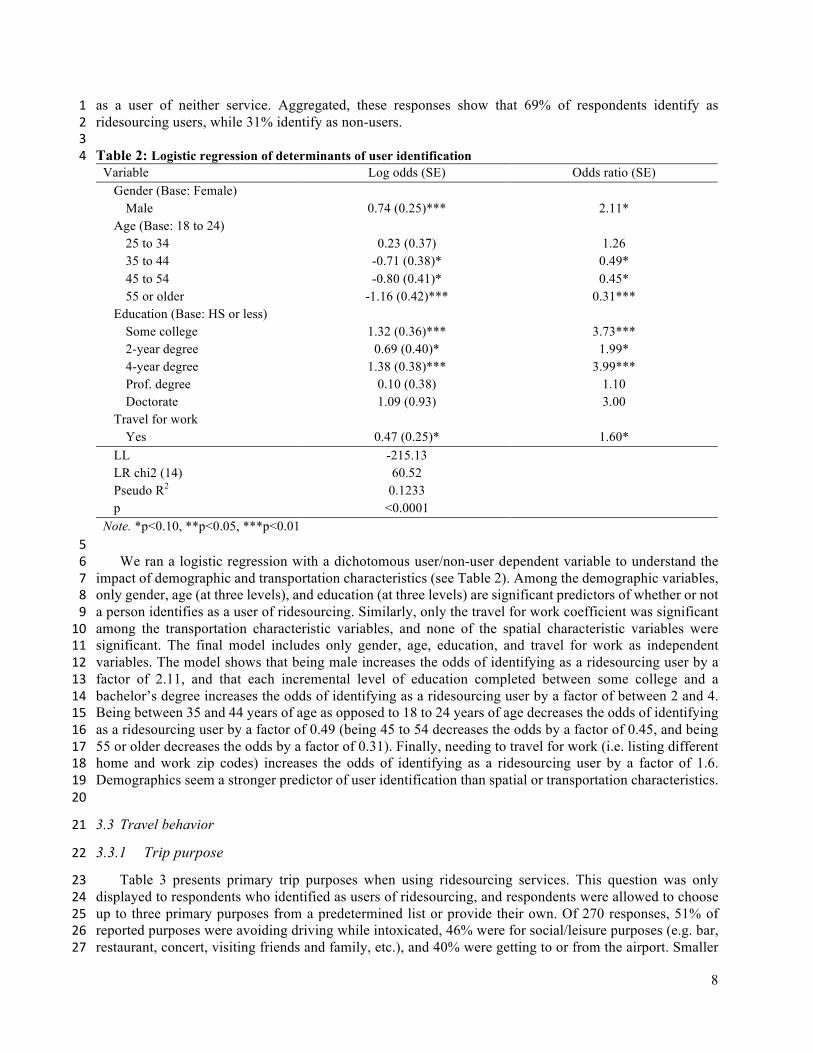
8
as a user of neither service. Aggregated, these responses show that 69% of respondents identify as 1ridesourcing users, while 31% identify as non-users. 2
3Table 2: Logistic regression of determinants of user identification 4
Variable Log odds (SE) Odds ratio (SE) Gender (Base: Female)
Male 0.74 (0.25)*** 2.11* Age (Base: 18 to 24)
25 to 34 0.23 (0.37) 1.26 35 to 44 -0.71 (0.38)* 0.49* 45 to 54 -0.80 (0.41)* 0.45* 55 or older -1.16 (0.42)*** 0.31***
Education (Base: HS or less) Some college 1.32 (0.36)*** 3.73*** 2-year degree 0.69 (0.40)* 1.99* 4-year degree 1.38 (0.38)*** 3.99*** Prof. degree 0.10 (0.38) 1.10 Doctorate 1.09 (0.93) 3.00
Travel for work Yes 0.47 (0.25)* 1.60*
LL -215.13 LR chi2 (14) 60.52 Pseudo R2 0.1233 p <0.0001
Note. *p<0.10, **p<0.05, ***p<0.01 5
We ran a logistic regression with a dichotomous user/non-user dependent variable to understand the 6impact of demographic and transportation characteristics (see Table 2). Among the demographic variables, 7only gender, age (at three levels), and education (at three levels) are significant predictors of whether or not 8a person identifies as a user of ridesourcing. Similarly, only the travel for work coefficient was significant 9among the transportation characteristic variables, and none of the spatial characteristic variables were 10significant. The final model includes only gender, age, education, and travel for work as independent 11variables. The model shows that being male increases the odds of identifying as a ridesourcing user by a 12factor of 2.11, and that each incremental level of education completed between some college and a 13bachelor’s degree increases the odds of identifying as a ridesourcing user by a factor of between 2 and 4. 14Being between 35 and 44 years of age as opposed to 18 to 24 years of age decreases the odds of identifying 15as a ridesourcing user by a factor of 0.49 (being 45 to 54 decreases the odds by a factor of 0.45, and being 1655 or older decreases the odds by a factor of 0.31). Finally, needing to travel for work (i.e. listing different 17home and work zip codes) increases the odds of identifying as a ridesourcing user by a factor of 1.6. 18Demographics seem a stronger predictor of user identification than spatial or transportation characteristics. 19
20
3.3 Travel behavior 21
3.3.1 Trip purpose 22
Table 3 presents primary trip purposes when using ridesourcing services. This question was only 23displayed to respondents who identified as users of ridesourcing, and respondents were allowed to choose 24up to three primary purposes from a predetermined list or provide their own. Of 270 responses, 51% of 25reported purposes were avoiding driving while intoxicated, 46% were for social/leisure purposes (e.g. bar, 26restaurant, concert, visiting friends and family, etc.), and 40% were getting to or from the airport. Smaller 27
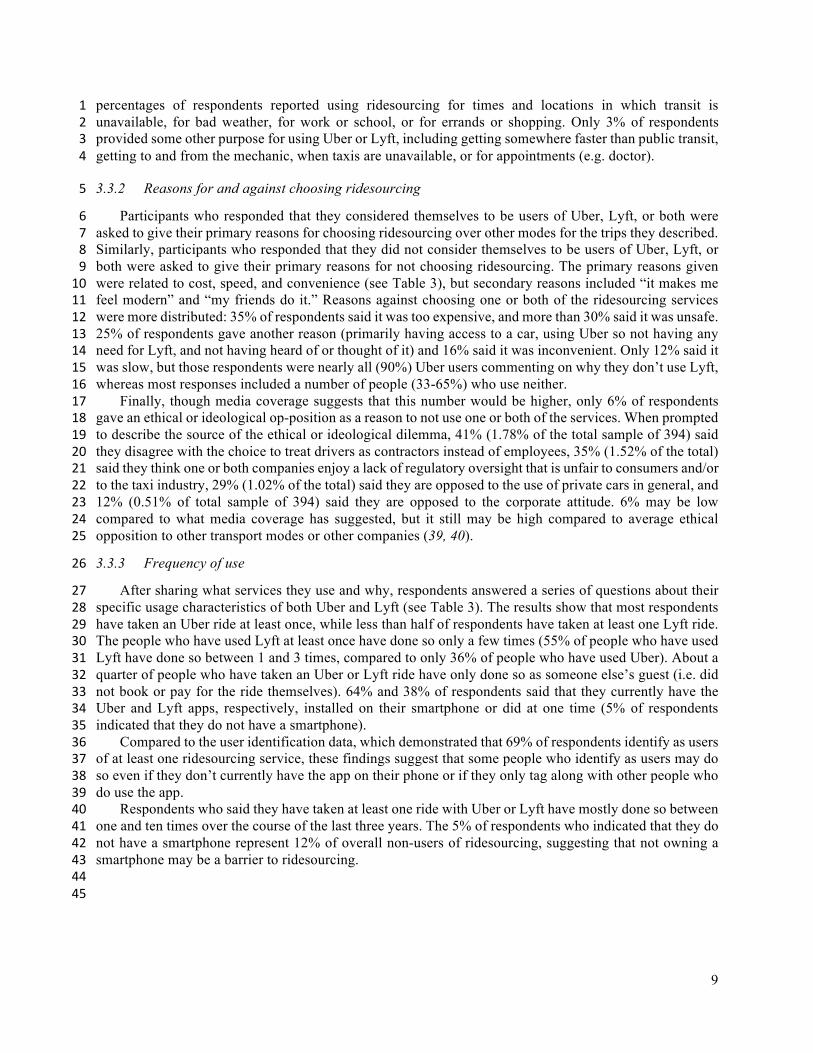
9
percentages of respondents reported using ridesourcing for times and locations in which transit is 1unavailable, for bad weather, for work or school, or for errands or shopping. Only 3% of respondents 2provided some other purpose for using Uber or Lyft, including getting somewhere faster than public transit, 3getting to and from the mechanic, when taxis are unavailable, or for appointments (e.g. doctor). 4
3.3.2 Reasons for and against choosing ridesourcing 5
Participants who responded that they considered themselves to be users of Uber, Lyft, or both were 6asked to give their primary reasons for choosing ridesourcing over other modes for the trips they described. 7Similarly, participants who responded that they did not consider themselves to be users of Uber, Lyft, or 8both were asked to give their primary reasons for not choosing ridesourcing. The primary reasons given 9were related to cost, speed, and convenience (see Table 3), but secondary reasons included “it makes me 10feel modern” and “my friends do it.” Reasons against choosing one or both of the ridesourcing services 11were more distributed: 35% of respondents said it was too expensive, and more than 30% said it was unsafe. 1225% of respondents gave another reason (primarily having access to a car, using Uber so not having any 13need for Lyft, and not having heard of or thought of it) and 16% said it was inconvenient. Only 12% said it 14was slow, but those respondents were nearly all (90%) Uber users commenting on why they don’t use Lyft, 15whereas most responses included a number of people (33-65%) who use neither. 16
Finally, though media coverage suggests that this number would be higher, only 6% of respondents 17gave an ethical or ideological op-position as a reason to not use one or both of the services. When prompted 18to describe the source of the ethical or ideological dilemma, 41% (1.78% of the total sample of 394) said 19they disagree with the choice to treat drivers as contractors instead of employees, 35% (1.52% of the total) 20said they think one or both companies enjoy a lack of regulatory oversight that is unfair to consumers and/or 21to the taxi industry, 29% (1.02% of the total) said they are opposed to the use of private cars in general, and 2212% (0.51% of total sample of 394) said they are opposed to the corporate attitude. 6% may be low 23compared to what media coverage has suggested, but it still may be high compared to average ethical 24opposition to other transport modes or other companies (39, 40). 25
3.3.3 Frequency of use 26
After sharing what services they use and why, respondents answered a series of questions about their 27specific usage characteristics of both Uber and Lyft (see Table 3). The results show that most respondents 28have taken an Uber ride at least once, while less than half of respondents have taken at least one Lyft ride. 29The people who have used Lyft at least once have done so only a few times (55% of people who have used 30Lyft have done so between 1 and 3 times, compared to only 36% of people who have used Uber). About a 31quarter of people who have taken an Uber or Lyft ride have only done so as someone else’s guest (i.e. did 32not book or pay for the ride themselves). 64% and 38% of respondents said that they currently have the 33Uber and Lyft apps, respectively, installed on their smartphone or did at one time (5% of respondents 34indicated that they do not have a smartphone). 35
Compared to the user identification data, which demonstrated that 69% of respondents identify as users 36of at least one ridesourcing service, these findings suggest that some people who identify as users may do 37so even if they don’t currently have the app on their phone or if they only tag along with other people who 38do use the app. 39
Respondents who said they have taken at least one ride with Uber or Lyft have mostly done so between 40one and ten times over the course of the last three years. The 5% of respondents who indicated that they do 41not have a smartphone represent 12% of overall non-users of ridesourcing, suggesting that not owning a 42smartphone may be a barrier to ridesourcing. 43
44 45
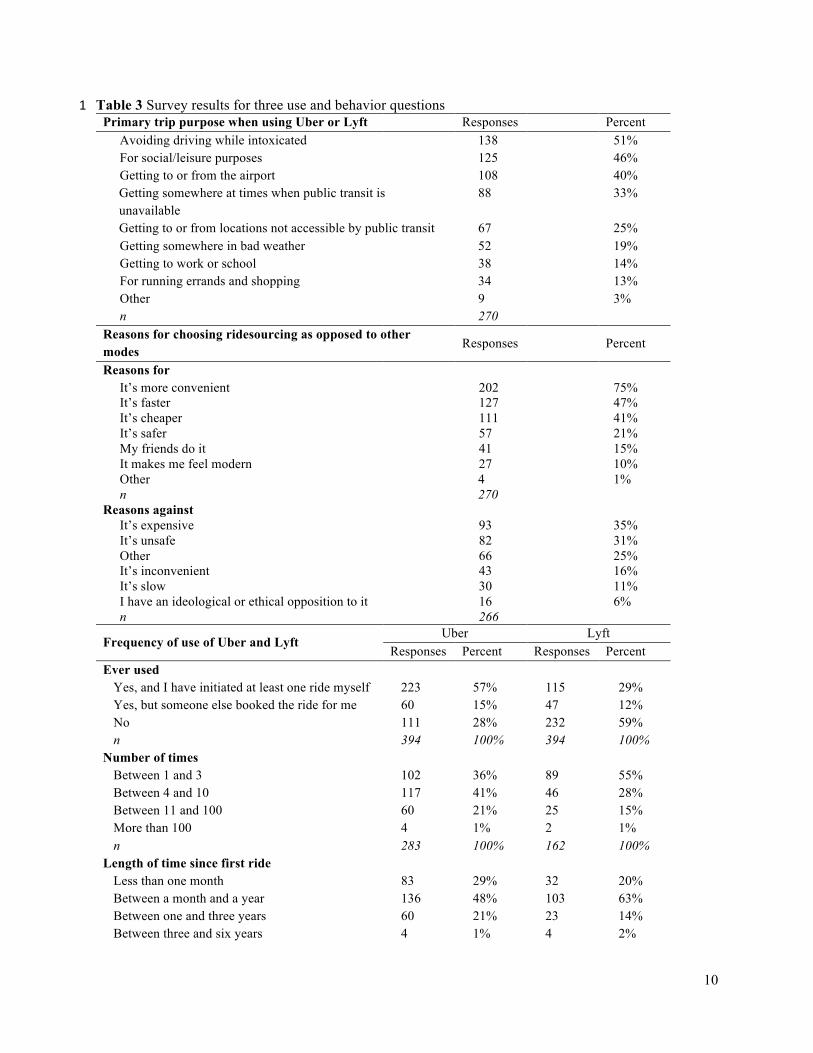
10
Table 3 Survey results for three use and behavior questions 1Primary trip purpose when using Uber or Lyft Responses Percent
Avoiding driving while intoxicated 138 51% For social/leisure purposes 125 46% Getting to or from the airport 108 40% Getting somewhere at times when public transit is unavailable
88 33%
Getting to or from locations not accessible by public transit 67 25% Getting somewhere in bad weather 52 19% Getting to work or school 38 14% For running errands and shopping 34 13% Other 9 3% n 270
Reasons for choosing ridesourcing as opposed to other modes Responses Percent
Reasons for It’s more convenient 202 75% It’s faster 127 47% It’s cheaper 111 41% It’s safer 57 21% My friends do it 41 15% It makes me feel modern 27 10% Other 4 1% n 270
Reasons against It’s expensive 93 35% It’s unsafe 82 31% Other 66 25% It’s inconvenient 43 16% It’s slow 30 11% I have an ideological or ethical opposition to it 16 6% n 266
Frequency of use of Uber and Lyft Uber Lyft
Responses Percent Responses Percent Ever used
Yes, and I have initiated at least one ride myself 223 57% 115 29% Yes, but someone else booked the ride for me 60 15% 47 12% No 111 28% 232 59% n 394 100% 394 100%
Number of times Between 1 and 3 102 36% 89 55% Between 4 and 10 117 41% 46 28% Between 11 and 100 60 21% 25 15% More than 100 4 1% 2 1% n 283 100% 162 100%
Length of time since first ride Less than one month 83 29% 32 20% Between a month and a year 136 48% 103 63% Between one and three years 60 21% 23 14% Between three and six years 4 1% 4 2%
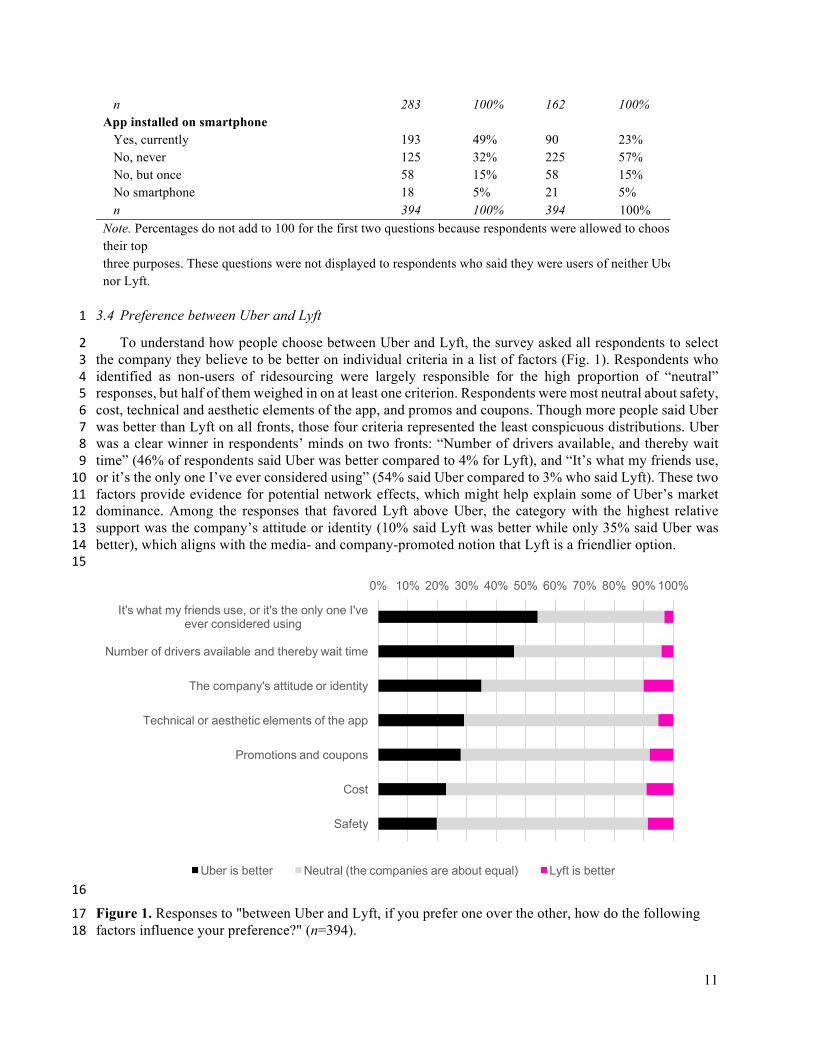
11
n 283 100% 162 100% App installed on smartphone
Yes, currently 193 49% 90 23% No, never 125 32% 225 57% No, but once 58 15% 58 15% No smartphone 18 5% 21 5% n 394 100% 394 100%
Note. Percentages do not add to 100 for the first two questions because respondents were allowed to choose their top three purposes. These questions were not displayed to respondents who said they were users of neither Uber nor Lyft.
3.4 Preference between Uber and Lyft 1
To understand how people choose between Uber and Lyft, the survey asked all respondents to select 2the company they believe to be better on individual criteria in a list of factors (Fig. 1). Respondents who 3identified as non-users of ridesourcing were largely responsible for the high proportion of “neutral” 4responses, but half of them weighed in on at least one criterion. Respondents were most neutral about safety, 5cost, technical and aesthetic elements of the app, and promos and coupons. Though more people said Uber 6was better than Lyft on all fronts, those four criteria represented the least conspicuous distributions. Uber 7was a clear winner in respondents’ minds on two fronts: “Number of drivers available, and thereby wait 8time” (46% of respondents said Uber was better compared to 4% for Lyft), and “It’s what my friends use, 9or it’s the only one I’ve ever considered using” (54% said Uber compared to 3% who said Lyft). These two 10factors provide evidence for potential network effects, which might help explain some of Uber’s market 11dominance. Among the responses that favored Lyft above Uber, the category with the highest relative 12support was the company’s attitude or identity (10% said Lyft was better while only 35% said Uber was 13better), which aligns with the media- and company-promoted notion that Lyft is a friendlier option. 14 15
16
Figure 1. Responses to "between Uber and Lyft, if you prefer one over the other, how do the following 17factors influence your preference?" (n=394). 18
0% 10% 20% 30% 40% 50% 60% 70% 80% 90% 100%
It's what my friends use, or it's the only one I've ever considered using
Number of drivers available and thereby wait time
The company's attitude or identity
Technical or aesthetic elements of the app
Promotions and coupons
Cost
Safety
Uber is better Neutral (the companies are about equal) Lyft is better
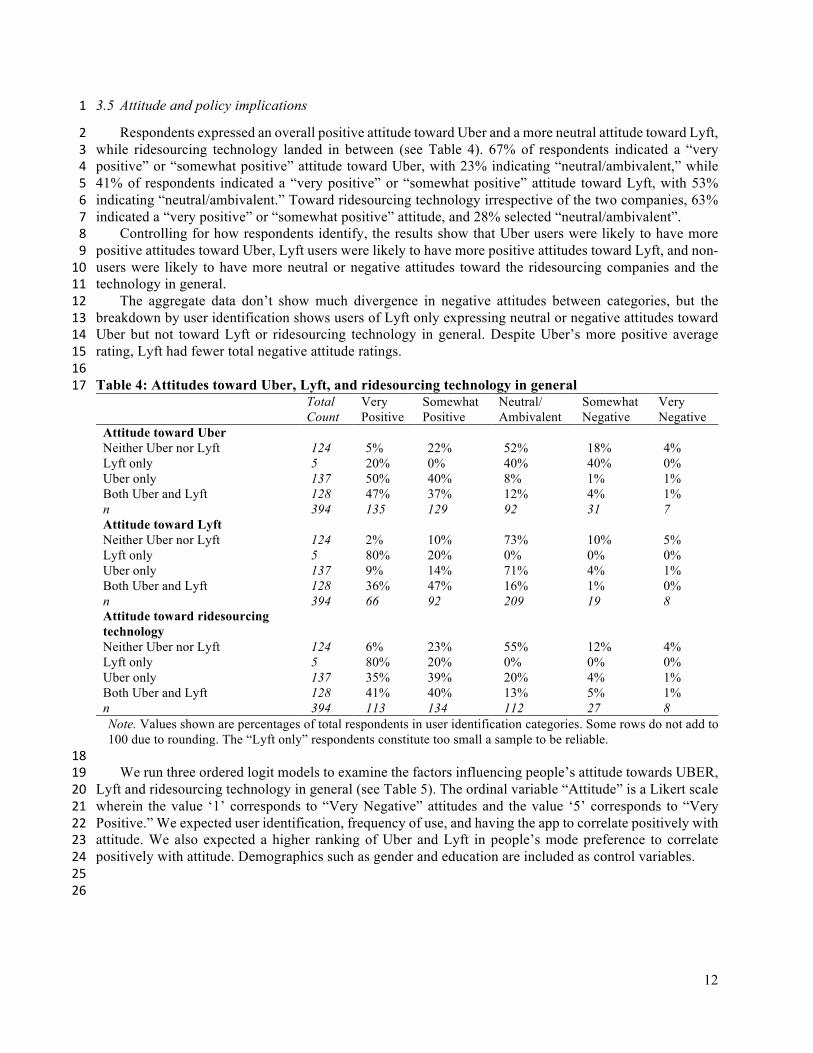
12
3.5 Attitude and policy implications 1
Respondents expressed an overall positive attitude toward Uber and a more neutral attitude toward Lyft, 2while ridesourcing technology landed in between (see Table 4). 67% of respondents indicated a “very 3positive” or “somewhat positive” attitude toward Uber, with 23% indicating “neutral/ambivalent,” while 441% of respondents indicated a “very positive” or “somewhat positive” attitude toward Lyft, with 53% 5indicating “neutral/ambivalent.” Toward ridesourcing technology irrespective of the two companies, 63% 6indicated a “very positive” or “somewhat positive” attitude, and 28% selected “neutral/ambivalent”. 7
Controlling for how respondents identify, the results show that Uber users were likely to have more 8positive attitudes toward Uber, Lyft users were likely to have more positive attitudes toward Lyft, and non-9users were likely to have more neutral or negative attitudes toward the ridesourcing companies and the 10technology in general. 11
The aggregate data don’t show much divergence in negative attitudes between categories, but the 12breakdown by user identification shows users of Lyft only expressing neutral or negative attitudes toward 13Uber but not toward Lyft or ridesourcing technology in general. Despite Uber’s more positive average 14rating, Lyft had fewer total negative attitude ratings. 15
16Table 4: Attitudes toward Uber, Lyft, and ridesourcing technology in general 17
18We run three ordered logit models to examine the factors influencing people’s attitude towards UBER, 19
Lyft and ridesourcing technology in general (see Table 5). The ordinal variable “Attitude” is a Likert scale 20wherein the value ‘1’ corresponds to “Very Negative” attitudes and the value ‘5’ corresponds to “Very 21Positive.” We expected user identification, frequency of use, and having the app to correlate positively with 22attitude. We also expected a higher ranking of Uber and Lyft in people’s mode preference to correlate 23positively with attitude. Demographics such as gender and education are included as control variables. 24
25 26
Total Count
Very Positive
Somewhat Positive
Neutral/ Ambivalent
Somewhat Negative
Very Negative
Attitude toward Uber Neither Uber nor Lyft 124 5% 22% 52% 18% 4% Lyft only 5 20% 0% 40% 40% 0% Uber only 137 50% 40% 8% 1% 1% Both Uber and Lyft 128 47% 37% 12% 4% 1% n 394 135 129 92 31 7 Attitude toward Lyft Neither Uber nor Lyft 124 2% 10% 73% 10% 5% Lyft only 5 80% 20% 0% 0% 0% Uber only 137 9% 14% 71% 4% 1% Both Uber and Lyft 128 36% 47% 16% 1% 0% n 394 66 92 209 19 8 Attitude toward ridesourcing technology
Neither Uber nor Lyft 124 6% 23% 55% 12% 4% Lyft only 5 80% 20% 0% 0% 0% Uber only 137 35% 39% 20% 4% 1% Both Uber and Lyft 128 41% 40% 13% 5% 1% n 394 113 134 112 27 8 Note. Values shown are percentages of total respondents in user identification categories. Some rows do not add to 100 due to rounding. The “Lyft only” respondents constitute too small a sample to be reliable.
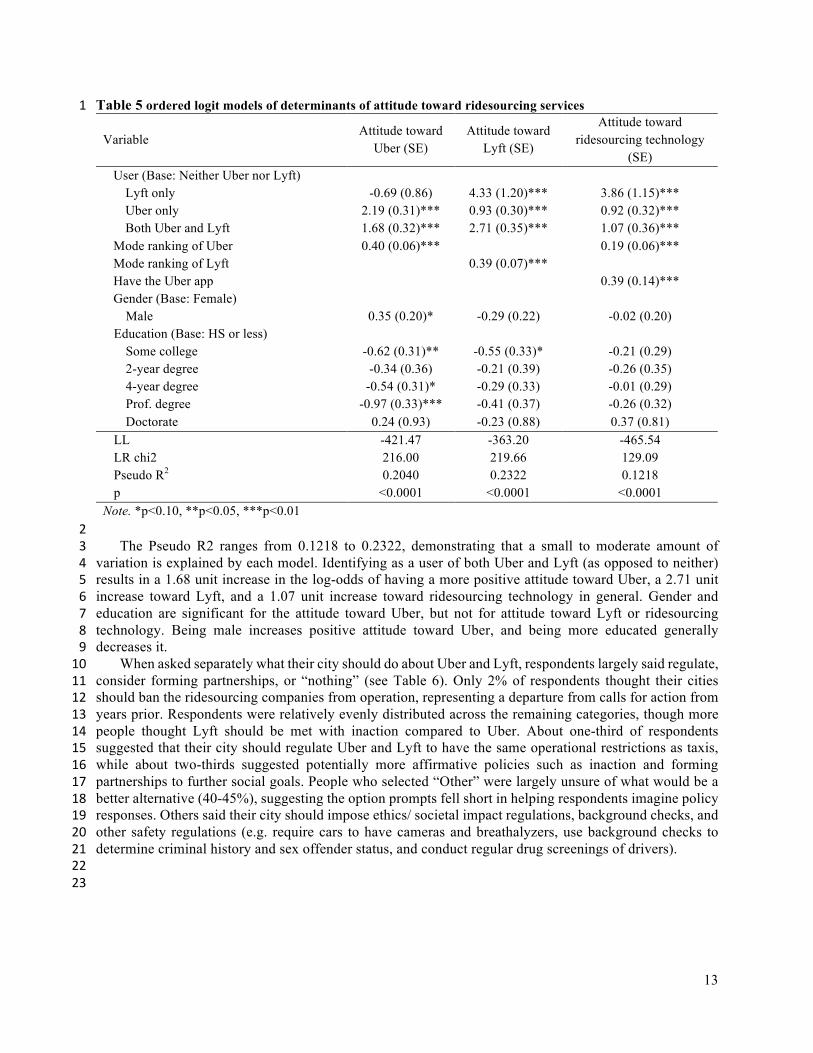
13
Table 5 ordered logit models of determinants of attitude toward ridesourcing services 1
Variable Attitude toward
Uber (SE) Attitude toward
Lyft (SE)
Attitude toward ridesourcing technology
(SE) User (Base: Neither Uber nor Lyft)
Lyft only -0.69 (0.86) 4.33 (1.20)*** 3.86 (1.15)*** Uber only 2.19 (0.31)*** 0.93 (0.30)*** 0.92 (0.32)*** Both Uber and Lyft 1.68 (0.32)*** 2.71 (0.35)*** 1.07 (0.36)***
Mode ranking of Uber 0.40 (0.06)*** 0.19 (0.06)*** Mode ranking of Lyft 0.39 (0.07)*** Have the Uber app 0.39 (0.14)*** Gender (Base: Female)
Male 0.35 (0.20)* -0.29 (0.22) -0.02 (0.20) Education (Base: HS or less)
Some college -0.62 (0.31)** -0.55 (0.33)* -0.21 (0.29) 2-year degree -0.34 (0.36) -0.21 (0.39) -0.26 (0.35) 4-year degree -0.54 (0.31)* -0.29 (0.33) -0.01 (0.29) Prof. degree -0.97 (0.33)*** -0.41 (0.37) -0.26 (0.32) Doctorate 0.24 (0.93) -0.23 (0.88) 0.37 (0.81)
LL -421.47 -363.20 -465.54 LR chi2 216.00 219.66 129.09 Pseudo R2 0.2040 0.2322 0.1218 p <0.0001 <0.0001 <0.0001
Note. *p<0.10, **p<0.05, ***p<0.01 2
The Pseudo R2 ranges from 0.1218 to 0.2322, demonstrating that a small to moderate amount of 3variation is explained by each model. Identifying as a user of both Uber and Lyft (as opposed to neither) 4results in a 1.68 unit increase in the log-odds of having a more positive attitude toward Uber, a 2.71 unit 5increase toward Lyft, and a 1.07 unit increase toward ridesourcing technology in general. Gender and 6education are significant for the attitude toward Uber, but not for attitude toward Lyft or ridesourcing 7technology. Being male increases positive attitude toward Uber, and being more educated generally 8decreases it. 9
When asked separately what their city should do about Uber and Lyft, respondents largely said regulate, 10consider forming partnerships, or “nothing” (see Table 6). Only 2% of respondents thought their cities 11should ban the ridesourcing companies from operation, representing a departure from calls for action from 12years prior. Respondents were relatively evenly distributed across the remaining categories, though more 13people thought Lyft should be met with inaction compared to Uber. About one-third of respondents 14suggested that their city should regulate Uber and Lyft to have the same operational restrictions as taxis, 15while about two-thirds suggested potentially more affirmative policies such as inaction and forming 16partnerships to further social goals. People who selected “Other” were largely unsure of what would be a 17better alternative (40-45%), suggesting the option prompts fell short in helping respondents imagine policy 18responses. Others said their city should impose ethics/ societal impact regulations, background checks, and 19other safety regulations (e.g. require cars to have cameras and breathalyzers, use background checks to 20determine criminal history and sex offender status, and conduct regular drug screenings of drivers). 21
22 23
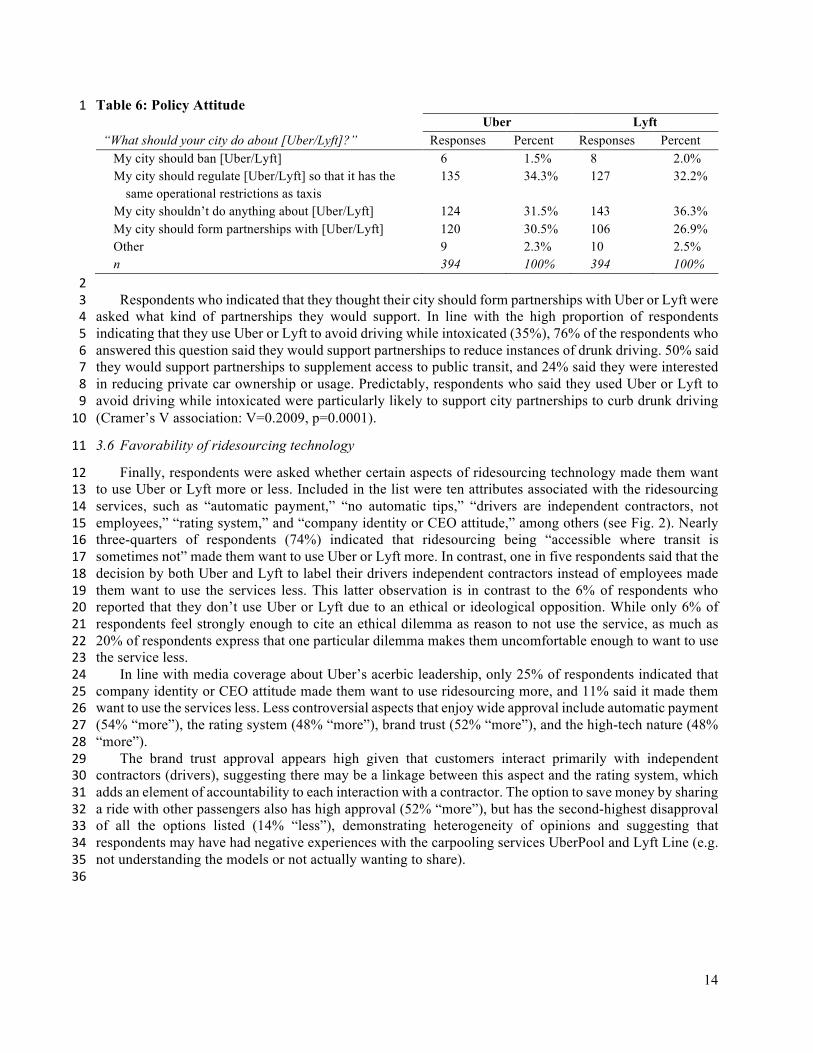
14
Table 6: Policy Attitude 1 Uber Lyft “What should your city do about [Uber/Lyft]?” Responses Percent Responses Percent
My city should ban [Uber/Lyft] 6 1.5% 8 2.0% My city should regulate [Uber/Lyft] so that it has the
same operational restrictions as taxis 135 34.3% 127 32.2%
My city shouldn’t do anything about [Uber/Lyft] 124 31.5% 143 36.3% My city should form partnerships with [Uber/Lyft] 120 30.5% 106 26.9% Other 9 2.3% 10 2.5% n 394 100% 394 100% 2Respondents who indicated that they thought their city should form partnerships with Uber or Lyft were 3
asked what kind of partnerships they would support. In line with the high proportion of respondents 4indicating that they use Uber or Lyft to avoid driving while intoxicated (35%), 76% of the respondents who 5answered this question said they would support partnerships to reduce instances of drunk driving. 50% said 6they would support partnerships to supplement access to public transit, and 24% said they were interested 7in reducing private car ownership or usage. Predictably, respondents who said they used Uber or Lyft to 8avoid driving while intoxicated were particularly likely to support city partnerships to curb drunk driving 9(Cramer’s V association: V=0.2009, p=0.0001). 10
3.6 Favorability of ridesourcing technology 11
Finally, respondents were asked whether certain aspects of ridesourcing technology made them want 12to use Uber or Lyft more or less. Included in the list were ten attributes associated with the ridesourcing 13services, such as “automatic payment,” “no automatic tips,” “drivers are independent contractors, not 14employees,” “rating system,” and “company identity or CEO attitude,” among others (see Fig. 2). Nearly 15three-quarters of respondents (74%) indicated that ridesourcing being “accessible where transit is 16sometimes not” made them want to use Uber or Lyft more. In contrast, one in five respondents said that the 17decision by both Uber and Lyft to label their drivers independent contractors instead of employees made 18them want to use the services less. This latter observation is in contrast to the 6% of respondents who 19reported that they don’t use Uber or Lyft due to an ethical or ideological opposition. While only 6% of 20respondents feel strongly enough to cite an ethical dilemma as reason to not use the service, as much as 2120% of respondents express that one particular dilemma makes them uncomfortable enough to want to use 22the service less. 23
In line with media coverage about Uber’s acerbic leadership, only 25% of respondents indicated that 24company identity or CEO attitude made them want to use ridesourcing more, and 11% said it made them 25want to use the services less. Less controversial aspects that enjoy wide approval include automatic payment 26(54% “more”), the rating system (48% “more”), brand trust (52% “more”), and the high-tech nature (48% 27“more”). 28
The brand trust approval appears high given that customers interact primarily with independent 29contractors (drivers), suggesting there may be a linkage between this aspect and the rating system, which 30adds an element of accountability to each interaction with a contractor. The option to save money by sharing 31a ride with other passengers also has high approval (52% “more”), but has the second-highest disapproval 32of all the options listed (14% “less”), demonstrating heterogeneity of opinions and suggesting that 33respondents may have had negative experiences with the carpooling services UberPool and Lyft Line (e.g. 34not understanding the models or not actually wanting to share). 35
36
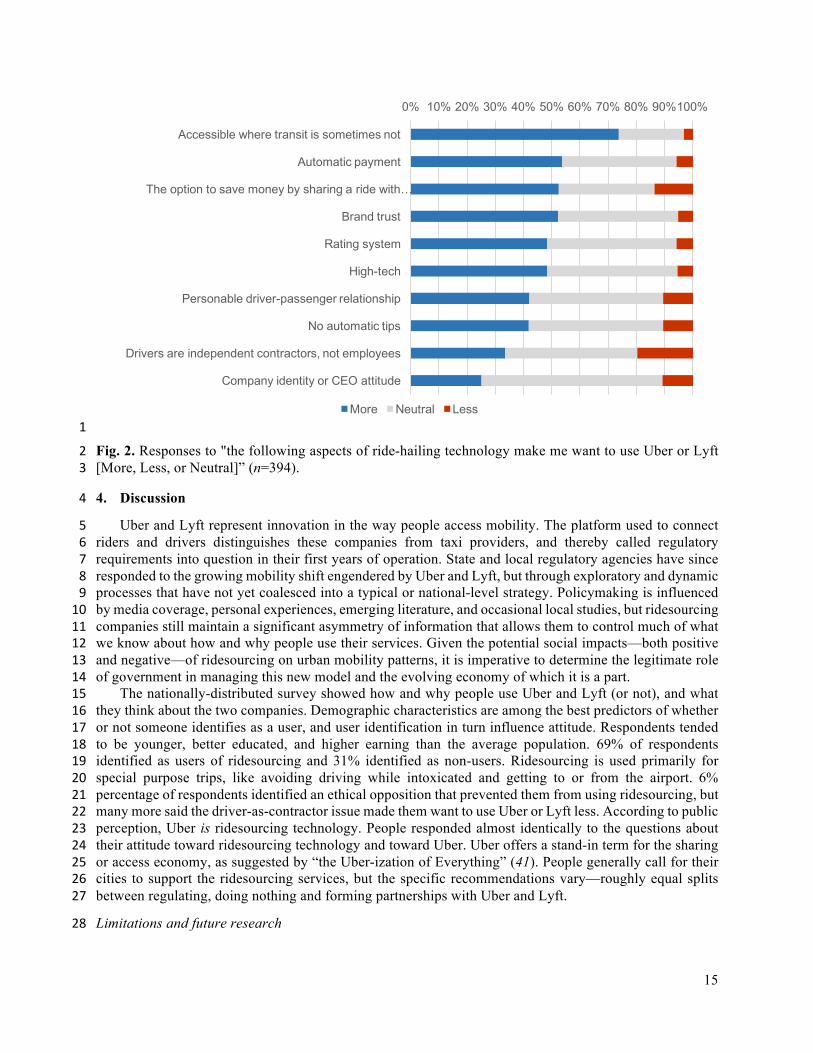
15
1
Fig. 2. Responses to "the following aspects of ride-hailing technology make me want to use Uber or Lyft 2[More, Less, or Neutral]” (n=394). 3
4. Discussion 4
Uber and Lyft represent innovation in the way people access mobility. The platform used to connect 5riders and drivers distinguishes these companies from taxi providers, and thereby called regulatory 6requirements into question in their first years of operation. State and local regulatory agencies have since 7responded to the growing mobility shift engendered by Uber and Lyft, but through exploratory and dynamic 8processes that have not yet coalesced into a typical or national-level strategy. Policymaking is influenced 9by media coverage, personal experiences, emerging literature, and occasional local studies, but ridesourcing 10companies still maintain a significant asymmetry of information that allows them to control much of what 11we know about how and why people use their services. Given the potential social impacts—both positive 12and negative—of ridesourcing on urban mobility patterns, it is imperative to determine the legitimate role 13of government in managing this new model and the evolving economy of which it is a part. 14
The nationally-distributed survey showed how and why people use Uber and Lyft (or not), and what 15they think about the two companies. Demographic characteristics are among the best predictors of whether 16or not someone identifies as a user, and user identification in turn influence attitude. Respondents tended 17to be younger, better educated, and higher earning than the average population. 69% of respondents 18identified as users of ridesourcing and 31% identified as non-users. Ridesourcing is used primarily for 19special purpose trips, like avoiding driving while intoxicated and getting to or from the airport. 6% 20percentage of respondents identified an ethical opposition that prevented them from using ridesourcing, but 21many more said the driver-as-contractor issue made them want to use Uber or Lyft less. According to public 22perception, Uber is ridesourcing technology. People responded almost identically to the questions about 23their attitude toward ridesourcing technology and toward Uber. Uber offers a stand-in term for the sharing 24or access economy, as suggested by “the Uber-ization of Everything” (41). People generally call for their 25cities to support the ridesourcing services, but the specific recommendations vary—roughly equal splits 26between regulating, doing nothing and forming partnerships with Uber and Lyft. 27
Limitations and future research 28
0% 10% 20% 30% 40% 50% 60% 70% 80% 90%100%
Accessible where transit is sometimes not
Automatic payment
The option to save money by sharing a ride with …
Brand trust
Rating system
High-tech
Personable driver-passenger relationship
No automatic tips
Drivers are independent contractors, not employees
Company identity or CEO attitude
More Neutral Less
16
This survey was not representative of individual metropolitan area populations and can therefore only 1support interpretations of national trends. Policymakers might need to conduct similar studies locally to 2reach meaningful conclusions for specific metropolitan areas. In attempting to take the temperature of the 3American public about adoption of ridesourcing, the questionnaire covered a variety of topics with limited 4investigation into implications for policy. Future research should explore the regulatory implications 5associated with acting on the findings outlined above, as well as delving deeper into some of the topics not 6addressed by this survey such as informal labor and accessibility concerns. Researchers and policymakers 7alike may benefit from a study that proposes specific policy responses to the population from two or three 8target cities with distinct regulatory styles. Analyzing the reactions to these proposals would offer direction 9for policymaking in the future.10
11Acknowledgments 12 13
We would like to thank the US Department of Transportation New England University Transportation 14Center for partially funding this research, and Lyndsey Rolheiser for reviewing this paper. 15 16 17
17
References 1
1. Bouton, S., Knupfer, S. M., Mihov, I., & Swartz, S. (2015, September). Urban mobility at a tipping point. 2Retrieved from http://www.mckinsey.com/business-functions/sustainability-and-resource-productivity/our-3insights/urban-mobility-at-a-tipping-point 4
2. Quintal, B. (2015, November 25). Smart Moves for Cities: The Urban Mobility Revolution Will Start With 5These 3 Projects. Retrieved from http://www.archdaily.com/777791/smart-moves-for-cities-the-urban-mobility-6revolution-will-start-with-these-3-projects 7
3. Botsman, R. (2013, November 21). The Sharing Economy Lacks A Shared Definition. Retrieved from 8http://www.fastcoexist.com/3022028/the-sharing-economy-lacks-a-shared-definition#3 9
4. Meelen, T., & Frenken, K. (2015, January 14). Stop Saying Uber Is Part Of The Sharing Economy. Retrieved 10from http://www.fastcoexist.com/3040863/stop-saying-uber-is-part-of-the-sharing-economy 11
5. Eckhardt, G. M., & Bardhi, F. (2015, January 28). The Sharing Economy Isn't About Sharing at All. Retrieved 12from https://hbr.org/2015/01/the-sharing-economy-isnt-about-sharing-at-all 13
6. Kenney, M. & Zysman, J. (2015). Choosing a Future in the Platform Economy: The Implications and 14Consequences of Digital Platforms. Manuscript in preparation. 15
7. Rayle, L., Dai, D., Chan, N., Cervero, R., & Shaheen, S. (2016). Just a better taxi? A survey-based comparison 16of taxis, transit, and ridesourcing services in San Francisco. Transport Policy, 45, 168-178. 17doi:10.1016/j.tranpol.2015.10.004 18
8. Flores, O. & Rayle, L. (2016). How Ridesourcing went from ‘Rogue’ to Mainstream in San Francisco. 19Manuscript in preparation. 20
9. Lien, T. (2016, January 5). Lyft defies predictions by continuing to grow as a rival to Uber. Retrieved from 21http://www.latimes.com/business/technology/la-fi-0105-lyft-growth-20160105-story.html 22
10. Huston, C. (2016, January 28). Lyft takes a friendlier road than Uber. Retrieved from 23http://www.marketwatch.com/story/lyft-takes-a-friendlier-road-than-uber-2016-01-27 24
11. Shahani, A. (2016, January 18). In The Battle Between Lyft And Uber, The Focus Is On Drivers. Retrieved 25from http://www.npr.org/sections/alltechconsidered/2016/01/18/463473462/is-uber-good-to-drivers-it-s-relative 26
12. Buhr, S. (2015, September 16). China’s Didi Kuaidi Put $100M Into Lyft, Inks Ridesharing Alliance To Rival 27Uber. Retrieved from http://techcrunch.com/2015/09/16/ubers-rivals-didi-kuadi-and-lyft-form-international-28ridesharing-partnership/ 29
13. Punit, I. S. (2015, December 03). The new global anti-Uber alliance: Ola, Lyft, Didi Kuaidi and GrabTaxi agree 30to ride together. Retrieved from http://qz.com/564795/a-new-anti-uber-alliance-strengthens-ola-lyft-didi-kuaidi-31and-grabtaxi-agree-to-ride-together/ 32
14. Carson, B. (2016, April 11). The global alliance against Uber just came online. Retrieved from 33http://www.businessinsider.com/lyft-didi-ola-grab-anti-uber-alliance-launches-2016-4 34
15. Gilbert, G., & Samuels, R. E. (1982). The taxicab: An urban transportation survivor. Chapel Hill: University of 35North Carolina Press. 36
16. Dempsey, P. S. (1996) Taxi Industry Regulation, Deregulation, and Reregulation: The Paradox of Market 37Failure. University of Denver College of Law, Transportation Law Journal, 24(1), 73-120. 38
17. Hodges, G. R. (2007). Taxi!: A social history of the New York City cabdriver. Baltimore: Johns Hopkins 39University Press. 40
18. Rubinstein, D. (2014, October 30). Uber, Lyft, and the end of taxi history. Retrieved from 41http://www.capitalnewyork.com/article/city-hall/2014/10/8555191/uber-lyft-and-end-taxi-history 42
19. Price Waterhouse. (1993). Analysis of Taxicab Deregulation and Re-Regulation I,(6). Retrieved from 43https://www.colorado.gov/pacific/sites/default/files/0708TransAttachI.pdf 44
20. Teal, R. F., & Berglund, M. (1987). The impacts of taxicab deregulation in the USA. Journal of Transport 45Economics and Policy, 21(1), 37-56. Retrieved from http://www.bath.ac.uk/e-46journals/jtep/pdf/Volume_XX1_No_1_37-56.pdf 47
21. Rogers, B. (2015). The Social Costs of Uber. The University of Chicago Law Review. 48doi:10.2139/ssrn.2608017 49
22. Metcalf, G., & Warburg, J. (2012, October 09). A Policy Agenda for the Sharing Economy. Retrieved from 50http://www.spur.org/publications/urbanist-article/2012-10-09/policy-agenda-sharing-economy 51
23. Silver, N., & Fischer-Baum, R. (2015, August 28). Public Transit Should Be Uber's New Best Friend. Retrieved 52from http://fivethirtyeight.com/features/public-transit-should-be-ubers-new-best-friend/ 53
24. Austin, D., & Zegras, P. (2012). Taxicabs as Public Transportation in Boston, Massachusetts. Transportation 54Research Record: Journal of the Transportation Research Board, 2277, 65-74. doi:10.3141/2277-08 55
18
25. King, D. A., Peters, J. R., & Daus, M. W. (2012, November 14). Taxicabs for Improved Urban Mobility: Are 1We Missing an Opportunity? TRB 2012 Annual Meeting. Retrieved from http://amonline.trb.org/12-2097-21.2377303?qr=1 3
26. Flegenheimer, M., & Fitzsimmons, E. G. (2015, July 16). City Hall and Uber Clash in Struggle Over New York 4Streets. Retrieved from http://www.nytimes.com/2015/07/17/nyregion/city-hall-and-uber-clash-in-struggle-5over-new-york-streets.html 6
27. Picchi, A. (2014, December 11). The rising safety issues that could throttle Uber. Retrieved from 7http://www.cbsnews.com/news/the-rising-safety-issues-that-could-throttle-uber/ 8
28. Russo, D., & DeBlasis, M. (2016, May 15). Safety concerns remain for Uber, Lyft ride sharing. Retrieved from 9http://marylandreporter.com/2016/05/15/safety-concerns-remain-for-uber-lyft-ride-sharing/ 10
29. Fritz, C. (2014, December 13). Mobility-as-a-service: Turning transportation into a software industry. Retrieved 11from http://venturebeat.com/2014/12/13/mobility-as-a-service-turning-transportation-into-a-software-industry/ 12
30. Lobel, O. (2015). The Law of the Platform. Manuscript in preparation. 1331. Perez, L. (2016, January 5). The Uber controversy reveals the rottenness of the taxi industry. Retrieved from 14
http://www.marxist.com/uber-controversy-reveals-rottenness-of-taxi-industry.htm 1532. Cramer, J., & Krueger, A. B. (2016). Disruptive Change in the Taxi Business: The Case of Uber. American 16
Economic Review, 106(5), 177-182. doi:10.1257/aer.p20161002 1733. City of New York, Office of the Mayor. (2016, January). For-Hire Vehicle Transportation Study (Rep.). 18
Retrieved http://www1.nyc.gov/assets/operations/downloads/pdf/For-Hire-Vehicle-Transportation-Study.pdf 1934. BOTEC Analysis Corporation. (2015, July). Faster and Cheaper: How Ride-Sourcing Fills a Gap in Low-20
Income Los Angeles Neighborhoods (Rep.). Retrieved http://botecanalysis.com/wp-21content/uploads/2015/07/LATS-Final-Report.pdf 22
35. Anderson, D. N. (2014). “Not just a taxi”? For-profit ridesharing, driver strategies, and VMT. Transportation, 2341(5), 1099-1117. doi:10.1007/s11116-014-9531-8 24
36. Hall, J. V. & Krueger, A. B. (2015, January). An Analysis of the Labor Market for Uber’s Driver-Partners in the 25United States. Working Papers (Princeton University. Industrial Relations Section); 587. Retrieved from 26http://arks.princeton.edu/ark:/88435/dsp010z708z67d 27
37. Corey, Canapary & Galanis Research. (2014). Travel Decisions Survey 2014 Summary Report (Rep.). CA: San 28Francisco Municipal Transportation Authority. 29
38. Morning Consult. (2015, June 31). National Tracking Poll #150505: Crosstabulation Results (Rep.). Retrieved 30https://morningconsult.com/wp-content/uploads/2015/06/150505_crosstabs_mc_v2_AD.pdf 31
39. Nisen, M. (2013, May 09). How Nike Solved Its Sweatshop Problem. Retrieved from 32http://www.businessinsider.com/how-nike-solved-its-sweatshop-problem-2013-5 33
40. Russell, J. (2014, November 19). Uber's Moral Compass Needs Recalibration. Retrieved from 34http://techcrunch.com/2014/11/19/uber-off/ 35
41. Grabar, H. (2015, January 10). The Uber-ization of everything. Retrieved from 36http://www.salon.com/2015/01/10/the_uber_ization_of_everything/ 37
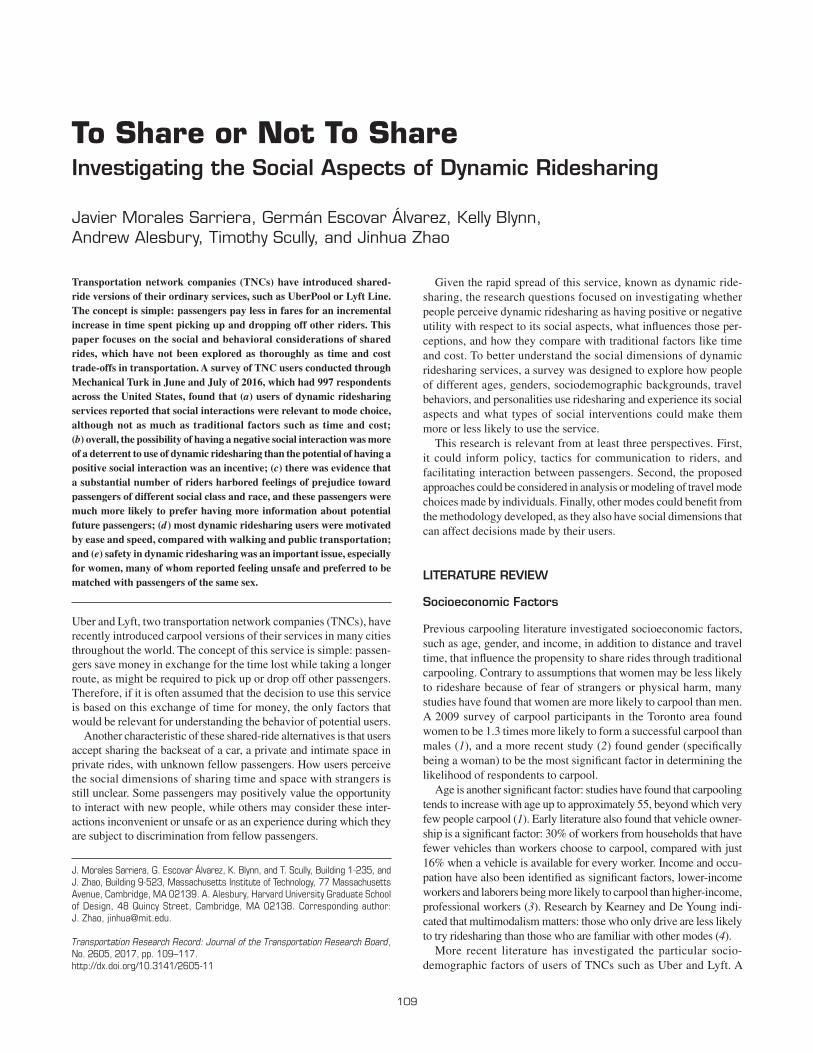
109
Transportation Research Record: Journal of the Transportation Research Board, No. 2605, 2017, pp. 109–117.http://dx.doi.org/10.3141/2605-11
Transportation network companies (TNCs) have introduced shared-ride versions of their ordinary services, such as UberPool or Lyft Line. The concept is simple: passengers pay less in fares for an incremental increase in time spent picking up and dropping off other riders. This paper focuses on the social and behavioral considerations of shared rides, which have not been explored as thoroughly as time and cost trade-offs in transportation. A survey of TNC users conducted through Mechanical Turk in June and July of 2016, which had 997 respondents across the United States, found that (a) users of dynamic ridesharing services reported that social interactions were relevant to mode choice, although not as much as traditional factors such as time and cost; (b) overall, the possibility of having a negative social interaction was more of a deterrent to use of dynamic ridesharing than the potential of having a positive social interaction was an incentive; (c) there was evidence that a substantial number of riders harbored feelings of prejudice toward passengers of different social class and race, and these passengers were much more likely to prefer having more information about potential future passengers; (d) most dynamic ridesharing users were motivated by ease and speed, compared with walking and public transportation; and (e) safety in dynamic ridesharing was an important issue, especially for women, many of whom reported feeling unsafe and preferred to be matched with passengers of the same sex.
Uber and Lyft, two transportation network companies (TNCs), have recently introduced carpool versions of their services in many cities throughout the world. The concept of this service is simple: passen-gers save money in exchange for the time lost while taking a longer route, as might be required to pick up or drop off other passengers. Therefore, if it is often assumed that the decision to use this service is based on this exchange of time for money, the only factors that would be relevant for understanding the behavior of potential users.
Another characteristic of these shared-ride alternatives is that users accept sharing the backseat of a car, a private and intimate space in private rides, with unknown fellow passengers. How users perceive the social dimensions of sharing time and space with strangers is still unclear. Some passengers may positively value the opportunity to interact with new people, while others may consider these inter-actions inconvenient or unsafe or as an experience during which they are subject to discrimination from fellow passengers.
Given the rapid spread of this service, known as dynamic ride-sharing, the research questions focused on investigating whether people perceive dynamic ridesharing as having positive or negative utility with respect to its social aspects, what influences those per-ceptions, and how they compare with traditional factors like time and cost. To better understand the social dimensions of dynamic ridesharing services, a survey was designed to explore how people of different ages, genders, sociodemographic backgrounds, travel behaviors, and personalities use ridesharing and experience its social aspects and what types of social interventions could make them more or less likely to use the service.
This research is relevant from at least three perspectives. First, it could inform policy, tactics for communication to riders, and facilitating interaction between passengers. Second, the proposed approaches could be considered in analysis or modeling of travel mode choices made by individuals. Finally, other modes could benefit from the methodology developed, as they also have social dimensions that can affect decisions made by their users.
Literature review
Socioeconomic Factors
Previous carpooling literature investigated socioeconomic factors, such as age, gender, and income, in addition to distance and travel time, that influence the propensity to share rides through traditional carpooling. Contrary to assumptions that women may be less likely to rideshare because of fear of strangers or physical harm, many studies have found that women are more likely to carpool than men. A 2009 survey of carpool participants in the Toronto area found women to be 1.3 times more likely to form a successful carpool than males (1), and a more recent study (2) found gender (specifically being a woman) to be the most significant factor in determining the likelihood of respondents to carpool.
Age is another significant factor: studies have found that carpooling tends to increase with age up to approximately 55, beyond which very few people carpool (1). Early literature also found that vehicle owner-ship is a significant factor: 30% of workers from households that have fewer vehicles than workers choose to carpool, compared with just 16% when a vehicle is available for every worker. Income and occu-pation have also been identified as significant factors, lower-income workers and laborers being more likely to carpool than higher-income, professional workers (3). Research by Kearney and De Young indi-cated that multimodalism matters: those who only drive are less likely to try ridesharing than those who are familiar with other modes (4).
More recent literature has investigated the particular socio- demographic factors of users of TNCs such as Uber and Lyft. A
To Share or Not To Shareinvestigating the Social aspects of Dynamic ridesharing
Javier Morales Sarriera, Germán Escovar Álvarez, Kelly Blynn, Andrew Alesbury, Timothy Scully, and Jinhua Zhao
J. Morales Sarriera, G. Escovar Álvarez, K. Blynn, and T. Scully, Building 1-235, and J. Zhao, Building 9-523, Massachusetts Institute of Technology, 77 Massachusetts Avenue, Cambridge, MA 02139. A. Alesbury, Harvard University Graduate School of Design, 48 Quincy Street, Cambridge, MA 02138. Corresponding author: J. Zhao, [email protected].
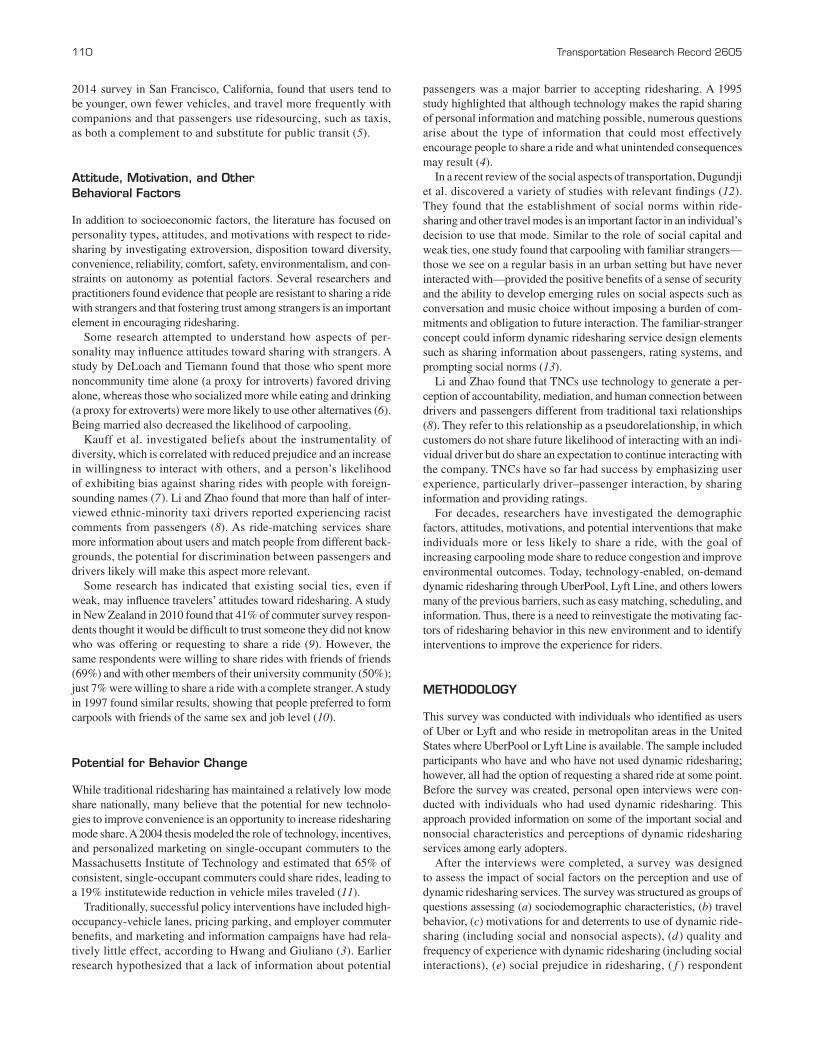
110 Transportation Research Record 2605
2014 survey in San Francisco, California, found that users tend to be younger, own fewer vehicles, and travel more frequently with companions and that passengers use ridesourcing, such as taxis, as both a complement to and substitute for public transit (5).
attitude, Motivation, and Other Behavioral Factors
In addition to socioeconomic factors, the literature has focused on personality types, attitudes, and motivations with respect to ride-sharing by investigating extroversion, disposition toward diversity, convenience, reliability, comfort, safety, environmentalism, and con-straints on autonomy as potential factors. Several researchers and practitioners found evidence that people are resistant to sharing a ride with strangers and that fostering trust among strangers is an important element in encouraging ridesharing.
Some research attempted to understand how aspects of per-sonality may influence attitudes toward sharing with strangers. A study by DeLoach and Tiemann found that those who spent more noncommunity time alone (a proxy for introverts) favored driving alone, whereas those who socialized more while eating and drinking (a proxy for extroverts) were more likely to use other alternatives (6). Being married also decreased the likelihood of carpooling.
Kauff et al. investigated beliefs about the instrumentality of diversity, which is correlated with reduced prejudice and an increase in willingness to interact with others, and a person’s likelihood of exhibiting bias against sharing rides with people with foreign-sounding names (7). Li and Zhao found that more than half of inter-viewed ethnic-minority taxi drivers reported experiencing racist comments from passengers (8). As ride-matching services share more information about users and match people from different back-grounds, the potential for discrimination between passengers and drivers likely will make this aspect more relevant.
Some research has indicated that existing social ties, even if weak, may influence travelers’ attitudes toward ridesharing. A study in New Zealand in 2010 found that 41% of commuter survey respon-dents thought it would be difficult to trust someone they did not know who was offering or requesting to share a ride (9). However, the same respondents were willing to share rides with friends of friends (69%) and with other members of their university community (50%); just 7% were willing to share a ride with a complete stranger. A study in 1997 found similar results, showing that people preferred to form carpools with friends of the same sex and job level (10).
Potential for Behavior Change
While traditional ridesharing has maintained a relatively low mode share nationally, many believe that the potential for new technolo-gies to improve convenience is an opportunity to increase ridesharing mode share. A 2004 thesis modeled the role of technology, incentives, and personalized marketing on single-occupant commuters to the Massachusetts Institute of Technology and estimated that 65% of consistent, single-occupant commuters could share rides, leading to a 19% institutewide reduction in vehicle miles traveled (11).
Traditionally, successful policy interventions have included high-occupancy-vehicle lanes, pricing parking, and employer commuter benefits, and marketing and information campaigns have had rela-tively little effect, according to Hwang and Giuliano (3). Earlier research hypothesized that a lack of information about potential
passengers was a major barrier to accepting ridesharing. A 1995 study highlighted that although technology makes the rapid sharing of personal information and matching possible, numerous questions arise about the type of information that could most effectively encourage people to share a ride and what unintended consequences may result (4).
In a recent review of the social aspects of transportation, Dugundji et al. discovered a variety of studies with relevant findings (12). They found that the establishment of social norms within ride-sharing and other travel modes is an important factor in an individual’s decision to use that mode. Similar to the role of social capital and weak ties, one study found that carpooling with familiar strangers— those we see on a regular basis in an urban setting but have never interacted with—provided the positive benefits of a sense of security and the ability to develop emerging rules on social aspects such as conversation and music choice without imposing a burden of com-mitments and obligation to future interaction. The familiar-stranger concept could inform dynamic ridesharing service design elements such as sharing information about passengers, rating systems, and prompting social norms (13).
Li and Zhao found that TNCs use technology to generate a per-ception of accountability, mediation, and human connection between drivers and passengers different from traditional taxi relationships (8). They refer to this relationship as a pseudorelationship, in which customers do not share future likelihood of interacting with an indi-vidual driver but do share an expectation to continue interacting with the company. TNCs have so far had success by emphasizing user experience, particularly driver–passenger interaction, by sharing information and providing ratings.
For decades, researchers have investigated the demographic factors, attitudes, motivations, and potential interventions that make individuals more or less likely to share a ride, with the goal of increasing carpooling mode share to reduce congestion and improve environmental outcomes. Today, technology-enabled, on-demand dynamic ridesharing through UberPool, Lyft Line, and others lowers many of the previous barriers, such as easy matching, scheduling, and information. Thus, there is a need to reinvestigate the motivating fac-tors of ridesharing behavior in this new environment and to identify interventions to improve the experience for riders.
MethODOLOgy
This survey was conducted with individuals who identified as users of Uber or Lyft and who reside in metropolitan areas in the United States where UberPool or Lyft Line is available. The sample included participants who have and who have not used dynamic ridesharing; however, all had the option of requesting a shared ride at some point. Before the survey was created, personal open interviews were con-ducted with individuals who had used dynamic ridesharing. This approach provided information on some of the important social and nonsocial characteristics and perceptions of dynamic ridesharing services among early adopters.
After the interviews were completed, a survey was designed to assess the impact of social factors on the perception and use of dynamic ridesharing services. The survey was structured as groups of questions assessing (a) sociodemographic characteristics, (b) travel behavior, (c) motivations for and deterrents to use of dynamic ride-sharing (including social and nonsocial aspects), (d) quality and frequency of experience with dynamic ridesharing (including social interactions), (e) social prejudice in ridesharing, ( f ) respondent

Morales Sarriera, Escovar Álvarez, Blynn, Alesbury, Scully, and Zhao 111
orientation on a social dominance scale (correlated with social prej-udice), (g) perception of women’s safety, and (h) personality traits of the respondents.
In most cases, the demographic and travel behavior questions were structured as multiple-choice questions, and those focusing on dynamic ridesharing perceptions, social dominance orientation, and personality were structured as Likert scale questions, in which the respondent was asked to state his or her opinion (strongly disagree to strongly agree) about or assign a frequency to (never to every time) statements focusing on specific aspects of the hypothesis being tested.
To reach a broad sample, a survey built on Qualtrics (an online sur-vey development service) was used, and participants were recruited through Mechanical Turk (a task distribution company that pays respondents a set amount to complete tasks, such as surveys). Mechan-ical Turk was used to reach as wide a variety of survey takers as pos-sible; however, there were limitations to acquiring a sufficiently representative sample of TNC users—an issue further discussed in relation to the sociodemographic characteristics of survey takers. Additionally, because Mechanical Turk survey takers are paid for the number of tasks they complete, they may complete surveys with less attention to detail than researchers would prefer. Thus, an attempt was made to screen poor survey-taking behavior by (a) requesting that only experienced and well-reviewed users take the survey (users with at least 97% of their previous tasks approved and with a total of at least 500 tasks completed), (b) adding atten-tion checks during the survey that eliminated respondents who randomly answer questions, and (c) creating a set of flags for com-pleted surveys that identified suspicious patterns or inconsistencies in responses.
Conducted between June 26 and July 4, 2016, the survey was completed by 1,222 respondents who had used Uber or Lyft and who resided in metropolitan areas in which UberPool or Lyft Line were available. From the initial sample of respondents, 225 were eliminated who did not meet at least two of the nine criteria (flags) used to gauge respondents who did not complete the survey with full attention. The final sample size of the analysis was 997 respon-dents, 752 of whom had previously used Lyft Line or UberPool and 245 who had not.
reSuLtS
The discussion of the survey results begins with a description of the makeup of participants, followed by an analysis of the results. The analysis discusses the statistics of the several groups of questions and their correlations with sociodemographic characteristics and travel behavior attributes.
Survey respondent Demographics
Survey respondents were predominantly young, male, white, edu-cated, and lower to medium income, as shown in Table 1. Most sur-vey respondents were younger than 35 (78%), were male (57%), and held an undergraduate or graduate degree (65%). Most respondents were white (70%); Asian, black, and Hispanic respondents made up 9%, 8%, and 7% of the total sample, respectively; and household income was fairly evenly distributed. Among other surveyed char-acteristics, 40% reported being single, 29% reported being married
or in domestic partnerships, and 29% reported being in a relationship. Finally, 74% did not have children in their households.
A comparison of the population of TNC users and the populations of U.S. Mechanical Turk users showed that the respondents were fairly representative of gender, age, education, and race but were skewed toward lower to middle income. Vugo passenger trip data from 2015 show that the population of TNC users is predominantly young, has more males than females, and contains people from all income levels (although it is skewed toward higher income) (14). Ipeirotis showed that most of the characteristics in the sample coin-cide with those of Mechanical Turk users, with the exception of gender (Mechanical Turk has more female than male participants) and race (Mechanical Turk more closely represents the racial breakdown of the U.S. population) (13).
With respect to the geographic distribution of the respondents, 26% resided in the Northeast, 24% in the West, 24% in the Southeast, 13% in the Great Lakes region, and 8% in the Southwest, according to the classification of the Bureau of Economic Analysis. Most respon-dents were in the metropolitan areas of Los Angeles, California; New York City; and Chicago, Illinois, but many were in metropoli-tan areas of San Francisco; Boston, Massachusetts; Philadelphia, Pennsylvania; Washington, D.C.; Atlanta, Georgia; and Miami, Florida, accurately representing the markets in which the dynamic ridesharing technology first arrived.
travel Behavior
Of the survey respondents, 75% indicated they have previously used dynamic ridesharing. Table 2 shows that there are statistically
TABLE 1 Survey Sociodemographics by Age Group
Age (%)
Demographic Total 18–25 26–30 31–3536 and Older
Totala 100.0 26.6 30.8 20.5 22.2
Gender Male 56.7 15.1 18.3 11.8 11.4 Female 42.8 11.0 12.5 8.5 10.7 Other 0.5 0.4 0.0 0.1 0.0
Education High school or less 6.2 1.9 1.7 1.0 1.6 Some college 27.9 11.6 6.4 4.5 5.3 College degree 49.4 11.8 16.9 10.7 10.0 Graduate degree 16.4 1.2 5.8 4.2 5.2
Income Less than $30,000 21.6 9.2 5.6 3.3 3.4 $30,000–$50,000 24.3 5.5 8.3 5.8 4.6 $50,000–$75,000 24.5 4.9 9.3 4.9 5.3 More than $75,000 29.7 6.9 7.5 6.4 8.8
Occupation Employed 79.7 14.5 26.8 18.9 19.6 Student only 13.5 10.0 2.3 0.6 0.6 Not employed 6.7 2.0 1.7 1.0 2.0
Race or ethnicity White 64.6 16.5 21.7 14.8 11.5 Asian 10.0 3.8 2.4 1.6 2.2 Black 8.8 2.0 2.5 2.7 1.6 Hispanic 7.2 2.6 3.0 0.8 0.8
a n = 997.
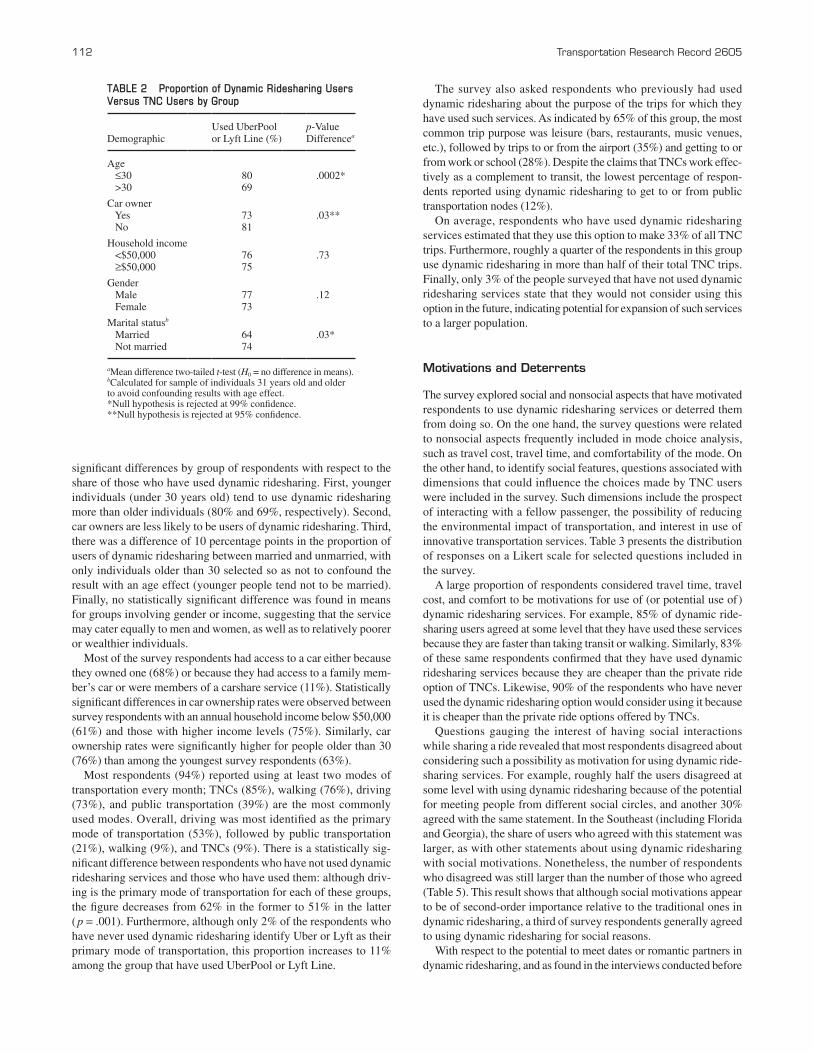
112 Transportation Research Record 2605
significant differences by group of respondents with respect to the share of those who have used dynamic ridesharing. First, younger individuals (under 30 years old) tend to use dynamic ridesharing more than older individuals (80% and 69%, respectively). Second, car owners are less likely to be users of dynamic ridesharing. Third, there was a difference of 10 percentage points in the proportion of users of dynamic ridesharing between married and unmarried, with only individuals older than 30 selected so as not to confound the result with an age effect (younger people tend not to be married). Finally, no statistically significant difference was found in means for groups involving gender or income, suggesting that the service may cater equally to men and women, as well as to relatively poorer or wealthier individuals.
Most of the survey respondents had access to a car either because they owned one (68%) or because they had access to a family mem-ber’s car or were members of a carshare service (11%). Statistically significant differences in car ownership rates were observed between survey respondents with an annual household income below $50,000 (61%) and those with higher income levels (75%). Similarly, car ownership rates were significantly higher for people older than 30 (76%) than among the youngest survey respondents (63%).
Most respondents (94%) reported using at least two modes of transportation every month; TNCs (85%), walking (76%), driving (73%), and public transportation (39%) are the most commonly used modes. Overall, driving was most identified as the primary mode of transportation (53%), followed by public transportation (21%), walking (9%), and TNCs (9%). There is a statistically sig-nificant difference between respondents who have not used dynamic ridesharing services and those who have used them: although driv-ing is the primary mode of transportation for each of these groups, the figure decreases from 62% in the former to 51% in the latter (p = .001). Furthermore, although only 2% of the respondents who have never used dynamic ridesharing identify Uber or Lyft as their primary mode of transportation, this proportion increases to 11% among the group that have used UberPool or Lyft Line.
The survey also asked respondents who previously had used dynamic ridesharing about the purpose of the trips for which they have used such services. As indicated by 65% of this group, the most common trip purpose was leisure (bars, restaurants, music venues, etc.), followed by trips to or from the airport (35%) and getting to or from work or school (28%). Despite the claims that TNCs work effec-tively as a complement to transit, the lowest percentage of respon-dents reported using dynamic ridesharing to get to or from public transportation nodes (12%).
On average, respondents who have used dynamic ridesharing services estimated that they use this option to make 33% of all TNC trips. Furthermore, roughly a quarter of the respondents in this group use dynamic ridesharing in more than half of their total TNC trips. Finally, only 3% of the people surveyed that have not used dynamic ridesharing services state that they would not consider using this option in the future, indicating potential for expansion of such services to a larger population.
Motivations and Deterrents
The survey explored social and nonsocial aspects that have motivated respondents to use dynamic ridesharing services or deterred them from doing so. On the one hand, the survey questions were related to nonsocial aspects frequently included in mode choice analysis, such as travel cost, travel time, and comfortability of the mode. On the other hand, to identify social features, questions associated with dimensions that could influence the choices made by TNC users were included in the survey. Such dimensions include the prospect of interacting with a fellow passenger, the possibility of reducing the environmental impact of transportation, and interest in use of innovative transportation services. Table 3 presents the distribution of responses on a Likert scale for selected questions included in the survey.
A large proportion of respondents considered travel time, travel cost, and comfort to be motivations for use of (or potential use of) dynamic ridesharing services. For example, 85% of dynamic ride-sharing users agreed at some level that they have used these services because they are faster than taking transit or walking. Similarly, 83% of these same respondents confirmed that they have used dynamic ridesharing services because they are cheaper than the private ride option of TNCs. Likewise, 90% of the respondents who have never used the dynamic ridesharing option would consider using it because it is cheaper than the private ride options offered by TNCs.
Questions gauging the interest of having social interactions while sharing a ride revealed that most respondents disagreed about considering such a possibility as motivation for using dynamic ride-sharing services. For example, roughly half the users disagreed at some level with using dynamic ridesharing because of the potential for meeting people from different social circles, and another 30% agreed with the same statement. In the Southeast (including Florida and Georgia), the share of users who agreed with this statement was larger, as with other statements about using dynamic ridesharing with social motivations. Nonetheless, the number of respondents who disagreed was still larger than the number of those who agreed (Table 5). This result shows that although social motivations appear to be of second-order importance relative to the traditional ones in dynamic ridesharing, a third of survey respondents generally agreed to using dynamic ridesharing for social reasons.
With respect to the potential to meet dates or romantic partners in dynamic ridesharing, and as found in the interviews conducted before
TABLE 2 Proportion of Dynamic Ridesharing Users Versus TNC Users by Group
DemographicUsed UberPool or Lyft Line (%)
p-Value Differencea
Age ≤30 80 .0002* >30 69
Car owner Yes 73 .03** No 81
Household income <$50,000 76 .73 ≥$50,000 75
Gender Male 77 .12 Female 73
Marital statusb
Married 64 .03* Not married 74
aMean difference two-tailed t-test (H0 = no difference in means). bCalculated for sample of individuals 31 years old and older to avoid confounding results with age effect.*Null hypothesis is rejected at 99% confidence.**Null hypothesis is rejected at 95% confidence.
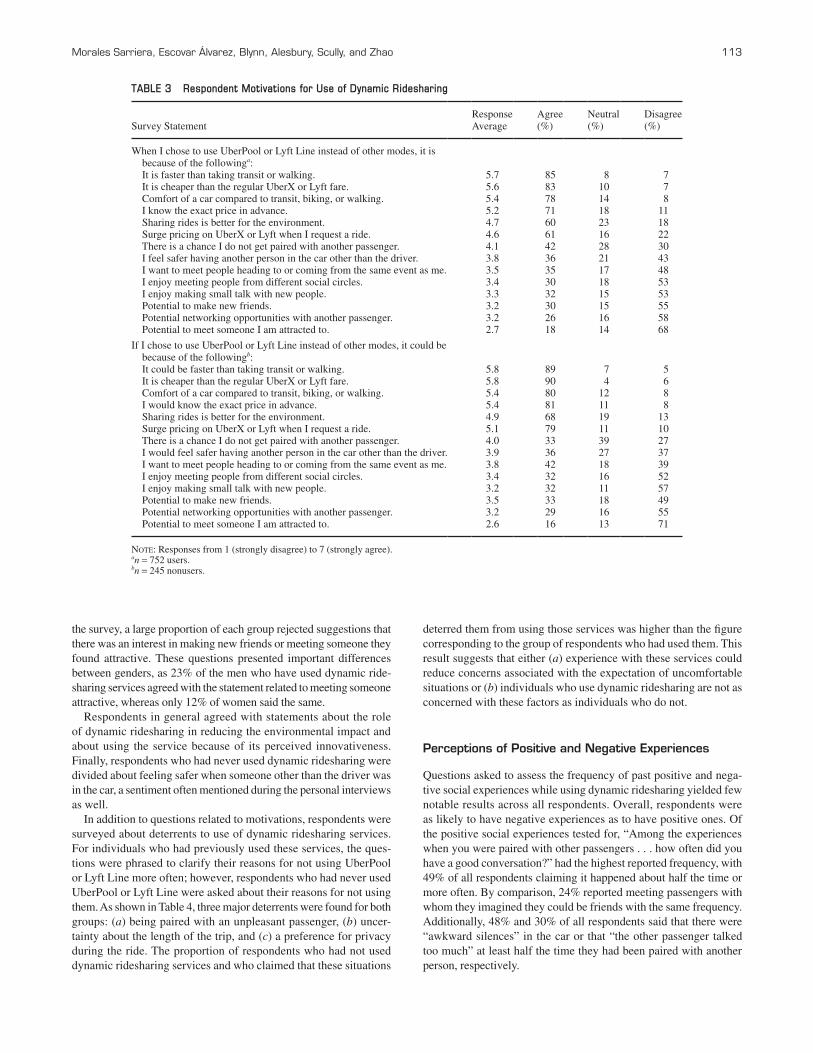
Morales Sarriera, Escovar Álvarez, Blynn, Alesbury, Scully, and Zhao 113
the survey, a large proportion of each group rejected suggestions that there was an interest in making new friends or meeting someone they found attractive. These questions presented important differences between genders, as 23% of the men who have used dynamic ride-sharing services agreed with the statement related to meeting someone attractive, whereas only 12% of women said the same.
Respondents in general agreed with statements about the role of dynamic ridesharing in reducing the environmental impact and about using the service because of its perceived innovativeness. Finally, respondents who had never used dynamic ridesharing were divided about feeling safer when someone other than the driver was in the car, a sentiment often mentioned during the personal interviews as well.
In addition to questions related to motivations, respondents were surveyed about deterrents to use of dynamic ridesharing services. For individuals who had previously used these services, the ques-tions were phrased to clarify their reasons for not using UberPool or Lyft Line more often; however, respondents who had never used UberPool or Lyft Line were asked about their reasons for not using them. As shown in Table 4, three major deterrents were found for both groups: (a) being paired with an unpleasant passenger, (b) uncer-tainty about the length of the trip, and (c) a preference for privacy during the ride. The proportion of respondents who had not used dynamic ridesharing services and who claimed that these situations
deterred them from using those services was higher than the figure corresponding to the group of respondents who had used them. This result suggests that either (a) experience with these services could reduce concerns associated with the expectation of uncomfortable situations or (b) individuals who use dynamic ridesharing are not as concerned with these factors as individuals who do not.
Perceptions of Positive and Negative experiences
Questions asked to assess the frequency of past positive and nega-tive social experiences while using dynamic ridesharing yielded few notable results across all respondents. Overall, respondents were as likely to have negative experiences as to have positive ones. Of the positive social experiences tested for, “Among the experiences when you were paired with other passengers . . . how often did you have a good conversation?” had the highest reported frequency, with 49% of all respondents claiming it happened about half the time or more often. By comparison, 24% reported meeting passengers with whom they imagined they could be friends with the same frequency. Additionally, 48% and 30% of all respondents said that there were “awkward silences” in the car or that “the other passenger talked too much” at least half the time they had been paired with another person, respectively.
TABLE 3 Respondent Motivations for Use of Dynamic Ridesharing
Survey StatementResponse Average
Agree (%)
Neutral (%)
Disagree (%)
When I chose to use UberPool or Lyft Line instead of other modes, it is because of the followinga: It is faster than taking transit or walking. 5.7 85 8 7 It is cheaper than the regular UberX or Lyft fare. 5.6 83 10 7 Comfort of a car compared to transit, biking, or walking. 5.4 78 14 8 I know the exact price in advance. 5.2 71 18 11 Sharing rides is better for the environment. 4.7 60 23 18 Surge pricing on UberX or Lyft when I request a ride. 4.6 61 16 22 There is a chance I do not get paired with another passenger. 4.1 42 28 30 I feel safer having another person in the car other than the driver. 3.8 36 21 43 I want to meet people heading to or coming from the same event as me. 3.5 35 17 48 I enjoy meeting people from different social circles. 3.4 30 18 53 I enjoy making small talk with new people. 3.3 32 15 53 Potential to make new friends. 3.2 30 15 55 Potential networking opportunities with another passenger. 3.2 26 16 58 Potential to meet someone I am attracted to. 2.7 18 14 68
If I chose to use UberPool or Lyft Line instead of other modes, it could be because of the followingb: It could be faster than taking transit or walking. 5.8 89 7 5 It is cheaper than the regular UberX or Lyft fare. 5.8 90 4 6 Comfort of a car compared to transit, biking, or walking. 5.4 80 12 8 I would know the exact price in advance. 5.4 81 11 8 Sharing rides is better for the environment. 4.9 68 19 13 Surge pricing on UberX or Lyft when I request a ride. 5.1 79 11 10 There is a chance I do not get paired with another passenger. 4.0 33 39 27 I would feel safer having another person in the car other than the driver. 3.9 36 27 37 I want to meet people heading to or coming from the same event as me. 3.8 42 18 39 I enjoy meeting people from different social circles. 3.4 32 16 52 I enjoy making small talk with new people. 3.2 32 11 57 Potential to make new friends. 3.5 33 18 49 Potential networking opportunities with another passenger. 3.2 29 16 55 Potential to meet someone I am attracted to. 2.6 16 13 71
Note: Responses from 1 (strongly disagree) to 7 (strongly agree).an = 752 users.bn = 245 nonusers.
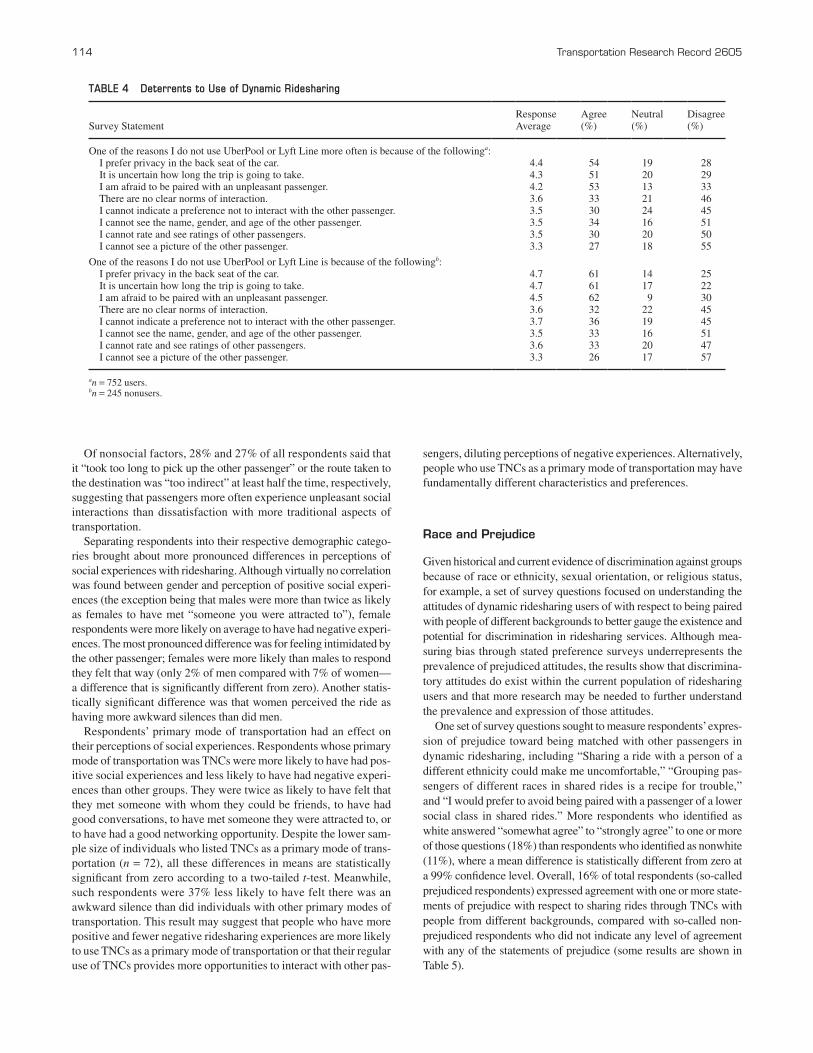
114 Transportation Research Record 2605
Of nonsocial factors, 28% and 27% of all respondents said that it “took too long to pick up the other passenger” or the route taken to the destination was “too indirect” at least half the time, respectively, suggesting that passengers more often experience unpleasant social interactions than dissatisfaction with more traditional aspects of transportation.
Separating respondents into their respective demographic catego-ries brought about more pronounced differences in perceptions of social experiences with ridesharing. Although virtually no correlation was found between gender and perception of positive social experi-ences (the exception being that males were more than twice as likely as females to have met “someone you were attracted to”), female respondents were more likely on average to have had negative experi-ences. The most pronounced difference was for feeling intimidated by the other passenger; females were more likely than males to respond they felt that way (only 2% of men compared with 7% of women— a difference that is significantly different from zero). Another statis-tically significant difference was that women perceived the ride as having more awkward silences than did men.
Respondents’ primary mode of transportation had an effect on their perceptions of social experiences. Respondents whose primary mode of transportation was TNCs were more likely to have had pos-itive social experiences and less likely to have had negative experi-ences than other groups. They were twice as likely to have felt that they met someone with whom they could be friends, to have had good conversations, to have met someone they were attracted to, or to have had a good networking opportunity. Despite the lower sam-ple size of individuals who listed TNCs as a primary mode of trans-portation (n = 72), all these differences in means are statistically significant from zero according to a two-tailed t-test. Meanwhile, such respondents were 37% less likely to have felt there was an awkward silence than did individuals with other primary modes of transportation. This result may suggest that people who have more positive and fewer negative ridesharing experiences are more likely to use TNCs as a primary mode of transportation or that their regular use of TNCs provides more opportunities to interact with other pas-
sengers, diluting perceptions of negative experiences. Alternatively, people who use TNCs as a primary mode of transportation may have fundamentally different characteristics and preferences.
race and Prejudice
Given historical and current evidence of discrimination against groups because of race or ethnicity, sexual orientation, or religious status, for example, a set of survey questions focused on understanding the attitudes of dynamic ridesharing users of with respect to being paired with people of different backgrounds to better gauge the existence and potential for discrimination in ridesharing services. Although mea-suring bias through stated preference surveys underrepresents the prevalence of prejudiced attitudes, the results show that discrimina-tory attitudes do exist within the current population of ridesharing users and that more research may be needed to further understand the prevalence and expression of those attitudes.
One set of survey questions sought to measure respondents’ expres-sion of prejudice toward being matched with other passengers in dynamic ridesharing, including “Sharing a ride with a person of a different ethnicity could make me uncomfortable,” “Grouping pas-sengers of different races in shared rides is a recipe for trouble,” and “I would prefer to avoid being paired with a passenger of a lower social class in shared rides.” More respondents who identified as white answered “somewhat agree” to “strongly agree” to one or more of those questions (18%) than respondents who identified as nonwhite (11%), where a mean difference is statistically different from zero at a 99% confidence level. Overall, 16% of total respondents (so-called prejudiced respondents) expressed agreement with one or more state-ments of prejudice with respect to sharing rides through TNCs with people from different backgrounds, compared with so-called non-prejudiced respondents who did not indicate any level of agreement with any of the statements of prejudice (some results are shown in Table 5).
TABLE 4 Deterrents to Use of Dynamic Ridesharing
Survey StatementResponse Average
Agree (%)
Neutral (%)
Disagree (%)
One of the reasons I do not use UberPool or Lyft Line more often is because of the followinga: I prefer privacy in the back seat of the car. 4.4 54 19 28 It is uncertain how long the trip is going to take. 4.3 51 20 29 I am afraid to be paired with an unpleasant passenger. 4.2 53 13 33 There are no clear norms of interaction. 3.6 33 21 46 I cannot indicate a preference not to interact with the other passenger. 3.5 30 24 45 I cannot see the name, gender, and age of the other passenger. 3.5 34 16 51 I cannot rate and see ratings of other passengers. 3.5 30 20 50 I cannot see a picture of the other passenger. 3.3 27 18 55
One of the reasons I do not use UberPool or Lyft Line is because of the followingb: I prefer privacy in the back seat of the car. 4.7 61 14 25 It is uncertain how long the trip is going to take. 4.7 61 17 22 I am afraid to be paired with an unpleasant passenger. 4.5 62 9 30 There are no clear norms of interaction. 3.6 32 22 45 I cannot indicate a preference not to interact with the other passenger. 3.7 36 19 45 I cannot see the name, gender, and age of the other passenger. 3.5 33 16 51 I cannot rate and see ratings of other passengers. 3.6 33 20 47 I cannot see a picture of the other passenger. 3.3 26 17 57
an = 752 users.bn = 245 nonusers.
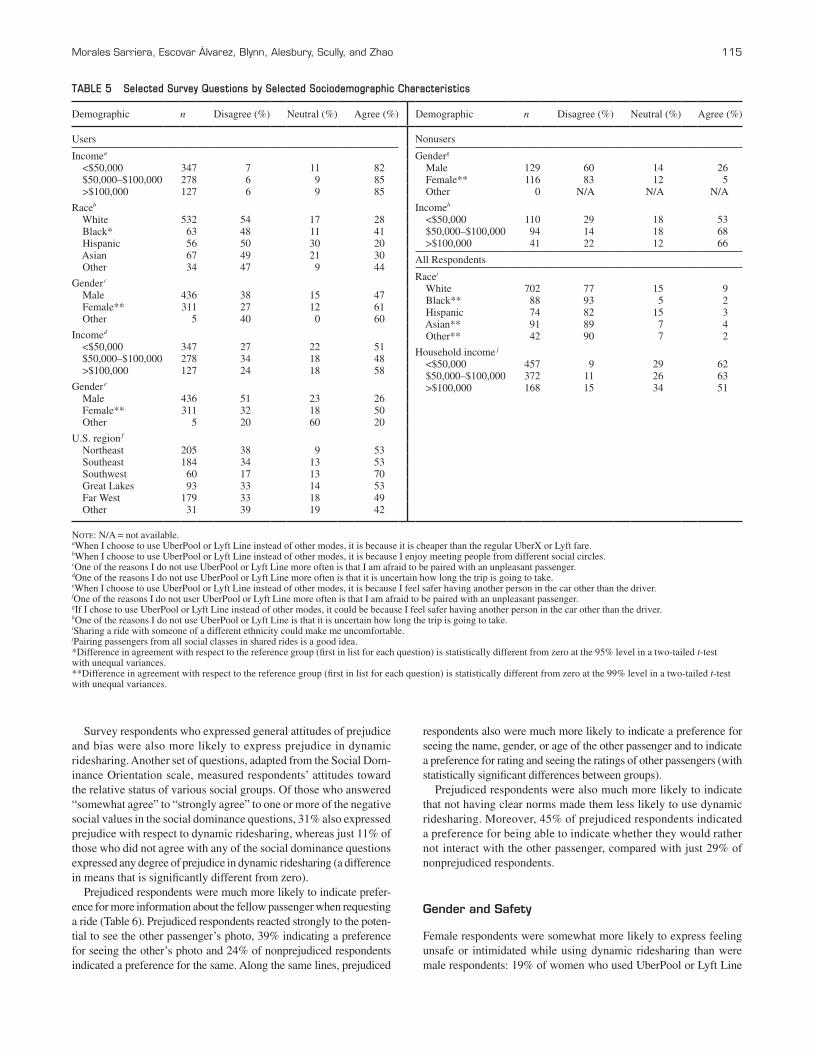
Morales Sarriera, Escovar Álvarez, Blynn, Alesbury, Scully, and Zhao 115
Survey respondents who expressed general attitudes of prejudice and bias were also more likely to express prejudice in dynamic ridesharing. Another set of questions, adapted from the Social Dom-inance Orientation scale, measured respondents’ attitudes toward the relative status of various social groups. Of those who answered “somewhat agree” to “strongly agree” to one or more of the negative social values in the social dominance questions, 31% also expressed prejudice with respect to dynamic ridesharing, whereas just 11% of those who did not agree with any of the social dominance questions expressed any degree of prejudice in dynamic ridesharing (a difference in means that is significantly different from zero).
Prejudiced respondents were much more likely to indicate prefer-ence for more information about the fellow passenger when requesting a ride (Table 6). Prejudiced respondents reacted strongly to the poten-tial to see the other passenger’s photo, 39% indicating a preference for seeing the other’s photo and 24% of nonprejudiced respondents indicated a preference for the same. Along the same lines, prejudiced
respondents also were much more likely to indicate a preference for seeing the name, gender, or age of the other passenger and to indicate a preference for rating and seeing the ratings of other passengers (with statistically significant differences between groups).
Prejudiced respondents were also much more likely to indicate that not having clear norms made them less likely to use dynamic ridesharing. Moreover, 45% of prejudiced respondents indicated a preference for being able to indicate whether they would rather not interact with the other passenger, compared with just 29% of nonprejudiced respondents.
gender and Safety
Female respondents were somewhat more likely to express feeling unsafe or intimidated while using dynamic ridesharing than were male respondents: 19% of women who used UberPool or Lyft Line
TABLE 5 Selected Survey Questions by Selected Sociodemographic Characteristics
Demographic n Disagree (%) Neutral (%) Agree (%) Demographic n Disagree (%) Neutral (%) Agree (%)
Users
Incomea
<$50,000 347 7 11 82 $50,000–$100,000 278 6 9 85 >$100,000 127 6 9 85
Raceb
White 532 54 17 28 Black* 63 48 11 41 Hispanic 56 50 30 20 Asian 67 49 21 30 Other 34 47 9 44
Gender c
Male 436 38 15 47 Female** 311 27 12 61 Other 5 40 0 60
Incomed
<$50,000 347 27 22 51 $50,000–$100,000 278 34 18 48 >$100,000 127 24 18 58
Gender e
Male 436 51 23 26 Female** 311 32 18 50 Other 5 20 60 20
U.S. region f
Northeast 205 38 9 53 Southeast 184 34 13 53 Southwest 60 17 13 70 Great Lakes 93 33 14 53 Far West 179 33 18 49 Other 31 39 19 42
Note: N/A = not available.aWhen I choose to use UberPool or Lyft Line instead of other modes, it is because it is cheaper than the regular UberX or Lyft fare.bWhen I choose to use UberPool or Lyft Line instead of other modes, it is because I enjoy meeting people from different social circles.cOne of the reasons I do not use UberPool or Lyft Line more often is that I am afraid to be paired with an unpleasant passenger.dOne of the reasons I do not use UberPool or Lyft Line more often is that it is uncertain how long the trip is going to take.eWhen I choose to use UberPool or Lyft Line instead of other modes, it is because I feel safer having another person in the car other than the driver.fOne of the reasons I do not user UberPool or Lyft Line more often is that I am afraid to be paired with an unpleasant passenger.gIf I chose to use UberPool or Lyft Line instead of other modes, it could be because I feel safer having another person in the car other than the driver.hOne of the reasons I do not use UberPool or Lyft Line is that it is uncertain how long the trip is going to take.iSharing a ride with someone of a different ethnicity could make me uncomfortable.jPairing passengers from all social classes in shared rides is a good idea.*Difference in agreement with respect to the reference group (first in list for each question) is statistically different from zero at the 95% level in a two-tailed t-test with unequal variances.**Difference in agreement with respect to the reference group (first in list for each question) is statistically different from zero at the 99% level in a two-tailed t-test with unequal variances.
Nonusers
Genderg
Male 129 60 14 26 Female** 116 83 12 5 Other 0 N/A N/A N/A
Incomeh
<$50,000 110 29 18 53 $50,000–$100,000 94 14 18 68 >$100,000 41 22 12 66
All Respondents
Racei
White 702 77 15 9 Black** 88 93 5 2 Hispanic 74 82 15 3 Asian** 91 89 7 4 Other** 42 90 7 2
Household income j
<$50,000 457 9 29 62 $50,000–$100,000 372 11 26 63 >$100,000 168 15 34 51
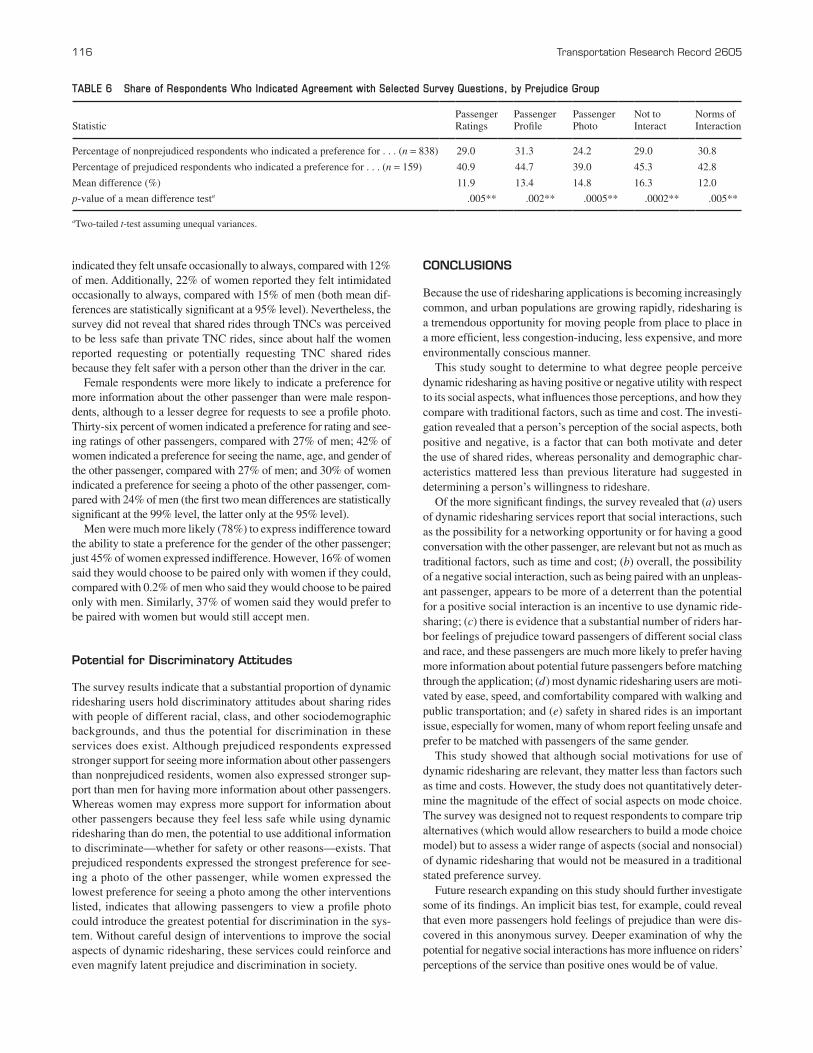
116 Transportation Research Record 2605
indicated they felt unsafe occasionally to always, compared with 12% of men. Additionally, 22% of women reported they felt intimidated occasionally to always, compared with 15% of men (both mean dif-ferences are statistically significant at a 95% level). Nevertheless, the survey did not reveal that shared rides through TNCs was perceived to be less safe than private TNC rides, since about half the women reported requesting or potentially requesting TNC shared rides because they felt safer with a person other than the driver in the car.
Female respondents were more likely to indicate a preference for more information about the other passenger than were male respon-dents, although to a lesser degree for requests to see a profile photo. Thirty-six percent of women indicated a preference for rating and see-ing ratings of other passengers, compared with 27% of men; 42% of women indicated a preference for seeing the name, age, and gender of the other passenger, compared with 27% of men; and 30% of women indicated a preference for seeing a photo of the other passenger, com-pared with 24% of men (the first two mean differences are statistically significant at the 99% level, the latter only at the 95% level).
Men were much more likely (78%) to express indifference toward the ability to state a preference for the gender of the other passenger; just 45% of women expressed indifference. However, 16% of women said they would choose to be paired only with women if they could, compared with 0.2% of men who said they would choose to be paired only with men. Similarly, 37% of women said they would prefer to be paired with women but would still accept men.
Potential for Discriminatory attitudes
The survey results indicate that a substantial proportion of dynamic ridesharing users hold discriminatory attitudes about sharing rides with people of different racial, class, and other sociodemographic backgrounds, and thus the potential for discrimination in these services does exist. Although prejudiced respondents expressed stronger support for seeing more information about other passengers than nonprejudiced residents, women also expressed stronger sup-port than men for having more information about other passengers. Whereas women may express more support for information about other passengers because they feel less safe while using dynamic ridesharing than do men, the potential to use additional information to discriminate—whether for safety or other reasons—exists. That prejudiced respondents expressed the strongest preference for see-ing a photo of the other passenger, while women expressed the lowest preference for seeing a photo among the other interventions listed, indicates that allowing passengers to view a profile photo could introduce the greatest potential for discrimination in the sys-tem. Without careful design of interventions to improve the social aspects of dynamic ridesharing, these services could reinforce and even magnify latent prejudice and discrimination in society.
CONCLuSiONS
Because the use of ridesharing applications is becoming increasingly common, and urban populations are growing rapidly, ridesharing is a tremendous opportunity for moving people from place to place in a more efficient, less congestion-inducing, less expensive, and more environmentally conscious manner.
This study sought to determine to what degree people perceive dynamic ridesharing as having positive or negative utility with respect to its social aspects, what influences those perceptions, and how they compare with traditional factors, such as time and cost. The investi-gation revealed that a person’s perception of the social aspects, both positive and negative, is a factor that can both motivate and deter the use of shared rides, whereas personality and demographic char-acteristics mattered less than previous literature had suggested in determining a person’s willingness to rideshare.
Of the more significant findings, the survey revealed that (a) users of dynamic ridesharing services report that social interactions, such as the possibility for a networking opportunity or for having a good conversation with the other passenger, are relevant but not as much as traditional factors, such as time and cost; (b) overall, the possibility of a negative social interaction, such as being paired with an unpleas-ant passenger, appears to be more of a deterrent than the potential for a positive social interaction is an incentive to use dynamic ride-sharing; (c) there is evidence that a substantial number of riders har-bor feelings of prejudice toward passengers of different social class and race, and these passengers are much more likely to prefer having more information about potential future passengers before matching through the application; (d) most dynamic ridesharing users are moti-vated by ease, speed, and comfortability compared with walking and public transportation; and (e) safety in shared rides is an important issue, especially for women, many of whom report feeling unsafe and prefer to be matched with passengers of the same gender.
This study showed that although social motivations for use of dynamic ridesharing are relevant, they matter less than factors such as time and costs. However, the study does not quantitatively deter-mine the magnitude of the effect of social aspects on mode choice. The survey was designed not to request respondents to compare trip alternatives (which would allow researchers to build a mode choice model) but to assess a wider range of aspects (social and nonsocial) of dynamic ridesharing that would not be measured in a traditional stated preference survey.
Future research expanding on this study should further investigate some of its findings. An implicit bias test, for example, could reveal that even more passengers hold feelings of prejudice than were dis-covered in this anonymous survey. Deeper examination of why the potential for negative social interactions has more influence on riders’ perceptions of the service than positive ones would be of value.
TABLE 6 Share of Respondents Who Indicated Agreement with Selected Survey Questions, by Prejudice Group
StatisticPassenger Ratings
Passenger Profile
Passenger Photo
Not to Interact
Norms of Interaction
Percentage of nonprejudiced respondents who indicated a preference for . . . (n = 838) 29.0 31.3 24.2 29.0 30.8
Percentage of prejudiced respondents who indicated a preference for . . . (n = 159) 40.9 44.7 39.0 45.3 42.8
Mean difference (%) 11.9 13.4 14.8 16.3 12.0
p-value of a mean difference testa .005** .002** .0005** .0002** .005**
aTwo-tailed t-test assuming unequal variances.
Morales Sarriera, Escovar Álvarez, Blynn, Alesbury, Scully, and Zhao 117
Dynamic ridesharing will become an increasingly prevalent mode of transportation. An understanding of the ways in which shared ride passengers interact with each other socially and how they perceive these social interactions will be valuable information for policy makers and TNC strategists alike. The results discussed here can be a starting point for future study and modification of ridesharing services.
reFereNCeS
1. Buliung, R. N., K. Soltys, C. Habel, and R. Lanyon. Driving Factors Behind Successful Carpool Formation and Use. Transportation Research Record: Journal of the Transportation Research Board, No. 2118, 2009, pp. 31–38. https://dx.doi.org/10.3141/2118-05.
2. Siddiqi, Z. Dynamic Ridesharing: Understanding the Role of Gender and Technology. MS thesis. University of Toronto, Ontario, Canada, 2012.
3. Hwang, K., and G. Giuliano. The Determinants of Ridesharing: Litera-ture Review. Transportation, Vol. 38, No. 28, 1990, pp. 1–25.
4. Kearney, A. R., and R. De Young. A Knowledge-Based Intervention for Promoting Carpooling. Environment and Behavior, Vol. 27, No. 5, 1995, pp. 650–678. https://doi.org/10.1177/0013916595275003.
5. Rayle, L., S. Shaheen, N. Chan, D. Dai, and R. Cervero. App-Based, On-Demand Ride Services: Comparing Taxi and Ridesourcing Trips and User Characteristics in San Francisco. UCTC-FR-2014-08. University of California Transportation Center, Berkeley, 2014.
6. DeLoach, S. B., and T. K. Tiemann. Not Driving Alone: American Com-muting in the Twenty-First Century. Transportation, Vol. 39, No. 3, 2012, pp. 521–537. https://doi.org/10.1007/s11116-011-9374-5.
7. Kauff, M., C. Issmer, and J. Nau. Pro-Diversity Beliefs and Everyday Ethnic Discrimination on Grounds of Foreign Names. Journal of Com-munity and Applied Social Psychology, Vol. 23, No. 6, 2013, pp. 536–542. https://doi.org/10.1002/casp.2143.
8. Li, C., and J. Zhao. Humanizing Travel: How E-Hail Apps Transform Stakeholder Relationships in the U.S. Taxi Industry. Presented at 94th Annual Meeting of the Transportation Research Board, Washington, D.C., 2015.
9. Chaube, V., A. L. Kavanaugh, and M. A. Pérez-Quiñones. Leveraging Social Networks to Embed Trust in Rideshare Programs. In Proceedings of the Annual Hawaii International Conference on System Sciences, 2010, pp. 1–8. https://doi.org/10.1109/HICSS.2010.255.
10. Dueker, K. J., B. O. Bair, and I. P. Levin. Ride Sharing: Psychological Fac-tors. Journal of Transportation Engineering, Vol. 103, 1997, pp. 685–692.
11. Amey, A. M. Real-Time Ridesharing: Exploring the Opportunities and Challenges of Designing a Technology-Based Rideshare Trial for the MIT Community. MS thesis. Massachusetts Institute of Technology, Cambridge, 2004.
12. Dugundji, E. R., A. Páez, T. A. Arentze, J. L. Walker, J. A. Carrasco, F. Marchal, and H. Nakanishi. Transportation and Social Interactions. Transportation Research Part A, Vol. 45, No. 4, 2011, pp. 239–247. https://doi.org/10.1016/j.tra.2011.01.001.
13. Ipeirotis, P. Demographics of Mechanical Turk. CeDER 10-01. Center for Digital Economy Research, New York, 2010.
14. Global Web Index. The Demographics of Uber U.S. Users. http://www.globalwebindex.net/blog/the-demographics-of-ubers-us-users. Accessed July 15, 2016.
The Standing Committee on Women’s Issues in Transportation peer-reviewed this paper.
Related Documents