CHAPTER 1 INTRODUCTION 1.1 PROFILE OF GENERAL I NSURANCE INDUSTRY History of Indian Insurance Market Insurance in India goes back to the time of the British. The first life insurance company to operate in India the Oriental Life Insurance Company was established in 1818in Calcutta. It was, however, a British company. The first Indian insurance company, the Bombay Mutual Life Assurance Society started its operations in1871. In 1956 the Indian life insurance industry was made up of 154 domestic life insurers, 16 foreign life insurers and 75 provident funds, and was still governed by the Insuran ce Act of 1938.In 1956 all life insurance companies were nationali zed, the story of non-lif e insurance in India is no diff erent. Though Lloyd. Insurance pioneered general insurance way back in 1688, the first non-life insurance company to set up shop in India was the Triton Insurance Company of Calcutta. In1907, the first Indian general insurer, the Indian Mercantile Insurance Company started its operations. The New India Assurance Company Ltd. was incorporated in1919. In 1972, the non-life insurance business in the country was nationalized and the GIC (General Insurance Corporation of India) was formed as a holding company with four subsidiaries: The National Insurance, Oriental Insurance, Uni ted India Insurance and the New India Assurance Company Ltd.Since then, insurance in India had a protect ive wall built around it, to keep it local players Market. The above companies control led the insuran ce industry for 1

Welcome message from author
This document is posted to help you gain knowledge. Please leave a comment to let me know what you think about it! Share it to your friends and learn new things together.
Transcript

8/6/2019 Yasir Final
http://slidepdf.com/reader/full/yasir-final 1/56
CHAPTER 1
INTRODUCTION
1.1 PROFILE OF GENERAL INSURANCE INDUSTRY
History of Indian Insurance Market
Insurance in India goes back to the time of the British. The first life
insurance company to operate in India the Oriental Life Insurance Company was
established in 1818in Calcutta. It was, however, a British company. The first
Indian insurance company, the Bombay Mutual Life Assurance Society started its
operations in1871. In 1956 the Indian life insurance industry was made up of 154
domestic life insurers, 16 foreign life insurers and 75 provident funds, and was
still governed by the Insurance Act of 1938.In 1956 all life insurance companies
were nationalized, the story of non-life insurance in India is no different. Though
Lloyd. Insurance pioneered general insurance way back in 1688, the first non-life
insurance company to set up shop in India was the Triton Insurance Company of
Calcutta. In1907, the first Indian general insurer, the Indian Mercantile Insurance
Company started its operations. The New India Assurance Company Ltd. was
incorporated in1919. In 1972, the non-life insurance business in the country was
nationalized and the GIC (General Insurance Corporation of India) was formedas a holding company with four subsidiaries: The National Insurance, Oriental
Insurance, United India Insurance and the New India Assurance Company
Ltd.Since then, insurance in India had a protective wall built around it, to keep it
local players Market. The above companies controlled the insurance industry for
1
8/6/2019 Yasir Final
http://slidepdf.com/reader/full/yasir-final 2/56
nearly 30 years or so. Current Insurance Market Structure General Insurance
business in India was under complete control of four Governments insurance
companies for nearly three decade. After much deliberation finally the market
was opened for competition from December2000 and also Government has de-
linked four Public sector companies from holding company GIC to operate as
independent company. In addition to four Public Sectors insurance companies
the Insurance Regulatory and Development Authority (.IRDA.)Has issued
licenses to the eight Private
1.2 COMPANY PROFILE
ICICI Lombard General Insurance Company
ICICI Lombard General Insurance Company Limited is a 74:26 joint
venture between ICICI Bank Limited and the US-based $ 26 billion Fairfax
Financial Holdings Limited. ICICI Bank is India's second largest bank; while
Fairfax Financial Holdings is a diversified financial corporate engaged in general
insurance, reinsurance, insurance claims management and investment
management. Lombard Canada Ltd., a group company of Fairfax Financial
Holdings Limited, is one of Canada's oldest property and casualty insurers.
ICICI Lombard General Insurance Company received regulatory approvals to
commence general insurance business in August 2001.
HIGHLIGHTS OF ICICI Lombard
India 's number one private general insurance company
First general insurance company in India to be ISO 9001:2000 certified
Highest brand recall
Simple and fast documentation
2

8/6/2019 Yasir Final
http://slidepdf.com/reader/full/yasir-final 3/56
Lightning fast claims settlement
Instant online policy issuance
Comprehensive product line
Highest security level offered through 128-bit encryption in case of online
data exchange.
First company to provide digitally signed documents through an online
interface.
Achieved financial breakeven in first full year of operations
Achieved underwriting breakeven in second year of operations
About Fairfax
Fairfax Financial Holding Limited is a financial services holding
company whose corporate objective is to achieve a high rate of return on
invested capital and build long-term shareholder value. It provides services in the
area of financial services, general insurance, reinsurance, insurance claims
management and investment management. Fairfax Group is amongst the largest
shareholder of ICICI Bank with about 4.5% shareholding
ABOUT ICICI Bank
• Second largest bank in India with asset size of over US $ 24 billion
• A network of 540 branches /offices and over 1,700 ATMs
• Presence across all financial products
• Only FI in India to pierce sovereign rating• Listed at the NYSE, around 72% of the company’s equity is held by
foreign investors
• Technology-enabled products and processes
3
8/6/2019 Yasir Final
http://slidepdf.com/reader/full/yasir-final 4/56
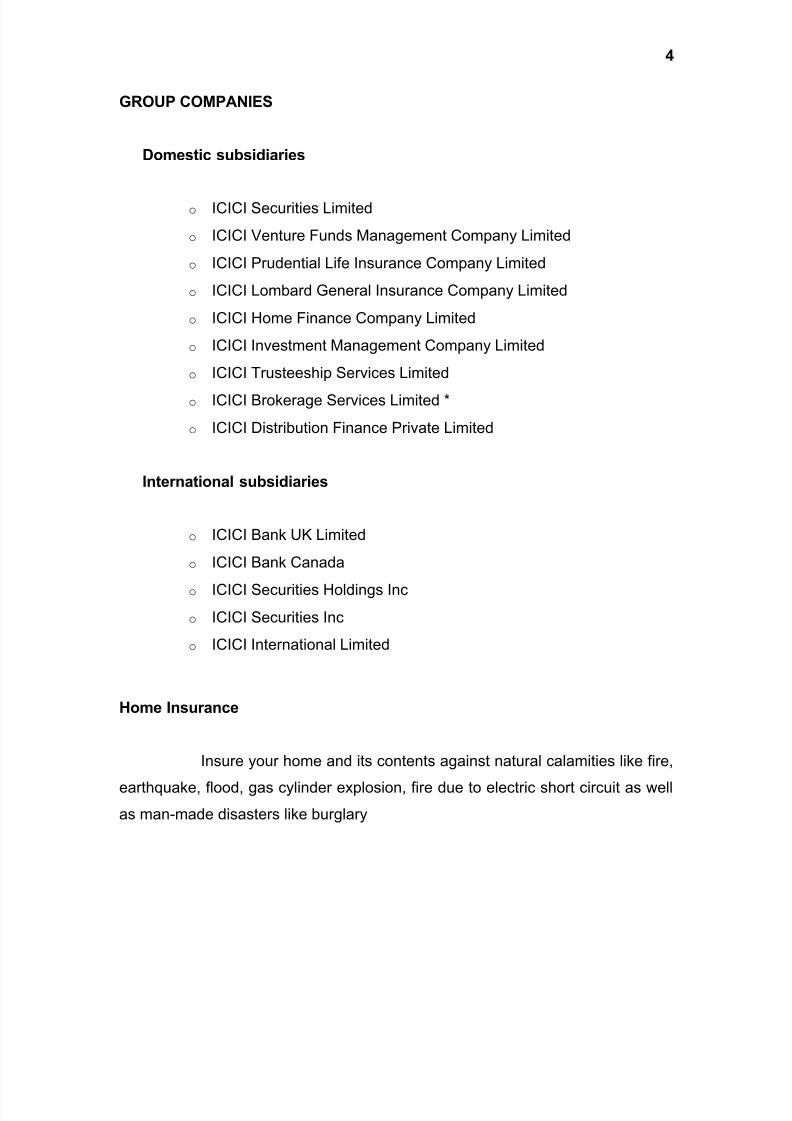
GROUP COMPANIES
Domestic subsidiaries
o ICICI Securities Limited
o ICICI Venture Funds Management Company Limited
o ICICI Prudential Life Insurance Company Limited
o ICICI Lombard General Insurance Company Limited
o ICICI Home Finance Company Limited
o ICICI Investment Management Company Limited
o ICICI Trusteeship Services Limited
o ICICI Brokerage Services Limited *
o ICICI Distribution Finance Private Limited
International subsidiaries
o ICICI Bank UK Limited
o ICICI Bank Canada
o ICICI Securities Holdings Inc
o ICICI Securities Inc
o ICICI International Limited
Home Insurance
Insure your home and its contents against natural calamities like fire,
earthquake, flood, gas cylinder explosion, fire due to electric short circuit as well
as man-made disasters like burglary
4

8/6/2019 Yasir Final
http://slidepdf.com/reader/full/yasir-final 5/56
CHAPTER 2
NEED, OBJECTIVES, SCOPE AND
LIMITATIONS OF THE STUDY
2.1 NEED FOR THE STUDY
ICICI Lombard’s home insurance division was started in October 2004.
Hence the company wanted to know to what extent the people were aware of
ICICI Lombard General insurance company and their perception towards home
insurance products. Hence this research was undertaken. The company wanted
to assess whether the present level of marketing efforts is sufficient or not and
the medium of communication which was most effective in creating awareness.
Hence it’s need for this research.
5
8/6/2019 Yasir Final
http://slidepdf.com/reader/full/yasir-final 6/56
2.2 OBJECTIVES
2.2.1 Primary Objective
To assess the level of awareness of the brand “ICICI Lombard”
general insurance company in Bangalore.
2.2.2 Secondary Objectives
To assess the level of awareness about different types of insurance and
the companies operating in the general insurance domain.
To assess the relative importance of home insurance among different
insurance products.
To assess the extent of the “need for home insurance” as perceived by the
public and their reasons.
To estimate the degree of brand recall achieved through logo, slogan and
Company name.
To assess the role of different media in generating awareness about the
brand “ICICI Lombard”.
6

8/6/2019 Yasir Final
http://slidepdf.com/reader/full/yasir-final 7/56
2.3 SCOPE OF THE STUDY
This study undertaken for ICICI Lombard aims to study and
understand the awareness level of the company and the market potential for
home insurance among the individuals residing in south east Bangalore,
This has been done by preparing the questionnaire which contains
questions put forth to the prospective individual’s, which would help in analyzing
the profile and individual’s perception towards home insurance, factors
influencing the individuals in going for home insurance, and awareness of variousschemes and insurance companies.
This study would help in determining the future market potential for
home insurance. The study would also help ICICI Lombard to direct their
marketing efforts by identifying customer preference and also the role of different
media in creating awareness.
7

8/6/2019 Yasir Final
http://slidepdf.com/reader/full/yasir-final 8/56
2.4 LIMITATION OF THE STUDY
The area of study is limited to south east region of Bangalore only,
hence the results may not be true for other geographical areas. Validity &
Reliability of the data obtained depends on the correctness of the responses by
the respondents, The time at the disposal of the researcher was limited and the
size of the sample comparing to the population was very less and hence it cannot
be said to represent the whole population.
8

8/6/2019 Yasir Final
http://slidepdf.com/reader/full/yasir-final 9/56
CHAPTER 3
RESEARCH METHODOLOGY
A proper research Methodology is imperative to derive meaningful
inferences and conclusions from the study. The Methodology followed for this
study is as follows.
3.1 RESEARCH DESIGN
In this market survey, the design used is “descriptive” in nature.
The information is collected from the individuals and analyzed with the
help of different statistical tools for describing the relationship between various
types of variables pertaining to market potential for home Insurance. Moreover
Cross table Analysis has been done for multivariate data and information has
been obtained to meet the objectives of the study.
9
8/6/2019 Yasir Final
http://slidepdf.com/reader/full/yasir-final 10/56
3.2 DATA
3.2.1 Nature of Data
Both primary and secondary data are used in this study in order to
meet the requirements of the objectives. Under the study primary data was
collected by using a Questionnaire.
3.2.2 Source of Data
The Primary data was collected from the individuals residing in southeast Bangalore, with the help of the questionnaire, which was prepared after
getting inputs from the experts and executives in ICICI Lombard. Secondary data
are sourced from General Insurance Companies, Magazines, Books, Pamphlets,
Websites etc.
3.3 METHOD OF DATA COLLECTION
Structured Questionnaire method is used as an instrument for
collecting information from the individuals. A Pilot study was conducted based on
which a few changes were made in the Questionnaire.
3.4 SAMPLING
Since the population of consumers of general Insurance is large in
number, researcher was unable to collect information from all individuals due to
limitation of time. So part of the population is taken for analyzing and generating
the findings.
10

8/6/2019 Yasir Final
http://slidepdf.com/reader/full/yasir-final 11/56
3.4.1 Sampling Unit
The respondents of the study are individuals residing in Jaya nagar,
Bansankari, Indira nagar and Koramangala, which are parts of Bangalore south
east.
3.4.2 Sample Size
The sample size was computed using the confidence level of 90%
and error level of ± 5%. The formula used for calculating the sample size is
N = z2 * p. q = 240(Calculations shown in appendix - V)
e2
3.4.3 Sampling Method
Cluster sampling method is used. The area to be surveyed was
divided into blocks. A number of blocks was chosen at random. Every household
in the chosen block was surveyed.
3.5 TOOLS USED
The data has been analyzed mainly by using the following methods,
namely.Cross Tabulation and Percentage method supplemented by appropriatecharts. Preference of the Respondents for different insurance products has been
analysed using Ranking method.
11

8/6/2019 Yasir Final
http://slidepdf.com/reader/full/yasir-final 12/56
3.5.1 Percentage Analysis
This is a univariate analysis where the percentage of a particular
factor with different categories is calculated, in order to help one get fair an idea
regarding the sample and there by that of the population.
3.5.2 Cross Tabulation
While percentage analysis is applicable to single variable, cross
tabulations help in identifying relationship between different variables.
3.5.3 Ranking method
This type of analysis is particularly useful when the purpose of the
question is to identify the preferences of the sample among different choices.
The respondents indicated the importance they assign to different
types of policies. The ranking was in the order of “1” for most important and “5”
for the least important. While doing the analysis the first rank was given a
weightage of 5 and the least rank was given the weightage of 1.
The rank assigned by all the respondents was cumulated using the
weightage. Accordingly the type of policy with the larger cumulative weightage
was ranked number 1 and so on.
12

8/6/2019 Yasir Final
http://slidepdf.com/reader/full/yasir-final 13/56
3.5.3 Questionnaire
The questionnaire includes both open ended and closed ended
questions with multiple choices, Open-ended questions enable wide range of
responses. This enables the respondent to express his views in his own
words.However this is difficult to tabulate and analyse.
Close-ended questions offer a limited choice of response .Respondents
find these easier to complete.Close-ended questions can also be tabulated and
analysed more easily.
13
8/6/2019 Yasir Final
http://slidepdf.com/reader/full/yasir-final 14/56
CHAPTER 4
ANALYSIS AND INTERPRETATION
4.1 ANALYSIS OF DATA
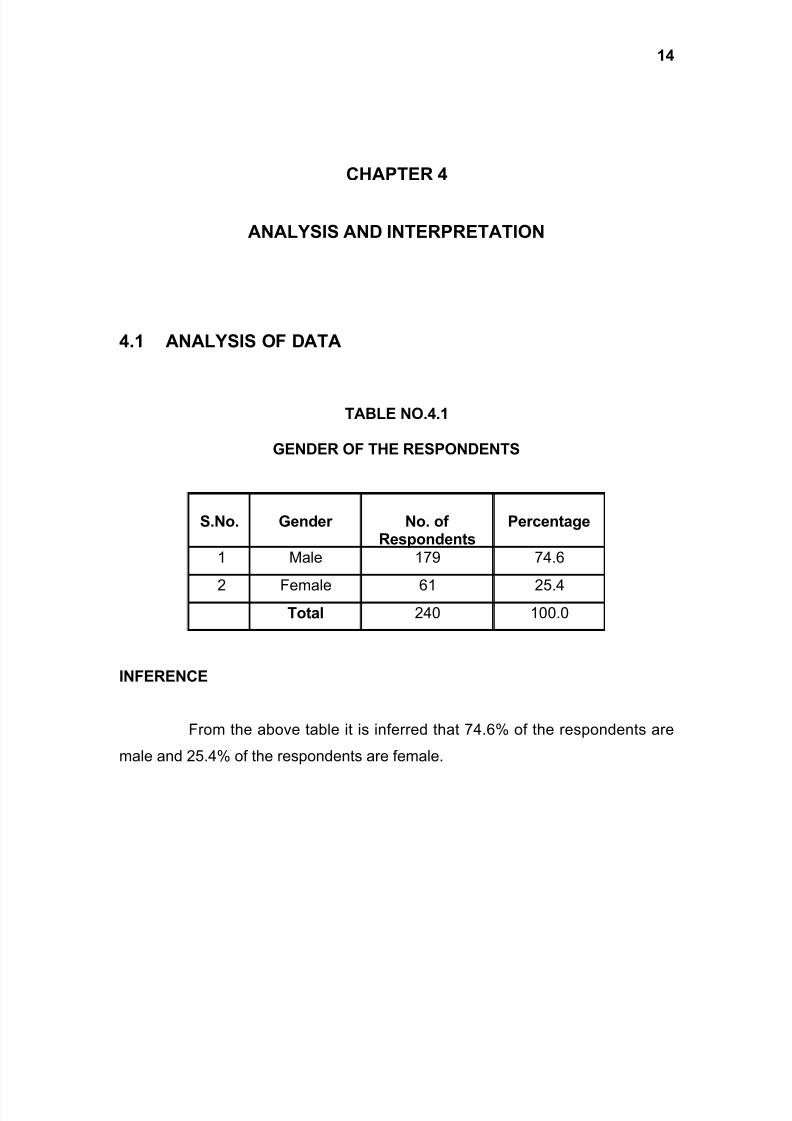
TABLE NO.4.1
GENDER OF THE RESPONDENTS
S.No. Gender No. of Respondents
Percentage
1 Male 179 74.6
2 Female 61 25.4Total 240 100.0
INFERENCE
From the above table it is inferred that 74.6% of the respondents are
male and 25.4% of the respondents are female.
14

8/6/2019 Yasir Final
http://slidepdf.com/reader/full/yasir-final 15/56
15

8/6/2019 Yasir Final
http://slidepdf.com/reader/full/yasir-final 16/56
TABLE NO. 4.2
AGE OF THE RESPONDENTS
S.No. Age No. of Respondents
Percentage
1 20-30 81 33.8
2 31-40 69 28.8
3 41-50 43 17.9
4 51-60 14 5.8
5 61-70 22 9.2
6 71-80 6 2.5
7 >80 5 2.1
Total 240 100.0
Average age of respondents = 39.375
INFERENCE
From the above table it is inferred that, 33.8% of the respondents are
in the age group of 20-30 years followed by 28.8% of the respondents who are in
the age group of 31-40 years followed by 17.9% of the respondents who are in
the age group of 41-50 years followed by 5.8% of the respondents who are in the
age group of 51-60 years followed by 9.2% of the respondents who are in the
age group of 61-70 years followed by 2.5% of the respondents who are in the
age group of 71-80 years and 2.1% of the respondents who are in the age group
of above 80 years.
16

8/6/2019 Yasir Final
http://slidepdf.com/reader/full/yasir-final 17/56

8/6/2019 Yasir Final
http://slidepdf.com/reader/full/yasir-final 18/56
TABLE NO. 4.3
OCCUPATION OF THE RESPONDENTS
S.No. OccupationNo. of
RespondentsPercentage
1 Salaried 121 50.4
2 Self employedprofessional
26 10.8
3 Self employedbusiness
36 15.0
4 Retired 35 14.6
5 Housewife 18 7.5
6 Others 4 1.7
Total 240 100.0
INFERENCE
From the above table it is inferred that 50.4% of the respondents are
salaried employees, 10.8% of the respondents are self-employed professionals,
15.0% of the respondents are self-employed in business, 14.6% of the
respondents are retired, 7.5% of the respondents are housewives and 1.7% of
the respondents belong to “others” category and are Students or unemployed
persons.
18

8/6/2019 Yasir Final
http://slidepdf.com/reader/full/yasir-final 19/56
19

8/6/2019 Yasir Final
http://slidepdf.com/reader/full/yasir-final 20/56
TABLE NO. 4.4
ANNUAL INCOME LEVEL OF THE RESPONDENTS
S.No. Annual incomeNo. of
RespondentsPercentage
1 <2Lakhs 138 57.5
2 2-4Lakhs 72 29.9
3 4-6Lakhs 19 7.9
4 6-8Lakhs 4 1.7
5 >8Lakhs 7 2.9
Total 240 100.0
INFERENCE
From the above table it is inferred that, 57.5% of the respondents
belong to the annual income group of less than Rs.2 lakhs, 29.9% of the
respondents belong to the annual income group of Rs.2lakhs – Rs.4lakhs, 7.9%
of the respondents belong to the annual income group of Rs.4lakhs – Rs6lakhs,1.7% of the respondents belong to the annual income group of Rs.6lakhs –
Rs.8lakhs and 2.9% of the respondents belong to above Rs.8lakhs income
group.
20

8/6/2019 Yasir Final
http://slidepdf.com/reader/full/yasir-final 21/56
21

8/6/2019 Yasir Final
http://slidepdf.com/reader/full/yasir-final 22/56
TABLE NO. 4.5
UNAIDED RECALL LEVEL OF ICICI LOMBARD (GIC)
S.No. CompanyNo. of
RespondentsPercentage
1 Not able to recall 168 70.0
2 Recall ICICILombard
72 30.0
Total 240 100.0
INFERENCE
From the above table it is inferred that, 30% of the respondents were
able to recall the company name “ICICI Lombard” with out any assistance and
70% of the respondents were not able to recall the company name with out any
assistance.
22

8/6/2019 Yasir Final
http://slidepdf.com/reader/full/yasir-final 23/56
23

8/6/2019 Yasir Final
http://slidepdf.com/reader/full/yasir-final 24/56
TABLE NO. 4.6
UNAIDED RECALL OF THE INSURANCE COMPANIES
S.No. Companies
No. of
Respondents
Percentage
1 Bajaj Allianz 19 7.9
2 Cholamandalam 3 1.3
3 HDFC-Chubb 5 2.1
4 Iffco-Tokyo 0 0
5 ICICI Lombard 72 30
6 Oriental Insurance 67 27.9
7 Royal Sundaram 9 3.8
8 Reliance 7 2.9
9 Tata AIG 40 16.7
10 United India Assurance 29 12.1
11 Others 70 29.2
12 Not Aware of any company 33 13.75
INFERENCE
From the above table it is inferred that with out any assistance, (7.9%)
of the respondents were able to recall the company “Bajaj Allianz”, (1.3%) of the
respondents were able to recall the company “Cholamandalam, (2.1%) of the
respondents were able to recall the company “HDFC-Chubb“,(30%) of the
respondents were able to recall the company name “ICICI Lombard”,
(27.9%) of the respondents were able to recall the company “Oriental Insurance“,
(3.8%) of the respondents were able to recall the company “Royal Sundaram“,
(2.9%) of the respondents were able to recall the company “Reliance“, (16.7%) of
the respondents were able to recall the company “Tata AIG“, (12.1%) of the
respondents were able to recall the company “United India Assurance”, (29.2%)
of the respondents were able to recall other companies which are not listed
above, and (13.75%) of the respondents were not able to recall any company
name with out any assistance.
24

8/6/2019 Yasir Final
http://slidepdf.com/reader/full/yasir-final 25/56
TABLE NO. 4.7
COMPANY RECOGNITION THROUGH LOGO AND INFLUENCE OF
ADVERTISING MEDIA
MediaCompany recognition
Cannotidentify
IciciIcici
LombardTotal
-101
(42.08%)
101(42.08%)
Print(PR)39
(16.25%)10
(4.17%)49
(20.42%)
Television(TV)49
(20.42%)
10
(4.17%)
59
(24.58%)Hoardings(HD)
9(3.75%)
10(4.17%)
19(7.92%)
Salespeople(SP)
14(5.83%)
19(7.92%)
33(13.75%)
PR,TV,HD6
(2.5%)2
(0.83%)8
(3.33%)
PR,TV9
(3.75%)3
(1.25%)12
(5.0%)TV,SP 4
(1.67%)0
4(1.67%)
INFERENCE
From the above table it is inferred that 42.08% of the respondents
were not able to recall the company name with the assistance of “LOGO”.
57.92% of the respondents were able to recall the company name with
assistance of logo. Among those who were able to recall, 16.25%were able to
recall “ICICI” and 4.17%were able to recall “ICICI Lombard” and they were aware
of the logo through Print media, 20.42%were able to recall “ICICI” and
4.17%were able to recall “ICICI Lombard” and they were aware of the logo
through Television, 3.75%were able to recall “ICICI” and 4.17%of were able to
recall “ICICI Lombard” and they were aware of the logo through advertisement
25

8/6/2019 Yasir Final
http://slidepdf.com/reader/full/yasir-final 26/56
Hoardings, 5.83%were able to recall “ICICI” and 7.92%were able to recall “ICICI
Lombard” and they were aware of the logo through Sales people, 2.5%were able
to recall “ICICI” and 0.83%were able to recall “ICICI Lombard” and they were
aware of the logo through Print media, Television and advertisement hoardings,
3.75%were able to recall “ICICI” and 1.25%were able to recall “ICICI Lombard”
and they were aware of the logo through Print media and Television, 1.67%
were able to recall “ICICI” and they were aware of the logo through Television
and Sales people.
26

8/6/2019 Yasir Final
http://slidepdf.com/reader/full/yasir-final 27/56
27

8/6/2019 Yasir Final
http://slidepdf.com/reader/full/yasir-final 28/56
TABLE NO. 4.8
COMPANY RECOGNITION THROUGH SLOGAN AND INFLUENCE OF
ADVERTISING MEDIA
MediaCompany recognition
Cannotidentify
IciciIcici
LombardTotal /
percentage
-174
(72.5)174
(72.5)
Print (PR)8
(3.33)6
(2.5)14
(5.83)
TV5
(2.08)7
(2.92)12(5)
Hoardings(HD) 07
(2.92)
7
(2.92)Sales people
13(5.42)
24(10.0)
37(15.42)
PR,TV,HD 02
(0.83)2
(0.83)
INFERENCE
From the above table it is inferred that 72.5% of the respondents were
not able to recall the company name with the assistance of “SLOGAN”. 27.5% of
the respondents were able to recall the company name with assistance of
slogan. Among those who were able to recall,3.33% were able to recall “ICICI”
and they were aware of the slogan through Print media, 2.5% were able to recall
“ICICI Lombard” and they were aware of the slogan through Print media, 2.08%
were able to recall “ICICI” and they were aware of the slogan through Television,
2.92% were able to recall “ICICI Lombard” and they were aware of the slogan
through Television, 2.92% of were able to recall “ICICI Lombard” and they were
aware of the slogan through advertisement Hoardings, 5.42% were able to recall
“ICICI” and they were aware of the slogan through Sales people, 10.0% were
able to recall “ICICI Lombard” and they were aware of the slogan through Sales
people, 0.83% were able to recall “ICICI” and they were aware of the slogan
through Print media, Television and advertisement hoardings.
28

8/6/2019 Yasir Final
http://slidepdf.com/reader/full/yasir-final 29/56
TABLE NO.4.9
COMPANY RECOGNITION AND ASSOSIATION WITH TYPE OF INSURANCE-THROUGH NAME, LOGO AND SLOGAN
Kind of insuranceNo. of
RespondentsWho Said Yes
No. of RespondentsWho Said No
Total /percentage
Cannot identify66
(27.5)66
(27.5)
Automobile Insurance10
(4.17)
10(4.17)
Health Insurance4
(1.67)
4(1.67)
Travel Insurance8
(3.33)
8
(3.33)
Home Insurance36
(15.0)
36(15.0)
General insurance116
(48.33)
116(48.33)
Total /Percentage
174(72.5)
66(27.5)
240(100)
INFERENCE
From the above table it is inferred that, (72.5)% of respondents were
able to recognize the company with the assistance of the company name, slogan
and logo, (4.17%) of the respondents said the company is associated with
Automobile Insurance, (1.67%) of the respondents said the company is
associated with Health Insurance, (3.33%) of the respondents said the company
is associated with Travel Insurance, (15.0%) of the respondents said the
company is associated with Home Insurance, (48.33%) of the respondents said
the company is associated with General insurance, (27.5%) of the total
respondent were not aware the company.
29

8/6/2019 Yasir Final
http://slidepdf.com/reader/full/yasir-final 30/56
30

8/6/2019 Yasir Final
http://slidepdf.com/reader/full/yasir-final 31/56
TABLE NO.4.10
AWARENESS LEVEL OF THE TYPES OF INSURANCE
S.No. TypesNo. of
RespondentsPercentage
1 Not aware 15 6.3
2 Automobile(A) 142 59.17
3 Health(H) 139 57.91
4 Travel(T) 90 37.5
5 Home(Ho) 134 55.83
6 A, H, T, Ho 65 27.1
7 A, H, Ho 13 5.4
8 A,H,T 8 3.3
9 H,T, Ho 6 2.5
10 A,H 22 9.2
11 A,T 2 .8
12 A, Ho 6 2.5
13 H, Ho 2 .8
14 T, Ho 1 .4
INFERENCE
From the above table it is inferred that 27.1% of the respondents are
aware of all types of general insurance namely automobile, health, travel and
home insurance. On the other hand 6.3% of the respondents are not aware of
any of the general insurance products. The remaining 66.6% of the sample have
varying degrees of awareness about the various general insurance products as
detailed below.
31

8/6/2019 Yasir Final
http://slidepdf.com/reader/full/yasir-final 32/56
55.83% of the respondents are aware of home insurance, 59.17% of
the respondents are aware of automobile insurance,57.91% of the respondents
are aware of health insurance, 37.5% of the respondents are aware of Travel
insurance,9.2% of the respondents are aware of automobile and health
insurance,5.4% of the respondents are aware of automobile, health and home
insurance,3.3% of the respondents are aware of automobile, health and travel
insurance, 2.5% of the respondents are aware of automobile and home
insurance, 2.5% of the respondents are aware of health, travel and home
insurance, 0.8% of the respondents are aware of automobile and travel
insurance and 0.8% of the respondents are aware of health and home insurance.
32

8/6/2019 Yasir Final
http://slidepdf.com/reader/full/yasir-final 33/56
33

8/6/2019 Yasir Final
http://slidepdf.com/reader/full/yasir-final 34/56
TABLE NO. 4.11
RELATIVE IMPORTANCE OF TYPES OF INSURANCE POLICY
S.No. Policy typesWeightage
scoreRank
1 Automobile 632 III
2 Health 761 II
3 Travel 344 V
4 Home 617 IV
5 Life 1040 I
INFERENCE
From the above table the relative importance assigned by the
respondents to different types of insurance can be clearly inferred.
‘Life insurance’ occupies Ist rank with the highest score of 1040 points.
‘Health insurance’ occupies IInd rank with the score of 761 points.
‘Automobile insurance’ occupies IIIrd rank with the score of 632 points.
‘Home insurance’ occupies IVth rank with the score of 617 points.
‘Travel insurance’ occupied Vth rank with the low score of 344 points.
34
8/6/2019 Yasir Final
http://slidepdf.com/reader/full/yasir-final 35/56
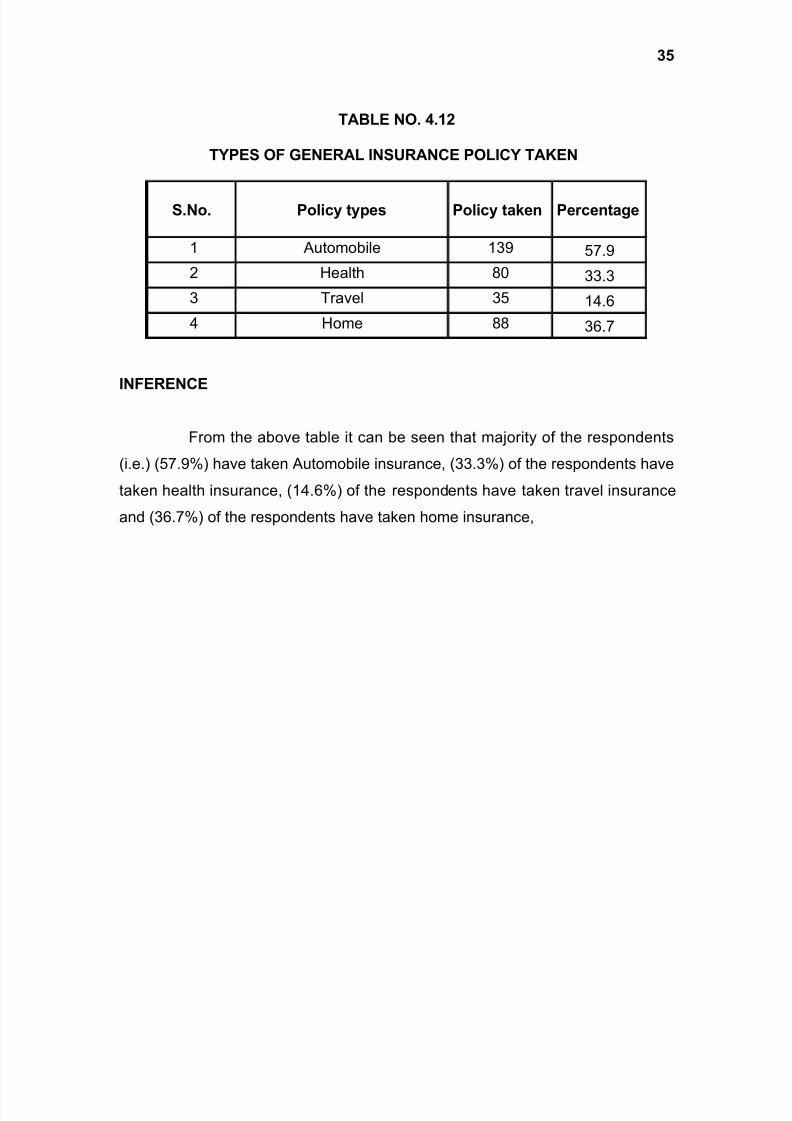
TABLE NO. 4.12
TYPES OF GENERAL INSURANCE POLICY TAKEN
S.No. Policy types Policy taken Percentage
1 Automobile 139 57.9
2 Health 80 33.3
3 Travel 35 14.6
4 Home 88 36.7
INFERENCE
From the above table it can be seen that majority of the respondents
(i.e.) (57.9%) have taken Automobile insurance, (33.3%) of the respondents have
taken health insurance, (14.6%) of the respondents have taken travel insurance
and (36.7%) of the respondents have taken home insurance,
35

8/6/2019 Yasir Final
http://slidepdf.com/reader/full/yasir-final 36/56
36

8/6/2019 Yasir Final
http://slidepdf.com/reader/full/yasir-final 37/56
TABLE NO. 4.13
TYPES OF POLICY TAKEN BY CLIENTS OF ICICI LOMBARD
S.No. Policy types No. of Respondents Percentage
1. AUTOMOBILE 17 22.372. HEALTH 6 7.893. TRAVEL 5 6.584. HOME 55 72.375 AUTO,HOME 7 9.22
INFERENCE
From the above table it is clearly understood that,(22.37%) of the
respondents have taken automobile insurance,( 7.89%) of the respondents have
taken health insurance, (6.58%) of the respondents have taken travel insurance,
(72.37%) of the respondents have taken home insurance,(9.22%) of the
respondents have taken automobile and home insurance,
37

8/6/2019 Yasir Final
http://slidepdf.com/reader/full/yasir-final 38/56
38

8/6/2019 Yasir Final
http://slidepdf.com/reader/full/yasir-final 39/56

8/6/2019 Yasir Final
http://slidepdf.com/reader/full/yasir-final 40/56
40
8/6/2019 Yasir Final
http://slidepdf.com/reader/full/yasir-final 41/56
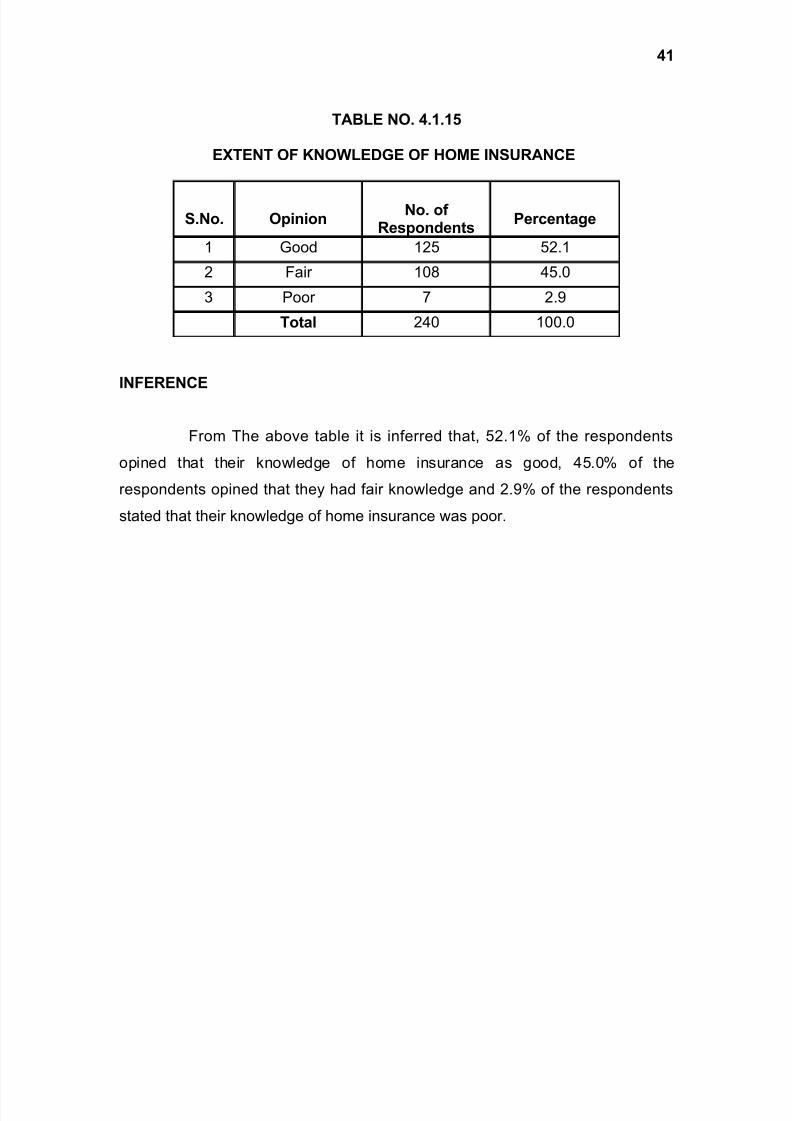
TABLE NO. 4.1.15
EXTENT OF KNOWLEDGE OF HOME INSURANCE
S.No. OpinionNo. of
RespondentsPercentage
1 Good 125 52.1
2 Fair 108 45.0
3 Poor 7 2.9
Total 240 100.0
INFERENCE
From The above table it is inferred that, 52.1% of the respondents
opined that their knowledge of home insurance as good, 45.0% of the
respondents opined that they had fair knowledge and 2.9% of the respondents
stated that their knowledge of home insurance was poor.
41

8/6/2019 Yasir Final
http://slidepdf.com/reader/full/yasir-final 42/56
TABLE NO. 4.16
OPINION ABOUT NEED FOR HOME INSURANCE
S.No. Opinion No. of Respondents Percentage
1 Necessary 200 83.3
2 Not necessary 21 8.8
3 No idea 19 7.9
Total 240 100.0
INFERENCE
From The above table it is inferred that, (83.3%) of the respondents
opined that home insurance is Necessary, (8.8%) of the respondents opined that
home insurance is Not Necessary, (7.9%) of the respondents had no clear
opinion about the need for home insurance.
42

8/6/2019 Yasir Final
http://slidepdf.com/reader/full/yasir-final 43/56
43

8/6/2019 Yasir Final
http://slidepdf.com/reader/full/yasir-final 44/56
TABLE NO. 4.17
NEED FOR HOME INSURANCE- (REASONS)
S.No. Reasons
No. of
Respondents Percentage
1 Burglary(BUR) 102 42.5
2 Natural disaster(ND) 66 27.5
3 Peace of mind(PCE) 51 21.25
4 Cost is less(<CST) 45 18.75
5 BUR,ND,PCE,<CST 4 1.7
6 BUR,ND,PCE 5 2.1
7 BUR,ND,<CST 3 1.2
8 BUR,PCE,<CST 2 0.8
9 BUR,ND 16 6.6
10 BUR,PCE 2 0.8
11 ND,PCE 2 0.8
12 ND,<CST 2 0.8
13 PCE,<CST 4 1.7
INFERENCE
From The above table it is inferred, that the respondents opined that
home insurance is Necessary because of the following reasons.( 42.5)% feel
Burglary may occur, (27.5%) feel natural disaster may occur any time,(21.25)%
feel it gives peace of mind, (18.75)% feel it costs very less, (!.7)% accept with all
the four reason, (2.1)% feel Burglary, natural disaster may occur and it gives
peace of mind, (1.2)% feel Burglary, natural disaster may occur and it cost very
less, (0.8)% feel Burglary may occur, it gives peace of mind and it cost very less,
(6.6)% feel Burglary, natural disaster may occur, (0.8)% feel Burglary and it gives
peace of mind, (0.8)% feel natural disaster may occur and it gives peace of mind,
(0.8)% feel natural disaster may occur and it cost very less (1.7)% feel it gives
peace of mind and it cost very less.
44

8/6/2019 Yasir Final
http://slidepdf.com/reader/full/yasir-final 45/56
TABLE NO. 4.18
REASONS WHY HOME INSURANCE IS NOT NECESSARY
S.No. ReasonsNo. of
RespondentsPercentage
1Nothing will
happen to home5 25.0
2 Waste of money 9 45.0
3Lack of
knowledge5 25.0
4Distrust about
honoring Claims1 5.0
Total 20 100.0
INFERENCE
From The above table it is inferred that among the 20 respondents who
felt home insurance is not necessary, (25.0) % of the respondents opined that
home insurance is Not Necessary because of the reason Nothing will happen to
home, (45.0%) of the respondents opined that taking home insurance is Waste of
money, (25.0%) of the respondents opined that they do not have the adequate
knowledge about home insurance, (5.0%) of the respondents opined that they
don’t trust general insurance companies to honor the claims in time.
45

8/6/2019 Yasir Final
http://slidepdf.com/reader/full/yasir-final 46/56
46

8/6/2019 Yasir Final
http://slidepdf.com/reader/full/yasir-final 47/56

8/6/2019 Yasir Final
http://slidepdf.com/reader/full/yasir-final 48/56
48

8/6/2019 Yasir Final
http://slidepdf.com/reader/full/yasir-final 49/56
TABLE NO. 4.20
COMPARISION OF PERCEIVED NEED FOR INSURANCE AND LEVEL OF
WILLINGNESS TO RECEIVE A SALE CALL
Level of willingnessOpinion on need for home insurance
NecessaryNot
NecessaryNo Idea Total
Definitely yes 14(5.83)
0 014
(5.83)Probably 43
(17.92)2
(0.83)7
(2.92)52
(21.61)Probably not 18
(7.5)4
(1.67)6
(2.5)28(11.67)
Definitely not 45(18.75)
10(4.17)
5(2.08)
60(25.0)
Already have 80(33.3)
5(2.08)
1(0.42)
86(35.833)
Total 200(83.33)
21(8.75)
19(7.92)
240(100)
INFERENCE
It is inferred from above, that only 5.83% said that home insurance is
necessary and they are willing to be approached by sales people. Around 18% of
the respondents who said home insurance was necessary expressed by saying
“probably they are willing” and 18.75% expressed that they do not want to be
disturbed by sales people.
49

8/6/2019 Yasir Final
http://slidepdf.com/reader/full/yasir-final 50/56
CHAPTER 5
FINDINGS, SUGGESTIONS AND CONCLUSION
5.1 FINDINGS
Level of awareness-Home Insurance &Companies
Among the respondents, majority is salaried employees and most of
the respondents have annual income below Rs2Lakh.
Among the various types of insurance, only (27.1%) of the total
respondents are aware of all types of insurance such as Automobile, Health,
Travel and Home insurance. Majority of the respondents (around 60%) are awareof automobile insurance and next to it (58%) are aware of health insurance.
Among various general insurance products, Automobile insurance was
most commonly used (i.e.) with around 60% of the respondents using it, The next
most common used product was Home Insurance (36%) health insurance came
third with 33% of the respondents using it.
When the preference among various insurance products was studied,
majority of respondent’s ranked Life insurance as number 1, followed by Health
50

8/6/2019 Yasir Final
http://slidepdf.com/reader/full/yasir-final 51/56
insurance as number 2, Automobile insurance as number 3 and Home insurance
was ranked 4th.
When opinion about the necessity of home insurance is studied,
majority of them (i.e.) 200 out of 240 respondents opined that it is necessary, but
still when the preference among the various insurance products is studied home
insurance was ranked at 4th place. When respondents who did not have a home
insurance policy were asked whether they were willing to be approached by
sales personnel, equal number of respondents replied affirmatively and
negatively.
When the awareness level of various companies providing Home
insurance was studied, majority of the respondents (i.e.) 70% of them, were
aware of ICICI Lombard Next to it around 50% of them were aware of Oriental
insurance and United India assurance and almost 40% of them are aware of
TATA AIG.
Most of the respondents expressed that they have good or fair
knowledge about home insurance.
Almost 90% of the respondents opined that home insurance is
“Necessary”. Responding to the question as to why home insurance was
necessary, 42.5% stated Burglary as the cause and 27.5% stated naturaldisaster as the reason
Among the total respondents, 10% opined that home insurance is Not
Necessary and among them (45%) fell it is a waste of money.
51
8/6/2019 Yasir Final
http://slidepdf.com/reader/full/yasir-final 52/56
Brand awareness
Only (30%) of the total respondents were able to recall ICICI Lombard
with out any assistance, However, among the various insurance companies, the
recall of ICICI Lombard was the highest (i.e.) 72 out of 240 respondents could
name ICICI Lombard.
Many of respondents (20.42%) who identified ICICI through the LOGO
were influenced by television and (8%) of them who identified ICICI Lombard
were influenced by the sales people.
Most of respondents (5.42%) who identified ICICI through the
SLOGAN were influenced by sales people and most of the respondents (10%)
who identified ICICI Lombard were also influenced by the sales people.
Majority of respondents (72.5%) identified ICICI Lombard through the
assistance of the company name, logo and slogan and were able to recognize
the industry with which the company is associated. Among those respondents
(48.33%) of them recognized it is a general insurance company, (15%) of them
recognized it as a home insurance company.
52

8/6/2019 Yasir Final
http://slidepdf.com/reader/full/yasir-final 53/56

8/6/2019 Yasir Final
http://slidepdf.com/reader/full/yasir-final 54/56
5.3 CONCLUSION
The study could be concluded by saying that home insurance is
deemed to be a great necessity today, especially after natural disasters like
Tsunami took place. However priority wise, it has a lower priority when
compared with other forms of insurance like life, health and automobile.
ICICI Lombard has fairly good recall levels. The need, awareness and
preferences for home insurance can be enhanced by communicating the core
need of the product consciously.
54

8/6/2019 Yasir Final
http://slidepdf.com/reader/full/yasir-final 55/56
REFERENCES
1. Umasekaran (2002), ' Research Methods for Business', John Wiley &
Sons, Inc. 4th edition.
2. Richard I. Levin, David S. Rubin (2002), 'Statistics for Management',
Prentice Hall of India Private Limited, New Delhi, 7th edition.
3. Kothari C.R (2002), 'Research Methodology', Wishwa Prakashan,
New Delhi, 2nd edition.
4. Philip Kotler (2003), ‘Marketing Management’, Pearson Education
Limited, Singapore, 11th edition.
6. Websites:
www.irda.com www.icici Lombard .com
www.google.com

8/6/2019 Yasir Final
http://slidepdf.com/reader/full/yasir-final 56/56
1-14,16,18,20,22,24,26,27,29,31,33,34,36,37,39,41,43,45,47,49,51,53-59
Related Documents