In Flow: The real effect of Native & content marketing

Yahoo In Flow research - the real effect of native and content marketing
Jul 28, 2015
Welcome message from author
This document is posted to help you gain knowledge. Please leave a comment to let me know what you think about it! Share it to your friends and learn new things together.
Transcript

In Flow:The real effect of Native & content marketing

B2B leadershipinterviews
with industry experts with media and
digital advertising backgrounds
Digital safari groups
4 x 1.5hr exploring stream environments on respondent’s own
devices
Eye tracking
40 x users across
smartphone and decktop
Understanding the consumer in flow
Neuroscience Theory
Quantitative (4 markets)
9000+ respondents
testing 41 formats across
smartphone and PC

Research Partners: Clients:Media agency partners:
+ 2 Global Autos brands
In Flow:
(UK)
(UK)(IT)
(ES)
(DE)
(DE)
(DE)
(DE)
(DE)
(UK & IT)

29% 23%
Media Time spent: Ofcom, April 2014
Attention is changing
All adults 16-24s
10% 26%Smartphone
TV
Time spent

DailyIntensivelyConsistently

Worse at sorting adverts from contentBetter at sorting adverts from content
`
High ability to sort
Medium ability to sort
Lowability to sort
Brain plasticity:sorting ads from content?

Users see a flow, not ads and content in silosUsers see a flow, not ads and content in silos
`
54%high ability to sort
52%medium ability to sort
52%low ability to sort
Brain plasticity:sorting ads from content?

Native ads drive visual engagement
85% 21%
See native ad on a smartphone
Greater visibility than mobile display
advertising
Behavioural eye tracking
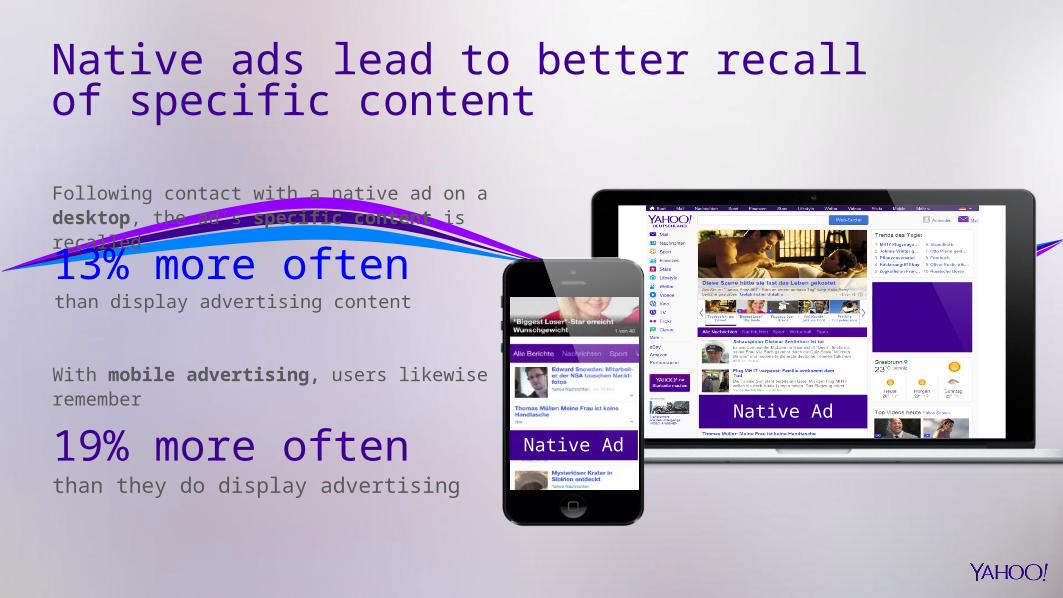
Native ads lead to better recall of specific content
Following contact with a native ad on a desktop, the ad‘s specific content is recalled
13% more oftenthan display advertising content
Native Ad
With mobile advertising, users likewise remember
19% more oftenthan they do display advertising
Native Ad
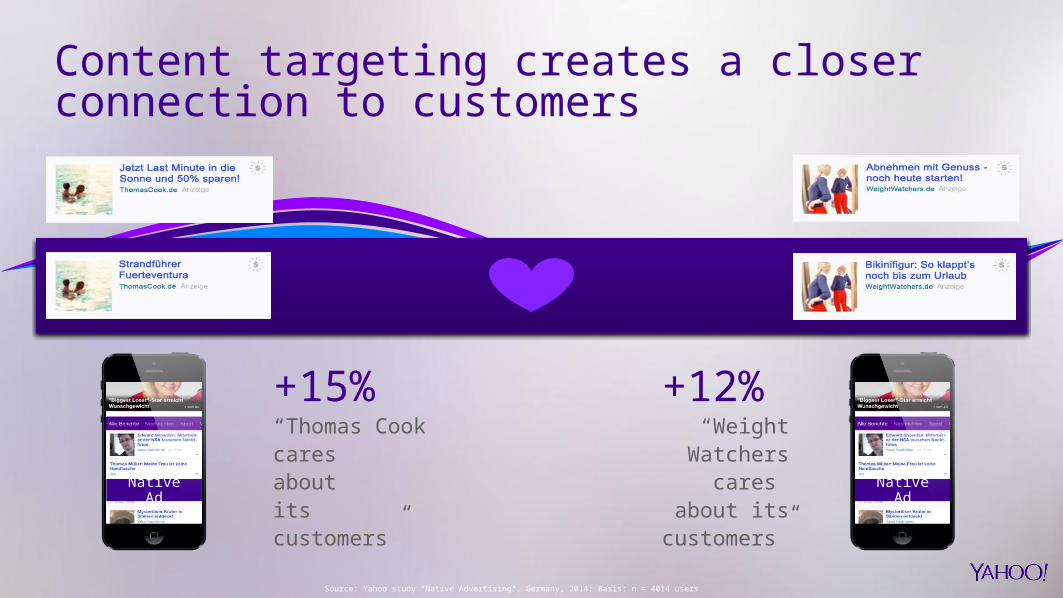
Content targeting creates a closer connection to customers
+15% “Thomas Cook caresaboutitscustomers”
+12% “Weight
Watchers cares about its
customers”
Source: Yahoo study “Native Advertising“, Germany, 2014; Basis: n = 4014 users
Native AdNative Ad
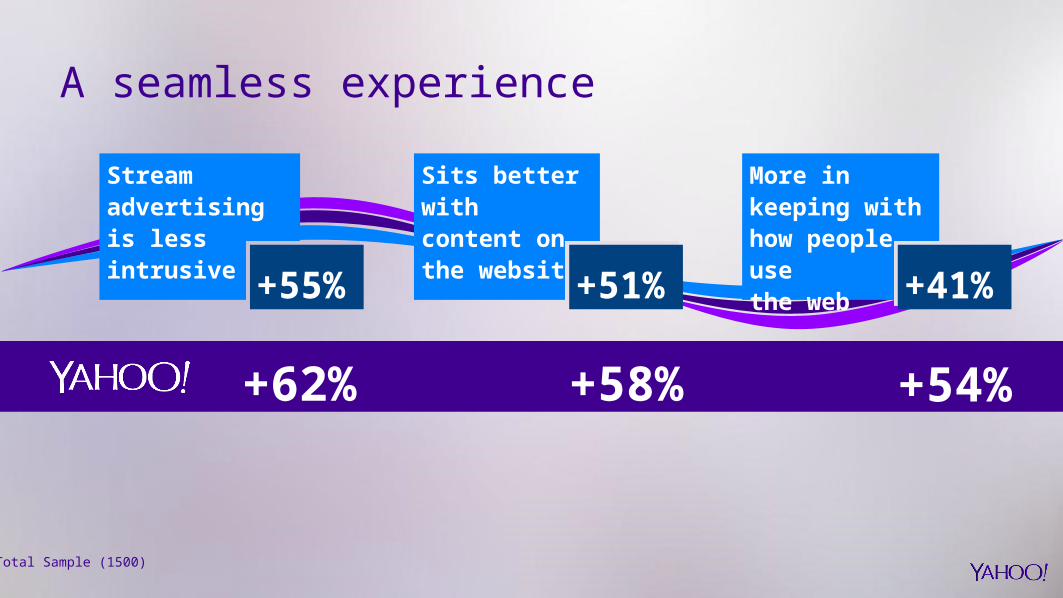
A seamless experience
Total Sample (1500)
Stream advertising is lessintrusive +55%+55%
Sits better with content on the website
+51%+51%
More in keeping with how people usethe web +41%+41%
+62% +58% +54%

Photos
Headlines
Shared by friends
User content
Video
Brand logos
Shading
From brands
Symbols
58%
51%
37%
33%
27%
26%
26%
17%
8%
Imagery driving in flow attention
63%
Look at pictures before words when browsing content on mobile
What captures attention in the stream environment?
Total Sample (1500)
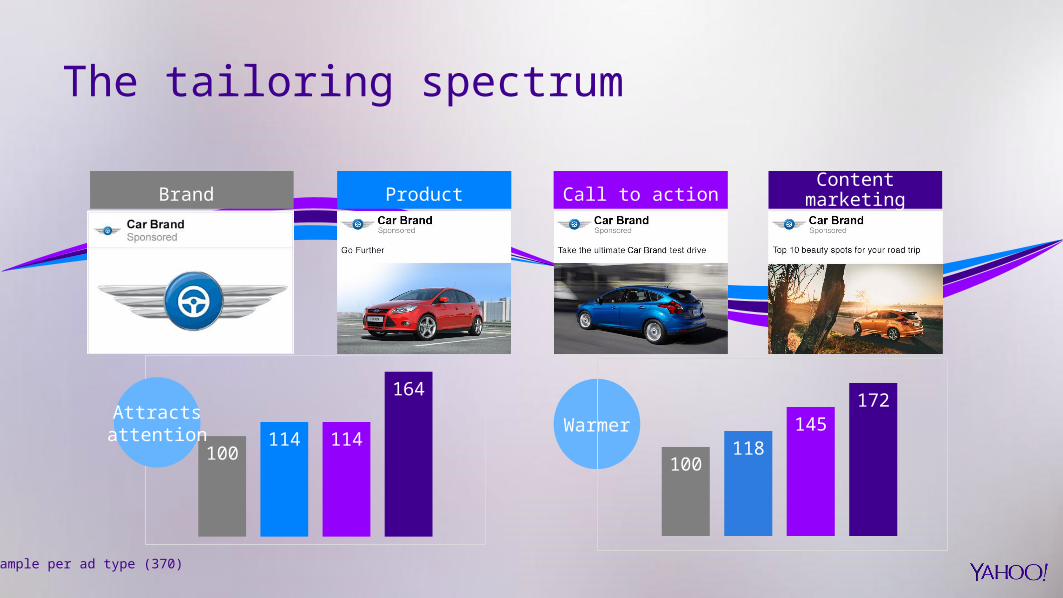
100114 114
164
Attractsattention
Sample per ad type (370)
Warmer
100118
145172
Brand Product Call to action Content marketing
The tailoring spectrum

100110
140100
129
152
Sample per stream (125)
Y+T proving greater impact: upper funnel
Social stream
StandsOut
Useful
Social stream

Y+T proving greater impact: lower funnel
Sample per stream (125)
Likelyto click
Call toaction
100 96111
100 106
130
Social stream
Social stream

If content is engaging then I don’t care it is
an advert x2.2

`
85% visually engage
with Yahoo stream ads
Flow insights
Content marketing
= 72% more
emotional response
Users are not filtering out ads – they see a
flow

In Flow:The real effect of Native & content marketing
Related Documents