1 I ' RR 94-010B :· page 8 ~y· ·. C.~~ , SUl2JAJ\Y/ D'fBODtJC'rJOH '• '. This method is. intended for determining residues of · the trimethylsulfonium cation (TMS) in soil at levels from o.ps to 5 ppm and in water at levels from 0.01 to 0.1 ppm. Glyphosate-trimesium, which is composed of .a 1:1 mixture of the trimethylsulfonium cation (CAS Registry No. 676-84-6] an~ the glyphosate(l-) anion, is the active herbicidal - i~gredient in the formulated product marketed by Zeneca Ag Products under the trademark, TOUCHDOWN®. 7 The TMS is extracted from water by passage through a column packed with cation exchange resin. The TMS is eluted from the . column with concentrated potassium chloride (l<Cl) solutio _ n. The TMS is extracted from soil samples by shaking with 10% aqueous potassium hydroxide solution. An aliquot of ~he aqueous , soil extract is cleaned-up. This is accomplished by - acidifying the extract, adding activated charcoal, and removing the charcoal by ~entrifugation followed by filtration. . . The cleaned-up soil extract or column eluate for the water sample is heat~d at 100° c in the presence of tin(II) chloride, potassium hydroxide, and toluene to dealkylate the TMS to dimethylsulfide (OMS). The OMS, which is trapped in the toluene, - is quantitated by using capillary, gas chromatography and a sulfur chemiluminescence detector {SCD) or a flame photometric · detector (FPO). -· .. . .. ...:. M .... , ' . • ,-~ - j . , ,.. (

Welcome message from author
This document is posted to help you gain knowledge. Please leave a comment to let me know what you think about it! Share it to your friends and learn new things together.
Transcript
1
I RR 94-010B middot page 8 ~ymiddotmiddot
C~~ SUl2JAJYDfBODtJCrJOH
bull
This method is intended for determining residues of middotthe trimethylsulfonium cation (TMS) in soil at levels from ops to 5 ppm and in water at levels from 001 to 01 ppm Glyphosate-trimesium which is composed of a 11 mixture of the trimethylsulfonium cation (CAS Registry No 676-84-6] an~ the glyphosate(l-) anion is the active herbicidal
-i~gredient in the formulated product marketed by Zeneca Ag Products under the trademark TOUCHDOWNreg 7
The TMS is extracted from water by passage through a column packed with cation exchange resin The TMS is eluted from the column with concentrated potassium chloride (lltCl) solutio_n
The TMS is extracted from soil samples by shaking with 10 aqueous potassium hydroxide solution An aliquot of ~he aqueous soil extract is cleaned-up This is accomplished by
- acidifying the extract adding activated charcoal and removing the charcoal by ~entrifugation followed by filtration
The cleaned-up soil extract or column eluate for the water sample is heat~d at 100deg c in the presence of tin(II) chloride potassium hydroxide and toluene to dealkylate the TMS to dimethylsulfide (OMS) The OMS which is trapped in the toluene -is quantitated by using capillary gas chromatography and a sulfur chemiluminescence detector SCD) or a flame photometric middotdetector (FPO)
-middot M bull -~ - j
~
(
page~RR 94-0lOB-
The recommended equipment and reagents are described Equipment with equivalent performance specifications and reagents of comparable purity can be substituted~
21 Apparatus
211 4-oz Wide-Mouthed Jars Jars with screw-caps
212 Shaker Eberbach Corporation Ann Arbor MI
21J centrifuge An International Equipment Company centra-8 centrifuge (Needham Heights MA)
214 capsule Vials middot2s x 70 mm 24-mL (6 drams) vial~ with screw-caps (Kimble catalog no 60957C-6)
21s 10-cc syringes Disposable plastic_syringes with Luer-Lok tips (Baxter catalog no S9521-lOL)
216 Syringe Filters Disposable 25-mm diameter 045-umbullporeshy
size with Luer hub (Nylon Acrodisc Gelman Sc~ences Ann Arbor MI catalog no 4438)
211 Column Rack Econo system Rack (Bio-Rad Hercules CA catalog no 731-8200)
218 Columns 20 by 10 cm id chromatographic col~s (BioshyRad catalog no 737-1021)
219 Beakers bull 100-mL c~pacity borosilicate glass beakers
_ -middot _ -
~ I
middot RR 94-010B page 10
2110 Pipetsmiddotand Pipet Filler Disposablemiddot 2- and 10mL capacity Red pipet filler (Baxter Scientific Products catalog no P5311-1)
10- 25- so- 100- and 1000-mL capacity
2111 Graduated cyl1nders
2112 15-mL Glass Vials with screw-caps Each cap has a hole and contains a silicone septum lined with a perfluoroethylene polymer (Supelco Bellefonte PA catalog-no 2-3284)
2113 Electric Heating-Module A Multi-Blok Heater (115 V 5060 Hz 100 watts) made by Lab-Line Instruments Inc (Melrose Park IL) The unit is equipped with an aluminum heating block (Supelco catalog no 3-3316) drilled with 8 holes (21 mm wide 31 mm deep) to accept glass vials for heating
2114 Disposable Pipets 15-cm length flint-glass Pasteur pipets
2115 Autosampler Vialswith Inserts 2-mL crimp-top vials (Sunbrokers catalog no 200-000) with crimp-tops (Sunbrokers catalog no 200-100) and 200-uL flat bottom limited-volume inserts (Sunbrokers catalog no 200-232)
2116 Gas-Chromatographic System A Hewlett-Packard (HP) model SSSOA Level 4 gas chromatograph equipped with a HP model 7673A autosamplerinjector The autosamplerinjector is equipped with a 10-uL syringe with a 23-gauge needle _ (Hamilton 701N) The instrument is equipped with amiddot350B Sulfur Chemiluminescence Detector made by Si~vers (Boulder CO) and an HP 3394Amiddot Integrator
Alternatively an HP model 5890 gas chromatograph equipped with an HP model 7673A high speed autosamplerinjector The autosampler is equipped with a 10-uL syringe with a 23-gauge needle (Hamilton 701N) The instrument is equipped with a
~- ~
IC
- ---
RR 94-010B bull page 11 middot
f~amemiddotphotometric detector with a sulfur bandpassbullfilter and anHP 3396A integrator
2117 Gas-Chromatographic Columnmiddot A 30 m by 053 mm id fusedshysilica capillary column bonded with a 15-um thickness of
(95)-dimethyl-(5)-diphenylsiloxane Durabond-5 (catalog no 125-5032 JampW scientific Folsom CA)
22 Reagents and Materials
221 Potassium Hydroxide Dry solid pellets with a minimum assay of 85 (EM Science catalog no PX 1490-1)
222 10 Potassium Hydroxide Solution Dissolve 100 g per liter of high-purity water
223 concentrated Hydrochloric Acid 365-38 Baker Analyzed reagent (J T Baker Phillipsburg NJ)
224 Activated Carbon Darcoreg G-60 -100 mesh powder (Aldrich Chemical co catalog no 24227-6)
225 Toluene A high-purity grade of solvent suitable for traceshyorganic analyses
226 Water High~purity water suitable for trace organic analysis
227 10 N Hydrochloric Acid (HCl) Aqueous solution ava~lable from Mallincrodt (catalog no 6388) Note Dilution of 83 mL of concentrated reagent HCl to 10 liter will yield a 1 H HCl solution
228 01 N HCl Solution 01 HCl is used for preparation of TMSmiddot solutions To prepare a 01 N HCl solution dilute the 10 li HCl 110 bull
bullbull middot_ 1bull bull
Imiddot
RR 94-010B middotpage 12
229 cationExchange Resin for Concentration AG 50W-X2 100-200 mesh hydrogen form anaiyticai-grade cationmiddotexchange resin
(Bio-Rad Labs cat bull 142-1241)
2210 Solid Glass Balls 15- to 2-mm diameter glass balls (Jencons Ltd marketed by scientific Products (Baxter) catalog no G6031-15) bull
2211 Potassium Chloride 99+ purity (Aldrich catalog no
20soo-o)
2212 1 M Potassium Chloride Solution 7456 gL of water
2213 TinfII) Chloride Dihydrate (SnC12 bull2H2Ql Assay ~ 98 (EM science catalog no SX0885-l)
23 Reference Materials
23l Reference Standard Trimethylsulfonium iodide assay~ 99 is available from Zeneca Ag Products 1200 South 47th middot street Box Number 4023 Richmond CA 94804-0023 Attention Manager Envi~onmental Sciences Department
The Material Identification number of the TMS iodide used in this study was ASW 1441A (Request number was 1993-156)
232 Calibration and Fortification stock Solutions Prepare two separate stock solutions Calibration solutions are used to calibrate the instrument Fortification solutions areused to fortify samples in order to demonstrate procedural
recoveries All solutions are prepared with 01 N HCl solution to inhibit microbial growth
Prepare a stock solution containing 266 mg of trimethylsulfonium iodide per milliliter of 01 N HCl [The formula weights of TMS iodide and TMS iodide are 77 127
middotmiddot-~-~-~---
-
3
RR 94-0lOB middot page 13
middot 7~C ol
and 20middot4 respectively therefore the TMSTMS iodidbulle ratio is
0377 and 266 mg TMS iodidemL multiplied times 0377 J I
equals 100 mg TMSmL] 1 bull
To prepare each stock solution place a known quantity(plusmn 01 mg) eg 266 mg of TMS iodide in a 4-oz amber glass
bottle Multiply the amount of milligrams weighed out by 0377 to calculate the weight of 01 N HCl to add to the TMS iodide eg if exactly 266 mg are weighed out add 100 g
of 01middot li HCl Add the calculated weight of 01 N HCl to the 4-oz bottle Close the bottle with a Poly-Seal cap or a cap lined with a fluorocarbon polymer such as Teflonreg Mix the contents thoroughly to dissolve the TMS iodide The concentration of the stock solution is 10 mg or 1000 ug TMSmL Starting with the stock solution ma~e 110 serial dilutions to prepare 10~ 10 and 10 ug TMSmL solutions Use 01 N HCl to prepare all solutions
ANALYTICAL PROCEDURE
3 1 Extraction of soil
31l Place 25 g of soil and 50 mL of 10 KOH solution in a 4-oz jar
Note l) The instruction assumes that the moisture content of the soil sample is s 20 by weight and that the resulting TMSanalytical error of S 10 is acceptable If more_ accuracy is required mdisture determination of the soil sample is required prior to extraction decrease the amount of KOH solution added by the amount of water contained in the soil sample 2) A PTFE-liner for the cap is unnecessary Do not use aluminum foil as it will react with the KOH 3) Avoid personal contact with the KOH solution Flush any contacted area with plenty of water bull
_middot_ ~ -middot
lUlt ~4-u~u~ bull page 14
31 2 Securely cap the jar and shake for 1 hr on a mechanical shaker
313 Centrifuge the jar eg 2500 rpm for 15 min to settle the soil
314 Decant the supernatant KOH extract into a clean 4-oz jar The extract represents 25 g50 mL or o5 gmiddot of soil per
milliliter
Note It is not necessary to decant the supernate the required aliquot can be removed directly from the jar with a pipet
315 To continue soil analysis skip to section 33
3 2 Extraction of Water The use of a column as described below to concentrate the TMS in water samples is necessary only if a 001-ppm
detection limit is desired and the detector sensitivity for instrumental analysis is inadequate Direct dealkylation of 10 mL of water sample in the presence of o5 mL of toluene would allow quantitation at an LOQ of 001 ppm under optimum conditions see section 34 bull If residues gt002 ppm are expected direct dealkylation of the water samples is recommended
321 Prepare Column Use a 20 by 10-cm (id) Bio-Rad chromatographic column Place 25 g of AGreg 50W-X2 resin in a 100-mL beaker and add about 15 mL of pure water Pour the resin-water slurry--into the column After the water has drained from the column wash the column with about 15 mLof pure water using roughly s-mL portions After the last wash water has been added and most of the resin has settled but before the last of the water has entered the resin bed placmiddote about 2 g of glass balls on top of the resin
middot_ ~
RR 94-010B middotpage 15
Note middot l) Water in addition to that specified above can be used for resin transfer coiwnn washing etc 2) The column can be prepared several days in advance It is only necessary that the bottom end of the column ismiddotcapped and the resin bed is kept filled with water
3 bull2 2 Add 25 mL of the water sample portionwise to the column
323 Elute the columnwith 7 mL of l H KCl solution Collect the eluate directly in a 15-mLdealkylation vial
324 To continue water analysis skip to section 34
33 Cleanup of Soil Extract
33l Place a 14-mL aliquot of the soil extract in a 6-dramvial
332 Add 2 mL of concentrated HCl and 250-260 mg of activated carbon to the vial Shake the mixture and allow it to stand for 10 to 15 min to let the carbon settle
Note Activated carbon also removes small amounts of TMS from solutionmiddot Decreasing the amount of carbon used will result in less loss of TMS but will also result in more background
333 Centrifuge the vials eg 2500 rpm for 15 min
3 3 4 middot Carefully draw the supernate into the barrel of a 10-cc syringe Fit a 045-um filter to the syringe barrel Filter the liquid into amiddotclean 6-dram vial The extract now represents 7 g16 mL or 044 g of soil per milliliter
Note Some soils especially silty clay loams are difficult to filter and can require the use of as many as four filters
I
middot RR 94-0lOB page 16
3 3 bull 5 To continue soil analysis proceed to section 3 4 middot middot
34 Dealkylation
34l Place 50 mL of a lO ug TMSmL calibration solution in a 15-mL dealkylation vial for use as a standard
342 Soil Place ao mL of the cleaned soil extract from section 3 3 4 into a 15-mL vial This volume represents 3 5 grams_ of soil
Water Use the column eluate 7 mL from section 323 or place 10 mL of water into a 15-mL vial
Note The above suggested volumes are for samples that contain TMS residues at the LOQ If high residues are anticipated use less soil extract or less water sample The dealkylation vial should contain a minimum of 5 mL of water If for example only one milliliter of extract or water sample is used then add 4 mL of distilled water to the vial
343 Add OO to 250 mg of tin(II) chloride dihydrate to each 15-mL vial and swirl the vial gently to partially suspend the tin(II) chloride Add 05 mL f t~l~~ne to vials containing the soil extract Add l mL of toluene to the column eluate of the water sample Add o5 mL toluene to 10 mL of water for direct dealkylation Add 5 0 0 mL of toluene to the_ vial containing the calibration solution
Note l) The recommended amounts of toluene added is based on samples containing residues at or_below the LOQ If high residues are anticipated the amount of water sample or soil extract used should be decreased or the watermiddot sample or soil extract should be diluted with pure water The amount of toluene can be increasedmiddotbut the total volume
bull-middot i --
I l
RR 94-0lOB bullpage 17
constraints of the vial must be kept in mind Usemiddot of only os mL of toluene means that accurate volumetric removal of the toluene forbulldilution purposes prior to analysis will be extremely difficult to accomplish 2) The tin(II) chloride is added as an antioxidant to minimize oxidation of the DMsmiddot to dimethylsulfoxide
344 Add to the vial 5 - 55 g of KOH pellets to water sampleseluates or 7 - 75 g of KOH pellets to soil extracts cap the vial immediately
Note The KOH pellets should be added smoothly eg on a firm sheet of paper to prevent loss of toluene through splashing They should be added quickly because of the rapid generation of heat Ensure that all pellets are of a size that will pass into the vial easily There can be bottle to bottle variations in the pellet size KOH pellets are hygroscopic
3 4 middotS Heat the vial at 100 degC for l to 2 hr in an electric heating module
Note l) All vials should be heated for the same amount of time 2) Occassionally the septum in the cap could pop out this is built into the procedure as a safety feature to relieve excessive pressure buildup due to unforseen circumstances eg elevated heating block temperatures If this occurs discard the sample and repeat with a newmiddot
middotaliquot of sample extract Do not loosen the cap because the volatile OMS could escape_ Appearance can be deceiving in that the seal ismiddot generally maintained even when the cap is a bit off of center The adequacy of the seal can be confirmed after heating by inspection of the indentation left on the septum by the rim of the glass vial~
bull ~
3 4 6 Cllrefully remove the hot vialsmiddot from the heating block Cool the- vials by placement in an ice water bath Alternatively 1) allowmiddot themiddotvials and their contents to coolmiddot to ambient temperature by locating the vial in a high draft area of the fume hood or 2) chill the vials by placing them ina freezer
Note The OMS solution in toluene is stable at ambient temperature for at least two weeks if it is l~ft in the dealkylation vial which is tightly capped
347 Centrifuge the vial eg 15 min at 2500 rpm
348 Unscrew the cap from the vial and place an aliquot of the toluene in an autosampler vial fitted with a limited-volume insert Crimp seal the vial immediately
Note Avoid areas that use or store carbon disulfide which is used as a solvent for many applications Carbon disulfide has a retention time nearly coincident to that for OMS
35 Fortifications
Analyze residue-free control samples and fortified residueshyfree control samples whenever possible along with any sample analysis It is recommended that one control sample and two fortified control sampies be analyzed each time for ev~ry set consisting of ten samples or less one of the fortified samples should be fortified at the methods lower limit of quantitation (LOQ) of 005 ppm (soil) or 001 ppm (water) To prepare a 005- or 001-ppm fortified sample add 125 uL of a 10 ug TMSmL fortification solution to 25 g of soil or 250 UL of a 1 ug TMSmL fortification solution to 25 mL of water The second fortified sample should be fortified at twice the LOQ or at a level expected in the unknown sample bull
middot~middot middot -
4
middotRR 94-0lOB page 19
I~SDOMErrlL ANALYSIS CONDITIONS
Follow the manufacturers instructions for operation of the gas chromatograph autosamplmiddoterinjector sulfur chemiluminescence detector (SCD) and flame photometric detector (FPD) The specific conditions listed below were used to generate the data and chromatograms presented in this report
41 Operating Parameters Outline
411 For the SCD use 115deg C for the inlet and isothermal column temperatures Use helium as the carrier gas set the column flow rate to about 7 mLmin Set the flow rates of air
(eg 280 mLmin) hydrogen (eg 200 mLmin) and auxillary helium supplied to the detector to the values recommended by the detector manufacturer Use a 3-uL injection volume with a splitless single-piece liner with -2 mm id straight bore Theretention time of OMS is about 1 min a large toluene peak will appear after about 2 min
412 For the FPD the column flow was 6 mLmin of helium A
splitless single-piece liner with -2 mm id straight bore was used The inlet and column temperatures were 150deg and 100deg c isothermal respectively The air and hydrogen flows to the detector were 94 and 64 mLmin respectively The volume injected was 2 uL Due to quenching of the detector response by residual toluene at least a 5-min run time between injections is recommended
42 calibration and Analysismiddot
Calibrate the gas chromatograph by using the appropriate TMS calibration standard prepared in section 23 and dealkylated in section J4
I c
RR 94-0lOB
-page 20
For amp9ll analyses dilute 200 and 500 uL of the l ugmL dealkyiatedstandard (high level) with 800 and 500 uL of
toluene respectively to prepare the 020-ugmL (low~level) and o5 ugmL (intermediate-level) standards middot
For water analyses dilute 250 and 500 uL of the l ugmL dealkylated standard (high~level) with 750 and 500 uL of toluene respectively to prepare the 025 ugmL (low-level) and 05 ugmL (intermediate-level) standards
Even though the TMS has been dealkylated to OMS it is simplest to continue expressing all concentrations in TMS equivalents Depending on the overall precision of the chromatographic system the analyst may opt to make duplicate injections of all calibration standards and sample
extracts The identity of the analyte peak in the sample chromatogram is assigned based upon the coincidence of retention times with the OMS peak of the calibrant_ chromatogram Sample extracts containing residues that are higher than the l ugmL calibrant solution must be diluted and reanalyzed
Following is a suggested ana~ytical scheme Injections can be made in the following order
1 Replicate injections (3 to 5) of the high-level standard to equilibrate the column
2 Injections of the high- intermediate- and lowshylevel standards to establish the calibration curve
3 Injection 9f up to 7 samples These samples can be extracts of untreated controls fortified controls treated-field samples etc Sample extracts containing residues that are higher thanthe highshylevel calibrant solution must be diluted and reanalyzed
4 Injections of the high- intermediate- and low- level standards to establish the calibration curve bull
middot_
lt (
5
RR 94-010B page 21
5 Repeat steps 3 and 4 until all samples have been injected
middot
CALCULTIONS
The concentration of the analytes in the original sample is calculated by using the external standard method that is the response obtained for the analytes in the sample extract is compared to the response obtained for a separate injection(s) of a known amount of analyte in the calibration solution To use the calculations shown below the injection volumes for all calibration solutions and sample extracts must be fixed at the same volume The average response obtained for all TMS standards used during the run is used for calculating the concentration of TMS in the samples
51 Linear Response Calculation Methods Appendix A gives sample calculations using both the calibration factor method described in 511 and the linear regression methods described in 512
511 Calibration factor Calculate the average response factor F(avg) for injection of high- intermediate- and low-level calibration solutions
F(avg) = [F(high) + F(intermediate) + F(low)J3
Individual-level response factors F are calculated as follows
C F =
R
Where
F =middotmiddot response factor ((ugmL)cm)
V
-RR 94-0l0B middot page 22
c = concentration of calibration solution (pgmL)
R = average response units from detector for calibration solution (cm)
Calculate the analyte in the sample as in 514
512 Linear Regression Analysis Alternatively perform a linear regression analysis on the results of the injections of the calibration standards using TMS concentration (x-axis) versus the sec detector response (y-axis) The regressionmiddot analysis will provide the constants m and b for the linear equation y = mx + b where mis the slope and bis theyshyintercept at x = 0 Calculate the TMS concentration X in each sample extract using the equation x = (y - b)m If any background corrections are applied substract the responses Calculate the analyte in the sample as in 522
513 Matrix in final extract Calculate the concentration of the sample matrix that is the amount of soil or water that the final extract represents as follows
For sQjJ sample W (sample) b x V (aliquot)
C= X V (solvent) V (lolucnc)
Where
C = concentration ofmiddot matrix (gmL)
W (sample) = weight of soil extracted (g)
V (solvent) = volume of extracting solvent used (mL)volume includes the endogenous water in the soil (mL) [Analyses in this reporthave disregarded volume contribution -middotfrom endoltJenous water as beingmiddotnonsignificant ie~ 10 ]
b = 0875 Factor representinltJ removal of 14 mL of KOH extract and diluting to 16 mL by addition of 2 mL of cone HCl solution
middot__ middot -middot )
_l
I
RR 94-010B middotpage 23
v (aliquot) = volumeof final cleaned aliquot placed
in dealkylation vial (mL)
V (toluene) = volume of toluene used to tra~ themiddot DMSvolume includes any toluene dilutions
(mL)
For water sample
W (sample) C=
V (toluene)
Where
C = concentration of matrix (gmL)
W (sample)= (l weight of water sample placeddirectly in dealkylation vial weightdoes not include any pure water used for diluting the sample (g) or (2) weightof water sample added to ion exchangecolumn to concentrate the TMS (g)
V (toluene) = volume of toluene used to tra~ OMS (mL)volume includes any toluene dilutions (mL)
514 Analyte in sample Calculate the analyte concentration A
in the original sample as follows
F X R A=
C
Where
A= concentration of analytein original sample (pgg mgkg or ppm)
F = response factor (microgmL) cm middot -R= average sample response from detector for sample
(cm)
C = concentration of matrix in final extract (gmL)
-middot
)
-
RR 94-0lOB middot page 24
52 N~nliriear Response Calculation Methods
For detector responses that significantly deviate from linearity such as the FPO middotthe following procedure can be used to calculate extract concentrations Appendix A gives an example calculation fo~ the linearregression analysis method described in 52l
52l Calculation of analyte concentration in extract
Perform a linear regression analysis on the results of the injections of the calibration standards using TMS concentrationmiddot (x-axis) versus the square root of the FPO detector response (y-axis) The regression analysis will provide the constants m and b for the linear equation y =
mx + b where mis the slope and bis they-intercept at x = o Calculate the TMS concentration X in each sample extract using the equation x = (y - b)m Note that y is the square root of the detector response If any background corrections are applied subtractthe square root of the responses rather than the responses themselves
Alternatively the calibration data can be plotted on graph paper and the TMS concentration X in each sample extract can be determined from the calibration curve Calculate the analyte inthe sample as in s22
522 Calculation of analyte ih sample bullCalculate the analyte concentration A in the original sample as follows -A (pgg mgkg or ppm) = XC
Where
X = analyte concentration in the final extract calculated from the curve fit equation or determined from a graphical standard curve (microgmL)
C =o matrix concentration in extract from section 513 (gmL) bull
bull
J
6
RR 94-010B -page 25
l_NTERFERENCES
61 Carbon Disulfide
Because analytical laboratories sometimes stock and use large amounts of carbon disulfide contamination by carbon
_disulfide is a potential problem Contaminations have occurred from l) using toluene from a bottle stored in a cabinet containing abottle of carbon disulfide and 2) usipg a centrifuge immediately after someone else had used it to centrifuge bottles containing carbon disulfide as the extraction solvent Carbon disulfide does resolve chromatographically from OMS if both are at low concentrations
62 Dimethylsulfide fDMS)
TMS is not the only source of OMS in the final solution subjected to dealkylation S-Methylmethionine called Vitamin U in the Merck Index is believed to be at least one source of OMS in samples Under alkaline conditions Vitamin U can readily produce OMS It has been isolated from cabbage and subsequently detected in the foliage of a range of higher plants including parsley pepper onion lettuce and turnip Its presenmiddotce has been established in (
tomato foliage and fruit potato and green tea Cabbage leaves and kohlrabi were found to contain relatively high levels of the compound corresponding to as much as 02 and 01 of the tissue dry weight respectively Vitamin U is probably ubiquitous in all plant tissues (reference l) Plant tissue exist in soil samples as root hairs and detritus and can contribute background DMS to soil samples
-middot --middot
I
7 coNFrRMATORY TECHNIQUES
RR 94-010B middot page 26
Unexpected positive results as in untreated controlsmiddotor preapplication samples should generally be confirmed by other means However if analysis is conducted by a sulfurshyselective detector and the retention time of the peak is coincident with that of OMS the peak is probably due to OMS so confirmatory work is not productive The origin_ of the OMS is likely from endogenous precursors in the sample matrix Because some peak resolution is lost in the SCD
transfer line the FPO is the better detector in terms of peak discrimination
a prscussroN This method is a revised version of the soil and water
portion of the method Determination of SC-0224 Cation Residues in Crops Water and Soil by Gas Chromatography (reference 2) Cleanup procedures have been expanded to lower background OMS originating from endogenous coextractives and thus giye lower apparent TMS residues A column technique is used to concentrate the TMS in water prior to dealkylation A capillary column is used for the gas chromatography The choice of detectors on the chromatograph has been expanded to include both a flame photometric detector (FPO) and a sulfur chemiluminescence detector (~CD) bullThe SCD has been added because the FPO responds nonlinearly to sulfur and requires more complex data handling than the linearly responding sco
81 Scope
This method is suitable for the determination of TMS in soil and water Recovery data given in Table I reflect the methodology described herein bull
middot -_

-
3
RR 94-0lOB middot page 13
middot 7~C ol
and 20middot4 respectively therefore the TMSTMS iodidbulle ratio is
0377 and 266 mg TMS iodidemL multiplied times 0377 J I
equals 100 mg TMSmL] 1 bull
To prepare each stock solution place a known quantity(plusmn 01 mg) eg 266 mg of TMS iodide in a 4-oz amber glass
bottle Multiply the amount of milligrams weighed out by 0377 to calculate the weight of 01 N HCl to add to the TMS iodide eg if exactly 266 mg are weighed out add 100 g
of 01middot li HCl Add the calculated weight of 01 N HCl to the 4-oz bottle Close the bottle with a Poly-Seal cap or a cap lined with a fluorocarbon polymer such as Teflonreg Mix the contents thoroughly to dissolve the TMS iodide The concentration of the stock solution is 10 mg or 1000 ug TMSmL Starting with the stock solution ma~e 110 serial dilutions to prepare 10~ 10 and 10 ug TMSmL solutions Use 01 N HCl to prepare all solutions
ANALYTICAL PROCEDURE
3 1 Extraction of soil
31l Place 25 g of soil and 50 mL of 10 KOH solution in a 4-oz jar
Note l) The instruction assumes that the moisture content of the soil sample is s 20 by weight and that the resulting TMSanalytical error of S 10 is acceptable If more_ accuracy is required mdisture determination of the soil sample is required prior to extraction decrease the amount of KOH solution added by the amount of water contained in the soil sample 2) A PTFE-liner for the cap is unnecessary Do not use aluminum foil as it will react with the KOH 3) Avoid personal contact with the KOH solution Flush any contacted area with plenty of water bull
_middot_ ~ -middot
lUlt ~4-u~u~ bull page 14
31 2 Securely cap the jar and shake for 1 hr on a mechanical shaker
313 Centrifuge the jar eg 2500 rpm for 15 min to settle the soil
314 Decant the supernatant KOH extract into a clean 4-oz jar The extract represents 25 g50 mL or o5 gmiddot of soil per
milliliter
Note It is not necessary to decant the supernate the required aliquot can be removed directly from the jar with a pipet
315 To continue soil analysis skip to section 33
3 2 Extraction of Water The use of a column as described below to concentrate the TMS in water samples is necessary only if a 001-ppm
detection limit is desired and the detector sensitivity for instrumental analysis is inadequate Direct dealkylation of 10 mL of water sample in the presence of o5 mL of toluene would allow quantitation at an LOQ of 001 ppm under optimum conditions see section 34 bull If residues gt002 ppm are expected direct dealkylation of the water samples is recommended
321 Prepare Column Use a 20 by 10-cm (id) Bio-Rad chromatographic column Place 25 g of AGreg 50W-X2 resin in a 100-mL beaker and add about 15 mL of pure water Pour the resin-water slurry--into the column After the water has drained from the column wash the column with about 15 mLof pure water using roughly s-mL portions After the last wash water has been added and most of the resin has settled but before the last of the water has entered the resin bed placmiddote about 2 g of glass balls on top of the resin
middot_ ~
RR 94-010B middotpage 15
Note middot l) Water in addition to that specified above can be used for resin transfer coiwnn washing etc 2) The column can be prepared several days in advance It is only necessary that the bottom end of the column ismiddotcapped and the resin bed is kept filled with water
3 bull2 2 Add 25 mL of the water sample portionwise to the column
323 Elute the columnwith 7 mL of l H KCl solution Collect the eluate directly in a 15-mLdealkylation vial
324 To continue water analysis skip to section 34
33 Cleanup of Soil Extract
33l Place a 14-mL aliquot of the soil extract in a 6-dramvial
332 Add 2 mL of concentrated HCl and 250-260 mg of activated carbon to the vial Shake the mixture and allow it to stand for 10 to 15 min to let the carbon settle
Note Activated carbon also removes small amounts of TMS from solutionmiddot Decreasing the amount of carbon used will result in less loss of TMS but will also result in more background
333 Centrifuge the vials eg 2500 rpm for 15 min
3 3 4 middot Carefully draw the supernate into the barrel of a 10-cc syringe Fit a 045-um filter to the syringe barrel Filter the liquid into amiddotclean 6-dram vial The extract now represents 7 g16 mL or 044 g of soil per milliliter
Note Some soils especially silty clay loams are difficult to filter and can require the use of as many as four filters
I
middot RR 94-0lOB page 16
3 3 bull 5 To continue soil analysis proceed to section 3 4 middot middot
34 Dealkylation
34l Place 50 mL of a lO ug TMSmL calibration solution in a 15-mL dealkylation vial for use as a standard
342 Soil Place ao mL of the cleaned soil extract from section 3 3 4 into a 15-mL vial This volume represents 3 5 grams_ of soil
Water Use the column eluate 7 mL from section 323 or place 10 mL of water into a 15-mL vial
Note The above suggested volumes are for samples that contain TMS residues at the LOQ If high residues are anticipated use less soil extract or less water sample The dealkylation vial should contain a minimum of 5 mL of water If for example only one milliliter of extract or water sample is used then add 4 mL of distilled water to the vial
343 Add OO to 250 mg of tin(II) chloride dihydrate to each 15-mL vial and swirl the vial gently to partially suspend the tin(II) chloride Add 05 mL f t~l~~ne to vials containing the soil extract Add l mL of toluene to the column eluate of the water sample Add o5 mL toluene to 10 mL of water for direct dealkylation Add 5 0 0 mL of toluene to the_ vial containing the calibration solution
Note l) The recommended amounts of toluene added is based on samples containing residues at or_below the LOQ If high residues are anticipated the amount of water sample or soil extract used should be decreased or the watermiddot sample or soil extract should be diluted with pure water The amount of toluene can be increasedmiddotbut the total volume
bull-middot i --
I l
RR 94-0lOB bullpage 17
constraints of the vial must be kept in mind Usemiddot of only os mL of toluene means that accurate volumetric removal of the toluene forbulldilution purposes prior to analysis will be extremely difficult to accomplish 2) The tin(II) chloride is added as an antioxidant to minimize oxidation of the DMsmiddot to dimethylsulfoxide
344 Add to the vial 5 - 55 g of KOH pellets to water sampleseluates or 7 - 75 g of KOH pellets to soil extracts cap the vial immediately
Note The KOH pellets should be added smoothly eg on a firm sheet of paper to prevent loss of toluene through splashing They should be added quickly because of the rapid generation of heat Ensure that all pellets are of a size that will pass into the vial easily There can be bottle to bottle variations in the pellet size KOH pellets are hygroscopic
3 4 middotS Heat the vial at 100 degC for l to 2 hr in an electric heating module
Note l) All vials should be heated for the same amount of time 2) Occassionally the septum in the cap could pop out this is built into the procedure as a safety feature to relieve excessive pressure buildup due to unforseen circumstances eg elevated heating block temperatures If this occurs discard the sample and repeat with a newmiddot
middotaliquot of sample extract Do not loosen the cap because the volatile OMS could escape_ Appearance can be deceiving in that the seal ismiddot generally maintained even when the cap is a bit off of center The adequacy of the seal can be confirmed after heating by inspection of the indentation left on the septum by the rim of the glass vial~
bull ~
3 4 6 Cllrefully remove the hot vialsmiddot from the heating block Cool the- vials by placement in an ice water bath Alternatively 1) allowmiddot themiddotvials and their contents to coolmiddot to ambient temperature by locating the vial in a high draft area of the fume hood or 2) chill the vials by placing them ina freezer
Note The OMS solution in toluene is stable at ambient temperature for at least two weeks if it is l~ft in the dealkylation vial which is tightly capped
347 Centrifuge the vial eg 15 min at 2500 rpm
348 Unscrew the cap from the vial and place an aliquot of the toluene in an autosampler vial fitted with a limited-volume insert Crimp seal the vial immediately
Note Avoid areas that use or store carbon disulfide which is used as a solvent for many applications Carbon disulfide has a retention time nearly coincident to that for OMS
35 Fortifications
Analyze residue-free control samples and fortified residueshyfree control samples whenever possible along with any sample analysis It is recommended that one control sample and two fortified control sampies be analyzed each time for ev~ry set consisting of ten samples or less one of the fortified samples should be fortified at the methods lower limit of quantitation (LOQ) of 005 ppm (soil) or 001 ppm (water) To prepare a 005- or 001-ppm fortified sample add 125 uL of a 10 ug TMSmL fortification solution to 25 g of soil or 250 UL of a 1 ug TMSmL fortification solution to 25 mL of water The second fortified sample should be fortified at twice the LOQ or at a level expected in the unknown sample bull
middot~middot middot -
4
middotRR 94-0lOB page 19
I~SDOMErrlL ANALYSIS CONDITIONS
Follow the manufacturers instructions for operation of the gas chromatograph autosamplmiddoterinjector sulfur chemiluminescence detector (SCD) and flame photometric detector (FPD) The specific conditions listed below were used to generate the data and chromatograms presented in this report
41 Operating Parameters Outline
411 For the SCD use 115deg C for the inlet and isothermal column temperatures Use helium as the carrier gas set the column flow rate to about 7 mLmin Set the flow rates of air
(eg 280 mLmin) hydrogen (eg 200 mLmin) and auxillary helium supplied to the detector to the values recommended by the detector manufacturer Use a 3-uL injection volume with a splitless single-piece liner with -2 mm id straight bore Theretention time of OMS is about 1 min a large toluene peak will appear after about 2 min
412 For the FPD the column flow was 6 mLmin of helium A
splitless single-piece liner with -2 mm id straight bore was used The inlet and column temperatures were 150deg and 100deg c isothermal respectively The air and hydrogen flows to the detector were 94 and 64 mLmin respectively The volume injected was 2 uL Due to quenching of the detector response by residual toluene at least a 5-min run time between injections is recommended
42 calibration and Analysismiddot
Calibrate the gas chromatograph by using the appropriate TMS calibration standard prepared in section 23 and dealkylated in section J4
I c
RR 94-0lOB
-page 20
For amp9ll analyses dilute 200 and 500 uL of the l ugmL dealkyiatedstandard (high level) with 800 and 500 uL of
toluene respectively to prepare the 020-ugmL (low~level) and o5 ugmL (intermediate-level) standards middot
For water analyses dilute 250 and 500 uL of the l ugmL dealkylated standard (high~level) with 750 and 500 uL of toluene respectively to prepare the 025 ugmL (low-level) and 05 ugmL (intermediate-level) standards
Even though the TMS has been dealkylated to OMS it is simplest to continue expressing all concentrations in TMS equivalents Depending on the overall precision of the chromatographic system the analyst may opt to make duplicate injections of all calibration standards and sample
extracts The identity of the analyte peak in the sample chromatogram is assigned based upon the coincidence of retention times with the OMS peak of the calibrant_ chromatogram Sample extracts containing residues that are higher than the l ugmL calibrant solution must be diluted and reanalyzed
Following is a suggested ana~ytical scheme Injections can be made in the following order
1 Replicate injections (3 to 5) of the high-level standard to equilibrate the column
2 Injections of the high- intermediate- and lowshylevel standards to establish the calibration curve
3 Injection 9f up to 7 samples These samples can be extracts of untreated controls fortified controls treated-field samples etc Sample extracts containing residues that are higher thanthe highshylevel calibrant solution must be diluted and reanalyzed
4 Injections of the high- intermediate- and low- level standards to establish the calibration curve bull
middot_
lt (
5
RR 94-010B page 21
5 Repeat steps 3 and 4 until all samples have been injected
middot
CALCULTIONS
The concentration of the analytes in the original sample is calculated by using the external standard method that is the response obtained for the analytes in the sample extract is compared to the response obtained for a separate injection(s) of a known amount of analyte in the calibration solution To use the calculations shown below the injection volumes for all calibration solutions and sample extracts must be fixed at the same volume The average response obtained for all TMS standards used during the run is used for calculating the concentration of TMS in the samples
51 Linear Response Calculation Methods Appendix A gives sample calculations using both the calibration factor method described in 511 and the linear regression methods described in 512
511 Calibration factor Calculate the average response factor F(avg) for injection of high- intermediate- and low-level calibration solutions
F(avg) = [F(high) + F(intermediate) + F(low)J3
Individual-level response factors F are calculated as follows
C F =
R
Where
F =middotmiddot response factor ((ugmL)cm)
V
-RR 94-0l0B middot page 22
c = concentration of calibration solution (pgmL)
R = average response units from detector for calibration solution (cm)
Calculate the analyte in the sample as in 514
512 Linear Regression Analysis Alternatively perform a linear regression analysis on the results of the injections of the calibration standards using TMS concentration (x-axis) versus the sec detector response (y-axis) The regressionmiddot analysis will provide the constants m and b for the linear equation y = mx + b where mis the slope and bis theyshyintercept at x = 0 Calculate the TMS concentration X in each sample extract using the equation x = (y - b)m If any background corrections are applied substract the responses Calculate the analyte in the sample as in 522
513 Matrix in final extract Calculate the concentration of the sample matrix that is the amount of soil or water that the final extract represents as follows
For sQjJ sample W (sample) b x V (aliquot)
C= X V (solvent) V (lolucnc)
Where
C = concentration ofmiddot matrix (gmL)
W (sample) = weight of soil extracted (g)
V (solvent) = volume of extracting solvent used (mL)volume includes the endogenous water in the soil (mL) [Analyses in this reporthave disregarded volume contribution -middotfrom endoltJenous water as beingmiddotnonsignificant ie~ 10 ]
b = 0875 Factor representinltJ removal of 14 mL of KOH extract and diluting to 16 mL by addition of 2 mL of cone HCl solution
middot__ middot -middot )
_l
I
RR 94-010B middotpage 23
v (aliquot) = volumeof final cleaned aliquot placed
in dealkylation vial (mL)
V (toluene) = volume of toluene used to tra~ themiddot DMSvolume includes any toluene dilutions
(mL)
For water sample
W (sample) C=
V (toluene)
Where
C = concentration of matrix (gmL)
W (sample)= (l weight of water sample placeddirectly in dealkylation vial weightdoes not include any pure water used for diluting the sample (g) or (2) weightof water sample added to ion exchangecolumn to concentrate the TMS (g)
V (toluene) = volume of toluene used to tra~ OMS (mL)volume includes any toluene dilutions (mL)
514 Analyte in sample Calculate the analyte concentration A
in the original sample as follows
F X R A=
C
Where
A= concentration of analytein original sample (pgg mgkg or ppm)
F = response factor (microgmL) cm middot -R= average sample response from detector for sample
(cm)
C = concentration of matrix in final extract (gmL)
-middot
)
-
RR 94-0lOB middot page 24
52 N~nliriear Response Calculation Methods
For detector responses that significantly deviate from linearity such as the FPO middotthe following procedure can be used to calculate extract concentrations Appendix A gives an example calculation fo~ the linearregression analysis method described in 52l
52l Calculation of analyte concentration in extract
Perform a linear regression analysis on the results of the injections of the calibration standards using TMS concentrationmiddot (x-axis) versus the square root of the FPO detector response (y-axis) The regression analysis will provide the constants m and b for the linear equation y =
mx + b where mis the slope and bis they-intercept at x = o Calculate the TMS concentration X in each sample extract using the equation x = (y - b)m Note that y is the square root of the detector response If any background corrections are applied subtractthe square root of the responses rather than the responses themselves
Alternatively the calibration data can be plotted on graph paper and the TMS concentration X in each sample extract can be determined from the calibration curve Calculate the analyte inthe sample as in s22
522 Calculation of analyte ih sample bullCalculate the analyte concentration A in the original sample as follows -A (pgg mgkg or ppm) = XC
Where
X = analyte concentration in the final extract calculated from the curve fit equation or determined from a graphical standard curve (microgmL)
C =o matrix concentration in extract from section 513 (gmL) bull
bull
J
6
RR 94-010B -page 25
l_NTERFERENCES
61 Carbon Disulfide
Because analytical laboratories sometimes stock and use large amounts of carbon disulfide contamination by carbon
_disulfide is a potential problem Contaminations have occurred from l) using toluene from a bottle stored in a cabinet containing abottle of carbon disulfide and 2) usipg a centrifuge immediately after someone else had used it to centrifuge bottles containing carbon disulfide as the extraction solvent Carbon disulfide does resolve chromatographically from OMS if both are at low concentrations
62 Dimethylsulfide fDMS)
TMS is not the only source of OMS in the final solution subjected to dealkylation S-Methylmethionine called Vitamin U in the Merck Index is believed to be at least one source of OMS in samples Under alkaline conditions Vitamin U can readily produce OMS It has been isolated from cabbage and subsequently detected in the foliage of a range of higher plants including parsley pepper onion lettuce and turnip Its presenmiddotce has been established in (
tomato foliage and fruit potato and green tea Cabbage leaves and kohlrabi were found to contain relatively high levels of the compound corresponding to as much as 02 and 01 of the tissue dry weight respectively Vitamin U is probably ubiquitous in all plant tissues (reference l) Plant tissue exist in soil samples as root hairs and detritus and can contribute background DMS to soil samples
-middot --middot
I
7 coNFrRMATORY TECHNIQUES
RR 94-010B middot page 26
Unexpected positive results as in untreated controlsmiddotor preapplication samples should generally be confirmed by other means However if analysis is conducted by a sulfurshyselective detector and the retention time of the peak is coincident with that of OMS the peak is probably due to OMS so confirmatory work is not productive The origin_ of the OMS is likely from endogenous precursors in the sample matrix Because some peak resolution is lost in the SCD
transfer line the FPO is the better detector in terms of peak discrimination
a prscussroN This method is a revised version of the soil and water
portion of the method Determination of SC-0224 Cation Residues in Crops Water and Soil by Gas Chromatography (reference 2) Cleanup procedures have been expanded to lower background OMS originating from endogenous coextractives and thus giye lower apparent TMS residues A column technique is used to concentrate the TMS in water prior to dealkylation A capillary column is used for the gas chromatography The choice of detectors on the chromatograph has been expanded to include both a flame photometric detector (FPO) and a sulfur chemiluminescence detector (~CD) bullThe SCD has been added because the FPO responds nonlinearly to sulfur and requires more complex data handling than the linearly responding sco
81 Scope
This method is suitable for the determination of TMS in soil and water Recovery data given in Table I reflect the methodology described herein bull
middot -_
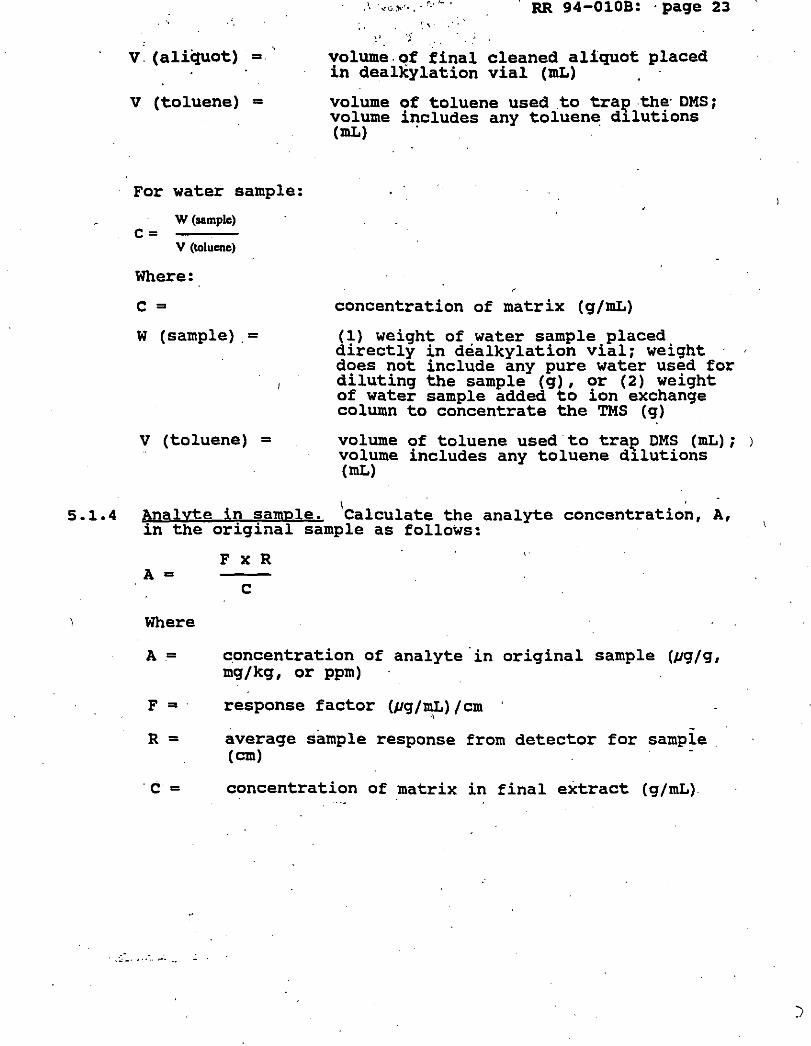
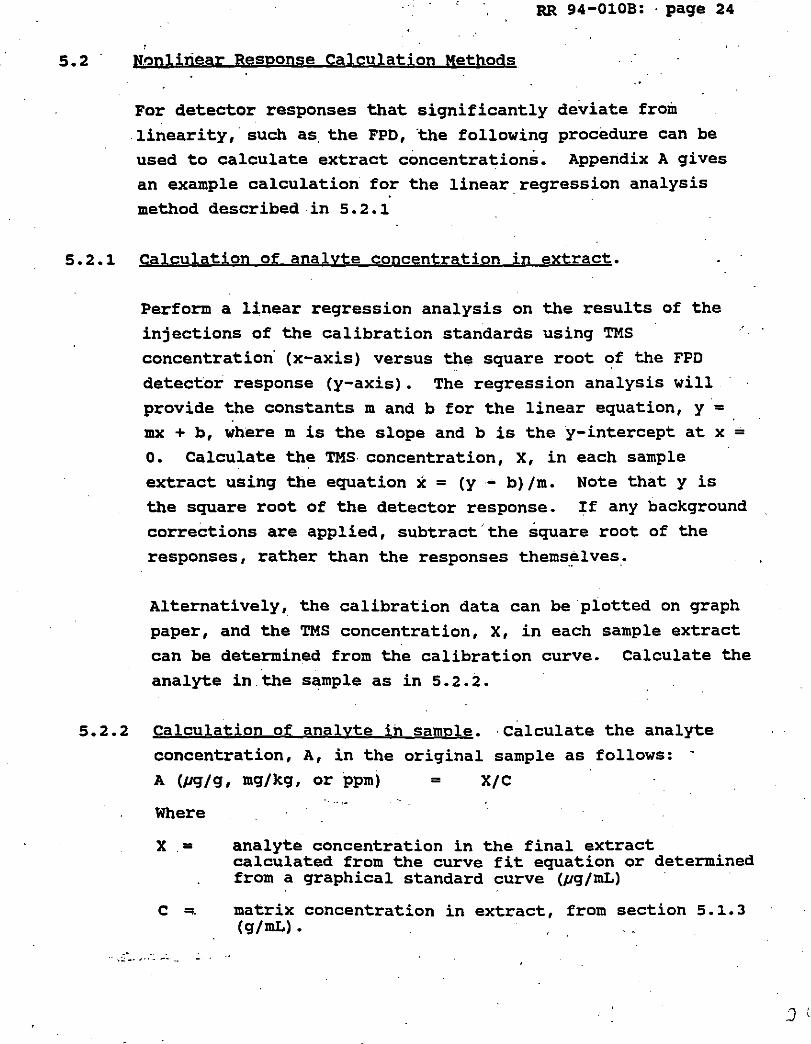
Related Documents