INFORMATION TO USERS This material was produced from a microfilm copy of the original document. While the most advanced technological means to photograph and reproduce this document have been used, the quality is heavily dependent upon the quality of the original submitted. The following explanation of techniques is provided to help you understand markings or patterns which may appear on this reproduction. 1.The sign or "target" for pages apparently lacking from the document photographed is "Missing Page(s)". If it was possible to obtain the missing page(s) or section, they are spliced into the film along with adjacent pages. This may have necessitated cutting thru an image and duplicating adjacent pages to insure you complete continuity. 2. When an image on the film is obliterated with a large round black mark, it is an indication that the photographer suspected that the copy may have moved during exposure and thus cause a blurred image. You will find a good image of the page in the adjacent frame. 3. When a map, drawing or chart, etc., was part of the materia! being photographed the photographer followed a definite method in "sectioning" the material. It is customary to begin photoing at the upper left hand corner of a large sheet and to continue photoing from left to right in equal sections with a small overlap. If necessary, sectioning is continued again — beginning below the first row and continuing on until complete. 4. The majority of users indicate that the textual content is of greatest value, however, a somewhat higher quality reproduction could be made from "photographs" if essential to the understanding of the dissertation. Silver prints of "photographs" may be ordered at additional charge by writing the Order Department, giving the catalog number, title, author and specific pages you wish reproduced. 5. PLEASE NOTE: Some pages may have indistinct print. Filmed as received. Xerox University Microfilms 300 North Zeeb Road Ann Arbor, Michigan 48106

Welcome message from author
This document is posted to help you gain knowledge. Please leave a comment to let me know what you think about it! Share it to your friends and learn new things together.
Transcript
INFORMATION TO USERS
This material was produced from a microfilm copy of the original document. While the most advanced technological means to photograph and reproduce this document have been used, the quality is heavily dependent upon the quality of the original submitted.
The following explanation of techniques is provided to help you understand markings or patterns which may appear on this reproduction.
1.The sign or "target" for pages apparently lacking from the document photographed is "Missing Page(s)". If it was possible to obtain the missing page(s) or section, they are spliced into the film along with adjacent pages. This may have necessitated cutting thru an image and duplicating adjacent pages to insure you complete continuity.
2. When an image on the film is obliterated with a large round black mark, it is an indication that the photographer suspected that the copy may have moved during exposure and thus cause a blurred image. You will find a good image of the page in the adjacent frame.
3. When a map, drawing or chart, etc., was part of the materia! being photographed the photographer followed a definite method in "sectioning" the material. It is customary to begin photoing at the upper left hand corner of a large sheet and to continue photoing from left to right in equal sections with a small overlap. If necessary, sectioning is continued again — beginning below the first row and continuing on until complete.
4. The majority of users indicate that the textual content is of greatest value, however, a somewhat higher quality reproduction could be made from "photographs" if essential to the understanding of the dissertation. Silver prints of "photographs" may be ordered at additional charge by writing the Order Department, giving the catalog number, title, author and specific pages you wish reproduced.
5. PLEASE NOTE: Some pages may have indistinct print. Filmed as received.
Xerox University Microfilms300 North Zeeb RoadAnn Arbor, Michigan 48106
I76-24,716
WRIGHT, Julia Ann, 1935- RELATION OF VISUAL AND MOTOR PERCEPTION TO READING ACHIEVEMENT AMONG CHILDREN WITH ONE YEAR OF STUDY IN SCHOOL.The Ohio State University, Ph.D., 1976 Education, psychology
Xerox University Microfilms, Ann Arbor, M ichigan 48106
© Copyright by
Julia Ann Wright
1976
RELATION OF VISUAL AND MOTOR PERCEPTION TO READING ACHIEVEMENT AMONG CHILDREN
WITH ONE YEAR OF STUDY IN SCHOOL
DISSERTATION
Presented in Partial Fulfillment of the Requirements for the Degree Doctor of Philosophy in the Graduate
School of The Ohio State University
ByJulia Ann Wright, B.S., M.S.
* * * * *
The Ohio State University 1976
Reading Committee:Charles B. Huelsraan, Jr. Victor M. Rentel Gerald Winer Robert Wherry
Approved By
College of Education
To My Mother Mary Burress Healy
For her faith, encouragement, and love
ii
ACKNOWLEDGMENTS
A very special acknowledgment to Dr. Charles B. Huelsman, Jr., my adviser and committee chairman, who provided encouragement, direction, and friendship throughout my doctoral studies. He was a constant source of wisdom and guidance. Dr. Huelsman's devotion to his work was unparalled and will serve as an inspiration throughout future years.
I am especially grateful to Dr. Robert Wherry for his aid in the statistical aspects of the study. His invaluable assistance contributed significantly to the analysis of the data.
I am indebted to Dr. Victor Rentel and Dr. Gerald Winer for their valuable assistance and suggestions at several stages of the study. Also, I am appreciative of their understanding and support during a very crucial period.
iii
V I T A
June 19, 1935 ........ B o m - Alliance, Ohio1957 ................... B.S., Miami University,
Oxford, Ohio1957-1962 ............. Art Teacher, Dayton Public
Schools, Dayton, Ohio1962-1967 ............. Art Teacher, Department of
Defense, Overseas Dependents Schools, Germany and Japan
1967-1969 ............. Art Teacher, Dayton PublicSchools, Dayton, Ohio
1969-1970 ............. EPDA Experienced TeacherFellowship, Indiana State University, Terre Haute, Indiana
1970 ................... M.S., Indiana State University, Terre Haute, Indiana
1970-1971 ............. Graduate Assistant, IndianaState University, Terre Haute, Indiana
1971-197 2............... Intern School Psychologist,Franklin County Schools, Columbus, Ohio
1972-present ........... Staff School Psychologist,Franklin County Schools, Columbus, Ohio
iv
TABLE OF CONTENTSPage
DEDICATION iiACKNOWLE DGMENTS iiiVITA ivLIST OF TABLES viiiLIST OF FIGURES ix
ChapterI. INTRODUCTION 1
Statement of the Problem Importance of the Study Definition of Terms LimitationOrganization of the Study
II. REVIEW OF THE LITERATURE . . . . 12Bender Gestalt TestPerception Skills-Reading Achievement Factors related to Reading
Visual Functioning Auditory Functioning Visual and Auditory Memory Speech and Language Development Cognitive Abilities Attention Abilities
Visual Perception Training Programs Summary
HypothesisIII. METHODOLOGY....................... 33
The SampleThe Instrumentation
The Bender Visual Motor Gestalt Test The Motor-Free Visual Perception Test Multiple-Choice Bender Slosson Intelligence Test Stanford Achievement Test-Primary I Van Orden Star
v
Wide Range Achievement Test Multiple-Choice Bender
Definition of Variables QuestionsCollection and Analysis of DataRESULTS ............................Analysis of Multiple-Choice Bender
Test-retest Reliability Item Analysis of Errors
Correlation ResultsRelationship of Independent and
Dependent Variables Relationship Between Group and
Individual Bender Relationship of MVPT and the Various
Administrations of the Bender Regression Results
Prediction of Stanford Achievement Test Scores
Prediction of WRAT Reading Scores The Effects of Multicollinearity on
the Prediction of Reading Two Further Analyses
A Factor Analysis Regression Analysis
SUMMARY AND CONCLUSIONS ...............Statement of the ProblemP rocedureSummary
Question One Question Two Question Three Question Four
Limitations Conclusions Implications
Implication One Implication Two Implication Three Implication Four Implication Five Implication Six Implication Seven Implication Eight
PageImplication Nine Implication Ten
APPENDIX................................ 84
BIBLIOGRAPHY ............................ 98
1 vii
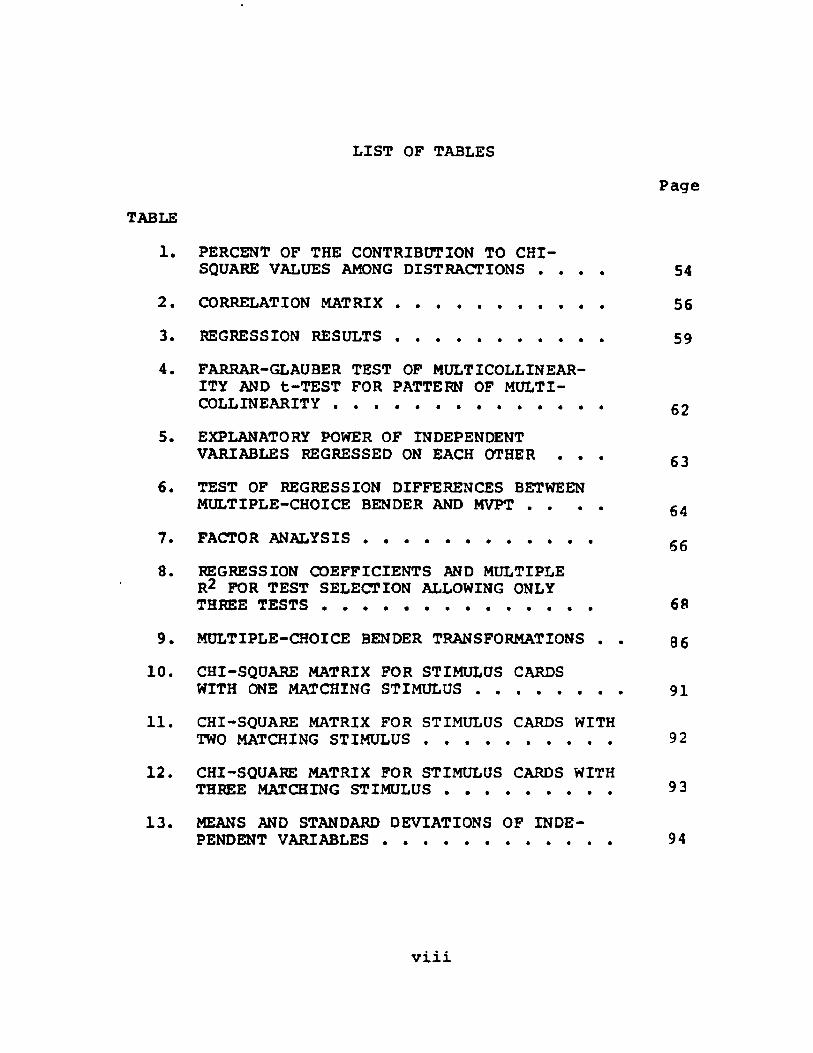
LIST OF TABLESPage
TABLE1. PERCENT OF THE CONTRIBUTION TO CHI-
SQUARE VALUES AMONG DISTRACTIONS . . . . 542. CORRELATION M ATRIX...................... 563. REGRESSION RESULTS ..................... 594. FARRAR-GLAUBER TEST OF MULTICOLLINEAR-
ITY AND t-TEST FOR PATTERN OF MULTI- COLLINEARITY ............................ 62
5. EXPLANATORY POWER OF INDEPENDENTVARIABLES REGRESSED ON EACH OTHER . . . g3
6. TEST OF REGRESSION DIFFERENCES BETWEENMULTIPLE-CHOICE BENDER AND MVPT . . . . g4
7. FACTOR ANALYSIS........................ gg8. REGRESSION COEFFICIENTS AND MULTIPLE
R2 FOR TEST SELECTION ALLOWING ONLYTHREE T E S T S ............................ 68
9. MULTIPLE-CHOICE BENDER TRANSFORMATIONS . . g610. CHI-SQUARE MATRIX FOR STIMULUS CARDS
WITH ONE MATCHING STIMULUS............... 9111. CHI-SQUARE MATRIX FOR STIMULUS CARDS WITH
TWO MATCHING STIMULUS ................... 9212. CHI-SQUARE MATRIX FOR STIMULUS CARDS WITH
THREE MATCHING STIMULUS................. 9313. MEANS AND STANDARD DEVIATIONS OF INDE
PENDENT VARIABLES....................... 94
viii
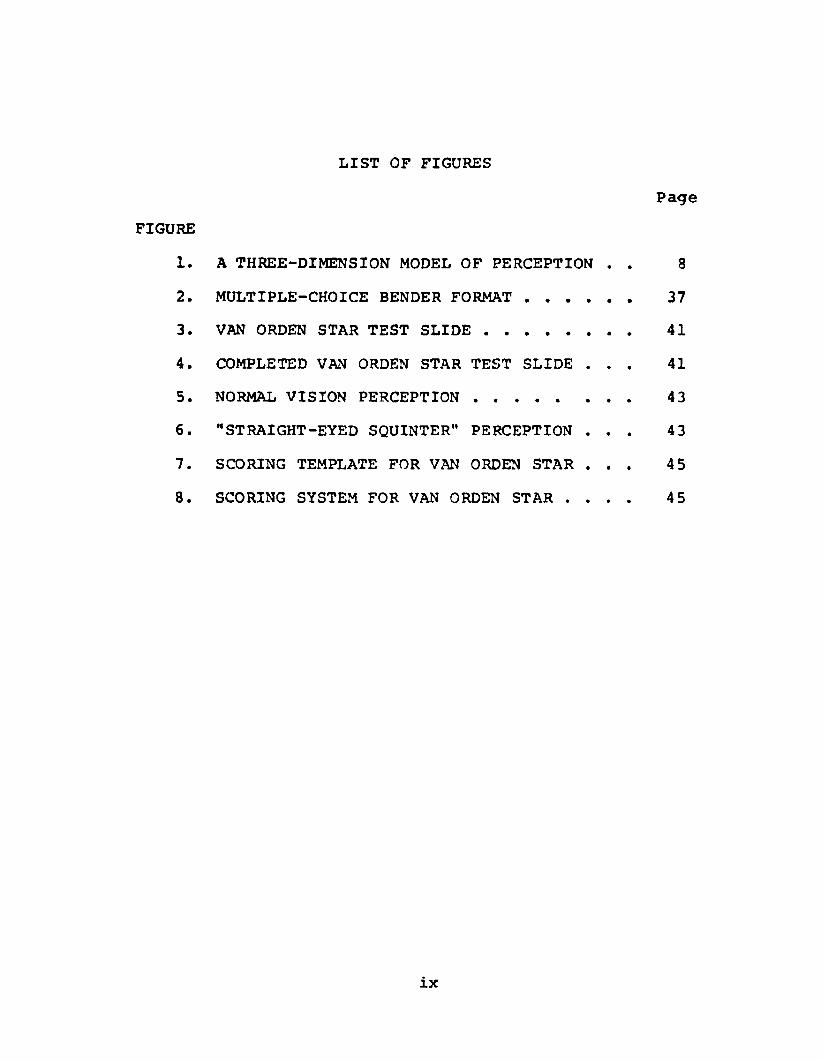
LIST OF FIGURESPage
FIGURE1. A THREE-DIMENSION MODEL OF PERCEPTION . . 82. MULTIPLE-CHOICE BENDER FORMAT ........... 373. VAN ORDEN STAR TEST S L I D E ............... 414. COMPLETED VAN ORDEN STAR TEST SLIDE . . . 415. NORMAL VISION PERCEPTION ................ 436. "STRAIGHT-EYED SQUINTER" PERCEPTION . . . 437. SCORING TEMPLATE FOR VAN ORDEN STAR . . . 458. SCORING SYSTEM FOR VAN ORDEN STAR . . . . 45
CHAPTER I
INTRODUCTION
Many abilities have been identified as contributing factors to a child's readiness to begin formal reading instruction. Many books, articles, and research studies have been devoted to the importance of various abilities as correlates of reading. The consensus has been that rarely is there a single causal factor which can be identified as specifically relating to failure in reading. Some of the cited causal factors and their relationship to the dynamics of the reading process are visual malfunctioning, auditory malfunctioning, memory span, dominance, reversal tendency, speech and language development, associative learning ability, and social and emotional development.
In recent years there has been an increasing body of research and theory which analyzes the hypothesis that reading retaxdation involves some visual perceptual deficit. Research accumulation has generally resulted in evidence which is inconsistent and often contradictory.On one end of the continuum, there are studies which report high correlation coefficients between various measures of nonverbal visual perceptual abilities and
1
\
2
reading achievement (Bryan, 1964; Coleman, 1969; Goins,1958; Harrington & Durrell, 1955; Krippner, 1968; Rosen, 1966). Counter-balancing the above findings are the investigations which have found a weak and/or non-significant relationship between reading proficiency and visual perception (Benton, 1962; Critchley, 1964; Jacobs, 1968; Olson, 1966; Panther, 1967).
The inconsistency of the reported evidence may be caused to some extent by the experimental inadequacy of many of the studies, differences between studies in the definitions of perception, and differing criteria employed for defining reading retardation. Too, the clinical evaluation of visual perception is usually limited to tests which require some behavioral evidence of the capacity which is being measured. A review of the visual perception tests that are utilized frequently in psychometric evaluations indicates that most of these tests require considerable motor ability (Calarusso, 1972). The most prevalent instruments are: Bender Visual Motor Gestalt Test forChildren (Bender, 1938), Memory-For-Designs Test (Graham 6 Kendall, 1960), Marianne Frostig Developmental Test of Visual Perception (Frostig, Maslow, Lefever, & Whittlesey, 1964). These tests for measuring perception rely heavily on the reproductive skills necessary for tracing and/or copying. Thus, the perceptual principles on which these
3
visual-motor tests are based imply that visual perception and motor development may well be a unitary process.
Statement of the Problem A significant body of opinion and research stresses
the value of measuring visual perception independently of motor involvement (Bortner & Birch, 1962; Birch & Leffords, 1963; Rosenblith, 1965) . However, while there is paucity of research which questions the validity of measuring visual perception by using a test of visual-motor integration; the existing research does suggest that failure on visual-motor tasks can result primarily from motor deficiencies rather than perceptual inadequacies. Braindamaged adults and children demonstrated that they were able to discriminate correctly Block Design patterns through multiple-choice matching that they failed to reproduce correctly on the Block Design Subtest of the WISC (Bortner & Birch, 1960, 1962). Motorically handicapped children were found to perform progressively poorer on the Bender Gestalt Test for Children as the severity of their motor handicap increased. Conversely, they tended to function appropriately for chronological age on the Motor- Free Test of Visual Perception regardless of the level of motoric disability (Newcomer & Hammill, 1973).
The purpose of the present study is to ascertain if
4visual discrimination and visual-motor development or behavior^- are to a considerable extent autonomous systems; and to determine the relationship of the systems to reading ability. The present research is exploratory and designed to generate further research. The tentative questions which the study sought to answer are as follows:
1. What relationships exist between visual discrimination ability and reading achievement for children between the ages of 7-0 and 8-5?
2. What relationships exist between visual- motor ability and reading achievement for children between the ages of 7-0 and 8-5?
3. What relationships exist between tests of visual discrimination and tests of visual- motor ability for children between the ages of 7-0 and 8-5?
Importance of the Study During the past fifteen years, educators and psy
chologists have become increasingly interested in visual perception as it relates to reading achievement. This interest has intensified efforts for early identification of children with visual perception deficits and stimulated the development and implementation of perceptual-motor training programs.
1 Visual-motor development or behavior, as used in this study, refers specifically to eye-hand coordination and the ability to respond to visual form stimuli by copying or reproducing the form.
5Although considerable research has been devoted to
investigating the significance of visual perception and its relationship to reading achievement, the reported findings are generally inconclusive. In a review of post- 1955 correlation studies, it was concluded that visual perception ability and reading comprehension were not significantly related (Hammill, 1972). In contrast, evidence has been presented that indicates that reading disability has a positive relationship with ineffectual visual perception (Goins, 1958; Barrett, 1965b; Bryan,1964). As a result of these discrepant findings, considerable debate has developed concerning the validity of current assessment procedures that utilize visual-motor tests for identifying children with a visual perceptual deficit.
Research has generally followed two trends in an attempt to measure perception and to relate findings to reading achievement. Some studies measure visual discrimination while others measure visual-motor ability.
The present study is important because it investigates visual discrimination and visual motor development as autonomous systems. A second important aspect of the study is to determine which type of visual perception test, visual discrimination or visual-motor, is more closely related to reading ability.
6
If it can be demonstrated that visual discrimination and visual-motor development are relatively independent systems and the relationship of the systems to reading achievement can be established, perhaps further light can be shed on developing better neuropsychological procedures to assess retardation in perceptual development. The writer feels that the identification of visual discrimination as a non-unitary process from visual-motor development can exercise a significant role in the identification of reading disability and the development of remediation models.
Definition of TermsFigure-Ground
This form of visual discrimination involves the ability to distinguish an object from its background.
Learning DisabilityRefers to children of near average, average, or
above average general intelligence with certain learning or behavioral disabilities ranging from mild to severe. These deviations may manifest themselves by various combinations of impairment in perception, conceptualization, language, memory, and control of attention, impulse, or motor function.
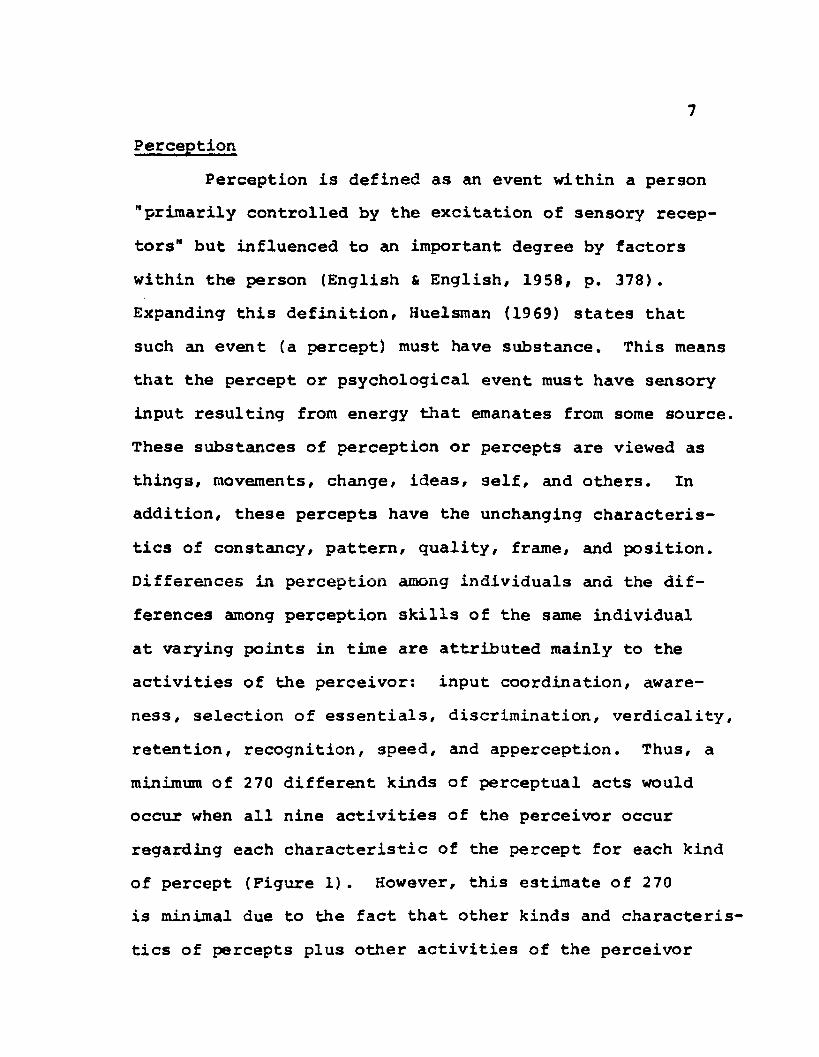
7Perception
Perception is defined as am event within a person "primarily controlled by the excitation of sensory receptors" but influenced to an important degree by factors within the person (English & English, 1958, p. 378). Expanding this definition, Huelsman (19 69) states that such am event (a percept) must have substance. This means that the percept or psychological event must have sensory input resulting from energy that emanates from some source. These substances of perception or percepts are viewed as things, movements, chamge, ideas, self, amd others. In addition, these percepts have the unchamging characteristics of constamcy, pattern, quality, frame, and position. Differences in perception among individuals and the differences among perception skills of the same individual at varying points in time are attributed mainly to the activities of the perceivor: input coordination, awareness, selection of essentials, discrimination, verdicality, retention, recognition, speed, and apperception. Thus, a minimum of 270 different kinds of perceptual acts would occur when all nine activities of the perceivor occur regarding each characteristic of the percept for each kind of percept (Figure 1). However, this estimate of 270 is minimal due to the fact that other kinds and characteristics of percepts plus other activities of the perceivor
CHAR
ACTE
R OF
TH
E PE
RC
EPTOthers
Self
ChongeMovement
Things
ACTIVITY OF THE PERCEIVER
Fig. 1 - A thtee-d linens ion model of perception
9may exist.
Reading DisabilityDefined as failure to reach a reading achievement
level proper to age, intelligence, and years of instruction.
Spatial RelationshipsThe ability to orient one's body in space and to
perceive the positions of objects in relation to oneself and to other objects.
Visual Closure , ,The ability to identify figures as incomplete when
only fragments are presented.
visual DiscriminationThe ability to respond to visual form stimuli by
recognizing likenesses and differences between forms quickly and accurately and by representing this response by minimal motor skill by pointing or checking a figure with a pencil.
Visual Form PerceptionA process involving a visual stimulus and a response
indicating that the individual has perceived something and cam specify the characteristics of that percept.
10
Visual MemoryThe ability to recall dominant features of one
visual stimulus item or to remember the sequence of several optically presented items.
Visual-MotorMotoric responses are present in all activities of
the perceiver. In the present study, visual-motor will be used to refer mainly to the ability to respond to visual form stimuli by copying or reproducing the form.
Visual PerceptionThe prominent theoretical constructs of visual
perception are: spatial relationships, visual discrimination, figure-ground, visual closure, and visual memory. Deficits in these constructs occur when there are errors in the activities of the perceiver.
LimitationThis study was limited to children of various socio
economic backgrounds who range from 7-1 to 8-3 years of age end have had one year of formal reading instruction in the Scott Foresman Reading Series. The results are generalizable only to this type of population and may not apply to specific minority groups, physically handicapped children, or economically deprived children.
11
Organization of the Study The succeeding chapters are arranged as follows:
(1) Chapter II presents a review of the related literature concerning visual perception abilities and/or the factors related to reading disability; (2) Chapter III covers procedures and methodology; (3) Chapter IV analyzes the results to determine the contribution of the independent variables in predicting reading achievement; and (4) Chapter V presents a summary of the study and lists conclusions and implications.
Chapter 2
REVIEW OP THE LITERATURE
The following sections systematically bring together some of the necessary dimensions for studying visual discrimination and visual-motor development as autonomous systems in primary-age children and the effects of each system as related to mastering the fundamentals of reading. Not all of the literature on visual perception abilities, and/or the factors related to disability in reading is relevant and only those studies which are especially pertinent to this investigation are reviewed. The following sections of this chapter include an analysis of the literature specific to the study. Included are studies related to the following areas: (1) the Bender Visual Motor GestaltTest for Children as a predictive and diagnostic measure of visual perception and reading performance, (2) relation of perception skills and reading achievement, (3) factors related to disability in reading, and (4) effect of visual perception training on reading achievement.
Bender Gestalt Test There is a venerable history in psychological re
search and in clinical practice to relate visual perception
12
13ability to reading achievement. The Bender Visual Motor Gestalt Test (BGT) is the clinical test most commonly used to measure visual perception and scores derived from performance on the BGT have then been correlated to scores on various diagnostic reading instruments. The results of these studies are conflicting in that some support the efficacy of the BGT as a valid predictor of reading ability, while other studies question the practice of making predictions on the strength of such test data.
During the past twenty years, there have been an impressive number of studies reported on the use and application of the BGT. In reviewing 28 studies which researched the relationship between Bender scores and reading achievement, 19 of the studies concluded that there was a positive, statistically significant relationship and that the BGT has predictive validity with respect to reading (Ames, 1969; Becker, 1970; Chang & Chang, 1967; DeHirsh, et al., 1969; Kelly & Amble, 1970; Koegh, 1969; Koegh & Smith, 1962; Koegh & Smith, 1967; Koppitz, 1964; Koppitz, et al., 1959; Koppitz, et al., 1961; Lessler, et al., 1970; Mlodnsky, 1972; Norfleet, 1970; Paul, 1971; Thweatt, 1963). The nine studies which found little substantial evidence to support the relationship between performance on the Bender and reading performance include the works of Ackerman, et al (1971), Black (1973), Connor (1968-69), Coy
14(1974)# Giebink & Birch (1970)# Koegh (1965), Koppitz (1973)# Lachmann (1960)# Nielsen & Ringe (1969). Even though Lackmann (1960) concluded that distortions on the Bender readily distinguishes children with reading disabilities from children with average reading ability# the study is listed among the negative studies# because the significance of the difference fell just below an acceptable level (£ C.07).
Attempts to clarify the controversy concerning the prediction of reading achievement on the basis of Bender scores have resulted in the expression of some valid concerns by researchers. One concern is that most of the studies are based on group data and rely heavily on correlation as the statistical procedure# and the statistical significant results are often too small to permit confident individual prediction (Koegh# 1969; Lessler# et al., 1970). Another concern is that when the effect of intelligence was held constant# the majority of the correlations between Bender total scores and major reading criteria become nonsignificant (Koegh, 1965; Aylarian & Meltzer# 1962). An additional problem concerns the scoring system for the Bender Gestalt Test. The Koppit2 Developmental Scoring System (1964) is subject to some degree of subjective judgment and a question has been raised concerning the validity of the Bender scores (Cundick & Robison#1972) .
15A final concern challenges the rationale for measur
ing visual perception by using a test of visual-motor integration. An inadequate performance on the Bender may be due to the inability to formulate a correct image of the design (receptive disturbance) and/or the inability to translate the design to paper (expressive disturbance). As a result, statements pertaining to visual perception based on the Bender alone may not be valid and the con- commitant studies may be affected (Birch & Lefford, 1963); Bortner & Birch, 1962; Condick & Robison, 1972; Koppitz, 1970; Lachmann, 1960; Rosenblith, 1965).
Perception Skills-Reading AchievementThe high incidence of visual perceptual problems
among children with learning disabilities is indisputable with reports ranging from 25% to 100% (Clements, 1966; Coleman, 1959; Frostig, et al., 1961). Universal acceptance of visual perception as an index of reading readiness and as a predictor of future reading success is evident in the unequivocal acceptance of reading readiness tests that have a high loading of visual perception factors, and the widespread implementation of visual perception training programs in an attempt to ameliorate reading deficits. To date, the cumulative results of research have been inconclusive in establishing the significance of visual perception to reading achievement.
16
Post-1955 correlation studies were reviewed that focused upon the relationship of visual perception to reading that met the following criteria: (1) tests ofreading comprehension were used, (2) applied statistical analyses were chosen, (3) the perceptual instrument was not a commonly used IQ measure, such as the Bender or the Draw-A-Man, and (4) first or second grade subjects comprised the sample. Forty-two studies were located with 12 studies meeting the above criteria. Eight of the 12 studies reported statistically significant coefficients of .35 or less and were deemed too low to have practical predictive ability (Hammill, 1972). The studies which found no practical relationship between visual perception and reading were the works of Barrett (1965a), Hammill, et al. (1971), Jacobs (1968), Jacobs, et al, (1968), Olson (1966), Panther (1967), Robinson, et al. (1958), Shorr & Svagr (1966). The four studies showing coefficients high enough to have predictive usefulness were the invest! gations of Bryan (1964), Goins (1958), Golden & Steiner (1969), Harrington & Durrell (1955). The present writer challenges Hammill*s citing of Barrett among the negative studies. Barrett's investigation was a review of the literature where he found that the majority reported positive correlations of >,35.
Research attention in recent years has been directed toward clarifying which single visual discrimina-
tion task or combination of visual discrimination tasks has the highest predictive relationship with reading. The Frostig Developmental Test of Visual Perception (DTVP) has been selected as an independent variable for many of these studies, since the DTVP claims to measure the five operationally defined visual perception functions of visual-motor coordination, figure-ground perception, perceptual constancy, position in space, and spatial relationships (Frostig & Horn, 1964). In reviewing ten studies, the Frostig Perceptual Quotient (PQ) was found to be significantly related to academic achievement in nine of the studies (Benger, 1968; Black, 1973; Bryan, 1964; Fuller, 1964; Goldmark, 1964; Olson, 1966; Shepherd, 1969; Sprague, 1963; Wallach, 1970). However, in three of the studies the correlations between the five subtests and achievement were much less conclusive in the significance of their results (Goldmark, 19 64; Olson, 1966; Shepherd, 1969). Intellectual variance was uncontrolled in two of the studies which makes the significant results questionable (Fuller, 1964; Sprague, 1963). Only one study showed that reading achievement did not correlate significantly with the Frostig PQ or any of the subtests of the DTVP (Smith & Marx, 1972).
The validity of the Frostig studies to measure separate perceptual abilities appears questionable in light of several factor analytic studies that suggest
18the Frostig scale is tapping only two factors. One factor appears to involve eye-hand coordination and an ability to understand and remember directions (Hueftle,1967) . The other factor is described as involving eye- hand skill, the ability to recognize and recall geometric shapes, and to understand and remember directions (Olson,1968).
In a review of the representative research that focuses on the relative contribution of various visual discrimination tasks to first grade reading, two major areas emerged: (1) verbal visual discrimination, i.e.,letters and words; and (2) non-verbal discrimination, i.e., pictures and geometric designs (Barrett, 1965a). Seven investigations that focused on verbal visual discrimination were examined with three of the studies indicating that discrimination of words was a better predictor of reading than discrimination of letters (Gates, Bond, & Russell, 1939; Gates, 1939; and Gates,194 0). Antithetical conclusions were drawn in the studies by Weiner and Feldman (1963) and Barrett (1965b). The two remaining investigations concluded that correlations between discrimination of words and reading achievement were relatively similar (Potter, 1949; Steinbach, 194 0). All of the studies failed to test the differences between the correlation coefficients or
19the regression coefficients; so the conclusion was that it was difficult in most cases to attribute the differences to anything other than chance. In evaluating six studies that utilized non-verbal discrimination, four of the studies reported correlations ranging from .47 to .60 between reading achievement and the tests (Goins, 1958; Keogh, 1963; Monroe, 1935; Potter, 1949). Two studies concluded that the selected non-verbal visual discrimination measure was a poor predictor of first grade reading achievement (Beck & Beck, 1960; Robinson, et al., 1958). The final conclusion was that the accumulated evidence suggests visual discrimination of letters and words may generally produce the best predictive relationship with reading.
The question of laterality and dominance and its relationship to reading is another prominent issue about which opinions are sharply divided. In reviewing eight studies, two of the investigations were found to support Orton's (1937) theory that disturbance in laterality may be causative in the case of reading problems (Harris, 1957; Zangwill, 1960). Contradictory results were reported in the other studies (Ayers, 1968; Belmont & Birch, 1965; Coleman & Deutch, 1965; Eisenson, 1963; Flick, 1966; Trieschman, 1968). Comparison of results is limited since the majority of the positive studies dealt with clinic populations while the majority of
20
negative studies used school populations.Lack of methodological sophistication is inherent
in many of the studies that have investigated the relationship of visual perception and reading, and these limitations have been noted by researchers. The coefficients reported in most studies represent static comparisons of the variables at only one point in time. These variables are often used as long-term predictors, not just correlates of reading (Goodman & Wiederholt, 1973) . Specification of population characteristics with respect to IQ is lacking in many studies. Without these data, the possibility arises that the mean IQ's are significantly different for the groups being compared (Hallaman,1975). The studies have rarely included comprehensive batteries of perceptual measures with the result that the definition of perception is relegated to being operationally defined by the instrument used to assess it. Investigations talking about perception may be measuring different things (Zach & Kaufman, 1972). Even though learning disabled children when compared to normal children as a group have greater difficulty attending selectively to visual stimuli, the variable of attention and its effect on test performance are missing in the majority of studies (Hallahan, 1975). The need for research using multivariate analysis to enable a clearer interaction of the critical variables in order to draw
21
more valid conclusions is evident in light of the past domination of correlation studies (Barrett, 1965a).
Factors Related to Reading Learning to read is a complex phenomenon involving
the interaction of many factors in the learner's physical, psychological, and environmental background. There is considerable disagreement and conflicting research as to the factors involved in reading and to the specific disability or combination of deficits that relate to retardation in reading. Research in the areas of reading achievement has focused on different aspects of the total problem. Some of the major factors that have been investigated are: (1) visual functioning, (2)auditory functioning, (3) visual and auditory memory,(4) speech and language development, (5) cognitive abilities, and (6) attention abilities. The literature is replete with research reports relating to the majority of these factors and the scope of this study permits direct reference to only a few.
Visual FunctioningReports on the association of vision difficulties
and achievement in reading have varied greatly. Summaries of research generally conclude that visual defects may impede reading progress and may be one of many
22
contributing factors in reading disability (Bing, 1951; Eames, 1959; Harris, 1961; Johnson, 1957; Mangrum, 1967). The findings in the literature indicate that binocular instabilities are the only consistent correlate of visual sensory factors in reading performance (Bond & Tinker, 1967).
The research which has centered on visual perception abilities that underlie reading were examined earlier in this review and are not reported here.
Auditory FunctioningStudies that investigated the relationship between
auditory acuity and reading disability were reviewed (Johnson, 1957). The general consensus was that no direct, significant relationship exists between auditory acuity and reading achievement except that high frequency losses and low achievement appear to be rather directly related.
Deficits in auditory discrimination, ability to detect differences in sounds, has generally been found to be related to poor readers (Dykstra, 1966; Morency, 1968; Thompson, 1963; Morency & Wepman, 1973). In addition, considerable support has been found recently that indicates that deficits in auditory skills rather than visual perception disabilities characterize disabled readers by the fifth or sixth grade (Flynn & Byrne,
231970; Golden & Steiner, 1969; Lingren, 1969).
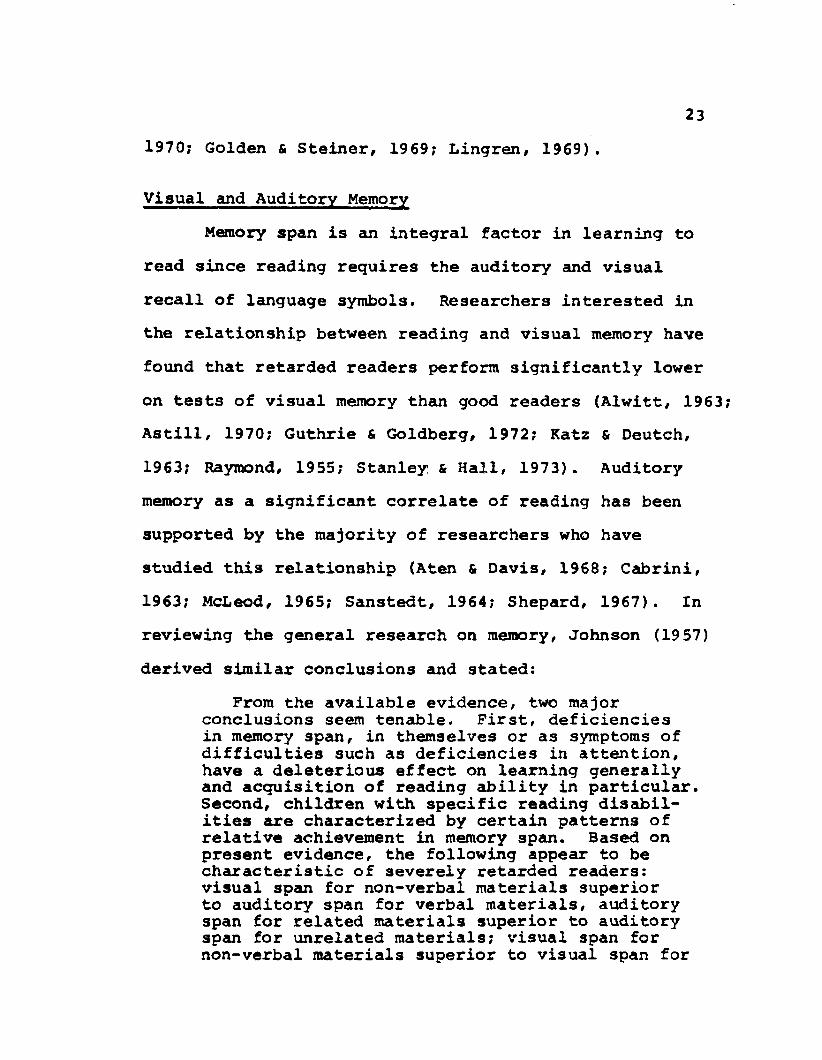
Visual and Auditory MemoryMemory span is an integral factor in learning to
read since reading requires the auditory and visual recall of language symbols. Researchers interested in the relationship between reading and visual memory have found that retarded readers perform significantly lower on tests of visual memory than good readers (Alwitt, 1963; Astill, 1970; Guthrie & Goldberg, 1972; Katz & Deutch, 1963; Raymond, 1955; Stanley & Hall, 1973). Auditory memory as a significant correlate of reading has been supported by the majority of researchers who have studied this relationship (Aten & Davis, 1968; Cabrini, 1963; McLeod, 1965; Sanstedt, 1964; Shepard, 1967). In reviewing the general research on memory, Johnson (19 57) derived similar conclusions and stated:
From the available evidence, two major conclusions seem tenable. First, deficiencies in memory span, in themselves or as symptoms of difficulties such as deficiencies in attention, have a deleterious effect on learning generally and acquisition of reading ability in particular. Second, children with specific reading disabilities are characterized by certain patterns of relative achievement in memory span. Based on present evidence, the following appear to be characteristic of severely retarded readers: visual span for non-verbal materials superior to auditory span for verbal materials, auditory span for related materials superior to auditory span for unrelated materials; visual span for non-verbal materials superior to visual span for
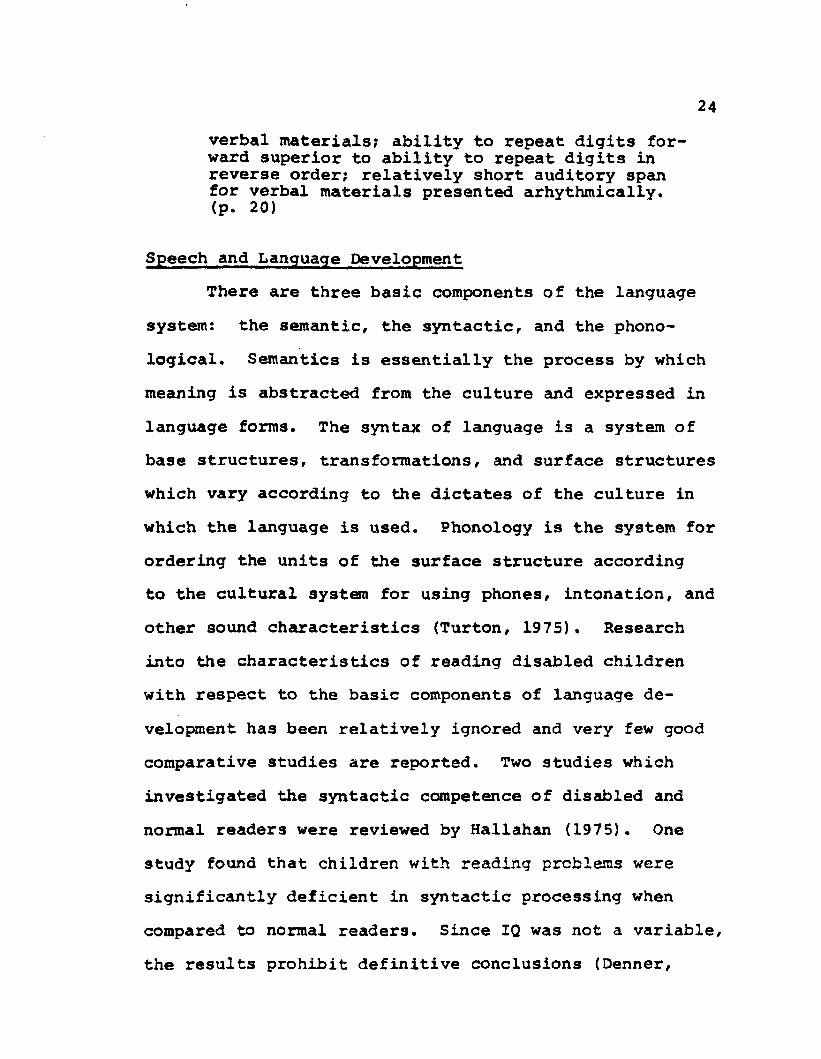
24verbal materials; ability to repeat digits forward superior to ability to repeat digits in reverse order; relatively short auditory span for verbal materials presented arhythmically.(p. 20)
Speech and Language DevelopmentThere are three basic components of the language
system: the semantic, the syntactic, and the phonological. Semantics is essentially the process by which meaning is abstracted from the culture and expressed in language forms. The syntax of language is a system of base structures, transformations, and surface structures which vary according to the dictates of the culture in which the language is used. Phonology is the system for ordering the units of the surface structure according to the cultural system for using phones, intonation, and other sound characteristics (Turton, 1975). Research into the characteristics of reading disabled children with respect to the basic components of language development has been relatively ignored and very few good comparative studies are reported. Two studies which investigated the syntactic competence of disabled and normal readers were reviewed by Hallahan (1975). One study found that children with reading problems were significantly deficient in syntactic processing when compared to normal readers. Since IQ was not a variable, the results prohibit definitive conclusions (Denner,
251970). The second study controlled for IQ and the results found no qualitative difference between normals and disabled readers with respect to the use of syntactic cues (Guthrie, 1973).
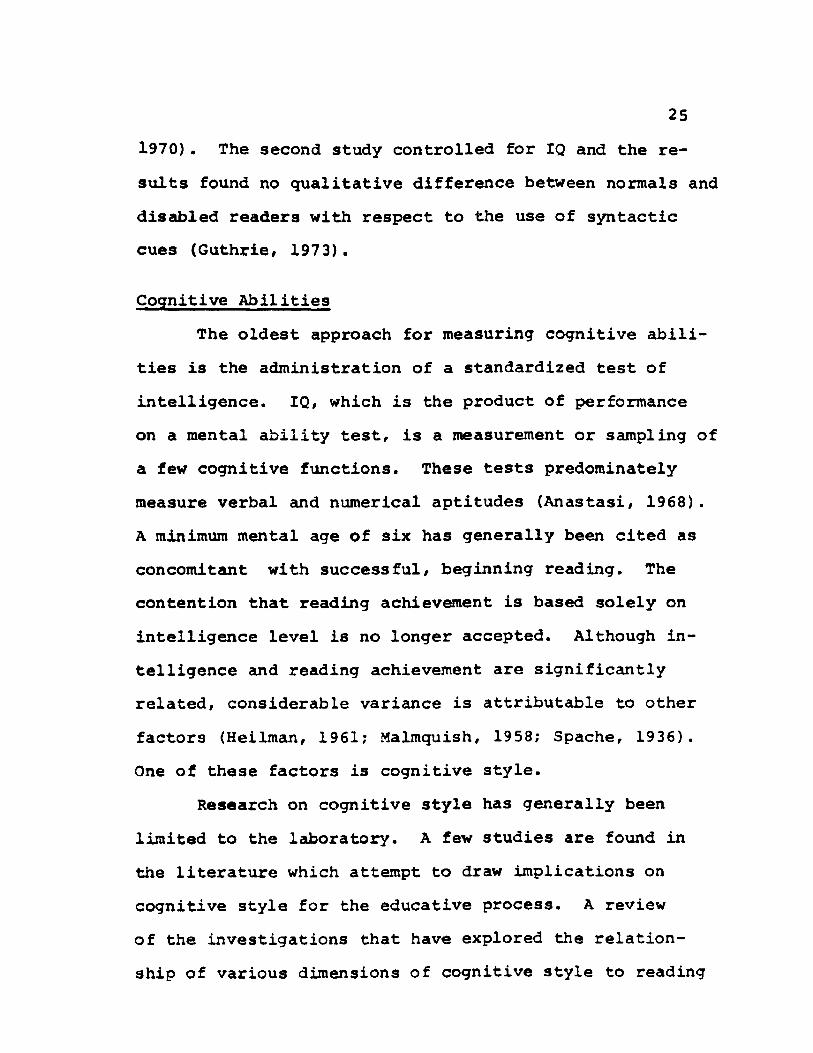
Cognitive AbilitiesThe oldest approach for measuring cognitive abili
ties is the administration of a standardized test of intelligence. IQ, which is the product of performance on a mental ability test, is a measurement or sampling of a few cognitive functions. These tests predominately measure verbal and numerical aptitudes (Anastasi, 1968).A minimum mental age of six has generally been cited as concomitant with successful, beginning reading. The contention that reading achievement is based solely on intelligence level is no longer accepted. Although intelligence and reading achievement are significantly related, considerable variance is attributable to other factors (Heilman, 1961; Malmquish, 1958; Spache, 1936). One of these factors is cognitive style.
Research on cognitive style has generally been limited to the laboratory. A few studies are found in the literature which attempt to draw implications on cognitive style for the educative process. A review of the investigations that have explored the relationship of various dimensions of cognitive style to reading
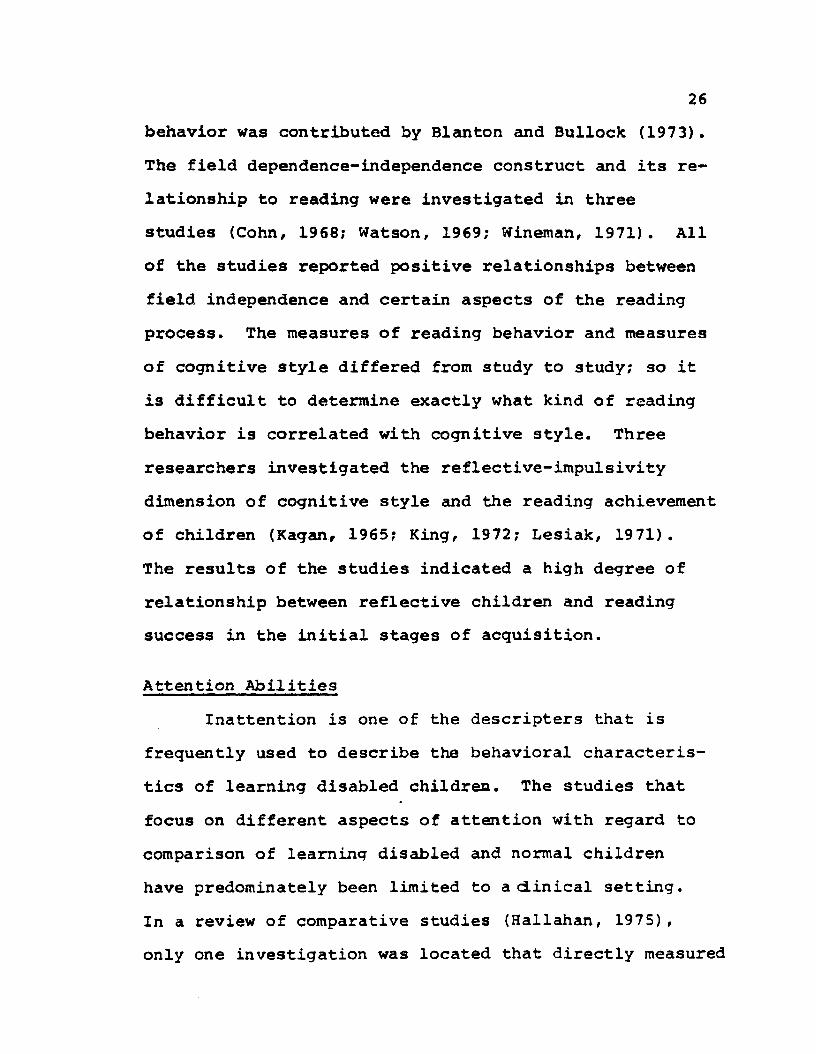
behavior was contributed by Blanton and Bullock (1973). The field dependence-independence construct and its relationship to reading were investigated in three studies (Cohn, 1968; Watson, 1969; Wineman, 1971). All of the studies reported positive relationships between field independence and certain aspects of the reading process. The measures of reading behavior and measures of cognitive style differed from study to study; so it is difficult to determine exactly what kind of reading behavior is correlated with cognitive style. Three researchers investigated the reflective-impulsivity dimension of cognitive style and the reading achievement of children (Kagan, 1965; King, 1972; Lesiak, 1971).The results of the studies indicated a high degree of relationship between reflective children and reading success in the initial stages of acquisition.
Attention AbilitiesInattention is one of the descripters that is
frequently used to describe the behavioral characteristics of learning disabled children. The studies that focus on different aspects of attention with regard to comparison of learning disabled and normal children have predominately been limited to a<±inical setting.In a review of comparative studies (Hallahan, 1975), only one investigation was located that directly measured
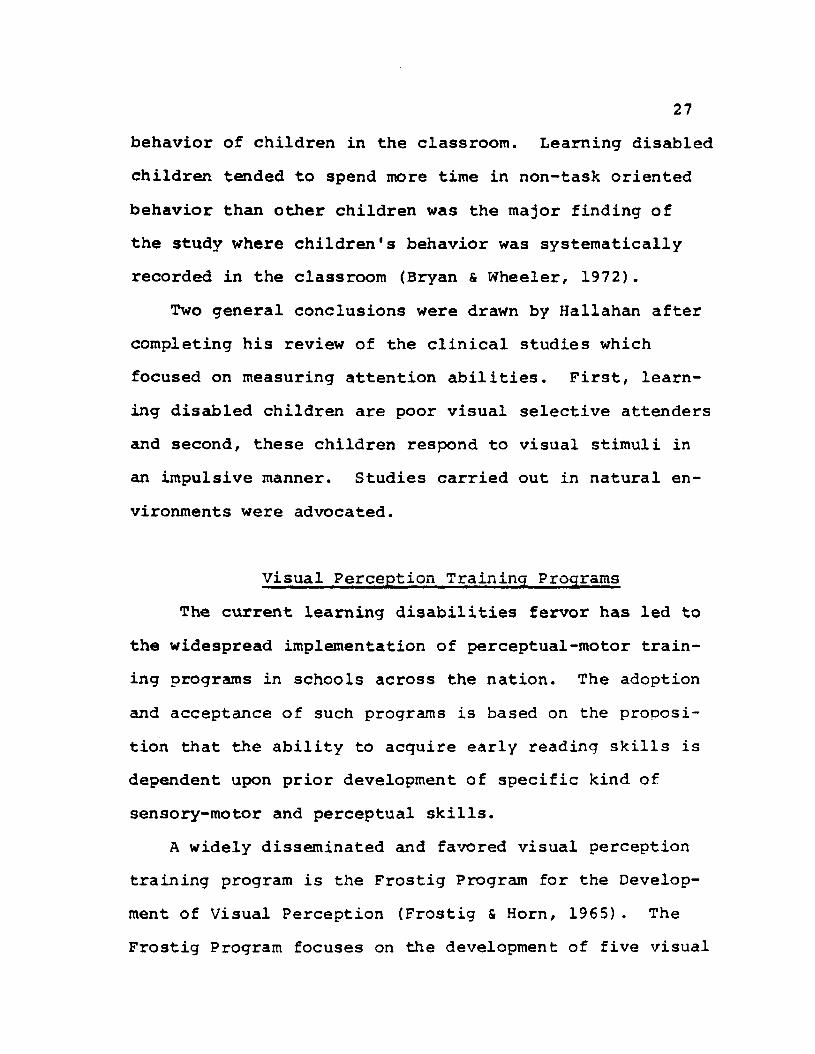
27behavior of children in the classroom. Learning disabled children tended to spend more time in non-task oriented behavior than other children was the major finding of the study where children's behavior was systematically recorded in the classroom (Bryan & Wheeler, 1972).
Two general conclusions were drawn by Hallahan after completing his review of the clinical studies which focused on measuring attention abilities. First, learning disabled children are poor visual selective attenders and second, these children respond to visual stimuli in an impulsive manner. Studies carried out in natural environments were advocated.
Visual Perception Training Frograms The current learning disabilities fervor has led to
the widespread implementation of perceptual-motor training programs in schools across the nation. The adoption and acceptance of such programs is based on the proposition that the ability to acquire early reading skills is dependent upon prior development of specific kind of sensory-motor and perceptual skills.
A widely disseminated and favored visual perception training program is the Frostig Program for the Development of Visual Perception (Frostig & Horn, 1965). The Frostig Program focuses on the development of five visual
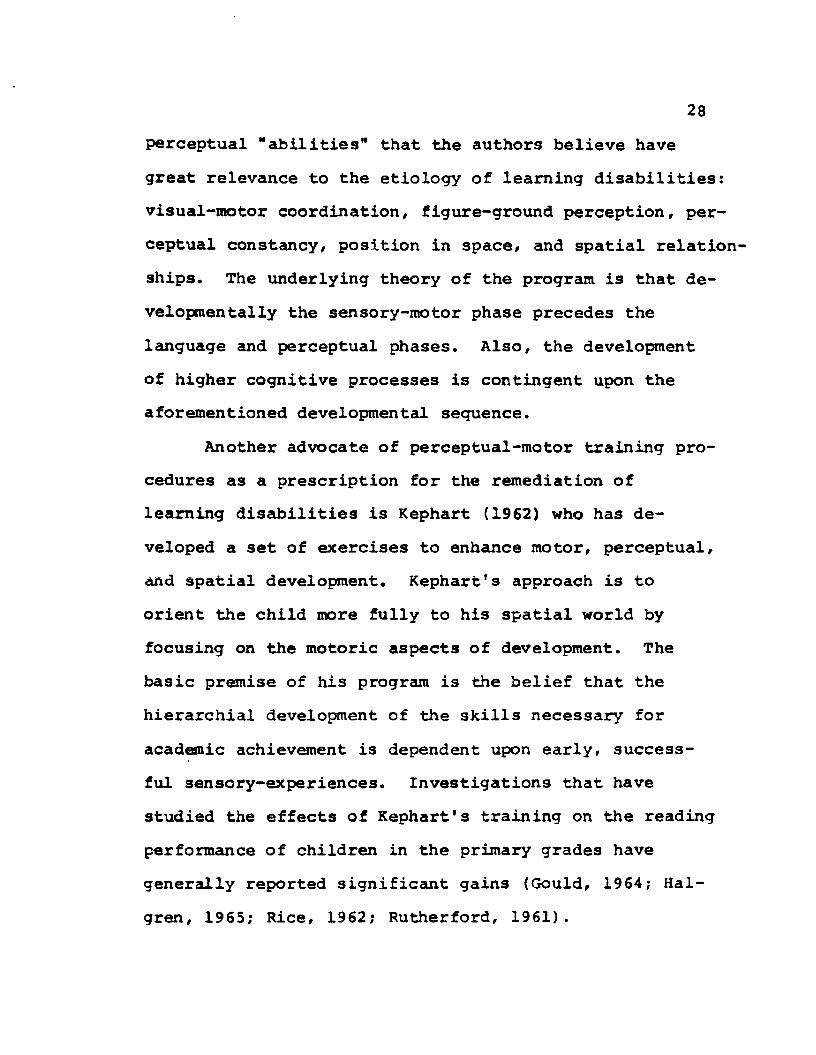
perceptual "abilities” that the authors believe have great relevance to the etiology of learning disabilities: visual-motor coordination, figure-ground perception, perceptual constancy, position in space, and spatial relationships. The underlying theory of the program is that developmental ly the sensory-motor phase precedes the language and perceptual phases. Also, the development of higher cognitive processes is contingent upon the aforementioned developmental sequence.
Another advocate of perceptual-motor training procedures as a prescription for the remediation of learning disabilities is Kephart (1962) who has developed a set of exercises to enhance motor, perceptual, and spatial development. Kephart's approach is to orient the child more fully to his spatial world by focusing on the motoric aspects of development. The basic premise of his program is the belief that the hierarchial development of the skills necessary for academic achievement is dependent upon early, successful sensory-experiences. Investigations that have studied the effects of Kephart's training on the reading performance of children in the primary grades have generally reported significant gains (Gould, 1964; Hal- gren, 1965; Rice, 1962; Rutherford, 1961).
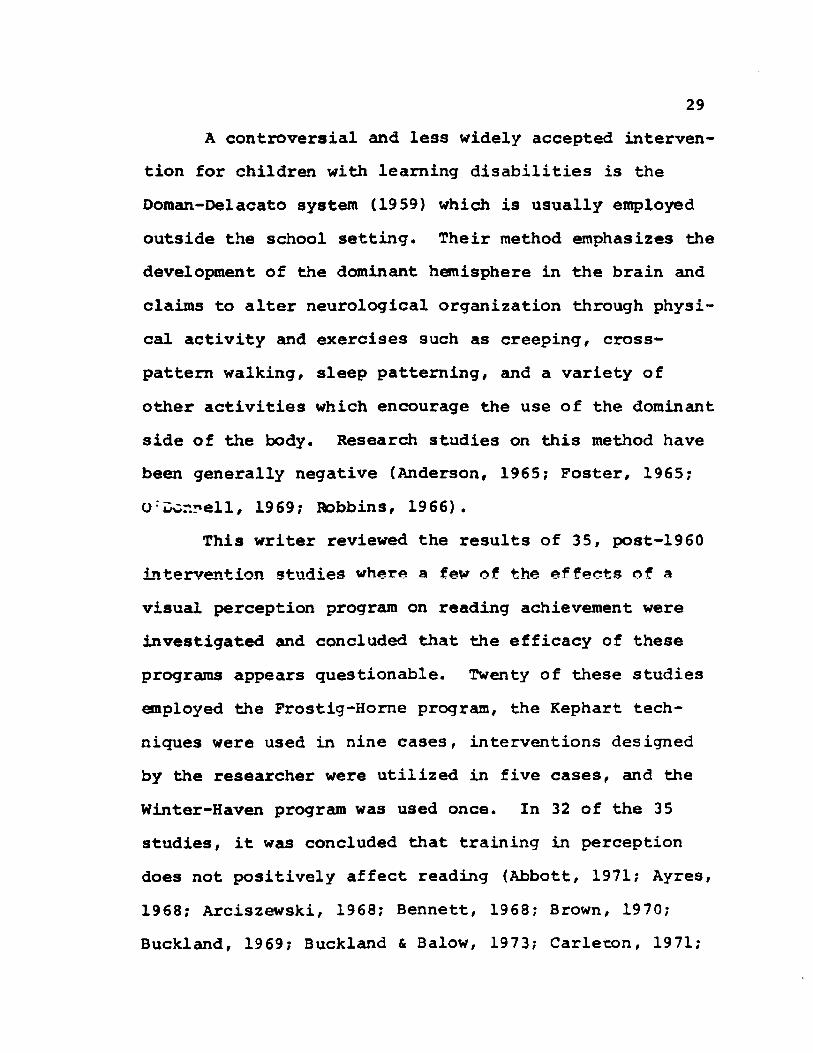
A controversial and less widely accepted intervention for children with learning disabilities is the Doraan-Delacato system (1959) which is usually employed outside the school setting. Their method emphasizes the development of the dominant hemisphere in the brain and claims to alter neurological organization through physical activity and exercises such as creeping, crosspattern walking, sleep patterning, and a variety of other activities which encourage the use of the dominant side of the body. Research studies on this method have been generally negative (Anderson, 1965; Poster, 1965;0 :Donnell, 1969; Robbins, 1966).
This writer reviewed the results of 35, post-1960 intervention studres where a f e of the ef fects of a visual perception program on reading achievement were investigated and concluded that the efficacy of these programs appears questionable. Twenty of these studies employed the Frostig-Home program, the Kephart techniques were used in nine cases, interventions designed by the researcher were utilized in five cases, and the Winter-Haven program was used once. In 32 of the 35 studies, it was concluded that training in perception does not positively affect reading (Abbott, 1971; Ayres, 1968; Arciszewski, 1968; Bennett, 1968; Brown, 1970; Buckland, 1969; Buckland & Balow, 1973; Carleton, 1971;
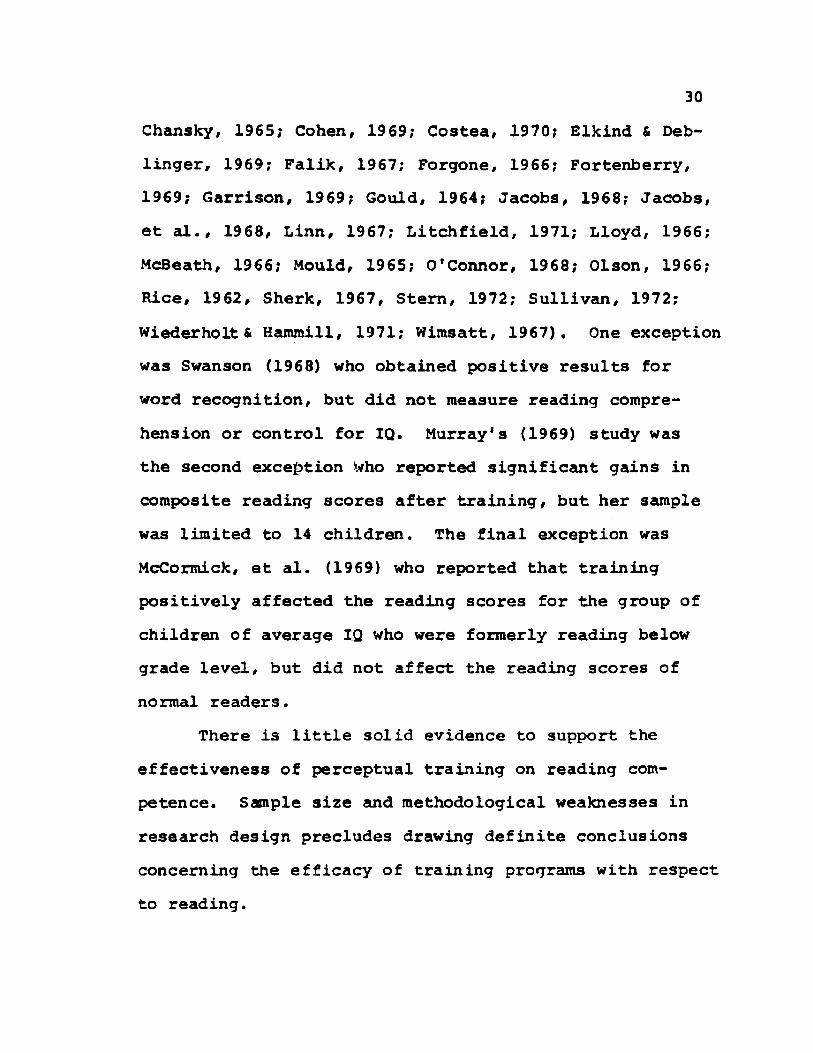
Chansky, 1965; Cohen, 1969; Costea, 1970; Elkind & Deb- linger, 1969; Falik, 1967; Forgone, 1966; Fortenberry, 1969; Garrison, 1969; Gould, 1964; Jacobs, 1968; Jacobs, et al., 1968, Linn, 1967; Litchfield, 1971; Lloyd, 1966; McBeath, 1966; Mould, 1965; O'Connor, 1968; Olson, 1966; Rice, 1962, Sherk, 1967, Stern, 1972; Sullivan, 1972; Wiederholt & Hammill, 1971; Wimsatt, 1967). One exception was Swanson (1968) who obtained positive results for word recognition, but did not measure reading comprehension or control for IQ. Murray's (1969) study was the second exception who reported significant gains in composite reading scores after training, but her sample was limited to 14 children. The final exception was McCormick, et al. (1969) who reported that training positively affected the reading scores for the group of children of average IQ who were formerly reading below grade level, but did not affect the reading scores of normal readers.
There is little solid evidence to support the effectiveness of perceptual training on reading competence. Sample size and methodological weaknesses in research design precludes drawing definite conclusions concerning the efficacy of training programs with respect to reading.
31
SummaryThe literature is loaded with studies looking for
a single cause or combination of deficits to explain reading difficulties. Investigations have focused on a variety of factors. Some of the major factors that have been studied are: visual functioning, auditoryfunctioning, visual and auditory memory, speech and language development, cognitive abilities, and attention abilities. Variability in research findings precludes drawing definite conclusions. The reported evidence does indicate that causation and symptomology in reading disabilities are usually multiple.
Visual perception is one of the areas most frequently investigated and the studies have generally shown that deficits in visual perception are common among children with learning disabilities. The studies which have researched the relationship between visual perception and reading have been contradictory in their findings which warrants the need for continued investigation. Research on perceptual deficits has predominately been limited to studies which employ measures of visual- motor integration. There is paucity of research which examines visual discrimination and visual-motor abilities as separate systems, but the existing research does indicate a need for further study in this area.
32Hypothesis
The research previously reviewed has been contradictory when measures of visual-motor integration have been used to study the relation between visual perception and reading. A few studies have shown that failure on visual-motor tests are a result of motor deficiencies rather than visual discrimination inadequacies. These results suggest that visual-motor coordination and visual discrimination may be autonomous systems and raises the possibility that reading may be more heavily dependent upon visual discrimination ability. Since additional research in this area is indicated, the following hypothesis is presented:
Visual discrimination ability is more closely related to reading ability than visual-motor ability.
CHAPTER III
METHODOLOGY
The general design and procedures of the study are presented in this chapter. The major objective of this exploratory research project was to examine the relationship of reading achievement with different variables and to ascertain if visual-motor and visual-discrimination tests are equally valid predictors of reading performance. The chapter is divided into five sections: (1) thesample, (2) the instrumentation, (3) the definition of variables, (4) the questions to which the study is addressed, and (5) the collection and analysis of the data.
The SampleThe sample was determined by administering the
Group Bender Gestalt Test to the first and second grade children in Reynoldsburg, Ohio, who were attending French Run School, Herbert Mills School, and Rose Hill School. Only the children who had had one year of formal reading instruction were eligible for the sample. This necessitated eliminating the children who had already repeated
33
first grade or were presently repeating second grade. After the Benders were scored, S's were separated into groups according to the number of errors and shuffled.In order to obtain a stratified random sample, the children were selected by drawing the first, fifth, ninth, etc. Bender from each error-group. The resultant sample (N * 70) was comprised of 33 boys and 37 girls ranging between the ages of 7-1 and 8-3, from various socio-economic backgrounds, and different races.
The Instrumentation The instruments for this research were chosen
after a critical review of the instruments used to measure reading achievement, visual-form perception, and intelligence. Also, special attention was given to those instruments selected for former research.
The Bender Visual Motor Gestalt Test (BGT)The Bender Visual Motor Gestalt Test (Bender, 1938),
commonly known as the Bender-Gestalt Test, is primarily a copying test. Nine simple designs are presented one at a time on cards and the subject is instructed to copy each design from the sample before him. The designs were selected by Bender from a longer series employed by Wertheimer (1923), one of the founders of the Gestalt school, in his studies of visual perception. The nine
designs were constructed so as to illustrate certain principles of Gestalt psychology, and Bender's own analyses of the test results are formulated in terms of Gestalt concepts. Koppitz (1964) carried out an extensive standardization of the Bender Gestalt Test with children. Kindergarten to fourth grade children (N * 1,104) in midwestern and eastern public schools comprised the norm group. Interscorer correlations vary from .88 to .96. Retest reliability over a four month interval within single grade groups range from .547 to .659. Correlations between the Bender Gestalt Test and standard intelligence tests (Stanford Binet or WISC) within single-year groups range from .48 to .79. At ages above ten, the Bender Gestalt scores correlate insignificantly with either intelligence test scores or age.
The Motor-Free Visual Perception Test (MVPT)The Motor-Free Visual Perception Test (Colarusso,
1972) is a test of visual perception which avoids the motor involvement of drawing. The test is a 36-item, individually administered, multiple-choice test of visual perception. Each stimulus card is presented individually and the subject is asked to point to one of four alternatives which he feels matches the stimulus card. Normal children aged four through eight in twenty-two states (N » 881) comprised the norm group.
36
Three reliability procedures — test-retest, split half, and Kuder Richardson — were performed with all coefficients statistically significant at the .01 level. To insure content validity, items were constructed proportionately under five perceptual skill areas: spatialrelationships, visual discrimination, figure-ground, visual closure, and visual memory. Construct validity was obtained by correlating the MVPT with three types of tests: school achievement or readiness, visual-motor, and intelligence. Correlations were higher with other measures of visual perception (median r = .49) them with tests of intelligence (median r = .31) and school performance (median r » .38).
Multiple-Choice Bender (M-CB)The Multiple-Choice Bender includes: (1) two
practice examples with each stimulus card having four or five distractors, and (2) the original nine Bender figures with eleven distractors for each figure. Contained in each set of distractors is a matching stimulus card.
The stimulus figures are presented to the subject one at a time along with the corresponding distractors. The cards are arranged in front of the subject as demonstrated in Figure 1.
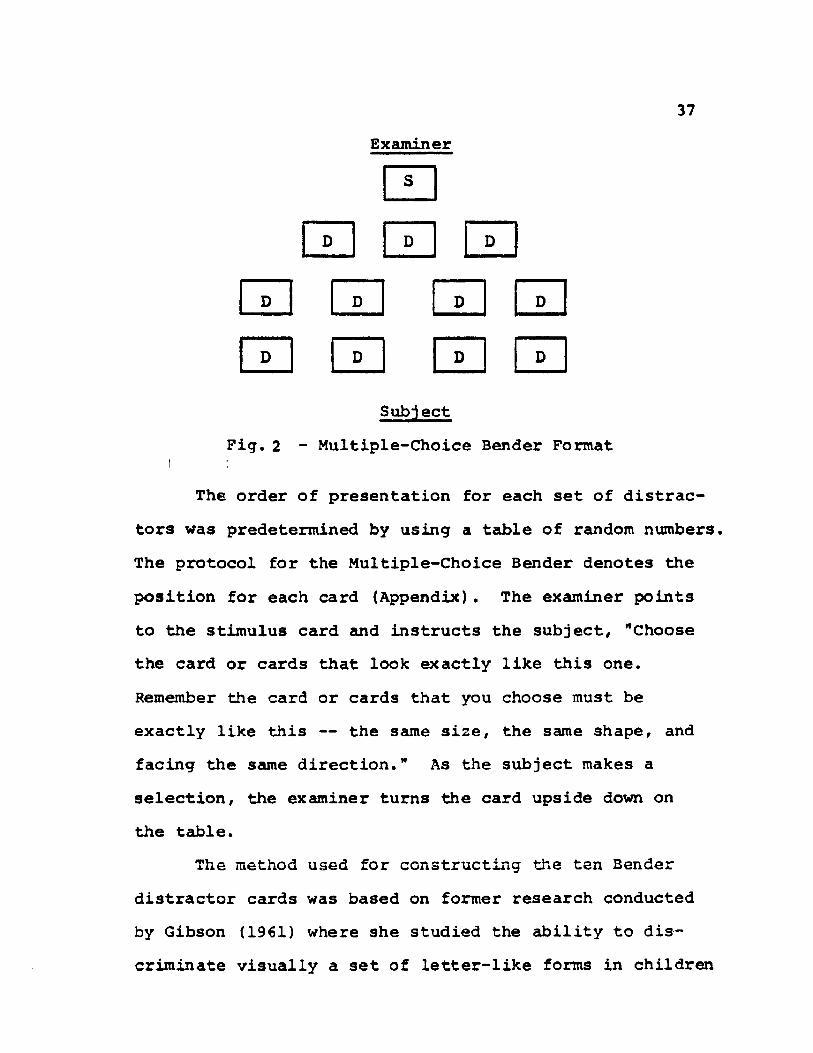
37Examiner
SubjectFig.2 - Multiple-Choice Bender Format
The order of presentation for each set of distractors was predetermined by using a table of random numbers, The protocol for the Multiple-Choice Bender denotes the position for each card (Appendix). The examiner points to the stimulus card and instructs the subject, "Choose the card or cards that look exactly like this one. Remember the card or cards that you choose must be exactly like this — the same size, the same shape, and facing the same direction." As the subject makes a selection, the examiner turns the card upside down on the table.
The method used for constructing the ten Bender distractor cards was based on former research conducted by Gibson (1961) where she studied the ability to discriminate visually a set of letter-like forms in children
four through eight years of age. The letter-like forms were constructed according to the same constraints which govern the formation of printed capitals. Twelve were chosen as standards, and twelve specified transformations were constructed for each standard. The transformations were three degrees of change from line to curve or vice versa; five changes in orientation; two perspective transformations; and two topological transformations.The discrimination task required the subject to match a standard form with an identical form. All subjects matched for all twelve standards. The same transformations were used for the Bender distractor cards except for the two topological transformations. The topological transformations were not utilized due to the fact that Gibson found that errors on these transformations were not significant. A photo reduction of the Multiple-Choice Bender along with the two practice examples are found in Table 9.
Slosson Intelligence Test (SIT)The Slosson Intelligence Test (Slosson, 1963) is
an individual test of intelligence which requires ten to twenty minutes to administer. The test items are similar to the Stanford-Binet tasks. Concurrent validity of the SIT was obtained by administering the SIT and the Stanford-
39Binet, L-M to 701 children and adults from both urban and rural areas in New York State (r * .90 to .98).The authors report the reliability as .97, but at all ages and not at one age as is usually recommended. A test-retest interval within a period of two months was employed with a population of 139 individuals from age 4 to 50 years.
Stamford Achievement Test - Primary I (SAT)The Stanford Achievement Test, Primary I (Madden,
et al., 1973) is designed for group administration.Four aspects of reading achievement are measured: vocabulary, word reading, paragraph meaning, and word study skills. A multiple-choice format is employed throughout the test. The norms provided for interpretation of scores include percentile ranks, stanines, grade equivalents, and scaled scores.
Three standardization programs were carried out for the Primary Level I Battery: one at the beginningof each grade (October, 1972), one at mid-year (February, 1972),and one at the end of the school year (May, 1972). A total of 109 school systems drawn from 43 states participated (N =* 275,000).
Two types of reliability are reported by the authors. Reliability coefficients for the four subtests based on odd-even scores corrected by Spearman-Brown
40Formula ranged from .86 to .95. The Kuder Richardson Formula 20 reported similar coefficients ( KR20 " .86 to .95).
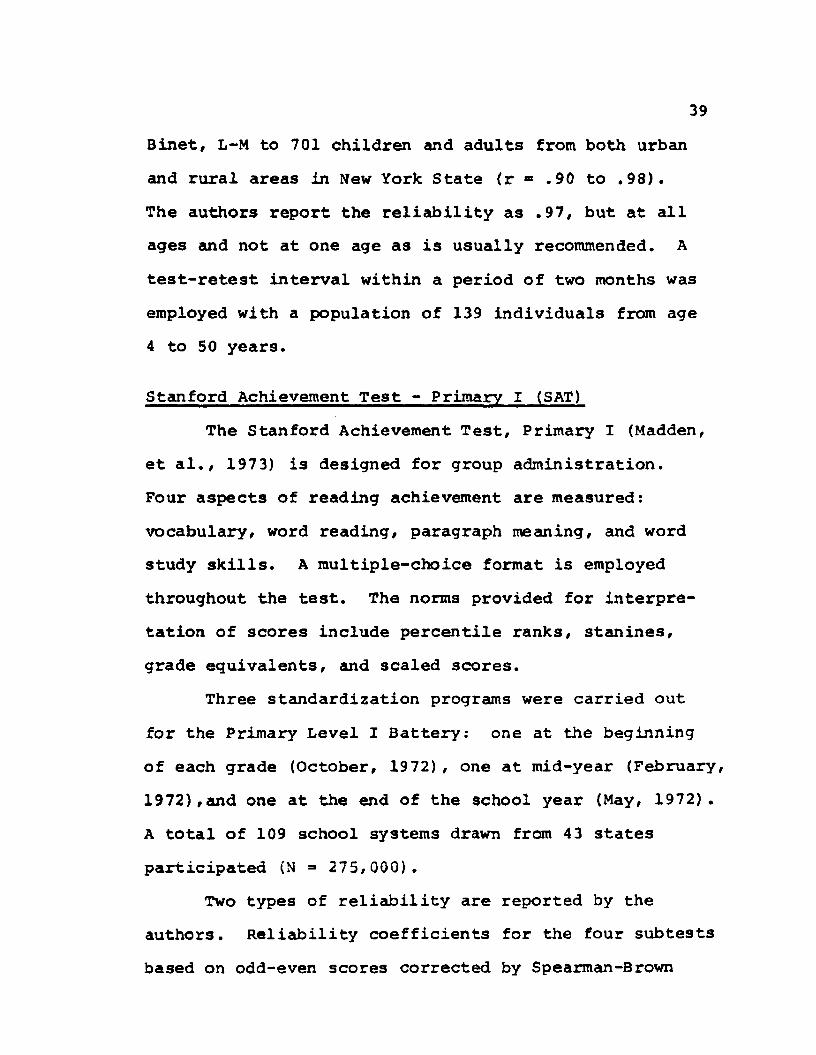
Van Orden Star (VOS)The Van Orden Star technique is used currently in
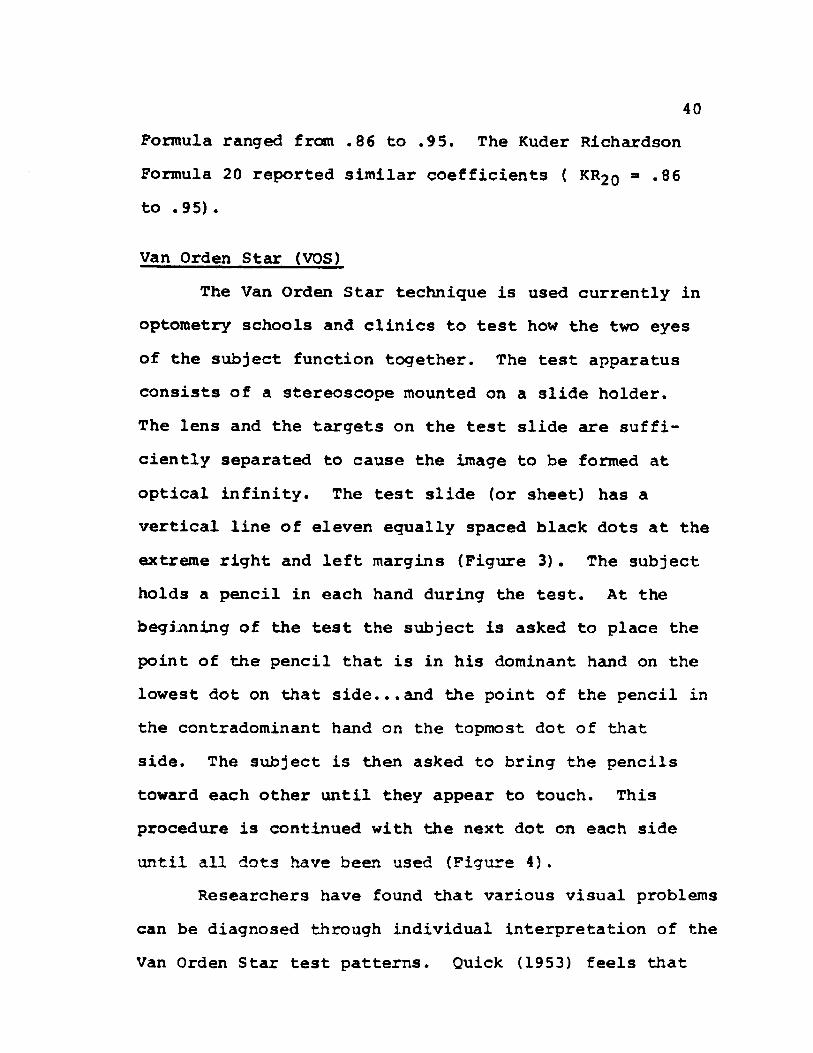
optometry schools and clinics to test how the two eyes of the subject function together. The test apparatus consists of a stereoscope mounted on a slide holder.The lens and the targets on the test slide are sufficiently separated to cause the image to be formed at optical infinity. The test slide (or sheet) has a vertical line of eleven equally spaced black dots at the extreme right and left margins (Figure 3). The subject holds a pencil in each hand during the test. At the beginning of the test the subject is asked to place the point of the pencil that is in his dominant hand on the lowest dot on that side...and the point of the pencil in the contradominant hand on the topmost dot of that side. The subject is then asked to bring the pencils toward each other until they appear to touch. This procedure is continued with the next dot on each side until all dots have been used (Figure 4).
Researchers have found that various visual problems can be diagnosed through individual interpretation of the Van Orden Star test patterns. Quick (1953) feels that
41
rig. 3. Van Ordan Teat Slide
rig. 4. Completed Van Orden Test Slide
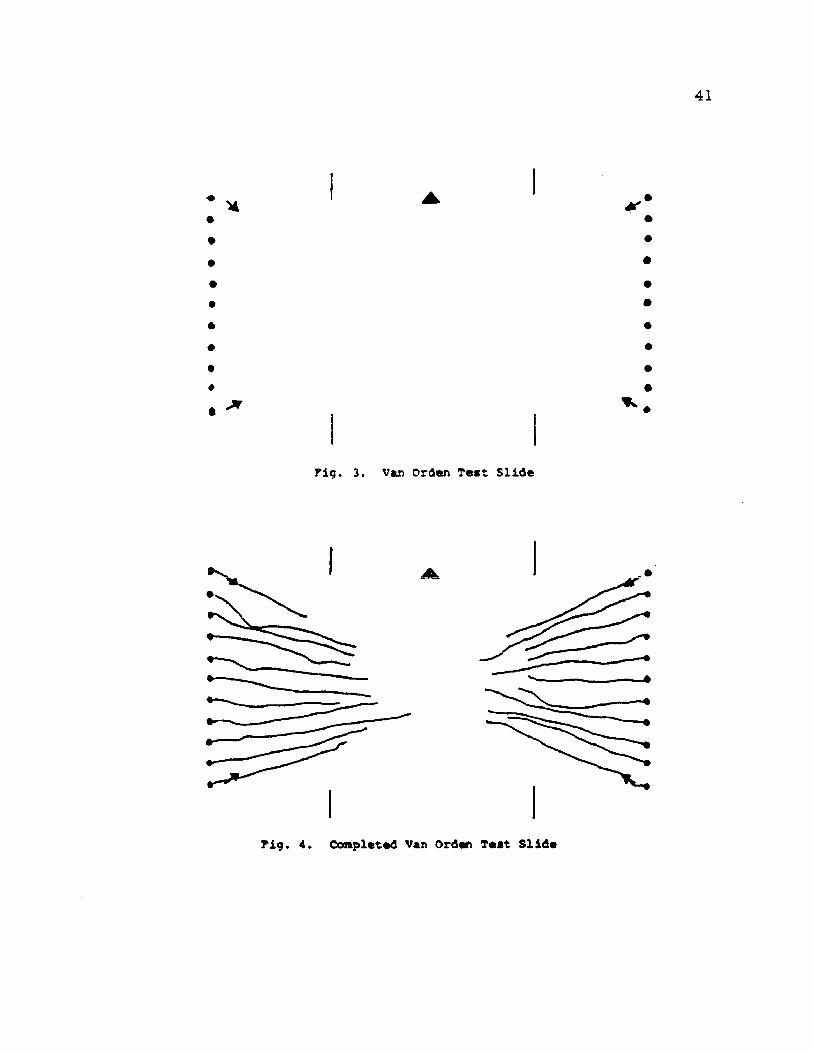
42the test patterns can reveal the conditions of esophoria or exophoria. Esophoria and exophoria are present when objects are seen closer or farther away than they really are, due to the tendency of the eye to deviate toward or away from its object of regard. In addition, Childress (1959) has found that other problems can be diagnosed with this technique: alternating suppression, amblyopia,and the "straight-eyed squinter.” Alternating suppression is a lack of perception of normally visible objects in all or part of the field of vision of first one eye, and then the other. It may occur for central vision (central suppression) or in the periphery (peripheral suppression). It can occur partially in one eye and partially in the other eye simultaneously (retinal rivalry). Amblyopia is a condition known as "lazy eye blindness," where the brain suppresses the images relayed by one eye over such a long period of time that the eye is no longer useful for sight. The "straight-eyed squinter" is a person who sees objects closer with one eye than he does with the other. The two eyes center at different points on the "Z" axis. See Figures 5 and 6 to compare the normal, non-distorted pictures to that of a "straight-eyed squinter" (Braddom, 1966).
A template designed by Dr. Charles B. Huelsman was used to score the Van Orden Star. The template
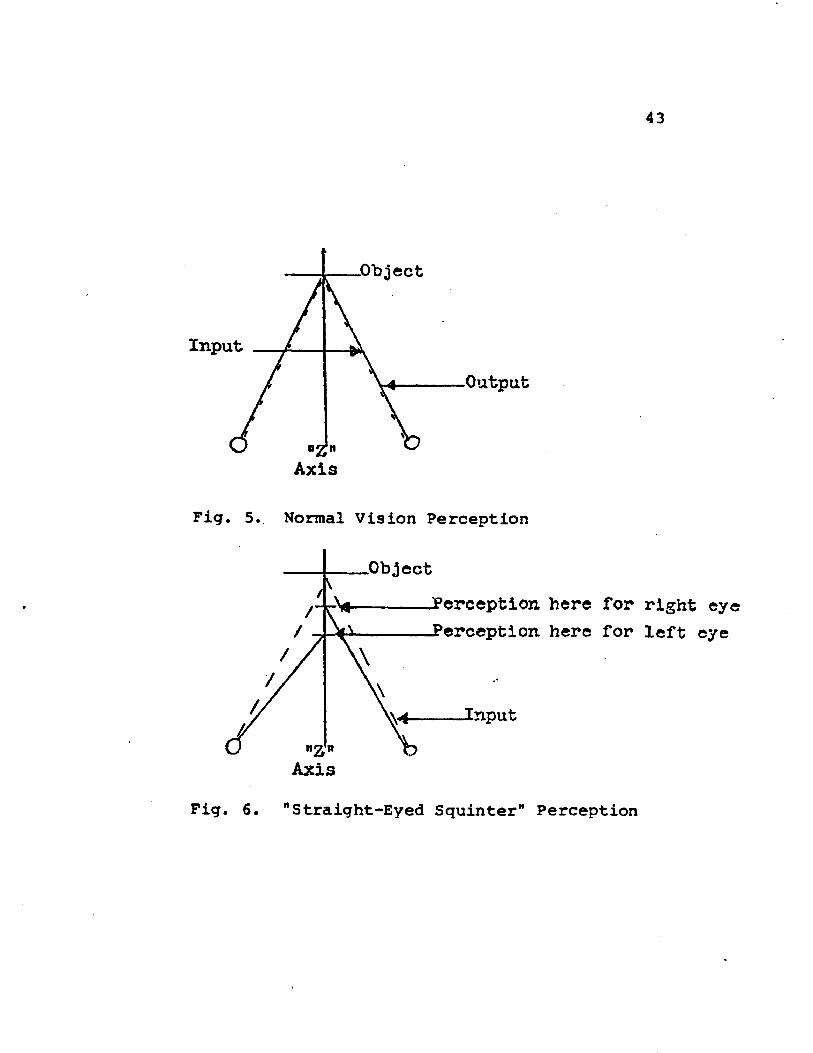
43
InputOutput
■Z n Axis
Fig. 5. Normal Vision Perception
.ObjectPerception here for right eye Perception here for left eye
Input«Z»
AxisFig. 6. "Straight-Eyed Squinter" Perception
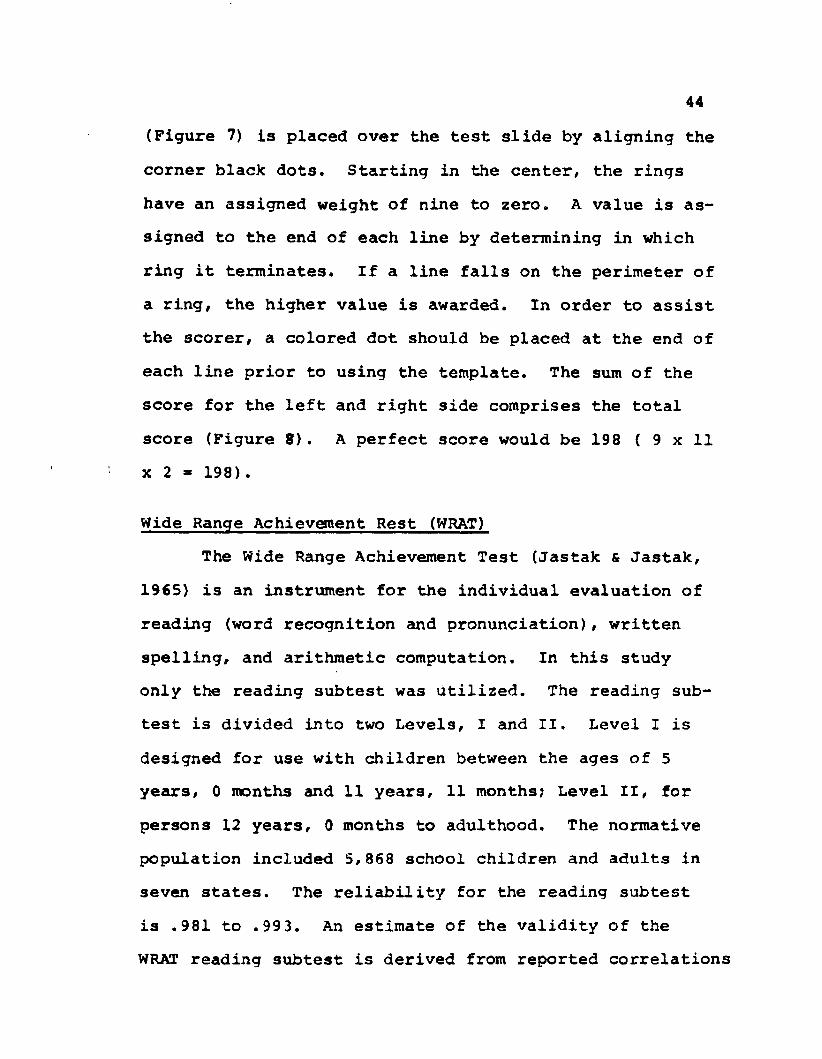
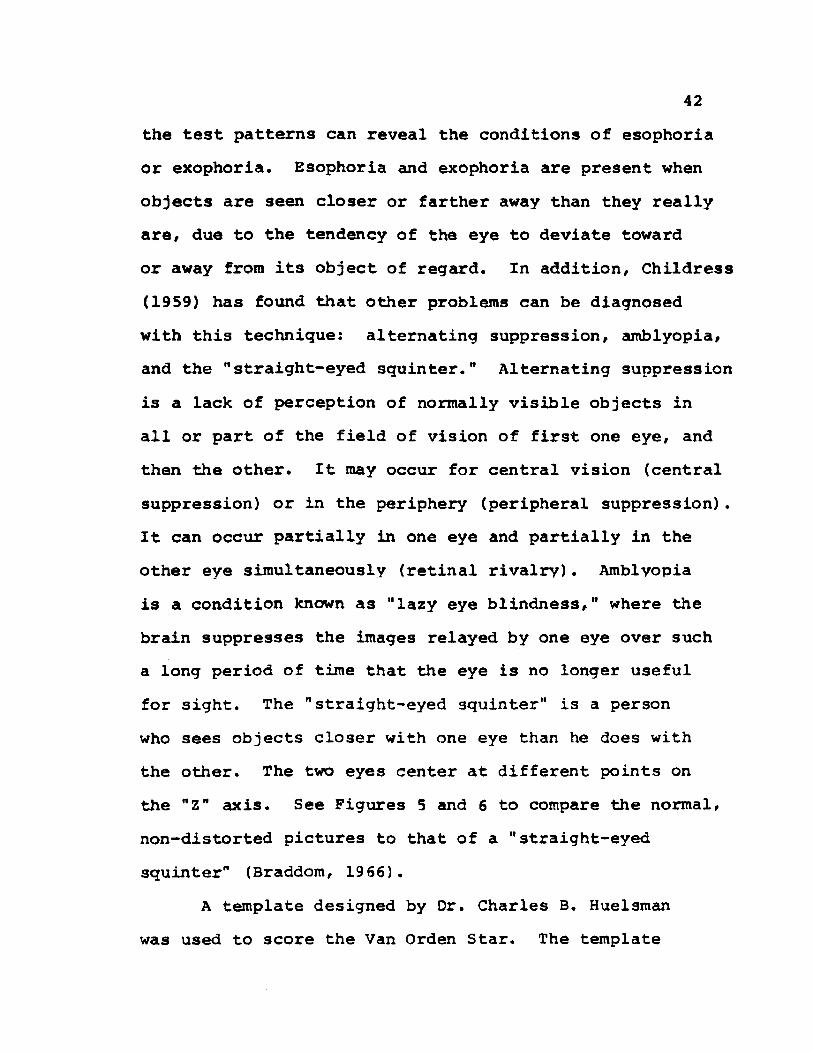
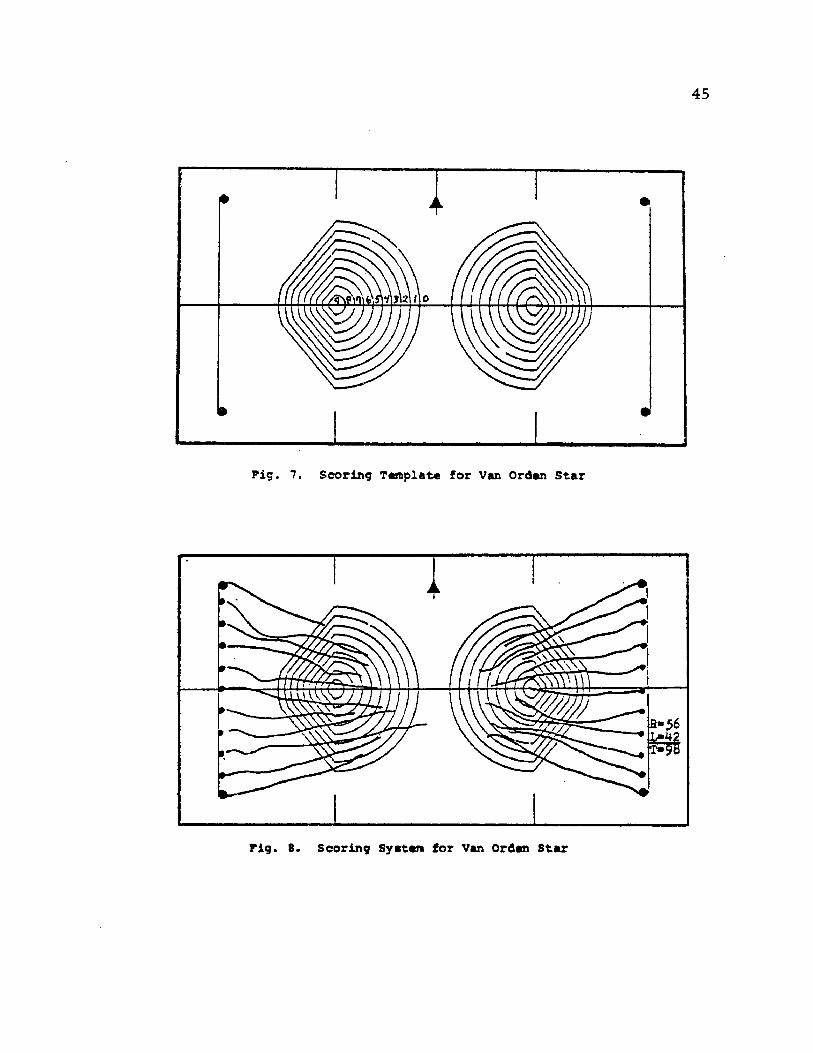
(Figure 7) is placed over the test slide by aligning the corner black dots. Starting in the center, the rings have an assigned weight of nine to zero. A value is assigned to the end of each line by determining in which ring it terminates. If a line falls on the perimeter of a ring, the higher value is awarded. In order to assist the scorer, a colored dot should be placed at the end of each line prior to using the template. The sum of the score for the left and right side comprises the total score (Figure 8). A perfect score would be 198 ( 9 x 11 x 2 » 198).
Wide Range Achievement Rest (WRAT)The Wide Range Achievement Test (Jastak & Jastak,
1965) is an instrument for the individual evaluation of reading (word recognition and pronunciation), written spelling, and arithmetic computation. In this study only the reading subtest was utilized. The reading subtest is divided into two Levels, I and II. Level I is designed for use with children between the ages of 5 years, 0 months and 11 years, 11 months; Level II, for persons 12 years, 0 months to adulthood. The normative population included 5,868 school children and adults in seven states. The reliability for the reading subtest is .981 to .993. An estimate of the validity of the WRAT reading subtest is derived from reported correlations
45
Pig. 7. Scoring Template for Van Orden Star
Pig. 8. Scoring System for Van Orden Star
46with other reading tests: WRAT reading (1946) vs. NewStanford Paragraph Reading, r » +.81 (N * 389); and WRAT reading vs. Woody-Sangren Silent Reading Test, r ■ +.80 (N = 47).
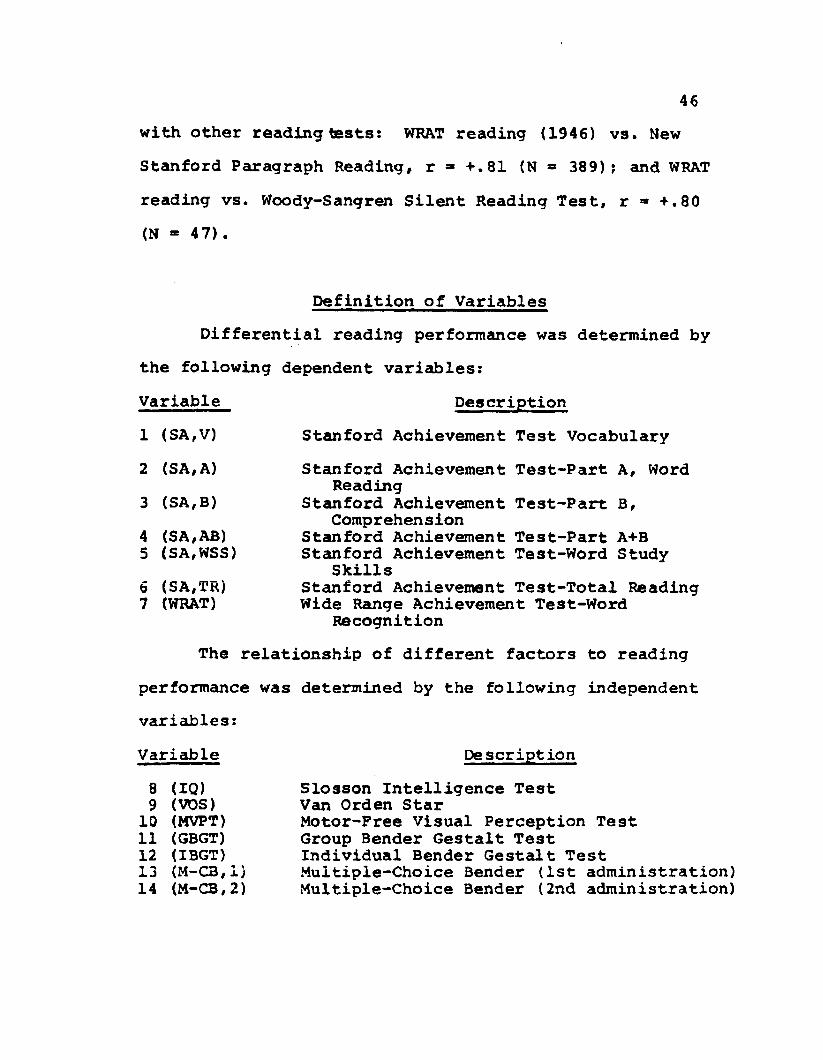
Definition of Variables Differential reading performance was determined by
the following dependent variables:Variable1 (SA,V)2 (SA, A)3 (SA,B)4 (SA, AB)5 (SA,WSS)6 (SA,TR)7 (WRAT)
DescriptionStanford Achievement Test VocabularyStanford Achievement Test-Part A, Word
ReadingStanford Achievement Test-Part B,
Comprehension Stamford Achievement Test-Part A+B Stamford Achievement Test-Word Study
SkillsStamford Achievement Test-Total Reading Wide Range Achievement Test-Word
RecognitionThe relationship of different factors to reading
performamce was determined by the following independent vauriables:Variable Description8 (IQ)9 (VOS)
10 (MVPT)11 (GBGT)12 (IBGT)13 (M-CB,1)14 (M-CB,2)
Slosson Intelligence Test Vam Orden StarMotor-Free visual Perception Test Group Bender Gestalt Test Individual Bender Gestalt Test Multiple-Choice Bender (1st administration) Multiple-Choice Bender (2nd administration)
QuestionsPerceptual skills and its relationship to the ac
quisition of reading skills have been cited repeatedly in the literature. The efficacy of visual-motor tests as a measure of visual perception has generally been accepted. However, concern has been expressed recently about the validity of measuring visual perception with tests that involve the motor ability of copying. The purpose of this present research was to investigate the relationship of different variables to reading achievement and to determine whether the prediction of reading success is related more to a measure of visual-motor functioning or to separate measures of visual discrimination. In order to accomplish the above purpose, the study sought answers to the following questions:1. How do scores from tests of selected independent
variables correlate with Stanford Achievement Test scores?
2. How do scores from tests of selected independent variables correlate with word recognition ability as measured by the Wide Range Achievement Test?
3. Which of the selected independent variables make a statistically significant contribution to the explanation of the variance on the Stamford Achievement Test?
4. Which of the selected independent variables make a statistically significant contribution to the explanation of the variance on the word recognition section of the Wide Range Achievement Test?
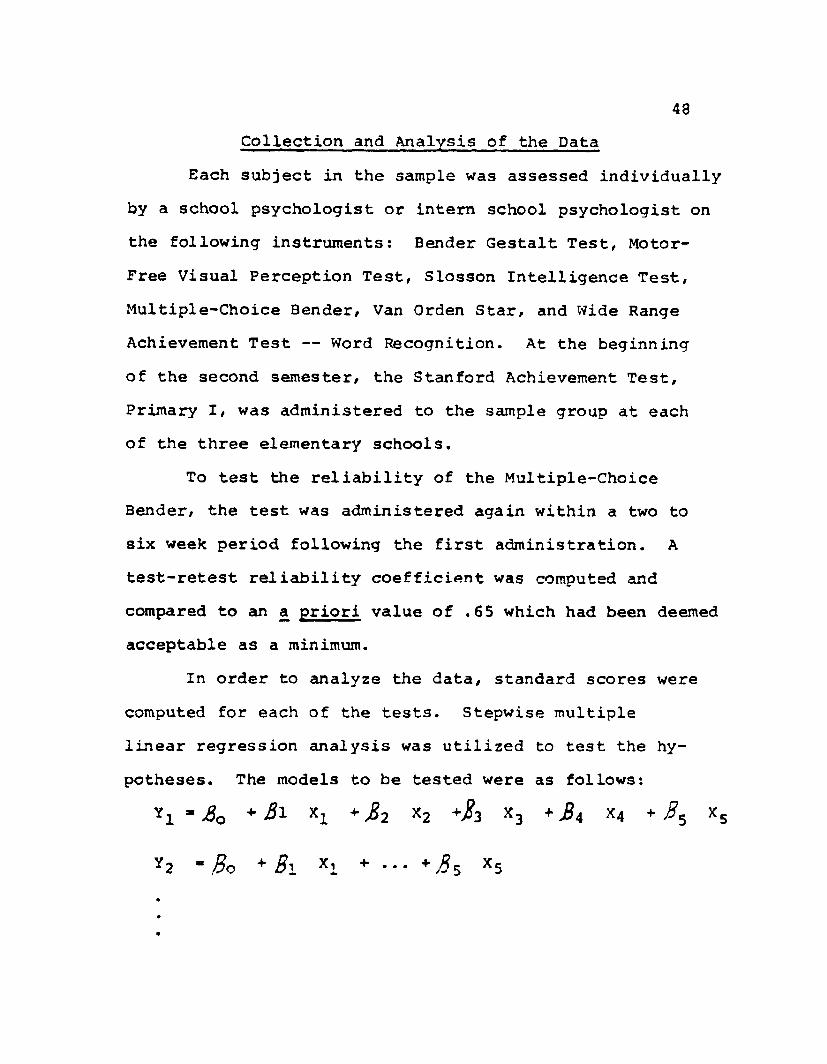
48Collection and Analysis of the Data
Each subject in the sample was assessed individually by a school psychologist or intern school psychologist on the following instruments: Bender Gestalt Test, Motor-Free Visual Perception Test, Slosson Intelligence Test, Multiple-Choice Bender, Van Orden Star, and Wide Range Achievement Test — Word Recognition. At the beginning of the second semester, the Stanford Achievement Test, Primary I, was administered to the sample group at each of the three elementary schools.
To test the reliability of the Multiple-Choice Bender, the test was administered again within a two to six week period following the first administration. A test-retest reliability coefficient was computed and compared to an a priori value of .65 which had been deemed acceptable as a minimum.
In order to analyze the data, standard scores were computed for each of the tests. Stepwise multiple linear regression analysis was utilized to test the hypotheses. The models to be tested were as follows:
Y 1 m So * X1 +#2 X2 +^3 x3 X4 +j?5 Xs
y2 - Bo * Bl X1 *■■■ * 3 5 X5
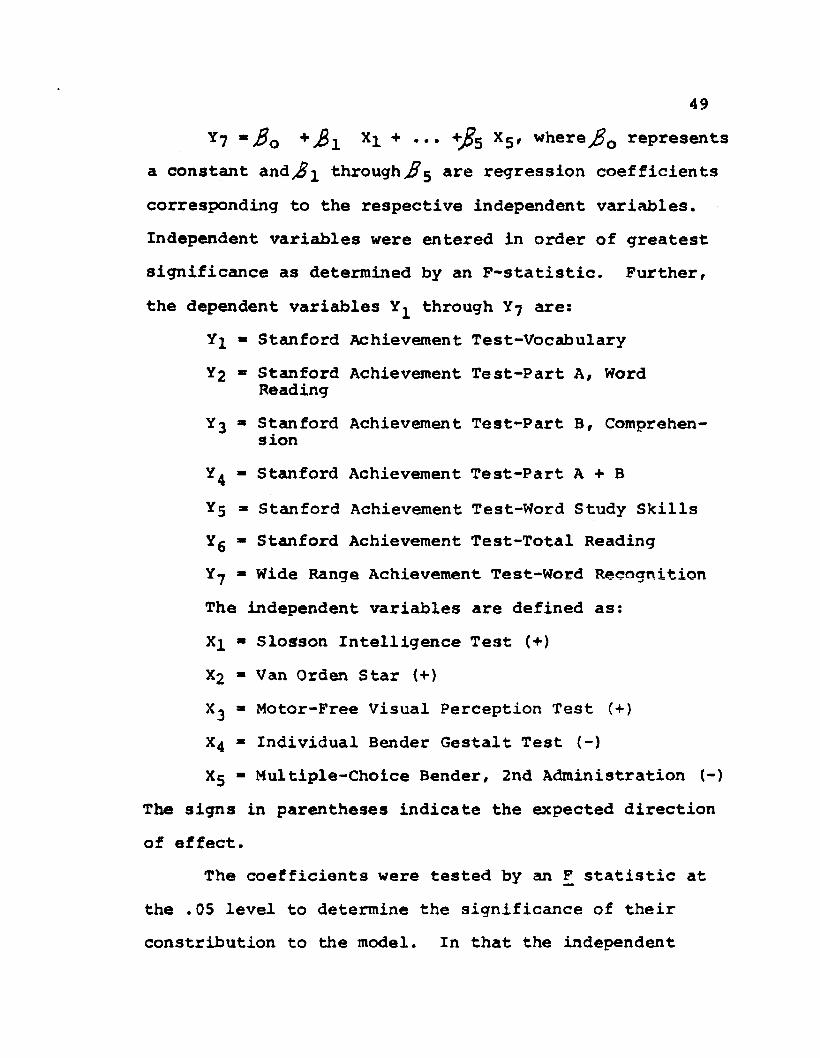
49Y7 m 3 o * 3 l X1 + ••• 5 x5' where represents
a constant and^^ through3 s are regression coefficientscorresponding to the respective independent variables.Independent variables were entered in order of greatestsignificance as determined by an P-statistic. Further,the dependent variables Y^ through Y7 are:
Y^ » Stanford Achievement Test-VocabularyY2 * Stamford Achievement Test-Part A, Word
ReadingY3 ■ Stamford Achievement Test-Part B, Comprehen
sionY^ - Stamford Achievement Test-Part A + B Y5 ■ Stamford Achievement Test-Word Study Skills Yg * Stamford Achievement Test-Total Reading Yj - Wide Range Achievement Test-Word Recognition The independent variables are defined as:
- Slosson Intelligence Test (+)X2 * Van Orden Star {+)X^ ■ Motor-Free Visual Perception Test (+)X4 * Individual Bender Gestalt Test {-)X5 - Multiple-Choice Bender, 2nd Administration (-)
The signs in parentheses indicate the expected direction of effect.
The coefficients were tested by am F statistic at the .05 level to determine the significamce of their constribution to the model. In that the independent
50variables were similar measures, it was hypothesized that multicollinearity may be a problem thus deflating the F ratios. A Farrer-Glauber statistic was used to test for this limitation.
Two additional analyses were conducted. Factor analysis was used to determine if the visual-motor coordination factor had been removed from the Multiple- Choice Bender and to determine the factor loadings for each variable. Regression analysis allowing test selection of only three tests was utilized in order to strengthen the prediction of the criterion. An F statistic at the .01 level was used to test the significance of the coefficients.
CHAPTER IV
RESULTS
This study was designed: (1) to determine the predictive validity of visual-motor and visual discrimination tests with respect to reading ability; (2) to examine the relationship of different variables to reading success; and (3) to measure differences in performance between visual-motor and visual discrimination tests. Seven instruments which employed individual or group assessment were utilized to assess intelligence, visual perception, or reading. The data were submitted to stepwise multiple linear regression analysis. The correlation matrix, regression results, and factor analysis constitute the further evidence used to answer the questions posed in Chapter III.
The chapter is divided into four sections. The first section is devoted to the Multiple-Choice Bender (M-CB) and discusses the reliability of the instrument and an item analysis of the errors. The second section examines the correlation between the various tests. The third section analyzes the stepwise multiple linear regression to determine the contribution of the independent variables in predicting reading achievement. The
51
52final section is devoted to two further analyses: (1)factor analysis and (2) regression analysis allowing test selection of only three tests.
Analysis of Multiple-Choice Bender Since the Multiple-Choice Bender has not been pre
viously validated, it was deemed necessary to test the reliability and score distribution of the measure. The results of this analysis follows.
Test-retest ReliabilityA test-retest reliability coefficient was computed
for the scores from the two administrations of the Multiple-Choice Bender. A strong correlation coefficient of .67 was found. This implies that the M-CB is reliable with respect to the criteria established a priori.
Item Analysis of ErrorsA chi-square statistic was computed and analyzed
in order to determine which of the distractors were the most difficult. Since some of the stimulus cards contained more than one potentially correct response, three separate analyses had to be performed: (1) one forcards containing only one matching stimulus; (2) one for cards containing two matching stimuli; and (3) one for cards containing four matching stimuli. A significant chi-square was found for all three. This implies
53that the distractors were not all equally difficult with respect to error scores. To assess which of the distractors were most difficult# the percent of contribution to the observed chi-square was computed using the formula
£(fo - fe)^ for each column (Tables 10 through 12).L £e J •Observation of Table 1 indicates that the L-C(l)
transformation appears to be the most difficult for all three stimulus card universes. In addition, S-B and L-C (2) contribute largely to explanation of errors for the first and second and first and third universes respectively. The U-D distractor proved to be the most difficult in the only universe in which it was interpreted as an error.The distractors appear to have the most uniform difficulty levels in the universe with only one possible matching stimulus, where 93 percent of the chi-square value is explained by six of the transformations. This compares to over 80 percent of the chi-square value being explained by only two distractors in the other two universes.
In the universe with two possible matching stimulus, the S-B and L-C(l) distractors account for 83.5 percent and in the universe with four possible matching stimulus, the L-C(2) and the L-C(l) distractors explain 85.8 percent of the chi-square value.
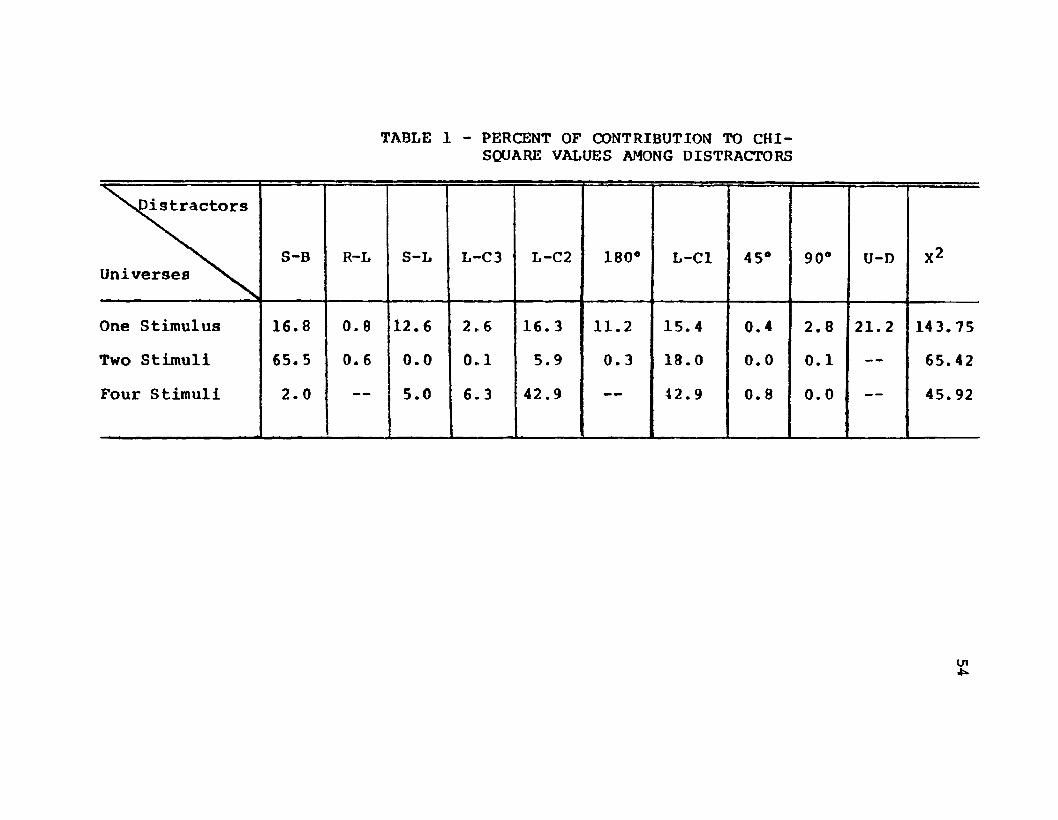
TABLE 1 - PERCENT OF CONTRIBUTION TO CHI- SQUARE VALUES AMONG DISTRACTORS
: = >sDis tractors
Universes \S-B R-L S-L L-C 3 L-C2 180° L-Cl 4 5® 90® U-D X2
One Stimulus 16.8 0. 8 12.6 2.6 16. 3 11.2 15.4 0.4 2.8 21.2 143.75Two Stimuli 65.5 0.6 0.0 0.1 5.9 0.3 18.0 0.0 0.1 — 65.42Four Stimuli 2.0 — — 5.0 6.3 42.9 — — 42.9 0.8 0.0 — 45.92
VI
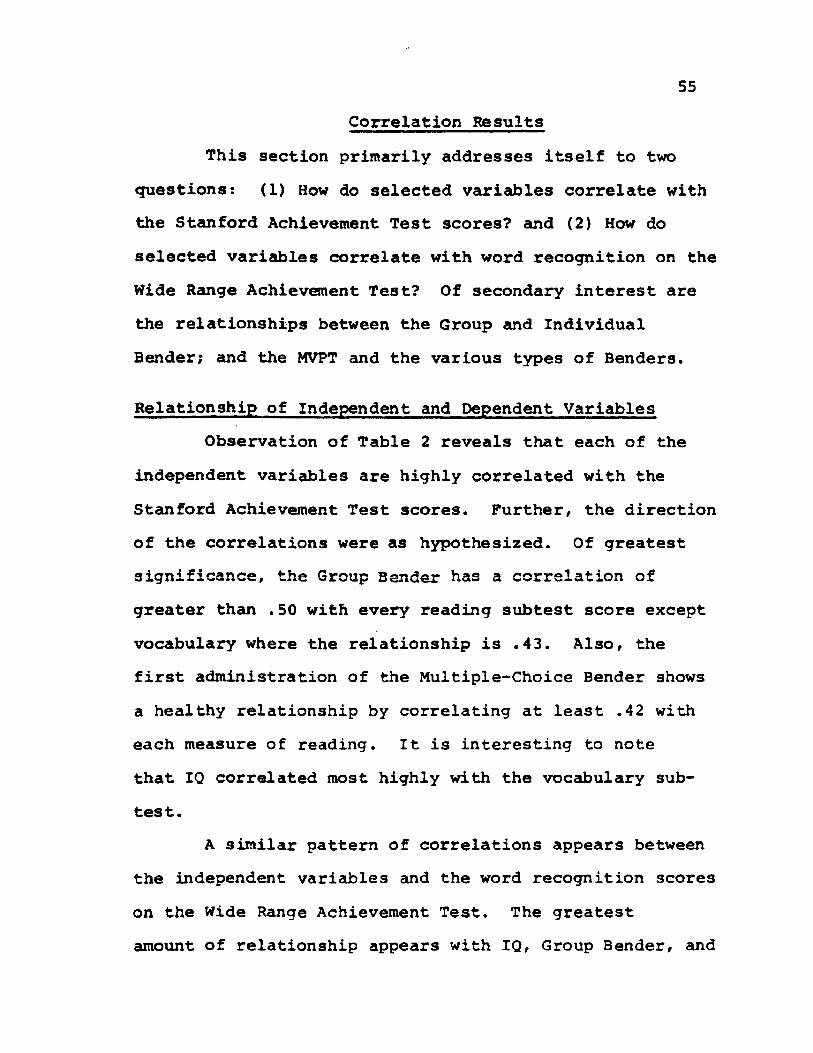
55Correlation Results
This section primarily addresses itself to two questions: (1) How do selected variables correlate withthe Stanford Achievement Test scores? and (2) How do selected variables correlate with word recognition on the Wide Range Achievement Test? Of secondary interest are the relationships between the Group and Individual Bender; and the MVPT and the various types of Benders.
Relationship of Independent and Dependent VariablesObservation of Table 2 reveals that each of the
independent variables are highly correlated with the Stanford Achievement Test scores. Further, the direction of the correlations were as hypothesized. Of greatest significance, the Group Bender has a correlation of greater than .50 with every reading subtest score except vocabulary where the relationship is .43. Also, the first administration of the Multiple-Choice Bender shows a healthy relationship by correlating at least .42 with each measure of reading. It is interesting to note that IQ correlated most highly with the vocabulary subtest.
A similar pattern of correlations appears between the independent variables and the word recognition scores on the Wide Range Achievement Test. The greatest amount of relationship appears with IQ, Group Bender, and
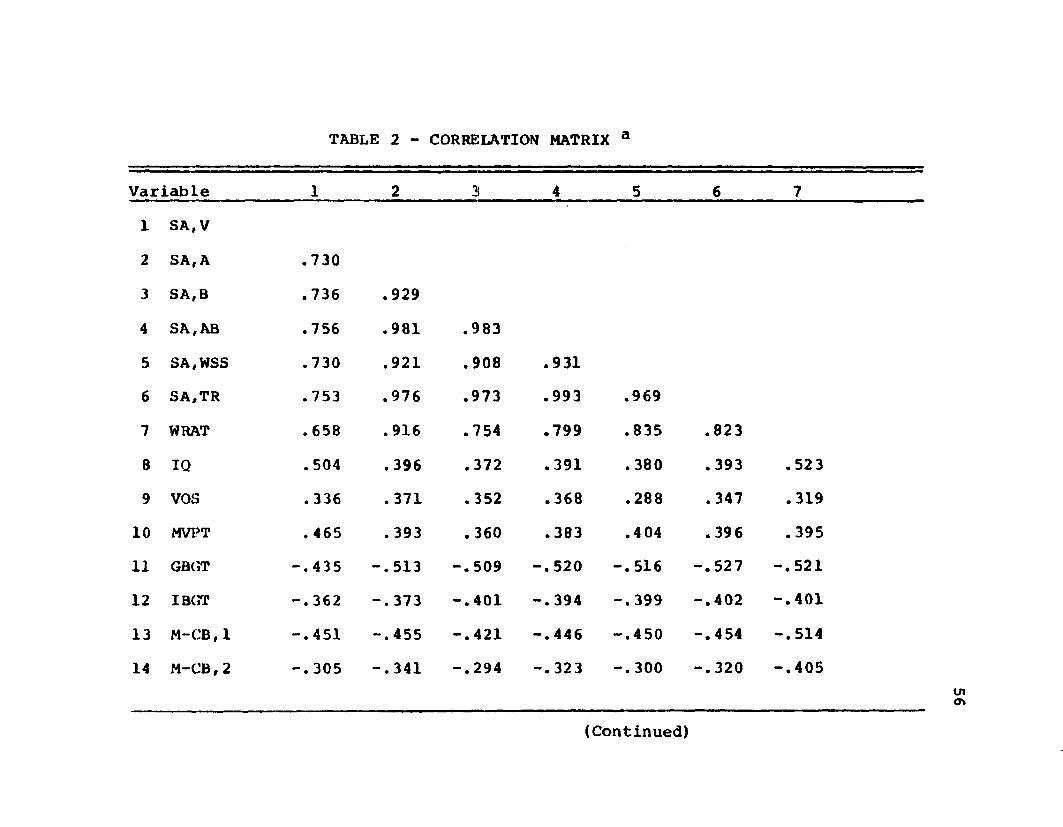
TABLE 2 - CORRELATION MATRIX a
Variable 1 2 3 4 5 6 71 SA, V2 SA, A .7303 SA, B .736 .9294 SA, AB .756 .981 .9835 SA,WSS .730 .921 .908 .9316 SA,TR .753 .976 .973 .993 .9697 WRAT .658 .916 .754 .799 .835 .8238 IQ .504 .396 .372 .391 .380 .393 .5239 VOS .336 .371 .352 .368 .288 .347 .31910 MVPT .465 .393 .360 .383 .4 04 .396 .39511 GBCJT -.435 -.513 -.509 -. 520 -.516 -.527 -.52112 IBGT -.362 -.373 -.401 -. 394 -.399 -.402 -.40113 M-CB,1 -.451 -.455 -.421 -.446 -.450 -.454 -.51414 M-CB,2 -.305 -.341 -.294 -.323 -.300 -.320 -.405
(Continued)
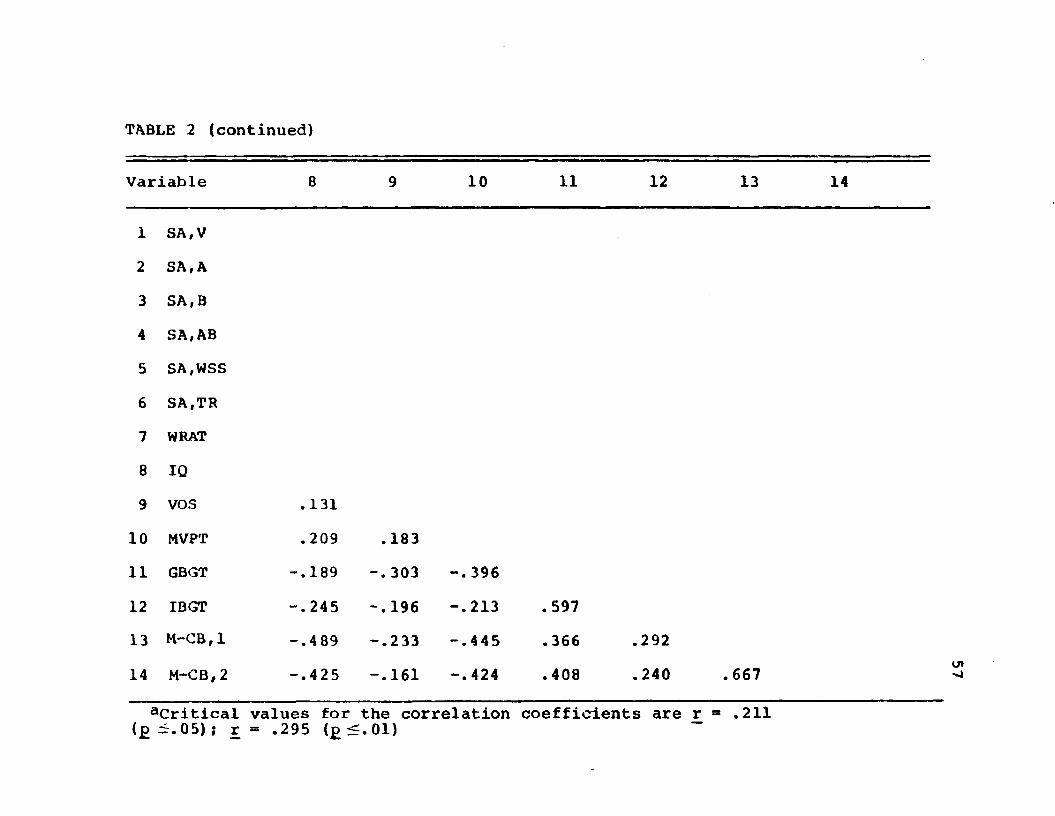
TABLE 2 (continued)
Variable 8 9 10 11 12 13 14
1 SA, V2 SA, A3 SA, B4 SA, AB5 SA,WSS6 SA,TR7 WRAT8 IQ9 VOS .131
10 MVPT .209 .18311 GBGT -.189 -. 303 -. 39612 IBGT -.245 -.196 -.213 .59713 M-CB,1 -.489 -.233 -.445 .366 .29214 M-CB,2 -.425 -.161 -.424 .408 .240 .667
aCritical values for the correlation coefficients are r = .211 (£^.05); r = .295 (£^.01)
58the first administration of the Multiple-Choice Bender, each of which have correlation coefficients of greater than .50.
Relationship Between Group and Individual BenderA significant correlation was found between the
scores on group administration and the individual administration of the Bender (££.01). This implies that the Bender is reliable as a group measure.
Relationship of MVPT and the Various Administrations of the Bender
The greatest amount of correlation was found between the MVPT and the Multiple-Choice Bender. The relationship between the Group Bender and MVPT is nearly as strong. However, the Individual Bender correlates only about half as well.
Regression Results The results of the stepwise multiple linear regres
sion analysis are presented in Table 3. The F-values associated with the adjusted R^ for each model indicate that a significant amount of variance associated with the dependent variable has been explained by the independent variables. The primary contributors to the variance explained by each model are indicated by statistically significant regression coefficients. These particular findings are presented below.
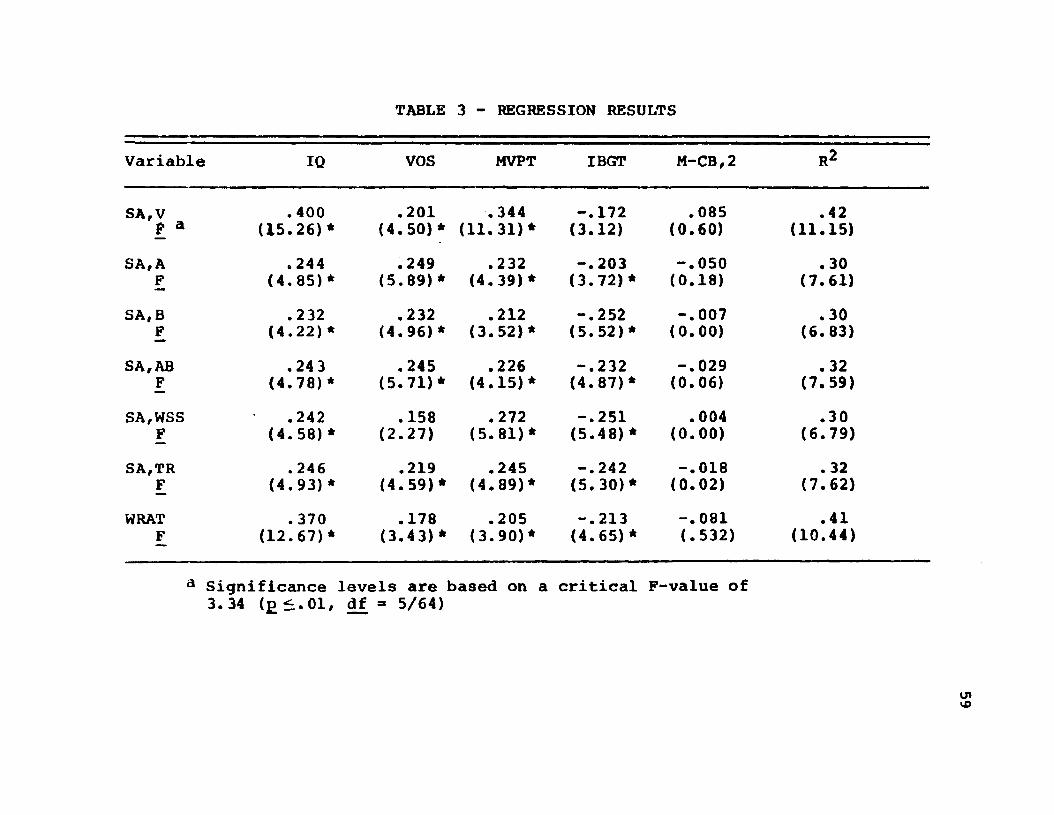
TABLE 3 - REGRESSION RESULTS
Variable IQ VOS MVPT IBGT M-CB,2 R2
SAf V .400 .201 .344 -.172 .085 .42I a (15.26)* (4.50)* (11.31)* (3.12) (0.60) (11.15)
SA, A .244 .249 .232 -.203 -.050 .30F (4.85)* (5.89)* (4.39)* (3.72)* (0.18) (7.61)
SA, B .232 .232 .212 -.252 -.007 .30F (4.22)* (4.96)* (3.52)* (5.52)* (0.00) (6.83)
SA, AB .24 3 .245 .226 -.232 -.029 .32F (4.78)* (5.71)* (4.15)* (4.87)* (0.06) (7.59)
SA,WSS .242 .158 .272 -.251 .004 .30F (4.58)* (2.27) (5.81)* (5.48) * (0.00) (6.79)
SA,TR .246 .219 .245 -.242 -.018 . 32F (4.93)* (4.59)* (4.89)* (5.30)* (0.02) (7.62)
WRAT . 370 .178 .205 -.213 -.081 .41F (12.67)* (3.43)* (3.90)* (4.65) * (.532) (10.44)
a Significance levels are based on a critical F-value of 3.34 (£ £.01, df = 5/64)
VO
60
Prediction of Stamford Achievement Test ScoresResults of the Stanford Achievement Test models
were basically as hypothesized. The predominance of significant coefficients for the IQ, MVPT, and Individual Bender tests indicate that these measures are most instrumental in the prediction of reading scores. Additionally, the Van Orden Star is useful in predicting scores on every reading subtest except word study skills. The Multiple-Choice Bender adds little by way of explanation to the models.
Prediction of WRAT Reading ScoresThe independent variables tended to predict WRAT
reading scores as well as Stanford Achievement Test scores. In fact, the R2 is higher for the WRAT than for any of the Stanford Reading Subtests, except vocabulary. Multiple-Choice Bender is again the only explanatory variable which does not make a significant contribution to the model.
The Effects of Multicollinearity on the Prediction of Reading
A Farrar-Glauber test of multicollinearity was run on the independent variables which enter into the regression models. A significant value was obtained which implies interdependence among the independent variables. Since multiple linear regression assumes independence
61
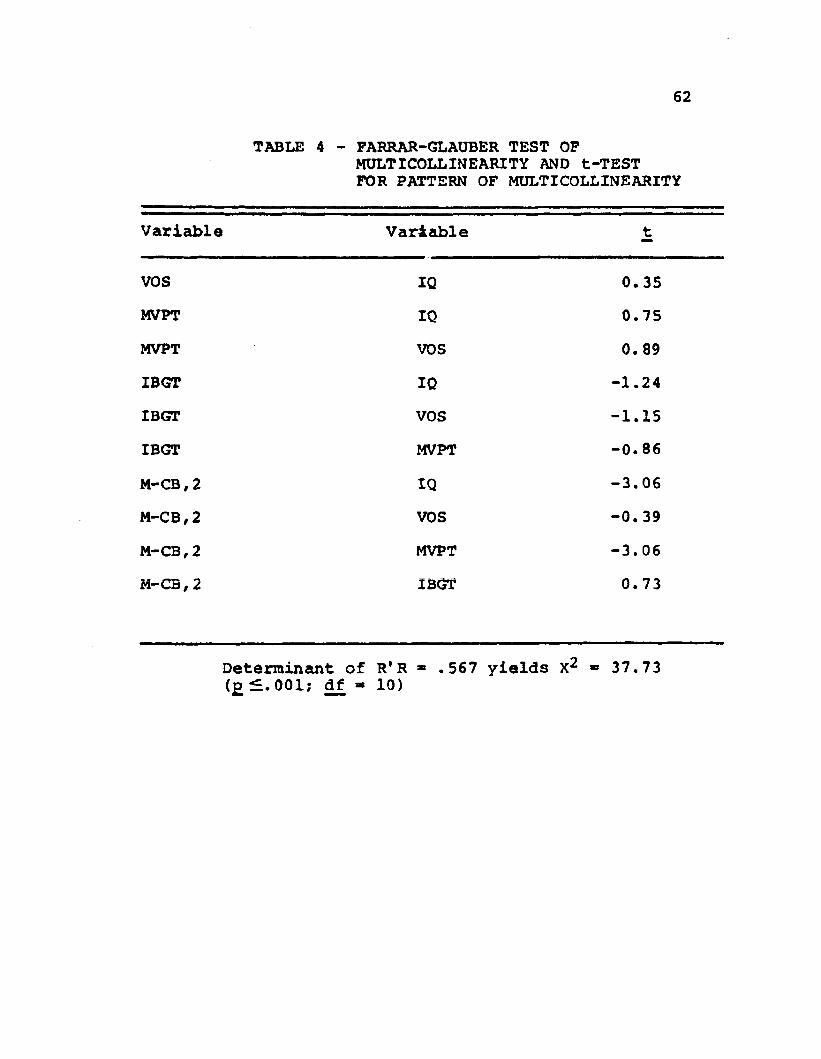
for these variables, such collinearity may affect the explanatory power of the model. To test this affect, a t-test was computed between each pair of independent variables. A significant value for the t indicates where the multicollinearity lies.
Significant results were found in the comparison between the Multiple-Choice Bender and IQ; and the Multiple-Choice Bender and the MVPT (Table 4). To ascertain which of these three variables were most interdependent with other variables in the model, a regression analysis was run which utilized each of them as a dependent variable to be explained by the remaining independent variables. The results of this analysis show that the Multiple-Choice Bender is most collinear with the other variables in the model (Table 5).
The results of the Farrar-Glauber analysis indicate that both the Multiple-Choice Bender and the MVPT were highly collinear with other independent variables in the model. Since both represent motor-free measures of perception, it was felt that they may contribute equally well to the explanation of the dependent variable if entered into separate models. A t-test was computed on the R2 resulting from these separate equations. Its significant value in favor of the MVPT indicates that the above assumption was not correct. The MVPT, indeed,
62
TABLE 4 - FARRAR-GLAUBER TEST OFMULTICOLLINEARITY AND t-TEST FOR PATTERN OF MULTICOLLINEARITY
Variable Variable t
VOS IQ 0.35MVPT IQ 0.75MVPT VOS 0. 89IBGT IQ -1.24IBGT VOS -1.15IBGT MVPT -0.86M-CB , 2 IQ -3.06M-CB,2 VOS -0.39M-CB,2 MVPT -3.06M-CB,2 IBGT 0.73
Determinant of R'R * .567 yields * 37.73 (£^.001; df * 10)
63
TABLE 5 - EXPLANATORY POWER OP INDEPENDENT VARIABLES REGRESSED ON EACH OTHER
Variable F-ratio R2
IQ 4.16 .20
VOS 1.14 .07MVPT 4.14 .20
IBGT 2.09 .11
M-CB,2 7.19 .31
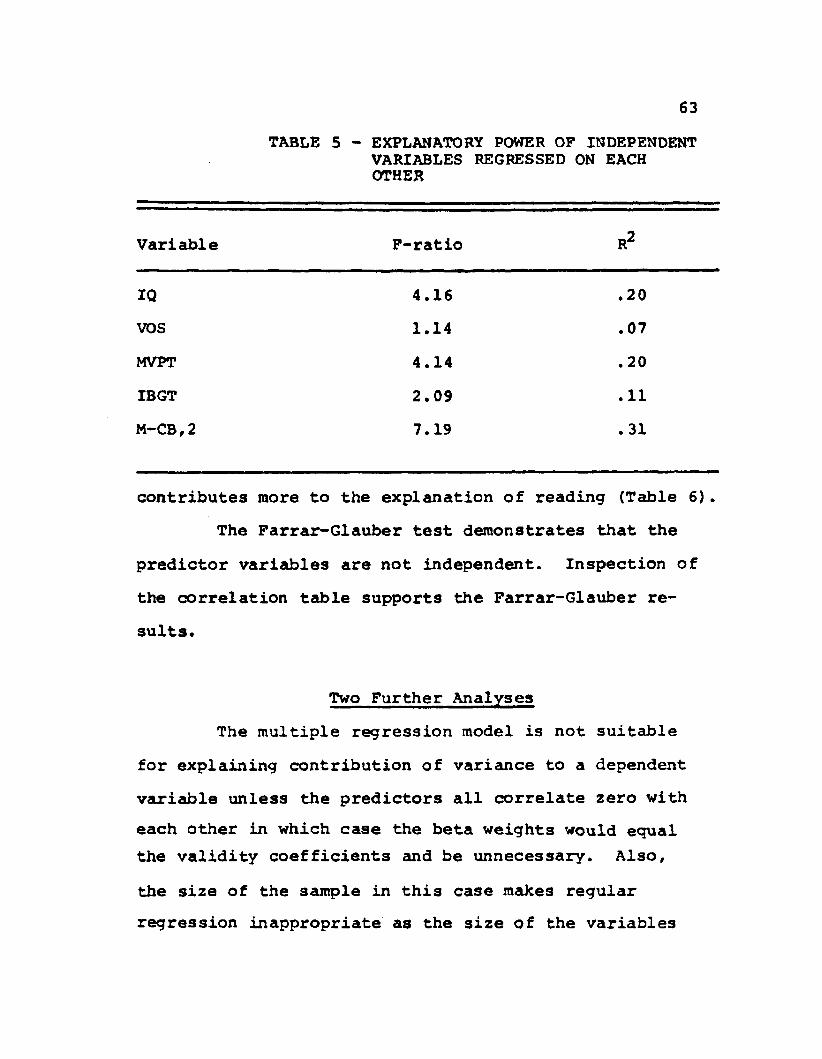
contributes more to the explanation of reading (Table 6). The Farrar-Glauber test demonstrates that the
predictor variables are not independent. Inspection of the correlation table supports the Farrar-Glauber results.
Two Further Analyses The multiple regression model is not suitable
for explaining contribution of variance to a dependent variable unless the predictors all correlate zero witheach other in which case the beta weights would equal the validity coefficients and be unnecessary. Also,the size of the sample in this case makes regular regression inappropriate as the size of the variables
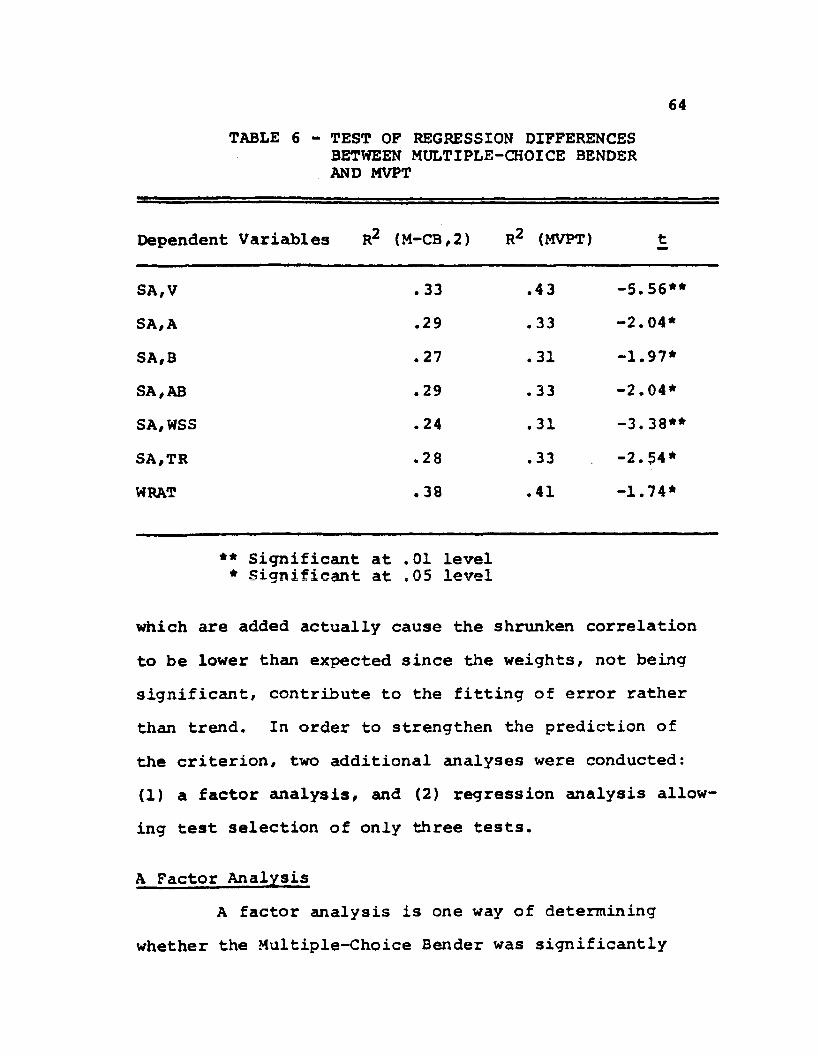
64TABLE 6 - TEST OP REGRESSION DIFFERENCES
BETWEEN MULTIPLE-CHOICE BENDER AND MVPT
Dependent Variables R2 (M-CB,2) R2 (MVPT) t
SA, V . 33 .43 -5.56**SA, A .29 .33 -2.04*SA,B .27 . 31 -1.97*SA,AB .29 .33 -2.04*SA,WSS .24 .31 -3.38**SA,TR .28 .33 -2.54*WRAT .38 .41 -1.74*
** Significant at .01 level* Significant at .05 level
which are added actually cause the shrunken correlation to be lower than expected since the weights, not being significant, contribute to the fitting of error rather them trend. In order to strengthen the prediction of the criterion, two additional analyses were conducted:(1) a factor analysis, and (2) regression analysis allowing test selection of only three tests.
A Factor AnalysisA factor analysis is one way of determining
whether the Multiple-Choice Bender was significantly
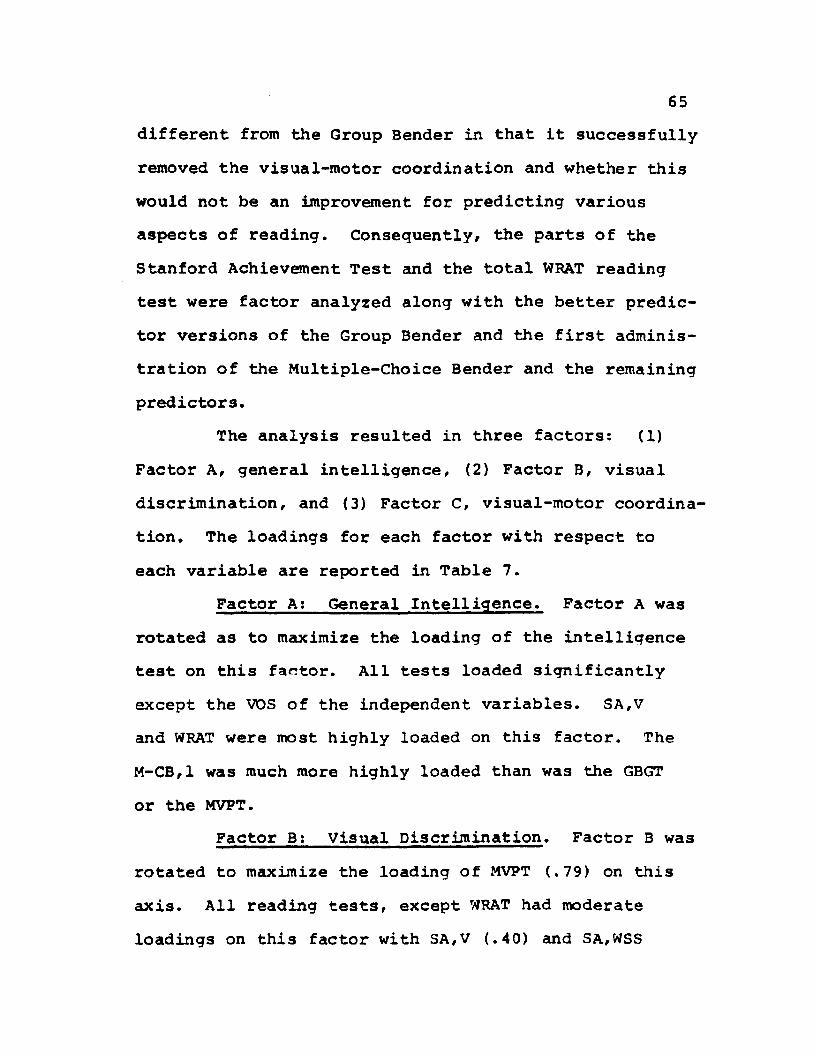
65different from the Group Bender in that it successfully removed the visual-motor coordination and whether this would not be an improvement for predicting various aspects of reading. Consequently, the parts of the Stanford Achievement Test and the total WRAT reading test were factor analyzed along with the better predictor versions of the Group Bender and the first administration of the Multiple-Choice Bender and the remaining predictors.
The analysis resulted in three factors: (1)Factor A, general intelligence, (2) Factor B, visual discrimination, and (3) Factor C, visual-motor coordination. The loadings for each factor with respect to each variable are reported in Table 7.
Factor A: General Intelligence. Factor A wasrotated as to maximize the loading of the intelligence test on this factor. All tests loaded significantly except the VOS of the independent variables. SA,V and WRAT were most highly loaded on this factor. The M-CB,1 was much more highly loaded than was the GBGT or the MVPT.
Factor B: Visual Discrimination. Factor B wasrotated to maximize the loading of MVPT (.79) on this axis. All reading tests, except WRAT had moderate loadings on this factor with SA,V (.40) and SA,WSS
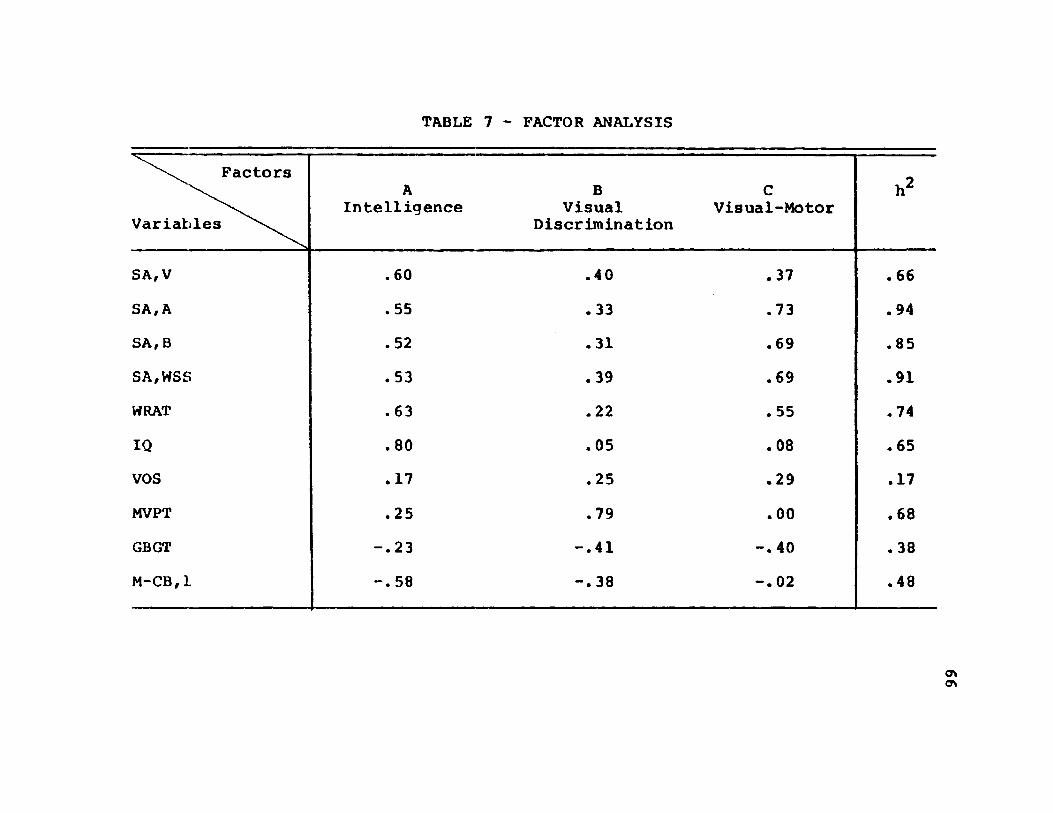
TABLE 7 - FACTOR ANALYSIS
Factors
VariablesA
IntelligenceB
VisualDiscrimination
CVisual-Motor
h2
SA, V .60 .40 .37 .66
SA, A .55 .33 .73 .94SA, B .52 .31 .69 .85SA,WSS . 53 .39 .69 .91WRAT .63 .22 . 55 .74IQ .80 .05 .08 .65VOS .17 .25 .29 .17MVPT .25 .79 .00 .68
GBGT -.23 -.41 -.40 .38M-CB,1. -.58 -.38 -.02 .48
OkOk
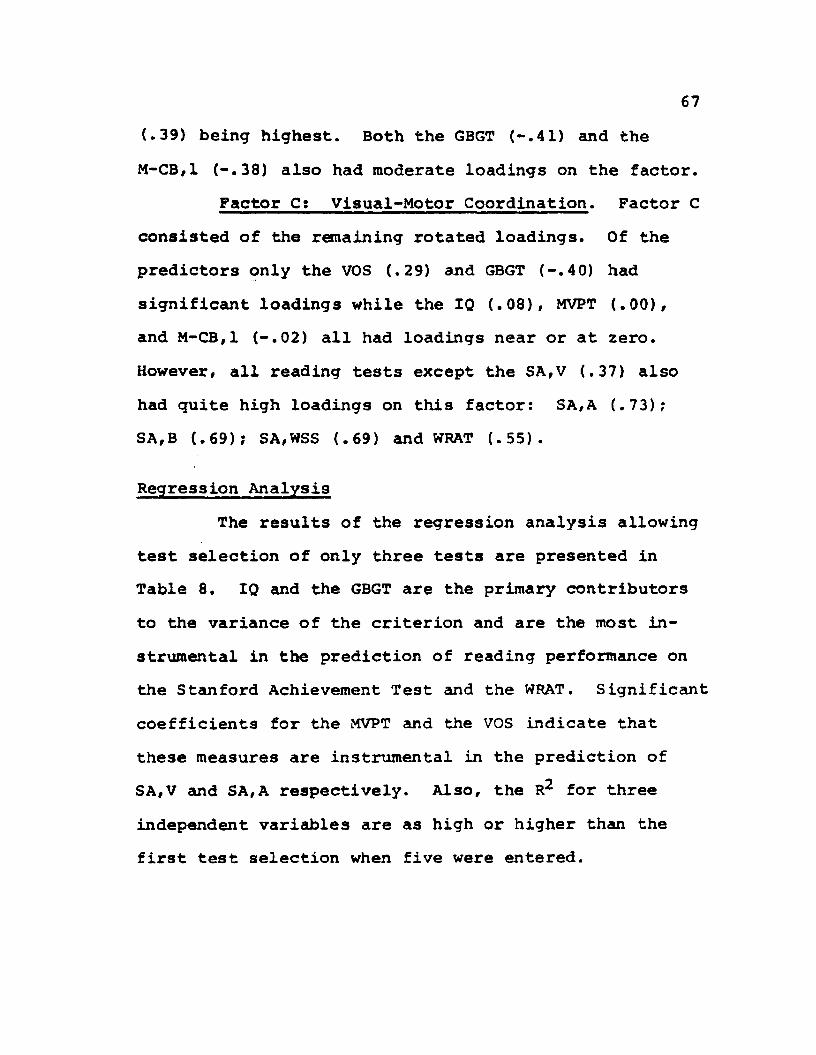
67(.39) being highest. Both the GBGT (-.41) and the M-CB,1 (-.38) also had moderate loadings on the factor.
Factor C: Visual-Motor Coordination. Factor Cconsisted of the remaining rotated loadings. Of the predictors only the VOS (.29) and GBGT (-.40) had significant loadings while the IQ (.08), MVPT (.00), and M-CB,1 (-.02) all had loadings near or at zero. However, all reading tests except the SA,V (.37) also had quite high loadings on this factor: SA,A (.73);SA,B (.69); SA,WSS (.69) and WRAT (.55).
Regression AnalysisThe results of the regression analysis allowing
test selection of only three tests are presented in Table 8. IQ and the GBGT are the primary contributors to the variance of the criterion and are the most instrumental in the prediction of reading performance on the Stanford Achievement Test and the WRAT. Significant
coefficients for the MVPT and the VOS indicate that these measures are instrumental in the prediction of SA,V and SA,A respectively. Also, the R2 for three independent variables are as high or higher than the first test selection when five were entered.
TABLE 8 - REGRESSION COEFFICIENTS AND MULTIPLE R2FOR TEST SELECTION ALLOWING ONLY THREE TESTS
Variable IQ VOS MVPT GBGT M-CB,2 R2
SA, V F a
.398 (17.64)*
.284(7.48)*
-.247(6.00)*
.44(17.47)
SA, A F
.294(9.06)*
.214(4.49)*
-. 393 (14.98)*
.39(13.88)
SA, BF
.271(7.40)*
.196(3.65)
-.399 (14.82)*
.38(15.97)
SA, ABF
.288(8.70)*
.208(4.28)*
-.403(15.76)*
.39(13.87)
SA, WSS F
.266(7.13)*
.195(3.31)
-.389(13.40)*
.39(13.62)
SA,TRF
.291 (8.88)*
.183(3.31)
-.417(16.89)*
.39(13.88)
WRATF
. 352 (12.11)*
-. 381 (16.08)*
-.203(3.61)
.49(18.84)
a Significant levels are based on a critical F-value of 4.12 (£ 01, df - 3/66)
SummaryThe major findings of the statistical analyses
be summarized as follows:Test-retest reliability for the Multiple-Choice Bender was established (£<.01).
Item analysis of the errors on the Multiple-Choice Bender indicated that the L-C(l) transformation was the most difficult for all three stimulus card universes. Major contributions to explanation of errors were the S-B distractor in the first and second universe and L-C(2) in the first and third universe. In the only universe which the U-D distractor was an error/ it proved to be the most difficult.
All the independent variables were highly correlated with the Stanford Achievement Test scores (£^.05). At the .01 level, only two of the independent variables were not significant with respect to one of the dependent variables: (1) second administration of the Multiple-Choice Bender and the comprehension subtest (.29), and (2) Van Orden Star and the word study skills subtest (.29). The significance was greatest for the Group Bender where correlations exceeded .50 for all reading
subtests except vocabulary (.43). A high correlation existed between IQ and the vocabulary subtest (.50).
Word recognition scores on the Wide Range Achievement Test were significantly correlated with all the independent variables {£ 5.01). The highest correlations were found with IQ, Group Bender, and the first administration of the Multiple-Choice Bender ( >.50).
Scores on the group administration and the individual administration of the Bender correlated significantly (£ 5.01) .
Significant correlations were found between the Motor-Free Visual Perception Test (MVPT) and the various administrations of the Bender (£ 5.05). The highest correlations were between the MVPT and the first administration of the Multiple-Choice Bender (.44) and the second administration of the Multiple- Choice Bender (.42). The relationship between the MVPT and the Group Bender was similar, but not quite as strong (.40). The Individual Bender correlated only half as well with the MVPT (.21).
717. The results of the stepwise multiple linear regres
sion analysis indicated that a significant amount of variance associated with the dependent variables had been explained by the independent variables.The MVPT and IQ were the most instrumental in the prediction of reading scores on all the subtestsof the Stamford Achievement Test (£<.01). The Van Orden Star and the Individual Bender predicted equally well for all the subtests except word study skills and vocabulary respectively. The second administration of the Multiple-Choice Bender was not a primary contributor to the variance. All independent variables, except the second administration of the Multiple-Choice Bender, predicted Wide Range Achievement Test reading scores as well as Stamford Achievement Test scores. The R2 was higher for the Wide Range Achievement Test reading subtest (.41) them any of the Stamford Reading Subtests except vocabulary (.42).
8. The results of the Farrar-Glauber analysis indicated that the Multiple-Choice Bender and the MVPT were highly collinear with the other independent variables. A test of regression differences resulted in a significant t-value at the .05 level in favor of the MVPT which indicates
72that the MVPT contributes more to the explanation of the reading variables.
9. Factor analysis produced three factors: (1) FactorA, general intelligence, (2) Factor B, visual discrimination, and (3) Factor C, visual-motor coordination. All tests loaded significantly with Factor A, except the Van Orden Star. The reading subtest of the Wide Range Achievement Test and the vocabulary subtest of the Stanford Achievement Test loaded highest. The loadings for all tests with Factor B ranged from moderate to low. The Van Orden Star, Group Bender, and all the reading tests, except the vocabulary subtest of the Stanford Achievement Test, had very high loadings with Factor C.
10. Regression analysis allowing test selection of only three tests indicated that the Group Bender and IQ were the most instrumental in the prediction of reading performance on the Stanford Achievement Test and the Wide Range Achievement Test. The R^ for the three independent variables were as high or higher than when five were entered,
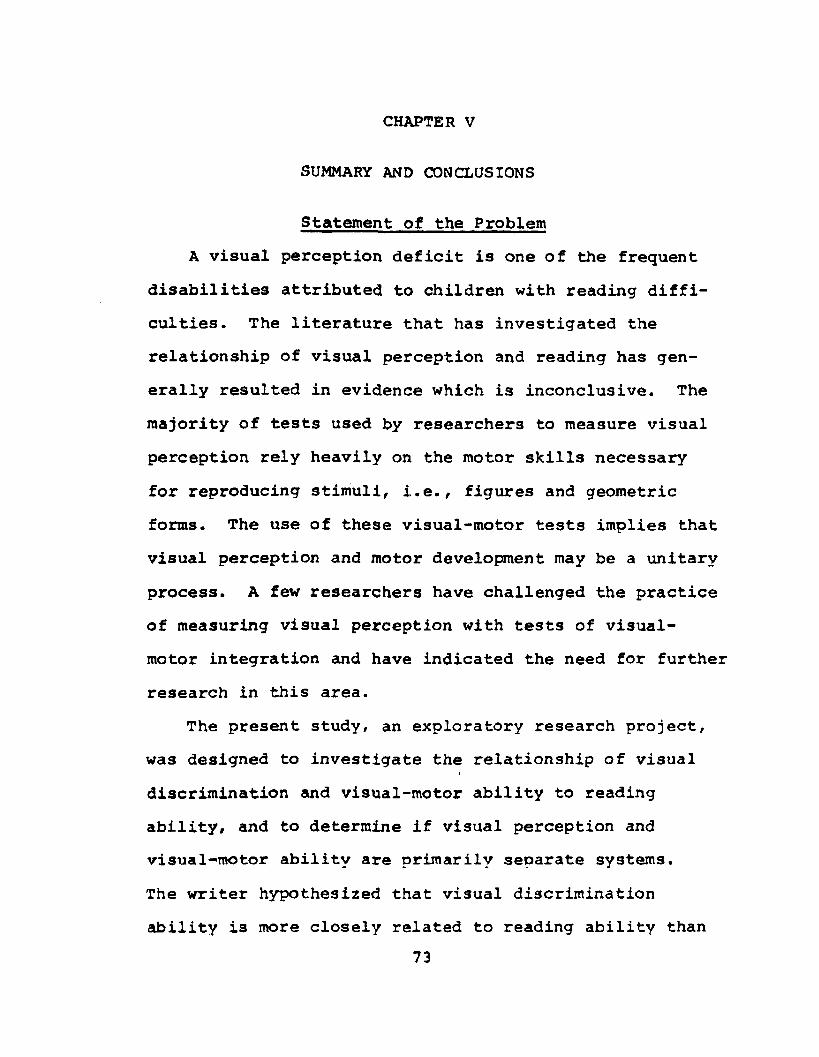
CHAPTER V
SUMMARY AND CONCLUSIONS
Statement of the Problem A visual perception deficit is one of the frequent
disabilities attributed to children with reading difficulties. The literature that has investigated the relationship of visual perception and reading has generally resulted in evidence which is inconclusive. The majority of tests used by researchers to measure visual perception rely heavily on the motor skills necessary for reproducing stimuli, i.e., figures and geometric forms. The use of these visual-motor tests implies that visual perception and motor development may be a unitary process. A few researchers have challenged the practice of measuring visual perception with tests of visual- motor integration and have indicated the need for further research in this area.
The present study, an exploratory research project, was designed to investigate the relationship of visual discrimination and visual-motor ability to reading ability, and to determine if visual perception and visual-motor ability are primarily separate systems.The writer hypothesized that visual discrimination ability is more closely related to reading ability than
73
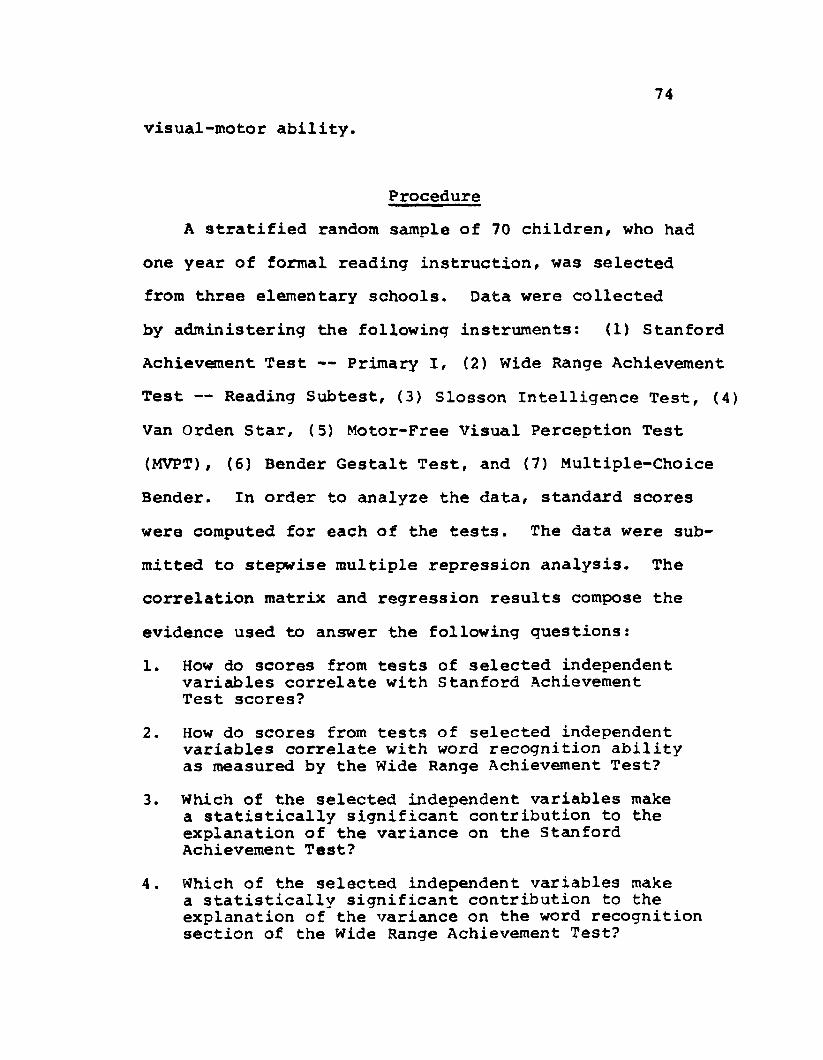
74visual-motor ability.
ProcedureA stratified random sample of 70 children, who had
one year of formal reading instruction, wa3 selected from three elementary schools. Data were collected by administering the following instruments: (1) StanfordAchievement Test — Primary I, (2) Wide Range Achievement Test — Reading Subtest, (3) Slosson Intelligence Test, (4) Van Orden Star, (5) Motor-Free Visual Perception Test (MVPT), (6) Bender Gestalt Test, and (7) Multiple-Choice Bender. In order to analyze the data, standard scores were computed for each of the tests. The data were submitted to stepwise multiple repression analysis. The correlation matrix and regression results compose the evidence used to answer the following questions:1. How do scores from tests of selected independent
variables correlate with Stanford Achievement Test scores?
2. How do scores from tests of selected independent variables correlate with word recognition ability as measured by the Wide Range Achievement Test?
3. Which of the selected independent variables make a statistically significant contribution to the explanation of the variance on the Stanford Achievement Test?
4. Which of the selected independent variables make a statistically significant contribution to the explanation of the variance on the word recognition section of the Wide Range Achievement Test?
SummaryThe findings are presented as they relate to each
of the research questions.
Question OneIn direct response to the question, "How do scores
from tests of selected independent variables correlate with Stanford Achievement Test scores?", it was found that all the independent variables significantly correlated at the .05 level with each subtest of the Stanford Reading Test. Only two of the independent variables were not significant at the .01 level with respect to a reading subtest: (1) second administration of theMultiple-Choice Bender and the comprehension subtest and (2) Van Orden Star and the word study skills subtest.
Question TwoIn direct response to the question, "How do scores
from tests of selected independent variables correlate with word recognition ability as measured by the Wide Range Achievement Test?", it was found that all independent variables were significant at the .01 level. IQ, Group Bender, and first administration of the Multiple- Choice Bender had the highest correlations with word recognition.
76Question Three
In direct response to the question, "Which of the selected independent variables make a statistically significant contribution to the explanation of the variance on the Stanford Achievement Test?", it was found that when five measures were selected that the MVPT and IQ were the most instrumental in the prediction of all reading subtest scores (£ ±.01). The Van Orden Star and the Individual Bender predicted equally well for the subtests except word study skills and vocabulary respectively. The second administration of the Multiple- Choice Bender was not a primary contributor to the variance.
In direct response to the question, "which of the selected independent variables make a statistically significant contribution to the explanation of the variance on the Stanford Achievement Test?", it was found that when test selection was limited to three tests, that the Group Bender and IQ were the strongest criterion in the prediction of reading. These results were verified by factor analysis. Factor A, general intelligence and Factor C, visual-motor coordination had significant loadings with all the reading subtests of the Stanford Achievement Test, except the vocabulary subtest.
77
Question FourIn direct response to the question, "Which of the
selected independent variables make a statistically significant contribution to the explanation of the variance on the word recognition section of the Wide Range Achievement Test?", it was found that when five measures were selected that the MVPT, Van Orden Star, Individual Bender, and IQ were all instrumental in the prediction of word recognition scores (£<.01). The second administration of the Multiple-Choice Bender was not a primary contributor to the variance.
In direct response to the question, "Which of the selected independent variables make a statistically significant contribution to the explanation of the variance on the word recognition section of the Wide Range Achievement Test?", it was found that when test selection was limited to three tests that the Group Bender and IQ were the strongest predictors of word recognition ability. Factor analysis supported these results in that the factors of general intelligence and visual-motor coordination loaded highest with the criterion of word recognition.
The major findings of the study were: (1) the GroupBender and IQ significantly predicted reading performance on the Stanford Achievement Test and the Wide Range
78 ,Achievement Test, and (2) the Stanford Achievement Test, except the vocabulary subtest, and the reading subtest of the Wide Range Achievement Test had significant high loadings on the factors of general intelligence and visual-motor coordination. The Multiple-Choice Bender was not a primary contributor to the variance.
LimitationsA limitation of the study is that the mean IQ was
114. The negative skewness of the IQ distribution prevents comparisons being made to an "average" population.
Another variable in operation was that four intern school psychologists administered the SIosson Intelligence Test, Motor-Free Visual Perception Test, Bender Gestalt Test, and the reading subtest of the Wide Range Achievement Test. Inter-scorer reliability was not established. Therefore, a limitation concerning the correlation validity of scores could exist.
ConclusionsBased on these findings and limitations, the follow
ing conclusion is derived. Visual-motor ability, rather them visual discrimination ability, is closely related to reading ability and significantly instrumental in the prediction of reading scores. Therefore, the hypothesis was not supported.
79Implications
The important aspects of the study are discussed in relation to practical application and needed research.
Implication OneThe significant correlation between scores on the
group administration and the individual administration of the Bender (£^.01) supported the findings of former studies (Becker & Sabatino, 1971; Keogh & Smith/ 1961). These results indicate that the Bender could be administered successfully as a group test; and used as a group screening device to collect perceptual-motor data on first and second grade children. Group administration would enable substantial savings in total administration time and could be incorporated in schools' testing programs without additional expense.
Implication TwoThe line-to-curve(l) in the transformations of the
Multiple-Choice Bender were the most difficult for all three stimulus card universes. This finding does not concur with Gibson's (1962) results where perspective transformations/ slant-left and tilt-back, constituted the highest percentage of errors for the seven year old group. Partial support for Gibson's findings was found in the first and second universe where the slant-back
80transformation explained 16 percent and 65 percent of the chi-square value respectively.
Implication ThreeThe Van Orden Star was found to significantly predict
performance on the word reading subtest of the Stanford Achievement Test, but not on the word recognition subtest of the Wide Range Achievement Test. Also, the Van Orden Star had moderate loadings on the factors of visual discrimination and visual-motor coordination, and a low loading on the factor of general intelligence. This would be an area for future research to explore such questions as: (1) What other factors are measured bythe Van Orden Star? (2) How do these factors affect or contribute to reading performance? and (3) Is the Van Orden Star instrumental in predicting reading performance across different age groups and socioeconomic levels?
Implication FourThe Slosson Intelligence Test primarily measures
verbal intelligence. Future investigations might use the Wechsler Intelligence Scale for Children (WISC) in order to determine: (1) How does performance ontests similar to subtests on the WISC relate to reading ability? (2) Is there a difference between the relationship of the WISC Verbal Scale to reading and the WISC
81
Performance Scale to reading? and (3) Which of these scales correlate significantly with visual discrimination tests and/or visual-motor tests?
Implication FiveA significant correlation was found between the
Multiple-Choice Bender and the dependent variables (£^.05), but the regression analysis indicated that the Multiple- Choice Bender was not instrumental in the prediction of reading scores. Since the Multiple-Choice Bender had a significant high loading on the factor of general intelligence and the reading criterion loaded highest on the factors of general intelligence and visual-motor coordination, the writer feels that modification of the Multiple-Choice Bender would be worthy of additional research. Possible modifications could be: (1) Increasethe number of stimulus designs, but reduce the number of distractors for each stimulus, (2) Change the scoring system; so the total for each type of error is recorded, and (3) Compare the types of error made on the Multiple-Choice Bender with the same errors on the Individual Bender, i.e., number of rotation errors, number of distortions.
Implication SixChildren in the sample were exposed to only one
reading system, Scott Foresman. Future research might
82focus on the question: Is there a significant differencein the performance of children on tests of visual discrimination and visual-motor ability when these children have been instructed in different reading systems?
Implication SevenThe Group Bender Gestalt Test was significant and
instrumental in the prediction of reading scores on the Wide Range Achievement Test and the Stamford Achievement Test. This finding is supported by other studies where IQ was also a variable (Keogh, 1965; Koppitz, 1973).Since IQ is significantly correlated with vocabulary and the Bender is significamtly correlated with IQ, future questions to explore might be: (1) What is theintercorrelation of factors as measured by intelligence tests and vocabulary tests? and (2) Would the results in the study be replicated if a different measure of vocabulary were utilized and/or the sample was comprised of children of different ages, different socioeconomic backgrounds, and different races?
Implication EightSince the mean IQ for the sample in the study was
114, generalization of results to the "average'1 population is limited. Future research might consider a sample of children whose mean IQ falls in the "average" range (90-109 IQ) .
83Implication Nine
Since the multiple are lower for the commonality of variance for the reading tests, this indicates that the criteria contain elements or factors not present in the current prediction battery. It would be interesting for future research to investigate an index of prediction that would involve the addition of auditory skills, attention span, and listening skills.
Implication TenFactor analysis indicated that all the reading
criterion, except the vocabulary subtest of the Stanford Achievement Test, loaded highest on the factor of visual- motor coordination. This finding suggests that programs such as the Perceptual Training Procedure for Beginning School Children (Winter Haven Lions Research Foundation, 1963) would be beneficial for children who have deficits in visual-motor coordination. Future investigations might employ the Winter Haven program in order to determine the program's effect on reading progress.
A P P E N D I X
84
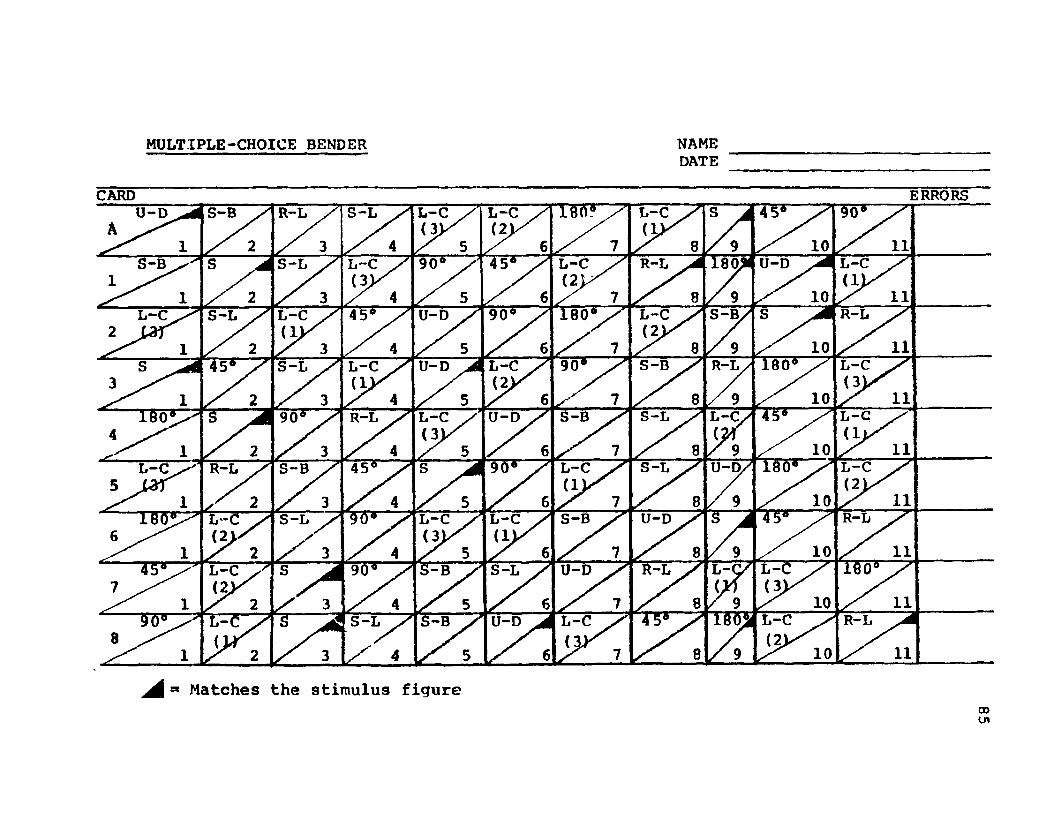
MULTIPLE-CHOICE BENDER NAMEDATE
CARD ERRORS45S-B S-L L-C L-C L-CU-D R-L
104590 L-CS-B L-CS-L L-C
1018090 S-B R-LL-C45 U-DL-C S-L L-C
10Tso*90 S-B L-CU-D L-C R-LS-L L-C10
L-CS-L L-CS-B90 L-C U-DR-L
90 L-CS-L U-D,45 L-CL-C R-L S-B10
R-LS-B U-DL-CS-L L-C10
L-CR-L45 90 S-L U-DL-C
r m L-C R-LL-CL-C S-L U-D10
ji4 * Matches the stimulus figure00Ut
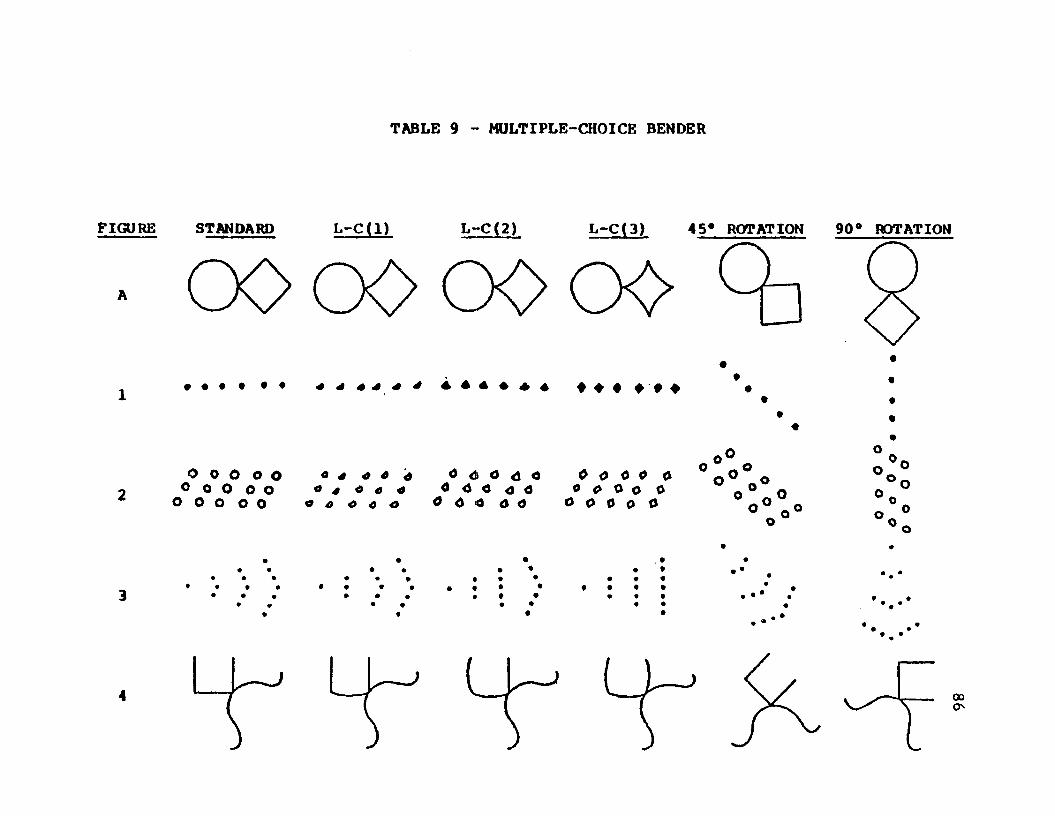
FIGURE
A
1
2
3
TABLE 9 - MULTIPLE-CHOICE BENDER
STANDARD L-C(1) L-C (2) L-C(3) 45* ROTATION 90* ROTATION
OO OO OO 00 On
o O O O o o o o o o o o o o o4 4 0 0 0 0 4 0 0 0 4 4 0 0 0
O®o° eo ° o° ° o ° °
U - - L U r ooO'
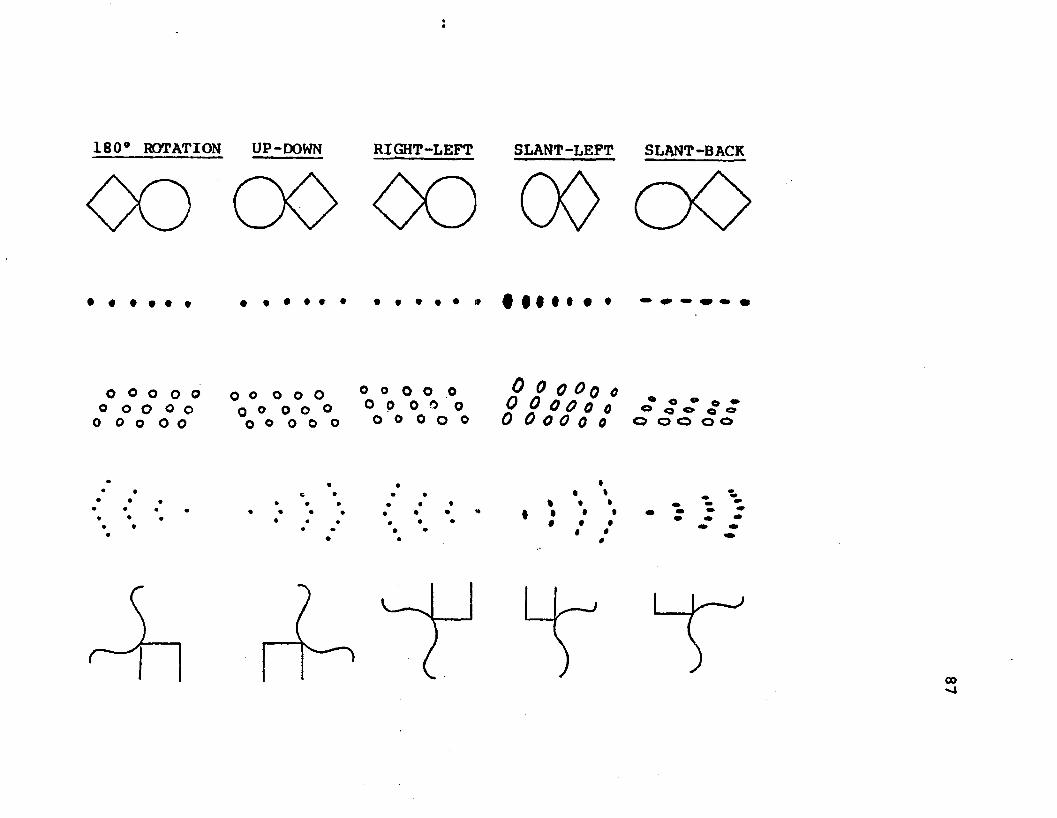
180* ROTATION UP-DOWN RIGHT-LEFT
o o o o o O O O O O O o O O Oo o o o o o o o o oO O o O O O O O O O o o o o o
SLANT-LEFT SLANT-BACK
# • • • • • • .........
0 0 0 O q 0 0 0 0 0 o o o 0 0 0 0 0 0 o o o o o
• *% » *I • • • •« * •i «
#
00-■J
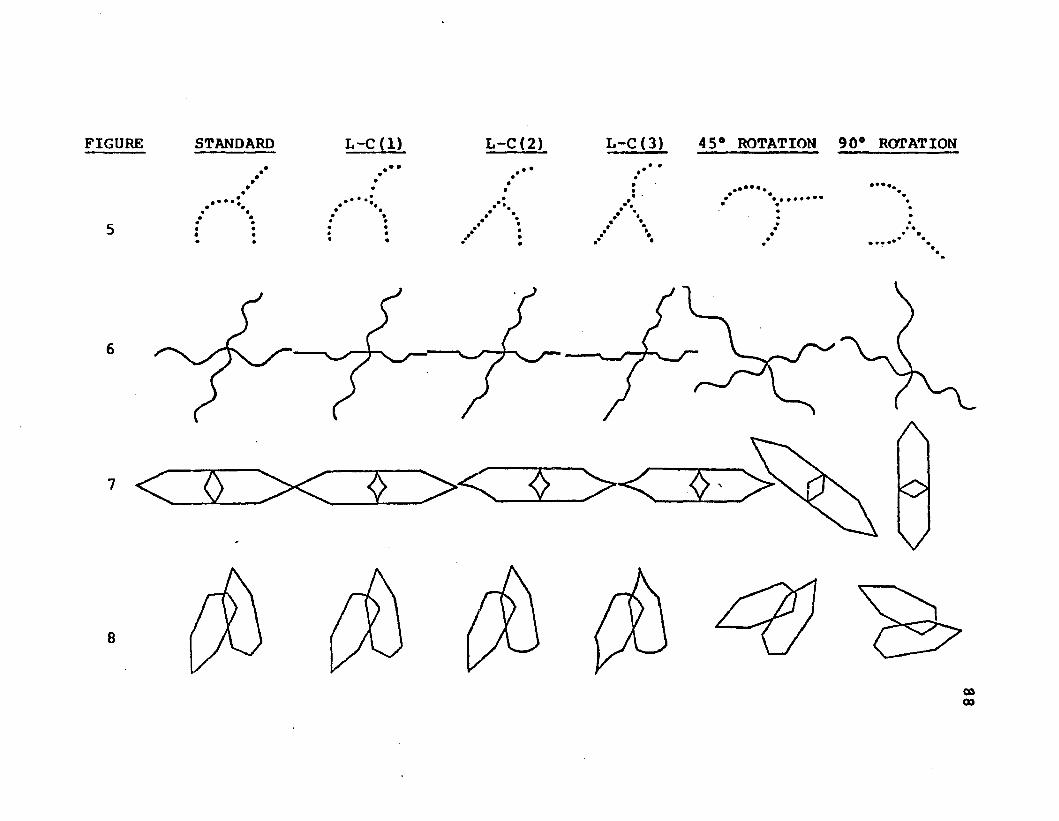
FIGURE STANDARD
7 < Z £
4 5° ROTATION 90° ROTATION
Ao
V
oaoo
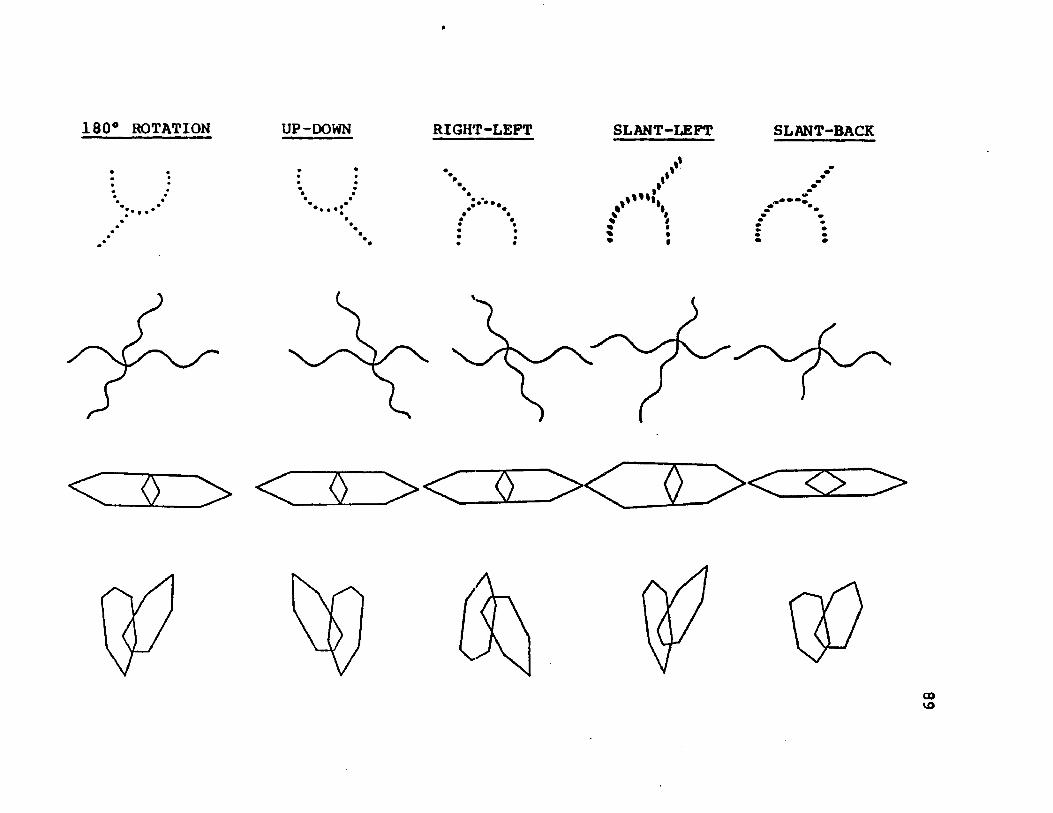
180° ROTATION UP-DOWN RIGHT-LEFT
• •
< Z 2 Z > < Z ? L > < C 5
• ♦♦I
SLANT-BACK
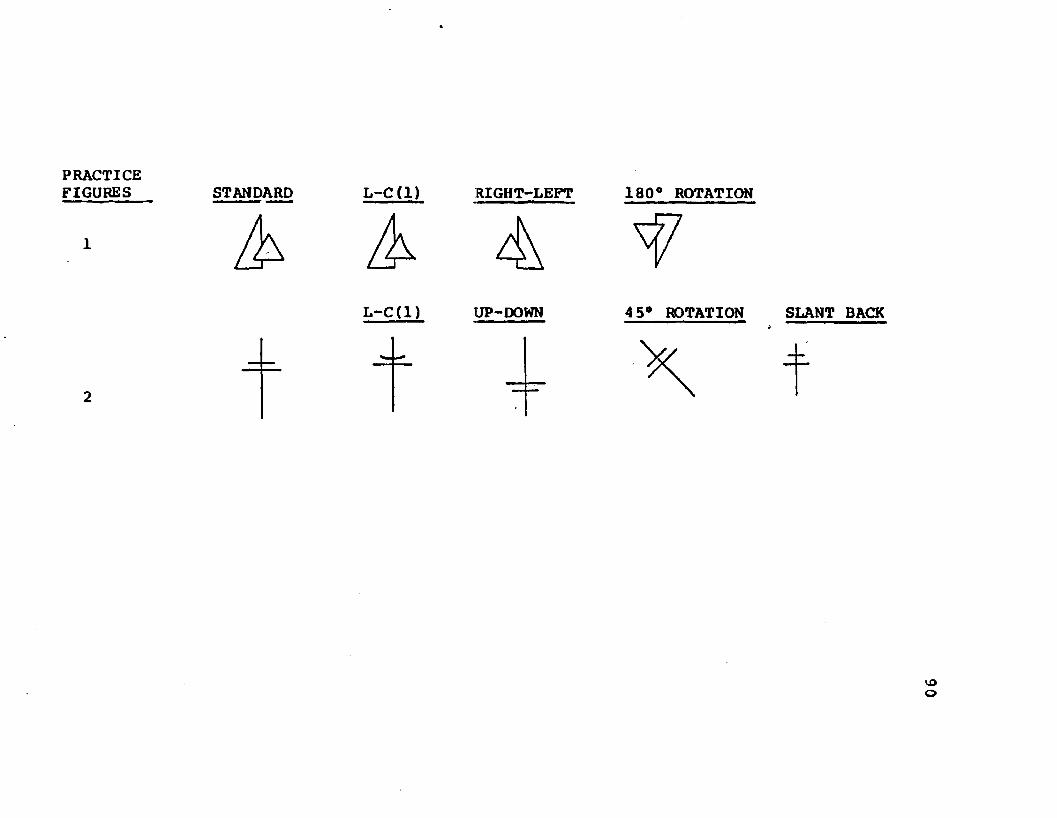
PRACTICEFIGURES
1
STANDARD
4
L-C(l)
L-C(l)
RIGHT-LEFT 180° ROTATION
4 ^
UP-DOWN 4 5® ROTATION SLANT BACK
o
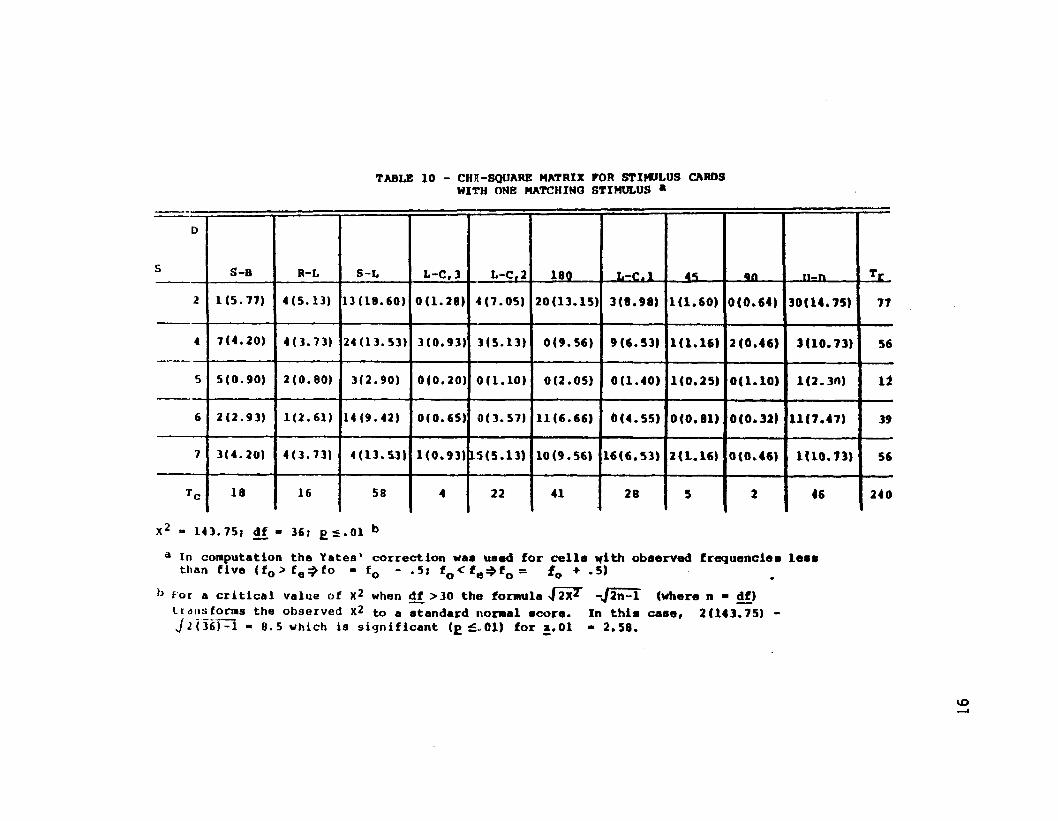
TABLE 10 - CHIT-SQUARE MATRIX FOR STIMULUS CARDSWITH ONE MATCHING STIMULUS *
D
S S-B R-L S-L L-C.3 L-C.2 180 L-C.l 45 4n n-n Tr2 1(5.77) 4(5.13) 13(18.60) 0(1.28) 4(7.05) 20(13.15) 3(8.98) 1(1.60) 0(0.64) 30(14.75) 77
4 7(4.20) 4(3.73) 24(13.53) 3(0.93) 3(5.13) 0(9.56) 9(6.53) 1(1.16) 2(0.46) 3(10.73) 56
5 5(0.90) 2(0.80) 3(2.90) 0(0.20) 0(1.10) 0(2.05) 0(1.40) 1(0.25) 0(1.10) 1(2.30) 12
6 2(2.93) 1(2.61) 14(9.42) 0(0.65) 0(3.57) 11(6.66) 0(4.55) 0(0.81) 0(0.32) 11(7.47) 39
7 3(4.20) 4(3.73) 4(13.53) 1(0.93) L5(5.13) 10(9.56) 16(6.53) 2(1.16) 0(0.46) 1(10.73) 56
TC 18 16 58 4 22 41 28 5 2 46 240
X2 - 14 3,7 5 j df - 36 j ££.01 ba In computation the Yates' correction was used for cells observed frequencies lessthan five (f0>fe^fo - f Q - ,5j *0 <*e=*f0 = f0 ♦ •5)
b for a critical value of X2 when df >30 the formula 4 2X2 - J ln - 1 (where n ■ df)transforms the observed X2 to a standard normal score. In this case* 2(143.75) -J2( 36)-1 -8.5 which is significant (££.01) for a.01 “ 2.58.
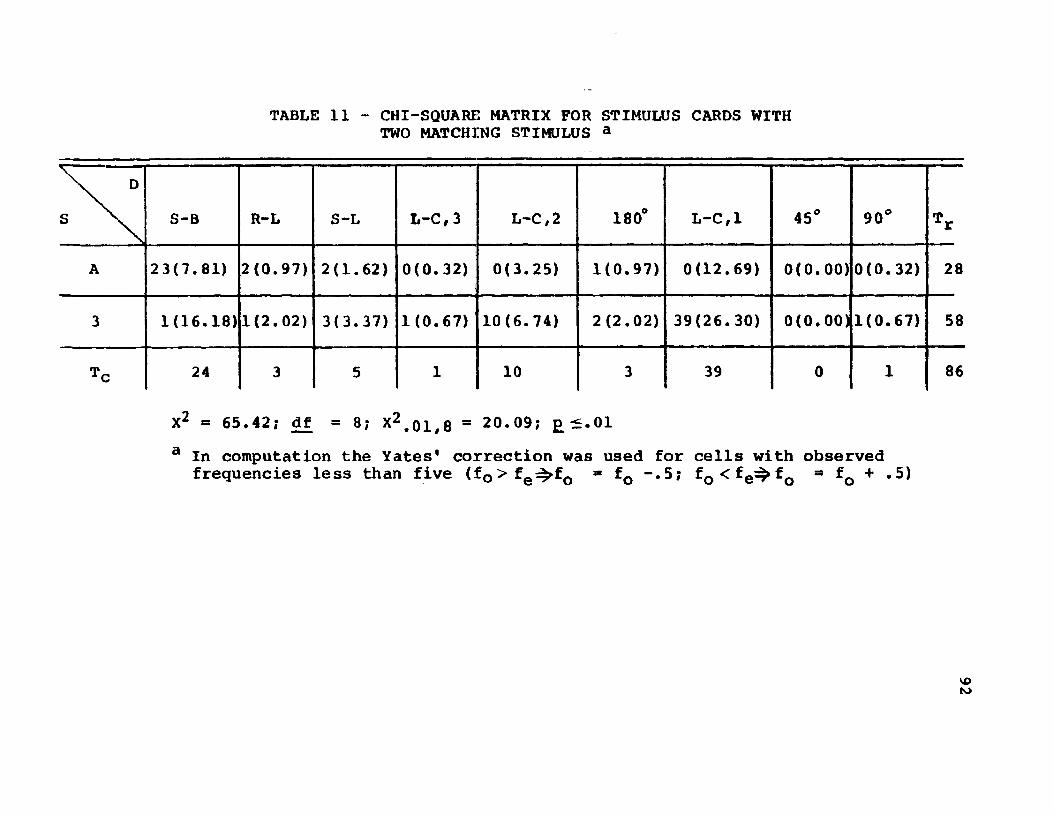
TABLE 11 - CHI-SQUARE MATRIX FOR STIMULUS CARDS WITH TWO MATCHING STIMULUS a
DS S-B R-L S-L L-C,3 L-C ,2 180° L-C, 1 45° 90° TAr
A 23(7.81) 2(0.97) 2(1.62) 0(0.32) 0(3.25) 1(0.97) 0(12.69) 0(0.00)0(0.32) 28
3 1(16.18) 1(2.02) 3(3.37) 1(0.67) 10(6.74) 2 (2.02) 39(26.30) 0(0.00)1(0.67) 58
Tc 24 3 5 1 10 3 39 0 1 86
= 65.42; djf = 8; X^.oi,8 = 20.09? £t5.01a In computation the Yates' correction was used for cells with observed
frequencies less than five (fQ > fe ^ fo 3 fo “*5'* fo <fe ^ fo = fo + *5)
VOto
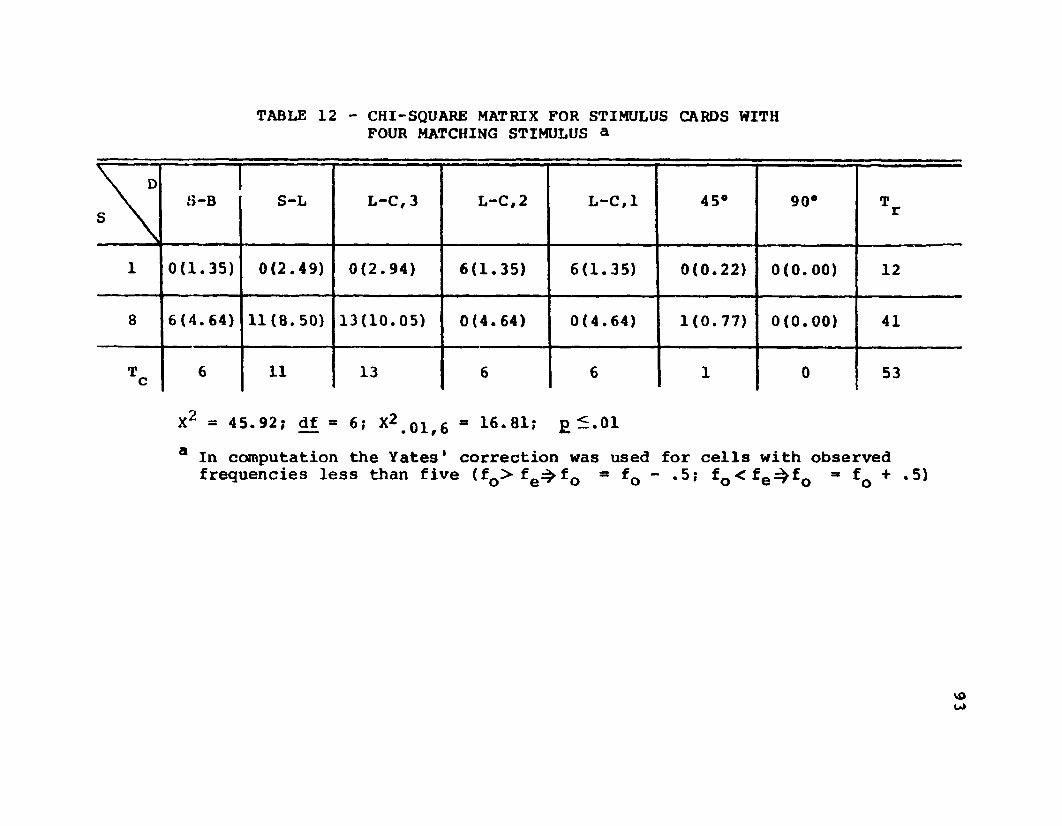
TABLE 12 - CHI-SQUARE MATRIX FOR STIMULUS CARDS WITHFOUR MATCHING STIMULUS a
\ D S \
1S-B S-L L-C, 3 L-C, 2 L-C, 1 oin
i•o
11
Tr
1 0(1.35) 0(2.49) 0(2.94) 6(1.35) 6(1.35) 0(0.22) 0(0.00) 12
8 6(4.64) 11(8.50) 13(10.05) 0(4.64) 0(4.64) 1(0.77) 0 (0.00) 41
TC 6 11 13 6 6 1 0 53
X2 = 45.92; df = 6; X2>01>6 * 16.81; £ 5.01a In computation the Yates' correction was used for cells with observed
frequencies less than five (fQ> f e=^f0 = fQ - .5; f0 < f e=^fQ » f + .5)
vOu»
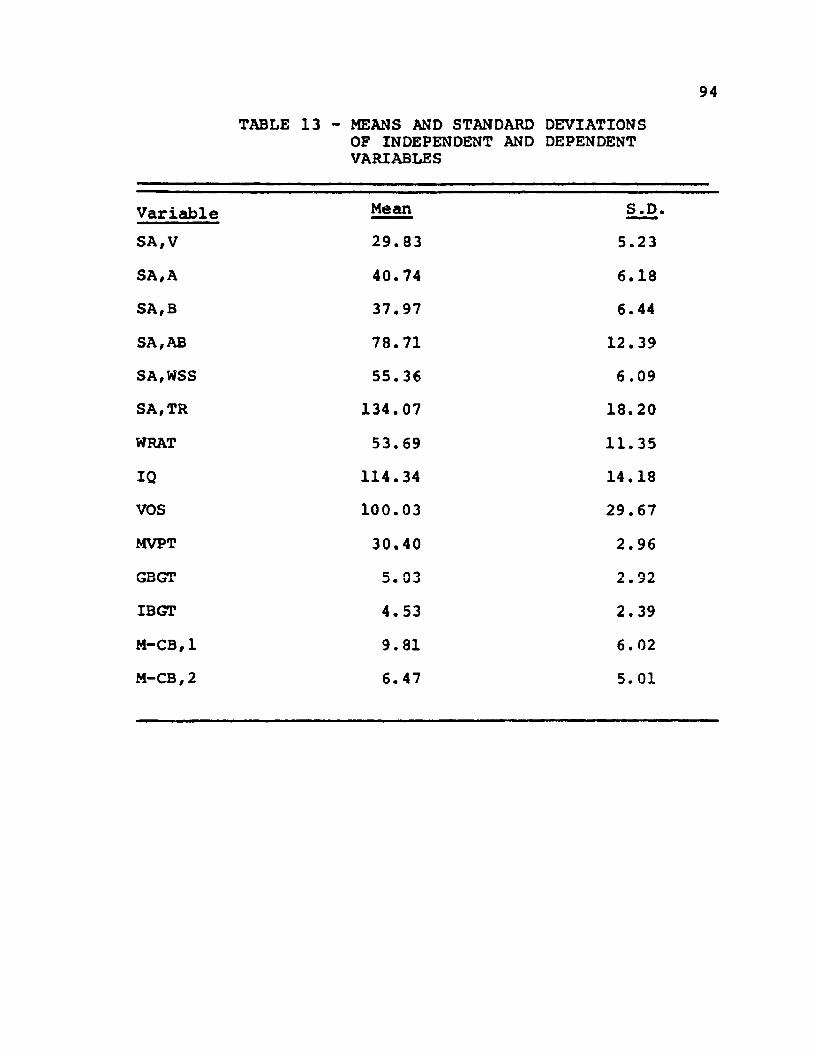
94TABLE 13 - MEANS AND STANDARD DEVIATIONS
OF INDEPENDENT AND DEPENDENT VARIABLES
Variable Mean S.DSA,V 29.83 5.23SA,A 40.74 6.18SA,B 37.97 6.44SA, AB 78.71 12.39SA,WSS 55.36 6.09SA,TR 134.07 18.20WRAT 53.69 11.35IQ 114.34 14.18VOS 100.03 29.67MVPT 30.40 2.96GBGT 5. 03 2.92IBGT 4.53 2.39M-CB/1 9.81 6. 02M-CB,2 6.47 5.01
95FRENCH RUN SCHOOL 1200 EPWORTH AVENUE REYNOLDSBURG, OHIO 43068
O c to b e r 8 , 1974
Dear Parent,Miss Julia Wright, our school psychologist, would
like to conduct a study with pupils selected at random from the first and second grades.
The purpose of this study is to examine various abilities of children at the primary grade level and to determine if these abilities correlate with reading achievement. Miss Wright will spend about 4 5 minutes with your child on an individual basis. Also, a group reading test will be administered to all of the children selected from French Run School.
Your child, , has been chosenfor participation in this study, ii you approve, please indicate below and return the permission form to your child's teacher. Also, if you have any questions, you may contact Miss Wright on Tuesdays at French Run School, Telephone: 866-5590.
Sincerely,(S) RALPH PARRILL
Principal
I approve of my child being included in this study.I do not approve of my child being included in this study.
Parent's Signature
96
ROSE HILL SCHOOL 760 ROSE HILL ROAD REYNOLDSBURG, OHIO 43068
O c to b e r 8 , 19 74
Dear Parent,Miss Julia Wright, our school psychologist, would
like to conduct a study with pupils selected at random from the first and second grades.
The purpose of this study is to examine various abilities of children at the primary grade level and to determine if these abilities correlate with reading achievement. Miss Wright will spend about 45 minutes with your child on an individual basis. Also, a group reading test will be administered to all of the children selected from Rose Hill School.
Your child, , has been chosenfor participation in this study. If you approve, please indicate below and return the permission form to your child's teacher. Also, if you have any questions, you may contact Miss Wright on Tuesdays at French Run School, Telephone: 866-5590.
Sincerely,(S) HAROLD LUDDEN
Principal
I approve of my child being included in this study.I do not approve of my child being included in this study.
Parent's Signature
97
HERBERT MILLS SCHOOL 6826 RET7AN ROAD REYNOLDSBURG, OHIO 43068
O c to b e r 8 , 1974
Dear Parent,Miss Julia Wright, our school psychologist, would
like to conduct a study with pupils selected at random from the first and second grades.
The purpose of this study is to examine various abilities of children at the primary grade level and to determine if these abilities correlate with reading achievement. Miss Wright will spend about 4 5 minutes with your child on an individual basis. Also, a group reading test will be administered to all of the children selected from Herbert Mills School.
Your child, , has been chosenfor participation in this study. If you approve, please indicate below and return the permission form to your child's teacher. Also, if you have any questions, you may contact Miss Wright on Tuesdays at French Run School, Telephone: 866-5590.
Sincerely,(S) HAROLD SCHEIDERER
Principal
I approve of my child being included in this study.I do not approve of my child being included in this study.
Parent's signature
B I B L I O G R A P H Y
98
BIBLIOGRAPHY
Abbott, J. C. A study of visual perceptual programming administered by mothers (Doctoral dissertation,The Pennsylvania State University, 1971). Dissertation Abstracts International, 1972, 32 {»l77A. (University Microfilms No. 72-13, 80¥T
Ackerman, P. T., Peters, J. E., & Dykman, R. A. Children with specific learning disabilities: BenderGestalt Test findings and other signs. Journal of Learning Disabilities, 1971, £, 437-446.
Alwitt, L. A. Decay of immediate memory for visually presented digits among nonreaders and readers. Journal of Educational Psychology, 1963, 54,144-148.
Alyarian, A., & Meltzer, M. L. The Bender Gestalt Test and intelligence. Journal of Consulting Psy- chology, 1962, 2£, 483.
Ames, L. B. Children with perceptual problems may also lag developmentally. Journal of Learning Disabilities, 1969, 2,205-208.
Anastasi, A. Psychology testing (3rd ed.). Toronto, Ontario: The Macmillan Co., 1969.
Anderson, R. W. Effects of neuro-psychological techniques on reading achievement. Unpublished doctoral dissertation, Colorado State College, 1965.
Arciszewski, R. A. The effects of visual perception training on the perceptual ability and reading* achievement of first grade studentsT Unpublished doctoral dissertation, Rutgers-The State University, 1968.
Astill, D. E. Visual memory deficits and reading disabilities (Doctoral dissertation, University of Utah, 1969). Dissertation Abstracts International, 1970, 30, 33101T (University Microfilms No.70-22 877
Aten, J., & Davis, J. Disturbances in the perception of auditory sequence in children with minimal cerebral dysfunction. Journal of Speech and Hearinq Research, 1968, 11, 236-7*11
99
100Ayres, A. J. Effect of sensorimotor activity on per
ception and learning in the neurologically handicapped child (Project No. H-126). Washington,D. C.: Children's Bureau, Department of Health,Education, & Welfare, 19 68.
Ayres, A. J. Reading-A product of sensory integrative processes. In H. K. Smith (Ed.), Perception and reading. Newark, Delaware: InternationalReacting Association, 1968.
Balow, B. Perceptual-motor activities in the treatment of severe reading disability. Reading Teacher,1971, 24, 513-525.
Barrett, T. The relationship between measures of pre- reading visual discrimination and first grade reading achievement: A review of the literature.Reading Research Quarterly. 1965a, 1, 51-76.
Barrett, T. C. Visual discrimination tasks as predictors of first grade reading achievement.Reading Teacher, 1965b, 1JJ, 276-282.
Beck, H. S., & Beck, R. C. The house-drawing test as a predictor of first grade school achievement.Journal of Experimental Education, 1960# 2J9# 197-200.
Becker, J. T. Spatial orientation and visual discrimination. Perceptual and Motor Skills, 1970, 31,943-946.
Becker, J. T., & Sabatino, D. A. Reliability of individual tests of perception administered utilizing group techniques. Journal of Clinical Psychology, 1971, 2J7, 86-88.
Belmont, L., & Birch, H. G. Lateral dominance, lateral awareness, and reading disability. Child Development, 1965, 3£, 57-72.
Bender, L. A visual motor Gestalt test and its clinical use. New tfork: American 6rthopsychliatricAssociation# 1938.
Benger, K. The relationships of perception, personality, intelligence, and grade one reading achievement.In H. K. Smith (Ed.), Perception and reading.Newark, Delaware: International Reading Associa-tion, 1968.
101Bennett, R. M. A study of the effects of a visual per
ception program upon school achievement, IQ, and visual perception. Unpublished doctoral dissertation, The University of Tennessee, 1968.
Benton, A. L. Dyslexia in relation to form perception and directional sense. In J. Money (Ed.),Reading Disability Progress and Research Meeds in PyslexiaT Baltimore, Maryland: The JohnsHopkins Press, 1962.
Bing, L. B. A critical analysis of the literature oncertain visual functions which seem to be related to reading achievement. Journal of the American Optometric Association, 19^1, 22, 454-463.
Birch, H., & Lefford, A. Intersensory development inchildren. Child Development Monograph, 1963, 28,No. 5.
Black, F. W. A study of visual perception and intelligence in learning disabled children (Doctoral dissertation, Boston College, 1972). Dissertation Abstracts International, 1973, 33,' 6169^ [university Microfilms No. 73-11, 364)
Blanton, W. E., & Bullock, T. Cognitive style and reading behavior. Reading World, 1973, 12,276-287. ------ —
Bond, G. L., & Tinker, M. A. Reading difficulties; Their diagnosis and correction (2nd ect.). New York: Appleton Century Crofts, 1967.
Bortner, M., & Birch, H. G. Perceptual and perceptual- motor dissociation in brain-damaged patients.Journal of Nervous and Mental Disorders, 1960,T K 7 T 9- $ r .---------- -----------------------
Bortner, M. , & Birch, IT. G. Perceptual and perceptual- motor dissociation in cerebral-palsied children. Journal of Nervous and Mental Disorders, 1962, 134,r-3 -m :----------------------------------- ---------
Braddom, C. L. The Van Qrden Star technique and itsrelationship to reaching achievement. Unpublished master thesis. The Ohio State University, 1966.
102Brown, J. L. The Frostig program for the development of
visual perception in relation to visual perception ability and reading ability (Doctoral dissertation. University of Southern California, 1969). Disserta tion Abstracts International, 1970, 3£, 4822A. ^University Microfilms No. 70-8518)
Bryan, A. The relative importance of intelligence and visual perception in predicting reading achievement. California Journal of Educational Research, 1964, 1^(157 44-48.
Bryan, T. S., & Wheeler, H. Perception of learning disabled children: The eye of the observer.Journal of Learning Disabilities, 1972, 5, 484-88.
Buckland, P. The effect of visual perception training on reading achievement: in low readiness £irst grade pupils. Unpublished doctoral dissertation, University of Minnesota, 1969.
Buckland, P., & Balow, B. Effect of visual perceptual training on reading achievement. Exceptional Children, 1973, 39(4), 299-304.
Cabrini, Sister M. Auditory memory span and functional articulatory disorders in relation to reading in grade two. Journal of Developmental Reading, 1963, 7, 24-28.
Carleton, R. C. An evaluative study of the Frostigprogram in remediating visual-perceptual defects with a group of high school children (Doctoral dissertation, Wayne State University, 1969). Dissertation Abstracts International, 1971, 32, 2477A. (University Microfilms No. 71-29, 943T
Chang, T. M., & Chang, V. A. Relation of visual-motor skills and reading achievement in primary-grade pupils of superior ability. Perceptual and Motor Skills, 1967, 24, 51-53.
Chansky, N. M. Effect of perceptual training on intelligence and achievement (Cooperative Research Projects No. S-060). Washington, D.C.: Officeof Education, U.S. Department of Health, Education, and Welfare, 196 5.
103
Childress, M. E. Interpretation of the Van Orden Star,Optometric Extension Program Papers, 1955, £, 21-28.
Clements, S. D. Learning disabilities - Who? Special Education: Strategies for Educational Progress,Council for Exceptional Children, 1966, 188-189.
Cohen, S. A. Studies of visual perception and reading in disadvantaged children. Journal of Learning Disabilities, 1969, 2, 498-5377
Cohn,M. L. Field dependence-independence and readingcomprehension. Unpublished doctoral dissertation.New York University, 1968.
Colarusso, R. P. The development of a motor-free test of visual perception (Doctoral dissertation,Temple University, 1972) . Dissertation Abstracts International, 1972, 33, 1549A. (University Microfilms No. 72-20,T88).
Colarusso, R., & Hammill, D. The Motor-Free Test of Visual Perception. San Rafael, California:Academic Therapy Publications, 1972.
Coleman, J. C. Perceptual retardation in reading disorders. Perceptual and Motor Skills,1959, 9, 117.
Coleman, R. I., & Deutsch, C. P. Lateral dominance and right-left discrimination: A comparison of normaland retarded readers. Perceptual and Motor Skills, 1964, 19, 43-50.
Connor, J. P. Bender Gestalt Test performance as a predictor of differential reading performance. Journal of School Psychology, 1968-69, 2(4), 41-44.
Costea, A. B. A study of a treatment designed toimprove visual/motor efficiency and readiness in kindergarten children (Doctoral dissertation, University of Maryland, 1970). Dissertation Abstracts International, 1971, 3l, 5^57A. TOni- versity Microfilms No. 71-12, l77)
Coy, M. N. The Bender Visual-Motor Gestalt Test as a predictor of academic achievement. Journal of Learning Disabilities, 1974, j>, 317-319.
104Critchley, M. Developmental dyslexia. Springfield,
Illinois: Charles C. Thomas, 1964.Cundick, B. P., & Robison, L. R. Performance of medi-
diagnosed brain damaged children and control SS. Perceptual and Motor Skills, 1972, 34, 307-310.
deHirsch, K., Jansky, J. J., & Langford, W. S. Predicting reading failure. New York: Harper & Row,1966.
Delacato, C. H. Treatment and prevention of reading problems. Springfield, Illinois: Charles C.Thomas, 1959.
Denner, B. Representational and syntactic competenceof problem readers. Child Development, 1970, 41, 881-87. —
Dykstra, R. Auditory discrimination abilities andbeginning reading achievement. Reading Research Quarterly, 1966, 1, 5-34.
Eames, T. H. Visual handicaps to reading. Journal of Education, 1959, 141, 1-35.
Eisenson, J. Disorders of language in children.Journal of Pediatrics, 1963, 62^ 20-24.
Elkind, D., & Deblinger, J. A. Reading achievement in disadvantaged children and a consequence of nonverbal perceptual training. Research in Education, 1969. (ERIC Document Reproduction Service No. ED 021 704)
English, H. B., & English, A. C. A comprehensive dictionary of psychological and psychoanalytical terms. New York: Longmans, Green & Co., 19 58.
Falik, L. H. The effects of special perceptual-motortraining in kindergarten on second grade reading. Journal of Learnina Disabilities, 1969, 2, 325-7 W . ------------------------------------
Fisher, S. Two test3 of perceptual-motor function:The Draw-A-Person and the Bender-Gestalt.Bulletin of the Orton Society, 1968, lj8, 55-61.
105Flick, G. L. Sinistrality revisited, a perceptual motor
approach. Child Development, 1966, 3T?, 613-622.Flynn, P. T., & Byrne, M. C. Relationship between
reading and selected auditory abilities of third grade children. Journal of Speech and Hearing Research, 1970, l3, 731-40.
Forgone, C . Effects of visual perception and language training upon certain abilities of retarded cHxldren. Unpublished doctoral dissertation. George Peabody College for Teachers, 1966.
Fortenberry, W. D. Effectiveness of a special program for development of word recognition by culturally disadvantaged first grade pupils. Research xi Education, 1969. (ERIC Document Reproduction Service No. ED 02 7 368)
Foster, J. J. Effect of mobility training upon reading achievement and intelligence. UnpuSlfsned doctoral dissertation, University of California at Los Angeles, 1965.
Frostig, M., & Horne, D. The Frostig program for the development of visual perception. Chicago:Follett Educ. Corp., 1964.
Frostig, M., Lefever, D. W., & Whittlesey, J. R. a developmental test of visual perception for evaluating normal and neurologically handicapped children. Perceptual and Motor Skills, 1961, 12. 383-394.
Fuller, C. B. Perceptual considerations in children with a reading disability. Psycholooy in the Schools, 1964, 1, 314-317.
Garrison, E. B. A study in visual-motor perceptiontraining in first grade. Research in Education,
(ERI<i Document Reproduction Service No.ED 031 292)
Gates, A. I. A further evaluation of reading readiness tests. Elementarv School Journal, 1940, 40, 577-591.
Gates, A. I. An experimental evaluation of readingreadiness tests. Elementary School Journal, 1939, 39, 497-508.
106
Gates, A. I., Bond, G. L., & Russell, D. H. Methods of determining reading readiness. New York: Bureauoi Publications, Teachers College, Columbia University, 1939.
Gibson, E. J., Bibson, J.J., Pick, A.D., & Osser, H. A.developmental study of the discrimination of letterlike forms. Journal of Comparative and Physiological Psychology,' l9t>2, 55, 897-906.
Giebink, J. W., & Birch, R. The Bender Gestalt Testas an ineffective predictor of reading achievement. Journal of Clinical Psychology, 1970, 26(4),404-4Si.
Goins, J. T. Visual perceptual abilities and earlyreading progress. University of Chicago Supplementary Educational Monographs, 1958, No. 8vt
Golden, N. E., Illinois, R., Steiner, S. R., & Wisconsin, K. Auditory and visual functions in good and poor readers. Journal of Learning Disabilities, 1969, 2(9), 476-ISr:
Goldmark, B. The relation of visual perception, auditory perception and one aspect of conceptualization to word recognition. Unpublished doctoral dissertation, University of Arizona, 1964.
Goodman, L., & Wiederholt, J. L. Predicting readingachievement in disadvantaged children. Psychology in the Schools, 1973, 10(2), 181-185.
Gould, L. N. A visual motor perceptual program in the Brentwood Public Schools. Proceedings of the Annual Convention of the International Reading AisoclatToir; 1364, 97 ST2-275.----------------
Graham, F. K., Kendall, B. S. Memory-For-Designs Test: Revised general manual. Perceptual and Motor Skills, 1960, 11, 147-188.
Guthrie, J. T. Reading comprehension and syntacticresponses in good and poor readers. Journal of Educational Psychology, 1973, J55, 294-99.
Guthrie, J. T., & Goldberg, H. K. Visual sequentialmemory in reading disability. Journal of Learning Disabilities, 1972, 5, 41-46.
107Halgren, M. R. Opus in see sharp. Education, 1961,
81, 369-71.Hallahan, D. P. Comparative research studies on the
psychological characteristics of learning disabled children. In w. M. Cruickshank & D. P. Hallahan (Eds.), Perceptual and learning disabilities in children (Vol. 3X1 New York:Syracuse University Press, 1975.
Hammer, G. T. The Group Bender Gestalt Test as apredictor of academic potential in first grade with attention to the environmental effects. Unpublished doctoral dissertation, University of California, 1967.
Hammill, D. Training visual perceptual processes.Journal of Learning Disabilities, 1972, 5,(10),
-----------------Hammill, D. D., Goodman, L., & Wiederholt, J. L.
Use of the Frostig DTVP with economically disadvantaged children. Journal of School Psychology, 1971, 9, 430-TT5T
Harrington, Sister M. J., & Durrell, D. Mental maturity versus perception abilities in primary reading. Journal of Educational Psychology, 1955, 46, 173-380.
Harris, A. J. Lateral dominance, directional confusion, and reading ability. Journal of Psychology,1957, £4, 283-294. ------
Harris, A. J. Visual sensation and perception of disabled readers. Journal of Developmental Reading, 1961, 4, 246-253.
Heilman, A. W. Principles and practices of teaching reading, Columbus, Ohio: Charles E. Merrill,it Ii .
Henderson, N. B., Butler, B. V., & Goffeney, B.Effectiveness of the WISC and Bender-Gestalt Test in predicting arithmetric and reading achievement for white and nonwhite children. Journal of Clinical Psychology, 1969, 2_5, 268-271.
108Hueftle, M. K. A factor analytic study of the Frostig
Developmental Test of Visual Perception/ the Illinois Test oi PsYCholinguistic Abilities, and the Wechsler Intelligence Scale for Children. Unpublished doctoral dissertation, Colorado State College, 1967.
Huelsman, C. B. The influence of vision training upon the subsequent reading achievement o^ fourth grade childrenT Research Project No. RF1(>03,U.S. Department of Health, Education, & Welfare,1969.
Jacobs, J. N. An evaluation of the Frostig visual- perception training program. Educational Leadership, 1968, 25, 332-340.
Jacobs, J. N., Wirhlin, L. D., & Miller, C. B. A follow-up evaluation of the Frostig visual perceptual training program. Educational Leader- ship Research Supplement, 1968, £, 169-175.
Jastak, J. F., & Jastak, S. R. The wide range achievement test. Wilmington, Delaware: GuidanceAssociates of Delaware, Inc., 1965.
Johnson, M. S. Factors related to disability in reading. Journal of Experimental Education, 1957, 26, 1-26.
Kagan, J. Reflection-impulsivity and reading ability in primary grade children. Child Development, 1965,35, 609-28. -----
Katz, P. A., & Deutsch, M. Visual and auditory efficiency yid its relationship to reading in children. New Vork: Institute tor Developmental Studies,Department of Psychiatry, New York Medical College, 1963.
Kelly, T., 6 Amble, B. IQ and perceptual motor scoresas predictors of achievement among retarded children. Journal of School Psychology, 1970, 8(2)99-102:
Koegh, B. K. Form copying tests for prediction offirst grade reading. 27th yearbook Claremont Reading conference. Claremont, California: ClaremontGraduate School Curriculum Laboratory, 1963, 141- 44.
109Keogh, B. K. School achievement associated with success
ful performance on the Bender Gestalt Test.Journal of School Psychology, 1965, 3>, 37-40.
Keogh, B. K. The Bender Gestalt as a predictive and diagnostic test of reading performance.Journal of Consulting Psychology, 1965, 2£, 83-84.
Keogh, B. K. The Bender-Gestalt Test with children;Research implications. Journal of Special Education, 1969, 3^
Keogh, B., & Smith, C. The group Bender-Gestalt as a reading screening instrument. Perceptual and Motor Skills, 1962, 15, 639-645.
Keogh, B. K., & Smith, C. E. Visuo-motor ability forschool prediction: A seven-year study. Perceptualand Motor Skills, 1967, 25, 101-110.
Kephart, N. C. The slow learner in the dassroom.Columbus, Ohio: Charles E. Merrill, I960.
King, I. B. An experimental investigation of thepotential of reflection-impulsivity as a deter- mant of success in early reading achievement. Unpublished doctoral dissertation, Boston College, 1972.
Koppitz, E. M. Bender Gestalt Test performance andschool achievement: A 9-year study. Psychologyin the schools, 1973, 1J)(3), 280-284.
Koppitz, E. M. Brain damage, reading disability and the Bender Gestalt Test. Journal of Learning Disabilities, 1970, 3, 429-433.
Koppitz, E. The Bender Gestalt Test for Young Children. New Ycrkl Grune-S Stratton, I9<j4
Koppitz, E., Mardis, V., & Stephens, T. A note onscreening school beginners with the Bender Gestalt Test. Journal of Educational Psvchology, 1961,52(2), sd-sr.
Koppitz, E. M., Sullivan, J., Blyth, D. P., & Shelton, J. Prediction of first grade school achievement with the Bender Gestalt Test and human figure drawings. Journal of Clinical Psychology, o959, 1_5, 164-168.
110
Krippner, S. Research in visual training and reading disability. Paper presented at 21st Annual School Vision Forum and Reading Conference,Cleveland, Ohio, 1968. (ERIC Document Reproduction No. ED 027 151)
Lachmann, F. M. Perceptual-motor development in children retarded in reading ability. Journal of Consulting Psychology, 1960, 2£, 427-431.
Lesiak, J. F. The relationship of the reflection-impulsivity dimension and the reading ability of elementary school children at grade levels (Doctoral dissertation, the Ohio State University,1970). Dissertation Abstracts International,1971, 32” 244A. (University Microfilms No.71-18,“544)
Lessler, D., Schoeninger, D. W. , & Bridges,'J. S.Prediction of first grade performance. Perceptual and Motor Skills, 1970, 31, 751-756.
Lingren, R. H. Performance of disabled and normal readers on the Bender-Gestalt Test, Auditory Discrimination Test, and Visual-Motor Matching. Perceptual and Motor Skills, 1969, 29[, 152-54.
Linn, S. H. A follow-ups Achievement report of first grade students after visual-perception training in kindergarten. Academic Therapy Quarterly, 1968,3, 179-80.
Litchfield, T. B. A program of visual-motor perceptual training to determine its effect upon primary level children with reading and learinq deficiencies. Research in Education, 1971. (ERIC Document Reproduction No. ED 043 9941
Lloyd, B. A. The effects of programmed perceptual training on reading achievement and mental maturity of selected first grade pupils: A pilot study.Journal of the Reading Specialist, 1966, 2,49-55.
Madden, R., Gardner, E. F. Rudman, H. C., Karlsen, B.,& Merwin, J. D. Stanford Achievement Test,Primary I, Form A. New York: Harcourt BraceJ'ovanovich, Inc., 1973.
I l l
McBeath, P. M. The effectiveness of three reading preparedness programs for perceptually handicapped kindergarteners'! Unpublished doctoral dissertation, Stanford University, 1966.
McCormick, C. C., Schnorbrich, J. N., & Footlik, S. W. The effect of perceptual-motor training on reading achievement. Academic Therapy, 1968, 4, 171-176.
McLeod, J . Some psychological and psycholinguisticaspects" of severe reading disability in children. Unpublished doctoral dissertation, University oi Queensland, 1965.
Malmquish, E. Factors related to reading disabilities in the first grade of the elementary school. Stockholm: Axmqvist & Wiksell, 1958.
Mangrum, C. T. Vision and reading ability. InOccasional papers in reading (Vol. 1). Bloomington"! Indiana: School of Education, IndianaUniversity, 1967.
Mlodnosky, L. B. The Bender Gestalt and the Frostig as predictors of first-grade reading achievement among economically deprived children. Psychology in the Schools, 1972, 9(1), 25-30.
Monroe, M. Reading aptitude tests for the prediction of success and failure in beginning reading. Education, 1935, jj6 (1), 7-14.
Morency, A. Auditory modality: Research and practice.In H. K. Smith (Ed.), Perception and reading. Newark, Delaware: International Reading Associa-tion, 1968, 17-21.
Morency, A., & Wepman, J. M. Early perceptual ability and later school achievement. Elementary School Journal, 1973, 73, 323-27.
Mould, R. E. An evaluation of the effectiveness of a special program for retarded readers manifesting (disturbed visual perception. Unpublished doctoral dissertation, Washington State University, 196 5.
Murray, B. A suggested method for pre-school identifies tion o£ reading disability. Research in Education------------- i—
112Newcomer, P., & Hammill, D. Visual perception of motor
impaired children: Implications for assessment.Exceptional Children, 1973, 3£(4), 335-37.
Nielsen,1 H. H., & Ringe, K. Visuo-perceptive and visuo- motor performance of children with reading disabilities. Scandinavian Journal of Psychology,1969, 10(4), 225-31. :
Norfleet, M. A. The Bender Gestalt as a group screeninginstrument for reading readiness (Doctoral dissertation, University of Oregon, 1969). Dissertation Abstracts International, 1970, 31, 1083-84A.^University Microfilms No. 70-137321)
O'Connor, C. M. The effects of physical activities upon motor ability, perceptual ability and academic achievement of first gradersT Unpublished doctoral dissertation, The University of Texas at Austin, 1968.
O'Donnell, P. A. The effects of Delacato training onreadincr achievement and visual-motor integration. Unpublished doctoral dissertation, Stamford University, 1969.
Olson, A. V. Factor analytic studies of the FrostigDevelopmental Test of visual Perception. Journal of Special Education, 1968, 2 (4), 429-433.
Olson, A. V. Relation of achievement test scores and specific reading abilities to the Frostig Developmental Te»~«‘ of Visual Perception. Perceptual and Motor Skilx^., 1966, 22# 179-184.
Orton, S. Reading, writing, and speech problems in children. New York; Norton, 1937.
Panther, E. E. Prediction of first grade readingachievement. Elementary School Journal, 1967, 68, 44-48.
Paul, L. M. WISC and Bender as predictors of readingperformance in children with learning disabilities Doctoral dissertation, University of Maryland,1971) . (Dissertation Abstracts International.1971, 32, 19 32A. {University Microfilms No. 71- 25, 5 4 U
113Potter, M. C. Perception of symbol orientation and
early reading success. Teacher College Contributions to Education, 1959, No. 939.
Quick, H. E. Office procedures for the Van OrdenStar. Ototometric Extension Program Papers, 1953,2, 39-4Z.
Raymond, D. M. The performance of reading achieverson memory span and association in reading tests. Journal of Educational Research, 1955, 48, 455-465.
Reed, J. C. The relationship between the primary mental abilities and reading achievement at given developmental levels. American Psychologist, 19 58.13, 324. (Abstract)
Rice, A. Rhythmic training and board balancing prepares a child for formal learning. Nation's Schools,1962, 6, 72. -----------------
Robbins, M. P. A study of the validity of Delacato'stheory of neurological organization. Exceptional Children, 1966, 12, 517-523.
Robinson, H. M. An evaluation of the children's visual achievement forms at grade one. American Journal of Optometry and Archives of American Academy o "* Optometry, 1956, 35, Si5-157 ' 1---
Rosen, C. L. An experimental study of visual perceptual training and reading achievement in first grade. Perceptual and Motor Skills, 1966, 22 , 979-986.
Rosenblith, J. F. Judgements of simple geometricfigures by children. Perceptual and Motor Skills, 1965, 21, 947-90.
Rutherford, W. S. Perceptual-motor training and readiness. International Reading Association, 1^65.
Sandstedt, B. Relationship between memory span andintelligence of severely retarded readers'! Unpub- lished doctoral dissertation, Temple University,1947.
Shepherd, C. W. Childhood chronic illness and visual-motor perceptual development. Exceptional Children, 1969, 36, 39-42.
114
Shepard, G. Selected factors in the reading ability of educable mentally retarded boys. American Journal of Mental Deficiency, 1967, 71, 563-^0.
Sherk, J. K. A study of the effects of a program of visual perception on the progress of retarded readers. Unpublished doctoral dissertation, Syracuse University, 1967.
Shorr, R., & Svagr, V. Relationship of perceptual andvisual skills with reading accuracy and comprehension. Journal of the American Optometric Association, 1755, 377 T7T-77:-------- ------------- -
Slosson, R. L. Slosson Intelligence Test for Children and AdultsT New York: slosson EducationalPublications, 1963.
Smith, P. A., & Marx, R. W. Some cautions on the use of the Frostig Test: A factor analytic study.Journal of Learning Disabilities, 1972, J5, 357-62.
Spache, G. D. Toward better reading. Champaign, Illinois: Garrard Publishing, 1963.
Sprague, R. H. Learning difficulties of first gradechildren diagnosed by the Frostig visual Perceptual Tests: A factor analytic study. Unpublisheddoctoral dissertation, Wayne State University,1963.
Stanley, G., & Hall, R. Short-term visual informationprocessing in dyslexics. Child Development, 1973, 44, 841-44.
Steinbach, Sister M. N. An experimental study of progress in first grade reading. Catholic University of America Educational ftesearch Monographs, 1^40, 12, l-ll8.
Stern, D. M. An investigation of the effects of theFrostig program, corrective reading instruction, and an attention placebo program upon reading progress of primary school-aged corrective readers with visual perceptual deficiencies (Doctoral dissertation, Syracuse University,1971). Dissertation Abstracts International, 1972, 32, 5623AT (University Microfilms No. "72-11, 868)
115
Sullivan, J. The effects of Kephart's perceptual motor- training on a clinic sample. Journal of Learning Disabilities, 1972, 5, 545-51.
Swanson, R. G. A study in the relationship betweenperceptual motor skills and the learning of word recognition. Unpublished doctoral dissertation, University of South Carolina, 1968.
Thompson, B. B. A longitudinal study of auditorydiscrimination. Journal of Educational Research, 1963, 56, 376-378”
Thweatt, R. C. Prediction of school learning disability through the use of the Bender Gestalt Test: Avalidation study of Koppitz's scoring technique. Journal of Clinical Psychology, 1963, 19, 216-217.
Trieschman, R. B. Undifferentiated handedness andperceptual development in children with reading problems. Perceptual and Motor Skills, 1968,27, 1123-34.
Turton, L. J. Developmental and linguistic aspect of learning disabilities. In W. M. Cruickshank &D. P. Hallahan (Eds.), Perceptual and learning disabilities in children (Vol. 1). New York: Syracuse University Press, 1975.
Wallack, E. S. Factors influencing the visual perceptual functioning of non-organic retarded children and intellectually average children (Doctoral dissertation, University of Miami, 1970). Dissertation Abstracts International, 19 70* 31, 2293-^46. (University Microfilms No. 70-1^7 173)
Watson, B. L. Field dependence and early readingachievement. Unpublished doctoral dissertation, University of California at Los Angeles, 1969.
Wertheimer, M. Studies in the theory of Gestalt psychology. Psychologische Forschung, 1923, £, 300.
Wiederholt, J. L., & Haramill, D. D. Use of the Frostig- H o m e perception program in the urban school. Psychology in the Schools, 1971, j3, 268-74.
Weiner, M., & Feldraann, S. Validation studies of areading prognosis for children of lower and middle socioeconomic status. Education and Psychological Measurement, 1963, 23 (4) , ^(T-T-Xi.
116Wimsatt, W. R. The effect of sensory-motor t r a i n i n g on
the learning abilities ol? grade school c h i l d r e n . Unpublished doctoral dissertation, University of Minnesota, 1966.
Wineman, J, H. Cognitive style and reading ability.California Journal of Educational Research, 1971,257 74-79.---------------------------------
Winter Haven Lions Research Foundation. Perceptualtraining procedure for beginning school c h i l d r e n . Winter Haven, Florida: Author, 1963. .
Zach, L., & Kaufman, J. How adequate is the c o n c e p t of perceptual deficit for education? Journal o f Learning Disabilities, 1972, 5, 351 -3S'<>.
Zangwill, o. Cerebral dominance and its relation to psychological junction. Edinburgh: Oliver &
Related Documents