1 XANTHINE OXIDASE INHIBITION AND ANTIOXIDANT ACTIVITY OF AN ARTICHOKE LEAF EXTREACT (Cynara scolymus L.) AND ITS COMPOUNDS By SASIPORN SARAWEK A DISSERTATION PRESENTED TO THE GRADUATE SCHOOL OF THE UNIVERSITY OF FLORIDA IN PARTIAL FULFILLMENT OF THE REQUIREMENTS FOR THE DEGREE OF DOCTOR OF PHILOSOPHY UNIVERSITY OF FLORIDA 2007

Welcome message from author
This document is posted to help you gain knowledge. Please leave a comment to let me know what you think about it! Share it to your friends and learn new things together.
Transcript
1
XANTHINE OXIDASE INHIBITION AND ANTIOXIDANT ACTIVITY OF AN ARTICHOKE LEAF EXTRACT (Cynara scolymus L.) AND ITS COMPOUNDS
By
SASIPORN SARAWEK
A DISSERTATION PRESENTED TO THE GRADUATE SCHOOL OF THE UNIVERSITY OF FLORIDA IN PARTIAL FULFILLMENT
OF THE REQUIREMENTS FOR THE DEGREE OF DOCTOR OF PHILOSOPHY
UNIVERSITY OF FLORIDA
2007
2
© 2007 by Sasiporn Sarawek

3
To my parents

4
ACKNOWLEDGMENTS
I would like to express my appreciation and very grateful thanks to Dr. Veronika
Butterweck for accepting me into her group and for her encouragement and support during my
Ph.D. program. My special thanks go to Dr. Hartmut Derendorf for his guidance and helpful
advice. Many thanks also go to the members of my supervisory committee, Dr. Günther
Hochhaus, Dr. Jeffrey Hughes and Dr. Saeed Khan, for their helpful advice throughout the years.
I would like to thank friends and staff in the Department of Pharmaceutics for their
friendship and support, especially to Whocely Victor De Castro for his suggestions during the
validation of the analytical methods. I also would like to thank Pattaraporn Vanachayangkul for
her friendship.
I would like to extend my thanks to the program assistants of the Department of
Pharmaceutics Mr. James Ketcham, Mrs. Patricia Khan, Ms. Michelle Griffin, Mrs. Andrea
Tucker, and Mrs. Penny Canino for their technical support. I also would like to thank all my
assistants: Carmen Michalski, Sandra Weiss, Eva Kremser, and Christine Haefele and the post-
doc fellows, especially Dr. Vipul Kumar and Dr. Jie Wang for their friendship and technical
support.
My personal thanks go to my mother and my father for their love, friendship, support,
guidance and encouragement throughout my life.

5
TABLE OF CONTENTS page
ACKNOWLEDGMENTS ...............................................................................................................4
LIST OF TABLES...........................................................................................................................9
LIST OF FIGURES .......................................................................................................................11
ABSTRACT...................................................................................................................................13
CHAPTER
1 INTRODUCTION ..................................................................................................................15
Artichoke (Cynara scolymus L.).............................................................................................15 Pharmacological Actions.................................................................................................15 Constituents .....................................................................................................................16 Dosage .............................................................................................................................17
Absorption and Metabolism of Caffeolyquinic Acids............................................................17 Absorption and Metabolism of Flavonoids ............................................................................17 Biological Effects of Flavonoids ............................................................................................19
Antioxidant Activity........................................................................................................19 Xanthine Oxidase Inhibitors............................................................................................20
Uric Acid, Hyperuricemia, and Gout......................................................................................22 Enzyme Inhibition ..................................................................................................................23
Competitive Inhibition.....................................................................................................24 Uncompetitive Inhibitions ...............................................................................................24 Mixed Inhibitions or Non Competitive Inhibitions .........................................................24
Pharmacokinetics....................................................................................................................24 Hypothesis and Objectives .....................................................................................................25
2 IDENTIFICATION AND QUANTIFICATION OF COMPOUNDS IN ARTICHOKE EXTRACT..............................................................................................................................40
Background.............................................................................................................................40 Specific Aim ...........................................................................................................................40 Materials and Methods ...........................................................................................................40
Materials ..........................................................................................................................40 Sample Preparation..........................................................................................................41 HPLC/DAD Analysis ......................................................................................................41 Work Solutions and the Preparation of Calibration Standards........................................41 Quantification ..................................................................................................................42 Validation ........................................................................................................................42
Results.....................................................................................................................................43 Linearity ..........................................................................................................................43 Sensitivity ........................................................................................................................43

6
Specificity........................................................................................................................43 Precision and Accuracy ...................................................................................................44 Stability............................................................................................................................44 Quantification of Caffeoylquinic Acids (Chlorogenic Acid, Cynarin) and Luteolin
Derivatives (Luteolin-7-O-glucoside, Luteolin-7-O-glucuronide) in Artichoke Leaf Extract..................................................................................................................44
Discussion and Conclusion.....................................................................................................44
3 EFFECT OF ARTICHOKE LEAF EXTRACT, CAFFEIC ACID DERIVATIVES AND FLAVONOIDS ON XANTHINE OXIDASE INHIBITORY ACTIVITY............................54
Background.............................................................................................................................54 Specific Aim ...........................................................................................................................54 Materials and Methods ...........................................................................................................54
Materials ..........................................................................................................................54 Preparation of Working Solutions and Test Solutions ....................................................55 Assay Procedure for Xanthine Oxidase Inhibitions ........................................................56 Lineweaver- Burk Plot ....................................................................................................57
Results.....................................................................................................................................57 Xanthine Oxidase Inhibitory Activity of Artichoke Extract ...........................................57 Xanthine Oxidase Inhibitory Activity of Various Flavonoids and Compounds in
Artichoke......................................................................................................................57 Inhibition Mechanism......................................................................................................58
Discussion and Conclusion.....................................................................................................58
4 EFFECTS OF ARTICHOKE LEAF EXTRACT AND VARIOUS FLAVONOIDS ON SERUM URIC ACID LEVELS IN OXONATE-INDUCED RATS .....................................67
Background.............................................................................................................................67 Specific Aim ...........................................................................................................................67 Materials and Methods ...........................................................................................................67
Materials ..........................................................................................................................67 Stock Solutions and Preparation of Calibration Standards..............................................68 Animals and Experimental Protocols ..............................................................................68
Animals ....................................................................................................................68 Animal model of hyperuricemia in rats....................................................................69
Drug Administration:.......................................................................................................69 1. Oral administration...............................................................................................69 2. Intraperitoneal administration ..............................................................................70
Uric Acid Assay ..............................................................................................................70 Preparation of Rat Serum ................................................................................................70 Statistical Analysis ..........................................................................................................71 Validation ........................................................................................................................71
Results.....................................................................................................................................72 Validation of Analytical Method to Measure Uric Acid in Rat Serum. ..........................72
Linearity ...................................................................................................................72 Sensitivity.................................................................................................................72
7
Specificity.................................................................................................................72 Precision, accuracy and recovery .............................................................................72 Stability ....................................................................................................................72
Effect of Artichoke Extract and Its Compounds on Serum Urate Levels in Hyperuricemic Rats .....................................................................................................73
Oral administration of artichoke in acute treatment.................................................73 Oral administration of artichoke in chronic treatment .............................................73 Oral administration of compounds in artichoke and various flavonoids in acute
treatment ...............................................................................................................73 Intraperitoneal administration of artichoke, compounds in artichoke and
various flavonoids in acute treatment ...................................................................74 Discussion and Conclusion.....................................................................................................74
5 THE EFFECT OF ARTICHOKE LEAF EXTRACT AND ITS COMPOUNDS ON ANTIOXIDANT ACTIVITY IN VITRO AND IN RATS ....................................................92
Background.............................................................................................................................92 Specific Aims..........................................................................................................................93 Materials and Methods ...........................................................................................................93
Materials ..........................................................................................................................93 Animals............................................................................................................................94
Acute treatment ........................................................................................................94 Chronic treatment .....................................................................................................94
Assessment of Antioxidative Capacity in Vitro and Plasma Antioxidant Status ............95 Assessment of Uric Acid in Plasma ................................................................................95 Assessment of Glutathione Peroxidase (GPx) in Plasma ................................................96 Statistical Analysis ..........................................................................................................97
Results.....................................................................................................................................97 Antioxidant Activity in Vitro...........................................................................................97 Plasma Antioxidant Activity in Vivo ...............................................................................97
Acute treatment ........................................................................................................97 Chronic treatment .....................................................................................................97
Plasma Urate Concentrations and Plasma Glutathione Peroxidase Activity after The Treatment with Artichoke Extract and Phenolic Compounds .....................................98
Discussion and Conclusion.....................................................................................................98
6 PHARMACOKINETICS OF LUTEOLIN AND ITS METABOLITES IN RATS.............108
Background...........................................................................................................................108 Specific Aims........................................................................................................................108 Materials and Methods .........................................................................................................108
Materials ........................................................................................................................108 Stock, Work Solutions, and Preparation of Calibration Standards ...............................109 Animals and Experimental Protocols ............................................................................110
Animals ..................................................................................................................110 Methods..................................................................................................................110
Analytical Methods .......................................................................................................111

8
Data Analysis.................................................................................................................112 Statistical Analysis ........................................................................................................114 Validation ......................................................................................................................114
Results...................................................................................................................................114 Validation of Analytical Method to Measure Luteolin in Rat Plasma ..........................114
Linearity .................................................................................................................114 Sensitivity...............................................................................................................115 Specificity...............................................................................................................115 Precision, accuracy and recovery ...........................................................................115 Stability ..................................................................................................................115
Validation of Analytical Method to Measure Luteolin in Rat Urine.............................116 Linearity .................................................................................................................116 Sensitivity...............................................................................................................116 Specificity...............................................................................................................116 Precision, accuracy and recovery ...........................................................................116 Stability ..................................................................................................................116
Pharmacokinetic Study of Luteolin ...............................................................................117 Non-compartmental analysis .........................................................................................117 Compartmental Analysis ...............................................................................................118
Discussion and Conclusion...................................................................................................118
7 CONCLUSION.....................................................................................................................139
LIST OF REFERENCES.............................................................................................................141
BIOGRAPHICAL SKETCH .......................................................................................................151
9
LIST OF TABLES
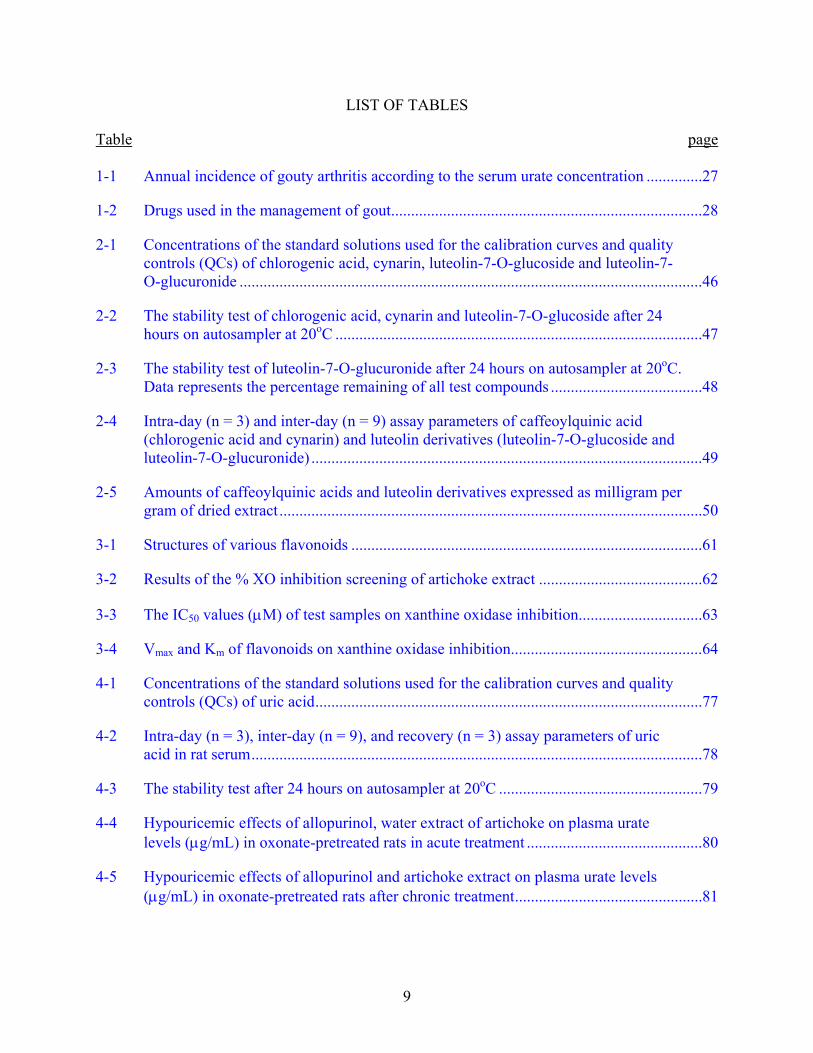
Table page 1-1 Annual incidence of gouty arthritis according to the serum urate concentration ..............27
1-2 Drugs used in the management of gout..............................................................................28
2-1 Concentrations of the standard solutions used for the calibration curves and quality controls (QCs) of chlorogenic acid, cynarin, luteolin-7-O-glucoside and luteolin-7-O-glucuronide ....................................................................................................................46
2-2 The stability test of chlorogenic acid, cynarin and luteolin-7-O-glucoside after 24 hours on autosampler at 20oC ............................................................................................47
2-3 The stability test of luteolin-7-O-glucuronide after 24 hours on autosampler at 20oC. Data represents the percentage remaining of all test compounds ......................................48
2-4 Intra-day (n = 3) and inter-day (n = 9) assay parameters of caffeoylquinic acid (chlorogenic acid and cynarin) and luteolin derivatives (luteolin-7-O-glucoside and luteolin-7-O-glucuronide) ..................................................................................................49
2-5 Amounts of caffeoylquinic acids and luteolin derivatives expressed as milligram per gram of dried extract..........................................................................................................50
3-1 Structures of various flavonoids ........................................................................................61
3-2 Results of the % XO inhibition screening of artichoke extract .........................................62
3-3 The IC50 values (μM) of test samples on xanthine oxidase inhibition...............................63
3-4 Vmax and Km of flavonoids on xanthine oxidase inhibition................................................64
4-1 Concentrations of the standard solutions used for the calibration curves and quality controls (QCs) of uric acid.................................................................................................77
4-2 Intra-day (n = 3), inter-day (n = 9), and recovery (n = 3) assay parameters of uric acid in rat serum.................................................................................................................78
4-3 The stability test after 24 hours on autosampler at 20oC ...................................................79
4-4 Hypouricemic effects of allopurinol, water extract of artichoke on plasma urate levels (μg/mL) in oxonate-pretreated rats in acute treatment ............................................80
4-5 Hypouricemic effects of allopurinol and artichoke extract on plasma urate levels (μg/mL) in oxonate-pretreated rats after chronic treatment...............................................81

10
4-6 Hypouricemic effects of allopurinol, apigenin, eriodictyol, luteolin, luteolin-7-O-glucoside, naringenin, quercetin on plasma urate levels (μg/mL) in oxonate-pretreated rats after oral administration .............................................................................82
4-7 Hypouricemic effects of allopurinol, apigenin, eriodictyol, luteolin, luteolin-7-O-glucoside, naringenin, quercetin on plasma urate levels (μg/mL) in oxonate-pretreated rats after i.p injection ........................................................................................83
5-1 ORAC values of artichoke extract ...................................................................................101
5-2 Relative ORAC values of pure chemicals with antioxidant activity ...............................102
5-3 ORAC values of plasma samples.....................................................................................103
5-4 ORAC values of plasma samples.....................................................................................104
5-5 Plasma urate concentrations in rats after administration of artichoke extract and phenolic compounds ........................................................................................................105
5-6 Plasma glutathione peroxidase activity in rats after administration of artichoke extract and phenolic compounds......................................................................................106
6-1 Concentrations of standard solutions used for the calibration curves and quality controls (QCs) of luteolin in plasma................................................................................122
6-2 Concentrations of standard solutions used for the calibration curves and quality controls (QCs) of luteolin in urine ...................................................................................123
6-3 Intra-day (n = 3), inter-day (n = 9), and recovery (n = 3) assay parameters of luteolin in rat plasma.....................................................................................................................124
6-4 The stability test after 48 hours on autosampler at 18oC .................................................125
6-5 Intra-day (n = 3), inter-day (n = 9), and recovery (n = 3) assay parameters of luteolin in rat urine ........................................................................................................................126
6-6 The stability test of luteolin in urine after 48 hours on autosampler at 18oC ..................127
6-7 Pharmacokinetic parameters of luteolin after oral and iv administration of luteolin at dose 50 mg/kg ..................................................................................................................128
6-8 Pharmacokinetic parameters of luteolin conjugates after oral and iv administration of luteolin at dose 50 mg/kg.................................................................................................129
6-9 Pharmacokinetic parameters of luteolin after oral and i.v. administration of luteolin 50 mg/kg ..........................................................................................................................130
6-10 The excretory recovery for 24 h of luteolin and luteolin conjugates in urine after oral and i.v administration of luteolin at dose 50 mg/kg.........................................................131
11
LIST OF FIGURES
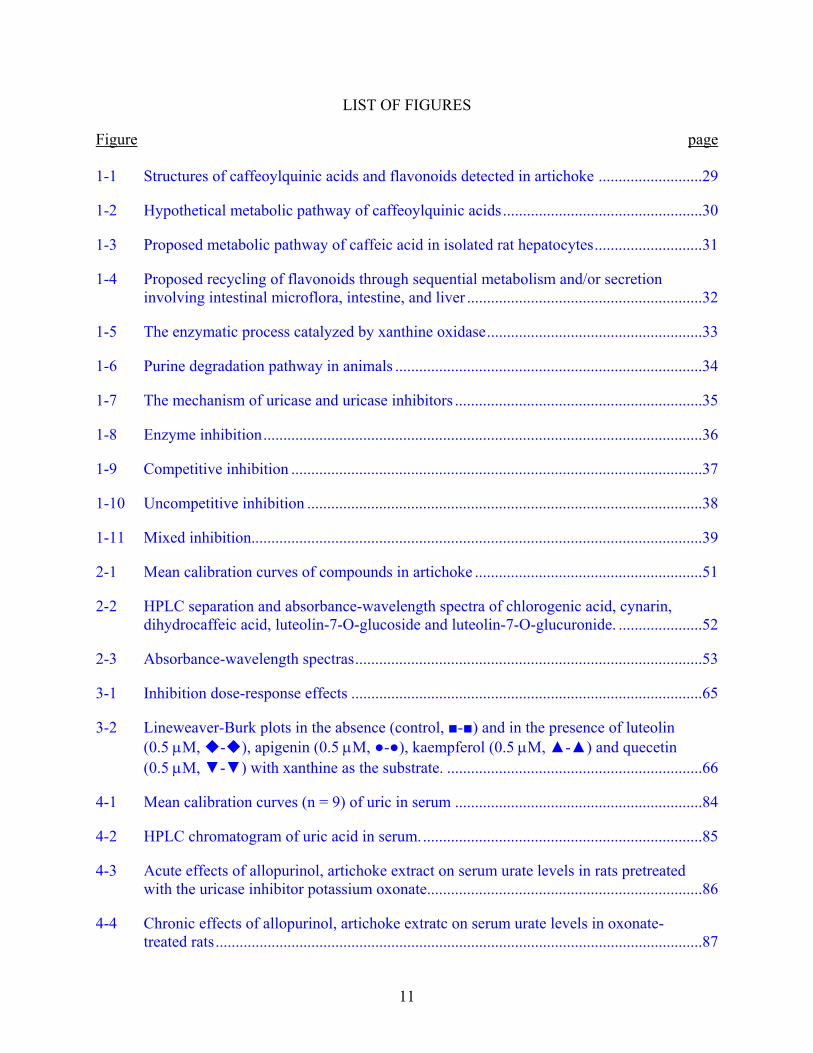
Figure page 1-1 Structures of caffeoylquinic acids and flavonoids detected in artichoke ..........................29
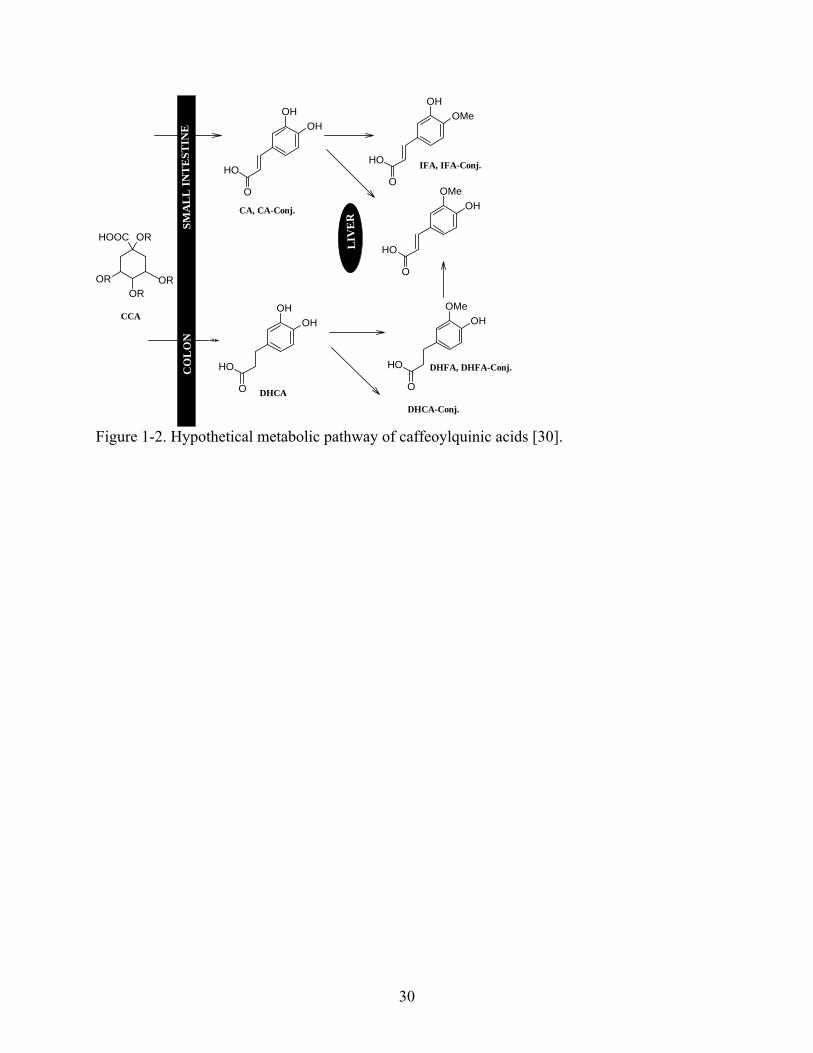
1-2 Hypothetical metabolic pathway of caffeoylquinic acids..................................................30
1-3 Proposed metabolic pathway of caffeic acid in isolated rat hepatocytes...........................31
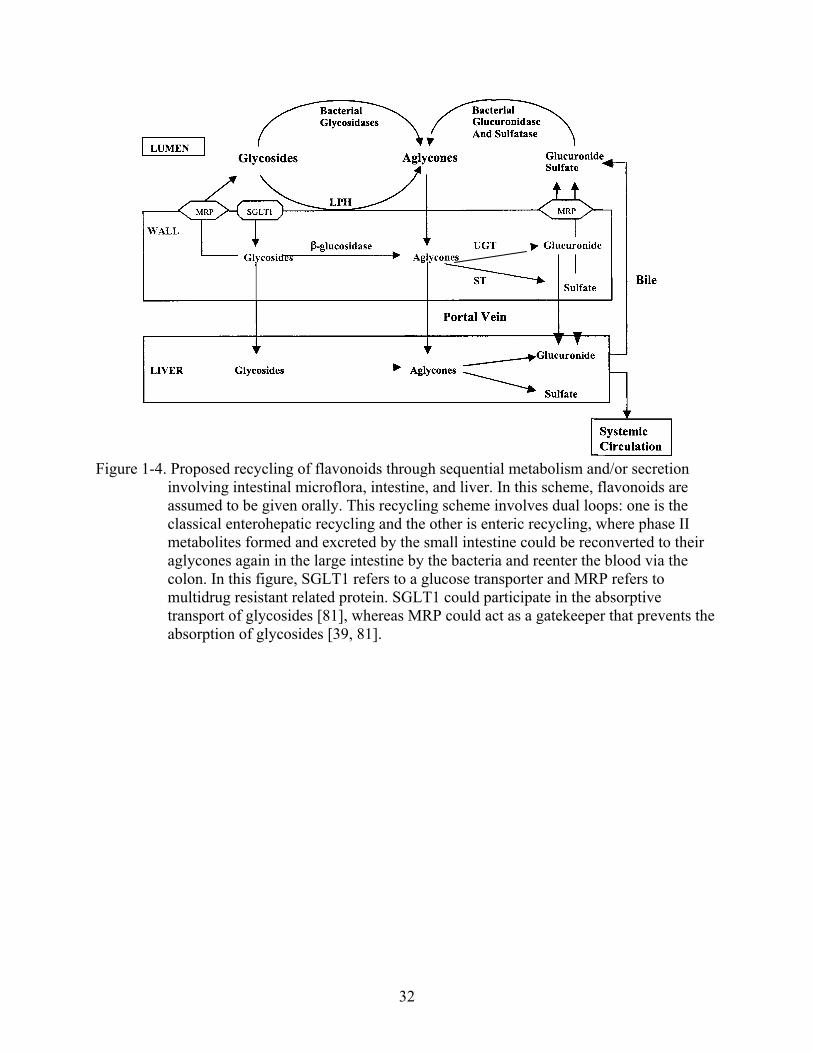
1-4 Proposed recycling of flavonoids through sequential metabolism and/or secretion involving intestinal microflora, intestine, and liver ...........................................................32
1-5 The enzymatic process catalyzed by xanthine oxidase......................................................33
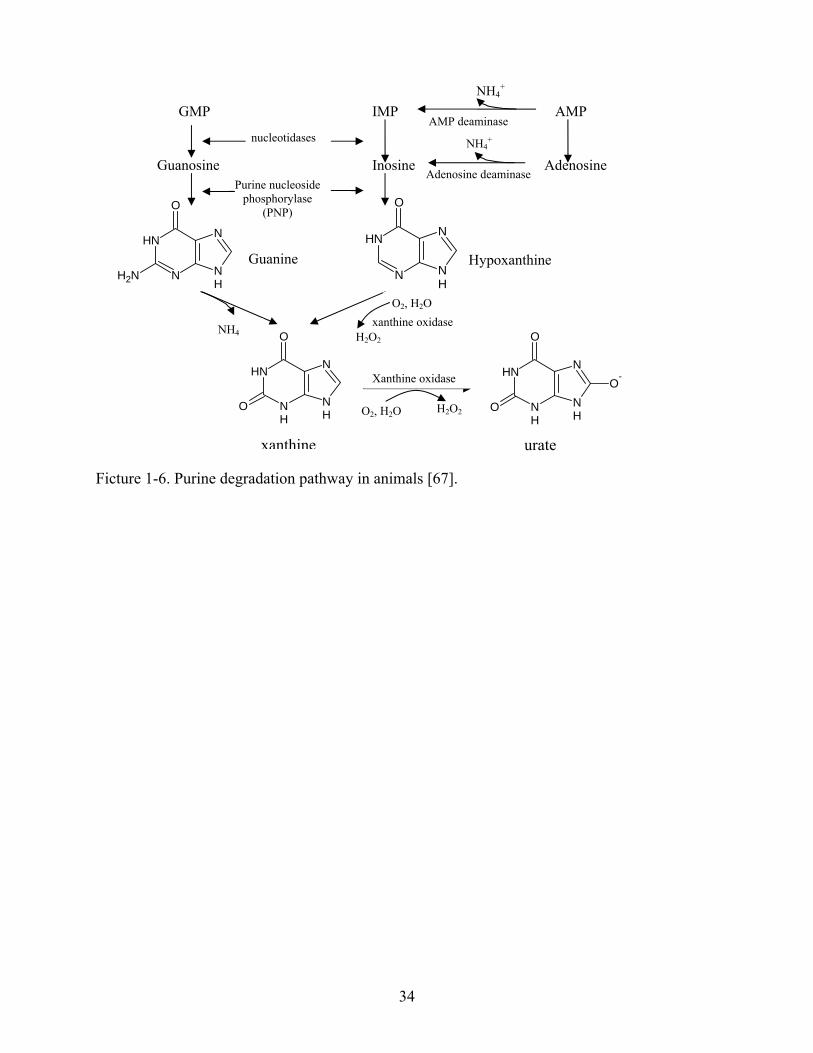
1-6 Purine degradation pathway in animals .............................................................................34
1-7 The mechanism of uricase and uricase inhibitors ..............................................................35
1-8 Enzyme inhibition..............................................................................................................36
1-9 Competitive inhibition .......................................................................................................37
1-10 Uncompetitive inhibition ...................................................................................................38
1-11 Mixed inhibition.................................................................................................................39
2-1 Mean calibration curves of compounds in artichoke .........................................................51
2-2 HPLC separation and absorbance-wavelength spectra of chlorogenic acid, cynarin, dihydrocaffeic acid, luteolin-7-O-glucoside and luteolin-7-O-glucuronide. .....................52
2-3 Absorbance-wavelength spectras.......................................................................................53
3-1 Inhibition dose-response effects ........................................................................................65
3-2 Lineweaver-Burk plots in the absence (control, ■-■) and in the presence of luteolin (0.5 μM, ◆-◆), apigenin (0.5 μM, ●-●), kaempferol (0.5 μM, ▲-▲) and quecetin (0.5 μM, ▼-▼) with xanthine as the substrate. ................................................................66
4-1 Mean calibration curves (n = 9) of uric in serum ..............................................................84
4-2 HPLC chromatogram of uric acid in serum.......................................................................85
4-3 Acute effects of allopurinol, artichoke extract on serum urate levels in rats pretreated with the uricase inhibitor potassium oxonate.....................................................................86
4-4 Chronic effects of allopurinol, artichoke extratc on serum urate levels in oxonate-treated rats..........................................................................................................................87
12
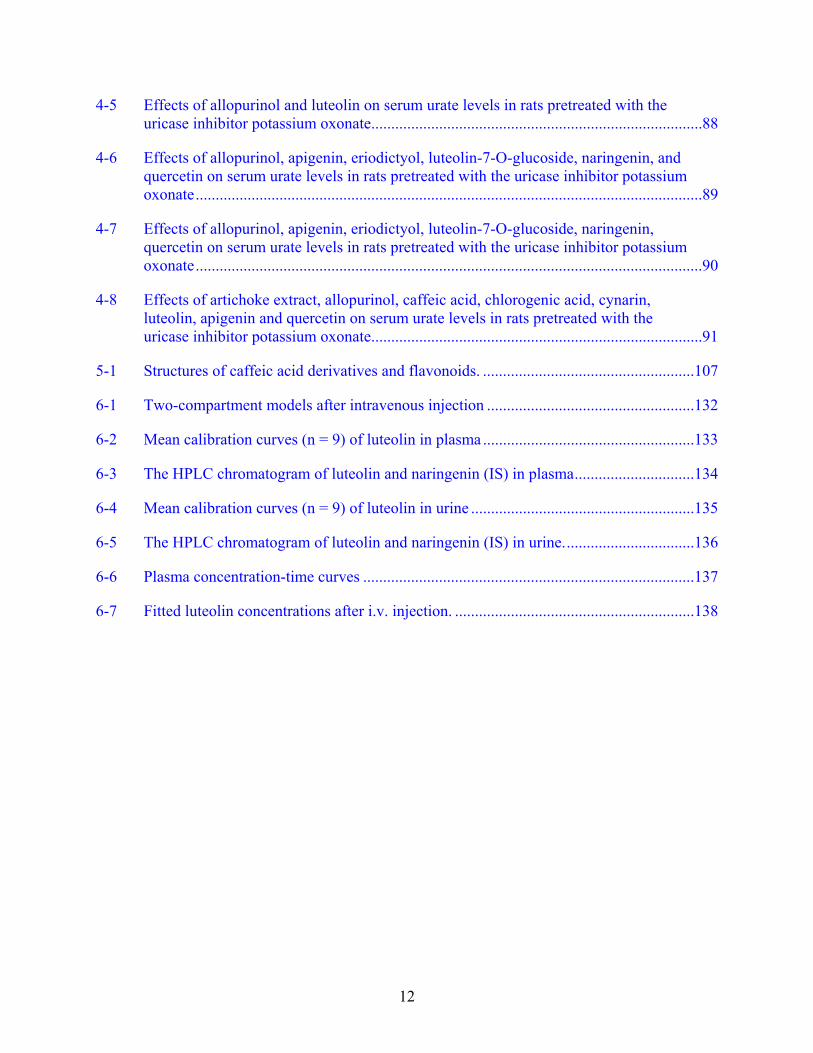
4-5 Effects of allopurinol and luteolin on serum urate levels in rats pretreated with the uricase inhibitor potassium oxonate...................................................................................88
4-6 Effects of allopurinol, apigenin, eriodictyol, luteolin-7-O-glucoside, naringenin, and quercetin on serum urate levels in rats pretreated with the uricase inhibitor potassium oxonate...............................................................................................................................89
4-7 Effects of allopurinol, apigenin, eriodictyol, luteolin-7-O-glucoside, naringenin, quercetin on serum urate levels in rats pretreated with the uricase inhibitor potassium oxonate...............................................................................................................................90
4-8 Effects of artichoke extract, allopurinol, caffeic acid, chlorogenic acid, cynarin, luteolin, apigenin and quercetin on serum urate levels in rats pretreated with the uricase inhibitor potassium oxonate...................................................................................91
5-1 Structures of caffeic acid derivatives and flavonoids. .....................................................107
6-1 Two-compartment models after intravenous injection ....................................................132
6-2 Mean calibration curves (n = 9) of luteolin in plasma .....................................................133
6-3 The HPLC chromatogram of luteolin and naringenin (IS) in plasma..............................134
6-4 Mean calibration curves (n = 9) of luteolin in urine ........................................................135
6-5 The HPLC chromatogram of luteolin and naringenin (IS) in urine.................................136
6-6 Plasma concentration-time curves ...................................................................................137
6-7 Fitted luteolin concentrations after i.v. injection. ............................................................138
13
Abstract of Dissertation Presented to the Graduate School of the University of Florida in Partial Fulfillment of the Requirements for the Degree of Doctor of Philosophy
XANTHINE OXIDASE INHIBITION AND ANTIOXIDANT ACTIVITY OF ARTICHOKE LEAF EXTRACT (Cynara scolymus L.) AND ITS COMPOUNDS
By
Sasiporn Sarawek
August 2007
Chair: Veronika Butterweck Cochair: Hartmut Derendorf Major: Pharmaceutical Sciences
Gout is a disease characterized by elevated levels of uric acid in body fluids. This
hyperuricemia results in the deposition of urate crystals in tissue, especially joints. The uric acid
deposition initiates an inflammation process involving the release of reactive oxygen species.
The common treatments of gout are the use of anti-inflammatory agents to relieve the symptoms
of the disease and xanthine oxidase (XO) inhibitors to block the synthesis of uric acid. The most
common xanthine oxidase inhibitor is allopurinol. However, its use is limited by unwanted side
effects such as hypersensitivity problems. Therefore, alternatives are required.
Artichoke leaves (Cynara scolymus L.) have been used traditionally by the Eclectic
physicians as a diuretic and depurative for the treatment of gout. The major compounds in
artichoke leaves are phenolic compounds such as caffeoylquinic acids and flavonoids. These
phenolic compounds have shown xanthine oxidase inhibitory activity and antioxidant activity in
vitro and in vivo. Therefore, the goal of the present study was to examine the xanthine oxidase
inhibitory activity and antioxidant activity of the artichoke extract, and its main compounds in
vitro and in vivo.

14
The in vitro study showed that the extract as well as caffeoylquinic acids showed only a
weak XO inhibition, whereas flavonoids (flavone and flavonols) had a highly inhibitory effect on
XO. Luteolin had the highest XO inhibition effect. This significant inhibition of XO by the
flavonoids in vitro suggested that they may suppress the production of uric acid in vivo.
However, the in vivo study showed that oral administration of the artichoke extract,
caffeoylquinic acids, and flavonoids could not decrease the serum urate levels in oxonate-treated
rats.
The antioxidant activities of the artichoke extract and its phenolic compounds were
determined using the oxygen radical absorbance capacity assay (ORAC). The results showed that
the artichoke extract and its compounds elicited an antioxidant activity in vitro, however, the
compounds again showed no antioxidant activity in vivo.
It was speculated that this lack of effect in vivo from both studies might be due to the
absorption, the high first pass effect through intestine and liver, the excretion into urine and bile
and the degradation in large intestine. Therefore, the pharmacokinetic of a compound in
artichoke was performed in order to explain the in vivo activity.
Pharmacokinetic study of luteolin, the compound which showed the highest XO
inhibition in vitro, showed that after oral administration of luteolin, luteolin rapidly absorbed and
metabolized in plasma. Additionally, plasma-concentration-time curves of luteolin metabolites
revealed secondary peaks. The bioavailability of luteolin was low and the urinary excretion of
luteolin and its conjugates did not dominate. This study could explain the lack of XO inhibitory
activity and antioxidant activity in vivo. Therefore, it can be concluded that artichoke might be
not a useful alternative treatment of gout.

15
CHAPTER 1 INTRODUCTION
Artichoke (Cynara scolymus L.)
Artichoke or globe Artichoke (Cynara scolymus L.), a member of the Compositae (daisy)
family, is native to the Mediteranean area. The leaves are the commonly used part.
Pharmacological Actions
Traditionally artichoke leaves have been used by the Eclectic physicians as a diuretic and
depurative, for the treatment of rheumatism, gout, jaundice and especially for dropsies. For the
modern use, the leaf of artichoke is reported to process choleretic, hypocholesterolaemic [1, 2],
hypolipidaemic [3], hepatoprotective [4], anticarcinogenic [5] and antioxidative [6-9]. Diuretic
effect of artichoke helps the elimination of water and the consequent toxin and specially the uric
acid.
Hypolipidaemic, hypocholesterolaemic and choleretic activities are well documented for
artichoke leaf extracts and particularly for the constituent cynarin [10]. Artichoke leaves not only
increases choleresis and, therefore, cholesterol elimination, but also has been shown to inhibit
cholesterol biosynthesis. Clinical trials investigating the use of globe artichoke and cynarin in the
treatment of hyperlipidaemia report positive results [10]. However, studies in animals and
humans by Saenz et al. [11] have suggested that these effects may be due to the
monocaffeoylquinic acids present in artichoke extract (eg. chlorogenic acid) [11]. In vitro studies
on cultured hepatocytes suggested that artichoke extract inhibits the incorporation of 14C-
labelled acetate into the non-saponifiable lipid fraction and thus reduce cholesterol biosynthesis
[12, 13]. Other studies suggested indirect inhibitory effects exerted at the level of HMGCoA
reductase, a key enzyme in cholesterol biosynthesis [13-15].

16
Antioxidant and hepatoprotective activity of artichoke leaves have been studied. In vitro, a
luteolin-rich artichoke leaf extract (flavonoid content around 0.4% w/w), the pure aglycone
luteolin, and luteolin-7-O-glucoside demonstrated a concentration-dependent reduction in low
density lipoprotein (LDL) oxidation [9]. The effects of artichoke extract and its constituents have
also been investigated for activity against oxidative stress in studies using human leucocytes. The
extract demonstrated a concentration-dependent inhibition of oxidative stress induced by several
agents, such as hydrogen peroxide, that generate reactive oxygen species. The constituents
cynarin, caffeic acid, chlorogenic acid and luteolin also showed concentration-dependent
oxidative stress inhibitory activity [16]. In addition, artichoke extract has marked protective
properties against oxidative stess induced by inflammatory mediators and ox-LDL in cultured
endothelial cells and monocytes [7]. In vivo, the administration of an edible artichoke in rats has
shown that artichoke extract increased the level of glutathione peroxidase activity in erythrocyte
and decreased the level of 2-Aminoadipic semialdehyde (a protein oxidation biomarker) [8].
Hepatoprotective and hepatoregenerating activities have been documented for cynarin in
vitro [4] and in rats [10, 17].
Artichoke extract has been reported to alleviated symptoms and improving the disease-
specific quality of life in patients with functional dyspepsia [18] and concomitant dyspepsia [19].
Constituents
The major chemical components of artichoke leaves include up to 2% phenolic acids with
mono-and dicaffeoylquinic acids, primarily chlorogenic acid, cynarin, and caffeic acid. Also up
to 0.1-1% flavonoids (Figure 1-1) [20-24].

17
Dosage
The German Commission E recommends an average daily dose of 6 g drug, or an
equivalent dose of extract (based on the herb-to-extract ratio) or other preparations, for dyspeptic
problems. A recommended dosage regimen for liquid extract (1: 2) is 3-8 ml daily. Dosage used
in clinical trials of globe artichoke leaf extract have assessed the effects of dosages of up to 1.92
g daily in divided doses for up to six months [25].
Absorption and Metabolism of Caffeolyquinic Acids
The mechanism and site of absorption of caffeoylquinic acids is still unclear. There is no
published evidence for enzymatic hydrolysis of chlogenic acid by intestine, liver or plasma
extracts [26, 27]. Moreover, chlorogenic acid has been reported to be stable in the digestive or
intestinal juice [28, 29]. However, Wittemer et al. [30] suggested absorption and de-esterification
of caffeoylquinic acids may occur somewhere in the upper gut. After the release of caffeic acid
(CA) from caffeoylquinic acids, CA may be conjugated with glucuronic acid in the enterocytes
[30]. After entering the systemic circulation, CA conjugates were most likely methylated by
catechol-O-methyltransferase [31] during the first liver passage to methylation products of
ferulic acid (FA) and isoferulic acid (IFA).They also suggested that CA may be metabolized by
the colonic microflora to dihydrocaffeic acid (DHCA) prior to absorption. In enterocyte, DHCA
was metabolited to dihydroferulic acid (DHFA) using catechol-O-methyltransferase, and then
FA was formed by the dehydrogenation of DHFA [30, 31]. The hypothetical metabolic pathways
of caffeoylquinic acids and caffeic acid are shown in Figure 1-2, and Figure 1-3.
Absorption and Metabolism of Flavonoids
Most of flavonoids presented in plants are attached to sugar moieties thus tending to be
water-soluble, although, occasionally, they are found as aglycones. Absorption of flavonoid
glycosides was considered negligible. Only flavonoid aglycones were be able to pass the gut
18
wall, and no enzymes that can split these β-glycosidic bonds are secreted into the gut or
presented in the intestinal wall [32]. Hydrolysis occurs in the colon by intestinal microflora,
which could be further metabolized by intestinal microflora to various single-ring aromatic
compounds [33, 34]. Hydrolytic enzymes of intestinal microflora could convert certain flavonoid
glycosides to their corresponding aglycones [33, 35]. Recently, it has been reported that enzymes
that are able to hydrolyse flavonoid glycosides are located in the cells (cytosolic beta-
glucosidase, CBG) and on the apical membrane (lactase-phlorizin hydrolase, LPH) [36].
Therefore, flavonoid glycosides may be hydrolysed by LPH and then the aglycone may diffuse
passively into the cell [37]. Alternatively, flavonoid glycosides may be enter the cell by sodium
dependent glucose transporter (SGTL1) [38] and then be cleaved inside the cell by CBG.
Absorbed flavonoids could undergo phase I (e.g., oxidation such as hydroxylation) and phase II
(e.g., conjugation such as glucuronidation) metabolisms in human intestine and liver. Phase I
metabolisms commonly attach a hydroxyl group to the molecule or break down a molecule so
that the compound can be further processed by the body. Phase II metabolisms can occur after
phase I metabolisms or simultaneously as phase I. Normally, phase II metabolisms convert
compounds and their phase I metabolites into hydrophilic and excretable conjugates which could
be eliminated by the urine or via the bile. In case of flavonoids, conjugated metabolites are
finally excreted into the intestinal lumen and eliminated or be hydrolysed by microbial
hydrolases (e.g., glucuronidases and sulfatase) at the intestinal lumen to aglycones, and then
transported into systemic circulation. (Figure 1-2) The low bioavailability of flavonoids may be
explained by duoenteric and enterohepatic recirculation [39].
19
Biological Effects of Flavonoids
Flavonoids have been shown to exert protective effects against many diseases, in particular
cardiovascular diseases and cancer. The health benefit of flavonoids is usually linked to two
properties: (1) antioxidant activity and (2) inhibition of certain enzymes such as xanthine oxidase
[40, 41].
Antioxidant Activity
Reactive oxygen species (ROS) such as hydrogen peroxide (H2O2), superoxide radical
anion (O2-•), hydroxyl radical (OH•), alkylperoxyl radical (ROO•), nitric oxide (NO•), singlet
oxygen (1O2) and hypochlorous acid (HOCl) react with biological molecules causing cell and
tissue injury. The ROS are considered to contribute to a wide variety of degenerative processes
and diseases such as atherosclerosis, Parkinson’s disease, Alzheimer’s dementia and reperfusion
injury of brain or heart [42]. Many studies have suggested that flavonoids exhibit biological
activities, including antiallergenic, antiviral, anti-inflammatory, vasodilating actions. These
pharmacological effects are linked to the antioxidant properties of flavonoids. Flavonoids can
express these properties by: (1) suppressing ROS formation by inhibiting some enzymes or
chelating trace elements involved in free radical production, (2) scavenging radical species and
more specially the ROS, or (3) up-regulating or protecting antioxidant defense [40].
Flavonoids can inhibit enzymes which are responsible for superoxide anion production
such as xanthine oxidase. Most of flavonoids can chelate trace metals, which play an important
role in oxygen metabolism, and therefore inhibit the initiation of the lipoxygenase reaction [43].
The possible metal-complexing sites within flavonoids are located between the C3 hydroxyl and
the carbonyl, the C5 hydroxyl and the carbonyl and between the ortho-hydroxyls on the B-ring
[40]. The radical scavenging activity of flavonoids depend on the structure and the substituents
of the heterocyclic and B-ring. The major determinants for radical-scavenging capacity are: (1)
20
the otho-dihydroxy structure on the B-ring, which has the best electron-donating properties, (2)
the 2, 3-double bond in conjugation with a 4-oxofunction in the C-ring is responsible for electron
delocalization from the B-ring, and (3) the 3-and 5-hydroxyl group with a 4-oxofunction in the A
and C-ring for maximum radical scavenging potential [40]. Some flavonoids, such as qurcetin,
myricetin, and fisetin, were shown to alleviate oxidative stress by inducing glutathione S-
transferase (GST), an enzyme used to protect cells against free-radical damage [44]. Studies have
indicated that flavonoid aglycones, including quercetin, luteolin, myricetin, and kaempferol have
greater antioxidant capacity than their glycosides such as quercetin-3-glucoside [45]. Noroozi et
al. [45] reported that, at equimolar concentration, most flavonoids showed greater antioxidant
capacity than vitamin C.
Currently, the relevance of in vitro studies to the in vivo situation is unclear. Terao et al.
[46] found that oral administration of (-) epicatechin and quercetin enhanced the antioxidant
capacity of rat plasma, although both flavonoids accumulated mainly as glucuronide and sulfate
conjugates in blood plasma. Morand et al. [47] had reported that the conjugate metabolites of
quercetin could inhibit the oxidation of LDL catalyzed with Cu+2.[47] Janisch et al.[48] found
that flavonoid intestinal and hepatic metabolism had an ability to inhibit LDL oxidation. These
finding suggests that conjugated metabolites of flavonoids may play a role in the antioxidant
defenses of blood plasma. In human, Arai et al. [49] found total intake of flavonoids among
women to be inversely correlated with plasma total cholesterol and low density lipoprotein
concentrations, after adjustment for age, body mass index, and total energy intake. Further in
vivo experiments are needed to explore.
Xanthine Oxidase Inhibitors
Xanthine oxidase has a role in the generation of ROS in various pathologies such as viral
infection [50], inflammation [51], brain tumors [52] or the process of ischemia/reperfusion [53,
21
54] has been studied. Xanthine oxidase belongs to the molybdenum-protein family containing
one molybdenum, one of the flavin adenine dinucleotide (FAD) and two iron-sulfur (2Fe - 2S)
centers of the ferredoxine type in each of its two independent subunits. Xanthine oxidase is a
cytosolic enzyme found in many species such as bacteria, higher plants, invertebrates and
vertebrates [55]. It is present in the liver, intestine, kidney, lungs, myocardium, brain, plasma,
and erythrocytes, and other tissues of several mammalian species including human [56]. In all
mammals, the liver and intestine have the highest xanthine oxidase activity [55]. This enzyme
catalyzes the conversion of both hypoxanthine to xanthine and xanthine to uric acid while
reducing O2 to O2-• and H2O2 according to Figure 1-5 [57].
The enzyme contains two separated substrate-binding sites. Xanthine oxidase inhibitors
can act either at the purine binding site such as allopurinol [58, 59] or at the FAD cofactor site
such as benzimidazole [60]. Allopurinol is a potent inhibitor of xanthine oxidase which has been
widely used to treat gout and hyperuricemia [61, 62]. However, severe toxicity of allopurinol
such as vasculitis, rash, eosinophilia, hepatitis has been reported [63]. Currently, no clinically
effective xanthine oxidase inhibitor for the treatment of hyperuricemia has been developed since
allopurinol. Therefore, new inhibitor devoid of undesired side effects has been investigated.
Many studies of natural polyphenols, especially flavonoids, in the form of plants or purified
extracts show that they could be used as xanthine oxidase inhibitors [64-66]. The essential
structural characteristics for the inhibition of xanthine oxidase are (1) the presence of the benzo-
γ-pyrone structure (2) the presence of free hydroxyl groups at positions 7, 3 and /or 5 in the
flavonoid structure [40] and (3) an α, β-unsaturated carbonyl group that helps π electronic
delocalization of phenyl ring B [40, 56].
22
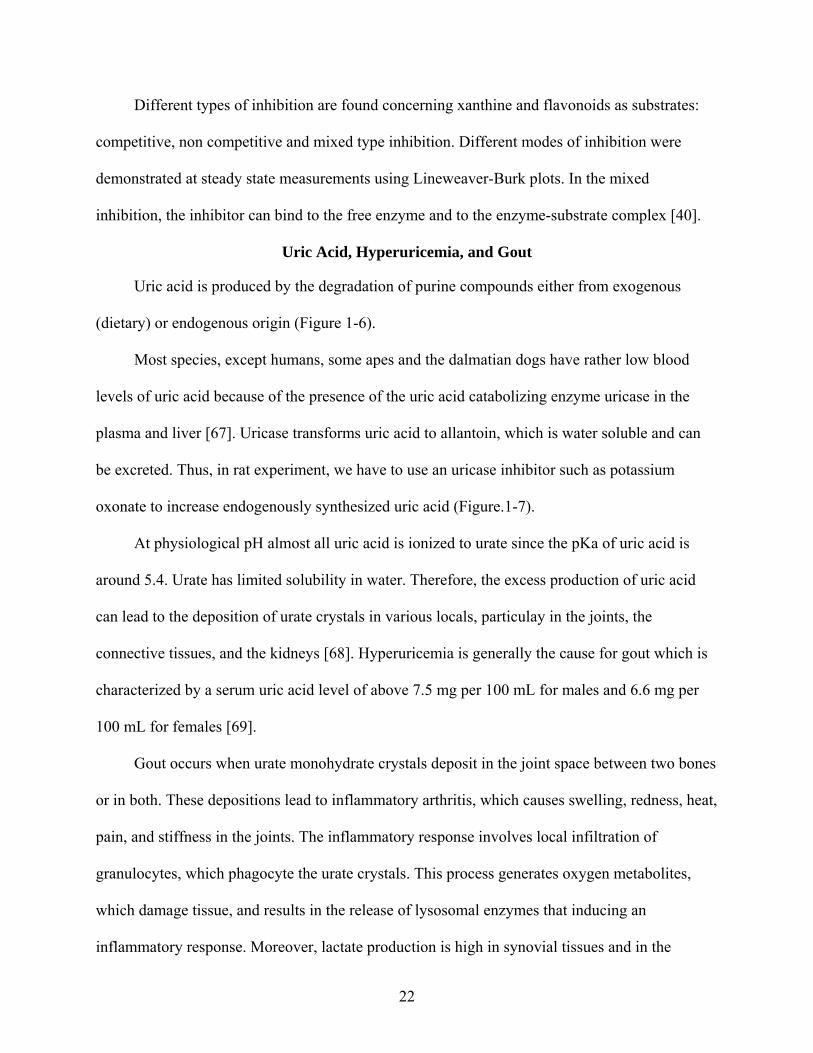
Different types of inhibition are found concerning xanthine and flavonoids as substrates:
competitive, non competitive and mixed type inhibition. Different modes of inhibition were
demonstrated at steady state measurements using Lineweaver-Burk plots. In the mixed
inhibition, the inhibitor can bind to the free enzyme and to the enzyme-substrate complex [40].
Uric Acid, Hyperuricemia, and Gout
Uric acid is produced by the degradation of purine compounds either from exogenous
(dietary) or endogenous origin (Figure 1-6).
Most species, except humans, some apes and the dalmatian dogs have rather low blood
levels of uric acid because of the presence of the uric acid catabolizing enzyme uricase in the
plasma and liver [67]. Uricase transforms uric acid to allantoin, which is water soluble and can
be excreted. Thus, in rat experiment, we have to use an uricase inhibitor such as potassium
oxonate to increase endogenously synthesized uric acid (Figure.1-7).
At physiological pH almost all uric acid is ionized to urate since the pKa of uric acid is
around 5.4. Urate has limited solubility in water. Therefore, the excess production of uric acid
can lead to the deposition of urate crystals in various locals, particulay in the joints, the
connective tissues, and the kidneys [68]. Hyperuricemia is generally the cause for gout which is
characterized by a serum uric acid level of above 7.5 mg per 100 mL for males and 6.6 mg per
100 mL for females [69].
Gout occurs when urate monohydrate crystals deposit in the joint space between two bones
or in both. These depositions lead to inflammatory arthritis, which causes swelling, redness, heat,
pain, and stiffness in the joints. The inflammatory response involves local infiltration of
granulocytes, which phagocyte the urate crystals. This process generates oxygen metabolites,
which damage tissue, and results in the release of lysosomal enzymes that inducing an
inflammatory response. Moreover, lactate production is high in synovial tissues and in the

23
leukocytes associated with the inflammatory process. The high level of lactate leads to a local
decrease in pH that fosters further deposition of uric acid. In fact, the major risk factor for the
development of gout is sustained asymptomatic hyperuricemia (Table 1-1) [70].The optimal
diagnosis of gout is the demonstrating urate crystals in synovial fluid or a tophus (a nodular
collection of urate crystals in soft tissue) [70, 71].
The commonly report of gout is 6 per 1000 population in men and 1 per 1000 population
for women [71]. The incidence of gout has been found to be increasing [72, 73]. With the
Rochester Epidemiology Project computerized medical record system, the incidence rate
increase more than twofold from 1977-1978 to 1986-1987 in Rochester, MN [73].
The goal of antihyperuricemic therapy is to reduce serum uric acid level below the
threshold required for supersaturation of extracellular fluid, to prevent or reverse tissue damage
resulting from uric acid deposition, and to decrease the incidence of recurrent attacks of gout
arthritis [69, 74]. Drugs used to reduce uric acid levels can be either uricosuric drugs or xanthine
oxidase inhibitors [74].
All the synthetic drugs used in the treatment of gout (Table 1-2) have some side effects,
therefore an alternative are required.
Enzyme Inhibition
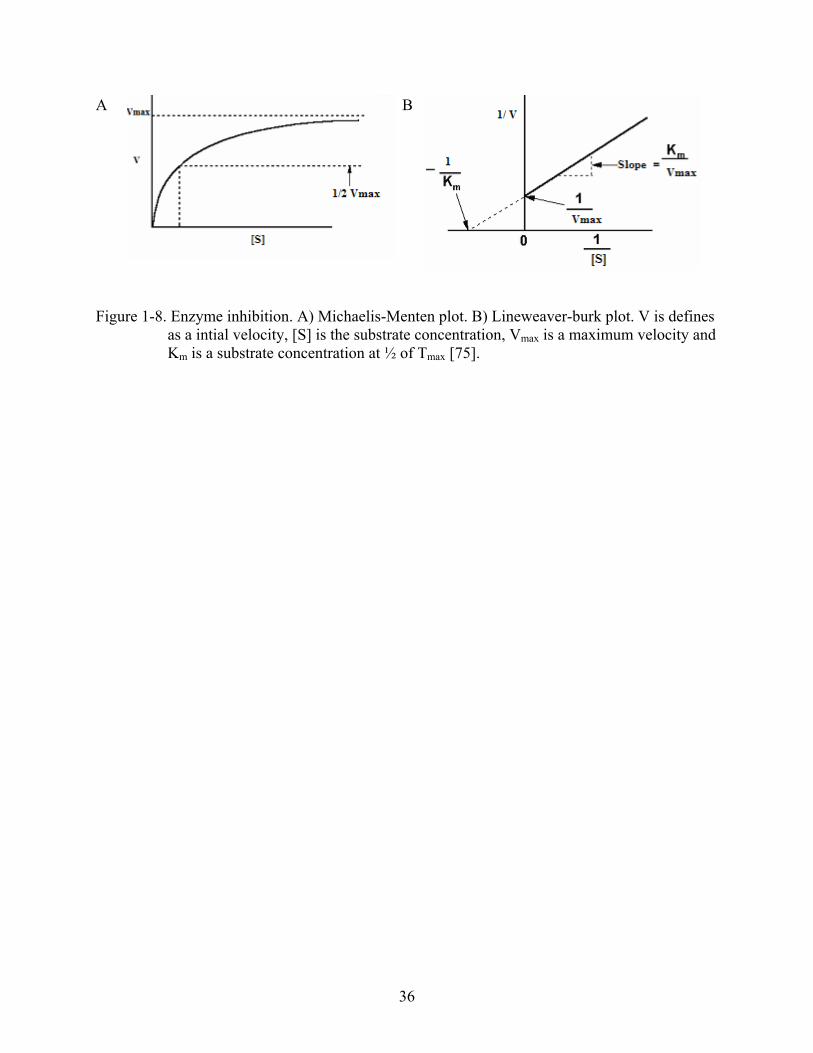
The basic equation of enzyme kinetics is Michaelis-Menten equation (V = Vmax [S]/ Km +
[S]). This equation has the same form as the equation for a rectangular hyperbola; the reaction
rate (V) versus substrate concentration [S] produces a hyperbolic rate plot (Figure 1-8). To avoid
dealing with curvilinear plots of enzyme catalyzed reactions, the Lineweaver-Burk plot was
introduced (Figure 1-8).The equation of Lineweaver-Burk is [1/V] = [Km (1)/ Vmax[S] + (1)/Vmax]
[75].

24
Enzyme inhibitors are substances that reduce an enzyme activity and have similar structure
to their enzyme’s substrate but either does not react or react very slowly compared to substrate.
The mechanisms of inhibition are described as follow.
Competitive Inhibition
A substance that competes directly with a normal substrate for an enzymatic binding site is
known as a competitive inhibitor. These inhibitors usually resemble the substrate and act by
reducing the concentration of free enzyme available for substrate binding. The general model for
competitive inhibition and the Lineweaver-Burk plot are showed in Figure 1-9 [75].
Uncompetitive Inhibitions
The inhibitor binds directly to the enzyme–substrate complex but not to the free enzyme as
shown in Figure 1-10.
Mixed Inhibitions or Non Competitive Inhibitions
The inhibitors bind to both the enzyme and enzyme-substrate complex bind inhibitor as
shown in Figure 1-11.
Pharmacokinetics
Pharmacokinetics (PK) is defined as the study of the time course of drug absorption,
distribution, metabolism and excretion. Absorption describes the process of drug molecules
moving from the site of administration to systemic circulation. Distribution describes the
movement of drug molecules from systemic circulation to extravascular sites. Metabolism
describes the enzymatic breakdown of drugs. It is frequently a primary defense mechanism used
by the body to avoid exposure to xenobiotics. Drugs molecules are converted to more
hydrophilic metabolites and excreted from the body. Metabolites can be inactive, active or toxic.
Therefore, understanding the pathway where a compound is metabolized and PK of its

25
metabolites is essential. Finally, excretion describes passive or active transport of drug molecules
into urine or bile [76].
Pharmacokinetics studies rely on the measurement of the active drugs and/or its
metabolites in biological fluid such as blood, plasma or urine. From this information,
concentration-time curves may be constructed and pharmacokinetic parameters such as area
under the curve (AUC), maximum concentration (Cmax), clearance (Cl), volume of
distribution(Vd) and elimination half-life ( t 1/2) may be calculated [77].
Pharmacokinetics is also applied to therapeutic drug monitoring (TDM) for very potent
drugs such as those with a narrow therapeutic range, in order to optimize efficacy and to prevent
any adverse toxicities [78].
Hypothesis and Objectives
Gout is a common disease with a worldwide distribution and continues to be a health
problem. It is often associated with elevated serum levels of uric acid. The most common
symptom in gout is painful arthritis joint inflammation, caused by deposition of insoluble
crystals of sodium urate. Nowadays, it seems to be accepted that the key factor to control this
disease is the prevention and the treatment. The treatment of gout includes the use of anti-
inflammatory agents such as non-steroidal anti-inflammatory drugs (NSAIDs) for symptomatic
relief and xanthine oxidase inhibitors to block the endogenous production of uric acid. However,
NSAIDs produce side effects such as naturopathy, nitrogen retention, and, hyperkalemia.
Allopurinol, the most common xanthine oxidase inhibitor, also has unwanted side effects such as
hypersensitivity problems. Therefore, alternative treatments are required.
The leaves of artichoke have been used traditionally by the Eclectic physicians as a diuretic
and depurative, for treatments of rheumatism, gout, jaundice and especially for dropsies. The
major compounds of artichoke are phenolic compounds such as caffeoylquinic acids and

26
flavonoids. The phenolic compounds have shown xanthine oxidase inhibition and antioxidant
activity in vitro and in vivo. Therefore, artichoke leaves containing polyphenolic compounds may
show xanthine oxidase inhibitory activity and antioxidant activity. In the present study the
xanthine oxidase inhibitory activity and antioxidant activity of artichoke extract, and its main
constituents were investigated in vitro and in vivo.
Furthermore, the pharmacokinetic of an active compound in artichoke extract was studied
in male Sprague-Dawley rats in order to assess the in vivo efficacy and obtain more information
about absorption and disposition. The concentration of a single compound and its metabolites
will be detected in plasma and urine and pharmacokinetic parameters will be calculated.
Therefore, to test the hypothesis of this study the following specific aims were purposed:
Specific aim#1: Phytochemical investigation of compounds in artichoke extract.
Specific aim#2: Determine whether artichoke extract and its compounds show the inhibition of
xanthine oxidase in vitro.
Specific aim#3: Investigate whether artichoke extract and its compounds can decrease uric acid
in rat serum.
Specific aim#4: Determine whether artichoke extract and its compounds show antioxidant
activity in vitro and in vivo.
Specific aim#5: Pharmacokinetic analysis of an active compound in artichoke extract.

27
Table 1-1. Annual incidence of gouty arthritis according to the serum urate concentration [70]. Serum Urate Concentration (mg/dl) Annual Incidence of Gout (%)
<7.0 0.1-0.57.0 - 8.9 0.5-1.2
≥9.0 4.9-5.7

28
Table 1-2. Drugs used in the management of gout [79, 80]. Drug Comment To treat acute gouty arthritis
Colchicine Inhibits crystal phagocytosis; no effect on urate metabolism; increased toxicity in patients who have renal or hepatic dysfunction or are receiving concomitant therapy with P-450 enzyme inhibitors such as cimetidine, erythromycin, and tolbutamide [79]; current treatment is an intravenous dose of 2 mg, diluted in 10 to 20 mL of 0.9% sodium chloride solution; a total dose of 4 mg should not be exceeded. To avoid cumulative toxicity, treatment with colchicines should not be repeated within 7 days [80].
NSAIDs Effective in relieving pain and reducing inflammation in patients with acute gout but use limited by side effects (naturopathy, nitrogen retention, reduced creatinine clearance, hyperkalemia, abnormal liver-function values, and headache); greater risk of side effects in patients with renal dysfunction [79, 80].
Corticosteroids Effective either by intraarticular (single joint) or systemic route (intramuscular, intravenous, or oral); potential for rebound inflammation and side effects; administered only when NSAIDs and colchicines have been ineffective or are contraindicated [79, 80].
To prevent acute attacks
Colchicine Effective in an oral dose (0.5-1.8 mg per day) adjusted so as not to cause diarrhea [80].
NSAIDs Useful if colchicine alone is insufficient and acute attacks recur frequently; usual dose is 150 to 300 mg of indomethacin per day or its equivalent [79].
To lower serum urate concentrations
Probenecid Increases urate excretion by inhibits urate reabsorption at renal tubule; interferes with excretion of many drugs; serious toxic effects rare, although nausea and rash reported in up to 10 % of patients [79]; effective in an oral dose of 250 mg twice daily for 1 week, following with 500 mg twice daily for chronic treatment [80].
Allopurinol Inhibits xanthine oxidase; common side effect are hypersensitivity reactions [80]

29
OH
OH
O
OH
OR4OR3
OR2HOOC
OR1 Caffeic acid Quinic acid Chlorogenic acid: R1=H, R2=H, R3=H, R4=caffeoyl 3,5-di-O-caffeoylquinic acid (Cynarin): R1=caffeoyl, R2=caffeoyl, R3=H, R4=H 3,5-di-O-caffeoylquinic acid: R1=H, R2=caffeoyl, R3=H, R4=caffeoyl 4,5-di-caffeoylquinic acid: R1=H, R2=H, R3=caffeoyl, R4=caffeoy
O
OOH
R1O
R2
OH
O
OOH
R1O
OH
luteolin-7-O-glucoside: R1=glc, R2=OH narirutin: R1=rutinose luteolin-7-O-rutinoside: R1=rut, R2=OH naringenin-7-O-glucoside: R1=glucose apigenin-7-O-glucoside: R1=glc, R2=H apigenin-7-O-rutinoside: R1=rut, R2=H Figure 1-1. Structures of caffeoylquinic acids and flavonoids detected in artichoke [22].
30
OHOH
OH
O
OHOMe
OH
OOMe
OH
OH
O
OMeOH
OH
O
OHOH
OH
O
OROR
HOOC OR
OR
CCA
IFA, IFA-Conj.
CA, CA-Conj.
DHFA, DHFA-Conj.
DHCA
DHCA-Conj.
LIV
ER
CO
LON
SMA
LL
INT
EST
INE
CO
LO
N
Figure 1-2. Hypothetical metabolic pathway of caffeoylquinic acids [30].

31
OO
COOH
OHOH
COOH
OHOH
COOH
OO
COOH
COOH
OHOCH3
OHOCH3
COOH
GS
COOH
OHOH
GS
COOH
OHOH
CYP 2E1
O2 or O2-
Acyl Co A dehydrogenase
(ATP, CoA)
Hydrogenase ?
CYP 2E1
o-quinone
GS-CA conjugate
Hydrogenase?
Acyl Co A dehydrogenase
(ATP, CoA)
GSH
CO
MT
CY
P 1 A1/ 2
CY
P 1A1 /2
CO
MT GSH
O 2 or O 2 -
FADHFA
Figure 1-3. Proposed metabolic pathway of caffeic acid in isolated rat hepatocytes [31].
32
Figure 1-4. Proposed recycling of flavonoids through sequential metabolism and/or secretion
involving intestinal microflora, intestine, and liver. In this scheme, flavonoids are assumed to be given orally. This recycling scheme involves dual loops: one is the classical enterohepatic recycling and the other is enteric recycling, where phase II metabolites formed and excreted by the small intestine could be reconverted to their aglycones again in the large intestine by the bacteria and reenter the blood via the colon. In this figure, SGLT1 refers to a glucose transporter and MRP refers to multidrug resistant related protein. SGLT1 could participate in the absorptive transport of glycosides [81], whereas MRP could act as a gatekeeper that prevents the absorption of glycosides [39, 81].

33
N
NH N
NH
O
NH
NH N
NH
O
O
NH
NH NH
NH
O
O
OH
Hypoxanthine Xanthine Uric acid
Figure 1-5. The enzymatic process catalyzed by xanthine oxidase [57].
Xanthine oxidase Xanthine oxidase
O2, H2O O2, H2O O2-•, H2O2 O2
-•, H2O2
34
Ficture 1-6. Purine degradation pathway in animals [67].
IMP
Inosine
AMP
Adenosine deaminase
AMP deaminase GMP
Guanosine
nucleotidases
Purine nucleoside phosphorylase
(PNP)
NH4+
N
NH N
NH
O
Xanthine oxidase
Hypoxanthine
O2, H2O H2O2
H2O2
O2, H2O xanthine oxidase
Adenosine
Guanine
NH4
NH
NH N
NH
O
O
NH
NH N
NH
O
O
O-
N
NH N
NH
O
NH2
NH4+
xanthine urate

35
NH
NH NH
NH
O
O
O
O
NH
NH2NH
NH
O
O
Figure 1-7. The mechanism of uricase and uricase inhibitors [67].
Uricase
O2 CO2 Uric acid Uricase Inhibitors Allantoin
36
A
B
Figure 1-8. Enzyme inhibition. A) Michaelis-Menten plot. B) Lineweaver-burk plot. V is defines as a intial velocity, [S] is the substrate concentration, Vmax is a maximum velocity and Km is a substrate concentration at ½ of Tmax [75].

37
A B
Figure 1-9. Competitive inhibition. A) The model for competitive inhibition. B) Lineweaver-
Burk plot of the competitively inhibited Michaelis-Menten enzyme. E is defined as enzyme, S is substrate, I is inhibitor; EI is enzyme-inhibitor complex and P is product. Note that Vmax, as defined as the maximum velocity of a reaction, is unchanged; Km, as defined by [S] required for ½ maximal activity, is increase [75].

38
A
B
Figure 1-10. Uncompetitive inhibition. A) The model for uncompetitive inhibition. B) Lineweaver-Burk plot of a single Michaelis Menten enzyme in the presence of uncompetitive inhibitor. Note that Vmax is decreased; Km, as defined by [S] required for ½ maximal activity, is decreased [75].

39
A B
Figure 1-11. Mixed inhibition. A) The model for mixed inhibition. B) Lineweaver-burk plot of a simple Michaelis Menton enzyme in the presence of a mixed inhibitor. Note that Vmax is decreased; Km appears unaltered [75].

40
CHAPTER 2 IDENTIFICATION AND QUANTIFICATION OF COMPOUNDS IN ARTICHOKE
EXTRACT
Background
The variation of the content of mono-and dicaffeoylquinic acids and flavonoids in
artichoke extracts has been reported [23, 82]. For example, the content of luteolin-7-O-glucoside
and 1, 3-O-dicaffeoylquinic acid were reported to vary from 1002 to 1616 mg/kg of dried
extracts and from 1292 to 30985 mg/kg of dried extracts, respectively [23]. This deviation of
phenolic compounds might affect the pharmacological activities of artichoke extracts.
Specific Aim
The objective of this study was to identify and quantify marker compounds in artichoke
extract.
Materials and Methods
Materials
Water extract of artichoke leaf (Cynara scolymus L.) was obtained from a German extract
manufacturing company (Finzelberg, Andernach, Germany). Dihydrocaffeic acid (90-95%) and
luteolin-7-O-glucoside (>90%) were purchased from Indofine Chemical Company, Inc.
(Somerville, NJ, USA). Chlorogenic acid (≥95%) was purchased Sigma Chemical Company (St.
Louis, MO, USA). Cynarin was purchased from Carl Roth GmbH+Co. (Germany). Acetonitrile
(CH3CN) and trifluoroacetic acid (TFA) were purchased from Fisher Scientific (Fair Lawn, NJ,
USA). Luteolin-7-O-glucuronide used in this study was a kind gift from Prof. Dr. A. Nahrstedt,
Institute of Pharmaceutical Biology and Phytochemistry, University of Münster, Germany. All
aqueous solutions were prepared with deionized water obtained from a NANOPure® system
from Barnstead (Dubuque, IA, USA).
41
Sample Preparation
500 mg of powdered extract of Cynara scolymus L.was dissolved in 20.0 mL of
MeOH/H2O (3:7) at 25 °C for 5 min. The solutions were filtered (0.45 μm) and were directly
analyzed by HPLC/DAD.
HPLC/DAD Analysis
Samples were analyzed using a reverse-phase partition mode of HPLC with diode array
detector. A Shimadzu VP series HPLC system (Kyoto, Japan) equipped with an SPD-M10Avp
diode array detector was used for this work. The column used was a 250- 4.0 mm i.d.(5μm )
Lichrospher® 100 RP-18e (Merck KgaA, Germany).The column temperature was kept at 25oC.
The eluents were (A) 0.3% TFA and (B) CH3CN. The following solvent gradient was applied:
5% B (5 min), 5-20% B (50 min), 20-5%B (15 min), total run time was 70 min. The injection
volume for all samples was 10 μL. Flow elution was 1 mLmin-1. Chromatograms were acquired
at 330 nm for the caffeoylquinic acid and 350 nm for the luteolin derivatives. UV-Vis spectra
were recorded in the range 200-400 nm.
Work Solutions and the Preparation of Calibration Standards
Chlorogenic acid, cynarin, and luteolin-7-O-glucoside work solutions (400 μg/mL):
The amount of 10.0 mg of chlorogenic acid, cynarin and luteolin-7-O-glucoside were accurately
weighed, and transferred to a 25.0 mL volumetric flask. The standards were then dissolved in
and brought to volume with methanol.
Luteolin-7-O-glucuronide work solution (500 μg/mL): The amount of 1.0 mg of
luteolin-7-O-glucuronide was weighted, and transferred to a 2.0 mL volumetric flask. The
standard was then dissolved in methanol to obtain a final concentration of 500 μg/mL. The
volume was completed with same solvent, and the final solution mixed thoroughly.

42
Standard solutions for chlorogenic acid, cynarin, and luteolin-7-O-glucoside: From the
chlorogenic acid, cynarin, and luteolin-7-O-glucoside work solutions, five different
concentrations of standard solutions of chlorogenic acid, cynarin, and luteolin-7-O-glucoside
and three quality controls (QC) were prepared in methanol according (Table 2-1). All solutions
were filtered through a 0.45 μm PVDF membrane filter (Millipore Corp.) before analysis.
Standard solutions for luteolin-7-O-glucuronide: From the luteolin-7-O-glucuronide
work solution, six different concentrations of standard solutions of -7-O-glucuronide and three
quality controls (QC) were prepared according to Table 2-1. The final volume was filled up with
methanol in 2.0 mL volumetric flask. All solutions were filtered through a 0.45 μm PVDF
membrane filter (Millipore Corp.) before analysis.
Quantification
Calibration was carried out by an external standardization method. Calculation was
performed using Microsoft Excel ®. The calibration curves were obtained by plotting the mean
area versus the corresponding concentration of the each standard solution. The calibration was
considered suitable if not more than 1/3 of the quality control standards showed a deviation from
the theoretical values equal or greater than 15%, except at the lower limit of quantification
(LLOQ), where it should not exceed 20%.
Validation
The method was validated over the range of concentration of the target compounds present
in the artichoke extracts. The validation parameters of linearity, sensitivity, specificity, precision,
accuracy and stability were determined.
The linearity of the calibration curves was determined by least-squares linear regression
method and expressed in terms of coefficient of determination (r2). The intra- and inter-day

43
precision and accuracy were measured by triplicate analyses of three different concentration
levels (low, medium and high) of quality control standards on the same day and on different
days. The precision was based on the calculation coefficient of variation (CV %), and the
accuracy was defined as the percent difference between the theoretical and measured values. The
limit of quantification for the assay was defined as the minimum concentration of quality
controls.
Results
Linearity
Calibration curves (n = 9) operating in the range of 5-500 μg/mL for all four artichoke
components were linear (r2 > 0.999) (Figure 2-1).
Sensitivity
In this study, the limit of quantification (LLOQ) is defined as the lowest concentration for
quality control with an accuracy and precision better than 20 %. The LLOQ of chlorogenic acid,
cynarin, luteolin-7-O-glucoside and luteolin-7-O-glucuronide were 0.5, 0.5, 1 and 5 μg/mL,
respectively.
Specificity
The methods provided good resolutions between chlorogenic acid, cynarin, luteolin-7-O-
glucoside and luteolin-7-O-glucuronide. Peaks of all test compounds had similar retention times
and the UV spectra (200- 400 nm) when compared to the standards. The wavelengths 350 and
330 nm used to quantify caffeolyquinic acids and luteolin derivatives at their maximum
absorption, respectively, were confirmed by their UV spectra (Figure 2-2). There was no
endogenous interference from artichoke extract (Figure 2-3) in this assay, indicating specificity
of the methods to the tested compounds. Additionally, The UV spectra of all tested compounds

44
showed more than 99% of similarity with those obtained using the respective standard
compounds (Figure 2-3).
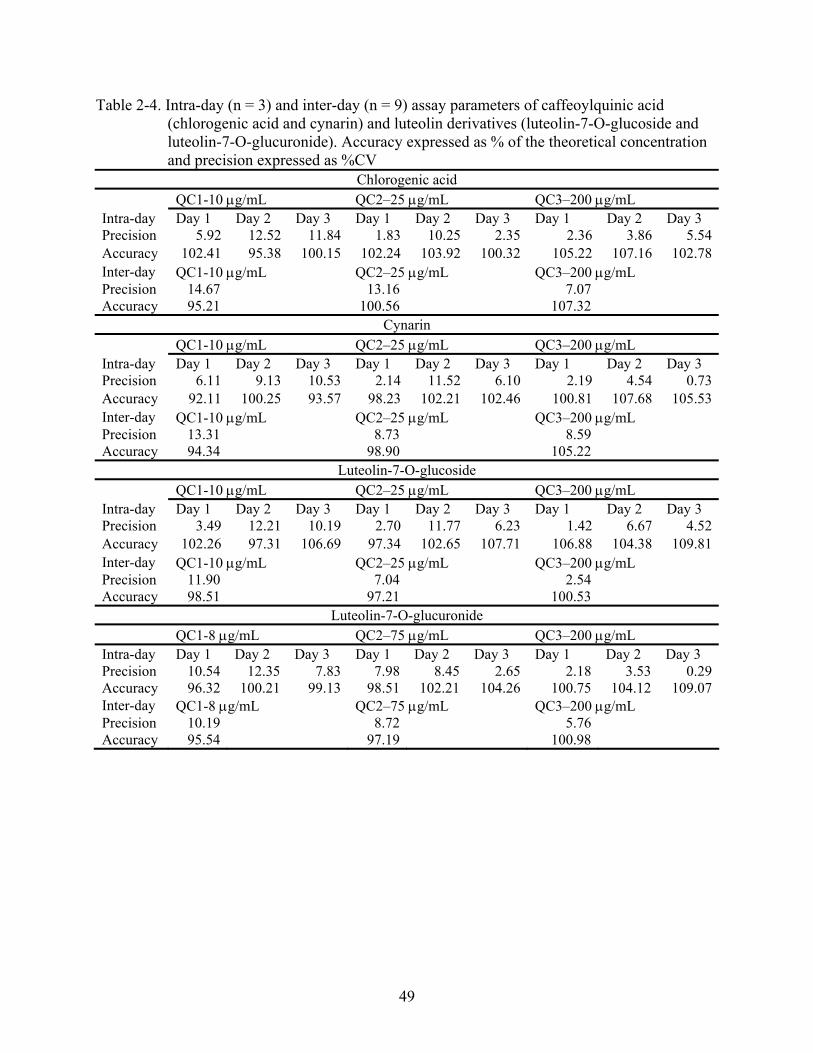
Precision and Accuracy
The precision intra- and inter-day for chlorogenic acid, cynarin, luteolin-7-O-glucoside and
luteolin-7-O-glucuronide were satisfactory with CV values between 0.73 and 12.35%. Similarly
the accuracy of the assay was between 94.34 and 107.32% for all compounds tested at three
different concentrations. The results are summarized in Table 2-4.
Stability
The standard solutions of caffeoylquinic acids and luteolin derivatives were found stable
on autosampler at 20oC within 24 hours (Table 2-2 and Table 2-3). The shifting of the areas of
each sample tested was less than 15 % of those obtained from a fresh solution at the same level
of concentrations.
Quantification of Caffeoylquinic Acids (Chlorogenic Acid, Cynarin) and Luteolin Derivatives (Luteolin-7-O-glucoside, Luteolin-7-O-glucuronide) in Artichoke Leaf Extract
The results from Table 2-5 showed that the caffeoylquinic acids were the predominant
phenolic compounds of the artichoke extract, with 5-O-caffeoylquinic acid showing the highest
amount. The predominant flavonoid was luteolin-7-O-glucoside, followed by luteolin-7-O-
glucuronide.
Discussion and Conclusion
This study reported a quantitative evaluation of phenolic marker compounds of artichoke
extract using a HPLC with photodiode array detector (HPLC/DAD). The identification of each
compound was performed by a comparison with available standards and by UV evaluation. This
approach made it possible to rapidly discriminate between caffeoyl derivatives and flavonoids.
The main chemical structures of the identified compounds are showed in Figure 2-2 as

45
chlorogenic acid, cynarin, dihydrocaffeic acid, luteolin-7-O-glucoside and luteolin-7-O-
glucuronide.
The HPLC profiles of the extract are shown in Figure 2-2 with a profile of the caffeoyl
derivatives at 330 nm and profiles of flavonoids at 350 nm. The quantitative HPLC/DAD
findings of caffeoylquinic ester and flavonoid are summarized in Table 2-4
The developed method is appropriate to completely characterize and quantify phenolic
marker compounds in artichoke extract.

46
Table 2-1. Concentrations of the standard solutions used for the calibration curves and quality controls (QCs) of chlorogenic acid, cynarin, luteolin-7-O-glucoside and luteolin-7-O-glucuronide
Compounds Standard solutions (μg/mL) QC (μg/mL) Chlorogenic acid 5, 10, 50, 100, 400 10, 25, 200Cynarin 5, 10, 50, 100, 400 10, 25, 200Luteolin-7-O-glucoside 5, 10, 50, 100, 400 10, 25, 200Luteolin-7-O-glucucronide 5, 10, 50, 100, 250, 500 8, 75, 200

47
Table 2-2. The stability test of chlorogenic acid, cynarin and luteolin-7-O-glucoside after 24 hours on autosampler at 20oC. Data represents the percentage remaining of all test compounds
% Remaining on autosampler at 20 oC within 24 hours Compound QC1-10 μg/mL QC2- 25 μg/mL QC3-200 μg/mL
Chlorogenic acid 90.41 ± 2.35 100.75 ± 2.33 104.58 ± 3.19Cynarin 95.83 ± 10.45 96.35 ± 0.73 98.58 ± 6.10Luteolin-7-O-glucoside 94.07 ± 5.72 98.77 ± 5.61 100.50 ± 6.23

48
Table 2-3. The stability test of luteolin-7-O-glucuronide after 24 hours on autosampler at 20oC. Data represents the percentage remaining of all test compounds
% Remaining on autosampler at 20 oC within 24 hours Compound QC1-8 μg/mL QC2-75 μg/mL QC3-200 μg/mL
Luteolin-7-O-glucuronide 90.43 ± 7.81 96.21 ± 3.45 101.53 ± 3.52
49
Table 2-4. Intra-day (n = 3) and inter-day (n = 9) assay parameters of caffeoylquinic acid (chlorogenic acid and cynarin) and luteolin derivatives (luteolin-7-O-glucoside and luteolin-7-O-glucuronide). Accuracy expressed as % of the theoretical concentration and precision expressed as %CV
Chlorogenic acid QC1-10 μg/mL QC2–25 μg/mL QC3–200 μg/mL Intra-day Day 1 Day 2 Day 3 Day 1 Day 2 Day 3 Day 1 Day 2 Day 3 Precision 5.92 12.52 11.84 1.83 10.25 2.35 2.36 3.86 5.54Accuracy 102.41 95.38 100.15 102.24 103.92 100.32 105.22 107.16 102.78Inter-day QC1-10 μg/mL QC2–25 μg/mL QC3–200 μg/mL Precision 14.67 13.16 7.07 Accuracy 95.21 100.56 107.32
Cynarin QC1-10 μg/mL QC2–25 μg/mL QC3–200 μg/mL Intra-day Day 1 Day 2 Day 3 Day 1 Day 2 Day 3 Day 1 Day 2 Day 3 Precision 6.11 9.13 10.53 2.14 11.52 6.10 2.19 4.54 0.73Accuracy 92.11 100.25 93.57 98.23 102.21 102.46 100.81 107.68 105.53Inter-day QC1-10 μg/mL QC2–25 μg/mL QC3–200 μg/mL Precision 13.31 8.73 8.59 Accuracy 94.34 98.90 105.22
Luteolin-7-O-glucoside QC1-10 μg/mL QC2–25 μg/mL QC3–200 μg/mL Intra-day Day 1 Day 2 Day 3 Day 1 Day 2 Day 3 Day 1 Day 2 Day 3 Precision 3.49 12.21 10.19 2.70 11.77 6.23 1.42 6.67 4.52Accuracy 102.26 97.31 106.69 97.34 102.65 107.71 106.88 104.38 109.81Inter-day QC1-10 μg/mL QC2–25 μg/mL QC3–200 μg/mL Precision 11.90 7.04 2.54 Accuracy 98.51 97.21 100.53
Luteolin-7-O-glucuronide QC1-8 μg/mL QC2–75 μg/mL QC3–200 μg/mL Intra-day Day 1 Day 2 Day 3 Day 1 Day 2 Day 3 Day 1 Day 2 Day 3 Precision 10.54 12.35 7.83 7.98 8.45 2.65 2.18 3.53 0.29 Accuracy 96.32 100.21 99.13 98.51 102.21 104.26 100.75 104.12 109.07 Inter-day QC1-8 μg/mL QC2–75 μg/mL QC3–200 μg/mL Precision 10.19 8.72 5.76 Accuracy 95.54 97.19 100.98

50
Table 2-5. Amounts of caffeoylquinic acids and luteolin derivatives expressed as milligram per gram of dried extract
Compound Amount of compounds in artichoke extract (mg/g) mean ± SEM
5-O-caffeoylquinic acid (chlorogenic acid) 8.71 ± 0.591,3-di-O-caffeoylquinic acid (cynarin) 2.47 ± 0.54luteolin-7-O-glucoside 3.60 ± 0.62luteolin-7-O-glucuronide 2.08 ± 0.73

51
A
0 100 200 300 400 5000
3.0×10⁶
6.0×10⁶
9.0×10⁶
1.2×10⁷
1.5×10⁷
chlorogenic acid[ug/mL]
Are
a
B
0 100 200 300 400 5000
5.0×10⁶
1.0×10⁷
1.5×10⁷
2.0×10⁷
cynarin[ug/mL]
Are
a
C
0 100 200 300 400 5000
1.0×10⁶
2.0×10⁶
3.0×10⁶
4.0×10⁶
5.0×10⁶
6.0×10⁶
7.0×10⁶
8.0×10⁶
Luteolin-7-0-glucoside[ug/mL]
Are
a
D
0 100 200 300 400 500 6000
1.0×10⁶
2.0×10⁶
3.0×10⁶
4.0×10⁶
5.0×10⁶
6.0×10⁶
7.0×10⁶
Luteolin-7-0-glucuronide[ug/mL]A
rea
Figure 2-1. Mean calibration curves of compounds in artichoke (n = 9). A) Chlorogenic acid. B) Cynarin. C) Luteolin-7-O-glucoside. D) Luteolin-7-O-glucuronide in methanol. Vertical bars represent the standard deviations (SD) of the means.
Y = 37766 X - 209223 R2 = 0.999
Y = 30030 X - 45570 R2 = 0.9992
Y = 11951 X - 86968 R2 = 0.9992
Y = 12680 X - 7939.7 R2 = 0.9997
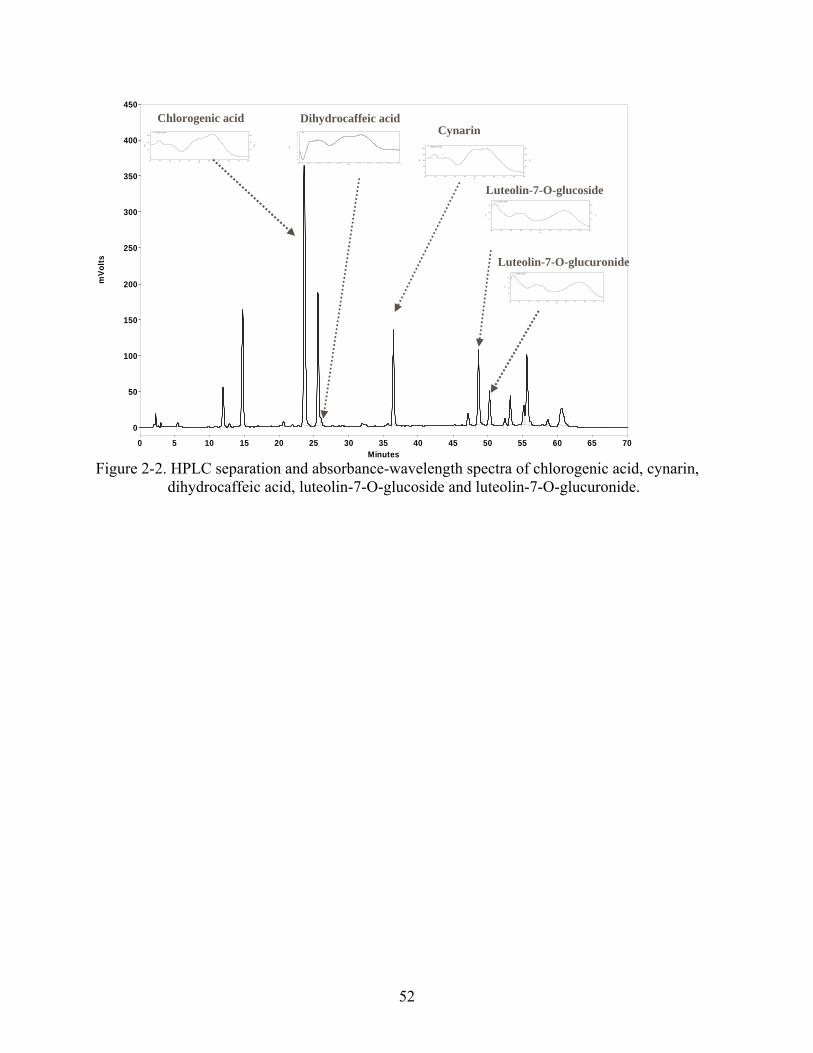
52
Figure 2-2. HPLC separation and absorbance-wavelength spectra of chlorogenic acid, cynarin,
dihydrocaffeic acid, luteolin-7-O-glucoside and luteolin-7-O-glucuronide.
Minutes0 5 10 15 20 25 30 35 40 45 50 55 60 65 70
mVo
lts
0
50
100
150
200
250
300
350
400
450Chlorogenic acid
Cynarin
nm200 220 240 260 280 300 320 340 360 380 400
mA
u
0
500
1000
1500
mA
u
0
500
1000
1500
25.20 Min / Smooth
nm
200 220 240 260 280 300 320 340 360 380 400
mAu
0
500
1000
1500
2000
mAu
0
500
1000
1500
200038.35 Min / Smooth
nm200 220 240 260 280 300 320 340 360 380 400
mAu
0
250
500
750
1000
mAu
0
250
500
750
1000
52.88 Min / Smooth
Luteolin-7-O-glucuronide
n m2 0 0 2 2 0 2 4 0 2 6 0 2 8 0 3 0 0 3 2 0 3 4 0 3 6 0 3 8 0 4 0 0
mA
u
- 6
- 4
- 2
0
2
4
6
8
1 0
mAu
- 6
- 4
- 2
0
2
4
6
8
1 02 5 . 6 3 M i n / S m o o t h
Dihydrocaffeic acid
Luteolin-7-O-glucoside
nm
200 220 240 260 280 300 320 340 360 380 400
mA
u
0
200
400
600
mA
u
0
200
400
600
51.33 Min / Smooth

53
A Similarity: 0.9998
nm200 250 300 350 400
mAu
-20
0
20
40
60
80
100
120
140
160
180
200
220
240
mAu
-20
0
20
40
60
80
100
120
140
160
180
200
220
240
Unknown Known
B Similarity: 0.9963
nm200 250 300 350 400
mAu
0
10
20
30
40
50
60
70
80
mAu
0
10
20
30
40
50
60
70
80
Unknown Known
C Similarity: 0.9807
nm200 250 300 350 400
mAu
0
10
20
30
40
50
60
70
80
90
mAu
0
10
20
30
40
50
60
70
80
90Unknown Known
D Similarity: 0.9753
nm200 250 300 350 400
mAu
0
5
10
15
20
25
30
35
40
45
50
mAu
0
5
10
15
20
25
30
35
40
45
50Unknown Known
Figure 2-3. Absorbance-wavelength spectras. A) Chlorogenic acid. B) Cynarin. C) Luteolin-7-O-glucoside. D) Luteolin-7-O-glucuronide. (1) Represents the spectra of the standard compound and (2) represents the spectra of the peak with same retention time of the corresponding standard but obtained after injection of artichoke extract.
1
2
1 2
1
2
1
2
54
CHAPTER 3 EFFECT OF ARTICHOKE LEAF EXTRACT, CAFFEIC ACID DERIVATIVES AND
FLAVONOIDS ON XANTHINE OXIDASE INHIBITORY ACTIVITY
Background.
Xanthine oxidase (XO) is a key enzyme that catalyses the oxidation of oxypurines
(hypoxanthine and xanthine) to uric acid in the purine metabolic pathway [67]. The uric acid
plays a vital role in producing hyperuricemia and gout. Allopurinol is a clinically used XO
inhibitor in the treatment of gout. However, due to the unwanted side effect of allopurinol such
as hypersensitivity problem [74], Steven-Johnson syndrome [83], renal toxicity [84], and fatal
liver necrosis [85] the alternative treatment with increased therapeutic activity and less side
effects is necessary.
The leaves of artichoke consists of many chemical components such as caffeoylquinic
acids and flavonoids and one or more of these components may be effective agents as XO
inhibitors. Flavonoids have been shown to be inhibitors of XO activity in vitro [65]. In this aim,
the efficacy of artichoke leaf extract and its main components in inhibiting XO was performed.
Additionally, various flavonoids such as flavones, flavonols and flavanones have been
investigated as XO inhibitors. The results are shown in Table 3-1.
Specific Aim
Determine the in vitro XO inhibition of Cynara scolymus L., its compounds and some
flavonoids.
Materials and Methods
Materials
Water extract of artichoke leaf (Cynara scolymus L.) were obtained from a German extract
manufacturing company (Finzelberg, Andernach, Germany). Allopurinol, chlorogenic acid (≥
95%), quercetin dihydrate (> 98%) and xanthine oxidase from bovine milk (25 units/1.3 mL),

55
NaH2PO4.H2O, Na2HPO4.12H2O were purchased from Sigma Chemical Company (St. Louis,
MO, USA). Apigenin (98%), eriodictyol (≥95%), dihydrocaffeic acid (90-95%), luteolin (99%),
luteolin-7-O-glucoside (> 90%) were purchased from Indofine Chemical Company, Inc.
(Somerville, NJ, USA). Cynarin and naringenin (≥ 96%) were purchased from Carl Roth
GmbH+Co. (Germany). Kaempferol (RG) was purchased from Chromadex (Santa Ana, CA,
USA). Xanthine was purchased from Carl MP Biomedicals (Solon, OH, USA). All buffers and
aqueous solutions were prepared with deionized water obtained from a NANOPure® system
from Barnstead (Dubuque, IA, USA).
Preparation of Working Solutions and Test Solutions
Phosphate buffer solution: (A). 0.2 M NaH2PO4 solutions: NaH2PO4.H2O (2.78 g) was
dissolved in distilled water to make 100.0 mL solution. (B). 0.2 M Na2HPO4 solution:
Na2HPO4.12H2O (71.50 g) was dissolved in distilled water to make 100.0 mL solution. 85 mL of
A solution and 915 mL of B solution were added to 1000.0 mL of distilled water to make 0.1 M
phosphate buffer solution, pH 7.8.
Xanthine buffer solution: Xanthine (12.20 mg.) was initially dissolved in 0.25 N NaOH
and then diluted with 0.1 mM phosphate buffer to obtain a 400 μM solution.
Xanthine oxidase: The xanthine oxidase solution was prepared by diluting xanthine
oxidase from cow’s milk to a final concentration of 0.4 U/mL in cold 0.1 mM phosphate buffer
(pH 7.8). (Enzyme 200.0 μL filled up to 10.0 mL)
Test solution: 1.36 mg of Allopurinol (M.W. = 136.1) was dissolved in 2000 μL of
DMSO to make a concentration of 50 mM solution, which was then diluted with 0.1 mM
phosphate buffer to obtain a 400, 200, 100, 50, 25, 10, 5, and 1 μM solution. Apigenin, caffeic
acid, chlorogenic acid, cynarin, dihydrocaffeic acid, eriodictyol, kaempferol, luteolin, luteolin-7-

56
O-glucoside, luteolin-7-O-glucuronide, quercetin, naringenin were prepared in the same way as
allopurinol. The final concentration of DMSO was less than 2%.
Artichoke extract. was dissolved in 1 mM phosphate buffer to make a concentration of
1000, 500, 300, 100 μg extracts/ mL phosphate buffer.
Assay Procedure for Xanthine Oxidase Inhibitions
The inhibitory activity of each compound was determined using a slight modification of
the reference methods [64, 86-88].
Control: 7.0 μL of xanthine oxidase buffer solution (0.4 U/mL) were added to 0.1 M
phosphate buffer (127.0 μL) and the mixture was incubated at 37°C for 10 minute Then 66.0 μL
of 400 μM xanthine buffer solution were added to the mixture and the absorbance at 295 nm of
the reaction mixture was measured at 37° C for 10 min by multi-detection microplate reader
(Synergy HT). The blank solution was prepared in an analogous way, but instead of the enzyme,
it contained 7 μL of phosphate buffer solution. The test was performed in triplicate.
Sample test: 7.0 μL of xanthine oxidase buffer solution (0.4 U/mL) was added to a solution
consisting of 0.1 M phosphate buffer pH 7.8 (77.0 μL) and 50.0 μL each of test samples which
was treated in the same way as the control. 3.5 μL of phosphate buffer solution were used instead
of xanthine oxidase solution (0.4 U) for blank tests.
Xanthine oxidase activity was expressed as percent inhibition of xanthine oxidase,
calculate as (1-B/A) x 100, where A is the change in absorbance of the assay without the test
samples. (∆ abs with enzyme -∆ abs without enzyme), and B is the change in absobance of the
assay with the test sample (∆ abs with enzyme - ∆ abs without enzyme). IC50 was calculated
using Graphpad Prism® (version 4.0, Sandiego, CA).

57
Lineweaver- Burk Plot
Enzyme kinetics was similar to xanthine oxidase assay methodology with varying
concentrations of xanthine as the substrate as 200, 150, 110, 100, 90, 80, 70, 60, and 50 μM.
Lineweaver-Burk plots were generated in Graphpad Prism® (version 4.0, Sandiego, CA). Vmax
(a maximal velocity) and Km (a concentration at 50% Vmax) were calculated.
Results
Xanthine Oxidase Inhibitory Activity of Artichoke Extract
The artichoke extract was assayed for xanthine oxidase inhibitory activity at 1000, 500,
300, 100 μg water extracts / mL (Table 3-2). Artichoke extracts showed a dose dependence XO
inhibitory effect with minimal XO inhibitory activity (< 5%) at 100 μg / ml.
Xanthine Oxidase Inhibitory Activity of Various Flavonoids and Compounds in Artichoke
The inhibition of xanthine oxidase results in a decreased production of uric acid was
measured spectrophotometrically at 295 nm. The IC50 values (50% inhibitory concentrations) of
caffeic acid derivatives and flavonoids were calculated and listed in Table 3-3 and Figure 3-1
Caffeic acid and caffeic acid derivatives such as dihydrocaffeic acid, chlorogenicacid and
cynarin showed weak xanthine oxidase inhibitory effect with IC50 > 100 μM. For flavonoids,
only flavones (luteolin, apigenin) and flavonols (kaempferol, quercetin) were shown to have
potent xanthine oxidase inhibitory activities, with IC50 values 1.49, 2.37, 3.35, and 2.34 μM,
respectively. Flavanones such as naringenin and eriodictyol showed weak xanthine oxidase
inhibitory activity with IC50 > 50μM. Flavonoid glycosides such as luteolin-7-O-glucoside
showed weaker activities with IC50 value 19.90 μM.

58
Inhibition Mechanism
Kinetic analysis using Lineweaver-Burk plots (Figure 3-2 and Table 3-4) revealed that
apigenin, luteolin and kaempferol had a linear mixed-type mode of inhibition, as can be seen
from different Vmax and different Km value. Quercetin showed a competitive type inhibition, as
can be concluded from similar Vmax and different Km values.
Discussion and Conclusion
Artichoke leaf extract inhibited XO in vitro in a dose-dependent manner with minimal XO
inhibitory activity (< 5%) at 100 μg/mL as shown in Table 3-1. To our knowledge , this is the
first time that the XO activity of artichoke had been observed.
The XO inhibitory of caffeoylquinic acids and flavonoids were shown in Table 3-3. and
Figure 3-1. Caffeic acid and caffeic acid derivatives such as dihydrocaffeic acid, chlorogenic
acid and cynarin showed weak XO inhibitory effect with IC50 > 100 μM. Our results were
similar to the previous study. Chan et al. [86] found hydrocaffeic acid was inactive, caffeic acid
and chlorogenic acid had IC50 values about 74.6 ± 11.04 μM and 126.28 ± 2.86 μM,
respectively. Nguyen et al.[89] reported IC50 value of 85.4 μM by caffeic acid.
The activity of flavonoids as inhibitors of xanthine oxidase in vitro has been reported to be
largely determined by the double bond between C-2 and C-3. Additionally, the absence of a
hydroxyl group at C-3 enhances slightly the inhibition effect on xanthine oxidase [65, 87, 90].
Our results are in agreement with these observations (Figure 3-1). Flavonoid aglycons, only
flavones and flavonols showed potent XO inhibitory activities. The IC50 values of luteolin,
apigenin, kaempferol and quercetin were 1.49, 2.37, 3.35, and 2.34 μM, respectively. Flavanones
such as naringenin and eriodictyol showed weak XO inhibitory activity with IC50 > 50 μM.

59
Flavonoid glycosides showed a much lower inhibition of xanthine oxidase than flavonoid
aglycons, such as luteolin-7-O-glucoside (IC50 = 19.90 μM). This result might be due to the steric
interactions of glycosides on xanthine oxidase [65, 90, 91].
The Lineweaver-Burk plot of apigenin, luteolin and kaempferol showed mixed-type
inhibition. Quercetin showed a competitive type inhibition. The different types of inhibition by
flavonoids have been reported in the previous studies. Lin et al. [92] reported competitive
inhibition by apigenin and quercetin. Cotelle et al. [40] reported competitive inhibition by
luteolin. Nguyen et al. [89] reported competitive inhibition by luteolin and apigenin. The
differences observed between these studies could be explained by the different reaction mixtures,
the different concentrations of enzyme and the different methods. However, Nagao et al. [65]
reported mixed-typed inhibition by luteolin and kaempferol. Van Hoorn et al. [87] and Chang et
al. [93] reported competitive inhibition by quercetin. Noro et al. [94] reported mixed-typed
inhibition by luteolin and apigenin. These reports are consistent with our results. The results
suggest that luteolin, kaempferol and apigenin inhibit XO activity not only by competitive mode,
but also by interaction with the enzyme at a site other than the active center.
The significant inhibition of XO by the flavonoids in vitro suggested that they may
suppress the production of active oxygen species in vivo under the conditions that XO works.
Additionally, their IC50 values are comparable to that of allopurinol (3.65 μM), a therapeutic
drug for treating gout, which indicated a possibility of flavonoids for treating gout. However,
recent studies have shown that after orally administration of quercetin in human, most of
quercetin was found in a form of metabolites in plasma [95]. Our study had shown that luteolin-
7-O-glucuronide, one of the metabolites of luteolin, showed weaker XO inhibitory (IC50 = 20.24
μM) comparing with luteolin (IC50 = 1.49 μM). This result presumably indicates a weaker XO
60
inhibitory activity of metabolites in vivo. However luteolin-7-O-glucuronide is not the only
metabolites found in plasma after incubation of luteolin with microsomal samples from human
intestine [96]. Therefore, the in vitro data obtained from the study does not necessarily predict
the in vivo effects of flavonoids on XO, and further study of the inhibitory effects by flavonoids
in vivo will be required.
In this study, artichoke extract, caffeoylquinic acids and various flavonoids were evaluated
for the inhibition of XO activity. The extract and caffeoylquinic acids showed weak XO
inhibition. Flavone and flavonols had a highly inhibitory effect on XO. The in vivo effect of
these compounds on urate accumulation by XO remains to be studied to clarify the roles of these
compounds in human health.

61
Table 3-1. Structures of various flavonoids Flavones Flavonols Flavanones
4
8
5
7
6
2
3
O
OOH
OH
4'
5'
3'
6'
2'OH
O
OOH
OH
OH
OH
O
OOH
OH
OHOH
Apigenin Kaempferol
Eriodictyol
O
OOH
OH
OH
OH
OH
R=H, Luteolin R=Glc, Luteolin-7-O-glucoside
Quercetin Naringenin
O
OOH
OH
OH
RO
O
OOH
OH
OH
A
B
C

62
Table 3-2. Results of the % XO inhibition screening of artichoke extract XO inhibition (%)
Test Sample 100μg/mL 300μg/mL 500μg/mL 1000μg/mL
Artichoke extract 5.11 ± 1.77 9.83 ± 2.07 19.76 ± 0.89 26.02 ± 1.81
Control 1 μM 10 μM 50 μM 100 μM
Allopurinol 5.35 ± 0.77 33.50 ± 1.18 93.22 ± 0.19 97.192 ± 0.28
Note: Data are expressed as mean ± SEM.

63
Table 3-3. The IC50 values (μM) of test samples on xanthine oxidase inhibition Compounds IC50 (μM) C.I. Caffeic acid and Caffeoylquinic acid Caffeic acid > 100 Cynarin > 100 Chlorogenic acid > 100 Dihydrocaffeic acid > 100 Flavonoids Flavone Apigenin 2.37 1.51 to 3.70Luteolin 1.49 1.23 to 1.83Luteolin-7-O-glucoside 19.90 17.97 to 22.09Luteolin-7-O-glucuronide 20.24 18.47 to 22.17Flavonol Quercetin 2.34 2.11 to 2.59Kaempferol 3.35 2.71 to 4.14Flavanone Naringenin > 50Eriodictyol > 50Control Allopurinol 3.65 3.38 to 3.72Note: Data are expressed as mean with 95% of confidence interval (C.I.).

64
Table 3-4. Vmax and Km of flavonoids on xanthine oxidase inhibition Compounds Vmax (μM / min)
Mean ± SEM Km (μM)
Mean ± SEM Type of Inhibition
Control 6.27 ± 0.35 8.18 ± 2.05 -Apigenin 0.5 μM 3.78 ± 0.14 17.84 ± 1.87 MixedLuteolin 0.5 μM 2.78 ± 0.07 21.10 ± 1.37 MixedQuercetin 0.5 μM 6.22 ± 0.34 21.38 ± 2.81 CompetitiveKaempferol 0.5 μM 4.50 ± 0.34 23.26 ± 4.04 MixedNote: Vmax is a maximum velocity; Km is a concentration at 50% Vmax.

65
10 -1 10 0 10 1 10 20
25
50
75
100
125
Apigenin (μM)
%ur
ic a
cid
Form
atio
n
10 -1 10 0 10 1 10 20
25
50
75
100
125
Luteolin (μM)
%ur
ic a
cid
Form
atio
n
10 -1 10 0 10 1 10 2 10 30
25
50
75
100
125
Luteolin-7-0-glucoside (μM)
%U
ric
Aci
d Fo
ram
atio
n
10 0 10 1 10 2 10 30
25
50
75
100
125
Luteolin-7-0-glucuronide (μM)
%ur
ic a
cid
Form
atio
n
10 -1 10 0 10 1 10 2 10 30
25
50
75
100
125
Quercetin (μM)
%ur
ic a
cid
Form
atio
n
10 -1 10 0 10 1 10 20
25
50
75
100
125
Kaempferol (μM)
%ur
ic a
cid
Form
atio
n
10 -1 10 0 10 1 10 2 10 30
25
50
75
100
125
Allopurinol (μM)
%ur
ic a
cid
Form
atio
n
Figure 3-1. Inhibition dose-response effects. A) Apigenin. B) Luteolin. C) Luteolin-7-O-glucoside. D) Quercetin. E) Kaempferol. F) Allopurinol. Data are expressed as mean ± SEM (n = 3). The IC50 values of each compound and their respective 95% of confidence interval (C.I.) were estimated by nonlinear regression using GraphPad Prism 4.0 as described in “Material and Methods”.
G
F
A B
C D
E
IC50 = 2.37 C.I. = 1.51-3.70
IC50 = 2.34 C.I. = 2.11-2.59
IC50 = 1.49 C.I. = 1.23-1.83
IC50 = 20.24 C.I. = 18.47-22.17
IC50 = 3.65 C.I. = 3.38-3.72
IC50 = 3.35 C.I. = 2.71-4.14
IC50 = 19.90 C.I. = 17.97-22.09

66
-0.15 -0.10 -0.05 -0.00 0.05 0.10 0.15
0.10.20.30.40.50.60.70.80.91.01.11.21.31.4
kaempferol 0.5 μM
Luteolin 0.5 μM
control
apigenin 0.5 μM
quercetin 0.5μM
1/[xanthine]μM
1/v
( μM
/min
)
Figure 3-2. Lineweaver-Burk plots in the absence (control, ■-■) and in the presence of luteolin
(0.5 μM, ◆-◆), apigenin (0.5 μM, ●-●), kaempferol (0.5 μM, ▲-▲) and quecetin (0.5 μM, ▼-▼) with xanthine as the substrate.

67
CHAPTER 4 EFFECTS OF ARTICHOKE LEAF EXTRACT AND VARIOUS FLAVONOIDS ON SERUM
URIC ACID LEVELS IN OXONATE-INDUCED RATS
Background
The previous in vitro study of XO inhibitory activity of artichoke and its components has
shown that the extract and caffeic acid derivatives had weak inhibitory activity on XO.
Flavonoids such as flavone and flavonols showed a highly inhibitory effect with IC50 < 20 μM.
However, the in vivo effect of artichoke extract and its components on urates accumulation by
XO is limited. Therefore, in this study, the effect of artichoke extract, and various flavonoids on
serum uric acid levels in oxonate induced rats was performed.
Most species, except humans, some apes and the dalmatian dogs have rather low blood
levels of uric acid because of the presence of the uric acid catabolizing enzyme uricase in the
plasma and liver. Uricase transforms uric acid to allantoin, which is water soluble and can be
excreted [67]. Thus, in rat experiment, an uricase inhibitor such as potassium oxonate was used
in order to increase endogenously synthesized uric acid.
Specific Aim
Investigate the hypouricemic activity of artichoke leaf extract, and various flavonoids.
Materials and Methods
Materials
Water extract of artichoke leaf (Cynara scolymus L.) were obtained from a German extract
manufacturing company (Finzelberg, Andernach, Germany). Allopurinol, CMC-Na,
NaH2PO4.H2O and propylene glycol were purchased from Sigma Chemical Company (St. Louis,
MO, USA). Apigenin (98%), eriodictyol (≥95%), dihydrocaffeic acid (90-95%), luteolin (99%),
luteolin-7-O-glucoside (> 90%) were purchased from Indofine Chemical Company, Inc.
(Somerville, NJ, USA). Naringenin (≥ 96%) were purchased from Carl Roth GmbH+Co.

68
(Germany). Kaempferol (RG) was purchased from Chromadex (Santa Ana, CA, USA). All
buffers and aqueous solutions were prepared with deionized water obtained from a NANOPure®
system from Barnstead (Dubuque, IA, USA).
Stock Solutions and Preparation of Calibration Standards
Uric acid stock solution: The amount of 20.0 mg of uric acid (MW = 580.53 g/mol) was
accurately weighed, and transferred quantitatively to a 200.0 mL volumetric flask. The standard
was then dissolved in 20.0 mL of 0.25 N NaOH, the volume was completed with phosphate
buffer (pH 2.3), and the final solution mixed thoroughly. The final concentration of uric acid was
100 μg/mL.
Standard solutions of uric acid: From the uric acid stock solution, six different
concentrations of standard solutions of uric acid and three quality controls (QC) were prepared in
phosphate buffer pH 2.3 according Table 4-1. All solutions were filtered through a 0.45 μm
PVDF membrane filter (Millipore Corp.) before analysis.
Animals and Experimental Protocols
Animals
Male Sprague Dawley rats (250-350 g.) were purchased from Harlan (IN, USA) and
divided into the experimental groups; containing 8-10 rats per group. They were housed in
plastic cages. They were allowed one week to adapt to their environment before used for
experiments. All the animals were maintained on a 12hr/12hr light/dark cycle with light on at 6
am. They were given standard chow and water ad libitum during the course of the study. All
animal experiments were performed according to the policies and guidelines of the Institutional
Animal Care and Use Committee (IACUC) of the University of Florida, Gainesville, USA (NIH
publication # 85-23).

69
Animal model of hyperuricemia in rats
Potassium oxonate (250 mg/kg) was injected intraperitoneally as a suspension in 0.8 %
carboxymethyl cellulose sodium salt (CMC-Na) 1 h before orally or intraperitoneal
administration of tested compounds as described as follows. [97, 98] The animals were
anaesthetized with halothane and blood samples (1000 μL) were taken from the sublingual vein
1 h. after compound administration. After the blood collection, approximately 1000 μL of
isotonic saline were given intraperitoneally in order to maintain the blood fluid. The blood was
allowed to clot for approximately 1 h. at room temperature and then centrifuged at 2800 x g for
15 min. to obtain the serum which was stored at -20°C until use.
Drug Administration:
1. Oral administration
Artichoke leaf extract: artichoke extract (250, 500, 1000 mg/kg) and allopurinol (50
mg/kg) were dissolved in 0.8% CMC-Na. The control groups received 0.8% CMC-Na. The
volume of the drug administered to each rats was based on the body weight of the animal
measured immediately prior to each dose. The extract and allopurinol were administered orally 1
h after the administration of potassium oxonate. For chronic treatment, test samples were given
orally once daily for 1, 3, 5, and 7 days.
Flavonoids: Luteolin (16, 32, 50, 100 mg/kg: test the optimum dose), other flavonoids
(50, 100 mg/kg) and allopurinol (50 mg/kg) were administered orally at one hour after potassium
oxonate. Flavonoids and allopurinol were suspended in 1:1 (propylene glycol (PG): water). The
control groups received 1:1 (PG: water). The volume of the drug administered to each rats was
based on the body weight of the animal measured immediately prior to each dose.
70
2. Intraperitoneal administration
Artichoke (500 mg/kg), caffeoylquinic acids (50mg/kg) such as caffeic acid, chlorogenic
acid, cynarin, and flavonoids (50mg/kg) such as luteolin, apigenin, quercetin and allopurinol
(50mg/kg) were administered intraperitoneal injection (i.p.) at one hour after potassium oxonate.
Artichoke extract were dissolved in 0.8% CMC-Na. Other test samples were suspended in 1:1
(PG: water). The control groups received 1:1 (PG: water).
Uric Acid Assay
Uric acid in rat serum was determined by reversed-phase high performance liquid
chromatography and photodiode array detection (DAD) [99] [100].Standards were prepared by
diluting the stock uric acid solution with 200 mM phosphate buffer (0.1 mg/mL). The stock
solution was prepared as follows. Uric acid has low solubility in water. Therefore, an aliquot
(20.0 mL) of a 0.25 N NaOH was dropped into 20.0 mg of uric acid. Sonicate shortly and fill up
with buffer to 200.0 mL. Samples were analyzed using a reverse-phase partition mode of HPLC
with diode array detector A Shimadzu VP series HPLC system (Kyoto, Japan) equiped with an
SPD-M10Avp diode array detector was used for this work. A Lichrospher® 100 RP-18 (5μm.
Merck KgaA) was used for the separation of uric acid. The column temperature was kept at
25oC. The mobile phase was 200 mM phosphate buffer (NaH2PO4, pH 2.0). The flow rate was
0.5 mL/min. Ten micro liters of each sample was injected into the RP-HPLC system. Comparing
the respective peak area in the chromatogram with the value from a standard calibration curve
quantitated uric acid.
Preparation of Rat Serum
The proteins in rat plasma were precipitate by adding 150.0 μL of 10% trichloroacetic acid
to 150.0 μL of plasma and adding 750.0 μL of buffer to make 1 mL. The precipitates were

71
removed from the mixture by centrifugation at 3,000 g for 3 min. Supernatants were filtered
through 0.45 μm filters and ten micro liters of the plasma sample were injected into the RP-
HPLC with photodiode array detector system.
Statistical Analysis
All data are expressed as the mean ± SEM. Group mean differences were ascertained with
analysis of variance (ANOVA). Multiple comparisons among treatment means were checked
with the Tukey’s test. The results were considered significant if the probability of error was <
0.05
Validation
The method was validated over the range of concentration of uric acid present in serum.
The validation parameters of linearity, sensitivity, specificity, precision, accuracy and stability
were determined.
The linearity of the calibration curves was determined by least-squares linear regression
method and expressed in terms of coefficient of determination (r2). The intra- and inter-day
precision and accuracy were measured by triplicate analyses of three different concentration
levels (low, medium and high) of quality control standards on the same day and on different
days. The precision was based on the calculation coefficient of variation (CV %), and the
accuracy was defined as the percent difference between the theoretical and measured values. The
limit of quantification for the assay was defined as the minimum concentration of quality
controls. The calibration was considered suitable if not more than 1/3 of the quality control
standards showed a deviation from the theoretical values equal or greater than 15%, except at the
lower limit of quantification (LLOQ), where it should not exceed 20%.
72
Results
Validation of Analytical Method to Measure Uric Acid in Rat Serum.
Linearity
Calibration curves (n = 9) operating in the range of 2-50 μg/mL for uric acid were linear
(r2> 0.999) (Figure 4-1).
Sensitivity
In this study, the limit of quantification (LLOQ) is defined as the lowest concentration for
quality control. This concentration would be acceptable with the precision (%CV < 20), and
accuracy (%error < 20).The LLOQ of uric acid in plasma was 0.1 μg/mL.
Specificity
The method provided good resolutions between uric acid and interference in serum. Peak
of uric acid had similar retention times to the standard. The method showed good specificity
since the chromatograms of the serum samples did not show any co-eluting peak with similar
retention time as uric acid as shown in Figure 4-2.
Precision, accuracy and recovery
The precisions intra- and inter-day for uric acid were satisfactory with CV values between
1.2 and 12.3%. Similarly, the accuracy of the assay obtained with quality control samples
containing 3, 12, and 35 μg/mL uric acid was between 91.9 and 109.1% of the nominal values.
The mean recovery assessed at three distinct levels of concentration (1, 10 and 20 μg/mL) ranged
from 92.8 to 94.7% of the expected values. The results are summarized in Table 4-2.
Stability
Uric acid was stable under the tested conditions. The mean % remaining in rat serum after
2 hours at room temperature was 98.1± 6.2, 100.4 ± 5.7, 100.3 ± 2.8 for the low, medium and

73
high concentrations, respectively. Uric acid was stable on autosampler at 20 oC within 24 hours
(Table 4-3).
Effect of Artichoke Extract and Its Compounds on Serum Urate Levels in Hyperuricemic Rats
Oral administration of artichoke in acute treatment
Uricase inhibitor potassium oxonate treatment showed hyperuricemia in rats, as indicated
by increased in serum uric acid levels from 9.76 to 33.40 μg/mL (Table 4-4 and Figure 4-3).
Artichoke water extracts did not affect the serum uric acid level after 1 h treatment. In contrast,
allopurinol (50 mg/kg) lowered the uric acid levels in hyperuricemic rats.
Oral administration of artichoke in chronic treatment
The hypouricemic effects of the orally administered artichoke water extracts on serum uric
acid levels in oxonate-petreated rats are shown in Table 4-5 and Figure 4-4. After day 1, 3, 5 and
7 treatment, when compared with that of the hyperuricemic control group, artichoke water
extract did not show effect on serum uric acid levels. In contrast, allopurinol (50 mg/kg) lowered
the uric acid levels in hyperuricemic rats after day 1, 3, 5 and 7 treatments.
Oral administration of compounds in artichoke and various flavonoids in acute treatment
Potassium oxonate treatment caused hyperuricemia in rats, as indicated by increase in
serum uric acid levels. As shown in Table 4-6, Figure 4-5, Figure 4-6 and Figure 4-7, luteolin at
dose 16 and 32 mg/kg did not show a decrease in serum urate levels compared with the control
group. Therefore, the higher doses such as 50 mg/kg and 100 mg/kg were performed for all
flavonoids. The results showed that at 50 and 100 mg/kg, apigenin, eriodictyol, luteolin, luteolin-
7-O-glucoside, naringenin, and quercetin did not affect the serum uric acid level as shown in
Table 4-6, Figure 4-6, and Figure 4-10. In contrast, the reference drug allopurinol (50 mg/kg)
significantly lowered the uric acid levels in hyperuricemic rats.

74
Intraperitoneal administration of artichoke, compounds in artichoke and various flavonoids in acute treatment
The hypouricemic effects of the intraperitoneal treatment of artichoke water extracts,
apigenin, eriodictyol, luteolin, luteolin-7-O-glucoside, naringenin and quercetin on serum uric
acid levels in oxonate-pretreated rats are shown in Table 4-7 and Figure 4-8. After 1 h treatment,
when compared with that of the hyperuricemic control group, none of the test samples showed
effect on serum uric acid levels. In contrast, allopurinol (50 mg/kg) was active in this
experiment.
Discussion and Conclusion
Our previous data showed that flavonoids could inhibit the formation of uric acid from
xanthine by XO in vitro. Thus, there is a possibility that the flavonoids may inhibit the XO in
vivo which results in the decrease of uric acid levels in plasma. Uricase inhibitor such as
potassium oxonate is needed to perform the experiment in rats. Potassium oxonate is an inhibitor
of uricase. An i.p. injection of oxonate could partially block the conversion of uric acid to
allantion and thus artificially elevate the plasma uric acid level in rats to provide a hyperuricemic
animal model [101, 102]. However, in the present study, the in vivo experiments demonstrated
that artichoke leaf extract (250,500 and 1000 mg/kg) and flavonoids (50 and 100 mg/kg) could
not exert hypouricemic in the oxonate-induced rats after 1 h oral administration. This lack of
effect via the oral route might be due to the first pass metabolism through gut, intestine or liver
as reported in previous studies. In vitro experiments demonstrated that 74% of luteolin was
conjugated to glucuronic acid after incubation with microsomal samples from human intestine
[96]. Wittemer et al. [30] had shown that after oral administration of artichoke leaf extract in
human, none of the genuine extract constituents such as caffeoylquinic acids (e.g. chlorogenic
acid, cynarin), caffeic acid and flavonoids (e.g. luteolin-7-O-glucosides) could be detected in
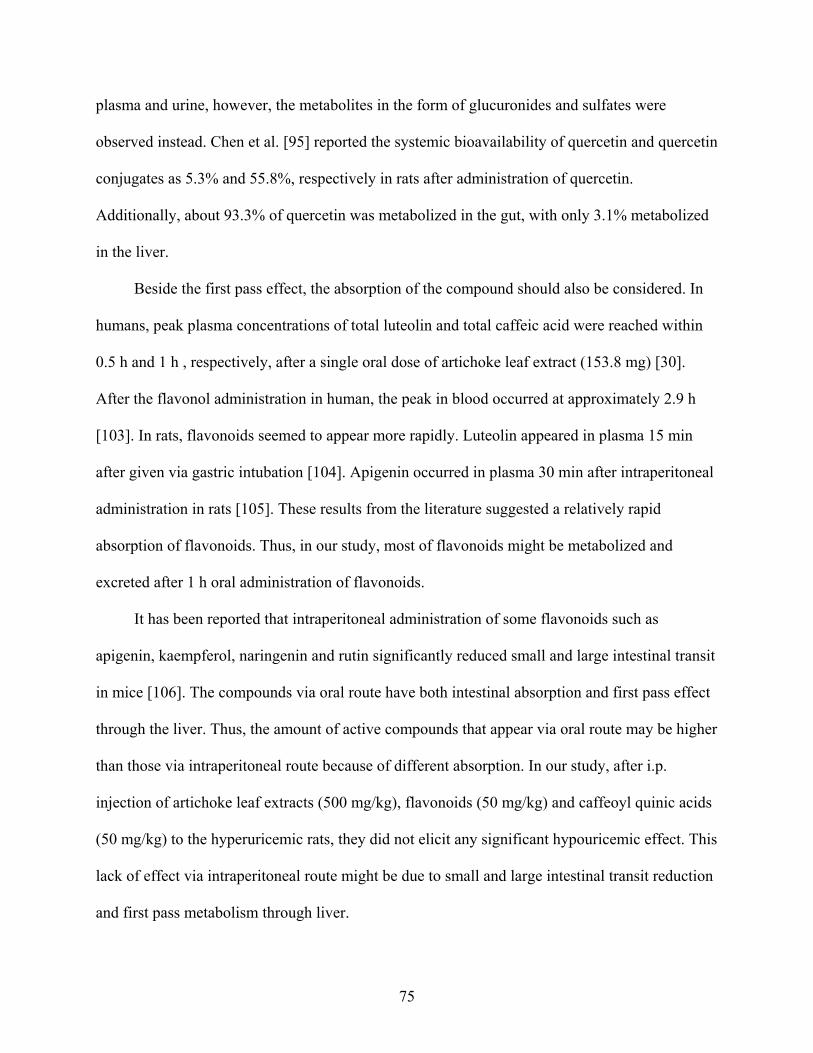
75
plasma and urine, however, the metabolites in the form of glucuronides and sulfates were
observed instead. Chen et al. [95] reported the systemic bioavailability of quercetin and quercetin
conjugates as 5.3% and 55.8%, respectively in rats after administration of quercetin.
Additionally, about 93.3% of quercetin was metabolized in the gut, with only 3.1% metabolized
in the liver.
Beside the first pass effect, the absorption of the compound should also be considered. In
humans, peak plasma concentrations of total luteolin and total caffeic acid were reached within
0.5 h and 1 h , respectively, after a single oral dose of artichoke leaf extract (153.8 mg) [30].
After the flavonol administration in human, the peak in blood occurred at approximately 2.9 h
[103]. In rats, flavonoids seemed to appear more rapidly. Luteolin appeared in plasma 15 min
after given via gastric intubation [104]. Apigenin occurred in plasma 30 min after intraperitoneal
administration in rats [105]. These results from the literature suggested a relatively rapid
absorption of flavonoids. Thus, in our study, most of flavonoids might be metabolized and
excreted after 1 h oral administration of flavonoids.
It has been reported that intraperitoneal administration of some flavonoids such as
apigenin, kaempferol, naringenin and rutin significantly reduced small and large intestinal transit
in mice [106]. The compounds via oral route have both intestinal absorption and first pass effect
through the liver. Thus, the amount of active compounds that appear via oral route may be higher
than those via intraperitoneal route because of different absorption. In our study, after i.p.
injection of artichoke leaf extracts (500 mg/kg), flavonoids (50 mg/kg) and caffeoyl quinic acids
(50 mg/kg) to the hyperuricemic rats, they did not elicit any significant hypouricemic effect. This
lack of effect via intraperitoneal route might be due to small and large intestinal transit reduction
and first pass metabolism through liver.
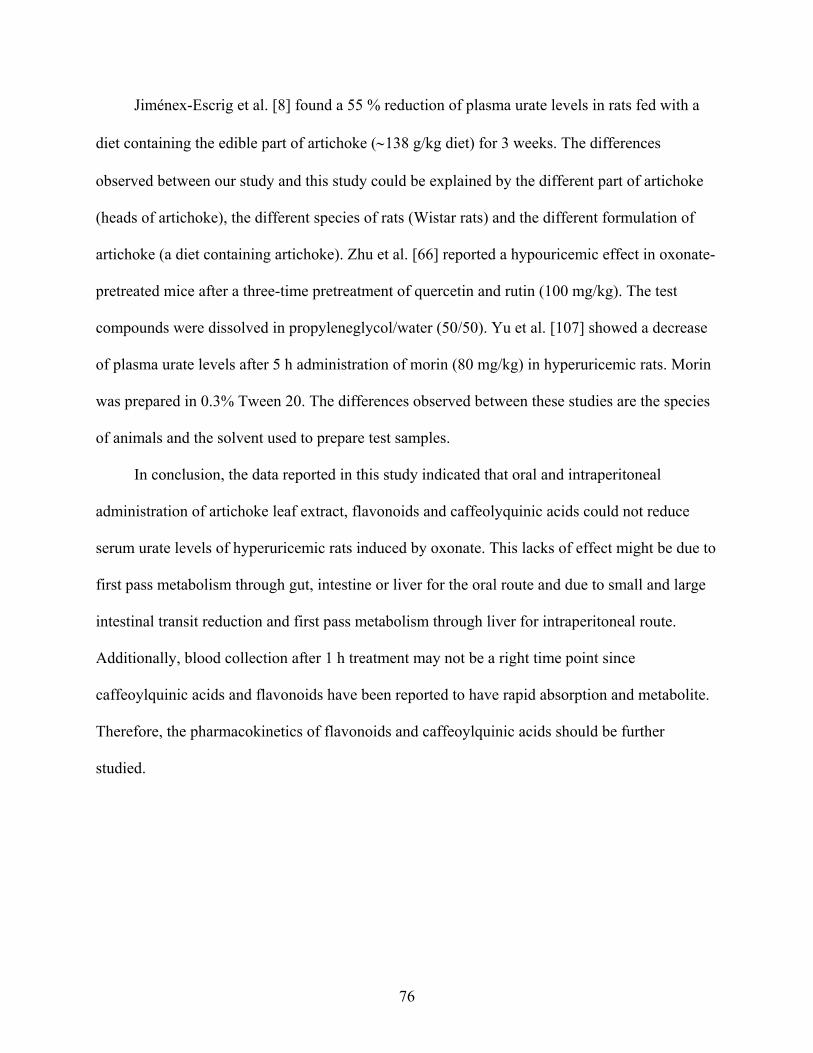
76
Jiménex-Escrig et al. [8] found a 55 % reduction of plasma urate levels in rats fed with a
diet containing the edible part of artichoke (∼138 g/kg diet) for 3 weeks. The differences
observed between our study and this study could be explained by the different part of artichoke
(heads of artichoke), the different species of rats (Wistar rats) and the different formulation of
artichoke (a diet containing artichoke). Zhu et al. [66] reported a hypouricemic effect in oxonate-
pretreated mice after a three-time pretreatment of quercetin and rutin (100 mg/kg). The test
compounds were dissolved in propyleneglycol/water (50/50). Yu et al. [107] showed a decrease
of plasma urate levels after 5 h administration of morin (80 mg/kg) in hyperuricemic rats. Morin
was prepared in 0.3% Tween 20. The differences observed between these studies are the species
of animals and the solvent used to prepare test samples.
In conclusion, the data reported in this study indicated that oral and intraperitoneal
administration of artichoke leaf extract, flavonoids and caffeolyquinic acids could not reduce
serum urate levels of hyperuricemic rats induced by oxonate. This lacks of effect might be due to
first pass metabolism through gut, intestine or liver for the oral route and due to small and large
intestinal transit reduction and first pass metabolism through liver for intraperitoneal route.
Additionally, blood collection after 1 h treatment may not be a right time point since
caffeoylquinic acids and flavonoids have been reported to have rapid absorption and metabolite.
Therefore, the pharmacokinetics of flavonoids and caffeoylquinic acids should be further
studied.
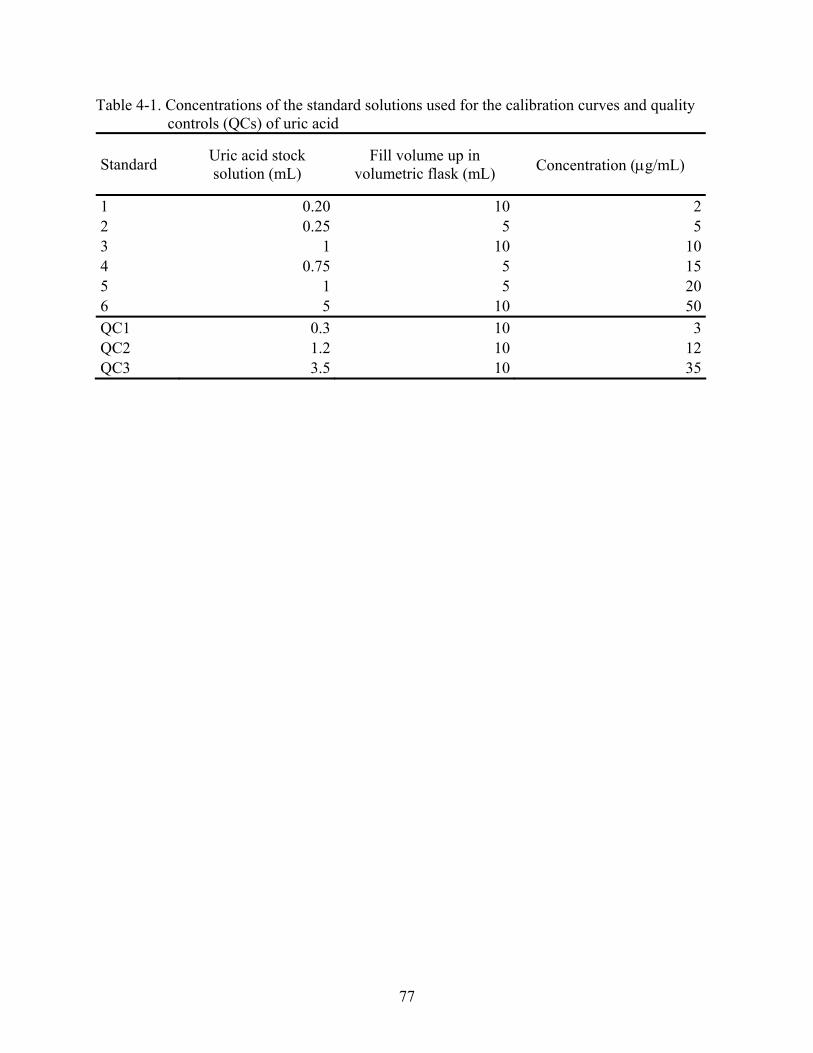
77
Table 4-1. Concentrations of the standard solutions used for the calibration curves and quality controls (QCs) of uric acid
Standard Uric acid stock solution (mL)
Fill volume up in volumetric flask (mL) Concentration (μg/mL)
1 0.20 10 22 0.25 5 53 1 10 104 0.75 5 155 1 5 206 5 10 50QC1 0.3 10 3QC2 1.2 10 12QC3 3.5 10 35

78
Table 4-2. Intra-day (n = 3), inter-day (n = 9), and recovery (n = 3) assay parameters of uric acid in rat serum. Precision expressed as CV%, accuracy and recovery as % of the theoretical concentration
Intra-day QC1 – 3 μg/mL QC2 – 12 μg/mL QC3 – 35 μg/mL Day 1 Day 2 Day 3 Day 1 Day 2 Day 3 Day 1 Day 2 Day 3
Precision 11.4 12.3 10.1 5.7 1.2 8.7 3.5 5.4 4.6Accuracy 94.7 91.9 94.5 100.8 95.3 98.7 109.1 100.6 102.3Inter-day QC1 – 3 μg/mL QC2 – 12 μg/mL QC3 – 35 μg/mL Precision 6.5 3.4 3.1 Accuracy 94.3 100.4 108.8 Recovery Uric acid – 1 μg/mL Uric acid – 10 μg/mL Uric acid – 20 μg/mL % 92.8 94.1 94.7 CV% 10.2 5.4 5.5

79
Table 4-3. The stability test after 24 hours on autosampler at 20oC. Data represents the percentage remaining of uric acid
% Remaining on autosampler Luteolin concentration 12 hours 24 hours
QC1-3 μg/mL 95.3 ± 6.5 98.6 ± 10.2QC2-12 μg/mL 101.5 ± 3.6 100.5 ± 5.2QC3-35 μg/mL 106.0 ± 2.4 106.7 ± 3.1
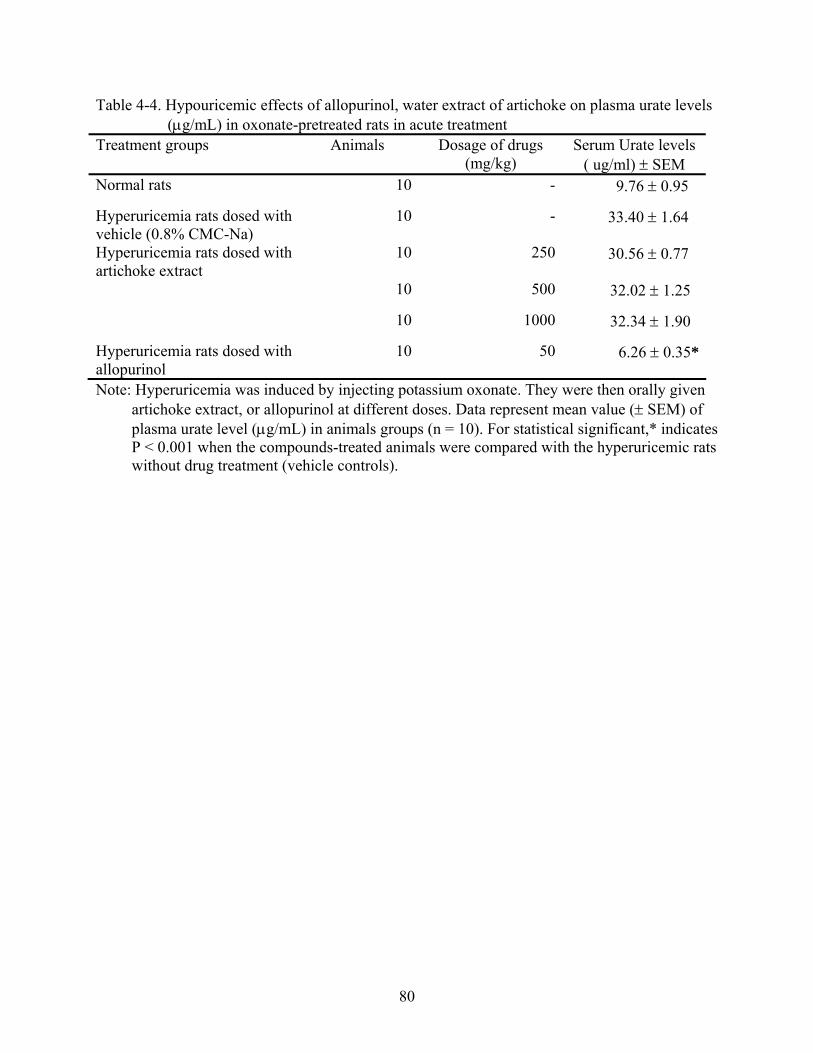
80
Table 4-4. Hypouricemic effects of allopurinol, water extract of artichoke on plasma urate levels (μg/mL) in oxonate-pretreated rats in acute treatment
Treatment groups Animals Dosage of drugs (mg/kg)
Serum Urate levels ( ug/ml) ± SEM
Normal rats 10 - 9.76 ± 0.95
Hyperuricemia rats dosed with vehicle (0.8% CMC-Na)
10 - 33.40 ± 1.64
Hyperuricemia rats dosed with artichoke extract
10 250 30.56 ± 0.77
10 500 32.02 ± 1.25
10 1000 32.34 ± 1.90
Hyperuricemia rats dosed with allopurinol
10 50 6.26 ± 0.35*
Note: Hyperuricemia was induced by injecting potassium oxonate. They were then orally given artichoke extract, or allopurinol at different doses. Data represent mean value (± SEM) of plasma urate level (μg/mL) in animals groups (n = 10). For statistical significant,* indicates P < 0.001 when the compounds-treated animals were compared with the hyperuricemic rats without drug treatment (vehicle controls).

81
Table 4-5. Hypouricemic effects of allopurinol and artichoke extract on plasma urate levels (μg/mL) in oxonate-pretreated rats after chronic treatment
Duration of drug treatment (days) Treatment groups N Dosage (mg/kg) 1 3 5 7
Normal rats 8 - 15.06 ± 0.77 18.95 ± 0.83
11.52 ± 0.83
14.82 ± 1.49
Hyperuricemia rats dosed with vehicle
8 - 29.94 ± 0.87 28.73 ± 1.38 26.22 ± 1.39 28.75 ± 0.73
Hyperuricemia rats dosed with artichoke extract
8 500 33.38 ± 1.19 27.87 ± 0.65 25.94 ± 1.34 29.67 ± 1.37
8 1000 31.35 ± 1.05 26.00 ± 1.53 24.57 ± 2.08 26.93 ± 1.22
Hyperuricemia rats dosed with allopurinol
8 50 9.02 ± 0.37* 9.31 ± 0.70* 5.89 ± 0.34* 6.10 ± 0.8*
Note: Hyperuricemia was induced by injecting potassium oxonate. They were then orally given artichoke or allopurinol at different doses. Data represent mean value (± SEM) of plasma urate level (μg/mL) in animals groups (n = 8). For statistical significant, * indicates P < 0.001 when the compounds-treated animals were compared with the hyperuricemic rats without drug treatment (vehicle controls).
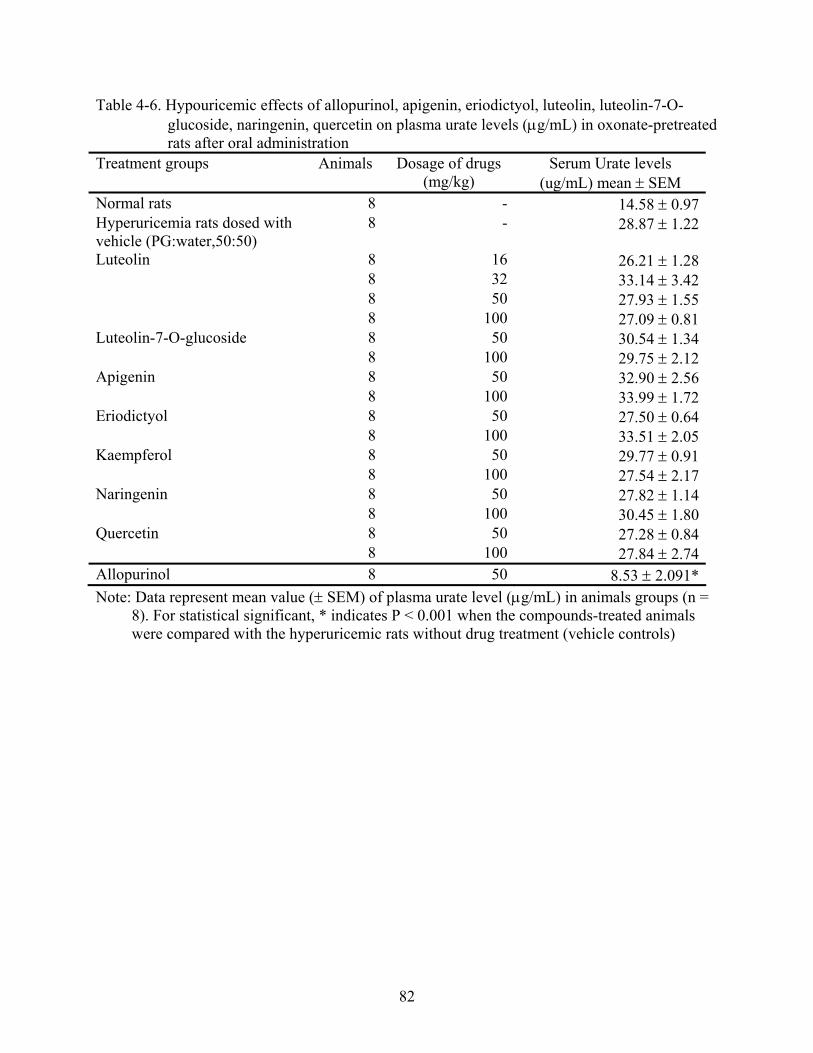
82
Table 4-6. Hypouricemic effects of allopurinol, apigenin, eriodictyol, luteolin, luteolin-7-O-glucoside, naringenin, quercetin on plasma urate levels (μg/mL) in oxonate-pretreated rats after oral administration
Treatment groups Animals Dosage of drugs (mg/kg)
Serum Urate levels (ug/mL) mean ± SEM
Normal rats 8 - 14.58 ± 0.97Hyperuricemia rats dosed with vehicle (PG:water,50:50)
8 - 28.87 ± 1.22
Luteolin 8 16 26.21 ± 1.28 8 32 33.14 ± 3.42 8 50 27.93 ± 1.55 8 100 27.09 ± 0.81Luteolin-7-O-glucoside 8 50 30.54 ± 1.34 8 100 29.75 ± 2.12Apigenin 8 50 32.90 ± 2.56 8 100 33.99 ± 1.72Eriodictyol 8 50 27.50 ± 0.64 8 100 33.51 ± 2.05Kaempferol 8 50 29.77 ± 0.91 8 100 27.54 ± 2.17Naringenin 8 50 27.82 ± 1.14 8 100 30.45 ± 1.80Quercetin 8 50 27.28 ± 0.84 8 100 27.84 ± 2.74Allopurinol 8 50 8.53 ± 2.091*Note: Data represent mean value (± SEM) of plasma urate level (μg/mL) in animals groups (n =
8). For statistical significant, * indicates P < 0.001 when the compounds-treated animals were compared with the hyperuricemic rats without drug treatment (vehicle controls)

83
Table 4-7. Hypouricemic effects of allopurinol, apigenin, eriodictyol, luteolin, luteolin-7-O-glucoside, naringenin, quercetin on plasma urate levels (μg/mL) in oxonate-pretreated rats after i.p injection
Treatment groups Animals Dosage of drugs (mg/kg)
Serum Urate levels (ug/mlL) mean ± SEM
Normal rats 5 - 11.06 ± 0.84 Hyperuricemia rats 5 - 31.14 ±1.65 Artichoke 5 500 27.32 ± 2.11 Caffeic acid 5 50 35.21 ± 3.02 Chlorogenic acid 5 50 33.86 ± 3.15 Cynarin 5 50 35.11 ± 4.05 Apigenin 5 50 34.06 ± 2.89 Quercetin 5 50 26.39 ± 0.92 Luteolin 5 50 27.60 ± 2.17 Allopurinol 5 50 9.12 ± 1.39*Note: The hyperuricemic rats were produced by potassium oxonate pretreatment. They were then
intraperitoneally given of artichoke leaf extracts (500 mg/kg), 50mg/kg of allopurinol, apigenin, eriodictyol, luteolin, luteolin-7-O-glucoside, naringenin and quercetin. Data represent (mean ± SEM) of plasma urate level (μg/ml) in animals groups (n = 5). For statistical significant, * indicates P < 0.001 when the compounds-treated animals were compared with the hyperuricemic rats without drug treatment (vehicle controls)
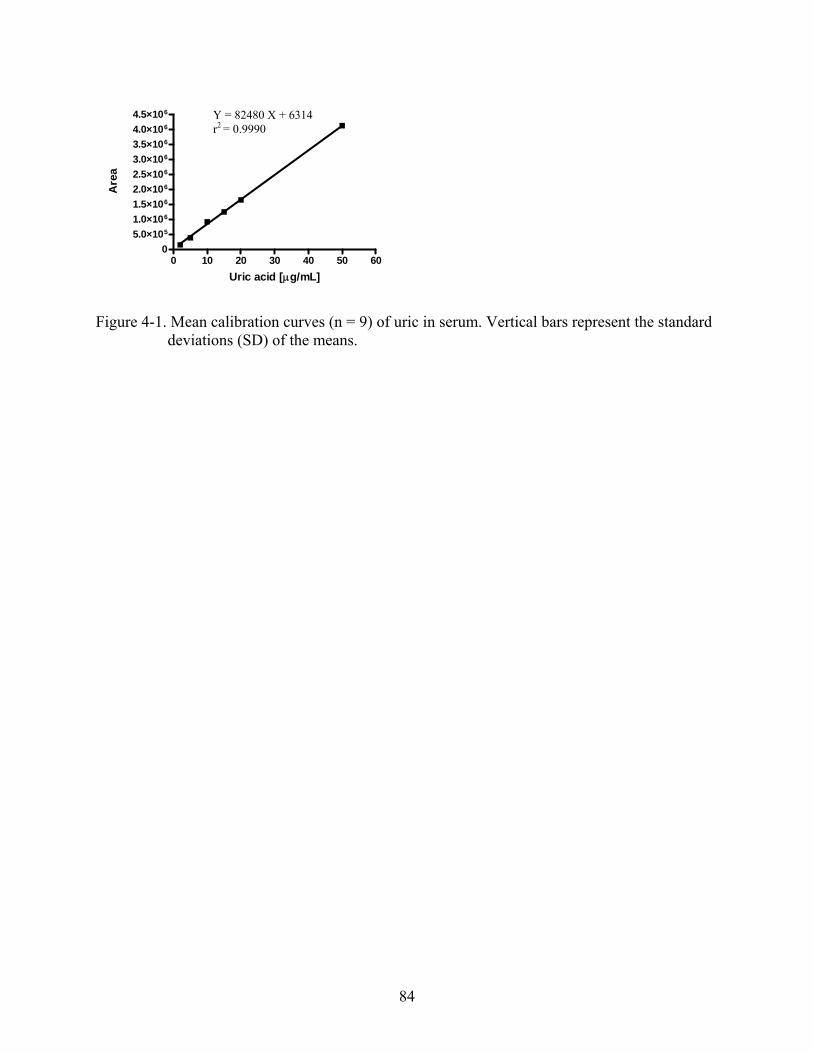
84
0 10 20 30 40 50 600
5.0×10⁵
1.0×10⁶
1.5×10⁶
2.0×10⁶
2.5×10⁶
3.0×10⁶
3.5×10⁶
4.0×10⁶
4.5×10⁶
Uric acid [μg/mL]
Are
a
Figure 4-1. Mean calibration curves (n = 9) of uric in serum. Vertical bars represent the standard deviations (SD) of the means.
Y = 82480 X + 6314 r2 = 0.9990

85
Minutes0 1 2 3 4 5 6 7 8 9 10 11 12 13 14 15 16 17 18 19
mVo
lts
-1
0
1
2
3
4
5
6
7
8
9
10
Figure 4-2. HPLC chromatogram of uric acid in serum.
Uric acid
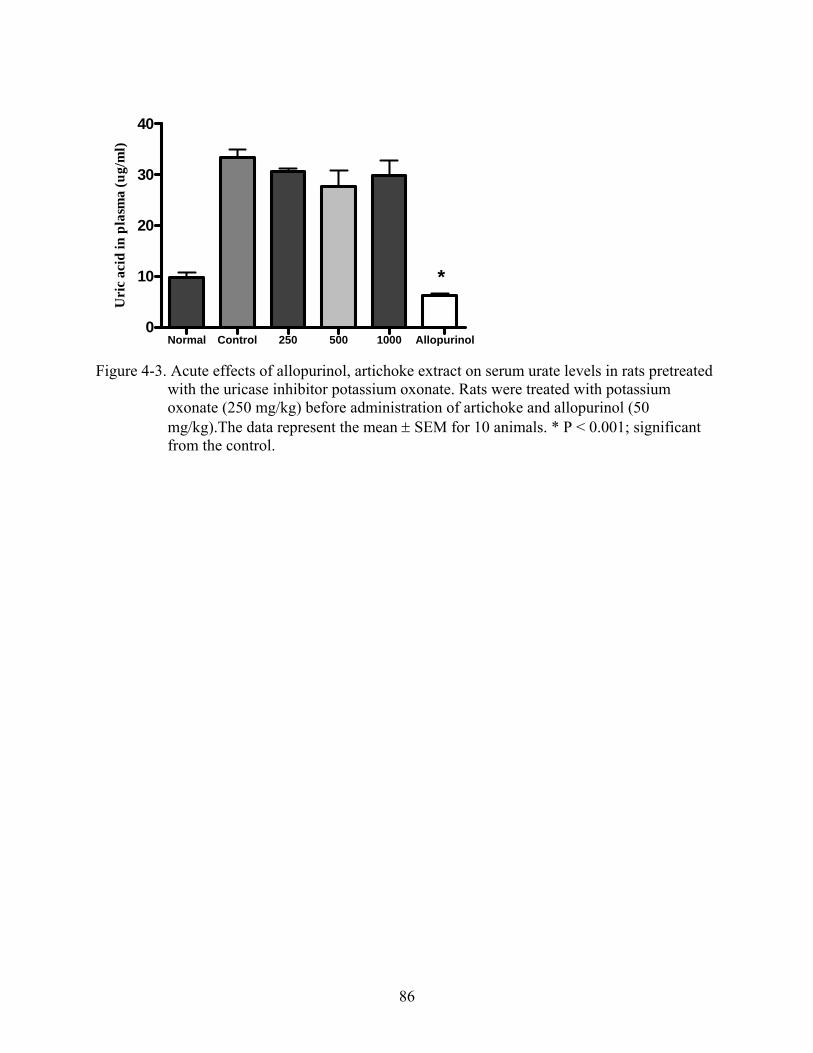
86
Normal Control 250 500 1000 Allopurinol0
10
20
30
40
*
Uri
c ac
id in
pla
sma
(ug/
ml)
Figure 4-3. Acute effects of allopurinol, artichoke extract on serum urate levels in rats pretreated
with the uricase inhibitor potassium oxonate. Rats were treated with potassium oxonate (250 mg/kg) before administration of artichoke and allopurinol (50 mg/kg).The data represent the mean ± SEM for 10 animals. * P < 0.001; significant from the control.

87
Day1
0
5
10
15
20
25
30
35
*
Uri
c ac
id in
seru
m(u
g/m
l)Day 3
0
5
10
15
20
25
30
35
*
NormalControlAllopurinol 50 mg/kgArtichoke500mg/kgArtichoke 1000 mg/kg
Uri
c aic
d in
pla
sma
(ug/
ml)
Day 5
0
5
10
15
20
25
30
35
*
Uri
c aci
d in
seru
m(u
g/m
l)
Day 7
0
5
10
15
20
25
30
35
*
NormalControlAllopurinol 50 mg/kgArtichoke500mg/kgArtichoke 1000 mg/kg
Uri
c aci
d in
seru
m (u
g/m
l)
Figure 4-4. Chronic effects of allopurinol, artichoke extratc on serum urate levels in oxonate-treated rats. Rats were treated with potassium oxonate (250 mg/kg) before administration of artichoke (500, 1000 mg/kg) and allopurinol (50 mg/kg) for 1, 3, 5 and 7 days. The data represent the mean ± SEM for 8 animals. * P < 0.001: significantly from the control.

88
Normal Control Allopurinol 16 32 50 1000
10
20
30
40
Luteolin (mg/k g)
*
Uri
c ac
id le
vels
in se
rum
(μg/
ml)
Figure 4-5. Effects of allopurinol and luteolin on serum urate levels in rats pretreated with the
uricase inhibitor potassium oxonate. Rats were treated with potassium oxonate (250 mg/kg) before oral administration of luteolin (16, 32, 50, 100 mg/kg) and allopurinol.The data represent the mean ± SEM for 8 animals. *P < 0.001: significantly from the control.

89
Normal Control Allopurinol Apigenin L-glc Kaempferol Quercetin Eriodictyol Naringenin0
10
20
30
40
*
Uri
c ac
id le
vels
in se
rum
(μg/
ml)
Figure 4-6. Effects of allopurinol, apigenin, eriodictyol, luteolin-7-O-glucoside, naringenin, and quercetin on serum urate levels in rats pretreated with the uricase inhibitor potassium oxonate. Rats were treated with potassium oxonate (250 mg/kg) before oral administration of 50 mg/kg of apigenin, eriodictyol, luteolin-7-O-glucoside, naringenin, quercetin and allopurinol. The data represent the mean ± SEM for 8 animals. * P < 0.001: significantly from the control.

90
Normal Control Allopurinol Apigenin L-glc Kaempferol Quercetin Eriodictyol Naringenin0
10
20
30
40
*
Uri
c ac
id le
vels
in se
rum
(μg/
ml)
Figure 4-7. Effects of allopurinol, apigenin, eriodictyol, luteolin-7-O-glucoside, naringenin, quercetin on serum urate levels in rats pretreated with the uricase inhibitor potassium oxonate. Rats were treated with potassium oxonate (250 mg/kg) before oral administration of 100 mg/kg of apigenin, eriodictyol, luteolin-7-O-glucoside, naringenin, quercetin and allopurinol (50 mg/kg).The data represent the mean ± SEM for 8 animals. * P < 0.001: significantly from the control.

91
Normal Control Artichoke Allopurinol Caffeic acid Chlorogenic Cynarin Apigenin Quercetin Luteolin0
10
20
30
40
*
Uri
c ac
id le
vels
in se
rum
( μg/
ml)
Figure 4-8. Effects of artichoke extract, allopurinol, caffeic acid, chlorogenic acid, cynarin,
luteolin, apigenin and quercetin on serum urate levels in rats pretreated with the uricase inhibitor potassium oxonate. Rats were treated with potassium oxonate (250 mg/kg) before i.p. injection of artichoke (500 mg/kg), and 50 mg/kg of allopurinol, caffeic acid, chlorogenic acid, cynarin, luteolin, apigenin and quercetin. The data represent the mean ± SEM for 8 animals. * P < 0.001: significantly from the control.
92
CHAPTER 5 THE EFFECT OF ARTICHOKE LEAF EXTRACT AND ITS COMPOUNDS ON
ANTIOXIDANT ACTIVITY IN VITRO AND IN RATS
Background
Reactive oxygen species (ROS) such as superoxide anion, hydrogen peroxide and singlet
oxygen are implicated in some diseases such as inflammation, cancer, ageing, and degenative
diseases [108]. ROS are common products of several oxidative systems, especially the xanthine-
xanthine oxidase system. Xanthine oxidase is an important enzyme which catalyses the oxidation
of hypoxanthine to xanthine and then to uric acid in man. The accumulation of uric acid can not
only lead to gout and hyperuricemia, but can also provoke inflammation by various mechanisms
such as an neutrophil recruitment and the release of leukotriene B4, interleukin-1 (IL-1),
interleukin-2 (IL-2) and superoxide [109, 110]. Therefore, the compound that can scavenge free
radicals could have a beneficial effect not only in the treating of gout and hypreuricemia, but also
in the alleviation of inflammation.
Artichoke leaves (Cynara scolymus L.) is a good source of natural antioxidants since major
compounds in artichoke leaves are polyphenolic compounds with mono- and dicaffeoylquinic
acids and flavonoids. Artichoke leaf extract has been reported to show antioxidative and
protective properties against hydroperoxide-induced oxidative stress in cultured rat hepatocytes
[6], to protect low density lipoprotein from oxidation in vitro [9], to inhibit hemolysis induced by
hydrogen peroxide and to inhibit oxidative stress when human leucocytes are stimulated with
agents that generate reactive oxygen species such as hydrogen peroxide [16]. The phenolic
compounds in artichoke have been reported to show antioxidant activity in vitro [24]. However,
only one study reported an effect of the edible part of artichoke on biomarkers of antioxidants in
rats [8]. Therefore, in vivo studies of artichoke leaves on antioxidant activity should be
performed.
93
In this study, the in vitro antioxidant properties of major compounds in artichoke extract
(caffeoylquinic acids and flavonoids) and some reference flavonoids (quercetin) as shown in
Figure 5-1 were investigated. Moreover, the effect of the intake of artichoke extract, and its
components for 2 h and 3 weeks on total antioxidant activity and antioxidant enzyme glutathione
peroxidase in plasma of male rats were evaluated.
Specific Aims
Investigate whether artichoke extract and its compounds show antioxidant activity in vitro
and in rats.
Materials and Methods
Materials
Artichoke leaf extract was obtained from a German extract manufacturing company
(Finzelberg, Andernach, Germany). Dihydrocaffeic acid (90-95%), luteolin (99%), and luteolin-
7-O-glucoside (> 90%) were purchased from Indofine Chemical Company, Inc. (Somerville, NJ,
USA). Chlorogenic acid (≥ 95%), dihydrate (> 98%), dipotassium hydrogenphosphate
(K2HPO4), sodium dihydrogenphosphate (NaH2PO4), and AAPH (2, 2’-Azobis (2-
amidinopropane) dihydrochloride were purchased from Sigma Chemical Company (St. Louis,
MO, USA). Cynarin was purchased from Carl Roth GmbH+Co. (Germany). Fluorescein was
purchased from Fluka (Milwaukee, WI, USA). Acetonitrile (CH3CN), methanol, perchlorogenic
acid (PCA), and trifluoroacetic acid (TFA) were purchased from Fisher Scientific (Fair Lawn,
NJ, USA). Trolox 97% (6-Hydroxy-2, 5, 7, 8-tetramethylchroman-2-carboxylic acid) (Biomol,
PA, USA), were used. All aqueous solutions were prepared with purified water obtained from a
NANOPure® system from Barnstead (Dubuque, IA, USA). Fluorescence filters with an
excitation wavelength of 485 nm and emission wavelength of 538nm were used. The microplate

94
reader (Synergy HT) was purchased from Bio-TEK® (Wincoski, VT, USA). The 96 well-plates
(Corning) were puchased from Fisher Scientific (Fair Lawn, NJ, USA).
Animals
Male Sprague Dawley rats (250-350 g) were purchased from Harlan (IN, USA) and
divided into the experimental groups; containing 8 rats per group. They were housed in plastic
cages. They were allowed one week to adapt to their environment before used for experiments.
All the animals were maintained on a 12h/12h light/dark cycle. They were given standard chow
and water ad libitum during the course of the study. All animal experiments were performed
according to the policies and guidelines of the Institutional Animal Care and Use Committee
(IACUC) of the University of Florida, Gainesville, USA (NIH publication # 85-23).
Acute treatment
Artichoke extract (500, 1000 mg/kg), luteolin (25, 50 mg/kg), and quercetin (25 mg/kg)
was administered orally. Artichoke was suspended in 0.8% carboxyl methylcellulose sodium salt
(CMC-Na). The control groups received 0.8% CMC-Na. The volume of the drug administered to
each rats was based on the body weight of the animal measured immediately prior to each dose.
Rats were anaesthetized with halothane and 500 μL blood samples were taken from sublingual
vein at 2 h into tubes containing sodium heparin 900 units. Each tube was centrifuged at 2800 x
g for 15 min to obtain the plasma which was stored at -80°C until use for antioxidant analysis.
Chronic treatment
Artichoke extract (500, 1000 mg/kg), luteolin (25, 50 mg/kg), and quercetin (25 mg/kg)
were administered orally once a day for 21 days. Artichoke and flavonoids were suspended in
0.8% carboxyl methylcellulose sodium salt (CMC-Na). The control groups received 0.8% CMC-
Na. 1000 μL blood samples were taken from sublingual vein on day 0, 7, 14 and 21. Prior to

95
blood collection, rats were anaesthetized with halothane and blood loss was replaced with an
equal volume of normal saline. Blood samples were treated in the same way as acute treatment.
Plasma samples were used for antioxidant activity, uric acid concentration and glutathione
peroxidase activity.
Assessment of Antioxidative Capacity in Vitro and Plasma Antioxidant Status
ORAC assays were carried out on a synergy HT plate reader (Biotex, USA) with
fluorescence filters (excitation wavelength: 485 nm, and emission filter: 538 nm).The
temperature of the incubator was set to 37 oC. Procedures were based on the previous report by
Ou et al.[111]. Briefly; AAPH was used as peroxyl generator and Trolox as a control standard.
50.0 μL of sample, blank, and Trolox calibration solutions were transformed to 98-well
microplates in triplicate. 100.0 μL of fluorescene solution were added and then 50 μL of AAPH
solution were added immediately before reading in microplate reader. Fluorescence reading were
taken every 10 min for a duration of 70 min. Final results were calculated based on the
difference in the area under the fluorescein decay curve between the blank and each sample.
Artichoke extracts 10.0 mg were dissolved in 10.0 mL of phosphate buffer pH 7.0 and then
dilute in a ratio of 1 to 100 with phosphate buffer; phenolic compounds were dissolved in DMSO
and then diluted with phosphate buffer pH 7.0. The concentration of DMSO was less than 0.1 %
for in vitro study. ORAC values were expressed as relative Trolox equivalents in respect to 25
μM of phenolic compounds and expressed as μmol Trolox quivalent (TE)/ g of artichoke
extracts.
Assessment of Uric Acid in Plasma
Uric acid was measured by reversed-phase high performance liquid chromatography and
photodiode array detection (DAD). Standards were prepared by diluting the stock uric acid

96
solution with 200 mM phosphate buffer (0.1 mg/mL). The stock solution was prepared as
follows. Uric acid has low solubility in water. Therefore, a small amount of 0.25 N NaOH was
added into uric acid. Sonicated shortly and filled up with buffer. The column temperature was
kept at 25 oC. The mobile phase was 200 mM phosphate buffer (NaH2PO4, pH 2.0). The flow
rate was 0.5 mL/min. Ten micro liters of each sample was injected into the RP-HPLC system.
Comparing the respective peak area in the chromatogram with the value from a standard
calibration curve quantitated uric acid.
The proteins in rat plasma were precipitated by adding 150.0 μL of 10% tricholoacetic acid
to 150.0 μL of plasma and adding 700.0 μL of buffer to make 1 mL. The precipitates were
removed from the mixture by centrifugation at 3,000 g for 3 min. Supernatants were filtered
through 0.45 μm filters and ten micro liters of the plasma sample were injected into the RP-
HPLC with photodiode array detector system and measured at a wavelength value 285 nm.
The plasma nonprotein fraction was prepared by diluting plasma with 0.5 M perchloric
acid (PCA) (1:1, v/v). The samples were vortexed for 15 sec and centrifuged at 4000 rpm for 10
min at 4° C. Then, the supernatant was removed as the plasma nonprotein fraction, and diluted in
a ratio of 1 to 20 with phosphate buffer pH 7.0 for the analysis. All plasma samples were
assessed within 1 week after blood drawing. ORAC values were expressed as mmol Trolox
equivalents per liter.
Assessment of Glutathione Peroxidase (GPx) in Plasma
GPx activity was determined by using a glutathione peroxidase assay kit. (Cayman
chemical company, Ann Arbor, MI, USA)

97
Statistical Analysis
All data are expressed as the mean ± SEM Group mean differences were ascertained with
analysis of variance (ANOVA). Multiple comparisons among treatment means were checked
with the Tukey’s test. The results were considered significant if the probability of error was <
0.05
Results
Antioxidant Activity in Vitro
The antioxidant activities of artichoke extract and phenolic compounds were estimated by
ORAC assay as shown in Table 5-1. One gram of artichoke extract had 1623.35 μmol of Trolox
equivalent. 1, 3-di-O-caffeoylquinic acid (cynarin), quercetin and luteolin showed the strongest
antioxidant activity with 6.73, 5.30 and 5.16 relative Trolox equivalent in vitro, respectively
(Table 5-2).
Plasma Antioxidant Activity in Vivo
Acute treatment
There was no significant difference in the plasma antioxidant activity between artichoke
group and the control group after orally treatment of artichoke (500, 1000 mg/kg), luteolin (25,
50 mg/kg) and quercetin (25 mg/kg) for 2 h as shown in Table 5-3.
Chronic treatment
After orally administration of 500 and 1000 mg/kg of artichoke extract for 21 days,
there was no significant difference in the plasma antioxidant activity between the artichoke
groups and the control groups. 25 and 50 mg/kg of luteolin and 25 mg of quercetin also did not
showed antioxidant activity in vivo as shown in Table 5-4.
98
Plasma Urate Concentrations and Plasma Glutathione Peroxidase Activity after The Treatment with Artichoke Extract and Phenolic Compounds
There were no significant difference in the plasma urate concentrations or glutathione
peroxidase activity between the experiment groups and the control group after orally
administration of 500 and 1000 mg/kg of artichoke extract, 25 and 50 mg/kg of luteolin and 25
mg of quercetin over a 21 days period as shown in Table5-5 and Table 5-6.
Discussion and Conclusion
The in vitro antioxidant activites were tested by using the ORAC assay, which evaluates
the radical scavenging activity of the test samples towards peroxyl radicals generated through the
thermal decomposition of a radical initiator (AAPH). Table 5-1 and Table 5-2 summarized the
results expressed as μmol of Trolox equivalents/ g of arichoke extract and relative Trolox
equivalents for caffeic acid derivatives and flavonoids. It showed that the extract and all the
compounds were found to be more active than Trolox.This result is consistant with previous
studies. Ou et al. [111] found that caffeic acid, chlorogenic acid and quercetin showed high
relative ORAC values. Wang et al. [24] measured the relative antioxidant activities (% inhibition
of DPPH free radicals) of phenolic compounds and found that cynarin, cynaroside, luteolin-7-
rutinoside and chlorogenic acid showed high antioxidant activities.
The antioxidant activities of phenolic compounds have been reported to be largely
determined by the number of hydroxyl groups on the aromatic ring and the position of the
substituents. The higher the number of hydroxyl groups, the greater the antioxidant activity. In
addition, the presence of a catechol group in phenolic ring also increases the antioxidant activity
[24]. Our results are in agreement with this report (Figure 5-1). Cynarin, with two adjacent
hydroxyl groups on both phenolic rings showed the highest antioxidant activity. Quercetin,
luteolin and luteolin-7-O-glucoside with two adjacent hydroxyl groups on one ring and only a

99
single hydroxyl group on the other ring showed less antioxidant activity, which was still higher
than chlorogenic acid, caffeic acid and dihydrocaffeic acid with two adjacent hydroxyl groups on
one ring. Artichoke leaf extract contains caffeoylqunic acids and flavonoids, thus, the antioxidant
activity of the extract was high (1623.36 ± 2.84 μmol TE/ g of dry extracts).
In vivo antioxidant activity showed that the acute and chronic treatment of artichoke
extract (500, 1000 mg/kg), luteolin (25, 50 mg/kg) and quercetin (25 mg/kg) could not increase
the total antioxidant activity in rats plasma. In addition, the chronic treatment did not lead to an
increase in the value of glutathione peroxidase (a marker of antioxidative defense), and in the
uric acid levels (endogenous antioxidant compound) in plasma. This lack of effect might be due
to the low absorption of caffeoylquinic acids and flavonoids. In human study, the maximal
plasma concentrations of flavonoids, reached between 1 and 3 h after consumption of flavonoid
–rich food, is between 0.06 and 7.6 μM for flavonols, flavanols and flavanones [112]. In rats, the
concentration of luteolin at 30 min was 15.5 ± 3.8 nmol/mL after administration of one single
dose of luteolin [104]. The maximum concentration of total caffeic acids and luteolin, reached at
0.83 and 0.36 h, respectively, were 59.07 and 6.51 ng/mL after consumption of artichoke leaf
extract (107 mg) [30]. In addition, the half-lives of flavonoids in human plasma are short, usually
in a range of a few hours [112]. In rats, after administration of artichoke extract (107 mg/kg), the
half-lives of total caffeic acid and luteolin were 3.08 and 2.50 h. These factors limit the
capability of dietary flavonoids to act as antioxidant in plasma in vivo. Chronic consumption of
flavonoid-rich foods does not result in the significant increase of amounts of flavonoids in
plasma. For example, the concentrations of quercetin at the steady-state in human plasma are less
than 1 μM [113].

100
Besides the poor absorption, caffeolyquinic acids and flavonoids are highly metabolized in
the intestine and liver. Flavonoids and caffeic acid are good substrates of phase II enzymes and
can be metabolized to glucuronidation, methylation and sulfation [31, 96, 114, 115]. These
biotransformations affect the physical properties of flavonoids, making them more water soluble
and may affect their antioxidant activity. Flavonoid metabolites generally are less potent
antioxidants than their parent compounds because of the modification of their catechol and
phenol group [47, 48, 116, 117]. Furthermore, the major part of ingested flavonoids is not
absorbed and is largely degraded by the intestinal microflora [118]. The breakdown products
may have antioxidant or non-antioxidant activities [119, 120].
More over, our in vitro preliminary study demonstrated that a plasma concentration higher
than 1 μg/mL of luteolin and quercetin was required to increase the antioxidant activity in
plasma above base line using the ORAC assay. Therefore, it might be possible that the maximum
plasma concentrations of luteolin and quercetin are below the plasma concentration necessary to
expect an increase in the antioxidant activity.
In conclusion, the in vitro antioxidant activity of artichoke and its compounds could not be
confirmed in a rat model. This lack of effect might be due to the low bioavailabilty of
caffeoylquinic acids and flavonoids. Therefore, the pharmacokinetics study of these compounds
should be performed.
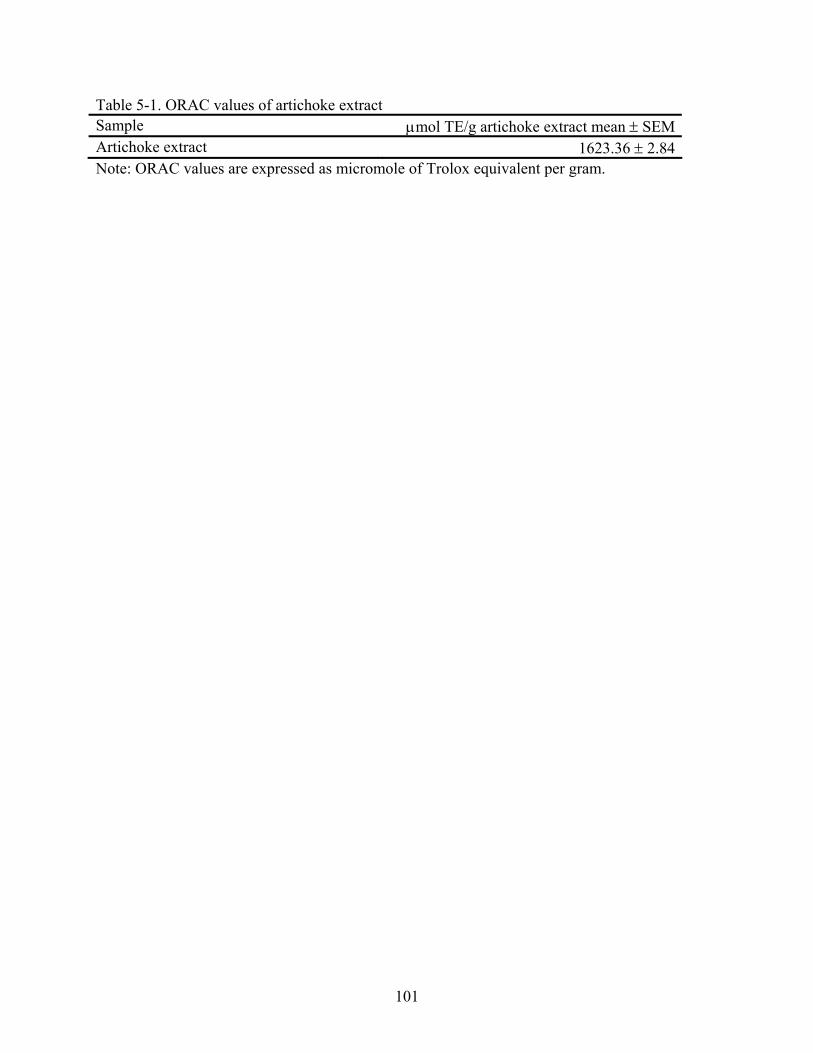
101
Table 5-1. ORAC values of artichoke extract Sample μmol TE/g artichoke extract mean ± SEMArtichoke extract 1623.36 ± 2.84Note: ORAC values are expressed as micromole of Trolox equivalent per gram.

102
Table 5-2. Relative ORAC values of pure chemicals with antioxidant activity Compound Relative Trolox Equivalent mean ± SEMCaffeic acid 3.48 ± 0.08Dihydrocaffeic acid 2.83 ± 0.06Chlorogenic acid 1.83 ± 0.22Cynarin 6.73 ± 0.06Luteolin 5.16 ± 0.05Luteolin-7-O-glucoside 4.35 ± 0.13Quercetin 5.30 ± 0.03Note: ORAC values are expressed as relative Trolox equivalent.

103
Table 5-3. ORAC values of plasma samples Test samples Dose (mg/kg) ORAC (mmol trolox equivalent/L) mean ± SEMcontrol - 0.27 ± 0.04Artichoke 500 0.22 ± 0.03 1000 0.21 ± 0.04Luteolin 25 0.38 ± 0.05 50 0.31 ± 0.03Quercetin 25 0.31 ± 0.05
Note: Rats were orally given artichoke extract, luteolin and quercetin at the different doses indicated for 2 h. Data represent mean value ± SEM (n = 8).

104
Table 5-4. ORAC values of plasma samples ORAC (mmol trolox equivalent/L) mean ± SEM
Compounds Day 0 Day7 Day14 Day21 Control 0.44 ± 0.03 0.50 ± 0.07 0.43 ± 0.05 0.40 ± 0.03Artichoke 500 mg/kg 0.34 ± 0.04 0.35 ± 0.03 0.37 ± 0.03 0.33 ± 0.04Artichoke 1000 mg/kg 0.49 ± 0.03 0.41 ± 0.02 0.43 ± 0.03 0.43 ± 0.02Luteolin 25 mg/kg 0.44 ± 0.03 0.38 ± 0.03 0.45 ± 0.04 0.39 ± 0.03Luteolin 50 mg/kg 0.46 ± 0.02 0.37 ± 0.03 0.37 ± 0.03 0.45 ± 0.02Quercetin 25 mg/kg 0.42 ± 0.01 0.33 ± 0.02 0.31 ± 0.04 0.39 ± 0.03Note: Rats were orally given artichoke extract, luteolin and quercetin at the different doses
indicated for 21 days. Data represent mean value ± SEM. (n = 8).

105
Table 5-5. Plasma urate concentrations in rats after administration of artichoke extract and phenolic compounds
Uric acid levels (ug/ml) Treatment Dose (mg/kg)
NDay 0 Day 7 Day 14 Day 21
Control - 8 4.82 ± 0.28 3.37 ± 0.38 4.05 ± 0.40 4.34 ± 0.67Artichoke 500 8 3.37 ± 0.57 3.04 ± 0.31 3.11 ± 0.18 3.68 ± 0.53 1000 8 3.79 ± 0.33 3.98 ± 0.54 4.19 ± 0.48 4.64 ± 0.56Luteolin 25 8 2.65 ± 0.15 3.09 ± 0.22 3.86 ± 0.51 4.01 ± 0.63 50 8 3.37 ± 0.29 3.36 ± 0.35 3.49 ± 0.27 3.69 ± 0.31Quercetin 25 8 2.41 ± 0.17 2.33 ± 0.13 3.16 ± 0.15 3.40 ± 0.34Note: Rats were orally given artichoke extract, luteolin and quercetin at the different doses
indicated for 21 days. Data represent mean value ± SEM (n = 8).

106
Table 5-6. Plasma glutathione peroxidase activity in rats after administration of artichoke extract and phenolic compounds
GPx Activity (nmol/min/ml) mean ± SEM Treatment
Day 0 Day 21Control 5436 ± 417.1 7279 ± 513.5Artichoke 500 mg/kg 5356 ± 281.9 6970 ± 249.8Artichoke 1000 mg/kg 7263 ± 271.6 7080 ± 852.5Luteolin 25 mg/kg 5501 ± 166.4 6529 ± 424.8Luteolin 50 mg/kg 6282 ± 454.2 5692 ± 490.2Quercetin 25 mg/kg 6418 ± 460.7 6282 ± 537.3Note: Rats were orally given artichoke extract, luteolin and quercetin at the different doses
indicated for 21 days. Data represent mean value ± SEM. (n = 8).
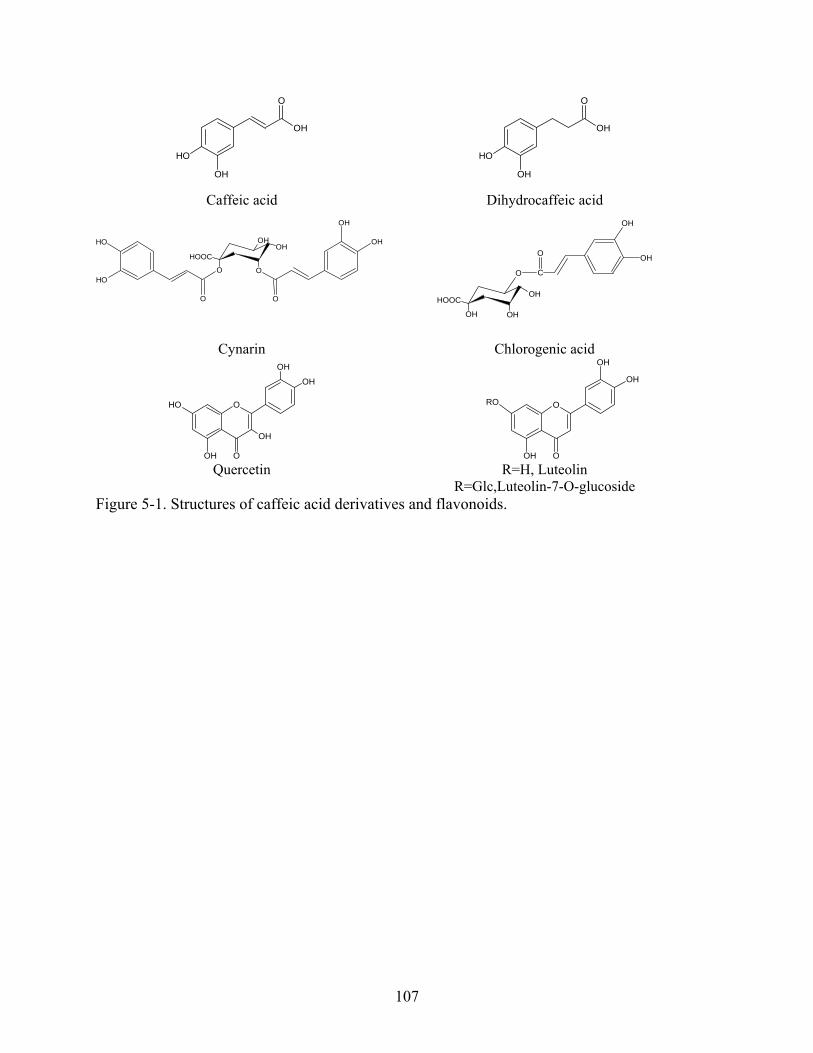
107
OH
OH
O
OH
OH
OH
O
OH
Caffeic acid Dihydrocaffeic acid
OH
O
OH
O
HOOC
O
OH
OH
O
OH
OH
OH
OH
O
OH
HOOC
C
O
OH
OH
Cynarin Chlorogenic acid
O
OOH
OH
OH
OH
OH
Quercetin R=H, Luteolin R=Glc,Luteolin-7-O-glucoside
Figure 5-1. Structures of caffeic acid derivatives and flavonoids.
O
OOH
OH
OH
RO

108
CHAPTER 6 PHARMACOKINETICS OF LUTEOLIN AND ITS METABOLITES IN RATS
Background
Luteolin, one of the active components in artichoke leaves (Cynara scolymus L.), had
strong xanthine oxidase inhibitory and antioxidant activity in vitro as shown in our previous
study. Luteolin also has been reported to be non-mutagenic [121], antitumorigenic [122], and has
been recognized as an inhibitor of protein kinase C [123]. Therefore, in view of the potential of
luteolin as a pharmacological agent, the pharmacokinetics should be carefully studied.
At present, the pharmacokinetics of luteolin has not been fully characterized, although a
number of studies have been reported in animals and humans. These studies showed that the
concentration of luteolin in plasma is low after oral administration. However high amount of
metabolites, for example, luteolin conjugates were found in systemic circulation [30, 104]. The
bioavailability of luteolin is unknown. Therefore, to obtain more information about absorption
and disposition, the pharmacokinetics of luteolin in rats treated with oral and intravenous
administration of luteolin should be performed.
Specific Aims
Pharmacokinetic analysis of luteolin and its metabolites in rats.
Materials and Methods
Materials
Luteolin (99%) was purchased from Indofine Chemical Company, Inc. (Somerville, NJ,
USA). Naringenin (≥96%) (internal standard) was purchased from Roth Carl Roth GmbH+Co.
(Germany). Acetone, acetonitrile (CH3CN), acetic acid, Dimethyl sulfoxide (DMSO), methanol,
orthophosphoric acid (85% p.a.) were obtained from Fisher Scientific (Fair Lawn, NJ, USA). L
(+)-ascorbic acid (≥ 99.9%) was obtained from Acros organics (New Jersey, USA).

109
Trifluoroacetic acid was obtained from Fluka (Milwaukee, WI, USA). β-glucuronidase/sulfatase
(type HP-2, Helix pomatia), polyethylene glycol 200, and sodium dihydrogenphosphate
monohydrate (NaH2PO4.H2O), were obtained from Sigma Chemical Company (St. Louis, MO,
USA). All buffers and aqueous solutions were prepared with purified water obtained from a
NANOPure® system from Barnstead (Dubuque, IA, USA).
Stock, Work Solutions, and Preparation of Calibration Standards
The stock solutions of luteolin 10.0 mg/mL and naringenin (internal standard) 22.05
mg/mL were prepared in DMSO and kept at -80oC.
Luteolin stock solution: (10 mg/mL): Luteolin 20.0 mg was accurately weighed and
transferred to a 2.0 mL volumetric flask. The standard was then dissolved in DMSO and the
volume was completed with the same solvent.
Naringenin stock solution: 22.05 mg/mL: Naringenin 110.25 mg was weighed and
transferred to a 5 mL volumetric flask and then dissolved in DMSO. The volume was completed
with the same solvent.
Luteolin work solution: 500 μg/mL: Volume of 100 μL from luteolin stock solution was
accurately transferred to a 2 mL volumetric flask. The volume was completed with methanol and
mixed thoroughly. The final concentration of luteolin was 500 μg/mL.
Naringenin work solution (internal standard): 1.05 mg/mL: Volume of 95.0 μL from
naringenin stock solution was transferred to a 2.0 mL volumetric flask and then completed the
volume with methanol. The final concentration of naringenin was 1.05 mg/mL.
Standard solutions of luteolin in plasma: From the luteolin work solution, five different
concentrations of standard solutions and three quality controls (QC) were prepared in methanol.
Then 10 μL of standard solutions was added to 200 μL plasma according Table 6-1.
110
Standard solutions of luteolin in urine: From the luteolin stock solution and work
solution, five different concentrations of standard solutions and three QC were prepared in
methanol and 10 μL of standard solutions was added to 200 μL urine according Table 6-2.
Animals and Experimental Protocols
Animals
Male Sprague-Dawley rats, weighing 250-350 g. were purchased from Harlan (IN, USA)
and divided into the experimental groups; containing 11 rats per group. They were housed in
plastic cages. They were allowed one week to adapt to their environment before used for
experiments. All the animals were maintained on a 12hr/12hr light/dark cycle. They were given
standard chow and water ad libitum during the course of the study. All animal experiments were
performed according to the policies and guidelines of the Institutional Animal Care and Use
Committee (IACUC) of the University of Florida, Gainesville, USA (NIH publication # 85-23).
Methods
The pharmacokinetic studies were carried out by the sparse sampling approach wherein
blood samples were collected from 8-11 different rats. Luteolin was administered in two groups
of rats (n = 8-11 in each group). Group one received a single i.v. dose of 50 mg/kg of luteolin via
a tail vein. Group two received the same dose orally by gavage. Luteolin was dissolved in 30%
DMSO and 70% PEG200. For luteolin analysis, plasma samples (500 μL per blood sample) were
collected from sublingual vein into heparinized tubes at 3, 5, 10, 30 min, and 1, 2, 4, 6, 12, 24 h
for i.v. injection and at 5, 10, 15, 30, 45 min, and 1, 2, 4, 6, 12, 24 h for oral administration. The
blood collections were separated into two different days apart by one week of wash out period
(5-6 blood collections per day per animal). For luteolin conjugates, plasma samples (1000 μL per
blood sample) were collected at 5, 10, 30 min and 1, 2, 4, 6, 12, 24 h for i.v. and oral

111
administration. The blood collections were separated into two different days apart by one week
of wash out period (3 blood collections per day per animal). The variability of the weight of each
animal on both periods was not higher than 20%. Prior to blood collection, the rats were
anaesthetized with halothane and the blood loss was replaced with an equal volume of normal
saline. The blood sample was centrifuged for 15 min at 4,000 rpm at 4oC. The supernatant in
aliquots of 200.0 μL was transferred into tubes and 10.0 μL of 0.58 M acetic acid was added to
each aliquot for stabilization. The plasma samples were stored at -80oC until analysis. Urine was
collected over 24 h and an aliquot of 50.0 mL was mixed with 1g ascorbic acid as antioxidant
and stored at -80oC until analysis.
Analytical Methods
The plasma concentrations of unchanged free and conjugated luteolin in rat plasma and
urine were determined by the method published earlier with a slight modification [124] Plasma
samples and urine samples were analyzed using a reverse-phase partition mode of HPLC with
diode array detector. A Shimadzu VP series HPLC system (Kyoto, Japan) equipped with an
SPD-M10Avp diode array detector was used for this work. A Lichrospher® 100 RP-18 (5μm.
Merck KgaA) was used for the separation of luteolin. The column temperature was kept at 25oC.
The eluents were (A) 50 mM phosphate buffer (NaH2PO4, pH 2.1) and (B) CH3CN.The
following solvent gradient was applied: 20% B (6 min) and 20-50% B (21 min).The gradient was
followed by 10 min column flushing and post-run equilibration, respectively. Total run time was
40 min. The flow rate was 1 mL/min. 40 μL of each sample was injected into the RP-HPLC
system. Chromatograms were acquired at 330nm.
For the determination of total luteolin, 10.0 μL of internal standard (naringenin, 1.05
mg/ml), 10.0 μL of 0.5% (m/v) ascorbic acid and 20.0 μL of acetic acid (0.58 M) were added to
112
200.0 μL of plasma sample; followed by the addition of 12.0 μL of β-glucuronidase/sulfatase
solution. The mixture was incubated at 37oC for 1 h. Protein was precipitated by adding 240 μL
of acetone. The mixture was vortexed for 1 min and centrifuged for 15 min at 4000 rpm at 4oC.
Then the supernatant was transferred to tubes containing 4.0 μL of 0.5% (m/v) ascorbic acid and
8.0 μL of 1 M trifluoroacetic acid and evaporated to dryness in a vacuum centrifuge. The residue
was reconstituted in 60 μL of methanol: water (1:1, v/v), centrifuged for 10 min at 13200 rpm,
and 40 μL was injected into HPLC.
For the determination of unchanged luteolin in plasma, the sample was extracted in the
same manner as described above without adding the enzyme.
The concentrations in urine was measured using the same method as plasma, except urine
samples were centrifuged for 15 min at 13200 rpm after adding 240.0 μL of acetone and then
40.0 μL of the supernatant was injected into HPLC.
The conjugates (glucuronides or sulfates) of luteolin were calculated by subtracting total
luteolin with unchanged luteolin.
Data Analysis
Plasma samples showed measurable concentrations for luteolin before administration of
luteolin. Therefore, plasma concentrations at each time points were subtracted with baseline level
before pharmacokinetic data analysis. Mean concentration of luteolin and its conjugates versus
time curves were generated in Grapad Prism® (version 4.0, San Diego, CA). The
pharmacokinetic parameters were determined by non-compartmental analysis and compartmental
analysis using WinNonlin software package, version 3.1, (Pharsight Corporation, USA). The
mean data was used for both analyses.

113
Non-compartmental PK analysis: The PK parameters determined were the areas under
the concentration time curve (AUC), maximum concentration in plasma (Cmax), time to reach
Cmax (Tmax), the elimination rate constant (ke), the elimination half life (t1/2), the volume of
distribution (Vd) and the clearance (CL). AUC 0→last was calculated using linear/log trapezoidal
method from time zero to last sampling point equal to or above the lower limit of quantification.
AUC 0→∞ was calculated as AUC 0→last + AUCextra, and AUCextra was determined as the
calculated last concentration (Clast)/ke. Both Cmax and Tmax were obtained from the plots of
plasma concentration versus time. The ke was obtained by linear regression of the terminal log
linear phase of the concentration-time curve. The elimination half-life (t1/2) was determined as
0.693/ke. The volume of distribution of central compartment (V) was calculated as D/C0, where
D is the dose. The clearance (Cl) was calculated as D/AUC. The systemic bioavailability (F %)
was calculated as F % = (AUC p.o. × Dose i.v. /AUC i.v. × Dose p.o.) × 100.
Compartmental PK analysis: Luteolin concentrations showed better fit in a two
compartment body model compared with one compartment body model. The equation for two
compartment model (Figure 6-1.) is as followed:
C = A.e-αt + B.e-βt (i.v.)
Where C is the concentration of drug in plasma at time t; A and B are mathematical
coefficient; α is the distribution rate constant; β is the elimination rate constant; and t is time.
After i.v. administration, AUC 0-∞ was calculated using following equation: AUC 0-∞ i.v. =
A/α + B/β. The elimination half life was calculated as ln (2/Ke). The volume of distribution of
central compartment (Vc) was calculated as Dose/Ke × AUC. The volume of distribution of
peripheral compartment (Vt) was calculated as Vc × k12/k21. The clearance (Cl) was calculated
as Dose/AUC.

114
Goodness of fit was determined by the AIC (Akaike Criteria) and SC (Schwartz Criteria).
The lower the AIC and SC, the more appropriate the selected model.
Statistical Analysis
WinNonlin software package, version 3.1, (Pharsight Corporation, USA) was used for
statistical analysis. Data are given as mean with corresponding standard deviation.
Validation
The method was validated over the range of concentration of luteolin present in plasma.
The validation parameters of linearity, sensitivity, specificity, precision, accuracy and stability
were determined.
The linearity of the calibration curves was determined by least-squares linear regression
method and expressed in terms of coefficient of determination (r2). The intra- and inter-day
precision and accuracy were measured by triplicate analyses of three different concentration
levels (low, medium and high) of quality control standards on the same day and on different
days. The precision was based on the calculation coefficient of variation (CV %), and the
accuracy was defined as the percent difference between the theoretical and measured values. The
calibration was considered suitable if not more than 1/3 of the quality control standards showed a
deviation from the theoretical values equal or greater than 15%, except at the lower limit of
quantification (LLOQ), where it should not exceed 20%.
Results
Validation of Analytical Method to Measure Luteolin in Rat Plasma
Linearity
Calibration curve (n = 9) operating in the range of 100-10000 ng/mL for luteolin in rat
plasma was linear (r2 > 0.99) (Figure 6-2).

115
Sensitivity
In this study, the limit of quantification (LLOQ) is defined as the lowest concentration for
quality control. This concentration would be acceptable with the precision (%CV < 20), and
accuracy (%error < 20).The LLOQ of luteolin in plasma was 100 ng/mL.
Specificity
The methods provided good resolutions between luteolin, β-glucuronidase and interference
in plasma and there was no endogenous interference from plasma (Figure 6-3) in this assay,
indicating the specificity of this method.
Precision, accuracy and recovery
The precisions intra- and inter-day for luteolin were satisfactory with CV values between
1.3 and 12.3%. Similarly, the accuracy of the assay obtained with quality control samples
containing 300, 800, and 3000 ng/mL luteolin was between 94.2 and 106.3 % of the nominal
values. The mean recovery assessed at three distinct levels of concentration (100, 500 and 10000
ng/mL) ranged from 95.7 to 106.4 % of the expected values. The results are summarized in
Table 6-3.
Stability
Luteolin was stable under the tested conditions. The mean % remainings in rat plasma after
2 hours at room temperature were 98.78 ± 5.34, 96.29 ± 1.47, 102.4 ± 7.76 for the low, medium
and high concentrations, respectively. The mean % remainings of luteolin after an evaporation
and keep at -20 °C for 24 hours were 106.68 ± 8.97, 102.40 ± 3.11 and 100.07 ± 0.50 for the
low, medium and high concentrations, respectively. Luteolin was stable on autosampler at 18 oC
within 48 hours (Table 6-4).

116
Validation of Analytical Method to Measure Luteolin in Rat Urine
Linearity
Calibration curve (n = 9) operating in the range of 500-50000 ng/mL for luteolin in rat
urine was linear (r2 > 0.99) (Figure 6-4).
Sensitivity
The limit of quantification (LLOQ) of luteolin in urine was 500 ng/mL.
Specificity
Good resolutions between luteolin, β-glucuronidase and interference in urine and no
endogenous interference from urine (Figure 6-5) indicated the specificity of this method.
Precision, accuracy and recovery
The precisions intra- and inter-day for luteolin were satisfactory with CV values between
0.30 and 13.25%. Similarly, the accuracy of the assay obtained with quality control samples
containing 500, 3000, and 10000 ng/mL luteolin was between 98.21 and 109.28 % of the
nominal values. The mean recovery assessed at three distinct levels of concentration (500, 3000
and 10000 ng/mL) ranged from 99.56 to 112.23 % of the expected values. The results are
summarized in Table 6-5.
Stability
Luteolin was stable under the tested conditions. The mean % remainings in rat urine after 2
hours at room temperature were 98.78 ± 5.34, 96.29 ± 1.47, 102.4 ± 7.76 for the low, medium
and high concentrations, respectively. Luteolin was stable on autosampler at 18 oC within 48
hours (Table 6-6).

117
Pharmacokinetic Study of Luteolin
Non-compartmental analysis
Plasma levels of luteolin after oral and i.v. administration of luteolin: The
concentration-time profiles and the pharmacokinetic parameters of luteolin after oral and i.v.
administration are presented on Figure 6-6 and Table 6-7. For oral administration, plasma
concentrations of luteolin attained maximum level of 5.49 μg/ml at 0.08 h and decreased to
below LOQ (100 ng/ml) after 1 h. Ke could not be calculated because the elimination phase was
below LOQ. Our assumption was Ke after oral administration was similar to ke after i.v
injection. Therefore, the AUC 0-∞ p.o. was calculated using ke from i.v. The low bioavailability (F)
of luteolin, 4.10 % at dose 50 mg/kg are presumably due to the significant first pass effect. For
i.v. administration, the maximum concentration of luteolin was 23.42 μg/mL at 0 h. The plasma
concentration versus time profile of luteolin was biphasic, subdivided into a distribution phase
and a slow elimination phase for oral and intravenous administration.
Plasma levels of luteolin conjugates after oral and i.v. administration of luteolin: The
concentration-time profiles and the pharmacokinetic parameters of luteolin conjugates after oral
and i.v. administration are presented on Figure 6-6 and Table 6-8. Plasma concentration of
luteolin conjugates after oral and i.v administration of luteolin attained maximum level of 5.77
μg/mL at 0.25 h and 4.31 μg/ml at 0.08 h, respectively, and decreased to below LOQ at 24 h.
The double peaks were found in luteolin conjugates after oral and i.v. administration at 0.25 and
1 h, respectively, suggesting it might pass enterohepatic circulation.
Urinary excretion of luteolin and its metabolites after oral and i.v. administration:
Urinary excretion of luteolin and luteolin conjugates within 24 h after oral and intravenous

118
administration of luteolin were very low (0.98 - 4.97% of the dose), suggesting these compounds
are not primarily excreted via the urine (Table 6-10).
Compartmental Analysis
Figure 6-7 shows the fitted luteolin concentrations versus time profiles with the two
compartment body model. It can be seen that the model describes luteolin data very well. The
AIC and SC were -11.18 and -9.59, representing a good fit. The PK parameters obtained by
fitting the mean concentration versus time profiles of luteolin concentrations after i.v. treatment
are presented in Table 6-9.
Discussion and Conclusion
Luteolin and luteolin conjugates were presented in rat plasma and urine after oral and
intravenous administration. However, the conjugates (glucuronides or sulfates) could not be
further identified in this study. The analytical methods were developed for the parent compound,
and the conjugates presumably coeluted with matrix compounds. The present of free luteolin
suggested that some luteolin can escape the intestinal and hepatic conjugation.
Pharmacokinetic profiles of luteolin and luteolin conjugates in rat plasma are shown in
Figure 6-6. When rats were given luteolin (50 mg/kg) in 30% DMSO: 70% PEG 200 orally, the
maximum concentration of luteolin and luteolin conjugates were 5.48 and 5.77 μg/mL at 5 min
and 15 min, respectively. The total concentration of luteolin in rat plasma at 5 min after dosing
was 9.25 μg/mL. Shimoi et al. [104] observed 15.5 ± 3.8 nmol/mL (∼4.4 ± 1.09 μg/mL) of total
luteolin concentration in rat plasma 30 min after administration of one single dose of luteolin (50
μmol/kg, ∼14.3 mg/kg) in propylene glycol. In dog, the maximum concentration of luteolin was
about 450 ng/mL at 3 h after a single oral dosing of Chrysanthemum morifolium Ramat extracts
(102 mg/kg containing 7.60% luteolin, ∼ 7.75 mg/kg luteolin) [125]. In human, peak plasma
119
concentrations of total luteolin were reached within 0.5 h with maximum level of 156.5 ± 92.29
ng/mL after a single oral dose of artichoke leaf extracts (153.8 mg containing luteolin-7-O-
glucosides; equivalent to 35.2 mg luteolin) [30]. The differences observed between these studies
could be explained by the different initial dose administration of flavonoids and the different
source of intake flavonoids.
The rapid absorption of flavonoids has been reported in previous literature. When diosmin
was administered to humans, a peak occurring 2 h after administration [126], whereas diosmetin
administered per os to rats appeared in blood after 6 h as unchanged and glucuronated compound
[127]. In pigs, after an oral dose of 50 mg/kg, only 17 % of the quercetin administered was
recovered in blood as free conjugate and derivative products within 8 h postadministration [128].
In humans, the peak in blood occurred more rapidly, approximately 2.9 h after the flavonol
administration [103]. In rats, flavonoids seemed to occur more rapidly. Luteolin given via gastric
intubation, appeared in plasma after 15 min [104]. Apigenin given to rats via the intraperitoneal
pathway appeared in plasma 30 min after administration [105]. From these literatures, the
presence of flavonoids in blood occurs within a few minutes to a few hours which are similar to
our result.
The low bioavailability of luteolin (F = 4.1%) and high metabolite concentrations indicate
first pass metabolism. Absorbed luteolin could undergo biotransformation (methylation,
glucuronidation or sulfation) as shown in previous literature. In vitro experiments demonstrated
that 74 % of luteolin was conjugated to glucuronic acid after incubation with microsomal
samples from human intestine. Most common binding sites of the molecule were the hydroxyl
groups in the 3′- and 4′- position (51% and 44%) [96]. Boersma et al. [96] found three
glucuronosyl conjugates of luteolin, the 7-O-, the 3′-O- and the 4′-O-glucuronosyl luteolin after
120
incubation with intestine microsomes and liver microsomes from rat and man. Shimoi et al. [104]
investigated the absorption of luteolin by rat everted small intestine. Luteolin was recovered in
rat plasma as two metabolites, glucuronidate or sulfate forms of O-methylate conjugate. Only a
small part of the compound remained unconjugated. Murota et al. [129] reported the uptake and
transport of flavonoids aglycones by human intestinal Caco-2 cells. The flavonoids, quercetin,
kaempferol, luteolin and apigenin, were converted to their glucuronide/sulfates by Caco-2 cells,
and the level of the intact aglycone form was less than those of the glucuronide/sulfates in the
basolateral solution. To our knowledge, this was the first study on bioavailability of luteolin, thus
a comparable data is lacking. However, the bioavailability of luteolin is similar to that of
quercetin. Chen et al. [95] reported the systemic bioavailability of quercetin and quercetin
conjugates as 5.3% and 55.8%, respectively in rats. Moreover after oral administration of
quercetin, about 93.3% of quercetin was metabolized in the gut, with only 3.1% metabolized in
the liver.
Only small amounts of luteolin and luteolin conjugates were found to be eliminated in the
urine in our study. This is consistent with the observations by others. Shimoi et al. [104] found
excretory recovery for 24 h as unmodified luteolin from the urine was about 4 % in rats. Luteolin
conjugates was recovered only 1.99 ± 1.50 % after intake of luteolin-7-O-glucoside (equivalent
to 35.2 mg luteolin) [30]. Only 0.58 % of apigenin was recovered in urine samples within 24 h
after parsley ingestion in human [130]. Gugler et al. [131] found that after intravenous
administration of a 100 mg quercetin, only 0.65 % of the dose was recovered in the form of
unchanged quercetin, while 7.4 % of the dose was excreted in the urine in the form of conjugated
metabolite of quercetin. In a phase I clinical trial of quercetin (in fifty-one cancer patients) at

121
dose of 60 to 2000 mg/m2, the percentage of quercetin in urine over 24 h ranged from 0.03% to
7.6% [132].Therefore, urinary elimination of luteolin is not the main excretion route in rats.
Our study found multiple peaks in a plasma concentration-time profile of luteolin
conjugates after oral and intravenous administration of luteolin suggesting an enterohepatic
recirculation of luteolin which is similar to other studies. Liu et al. [39] reported a rapidly
absorbed and rapidly metabolized of aglycones such as apigenin and quercetin into phase II
conjugates, which were then excreted back into the lumen; following and enteric and
enterohepatic recycling. Ma et al. [133] reported an enterohepatic recirculation of naringenin in
rat plasma. Our data did not show multiple peaks in a plasma concentration-time profile of free
luteolin after intravenous and oral administration presumably due to the limit of data time points.
In the present investigation, pharmacokinetics of luteolin and its metabolites in rats were
studied. After oral administration of luteolin, luteolin was rapidly absorbed and metabolized in
plasma; moreover, plasma-concentration-time curves of luteolin metabolites revealed secondary
peaks. The bioavailability of luteolin is low and the urinary excretion of luteolin and its
conjugates did not dominate. This study could explain a lack of in vivo activity of artichoke leaf
and its compounds on xanthine oxidase inhibitory and antioxidant activity. Moreover, it can be
used to predict the in vivo activity of other herbal products that contain this compound.
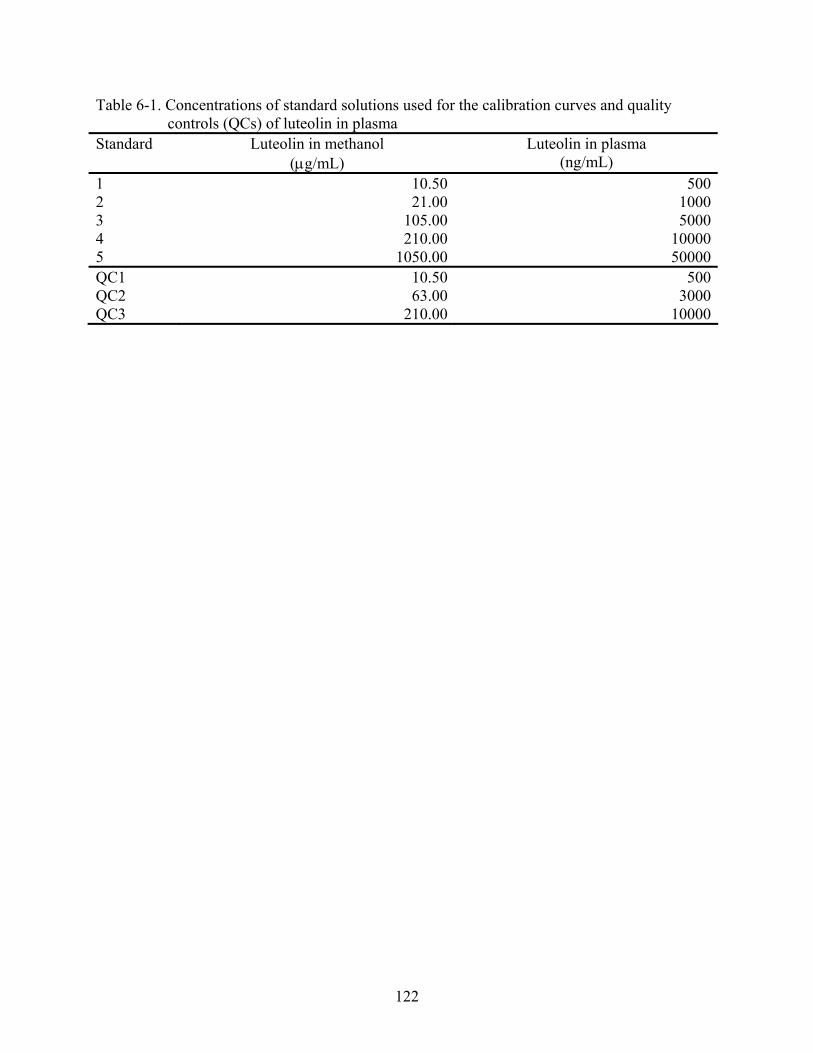
122
Table 6-1. Concentrations of standard solutions used for the calibration curves and quality controls (QCs) of luteolin in plasma
Standard Luteolin in methanol (μg/mL)
Luteolin in plasma (ng/mL)
1 10.50 5002 21.00 10003 105.00 50004 210.00 100005 1050.00 50000QC1 10.50 500QC2 63.00 3000QC3 210.00 10000

123
Table 6-2. Concentrations of standard solutions used for the calibration curves and quality controls (QCs) of luteolin in urine
Standard Luteolin in methanol (μg/mL)
Luteolin in plasma (ng/mL)
1 2.10 1002 10.50 5003 21.00 10004 105.00 50005 210.00 10000QC1 2.10 100QC2 16.80 800QC3 63.00 3000

124
Table 6-3. Intra-day (n = 3), inter-day (n = 9), and recovery (n = 3) assay parameters of luteolin in rat plasma. Precision expressed as CV%, accuracy and recovery as % of the theoretical concentration
Intra-day QC1 100 ng/mL QC2 800 ng/mL QC3 3000 ng/mL Day 1 Day 2 Day 3 Day 1 Day 2 Day 3 Day 1 Day 2 Day 3 Precision 3.82 12.34 8.71 1.33 5.70 5.29 1.73 5.92 2.28Accuracy 94.20 98.72 100.21 102.57 104.06 104.30 106.25 104.68 104.12Inter-day QC1 100 ng/mL QC2 800 ng/mL QC3 3000 ng/mL Precision 9.65 2.82 3.02 Accuracy 98.17 104.69 104.21 Recovery Luteolin-100 ng/mL Luteolin-500 ng/mL Luteolin-10000 ng/mL % 95.78 96.42 106.40 CV% 10.94 8.46 5.48
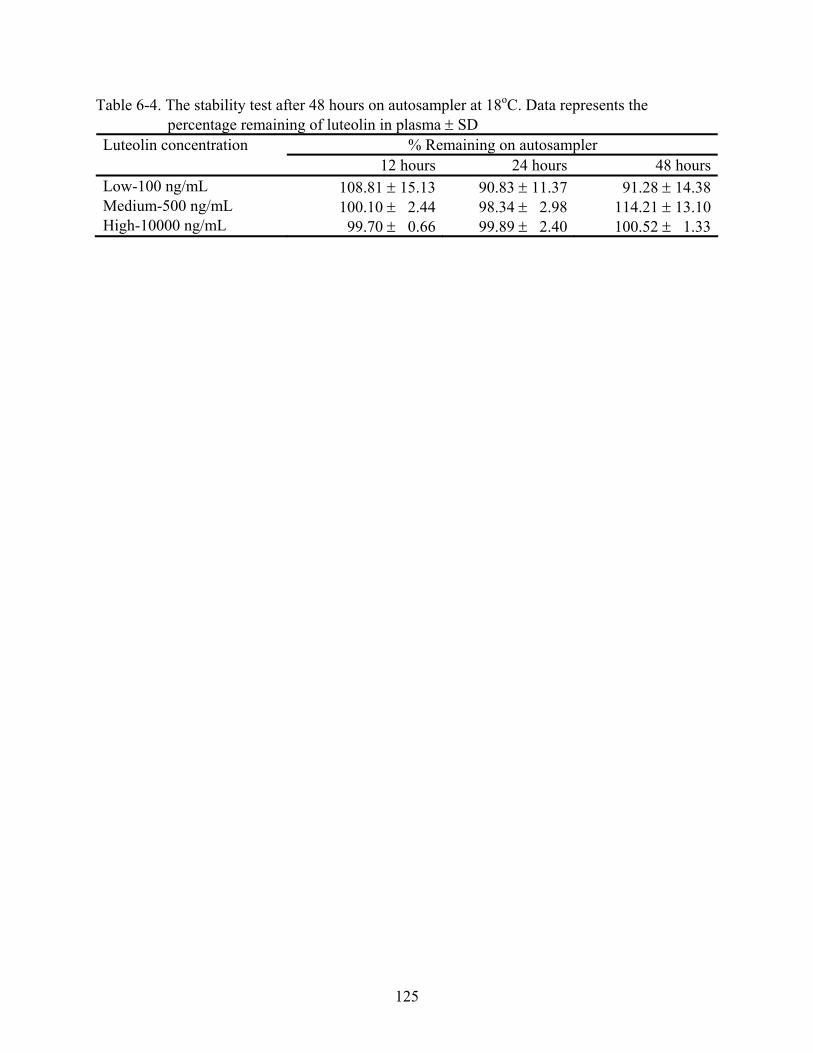
125
Table 6-4. The stability test after 48 hours on autosampler at 18oC. Data represents the percentage remaining of luteolin in plasma ± SD
% Remaining on autosampler Luteolin concentration 12 hours 24 hours 48 hours
Low-100 ng/mL 108.81 ± 15.13 90.83 ± 11.37 91.28 ± 14.38Medium-500 ng/mL 100.10 ± 2.44 98.34 ± 2.98 114.21 ± 13.10High-10000 ng/mL 99.70 ± 0.66 99.89 ± 2.40 100.52 ± 1.33

126
Table 6-5. Intra-day (n = 3), inter-day (n = 9), and recovery (n = 3) assay parameters of luteolin in rat urine. Precision expressed as CV%, accuracy and recovery as % of the theoretical concentration
Intra-day QC1 500 ng/mL QC2 3000 ng/mL QC3 10000 ng/mL Day 1 Day 2 Day 3 Day 1 Day 2 Day 3 Day 1 Day 2 Day 3
Precision 6.48 7.24 0.81 0.30 0.73 1.52 2.96 0.61 1.66Accuracy 98.21 100.12 98.51 101.81 101.92 100.98 110.01 112.45 108.99Inter-day QC1 500 ng/mL QC2 3000 ng/mL QC3 10000 ng/mL Precision 13.25 3.24 1.37 Accuracy 98.72 103.49 109.28 Recovery Luteolin-500 ng/mL Luteolin-3000 ng/mL Luteolin-10000 ng/mL % 99.56 108.46 112.23 CV% 3.19 3.32 3.21

127
Table 6-6. The stability test of luteolin in urine after 48 hours on autosampler at 18oC. Data represents the percentage remaining of luteolin ± SD
% Remaining on autosampler Luteolin concentration 24 hours 48 hours
Low-500 ng/mL 97.44 ± 2.38 92.98 ± 0.61Medium-3000 ng/mL 98.77 ± 0.71 98.85 ± 1.48High-10000 ng/mL 100.10 ± 0.53 100.32 ± 1.65

128
Table 6-7. Pharmacokinetic parameters of luteolin after oral and iv administration of luteolin at dose 50 mg/kg
Parameter Luteolin oral Luteolin ivTmax (h) 0.08 0Cmax (μg/mL) 5.48 23.42Ke (1/h) ND 0.08t ½ (h) ND 8.94Cl/F (L/h/kg) NDVd/F (L/kg) NDCl (L/h/kg) 2.14Vd (L/kg) 27.58AUC0-last (h*μg/mL) 0.87 20.55AUC0-α (h*μg/mL) 0.96 23.39F (%) 4.10
Note: All Pk parameters are mean values calculated by a normalized dose (50 mg/kg)

129
Table 6-8. Pharmacokinetic parameters of luteolin conjugates after oral and iv administration of luteolin at dose 50 mg/kg
Parameter Luteolin conjugates oral Luteolin conjugates ivTmax (h) 0.25 0.08Cmax (μg/mL) 5.77 4.31Ke (1/h) 0.10 0.14t ½ (h) 6.57 4.98AUC0-last (h*μg/mL) 11.49 12.83AUC0-α (h*μg/mL) 15.68 15.26
Note: All pk parameters are mean values calculated by a normalized dose (50 mg/kg)

130
Table 6-9. Pharmacokinetic parameters of luteolin after i.v. administration of luteolin 50 mg/kg. Data was fitted to a two-compartment model.
Parameter Luteolin i.v.A (μg/mL) 9.66 ± 1.14B (μg/mL) 1.36 ± 0.16α (1/h) 1.95 ± 0.32β (1/h) 0.08 ± 0.01K12 (1/h) 1.24 ± 0.25K21 (1/h) 0.31 ± 0.06Ke (1/h) 0.48 ± 0.06Vc (L/kg) 4.54 ± 0.48Vt (L/kg) 18.26 ± 2.24Cl (L/h/kg) 2.18 ± 0.13 t1/2 α (h) 0.36 ± 0.06t1/2 β (h) 9.15 ± 1.15t1/2 Ke (h) 1.44 ± 0.17AUC (h μg /mL) 22.93 ± 1.39Cmax (μg /mL) 11.02 ± 1.15Note: All pk parameters are mean ± S.D.

131
Table 6-10. The excretory recovery for 24 h of luteolin and luteolin conjugates in urine after oral and i.v administration of luteolin at dose 50 mg/kg
Treatment % Luteolin % Luteolin conjugatesoral 0.98 ± 0.98 3.91 ± 0.52i.v. 2.05 ± 0.90 4.97 ± 1.68
Note: Data expressed as mean ± SD (n = 11)
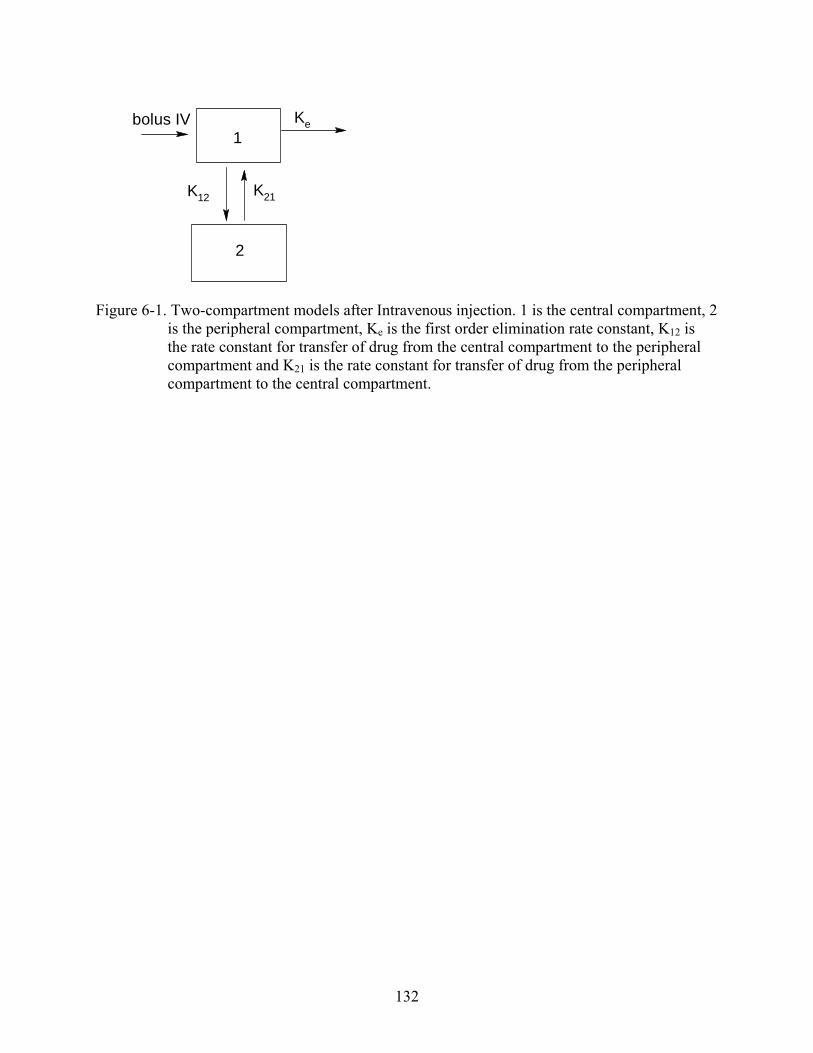
132
bolus IV
1
2
K12 K21
Ke
Figure 6-1. Two-compartment models after Intravenous injection. 1 is the central compartment, 2 is the peripheral compartment, Ke is the first order elimination rate constant, K12 is the rate constant for transfer of drug from the central compartment to the peripheral compartment and K21 is the rate constant for transfer of drug from the peripheral compartment to the central compartment.

133
0 2500 5000 7500 10000 125000.0
0.5
1.0
1.5
2.0
2.5
Luteolin [ng/ml]
Rat
io( a
rea
lute
olin
: are
a IS
)
Figure 6-2. Mean calibration curves (n = 9) of luteolin in plasma. Vertical bars represent the
standard deviations (SD) of the means.
Y = 0.0002057 X - 0.003217 R = 0.9978

134
Minutes0 2 4 6 8 10 12 14 16 18 20 22 24 26 28 30 32 34 36 38
mVo
lts
0
20
40
60
80
100
120
140
160
180
200
Minutes0 2 4 6 8 10 12 14 16 18 20 22 24 26 28 30 32 34 36 38
mVo
lts
0
25
50
75
100
125
150
175
200
225
250
275
300
325
350
Figure 6-3. The HPLC chromatogram of luteolin and naringenin (IS) in plasma. A) With out β-
glucuronidase. B) With β-glucuronidase/sulfatase.
A B
Naringenin
Luteolin
Luteolin
Naringenin
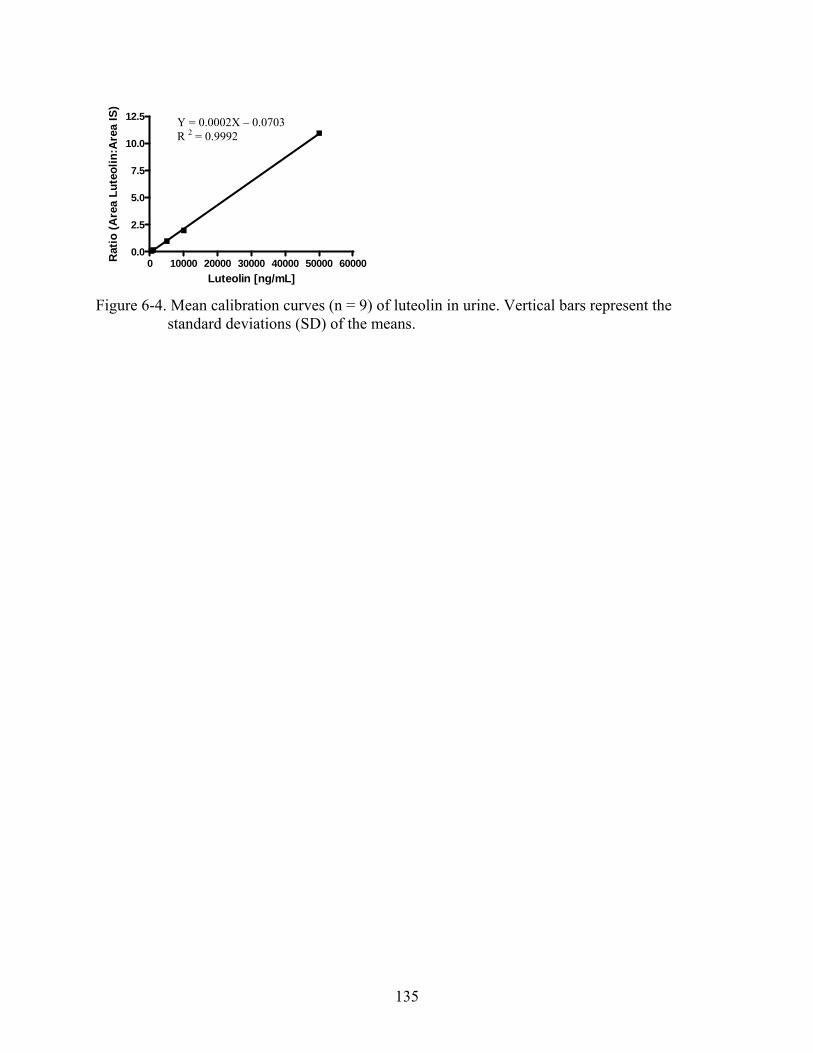
135
0 10000 20000 30000 40000 50000 600000.0
2.5
5.0
7.5
10.0
12.5
Luteolin [ng/mL]
Rat
io (A
rea
Lute
olin
:Are
a IS
)
Figure 6-4. Mean calibration curves (n = 9) of luteolin in urine. Vertical bars represent the
standard deviations (SD) of the means.
Y = 0.0002X – 0.0703 R 2 = 0.9992
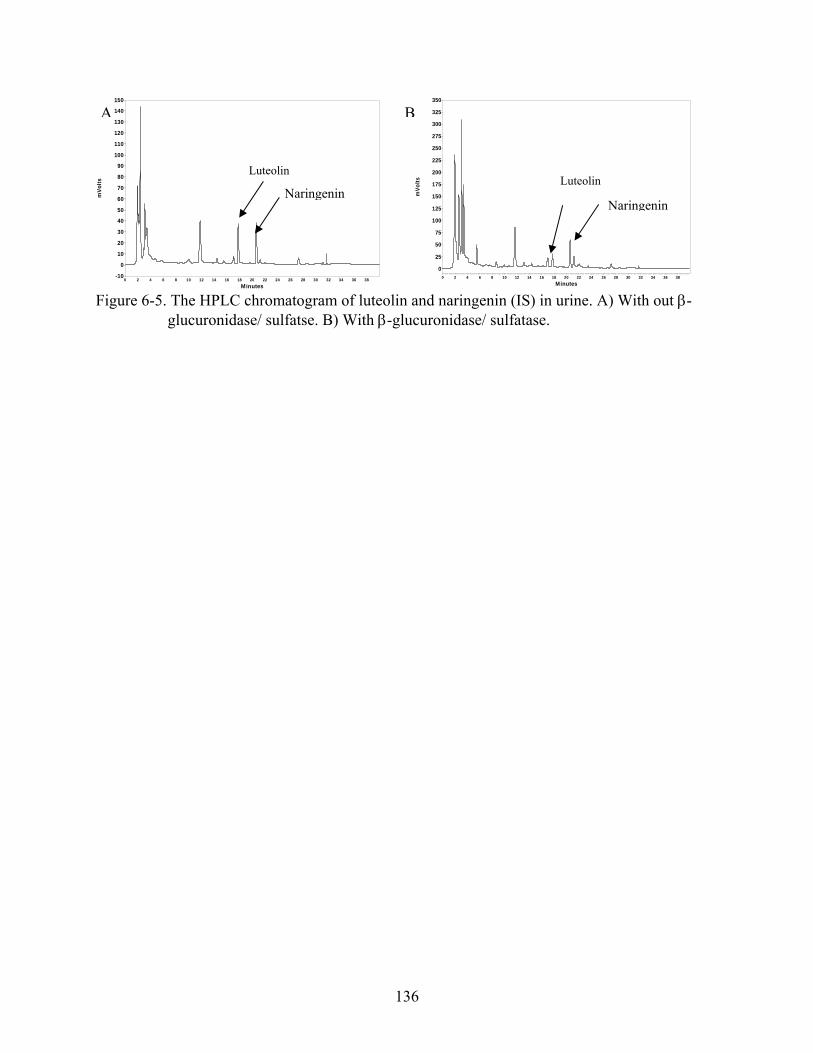
136
Minutes0 2 4 6 8 10 12 14 16 18 20 22 24 26 28 30 32 34 36 38
mVo
lts
-10
0
10
20
30
40
50
60
70
80
90
100
110
120
130
140
150
Minutes0 2 4 6 8 10 12 14 16 18 20 22 24 26 28 30 32 34 36 38
mVo
lts
0
25
50
75
100
125
150
175
200
225
250
275
300
325
350
Figure 6-5. The HPLC chromatogram of luteolin and naringenin (IS) in urine. A) With out β-
glucuronidase/ sulfatse. B) With β-glucuronidase/ sulfatase.
A B
Naringenin
Luteolin
Naringenin
Luteolin
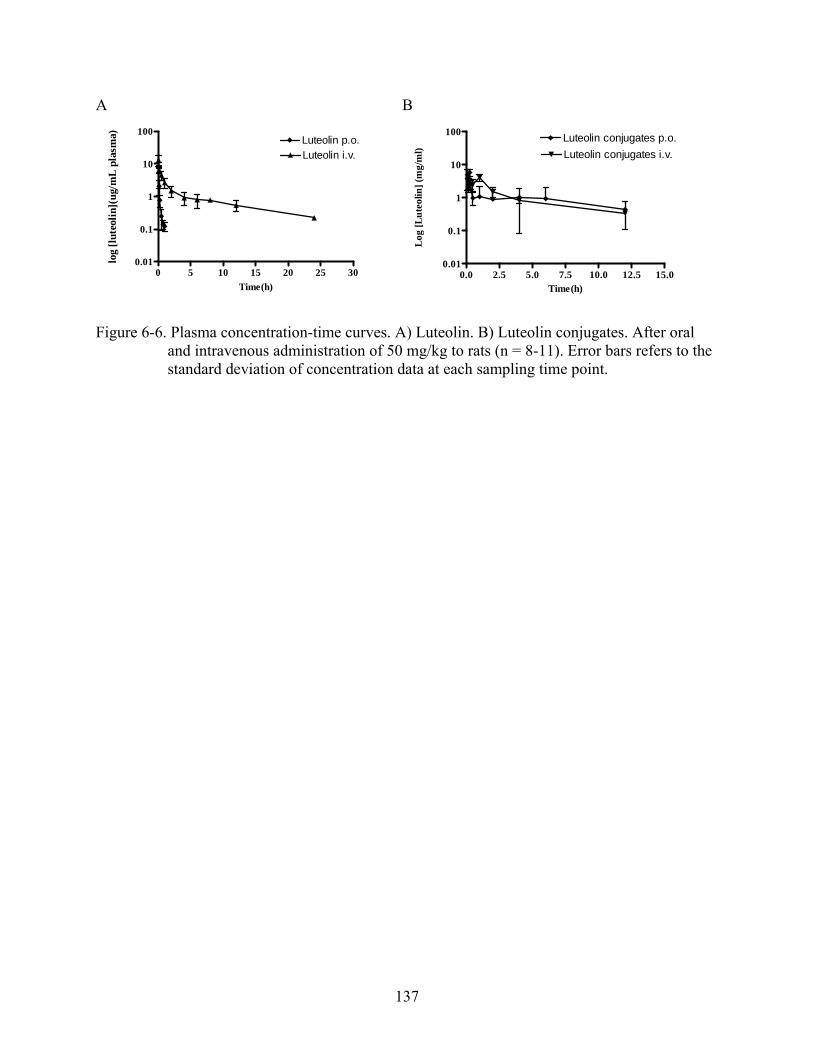
137
A
0 5 10 15 20 25 300.01
0.1
1
10
100Luteolin p.o.Luteolin i.v.
Time(h)
log
[lut
eolin
](ug
/mL
pla
sma)
B
0.0 2.5 5.0 7.5 10.0 12.5 15.00.01
0.1
1
10
100
Luteolin conjugates i.v.Luteolin conjugates p.o.
Time(h)
Log
[Lut
eolin
] (m
g/m
l)
Figure 6-6. Plasma concentration-time curves. A) Luteolin. B) Luteolin conjugates. After oral and intravenous administration of 50 mg/kg to rats (n = 8-11). Error bars refers to the standard deviation of concentration data at each sampling time point.

138
Figure 6-7. Fitted luteolin concentrations after i.v. injection. Experimental points represent the
means of 8-11 rats.
0.1
1.0
10.0
100.0
0 5 10 15 20 25
Time (h)
Observed
Predicted
139
CHAPTER 7 CONCLUSION
Gout is a common metabolic disorder in human. It results from deposits of needle-like
crystals of uric acid in connective tissue, in the joint space between two bones, or in both. These
depositions lead to inflammatory arthritis, which causes swelling, redness, heat, pain, and
stiffness in the joints. The common treatments for an acute attack of gout are colchicine, non-
steroidal anti-inflammatory drugs (NSAIDs) and corticosteroids. Allopurinol, a xanthine oxidase
inhibitor, is used for the prevention of chronic gout attacks. Its use is limited by unwanted side
effects such as hypersensitivity problems. Therefore, alternatives are required.
Leaf of Artichoke (Cynara scolymus L.) is a good source of polyphenolic compounds such
as mono- and dicaffeoylquinic acids and flavonoids. Polyphenolic compounds have a role in the
prevention of degenerative diseases such as cancer, cardiovascular disease and
neurodegenerative diseases, which is usually linked to two properties: antioxidant activity and
inhibition of certain enzymes such as xanthine oxidase. Therefore, artichoke leaves containing
polyphenolic compounds may show xanthine oxidase inhibitory activity and antioxidant activity.
In this study, artichoke leaf extract and caffeoylquinic acids showed weak or no XO
inhibitory activity in vitro; whereas, the inhibitions of most flavonoids on XO were stronger than
a standard compound, allopurinol. However, after oral and intraperitoneal administration of
different doses of artichoke and polyphenolic compounds in rats, none of the test compounds
could decrease serum urate levels. This result of the XO study was similar to that of the
antioxidant study. The study of antioxidant activity of artichoke and its components also showed
that although there was an antioxidant activity in vitro, the antioxidant activity in vivo was not
found after oral treatment. This lack of XO and antioxidant activity in vivo might be explained
by low absorption, high first pass effect through gut, intestine and liver, rapid excretion into

140
urine and bile, degradation and metabolization by the colonic microflora. In addition, the
metabolites may differ from the native substances in terms of biological activity. Therefore, the
further studies of bioavailability of polyphenolic compounds and the activity of metabolites are
essential.
The activity of metabolites such as luteolin-7-O-glucuronide has shown a weaker
inhibition on XO comparing to luteolin in vitro. Moreover the pharmacokinetics of luteolin
showed that luteolin has low bioavailability after oral administration. These results could explain
a lack of activity of artichoke leaf extract and its components on xanthine oxidase inhibitory
activity and antioxidant activity in vivo. Therefore, we can conclude artichoke leaf does not seem
to be an alternative for treating gout.

141
LIST OF REFERENCES
1. Pittler, M.H., C.O. Thompson, and E. Ernst, Artichoke leaf extract for treating hypercholesterolaemia. Cochrane Database Syst Rev, 2002(3): p. CD003335.
2. Thompson Coon, J.S. and E. Ernst, Herbs for serum cholesterol reduction: a systematic view. J Fam Pract, 2003. 52(6): p. 468-78.
3. Englisch, W., et al., Efficacy of Artichoke dry extract in patients with hyperlipoproteinemia. Arzneimittelforschung, 2000. 50(3): p. 260-5.
4. Adzet, T., J. Camarasa, and J.C. Laguna, Hepatoprotective activity of polyphenolic compounds from Cynara scolymus against CCl4 toxicity in isolated rat hepatocytes. J Nat Prod, 1987. 50(4): p. 612-7.
5. Clifford, M., Chlorogenic acids and other cinnamates-nature, occurence, dietary burden, absorption and metabolism. J.Sci.Food Agric., 2000. 80: p. 1033-1043.
6. Gebhardt, R., Antioxidative and protective properties of extracts from leaves of the artichoke (Cynara scolymus L.) against hydroperoxide-induced oxidative stress in cultured rat hepatocytes. Toxicol Appl Pharmacol, 1997. 144(2): p. 279-86.
7. Zapolska-Downar, D., et al., Protective properties of artichoke (Cynara scolymus) against oxidative stress induced in cultured endothelial cells and monocytes. Life Sci, 2002. 71(24): p. 2897-08.
8. Jimenez-Escrig, A., et al., In vitro antioxidant activities of edible artichoke (Cynara scolymus L.) and effect on biomarkers of antioxidants in rats. J Agric Food Chem, 2003. 51(18): p. 5540-5.
9. Brown, J.E. and C.A. Rice-Evans, Luteolin-rich artichoke extract protects low density lipoprotein from oxidation in vitro. Free Radic Res, 1998. 29(3): p. 247-55.
10. Kraft, K., Artichoke leaf extract-recent findings reflecting effects on lipid metabolism, liver and gastrointestinal tratcs. Phytomedicine, 1997: p. 367-378.
11. Saenz Rodriguez, T., D. Garcia Gimenez, and R. de la Puerta Vazquez, Choleretic activity and biliary elimination of lipids and bile acids induced by an artichoke leaf extract in rats. Phytomedicine, 2002. 9(8): p. 687-93.
12. Gebhardt, R., Artischockenextrakt - in vitro Nachweis einer Hemmwirkung auf die Cholesterinbiosynthese. Med Welt, 1995. 46: p. 348-350.
13. Gebhardt, R., Neue Erkenntnisse zur Wirkung von Artischockenblaetterextrakt]. Z Allg Med, 1996. 72: p. 20-2.

142
14. Fintelmann, V., Therapeutic profile and mechanism of action of artichoke leaf extract: hypolpemic, antioxidant, hepatoprotective and choleretic properties. Phytomedicine, 1996. Supplement 1:50.
15. Gebhardt, R., Inhibition of hepatic cholesterol biosynthesis by artichoke leaf extracts is mainly due to luteolin. Cell Bio Toxicol, 1997(13): p. 58.
16. Perez-Garcia, F., T. Adzet, and S. Canigueral, Activity of artichoke leaf extract on reactive oxygen species in human leukocytes. Free Radic Res, 2000. 33(5): p. 661-5.
17. Maros , T.e.a., Wirkungen der Cynara scolymus Extrakte auf die regeneration der Rattenleber. Arzneimittelforschung, 1966. 16: p. 127-129.
18. Holtmann, G., et al., Efficacy of artichoke leaf extract in the treatment of patients with functional dyspepsia: a six-week placebo-controlled, double-blind, multicentre trial. Aliment Pharmacol Ther, 2003. 18(11-12): p. 1099-105.
19. Bundy, R., et al., Artichoke leaf extract reduces symptoms of irritable bowel syndrome and improves quality of life in otherwise healthy volunteers suffering from concomitant dyspepsia: a subset analysis. J Altern Complement Med, 2004. 10(4): p. 667-9.
20. Simon Mills, k.B., Principles and Practice of Phytotherapy ( Modern Herbal Medicine). 2000: Churchill Livingstone. 533-438.
21. Zhu, X., H. Zhang, and R. Lo, Phenolic compounds from the leaf extract of artichoke (Cynara scolymus L.) and their antimicrobial activities. J Agric Food Chem, 2004. 52(24): p. 7272-8.
22. Schutz, K., et al., Identification and quantification of caffeoylquinic acids and flavonoids from artichoke (Cynara scolymus L.) heads, juice, and pomace by HPLC-DAD-ESI/MS(n). J Agric Food Chem, 2004. 52(13): p. 4090-6.
23. Mulinacci, N., et al., Commercial and laboratory extracts from artichoke leaves: estimation of caffeoyl esters and flavonoidic compounds content. J Pharm Biomed Anal, 2004. 34(2): p. 349-57.
24. Wang, M., et al., Analysis of antioxidative phenolic compounds in artichoke (Cynara scolymus L.). J Agric Food Chem, 2003. 51(3): p. 601-8.
25. Joanne Barnes, L.A.a.a.J.D.P., Herbal medicines: A guide for healthcare professionals. 2 ed. 2002: The pharmaceutical Press.
26. Plumb, G.W., Garca-Conesa, M.T., roon, P.A., Rhodes, M., Ridley, S., Williamson, G., Metabolism of chlorogenic acid by human plasma, liver, liver, intestine and gut microflora. J. Sci. Food Agric., 1999. 79: p. 390-392.

143
27. Andreasen, M.F., et al., Esterase activity able to hydrolyze dietary antioxidant hydroxycinnamates is distributed along the intestine of mammals. J Agric Food Chem, 2001. 49(11): p. 5679-84.
28. Takenaka, M., T. Nagata, and M. Yoshida, Stability and bioavailability of antioxidants in garland (Chrysanthemum coronarium L.). Biosci Biotechnol Biochem, 2000. 64(12): p. 2689-91.
29. Olthof, M.R., P.C. Hollman, and M.B. Katan, Chlorogenic acid and caffeic acid are absorbed in humans. J Nutr, 2001. 131(1): p. 66-71.
30. Wittemer, S.M., et al., Bioavailability and pharmacokinetics of caffeoylquinic acids and flavonoids after oral administration of Artichoke leaf extracts in humans. Phytomedicine, 2005. 12(1-2): p. 28-38.
31. Moridani, M.Y., H. Scobie, and P.J. O'Brien, Metabolism of caffeic acid by isolated rat hepatocytes and subcellular fractions. Toxicol Lett, 2002. 133(2-3): p. 141-51.
32. Kuhnau, J., The flavonoids. A class of semi-essential food components: their role in human nutrition. World Rev Nutr Diet, 1976. 24: p. 117-91.
33. Kim, D.H., et al., Intestinal bacterial metabolism of flavonoids and its relation to some biological activities. Arch Pharm Res, 1998. 21(1): p. 17-23.
34. Winter, J., et al., C-ring cleavage of flavonoids by human intestinal bacteria. Appl Environ Microbiol, 1989. 55(5): p. 1203-8.
35. Macdonald, I.A., J.A. Mader, and R.G. Bussard, The role of rutin and quercitrin in stimulating flavonol glycosidase activity by cultured cell-free microbial preparations of human feces and saliva. Mutat Res, 1983. 122(2): p. 95-102.
36. Nemeth, K., et al., Deglycosylation by small intestinal epithelial cell beta-glucosidases is a critical step in the absorption and metabolism of dietary flavonoid glycosides in humans. Eur J Nutr, 2003. 42(1): p. 29-42.
37. Day, A.J., et al., Dietary flavonoid and isoflavone glycosides are hydrolysed by the lactase site of lactase phlorizin hydrolase. FEBS Lett, 2000. 468(2-3): p. 166-70.
38. Arts, I.C., A.L. Sesink, and P.C. Hollman, Quercetin-3-glucoside is transported by the glucose carrier SGLT1 across the brush border membrane of rat small intestine. J Nutr, 2002. 132(9): p. 2823; author reply 2824.
39. Liu, Y., et al., Enteric disposition and recycling of flavonoids and ginkgo flavonoids. J Altern Complement Med, 2003. 9(5): p. 631-40.
40. Cotelle, N., et al., Antioxidant properties of hydroxy-flavones. Free Radic Biol Med, 1996. 20(1): p. 35-43.

144
41. Scalbert, A., et al., Dietary polyphenols and the prevention of diseases. Crit Rev Food Sci Nutr, 2005. 45(4): p. 287-306.
42. Halliwell, B., Gutteridge, J.M.C., In free radicals in bilogy and medicine. 2 ed. 1989: Clarendron Press. 422-437.
43. McAnlis, G.T., et al., The effect of various dietary flavonoids on the susceptibility of low density lipoproteins to oxidation in vitro using both metallic and non-metallic oxidising agents. Biochem Soc Trans, 1997. 25(1): p. 142S.
44. Fiander, H. and H. Schneider, Dietary ortho phenols that induce glutathione S-transferase and increase the resistance of cells to hydrogen peroxide are potential cancer chemopreventives that act by two mechanisms: the alleviation of oxidative stress and the detoxification of mutagenic xenobiotics. Cancer Lett, 2000. 156(2): p. 117-24.
45. Noroozi, M., W.J. Angerson, and M.E. Lean, Effects of flavonoids and vitamin C on oxidative DNA damage to human lymphocytes. Am J Clin Nutr, 1998. 67(6): p. 1210-8.
46. Terao, J., Dietary flavonoids as antioxidants in vivo: conjugated metabolites of (-)-epicatechin and quercetin participate in antioxidative defense in blood plasma. J Med Invest, 1999. 46(3-4): p. 159-68.
47. Morand, C., et al., Plasma metabolites of quercetin and their antioxidant properties. Am J Physiol, 1998. 275(1 Pt 2): p. R212-9.
48. Janisch, K.M., et al., Properties of quercetin conjugates: modulation of LDL oxidation and binding to human serum albumin. Free Radic Res, 2004. 38(8): p. 877-84.
49. Arai, Y., et al., Dietary intakes of flavonols, flavones and isoflavones by Japanese women and the inverse correlation between quercetin intake and plasma LDL cholesterol concentration. J Nutr, 2000. 130(9): p. 2243-50.
50. Akaike, T., et al., Dependence on O2- generation by xanthine oxidase of pathogenesis of influenza virus infection in mice. J Clin Invest, 1990. 85(3): p. 739-45.
51. Ferrandiz, M.L. and M.J. Alcaraz, Anti-inflammatory activity and inhibition of arachidonic acid metabolism by flavonoids. Agents Actions, 1991. 32(3-4): p. 283-8.
52. Kokoglu, E., et al., Xanthine oxidase levels in human brain tumors. Cancer Lett, 1990. 50(3): p. 179-81.
53. McCord, J.M., Oxygen-derived free radicals in postischemic tissue injury. N Engl J Med, 1985. 312(3): p. 159-63.
54. Nishino, T., et al., Conversion of xanthine dehydrogenase into oxidase and its role in reperfusion injury. Biochem Soc Trans, 1997. 25(3): p. 783-6.

145
55. Parks, D.A. and D.N. Granger, Xanthine oxidase: biochemistry, distribution and physiology. Acta Physiol Scand Suppl, 1986. 548: p. 87-99.
56. F. Borges, E.F., and F. Roleira, Progress towards the discovery of xanthine oxidase inhibitors. Current Medicinal Chemistry, 2002. 9: p. 195-217.
57. Hille, R. and T. Nishino, Flavoprotein structure and mechanism. 4. Xanthine oxidase and xanthine dehydrogenase. Faseb J, 1995. 9(11): p. 995-1003.
58. Hille, R. and V. Massey, Tight binding inhibitors of xanthine oxidase. Pharmacol Ther, 1981. 14(2): p. 249-63.
59. Hawkes, T.R., G.N. George, and R.C. Bray, The structure of the inhibitory complex of alloxanthine (1H-pyrazolo[3,4-d]pyrimidine-4,6-diol) with the molybdenum centre of xanthine oxidase from electron-paramagnetic-resonance spectroscopy. Biochem J, 1984. 218(3): p. 961-8.
60. Skibo, E.B., Noncompetitive and irreversible inhibition of xanthine oxidase by benzimidazole analogues acting at the functional flavin adenine dinucleotide cofactor. Biochemistry, 1986. 25(15): p. 4189-94.
61. Rundles, R.W., E.N. Metz, and H.R. Silberman, Allopurinol in the treatment of gout. Ann Intern Med, 1966. 64(2): p. 229-58.
62. Klinenberg, J.R., S.E. Goldfinger, and J.E. Seegmiller, The Effectiveness of the Xanthine Oxidase Inhibitor Allopurinol in the Treatment of Gout. Ann Intern Med, 1965. 62: p. 639-47.
63. Young, J.L., Jr., R.B. Boswell, and A.S. Nies, Severe allopurinol hypersensitivity. Association with thiazides and prior renal compromise. Arch Intern Med, 1974. 134(3): p. 553-8.
64. Hayashi, T., et al., Inhibition of cow's milk xanthine oxidase by flavonoids. J Nat Prod, 1988. 51(2): p. 345-8.
65. Nagao, A., M. Seki, and H. Kobayashi, Inhibition of xanthine oxidase by flavonoids. Biosci Biotechnol Biochem, 1999. 63(10): p. 1787-90.
66. Zhu, J.X., et al., Effects of Biota orientalis extract and its flavonoid constituents, quercetin and rutin on serum uric acid levels in oxonate-induced mice and xanthine dehydrogenase and xanthine oxidase activities in mouse liver. J Ethnopharmacol, 2004. 93(1): p. 133-40.
67. Donald voet, J.G.V., Biochemistry. 3 ed. 2004: Von Hoffmann Corporation. 1096.
68. Haliwell, B., "Uric acid:an example of antioxidant evaluation"In handbook of antioxidants, ed. E.P. Cadenas, L. 1996, Newyork: Marcel Dekker,Inc.

146
69. Gennaro, A.R.C., G.D.;Marderosian,A.;Harvey,S.C.;Hussar,D.A., Remington's Pharmaceutical Sciences. 18 ed. 1990: Mack Publishing Company, USA.
70. Schlesinger, N., Management of acute and chronic gouty arthritis: present state-of-the-art. Drugs, 2004. 64(21): p. 2399-416.
71. Rott, K.T. and C.A. Agudelo, Gout. Jama, 2003. 289(21): p. 2857-60.
72. Kim, K.Y., et al., A literature review of the epidemiology and treatment of acute gout. Clin Ther, 2003. 25(6): p. 1593-617.
73. Arromdee, E., et al., Epidemiology of gout: is the incidence rising? J Rheumatol, 2002. 29(11): p. 2403-6.
74. Star, V.L. and M.C. Hochberg, Prevention and management of gout. Drugs, 1993. 45(2): p. 212-22.
75. Donald voet, J.G.V., Biochemistry. 3 ed. 2004: Von Hoffmann Corporation. 477-486.
76. Jang, G.R., R.Z. Harris, and D.T. Lau, Pharmacokinetics and its role in small molecule drug discovery research. Med Res Rev, 2001. 21(5): p. 382-96.
77. Derendorf, H., et al., Pharmacokinetic/pharmacodynamic modeling in drug research and development. J Clin Pharmacol, 2000. 40(12 Pt 2): p. 1399-418.
78. Leon Shargel, S.W.-P., Andrew B.C. Yu, Applied biopharmaceutics and pharmacokinetics. 5 ed. 2005: The McGraw-Hill Companies, Inc.
79. Emmerson, B.T., The management of gout. Drug Therapy, 1996. 334(7): p. 445-451.
80. JOel G. Hardman, A.G.G., Lee E.Limbird, Goodman & Gilman's The Pharmacological Basis of Therapeutics. 9 ed. 1995: R.R Donnelley and Sons Company.
81. Walgren, R.A., et al., Cellular uptake of dietary flavonoid quercetin 4'-beta-glucoside by sodium-dependent glucose transporter SGLT1. J Pharmacol Exp Ther, 2000. 294(3): p. 837-43.
82. Schutz, K., et al., Quantitative determination of phenolic compounds in artichoke-based dietary supplements and pharmaceuticals by high-performance liquid chromatography. J Agric Food Chem, 2006. 54(23): p. 8812-7.
83. Fritsch, P.O. and A. Sidoroff, Drug-induced Stevens-Johnson syndrome/toxic epidermal necrolysis. Am J Clin Dermatol, 2000. 1(6): p. 349-60.
84. Horiuchi, H., et al., Allopurinol induces renal toxicity by impairing pyrimidine metabolism in mice. Life Sci, 2000. 66(21): p. 2051-70.
85. Pereira, S., et al., [Fatal liver necrosis due to allopurinol]. Acta Med Port, 1998. 11(12): p. 1141-4.

147
86. Chan, W.S., P.C. Wen, and H.C. Chiang, Structure-activity relationship of caffeic acid analogues on xanthine oxidase inhibition. Anticancer Res, 1995. 15(3): p. 703-7.
87. Van Hoorn, D.E., et al., Accurate prediction of xanthine oxidase inhibition based on the structure of flavonoids. Eur J Pharmacol, 2002. 451(2): p. 111-8.
88. Chiang, H.C., Y.J. Lo, and F.J. Lu, Xanthine oxidase inhibitors from the leaves of Alsophila spinulosa (Hook) Tryon. J Enzyme Inhib, 1994. 8(1): p. 61-71.
89. Nguyen, M.T., et al., Xanthine oxidase inhibitors from the flowers of Chrysanthemum sinense. Planta Med, 2006. 72(1): p. 46-51.
90. Cos, P., et al., Structure-activity relationship and classification of flavonoids as inhibitors of xanthine oxidase and superoxide scavengers. J Nat Prod, 1998. 61(1): p. 71-6.
91. Cimanga, K., Constituents from Morinda morindoides leaves as inhibitors of xanthine oxidase and scavengers of superoxide anions. Pharm. Pharmacol. Commum., 1999. 5: p. 419-424.
92. Lin, C.M., et al., Molecular modeling of flavonoids that inhibits xanthine oxidase. Biochem Biophys Res Commun, 2002. 294(1): p. 167-72.
93. Chang, W.S., et al., Inhibitory effects of flavonoids on xanthine oxidase. Anticancer Res, 1993. 13(6A): p. 2165-70.
94. Noro, T., et al., Inhibitors of xanthine oxidase from the flowers and buds of Daphne genkwa. Chem Pharm Bull (Tokyo), 1983. 31(11): p. 3984-7.
95. Chen, X., et al., Pharmacokinetics and modeling of quercetin and metabolites. Pharm Res, 2005. 22(6): p. 892-901.
96. Boersma, M.G., et al., Regioselectivity of phase II metabolism of luteolin and quercetin by UDP-glucuronosyl transferases. Chem Res Toxicol, 2002. 15(5): p. 662-70.
97. Hall, I.H., et al., Substituted cyclic imides as potential anti-gout agents. Life Sci, 1990. 46(26): p. 1923-7.
98. Stavric, B., et al., Some in vivo effects in the rat induced by chlorprothixene and potassium oxonate. Pharmacol Res Commun, 1975. 7(2): p. 117-24.
99. Iwamoto, T., M. Yoshiura, and K. Iriyama, A simple, rapid and sensitive method for the determination of rat serum uric acid by reversed-phase high-performance liquid chromatography with electrochemical detection. J Chromatogr, 1983. 278(1): p. 156-9.
100. Masahiko Yoshiura TI, K.I., Toshinori Kanki, Yasuo Kato, Hiroaki Sekino, and Norio Nakamura, A simple and sensitive method for the determination of uric acid in human cerebrospinal fluid by reversed-phase high-performance liquid chromatography with electrochemical detection. Jikeikai MedJ, 1983. 30: p. 235-238.

148
101. Johnson, W.J., B. Stavric, and A. Chartrand, Uricase inhibition in the rat by s-triazines: an animal model for hyperuricemia and hyperuricosuria. Proc Soc Exp Biol Med, 1969. 131(1): p. 8-12.
102. Osada, Y., et al., Hypouricemic effect of the novel xanthine oxidase inhibitor, TEI-6720, in rodents. Eur J Pharmacol, 1993. 241(2-3): p. 183-8.
103. Hollman, P.C., et al., Absorption of dietary quercetin glycosides and quercetin in healthy ileostomy volunteers. Am J Clin Nutr, 1995. 62(6): p. 1276-82.
104. Shimoi, K., et al., Intestinal absorption of luteolin and luteolin 7-O-beta-glucoside in rats and humans. FEBS Lett, 1998. 438(3): p. 220-4.
105. Romanova, D., et al., Determination of apigenin in rat plasma by high-performance liquid chromatography. J Chromatogr A, 2000. 870(1-2): p. 463-7.
106. Di Carlo, G., et al., Inhibition of intestinal motility and secretion by flavonoids in mice and rats: structure-activity relationships. J Pharm Pharmacol, 1993. 45(12): p. 1054-9.
107. Yu, Z., W.P. Fong, and C.H. Cheng, The dual actions of morin (3,5,7,2',4'-pentahydroxyflavone) as a hypouricemic agent: uricosuric effect and xanthine oxidase inhibitory activity. J Pharmacol Exp Ther, 2006. 316(1): p. 169-75.
108. Halliwell, B., Gutteridge, J.M.C, Free radicals in biology and medicine. 2nd ed. 1989: Clarendron Press, Oxford. 422-437.
109. Holers, C.J.S.V.M., Gout, Hyperuricemia, and other Crystal-Associated Arthropathies. 1999: Marcel Dekker, Inc. 1-4.
110. Dalbeth, N. and D.O. Haskard, Mechanisms of inflammation in gout. Rheumatology (Oxford), 2005. 44(9): p. 1090-6.
111. Ou, B., M. Hampsch-Woodill, and R.L. Prior, Development and validation of an improved oxygen radical absorbance capacity assay using fluorescein as the fluorescent probe. J Agric Food Chem, 2001. 49(10): p. 4619-26.
112. Manach, C., et al., Bioavailability and bioefficacy of polyphenols in humans. I. Review of 97 bioavailability studies. Am J Clin Nutr, 2005. 81(1 Suppl): p. 230S-242S.
113. Moon, J.H., et al., Accumulation of quercetin conjugates in blood plasma after the short-term ingestion of onion by women. Am J Physiol Regul Integr Comp Physiol, 2000. 279(2): p. R461-7.
114. Kong, A.N., et al., Induction of xenobiotic enzymes by the MAP kinase pathway and the antioxidant or electrophile response element (ARE/EpRE). Drug Metab Rev, 2001. 33(3-4): p. 255-71.

149
115. Walle, U.K. and T. Walle, Induction of human UDP-glucuronosyltransferase UGT1A1 by flavonoids-structural requirements. Drug Metab Dispos, 2002. 30(5): p. 564-9.
116. Natsume, M., et al., In vitro antioxidative activity of (-)-epicatechin glucuronide metabolites present in human and rat plasma. Free Radic Res, 2004. 38(12): p. 1341-8.
117. Justino, G.C., et al., Plasma quercetin metabolites: structure-antioxidant activity relationships. Arch Biochem Biophys, 2004. 432(1): p. 109-21.
118. King, R.A. and D.B. Bursill, Plasma and urinary kinetics of the isoflavones daidzein and genistein after a single soy meal in humans. Am J Clin Nutr, 1998. 67(5): p. 867-72.
119. Ward, N.C., et al., Supplementation with grape seed polyphenols results in increased urinary excretion of 3-hydroxyphenylpropionic Acid, an important metabolite of proanthocyanidins in humans. J Agric Food Chem, 2004. 52(17): p. 5545-9.
120. Rios, L.Y., et al., Chocolate intake increases urinary excretion of polyphenol-derived phenolic acids in healthy human subjects. Am J Clin Nutr, 2003. 77(4): p. 912-8.
121. Nagao, M., et al., Mutagenicities of 61 flavonoids and 11 related compounds. Environ Mutagen, 1981. 3(4): p. 401-19.
122. Yasukawa, K., et al., Effect of chemical constituents from plants on 12-O-tetradecanoylphorbol-13-acetate-induced inflammation in mice. Chem Pharm Bull (Tokyo), 1989. 37(4): p. 1071-3.
123. Ferriola, P.C., V. Cody, and E. Middleton, Jr., Protein kinase C inhibition by plant flavonoids. Kinetic mechanisms and structure-activity relationships. Biochem Pharmacol, 1989. 38(10): p. 1617-24.
124. Wittemer, S.M. and M. Veit, Validated method for the determination of six metabolites derived from artichoke leaf extract in human plasma by high-performance liquid chromatography-coulometric-array detection. J Chromatogr B Analyt Technol Biomed Life Sci, 2003. 793(2): p. 367-75.
125. Li, L., et al., Simultaneous determination of luteolin and apigenin in dog plasma by RP-HPLC. J Pharm Biomed Anal, 2005. 37(3): p. 615-20.
126. Cova D, D.A.L., Giavarini F, Palladini G, and Perego R, Pharmacokinetics and metabolism of oral diosmin in healthy volunteers. Int J Clin Pharmacol Ther Toxicol, 1992. 30: p. 29-33.
127. Boutin, J.A., et al., In vivo and in vitro glucuronidation of the flavonoid diosmetin in rats. Drug Metab Dispos, 1993. 21(6): p. 1157-66.
128. Ader, P., A. Wessmann, and S. Wolffram, Bioavailability and metabolism of the flavonol quercetin in the pig. Free Radic Biol Med, 2000. 28(7): p. 1056-67.

150
129. Murota, K., et al., Unique uptake and transport of isoflavone aglycones by human intestinal caco-2 cells: comparison of isoflavonoids and flavonoids. J Nutr, 2002. 132(7): p. 1956-61.
130. Nielsen, S.E., et al., Effect of parsley (Petroselinum crispum) intake on urinary apigenin excretion, blood antioxidant enzymes and biomarkers for oxidative stress in human subjects. Br J Nutr, 1999. 81(6): p. 447-55.
131. Gugler, R., M. Leschik, and H.J. Dengler, Disposition of quercetin in man after single oral and intravenous doses. Eur J Clin Pharmacol, 1975. 9(2-3): p. 229-34.
132. Ferry, D.R., et al., Phase I clinical trial of the flavonoid quercetin: pharmacokinetics and evidence for in vivo tyrosine kinase inhibition. Clin Cancer Res, 1996. 2(4): p. 659-68.
133. Ma, Y., et al., LC/MS/MS quantitation assay for pharmacokinetics of naringenin and double peaks phenomenon in rats plasma. Int J Pharm, 2006. 307(2): p. 292-9.
151
BIOGRAPHICAL SKETCH
Sasiporn Sarawek was born in April 14th, 1978, in Chiangmai, Thailand. She obtained her
bachelor’s degree in Pharmacy in 2001 from Chiangmai University. She started her PhD
program in January 2003 in the Department of Pharmaceutics of the University of Florida under
supervision of Dr. Veronika Butterweck and Dr. Hartmut Derendorf. Sasiporn received her PhD
in Pharmaceutics in August 2007.
Related Documents