www.floodrisk.o rg.uk EPSRC Grant: EP/FP202511/1 Visualising Uncertain Flood Inundation Maps David Leedal 1 , Jeff Neal 2 , Keith Beven 1,3 and Paul Bates 2 . (1)Lancaster Environment Centre, Lancaster University, Lancaster, UK; (2)School of Geographical Sciences, University of Bristol, Bristol, UK; (3)Geocentrum, Uppsala University, Uppsala, Sweden

Www.floodrisk.org.uk EPSRC Grant: EP/FP202511/1 Visualising Uncertain Flood Inundation Maps David Leedal 1, Jeff Neal 2, Keith Beven 1,3 and Paul Bates.
Dec 18, 2015
Welcome message from author
This document is posted to help you gain knowledge. Please leave a comment to let me know what you think about it! Share it to your friends and learn new things together.
Transcript

www.floodrisk.org.uk EPSRC Grant: EP/FP202511/1
Visualising Uncertain Flood Inundation Maps
David Leedal1, Jeff Neal2, Keith Beven1,3 and Paul Bates2.
(1) Lancaster Environment Centre, Lancaster University, Lancaster, UK;(2) School of Geographical Sciences, University of Bristol, Bristol, UK;
(3) Geocentrum, Uppsala University, Uppsala, Sweden

www.floodrisk.org.uk EPSRC Grant: EP/FP202511/1
Visualising Uncertain Flood Inundation Maps
Outline
1. Demonstrate the Google uncertain flood inundation map tool
2. Talk about why information visualisation is important in this context
3. Discuss the potential impact of ‘smart operations’ such as the visualisation tool within flood risk management

www.floodrisk.org.uk EPSRC Grant: EP/FP202511/1
Visualising Uncertain Flood Inundation Maps
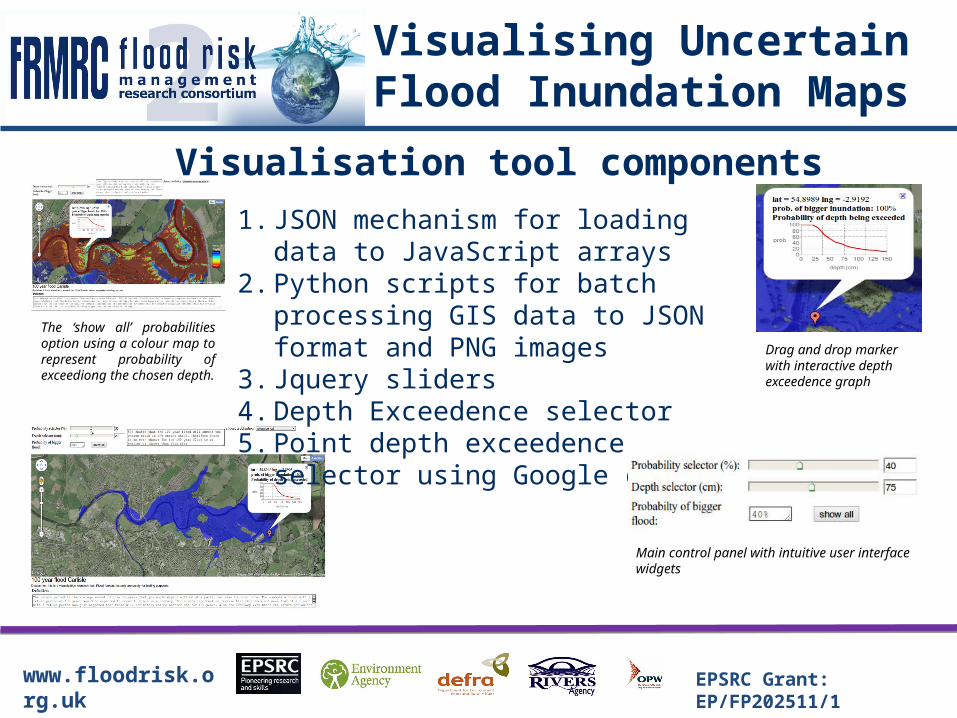
Visualisation tool components
1. JSON mechanism for loading data to JavaScript arrays
2. Python scripts for batch processing GIS data to JSON format and PNG images
3. Jquery sliders4. Depth Exceedence selector5. Point depth exceedence selector using
Google charts
www.floodrisk.org.uk EPSRC Grant: EP/FP202511/1
Visualising Uncertain Flood Inundation Maps
Visualisation tool components
1. JSON mechanism for loading data to JavaScript arrays
2. Python scripts for batch processing GIS data to JSON format and PNG images
3. Jquery sliders4. Depth Exceedence selector5. Point depth exceedence selector using
Google charts
Drag and drop marker with interactive depth exceedence graph
Main control panel with intuitive user interface widgets
The ‘show all’ probabilities option using a colour map to represent probability of exceediong the chosen depth.
www.floodrisk.org.uk EPSRC Grant: EP/FP202511/1
Visualising Uncertain Flood Inundation Maps
Why is information visualisation important?
Some useful definitions:
• The human/floodplain system
• ‘Objects’ or ‘blocks’
• Operations
• Data > information > understanding
• Semiotic mechanism

www.floodrisk.org.uk EPSRC Grant: EP/FP202511/1
Visualising Uncertain Flood Inundation Maps
Examples of ObjectsHuman systems:
• Governance
• National
• Regional
• local
• Developer
• Environmental NGO (EA)
• Consultant
• Resident of floodplain

www.floodrisk.org.uk EPSRC Grant: EP/FP202511/1
Visualising Uncertain Flood Inundation Maps
Examples of ObjectsPhysical systems:
• A risk zone
• A residential property
• A factory
Documents:
• Planning proposal
• Flood risk Assessment
• Risk map

www.floodrisk.org.uk EPSRC Grant: EP/FP202511/1
Visualising Uncertain Flood Inundation Maps
Examples of ObjectsEach object:
• encapsulates its own data (which could be other objects)
• can perform operations on its data
• Can interact with other objects

www.floodrisk.org.uk EPSRC Grant: EP/FP202511/1
Visualising Uncertain Flood Inundation Maps
Examples of ObjectsObjects represented by UML/SySML:
www.floodrisk.org.uk EPSRC Grant: EP/FP202511/1
Visualising Uncertain Flood Inundation Maps
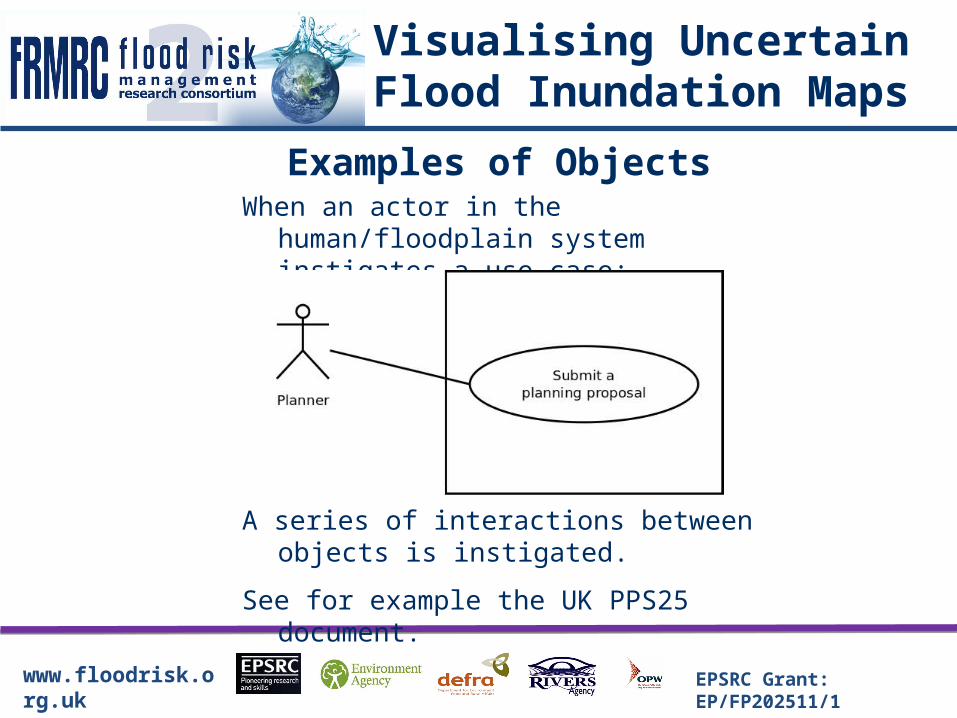
Examples of ObjectsWhen an actor in the human/floodplain
system instigates a use-case:
A series of interactions between objects is instigated.
See for example the UK PPS25 document.

www.floodrisk.org.uk EPSRC Grant: EP/FP202511/1
Visualising Uncertain Flood Inundation Maps
Data > understanding
• Data is not information
• Information is not understanding
• Information implies data in flow
• Understanding comes about through the decoding of information by a suitable semiotic system

www.floodrisk.org.uk EPSRC Grant: EP/FP202511/1
Visualising Uncertain Flood Inundation Maps
Operations are high level
Example: a ‘resident’ object may contain the operation:
‘Show me the estimated risk that my property will flood sometime in the next 100 years’
The operation must be designed to create understanding (combination of data and semiotic processes)
www.floodrisk.org.uk EPSRC Grant: EP/FP202511/1
Visualising Uncertain Flood Inundation Maps
Complicated to Complex systems
Well designed operations should aim to:
• Increase the degree of understanding that actors can extract from available information
• Increase the ease with which actors can access and exchange information
• Increase the capacity to archive information

www.floodrisk.org.uk EPSRC Grant: EP/FP202511/1
Visualising Uncertain Flood Inundation Maps
Complicated to Complex systems
medieval
1800
1890

www.floodrisk.org.uk EPSRC Grant: EP/FP202511/1
Visualising Uncertain Flood Inundation Maps
Complicated to Complex systems
Present (OS crown (c))

www.floodrisk.org.uk EPSRC Grant: EP/FP202511/1
Visualising Uncertain Flood Inundation Maps
Complicated to Complex systems
Present (OS crown (c))

www.floodrisk.org.uk EPSRC Grant: EP/FP202511/1
Visualising Uncertain Flood Inundation Maps
Desirable properties of a complex human/floodplain system
To redistribute and allocate land use types to achieve:
• Self adapting behaviour
• Robustness
• Decentralisation
• Optimal seeking

www.floodrisk.org.uk EPSRC Grant: EP/FP202511/1
Visualising Uncertain Flood Inundation Maps
Summary• The human/floodplain system is complicated but not Complex. If we can move
towards a Complex system we may achieve robustness, self adaptation and efficient allocation of land use types
• Transition to self adaptation may be hastened by the design of effective operations
• Understanding
• Access
• Exchange
• Archive
• Probabilistic inundation mapping is key
• The google maps visualisation tool is an attempt to design such an operation

www.floodrisk.org.uk EPSRC Grant: EP/FP202511/1
Visualising Uncertain Flood Inundation Maps
David Leedal1, Jeff Neal2, Keith Beven1,3 and Paul Bates2.
Fig(d). Drag and drop marker with interactive depth exceedence graph
Fig(a) Main control panel with intuitive user interface widgets
Fig(b). The ‘show all’ probabilities option using a colour map to represent probability of exceediong the chosen depth.
Fig(c). The web-tool for visualising uncertain flood inundation data. The figure shows the main components of the tool including a georeferenced overlay selectable by the user via slider controls, a point-specific marker showing depth against probability of exceedence, and text areas providing word-based summaries of the chosen overlay and key technical terms.
Related Documents