WS2-1 ADM730, Workshop 2, September 2005 Copyright 2005 MSC.Software Corporation WORKSHOP 2 UNDERSTANDING FACTORS AND RESPONSES

WS2-1 ADM730, Workshop 2, September 2005 Copyright 2005 MSC.Software Corporation WORKSHOP 2 UNDERSTANDING FACTORS AND RESPONSES.
Dec 13, 2015
Welcome message from author
This document is posted to help you gain knowledge. Please leave a comment to let me know what you think about it! Share it to your friends and learn new things together.
Transcript
WS2-1ADM730, Workshop 2, September 2005 Copyright 2005 MSC.Software Corporation
WORKSHOP 2
UNDERSTANDING FACTORS AND RESPONSES
WS2-2ADM730, Workshop 2, September 2005 Copyright 2005 MSC.Software Corporation
WORKSHOP 2 – UNDERSTANDING FACTORS AND RESPONSES
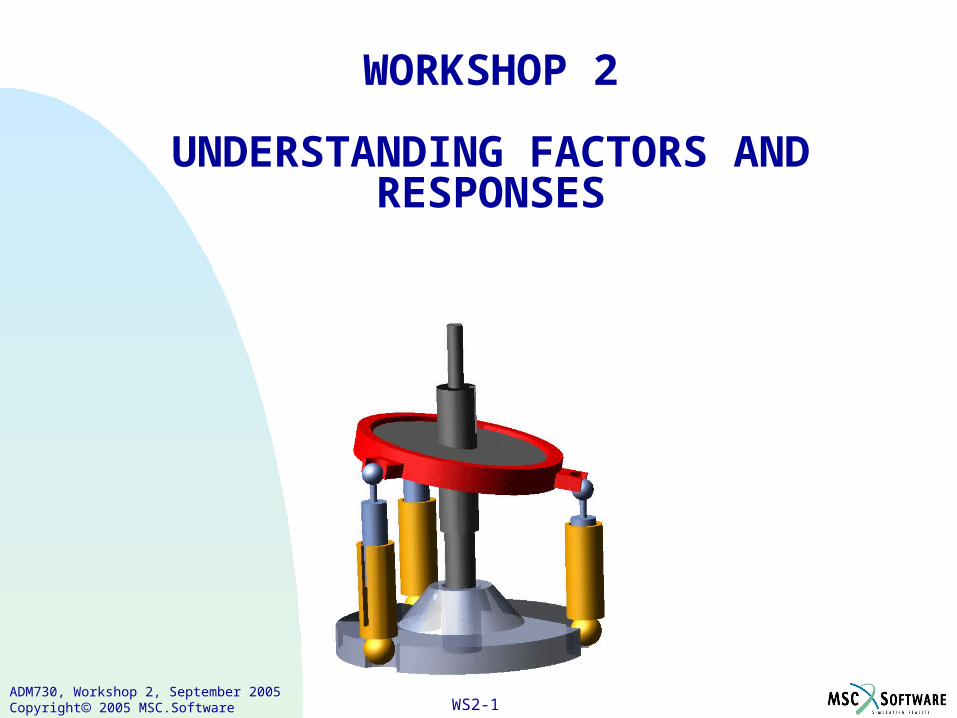
Problem statement Change pump characteristics to maximize flow output.
Publish factor-to-response relationship to a Web page.
WS2-3ADM730, Workshop 2, September 2005 Copyright 2005 MSC.Software Corporation
WORKSHOP 2 – UNDERSTANDING FACTORS AND RESPONSES
Getting started First you will start ADAMS/View and import the model.
To import the model:1. Start ADAMS/View from the working directory exercise_dir/
mod_02_factors_and_responses (where exercise_dir is the directory where your exercise files are installed).
2. Import the model wobble_pump.cmd.

WS2-4ADM730, Workshop 2, September 2005 Copyright 2005 MSC.Software Corporation
WORKSHOP 2 – UNDERSTANDING FACTORS AND RESPONSES
Viewing design variablesNow, you will review the factors and responses, and then simulate the model.
In ADAMS/View there are two kinds of modeling entities that can be factors in ADAMS/Insight. They are:
Design variables
Construction points
Design variables and construction points are used to parameterize a model in ADAMS/View, so when ADAMS/Insight is given a model from ADAMS/View, it knows to look for these particular parametric entities.
WS2-5ADM730, Workshop 2, September 2005 Copyright 2005 MSC.Software Corporation
WORKSHOP 2 – UNDERSTANDING FACTORS AND RESPONSES
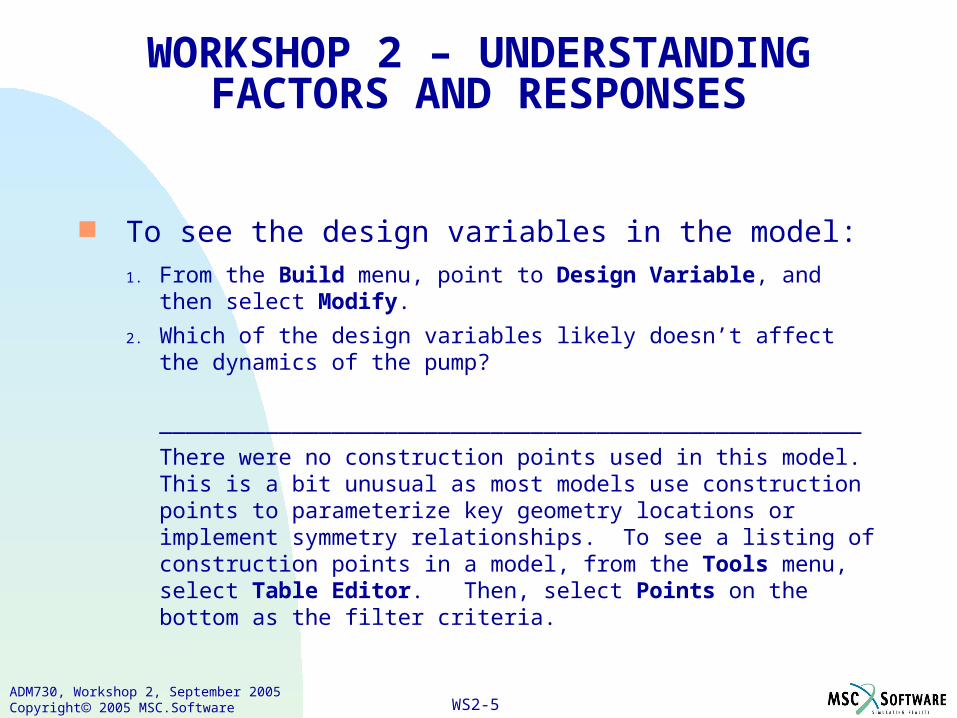
To see the design variables in the model:1. From the Build menu, point to Design Variable, and then select
Modify.
2. Which of the design variables likely doesn’t affect the dynamics of the pump?
_____________________________________________________
There were no construction points used in this model. This is a bit unusual as most models use construction points to parameterize key geometry locations or implement symmetry relationships. To see a listing of construction points in a model, from the Tools menu, select Table Editor. Then, select Points on the bottom as the filter criteria.
WS2-6ADM730, Workshop 2, September 2005 Copyright 2005 MSC.Software Corporation
WORKSHOP 2 – UNDERSTANDING FACTORS AND RESPONSES
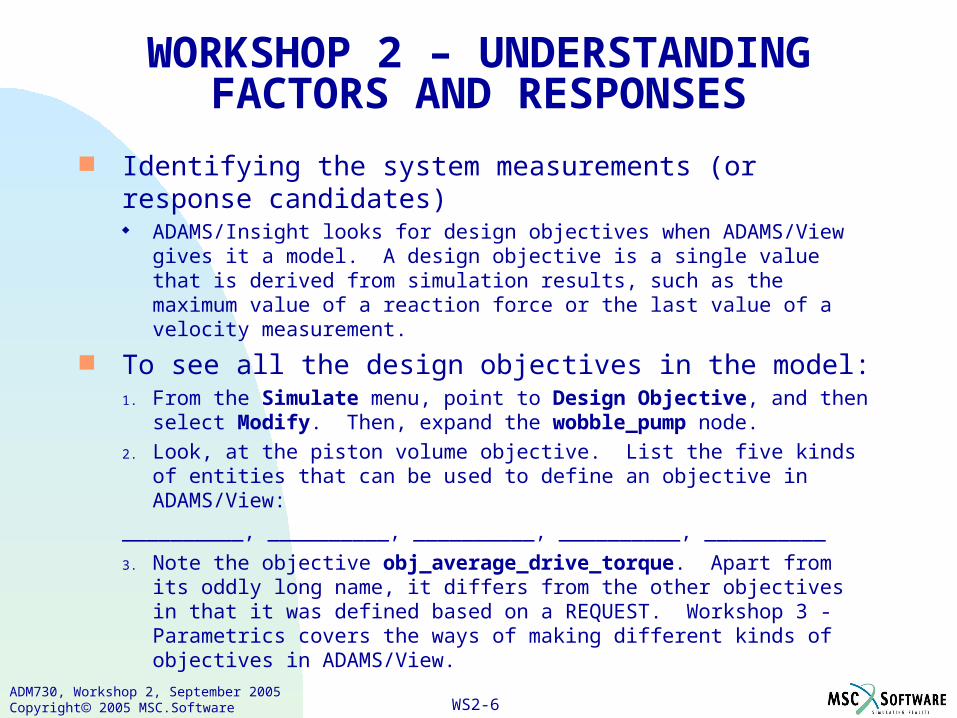
Identifying the system measurements (or response candidates) ADAMS/Insight looks for design objectives when ADAMS/View
gives it a model. A design objective is a single value that is derived from simulation results, such as the maximum value of a reaction force or the last value of a velocity measurement.
To see all the design objectives in the model:1. From the Simulate menu, point to Design Objective, and then
select Modify. Then, expand the wobble_pump node.
2. Look, at the piston volume objective. List the five kinds of entities that can be used to define an objective in ADAMS/View:
__________, __________, __________, __________, __________
3. Note the objective obj_average_drive_torque. Apart from its oddly long name, it differs from the other objectives in that it was defined based on a REQUEST. Workshop 3 - Parametrics covers the ways of making different kinds of objectives in ADAMS/View.
WS2-7ADM730, Workshop 2, September 2005 Copyright 2005 MSC.Software Corporation
WORKSHOP 2 – UNDERSTANDING FACTORS AND RESPONSES
Simulating the model
You want to ensure that our design variables (potential factors) influence the objectives (potential responses) before you perform a DOE. First, you must simulate the model to generate a baseline dataset from which to work.
Having a simulation script that runs the model is good practice, particularly if you need to string together analyses (for example, you always do a static first, then run your dynamic simulation).
WS2-8ADM730, Workshop 2, September 2005 Copyright 2005 MSC.Software Corporation
WORKSHOP 2 – UNDERSTANDING FACTORS AND RESPONSES
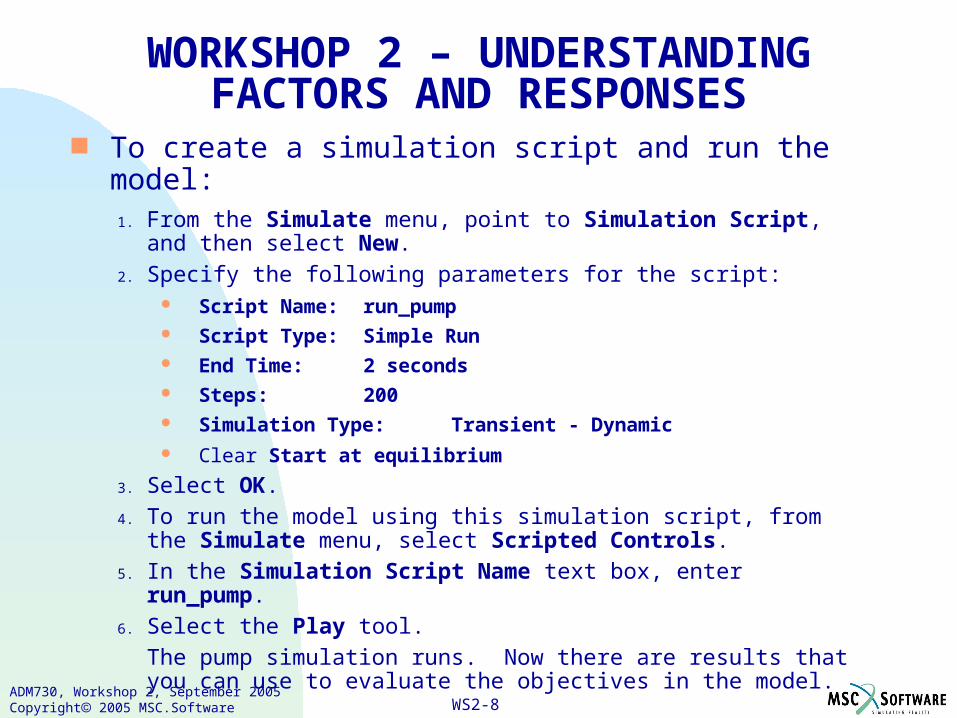
To create a simulation script and run the model:1. From the Simulate menu, point to Simulation Script, and then
select New.
2. Specify the following parameters for the script: Script Name: run_pump Script Type: Simple Run End Time: 2 seconds Steps: 200 Simulation Type: Transient - Dynamic Clear Start at equilibrium
3. Select OK.
4. To run the model using this simulation script, from the Simulate menu, select Scripted Controls.
5. In the Simulation Script Name text box, enter run_pump.
6. Select the Play tool.
The pump simulation runs. Now there are results that you can use to evaluate the objectives in the model.
WS2-9ADM730, Workshop 2, September 2005 Copyright 2005 MSC.Software Corporation
WORKSHOP 2 – UNDERSTANDING FACTORS AND RESPONSES
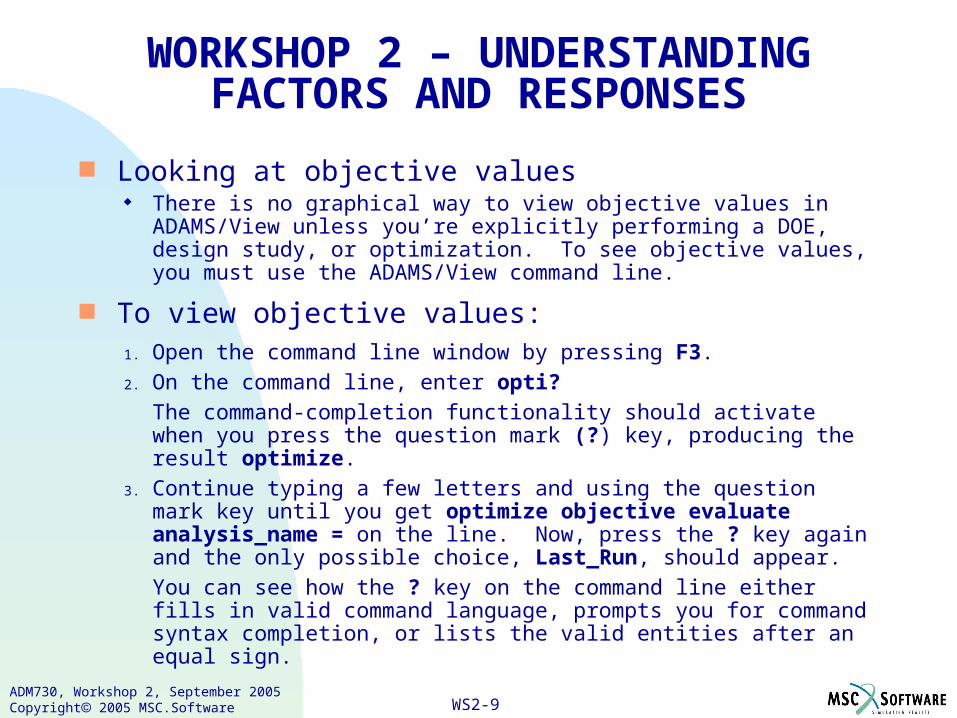
Looking at objective values There is no graphical way to view objective values in ADAMS/View
unless you’re explicitly performing a DOE, design study, or optimization. To see objective values, you must use the ADAMS/View command line.
To view objective values:1. Open the command line window by pressing F3.
2. On the command line, enter opti?
The command-completion functionality should activate when you press the question mark (?) key, producing the result optimize.
3. Continue typing a few letters and using the question mark key until you get optimize objective evaluate analysis_name = on the line. Now, press the ? key again and the only possible choice, Last_Run, should appear.
You can see how the ? key on the command line either fills in valid command language, prompts you for command syntax completion, or lists the valid entities after an equal sign.
WS2-10ADM730, Workshop 2, September 2005 Copyright 2005 MSC.Software Corporation
WORKSHOP 2 – UNDERSTANDING FACTORS AND RESPONSES
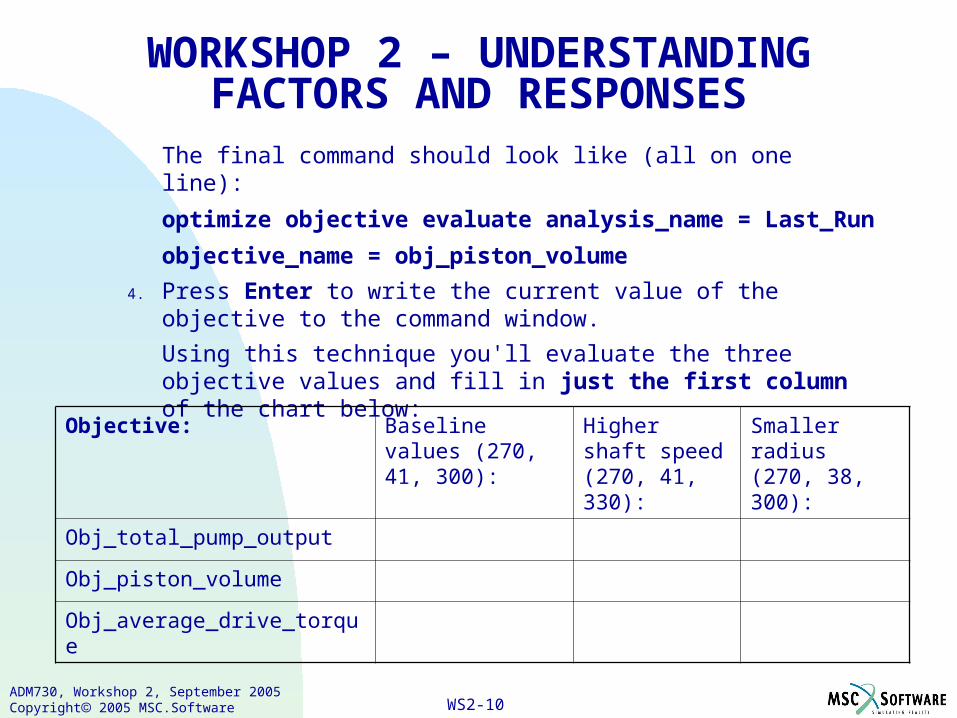
The final command should look like (all on one line):
optimize objective evaluate analysis_name = Last_Run
objective_name = obj_piston_volume
4. Press Enter to write the current value of the objective to the command window.
Using this technique you'll evaluate the three objective values and fill in just the first column of the chart below:
Objective: Baseline values (270, 41, 300):
Higher shaft speed (270, 41, 330):
Smaller radius (270, 38, 300):
Obj_total_pump_output
Obj_piston_volume
Obj_average_drive_torque
WS2-11ADM730, Workshop 2, September 2005 Copyright 2005 MSC.Software Corporation
WORKSHOP 2 – UNDERSTANDING FACTORS AND RESPONSES
Before performing any multi-run analysis, one must always ensure that the Factors influence the Responses in the model. To do this:5. Run two additional simulations in which:
1. First run: the baseline variable values are used, but shaft_speed is increased to 330 deg/sec.
2. Second run: again, starting from the baseline set of variable values, alter just the piston_radius variable, setting it to be 38 mm.
After each of the simulations, evaluate all three Objectives and complete the chart shown in step 4.
Question: Do the Objective values change as the variables are altered? Yes / No (circle one)
WS2-12ADM730, Workshop 2, September 2005 Copyright 2005 MSC.Software Corporation
WORKSHOP 2 – UNDERSTANDING FACTORS AND RESPONSES
Now you will use ADAMS/Insight to fit a response surface to the relationship between the three objectives and two of the design variables.
To define factors and responses:1. Set all of the variable values to be the ‘baseline’ set, described
earlier.
2. Transfer the current model from ADAMS/View to ADAMS/Insight by doing the following:
From the Simulate menu, point to ADAMS/Insight, and then select Export.
3. Specify the following: Experiment: exp_wobble Model: wobble_pump Simulation script: use the script that you created earlier.
To see the current scripts in the model, from the Simulate menu, point to Simulation Script, and then select Modify.
WS2-13ADM730, Workshop 2, September 2005 Copyright 2005 MSC.Software Corporation
WORKSHOP 2 – UNDERSTANDING FACTORS AND RESPONSES
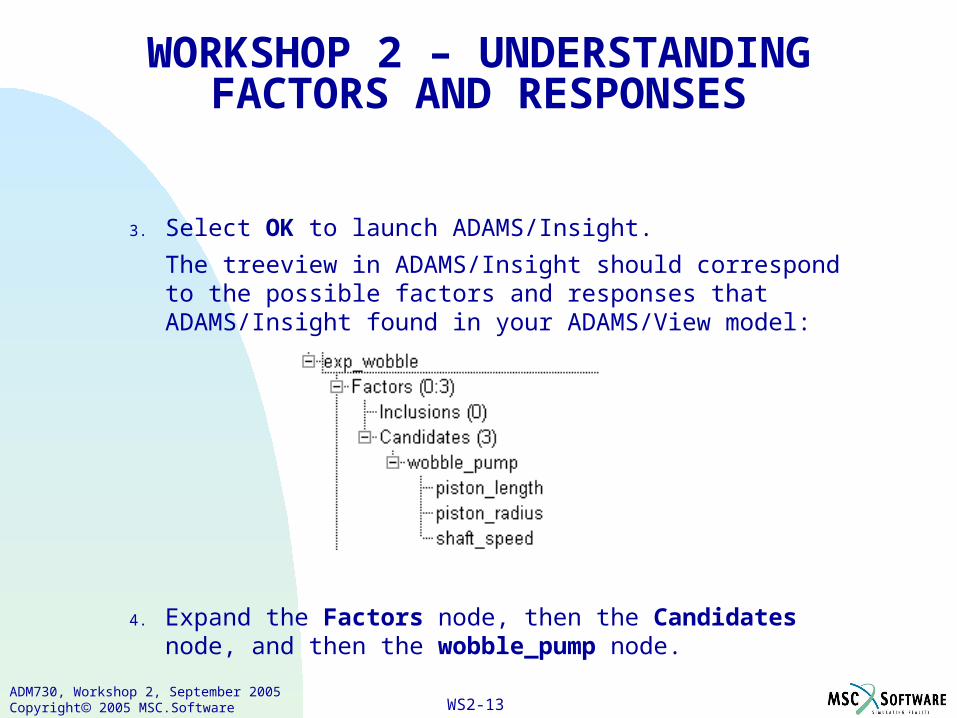
3. Select OK to launch ADAMS/Insight.
The treeview in ADAMS/Insight should correspond to the possible factors and responses that ADAMS/Insight found in your ADAMS/View model:
4. Expand the Factors node, then the Candidates node, and then the wobble_pump node.
WS2-14ADM730, Workshop 2, September 2005 Copyright 2005 MSC.Software Corporation
WORKSHOP 2 – UNDERSTANDING FACTORS AND RESPONSES
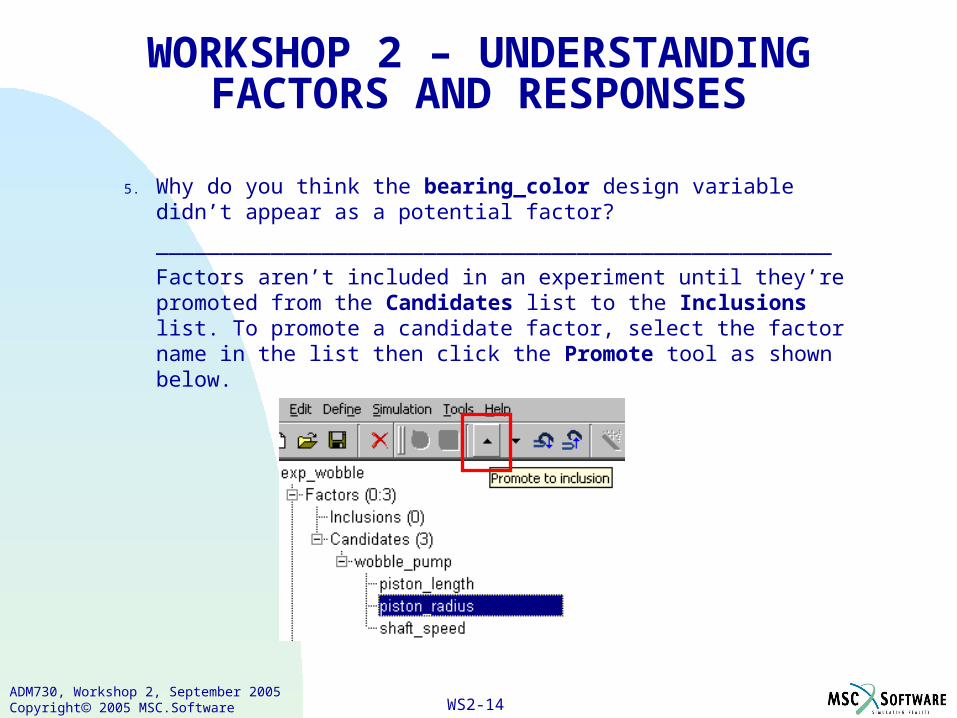
5. Why do you think the bearing_color design variable didn’t appear as a potential factor?
_____________________________________________________
Factors aren’t included in an experiment until they’re promoted from the Candidates list to the Inclusions list. To promote a candidate factor, select the factor name in the list then click the Promote tool as shown below.
WS2-15ADM730, Workshop 2, September 2005 Copyright 2005 MSC.Software Corporation
WORKSHOP 2 – UNDERSTANDING FACTORS AND RESPONSES
6. Promote the piston_radius and shaft_speed factors to the Inclusions list. Note that the design variable characteristics of each factor have been retained from the ADAMS/View model (the piston_radius factor is continuous, having a relative delta type; the shaft_speed is also continuous, but has a relative percent delta type as specified by the ADAMS/View design variable).
Note: For more information on factor and response specification methods, press F1 and review the online help.
7. Change the default abbreviation for the factors as follows: piston_radius: radius shaft_speed: speed
8. Select Apply to apply your changes.
WS2-16ADM730, Workshop 2, September 2005 Copyright 2005 MSC.Software Corporation
WORKSHOP 2 – UNDERSTANDING FACTORS AND RESPONSES
9. Using the same procedures used earlier, promote the following responses to the Inclusions list under the Responses node:
obj_average_drive_torque obj_total_pump_output
10. Change the abbreviations as follows: obj_average_drive_torque: torque obj_total_pump_output: pump_output
WS2-17ADM730, Workshop 2, September 2005 Copyright 2005 MSC.Software Corporation
WORKSHOP 2 – UNDERSTANDING FACTORS AND RESPONSES
Setting the Design Specification
Having defined the factors and responses of interest, an experiment type must be chosen. Typical questions at this point might be:
1. Will a simple Sweep or Perimeter Study yield sufficient information about your design behavior?
2. Are the specific effects of Factors on Responses sought? If so, one of the DOE types is likely most appropriate.
3. Is the effect of Factor variability the greatest concern? If so, the Variation methods are likely of interest.
The goal for this experiment is to try and understand which Factors influence which Responses the most and understand whether or not the Factors interact with one another to jointly effect a particular Response. For this kind of study a Response Surface experiment should be suitable.
WS2-18ADM730, Workshop 2, September 2005 Copyright 2005 MSC.Software Corporation
WORKSHOP 2 – UNDERSTANDING FACTORS AND RESPONSES
To specify a linear response surface model:1. Select the Design Specification tool.
Note: For more information on the entries in the toolbar, press F1 and review the online help.
2. Under Investigation Strategy, select DOE Response Surface.
3. Set Model to Linear. This means that you want to fit a linear relationship between the responses and factors so that you can write an equation relating them as follows:
Response_1 = a1 * Factor_1 + a2 * Factor_2 Response_2 = b1 * Factor_1 + b2 * Factor_2
You know that the total pump output varies with the piston radius squared:
cylinder volume = PI * cylinder_length * cylinder_radius**2
so assuming a linear relationship is perhaps an over-simplification. The results will show whether or not this is a valid assumption.
4. Select Apply.
WS2-19ADM730, Workshop 2, September 2005 Copyright 2005 MSC.Software Corporation
WORKSHOP 2 – UNDERSTANDING FACTORS AND RESPONSES
Generating the project workspace
ADAMS/Insight now knows the kind of response surface being fit, as well as boundary information about the factors in the model. Using this information, ADAMS/Insight determines what trials (experiments) to run so that enough information is obtained to calculate the response surface equations.
Each experiment is called a trial; a sequence of trials is referred to as a project workspace.
To generate the project workspace:1. Select the Create Work Space tool.
WS2-20ADM730, Workshop 2, September 2005 Copyright 2005 MSC.Software Corporation
WORKSHOP 2 – UNDERSTANDING FACTORS AND RESPONSES
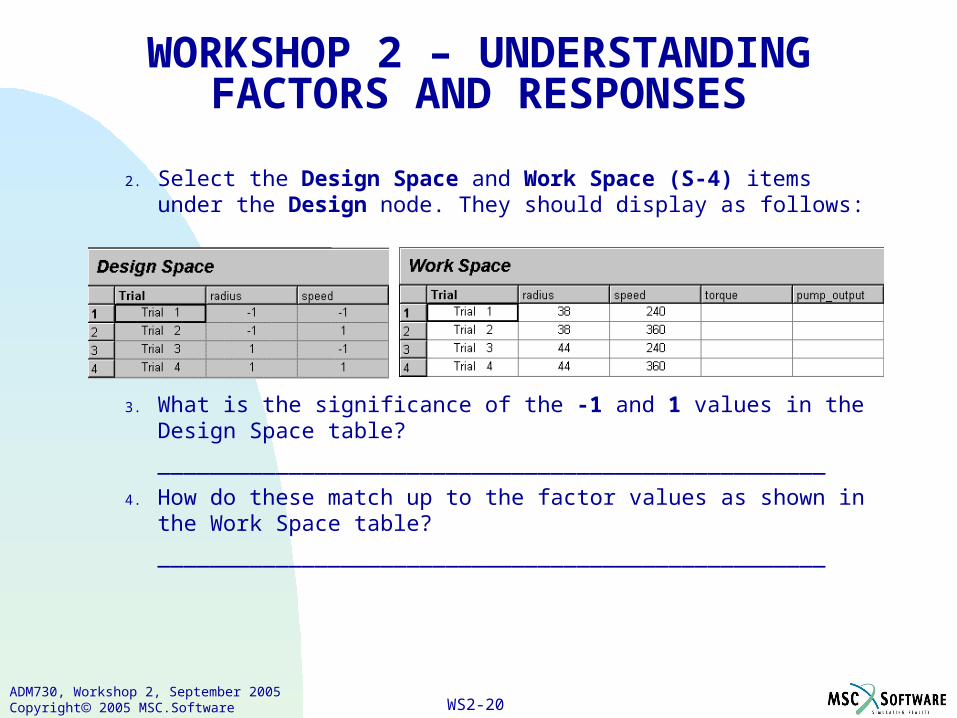
2. Select the Design Space and Work Space (S-4) items under the Design node. They should display as follows:
3. What is the significance of the -1 and 1 values in the Design Space table?
___________________________________________________
4. How do these match up to the factor values as shown in the Work Space table?
___________________________________________________
WS2-21ADM730, Workshop 2, September 2005 Copyright 2005 MSC.Software Corporation
WORKSHOP 2 – UNDERSTANDING FACTORS AND RESPONSES
Previewing model configurations
ADAMS/Insight can request that ADAMS/View display all of the design configurations that must be evaluated. This allows you to visually inspect all of the models as a simple check.
To inspect the models: 1. From the Simulation menu, select Preview.
ADAMS/Insight closes and ADAMS/View displays.
2. To pause after each frame, select Yes in the Warning box that appears.
The first model configuration displays.
3. Look at the piston and cylinder radii as you select Continue in the Paused dialog box. The changes are subtle, but noticeable.
WS2-22ADM730, Workshop 2, September 2005 Copyright 2005 MSC.Software Corporation
WORKSHOP 2 – UNDERSTANDING FACTORS AND RESPONSES
4. After all the frames are displayed, return to ADAMS/Insight: From the Simulate menu, point to ADAMS/Insight, and then select
Display.
The name of the experiment should appear in the dialog box.
Select OK.
For a large model with many geometric factors, this can be a useful tool for verifying the design configurations.
Evaluating the trials
The Work Space (S-4) node does not have torque and pump_output values for each of the trials. To determine Response values, each design trial must be simulated.
To evaluate the trials, select the Run Simulations tool.
ADAMS/Insight closes and ADAMS/View displays, running the model with the four different configurations.
WS2-23ADM730, Workshop 2, September 2005 Copyright 2005 MSC.Software Corporation
WORKSHOP 2 – UNDERSTANDING FACTORS AND RESPONSES
Viewing results and publishing a Web page
Here you will view your results and publish them to a Web page.
To view and fit the results:
1. Return to ADAMS/Insight by doing the following: From the Simulate menu, point to ADAMS/Insight, and then select Display.
Specify exp_wobble as the experiment.
Select OK.
2. In the treeview, expand the Design node, and then select Work Space (S-4). Note that all of the response values are now filled in.
3. Press the Fit Results tool on the toolbar.
A new node named Model_1 appears in the treeview under the Analysis node.
WS2-24ADM730, Workshop 2, September 2005 Copyright 2005 MSC.Software Corporation
WORKSHOP 2 – UNDERSTANDING FACTORS AND RESPONSES
4. To review the statistics for the fit, select Model_01 in the treeview. In the two columns at the bottom, select the following:
Summary Rules of Thumb: The yellow and red icons give an indication that the linear fit between the design variables and the outputs is likely not good.
obj_average_drive_torque Fit: The red icons indicate that a linear response surface isn't the best choice for correlating the design variables to this design objective.
obj_total_pump_output Fit: The green icons indicate that there may be some meaning in relating the pump output to the design variables using a linear relationship.
You will learn more about the statistics in Results Interpretation in Section 5. For now, a simple change can be made to the experiment definition, as shown in the next steps.
5. From the Tools menu, point to Refine Model Manually, and then select Change Order.
WS2-25ADM730, Workshop 2, September 2005 Copyright 2005 MSC.Software Corporation
WORKSHOP 2 – UNDERSTANDING FACTORS AND RESPONSES
5. Select all of the Responses in the upper box, then change the model Order to be Interactions. Select OK.
Note that the Fit data for each response now displays many green (good) indicators. This indicates that an Interactions fit may have been more appropriate for this problem. Different fitting methods will be explained in later modules.
7. Change the model order back to Linear.
To publish to a Web page:1. Press the Export to Web button on the toolbar.
2. Enter the name of the HTML file you want to create.
3. Select Save.
You can now open your results file in a Web browser.
Verifying results
Now you will use a Web page to verify the response surface fit.
WS2-26ADM730, Workshop 2, September 2005 Copyright 2005 MSC.Software Corporation
WORKSHOP 2 – UNDERSTANDING FACTORS AND RESPONSES
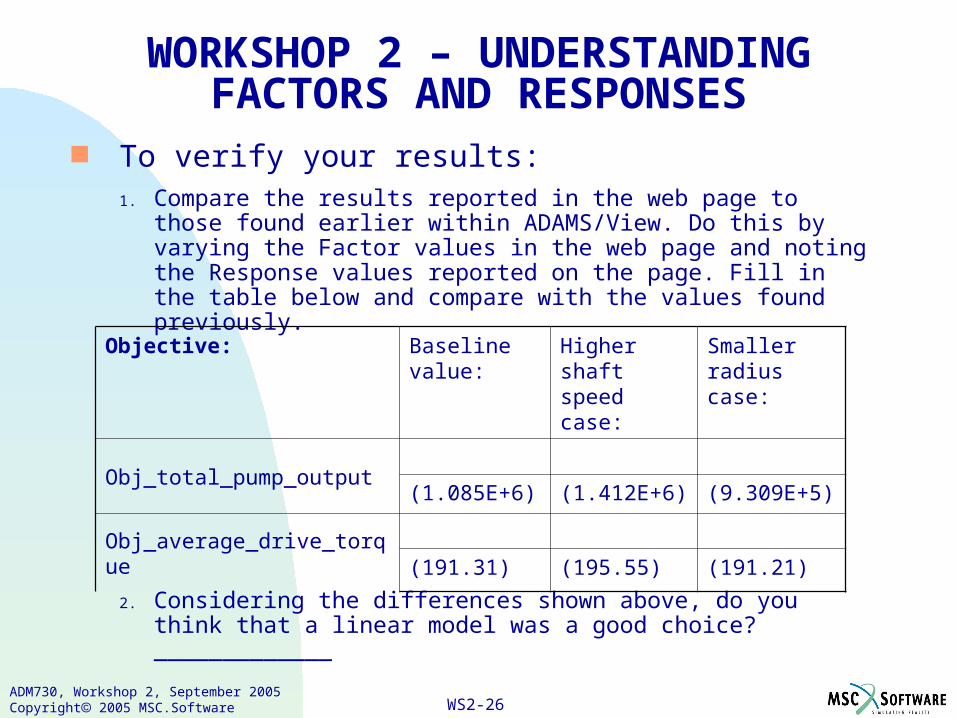
To verify your results:1. Compare the results reported in the web page to those found
earlier within ADAMS/View. Do this by varying the Factor values in the web page and noting the Response values reported on the page. Fill in the table below and compare with the values found previously.
2. Considering the differences shown above, do you think that a linear model was a good choice? _____________
Objective: Baseline value:
Higher shaft speed case:
Smaller radius case:
Obj_total_pump_output(1.085E+6) (1.412E+6) (9.309E+5)
Obj_average_drive_torque(191.31) (195.55) (191.21)
WS2-27ADM730, Workshop 2, September 2005 Copyright 2005 MSC.Software Corporation
WORKSHOP 2 – UNDERSTANDING FACTORS AND RESPONSES
4. What were the four choices for the Model fit for a response-surface?
Linear
__________
Quadratic
__________
5. Check the Effects box on the Web page.
The effect of each factor on each response is displayed as a Pareto chart. Which Factor has the most effect on the obj_average_drive_torque Response? ___________________
WS2-28ADM730, Workshop 2, September 2005 Copyright 2005 MSC.Software Corporation
WORKSHOP 2 – UNDERSTANDING FACTORS AND RESPONSES
Moving ahead
This module considered the differences between factors and responses. A typical goal when running a DOE is to fit a response surface between the factors and responses so that physical or virtual testing runs need not be done; an analytical relationship is used to
predict the system response for other configurations.
Some of the key elements that need further exploration are: Setting up parameterization in your model
Interpreting the statistical results
Using different model fits for more accurate prediction
Reducing the number of significant factors through screening
WS2-29ADM730, Workshop 2, September 2005 Copyright 2005 MSC.Software Corporation
WORKSHOP 2 – UNDERSTANDING FACTORS AND RESPONSES
Additional material: Calculating the pump output
To calculate the pump output, we assumed that the pump only discharges flow in one stroke direction. To determine when the pump was discharging, a state variable (piston_velocity) was created, having a positive velocity value when the piston moves into the cylinder.
MSC.ADAMS can integrate values in time using the DIFF statement, so the differential pump volume needs to be written as a differential with respect to time.
WS2-30ADM730, Workshop 2, September 2005 Copyright 2005 MSC.Software Corporation
WORKSHOP 2 – UNDERSTANDING FACTORS AND RESPONSES
If: V = volume
v = velocity
then: Total volume = integral (dV)
but dV = A dx, where dx = piston differential displacement
A = piston area
dx = v dt
dV = A v dt
Therefore, the differential pump output can be written as A v dt. This value is continuously calculated in the state variable piston_volume_differential. This is then used in a DIFF statement (diff_integrated_volume) to calculate the pump output as a function of time.
Related Documents