i C Written Case P i P ract i ce case All rights reserved. onsulting Group, Inc. A 2016 by The Boston Co Slides IB de préparation - fev 2016_rev HC.pptx 0 Draft—for discussion only Copyright © 2

Welcome message from author
This document is posted to help you gain knowledge. Please leave a comment to let me know what you think about it! Share it to your friends and learn new things together.
Transcript

i CWritten Case
P iPractice case
All
right
s re
serv
ed.
onsu
lting
Gro
up, I
nc. A
2016
by
The
Bos
ton
Co
Slides IB de préparation - fev 2016_rev HC.pptx 0Draft—for discussion only
Cop
yrig
ht ©
2

INSTRUCTIONS (1/3)
During our recruiting process, you will experience BCG's written case study. Like our case interviews, it
is an opportunity for us to assess some of the skills you will need as a consultant, such as your ability to
structure a problem, manage your time and deliver clear and concise messages.
You will have access to a set of documents containing most of the information you need to answer a
few questions from a partner regarding a business situation. You will then have 2 hours to answer these
questions in the form of a 3–5-slide presentation on paper If you feel that some information is missingquestions in the form of a 3 5 slide presentation on paper. If you feel that some information is missing
to answer the questions, do not hesitate to draw explicit hypotheses. At the end of these 2 hours, you
will present your recommendations in 15 minutes to the interviewer that will play the role of the client
or of your project leader. Finally, the interview ends with a 15-minute Q&A session to deep-dive on
certain more personal topics about you or clarify some aspects of your presentation.
THE BOSTON CONSULTING GROUP 11
INSTRUCTIONS (2/3)
DO DON'T
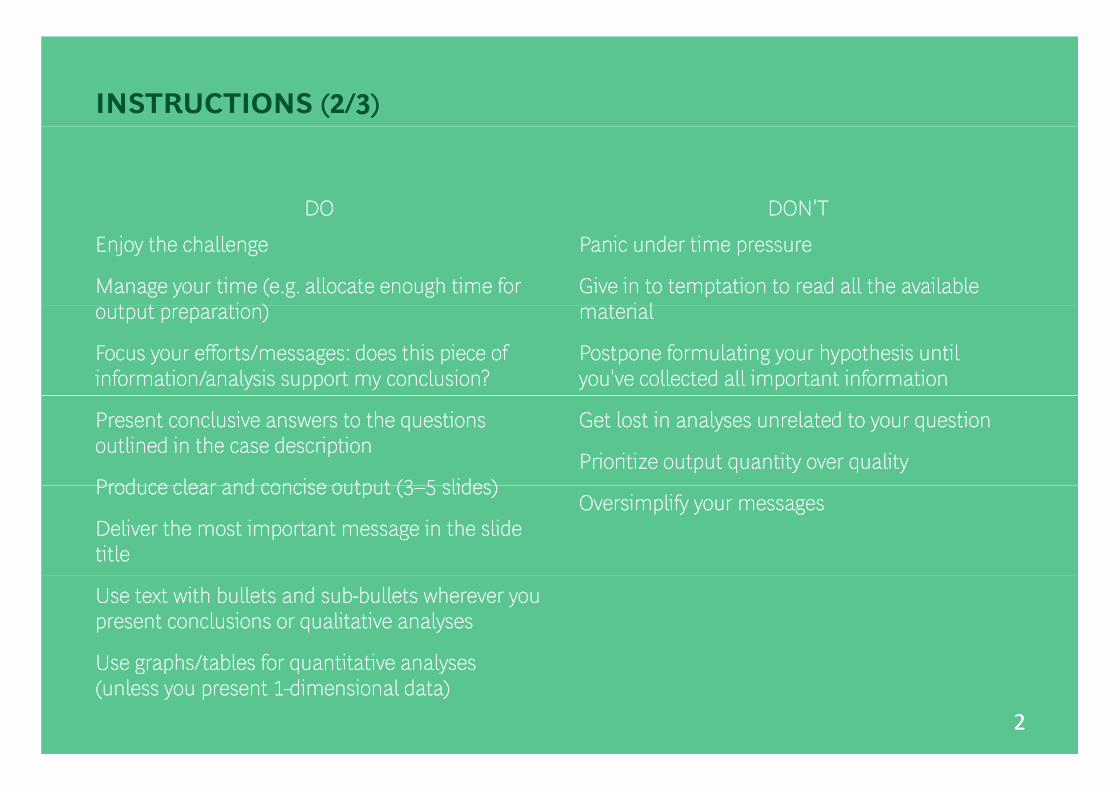
Enjoy the challenge
Manage your time (e.g. allocate enough time for t t ti )
Panic under time pressure
Give in to temptation to read all the available t i loutput preparation)
Focus your efforts/messages: does this piece of information/analysis support my conclusion?
material
Postpone formulating your hypothesis until you've collected all important information
Present conclusive answers to the questions outlined in the case description
Produce clear and concise output (3 5 slides)
Get lost in analyses unrelated to your question
Prioritize output quantity over quality Produce clear and concise output (3–5 slides)
Deliver the most important message in the slide title
Oversimplify your messages
Use text with bullets and sub-bullets wherever you present conclusions or qualitative analyses
Use graphs/tables for quantitative analyses
THE BOSTON CONSULTING GROUP
Use graphs/tables for quantitative analyses (unless you present 1-dimensional data)
22

INSTRUCTIONS (3/3)
This booklet contains an example to help you prepare for the written case. Like the real test, you should
complete it in no more than 2 hours. You can use a basic calculator but no other calculating tool (e.g.
spreadsheets). You can also use any other material you need (scratch paper, colored pencils, etc.).
During the real test, you will not be able to write on the documents.
U l d f t t t lid bl k d t i t i th ti th h thUse a landscape format to create your slides on blank paper: do not over invest in aesthetic, though the
output must be clear and easily readable.
The practice test starts on the next page. Once you have completed it, you can check a possible answer
at the end of this booklet.
Good luck!
THE BOSTON CONSULTING GROUP 3

CHATEAU BOOMERANG CASE
JOE PARTNER
To: Château Boomerang Project TeamS bj t G h SSubject: Growth StrategyDate: 11 July 2003
Hi Team,We have a meeting in a few days' time with our client Château Boomerang an Australian wine producer We need to start thinkingWe have a meeting in a few days time with our client, Château Boomerang, an Australian wine producer. We need to start thinkingabout a few of their concerns ahead of that meeting. During the meeting, you will have 15 minutes to present your conclusions about three main questions. Please prepare a short written presentation (3 to 5 presentation slides) to support your speech. Format is not a problem: you can use text, graphs or tables to your convenience. The issues I would like you to address are:
• I believe the U.S. should be their #1 priority. Is this correct? What makes this country attractive for them?– They currently have different options in mind in terms of priority products to enter the U.S. market with. This is a major
issue for them because product-marketing decisions require long term planning to take into account the grape-to-bottle lead-time, so please address it as deeply and accurately as possible.
• Which products have the highest chance of being profitable and competitive in the U.S.?• What are the strengths that make Australian wines competitive in the US market vs. their main competitors?
T t t t d I h ll t d d t b t th A t li i i d t th l b l i i d t t ti tiTo get you started, I have collected some documents about the Australian wine industry, the global wine industry, some statistics about selected wine producing nations, and basic wine economics. Try and make the best of what we have, being as fact-based as possible. If you need to make some assumptions, make sure you highlight those so that we can check them thoroughly at a later stage.
Have fun.
THE BOSTON CONSULTING GROUP
Regards,Joe
4
Extracts From IndustryExtracts From Industry Reports On TheReports On The Australian Wine IndustryAustralian Wine Industry
THE BOSTON CONSULTING GROUP 5
THE AUSTRALIAN WINE INDUSTRY
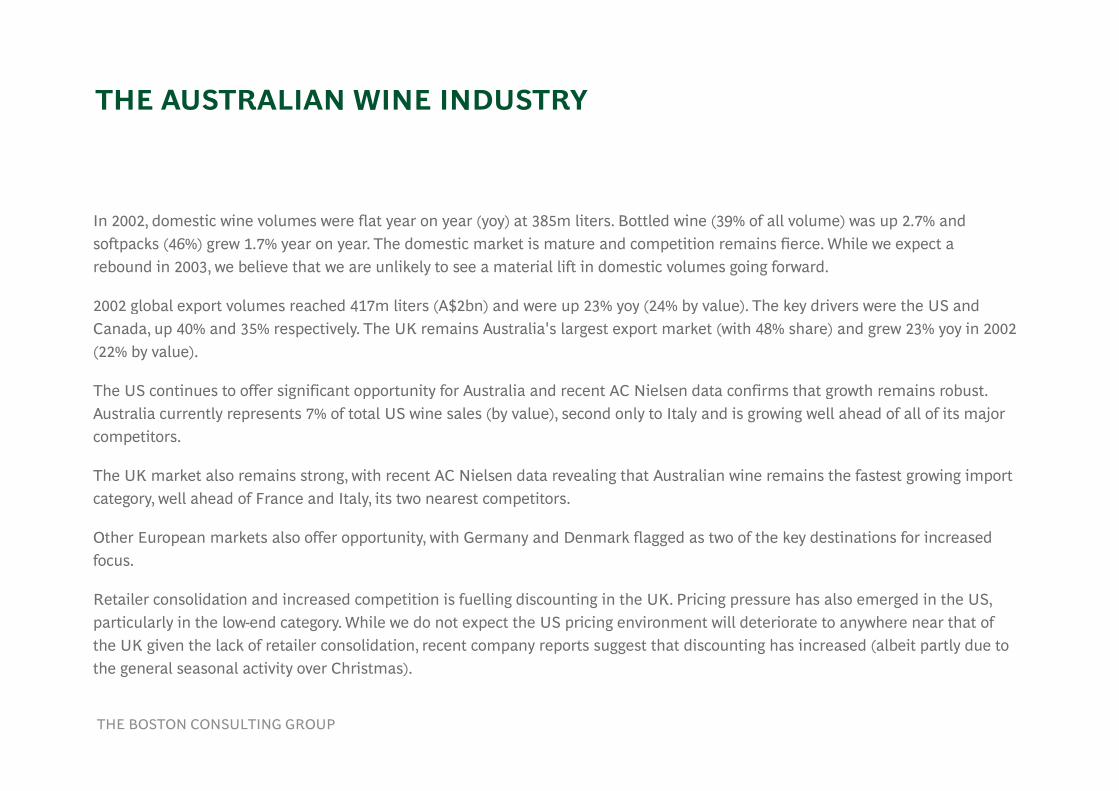
I 2002 d ti i l fl t ( ) t 385 lit B ttl d i (39% f ll l ) 2 7% dIn 2002, domestic wine volumes were flat year on year (yoy) at 385m liters. Bottled wine (39% of all volume) was up 2.7% and softpacks (46%) grew 1.7% year on year. The domestic market is mature and competition remains fierce. While we expect a rebound in 2003, we believe that we are unlikely to see a material lift in domestic volumes going forward.
2002 global export volumes reached 417m liters (A$2bn) and were up 23% yoy (24% by value) The key drivers were the US and2002 global export volumes reached 417m liters (A$2bn) and were up 23% yoy (24% by value). The key drivers were the US and Canada, up 40% and 35% respectively. The UK remains Australia's largest export market (with 48% share) and grew 23% yoy in 2002 (22% by value).
The US continues to offer significant opportunity for Australia and recent AC Nielsen data confirms that growth remains robust.The US continues to offer significant opportunity for Australia and recent AC Nielsen data confirms that growth remains robust. Australia currently represents 7% of total US wine sales (by value), second only to Italy and is growing well ahead of all of its major competitors.
The UK market also remains strong, with recent AC Nielsen data revealing that Australian wine remains the fastest growing importcategory, well ahead of France and Italy, its two nearest competitors.
Other European markets also offer opportunity, with Germany and Denmark flagged as two of the key destinations for increased focus.
Retailer consolidation and increased competition is fuelling discounting in the UK. Pricing pressure has also emerged in the US,particularly in the low-end category. While we do not expect the US pricing environment will deteriorate to anywhere near that of the UK given the lack of retailer consolidation, recent company reports suggest that discounting has increased (albeit partly due to th l l ti it Ch i t )
THE BOSTON CONSULTING GROUP
the general seasonal activity over Christmas).
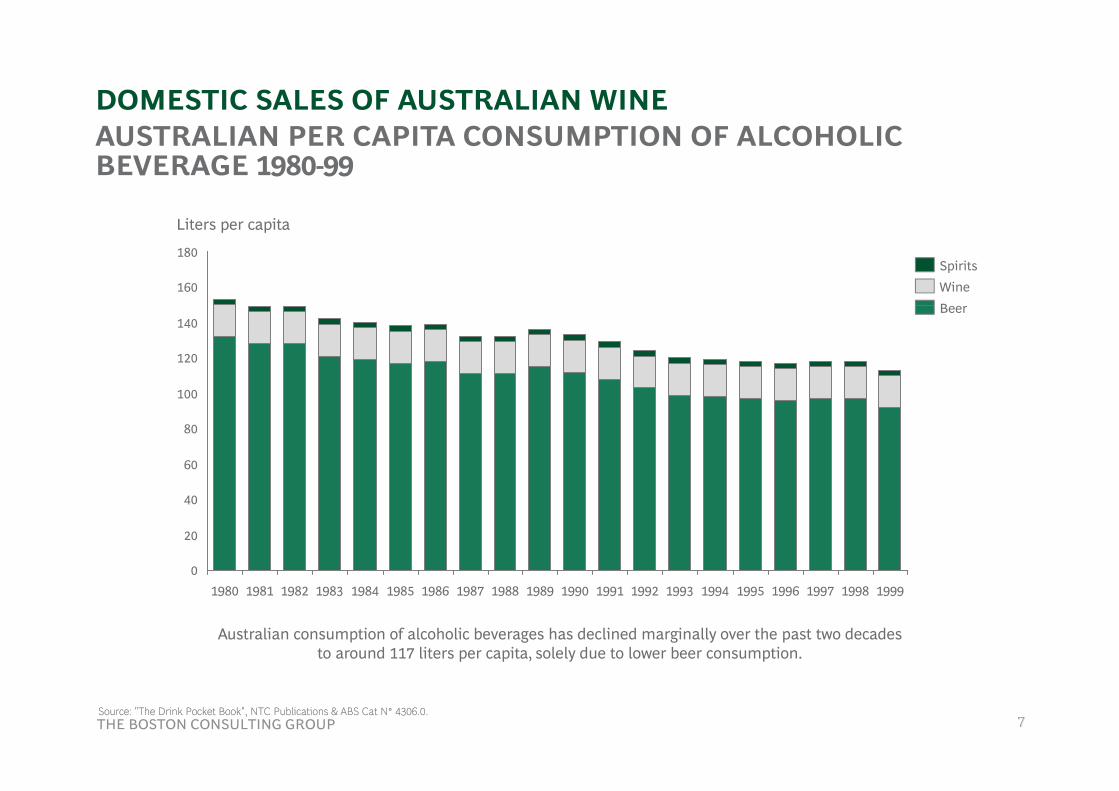
DOMESTIC SALES OF AUSTRALIAN WINEAUSTRALIAN PER CAPITA CONSUMPTION OF ALCOHOLICAUSTRALIAN PER CAPITA CONSUMPTION OF ALCOHOLIC BEVERAGE 1980-99
160
180
Liters per capita
Spirits
BeerWine
100
120
140Beer
60
80
100
0
20
40
19951994 1996 1997 1998 199919821981 19891988 1990 1991 1992 19931980 1984 19851983 1986 1987
Australian consumption of alcoholic beverages has declined marginally over the past two decades to around 117 liters per capita, solely due to lower beer consumption.
THE BOSTON CONSULTING GROUP 7Source: "The Drink Pocket Book", NTC Publications & ABS Cat N° 4306.0.
7
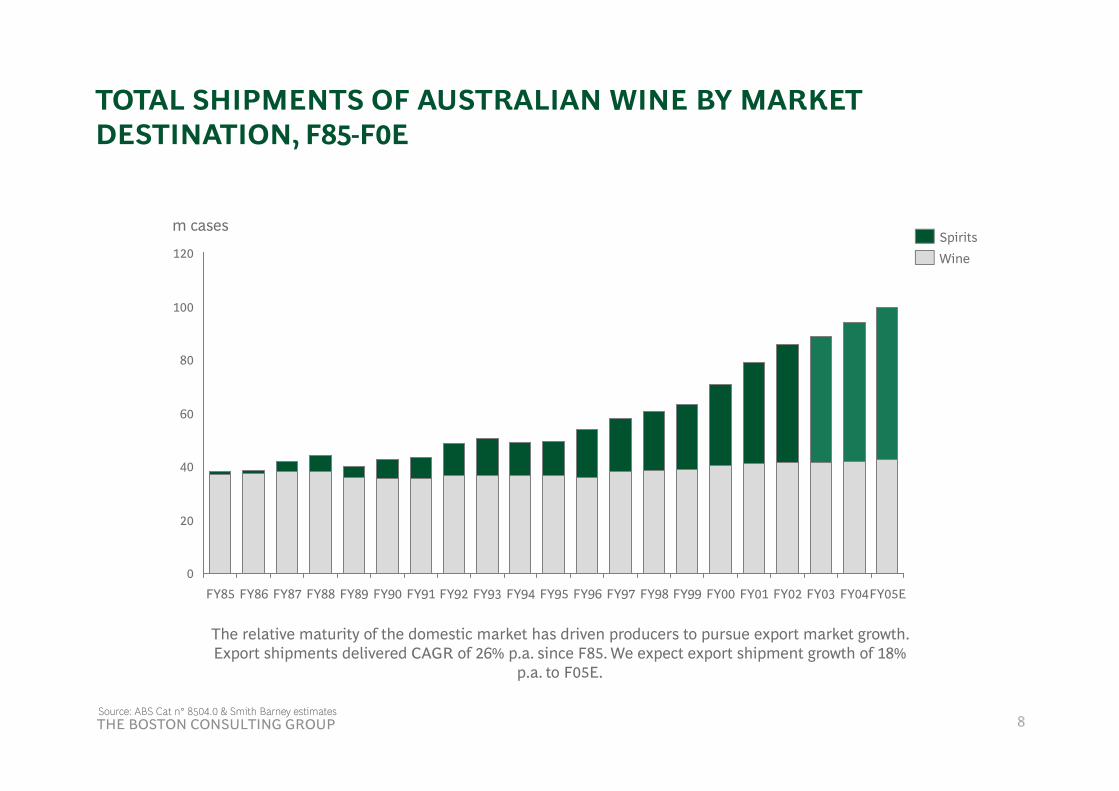
TOTAL SHIPMENTS OF AUSTRALIAN WINE BY MARKET DESTINATION F85 F0EDESTINATION, F85-F0E
100
120
m cases
WineSpirits
80
100
40
60
0
20
0FY90FY89FY88FY87FY86FY85 FY96FY95FY94FY93FY92FY91 FY02FY01FY00FY99FY98FY97 FY05EFY04FY03
The relative maturity of the domestic market has driven producers to pursue export market growth. Export shipments delivered CAGR of 26% p.a. since F85. We expect export shipment growth of 18%
THE BOSTON CONSULTING GROUP 8Source: ABS Cat n° 8504.0 & Smith Barney estimates
p.a. to F05E.
8
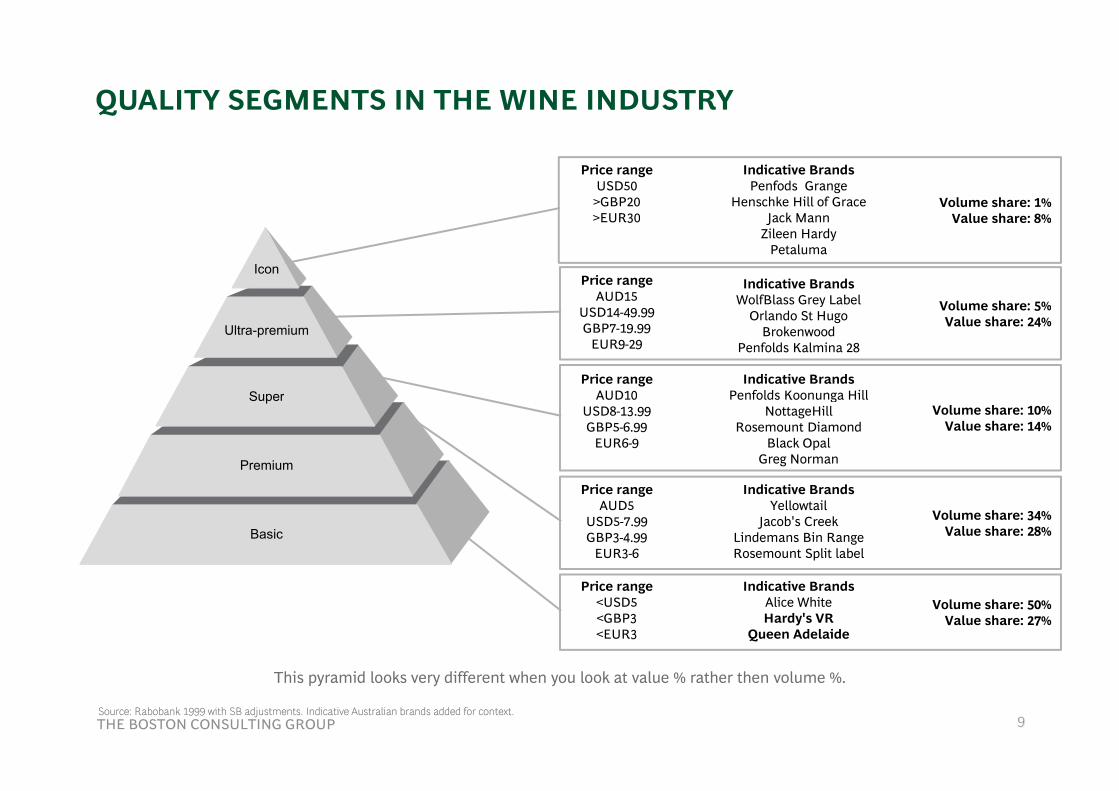
QUALITY SEGMENTS IN THE WINE INDUSTRY
Volume share: 1%Value share: 8%
Price rangeUSD50>GBP20>EUR30
Indicative BrandsPenfods Grange
Henschke Hill of GraceJack Mann
Icon
Value share: 8%>EUR30 Jack MannZileen Hardy
Petaluma
Volume share: 5%
Price rangeAUD15
Indicative BrandsWolfBlass Grey Label
Super
Ultra-premium
Volume share: 5%Value share: 24%
USD14-49.99GBP7-19.99
EUR9-29
yOrlando St Hugo
BrokenwoodPenfolds Kalmina 28
Price rangeAUD10
Indicative BrandsPenfolds Koonunga HillSuper
Premium
Volume share: 10%Value share: 14%
AUD10USD8-13.99GBP5-6.99
EUR6-9
Penfolds Koonunga HillNottageHill
Rosemount DiamondBlack Opal
Greg Norman
P i I di ti B d
BasicVolume share: 34%
Value share: 28%
Price rangeAUD5
USD5-7.99GBP3-4.99
EUR3-6
Indicative BrandsYellowtail
Jacob's CreekLindemans Bin RangeRosemount Split label
Volume share: 50%Value share: 27%
Price range<USD5<GBP3<EUR3
Indicative BrandsAlice WhiteHardy's VR
Queen Adelaide
THE BOSTON CONSULTING GROUP 9Source: Rabobank 1999 with SB adjustments. Indicative Australian brands added for context.
This pyramid looks very different when you look at value % rather then volume %.
9
EXPORTS – THE AUSTRALIAN WINE INDUSTRY GROWTH ENGINEA NUMBER OF FACTORS ARE KEY TO AUSTRALIA'S ONGOINGA NUMBER OF FACTORS ARE KEY TO AUSTRALIA'S ONGOING SUCCESS INTERNATIONALLY*
1. Strong brands;
2. Clarity of offer;
3 Good value for money;3. Good value for money;
4. The quality and style of wines;
5. The scale and efficiency of operators;
6. The strenght of the industry organisations;
7. The environmentally friendly perception of Australia;
8. The healthy and trendy perception driving increased premium wine consumption globally; andy y p p g p p g y;
9. Access to equity and debt capital;
THE BOSTON CONSULTING GROUP 10Notes : *Sources from Orlando Wyndham presentation
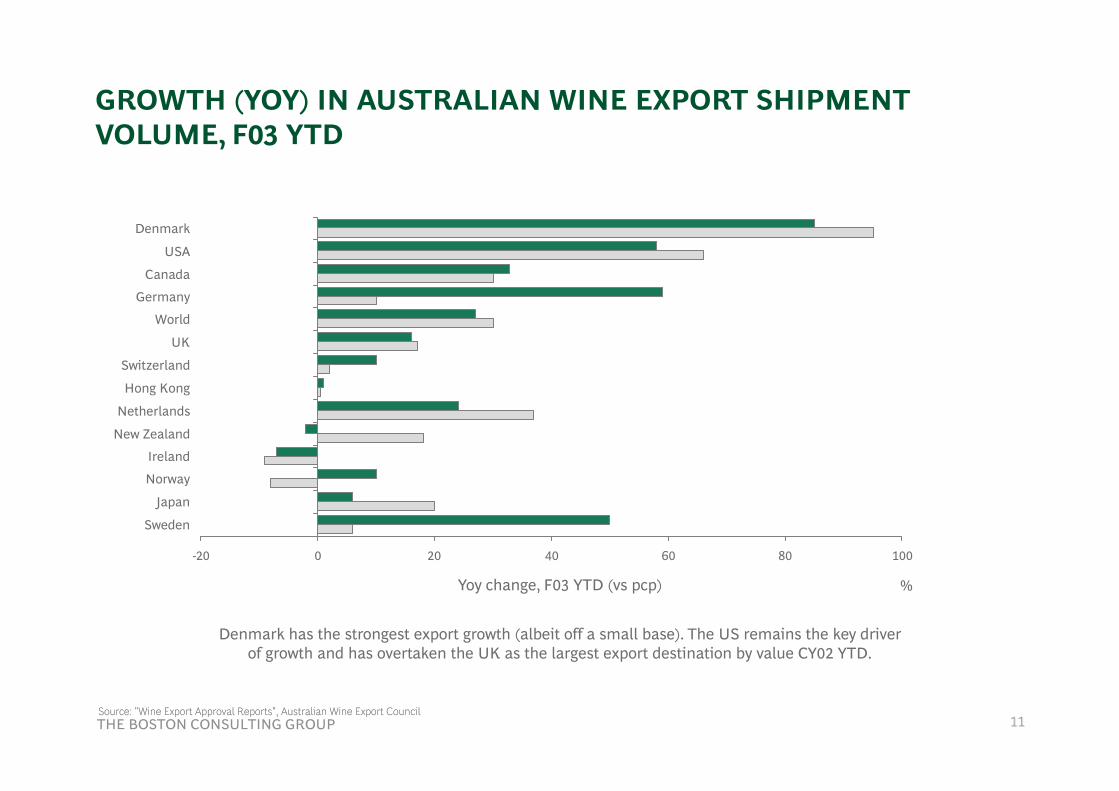
GROWTH (YOY) IN AUSTRALIAN WINE EXPORT SHIPMENT VOLUME F03 YTDVOLUME, F03 YTD
Denmark
USA
Canada
Germany
UK
Hong Kong
World
Switzerland
New Zealand
Ireland
Norway
Netherlands
-20 0 20 40 60 80 100
Japan
Sweden
y
Denmark has the strongest export growth (albeit off a small base). The US remains the key driver of growth and has overtaken the UK as the largest export destination by value CY02 YTD.
%Yoy change, F03 YTD (vs pcp)
THE BOSTON CONSULTING GROUP 11Source: "Wine Export Approval Reports", Australian Wine Export Council
11

AVERAGE PRICE PER LITER ACHIEVED, F93-F03E
50
60
5
6
Average price per literm cases
30
40
3
4
10
20
30
1
2
3
0
10
0
1
F02 F03EF93 F00F95 F97F96 F98 F01F99F94
The average price per liter has grown at a CAGR of 6.1% p.a. over the last decade. However, this has slowed markedly over the last few years. Average price per liter grew just 0.7% in F02.
Avg export price per litreAust. wine export shipment (m cases)
THE BOSTON CONSULTING GROUP 12Source: "Wine Export Approval Reports", Australian Wine Export Council & Smith Barney estimates
12
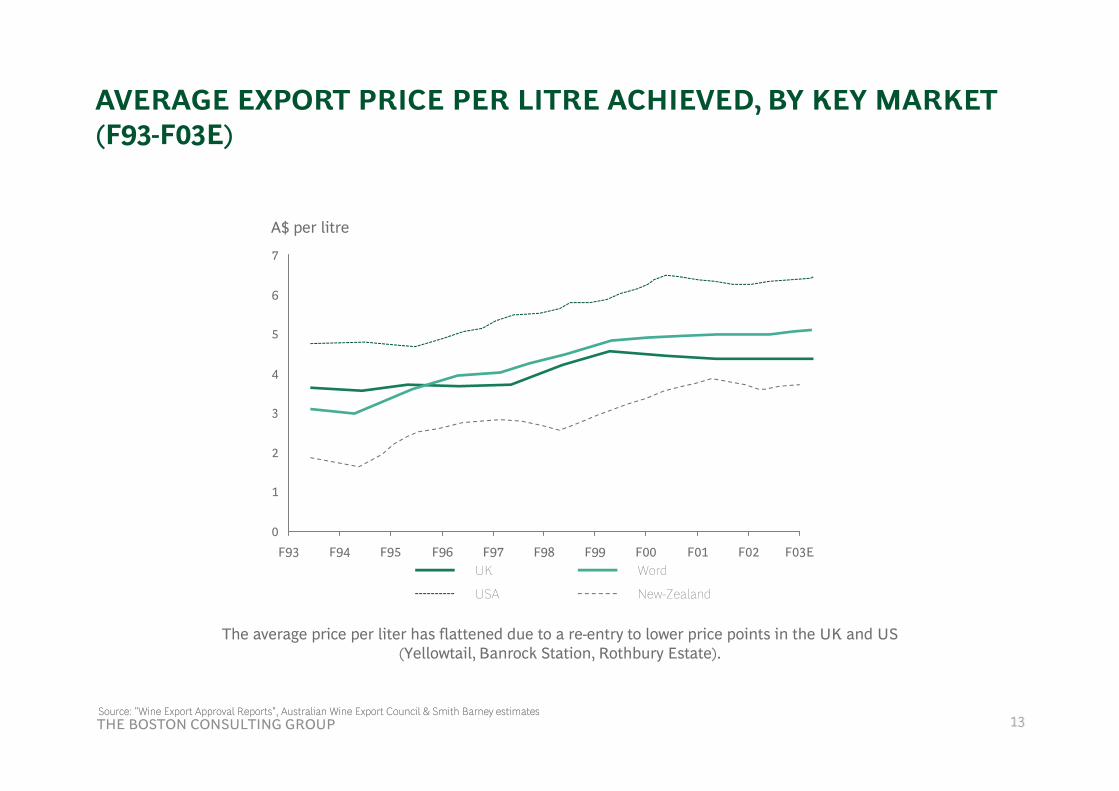
AVERAGE EXPORT PRICE PER LITRE ACHIEVED, BY KEY MARKET (F93 F03E)(F93-F03E)
6
7
A$ per litre
4
5
2
3
UK Word
0
1
F99 F00 F03EF01 F02F98F97F96F95F94F93
USA New-Zealand
The average price per liter has flattened due to a re-entry to lower price points in the UK and US (Yellowtail, Banrock Station, Rothbury Estate).
THE BOSTON CONSULTING GROUP 13Source: "Wine Export Approval Reports", Australian Wine Export Council & Smith Barney estimates
13

1992 AUSTRALIAN WINE EXPORTS (VALUE), BY KEY MARKET
ROW
11
3
UK
11Japan
39Sweden UK
Ireland
12
2
1
7
Netherlands 1Germany
Ireland
Canada
2
US
NZ7
17
The UK has always been the dominant market for Australian wine, but its significance grew throughout the 1990s.
THE BOSTON CONSULTING GROUP 14Source: "Wine Export Approval Reports", Australian Wine Export Council
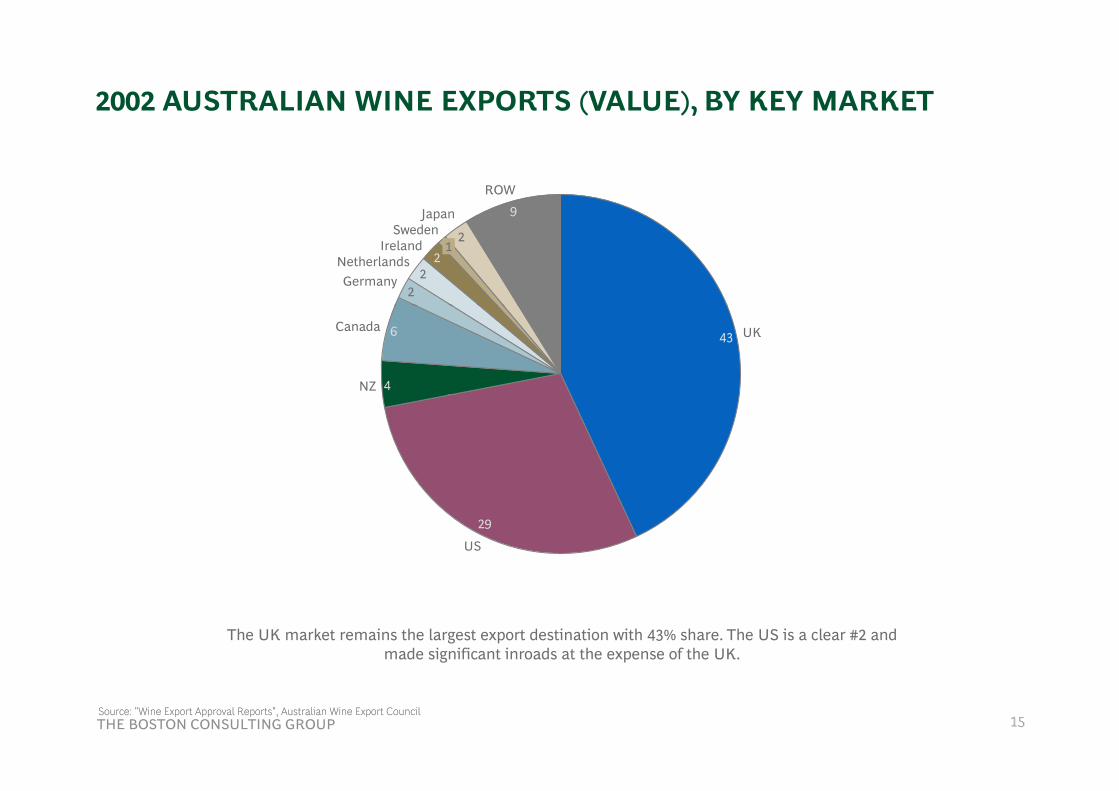
2002 AUSTRALIAN WINE EXPORTS (VALUE), BY KEY MARKET
9ROW
Japan
2Germany 2
IrelandNetherlands
Sweden 21
9
2
Japan
Canada436
4NZ
UK
29
US
The UK market remains the largest export destination with 43% share. The US is a clear #2 and made significant inroads at the expense of the UK.
THE BOSTON CONSULTING GROUP 15Source: "Wine Export Approval Reports", Australian Wine Export Council
15
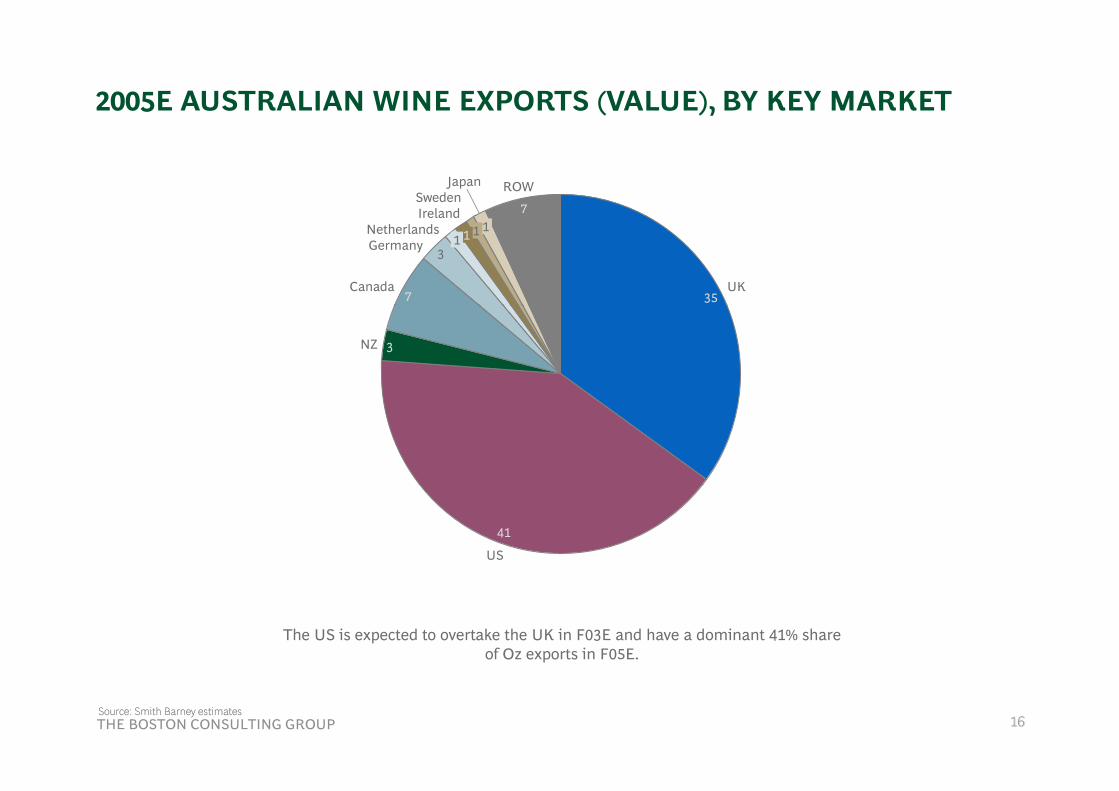
2005E AUSTRALIAN WINE EXPORTS (VALUE), BY KEY MARKET
SwedenJapan
7
ROW
Ireland11
Ireland
1Netherlands1Germany
3
Canada7
UK35
NZ 3
41
US
The US is expected to overtake the UK in F03E and have a dominant 41% shareof Oz exports in F05E.
THE BOSTON CONSULTING GROUP 16Source: Smith Barney estimates
16

WINE PRODUCTION, EXPORTS AND CONSUMPTION (SELECTED COUNTRIES) 2002ECOUNTRIES), 2002E
Wine d ti
Wine d ti
Share of world d ti
Wine t
Exportsas a propor-
tion of d ti
Wine consump-
ti
Per capita consump-
ti
Italy
France
production (mL)
6,163
5 742
production (cases)
685
638
production (%)
20
18
exports (mL)
2,308
1 781
production (%)
37
31
tion(mL)
3,311
3 767
tion(L)
54.2
58 7France
Spain
USA
5,742
3,783
2,239
638
420
249
18
12
7
1,781
1,081
301
31
29
13
3,767
1,592
2,124
58.7
39.5
10.8
Argentina
Germany
South Africa
1,380
845
812
153
94
90
3
3
96
226
165
7
27
20
1,354
2,013
415
38.4
23.9
8.6
Australia
Chile
Other
1,205
709
8,201
134
79
911
4
2
26
471
342
1,117
39
48
14
364
303
7,233
19.8
18.2
Australia represents just 4% of worldwide wine production. Australia exports more than it consumes domestically, however, the current oversupply masks it.
World total 31,078 3,453 100 7,888 25 22,476
THE BOSTON CONSULTING GROUP 17Source: ABS 1323.0, Dutruc-Rosset 2001, Smith Barney 2002 estimates
17
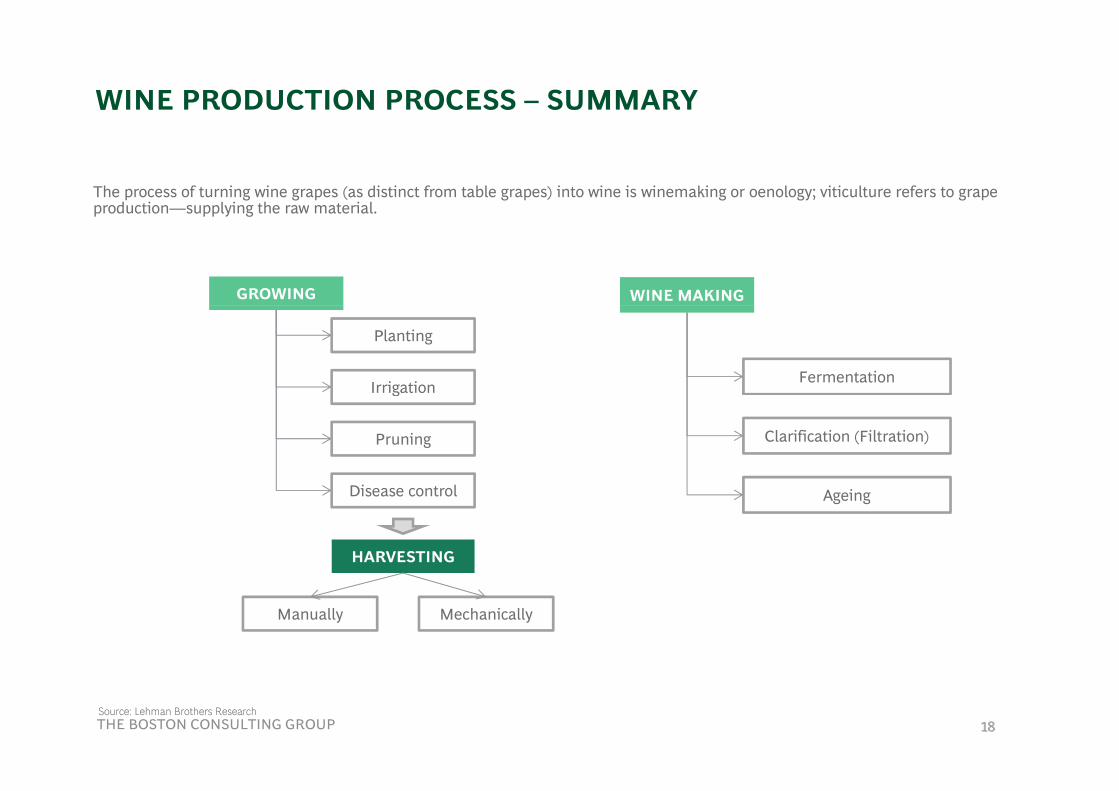
WINE PRODUCTION PROCESS – SUMMARY
The process of turning wine grapes (as distinct from table grapes) into wine is winemaking or oenology; viticulture refers to grape production—supplying the raw material.p pp y g
GROWING WINE MAKING
Planting
IrrigationFermentation
g
Pruning
Di l
Clarification (Filtration)
Disease control
HARVESTING
Ageing
Manually Mechanically
THE BOSTON CONSULTING GROUP 18Source: Lehman Brothers Research
18

HARVEST SIZE, PLANTINGS AND YIELD
D t f l b l i d ti i l ti t l ti h i th t bl b lData for global wine production in relation to plantings are shown in the tables below.
Globally, the picture is reasonably stable. Chile and Australia both increased production yield per planted area. Their crudeproduction yields rose by 60.0% and 27.8% respectively during 1993-99.
Argentina is the only country with a sharp drop in production in relation to planted area, which reflects the drop in overallproduction.
Plantings are useful as an indicator of forward production. The planted area increased by 13.7% in fiscal 2000 compared with a 24.6% increase the previous year.
THE BOSTON CONSULTING GROUP 19
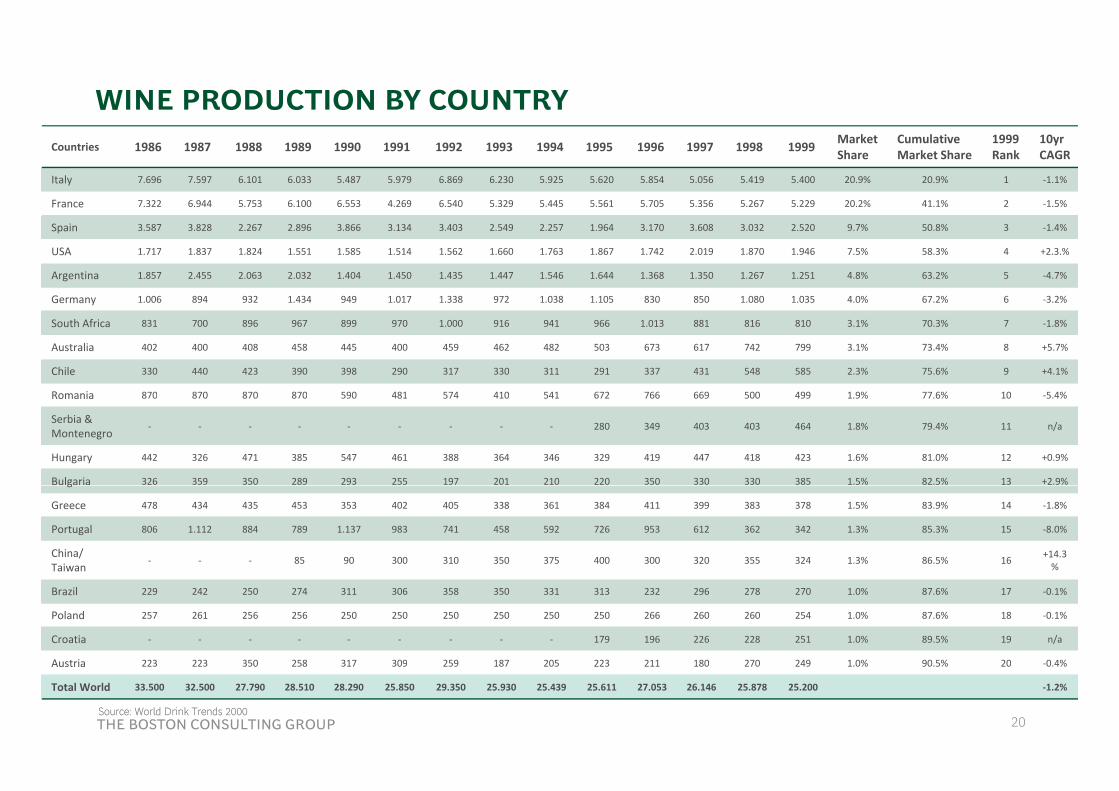
WINE PRODUCTION BY COUNTRYCountries 1986 1987 1988 1989 1990 1991 1992 1993 1994 1995 1996 1997 1998 1999 Market
ShareCumulativeMarket Share
1999 Rank
10yr CAGR
Italy 7.696 7.597 6.101 6.033 5.487 5.979 6.869 6.230 5.925 5.620 5.854 5.056 5.419 5.400 20.9% 20.9% 1 ‐1.1%
France 7.322 6.944 5.753 6.100 6.553 4.269 6.540 5.329 5.445 5.561 5.705 5.356 5.267 5.229 20.2% 41.1% 2 ‐1.5%
Spain 3.587 3.828 2.267 2.896 3.866 3.134 3.403 2.549 2.257 1.964 3.170 3.608 3.032 2.520 9.7% 50.8% 3 ‐1.4%
USA 1.717 1.837 1.824 1.551 1.585 1.514 1.562 1.660 1.763 1.867 1.742 2.019 1.870 1.946 7.5% 58.3% 4 +2.3.%
Argentina 1.857 2.455 2.063 2.032 1.404 1.450 1.435 1.447 1.546 1.644 1.368 1.350 1.267 1.251 4.8% 63.2% 5 ‐4.7%
Germany 1.006 894 932 1.434 949 1.017 1.338 972 1.038 1.105 830 850 1.080 1.035 4.0% 67.2% 6 ‐3.2%
South Africa 831 700 896 967 899 970 1.000 916 941 966 1.013 881 816 810 3.1% 70.3% 7 ‐1.8%
Australia 402 400 408 458 445 400 459 462 482 503 673 617 742 799 3.1% 73.4% 8 +5.7%
Chile 330 440 423 390 398 290 317 330 311 291 337 431 548 585 2.3% 75.6% 9 +4.1%
Romania 870 870 870 870 590 481 574 410 541 672 766 669 500 499 1 9% 77 6% 10 ‐5 4%Romania 870 870 870 870 590 481 574 410 541 672 766 669 500 499 1.9% 77.6% 10 ‐5.4%
Serbia & Montenegro
‐ ‐ ‐ ‐ ‐ ‐ ‐ ‐ ‐ 280 349 403 403 464 1.8% 79.4% 11 n/a
Hungary 442 326 471 385 547 461 388 364 346 329 419 447 418 423 1.6% 81.0% 12 +0.9%
Bulgaria 326 359 350 289 293 255 197 201 210 220 350 330 330 385 1.5% 82.5% 13 +2.9%g
Greece 478 434 435 453 353 402 405 338 361 384 411 399 383 378 1.5% 83.9% 14 ‐1.8%
Portugal 806 1.112 884 789 1.137 983 741 458 592 726 953 612 362 342 1.3% 85.3% 15 ‐8.0%
China/Taiwan
‐ ‐ ‐ 85 90 300 310 350 375 400 300 320 355 324 1.3% 86.5% 16 +14.3%
Brazil 229 242 250 274 311 306 358 350 331 313 232 296 278 270 1.0% 87.6% 17 ‐0.1%
Poland 257 261 256 256 250 250 250 250 250 250 266 260 260 254 1.0% 87.6% 18 ‐0.1%
Croatia ‐ ‐ ‐ ‐ ‐ ‐ ‐ ‐ ‐ 179 196 226 228 251 1.0% 89.5% 19 n/a
Austria 223 223 350 258 317 309 259 187 205 223 211 180 270 249 1 0% 90 5% 20 ‐0 4%
THE BOSTON CONSULTING GROUP 20
Austria 223 223 350 258 317 309 259 187 205 223 211 180 270 249 1.0% 90.5% 20 0.4%
Total World 33.500 32.500 27.790 28.510 28.290 25.850 29.350 25.930 25.439 25.611 27.053 26.146 25.878 25.200 ‐1.2%
Source: World Drink Trends 2000

WINE CONSUMPTION BY COUNTRYCountries 1986 1987 1988 1989 1990 1991 1992 1993 1994 1995 1996 1997 1998 1999 Market
ShareCumulativeMarket Share
1999 Rank
10yr CAGR
France 4.244 4.192 4.170 4.181 4.125 3.823 3.701 3.661 3.619 3.663 3.502 3.516 3.419 3.380 13.4% 13.4% 1 ‐2.1%
Italy 3.911 3.740 3.611 3.544 3.546 3.491 3.468 3.446 3.306 3.300 3.116 3.077 2.963 2.968 11.8% 25.2% 2 ‐1.8%
USA 2.214 2.198 2.078 1.976 1.940 1.768 1.803 1.703 1.741 1.778 1.909 1.978 2.008 2.089 8.3% 33.5% 3 +0.6%
Germany 1.810 2.005 2.023 2.069 2.071 1.936 1.934 1.835 1.840 1.821 1.884 1.887 1.870 1.880 7.5% 40.9% 4 ‐1.0%
Argentina 1.822 1.814 1.769 1.723 1.763 1.728 1.654 1.504 1.483 1.429 1.448 1.438 1.401 1.302 5.2% 46.1% 5 ‐2.8%
Spain 1.363 1.353 1.209 1.168 1.138 1.145 1.032 1.066 1.017 976 973 1.135 1.158 1.102 4.4% 50.5% 6 ‐0.6%
Russia ‐ ‐ ‐ 962 891 818 520 519 697 858 841 868 880 1.048 4.2% 54.6% 7 +0.9%
United Kingdom
591 629 649 668 665 667 679 710 739 750 769 844 853 863 3.4% 58.1% 8 +2.6%
Romania 639 342 646 391 603 441 565 435 427 574 588 530 567 674 2.7% 60.7% 9 +5.6%
Portugal 709 640 538 527 627 620 606 593 583 576 562 542 531 517 2.1% 62.8% 10 ‐0.2%
South Africa 315 315 315 330 316 329 329 314 340 355 363 359 367 409 1.6% 64.4% 11 n/a
Greece 236 317 299 300 331 330 325 365 352 362 358 369 382 376 1.5% 65.9% 12 +2.3%
Australia 346 340 344 325 316 309 327 323 332 333 335 352 369 366 1.5% 67.4% 13 +1.2%
Japan 86 99 118 129 135 117 101 121 136 157 189 232 233 316 1.3% 68.6% 14 +9.4%
Brazil 323 206 210 256 260 265 269 273 277 280 300 303 307 312 1.2% 69.9% 15 +2.0%
Switzerland 316 324 329 329 331 320 316 319 310 307 306 308 307 312 1.2% 71.1% 16 ‐0.6%
Hungary 249 231 220 237 287 299 307 324 299 272 308 294 293 301 1.2% 72.3% 17 +2.4%
Netherlands 217 214 218 221 217 231 242 232 241 256 266 273 289 294 1.2% 73.4% 18 +2.9%
Canada 258 255 266 259 248 238 235 233 232 238 246 258 268 271 1.1% 74.5% 19 n/a
Belgium 214 227 230 229 249 240 250 259 243 254 254 255 255 255 1.0% 75.5% 20 +1.1%
THE BOSTON CONSULTING GROUP 21
Total Top 37Countries
21.686 21.758 21.257 21.766 22.038 21.102 20.854 20.630 20.531 20.878 20.772 21.045 21.038 21.336 ‐0.2%
Note : Consumption and production totals do not always agree due to fluctuation in stock levels and due to the inclusion of bulk exports for other applications—fortified wines—in the output , umbers. We have based market share on world production of 25.2 billion liters.Source: World Drink Trends 2000

SELECTED WINE PRODUCING COUNTRY PROFILESA C
Key points
FRANCE
Key points
– Massive reduction in overall level of both wine and alcohol consumption.– Trading up is a positive; better marketing would firm this trend.– Exports rising, but not always a clear winner.– Substantial opportunity for consolidation and repositioning of the industry.
Despite a dramatic fall in consumption, France remains the world's largest wine consumer. Beer and spirits have moved to within sight of accounting for half of French alcohol consumption from just over one-third in 1980. Per capita wine consumption stands at 58 liters annually. Reduced alcohol intake can partly be explained by a trend towards the global norm. France was well ahead of58 liters annually. Reduced alcohol intake can partly be explained by a trend towards the global norm. France was well ahead of other countries in terms of total intake. In addition, there have been cultural shifts away from weekday lunchtime wine consumption—largely in favor of mineral water.
However, there is at least trading up. In the past 20 years, the portion of AOC (Appellation d'Origine Contrôlée) wine consumed has increased from 30% to 50%, indicating that quality concerns have been increasing year-on-year. This presents a significant opportunity for wine companies with a commitment to marketing and an endorsement of higher-quality brands.
THE BOSTON CONSULTING GROUP 22

SELECTED WINE PRODUCING COUNTRY PROFILESA C
E t f F h i i d t dil i th t fi Thi t d ill b bl ti H i
FRANCE
Exports of French wines increased steadily in the past five years. This trend will probably continue. However, our experienceelsewhere in the beverage alcohol industry suggests that the French should be careful not to make two mistakes. First, a weakdomestic industry rarely translates into a sustainably strong export market. Both Australia and California support their domestic wine industries wholeheartedly. Second, it is difficult to offset a major market that is in decline with the establishment of new markets. Note how Scotch whisky's failure in its largest market (the US) offset its progress in the newer markets. Furthermore, as our other country reviews show, the export market is very competitive. And although France has a leading overall position in the UK and in the US, Australia and new world wines have been growing at faster rates. The position with individual brands is more striking. The market leader in the US imported sector is now Concha Y Toro, the listed Chilean company, while the leading French brand is Georges Duboeuf, the sixth largest import.
The French wine industry could benefit from adopting some of the technology that has been one of the driving platforms for the new world wines success. Examples would be drip irrigation systems used extensively in Australia as well as the practice of using
d hi i th f t ti t dd k fl t th i d t i ti th t fl th h i i kwood chips in the fermentation process to add oak flavors to the wine, as opposed to imparting that flavor through aging in oak barrels, which is a technique also perfected by the Australians. In some cases, French wine producers would like to adopt these technologies, however, they are prevented from doing so through stringent and often ancient regulations that prohibit such practices.
THE BOSTON CONSULTING GROUP 23
SELECTED WINE PRODUCING COUNTRY PROFILESSA
Key points
USA
Key points
– Strong domestic producer with rising demand for imports.– Growth market with substantial trading up.– Both listed and commercially minded private wine companies.
The US wine market is interesting because it combines strong domestic production with a growing import market. Overall, the US is a net wine importer. Moreover, per capita consumption is low. As a result, there is a significant opportunity for consumption to increase.
US wine companies tend to commit to a higher quality profile and to building brand awareness through advertising. While consumption is geographically diverse, production is concentrated in California—around 90% of US output in volume terms according to the Wine Institute. The US is the fourth largest wine producer in the world with total production of 1.9bn liters—equivalent to around 200m cases.
US wine consumption recovered in the mid-1990s and continues to have high potential. Per capita consumption is low for such a large wine producing country. In 1997, the US was the number 31 in the world on this basis with a minuscule intake of 7.4 liters per annum. This is half of the UK level and a mere 10% of the levels enjoyed in Southern Europe. In the second half of the decade, volume grew at a brisk 4% compounded annual rate.
THE BOSTON CONSULTING GROUP

SELECTED WINE PRODUCING COUNTRY PROFILESSA
I dditi t it iti d l i l th th US k t b fit i ifi tl f t di A di t d t
USA
In addition to its positive underlying volume growth, the US market benefits significantly from trading up. According to datapublished by Allied Domecq, the high-premium segment (for them, >$7 per bottle) in the past four years grew at a rate of 10–14% with the premium segment as a whole averaging 7%.
There were markedly faster rates than for the industry as a whole The shift to premium wines is positive both for the domesticThere were markedly faster rates than for the industry as a whole. The shift to premium wines is positive both for the domestic producers' profitability outlook and for exporters to the US.
The top five US wine brands enjoy a 30% share of the domestic premium market. While less concentrated in comparison with other US alcoholic beverages, this is relatively concentrated for premium wine brands when compared with other countries, and isUS alcoholic beverages, this is relatively concentrated for premium wine brands when compared with other countries, and is consistent with a higher focus on advertising. Robert Mondavi spends 4–5% of sales on advertising, which is more than the major Australian listed companies spend in their domestic market.
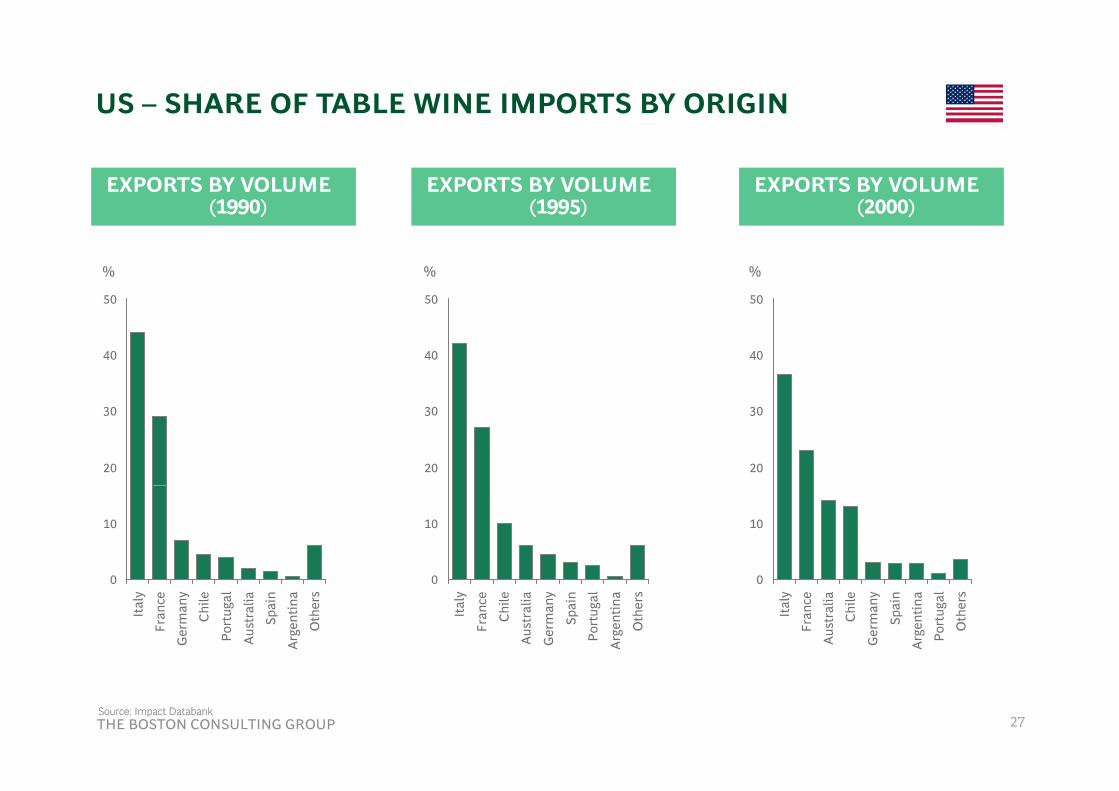
In the 1990s, Americans doubled their consumption of imported wine, which increased from 21.2m cases in 1990 to 43.8m cases in 2000. The import share rose from 9.8% to 18%. Italy and France remain the largest exporters to the US. However, Australia has been comfortably the fastest growing. Brand building and a commitment to advertising is a critical component of success in the US wine market as a whole. The import sector is no different.
THE BOSTON CONSULTING GROUP 25
SELECTED WINE PRODUCING COUNTRY PROFILESSA
A t li ' R t d Li d ' b th th t fi i t d US i b d d it th t ' ll l
USA
Australia's Rosemount and Lindeman's are both among the top five imported US wine brands despite the country's overall volumeshare of only 14.0%. Chile, with an overall share of 13.3%, boasts the number one seller—Concha Y Toro. France's lack of commitment to brands is telling—only one of the top brands is French despite an overall imported share of 22.9%. Italian brands fare much better.
Wine production in the United States has increased dramatically in the past ten years, aided in many respects by technological innovations. A good example of this innovation is the drip irrigation system pioneered in California in the 70s and 80s. It is basically a long pipe with micro jets inserted with the trellises that allow vines to grow roots deeper into the ground, ensuring higher quality at a given yield Additionally this form of irrigation is more efficient in water and fertilizer use thereby allowing more arid landat a given yield. Additionally this form of irrigation is more efficient in water and fertilizer use, thereby allowing more arid land areas to be used for grape growth. The use of different soils increases the spectrum of wine characteristics from the grape allowing greater product differentiation and is also less stressful on the land, thereby ensuring yields in the long run. EU legislation however, prohibits Spanish, Italian and French producers from irrigating their lands, thereby crippling their ability to take advantage of this k d l t hi h i th US d t i lik A t li d t i i d tikey development, which gives the US and countries like Australia an advantage in wine production.
U.S. wine producers also benefit from a relative lack of regulations that serve to restrict their production efforts—they are free to use whatever technologies they deem worth it to further the competitiveness of their products. Their European competitors are not so luckyso lucky.
THE BOSTON CONSULTING GROUP 26
US – SHARE OF TABLE WINE IMPORTS BY ORIGIN
EXPORTS BY VOLUME(1990)
EXPORTS BY VOLUME(1995)
EXPORTS BY VOLUME(2000)
50
%
50
%
50
%
( ) ( ) ( )
40 40 40
20
30
20
30
20
30
10 10 10
0
Port
ugal
Chile
Oth
ers
Spai
n
Aust
ralia
Ital
y
Ger
man
y
Fran
ce
Arge
ntin
a
0
Ger
man
y
Aust
ralia
Oth
ers
Port
ugal
Spai
n
Ital
y
Chile
Fran
ce
Arge
ntin
a
0
Ger
man
y
Chile
Oth
ers
Arge
ntin
a
Spai
n
Ital
y
Aust
ralia
Fran
ce
Port
ugal
THE BOSTON CONSULTING GROUP 27Source: Impact Databank
27
SELECTED WINE PRODUCING COUNTRY PROFILESA S A A
Key points
AUSTRALIA
Key points
– Export-driven growth—quality, increasingly marketing-driven, and low-cost base.– Domestic market stable.– Dominated by listed companies which look to consolidate domestically and internationally.– Looking to add new success stories to US and UK.
Dominance by listed companies that have access to equity capital, intelligent handling of distribution, a focus on quality and an unusually weak currency explain the success of the Australian wine industry. Domestic consumption remains steady—lifted more by population growth than taste changes—and provides a firm financial platform for international expansion.
The Australian wine industry's growth is based on international expansion. Domestically, the industry is fairly uninteresting. Australians drink around 20 liters of wine per year on average and have done so for the past two decades. The main barriers to domestic volume growth are relatively high taxes and Australia's maturity (in all senses) as an alcohol market. Moreover, taxes in Australia are levied on the value of the product, which inhibits the growth of the premium segment.
THE BOSTON CONSULTING GROUP
AUSTRALIAN WINE EXPORTS BY DESTINATION
EXPORTS BY VALUEEXPORTS BY VOLUME
50
%
50
%
40 40
20
30
20
30
10 10
0
Oth
er
Irel
and
Japa
n
Cana
da
New
Zea
land
USAU
K
Swed
en
Switz
erla
nd
Ger
man
y
0
Oth
er
Swed
en
Switz
erla
nd
Ger
man
y
Irel
and
Japa
n
Cana
da
New
Zea
land
USAU
K
THE BOSTON CONSULTING GROUP 29Source: Wine Trade
N N29
SELECTED WINE PRODUCING COUNTRY PROFILESA S A A
Th t k t i h A t li i h b i l f l N t l h A t li bb d th b t
AUSTRALIA
The export market is where Australian wines have been conspicuously successful. Not only has Australia grabbed the number twostatus in the UK but is now number three in the US, having dislodged Chile. In the four years to 2000, Australian wine exports to America increased at a 30% compound rate—significantly faster than any of its main competitors. Australian exports to the US arealready as much as one third of the Italians.
Furthermore, Australian wine vintages refer to the year in which the grapes are bottled—not to when they are picked. Thus, Australia can achieve greater consistency by blending grapes of different vintages.
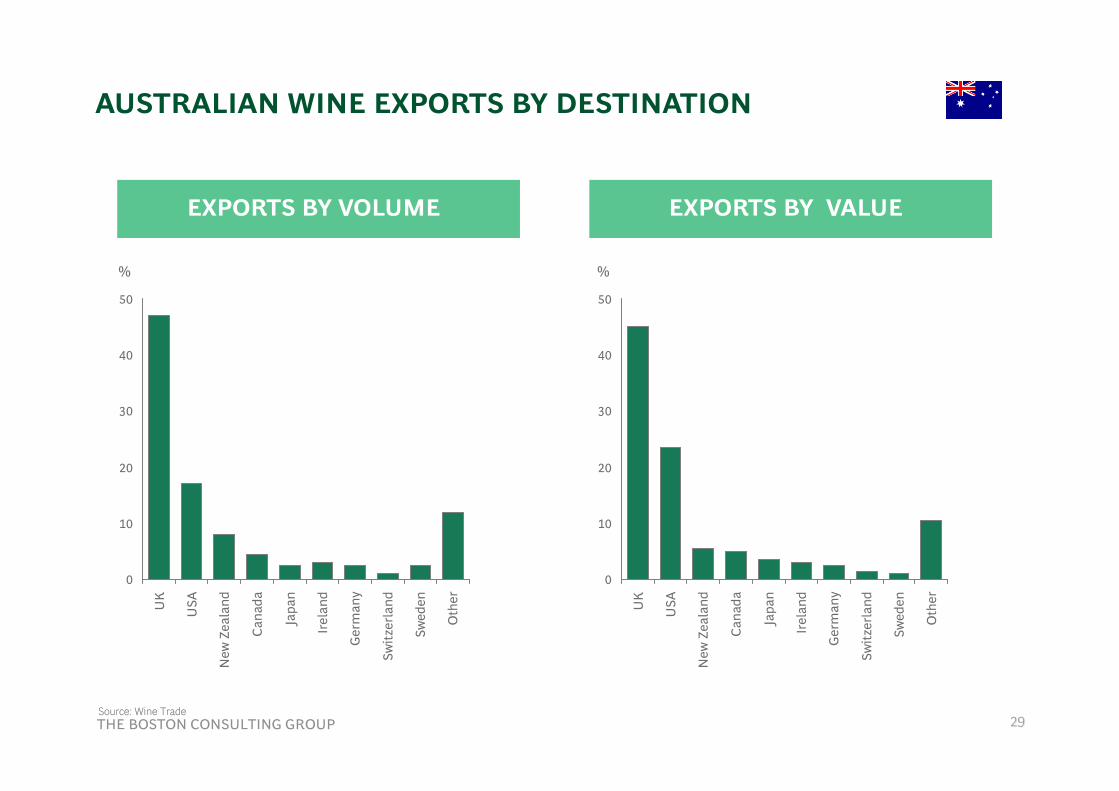
As the above table shows, the UK and US absorb 65% of Australia's wine exports by volume. New Zealand, which relies on AustraliaAs the above table shows, the UK and US absorb 65% of Australia s wine exports by volume. New Zealand, which relies on Australiato satiate its thirst for quality full- bodied red wines, takes up a further 9%.
Australia's successes have so far been in English speaking markets. However, this is less important as a measure of the winemakers' competence than the ability of Australia to sell into countries which are strong domestic producers. The US success is arguably a more positive indicator than the UK.
THE BOSTON CONSULTING GROUP
SELECTED WINE PRODUCING COUNTRY PROFILESA S A A
A t li h i ifi t t b d t th t i I ti l h it t i th US k t it d
AUSTRALIA
Australia has a significant cost base advantage over other countries. In particular, when it competes in the US market it does so against companies whose land costs are massively higher. In terms of overall costs per case, Australian listed wine companiesaverage, about half their North American counterparts.
From a technological standpoint innovation in wine technology has helped the Australian wine industry launch itself upon theFrom a technological standpoint, innovation in wine technology has helped the Australian wine industry launch itself upon theworld. An example of innovation pioneered by the Australian producers is the use of oak during the fermentation process. Aging in oak barrels gives the wine its flavor (or bouquet), with the barrel size, age (newer is better) and oak type influencing the flavors imparted into the wine. While the use of oak barrels cannot be circumvented for the production of top-end wines, Australian wineries have adopted stainless steel vats to ferment their middle range wines in By adding oak woodchips to the vats duringwineries have adopted stainless steel vats to ferment their middle range wines in. By adding oak woodchips to the vats duringfermentation, Australian wine producers add the desired oak flavors and gain a significant scale advantage over producers whoadhere strictly to barrel fermentation. This practice is seriously outlawed in France, despite the significant cost advantage.
THE BOSTON CONSULTING GROUP
SELECTED WINE PRODUCING COUNTRY PROFILESA
K i t
ITALY
Key points
– Fragmentation restricts profitability.– Consumption volumes trading down but consumers trade up.– Opportunities are in export and brand building– Opportunities are in export and brand building.
Italy is the world's largest wine producer. Most of the country's winegrowers are part of a Cooperativa (i.e., they have co-operative ownership structures). These associations of winegrowers initially existed to optimize costs and secure distribution. At present, they represent the biggest operators in the industry, together with some well-known families, such as Caviro, Massaro, Coltiva (10,000 ha) and Cantine Riunite, or Zonin Family (1,500 ha) for table wine and premium wine, and Cinzano (Campari group), Gancia and Martini (Bacardi Group) for sparkling wines.
The average winery holds around 1 ha of land, although Northeastern wineries tend to be slightly bigger, around 1.26 ha, which reflects the co operatives structure and the non existence of major public companies (excluding Campari which is mainly inreflects the co-operatives structure and the non-existence of major public companies (excluding Campari, which is mainly in sparkling). Though this average seems very low, it actually hides a very wide range of winery sizes, implying that, despite of aconsiderable fragmentation, there is a much room for consolidation.
THE BOSTON CONSULTING GROUP

SELECTED WINE PRODUCING COUNTRY PROFILESA
Th l i i f d i N th It l ith th ti f Si il Th th i ith t d d Pi d t
ITALY
The larger wineries are found in Northern Italy, with the exception of Sicily. The other regions with extended acreage are Piedmont (Barbera, Barolo and Barbaresco), with around 1.5 ha and Tuscany (Chianti) with 1.4 ha. These averages compare with the Zoninfamily, holding around 1,500 ha spread across 7 prestigious wine regions, and the Coltiva co- operative, holding around 10,000 ha. In other words, there are large discrepancies in winery sizes and this have a direct impact on the wine industry in terms of brand building.
Critical size for production and marketing purposes is somewhat missing. Wine production fell by one third from 7,800m liters to5,500m liters in the 15 years to 2000.The acreage utilization dropped by 10%. We expect this trend to continue as a result of three main factors:main factors:
– As indicated, the production network is very fragmented except for a limited number of large families. The existing myriad of small, family-owned wineries, who are not members of co-operatives, do not hold a brand name, nor is the quality of their product good enough to ensure survival in the long run. Therefore, these smaller winegrowers might didisappear.
– In 1997, 39% of the heads of wineries were aged 65 plus and 46% were aged 45-–64 years. The younger generation might be expected to sell out.
– Finally, the appellations restrict the production areas and the yields per hectare. Therefore, there will be a land constraint in terms of acreageconstraint in terms of acreage.
THE BOSTON CONSULTING GROUP

SELECTED WINE PRODUCING COUNTRY PROFILESA
L d ti i b i ff t b i d lit Thi i i l d i b t f t
ITALY
Lower production is being offset by improved quality. This is mainly driven by two factors:
– As domestic consumption decreases every year, wineries look at opportunities to grow abroad. The image of Italian wine is well established. But competition is tough in major markets such as the US, the UK, Japan or Germany. Therefore, brand building will gradually become a necessity to compete in the export market of good quality wines.
– More emphasis is attributed to good quality wines and their origin and the appellations are one of the tools used to leverage on quality and drive prices higher. Government and related agencies fully support and promote the appellation system.
Italian winemakers have growth potential both in Italy, attributable to trading up, and abroad where, despite intense competition, the country's profile remains strong.
THE BOSTON CONSULTING GROUP

ITALY – WINE EXPORTS BY VOLUME AND BY VALUE
EXPORTS BY VOLUME EXPORTS BY VALUE
40
%
40
%
30 30
20 20
10 10
0
Oth
er
Aust
ria
Switz
erla
ndUK
USA
Fran
ce
Ger
man
y
Net
herla
nds
Cana
da
Japa
n
0
Oth
er
Net
herla
nds
Aust
ria
Cana
da
Fran
ce
Switz
erla
nd
Japa
n
UK
USA
Ger
man
y
THE BOSTON CONSULTING GROUP 35Source: Wine Trade
35

KEY WINE MAKING METRICS – JULY 2002
C dit P iSuper
P iUltra
P i
Prices for crushed and delivered grapes (US$ / Ton)
• Australia
Commodity
$75
Premium
$400
Premium
$1,500
Premium
$2,000• Chile• France• Italy• United States
$$85$125$95$150
$$450$700$600$500
$ ,$2,000$5,000$3,500$3,600
$ ,$4,000$12,500$7,500$5,000
Cases per Tonne
Bottles per Case
A d i & b li
85
12
$ 8
70
12
$
63
12
$ 6
55
12
$Average production & bottling cost per bottle (US$)1
Average wholesale price per bottle (US$)1
$0.80
$1.50
$0.90
$4.00
$1.60
$8.00
$2.10
$20.00
( )
Freight cost (US to Australia or Australia to US) (US$/btl)
$0.60 $0.60 $0.60 $0.60
THE BOSTON CONSULTING GROUP 36361. Average cost and price are the same for all competitors

Press Search ArticlesPress Search Articles
THE BOSTON CONSULTING GROUP 37
US WILL BE A KEY MARKET (1/2)i b l
( ) 2003 H ld d W kl Ti Li it d
By Lucia Isabel2 July 2003Herald and Weekly Times
(c) 2003 Herald and Weekly Times Limited
The Australian wine industry's golden future may lie with the United States.
Australian Wine and Brandy Corporation senior analyst Lawrie Stanford said the nation's export performance was beginning to y p y p p g gplateau in our largest export destination, the United Kingdom. Mr Stanford said the US was the industry's biggest growth prospect.
"The US is rapidly approaching our value performance in the UK, so it seems our golden future may be with the US," he said.
"W h t ti f l i th l i d t d i ""We have a concentration of sales in the popular premium and top-end wines."
But the competition will be fierce, particularly from France, where growers are calling for authorization to blend varietal wines, more liberal winemaking techniques, such as oak chip use, a proactive branding policy, and consumer-driven research. Mr Stanford, a key speaker at the NSW Wine Industry Association seminar said domestic wine sales were growing at 2 percent a year but thea key speaker at the NSW Wine Industry Association seminar, said domestic wine sales were growing at 2 percent a year, but the export market was where the industry's future lay. Australian exports make up just 5 percent of world volume and 7 percent interms of value.
"This means we could be trodden on quite easily, particularly by France, or there is still a lot of expansion we could still do," Mrq y, p y y , p ,Stanford said.
He said the industry needed to target the emerging wine consuming nations of Denmark, Netherlands, the UK, Sweden, Ireland, Finland and Japan.
THE BOSTON CONSULTING GROUP 38
i b lUS WILL BE A KEY MARKET (2/2)By Lucia Isabel2 July 2003Herald and Weekly Times
"We are doing well in all these markets because emerging wine consumers don't want to be intimidated by wine; they want to workg g g y ; yout what they do like," Mr Stanford said.
"We label our wine in a friendly way. We ensure it is branded and consumers are not being looked down on."
M St f d id th i k t t d diff t t iti f A t li i d G d JMr Stanford said the emerging markets represented different opportunities for Australian wine producers. Germany and Japan offer niche opportunities, while the US and Canada were volume markets for good-value wine.
"We are well established in the UK and have category status. The distributors have the attitude that it's a must-have category," MrStanford said "We are now ready to move on to regional wine (branding) "Stanford said. We are now ready to move on to regional wine (branding).
Cowra vigneron David O'Dea said the bias towards export was strong and the domestic market should not be ignored.
Mr O'Dea said Queensland was emerging as an important market. "They want different wines to what we sell in Victoria and NSW," he said. "They are looking for chilled, lighter reds and more fruit-driven wines."
THE BOSTON CONSULTING GROUP 39

REGULATIONS CUT INTO OLD WORLD WINE PRODUCERS COMPETITIVENESS (1/3)By Paul Tranter20 September 2002The Times
COMPETITIVENESS (1/3)
A large part of the performance gap between the New World and Old World wine countries is explained through an examination ofthe differences in the regulatory framework and the activities of institutions in each country/region. Essentially, the New World has taken a market-driven approach to the development of the wine industry, while the Europeans have taken a more protectionist approach facilitated through the Common Agriculture Policy (CAP).
There are some reasons surrounding this approach: -wine has a high contribution value to final agriculture output in the major markets (5.4% in Spain, 14.3% in France and 9.8%) Additionally it is the most significant agricultural export product and the areas that are under vine are susceptible to soil erosion if vines are removed.
Alongside the CAP, a network of Appellation Control Committees polices the production in Old World countries. In France theseAppellation Committees were first established in 1930 and are responsible for setting the minimum requirements for each wine region The original and still e isting intention of these Control Committees is to protect the standard of the ine prod ced ithinregion. The original and still existing intention of these Control Committees is to protect the standard of the wine produced within the region. Wines that pass the prescribed tests are then branded with the appellation control stamp. In reality the application of these regulations has led to an endorsed legacy of rigid wine techniques within the French industry denying local winemakers of access to much of the innovation adopted by the less regulated New World Wine Countries.
THE BOSTON CONSULTING GROUP 40
REGULATIONS CUT INTO OLD WORLD WINE PRODUCERS COMPETITIVENESS (2/3)COMPETITIVENESS (2/3)By Paul Tranter20 September 2002The Times
The appellation regulation is highly prescriptive, touching all parts of the wine-making process, and its application can result in seemingly perverse outcomes. For example, the alcohol content of a Sauvignon Blanc wine grown in Bordeaux is restricted to nogreater than 12.5%. However given the influence of weather, often growing conditions and limited harvesting opportunities cancombine to produce a ripe crop that, if processed naturally, would result in the wine exceeding the allowable limit of 12.5%. In the New World the winemaker would be delighted, sensing an opportunity to produce a powerful fruity wine that could be differentiated from other competitors or alternatively, blended with other wines to ensure product consistency. However in the Old World of Bordeaux the winemaker is restricted to two much more grim alternatives, either use production processes to effectivelyg p p ywater down the wine, or alternatively to break the law and produce a wine that doesn't conform to the regulation.
On a macro level, the appellation framework (a) underwrites production (b) restricts growth and output and (c) limits the use oftechnology. The following table in exhibit 17 highlights the differences in regulation between France and Australia across anassortment of winemaking activities. As a result, Old World producers are limited in their ability to innovate and meet changingcustomer's demands. Additionally, the appellation quality control mechanisms are not end-product focused (they primarily govern the inputs), which means that there are free-rider incentives for the Old World producers—it is not uncommon to have wide variability within a given appellation which undermines the value of the appellation structure and prevents the establishment ofsuccessful brands.
THE BOSTON CONSULTING GROUP 41
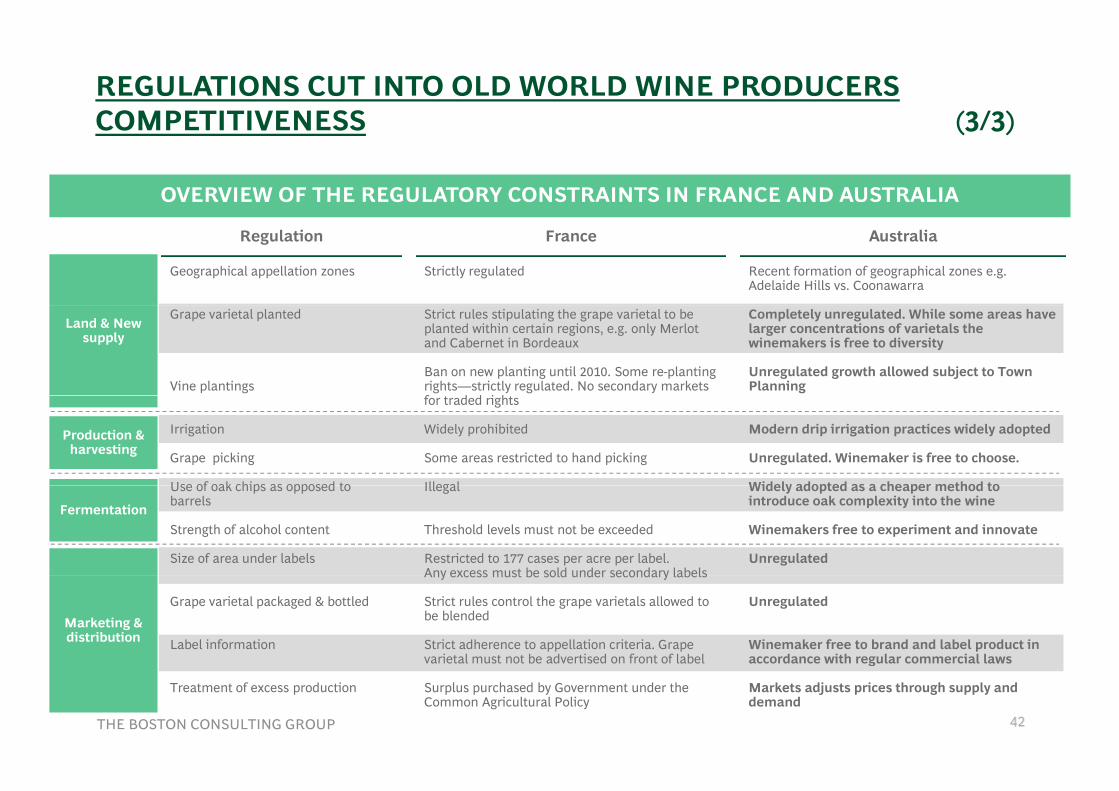
REGULATIONS CUT INTO OLD WORLD WINE PRODUCERS COMPETITIVENESS (3/3)COMPETITIVENESS (3/3)
OVERVIEW OF THE REGULATORY CONSTRAINTS IN FRANCE AND AUSTRALIA
Regulation
Geographical appellation zones
France
Strictly regulated
Australia
Recent formation of geographical zones e.g. Adelaide Hills vs. Coonawarra
Grape varietal planted
Vine plantings
Strict rules stipulating the grape varietal to be planted within certain regions, e.g. only Merlot and Cabernet in Bordeaux
Ban on new planting until 2010. Some re-planting rights—strictly regulated. No secondary markets f d d i h
Completely unregulated. While some areas have larger concentrations of varietals the winemakers is free to diversity
Unregulated growth allowed subject to Town Planning
Land & New supply
Irrigation
Grape picking
Use of oak chips as opposed to
for traded rights
Widely prohibited
Some areas restricted to hand picking
Illegal
Modern drip irrigation practices widely adopted
Unregulated. Winemaker is free to choose.
Widely adopted as a cheaper method to
Production & harvesting
Use of oak chips as opposed to barrels
Strength of alcohol content
Size of area under labels
Illegal
Threshold levels must not be exceeded
Restricted to 177 cases per acre per label. Any excess must be sold under secondary labels
Widely adopted as a cheaper method to introduce oak complexity into the wine
Winemakers free to experiment and innovate
Unregulated
Fermentation
Grape varietal packaged & bottled
Label information
Any excess must be sold under secondary labels
Strict rules control the grape varietals allowed to be blended
Strict adherence to appellation criteria. Grape varietal must not be advertised on front of label
Unregulated
Winemaker free to brand and label product in accordance with regular commercial laws
Marketing & distribution
THE BOSTON CONSULTING GROUP 42
Treatment of excess production Surplus purchased by Government under the Common Agricultural Policy
g
Markets adjusts prices through supply and demand
42
LOOKING UP DOWN UNDER FAST-GROWING AUSTRALIA WINE INDUSTRY SECOND-BIGGEST SELLER IN THE U.S. (1/3)INDUSTRY SECOND BIGGEST SELLER IN THE U.S. (1/3)BLOOMBERG NEWS – 29 April 2003Pittsburgh Post-Gazette
Copyright (c) 2003 Bell & Howell Information and Learning Company. All rights reserved.
ADELAIDE, Australia
Adelaide is in the heart of the world's fastest-growing wine region. Australian-based companies have captured more than 10 percent of the $13.8 billion international wine trade, according to Dutch agribusiness lender Rabobank International. And the value of Australia's wine exports has grown an average of 33 percent a year since 1986, reaching $1.48 billion in the year ended in March, says Australian Wine and Brandy Corp a government regulatory bodysays Australian Wine and Brandy Corp., a government regulatory body.
Australia became the largest wine exporter to Britain last year, overtaking France. And in the United States, it's now the second-biggest source of imports behind Italy, and its sales volume grew 67 percent last year, according to Salomon Smith Barney, now called Citigroup Global Markets Inc. California wine sales, which have 70 percent of the U.S. market, grew by 3 percent.called Citigroup Global Markets Inc. California wine sales, which have 70 percent of the U.S. market, grew by 3 percent.
"The growth of Australian wine sales in the U.S. is staggering," said Jon Fredrikson, CEO of Woodside, Calif.-based wine industry consulting group Gomberg, Fredrikson & Associates. "The Aussies have shown the French how to write the book when it comes to marketing."
THE BOSTON CONSULTING GROUP 43

LOOKING UP DOWN UNDER FAST-GROWING AUSTRALIA WINE INDUSTRY SECOND-BIGGEST SELLER IN THE U.S. (2/3)INDUSTRY SECOND BIGGEST SELLER IN THE U.S. (2/3)BLOOMBERG NEWS – 29 April 2003Pittsburgh Post-Gazette
Climatically perfect
The secret of Australia's success, says California wine consultant Robert Nicholson, is that its wines are simply better values than h i C lif i d i l " h d li f h i " id i h l i i l f i l i itheir California and European rivals. "They over deliver for the price," said Nicholson, principal of International Wine Associates,
which has advised on $650 million worth of wine industry mergers and acquisitions in the past 10 years. "You can get the samequality from a $7 bottle of Australian wine as you can from a $9 or $10 Californian equivalent."
Australian winemakers and their rivals cite several reasons for that ability to deliver Most important they say are cost and climateAustralian winemakers and their rivals cite several reasons for that ability to deliver. Most important, they say, are cost and climate. Australia, a country the size of the mainland United States with a population of just 19 million -- less than that of Texas -- has abundant cheap land. A sweeping, sunny 1,860-mile arc of that territory, between the barren outback and the modern cities built on the coast of southern Australia, is climatically perfect for growing grapes, says Nicholson. Australia's first white settlers, British con icts ho'd been deported to A stralia to set p the colon of Ne So th Wales aro nd S dne Co e in 1788 planted ines soonconvicts who'd been deported to Australia to set up the colony of New South Wales around Sydney Cove in 1788, planted vines soonafter their arrival.
Fifty years later, non-convict European immigrants settling outside Adelaide in the colony of South Australia began growing grapes in the Barossa Valley and the McLaren Vale Today South Australia is the country's most important wine-growing areain the Barossa Valley and the McLaren Vale. Today, South Australia is the country s most important wine growing area.
"You can buy the land and plant a vineyard in McLaren Vale for a low price per acre," says wine consultant Fredrikson. "In Sonoma, here in California, it would cost you two or three times as much. In the Napa Valley, it would be four or five times higher."
THE BOSTON CONSULTING GROUP 44
LOOKING UP DOWN UNDER FAST-GROWING AUSTRALIA WINE INDUSTRY SECOND-BIGGEST SELLER IN THE U.S. (3/3)INDUSTRY SECOND BIGGEST SELLER IN THE U.S. (3/3)BLOOMBERG NEWS – 29 April 2003Pittsburgh Post-Gazette
Few restrictions
Millar says cost is only one Australian advantage. Another is the fact that Australia lacks the regulations that restrict so-called old-ld d iworld producers in Europe.
Many French winemakers have to operate under the Appellation d'Origine Contrôlée system -- a set of rules that restricts them to using only those grapes from their immediate locality and of specified varieties.
"The rules in France are much too strict," said Pernod-Ricard's Patrick Ricard. "As long as France cannot change them, it will not be in a good position to compete against wines of the new world."
In Australia, winemakers face few such restrictions. They can use grapes from any of scores of wine-growing areas stretching from the Hunter Valley just inland from the Pacific Ocean north of Sydney to the Margaret River on the Indian Ocean south of Perth inWestern Australia.
France's share of the international wine trade has declined to 40 percent from 50 percent in the past 10 years, according to theFederation of French Wine and Spirits Exporters.
THE BOSTON CONSULTING GROUP 45

ANSWERS (1/2)
Overview of possibleOverview of possible answersanswers
THE BOSTON CONSULTING GROUP 46
Q1 . I BELIEVE THE US SHOULD BE THEIR #1 PRIORITY. IS THIS CORRECT? WHAT MAKES THIS COUNTRY ATTRACTIVEIS THIS CORRECT? WHAT MAKES THIS COUNTRY ATTRACTIVE FOR THEM?To ans er this q estion o need to foc s on ke iss es to anal e the market incl ding: hat is the market si e and its historicalTo answer this question, you need to focus on key issues to analyze the market, including: what is the market size and its historical growth? Is it profitable? Is there a future potential for growth?
We suggest an approach in 3 slides:We suggest an approach in 3 slides:
– Illustration of the need for Australian wines companies to focus on exportations due to a flat domestic market– Comparison between the different potential markets (volume, growth, prices) showing US is attractive in both volume
and price– Illustration of positive market outlook: low consumption in the US and low market penetration of Australian wine
companies
It is also possible to illustrate the threat of competition in the US market (especially as US is self-sufficient in terms of p p ( p yproduction).
Instead of the three slides version, you could also have illustrated the attractiveness of the US market on a single slide bycomparing it with other countries on key market drivers (volume, growth, prices, consumption per capita, etc.).
THE BOSTON CONSULTING GROUP 47
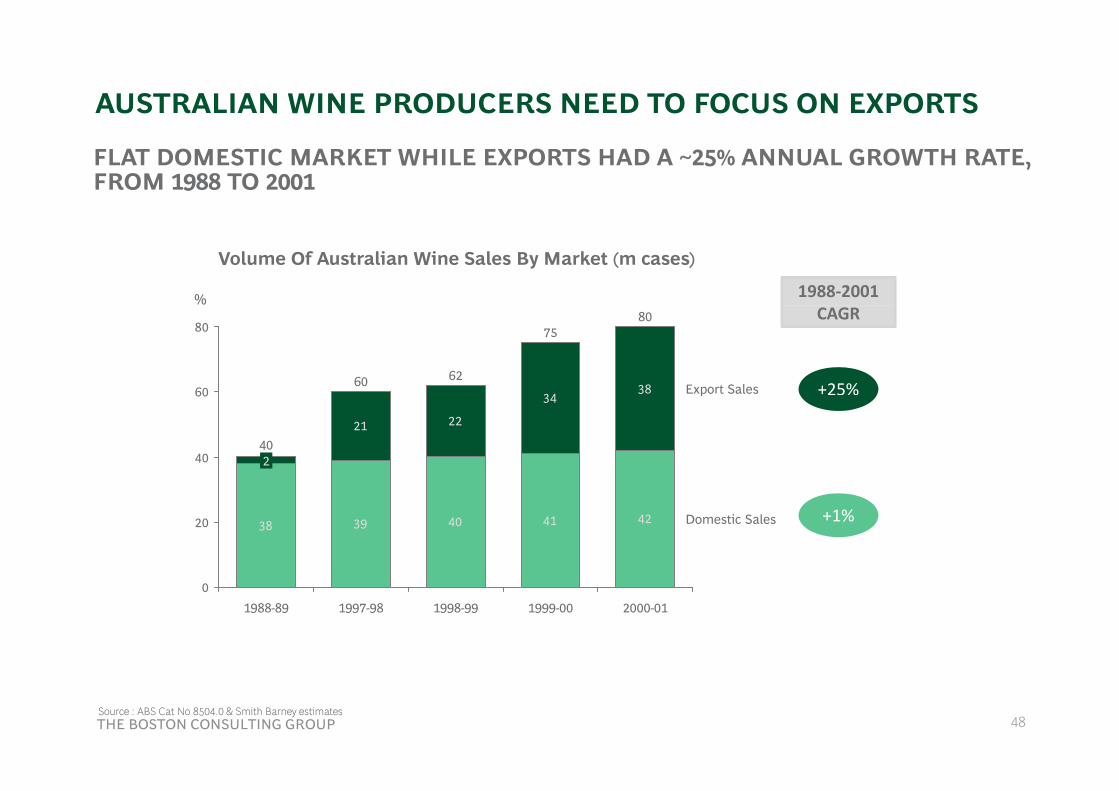
AUSTRALIAN WINE PRODUCERS NEED TO FOCUS ON EXPORTS
FLAT DOMESTIC MARKET WHILE EXPORTS HAD A ~25% ANNUAL GROWTH RATE, FROM 1988 TO 2001
Volume Of Australian Wine Sales By Market (m cases)
% 1988‐2001
343860
80
Export Sales
8075
6260
CAGR
+25%
21 22
34
40
60 p
402
38 39 40 41 4220 Domestic Sales +1%
02000-011999-001998-991997-981988-89
THE BOSTON CONSULTING GROUP 48Source : ABS Cat No 8504.0 & Smith Barney estimates
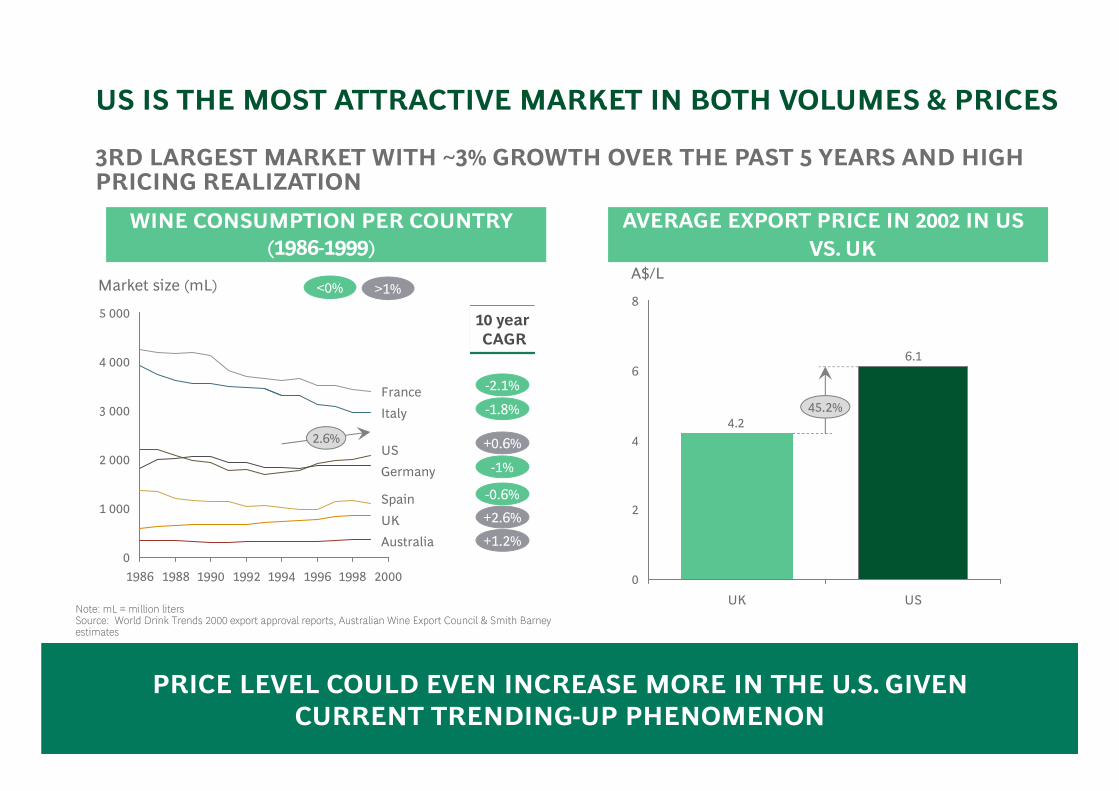
US IS THE MOST ATTRACTIVE MARKET IN BOTH VOLUMES & PRICES
3RD LARGEST MARKET WITH ~3% GROWTH OVER THE PAST 5 YEARS AND HIGH PRICING REALIZATION
AVERAGE EXPORT PRICE IN 2002 IN USWINE CONSUMPTION PER COUNTRY AVERAGE EXPORT PRICE IN 2002 IN US VS. UK
WINE CONSUMPTION PER COUNTRY (1986-1999)
8
A$/LMarket size (mL) >1%<0%
6.16
4 000
5 000
France
10 yearCAGR
-2.1%
4.24
45.2%
2 000
3 000
2.6%
GermanyUS
ItalyFrance
-1.8%
+0.6%
-1%
2
0
1 000
1986 1988 1990 1992 1994 1996 1998 2000
AustraliaUKSpain -0.6%
+2.6%+1.2%
Note: mL = million liters Source: World Drink Trends 2000 export approval reports, Australian Wine Export Council & Smith Barney estimates
0USUK
1986 1988 1990 1992 1994 1996 1998 2000
THE BOSTON CONSULTING GROUP 49
PRICE LEVEL COULD EVEN INCREASE MORE IN THE U.S. GIVEN CURRENT TRENDING-UP PHENOMENON

GROWTH POTENTIAL IN THE US GIVEN LOW CONSUMPTION PER CAPITA ESP FOR AUSTRALIA THAT CURRENTLY HAS A LOWCAPITA, ESP. FOR AUSTRALIA THAT CURRENTLY HAS A LOW PENETRATION RATE
A li d i h US f b hi dAUSTRALIA 3RD EXPORTER IN THE US FARAustralia 3rd exporter in the US, far behind leaders and with a share lower than in the UK
PER CAPITA CONSUMPTION IN THE US WAY BELOW UK AND FRANCE
Import shares in the U S in 2000 (by volume) in %Per capita consumption in 2002 (L)
AUSTRALIA 3RD EXPORTER IN THE US, FAR BEHIND LEADERS AND WITH A SHARE
LOWER THAN IN THE UK
37%40%
-37.8%
40
Import shares in the U.S. in 2000 (by volume), in %5960
Per capita consumption in 2002 (L)
23%
20%
30%
40
13%14%
10%16
11
20
3%
0%Chile GermanyAustraliaFranceItaly
0FranceUKUS
THE BOSTON CONSULTING GROUP 501. Hypothesis: UK per capita consumption calculated as 150% of US (was 200% in 1997 when US had 7.4L/capita consumption)Source: Impact Databank, press
50

Q2. WHICH PRODUCTS HAVE THE HIGHEST CHANCE OF BEING PROFITABLE AND COMPETITIVE IN THE US?
They currently have different options in mind in terms of priority products to enter the U.S. market with.
PROFITABLE AND COMPETITIVE IN THE US?
This is a quantitative question, all the information needed being in page 18 (Key Wine Making Metrics).
This is a major issue for them because product marketing decisions require long term planning to take into account the grape-to-bottle lead-time so please address it as deeply and accurately as possible.
The easiest way to present the results is through a table of data comparing Australian vs. US costs (US internal competitors being the highest threat).
THE BOSTON CONSULTING GROUP 51
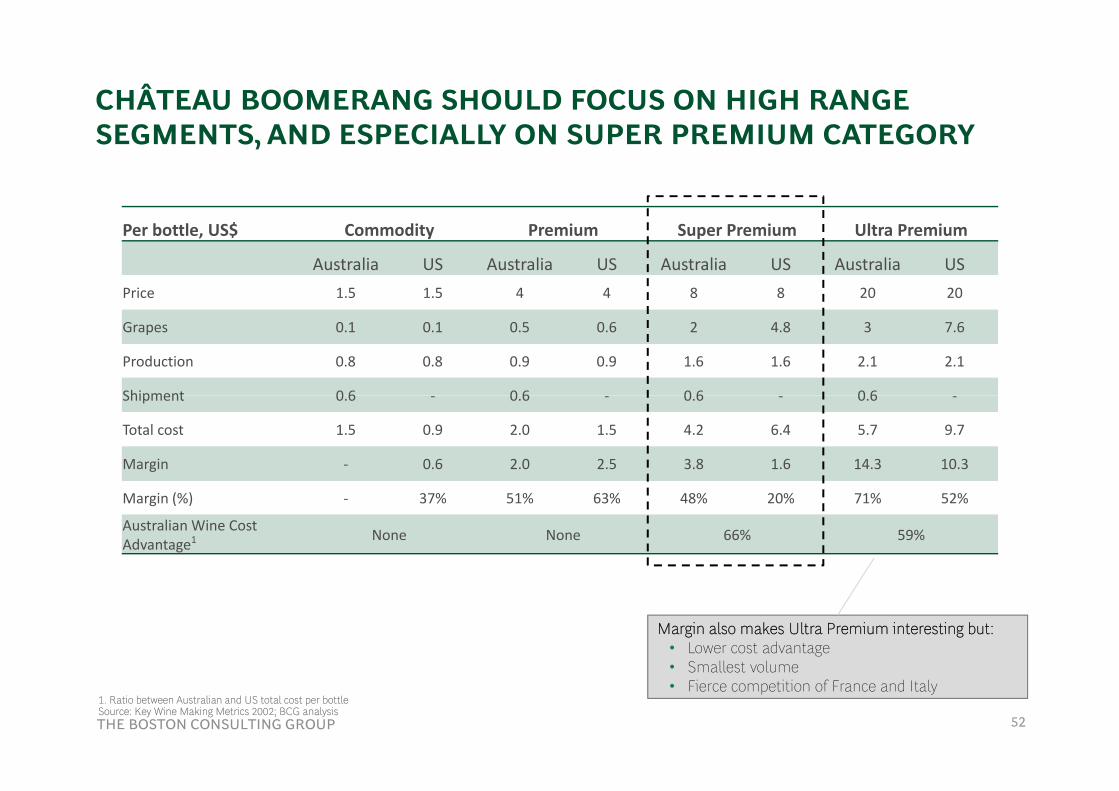
CHÂTEAU BOOMERANG SHOULD FOCUS ON HIGH RANGE SEGMENTS AND ESPECIALLY ON SUPER PREMIUM CATEGORYSEGMENTS, AND ESPECIALLY ON SUPER PREMIUM CATEGORY
Per bottle, US$ Commodity Premium Super Premium Ultra Premium
Australia US Australia US Australia US Australia USPrice 1.5 1.5 4 4 8 8 20 20
Grapes 0.1 0.1 0.5 0.6 2 4.8 3 7.6
Production 0.8 0.8 0.9 0.9 1.6 1.6 2.1 2.1
Shipment 0 6 0 6 0 6 0 6Shipment 0.6 ‐ 0.6 ‐ 0.6 ‐ 0.6 ‐
Total cost 1.5 0.9 2.0 1.5 4.2 6.4 5.7 9.7
Margin ‐ 0.6 2.0 2.5 3.8 1.6 14.3 10.3
Margin (%) ‐ 37% 51% 63% 48% 20% 71% 52%
Australian Wine Cost Advantage1 None None 66% 59%
Margin also makes Ultra Premium interesting but:• Lower cost advantage• Smallest volume
THE BOSTON CONSULTING GROUP 52
• Smallest volume• Fierce competition of France and Italy
1. Ratio between Australian and US total cost per bottleSource: Key Wine Making Metrics 2002; BCG analysis
Q3 . WHAT ARE THE STRENGTHS THAT MAKE AUSTRALIAN WINES COMPETITIVE IN THE US MARKET VS THEIR MAINWINES COMPETITIVE IN THE US MARKET VS. THEIR MAIN COMPETITORS?
Y t t lid th fi t t li t h t th k f t (KSF ) i thi i d t th d tYou can create two slides: the first one to list what the key success factors (KSFs) are in this industry, the second one to compare the different countries on each of them.
The other option is to create only one slide that compares the different countries and illustrate in your oral presentation why you chose these KSFs e g :chose these KSFs, e.g.:
– Legislation: drives the ability to use techniques enhancing quality, at lower cost and allowing simple branding based on varietals
– Land availability and climatic conditions: drives cost of land and cost of grapes (through yield) as well as quality – Volume of exports & consolidation: allows for economies of scale in distribution and branding among others
If you have enough time left, you can also prepare an Executive Summary to list the key messages of your presentation on a slide, but don't forget your overall presentation should not exceed 5 slides maximum.
THE BOSTON CONSULTING GROUP 53

AUSTRALIA HAS SIGNIFICANT COMPETITIVE ADVANTAGES ON KEY SUCCESS FACTORS IN THIS INDUSTRYSUCCESS FACTORS IN THIS INDUSTRY
Australia US Europe1 ChileAustralia US Europe1 Chile
Legislation + + − +Land & climate + − − ?
Export volume (mL) 471 301 5 396 342
C lid ti + + ?Consolidation
Grapes costs
+ + − ?
+ − − −+1.France, Italy, Spain and Germany
THE BOSTON CONSULTING GROUP 54
AUSTRALIA ADVANTAGE IS PROBABLY SUSTAINABLE (E.G. LONG LEAD TIME FOR LEGISLATION TO BE RELAXED)

ANSWERS (2/2)
Examples of slides pprepared by three p p yBCG candidatesBCG candidates (initially hand-written)(initially hand-written)
THE BOSTON CONSULTING GROUP 55
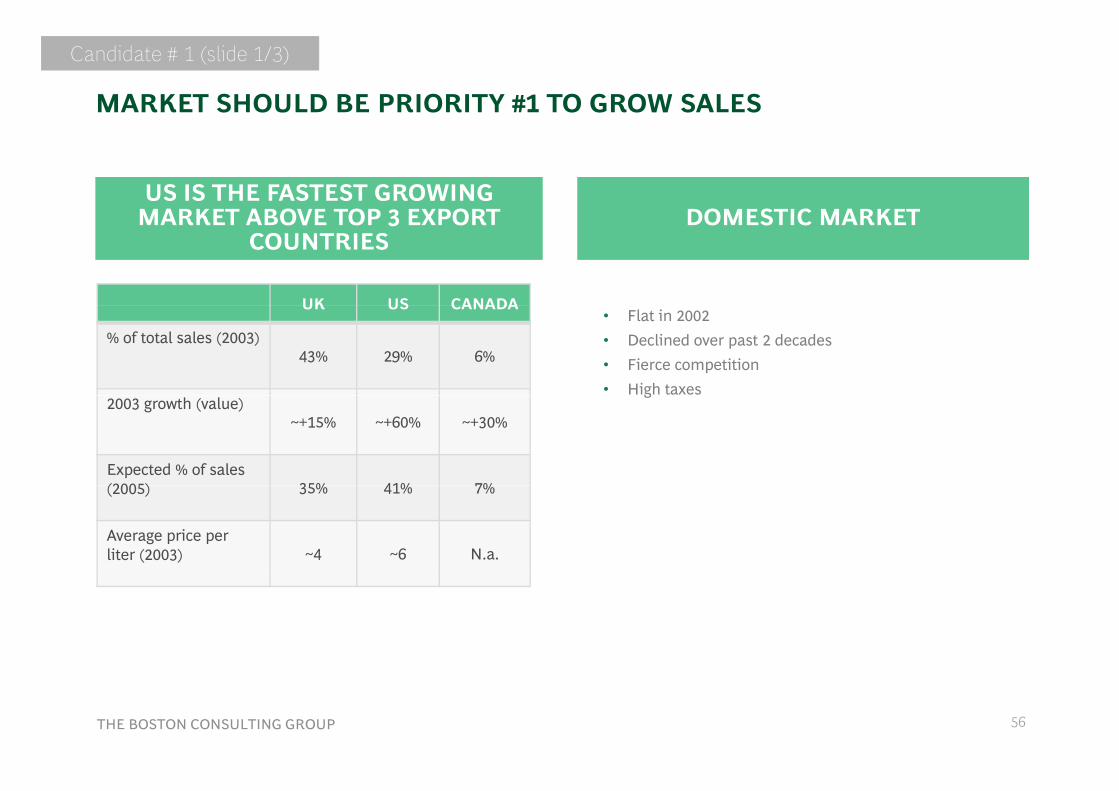
MARKET SHOULD BE PRIORITY #1 TO GROW SALES
Candidate # 1 (slide 1/3)
DOMESTIC MARKETUS IS THE FASTEST GROWING
MARKET ABOVE TOP 3 EXPORT DOMESTIC MARKETMARKET ABOVE TOP 3 EXPORT COUNTRIES
UK US CANADA• Flat in 2002• Declined over past 2 decades• Fierce competition• High taxes
UK US CANADA
% of total sales (2003)43% 29% 6%
g2003 growth (value)
~+15% ~+60% ~+30%
Expected % of sales (2005) 35% 41% 7%(2005) 35% 41% 7%
Average price per liter (2003) ~4 ~6 N.a.
THE BOSTON CONSULTING GROUP 56

CHATEAU BOOMERANG SHOULD FOCUS ON ULTRA PREMIUM WINES TO ENTER 115 MARKET
Candidate # 1 (slide 2/3)
TO ENTER 115 MARKET
SIMPLIFY P&L FOR AUSTRALIAN WINE PROTECTION (115$)PROTECTION (115$)
COMMODITY PREMIUM SUPER ULTRA • Ultra premium segment would be the
most profitable one for Australian wines (~14$/bottle)
• Ultra premium segment represents 24% of US market
COMMODITY PREMIUM PREMIUM PREMIUM
Cost of groups (1 tonne) 75$ 400$ 1500$ 2000$
24% of US market• Premium segment has been growing
faster than market over pastCrates (12 bottles / crate) 85 70 63 55
Grapes cost / bottle -0.1 -0.5 -2 -3
Other costs / bottle (0.6$ for freight) -1.4 -1.5 -2.2 -2.7
Total cost / bottle -1.5 -2.0 -4.2 -5.7
Selling Price (average) 1.5 4.0 8.0 20.0
Potential Marginper bottle 0 +2.0 +3.8 +14.3
THE BOSTON CONSULTING GROUP 57
Volume Share of US Market 27% 28% 14% 24%
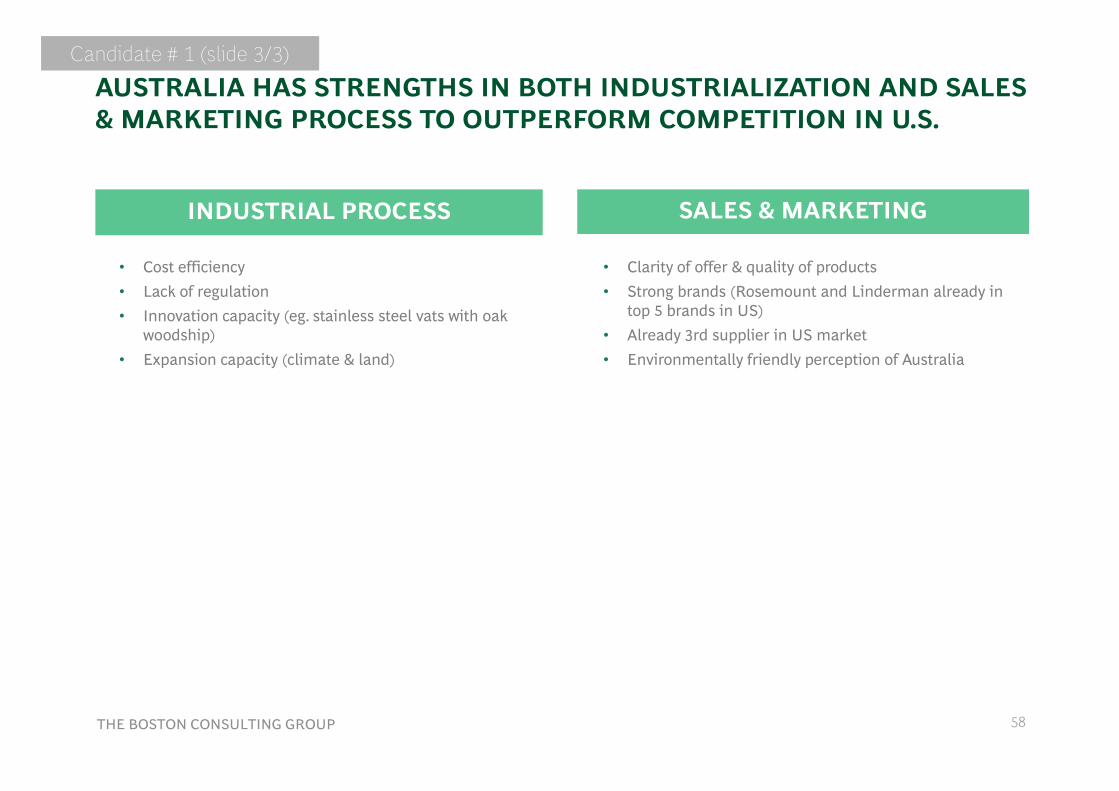
AUSTRALIA HAS STRENGTHS IN BOTH INDUSTRIALIZATION AND SALES & MARKETING PROCESS TO OUTPERFORM COMPETITION IN U.S.
Candidate # 1 (slide 3/3)
& MARKETING PROCESS TO OUTPERFORM COMPETITION IN U.S.
SALES & MARKETINGINDUSTRIAL PROCESS
• Clarity of offer & quality of products• Strong brands (Rosemount and Linderman already in
t 5 b d i US)
SALES & MARKETINGINDUSTRIAL PROCESS
• Cost efficiency• Lack of regulation
top 5 brands in US)• Already 3rd supplier in US market• Environmentally friendly perception of Australia
• Innovation capacity (eg. stainless steel vats with oak woodship)
• Expansion capacity (climate & land)
THE BOSTON CONSULTING GROUP 58
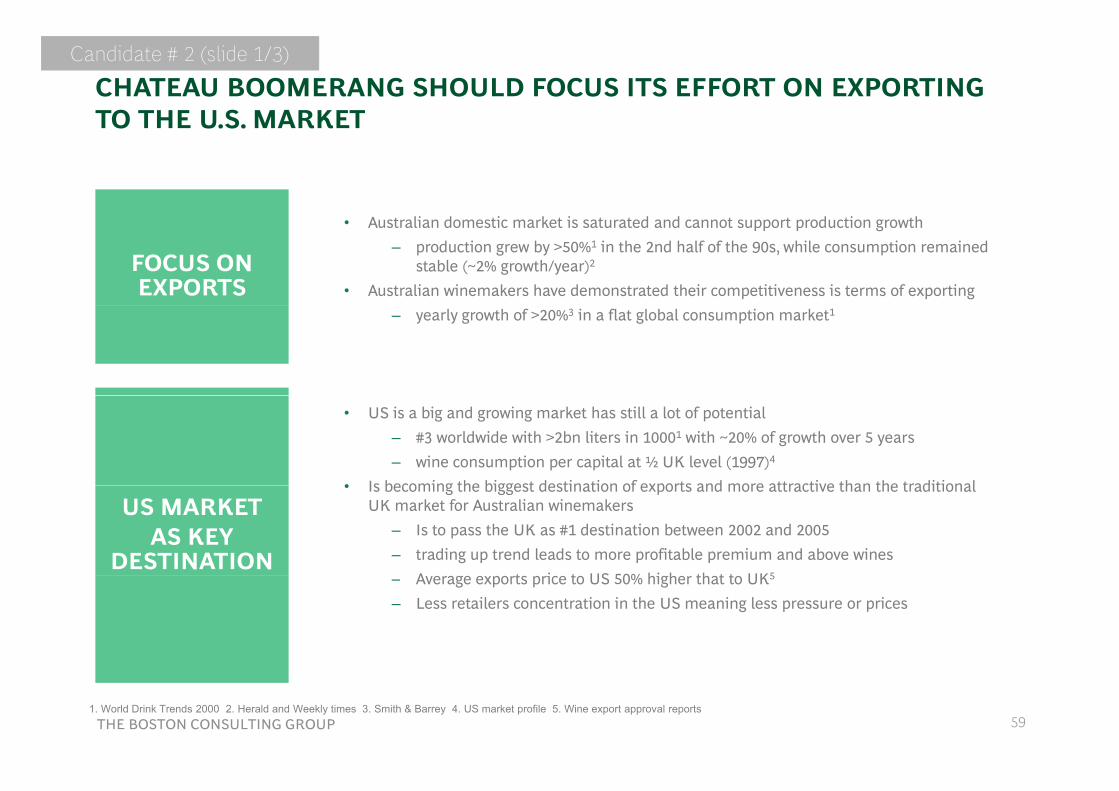
CHATEAU BOOMERANG SHOULD FOCUS ITS EFFORT ON EXPORTING TO THE U.S. MARKET
Candidate # 2 (slide 1/3)
TO THE U.S. MARKET
i i i i
FOCUS ON EXPORTS
• Australian domestic market is saturated and cannot support production growth– production grew by >50%1 in the 2nd half of the 90s, while consumption remained
stable (~2% growth/year)2
• Australian winemakers have demonstrated their competitiveness is terms of exporting– yearly growth of >20%3 in a flat global consumption market1
• US is a big and growing market has still a lot of potential– #3 worldwide with >2bn liters in 10001 with ~20% of growth over 5 years– wine consumption per capital at ½ UK level (1997)4
• Is becoming the biggest destination of exports and more attractive than the traditional• Is becoming the biggest destination of exports and more attractive than the traditional UK market for Australian winemakers
– Is to pass the UK as #1 destination between 2002 and 2005 – trading up trend leads to more profitable premium and above wines
A t i t US 50% hi h th t t UK5
US MARKET AS KEY
DESTINATION– Average exports price to US 50% higher that to UK5
– Less retailers concentration in the US meaning less pressure or prices
THE BOSTON CONSULTING GROUP 591. World Drink Trends 2000 2. Herald and Weekly times 3. Smith & Barrey 4. US market profile 5. Wine export approval reports

SUPER PREMIUM AND ULTRA PREMIUM PRODUCTS TO BE PUT FORWARD IN PRIORITY
Candidate # 2Candidate # 2 (slide 2/3)
FORWARD IN PRIORITY
COMMODITY PREMIUM SUPER ULTRA COMMENTPREMIUM PREMIUM
Value share 27% 28% 14% 32% A potential close to ½ of the value share
Growth (volume) <4% ~7% 10-14% 10-14% Fastest growing segments with a growth 3x times the market average (4%)
Profitability ~2% ~50% ~50% 72% Top segments are the mostProfitability ~2% ~50% ~50% 72% Top segments are the most profitable
CompetitivenessCost advantage - - (50% higher than - (25% higher ++ (V3 ) - (25% higher
Although profitable, fragile position in the highly
t t d i
Brand
US)
++ (friendly branding)
than US concentrated)
++++ (friendly
than US concentrated)
++
concentrated premium segment
Strong cost advantage on super premium and ultra premium
bi d ith llBrand impact/marketing
++ (friendly branding)
combined with an overall favorable brand position
THE BOSTON CONSULTING GROUP 60

AUSTRALIAN WINES HAVE SEVERAL KEY ADVANTAGES THAT ALLOW THEM TO COMPETE SUCCESSFULLY IN THE U.S.
Candidate # 2 (slide 3/3)
ALLOW THEM TO COMPETE SUCCESSFULLY IN THE U.S.
ADEQUATE MARKETING &
BRANDING
• Clarity and diversity of offer, innovation• Strong brands supported by efficient communication• Friendly labeling ensuring (inexperienced) consumers "are not being looked upon"
• Cheap and abundant laud, flexibilityP d ti il th k t f bl li t d f i i ti (b d i E )
LOW • Productive soil thanks to favorable climate and use of irrigation (banned in Europe)• Innovation in production techniques (e.g. use of oak chips instead of barrels) & flexibility
in terms of grape selection and picking
PRODUCTION COST &
PRODUCTIVITY
• Perceived quality higher than US competitors (10$ for a Californian wine and 7$ for an QUALITY & VALUE FOR y g
Australian wine for comparable quality)MONEY
THE BOSTON CONSULTING GROUP 61
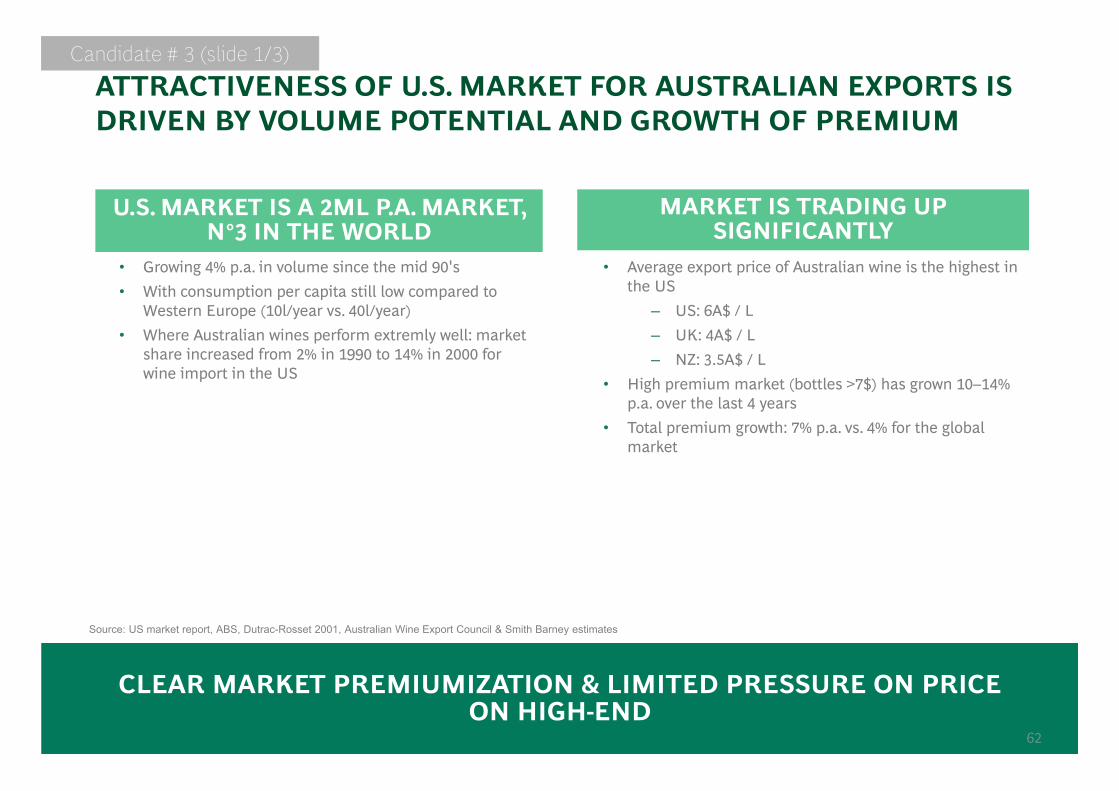
ATTRACTIVENESS OF U.S. MARKET FOR AUSTRALIAN EXPORTS IS DRIVEN BY VOLUME POTENTIAL AND GROWTH OF PREMIUM
Candidate # 3 (slide 1/3)
DRIVEN BY VOLUME POTENTIAL AND GROWTH OF PREMIUM
MARKET IS TRADING UP U.S. MARKET IS A 2ML P.A. MARKET, SIGNIFICANTLY
,N°3 IN THE WORLD
• Average export price of Australian wine is the highest in the US
US 6A$ / L
• Growing 4% p.a. in volume since the mid 90's• With consumption per capita still low compared to
W t E (10l/ 40l/ ) – US: 6A$ / L– UK: 4A$ / L– NZ: 3.5A$ / L
• High premium market (bottles >7$) has grown 10–14%
Western Europe (10l/year vs. 40l/year)• Where Australian wines perform extremly well: market
share increased from 2% in 1990 to 14% in 2000 for wine import in the US
p.a. over the last 4 years• Total premium growth: 7% p.a. vs. 4% for the global
market
Source: US market report, ABS, Dutrac-Rosset 2001, Australian Wine Export Council & Smith Barney estimates
THE BOSTON CONSULTING GROUP 62
CLEAR MARKET PREMIUMIZATION & LIMITED PRESSURE ON PRICE ON HIGH-END
62

AUSTRALIAN WINES ALREADY HAVE A GOOD VALUE FOR MONEY IMAGE AND CAN FURTHER MOVE INTO HIGHERENDS SEGMENTS
Candidate # 3 (slide 2/3)
IMAGE AND CAN FURTHER MOVE INTO HIGHERENDS SEGMENTS
ULTRA PREMIUM MARKETSUPER PREMIUM MARKET
• Represents about 5% of current market• Growing above 10% p.a.
B ildi b d i k i h U S k d
ULTRA PREMIUM MARKETSUPER PREMIUM MARKET
• Represents about 10% of current market• Growing above 5% p.a.
C i i f F b b l if • Building strong brand is key in the U.S. market and Australia is good at it.
• Competition from France can be strong but only if regulations are smoothened in Europe
Australian wines much
US$ PER BOTTLE COMMODITY PREMIUM SUPER PREMIUM ULTRA PREMIUM
Australian wines much more competitve and
profitableIn Premium, competition from US
domestic production is fierce
US$ PER BOTTLE COMMODITY PREMIUM SUPER PREMIUM ULTRA PREMIUM
AUS 1.47 1.89 3.67 4.66
FR 1 32 1 98 6 90 14 75Wine cost split
FR 1.32 1.98 6.90 14.75
US 0.95 1.39 5.13 7.00
Sales price 1.5 4.0 8.0 20.0
THE BOSTON CONSULTING GROUP
p
Benefits for AUS wines 0.03 (2%) 2.11 (53%) 4.33 (54%) 15.34 (77%)
63
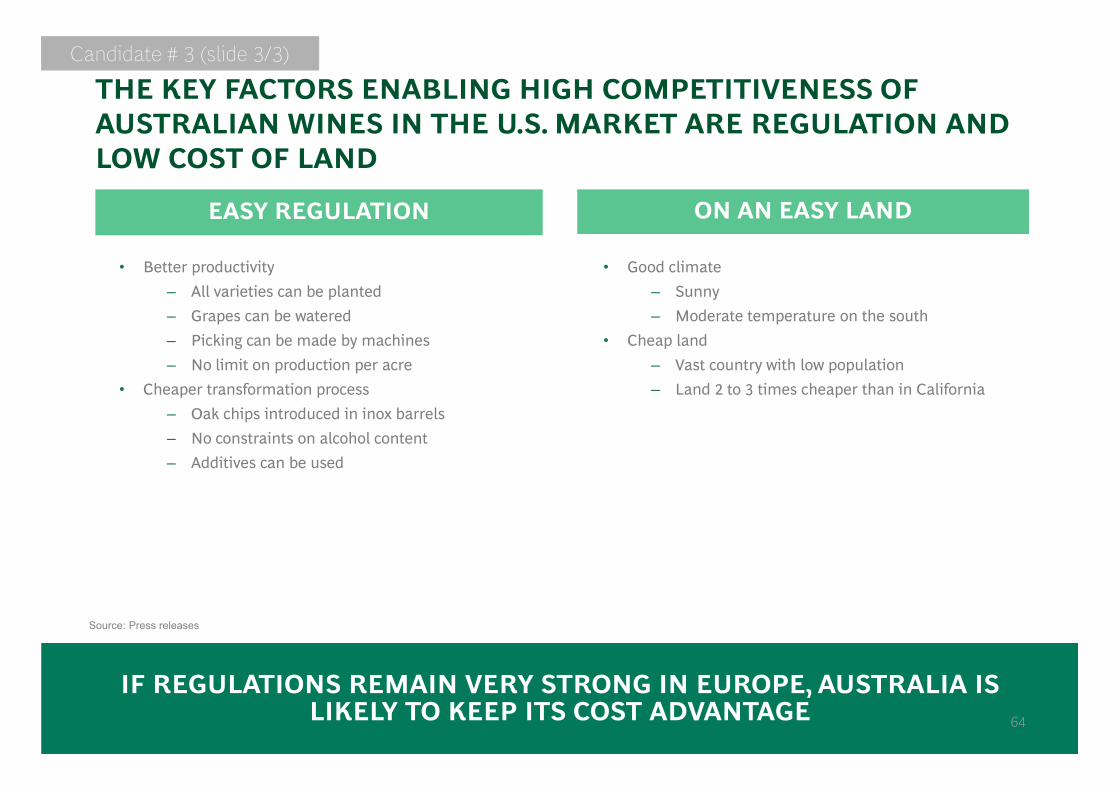
THE KEY FACTORS ENABLING HIGH COMPETITIVENESS OF AUSTRALIAN WINES IN THE U S MARKET ARE REGULATION AND
Candidate # 3 (slide 3/3)
AUSTRALIAN WINES IN THE U.S. MARKET ARE REGULATION AND LOW COST OF LAND
ON AN EASY LANDEASY REGULATION ON AN EASY LANDEASY REGULATION
• Good climate– Sunny
• Better productivity– All varieties can be planted
– Moderate temperature on the south• Cheap land
– Vast country with low population– Land 2 to 3 times cheaper than in California
– Grapes can be watered– Picking can be made by machines– No limit on production per acre
• Cheaper transformation process pp p– Oak chips introduced in inox barrels– No constraints on alcohol content – Additives can be used
Source: Press releases
THE BOSTON CONSULTING GROUP
IF REGULATIONS REMAIN VERY STRONG IN EUROPE, AUSTRALIA IS LIKELY TO KEEP ITS COST ADVANTAGE 64
Related Documents