WORLD MALARIA REPORT 2014 SUMMARY

Welcome message from author
This document is posted to help you gain knowledge. Please leave a comment to let me know what you think about it! Share it to your friends and learn new things together.
Transcript
WORLD MALARIAREPORT 2014 SUMMARY

2014WORLD MALARIA REPORT SUMMARY
© World Health Organization 2015
All rights reserved. Publications of the World Health Organization are available on the WHO website (www.who.int) or can be purchased from WHO Press, World Health Organization, 20 Avenue Appia, 1211 Geneva 27, Switzerland (tel.: +41 22 791 3264; fax: +41 22 791 4857; email: [email protected]).
Requests for permission to reproduce or translate WHO publications – whether for sale or for noncommercial distribution – should be addressed to WHO Press through the WHO website (http://www.who.int/about/licensing/copyright_form/en/index.html).
The designations employed and the presentation of the material in this publication do not imply the expression of any opinion whatsoever on the part of the World Health Organization concerning the legal status of any country, territory, city or area or of its authorities, or concerning the delimitation of its frontiers or boundaries. Dotted and dashed lines on maps represent approximate border lines for which there may not yet be full agreement.
The mention of specific companies or of certain manufacturers’ products does not imply that they are endorsed or recommended by the World Health Organization in preference to others of a similar nature that are not mentioned. Errors and omissions excepted, the names of proprietary products are distinguished by initial capital letters.
All reasonable precautions have been taken by the World Health Organization to verify the information contained in this publication. However, the published material is being distributed without warranty of any kind, either expressed or implied. The responsibility for the interpretation and use of the material lies with the reader. In no event shall the World Health Organization be liable for damages arising from its use.
Printed by the WHO Document Production Services, Geneva, Switzerland
WHO/HTM/GMP/2015.2
2014WORLD MALARIA REPORT SUMMARY
Introduction
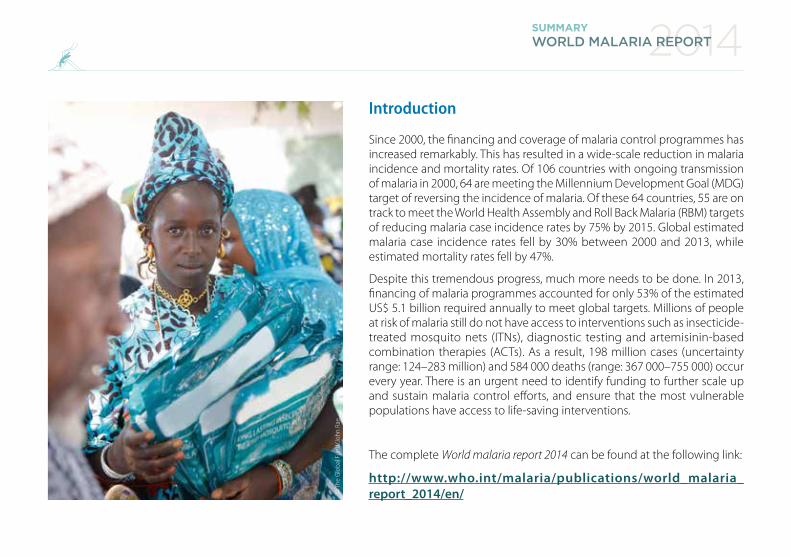
Since 2000, the financing and coverage of malaria control programmes has increased remarkably. This has resulted in a wide-scale reduction in malaria incidence and mortality rates. Of 106 countries with ongoing transmission of malaria in 2000, 64 are meeting the Millennium Development Goal (MDG) target of reversing the incidence of malaria. Of these 64 countries, 55 are on track to meet the World Health Assembly and Roll Back Malaria (RBM) targets of reducing malaria case incidence rates by 75% by 2015. Global estimated malaria case incidence rates fell by 30% between 2000 and 2013, while estimated mortality rates fell by 47%.
Despite this tremendous progress, much more needs to be done. In 2013, financing of malaria programmes accounted for only 53% of the estimated US$ 5.1 billion required annually to meet global targets. Millions of people at risk of malaria still do not have access to interventions such as insecticide-treated mosquito nets (ITNs), diagnostic testing and artemisinin-based combination therapies (ACTs). As a result, 198 million cases (uncertainty range: 124–283 million) and 584 000 deaths (range: 367 000–755 000) occur every year. There is an urgent need to identify funding to further scale up and sustain malaria control efforts, and ensure that the most vulnerable populations have access to life-saving interventions.
The complete World malaria report 2014 can be found at the following link:
http://www.who.int/malaria/publications/world_malaria_report_2014/en/©
The
Glo
bal F
und/
John
Rae
2014WORLD MALARIA REPORT SUMMARY
THE MALARIA SITUATION
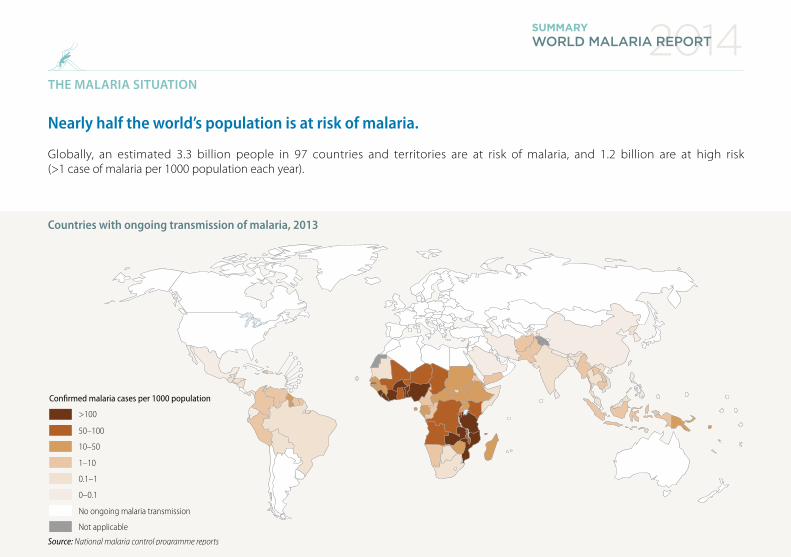
Nearly half the world’s population is at risk of malaria.
Globally, an estimated 3.3 billion people in 97 countries and territories are at risk of malaria, and 1.2 billion are at high risk (>1 case of malaria per 1000 population each year).
Countries with ongoing transmission of malaria, 2013
Source: National malaria control programme reports
Confirmed malaria cases per 1000 population
0.1–1
0–0.1
10–50
1–10
No ongoing malaria transmission
Not applicable
>100
50–100
2014WORLD MALARIA REPORT SUMMARY
MALARIA AND POVERTY
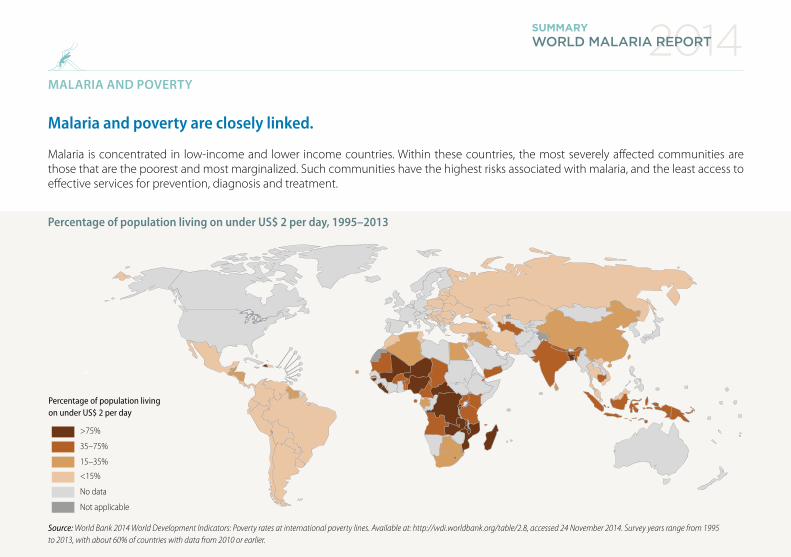
Malaria and poverty are closely linked.
Malaria is concentrated in low-income and lower income countries. Within these countries, the most severely affected communities are those that are the poorest and most marginalized. Such communities have the highest risks associated with malaria, and the least access to effective services for prevention, diagnosis and treatment.
Percentage of population living on under US$ 2 per day, 1995–2013
Source: World Bank 2014 World Development Indicators: Poverty rates at international poverty lines. Available at: http://wdi.worldbank.org/table/2.8, accessed 24 November 2014. Survey years range from 1995 to 2013, with about 60% of countries with data from 2010 or earlier.
Percentage of population living on under US$ 2 per day
>75%
35–75%
15–35%
<15%
No data
Not applicable

2014WORLD MALARIA REPORT SUMMARY
FINANCING FOR MALARIA PROGRAMMES
Annual funding for malaria control in 2013 was three times the amount spent in 2005, but represented only 53% of global funding needs.
Annual funding for malaria control and elimination totalled US$ 2.7 billion in 2013. International investments represented 82% of total malaria funding, with domestic investments for malaria control reaching 18% (US$ 527 million).
An estimated US$ 5.1 billion is required to achieve global targets for malaria control and elimination. If the funding gap of US$ 2.4 billion is to be narrowed, governments of malaria-endemic countries and international funders need to give greater priority to investments in malaria control.
US$
(mill
ion)
AMFm, A�ordable Medicine Facility–malaria; DFID, United Kingdom Department for International Development; Global Fund, Global Fund to Fight AIDS, Tuberculosis and Malaria; GMAP, Global Malaria Action Plan; PMI, United States President’s Malaria Initiative; USAID, United States Agency for International Development
Source: National malaria control programmes; Global Fund, USAID and Centers for Disease Control and Prevention (CDC) websites; Organisation for Economic Co-operation and Development (OECD) creditor reporting system; and Roll Back Malaria 2008 GMAP
5000
4000
3000
2000
1000
0
Government Global Fund World Bank USAID/PMIDFID OtherAMFm
GMAP investment target of US$ 5100 million
20122011201020092008200720062005 2013
2013 funding gap:US$ 2430 million
Trends in total funding for malaria control and elimination 2005–2013, and 2013 estimated funding gap
2014WORLD MALARIA REPORT SUMMARY
FINANCING FOR MALARIA PROGRAMMES
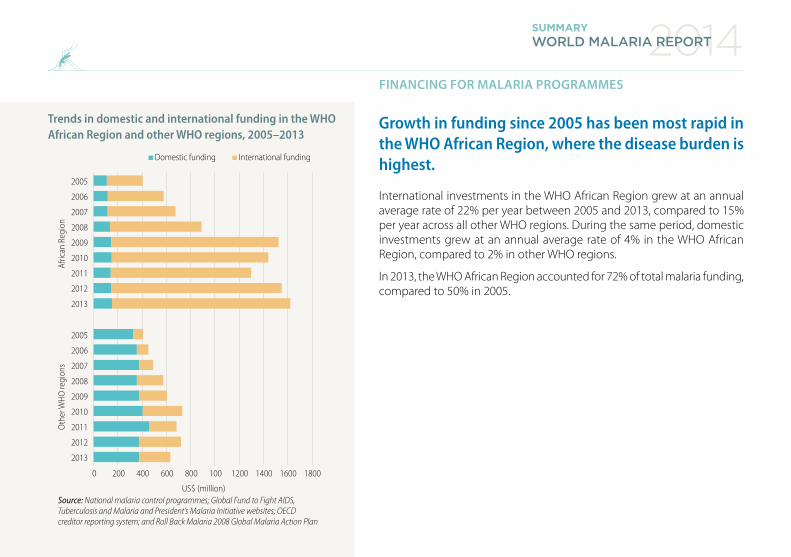
Growth in funding since 2005 has been most rapid in the WHO African Region, where the disease burden is highest.
International investments in the WHO African Region grew at an annual average rate of 22% per year between 2005 and 2013, compared to 15% per year across all other WHO regions. During the same period, domestic investments grew at an annual average rate of 4% in the WHO African Region, compared to 2% in other WHO regions.
In 2013, the WHO African Region accounted for 72% of total malaria funding, compared to 50% in 2005.
Afric
an R
egio
nO
ther
WHO
regi
ons
Source: National malaria control programmes; Global Fund to Fight AIDS, Tuberculosis and Malaria and President’s Malaria Initiative websites; OECD creditor reporting system; and Roll Back Malaria 2008 Global Malaria Action Plan
2005
2006
2007
2008
2009
2010
2011
2012
2013
2005
2006
2007
2008
2009
2010
2011
2012
2013
Domestic funding International funding
1600140012001008006004002000 1800
US$ (million)
Trends in domestic and international funding in the WHO African Region and other WHO regions, 2005–2013

VECTOR CONTROL FOR MALARIA – ITN ACCESS AND USE
The proportion of the population with access to an ITN – and sleeping under an ITN – has increased substantially over the past 10 years.
In 2013, an estimated 49% of the population at risk of malaria in sub-Saharan Africa had access to an ITN in their household, compared to 3% in 2004. ITNs are used by a high proportion of those who have access to them, and 44% of the population at risk were sleeping under an ITN in 2013 (compared to 2% in 2004).
The proportion of households owning at least one ITN rose from 5% in 2004 to 67% in 2014. However, in 2013, only 29% of households had enough ITNs for all household members.
ITN, insecticide-treated mosquito netSource: ITN coverage model from the Malaria Atlas Project (based at the University of Oxford)
Population sleeping under an ITN
Population with access to an ITN
95% con�dence interval
Households with enough ITNs for all occupants
Households with at least one ITN
95% con�dence interval
2012
2011
2010
2009
2008
2007
2006
2005
2004
2003
2002
2001
2000
2013
(a)100%
80%
60%
40%
20%
00%
2012
2011
2010
2009
2008
2007
2006
2005
2004
2003
2002
2001
2000
2013
(b)100%
80%
60%
40%
20%
00%
a) Proportion of population with access to an ITN and proportion sleeping under an ITN, b) Proportion of households with at least one ITN and proportion of households with enough ITNs for all persons, sub-Saharan Africa, 2000–2013
2014WORLD MALARIA REPORT SUMMARY
2014WORLD MALARIA REPORT SUMMARY
VECTOR CONTROL FOR MALARIA – ITN USE
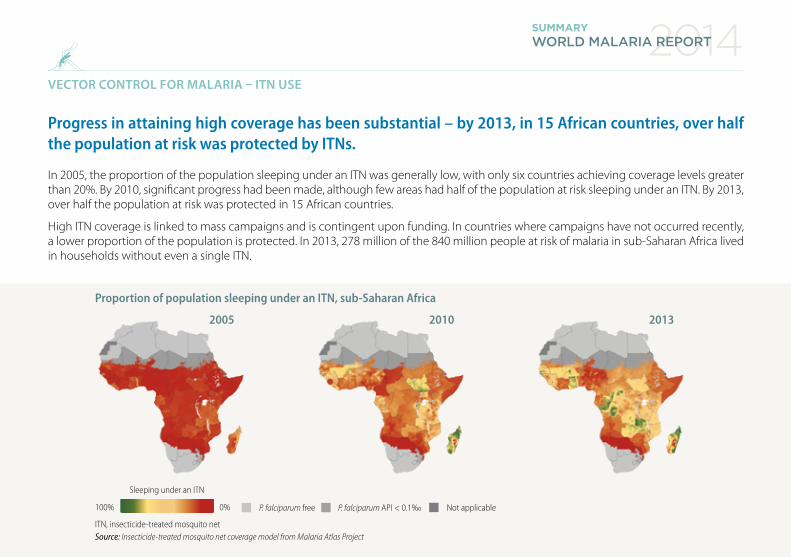
Progress in attaining high coverage has been substantial – by 2013, in 15 African countries, over half the population at risk was protected by ITNs.
In 2005, the proportion of the population sleeping under an ITN was generally low, with only six countries achieving coverage levels greater than 20%. By 2010, significant progress had been made, although few areas had half of the population at risk sleeping under an ITN. By 2013, over half the population at risk was protected in 15 African countries.
High ITN coverage is linked to mass campaigns and is contingent upon funding. In countries where campaigns have not occurred recently, a lower proportion of the population is protected. In 2013, 278 million of the 840 million people at risk of malaria in sub-Saharan Africa lived in households without even a single ITN.
2005 20132010
ITN, insecticide-treated mosquito net Source: Insecticide-treated mosquito net coverage model from Malaria Atlas Project
P. falciparum API < 0.1‰ Not applicableP. falciparum free100% 0%
Sleeping under an ITN
Proportion of population sleeping under an ITN, sub-Saharan Africa
2014WORLD MALARIA REPORT SUMMARY
VECTOR CONTROL FOR MALARIA – IRS COVERAGE
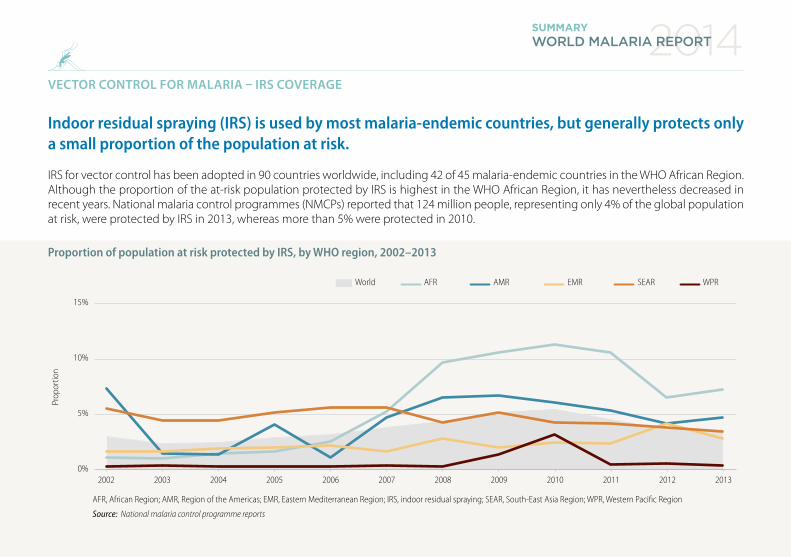
Indoor residual spraying (IRS) is used by most malaria-endemic countries, but generally protects only a small proportion of the population at risk.
IRS for vector control has been adopted in 90 countries worldwide, including 42 of 45 malaria-endemic countries in the WHO African Region. Although the proportion of the at-risk population protected by IRS is highest in the WHO African Region, it has nevertheless decreased in recent years. National malaria control programmes (NMCPs) reported that 124 million people, representing only 4% of the global population at risk, were protected by IRS in 2013, whereas more than 5% were protected in 2010.
Prop
ortio
n
AFR, African Region; AMR, Region of the Americas; EMR, Eastern Mediterranean Region; IRS, indoor residual spraying; SEAR, South-East Asia Region; WPR, Western Paci�c Region
Source: National malaria control programme reports
15%
10%
5%
0%
World
20122011201020092008200720062005200420032002 2013
AFR AMR SEAREMR WPR
Proportion of population at risk protected by IRS, by WHO region, 2002–2013
2014WORLD MALARIA REPORT SUMMARY
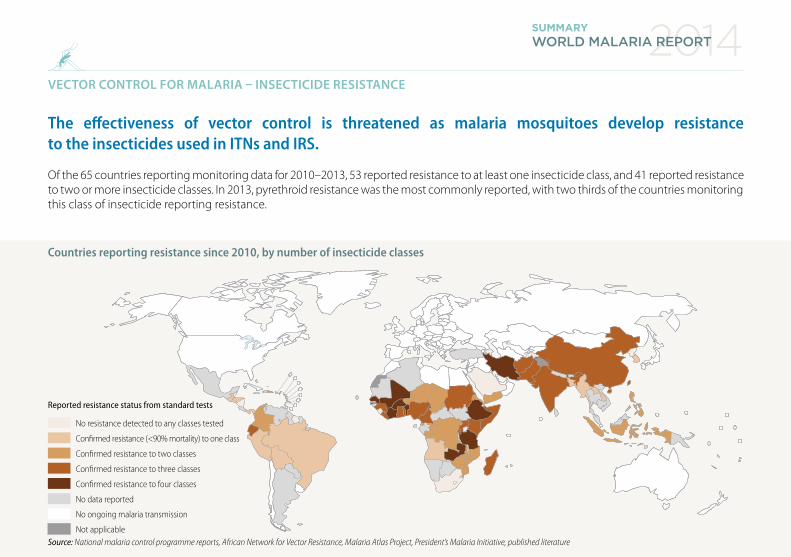
VECTOR CONTROL FOR MALARIA – INSECTICIDE RESISTANCE
The effectiveness of vector control is threatened as malaria mosquitoes develop resistance to the insecticides used in ITNs and IRS.
Of the 65 countries reporting monitoring data for 2010–2013, 53 reported resistance to at least one insecticide class, and 41 reported resistance to two or more insecticide classes. In 2013, pyrethroid resistance was the most commonly reported, with two thirds of the countries monitoring this class of insecticide reporting resistance.
Reported resistance status from standard tests
No resistance detected to any classes tested
Confirmed resistance (<90% mortality) to one class
Confirmed resistance to three classes
Confirmed resistance to four classes
No data reported
No ongoing malaria transmission
Not applicable
Confirmed resistance to two classes
Source: National malaria control programme reports, African Network for Vector Resistance, Malaria Atlas Project, President’s Malaria Initiative, published literature
Countries reporting resistance since 2010, by number of insecticide classes
PREVENTIVE THERAPIES FOR MALARIA
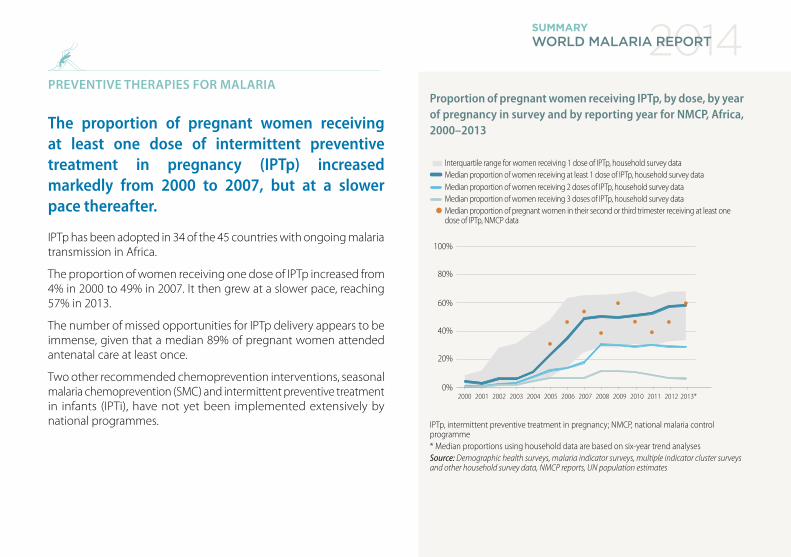
The proportion of pregnant women receiving at least one dose of intermittent preventive treatment in pregnancy (IPTp) increased markedly from 2000 to 2007, but at a slower pace thereafter.
IPTp has been adopted in 34 of the 45 countries with ongoing malaria transmission in Africa.
The proportion of women receiving one dose of IPTp increased from 4% in 2000 to 49% in 2007. It then grew at a slower pace, reaching 57% in 2013.
The number of missed opportunities for IPTp delivery appears to be immense, given that a median 89% of pregnant women attended antenatal care at least once.
Two other recommended chemoprevention interventions, seasonal malaria chemoprevention (SMC) and intermittent preventive treatment in infants (IPTi), have not yet been implemented extensively by national programmes.
IPTp, intermittent preventive treatment in pregnancy; NMCP, national malaria control programme* Median proportions using household data are based on six-year trend analysesSource: Demographic health surveys, malaria indicator surveys, multiple indicator cluster surveys and other household survey data, NMCP reports, UN population estimates
100%
80%
60%
40%
20%
0%
Median proportion of women receiving at least 1 dose of IPTp, household survey dataMedian proportion of women receiving 2 doses of IPTp, household survey dataMedian proportion of women receiving 3 doses of IPTp, household survey dataMedian proportion of pregnant women in their second or third trimester receiving at least one dose of IPTp, NMCP data
Interquartile range for women receiving 1 dose of IPTp, household survey data
2012201120102009200820072006200520042003200220012000 2013*
Proportion of pregnant women receiving IPTp, by dose, by year of pregnancy in survey and by reporting year for NMCP, Africa, 2000–2013
2014WORLD MALARIA REPORT SUMMARY

© G
AVI A
llian
ce/D
iane
Sum
mer
s
2014WORLD MALARIA REPORT SUMMARY
DIAGNOSTIC TESTING FOR MALARIA
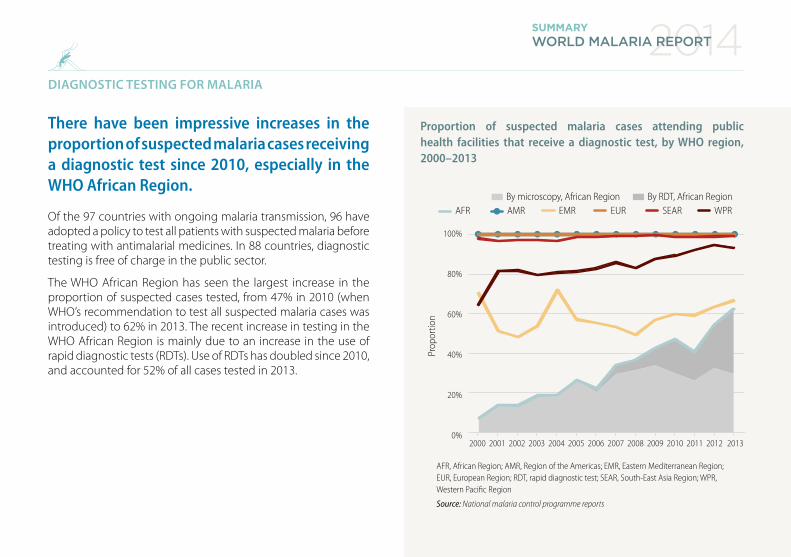
There have been impressive increases in the proportion of suspected malaria cases receiving a diagnostic test since 2010, especially in the WHO African Region.
Of the 97 countries with ongoing malaria transmission, 96 have adopted a policy to test all patients with suspected malaria before treating with antimalarial medicines. In 88 countries, diagnostic testing is free of charge in the public sector.
The WHO African Region has seen the largest increase in the proportion of suspected cases tested, from 47% in 2010 (when WHO’s recommendation to test all suspected malaria cases was introduced) to 62% in 2013. The recent increase in testing in the WHO African Region is mainly due to an increase in the use of rapid diagnostic tests (RDTs). Use of RDTs has doubled since 2010, and accounted for 52% of all cases tested in 2013.
Prop
ortio
n
AFR, African Region; AMR, Region of the Americas; EMR, Eastern Mediterranean Region; EUR, European Region; RDT, rapid diagnostic test; SEAR, South-East Asia Region; WPR, Western Pacific Region
Source: National malaria control programme reports
100%
80%
60%
40%
20%
0%2012201120102009200820072006200520042003200220012000 2013
By microscopy, African RegionAFR EMR EUR SEAR WPRAMR
By RDT, African Region
By RDT, African Region
By microscopy, African Region
Proportion of suspected malaria cases attending public health facilities that receive a diagnostic test, by WHO region, 2000–2013
2014WORLD MALARIA REPORT SUMMARY
MALARIA TREATMENT – USE OF ACTs
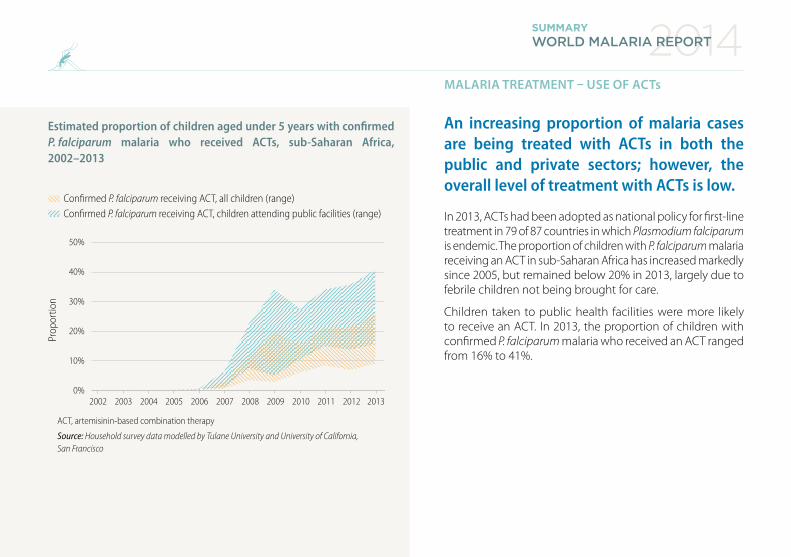
An increasing proportion of malaria cases are being treated with ACTs in both the public and private sectors; however, the overall level of treatment with ACTs is low.
In 2013, ACTs had been adopted as national policy for first-line treatment in 79 of 87 countries in which Plasmodium falciparum is endemic. The proportion of children with P. falciparum malaria receiving an ACT in sub-Saharan Africa has increased markedly since 2005, but remained below 20% in 2013, largely due to febrile children not being brought for care.
Children taken to public health facilities were more likely to receive an ACT. In 2013, the proportion of children with confirmed P. falciparum malaria who received an ACT ranged from 16% to 41%.
Prop
ortio
n
ACT, artemisinin-based combination therapy
Source: Household survey data modelled by Tulane University and University of California, San Francisco
50%
40%
30%
20%
10%
0%20122011201020092008200720062005200420032002 2013
Confirmed P. falciparum receiving ACT, all children (range)Confirmed P. falciparum receiving ACT, children attending public facilities (range)
Estimated proportion of children aged under 5 years with confirmed P. falciparum malaria who received ACTs, sub-Saharan Africa, 2002–2013
2014WORLD MALARIA REPORT SUMMARY
MALARIA TREATMENT – ANTIMALARIAL DRUG RESISTANCE
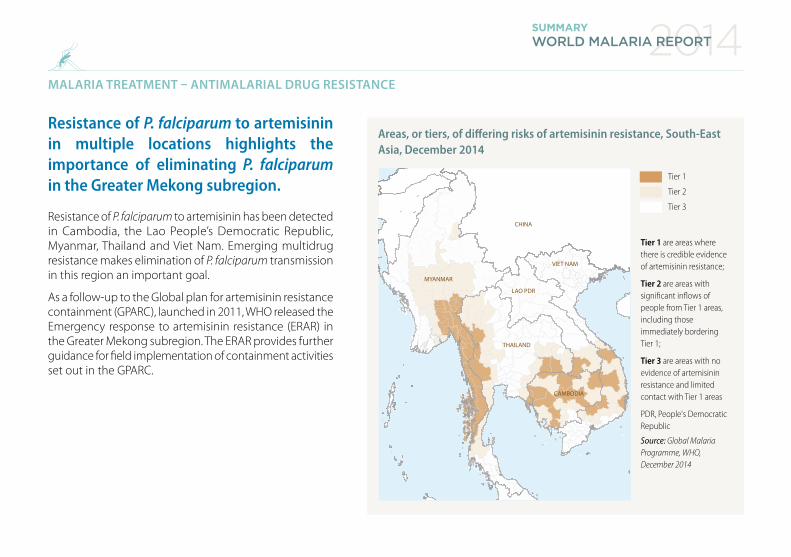
Resistance of P. falciparum to artemisinin in multiple locations highlights the importance of eliminating P. falciparum in the Greater Mekong subregion.
Resistance of P. falciparum to artemisinin has been detected in Cambodia, the Lao People’s Democratic Republic, Myanmar, Thailand and Viet Nam. Emerging multidrug resistance makes elimination of P. falciparum transmission in this region an important goal.
As a follow-up to the Global plan for artemisinin resistance containment (GPARC), launched in 2011, WHO released the Emergency response to artemisinin resistance (ERAR) in the Greater Mekong subregion. The ERAR provides further guidance for field implementation of containment activities set out in the GPARC.
Areas, or tiers, of differing risks of artemisinin resistance, South-East Asia, December 2014
Tier 1
Tier 2
Tier 3
Tier 1 are areas where there is credible evidence of artemisinin resistance;
Tier 2 are areas with signi�cant in�ows of people from Tier 1 areas, including those immediately bordering Tier 1;
Tier 3 are areas with no evidence of artemisinin resistance and limited contact with Tier 1 areas
PDR, People's Democratic Republic
Source: Global Malaria Programme, WHO, December 2014
MYANMAR
CHINA
VIET NAM
LAO PDR
THAILAND
CAMBODIA

2014WORLD MALARIA REPORT SUMMARY
GAPS IN INTERVENTION COVERAGE
Despite impressive increases in malaria intervention coverage, millions of people still do not receive the services they need.
Household surveys conducted in sub-Saharan Africa during 2011–2013 showed that a median of 41% of households did not have an ITN, 33% of pregnant women did not receive IPTp and, among febrile children treated for malaria, 57% did not receive an ACT. Based on comprehensive assessments of intervention coverage, an estimated 278 million people lived in households without an ITN, 15 million pregnant women did not receive IPTp, and 56–69 million children with malaria did not receive an ACT.
Proportion of households, women or children not covered by interventions, 2011–2013
ACT, artemisinin-based combination therapy; IPTp, intermittent preventive treatment in pregnancy; ITN, insecticide-treated mosquito net
Source: Household surveys
Households without an ITN
Pregnant women whodid not receive IPTp
Febrile children who did not receive fever care
Febrile children who did not receive an ACT out of all antimalarials
Febrile children who did not receive a diagnostic test
100%
90%
80%
70%
60%
50%
40%
30%
20%
10%
0%
2014WORLD MALARIA REPORT SUMMARY
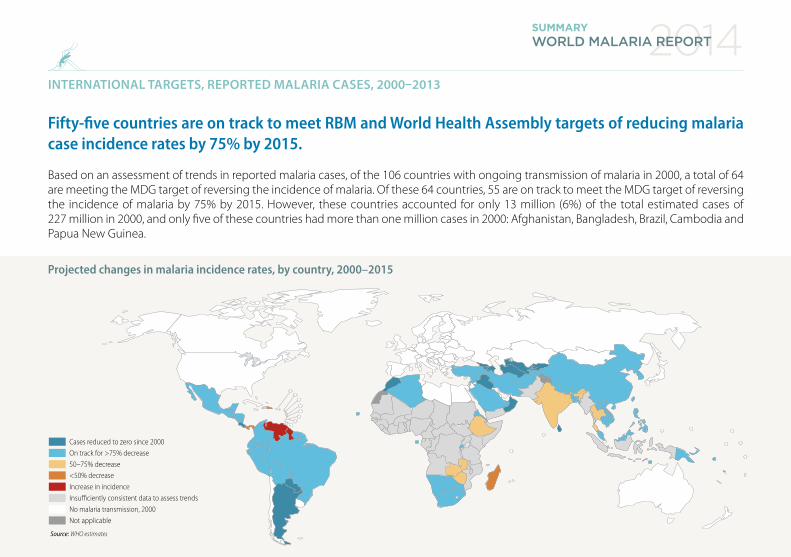
INTERNATIONAL TARGETS, REPORTED MALARIA CASES, 2000–2013
Fifty-five countries are on track to meet RBM and World Health Assembly targets of reducing malaria case incidence rates by 75% by 2015.
Based on an assessment of trends in reported malaria cases, of the 106 countries with ongoing transmission of malaria in 2000, a total of 64 are meeting the MDG target of reversing the incidence of malaria. Of these 64 countries, 55 are on track to meet the MDG target of reversing the incidence of malaria by 75% by 2015. However, these countries accounted for only 13 million (6%) of the total estimated cases of 227 million in 2000, and only five of these countries had more than one million cases in 2000: Afghanistan, Bangladesh, Brazil, Cambodia and Papua New Guinea.
Projected changes in malaria incidence rates, by country, 2000–2015
Source: WHO estimates
<50% decreaseIncrease in incidenceInsu�ciently consistent data to assess trendsNo malaria transmission, 2000Not applicable
Cases reduced to zero since 2000On track for >75% decrease50–75% decrease

2014WORLD MALARIA REPORT SUMMARY
ESTIMATED MALARIA PREVALENCE, 2000–2013
In sub-Saharan Africa, average infection prevalence in children aged 2–10 years dropped from 26% in 2000 to 14% in 2013, a relative decline of 46%.
Nationally representative surveys of P. falciparum infection prevalence are increasingly being undertaken in sub-Saharan Africa. Such surveys can provide information on malaria trends.
Infection prevalence in children aged 2–10 years fell dramatically during the period 2000–2013, from 26% in 2000 to 14% in 2013 – a relative decline of 46%. Even with a large growth in underlying populations, this resulted in a 26% reduction in the number of people infected, from an average of 173 million concurrent infections in 2000 to 128 million in 2013.
Proportion of children aged 2–10 years infected with P. falciparum, comparison between a) 2000 and b) 2013
Source: Malaria Atlas Project
PfPR
(a)
Source: Malaria Atlas Project
Proportion of children aged 2–10 years infected with P. falciparum
(b)
Not applicable100% 0% P. falciparum API < 0.1‰P. falciparum free

2014WORLD MALARIA REPORT SUMMARY
ESTIMATED MALARIA CASES AND DEATHS, 2013
In 2013, there were an estimated 198 million cases of malaria (uncertainty range: 124–283 million) and 584 000 malaria deaths globally (range: 367 000–755 000).
In 2013, approximately 82% of malaria cases and 90% of malaria deaths occurred in the WHO African Region, with children aged under 5 years and pregnant women most severely affected.
WHO estimates of the number of malaria cases and deaths in 2013
Estimated cases (‘000s) Estimated deaths
Region Estimate Lower Upper Estimate Lower Upper
Africa 163 000 90 000 243 000 528 000 315 000 689 000
Americas 700 600 900 800 500 1 200
Eastern Mediterranean
9 000 6 000 14 000 11 000 5 000 23 000
Europe 2 2 2 0 0 0
South-East Asia 24 000 17 000 36 000 41 000 23 000 69 000
Western Pacific 1 000 1 000 2 000 3 300 1 700 5 600
World 198 000 124 000 283 000 584 000 367 000 755 000
Source: WHO estimates
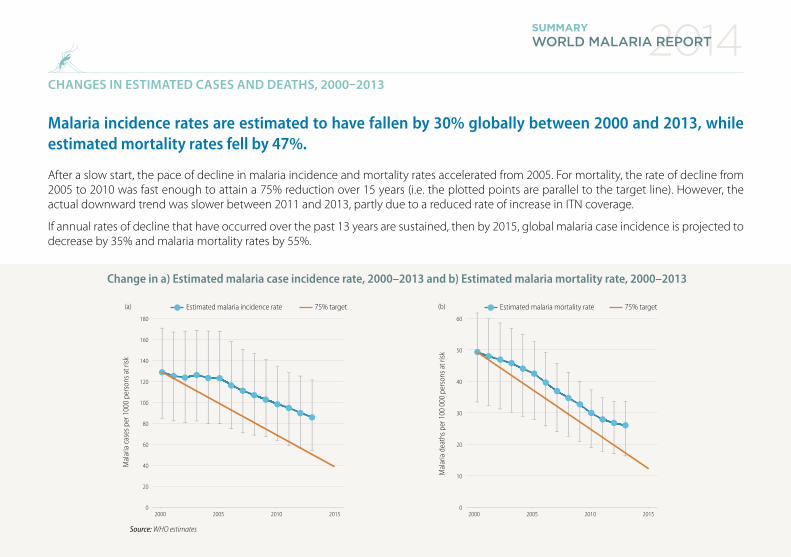
CHANGES IN ESTIMATED CASES AND DEATHS, 2000–2013
Malaria incidence rates are estimated to have fallen by 30% globally between 2000 and 2013, while estimated mortality rates fell by 47%.
After a slow start, the pace of decline in malaria incidence and mortality rates accelerated from 2005. For mortality, the rate of decline from 2005 to 2010 was fast enough to attain a 75% reduction over 15 years (i.e. the plotted points are parallel to the target line). However, the actual downward trend was slower between 2011 and 2013, partly due to a reduced rate of increase in ITN coverage.
If annual rates of decline that have occurred over the past 13 years are sustained, then by 2015, global malaria case incidence is projected to decrease by 35% and malaria mortality rates by 55%.
2014WORLD MALARIA REPORT SUMMARY
Mal
aria
cas
es p
er 1
000
pers
ons a
t risk
180
160
140
120
100
80
60
40
20
0201020052000 2015
75% targetEstimated malaria incidence rate
Source: WHO estimates
Number of persons infected with P. falciparum(million)
(a)
Mal
aria
dea
ths p
er 1
00 0
00 p
erso
ns a
t risk
60
50
40
30
20
10
0201020052000 2015
75% targetEstimated malaria mortality rate(b)
Source: Malaria Atlas Project
Proportion of children aged 2–10 years infected with P. falciparum
Mal
aria
cas
es p
er 1
000
pers
ons a
t risk
180
160
140
120
100
80
60
40
20
0201020052000 2015
75% targetEstimated malaria incidence rate
Source: WHO estimates
Number of persons infected with P. falciparum(million)
(a)
Mal
aria
dea
ths p
er 1
00 0
00 p
erso
ns a
t risk
60
50
40
30
20
10
0201020052000 2015
75% targetEstimated malaria mortality rate(b)
Source: Malaria Atlas Project
Proportion of children aged 2–10 years infected with P. falciparum
Change in a) Estimated malaria case incidence rate, 2000–2013 and b) Estimated malaria mortality rate, 2000–2013
2014WORLD MALARIA REPORT SUMMARY
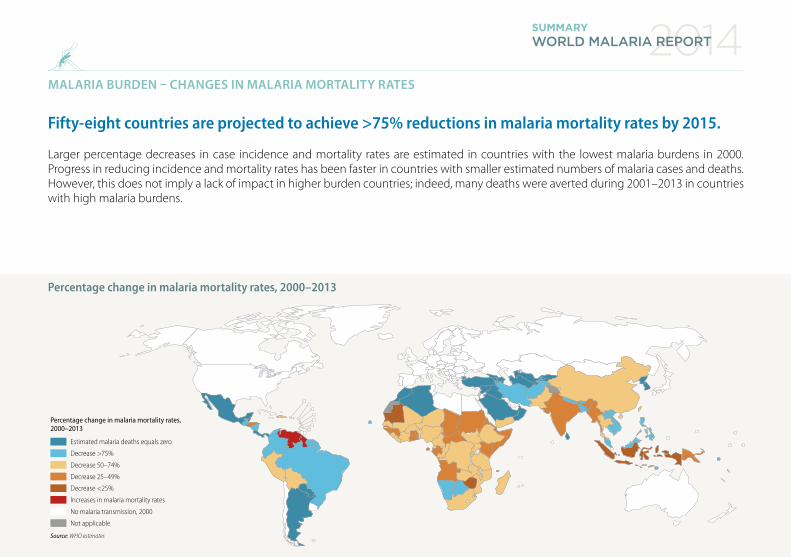
MALARIA BURDEN – CHANGES IN MALARIA MORTALITY RATES
Fifty-eight countries are projected to achieve >75% reductions in malaria mortality rates by 2015.
Larger percentage decreases in case incidence and mortality rates are estimated in countries with the lowest malaria burdens in 2000. Progress in reducing incidence and mortality rates has been faster in countries with smaller estimated numbers of malaria cases and deaths. However, this does not imply a lack of impact in higher burden countries; indeed, many deaths were averted during 2001–2013 in countries with high malaria burdens.
Estimated malaria deaths equals zero
Decrease >75%
Decrease 50–74%
Decrease 25–49%
Decrease <25%
Increases in malaria mortality rates
Source: WHO estimates
Percentage change in malaria mortality rates, 2000–2013
No malaria transmission, 2000
Not applicable
Percentage change in malaria mortality rates, 2000–2013
2014WORLD MALARIA REPORT SUMMARY
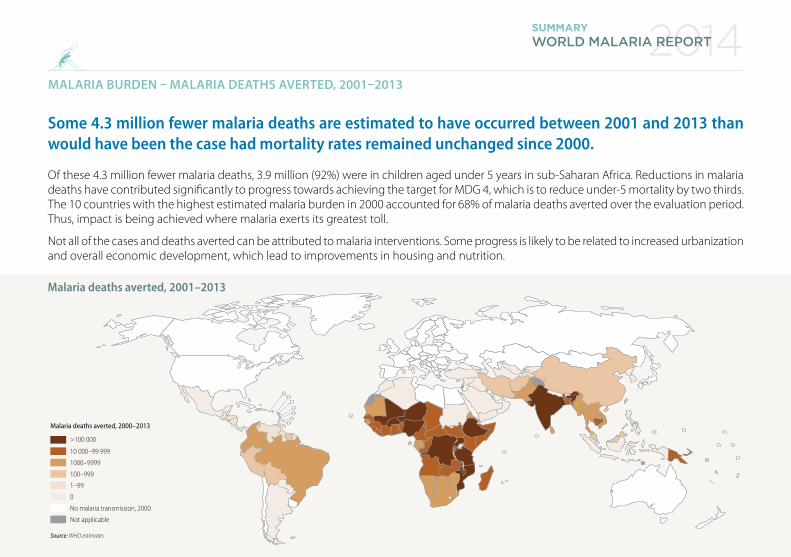
MALARIA BURDEN – MALARIA DEATHS AVERTED, 2001–2013
Some 4.3 million fewer malaria deaths are estimated to have occurred between 2001 and 2013 than would have been the case had mortality rates remained unchanged since 2000.
Of these 4.3 million fewer malaria deaths, 3.9 million (92%) were in children aged under 5 years in sub-Saharan Africa. Reductions in malaria deaths have contributed significantly to progress towards achieving the target for MDG 4, which is to reduce under-5 mortality by two thirds. The 10 countries with the highest estimated malaria burden in 2000 accounted for 68% of malaria deaths averted over the evaluation period. Thus, impact is being achieved where malaria exerts its greatest toll.
Not all of the cases and deaths averted can be attributed to malaria interventions. Some progress is likely to be related to increased urbanization and overall economic development, which lead to improvements in housing and nutrition.
Malaria deaths averted, 2001–2013
Source: WHO estimates
Malaria deaths averted, 2000–2013
>100 000
10 000–99 999
1000–9999
100–999
1–99
0
No malaria transmission, 2000
Not applicable

2014WORLD MALARIA REPORT SUMMARY
Eastern Mediterranean European South-East Asia Western Pacific
Afghanistan, Iran (Islamic Republic of), Iraq*, Morocco*, Oman*, Saudi Arabia and Syrian Arab Republic
Armenia*, Azerbaijan*, Georgia*, Kyrgyzstan*, Tajikistan, Turkey, Turkmenistan* and Uzbekistan*
Bangladesh, Bhutan, Democratic People’s Republic of Korea, Nepal, Sri Lanka* and Timor-Leste
Cambodia, China, Lao People’s Democratic Republic, Malaysia, Papua New Guinea, Philippines, Republic of Korea, Solomon Islands, Vanuatu and Viet Nam
India and Thailand
Djibouti, Pakistan, Somalia, Sudan and Yemen Indonesia and Myanmar
ANNEX: PROJECTED CHANGES IN MALARIA INCIDENCE RATES, BY COUNTRY, 2000–2015
WHO region African Americas
On track for ≥75% decrease in incidence 2000–2015
Algeria, Botswana, Cabo Verde, Eritrea, Namibia, Rwanda, Sao Tome and Principe, South Africa and Swaziland
Argentina*, Belize, Bolivia (Plurinational State of), Costa Rica, Ecuador, El Salvador, French Guiana (France), Guatemala, Honduras, Mexico, Nicaragua, Paraguay*, Suriname, Brazil, Colombia and Peru
50–75% decrease in incidence projected for 2000–2015 Ethiopia, Zambia and Zimbabwe Dominican Republic and Panama
<50% decrease in incidence projected for 2000–2015 Madagascar
Increase in incidence projected for 2000–2013 Guyana and Venezuela (Bolivarian Republic of )
Insufficiently consistent data to assess trends
Angola, Benin, Burkina Faso, Burundi, Cameroon, Central African Republic, Chad, Comoros, Congo, Côte d’Ivoire, Democratic Republic of the Congo, Equatorial Guinea, Gabon, Gambia, Ghana, Guinea, Guinea-Bissau, Kenya, Liberia, Malawi, Mali, Mauritania, Mayotte (France), Mozambique, Niger, Nigeria, Senegal, Sierra Leone, Togo, Uganda and United Republic of Tanzania
Haiti

2014WORLD MALARIA REPORT SUMMARY
Eastern Mediterranean European South-East Asia Western Pacific
Afghanistan, Iran (Islamic Republic of), Iraq*, Morocco*, Oman*, Saudi Arabia and Syrian Arab Republic
Armenia*, Azerbaijan*, Georgia*, Kyrgyzstan*, Tajikistan, Turkey, Turkmenistan* and Uzbekistan*
Bangladesh, Bhutan, Democratic People’s Republic of Korea, Nepal, Sri Lanka* and Timor-Leste
Cambodia, China, Lao People’s Democratic Republic, Malaysia, Papua New Guinea, Philippines, Republic of Korea, Solomon Islands, Vanuatu and Viet Nam
India and Thailand
Djibouti, Pakistan, Somalia, Sudan and Yemen Indonesia and Myanmar
Source: National malaria control programme reports. Countries in prevention of reintroduction phase are not included in this table; countries in bold achieved ≥75% decrease in case incidence by 2013; *country reported zero indigenous cases in 2013.
ANNEX: PROJECTED CHANGES IN MALARIA INCIDENCE RATES, BY COUNTRY, 2000–2015
WHO region African Americas
On track for ≥75% decrease in incidence 2000–2015
Algeria, Botswana, Cabo Verde, Eritrea, Namibia, Rwanda, Sao Tome and Principe, South Africa and Swaziland
Argentina*, Belize, Bolivia (Plurinational State of), Costa Rica, Ecuador, El Salvador, French Guiana (France), Guatemala, Honduras, Mexico, Nicaragua, Paraguay*, Suriname, Brazil, Colombia and Peru
50–75% decrease in incidence projected for 2000–2015 Ethiopia, Zambia and Zimbabwe Dominican Republic and Panama
<50% decrease in incidence projected for 2000–2015 Madagascar
Increase in incidence projected for 2000–2013 Guyana and Venezuela (Bolivarian Republic of )
Insufficiently consistent data to assess trends
Angola, Benin, Burkina Faso, Burundi, Cameroon, Central African Republic, Chad, Comoros, Congo, Côte d’Ivoire, Democratic Republic of the Congo, Equatorial Guinea, Gabon, Gambia, Ghana, Guinea, Guinea-Bissau, Kenya, Liberia, Malawi, Mali, Mauritania, Mayotte (France), Mozambique, Niger, Nigeria, Senegal, Sierra Leone, Togo, Uganda and United Republic of Tanzania
Haiti

2014WORLD MALARIA REPORT SUMMARY
Acknowledgements
Numerous people provided valuable help to the development of the World malaria report 2014. We are especially grateful to staff of NMCPs that submit the data and respond to queries with the support of WHO country and regional offices. The following organizations also contributed to the production of the report: African Leaders Malaria Alliance; Global Fund to Fight AIDS, Tuberculosis and Malaria; Johns Hopkins Bloomberg School of Public Health; Kaiser Family Foundation; Milliner Global Associates; Tulane University; University of California, San Francisco (UCSF) Global Health Group; United States Centers for Disease Control and Prevention; United States President’s Malaria Initiative; and University of Oxford.
We are also thankful for financial support from the United Kingdom Department of International Development, the United States Agency for International Development, and the Swiss Agency for Development and Cooperation (through a grant to the Swiss Tropical and Public Health Institute).
©
The
Glo
bal F
und/
John
Rae


m a l a r i a a t l a s p r o j e c t
The mark “CDC” is owned by the US Dept. of Health and
Human Services and is used with permission. Use of this logo is not an endorsement by HHS or CDC
of any particular product, service, or enterprise.
For further information please contact:Global Malaria ProgrammeWorld Health Organization20, avenue AppiaCH-1211 Geneva 27Web: www.who.int/malariaEmail: [email protected]
“Each year, more people are being reached with core malaria interventions, and as a result, more lives are being saved.”
WHO/HTM/GMP/2015.2
© T
he G
loba
l Fun
d/Jo
hn R
ae
Dr Margaret ChanDirector-General
World Health Organization
Related Documents