RESEARCH Open Access The Summary Index of Malaria Surveillance (SIMS): a stable index of malaria within India Alan A Cohen 1* , Neeraj Dhingra 2 , Raju M Jotkar 3 , Peter S Rodriguez 1 , Vinod P Sharma 4 , Prabhat Jha 1 Abstract Background: Malaria in India has been difficult to measure. Mortality and morbidity are not comprehensively reported, impeding efforts to track changes in disease burden. However, a set of blood measures has been collected regularly by the National Malaria Control Program in most districts since 1958. Methods: Here, we use principal components analysis to combine these measures into a single index, the Summary Index of Malaria Surveillance (SIMS), and then test its temporal and geographic stability using subsets of the data. Results: The SIMS correlates positively with all its individual components and with external measures of mortality and morbidity. It is highly consistent and stable over time (1995-2005) and regions of India. It includes measures of both vivax and falciparum malaria, with vivax dominant at lower transmission levels and falciparum dominant at higher transmission levels, perhaps due to ecological specialization of the species. Conclusions: This measure should provide a useful tool for researchers looking to summarize geographic or temporal trends in malaria in India, and can be readily applied by administrators with no mathematical or scientific background. We include a spreadsheet that allows simple calculation of the index for researchers and local administrators. Similar principles are likely applicable worldwide, though further validation is needed before using the SIMS outside India. Background Malaria in India has a long and tumultuous history. Apparently not widespread before British agricultural projects created ideal breeding conditions for the mos- quito vectors, by the end of the 19 th century, malaria had become a severe public health concern: a constant endemic problem in northeastern regions such as Bengal and a periodically ravaging epidemic in the northwes- tern states such as Punjab, where a single epidemic killed in excess of 300,000 people in late 1908 [1-3]. During this time, falciparum malaria - substantially more severe and deadly than the other species - became widespread. After independence, a control program nearly succeeded in eliminating malaria entirely, but in 1965, on the verge of success, funding was cut, and there was a substantial rebound of the disease in the fol- lowing years[4,5]. Currently, malaria is much less severe than before the control program, but it continues to be a major public health concern, accounting for perhaps 1-2% of all deaths in India (AAC and PJ, unpublished data). In some states, particularly Orissa, disease burden is much worse[5]. As part of the National Malaria Eradication Pro- gramme (which became the National Vector-born Dis- ease Control Program, or NVBDCP), a surveillance system was set up in 1958 to measure malaria incidence based on examination of blood smears at Primary Health Centers (PHCs)[1]. However, because most of the surveillance is passive, slides are much more likely to come from people who have malaria than expected from a random sample of the population. These mea- sures are thus not a reliable way to estimate overall inci- dence, morbidity, or mortality. Better anti-malarial treatment and surveillance in high-malaria areas may also result in relative underestimation of malaria in low- malaria areas. Statistics are compiled yearly for each district. Con- vention and the nature of the data collection have resulted in the calculation of seven different indices for * Correspondence: [email protected] 1 Centre for Global Health Research, Li Ka Shing Knowledge Institute, St Michael’s Hospital, Toronto, Ontario, Canada Cohen et al. Population Health Metrics 2010, 8:1 http://www.pophealthmetrics.com/content/8/1/1 © 2010 Cohen et al; licensee BioMed Central Ltd. This is an Open Access article distributed under the terms of the Creative Commons Attribution License (http://creativecommons.org/licenses/by/2.0), which permits unrestricted use, distribution, and reproduction in any medium, provided the original work is properly cited.

Welcome message from author
This document is posted to help you gain knowledge. Please leave a comment to let me know what you think about it! Share it to your friends and learn new things together.
Transcript
RESEARCH Open Access
The Summary Index of Malaria Surveillance(SIMS): a stable index of malaria within IndiaAlan A Cohen1*, Neeraj Dhingra2, Raju M Jotkar3, Peter S Rodriguez1, Vinod P Sharma4, Prabhat Jha1
Abstract
Background: Malaria in India has been difficult to measure. Mortality and morbidity are not comprehensivelyreported, impeding efforts to track changes in disease burden. However, a set of blood measures has beencollected regularly by the National Malaria Control Program in most districts since 1958.
Methods: Here, we use principal components analysis to combine these measures into a single index, theSummary Index of Malaria Surveillance (SIMS), and then test its temporal and geographic stability using subsets ofthe data.
Results: The SIMS correlates positively with all its individual components and with external measures of mortalityand morbidity. It is highly consistent and stable over time (1995-2005) and regions of India. It includes measures ofboth vivax and falciparum malaria, with vivax dominant at lower transmission levels and falciparum dominant athigher transmission levels, perhaps due to ecological specialization of the species.
Conclusions: This measure should provide a useful tool for researchers looking to summarize geographic ortemporal trends in malaria in India, and can be readily applied by administrators with no mathematical or scientificbackground. We include a spreadsheet that allows simple calculation of the index for researchers and localadministrators. Similar principles are likely applicable worldwide, though further validation is needed before usingthe SIMS outside India.
BackgroundMalaria in India has a long and tumultuous history.Apparently not widespread before British agriculturalprojects created ideal breeding conditions for the mos-quito vectors, by the end of the 19th century, malariahad become a severe public health concern: a constantendemic problem in northeastern regions such as Bengaland a periodically ravaging epidemic in the northwes-tern states such as Punjab, where a single epidemickilled in excess of 300,000 people in late 1908 [1-3].During this time, falciparum malaria - substantiallymore severe and deadly than the other species - becamewidespread. After independence, a control programnearly succeeded in eliminating malaria entirely, but in1965, on the verge of success, funding was cut, andthere was a substantial rebound of the disease in the fol-lowing years[4,5]. Currently, malaria is much less severethan before the control program, but it continues to be
a major public health concern, accounting for perhaps1-2% of all deaths in India (AAC and PJ, unpublisheddata). In some states, particularly Orissa, disease burdenis much worse[5].As part of the National Malaria Eradication Pro-
gramme (which became the National Vector-born Dis-ease Control Program, or NVBDCP), a surveillancesystem was set up in 1958 to measure malaria incidencebased on examination of blood smears at PrimaryHealth Centers (PHCs)[1]. However, because most ofthe surveillance is passive, slides are much more likelyto come from people who have malaria than expectedfrom a random sample of the population. These mea-sures are thus not a reliable way to estimate overall inci-dence, morbidity, or mortality. Better anti-malarialtreatment and surveillance in high-malaria areas mayalso result in relative underestimation of malaria in low-malaria areas.Statistics are compiled yearly for each district. Con-
vention and the nature of the data collection haveresulted in the calculation of seven different indices for
* Correspondence: [email protected] for Global Health Research, Li Ka Shing Knowledge Institute, StMichael’s Hospital, Toronto, Ontario, Canada
Cohen et al. Population Health Metrics 2010, 8:1http://www.pophealthmetrics.com/content/8/1/1
© 2010 Cohen et al; licensee BioMed Central Ltd. This is an Open Access article distributed under the terms of the Creative CommonsAttribution License (http://creativecommons.org/licenses/by/2.0), which permits unrestricted use, distribution, and reproduction inany medium, provided the original work is properly cited.
each district in each year (see Methods for details), eachwith a slightly different interpretation. Some measuresare for all malaria; others just for the more severe spe-cies, falciparum. This has resulted in the need to pre-sent many different graphs or columns to show trendsfor so many indices, and it is not always clear how tointerpret countervailing trends in different indices[5].Further, each index has strengths and weaknesses, andnone alone seems to adequately summarize malarialevels for an area.Here, using principal components analysis (PCA), we
combine the existing measures into the Summary Indexof Malaria Surveillance (SIMS), a single summary indexof malaria trends. This index is scaled between 0 and100, with higher numbers indicating more malaria, mak-ing it easy for laymen to interpret. We confirm thevalidity of this index using both internal and externalvalidation. Internal validation includes confirming that(a) all measures load in the same direction on the index(the first PCA axis); (b) the first PCA axis explains asubstantial portion of the variation; (c) the axis is robustwhen generated from different subsets of the data; and(d) the axis is robust when generated from differentcombinations of the measures. External validation isconducted by assessing the correlation of our index andthe original measures with independent measures ofmalaria mortality and morbidity in India from the Mil-lion Death Study (MDS) and District-level HouseholdSurvey (DLHS), respectively. Lastly, we provide a Micro-soft Excel spreadsheet that can easily be used byresearchers and local officials to calculate the SIMSfrom raw data.
MethodsDataNVBDCP (National Vector-born Disease Control Program)The NVBDCP in India collects laboratory surveillancedata (peripheral blood smears) primarily from patientswho present themselves with fevers at a Primary HealthCenter (PHC) or any public health facility, instructinghealth workers to take blood smears (passive surveil-lance). In addition, health workers visit households intheir jurisdictions once each fortnight and ask if any-body is presently suffering from fever or has since thelast visit. If yes, a blood smear is collected, and chloro-quine tablets are given as a presumptive treatment(active surveillance). The slides are then examined forevidence of malaria, and this is recorded as being nega-tive, positive for Plasmodium falciparum, positive forother Plasmodium species (vivax or malariae, mostlyvivax), or positive for both P. falciparum and other spe-cies. On receipt of positive results, radical treatment formalaria is supposed to be given to the patient. Thisshould happen before development of gametocytes in
the body (within 21 days) to halt the transmission(Table 1)[5] (GPS Dhillon and GS Sonal, personal com-munication). Time lag between collection of the slideand administration of treatment is an operational qualityindicator for the program.These results are then compiled at the district level -
there are currently about 600 districts in the 35 Indianstates and union territories - and used to generate a ser-ies of statistics. The raw numbers collected include:population of the district in thousands (“Pop”); bloodsmears collected (“BSC”); blood smears examined(“BSE”); # of slides positive for P. vivax or malariae(“Pv”); # of slides positive for P. falciparum (“Pf”); and #of slides positive for both (“mixed”). These raw numbersare then used to calculate several indices: total numberof positive slides (“positive” = Pv + Pf + mixed); percentof positive slides that are positive for P. falciparum (“%Pf” = (Pf + mixed)/positive); annual blood examinationrate (“ABER” = BSE/Pop/10); annual parasite index(“API” = positive/Pop); annual falciparum index (“AFI”= (Pf + mixed)/Pop); slide positivity rate (“SPR” = 100 ×positive/BSE); and slide falciparum rate (“SFR” = 100 ×(Pf + mixed)/BSE). The number of malaria deaths certi-fied by the NVBDCP (“deaths”) is also recorded. Themeasures traditionally used to monitor malaria levels are%Pf, ABER, API, AFI, SPR, SFR, and deaths.Each of the measures above has a particular interpre-
tation. ABER measures coverage of the surveillance pro-gram, and potentially also local fever incidence.Convention suggests that when ABER is less than 10%,coverage is poor enough that population-referent mea-sures such as API and AFI should be viewed with skep-ticism[5]. However, ABER may be associated withmalaria rates to the extent that sick people seek treat-ment and therefore have slides examined. Falciparum-positivity is important to distinguish from overallpositivity because falciparum malaria is more deadly.API and AFI, though not true measures of populationprevalence or incidence, do provide an approximation ofdisease burden in the population, because presumablymany who fall ill do come to PHCs or health facilitiesfor treatment and thus have slides taken. SPR and SFRare measures of disease burden that avoid the problemof referencing population size when only a small portionof the population is sampled, but could be biased intheir own right by the incidence of nonmalarial feversthat would lead people to come to clinics and thusboost the denominator (BSE). %Pf should be a goodmeasure of the relative occurrence of falciparum andnon-falciparum malaria but provides no information onabsolute occurrence. Because the standards are high andrigid for labeling of a death as malaria by the NVBDCP(i.e., only when a peripheral blood smear or rapid diag-nostic test is positive; even quantitative buffy coat and
Cohen et al. Population Health Metrics 2010, 8:1http://www.pophealthmetrics.com/content/8/1/1
Page 2 of 12
indirect antibody tests are not recognized), most malariadeaths are not recorded by the surveillance program.Data were generally collected for districts that were
recognized administrative units at time of collection;thus, new districts often have data for only some of theyears, and district boundaries change over time withinthe dataset. We thus aggregated districts as needed toensure that units were consistent over time, resulting ina final list of 499 districts. We used data from 1995-2005, considering each district in each year as an inde-pendent data point for our purposes (“district-years,”5,386 used in this analysis). Data were missing for cer-tain districts in certain years; 103 such district-yearswere ignored.MDS (Million Death Study)The MDS gives estimates of cause-specific death ratesthroughout India, and we used it here to generate esti-mates of district-year-specific malaria mortality as anexternal check on the validity of our indices from theNVBDCP. The study was conducted in 1.1 millionhomes in 6,671 small areas chosen from all parts ofIndia (about 1,000 persons per area) to be representativeat the state level. The Sample Registration System wasestablished by the Registrar General of India to monitorall births and deaths in these areas[6,7]. Each home inwhich a death had been recorded between 2001 and2003 was visited by one of 900 nonmedical field work-ers, and the underlying causes of all deaths were soughtby verbal autopsy (a structured investigation of eventsleading to the death conducted by at least two trainedphysicians) [8-10]. Details of the methods, quality-con-trol checks, and validation results have been reportedpreviously[8,10-12].
For the purpose of this study, we limited our sampleof the MDS to deaths occurring at ages 1-69, when mis-diagnosis is less problematic and when the bulk ofmalaria mortality occurs. For each district-year (2001-2003), we calculated the percentage of total deaths inthis age range that were attributable to malaria based onthe verbal autopsy results. As a check, we also includedpercentage of deaths due to fever of unknown origin.For some analyses, we included only district-years whenthere was at least one malaria death.DLHS (District-level Household Survey)The DLHS is an India-wide, door-to-door householdsurvey that contains questions about whether householdmembers have suffered from malaria recently. Fulldetails of the methodology are available at the Web siteof the International Institute for Population Scienceshttp://www.rchiips.org/ and publications therein[13,14].We used it here as a way to estimate district-specificmalaria morbidity in the years of the survey as an exter-nal check on our NVBDCP indices. The DLHS was con-ducted in three rounds - in 1998-99, 2002-2003, and2005-06 - but we use data from only the first tworounds. Each round had hundreds of questions, one ofwhich was whether any member of the household hadsuffered from malaria in the past three months (round1) or past two weeks (round 2). If the answer was yes,data were collected on the age and sex of the peoplewith malaria and whether they received treatment, forup to five people per household (round 1) or all withmalaria (round 2). By combining this with the numberof members in the household, we can generate estimatesof morbidity as the number of individuals in a districtwho suffered from malaria in the specified period
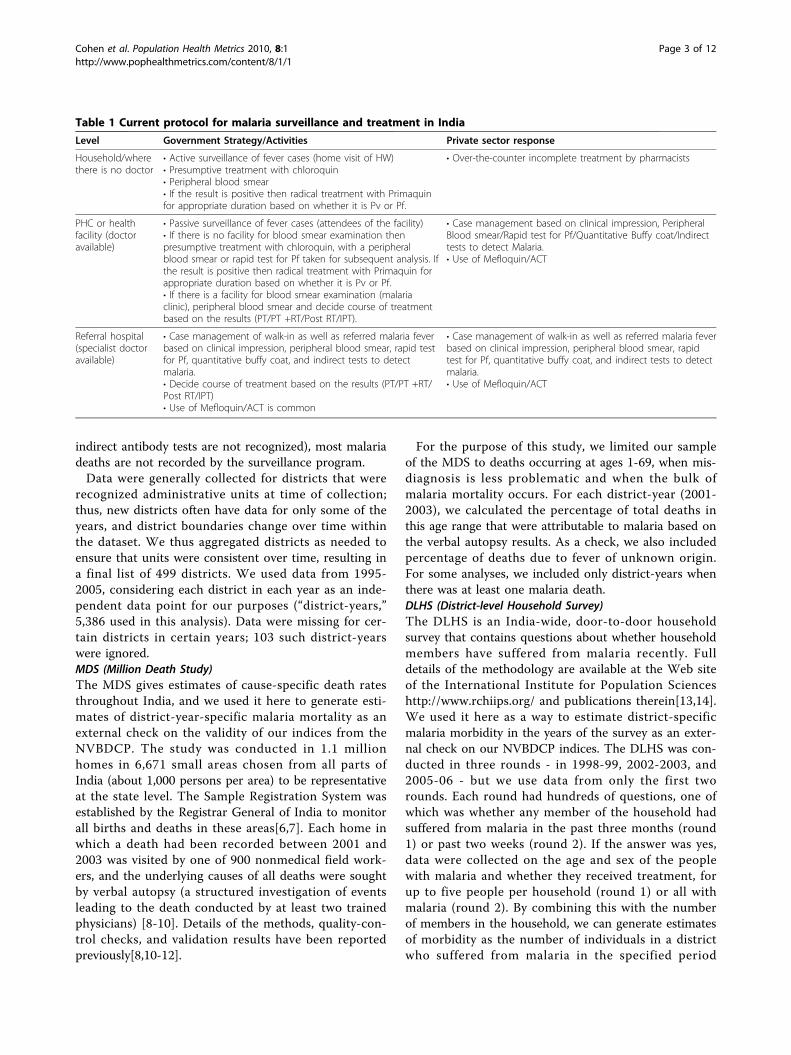
Table 1 Current protocol for malaria surveillance and treatment in India
Level Government Strategy/Activities Private sector response
Household/wherethere is no doctor
• Active surveillance of fever cases (home visit of HW)• Presumptive treatment with chloroquin• Peripheral blood smear• If the result is positive then radical treatment with Primaquinfor appropriate duration based on whether it is Pv or Pf.
• Over-the-counter incomplete treatment by pharmacists
PHC or healthfacility (doctoravailable)
• Passive surveillance of fever cases (attendees of the facility)• If there is no facility for blood smear examination thenpresumptive treatment with chloroquin, with a peripheralblood smear or rapid test for Pf taken for subsequent analysis. Ifthe result is positive then radical treatment with Primaquin forappropriate duration based on whether it is Pv or Pf.• If there is a facility for blood smear examination (malariaclinic), peripheral blood smear and decide course of treatmentbased on the results (PT/PT +RT/Post RT/IPT).
• Case management based on clinical impression, PeripheralBlood smear/Rapid test for Pf/Quantitative Buffy coat/Indirecttests to detect Malaria.• Use of Mefloquin/ACT
Referral hospital(specialist doctoravailable)
• Case management of walk-in as well as referred malaria feverbased on clinical impression, peripheral blood smear, rapid testfor Pf, quantitative buffy coat, and indirect tests to detectmalaria.• Decide course of treatment based on the results (PT/PT +RT/Post RT/IPT)• Use of Mefloquin/ACT is common
• Case management of walk-in as well as referred malaria feverbased on clinical impression, peripheral blood smear, rapidtest for Pf, quantitative buffy coat, and indirect tests to detectmalaria.• Use of Mefloquin/ACT
Cohen et al. Population Health Metrics 2010, 8:1http://www.pophealthmetrics.com/content/8/1/1
Page 3 of 12
divided by total individuals in the district. The tworounds provide somewhat different measures of morbid-ity, but because they are internally consistent acrossIndia, they can each be used to validate the NVBDCPindices. Our DLHS 1 sample included 3.2 million indivi-duals, with a mean ± SD of 6380 ± 1680 individuals perdistrict. Our DLHS 2 sample covered 3.5 million indivi-duals, with 5860 ± 760 individuals per district. Thus,even at relatively low malaria levels, our district morbid-ity estimates should be fairly robust.
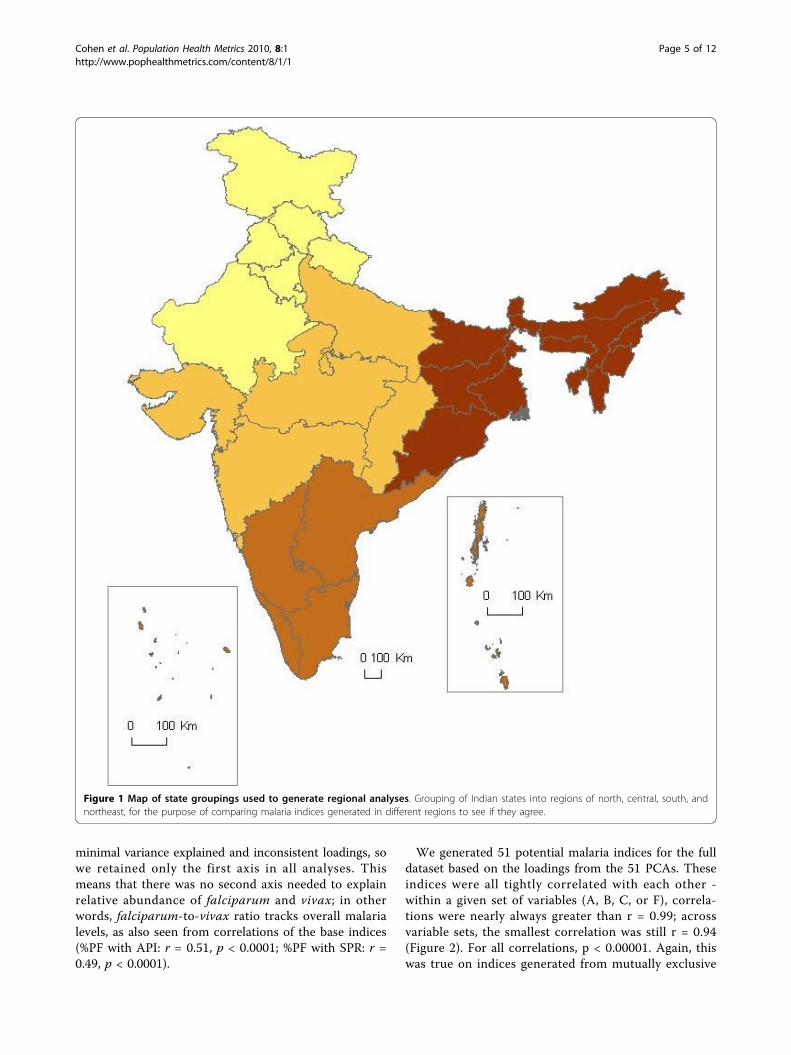
StatisticsAll analyses were conducted in R, v. 2.8.0. Data weretransformed for normality and standardized by subtract-ing the mean and dividing by the standard deviation asdescribed in Additional file 1. (A summary of principalcomponents analysis is also provided in Additional file1.) PCA was run using the princomp function in R. Weattempted to generate a general malaria index (SIMS) asthe first PCA axis of the analyses, and also pursued butultimately rejected the idea of an additional falciparum-specific index that might better predict mortality. Weran the analyses on 51 subsets of the data: three subsetsof the variables for the SIMS and one for the falciparumindex, and 13 subsets of the observations, in most possi-ble combinations. (The falciparum-only measures couldnot be run on the full dataset due to excessive zeroes).The variable subsets run were: (A) all variables; (B)excluding API and AFI, which should be redundant ifABER, SPR, and SFR are included, and which are hardto interpret given the variation in ABER; (C) excludingAPI, AFI, and MR, which can be problematic not onlybecause of the large number of zeroes but because inmost nonzero districts there was only one death; and(F), the three falciparum measures: %Pf, AFI, and SFR.The 13 subsets of observations included: (1) all observa-tions (district-years); (2) district-years with at least onefalciparum positive slide (SFR>0); (3) district-years withat least one death; (4) district-years with at least 15% ofpositive slides falciparum-positive (%Pf>15); (5) 1995-1996 only; (6) 1997-1998 only; (7) 1999-2000 only; (8)2001-2002 only; (9) 2003-2005 only; (10) only the north-ern states of Jammu and Kashmir, Himachal Pradesh,Uttaranchal, Punjab, Haryana, and Rajasthan, as well asChandigarh and Delhi; (11) only the northeastern statesof Orissa, Bihar, Jharkhand, Sikkim, West Bengal,Assam, Tripura, Manipur, Mizoram, Meghalaya, Naga-land, and Arunachal Pradesh; (12) only the central statesof Uttar Pradesh, Gujarat, Madhya Pradesh, Chhattis-garh, Maharashtra, and Goa, as well as Daman and Diuand Dadra and Nagar Haveli; (13) only the southernstates of Karnataka, Andhra Pradesh, Tamil Nadu, andKerala as well as Pondicherry, Lakshadweep, and theAndaman and Nicobar Islands. Thus, subsets 2-4 are
based on malaria severity, 5-9 are based on time, and10-13 are based on geography. The geographic divisionsare those used in the National Family Health Survey[15], except that eastern and northeastern states arepooled here, as are central and western states (Figure 1).The highest malaria areas in India are almost all in ourblock of northeastern states. We refer to the analysesbased on the numbers and letters described above; forexample, B2 would be excluding API and AFI, run ondistrict-years with at least one falciparum-positive slide.The falciparum-only PCAs were run on the above sub-sets after excluding all district-years with no falciparumrecorded. We ran additional validation analyses that arepresented in Additional file 1, including using analysesof the raw variables (BSE, PV, PF + mixed, and deaths),and comparing heterogeneity of correlations betweenthe seven indices across the subsets used for PCAvalidation.For each of the above PCA analyses, we expected thefirst PCA axis, which explains the most variation, to bethe one of interest. Thus, after assessing the variancethat the first PCA axis explained and confirming thatthis was much higher than for any of the other PCAaxes, we took the component loadings for this axis fromeach of the 51 PCA analyses and used them to calculatePCA scores for the whole dataset. This resulted in 51new variables, potential indices generated from the sub-sets of the data. For example, the loadings for the firstaxis calculated with only the 1995-1996 district-yearswere used to create a variable from the whole dataset,including all district-years. Comparison between thisand similar indices created from the PCAs run on otheryears allowed assessment of whether the index hadchanged over time or was stable. We assessed this bycalculating the correlations among these 51 axes andwith the seven original variables. This was also used tochoose a best axis for the Summary Index of MalariaSurveillance based on strength of correlations with theoriginal variables and comprehensiveness. For externalvalidation, we calculated the correlation between MDS-recorded deaths and this axis in the years 2001-2003,and between DLHS-recorded morbidity and this axis inthe years 1998-1999 and again for 2002-2003.
ResultsFor the 51 PCAs we ran, the variance explained by thefirst axis was between 49% and 89% (Additional file 2).As predicted, all measures loaded in the same directionon the first axis of each PCA. Even on mutually exclu-sive portions of the dataset (e.g., Additional file 2, col-umns 5-9), the variable loadings were nearly identical,suggesting substantial stability of the relationships. Thecorrelations of the indices over these subsets were morevariable (see Additional file 1). Additional axes had
Cohen et al. Population Health Metrics 2010, 8:1http://www.pophealthmetrics.com/content/8/1/1
Page 4 of 12
minimal variance explained and inconsistent loadings, sowe retained only the first axis in all analyses. Thismeans that there was no second axis needed to explainrelative abundance of falciparum and vivax; in otherwords, falciparum-to-vivax ratio tracks overall malarialevels, as also seen from correlations of the base indices(%PF with API: r = 0.51, p < 0.0001; %PF with SPR: r =0.49, p < 0.0001).
We generated 51 potential malaria indices for the fulldataset based on the loadings from the 51 PCAs. Theseindices were all tightly correlated with each other -within a given set of variables (A, B, C, or F), correla-tions were nearly always greater than r = 0.99; acrossvariable sets, the smallest correlation was still r = 0.94(Figure 2). For all correlations, p < 0.00001. Again, thiswas true on indices generated from mutually exclusive
Figure 1 Map of state groupings used to generate regional analyses. Grouping of Indian states into regions of north, central, south, andnortheast, for the purpose of comparing malaria indices generated in different regions to see if they agree.
Cohen et al. Population Health Metrics 2010, 8:1http://www.pophealthmetrics.com/content/8/1/1
Page 5 of 12
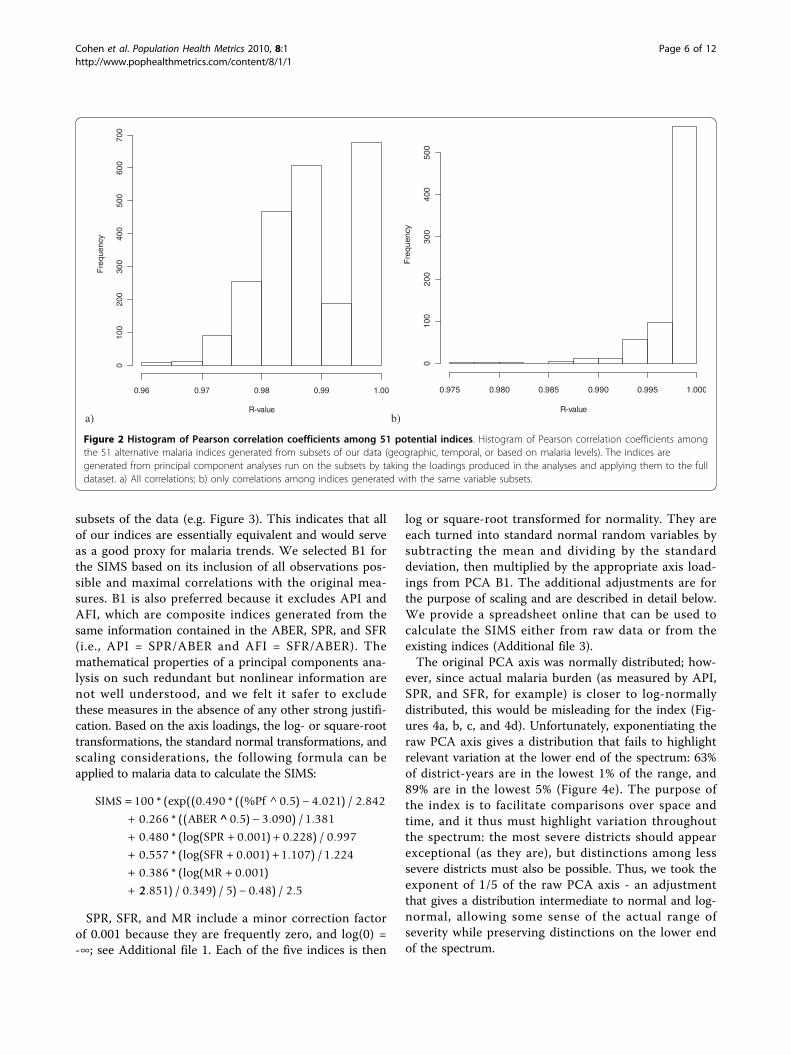
subsets of the data (e.g. Figure 3). This indicates that allof our indices are essentially equivalent and would serveas a good proxy for malaria trends. We selected B1 forthe SIMS based on its inclusion of all observations pos-sible and maximal correlations with the original mea-sures. B1 is also preferred because it excludes API andAFI, which are composite indices generated from thesame information contained in the ABER, SPR, and SFR(i.e., API = SPR/ABER and AFI = SFR/ABER). Themathematical properties of a principal components ana-lysis on such redundant but nonlinear information arenot well understood, and we felt it safer to excludethese measures in the absence of any other strong justifi-cation. Based on the axis loadings, the log- or square-roottransformations, the standard normal transformations, andscaling considerations, the following formula can beapplied to malaria data to calculate the SIMS:
SIMS Pf
ABER
100 0 490 0 5 4 021 2 842
0 266
*(exp(( . *((% ^ . ) . ) / .
. *(( ^̂ . ) . ) / .
. *(log( . ) . ) / .
0 5 3 090 1 381
0 480 0 001 0 228 0 997
0
SPR
.. *(log( . ) . ) / .
. *(log( . )
557 0 001 1 107 1 224
0 386 0 001
SFR
MR
22 851 0 349 5 0 48 2 5. ) / . ) / ) . ) / .
SPR, SFR, and MR include a minor correction factorof 0.001 because they are frequently zero, and log(0) =-∞; see Additional file 1. Each of the five indices is then
log or square-root transformed for normality. They areeach turned into standard normal random variables bysubtracting the mean and dividing by the standarddeviation, then multiplied by the appropriate axis load-ings from PCA B1. The additional adjustments are forthe purpose of scaling and are described in detail below.We provide a spreadsheet online that can be used tocalculate the SIMS either from raw data or from theexisting indices (Additional file 3).The original PCA axis was normally distributed; how-
ever, since actual malaria burden (as measured by API,SPR, and SFR, for example) is closer to log-normallydistributed, this would be misleading for the index (Fig-ures 4a, b, c, and 4d). Unfortunately, exponentiating theraw PCA axis gives a distribution that fails to highlightrelevant variation at the lower end of the spectrum: 63%of district-years are in the lowest 1% of the range, and89% are in the lowest 5% (Figure 4e). The purpose ofthe index is to facilitate comparisons over space andtime, and it thus must highlight variation throughoutthe spectrum: the most severe districts should appearexceptional (as they are), but distinctions among lesssevere districts must also be possible. Thus, we took theexponent of 1/5 of the raw PCA axis - an adjustmentthat gives a distribution intermediate to normal and log-normal, allowing some sense of the actual range ofseverity while preserving distinctions on the lower endof the spectrum.
a)R-value
Fre
quen
cy
0.96 0.97 0.98 0.99 1.00
010
020
030
040
050
060
070
0
b)R-value
Fre
quen
cy
0.975 0.980 0.985 0.990 0.995 1.000
010
020
030
040
050
0
Figure 2 Histogram of Pearson correlation coefficients among 51 potential indices. Histogram of Pearson correlation coefficients amongthe 51 alternative malaria indices generated from subsets of our data (geographic, temporal, or based on malaria levels). The indices aregenerated from principal component analyses run on the subsets by taking the loadings produced in the analyses and applying them to the fulldataset. a) All correlations; b) only correlations among indices generated with the same variable subsets.
Cohen et al. Population Health Metrics 2010, 8:1http://www.pophealthmetrics.com/content/8/1/1
Page 6 of 12

a)
-4 -2 0 2 4
-4-2
02
4
Index generated with data from 1995-1996
Ind
ex g
ene
rate
d w
ith d
ata
fro
m 2
003-
200
5
b)
-4 -2 0 2 4
-4-2
02
4
Index generated with data from northeastern states
Inde
x ge
nera
ted
with
dat
a fro
m s
outh
ern
sta
tes
Figure 3 Correlations between two malaria indices generated from mutually exclusive portions of the dataset. Loadings from twoseparate principal components analyses using the measures %Pf, ABER, SPR, SFR, and MR were applied to the full dataset to generate theindices: a) 1995-1996 vs. 2003-2005; b) northeastern states (high malaria) vs. southern states (low malaria).
Cohen et al. Population Health Metrics 2010, 8:1http://www.pophealthmetrics.com/content/8/1/1
Page 7 of 12

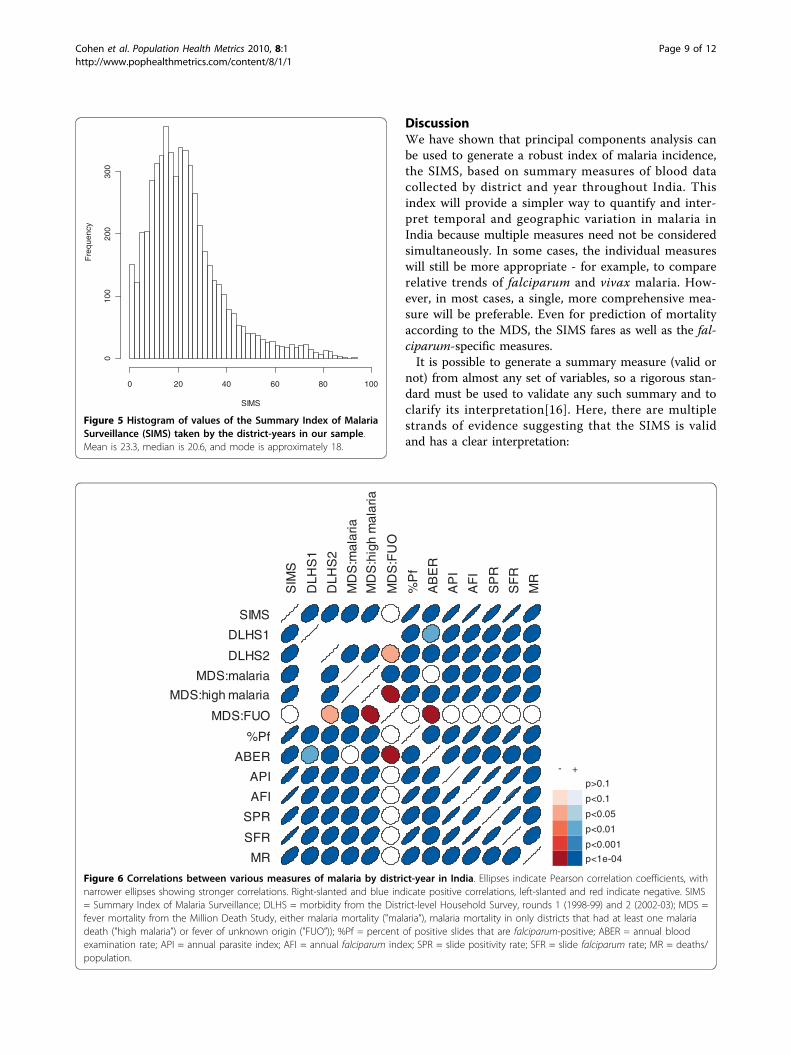
The final task was to put this measure on a scale of 0to 100, leaving room for values that might lie outsidethe range we observed. We would have liked 0 and 100to be precise theoretical maxima and minima, but this isnot possible if we wish to preserve the roughly realisticsemi-exponential distribution. The choice of how muchadditional range to leave was arbitrary. To scale ourobserved points from 0 to 100, we would subtract theminimum (0.483) and divide by the range (2.31) of theunscaled index, then multiply by 100. We chose insteadto use 0.48 and 2.5 respectively, resulting in ourobserved values ranging between 0.12 and 93. This deci-sion was made on the assumption that some of our dis-tricts had essentially no malaria (0.12 is very close to0.00), but that there was more room at the upper endfor transmission levels higher than we had observed.
With these adjustments, the SIMS is easily interpretable(Figures 4f and 5).For comparisons of correlations among variables, all
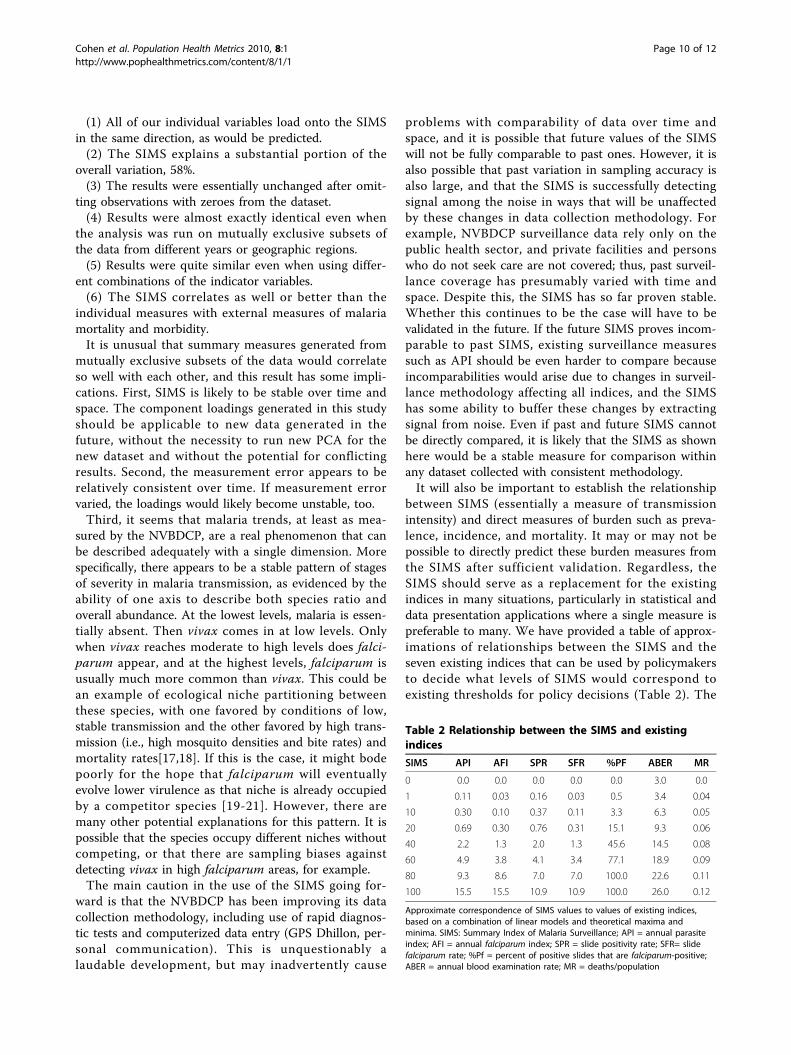
were transformed as necessary to achieve approximatelynormal distributions. The SIMS correlated with percent ofdeaths attributable to malaria by district-year according toMDS and with self-reported malaria morbidity accordingto the DLHS (Figure 6, Additional file 4). This was betterthan most of the individual measures, though SFR was atleast as closely associated with MDS deaths, and API andAFI were at least as well associated with DLHS morbidity.However, the SIMS was clearly unassociated with MDSdeaths due to fever of unknown origin, providing evidenceboth that the SIMS is picking up the appropriate trendsand that the MDS verbal autopsy methodology does notunderestimate malaria due to vague diagnoses.
Figure 4 Maps of SIMS and other malaria indices by district in India, averaged 1995-2005. a) API (annual parasite index); b) SPR (slidepositivity rate); c) SFR (slide falciparum rate); d) a normally distributed version of the SIMS (Summary Index of Malaria Surveillance); e) a fullyexponentiated version of the SIMS; and f) the final SIMS. Scales differ across measures, but colors are divided into 12 equal classes comprisingthe full range of values for each measure and ensuring visual comparability across a) through f) for inferring the distribution. Note that theexponentiated SIMS matches the API, SPR, and SFR, but fails to distinguish well among districts at the lower end of the spectrum. The normallydistributed SIMS fails to convey how much worse the problem is in high-malaria districts relative to most districts.
Cohen et al. Population Health Metrics 2010, 8:1http://www.pophealthmetrics.com/content/8/1/1
Page 8 of 12
DiscussionWe have shown that principal components analysis canbe used to generate a robust index of malaria incidence,the SIMS, based on summary measures of blood datacollected by district and year throughout India. Thisindex will provide a simpler way to quantify and inter-pret temporal and geographic variation in malaria inIndia because multiple measures need not be consideredsimultaneously. In some cases, the individual measureswill still be more appropriate - for example, to comparerelative trends of falciparum and vivax malaria. How-ever, in most cases, a single, more comprehensive mea-sure will be preferable. Even for prediction of mortalityaccording to the MDS, the SIMS fares as well as the fal-ciparum-specific measures.It is possible to generate a summary measure (valid or
not) from almost any set of variables, so a rigorous stan-dard must be used to validate any such summary and toclarify its interpretation[16]. Here, there are multiplestrands of evidence suggesting that the SIMS is validand has a clear interpretation:
SIMS
Fre
quen
cy
0 20 40 60 80 100
010
020
030
0
Figure 5 Histogram of values of the Summary Index of MalariaSurveillance (SIMS) taken by the district-years in our sample.Mean is 23.3, median is 20.6, and mode is approximately 18.
SIMS
DLHS1
DLHS2
MDS:malaria
MDS:high malaria
MDS:FUO
%Pf
ABER
API
AFI
SPR
SFR
MR
SIM
S
DLH
S1
DLH
S2
MD
S:m
alar
ia
MD
S:h
igh
mal
aria
MD
S:F
UO
%P
f
AB
ER
AP
I
AF
I
SP
R
SF
R
MR
p<1e-04
p<0.001
p<0.01
p<0.05
p<0.1
p>0.1
- +
Figure 6 Correlations between various measures of malaria by district-year in India. Ellipses indicate Pearson correlation coefficients, withnarrower ellipses showing stronger correlations. Right-slanted and blue indicate positive correlations, left-slanted and red indicate negative. SIMS= Summary Index of Malaria Surveillance; DLHS = morbidity from the District-level Household Survey, rounds 1 (1998-99) and 2 (2002-03); MDS =fever mortality from the Million Death Study, either malaria mortality ("malaria”), malaria mortality in only districts that had at least one malariadeath ("high malaria”) or fever of unknown origin ("FUO”)); %Pf = percent of positive slides that are falciparum-positive; ABER = annual bloodexamination rate; API = annual parasite index; AFI = annual falciparum index; SPR = slide positivity rate; SFR = slide falciparum rate; MR = deaths/population.
Cohen et al. Population Health Metrics 2010, 8:1http://www.pophealthmetrics.com/content/8/1/1
Page 9 of 12
(1) All of our individual variables load onto the SIMSin the same direction, as would be predicted.(2) The SIMS explains a substantial portion of the
overall variation, 58%.(3) The results were essentially unchanged after omit-
ting observations with zeroes from the dataset.(4) Results were almost exactly identical even when
the analysis was run on mutually exclusive subsets ofthe data from different years or geographic regions.(5) Results were quite similar even when using differ-
ent combinations of the indicator variables.(6) The SIMS correlates as well or better than the
individual measures with external measures of malariamortality and morbidity.It is unusual that summary measures generated from
mutually exclusive subsets of the data would correlateso well with each other, and this result has some impli-cations. First, SIMS is likely to be stable over time andspace. The component loadings generated in this studyshould be applicable to new data generated in thefuture, without the necessity to run new PCA for thenew dataset and without the potential for conflictingresults. Second, the measurement error appears to berelatively consistent over time. If measurement errorvaried, the loadings would likely become unstable, too.Third, it seems that malaria trends, at least as mea-
sured by the NVBDCP, are a real phenomenon that canbe described adequately with a single dimension. Morespecifically, there appears to be a stable pattern of stagesof severity in malaria transmission, as evidenced by theability of one axis to describe both species ratio andoverall abundance. At the lowest levels, malaria is essen-tially absent. Then vivax comes in at low levels. Onlywhen vivax reaches moderate to high levels does falci-parum appear, and at the highest levels, falciparum isusually much more common than vivax. This could bean example of ecological niche partitioning betweenthese species, with one favored by conditions of low,stable transmission and the other favored by high trans-mission (i.e., high mosquito densities and bite rates) andmortality rates[17,18]. If this is the case, it might bodepoorly for the hope that falciparum will eventuallyevolve lower virulence as that niche is already occupiedby a competitor species [19-21]. However, there aremany other potential explanations for this pattern. It ispossible that the species occupy different niches withoutcompeting, or that there are sampling biases againstdetecting vivax in high falciparum areas, for example.The main caution in the use of the SIMS going for-
ward is that the NVBDCP has been improving its datacollection methodology, including use of rapid diagnos-tic tests and computerized data entry (GPS Dhillon, per-sonal communication). This is unquestionably alaudable development, but may inadvertently cause
problems with comparability of data over time andspace, and it is possible that future values of the SIMSwill not be fully comparable to past ones. However, it isalso possible that past variation in sampling accuracy isalso large, and that the SIMS is successfully detectingsignal among the noise in ways that will be unaffectedby these changes in data collection methodology. Forexample, NVBDCP surveillance data rely only on thepublic health sector, and private facilities and personswho do not seek care are not covered; thus, past surveil-lance coverage has presumably varied with time andspace. Despite this, the SIMS has so far proven stable.Whether this continues to be the case will have to bevalidated in the future. If the future SIMS proves incom-parable to past SIMS, existing surveillance measuressuch as API should be even harder to compare becauseincomparabilities would arise due to changes in surveil-lance methodology affecting all indices, and the SIMShas some ability to buffer these changes by extractingsignal from noise. Even if past and future SIMS cannotbe directly compared, it is likely that the SIMS as shownhere would be a stable measure for comparison withinany dataset collected with consistent methodology.It will also be important to establish the relationship
between SIMS (essentially a measure of transmissionintensity) and direct measures of burden such as preva-lence, incidence, and mortality. It may or may not bepossible to directly predict these burden measures fromthe SIMS after sufficient validation. Regardless, theSIMS should serve as a replacement for the existingindices in many situations, particularly in statistical anddata presentation applications where a single measure ispreferable to many. We have provided a table of approx-imations of relationships between the SIMS and theseven existing indices that can be used by policymakersto decide what levels of SIMS would correspond toexisting thresholds for policy decisions (Table 2). The
Table 2 Relationship between the SIMS and existingindices
SIMS API AFI SPR SFR %PF ABER MR
0 0.0 0.0 0.0 0.0 0.0 3.0 0.0
1 0.11 0.03 0.16 0.03 0.5 3.4 0.04
10 0.30 0.10 0.37 0.11 3.3 6.3 0.05
20 0.69 0.30 0.76 0.31 15.1 9.3 0.06
40 2.2 1.3 2.0 1.3 45.6 14.5 0.08
60 4.9 3.8 4.1 3.4 77.1 18.9 0.09
80 9.3 8.6 7.0 7.0 100.0 22.6 0.11
100 15.5 15.5 10.9 10.9 100.0 26.0 0.12
Approximate correspondence of SIMS values to values of existing indices,based on a combination of linear models and theoretical maxima andminima. SIMS: Summary Index of Malaria Surveillance; API = annual parasiteindex; AFI = annual falciparum index; SPR = slide positivity rate; SFR= slidefalciparum rate; %Pf = percent of positive slides that are falciparum-positive;ABER = annual blood examination rate; MR = deaths/population
Cohen et al. Population Health Metrics 2010, 8:1http://www.pophealthmetrics.com/content/8/1/1
Page 10 of 12
SIMS should be sufficient without conversion, but manyusers may wish to see such a table of equivalences untilthey are more familiar with the SIMS.The SIMS described here should help improve the
clarity of malaria surveillance in India and perhaps else-where. It is designed for easy use and interpretation bypeople with no statistical background. In particular,when looking at maps and graphical representations ofmalaria distribution, it will help to have a single measurerather than several of uncertain interpretation. Thestrong support we get for a stable measure suggests thatit would be worthwhile to pursue similar indices inother settings where different measures of malaria havebeen collected[22]. Within India, this measure mayserve as an analytical tool for researchers assessing theprogress of control and eradication programs, and alsoperhaps as a clear benchmark for holding local authori-ties accountable for progress. Internationally, it seemslikely that similar principles will facilitate the ability togenerate a single standard index for malaria transmis-sion intensity.
ConclusionsWe have demonstrated that principal components analy-sis can be used to construct a single measure, the SIMS,that summarizes most relevant variation in malaria sur-veillance measures across time and space. It can beinterpreted as a relative measure of transmission inten-sity. Species abundance tracks overall levels, meaningthat a separate measure is not needed. The SIMS isrobust over time and space - alternate versions calcu-lated from subsets of the data did not differ noticeably.We have provided a spreadsheet calculator, ensuringthat even field workers with no mathematical back-ground can accurately use the measure. We expect thatthe SIMS will simplify and improve malaria surveillancein India, and that similar measures should be applicablein other settings as well.
Additional file 1: Data preparation, Additional validation,Methodological Discussion, and Introduction to Principal ComponentsAnalysis. MS Word document, SIMS Appendix A_rev.doc.Click here for file[ http://www.biomedcentral.com/content/supplementary/1478-7954-8-1-S1.DOC ]
Additional file 2: Variance explained and loadings of raw malariameasures on the first principal component axis, run with various subsetsof the data, SIMS_PHM_Table_S1.xls.Click here for file[ http://www.biomedcentral.com/content/supplementary/1478-7954-8-1-S2.XLS ]
Additional file 3: SIMS calculator in an MS Excel spreadsheet, SIMScalculator.xls.Click here for file[ http://www.biomedcentral.com/content/supplementary/1478-7954-8-1-S3.XLS ]
Additional file 4: Correlations among index measures and externalmeasures of malaria morbidity and mortality. MS Excel Spreadsheet,SIMS_PHM_Table_S2.xls.Click here for file[ http://www.biomedcentral.com/content/supplementary/1478-7954-8-1-S4.XLS ]
AcknowledgementsWe thank GPS Dhillon, GS Sonal, and participants at the June 8, 2009,malaria working group meeting in New Delhi, India, for helpful comments.External funding is from the Fogarty International Centre of the US NationalInstitutes of Health (grant R01 TW05991-01), Canadian Institute of HealthResearch (CIHR; IEG- 53506), International Research Development Centre(Grant 102172), and Li Ka Shing Knowledge Institute and Keenan ResearchCentre at St. Michael’s Hospital, University of Toronto (CGHR support). PJ issupported by the Canada Research Chair program.
Author details1Centre for Global Health Research, Li Ka Shing Knowledge Institute, StMichael’s Hospital, Toronto, Ontario, Canada. 2National AIDS ControlOrganization, Delhi, India. 3Centre for Global Health Research, St John’sResearch Institute, Bangalore, Karnataka, India. 4National Institute of MalariaResearch, Delhi, India.
Authors’ contributionsAAC designed and carried out the analysis and wrote the manuscript. ND,RJM, VPS, and PJ provided and helped interpret data, helped structure andinterpret the analyses, and edited the manuscript. PSR integrated the data,produced the maps, and edited the manuscript. All authors read andapproved the final manuscript.
Competing interestsThe authors declare that they have no competing interests.
Received: 2 July 2009 Accepted: 11 February 2010Published: 11 February 2010
References1. Choudhury DS: Malaria in India: Past, present and future. Indian Journal of
Pediatrics 1985, 52:243-248.2. Singh J: Malaria and Its Control in India. Perspectives in Public Health 1952,
72:515-525.3. Zurbrigg S: Re-thinking the “human factor” in malaria mortality: the case
of Punjab, 1868-1940. Parassitologia 1994, 36:121-135.4. Akhtar R, Learmonth A, Keynes M: The resurgence of Malaria in India
1965-76. GeoJournal 1977, 1:69-80.5. Kumar A, Valecha N, Jain T, Dash AP: Burden of Malaria in India:
Retrospective and Prospective View. American Journal of Tropical Medicineand Hygiene 2007, 77:69-78.
6. Sample registration system, statistical report: 2004. New Delhi, India:Registrar-General of India 2005.
7. Jha P, Kumar R, Vasa P, Dhingra N, Thiruchelvam D, Moineddin R: Lowmale-to-female sex ratio of children born in India: national survey of 1·1 million households. The Lancet 2006, 367:211-218.
8. Gajalakshmi V, Peto R, Kanaka S, Balasubramanian S: Verbal autopsy of 48000 adult deaths attributable to medical causes in Chennai (formerlyMadras), India. BMC Public Health 2002, 2:7.
9. Gajalakshmi V, Peto R, Kanaka TS, Jha P: Smoking and mortality fromtuberculosis and other diseases in India: retrospective study of 43,000adult male deaths and 35,000 controls. The Lancet 2003, 362:507-515.
10. Jha P, Gajalakshmi V, Gupta PC, Kumar R, Mony P, Dhingra N, Peto R:Prospective Study of One Million Deaths in India: Rationale, Design, andValidation Results. PLoS Medicine 2006, 3:e18.
11. Joshi R, Cardona M, Iyengar S, Sukumar A, Raju CR, Raju KR, Raju K,Reddy KS, Lopez A, Neal B: Chronic diseases now a leading cause ofdeath in rural India–mortality data from the Andhra Pradesh RuralHealth Initiative. Int J Epidemiol 2006, 35:1522-1529.
Cohen et al. Population Health Metrics 2010, 8:1http://www.pophealthmetrics.com/content/8/1/1
Page 11 of 12

12. Kumar R, Thakur J, Rao B, Singh M, Bhatia S: Validity of verbal autopsy indetermining causes of adult deaths. Indian Journal of Public Health 2006,50:90-94.
13. International Institute for Population Sciences (IIPS): Reproductive andChild Health Project, Rapid Household Survey (Phase I & II). Mumbai: IIPS1999.
14. International Institute for Population Sciences (IIPS): District LevelHousehold Survey (DLHS-2), 2002-04: India. Mumbai: IIPS 2006.
15. National Family Health Survey (NFHS-3), 2005-06: India. (InternationalInstitute for Population Sciences (IIPS) and Macro International, ed. Mumbai:IIPS; 2007, I.
16. Rossiter JR: Reminder: a horse is a horse. International Journal of Researchin Marketing 2005, 22:23-25.
17. Chase JM, Leibold MA: Ecological Niches: Linking Classical and ContemporaryApproaches Chicago: University of Chicago Press 2003.
18. Peterson AT: Ecologic Niche Modeling and Spatial Patterns of DiseaseTransmission. Emerging Infectious Diseases 2006, 12:1822-1826.
19. Abderrhaman I, Jean-Claude K, Gauthier S, Jean-Jules T: Global Analysis ofNew Malaria Intrahost Models with a Competitive Exclusion Principle.SIAM Journal on Applied Mathematics 2006, 67:260-278.
20. de Roode JC, Culleton R, Cheesman SJ, Carter R, Read AF: Hostheterogeneity is a determinant of competitive exclusion or coexistencein genetically diverse malaria infections. Proceedings of the Royal Society B:Biological Sciences 2004, 271:1073-1080.
21. Ewald PW: Evolution of virulence. Infectious Disease Clinics of North America2004, 18:1-15.
22. Ceesay SJ, Casals-Pascual C, Erskine J, Anya SE, Duah NO, Fulford AJC,Sesay SSS, Abubakar I, Dunyo S, Sey O, et al: Changes in malaria indicesbetween 1999 and 2007 in The Gambia: a retrospective analysis. TheLancet 2008, 372:1545-1554.
doi:10.1186/1478-7954-8-1Cite this article as: Cohen et al.: The Summary Index of MalariaSurveillance (SIMS): a stable index of malaria within India. PopulationHealth Metrics 2010 8:1.
Submit your next manuscript to BioMed Centraland take full advantage of:
• Convenient online submission
• Thorough peer review
• No space constraints or color figure charges
• Immediate publication on acceptance
• Inclusion in PubMed, CAS, Scopus and Google Scholar
• Research which is freely available for redistribution
Submit your manuscript at www.biomedcentral.com/submit
Cohen et al. Population Health Metrics 2010, 8:1http://www.pophealthmetrics.com/content/8/1/1
Page 12 of 12
Related Documents