HAL Id: hal-01355255 https://hal.archives-ouvertes.fr/hal-01355255 Submitted on 22 Aug 2016 HAL is a multi-disciplinary open access archive for the deposit and dissemination of sci- entific research documents, whether they are pub- lished or not. The documents may come from teaching and research institutions in France or abroad, or from public or private research centers. L’archive ouverte pluridisciplinaire HAL, est destinée au dépôt et à la diffusion de documents scientifiques de niveau recherche, publiés ou non, émanant des établissements d’enseignement et de recherche français ou étrangers, des laboratoires publics ou privés. Mapping a Knowledge-Based Malaria Hazard Index Related to Landscape Using Remote Sensing: Application to the Cross-Border Area between French Guiana and Brazil Zhichao Li, Emmanuel Roux, Nadine Dessay, Romain Girod, Aurelia Stefani, Mathieu Nacher, Adrien Moiret, F. Seyler To cite this version: Zhichao Li, Emmanuel Roux, Nadine Dessay, Romain Girod, Aurelia Stefani, et al.. Mapping a Knowledge-Based Malaria Hazard Index Related to Landscape Using Remote Sensing: Application to the Cross-Border Area between French Guiana and Brazil. Remote Sensing, MDPI, 2016, 8 (4), 10.3390/rs8040319. hal-01355255

Welcome message from author
This document is posted to help you gain knowledge. Please leave a comment to let me know what you think about it! Share it to your friends and learn new things together.
Transcript

HAL Id: hal-01355255https://hal.archives-ouvertes.fr/hal-01355255
Submitted on 22 Aug 2016
HAL is a multi-disciplinary open accessarchive for the deposit and dissemination of sci-entific research documents, whether they are pub-lished or not. The documents may come fromteaching and research institutions in France orabroad, or from public or private research centers.
L’archive ouverte pluridisciplinaire HAL, estdestinée au dépôt et à la diffusion de documentsscientifiques de niveau recherche, publiés ou non,émanant des établissements d’enseignement et derecherche français ou étrangers, des laboratoirespublics ou privés.
Mapping a Knowledge-Based Malaria Hazard IndexRelated to Landscape Using Remote Sensing:
Application to the Cross-Border Area between FrenchGuiana and Brazil
Zhichao Li, Emmanuel Roux, Nadine Dessay, Romain Girod, Aurelia Stefani,Mathieu Nacher, Adrien Moiret, F. Seyler
To cite this version:Zhichao Li, Emmanuel Roux, Nadine Dessay, Romain Girod, Aurelia Stefani, et al.. Mapping aKnowledge-Based Malaria Hazard Index Related to Landscape Using Remote Sensing: Applicationto the Cross-Border Area between French Guiana and Brazil. Remote Sensing, MDPI, 2016, 8 (4),�10.3390/rs8040319�. �hal-01355255�

remote sensing
Article
Mapping a Knowledge-Based Malaria Hazard IndexRelated to Landscape Using Remote Sensing:Application to the Cross-Border Area betweenFrench Guiana and BrazilZhichao Li 1,*, Emmanuel Roux 1,*, Nadine Dessay 1, Romain Girod 2, Aurélia Stefani 3,Mathieu Nacher 3, Adrien Moiret 1 and Frédérique Seyler 1
1 ESPACE-DEV, UMR 228 IRD/UM/UR/UG, Institut de Recherche pour le Développement,500 rue Jean-François Breton, Montpellier 34000, France; [email protected] (N.D.);[email protected] (A.M.); [email protected] (F.S.)
2 Unité d’Entomologie Médicale, Institut Pasteur de la Guyane, 23 Avenue Pasteur BP 6010,Cayenne Cedex 97306, French Guiana; [email protected]
3 EPaT Team (EA 3593), UFR de Médecine—Université des Antilles et de la Guyane, Cayenne Cedex 97336,French Guiana; [email protected] (A.S.); [email protected] (M.N.)
* Correspondence: [email protected] (Z.L.); [email protected] (E.R.);Tel.: +33-467-415125 (Z.L. & E.R.)
Academic Editors: Zhong Lu and Prasad S. ThenkabailReceived: 8 February 2016; Accepted: 7 April 2016; Published: 11 April 2016
Abstract: Malaria remains one of the most common vector-borne diseases in the world and thedefinition of novel control strategies can benefit from the modeling of transmission processes.However, data-driven models are often difficult to build, as data are very often incomplete,heterogeneous in nature and in quality, and/or biased. In this context, a knowledge-based approachis proposed to build a robust and general landscape-based hazard index for malaria transmissionthat is tailored to the Amazonian region. A partial knowledge-based model of the risk of malariatransmission in the Amazonian region, based on landscape features and extracted from a systematicliterature review, was used. Spatialization of the model was obtained by generating land useand land cover maps of the cross-border area between French Guiana and Brazil, followed bycomputing and combining landscape metrics to build a set of normalized landscape-based hazardindices. An empirical selection of the best index was performed by comparing the indices in terms ofadequacy with the knowledge-based model, intelligibility and correlation with P. falciparum incidencerates. The selected index is easy to interpret and successfully represents the current knowledgeabout the role played by landscape patterns in malaria transmission within the study area. It wassignificantly associated with P. falciparum incidence rates, using the Pearson and Spearman correlationcoefficients (up to 0.79 and 0.75, respectively; p-value < 0.001), and the linear regression coefficient ofdetermination (reaching 0.63; p-values < 0.001). This study establishes a spatial knowledge-driven,landscape-based hazard malaria index using remote sensing that can be easily produced on a regularbasis and might be useful for malaria prediction, surveillance, and control.
Keywords: remote sensing; land use and land cover; landscape metric; knowledge-based hazardmodeling; malaria; cross-border area between French Guiana and Brazil
1. Introduction
Malaria is one of the most common vector-borne diseases in the world, with an estimated214 million new cases and 438,000 deaths in 2015 [1]. The area of transmission mostly covers tropicaland subtropical zones. In the Americas, the Amazonian region, which extends over nine countries
Remote Sens. 2016, 8, 319; doi:10.3390/rs8040319 www.mdpi.com/journal/remotesensing
Remote Sens. 2016, 8, 319 2 of 22
(Bolivia, Brazil, Colombia, Ecuador, France/French Guiana, Guyana, Peru, Suriname, and Venezuela),is the most affected by the disease. Among these countries, Brazil accounted for 42% of malaria casesand half of the deaths in the Americas (390,000 cases and 79 deaths) in 2014 [1].
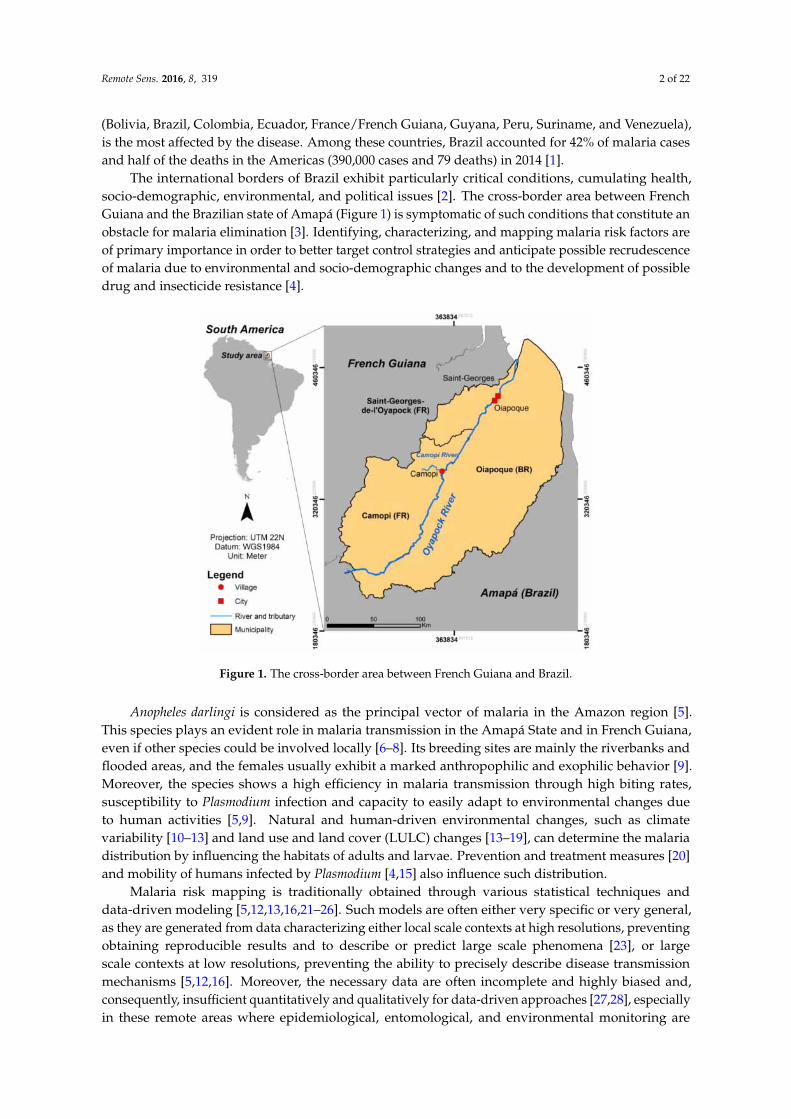
The international borders of Brazil exhibit particularly critical conditions, cumulating health,socio-demographic, environmental, and political issues [2]. The cross-border area between FrenchGuiana and the Brazilian state of Amapá (Figure 1) is symptomatic of such conditions that constitute anobstacle for malaria elimination [3]. Identifying, characterizing, and mapping malaria risk factors areof primary importance in order to better target control strategies and anticipate possible recrudescenceof malaria due to environmental and socio-demographic changes and to the development of possibledrug and insecticide resistance [4].
Remote Sens. 2016, 8, 319 2 of 22
(Bolivia, Brazil, Colombia, Ecuador, France/French Guiana, Guyana, Peru, Suriname, and Venezuela), is the most affected by the disease. Among these countries, Brazil accounted for 42% of malaria cases and half of the deaths in the Americas (390,000 cases and 79 deaths) in 2014 [1].
The international borders of Brazil exhibit particularly critical conditions, cumulating health, socio-demographic, environmental, and political issues [2]. The cross-border area between French Guiana and the Brazilian state of Amapá (Figure 1) is symptomatic of such conditions that constitute an obstacle for malaria elimination [3]. Identifying, characterizing, and mapping malaria risk factors are of primary importance in order to better target control strategies and anticipate possible recrudescence of malaria due to environmental and socio-demographic changes and to the development of possible drug and insecticide resistance [4].
Figure 1. The cross-border area between French Guiana and Brazil.
Anopheles darlingi is considered as the principal vector of malaria in the Amazon region [5]. This species plays an evident role in malaria transmission in the Amapá State and in French Guiana, even if other species could be involved locally [6–8]. Its breeding sites are mainly the riverbanks and flooded areas, and the females usually exhibit a marked anthropophilic and exophilic behavior [9]. Moreover, the species shows a high efficiency in malaria transmission through high biting rates, susceptibility to Plasmodium infection and capacity to easily adapt to environmental changes due to human activities [5,9]. Natural and human-driven environmental changes, such as climate variability [10–13] and land use and land cover (LULC) changes [13–19], can determine the malaria distribution by influencing the habitats of adults and larvae. Prevention and treatment measures [20] and mobility of humans infected by Plasmodium [4,15] also influence such distribution.
Malaria risk mapping is traditionally obtained through various statistical techniques and data-driven modeling [5,12,13,16,21–26]. Such models are often either very specific or very general, as they are generated from data characterizing either local scale contexts at high resolutions, preventing obtaining reproducible results and to describe or predict large scale phenomena [23], or large scale contexts at low resolutions, preventing the ability to precisely describe disease transmission mechanisms [5,12,16]. Moreover, the necessary data are often incomplete and highly biased and, consequently, insufficient quantitatively and qualitatively for data-driven approaches [27,28], especially in these remote areas where epidemiological, entomological, and environmental
Figure 1. The cross-border area between French Guiana and Brazil.
Anopheles darlingi is considered as the principal vector of malaria in the Amazon region [5].This species plays an evident role in malaria transmission in the Amapá State and in French Guiana,even if other species could be involved locally [6–8]. Its breeding sites are mainly the riverbanks andflooded areas, and the females usually exhibit a marked anthropophilic and exophilic behavior [9].Moreover, the species shows a high efficiency in malaria transmission through high biting rates,susceptibility to Plasmodium infection and capacity to easily adapt to environmental changes dueto human activities [5,9]. Natural and human-driven environmental changes, such as climatevariability [10–13] and land use and land cover (LULC) changes [13–19], can determine the malariadistribution by influencing the habitats of adults and larvae. Prevention and treatment measures [20]and mobility of humans infected by Plasmodium [4,15] also influence such distribution.
Malaria risk mapping is traditionally obtained through various statistical techniques anddata-driven modeling [5,12,13,16,21–26]. Such models are often either very specific or very general,as they are generated from data characterizing either local scale contexts at high resolutions, preventingobtaining reproducible results and to describe or predict large scale phenomena [23], or largescale contexts at low resolutions, preventing the ability to precisely describe disease transmissionmechanisms [5,12,16]. Moreover, the necessary data are often incomplete and highly biased and,consequently, insufficient quantitatively and qualitatively for data-driven approaches [27,28], especiallyin these remote areas where epidemiological, entomological, and environmental monitoring are

Remote Sens. 2016, 8, 319 3 of 22
inefficient and/or irregular. Finally, cross-border contexts provide very heterogeneous data in termsof nature and quality, due to differences in acquisition protocols, health policies, and/or peoples’behaviors in each country, making data-driven modeling approaches difficult to utilize.
Under such constrained circumstances, knowledge-based risk mapping appears particularlyrelevant. The review by Stevens et al. [29] emphasizes that knowledge-based risk mapping couldprovide a pertinent framework for modeling qualitative and quantitative variables in data-sparsecontexts, integrating statistical methods and expert knowledge concerning vectors, reservoirs, andhumans, and/or their interactions. Garni et al. [30] established hazard maps (i.e., presence of bothvectors and reservoirs) using expert and bibliographic knowledge and remote sensing data, andcombining them with vulnerability maps for mapping the risk of occurrence of cutaneous leishmaniasisin Ghardaïa in Algeria. Vector habitat and risk maps were established using available entomologicaland epidemiological data. De Glanville et al. [28] predicted the suitability for African swine fever(ASF) endemicity in Africa using multi-criteria decision analysis, and validated its performance viastatistical methods using available ASF outbreak data. Stefani et al. did a systematic review of theliterature [14], and proposed a consensual knowledge-based model that qualitatively estimates the levelof malaria transmission risk in the Amazon in relation to deforestation patterns. Knowledge-based riskmodeling can elaborate the relationship between malaria vectors and environmental variables, explaininteractions between environmental changes and vector dynamics, and provide a knowledge base todemonstrate how the environment affects malaria transmission [31]. In addition, knowledge-basedrisk modeling requires decomposing the malaria risk into independent factors easier to apprehendand quantify. The decomposition is a particularly tricky issue, especially when highly anthropophilicvectors (like An. darlingi) are involved, since the presence and the vector density strongly depend onthe presence and the density of human beings. Stefani et al. did a systematic review of the literature [14],and proposed a consensual knowledge-based model that qualitatively estimates the level of malariatransmission risk in the Amazon in relation to deforestation patterns. More precisely, this modeldemonstrated that landscape features play a key role in the malaria risk construction, by generatingmore or less favorable conditions for the encounter between mosquitoes and human beings. In thisstudy, it is assumed that the contribution of landscape features (i.e., to what extent the landscape is a“factor of danger” in the context of malaria) can be separately assessed.
Landscape metrics are widely used to analyze landscape features for many studies relatedto landscape. Uuemaa et al. [32] showed that landscape metrics are appropriate for detecting byremote sensing data the changes in landscape composition and configuration caused by deforestationand forest fragmentation. In the framework of disease transmission, Ostfeld et al. [33] stated thatlandscape structure has “a strong potential to influence disease dynamics through impacts on bothabiotic conditions and species interactions that are important to disease spread and prevalence”.More specifically, the analysis of landscape structure permits to predict the presence of anophelinemosquitoes and shows that landscape management could be used for malaria control [34].
In this context, focusing on the relationship between landscape features and malaria transmission,the present paper proposes to perform the spatialization of the knowledge-based model in order tobuild a landscape-based malaria transmission hazard index. The method consisted of materializingthe knowledge-based model through computation and combination of landscape metrics, using LULCmaps derived from remote sensing images. The approach was applied to the cross-border regionbetween French Guiana and Brazil and was evaluated using available malaria incidence data.
2. Materials and Methods
2.1. Study Area
The study was carried out in the cross-border region between French Guiana and Brazil, includingthe French municipalities of Camopi and Saint-Georges-de-l’Oyapock, which are located on the westernbank of the Oyapock River that delimits the international border between French Guiana and Brazil,
Remote Sens. 2016, 8, 319 4 of 22
and the Brazilian municipality of Oiapoque on the eastern bank of the river (Figure 1). According tothe French National Institute of Statistics and Economic Studies (INSEE), Saint-Georges-de-l’Oyapockand Camopi had 3946 and 1645 inhabitants, respectively, in 2011 [35,36], whereas Oiapoque had20,509 inhabitants in 2010, according to the Brazilian Institute of Geography and Statistics (IBGE) [37].The climate in the study area is typically tropical, with an average annual temperature of 27 ˝C andhumidity ě80%. There are four seasons in the region, the long rainy season from April to June, thelong dry season from July to November, the short rainy season from December to February, and theshort dry season in March. The average annual precipitation is about 2500 mm in Camopi, 3400 mm inSaint-Georges-de-l’Oyapock, and 3300 mm in Oiapoque.
The Saint-Georges-de-l’Oyapock municipality consists of the city of Saint-Georges-de-l’Oyapockand several rural hamlets. Agricultural practices include traditional slash-and-burn agriculture withsmall plots and cattle farming. The Camopi municipality includes the village of Camopi (with about1200 inhabitants in a main central hamlet and 28 hamlets within a 15 km2 area, situated along theOyapock and the Camopi Rivers) and Trois-Sauts (composed by 10 hamlets on the upper OyapockRiver). The resident population of Camopi and Trois-Sauts is mainly composed of Amerindians(Wayampi and Teko ethnic groups). Most of the inhabitants live in traditional houses, locally called“carbets”, which are made of wood with a roof of palm leaves, steel sheet, or tarpaulin. The mainsubsistence activities are hunting, fishing, slash-and-burn agriculture, and the gathering of forestproducts. On the French side, there are (legal and illegal) gold mining activities that lead to variousdegree of deforestation and the installation of semi-permanent human structures. On the Brazilianside, the Oiapoque municipality consists of the main city (Oiapoque) with a relatively high level ofurbanization, and several rural localities. Agricultural practices include traditional slash-and-burnagriculture with small plots and cattle farming, but also large plots created at the expense of the nativedense forest. Several protected areas exist within this cross-border zone, but with different levels ofprotection and natural sites, generating different land use patterns [38].
In Camopi, the annual incidence of malaria has exceeded 50% among children less than seven yearold in the early 2000s [10], and has even reached 100% in 2006 [39]. From 2006 to 2012, the total numberof reported malaria cases from Camopi and Trois-Sauts, a village in the municipality of Camopi,began to decrease, with a sharp reduction starting in 2009 [40,41]. In Saint-Georges-de-l’Oyapock,the main French town at the border with Brazil, a significant increasing trend was observed for thetotal number of reported malaria cases from 2005 to 2009, with a peak in 2007 [40]. After 2009, anapparent decrease was also observed [40,41]. However, a global recrudescence of the number ofmalaria cases occurred in the inland region (Saül, Cacao, Régina) and Eastern French Guiana (Camopiand Saint-Georges-de-l’Oyapock), with a global incidence rate reaching 55.2 cases per 1000 inhabitantsin 2013 [4]. On the other side of the border, Oiapoque is the most affected municipality of the Stateof Amapá, with about 3940 cases reported between January and October 2011, representing a 12%increase when compared to the same period in 2010 [42]. Despite a 22.9% decrease in the number ofcases between 2011 and 2012, this number and the transmission risk remained high, with 2838 reportedcases and a 9.2% Annual Parasite Index (API) in 2013 [43].
2.2. Knowledge-Based Model
From an ecological standpoint, the knowledge-based model (Figure 2) is likely to represent thefollowing process [14,44] where: (i) deforested areas provide favorable conditions for malaria vectorbreeding and feeding; and (ii) forest and secondary forest can define resting sites for adult mosquitoesthat return to the forest and secondary forest after feeding. Consequently, the more the forest andsecondary forest patches interact with deforested patches (situation described in the bottom-rightbox of Figure 2), the more the landscape is favorable to vectors and vector-human being encounters.Indeed, such landscape tends to maximize the densities of vector breeding (larvae) and resting (adults)sites and facilitate host seeking by shortening the distances between resting sites and hosts, which are

Remote Sens. 2016, 8, 319 5 of 22
preferentially human beings regarding the marked anthropophilic behavior of An. darlingi, the mainmalaria vector in the region.Remote Sens. 2016, 8, 319 5 of 22
Figure 2. Knowledge-based model of malaria transmission risk associated with land use and land cover [14].
As such, this model provides a useful description of the role played by the landscape in the chance of encounters between humans and malaria vectors, and represents a solid foundation to build a landscape-based hazard index (LHI) related to malaria transmission. The LHI is related to two landscape features: a compositional one (i.e., the relative surface occupied by forest and secondary forest); and a configurational one, involving the edge, shape, or subdivision of forest and secondary forest patches.
On the basis of the knowledge-based model, the LHI should: (i) correspond to a baseline level (the null value was chosen here) with no deforestation, i.e., 100% forest and a minimum of configurational complexity (top box in Figure 2); (ii) range from “low” to “high” when human presence or activity is not null. Especially, the value of the hazard index should increase with an increase in configurational complexity for a given value of the proportion of forest and secondary forest (bottom-right box in Figure 2); and (iii) reach a null value when the anthropogenic pressure becomes the maximum as both the proportion of forest and secondary forest and the configurational complexity become null in this case (bottom-left box in Figure 2). Ultimately, the LHI should be intelligible and easy to interpret for public health managers who are not specialists in the area of landscape quantitative characterization and modeling.
2.3. Methodology of Model Implementation
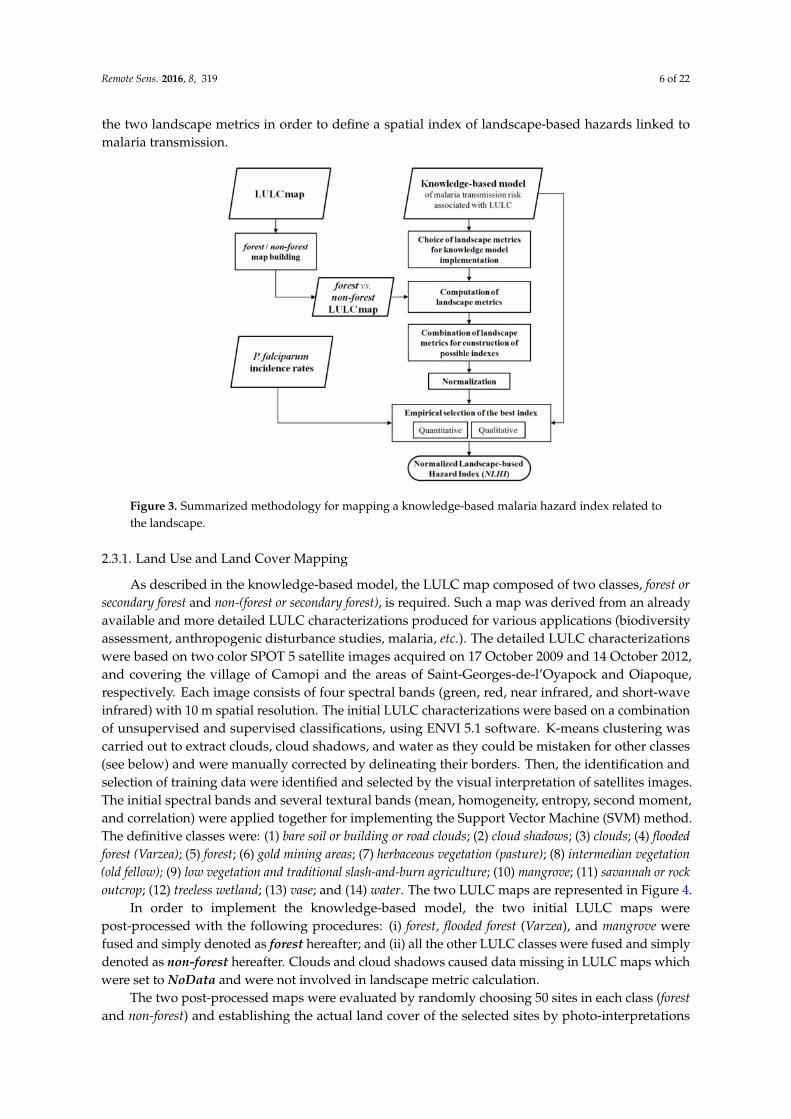
The overall methodology is presented in Figure 3. The different steps are detailed hereafter. Building the LHI requires the following steps: (1) the characterization of the LULC from satellite
imagery. In this study, it is assumed that the different levels of deforestation observed at different locations in LULC map can represent the different stages of anthropization mentioned in the model. The model can, therefore, be implemented by using a static LULC characterization; (2) the computation of landscape metrics characterizing: (i) the relative surface occupied by forest and secondary forest; and (ii) the configurational complexity of forest and secondary forest; and (3) the combination of the two landscape metrics in order to define a spatial index of landscape-based hazards linked to malaria transmission.
Figure 2. Knowledge-based model of malaria transmission risk associated with land use and landcover [14].
As such, this model provides a useful description of the role played by the landscape in thechance of encounters between humans and malaria vectors, and represents a solid foundation tobuild a landscape-based hazard index (LHI) related to malaria transmission. The LHI is related to twolandscape features: a compositional one (i.e., the relative surface occupied by forest and secondaryforest); and a configurational one, involving the edge, shape, or subdivision of forest and secondaryforest patches.
On the basis of the knowledge-based model, the LHI should: (i) correspond to a baseline level (thenull value was chosen here) with no deforestation, i.e., 100% forest and a minimum of configurationalcomplexity (top box in Figure 2); (ii) range from “low” to “high” when human presence or activity isnot null. Especially, the value of the hazard index should increase with an increase in configurationalcomplexity for a given value of the proportion of forest and secondary forest (bottom-right box inFigure 2); and (iii) reach a null value when the anthropogenic pressure becomes the maximum as boththe proportion of forest and secondary forest and the configurational complexity become null in thiscase (bottom-left box in Figure 2). Ultimately, the LHI should be intelligible and easy to interpret forpublic health managers who are not specialists in the area of landscape quantitative characterizationand modeling.
2.3. Methodology of Model Implementation
The overall methodology is presented in Figure 3. The different steps are detailed hereafter.Building the LHI requires the following steps: (1) the characterization of the LULC from satellite
imagery. In this study, it is assumed that the different levels of deforestation observed at differentlocations in LULC map can represent the different stages of anthropization mentioned in the model.The model can, therefore, be implemented by using a static LULC characterization; (2) the computationof landscape metrics characterizing: (i) the relative surface occupied by forest and secondary forest;and (ii) the configurational complexity of forest and secondary forest; and (3) the combination of
Remote Sens. 2016, 8, 319 6 of 22
the two landscape metrics in order to define a spatial index of landscape-based hazards linked tomalaria transmission.Remote Sens. 2016, 8, 319 6 of 22
Figure 3. Summarized methodology for mapping a knowledge-based malaria hazard index related to the landscape.
2.3.1. Land Use and Land Cover Mapping
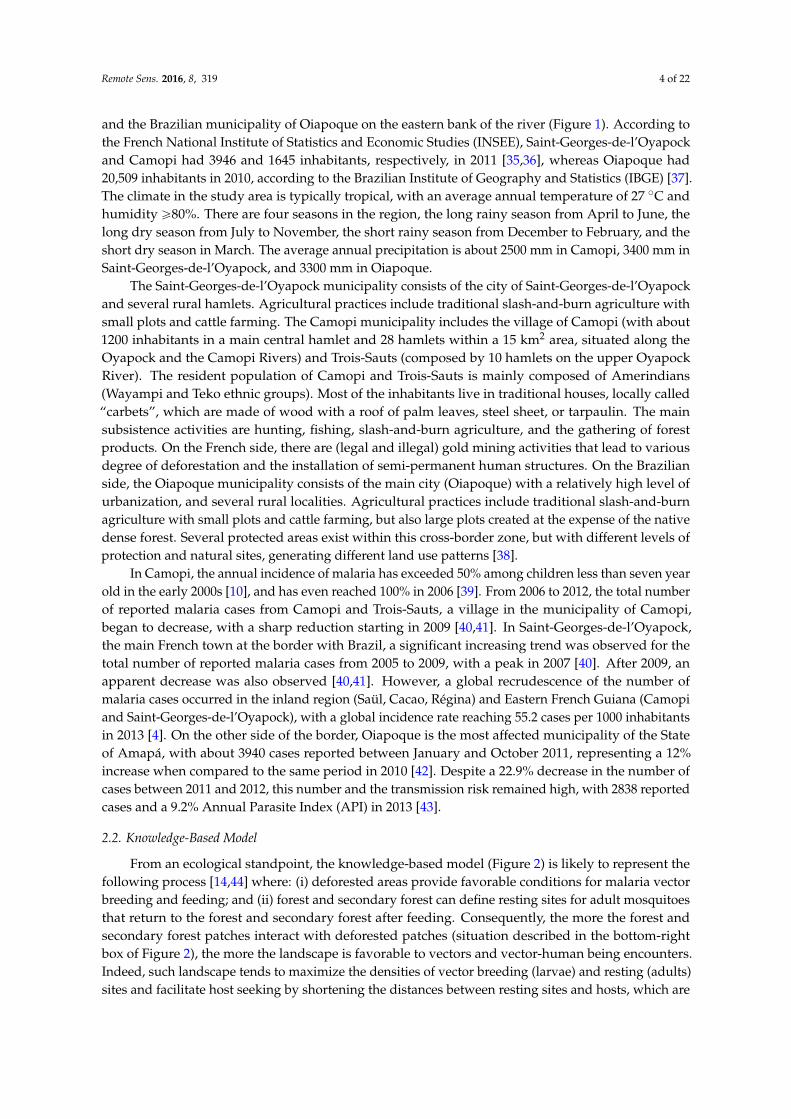
As described in the knowledge-based model, the LULC map composed of two classes, forest or secondary forest and non-(forest or secondary forest), is required. Such a map was derived from an already available and more detailed LULC characterizations produced for various applications (biodiversity assessment, anthropogenic disturbance studies, malaria, etc.). The detailed LULC characterizations were based on two color SPOT 5 satellite images acquired on 17 October 2009 and 14 October 2012, and covering the village of Camopi and the areas of Saint-Georges-de-l’Oyapock and Oiapoque, respectively. Each image consists of four spectral bands (green, red, near infrared, and short-wave infrared) with 10 m spatial resolution. The initial LULC characterizations were based on a combination of unsupervised and supervised classifications, using ENVI 5.1 software. K-means clustering was carried out to extract clouds, cloud shadows, and water as they could be mistaken for other classes (see below) and were manually corrected by delineating their borders. Then, the identification and selection of training data were identified and selected by the visual interpretation of satellites images. The initial spectral bands and several textural bands (mean, homogeneity, entropy, second moment, and correlation) were applied together for implementing the Support Vector Machine (SVM) method. The definitive classes were: (1) bare soil or building or road clouds; (2) cloud shadows; (3) clouds; (4) flooded forest (Varzea); (5) forest; (6) gold mining areas; (7) herbaceous vegetation (pasture); (8) intermedian vegetation (old fellow); (9) low vegetation and traditional slash-and-burn agriculture; (10) mangrove; (11) savannah or rock outcrop; (12) treeless wetland; (13) vase; and (14) water. The two LULC maps are represented in Figure 4.
In order to implement the knowledge-based model, the two initial LULC maps were post-processed with the following procedures: (i) forest, flooded forest (Varzea), and mangrove were fused and simply denoted as forest hereafter; and (ii) all the other LULC classes were fused and simply denoted as non-forest hereafter. Clouds and cloud shadows caused data missing in LULC maps which were set to NoData and were not involved in landscape metric calculation.
The two post-processed maps were evaluated by randomly choosing 50 sites in each class (forest and non-forest) and establishing the actual land cover of the selected sites by photo-interpretations of the 2.5-meter spatial resolution SPOT images resulting from the fusion of the color (used for initial classification) and panchromatic modes. Overall classification accuracies were of 0.94 and 0.93 for the maps of Camopi and Saint-Georges-de-l’Oyapock regions, respectively. Accuracies (true positive rate) for the forest class (non-forest class) were 0.91 (0.98) and 0.92 (0.94), for Camopi and Saint-
Figure 3. Summarized methodology for mapping a knowledge-based malaria hazard index related tothe landscape.
2.3.1. Land Use and Land Cover Mapping
As described in the knowledge-based model, the LULC map composed of two classes, forest orsecondary forest and non-(forest or secondary forest), is required. Such a map was derived from an alreadyavailable and more detailed LULC characterizations produced for various applications (biodiversityassessment, anthropogenic disturbance studies, malaria, etc.). The detailed LULC characterizationswere based on two color SPOT 5 satellite images acquired on 17 October 2009 and 14 October 2012,and covering the village of Camopi and the areas of Saint-Georges-de-l’Oyapock and Oiapoque,respectively. Each image consists of four spectral bands (green, red, near infrared, and short-waveinfrared) with 10 m spatial resolution. The initial LULC characterizations were based on a combinationof unsupervised and supervised classifications, using ENVI 5.1 software. K-means clustering wascarried out to extract clouds, cloud shadows, and water as they could be mistaken for other classes(see below) and were manually corrected by delineating their borders. Then, the identification andselection of training data were identified and selected by the visual interpretation of satellites images.The initial spectral bands and several textural bands (mean, homogeneity, entropy, second moment,and correlation) were applied together for implementing the Support Vector Machine (SVM) method.The definitive classes were: (1) bare soil or building or road clouds; (2) cloud shadows; (3) clouds; (4) floodedforest (Varzea); (5) forest; (6) gold mining areas; (7) herbaceous vegetation (pasture); (8) intermedian vegetation(old fellow); (9) low vegetation and traditional slash-and-burn agriculture; (10) mangrove; (11) savannah or rockoutcrop; (12) treeless wetland; (13) vase; and (14) water. The two LULC maps are represented in Figure 4.
In order to implement the knowledge-based model, the two initial LULC maps werepost-processed with the following procedures: (i) forest, flooded forest (Varzea), and mangrove werefused and simply denoted as forest hereafter; and (ii) all the other LULC classes were fused and simplydenoted as non-forest hereafter. Clouds and cloud shadows caused data missing in LULC maps whichwere set to NoData and were not involved in landscape metric calculation.
The two post-processed maps were evaluated by randomly choosing 50 sites in each class (forestand non-forest) and establishing the actual land cover of the selected sites by photo-interpretations
Remote Sens. 2016, 8, 319 7 of 22
of the 2.5-meter spatial resolution SPOT images resulting from the fusion of the color (used forinitial classification) and panchromatic modes. Overall classification accuracies were of 0.94 and0.93 for the maps of Camopi and Saint-Georges-de-l’Oyapock regions, respectively. Accuracies (truepositive rate) for the forest class (non-forest class) were 0.91 (0.98) and 0.92 (0.94), for Camopi andSaint-Georges-de-l’Oyapock scenes, respectively. Eventually, Kappa coefficients were of 0.88 and0.86, respectively.
Remote Sens. 2016, 8, 319 7 of 22
Georges-de-l’Oyapock scenes, respectively. Eventually, Kappa coefficients were of 0.88 and 0.86, respectively.
Figure 4. Land use and land cover characterizations of the study area.
2.3.2. Landscape Metric Computation
The relative surface of the forest, referred to as pF, was simply obtained by computing the percentage of forest in the computation window (see below for the definition of computation window) (see [45] and Table 1). The landscape configuration is a broader and vague notion related to several metrics (see [45] and Table 1): edge density (ED), patch density (PD), landscape division index (DIVISION), splitting index (SPLIT), perimeter-area ratio (PARA), shape index (SHAPE), fractal dimension index (FRAC), related circumscribing circle (CIRCLE), and contiguity index (CONTIG).
Moreover, PARA, SHAPE, FRAC, CIRCLE, and CONTIG were initially computed at the patch level, and then the summary statistics were computed to provide a metric value at the landscape level. Mean (MN) and area-weighted mean (AM) (with the patch areas as weights) were chosen as summary statistics, resulting in a total of 14 configurational metrics (CM): ED, PD, DIVISION, SPLIT, PARA_MN, PARA_AM, SHAPE_MN, SHAPE_AM, FRAC_MN, FRAC_AM, CIRCLE_MN, CIRCLE_AM, CONTIG_MN, and CONTIG_AM.
The quantitative landscape characterization, based on forest vs. non-forest maps, requires defining a spatial window for the metric computation. Around any location in the study area (i.e., around any pixel in the forest vs. non-forest maps), such a window corresponds to a zone where the landscape characteristics are the most likely to influence the chance of encounter of anopheles mosquitoes with human beings. While a discoidal window intuitively seems the most appropriate, the choice of the disk radius is not trivial. Stefani et al. used a data-driven selection for the optimal radius of the discoïdal window to explain the malaria incidence rates in the village of Camopi, and concluded that the optimal radius was 400 m for the P. falciparum and 100 m for the P.vivax incidence rates [46]. However, it was shown that P. vivax incidence was poorly correlated to the landscape features in comparison with P. falciparum incidence, suggesting that the P. vivax relapses were not correctly identified [46]. Therefore, only the P. falciparum incidence rates were used in the present study and the computation window was defined as a moving discoidal window with a 400 m radius. The
Figure 4. Land use and land cover characterizations of the study area.
2.3.2. Landscape Metric Computation
The relative surface of the forest, referred to as pF, was simply obtained by computing thepercentage of forest in the computation window (see below for the definition of computation window)(see [45] and Table 1). The landscape configuration is a broader and vague notion related to severalmetrics (see [45] and Table 1): edge density (ED), patch density (PD), landscape division index(DIVISION), splitting index (SPLIT), perimeter-area ratio (PARA), shape index (SHAPE), fractaldimension index (FRAC), related circumscribing circle (CIRCLE), and contiguity index (CONTIG).
Moreover, PARA, SHAPE, FRAC, CIRCLE, and CONTIG were initially computed at the patchlevel, and then the summary statistics were computed to provide a metric value at the landscapelevel. Mean (MN) and area-weighted mean (AM) (with the patch areas as weights) were chosen assummary statistics, resulting in a total of 14 configurational metrics (CM): ED, PD, DIVISION, SPLIT,PARA_MN, PARA_AM, SHAPE_MN, SHAPE_AM, FRAC_MN, FRAC_AM, CIRCLE_MN, CIRCLE_AM,CONTIG_MN, and CONTIG_AM.
The quantitative landscape characterization, based on forest vs. non-forest maps, requires defininga spatial window for the metric computation. Around any location in the study area (i.e., around anypixel in the forest vs. non-forest maps), such a window corresponds to a zone where the landscapecharacteristics are the most likely to influence the chance of encounter of anopheles mosquitoes withhuman beings. While a discoidal window intuitively seems the most appropriate, the choice of the diskradius is not trivial. Stefani et al. used a data-driven selection for the optimal radius of the discoïdalwindow to explain the malaria incidence rates in the village of Camopi, and concluded that the optimal

Remote Sens. 2016, 8, 319 8 of 22
radius was 400 m for the P. falciparum and 100 m for the P.vivax incidence rates [46]. However, it wasshown that P. vivax incidence was poorly correlated to the landscape features in comparison withP. falciparum incidence, suggesting that the P. vivax relapses were not correctly identified [46]. Therefore,only the P. falciparum incidence rates were used in the present study and the computation window wasdefined as a moving discoidal window with a 400 m radius. The computation of all the metrics wasperformed with the forest vs. non-forest raster grid as the input (the pixels being aligned with the onesof SPOT 5 image), a moving discoidal window of 400 m radius and an 8-connexity implementation ofthe algorithm, using FRAGSTATS software 4.2 (Amherst, MA, USA).
Table 1. Landscape metrics discussed in this study.
Metric(Abbreviation) Description (Adapted from [45]) Units Range
Percentage offorest (pF)
Percentage of forest in the computation window (ratio of forest area toarea of computation window), multiplied by 100. Percent (0, 100)
Edge Density (ED) Total length of forest edges in the computation window, per hectare. Meters/hectare ě0
Patch Density (PD) Total number of patches of forest and non-forest in the computationwindow, per square meter. Number/m2 ě1.99
Landscape DivisionIndex (DIVISION)
Probability that two randomly chosen pixels in the computationwindow are not situated in the same patch. Proportion (0, 1)
Splitting Index(SPLIT)
Number of patches one gets when dividing the computation windowinto parts of equal size in such a way that this new configuration leadsto the same degree of landscape division as obtained for the observedlandscape in the computation window.
No units
(1, number ofcells in thelandscape
area squared)
Perimeter-areaRatio (PARA)
Simple ratio of patch perimeter to area for each patch in thecomputation window No units >0
Shape Index(SHAPE)
Normalized ratio of patch perimeter to area in which the complexity ofpatch shape is compared to a square of the same size, for each patch inthe computation window.
No units ě1
Fractal DimensionIndex (FRAC)
Normalized ratio of patch perimeter to area in which perimeter andarea are log transformed. Reflecting shape complexity across a range ofspatial scale (patch size), for each patch in the computation window.
No units (1, 2)
RelatedCircumscribingCircle (CIRCLE)
Assessing shape based on the ratio of patch area to the area of thesmallest circumscribing circle, for each patch in the computationwindow.
No units (0, 1)
Contiguity Index(CONTIG)
Assessing patch shape based on the spatial connectedness, orcontiguity, of cells within a patch, for each patch in the computationwindow. Large contiguous patches (small non-contiguous patches)result in low (high) configurational complexity. Note that this indexcorresponds to one minus the contiguity index as defined by Fragstatsin order to be consistent with other complexity metrics.
No units (0, 1)
2.3.3. Landscape-Based Hazard Index Construction
A set of LHI candidate measures that correspond to each of the different configurational metricswas computed using the product operator as conjunctive (logic AND) operator:
LHI “ pF ˆ CM (1)
The normalized Landscape-based Hazard Index (NLHI) was then defined for each LHI, varyingfrom 0 (minimum) to 1 (maximum) for the study area:
NLHI “LHI´min pLHIq
max pLHIq ´min pLHIq(2)
where min(LHI) and max(LHI) are the observed minimum and maximum values of the LHI,respectively, within the considered study area.
Remote Sens. 2016, 8, 319 9 of 22
2.3.4. Qualitative Analysis
Some of the landscape metrics are often highly correlated among themselves [45,47,48].The information content of the 14 CM was, therefore, analyzed by means of a Principal ComponentAnalysis (PCA) for eliminating the redundant metrics among them. Moreover, the empirical behaviorsof both the selected candidate CM and the associated NLHI were analyzed with regard to the criteriaoutlined in the Knowledge-Based Model section.
2.3.5. Quantitative Evaluation
In the absence of entomological data with sufficient temporal and spatial consistency with ourLULC characterizations, the NLHI candidates were quantitatively evaluated using the incidence ratedata at the hamlet level of the village of Camopi.
‚ Incidence rates
Malaria cases have been recorded since 1 January 2001 by following an open cohort study ofchildren less than seven year old from the village of Camopi (see Stefani et al. [46], Hustache et al. [49]and Stefani et al. [10] for more details on this cohort). The P. falciparum incidence rates were computedfor 28 of the 29 hamlets of the village of Camopi for the period of 2009–2013 (The P. falciparum incidencerates could not be computed for one hamlet because it did not include any children less than sevenyear old since 2009). In fact, 2009 corresponds to the acquisition year of the satellite image processedto produce the LULC map including the village of Camopi (see Land use and land cover mappingsection). Considering the 2009–2013 period for the incidence computation instead of the year 2009alone provided more robust incidence data. It was assumed that the deforestation rate, the agriculturalpractices, and the human settlements have not significantly changed during this period.
Using such epidemiological data to evaluate the candidate NLHI was done under the hypothesisthat the P. falciparum incidence rates in Camopi are largely explained by the landscape features. As inStefani et al. [46], the assumption is also made that the transmission is domiciliary, making it possible tolink incidence rates to the dwellings and the environment features surrounding them; due to the smallmagnitude of the study area (15 km2), the spatial disparity of the incidence rates cannot be explainedby climatic and/or major environmental disparities in space; finally, the children in the cohort sharesimilar immunity levels and genetic susceptibility to malaria transmission [10]. However, according toStefani et al. [10], the number of inhabitants in the home, the use of tropical repellents and domesticinsecticides, the interventions of the county mosquito control services, and going to bed before 7:00 pmare protective factors against malaria transmission and can partially explain incidence rate disparities.In fact, we expect that the NLHI might predict the null or lower incidence rates with less accuracythan the higher ones, as the protective behaviors described above should make the incidence ratessignificantly lower, regardless of the landscape context. Thus, we defined two validation datasets byconsidering (i) all the hamlets of Camopi; and (ii) the hamlets exhibiting non-null incidence rates only.
‚ Computation of domiciliary NLHI
All households in the village of Camopi were geolocalized with the global positioningsystem (GPS)—Magellan eXplorist™ 600—or by digitalization from the aerial photographs ofBD-ORTHO® [10,46]. For each NLHI candidate, the values were extracted for the locations of thosehouseholds with at least one child less than seven year old included in the cohort, and then averagedat the hamlet level to explore the correlation between NLHI and P. falciparum incidence rates.
‚ Statistical relationship between incidence rates and candidate NLHI
The Pearson and Spearman correlation coefficients and the linear regression coefficient ofdetermination between incidence rates, landscape metrics, and candidate NLHI were computedby considering either all the hamlets of Camopi or only those exhibiting non-null incidence rate values.
Remote Sens. 2016, 8, 319 10 of 22
3. Results
3.1. Qualitative Analysis: Information Content Analysis of Configurational Metrics
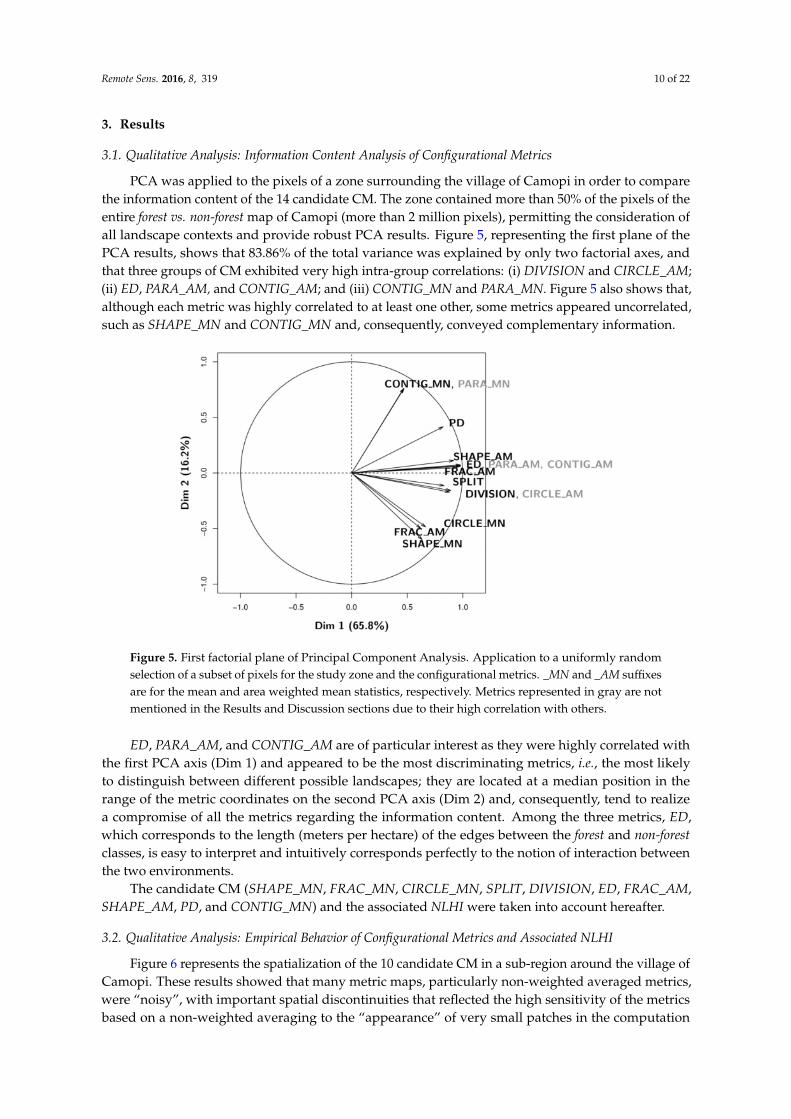
PCA was applied to the pixels of a zone surrounding the village of Camopi in order to comparethe information content of the 14 candidate CM. The zone contained more than 50% of the pixels of theentire forest vs. non-forest map of Camopi (more than 2 million pixels), permitting the consideration ofall landscape contexts and provide robust PCA results. Figure 5, representing the first plane of thePCA results, shows that 83.86% of the total variance was explained by only two factorial axes, andthat three groups of CM exhibited very high intra-group correlations: (i) DIVISION and CIRCLE_AM;(ii) ED, PARA_AM, and CONTIG_AM; and (iii) CONTIG_MN and PARA_MN. Figure 5 also shows that,although each metric was highly correlated to at least one other, some metrics appeared uncorrelated,such as SHAPE_MN and CONTIG_MN and, consequently, conveyed complementary information.
Remote Sens. 2016, 8, 319 10 of 22
3. Results
3.1. Qualitative Analysis: Information Content Analysis of Configurational Metrics
PCA was applied to the pixels of a zone surrounding the village of Camopi in order to compare the information content of the 14 candidate CM. The zone contained more than 50% of the pixels of the entire forest vs. non-forest map of Camopi (more than 2 million pixels), permitting the consideration of all landscape contexts and provide robust PCA results. Figure 5, representing the first plane of the PCA results, shows that 83.86% of the total variance was explained by only two factorial axes, and that three groups of CM exhibited very high intra-group correlations: (i) DIVISION and CIRCLE_AM; (ii) ED, PARA_AM, and CONTIG_AM; and (iii) CONTIG_MN and PARA_MN. Figure 5 also shows that, although each metric was highly correlated to at least one other, some metrics appeared uncorrelated, such as SHAPE_MN and CONTIG_MN and, consequently, conveyed complementary information.
Figure 5. First factorial plane of Principal Component Analysis. Application to a uniformly random selection of a subset of pixels for the study zone and the configurational metrics. _MN and _AM suffixes are for the mean and area weighted mean statistics, respectively. Metrics represented in gray are not mentioned in the Results and Discussion sections due to their high correlation with others.
ED, PARA_AM, and CONTIG_AM are of particular interest as they were highly correlated with the first PCA axis (Dim 1) and appeared to be the most discriminating metrics, i.e., the most likely to distinguish between different possible landscapes; they are located at a median position in the range of the metric coordinates on the second PCA axis (Dim 2) and, consequently, tend to realize a compromise of all the metrics regarding the information content. Among the three metrics, ED, which corresponds to the length (meters per hectare) of the edges between the forest and non-forest classes, is easy to interpret and intuitively corresponds perfectly to the notion of interaction between the two environments.
The candidate CM (SHAPE_MN, FRAC_MN, CIRCLE_MN, SPLIT, DIVISION, ED, FRAC_AM, SHAPE_AM, PD, and CONTIG_MN) and the associated NLHI were taken into account hereafter.
3.2. Qualitative Analysis: Empirical Behavior of Configurational Metrics and Associated NLHI
Figure 6 represents the spatialization of the 10 candidate CM in a sub-region around the village of Camopi. These results showed that many metric maps, particularly non-weighted averaged metrics, were “noisy”, with important spatial discontinuities that reflected the high sensitivity of the metrics based on a non-weighted averaging to the “appearance” of very small patches in the
Figure 5. First factorial plane of Principal Component Analysis. Application to a uniformly randomselection of a subset of pixels for the study zone and the configurational metrics. _MN and _AM suffixesare for the mean and area weighted mean statistics, respectively. Metrics represented in gray are notmentioned in the Results and Discussion sections due to their high correlation with others.
ED, PARA_AM, and CONTIG_AM are of particular interest as they were highly correlated withthe first PCA axis (Dim 1) and appeared to be the most discriminating metrics, i.e., the most likelyto distinguish between different possible landscapes; they are located at a median position in therange of the metric coordinates on the second PCA axis (Dim 2) and, consequently, tend to realizea compromise of all the metrics regarding the information content. Among the three metrics, ED,which corresponds to the length (meters per hectare) of the edges between the forest and non-forestclasses, is easy to interpret and intuitively corresponds perfectly to the notion of interaction betweenthe two environments.
The candidate CM (SHAPE_MN, FRAC_MN, CIRCLE_MN, SPLIT, DIVISION, ED, FRAC_AM,SHAPE_AM, PD, and CONTIG_MN) and the associated NLHI were taken into account hereafter.
3.2. Qualitative Analysis: Empirical Behavior of Configurational Metrics and Associated NLHI
Figure 6 represents the spatialization of the 10 candidate CM in a sub-region around the village ofCamopi. These results showed that many metric maps, particularly non-weighted averaged metrics,were “noisy”, with important spatial discontinuities that reflected the high sensitivity of the metricsbased on a non-weighted averaging to the “appearance” of very small patches in the computation

Remote Sens. 2016, 8, 319 11 of 22
window. This noise can be quite disconcerting to the users. In contrast, ED had a smooth appearance,making it less sensitive than the other metrics to small changes in the computation window.
Remote Sens. 2016, 8, 319 11 of 22
computation window. This noise can be quite disconcerting to the users. In contrast, ED had a smooth appearance, making it less sensitive than the other metrics to small changes in the computation window.
Figure 6. Spatialization of the configurational metrics. The top sub-figure represents the forest vs. non-forest map around the village of Camopi. The ten gray-scale images depict the configurational metric values for the same region for each sub-figure, with the metric name and legend on the right. Metrics were computed with the forest vs. non-forest maps, a moving discoidal window with a 400 m radius and an 8-connexity implementation of the algorithm.
Figure 7 represents NLHI values as a function of both the pF and the CM used for their computations. The differences in empirical NLHI behavior were represented as a function of the CM used. For a given high value of pF, sharp changes in NLHI could be observed as a function of the CM (SHAPE_MN, FRAG_MN, CIRCLE_MN, and CONTIG_MN). This may reflect the high sensitivity of these indices to small openings in the forest. Such specific behaviors are difficult to justify without complementary knowledge on the actual relationships between the hazard levels and the metric values.
Figure 6. Spatialization of the configurational metrics. The top sub-figure represents the forest vs.non-forest map around the village of Camopi. The ten gray-scale images depict the configurationalmetric values for the same region for each sub-figure, with the metric name and legend on the right.Metrics were computed with the forest vs. non-forest maps, a moving discoidal window with a 400 mradius and an 8-connexity implementation of the algorithm.
Figure 7 represents NLHI values as a function of both the pF and the CM used for theircomputations. The differences in empirical NLHI behavior were represented as a function of theCM used. For a given high value of pF, sharp changes in NLHI could be observed as a function of theCM (SHAPE_MN, FRAG_MN, CIRCLE_MN, and CONTIG_MN). This may reflect the high sensitivity

Remote Sens. 2016, 8, 319 12 of 22
of these indices to small openings in the forest. Such specific behaviors are difficult to justify withoutcomplementary knowledge on the actual relationships between the hazard levels and the metric values.Remote Sens. 2016, 8, 319 12 of 22
Figure 7. Three-dimensional plots of NLHI as a function of the pF/100 and configurational metrics. The x-axis (horizontal axis in bottom plane), y-axis (axis on the right in bottom plane), and z-axis (vertical axis on the left) represent the pF/100, the candidate CM and the corresponding NLHI, respectively. The gray dots represent the projections onto the xz-plane (back face of the box) and the yz-plane (left face). Red dots with vertical lines correspond to averaged values of the NLHI for the 28 hamlets of the Camopi village. Red squares correspond to the projections onto the xz-plane and the yz-plane of the averaged values for the 28 hamlets of the Camopi village.
3.3. Quantitative Evaluation: Relationship between NLHI and Actual Incidence Rates
Figure 8 presents the P. falciparum incidence rates for the 28 hamlets of Camopi, as a function of the NLHI values. While all the NLHI seemed to be correlated with the incidence rates (at least for non-null values), some (computed with SHAPE_MN, FRAC_MN, CIRCLE_MN, PD, SHAPE_AM, and
Figure 7. Three-dimensional plots of NLHI as a function of the pF/100 and configurational metrics.The x-axis (horizontal axis in bottom plane), y-axis (axis on the right in bottom plane), and z-axis(vertical axis on the left) represent the pF/100, the candidate CM and the corresponding NLHI,respectively. The gray dots represent the projections onto the xz-plane (back face of the box) andthe yz-plane (left face). Red dots with vertical lines correspond to averaged values of the NLHI for the28 hamlets of the Camopi village. Red squares correspond to the projections onto the xz-plane and theyz-plane of the averaged values for the 28 hamlets of the Camopi village.
Remote Sens. 2016, 8, 319 13 of 22
3.3. Quantitative Evaluation: Relationship between NLHI and Actual Incidence Rates
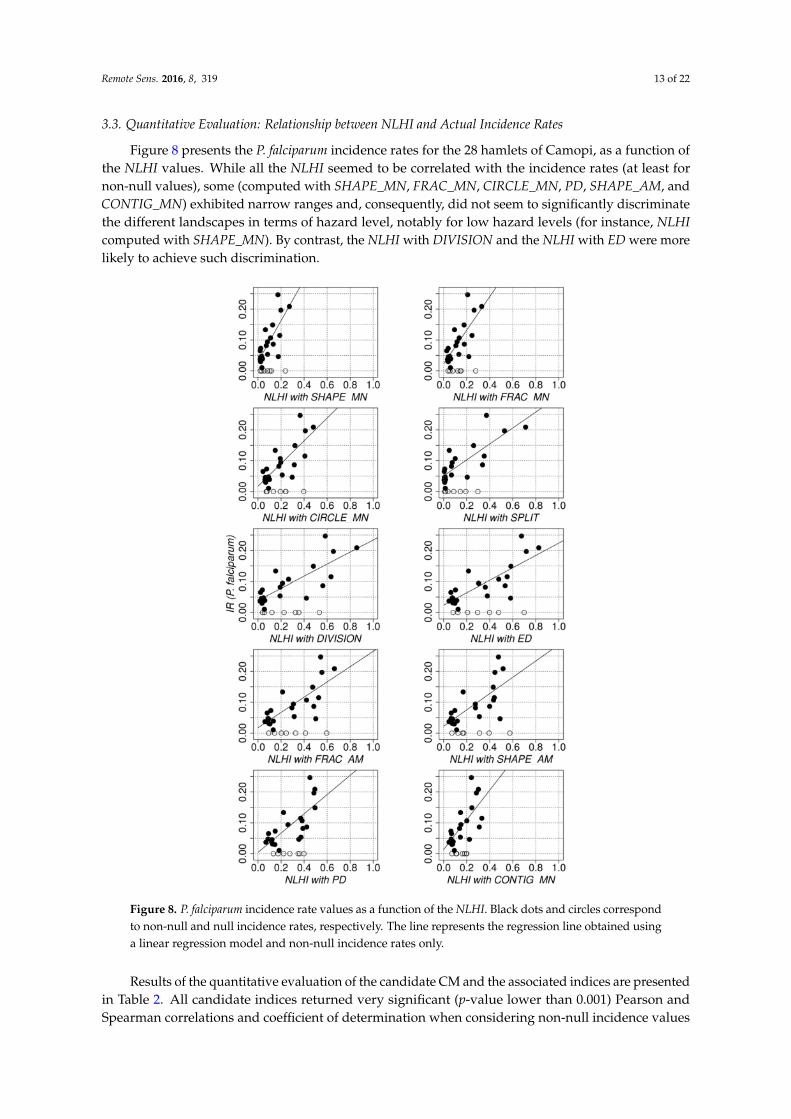
Figure 8 presents the P. falciparum incidence rates for the 28 hamlets of Camopi, as a function ofthe NLHI values. While all the NLHI seemed to be correlated with the incidence rates (at least fornon-null values), some (computed with SHAPE_MN, FRAC_MN, CIRCLE_MN, PD, SHAPE_AM, andCONTIG_MN) exhibited narrow ranges and, consequently, did not seem to significantly discriminatethe different landscapes in terms of hazard level, notably for low hazard levels (for instance, NLHIcomputed with SHAPE_MN). By contrast, the NLHI with DIVISION and the NLHI with ED were morelikely to achieve such discrimination.
Remote Sens. 2016, 8, 319 13 of 22
CONTIG_MN) exhibited narrow ranges and, consequently, did not seem to significantly discriminate the different landscapes in terms of hazard level, notably for low hazard levels (for instance, NLHI computed with SHAPE_MN). By contrast, the NLHI with DIVISION and the NLHI with ED were more likely to achieve such discrimination.
Figure 8. P. falciparum incidence rate values as a function of the NLHI. Black dots and circles correspond to non-null and null incidence rates, respectively. The line represents the regression line obtained using a linear regression model and non-null incidence rates only.
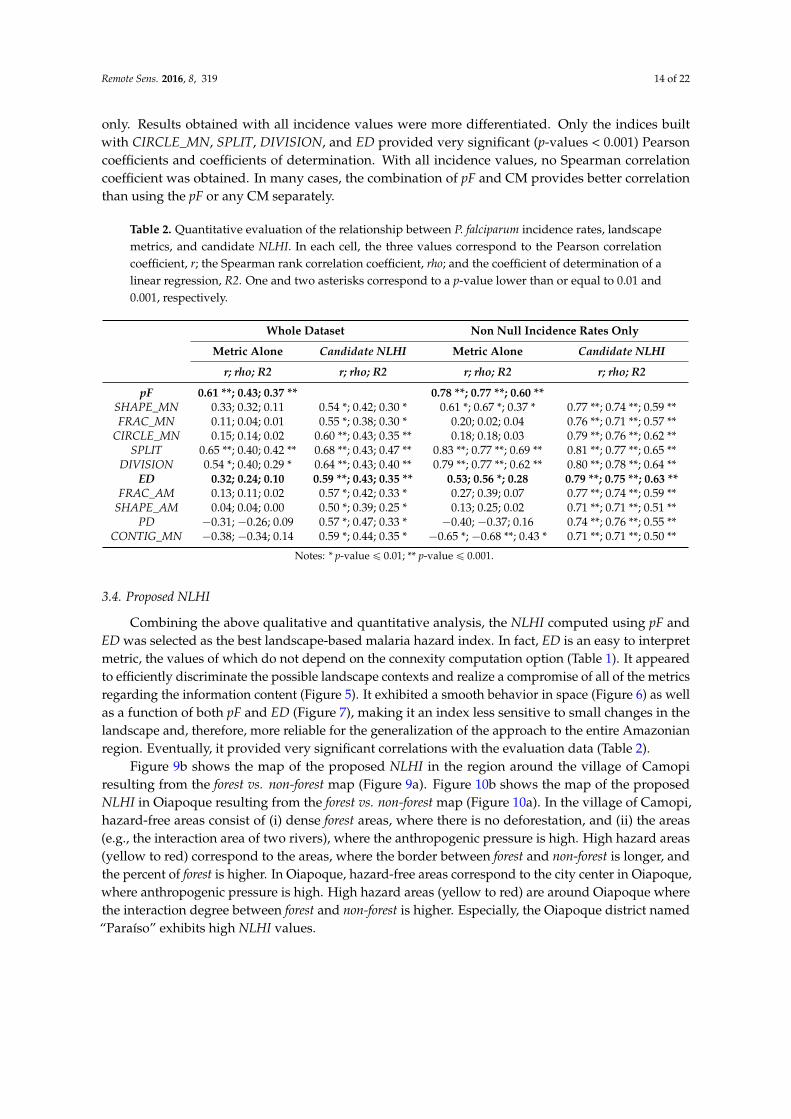
Results of the quantitative evaluation of the candidate CM and the associated indices are presented in Table 2. All candidate indices returned very significant (p-value lower than 0.001) Pearson and Spearman correlations and coefficient of determination when considering non-null incidence values only. Results obtained with all incidence values were more differentiated. Only the indices built with CIRCLE_MN, SPLIT, DIVISION, and ED provided very significant (p-values < 0.001) Pearson coefficients and coefficients of determination. With all incidence values, no Spearman correlation coefficient was obtained. In many cases, the combination of pF and CM provides better correlation than using the pF or any CM separately.
Figure 8. P. falciparum incidence rate values as a function of the NLHI. Black dots and circles correspondto non-null and null incidence rates, respectively. The line represents the regression line obtained usinga linear regression model and non-null incidence rates only.
Results of the quantitative evaluation of the candidate CM and the associated indices are presentedin Table 2. All candidate indices returned very significant (p-value lower than 0.001) Pearson andSpearman correlations and coefficient of determination when considering non-null incidence values
Remote Sens. 2016, 8, 319 14 of 22
only. Results obtained with all incidence values were more differentiated. Only the indices builtwith CIRCLE_MN, SPLIT, DIVISION, and ED provided very significant (p-values < 0.001) Pearsoncoefficients and coefficients of determination. With all incidence values, no Spearman correlationcoefficient was obtained. In many cases, the combination of pF and CM provides better correlationthan using the pF or any CM separately.
Table 2. Quantitative evaluation of the relationship between P. falciparum incidence rates, landscapemetrics, and candidate NLHI. In each cell, the three values correspond to the Pearson correlationcoefficient, r; the Spearman rank correlation coefficient, rho; and the coefficient of determination of alinear regression, R2. One and two asterisks correspond to a p-value lower than or equal to 0.01 and0.001, respectively.
Whole Dataset Non Null Incidence Rates Only
Metric Alone Candidate NLHI Metric Alone Candidate NLHI
r; rho; R2 r; rho; R2 r; rho; R2 r; rho; R2
pF 0.61 **; 0.43; 0.37 ** 0.78 **; 0.77 **; 0.60 **SHAPE_MN 0.33; 0.32; 0.11 0.54 *; 0.42; 0.30 * 0.61 *; 0.67 *; 0.37 * 0.77 **; 0.74 **; 0.59 **FRAC_MN 0.11; 0.04; 0.01 0.55 *; 0.38; 0.30 * 0.20; 0.02; 0.04 0.76 **; 0.71 **; 0.57 **
CIRCLE_MN 0.15; 0.14; 0.02 0.60 **; 0.43; 0.35 ** 0.18; 0.18; 0.03 0.79 **; 0.76 **; 0.62 **SPLIT 0.65 **; 0.40; 0.42 ** 0.68 **; 0.43; 0.47 ** 0.83 **; 0.77 **; 0.69 ** 0.81 **; 0.77 **; 0.65 **
DIVISION 0.54 *; 0.40; 0.29 * 0.64 **; 0.43; 0.40 ** 0.79 **; 0.77 **; 0.62 ** 0.80 **; 0.78 **; 0.64 **ED 0.32; 0.24; 0.10 0.59 **; 0.43; 0.35 ** 0.53; 0.56 *; 0.28 0.79 **; 0.75 **; 0.63 **
FRAC_AM 0.13; 0.11; 0.02 0.57 *; 0.42; 0.33 * 0.27; 0.39; 0.07 0.77 **; 0.74 **; 0.59 **SHAPE_AM 0.04; 0.04; 0.00 0.50 *; 0.39; 0.25 * 0.13; 0.25; 0.02 0.71 **; 0.71 **; 0.51 **
PD ´0.31; ´0.26; 0.09 0.57 *; 0.47; 0.33 * ´0.40; ´0.37; 0.16 0.74 **; 0.76 **; 0.55 **CONTIG_MN ´0.38; ´0.34; 0.14 0.59 *; 0.44; 0.35 * ´0.65 *; ´0.68 **; 0.43 * 0.71 **; 0.71 **; 0.50 **
Notes: * p-value ď 0.01; ** p-value ď 0.001.
3.4. Proposed NLHI
Combining the above qualitative and quantitative analysis, the NLHI computed using pF andED was selected as the best landscape-based malaria hazard index. In fact, ED is an easy to interpretmetric, the values of which do not depend on the connexity computation option (Table 1). It appearedto efficiently discriminate the possible landscape contexts and realize a compromise of all of the metricsregarding the information content (Figure 5). It exhibited a smooth behavior in space (Figure 6) as wellas a function of both pF and ED (Figure 7), making it an index less sensitive to small changes in thelandscape and, therefore, more reliable for the generalization of the approach to the entire Amazonianregion. Eventually, it provided very significant correlations with the evaluation data (Table 2).
Figure 9b shows the map of the proposed NLHI in the region around the village of Camopiresulting from the forest vs. non-forest map (Figure 9a). Figure 10b shows the map of the proposedNLHI in Oiapoque resulting from the forest vs. non-forest map (Figure 10a). In the village of Camopi,hazard-free areas consist of (i) dense forest areas, where there is no deforestation, and (ii) the areas(e.g., the interaction area of two rivers), where the anthropogenic pressure is high. High hazard areas(yellow to red) correspond to the areas, where the border between forest and non-forest is longer, andthe percent of forest is higher. In Oiapoque, hazard-free areas correspond to the city center in Oiapoque,where anthropogenic pressure is high. High hazard areas (yellow to red) are around Oiapoque wherethe interaction degree between forest and non-forest is higher. Especially, the Oiapoque district named“Paraíso” exhibits high NLHI values.

Remote Sens. 2016, 8, 319 15 of 22
Remote Sens. 2016, 8, 319 15 of 22
Figure 9. Maps resulting from the application of the proposed method in the region of Camopi. (a) Forest vs. non-forest map; and (b) map of the proposed NLHI (using pF and ED). Figure 9. Maps resulting from the application of the proposed method in the region of Camopi.(a) Forest vs. non-forest map; and (b) map of the proposed NLHI (using pF and ED).

Remote Sens. 2016, 8, 319 16 of 22
Remote Sens. 2016, 8, 319 16 of 22
Figure 10. Maps resulting from the application of the proposed method in Oiapoque. (a) Forest vs. non-forest map; and (b) map of the proposed NLHI (using pF and ED). Polygons represent the districts of Oiapoque with their names.
Figure 10. Maps resulting from the application of the proposed method in Oiapoque. (a) Forest vs.non-forest map; and (b) map of the proposed NLHI (using pF and ED). Polygons represent the districtsof Oiapoque with their names.

Remote Sens. 2016, 8, 319 17 of 22
The missing data in LULC maps (due to presence of clouds and cloud shadows) were set toNoData (see Land Use and Land Cover Mapping section) and were not used in the NLHI calculation.This caused the 400 m buffer zones around clouds and cloud shadows with missing NLHI values(white areas in Figures 9b and 10b).
4. Discussion
The proposed NLHI, obtained using pF and ED, is able to accurately represent the current andscientifically-founded knowledge on the relationship between LULC and malaria transmission inthe Amazonian region. It provides a general and high sensitivity measure that accounts for variousconditions, while maintaining a low sensitivity to low variations in the landscape metrics (Figure 7).
It is of interest that the combination of pF and CM provides better correlation in many cases thanusing the pF or any CM separately, supporting the use of such combination and confirming the impactof both the compositional and configurational aspects of the landscape.
The quantitative evaluations indicate that the proposed NLHI exhibits very significant(p-values < 0.01) relationships with malaria incidence rates, with a Pearson correlation coefficient (r)and a linear regression coefficient (R2) equal to, respectively, 0.59 and 0.35 with the whole dataset,and to 0.79 and 0.63 with the non-null incidence rates. The Spearman rank correlation coefficient (rho)appears only significant (rho = 0.75) when taking into account the non-null incidence rates. The factthat some other indices computed with SPLIT and DIVISION metrics give higher coefficients doesnot invalidate the proposed one, because the malaria incidence rates (resulting from environmentaland human factors that are not taken into account by the NLHI) cannot, by themselves, definitely andobjectively determine which one is the best. The excellent correlations found between the possibleindices and P. falciparum incidence rates can be explained by the fact that: (i) the NLHI implementsa knowledge-based model that realizes a consensual synthesis of the conclusions of all the studiesreviewed by Stefani et al. [14] and related to the impacts of land cover, land use, and landscape structureto malaria transmission; and (ii) the village of Camopi has quite homogeneous environmental andsocietal contexts where the landscape features play a key role in vector-human encounters and, thus,in malaria transmission. As previously discussed in the Quantitative Evaluation section, the hypothesisthat the P. falciparum incidence rates in Camopi are largely explained by the landscape features, in thisparticular context, justifies the use of incidence rates as evaluation data.
Nevertheless, it is worth noting that the available evaluation data are not associated to allrepresentative landscape contexts (see red points in Figure 7). Further investigations should beconducted to evaluate, quantitatively, the indices for the very high forest proportions.
We could not evaluate the proposed NLHI in the surrounding region of Saint-Georges-de-l’Oyapock and Oiapoque, as we did not benefit from sufficient data, both in quantity and quality.However, the results depicted in Figure 10b seem to correspond to the knowledge on environmentsat risk in this area. Especially, Paraíso district of Oiapoque, that exhibits high NLHI index values(Figure 10b), is associated to a very high risk of malaria transmission, according to an entomologicalstudy [43].
Although knowledge-based risk mapping has proven to be useful in a data-sparse context, thereare two important limitations that should be underscored: (i) such mapping requires the gathering andanalysis of an extensive knowledge on disease vectors, reservoirs, humans, and/or their interactions.This process needs a profound reflection and a long period of time [50]; and (ii) author bias maybe associated with the identification, choice, and interpretation of the disease risk factors [29,30].In the present study, a systematic literature review of the studies dealing with the relations betweenLULC and malaria transmission in the Amazon was done prior to establishing the model which,in conjunction with the consensual nature of the knowledge-based model, tends to reduce investigatorbias and make the NLHI pertinent. The use of different possible landscape metrics also permits limitingthe subjectivity of the approach. Furthermore, the availability of alternative significant metrics to
Remote Sens. 2016, 8, 319 18 of 22
compute the NLHI provides a means by which to improve the index in the future, according to newscientific evidence on the relationships between hazard levels and landscape features.
The implementation of the knowledge-based model considers only forest and non-forest classes,whereas the model deals with the notion of deforestation. In this study, natural openings of thedense forest, like large rivers or rock outcrops, were considered in the same way as the anthropogenicopenings. Particularly, the NLHI appears to be highly influenced by the hydrographic network. In fact,such impact is not due to the capacity of rivers for creating the mosquito breeding sites, but only to thecapacity for producing the landscapes that favor the interactions between forested and non-forestedareas. Rivers create such landscapes in two main ways, by creating openings in the dense forest (forlarge rivers), or maintaining gallery forests in anthropogenic areas.
Considering natural and anthropogenic forest openings in the same way is a fully assumed choicein order to define an index that reflects solely the landscape contribution to malaria transmission risk.In a second step, such an index should be combined with geographic layers characterizing the vectorhabitats and the human footprint [51] in order to consider which areas are actually associated with thepresence of vectors and humans, and to what extent. More generally, it is worth noting that such ahazard index is only a component of a global and integrated risk index that should take into accountspatialized information layers related to the presence and density of vectors and human populations,the presence of the parasite and the parasite load in the human populations, the human immunitylevel and genetic susceptibility, and climatic and behavioral factors. However, the restricted domain ofinterpretation of the NLHI does not minimize its value. In fact, to our knowledge, this work is the firstattempt to spatialize the landscape contribution to malaria transmission, through a general and robustindex. The separate assessment of landscape contribution can greatly improve integrated risk modelsas it has been previously stated in the Introduction section.
This study confirms that remote sensing is an efficient tool for identifying environmental featuresrelated to malaria transmission. However, the presence of clouds and cloud shadows results in missingdata in optical satellite images, particularly in tropical areas. Moreover, many environment variables,like wetlands under vegetation cover, can correspond to the breeding sites for malaria vectors, andare not observable by optical remote sensing. Synthetic aperture radar (SAR) has the capability forpenetrating such barriers and, consequently, might be used or combined with optical remote sensingfor extracting environmental characteristics related to vector habitats [52]. Eventually, further worksshould consider the temporal aspects of the deforestation by producing diachronic land cover maps,and then the temporal evolution of the NLHI associated with malaria in the Amazonian region.
5. Conclusions
A knowledge-based risk mapping approach was developed to build a NormalizedLandscape-based Hazard Index (NLHI) of malaria transmission from satellite images. The approachwas validated with actual malaria incidence rates from the cross-border region between FrenchGuiana and Brazil. The data show that landscape characterization based on remotely-sensed LULCmaps permits the estimation of the landscape contribution to malaria risk transmission. Beingbased on consensual knowledge about the relations between LULC and malaria transmission inthe Amazonian region and exploiting a simple characterization of the land cover (namely forest vs.non-forest), the present approach can be used on a regular basis to perform malaria transmission riskevaluations, and be easily generalized to the entire Amazonian region.
Remote Sens. 2016, 8, 319 19 of 22
Acknowledgments: This study was supported by the China Scholarship Council, the OSE-Guyamapá project(FEDER-Guyane, PO-Amazonie call) the TéléPal project (CNES-TOSCA 2014 call) and the GAPAM-Sentinelaproject (Guyamazon call). SPOT images were provided by the SEAS-Guyane project. The authors would like tothank the members of the Environment, Societies and Health Risks inter-disciplinary work-group (ESoR group) ofthe ESPACE-DEV Unit for the constructive discussions that enriched the paper. The authors wish to thank BioMedCentral Ltd. for the permission of reproduction of a figure. The Figure 2 was reproduced based on the originalversion (the Figure 3 in Stefani et al. [14]) which has been published by BioMed Central Ltd. BioMed Central Ltd.declares that the reproduction of figure is permitted free of charge and without formal written permission fromBioMed Central Ltd. (as the original publisher) or the copyright holder.
Author Contributions: Z.L. participated in the research design, data collection, analysis and interpretation, andprepared the manuscript. E.R. participated in the research design, data collection, analysis and interpretation, andreviewed the manuscript. N.D. participated in the research design, data collection, analysis and interpretation, andreviewed the manuscript. A.S. was responsible for the children’s cohort in Camopi and computed the incidencerates used for the validation method. A.M. produced the land use and land cover maps. R.G. and F.S. reviewedthe manuscript. All authors read and approved the final manuscript.
Conflicts of Interest: The authors declare no conflict of interest.
Abbreviations
The following abbreviations are used in this manuscript:
AM Area-weighted meanAPI Annual Parasite IndexASF African swine feverCIRCLE Related Circumscribing CircleCM Configurational metricsCONTIG Contiguity IndexDIVISION Landscape Division IndexED Edge DensityFRAC Fractal Dimension IndexGPS Global Positioning SystemIBGE Brazilian Institute of Geography and StatisticsIGN National Institute of Geographic and Forestry InformationINSEE National Institute of Statistics and Economic StudiesLULC Land use and land coverLHI Landscape-based Hazard IndexMN MeanNLHI Normalization Landscape-based Hazard IndexPARA Perimeter-area ratioPCA Principal Component AnalysisPD Patch densitypF Proportion of the forestSAR Synthetic aperture radarSHAPE Shape IndexSPLIT Splitting IndexSVM Support Vector Machine
References
1. WHO. World Malaria Report 2015; 9789241565158; WHO: Geneva, Switzerland, 2015.2. Peiter, P.C. Living conditions, health status and health services availability along the brazilian border:
A geographical approach. Cad Saúde Pública 2007, 23, 237–250. [CrossRef]3. Wangdi, K.; Gatton, M.L.; Kelly, G.C.; Clements, A.C. Cross-border malaria: A major obstacle for malaria
elimination. Adv. Parasitol. 2015, 89, 79–107. [CrossRef] [PubMed]4. Musset, L.; Pelleau, S.; Girod, R.; Ardillon, V.; Carvalho, L.; Dusfour, I.; Gomes, M.S.M.; Djossou, F.;
Legrand, E. Malaria on the guiana shield: A review of the situation in French Guiana. Mem. Inst. Oswaldo Cruz2014, 109, 525–533. [CrossRef] [PubMed]
Remote Sens. 2016, 8, 319 20 of 22
5. Sinka, M.E.; Rubio-Palis, Y.; Manguin, S.; Patil, A.P.; Temperley, W.H.; Gething, P.W.; Van Boeckel, T.;Kabaria, C.W.; Harbach, R.E.; Hay, S.I. The dominant anopheles vectors of human malaria in the Americas:Occurrence data, distribution maps and bionomic precis. Parasites Vectors 2010, 3. [CrossRef] [PubMed]
6. Galardo, A.K.; Arruda, M.; D’Almeida Couto, A.A.; Wirtz, R.; Lounibos, L.P.; Zimmerman, R.H. Malariavector incrimination in three rural riverine villages in the Brazilian Amazon. Am. J. Trop. Med. Hyg. 2007, 76,461–469. [PubMed]
7. Girod, R.; Roux, E.; Berger, F.; Stefani, A.; Gaborit, P.; Carinci, R.; Issaly, J.; Carme, B.; Dusfour, I. Unravellingthe relationships between anopheles darlingi (diptera: Culicidae) densities, environmental factors andmalaria incidence: Understanding the variable patterns of malarial transmission in French Guiana (SouthAmerica). Ann. Trop. Med. Parasitol. 2011, 105, 107–122. [CrossRef] [PubMed]
8. Dusfour, I.; Issaly, J.; Carinci, R.; Gaborit, P.; Girod, R. Incrimination of anopheles (anopheles) intermediusperyassu, an. (Nyssorhynchus) nuneztovari gabaldon, an. (NYS.) oswaldoi peryassu as natural vectors ofplasmodium falciparum in French Guiana. Mem. Inst. Oswaldo Cruz 2012, 107, 429–432. [CrossRef] [PubMed]
9. Hiwat, H.; Bretas, G. Ecology of anopheles darlingi root with respect to vector importance: A review. ParasitesVectors 2011, 4, 177. [CrossRef] [PubMed]
10. Stefani, A.; Hanf, M.; Nacher, M.; Girod, R.; Carme, B. Environmental, entomological, socioeconomic andbehavioural risk factors for malaria attacks in Amerindian children of Camopi, French Guiana. Malar. J.2011, 10, 246. [CrossRef] [PubMed]
11. Patz, J.A.; Olson, S.H. Malaria risk and temperature: Influences from global climate change and local landuse practices. Proc. Natl. Acad. Sci. USA 2006, 103, 5635–5636. [CrossRef] [PubMed]
12. Olson, S.H.; Gangnon, R.; Elguero, E.; Durieux, L.; Guegan, J.F.; Foley, J.A.; Patz, J.A. Links between climate,malaria, and wetlands in the Amazon Basin. Emerg. Infect. Dis. 2009, 15, 659–662. [CrossRef] [PubMed]
13. Kraemer, M.U.; Hay, S.I.; Pigott, D.M.; Smith, D.L.; Wint, G.R.; Golding, N. Progress and challenges ininfectious disease cartography. Trends Parasitol. 2016, 32, 19–29. [CrossRef] [PubMed]
14. Stefani, A.; Dusfour, I.; Correa, A.P.; Cruz, M.C.; Dessay, N.; Galardo, A.K.; Galardo, C.D.; Girod, R.;Gomes, M.S.; Gurgel, H.; et al. Land cover, land use and malaria in the Amazon: A systematic literaturereview of studies using remotely sensed data. Mala. J. 2013, 12, 192. [CrossRef] [PubMed]
15. Barbieri, A.F.; Sawyer, I.O.; Soares-Filho, B.S. Population and land use effects on malaria prevalence in thesouthern Brazilian Amazon. Hum. Ecol. 2005, 33, 847–874. [CrossRef]
16. Guerra, C.A.; Snow, R.W.; Hay, S.I. A global assessment of closed forests, deforestation and malaria risk.Ann. Trop. Med. Parasitol. 2006, 100, 189–204. [CrossRef] [PubMed]
17. Vittor, A.Y.; Gilman, R.H.; Tielsch, J.; Glass, G.; Shields, T.; Lozano, W.S.; Pinedo-Cancino, V.; Patz, J.A. Theeffect of deforestation on the human-biting rate of anopheles darlingi, the primary vector of falciparummalaria in the Peruvian Amazon. Am. J. Trop. Med. Hyg. 2006, 74, 3–11. [PubMed]
18. Vittor, A.Y.; Pan, W.; Gilman, R.H.; Tielsch, J.; Glass, G.; Shields, T.; Sanchez-Lozano, W.; Pinedo, V.V.;Salas-Cobos, E.; Flores, S.; et al. Linking deforestation to malaria in the Amazon: Characterization of thebreeding habitat of the principal malaria vector, anopheles darlingi. Am. J. Trop. Med. Hyg. 2009, 81, 5–12.[PubMed]
19. Olson, S.H.; Gangnon, R.; Silveira, G.A.; Patz, J.A. Deforestation and malaria in Mancio Lima county, Brazil.Emerg. Infect. Dis. 2010, 16, 1108–1115. [CrossRef] [PubMed]
20. Fraser, B. Taking on malaria in the Amazon. Lancet 2010, 376, 1133–1134. [CrossRef]21. Omumbo, J.A.; Hay, S.I.; Snow, R.W.; Tatem, A.J.; Rogers, D.J. Modelling malaria risk in east africa at
high-spatial resolution. Trop. Med. Int. Health 2005, 10, 557–566. [CrossRef] [PubMed]22. Zeilhofer, P.; dos Santos, E.S.; Ribeiro, A.L.; Miyazaki, R.D.; dos Santos, M.A. Habitat suitability mapping
of anopheles darlingi in the surroundings of the Manso hydropower plant reservoir, Mato Grosso, CentralBrazil. Int. J. Health Geogr. 2007, 6, 7. [CrossRef] [PubMed]
23. Maheu-Giroux, M.; Casapia, M.; Soto-Calle, V.E.; Ford, L.B.; Buckeridge, D.L.; Coomes, O.T.; Gyorkos, T.W.Risk of malaria transmission from fish ponds in the peruvian amazon. Acta Trop. 2010, 115, 112–118.[CrossRef] [PubMed]
24. Patil, A.P.; Gething, P.W.; Piel, F.B.; Hay, S.I. Bayesian geostatistics in health cartography: The perspective ofmalaria. Trends Parasitol. 2011, 27, 246–253. [CrossRef] [PubMed]
25. Stuckey, E.M.; Smith, T.A.; Chitnis, N. Estimating malaria transmission through mathematical models.Trends Parasitol. 2013, 29, 477–482. [CrossRef] [PubMed]
Remote Sens. 2016, 8, 319 21 of 22
26. Hardy, A.; Mageni, Z.; Dongus, S.; Killeen, G.; Macklin, M.G.; Majambare, S.; Ali, A.; Msellem, M.;Al-Mafazy, A.W.; Smith, M.; et al. Mapping hotspots of malaria transmission from pre-existing hydrology,geology and geomorphology data in the pre-elimination context of Zanzibar, United Republic of Tanzania.Parasites Vectors 2015, 8, 41. [CrossRef] [PubMed]
27. Clements, A.C.; Pfeiffer, D.U.; Martin, V. Application of knowledge-driven spatial modelling approaches anduncertainty management to a study of rift valley fever in Africa. Int. J. Health Geogr. 2006, 5, 57. [CrossRef][PubMed]
28. De Glanville, W.A.; Vial, L.; Costard, S.; Wieland, B.; Pfeiffer, D.U. Spatial multi-criteria decision analysisto predict suitability for African swine fever endemicity in Africa. BMC Vet. Res. 2014, 10, 9. [CrossRef][PubMed]
29. Stevens, K.B.; Pfeiffer, D.U. Spatial modelling of disease using data- and knowledge-driven approaches.Spat Spatiotemporal Epidemiol. 2011, 2, 125–133. [CrossRef] [PubMed]
30. Garni, R.; Tran, A.; Guis, H.; Baldet, T.; Benallal, K.; Boubidi, S.; Harrat, Z. Remote sensing, land coverchanges, and vector-borne diseases: Use of high spatial resolution satellite imagery to map the risk ofoccurrence of cutaneous leishmaniasis in Ghardaia, Algeria. Infect. Genet. Evol. 2014, 28, 725–734. [CrossRef][PubMed]
31. Alimi, T.O.; Fuller, D.O.; Quinones, M.L.; Xue, R.D.; Herrera, S.V.; Arevalo-Herrera, M.; Ulrich, J.N.;Qualls, W.A.; Beier, J.C. Prospects and recommendations for risk mapping to improve strategies for effectivemalaria vector control interventions in Latin America. Malaria J. 2015, 14, 519. [CrossRef] [PubMed]
32. Uuemaa, E.; Mander, Ü.; Marja, R. Trends in the use of landscape spatial metrics as landscape indicators:A review. Ecol. Indic. 2013, 28, 100–106. [CrossRef]
33. Ostfeld, R.S.; Glass, G.E.; Keesing, F. Spatial epidemiology: An emerging (or re-emerging) discipline.Trends Ecol. Evol. 2005, 20, 328–336. [CrossRef] [PubMed]
34. Overgaard, H.J.; Ekbom, B.; Suwonkerd, W.; Takagi, M. Effect of landscape structure on anopheline mosquitodensity and diversity in Northern Thailand: Implications for malaria transmission and control. Landsc. Ecol.2003, 18, 605–619. [CrossRef]
35. INSEE. Insee. Saint-Georges (97038). Available online: http://www.insee.fr/fr/themes/comparateur.asp?codgeo=com-97308 (accessed on 11 February 2015).
36. INSEE. Insee. Camopi (97356). Available online: http://www.insee.fr/fr/themes/comparateur.asp?codgeo=com-97356 (accessed on 11 February 2015).
37. IBGE. Oiapoque. Available online: http://cod.ibge.gov.br/12XVS (accessed on 12 February 2015).38. Boyrie, A.; Laques, A.E.; Gurgel, H.C. Avaliação de políticas públicas para o desenvolvimento a partir de um
estudo sobre a fragmentação da floresta na bacia do oiapoque (guiana francesa/amapá). In Proceedings ofthe 16th Brazilian Symposium of Remote Sensing, Foz do Iguaçu, Brazil, 13–18 April 2013.
39. Carme, B.; Ardillon, V.; Girod, R.; Grenier, C.; Joubert, M.; Djossou, F.; Ravachol, F. Update on theepidemiology of malaria in French Guiana. Med. Trop. 2009, 69, 19–25.
40. Ardillon, V.; Eltges, F.; Chocho, A.; Chantilly, S.; Carvalho, L.; Flamand, C.; Carme, B. Evolution de la SituationEpidémiologique du Paludisme en Guyane de 2005 à 2011; French Institute for Public Health Surveillance:Saint-Maurice, French, 2012.
41. Ardillon, V.; Carvalho, L.; Prince, C.; Djossou, F. Bilan 2012 de la Situation Epidémiologique du Paludisme enGuyane; French Institute for Public Health Surveillance: Saint-Maurice, French, 2013.
42. Cenci, D.; Ferreira, A.C.; Santelli, S. Situation Epidémiologique du Paludisme dans L’etat D’amapà et dans laMinicipalité D’oiapoque (Brésil); French Institute for Public Health Surveillance: Saint-Maurice, French, 2012.
43. Zanini, V.M.; Gomes, M.S.M.; Galardo, A.K.R.; Lima, A.C.S.F.; Correa, A.P.S.A.; Stefani, A.; Roux, E.;Souza, R.T.L.; Póvoa, M.M.; Souto, R.N.P. Potencial de transmissão de malária no município deoiapoque-Amapá-Brasil. In Proceedings of the 50th Congress of the Brazilian Society of Tropical Medicine,Rio Branco, Brazil, 21–24 September 2014.
44. Tadei, W.P.; Thatcher, B.D.; Santos, J.M.; Scarpassa, V.M.; Rodrigues, I.B.; Rafael, M.S. Ecologic observationson anopheline vectors of malaria in the brazilian amazon. Am. J. Trop. Med. Hyg. 1998, 59, 325–335. [PubMed]
45. McGarigal, K.; Cushman, S.; Ene, E. Fragstats v4: Spatial Pattern Analysis Program for Categorical andContinuous Maps. Available online: http://www.umass.edu/landeco/research/fragstats/fragstats.html(accessed on 4 April 2016).

Remote Sens. 2016, 8, 319 22 of 22
46. Stefani, A.; Roux, E.; Fotsing, J.M.; Carme, B. Studying relationships between environment andmalaria incidence in Camopi (French Guiana) through the objective selection of buffer-based landscapecharacterisations. Int. J. Health Geogr. 2011, 10, 65. [CrossRef] [PubMed]
47. Carvalho, F.M.V.; De Marco, P.; Ferreira, L.G. The cerrado into-pieces: Habitat fragmentation as a function oflandscape use in the savannas of central brazil. Biol. Conserv. 2009, 142, 1392–1403. [CrossRef]
48. Hargis, C.D.; Bissonette, J.A.; David, J.L. The behavior of landscape metrics commonly used in the study ofhabitat fragmentation. Landsc. Ecol. 1998, 13, 167–186. [CrossRef]
49. Hustache, S.; Nacher, M.; Djossou, F.; Carme, B. Malaria risk factors in Amerindian children in FrenchGuiana. Am. J. Trop. Med. Hyg. 2007, 76, 619–625. [PubMed]
50. Hongoh, V.; Hoen, A.G.; Aenishaenslin, C.; Waaub, J.P.; Belanger, D.; Michel, P.; Lyme, M.C. Spatiallyexplicit multi-criteria decision analysis for managing vector-borne diseases. Int. J. Health Geogr. 2011, 10, 70.[CrossRef] [PubMed]
51. De Thoisy, B.; Richard-Hansen, C.; Goguillon, B.; Joubert, P.; Obstancias, J.; Winterton, P.; Brosse, S. Rapidevaluation of threats to biodiversity: Human footprint score and large vertebrate species responses in FrenchGuiana. Biodivers. Conserv. 2010, 19, 1567–1584. [CrossRef]
52. Machault, V.; Vignolles, C.; Borchi, F.; Vounatsou, P.; Pages, F.; Briolant, S.; Lacaux, J.P.; Rogier, C. The use ofremotely sensed environmental data in the study of malaria. Geospat. Health 2011, 5, 151–168. [CrossRef][PubMed]
© 2016 by the authors; licensee MDPI, Basel, Switzerland. This article is an open accessarticle distributed under the terms and conditions of the Creative Commons Attribution(CC-BY) license (http://creativecommons.org/licenses/by/4.0/).
Related Documents


