Document of the World Bank FOR OFFICIAL USE ONLY Report No. 19640 IMPLEMENTATION COMPLETION REPORT URUGUAY WATER SUPPLY REHABILITATION PROJECT (LOAN 2921-UR) September 10, 1999 Finance, Private Sector and Infrastructure Country Management Unit 7 Regional Office for Latin America and the Caribbean This document has a restricted distribution and may be used by recipients only in the performance of their official duties. Its contents may not otherwise be disclosed without World Bank authorization. Public Disclosure Authorized Public Disclosure Authorized Public Disclosure Authorized Public Disclosure Authorized

Welcome message from author
This document is posted to help you gain knowledge. Please leave a comment to let me know what you think about it! Share it to your friends and learn new things together.
Transcript

Document of theWorld Bank
FOR OFFICIAL USE ONLY
Report No. 19640
IMPLEMENTATION COMPLETION REPORT
URUGUAY
WATER SUPPLY REHABILITATION PROJECT
(LOAN 2921-UR)
September 10, 1999
Finance, Private Sector and InfrastructureCountry Management Unit 7Regional Office for Latin America and the Caribbean
This document has a restricted distribution and may be used by recipients only in theperformance of their official duties. Its contents may not otherwise be disclosed withoutWorld Bank authorization.
Pub
lic D
iscl
osur
e A
utho
rized
Pub
lic D
iscl
osur
e A
utho
rized
Pub
lic D
iscl
osur
e A
utho
rized
Pub
lic D
iscl
osur
e A
utho
rized
CURRENCY EQUIVALENTS[exchange rate as of August 18, 1999]
Currency Unit = Peso Uruguayo (UYU)Peso Uruguayo = US$0.0861US$1.00 = 11.630 Pesos
FISCAL YEARJanuary 1 - December 31
WEIGHTS AND MEASURESMetric
ABBREVIATIONS AND ACRONYMS
ANTEL - National Telephone CompanyAPL - Adaptable Program LoanGoU - Government of UruguayICB - International Competitive BiddingIDB - Inter-American Development BankLCB - Local Competitive BiddingLYSA - Lyonnaise Des Eaux America LatinaOSE - Administraci6n de las Obras Sanitarias del
EstadoPMU - Project Management UnitSANEPAR - Companhia de Saneamento de Parana
(BRAZIL)SAR - Staff Appraisal ReportUFW - Unaccounted-for-waterUTE - National Electric Company
Vice-President Shahid Javed BurkiCountry Management Unit Director Myrna AlexanderSector Management Unit Director Danny LeipzigerTask Manager Anna Wellenstein
FOR OFFICIAL USE ONLY
IMPLEMENTATION COMPLETION REPORT
URUGUAY
WATER SUPPLY REHABILITATION PROJECT (LOAN 2921-UR)
Table of Contents
Preface.Evaluation Summary ........................................................ ii
Part I - Implementation Assesment from the Bank's Perspective
A . Project Identity.IB. Backgrounnd.C. Project Objectives and Description .3D. Project Design and Preparation .5E. Project implementation .6F. Project Results.9G. Project Sustainability .18H. Bank Performance.181. Borrower Performance .19J. Bank-Borrower Relationship .20K. Assessment of Outcome .21L. Future Operations.21M. Lessons Learned.22
Part 11 - Statistical Tables
Table 1: Summary of Assessments .25Table 2: Related Bank LoansCredits .26Table 3: Project Timetable .27Table 4: Loan Disbursements: Cumulative Estimated vs. Actual .28Table 5: Project Scope and Implementation .29Table 6: Studies Included in Project .31Table 7: Implementation Schedule and Procurement Method .32Table 8: Procurement Method by Disbursement Category .34Table 9: Project Costs.35Table 10: Project Financing .36Table I 1: Comparative Price Indices .37Table 12: Allocation of Loan Proceeds by Disbursement Category .38Table 13: Minimum Performance Targets .39Table 14: Recalculation of Rate of Return - Additional Water Production from Aguas Corrientes Water
Treatment Plant .40Table 15: Recalculation of Rate of Return - New Water Connections .41Table 16: Ex-Post Qualitative Review of OSE With and Without Project .42Table 17: Evolution of Tariff Structure and Levels .43Table 18: OSE's Cash Flow Statements .44Table 19: OSE's Income Statements ......................... 45Table 20: OSE's Balance Sheets .46
i ~Table 21: Staff Inputs.47Table 22: Status of Legal Covenants .48
This document has a restricted distribution and may be used by recipients only in theperformance of their official duties. Its contents may not otherwise be disclosed withoutWorld Bank authorization.

Appendices:
A Borrower's Contribution to ICR ....................... 50B Comments from the Borrower ....................... 59C Mission Aide Memoire ....................... 62D Map ....................... 65

i
IMPLEMENTATION COMPLETION REPORT
URUGUAY
WATER SUPPLY REHABILITATION PROJECT (LOAN 2921-UR)
Preface
This is the Implementation Completion Report (ICR) for the Water Supply RehabilitationProject in Uruguay, for which a US$23.3 million equivalent loan was approved on March22, 1988, and made effective July I1, 1988. The borrower was the Republica Orientaldel Uruguay.
The loan closed on January 31, 1999, ten and a half years after Board approval and twoand a half years after the original closing date. Disbursements total US$22,221,449.45,leaving a balance of US$78,550.55 (of the adjusted loan amount of US$22.3 million) inthe loan account, which was cancelled on June 24, 1999.
The ICR was prepared by Anna Wellenstein, Task Manager, and Franz Drees, Engineer,of the Finance, Private Sector and Infrastructure Department of the Latin America andCaribbean Region, and reviewed by Myma Alexander, Country Director, Asif Faiz,Sector Leader (LCC7C), and Carlos E. Velez, Senior Economist (LSCFP). AntonioTrivizo of LCSFP provided support in preparation of document tables and formatting.The Task Manager for project appraisal was Bernardo Gomez (Principal FinancialAnalyst), assisted by Emanuel Idelovitch (Engineer), Roberto Cucullu (Lawyer), PabloCarraro (Consultant) and Carlos Pasten (Consultant). Task managers duringimplementation were Emanuel Idelovitch, Franz Kriegler, Luis Chang, Emilio Rodriguez,and Abel Mejia.
Preparation of this ICR began in December of 1998, and in March 1999 a mission wascarried out to gather information for the preparation of the ICR. The report is based onthe findings of that mission, interviews with Bank staff involved in the preparation andexecution of the project, as well as semester progress reports by the Borrower, Banksupervision reports, correspondence, and internal Bank documents found in the projectfiles. The Borrower contributed to the preparation of the ICR by submitting technical andeconomic data, and by facilitating and participating in discussions regarding the loanduring Bank mission. The Borrower's contribution and comments are to be included asAppendices A and B.


IMPLEMENTATION COMPLETION REPORT
URUGUAY
WATER SUPPLY REHABILITATION PROJECT (LOAN 2921-UR)
Evaluation Summary
Project Objectives
i. The project proposed to assist the Government of Uruguay (GoU) to improve theefficiency and quality of services provided by the public water and sanitation utility(OSE) while reducing its reliance on government subsidies. Specific project objectiveswere: (i) to meet short- to medium-term water demand through rehabilitation of existingfacilities, operational improvements and expansion of water production, transmission anddistribution capacity; (ii) to improve the quality and reliability of water service; (iii) toimprove OSE's financial performance by reducing recurrent costs; and, (iv) to implementa revised sector strategy to meet the long-term demand for water and sewerage services.The conceptual approach was based on the premise that improved service quality andutility performance hinged on increasing the technical and financial capacity of OSE.Efficiency gains were to be brought about through intensive training in the context of acorporate twinning arrangement and through loan financing of infrastructure andequipment. Improvements in OSE efficiency were to be coupled with tariff reform andcost-effective investment planning to increase financial self-sufficiency.
ii. The project was made up of four components comprising investment andtechnical assistance for the systems in Montevideo and up to eight medium-sized cities inthe interior. Component A, Institutional Development, provided for the corporatetwinning arrangement which emphasized increased labor productivity, and improvedoperations, customer relations, personnel management, transportation, purchasing andinventory management, and accounting and information systems. Under thisarrangement, OSE worked closely with SANEPAR, the water company of the BrazilianState of Parana, which had a track record as a strong performer in the sector. ComponentB, Rehabilitation of Water Supply Systems, supported rehabilitation works including theupgrading of the Aguas Corrientes treatment plant and transmission mains, repair andreplacement of deteriorated equipment and installations in the production and distributionsystems of several medium-size cities and Montevideo, and the purchase and installationof equipment for improving OSE's operations, including water metering. Component C,Expansion of the Montevideo Distribution System, provided for the expansion of thedistribution network and for household connections. Component D, Preparation of aNational Water and Sanitation Plan, included financing for long term planning, tariffstudies, and feasibility studies for priority works.

ii
Project Implententation
iii. The project was appraised in February of 1987, approved by the Board on March22, 1988, and made effective on July 11, 1988. Implementation took two and a half yearslonger than anticipated at appraisal. The loan closed on January 31. 1999, after threeextensions. The long delay between appraisal and loan effectiveness is attributed tolengthy discussions on the Uruguayan side regarding the details of the on-lendingagreement between the Borrower, through the Ministry of Transport and OSE (ExecutingAgency). Implementation lags were due to the slow pace at which OSE finalized designsand bid documents as well as delays in conducting the tendering process itself.
iv. Total project cost including contingencies was appraised at US$30.7 million. Bythe time the loan closed, total project costs had risen to US$34.3 million. While, theoverall project cost increased only 7% over the contingency adjusted SAR estimates,actual cost increased substantially for several individual components and activities. Costsfor the Institutional Development Component increased by 1 17%, the Expansion of theMontevideo Distribution System Component by 79% and the National Water andSanitation Plan component by 33%. Cost overruns were due to incomplete designdefinition at the time of appraisal, changes in project scope over the long life of the loan,procurement delays and country-wide cost increases.
v. Throughout project implementation, OSE financial statemenits were subimittedwith delays of 18 to 24 months after the close of the fiscal year. Until 1996, similardelays were common with the project and special account audits. The delays had severalcauses. In the early years of the project, OSE could be characterized as a companyorganized according to engineering needs, with only a rudimentary accounting system.Certain changes stemming from the corporate twinning arrangement with SANEPARfurther deteriorated the accounting capacity by changing particular components of theinformation system without regard for accounting procedures. In 1994, the NationalElectricity Company (UTE) was contracted to develop a new financial infornationsystem. Several years were required to establish links between the newfinancial/accounting system and other OSE departments. The 1996 financial statementswere the first to be developed under the new systems and were issued in January of 1998.OSE issued the 1998 audited statements within the required time frame.
Project Results
vi. The gradual approach of improving services through rehabilitation and expansionof physical infrastructure along with institutional improvements through the SANEPARcorporate twinning arrangement met the modest objectives defined at appraisal. Whilethe project's four objectives remained unchanged, the specific set of investmentmeasures, studies and technical assistance services that contributed to meeting theobjectives evolved over the course of the project. The project met short to medium-termwater demand in Montevideo by expanding production capacity at the Aguas Corrientestreatment plant from 440,000 m3/day to 540,000 m3 /day, though not by water savings(unaccounted-for-water in Montevideo was 34% in 1988 and 45% in 1997). Montevideo

iii
water quality, particularly residual chlorine concentrations, improved with theintroduction of rechlorination stations at intermediate points in the transmission system.OSE's financial performance improved through increased labor productivity from 12.7employees/1000 connections in 1987 to 7.9 employees/1000 connections in 1997. Whilethe corporate twinning arrangement had little impact on OSE overall, it contributed toachieving these goals by significantly improving performance in several specific areasincluding operations, maintenance and customer service activities, as well asprocurement, inventory and stock control functions. On an organizational level,SANEPAR provided the guidance and technical support that allowed OSE todeconcentrate its operations by shifting limited responsibilities to four regional officesand a Metropolitan Montevideo operating unit.
vii. Progress toward the fourth objective, implementation of a revised sector strategy,was more modest, as the relevant project components emphasized improvements to OSErather thanl changes to the incentives driving utility management. The proposed changesto increase efficiency were planned within a sector structure devoid of real competitionand consumer pressure to make such changes necessary. Tariff reform studies were nevercompleted, though tariffs were increased to cover salary increases and growinginvestment costs. A long-term plan was prepared in place of the five-year plan originallyproposed. Significantly, the project did little to endow OSE with a cost-effectiveinvestment planning process, though studies to this effect were undertaken. The twinningarrangement's impact on human resource management was limited and its benefits forplanning and finance were virtually imperceptible. Nonetheless, OSE increased thepercentage of investments financed from operations from 52% (1988) to over 74%(1997). This improvement has been achieved in spite of a significant increase ininvestments from about US$8 million/year in the mid-eighties to between US$60 andUS$85 million/year today.
viii. OSE's financial performance improved during the project implementation period.OSE drastically increased revenues and investment. Steep tariff increases during projectimplementation boosted the average price of water over 70%. As noted above, internalfinancing of investment was always well above the 30% minimum established in theProject Agreement. Personnel costs versus operating costs outperformed the targetsduring all but one year of project implementation. While income and investment grew,OSE progress on improving financial management in terms of efficient investmentplanning and maximization of revenue generation has been modest at best. Majorinvestments are increasingly financed through short-term debt. By 1997, OSE had overtwice the total assets projected, but also over twice the long term liabilities and almost tentimes the current liabilities. The slow growth and recent downward trend of the rate ofreturn on fixed assets points to the decreasing revenue generating capacity ofinvestments, due in part to OSE's supply-side investment planning. OSE met targets foraccounts receivable in only four of the eleven years of the project. In these years, thereductions were due to large debt write-downs rather than improvements in collectionprocedures.
iv
ix. Economic returns were re-evaluated on a limited set of investments, specificallywater supply expansion and new connections. Production capacity of the AguasCorrientes water treatment plant increased from 440,000 m3/day to 540,000 m3/day, withan estimated internal rate of return of 41% and a net present value of US$14 millionusing a 10% discount rate. The internal rate of return for the 3,500 additional householdwater connections and the new water supply distribution network financed by the projectis 10%. The benefit stream was estimated over a 25 year time frame (1988-2012).Returns on other investments were not analyzed due to the lack of accurate benefitmeasures.
x. The project as a whole was not re-evaluated due to the diluted impact of projectmeasures on overall OSE performance. The original SAR estimates used 90% of allprojected revenue growth as the project benefit stream, and correspondingly the projectmonitoring indicators tracked utility performance as a whole, rather than particularinvestments. However, during the project implementation period OSE investments grewat a rate far above that foreseen in the SAR (over US$365 million from 1988-1997).Given the actual size of the OSE investment program and the extended implementationperiod, project activities formed only a small fraction of the investments undertaken toachieve the observed revenue increase. The impact of US$31 million in works andactivities funded under the project on the monitoring indicators is considerably dilutedand the indicators capture far more than the impact of project activities alone.
xi. At appraisal, about one third of the population to benefit from water supplyexpansion was thought to be poor. SAR estimates indicate that approximately 175,000additional people in Montevideo and 58,000 in medium-sized cities in the interior were tobenefit from 49,000 and 16,000 new connections respectively. While the project was toimprove production and transmission capacity to supply water to all of the newconnections, the project proposed to fund construction of only 5,000 of the 65,000 newconnections. By loan closure, 235,000 additional people were served by 169,000 newconnections in Metropolitan Montevideo. The production capacity increases (though notthe transmission improvements) necessary to reach these new customers had beenfinanced entirely with project funds. The project came near its coverage targets inmetropolitan Montevideo, but did little to improve service in the interior. Only 3,500 (ofthe 5,000) new connections to be directly financed under the project were actually built,serving 12,600 new customers. Nonetheless, 13,400 additional new customers for whomthe IDB had financed distribution networks in a marginal area not considered at appraisalwere connected through small transmission mains financed under the project. Insummary, the project met its general coverage target and came near its connection target.The project failed to balance benefits between Montevideo and the interior.
Project Sustain ability
xii. Though the project's attempt to promote institutional development throughtwinning with SANEPAR had very limited impact on OSE overall, it managed toimprove performance in several areas including (i) operations, maintenance and customerservice activities, (ii) procurement, inventory and stock control, and, to a lesser extent,

v
(iii) human resource management. The twinning arrangement also developed the detailsof OSE's deconcentration strategy. All of the above organizational changes are well-entrenched and show positive results. At the same time it is clear that in the absence ofcompetition and effective regulation in Uruguay's water and sanitation sector, furtherinstitutional improvements are very unlikely. High tariffs insulate the company from theneed to overcome organizational rigidities and reduce costs.
xiii. Improvements to OSE's water production, transmission and distribution capacityare both critical to the company's operations and highly visible, and as a result they willundoubtedly enjoy the management support necessary to ensure their sustainability.Given the company's insulation from cost-recovery considerations, the sustainability ofother project investments that are not immediately related to service delivery is far morequestionable. Since OSE still does not have a dedicated budget line item that ensures thereplacement of a defined number of obsolete water meters every year, there is noguarantee, for example, that recent gains in the number of connections with workingmeters can be sustained over time. Similarly, though the UFW reduction program pilotedin Minas reduced UFW from 53% to 34%, experience with public water utilities in theregion suggests that such gains are very difficult to maintain without sustained market-driven attention to cost reduction.
Bank Performance
xiv. Bank performance was satisfactory during identification and preparation andmarginally satisfactory during appraisal and supervision. In retrospect, a higher level ofproject definition at appraisal, including detailed designs and tender documents for thefirst year's works, might have accelerated implementation. However, since the Bank hadnever before worked with OSE as an executing agency, this chain of events would havebeen difficult to foresee at the time of project preparation. The composition ofmonitoring indicators tracks the overall performance of OSE well. However, given theunanticipated ten-fold increase in OSE's investment budget and the small percentage ofoverall investment that the loan came to represent, the utility-level indicators are notmeaningful in terms of the impact of project funded activities.
xv. Due to the length of implementation and the large number of task managers (6)that worked on the project from identification to loan closure, documentation in Bankfiles is incomplete. It appears that task managers prioritized project elements differentlyand requested what seemed to the counterparts to be arbitrary changes in projectreporting requirements. Moreover, the Bank did not provide sufficient periodic feedbackon some of the less successful technical assistance, most notable on the tariff study andthe financial management system. OSE has commented that despite high task managerturn-over, it never encountered significant delays in operational support. Given the smallsize of the loan and the length of implementation, supervision performance may beconsidered moderately satisfactory.
vi
Borrowver Performance
xvi. Borrower performance over the life of the loan was satisfactory. Support from thetop tier of OSE waned temporarily following the appointment of new management afterthe 1991 and 1996 national elections. Despite these periods of weak political backing,the Project Management Unit (PMU) displayed a high level of continuity. The PMUdemonstrated generally good technical and administrative capacity, though at times itlacked the political and administrative authority to move project measures through OSEexpeditiously.
Assessment of Outcomes and Future Operation
xvii. The overall outcome is considered satisfactory. The physical objectives werefully met and the institutional objectives partially achieved.
xviii. OSE will continue to provide water and sanitation services to the majority of thecountry over the short to medium tenn. Given the technical and financial capacity ofOSE, it is likely that project funded investments and reforms will be maintained.However, further efficiency improvements beyond those envisioned in Loan 2921 willrequire the introduction of competition and regulation into the sector. An adaptableprogram loan (ALP) is under preparation to support these sector refomls.
Lessons Learned
Project Design Lessons
xix. Twinning arrangements may have a positive yet limited impact in the context of acompany with a clear vision and well defined mandate and where the company lendingassistance has considerable expertise in priority areas. In the case of OSE, the companylacked a clear vision of its future and where assistance was needed. As a result, thetwinning arrangement was neither defined or controlled. Moreover, because OSE did nothave a clear and well defined mandate, changes in members of the Board lead to aweakening of support for improvements in company operations.
xx. Project implementation should be timed to coincide with election cycles and bewithin a reasonable span to assure consistency in implementation teams. The long timeperiod for preparation and implementation of Loan 2921 (13 years) made the projectvulnerable to changes in the leadership of OSE, the Government of Uruguay and theBank project team. The impact of these changes included shifts in priorities of OSEleadership and failure to adopt previously agreed upon policies, poorly maintained Bankproject records, what at times appears arbitrary changes in reporting requirements and laxenforcement of project and loan agreement covenants.
xxi. Policy and institutional changes must be realistic for the country context, beagreed on prior to loan approval, andform part of a clearly defined reform agenda. Incases where the details of policy and reform cannot be defined at the time of loan

vii
approval, a flexible lending instrument (APL) could provide the opportunity to advanceon reform while refining agreements and commitments from the borrower and the Bank.Many of the policy changes originally proposed under Loan 2921 were not part of a clearagenda for OSE nor the GoU. In particular, the changes necessary to substantiallyadvance project objectives on financial performance were not among company prioritiesat the time of project design, and throughout most of project implementation.Consequently, little progress was made toward achieving these objectives. At the time ofloan preparation, Uruguay had recently ended a period of military government, duringwhich OSE staff grew and sector investment deteriorated sharply. As a result,government priorities in the sector were to improve investment and service rather than tostrengtheni the commercial orientation/efficiency of OSE operations. While strengtheninigthe commercial orientation of activities would likely have improved the costeffectiveness of investments, the government and OSE prioritized quick physical resultson the most urgent infrastructure needs. As a result, physical investments, and measuresto increase the pace and scope of these investments, were consistently prioritized overmeasures to improve financial management and planning of the company.
Policy Lessons
xxii. Sustainable improvement in utility performance requires a sector structure whichprovides incentives for economic efficiency. Due to the current, non-competitiveenvironment, OSE leadership is able to manage the utility based on social and politicalobjectives and teclnical principles which result in the continued weak financialperformance of the company. Loan 2921's financing for investment and improvementsin OSE operations did not address the causes of poor service, only the symptoms. OSEcontinues to need external investment financing due to poor management of internallygenerated fumds. Focused sector reform, specifically increased competition, would help toimprove incentives for more efficient operations and investment based on customerdemand.
xxiii. Mustering the political will to increase tariffs for a monopoly provider mayinsulate the utility from pressures to invest more efficiently. In higher income countriessuch as Uruguay, the population's tolerance of relatively high tariffs (that remain low as afraction of disposable household income) may result in less pressure for reform than inpoorer countries where high water tariffs are felt more acutely. During the projectimplementation period, OSE increased combined water and sewer tariffs by over 70% inreal terms. OSE improved cost recovery due to increased tariffs, not improved investmentplanning. In fact, tariff increases may have insulated OSE from the need to reform.
Implementation Lessons
xxiv. Designs and tender documents should be prepared prior to loan approval wherefeasible.
Operational improvement depends not only on managerial buy-in, but on the support ofvarious levels of company stakeholders. In this regard, the twinning arrangement was

viii
effective. The first hand knowledge gained by taking several dozen workers to see lhowservices were organized in the State of Parana (Brazil) proved more effective atconvincing workers of the benefits of change than managers' directives or intellectualdiscussions.
xxv Project monitoring and reporting requtirements should be scheduled to coincidewi/h utility and government budgeting cycles. OSE was required to submit projectbudgets and projections three months prior to the establishment of the governmentbudget. As a result, the project budget and action plan were consistently delayed andwhen submitted on time, were only in draft form.
xxvi. Projecl financial and monitoring inidicators should hlive mneaning not only /brBank reporJing purposes, but .for the utility itself: Project financial and monitoringindicators were detached from OSE financial planning, or lack thereof. Even though thenames of the indicators are the same as those commonly used in the Bank and OSE, themethod for calculating the indicators was different than the norm and the indicators werenot calculated directly from OSE financial statements. As a result, the indicators held nomeaning for the utility, nor could one look to the utility's financial reporting for furtherinsight into particular indicators. The importance of the indicators as measures ofcompany performance should be understood and agreed upon between the utility and theBank. It is also recommended that standard indicators be used to allow for benchmarkingagainst other utilities, as currently undertaken by the Bank's TWUWS unit.
xxvii. Monitoring indicators should be designed to track project implementation andimpact. Loan 2921 monitoring indicators tracked the overall performance of OSE, butdid not allow a clear assessment of the contribution of project activities to performanceimprovements. The currently used log-framework, when fully employed, addresses thisneed through planning of investments and monitoring at the level of disbursement offunds, execution of works and technical assistance and contribution of executed worksand assistance toward project objectives. In order to realistically use the indicators tomonitor progress and to quantify impacts, the indicators must be specific, measurable,accountable, reliable and time bound (SMART).

PART 1- PROJECT IMPLEMENT ASSEMENT
A. Background
General
1. Uruguay is divided into 19 departments, including the capital, Montevideo.Population growth is low, estimated at 0.5% between 1975 and 1986. The 1986 totalpopulation was 3.0 million, of which 2.5 million (85%) was urban with over 50% of theurban population concentrated in Montevideo. For 1986, the SAR reported that 83% ofthe urban and 27% of the rural population had domestic water connections, and 63% ofthe urban and 20% of the rural population was served by public sewerage. The rest of thepopulation had access to acceptable alternative systems (standpipes, private wells, septictanks and latrines). Service quality was deemed satisfactory. Infrastructure sufferedfrom insufficient maintenance, rehabilitation and replacements. Unaccounted for waterwas estimated at 20% in 1952 and 40% in 1987. At this time, water related diseases suchas enteritis and other diarrheal diseases still figured among the five main causes ofmortality. Infant mortality in 1984 was 27 per 1,000 live births, compared to 21 in Chile,30 in Argentina and 55 in southern Brazil.
2. Starting in the 1950's, the Adminstracion de las Obras Sanitarias del Estado(OSE) became an instrument of income redistribution and fiscal policy at the cost ofeconomic efficiency. Tariffs were held below the cost of services in the presumedinterest of slowing inflation and benefiting low-income populations. Over-employment,together with the payment of non-competitive salaries to qualified personnel, wasencouraged as a means of redistributing income to and among public employees.Operation, maintenance and investment budgets were tailored to sector financialconstraints and the Government's fiscal situation, rather than to the requirements oforderly sector development.
Sector Objectives
3. At the time of project preparation, the GoU and OSE intended to redress pastpolicies with aims to: (a) modernize and restructure sector institutions, with emphasis onincreasing staff and technological efficiency; (b) expand sector infrastructure to provideservices to low-income population and to meet the expanding requirements of theeconomy; and (c) introduce financial and cost recovery policies that were to promoteefficient water use, and ensure the affordability of services to low-income population.
4. OSE's US$24 million investment plan for 1988-89 was designed to extend andimprove water and sewerage services by more fully utilizing the capacity of existingfacilities. The plan included: expansion of services in medium-size cities; rehabilitationand replacement of obsolete installations and equipment; and modernization andefficiency improvements in OSE's operations. The first item was funded by an IDB loan
-1-
and by Government counterpart funds. The last two items were to be financed throughOSE's internal cash generation and the Bank loan.
Sector Organization
5. All urban and rural water supply and sewer systems were planned, constructedand operated by OSE, with the exception of Montevideo sewerage which was, and still is,the responsibility of the Municipality. OSE was created by Law 11907 in 1952 andinitiated operations by taking over the water system in Montevideo and water supply andsewer systems outside the capital. In 1987, OSE was a decentralized service providerunder the Ministry of Transport and Public Works. About one half of the 6,900 OSEemployees worked in Montevideo, the rest were located in 20 regional offices, whichoperated 240 systems. Water and sanitation services in Montevideo were coordinated bytwo committees, one at the policy-making level and another at the teclnical level.
6. In 1990 OSE was transferred the newly created Ministry of Housing, LandManagement and Environment. The creation of this Ministry and its supportingregulations had little effect on OSE operations, outside of the new requirementsapplicable to all agencies, to carry out environmental impact assessments of new civilworks. Several structural changes occurred within OSE during execution of the loan. In1991, the General Manager, previously a career service position, became a politicallyappointed post. Seven years after loan signing, two additional positions of sub-managerwere added, with one manager handling OSE operations, a second the Maldonadoconcession, and the third special projects. Additional changes resulted from therecommendations of the corporate twinning arrangement between Companhia deSaneamento de Parana (SANEPAR) and OSE undertaken as part of the Project. Mostnotable among these were the creation of training and regional management units and theunification of the planning, budget, investment, and organization & metlhodologiesdepartmnents.
Bank Sector Lending
7. A key aspect of the Bank's strategy in Uruguay was to pursue structural andfinancial reforms of public enterprises. This, the first Bank-financed project in the waterand sanitation sector in Uruguay, aimed to assist the Government and OSE inimplementing essential components of an overall sector strategy that included: (i) theimprovement of OSE's financial perfornance by reducing costs through increased laborproductivity and staff reductions; (ii) the maintenance, rehabilitation and technologicalupgrading of existing installations and equipment; and, (iii) the implementation of cost-effective investments in system expansion. Previously, the Bank had assisted OSE inestablishing a twinning relationship with the SANEPAR, in the identification of systemrehabilitation investments, and in operations and maintenance improvements. Thetwinning arrangement was continued under the Bank loan. At the time the project wasdesigned, it was anticipated that further Bank initiatives would emphasize systemexpansion, particularly outside of Montevideo, and better coordination and more efficientoperation of the water and sewer systems in Montevideo. During project implementation,
-2 -

the World Bank funded the 1996 study, Reform Options for Uruguay's Wcaler candSanitation SecJor, and in 1997 the sector study, Towarrds a Nemw Role fir the Slate inUruguay's Utilities.
B. Project Objectives and Description
Project Objectives
8. The project aimed to modernize and restructure OSE by reducing operating costsand increasing productivity to enable it to operate without subsidies. The project alsoemphasized the provision of adequate services to low-income groups at affordable prices.Specific project objectives were:
(a) to meet short- to medium-term water demand at minimum cost through: (i) watersavings resulting from the rehabilitation of existing facilities and the introduction ofeffective operations, maintenance and commercial practices; and, (ii) increasedexpansion of water production, transmission and distribution capacity from thetechnological upgrading and improvement of water treatment installations, therehabilitation of transmission mains, and the expansion of the distribution network tonew areas in Montevideo;
(b) to improve the quality of the water supplied to consumers and the reliability ofservice;
(c) to improve OSE's financial performance by reducing operating costs, particularlythrough increased labor productivity; and
(d) to implement a revised sector strategy, including cost recovery policies and a cost-effective investment plan (1990-95) to meet the long-term demand for water andsewerage services.
Project Description
9. The project comprised four components of investment and technical assistance forthe systems in Montevideo and up to eight medium-sized cities. The following describesthe components and their percentage of overall project budget at the time of loan signing.
Component A: Institutional Development of OSE (7% of project cost)
Al) technical cooperation and training through a corporate twinningarrangement, emphasizing increased labor productivity, and improvedoperations, customer relations, personnel management, transportation,purchasing and inventory management, and accounting and informationsystems; and
-3 -
A2) technical cooperation for planning and coordination of the proposedproject.
Component B: Rehabilitation of Water Supply Systems (85% of project cost)
B]) upgrade the Aguas Corrientes treatment plant to incr-ease its productioncapacity by about 20% and to improve water quality;
B2) restore the carrying capacity of two transmission mains from the AguasCorrientes Treatment Plant to the Montevideo reservoirs, and rehabilitate/replace a short section of another transmission main in the Las Piedraszone;
B3) repair and replace deteriorated equipment and installations in theproduction and distribution systems of several medium-size cities and inthe Montevideo distribution system; and
B4) purchase and install equipment for the operation, control and maintenanceof the water and sewer systems, and support equipment required forimproving OSE's operations and customer services, including watermetering.
Component C: Expansion of Montevideo Distribution System (3% of project cost)
C1) construction of water distribution networks (about 40 km), and
C2) construction of house connections (about 5,000) and standpipes.
Component D: Preparation of OSE's Water Supply and Sanitation Plan (5% of projectcost)
Dl) technical assistance, including consulting services, on the job training forOSE staff, and fellowships for formulating:
- demand projections, and service targets and standards;
- a cost-effective investment plan for 1990-95 to meet the demand for water andsewerage services in the long-term;
- a tariff policy adequate to: (a) reflect as accurately as possible the economiccost of meeting the projected demand for water and sewer services; (b)provide such services by the public sector in a financially self-sufficientmanner; and (c) ensure that services will be affordable to the wholepopulation;
-4 -

- procedures to adjust tariffs and other charges on a regular basis to reflectinflation and cost reductions resulting from increased labor and technologicalefficiency;
- a manpower development plan for the sector, including the revision ofinstitutional aspects related to the execution of such a plan; and
- feasibility studies and final designs for further expansion of the MontevideoWater Supply System, and for other priority projects included in the 1990-95investment plan.
Executing Agencies
10. The Repuiblica Oriental del UruLguay (the Borrower), through the Ministry ofTransportation, made the loan proceeds available to OSE, as the project executingagency, on the same terms and conditions as those of the loan. As a condition for loaneffectiveness, the Borrower through the Ministry of Transportation entered into asubsidiary loan agreement with OSE.
11. The overall direction and supervision of project implementation was to be carriedout by a committee made up of OSE's President, the General Manager and a full-timeProject Director. The Committee was established and a qualified Project Directorappointed at the time of appraisal. The day-to-day activities under the project were to bedirected by the Project Management Unit and carried out by OSE's operating departmentsas were the technical assistance and the project-related training executed under thetwiniing arrangement.
C. Project Design and Preparation
Project Design
12. The Project was designed in response to the government's request for assistanceto improve the efficiency and quality of services of public utilities and reduce utilityreliance on government subsidies. The conceptual approach of the project was based onthe premise that improved service quality and utility performance hinged on increasingthe technical and financial capacity of OSE. Efficiency gains were to be brought aboutthrough intensive training in the context of a corporate twinning arrangement and throughloan financing of infrastructure and equipment. Improvements in OSE efficiency were tobe coupled with tariff reform and cost-effective investment planning to increase financialself-sufficiency. The approach assumed that necessary institutional and operationalreforms would be carried out based on the commitment and professional capacity of OSEleadership.
-5-

Project Preparation
13. Bank assistance was first requested in 1985, preappraisal took place in late 1986and appraisal in February/March of 1987. The project was prepared by OSE with theassistance of Pan American Health Organization consultants and SANEPAR. At the timeof appraisal, an overall strategy and plan for the institutional development program forthe first two years of project execution had been completed. The staff appraisal reportalso states that investment designs were well advanced for the upgrading andrehabilitation of the Montevideo treatment plant and well advanced for distributionnetwork expansions. It was anticipated that all designs would be finished within fourmonths of appraisal. The time required for completing designs was underestimated,likely due to the lack of World Bank experience in working with OSE. Delays inpreparation of designs and bid documents were a principal cause of slow-downs duringproject implementation.
D. Project implementation
Project Start-Up and Completion
14. There was a large time lapse between the February/March 1987 appraisal, theMarch 22, 1988 Board approval, and the July 11, 1988 loan effectiveness. Most of thisdelay is attributable to lengthy discussions on the Uruguayan side regarding the details ofthe on-lending agreement between the Borrower through the Ministry of Transport andOSE (Executing Agency). After three extensions, the loan finally closed on January 31,1999.
Project Implementation Schedule and Procurement
15. Despite a delay of 16 months between appraisal and loan effectiveness, OSE wasnot ready to proceed with physical investments (components B and C) when fundingultimately became available. Despite SAR statements on the advanced state of designand bid documents, no invitation to tender was issued for any works until August, 1989.Delays in finalizing designs and bid documents as well as delays in conducting thetendering process itself continued to push back civil works thereafter, as shown in thefollowing table.
Table I: Delays in Bidding Schedule of Major Works
tem Component / Sub-Component Bid inv. target Bid inv. actualB. I Rehab of WS Systems / Water Treatment Plant 4/88 8/89B.2 Rehab of WS Systems ! Transmission Mains 1/88 12/92B.3 Rehab of WS Systems / Montevideo distribution syst. 11/87 11/89B.4 Rehab of WS Systems / Interior distribution syst. 12/89 12/95C 4Expansion of Montevideo distribution system 3/88 6/89
-6 -

Implementation accelerated temporarily between August 1990 and March 1995 whenmost of the project's operating equipment purchases (sub-components B5 and B6, 17%of total project cost) were made. Overall, the project took 10.5 years to implement,compared with 8 years initially planned.
Procurement Plan
16. The project's procurement plan evolved over the life of the loan to favor moreinternational competitive bidding (ICB, 70% vs. 64% initially projected) over localcompetitive bidding (LCB, 7% vs. 20% initially projected, see Statistical Table 8 formore information). An increase in the scope of consulting services contracted resulted ina higher percentage of "other" procurement than initially projected (24 % vs. 17%). Inpart, these modifications reflect changes in project design toward more equipment,engineering and technical assistance and less civil works (see section F below). Theyalso reflect OSE's preference for ICB, even in situations where contract amounts werebelow agreed ICB thresholds. This is due to the fact that Uruguayan legislation allowsimport duty exemptions for goods procured under ICB when financing is providedthrough international loan agreements.
Project Costs
17. Total project cost including contingencies was appraised at US$30.7 million andtotal financing requirements, including taxes and interest on the Bank loan, estimated atUS$33.2 million (Bank: US$22.3 million, OSE: US$10.9 million). By the time the loanclosed, total project costs had risen to US$34.3 million due both to delays in projectimplementation, and changes in project scope over the long life of the loan. A detailedoverview of final project costs is provided in Statistical Table 9. Table II belowsummarizes changes in project cost by component. The outputs achieved as a result ofthese investments are discussed in detail in section E of this report.
Table II: Change in Project Cost by Component
Component Costs (US$ millions)SAR w/o c SAR w/ c Actual Change
A. Institutional Development 1.80 2.09 4.53 117 %B. Rehabilitation of Water Supply Systems 22.60 26.27 26.29 0 %C. Expansion of Montevideo Distribution System 0.80 0.93 1.67 79 %D. Preparation of Nati. Water and San. Plan 1.20 1.40 1.86 33 %TOTAL SAR wlo c: 7%
Key: SAR w/o c: appraisal estimate without contingenciesSAR w/ c: appraisal estimate with contingenciesActual: actual component costs by project closeChange: percentage change Actual vs. SAR w/contingencies
The table shows that despite significant cost increases for Components A, C, and D(particularly for the Institutional Development component which more than doubled insize), overall cost increased only 7% over the contingency adjusted SAR estimates. Therelative weight of Component B (Rehabilitation of Water Supply Systems) which
-7 -
accounted for 86% of all spending at appraisal, masks the size of cost overruns on theother components. Component B costs held steady only because its single largestinvestment, a US$7.6 million restoration of the carrying capacity of two transmissionmains to Montevideo, was dropped from the project altogether. The reasons for projectscope modifications in general and the decision not to go forward with the transmissionmains sub-component in particular are discussed in section E.
Disbursements
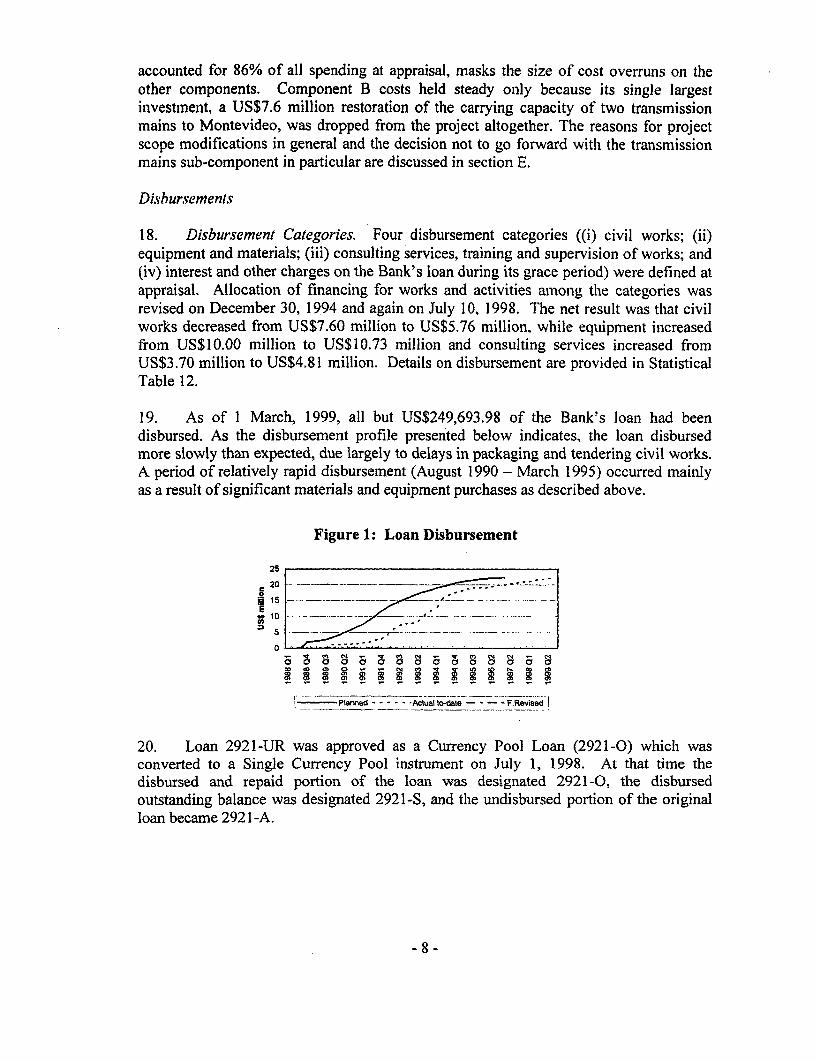
18. Disbursement Categories. Four disbursement categories ((i) civil works; (ii)equipment and materials; (iii) consulting services, training and supervision of works; and(iv) interest and other charges on the Bank's loan during its grace period) were defined atappraisal. Allocation of financing for works and activities among the categories wasrevised on December 30, 1994 and again on July 10, 1998. The net result was that civilworks decreased from US$7.60 million to US$5.76 million, while equipment increasedfrom US$10.00 million to US$10.73 million and consulting services increased fromUS$3.70 million to US$4.81 million. Details on disbursement are provided in StatisticalTable 12.
19. As of 1 March, 1999, all but US$249,693.98 of the Bank's loan had beendisbursed. As the disbursement profile presented below indicates, the loan disbursedmore slowly than expected, due largely to delays in packaging and tendering civil works.A period of relatively rapid disbursement (August 1990 - March 1995) occurred mainlyas a result of significant materials and equipment purchases as described above.
Figure 1: Loan Disbursement
25
5 . - - - - , -- --
20
- (Q N 'w Cq N N 11 Nto o a000a 00000
,- Planned ----- Actual to-date - - - F.Revised !
20. Loan 2921-UR was approved as a Currency Pool Loan (2921-0) which wasconverted to a Single Currency Pool instrument on July 1, 1998. At that time thedisbursed and repaid portion of the loan was designated 2921-0, the disbursedoutstanding balance was designated 2921-S, and the undisbursed portion of the originalloan became 2921-A.
-8 -

E. Project Results
Achievement of Project Objectives
21. The project's four objectives remained unchanged over the life of the loan,though the specific set of investment measures, studies and technical assistance servicesevolved over the course of the project. The first three objectives were largely met. Theproject met short to medium-term water demand in Montevideo by expanding productioncapacity at the Aguas Corrientes treatment plant from 440,000 m3 /day to 540,000 m3/day,though not by water savings (Unaccounted-for-water (UFW) in Montevideo was 34% in1988 and 45% in 1997). Montevideo water quality, particularly residual chlorineconcentrations, improved with the introduction of rechlorination stations at intermediatepoints in the transmission system. OSE's financial performance improved throughincreased labor productivity from 12.7 employees/1000 connections in 1987 to 7.9employees/1000 connections in 1997.
22. Progress toward the fourth objective, implementation of a revised sector strategy,was more modest, as the relevant project components (particularly A and D) emphasizedimprovements to OSE rather than changes to the incentives driving utility management.The proposed changes to increase efficiency were planned within a sector structuredevoid of real competition and consumer pressure to make such changes necessary.Nonetheless, during project implementation OSE increased average water and sanitationtariffs over 70% in real terms and increased the percentage of investments financed fromoperations from 52% (1988) to over 74% (1997). This improvement has been achievedin spite of a significant increase in investments from about US$8 million/year in the mid-eighties to between US$60 and US$85 million/year today. Significantly, the project didlittle to endow OSE with a cost-effective investment planning process, though studies tothis effect were undertaken. Table III below presents selected performance targets.
Table III: Selected Minimum Performance Targets
Target 1989 1995 1997Employees/1000 water Target 12.10 9.40connections Real 11.80 8.90 7.90Operating Expenses/Operating Target 79.00% 70.00%Income Real 83.00% 69.22% 71.86%Internally generated funds/total Target 30.00% 30.00%investments' Real 79.12% 61.98% 74.35%
23. The following sections discuss the project's physical outputs (components B andC), study results (component D), and benefits derived from institutional changes(component A). Statistical Table 5 provides an overview of the project's scope andimplementation results.
'Three year average
-9-

Physical Results
24. Component B: Rehabilitation of Water Supply Systems (86% of appraised projectcost). Under sub-component Bl, the production capacity at the Aguas Corrientes plantwas indeed increased from 440,000 m3/day to 540,000 m3/day (+23%) though costsincreased from US$4.1 million (SAR w/contingencies) to US$8.4 million. There wereseveral reasons for th e cost overrun. First, detailed designs for the proposedrehabilitation measures to civil structures (mainly, repairs to sedimentation basins andfilters and construction of a gravity channel between "old" and "new" plant) were notfinalized by appraisal and costs rose as the true extent of works became apparent.Second, the cost of refurbishing the plant's instrumentation (US$1.2 million) was notconsidered at the time of appraisal. Finally, construction costs in Uruguay rosesignificantly both in Peso and Dollar terms over the life of the loan, meaning thatprocurement delays resulted in significant cost increases (see Statistical Table 11 for acomparison of cost indices).
25. Sub-component B2 proposed an in-situ application of cement-mortar lining to twosteel transmission mains (No. 2 built in 1909 and No. 3 built in 1931) that had sufferedsignificant corrosion due to the acidity of treated water from Aguas Corrientes (minimumaverage pH values as low as 4.5 to 6.0 pre-project). The repairs were budgeted at US$6.5million (US$7.6 million with contingencies) at appraisal. As a result of procurementdelays and the growth in demand that occurred during the delay, it was no longer feasibleto take either line out of service for the duration of the repair. Actual bids came in inexcess of US$15.0 million when OSE added the constraint that the pipelines could not betaken completely out of service. An expensive "moving by-pass" would have beenrequired that made this sub-component economically unviable, and as a result, theoriginally planned works were dropped. In 1995/96, construction of a fifth transmissionmain between the Aguas Corrientes treatment plant and Montevideo (financed by OSEalone) made the repairs to lines 2 and 3 superfluous.
26. Under sub-component B3, the costs of replacement/rehabilitation of pipes, houseconnections, water meters and other installations in Montevideo increased from US$7.7million (SAR with contingencies) to US$9.2 million due to a significant expansion in thescope of works. 100 km of pipes were replaced instead of 80 km originally budgeted,and 140,000 new water meters were installed instead of 70,000 initially proposed. Inaddition, secondary chlorination facilities for several transmission lines weresatisfactorily installed, reducing bacteria regrowth in distribution systems and secondarystorage reservoirs. A comprehensive macro-metering system also installed under thissub-component has since become incomplete, as it has yet to be fully adapted to theneeds of the new fifth transmission line.
27. The focus of sub-component B4 changed somewhat over the life of the loan as didits costs which increased from US$2.4 million (SAR w/ contingencies) to US$2.9million. Instead of replacing/rehabilitating 80 km of distribution system pipes insecondary cities, the project focused investments on an integrated package of UFWreduction measures in Minas (which reduced UFW from 53% to 35%) and upgrades to
- 10-

the Minas water treatment plant (pumps, overflow channels, instrumentation). Finally,60,000 new household water meters were installed instead of the 30,000 initiallyprojected.
28. The SAR is vague about the number and type of O&M equipment that were tohave been procured for a contingency-adjusted amount of US$3.9 million as part of sub-component B5. In fact, OSE acquired US$3.9 million worth of pick-up trucks, excavatortrucks, back-hoe excavators, compressors and miscellaneous equipment (Statistical Table5) in support of operational improvements that grew out of the SANEPAR/OSE twinningarrangement. OSE spent an additional US$2.0 million on upgrades to customer servicefacilities and support equipment. On balance, these investments appear to have improvedOSE's operations and customer services significantly (for furtlher discussion ofoperational improvements, see paragraph 33).
29. C'omponent C: Expansion of the Montevideo Distributtion System (3% ofappraised project cost). Approximately 43 km of pipes and 3,500 connections wereinstalled to provide services to Villa Garcia, Pajas Blancas and Santa Ana and to connectPueblo General Artigas, where a distribution system had been financed by IDB, to theMontevideo network. Costs increased to US$1.7 million when detailed designs wereprepared after appraisal and the full scope of civil works to be undertaken became clear.The remaining 1,500 connections planned were not constructed due to lack of demand(actual demand below projected growth). However, more than 1,500 households havesince connected to the project funded distribution network. Later connections werefinanced by OSE and users.
30. Component D: Preparation of OSE's Water Supply and Sanitation Plan (5% ofappraised project cost). After three years under execution, the contracted tariff study wascancelled in its final phase due to unsatisfactory quality (for further discussion on tariffs,see paragraph 43). A long term investment plan was prepared in place of the five-yearplan (1990-95) initially proposed. US$1.55 million (against US$0.93 budgeted withcontingencies) were spent on diagnostic and feasibility studies by Tahal for four interiorcities and UFW studies by LYSA in Montevideo and a range of cities in the interior.Given limits on project funds, only the Tahal studies for Minas resulted in works underloan 2921 -UR. The other three, as well as the UFW work was conducted in preparationfor a follow-on loan. Statistical Table 6 provides an overview of all studies contractedunder the loan.
Institutional Results
31. Component A: Institutional Development of OSE (7% of cost at appraisal). Theproject provided for a twinning arrangement between OSE and the Companhia deSaneamento do Parana (SANEPAR), a highly effective water utility in southern Brazil,that was to strengthen OSE in operational areas (operations control, pitometry,metering, distribution system rehabilitation, reduction of operating costs, maintenanceand customer relations) and support systems (information and financial managementsystems, purchasing and inventory, and training). Later, it became clear that SANEPAR
- 11 -

was unable to provide OSE with an appropriate financial information system. OSE thencontracted the National Electricity Company (UTE), in support of component Aobjectives using OSE resources. Two contracts, valued at US$4.4 million wereconcluded between OSE and SANEPAR, and provided for a level of cooperation far inexcess of the US$1.7 million (SAR with contingencies) program envisioned at appraisal.
32. Though quite successful in several areas discussed in greater detail below, OSEitself concluded in a 1996 internal report that the twinning arrangement had been unableto significantly change the existing situation. The report concludes that though thetwinning arrangement included the appropriate areas of the company, the set of projectsundertaken had been backed neither by a cohesive vision of the type of company OSEwished to become, nor by clear water and sanitation sector policies at a national level.The report emphasized that insufficient attention had been paid to the difficulty oftransferring efficient systems from the state of Parana to OSE, which operates in adifferent statutory, political, social and cultural context. It is worth mentioning that OSEemerged from the mid-1980's with low investment levels of only about US$8 million peryear and tended to look more outward at pressing rehabilitation needs and service targetsthan inward at structural change. Thus, in spite of the fact that the twinning arrangementfit neatly with the first post-military government's policy of helping public companies tochange internally (first Sanguinetti presidency, 1985-90), internal reform competed forOSE management "mind space" along side pressing investment needs and lost.Significantly, the national government's policy (second Sanguinetti presidency, 1995-00)has since shifted to helping public companies to change by changing their sector and byintroducing competition. Against this backdrop it is clear that new Bank lending musttake a sector, rather than a utility-centered approach.
33. Despite low overall impact, the twinning arrangement brought significantimprovement to OSE's operations, maintenance and customer service activities.Work crews, office employees, and managers went to Parana to see first hand howoperations could improve. On SANEPAR's advice, OSE procured 36 back-hoe truckswith project funds and slimmed metropolitan Montevideo maintenance crews from 600workers to 300 while increasing service calls from 70,000 to 110,000/year. In addition,metropolitan Montevideo was divided into three customer service zones that reducedwork-crew travel times from zonal offices to network locations where repairs wereneeded. Telephone receptionists that take customer service requests were trained andincreased in number from 5 to 25. Service orders were computerized and prioritized,allowing workers to attend to the most pressing problems first. The twinningarrangement had limited impact on human resource management but did create OSE'sfirst internal training unit. SANEPAR proposed the creation of OSE's micrometering unitwhich since 1996 has standardized policy on metering, calibration and connectionprocedures. Finally, SANEPAR had a significant impact on OSE's procurement,inventory and stock control functions. Streamlined work procedures, clear jobdescriptions and the addition of new fork lifts have reduced personnel in the ProcurementDepartment from 190 to 87 since 1990, even as turn-around times on materials ordershave been cut from 30 - 45 to 10 - 15 days.
- 12 -

34. On a more macro level, SANEPAR proposed that OSE reorganize intometropolitan Montevideo and 4 interior regions. This deconcentration has brought OSEcloser to its customers, particularly in the interior which accounts for half of Uruguay'spopulation.
35. Planning and finance are two areas that benefited little from the twinningarrangement. The reason, in part, appears to be that SANEPAR itself did not have a top-flight financial management system so that after 1994 OSE turned to UTE for assistance.A more fundamental reason, however, stems from the difficulty of trying to introducecost-effective planning and financial management systems in a utility that has nottraditionally faced any competition and can pass the consequences of poor investmentdecisions and inefficient operations to consumers in the form of higher tariffs.
36. The twinning arrangement with SANEPAR helped OSE to meet or approachl twoof the minimum performance targets set out in the SAR. According to project design,OSE was to improve from 12.7 employees/I 000 connections in 1987 to 9.4employees/l000 connections in 1995. In fact, OSE reached 8.9 employees/1000connections in 1995 and improved to 7.9 employees/1000 connections by 1997. WhileOSE's workforce did decrease from 6,670 in 1988 to 5,375 in 1997 - thaanks largely toseverance initiatives supported by the government in 1990/91 and again in 1996/97 -most of the improvement in efficiency is due to the significant increase in total waterconnections from 542,000 in 1988 to 712,000 in 1997. The number of connections withworking meters has not increased as rapidly, climbing slowly from 89% in 1988 to 93%in 1997. This falls short of the SAR target of 94% effective metering by 1995. It alsomasks the fact that the fraction of connections with working meters remained virtuallyunchanged for the first eight years of the loan and has only recently improved with thecreation of a dedicated micrometering unit. Nonetheless, OSE will continue to strugglewith metering targets, despite the 200,000 meters purchased under the loan, as long as itfails to establish a permanent budget line item that commits the company to replacing afixed fraction of obsolete meters every year.
Statutory Changes
37. The Project Agreement (section 2.06 (ii)) committed the Borrower to reviewingOSE's statutes and submitting a reform proposal to the Legislature that would facilitateimplementation of Component A (Institutional Reform). Specific reform requirementswere never specified and an agenda for legal change was never mapped out. In theabsence of a well-defined reform agenda, there was little movement during the loanimplementation period to develop the legal tools that might have supported reform.Ultimately, the Borrower prepared a draft law that would have converted OSE's statusfrom that of a decentralized service to an autonomous corporation, the status alreadyenjoyed by UTE and state telephone company (ANTEL). The change in status wouldhave given OSE greater autonomy from its supervising ministry in the areas of personnel,budgeting and dispute resolution procedures. The proposed law has never left theLegislature. Thus at loan closure in 1999, OSE's legal set-up is no different than it hadbeen in 1988.
- 13 -

Financial Performnance
38. OSE financial statements were reviewed for the project implementation period.As a result of changes and anomalies in financial reporting, the statements were reviewedfor broad trends rather than detailed findings. Most notably, in 1991 OSE revised itsaccounting classification system, and in 1996 OSE revised its accounting procedures inaccordance with the independent auditor's recommendations. OSE also wrote down asubstantial amount of accounts receivable in 1990 and then annually starting in 1997.Financial statements with projected and actual data are presented in Statistical Tables 18-20.
39. Income cand Investment. During the project implementatioll period, OSEdrastically increased revenues and investment. OSE outperformed SAR incomeprojections, with the exception of a downturn in 1989-90. Internal financing ofinvestment was well above the 30% minimum established in the Project Agreement,actually averaging over 70% per year. The performance is particularly notableconsidering the increase in investment from US$8 million in 1988 to over US$84 millionin 1997.
40. Financial Planning. The audited statements show a financial profile matching theprevious description of OSE as a company that generates large investments, but with littleconsideration for financial management in terms of efficient investment planning andmaximizing revenue generation. A 1994 Ayuda Memoria agreement to create an internalunit in OSE to prepare financial projections was never fulfilled. Though the PlanningDepartment carries out projections each year, the projections have yet to become anintegral part of OSE management. Evidence of the lack of long tern financial planning isshown in OSE balance sheets, as major investments are increasingly financed throughshort-term debt. While the debtl(debt+equity) ratio is well below the original projections,the perspective on OSE solvency is very different when short-term debt is considered.Short term debt was double that of long term debt by 1997, with short term loansreaching over US$50 million. Accounts payable for services also rose during the projectimplementation period. The current ratio is well below the levels projected in the SARand indicates the trend toward financing investments with short term debt. By 1997, OSEhad over twice the total assets projected, but also over twice the long term liabilities andalmost ten times the current liabilities. The slow growth and recent downward trend ofthe rate of return on fixed assets points to the decreasing revenue generating capacity ofinvestments, due in part to OSE's supply-side investment planning.
41. Accounts Receivable. OSE met targets for accounts receivable in only four of theeleven years of the project. In these years the reductions were due to large debt write-downs rather than improvements in collection procedures. In 1990 OSE and other publicutilities, wrote downa mutual debts, after which accounts receivable grew steadily.Following the recommendation of the 1996 external auditor, Tea Deloitte Touche, OSEwrote off a large portion of accounts receivable and instituted a debt write-down policy.
- 14 -

42. Personnel Costs. Personnel costs versus operating costs outperformed the targetseach year, with the exception of 1996. The increase in 1996 is largely due to changes inaccounting standards after which subsistence expenses were reclassified as personnelcosts. A slight downward trend was again noted for 1997. No information was availableon personnel cost incurred through outsourcing, though outsourcing increased from 7% to15% of operating cost during project implementation.
43. Tarif Increases. Though the tariff study agreed to in the loan document wasnever completed, OSE increased the average water and sanitation tariff over 70% in realterms during the project implementation period to keep pace with salary increases and tocover growing operation and investment costs. Increases were also necessary due to thefact that OSE had no policy of debt write-down during most of the projectimplementation period and the cumulative effect of the collectibles threatened OSEsolvency. Changes in tariff structure and level are presented in Statistical Table 17. Inaddition to tariff increases, OSE has levied additional charges (tacrfiis adicionales) tocover part of investment costs. These charges recover cost directly from the customers tobenefit from the new infrastructure. On average over the last four years, OSE has taken inUS$10 million per year in revenues from these additional charges.
Project Accounts and Auditing Reports
44. Throughout project implementation, OSE financial statements were submittedwith delays of 18 to 24 months after the close of the fiscal year. Until 1996, similardelays were common with the project and special account audits. The delays haveseveral causes. In the early years of the project, OSE could be characterized as acompany organized according to engineering needs, with only a rudimentary accountingsystem. In some cases, the SANEPAR twinning program further deteriorated theaccounting capacity. For example, SANEPAR recommended reform of stock codes forthe procurement and storage department; however, these reforms were based onoptimizing the operations of the storage system and in isolation of other informationsystem reforms. The end result was a deterioration of the accounting department'scapacity to track and value inventory, and, consequently, to produce yearly financialstatements.
45. In 1994 UTE was contracted to develop a new financial/accounting informationsystem. The UTE financial/accounting system formed part of a company-wide integratedinformation system, while OSE only contracted the transfer of the financial/accountingcomponent of this system. As a result, several years were required to adapt the UTEsystem so as to be able to establish the links between the new financial/accounting systemand other OSE departments. The 1996 financial statements were the first to be developedunder the new system and were issued in January of 1998. OSE issued the 1998 auditedwithin the required time frame.
- 15 -

Economic Reevaluation
46. Economic returns were re-evaluated on a limited set of investments, specificallywater supply expansion and new connections (see Statistical Tables 14 and 15).Statistical Table 16 presents scenarios with and without the project and describesqualitative impacts for these project components. The returns of other investments werenot analyzed due to the lack of accurate benefit measures.
47. The project as a whole was not re-evaluated due to the following reasons:
Diluted impact of project on overall OSE performance. Project monitoringindicators present the performance of OSE, not particular project activities.During the project implementation period, OSE investments grew at a rate abovethat foreseen in the SAR, for a total of over US$365 million from 1988-1997.Given the actual size of the OSE investment program, the impact of US$31million in works and activities funded by the project on the monitoring indicatorsmay be considerably diluted and the indicators may not represent the impact ofproject activities.
Sparse Physical Monitoring Indicators. The majority of project funds wereused to finance physical works (over 80% of project financed activities), howeverthe project included few physical monitoring indicators. As a result, there are noclear measures of the overall physical impact of project activities and investments,though in specific cases, impacts can be estimated (see below).
48. Applying a methodology comparable to that used for the SAR would yield aninaccurate measure of project returns. The original analysis took 90% of all projectedrevenue growth as the project benefit stream. In fact, project activities formed only asmall portion of the investments undertaken to achieve that incremental revenue,particularly given the extended project implementation period. Consequently, the returnsestimated in this ICR employ a substantially different approach and are not comparable tothe original SAR estimates.
49. Estimated Returns. Production Capacity of the Aguas Corrientes plant increasedfrom 440,000 m3/day to 540,000 m3 /day due to project investments, with an estimatedinternal rate of return of 41% and a net present value of US$14 million using a 10%discount rate. The return is based on the benefits and costs of avoided rationing. Thebenefit stream is estimated over a 25 year time frame (1988-2012), and includes theincremental water revenue generated from the additional production capacity. The newcapacity was assumed to be fully utilized by year 1999. Incremental costs include projectinvestment costs and variable cost (energy, chemical, personnel, materials andadministrative costs). All values were calculated in US dollars, with a base year of 1987.This approach is likely to overestimate as it assumes excess capacity in all otherinfrastructure necessary to delivery treated water to the customer.
- 16-

50. The internal rate of return for the 3,500 additional connections and the newdistribution network is estimated at 10% and the net present value at zero using a 10%discount rate. The returns are based on the incremental water revenues derived from thenew connections over a 25-year time span (1988-2012). The cost stream includes projectinvestment costs and variable costs associated with water produced (energy, cheemicals,personnel, materials and administrative costs). All values were calculated in US dollarswith a base year of 1987.
51. The estimated return on new connections likely underestimates project benefits.The approach takes financial benefits (revenues) as equal to economic benefits, andtherefore underestimates economic returns by not accounting for consumer surplus. Themethodology employed also likely undervalues the positive environmental and healthexternalities associated with potable water supply.
52. The impact of institutional development activities and associated equipmentpurchases were not clearly defined at project initiation, and therefore monitoringindicators are not available to distinguish the impact of these activities from othersundertaken in OSE over the 11 year project implementation period. Installation of watermeters yielded only financial benefits and the rehabilitation of pipes is considered part ofregular maintenance undertaken by the utility, therefore not yielding economic benefits.There are no quantifiable estimates of benefits available for the installation of secondarychlorination facilities.
Impact on the Poor
53. At appraisal, it was estimated that approximately 175,000 additional people inMontevideo and 58,000 in medium-sized cities in the interior were to benefit from 49,000and 16,000 new connections respectively. While the project was to improve productionand transmission capacity to supply water to all of the new connections, only 5,000 of the65,000 connections listed above were actually to be constructed with project funds.About a third of the population to be served by the new connections was thought to bepoor.
54. By loan closure, 235,000 additional people (slightly more than the 233,000projected for Montevideo plus the interior at appraisal) were served by 169,000 newconnections in Metropolitan Montevideo. The production capacity increases (though notthe transmission improvements) necessary to reach these new customers had beenfinanced entirely with project funds. The project came near its coverage targets inmetropolitan Montevideo, but was less effective in improving service in the interior.Only 3,500 of the 5,000 new connections to be directly financed under the project inmarginal areas were actually built. The connections built served 12,600 new customersin the Villa Garcia, Pajas Blancas and Santa Ana neighborhoods. Nonetheless, 13,400additional new customers for whom the IDB had financed distribution networks in amarginal area known as "Pueblo General Artigas" not considered at appraisal wereconnected through small transmission mains financed under the project. Thus, insummary, it is fair to conclude that the project met its general coverage target (production
- 17 -

capacity for 235,000 new customers versus 233,000 at appraisal) and came near itsconnection target (3,500 project-financed new connections in Villa Garcia plus 3,900new connections supplied with water in Pueblo General Artigas, as compared with 5,000new connections projected at appraisal). The project failed to balance benefits betweenMontevideo and the interior.
F. Project Sustainability
Institutional Reform
55. Though the project's attempt to promote institutional development throughtwinning with SANEPAR had very limited impact on OSE overall, it managed toimprove performance in several areas including (i) operations, maintenance and customerservice activities, (ii) procurement, inventory and stock control, and, to a lesser extent,(iii) hlunman resource management. The twinning arrangement also developed the detailsof OSE's deconcentration strategy. All of the above organizational changes are well-entrenched and show positive results as previously described. At the same time it is clearthat in the absence of competition and effective regulation in Uruguay's water andsanitation sector, further institutional improvements are very unlikely. High tariffsinsulate the company from the need to overcome organizational rigidities and reducecosts. The twinning arrangement has taken OSE from the ranks of the very poorperformers to a new plateau of mediocrity from which it will not rise without meaningfulsector reform.
Physical Achievements
56. Since improvements to OSE's water production, transmission and distributioncapacity are both critical to the company's operations and highly visible, they willundoubtedly enjoy the management support necessary to ensure their sustainability.Given the company's insulation from cost-recovery considerations, the sustainability ofother project investmnents that are not immediately related to service delivery is far morequestionable. Since OSE still does not have a dedicated budget line item that ensures thereplacement of a defined number of obsolete water meters every year, there is noguarantee, for example, that recent gains in the ;.umber of connections with workingmeters can be sustained over time. Similarly, though the UFW reduction program pilotedin Minas reduced UFW from 53% to 34%, experience with public water utilities in theregion suggests that such gains are very difficult to maintain without sustained market-driven attention to cost reduction.
G. Bank Performance
Identifi cation, Preparation and Appraisal
57. Bank performance was satisfactory during identification and preparation andmarginally satisfactory during appraisal and supervision. In retrospect, a higher level of
- 18-

project definition at appraisal, including detailed designs and tender documelnts for thefirst year's works, might have accelerated implementation. However, since the Bank hadnever before worked with OSE as an executing agency, this chain of events would havebeen difficult to foresee at the time of project preparation. The composition ofmonitoring indicators tracks the overall performance of OSE well. However, given theunanticipated ten-fold increase in OSE's investment budget and the small percentage ofoverall investment that the loan came to represent, the utility-level indicators are notmeaningful in terms of the impact of project funded activities.
Supervision
58. Due to the length of implementation (10.5 years) and the large number of taskmanagers (6) that worked on the project from identification to loan closure,documentation in Bank files is incomplete. Supervision performance was uneven asshown in Table IV2.
Table IV: Supervision Missions
| Year j 1988 1989 1990 1991 | 1992 1993 11994 11995 1996 j 1997 119981Missions 1 2 1 1 I 1 1 2 4 2 0
On average, the Bank conducted only one to two full supervision missions per year.Only in 1996, when preparations for a new loan picked-up speed, did Bank supervisionintensify. OSE has commented that despite high task manager turn-over, it neverencountered significant delays in obtaining "no-objections" from the Bank team.Nonetheless, Bank technical support during supervision was less smooth than support foroperational aspects of the project. It appears that task managers prioritized projectelements differently and requested what seemed to the counterparts to be arbitrarychanges in project reporting requirements. Moreover, the Bank did not provide sufficientperiodic feedback on some of the less successful technical assistance, most notable on thetariff study and the financial management system. Nonetheless, given the small size ofthe loan and the length of implementation, supervision performance may be consideredmoderately satisfactory.
H. Borrower Performance
Overall Assessment
59. Borrower performance over the life of the loan was satisfactory. Support from thetop tier of OSE waned temporarily following the appointment of new management afterthe 1991 and 1996 national elections. Despite these periods of weak political backing,the Project Management Unit (PMU) displayed a high level of continuity. The PMU
2 The table counts only full supervision missions conducted after loan effectiveness that left Aide-Memoires in the field. OSE reports that the actual number of missions (counting brief stopovers by Bankstaff involved with the project) was higher.
- 19 -
demonstrated generally good technical and administrative capacity, tlhougli at times itlacked the political and administrative authority to move project measures tlhrough OSEexpeditiously.
Procuirement and Financial Reporting
60. Nowhere is the absence of high-level managerial backing witlhin OSE moreapparent than in the areas of procurement and financial reporting. Many of the project'sfinal designs were prepared in-house by OSE's technical department. Projectinvestments competed for the technical department's engineering time alongside thecompany's other investments (approximately US$ 8 million at the beginling and US$60- 85 million at the end of the project). Consequently, detailed designls and tenderdocuments took far longer to finalize than projected at appraisal. Once works had beentendered, additional delays occurred before contracts witlh successful bidders wereultimately signed. It is clear that consistent senior management support over the life ofthe project would have allowed the loan to disburse on schedule. Financial reporting isanother case in point. While technical difficulties with an antiquated accounting systemand then with the UTE system explain a part of the annual delays in producing OSE'sfinancial statements in a timely manner, a significant part of the delay is also due to alack of senior management priority on financial reporting and management.
Institutional Continuity
61. Despite the uneven performance of senior OSE management, the PMU displayeda high level of continuity. The PMU demonstrated generally good technical andadministrative capacity, but lacked the political and administrative authority to moveproject measures through OSE expeditiously.
62. OSE complied with most loan and project agreement covenants, though oftenwith delays. The Borrower and OSE met requirements of the on lending agreement andmaintenance of special and project accounts. OSE established and maintained a projectcommittee and a director, carried out a study on personnel management, presentedrevisions of OSE statues to the legislature (see paragraph 37), and carried out a trainingprogram according to agreed timelines. With regular delays, OSE submitted yearlyaction plans and audited financial statements, and niaintained adequate insurance. OSEonly partially met performance targets as shown in Statistical Table 13 of this document.Submission of forecasts and plans for meeting targets for subsequent years were oftendelayed. OSE never fully completed the required tariff study, though it has sincecontracted the final stages of the study with its own funds. Further details on loancovenant compliance are presented in Statistical Table 22.
I. Bank-Borrower Relationship
63. The Bank and the Borrower maintained a constructive working relationshipthroughout the long implementation period. The Bank showed flexibility in authorizing
-20 -

works and equipment purchases that were only defined in relatively general terms atappraisal. It did so while maintaining a clear focus on the established project objectives.As previously discussed in the section on Bank Performance, the Bank was prompt inresponding to Borrower requests for "no-objections". Another factor underpinning therelatively smooth operating relationship was that the Bank for niany years remainedcontent not to push OSE harder on institutional change than the company itself waswilling to go. The project opted for a soft-touch, gradualist internal reforn process withinOSE that successfully improved the company in several areas while never exposing it tothe hard choices that strong sector reform with competition from outside providers wouldhave demanded.
J. Assessment of Outcome
Physical Objectives and Outcomes
64. The project achieved both of its physical objectives, (i) meeting short- to mediumtern water demand, and (ii) improving the quality of water supplied to consumers and thereliability of the service. The project also met most of its physical outcomes: (i)upgrading the Aguas Corrientes treatment plant; (ii) repairing and replacing deterioratedequipment and installations in the production and distribution systems of severalmedium-sized cities and in the Montevideo distribution system; (iii) purchasing andinstalling equipment; and, (iv) expanding the Montevideo distribution system. With goodreason, it did not follow through on a sub-component to restore the carrying capacity oftwo transmission mains which proved to be economically unviable. The elimination ofthis sub-component freed up funds that financed cost overruns on other physicalinvestments, which occurred due to procurement delays and country-wide constructioncost increases, as well as incomplete design definition at appraisal.
Institutional Objectives and Outcomes
65. While the corporate twinning arrangement with SANEPAR had little impact onOSE overall, it significantly improved performance in several areas including operations,maintenance and customer service activities, and procurement, inventory and stockcontrol functions. The twinning arrangement's impact on human resource managementwas limited and its benefits for planning and finance were virtually imperceptible. On anorganizational level, SANEPAR provided the guidance and technical support thatallowed OSE to deconcentrate its operations by shifting limited responsibilities to fourregional offices and a Metropolitan Montevideo operating unit.
K. Future Operations
66. OSE will continue to provide water and sanitation services to the majority of thecountry over the short to medium term. The project investments, particularly in waterproduction, transmission and distribution still form critical elements of the company's
- 21 -

operations. Some of the loan funded institutional reforms continue show benefits forOSE, particularly those in (i) operations, maintenance and customer service, and (ii)procurement, inventory and stock control. The deconcentration strategy developed aspart of the SANEPAR twinning arrangement formed the basis for the decentralizationproject funded by IDB (scheduled to close in 2000). Given the technical and financialcapacity of OSE, it is likely that project funded investments and reforms will bemaintained.
67. Further efficiency improvements beyond those envisioned in Loan 2921 willrequire the introduction of competition and regulation into the sector. An adaptableprogram loan (ALP) is under preparation to support these sector reforms. The projectteam for the APL prepared this ICR and several lessons have been directly brought intothe strategy of the new project. Major issues include the emphasis on sector reform asopposed to a utility based investment loan, incremental reform through increasedcompetition and strengthening of the regulatory framework, loan disbursement in phasestriggered by the achievement of reform targets, and public commitment to performanceimprovements. The project under preparation also takes into account lessons learned onelection cycles and the timing of project preparation and implementation. The proposedAPL includes a short first phase (APL 1) with moderate reforms, with subsequent phases(APL2 and APL3) including deeper sector reform to be appraised, negotiated andimplemented with the new government taking office in January 2000.
L. Lessons Learned
Project Design Lessons
68. Twinning arrangements may have a positive yet limited impact in the context of acompany with a clear vision and well defined mandate and where the company lendingassistance has considerable expertise in priority areas. In the case of OSE, the companylacked a clear vision of its future and where assistance was needed. As a result, thetwinning arrangement was neither defined or controlled. Moreover, because OSE did nothave a clear and well defined mandate, changes in members of the Board lead to aweakening of support for improvements in company operations.
69. Project implementation should be timed to coincide with election cycles and bewithin a reasonable span to assure consistency in implementation teams. The long timeperiod for preparation and implementation of Loan 2921 (13 years) made the projectvulnerable to changes in the leadership of OSE, the Government of Uruguay and theBank project team. The impact of these changes included shifts in priorities of OSEleadership and failure to adopt previously agreed upon policies, poorly maintained Bankproject records, what at times appears arbitrary changes in reporting requirements and laxenforcement of project and loan agreement covenants.
70. Policy and institutional changes must be realistic for the country context, beagreed on prior to loan approval, and form part of a clearly defined reform agenda. In
- 22 -

cases where the details of policy and reform cannot be defined at the time of loanapproval, a flexible lending instrument (APL) could provide the opportunity to advanceon reform while refining agreements and commitments from the borrower and the Bank.Many of the policy changes originally proposed under Loan 2921 were not part of a clearagenda for OSE nor the GoU. In particular, the changes necessary to substantiallyadvance project objectives on financial performance were not among company prioritiesat the time of project design, and throughout most of project implementation.Consequently, little progress was made toward achieving these objectives. At the time ofloan preparation, Uruguay had recently ended a period of military government, duringwhich OSE staff grew and sector investment deteriorated sharply. As a result,government priorities in the sector were to improve investment and service rather than tostrengthen the commercial orientation/efficiency of OSE operations. While strengtheningthe commercial orientation of activities would likely have improved the costeffectiveness of investments, the government and OSE prioritized quick physical resultson the most urgent infrastructure needs. As a result, physical investments, and measuresto increase the pace and scope of these investments, were consistently prioritized overmeasures to improve financial management and planning of the company.
Policy Lessons
71. Sustainable improvement in utility performance requires a sector structure whichprovides incentives for economic efficiency. Due to the current, non-competitiveenvironment, OSE leadership is able to manage the utility based on social and politicalobjectives and technical principles which result in the continued weak financialperformance of the company. Loan 2921's financing for investment and improvementsin OSE operations did not address the causes of poor service, only the symptoms. OSEcontinues to need external investment financing due to poor management of internallygenerated funds. Focused sector reform, specifically increased competition, would help toimprove incentives for more efficient operations and investment based on customerdemand.
72. Mustering the political will to increase tariffs for a monopoly provider mayinsulate the utility from pressures to invest more efficiently. In higher income countriessuch as Uruguay, the population's tolerance of relatively high tariffs (that remain low as afraction of disposable household income) may result in less pressure for reform than inpoorer countries where high water tariffs are felt more acutely. During the projectimplementation period, OSE increased combined water and sewer tariffs by over 70% inreal terms. OSE improved cost recovery due to increased tariffs, not improved investmentplanning. In fact, tariff increases may have insulated OSE from the need to reform.
Implementation Lessons
73. Designs and tender documents should be prepared prior to loan approval wherefeasible.
- 23 -

74. Operational improvement depends not only on managerial buty-in, but on thesupport of various levels of company slakeholders. In this regard, the twinningarrangement was effective. The first hand knowledge gained by taking several dozenworkers to see how services were organized in the State of Parana (Brazil) proved moreeffective at convincing workers of the benefits of change than managers' directives orintellectual discussions.
75. Project monitoring and reporting requirements should be scheduled to coincidewRith utility and government budgeting cycles. OSE was required to submit projectbudgets and projections three months prior to the establishment of the governmentbudget. As a result, the project budget and action plan were consistently delayed andwhen submitted on time, were only in draft form.
76. Project financial and monitoring indicators should have 7eaning nol only forBank reporting purposes, but,for the utility itself Project financial and monitoringindicators were detached from OSE financial planning, or lack thereof. As a result, theindicators held no meaning for the utility, nor could one look to the utility's financialreporting for further insight into particular indicators. The importance of the indicators asmeasures of company performance should be understood and agreed upon between theutility and the Bank. It is also recommended that standard indicators be used to allow forbenchmarking against other utilities, as currently undertaken by the Bank's TWUWSunit.
77. Monitoring indicators should be designed to track project implementation andimpact. Loan 2921 monitoring indicators tracked the overall performance of OSE, butdid not allow a clear assessment of the contribution of project activities to performanceimprovements. The currently used log-framework, when fully employed, addresses thisneed through planning of investments and monitoring at the level of disbursement offunds, execution of works and technical assistance and contribution of executed worksand assistance toward project objections. In order to realistically use the indicators tomonitor progress and to quantify impacts, the indicators must be specific, measurable,accountable, reliable and time bound (SMART).
- 24 -

WATER SUPPLY REHABILITATION PROJECT (LOAN 2921-UR)IMPLEMENTATION COMPLETION REPORT
Table 1: Summary of Assessments
A. Achievement of Objectives Substantial Partial Negligible Not applicable
Macro Policies '/
Sector Policies IFinancial Objectives /
Institutional Development IPhysical Objectives ,/
Poverty Reduction I
Gender Issues
Other Social Objectives V
Environmental Objectives /
Public Sector Management IPrivate Sector Development ..Other (specify)
B. ProjectSusaLikely Unlikely Uncertain,B. Project Sustainability (8)(w) (V)
Highly MarginallyC. Bank Performance Satisfactory Satisfactory Satisfactory Deficient
Identification
Preparation Assistance I
Appraisal /
Supervision V
HighlyD. Borrower Performance Satisfactoy Satisfactory Deficient
(vi) (1) (1)
Preparation I
Implementation
Covenant Compliance
Operation (if applicable)
Highy HihyE. Assessment of Outcome Satisfactory Satisfactory Unsatisfactory unsatisfactory
( -/) (2/)
-25 -

WATER SUPPLY REHABILITATION PROJECT (LOAN 2921-UR)IMPLEMENTATION COMPLETION REPORT
Table 2: Related Bank Loans/Credits
Loan/Credit and Title Purpose Amount Year Status(USD Million)
Preceding OperationsPublic Enterprise Reform Technical assistance to 11.0 1992 Closed(UR-35 17) support the Government's
public enterprise reform& privatization program.
Concurrent OperationsNone.
Following OperationsWater Sector To increase the 15.0 APLI 1999 PreparationModernization and efficiency, coverage and (90.0 totalRehabilitation (UR-PE- sustainability of water APL Program)63383) supply and sanitation
services in Uruguay
- 26 -

WATER SUPPLY REHABILITATION PROJECT (LOAN 2921-UR)IMPLEMENTATION COMPLETION REPORT
Table 3: Project Timetable
Steps in Project Cycle Date Planned Date Actual/LatestEstimate
Identification May 1985 May 1985
Pre-appraisal October 86
Appraisal January 1987 Feb/March 1987
Negotiations July 1987 Jan/Feb. 1988
Board Approval September 1987 March 22, 1988
Signing November 1987 April 14, 1988
Effectiveness July 11, 1988
Loan Closing June 30, 1996 Jan. 31, 1999
- 27 -

WATER SUPPLY REHABILITATION PROJECT (LOAN 2921-UR)IMPLEMENTATION COMPLETION REPORT
Table 4: Loan Disbursements: Cumulative Estimated vs. Actual
(USS Millions)Bank FY Half Estimate Actual Actual as % of Estimate
1988 1 0.00 0.00 0.0%1988 2 2.00 0.00 0.0%1989 1 2.40 0.07 0.3%1989 2 3.40 1.16 5.2%1990 1 5.00 1.28 5.7%1990 2 6.70 1.36 6.1%1991 1 8.80 1.91 8.6%1991 2 11.80 3.02 13.5%1992 1 14.00 6.02 27.0%1992 2 15.60 7.77 34.8%1993 1 17.20 8.57 38.4%1993 2 18.40 11.67 52.3%1994 1 19.50 15.55 69.7%1994 2 20.50 17.50 78.5%1995 1 21.2 18.61 83.5%1995 2 21.8 19.09 85.6%1996 1 22.1 19.34 86.7%1996 2 22.3 19.92 89.3%1997 1 22.3 20.33 91.2%1997 2 22.3 20.88 93.6%1998 1 22.3 21.42 96.1%1999 1 22.3 21.95 98.4%1999 2 22.3 22.23 99.7%
Cumulative Loan Disbursement
25I __ _ _ - -
. 15 . _____ _
v= 10 -
~~~~~~~~ 5 ~------- 1--.--------.----- '-- --.- -! - I
U,~ ~ _ __
Planned - ~~~ Actual to-date - - - F.Revised,
U) ~ ~ ~ ~ ~ ~ _ ,. .. .
5~~- 2

WATER SUPPLY REHABILITATION PROJECT (LOAN 2921-UR)IMPLEMENTATION COMPLETION REPORT
Table 5: Project Scope and Implementation
Project Component Type Unit SAR Actual Completion
Estimate Date1. Institutional Development
A Twvinning arrangement wivh a highly effective paler utility. Oct-94According to SAR, activities wvere to provide supportfor:- operations control o.d. (I) - Yes Yes- pitometry o.d. ll) - Yes No- metering o.d. (I) - Yes Yes- rehabilitation of distribution system o.d. (I) - Yes Yes- reduction of operating costs o.d. (I) Yes Yes- maintenance o.d. (I) - Yes Yes- consumer relations o.d. (I) - Yes Yes- information and financial management system o.d. (I) - Yes No (2)- purchases and inventory o.d. (I) - Yes Yes- training o.d. (I) - Yes Yes
B In addition to activities outlined in the SAR, the twinningarrangement provided supportfor:- OSE's technical department (technology transfer for water o.d. (I) - No Yes
and sewage treatment plants, standardization of costestimates, etc.)
* OSE's commercial department (billing, meter reading, etc.) o.d. (I) - No Yes- OSE's deconcentration (creation of 4 interior regions) o.d. (1) - No Yes
11 Rehabilitation of Water Supply Systems
A Upgrading of Aguas Corrientes Treatment Plant(Rehabilitation of sedimentation basins and filters, volume m3/d from 444,000 to from 444,000 to Dec-96construction of a gravity channel between "old" and"new" 530,000 530,000plant, instrumentation etc. to increase production capacity)
B Restoring Capacity of Transmission Mains to Montevideo length km 35 km (2nd line) - cancelled46 km (3rd line) - cancelled
C Montevideo Distribution System- Repair and replacement of pipes and valves length km 80 100 Jan-99- Secondary chlorination facilities - - along 3rd and 4th along 3rd and 4th Oct-94
transmission transmission mainmain
- Macro- and micrometering and other installations number - 70,000 140,000 1994
D Medium-size Cities- Repair and replacement of pipes and valves number km 80 N.A. (3) Jun-98- Rehabilitation of Minas water treatment plant - - Not foreseen Yes Dec-97- Micrometering number - 30,000 60,000
E 0 & M Equipment- pick-up trucks for pitometry number - Not defined 2 Mar-94- excavator trucks number - Not defined 36 Dec-95- back-hoe excavators number - Not defined 3 Sep-93- compressors number - Not defined 8 Oct-93- two-way communication system - - Not defined Yes Aug-95- meter reading equipment number - Not defined I Feb-92
F Support Equipment- remodeling of customer service area in OSE/Montevideo - - Not defined Yes Aug-93- new telephone system for customer service - Not defined Yes May-92- new computer systems - - Not defined Yes Dec-91-remodeling of Carrasco regional office - - Not defined Yes
- remodeling of westem regional office - - Not defined Yes- remodeling of warehouse + forklift, cranes etc. - - Not defined Yes
- 29 -
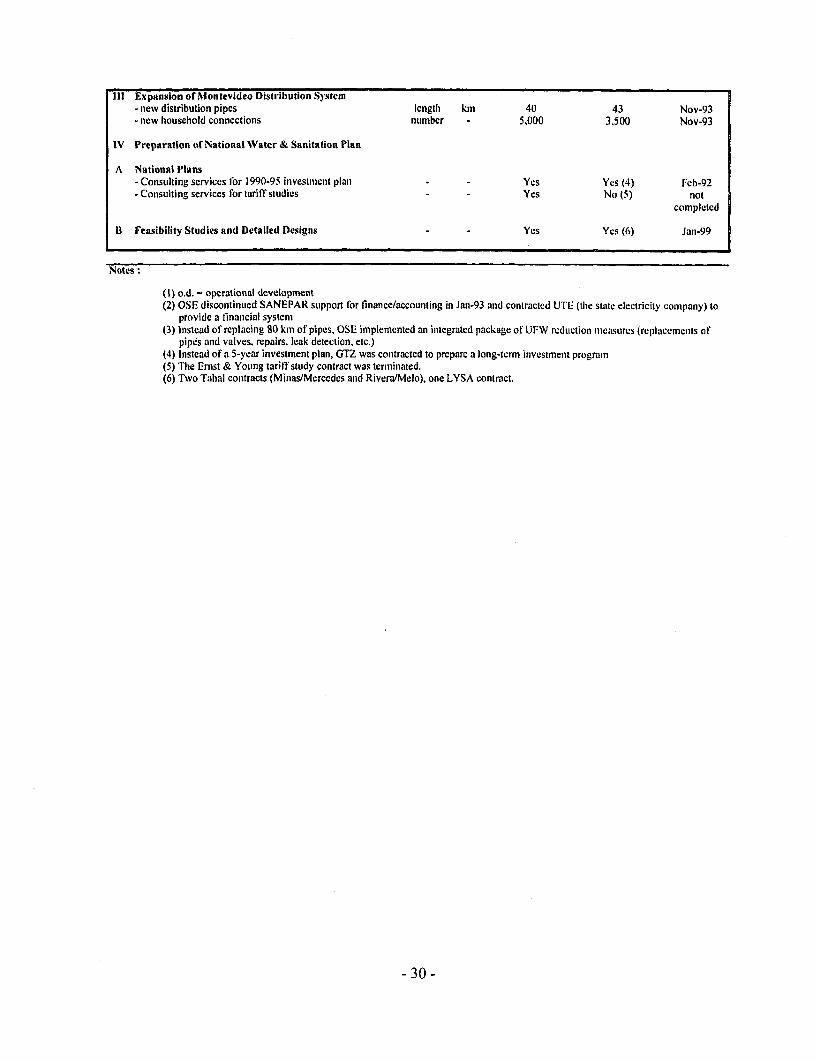
111I Expansion of Monitevideo Distribution System- new distribution pipes length klm 40 43 Nov-93- new houschold conncctions number - 5,000 3,500 Nov-93
IV Preparation of National Water & Sanitation Plan
A National Plans- Consulting services for 1990-95 invesiment plan . - Yes Yes (4) reb-92- Consultiig services for tariff studies Yes No (5) not
completed
B Feasibility Studies and Detailed Designs - - Yes Yes (6) Jan-99
Notes:
(I) o.d. = operational development(2) OSE discontinued SANEPAR support Ibr finance/accounting in Jan-93 and contracted lJTE (thie state electricity company) to
provide a financial system(3) Instead of replacing 0S kn of pipes, OSE implemented an integrated package of UFW reduction mewsurcs (replacements of
pipes and valves, repairs, leak detection, etc.)(4) Instead of a 5-year investment plan, GTZ was contracted to prepare a long-term investment program(5) The Ernst & Young tariff study contract was terminiated.(6) Two Tahal contracts (Minas/Mercedes and Rivera/Melo), one LYSA contract.
-30 -

WATER SUPPLY REHABILITATION PROJECT (LOAN 2921-UR)IMPLEMENTATION COMPLETION REPORT
Table 6: Studies Included in Project
Study Consultant Study Objective Actual Cost Initiatioii Ternmination f Status(in 000 USS) Date Datc
1) First technical Sanepar TA and tr aining for 1,434 Mar-87 Jun-92 Completedcooperation improved labor productivity,contract (original operations, customer+ extension) relations, and logistical and
admin systems.2) Second Sanepar Same 2,015 Dec-92 Oct-94 Completedtechnical incooperation shortenedcontract lorrm
3) Prcparation of Individual Elaboration of bid 9 Jul-89 .lan-9() CompletedBid Documents documents for thefor Rehabilitation rehabilitation of the 2nd andof 2 nd and 3rd 3rd transmission lines for theTransmission Montevideo SystemMains
4) Rehabilitation Tahal Study of the water systems 245 Jul-92 Jun-93 Completedof Minas and in Minas and MercedesMercedes PotableWater Systems
5) Rehabilitation Tahal Study of the water systems 245 Jul-94 Aug-95 Completedof Rivera and in Rivera and MeloMelo PotableWater Systems
6) Tariff Study Ernst & Study to review current and 161 Nov-92 Jun-92 ContractYoung propose new tariff structure terminated
for OSE
7) Audited Tea Deloite Auditing of financial 213 Aug-96 Jan-98 CompletedFinancial & Touche statementsStatements forLoan Accountsand OSE
8) Preparation of Individual Elaboration of terms of 9 Aug-94 Jan-95 CompletedBid Documents reference for the executionfor Unaccounted of a program for UFWFor Water Study reduction and control
9) Unaccounted Lyonnaise Design of UFW reduction 838 Dec-96 Jan-98 CompletedFor Water Study des Eaux and control program for the- Montevideo and Department of MontevideoInterior
10) Financial U.T.E. Design and installation of a 1,050 Dec-94 May-97 CompletedManagement new financial managementSystem system for OSE
1 1) Long Term GTZ Development of long term 150 Feb-90 Jul-90 CompletedInvestment Plan investment plan for OSE
- 31 -

WATER SUPPLY REHABILITATION PROJECT (LOAN 2921-UR)IMPLEMENTATION COMPLETION REPORT
Table 7: Implementation Schedule and Procurement Method
Component Bid Invitation Contract Signature Completion Procurement Observationsmonth/year month/year Date Method
A - Institutional Development
1. Technical Cooperation & TrainingI'lanned ---- May-87 ---- Other (a)Actual
I) First contract: Sanepar ---- May-87 Oct-94 Direct SANEPARContracting
2) Last contract: U.T.E. ---- Dec-94 May-98 I)ireclt lTEContracting
2. P'roject Planining & CoordinationPlained Oct-87 Dec-87 ---- Other (b)Actual ---- May-87 May-87 ---- SANEPAR
B - Rehabilitation of Water Supply Systems
1. tUpgrading of Aguas Corrientes TreatmentPlant
Planned Apr-88 Jul-88 Feb-89 ICBActual
I) First contract: SACEEM Aug-89 Oct-89 Jul-90 LCB Pilot plant2) Last contract: Consorcio Idreco-Teyma Nov-89 May-90 Dec-96 ICB Aguas Corrientes
treatment plantrehabilitation
2. Restoring Capacity of Transmission MainsTo Montevideo
Planned Jan-88 Apr-88 Jun-88 ICBActual Dec-92 ---- -- lCB No contract
awarded, Sub-component
dropped fromproject.
3. Montevideo Distribution SystemPlanned Nov-87 Feb-88/Jan-90 Mar-88/Feb- ICB/LCB
90Actual
I) First contract: Consorcio Teyma-ldreco Nov-89 May-90 Oct-94 ICB Secondarychloriniation
facilities2) Last contract: Subgrupo I y 11 - CITESA
Subgrupo II1 - Raul Clere S.A. Aug-94 Mar-95 Jan-98 [CB Replacement ofpipes (original
contract +amendment)
4. Medium-Size CitiesPlanned Dec-89 Jan-90/Jan-93 Feb-90/Feb- LCB
93Actual
I) First contract: Consorcio Lavalleja Dec-95 Sep-96 Jun-98 ICB Pipe replacementand leakage
control2) Last contract: CIEMSA Oct-95 Jul-96 Dec-97 ICB Improvements to
Minas watertreatment plant
5. 0 & M EquipmentPlanned Feb-gS/Sep-89 Apr-8S/Mar-90 May-8g/Apr- ICB/LCB
90Actual
I) First contract: Computer Center - Dec-89 Aug-90 Apr-91 LCB Purchase ofUrudata computer
- 32 -

cquipmenit2) Last contract: Raycom Nov-90 Jul-94 Mar-95 ICB Radio
communicationsystem
6. Support EquipmentPlannedActual
I) First contract: RIORO May-90 Oct-90 Aug-93 LCB Rehabilitation or"I'lanta Baja"
2) Last contract: FTV Ingenieria S.R.L. Sep-91 Dec-92 Mar-95 LCB OSE westernregional otfice
C - Expansion of Montevideo DistributionSystem
Planned Mar-88 Jul-88 Oct-88 ICB/LCBActial
I) First contract: Barbara -Eternit Junl-89 May-90 Jln-92 ICB Suplply2) Last contract: CITESA - DESPAR Dec-89 Oct-90 Nov-93 LCB Civil works
D - Preparation of National Water andSanitation Plan
1. National Plan 1990- 1995Planned Sep-89 Jan-89 ---- Other (b)Actual
I) First contract: GTZ ---- May-91 Feb-92 Other (c) GermanTeclnical
Cooperation(GTZ)
2) Last contract: Ernst & Young --- ---- Nov-95 Other (b) Tarit}study
2. Feasibility Studies & DesignPlanned Jul-89 Nov-89 --- Other (b)Actual
I ) First contract: Tabal ---- Sep-92 Aug-93 Direct I st. TahalContracting contract
2) Last contract: Lyonnaise des Eaux Dec-96 Jun-97 Jan-99 Other (b) Unaccounted-for-water (UFW)
Notes:
(a) Twinning arrangement OSE/SANEPAR(b) According to Bank Guidelines for consultant selection(c) Bi-lateral cooperation Uruguay/Germany
- 33 -

WATER SUPPLY REHABILITATION PROJECT (LOAN 2921-UR)IMPLEMENTATION COMPLETION REPORT
Table 8: Procurement Method by Disbursement Category
(US$ Millions)ICB LCB Other Total
Civil WorksPlanned 9.3 5.0 1.5 15.8Actual 9.5 2.2 0.3 12.1
Equipment and MaterialsPlanned 10.2 1.0 0.0 11.2Actual 14.4 0.1 1.3 15.8
Engineering and Technical AssistancePlanned 0.0 0.0 3.7 3.7Actual 0.0 0.0 6.4 6.4
TotalPlanned 19.5 6.0 5.2 30.7Actual 24.0 2.3 8.1 34.4
- 34 -

WATER SUPPLY REHABILITATION PROJECT (LOAN 2921-UR)IMPLEMENTATION COMPLETION REPORT
Table 9: Project Costs
(US$ Thousands)SAR Estimate Actual Change
Componeni/Subcomponent Local Foreign Total rotal Local Foreigin Total %(w/o col.) (w/ coil.)
A - Institutional DevelopmentI.'Technical Cooperation &Training 375 1,125 1.500 1,744 275 4.005 4.280 145.4%2. Project Planning& Coordination 180 120 300 349 0 250 250 -28.3%
Subtotal (A) 555 1,245 1,800 2,093 275 4,255 4.53(1 116.5%
B - Rehabilitation of Water Supply Systemsl. Upgrading orAguas Corrienites Treatmenit 2,100 1,400 3,500 4.069 3.879 4.477 8.356 105.4%
Plant2. Restoring Capacity of Transmission Mains To 1,625 4,875 6,500 7,556 9 0 9 -99.9%
Montevideo3. Montevideo Distribution System
Pipelines 667 2.233 2,900 3,371 3.336 1,144 4.480 32.9%I-louse Connections 437 1,463 1,900 2,209 0 0 0 -100.0%Water Meters & Other Installations 414 1,386 1,800 2,093 735 3,951 4,686 123.9%Subtotal (3) 1,518 5,082 6,600 7,673 4,071 5.095 9.166 19.5%
4. Medium-Size CitiesPipelines 276 924 1,200 1,395 1,010 0 1,010 -27.6%[louse Connections 115 385 500 581 0 0 0 -100.0%Water Meters & Other Installations 92 308 400 465 280 1,586 1.866 301.3%Subtotal (4) 483 1,617 2,100 2,441 1.290 1,586 2.876 17.8%
5. 0 & M Equipment 782 2,618 3,400 3,953 14 3,906 3,920 -0.8%6. Support Equipment 115 385 500 581 1,582 377 1,959 237.0%
Subtotal (B) 6,623 15,977 22,600 26,273 10,843 15,442 26,285 0.0%
C-Expansion ofMontevideo Distribution 480 320 800 930 1,076 590 1,666 79.2%System
D - Preparation of National Water andSanitation Plan
1. National Plan 1990 - 1995 132 268 400 465 34 277 311 -33.1%2. Feasibility Studies & Design 264 536 800 930 303 1,245 1,548 66.5%
Subtotal (D) 396 804 1,200 1,395 337 1,522 1,859 33.3%
Base Cost 8,054 18,346 26,400 30,690 12,532 21,809 34,341Physical Contingencies 805 1,835 2,640Price Contingencies 503 1,147 1,650
TOTAL NET PROJECT COST 9,362 21,328 30,690 30,690 12,532 21,809 34,341
Value added tax 1,500Interest on Bank Loan 1,000 1,000
TOTAL PROJECT COST 10,862 22,328 33,190 33,190 12,532 22,809 35,341 6.5%
Notes:
(1) SAR total cost estimates given without and with contingencies.(2) % change shows change with respect to contingency adjusted SAR amounts.(3) Actual costs include value added tax.
- 35 -
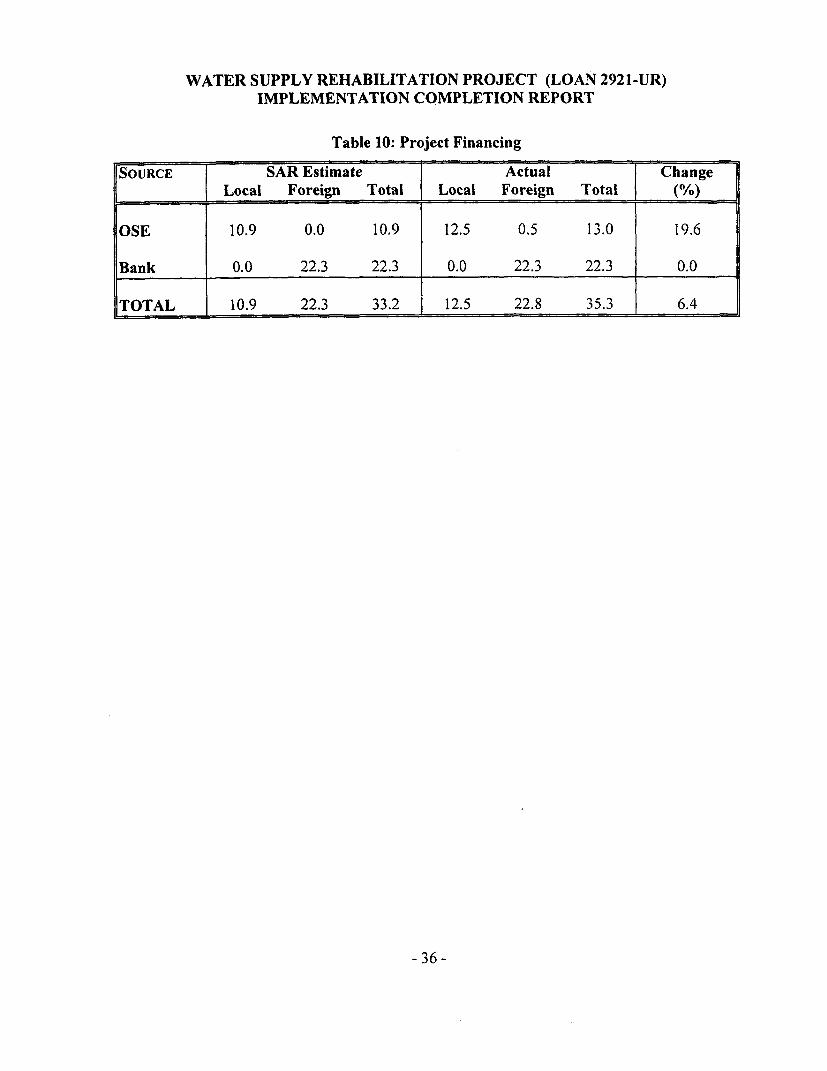
WATER SUPPLY REHABILITATION PROJECT (LOAN 2921-UR)IMPLEMENTATION COMPLETION REPORT
Table 10: Project Financing
SOURCE SAR Estimate Actual ChangeLocal Foreign Total Local Foreign Total (%)
OSE 10.9 0.0 10.9 12.5 0.5 13.0 19.6
Bank 0.0 22.3 22.3 0.0 22.3 22.3 0.0
TOTAL 10.9 22.3 33.2 12.5 22.8 35.3 6.4
-36 -

WATER SUPPLY REHABILITATION PROJECT (LOAN 2921-UR)IMPLEMENTATION COMPLETION REPORT
Table 11: Comparative Price Indices3
[ 1987 1988 1989 1990 1991 1992 1993 1994 1995 1996 1997 1998
|Dollar 100 149 236 398 770 1,328 1,991 2,597 3,324 4,179 5,246 6,890IPC 100 164 265 479 1,017 2,055 3,462 5,334 7,721 10,982 14,095 18,714IGC 100 178 283 525 1,114 2,306 3,740 5,490 8,021 11,232 14,186 18,566|UR 100 164 289 565 1,210 2,110 3,405 5,825 7,898 8,962 10,667 12,349l
Comparison of Indices
20000
15000
10000
5000
0A IL~~~~~~~~~~~~~~~~~~~~~~~~~~~~~~~~~
0~~~~~) ; CP C>9 ON 99) V39>9599o959
s IPC +Dollar IGC UR:
Notes:IPC: Uruguay Consumer Price IndexDollar: US$ Price IndicesIGC: Construction Price IndexUR: Inflation Adjusted Uruguayan Peso
3 Prepared by Alicia Arauijo, Economist, OSE Unidad de Estudios
- 37 -

WATER SUPPLY REHABILITATION PROJECT (LOAN 2921-UR)IMPLEMENTATION COMPLETION REPORT
Table 12: Allocation of Loan Proceeds by Disbursement Category
CATEGORY APPRAISAL 1st REVISION FINAL CHANGE12/30/94 7/10/98 (%)
CIVIL WORKS 7.60 5.20 5.76 -24.2GOODS 10.00 11.10 10.73 7.3SERVICES 3.70 5.00 4.81 29.9INTEREST 1.00 1.00 1.00 0.0
TOTAL 22.30 22.30 22.30 0.0
-38 -

WATER SUPPLY REHABILITATION PROJECT (LOAN 2921-UR)IMPLEMENTATION COMPLETION REPORT
Table 13: Minimum Performance Targets
Target 1989 1990 1991 1992 1993 1994 1995 1996 1997
Employees/b00 Target 12.10 11.60 11.10 10.70 10.20 9.8() 9.40water connections
Real 11.80 11.30 10.27 9.60 9.50 9.20 8.90 8.80 7.90
Conniections witli 'arget 89.00% 90.00% 93.00% 93.00% 94.00% 94.00% 94.00%Working Meter(%) Real 86.36% 86.38% 86.49% 88.70% 91.81% 91.88% 88.20% 89.60% 92.81%
Accounlts Tarrgel 3.00 2.80 2.50 2.50 2.50 2.50 2.51)Receivabite
Real 3.23 2.20 2.40 2.30 2.70 2.80 2.90 2.6 2.10
Personiel Target 60.00% 59.00% 59.00% 58.00% 58.00% 57.00% 57.00%Expenses/Operating Expenses Real 57.80% 55.50% 56.70% 53.40% 53.80% 50.15% 46.20%Y. 57.19% 50.40%
Current Target 2.50 2.50 2.50 2.50 2.5 2.50 2.50Assets/CurrenitLiabilities Real 1.52 1.50 2.70 2.40 2.6 2.00 L.S0 1.60 1.30
Operating Target 79.00% 77.00% 76.00% 74.00% 73.00% 71.00% 70.00%Expenses/Operatingincome Real 83.00% 79.00% 64.41% 66.27% 63.24% 62.18% 69.22% 68.38% 71.86%
Intemally Target 30.00% 30.00% 30.00% 30.00% 30.00% 30.00% 30.00%generatedfunds/total Real 79.12% 83.25% 62.68% 64.13% 50.10% 92.61% 61.98% 71.88% 74.35%investments'
4 In months of sales5 Three year average
- 39-

WATER SUPPLY REHABILITATION PROJECT (LOAN 2911-UR)
IMPLEMENTATION COIIIPLETION REPORT
Table 14: Recalculaton of Rate of Return
New Water Connections
La 2921Incremental Returns of Project Funded Water Connections
(in US0080) 1987 1988 1989 1990 1991 1992 1993 1994 1995 1996 1997 1998-2012
Connecdons
Connectionsswithout Project Montevideo 272.60 282.58 289.82 298.54 294.63 304.49 308.53 315.28 317.02 325.15 333.33 4,999.95
Interior 269.78 280.14 29S.29 313.80 329.40 338.76 347.33 358.92 368.66 383.74 400.07 6,001.05
New Conn from Project Montevideo (incremental) 3.50
Investments Total 0.00 0.00 0.00 0.00 3.50 3.50 3.50 3.50 3.50 3.50 3.50 52.50
Water Produced (ri3) Niontevideo 139,101.00 147,848.00 153,100.00 153,900.00 159,600.00 161,992.00 164,566.00 166,905.00 169,950.00 165,329.00 175,536.00 2,633,040.00
Interior 77,747.00 78,701.00 80,900.00 82,600.00 86,900.00 90,000.00 92,372.00 94,87700 95,543.00 99,866.00 101,890.00 1,52S,350.00
Total 216,848.00 226,549.00 234,000.00 236,500.00 246,500.00 251,992.00 256,938.00 261,782.00 265,493.00 265,195.00 277,426.00 4,161,390.00
Costs
Investment Total 0.90 0.00 0.00 1,700.00 0.00 0.00 0.00 0.00 0.00 0.00 0.00 0.00
Variable Chem 1,827.71 2,030.33 2,114.49 1,566.57 3,235.2S 3,282.93 3,845.85 3,463.81 2,946.19 3,395.40 4,438.32 66,574.80
Power 6,081.82 6,932.51 8,709.08 10,074.95 9,268.92 8,817.79 10,285.49 11,193.87 13,139.05 14,802.24 13,392.47 200,887.05Materials 2,415.15 2,835.52 3,106.69 2,563.57 3,259.51 4,422.81 5,387.27 6.038.S2 6,443.33 6,209.19 6,471.10 97,066.50
Priv. Contractors 2,582.25 2.811.75 3,467.52 4,1012.3 4,977.66 4,101.96 9,803.34 13,350.22 13,695.77 21,458.23 24,993.32 374,899.80
Admin Cost 1,215.15 1,083.06 1,130.83 1,278.37 1,478.96 6,297.77 4,047.39 6,098.07 8,766.15 3,713.45 6,993.14 104,897.10
Personnel 24,974.89 24,619.95 25,434.39 25,640.77 30,682.86 37,456.64 47,156.13 57,348.17 7,356.29 93,662.56 91,979.50 1,379,692.50
TotVar 39,096.97 40,313.12 43,963.00 45,225.36 52,903.09 64,378.90 80,525.47 97,492.96 54,346.78 143,241.07 148,267.85 2,224,017.75
Variable Cost on Incremental Connections 0.00 0.00 0.00 295.06 348.40 427.44 503.51 276.00 703.75 704.22 10,563.25
Total Cost on Incremental Connections 0.00 0.00 1,700.00 295.06 348.40 427.44 503.51 276.00 703.75 704.22 10,563.25
Revenues Water 44,966.67 44,039.07 43,025.16 49,272.89 64,027.86 78,210.22 101,201.49 134,549.87 155,186.41 174,576.35 192,750.45 2,891,256.75
Water Revenues on Incremental Connections 0.00 0.00 0.00 357.11 423.25 537.19 694.89 788.12 857.71 915.49 13.732.39
NetCashFloiv Revenue-ProjCosts 0.00 0.00 0.00 -1,700.00 62.05 74,85 109.75 191.38 512.12 153.95 211.28 3,16914
on World BnkIk Connections
[RR 9.78% years - 25
NPV -23.004 discount rate 10/

WATER SUPPLY REHABILITATION PROJECT (LOAN 2921-UR)IMPLEMENTATION COMPLETION REPORT
Table IS: Recalculation of Rate of ReturnAdditional Water Production from Aguas Corrientes Water Treatment Plant
Ln 2921Incremental Retirn on Aguas Corrienites Improvements
(in USS'000) 1987 1988 1989 1990 1991 1992 1993 1994 199S 1996 1998-2012
Water Produced (m3) Montevideo 139,101.000 147,848.000 153,100.000 153,900.000 159,600.000 161,992.000 164,566.000 166,905.000 169,950.000 160.600.000 2,254.414.400
Interior 77,747,000 78,701.000 80,900.000 82,600.000 86,900.000 90,000.000 92,372.000 94.877.000 95,543.000 99,866.000 1.630,240.000
Incremental Water Produced from Project Investment 4,729.000 534,159.786
Total Production 216,S48.000 226.549.000 234,000.000 236,500.000 246,500.000 251,992.000 236,938.0D0 261.782.000 265,493.000 265,195.000 4,438,814.182
CostsInvestment 0.000 0.000 0.000 0.0°° 0.000 0°000 0°000 0°000 8,400.000 0.000 0.000
Variable Chem 1,827.710 2,030.330 2,114.490 1.566.570 3,235.180 3,281.930 3,845.850 3,463.810 2,946.190 3.395.400 71,013.120
Power 6,081.820 6,932.510 8,709.080 10,074,950 9,268.920 8,817.790 10,285.490 11.193.870 13.139.050 14,802.240 214,279.520
Materials 2,415.150 2,835.520 3,106.690 2,563.570 3,259.510 4,422.810 5,387.270 6,038.820 6,443.330 6,209.190 103.537.600
Priv. Contractors 2,582.250 2,811.750 3,467.520 '4,101.130 4,977.660 4,101.960 9,803.340 13.350.220 15,695.770 21,458.230 399.S93.120
Admin Cost 1,215.150 1,083.060 1,130.830 1,278,370 1.478.960 6,297.770 4,047.390 6,098.070 8,766.150 3,713450 111.890.240
Personnel 24,974.890 24,619.950 25,434.390 25,640.770 30.682.860 37,456.640 47,156.130 57,348.170 7,356.290 93,662.560 1,471,672.000
TotVar 39,096.970 40,313.120 43,963.000 45,225,360 52,903.090 64,378.900 80.525.470 97,492.960 54,346.780 143,241 070 2.372,285.600
Var. Cost for incremental water due to investrment 0.000 0.000 0.000 0.000 0.000 0.000 2.554.298 296,165.805
Total Cost for incremental water due to investrnenl 0.000 0.000 0.000 0.000 0.000 8,400.000 2,554.298 296,165.805
Revenues Total Water 44,966.670 44.039.070 43,025.160 49,272.890 64,027.860 78,210.220 101,201.490 134,549.870 155,186.410 151.641.070 2,224,017.750
Rev/m3 prod 0.207 0.194 0.184 0.208 0.260 0.310 0.394 0.514 0.587 0658 0.695
Revenue from incremental water produced due to investment 0.000 0.000 0.000 0.000 0.000 0.000 3,113 074 385,020.031
NetCashFlow Revenue-Project Costs 0.000 0.000 0.000 0.000 0.000 0.000 0.000 0.000 .8.400.000 558.776 88.854.226
IRR 40.52% year 25.000
NPV 13,938.590 discount rate 10/

WATER SUPPLY REHABILITATION PROJECT (LOAN 2921-UR)IMPLEMENTATION COMPLETION REPORT
Table 16: Ex-Post Qualitative Review of OSE With and Without Project
Component With Project Without ProjectA. Institutional i) Twinning arrangements (coupled with equipmncnt of i) UFW greater than current level as a rcsultDcvelopment Component B) resulting in improvements in operations, of haphazard approach to mainteniance and
maintenance and customer service. Maintenance crews poor customer service.reduced by 300, service calls increased from 70,000 to ii) All operational responsibilities for the110.000 per year; increased from 5 to 25 the interior are still concentrated inreceptionists that take customer requests; service orders Montevideo. resulting in reduce customercomputerized and prioritized to so that work crews responsiveness, increased repairs, and poorattend the most pressing problems first. For investment planning.procurement, inventory and stock control department.streamlined work procedures. clear job descriptions andnew fork lifts made possible reductions in procurementdpt. personnel from 190 to 87, as turn around onmaterials orders are cut from 30-45 to 10-15 days.ii) Decentralization process prepared by SANEPARprovides groundwork for strengthening of regionaloffice.
B. Rehabilitation i) Aguas Corrientes Treatment Plant production i) Without this 23% increase in supply, theof Water Supply increased by 23%. customers receiving service through theSystems ii) Replacement of 100 km of pipe helps contain approximately 169,000 connections could
physical losses. experience rationing.iii) 140,000 new water meters helps limit commercial ii) Without the pipe replacement,losses. deterioration results in increased physicaliv) Secondary chlorination facilities improve water water losses and nuisance repairs.quality by increasing chlorine residual. iii) Without new meters, commercial lossesv) Integrated UFW reduction in Minas results in water increase above the current level.savings estimated at 18% of production each year. iv) The regrowth of bacteria within thevi) Upgrading of the Minas Water Treatment Plant systems may cause water to fall belowexpands capacity to meet growing demand, drinking level standards, possibly placing
all Montevideo customers at risk for waterborne diseases.v) By 1997, water losses in Minas areestimated at over the 1987 level of 53% ofproduction.vi) Minas water treatment plant capacitydeteriorates, reliability of service at risk for30,000 customers.
C. Expansion of i) 43 km of pipes and 3,500 connections provide service i) 26,000 potential customers purchasingMontevideo to an additional 12,600 people. Transmission mains in water from a vendor or stealing water fromDistribution Pueblo General Artigas provide 13,400 people with OSE.System access to connect to the piped water system.
D. Preparation of i) Long term plan provides basic demand information i) OSE continues to make investnentOSE's Water from which to drive overall investment planning. estimates based on out of date demandSupply and ii) Diagnostic and feasibility studies provide ground patterns, resulting in financing shortfallsSanitation Plan work for investment priorities. and investment lags.
iii) UFW studies provide ground work for institutional ii) Investment decisions made on politicalfocus of UFW reduction program. grounds resulting in improper sequencing of
large investments.iii) Misplaced priorities for UFW reduction,making UFW reductions resulting from
__________________ ._________________________________________ .physical works unsustainable.
- 42 -

WATER SUPPLY REHABILITATION PROJECT (LOAN 2921-UR)IMPLEMENTATION COMPLETION REPORT
Table 17: Evolution of Tariff Structure and Levels
Change in Tariff LevelYear Ave. Water Tariff Ave. Water and Sewer Tariff
(UR$/m3) (UR$SIm3)Nominal Real (1998UR$)* Nominal Real (1998URS)*
1988 0.1 7.8 0.1 7.31989 0.2 7.2 0.2 6.71990 0.4 7.1 0.4 6.91991 0.9 7.7 0.9 7.61992 1.7 8.3 1.7 8.11993 2.8 9.5 2.8 9.41994 4.9 15.6 4.8 15.31995 7.0 15.3 6.7 14.61996 9.7 15.0 9.1 14.01997 12.5 15.0 11.5 13.81998 13.8 13.8 12.7 12.7
*Based on Uruguay CPI (yearly average)
MAJOR CIIANGES IN TARIFF STRUCTURE: 1998-1999
Feb '90 OSE authorized to levy additional charges to recover 50% of actual investment cost from localitiesthat receive investment and up to 100% in beach front areas. Starting in Aug. '90, OSE leviedadditional charges in Maldonado and Salto for 8 years, in Punta del Este for 4 years, and inMontevideo for 5 years.
Jun '90 The variable charge on sewerage was increased from 50% to 100% of the variable charge on water,the fixed charge on water increased by 15%.
May '91 Over the period from May to Aug., the variable charge on water for residential customersconsuming between 0 and 5m3/month was gradually increased by 54%.
Aug '92 The price of a household connection was reduced by 50% for house not larger than 80m and notlocated in a beach front area.
May '93 For residential consumer, the charge for consumption below 15m3/month was increased by 36%.
Jan '95 Began to levy an addition charge to recover investment cost from all localities provided with watersupply from the Montevideo system. Charge to continue for period of 8 years.
Sept '96 Began to charge connections small bore sewer systems the same fixed charge as for traditionalsewerage and the variable charge of 50% of the variable charge on water.
May '97 Began to levy an additional fixed charge for sewerage on commercial establishments whichproduce food which the establishment sells directly to the public.The variable charge on sewerage for residential customers was reduced from 100% to 80% of thevariable charge on water.The variable charge on sewerage for residential customers connected to small bore systems wasreduced from 50 to 40% of the variable charge on water.
Sept '97 The variable charge on sewerage for domestic customers connected to the traditional sewer systemwas reduced from 80% to 60% of the variable charge on water.The variable charge on sewerage for domestic customers connected to small bore systems wasreduced from 40% to 30% of the variable charge on water.
Jul '98 The variable charge for industrial customers and large consumers was reduced.
- 43 -

WATER SUPPLY REHABILITATION PROJECT (LOAN 2921-UR)IMPLEMENTATION COMPLETION REPORT
Table IS: OSE's Cash Flow Statements
1987 1988 1989 1990 1991 1992 1993 1994 1995 1996 1997
SAR Actual SAR Actual SAR Actual SAR Actual SAR Actual SAR Actual SAR Actual SAR Actual SAR Actual SAR Actual SAR Actual
lnconme Before Depreicotion 9,290 9.950 9.736 11.270 8.509 12.620 11.909 14.150 26.054 15.850 36.120 17.390 48.483 19.640 76.374 2.1 170 60.817 50.004 61.946
Interest on Iv. And Other Nonoper 0.000 0.000 -0.813 0.000 -0.665 0.000 -I l0ll -8.704 -7.204 -9.618 -20.498 .20.88I -16.123 -23.120
Intemnal Cash Generatiots 9.290 9.950 8.923 I 1.270 7.844 12.620 0.892 14.150 17.350 15.850 28.916 17.390 38.865 19.640 55876 22.170 39.936 33.081 38.826
Amortization 0.940 0.390 0.212 0.350 0.207 0.350 0.202 0.200 0.197 L.880 1.447 1.880 2.610 1.9800 0.183 1.880 1.898 1.893 1.861
InterestEFxpetise 0.380 0.340 0.166 0.510 0.121 0,750 0.104 1.020 0.157 1.200 1.024 1.290 1.062 1.290 7.849 1.230 2.436 4.342 4.755
TotaliDebt Service 1.120 0.730 0.380 0.860 0.328 1.100 0.306 1.220 0.355 3.080 2.471 3.170 3.671 3.170 8.031 3.110 4.334 6.235 6.616
Working Capital Needs 6.490 5.170 -1.697 -0.560 -0.078 -1.740 .1.138 .2.150 9.479 -0.650 10.653 0.120 19.040 0.220 -11.066 1.280 -24.668 5.975 -30.678
Other Assets and Liabilities Needs 0.671 1.823 -3.785 -14.773 -2.928 -0.979 3.650 26.579 -6.803 7.402
Contribution to Investment 1.690 4.050 9.569 10.970 5.771 13.260 5.508 15.060 22.288 13.420 18.719 14.110 17.132 16.250 55.261 17780 33.691 27.674 55.485
levestrment Cost, IBIlD Project 0.230 3.370 4.7S0 5.A70 S3.80 5.030 4.508 3.650 7.029 1.020 4.197 0.860 1.973 2.346
Investment Cask Othrer Proect 11.820 9.500 10.322 8.000 8.438 17.00)0 11.600 17.000 28.940 38.000 17.479 20.000 21.451 23.000 51.843 26.000 34.437 72.349 84.602
Other WorksPonated lnvestnenetsOther IOther 2
Investments Subtotal 10.322 8.438 13.600 28.940 21.987 28.4810 56,040 36.430 74.106 84.602
Capitalized interest
Total Investment Interest 12.050 12.870 10.322 12,750 8,438 223170 11.600 22.830 28.940 23.030 21.987 23.650 28.480 24.820 56.040 26.860 36.410 74,706 84.602
Required Financing 10.360 8.020 0.753 1.780 2.667 8.930 6.092 7.750 6.652 9.610 3.267 9.540 11.348 8.570 0.779 9.080 2.719 47.032 29.117
Disbursements, 3BRW Loan 0.140 2.090 3.440 3.720 3.830 3.490 3.928 2.640 8.024 L.470 3.202 0.710 2.108 -0.156 0.300
D3isbursemsents, Co-financier LoanD3isbursemennts, Other Loan I 0.892 0,324 6.822 9.918 5.000 0.403 6.000 0.660 7.000 2.700 7.000 3.976 2.810 308932
Disbursements, Other Loan 2 0.000 0.360 13195 40.997
Disbursements, Other Loan 3
'Total Loans 0.140 2.090 0.892 3.440 0.324 3.720 6.822 3.830 9.91% 0.490 4.333 8 640 0.605 8.470 6.262 7.710 7.280 43.652 30.92
Total Contributions 6.710 7.390 4.250 3.~000 2.910 0.000 0 000 0.000 0.0O
Total Finnocing 6.850 9.480 0.892 7.690 0.324 6.720 6.822 6.740 9.918 0 490 4.333 8 .640 8.685 8 470 6.262 7.710 7 280 43.652 30 932
Change in Cash -3.510 0.650 0.339 5.920 -2.343 -2.190 0.730 -tOlD0 3.26,6 .1.120 3.064 -0.910 -2.664 -0. I D 5.483 -1.370 4.560 -3.380 3 834

VATER SUPPLY REHABILITATION PROJECT (LOAN 2921-UR)IMPLEMENTATION COMPLETION REPORT
Table 19: OSE's Income Statements
(US$ millions)
19N7 19SS 1989 1990 1991 1992 1993 1994 1993 196 1997
SAR Actual SAR Actual SAR Actual SAR Actual SAR Actual SAR Actual SAR Actual SAR Actual SAR Actual SAR Actual SAR Actual
WaterRRcenuces 47.370 44.966 49.820 44.039 31.430 46.025 52.880 49.727 53.030 64.027 37.930 79.210 61.010 101.201 64.210 134.349 67,560 135.196 174.376 192.750
Sc,,c,agcRosenues 2.490 2.519 2.610 2.453 2.730 2.563 2.990 4.502 3.100 6.76s 3.350 g.637 3.620 12410 3.910 17.339 4.210 20.013 17.949 17.124
Connecton Fees 0.060 1.460 0.040 2.037 0.030 1.9S9 0.030 2.115 0.030 3.932 0.030 5.431 0.030 6159 0.040 7.487 0.040 9.597 9.343 8.203
Rconnction Fccs and Other 2.270 2.340 2.380 1.977 2460 2.398 2.530 2.S01 2.630 5.134 2.770 8.2S3 2.920 10t0o 3.070 15.193 3.230 20.007 2S.426 11.473
Oposidng Rean.us 52.190 51.2t7 54.850 50.527 36.650 52.976 39.330 59.147 60.790 79.863 64.100 100.563 67.380 130.622 71.220 174.370 73.030 204S 06 230.297 235.350
Personnel Costs 24.320 24.974 24.960 24.619 25.140 25.434 25.070 25.640 25.650 30.682 26.180 37.456 27.330 47.156 27.S60 57.34S 29.650 73.756 93.662 91.9179
ChemicalCosIo 1.900 1.827 1.830 2.030 1.S20 2.114 1.790 2.566 1.790 3.235 1.S20 3.281 1.S20 3.845 1.S20 3.463 1.830 2.946 3.393 4.43S
Poeae Costs 6.620 6.0S1 6.050 6.932 6.960 0.709 6.930 10.074 6.990 9.260 7.250 8.S17 7.520 10.285 7.800 11.193 7.930 13.139 14.802 13.392
Matedals. Fuel and Oil 2.700 2.413 2.980 2.835 3.170 3.106 3.420 2.563 3.590 3.239 3.970 4.422 4.220 5.397 4.530 6.038 4.770 6.443 6.209 6.471
Pdiate Conlatctots 0.S30 2.5S2 0.910 2.811 0.990 3.467 1.070 4.101 1.170 4.977 1.290 4.101 1.390 9.803 1.490 13350 1.370 13.693 21.43S 24.993
OtherExpenditu;s andtTaiTs 3.400 3.760 3.920 4.230 4.400 4.860 3.200 3.580 5.S70
Losses on Revivables 3.139 0.314 3.620 0.497 3.400 0.504 3.210 1.013 3.040 0.906 2.SB0 0064 2.700 1.613 2.490 0.703 2.250 11.60S 23.696 13.9S9
Adminslatti Costs 1.215 1.0S3 1.130 1.278 1.47t 6.297 4.047 6.09t t.766 3.713 6.993
Total Operating Costs 4Z.90 39.411 44.900 40.791 45.390 44.467 45.710 47.238 46.640 53.S10 48.260 64.442 50.190 82.139 31.3N0 98.196 52.870 132.335 166.937 162.237
IncomelBcfoec pneclation 9.290 11.875 9.950 9.735 11.270 8.509 12.620 11.909 14.150 26.033 15.t50 36.120 17.390 4S.493 19.640 76.374 22.170 72.451 63.339 73.293
Depreciation 7.700 7.073 8.430 0.527 8.90 7.903 9.130 10.023 9.540 14.166 10.160 13.29S 10.970 13.600 11,010 18.157 12.690 21.477 19.060 19.360
Oputating Incons L.90 t4001 1.330 1.20S 2.470 0.603 3.4S0 1.8t5 4.610 11.887 5.600 22.821 6.420 32.8S2 7.030 3S.216 9.J40 50.973 44298 53.933
Intetest Expetses 0.180 0.263 0.340 0.168 0.510 0.121 0.750 0.104 1.020 0.157 1.200 1.024 1.290 1.061 1.290 7.S48 1.230 3.223 6.787 6.667
Interest Eamed on Inscstm8nts 0.000 1.444 0.000 1.318 0.000 1.192 0.000 1.379 0.800 1.072 0.000 1.698 0.000 1.118 0.000 1.199 0.000 1.315 1.291 2.695
Foreign Exehange Losses 0.000 0.000 0.000 .000 0.000 0.000 0,000 ll000 0.000 -9285 -13.409
Othcr Non-Operating Income 2.635 -2.130 -18,37 -12.397 -9.776 -1.842 -3.607 -7.799 -10.912
IncomeTax 7.061 7.129 13.S98 20.375 16046 18.663
Propcrt Tax 3.212 3360
Net Income 1.140 2.347 1.180 10.227 1.970 -0.180 2.740 -9.236 3.600 3.024 4.480 14.393 5.140 22.2'2 6.340 29.S69 8.250 15.975 9.459 14327

WVATER SUPPLY REHABILITATION PROJECT (LOAN 2921-UR)IMPLEMENTATION COMPLETION REPORT
Table 20: OSE's Balance Sheets(USS million)
1987 1988 1989 1990 1991 199? 1993 1994 1995 1996 2997SAR Actual SAR Actual SAR Actual SAR Actual SAR Actual SAR Actual SAR Actual SAR Actual SAR Actual SAR Actual SAR Actual
Fixed Assets 411.000 385.115 431.620 392.668 447.990 398,684 465.340 446.134 488.560 552.609 522.830 637.523 569.130 776.311t 622.080 884.778 657.150 977.484 1010.209 1046.390Accumulated Depreciation 212.760 186.262 225.440 191.754 236.490 198.065 247.990 213.384 263.120 26t.439 282.480 308.011 303.330 384.303 325.760 439.213 349.860 485.220 509.432 525.503
Net FiKed Assets 198.240 198.853 206.280 200.914 22 1.500 200.619 217.350 232.750 225.450 291.169 245.350 329.512 265.800 392.008 286.320 445.566 307.290 492.264 500.377 502 887
Work in Progress 8.460 9.025 8.930 6.624 9.630 5.931 18.930 13.436 29.010 22.467 29.870 24.573 30.690 48.906 32.480 92.775 35.690 100.947 150.426 192.10a
Accounts Receivable Long 26.720Uncollectables -26. 720
Cast 3.110 4.486 3.760 4.624 9.680 2.297 7.490 3.040 6.490 6.106 5.360 7.369 4.460 4,706 4.360 10.288 2.980 14.701 22.255 122818Accounts Receivable5eevices 13.240 11.591 13.830 I2.511 13.310 14.507 12.680 13.908 12.030 20.117 12.750 31.890 13.510 51.277 14.320 62.208 25.260 65.662 81.218 56.192Uncolleerables -0.863 -0.926 -0.912 -1.201 -3.766 -2.230 -2.451 -2.160 .10.372 -31.439 .13.608Inventory 9.000 7.768 10.D00 6.837 20.000 7.335 9.580 8.520 9.870 15.003 8.650 20.208 8.270 31.383 7.790 28.807 8.360 35.667 50.394 38.963Other Current Assets 6I 0.000 O.DOoOther Cureent Assets 62 0.563 0.374 0.297 1.026 2.774 5.000 4.398 3.432 20.865 7.538 5.402
Total Current Assets 26.350 23.544 27.600 23.428 32.990 23.524 29.750 25.292 28.390 40.434 26.760 62.247 26.140 09.3123 26.470 102.474 26.510 226.523 228.856 99.768
Total Assets 232.060 232.423 242.720 230.956 254.220 230.074 266.030 271.478 282.850 344.070 302.980 421.333 322.620 534.625 345.270 644.245 369.500 729.733 777.597 812.762
Long Tern Debt Beginning Balanc 2.780 2.982 4.400 1.770 7.570 1.563 10.940 2.044 24.570 2.674 21.180 4.330 27.940 6.052 34.520 12.933 40.350 26.837 22.031I 22.824Long Term Debt,.incremrental Revaulation 0.683 0.827 3.203 4.331 8,685 5.902 6.085 2.635 2 304
Long Terr Debt, Revalued, Ending Balanc 1.982 1.770 2.246 2.872 5.777 8.661 14.736 18.735 22.922 24.685 24.129Long Term Debt, Current Portion 0.390 0.212 0.350 0.207 0.350 0.202 0.200 0.197 1.880 1.447 1.800 2.620 2.880 182.700 2.880 1.898 1.760 2.893 1.861 2.049
Lang Term Debt, Lang Terin 2.770 1.563 2.044 2.674 4.330 6.051 14.553 16.837 22.029 22.824 22.079Other Lang Terms Liabilities 0.467 2.359 2.002 6.996 13.811 14.2100 112.443 10.074 6.648 43.843 39.4211
Total Long Terse Liabilities 2.390 2.238 4.130 2.923 7.220 3.045 10.740 9.670 22.690 18.141 19.300 20.151 26.060 25.996 32.640 26.912 38.590 27.677 66.667 81.490
Acwounts Payable 8.000 5.608 4.430 8.384 4.470 12.129 5.300 12.288 5.400 9.513 5.520 8.866 5.650 9.839 5.840 24.935 6.070 13.384 29.260 23 022Long TermDebt, Current Portion 0.390 0.212 0.350 0.207 0.350 0.202 0.200 0.297 2.880 2.447 1 880 2.610 1.880 0.283 2.880 2.890 1.760 2.893 1.861 2.049Other Current Liabilities 0.590 6.365 0.620 5.275 0.620 4.116 0.630 5.393 0.650 8.816 0.670 17.333 0.700 27.631 0.730 36.75 0.750 59.384 44 727 32 023Sbort Tern Loans 21.572
Total Cunrent Liabilities 8.980 12.186 5.390 13.866 5.440 16.448 6.130 17.878 7.920 29.776 8.070 28.809 8.230 37.673 8.450 53.407 8.500 74.661 75.849 78.666
Total Liabilities 2 1.370 24,423 9.520 16.789 22.660 29.493 16.870 27.548 20.610 37.917 27.370 48.960 34.290 63.699 41.090 80 328 47.270 202.338 142.516 160.155
Equnity 220.690 216.999 233.180 214.167 241.460 210.581 249.160 243.930 262.240 306.153 274.610 372 373 208.330 470.956 30-.1.80 563.927 322.320 617.3%6 635.081 652 606
Total Equity and Liabilities 232.060 231.423 242.710 230.956 254.120 230.074 266.030 272.478 282.850 344.070 301.980 422,333 322.628 334 623 345.270 644.245 369.500 729.733 - 777.597 812.762
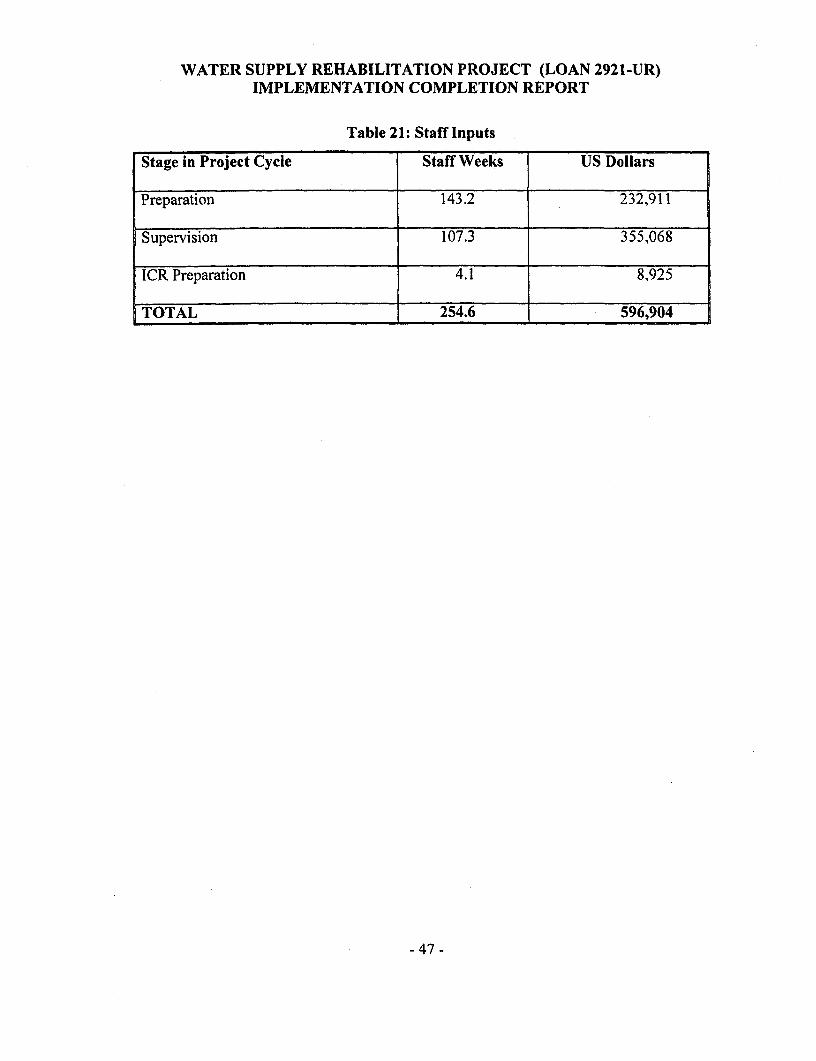
WATER SUPPLY REHABILITATION PROJECT (LOAN 2921-UR)IMPLEMENTATION COMPLETION REPORT
Table 21: Staff Inputs
Stage in Project Cycle Staff Weeks US Dollars
Preparation 143.2 232,911
Supervision 107.3 355,068
ICR Preparation 4.1 8,925
TOTAL 254.6 596,904
-47 -

Azreenwt S cteDnCovenmnt Shti Otgrl Fulfill Description of Covensat CommentsilKf fDate
Project Agreement 2.01 (b) 5 C Establisih Project Committee andDirector
Project Agreement 2.05 (a) 5 C Annual action plan (paris A, B) 6/30annually
Project Agreement 2.06 (i) 5 C 06/30/1989 Study on personnel management IV
r~ r
Project Agreement 2.06 (ii) 5 C 06/30/1989 Project of new legal set-up
Project Agreement 2.07 5 C 09/30/1988 Training Program > t
-. I
I Project Agreement 2.08 (i) 2 CP 06/30/1990 Tariff study Study terdinated before conpletion. OSE as >
4:4 ~~~~~~~~~~~~~~~~~~~~~~~~~~~~contr'acted lidw tariff study. 0o-i00 r =
Project Agreement 2.08 (ii) 2 CP 09/30/1996 Implementation of recommendations Tariffleels adjlsted, bit only minor changes in vqoftariffstudy tariffstnhclure
Project Agreement 3.01(b) 2 C Carry out Action Plan and achieveoperational performance targets °annutallvy
Project Agreement 3.03 5 C Adequate insurance r
00
Project Agreement 4.01 (b) (ii) I C Financial statemcnts anid atidit report .36/30 annually t
Project Agreement 4.01 (c) (iv) I C Audit Report SOE 630 annuallyC
Project Agreement 4.02 (a) 2 C Financing of 30D% of 3 vear a%erage 74% for latest 3 yr. a cragecapital expenditures from internalsources 6/30 annually
Ptoject Agreement 4.02 (b) 2 C Forecast for compliance with 4.02 (a)for current and coming year 10/01annuallv
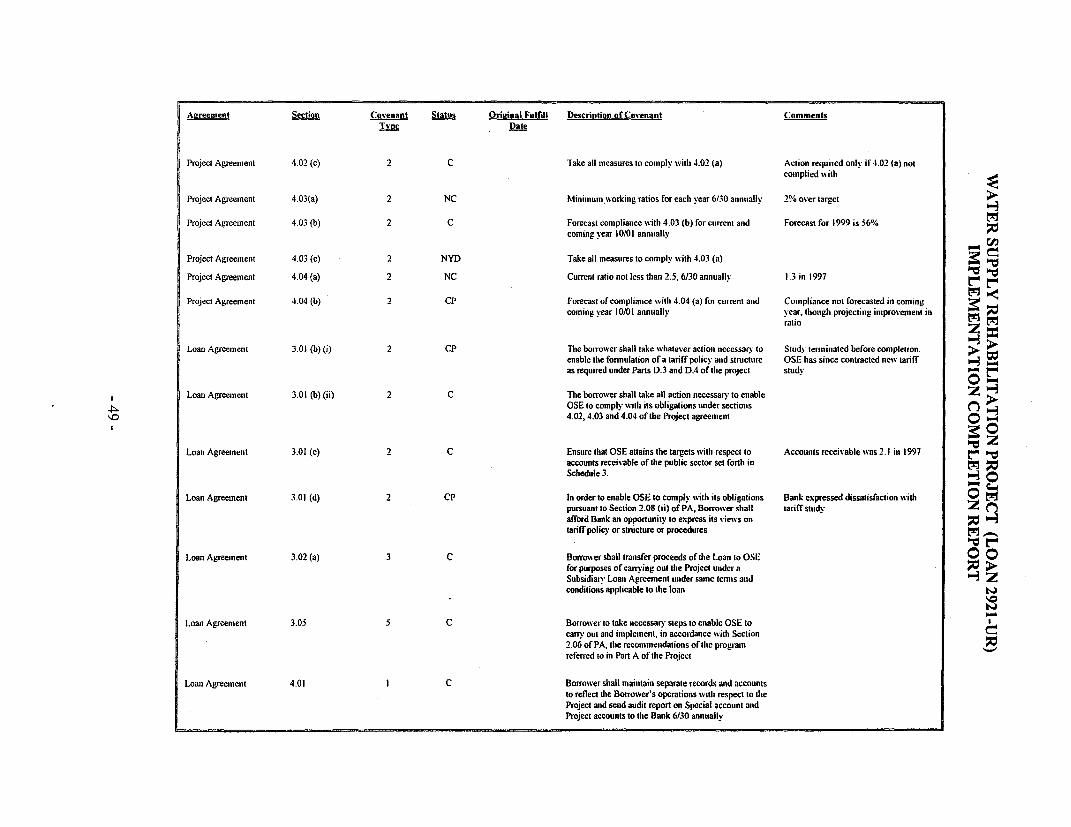
Aereement Section Covenant Status Orizinal Fulfill Descrintion of Covenant Comments
TvDe Date
Project Agreement 4.02 (c) 2 C Take all measures to comply with 4.02 (a) Action required only if 4.02 (a) notcomplied with
Project Agreement 4.03(a) 2 NC Minimum working ratios for each year 6/30 annually 2% over target
Project Agreement 4.03 (b) 2 C Forecast compliance with 4.03 (b) for current and Forecast for 1999 is 56%
coming year 10/01 anstially
Project Agreement 4.03 (c) 2 NYD Take all measures to comply with 4.03 (a)
Project Agreement 4.04 (a) 2 NC Current ratio not less than 2 5, 6130 annually 1.3 in 1997
Project Agreemenit 4.04 (b) 2 CP Forecast of compliance withi 4.04 (a) for current and Comipliance not forecasted in coming
coming year 10/01 anntually year, though projecting improvement inratio i
Loan Agreement 3.01 (b) (i) 2 CP The borrower shall take whatever actioi necessary to Study terminated before completion. >
enable the fonnulation of a tariff policy and structure OSE has since contracted new tariff -3as required under Parts D.3 and D04 of tie project study i-
Loan Agreement 3.01(b) (ii) 2 C The borrover shall take all action necessary to enableOSE to comply vith its obligations under sectiotis 4.02, 4.03 and 4.04 of the Project agreemetit 0 -
Loan Agreement 3.01 (c) 2 C Ensure that OSE attains the targets withi respect to Accounts receivable w as2.1 in 1997accounts receivable of the public sector set forth inSchedule 3.
Loan Agreement 3.01 (d) 2 CP In order to enable OSE to complyv ith its obligations Bank expressed dissatisfaction withpursuant to Section 2.08 (ii) of PA, Borrowver shall tariff study Z ^
afford Bank an opportunity to express its views onjtariff policy or structure or procedures M
Loan Agreement 3.02 (a) 3 C Borroxwer shail transfer proceeds of the Loan to OSE 00for purposes of camrvimsg out the Project uttdcr a >
Subsidiary Loatn Agreement tinder sainc tenins amidconditionis applicable to the loan
Loan Agreement 3.05 5 C Borrower to take necessany steps to enable OSE tocarry out anid implement, in accordance wvith Section2.06 of PA, thc recommendations of the programreferred to in Part A of the Project
Loan Agreement 4.01 I C Borrower shall maintain separate records amid accountsto reflect the Borrower's operations vith respect to theProject and send audit report on Special account andProject accounts to the Bank 6/30 annually

Appendix A
"OBRAS SANITARIAS DEL ESTADO" (OSE)(STATE WATERWORKS)
REPORT ON PROJECT COMPLETIONLOAN 2921-UR
URUGUAY
INTRODUCTION
An outstanding feature of the legal system applying to the
Uruguayan waters is the concurrent jurisdiction of different
state authorities. This is the result of territorial or functional
decentralization associated with an extremely low allocation
of legal powers and jurisdictions to the Administration of
State Waterworks, even in the fields where the law expressly
provides for its specific duties. According to the Uruguayan
legislation, the Executive, through the Department of
Housing, Territorial Regulations and Environment
(MVOTMA) is the leading authority on drinking water and
sanitation matters. Upon initiation of the Project, the "Water
Authority" in charge was the Department of Transportation
and Public Works (MTOP). The jurisdiction of this
Department on practically all these matters was transferred to
MVOTMA upon its establishment. There was a change in the
administrative scenario of the relations between OSE and the
Executive. Although this change did not have a significant
-50-

impact, it called for a period of learning and internalization of
the coordination bureaucratic mechanisms.
At the time of designing the project, the participation of
private entities in the area of public utilities (drinking water
and sanitation) was practically non-existing. However, private
entities are currently involved in this sector and a concession
is in process that would incorporate another private firm to
this sector. OSE must address this situation using the same
legal tools and applying the same principles that were
established at its inception, almost 50 years ago. In spite of
the strengthening sought and materialized through the project,
no guaranty exists that OSE may succeed. This reality should
be considered at the time of evaluation: it would be a great
mistake to weigh the results against the governmental policies
on public utilities since 1985. However, it is vital to keep
them in mind for future actions.
From this standpoint, the brief analysis that follows strictly
sticks to the policies and mission statements set forth at the
time of formulating the project. Although the project's goals
were achieved later than expected, physical targets can be
considered satisfactorily met. However, institutional targets
were not as satisfactory as expected.
-51-

1. PROJECT GOALS, CREATION, DESIGN AND SIZING
The project's general goals were OSE's updating and
reorganization with a view to the reduction of operating costs
and an increase in productivity.
Although for the most part the goals set by the program were
accomplished, their implementation did not follow strictly the
previously established time schedule.
It should be noted that the only physical target that could not
be met, not even partially, was the coating of the Td and 3 rd
pumping line. Both the Bank and OSE agreed to cancel this
work after considering the high costs involved.
With regard to institutional development targets, these were
addressed as scheduled through the implementation of a
twinning program with SANEPAR, which included several
projects. Although these projects were based on an
appropriate selection of their individual scope, the activities
developed within each project failed to boost by themselves a
significant improvement in OSE' global management.
The Project provided for the formulation of a proposal to
amend OSE's Institutional Act but without stating any
orientation therefor. Anyway, notwithstanding the fact that
the bill drafted and referred to the Executive was not passed
by the Legislative, the possibility of rethinking OSE as a
substantially different organization, or of reorganizing OSE
and providing it with the necessary tools to act efficiently in
-52-

an entirely different scenario, was not considered at all.
Consequently, the possibility of giving OSE more autonomy
and certain specific powers, and of taking remedial actions
for specific issues that had been identified as obstacles for its
management was barely suggested.
2. IMPLEMENTATION OF THE PROJECT
The implementation of the project was hindered by the
following drawbacks:
3 The Ministry of Transportation and Public Works, the
authority to which OSE reported at the time of subscribing
the loan agreement, was appointed as the borrower's
representative. That appointment led to the subsequent
formulation and execution of an ancillary agreement
between MTOP and OSE. If we also consider that during
the performance of the loan OSE was under the authority of
the Ministry of Housing, Territorial Regulation and
Environment, we can conclude that despite the efforts
made, the implementation of the project was affected by the
above situation, although not to a great extent.
* At the time of subscribing the loan agreement the bidding
documents for most of the projects were not ready. This
situation delayed the disbursement process.
* One of the aspects contemplated in the project was the
functional reorganization of OSE, with a view to remedy
-53-

one of OSE's most conspicuous and long-standing
deficiencies, which was aggravated during the de facto
period. The project's reorganization activities were
constantly impacted by external events alien to OSE:
A) Reinstatement of employees.
B) Act No. 16.127.
C) Retirement incentives.
D) Amendment to the social security system.
3. PERFORMANCE OF THE BANK
Two stages can be identified to evaluate the Bank's
performance during the life of the loan agreement:
(i)The first stage includes several preliminary steps leading to
the execution of the loan agreement. During this stage, the
Bank performed satisfactorily and co-operated with OSE in
the project's design. As an exception, it should be
mentioned that the deadlines the Bank accepted for OSE to
complete the different projects, as evidenced later, were not
real.
(ii)The second stage includes the actual implementation of the
project. During this stage the Bank made some changes,
mainly in connection with the supervisory staff. Although
these changes did not have a severe impact on the
implementation of the program, they did pose some minor
-54-

inconveniences derived from the failure to remember some
decisions adopted during the program.
4. O.S.E.'s PERFORMANCE
During the implementation of the project, O.S.E.'s
performance was irregular:
* The initial phase -1988 to 1990- was very slow as a
consequence of the delay in the development of the
projects. Thus, during the first 3 years the disbursements
were made at a very low rate.
* Afterwards, the implementation developed quite normally,
especially in connection with civil works and equipment.
There were some difficulties to implement the projects in
the institutional sector; these difficulties could be explained
in the light of the scenario outlined in the introduction of
this report, and of the ups and downs of a twinning program
with another Company operating an organization of the
same sector, but belonging to a country with different laws,
culture and usages.
5. RECOMMENDATIONS
For future operations, it would be advisable:
* To have available as many projects as possible to enter bids
at the time of subscribing the loan agreement, thus avoiding
delays in the performance of the loan agreement.
-55-

* That OSE, if possible, directly represents the borrower in
order to avoid bureaucratic procedures.
* To prepare a list of indicators to facilitate a more efficient
follow-up of the program's development and impacts.
6. LESSONS
The following lessons should be recalled and kept in mind for
future operations:
* Twinning program with SANEPAR: programs with such a
vast scope are difficult to monitor. Less ambitious goals
and clearly identified areas facilitate the results. Once the
initial goals have been achieved, the program's scope can
be extended.
3 As already stated, it is very important to have available as
many projects as possible to enter bids at the time of
subscribing the loan agreement. Delays in the performance
of the loan will thus be avoided and OSE will not have to
pay unnecessarily for a longer period the fee corresponding
to the preliminary agreement.
* It is important to clearly identify a list of indicators for the
proper monitoring of the overall performance of the loan
agreement, and not only the physical or accounting
progress.
-56-

7. FUTURE ACTIONS
During 1999 and until the year 2003, OSE will carry out its
management activities in compliance with the following
general policy definitions established in Resolution No.
1011/96 of the Board of Directors and included in the Budget
per Program approved by the Executive through Executive
Decree No. 301/98 of October 28, 1998:
* To preserve OSE as a nationwide public utility showing a
clear territorial decentralization in service rendering and in
resource management. The territorial decentralization is
based on the four Upcountry Regions established in R/P No.
7/94 of August 11, 1994 and in the Regional Arrangement
of the Montevideo System.
* To apply the public work and service concession system to
accelerate investments and the implementation of projects
necessary to improve and extend the drinking water supply
and sanitation services. This system is currently in progress
in the department of Maldonado.
* To hire third parties to provide ancillary services in order
to meet the requirements.
* To develop a corporate-oriented management to assure the
recovery of the global operating costs and to improve OSE's
investing capacity.
* To make drinking water and sanitation services available to
individuals from all social classes and geographical
-57-

locations, even if this has a negative impact on OSE's
financial results. These operations will be carried out along
with national and local authorities or with customers.
-58-

Appendix B
Administracidn de la Obras Sanitarias del Estado
|[ Z L1 M Of/cina Proyecto Desaro/lo de O.S.E.
Montevideo, 28 de julio de 1999.-
Ec. Anna WellensteinEspecialista de Desarrollo UrbanoGrupo de Finanzas, Sector Privado e InfraestructuraOficina Regional para America Latina y el Caribedel Banco Mundial
Ref: Informe Final de Ejecuci6n del Prestamo N° 2921-UR
Por la presente le hacemos Ilegar nuestros principales comentarios con respecto ala evaluaci6n elaborada por el Banco Mundial para el Proyecto de Rehabilitaci6ndel Sector de Agua (Prestamo 2921-UR).
* Las apreciaciones que se realizan sobre la importancia de los objetivos yresultados alcanzados por el prestamo, estan determinadas por los cambios enla empresa y el contexto de su actuaci6n que se dieron durante el muyprolongado periodo que medi6 entre la preparaci6n del prestamo y laconclusi6n de su ejecuci6n. Si hubo fracasos o metas incumplidas, los mismosdeberian ser juzgados como compartidos entre todos los actores involucrados.Durante ese periodo las inversiones de OSE, como se indica en el informe delBanco, experimentaron un fuerte crecimiento y las preocupaciones de laempresa se concentraron en la soluci6n de los problemas de infraestructura deservicios. No obstante, desde 1996 se ha hecho evidente una preocupaci6ncreciente por la mejora de gesti6n y los problemas de orden comercial yfinanciero, que ha pasado a ser la preocupaci6n dominante desde este mismoafio, y una de los aspectos mas importantes para el futuro de la empresa. Porotra parte, la politica de subinversi6n, hoy ya revertida, que caracteriz6 lagesti6n del organismo durante decadas , ha sido la causa y la consecuencia delas permantes angustias financieras.
* Es de conocimiento del Banco que el servicio que presta OSE es juridica ydoctrinariamente un servicio puiblico, y que en esa medida se corren los riesgosasociados a la existencia de estructuras monop6licas de producci6n de bienes yservicios. Pero ello no implica que partiendo de esa definici6n juridica ydoctrinaria la empresa este condenada a su propia ineficiencia e ineficacia yaislada de los problemas de competitividad (por ej: intervenci6n del sectorprivado en concesiones de obras puTblica).
-59-

Administracdon de la Obras Sanltarlas del Estado
It 61 ~I HOflcina Proyecto Desarrolo de O,S.E.
En primer lugar, OSE no fija la tarifa de los servicios que presta. Losincrementos tarifarios son aprobados por el Gobierno Central atendiendo a supolitica de empresas piiblicas. Durante la mayor parte de 1997, todo 1998 y loque va de 1999, los incrementos tarifarios se ajustaron a la evoluci6n de laeconomia nacional, e incluso el Directorio aprob6 una reducci6n de la tarifa desaneamiento y de los grandes consumidores y de las tasas de conexi6n, queimplicaron una disminuci6n del orden de U$S 10.000.000 anuales de ingresode la Administraci6n y por lo tanto de egreso de los clientes.Seguin informes propios del BIRF las familias (que representan aprox. el 90%de los clientes de nuestra empresa), pagan por concepto de tarifa menos del 1%del ingreso familiar definido por el INE (Instituto Nacional de Estadistica),cuando los parametros intemacionales 6ptimos situan el guarismo en el 5% delcitado ingreso.En estas condiciones, la mejora de la gesti6n es una necesidad para que laempresa pueda mantener sus niveles de operaci6n e inversi6n, e incluso para supropia supervivencia.Es probable que OSE deba mejorar ciertos mecanismos que promueven lacompetitividad, pero no es exacto que su posici6n juridica y doctrinaria la hagaindiferente a este tipo de requerimientos.
* Si bien es cierto que no existe un ente regulador del sector, el Gobierno Central(especialmente a traves de la Oficina de Planeamiento y Presupuesto de laPresidencia de la Repiiblica) interviene en forma efectiva y findamentalmente,en la determinaci6n de la tarifa, las decisiones sobre inversiones y acceso alcredito y el control de ciertos indicadores de gesti6n.
* Durante los ultimos an±os OSE ha tenido que evolucionar desde una modalidadde gesti6n que priorizaba la ampliaci6n de la cobertura de sus servicios sobrelas consideraciones de tipo econ6mico y la calidad de la gesti6n en aspectosdiferentes a los de ingenieria, a un mayor balance entre los objetivos de tiposocial y empresarial ( Ley Organica N° 11907 del 19/12/52 en su Art. 30establece: "... La prestaci6n del servicio de obras sanitarias, y los cometidosdel organismo, deberan hacerse con una orientaci6n fundamentalmentehigienica, anteponiendose las razones de orden social a las de ordenecon6mico."). En ese sentido la Administraci6n ha promovido variasiniciativas en materia de gesti6n empresarial como ser el ajuste parcial de suLey Organica (ver Anexo I) y la incorporaci6n en el Decreto Tarifario demecanismos que posibiliten y den mayor seguridad y flexibilidad a larecuperaci6n de inversiones (ver Anexo II).
-60-

-___- Administracilon de la Obras Sanitarias del Estado
Oflcina Proyecto Desarrollo de O.S.E.
La RD 1011/96 recoge la politica empresarial que esta liderando ese camnbio yplantea nuevas definiciones sobre la misi6n y la visi6n de la empresa, que hanservido de guia a los proyectos especificamente orientados a la mejora de lagesti6n.
Ing. Natan Wajner Ing. Arturo CastagninoDirector Gerente General
Of. Proyecto Desarrollo de O.S.E. O.S.E.
Wilson Elso GoniPresidente
O.S.E.
-61-
PROYECTO DE REHABILITACION DEL; SECTOR DE AGUAPRESTAMO UR-2921
MISION DE PREPARACION DEL INFORME DE CONCLUSION DEL PROYECTO(ICR)
AYUDA MEMORIA
Montevideo, 20 de marzo de 1999
1. Una misi6n del Banco Mundial integrada por la sefiora Anna Wellenstein (ICRtask manager) y el sefior Franz Drees (ingeniero) visit6 Uruguay del 14 de marzo al 20 demarzo de 1999 con el prop6sito de preparar el Informe de Conclusi6n del Proyecto deRehabilitaci6n y Suministro del Sector de Agua, Prestamo UR-2921.
2. La misi6n agradece la hospitalidad y la atenci6n con que los representantes de laOficina de Planeamiento y Presupuesto (OPP) y de las Obras Sanitarias del Estado (OSE)los recibieron y atendieron durante el transcurso de la mnisi6n. La lista de las personasque participaron en las reuniones se presenta en el Anexo 1.
3. Las conclusiones preliminares de la misi6n se presentan a continuaci6n. ElInforme Final de Conclusi6n del Proyecto incluiri una evaluaci6n del Proyecto por elGobierno del Uruguay y comentarios del Gobierno de Uruguay sobre la evaluaci6n delBanco.
4. Con base en la docurnentaci6n disponible, la informaci6n adicionalproporcionada por OSE y las discusiones sostenidas con los distintos actoresinvolucrados en la ejecuci6n del prestamo, la misi6n concluy6 que el proyecto cumpli6con la mayoria de sus objetivos. En cuanto a las metas fisicas establecidas al inicio delpr6stamo, el proyecto logr6 (i) asegurar el abastecimiento de Montevideo con aguapotable a corto y mediano plazo mediante una rehabilitaci6n/expansi6n de la planta deAguas Corrientes, cuya capacidad aurnent6 de 440,000 rn3/dia a 540,000 m3/dia y (ii) unamejora importante de la calidad de agua suministrada a traves de la instalaci6n deunidades de recloraci6n en el sistema de transmisi6n. Ademas, el proyecto posibilit6 larehabilitaci6n de 100 kmn. de tuberia en la red de Montevideo, la compra y instalaci6n de200.000 medidores en todo el pais, una campafia de reducci6n de agua no-contabilizada ymejoras en la planta potabilizadora de Minas, 43 km. de extensiones de red y 3.500nuevas conexiones en los barrios de Villa Garcia, Pajas Blancas y Santa Ana en la Regi6nMetropolitana de Montevideo, asi como la construcci6n de sedes de operaci6n en laRegi6n Metropolitana y de equipamniento para las areas de operaci6n de Montevideo y delInterior del Pais. Cabe resaltar que los precios de construcci6n aumentaron mucho en eltranscurso del proyecto y s6lo la no ejecuci6n del sub-proyecto B2 (rehabilitaci6n de laslineas de transmisi6n II y III), debido a su alto costo, permiti6 alcanzar substancialmentelas metas fisicas de los demas sub-proyectos.
-62-

5. Aunque el contrato de cooperaci6n OSE-SANEPAR no consigui6 cambiarsignificativamente la situaci6n institucional de la empresa, la misi6n considera que seprodujeron resultados importantes en determinadas areas, entre ellas las de operaci6n ymantenimiento, micromedici6n, atenci6n al cliente y suministros. El impacto de lacooperaci6n en las areas de planeamiento de proyectos, gesti6n financiera y recursoshumanos fue minumo.
6. De acuerdo con la informaci6n suministrada por OSE, durante los aAos deimplementaci6n del Proyecto la Empresa sobrepas6 las metas de empleados por milconexiones de agua y mantuvo sus inversiones financiadas a traves de su generaci6ninterna de fondos, a un nivel substancialmente superior al 30% establecido en el Acuerdode Prestamo. OSE no alcanz6 las metas establecidas para conexiones de agua conmedidor funcionando, aunque en los hltimos tres anios su tendencia mejor6 en esta Area.OSE no mostr6 el mismo nivel de progreso en terminos de reducci6n de cuentas nocobradas, activos corrientes/pasivos corrientes y gastos operaci6n/ingresos operaci6n.Ademas, OSE tuvo dificultades constantes en emitir sus balances auditados en el tiempoacordado con el Banco (seis meses despues del cierre del afno fiscal). Sin embargo, lamisi6n constat6 con satisfaccion que OSE ha hecho un progreso significativo en estesentido gracias a un nuevo sistema de informaci6n. Tambien tuvo atrasos similares hasta1996 en entregar balances auditados de la cuenta especial y en las otras cuentas delProyecto.
7. El proyecto se implement6 en un periodo de 10.5 afios (2.5 afnos mas de losprevistos en el appraisal), despues de dos extensiones en la fecha de clausura delprestamo. El ritmo lento de desembolsos se debi6 sobre todo a atrasos importantes en lapreparacion de los diseflos ejecutivos y de los documentos de licitaci6n y en la ejecucionde los procesos de licitaci6n. La misi6n manifest6 su complacencia con la forma en quela TJnidad de Gerenciamniento del Proyecto ejerci6 sus funciones durante la ejecucion delproyecto. La relaci6n de trabajo entre OSE y el Banco se mantuvo a un nivel constructivodurante todo el tiempo de ejecuci6n del proyecto, periodo durante el cual ambas partesenfrentaron los retos propios de su trabajo con flexibilidad y dedicaci6n.
8. La misi6n no pudo revisar el informe de evaluaci6n del Proyecto correspondientea OSE, por cuanto este aiun no se encontraba terminado. La misi6n enfatiz6 que talresumen debera ser entregado al Banco antes del 14 de mayo, e indic6 que un borradordel informe del Banco le sera entregado a OSE antes del fin de abril, fecha a partir de lacual OSE tendrA un mes para emitir sus comentarios al Banco.
Anna WellensteinBanco Mundial
-63-

Anexo 1: Lista de Participantes
Organizaci6n Persona Cargo
OSE/Montevideo Natan Wajner Director del Proyecto deDesarrollo de OSE
Gonzalo Sintas Sub-Director del Proyecto deDesarrollo de OSE
Rosa Sosa Jefa de Contabilidad y Operaci6ndel Prestamo
Raul Pais Gerente, Regi6n MetropolitanaEstela Soria Jefa, Unidad de EstudioAlicia Araujo Economista, Unidad de EstudiosElena Garmendia Contadora, Unidad de EstudiosSantina Caro Ingeniera, Unidad de EstudiosDaniel Siccardi Jefe de Divisi6n Micromedici6nMartes Navarrete Presidente de la Comisi6n
Asesora de Adjudicaci6n deLicitaciones/Asesor de la OficinaProyecto Desarrollo de OSE
Julio Guerra Jefe de Planeamiento y ControlStock
Luis Ismnael Corto Sub-Gerente DepartamentoSaneamiento
Carlos Ons ConsultorOPP Graciela Perez Montero Directora, Divisi6n Empresas
Pfiblicas
-64-

IBRD 304658 1 154'
58° tellaUnl6n, \i_ ~56° URUGUAYjIloaUni6n.
ARTIGArtgS WATER SUPPLYAc ix AR f I G A S REHABILITATION PROJECT
z 17 .* ('Rivero - MAIN ROADS
_ tiuci6( o+1 \ .-. - RIVERS
2/Con. s .l . 4 5 0 TOWNS/ ostitucion 'o /g ,,
z .:>4 - - - 0 t 9 r, ^ <> vs@ NATIONAL CAPITAL
I t : ' ' / A BRIDGES
(0) II I, I V' 1-.. AIRPORTS
Cl:: ) oo Tactaremb- Vlcladero4
.K PORTS
6tB / Ac-gu6 ~ .- JDEPARTMENT BOUNDARIES
'N / 'b 'i0 8 gt >9 19 Piedrog 6 X / A 9 ttjuv^tW -*-INTERNATIONAL BOUNDARIES
-32, Solo
1 ~~~~~~~~~~~~~~~02) I_-hilDgtJczy (,, ,, - 4 ~'5- 8 M
).tPc/s-nd1 Paso Te,J .d \CL .V' M[. (Vg CER RO M dLARGO .'l
, Young RI o. Tolo - , Ro j
ER OI 0 TO Tc ora /
Mercede ') 'N E G R °
(!/ . .' . - <' - < ~~~D U R A Z N O T R E I N9tA ES
Fray Bentok T R . A - TTey
nS.riaa de . 3 lY Th ie boundaries, uolo,derommhotios
t i s o R1sA N O mTrinidedi \ > eJ 9 ; andthais6Ynn°apiearonotimpfyon"10~~~~~~on his p d n.frnpy, o thj SORIANO .' 14 [ ~~~~~~~~~~~~~~~~~~~~~~~~~~~~~~~~~~~~~~ar fThe World Bork Group, any
i 79olor < S 8 F L OtE S . \F L 0 R I D A - Sh legal stof
ardona~~~~~~~~~~~~~~~~~~~~~~~~~~~~~trioy,nyd-nno.... x .5> eprona ' L AVA LL LJ A 14 -" La Coronilla cepace of such boundaries.
Nueva Polmira 2A IRO C H -34~ a O Jy S E Florida CI * . 1 BR_ I
COLON~~~IA j MJoanom,i5
BOLIVIA
11 ~ ~Mayo ~ Minoay?
'4AyNELONES /R. CHILE 'SColonr'usdel O> <",CIEs'0Sacramento Juan Is ,/svl
4 Lacaze 0
0 II 20 30 40 50 Miles UR UGA MALDONADOY oPaloma /
I I i I I I I I I MONTEVIDEO 8,>,, Atiantida 'K 4Maldo AGENTINA Mostvidoo
0 20 40 60 80 Kilometers Montevideo bpourta del Este0 60 4~ 561 4A 5l' 99
AUGUST 1999
Related Documents


