vironmentlly Snable AFTES Working PaperNo. 19 DevelopmentDivision Environmental Policy and Planning 20017 THE ECONOMICS OF WILDLIFE: CASE STUDIES FROM GHANA, KENYA, NAMIBIA, AND ZIMBABWE By Jan Bojo February 1996 Environmentally Sustainable Development Division l Technical Department - - Africa Region The World Bank Public Disclosure Authorized Public Disclosure Authorized Public Disclosure Authorized Public Disclosure Authorized Public Disclosure Authorized Public Disclosure Authorized Public Disclosure Authorized Public Disclosure Authorized

Welcome message from author
This document is posted to help you gain knowledge. Please leave a comment to let me know what you think about it! Share it to your friends and learn new things together.
Transcript

vironmentlly Snable AFTES Working Paper No. 19Development Division
Environmental Policy and Planning
20017
THE ECONOMICS OF WILDLIFE:CASE STUDIES FROM GHANA, KENYA,
NAMIBIA, AND ZIMBABWE
By Jan Bojo
February 1996
Environmentally Sustainable Development Division lTechnical Department --Africa Region
The World Bank
Pub
lic D
iscl
osur
e A
utho
rized
Pub
lic D
iscl
osur
e A
utho
rized
Pub
lic D
iscl
osur
e A
utho
rized
Pub
lic D
iscl
osur
e A
utho
rized
Pub
lic D
iscl
osur
e A
utho
rized
Pub
lic D
iscl
osur
e A
utho
rized
Pub
lic D
iscl
osur
e A
utho
rized
Pub
lic D
iscl
osur
e A
utho
rized

THE ECONOMICS OF WILDLIFE:
Case Studies from
Ghana, Kenya, Namibia, and Zimbabwe
Jan Bojo(Editor)
Senior Environmental EconomistEnvironmentally Sustainable Development Division
Technical DepartmentAfrica Region
(AFTES)
THE WORLD BANK1818 H Street NW
Washington, DC 20433USA

TABLE OF CONTENTS
Foreword .................................................................... . Ix
CHAPTER 1: THE ECONOMICS OF WILDLIFE: BACKGROUND ANDLESSONS FROM THE CASE STUDIES ....................................... 1
1.1 Background of the Study .................................................................... 1l1 ..1 The "Wildlife Advantage Hypothesis" ..................................................................... 21.1.2 Some Key Concepts ..................................................................... 3
1.2. Lessons from the Country Case Studies ..................................................................... 41.2.1 Financial and Economic Viability of Wildlife ..................................................................... 41.2.2 The Significance of "Bush Meat" ..................................................................... 51.2.3 Policy Implications of the Findings ..................................................................... 61.2.4 Environmental Impacts ..................................................................... 7
1.3 The World Bank and Wildlife Projects ..................................................................... 7
1.4 References.................................................................................................................................... 8
CHAPTER 2: THE ECONOMICS OF LIVING WITH WILDLIFE IN GHANA ...... 11
2.1 Wildlife Policies and Utilization in Ghana ....................................................................... 122.1.1 The Historical Perspective ...................................................................... 12
- 2.1.2 Current Wildlife Management Practices ......................................... , , .,. 132.1.3 Wildlife Production and Utilization in Ghana ........................................ 15
2.2 The Relative Profitability of Wildlife Management ........................................ 202.2.1. Competing Land Uses .202.2.2 Financial and Economic Analysis ................................................................. 222.2.3 Economic Policies and Wildlife ................................................................. 30
2.3 Livestock, Wildlife, and the Environment ................................................................... 33
2.4 Summary and Conclusions ................................................................... 34
2.5 References .................................................................... 34
CHAPTER 3: THE ECONOMICS OF LIVING WTH WILDLIFE IN KENYA ...... 39
3.1 Wildife Management Policies and Legislation ..................................................................... 403. 1.1 Thne Policy Environment ..................................................................... 403.1.2 Financial and Economic Status of Wildlife ..................................................................... 433.1.3 Wildlife Management and Utilization in Kenya ...................................................................... 453.1.4 Economic and Political Conditions and Their Influence ............................................................. 463.1.5 Land-Tenure Policies and Practices ..................................................................... 473.1.6 Other Relevant Issues ...................................................................... 47
v

THE ECONOMICS OF WILDLIFE
3.2 The Economics of Living with Wildlife.........................................................................................3.2.1 W ildlife Utilization as Land Use ...............................................................................................3.2.2 Financial Analysis ....................................................................................................................
3.3 Environm ental Im pact....................................................................................................................3.3.1 Livestock and W ildlife in the Rangelands .................................................................................3.3.2 Herbivore Efficiency ................................................................................................................3.3.3 Vegetation Changes...................................................................................................................3.3.4 Sustainability of Crop Production..............................................................................................3.3.5 Carrying Capacities and Offtake................................................................................................3.3.6 Livestock Diseases and Parasites...............................................................................................
3.4 Summary and Conclusions.............................................................................................................3.4.1 The Data and Their Quality .......................................................................................................3.4.2 Each Case is Unique..................................................................................................................3.4.3 The Devastating Implications of Population Growth ................................................................3.4.4 Policies and Legislation.............................................................................................................3.4.5 Land Tenure and Control Over Land Use .................................................................................
3.4.6 Revenue Sharing Administered by Communities.......................................................................
3.4.7 Economic Management and Incentives ......................................................................................
3.4.8 Research and Development ........................................................................................................
3.5 References.........................................................................................................................................
CHAPTER 4: THE ECONOMICS OF LIVING WITH WILDLIFE IN NAMIBIA
4.1 The H istorical Perspective..............................................................................................................4.1.1 Pre-Independence Wildlife Utilization Policies.........................................................................
4.1.2 Current W ildlife M anagem ent.............................................................................................
4.1.3 Areas Currently Used for W ildlife.............................................................................................
4.1.4 Wildlife Numbers and Economic Significance..........................................................................
4.1.5 Current Property Rights .............................................................................................................
4.1.6 Land Use and Government Policy ..............................................................................................
4.1.7 Bush Meat Consumption and Marketing ....................................................................................
4.2 Land Use Options: Financial and Economic Assessment.............................................................
4.2.1 Com peting Land Uses................................................................................................................
4.2.2 Financial and Economic Analysis..............................................................................................
4.2.3 Policy Issues..............................................................................................................................
4.3 Relative Environmental Impacts of Wildlife ................................................................................
4.3.1 Behavior of W ildlife ..................................................................................................................
4.3.2 Physiological Attributes of W ildlife ..........................................................................................
4.3.3 Interaction with the Environm ent..............................................................................................
4.4 Summary and Conclusions.............................................................................................................
4.5 References ...........
vi

CONTENTS
CHAPTER 5: ECONOMIC POLICY, WILDLIFE, AND LAND USE INZIMBABWE ............................... 117
5.1 Wildlife Policy and Utilization in Zimbabwe .................................................... 1175.1.1 Development of Wildlife Industry on Privately Owned Land ................................................... 1185.1.2 Development of Wildlife Industry on Communal Land .................................................... 1205.1.3 Wildlife and the Economy .................................................... 121
5.2 Economic Development and Wildlife .................................................... 1235.2.1 The National Economy, the Resources, and Land Use Systems ................................................ 1235.2.2 An Economic Analysis of Wildlife Utilization .................................................... 125
5.3 The Policy Environment and Its Impact on the Future of Wildlife ........................................... 1365.3.1 The Impact of Macroeconomic Policies on the Wildlife Sector .............................................. 1365.3.2 The Impact of Sectoral Policies on the Wildlife Sector ............................................................. 1385.3.3 Conclusions ................................................................ 140
5.4 References ................................................................ 140
APPENDIX: RELATIVE ENVIRONMENTAL IMPACTS OF WILDLIFE ........... 147
The Evidence for Herbivore Impacts on Zimbabwean Rangelands ................................................. 147
The Major Factors Influencing Environmental Impacts ................................................. 150
References ................................................. 150
vii
CONTENTS
CHAPTER 5: ECONOMIC POLICY, WILDLIFE, AND LAND USE INZIMBABWE ................. 117
5.1 Wildlife Policy and Utilization in Zimbabwe ................................... 1175.1.1 Development of Wildlife Industry on Privately Owned Land .................................................. 1185.1.2 Development of Wildlife Industry on Communal Land .................................................. 1205.1.3 Wildlife and the Economy .................................................. 121
5.2 Economic Development and Wildlife .................................................... 1235.2.1 The National Economy, the Resources, and Land Use Systems ................................................ 1235.2.2 An Economic Analysis of Wildlife Utilization .................................................... 125
5.3 The Policy Environment and Its Impact on the Future of Wildlife . ............................ 1365.3.1 The Impact of Macroeconomic Policies on the Wildlife Sector ................................................ 1365.3.2 The Impact of Sectoral Policies on the Wildlife Sector ...................................... 1385.3.3 Conclusions .................................................... 140
5.4 References ................................................................ 140
APPENDIX: RELATIVE ENVIRONMENTAL IMPACTS OF WILDLIFE ........... 147
The Evidence for Herbivore Impacts on Zimbabwean Rangelands ................................................. 147
The Major Factors Influencing Environmental Impacts .................................................................. 150
References ................................................................... 150
vii

ForewordThis study was initiated in 1991 by what was at the time ihe Environment Division of the Africa
Region's Technical Department (AFTEN). Leif Christoffersen, division chief of AFTEN, wasinstrumental in organizing the study and appointed Emmanuel Asibey and Jan Bojo to serve as joint taskmanagers. As of mid-1992, the current editor became solely responsible for managing the study.
After a difficult period searching for adequate funds to support the study, funding was obtainedthrough a Swedish trust fund for the environment. This generous and untied funding is hereby gratefullyacknowledged. National teams in Ghana, Kenya, Namibia, and Zimbabwe were then recruited. A strongand successful effort was made to recruit nationals or at least resident experts on wildlife and economicsin the countries involved.
A World Bank reorganization came into effect in January 1993, implying a merging of AFTENand two other divisions to form AFTES (Africa Technical Department, Environmentally SustainableDevelopment Division). Under the context of this merger, which resulted in a much smaller TechnicalDepartment, the study did not fit well into the ensuing drastically reduced work program; hence, theambitions for the current study had to be streamlined. An informal compilation of the first three casestudies completed was circulated within the World Bank in June 1994. The Zimbabwean case study waspublished by the World Bank's Environment Department in a modified, shortened version as EconomicPolicy, Wildlife, and Land Use in Zimbabwe (Environment Working Paper No. 68, September 1994).With the completion of the Ghana case and based on the positive reactions to the preceding publications,it was decided to further edit the full set of case studies and publish them jointly in this paper.
The target group for this paper is World Bank staff involved in wildlife-related activities, staff ofother donor organizations, nongovernmental organizations (NGOs) with similar interests, as well asdiverse groups of people in Africa involved in wildlife management.
Sincere thanks go to all those who have supported the study and above all to the authors, whohave contributed so much of their time and expertise to this work. Jan Boj6 substantially reduced thevolume of the original case studies to distill the substance into a format that would be accessible for awider audience. He also wrote the introductory chapter. Thanks also go to Liisa Hietala and CaterinaBetancourt for many hours of word processing, P. C. Mohan for an initial round of copyediting, andPamela Cubberly for a thorough job of getting this voluminous manuscript in shape.
Frangois Falloux
Environment Adviser
Africa Region
ix

Chapter 1:
The Economics of Wildlife: Background and Lessonsfrom the Case Studies
By Jan Bojo
This chapter presents the background on this study of wildlife economics in four Africancountries, defines its objectives, and synthesizes its results.
1.1 Background of the StudyA major source of inspiration for the study was a World Bank technical paper edited by Agnes
Kiss and entitled Living with Wildlife (Kiss 1990). It addressed a wide array of economic, political,technical, sociological, and institutional issues pertaining to community-based wildlife management.Although economic aspects were given some attention, it was agreed that this theme deserved furtherconsideration in a separate study. As a result, a new study to analyze the following objectives wasdesigned:
* Financial and economic viability of (integrated) wildlife management systems
* Actual and potential significance of wildlife as a source of food and income in an economy-wide context
* Policy implications of the above objectives
The current study on the economics of wildlife is built on four country case studies on Ghana,Kenya, Namibia, and Zimbabwe. These countries were chosen to cover a variety of natural, economic,and political conditions and to produce a rich set of experiences to help shape policy and projectinterventions.
The resulting case studies contain a wealth of information but may appear too voluminous for anaudience that is not entirely specialized on the subject. The main editor thought that a more condensedformat could reach a wider audience, but the full papers are, of course, available on request.
Little has been published on the economics of wildlife; this work is an initial step in addressingthat gap. What is offered is a set of country case studies that will hopefully inspire both a broad policydiscussion as well as more localized studies to be undertaken in view of a pending land use decisiorns bypublic authorities, communal or private land managers.
Jan Bojo is senior environmental economist in the Environmentally Sustainable Development Division, Technical Department, AfricaRegion of the World Bank.
t See title page for the address.
1

THE ECONOMICS OF WILDLIFE
1.1.1 The "Wildlife Advantage Hypothesis"'Another source of inspiration for this study has been what can be called the "wildlife advantage
-hypothesis. " That is the assumption that wildlife embodies a number of advantages in comparison withcompeting land uses, but that these values are not appropriately recognized by market forces, publicpolicies, or both; hence, the following may be needed:
* Amend market signals so that the full value of wildlife is recognized
o Reform distorted policies that disadvantage wildlife
The case has been made that wildlife possesses a number of advantages over livestock,specifically in terms of:
* Diversity in resource use. A mixture of wildlife species can utilize the primary biomassproduction in a more diversified manner.
* Primary efficiency. Wildlife utilizes constrained primary resources more efficiently (waterand vegetation).
* Secondary efficiency. Wildlife species are more efficient secondary producers (fasterreproduction and growth).
R Resilience. Wildlife is better adapted to resist diseases.
* Nutritional value. Wildlife meat tends to be low in fat while equal or better than beef,mutton, or pork in protein content and much better in vitamin content.
The extent of the advantages summarized here is controversial; the reader is referred to thischapter's brief bibliography as well as the ensuing case studies for a discussion of these points.
Obviously, the scope of testing the comparative advantage of wildlife must be wider than meatproduction and include all other revenue-generating aspects, as will be discussed below. The absence ofsuccessful ranches in Africa that specialize in wildlife meat production inspires a search for thedisadvantages that appear to counterbalance the factors mentioned above.
The initiators of this study hypothesized that a key factor in determining the choice betweenwildlife and livestock utilization is the property rights structure. State ownership and legal restrictionsagainst hunting serve the good intention of protecting the stock of animal species from exploitation. Ifenforced, it may actually achieve the intended preservation effect; however, by denying local people theright to receive the benefits of wildlife, poaching becomes the only way for local people to reap benefitsfrom this asset. In contrast, livestock systems are generally characterized by household ownership ofanimals, while the land is often under communal or, formally, state ownership.
Even if legislation delegates usufruct rights to land managers, the migratory nature of wildlife isa complication. The benefits of livestock products can be privately controlled by the herding of brandedlivestock on communal land or stall feeding at homesteads. Wildlife management requires either large-scale private units or coordinated communal management over large areas.
In addition to the fundamental factor of property rights, the initiators of this study hypothesizedthat a number of mostly policy-related factors are probably relevant in favoring livestock versus wildlifemanagement systems: veterinary restrictions pertaining to wildlife, subsidies extended to livestock, high
2

BACKGROUND AND LESSONS
management costs for wildlife and poor marketing facilities. The reader will find these issues discussedin the case studies.
A final issue the authors of the case studies were asked to pursue was, Is wildlife better adaptedto the environment than livestock? What is the empirical evidence.for this? The answer is less evidentthan some of the initiators of this study hypothesized.
1.1.2 Some Key ConceptsBefore delving into the lessons of the studies, a note on terminology is needed to clarify the
analytical approach the case study authors were asked to apply. Three aspects are essential to theanalysis:
* Financial profitability
* Economic profitability
* Environmental sustainability
Thefinancial perspective refers to the costs and revenues an individual, household, or companypays and receives. Even the impacts on the government's budget can be analyzed from a financialperspective. The prices used are market prices.
By contrast, economic analysis serves to evaluate the costs and benefits to society as a whole,that is, the sum total of all individuals affected. This concept should be distinguished from thegovernment, an institution within society that represents the interests of society as a whole more or lesswell. The prices used in the economic analysis may deviate from market prices to include, for example,negative external impacts on the environment that the market ignores.
Improved financial profitability is generally a necessity for the ranch owner or the household in acommunal area to engage in wildlife management as opposed to livestock raising or crop cultivation;however, financial profitability that is based on government subsidies or the neglect of externalities willnot pass the test of economic profitability.
Economic profitability can conceivably be maximized by short-term exploitation of a resourcesuch as rangeland. The price, however, may be irreversible damage to the resource. To the extent that thereturns from such exploitation are invested in other activities (whether in agriculture, manufacturing, orservice production), the economic system as a whole may continue on a sustainable path. In spite of this,the particular section of the rangeland may be devastated as an ecosystem. Although the interpretation ofsustainability remains a controversial issue, we are interested in exploring if financially andeconomically profitable management schemes are also compatible with a localized ecosystem-levelinterpretation of sustainability.
Pasture and rangelands occupy 64 percent of the land area of Africa. These areas are largelyunsuitable for rainfed crop production but can often support livestock or wildlife; thus, the discussion isstylized-contrasting a wildlife option to a livestock option. It is understood, though, that the real worldoffers many opportunities to combine management systems; indeed, some of the examples offered in thecase studies include such combinations.
3

THE ECONOMICS OF WILDLIFE
1.2. Lessons from the Country Case StudiesWhat are the lessons learned from the country case studies? Each country differs from the others
but also shares some of their features. Generalizations have their limitations, but four major themes willbe addressed. The first three directly relate to the major objectives of the studies as specified above; thefourth point concerns the environmental impacts of wildlife.
1.2.1 Financial and Economic Viability of WildlifeThe first objective of the study was to address the financial and economic viability of wildlife
enterprise in comparison with other appropriate forms of land use.
The financial analysis from Ghana indicates that private wildlife ranching is superior to thepublicly managed in terms of profitability. Furthermore, small-scale farmning is more profitable than thelarge-scale option analyzed. Small-scale grasscutter farming shows the best returns, followed by poultryand rabbit. The study suggests that support should be given to small-scale wildlife domesticated activityin terms of breed development, credit, and technical information.
On ranches owned or controlled by single proprietors or companies in Kenya, a number ofsuccessful wildlife conservation projects are in place and many more are planned. The key is in controlof the land and in well-defined land-use objectives. In contrast, communal lands tend to harbor diverseobjectives and inequitable control of land resources, the report argues.
It is the consultants' conclusion that wildlife utilization in Kenya is unlikely to be a competitiveland use in certain agroclimatic zones with high potential for crop production and livestock rearing. Thisfinding provides a benchmark for formulating land-use strategies and leaves considerable areas wherewildlife is likely to be at an advantage. The report suggests that the efforts to conserve and utilizewildlife in dispersal areas should be concentrated in four districts: Narok, Kajiado, Laikipia, and Isiolo.Other areas, such as the Tsavo National Parks, should be assessed for their specific merits with explicitvaluation of biodiversity and other possible economic uses.
The detailed case studies included in the Kenyan report attempt to highlight that many avenuesfor complementarity exist and suggest that wildlife can be used to enhance the returns from land, inaddition to other land uses.
The need for community participation and revenue sharing is noted, but so is the vulnerability tomisappropriation and inequitable distribution of funds. As argued by the Kenyan study, the investment ofreturns from wildlife and tourism in job creation and social welfare projects has proved to be the mostsuccessful system of distributing revenues. Income paid in cash to group ranch management has not beenwisely invested nor equitably distributed in the Kenyan cases studied.
The case study from Namibia suggests that the net economic return to commercial andcommunal livestock farming, particularly in the more arid communal regions of the country, is almostcertainly negative. Wildlife utilization (combining tourism, hunting, and cropping) is shown to offersignificantly more favorable returns in communal areas, while trophy hunting has proved a growingsuccess on private farms. Despite this evidence, the report argues, a widespread switch to wildlife usefrom livestock farming is unlikely. Most rural communities in Namibia place a high value onlivestock-particularly cattle-for cultural and social reasons. Consequently, demonstrating theeconomic superiority of wildlife utilization will probably not lead to an extensive conversion fromlivestock production.
4

BACKGROUND AND LESSONS
In conclusion, it is noted that wildlife utilization does appear to offer significant economicopportunities to rural communities in Namibia. With enabling legislation and some development of themanagerial capacity of local communities, wildlife utilization can be a major force for sustainable ruraldevelopment.
Results from a large sample study in Zimbabwe show that wildlife enterprises in the large-scalecommercial ranch sector are often more financially profitable than cattle enterprises. A less regulatedeconomy and a liberalized exchange rate in particular would contribute to its profitability. This, however,is also true for the competing cattle enterprises that have been affected by politically depressed beefprices since 1985. Complete deregulation may even favor cattle over wildlife.
Although wildlife may be the most economically efficient option from a social welfareperspective in many arid and semiarid communal areas, it is currently significantly less attractive for thefarmers living there than subsistence farming. Along with macroeconomic distortions, the control overthe resources at the district rather than the local level has contributed to the wide divergence betweennational and individual interests. Safari hunting accounts for the bulk of revenue earned in communalareas. A ban on imports of hunting trophies, particularly from elephants, would have a very negativeimpact on community wildlife schemes.
1.2.2 The Significance of "Bush Meat"The second objective of the study is to provide data on the importance of bush meat as a source
of food and income. As expected, this differs considerably across countries.
The changing importance of wildlife as meat, popularly called bush meat, has been welldemonstrated in the Ghana paper. Bush meat in the past used to be the most common source of animalprotein especially in the rural areas; it is still regarded as the most preferred meat. Grasscutter is the mostpopular species, not solely because it is abundant but also because of its quality meat. Today, however,bush meat constitutes a small portion of the protein intake of most people, especially those in the ruralareas because of the meat's scarcity, relatively high price, and unavailability in small affordable pieces.
In Kenya, game meat has mainly been sold in butcheries as a luxury item. Although most bushmeat is obtained illegally, game meat sold in butcheries has been cropped on license. Its value can beenhanced two- or three-fold by processing it into such luxury products as smoked, dried (biltong), orsausage products. Wildlife meat is a gourmet food and not necessarily viable if marketed cheaply. Ifillegally harvested, however, it is cheap enough to be consumed by the low income sector of rural andperi-urban areas. No literature for Kenya quantifying bush meat consumption was found.
In Namibia, game is widely utilized by commercial farmers, but only a specialized minority doso commercially. An important reason for this is that commercial game ranching currently suffers fromthe problem of low prices per kilogram in comparison to livestock. This could largely be alleviated byimproved and sustained access to venison export markets. The report concludes that detailed research isneeded on this issue.
In Zimbabwe the consumption of bush meat has been virtually ignored, although theconsumption of rabbits, rodents, and wild flora is widespread. The consumption of larger mammals isalmost exclusively confined to isolated communities with large wildlife and small human populations.Assuming that some 25,000 households live in such areas, a rough estimate of the value to the nation oflarge mammal bush meat is less than US$1 million per annum.
5

THE ECONOMICS OF WILDLIFE
1.2.3 Policy Implications of the FindingsThe third objective of this study is to consider policy implications of the findings under the first
two headings.
The Ghana report argues that a reduction of interest rates on loans to wildlife enterprises andincrease in research on wildlife feed and extension to popularize grass cutter cultivation would greatlycontribute to the viability of wildlife enterprises. Although research and extension can be seen aslegitimate public interventions, it is less convincing to argue that, for example, breeding of grasscuttersshould qualify for preferential credits, as compared to other economic enterprises.
Kenya government policy on wildlife management recently has undergone major changes in anattempt to address the fact that the pattern of land tenure is changing swiftly toward one of privatelyowned land. The Kenya Wildlife Service (KWS) is experimenting with wildlife utilization options. Theauthors of the Kenyan report argue that government and KWS in particular should consider taking moreof a facilitating role and less of a regulatory role with direct involvement.
Present policy and legislation on wildlife utilization in Kenya contains contradictions, mainly inthe area of implementation-for example, offtake rates for cropping at well below observed reproductiorrates. Agricultural policy seeks to utilize areas for small-scale irrigation that are dry season and wildlifegrazing areas or to develop new plant strains that are suitable for arid and semiarid areas. The drivetoward increased settlement in these areas is an established strategy, despite obvious conflict withwildlife.
The Kenyan report argues that the evidence from the case studies involving community landssuggests that the key to long-term conservation and utilization of wildlife lies in ownership andmanagement of land. The authors caution, however, that even where key inputs of management andmarketing have been provided to group ranches in the Maasai Mara and Kajiado, the pressures that resullin a deterioration in the tourism experience continued: these include expansion of cropping andintensification of grazing, the unplanned construction of unattractive buildings and settlements,poisoning of predators and exclusion of grazers, and insecurity and harassment of visitors.
The report from Namibia argues that existing legislation presents an obstacle to communitiesthat aspire to realize these gains in communal areas. Locally cropped game meat cannot legally be soldand communities cannot claim revenue from those who utilize it. Legislative reform is thereforenecessary for communities to achieve the potential benefits from wildlife.
It is also argued that livestock farming in Namibia continues to be favored by policies that permia large proportion of the costs to be borne by society as a whole. As a result, livestock farming can be ahighly remunerative activity for the individual farmers concerned. The authors recommend that usercharges should be introduced and tax advantages limited so that the true cost of owning livestock isborne by the owner.
In Zimbabwe changes in the legislation and institutions have transformned the role of wildlifefrom a state-owned treasure to be preserved and isolated in national parks into an active resource,controlled and utilized by landholders. Wildlife has increased significantly in commercial farm lands assafari hunting, live animal sales, and tourism are incorporated into the farm systems. In the communalfarming areas, awareness has markedly increased of the contribution of wildlife, but revenue distributionremains controversial.
Reductions in macroeconomic distortions in Zimbabwe and a more competitive marketingsystem have resulted in marked increases in district returns from wildlife. Evidence also exists of
6

BACKGROUND AND LESSONS
increasing empowerment and effectiveness of local communities, ensuring their more activeparticipation in the benefits from and control over their resources; however, poaching and new settlementthreaten to overwhelm those areas that still have viable wildlife populations.
1.2.4 Environmental ImpactsEvidence of comparative environmental impacts of wildlife and livestock remains almost
completely qualitative and anecdotal. The Namibian report notes that wildlife is better adapted to thecountry's arid and semiarid environment than livestock. The ability of game to range widely aroundwater points can reduce overgrazing; however, wildlife does not offer an automatic solution to theproblems of overgrazing. If farmers are unable or unwilling to destock when the carrying capacity oftheir land is reduced by drought, game is also likely to be overstocked-and overgrazing will result.
The report from Zimbabwe contains a section that explores the environmental impact of wildliferelative to cattle. Some evidence exists that the former is less severe, but the strongest evidence showsthat the environmental impacts are related to the stocking rate rather than the type of herbivore involved.Wildlife has an advantage to the extent that financially viable enterprises can be maintained with lowerstocking rates than alternative land uses. More important, a wildlife enterprise directly depends onmaintaining an environment that can continue to attract visitors.
1.3 The World Bank and Wildlife ProjectsBetween 1970 and 1992, the World Bank invested in fifteen wildlife-related projects in Africa.
The total lending volume was US$368 million. This corresponds to about 1 percent of the Bank's totallending during the same period. Lending for wildlife projects has increased, with about three-quarters ofthe lending falling after 1989.
Geographically, wildlife projects are concentrated in East Africa, especially Kenya, with aboutone third of the lending volume on its own. Other projects with a wildlife component have beensupported in Somalia, Malawi, Botswana, C6te d'Ivoire, Zimbabwe, Ghana, Central African Republic,Burkina Faso, and Mali.
Projects have occurred in three types of categories: (a) wildlife-based tourism development, (b)wildlife conservation in protected areas, and (c) wildlife management for the benefit and with the activeinvolvement of local people. Obviously, some projects have activities that cover more than one category,but the latter type of project appears to be increasingly emphasized. The evidence presented here givesfurther impetus for this drift toward community-based wildlife projects, while acknowledging theobstacles to successful implementation that the case studies, in particular from Kenya and Zimbabwe,have brought out.
Most fundamental, the importance of a sound policy framework has been well ijlustrated in thecase studies. Localproperty rights assignment andfinancial rewards to match the economic benefitsmust be channeled back to local communities and individual farmers. To be able to compete withlivestock and other economic activities occupying the same territory, wildlife needs a fair chance andequal "rules of the game." That is an area to which the Bank can contribute in its dialogue withborrowing countries.
7

THE ECONOMICS OF WIILDLFE
1.4 References
Asibey, E. 0. A. 1974. "Wildlife as a Source of Protein in Africa South of the Sahara." BioConservation 6(l):32-39.1990. "Status and Potential of Wildlife and Other Non-Timber Products in Tropical Forestry in Africa."Paper presented at ITTO international seminar on status and potential of nontimber products in sustainabledevelopment of tropical forests. Nov. 17, 1990.
Asibey, E. 0. A. and J. Bojo. 1992. "Economics of Living with Wildlife." Mimeograph. The World Bank.Kiss, A. 1990. Living with Wildlife: Wildlife Resources Management with Local Participation in Africa World
Bank Technical Paper No. 130. Africa Technical Department Series. Washington, D.C.: The World Bank.Talbot, L. M. 1963. "Comparison of the Efficiency of Wild Animals and Domestic Livestock in Utilization of East
African Rangelands." In Conservation of Nature and Natural Resources in Modern African States. IUCNNew Series No. 1. Morges, Switzerland: IUCN.1966. Wild Animals as a Source of Food Special Scientific Report, Wildlife, No. 98. Washington, D.C.:U.S. Department of the Interior, Fish and Wildlife Service, Bureau of Sport Fisheries and Wildlife.
World Resources Institute and the International Institute for Environment and Development. 1988. WorldResources 1988-89. Prepared in collaboration with the United Nations Environment Programme. NewYork: Basic Books.
8

THE ECONOMICS OF WILDLIFE
Abstract
The value of wildlife in Ghana, as in most West African countries, is by and large consumptive.Ghanaians have a long tradition of relishing bush meat as a food resource. Despite the intensivedepletion of wildlife in Ghana, wild animals and their products continue to play significant roles in thehousehold economy.
This study analyzes the actual and potential significance of wildlife as a source of food andincome. Particular emphasis is placed on the grasscutter, which is the most popular and abundant speciesof bush meat. The study assesses the financial and economic viability of wildlife management systemsbased on Net Present Value and Internal Rate of Return criteria. Both the policy implications and therelative environmental impact of wildlife exploitation are taken into consideration.
Economic and financial analyses both indicate that private wildlife ranching is more profitablethan official ventures, whereas wildlife domestication emerges as the most profitable. Furthermore,small-scale farming is more profitable than large-scale farming. In the financial analysis, small-scalegrasscutter farming shows the best returns, followed by poultry and rabbit, whereas poultry and small-scale grasscutter tend to be viable using the economic analysis. In considering the relative return to cropsand wildlife, the grasscutter compares favorably to the most profitable cropping activities.
The analysis favors providing support to small-scale, domesticated wildlife in the form of breeddevelopment, credit, and technical information. Encouraging such profitable activity in rural areas wouldenhance income-earning capability and increase protein intake of rural dwellers.

Chapter 2:
The Economics of Living with Wildlife in Ghana
By K. A. Tutu, Y. Ntiamoa-Baidu, and S. Asuming-Brempongt
Ghanaians have a long tradition of relishing bush meat as a food resource. All species of wildanimals, ranging from a variety of invertebrates to monkeys and including termites, snails, reptiles, androdents, are eaten. In the past, large areas of Ghana's forest and savanna lands supported significant anddiverse populations of wild animals. Wildlife was the main source of animal protein, a source ofmedicines, and a symbol of cultural identity and ethnic origin.
Communities in Ghana managed their wildlife resources through traditional rules that protectedsome species and Tegulated exploitation. In the colonlial era, the establishment of protected areas underthe control of central government was introduced in the 1 920s. After independence, new policies wereput in place to manage wildlife resources more efficiently.
Ghana's population has grown rapidly in past decades to 16.2 million on a land area of 23.9million hectares. The increased demand for resources has led to overexploitation of wildlife andextensive modification of wildlife habitats. About 70 percent of the country's original 8.22 millionhectares of closed forest has been destroyed, and the deforestation rate is put at 220 square kilometers perannum (IUCN 1988, WRI 1990, IIED 1992). Most wild animal species are believed to be seriouslydepleted, and at least eighteen of the 222 mammalian species recorded in Ghana are under threat (IUCN1988).
Despite the intensive depletion of wildlife, wild animals and their products continue to playsignificant roles in the economy. The current rate of exploitation of forest and wildlife resources,however, is unsustainable. An urgent need exists, therefore, to develop sustainable systems forimproving the wildlife resource base. Living with wildlife entails not only increased access to foodresources, employment, and sources of income but also the loss of access to traditional lands and croplosses from wild animal damage.
* The original version of this paper (sixty-three pages and nine appendixes) has been edited for the purposes of this publication. The full-
length version can be requested from AFTES.
t All three authors are affiliated with the University of Ghana, located in Legon, Ghana: Tutu is a lecturer in the Economics Department,Ntiamoa-Baidu is a senior lecturer in the Department of Zoology, and Asuming-Brempong is a lecturer in the Department of Agricultural
Economics and Farm Management.
11
THE ECONOMICS OF WILDLIFE
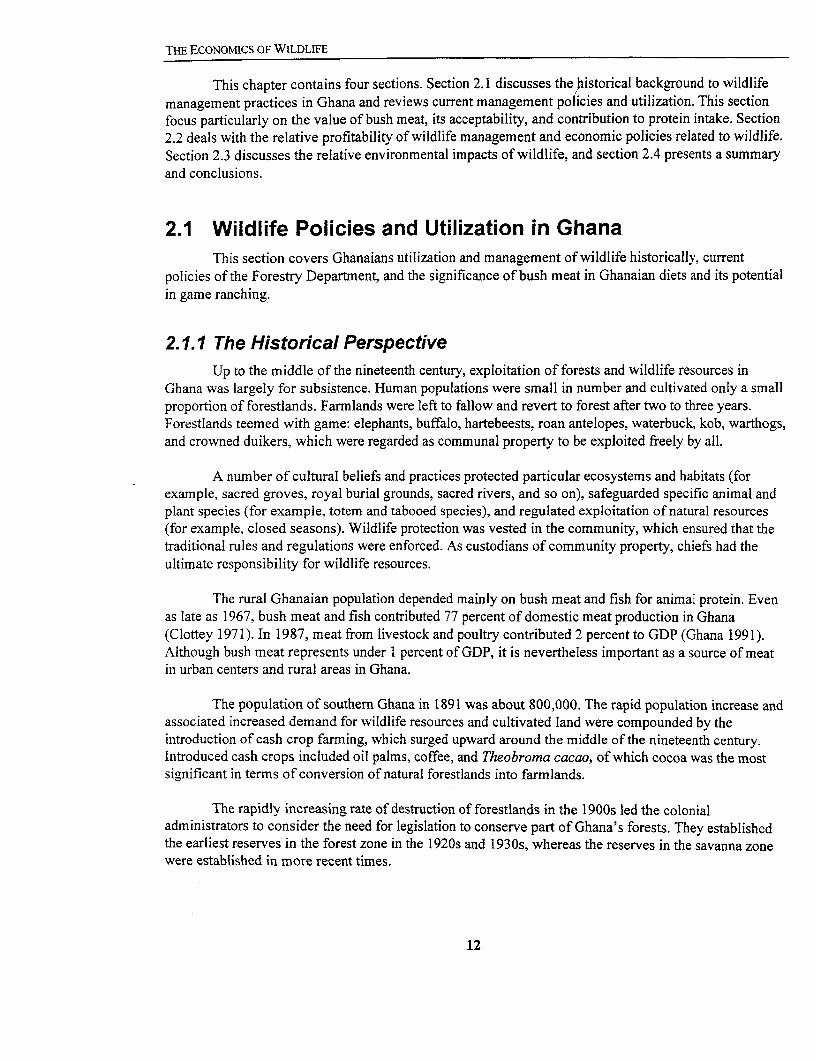
This chapter contains four sections. Section 2.1 discusses the historical background to wildlifemanagement practices in Ghana and reviews current management policies and utilization. This sectionfocus particularly on the value of bush meat, its acceptability, and contribution to protein intake. Section2.2 deals with the relative profitability of wildlife management and economic policies related to wildlife.Section 2.3 discusses the relative environmental impacts of wildlife, and section 2.4 presents a summaryand conclusions.
2.1 Wildlife Policies and Utilization in GhanaThis section covers Ghanaians utilization and management of wildlife historically, current
policies of the Forestry Department, and the significance of bush meat in Ghanaian diets and its potentialin game ranching.
2.1.1 The Historical PerspectiveUp to the middle of the nineteenth century, exploitation of forests and wildlife resources in
Ghana was largely for subsistence. Human populations were small in number and cultivated only a smallproportion of forestlands. Farmlands were left to fallow and revert to forest after two to three years.Forestlands teemed with game: elephants, buffalo, hartebeests, roan antelopes, waterbuck, kob, warthogs,and crowned duikers, which were regarded as communal property to be exploited freely by all.
A number of cultural beliefs and practices protected particular ecosystems and habitats (forexample, sacred groves, royal burial grounds, sacred rivers, and so on), safeguarded specific animal andplant species (for example, totem and tabooed species), and regulated exploitation of natural resources(for example, closed seasons). Wildlife protection was vested in the community, which ensured that thetraditional rules and regulations were enforced. As custodians of community property, chiefs had theultimate responsibility for wildlife resources.
The rural Ghanaian population depended mainly on bush meat and fish for animal protein. Evenas late as 1967, bush meat and fish contributed 77 percent of domestic meat production in Ghana(Clottey 1971). In 1987, meat from livestock and poultry contributed 2 percent to GDP (Ghana 1991).Although bush meat represents under 1 percent of GDP, it is nevertheless important as a source of meatin urban centers and rural areas in Ghana.
The population of southern Ghana in 1891 was about 800,000. The rapid population increase andassociated increased demand for wildlife resources and cultivated land were compounded by theintroduction of cash crop farming, which surged upward around the middle of the nineteenth century.Introduced cash crops included oil palms, coffee, and Theobroma cacao, of which cocoa was the mostsignificant in terrns of conversion of natural forestlands into farmlands.
The rapidly increasing rate of destruction of forestlands in the l900s led the colonialadministrators to consider the need for legislation to conserve part of Ghana's forests. They establishedthe earliest reserves in the forest zone in the 1920s and 1930s, whereas the reserves in the savanna zonewere established in more recent times.
12

GHANA
The colonial administrators' approach to game preservation lacked the necessary human andfinancial resources for effective implementation. The first game reserves were constituted in 1909. Underthe Game Preservation Ordinance, only nonnatives required a license to hunt, a provision that hadpractically no effect on wildlife protection since nonnative hunters were relatively insignificant. Collins(1961) sums up the result: "Official ignorance and indifference achieved what might be expected: thedestruction almost to the point of extinction of thousands of elephanis, hundreds of antelopes, monkeys,and pigs, all slaughtered without consideration of age or sex."
In 1953 the colonial administrators put game preservation under the Tsetse Control Unit with themandate of eradicating the tsetse fly. Ironically, the policy was to eliminate the tsetse fly by theextirpation of thousands of herbivorous game animals. They constituted the Black Volta Game reservepresumably to concentrate the country's big game and its attendant tsetse flies. Again, no resources weremade available to manage this or any of the earlier reserves.
Soon after independence in 1957, the new government abolished the Tsetse Control Department,transferred the Game Section of the Tsetse Control Unit to the Department of Forestry, and amended theWild Animal Preservation Ordinance. It dereserved several depleted reserves and proposed three newreserves: Mole, Shai Hills, and Owabi (Cansdale 1964). The enactment of the Wild Animal PreservationAct formed the basis for the present wildlife conservation practices in Ghana.
In 1965 the government upgraded the Game Branch of the Forestry Department to a fulldepartment, the Department of Game and Wildlife, and gave it responsibility for managing Ghana'swildlife resources both within and outside conservation areas. Based on the provisions of the WildAnimals Preservation Act, the government legally established the first batch of six wildlife conservationareas in 1971.
The government adopted the Ghana Wildlife Conservation Policy in 1974. The policy's aimswere to survey, conserve, and scientifically manage the country's wildlife resources, placing majoremphasis on national parks and other protected areas and establishing wildlife conservation areas thatcontained representative assemblages of Ghana's fauna and flora. The main deficiencies of the 1974policy were twofold: its strict protectionist approach (when enacted, essential at that point if any of thecountry's wildlife resources were to be saved) and its failure to involve local communities in managingtheir wildlife resources.
A revision of the 1974 policy is currently under discussion by the Department of Game andWildlife under the Ghana Government/World Bank Forest Resources Management Project. The draftrevised policy is based on the conviction that Ghanaians have the right to resources needed for areasonable standard of living and the right to derive economic and other benefits from wild- species. Atthe same time, they have the responsibility to ensure that their use of wild species is sustainable. The newpolicy places greater emphasis on conserving the country's wildlife resources for the benefit of localcommunities and the contribution that local communities can make toward the effective management ofthe country's wildlife resources.
2.1.2 Current Wildlife Management PracticesPresently, the Forestry Department administers over 280 forest reserves covering a total area of
23,729 square kilometers. About 75 percent of the reserves are exploited for timber, whereas theremaining are protection reserves. The management plans for the forest reserves include no clear wildlife
13

THE ECONOMICS OF WILDLIFE
management practices but do afford a measure of wild animal protection, since hunting requirespermission.
Currently, sixteen legally constituted wildlife conservation areas comprise six national parks,one strict nature reserve, six game production reserves, and three wildlife sanctuaries. In addition, thedepartment has proposed two wildlife conservation areas. It has estimated the total area of reserveswithin this zone at about 1.8 million hectares or 73 percent of the remaining forests in the country. Inaddition to the forest and wildlife reserves controlled by the central government, a number of smalltraditionally protected patches of forest are scattered all over Ghana.
The hunting, capture, and destruction of any animal as well as the collection or destruction ofany plant is legally prohibited in all wildlife conservation areas. The chief game and wildlife officer hasthe authority to grant permission for the collection of flora and fauna from reserves but has hithertoexercised this authority only for the collection of specimens for scientific purposes. In the case of forestreserves, the policy is more flexible regarding usage. Production reserves may be given out as timberconcessions and are logged under prescribed conditions. In most cases, the local people who originallyowned the land retain the rights for hunting and collection of certain forest products from forest reserveswith permission from the forestry officer. Farms may also be allowed on small portions of somereserves.
The strategy adopted for the protection of both forest and wildlife reserves involves externallyenforced exclusion of local communities. Little or no attempt has been made to encourage participationof local communities in managing protected areas.
The effectiveness of protective measures in forest and wildlife reserves vary from one reserve tothe other, but no reserve is 100 percent protected. Forest reserves are under constant pressure from illegafarming, and illegal hunting continues in all wildlife conservation areas. Overexploitation remains themajor cause for the decline of wild animal populations in Ghana. In a study of local people's perceptionand value of forest and wildlife, 60 percent of the respondents attributed scarcity of bush meat anddecline in wild animal populations to overexploitation, 36 percent attributed the decline to habitatdestruction (through bush fires, farming, and timber logging), whereas the remaining 4 percent attributedit to natural causes such as death and predation (Ntiamoa-Baidu and others 1992).
Quantitative data on populations of wild animals within and outside protected areas in Ghana arescanty. Species records are, however, available for most of the wildlife conservation areas. Mammalianrecords for the country include fifteen species of primates, seventeen or eighteen species of antelopes,and thirteen species of fruit bats. Antelope species that are still locally common and heavily exploited asbush meat include Maxwell's duiker, bay duiker, black duiker, bushbuck, and royal antelope. Threespecies of rodents--the grasscutter, the brush-tailed porcupine, and the giant rat-also feature commonl:on the bush meat markets.
Although no regular wild animal population studies exist to enable comparison of numbers in thepast to what prevails at present, the numbers of wild animals in Ghana have clearly declinedconsiderably over the years. This is evident from the present scarcity of bush meat as compared with theabundance referred to by earlier writers (Collins 1961, Cansdale 1964) and the qualitative descriptions oianimal abundance in various reserves in the past as compared to present populations.
14

GHANA
Information on public spending on wildlife management and revenue earnings from wildlife areavailable from the Department of Game and Wildlife (GW). Data on other expenditures, such as costs ofpest control, crop losses due to damage by wild animals, and revenue and income from wildlife productsand related industries, are not available. GW has an approved staff establishment of 1,051 plus anadditional 89 unestablished posts comprising grades such as artisans, drivers, and watchmen. Over 68percent of the approved professional staff positions remain vacant, whereas only 70 percent of thetechnical positions are filled. The poor staffing situation of the department is partly due to the lack ofgraduates with appropriate training and the unattractive conditions for wildlife staff.
Governmental budgetary allocation and actual annual expenditures on wildlife management forthe five-year period 1988-92 increased from 1.6 million (cedis) in 1988 to 03.3 million in 1992(constant 1977 cedis). The actual real expenditures fluctuated more than the approved real allocation.The largest fall in real expenditures by 25 percent occurred in 1992, not a healthy development for thewildlife sector, especially since capital expenditures experienced a real fall. In all but one year (1991),10-40 percent of the approved budget went back to the government chest due to constraints inimplementing approved programs, a freeze on expenditure under specific budget lines by centralgovernment, or both. The bulk of the money allocated and spent every year went into personnelemoluments.
Compared with government expenditure, revenue earnings by GW are insignificant. The mainsources of revenue were licenses on wild animal exploitation and trade (game hunting and exportpermits), entrance fees to the zoos, and motel/rest house operations. The total earnings over the five-yearperiod 1988-92 amounted to 4.4 percent of the actual expenditures for the same period. This means thatwildlife management is still far from being self-supporting and will continue to depend on public fundingfor a long time.
Land tenure systems in Ghana vary from traditional communal tenure (in which every memberof a tribe, clan, or family has the right to cultivate a piece of land and transmit it to their descendants) tocustomary freeholds (in which a member of a group can enjoy cultivation rights in perpetuity but haslimited powers of disposition through sale) to a whole range of land-holding categories, includingsharecropping and absolute ownership. Wildlife, however, is still regarded as communal property, andpeople are free to hunt anywhere outside protected areas including farmlands. This situation could createproblems of access and ownership of the animals in the case of private game ranches, unless such areaswere completely fenced; this has perhaps contributed to the lack of private investments in wildliferanches in the country.
Under the Wild Animals Preservation Act, the government has the right of compulsoryacquisition of any land considered to be suitable for wildlife conservation without paying compensationto the original owners of the land; it has established most of the country's wildlife conservation areasunder this system. More recently, however, a number of communities that owned land within wildlifeconservation areas have demanded compensation in lieu of user rights.
2.1.3 Wildlife Production and Utilization in GhanaThis section presents a new survey of the significance of bush meat in the Ghanaian diet, reflects
on the experience in grasscutter domestication, and finally discusses the potential for game ranching inGhana.
15

THE ECONOMICS OF WILDLIFE
The Significance of Bush Meat
The importance of bush meat as a food resource in Ghana is well documented. Surveys initiatedin Ghana by Asibey in the 1970s were the first attempt to document the economic value and the highdemand for bush meat in the country.
Asibey (1977) estimated that 70 percent of the Ghanaian population ate bush meat, whereaswildlife constituted the main source of animal protein for rural communities. In a survey ofnontraditional forest products in selected areas in southern Ghana, Falconer ( 1992) found that bush meatwas one of the most valued forest products, constituting an important source of meat in both rural andurban diets, although eaten in small quantities. Ninety-five percent of the people interviewed in thesurvey would eat bush meat if it were available. The survey found, however, that the importance of bushmeat in rural and urban diets varied greatly and that consumption was declining as a result ofunavailability.
Virtually every wild animal species is acceptable as a food resource to some groups. Thissituation has resulted in serious overexploitation of wildlife and severe depletion of the populations ofmany species. Presently bush meat is unavailable to most rural communities because hunters prefer tosell their catch and buy cheaper fish to feed their families and it is beyond the means of many urbandwellers.
To assess the current value of bush meat and its contribution to protein intake, the authorsselected three sites for a detailed survey:* (1) Doryum (a rural community), (2) Mankesim (an urbantown), and (3) Accra (the capital city of Ghana). Doryum is a village within the Shai traditional area, 45kilometers from Accra. Its population was 754 as of the 1984 census. It is the nearest village to the ShaiHills Game Production Reserve in which a major game-ranching venture is planned. The data collectedcould enable the assessment of the current bush meat situation and the acceptability, as well as possiblevalue, of the meat produced from the ranch to the local communities. Mankesim is situated 105kilometers west of Accra in the central region on the main Accra-Cape Coast road. The population of thetown as of the 1984 census was 8,386. The town and its surrounding villages are traditionally popular forthe abundance of bush meat, particularly grasscutters. Fresh bush meat for sale is common along theroadside; a large proportion of the bush meat sold at the main bush meat market in Accra, Kantamantomarket, came from this area. This area provides a good comparison with Doryum where, like most ruralcommunities in the southern part of Ghana, bush meat is relatively scarce.
At both Doryum and Mankesim, the study focused on households, using questionnaires todetermine the meat preference of members of the community as well as protein composition of their diet,bush meat consumption, and sources of supply. The method of selection involved interviewing inalternate houses. In each household, researchers interviewed one or two persons. In view of the sheer sizeof Accra, the survey was limited there to chop bars (traditional restaurants that serve both domestic meatand bush meat dishes). Researchers spent three to four hours at each establishment to interviewcustomers. They attempted to interview every person who came to the bar during the period, but somepeople declined to answer questions. Researchers interviewed a minimum of 20 persons at each chop barand visited a total of 25 chop bars. These surveys were carried out in May and June 1993. The totalnumber of persons interviewed in each area were: 109 in Mankesim, 88 in Doryum, and 374 in the chopbars in Accra.
* The details of this study can be found in the full-length version of this report
16

GHANA
Bush meat remains popular in Ghana, and most people would eat it if it were available. Amajority of the people interviewed in all three localities answered in the affirmative when asked thequestion "Do you eat bush meat?" (Doryum, 95.5 percent of responses; Mankesim, 86 percent; Accra,92.5 percent). In most cases, however, the answer was followed by a statement like "but I haven't eatenany for a long time because I cannot get it." The few people encountered who did not eat bush meat didnot do so mainly for religious reasons.
The meat preferred by the communities interviewed was determined by asking people to indicatetheir preference (most preferred and second choice), given a choice of bush meat, poultry, pork, mutton,beef, and fish. In all three areas, bush meat was the most preferred meat (Doryum, 51 percent of scores;Mankesim, 37 percent; and Accra, 71 percent), followed by fish. Of the different bush meat species, thegrasscutter was the favorite in all three areas followed by the royal antelope. The popularity of bushmeat, and more specifically the grasscutter, was further confirmed by the results of the survey of themeat component of meals eaten by customers visiting chop bars in Accra where they had a choice ofvarious types of meat and fish.
Two methods were used to assess the contribution of bush meat to the actual protein intake of thepeople interviewed: (1) by scoring the number of times bush meat was eaten in a week and (2) byrecording the meat items used in preparing the previous day's meals (breakfast, lunch, and supper).Despite the obvious popularity of bush meat among the communities studied, the actual proportion oftotal protein intake accounted for by bush meat was small. Over 70 percent of the people interviewed inthe households in both Doryum and Mankesim never ate bush meat. This trend was confirmed by the lowfrequency of bush meat in the items used in preparing the previous day's meals, 2.4 percent in Doryumand 4.6 percent in Mankesim. Fish accounted for the greatest proportion of animal protein intake in thecommunities studied.
The low contribution of bush meat to the protein intake was attributed to unavailability due toscarcity or, in areas where bush meat was relatively abundan. (for example, Mankesim), due to highprices and the fact that the meat was not retailed in a form (for example, in small pieces as is done in citymarkets and chop bars) that the ordinary person could afford.
Market centers in four localities were selected for the study on bush meat exploitation and trade:Accra in the south, Kumasi in the center, Sunyani in the midwest, and Tamale in the north. Apart fromthe need for countrywide coverage, selection of the four centers was also based on the fact that somestudies had been done in those areas in the past (Asibey 1966a-b, and 1974a-d) and therefore theyprovided the opportunity for comparison. A visit to Tamale in mid-April 1993 showed that the bush meatmarket there had collapsed. This has been attributed to the decline in wild animal populations and thefact that the hunters preferred to sell to bush meat traders from the south.
The outlet for bush meat in Sunyani was mainly through chop bar operators, each of whom wassupplied by a group of hunters. Kumasi had three main bush meat market centers, Atwemonom(Kumasi), Kejetia, and Central markets. The Atwemonom market had a well-organized bush meat tradeand served as the main outlet for fresh bush meat, whereas most of the smoked bush meat came to theCentral market. Although smoked bush meat was sold in several markets in Accra, the Kantamanto(Accra) market was the main center for sale of fresh bush meat in Accra. The studies concentrated onvolume of bush meat trade, species exploited and on the operations of hunters and bush meat traders inthe main centers, Atwemonom, Kantamanto, and selected chop bars in Sunyani. Data from each centerwere collected over a period of one week.
17

THE ECONOMICS OF WILDLIFE
Data on hunters were obtained from the Atwemonom market, where hunters brought their catchdirectly to middlemen for retail. A total of twenty-five hunters, all males, were interviewed. All of themwere part-time hunters whose main occupations were either as farmers, drivers, or artisans. The twoprimary methods used were shooting with guns and trapping by snares. In the past, communal huntingwas common but, with the ban on communal hunting, most hunters operated individually. The hunters'direct costs were the price of the shot gun (often owned by someone else who shared the huntingproceeds with the hunter), the cost of ammunition (¢ 180-200 per cartridge), the cost of hunting lamp anthe cost of a game license (varied with the type of animal hunted, ranging from ¢300 for a grasscutter to012,000 for large game). The average income in 1993 of 09,850 per week from hunting comparesfavorably with the salaries of government employees in grades equivalent to the full-time jobs of thehunters interviewed.
The bush meat trade is dominated by women. Both the "middlemen" (bush meat traders A), whcwere supplied directly by the hunters, and the retailers (bush meat traders B), who purchased from the"middlemen" for retail to consumers at both Kantamanto and Atwemonom, were mostly women. Thefew men encountered in the trade were chop bar operators who also bought their meat from traders A ancan therefore be classified with the trader B group. The interviews indicated that the business was handedown by family members.
Traders were reluctant to answer direct questions on their income from the bush meat trade. Anindication of profits made by traders A was obtained by recording the purchase price and the sellingprice wherever possible. The profit margin varied with the species of animal but ranged from 30 to 250percent.
During a one-week survey, every animal that came to the market was recorded, as well as thespecies, numbers, and prices. The total number of animals recorded were: 742 for Kantamanto, Accra;534 in Atwemonom, Kumasi; and 276 for Sunyani. The total purchase price in millions of cedis was 3.2,2.9, and 1.1 respectively for the three areas.
A preliminary analysis of the weights and prices of the most common animals coming intoKantamanto market in 1974, 1985, and 1993 is presented in table 2.1. The mean real prices of all speciesfell from 1975 to 1993 with the exception of bushbuck, which experienced an increase from 1975 to1985. This could be due to the reduced real income during the latter half of the 1980s and 1990scompared to 1975. This certainly resulted in a reduction of demand, making the real price go down, andties in with the finding that there is little indication of decreases in the sizes of animals being hunted.
In the case of the bushbuck, the average weight of animals being marketed in 1993 was actuallyabout twice what it was in 1975. A preliminary analysis of the volume of bush meat coming to themarkets also indicated that, whereas there have been changes in the species composition and volume ofindividual species traded, the overall level of exploitation had not changed much. This would suggestthat, although the populations of most wild animal species are believed to be declining in Ghana,sufficient effort continues to be put into exploitation.
18

GHANA
Table 2.1: Changes in Price of Common Animals Marketed at Kantamanto MarketSpecies Mean price per head constant 1977 (cedis)
1975 1985 1993Grasscutters 38 26. 18Brush tailed porcupines 30 18 10Giant rats 6 4 3Maxwell duikers 44 36 18Black duikers 89 68 47Red flanked duikers N/A 39 23Royal antelopes 22 13 7Bushbuck 78 91 63Spot-nosed monkeys 21 15 5
Although the real prices of bush meat were declining over the years compared to other high-valued meat such as beef and mutton, the prices of bush meat were relatively higher. Between 1970 and1973, the price of grasscutters was higher than beef but lower than mutton, whereas in 1990 and 1993 itwas higher than both beef and mutton. The average bush meat price was higher than for beef and muttonin 1990 but lower in 1993. Using prices to value the significance of meat, we see that bush meat ingeneral and the grasscutter in particular is highly valuable and comparable to the main leading meatsources of beef and mutton.
Grasscutter Domestication
In the early 1970s, significant effort was put into the domestication of the grasscutter, the mostpopular bush meat in many parts of Ghana. The project was initially based within GW, whose extensionofficers assisted interested farmers in obtaining breeding stock and offered technical expertise. The efforthas met with a measure of success: a number of people keep grasscutters in their backyards in Accra;however, GW has not been able to maintain contact with farmers and information on the total number ofgrasscutter farmers is not readily available.
Grasscutter farming is a worthwhile venture that must be seriously considered in any attempts toincrease animal protein supply in Ghana. More research should be conducted into (1) selective breedingto improve litter size, (2) diseases, and (3) feed options with the possibility of developing commercialfeed to supplement the natural grass diet during the dry season. Both the Animal Research Institute(Council for Scientific and Industrial Research) and the Department of Animal Husbandry (Ministry ofAgriculture) have recently initiated studies to promote large-scale farning of grasscutters.
Shai Hills
The potential for game ranching has not been sufficiently explored in Ghana. The concept ofwildlife (or game) ranching is used here to mean the culling of wild animals from habitat managedspecifically for this objective, possibly in combination with other activities such as livestock rearing. Theconcept is also used here to include the keeping and breeding of common wild animals, such as thegrasscutter, in a captive environment. No private game ranches exist; the only proposed governmentwild animal ranch, Shai Hills, has been on the books since the early 1 970s. The reserve covers an area of4,800 hectares and is situated approximately 50 kilometers from Accra, potentially serving a largenumber of people from the Accra and Tema metropolitan areas in terms of recreation, education, andresearch. The objective for protection was to conserve flora and fauna to produce bush meat.
19

THE ECONOMICS OF WILDLIFE
The entire reserve was fenced and dams constructed to provide year-round sources of water.Plans for restocking were never implemented and, despite the protection given over the years, animalpopulations have in many cases declined in Shai. An invasion of the neem tree Azadirachta indica hasseriously threatened the natural vegetation. The holding pens are still in fairly good shape and requireminimal repairs to put them into service, but several sections of the fence are now badly damaged. Of thnine dams constructed in the reserve, only two (those constructed by the local herdsmen) regularly holdwater.
Under the World Bank/Ghana Forest Resources Management Project, GW has prepared newmanagement plans for the Shai Hills Game Production Reserve. The proposed management strategyadvocates a zonation system to include a 38.5-square-kilometer multiple use zone, whose managementobjectives would include promotion of game ranching for meat production.
The management plan proposes that animals be captured from Mole National Park and transported toShai Hills for restocking purposes. The Multiple Use Zone within the Shai Game Production Reservecould support an estimated 924 bushbuck, 543 kob, 231 waterbuck, or 177 roan antelopes.
2.2 The Relative Profitability of Wildlife ManagementThis section discusses the major land-use options in Ghana, presents a financial and economic
comparison of a set of wildlife and livestock activities, reviews the returns to food crop cultivation, andfinally highlights a number of links between economic policies and wildlife utilization.
2.2.1. Competing Land UsesSeven major land use patterns are presented in table 2.2. This means that some annual crops ma-
be found in a fallow area. Savanna woodlands are the largest surface area. The savanna zone is dividedinto the coastal or Guinea savanna and the north or Sudan savanna. Only about 12 percent of the land ispresently cultivated; however, the area for annual crops includes only the area cultivated in a particularyear.
The Livestock Sector
The main livestock areas for cattle and small ruminants, sheep, goats, and pigs are in the savann.woodlands. More than 30 percent of farm families keep ruminants. The livestock subsector contributedabout 5 percent of agricultural GDP in 1987 or about 2.3 percent of total GDP.
The national herd has risen to an estimated 1,150,000 in 1991 (ISSER 1993). Almost 75 percentof the herd is concentrated in the northern three regions. Most cattle are owned by sedentary farmers andgrazed on communal lands for free. There are a few public and joint public/private ranches. It is onlyduring community ceremonial periods that farmers are asked to pay a token fee in cash or in kind. Fewfarms, if any, grow fodder for livestock feed, and there is little attempt to conserve crop residue for dry
20

GHANA
Table 2.2: Land Use in GhanaLand Use Area (J,OOOs of kim) Percent of totalSavanna woodlands 71 30Unimproved pasture 36 27Forest reserve 21 9Tree crops 17 7Annual crops 12 5Wildlife reserve 12 5Unreserved forest 5 2Other 65 15Total 239 100Source: Ghana 1990a-b, p. 35.
season feeding. On average traditional farmers own three to five head of cattle. Animals from severalcompounds may make up the grazing herd, often with Fulani people engaged as herdsmen. In most cases,a herd may be comprised of cattle owned by absentee urban dwellers.
It is estimated that there were about 2.56 million sheep and 2.83 million goats in Ghana in 1990(Ghana 1991). Although a few farmers may have large herds of sheep or goats, large numbers of smallfarmers throughout the country own two to five animals, which are tethered in or close to the compoundor tended by children.
The Crop Sector
Farm size is generally small with 60 percent of all farms less than 1.2 hectares, whereas only 15percent have a size greater than 2 hectares (ISSER 1993).
Ghana's farming systems depend on long bush fallow periods, mixed cropping and some limitedintegration of crop/livestock farming to restore fertility. Tree crops, mainly cocoa, oil palm, rubber, andcoffee, are grown in the forest zones, and many farmers may cultivate more than one tree crop.
In general, food crop and tree crop holdings are separated, although intercropping of food cropswith the tree crops is common while trees are being established. Food crops are generally grownintercropped; common combinations are maize/plantain/cocoyam and maize/plantainJcassava.
Although oil palm is grown in the southern part of the transition zone from bush fallow to forest,the area is marginal for tree crop production. Tobacco and cotton are the main nonfood crops grown.These are grown as sole crops but form part of a farm in which food crops are grown in onegf thefollowing cropping systems: intercropped maize/cassava or maize/legumes/cocoyam, solely croppedmaize, yams, or legumes or rainfed rice in valley bottoms.
In the Guinea savanna zone, the predominant cropping systems are intercroppedsorghum/cowpea, maize/cowpea, singly cropped maize, yam, sorghum, legumes, or rainfed rice in valleybottoms. Cultivation of cassava is increasing in this area, especially since the drought years of the early1980s. In the drier Sudan savanna zones, intercropped sorghum/millet or sorghum/millet/cowpea are thepredominant cropping systems. Crop production technology is mainly traditional with little use ofpurchased inputs, although input packages are provided by commercial companies for cotton, tobacco,and oil palms. Land preparation is manual in most areas, although the use of oxen for plowing is
21

THE ECONOMICS OF WILDLIFE
common in the upper east region and is spreading to the upper west and northern regions. Some tractorsare also used for plowing. Average yields are low and in the northeast. The unreliability of rainfall meansthat the risk of crop failure is high.
2.2.2 Financial and Economic AnalysisThe investments in wildlife and domesticated animals are analyzed in this case study using cost-
benefit analysis and taking into consideration both financial and economic perspectives. Prices were notadjusted for inflation, since it was expected that prices of output would change proportionately with thecosts of inputs and 1993 was used as the base year.
The assumption when loans were disbursed in the financial analysis is a five-year repaymentperiod, with a one-year grace period and 35 percent interest rate. The corporate tax of 35 percent isapplicable after five years of operation.
The interest rate on loans averages around 35 percent a year. The inflation rate in the late 1970sand early 1980s was in the double digits and on two occasions in the triple digits. This, together with lowinterest rates, resulted in real negative interest rates. The rate of inflation averaged about 40 percent forthe 1 980s and was 27 percent in 1992 and about 20 percent in 1993. Since 1993 constant prices areemployed, a 15 percent real-interest cost was used (the difference between the nominal rate and theinflation rate).
For the financial analysis, the competitive market prices observed by the private investor wereused. In the economic analysis, the values used reflected market prices if they were good estimates ofeconomic value, or else they represented shadow prices when market prices were adjusted for distortions.Financial prices of tangible items were adjusted to reflect economic values in three stages:
1 . Direct transfer payments2. Price distortions in tradable items3. Price distortions in nontradable items
Opportunity cost was used to value all intermediate inputs and outputs; however, for some finalgoods and services, it is consumption value that sets the economic value, not value in some alternativeuse. In such instances, the "willingness to pay" principle was used, especially when the good wasnontraded. In a competitive market situation, willingness to pay is approximated by the equilibriumprices. Ghana's Economic Recovery Programme has created a competitive market structure for mostinputs and outputs as well as for resources used in this study. Constant 1993 prices were used in theeconomic analysis, as in the financial analysis.
There are two equivalent ways of incorporating the premium on foreign exchange in economicanalysis (Gittinger 1982). The first is to get the sha low exchange rate (SER) by multiplying the officialexchange rate (OER) by the foreign exchange premium. The SER has been used by the World Bank andin the UNIDO Guidelines (1972). The second way is the standard conversion factor (SCF). The SCF isderived by taking the ratio of the value of all exports and imports at border prices (Squire and van derTak 1975).
For the past 12 months, the average private market rate has been greater than the officialexchange rate by about 8 percent. An analysis done by Danquah ( 1993) showed that the foreign exchange
22

GHANA
premium was about 5.85 percent. The average of the interbank rate and the forex rate was used as theforeign exchange premium. At the time of the analysis, the forex rate was 0700 to US$ 1.00, whereas theinterbank rate was ¢680. The simple average as the shadow exchange rate, which was 0690 to US$1.00,was used. All other conversions of amounts from cedis to dollars found in the paper were calculated atthe rate of ¢700 to US$1.00.
Direct transfer payments are those that do not represent the use of real resources but just transferclaims to real resources from one person in society to another. These include taxes, subsidies, credittransactions including loans, receipts, repayment of principal, interest payments, and accounts payableand receivable. These were taken out of our economic analysis.
For traded goods, the analysis begins by deterrnining the border prices based on imports ofvehicles. This is adjusted to take account of domestic transport between the point of import and theproject site. The cost, insurance, and freight (c.i.f.) value of the vehicle were taken and converted to thec.i.f. value using the SER, since no duties apply.
Buildings, land, and feed for bush meat were considered as nontraded. The conversion factorscalculated by Danquah (1993) and used at the Ghana Investment Center were applied in the analysis.
A discount factor of 18 percent was used in discounting the net cash flows. It represents theopportunity cost of capital according to the Ghana Investment Center.
Most land is leased or rented but rarely sold. Where land is leased or sold, especially in theAccra Plains where ranching or grasscutter domestication is ideal, the price reflects the market value. Inthis case, most of the land is idle and the net value could be taken as zero; however, the next bestalternative use of the land is cropping mainly of maize. The method to get the economic value of land isto take the gross value of the land's output at market prices and deduct from that all costs of productionon the land. The residual is the opportunity cost. The conversion factor used at the Ghana InvestmentCentre is 1.00. This is expected to be land in the city where the market price reflects its opportunity cost.Since most land in the Accra Plains is idle, the factor was assumed to be 0.4.
Skilled labor was assumed to be fully employed without the project; hence, the market wagerepresents the opportunity cost. Unskilled labor was assumed to be employed from the rural areas.Whereas the daily wage in the rural area is about twice the minimum wage, at least most labor will beidle for about 25 percent of the year. Since 75 percent employment is expected in the year, a conversionfactor of 0.75 shall be used.
Conversion factors for administration and sales expenditures, utilities, fuel and lubricants,insurance, and maintenance and repairs were derived by disaggregating the expenditures into theirvarious components, taking note of the traded and nontraded components and using the proportions andconversion factors that are used by the Ghana Investment Centre.
Two situations are considered. The first one is whether a crop or livestockfarner can go intowildlife ranching as a way of diversifying or replacing existing activity. The second is whether a personwho wants to go intofarming will go into livestock, food fanning, cash crop farming, or wildliferanching. The answer will depend on the relative profitability.
23

THE ECONOMICS OF WILDLIFE
Apart from the wildlife reserves, no wildlife ranching exists in Ghana. Through the effort of thiDepartment of Game and Wildlife, the domestication of grasscutters, which are the most common andhighly prized wildlife, became popular in the 1970s. Most people who invested in this were officials inthe public sector, who did it on a part-time basis. Unfortunately, the support that was given to thepotential farmers by the GW waned. Since the new farmers had not gained sufficient experience, theexperiment fizzled.
The analysis of grasscutters was based on the estimates of Mr. Ofori who started grasscutterfarming in 1974 and still undertakes it on part-time basis. Even for the few backyard domesticatedwildlife enterprises that exist at present, there are no time series data. An ex ante returns to investmentsin wildlife is therefore considered. The return to investments shall be examined in cattle, chicken, andfood crop farming. These will be compared to the return to five cases of wildlife ranching, namely:
1. Small-scale backyard wildlife farming (grasscutter)2. Large-scale wildlife ranching of certain animals (grasscutter)3. Small-scale backyard rabbit farming4. Official proposed wildlife ranching5. Private or communal ranching
The net present value (NPV) and internal rate of return (IRR) serve as the criteria. Each case isinvestigated to determine whether it is potentially viable by the criteria. In the next step, all the activiticare compared. The final step involves a sensitivity analysis of policy variables to profitability.
Investment in Cattle
Before choosing the type of investment to study, the availability of data was considered andprivate and public cattle ranches were toured. The public ranches had adequate data, but most of themwere not financially viable, either because they were research stations or performed veterinary and otheservices, such as dipping of cattle belonging to private farmers, free of charge. The Aveyime cattle rancwhich is a quasi-private company, was selected because it is the best managed among the public rancheOne of the private cattle ranchers whose feeding activity is free-range was also chosen.
The Aveyime Cattle Ranch Ltd. is wholly owned by the Volta Regional DevelopmentCorporation (VRDC). It was incorporated on May 13, 1982. The project was cosponsored by thegovernment of Ghana and the European Union (EU). The objective of the company was to breed cattlefor sale and provide extension services to private farmers. The company began with two expatriate stafthe general manager (project co-coordinator), and project manager (livestock expert). In 1991 when thelast expatriate staff left, there were 52 permanent employees and 13 casual employees.
The two major sections of the company are the animal section, which deals with breeding forsale, and the extension service, which includes work on the ranch and servicing the cattle of thetraditional owners.
By 1991 the company had 28 kraals (1,470 square meters each), a crush and pen (80 meterslong), office buildings, buildings for herdsmen and watchmen, staff houses, cattle building facilities,such as a dip and spray race. The stock of cattle increased by 46 percent between 1985 and 1991 withonly a year's decline in 1989.
24

GHANA
The net cash flow for both the financial and economic analyses for all the years except 1992 isnegative. Using a discount rate of 18 percent, the net present value for the financial and economicanalyses were both negative. The unattractiveness of this venture is mainly due to the low proportion ofsales and the generally cost ineffectiveness of public projects.
An analysis was made of a private cattle ranch in the AccraPlains about 32 kilometers fromAccra. The ranch is owned by Alhaji Munkaila and managed by a retired army officer. The ranch hadten other workers and 807 cattle. Open access feeding was practiced in which each morning, workerstook out herds to graze outside the ranch. During dry seasons when grass is rare, the herdsmen take thecattle several miles out to places that have water and grass. There was no secondary feed. A herdconsisted of about 80 cattle. They did not have time series data but had data on expenditures and outputfor 1993. The owner seemed only to be interested in building up stocks since few cattle were soldannually. This is the traditional practice of most cattle owners, especially those from the north. They donot operate it as an economic venture in which mature livestock will be sold. The cost estimates of thisprivate ranch for our proposed investment was used.
Poultry
An analysis was made of a proposed small-scale farm that raises broilers for sale as meat. Thedata were based on the actual activity of a small-scale farmer who started poultry some two years ago.Small-scale poultry is an activity that can be undertaken by most people due to the relatively littleinvestment cost required. The analysis focused on a small-scale farm with initial stock of 220 and amaximum maturation period of seven weeks. The mortality rate ranges from S to 10 percent. In the caseof this farmer, the mortality rate averages 20 out of 220. Thus, in a year, 1,200 chickens can be producedusing the investment of a building, water containers, and feeding boxes. The financial retums show anegative NPV but the economic retums are high with a positive NPV.
Wildlife'
The return to investment in wildlife in the five cases identified above shall be considered. Twowildlife species are analyzed-grasscutters and rabbit-that have experienced domestication in Ghana.The first two cases involve the grasscutter, which was identified based on its popularity, a ready market,and some experience in its rearing. The next species was rabbits, for which a national project wasestablished in the 1970s.
Grasscutter Farming
The only case study that could have been used for the financial and economic analysis was thatof Mr. Addo whose farm had existed since 1974. Unfortunately, he did not have any time series data oncosts and revenues. Consequently, his present cost estimates are used.
Two small-scale grasscutter-farming activities with a duration of ten years were considered. Onewas considered to be micro-scale with a yearly stock of 128 animals and the other was known as small-scale with a yearly stock of 260. The two analyses are important because if most farmers want toundertake this kind of activity in addition to other agricultural activities, they might opt for the microscale because of the relatively small investment and animals involved. The small-scale ones may beundertaken by either retired or retrenched persons or as part-time activity for some workers.
25

THE ECONOMICS OF WILDLIFE
The cost estimates, such as feeding, wooden cage, and prices of grasscutters were obtained froAddo's operations. Two workers for both the micro and small scale were assumed. For the micro scalean income of US$36 a month was estimated for the owner and US$17 a month for an additional workeThese amounts are significant in a rural setting in which most of the micro-scale farms would take plaFor the small scale, monthly earnings of about US$62 for the manager/owner and US$36 for an unskilworker are competitive in the cities in which the minimum daily wage is about US$23 a month. Theserates are assumed in almost all the other analyses.
The beginning breeding stock comprised four one-year-old males and twenty one-year-oldfemales; this was maintained throughout the period. The yearly stock of animals was 128 with forty-eimales and eighty females.
A small-scale grasscutter farming activity with a yearly stock of 260 animals was also analyze,The beginning stock comprised sixty with twenty males and forty females. The breeding stock is kept;forty females and ten males.
Potential large-scale grasscutter farming where the yearly stock included 2,440 animals with ayearly sale of 3,200, comprised of 2,360 carcasses and 840 live animals, was examined. This includedfour workers, the manager, an unskilled worker, driver, and watchman. The investment cost included aoffice, a fenced yard to keep the animals, and a vehicle to help in feed transportation. Since this involva more significant investment than the small-scale option, the investment was evaluated over a fifteen-year period.
The IRRs for all scales of grasscutter farming were comparatively high with positive NPVs. TIsmall-scale activity turned out to be the most profitable. It was followed by the micro scale and largescale with IRRs of 60 percent, 48 percent, and 30 percent, respectively, for the financial analysis. Theeconomic analysis had IRRs of 53 percent, 30 percent, and 25 percent forthe small-, large-, and micro-scale enterprises, respectively.
The major distinguishing cost item from the small scale is the vehicle. This significantlyincreases both the repair and maintenance and utilities costs each to about 20 percent of yearly operatircost. Vehicle maintenance alone is 86 percent of total yearly maintenance, whereas vehicle fuel is 93percent of utility cost.
Rabbit Farming
The financial and economic returns to a small-scale rabbit farm were analyzed. Interviews fronNana Ampratwum and Mr. Mamattah; Opoku and Lukefahr (1990) and Mamattah and Amaning-Kwarteng ( 1975) showed an average breeding rate of four litters a year with a litter size of five. Withthis, a yearly stock of 366 and a yearly sale of 640 was estimated, out of which 104 are sold live forbreeding purposes.
Rabbits are kept in wooden or steel cages identical to those of grasscutters but with slightlydifferent sizes. The labor requirement is the same as that of grasscutter. The only difference is withfeeding. It was not possible to get estimates of local feed. Rather, Nana Ampratwum provided the costprepared feed and water needed for the rabbits. Although this could lead to higher yields, it costs morethan local grass and other food items.
26

GHANA
The proposed rabbit project showed a profitable outcome. The private return recorded a positiveNPV of US$730 with an IRR of 4 percent, whereas the economic analysis turned out to be moreattractive with an NPV of US$700 and IRR of 28 percent.
Wildlife Ranching Project
The wildlife ranching analyses consist of two cases. Estimates of inputs and costs in the GW-proposed "official ranching project" over fifteen years are used. The other case considers what a privateperson or community, like the Shai Hills area, would do if they were to undertake such activity. This wascalled a private or community ranching activity.
The official ranching project proposed the introduction of six different species of animals, butthe analysis here is limited to kob and waterbuck, because their reproduction rates and the market pricesare known. A yearly stock of 520 and a sale of 400 for both animals were considered. The initial stock is100 for each species with twenty male and eighty females. After a year, each female is capable oflittering once a year with a litter size of one. Adding a yearly stock of grasscutters of 6,100 and a sale of8,000 was also considered.
The total investment cost comes to US$1.48 million with the largest cost item being the fencingof the reserve. The other significant investment items are electricity supply, staff and officeaccommodation, animal introduction, pipeline connection, and dam construction. The total operatingcosts come to US$96,423 with the major cost components being repairs and fuel. Average yearlyrevenues come to US$95,143, which is less than the annual operating costs. Both financial and economicanalyses show negative IRR and NPV. A sensitivity analysis for a thirty-year period still yields negativereturns.
Consider now the community ranching activity. With Shai Hills designated as the project site,the community can own it, collecting a yearly rent of US$8,471 in addition to any other return that willbe derived. They would then appoint a manager for the project. Hunters in the area would be allowed toshoot animals for a small fee. An analysis was made for both fifteen and thirty years.
The difference in cost between official and private estimates was in office, fencing, electricitysupply, dam construction, staff accommodation, and animal introduction. Private estimates of these itemsinstead of the official GW ones were used. The costs of fencing and dam construction were significantlylower. The cost of dam construction and fencing was reduced by 76 percent and 33 percent, respectively.The fact that a private person would spend a smaller amount in renting places for the workers while gaslamps would be used instead of electricity, almost eliminating the huge electricity investment, was takeninto consideration. The official ranch was planned for seventeen workers whereas the community ranchwill have eight workers. The estimates for the introduction of animals were arrived at by taking themarket price of the animals and adding transportation costs.
The new cost estimates reduce investment cost by 48 percent. The average annual revenues cometo US$95,714, whereas the yearly operating costs come to only 54 percent of revenues. The financialIRR is only 3 percent with a negative NPV of US$176,857, whereas the economic IRR is 8 percent witha negative NPV of US$128,343. When the analysis was done for a thirty-year period, the NPVs were stillnegative.
27

THE ECONOMICS OF WILDLIFE
It is now possible to summarize the relative profitability of investment in wildlife and domesticlivestock as shown in table 2.3.
Table 2.3: Relative Profitability of Investment in Wildlife and Domestic LivestockType of Activity Level of Operating Revenues Financial Returns Economic Returns
Investment Costs(thousands (thousands (thousands NPV IRR NPV IRR
of US$) of US$) of US$)Cattle
Public (Aveytime) N/A 43 15 -289 N/A -318 N/APrivate 16 2 5 -9 -I -6 -.1
Small-Scale Poultry .87 4 5 -I N/A .69 208Grasscutter
Micro-scale .80 1 2 .09 48 .28 25Small-scale 2 3 4 .62 60 3 53Large-scale 41 18 28 4.7 30 19 30
Rabbit 1 3.6 4 .73 4 .70 28State Wildlife 644 96 95 -1,436 -18 -536 -11
RanchPrivate Wildlife 344 52 96 -177 3 -128 8
Ranch
Considering wildlife activity, it is observed that those with a small amount of investment aremicro-scale grasscutter, small-scale grasscutter, poultry, and rabbit. Considering the present lendinginterest rate of 35 percent a year, the only viable one is the micro-scale grasscutter. The small-scalegrasscutter with an IRR of 28 percent is quite attractive with average annual revenues exceeding averagoperating costs. Poultry and small-scale grasscutters tend to be viable using the economic analysis.Considering both financial and economic analyses, micro- and small-scale grasscutter farming come ouas the most profitable.
The large-scale activities turn out to be nonviable economically. The larger the initialinvestment, the poorer the viability of the project. What comes out clearly is that grasscutter activity isthe dominant productive venture. All sizes are profitable using both financial and economic analysis.Furthermore, state ventures are actually or potentially less viable than private activities. The reason ismainly the cost-effectiveness of private ventures. Even for the large-scale ventures, grasscutters tend tobe more viable than private cattle ranches.
For the actual wildlife ranch, the private or community ranch with an investrnent smaller thanthat of the state has a small positive IRR, although NPVs for both financial and economic analyses arenegative. It is interesting to note that the average revenue is 1.8 times the operating cost.
The environmental benefits of maintaining species that are endangered were not integrated intothe analysis. If this is considered in addition to a yearly earning of US$8,471 as rent for the land and thefact that revenues exceed yearly operating costs, a community wildlife ranch can be viable even thoughthe returns do not serve as a strong incentive for a purely private entrepreneur to undertake.
All the analyses show that investment in grasscutters-especially small-scale--is profitable. Thlarge scale is problematic because of feeding difficulty. There is a large demand for grass, which will bedifficult to meet during the dry season. The small- or micro-scale level is preferable because of therelatively small amount of investment, which will enable individual farmers to undertake it as backyard
28

GHANA
activity. Although it is normally difficult for rural families to purchase a whole carcass due to their lowincomes, it can be smoked and sold in little pieces to make it easier for them to purchase the meat oncesuch small- or micro-scale activity exists in the rural areas. It will both supplement the incomes of thefarmers and improve the protein content of their diets. Furthermore, the monthly earnings are highlyattractive.
Food Crop Cultivation
The cropping activity is relatively inexpensive with total cost averaging US$ 154 per acre for thenine activities (table 2.4). The return for the highest activity is an acre of tomatoes and for the lowest isimproved, nonmechanized maize. The problem associated with cropping activity is that it is a yearlyenterprise whose returns depend on the vagaries of the weather. Thus, cropping activity is far riskier thanbackyard wildlife farming. Secondly, the returns were based on normal yield and urban prices. But onemajor problem with the food crop sector is marketing. Farm gate prices are generally lower than prices inurban areas.
Table 2.4: Return to Food Crop Activity(US$ per I acre or 0.4 hectare)Activity Total Cost Net ReturnMechanized improved technology, maize 147 52Improved nonmnechanized technology, maize 136 35Improved irrigated rice 224 464Improved rainfed rice 201 211Improved technology, tomato 94 749Traditional technology, yam 173 255Traditional technology, maize/cassava 133 72Traditional technology, yam/groundnut 155 217Traditional maize/cassava/plantain 127 75Source: Ministry of Agriculture 1991.
In comparing the relative return to crops and wildlife, the two most attractive ventures areexamined-micro-scale grasscutter and tomato farming. In the case of grasseutter, there are two workers,the farmer and another person assumed to be a family member. It is further assumed that about 80percent of the total cost of cropping activity will be labor, which can be composed of one family memberor two. For simplicity, this total cost is considered to be only labor cost and the net income as a return tofamily labor. For the grasscutter, the family income for the two persons comes to US$743 a year for tenyears. In the case of tomato farming the return is US$843. If the next most profitable scenarios-small-scale grasscutter farming and improved irrigated rice-are considered, the grasscutter is more viable. Forthese two activities, there is a yearly income of US$1,386 for grasscutters and US$688 for improvedirrigated rice. It must also be noted that it is easy to combine cropping activity with backyard ranching;this is what most farmers will do since monocultural activity is alien to most communities in Ghana. Theissue is not either a choice between wildlife ranching or cropping activity but combining both activitiesin some proportion. The alternative must be to determine which one of the species of animals should beundertaken. In this case, the analyses indicate that the grasscutter is the most viable option.
29

THE ECONOMICS OF WILDLIFE
If such investments are profitable, why is there a lack of interest? Although small-scale farmiiin grasscutters and rabbits tends to be more profitable than poultry, the latter is more popular. Thereasons stem from a lack of technical knowledge and support and the unavailability of breeding stock.the case of poultry, for instance, there is significant knowledge through a long period of practice andsupport from veterinary institutions and firms that conduct research and supply feed and chicken tofarmers.
The livestock sector of the Ministry of Agriculture deals with the promotion of poultry, goats,sheep, cattle, and pigs. Wildlife activities are not promoted. Two cases can be used to illustrate the nefor support structures for wildlife ranching. First, during the 1970s, when the GW vigorously pursuedextension services in terms of supplying breeding stock and giving technical know-how to farmers,several civil servants undertook grasscutter farming with success. Second, during the 1970s when theNational Rabbit Project was launched, the enterprise came into the limelight and several people startethe project. When the director retired in the early 1980s and the emphasis was not continued, interest lthe project waned.
2.2.3 Economic Policies and WildlifeFrom 1961 to 1982 Ghana pursued nonmarket economic policies. It was only in 1970-71 and
1978-79 that attempts to liberalize the economy were made; however, as a result of economic stagnatduring the greater part of the 1970s and early 1980s, the government in April 1983 embarked on anoverhaul of economic policies that was enshrined in the Structural Adjustment Programme(SAP)/Economic Recovery Programme (ERP).
The broad objectives of the program were to give incentives to producers, rehabilitateinfrastructure and industry, curb inflation, and promote sustained economic growth. The policiesincluded exchange rate reform, budgetary restraint-which resulted in cuts in governmentexpenditures-prudent monetary policies, withdrawal of subsidies, removal of controls, privatization I
state enterprises, and removal of trade restrictions. An overview of the policy changes to assess theirimpact on livestock and wildlife has been undertaken.
The monetary policies since 1961 have been to promote a high rate of economic growth withreasonable price stability and an improved balance of payments position. The general direction was tomaintain a tight monetary policy to control inflation, whereas between 1975 and 1985, credit wasdirected to priority sectors. Part of the objective was to curtail the share of aggregate credit going to tdpublic sector to free resources for increased private sector investment.
Fixed interest rate policy was maintained until 1984. The lending and savings deposit rates wefixed at 10.5 percent and 7.5 percent respectively from 1975 and remained so with slight changes unti]1983. Since 1984 the policy has been to operate a flexible system that gives an interest rate higher thaithe rate of inflation. The objective was to increase voluntary domestic private savings, improve financintermediation by domestic financial institutions, and increase the inflow of foreign capital. Thisobjective has been reached since 1991. The current lending rate for most transactions is 35 percent.
Since the interest rate was not used as a tool to direct credit, selective credit controls wereundertaken. The Bank of Ghana in an August 1974 regulation prioritized the following sectors:agriculture, manufacturing and export trade, construction, transport, communications, and storage. Thtbanks were to lend specified, significant proportions at lower rates to these sectors. Since 1988 all
30
GHANA
sectoral credit ceilings and discriminatory lending rates have been removed. The likely negative effect ofthese policies is a high lending rate, which will make most investments in wildlife unprofitable. There isalso the possibility of a lack of credit especially to rural farmers who may want to undertake some small-scale wildlife activities but who may not have the requisite qualifications and collateral to qualify for aloan.
The exchange rate policy has moved from a fixed system since independence with occasionaldevaluations to the present flexible and market-determined interbank and forex bureaux system. Theflexible exchange rate system was adopted to improve Ghana's competitiveness, give incentives toexporters, and encourage the use of more local inputs.
In April 1983, when the ERP was introduced, a system of multiple exchange rates based onbonuses and surcharges applied to specified transactions was tried and abandoned.
In October 1983 the rate was unified at ¢30 to US$ 1.00. During 1985 the exchange rate of thecedi was adjusted three times resulting in a rate of 060 to US$1.00. In January 1986 the exchange rate fora dollar was again adjusted to ¢90.
In September 1986 the government introduced an auction system. The existence of the auctiondid not prevent the flourishing of a parallel market due to some significant differential between theauction rate and the parallel rate. The continued operation of the parallel market despite the auction madethe govemment legislate the setting up of the forex bureaux in 1988.
The auction continued until 1992 when an interbank market-determined exchange rate took over.The exchange rate has continued to depreciate from ¢202.35 to US$1.00 in 1988 to an interbank rate ofp690 to US$1.00, with the forex bureaux rate being ¢710 to US$1.00 in October 1993. Althoughimported inputs for the livestock industry, such as drugs, feed, and vehicles, have generally beenavailable during the ERP period, the depreciating exchange rate has significantly increased their cost.
Export restrictions were imposed when there were scarcities of commodities, mainly food items.These scarcities were prevalent between 1982 and 1984. With the promotion of exports of nontraditionalproducts, more food items and animals are exported. With increased exports of wildlife, especiallyreptiles, the likelihood of extinction if proper management practices are not adopted is high.
The period 1961-83 was generally characterized by strict import controls. A relatively high tariffrate was maintained as an instrument of import control. With the removal of the import licensing systemin 1989, the cost of importing was reduced. The tax rates on other raw materials and capital goods werereduced in 1990. These low levels of taxes and the narrowed range have been maintained un'til 1993. Theliberalized import system was expected to improve productive capacity through the availability ofimported input and also to generate more tax revenues through the reduction of corruption and awillingness to pay the lower tariffs by importers. This should imply availability of inputs to wildlifeentrepreneurs, but the continual depreciation of the currency still makes the cost of imported inputs high.
Prior to 1983 there were significant levels of subsidies on most commodities, including inputs tothe agricultural sector. Output prices of most items were administratively controlled; however, with theintroduction of the ERP, these controls were systematically dismantled to the extent that, in 1993, thereare neither subsidies nor price controls on any commodity.
31
THE ECONOMICS OF WILDLIFE
The broad objective of the livestock sector earmarked in the Medium Term AgriculturalDevelopment Programme (MTADP) is to promote the growth of livestock. This is expected to beachieved by improving livestock productivity through improved nutrition, water supply, animal healthand breed improvement. Regarding animal health, the full cost of curative medicine is charged. Thereplans to give incentives, such as credit, to develop private veterinary services.
The major catalyst of the improvement of livestock productivity will be the improvement of thindigenous breed. The strategy is to utilize livestock owners in a participatory program with governmneagencies, such as animal research institutes and the universities.
A sensitivity analysis was undertaken for certain policy variables to find their impact on thevarious enterprises in livestock and wildlife. The main policies examined were taxation, interest rate,wage changes, and feeding cost. In the case of an interest rate, the reduction of the lending rate from thpresent exceedingly high rate of 35 percent to 18 percent was considered as well as a reduction of the trate from 35 percent to 20 percent and an extension of the five-year tax holiday to ten years.
Considering poultry activity, it is found that a 20 percent wage fall and 15 percent fall in thefeeding cost changes the NPV from negative to positive. Indeed, labor cost is the most sensitive variableading to a change from a negative to a positive IRR of 22 percent.
In the case of rabbit farming, in which the original position had a negative NPV of US$730 anan IRR of 4 percent, wage fall tends to be the most sensitive followed by feeding cost. A tax-free periofor ten years was of slight importance.
For grasscutters, the two policy variables that showed sensitivity were the interest rate and taxholiday for both small- and large-scale activity.
For cattle, the policy variables did not make any significant impact on the NPV and IRR.Although the IRR turned from negative to positive, they were all less than 1 percent. Improvedproductivity, such as improved breeding, may be the most sensitive variable.
The results for wildlife were the same as those for cattle: no policy variable was significantwithin the ranges tested here. The variables that would affect the profitability of wildlife domesticationare wages, feeding cost, interest rate, and a ten-year tax-free period.
The wage rate policy is a variable for the employer since it is now possible to set a wage that isnot based on the official minimum wage. It is also a variable that is feasible to manipulate because theaverage wages per month of about US$71 for the owner and US$43 for a second employee are high eviby urban standards. Even a 20 percent wage fall, which makes poultry and rabbits quite profitable, resuin close to twice the minimum wage.
It has been noted that part of the policy of the government is to undertake research intosupplementary feeding. This was highly recommended for rabbits since the cost of grass as feed tends 1be enormous. In addition to improving productivity with better supplementary feed, it is likely to reduccosts since local inputs will form a significant proportion.
We found that a lower interest rate and ten-year tax-free period make the grasscutter businesshighly profitable. As a result, such specific policies can be applied to the sector as an incentive to
32

GHANA
promote it. Since small-scale ventures tend to be more profitable, we expect farmers in rural areas to beinterested. This is important since the enterprise will improve their incomes and diet; consequently,special credit policies for these activities ought to be developed. Without special policies, it is impossiblefor most of the farmers who might be interested in the ventures to obtain loans.
2.3 Livestock, Wildlife, and the EnvironmentCattle is the major livestock, in terns of numbers that undertake open-access feeding. To a lesser
extent, goats and sheep are also in this category. Although cattle, goats, sheep, and poultry have been themain source of meat for the nation, the continuous occurrences of diseases are examples of problems ofadaptation to the environment. The prevalence of serious diseases, such as trypanosomiasis, is animportant constraint to livestock production. The disease problem is also likely to be due partly to highpopulation growth of ruminants and the development of new breeds.
There is significant institutional support for livestock in terms of research, feed, breeding, andveterinary services. These have ensured the continued growth of the livestock population at the increasedcost of importation of relevant inputs. The analysis shows that livestock in general have adapted to theenvironment as a result of the institutional support given to the sector.
Convery and Tutu (1991) have shown that severe deficiencies exist in livestock feed derivedfrom natural vegetation and crop residues. The result is the threat of desertification, especially innortheast Ghana, partly due to free grazing and lack of supplementary feed. There is also some indicationof overgrazing in the coastal savanna areas by cattle (Ghana 1 990a-b). Grazing by sheep and goats doesnot cause widespread environmental hazards, apart from occasional destruction of backyard gardens,which occurs in rural areas.
Indirect degradation of vegetation caused by livestock can be seen in the case of poultry, whichconsumes a large quantity of grain. The demand from poultry together with that of humans exertspressure on the land for maize production. A positive relationship between increased maize productionand environmental degradation in Ghana has been established (Convery and Tutu 1991).
Wildlife in their natural habitats sometimes feed on crops, as shown by traps that farmers set tocapture species that are considered pests. Otherwise, wildlife in their natural habitats have coexisted inequilibrium with the natural environment. Until recently, the situation was sustainable. For those animalsin captive environments, such as the grasscutter and rabbit, little disease has been found and drugs havenot been used. An insignificant proportion die before they reach maturity. This may be due to the factthat the stocks used are pure domestic breeds. Health hazards have been linked to the drugs that are givento livestock, especially poultry. The fact that the grasscutter can be reared without the use of drugs is apositive health effect for wildlife ranching.
Wildlife ranching, especially in a captive state as illustrated by grasscutters and others, impliesan increased demand for feed. As indicated in the analysis, grasscutter domestication will result inincreased demand for grass if many people take it up as a vocation. Should this occur, the grass may haveto be grown; this is possible in savanna areas.
33

THE ECONOMICS OF WILDLIFE
2.4 Summary and ConclusionsForestry and wildlife resource management have been undertaken by public agencies since
colonial times to the virtual exclusion of the communities interacting with the resources. Yet it has b4documented that the most effective method of management is achieved through traditional institutiorregulations based on adherence to cultural and traditional practices. Recently, however, observance cregulations has waned with consequent overexploitation. This calls for community participation in thevolution and management of these resources.
The importance of wildlife as meat, popularly called bush meat, has been well demonstratedthis chapter. It has been established that bush meat used to be the most common source of animal proespecially in the rural areas and that it is still regarded as the most preferred meat. Grasscutters are thmost popular species and the most abundant among bush meat species. Today, bush meat constitutesonly a small proportion of the protein intake of most people, especially those in rural areas because oscarcity, relatively high price, and unavailability in small, affordable pieces.
Although the nation does not earn significant foreign exchange from wildlife, the local mark(quite active. Hunters earn incomes that are comparable to workers in the formal sector. The retail mais dominated by a few women who operate in a cartel in segmented areas. This leads to significantmonopoly profits earned by the retailers ranging from 30 percent to 250 percent per animal.
Net present value and internal rate of return criteria were used as indications of the viabilitythe various wildlife ventures. The financial analyses indicate that private wildlife ranching is superioiofficial wildlife ranching in terms of profitability, whereas wildlife domestication turns out to be themost profitable. Furthermore, small-scale farming is more profitable than large-scale farming. Small-scale grasscutter farming turns out to be the most profitable followed by farming of poultry and rabbi
The analysis favors providing support to domesticated activity in small-scale wildlife in termbreed development, credit, and other technical information. Encouraging such profitable activity in nareas would enhance the income-earning capability of most people and lead to a viable way of increathe protein intake of rural dwellers, who make up about 65 percent of the population. Such a ruralindustrv would lead to a market in which bush meat would be sold at affordable prices.
Integrating environmental concerns, including tourism, would enhance wildlife ranchingviability; it was found that community ownership of a big wildlife ranch, such as the proposed Shai FRanch, would prove attractive. A partnership of state and community management is highly desirable
The profitability of wildlife farming has been found to be sensitive to interest rate. Prudentpolicies, in terms of curbing huge budget deficits and high money growth rates, would help to bringdown inflation and interest rates.
2.5 References
Ankudey, N. K. and B. Y. Ofori-Frimpong. 1990. "Antelopes of Ghana." In R. East, ed. Antelopes, Global Surand Regional Action Plans, Part 3: West and Central Africa. Gland, Switzerland: IUCN. -
Asibey, E. 0. A. 1965. "Utilisation of Wildlife in Ghana." The Ghana Farmer IX: 91-93. Accra.
34

GHANA
1966a. "Why Not Bush Meat Too?" The Ghana Farmer X (3): 165-170. Accra.
1966b. "The Case for Wildlife in Ghana." The Ghana Farmer X: 66-72. Accra.
1969. Wild Animals and Ghana's Economy, An Investigation into Bush Meat as a Source of Protein. Accra:Department of Game and Wildlife, Ghana. Mimeo.
1970. "The Status of Wildlife Conservation in Ghana." In Proceedings of the Symposium on WildlifeConservation in West Africa. Seventh Biennial Conference of the West African Science Association.Gland, Switzerland: IUCN.
1971 a. Shai Hills Bush Meat Production Project. Accra: Department of Game and Wildlife, Ghana.Mimeo.
1971 b. Some Economic Factors of Grasscutter as a Food Source in Ghana. Accra: Departnent of Gameand Wildlife, Ghana. Mimeo.
1974a. Some Ecological and Economic Aspects of the Grasscutter, Thryonomys Swinderianus Temminck(Mammalia, Rodentia, Hystricomorpha) in Ghana. Aberdeen, Scotland: University of Aberdeen.Unpublished Ph.D. thesis.
1974b. "The Grasscutter Thryonomys Swinderianus Temminck in Ghana." Symp. Zool. Soc. Lond. 34.
1974c. "Reproduction in the Grasscutter, Thryonomys Swinderianus Temminck in Ghana," Symp. ZooLSoc. Lond 34.
1974d. "Wildlife as a Source of Protein in Africa South of the Sahara." Biological Conservation 6: 32-39.
1977. "Expected Effects of Land-Use Patterns of Future Supplies of Bush Meat in Africa, South of theSahara. Biological Conservation 4 (1): 43-49.
1978. "Wildlife Production as a Means of Protein Supply in West Africa with Particular Reference toGhana." Paper presented to the Eighth World Forestry Congress. October 1978.
1980. "Traditional Hunting in West Africa with Special Reference to Ghana." In M. L. Nchunga, ed.Wildlife Management and Utilisation. Gabarone: Department of Wildlife and National Parks, Botswana.
1987. The Grasscutter. Paper prepared for the Ghana 1987 Livestock Show. Accra: Ministry ofAgriculture, Ghana, and the Ghana Animal Science Association.
Aveyime Cattle Ranch. 1992. Annual Reports ofAveyime Cattle Ranch Ltd, 1983-92. Aveyime, Ghiana.
Cansdale, G. S. 1964. The Establishment of Zoological Gardens and Wildlife Conservation. Report to theGovernment of Ghana. FAO Report No. 1800. Rome: FAO.
Clottey, St. John A. 1971. "Wildlife as a Source of Protein in Ghana." Food and Nutrition in Africa 9: 7-11.
Collins, W. B. 1961. "Wildlife Conservation." Ghana African Wildlife 15 (3): 205-212.
Convery, F. J. and K. A. Tutu 1991. Evaluating the Costs of Environmental Degradation in Ghana. Accra:Environmental Protection Council.
35

THE ECONOMICS OF WILDLIFE
Danquah, F. 1993. Calculating the Shadow Prices for the Ghanaian Economy, Accra: National Investment Center.
Dasgupta, Partha and others. 1972. Guidelines for Project Evaluation. New York, N.Y.: United Nations IndustrialDevelopment Organisation.
Dorm-Adzobu, C., 0. Ampadu-Agyei, and P. A. Veight. 1991. Religious Beliefs and Environmental Protection: T7Malshegu Sacred Grove in Northern Ghana. Washington, D.C.: World Resources Institute and Nairobi:Acts Press.
Environmental Protection Council. 1991. Ghana: Environmental Action Plan. Accra.
Ewer, R. F. 1969. "Forrn and Function in the Grasscutter, Thryonomys Swinderianus Temminck (Rodentia,Thryonomyidae)." Ghana Journal of Science 9: 131-149.
Falconer, J. 1990. The Major Significance of "Minor" Forest Products: The Local Use and Value of Forests in theWest African Humid Zone. Rome: FAO.
Falconer, J. 1992. People's Uses and Trade in Non-Timber Forest Products in Southern Ghana: A Pilot Study.Overseas Development Administration Report. 1986 Food Balance Sheets for Ghana. Rome: FAO.
Gaisie, S. K. and K. T. de Graft Johnson. 1976. The Population of Ghana. Paris: Committee for InternationalCoordination of Natural Resource Demographics. Quoted in J. B. Hall and M. D. Swayne. 1981.Distribution and Ec 7logy of Vascular Plants in a Tropical Rain Forest, Forest Vegetation in Ghana. TheHague, Netherlands: Dr. W. Junk Publishers.
Ghana, Ministry of Agriculture. 1990a. Medium Term Agricultural Development Programme. Accra.
1990b. Medium Term Agricultural Development Programme. Working Paper of the Livestock Sector, No.4. Accra.
1991. Agriculture in Ghana: Facts and Figures. Accra.
Gittinger, P. J. 1982. Economic Analysis ofAgricultural Projects. Economic Development Series in EconomicDevelopment. Baltimore, Md.: The Johns Hopkins University Press.
Hall, J. B. and M. D. Swaine. 1981. Distribution and Ecology of Vascular Plants in a Tropical Rain Forest: ForestVegetation in Ghana. The Hague, Netherlands: Dr. W. Junk Publishers.
Institute of Statistical, Social, and Economic Research (ISSER). 1993. The State of the Ghanaian Economy in 1992Accra: University of Ghana.
International Institute for Environment and Development (IIED). 1992. Environmental Synopsis of Ghana LondonOverseas Development Administration.
International Union for the Conservation of Nature. 1988. Ghana: Forest Conservation Issues. Doc. No. 10385.Cambridge: IUCN Tropical Forest Programme, IUCN Conservation Monitoring Centre.
Mamattah, N. and K. Amaning-Kwarteng. 1975. Raising Rabbits in Ghana. Accra. Mimeo.
Ntiamoa-Baidu, Y. 1987. "West African Wildlife: a Resource in Jeopardy." Unasylva 39: 56,27-35.
36
GHANA
. 1991. "Local Perceptions and Value of Wildlife to Communities Living in the Vicinity of Forest NationalParks in Westem Ghana." In Protected Area Development in South West Ghana. Report. Oxford, UK:Enviromnent Group.
. 1992. Indigenous Versus Introduced Biodiversity Conservation Strategies: The Case of Protected AreaSystems in Ghana. Report prepared for the Biodiversity Support Program. Washington, D.C.: WorldWildlife Fund.
Ntiamoa-Baidu, Y., L. J. Gyatnfi Fenteng, and D. Abbiw. 1992. Management Strategyfor Sacred Groves in Ghana.Washington, D.C.: World Bank and the U.S. Environmental Protection Agency.
Opoku, M. and S. D. Lukefahr. 1990. Rabbit Production and Development in Ghana: The National Rabbit ProjectExperience. Accra. Mimeo.
Pegg, P. J. 1969. Wildlife Management in Mole Game Reserve. Report to the Government of Ghana. Rome: FAO.
Squire, L. and H. G. van der Tak. 1975. Economic Analysis of Projects. Baltimore, Md.: Johns Hopkins UniversityPress.
Stryker, D. 1990. "Trade, Exchange Rate, and Agricultural Pricing Policies in Ghana." Washington, D.C.: WorldBank.
Tietenberg, T. 1992. Environmental and Natural Resource Economics. 3rd Edition. New York: Harper CollinsPublishers Inc.
Wilson, V. J. and D. Kpelle. 1992. Zoological Survey of the Shai Hills Game Production Reserve. Accra: ForestResources Research Project, Department of Game and Wildlife, Ghana.
World Resources Institute. 1990. World Resources 1990-91: A Guide to the Global Environment. Washington,D.C.: Oxford University Press.
37

THE EcoNoMIcs OF WILDLIFE
Abstract
In the past, Kenya has focused wildlife conservation efforts on establishing parks and reserves,often without regard to the total ecosystems used by animal populations; hence, much wildlife still existon private lands, which owners may legally "develop" as they will. A burgeoning human population isnow increasing pressure on both public and private lands, by encroaching on parks and reserves andusing private land important to wildlife more intensively.
Kenya's wildlife has long been a public asset tapped largely for private gain, often by those whcdo not have to support it. Only with an increase in land-use conflicts has the government recognized thalwildlife must return economic benefits to rural populations who compete with wildlife for land and otheresources. Although the Kenya Wildlife Service has little jurisdiction over private landowners, thisprinciple now underpins its management strategies in wildlife "dispersal areas" and on private lands witresident wildlife populations.
The chapter begins by presenting the historic context of wildlife management in Kenya, itscurrent status, and wildlife management policies, legislation, institutions, and actions. The authorsdiscuss the influence of demography, economic conditions, legislation, land tenure, management, andsocial values on wildlife; examine whether wildlife utilization is a viable land use; and considerenvironmental impacts of both agricultural and wildlife utilization options.
Although the data available for economic analysis are poor, the authors come to severalconclusions on wildlife utilization in Kenya. The viability of each land-use enterprise described dependson a range of local factors, such as marketing opportunities, management, and finance. The authors pointo population growth as the single most important cause of environmental degradation and unsustainableresource use; all development and conservation efforts are pointless unless this problem is fullyaddressed. Development organizations and the Kenyan government have not focused sufficiently on thisissue.
Kenya's policies on wildlife management, while changing to address landowners' influence onthe diversity and distribution of flora and fauna, have been limited by agency understaffing, corruption,and poor management. Policies are often contradictory, weak, and unenforced. Unless agencies exerciseappropriate control over land use, however, potential benefits from wildlife will not be realized ordistributed to rural people.
Wildlife utilization in Kenya is unlikely to be competitive in agroclimatic zones with potentialhigher than zone V or zone UMS under the nation's agroecological zoning classifications, providing abenchmark for land-use strategies. Based on wildlife densities, location of parks and reserves, landtenure, local attitudes, infrastructure, tourism investments, and government budget and managementconstraints, efforts to conserve and use wildlife in dispersal areas should concentrate in Narok, Kajiado,Laikipia, and Isiolo districts. Additional conservation areas to preserve wilderness and wildlife should b4based on objective parameters of plant and wildlife diversity and density; compensation equivalent toopportunity cost should be paid. Communities should be closely involved in deciding how revenues fronprotected areas are utilized or distributed. The authors also make a number of recommendations on howgovernment policy can encourage sustainable wildlife utilization.
38

Chapter 3:
The Economics of Living with Wildtife in Kenya
By Peter V. Byrne, Christopher Staubo, and Jan G. Grootenhuist
The study team could find few cases in which economics had been applied to the appraisal ofwildlife-based projects or policies in Kenya. Even investigations of financial viability of such projectsare, in general, absent. Some studies (Mwenge International Associates 1980; Mitchell 1968a; EIU 1979)have discussed the principles of wildlife-generated benefits at the national or regional level but have notconcerned themselves with specific areas or projects. The value of specific animals as tourism attractionshas been evaluated (Thresher 1992; Western and Henry 1980). Returns (US$ per square kilometer) fromtourism have been calculated (Douglas Hamilton & Associates 1988; EcoSystems 1982b) and comparedwith alternatives, such as cattle grazing and farming (Norton Griffiths 1995).
Natural resources and land potential in Kenya are described within a system that classifies areasinto agroecological zones (AEZs) that are defined principally according to rainfall, temperature, and soilconditions. The use of AEZs has become the accepted form of classification and supersedes theagroclimatic zone (ACZ) system developed by the Kenya Soil Survey; however, the latter is moresuitable for broad-based land classification of large areas, such as the arid and semiarid lands (ASAL) inKenya in which most wildlife occurs.
There is increasing encroachment on national parks and reserves in Kenya, but more important isthe growing intensity of land use in "dispersal areas" essential to wildlife. Wildlife clearly is losing thebattle, as shown in section 3.3; however, wildlife densities are often highest outside national parks andreserves (table 3.1), because national parks and reserves were demarcated without full appreciation of thetotal ecosystem utilized by the animal population.
Section 3.1 begins with the historic context of wildlife, followed by a summary of the presentstatus, management policies and actions, legislation, and institutional structures related to it. Wildlifeutilization-past, present, and possible-is reviewed. The role and influence of demography, economicconditions, legislation, land tenure, management, and social values are discussed. Section 3.2 examines
* The original report has been shortened considerably and edited to its current form by Jan Bojo, Environmentally Sustainable DevelopmentDivision, Africa Technical Department, The World Bank. The authors wish to thank all those who contributed information, time, and ideasin completing this study, particularly to John Sutton for being a member of the study team and assisting them in understanding aspects ofwildlife management and possible utilization that have received little attention in tourism development.
t The authors are consultants associated with Capricom Consultants Ltd., Nairobi, Kenya.
39

THE ECONOMICS OF WILDLIFE
Table 3.1: Wild~life Den-sities Within and Outside National Parks: the Case ofTso,18Wildlife densities
Wildlife High Medium Low Very Low
Density (square kilometers) >10 5-10 2-5 <2Within parks (percent) 1 19 76 4Outside parks (percent) 7 30 45 18Whole area (percent) 6 28 52 14Source: EcoSystems 1982b.a. The percent shows the proportion of the area at different wildlife densities for those areas supporting wildlife; high and
medium densities of wildlife are found outside the parks in dispersal areas.
the hypothesis that wildlife utilization is a viable form of land use. Specific case studies* are drawn on tillustrate the conclusions. Section 3.3 considers the environmental effects of both agricultural andwildlife utilization options. This may prove to be a principal battleground for choosing among land-useoptions. To conclude, section 3.4 presents the main findings.
3.1 Wildlife Management Policies and LegislationThis section discusses how wildlife management in Kenya is influenced by its political,
economic, demographic, and legal surroundings.
3 1.1 The Policy EnvironmentThere have been considerable changes in the Kenyan government's wildlife policies over the las
century, as briefly sketched in this section.
Historical Perspective and the "Conservation Ethic"
Wildlife conservation has a long history in Kenya. The first legislation on wildlife was enactedin 1898 with regulations establishing game reserves and controls on hunting. In 1907 a game departmeniwas set up to manage wildlife. Several national parks were established, one of the first, Nairobi NationalPark, in 1946.
Conservation "for conservation's sake" was the primary goal of government conservation policyin the original ordinance of 1945 (Royal National Parks of Kenya Ordinance) as well as in the WildlifeConservation and Management Act of 1976. Economic returns were considered, but, with the growth ofland-use conflicts, the pendulum has now swung from aesthetics to economics.
In 1976 the Kenya government decided to amalgamate the game department and the national parks intothe Wildlife Conservation and Management Department (WCMD). By 1977 rampant poaching causedthe government to ban all hunting of wildlife. In the years to come, inadequate funding contributedgreatly to poor management standards. Low personnel salaries contributed to extreme demoralization ofthe staff and an environment conducive to the growth of corruption, especially poaching (Kenya 1990a).
* There are six case studies in the original report, which are not included here.
40

IBRD 27050
The boundaries, colors, denomninationsond 36- K E N Y Aany other inforrnation shown onThe World Bank Group, any judgment WI LDLI FE POPULATION DENSITYcn the legal status of any territory, or HERBIVORES
edrmet or arceptance ofL RGsuch boundaies.
SU D AN \ i MORE THAN 1.0 ANIMALS PER KM2 RIVERSFEWER THAN 1.0 ANIMALS PER KM2 0 SELECTED CITIES AND TOWNS
7 i NATIONAL PARKS '----- DISTRICT BOUNDARIES_____ 4, |iNATIONAL RESERVES PROVINCE BOUNDARIES
INTERNATIONAL BOUNDARIES
~4°' ."! X W sN E T H I O P I A 74L ake _ _ ,/
J kB A N DueR A /
Lodwa TjI?lRKANA AP'AI- "./r < s~~~~~~~M A R S A B I rT !
\\ ~EI MoIoEComp ( f C.p
\R'' 2 I fI T
UGANDA \ \ A'L EF g i I '---- , WAJ iE
j ( -> / --' J X vo 2 k0 T H . g
<feSf ( .- A \ ./ f SAXISURIV > '* < $ I / W *> i s .w X E ~~~~~~~~~S, A T E IR .1
t ~~~~~~~~~~~~~~~~~~~~~~~~~~~~~~~~~~~~~~~~~~5 a '
L /,
LN~!L
WE STE Rq O C Eldw A N 4 zm WATERBUCK
^ < ~ ~~PKT < \ \ (cAE/°wl WB WLDEEES
KAKA,V ;_ --, K<ORC -A/ZER
1 go Meru , 0 aosm-,?SiA', A,- / %/ K '
O-Z
/ Kerict' - w,; NAKU R U1 MHR_ .IJNG / ~ _, Go 4M/SrZA) 90 -nKERCAGR MARCH 1
I A~~~~~~~~~~' anyuU~ ~~~~~~~~~~~~GA
NYAN~ZA'+IK.. _ i -as
NARCK K~~~gng 0:N7A10B tui;U~~~ALW~~~~~"APi iaKIT<j 77 NA/
NAIRO ~~~~~~~Mocha R-os
I AIDO ~7~ 5
SUDAN W
,J EIHJORA ~ - /"
A~rea of mp , ------- ~ ~ ~ ~ ~ ~ ~ ~ ~ ~ ~ ~ ~ ~ oja PREDOMINANT SPECIES:
71 KENYA IEL ELEPHANTB BUFFALO
INDIAN ~ ~ DNI - ~~Mor6anA GZB GREVY ZEBRA
WTB WATERBUCKKWALE lwoe WS WILDEBEEST
N. ~~~~~~~~~ZB BURCHELL'S0 50 100 1 50 KILOMTRHR ATEES
36' ~~~5 50 75 100O MILES Source: KWS
MARCH 1996

360
K E N Y A
WILDLIFE DISPERSAL AREAS AND CORRIDCS U DAN
\ : 00 ~~~~~~~NATIONAL PARKS .-- RIVERS/ 4s ! , ~~~~~~~~~~NATIONAL RESERVES O SELECTED CITIES AND TOY
*~~ * t -- ~~~~ ~~ ~~ - < ~WILDLIFE DISPERSAL AREAS ---- DISTRICT BOUNDARIES/ \<,> -~~~~~~~ANIMAL MOVEMENT PROVINCE BOUNDARIES
* 0 1 t - ---~~~~~~~~~~~~~~~INTERNATIONAL BOUNDAI
-A" . ) t! 0 E T H I O P I A '\ -
<1 \: 0 g Loke '-~~1' Lakt it s ~~~~~~~~Turkanc '| I M A N D fER A j
-v StRKANA f" '-'-'J >\ ,1~~~' A R S A S:i T'
t ' > \ ~~~~~~~El MaIo Camp f -
\. ~~R i F T .'* -i ' |UGANDA Es ,- .wAii2
';<J WEsr jW ./ ' ~~~~~~ .~~ - - ;. ,f >;, irl~~~,C) R T H , PCKCT . SA,1>-5MBU-RU.,' '_- |
{<_tbr > 51 j;ts -E'GE H i swe i
fleSUNyGC.M^ i. BRNO - -: - |WESTERN eEld a.......''jtro ................ ''~-.
t S h; t8<AKAMEGAX
N 4 KI _ JRUi A - ;xn. _.. .............. .. . ............ .................___ .......... . ,, ,3.s X \ C<(OS < X t <~~~~~~~~~~~~~~~~Griso
N.AZA--i.~ ... .. . .... -A ..... .ei imcy.o
{'t ( 1 . , \ ~ ~ ~ cny judgmentAMn,~~~~~~~~~~~ ..........KOMTRSssg orlrrtor
hA- t~~~~t { L_
VAC~ ~/ ~ E A--S T E R-R-M

KENYA
This corruption, organized and ordered at senior levels, was heightened even further in the late1970s by the soaring values of elephant tusks and rhino horns on the international market. Park fees alsobegan to be embezzled. This continued to a practically uncontrollable level until the late 1980s. By thistime, the WCMD had presided over reductions in the country's elephant and rhino populations of 85percent and 97 percent, respectively. During the fifteen years of WCMD's tenure, the infrastructure ofthe national parks deteriorated sharply. It should be noted that the number of visitors to Kenya increasedcontinuously over these years, despite the decimation of certain wildlife species. It was only in the late1980s, when their personal safety was threatened due to the security situation in the country, that thenumber of visitors to Kenya began to fall.
By comparison, wildlife was doing well on private land, which partly assured the survival of theblack rhino in Kenya. On the other hand, tolerance of wildlife on private land was strained to the limit bythe prohibition of hunting.
Current Wildlife Management Policies
The agency that inherited the role of the WCMD, the Kenya Wildlife Service (KWS), has threeprincipal goals:
e To conserve the natural environments of Kenya* To use the wildlife resources of Kenya sustainably for the economic development of the
nation and for the benefit of people living in wildlife areasa To protect people and property from injury or damage caused by wildlife (Kenya 1990a)
KWS's main policies emphasize an advisory role rather than a stringent management role indearing with dispersal areas outside the parks and reserves. KWS has laid out policies for wildlifemanagement, which went into effect in 1991, involving the creation of a national network of protectedareas. In other wildlife areas of national interest, primarily surrounding parks and reserves, KWS willensure that wildlife management is a land use but not to the exclusion of other compatible land uses.
For land outside protected areas devoted to land uses that are more economically beneficial thanwildlife, KWS will support conservation of only those species that are compatible with the alternativeland use. KWS will assist local governments in facilitating wildlife-based development and also ensurethat any development does not harm the protected areas. Finally, it will delegate more responsibilities tolandowners to develop their custodial skills and allow wildlife management to compete economically.This also implies permitting consumptive use of wildlife.
Landowners already have rights to use wildlife for tourism and recreation, but certain restrictionsgovern consumptive and nonconsumptive uses. The state retains ownership of wildlife and will intervenein cases of misuse. User rights will be granted only to applicants with acceptable management plans.Consumptive use rights will be granted only for selected species and only in areas remote fromnonconsumptive tourism activities.
3.1.2 Financial and Economic Status of WildlifeKenya's tourist industry developed steadily until 1983, after which it experienced extremely
rapid growth during a period of worldwide tourism expansion. Several positive factors coincided: the1980s saw good economic conditions in Europe and the United States, wildlife tourism was in vogue, air
43

THE ECONOMICS OF WILDLIFE
connections were good and developed in response to demand, Kenya's economic climate suited invein tourist facilities, and a well-trained workforce emerged from colleges and private training progranstaff hotels and lodges throughout the country.
The tourism sector represents Kenya's most successful area of economic diversification; willhas been central to this achievement. KWS estimates that more than 50 percent of the earnings showtable 3.2 was generated by wildlife.
Table 3.2: Foreign Exchange Earnings From Tourism in Kenya, 1977-911977 1985 1986 1987 1988 1989 1990 1991
KES (billions) 0.96 4.18 4.92 5.84 6.98 8.64 10.66 11.88US$ (millions) 129 239 306 355 394 420 444 333Total visitors 344 477 542 587 616 696 740 727
(thousands)Earnings per 375 501 564 605 640 603 600 458
visitor (US$)Source: Statistical Abstract, Economic Survey 1992.Note: These figures do not include expenditures billed to credit cards or attributable to other channels of
payments.
"The most effective way to ensure conservation of wildlife is to increase human dependenceit. Only if the rural population can be made to see the financial benefits to be achieved from wildlifeare allowed to earn those benefits, will conservation be accepted" (Mwenge International Associates1980). This is the main principle now underpinning management strategies in wildlife dispersal areasKenya and on private lands with resident wildlife populations.
The statement "that those who gain most from wildlife are not those who have to support it"describes the conflict in wildlife utilization in Kenya (Douglas-Hamilton and Associates 1988). Wildis a public asset used largely for private gain. The tourist industry benefits the companies and theiremployees, usually based outside the wildlife areas, whereas landowners have not been in a positiontake advantage of the economic opportunities presented by the animals on their land. Although thegovernment receives revenues from the parks and taxes paid by the companies and individuals who aengaged in the tourist industry, the pastoral areas that support almost all the wildlife on which theindustry depends have received a disproportionately low level of public investment and social welfar,support.
Little of Kenya's protected areas is suitable for cultivation, but their extensive range andwoodland cover are suitable for livestock grazing or fuelwood harvesting. In addition to increasedpressure from these activities, fanning has spread into marginal areas, placing further pressure ondiminishing grazing areas and bringing pastoralists into greater conflict with wildlife. The arid andsemiarid lands that are not part of the KWS protected area system form important wildlife dispersalareas, especially during wet seasons, and agricultural development and overgrazing in these areas arethreatening to close critical game dispersal and migration corridors.
44

KENYA
3.1.3 Wildlife Management and Utilization in KenyaKenya's population tripled between 1948 and 1979 and is believed to be growing at about 3.8
percent per annum. By the year 2000, more than 30 million people will live in Kenya.
Some of the fastest rates of population growth in Kenya are in those areas around parks andreserves. For example, there has been a 7 percent per annum population growth in recent years in theremaining Maasai Mara dispersal area (Kenya 1 990a).
Simply put, we believe that population growth is the most pressing problem in Kenya, and thatall development and conservation efforts are pointless unless this problem is fully addressed and realefforts to reduce family size are incorporated into all community development programs. Unbridledpopulation growth is the cause of environmental degradation and the unsustainable resource use takingplace.
The pattern of land tenure in Kenya has undergone a transformation in the last two decades withland adjudication to individual titles, long-term leases, and group or commercial ranches. Many ownersof what was formerly tribal trust land wish to "develop" their property, implying agricultural or livestockinfrastructure and, effectively, the loss of wilderness and forms of land use that preclude even wildliferanching. These rights cannot be denied landowners unless land use bylaws or regulations arecontravened.
For many African people, the consumption of wildlife bears a stigma of "backwardness." This isrelated to the socioeconomic status of those tribes that still rely on game meat. Livestock remains moreacceptable to meat eaters, and livestock meats have been more readily available.
In spite of the widespread perception of game meat as second rate, game meat has been sold inbutcheries as a luxury item targeted to a limited group of well-to-do customers; however, recentlywholesale prices have become competitive with the price of beef. Game meat sold in butcheries has beencropped on license, whereas most bush meat is obtained illegally. Poached or stolen goods are alwayscheaper than the "real thing." The value of game meat can be enhanced two- or three-fold by processingit into such luxury products as smoked, dried (biltong), or sausage products.
The use of wildlife requires a substantial degree of management, international marketing skillsand long-term investment. The exceptions are traditional hunting and simple consumption of game meat.The tourism industry in Kenya is the direct result of this "management specialty," and it is this industrythat retains by far the greatest proportion of gross earnings as figure 3.3 shows.
For community-based wildlife projects, this management requirement will remain a-constraintand will impose a dependence on technical assistance or partnerships with tourism and wildlifeutilization companies. There is also a need to develop among landowners an understanding of thepreferences of tourists, hunters, and other consumers and the corresponding investment required.
45

THE ECONOMICS OF WILDLIFE
Figure 3.3: Direct Distribution of Gross Earnings of the Mara Area, 1987
Lodge/Camp Shops
Air Charter Operators
HotelEmployees (Other) Operators/Owners
Employees (Narok)
Narok County Council
Balloon Operators
yGoverment TaxesMasai Group Ranches
Safar Companies Travel Agents/TourTour Companies Organizers
Source: Douglas Hamilton & Associates 1988.
3.1.4 Economic and Political Conditions and Their InfluenceKenya's economy performed well for most of the 1970s and 1980s with a growth in GDP of
nearly 5 percent per annum. By the end of the latter decade, deteriorating terms of trade, a slowdown inexport growth, high inflation rates, a burgeoning population, and rapid growth in governmentexpenditure had brought a turnaround. In addition, drought and vastly increased expenditure on oilimports contributed to the problems.
Kenya faces a bleak economic future in the short term because of the downturn in tourism andmarket conditions for tea and coffee, its major traditional exports. An additional economic shock hasbeen induced by lower aid, a result of the political transition Kenya has been undergoing since 1991.
Over the medium term, future economic growth could be low if the government does not tackleproblems of deteriorating public-sector efficiency and encourage development of the private sector'spotential for accelerated, efficient, and outward-oriented expansion (World Bank 1992). Kenya needs tocreate 400,000 jobs per year to keep pace with newcomers to the job market, whereas only 80,000-90,000 jobs are being created each year, the majority of which are in the unsustainable public sector. TheKenya government has liberalized crop marketing and foreign exchange controls, causing the Kenyashilling (KES) to slide dramatically in value to KES 66/US$ 1 by July 1993.
46
KENYA
3.1.5 Land-Tenure Policies and PracticesPrivate landowners are free to decide what kinds of wildlife, if any, they wish to have on their
land and can implement these decisions through habitat modification (for example, burning and plowing)or by limiting movements and entry through fencing. These private management prerogatives arecompletely beyond the control and influence of the KWS. As a result:
The most extensive natural resource problem in Kenya is probably the reduction in vegetativecover and an unsustainable intensification of crop and livestock production leading to soil erosionand insufficient replenishment of perennial resources. These problems are most severe in the aridand semiarid lands. (DANIDA 1989, quoted in Kenya 1990b).
Government must bear the responsibility for much of the legal inconsistency attending land usein Kenya. This is the result of a combination of history and the persistence of contradictory legislationand policy. In the late 1960s and early 1970s, when group ranches were created, the government realizedthat the conflict with wildlife would be raised. The government announced that "no rancher in theadjudicated areas should be required to sustain wildlife on his land if this means lower returns" (WorldBank 1973, p. 4).
At that time, hunting and other forms of consumptive utilization were possible, and the U.N.Development Programme (UNDP)/Food and Agriculture Organization (FAO) Wildlife ManagementProject had been formulated to develop mechanisms for community utilization among ranchers andtraditional pastoralists. The economics of wildlife utilization were shattered with the government'shunting ban in 1977. Data collected by the consultants for this study indicate that wildlife utilizationbecomes a competitive and attractive land use only when consumptive utilization, especially hunting, isemployed (see section 3.2).
One of the strongest threats to wildlife areas is the subdivision of communal land. The pattern ofland tenure in Kenya is of conversion from communally owned land, with open access for all communitymembers, to private ownership (long-term leases, gazetted or commercial ranches, private title deeds).There is a continuing trend for group ranches to split into privately owned land parcels.
Traditional Kenyan communities are now exerting strong pressure for their members to owntheir own land, a development that has resulted from encroachment on communal land by crop farmers;fear of losing land to members of their own communities capable of using power, money, and influenceto acquire large holdings; a response to market increases in land values (Kohler 1987); and inequity inthe distribution of land revenues from external sources
The overall picture in Kenya's arid and semiarid lands is one of a declining resource base as aresult of land clearing, overcultivation, and overgrazing.
3.1.6 Other Relevant IssuesThis section reviews the nature of land uses competing with wildlife and sketches a comparative
financial analysis.
47

THE ECONOMICS OF WILDLIFE
The Distribution of Benefits and CostsIn some areas near the Maasai Mara, private individuals, usually tour operators, have created
agreements in the form of concession areas. These arrangements usually involve paying landownersdirectly in the form of cash. Another effective way to share revenues is by developing infrastructure andemployment for the people in the concession area. More often than not, however, cash has to be handedover as well, since certain kinds of developments may not be interesting to all parties.
Cash revenue sharing may, however, change people's attitudes and lead to other unwanteddevelopments that are not compatible with wildlife. But if revenues are distributed solely to communitie!for developments, everyone may not benefit (that is, if a school is built, people without children will notfeel that they benefit from their conservation activities).
Revenue sharing with landowners has been taking place over a period of about ten years, butrelatively unsuccessfully. Figure 3.3 above is a graphic depiction of the fundamental problem in Kenya'swildlife dispersal areas. The portion of revenues shared with the Maasai group ranches is so small thatmany landowners do not consider maintaining an agreement to conserve wildlife worthwhile.Furthermore, group ranches have not received these shared revenues in proportions that reflect the coststhey bear.
An additional major problem is the diversion of money, since the existing distribution systems inKajiado and Narok, for example, reflect the political power bases of the day. These are old problems(FAO 1975 and 1977).
It is thought that KWS will set up the Revenue Sharing and Wildlife Development Fund (WDF).It is envisaged that WDF will be based on two funded activities, enterprise development and communitydevelopment and that funding will include both grants and credit. All funding under WDF will have tomeet certain criteria and the main issue will be the conservation value to KWS. WDF will not replaceother sources of support but merely strengthen areas or groups that bear the major costs of coexistingwith wildlife.
Damage by Wildlife
For many Kenyans, living with wildlife means predation of their livestock and destruction oftheir subsistence and cash crops. There is much injury and loss of life as well from lions, buffalo, andhippopotamuses. To alleviate the problems wildlife poses, the Kenya government instituted a system ofcompensation in the 1970s. The system never worked and was subject to systematic misappropriation offunds. It has now been officially abandoned.
Areas that have both wildlife and development often necessarily must be fenced in certain areasto prevent further conflict or damage to crops. With such fencing, the question arises: Who is going tomaintain it? In Laikipia District, numerous farmers have installed hundreds of kilometers of fence, bothto keep the animals in and to keep them out. They have in many instances had their fencing stolen, and,in repairing it, have found themselves unable to keep up with the rate of theft. Fencing to curtail damageby wildlife, therefore, should be done only if the local community is willing not only to maintain fencesbut also somehow contribute to their construction.
48

KENYA
Wildlife and Livestock Diseases
The wildlife-livestock disease transmission route is of less importance than many peoplecommonly believe and is appropriately described in the following words: "It is stressed that wildlife,compared to livestock, plays only a minor role in the spread of a number of viral and bacterial diseases inKenya" (Paling 1990). The role of wildlife as maintenance host for~tick populations and the role ofbuffalo as a reservoir of the most important cattle disease (East Coast Fever) in addition to being areservoir of foot-and-mouth disease present direct costs to the farner. A case study made for this reportshowed that although the costs of tick control as a result of the presence of wildlife is considerable, it isminor in relation to the cost of grazing competition.
Kenya has been relatively successful in curbing poaching, but the problem is far from over. Theconservation community's success in banning the international ivory trade is a controversial issue incountries that have been able to conserve their elephant populations.
Subsistence meat poaching by local people does not occur at anywhere near the levels that haveled to the near-extermination of elephants and rhinos for overseas markets. This form of poaching can bestopped (or legalized and regulated) only by providing a suitable legal environment and througheducation and community involvement of local people.
3.2 The Economics of Living with WildlifeThis section discusses wildlife utilization as a land use and financial analysis of the viability of a
protected wildlife area.
3.2.1 Wildlife Utilization as Land UseA widely held belief is that the net economic benefits of wildlife utilization will be greater than
the return from cattle production on the same area of land. Proponents of this view emphasize that thewhole range of utilization opportunities must be considered and that the issue of sustainability ofvegetation, soil, and water must be included in the comparison.
Little published data either support or negate the hypothesis that wildlife is a resource that offersattractive financial returns on a sustainable basis; however, evidence from the livestock sector shows thatcattle ranching is a marginal business (Capricorn Consultants Limited 1992 and Nsibandze 1982). Ourcase studies indicate returns on investment of 6-8 percent for cattle ranching. Nsibandze found that fornine ranches in the Machakos area the highest financial return on investment was 8.5 percent, theaverage was 2.3 percent, and two were loss making. It must be added that the govermnent wascontrolling meat prices at artificially low levels at that time. Costs have soared in the industry, there arevirtually no export markets in which Kenya can compete, and a beef-marketing cartel at the high-classbutcher/restaurant level is operating in the country.
We have been able to study cattle and wildlife ranching in some detail through the kindassistance of Drs. D. Hopcraft and M. Sommerlatte of Wildlife Ranching Limited. Our conclusions arethat game management offers at least a competitive land use option once all aspects of utilization aretaken into account and that game and cattle together offer the best option and a return on investment of7-12 percent. Returns are even greater when correlated activities-photographic and educational
49

THE ECONOMICS OF WILDLIFE
tourism, bird-shooting, hunting, and preparation and sale of trophies and skins-can be added to generatincome.
If wildlife offers viable, land use options, alone or in combination with livestock and crops, whyhas such utilization not emerged as a standard land-use option in Kenya? The answer lies in therestrictive policies and legislation concerning wildlife and perhaps with a traditional "beef mentality."
Until recently, Kenya left few options that involved wildlife utilization open to landowners.Instead, landowners were expected to live with the migration or seasonal movements of animals andaccept the ravages of baboons, buffalo, and elephants under the doctrine that tourism had becomeKenya's main foreign exchange-earning industry. Landowners could, of course, make life difficult forthe wildlife-by fencing and even by obtaining permission to shoot pesky game. Large numbers ofbuffalo, for example, have been destroyed in the past to prevent crop losses in the wheat- and maize-growing areas. But an extraordinary situation prevailed in that landowners by law were not permitted toutilize wildlife culled in this way.
Until 1990 only one game-cropping system existed in Kenya. Since that time, a growing numberof projects and community development programs based on wildlife have been initiated.
Competing Land Uses
Crop production is in direct conflict with wildlife land-use options. There is no evidence,however, that in environmental zones where crop production is recommended, wildlife-based land usecan compete with agriculture.
Table 3.3 provides official estimates of gross returns from intensive land use in the medium- anchigh-potential zones* in which there is little or no wildlife land use. The data, therefore, provide upperlimits of "average" gross returns from agriculture that could potentially be obtained in wildlife areas.
These can be compared with gross revenues from the Maasai Mara National Reserve in 1988 ofapproximately KE 147 per hectare (US$183) a figure comparable to maize and beans, but less than wheaand barley (the main threats to wildlife range in the Mara area). This estimate does not take into accountthe wildlife dispersal areas. If these were included, the gross return to wildlife per hectare would behalved. The landowner receives a fraction of this amount. Thus, what finally can be considered a returnto the land is insufficient for those who have alternative land uses to even treat tourism as a seriousalternative. Even ranching offers a gross return of over US$11 per hectare, which is much more than theMaasai obtained on Koyaki Ranch, a prime game-viewing area adjacent to the Maasai Mara, in 1992;however, this was for photographic tourism only.
In the marginal agroecological zones in which dryland cropping is not recommended, wildlife-based land uses can offer more competitive returns and offer ecological benefits in terms of long-termland use (provided there is correct management). Crop production in marginal areas is supported by off-farmn incomes or technology not available to smallholders.
Unfortunately, there are little or no data readily available on net returns per unit of land, nor on units of capital invested.
50

Table 3.3: Estimated Areas, Value, and Value Per Hectare for Selected CommoditiesCommodity Area Valued Value per hectare
(percent) (rank) (perceno (rank) (KC'hectare (rank)Milk 46.6 (1) 16.3 (3) 70 (16)Maize and beansa 22.6 (2) 16.6 (2) 153 (12)Root cropsb 7.9 (3) 8.1 (5) 205 (9)Sorghum and millet 6.7 (4) 1.5 * (11) 48 (17)Coffee 2.9 (5) 21.6 - (1) 1,489 (1)Wheat 2.2 (6) 2.1 (10) 191 (10)Cotton 2.1 (7) 0.4 (18) 32 (18)Fruits 2.1 (8) 3.1 (9) 296 (7)Sugar 1.7 (9) -3.6 (21) 432 (19)Tea 1.6 (10) 11.9 (4) 1,325 (2)Sisal 1.1 (11) 1.1 (12) 137 (14)Vegetables 0.7 (12) 3.4 (8) 913 (3)Cashew nuts 0.5 (13) 0.4 (15) 162 (11)Groundnuts 0.4 (14) 0.2 (20) 84 (15)Barley 0.3 (15) 0.4 (17) 249 (8)Sunflower 0.2 (16) 0.2 (19) 141 (13)Pyrethrum 0.2 (17) 0.4 (16) 419 (6)Rice 0.2 (18) 0.5 (13) 519 (5)Tobacco 0.1 (19) 0.5 (13) 885 (4)Beef 6.8 (6)Sheep and goats 4.9 (7) -
Others 3.1 -Total 100.0e 100.0e 170f
Source: Kenya, Sessional Paper No. 1, 1986.Notes:a. Because beans are typically interplanted with maize, the two crops are considered together. Maize alone accounts for
13.3 percent of total value.b. Includes potatoes, which account for 5.3 percent of total value.c. No estimates available.d. Value at farm gate.e. The total area is 5.17 million hectares and the total value is KE 1,035 million (US$32 million at 1992 exchange
rate).f Excludes beef, sheep, goats, and "others."
Cash crop (export) agriculture (Sharpley 1986) and tourism (EIU 1979) have similar demandsfor foreign exchange inputs: approximately US$0.40 of foreign exchange is required to generateUS$1.00 in earpings in both sectors.
In any case, the wildlife resource in all agroecological zones with farming potential in Kenya isheavily depleted. There are, nevertheless, opportunities for complementary utilization, such as game birdenterprises or intensive farming (for exampie, ostrich) using crop by-products.
When considering livestock land uses, pastoralist and ranching enterprises must be consideredseparately due to their entirely different structures. Offtake rates among pastoralists range; from 6 to 15percent. Hides and skins, milk, and offals add to the yield. Commercial ranching, with offtakes of meatalone, range from 17 percent to 28 percent. Commercial ranches can achieve offtakes of up to 16.5kilograms per hectare of meat by applying a fattening/trading enterprise, about 8.8 kilograms per hectarewith breeding/growing/fattening, and 12 kilograms per hectare under a mixed operation in which thetrading/fattening operation is used to take advantage of feed availability. This flexibility of managementis a fundamental advantage of cattle ranching.
51

THE ECONOMICS OF WILDLIFE
Cattle ranching requires substantial investments in water supply, animal handling facilities,roads, buildings, vehicles, and operating cost inputs to ensure these high rates of meat production.
In either case, livestock production is not automatically compatible with long-term wildlifeconservation interests because of the grazing resources required for cattle and because of the attendantmodifications to the land that normally accompany pastoralism or settled ranching once the livestocksystem becomes more intensive. One observer has commented that:
Wildlife and cattle only truly coexist under conditions of nomadic pastoralism. The reason for thisis that pastoralists lack the physical infrastructure and the management infrastructure to influencewildlife, although habitat modification through the use of fire by pastoralists has greatlyinfluenced the numbers and distribution of wildlife in some areas. (EcoSystems 1982a)
Our findings, however, indicate that coexistence under commercial conditions is not onlypossible but desirable for maximum forage and infrastructure utilization, greatest meat offtake, and bestfinancial returns. The overlap in food requirements is considerable and depends on the wildlife mix(specifically the biomass of grazers) and season, but the substitution rate is not 1:1, as wildlife utilizeadditional food niches of trees and bushes for browse, forbs, and litter.
Cattle distributions change radically from season to season as they are herded away from heavilgrazed areas to new, green pastures. Usually the wild grazers also are migrating onto rangelands that aregreening up." As cattle feed primarily on herbaceous forage, they will compete mainly with grazers
such as zebras, wildebeests, topi, kongoni, and Thomson's gazelles. Sheep and goats are mixed feedersthat forage on grasses, herbs, and shrubs. Wild herbivores that are also mixed feeders include elephants,impalas, Grant's gazelles, oryx, roan antelopes, and klipspringers; however, under careful managementconflict can be minimized, provided that combined livestock and wildlife populations do not exceed theland's overall carrying capacity. In other words, conflict is an induced situation, the result of increase inpastoral herds, alienation of land or gradual loss in range productivity. In Kenya, the greatest conflictsbetween livestock and wild herbivores for food and water occur in the grasslands and shrublands of thesouthwest (Narok) and southeast (Kajiado) Laikipia, Machakos, and Sam buru, especially among cattle,sheep, and goats competing with wildebeests, buffalo, kongoni, topi, Burchell's zebras, impalas, andGrant's and Thomson's gazelles (Andere and others 1981).
Domestic livestock are generally selective feeders, and certain wildlife species provide anavenue for maximizing land use through increased grazing and browsing. Nevertheless, the consultants'investigations suggest that one zebra displaces an average of 1.8 cattle, although this may be anoverestimate (Peden [19843 suggests a ratio of 1.1 zebra per cattle unit).
Cattle ranching has become increasingly difficult to sustain profitably for landowners in a worldin which prices have been eroded by inflation (see table 3.4) and a drastic decline has occurred in thevalue of the shilling. (There is a high import content in essential dips, drugs, and vaccines).
52

KENYA
Table 3.4: Declining Real Producer Meat Prices in KenyaYear Price (KES/kg) Deflatora Real Price
steak meat and bone steak meat and bone1978 13 9 71 - .18 131983 18 14 112 - 16 131986 20 17 145 14 121991 25 20 227 1 1 9Source: Capricorn Consultants and file records.a To attain constant prices (1982=100). Prices are maximum wholesale rates.
Wildlife-Based Land Use
A number of studies have considered alternative land uses and possible returns (Norton-Griffiths1992; Douglas-Hamilton and Associates 1988; EcoSystems 1982b) as a method of establishing the likelycourse of events or determining minimum compensation levels for continuing wildlife land uses.
It is estimated that wildlife could produce a sustainable biomass level of 75 kilograms perhectare (Hopcraft, pers. com. 1993). At present, it is approximately 30 kilograms per hectare on GameRanching's ranch at Athi River. Currently, Game Ranching is achieving an offtake of about 19 percent ofbiomass or 4.9 kilograms per hectare live weight; this provides a return of US$8.6 per hectare, muchhigher than a beef enterprise.
Wildlife also has a higher dressing-out rate of approximately 57 percent (some species as high as64 percent); cattle dress out at no more than 48 percent. Wildlife has fewer input requirements such asveterinary drugs, although the potential economic returns of applying these are not known; however,more roads may be required if shooting is the harvesting technique, and an abattoir/cold room is essentialwithin the cropping area. Wildlife cannot be caught and trucked to abattoirs, as cattle can be.
The marketing of some of the most valuable by-products-the horns and hides-has beenprevented by the government, limiting the economic potential of game ranching. Even under more liberalconditions now in place in Kenya, hides must be dehaired and thereby effectively become leather.Whereas all cattle hides and sheep and goat skins must be at least partially tanned before leaving Kenya(blue tanning), wild animal hides must be exported dried only.
Returns from wildlife on meat alone are probably insufficient, in any scenario. The whole rangeof income-generating opportunities is required to ensure viability: photographic and educational tourism,hunting, sale of trophies, and live animal exports.
Our recommendation is that cattle and other domestic stock be combined with wildlifeoperations for maximum range use. A rapid and dramatic move to game ranching or cropping wouldoverwhelm the market and is not re,alistic in terms of subsistence uses of domestic stock (in the case ofpastoralists) and management capabilities on commercial ranches. A great deal of technical assistancewill have to be provided for extension and monitoring. Maximum freedom should be given tolandowners to manage their wildlife resource and its products under the supervision of the KWS. Thelandowner needs to have the flexibility to determine offtake, species mix and herd structures and not bebridled with "safety level" offtakes that are not based on any of the fundamental factors affecting thelandowner: biomass, offtake potential, consumer preferences, market prices, and so on.
53

THE ECONOMICS OF WILDLIFE
Close supervision will be required to avoid "harvesting" operations that are not attended by loterm management plans. The distinction needs to be drawn among game cropping, game ranching, an(game farming on the one hand and management guidelines and controls applied respectively to themthe other hand.
Price has played an important role in maintaining game meat as an attractive enterprise. It hasbeen consistently higher per kilogram than beef, the price of which had been controlled by thegovernment until 1989. King and Heath (1971) showed that domesticated oryx provided better returnsthan Boran cattle under the same management regimes, mainly because oryx meat could be sold at apremium and the horns and hides at trophy values.
Table 3.5: Comparison of Beef and Game Meat PricesYear Gazelle, etc. (live weight) Beef (live weight)
(KES) (US$) (KES) (US$)1981 14.28 7.001992 45.70 1.27 16.50 0.461993 54.20 0.68 25.00 0.31
Note: This assumes 57 percent carcass recovery for game and 48 percent for cattle.Source: D. Hopcraft, pers. com. 1993.
Wildlife meat is a gourmet food and not necessarily viable if marketed cheaply, although meafrom wildlife harvested illegally is cheap and consumed by low income earners of rural and peri-urbarareas. We found no literature for Kenya quantifying this type of consumption.
Multiple Land-Use Options
The construction of multiple land-use options for conservation areas has been discussed for bcparks and private land in Kenya (EcoSystems 1982b; Douglas-Hamilton and Associates 1988); howevmanagement of such schemes represents a major challenge. This is partly because the "conservationisiperception that any form of joint use will result in a "give-an-inch, take-a-mile" problem. Another facdis that the conservation ethic in Kenya is overlaid with a historical jealousy over the control of gazetteconservation areas. (In many cases the boundaries and management pattern of parks and reserves can 1traced to the individuals who played instrumental roles in establishing them.)
3.2.2 Financial AnalysisThere are two aspects to this discussion of a protected wildlife area's viability: (1) whether a
conservation area is financially self-supporting and (2) whether conservation is its most attractive useeconomic terrns. There are currently 57 protected wildlife areas within the KWS framework, coveringapproximately 8 percent of Kenya's land area (Kenya 1990a), of which fewer than half yield anysignificant revenues. In 1991 KWS collected approximately KES 190 million in revenues from twentytwo national parks and reserves; of this sum, more than 60 percent (KES 140 million) came from onlyseven national parks (this excludes Maasai Mara National Reserve, which is the highest single earner,and Samburu, Buffalo Springs, and Shaba reserves, which are also high earners). Visits to national parand reserves dropped steeply from about 1.4 million in 1991 to about 600,000 in 1992, which must ha'affected gross revenues severely. Unfortunately, data do not allow the deterrnination of net financial
54

KENYA
benefits (Kenya 1992b). No studies have been done on the economic value of specific conservation areasin Kenya.
Statements such as the following remain totally unsupported by evaluation or experience: "Theloss of wildlife habitat in the dispersal areas of the parks and reserves would be disastrous for Kenya'seconomy" and "Also of national concern are areas that are rich in wildlife and are either earmarked aspossible parks or reserves or have high economic potential for tourism" (Kenya 1990a, annex 10, p. iv).Management and development plans for existing and proposed parks and reserves contain no marketanalysis, financial evaluation, or benefit-cost calculations. In its Policy Framework and DevelopmentProgramme, KWS concludes that it must undertake further work on "defining the location, extent, andcharacteristics of the priority wildlife areas," but no mention is made of arguing the case on economicgrounds.
Private landowners in the arid and semiarid lands increasingly are pressed to consider alternativeforms of land use due to the declining viability of the domestic livestock industries. Sommerlatte(undated) estimates that the reintroduction of safari hunting could earn Kenya US$12-20 millionannually, of which landowners would receive at least US$2.9 million in the form of trophy andconcession fees. With some 1.8 million hectares on ninety ranches (group, cooperative, company, andprivate) suitable for safari hunting in the country, this figure would represent earnings of US$1.60 perhectare per annum on the land used. Providing accommodations and other services would present otheropportunities to generate income.
Lusiola (1992) reported that 228 ranches with substantial wildlife populations had beenidentified. By late 1992 KWS had received twenty-six applications for wildlife usage rights; eighteen ofthe'applicants had been issued quotas, and five applications were being processed.
A total of twenty-two game farms (ostrich, crocodile, and so on) and thirty-seven game rancheswere in operation at the end of 1992, and several more were being reviewed.
The only case, to the consultants' knowledge, of a recent financial assessment of the returns fromwildlife is that of the Koyaki concession coordinated by Ker and Downey Safaris Limited. Theconcessionaires estimated the returns the Maasai could obtain from altemative uses (including land leasefor cropping and construction of a lodge) and have guaranteed payment of an annual fee greater than thisamount.
Wildlife management requires large areas of land. In communal areas this means that manylandowners will have to cooperate; by implication, this means that they should at least have similarobjectives. For investments to take place for wildlife utilization in these areas, a long-term commitmentby this group of people is a prerequisite. Is this a reasonable expectation? Even in areas where multipleland use is practiced, conflicts constantly arise because of the difficulty of managing the lInd to maintainthe wilderness element.
Nevertheless, Thresher in FAO (1977) believes that the problem of preventing wild herbivoresfrom disappearing from the ranches around Amboseli National Park technically could be solved bypaying ranch members equitably-that is, in proportion to the grazing resource made available in thetotal ecosystem. The consultants' own observation is that wildlife utilization will remain a secondaryenterprise, with livestock management firnly the priority for pastoralists; thu avenues for enhancingreturns using wildlife to complement livestock are likely to be most successful!
55

THE ECONOMICS OF WILDLIFE
From hunting in 1973, Kajiado District earned KES6 million for Kenya, all in the form offoreign exchange (15 percent of the national total) and a further KES0.4 million directly in fees tolandowners (FAO 1975). It was concluded that this form of land use could by itself produce greaterreturns than cattle, yet could be continued in conjunction with livestock husbandry. Hunting offtakes
were less than 1 percent of the wild animal population.
KWS has for a period of time held meetings with landowners to encourage landowners toorganize themselves into Wildlife Management Units. This program has to date involved six districts;recent meetings indicate that landowners are limited by current policies in terms of generating revenueand want KWS to consider gradual expansion of the use right program. The director of KWS has inprinciple agreed to the reintroduction of hunting. The biggest problem is the justification to parliament
that the activity is needed by the rural people and that it can be controlled.
The last census done on wildlife populations was done in the 1980s, which has little bearing on
current population; however, on the basis of fee estimates (see table 3.6) and expected numbers ofhunters, it can be estimated that approximately US$20 million will be generated in direct (gross) reveni
from the reintroduction of hunting.
Table 3.6: Estimated Possible Fees from HuntingCitizens Noncitizens(KES) (US$)
Buffalo 8,000 600Elands 8,000 600Giraffes 12,000 600Zebras 8,000 600Impalas 4,000 200Grants gazelles 4,000 200Thomson's gazelles 3,000 150Hartebeests 6,000 400Wildebeests 6,000 400Source: Consultants' estimates based on interviews with KWS.
Currently there are thirty-one ranches with cropping user rights in Kenya. Game cropping is
currently only done by special permission from KWS. To some ranches, this has created problems, asthey are not able to maintain a healthy number of game on their land. There is a need to crop sufficientnumbers to stabilize the population of some of their plains game as they are overstocked with speciessuch as the zebra and Thomson's gazelle, which are the main competitors for grazing with livestock. Itthe intention of KWS to increase cropping quotas to many more users bringing it up to its potential.
In 1989 there was only one cropping company in Kenya operating on three ranches (currentlyfive) and producing approximately 45 tons of meat per annum. KWS estimates that possible demand fogame meat by the end of 1995 will reach 500 tons per annum, which is much less than the potentialproduction. It is the intention of KWS to generate a cropping market mainly for export. There is greatinterest in this field for both local and foreign consumption, but stringent European EconomicCommunity regulations on meat imports hinders exports. Current potential markets exist elsewhere inAfrica (that is, Somalia) and the Near East for venison where restrictions are less severe. The local
56

KENYA
Table 3.7: A Five-Year Projection of Maximum Levels of Game Cropping in KenyaYear Ranches Hectares Operators Animals Dressed Meat Hides Total
(1, 000s) (I, O0Os) Meat Value Value Value(1,OOOs (millions (millions (millionsof kg) -. KES) KES) KES)
1 20 400 4 13.2 545 23.1 1.9 25.03 35 700 7 23.1 954 40.4 3.3 43.75 45 900 9 29.7 1,226 51.9 4.2 56.1
Source: KWS estimates.
market is poorly marketed with few butcheries selling game meat and only one restaurant specializes inserving game meat on the menu.
Current sales prices for game meat are approximately twice that of beef. Although it is importantto give the impression that game meat is not a cheap type of meat but rather a quality product demandinga high price, it is still important to be able to compete with the livestock sector. By introducing additionaloperators, the prices may well come down; however, one constraint for further development in this fieldwas the government's restriction on hides for export. These restrictions on export of hides are now beingreduced, which will increase the return per animal considerably.
Summary: A comparison of land use options
Table 3.8 shows current and estimated gross revenues per hectare for national parks and reservesin Kenya. This is revenue collected by KWS, not total revenue for the areas, that is, lodges and privateoperators. Agricultural revenue has been calculated by estimating total possible agricultural areaaccording to agroecological zones (AEZ) derived from the Range Management Handbook (1982), with10 percent off for unsuitable landscapes, such as rocks, rivers, hills, and so on. Although each area mayhave different cropping options, maize has been used as an economic indicator for all areas. Livestockrevenues have been estimated according to areas that are not utilized for agriculture and then calculatedwith a 10 percent offtake per annum.
Apart from higher ground areas, most of the areas set aside for parks and reserves are not wellsuited for agriculture and cannot, therefore, compete with tourism, at least not to smallholders that havelittle technology and few means of improving the land.
3.3 Environmental ImpactApart from strictly financial and economic concerns about the relative returns to different kinds
of land use, there may be additional environmental aspects to consider, as discussed in this section.
3.3.1 Livestock and Wildlife in the Rangelands- On private land on which there is development of infrastructure, such as water sources, andindirect protection through management, populations of wild herbivores appear to have increasedmarkedly during the 1 980s. Fluctuations have occurred as a result of the droughts of 1973-75, 1983-84,and 1988, with maximum populations recorded in 1970-73. Elephants and rhinoceroses are special casesthat have been subject to devastating poaching.
57

THE ECONOMICS OF WILDLIFE
Table 3.8: Revenue Summary of Tourism, Estimated Agriculture, and Livestock Earnings for National Parks and Reserves
Name Tourism Agriculture Estimated livestock Agricultural livestockrevenue revenue revenues versus tourism revenues
(KES per hectare per (KES per hectare per (KES per hectare perannum) annum) annum)
Nairobi N.P. 1,363 17,500 59 16,196Amboseli N.P. 854 17,500 60 16,706Lake Nakuru N.P. 1,257 17,500 100 16,343Tsavo East N.P. 22 17,500 50 17,528Tsavo West N.P. 23 17,500 60 17,537Aberdares N.P. 709 17,500 101 16,891Shimba Hills N.P, 393 17,500 60 17,168Malindi N.P. 128 - - (128)Meru N.P. 19 17,500 60 17,541Marsabit N.P. 3 17,500 50 17,547Mount Kenya N.P. 70 17,500 75 17,505Mount Elgon N.P. 24 17,500 75 17,552Kisite Mpunguti N.P. 991 - - (991)Oldonyo Sabuk N.P. 17 17,500 74 17,558Hell's Gate N.P. 312 17,500 75 17,263Sibiloi N.P. I - 50 49Ruma N.P. 1 17,500 100 17,599Saiwa N.P. 1,410 17,500 45 16,135Central Island N.P. 97 17,500 44 17,447Mombasa N.P. 3,899 - - (3,899)Watamu N.P. 6,312 - - (6,312)MaasaiMaraN.R.a 443 17,500 60 17,117
Source: Authors estimates.Note: Agricultural revenue is estimated on maize production at an average yield of 2.5 tons per hectare and KES7 per kilogram.a. This figure is an estimate as the County Council will not release any data.

IBRD 27052
36°
K E N YAI 50 100 15KILOMETERS NATIONAL PARKS AND RESERVES
0 25 50 75 100 MII.ES NATIONAL PARKS GAME SANCTUARY
; L I NATIONAL RESERVES r--- FOREST RESERVE, INCLUDINGS U D A N * NATIONAL MARINE PARKS '--- NATURE RESERVES7- s t NATIONAL MARINE RESERVES (AND * BIOSPHERE RESERVES
/ 4r\7f, -1 NATIONAL MARINE RESERVES, 0 PROPOSED/ 1s:, X INCLUDING NATIONAL MARINE PARKS) * NATURE PARK
PRIMATE RESERVE
.If)o }* ( t X SIBILOI *\ E T H I O P I A
CENTRAL' 'Lk/I151,AND i, Turkana M AANDERA
Lodwar, ~i I
, URKANA.M A R S A I T"
'0EI Molo Camp MT. KULAL MARSABIT
SOUTH 15tAND S|A
RI fT M SABIT ' \
UGANDA kNASOLOT - ...... WA -J i UGANDA %~~~jj\V A, '..L E,Y 01 ."~
TUJRKANA'L/A,? T L I -' O R T H .IC' FI_KOF, -N I ,' >
F AI SSP 5 0E `A, S T E R i~~~~~~~~~~~~~~~~~~~~
l~GO'EA,-. i\o i fl b BARe!NGrSO --. 'IURU -- 5ABUIWESTERNK',J Eldo`-t KERIO _ S$BAB*
SI VALLEY"< } , fAl |\~~) K N ~-4.BOGORIA /5RNG IS_DI-
,. 9eqf Mos snoo 1_ /-r_ {E- f z , 4Ayeburu k' i Meru HO
* efl~~~oNA NokJlJ~ Ot KENYA 'e Q : endiwhiA~~~~~~~KURUS a ;W U Grm,t
:~- \G A RI S E A VI LAMBVWE Han* L'L 0_ gmR..GEA iI! TN
> VALLEY-- go ('b/ rcRUJMAi ''s. Kc ho \ ,,...MJ A Rl >I
.ALVP~m: TEAN I NA LR E A 'S E R A A
T AN \\Kiti II /, 0AJROBI -A R fit D Nc
.Kt ~ ~ ~ ~ ~ MR ARE CIO- ~ ,, RIER RIVW tER IIKw ;mly Bon drfo
KAJIADO ~~~~~~~~~S. KITUI DOO
/ 2t, ~-, 3 0s ______ Dw5TCsTCETDBCCI AND sKASHADOTANA R L
AMB0SEU \ NGAi\~'',\
Ar 9 \ t / i--- PROVINCE BOUNDARIES Flosm-PuNGur IoNDIA N
TA I A a -- INERAIOALOUD I 4A0S orce:Wand TRSRSOCEAN - RIVRS TANZWAL IF,-e nNdATM
w /07.7' Sourc0SLETEeITE;AD ONS %,SIMA *DAI n KWSt ond DRSRSa
%/~~~ ~~~~~ DITITBUDRE dUoratus on1 and anroy,---- --- -- J--- POVICEBONDAIEBASAT PNAil rayenasmn
36 ~~~INTERNATINALABUNDARES 6 imply,oundar pares o
Th Mo anCH Gr 99p

36 K E N Y Ao so 100 150KILOMETERS AGROCLIMATIC ZONES
0 5 50 7 100 MILES AGROClIMATIC ZONES:
S U D A N w
. i ~~~~~~~~~~~~~~~~~~~~IV
UGANDA <, V \> N e R I U | i~~~~~~~~~~~~~~~~~~I
¢^12asE,MwA. 6 -- NENAINL ONAIE t N40 hcost~~~~~~~~~~~~~~~~~~~~~~~~~~~~~~iE T H IOPIA v,~~~~~MAR

KENYA
The aerial survey data base on livestock and wildlife populations in the rangelands, however,suggests that wild animal populations there are declining steadily. Cattle, sheep, goat, donkey, and camelnumbers, on the other hand, are static (Grunblatt 1989; Peden 1984). Although wide variations inpopulation estimates can be expected from seasonal changes and long-distance movements, the trendappears to be undeniable.
Table 3.9 summarizes livestock and wildlife densities in selected districts of Kenya for theperiod 1977-83 (Peden 1984). Narok (Maasai Mara), Kajiado (Amboseli), Lamu, Taita-Taveta (TsavoWest), Samburu and Isiolo (Samburu/Buffalo Springs/Shaba), and Laikipia (large-scale ranches) clearlyhold the highest wildlife densities, offer low levels of conflict with human populations, and have thelowest agricultural potential. They also have compatible forms of land tenure and therefore offer the besteconomic prospects for wildlife utilization.
Table 3.9: Average Stocking Levels and Human Population Density for Selected Districts in Kenya,1977-83
District Livestock Density Wildlife Density Ratio of Livestock Human Population(TLU/km2)a (TLU/km2)a to Wildlife Density (no./kn?)
Baringo 9.8 0.2 58.8 20.6Garissa 7.4 2.3 3.2 2.9Isiolo 9.6 1.4 6.7 1.7Kajiado 17.5 5.0 3.5 7.6Kilifi 6.2 1.3 4.8 34.7Kitui 5.4 1.2 4.5 15.8Kwale 10.7 0.6 18.1 34.9Laikipia 18.4 8.9 2.1 13.8Lamu 2.4 9.5 0.3 6.5Mandera 7.0 0.4 15.8 4.0Marsabit 3.3 0.6 5.5 1.3Narok 24.9 21.4 1.2 13.1Samburu 7.9 2.0 3.9 4.4Taita-Taveta 3.4 8.8 0.4 8.7Tana River 5.1 2.0 2.5 2.4Turkana 5.7 0.3 20.6 2.3Wajir 6.4 0.7 9.5 2.5West Pokot 9.4 0.1 104.5 17.5a. TLU is a tropical livestock unit, equivalent to a 250 kg steer.Note: Total density in high-potential districts equals livestock density as wildlife densities were assumed negligible.Source: Adapted from Peden 1984.
3.3.2 Herbivore EfficiencyThe principle underlying wildlife management is that a mixture of wildlife species will utilize
the whole vegetation spectrum. Biomass and meat offtake may be much greater under wildlifemanagement and may be more easily sustainable (table 3.10).
In addition, hides and skins of game animals may be of greater and management costs of lowervalue than those of livestock. For example, some salted, dried zebra hides are sold at US$100 each(Mugie Ranch, pers. com. 1993) cattle hides are worth a fraction of this amount.
61

THE ECONOMICS OF WILDLIFE
Table 3.10: Comparison of Cattle and Game ProductivityBiomass Management System Lean Meat Produced
(lbs/kM2) (lbslacre)
Cattle (pastoralism) 12,000 1.0Cattle (stock farms) 45,000-50,000Plains game (low) 75,000-100,000 7.9Plains game (high) 100,000-140,000 14.6Source: SWRL Research and Development 1982.
An extensive literature on the apparently higher productivity of game animals strongly suppothis concept and suggests that under management, offtake rates can be high. For example, studies ofThomson's gazelle on Kekopey (Nakuru) and Suguroi (Laikipia) ranches registered annual populatioigrowth rates of 60 percent and indicated a sustainable offtake of 40 percent except in dry years (FAO1975). A joint Texas A & M University and FAO study on Kekopey provided information on populatdynamics, growth rates, and quantitative food intake of ranch cattle and two antelope species, the imyand Thomson's gazelle. Game animals had much faster rates of growth than cattle, so that, on a bodyweight conversion basis, they are more efficient meat producers; however, in relation to body size, thsmall antelopes consume more food, and it is necessary to compare vegetation trade-off ratios. In acommercial ranching situation, a realistic efficiency for impala was determined as 10-20 percent greathan for cattle. The cattle on Kekopey, however, were well managed and had high growth rates incomparison to cattle held under traditional pastoralist systems. Therefore, the efficiency margin ofwildlife is probably much greater than 20 percent.
3.3.3 Vegetation ChangesDocumentation of forest cover and rangeland vegetation changes has not been supported by d
on grazing potential and rangeland "carrying capacity" performance, so that the environmental impacpastoralism is still relegated to the "opinion tray."
Mwichabe (1992) studied both unfenced and fenced rangeland areas in the Mara from 1985 t(1987 and concluded that overstocking and overgrazing exist in Koyaki Group Ranch and have led to,"considerable" reduction in vegetation cover. This is the result of the addition of wildlife to the alread"optimal" number of livestock and is further complicated by restrictions in the grazing movementsimposed by group ranch boundaries and conversion of land to cultivation. Spacing of water points hassignificant influence on trampling. The author concludes that "the situation on the demonstration rancclearly shows that vegetation can be improved by keeping wildlife out of the pastures, introducingrotational grazing, and increasing watering points" (Mwichabe 1992, p. 413).
Land potential often changes as a result of modification of vegetation cover. For example, lesbush means less tsetse habitat and expands the economic range for cattle. Fire may also enhancegrassland cover.
Both agricultural and wildlife management options have negative environmental effects. Theimuch discussion of "optimal visitor carrying capacity" in national parks and reserves due to theecological impact and the maintenance of the wilderness element in "visitor experience" (Gakahu 199Vegetation loss due to the impact of vehicles and interference with animal behavior are particular
62

KENYA
concerns. Cases in the Maasai Mara have shown that behavioral patterns in feeding have changed withcontinuous harassment from visitors (Kenya 1990a); however, better management of game viewing,development of road infrastructure and stringent enforcement could reduce this impact, as could theimplementation of alternative game-viewing methods such as walkihg, hides, and observation points.
3.3.4 Sustainability of Crop ProductionOne argument in marginal areas is that crop production is unsustainable in the long-term due to
declining soil fertility and structure. In marginal areas where conflict has arisen (Maasai Mara region,southwest Laikipia, east of Tsavo), the colonization of these harsh areas has been supported by off-farmincome. Such areas are not self-supporting for subsistence, but clearly they are financially attractive tolarge-scale farmers, whose businesses can accept a range of crop yields from year to year. They usuallyare sufficiently well financed to purchase fertilizers in bulk and cultivate large blocks in a number oflocations, thus reducing costs and spreading risks. The environmental impact of crop production has notbeen studied in either the smallholder areas or the large-scale farming areas, although there is clearevidence that there is an impact (vegetation loss, abandoned cultivation with weed growth, and erosion).
It is important to note that those limited areas in zones V., VI, and VII that are suitable forseasonal farming, irrigation, or both are the critical dry-season grazing areas for both pastoralists andwildlife. Where they are identified on land potential maps as suitable for agriculture, an additionalopportunity cost for their utilization-the impact on both pastoralists and wildlife-should be noted.
3.3.5 Carrying Capacities and OfftakeFew studies have been done to establish wildlife carrying capacities. The reason is the complex
mix of animals, vegetation types, and feeding niches adopted, which change within and between seasons.Although data on stocking rates for one or two species kept together on game farms is available forspecific vegetation types in South Africa, as yet no adequate tools have been developed for modelingwildlife populations in more complex biological frames.
Three methods are used at present: simple estimation, energy production-intake requirementanalysis, and large-animal stock unit estimation; however, each ranch must be studied in detail to derivean acceptable estimate of carrying capacity (Bothma 1989). The economic and ecological carryingcapacities are not coincident. The latter tend toward a much lower level, deternined by interaction ofgrazing resource and the wildlife community in a constantly changing pattern; the former is establishedby man's influence through management (species encouragement, fodder management, and so on).Habitat type is the key to establishing the economic viability of consumptive use of game, itscohabitation with domestic animals, or both.
From data gathered during this study and references (Davis 1972; McDowell and others 1982;Sommerlatte and Hopcraft 1992; Stelfox and others 1983), it is possible to infer carrying capacities foragroecological zone V, as represented by the Athi Plains and Northern Kajiado. Here the maximumbiomass of cattle is estimated at 90 kilograms per hectare; for wildlife, the limit is believed to be 110kilograms per hectare. A beef breeding/growing/fattening operation would obtain about 65 kilograms perhectare; only trading allows a higher rate of land use because it provides the essential flexibility.
63

THE ECONOMICS OF WILDLIFE
Wildlife biomass varies with seasonal movements, which makes estimation of "average"biomass problematic. In Kajiado biomass estimates range from 20-36 kilograms per hectare and seldsapproach domestic stock biomass. Species composition and distribution obviously have a bearing onbiomass, and there is no apparent reason for a specific limit.
It is not clear whether wildlife does not succeed in reaching the full biomass potential (becauof droughts) or if there is a "competition instinct" that limits breeding potential (in captivity buffalo aelands, for example, breed prolifically). Predation may be an important factor, and diseases and parasare known constraints.
Our conclusion is that it is advantageous to have both cattle and wildlife, in a biomass ratio oapproximately 70:30 to fully utilize pastoral rangeland areas, and maximize economic returns. Withincattle operation, an element of trading is preferred for flexibility, risk reduction, and forage utilization
3.3.6 Livestock Diseases and ParasitesConclusions of the study with respect to the importance of wildlife as disease reservoir hosts
be summarized in the following points:
* Data are generally lacking on the prevalence and economic importance of animal disease.This report is the first attempt to quantify the role of wildlife in the economics of livestocproduction using available data, including the case studies in annex 3 of the full-lengthversion of this report.
* Wildlife and livestock can in general share the same habitat without serious risk of diseastransmission.
* Relative to grazing competition, disease is a minor cost factor inflicted by wildlife onlivestock.
* The African buffalo is the most important disease reservoir host and is, without preventivimeasures, incompatible to sharing its habitat with cattle.
* The control of Corridor Disease-East Coast Fever derived from buffalo is technicallypossible, and its application would not only reduce tick control cost by at last 50 percent talso allow the development of the economic potential of buffalo, mixed with cattle ranchi
* Because wildlife does not require a veterinary input for disease control, it is surprising thEwild animals are not used on a large scale and on a sustainable offtake basis for animalproduction.
* Malignant catarrhal fever, African horse sickness, African swine fever, and bovine petechfever are examples of diseases of livestock with a defined wildlife reservoir but of relativelow importance to the economy of Kenya's national livestock production.
3.4 Summary and ConclusionsThis section discusses the quality of the data base available on wildlife economics in Kenya a]
the uniqueness of the various case studies described in this chapter. The implications of populationgrowth on wildlife are noted as well as how policies and legislation, land tenure and use, revenuesharing, and economic management and incentives can be used to influence the economic value ofwildlife.
64

KENYA
3.4.1 The Data and Their QualityThe data base for economic analysis of cases in which landowners are "living with wildlife" is
extremely poor; relevant data that can be brought into calculations is scattered in the literature, so thatany analysis has to be made using unconnected material. It has been necessary to consider a series ofspecific case studies, each of which is also limited by data constrairits.
Despite its relatively long history in East Africa, game ranching in the region has yet to producean adequate body of economic data. This situation is partly attributable to the restrictions placed on gameranching in Kenya in the 1980s, insecurity in Uganda, and the socialist economy that prevailed inTanzania.
The literature search yielded no data on the size and characteristics of the markets that areexpected to underpin greater wildlife utilization. The game meat market in Kenya, may be fragile.Hunting remains popular but it is suffering from negative publicity and its market inelasticity (Kiss1990) requires testing.
In Kenya there has been virtually no economic valuation of the costs and benefits of wildlifeutilization. Only one study (Mwenge International 1980) involved economic analysis of some land-useoptions involving wildlife utilization (notably hunting); one genre of studies has calculated the value ofindividual animals to photographic tourism (Western and Henry 1980; Western 1984; Thresher 1992);others have evaluated the role of tourism in the economy (Mitchell 1968; EIU 1979; Migot-Adholla andothers 1982); several recent works have compared land-use options (Douglas-Hamilton and Associates1988; Norton-Griffiths 1995). Statements in policy documents concerning the importance ofbiodiversity, cultural aspects of conservation, environmental impact of transfer of conservation areas toagriculture, livestock, or fisheries, and the value of specific areas to tourism are unsupported byvaluation of benefits and costs.
3.4.2 Each Case is UniqueThe present study is a timely effort to collate and assimilate available information and highlight
possible courses of action and gaps in knowledge.The literature survey and consideration of case studies illustrates that no two situations are alike.
The absence of case study evaluations to guide Kenya means that each case should be considered as aseparate land-use enterprise and be evaluated in social, legal, technical, business management, financial,and economic terms in the same manner as a business venture is tested for viability by its sponsors.Common factors dictate potential in all cases, but viability is "localized" and depends on a host ofspecific factors such as marketing opportunities, management, and finance. Wildlife utilization, like anyother form of land use, will be economically dynamic.
3.4.3 The Devastating Implications of Population GrowthIn this study we have emphasized the role of population growth and the inevitable rise of poverty
as the fundamental, negative force militating against conservation and wildlife utilization. Organizationsengaged in development activities in Kenya-including the government itself-have focusedinsufficiently on this issue. The literature clearly acknowledges the issues, but action dissolves intofrustration in the face of the government's politically motivated unwillingness to accept and implementthe hard solutions.
65

THE ECONOMICS OF WILDLIFE
3.4.4 Policies and LegislationKenya government policy on wildlife management recently has undergone major changes to
address the fact that the pattern of land tenure is changing swiftly toward one of privately owned parceof land on which the owner can influence the diversity and distribution of flora and fauna. The historicconservation ethic-rooted in concepts of managing "game animals" and "game birds" on state land-out of step with current trends in land tenure and land use.
KWS, however, is still establishing management systems and experimenting with wildlifeutilization options. It is probably technically understaffed to handle the plethora of possible projects thsfall under its jurisdiction. Policy statements made in documents or by representatives of KWS remainunfulfilled or are receiving no attention. For wildlife management, the decade 1977-86 is regarded aslost-through poor management and corruption. Government, and KWS in particular, should considermore of a facilitating and less of a regulatory role with direct involvement. Incentives, however, requirdegree of regulation, enforcement, and monitoring.
Present policy and legislation on wildlife utilization contain contradictions, mainly in the areaimplementation-for example, offtake rates for cropping at well below observed reproduction rates. TImore serious and difficult conflicts are the contradictions among legislative instruments. Consequently,agricultural policy seeks to utilize areas for small-scale irrigation that are dry-season and wildlife-grazing areas or to develop new plant strains that are suitable for arid and semiarid land areas. The drivtoward increased settlement in the arid and semiarid lands is an established strategy, despite obviousconflict with wildlife for resources and with biodiversity conservation goals. Agricultural developmentaction is often in conflict even with traditional pastoralism.
Land-use legislation exists but is weak and not enforced. For political reasons, the measurescovered by the law probably are unenforceable and do not offer a solution. We believe that facilitatingthe use of wildlife offers the best use of resolving the apparent conflict, because it offers to landownersthe basic option of treating wild animals as a land resource.
3.4.5 Land Tenure and Control Over Land UseConservation of wild animals outside protected areas depends on two forms of land tenure: (1)
protection in communal lands owned by pastoralists and (2) management of large holdings owned byindividual companies.
The key to long-term conservation and utilization of wildlife in community lands lies inownership and management of land. Even where key inputs of management and marketing have beenprovided to group ranches in the Maasai Mara and Kajiado, deterioration in the tourism experience hasresulted due to continuing pressure from conflicting land uses with expansion of cropping andintensification of grazing, unplanned construction of unattractive buildings and settlements, poisoningpredators and exclusion of grazers, and insecurity and harassment of visitors. Game cropping has limitepotential on traditional lands because of the lack of infrastructure needed to meet processing standardsand because of the limited size of the export and local markets. Consequently, the immediate potentiallies in tourism.
The pressures of population and demand for land are increasing. Management structures on thegroup ranches have, in nearly all cases reviewed, led to inequitable distribution of revenues from
66

wildlife; the management skills and aspirations of the management committees do not coincide withgame conservation in an environment of competition for resources. The control necessary to continue topreserve the wilderness and game does not exist, nor does the desire to do so. Traditional communitieswant to move on to better housing and social conditions, not to continue living in traditionalhouses-even though cultural villages may be preserved or constructed anew for tourism.
In contrast, in Kenya a number of successful wildlife conservation projects are in place andmany more are planned on ranches owned or controlled by single owners or companies with clearcorporate objectives. The key is in control of the land and well-defined, land use objectives.
Our conclusion is that, unless control over land use is exercised by agencies that understandwhat is required in terms of wildlife management, tourism marketing, or both, it is improbable thatchanges in land use that lead to a deterioration in potential benefits from wildlife can be averted. It isdifficult to imagine being able to ensure that the objectives of conserving wilderness areas can bereconciled with the aspirations of group ranch members. This implies that alienation of the management(not ownership) of the land is the only possible solution, a strategy that is unacceptable to group ranchesand probably politically unacceptable also (Douglas-Hamilton and Associates 1988).
It is essential to remove the emotionalism from the wildlife utilization-conservation complex andconcentrate on the issue of land use; what is of concern is to identify, plan, and manage the land to itsbest sustainable use with the resources available. The term best ascribes social, economic, technical, andlegal considerations. If evaluation concludes that wildlife utilization is not the best form of land useoutside demarcated conservation areas, then it should be accepted that people come first and the landshould be turned over to its best use.
It is the consultants' conclusion that wildlife utilization is unlikely to be a competitive land usein agroclimatic zones with potential higher than zone V or zone UM5 under the agroecological zoningclassification (see figure 3.5). This provides a benchmark for land-use strategies. Although small-scaleagriculture and opportunistic large-scale farming take place in zones 5 and 6 in Kenya, these forms ofland use take place because they are externally funded; in the case of smallholder farrning, repatriatedearnings from family members working elsewhere supplement incomes and consumption. Large-scalefarming is based on low land-lease costs and minimum-investment methods of farming that ignore long-term land management investments such as erosion embankments and tree windbreaks. Cropping wouldnot otherwise be viable nor sustainable as a sole land use activity in zones V, VI, or VII.
Consideration of wildlife densities and location of national parks and reserves, land tenure, localattitudes, infrastructure, tourism investments, government budgetary constraints, and ability to managesuggest that the efforts to conserve and utilize wildlife in dispersal areas should be concentrated in fourdistricts: Narok, Kajiado, Laikipia. and Isiolo. Any other areas with perceived vital importance, such asEast and West Tsavo National Parks, should be assessed on their specific merits with explicit valuationof biodiversity and other possible economic uses and comparison with alternatives.
The principle of establishing conservation areas to preserve wilderness and wildlife is anaccepted social, cultural, and scientific necessity for any country. These should be determined usingobjective parameters of plant and wildlife diversity and density. Areas essential to this heritage should beidentified and land use regulations applied thereto; in these areas, compensation equivalent to theopportunity cost should be paid.
67
THE ECONOMICS OF WILDLIFE
3.4.6 Revenue Sharing Administered by CommunitiesThe concept of revenue sharing is controversial mainly because of its vulnerability to
misappropriation and inequitable distribution of the funds distributed to communities. The investmerreturns from wildlife and tourism in job creation and social welfare projects has proved the mostsuccessful system. Cash paid to group ranch management has not been wisely invested nor equitablydistributed in the cases studied. The more communities are involved in deciding how revenues are toutilized or distributed, the more likely it is that equity will be achieved.
3.4.7 Economic Management and IncentivesTo encourage wildlife utilization, policies will need to reflect the values put on the resource
government. This could be done through such measures as punitive taxes for those wishing to destro'wildlife in zoned conservation areas, subsidies (technical assistance and credit) for those who presenwildlife, or both. Furthermore, zoning would be accompanied by strict land-management legislationconcerning structures such as fences and ditches that interfere with wildlife movements.
Government policy on agriculture is explicit in its assertion that the country contains extensitracts of idle high- and medium-potential land and that agricultural production could be much moreefficient. This implies that the high degree of pressure on marginal lands is unnecessary and thatgovernment services, such as extension, are inadequate.
The involvement of government in encouraging and even enforcing offtake through marketiilivestock from pastoral areas dates from the 1950s when it was determined that pastoralists kept larginumbers of surplus animals that in turn caused degradation. Although the link between overstockingdegradation can still be made (Shaabani and others 1992), the traditional livestock managementstrategies of pastoralists are now better understood; it is clear that even if the range is overstocked, n(amount of marketing advice is likely to persuade producers to sell if they have no surplus animals aftmeeting their subsistence requirements or if they have no need to sell for cash or the prices are notattractive.
Government's facilitating (rather than direct) role in livestock marketing is appropriate althopresently ineffective. This includes development and maintenance of the roads in arid and semiaridlands, enforcement of the use of designated stock routes and veterinary movement regulations, provizof basic facilities at holding grounds and on stock routes, and arrangement and publicity of markets aauctions.
3.4.8 Research and DevelopmentThe term "research" is intended in its widest use and not restricted to scientific endeavor; thu
is applied to testing land- and wildlife-management systems, wildlife utilization (both consumptive anonconsumptive), and product marketing. Perhaps "adaptive" is an appropriate term in the sense ofadapting wildlife utilization to land use. KWS should be prepared to allow landowners a great deal oifreedom to undertake land use with wildlife and desist from the time-consuming approval system thacurrently delays many projects.
The land use situation in marginal areas is dynamic: livestock production economics is chanidisease challenges are altering (for example, increasing resistance to trypanosome drugs that presenti
68

allow cattle to be managed in tsetse areas), and research is allowing new land uses in marginal areas(new varieties, techniques such as agroforestry, and underexploited crops).
We also recommend a feasibility study to investigate the setup of an institutional frameworkunder control of the land users rather than the national government.
3.5 References
Allaway, J. 1988. Wildlife Utilization and Tourism Development in Kenya's Arid and Semiarid Lands. Nairobi,Kenya: Ministry of Planning and National Development, Kenya, and the International Fund forAgricultural Development.
Allonby, E. W. 1981. "The Role of Wild Ruminants in the Epidemiology of Nematodiasis in Kenya." In L. Karstad,B. Nestel, and M. Graham, eds. Wildlife Disease Research for Economic Development. Ottawa, Canada:International Development Research Centre.
Andere, D. K., J. G. Stelfox, and S. W. Mbugua. 1981. Distribution and Densities of Livestock and Wild Herbivoresin the Rangelands of Kenya: 1977 and 1978. Technical Report Series No. 21. Nairobi: Kenya RangelandEvaluation and Monitoring Unit, Ministry of Tourism and Wildlife, Kenya.
Berger, D. 1990. "Empowering the Keepers of God's Creation." Swara 13 (2): 29-31.
Bothma, J. Du P., ed. 1989. Game Ranch Management. Pretoria, South Africa: J. L. van Schaik Ltd.
Braun, H. M. H. 1980. Agroclimatic Zones of Kenya. Report No. S649/MK/HMB. Nairobi: Kenya Soil Survey,National Agricultural Laboratories, Ministry of Agriculture, Kenya.
Braun, H. M. H. and D. N. Mungai. 1981. The Agroclimatic Zones of Kenya's Arid and Semiarid Lands, Report No.S676/DNM/JO. Nairobi: Kenya Soil Survey, National Agricultural Laboratories, Ministry of Agriculture, -Kenya.
Campbell, D. 1979. Development or Decline: Resources, Land Use, and Population Growth in Kajiado District.Working Paper No. 352. Nairobi: Institute for Development Studies, University of Nairobi.
Capricorn Consultants Limited. 1983. Samburu, Buffalo Springs, Shaba National Reserves Visitor Study. Nairobi:Wildlife Planning Unit, Wildlife Conservation and Management Department, Ministry of Tourism andNatural Resources, Kenya.
1992. Manyara Ranch Feasibility Study and Development Plan Prepared in association with the NationalRanching Company, Tanzania.
Child, B. 1991. "The Economics of Wildlife Utilization." Wildlife Research for Sustainable Development. J. G.Grootenhuis, S. G. Njuguna, and P. W. Kat, eds. Nairobi: Kenya Agricultural Research Institute, the KenyaWildlife Service, and the National Museums of Kenya.
The Courier. "Dossier: Tourism." July-August 1990.
Cumming, D. H. M. 1985. "Environmental Limits and Sustainable Harvests." Paper presented to the PlenarySession of the Zimbabwe National Conservation Strategy Conference, Harare, May 22-25.
69

TBE ECONOMICS OF WILDLIFE
Cumming, D. H. M., R. F. DuToit, and S. N. Stuart. 1990. African Elephants and Rhinos Status Survey andConservation Action Plan. Gland, Switzerland: IUCN/SSC African Elephant and Rhino Specialist Groul
Davis, R. K. 1971. Some Issues in the Evolution, Organization, and Operation of Group Ranches in Kenya.Discussion Paper No. 93. Nairobi: Institute for Development Studies, University of Nairobi.
1972. "The Trade-Off Between Wildlife and Livestock in One Ranching Area of Kenya." East AfricaJournal of Rural Development 5 (1-2).
De Leeuw, P. N. and J. C. Tothill. 1990. The Concept of Rangeland Carrying Capacity in Sub-Saharan Africa:Myth or Reality? Pastoral Development Network Paper 29b. London: Overseas Development Institute.
Diamond, Peter. January, 1969. On the Economics of Tourism. Discussion Paper No. 76. Nairobi: Institute forDevelopment Studies, University of Nairobi.
Dieke, P. U. C. 1991. "Policies for Tourism Development in Kenya." Annals of Tourism Research 18 (2): 269-2s
Doherty, D. A. 1979. A Preliminary Report on Group Ranching in Narok District. Working Paper No. 350. NairaInstitute for Development Studies, University of Nairobi.
Douglas-Hamilton and Associates. December 1988. Identification Study for the Conservation and Sustainable Usof the Natural Resources in the Kenyan Portion of the Mara-Serengeti Ecosystem. Final Report. Nairobi:European Development Fund, European Economic Community.
East African Wildlife Society. 1978. Report of the Working Group on the Distribution and Status of East AfricanMammals 1977. Scientific and Technical Committee. Part I: Large Mammals. Nairobi.
1990. "Richard Leakey Talks to Swara." Swara 13 (2): 15-18.
Ecodynamics Consultants. 1983. Mara-Loita Plains Resource. Final report of consultant study. Nairobi: MinistryTourism and Wildlife, Kenya.
Economist Intelligence Unit. 1979. Study of Pricing Policy for Tourism. Annex IV. The Economics of Tourism.Report to the Ministry of Tourism and Wildlife.
EcoSystems Limited. 1982a. Amboseli/Lower Rift Regional Study. Final report prepared for the Wildlife PlanningUnit, Ministry of Tourism and Wildlife, Kenya.
1 982b. Tsavo Regional Land Use Study. Final Report. Ministry of Tourism and Wildlife, Kenya.
Food and Agriculture Organization (FAO) of the United Nations. 1970. Wildlife Management in Kenya. Report ofUNDP/FAO Mission FO:SF/Kenya/l.
1975. Wildlife Management Kenya Interim Report. FO:DP/KEN/71/526.
1977. Kajiado District Workshop Report on Wildlife Conservation and Management. Amboseli NationalPark FAO/PBFL, FAO/KWMP and WCMD No. 34.
1986. Mau-Narok Forest Resources Development Plan. Mimeo. Nairobi.
Food and Agriculture Organization (FAO) of the United Nations and the United Nations Development Prograrnmi1980. Wildlife Management Kenya: Project Findings and Recommendations FO:DP/KEN/71/526.
70

"Kenya's Tourist Boom." Executive. October, 1988.
Gakahu, C. G. ed. March 1991. Tourist Attitudes and Use Impacts in Maasai Mara National Reserve. Proceedingsof a workshop organized by Wildlife Conservation International at Maasai Mara National Reserve.
Galaty, J. G., D. Aronson, P. Salzman, and A. Chouinard. 1980. The Future of Pastoral Peoples. Proceedings of aconference held in Nairobi. Ottawa, Canada: International Development Research Centre.
Gauff, J. B. 1992. Amala River: Narok Road Feasibility Study. Nairobi: Ministry of Public Works, Kenya.
Grootenhuis, J. G., S. G. Njuguna, and P. W. Kat, eds. 1990. Wildlife Research for Sustainable Develpment.Proceedings of an International Conference held in Nairobi, April 22-26, 1990. Nairobi: KenyaAgricultural Research Institute, Kenya Wildlife Service, and National Museums of Kenya.
Grootenhuis, J. G. and R. 0. Olubayo. 1993. Disease Research in the Wildlife: Livestock Interface in Kenya.Mimeo. Nairobi.
Grunblatt, J., M. Y. Said, and J. K. Mutira. 1989. Livestock and Wildlife Data Summary, 1987-88, for KenyaRangelands. Data Summary No. 1. Department of Resource Surveys and Remote Sensing. Ministry ofPlanning and National Development, Kenya.
Halderman, J. M. 1972. An Analysis of Continued Semi-Nomadism on the Kaputiei Maasai Group Ranches: Socio-Ecological and Ecological Factors. Discussion Paper No. 152. Nairobi: Institute for Development Studies,University of Nairobi.
Hedlund, H. G. B. 1971. The Impact of Group Ranches on a Pastoral Society. Staff Paper No. 100. Nairobi:Institute for Development Studies, University of Nairobi.
Henry, W. R. 1975. A Preliminary Report on Visitor Use in Amboseli National Park Working Paper No. 263.Nairobi: Institute for Development Studies, University of Nairobi.
1980. Management Planningfor Tourism in Amboseli: Incorporating Behavioural Information on ParkUsers. Working Paper No. 365. Nairobi: Institute for Development Studies, University of Nairobi.
Hewett, D. P. J. September 1991. Wildlife, An Economic Resource in Need of Valuation in Developing Countries?Dissertation submitted in partial fulfillment of the requirements for the Degree of Master of Science inAgricultural Economics at the University of Oxford, Institute of Agricultural Economics, St. Hugh'sCollege, Oxford, United Kingdom.
Heyer, Judith. 1964. A Linear Programming Modelfor Peasant Agriculture in Kenya. Discussion Paper No. 2.Nairobi: Institute for Development Studies, University of Nairobi.
Homewood, K. M. and W. A. Rodgers. 1991. Maasailand Ecology: Pastoralist Development and WildlifeConservation in Ngorongoro, Tanzania. Cambridge, England: Cambridge University Press.
Hopcraft, D. 1975. Productivity Comparison Between Thomson's Gazelle and Cattle, and Their Relation to theEcosystem in Kenya Dissertation in partial fulfillment of requirements for the Ph.D. thesis at CornellUniversity, Ithaca, New York.
1991. "Commercial Wildlife Production in Kenya." In J. G. Grootenhuis, S. G. Njuguna, and P. W. Kat,eds. Wildlife Research for Sustainable Development. Nairobi: Kenya Agricultural Research institute, theKenya Wildlife Service, and the National Museums of Kenya.
71

THE ECONOMICS OF WILDLIFE
International Foundation for the Conservation of Game (IGF), International Council for Game and WildlifeConservation, and the U.N. Food and Agriculture Organization. 1987. "Management in Sub-SaharanAfrica." Prepared for the International Symposium and Conference on Sustainable Economic Benefits andContribution Towards Rural Development. Harare, Zimbabwe.
International Livestock Centre for Africa. 1979. District Ranch Development Briefs. Working Document 13.Nairobi.
Jaetzold, R. and H. Schmidt. 1983. Farm Management Handbook of Kenya. Vol. II. Natural Conditions and FarmManagement Information. Vol. II/B. Central Kenya (Rift Valley and Central Provinces). Nairobi: Ministryof Agriculture, Kenya.
Jahnke, H. E. 1979. Livestock in Economic Development. Mimeo. Addis Ababa, Ethiopia: International LivestockCentre for Africa.
Jenkins, P. R. and P. H. Hamilton. 1982. The Laikipia Elephant Problem. Nairobi: Wildlife Conservation andManagement Department, Ministry of Tourism and Wildlife, Kenya.
Kabuage, S. L., C. Leibundgut, T. Mozer, and U. Weismann. 1991. Water Development Plan for Laikipia District,Kenya: Part 1: Final Report. Nairobi: Ministry of Reclamation and Development of Arid, Semiarid andWaste Lands, Kenya.
Karime, O. N. 1. 1990. The Changing Land Use Patterns in the Ngorongoro/Loita Plains. Technical Report No.135. Department of Resource Surveys and Remote Sensing, Ministry of Planning and NationalDevelopment, Kenya.
Karstad, L., B. Nestel, and M. Graham. 1981. Wildlife Disease Research and Economic Development. Proceedingsof a workshop held in Kabete, Kenya, September 8-9, 1980. Ottawa, Canada: International DevelopmentResearch Centre.
Kenya. 1975. Statement on Future Wildlife Management Policy in Kenya. Sessional Paper No. 3 of 1975.
1979. Distribution and Densities of Cattle, Sheep, Goats, Camels, Donkeys, and Wildlife in the Rangelandsof Kenya. Based on KREMU 1977 ecological surveys. Nairobi: Ministry of Tourism and Wildlife, KenyaRangeland Ecological Monitoring Unit
1983. Population Projections for Kenya 1980-2000. Nairobi: Ministry of Economic Planning andDevelopment. Published courtesy of UNICEF, Kenya.
1986. Economic Managementfor Renewed Growth. Sessional Paper No. I of 1986.
1988. Kajiado Livestock Census Integrated Livestock Census and Infrastructure Survey Report. Kajiado:Livestock Production Department, Ministry of Livestock Development.
1990a. A Policy Framework and Development Programme 1991-1996. Main report and eleven annexes.Nairobi: Kenya Wildlife Service.
1990b. ASAL Policy Development. Draft 3. Nairobi: Ministry of Reclamation and Development of Arid,Semiarid Areas, and Wastelands.
1 992a. Economic Survey 1992. Also for prior years. Nairobi: Central Bureau of Statistics, Ministry ofPlanning and National Development.
72

. 1992b. Revenue Collection Summary for National Parks for 1991. Nairobi: Kenya Wildlife Service,Licensing Office.
. 1992c. Statistical Abstract 1991. Also for prior years. Nairobi: Central Bureau of Statistics, Ministry ofPlanning and National Development.
. The Royal National Parks of Kenya Ordinance. Cap. 377 Rev. 1962.
. The Land (Group Representatives) Act. Cap. 287. Rev. 1970.
. The Wildlife (Conservation and Management) Act. Cap. 376 Rev. 1985 1977).
The Wildlife (Conservation and Management) (Amendment) Act. No. 16 of 1989 Kenya GazetteSupplement No. 95 (Acts No. 9).
King, J. M. and B. R. Heath. 1971. Game Domestication for Animal Production in Africa. Mimeo. Based on trialson Galana Ranch, Kenya.
Kiss, Agnes, ed. 1990. Living with Wildlife, Wildlife Resource Management with Local Participation in Africa.Technical Paper No. 130. Africa Technical Department Series. Washington, D.C.: World Bank.
Kohler, T. 1987. Land Use in Transition. Aspects and Problems of Small-Scale Farming in a New Environment: TheExample of Laikipia District. African Studies Series A5. Kenya Institute of Geography in association withthe University of Beme.
Kufwafwa, J. W. and J. G. Stelfox. 1979. Distribution of Livestock and Wildlife in Areas Within andAdjacent to theLake Kenyatta Settlement Scheme and Some Implicatfons of Proposed Land Use Plans on the Conservationof Wildlife in the Area. Aerial Survey Technical Report Series No. 8. Nairobi: Kenya Rangeland EcologicalMonitoring Unit, Ministry of Tourism and Wildlife, Kenya.
Lamprey, R. H. 1984. Maasai Impact on Kenya Savanna Vegetation: A Remote Sensing Approach. Dissertationsubmitted in partial fulfillment of the Ph.D. Thesis. Birmingham: University of Aston.
Lane, C. and J. Swift. 1989. East African Pastoralism: Common Land, Common Problems. Drylands NetworksProgramme Issues Paper No. 8. London: International Institute for Environment and Development.
Lindberg, K. 1991. Policies for Maximizing Nature Tourism's Ecological and Economic Benefits. InternationalConservation Financing Project Working Paper. Washington, D.C.: World Resources Institute.
Livingstone, Ian. 1976. Cowboys in Africa: The Socio-Economics of Ranching. Occasional Paper No. 17. Nairobi:Institute for Development Studies, University of Nairobi.
1986. Rural Development, Employment, and Incomes in Kenya. Gower Publishing Company, Ltd. and theInternational Labour Organization.
Lusiola, G. J. 1992. "The Role of the COBRA Project in Economic Development of Local Communities." Paperpresented at the Kenya Ecotourism Workshop.
Marais, G. 1988. "The Maasai: A People Under Threat." Traveler 18 (3).
Marshall, C. N. and K. Robbins. 1982. Mara Visitor Study, Wildlife Planning Unit. Nairobi: EcodynamicsConsultants.
73

THE ECONOMICS OF WILDLIFE
Massell, Benton F. 1962. Farm Management in Peasant Agriculture: An Empirical Study. Discussion Paper No. 3 Nairobi: Institute for Development Studies, University of Nairobi.
McDowell, R. E., D. G. Sisler, E. C. Schermerhorn, and J. D. Reed. 1982. Game or Cattle for Meat Production onKenya Rangelands? Mimeo. Ithaca, New York: Cornell Institute of Agriculture, Cornell University.
McNeely, J. A. 1990. "Conservation Must Pay." Zoogoer. January-February, 1990.
1992. "Economic Incentives for Conserving Biodiversity: Lessons for Africa." Paper presented at theconference "Conservation of Biodiversity in Africa," Kenya.
Migot-Adholla, S. E, K. G. C. Mkangi, and J. Mbindyo. 1982. Study of Tourism in Kenya with Emphasis on theAttitudes of Residents of the Kenya Coast. IDS Consultancy Reports No. 7. Nairobi: Institute forDevelopment Studies, University of Nairobi.
1990. Kajiado DistrictAtlas. ASAL Programme, Kajiado District.
Mitchell, F. 1968a. "The Economic Value of Wildlife Viewing as a Form of Land Use." East Africa Agriculture arForestry Journal Special Issue, 33: June, 1968.
1968b. The Costs and Benefits of Tourism in Kenya. Prepared for the Kenya Tourist DevelopmentCorporation. Nairobi: Institute for Development Studies, University of Nairobi.
1969. The Value of Tourism in East Africa. Discussion Paper No. 82. Nairobi: Institute for DevelopmentStudies, University of Nairobi.
1971. The Economic Impact of Tourism. Prepared for the 1970 Dag Hammerskjold/UNECA Seminar onthe Development of Tourism in Africa. Uppsala, Sweden: The Dag Hammerskjold Foundation.
Morzaria, S. P., A. D. Irvin, J. Wathanga, D. D'Souza, J. Katende, A. S. Young, J. Scott, and G. Gettinby. 1988."The Effect of East Coast Fever Immunisation and Different Acaricidal Treatments on the Productivity ofBeef Cattle. " The Veterinary Record 123: 313-320.
Mukolwe, S. W. 1993. Evaluation of the Potential of Four Wildlife Species to Act as Reservoirs for Heartwater.Proceedings of second biennial conference of the American Society of Tropical Veterinary Medicine,Guadaloupe, French West Indies, February 2-6, 1993.
Mwenge International Associates. 1980. A Study on the Management of Very Large Herbivores in Kenya. Finalreport. Nairobi: Ministry of Environment and Natural Resources, Kenya.
1984. Narok Agricultural Development Survey. Final report. Nairobi: Ministry of Agriculture andLivestock Development, Kenya.
Mwichabe, S. 1990. Present Land Use of the Narok Area. Soil Survey Report No. M3 1. Nairobi: Ministry ofAgriculture, Kenya.
1992. "The Effect of Range Management on Vegetation Cover in the Narok Area." In H. Hurni and KebedTato, eds. Erosion, Conservation, and Small-Scale Farming. Berne: Geographica Bernensia.
Norton-Griffiths, M. 1995. "The Long-Tern Conservation of Wildlife on the Rangelands of the SerengetiEcosystem." In A. R. E. Sinclair and P. Arcese, eds.. Serengeti: Research and Management for EcosystemConservation. Chicago, Ill.: University of Chicago Press.
74

Norval, R. A. I., B. D. Perry, and A. S. Young. 1992. The Epidemiology of Theileriosis in Africa. London and SanDiego: Harcourt Brace Jovanovich Publishers Academic Press.
Nsibandze, A. 1982. The Economics of Cattle Ranching in Machakos District, Kenya Ph.D. thesis, University ofNairobi, Nairobi.
Ominde, S. H., ed. 1988. Kenya's Population Growth and Development to the Year 2000 AD. Kenya: Heinemann.
Paling, R. W. 1990. A Contribution to the Understanding of the Epidemiology and Control ofLivestock Diseases inAfrica These in fulfillment of D. Phil., University of Utrecht, Netherlands.
Peden, D. 1984. Livestock and Wildlife Population Inventories by District in Kenya, 1977-1983. Technical ReportNo. 102. Nairobi: Kenya Rangeland Evaluation and Monitoring Unit, Ministry of Tourism and Wildlife,Kenya.
Phillipson, J. 1975. "Rainfall, Primary Production, and Carrying Capacity of Tsavo National." East Africa WildlifeJournal 13: 171-202.
Pratt, D. J. and M. D. Gwynne, eds. 1977. Rangeland Management and Ecology in East Africa. London: Hodderand Stoughton.
Report on the Ecological Impacts of the Proposed Export Processing Zone at Athi River on the Wildlife of the Athi-Kapiti Plains and the Nairobi National Park. Mimeo. Report for the Friends of Kitengela, Nairobi.
Scott, J. 1992. "Kingdom of Lions." Maasai Mara Series, Part Two. Swara 15 (5): 16-21.
Sewell, M. M. H. and D. W. Brocklesby, eds. 1990. Handbook on Animal Diseases in the Tropics. 4th edition.London, U.K.: Bailiere Tindall. p. 385
Shaabani, S. B., M. Walsh, D. Herlocker, and D. Walther, eds. 1992. Range Management Handbook of Kenya,Volume II, 2 Samburu District. Part of a series covering ten ASAL districts of Kenya. Ministry ofLivestock Development (MOLD), Kenya. Nairobi: German Office of Cooperation.
Sharpley, J. 1986. Economic Policies and Agricultural Performance: The Case of Kenya Development CentrePapers. Paris: Organisation for Economic Cooperation and Development.
Siderius, W., ed. 1984. Proceedings of the Workshop on Land Evaluationfor Extensive Grazing (LEEG).International Workshop on Land Evaluation for Extensive Grazing. Ethiopia 1983. Publication 36. AddisAbaba: International Livestock Research Institute.
Sinclair, M. T. 1991. Tourism Development in Kenya. Consultant's report. Washington, D.C.: World Bank.
Smith, Graham. 1969. Industry and Labour in East Africa. Nairobi: East African Publishing House.
Smith, A. B. 1992. Pastoralism in Africa: Origins and Development Ecology. London: Hurst and Company.
Sombroek, W. G., H. M. H. Braun, and B. J. A. Van der Pouw. 1980. Exploratory Soil Map andAgro-ClimaticZone Map of Kenya, 1980. Report El. Nairobi: Kenya Soil Survey, National Agricultural Laboratories,Ministry of Agriculture, Kenya.
Sommerlatte, M. Undated. Development of Safari Hunting in Kenya. Report to the African Wildlife Foundation forthe Kenya Wildlife Service Policy Framework.
75

THE ECONOMICS OF WILDLIFE
Sommerlatte, M. and D. Hopcraft. 1992. The Economics of Game Cropping on a Kenyan Ranch. Paper presente,the Third International Wildlife Ranching Symposium, Pretoria, South Africa, October 27-30.
Starfield, A. M. and A. L. Bleloch. 1986. Building Models for Conservation and Wildlife Management. New YoMacmillan Publishing Company.
Stelfox, J. G., J. W. Kufwafwa, and W. K. Ottichilo. 1981. Distribution and Population Trends of Elephants ancRhinoceros in Kenya, 1977-1980. Technical Report No. 43. Nairobi: Kenya Rangeland Evaluation andMonitoring Unit, Ministry of Tourism and Wildlife, Kenya.
Stelfox, J. G., D. G. Peden, S. W. Mbugua, C. L. Amuynuzu, and R. J. Hudson. 1980. Populations, Stocking Raiand Distribution of Wildlife and Livestock on the Mara and Loita Plains: December, 1978-November,1979. Kenya: Rangeland Ecological Monitoring Unit, Ministry of Environment and Natural Resources.
Stelfox, J. B., D. G. Sisler, R. J. Hudson, and D. Hopcraft. 1983. A Comparison of Wildlife and Cattle Ranchingthe Athi Plains, Kenya Mimeo.
Stevenson, P., A. Jones, and L. F. Khalil. 1981. "The Public Health Significance of Cysticercosis in African GanAnimals." In L. Karstad, B. Nestel, and Michael Graham, eds. Wildlife Disease Research for EconomicDevelopment. Ottawa: International Development Research Centre.
Stiles, D. 1990. "East African Cultures and Wildlife Conservation." Swara 13 (3): 15-17.
Swank, W. G, R. L. Casebeer, P. B. Thresher, and M. H. Woodford. Cropping, Processing, and Marketing ofWildlife in Kajiado District, Kenya. Project KEN:71/526 Working Document No. 6. Nairobi: U.N. Foo(and Agriculture Organization.
Swanson, T. M. 1991. Wildlife Utilisation as an Instrument for Natural Habitat Conservation: A Survey of theLiterature and of the Issues. LEEC Paper DP 91-03. London: International Institute for the Environmenand Development.
Swanson, T. M. and E. B. Barbier, eds. 1992. Economics for the Wilds: Wildlife, Diversity and Development.Washington, D.C.: Island Press.
SWRL Research and Development. 1982. Establishment of Demonstration Wildlife Ranches in Developing Nati(Mimeo. California.
Talbot, L. M. and M. H. Talbot. 1960. Land Use Survey of Narok District. District Commissioner's Office, NarolNairobi: Ministry of Agriculture, Kenya.
Thresher, P. 1973. Some Economic Problems of Wildlife Utilization in Kajiado District. Working Paper No. 124.Nairobi: Institute for Development Studies, University of Nairobi.
1992. "The Present Value of an Amboseli Lion." World Animal Review (40).
UNICEF. 1985. "Socio-Economic Maps Kenya." Social Statistics Bulletin 8 (1). Eastern and Southern AfricaRegional Office.
U.S. Agency for International Development. 1992. Critical Issues for American Investors in Kenya. Washington,D.C.: Labat-Anderson Inc.
University of Nairobi, Institute for Development Studies. 1978. Survey of Land Use Problems in Kajiado DistricReview of Methodology. Working Paper No. 334. Nairobi.
76

Upton, M. 1990. The Economic Importance of Veterinary Viral and Tick-Borne Diseases on Livestock Production inKenya Reading, England: PAN Livestock Services Ltd. p. 71.
Western, D. 1984. "Amboseli National Park: Human Values and the Conservation of a Savanna Ecosystem." In J.McNeely and K. Miller, eds. National Parks Conservation and Development. Washington, D.C.:Smithsonian Institution.
Western, D. and W. Henry. 1980. "Economics and Conservation in Third World National Parks." Bioscience 29 (7):414-418.
White, J. M. and S. J. Meadows. 1979. Structure of the Herd and Determinants of Offiake Rates in Kajiado District1962-77. Pastoral Network Paper. London: Overseas Development Institute.
World Bank. 1973. "Agricultural Sector Survey Kenya." Annex 15. In Wildiffe and Tourism in Rural DevelopmentVol. 2. Report 254KE. Washington, D.C.
1992. Kenya Re-investing in Stabilization and Growth through Public Sector Adjustment. Vol. 1. MainReport, Report No. 9998-KE. Washington, D.C.
Young, A. S., J. J. Mutugi, D. P. Kariuki, D. Lampard, A. C. Maritim, P. N. Ngumi, A. Linyoni, B. L. Leitch, S. G.Ndungu, A. C. Lesan, S. K. Mining, J. G. Grootenhuis, G. 0. Orinda, D. Wesonga. May 1992."Immunisation of Cattle Against Theileriosis in Nakuru District of Kenya by Infection and Treatment andthe Introduction of Unconventional Tick Control." Veterinary Parasitology 42 (3): 225-240.
Young, A. S., J. J. Mutugi, and A. C. Maritim. 1990. Progress Towards the Control of East Coast Fever(Theileriosis) in Kenya Muguga: Kenya Agricultural Research Institute, National Veterinary ResearchCentre.
Economic Evaluation Methodologies and Techniques
Ahmed, S. 1983. Shadow Prices for Economic Appraisal of Projects. Staff Working Papers Number 609.Washington, D.C.: World Bank.
Brown, G. M. and J. H. Goldstein. 1984. "A Model for Valuing Endangered Species." Journal of Environment,Economics, and jManagement 11: 303-309.
Duvigneu, J. C. and R. N. Prasad. 1984. Guidelines for Calculating Financial and Economic Rates of Return forDFC Projects. Technical Paper Number 33. Washington, D.C.: World Bank.
Gittinger, J. P. 1982. Economic Analysis ofAgricultural Projects. EDI Series in Economic Development. Baltimore,Md.: Johns Hopkins University Press.
Langford, W. A. and D. J. Cocheba. 1978. The Wildlife Valuation Problem: A Critical Review of EconomicApproaches. Occasional Paper Number 37. Ottawa: Canadian Wildlife Service.
McNeely, J. A. 1988. Economics and Biological Diversity: Executive Summary and Guidelines for UsingIncentives. Gland, Switzerland: International Union for the Conservation of Nature.
1989. The Economic Benefits of Conserving Biological Diversity. Paper prepared for the conference"Towards a Strategy for Australia's Threatened Species." Gland, Switzerland: International Union for theConservation of Nature.
77

THE ECONOMICS OF WILDLIFE
Pearce, D. W. 1992. Economic Values and the Natural World Report 92-02. Norwich: Centre for Social andEconomic Research on the Global Environment, University of East Anglia.
Pearce, D. W. and K. Turner. 1990. Economics of Natural Resources and the Environment. London: Harvester-Wheatsheaf.
Warford, J. J. 1986. Natural Resource Management and Economic Development. Mimeo. Washington, D.C.:Projects Policy Department, World Bank.
78

THE ECONOMICS OF WILDLIFE
Abstract
Namibia is known as a land of wide, open spaces and has a growing reputation for its wildlife. Atthe same time, much of this land is arid or semiarid and faces severe environmental pressures due todrought and overgrazing by livestock. To date, little is known of the role played by wildlife in thenation's economy and the potential it has to contribute to sustainrabte development. This lacuna isparticularly evident with regard to communal land, on which mostfofNamibia's population lives.
This paper attempts to assess the current and potential economic role of wildlife in Namibia,with an emphasis on communal areas. Case studies are used to illustrate the returns to wildlife, bothabsolute and relative to livestock, and some of the institutional issues that have to be addressed if thepotential of this sector is to be realized.
Our findings are that, where rural communities have been able to establish a stake in theutilization of their area's wildlife, the community, government, and wildlife have benefited. Yet, it has tobe said that much of the discussion is in terms of potential benefits from wildlife utilization. Existinglegislation presents an obstacle to communities that aspire to realize these gains in communal areas.Locally cropped game meat cannot be sold and communities have no legal basis for claiming revenuefrom those who utilize the wildlife in their locality, whether they are tourists or trophy hunters. Enablinglegislation is, therefore, necessary for communities to achieve many of the potential benefits fromwildlife we have identified. Yet, it is far from sufficient. In some areas, nongovernmental organizations(NGOs) have acted as catalysts to bring together local communities and tour operators. Further work isneeded to establish an institutional framework in which community representatives, private business,NGOs, and local government can devise development strategies that effectively utilize wildliferesources.
As for a comparison of the returns to livestock and wildlife, our research suggests that the neteconomic return to livestock farming, particularly in the more arid communal regions of Namibia, isalmost certainly negative. Other research quoted in this study suggests the same is true of commerciallivestock production. Wildlife utilization (combining tourism, hunting, and cropping) is shown to offersignificantly more favorable returns in communal areas, whereas trophy hunting has proved a growingsuccess on private farms. Despite this, widespread switching to wildlife use from livestock farming isunlikely.
Economic factors provide some of the explanation for this rigidity. Livestock farming inNamibia has, and continues to be, favored over other forms of land use by policies that permit a largeproportion of the costs of livestock production to be borne by society as a whole. As a result, livestockfarming can be a highly remunerative activity for the individual farmers concerned. Noneconomic factorsare also very important in understanding the reluctance to utilize wildlife in place of livestock. Most ruralcommunities in Namibia place a high value on livestock- particularly cattle-for cultural and socialreasons. Consequently, demonstrating the economic superiority of wildlife utilization shpuld not beexpected to lead to widespread switching from livestock production in the short term.

Chapter 4:
The Economics of Living With Wildlife in Namibia
By Gil Yaron, Tim Healy, and Chris Tapscottt
Namibia is known as a land of wide, open spaces and has a growing reputation for its wildlife. Atthe same time, much of this land is arid or semiarid and faces severe environmental pressures due todrought and overgrazing by livestock. To date, little is known of the role played by wildlife in thenation's economy and the potential it has to contribute to sustainable development. This lacuna isparticularly evident with regard to communal land, on which most of Namibia's population live.
This paper attempts to assess the current and potential economic role of wildlife in Namibia,with an emphasis on communal areas. Case studies are used to illustrate the returns to wildlife, bothabsolute and relative to livestock, and some of the institutional issues that have to be addressed if thepotential of this sector is to be realized.
The structure of the paper is as follows: section 4.1 provides an overview of wildlife policies andutilization in Namibia from both a historical and current management perspective; a description of landuses that compete with wildlife is given in subsection 4.2.1, whereas subsection 4.2.2 contains thefinancial and economic analysis of the wildlife resource. Subsection 4.2.3 provides an assessment of themajor policy issues that affect wildlife utilization in Namibia. The factors determining the adaptability ofwildlife to Nanibia's environment are discussed in section 4.3, and section 4.4 presents the conclusions.
4.1 The Historical PerspectiveNamibia, situated in the southwestern part of Africa, occupies a land mass of 824,269 square
kilometers. The country consists of three major physiographic regions. The Namib Desert, which extendsalong the western coastal plain, comprises about 15 percent of the land area and is characterized by lowrainfall. To the east, the altitude rises rapidly to an interior plateau, which covers more than half of thetotal land surface area and stretches across the country from the northern to the southern border. The
* The authors would like to thank the Ministry of Wildlife, Tourism, and Conservation, in particular, Mick de Jager, for their assistance in our
undertaking this research. The original report has been edited and shortened considerably by Jan Bojo, for the purposes of this publication.The full-length report (seventy-five pages and ten appendixes) can be obtained on request from AFTES.
t Gil Yaron and Tim Healy undertook this research when they were freelance consultants and research associates of the Namibian Institute ofSocial and Economic Research (NISER), University of Namibia. At the time, Chris Tapscott was director of NISER. Different subsections of
this paper are attributable to each of the authors: this introduction, sections 4.2.2, 4.2.3, and 4.4 were completed by Yaron; 4.2.1 and 4.3 by
Healy; and 4.1 by Tapscott.
81

THE ECONOMICS OF WILDLIFE
Abbreviations
CGG Community Game GuardDVS Department of Veterinary Services, MAWRDIRDNC Integrated Rural Development and Nature ConservationMAWRD Ministry of Agriculture, Water, and Rural DevelopmentMWCT Ministry of Wildlife, Conservation, and TourismNAPHA Namibian Professional Hunting AssociationNEPRU Namibian Economic Policy Research UnitNGO Nongovernmental organizationNISER Namibian Institute for Social and Economic Research, University of NamibiaSADF South African Defense ForceSRT Save the Rhino TrustSWA South West AfricaSWAPO South West African People's OrganisationVCF Veterinary Cordon Fence
third region is the Kalahari semiarid zone, which lies along most of the eastern area and which ischaracterized by sands and limestone and an almost complete lack of surface water.
With a mean annual rainfall of approximately 250 millimeters, Namibia has the driest climatesub-Saharan Africa. Just 54 percent of the total land mass is classified as "arable," but even in areas ahigh rainfall in the north, arable agriculture is precarious. Elsewhere, an erratic rainfall regime and saand sodic soils, with high absorptive capacity and poor fertility, renders the land generally unsuitablecultivation.
The wildlife of Namibia corresponds to the three most important physiognomic groups: deservegetation, savanna, and woodland. The desert region supports species adapted to the arid conditions,especially ostriches, springboks, and oryx. The savanna supports wildlife species characteristic ofsavanna regions elsewhere in Africa. Woodland vegetation, which is restricted to the northeast, suppcspecies not found elsewhere in the country; these include sables, roan antelopes, tsessebes, and buffal
4.1.1 Pre-independence Wildlife Utilization PoliciesDespite resistance from the indigenous population, Namibia was proclaimed a German
protectorate in 1884 (German South West Africa). The first game reserves in the colony were establisin 1907. With the exception of the desert preserve, all these areas fell outside the area occupied by wlsettlers. Loss of access was thus felt most directly by the indigenous population.
With the South African takeover of the country in 1915, there was a reduction in the amount,land allocated as nature reserves. In 1947 the major part of the Kaokoland reserve was degazetted tocreate a "homeland" for the local ethnic population. Following the recommendations of the OdendaalCommission in 1963, which advocated the extension of South Africa's apartheid policies to Namibia,
82
NAMIBIA
additional reserve land was degazetted and incorporated into various ethnic "homelands." Despite theselosses, however, the amount of land set aside for conservation (8.7 percent) was comparable withsurrounding African countries.
Under colonial rule, the Directorate of Nature Conservation of the South West African (SWA)Administration administered the state-owned national parks, nature reserves, and national recreationalareas. The primary functions of the directorate were care of the animal population, administration oflicensed hunting, combating of wildlife-borne epidemics, research, and the maintenance of recreationalfacilities. Significantly, the directorate perceived its role to be predominantly one of preservation ratherthan conservation.
The most important piece of wildlife legislation to be enacted under South African colonial rulewas the Nature Conservation Ordinance (1967). Under this ordinance, commercial farmers (virtually allof whom were white) effectively gained full ownership of the wildlife on their farms. With this incentive,many farmers sought to utilize their wildlife for domestic consumption, trophy hunting, and sale. Thispractice, in turn, led to the build-up of wildlife numbers in many areas outside the national reserves.
In contrast, within the designated communal areas, hunting was officially prohibited. Inconsequence, under this administrative system, the importance of bush meat in the diets of most of theindigenous population declined to negligible levels. Hunting, for most households, became a clandestineactivity, which carried with it the risk of high penalties. Despite these restrictions, however, wildlifenumbers in the communal reserves declined rather than increased during the decades leading up toindependence. This was due to increased population pressure, a succession of droughts, and widespreadpoaching by both the South African military and by community members.
4;1.2 Current Wildlife ManagementIndependence in March 1990 brought with it a new impetus for the conservation of wildlife in
Namibia.-The new constitution committed the state to the maintenance of ecosystems, essentialecological processes, and the biological diversity of Namibia and the utilization of living naturalresources on a sustainable basis for the benefit of all Namibians, both present and future.
Pursuant to this philosophy, the newly formed Ministry of Wildlife, Conservation, and Tourism(MWCT) has embarked on a broad program to promote sustainable use of wildlife resources. This entailsthe formulation of policy to address the ownership of game, the financial benefits to communities, theeconomics of conservation, sustainable utilization regimes, the creation and structure of conservancies,and the role of different organizations and interest groups in the utilization and management of wildlife.Particular efforts are being made to ensure that local communities are involved in all consultative anddecision-making processes.
4.1.3 Areas Currently Used for WildlifeAt present, Namibia is in the unusual position of having more than 90 percent of its wildlife,
particularly larger mammals, located outside formally proclaimed conservation areas and mainly onagricultural land. About 80 percent of the larger game species are found on privately owned commercialfarms, which comprise 44 percent of the surface area of the country but which accommodate less than 5percent of the national population. In contrast, the communal areas, which comprise 41 percent of the
83
z . r - n R~~~~77
THE ECONOMICS OF WILDLIFE
country and which accommodate 67 percent of the total population, support around 9 percent of thelarger game species.
At present, there are twenty-one designated conservation areas in Namibia covering some108,000 square kilometers or 13 percent of the surface area of the country. Since independence, two ne,national parks have been proclaimed in the Caprivi region and plans are afoot to establish an additionalsix reserves. An investigation is also under way into the establishment of a buffer zone system adjacentto conservation areas.
A community-based wildlife management program has existed in northwestern Namibia for thepast decade. The approach, involving community game guards, has met with considerable success.Poaching has decreased dramatically and livestock numbers are increasing. The project, initiated by thenongovernmental organization (NGO) Integrated Rural Development and Nature Conservation (IRDNChas since been recognized MWCT and has become a model for similar projects elsewhere.
4.1.4 Wildlife Numbers and Economic SignificanceAlthough relatively accurate game censuses have been undertaken in national parks and in the
commercial farming areas, statistics on the communal areas are generally based on estimates andinformed guesses. More formal counting of wildlife in the northern communal areas was complicated bnearly two decades of bush warfare. Such statistics as do exist for the country as a whole reflect aconsistent pattern: a general increase in wildlife numbers in the commercial areas and, to a lesser extentin the national parks and a secular decline of game in most communal areas.
In contrast to other communal areas, results from regions in which community-based gamemanagement has been introduced have been encouraging. As most communal areas adjoin nationalwildlife reserves, they retain important roles as corridors for the movement of game and ultimately forthe maintenance of genetic diversity within given species.
Accurate data on public and private expenditure in this sector are weak. Reflecting a strongergovernment commitment to conservation, the annual budget for nature conservation within MWCT hasseen a 50 percent increase from R12 million in 1990 to Rl8 million in 1993.*
Within the private sector, evidence of an increase in investment may be seen in the increasednumber of guest farms from twenty-seven in 1987 to thirty-five in 1991. At the same time, there was a102 percent increase (from 217 to 440) in the number of rooms at rest camps and game farns between1987 and 1991 (Namibia 1992b).
The income derived from wildlife-related activities may be divided into consumptive andnonconsumptive activities. Consumptive activities relate to trophy and sport hunting, culling, live gamedealing, and shooting for own consumption. Data from 1989 and 1990, although limited, give anindication of general increase in retums from this sector (see table 4.1).
* This research predates introduction of Namibian currency; hence, all costs and revenues are shown in rands (R), the currency at the time.
US$I = 3.3 rands (1993).
84

NAMIBIA
Table 4.1: Game Utilization: 1989-901989 % 1990 % 1989 % 1990 %
Sport Hunt 11,227 16.9 21,235 23.9 2.43 12.5 8.18 24.8Trophy Hunt .2711 4.0 7,323 8.2 6.04 31.1 14.05 42.6Game Hunt 43,029 53.3 32,285 6.6 3.26 16.8 3.09 9.4Game (Live) 6,074 9.2 4,893 5.5 6.53 33.6 5.26 15.9Shot/Sold 4,026 6.1 6,829 7.7 1.17 6.0 2.39 7.3Own Use 8,283 12.5 16,282 18.3 - -Total 66,350 100 88,847 100 19.43 100 32.97 100
Source: Du Plessis 1991
The Namibia Professional Hunting Association handles about 1,500 clients a year with anaverage of about 1.75 observers accompanying each hunter-a total of about 5,000 clients. During 1991an estimated R44 million was earned in foreign exchange from trophy fees, accommodations, air fares,and trophy export charges (Attwell 1991).
Income from the nonconsumptive sector is less easily quantified. The Directorate of WildlifeConservation and Research administers nine rest camps and seven reserves, totaling 2,400 beds. Apartfrom that sector of the tourist market that is self-catering (own vehicle, camping, and so on) most touristsdeal with tourist operators. These operators are represented by the Touring Safari Association (TASA).The association has 36 members, comprised of fly-in safaris (3), coastal operators (4), fully-inclusivetours (2), camping safaris (6), and guest farms, hotels, and lodges (21).
The employment derived from the wildlife sector is difficult to compute as workers may not beengaged full-time in activities related to game management. The Directorate of Wildlife Conservationand Research currently employs 1,600 individuals, of whom 700 work in their various resorts. Anapproximate figure relating to those directly or indirectly involved in wildlife-related employment wouldamount to some 15,000 employees.
4.1.5 Current Property RightsPrivate commercial farmers effectively own the wildlife on their land; however, this ownership
is regulated by a range of permits and licenses. These relate to "specially protected game" (ten species,including elephants, white and black rhinos, hippos, and giraffes), "protected game" (thirty-one species,including leopards, cheetahs, crocodiles, and a range of antelopes), "huntable game" (six species,comprising buffalo, oryx, kudus, springboks, warthogs, and bush pigs) and "problem game" (six species,including baboons and rock hyraxes). "Specially protected game" and "protected game" may only behunted with a permit granted by the Namibian Cabinet, although small numbers are readily attained eachyear. "Huntable game" becomes the property of the owner, provided the land is adequately fenced orexceeds 1,000 hectares (Attwell 1991).
Irrespective of ownership, there are a several other categories of users who may gain access togame with the appropriate licenses. These are trophy hunters (who generally operate throughprofessional hunting firms), sport hunters (who hunt for venison with the consent of a farm owner), gameharvesters (who undertake nocturnal culls on private farms), commercial shooting for sale (undertakenby farm owners), and live game capture (undertaken by professional capture teams).
85

THE ECONOMICS OF WILDLIFE
Farmers whose farms contain wildlife may shoot game for their own use without a permitprovided this is "huntable game." Statistics on game utilized in this manner are generally underreporGiven that there are 6,000 registered private farms in Namibia, offtake of this form could be conside-if a conservative estimate of five animals were consumed per farm annually.
Within the communal areas, wildlife utilization continues to be retarded by existing legislatichowever, as indicated, the introduction of community-based wildlife management methods is likely t,improve this situation. The retums to communities from such systems derive from both concession feand meat culled. Concession fees in the Damaraland region have been channeled into community-basprojects. Despite these changes, however, game meat cannot be said to be an open access resource inNamibia. Only a small proportion of the population (possibly 10 percent or less) might realistically gLaccess to this resource.
4.1.6 Land Use and Government PolicyDespite the obvious potential of wildlife in Namibia, its quantifiable and direct contribution tc
the Gross Domestic Product (GDP) remains relatively small. In consequence, the economic potential ithe sector appears not to have been fully recognized by some policy-makers. Game farming is seen assupplement to livestock farming. As such, it is not recognized as a formal agricultural activity and ganfarms are ineligible for the tax deductions and loans that farmers might normally expect.
Land used exclusively for game farming is seen by many Namibians as underutilized. In acontext in which land is scarce and nearly 70 percent of arable land is in the hands of a small whitecommunity, this issue remains politically charged. Despite the fact that much of the land currentlyutilized for wildlife production is agriculturally marginal and hence unsuitable for small-scaleredistribution, its current use is seen by some as an unnecessary luxury, the argument-being that the larcould be more fruitfully utilized for livestock farming.
4.1.7 Bush Meat Consumption and MarketingWith the exception of the San population in the region formerly known as Bushmanland (fewe
than 4,000 people), there are no communities in Namibia that rely to any significant degree on gamemeat. Game meat is consumed by both owners and their employees on commercial farms on whichwildlife is utilized. Within commercial outlets in urban areas, bush meat is sold as a delicacy (as driedmeat preserve, for example, biltong and venison).
At present, there is a slump in the international market for venison. This is in part due to adecline in buyers from South Africa since Namibia's independence and, as argued by Du Plessis (1991in part due to changes in Eastern Europe and the opening up of new markets. Even assuming theexistence of a strong demand for venison, the infrastructure necessary to transport carcasses from thecommercial farms to the processing facilities in Namibia is inadequate.
4.2 Land Use Options: Financial and Economic AssessmerThis chapter first reviews the competing land-use options in three categories of land ownership
It proceeds to assess their financial and economic reforms and finally addresses some related policyissues.
86

NAMIBIA
4.2.1 Competing Land UsesNamibia can be divided into three categories of land (see figure 4.2 in section 4.2.2) as follows:
"Commercial areas" owned predominantly by private landowners and covering 44percent of total land
* "Communal areas," also known as "reserves" or "homelands," designated forsubsistence living by native black Namibians, covering 41 percent of total land
"State land," composed primarily of nature reserves and Diamond Area I (whichforms part of the Namib desert), covering 15 percent of total land
Commercial Areas
Joubert and Mostert (1975) showed that 60 percent of the game species in Namibia occur onprivately owned land; however, estimated game population figures for all the various species have shownthat approximately 90 percent of actual game numbers occur in the commercial areas. Joubert andMorsbach (undated), commenting on a game survey in 1982, stated that there were surprising andcomforting facts based on the relatively constant information on many species from 1975 to 1982.
The distribution of game on commercial land reflects the quality of grazing available to bothdomestic livestock and game in the savanna region, as shown in table 4.2. The central region(predominantly areas A, B, and C) has high densities of springboks, kudus, and gemsboks. In addition,the central eastern region (areas D and E) has high densities of red hartebeests, the central western region(areas D, E, and F) has Hartmann's zebras, whereas the central northern region has elands and giraffes inthe mountain savanna and Kartsveld. Meanwhile, commercial land in the southern region (areas E, F, andG) are relatively poor open parkland with Karoid shrubs. This has a high number of springboks and somegemsboks.
Table 4.2: Commercial Agricultural Areas and their Agricultural PotentialArea Farming Units Hectares Mean Official Carrying
Hectares CapacityNumber % Total % (haLSU)
Areas A and B 1,851 43.5 12,517,565 34.6 6,763 8-10(beef cattle)
Areas C, D, E 923 21.7 6,287,247 17.4 6,812 2-?15(sheep and cattle)
Areas E and F 1,129 26.6 11,967,599 33.1 10,600 18-30(sheep/high)
Area G 348 8.2 5,392,469 14.9 15,496 36-60(sheep/low)
Total 4,251 100.0 36,164,880 100.0 8,507 8-60
a Large Stock Unit, which is equivalent to an animal with an approximate mass of 500 kilograms.Source: Namibia, Department of Agriculture, Water, and Rural Development, raw data, 1991.
The competing land uses in areas suitable for wildlife management depend on the enterprises ineach region, as shown in table 4.2, showing land with high productivity for grazing; however, land
87

THE ECONOMICS OF WILDLIFE
classified as "A" grade may also have potential for dryland agronomy in which rainfall is above 500millimeters per annum (Adams and Wemer 1990). The conflicts of interest with different enterprisesdiscussed in this chapter for livestock farming and dryland and irrigation agronomy. Forestry orwoodland utilization are not discussed as this form of land utilization is not practiced commercially oused for subsistence living in the commercial areas.
The farming of domestic livestock covers almost the entire commercial area, principally for tproduction of beef from cattle (43.5 percent of the total area); however, this area includes a small am,of dairy farming in the vicinity of most large towns. Meanwhile, 32.8 percent is used for sheep farmiiin the south of the commercial area, whereas the remaining 21.7 percent is used for sheep and cattleproduction in parts of the southern region.
The livestock is often kept at conservative stocking rates, whereas the carrying capacities ofdifferent areas have changed from year to year (Namibia 199 lb). Farners in the commercial areas,during drought years, avoid selling the cattle for as long as possible, as prices will have dropped rapi(throughout the country (Bester 1993, pers. com.).
Disease transfer from game to domestic stock using the same land poses no significant problhhowever, the introduction of buffalo into the commercial areas as requested by the NamibianProfessional Hunting Association (Vaatz 1993, pers. com.) does pose a serious danger with the transfof foot-and-mouth disease (R. Paskin 1993, pers. com.).
The conflict of interest between land use for agronomy and wildlife in Namibia is not significdue to the small scale of crop production in commercial areas; however, points of dispute that may arare described subsequently.
Communal AreasThe distribution of wildlife in communal areas as described in this subsection represents a sh;
of the 40 percent of game species and 1O percent of the population of game species for Namibia as awhole (Joubert and Mostert 1975). The distribution of key species within the formerly named commudistricts are shown in table 4.3.
Table 4.3: The Population of Key Species in Communal AreasAreas/ Bushman- Caprivi Caprivi Damara- Herero- Kaoko- Kavango Nama- OwamtSpecies land East West land land land landGemsbok 198 - - 1,374 669 665 350 - 40+Springbok - - - 7,856 500 1,646 - 4,400 50+Eland 150 - 10 - 237 - 500 - -Kudu 325 45 200 - 145 - 200 200 40+Buffalo 11 421 a _ _
Lechwe - 1,630 - -10 - -Elephant 401 3,000a a 198 19 30 200 - 50+B. Wildebeest 400 _ b _ 117 - 150 - 10+Cheetah - - - - - - 100+ - -Leopard - - - - - - 100+ -Total 1,485 5,096a 210a 9,428 1,687 2,341 1,610 4,600 150+Source: Adapted from Du Plessis 1991.a. These species are seasonal migrants with fluctuating numbers.b. Species present.
88

NAMIBIA
The competing land uses involving wildlife are similar to those addressed for commercial areas.The communal areas vary in their utilization of the land, but they can be categorized as follows:
In Rehoboth and Namaland, the land is grazed principally by goats and sheep.
Damaraland can be divided into sectors, with cattle on approximately 25 percent of the land inthe southern sector and goats on approximately 25 percent of the land in the northern sector,whereas the remaining area is predominantly unused for grazing due to its condition.
Approximately 66 percent of the land in Kaokoland is utilized by cattle and goats, whereas theremainder is predominantly unused due to its condition.
The land in Owambo is used entirely by cattle and goats.
In Kavango approximately 80 percent of the land is used for cattle and sheep production.
The land in East Caprivi is used predominantly for cattle and sheep rearing.
The land in Bushmanland is not used for grazing by domestic livestock but for hunting andgathering by the bushmen.
Domestic livestock farming in the communal areas aims to satisfy a subsistence living; however,community management of land has been lost in many areas leading to excessive numbers of stock. Thishas been partly due to large human populations surrounding towns or villages in the communal areas,particularly Owambo, with over 400,000 people.
A recent report for Namaland suggested that the carrying capacity for that region wasapproximately 27 hectares per Large Stock Unit (LSU). This figure is almost half the carrying capacitysuggested by South West Africa's Five-Year Plan in 1966 (Adams and Werner 1990). It is reasonable toassume that the figures for carrying capacities for the remaining seven communal areas are equallyunreliable. The justification for this statement can be based on the mass degradation of vegetation sincethe 1 960s, when the Five-Year Plan was formulated by the SWA Administration.
A danger to communal farming practices in northern communal areas concerns the damage byelephants on wells and boreholes, particularly in Kaokoland and Damaraland, where elephant numbershave increased recently with successful conservation projects. Local people have had to combat thisproblem by constructing large stone walls around the boreholes (G. Owen-Smith 1993, pers-.com.).
Dryland cultivation is present in the northern communal areas. The area cultivated in Owambowas 2.7 percent of the whole region (Adams and Werner 1990). This fact places the cultivated area intocontext; the important fact, however, is the number of independent units in Owambo (approximately61,000 units based on the area cultivated and average size of each unit). Irrigation agronomy has beenadopted by some farmers in East Caprivi to sell their products rather than live by subsistence only. Themost common crop grown in East Caprivi is maize sold within the region.
Dry woodlands cover 20 percent of Namibia. Of this, approximately 12 percent may be classifiedas forested (central Caprivi) and about 2 percent (1.9 million hectares) is estimated to be commerciallyexploitable forest (Namibia 199 Ia). This woodland occurs from Caprivi to near Ondangwa extending
89
THE ECONOMICS OF WILDLIFE
south approximately 300 kilometers to the Botswana border. The impact of wildlife on woodlands innorthern Namibia may include increasing demand for wood to protect crops and damage to trees,particularly by elephants.
State LandState land is managed or leased by the government, covering 8.8 million hectares, and the
diamond concession area, covering 3.5 million hectares. There are conflicts over some conservationareas due to the demand for land in parts of Namibia. Parks with potential for mining could pose aserious threat to wildlife in the future. Local people want to open up Etosha Park, situated next toOwambo, in which there is excessive overgrazing, to allow free movement of their livestock. Naturalmigration of wildlife from the Skeleton Coast to Etosha Pan has been curtailed by the fencing of thepark, in which a wildlife corridor used to allow the passage of animals from both areas. This had theeffect of minimizing overgrazing throughout the area.
4.2.2 Financial and Economic AnalysisThis section reviews wildlife utilization, primarily in communal areas, from a regional
perspective. At the end of the section, wildlife utilization in commercial areas is also discussed.
Wildlife Utilization in Namibia's Communal Areas
The potential offered by wildlife utilization is illustrated by the case studies in this section.Individuals on communal lands in Namibia face a big disadvantage with respect to wildlife utilizatioiWildlife on communal land belongs to the state and can only be hunted under specific circumstancesonly with the involvement MWCT officials. This, a priori, rules out CAMPFIRE*-type projects inNamibia. The government has, in principle, accepted the right of inhabitants of communal areas to gzeconomic benefits from the utilization of wildlife in their neighborhood. The precise form of such us;rights will find expression in legislation that could be enacted in 1994.
With the possible exception of game farming, the options for wildlife utilization set out hereconsistent with livestock farming. Occasionally, the supply of water is so limited that livestock-offercompetition to wildlife. Competition can also arise if poor dry-season grazing is combined with fencethat prevent game movement or if tourism is set back by the presence of livestock in wildlife areas. Iigeneral, however, the ability of game to utilize a far greater area around a water source than domesticanimals permits water sources to be shared. Even where the same range is shared, differences inbrowsing and grazing behavior provide some complementarity.
Although wildlife can often supplement livestock farming, the scope for outright substitutiongenerally limited. Livestock-cattle in particular-have an important social, religious, and economicrole for most traditional societies in Namibia. The question of whether to farrn wildlife in place oflivestock is meaningless in societies in which "a man without cattle is not a man."
This report's analysis of communal areas is structured by region, which is complicated by therecent (1992) delimitation of new regions in Namibia. The previous ethnically based map has beenredrawn-in some cases leading to significant changes in regional boundaries. These are illustrated ii
* Communal Areas Management Program for Indigenous Resources (CAMPFIRE). See chapter S on Zimbabwe for more background.
90

NAMIBIA
the subsequent maps. Figure 4.1 indicates current regional boundaries and provides some data on theirareas, whereas figure 4.2 is drawn on the basis of the previous boundaries and indicates rainfall acrossthe country.
Kunene Region
The objective of the following case studies is to illustrate the interaction of the various elementsof community wildlife utilization. This region, which covers 144,000 square kilometers but is home toonly 25,000 people, is predominantly arid rangeland. The case study area within it, the western censusregion, covers for game count purposes approximately 25,000 square kilometers and has a population ofless than 1,000. The area is at the forefront of community-based wildlife utilization. Community gameguard and tourism levy projects have been replicated in other areas.
Community Game Guards
The community game guard (CGG) project operates predominantly in the northwest of Namibiaon communal land that lies above the veterinary cordon fence (VCF). Much of this land consists ofprivately operated tourist concession areas. Although generally arid, this area has traditionally supportedsignificant populations of black rhinoceroses and elephants.
The 1979-81 drought, however, led to local communities losing 80 percent of their cattle and adesperation to rebuild herds. At the same time, local people received no officially sanctioned benefitsfrom the wildlife in their area. The South African Government also issued 2,000 rifles to people inKaokoland to "counter the SWAPO threat," while a ready market existed for rhino horn, ivory, and gameskins. This combination of factors led to a massive upsurge in poaching.
By 1981 almost no elephant or rhinoceros remained in Kaokoland. . . Burchell's zebra wereextinct in Kaokoland. Assertions this was due to the drought should be balanced against thefact this species had survived previous droughts. (Carter 1990, p.13).
The first CGGs started work in 1983. There are currently more than forty CGGs in communitiesacross the region, each receiving a R240 ration/cash income package per month from IRDNC-the NGOoperating the scheme. CGGs use local means of transport (mainly donkey carts) and, initially, were paidonly food rations. This constitutes an important source of employment. Funding for CGGs is provided byvarious donor agencies.
The CGG scheme is generally credited with the sustained recovery of wildlife numbers recordedin this region (Carter 1990). In less than one decade (1984-93), the black rhino population in-what wasformally Damaraland and Kaokoland has risen 100 percent. The holders of tourist concessions in theregion also attribute the sustained increase in wildlife numbers in these areas to the CGGs. Although thereturns from wildlife have only been modest, it is the community support for the CGG scheme thatunderlies these gains.
The Purros Project
The Purros project was started in western Kaokoland in 1987. The plan was to derive revenuefrom a voluntary levy negotiated with tour operators visiting the Purros area. Tourists would pay anadditional US$8 if staying overnight or US$1.60 for a morning or afternoon visit. Craft sales would alsoprovide informal employment opportunities to local people. Payment would be made bimonthly to a
91

ZAIR E TANZANLA NAMIBIA
/ ANGOLA . l '-> i_._e CURRENT REGIONAL BOUNDAIJ ZAMBIA REGION AREA ISQ.M. PERIMETER (KM.)
Ar-- o-map i f'- 1. KUNENE 144,254.641 1,907.137I -----.. j MO7AWTIQUE 2. OMUSATI 13,637.554 526.793r &-W a, DMaA3. OSHANA 5,290.943 337.651
* ' '. , / (4. OHANGWENA 10,582.016 599.090BINAAJA BOTS NDIAN 5. OSHIKOTO 26,607.162 914.144
Wif¶nok ' ' ?OCEAN' 6. OKAVANGO 43,417.523 1,005.503l L I f ,7. UAMBEZI 19,532.277 1,072.853
SOJUH ( -AND 8. ERONGO 63,719.781 1,264.645, |.J" -2 , 'i,'9. OTJOZONDJUPA 105,327.781 2,047.672
ATtANFC , j / 10. OMAHEKE 84,731.992 1,475.112.--------- i_ ----------- (ipTHS11. KHOMAS 36,804.672 1,383.350
OCEAN SOUTH0AFRICA 12. HARDAP 109,888.070 2,029.431\ /OIJTH AFRICA 13. KARAS 161,324.500 2,112.536h. ,-...-....,-- TOTAL: 825,118.875 5,411.764
'12' 14' 16- _ \18- 20- 24
A - s N C,~~~~~~~,
I,,OSIrzOIIO3-HANGWENA | ' Ma -
18- '> - | tz vO';> OndongwoOSHIKOTO OKVANGm !-< V
jKUNENE tasjippn TsunebioKrJmanjJb ;rootfontein I
-20- \ _'~> OutioO ,> ' OTrJ O Z O'N D J U PA '\ ; ' Sw,ampsFrornsfnteino - I / /~
,Khorixas o , c _ _,Okakoraro
OMAIHEKE K j BOTSWAN.
22' I 'ER0NG okhnd. ---- -------Usolkos(
Windhoek' W,ei ;W Gso6iabs 0 SELECTED CITIES AND TCSwctkopnund'p--X----HOMAS: , ® NATIONAL CAPITALWalvisBo-1O RIVERS
) 8 +' , > 4< _, ,{fA, iLeonardoville | _, - _- INTERMITTENT STREAMS
2'- -'-- REGION BOUNDARIES24' S O U T H oArnos --- INTERNATIONAL BOUNC
H A,.R D A P ".| NOTE: THIS MAP SHOWS AMorientolo Vs BOUNDARIES IN EFFECT Almaltol,66'C,'REFORM IN 1992.
P A C I F I C '--- ..-- IonO C E A N Kes
KILOMETERS AusO BKeetmanshoop.
0 100 200 300 K 'A.R A S Aro*o,6 ' -- '
The boundaries, colors, denominations \ ,and any other inlrmntion shown an
-. Ko~~~~~~~~~~~~_" rcs6urg ! 1ihe WadS Bank Group, any judgmen° Ariamsvleu SOUTH AFRICAon the legal status of any territ.si, or \ Wannbod A nsv -Lany endorsement or acceptanc aof 1 0 / I /fsuch boundaries. Y'___
Source: InfoScience. Data compiled by First Delimifauian Comm,ission. \ '- < '\1'14 16' 18- 20' e 22' 2'°I I .I I-. I ' s .f -

IBRD 27055
. : > j ~ZA I RE f- TANZANIA
- X j-t i 9~ZA RA I NFAL LArea of map' G= 4S ,
. x -_ 2,_6$ ) MOZ+IG'NJ~E 600 -- - MEAN ANNUAl PAINFALU, IN MILLIMETERS; . \' ( \. < . ...................... °-SELECTED CITIES AND TOWNS
, \ NAUB4A { BTSW4NA < "/ ';INDIAN 69 NATIONAL CAPITAL. | wiaSl0elts r , i 4 jOCEAN RIVERS
5 OU7H ' ' ,SND_ _-INTERMITTENT STREAMS
. AftANTlC \\<>. j g -- ~~~~~~~~~DISTRICT BOUNDARIESl @ _ ~~- -:--------- (\<- -- INTERNATIONAL BOUNDARIES
;. OCEA N \ SOIJrFI AFRICA X ~~~~~~~~~~NOTE: THIS MAP IS BASED CN THE REGIONAL:. \ , ~~~~~~~~~~~~~~~~~~~~~BOUNDARIES BEFORE 1992.
.~~~~~~~t <
<;94 9 ~~A N,G-Ob L Aa .
018° \ \_An ' X s° OOndJngwc s _ ~~~~~~~~~~~~CAPRIV~
KAOKOLA E;vt/SS - s KAV & -
Y\ ,~~~ E ( \> t~~~~ Etoshc Pon 0/Tuet > _ 1~__ <
( ;\ \ AW O~~~~~~~Komanjcb 0 Orrv4ontfe,i USCHMANN_ , '1
N z ssaYo owAi, j $, -, g vs . HERERO~~~~LAND"-1 ' t
SWolsopmundl---!- b!iornq --------hok < ~ W-v\hois os Br4\,_s - _s ' 4 r
2240 1. I.. a \<ona 1 i~ 224
S O U T H 9 } v - o gSumpne Xr !A O
) \' " NAMA LAND° ° 1 0
5 0 U T H ~ ~ Metorient'ai`b ~ ; J r
PA~~~~ ~ ~ C If F It -- _ k G eqi_
. hebunvris clrs enmnoins' O t Aosve° SOU AFRAMAA , < 8
Th ColtBn Enup an juJmnt 00rsb 0_t a
0 14- 200 3080fie > 2,->K io -

THE EcoNoMICs OF WILDLIFE
committee of lineage (family) heads. Five years on, the project has managed to achieve most of itsobjectives.
Although only one tour operator was participating in this project as of 1994, the economic gato the community have been substantial. Some US$19,000 has been generated by the tourism levy an(sales of crafts produced over the past five years. Annual earnings are now approximately US$6,300.,has been shared by roughly 100 people in eight extended families. The cost of establishing the projeciwas limited to the staff time of the NGO involved.
Livestock continues to be kept. Indeed, tourism revenues facilitated the rebuilding of herdsdecimated by the drought of the early 1980s and cushioned the effects of the 1992 drought.
This area is a critical conservation area based around a fresh water spring in the dry Hoarusibriver bed. It provides essential water for big game in their movement across northern Kunene; howev(by the early 1 980s, massive poaching in the wake of a serious drought had all but eliminated big gamifrom this area.
The Purros project appears to have engendered a feeling of "community ownership" of localwildlife resources. This naturally deters poaching by community members and provides a solid base fcommunity game guard project-designed to combat poaching by outsiders. Elephant and rhinopopulations have now reestablished themselves locally and the MWCT has translocated oryx and girato this area.
Lions periodically visit the area, leading to a number of incidents of livestock loss. As cattlehave an important religious, social, and economic role in Himba and Herero society, this has potentiaiserious implications; however, people are now prepared to give MWCT the chance to translocate lionout of the immediate area.
The community now negotiates directly with the tour operator concerning the levy and problkthat arise. This has turned local people from being largely objects of curiosity to active participants intourism business. Most tourists are reportedly happy to be able to contribute to the local communitywhen the use of these funds is explained. This also has to be seen in the context of paying a US$8 lev:a holiday package costing US$1,590. Nonetheless, no mechanism exists for collecting the levy fromthose who decline to pay it. These are the majority of tourists; the councilor to the headman for this aiwas concerned that they did not pay any contribution to the local community.
Game Cropping for and by Local Communities
Local communities (as well as those in other parts of the region) have also benefited fromoccasional game cropping (in 1987-89 and 1991-92). Only state-organized cropping has been alloweThe 1992 crop was a major exercise with professional teams shooting 130,000 kilograms for distributto local communities in Kaokoland and Damaraland. This operation presented some major logisticaldifficulties. Although most wildlife is found above this border, veterinary restrictions permit only zeb(which are not vulnerable to foot-and-mouth disease) to be brought southward. The desire for fresh mrequired the use of freezer trucks in difficult terrain, and hunting itself in such terrain led to vehicledamage.
94
NAMIBIA
It is estimated that the cost of this operation was greater than the financial value of the meatobtained (R. Loutit 1993, pers. com.). The MWCT has now decided to allow the communities themselvesto undertake this year's cull with MWCT staff acting as monitors.
The attitude of the various communities involved appears to vary from enthusiastic to anxious-depending largely on their view of the hunters in their midst. Legal restrictions preclude the sale of anycropped meat, which many feel gives an incentive to the hunter to consume a large proportion of what isshot.
Wildlife Utilization and Concession Area Use
Prior to independence, the then Damara Administration awarded the right of exclusive touroperations in five areas. This chapter concerns itself with two of these areas (Palmwag and Etendeka),which cover a significant proportion of the western census area. The main gains from wildlife have beenin terms of community game guard employment and meat cropped from the area. The tented camp atEtendeka and the larger lodge and camping operation at Palmwag have brought some employment andopportunities for craft sales. Nonetheless, livestock herding around the natural springs in theseconcession areas remains the principal economic activity.
Both the concession holders and local people accept that a greater return to local communitiesfrom their environmental assets should be possible. One option, agreed with Etendeka and underdiscussion with Palmwag, is for a tourism levy-as with the Purros project. In return, livestock would bekept away from tourism-intensive areas. Local involvement in the tourism industry has also increasedwith the establishment of a camp site by the Khowarib community with assistance by Save the RhinoTrust.
The opportunities presented by such tourism-centered development need to be compared withthat offered by livestock farming and also that offered by trophy hunting. If, as is expected, futurelegislation confers wildlife utilization rights on local communities, trophy hunting will become apotential source of revenue for communities in this area.
The view of the concession holders spoken to was that zoning of the area for hunting and photo-safaris would be difficult and that the two could not be mixed. Consequently, photo-safari and trophyhunting activities represent alternative development opportunities for this area. The actual returns totourism (photo-safari) and livestock farming in these areas and the potential returns to trophy hunting arepresented in tables 4.4-4.8.
Livestock farming is moderately profitable for the farmers concerned. Slightly more thanUS$16,000 is estimated to be earned by the hundred or so families that graze animals in and around theconcession areas; however, as veterinary services and boreholes (two) are provided by the state,economic costs are greater than the financial (private) costs borne by farmers. Once these are accountedfor, the net (economic) return is negative. Indeed, the true economic return to livestock is likely to beeven lower than that indicated in table 4.8 as no account has been taken of the effects of localizedovergrazing. This has evidently hindered the recovery of grazing in the vicinity of some settlements inthe wake of the 1992 drought, and this loss of productivity has an economic cost.
95

THE ECONOMICS OF WILDLIFE
Table 4.4: Potential Revenue From Livestock Kunene Western Census RegionArea: 13,370 square kilometers
Population: 100-200 households1 2 3 4
Estimated offtake Revenue/beast Livestock revenue p.a. Unit mass(number) (rands) (rands) (kg)
Cattle 112 800 89,600 270Horses 2 250 500 200
Donkeys 4 200 800 180
Sheep and goats 750 80 60,000 35
Total 868 150,900Total/ha 0.11Total/kg 0.16Source: Authors' estimates. See full-length report for background.
Table 4.5: Livestock Costs, Kunene Western Census RegionFinancial (Private) Economic (Social)
Veterinary services/animal (Ralkg) 0.07Labor/animal (R/kg) 0.10 0.10Annualized borehole capital cost/animal (R/kg) 0.01Diesel pump maintenance/animal (klkg) 0.01Fuel and oil/animal (k/kg) 0.005Livestock in region (kg) 953,565 953,565Total livestock cost, Kunene (R) 98,888 184,097Total cost (Rkkg) 0.10 0.19Total cost (R/ha) 0.07 0.14
Source: Authors' estimates. See full-length report for background.a. R = rand.
Wildlife utilization is estimated to provide a far higher net financial and economic return fr
area than livestock rearing. The divergence between financial and economic wildlife costs is due to
costs of game protection borne by those outside the local area (by the Government of Namibia and
agencies). Despite these costs, the net returns to wildlife utilization remain substantial. Nonetheless
argued here, the existing culture and socioeconomic structure of local communities make wildlife a
supplement to, rather than a substitute for, small-scale livestock farming.
Trophy hunting and photo-safari activities appear to offer similar net economic revenues. I
4.8 illustrates a potential division of these returns based on similar shares to those used (for trophy
hunting) in CAMPFIRE projects. In practice "fair" net revenue shares will have to be negotiated be
the parties concerned. It is also important to note that the net revenue attributed to the state in table
assumes that all game protection costs are borne by the state-wildlife protection being financed b3
utilization. Currently, the costs of wildlife protection are partially borne by donor agencies.
For the potential revenue from wildlife utilization to be realized, legislative changes are rec
Some progress may be possible using a voluntary arrangement such as that used in the Purros proje
however, a statutory arrangement is likely to be fairer as it would affect all concession holders equa
would also be more easily administered if it constituted a fixed proportion of the concession fee. (T
study has taken 50 percent as an illustrative figure in table 4.8.)
96

NAMIBIA
Table 4.6: Summary of Total Revenue and Costs of Wildlife Utilization Kunene Western Census Region (rands)Financial Economic
Gross Revenue Costs CostsTotal trophy fee revenue 145,663.0 Trophy hunting annualized capital costs 124,160.5 124,160.5Trophy animal meat value 33,990.0 Trophy hunting operating costs, including tender fee 363,945.0 363,945Hunter days 190.0 Additional aerial census 0 20,000Observer days 332.5 Game protection, CGG 0 80,000Revenue from hunter days 381,000Revenue from observers 99,750.0 Photo-tourism annualized capital cost 66,243.6 66,243.6Revenue from craft purchase by hunters 5,225.0 Photo-tourism operating cost 1,282,388.8 1,282,388.8Subtotal for trophy hunting 665,628.0 Game protection, CGG 0 80,000Trophy hunting revenue/ha 0.5Trophy hunting revenue/kg wildlife 0.4Live capture (net) revenue 754,500.0Cropping (net) revenue (local market) 72,711.1Commercial photography fees 5,000.0CGG scheme spending-local 80,000employment etc.Photo-tourism revenue 1,522,945.0Photo-tourism revenue/ha 1.1Photo-tourism revenue/kg wildlife 0.8TOTAL (with trophy hunting) 1,577,839.1 TOTAL COSTS (based on trophy hunting) 488,105.5. 588,105.5Gross return per ha 1.2 Trophy hunting cost/ha 0.4 0.4Gross return per kg 0.9 Trophy hunting cost/kg wildlife 0.3 0.3TOTAL (with photo-tourism) 2,435,156.1 TOTAL COSTS (based on photo-tourism) 1,348,632.4 1,428,632.4Gross return per ha 1.8 Photo-tourism cost/la 1.0 1.1Gross return per kg 1.3 Photo-tourism cost/kg wildlife 0.7 0.8Source: Author's estimates. See full-length report for background.
97

THE ECONOMICS OF WILDLIFE
Table 4.7: Net Revenue for Wildlife Utilization and Livestock Production, Kunene WesternCensus Region
1 2 3 4 5Gross Financial Economic Net Revenue Net Revenue
Revenue Cost Cost (Financial) (Economic)Livestock (rands) 150,900.0 98,888.2 184,097.2 52,011.8 -33,197.2Livestock 0.11 0.07 0.14 0.04 -0.02(rands/ha)Livestock (rands/kg) 0.16 0.10 0.19 0.05 -0.03Wildlifea (rands) 2,435,156.1 1,348,632.4 1,428,632.4 1,086,523.7 1,006,523.7Wildlifea (rands/ha) 1.82 1.01 1.07 0.81 0.75Wildlifea (rands/kg) 1.32 0.73 0.78 0.59 0.55Wildlifeb (rands) 1,529,839.1 488,105.5 588,105.5 1,041,733.6 941,733.6Wildlifeb (rands/ha) 1.14 0.37 0.44 0.78 0.70Wildlifeb (rands/kg) 0.83 0.27 0.32 0.57 0.51
Source: Author's estimates. See full-length report for background.a. Photo-safaris, game capture, and croppingb. Trophy hunting, game capture, and cropping.
Table 4.8: Net (Economic) Revenue Division: Kunene Western Census Region (rands)1 2 3
Local State PrivateCommunity Business
Livestock 52,012 -85,209 0 -
Wildlifea 562,188 359,889 84,447Wildlifeb 612,089 317,550 87,695
Source: Author's estimates. See full-length report for background.a. Photo-safaris, game capture, and croppingb. Trophy hunting, game capture, and cropping.
Although table 4.7 shows the net economic return to photo-safari tourism and trophy huntinEbe similar, there are reasons to believe that photo-tourism offers a greater scope for this area'sdevelopment. One local community is actively involved in running and developing camping facilitie!Khowarib) and, with some support from the Save The Rhino Trust, they have begun to establishthemselves as a tourist destination. The objective is now to develop local managerial skills toprogressively add value to their tourism operation.
In the foregoing analysis, we have assumed that those farming livestock in this area wouldconstitute the community gaining the "community share" from the area's wildlife. This would yieldapproximately US$1,750 per family and would appear to be targeted to those living in proximity to tlwildlife resource and making a real difference to the income of the recipients. In practice, however, treturns to wildlife may be more widely distributed. For example, meat from previous cropping exerciwas distributed to the needy in towns some distance from the cull sites. In the future, the fact that loccommunities will themselves be doing the cropping suggests that they will also receive the meat.
It is also uncertain whether the government would be willing to allow a 50 percent share of tlrevenue from the live capture and sale of the black rhinoceros to accrue to the communities in thissparsely populated area. They will certainly face pressure to spread these returns to the politically mcarticulate local town dwellers. There is clearly a need to establish an institutional framework forallocating the return to wildlife to the people involved in nurturing this resource. The role of tradition
98

NAMIBIA
and district council structures has to be clarified and an appropriate unit of involvement has to be agreedon. It is unlikely that a uniform model can be applied across regions, given the variation that prevails insocial structures and attitudes toward traditional authorities.
Caprivi Region
The Caprivi, in northeast Namibia, appears to present a different environment from the Kunenein which to assess the viability of community wildlife utilization. Average rainfall is approximately 650millimeters per annum and fishing and arable agriculture play an important role in the region'ssocioeconomy in addition to small-scale livestock farming. Nonetheless, there are important similaritiesin that the colonial period has seen communities alienated from their wildlife resource, which hassubsequently been decimated by local and South African Defense Force poachers.
The region has had a game reserve in the western section since 1907 and two small reserves inthe more densely populated eastern section since 1990. Animal populations have begun to increase in theregion and trophy-hunting concessions have been awarded since 1988. This situation coexists withgrowing photo-safari tourism.
There are two recent developments that are likely to improve the sustainable utilization ofwildlife by local communities. The first is the extension by IRDNC of the Community Game Guardsystem to the region. Second, the hunting safari company that won the tender for the region's concessionareas has agreed to assist the Barakwena Bushmen in establishing their own tourism camp on theOkavango river. This area has significant potential as a center for photo-safaris in and around the westCaprivi game reserve. The relative returns to livestock and wildlife utilization in this region are
-summarized in tables 4.9-4.10.
Table 4.9: Net Revenue for Wildlife Utilization and Livestock Production: Caprivi1 2 3 4 5
Gross Financial Economic Net Revenue Net RevenueRevenue Cost Cost (Financial) (Economic)
Livestock (rands) 5,727,428 2,973,942 5,171,059 2,753,486 556,369Livestock (rands/ha) 2.93 1.52 2.65 1.41 0.28Livestock (randslkg) 0.20 0.10 0.18 0.10 0.02Livestock 799 415 722 384 78
(randslhousehold)Wildlifea (rands) 7,494,969 3,926,424 4,383,174 3,568,545 3,111,795Wildlifea (rands/ha) 3.8 2.0 2.2 1.83 - -1.59Wildlifea (rands/kg) 0.9 0.5 0.5 0.41 -0.36Wildlifea 1,046 548 612 498 434
(rands/household)Source: Author's estimates. See full-length report for background.a. Hunting and photo-safaris, game capture, and cropping.
* The full set of results used to derive these summary tables can be found in appendix 5 of the full-length report referred to at the beginning ofthis chapter
99

THE ECONOMICS OF WILDLIFE
Table 4.10: Net (Economic) Revenue Division: Caprivi (rands)1 2 3
Local Community State Private BusinessLivestock 2,753,486 -2,197,117 0Wildlifea 1,949,143 372,051 128,628
Source: Author's estimates. See full-length report for background.a Hunting and photo-safari, game capture and cropping.
Livestock farming in this region provides income from plowing by oxen, as well as from livesales or slaughter. It is estimated to be a profitable activity from the communal farners' perspective-yielding almost US$120 per rural household. Naeraa and others (1993) reported that 70 percent of rutCaprivian households interviewed own cattle, which makes the actual return from livestock per cattleowning household approximately US$176. This, however, excludes the costs of veterinary services aiwater supply, which are borne by society at large. Once these economic costs are taken into account, Ireturn to livestock farming falls from RO. 1 per kilogram of livestock to RO.02 per kilogram.
To these economic costs need to be added the loss in range potential from overgrazing. This cis likely to be limited in comparison with those of other communal areas, as this region has suffered fless than most others from overgrazing, despite the rise in livestock numbers from approximately 40,(in 1984 to the current figure of approximately 1 10,000.
The estimated financial returns to wildlife are approximately 30 percent higher at US$159 peihousehold than the returns to livestock. Moreover, the costs of game protection are small relative to tlcosts borne by taxpayers for the production of livestock. These lower estimated economic costs lead trather higher net economic return-US$138 per rural household in comparison to US$25 for wildlifelivestock. As the return to livestock is achieved with far less animal mass, the estimated economic retper kilogram of wildlife is eighteen times greater than the return per kilogram of livestock.
Tourism is by far the most important component of net economic revenue (almost two-thirds)with live capture and cropping contributing slightly more than 20 percent and trophy hunting almost Ipercent. It is important to note that unlike the case studies from the Kunene region, trophy hunting an(photo-safari tourism currently coexist in Caprivi; hence, at current volumes of tourism, the wildliferesource is capable of supporting both forms of utilization. Although, if the new tar road to the regiondoes bring a large increase in tourism to the region, conflict of access may well arise.
The returns from wildlife currently flowing to local communities in this region are limited. Italso worth reiterating that rural communities in Caprivi do not view livestock ownership simply as a"means to a living." The centrality of cattle, in particular, to rural culture implies that despite the fact iwildlife has far greater economic potential than livestock, one is not about to witness the imminentdemise of pastoralism.
Even if households were willing to switch to the economic activity with the highest return, theare likely to stick with livestock farming as long as the state bears a significant proportion of the cost.revenue-sharing arrangement yielding local communities almost two-thirds of net financial tourism anhunting revenues would be substantially less remunerative than the net financial revenue accruing tolivestock farming. The current estimated level of subsidy to livestock production in the region wouldmake a switch to wildlife utilization unprofitable from the farmers' point of view.
100

NAMIBIA
Ojozondjupa Region
This region covers areas previously known as Bushmanland and parts of Hereroland, as well ascommercial farming areas. For the purposes of sensibly discussing wildlife utilization on communalland, it is necessary to use the previous regional delimitation as reference points.
Bushmanland: Wildlife utilization has been a central feature of the Ju/Wasi bushmen's existencefor many thousands of years. Their hunter-gatherer lifestyle relied on making use of some 60,000 squarekilometers of land. Consequently, the creation of an enclave a tenth of this size by the South AfricanAdministration and the incorporation of many bushmen as trackers for the South African Defense Force(SADF) led to profound changes in the pattern of this people's lives. Some attempts, without muchsuccess, have been made to develop livestock and arable agriculture in this region, which has 450millimeters of rain per annum on average but sandy soils.
Traditional hunting has continued in the area originally designated by the Odendaal Commissionas Bushmanland, the Bushmen or San being the only people allowed to hunt on communal land without apermit and professional hunting license. They are, however, restricted to using traditional weapons andhunting for their own use. Despite the limited offtake of game that this involves, wildlife populationswere greatly depleted by poaching in the 1980s and have only recently begun to recover. Trophy huntinghas been suggested as being an ideal means of generating revenue, which could be utilized by thecommunity of up to 4,000 people in what was previously known as west and east Bushmanland.
The costs of a trophy safari operation suggest that the returns to the local community at theestimated existing stocking rates would be small indeed, as an operation is unlikely to be profitable. Inaddition to these estimates, the study has some actual data on the trophy-hunting safari operated in 1988and those thereafter. These figures suggest that trophy hunting does present a significant opportunity forrevenue generation in the region, and a substantially more remunerative one than livestock farning.Indeed; this is perhaps the only area of Namibia in which livestock has no particular cultural significanceand can be considered purely for its economic value. The mechanism for local community access to therevenue generated from trophy hunting remains to be formalized.
The vast reservoir of tracking skills and unique understanding of wildlife among the Ju/Wasipresents the opportunity to develop ecotourism in this region. An active partnership between the localcommunity and a professional tour company, perhaps with NGO support, would offer an importantadditional means of sustainably utilizing local wildlife.
Table 4.11: Potential Gross Revenues from Wildlife and Livestock PopulationAt estimated current At estimated maximum futurestocking rate (rands) stocking rate x 0.75 (rands)
WildlifeDaily Rates 76,860 230,580Concession and Trophy Fees 70,700 212,300Cropping and Harvesting 4,242 163,205Subtotal 151,802 606,085
Livestock 8,849 174,994Source: Cumming 1990.
* The costs of a trophy safari operation are described in the full-length reporL
101

THE EcoNoMics OF WILDLIFE
Hereroland
Wildlife numbers have been severely depleted in much of this area, in which the primaryeconomic activity is livestock farming. In fact, livestock production in this area is the most commerciof all the communal areas with a number of farmers supplying weaned calves for the South Africanmarket. The existence of farmers with commercial experience, an average annual rainfall ofapproximately 400 millimeters and a position south of the veterinary cordon fence (VCF) gives this apotential for game and mixed game and livestock farming. Fairly high concentrations of game could,theory, be farmed and cropped for export; cattle, however, remain central to Herero culture; it is likelthat game would only be farmed in addition to livestock.
Any expansion of animal biomass in this area has to be approached with caution as severeovergrazing has already been noted in recent studies (German Office of Cooperation 1991). At the satime, there is a significant area of unsettled land in this region-estimated at 2 million hectares by th4Namibian Economic Policy Research Unit (Namibia 1991b). Developing this unsettled land for livesifarming would involve huge fixed costs-primarily for boreholes-with the consequence that theestimated net financial return is strongly negative. An alternative that deserves further consideration idevelop this area for game farming. This would require far fewer water points and the chances forfinancial viability would be correspondingly much higher.
Erongo Region
Farmers in this region rely on an average rainfall of 50 millimeters in the arid west to 200millimeters in the semiarid east to raise livestock, mainly goats. This area, comprising much of formtDamaraland, was perhaps hardest hit of all communal areas by the 1992 drought. Tourism to this regihas, in contrast, been relatively healthy, the attractions being wildlands and wildlife in addition toimportant historic sites. Community gains from wildlife utilization have been largely in terms ofemployment.
There is a significant population of elephants that use the Huab river valley for both food andwater. Although this offers tourists the chance to see elephants in an unfenced, wild environment,farmers in neighboring areas have frequently been in conflict with elephants, mainly over damage toboreholes. Photo-safari and ecotourism offer the potential for these farmers to gain from the presenceelephants. To succeed in practice, this requires a significant investment to develop the tourismmanagement resources of local communities.
The superior adaptation of wildlife to semiarid environments, the situation of Erongo south othe VCF and a limited cultural commitment to livestock among the Damara people all suggest thatwildlife farming might substitute for livestock in this region. Indeed, springboks have been successfufarmed on equally arid commercial farms in the south of Namibia. In terms of gross revenue, springb(R4 per kilogram) appear to have the advantage over goats, typically sold at R80 for a 25-35 kilograranimal (R2-3 per kilogram). Once the costs of water supply for livestock and veterinary services areadded, the gains in terms of net economic revenue from wildlife production begin to look substantial.There is good reason to believe that the negative net economic retums to livestock identified for Kun,would be even lower in the Erongo region-there are, for instance, far more boreholes on isolated calposts in Erongo. The problem of overgrazing and loss of range productivity is also particularly acutemany parts of this region.
102
NAMIBLI
Game farming does, therefore, appear to offer significant potential as at least a partial substitutefor livestock in this area- But is this a realistic proposition? There are, unfortunately, a number ofobstacles to be overcome. Firstly, the private costs borne by livestock farmers in this region are low.Provided owners pay only a proportion of the total costs of livestock production, it is a profitableexercise from their perspective. This naturally reduces the incentive for any individual farmer oncommunal land to abandon livestock farming. Such farmers have also invested in acquiring expertise inlivestock farming, only some of which is transferable to game farming. This adds to the risk ofundertaking a new venture-a variety of investments have to be made with far from certain returns. It isreasonable to suppose that farmers with limited savings and facing catastrophic consequences from anunsuccessful venture will be risk averse.
A further issue, which requires serious consideration before encouraging policies to facilitate aswitch to game farming, is whether problems of overstocking and overgrazing would be prevented bysuch a switch. Here too, caution is required. The causes of current overstocking include the following:
* Farmers are not well connected to the commercial auction system-transport is limited andanimals brought to auction virtually have to be sold-imposing a weak bargaining position onthese farmers. As a result of poor offer prices, a culture of not selling to white farmers to avoidexploitation has arisen.
* Farmers may not have a bank or post office account, which means that cash from stock sold indry periods is not easily kept for restocking when grazing improves. Even those with savingsaccounts often have problems of access to them in an area in which transport and infrastructureis poor.
Land is not owned nor long-term usage rights guaranteed, which reduces the incentive to makelong-term investments in that land. Consumption of environmental capital is thereforeencouraged.
* Livestock owners sometimes live in towns, leaving herd management to farm workers who lackthe training or incentives to manage resources optimally.
* All complementary resources (water pumping, veterinary services, and so on) are heavilysubsidized by the government. This tends to lead to overutilization of these resources; onemanifestation of overutilization is overstocking.
The above suggests that many of the pressures that have led to the overstocking of livestock inthe Erongo region would also be present if farmers switched to game production. Consequently, farmersare also likely to overstock and overgraze any ranched wildlife.
Omusati, Oshana, Oshikoto, and Okavango Regions
The first three of these regions constitute the major part of the region formally known asOwambo, in which more than half of the country's entire population lives. Wildlife populations havebeen reduced to negligible proportions, existing only in isolated areas in which limited or saline waterprevents extensive human settlement. One such area lies north of the Etosha pan. If the legislation werein place to confer usage rights over wildlife to local communities, trophy hunting and photo-safaris inthis area could bring significant benefits to local communities. Trophy hunting currently occurs in two
103

THE ECONOMICS OF WILDLIFE
areas of Okavango. To date, however, the gains of local communities have been limited to seasonalemployment and the meat from shot animals. As in other areas, legislative changes would permit localcommunities to gain from developing the wildlife resources in these areas. There is also likely to bescope for game ranching or at least mixed game and cattle ranching in the Mangetti area and currentlyunsettled land in eastern Oshikoto and southern Okavango.
Wildlife Utilization in Commercial Areas
As noted in section 4.1.4, the commercial use of game on private farms accounts forapproximately two-thirds of the numbers of animals utilized by this sector; however, as shown in table4.12, only a specialized minority of farmers actually shoot game for commercial purposes. The vastmajority are livestock farmers (see table 4.13) who utilize the wildlife that happens to be on their farm.for their families, friends, and workers.
Table 4.12: Commercial Farmer Game UtilizationGame Use Average/Farmer Proportion of Farmers
Utilizing Game for Use(percent)
Rations (for workers) 17 67Own use 8 77Grants to friends, etc. 3 46Shot for marketing 22 14Night culling 4 4Sport hunting 6 15Trophy hunting 23 17Live capture 5 6Total 88Source: Derived from MWCT 1992 survey data for 671 farmers with average ownership of 1.4 farms (940 in total).
Table 4.13: Game Utilization and Commercial Farm TypesProperty type Proportion owned by game-utilizing farmers
(percent)Private nature reserve 5Game farm 5Guest farm 4Hunting farm 14Livestock/crop farm 95
Source: Derived from MWCT 1992 survey data 671 farmers surveyed with average ownership of 1.4 farns (940 in total).Note: Multiple farm ownership means that the table percentages sum to more than 100 percent.
To understand why relatively few of Namibia's commercial farmers specialize in wildlife, it ishelpful to look at a particular case history: the Wisenfels farm.
Mr. Lombard farms some 15,000 hectares approximately 120 kilometers southwest of Windho(in an area in which annual rainfall is usually between 120-180 millimeters. This part of Namibia hasbeen used for karakul sheep (pelt) farming for much of the century. In the 1960s, 80 percent of the farrrwas utilized for karakul sheep. In the early 1980s, the price of karakul pelts fell sharply and Lombard
104

NAMIBIA
moved to cattle and a limited amount of mutton sheep farming. Guest facilities have recently beenupgraded to cater to the growing number of tourists who pass by the farm on route to the coast.
He has found some conflict between livestock and game farming resulting from the fencing usedfor rotational grazing. Some twenty years ago, there were roughly 300 springboks on the farm. Over theyears, as the number of grazing camps was increased (to 75 at present) the numbers of springboksdeclined. Currently there are no more than twenty. Lombard attributes this primarily to the greatersuccess rates of jackals and cheetahs when their prey are fenced in and unable to escape.
Approximately 300 Hartmann's zebras live in the mountains bordering this farm. These are seenas problem animals by local farmers as they move onto the farms in the dry season and consume valuablegrazing. Perhaps surprisingly, they are not seen as a readily utilizable resource: hunting in mountainousterrain is too specialized for local farmers-animals are difficult to locate and vehicles are easilydamaged-and the meat is not eaten by farmers or served to tourists. According to Lombard, the keyeconomic factor is the value of the skins, which have fallen from R300 to less than R75 in the past fiveyears.
Some years ago, night culling was regularly carried out in this area using teams with their ownrefrigerated truck, and so on; however, the depletion of game in the area has stopped this fromhappening. Currently, game is utilized indirectly. Tourists who stay on the guest farm like to eat gameand to see live game on drives or walks.
On this farrn, as on many others, wildlife serves to complement the livestock operation, tapping anew source of income and helping to spread risk. There are, however, limited incentives to switch tomore specialized game utilization such as ranching or trophy hunting. These include the development ofmost livestock farms over a number of years to provide rotational grazing and water supply via a largenumber of camps. Game ranching requires the removal of much of this infrastructure, which has thebenefit of reducing operating costs (fence repairs, and so on) but, once a transition is made, the costs ofreturning to cattle farming would be prohibitive.
Aside from the risk, there is a widespread belief among farmers that game farming and ranchingfor meat is less profitable than livestock farming. The price of venison has been depressed oninternational markets. Certainly, the purchase price per kilogram for game in Namibia is below that ofcattle or small stock. This suggests that a major, if not key, determinant of commercial game meatproduction in Namibia is the strength of the market for Namibian game exports and the ability ofNamibian producers to reach that market. If a sufficiently large marketing niche in the European venisonmarket can be developed, an increase in local game meat purchase prices will result.
Trophy hunting offers a significantly higher revenue per animal than either livestock or gamefarming. The Namibian Professional Hunting Association has recommended prices for trophy hunting onprivate land of R580 per springbok, for example. In addition, a hunter could expect to pay approximatelyR1,000 per day for accommodations. Despite offtake rates that can be a tenth or less of those used forgame cropping, trophy hunting is generally regarded as the most profitable use of wildlife on Namibia'scommercial farms.
The number of farms offering trophy hunting has been increasing steadily. Child (1990) reports96 in 1977 and 289 by the early 1980s. Survey data suggests that this figure may have risen to 850
105

THE ECONOMICS OF WILDLIFE
private farms in 1992. Although future expansion of this sector is likely, it is limited by the expense o:advertising and marketing abroad and the absence of big game on most farms.
4.2.3 Policy IssuesEconomic policy, by default or by intention, affects wildlife utilization. This section discusses
the impacts of livestock subsidies, international trade agreements involving veterinary restrictions, an(allocation of tourist and hunting concessions.
Livestock Subsidies
Moll (1991) identifies three major sources of subsidy to the commercial farming sector:concessionary finance, direct support (for example, drought relief), and veterinary assistance. These 'estimated at R49 million, R5 million, and R5 million respectively for 1990-R59 million (US$19million) in total. Moreover, tax concessions permitting "standard values" rather than market prices forlivestock valuation, tax rate averaging over five years and sales tax exemption were calculated to beworth R47 million (US$15 million).
The question that we face here is the extent to which these subsidies and tax concessions arelivestock specific. If this is the case, their removal or reduction would favor wildlife farming. Althougdetailed treatment of Namibia's tax regime is beyond the scope of this paper, it is possible to concludethat the bulk of this state support is directed toward commercial farmers per se and is potentiallyavailable to game farmers. The criterion for drought relief, for example, has been when herd sizes(livestock or wildlife) fall below 60 percent of their normal levels. The VCF can also be said to benecessary for game as well as livestock exports to the European Community market.
In contrast, subsidies in the communal areas are inherently livestock-specific, as the residentsthese areas are precluded from owning game. Price support for stock sales in drought-affected commuareas could only, therefore, apply to livestock. Even with legislative changes to confer wildlife utilizatrights on those living in communal areas, veterinary services are likely to continue to be directedprimarily toward livestock populations. Thus, it makes sense to consider the effect of introducing userpayments for veterinary services on livestock. Likewise, the provision of boreholes and pumps foranimal use, as many of these water points are not necessary for more wide-ranging wildlife. To illustrathe potential effect of the elimination of this subsidy, we consider charging the full cost of water supplfor approximately one-eighth of the boreholes in the Caprivi region-a broad estimate of those directetoward livestock use.
Introducing veterinary and water charges (the former being the main one in this communal arewould effectively transfer the costs currently borne by the state to the farmers concerned. Thus, netfinancial and economic revenues would be equal. Net financial revenue now falls to the same level as leconomic revenue, that is, RO.28 per hectare. Livestock production would, therefore, be significantly liattractive to farmers than it now is. This is illustrated in table 4.14. In this scenario, unlike the base caslivestock production is less remunerative for local communities than potential wildlife-based economi(activity.
106
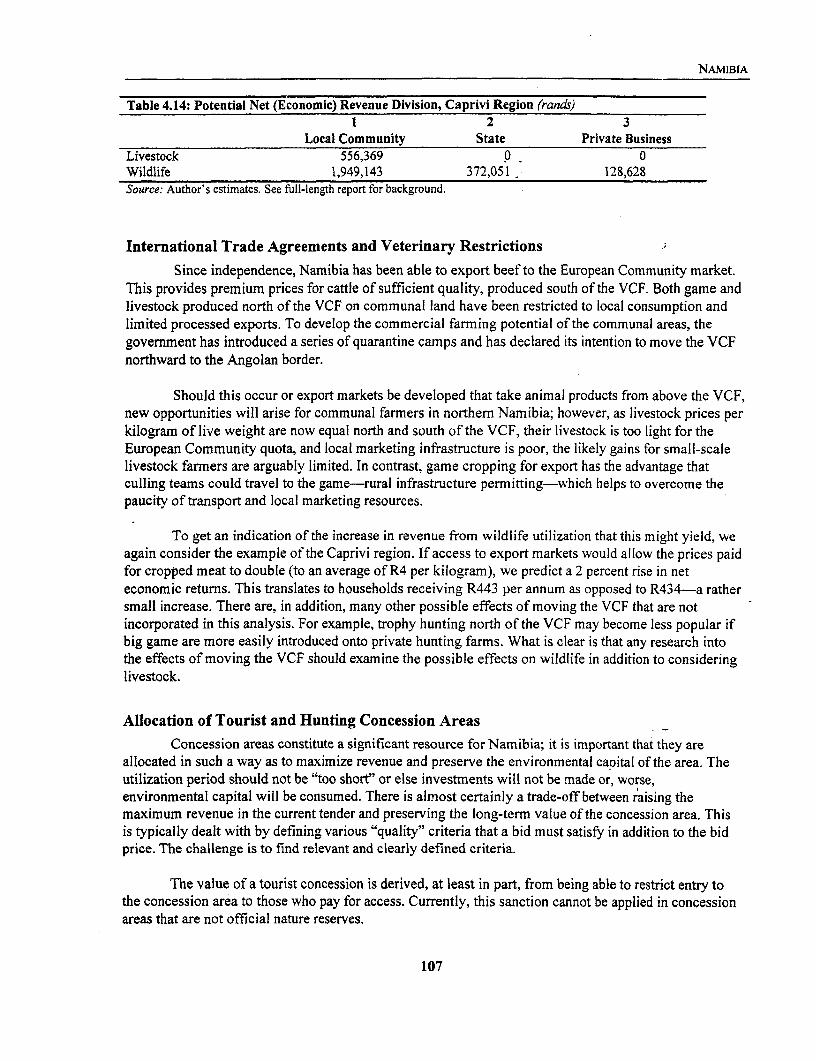
NAMIBIA
Table 4.14: Potential Net (Economic) Revenue Division, Caprivi Region (rands)1 2 3
Local Community State Private BusinessLivestock 556,369 0 0Wildlife 1,949,143 372,051 128,628Source: Author's estimates. See full-length report for background.
International Trade Agreements and Veterinary Restrictions
Since independence, Namibia has been able to export beef to the European Community market.This provides premium prices for cattle of sufficient quality, produced south of the VCF. Both game andlivestock produced north of the VCF on communal land have been restricted to local consumption andlimited processed exports. To develop the commercial farming potential of the communal areas, thegovernment has introduced a series of quarantine camps and has declared its intention to move the VCFnorthward to the Angolan border.
Should this occur or export markets be developed that take animal products from above the VCF,new opportunities will arise for communal farmers in northern Namibia; however, as livestock prices perkilogram of live weight are now equal north and south of the VCF, their livestock is too light for theEuropean Community quota, and local marketing infrastructure is poor, the likely gains for small-scalelivestock farmers are arguably limited. In contrast, game cropping for export has the advantage thatculling teams could travel to the game-rural infrastructure permitting-which helps to overcome thepaucity of transport and local marketing resources.
To get an indication of the increase in revenue from wildlife utilization that this might yield, weagain consider the example of the Caprivi region. If access to export markets would allow the prices paidfor cropped meat to double (to an average of R4 per kilogram), we predict a 2 percent rise in neteconomic returns. This translates to households receiving R443 per annum as opposed to R434-a rathersmall increase. There are, in addition, many other possible effects of moving the VCF that are notincorporated in this analysis. For example, trophy hunting north of the VCF may become less popular ifbig game are more easily introduced onto private hunting farms. What is clear is that any research intothe effects of moving the VCF should examine the possible effects on wildlife in addition to consideringlivestock.
Allocation of Tourist and Hunting Concession AreasConcession areas constitute a significant resource for Namibia; it is important that they are
allocated in such a way as to maximize revenue and preserve the environmental capital of the area. Theutilization period should not be "too short" or else investments will not be made or, worse,environmental capital will be consumed. There is almost certainly a trade-off between raising themaximum revenue in the current tender and preserving the long-term value of the concession area. Thisis typically dealt with by defining various "quality" criteria that a bid must satisfy in addition to the bidprice. The challenge is to find relevant and clearly defined criteria.
The value of a tourist concession is derived, at least in part, from being able to restrict entry tothe concession area to those who pay for access. Currently, this sanction cannot be applied in concessionareas that are not official nature reserves.
107

THE ECONOMICS OF WILDLIFE
4.3 Relative Environmental Impacts of WildlifeThe key aspects of wildlife representing important adaptations or assets in an arid and semiar
country relate to their behavior, that is, feeding, physiological attributes, and their interaction with theenvironment.
4.3.1 Behavior of WildlifeThe behavior of wildlife can be associated with their feeding practices, localized movements,
and migration. These will reflect the adaptability of wildlife to the environmental constraints. Thefeeding practices of wildlife are diverse due to the different feeding preferences of species. Herbivorecan be classified into three main groups according to their way of feeding, that is, as grazers, browser(feeding on both shrubs and trees), or mixed or intermediate feeders. The feeding groups of wildlife hadvantageous potential for integrated management with many species and domestic livestock. Brows(such as kudus will complement grazing cattle and sheep. Thus, where grazers predominate, browsersmay actually help to maintain an open canopy (German Office of Cooperation 1991).
Gemsboks, springboks, and red hartebeests are not water dependent (Bothma, unknown), andappropriate for arid and semiarid zones. Kudus are a water-dependent species, as a result, this speciesinhabits bushveld areas. Wildlife living in the arid regions of Namibia have the capacity to utilizecondensed fog, dew, and water vapor. Gemsboks and ostriches are known to restrict their feeding to tearly hours of the morning, when the humidity is at its maximum.
4.3.2 Physiological Attributes of WildlifePopulations of wildlife respond to natural conditions. The reproduction of females is partly
controlled by the quality of vegetation, which can retard puberty, or the start and finish of the matingseason; however, once game has conceived, it has a remarkable resistance to detrimental effects. Thisnecessary as most game species need to survive throughout the winter, when there is limited and pooivegetation.
The breeding period of animals varies for different species. The blue wildebeest tends to breea herd during a short synchronized period. Since the animal is not generally social, this method oflimiting the calving period for all the females minimizes the predation of individuals throughout theBurchell's zebras are social animals, whose breeding pattern is individually spaced through the yearwhen other members of the herd protect the calves (Louw and Seely 1982).
A comparison study of impalas and Dorper sheep on arid, sweet bushveld by Eloff (1973)showed that between birth and maturity the body mass of impalas compared favorably with Dorpersheep. This was unexpected as the sheep were bred selectively for meat production, whereas the implis an "unimproved" species that evolved through natural selection for survival. The results of the stucshowed that the impala justified its existence in the bushveld from an economic perspective to a fullextent, particularly as the animal does not compete for vegetation.
Indigenous wildlife in Namibia, such as gemsboks, can maintain "normal" body temperature:within the range of 34-42 degrees Celsius (Louw & Seely 1982); however, the thermoneutral zone orNamibian dairy cows of north European origin is 0-16 degrees Celsius. These cows can suffer from ]
108

NAMIBIA
stress when the temperature humidity index is at its highest during November to March in Namibia (DuPreez 1992). The result of heat stress can critically interfere with general health, udder condition,production, and reproduction.
The shape of extremities in species from arid and semiarid countries facilitates heat loss. Thisincludes ears with large and flat conformation and large dewlaps (loose skin hanging from the animal'schest) (Louw & Seely 1982). The thickness of the pelage is lowef for animals that frequent hot and drysavannas. Indigenous species of animals in hot climates try to minimize water loss with the storage ofheat, reabsorption of water from fecal material, concentrated urine, and a low metabolic rate.
4.3.3 Interaction with the EnvironmentA combination of events led to the development of wildlife management in Namibia. An
outbreak of foot-and-mouth disease restricted the movement of cattle on farms between 1961 and 1964,which led to the degradation of land. Over the following years, farmers were encouraged to reduce theirstock numbers, which was followed by a period of high rainfall with low numbers of stock. The result ofa reduction in pressure on the carrying capacity with good vegetation growth increased populations ofwildlife dramatically.
Previous management had caused overgrazing and encouraged bush development, which was theprincipal diet of kudus. This led to a population explosion of kudus culminating in large-scale mortalityand an outbreak of foot-and-mouth disease. These events set in motion the development of game farmingas people responded to the interaction of wildlife with the environment.
Bush encroachment is still a major problem in Namibia with approximately 10 million hectares(12 percent of the total) of land encroached on by bush (Marsh 1992). There is definite potential for thebrowser, particularly kudus, to reverse the trend and encourage the development of grassland for thegrazer. Grazers may be cattle, goats, or sheep or, alternatively, wild grazers such as red hartebeests. Thiscould be encouraging since the limitation on red hartebeests shot in Namibia has led to the expansion oftheir range in commercial lands and an increase in population from 12,000 in 1972 to approximately18,000 in 1982, when 3,500 animals were utilized (Joubert & Morsbach, undated). This shows thepotential for managing wild resources; however, it is important to note that a study by Stuart-Hill andTainton (1988) showed that if browsers are included in a system, the stocking rate of grazers may have tobe reduced because of the apparent negative influence of browsing on the growth rate of grass. Equally,excessive grazing was shown to encourage bush development. This leads to the theory that anappropriate stocking of both browsers and grazers would deliver the desired effect of stability; however,the populations would have to be monitored constantly, to take into consideration natural changes indensities of species and the fluctuating influence of the climate.
Utilization of riverine vegetation on the Kuiseb within the Namib Desert showed oryx had aseasonal pattern to their grazing, whereas the goats grazing in the area had no seasonal pattern; however,the goats showed a decrease in utilization of land at their limit with peak utilization of grazing near theirwater supply (Huntley 1985). This shows the dependency of domestic stock to be herded to sources ofnutrition, whereas the gemsbok shows greater foraging skills and efficient utilization of an area.
The impact of people on the natural interaction of wildlife has often been negative. During theperiod from 1977 to 1984, the total number of springboks, gemsboks, zebras, and ostriches in theNamib-Naukluft Park dropped from 12,000 to 2,000 as a result of high mortalities. This evolved due to a
109

THE ECONOMICS OF WILDLIFE
combination of poor rainfall, particularly between 1981-82, and a 500-kilometer fence on the east side olthe park preventing the movement of wild animals to and from the desert (Berry 1992). Similarly, therehave been outbreaks of anthrax due to environmental stress and cases of starvation in springboks atEtosha Park. The overstocking of Etosha due to the enclosed nature of the area is leading to overgrazingand degradation (Bester pers. com. 1993).
Wildlife in Namibia is capable of responding to fluctuating food reserves, as rainfall plays amajor role on plant growth. The adaptive nature of wildlife is essential in a country with extremevariability at a spacial and temporal level.
4.4 Summary and ConclusionsIn Namibia, where rural communities have been able to establish a stake in the utilization of
their area's wildlife, the community, the government, and wildlife have benefited. The CommunityGame Guard scheme illustrates the significant gains that can be made from a combination of grass-rootsparticipation and modest economic returns to the communities concerned. Nonetheless, much of thediscussion in this paper has been in terms of potential benefits from wildlife utilization. Existinglegislation presents an obstacle to communities that aspire to realize these gains in communal areas.Locally cropped game meat cannot be sold and communities have no legal basis for claiming revenuefrom those who utilize the wildlife in their locality. Enabling legislation is, therefore, necessary forcommunities to achieve the potential benefits from wildlife we have identified.
In some areas, NGOs have acted as a catalyst to bring together local communities and touroperators. Further work is needed to establish an institutional framework in which communityrepresentatives, private businesses, NGOs, and local government can devise development strategies thateffectively utilize wildlife resources. Photo-tourism, in particular, but also game cropping and trophyhunting offer significant development opportunities for local communities; however, donor and NGOsupport is certain to be required to realize these opportunities.
Our research suggests that the net economic return to livestock farming, particularly in the morearid communal regions of Namibia, is almost certainly negative. Other research quoted in this studysuggests the same is true of commercial livestock production. Wildlife utilization (combining tourism,hunting, and cropping) is shown to offer significantly more favorable returns in communal areas,whereas trophy hunting has proved a growing success on private farms. Despite this, widespreadswitching to wildlife use from livestock farming is unlikely.
Economic factors provide some of the explanation for this rigidity. Livestock farming inNamibia continues to be favored by policies that permit a large proportion of the costs to be borne bysociety as a whole. As a result, livestock farming can be a highly remunerative activity for the individualfarmers concerned. It can only help the long-term performance of the Namibian economy if user chargesare introduced and tax advantages limited so that the true cost of owning livestock is borne by the owner
Game is widely utilized by commercial farmers, but only a specialized minority do socommercially. An important reason for this is that commercial game ranching currently suffers from theproblem of low prices per kilogram in comparison to livestock. This could largely be alleviated byimproved and sustained access to venison export markets. Detailed research is needed on this issue.
110

NAMIBiA
Noneconomic factors are also important in understanding the reluctance to utilize wildlife. Mostrural communities in Namibia place a high value on livestock-particularly cattle-for cultural andsocial reasons. Consequently, demonstrating the economic superiority of wildlife utilization should notbe expected to lead to widespread switching from livestock production.
Wildlife is better adapted to Namibia's arid and semiarid environment than livestock; the abilityof game to range widely about water points can reduce overgrazing; however, wildlife does not offer anautomatic solution to the problems of overgrazing. If overgrazing results from the inability andunwillingness of farmers to destock when the carrying capacity of their marginal land is reduced bydrought, game is also likely to be overstocked-and overgrazing will result. Despite these cautionarynotes, wildlife utilization does appear to offer significant economic opportunities to rural communities inNamibia. With enabling legislation and some development of the managerial capacity of localcommunities, wildlife utilization can be a major force for sustainable rural development.
4.5 References
Adams, F. and W. Werner. 1990. The Land Issue in Namibia: an Inquiry. Windhoek: Namibian Institute for Socialand Economic Research, University of Namibia.
Attwell, C. 1991. Survey of Wildlife Utilization in SADCC Countries: Namibia. Harare: U.N. Food and AgricultureOrganization.
Barbier, E. B. 1992. "Community-based Development in Africa." In E. B. Barbier and T. M. Swanson, eds.Economics for the Wilds. London: Earthscan.
Barbier, E. B. and T. M. Swanson, eds. 1992. Economics for the Wilds. London: Earthscan.
Benke, R. H. and I. Scoones. 1992. "Rethinking Range Ecology: Implications for Rangeland Management inAfrica." Working Paper No. 53. Washington, D.C.: Environment Department, World Bank.
Berry, H. 1992. Namib Desert Biology is Directly Dependent on Episodic Weather Events. No. 22. Institute forMathematics and Science Teaching.
Blakenship, I. S. C. and S. A. Qvortrup. 1973. "Resource Management on a Kenya Ranch." In Proceedings ofSymposium on Wildlife Conservation and Utilisation in Africa. Pretoria: South African WildlifeManagement Association.
Bothma, J., ed. Undated. "Game Range Management." Mimeo. Pretoria: University of Pretoria.
Carter, L. A. 1990. The Wildlife Survey of Skeleton Coast Park, Damaraland and Kaokoland, North West Namibia.Unpublished report. Windhoek: Ministry of Wildlife, Conservation, and Tourism, Namibia.
Child, B. 1990. "Assessment of Wildlife Utilisation as a Land Use Option in the Semiarid Rangeland of SouthemAfrica." In A. Kiss, ed. Living with Wildlife. Technical Paper Number 130. Washington D.C.: World Bank.
Coetee. 1980. "Evaluation of Drought-Feeding Practices in Southem Africa." Southern Africa RegionalCommission for the Conservation and Utilisation of the Soil.
111

THE ECONOMICS OF WILDLIFE
Cumming, D. H. M. 1990. Communal Land Development and Wildlife Utilisation: Potential and Options inNorthern Namibia. Paper prepared for Namibia/Zimbabwe Programme and Policy Experience Conferencein conjunction with the Southern African Foundation for Economic Research and World Wide Fund forNature, Harare, Zimnbabwe.
Du Plessis, J. 1991. The Role of Wildlife in the Economy ofNamibia. Unpublished masters thesis translated fromAfrikaans. Stellenbosch: University of Stellenbosch.
Du Preez, J. H. 1992. "Heat Stress in Dairy Cattle and Other Livestock Under Southern African Conditions."Mimeo. Pretoria: Department of Agricultural Development, South Africa.
Eloff, H. P. 1973. "A Comparison Between the Growth of the Impala and that of Dorper Sheep in Arid, SweetBushveld." In Proceedings of Symposium on Wildlife Conservation and Utilisation in Africa. Pretoria:Southern African Wildlife Management Association.
Feasibility study for the trans-Caprivi highway 1992. Windhoek: Ministry of Works, Transport, andCommunications, Namibia.
Geiss, W. 1971. "'n Voorlopige plantegroeikaart van Suid-wes Afrika." Dinteria 4.
German Office of Cooperation. 1991. Sustainable Livestock Production in the Less Developed Areas ofNamibia.Project No. 89.2015.9-03.107. Berlin, Germany.
Gibson, G., T. Larson, and C. McGurk. 1981. The Kavango Peoples. Wiesbaden: Franz Steiner Verlag.
Huntley, B. J., ed. 1985. South African Scientific Report. No. 106. Pretoria.
Joubert, E. 1974. "Mammals Show How to Survive in the Desert." In SWA Yearbook. Windhoek.
Joubert, E. 1971. "Observations on the Habitat Preferences and Population Dynamics of the Black-faced ImpalaAepfeeros Petersi Bocage, 1875, in South West Africa." Madoqua 1 (3). Windhoek: Department ofAgriculture and Nature Conservation, Government of Namibia.
Joubert, E., P. Brand, and G. Visagie. 1983. "An Appraisal of the Utilisation of Game on Private Land in SouthWest Africa." Madoqua 13 (3). Windhoek: Department of Agriculture and Nature Conservation,Government of Namibia.
Joubert, E. and D. Morsbach. Undated. "The 1982 Distribution and Status of Some Mammals in South WestAfrica." Mimeo.
Joubert, E. and P. K. N. Mostert. 1975. "Distribution Patterns and Status of Some Mammals in South West Africa.'Madoqua 9 (1). Windhoek: Department of Agriculture and Nature Conservation, Government of Namibia
Kinahan, J. 1991. Pastoral Nomads of the Central Namib Desert. Windhoek: New Namibia Books.
Kiss, A., ed. 1990. Living with Wildlife. Technical Paper Number 130. Washington D.C.: World Bank.
Lau, B. 1987. Namibia in Jonker Afrikaner's Time. Windhoek: Windhoek Archives.
Liebenberg, L. 1990. The Art of Tracking: The Origin of Science. Claremont, South Africa: D. Philip.
Loutit, B. and I. Douglas Hamnilton. 1992. Elephant Census in the Kunene Region of Namibia. Unpublished report.Windhoek.
112

NAMIBIA
Louw, G. N. and M. Seely. 1982. Ecology of Desert Organisms. New York: Longman.
Lungu, F. 1990. "Luangwa Integrated Rural Development Project (LIRDP) and Administrative Design for GameManagement Areas (ADMADE)." In A. Kiss, ed. Living with Wildlife. Technical Paper Number 130.Washington D.C.: World Bank.
Marsh, A. 1992. Namibia: Environmental Degradation and the Future. Windhoek: Swedish InternationalDevelopment Authority.
Moll P. 1991. Subsidization, Taxation and Viability of the Commercial Agricultural Sector. Background paper forthe National Conference on Land Reforn and the Land Question, June 1991. Windhoek: NamibianEconomic Policy Research Unit, Namibia.
Murindagomo, F. 1990. "CAMPFIRE Program (Dande Communal Lands): Zimbabwe." In A. Kiss, ed. Living withWildlife. Technical Paper Number 130. Washington D.C.: World Bank.
Murphree, M. W. 1990. "Decentralising the Proprietorship of Wildlife Resources in Zimbabwe's CommunalLands." Mimeo. Harare: Centre for Applied Social Sciences, University of Zimbabwe.
Naeraa, T., S. Devereux, B. Frayne, and P. Harnett. 1993. Coping with Drought in Namibia: Informal SocialSecurity Systems in Caprivi and Erongo, 1992. Draft report. Windhoek: Narnibian Institute for Social andEconomic Research, University of Namibia.
Namibia, 1986. Preliminary Reconnaisance Report on the Irrigation Possibilities along the Kavango River. ReportNo. 2500/2/29/PZ. Windhoek: Department of Water Affairs.
1991 a. Annual Report. Windhoek: Ministry of Agriculture, Water, and Rural Development, Directorate ofVeterinary Services.
1991 b. Economic Analysis of Land Reform Options. Background paper for the National Conference onLand Reform and the Land Question, June 1991. Windhoek: Namibian Economic Policy Research Unit.
1992a. Namibia 's Green Plan. Windhoek: Ministry of Wildlife, Conservation and Tourism.
1 992b. Visitor Survey 1992. Windhoek: Ministry of Wildlife, Conservation and Tourism.
1 992c. Statistical Abstract. Windhoek: National Planning Commission.
Owen-Smith, G. and M. Jacobsohn. 1988. The Eastern Caprivi: A Situation Report. Unpublished report. Windhoek.
1990. The Role of Non-Government Organisations in Nature Conservation in Namibia and Key Issues to beAddressed in Future Conservation Policy. Paper delivered to the Nature Conservation Workshop,Windhoek, Namibia, November 1990,.
1991. Pastoralism in Arid and Semiarid North-West Namibia Paper presented to the Nordic Man andBiosphere Meeting, Windhoek, Namibia, 1991.
Seely, M. 1991. Drought and Desertification. Windhoek: Gamsberg Macmillan.
Seely, M. and A. Marsh. 1992. Oshanas: Sustaining People, Environment and Development in Central Owambo,Namibia. Windhoek: DRFN and Swedish International Development Authority.
113

THE ECONOMICS OF WILDLIFE
Stuart-Hill G. C. and N. M. Tainton. 1988. "Browse and Herbiage Production in the Eastern Cape Thorn Veld irResponse to Tree Size and Defoliation Frequency." Journal of the Grassland Society of Southern Africe
(1).
Vedder, H. 193 8. South West Africa in Early Times. London: Oxford University Press.
Williams. F. 1991. Precolonial Communities of Southwestern Africa Windhoek: National Archives of Namibia.
Yaron, G., T. Forbes Irving, and S. Jansson. 1993. Solar Powerfor Rural Namibia, Windhoek: Nainibian Institufor Social and Economic Research.
Yaron, G., G. Janssen, U. Maamberua, and D. Hubbard, 1992. Rural Development in the Okavango Region ofNamibia. Windhoek: Gamsberg Macmillan in conjunction with Namibian Institute for Social andEconomic Research and Oxfam Canada.
114

THE ECONOMICS OF WILDLIFE
Abstract
Changes in the legislation and institutions in Zimbabwe have transformed the role of wildlifefrom a state-owned treasure to be preserved and isolated in national parks into an active resource,controlled and utilized by landholders. There has been a significant increase in wildlife on commercialfarmlands, as safari hunting, live animal sales, and tourism are incorporated into farming systems. Incommunal farming areas, there has been a marked increase in the awareness of the contribution ofwildlife, but the institutions developed so far still do not effectively link costs and benefits.
Wildlife enterprises in the large-scale commercial ranch sector are often more financiallyprofitable than cattle enterprises. A less regulated economy and a liberalized exchange rate in particularwould contribute to its profitability. This, however, is also true for the competing cattle enterprises,which have been affected by politically depressed beef prices since 1985. Complete deregulation maymake cattle enterprises more competitive.
Wildlife may be the most economically efficient option from a social welfare perspective inremote, arid communal areas, but it is currently significantly less attractive than subsistence farming forthe farmers living there. The relatively closed marketing system, control over the resources at districtrather than local levels, and macroeconomic distortions, particularly an overvalued exchange rate, havecontributed to the wide divergence between national and individual interests. Safari hunting accounts forthe bulk of revenue earned in communal areas. A ban on imports of hunting trophies, particularly fromelephants, would have a negative impact on community wildlife schemes.
Reductions in macroeconomic distortions and a more competitive marketing system have alreadyresulted in marked increases in district returns from wildlife. There is also evidence of increasingempowerment and effectiveness of local communities, ensuring their more active participation in thebenefits from and control over their resources; however, poaching and new settlement threaten tooverwhelm those areas that still have viable wildlife populations. Until the local population receives theirfull share of the benefits, such that both their opportunity and direct costs are covered, they will continueto encourage elimination of wildlife through poaching and habitat destruction.
An annex to this paper explores the environmental impacts of wildlife relative to cattle. There issome evidence that the former are less severe, but the strongest evidence shows that environmentalimpacts are related to the stocking rate rather than the type of herbivore involved. Wildlife has anadvantage to the extent that financially viable enterprises can be maintained with lower stocking ratesthan alternative land uses. In addition, wildlife enterprises are more directly concerned with maintainingan environment that can continue to attract visitors.

Chapter 5:
Economic Policy, Wildlife, and Lancd Use in Zimbabwe
By Kay Muir and Jan Bojo with Robert Cunliffe on Environmental Impactst
Zimbabwe has chartered its own unique course in terrns of wildlife management and transfonnedthe role of wildlife from a state-owned treasure to be preserved into an active resource, controlled andused by both commercial farmers and smallholders in communal lands. This chapter starts with anoverview of wildlife policy and utilization in Zimbabwe, in both private and communal areas. The coreof the chapter is concemed with a comparative financial and economic analysis of livestock, wildlife,and crop production, as they are partially competitive forms of land use. Finally, the chapter discusseshow the policy environment affects the future of wildlife enterprises. An appendix discusses theenvironmental impacts of livestock and wildlife.
5.1 Wildlife Policy and Utilization in ZimbabweThe wildlife utilization industry in Zimbabwe's private sector developed rapidly once legislation
had been changed to allow landowners to benefit from wildlife conservation through utilization. Thisconcept has resulted in significant increases in wildlife in commercial ranching areas and has effectivelyhalted the systematic elimination of wild animals in these areas.
Wildlife service and commodity prices have been undermnined by macroeconomic distortionsand, particularly in communal areas, the relatively closed marketing system. More competitive marketinghas changed this significantly in the last two years. Better access to foreign currency and effectivecurrency devaluation have moved market prices closer to opportunity costs; however, market prices cannever reflect the true social value of wildlife resources when environmental impacts, genetic resources,and existence/bequest values are not incorporated. When the extemalities are significant, attempts couldbe made to internalize them through a system of taxes/subsidies.
* The authors would like to thank Doris Jansen for the benefit-cost analysis; T. Chamboko, F. Murindagomo, and 1. Bond for data onCAMPFIRE and communal agriculture; John Dixon and Kent Redford for commenting on a previous draft; and Liisa Hietala for wordprocessing. The authors, of course, retain responsibility for the expressed opinions and possible errors.
t Kay Muir, the main author, is a senior lecturer at the University of Zimbabwe, Department of Agricultural Economics and Extension, inHarare, Zimbabwe. Jan Bojo is senior environmental economist in the Environmentally Sustainable Development Division, TechnicalDepartment, Africa Region of the World Bank. Robert Cunliffe is an ecologist at World Wildlife Fund-Zimbabwe.
117
THE ECONOMICS OF WILDLIFE
The most lucrative outputs from the wildlife industry in Zimbabwe are photographic tourism 2
safari hunting. Hunting is important for developing the wildlife option in areas with lower concentrati(of wildlife and poor infrastructure. Some specialist wildlife production units are also offering lucrativeoptions, for example, crocodile and ostrich farming. Meat, hides, and horns are outputs of minorsignificance, and ivory sales are negligible because of CITES (Convention on International Trade inEndangered Species of Flora and Fauna) regulations.
Zimbabwe is well endowed with large mammals, including elephants. The central high veld iintensively farmed with limited wilderness and wildlife but with some opportunities for recreationaltourism. The periphery, particularly along the northern, southern, and western borders, has largeconcentrations of game. The large-scale ranching areas are not allowed to run buffalo with cattle. Buflwere totally eradicated in these areas to comply with European Union veterinary regulations. The lackbuffalo significantly reduces returns to wildlife ranching, but there is a movement to reintroduce buffain some ranching areas. Buffalo were not eradicated in those communal areas in which tsetse fliesprecluded cattle and the communal areas that still have buffalo and elephants play an important role irthe hunting industry.
Zimbabwe follows a policy of sustainable utilization and views all its mammals as renewablenatural resources to be managed. Protection of species and species diversity takes precedence overprotection of individuals and groups. The estimated elephant population in 1960 was 32,700, and by1988 it was up to 52,000, despite the fact that 44,500 elephants were culled during those twenty-eightyears (Martin, Craig, and Booth 1989). At the end of 1992 it was estimated that there were some 80,0(elephants in Zimbabwe, and there are increasingly serious conflicts as elephant populations exceedcarrying capacity in national parks. Elephants are important in wildlife enterprises, particularly in thepeasant farm sector where they account for some 70 percent of the revenue.
5. 1.1 Development of Wildlife Industry on Privately Owned LandFrom 1960 farmers were given permits to utilize and trade in wildlife. The Department of
National Parks and Wildlife Management (DNPWLM) noted the positive response and how quicklywildlife numbers recovered in certain areas. The Parks and Wildlife Act (14/1975) was implemented i1975. It allocated full custodial rights over wild animals (except for "specially protected" species) toappropriate authorities (landholders) while the animal is on their land. "Specially protected" animals conly be killed in defense of life, and they and their parts and derivatives may not be traded. Restrictedspecies may be utilized on receipt of special permits. Local committees may also declare a species"specially protected" within its own area. In most instances the animals do not benefit from thisprotection, since it is loss of habitat rather than hunting that is the major danger.
No person can hunt, capture, or remove any animal or plant from privately or communallyowned land without the appropriate authority/landholder's permission. Landholders may hunt or markany plant or animal on their land (except those species listed as "specially protected" or "restricted").market a live animal or trophy, however, the landholder must first obtain a specific permit. Under the
* Open country with grass, bushes, or shrubs or thinly forested, characteristic of Southern Africa
118

ZIMBABWE
1975 Act, appropriate authority was immediately granted to all private landholders. In the communalareas where the land is formally owned by the president of the country, authority remained with the state,which became the wildlife custodian on behalf of the peasant farmers on communally owned land.
The introduction of wildlife legislation allowing landholders access to their resource wassuccessful in the large-scale farming areas of Zimbabwe. It resulted in widespread increases in wildlifein all the less arable farming areas and even in the intensive cropping zones where farmers arereintroducing game. In 1960 there were only three game ranches and 350 square kilometers weredesignated for wildlife outside state land. By 1990, 55,000 square kilometers had been partially orcompletely allocated to wildlife enterprises in commercial and communal farming areas with anadditional area of about equal size in the parks and wildlife and forest reserves. A Wildlife ProducersAssociation (WPA) has a membership of over 10 percent of Zimbabwe's large-scale farmers. Althoughmembership has increased in recent years, it has been the movement from passive to active membershipthat has been significant. Safari hunting is the most important component in large wildlife enterprisesand registered safari operators have increased significantly since 1980. In the more predominantlyagricultural zones, wildlife tourism is an increasing and supplementary enterprise with some farmersinvesting in visitor camps, lodges, and recreational facilities.
The large wildlife enterprises are found in the arid areas of Zimbabwe where farmers concentrateon extensive game or mixed game and cattle ranching. The wildlife is not used for meat production; mostof the meat that is generated is sold locally at prices significantly lower than beef prices. Safari hunting isthe dominant income earner. Ranch hunting is often sold as a complement to hunting safaris on statehunting concessions and in communal areas. Hunting requires less infrastructural development and loweranimal densities than are necessary for general tourism. Once the infrastructure has been developed andareas become less remote and provided wildlife density is relatively high, the greater volume feasiblewith photo safaris may make tourism ventures more profitable than hunting.
Gross income from international safari hunting increased from US$2 million in 1984 to US$9.3million in 1990. Jansen (1990) estimated that if the entire hunting quota (2 percent of animal populationsin state hunting and communal areas) was sold to foreign clients, it would earn US$13 million, whichtogether with an estimated US$7 million by commercial ranchers indicates that hunting revenues couldhave been doubled.
Photo safaris and wildlife-related tourism have grown significantly and rely heavily on thecontinued viability and attractiveness of the national parks and state wildlife reserves. During 1972-82there was effectively only one tour operator, but by 1990 there were over fifty registered operators.
The value of live animals for breeding purposes has increased dramatically. The DNPWLMoperated a central allocation system with long waiting lists for animals, and a thriving private tradeemerged in the late 1980s. In 1989 there was a waiting list for approximately 5,250 animals to restockprivate land with wildlife from the DNPWLM. Live animal prices in the private sector rose some 400percent in three years. The development of private trade in live animals has been hampered by veterinaryregulations and by the 1992 drought.
Crocodile ranching has been encouraged since 1960, and producers are required to return aproportion of hatchlings to the wild. Wild numbers have increased significantly and earnings in thecrocodile industry have increased from US$300,000 in 1983 to US$2.6 million in 1989.
119

THE ECONOMICS OF WILDLIFE
The encouragement of ostrich ranching has been successful. Where wild eggs are harvested, aproportion of the chicks are returned to the wild. As with crocodiles, those returned are a slightly greaproportion than has been estimated would normally survive to that stage. Crocodile and ostrich ranchihave successfully increased both domestic and wild populations.
Ivory sales are important only in the state and communal sector where they earned almost US:million between 1981 and 1988 from approximately 31,000 tusks (Martin, Craig, and Booth 1989).Current elephant ivory stocks held by the DNPWLM are valued at over US$ 10 million with a signific;proportion due to be repatriated to peasant communities when sales are made. The CITES ban has me;that little ivory is sold, with most of the sales being made to Zimbabwean carving companies for salethe local tourist market.
5.1.2 Development of Wildlife Industry on Communal LandSince 1980 the DNPWLM has managed the wildlife in these areas on behalf of the communit.
They have leased hunting rights and collected the fees on behalf of the communities but were requirecpass the revenue earned to the national treasury. Treasury was then supposed to reallocate those revento the concerned communities on presentation of proposals for development projects. In practice,Treasury retained a large proportion of the money earned: of the Z$5.8 million* earned by safari huntiin communal areas in 1987-88 only Z$3.3 million was paid out to district councils (Zimbabwe 1988).
The Parks and Wildlife Act of 1975 enabled the minister of Natural Resources and WaterDevelopment to designate district councils in communal lands as appropriate authorities with fullcustodial rights to their wildlife, but this only began to be implemented in 1988 under CAMPFIREt(Communal Areas Management Programme for Indigenous Resources). The limited wildlife revenuegenerated in communal areas, which was returned to district councils, is used for developmentthroughout the district, although only a few communities in the district pay the cost and actually livewith the wildlife that generated these revenues. For the most part, these communities view theeradication of wildlife favorably. They see no contradiction in eliminating the species that causedepredation while maintaining those species that contribute so significantly to their subsistence diets.a result, outside poachers are both encouraged and assisted.
Effective in 1988, legal control over wildlife resources was granted to districts who apply forprovided they meet specified requirements. In 1993 there were twelve communal lands in Zimbabwewith appropriate authority and more than 19,500 square kilometers of communally owned land officiadesignated to include wildlife in the land use system and managed under the CAMPFIRE program.
*
Zimbabwean dollars (ZS) per US$Year Average Rate1990 2.451991 3.431992 5.091993 6.47
Source: IMF. 1994. International Financial Statistics
t Much has been written on CAMPFIRE; see the original documents by Martin (1986), Murphree (1988), Jansen (1990), Child and Peter.
(1991), and Murombedzi (1992).
120

ZIMBABWE
It was anticipated that communities would form natural resource cooperatives or managementtrusts or companies with membership open to all adult males and females in the community. Eachcommunity would draw up their own constitution. The allocation of rights would be affected by thepopulation/resource ratio. Defining the boundaries of a communal resource area in the CAMPFIREprogram would be a process of negotiation between the national, district, and village representatives.Water, forestry, and wildlife would be closely controlled with specified community management andaccess strategies but with arable land being accorded individual responsibility.
In fact, appropriate authority is only granted to the district council, and local communities haveyet to be given the opportunity to form effective resource management units. Most CAMPFIRE projectsare still a long way from achieving the objectives of granting control over resources to localcommunities.
CAMPFIRE has, however, succeeded in generating debate over access to resources and mayeventually fulfill some of its original goals. Some communities currently see CAMPFIRE as a means ofincreasing agricultural potential, whose development could eventually reduce wildlife and undermineCAMPFIRE, thus creating tension between villagers and implementers.
The local communities still have little sense of ownership or control in some districts, andsubsistence hunting is still illegal. One of the major concerns is that district council authorities receive allthe wildlife revenue and then allocate these revenues over a much wider population than that living withwildlife. Both wildlife and tree resources are generally viewed as belonging to all Zimbabweans, butprogress is being made in some districts, which have recognized that for people in these marginal areas"their wildlife is their cattle."
5.1.3 Wildlife and the EconomyIt is extremely difficult to ascertain the value of Zimbabwe's wildlife industry. The consumption
of bush meat has been virtually ignored, although the consumption of rabbits, rodents, insects, and wildflora is widespread throughout the country. The consumption of larger mammals is almost exclusivelyconfined to isolated communities with high wildlife and low human populations. Assuming that there aresome 25,000 households living in such areas, a rough estimate of the value to the nation of largemammal bush meat is some Z$4 million per annum based on the 60 percent contribution to total incomemade by wildlife to household income in Angwa, Zambezi Valley (Murindagomo 1988).
The contribution of the wildlife industry to the formal sector is also difficult to ascertain.Published statistics do not separate tourism or wildlife-based industries as a proportion of GDP.Ministerial statements have indicated that in recent years tourism has earned between Z$300 million andZ$1 billion per annum or between 2 and 5 percent of GDP. The most credible revenue estimate appearsto be around Z$500 million in 1990-91. Safari hunting and wildlife management services add anotherZ$50 million. Crocodiles and ostriches at Z$35 million and other game products (skins,; meat, and ivory)at Z$1 million contribute more than formal sector sheep and goats but still account for less than 0.5percent of agricultural income; however, as with agriculture, the multiplier effects of tourism andwildlife are strong, and they are important contributors to foreign exchange earnings. Tourism operationsqualifying for the export retention scheme claimed Z$165 million in 1990-9 1. It has been crudelyestimated that, during this period, the wildlife sector generated Z$344 million in foreign exchangeearnings (Jansen 1992a); national data on export earnings are not available for this period yet, but this isprobably in the area of 20 percent of total.
121

THE ECONOMICS OF WILDLIFE
The industry has strong backward linkages with the manufacturing sector as well as someforward linkages with the informal sector: the curio and clothing industries. Most tourist industry inpuare locally manufactured. In the large hotel sector, 80 percent of fixed costs are local expenditures,whereas it is close to 100 percent for the safari camps and lodges. For all tourism ventures, 85 percentvariable costs are local, the major linkages being food and beverages. The industry is a high foreigncurrency converter but relies heavily on adequate transport and communications facilities, which areforeign currency-dependent. The forward linkages are mainly in the form of arts and crafts.
Tourism has grown significantly since 1987; bed occupancy is up to 50 percent in 1990 despit4an increase of 86 percent in beds available. Employment grew 20 percent in three years compared wit}nonagricultural employment elsewhere in the economy, which grew 0.5 percent. Nonconsumptivetourism is considerably more labor-intensive than sport hunting; over 50 percent of hotel and lodgeemployees could be drawn from unskilled local populations (Bond 1992).
The role of wildlife in the economy is significantly increased if adjustments are made to reflecthe opportunity cost of the foreign currency eamed by the sector (see table 5.1). For most of the 1980s.various estimates indicated the average overvaluation was 50 percent, climbing to over 70 percent by1990. From mid- 1991, the government started a deliberate policy of devaluation to realign the currencAccording to Jansen and Rukovo (1992), the local currency was overvalued 77 percent in 1990 baseda ratio of tradable to nontradable prices.
Table 5.1: Adjusted Contribution of Wildlife to the Economy, 1990-91a
Sector Total earnings Forex earnings(Z$ million) (Z$ million)
1. Tourism 731.0 531.02. Hunting 81.5 81.13. Wildlife management services and live animals sales 6.2 b
4. Game products (meat, hides/skins, horns) 1.0 b
5. Crocodile production 26.6 26.66. Ostrich production 35.4 35.4Total 881.7 674.1
Source: Jansen 1992aa. Based on Equilibrium Exchange Rate. All of the figures must be considered rough estimates due to severe data limitatiorb. Negligible.
Tourism in Zimbabwe is based on wildlife and wilderness and has significant potential forexpansion. The high numbers of large mammals, particularly elephants, and the relatively sophisticatedinfrastructure give Zimbabwe certain advantages. The current structural adjustment program willencourage investment in export industries with more realistic exchange rates and easier access toimported inputs. The international recession will have less effect on tourism to Zimbabwe, which reliemost on high-income tourism. The negative publicity associated with the drought was a short-termphenomenon, and tourism was recovering by the end of 1993.
122

ZIMBABWE
5.2 Economic Development and WildlifeThis section views wildlife management in the context of the national economy, presents an
economic analysis of wildlife both in large-scale commercial and in small-scale communal areas, andfinally compares the returns to competing land uses.
5.2.1 The National Economy, the Resources, and Land Use SystemsZimbabwe lies within the tropics, but, given altitudes of between 600 and 1,200 meters, most of
the country has a subtropical climate, which is perfect for year-round tourism. The rainy seasoncoincides with northern winters, but even during this season the days are mostly sunny, with the rainoccurring in sporadic thunderstorms and late afternoon showers. Although agriculture accounts for onlysome 10-14 percent of GDP, it has a major impact on growth through its backward and forwardlinkages, its contribution to export earnings, and both formal and informal employment.
There have been some significant advances in the provision of social services-includingdecreases in infant mortality and increases in education and access to physicians since independence;however, these achievements together with high defense expenditures, a large expansion of the publicsector, and parastatal subsidies resulted in significant increases in government expenditures; by 1990Zimbabwe had a long-term external debt of some Z$12 billion. The economy is highly regulated andbiased toward large-scale production, and barriers to entry abound. With significant subsidies to theindustrial sector, a large proportion of GDP spent on government consumption expenditures and rapidpopulation growth have resulted in disappointing economic performance, with GDP per capita declining7 percent since independence.
Zimbabwe is broadly categorized into five natural regions, dominated by rainfall. Region 1 hasthe highest rainfall, but, because of topography, production is dominated by exotic timber plantations,tea, coffee, and horticulture. Region 2 normnally has more than 700 millimeters and is the main crop-growing region in the country. Regions 3, 4, and 5 are increasingly arid and, although cultivated incommunal areas, are predominantly only suited to extensive livestock production. The annual variationsare large, and the reliability of monthly rainfall is much lower than the seasonal total and decreases ingeneral from north to south.
Only 37 percent of the country receives more than the 700 millimeters annual averageconsidered necessary for semi-intensive farming, and in most parts less than a third of this area isactually arable. In the intensive farming systems followed in Zimbabwe, the natural growing season isconfined to the rainy months and both the total rainfall and its distribution during the season are theoverriding limiting factors in agricultural production.
The indigenous vegetation is savanna grassland along the central plateau with wooded savannathroughout most of the rest of the country and some montane forest in the eastern districts toward theborder with Mozambique. In general, the topography, soils, and climate of Zimbabwe are not favorablefor intensive agricultural production. More than 75 percent of the country is subject to conditions thatmake dryland crop production a risky venture.
123

t ! Z A I R E .tANZANLA ( 28° 300 2 Lake Cabora Bassa 320
ANGOLA (o - -\ P!' ' * - - - - > -{ r ZAMBiA SoM 7 ' " ,
, O ,AJe.BK; (i >/f 16 \-g z L ... !_ >,_-\ MOZAMBIQUE 16
NAMIIA BTSW\ZIMBABWEj NINZ M A| SOUI8f i-. 1 (, INIAN llZ A M B I A j @",>--SOUJTH ----- OCEAN
ATLANTIC 'L /.
OCEAN _ 31 , 0 f.Lak,
SOUTH AFRICA 7/ t '' Ka(ibo\
NAMIBIA 2 ( ,
-180 t_\4,.fe }/4 / '1
NORTH
ZIMBABWE
NATURAL REGIONS 201NATURAL REGIONS: '/ L asyin2
I la s j20 i r _________ S 0> ut £g :S VI.G O
. Jllb 3C t 1 M
1 . 1 lV l < MATABALELAND [--< _;t % ' £)~~~~~~~~~~~~~~~~~~~~~~~~~~~~~~~~ .~. - ssna.j~ ATBAELN
1 j iv \ \,X 4, \-'-5- %c---~- RIVERS \ \ \ SOUTH \ \ > X rf tj o ........
6 NATIONAL CAPITAL ^
0 PROVINCE CAPITALS .e /22° PROVINCE BOUNDARIES K. . , _ col d \ u n
_. lkiTrDKIATlAKtAIDl )l1KltEAtt1C,c" - /* Th. ho-ndoritts. colors. dteno.mi-ain

ZIMBABWE
Since independence in 1980, there are no longer de jure racial divisions, but land-size categoriesremain effectively unchanged, with permission to subdivide almost impossible to obtain. Ownership ofthe land in the former Tribal Trust Lands is officially vested in the president but is farmed alongtraditional communal tenure arrangements. This implies good secuiity over homestead and arable land,but effectively open access to the grazing and woodland areas. Land allocation remains a source ofconflict within communal areas, with local government, political parties, and tribal authorities all havingvarying degrees of control. The commercial sector is made up predominantly of large-scale farms (theformer white farming area) and a few smaller-scale freehold farmers (from former African Purchaseareas). The communal sector is that which is communally farmed and includes resettlement schemes inwhich tenure is not freehold but retained by the state.
The government is involved in an active land resettlement program and has declared its intentionto take over 50 percent of the large-scale sector for reallocation to smallholders. Tenure arrangements inthe resettled areas are uncertain, with settlers having permits to weside and cultivate for as long as theyfarm it "correctly"; the lack of tenure may have serious implications for environmental integrity. Theuncertainty of the resettlement program has also created long-term insecurity for large-scale farmers,which could also affect the environment. For most of the population, however, there are highexpectations that old wrongs will be redressed soon by land redistribution. Given the limited capacity forgovernment to implement the program expeditiously, a serious crisis of expectations may result inattempts to settle people on any available land. This could have serious consequences for communalareas with low human population densities and ones that are developing wildlife systems.
Zimbabwe's population is growing at 2-3 percent per annum and, given the extreme poverty ofcommunities in the marginal lands, these population pressures could be translated into demands foraccess to resources in neighboring parks. The overgrazing and cultivation of poor land have led towidespread erosion and depletion of the forest and grass cover, so that the neighboring parks are seen ashaving the resources needed to support an increasing population.
Almost 90 percent of the parks and Wildlife Estate is situated in areas unsuitable for cropping, asis 75 percent of communally owned land. Increasing person/land ratios and growing cultivation ofmarginal land is causing widespread deforestation and erosion.
Political support for wildlife is negligible, and the wildlife sector receives small allocations fromthe central government. This may change with the increased awareness of the potential role of wildlife ingenerating growth through foreign currency generation and the strong backward linkages that exist inZimbabwe for the tourist industry. The wildlife sector, despite the advances made with CAMPFIRE, isstill seen as white dominated and is much resented. Black entrepreneurs need to be given exposure andopportunities to participate in this growth industry.
5.2.2 An Economic Analysis of Wildlife UtilizationThere is a sharp dichotomy in Zimbabwe between the large-scale, privately owned ranching
sector and the more subsistence-oriented and small-scale, communal sector. Both have found their ownway of effectively utilizing wildlife as a viable enterprise. This warrants separate discussions in thefollowing section.
125

THE ECONOMICS OF WILDLIFE
The Large-Scale Commercial Ranching Sector
Child (1988) carried out a detailed time-series analysis of cattle and wildlife on Buffalo Rangethe Southeastern low veld. The analysis showed that the cattle-section gross profits increased during the1960s but fell rapidly from a peak in 1975 to losses in 1984. The falling profits were a result of declininherd productivity with calving rates dropping and live mass gains falling off dramatically, even beforethe major drought. This was primarily a result of veld degradation caused by overstocking.
The wildlife populations on Buffalo Range, however, continued to grow, and the range was lessdegraded in that sector of the farm. In 1973 Taylor carried out transects on the ranch to compareenvironmental conditions, but the results between the cattle and wildlife sections were indeterminate(Taylor in Child 1988). These transects were repeated in 1985; this time environmental conditions in thigame section were significantly better than in the cattle section. Child concluded that, despite the heavyimplicit subsidies for beef, which favored the cattle section in most years, and the overvalued exchangerates, which greatly disadvantaged wildlife, wildlife offered the most lucrative and sustainable option ftBuffalo Range (Child 1988).
Jansen, Bond, and Child (1992) carried out a survey of eighty-nine cattle, wildlife, and combinecattle/wildlife ranches in 1989-90 in the more arid Natural Regions 4 and 5 to determine the relativeprofitability of cattle and wildlife. They estimated returns to investment and the comparative advantageof ranching cattle only, wildlife only, and a combination of cattle and wildlife. The survey year was anaverage rainfall year with no unusual occurrences that would mean unusually high or low profits foreither commodity.
Cattle-only enterprises had an average 1.8 percent financial (private) return oa investment, andthe return to cattle on ranches combining cattle and wildlife was 2.6 percent. The weighted averagereturn of cattle enterprises was Z$2.78 per hectare. Only four of the seventy-seven ranches producingbeef had a greater than 10 percent return on investment. The speculative return on holding land wasexcluded from all analyses. Only three cattle enterprises had returns greater than Z$25/hectare. Thirty-nine percent of the cattle enterprises had a negative adjusted net revenue, and, to continue in operation,most of the ranches were destocking or borrowing. Wildlife-only ranches were the most financiallyviable with average returns on investment of 10.5 percent. Over half of the wildlife enterprises had agreater than 10 percent return on investment and only four had negative adjusted net revenue. Theweighted average return of wildlife enterprises was Z$5.8 per hectare.
An economic (social) analysis of these returns was carried out using estimated opportunity costprices to incorporate the effects of market prices not reflecting true social values with respect to the pricof cattle, the exchange rate, price of land, the interest rate, and the cost of degradation from overstockinJansen, Bond, and Child (1992) vary their assumptions in a number of sensitivity runs, but all theconclusions essentially remain the same. The base-run assumptions assumed a particularly conservativeestimate of overvaluation of the Zimbabwe dollar to avoid favoring the wildlife option.
The analysis showed both cattle and wildlife to be more economically (socially) than financiall'(privately) profitable with the average rate of return on investment for wildlife enterprises at 21.5 perce.and 13.1 percent on cattle. The returns to land, however, were higher for cattle than for wildlife afteradjusting for government-controlled prices and exchange rate distortions, with average economic returnto land for cattle at Z$17 per hectare and for wildlife at Z$14 per hectare.
126

ZIMBABWE
The financial results from Jansen and others' study are consistent with the reported drift intomore wildlife enterprises, in that these, pure or combined, show a higher net absolute return per hectarethan cattle enterprises even when combined with minor wildlife activities. Retums to enterprises aregenerally low per area unit, but it should be emphasized that the average farm in the sample islarge-some 22,000 hectares-and that returns are net of production costs. Furtherrnore, the possibilityof offsetting losses in these enterprises against capital gains elsewhere while maintaining a certainlifestyle, the prospect of speculative returns to land holdings and attachment to sunk investment, as wellas the unfamiliarity with wildlife enterprises all serve to explain the inertia in leaving a financiallyunprofitable business.
It is clear from a comparison across financial and economic results that the profitability iscurrently greatly depressed by economic policy interventions. Both cattle and wildlife enterprises showmuch higher profitability under economic prices. In addition, the profitability of cattle is actuallyimproving more than that for wildlife enterprises in the economic calculations. The main factor is thepolitically determined depression of beef prices since 1985. Prior to this, beef production had beenheavily subsidized both explicitly and implicitly in most years since the 1930s. Liberalization of theinternal and external beef markets may swing the balance back toward cattle.
With respect to employment, wildlife enterprises are less wage-labor intensive and require moreskilled manpower than cattle enterprises, making cattle the preferred option from an employmentperspective. This results from the current heavy concentration of the wildlife enterprises on safarihunting. Tourism ventures have much greater employment capacity and are becoming an increasinglyimportant component of the wildlife industry. On the other hand, net foreign currency earnings aregreater for wildlife than for cattle.
The Communally Owned Small-Scale Farm SectorBetween January 1989 and April 1991, twelve districts received "appropriate authority" over
their wildlife, although in many of these districts not all wards have a wildlife resource. All thesedistricts are engaged in obtaining revenue from wildlife utilization (by entering into contracts with safari-hunting companies and tour operators), attempting to manage their wildlife (by protecting it and settingquotas for its exploitation), and finally distributing benefits to the participating wards and "producercommunities." Administratively, communal areas are divided into district councils, which have legalstatus and are serviced by the Ministry of Local Government and Housing. These district councils arethen further subdivided into wards with Ward Development Committees (WADCOs), comprising anumber of villages with Village Development Committees (VIDCOs). The WADCOs and VIDCOs arerecent political institutions and are more effective in some areas than others.
By 1992 CAMPFIRE had grown to encompass both a large area and a large population, amongwhom the benefits of the wildlife are to be shared. Safari hunting dominates the revenue earned. Mostdistricts now put their hunting quotas out to competitive tender. The safari operators then market thehunting internationally. International safari hunting accounts for over 85 percent of the revenue in mostCAMPFIRE areas. The bulk of the revenue is derived from elephants. Any ban on imports of elephanttrophies into the major client regions-Europe and the United States-would have a negative impact oncommunity wildlife schemes. Quotas used for culling are normally restricted to those animals that have alimited safari market, for example, impalas; no districts have yet established mechanisms to legalize,allocate, and manage subsistence hunting. The communal areas play an important role in the safari-
127

THE ECONOMICS OF WILDLIFE
hunting industry and complement the plains game hunting sold on most commercial ranches; 52 perceof all elephants and 39 percent of all buffalo trophies came from communal areas in 1990 (Bond 1992
CAMPFIRE Revenue Generation and Distribution
Although CAMPFIRE programs are administered by district councils, there are usually only afew wards that have the wildlife resources to be actively involved in wildlife projects. It would bedesirable to devolve authority to ward or even village levels, but this is not possible because the districcouncil is the lowest level of govemment with legal authority as opposed to advisory powers (Petersor1992). In addition, the migratory nature of the resource and the large areas required for safari huntingwould make cooperation between neighboring producer units important.
The total gross income from wildlife accruing to the district councils from CAMPFIRE was Zmillion in 1991. Total wealth generated but accruing more widely (for example, including safarioperators and airlines) is considerably greater. The DNPWLM has issued "Campfire Guidelines," whirecommend that no more than 15 percent of revenue be allocated to the district council in the form of,levy and no more than 35 percent be spent on management costs, so that at least 50 percent of revenuecan be passed on to the community in the form of cash or project benefits. These guidelines were not rin four of the nine districts for which data are available. In Nyaminyami and Guruve, community benewere distributed as ward dividends but represented only one-third of revenue and, in Binga, theyrepresented only 40 percent. In Hurungwe, none of the wildlife revenue was distributed to the producecommunities: the council spent all of it on a truck. In contrast, ward dividends represented considerablmore than 50 percent of revenue in four districts.
Not all of the earned revenue is available for the provision of benefits to the communities, sincthere are costs incurred in managing the wildlife. The larger programs, such as Nyaminyami and Guruhave wildlife managers who receive salaries and are provided with vehicles and housing. Many districchoose to employ game guards whose main tasks are anti-poaching and problem animal control.
Capital costs, principally vehicles and electric fencing, have been provided by donors in severdistricts; thus far, earned CAMPFIRE revenue has generally not had to be used for capital costs. Therea danger, however, that the recurrent maintenance and eventual replacement costs of the donated capitassets may lead to increased management costs and thus result in a smaller percentage of the revenuebeing available for community benefits.
The budget of Nyaminyami Wildlife Management Trust (NWMT), shows a build-up of a"wildlife management bureaucracy." Recurrent costs have increased 360 percent in two years, wherea,revenue increased by 79 percent. If the cost of living with wildlife remains higher than the benefitsreceived in the producer communities, then the policing costs will continue to escalate as locals continto encourage poaching and in-migration. The NWMT has capital assets of nearly Z$800,000. In 1991 iwithheld 15 percent of its net revenue for a depreciation reserve further reducing the revenue availablefor distribution.
In districts where the CAMPFIRE program has been implemented more recently, the proporticof wildlife revenue distributed to the wards is considerably higher. This may be because the "wildlifemanagement establishment" has not yet had an opportunity to be created. Alternatively, perhaps districthat are only just now beginning to implement CAMPFIRE (and the NGO collaborative groups whoassist them) are learning from the mistakes of the "pioneer" districts (Nyaminyami and Guruve) and w
128

ZIMBABWE
try to keep wildlife management costs within or below the 35 percent guideline. Mechanisms could beestablished that would give full control over utilization and poaching to the concemed villages. Thiswould give them hunting access to those animals not attractive to those involved in the more lucrativesafari hunting; but local hunters should pay royalties to the local village community to avoidoverexploitation. The management costs in wildlife protection would be significantly reduced as thevillagers would have greater incentives to police themselves and report outside poachers. It is widelyaccepted that self-policing is much less expensive and more effective than centralized regulation intheory; the challenge is to develop appropriate institutions for self-regulation.
Benefit/Cost Analysis of Wildlife Utilization in Communal Areas
Jansen (1992b) undertook a cost-benefit analysis in three districts. The analysis projects forward,covering a ten-year period and begins with the first year of the CAMPFIRE program in each district.Scenario I assumes no change in management, dividend distribution, poaching, and human immigration.This leads to a further decline in revenue and increases in costs and in poaching and immigration inNyaminyami and Guruve. In Mahenye, by contrast, the status quo is based on continued goodmanagement and control of poaching and immigration. Macroeconomic reforms are not implemented,and the Zimbabwean dollar remains overvalued. All values are presented in constant 1991 Zimbabweandollars.
In Nyaminyami there have been substantial increases in recurrent costs during the first threeyears. This is in part due to the inexperienced management and to the decision to employ sixteen gameguards with conditions of service similar to that provided by DNPWLM. It is important that thecommunity find more cost-effective poaching-control mechanisms. Scenario 1 assumes that this situationis not rectified: efforts to date to do so have failed. As a result, it is assumed that recurrent costs increaseat an 1 1 percent rate in real terms.
Capital costs, which have been substantial and almost totally financed by donor aid (ZimbabweTrust), are assumed to represent replacement of existing assets plus the additional buildings planned forNWMT. No distinction is made between the source of finance for the capital costs, since they representuse of resources that would presumably be available elsewhere in the economy if they were not used forNWMT. Despite the problems of continuing with the status quo, the NPV for the district ispositive-Z$ 1.5 million using a discount rate of 10 percent and Z$333,000 using a discount rate of 40percent. This would probably not be true over a longer period or if the assumptions of the negativeeffects of poaching and immigration are too conservative.
Scenario 2 is a more optimistic scenario, including 25 percent adjustments for overvaluation ofthe Zimbabwe dollar. It assumes that the Economic Standard Adjustment Program (ESAP)-succeeds,local management improves, and poaching and immigration are controlled. As a result, the net presentvalue to the district, based on a 10 percent discount rate, increases to Z$3.6 million. The optimisticscenario assumes that present constraints on performance, particularly in Nyaminyami and Guruve, areeased and ESAP succeeds. It also assumes increases in revenue by 10 percent annually as a result ofdevaluation of the Zimbabwe dollar and good wildlife populations due to declines in poaching activityand immigration. Finally, this scenario assumes that (1) recurrent costs do not increase in real termsafter 1993 due to improved management, (2) capital costs are restricted to replacement, (3) immigrationis controlled, and (4) population increases by 3.5 percent. Ward benefits are distributed only to producerwards.
129

THE ECONOMICS OF WILDLIFE
This type of analysis fails to take into consideration the distribution of the net benefit stream. Ifthe net benefits do not accrue to the producer community, the link between the benefits and costs ofwildlife will not be made and the current trend of encouraging wildlife eradication, immigration, andincreased cattle stocking will continue.
Scenario 1 assumes that the ward benefits continue to be spread evenly among all twelve wardsAs a result, benefits per household never exceed Z$ 100 per annum and in fact become negative after ye;seven. Thus, even though this project has a positive NPV for the district, it should not be implemented,unless some alternative mechanism of allocating the net benefits is instituted. In other words, a positiveNPV is a necessary but not sufficient criterion for going ahead with the project. If the project is to beimplemented as an alternative to some other land use option, then its NPV will need to be higher than tkcompeting options, and since wildlife is a less well-recognized option it will need to be considerablyhigher before it is chosen in place of conventional options.
Scenario 2 shows that under a more optimistic scenario with respect to revenue generation, costcontrol, lower tax levy, and lower population increase, the benefit per household increases and is Z$470per annum (in real terms) in year ten. This assumes that the dividends are paid in the form of householdcash dividends with social service or infrastructure projects paid directly by farmers.
Similar benefit/cost analysis for the CAMPFIRE project in Guruve District shows that, likeNyaininyami, the project has received substantial capital investment donated by Zimbabwe Trust and hegood revenue from hunting and tourism. Also like Nyaminyami, it has sizable and increasing recurrentwildlife management costs. If the ward dividends were to be split in future between all eight wards, as iithe case in Nyaminyami, scenario I shows that the benefits per household diminish and in fact becomenegative by year ten. Under the optimistic scenario 2, with benefits split between only three producerwards, the distribution increases to over Z$500 per household and could result in a viable wildlifeutilization option. This assumes that the link between the benefits and wildlife resources is successfullyestablished. This is not yet the case but the situation is improving steadily as institution building at theward and village level is taking place. It should be noted that, under both scenarios, the NPVs arepositive but the distribution per household is significantly different.
Benefit/cost analyses of the CAMPFIRE project in the Mahenye ward of Gazaland District(Chipinge) indicates that the hunting revenue is considerably smaller there, but so are the recurrent andcapital costs. As a result, the NPVs are not much lower than in Nyaminyami and Guruve. Scenario Ishows the effect of poor macroeconomic policies, but, with wildlife revenues distributed solely to theproducer community, household dividends peak at Z$8 13 in 1993 and decline thereafter. Under theoptimistic scenario 2, the household dividends steadily increase and are significantly larger than inNyaminyami and Guruve, exceeding Z$ 1,000 per household from 1993. Although revenue potential forthe district is lower, there are considerably fewer households involved even if Nyaminyami and Guruvefocus the benefit distribution more carefully. This indicates the importance of limiting the populationbenefiting from wildlife if revenues generated are to be meaningful to households and change theirdecision making to favor wildlife.
Summary of Necessary Conditions for Success of CAMPFIRE Projects
There are a number of principles that can be universally applied. The most important of these isthat the benefits must outweigh the costs for the residents if they are to encourage wildlife by reducingpoaching and habitat destruction. A uniform distribution model of the benefits shared between all the
130
ZIMBABWE
wards in a district-or even all the wards with some wildlife-is unlikely to result in benefitsoutweighing costs in the important producing areas. Where wildlife revenue is used to fund socialservices and infrastructure projects in a district, the links between costs and benefits become weak.
With the migratory nature of wildlife, it is difficult to closely define the producer communities.Even when it is possible to define boundaries, it is difficult to ensure that those paying the highest costsreceive the greatest benefits. Within wards, there are differences in animal densities and in crop andlivestock damage due to wildlife. Defining the producer community is difficult, even when the districthas decided that the residents "living with wildlife" should be the principal beneficiaries. A number ofcriteria can be used-according to animal densities, according to the exact location of where the trophieswere taken, or based on relative crop and livestock damage. This cannot necessarily be done at wardlevel, and, as in Beitbridge district, it may be one or more village (VIDCO). It is only when wildlife isaccepted as "belonging" to those who both live with it and pay its costs that the various models thatenable the producer communities to receive larger shares will be accepted without creating communitystrife.
It is important for communities to play an active role in deciding how the wildlife revenue is tobe distributed, but, even if they are closely involved, there is often a problem with the implementation ofcommunity projects. This is largely due to a lack of implementation skills at the district and ward levels.In many wards, the ward dividends remain in the bank where their purchasing power erodes due to thehigh inflation rate in Zimbabwe. Also eroding is the link between the wildlife costs and wildlife benefits:the costs are felt immediately in terms of crop damage and threat to human life, while the benefits aredelayed. These delays unfortunately parallel the delays these communities experienced in the past ingetting wildlife revenue back from the Treasury.
It is also essential that the communities receive an adequate proportion of the value of thewildlife sold from their land. Safari hunting involves high overheads in marketing and operations, but itis only with the introduction of more open and competitive marketing that prices paid by operatorsincrease. The local communities need to establish openly competitive systems and to be trained andassisted in marketing their resources to operators.
Comparative Analysis of Wildlife and Subsistence Agriculture in Communal AreasIn the communal areas in Zimbabwe, animal production regimes largely consist of cattle, which
are used primarily for draught power, as a store of wealth, and for providing manure and milk. Smalldomestic animals are part of most household economies and in some of the more remote areas, wildlifeplays an important role in subsistence income. In a few isolated areas where tsetse flies still exist,wildlife dominates and even small domestic livestock are limited. Household surveys have shown that, inthe more arid areas of the country, nonfarm income is important and that without off-farm income,government-sponsored drought relief is necessary even in average rainfall years.
Most agricultural officers and farmers prefer irrigation as a strategy for increasing incomes andgenerating revenues in the marginal areas; however, the irrigation schemes are generally uneconomicunless the costs of establishing water sources are not included. Even when the water provision costs areexcluded, the IRRs are normally around 10-15 percent. The higher return schemes tend generally to besmall schemes with limited infrastructural investment.
131

THE ECONOMICS OF WILDLIFE
The analysis of agricultural projects seldom includes any of the subsistence benefits fromwildlife since hunting is illegal. The value of woodland resources are also seldom incorporated as anopportunity cost to clearing land for cultivation (Bradley and McNamara 1993). This may be partiallydue to the fact that the irrigation schemes do not necessarily deplete much of the surrounding woodlandbut the increased population pressure will do so in the long term. These resources play an essential rolein coping with drought and in improving the quality of nutrition, particularly for children; the impacts ofreducing access to these resources must be incorporated in all development strategies, particularly in aridareas (Chimedza 1992).
The real and perceived benefits of cattle are high for peasant farmers, while the costs are low,since the farmer's costs of food and care are negligible. The community bears the costs of depleting theopen access to grazing resources, and the government bears most veterinary costs through their animalhealth and animal-dipping programs.
In a recent attempt to compare household returns from agriculture and wildlife, a survey wascarried out in four wards in the Sebungwe region of the Zambezi Valley (Murindagomo, forthcoming).The survey showed that in Gokwe over 80 percent of annual household income is from cropping(including grain retentions), 8-10 percent from off-farm employment, and 5-15 percent from livestocksales. If wildlife earnings had been paid out in cash, they would have represented 2-4 percent. In theOmay, on the other hand, over 70 percent is from off-farm employment and only 17 percent fromcropping. Livestock sales were around 3 percent, and the household revenue from wildlife would havebeen 4 percent if it had been paid out in cash and not retained by the ward for projects. The survey alsoshowed that incomes in noncattle areas are half those in cattle areas. Similar income differentials wereobserved in Gutsa (mid-Zambezi valley) between houses with and without access to draught power(Barrett 1992; in most communal household surveys throughout Zimbabwe, access to draught power hasbeen the most important variable in determining income levels. This is explained by the importance ofdraught in adding value to crops through the expansion of area cultivated and timely cultivation.
Even though the CAMPFIRE project is active in three out of the four wards surveyed andconsiderable wildlife still exists in these areas, it plays a small role in household revenue generation,particularly when these revenues are retained at ward level for projects. It plays a more significant role inhousehold costs (through crop and livestock damage and time spent protecting resources and people fromwildlife), but these have not been estimated.
Both the Omay and Nenyunka, which have relatively abundant wildlife populations, are faced,given tsetse fly eradication, with potential land pressures from immigrants with cattle. At this stage ofdevelopment, when access to land is not the limiting factor, the existing households welcome immigrantsbecause they bring potential access to cattle for draught power and because increased populations givethem more lobbying power to gain access to government services (roads, schools, clinics, and so on).
Under poor agronomic conditions, it is only under particular circumstances that wildlife cansubstitute for cattle at the household level, unless a considerably increased proportion of the revenuegenerated by wildlife can be retained by producers. Since draught power is the most valuable outputfrom cattle, it is possible that, where wildlife and cattle cannot be compatible, other forms of draughtpower may reduce the opportunity costs of wildlife versus cattle for the households. Measures to reducewildlife predation (for example, fencing of cropping zones) may also reduce opportunity costs. Localizedcontrol systems that include allowing individual hunting may also result in substantial increases inhousehold welfare at small losses-and possibly substantial gains-in wildlife numbers.
132

ZIMBABWE
Despite the importance of cropping of maize in revenue generation in the nonwildlife areas,maize gross margins are mostly negative when the cost of the farmer's own labor and draught power isincluded in the calculations. The decision to grow maize is rational when the cost of producing the maizeis compared to the cost of importing it from major urban centers, particularly when the risk of pooraccess is added to the cost of purchase. The lack of cash resources to purchase maize also encourageshome production. It is, therefore, possible that, if markets were more effectively integrated, householderswould not need to rely on expensive self-sufficiency strategies. Wildlife production systems that includehigh value production of specialty outputs may become more financially attractive to peasant householdsand considerably increase both rural and national growth, but food market reliability would then becomean important factor (Muir 1987).
Given the difficulties of comparing cattle and wildlife in peasant farming communities, sincecattle are mostly an input, it may to be better to estimate opportunity costs of cattle by comparing the"with" and "without" scenarios. This is carried out in table 5.3 in which the assumption is made thathaving cattle and population densities similar to those in Chireya 3 precludes the option of wildlife butbrings with it concomitant increases in average household incomes. The subsistence incomes are higheras a result of direct income generated by livestock, increased cropping incomes, and reduced losses fromwildlife. Total area cultivated also increases because there are more households that are farming. It isassumed that the increased income would be evenly distributed among households. Income distributionis highly skewed in rural areas, and less than 20 percent of the population normally own adequate cattlefor draught.
Wildlife has the potential to reduce-or at least not to increase-income differentiation if thenew institutions developed to manage and share benefits and costs are carefully established. If, however,households in the densely settled areas with access to cattle and little or no loss to wildlife predationbenefit equally with those in the wildlife areas, socioeconomic stratification will increase.
Under current revenue distribution in communal areas, wildlife is only rarely more viable to theindividual householder than subsistence agriculture. The question remains: is wildlife the moreeconomically viable option in communal areas at the national level? An example is given in table 5.2 ofthe opportunity costs of wildlife and subsistence agriculture using Nyaminyamni District. The analysisshows that the best option from an international economic perspective is wildlife production withimproved agricultural output but with no increase in population. This is because the increase in humanpopulation does reduce wildlife revenue and, as the international community as a whole benefits by 20percent more than the nation, it has a larger stake in the wildlife option.
The best option from a national economic perspective is wildlife production with humanpopulation increasing to 7,500 households; this is due to the additional income generated by more peoplefarming in the area. The crude assumption is that household farm income doubled with improvedagriculture in a best case scenario in which wildlife revenue only declines by 12.5 percent. If agriculturalincomes cannot be improved while retaining wildlife, the wildlife-only option is preferred from anational social welfare perspective.
These estimates all assume that the immigrants are moving from overcrowded areas and that all the slack created by their exodus is taken upby the remaining population. This is not likely to be true in the short-term.
133

THE ECONOMICS OF WILDLIFE
Table 5.2: Comparative Analysis of Wildlife and Subsistence Agriculture: Total Revenue EstimatesUsing Nyaminyami District, Zimbabwe Wildlife Revenue Estimates and Allocation'
(1992 US$ per annum)Direct Revenues International National District Household All Wildlifefrom: Households HouseholdsHunting 1,034,066 827,252 212,000Tourism 781,250 625,000 7,200Total 1,815,316 1,452,252 219,200 70,667 14 35Airfares 450,000Outfitting 200,000Taxidermy 51,703 51,703Curios 10,000 10,000 6,000Meat 20,000 20,000 10,000Ivoryb - - -Total US$ 2,547,019 1,533,956 219,200 86,667 17 43Environmental
protection'Genetic resourcescBequest valuecExistence valuecTotal Wildlife'
Source: Authors' estimates. See notes below for background.
Table 5.3: Alternative Land Use Scenarios for Nyaminyami5
1992 US$ per annumOptions International National District Household All Wildlife
Households HouseholdsSubsistence agriculture with wildlife5,000 households' 262,000 262,000 262,000 52 52
agricultural incomeTotal including 2,809,019 1,795,956 219,200 348,667 70 96
wildlife incomeSubsistence agriculture with no wildlife10,000 households 1,048,000 1,048,000 1,048,000 105 1055,000 households 524,000 524,000 524,000 105 105Retain wildlife with reorganized and improved agriculture7,500 households 3,014,641 2,128,211 219,200 872,667 122 1485,000 households 3,071,019 2,057,956 219,200 610,667 122 148Source: Authors' estimates. See notes below for background.a. "International" refers to revenue generated for the world population. "National" refers to the revenue generated that
remains within Zimbabwe. "District" refers to the proportion paid to a district council. "Household" refers to proportion o:income accruing to producers. "All households" refers to per household distribution based on 5,000 households. "Wildlifehouseholds" is based on 2,000 households living with wildlife.
b. No ivory revenue is recorded.c. Not estimated, but could be substantial.
Notes to tables 5.2 and 5-3:
1. Hunting revenue. The estimated total value from hunting sold, based on projected international hunting prices for 1993with 5 percent deducted for international inflation. International safari prices have not in fact risen; it is possible that the1992 value should be the same as that for 1993, but a conservative estimate was preferred. Precise 1992 data were not easil:available.
2. Hunting revenue retained in Zimbabwe. A deduction of 20 percent to cover external marketing costs and wholesaler andagent commissions and fees. The remainder is what is paid into the economy of Zimbabwe.
3. Hunting revenue retained by the district council. The trophy and concession fees paid to the district council(Z$1,060,000 converted to US$ at a ratio of 5: 1).
134

ZIMBABWE
4. Tourist revenue generated by Nyaminyami wildlife. An estimate of the revenue earned by Bumi Hills Safari Lodge andTiger Bay Lodge because of the wildlife in Omay. If there were no wildlife, it is estimated that Bumi would lose 50 percentand Tiger Bay 25 percent of its customers. (It is closer to the national park and caters more heavily to fishermen.) Both wereestimated at 5,000 bed/nights: Bumi at US$250 per night and Tiger Bay at US$125 per night, with full board and tours.
5. Tourist revenue retained in Zimbabwe. A deduction of 20 percent for external marketing agents' fees and so on. This isprobably too high as much of the marketing costs and fees may be retained locally.
6. Tourism revenue paid to district council. Tourism numbers for 1992 were calculated as lower than 1991 (particularly forBumi) because of the effect of drought on international visitors. Assuming that the per visitor fee to be paid to the districtcouncil in 1992 is higher, the revenue to the district council is assumed to be the same as in 1991 (Z$36,000).
7. Hunting and tourism revenue allocated for wards. Assumes that the district council pays 33 percent of its total earningsas ward dividends (as for 1991).
8. Ward allocation to individual households. Assumes 5,000 households in Nyaminyami. Assumes that the ward dividendsare distributed evenly among the 5,000 households (whether as cash or projects).
9. Ward allocation if only to wildlife households. Assumes that the revenue is shared only by those living in areas withsubstantial wildlife resources. The number of households is estimated to be 2,000.
10. Value of airfares of incoming hunters. It is guesstimated that there are 145 hunters and companions, based on the numberof hunts. No airfare value is given for those coming in for tourism on the assumption that they would fly to Zimbabwe, evenif there was no Nyaminyami wildlife.
11. Value of guns and so on. Assumes that each safari party spends US$1,400 in their home country on equipment,ammunition, and outfitting (safari outfits and so on).
12. Value of taxidermy. Each client spends 5 percent on mounting trophies.13. Value of curio sales. An estimate based on Binga sales of Z$80,000. It is estimated that the handicraft center at Bumi will
earn Z$50,000.14. Value of curio sales to households. The producers retain 60 percent. Although averaged over all Omay residents, it is
likely the income will be concentrated among certain households and not easily represented in the individual householddividends.
15. Value of meat. Includes meat, hides, and so on from cropping of animals and problem animal control-assumes meat isless available but at a higher price so revenue remains the same as in 1991. National social price is doubled as meat wassold at a subsidized price. Opportunity cost value was not adjasted at the household level because, for those individuals, theopportunity costs are hunting time and illegality risk, which may be even less than the money saved by access to cheapmeat.
16. Current value of subsistence agriculture in Nyaminyami. Based on Z$262 per household per annum currently generatedby crop, livestock, and beer sales and grain retentions (average crop returns for Negande Ward in Murindagomo 1992).Most household income is from off-farm work and drought relief Z$262 by 5,000 households was converted to US dollars.
17. Value of subsistence agriculture with cattle and no wildlife. Using survey results of VIDCOs with and without cattle,average farm income doubles. This would be a result of increased access to draught power, immigrants with greater accessto cash or credit for input purchases, and reduced wildlife depredation. It is assumed that there are no agronomic differencesamong the VIDCOs, which may have caused the differential. It is further assumed that, with the elimination of tsetse fliesand increased demand for land, immigrants move in, doubling the population and increasing habitat destruction andpoaching, which reduces wildlife to insignificance. The calculation doubles Z$262, multiplies it by 10.000 households, andconverts it to US dollars.
18. Household value of subsistence agriculture with cattle and no wildlife. This assumes that the increased incomes areevenly distributed, when they are actually usually highly concentrated among those who own cattle. The current residentswill benefit from increased access to cattle and more people in the area to lobby for services and to sell beer to, but it isunlikely that they will in fact double their current incomes.
19. Value of wildlife and subsistence agriculture with a project to reorganize agriculture. Some wildlife experts-naintain that itis not currently desirable to incorporate cattle into subsistence agricultural systems in wildlife areas and, furthermore, thatany increases in population would not be sustainable; however, it seems that reorganization, including possibly greaterseparation of people and wildlife, access to alternative draught or livestock-holding pens, and so on could be used to try toenable increased agricultural production alongside continued wildlife enterprises; this has been achieved in the commercialranch sector. It is more difficult in the communal sector but may be possible.
135

THE ECONOMICS OF WILDLIFE
This option would also be best for the households, since they would achieve increased incomesfrom better agriculture as well as the wildlife revenue. If agricultural incomes cannot be improved withwildlife production, then the best option for the farmers is to eliminate wildlife and encourageimmigrants and cattle.
The calculation assumes that the same per capita agricultural productivity is achieved bydiminishing wildlife revenues by only 12.5 percent but with bringing in only half the new immigrants sothat the population is 7,500 households. If agriculture is improved but there is no immigration, thenwildlife revenue remains the same. In reality it would probably improve if the subsistence agriculturalsystem had been reorganized to allow for the interface.
It is imperative to ensure that the "trickle-down" revenue is considerably greater than it is atpresent. The issue of greater producer participation in CAMPFIRE has been repeatedly addressed in thispaper and in Murombedzi (1992) but is essential to the continued existence of wildlife in this area. Theissue of greater producer share in hunting and tourism industry revenue is essential if wildlife is tocontinue to be available; districts must develop institutions that return a greater share to the producers.The safari operators must find mechanisms to ensure that a greater proportion of the revenue generated isreturned to the districts.
5.3 The Policy Environment and Its Impact on the Future ofWildlifeThe Zimbabwean economy is characterized by its highly centralized and heavily regulated
structure with widespread state ownership and parastatals. International borrowing subsidized theexpansion of the civil service and social services. Exports have increased but total imports havestagnated as debt service payments rose to 37 percent of exports in 1987. Real GNP per capita stagnatedin the 1980s. Zimbabwe has embarked on an economic structural adjustment program (ESAP) designedto facilitate growth.
5.3.1 The Impact of Macroeconomic Policies on the Wildlife SectorGeneral macroeconomic policy, such as exchange rate, monetary, and fiscal policies, are
designed with their own objectives, divorced from any considerations about the impacts on wildlife.Nevertheless, there are important links between such general policies and the utilization of wildlife, asdiscussed in this section.
Foreign Exchange
For most of the 1980s, overvaluation was greater than 50 percent, but with ESAP this had fallento 15-20 percent by the end of 1993. The overvalued exchange rate has had a negative effect on thewildlife industry. The limited access to foreign exchange has severely constrained access to importedinputs, particularly vehicles, spare parts, and the luxury commodities that high-value tourism and huntingdemands. The regulations pertaining to access have significantly increased transaction costs and havefavored established industries and firms, affecting industry growth and effectively reducing returns toCAMPFIRE. In a survey of safari operators, the most significant constraint to growth was cited as theshortage of foreign exchange.
136

ZIMBABWE
Recent changes under ESAP have considerably improved the wildlife sector's access to foreignexchange especially with the introduction of the export retention scheme (ERS) in July 1990. Thisscheme allows exporters the right to utilize 35 percent of export earnings to import inputs that are not onthe negative list. Although it favors existing operators, ERS quotas are now tradable at a premium ofbetween 20 and 50 percent; this has helped new entrants. There are still considerable transaction costs inaccessing these rights and delays in clearing imported inputs, but the-situation has improved. Theincreased retention has reduced incentives to engage in illegal foreign currency deals and under-invoicing. Some of the items on the "negative list" (imported luxuries and vehicles above a certain value)are necessary for the wildlife industry and will need to be included for wildlife enterprises.
Fiscal Policy
The Zimbabwean government has greatly enlarged its bureaucracy since independence, andexpenditure on salaries is extremely high. The budget deficit and high government expenditures havedirectly contributed to the need for tight monetary controls. This has affected the wildlife sector at a timewhen it appeared ready for major expansion. Continued fiscal imprudence with expenditures directedtoward ruling party rather than national priorities is a serious threat to the entire Zimbabwean economy,including the wildlife sector. The Ministry of Environment and Tourism (which includes DNPWLM)accounted for 0.68 percent of total government expenditures in 1990-91. DNPWLM received only halfof the expenditures that were allocated to Veterinary Services and only 60 percent of that allocated to theMinistry of Political Affairs. This is an indication of the low priority accorded wildlife despite itspotential for growth.
Monetary PolicyOne area in which the government does appear to be committed to structural adjustment is
monetary policy, through which interest rates have been forced up by requiring the banks to remainliquid. This has been part of the policy to contain inflation; unfortunately, this tight monetary policy hasnot been matched by a tight fiscal policy. The position has been made significantly worse by the drought,which has forced government to incur large deficits in importing essential food and raw materialsnormally produced locally and exported. Given the lack of progress by government in containingnondrought-related expenditures, the prognosis for the future must include the burden of high nationaldebt. Monetary policy alone can only control inflation at the expense of growth, with supply severelyconstrained by high interest rates. These high interest rates also affect the wildlife industry. This situationexcludes new entrants with limited collateral and will, therefore, exacerbate the trend of a white-dominated industry, unless an affirmative action program with special credit facilities and training is putin place.
137

THE ECONOMICS OF WILDLIFE
EmploymentThe government is concerned about increasing employment and reducing underemployment. The
industrial sector cannot grow fast enough to absorb the rapidly increasing population, however, theagricultural resettlement program is supposed to assist to accommodate this pressure. The exercise isconsiderably slowed by the requirement that full facilities and services are provided for the resettledfarmers so that they can be productive. The slow pace means that the current trend of informal settlementwill continue to threaten communal areas that are not overpopulated, including many of the CAMPFIREareas. Most wildlife options in communal areas at the moment are land intensive and absorb few peoplerelative to subsistence agriculture. It is important to develop institutions and technologies that enablewildlife systems to employ or at least accommodate more people without reducing wildlife densities.This could be achieved either by developing more labor-intensive wildlife options or by reorganizing thesubsistence communities and wildlife areas in such a way that they can accommodate more people.
Investment Policy
The Zimbabwe Investment Center (ZIC) has been established to facilitate private sectorinvestment. Government policy places a premium on investment in the mining and manufacturing sectorsas compared to the wildlife sector.
5.3.2 The Impact of Sectoral Policies on the Wildlife SectorMoving from the general policies to the more specific sectoral interventions, it is clear that
public policy, by default or intention, has important ramifications for the wildlife industry.
Sectoral Allocation
The viability of the wildlife industry in Zimbabwe rests heavily on an effective national parkstructure. Capital expenditures for DNPWLM in 1991 had declined 27 percent since independence.Recurrent expenditure for the department has fallen 6 percent in real terms since 1988, despite the factthat there has been a significant increase in the demand for DNPWLM services. The result of inadequatefinancing has been a decline in the capacity of this department to service the rapidly expanding wildlifeindustry and to sustain the national parks estate. In addition to the low budget, DNPWLM has had toservice an increasing mandate and has had to face significant increases in poaching. Time, skills,financial, and other resources have been directed away from traditional concentration on parkmanagement and research to service all these new demands. The decline in funding has resulted indeterioration of roads, boreholes, buildings, plant, vehicles, and equipment. It has also affected research,extension and interpretive services, park management, and law enforcement, thus threatening wildlifeconservation, habitat protection, and the economic productivity of the wildlife sector as a whole.
Land
The current land policy aims to reallocate half the land in the large-scale freehold sector to thesmall-scale sector but will retain the same basic dualistic structure. There is considerable concern thatfarms with wildlife enterprises will be targeted for resettlement. These fears arise from the belief thatwildlife is considered a luxury and not a productive land-use system by some bureaucrats and politicians.There is, therefore, an urgent need to disseminate information on the productivity of wildlife.
138

ZIMBABWE
The country is to introduce a land tax that will encourage large-scale farmers to utilize currentlyunderutilized areas of their properties. On areas that cannot be used for agriculture, there may beincreasing investments in wildlife and recreational tourism; this would increase the growth of thewildlife sector. Regulations that discourage subdivision will reinforce this trend since the farmers willnot be able to sell the land they are not using for agriculture. There is some uncertainty as to the nature ofthe land tax, with some inference that it may be used to affect production systems. If this is the case, thesubsequent distortions will have severe impacts on the economic efficiency of agriculture and, given thegenerally negative attitudes toward wildlife as a productive land-use system, will prejudice it.
The negative attitudes of most of the agricultural bureaucracy to wildlife derives fromuncertainty over its actual economic value as well as lack of expertise in and technologies for wildlifeenterprises. This has more serious consequences in the communal areas and resettlement schemes inwhich land use planners hesitate to allocate land to wildlife. Those responsible for resettlement find thatwildlife is land intensive and restricts their mandate to resettle the maximum number of people fromovercrowded communal farming areas.
Marketing and Price Policies
In the large-scale sector, cattle are the major competitor with wildlife for land. Beef productionhas been heavily supported by the government since the 193 Os. This includes large marketing andprocessing investment in beef by the state. Producers or consumers (and at times both) have been directlyand indirectly subsidized by government marketing and pricing policies for beef over the decades. Thedistortions created by the implicit and explicit support for beef have particularly affected thedevelopment of the goat industry and have probably had similar effects on game meat. Sinceindependence, the Cold Storage Commission (CSC) has received subsidies of Z$40 million per annum.Prior to 1985 producers and consumers were subsidized; subsequently, inefficient marketing andconsumers have been subsidized by the state and indirectly by farmers who received prices, that is,income, below export parity.
Veterinary and Health Controls
The erection of fences and the eradication of buffalo from large-scale ranches have had negativeeffects on both the economy and the viability of wildlife enterprises on ranches. It is unlikely that thevalue of the buffalo eradicated to allow for beef exports to Europe can ever be recouped despite the highprices obtained from privileged access to their controlled markets. No analysis has been carried out onthe economics of the fences nor on their impact on wild animal migrations. The continued effect ofdisallowing buffalo in cattle areas affects wildlife profitability, since buffalo add significantly to thevalue of hunting on ranches (Child 1988). Movement controls implemented to satisfy EuropeanEconomic Community requirements considerably increase the cost of live animal sales by requiring longquarantine periods. There are also a number of municipal and national regulations that restrict the freemovement of game meat sales and require various inspections.
External Trade Controls
Exports of wildlife products and of live animals are subject to various permits, licenses, andrestrictions. These restrictions are normally either to fulfill the requirements of international conventions(for example, CITES) or are an attempt to build up the local industry. The restrictions on the sale of live
139

THE ECONOMICS OF WILDLIFE
animals are controversial and tend to result in industry concentration. The export of game meat and otherwildlife products is severely restricted by the importing countries.
Sale and Utilization ControlsAlthough landholders and appropriate authorities may utilize wild animals found on their land,
the method used and sale of various services and products are controlled (Booth 1992). In the communalareas, residents are still prohibited from hunting any wild animals even in districts that have been grantedappropriate authority. Subsistence hunting continues, but negative attitudes to wildlife result from theseprohibitions. The Zimbabwean economy is highly regulated, and these national, municipal, and industryrestrictions often act as barriers to entry and have restricted the growth of wildlife and tourism ventures.
5.3.3 ConclusionsWildlife in the commercial ranch sector is often more financially profitable than cattle,
particularly in the more arid parts of Zimbabwe. An improved macroeconomic environment and a lessregulated economy will contribute to its viability and continued growth but will also benefit cattleenterprises greatly and may even tilt the balance in their favor vis-a-vis wildlife. In the remote, semiaridcommunal sector, the CAMPFIRE program appears to be the most economic option from a socialwelfare perspective, but it is seldom the rational choice for households living in these areas. Moreeffective mechanisms and institutions need to be developed so that the gainers compensate the losers.
The direct benefits to the world community from retaining wildlife can be considerable. If theseare added to the global environmental advantages of the wildlife option over subsistence agriculture(through greater species diversity, less degradation, and greater tree coverage) and the bequest andexistence values of the animals, then in certain areas the international community clearly benefits fromland allocated to wildlife. Institutions and mechanisms, such as the Global Environment Facility (GEF),that link costs and benefits at the international level need to be made more accessible.
5.4 References
Anderson, G. D. and B. H. Walker. 1974. "Vegetation Composition and Elephant Damage in the Sengwa WildlifeResearch Area, Rhodesia." Journal of the Southern African Wildlife Management Association 4: 1-14.
AGRITEX. June 1990. "Feasibility and Design Report of Nabusenga Small-Scale Irrigation Scheme." Harare:Irrigation Division, Ministry of Lands, Agriculture, and Rural Resettlement, Zimbabwe.
Behnke, R. H. and r. Scoones. 1992. Rethinking Range Ecology: Implications for Rangeland Management in AfricaDryland Networks Programme Paper No. 33. London: Overseas Development Institute.
Behr, J. and J. A. Groenewald. 1990. "Commercial Game Utilization on South African Farms." Agrekon 29 (1): 55-58.
Benson, D. E. April-May 1986. "Game Farming Survey." Farmer's Weekdy.
Berry, M. P. S. 1986. "A Comparison of Different Wildlife Production Enterprises in the Northern Cape Province,South Africa." S. Afr. Tudskr. Natuurnay 16 (4): 124-128.
140

ZIMBABWE
Bond, Ivan. 1992. "Tourism, Hunting, and Management Services." In Price Waterhouse and EnvironmentalResources Ltd. Wildlife Management and Environmental Conservation Project, Task 2: The Role ofWildlife in the Economy. Prepared for the Department of National Parks and Wildlife Management,Zimbabwe.
Booth, V. 1992. "Wildlife Utilization, Management, and Planning Outside the Parks and Wildlife Estate." PriceWaterhouse and Environmental Resources Ltd. Wildlife Management and Environmental ConservationProject. Prepared for the Department of National Parks and Wildlife Management, Zimbabwe.
Bradley, P. and K. McNamara, eds. 1993. Living with Trees, Policies for Forestry Management in Zimbabwe.Technical Paper Number 210. Washington, D.C.: World Bank.
Child, B. 1988. The Role of Wildlife Utilization in the Sustainable Economic Development of Semiarid Rangelandsin Zimbabwe. Unpublished Ph.D. dissertation. Oxford: School of Forestry, Oxford University.
Child, B. and J. Peterson, Jr. 1991. CAMPFIRE in Rural Development: The Beitbridge Experience. Joint WorkingPaper 1/91. Harare: Department of National Parks and Wildlife Management, Zimbabwe, and Center forApplied Social Sciences, University of Zimbabwe.
Child, Graham. Forthcoming. Wildlife in Zimbabwe. Unpublished book manuscript.
Childes, S. L. 1984. The Population Dynamics of Some Woody Species in the Kalahari Sand Vegetation of HwangeNational Park- Master of science thesis. Johannesburg, South Africa: University of Witwatersrand.
Chimedza, R. 1992. Women, Household Food Security, and Wildlife Resources. Draft working paper. Harare:Department of Agricultural Economics and Extension, University of Zimbabwe.
Collinson, R. F. H. 1979. "Production Economics of Impala." Proceedings of a Symposium on Beef and GameManagement. M. A. Abbot, ed. Pieterrnartizburg: Cedara Press.
Colvin, I. S. 1984. An Enquiry into Game Farming in the Cape Province. Master of science thesis. Cape Town:University of Cape Town.
Conroy, A. M and I. Gaigher. 1982. "Venison, Aquaculture, and Ostrich Meat Production." South Africa Journal ofAnimal Science 12: 219-222.
Conybaere, A. M. 1991. Elephant Occupancy and Vegetation Change in Relation to Artificial Water Points in aKalahari Sand Area ofHwange National Park Ph.D. thesis. Harare: University of Zimbabwe.
Coulson, I. C. 1992. "Elephants and Vegetation in the Sengwa Wildlife Research Area." R. B. Martin, G. C. Craig,V. R. Booth, and A. M. G. Conybeare, eds. Elephant Management in Zimbabwe. Second edition. Harare:Departrnent of National Parks and Wildlife Management, Zimbabwe.
Cumming, D. H. M. and I. Bond 1991. Animal Production in Southern Africa: Present Practice and Opportunitiesfor Peasant Families in Arid Lands. Nairobi: Intemational Development Research Center.
Dassmann, Raymond F. and Archie S. Mossman. September/December 1961. "Commercial Use of Game Animalson a Rhodesian Ranch." Wildlife 3.
Dublin, H. T., A. R. E. Sinclair, and J. McGlade. 1990. "Elephants and Fire as Causes of Multiple Stable States inthe Serengeti-Mara Woodlands." Journal ofAnimal Ecology 59 (3): 1147-1164.
141

THE ECONOMICS OF WILDLIFE
Dunham, K. M. 1990. "Biomass Dynamics of Herbaceous Vegetation in Zambezi Riverine Woodlands." AfricanJournal of Ecology 28 (3): 200-212.
Ellis, J. E. and D. M. Swift. 1988. "Stability of African Pastoral Ecosystems: Alternate Paradigms and Implicationsfor Development." Journal of Range Management 41 (6): 450-459.
Elwell, H. A. and M. A. Stocking. 1974. Rainfall Parameters and a Cover Model to Predict Runoff and Soil Lossfrom Grazing Trials in the Rhodesian Sandveld. Proceedings of the Grassland Society of Southern Africa9: 157-164.
1982. "Developing a Simple Yet Practical Method of Soil-Loss Estimation." Tropical Agriculture 59: 43-48. Trinidad.
Epstein, H. 1971. The Origins of the Domestic Animals of Africa. Volumes I and II. New York: Africana PublishingCorporation.
Gambiza, J. 1987. Some Effects of Different Stocking Intensities on the Physical and Chemical Properties of the Soilin a Marginal Rainfall Area of Southern Zimbabwe. Master of science thesis in tropical resource ecology.Harare: University of Zimbabwe.
Zimbabwe. 1992. "Wild Life Policy." Harare: Department of National Parks and Wildlife Management.
September, 1988. "Value of Wildlife." In Parliamentary Debates. Hansard series. pp. 1628-1644. Houseof Assembly.
Guy, P. R. 1981. "Changes in the Biomass and Productivity of Woodlands in the Sengwa Wildlife Research Area,Zimbabwe." Journal ofApplied Ecology 18: 507-519.
Hawkes, R. K. 1991. Crop and Livestock Losses to Wild Animals in the Bulilima Mangwe Natural ResourcesManagement Project Area. Working Paper Series 1/91. Harare: Center for Applied Social Sciences,University of Zimbabwe.
Hitchcock, P. and F. Nangati. 1992. "Interim Assessment of Zimbabwe Natural Resources Management Project."Draft report. Harare: Price Waterhouse.
Ivy, P. 1969. "Veld Condition Assessments." Proceedings of the Veld Management Conference, Bulawayo, May1969. pp. 105-112. Salisbury: Department of Conservation and Extension, Rhodesia.
Jansen, D. 1990. "Sustainable Wildlife Utilization in the Zambezi Valley of Zimbabwe: Economic, Ecological, andPolitical Tradeoffs." Multispecies Animal Production Systems Project Paper No. 10. Harare: WWF.
1 992a. "The Role of Wildlife in the Economy." In Price Waterhouse and Environmental Resources Ltd.Wildlife Management and Environmental Conservation Project, Task 2: The Role of Wildlife in theEconomy. Prepared for the Department of National Parks and Wildlife Management, Zimbabwe.
1992b. The Economics of Campfire: Lessons to Date. Background report. Washington, D.C.: AfricaTechnical Department, World Bank.
Jansen, D., I. Bond, and B. Child. 1992. Cattle, Wildlife, Both or Neither: Results of a Financial and EconomicSurvey of Commercial Ranches in Southern Zimbabwe. Multispecies Animal Systems Project Paper No. 27.Harare: WWF.
142
ZIMBABWE
Jansen, D. and K. Muir. 1991. "Trade and Exchange Rate Policy and Agriculture." Paper presented at Conferenceon Zimbabwe's Agricultural Production Revolution, Victoria Falls, Zimbabwe.
Jansen, D. and A. Rukovo 1992. Agriculture and the Policy Environment in Zambia and Zimbabwe: PoliticalDreams and Policy Nightmares. Technical Paper No 74. Paris: Organisation for Economic Cooperationand Development.
Johnstone, P. A. 1973. "Evaluation of a Rhodesia Game Ranch." Journal of Southern African Wildlife ManagementAssociation 5 (1): 43-5 1.
Kaufman, I. 1992. "Development of Wildlife Tourism in Zimbabwe." In Price Waterhouse and EnvironmentalResources Ltd. Wildlife Management and Environmental Conservation Project, Task 2: The Role ofWildlife in the Economy. Prepared for the Department of National Parks and Wildlife Management,Zimbabwe.
Kerr, M. A. 1972. Annual Report: Rhodesia. Salisbury: Department of National Parks and Wildlife Management,Rhodesia.
La Grange, M. 1988. "Innovative Approaches in the Control of Quelea in Zirnbabwe." In R. Marsh, ed. Proceedingsof the 13th Vert. Pest Conference. Davis, Ca.: University of California.
McDowell, R E., D. G. Sisler, E. C. Schermerhom, and J. D. Reed. 1982. Game or Cattlefor Meat Production onKenya Rangelands? Mimeo. Ithaca, New York: Cornell Institute of Agriculture, Comell University.
Marks, S. A. 1973. "Prey Selection and Annual Harvest of Game in a Rural Zambian Community." East AfricanWildlife Journal 11: 113-128.
NMartin, R. B. 1986. Communal Areas Management Programme for Indigenous Resources (CAMPFIRE). Workingdocument 1/86. Harare: Department of National Parks and Wildlife Management, Zimbabwe.
1989. The Status of Projects InvGlving Wildlife in Zimbabwe. Harare: Departnent of National Parks andWildlife Management, Zimbabwe.
Martin, R., G. Craig, and V. Booth. 1989. Elephant Management in Zimbabwe. Harare: Department of NationalParks and Wildlife Management, Zimbabwe.
Monke, E. A. and Scott Pearson. 1989. The Policy Analysis Matrix for Agricultural Development. Ithaca, NewYork: Cornell University Press.
Mossman, S. L. and A. S. Mossman. 1976. Wildlife Utilization and Game Ranching. Occasional Paper No. 17.Gland, Switzerland: IUCN - The World Conservation Union.
Muir, Kay, ed. 1983. Agricultural Marketing in Zimbabwe. Working Paper 1/83. Harare: Departnent of LandManagement, University of Zimbabwe.
1987. "Marketing Wildlife Products and Services." In proceedings of the Intemational Symposium onWildlife Management in Sub-Saharan Africa, October, 1987, Harare, Zimnbabwe. Paris: IntemationalFoundation for the Conservation of Game.
1989. "The Potential Role of Indigenous Resources in the Economic Development of Arid Environments inSub-Saharan Africa: The Case of Wildlife Utilization in Zimbabwe." Society and Natural Resources 2 (4):307-318.
143

THE ECONOMICS OF WILDLIFE
Murindagomo, F. Forthcoming. A Comparative Analysis of Wildlife and Agriculture in Communal SubsistenceCommunities in Gokwe and Nyaminyami. Doctoral dissertation. Harare: University of Zimbabwe.
1988. "Preliminary Investigations into Wildlife Utilization and Land use in Angwa, Mid-Zambezi Valley."Unpublished master's degree thesis. Harare: Department of Agricultural Economics and Extension,University of Zimbabwe.
Murombedzi, James. 1992. Decentralization or Recentralization: Implementing Campfire in the Omay CommunalLands of the Nyaminyami District Council of Zimbabwe's Wildlife Management Programme. WorkingPaper 2/1992. Harare: Center for Applied Social Sciences, University of Zimbabwe.
Murphree, M. 1988. Decentralizing the Proprietorship of Wildlife Resources in Zimbabwe's Communal Lands.Paper presented to African Studies Association, Cambridge, England.
1991. Communities as Institutions for Resource Management. Harare: Center for Applied Social Sciences,University of Zimbabwe.
Pangeti, G. 1989. Administration and Inter-Agency Coordination of Wildlife Management and the Effects ofLegislation in Implementation. Paper presented at Wildlife Resource Management Workshop, HwangeNational Park, Zimbabwe, 1989.
Peterson, J. 1992. A Proto-Campfire Initiative in Mahenye Ward, Chipinge District. Occasional Paper 3/1992.Harare: Center for Applied Social Sciences, University of Zimbabwe.
Richardson, F. D. 1983. Short and Long-Terrn Influences of Under-Nutrition on Range Cattle Production.Zimbabwe Agricultural Journal 80: 175-182.
Smithers, R. H. N. 1988. The Mammals of the Southern African Subregion. Pretoria: University of Pretoria.
Stanning, J. 1987. "Household Grain Storage and Marketing in Surplus and Deficit Communal Farming Areas." InM. Rukuni and C. K. Eicher, eds. Food Security for Southern Africa. Harare: Department of AgriculturalEconomics and Extension, University of Zirnbabwe.
Stocking, M. 1986. The Costs of Soil Erosion in Zimbabwe in Terms of the Loss of Three Major Nutrients.Consultants' Working Paper No. 3. p. 164. Rome: Soil Conservation Programme, Land and WaterDivision, U.N. Food and Agriculture Organization.
1992. Land Degradation and Rehabilitation Research in Africa 1980-90: Retrospect and Prospect.Dryland Networks Paper No. 34. London: International Institute for Environment and Development.
Swanepoel, C. M. 1989. Patterns of Habitat Use by African Buffalo in Mana Pools National Park Zimbabwe. Ph.D.thesis. Harare: University of Zimbabwe.
Thompson, P. J. 1975. "The Role of Elephants, Fire, and Other Agents in the Decline of Brachystegia BoehmiiWoodland." Journal of the Southern African Wildlife Management Association 5: 11-18.
Walker, B. H., D. A. Matthews, and P. J. Dye. 1986. "Management of Grazing Systems, Existing Versus an Event-Orientated Approach." South African Journal of Science 82: 172.
Watt, M. 1913. "The Dangers and Prevention of Soil Erosion." Rhodesian Agriculture Journal 10: 5.
Western, D. 1979. "Size, Life History, and Ecology in Mammals." African Journal of Ecology 17: 185-204.
144

ZIMBABWE
. 1988. Land Degradation in Zimbabwe: A Geographical Study. Harare: Natural Resources Board,Zimbabwe.
Whitlow, J. R. and B. Campbell. 1989. "Factors Influencing Erosion in Zimbabwe: a Statistical Analysis." Journalof Environmental Management 29 (1): 17-29.
145

Appendix:
Relative Environmental Impacts of Wildlife
Concerns about overgrazing and rangeland degradation have played a central role in the shaping of thenational livestock policy, giving rise to schemes of limiting stock numbers and in some cases of actuallydestocking. * Attention has also been drawn to the impacts, especially of elephants, in the destruction of woodlands.Degradation is seen as manifesting itself when a plant community that is dominated by perennial grasses changes toa community that includes a greater proportion of woody species, annual grasses, and bare ground. Thus, rainfall,which was used efficiently in the production of a relatively stable supply of fodder, is now wasted; less fodder isproduced; and the fodder supply is more variable from year to year.
Initially, utilization results in changes in the herbaceous species composition of the veld,t especially fromperennial grasses to a combination of annual grasses and less palatable perennial grasses with reduced vigor.Ground cover and litter cover decreases, leading to increased soil compaction and crusting and thus enhanced runoffand erosion. Rainfall infiltration is reduced substantially and, because the density of grass roots near the soil surfaceis lower, a greater proportion of the water that does enter the soil becomes available to more deeply rooted woodyspecies. This gives them a competitive advantage, which they are able to maintain at the expense of grasses, so thatthe supply of fodder is permanently reduced. As bush encroachment and the above induced drought conditionscontinue to develop, sheet and gully erosion become more widespread and previously permanent streams becomemore intermittent.
The Evidence for Herbivore Impacts on Zimbabwean RangelandsBoth livestock and wildlife can have significant impacts on their natural surroundings. The body of hard,
quantitative evidence of this is limited, however, and there is little directly comparative research. This gives rise tolarge discrepancies in the interpretation of the relative impacts.
National Surveys
For Zimbabwe as a whole, over the ten-year period from 1963 to 1973, closed woodland and openwoodland declined in area by 4 percent and 16 percent respectively, while the area of sparse woodland andcultivated land increased by 12 percent and 8 percent respectively (Whitlow 1980). The main decreases in-woodyvegetation were recorded in areas of high to moderate population densities, particularly within the communal lands.This was ascribed primarily to the expansion of cultivated lands, and to a lesser extent to the collection of firewoodand building materials. Attention was also drawn to the rapid rate of destruction of woodlands on some of the stateland in the west and northwest of Zimbabwe, which was ascribed mainly to the buildup of high elephant densitieswithin these areas.
* This appendix is based exclusively on the background paper prepared by Robert Cunliffe.
t Open country with grass, bushes, or shrubs or thinly forested, characteristic of Southern Africa.
147

THE ECONOMICS OF WILDLIFE
Commercial Livestock Production Systems
Stocking rate has repeatedly been shown to have a marked effect on both rangeland composition andanimal productivity (Clatworthy 1989). There is a consistent trend for perennial grass cover to decline withincreasing stocking rate. For animal performance, both wet season gain and dry season losses are affected bystocking rate, with the former decreasing and the latter increasing as the stocking rate is increased; however, for agiven stocking rate, the wide range of grazing procedures examined have had almost no differential effects onbotanical composition nor on the condition of the veld.
Kennan (1969), O'Connor (1985), and Clatworthy (1989) all emphasize that the impact of livestock onveld condition depends on both rainfall and soil conditions. A number of studies have demonstrated that long-termrainfall variability has an overriding effect on herbaceous compositional trends, independent of grazing regimes,particularly in the drier rangelands, where rainfall is more variable and primary production is strongly limited bysoil moisture availability. In moister savannas, annual variability in rainfall is lower and the relationship betweenvegetation production and rainfall is less marked. The influence of grazing varies, with the most pronounced effectsbeing observed in low rainfall regions.
Wild Herbivore SystemsDespite the diversity of large herbivores, which is characteristic of African savanna communities, only a
limited number of species have been reported as having dramatic effects on the environment. Analysis shows thatcommunities tend to be dominated by a few large species such as elephants, hippopotamuses, buffalo, zebras andwildebeests (Cumming 1982). It is these species, particularly the elephant, which have been reported as havingdramatic effects on the environment.
Craig (1992) and Martin (1992) have calculated that elephant densities need to be held below about 0.5animals per square kilometer to maintain existing woodland canopy cover intact. This is far lower than the densitiescurrently occurring in many of the national parks and safari areas, which in 1991 were estimated to range from 0.25to 2.12 animals per square kilometer.
Communal Land Agro-Pastoral SystemsSince early in the colonial period, overstocking and degradation of communal land rangelands have caused
concern. For much of this century and continuing to the present, government officials have sought ways in which tocontrol or even reduce livestock numbers in the communal lands. Stocking rates in the communal lands, frequentlyon the order of two to three hectares per livestock unit, are typically higher than those found on other types of land.Livestock, particularly cattle, form an integral part of the agropastoral farming system, particularly through theprovision of draught power and manure, which is widely used to maintain or improve soil fertility. Recent studies,such as those by Swift and others (1989) on nitrogen cycling in communal-land farning systems and Barrett (1992)on the economic role of cattle in communal land farning systems, indicate that the majority of households do notown sufficient livestock to satisfy their needs for draught power and manure.
Despite the widespread concern about the deterioration of communal land rangelands, remarkably littleresearch has been directed at this problem. This has been highlighted by a number of recent studies that question theofficial view of the extent and significance of degradation in these areas (Abel and Blaikie 1989; Barrett and others1991; Sandford 1982; Scoones 1990; Warren and Agnew 1988).
Scoones (1990) examined livestock production records over several decades for seven, heavily stocked,communal lands in southern Zimbabwe. Govermnent officials in 1944 considered the stocking rates of six of theseven communal lands studied by Scoones to be in excess of the recommended carrying capacities for these areas.Yet for each communal land, the 1986 cattle population density was considerably in excess of its 1944 stocking rate.Despite large fluctuations in response to rainfall, cattle populations appeared to have been successfully maintainedover the last twenty-five years for all communal lands. There were obvious signs of soil erosion on the rangelands,
148

APPENDIX
and yet there was no evidence that cattle populations were declining and neither was their potential productivitybeing detrimentally impacted. Scoones (1990) suggested that the impact of erosion on secondary production issufficiently low as to not be felt on a relatively short timescale, or else that the sites where erosion is occurringmight not contribute significantly to the overall livestock production, or both.
The Save study (Campbell and others 1989), however, perceived th'e environment as being degradedthrough deforestation, overgrazing, loss of soil, loss of soil fertility, siltation of rivers, and increased runoff. Itconcluded that there was a severe imbalance between the human population and the resource base, such that theenvironment was less able to satisfy the needs of current and future human populations.
Comparative StudiesKelly and Walker (1976) undertook a comparative study of four sites under different land tenure, which
were apparently similar in every respect except for the type and intensity of grazing and browsing by largeherbivores. De Jager (1988) repeated measurements of vegetation and range condition. Kelly's study concluded thatthe intensively utilized communal land site was in fact degraded in comparison to the other three sites in that theperennial grasses had largely been replaced by annual grasses; herbaceous production was more variable betweenyears.
De Jager's follow-up study failed to reveal any firm evidence of directional trends that could be related todifferences in the intensity of utilization by herbivores. The herbaceous vegetation of the communal land site wasstill dominated by annual grasses as opposed to perennials on the other three sites. Basal cover of grasses was alsolowest for the communal land site, as was the litter cover and the rate of infiltration. There were indications that thecommunal land soils were now of lower fertility than those of the other three sites, but none of these differenceswere significant. Woody vegetation had changed considerably in density, and the heterogeneity among plots withinsites tended to mask differences between sites.
A comparison of separate game and cattle enterprises, which have been run since 1960 on adjoining,ecologically similar areas under the same overall management, was undertaken on Buffalo Range (Child 1988).Rangeland condition has been assessed in detail in 1973, in 1986 (Child 1988), and 1990, although the results ofthis latest survey have not yet been made available.
In 1973 the cattle section was ecologically in better condition than the game section. Thirteen years later,there were definite indications that range condition on the game section had improved, whereas it had deterioratedon the cattle section. The area under cattle now exhibited twice as much erosion as that under game, and, althoughthere was an increase in soil capping on both the cattle and game sections, the increase on the former was threefoldthat of the latter. These changes in range condition can be related directly to trends in secondary production. Thelevels of meat harvested fluctuated but, over a twenty-six-year period, show the two systems yielded similaramounts of meat. Cattle productivity, however, was reduced by declining calving rates.
Child (1988) relates declining cattle productivity to the overstocking. The stocking rate of wildlifefluctuated considerably, increasing rapidly during the high rainfall years of the 1970s but declining massivelyduring the drought years from 1982-84. After 1984 populations increased through natural growth at a slower ratethan on the cattle section, which was restocked with cattle from elsewhere. At no point in time has'the stocking rateof wild herbivore grazers on the game section ever exceeded that of cattle on the cattle section. At the time of the1986 measurements, the cattle stocking rate was some 1.5 times that of game.
This study suggests that the meat production potential of the cattle and game enterprises is similar and thatrangeland impact is largely a function of the stocking rate of herbivores. Child (1988) makes the important pointthat the generation of revenue from the cattle enterprise is directly related to the secondary production of beef,whereas for the wildlife enterprise the major form of revenue generation is through safari-hunting operations, thusenabling more conservative stocking rates to be maintained.
149

THE ECONOMICS OF WILDLIFE
The Major Factors Influencing Environmental ImpactsThere is no single biologically optimal carrying capacity that can be defined independently of the different
management objectives associated with different forms of animal exploitation. Thus, for semiarid rangelands, whichare subjected to erratic rainfall and characterized by large fluctuations in plant species composition, cover, andbiomass, the problem becomes one of distinguishing between drought-induced fluctuations and permanent changesin vegetation states. It is doubtful that our current knowledge of savanna systems allows these distinctions to bemade at present with any degree of confidence.
Comparisons of herbivore community structure between wildlife and domestic livestock systems, in termsof the biomass contributions of the different classes of feeders, leads to the important conclusion that the impact ofwild as opposed to domestic herbivores on the environment, is more likely to be a question of degree rather than ofa fundamentally different kind, associated with the unique effects of different herbivore species (Cumming 1982).The comparison of Child (1988) between wildlife and a commercial cattle system suggests that the environmentalimpacts of wildlife and cattle are determined largely by the stocking rate, rather than the different types ofherbivores; this is supported by the literature reviewed by Clatworthy (1989). The research reviewed above furthersuggests that, particularly in semiarid environments, vegetation changes are unreliable indicators of rangelanddegradation. Rates of soil loss and changes in soil chemistry and physical properties may be more reliableindicators.
Given that the environmental impacts of different herbivore communities are determined essentially by thestocking rate rather than the types of herbivores involved, some consideration of the stocking rates required to meetthe specific objectives of different animal production systems becomes important. Data from Buffalo Rangeillustrate that wildlife can be profitably stocked at a significantly lower rate than that requiredfor cattle, due to thehigh values associated with hunting safaris. Studies of communal-land farrning systems show that the current highlivestock numbers consistently fall far short of the populations required to satisfy the multiple needs of farmers.Thus, the communal lands are likely to continue to be heavily stocked.
References
Abel, N. 0. J. and P. M. Blaikie. 1989. "Land Degradation, Stocking Rates, and Conservation Policies in theCommunal Rangelands of Botswana and Zimbabwe." Land Degradation and Rehabilitation 1: 1-23.
Barrett, J. C. 1992. The Economic Role of Cattle in Communal Farming Systems in Zimbabwe. PastoralDevelopment Network Paper 32b. London: Overseas Development Institute.
Barrett, J. C., P. Brinn, and J. Timberlake. 1991. Tsetse Control, Agropastoralism And Land Degradation: A CaseStudy in Chiswiti Communal Land, Final Report. Unpublished report. Harare: Tsetse and TrypanosomiasisControl Branch, Department of Veterinary Services, Zimbabwe.
Campbell, B. M., R. F. Du Toit, and C. A. M. Attwell. 1989. "The Save Study: Relationships Between theEnvironment and Basic Needs Satisfaction in the Save Catchment, Zimbabwe." Supplement to Zambezia.Harare: University of Zimbabwe.
Child, B. 1988. The Role of Wildlife Utilization in the Sustainable Economic Development of Semiarid Rangelandsin Zimbabwe. Unpublished Ph.D. dissertation. Oxford: School of Forestry, Oxford University.
Clatworthy, J. N. 1989. "A Review of Rangeland Utilization Trials in Zimbabwe, 1970 to 1985." In A. R. Maclaurinand B. V. Maasdorp, eds. Rangeland Potential in the SADCC Region, Proceedings of a Regional
150

APPENDIX
Workshop, Bulawayo, 1-5 June, 1987. Harare: Ministry of Lands, Agriculture, and Rural Resettlement,Zimbabwe.
Craig, G. C. 1992. "A Simple Model of Tree/Elephant Equilibrium." In R. B. Martin, G. C. Craig, V. R. Booth, andA. M. G. Conybeare, eds. Elephant Management in Zimbabwe. Second edition. Harare: Department ofNational Parks and Wildlife Management, Zimbabwe.
Cumming, D. H. M. 1982. "The Influence of Large Herbivores on Savanna Structure in Africa." B. J. Huntley andB. W. Walker, eds. Ecological Studies, VoL 42: Ecology of Tropical Savannas. Berlin: Springer-Verlag.
De Jager, P. 1988. Environmental Degradation in Communal Land. Master of science thesis. Harare: University ofZimbabwe.
Kelly, R. D. and B. W. Walker. 1976. "The Effects of Different Forms of Land Use on the Ecology of a SemiaridRegion in Southeastern Rhodesia." Journal of Ecology 64: 553-576.
Kennan, T. C. D. 1969. "A Review of Research into the Cattle/Grass Relationship in Rhodesia." Proceedings of theVeld Management Conference, Bulawayo, 2 7-31 May. Salisbury: Department of Conservation andExtension, Rhodesia.
Martin, R. B. 1992. "Relationship Between Elephant and Canopy Tree Cover." In R. B. Martin, G. C. Craig, V. R.Booth, and A. M. G. Conybeare, eds. Elephant Management in Zimbabwe. Second edition. Harare:Department of National Parks and Wildlife Management, Zimbabwe.
O'Connor, T. G. 1985. A Synthesis of Field Experiments Concerning the Grass Layer in the Savanna Regions ofSouthern Africa. South African National Scientific Programs Report No 114. Pretoria: Foundation forResearch and Development, Council for Scientific and Industrial Research.
Sandford, S. 1982. Livestock in the Communal Areas of Zimbabwe. Harare: Ministry of Lands, Resettlement andRural Development, Zimbabwe.
Scoones, I. C. 1990. Livestock Populations and the Household Economy. A Case Study from Southern Zimbabwe.Ph.D. thesis. London: University of London.
Swift, M. J., P. G. H. Frost, B. M. Campbell, J. C. Hatton, and K. B. Wilson. 1989. "Nitrogen Cycling in FarmningSystems Derived from Savanna: Perspectives and Challenges." In M. Clarholm and L. Bergstrom, eds.Ecology ofArable Land. Dordrecht: Kluwer Academic Publishers.
Warren, A. and C. Agnew. 1988. An Assessment of Desertification and Land Degradation in Arid and SemiaridAreas. Drylands Programme Research Paper, No. 2. London: International Institute for Environment andDevelopment.
Whitlow, J. R. 1980. "Deforestation in Zimbabwe." Supplement to Zambezia. Harare: University of Zimbabwe.
151
Related Documents