OECD Social, Employment and Migration Working Papers No. 169 Working and learning: A diversity of patterns Glenda Quintini https://dx.doi.org/10.1787/5jrw4bz6hl43-en

Welcome message from author
This document is posted to help you gain knowledge. Please leave a comment to let me know what you think about it! Share it to your friends and learn new things together.
Transcript
OECD Social, Employment and Migration Working PapersNo. 169
Working and learning: Adiversity of patterns
Glenda Quintini
https://dx.doi.org/10.1787/5jrw4bz6hl43-en
1
WORKING AND LEARNING: A DIVERSITY OF PATTERNS
Authorised for publication by Stefano Scarpetta, Director,
Directorate for Employment, Labour and Social Affairs
2
DIRECTORATE FOR EMPLOYMENT, LABOUR AND SOCIAL AFFAIRS
www.oecd.org/els
OECD SOCIAL, EMPLOYMENT AND MIGRATION
WORKING PAPERS
www.oecd.org/els/workingpapers
OECD Working Papers should not be reported as representing the official views of the OECD or of its
member countries. The opinions expressed and arguments employed are those of the author(s).
Working Papers describe preliminary results or research in progress by the author(s) and are
published to stimulate discussion on a broad range of issues on which the OECD works. Comments on
Working Papers are welcomed, and may be sent to the Directorate for Employment, Labour and Social
Affairs OECD, 2 rue André-Pascal, 75775 Paris Cedex 16, France.
This series is designed to make available to a wider readership selected labour market, social policy
and migration studies prepared for use within the OECD. Authorship is usually collective, but principal
writers are named. The papers are generally available only in their original language – English or French –
with a summary in the other.
This document and any map included herein are without prejudice to the status of or sovereignty over
any territory, to the delimitation of international frontiers and boundaries and to the name of any territory,
city or area.
Applications for permission to reproduce or translate
all or part of this material should be made to:
Head of Publications Service
OECD
2, rue André-Pascal
75775 Paris, CEDEX 16
France
Copyright OECD 2015
3
ACKNOWLEDGEMENTS
Glenda Quintini is a Senior Economist in the Directorate for Employment, Labour and Social Affairs,
Division for Employment Analysis and Policy.
The author is grateful to Mark Keese and Simon Fields for their useful feedback and suggestions.
4
SUMMARY
The combination of work and study has been hailed as crucial to ensure that youth develop the skills
required on the labour market so that transitions from school to work are shorter and smoother. This paper
fills an important gap in availability of internationally-comparable data. Using the 2012 Survey of Adult
Skills (PIAAC), it draws a comprehensive picture of work and study in 23 countries/regions. Crucially, it
decomposes the total share of working students by the context in which they work (VET, apprenticeships
or private arrangements) and assesses the link between field of study and students’ work. The paper also
assesses how the skills of students are used in the workplace compared to other workers and identifies the
socio-demographic factors and the labour market institutions that increase the likelihood of work and
study. Finally, while it is not possible to examine the relationship between work and study and future
labour market outcomes at the individual level, some aggregate correlations are unveiled.
RESUMÉ
La plupart des études sur le chômage des jeunes attribuent une importance clé au cumul emploi/études
pour raccourcir et améliorer les transitions de l’école à l’emploi et cela sur la base du fait qu’il permet aux
jeunes d’acquérir les compétences demandées sur le marché du travail. Ce papier remplit le manque de
données comparables à niveau international sur ce sujet. Grâce à l’Enquête sur les Compétences des
Adultes (PIAAC), il permet d’évaluer l’étendue du cumul emploi/études dans 23 pays ou régions. Plus
particulièrement, il permet d’identifier ces composantes principales (la formation professionnelle en
alternance, l’apprentissage ou le travail des étudiants en dehors de ces programmes) et d’évaluer le lien
entre le domaine d’étude et la nature du travail étudiant. Le papier étudie aussi comment les compétences
des étudiants travailleurs sont utilisées aux seins des entreprises par rapport à celles des autres travailleurs
et identifie les caractéristiques sociodémographiques ainsi que les institutions du marché du travail qui sont
associées avec une probabilité accrue de cumul emploi/études. Pour finir, même s’il n’est pas possible
d’examiner la relation entre le statut en termes de cumul emploi/études de chaque individu et sa réussite
sur le marché du travail une fois les études terminées, le papier décèle quelques relations agrégées entre
l’incidence du cumul emploi/études et le taux de chômage des jeunes sortis du système scolaire.
5
TABLE OF CONTENTS
ACKNOWLEDGEMENTS ............................................................................................................................ 3
SUMMARY .................................................................................................................................................... 4
RESUMÉ ......................................................................................................................................................... 4
INTRODUCTION ........................................................................................................................................... 6
1. The incidence of work and study and its role in skills accumulation ...................................................... 6 2. What working students do ....................................................................................................................... 9 3. Individual determinants of work and study choices ............................................................................... 13 4. Work and study, information processing skills and aggregate labour market outcomes ....................... 17 Conclusions ................................................................................................................................................ 20
ANNEX A.1. Coding of ISCO-08 3-digit occupation classification to fields
for field-of-study mismatch ........................................................................................................................... 23
Tables
Table 1. Socio-demographic characteristics and the likelihood of work and studya .................................... 16
Table 2. Socio-demographic characteristics and different forms of work and studya .................................. 17
Figures
Figure 1. Share of youth (16-29) combining work and studya ....................................................................... 7
Figure 2. Composition of work and study by type of programmea ................................................................ 9
Figure 3. Link between students’ field of study and area of work while studyinga ..................................... 10
Figure 4. Correlation between field-of-study mismatch in the labour market
and field-of-study mismatch among studentsa .............................................................................. 11
Figure 5. Incidence of part-time and full-timea work among working students
a .......................................... 12
Figure 6. Difference in skill use between working students and other workers ........................................... 13 Figure 7. Incidence of work and study by education level
a .......................................................................... 14
Figure 8. Students’ work by field of studya .................................................................................................. 14
Figure 9. Literacy proficiency scores by work and study status ................................................................... 18 Figure 10. Correlation between the incidence of work and study and youth unemployment
a ..................... 20
6
INTRODUCTION
1. The combination of work and study has been hailed as crucial to ensure that youth develop the
skills required on the labour market so that transitions from school to work are shorter and smoother.
As a result, in the current context of record high unemployment rates, many governments have set out to
encourage learning on the job, particularly when it comes as part of certified programmes such as
vocational education and training pathways (VET) or apprenticeships. Despite this central role in current
policy thinking, comparative statistics on work and study are hard to come by and information is patchy at
best when it comes to the context in which most students work – crucially, whether there is a (formal or
informal) link between their schooling and their job.
2. This paper draws a comprehensive picture of work and study in 23 countries/regions participating
in the 2012 Survey of Adult Skills (PIAAC). It decomposes the total share of students who work by the
context in which they work (VET, apprenticeships or private arrangements) and assesses the link between
field of study and students’ work (Sections 1 and 2). The paper also identifies the socio-demographic
factors, the characteristics of the education system and the labour market institutions that increase the
likelihood of work and study (Section 3). Finally, while it is not possible to examine the relationship
between work and study and future labour market outcomes at the individual level, some aggregate
correlations are unveiled (Section 4).
1. The incidence of work and study and its role in skills accumulation
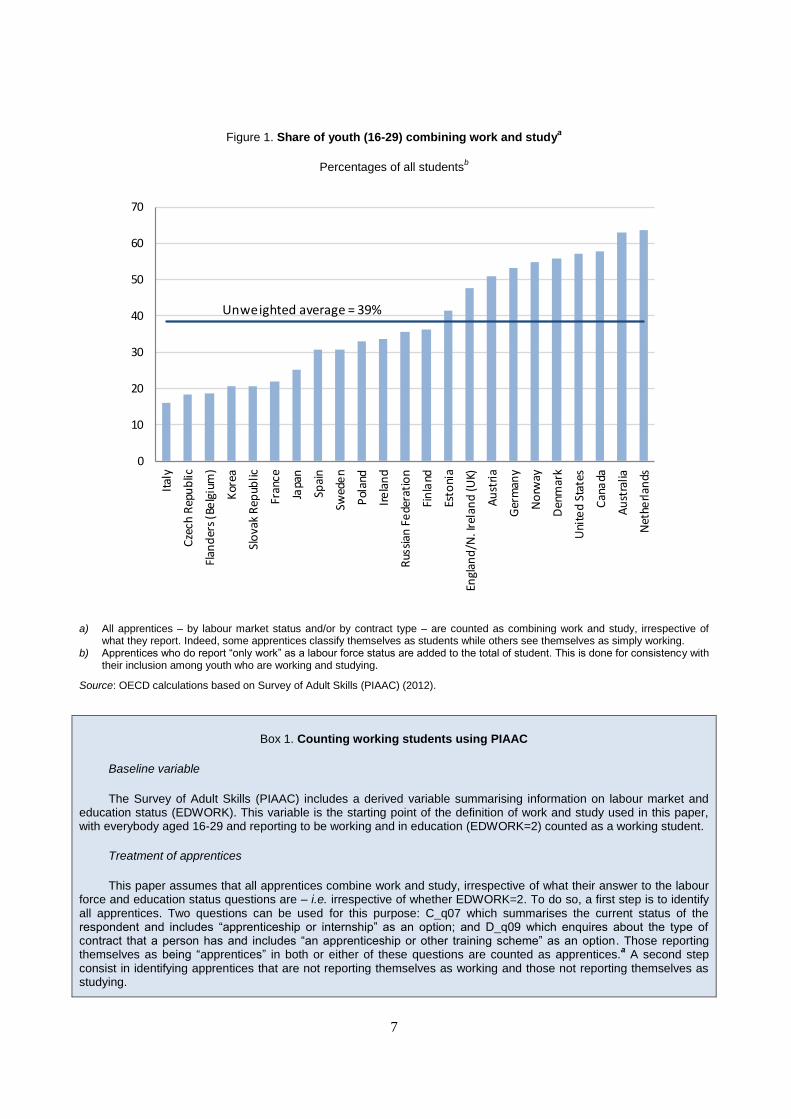
3. The Survey of Adult skills provides unique comparable cross-country information on the
incidence and composition of work and study. Combining information on student and work status,
educational pathway and apprenticeship status (see Box 1), the survey suggests that 39% of 16-29 year-old
students worked in 2012 (Figure 1). However, this average hides major differences across countries: the
combination or work and study is found to be most common in Anglo-Saxon countries as well as countries
with a long tradition of apprenticeships where more than half of students work; it is least common in the
Czech Republic, Flanders and Italy where fewer than 20% of students work.
7
Figure 1. Share of youth (16-29) combining work and studya
Percentages of all studentsb
a) All apprentices – by labour market status and/or by contract type – are counted as combining work and study, irrespective of what they report. Indeed, some apprentices classify themselves as students while others see themselves as simply working.
b) Apprentices who do report “only work” as a labour force status are added to the total of student. This is done for consistency with their inclusion among youth who are working and studying.
Source: OECD calculations based on Survey of Adult Skills (PIAAC) (2012).
Box 1. Counting working students using PIAAC
Baseline variable
The Survey of Adult Skills (PIAAC) includes a derived variable summarising information on labour market and education status (EDWORK). This variable is the starting point of the definition of work and study used in this paper, with everybody aged 16-29 and reporting to be working and in education (EDWORK=2) counted as a working student.
Treatment of apprentices
This paper assumes that all apprentices combine work and study, irrespective of what their answer to the labour force and education status questions are – i.e. irrespective of whether EDWORK=2. To do so, a first step is to identify all apprentices. Two questions can be used for this purpose: C_q07 which summarises the current status of the respondent and includes “apprenticeship or internship” as an option; and D_q09 which enquires about the type of contract that a person has and includes “an apprenticeship or other training scheme” as an option. Those reporting themselves as being “apprentices” in both or either of these questions are counted as apprentices.
a A second step
consist in identifying apprentices that are not reporting themselves as working and those not reporting themselves as studying.
0
10
20
30
40
50
60
70
Ital
y
Cze
ch R
epu
blic
Flan
der
s (B
elg
ium
)
Kor
ea
Slo
vak
Rep
ublic
Fran
ce
Japa
n
Spai
n
Swed
en
Pol
and
Ire
lan
d
Rus
sian
Fe
dera
tio
n
Fin
land
Esto
nia
Engl
and
/N. I
rela
nd
(UK)
Au
stri
a
Ger
man
y
No
rway
Den
mar
k
Uni
ted
Stat
es
Can
ada
Au
stra
lia
Net
herl
ands
Unweighted average = 39%
8
Box 1. Counting working students using PIAAC (cont.)
These will not be included in the baseline definition of work and study, based on the EDWORK variable, hence need to be added to the total of working students. In addition, apprentices who do not report being students also need to be added to the total of 16-29-year olds who are studying which represents the reference group – i.e. the denominator – to calculate the incidence of work and study. Finally, youth who report being apprentices and on a vocational education and training are treated as apprentices only to avoid double counting.
Isolating working students in Vocational Education and Training programmes
Whether the person is currently studying towards a Vocational Education and Training (VET) qualification is defined using the same correspondence employed for VET status in the highest educational qualification of the respondent (available upon request). Because VET courses can be entirely class-based, contrary to the treatment of apprentices, only VET students declaring that they are working and studying are included in the analysis for this paper. It is noteworthy that VET status is only available at educational levels where the choice between academic or vocational education is possible. As a result, in most countries, VET status is only available for students in upper secondary education or higher. However, some exceptions exist for countries where VET education is available in lower secondary education.
a) Some respondents will declare to be working and then to have an apprenticeship contract (C_q07=1 or 2; and D_q09=4) while others will simply say they are apprentices (C_q07=5). In both cases, the respondent is counted as an apprentice and as combining work and study.
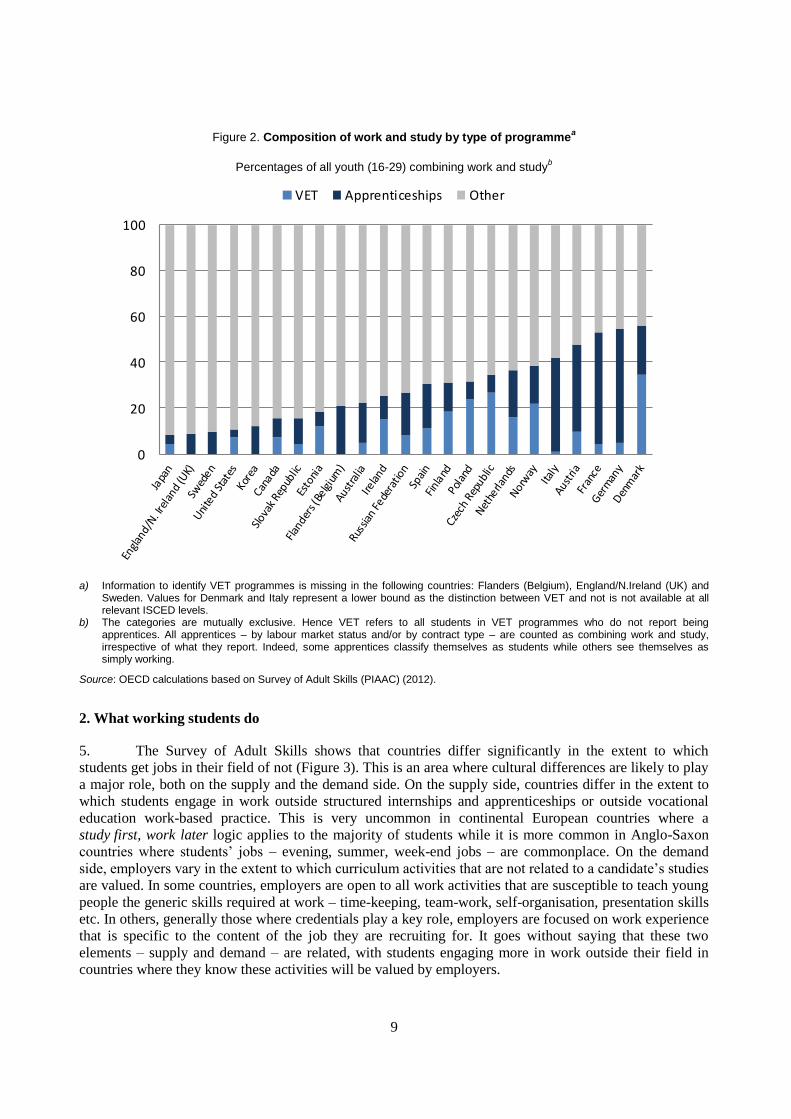
4. Apprenticeships account for about 50% of all work and study in Germany and France, about
40% in Austria and Italy, 20% in Denmark, Flanders (Belgium), the Netherlands and Spain while they
represent less than 10% of the total in most other countries (Figure 2). VET programmes also account for a
large portion of work and study in some countries, exceeding 20% in the Czech Republic, Denmark,
Norway and Poland. However, many youth who combine work and study are neither apprentices nor
studying towards a VET programme. This is particularly the case in England/N. Ireland, Japan, Korea,
Sweden and the United States where this group accounts for about 90% of work and study.1
1. A further split (not shown here) would show that most youth working outside VET or apprenticeship
programmes are in tertiary education.
9
Figure 2. Composition of work and study by type of programmea
Percentages of all youth (16-29) combining work and studyb
a) Information to identify VET programmes is missing in the following countries: Flanders (Belgium), England/N.Ireland (UK) and Sweden. Values for Denmark and Italy represent a lower bound as the distinction between VET and not is not available at all relevant ISCED levels.
b) The categories are mutually exclusive. Hence VET refers to all students in VET programmes who do not report being apprentices. All apprentices – by labour market status and/or by contract type – are counted as combining work and study, irrespective of what they report. Indeed, some apprentices classify themselves as students while others see themselves as simply working.
Source: OECD calculations based on Survey of Adult Skills (PIAAC) (2012).
2. What working students do
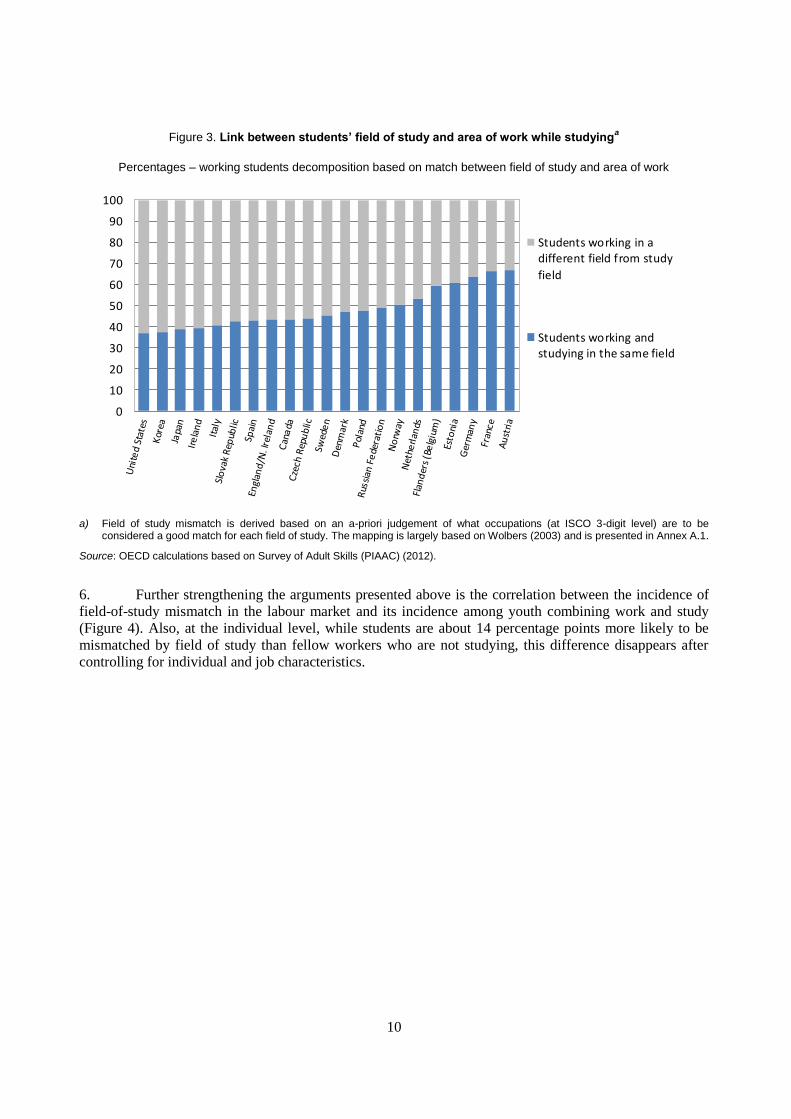
5. The Survey of Adult Skills shows that countries differ significantly in the extent to which
students get jobs in their field of not (Figure 3). This is an area where cultural differences are likely to play
a major role, both on the supply and the demand side. On the supply side, countries differ in the extent to
which students engage in work outside structured internships and apprenticeships or outside vocational
education work-based practice. This is very uncommon in continental European countries where a
study first, work later logic applies to the majority of students while it is more common in Anglo-Saxon
countries where students’ jobs – evening, summer, week-end jobs – are commonplace. On the demand
side, employers vary in the extent to which curriculum activities that are not related to a candidate’s studies
are valued. In some countries, employers are open to all work activities that are susceptible to teach young
people the generic skills required at work – time-keeping, team-work, self-organisation, presentation skills
etc. In others, generally those where credentials play a key role, employers are focused on work experience
that is specific to the content of the job they are recruiting for. It goes without saying that these two
elements – supply and demand – are related, with students engaging more in work outside their field in
countries where they know these activities will be valued by employers.
0
20
40
60
80
100
VET Apprenticeships Other
10
Figure 3. Link between students’ field of study and area of work while studyinga
Percentages – working students decomposition based on match between field of study and area of work
a) Field of study mismatch is derived based on an a-priori judgement of what occupations (at ISCO 3-digit level) are to be considered a good match for each field of study. The mapping is largely based on Wolbers (2003) and is presented in Annex A.1.
Source: OECD calculations based on Survey of Adult Skills (PIAAC) (2012).
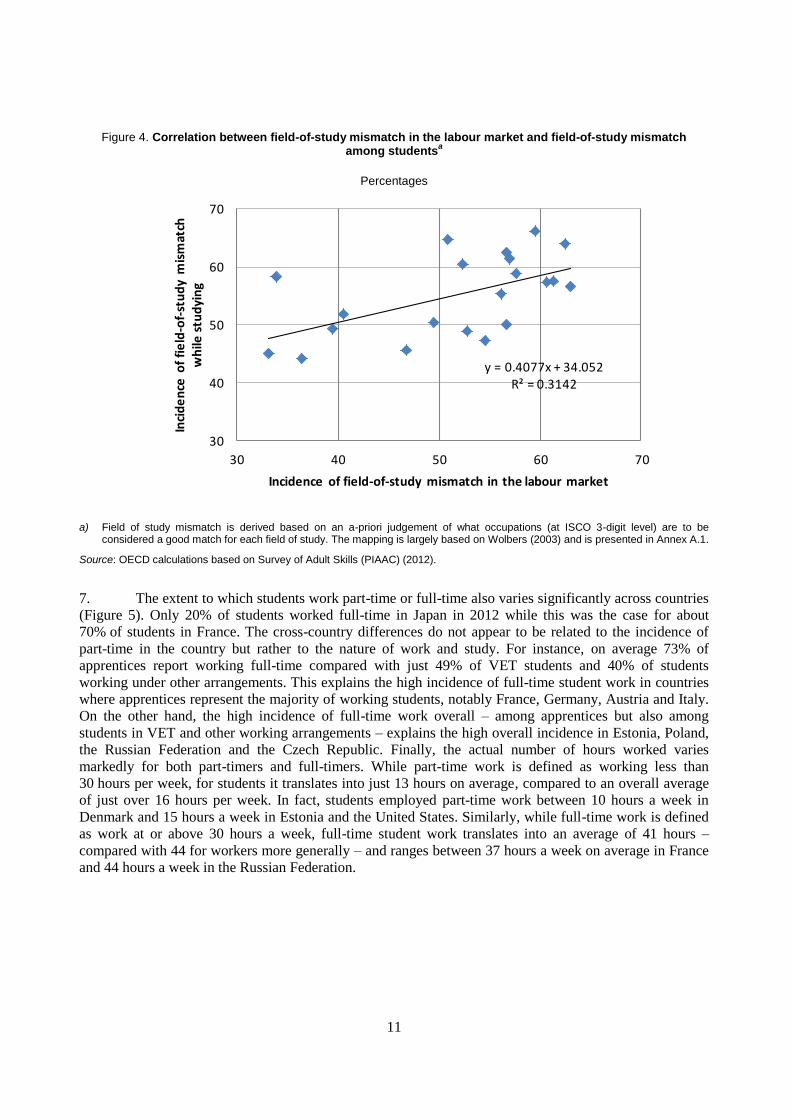
6. Further strengthening the arguments presented above is the correlation between the incidence of
field-of-study mismatch in the labour market and its incidence among youth combining work and study
(Figure 4). Also, at the individual level, while students are about 14 percentage points more likely to be
mismatched by field of study than fellow workers who are not studying, this difference disappears after
controlling for individual and job characteristics.
0
10
20
30
40
50
60
70
80
90
100
Students working in adifferent field from study
field
Students working andstudying in the same field
11
Figure 4. Correlation between field-of-study mismatch in the labour market and field-of-study mismatch among students
a
Percentages
a) Field of study mismatch is derived based on an a-priori judgement of what occupations (at ISCO 3-digit level) are to be considered a good match for each field of study. The mapping is largely based on Wolbers (2003) and is presented in Annex A.1.
Source: OECD calculations based on Survey of Adult Skills (PIAAC) (2012).
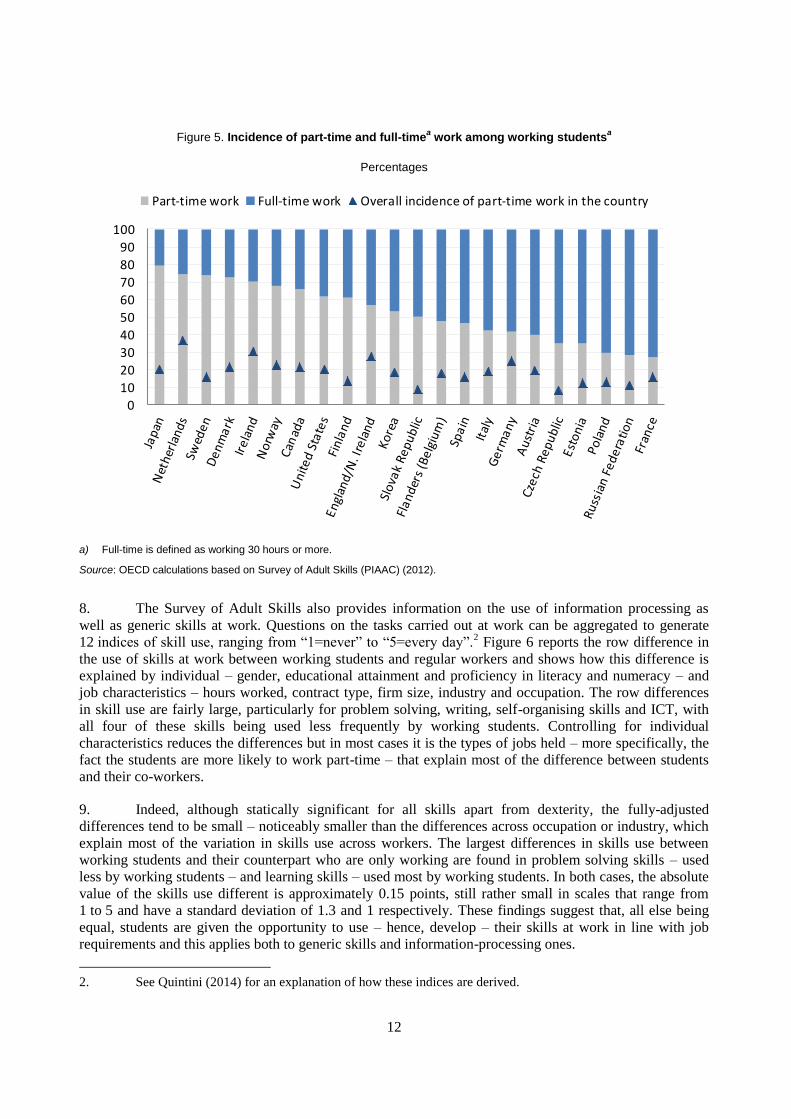
7. The extent to which students work part-time or full-time also varies significantly across countries
(Figure 5). Only 20% of students worked full-time in Japan in 2012 while this was the case for about
70% of students in France. The cross-country differences do not appear to be related to the incidence of
part-time in the country but rather to the nature of work and study. For instance, on average 73% of
apprentices report working full-time compared with just 49% of VET students and 40% of students
working under other arrangements. This explains the high incidence of full-time student work in countries
where apprentices represent the majority of working students, notably France, Germany, Austria and Italy.
On the other hand, the high incidence of full-time work overall – among apprentices but also among
students in VET and other working arrangements – explains the high overall incidence in Estonia, Poland,
the Russian Federation and the Czech Republic. Finally, the actual number of hours worked varies
markedly for both part-timers and full-timers. While part-time work is defined as working less than
30 hours per week, for students it translates into just 13 hours on average, compared to an overall average
of just over 16 hours per week. In fact, students employed part-time work between 10 hours a week in
Denmark and 15 hours a week in Estonia and the United States. Similarly, while full-time work is defined
as work at or above 30 hours a week, full-time student work translates into an average of 41 hours –
compared with 44 for workers more generally – and ranges between 37 hours a week on average in France
and 44 hours a week in the Russian Federation.
y = 0.4077x + 34.052R² = 0.3142
30
40
50
60
70
30 40 50 60 70
Inci
de
nce
of
fie
ld-o
f-st
ud
y m
ism
atch
w
hile
stu
dyi
ng
Incidence of field-of-study mismatch in the labour market
12
Figure 5. Incidence of part-time and full-timea work among working students
a
Percentages
a) Full-time is defined as working 30 hours or more.
Source: OECD calculations based on Survey of Adult Skills (PIAAC) (2012).
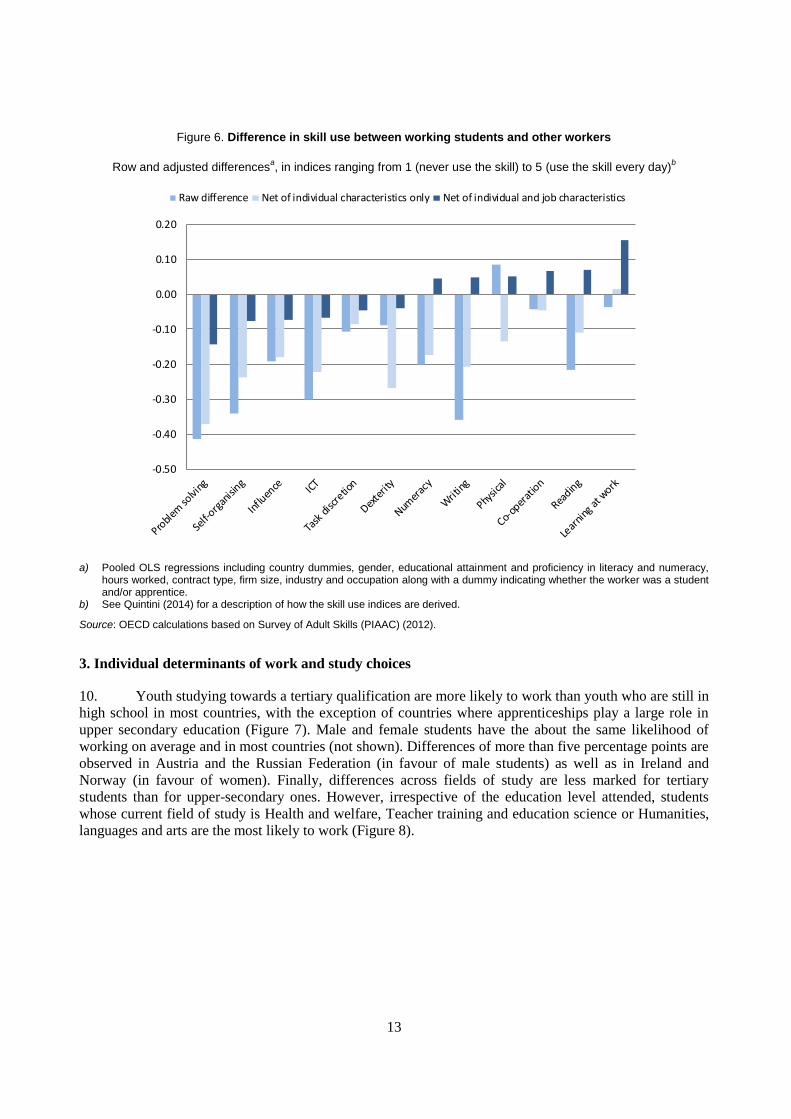
8. The Survey of Adult Skills also provides information on the use of information processing as
well as generic skills at work. Questions on the tasks carried out at work can be aggregated to generate
12 indices of skill use, ranging from “1=never” to “5=every day”.2 Figure 6 reports the row difference in
the use of skills at work between working students and regular workers and shows how this difference is
explained by individual – gender, educational attainment and proficiency in literacy and numeracy – and
job characteristics – hours worked, contract type, firm size, industry and occupation. The row differences
in skill use are fairly large, particularly for problem solving, writing, self-organising skills and ICT, with
all four of these skills being used less frequently by working students. Controlling for individual
characteristics reduces the differences but in most cases it is the types of jobs held – more specifically, the
fact the students are more likely to work part-time – that explain most of the difference between students
and their co-workers.
9. Indeed, although statically significant for all skills apart from dexterity, the fully-adjusted
differences tend to be small – noticeably smaller than the differences across occupation or industry, which
explain most of the variation in skills use across workers. The largest differences in skills use between
working students and their counterpart who are only working are found in problem solving skills – used
less by working students – and learning skills – used most by working students. In both cases, the absolute
value of the skills use different is approximately 0.15 points, still rather small in scales that range from
1 to 5 and have a standard deviation of 1.3 and 1 respectively. These findings suggest that, all else being
equal, students are given the opportunity to use – hence, develop – their skills at work in line with job
requirements and this applies both to generic skills and information-processing ones.
2. See Quintini (2014) for an explanation of how these indices are derived.
0
10
20
30
40
50
60
70
80
90
100
Part-time work Full-time work Overall incidence of part-time work in the country
13
Figure 6. Difference in skill use between working students and other workers
Row and adjusted differencesa, in indices ranging from 1 (never use the skill) to 5 (use the skill every day)
b
a) Pooled OLS regressions including country dummies, gender, educational attainment and proficiency in literacy and numeracy, hours worked, contract type, firm size, industry and occupation along with a dummy indicating whether the worker was a student and/or apprentice.
b) See Quintini (2014) for a description of how the skill use indices are derived.
Source: OECD calculations based on Survey of Adult Skills (PIAAC) (2012).
3. Individual determinants of work and study choices
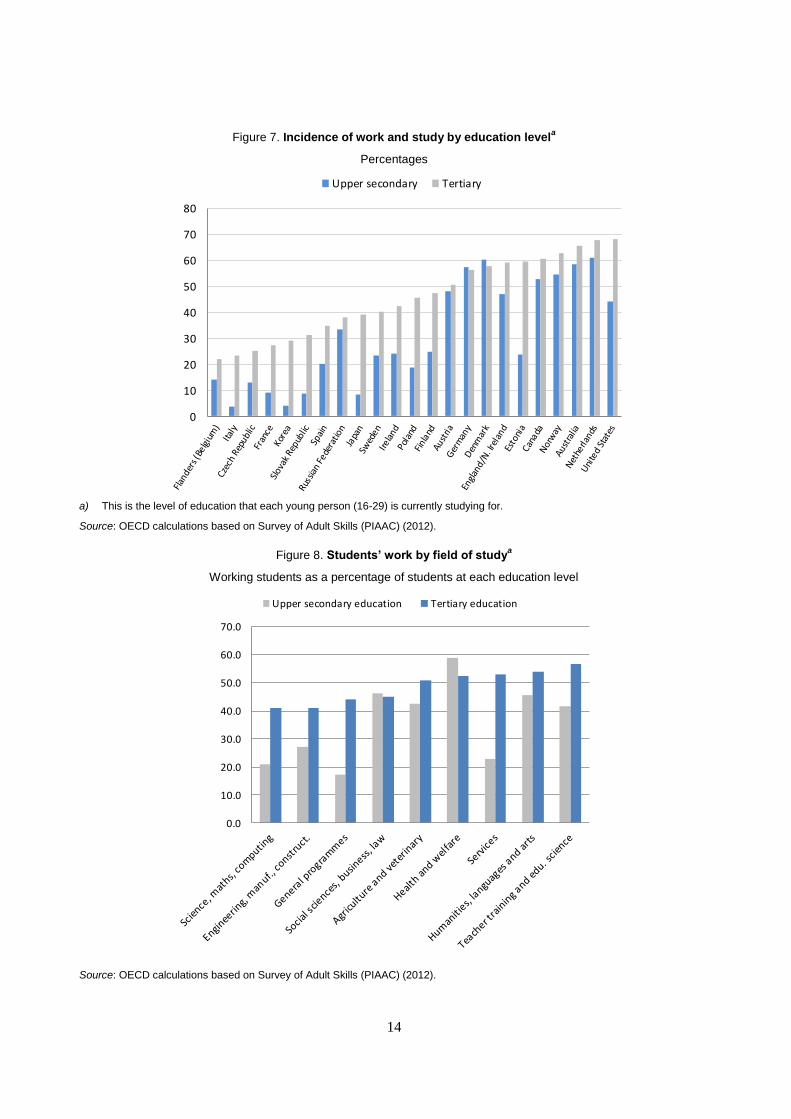
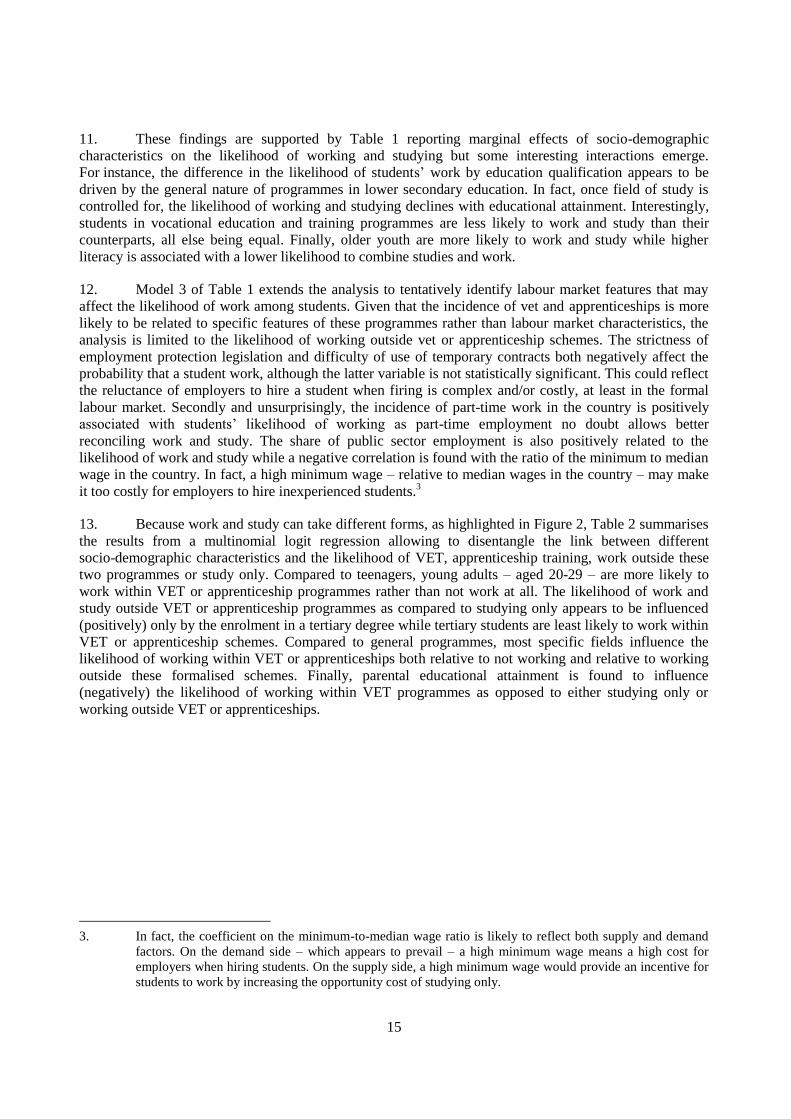
10. Youth studying towards a tertiary qualification are more likely to work than youth who are still in
high school in most countries, with the exception of countries where apprenticeships play a large role in
upper secondary education (Figure 7). Male and female students have the about the same likelihood of
working on average and in most countries (not shown). Differences of more than five percentage points are
observed in Austria and the Russian Federation (in favour of male students) as well as in Ireland and
Norway (in favour of women). Finally, differences across fields of study are less marked for tertiary
students than for upper-secondary ones. However, irrespective of the education level attended, students
whose current field of study is Health and welfare, Teacher training and education science or Humanities,
languages and arts are the most likely to work (Figure 8).
-0.50
-0.40
-0.30
-0.20
-0.10
0.00
0.10
0.20
Raw difference Net of individual characteristics only Net of individual and job characteristics
14
Figure 7. Incidence of work and study by education levela
Percentages
a) This is the level of education that each young person (16-29) is currently studying for.
Source: OECD calculations based on Survey of Adult Skills (PIAAC) (2012).
Figure 8. Students’ work by field of studya
Working students as a percentage of students at each education level
Source: OECD calculations based on Survey of Adult Skills (PIAAC) (2012).
0
10
20
30
40
50
60
70
80
Upper secondary Tertiary
0.0
10.0
20.0
30.0
40.0
50.0
60.0
70.0
Upper secondary education Tertiary education
15
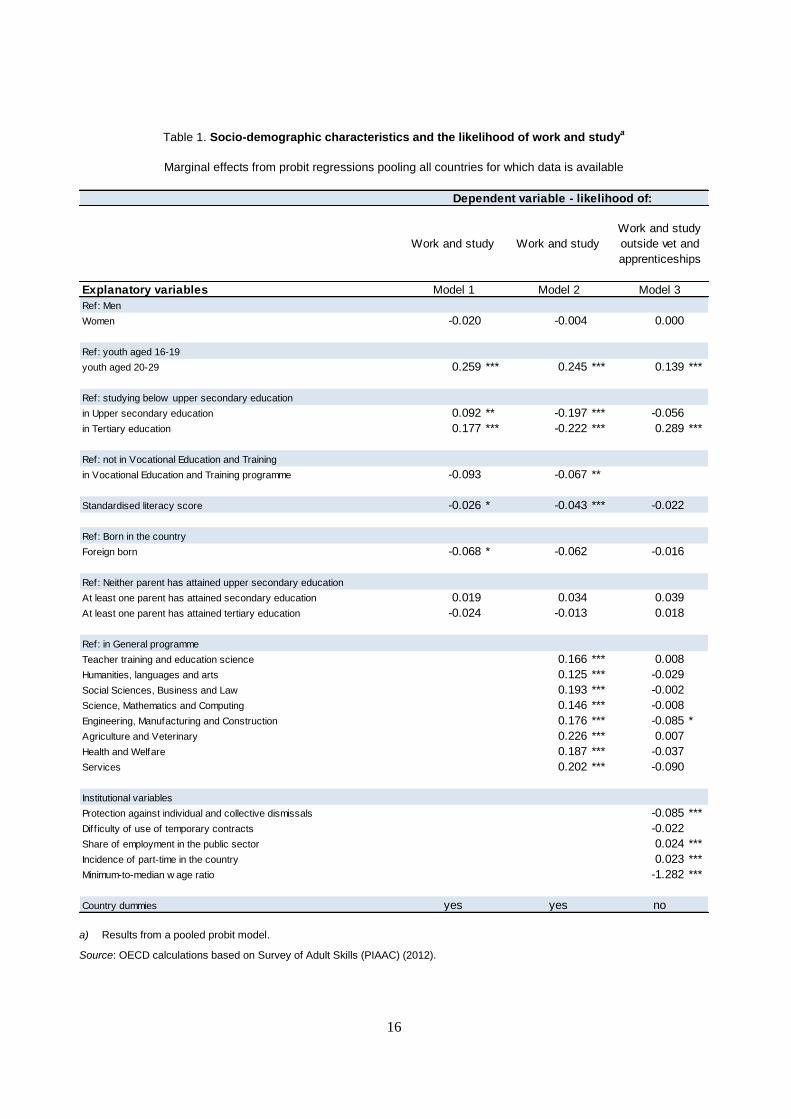
11. These findings are supported by Table 1 reporting marginal effects of socio-demographic
characteristics on the likelihood of working and studying but some interesting interactions emerge.
For instance, the difference in the likelihood of students’ work by education qualification appears to be
driven by the general nature of programmes in lower secondary education. In fact, once field of study is
controlled for, the likelihood of working and studying declines with educational attainment. Interestingly,
students in vocational education and training programmes are less likely to work and study than their
counterparts, all else being equal. Finally, older youth are more likely to work and study while higher
literacy is associated with a lower likelihood to combine studies and work.
12. Model 3 of Table 1 extends the analysis to tentatively identify labour market features that may
affect the likelihood of work among students. Given that the incidence of vet and apprenticeships is more
likely to be related to specific features of these programmes rather than labour market characteristics, the
analysis is limited to the likelihood of working outside vet or apprenticeship schemes. The strictness of
employment protection legislation and difficulty of use of temporary contracts both negatively affect the
probability that a student work, although the latter variable is not statistically significant. This could reflect
the reluctance of employers to hire a student when firing is complex and/or costly, at least in the formal
labour market. Secondly and unsurprisingly, the incidence of part-time work in the country is positively
associated with students’ likelihood of working as part-time employment no doubt allows better
reconciling work and study. The share of public sector employment is also positively related to the
likelihood of work and study while a negative correlation is found with the ratio of the minimum to median
wage in the country. In fact, a high minimum wage – relative to median wages in the country – may make
it too costly for employers to hire inexperienced students.3
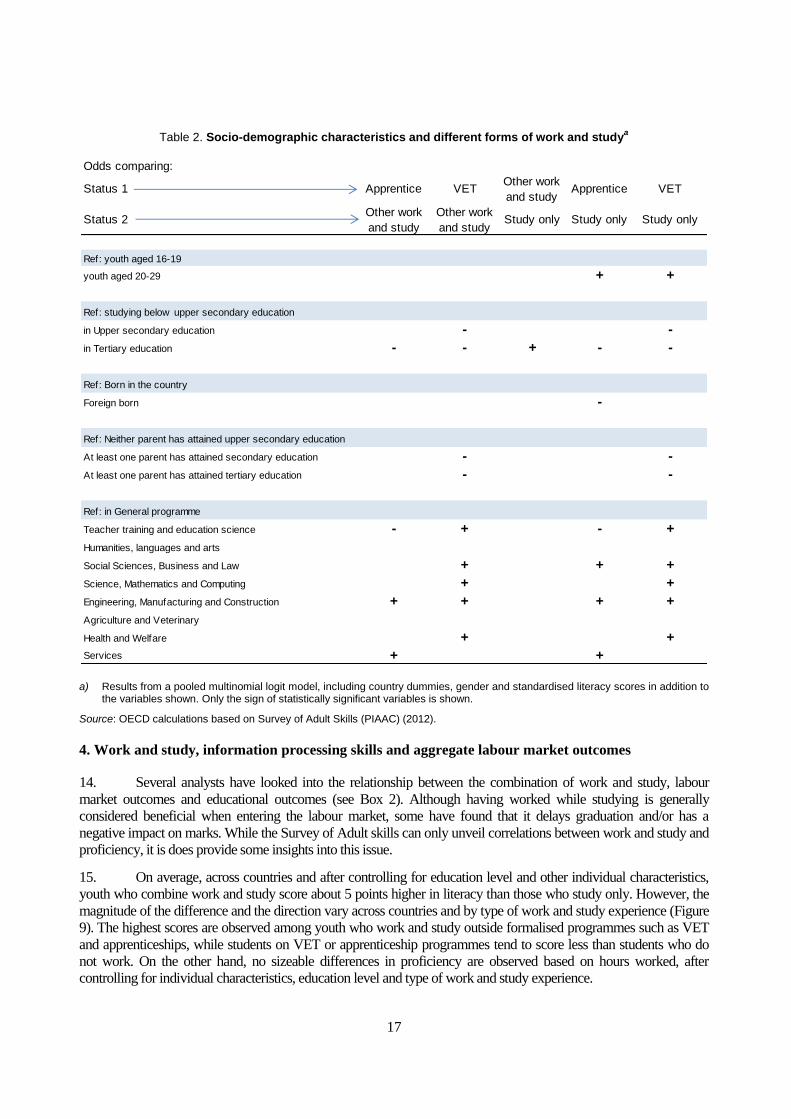
13. Because work and study can take different forms, as highlighted in Figure 2, Table 2 summarises
the results from a multinomial logit regression allowing to disentangle the link between different
socio-demographic characteristics and the likelihood of VET, apprenticeship training, work outside these
two programmes or study only. Compared to teenagers, young adults – aged 20-29 – are more likely to
work within VET or apprenticeship programmes rather than not work at all. The likelihood of work and
study outside VET or apprenticeship programmes as compared to studying only appears to be influenced
(positively) only by the enrolment in a tertiary degree while tertiary students are least likely to work within
VET or apprenticeship schemes. Compared to general programmes, most specific fields influence the
likelihood of working within VET or apprenticeships both relative to not working and relative to working
outside these formalised schemes. Finally, parental educational attainment is found to influence
(negatively) the likelihood of working within VET programmes as opposed to either studying only or
working outside VET or apprenticeships.
3. In fact, the coefficient on the minimum-to-median wage ratio is likely to reflect both supply and demand
factors. On the demand side – which appears to prevail – a high minimum wage means a high cost for
employers when hiring students. On the supply side, a high minimum wage would provide an incentive for
students to work by increasing the opportunity cost of studying only.
16
Table 1. Socio-demographic characteristics and the likelihood of work and studya
Marginal effects from probit regressions pooling all countries for which data is available
a) Results from a pooled probit model.
Source: OECD calculations based on Survey of Adult Skills (PIAAC) (2012).
Explanatory variables
Ref: Men
Women -0.020 -0.004 0.000
Ref: youth aged 16-19
youth aged 20-29 0.259 *** 0.245 *** 0.139 ***
Ref: studying below upper secondary education
in Upper secondary education 0.092 ** -0.197 *** -0.056
in Tertiary education 0.177 *** -0.222 *** 0.289 ***
Ref: not in Vocational Education and Training
in Vocational Education and Training programme -0.093 -0.067 **
Standardised literacy score -0.026 * -0.043 *** -0.022
Ref: Born in the country
Foreign born -0.068 * -0.062 -0.016
Ref: Neither parent has attained upper secondary education
At least one parent has attained secondary education 0.019 0.034 0.039
At least one parent has attained tertiary education -0.024 -0.013 0.018
Ref: in General programme
Teacher training and education science 0.166 *** 0.008
Humanities, languages and arts 0.125 *** -0.029
Social Sciences, Business and Law 0.193 *** -0.002
Science, Mathematics and Computing 0.146 *** -0.008
Engineering, Manufacturing and Construction 0.176 *** -0.085 *
Agriculture and Veterinary 0.226 *** 0.007
Health and Welfare 0.187 *** -0.037
Services 0.202 *** -0.090
Institutional variables
Protection against individual and collective dismissals -0.085 ***
Diff iculty of use of temporary contracts -0.022
Share of employment in the public sector 0.024 ***
Incidence of part-time in the country 0.023 ***
Minimum-to-median w age ratio -1.282 ***
Country dummies
Model 3
no
Model 1 Model 2
yesyes
Dependent variable - likelihood of:
Work and study Work and study
Work and study
outside vet and
apprenticeships
17
Table 2. Socio-demographic characteristics and different forms of work and studya
a) Results from a pooled multinomial logit model, including country dummies, gender and standardised literacy scores in addition to the variables shown. Only the sign of statistically significant variables is shown.
Source: OECD calculations based on Survey of Adult Skills (PIAAC) (2012).
4. Work and study, information processing skills and aggregate labour market outcomes
14. Several analysts have looked into the relationship between the combination of work and study, labour
market outcomes and educational outcomes (see Box 2). Although having worked while studying is generally
considered beneficial when entering the labour market, some have found that it delays graduation and/or has a
negative impact on marks. While the Survey of Adult skills can only unveil correlations between work and study and
proficiency, it is does provide some insights into this issue.
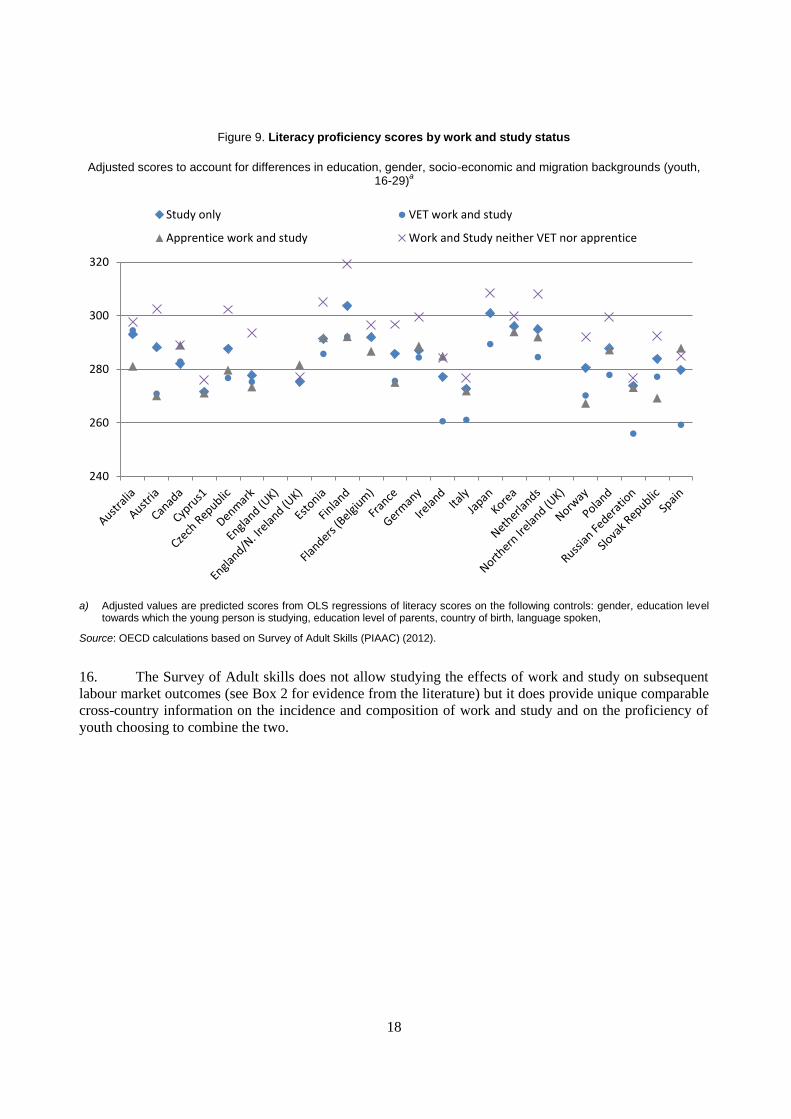
15. On average, across countries and after controlling for education level and other individual characteristics,
youth who combine work and study score about 5 points higher in literacy than those who study only. However, the
magnitude of the difference and the direction vary across countries and by type of work and study experience (Figure
9). The highest scores are observed among youth who work and study outside formalised programmes such as VET
and apprenticeships, while students on VET or apprenticeship programmes tend to score less than students who do
not work. On the other hand, no sizeable differences in proficiency are observed based on hours worked, after
controlling for individual characteristics, education level and type of work and study experience.
Odds comparing:
Status 1 Apprentice VETOther work
and study Apprentice VET
Status 2Other work
and study
Other work
and studyStudy only Study only Study only
Ref: youth aged 16-19
youth aged 20-29 + +
Ref: studying below upper secondary education
in Upper secondary education - -
in Tertiary education - - + - -
Ref: Born in the country
Foreign born -
Ref: Neither parent has attained upper secondary education
At least one parent has attained secondary education - -
At least one parent has attained tertiary education - -
Ref: in General programme
Teacher training and education science - + - +
Humanities, languages and arts
Social Sciences, Business and Law + + +
Science, Mathematics and Computing + +
Engineering, Manufacturing and Construction + + + +
Agriculture and Veterinary
Health and Welfare + +
Services + +
18
Figure 9. Literacy proficiency scores by work and study status
Adjusted scores to account for differences in education, gender, socio-economic and migration backgrounds (youth, 16-29)
a
a) Adjusted values are predicted scores from OLS regressions of literacy scores on the following controls: gender, education level towards which the young person is studying, education level of parents, country of birth, language spoken,
Source: OECD calculations based on Survey of Adult Skills (PIAAC) (2012).
16. The Survey of Adult skills does not allow studying the effects of work and study on subsequent
labour market outcomes (see Box 2 for evidence from the literature) but it does provide unique comparable
cross-country information on the incidence and composition of work and study and on the proficiency of
youth choosing to combine the two.
240
260
280
300
320
Study only VET work and study
Apprentice work and study Work and Study neither VET nor apprentice
19
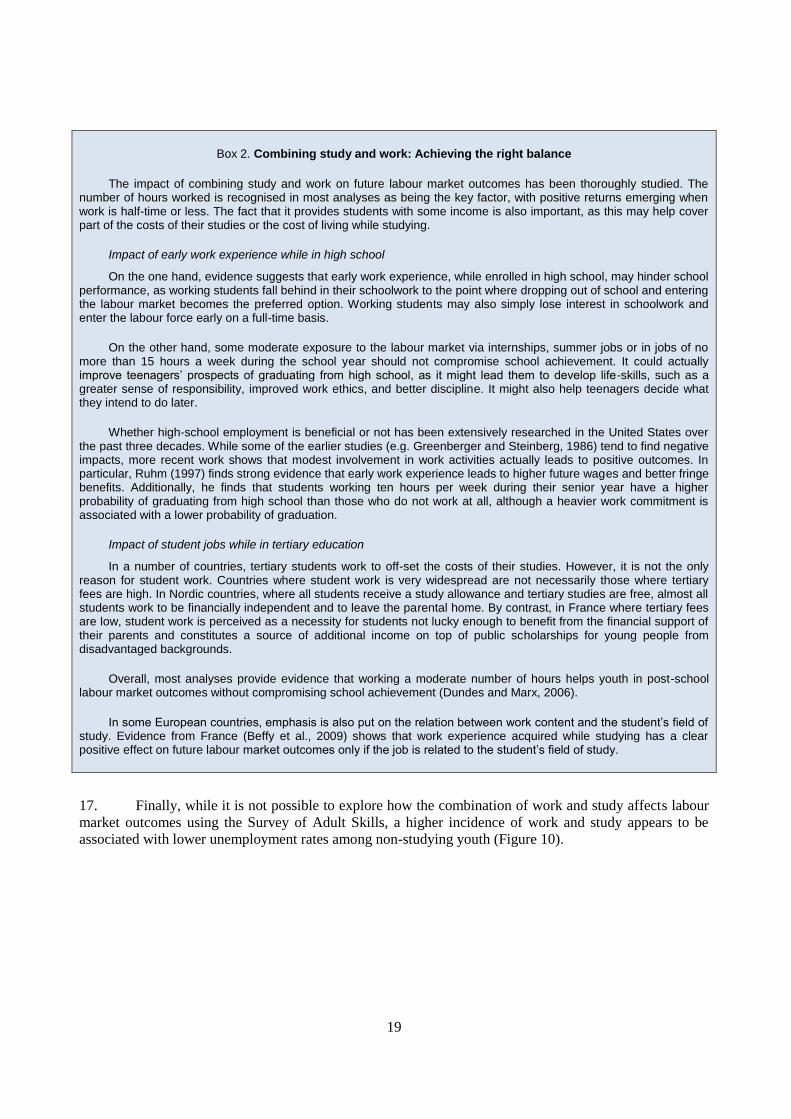
Box 2. Combining study and work: Achieving the right balance
The impact of combining study and work on future labour market outcomes has been thoroughly studied. The number of hours worked is recognised in most analyses as being the key factor, with positive returns emerging when work is half-time or less. The fact that it provides students with some income is also important, as this may help cover part of the costs of their studies or the cost of living while studying.
Impact of early work experience while in high school
On the one hand, evidence suggests that early work experience, while enrolled in high school, may hinder school performance, as working students fall behind in their schoolwork to the point where dropping out of school and entering the labour market becomes the preferred option. Working students may also simply lose interest in schoolwork and enter the labour force early on a full-time basis.
On the other hand, some moderate exposure to the labour market via internships, summer jobs or in jobs of no more than 15 hours a week during the school year should not compromise school achievement. It could actually improve teenagers’ prospects of graduating from high school, as it might lead them to develop life-skills, such as a greater sense of responsibility, improved work ethics, and better discipline. It might also help teenagers decide what they intend to do later.
Whether high-school employment is beneficial or not has been extensively researched in the United States over the past three decades. While some of the earlier studies (e.g. Greenberger and Steinberg, 1986) tend to find negative impacts, more recent work shows that modest involvement in work activities actually leads to positive outcomes. In particular, Ruhm (1997) finds strong evidence that early work experience leads to higher future wages and better fringe benefits. Additionally, he finds that students working ten hours per week during their senior year have a higher probability of graduating from high school than those who do not work at all, although a heavier work commitment is associated with a lower probability of graduation.
Impact of student jobs while in tertiary education
In a number of countries, tertiary students work to off-set the costs of their studies. However, it is not the only reason for student work. Countries where student work is very widespread are not necessarily those where tertiary fees are high. In Nordic countries, where all students receive a study allowance and tertiary studies are free, almost all students work to be financially independent and to leave the parental home. By contrast, in France where tertiary fees are low, student work is perceived as a necessity for students not lucky enough to benefit from the financial support of their parents and constitutes a source of additional income on top of public scholarships for young people from disadvantaged backgrounds.
Overall, most analyses provide evidence that working a moderate number of hours helps youth in post-school labour market outcomes without compromising school achievement (Dundes and Marx, 2006).
In some European countries, emphasis is also put on the relation between work content and the student’s field of study. Evidence from France (Beffy et al., 2009) shows that work experience acquired while studying has a clear positive effect on future labour market outcomes only if the job is related to the student’s field of study.
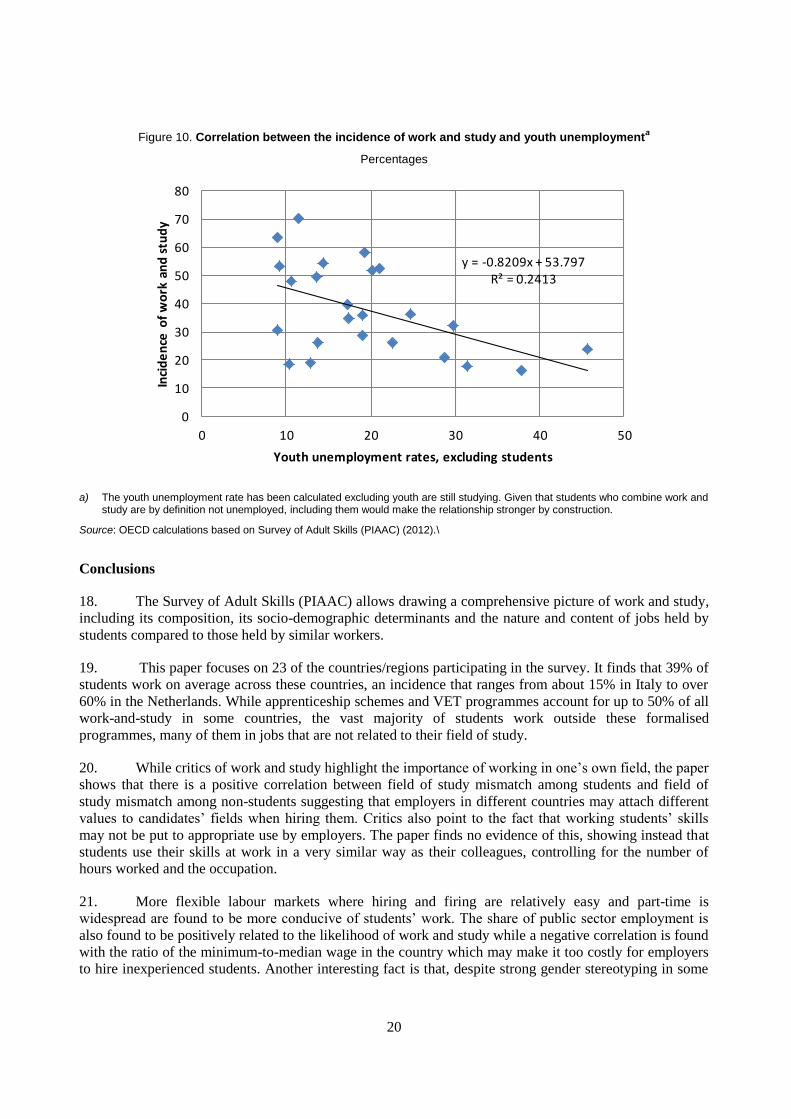
17. Finally, while it is not possible to explore how the combination of work and study affects labour
market outcomes using the Survey of Adult Skills, a higher incidence of work and study appears to be
associated with lower unemployment rates among non-studying youth (Figure 10).
20
Figure 10. Correlation between the incidence of work and study and youth unemploymenta
Percentages
a) The youth unemployment rate has been calculated excluding youth are still studying. Given that students who combine work and study are by definition not unemployed, including them would make the relationship stronger by construction.
Source: OECD calculations based on Survey of Adult Skills (PIAAC) (2012).\
Conclusions
18. The Survey of Adult Skills (PIAAC) allows drawing a comprehensive picture of work and study,
including its composition, its socio-demographic determinants and the nature and content of jobs held by
students compared to those held by similar workers.
19. This paper focuses on 23 of the countries/regions participating in the survey. It finds that 39% of
students work on average across these countries, an incidence that ranges from about 15% in Italy to over
60% in the Netherlands. While apprenticeship schemes and VET programmes account for up to 50% of all
work-and-study in some countries, the vast majority of students work outside these formalised
programmes, many of them in jobs that are not related to their field of study.
20. While critics of work and study highlight the importance of working in one’s own field, the paper
shows that there is a positive correlation between field of study mismatch among students and field of
study mismatch among non-students suggesting that employers in different countries may attach different
values to candidates’ fields when hiring them. Critics also point to the fact that working students’ skills
may not be put to appropriate use by employers. The paper finds no evidence of this, showing instead that
students use their skills at work in a very similar way as their colleagues, controlling for the number of
hours worked and the occupation.
21. More flexible labour markets where hiring and firing are relatively easy and part-time is
widespread are found to be more conducive of students’ work. The share of public sector employment is
also found to be positively related to the likelihood of work and study while a negative correlation is found
with the ratio of the minimum-to-median wage in the country which may make it too costly for employers
to hire inexperienced students. Another interesting fact is that, despite strong gender stereotyping in some
y = -0.8209x + 53.797R² = 0.2413
0
10
20
30
40
50
60
70
80
0 10 20 30 40 50
Inci
de
nce
of
wo
rk a
nd
stu
dy
Youth unemployment rates, excluding students
21
VET and apprenticeship programmes, gender does not appear to influence the likelihood of work and
study, once other factors are controlled for.
22. Finally, the paper presents how some outcome variables are associated with the probability of
work and study. Although reverse causality is a serious issue, it is shown that while VET working students
and apprentices tend to have lower scores than non-working students after controlling for other
socio-demographic characteristics, the opposite is true for those working outside these formalised
programmes. Also, while it is not possible to examine the relationship between work and study and future
labour market outcomes at the individual level, a negative correlation between the share of students who
work and study and youth unemployment is found.
22
BIBLIOGRAPHY
Beffy, M., D. Fougère and A. Maurel (2009), “L’impact du travail salarié des étudiants sur la réussite et la
poursuite des études universitaires”, Économie et Statistique, No. 422, Paris.
Dundes, L. and J. Marx (2006), “Balancing Work and Academics in College: Why Do Students Working
10 to 19 Hours per Week Excel?”, Journal of College Student Retention: Research, Theory and
Practice,Vol. 8, No. 1.
Greenberger, E. and L.D. Steinberg (1986), The Psychological and Social Costs of Adolescent
Employment, Basic, New York.
Quintini, G. (2014), "Skills at Work: How Skills and their Use Matter in the Labour Market", OECD
Social, Employment and Migration Working Papers, No. 158, OECD Publishing, Paris,
http://dx.doi.org/10.1787/5jz44fdfjm7j-en.
Ruhm, C.J. (1997), “Is High School Employment Consumption or Investment?”, Journal of Labor
Economics, No. 15.
Wolbers, M. (2003), “Job mismatches and their labour market effects among school-leavers in Europe”
European Sociological Review, Vol. 19, pp. 249-266.
23
ANNEX A.1. CODING OF ISCO-08 3-DIGIT OCCUPATION CLASSIFICATION TO FIELDS
FOR FIELD-OF-STUDY MISMATCH
The following correspondence defines well matched individuals based on their field-of-study
(in italics) and ISCO-08 occupation. The same correspondence table categorises occupations into
occupational groups.
(2) Teacher training and education science: university, higher education, vocational, secondary,
primary, early childhood and other teaching professionals (ISCO 231-235); sports and fitness
workers (ISCO 342); and child care workers and teaches’ aides (ISCO 531).
(3) Humanities, languages and arts: university, higher education, vocational and secondary
education teaching professionals (ISCO 231-233); architects, planners, surveyors and designers
(ISCO 216); librarians, archivists and curators (ISCO 262); social and religious professionals
(ISCO 263); authors, journalists and linguists (ISCO 264); creative and performance artists
(ISCO 265); legal, social and religious associate professionals (ISCO 341); and artistic, cultural
and culinary associate professionals (ISCO 343).
(4) Social sciences, business and law: directors and chief executives (ISCO 112), managers
(ISCO 121-122, 131-134, 141-143); university, vocational and secondary education teaching
professionals (ISCO 231-233); business and administration professionals (ISCO 241-243); other
health professionals (ISCO 226); legal professionals (ISCO 261); librarians, archivists and
curators (ISCO 262); social and religious professionals (ISCO 263); authors, journalists and
linguists (ISCO 264); business and administration associate professionals (ISCO 331-335); other
health associate professionals (ISCO 325); legal, social and religious associate professionals
(ISCO 341); clerical support workers (ISCO 411-413, 421-422, 431-432, 441); sales workers
(ISCO 521-524); and street vendors (excluding food) (ISCO 952).
(5) Science, mathematics and computing: physical and earth science professionals (ISCO 211);
mathematicians, actuaries and statisticians (ISCO 212); life science professionals (ISCO 213);
other health professionals (ISCO 226); university, vocational and secondary education teaching
professionals (ISCO 231-233); Information and communications technology professionals (ISCO
251-252); physical and engineering science technicians (ISCO 311); process control technicians
(ISCO 313); life science technicians and related associate professionals (ISCO 314); medical and
pharmaceutical technicians (ISCO 321); financial and mathematical associate professionals
(ISCO 331); information and communications technicians (ISCO 351-352).
(6) Engineering, manufacturing and construction: engineering professionals (ISCO 214);
electrotechnology engineers (ISCO 215); architects, planners, surveyors and designers
(ISCO 216); university, higher education and vocational education teaching professionals (ISCO
231-232); information and communications technology professionals (ISCO 251-252); physical
and engineering science technicians (ISCO 311); mining, manufacturing and construction
supervisors (ISCO 312); process control technicians (ISCO 313); ship and aircraft controllers and
technicians (ISCO 315); regulatory government associate professionals (ISCO 335); information
and communications technicians (ISCO 351-352); building and housekeeping supervisors (ISCO
515); crafts and related trades workers (ISCO 711-713, 721-723, 731-732, 741-742, 751-754);
plant and machine operators and assemblers (ISCO 811-818, 821, 831-835); and labourers in
mining, construction, manufacturing and transport (ISCO 931-933).
24
(7) Agriculture and veterinary: life science professionals (ISCO 213); veterinarians (ISCO 225);
university, higher education and vocational education teaching professionals (ISCO 231-232);
life science technicians and related associate professionals (ISCO 314); medical and
pharmaceutical technicians (ISCO 321); veterinary technicians and assistants (ISCO 324); other
health associate professionals (ISCO 325); skilled agricultural, forestry and fishery workers
(ISCO 611-613, 621-622, 631-634); food processing and related trades workers (ISCO 751);
other craft and related workers (ISCO 754); mobile plant operators (ISCO 834); and agricultural,
forestry and fishery labourers (ISCO 921);
(8) Health and welfare: life science professionals (ISCO 213), health professionals
(ISCO 221-227); university and higher education teaching professionals (ISCO 231); primary
school and early childhood teachers (ISCO 234); social and religious professionals (ISCO 263);
health associate professionals (ISCO 321-325); legal, social and religious associate professionals
(ISCO 341); other personal service workers (ISCO 516); personal care workers (ISCO 531-532);
and protective services workers (ISCO 541).
(9) Service: professional services managers (ISCO 134); sales, marketing and public relations
professionals (ISCO 243); other health associate professionals (ISCO 325); administrative and
specialised secretaries (ISCO 334); regulatory government associate professionals (ISCO 335);
legal, social and religious associate professionals (ISCO 341); artistic, cultural and culinary
associate professionals (ISCO 343); clerical support workers (ISCO 411-413, 421-422, 431-432,
441); service and sales workers (ISCO 511-516, 521-524, 531-532, 541); drivers and mobile
plant operators (ISCO 831-835); cleaners and helpers (ISCO 911-912); food preparation
assistants (ISCO 941); street and related service workers (ISCO 951); and street vendors
(excluding food) (ISCO 952).
Coded as missing: all self-employed workers and those who majored in “general programmes”;
armed forces occupations (ISCO major group 0); legislators and senior officials (ISCO 111); and
refuse workers and other elementary workers (ISCO 961-962).
25
OECD SOCIAL, EMPLOYMENT AND MIGRATION WORKING PAPERS
Most recent releases are:
No. 168 THE EFFECTS OF VOCATIONAL EDUCATION ON ADULT SKILLS AND WAGES. WHAT CAN WE
LEARN FROM PIAAC?, Giorgio Brunello and Lorenzo Rocco (2015)
No. 167 THE CAUSES AND CONSEQUENCES OF FIELD-OF-STUDY MISMATCH: AN ANALYSIS USING
PIAAC, Guillermo Montt (2015)
No. 166 HOW DEMANDING ARE ELIGIBILITY CIRTERIA FOR UNEMPLOYMENT BENEFITS,
QUANTITATIVE INDICATORS FOR OECD AND EU COUNTRIES, Kristine Langenbucher (2015)
No. 165 LOST AND FOUND? THE COST OF JOB LOSS IN FRANCE, Vahé Nafilyan (2015)
No. 164 NEET YOUTH IN THE AFTERMATH OF THE CRISIS: CHALLENGES AND POLICIES, Stéphane
Carcillo, Rodrigo Fernández and Sebastian Königs, OECD Directorate for Employment, Labour and Social
Affairs, Social Policy Division; Andreea Minea, Sciences Po Paris (2015)
No. 163 TRENDS IN INCOME INEQUALITY AND ITS IMPACT ON ECONOMIC GROWTH, Federico Cingano
(Forthcoming)
No. 162 ARE RECIPIENTS OF SOCIAL ASSISTANCE 'BENEFIT DEPENDENT'? CONCEPTS, MEASUREMENT
AND RESULTS FOR SELECTED COUNTRIES, Herwig Immervoll, Stephen P. Jenkins, Sebastian Königs
(2014)
No. 161 MENTAL HEALTH AND WORK: ACHIEVING WELL-INTEGRATED POLICIES AND SERVICE
DELIVERY, Iris Arends, Niklas Baer, Veerle Miranda, Christopher Prinz and Shruti Singh (2014)
No. 160 A NEW PROFILE OF MIGRANTS IN THE AFTERMATH OF THE RECENT ECONOMIC CRISIS, Cansin
Arslan, Jean-Christophe Dumont, Zovanga Kone, Yasser Moullan, Caglar Ozden, Christopher Parsons,
Theodora Xenogiani (2014)
No. 159 TRENDS IN TOP INCOMES AND THEIR TAXATION IN OECD COUNTRIES, Michael Förster, Ana
Llena-Nozal and Vahé Nafilyan (2014)
No. 158 SKILLS AT WORK: HOW SKILLS AND THEIR USE MATTER IN THE LABOUR MARKET, Glenda Quintini (2014)
No. 157 CHANGES IN FAMILY POLICIES AND OUTCOMES: IS THERE CONVERGENCE?, Willem Adema,
Nabil Ali, and Oliver Thévenon
No. 156 RETOUR À L’EMPLOI DES CHOMEURS SENIORS FRANÇAIS AYANT BENEFICIE D’UN
ACCOMPAGNEMENT RENFORCE VERS L’EMPLOI EN 2009 ET 2010, Gwenn Parent (2014)
No. 155 MIGRATION AS AN ADJUSTMENT MECHANISM IN THE CRISIS? A COMPARISON OF EUROPE
AND THE UNITED STATES, Julia Jauer, Thomas Liebig, John P. Martin and Patrick Puhani (2014)
No. 154 SAME BUT DIFFERENT: SCHOOL-TO-WORK TRANSITIONS IN EMERGING AND ADVANCED
ECONOMIES, Glenda Quintini and Sébastien Martin (2014)
No. 153 A NEW MEASURE OF SKILLS MISMATCH, Michele Pellizzari and Anne Fichen (2013)
No. 152 CATASTROPHIC JOB DESTRUCTION, Anabela Carneiro, Pedro Portugal and José Varejão (2013)
No. 151 THE PERVERSE EFFECTS OF JOB-SECURITY PROVISIONS ON JOB SECURITY IN ITALY: RESULTS
FROM A REGRESSION DISCONTINUITY DESIGN, Alexander Hijzen, Leopoldo Mondauto, Stefano
Scarpetta (2013)
No. 150 REDISTRIBUTION POLICY IN EUROPE AND THE UNITED STATES: IS THE GREAT RECESSION A
'GAME CHANGER' FOR WORKING-AGE FAMILIES? Herwig Immervoll, Linda Richardson (2013)
No. 149 A BIRD’S EYE VIEW OF GENDER DIFFERENCES IN EDUCATION IN OECD COUNTRIES Angelica
Salvi Del Pero and Alexandra Bytchkova (2013)
No. 148 TRENDS IN POVERTY AND INEQUALITY IN DECENTRALISING INDONESIA Riyana Miranti, Yogi
Vidyattama, Erick Hansnata, Rebecca Cassells and Alan Duncan (2013)
26
No. 147 WOMEN ENTREPRENEURS IN THE OECD: KEY EVIDENCE AND POLICY CHALLENGES Mario
Piacentini (2013)
No. 146 AN EVALUATION OF INTERNATIONAL SURVEYS OF CHILDREN, Dominic Richardson and Nabil Ali
(2014)
No. 145 DRIVERS OF FEMALE LABOUR FORCE PARTICIPATION IN THE OECD Olivier Thévenon (2013)
No. 144 THE ROLE OF SHORT-TIME WORKING SCHEMES DURING THE GLOBAL FINANCIAL CRISIS AND
EARLY RECOVERY, Alexander Hijzen, Sébastien Martin (2012)
No. 143 TRENDS IN JOB SKILL DEMANDS IN OECD COUNTRIES, Michael J. Handel (2012)
No. 142 HELPING DISPLACED WORKERS BACK INTO JOBS AFTER A NATURAL DISASTER: RECENT
EXPERIENCES IN OECD COUNTRIES, Danielle Venn (2012)
No. 141 LABOUR MARKET EFFECTS OF PARENTAL LEAVE POLICIES IN OECD COUNTRIES, Olivier
Thévenon & Anne Solaz (2012)
No. 140 FATHERS’ LEAVE, FATHERS’ INVOLVEMENT AND CHILD DEVELOPMENT: ARE THEY RELATED?
EVIDENCE FROM FOUR OECD COUNTRIES, Maria C. Huerta, Willem Adema, Jennifer Baxter, Wen-
Jui Han, Mette Lausten, RaeHyuck Lee and Jane Waldfogel (2012)
No. 139 FLEXICURITY AND THE ECONOMIC CRISIS 2008-9 – EVIDENCE FROM DENMARK, Tor Eriksson
(2012)
No. 138 EFFECTS OF REDUCING GENDER GAPS IN EDUCATION AND LABOUR FORCE PARTICIPATION
ON ECONOMIC GROWTH IN THE OECD, Olivier Thévenon, Nabil Ali, Willem Adema and Angelica
Salvi del Pero (2012)
No. 137 THE RESPONSE OF GERMAN ESTABLISHMENTS TO THE 2008-2009 ECONOMIC CRISIS, Lutz
Bellman, Hans-Dieter Gerner, Richard Upward (2012)
No. 136 Forthcoming THE DYNAMICS OF SOCIAL ASSISTANCE RECEIPT IN GERMANY Sebastian Königs
No. 135 MONEY OR KINDERGARTEN? DISTRIBUTIVE EFFECTS OF CASH VERSUS IN-KIND FAMILY
TRANSFERS FOR YOUNG CHILDREN, Michael Förster and Gerlinde Verbist (2012)
No. 134 THE ROLE OF INSTITUTIONS AND FIRM HETEROGENEITY FOR LABOUR MARKET
ADJUSTMENTS: CROSS-COUNTRY FIRM-LEVEL EVIDENCE, Peter N. Gal (VU University
Amsterdam), Alexander Hijzen and Zoltan Wolf (2012)
No. 133 CAPITAL’S GRABBING HAND? A CROSS-COUNTRY/CROSS-INDUSTRY ANALYSIS OF THE
DECLINE OF THE LABOUR SHARE, Andrea Bassanini and Thomas Manfredi (2012)
No. 132 INCOME DISTRIBUTION AND POVERTY IN RUSSIA, Irinia Denisova (2012)
No. 131 ELIGIBILITY CRITERIA FOR UNEMPLOYMENT BENEFITS, Danielle Venn (2012)
No. 130 THE IMPACT OF PUBLICLY PROVIDED SERVICES ON THE DISTRIBUTION OF RESOURCES:
REVIEW OF NEW RESULTS AND METHODS, Gerlinde Verbist, Michael Förster and Maria Vaalavuo
(2012)
No. 129 AN OVERVIEW OF AUSTRALIA'S SYSSTEM OF INCOME AND EMPLOYMENT ASSISTANCE FOR
THE UNEMPLOYED, Peter Davidson, Peter Whiteford (2012)
No. 128 THE INTEGRATION OF IMMIGRANTS AND THEIR CHILDREN INTO THE LABOUR MARKET IN
SWITZERLAND, Thomas Liebig, Sebastian Kohls and Karoline Krause (2012)
No. 127 THE LABOUR MARKET INTEGRATION OF IMMIGRANTS AND THEIR CHILDREN IN AUSTRIA,
Karolin Krause and Thomas Liebig (2011)
No. 126 ARE RECENT IMMIGRANTS DIFFERENT? A NEW PROFILE OF IMMIGRANTS IN THE OECD
BASED ON DIOC 2005/06, Sarah Widmaier and Jean-Christophe Dumont (2011)
No. 125 EARNINGS VOLATILITY AND ITS CONSEQUENCES FOR HOUSEHOLDS, Danielle Venn (2011)
27
No. 124 CRISIS, RECESSION AND THE WELFARE STATE, Willem Adema, Pauline Fron and Maxime Ladaique
(2011)
No. 123 AGGREGATE EARNINGS AND MACROECONOMIC SHOCKS Andrea Bassanini (2011)
No. 122 REDISTRIBUTION POLICY AND INEQUALITY REDUCTION IN OECD COUNTRIES: WHAT HAS
CHANGED IN TWO DECADES? Herwig Immervoll, Linda Richardson (2011)
No. 121 OVER-QUALIFIED OR UNDER-SKILLED, Glenda Quintini (2011)
No. 120 RIGHT FOR THE JOB, Glenda Quintini (2011)
No. 119 THE LABOUR MARKET EFFECTS OF UNEMPLOYMENT COMPENSATION IN BRAZIL ,
Alexander Hijzen (2011)
No. 118 EARLY MATERNAL EMPLOYMENT AND CHILD DEVELOPMENT IN FIVE OECD COUNTRIES,
Maria del Carmen Huerta, Willem Adema, Jennifer Baxter, Miles Corak, Mette Deding, Matthew C.
Gray, Wen-Jui Han, Jane Waldfogel (2011)
No. 117 WHAT DRIVES INFLOWS INTO DISABILITY?EVIDENCE FROM THREE OECD COUNTRIES
Ana Llena-Nozal and Theodora Xenogiani (2011)
No. 116 COOKING, CARING AND VOLUNTEERING: UNPAID WORK AROUND THE WORLD,
Veerle Miranda (2011)
No. 115 THE ROLE OF SHORT-TIME WORK SCHEMES DURING THE 2008-09 RECESSION,
Alexander Hijzen and Danielle Venn (2010)
No. 114 INTERNATIONAL MIGRANTS IN DEVELOPED, EMERGING AND DEVELOPING COUNTRIES: AN
EXTENDED PROFILE,
Jean-Christophe Dumont, Gilles Spielvogel and Sarah Widmaier (2010)
No. 113 ACTIVATION POLICIES IN JAPAN ,
Nicola Duell, David Grubb, Shruti Singh and Peter Tergeist (2010)
No. 112 ACTIVATION POLICIES IN SWITZERLAND,
Nicola Duell and Peter Tergeist with contributions from Ursula Bazant and Sylvie Cimper (2010)
No. 111 ECONOMIC DETERMINANTS AND CONSEQUENCES OF CHILD MALTREATMENT
Lawrence M. Berger, Jane Waldfogel (forthcoming)
No. 110 DISTRIBUTIONAL CONSEQUENCES OF LABOR DEMAND ADJUSTMENTS TO A DOWNTURN:
A MODEL-BASED APPROACH WITH APPLICATION TO GERMANY 2008-09,
Herwig Immervoll, Olivier Bargain, Andreas Peichl, Sebastian Siegloch (2010)
No. 109 DECOMPOSING NOTIONAL DEFINED-CONTRIBUTION PENSIONS: EXPERIENCE OF OECD
COUNTRIES’ REFORMS, Edward Whitehouse (2010)
No. 108 EARNINGS OF MEN AND WOMEN WORKING IN THE PRIVATE SECTOR: ENRICHED DATA FOR
PENSIONS AND TAX-BENEFIT MODELING, Anna Cristina D’Addio and Herwig Immervoll (2010)
No. 107 INSTITUTIONAL DETERMINANTS OF WORKER FLOWS: A CROSS-COUNTRY/CROSS-INDUSTRY
APPROACH, Andrea Bassanini, Andrea Garnero, Pascal Marianna, Sebastien Martin (2010)
No. 106 RISING YOUTH UNEMPLOYMENT DURING THE CRISIS: HOW TO PREVENT NEGATIVE
LONG-TERM CONSEQUENCES ON A GENERATION?
Stefano Scarpetta, Anne Sonnet and Thomas Manfredi (2010)
No. 105 TRENDS IN PENSION ELIGIBILITY AGES AND LIVE EXPECTANCY, 1950-2050
Rafal Chomik and Edward Whitehouse (2010)
No. 104 ISRAELI CHILD POLICY AND OUTCOMES
John Gal, Mimi Ajzenstadt, Asher Ben-Arieh, Roni Holler and Nadine Zielinsky (2010)
No. 103 REFORMING POLICIES ON FOREIGN WORKERS IN ISRAEL
Adriana Kemp (2010)
28
No. 102 LABOUR MARKET AND SOCIO-ECONOMIC OUTCOMES OF THE ARAB-ISRAELI POPULATION
Jack Habib, Judith King, Asaf Ben Shoham, Abraham Wolde-Tsadick and Karen Lasky (2010)
No. 101 TRENDS IN SOUTH AFRICAN INCOME DISTRIBUTION AND POVERTY SINCE THE FALL
OF APARTHEID
Murray Leibbrandt, Ingrid Woolard, Arden Finn and Jonathan Argent (2010)
No. 100 MINIMUM-INCOME BENEFITS IN OECD COUNTRIES: POLICY DESIGN, EFFECTIVENESS
AND CHALLENGES
Herwig Immervoll (2009)
A full list of Social, Employment and Migration Working Papers is available at www.oecd.org/els/workingpapers.
Other series of working papers available from the OECD include: OECD Health Working Papers.
29
RECENT RELATED OECD PUBLICATIONS:
EMPLOYMENT OUTLOOK 2015, http://www.oecd.org/employment/oecdemploymentoutlook.htm
MENTAL HEALTH AND WORK: NETHERLANDS, http://www.oecd.org/netherlands/mental-health-and-work-
netherlands-9789264223301-en.htm
MATCHING ECONOMIC MIGRATION WITH LABOUR MARKET NEEDS, http://www.oecd.org/eu/matching-economic-
migration-with-labour-market-needs.htm
EMPLOYMENT OUTLOOK 2014, http://www.oecd.org/employment/oecdemploymentoutlook.htm
CONNECTING PEOPLE WITH JOBS UK,
http://www.oecd.org/employment/emp/activelabourmarketpoliciesandactivationstrategies.htm
RECRUITING IMMIGRANT WORKERS NEW ZEALAND, http://www.oecd.org/migration/recruiting-immigrant-workers-
nz-2014.htm
JOBS FOR IMMIGRANTS VOL. 4 ITALY, http://www.oecd.org/els/jobsforimmigrantsseries.htm
THE 2012 LABOUR MARKET REFORM IN SPAIN, http://www.oecd.org/employment/spain-labourmarketreform.htm
INVESTING IN YOUTH: BRAZIL (2014), www.oecd.org/employment/action-plan-youth.htm
AGEING AND EMPLOYMENT POLICIES: NETHERLANDS 2014, http://www.oecd.org/els/ageing-and-employment-
policies-netherlands-2014-9789264208155-en.htm
OECD REVIEWS OF PENSION SYSTEMS: IRELAND, http://www.oecd.org/els/public-pensions/reforms-essential-to-
make-irelands-pensionsystem-fairer.htm
AGEING AND EMPLOYMENT POLICIES: NETHLERLANDS 2014, www.oecd.org/els/employment/olderworkers
SOCIETY AT A GLANCE 2014, www.oecd.org/els/societyataglance.htm
MENTAL HEALTH AND WORK: UNITED KINGDOM (2014), www.oecd.org/els/emp/mentalhealthandwork-
unitedkingdom.htm
VIEILLISSEMENT ET POLITIQUES DE L'EMPLOI : FRANCE 2014: MIEUX TRAVAILLER AVEC L'ÂGE,
www.oecd.org/fr/emploi/emp/vieillissementetpolitiquesdelemploi.htm
MENTAL HEALTH AND WORK: SWITZERLAND (2014), www.oecd.org/els/emp/mentalhealthandwork-switzerland.htm
PENSIONS AT A GLANCE 2013, www.oecd.org/els/public-pensions/pensionsataglance.htm
HEALTH AT A GLANCE 2013: OECD INDICATORS, www.oecd.org/health/health-systems/health-at-a-glance.htm
OECD EMPLOYMENT OUTLOOK 2013, www.oecd.org/els/emp/oecdemploymentoutlook.htm
CLOSING THE GENDER GAP: ACT NOW, www.oecd.org/gender/closingthegap.htm
OECD PENSIONS OUTLOOK 2012, www.oecd.org/finance/privatepensions/
INTERNATIONAL MIGRATION OUTLOOK 2012, www.oecd.org/els/internationalmigrationpoliciesanddata/
OECD EMPLOYMENT OUTLOOK 2012, www.oecd.org/employment/employmentpoliciesanddata
SICK ON THE JOB: Myths and Realities about Mental Health and Work (2011), www.oecd.org/els/disability
DIVIDED WE STAND: Why Inequality Keeps Rising (2011), www.oecd.org/els/social/inequality
EQUAL OPPORTUNITIES? The Labour Market Integration of the Children of Immigrants (2010), via OECD Bookshop
30
OECD REVIEWS OF LABOUR MARKET AND SOCIAL POLICIES: ESTONIA (2010), www.oecd.org/els/estonia2010
JOBS FOR YOUTH: GREECE (2010), www.oecd.org/employment/youth
JOBS FOR YOUTH: DENMARK (2010), www.oecd.org/employment/youth
OECD REVIEWS OF LABOUR MARKET AND SOCIAL POLICIES: ISRAEL (2010),
www.oecd.org/els/israel2010
JOBS FOR YOUTH: UNITED STATES (2009), www.oecd.org/employment/youth
JOBS FOR YOUTH: POLAND (2009), www.oecd.org/employment/youth
OECD EMPLOYMENT OUTLOOK: Tackling the Jobs Crisis (2009), www.oecd.org/els/employmentpoliciesanddata/
DOING BETTER FOR CHILDREN (2009), www.oecd.org/els/social/childwellbeing
SOCIETY AT A GLANCE – ASIA/PACIFIC EDITION (2009), www.oecd.org/els/social/indicators/asia
OECD REVIEWS OF LABOUR MARKET AND SOCIAL POLICIES: SLOVENIA (2009), www.oecd.org/els/slovenia2009
INTERNATIONAL MIGRATION OUTLOOK: SOPEMI (2010) www.oecd.org/els/migration/imo
PENSIONS AT A GLANCE 2009: Retirement-Income Systems in OECD Countries (2009),
www.oecd.org/els/social/pensions/PAG
JOBS FOR YOUTH: FRANCE (2009), www.oecd.org/employment/youth
SOCIETY AT A GLANCE 2009 – OECD Social Indicators (2009), www.oecd.org/els/social/indicators/SAG
JOBS FOR YOUTH: AUSTRALIA (2009), www.oecd.org/employment/youth
OECD REVIEWS OF LABOUR MARKET AND SOCIAL POLICIES: CHILE (2009), www.oecd.org/els/chile2009
PENSIONS AT A GLANCE – SPECIAL EDITION: ASIA/PACIFIC (2009), www.oecd.org/els/social/pensions/PAG
SICKNESS, DISABILITY AND WORK: BREAKING THE BARRIERS (VOL. 3) – DENMARK, FINLAND, IRELAND
AND THE NETHERLANDS (2008), www.oecd.org/els/disability
GROWING UNEQUAL? Income Distribution and Poverty in OECD Countries (2008), www.oecd.org/els/social/inequality
JOBS FOR YOUTH: JAPAN (2008), www.oecd.org/employment/youth
JOBS FOR YOUTH: NORWAY (2008), www.oecd.org/employment/youth
JOBS FOR YOUTH: UNITED KINGDOM (2008), www.oecd.org/employment/youth
JOBS FOR YOUTH: CANADA (2008), www.oecd.org/employment/youth
JOBS FOR YOUTH: NEW ZEALAND (2008), www.oecd.org/employment/youth
JOBS FOR YOUTH: NETHERLANDS (2008), www.oecd.org/employment/youth
For a full list, consult the OECD online Bookshop at www.oecd.org/bookshop
Related Documents