Women Don’t Run? Election Aversion and Candidate Entry Kristin Kanthak * University of Pittsburgh Jonathan Woon † University of Pittsburgh February 19, 2013 ‡ Abstract In an effort to control for confounding factors that might affect the relative propen- sities for women and men to enter politics, we take the question of candidate emergence into the laboratory. We find evidence that women are election averse while men are not. This difference does not arise from disparities in abilities, risk aversion, or beliefs, but rather from the specific competitive and strategic context of campaigns and elec- tions. The key features of our experimental design involve (1) an objective task that represents policymaking ability, (2) monetary rewards that ensure that all subjects, re- gardless of gender, face the same incentives to select a representative with the highest task ability, and (3) a comparison of alternative selection mechanisms. In Experiment 1, we find that men and women are equally likely to volunteer when the representa- tive is selected randomly, but that women are less likely to be candidates when the representative is chosen through an election. In Experiment 2, we find that women’s election aversion persists with variations in the electoral environment; it disappears only when campaigns are both more truthful and less costly. * Associate Professor, Department of Political Science, [email protected] † Associate Professor, Department of Political Science, and Faculty, Pittsburgh Experimental Economics Laboratory, [email protected] ‡ This research is supported by the National Science Foundation under Grant No. SES-1154739. We thank Eric Dickson, Sera Linardi, Rose McDermott, and Lise Vesterlund, for helpful comments and discussions. Previous versions were presented at the 2012 Meeting of the International Society of Political Psychology, the 2012 NYU-CESS Experimental Political Science Conference, the 2011 Midwest Political Science Association meeting, the 2011 American Political Science Association annual meeting, and the 2011 North American Economic Science Association conference. 1

Welcome message from author
This document is posted to help you gain knowledge. Please leave a comment to let me know what you think about it! Share it to your friends and learn new things together.
Transcript
Women Don’t Run?Election Aversion and Candidate Entry
Kristin Kanthak∗
University of PittsburghJonathan Woon†
University of Pittsburgh
February 19, 2013‡
Abstract
In an effort to control for confounding factors that might affect the relative propen-sities for women and men to enter politics, we take the question of candidate emergenceinto the laboratory. We find evidence that women are election averse while men arenot. This difference does not arise from disparities in abilities, risk aversion, or beliefs,but rather from the specific competitive and strategic context of campaigns and elec-tions. The key features of our experimental design involve (1) an objective task thatrepresents policymaking ability, (2) monetary rewards that ensure that all subjects, re-gardless of gender, face the same incentives to select a representative with the highesttask ability, and (3) a comparison of alternative selection mechanisms. In Experiment1, we find that men and women are equally likely to volunteer when the representa-tive is selected randomly, but that women are less likely to be candidates when therepresentative is chosen through an election. In Experiment 2, we find that women’selection aversion persists with variations in the electoral environment; it disappearsonly when campaigns are both more truthful and less costly.
∗Associate Professor, Department of Political Science, [email protected]†Associate Professor, Department of Political Science, and Faculty, Pittsburgh Experimental Economics
Laboratory, [email protected]‡This research is supported by the National Science Foundation under Grant No. SES-1154739. We thank
Eric Dickson, Sera Linardi, Rose McDermott, and Lise Vesterlund, for helpful comments and discussions.Previous versions were presented at the 2012 Meeting of the International Society of Political Psychology, the2012 NYU-CESS Experimental Political Science Conference, the 2011 Midwest Political Science Associationmeeting, the 2011 American Political Science Association annual meeting, and the 2011 North AmericanEconomic Science Association conference.
1
Many democratically elected legislatures fail to resemble the people they purport to
represent. Only two African Americans currently serve in the US Senate (neither of whom
was elected), despite the fact that African Americans comprise more than 13 percent of the
US population. More than 50 percent of the US population are women, yet women comprise
only 18 percent of the U.S. House of Representatives and 20 percent of the U.S. Senate. These
numbers are troubling to those who are concerned with descriptive representation because
they make clear that the demographic characteristics of the U.S. Congress do not reflect
the characteristics of the constituencies that elect its members. Yet Pitkin (1967) argues
that descriptive representation is far less normatively important than substantive. Hence,
empirical scholars of representation—following the lead of Miller and Stokes (1963)—tend to
eschew the notion of descriptive representation and focus on questions of policy congruence
and constituency influence.
While the literature has made important advances since Miller and Stokes (e.g.,
Ansolabehere and Jones 2010, Bartels 1991, Bafumi and Herron 2010), a narrow focus
on the relationship between constituency opinion and congressional voting behavior misses
much of what may be important about the process of translating constituents’ interests
into public policy. For example, if legislatures included more diverse voices and perspec-
tives, the issues upon which legislators voted would themselves be different (Bratton and
Haynie 1999, Swers 2005). Similarly, the translation of interests to policy may not be straight-
forward. To the extent that it is not, potential representatives may differ in their abilities
to make those translations.
More important, a narrow conception of representation that prioritizes what is readily
measurable may miss other facets of representation that are central to our rich conception
of liberal democracy (Achen 1978). Indeed, representation is much more than correctly
deciding how constituents would vote on a dichotomous roll call. It is about knowing which
issues ought to be brought to the fore. It is about generating solutions to tough social and
economic problems. It is about finding common ground and forging consensus on policies that
2
benefit the public good. Thus, properly representing constituents’ interests might require
a variety of strengths, cognitive styles, and interpersonal skills. Indeed, diverse groups
typically make better decisions than do homogeneous ones (Page 2007). The descriptive
under-representation of certain groups of people therefore matters not because descriptive
representation is itself inherently important—a point we do not contest—but rather because
it has powerful implications for substantive representation, broadly construed.
In this sense, then, the question of why American legislatures are not more diverse is
an important one for the quality of representation. What factors contribute to the under-
representation of women, minorities, and other types of representatives? While it is easy to
suspect that biased voters, partisan politics, or an otherwise skewed electoral process might
be to blame, we know, instead, that when women, for example, run for office, they win with
at least as much frequency as do men (Darcy, Welch and Clark 1994). Thus, we look for
another potential culprit: the possibility that certain groups of people systematically choose
not to become candidates in the first place. The central issue is therefore one of candidate
emergence.
In this study, we focus on the emergence of a particular group—women—and conduct
a laboratory experiment to investigate whether the under-representation of women relative
to men stems from differences in how these groups decide to run for office.1 We pay particular
attention to the prevailing explanation that women with qualifications similar to those of men
are significantly less likely to perceive themselves as qualified to run for office (Lawless and
Fox 2005). By taking the question to the laboratory, we can directly measure task ability—
normally unobservable outside the lab—and exercise careful control over an environment that
is free from external, confounding factors that may create other differences in the willingness
to run for office.
1The dearth of women is itself a significant problem for democracy, a problem we do not wish to minimizewith our focus here on ability to represent, braodly defined. Legislatures with more women enjoy greaterlegitimacy among the governed (Schwindt-Bayer and Mishler 2005), diverse groups in general make betterdecisions (Page 2007), and groups with more women tend to work together more effectively (Woolley, Chabris,Pentland, Hashmi and Malone 2010). Women also tend to mitigate the deleterious effects of ideologicalpreference divergence in legislatures (Kanthak and Krause 2010, Kanthak and Krause 2012). Furthermore,observing women candidates creates an increased sense of efficacy among girls (Campbell and Wolbrecht2006). 3
Our findings point to a distinct phenomenon, election aversion, whereby elections
themselves—rather than differences in ability or relative confidence—dissuade women from
entering the fray. Specifically, we find that both men and women volunteer to be the repre-
sentative of a group at equal rates, and they are equally responsive to task ability, provided
that the selection of the representative does not involve an election. However, when selec-
tion involves an election, women’s willingness to represent decreases substantially, and we
show that the decline in candidate entry cannot be attributed to differences in ability, con-
fidence about relative ability, or risk aversion. Instead, our findings indicate twin concerns:
Campaigns are at once too costly and too noisy affairs. The din of the typical campaign
environment and the arduousness of properly communicating their qualifications to voters
renders the whole process an insufficiently worthwhile undertaking. It is bearing the costs of
running for election, coupled with a campaign setting in which low-information voters can-
not properly discern women’s qualifications, that impedes women from entering the electoral
arena.
Differences in Candidate Emergence
Research across several social science disciplines points to a variety of behavioral differences
between men and women. Women communicate differently (Gilligan 1993), are less likely to
engage in negotiation (Babcock and Laschever 2003), show less confidence in their abilities
(Furnham and Rawles 1995), tend to be more risk averse (Croson and Gneezy 2009, Eckel and
Grossman 2002), more prosocial (Eckel and Grossman 1998), and less competitive (Niederle
and Vesterlund 2007) than their male counterparts. Taken together, these gender differences
may imply that women and men take different approaches to the decision of whether or not
to run for office. More specifically, women may be more election averse than are men, where
election aversion is a phenomenon that is perhaps related to the other behavioral differences
outlined above, but is also wholly distinct from them.
4
In our theoretical framework, we decompose the component parts of that decision
and propose three factors that contribute to an individual’s decision to run for elective
office. This decomposition allows us to better understand how each of these factors affects
an individual’s level of election aversion. By considering and accounting for each of these
factors, we can not only determine whether men and women differ in their choices to run for
office, but also investigate which portion of the decision-making process plays the strongest
role. Furthermore, we can rely on the extant literature on the differences between men and
women to guide our theoretical expectations at each stage. We now discuss each of the
factors that comprise election aversion in more detail.
The first factor any prospective candidate must consider is whether or not they want
to act on behalf of—or represent—others. That is, at a basic level, individuals may differ in
their willingness to serve. The extant literature would lead us to believe that the reluctance
of women to run for public office is not located here. If anything, women are more likely
to serve than men. Women are more likely than men to engage in a number of political
activities, including attending rallies and meetings (Conway, Steurnagel and Ahern 1997),
and women perform volunteer service at a much higher rate than men, across age group,
level of education, and other demographic characteristics, although slightly more men than
women volunteer for “civic, political, professional, or international” groups (Bureau of Labor
Statistics 2011). Furthermore, we know that although women do more volunteer work than
men do, they are less visible (Margolis 1979) and tend to downplay their efforts and abilities
in volunteerism (Abrahams 1996, Blackstone 2004, Daniels 1985). This would lead us to
expect that women would be at least as likely to volunteer to represent a group as would
men.
Second, a candidate must be willing to run in an election. This factor is conceptually
distinct from beliefs about ability or willingness to serve and involves beliefs about one’s likely
success in the electoral process, due to need to campaign for votes as well as expectations
about how others may judge one’s ability to serve. Our expectations of a gender difference
5
are heightened here. This is largely because running for election requires asking voters to
support one’s candidacy. If, as previous research suggests, women are less likely to ask
for raises or other tangible rewards for their performance (Babcock and Laschever 2003),
then they are likely similarly unwilling to ask voters to “hire” them for the role of their
representative. Indeed, women may be wise to be reluctant to ask for such support. Women
are both perceived to be less capable (Goldin and Rouse 2000) and are less likely to boast
about their abilities than men, but their claims are believed equally, leading to a gender
gap in perceived ability (Reuben, Sapienza and Zingales 2009). In this manner, if women
feel they want to represent and also feel capable of representing, but they do not enter the
election, we can infer that it is something inherent in the election itself (likely, having to ask
for support from potential constituents or beliefs about the likelihood of receiving enough
support) that affects the decision not to enter. Notably, this line of thinking implies that
women are simply less likely to run for political office in general. And if it is correct, women
simply don’t run, regardless of their perception, or the reality, of their capability of serving.
In other words, women don’t run despite feeling that they are qualified.
Third, potential candidates may differ both in their abilities and in how they assess
those abilities in relation to others. In other words, candidates and officeholders will vary in
their underlying ability to perform the duties of office (whatever those duties may be) and the
higher one’s actual ability or level of competence, the more worthwhile and attractive it will
be to hold office (both for the representative and for his or constituents). However, individ-
uals also vary in the extent to which they correctly judge their own abilities, with men being
generally more overconfident than women (Lichtenstein, Fischoff and Phillips 1982, Lunde-
berg, Fox and Punccohar 1994). Here, we may also expect to see gender differences, with
men being more likely to enter because they have greater confidence in their own ability
to perform the duties of office. For example, women underestimate their own intelligence,
whereas men overestimate theirs (Furnham and Rawles 1995) and men tend to be overconfi-
dent about their own skill set (Kling, Hyde, Showers and Buswelll 1999). Similarly, despite
6
there being no gender difference, men, in fact, rate their math skills higher than do women
(Wigfield, Eccles and Pintrich 1996). If these differences affect women and men differentially
as they consider whether or not to serve, we would expect them to display differing levels of
sensitivity to changes in their ability to perform a task.
In our framework, women and men may differ in terms of each of these three factors.
We can test each of these implications in the laboratory, where our ability to control the ex-
perimental environment allows us to identify the distinct effects of each of these components.
Our approach, moreover, allows us to consider the effect of ability more finely than previous
research, which relies on answers to survey questions and finds that women self-report that
they think they are not qualified. But our research can allow us to consider what, precisely,
are the qualifications women think they lack. When they report not feeling qualified, do
women mean they are not up to the job of the representative? If so, that will manifest
equally in an unwillingness to volunteer and an unwillingness to become a candidate in an
election to represent the group. On the other hand, do women mean they do not feel they
are able to convince others that they are qualified to represent the group? If that is the case,
we should see the effect manifest only in the decision to become a candidate, but not in the
decision to volunteer—that is, we would observe evidence of election aversion.
Experiment 1: Volunteers and Candidates
Our first experiment tests whether differences in the willingness to become a candidate de-
pend on confidence in one’s underlying abilities or whether such differences arise instead
from the nature of electoral competition.2 Three features of the design are central to distin-
guishing between these non-environmental factors that may comprise election aversion as a
phenomenon distinct from other gender-based behavioral differences. First, the experiment
2The lab also allows us to ignore external factors, such as familial responsibilities, access to campaignfundraising money, or political networks that may also affect women’s and mens’ choices to run differentially.But we maintain that this is a feature, not a bug, of our laboratory approach. Is it possible to find behavioralevidence of gender-based election aversion even without accounting for these other—certainly powerful—factors?
7
revolves around an objective problem-solving task. Performance on the task serves as an
observable and objective measure of underlying ability, which we can think of as the lab-
oratory analogue of policy-making ability or the ability to translate constituents’ interests
into good policy—in other words, the potential quality of the representative. Such ability
is not normally observable using non-experimental data. Second, we designed the monetary
payment scheme so that all members of a group have common incentives to select the highest
ability member as their representative. This allows us to control for heterogeneity in the
value of holding office that is likely to exist between individuals. Third, we compare the
decision to enter the pool of potential representatives under two alternative group selection
mechanisms: one with an election and one without. Thus, we can carefully assess whether
gender differences depend specifically on the prospect of electoral competition or whether
they arise from differences in relative confidence in ability.
Design and Procedures
We selected the Five-Minute Addition Task used by Niederle and Vesterlund (2007) to study
preferences for competition as the task for our experiment. It involves computing the sum
of five randomly selected two-digit numbers and doing as many of these sums as possible
correctly within five minutes. For our purposes, the Addition Task has several desirable
properties. It is specifically void of ideological or political content, which controls for subjects’
knowledge and interest in particular political questions of the day. In this sense, then, it is
akin to the intangible qualities that allow some representatives to maximize the congruence
between constituency interests and policy outcomes better than others. It is also a task for
which there is heterogeneity between subjects, and that previous research suggests is gender
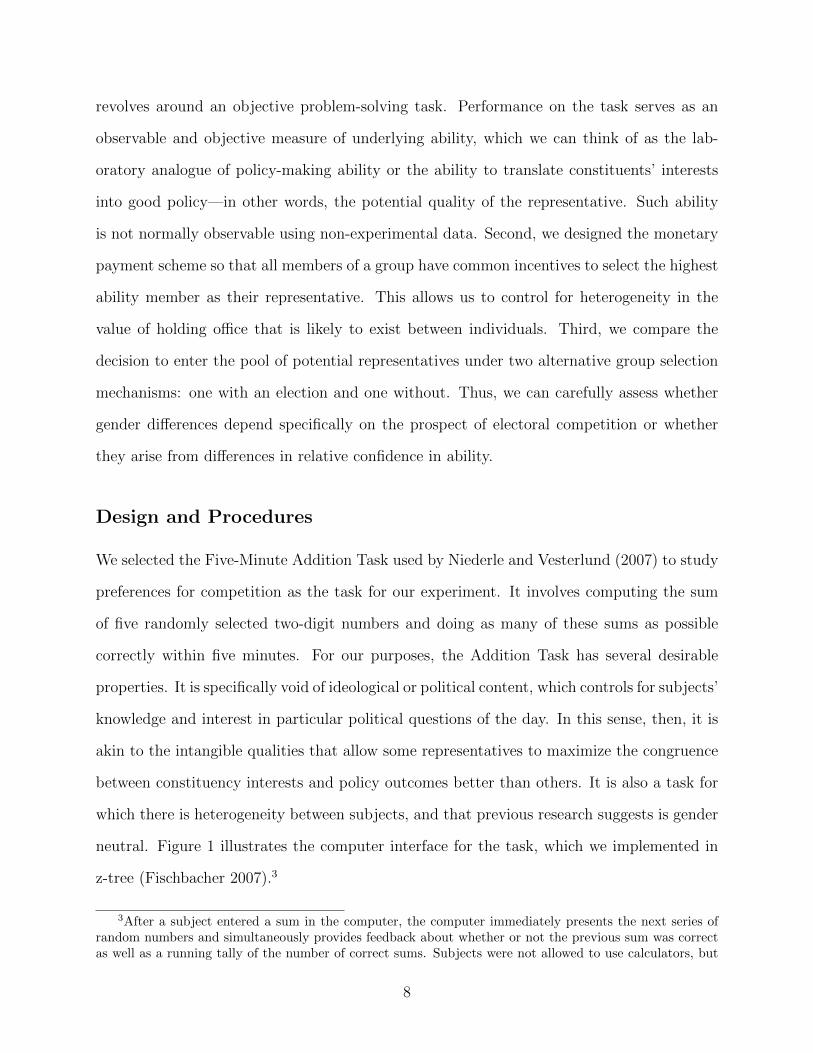
neutral. Figure 1 illustrates the computer interface for the task, which we implemented in
z-tree (Fischbacher 2007).3
3After a subject entered a sum in the computer, the computer immediately presents the next series ofrandom numbers and simultaneously provides feedback about whether or not the previous sum was correctas well as a running tally of the number of correct sums. Subjects were not allowed to use calculators, but
8
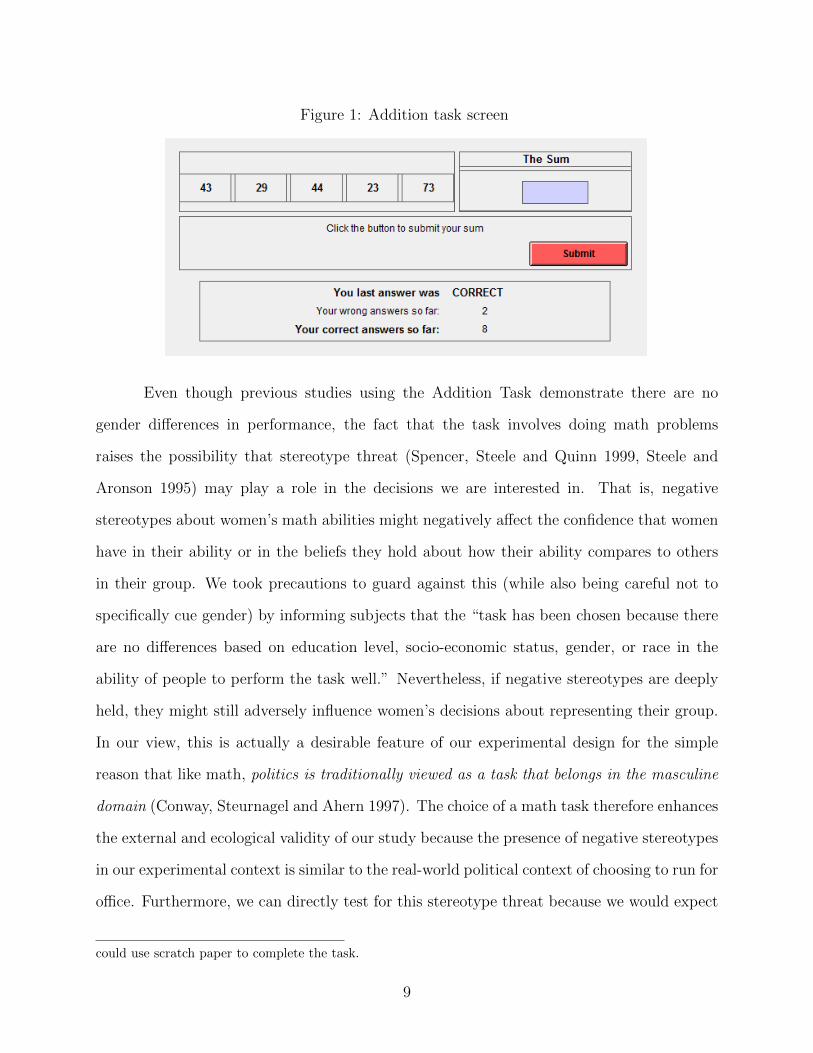
Figure 1: Addition task screen
Even though previous studies using the Addition Task demonstrate there are no
gender differences in performance, the fact that the task involves doing math problems
raises the possibility that stereotype threat (Spencer, Steele and Quinn 1999, Steele and
Aronson 1995) may play a role in the decisions we are interested in. That is, negative
stereotypes about women’s math abilities might negatively affect the confidence that women
have in their ability or in the beliefs they hold about how their ability compares to others
in their group. We took precautions to guard against this (while also being careful not to
specifically cue gender) by informing subjects that the “task has been chosen because there
are no differences based on education level, socio-economic status, gender, or race in the
ability of people to perform the task well.” Nevertheless, if negative stereotypes are deeply
held, they might still adversely influence women’s decisions about representing their group.
In our view, this is actually a desirable feature of our experimental design for the simple
reason that like math, politics is traditionally viewed as a task that belongs in the masculine
domain (Conway, Steurnagel and Ahern 1997). The choice of a math task therefore enhances
the external and ecological validity of our study because the presence of negative stereotypes
in our experimental context is similar to the real-world political context of choosing to run for
office. Furthermore, we can directly test for this stereotype threat because we would expect
could use scratch paper to complete the task.
9
it to reveal itself as part of confidence in ability to do the job for which a representative is
being selected. Because of this, we should see the effects of stereotype threat in both electoral
and non-electoral settings.
We conducted our experiments at the Pittsburgh Experimental Economics Labora-
tory at the University of Pittsburgh. A total of 130 subjects (65 men and 65 women) par-
ticipated in Experiment 1. There were ten participants (five men and five women) in each
session, which lasted under an hour. All interaction between subjects took place anony-
mously via a computerized interface. Subjects were assigned ID numbers and were identified
in their interactions with other group members only by their ID number. While subjects
could observe the gender of the other participants in the session, we randomly assigned
them to two groups of five members so that they would know neither which of the other
participants were in their group nor its exact gender composition. Experiment 1 involves a
within-subject design, so the rules and payoff structure for every session was identical. Each
session was divided into three parts, and at the beginning of each part we distributed and
read the instructions aloud for that part of the experiment. At the end of the experimental
session, subjects completed a questionnaire that included demographic questions, one of the
three parts was randomly selected for payment (to guard against subjects using one part to
hedge against decisions in other parts), and subjects were paid. In addition to their earnings
from one of the parts of the experiment, subjects received a $7 show-up fee.
In Part 1, which we designated Piece Rate, we introduced the task and paid subjects
for their performance. Each subject earns 75 cents for each correct sum if this part is selected
for payment and receives feedback only about his or her own individual performance. No
subject learns anything about the performance of the other members of the group. The
purpose of Part 1 is for subjects to learn their ability in absolute, but not relative, terms.
In Part 2, we introduce Group Representation. Subjects first decide whether or not
they are willing to be selected as the group representative, and then a representative is
10
randomly selected from the set of willing members of each group.4 We deem such willing
members volunteers (although we do not use the term in our instructions so as not to induce
or activate social desirability, norms, or other-regarding preferences). Subjects then repeat
the task and, if Part 2 is selected for payment, are paid 50 cents for each of the representative’s
correct answers plus 25 cents for each of their own correct answers. (Although we provide
feedback about subjects’ own performance on the task in Part 2, we do not provide feedback
about payoffs or the representative’s performance until the end of the experiment so that
subjects do not gain any information about relative abilities.) Subjects maximize their
payoffs if the highest performer in the group is selected as the representative, and thus group
members’ preferences are aligned. As we explain in the next section, the decision to volunteer
should primarily depend on subjects’ beliefs about their relative ability and therefore serves
as our non-electoral baseline for comparison.
In Part 3, we introduce an Election for selecting the group representative, which
replaces the random selection mechanism from Part 2. After the election, subjects repeat
the Addition Task and are paid for performance on the task the same way as in Part 2:
They earn 50 cents for each of the representative’s correct answers and 25 cents for each
of their own. The incentives for selecting the highest performer are therefore the same as
in Part 2. We also include two features of the electoral environment that we believe may
affect subjects’ willingness to run for office: a campaign and costs and benefits of running
for office.
The campaign works as follows. If there are two or more candidates in a group, each
candidate writes a brief text message. This message is the only information that other group
members have when they vote. Candidates can write whatever they like, so the message is
“cheap talk.” Moreover, if subjects choose to do so, they can lie about their past performance
on the task. Subjects then each cast one vote for a candidate (voting for oneself is permitted)
and the representative is selected by plurality rule with ties broken randomly.
4If no group member is willing, we randomly select one member from all members of the group.
11
The costs and benefits associated with becoming a candidate are as follows. Subjects
receive $1 for each vote they receive in the election while incurring a fixed cost of running
for office of $2. Introducing these costs and benefits ensures that subjects’ expectations
about their electoral performance are relevant to their incentives to run for office. Note that
the cost-benefit structure is designed so that there is no net benefit to running if a subject
expects to receive two votes (e.g., votes for himself or herself and garners one other vote),
a net benefit for receiving three or more votes, and a net cost if a candidate cannot garner
at least one other vote. If there is only one candidate, then that candidate automatically
becomes the representative and earns a net benefit of $3 from running, but if there are no
candidates, a representative is selected at random from all members of the group and does
not receive any additional benefit from being selected.5
Theoretical Expectations
Our analysis of the incentives for choosing to be a volunteer or a candidate in the experiment
helps to identify potential sources of behavioral differences between men and women within
a common theoretical framework. We begin by considering the decision problem from the
perspective of an expected payoff-maximizing individual, which provides a gender-neutral
benchmark for behavior.6 We then discuss how men and women might differ within this
framework and discuss observable implications of these differences.
Volunteers. An individual’s decision to volunteer or not boils down to a comparison
between her own score and the beliefs she holds about other volunteers’ scores.7 If she is
risk neutral, then she will prefer to volunteer if and only if her score, si, is above the average
score of the other volunteers, vj. The intuition is straightforward. Recall that in Part 2,
each volunteer is equally likely to be selected as the group’s representative. If her score is
5In game theoretic terms, our incentive structure ensures that there cannot be a Nash equilibrium inwhich there are no candidates or in which all group members become candidates.
6Implicit in the assumption of expected payoff maximization is risk neutrality. We will consider theimplications of risk aversion later in the analysis.
7See the Theoretical Appendix for formal analysis.
12
above vj, then volunteering raises the expected score of the group’s representative, but if her
score is below vj, then volunteering lowers it.
If men and women have the same beliefs about others and if there are no gender dif-
ferences in performance, then we would also expect there to be no differences in volunteering
decisions. If there are no gender differences in beliefs, but men have higher task ability
than women, then we would expect men to be more likely to volunteer than women only
in the aggregate but for there to be no gender differences in the probability of volunteering
when controlling for task ability. We should therefore expect differences in the probability
of entering (when controlling for task ability) only when men and women have different be-
liefs about their ability relative to others. Thus, all else equal, to the extent that men are
overconfident in their abilities, and women underconfident, we would expect to observe men
volunteering at greater rates than women. However, if men and women are equally confident
in their abilities, we would expect the rates of volunteering to be the same.
The above argument appears to depend on the assumption that men and women are
both risk neutral. If we allow for risk preferences to vary, the decision to volunteer still takes
the form of a cutoff rule: i volunteers if and only if si is above some cutoff k, where k can be
thought of as the minimum willingness to run and depends on a subject’s risk preferences.
Different rates of volunteering might therefore be explained by differences in risk preferences,
even when subjects have the same beliefs about others.
Intuition suggests that subjects who are more risk averse should be less likely to
volunteer, but this intuition is wrong. Instead, greater risk aversion should increase the
willingness to volunteer. That is, risk aversion lowers the value of the threshold k. To see
why, consider a subject whose score is equal to the expected value of other volunteers’ scores.
A risk neutral subject would be indifferent between volunteering and not volunteering. A risk
averse subject, however, has a strict preference for volunteering because doing so reduces the
variance of the representative’s score while leaving the expected value unchanged. Thus, if
women are generally more risk averse than men, then they should be more likely to volunteer
than men with the same ability and beliefs.
13
Candidates. In Part 3, moving from a random selection mechanism to an election
introduces new considerations into the decision calculus. The addition of a campaign stage
with costs and benefits of running for office implies that expectations of electoral success
should play an important role alongside beliefs and risk preferences. In this sense, differences
in willingness to enter bewteen Parts 2 and 3 may capture how election seeking or election
averse subjects are. We postulate that such expectations will depend, in large part, on
how informative individuals expect the electoral process to be. The informativeness of the
election depends, in turn, on the degree of honesty one expects of other group members as
well as one’s own aptitude for conveying to others his or her task ability.
To analyze how the informativeness of the election (combined with direct costs and
benefits of office-seeking) affects the decision to run, we consider the polar cases in which
elections are either completely uninformative or completely informative. Although extreme,
the case of uninformative elections is not entirely unreasonable to the extent that campaign-
ing typically involves strategic incentives for candidates to misrepresent their true abilities.
In our experiment, such incentives are present but small since group members have common
incentives to elect the best representative possible.8 At the other extreme, the election might
be completely informative if all group members recognize their shared goals and candidates
report their scores honestly because they view the purpose of the election as a way to find
the best group member.
In the case in which the election is uninformative, we can expect the votes of non-
candidates—and thus the results of the election—to be determined randomly. Hence, choos-
ing to run affects the expected quality of the representative in the same way that it does in
Part 2 with random selection. Holding ability and beliefs constant, the expected net benefit
of running depends on the number of other candidates expected (because the cost is fixed
8The best possible outcome for an election-seeking individual is to win all five votes and earn a net benefitof $3. So, if an individual believes he will win all five votes with certainty (which is an unreasonable, highlyoptimistic belief) and his score is within 6 of the highest score, then he has an incentive to lie to seek votes.However, the fewer votes he expects to receive (e.g., the more intense he expects electoral competition tobe), then his score must be closer to what he believes to be the highest score for vote-seeking to be preferableto allowing the best representative to be elected.
14
while the expected benefit is decreasing in the number of candidates). Formally, a expected
payoff-maximizing subject prefers to become a candidate if her score exceeds cj + 4n − 6
where cj is the average score of the n other candidates. The threshold is increasing in n,
which implies that all else equal, the willingness to run is decreasing in the expectation of
greater electoral competition. For example, if n = 1, then any subject whose score is below
the average by 2 is indifferent between running and not running, and any subject whose
score is above this value strictly prefers to run. In contrast, if n = 3, a subject must have a
score at least 6 above the average to be willing to run.
At the other extreme, if elections are perfectly informative, then the highest ability
candidate will always be elected. Thus, the relevant belief about the distribution of scores is
not whether one’s own score si is above or below the mean, but the probability that si is the
highest score among the pool of candidates. By choosing to become a candidate, individual
i effectively sets the minimum score of the representative (i.e., the representative’s score
cannot not be below si because no candidate with a score below si will be elected as the
representative). For example, if si is the average score, then being a candidate guarantees
that the expected representative’s score will be above average (i.e., average if i wins and
above average if i loses). Thus, the more informative individuals believe the campaign to
be, the more likely they are to run (because it lowers the minimum willingness to run).
In addition, the probability that si is the highest score is decreasing in the number of
candidates. This is because with more candidates, repeated draws from same distribution
provide more frequent opportunites to draw a higher score. The expected net benefit from
choosing to run in terms of the effect on the expected quality of the representative is therefore
decreasing in the number of candidates, as it is with uninformative elections. In this case,
the more intense electoral competition is expected to be, the less likely that si is the highest
score, and the less likely that individual i is to run.
Summary. In establishing a benchmark for what expected payoff-maximizing indi-
viduals would do in our experiment, our theoretical analysis generates several key insights
15
about factors that contribute to the decision to volunteer and to run for office. Central to
our experimental design is an objective measure of candidate ability, and our analysis verifies
that any differences we observe between men and women under the random selection mech-
anism in Part 2 should be due primarily to differences in their beliefs about the distribution
of ability. This allows us to test directly a central component of much of the literature on
gender differences in candidate emergence: the notion that women are more likely to think
they are unqualified for office. If men underestimate the overall distribution (leading to
overconfidence in their abilities) or if women overestimate it (leading to underconfidence),
our analysis implies that we would indeed observe gender differences in Part 2.
If candidate entry decisions instead hinge on factors related specifically to electoral
competition—such as inhibitions about asking for votes or a lack of confidence in the potential
for electoral success—rather than on confidence in one’s relative ability as a representative,
then we would not expect to see gender differences in Part 2 decisions but instead observe
them only in Part 3 decisions. Our theoretical analysis identifies two potential reasons for
this.
First, gender differences in candidate entry might be due to different beliefs about
electoral competition. Individuals are more likely to run if they expect less electoral competi-
tion. If men underestimate or women overestimate the degree of electoral competition, then
men are more likely to run than women even holding ability constant. This is an explanation
that, to our knowledge, is not recognized in the existing literature.
Second, gender differences in elections might arise from differing beliefs about the
informativeness of elections. Running for office is less beneficial (both personally and for the
group) the more randomness there is in electoral outcomes. Thus, we would expect women
to be less likely than men to run if they believed elections were less informative—in other
words, if they tend to believe (more than men do) that elections are less about merit and
more about strategic posturing, misrepresentation, or vote-seeking.
16
Results
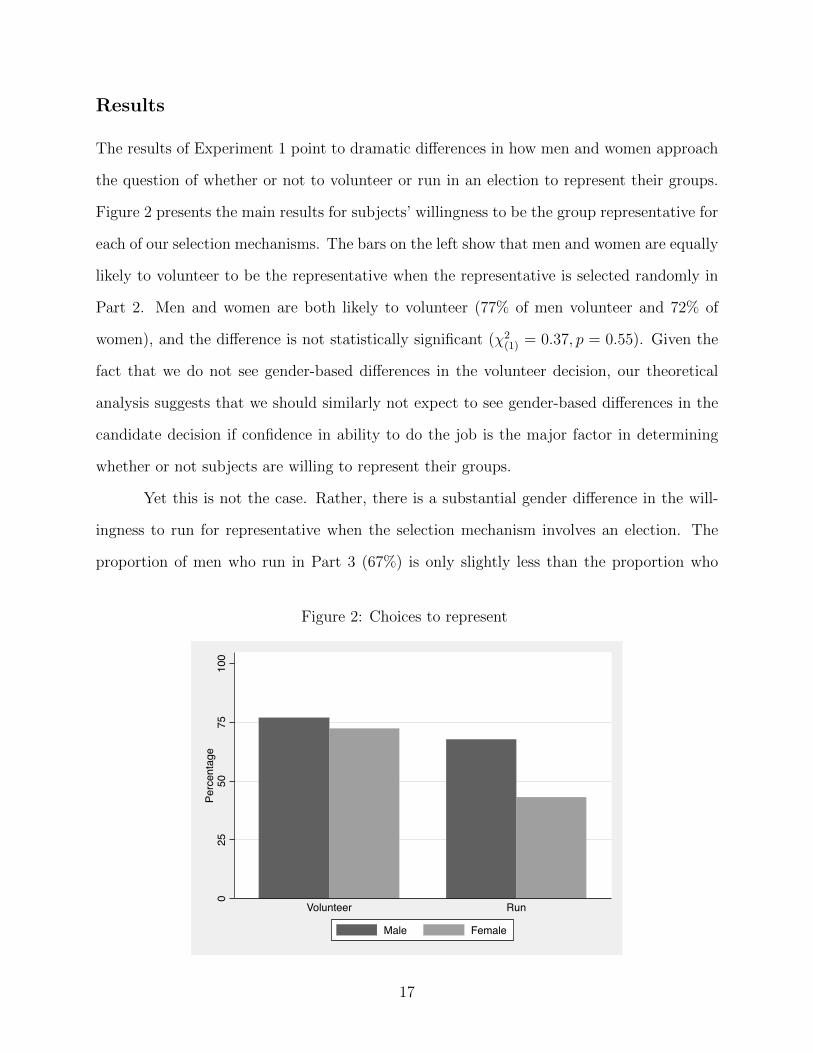
The results of Experiment 1 point to dramatic differences in how men and women approach
the question of whether or not to volunteer or run in an election to represent their groups.
Figure 2 presents the main results for subjects’ willingness to be the group representative for
each of our selection mechanisms. The bars on the left show that men and women are equally
likely to volunteer to be the representative when the representative is selected randomly in
Part 2. Men and women are both likely to volunteer (77% of men volunteer and 72% of
women), and the difference is not statistically significant (χ2(1) = 0.37, p = 0.55). Given the
fact that we do not see gender-based differences in the volunteer decision, our theoretical
analysis suggests that we should similarly not expect to see gender-based differences in the
candidate decision if confidence in ability to do the job is the major factor in determining
whether or not subjects are willing to represent their groups.
Yet this is not the case. Rather, there is a substantial gender difference in the will-
ingness to run for representative when the selection mechanism involves an election. The
proportion of men who run in Part 3 (67%) is only slightly less than the proportion who
Figure 2: Choices to represent
025
5075
100
Percentage
Volunteer Run
Male Female
17
volunteer in Part 2, while the proportion of women who run drops substantially, to fewer
than a majority (43%), a difference that is statistically significant (χ2(1) = 7.97, p < 0.01).
Men and women differ dramatically in their willingness to run for office, even in the absence
of external forces that the extant literature suggests are important, such as family obliga-
tions. Most significantly, lack of confidence in doing the job cannot explain these gender
differences. Previous research finds that women report that they think they are not qualified
to run for election, but our results here indicatee that women are quite capable of responding
appropriately to task ability, provided that they are in a non-electoral environment. Women
know when they are capable of serving as quality representatives, and they can effectively
bring that knowledge to bear on the question of whether or not to volunteer. Yet when it
comes to elections, women are far less willing than men to enter the fray.
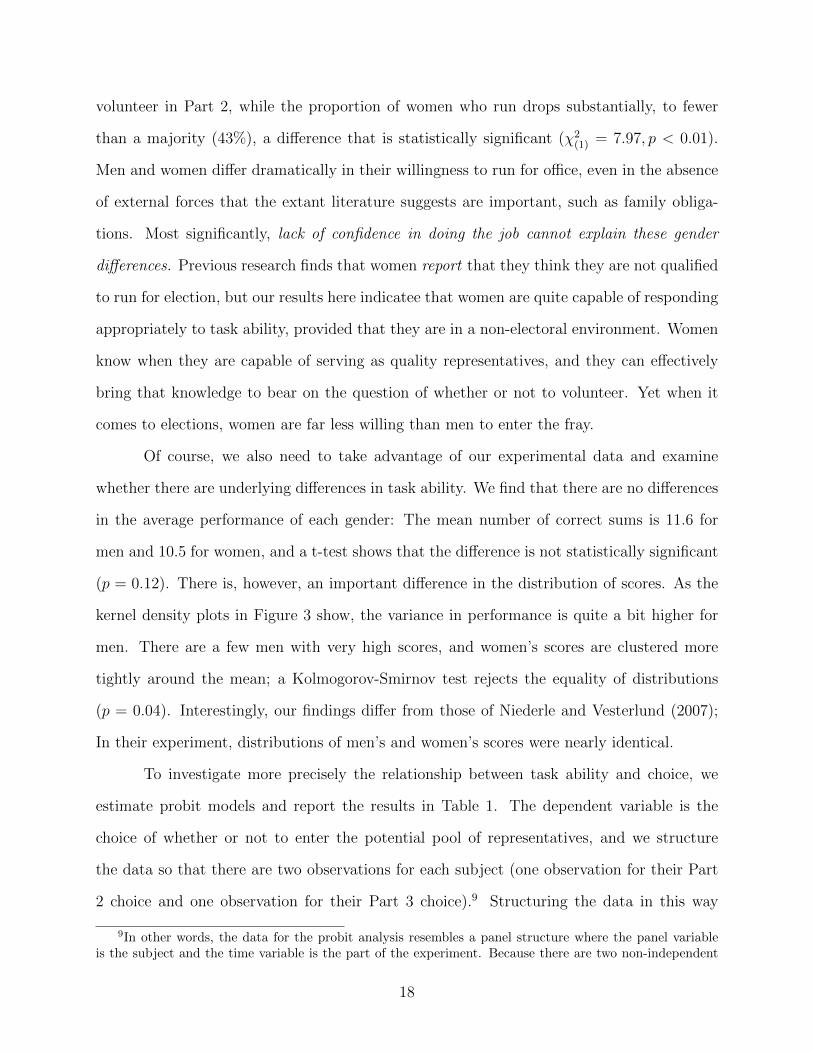
Of course, we also need to take advantage of our experimental data and examine
whether there are underlying differences in task ability. We find that there are no differences
in the average performance of each gender: The mean number of correct sums is 11.6 for
men and 10.5 for women, and a t-test shows that the difference is not statistically significant
(p = 0.12). There is, however, an important difference in the distribution of scores. As the
kernel density plots in Figure 3 show, the variance in performance is quite a bit higher for
men. There are a few men with very high scores, and women’s scores are clustered more
tightly around the mean; a Kolmogorov-Smirnov test rejects the equality of distributions
(p = 0.04). Interestingly, our findings differ from those of Niederle and Vesterlund (2007);
In their experiment, distributions of men’s and women’s scores were nearly identical.
To investigate more precisely the relationship between task ability and choice, we
estimate probit models and report the results in Table 1. The dependent variable is the
choice of whether or not to enter the potential pool of representatives, and we structure
the data so that there are two observations for each subject (one observation for their Part
2 choice and one observation for their Part 3 choice).9 Structuring the data in this way
9In other words, the data for the probit analysis resembles a panel structure where the panel variableis the subject and the time variable is the part of the experiment. Because there are two non-independent
18
Figure 3: Task performance (kernel densities)
0.0
5.1
.15
Den
sity
0 10 20 30Performance (Piece rate)
Male Female
allows us to estimate the effects of task ability (performance in Part 1) on choices, as well
as to estimate the “treatment effect” of electoral competition and the interaction between
the electoral environment and performance. We also estimate the model separately for each
gender, which is equivalent to estimating a single encompassing model in which all of the
coefficients are gender-specific.
Men’s choices in both Part 2 and Part 3 are sensitive to their task ability, but their
decisions depend somewhat less on task ability when the selection mechanism is an election
than when it involves random selection. The main coefficient for performance is positive
and statistically significant, which implies that men are more likely to volunteer the higher
their task ability in Part 2. However, the interaction between electoral competition and
performance is negative and statistically significant, which means that men are less likely
to run for election in Part 3 as a function of task ability than they are to volunteer in Part
2. The sum of this interaction coefficient and the main coefficient for performance remains
observations per subject, we cluster the standard errors by subject.
19
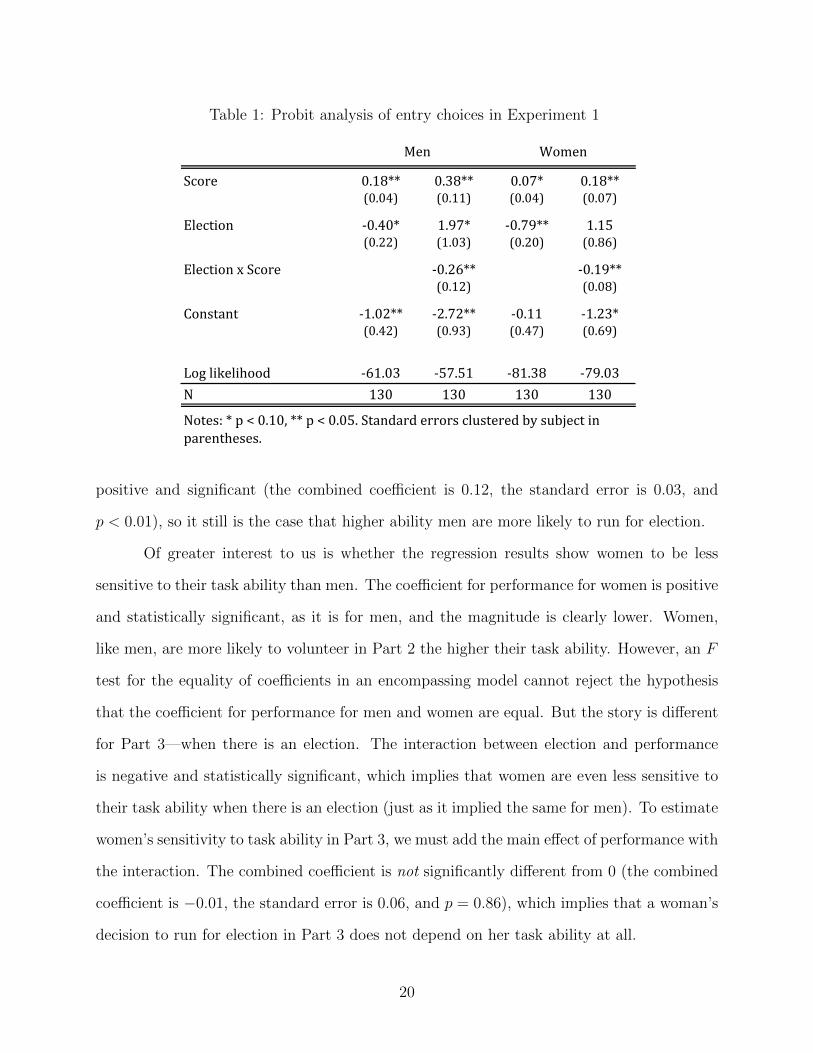
Table 1: Probit analysis of entry choices in Experiment 1
Score 0.18** 0.38** 0.07* 0.18**(0.04) (0.11) (0.04) (0.07)
Election -‐0.40* 1.97* -‐0.79** 1.15(0.22) (1.03) (0.20) (0.86)
Election x Score -‐0.26** -‐0.19**(0.12) (0.08)
Constant -‐1.02** -‐2.72** -‐0.11 -‐1.23*(0.42) (0.93) (0.47) (0.69)
Log likelihood -‐61.03 -‐57.51 -‐81.38 -‐79.03N 130 130 130 130
Men Women
Notes: * p < 0.10, ** p < 0.05. Standard errors clustered by subject in parentheses.
positive and significant (the combined coefficient is 0.12, the standard error is 0.03, and
p < 0.01), so it still is the case that higher ability men are more likely to run for election.
Of greater interest to us is whether the regression results show women to be less
sensitive to their task ability than men. The coefficient for performance for women is positive
and statistically significant, as it is for men, and the magnitude is clearly lower. Women,
like men, are more likely to volunteer in Part 2 the higher their task ability. However, an F
test for the equality of coefficients in an encompassing model cannot reject the hypothesis
that the coefficient for performance for men and women are equal. But the story is different
for Part 3—when there is an election. The interaction between election and performance
is negative and statistically significant, which implies that women are even less sensitive to
their task ability when there is an election (just as it implied the same for men). To estimate
women’s sensitivity to task ability in Part 3, we must add the main effect of performance with
the interaction. The combined coefficient is not significantly different from 0 (the combined
coefficient is −0.01, the standard error is 0.06, and p = 0.86), which implies that a woman’s
decision to run for election in Part 3 does not depend on her task ability at all.
20
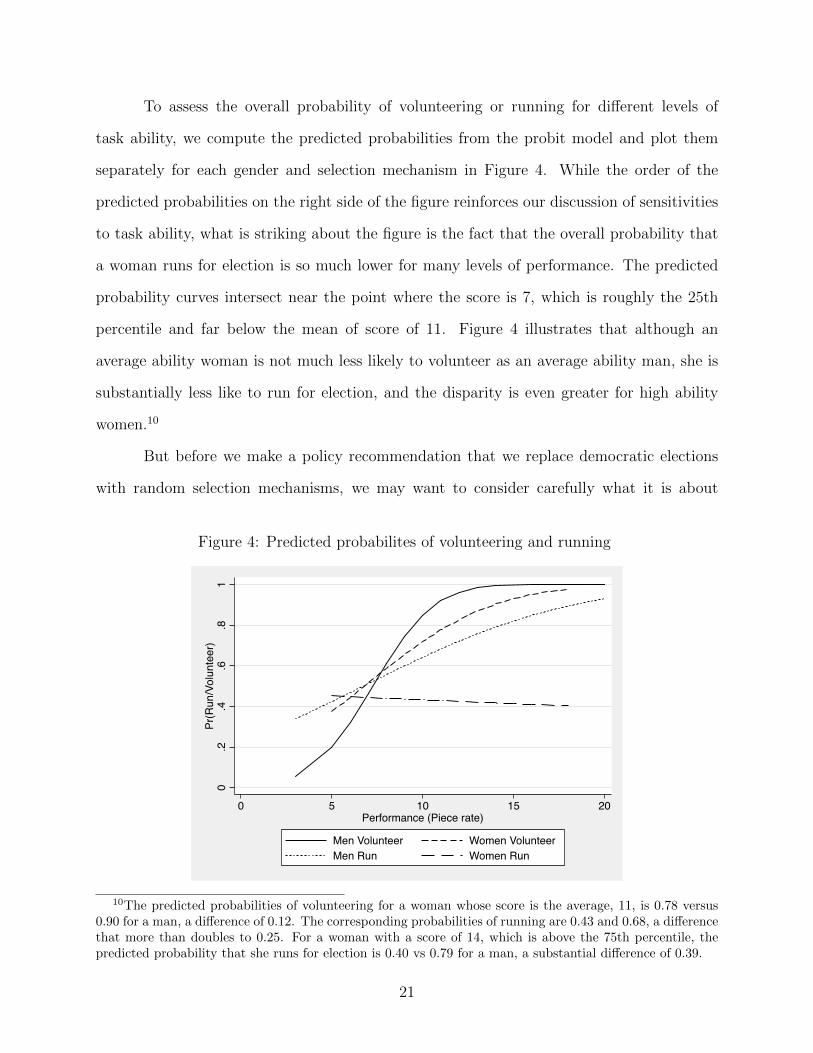
To assess the overall probability of volunteering or running for different levels of
task ability, we compute the predicted probabilities from the probit model and plot them
separately for each gender and selection mechanism in Figure 4. While the order of the
predicted probabilities on the right side of the figure reinforces our discussion of sensitivities
to task ability, what is striking about the figure is the fact that the overall probability that
a woman runs for election is so much lower for many levels of performance. The predicted
probability curves intersect near the point where the score is 7, which is roughly the 25th
percentile and far below the mean of score of 11. Figure 4 illustrates that although an
average ability woman is not much less likely to volunteer as an average ability man, she is
substantially less like to run for election, and the disparity is even greater for high ability
women.10
But before we make a policy recommendation that we replace democratic elections
with random selection mechanisms, we may want to consider carefully what it is about
Figure 4: Predicted probabilites of volunteering and running
0.2
.4.6
.81
Pr(R
un/V
olun
teer
)
0 5 10 15 20Performance (Piece rate)
Men Volunteer Women VolunteerMen Run Women Run
10The predicted probabilities of volunteering for a woman whose score is the average, 11, is 0.78 versus0.90 for a man, a difference of 0.12. The corresponding probabilities of running are 0.43 and 0.68, a differencethat more than doubles to 0.25. For a woman with a score of 14, which is above the 75th percentile, thepredicted probability that she runs for election is 0.40 vs 0.79 for a man, a substantial difference of 0.39.
21
elections that cause men, and especially women, to be insensitive to their own abilities when
deciding to run. Again, we can rely on the use of laboratory experiments to provide us
with an opportunity to consider carefully and independently the myriad factors that affect
the entry decisions of potential candidates. We take advantage of those opportunities in
Experiment 2, which allows us to decompose election aversion into its various parts and to
determine which are most significant.
Experiment 2: Costless and Truthful Campaigns
To more systematically investigate the potential causes of the substantial gender differences
we uncovered in Experiment 1, we devised a second experiment that leverages the many
advantages of experimental control, relying on both within and between subject comparisons
as well as incentivized measurement procedures. To test whether the prospect of strategic
campaigning deters women from becoming candidates, we vary the campaign environment
and compare truthful campaigns with the free-form chat campaigns used in Experiment 1.
To test whether the financial costs of campaigning may be the culprit, we compare volunteer
and candidate decisions with and without costs and benefits, holding these incentives constant
within sessions. Varying these two factors yields four treatments in a 2× 2 factorial design:
chat with costs and benefits (CCB), chat without costs and benefits (CNO), truth with costs
and benefits (TCB), and truth without costs and benefits (TNO). Note that the design also
allows us to assess the interaction between these factors.
In all four treatments, we also add two incentived measurement tasks. The first is
a belief elicitation procedure. Because beliefs about others’ abilities play a crucial role in
maximizing expected payoffs, differences in behavior in Experiment 1 might have arisen from
unobserved heterogeneity in subjects’ beliefs about others. Thus, we elicit beliefs about the
distribution of other group members’ scores directly so that tests for differences, control for
them in the statistical analysis, and assess whether such beliefs are sensitive to changes in the
22
campaign environment. The second incentivized measurement task elicits risk preferences.
Although the results of Experiment 1 contradict the theoretical prediction that greater risk
aversion among women should lead to higher levels of candidate entry, it is nevertheless
possible that decisions may be related to risk preferences in unexpected ways. Thus, it is
important that we measure risk preferences directly.
Design and Procedures
Many of the basic procedures for Experiment 2 are similar to those for Experiment 1. Part
1 consists of the Addition Task with the individual Piece Rate compensation, Part 2 is
Group Representation involving the random selection of the representative from the set
of volunteers, and Part 3 involves selecting the representative by Election. Rewards from
performance are also identical: 75 cents for each correct answer in Part 1, 50 cents for each
of the representative’s correct answers in Parts 2 and 3, and 25 cents from one’s own correct
answers in Parts 2 and 3. As before, each session involved an equal number of men and
women, randomly divided into groups of 5, who interacted anonymously through networked
computers. We did, however, increase the number of subjects from 10 to 20.
In the campaign chat treatments (CCB and CNO), the sequence of actions in the
Election stage was identical to that of Experiment 1. Subjects first decided whether to
become candidates, candidates then wrote free-form text campaign messages, and group
members voted to elect the representative. In contrast, candidates cannot send messages
in the truthful campaign treatments (TCB and TNO). Instead, the only information that
group members have when voting is an accurate report of a candidate’s Part 1 score.
In treatments with costs and benefits (CCB and TCB), the payoff structure differs
somewhat from that of Experiment 1. In Experiment 2, subjects pay an entry cost of $1
if they are willing to be the representative and earn a reward of $2 if they are both willing
and selected as the representative. These costs and benefits apply both to the decision to
volunteer and to the decision to become a candidate. Note that the incentives are weaker or
23
more subtle than in Experiment 1, but also that the costs and benefits of being willing to
enter the pool of potential representatives are identical in Parts 2 and 3 within the CCB and
TCB treatments, which allows for a cleaner within-subject comparison. In the treatments
without costs and benefits (CNO and TNO), there are simply no costs or benefits associated
with the Part 2 and Part 3 decisions other than the payoffs from task performance. Removing
the costs and benefits provides for a cleaner between-subjects comparison to assess the effects
of the truthfulenss of the campaign environment as well as to assess the effects of costs and
benefits within campaign environments.
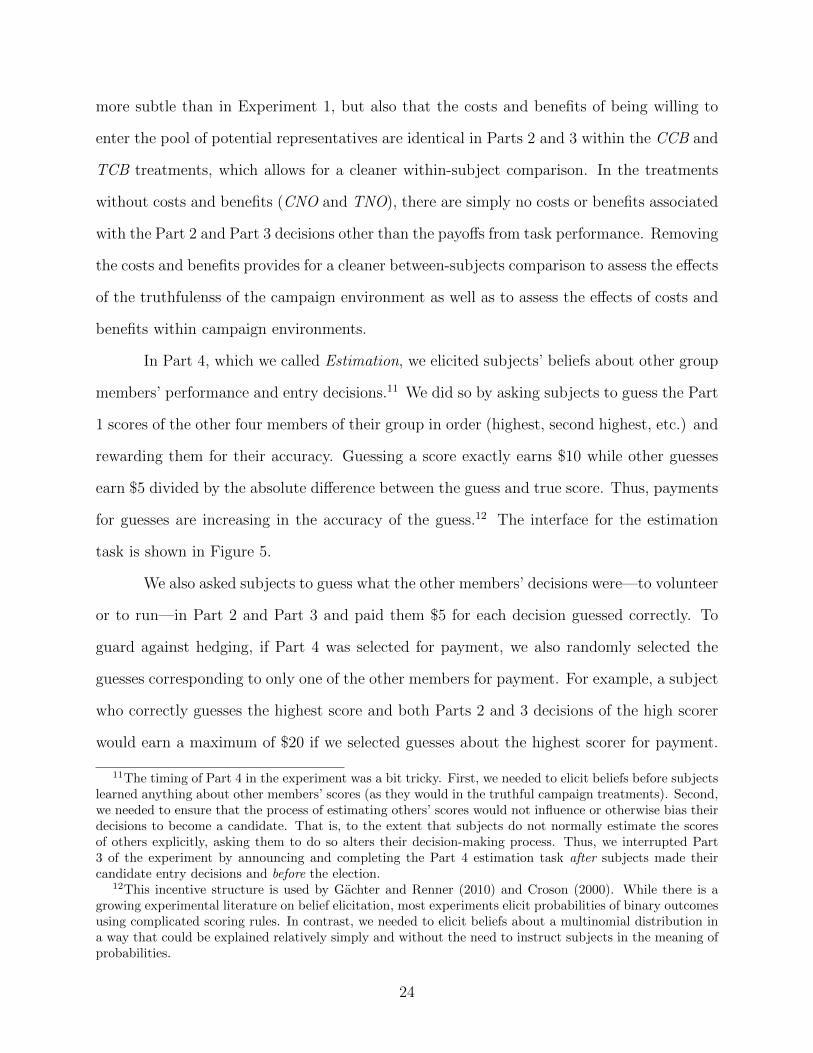
In Part 4, which we called Estimation, we elicited subjects’ beliefs about other group
members’ performance and entry decisions.11 We did so by asking subjects to guess the Part
1 scores of the other four members of their group in order (highest, second highest, etc.) and
rewarding them for their accuracy. Guessing a score exactly earns $10 while other guesses
earn $5 divided by the absolute difference between the guess and true score. Thus, payments
for guesses are increasing in the accuracy of the guess.12 The interface for the estimation
task is shown in Figure 5.
We also asked subjects to guess what the other members’ decisions were—to volunteer
or to run—in Part 2 and Part 3 and paid them $5 for each decision guessed correctly. To
guard against hedging, if Part 4 was selected for payment, we also randomly selected the
guesses corresponding to only one of the other members for payment. For example, a subject
who correctly guesses the highest score and both Parts 2 and 3 decisions of the high scorer
would earn a maximum of $20 if we selected guesses about the highest scorer for payment.
11The timing of Part 4 in the experiment was a bit tricky. First, we needed to elicit beliefs before subjectslearned anything about other members’ scores (as they would in the truthful campaign treatments). Second,we needed to ensure that the process of estimating others’ scores would not influence or otherwise bias theirdecisions to become a candidate. That is, to the extent that subjects do not normally estimate the scoresof others explicitly, asking them to do so alters their decision-making process. Thus, we interrupted Part3 of the experiment by announcing and completing the Part 4 estimation task after subjects made theircandidate entry decisions and before the election.
12This incentive structure is used by Gachter and Renner (2010) and Croson (2000). While there is agrowing experimental literature on belief elicitation, most experiments elicit probabilities of binary outcomesusing complicated scoring rules. In contrast, we needed to elicit beliefs about a multinomial distribution ina way that could be explained relatively simply and without the need to instruct subjects in the meaning ofprobabilities.
24
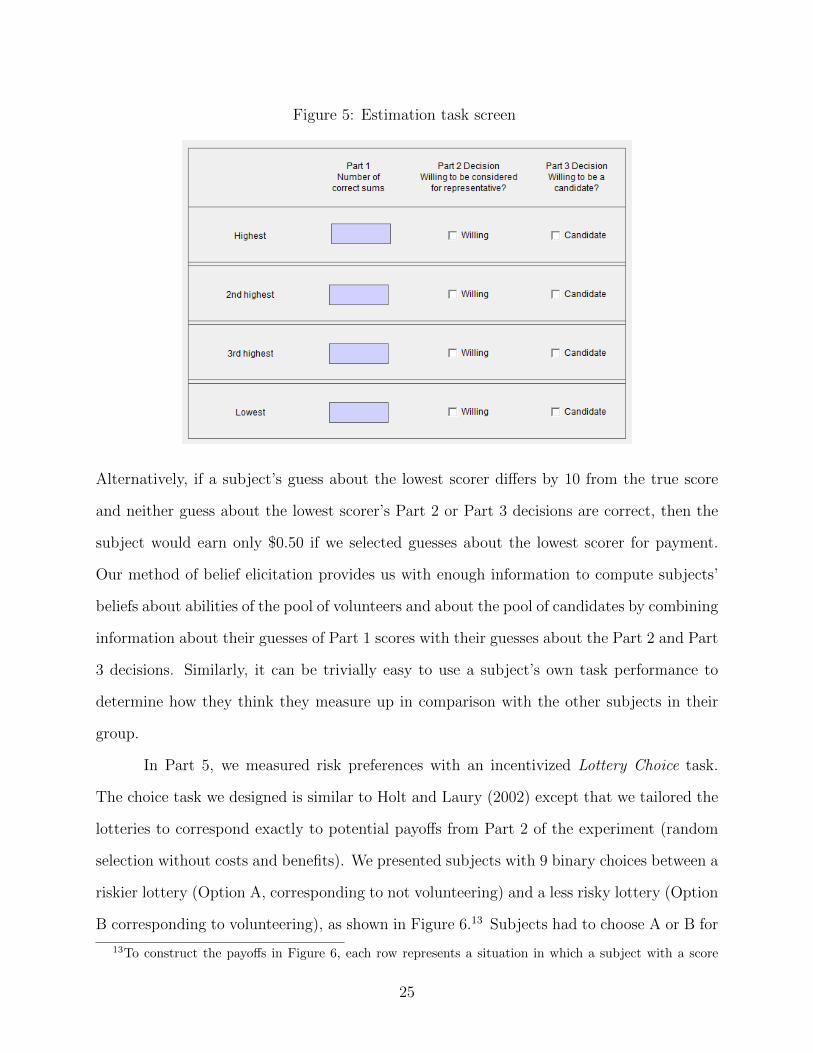
Figure 5: Estimation task screen
Alternatively, if a subject’s guess about the lowest scorer differs by 10 from the true score
and neither guess about the lowest scorer’s Part 2 or Part 3 decisions are correct, then the
subject would earn only $0.50 if we selected guesses about the lowest scorer for payment.
Our method of belief elicitation provides us with enough information to compute subjects’
beliefs about abilities of the pool of volunteers and about the pool of candidates by combining
information about their guesses of Part 1 scores with their guesses about the Part 2 and Part
3 decisions. Similarly, it can be trivially easy to use a subject’s own task performance to
determine how they think they measure up in comparison with the other subjects in their
group.
In Part 5, we measured risk preferences with an incentivized Lottery Choice task.
The choice task we designed is similar to Holt and Laury (2002) except that we tailored the
lotteries to correspond exactly to potential payoffs from Part 2 of the experiment (random
selection without costs and benefits). We presented subjects with 9 binary choices between a
riskier lottery (Option A, corresponding to not volunteering) and a less risky lottery (Option
B corresponding to volunteering), as shown in Figure 6.13 Subjects had to choose A or B for
13To construct the payoffs in Figure 6, each row represents a situation in which a subject with a score
25
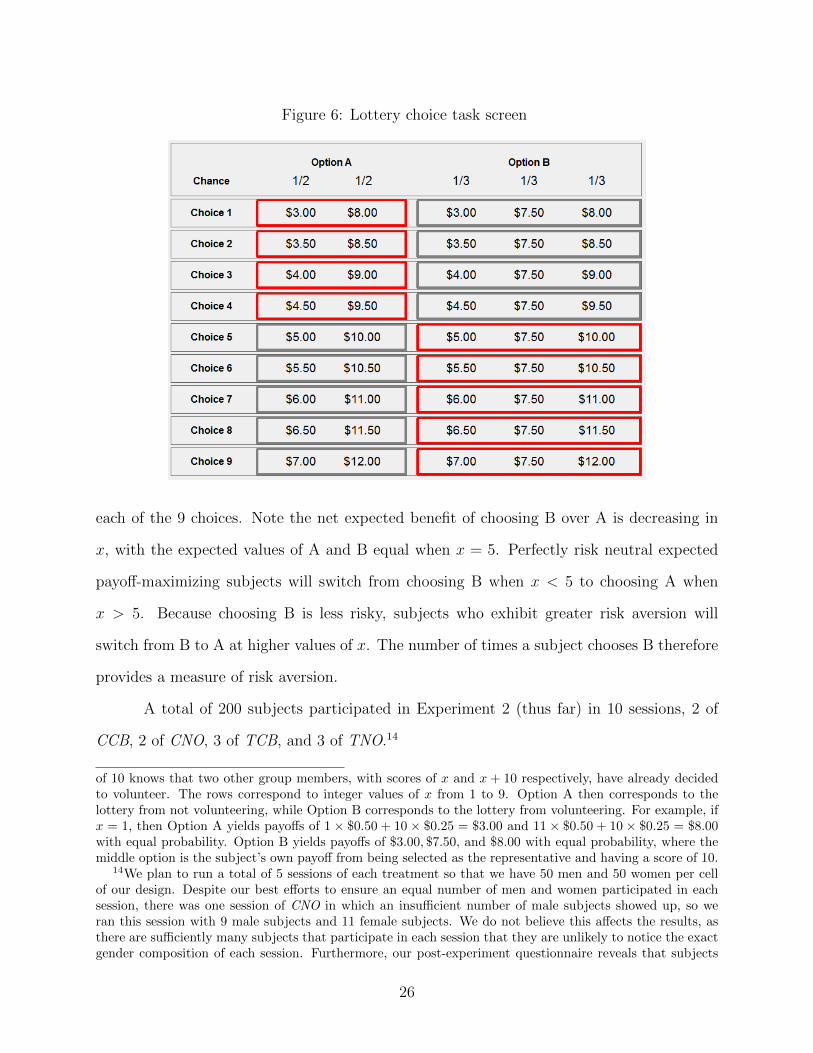
Figure 6: Lottery choice task screen
each of the 9 choices. Note the net expected benefit of choosing B over A is decreasing in
x, with the expected values of A and B equal when x = 5. Perfectly risk neutral expected
payoff-maximizing subjects will switch from choosing B when x < 5 to choosing A when
x > 5. Because choosing B is less risky, subjects who exhibit greater risk aversion will
switch from B to A at higher values of x. The number of times a subject chooses B therefore
provides a measure of risk aversion.
A total of 200 subjects participated in Experiment 2 (thus far) in 10 sessions, 2 of
CCB, 2 of CNO, 3 of TCB, and 3 of TNO.14
of 10 knows that two other group members, with scores of x and x + 10 respectively, have already decidedto volunteer. The rows correspond to integer values of x from 1 to 9. Option A then corresponds to thelottery from not volunteering, while Option B corresponds to the lottery from volunteering. For example, ifx = 1, then Option A yields payoffs of 1 × $0.50 + 10 × $0.25 = $3.00 and 11 × $0.50 + 10 × $0.25 = $8.00with equal probability. Option B yields payoffs of $3.00, $7.50, and $8.00 with equal probability, where themiddle option is the subject’s own payoff from being selected as the representative and having a score of 10.
14We plan to run a total of 5 sessions of each treatment so that we have 50 men and 50 women per cellof our design. Despite our best efforts to ensure an equal number of men and women participated in eachsession, there was one session of CNO in which an insufficient number of male subjects showed up, so weran this session with 9 male subjects and 11 female subjects. We do not believe this affects the results, asthere are sufficiently many subjects that participate in each session that they are unlikely to notice the exactgender composition of each session. Furthermore, our post-experiment questionnaire reveals that subjects
26
Results
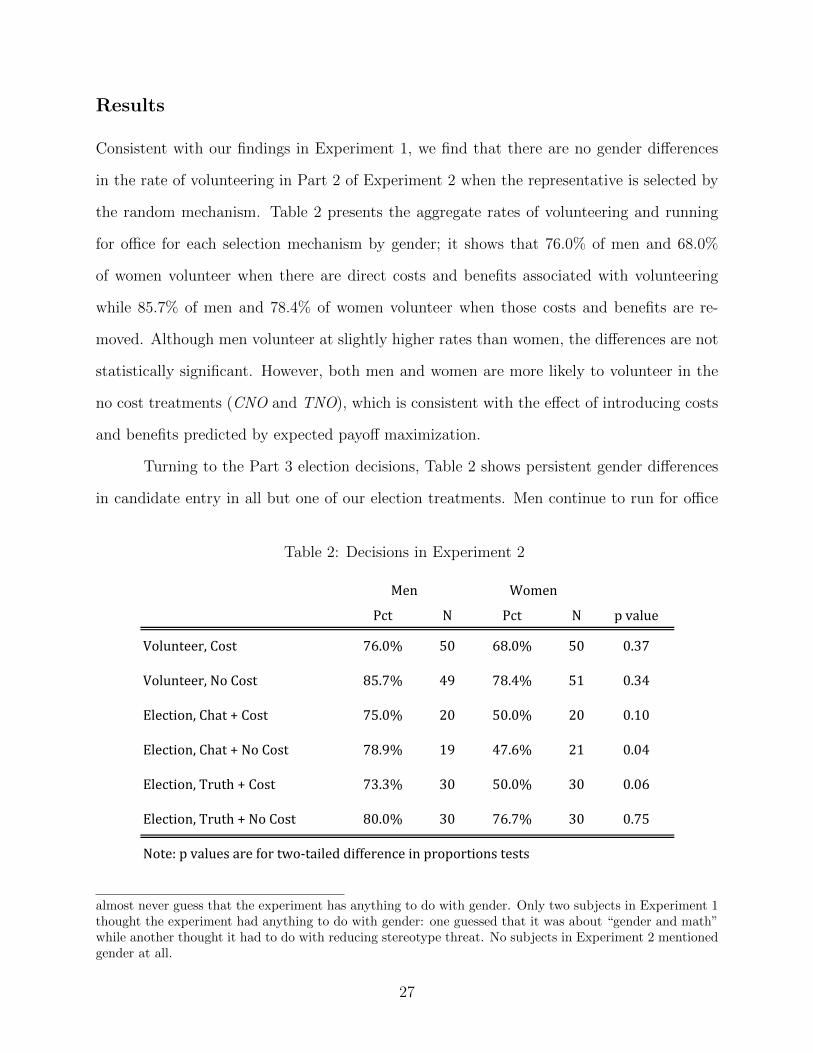
Consistent with our findings in Experiment 1, we find that there are no gender differences
in the rate of volunteering in Part 2 of Experiment 2 when the representative is selected by
the random mechanism. Table 2 presents the aggregate rates of volunteering and running
for office for each selection mechanism by gender; it shows that 76.0% of men and 68.0%
of women volunteer when there are direct costs and benefits associated with volunteering
while 85.7% of men and 78.4% of women volunteer when those costs and benefits are re-
moved. Although men volunteer at slightly higher rates than women, the differences are not
statistically significant. However, both men and women are more likely to volunteer in the
no cost treatments (CNO and TNO), which is consistent with the effect of introducing costs
and benefits predicted by expected payoff maximization.
Turning to the Part 3 election decisions, Table 2 shows persistent gender differences
in candidate entry in all but one of our election treatments. Men continue to run for office
Table 2: Decisions in Experiment 2
Pct N Pct N p value
Volunteer, Cost 76.0% 50 68.0% 50 0.37
Volunteer, No Cost 85.7% 49 78.4% 51 0.34
Election, Chat + Cost 75.0% 20 50.0% 20 0.10
Election, Chat + No Cost 78.9% 19 47.6% 21 0.04
Election, Truth + Cost 73.3% 30 50.0% 30 0.06
Election, Truth + No Cost 80.0% 30 76.7% 30 0.75
Note: p values are for two-‐tailed difference in proportions tests
Men Women
almost never guess that the experiment has anything to do with gender. Only two subjects in Experiment 1thought the experiment had anything to do with gender: one guessed that it was about “gender and math”while another thought it had to do with reducing stereotype threat. No subjects in Experiment 2 mentionedgender at all.
27
when there is an election at about the same rate that they volunteer when the representative
is chosen randomly (between 73.3% and 80.0%), but women’s willingness to run drops to
around 50%—to almost the same level as in Experiment 1—in the CCB, CNO, and TCB
treatments. In other words, we continue to find that, in contrast to men, women exhibit a
high degree of election aversion.
The only exception to this pattern occurs when we simultaneously guarantee that
elections truthfully reveal candidates’ abilities and remove the direct costs of entry. In the
TNO treatment, 76.6% of women run for office, a rate that is statistically indistinguishable
from that of men (80.0%) and comparable to the rate of volunteering. Our findings therefore
suggest that removing the strategic elements of campaigning and removing (or reducing) the
financial downsides to running for office may both be necessary to eliminate election aversion
in women.
To assess the extent to which our aggregate findings may be due to differences in nor-
mally unobservable beliefs or risk preferences, we next analyze the data from our incentivized
measurement tasks. We then use these measures as controls in our regression analysis.
Beliefs. Table 3 summarizes the results from our belief elicitation task (Part 4 of the
experiment). The first four rows show the mean guesses about other group members’ scores
(by rank, as described in the procedures) broken down by the gender of the subject making
the guesses. The fifth row shows the mean belief about the average score, which is computed
by taking the average across a subject’s four guesses. The remainder of the table summa-
rizes the beliefs held about other group members’ decisions and the mean average scores of
others willing to be the representative for each selection mechanism and treatment.15 For
comparison, the right-most column of the table presents the actual values of each quantity.
15Although subjects do not guess the averages directly, they are implied by the beliefs we elicited. Indi-
vidual i’s belief about the average score of the (other) volunteers is∑4
j=1 Vjsj∑4j=1 Vj
where Vj is a dummy variable
indicating whether i believed that the member with rank j volunteered and sj is the score that i guessed
about j. Similarly, the average implied score of (other) candidates is∑4
j=1 Cjsj∑4j=1 Cj
, where Cj indicates whether
i believed j was a candidate.
28
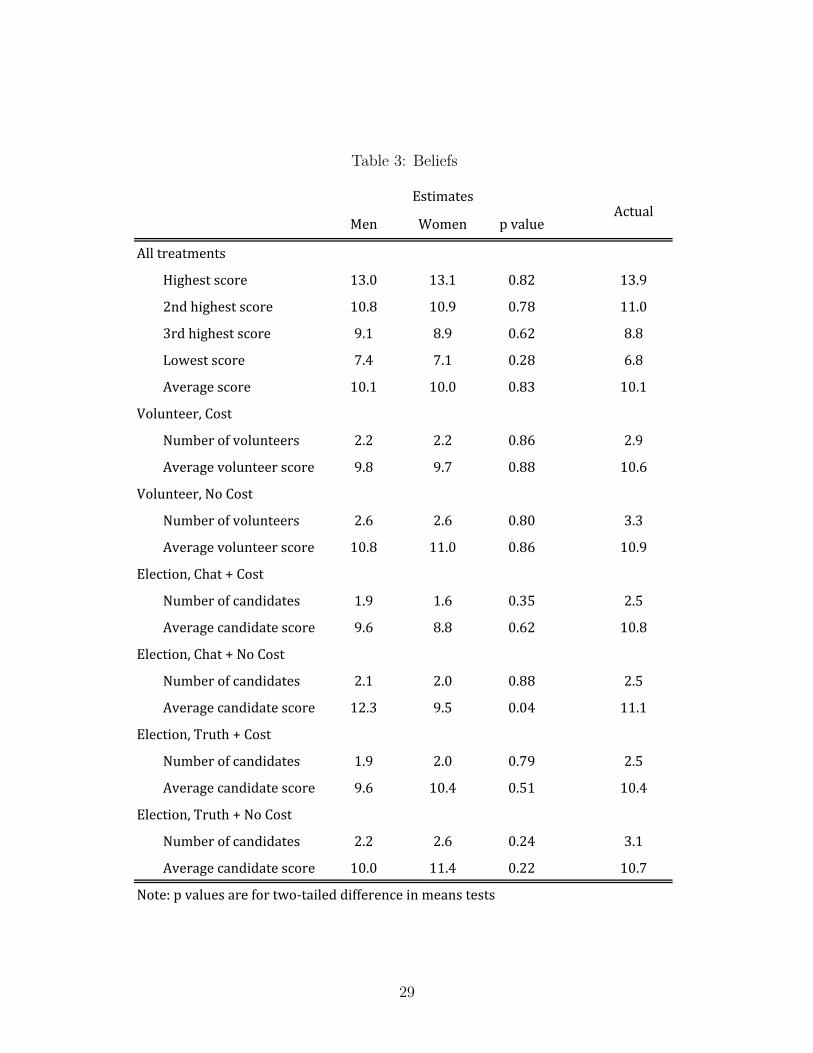
Table 3: Beliefs
Men Women p value
All treatments
Highest score 13.0 13.1 0.82 13.9
2nd highest score 10.8 10.9 0.78 11.0
3rd highest score 9.1 8.9 0.62 8.8
Lowest score 7.4 7.1 0.28 6.8
Average score 10.1 10.0 0.83 10.1
Volunteer, Cost
Number of volunteers 2.2 2.2 0.86 2.9
Average volunteer score 9.8 9.7 0.88 10.6
Volunteer, No Cost
Number of volunteers 2.6 2.6 0.80 3.3
Average volunteer score 10.8 11.0 0.86 10.9
Election, Chat + Cost
Number of candidates 1.9 1.6 0.35 2.5
Average candidate score 9.6 8.8 0.62 10.8
Election, Chat + No Cost
Number of candidates 2.1 2.0 0.88 2.5
Average candidate score 12.3 9.5 0.04 11.1
Election, Truth + Cost
Number of candidates 1.9 2.0 0.79 2.5
Average candidate score 9.6 10.4 0.51 10.4
Election, Truth + No Cost
Number of candidates 2.2 2.6 0.24 3.1
Average candidate score 10.0 11.4 0.22 10.7
Note: p values are for two-‐tailed difference in means tests
ActualEstimates
29
By and large, our results show that men and women hold remarkably similar beliefs
about the abilities of others. The mean guesses of the highest other group members are 13.0
for men and 13.1 for women; for the second highest are 10.8 and 10.9; for the third highest
are 9.1 and 8.9; for the lowest are 7.4 and 7.1; and for the average are 10.1 and 10.0. Not
only are their mean beliefs nearly identical, but they are also quite accurate, especially for
the middle scores: compare these guesses to the actual scores of 13.9, 11.0, 8.8, and 6.8,
respectively. It is interesting to note that both men and women tend to underestimate the
highest score and overestimate the lowest score, suggesting some degree of conservatism in
beliefs.
Men and women also form indistinguishable beliefs about the decisions of others to
join the pool of candidates. Although subjects of both genders tend to underestimate the
number of volunteers and candidates by a slight amount, there are no statistically significant
differences between their estimates of the number of other group members who are willing
to be considered for the representative. There are no differences in the implied average
scores either, except in the CNO treatment. In general, we also find that beliefs appear
to be responsive to our manipulation of the selection mechanism. For example, the mean
number of expected volunteers or candidates and their average scores are higher in the
treatments without costs and benefits than in the treatments with costs and benefits, as
payoff maximization implies. This suggests that subjects not only recognize the role that
costs and benefits play in the willingness to represent one’s group but that they recognize
that other subjects’ actions will depend on them as well.
The results of our incentivized belief elictation task provide direct evidence that
women’s election aversion cannot be attributed to underconfidence in their Addition Task
ability, a finding that contrasts with the extant literature’s conventional wisdom that women
do not run because they do not feel qualified. Our results show that it is not underconfidence
in ability to do the task for which the election is held that explains women’s greater election
aversion. This corroborates our claim that the equal rates of volunteering in Part 2 decisions
30
indeed stem primarily from parity in relative confidence in abilities. Of course, there remains
some possibility that beliefs might still play a role. Even if men and women have similar
beliefs, they might be differentially responsive to those beliefs. We will address this in the
regression analysis after we examine whether there are differences in risk preferences in the
context of volunteering choices.
Risk Preferences. Recall that we designed our second incentivized measurement
task so that subjects faced a series of risky choices with financial incentives identical to the
decision to volunteer. Subjects made nine choices in which Option A, the riskier choice, is
equivalent to a subject with a score of 10 randomly selecting group members with scores of x
and x+10 as the representative, with x ∈ {1, . . . , 9}. Option B, the safer choice, is equivalent
to the decision to volunteer, in which there is an equal probability of being selected oneself,
selecting the member with a score of x, and selecting the member with a score of x + 10.
This option is less risky because increasing the probability of selecting an intermediate value
reduces the variance in the outcome.
Table 4 shows the percentage of men and women who chose the safer Option B for
each of the nine choices. For both men and women, we find that as x increases, the proportion
choosing Option B decreases. This pattern is consistent with expected payoff maximization,
as the expected net benefits of choosing Option B decrease in x, with those benefits being
positive for x < 5 and negative for x > 5. Not surprisingly, the fact that 75% of men and
82% of women choose the safer option when x = 5 (when A and B are equal in expected
value) suggests that both genders exhibit some degree of risk aversion.
However, we also see that women are more likely to choose the safer option than men
for values of x above 6, and all of these gender differences are statistically significant. By the
time x = 9, when the expected benefit of choosing Option A is greatest, the proportion of
men who chose Option B drops to 19% while the proportion of women who made the same
choice is more than twice as high, at 42%. Thus, our results strongly suggest that, with
respect to the risk involved with entry decisions, women indeed exhibit greater risk aversion
31
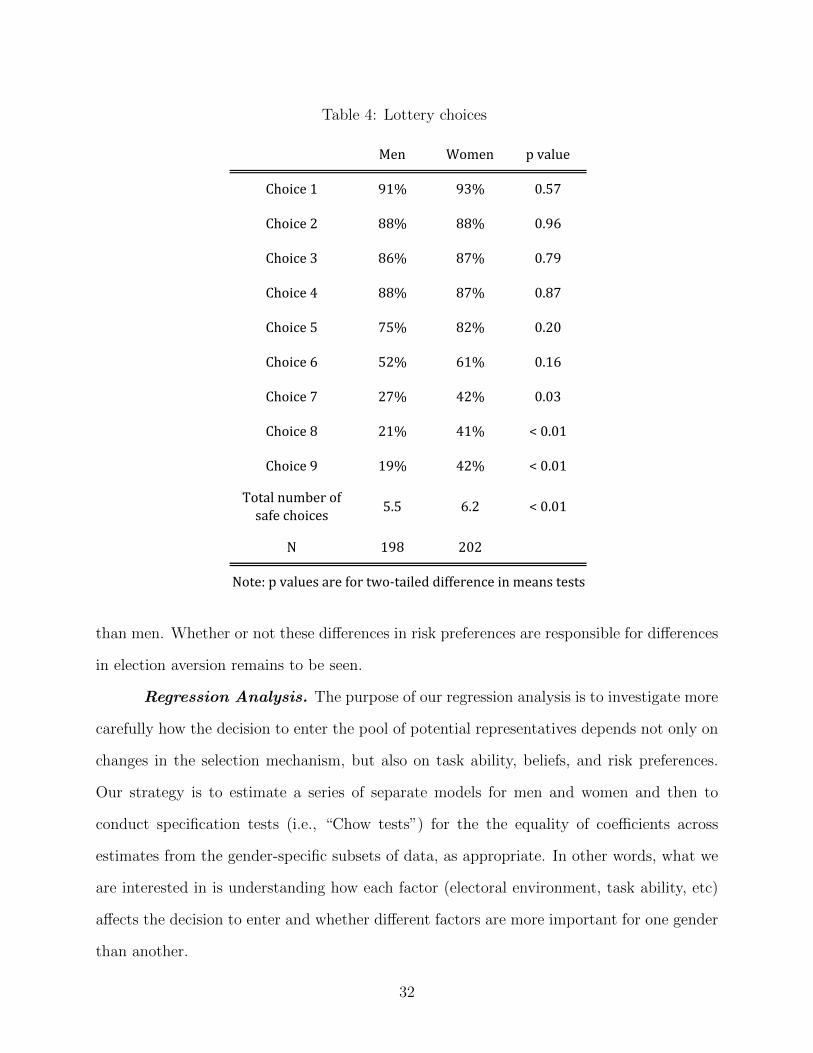
Table 4: Lottery choices
Men Women p value
Choice 1 91% 93% 0.57
Choice 2 88% 88% 0.96
Choice 3 86% 87% 0.79
Choice 4 88% 87% 0.87
Choice 5 75% 82% 0.20
Choice 6 52% 61% 0.16
Choice 7 27% 42% 0.03
Choice 8 21% 41% < 0.01
Choice 9 19% 42% < 0.01
Total number of safe choices 5.5 6.2 < 0.01
N 198 202
Note: p values are for two-‐tailed difference in means tests
than men. Whether or not these differences in risk preferences are responsible for differences
in election aversion remains to be seen.
Regression Analysis. The purpose of our regression analysis is to investigate more
carefully how the decision to enter the pool of potential representatives depends not only on
changes in the selection mechanism, but also on task ability, beliefs, and risk preferences.
Our strategy is to estimate a series of separate models for men and women and then to
conduct specification tests (i.e., “Chow tests”) for the the equality of coefficients across
estimates from the gender-specific subsets of data, as appropriate. In other words, what we
are interested in is understanding how each factor (electoral environment, task ability, etc)
affects the decision to enter and whether different factors are more important for one gender
than another.
32
As we did for the analysis of the Experiment 1 data, we stack the data so that the
dependent variable is the Choice to represent so that there are two observations for each
subject (one for the choice to volunteer and one for the choice to be a representative).
Thus, we can estimate both the between- and within-subjects effects within the same model,
clustering the standard errors by individual.
The first model specification provides us with baseline estimates of the effects of vary-
ing the selection mechanism on the probability of entering while controlling for task ability.
The specification includes a subject’s Score on the Piece Rate task and set of dummy vari-
ables for the electoral environment. The baseline (omitted) case is the decision to volunteer
in the CCB treatment. No Cost is 1 for the CNO and TNO treatments for both the Part 2
and Part 3 decisions. Election is 1 for Part 3 (candidate) decisions. No Cost Election is 1
for the Part 3 decision if the treatment is CNO or TNO. Truth Election is 1 for the Part 3
decision if the treatment is TCB or TNO. The results are shown in Table 5.
The results for the first model are consistent with our interpretation of the aggregate
results. Men and women appear to be equally sensitive to task ability and, when controlling
for this ability, women are less likely to run than men. Thus, even when we account for
task ability, women appear to be election averse. Although the effect of making elections
truthful is positive, it is not statistically significant, which suggests that making elections
more truthful is not sufficient to mitigate election aversion. However, the combined effect
of truthful elections and the removal of costs and is statistically significant when controlling
for task ability.16
In the second specification, we add belief and risk aversion measures to the model. We
include the two summary measure of beliefs suggested by our theoretical analysis. Number
Willing is a measure of the expected competition for representative. It is the number of
other group members that a subject expects to be in the pool of potential representatives
(the number of volunteers if the observation corresponds to the Part 2 decision and the
16The combined effect is the sum of the coefficients for No Cost, No Cost Election, and Truthful Election.The sum is 0.76 with a standard error of 0.39, which is statistically significant at the 0.05 level.
33
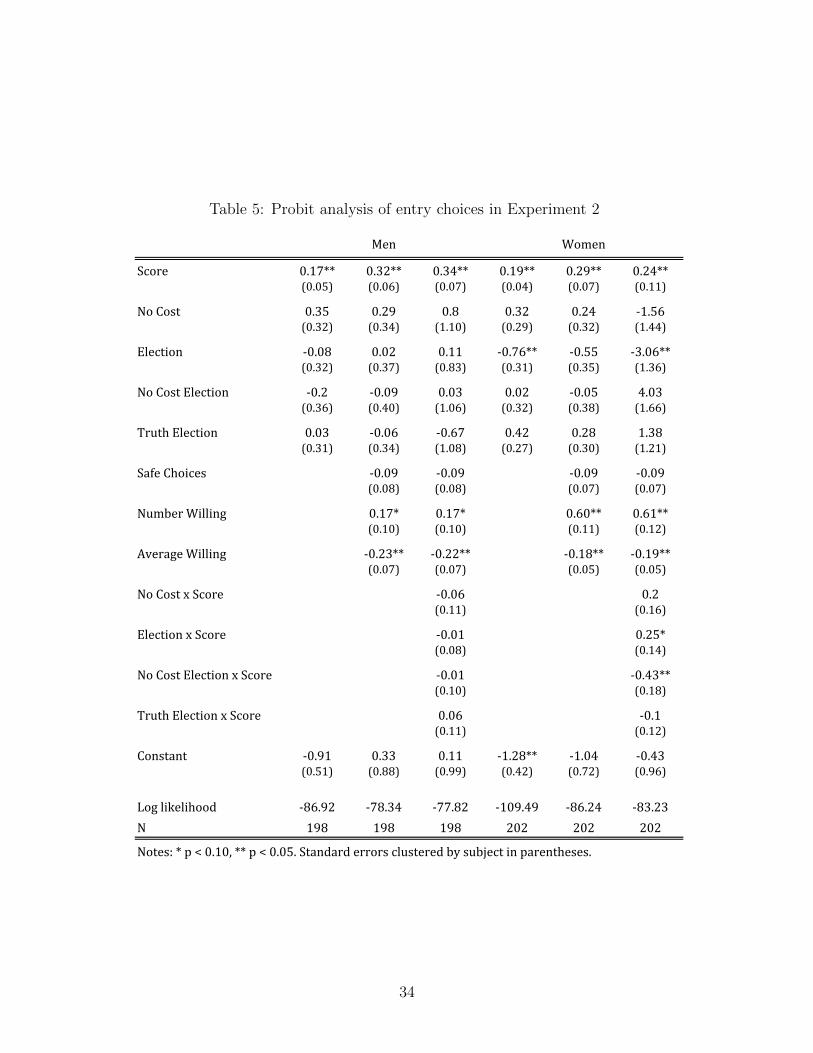
Table 5: Probit analysis of entry choices in Experiment 2
Score 0.17** 0.32** 0.34** 0.19** 0.29** 0.24**(0.05) (0.06) (0.07) (0.04) (0.07) (0.11)
No Cost 0.35 0.29 0.8 0.32 0.24 -‐1.56(0.32) (0.34) (1.10) (0.29) (0.32) (1.44)
Election -‐0.08 0.02 0.11 -‐0.76** -‐0.55 -‐3.06**(0.32) (0.37) (0.83) (0.31) (0.35) (1.36)
No Cost Election -‐0.2 -‐0.09 0.03 0.02 -‐0.05 4.03(0.36) (0.40) (1.06) (0.32) (0.38) (1.66)
Truth Election 0.03 -‐0.06 -‐0.67 0.42 0.28 1.38(0.31) (0.34) (1.08) (0.27) (0.30) (1.21)
Safe Choices -‐0.09 -‐0.09 -‐0.09 -‐0.09(0.08) (0.08) (0.07) (0.07)
Number Willing 0.17* 0.17* 0.60** 0.61**(0.10) (0.10) (0.11) (0.12)
Average Willing -‐0.23** -‐0.22** -‐0.18** -‐0.19**(0.07) (0.07) (0.05) (0.05)
No Cost x Score -‐0.06 0.2(0.11) (0.16)
Election x Score -‐0.01 0.25*(0.08) (0.14)
No Cost Election x Score -‐0.01 -‐0.43**(0.10) (0.18)
Truth Election x Score 0.06 -‐0.1(0.11) (0.12)
Constant -‐0.91 0.33 0.11 -‐1.28** -‐1.04 -‐0.43(0.51) (0.88) (0.99) (0.42) (0.72) (0.96)
Log likelihood -‐86.92 -‐78.34 -‐77.82 -‐109.49 -‐86.24 -‐83.23N 198 198 198 202 202 202
Notes: * p < 0.10, ** p < 0.05. Standard errors clustered by subject in parentheses.
Men Women
34
number of candidates for the Part 3 decision). Average Willing is the implied belief about
average ability of the pool. It is the average expected volunteer’s score if the number of
volunteers is non-zero in Part 2, the average expected candidate’s score if the number of
candidates is non-zero in Part 3, and the average group score if the belief about the number
of volunteers or candidates is 0. Safe Choices is the number of times that the subject chose
Option B in the Lottery Choice task; higher numbers of safe choices indicate greater risk
aversion.
When we add beliefs and risk measures, the magnitudes of the coefficients for the
selection mechanism variables diminish slightly but remain qualitatively similar. For both
men and women, removing costs increases both the probability that men and women volun-
teer and run; it decreases the probability that women run in any electoral environment; and
it increases the probability that women run in elections with truthful campaigns. However,
none of these coefficients are statistically significant (perhaps due to the small sample size
we currently have for each treatment and gender).
The estimates for the second specification also show that beliefs affect the decision to
enter although risk aversion does not. Although the coefficients for Safe Choices are negative
for both men and women, they are close to zero and neither one is statistically significant.
Thus, contrary to what intuition might suggest, the evidence instead demonstrates that
risk aversion plays little part in subjects’ decision calculus. In contrast, the coefficients for
Average Willingness are negative and statistically significant. This is consistent with the
predictions of the theoretical analysis: When subjects believe that the pool of volunteers or
candidates is of higher quality, they are less likely to enter. It is also worth noting that the
magnitudes appear to be similar across gender. (The F test, or Chow test, cannot reject the
hypothesis that the two coefficients are equal, χ2(1) = 0.4 and p = 0.52.)
The coefficients for Number Willing are also statistically significant, but positive. The
directions of these latter coefficients, however, are inconsistent with our theoretical expecta-
tions: Entry decisions should be negatively related to the number of other group members in
35
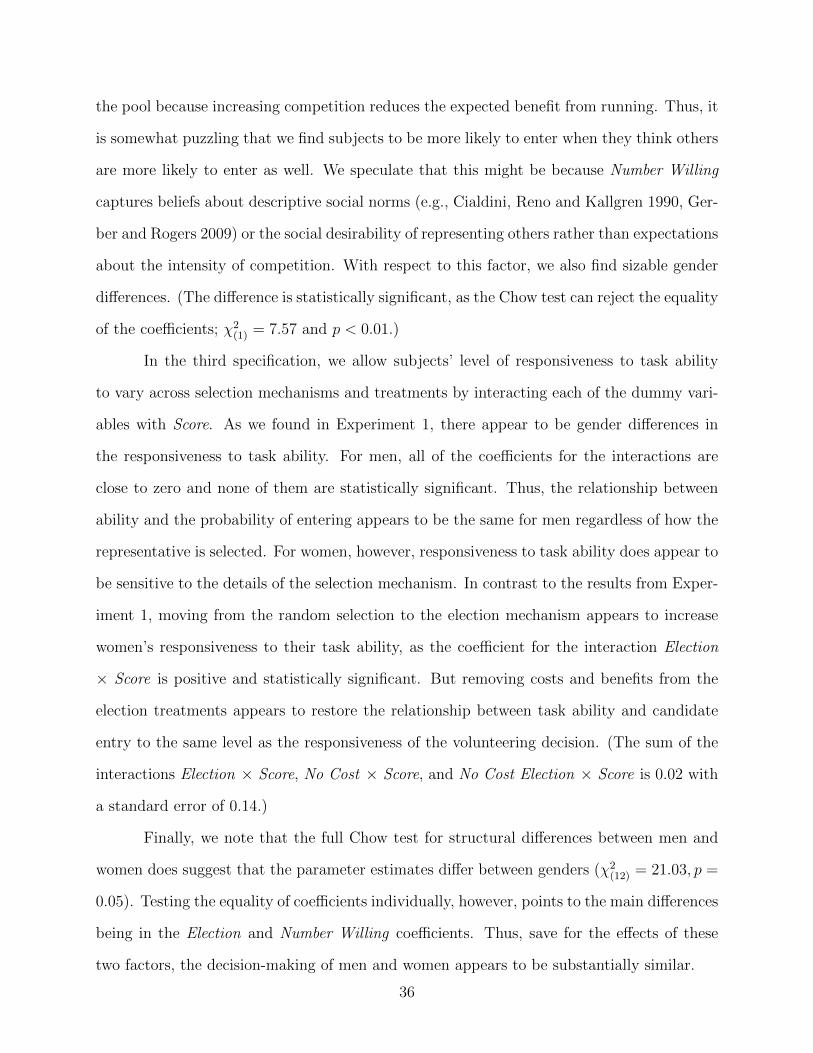
the pool because increasing competition reduces the expected benefit from running. Thus, it
is somewhat puzzling that we find subjects to be more likely to enter when they think others
are more likely to enter as well. We speculate that this might be because Number Willing
captures beliefs about descriptive social norms (e.g., Cialdini, Reno and Kallgren 1990, Ger-
ber and Rogers 2009) or the social desirability of representing others rather than expectations
about the intensity of competition. With respect to this factor, we also find sizable gender
differences. (The difference is statistically significant, as the Chow test can reject the equality
of the coefficients; χ2(1) = 7.57 and p < 0.01.)
In the third specification, we allow subjects’ level of responsiveness to task ability
to vary across selection mechanisms and treatments by interacting each of the dummy vari-
ables with Score. As we found in Experiment 1, there appear to be gender differences in
the responsiveness to task ability. For men, all of the coefficients for the interactions are
close to zero and none of them are statistically significant. Thus, the relationship between
ability and the probability of entering appears to be the same for men regardless of how the
representative is selected. For women, however, responsiveness to task ability does appear to
be sensitive to the details of the selection mechanism. In contrast to the results from Exper-
iment 1, moving from the random selection to the election mechanism appears to increase
women’s responsiveness to their task ability, as the coefficient for the interaction Election
× Score is positive and statistically significant. But removing costs and benefits from the
election treatments appears to restore the relationship between task ability and candidate
entry to the same level as the responsiveness of the volunteering decision. (The sum of the
interactions Election × Score, No Cost × Score, and No Cost Election × Score is 0.02 with
a standard error of 0.14.)
Finally, we note that the full Chow test for structural differences between men and
women does suggest that the parameter estimates differ between genders (χ2(12) = 21.03, p =
0.05). Testing the equality of coefficients individually, however, points to the main differences
being in the Election and Number Willing coefficients. Thus, save for the effects of these
two factors, the decision-making of men and women appears to be substantially similar.
36
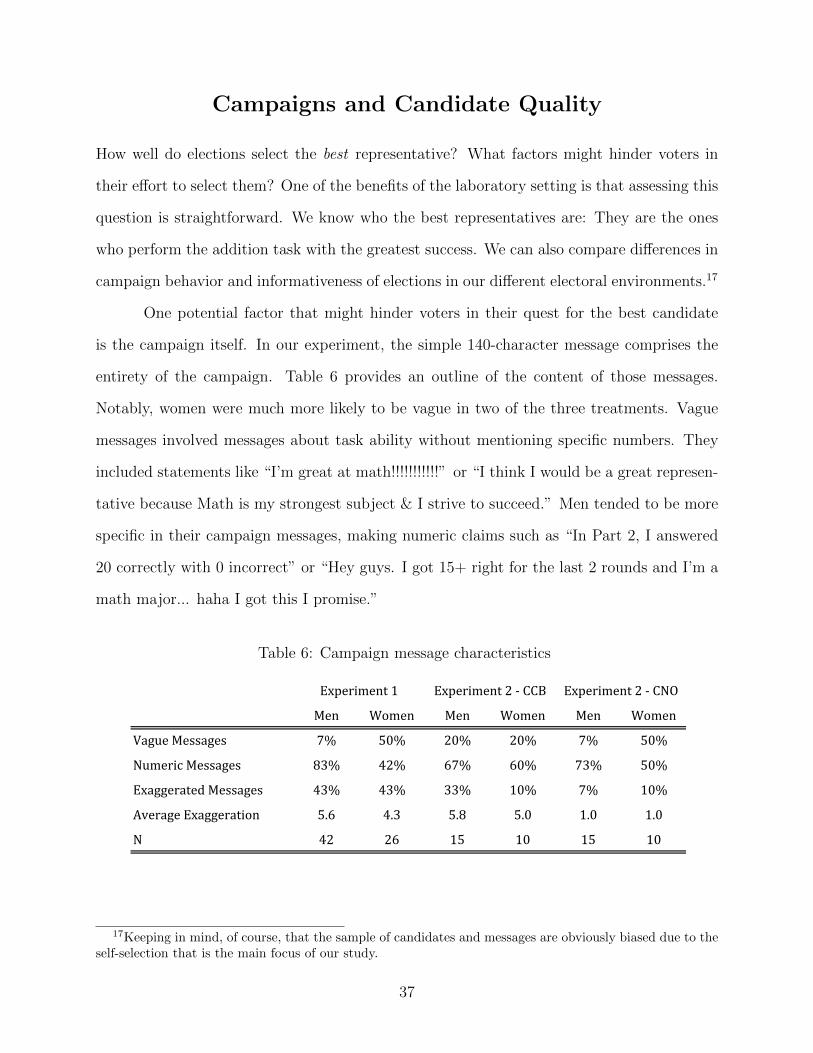
Campaigns and Candidate Quality
How well do elections select the best representative? What factors might hinder voters in
their effort to select them? One of the benefits of the laboratory setting is that assessing this
question is straightforward. We know who the best representatives are: They are the ones
who perform the addition task with the greatest success. We can also compare differences in
campaign behavior and informativeness of elections in our different electoral environments.17
One potential factor that might hinder voters in their quest for the best candidate
is the campaign itself. In our experiment, the simple 140-character message comprises the
entirety of the campaign. Table 6 provides an outline of the content of those messages.
Notably, women were much more likely to be vague in two of the three treatments. Vague
messages involved messages about task ability without mentioning specific numbers. They
included statements like “I’m great at math!!!!!!!!!!!” or “I think I would be a great represen-
tative because Math is my strongest subject & I strive to succeed.” Men tended to be more
specific in their campaign messages, making numeric claims such as “In Part 2, I answered
20 correctly with 0 incorrect” or “Hey guys. I got 15+ right for the last 2 rounds and I’m a
math major... haha I got this I promise.”
Table 6: Campaign message characteristics
Men Women Men Women Men Women
Vague Messages 7% 50% 20% 20% 7% 50%
Numeric Messages 83% 42% 67% 60% 73% 50%
Exaggerated Messages 43% 43% 33% 10% 7% 10%
Average Exaggeration 5.6 4.3 5.8 5.0 1.0 1.0
N 42 26 15 10 15 10
Experiment 1 Experiment 2 -‐ CCB Experiment 2 -‐ CNO
17Keeping in mind, of course, that the sample of candidates and messages are obviously biased due to theself-selection that is the main focus of our study.
37
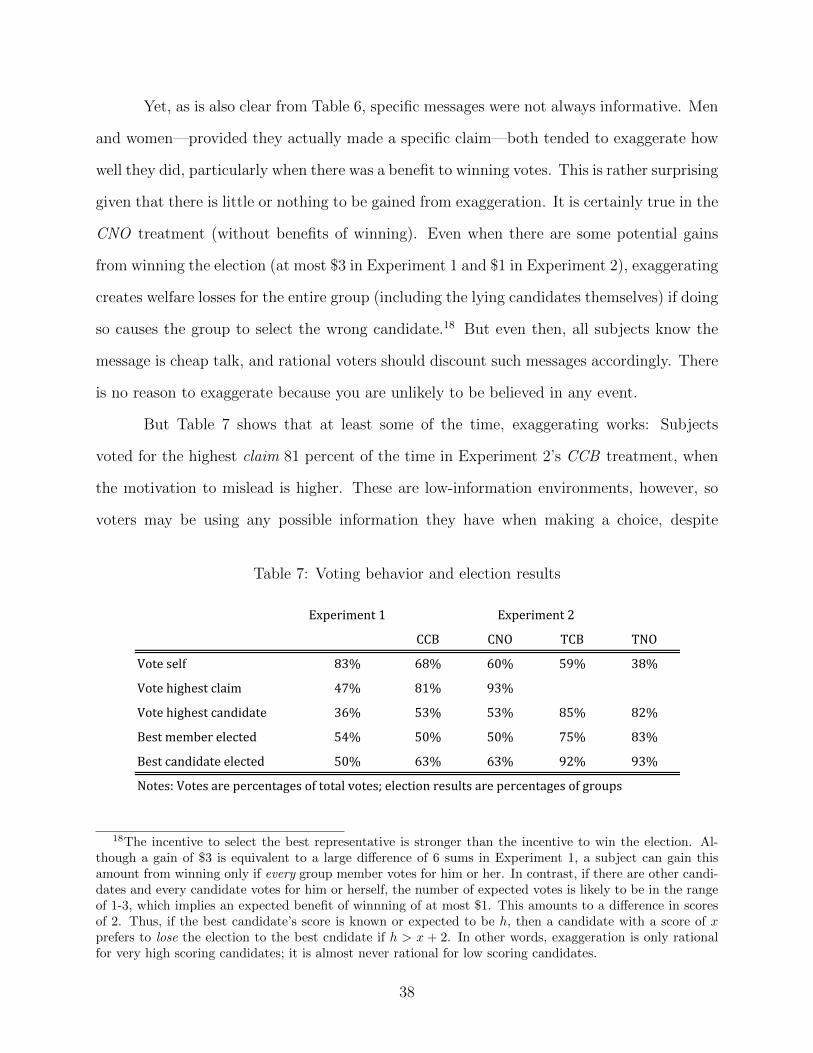
Yet, as is also clear from Table 6, specific messages were not always informative. Men
and women—provided they actually made a specific claim—both tended to exaggerate how
well they did, particularly when there was a benefit to winning votes. This is rather surprising
given that there is little or nothing to be gained from exaggeration. It is certainly true in the
CNO treatment (without benefits of winning). Even when there are some potential gains
from winning the election (at most $3 in Experiment 1 and $1 in Experiment 2), exaggerating
creates welfare losses for the entire group (including the lying candidates themselves) if doing
so causes the group to select the wrong candidate.18 But even then, all subjects know the
message is cheap talk, and rational voters should discount such messages accordingly. There
is no reason to exaggerate because you are unlikely to be believed in any event.
But Table 7 shows that at least some of the time, exaggerating works: Subjects
voted for the highest claim 81 percent of the time in Experiment 2’s CCB treatment, when
the motivation to mislead is higher. These are low-information environments, however, so
voters may be using any possible information they have when making a choice, despite
Table 7: Voting behavior and election results
Experiment 1
CCB CNO TCB TNO
Vote self 83% 68% 60% 59% 38%
Vote highest claim 47% 81% 93%
Vote highest candidate 36% 53% 53% 85% 82%
Best member elected 54% 50% 50% 75% 83%
Best candidate elected 50% 63% 63% 92% 93%
Notes: Votes are percentages of total votes; election results are percentages of groups
Experiment 2
18The incentive to select the best representative is stronger than the incentive to win the election. Al-though a gain of $3 is equivalent to a large difference of 6 sums in Experiment 1, a subject can gain thisamount from winning only if every group member votes for him or her. In contrast, if there are other candi-dates and every candidate votes for him or herself, the number of expected votes is likely to be in the rangeof 1-3, which implies an expected benefit of winnning of at most $1. This amounts to a difference in scoresof 2. Thus, if the best candidate’s score is known or expected to be h, then a candidate with a score of xprefers to lose the election to the best cndidate if h > x + 2. In other words, exaggeration is only rationalfor very high scoring candidates; it is almost never rational for low scoring candidates.
38
knowing the information is useless. This tendency also has important implications for our
normative questions about selecting the best representative. If some people are willing to
lie, and most people are willing to believe their lies, selecting the highest-quality candidate
becomes most difficult. We strongly suspect that the noisiness of the campaign environment
is, to a large extent, an important source of election aversion. Perhaps women are averse to
elections because they don’t want to lie, or on the other side of the same coin, they fear their
honest statements of their qualities will not believed through the campaign babel spewed by
others. Indeed, these fears are not unfounded, as groups are much more likely to select the
best candidates—and thereby more successful in selecting the best representatives—in the
truthful campaign treatments than in the chat campaign treatments.
Conclusion
According to traditional democratic theory, elections are supposed to be the catalyst for
proper representation. They are what encourages representatives to translate their con-
stituents’ interests into policy outcomes. But we also expect people—potential candidates—
to differ in their ability to perform the tasks of the representative well and for elections to
select those candidates who truly have the best ability to do so. Our analysis indicates that
this may not be the case. Ideally, we would hope that election aversion would be inversely
related to task ability: Those worst at the task of representing would be the same people
who would be most averse to running for election to perform the task for the group. Alas,
this is not the case.
Instead, election aversion is distributed across people in a way that is much more
highly correlated with gender than with task ability. Notably, both men and women become
less sensitive, we find, to task ability in an electoral, as opposed to a volunteer, environment.
Yet the decrease in sensitivity is dramatically higher in women than in men. Of course,
this pattern has important normative implications for women’s representation which we do
39
not intend to minimize. But even beyond issues of descriptive representation, we contend
that fewer women candidates translates directly into lower of quality representation and of
representative government, as less qualified representatives attempt to make policy decisions
that highly qualified people—who did not even choose to run—would be better able to make.
The relationship between voters and their representatives requires high quality electoral
candidates, but election aversion seems to preclude their availability.
But getting back to the issue of women specifically, gender-based election aversion
may play a significant role in the ability, or lack thereof, of Congress to perform its essen-
tial functions. Research in behavioral economics and psychology indicates that having more
women in a group of decision-makers fundamentally alters how that group performs. Men
tend to suffer from a “mythical fixed pie bias” that causes them to see negotiations as a
zero-sum game (Babcock and Laschever 2003) and to be more confrontational in negoti-
ations (Kimmel, Pruitt, Magenau, Konar-Goldband and Carnevale 1980), whereas women
tend to be more cooperative (Walters, Stuhlmacher and Meyer 1998) and are concerned
more with sharing information with those with whom they have negotiated (Helgesen 1990).
These differences in how women and men interact may cause groups with more women to
be “smarter” (that is, more effective at collective decision-making) than groups with fewer
women (Woolley et al. 2010). How might the recent fiscal cliff negotiations have worked
differently if Congress were peopled with more representatives who saw negotiation as a
means to find tractable solutions in the common interest, rather than opportunities to dom-
inate their foes? Would we remain a nation that operates, as President Obama expressed
in his 2013 State of the Union address, by “conducting its business by drifting from one
manufactured crisis to the next”?
The current project does not attempt to offer an answer to that question, but it does
present a potential roadmap for finding out. Specifically, our results provide direction for
those practitioners who seek to decrease the deleterious effects of election aversion on the
emergence of women candidates. In contrast to what other research might suggest, potential
40
candidates do not need convincing that they can do the job—they know when they can,
and respond correctly to their own task ability. But they do so only when that response
does not require the traditional difficulties that come with running for office. Our results
in Experiment 2 clearly point to two of those difficulties: paying the costs of running as a
candidate paired with substantial uncertainty about the efficacy of messages that convey to
voters that women are qualified.
Not only have we identified election aversion as an important behavioral phenomenon,
but we have also discovered a remedy for curtailing its undesirable consequences. Election
aversion is at its greatest for women either when elections are high-stakes or when there
inadequate mechanisms by which to report qualifications to voters. Men show dramatically
lower levels of election aversion: High stakes and low information environments deter them
much less frequently.
In other words, women know they are qualified. But what they may be unsure about
is how to convince voters of that and how to do that convincing in a more cost-effective
manner. Organizations like Emily’s List, that provide funds for women candidates in the
early stages of election, may help mitigate the effects of campaign costs on election aversion.
Similarly, organizations might pledge assistance to women candidates in helping to convince
others of their qualifications. If women know they will be judged on their true qualifications
and they are not worried about the burdens and the hefty tolls that campaigning extracts,
election aversion disappears. The truth, we find, convinces women to run.
References
Abrahams, Naomi. 1996. “Negotiating Power, Identity, Family, and Community: Women’sCommunity Participation.” Gender & Society 10(6):768–96.
Achen, Christopher H. 1978. “Measuring Representation.” American Journal of PoliticalScience pp. 475–510.
Ansolabehere, Stephen and Philip Edward Jones. 2010. “Constituents’ Responses to Con-gressional Roll-Call Voting.” American Journal of Political Science 54(3):583–597.
41

Babcock, Linda and Sara Laschever. 2003. Women Don’t Ask: Negotiation and the GenderDivide. Princeton, NJ: Princeton University Press.
Bafumi, Joseph and Michael C Herron. 2010. “Leapfrog Representation and Extremism: AStudy of American Voters and Their Members in Congress.” American Political ScienceReview 104(03):519–542.
Bartels, Larry M. 1991. “Constituency Opinion and Congressional Policy Making: TheReagan Defense Buildup.” American Political Science Review 85(2):457–474.
Blackstone, Amy. 2004. “Its Just About Being Fair: Activism and the Politics of Volunteeringin the Breast Cancer Movement.” Gender & Society 18(3):350–68.
Bratton, Kathleen A and Kerry L Haynie. 1999. “Agenda Setting and Legislative Success inState Legislatures: The Effects of Gender and Race.” Journal of Politics 61:658–679.
Bureau of Labor Statistics. 2011. “Volunteering in the United States–2010.”. Accessed3/16/2011.URL: http://www.bls.gov/news.release/volun.nr0.htm
Campbell, David E. and Christina Wolbrecht. 2006. “See Jane Run: Women Politicians asRole Models for Adolescents.” The Journal of Politics 69(May):233–47.
Cialdini, Robert B, Raymond R Reno and Carl A Kallgren. 1990. “A Focus Theory ofNormative Conduct: Recycling the Concept of Norms to Reduce Littering in PublicPlaces.” Journal of personality and social psychology 58(6):1015.
Conway, M. Margaret, Gertrude A. Steurnagel and David W. Ahern. 1997. Women andPolitical Participation. Washington, D.C.: Congressional Quarterly Press.
Croson, Rachel TA. 2000. “Thinking Like a Game Theorist: Factors Affecting the Frequencyof Equilibrium Play.” Journal of Economic Behavior & Organization 41(3):299–314.
Croson, Rachel and Uri Gneezy. 2009. “Gender differences in preferences.” Journal of Eco-nomic Literature 47(2):448–474.
Daniels, Arlene Kaplan. 1985. “Good Times and Good Works: The Place of Sociability inthe Work of Women Volunteers.” Social Problems 32(4):363–74.
Darcy, Robert, Susan Welch and Janet Clark. 1994. Women, Elections, and Representation.2nd ed ed. Lincoln, NE: University of Nebraska Press.
Eckel, Catherine C and Philip J Grossman. 1998. “Are Women Less Selfish Than Men?:Evidence From Dictator Experiments.” The economic journal 108(448):726–735.
Eckel, Catherine C and Philip J Grossman. 2002. “Sex Differences and Statistical Stereotyp-ing in Attitudes Toward Financial Risk.” Evolution and Human Behavior 23(4):281–295.
Fischbacher, Urs. 2007. “z-Tree: Zurich Toolbox for Ready-Made Economics Experiments.”Experimental Economics 10:171–8.
42
Furnham, A. and R. Rawles. 1995. “Sex Differences in the Estimation of Intelligence.”Journal of Social Behavior and Personality 10:741–748.
Gachter, Simon and Elke Renner. 2010. “The Effects of (Incentivized) Belief Elicitation inPublic Goods Experiments.” Experimental Economics 13(3):364–377.
Gerber, Alan S and Todd Rogers. 2009. “Descriptive Social Norms and Motivation to Vote:Everybody?s Voting and So Should You.” The Journal of Politics 71(1):178–191.
Gilligan, Carol. 1993. In a Different Voice: Psychological Theory and Women’s Development.Cambridge: Harvard University Press.
Goldin, Claudia and Cecilia Rouse. 2000. “Orchestrating Impartiality: The Impact of ’Blind’Auditions on Female Musicians.” American Economic Review 90(4):715–41.
Helgesen, Sally. 1990. The Female Advantage: Women’s Ways of Leadership. New York:Doubleday Currency.
Holt, Charles A and Susan K Laury. 2002. “Risk Aversion and Incentive Effects.” TheAmerican Economic Review 92(5):1644–1655.
Kanthak, Kristin and George A. Krause. 2010. “Valuing Diversity in Political Organizations:Gender and Token Minorities in the U.S. House of Representatives.” American Journalof Political Science 54(3):839–54.
Kanthak, Kristin and George A. Krause. 2012. The Diversity Paradox: Political Parties,Legislatures, and the Organizational Foundations of Representation in America. NewYork: Oxford University Press.
Kimmel, Melvin J., Dean G. Pruitt, John M. Magenau, Ellen Konar-Goldband and Peter J.D.Carnevale. 1980. “Effects of Trust, Aspiration, and Gender on Negotiation Tactics.”Journal of Personality and Social Psychology 38(1):9–22.
Kling, Kristen C., J. Hyde, C. Showers and B. Buswelll. 1999. “Gender Differences in Self-Esteem: A Meta- Analysis.” Psychological Bulletin 125(4):470–500.
Lawless, Jennifer L. and Richard L. Fox. 2005. It Takes a Candidate: Why Women Run forOffice. New York: Cambridge University Press.
Lichtenstein, Sarah, Baruch Fischoff and Lawrence D. Phillips. 1982. Calibration of Proba-bilities: The State of the Art to 1980. In Judgment under Uncertainty: Heuristics andBiases, ed. Daniel Kahneman, Paul Slovic and Amos Tversky. Cambridge: CambridgeUnversity Press.
Lundeberg, Fox and Punccohar. 1994. “Highly Confident but Wrong: Gender Differences andSimilarities in Confidence Judgments.” Journal of Educational Psychology 86(1):114–21.
Margolis, Dinae Rothbard. 1979. “The Invisible Hands: Sex Roles and the Division of Laborin Two Local Political Parties.” Social Problems 26(3):314–24.
43
Miller, Warren E. and Donald E. Stokes. 1963. “Constituency Influence in Congress.” Amer-ican Political Science Review 57(1):45–56.
Niederle, Muriel and Lise Vesterlund. 2007. “Do Women Shy Away from Competition? DoMen Compete Too Much?” Quarterly Journal of Economics 122(3):1067–1101.
Page, Scott E. 2007. The Difference: How the Power of Diversity Creates Better Groups,Firms, Schools, and Societies. Princeton, N.J.: Princeton University Press.
Pitkin, Hannah F. 1967. The Concept of Representation. Berkeley, CA: University of Cali-fornia Press.
Reuben, E., P. Sapienza and L. Zingales. 2009. “The glass ceiling in experimental markets.”Working paper.
Schwindt-Bayer, Leslie A. and William Mishler. 2005. “An Integrated Model of Women’sRepresentation.” Journal of Politics 67(2):407–28.
Spencer, Steven J, Claude M Steele and Diane M Quinn. 1999. “Stereotype Threat andWomen’s Math Performance.” Journal of Experimental Social Psychology 35(1):4–28.
Steele, Claude M and Joshua Aronson. 1995. “Stereotype Threat and the IntellectualTest Performance of African Americans.” Journal of Personality and Social Psychol-ogy; Journal of Personality and Social Psychology 69(5):797.
Swers, Michele L. 2005. “Connecting Descriptive and Substantive Representation: AnAnalysis of Sex Differences in Cosponsorship Activity.” Legislative Studies Quarterly30(3):407–433.
Walters, AE, AF Stuhlmacher and LI Meyer. 1998. “Gender and Negotiator Competitiveness:A Meta-analysis.” Organizational Behavior and Human Decision Processes 76(1):1–29.
Wigfield, A., J.S. Eccles and P.R. Pintrich. 1996. Development Between the Ages of 11 and25. In Handbook of Educational Psychology, ed. D.C. Berliner and R.C. Calfee. NewYork: MacMillan.
Woolley, Anita Williams, Christopeher F. Chabris, Alex Pentland, Nada Hashmi andThomas W. Malone. 2010. “Evidence of a Collective Intelligence Factor in the Per-formance of Human Groups.” Science 330(6004):686–688.
44
Theoretical Appendix
Let si denote individual i’s ability or score.19 For all i, we assume that scores are continuousrandom variables drawn independently from the same distribution with PDF f(s). Letthe probability that i volunteers be pi, and let vi be an indicator denoting the realizationof whether i volunteers for office (vi = 1) or not (vi = 0). We use s, p, and v (withoutsubscripts) to denote the appropriate vectors, and follow the usual convention that thesubscript −i denotes a vector of all other individuals excluding i. Note that in our modelthere are two forms of uncertainty: uncertainty about abilities represented by the distributionf and uncertainty about whether or not others run for office represented by p.
Assume that every individual has a Bernoulli utility function u(x) that is increasingand weakly concave, u′(x) > 0 and u′′(x) ≤ 0, where x denotes i’s monetary payoff. In ourexperimental setup, x = si + 2r, where r denotes the score of the selected representative.20
For convenience, we will let µi denote i’s expected utility from the event that another memberj is elected with certainty.
µi =
∫u(si + 2sj)f(sj)dsj (1)
We begin by assuming that i is uncertain only about others’ scores but not aboutwho runs. This simplification helps to understand the basic elements of the decision to runfor office in our framework as well as the role that risk aversion might play in the decision.Formally, this case corresponds to the assumption that pi ∈ {0, 1} for all i and implies thatwe can omit notation for pi since vi = pi. We also assume that i knows her own score withcertainty, which nevertheless still allows i to be uncertain about her relative ability. Ourfirst insight is that i’s decision rule boils down to a comparison of her own ability with thedistribution of others’ ability.
Proposition 1. Given the decisions of other members v−i, member i prefers to volunteerif and only if she would also prefer being selected as the group’s sole representative withcertainty to the selection of any other group member whose ability is unknown.
Proof. If i does not volunteer, her expected utility is
EUi(vi = 0) =1
n
∑j 6=i
vjµi = µi (2)
where n =∑
j 6=i vj is simply the number of other members who volunteer. If i insteadvolunteers, her expected utility is
EUi(vi = 1) =1
n+ 1
(u(3si) +
∑j 6=i
vjµi
)=u(3si) + nµi
n+ 1(3)
19The notation in this Appendix might differ from the main text of the paper, as it is from a previousversion of the paper and we have not updated it.
20Technically, x = si+r4 , but we can omit the denominator since doing so simply amounts to a rescaling
of the scores si.
45
Individual i will prefer to volunteer if EUi(vi = 1) ≥ EUi(vi = 0). Substituting the right-hand sides of (2) and (3) into the inequality and algebraic manipulation yields
u(3si) ≥ µi (4)
Note that as (2) indicates, it does not actually matter how many other memberschoose to volunteer. This is because i knows only that all sj (j 6= i) are independently andidentically distributed; the number of volunteers does not affect the distribution of outcomes.
If i is risk neutral, then it is appropriate to substitute expected scores for expectedutility in the decision rule (µi = 3si and EUi(vi = 0) = si + 2E[s]). It then follows that i’sdecision rule amounts to a comparison of her own score with the expected score of the othervolunteers.
Corollary 1. Given the decisions of other members v−i, if member i is risk neutral, sheprefers to volunteer if her own ability exceeds the expected ability of the other volunteers; thatis, si ≥ E[s].
In other words, when there is no uncertainty about who volunteers, the decision rulethat risk neutral members involves a simple cutoff: members prefer to volunteer if they areabove the average ability of the other volunteers.21
Although risk aversion changes the exact value of the cutoff, it does not dramaticallyaffect the basic nature of the decision rule. To see why, note that the decision rule in (4)can be rewritten using a multiple of the certainty equivalent, c = 1
3EUi(vi = 0): volunteer if
si ≥ c. The cutoff rule for risk neutral preferences described in Corollary 1 is simply a specialcase of the certainty equivalent form of the cutoff rule with cN = E[s]. For an increasingutility function representing preferences that exhibit risk aversion, the certainty equivalentis well-known to be lower than under risk neutrality, c < cN Thus, i’s decision rule involvesa lower cutoff than that of an otherwise identical agent with risk neutral preferences.
Corollary 2. Given ability si and others’ decisions v−i, member i will volunteer if si ≥ cwhere c ≤ cN . If i’s preferences exhibit risk aversion, then c < cN .
To provide a clearer picture of the logic underlying this somewhat counterintuitiveresult, consider an example in which only the best and worst members volunteer (withabilities bi and wi, respectively) and where i’s ability is exactly the midpoint between them.If i is risk neutral, she will be indifferent between volunteering and not volunteering becausethe expected score of a randomly selected representative remains the same (i.e., her scoresi equals the cutoff bi+wi
2. If she is risk averse, however, she prefers to volunteer because,
even though volunteering leaves the expected score unchanged, it lowers the probability ofextreme scores and raises the probability of a moderate score, thereby reducing the varianceof the outcomes.
21Although Nash equilibrium is an unrealistic benchmark, with complete information about others’ scores,in any Nash equilibrium, only the highest ability members volunteer.
46
Importantly, our analysis of the effects of risk aversion on the decision to volunteerhas two implications for our experiment. First, every group member who believes theirability is above average should choose to volunteer regardless of their degree of risk aversion.Second, below average members will be willing to volunteer if they are sufficiently risk averse;correspondingly, greater risk aversion implies a lower average quality of volunteers.
When we generalize the model to allow each group member to choose non-degenerateprobabilities of volunteering, pi ∈ [0, 1], the decision rule described in Proposition 1 continuesto hold. The only difference is that the proof is slightly more complicated.
Proposition 2. Given the probabilistic volunteering choices of other members, p−i, memberi prefers to volunteer if and only if she would also prefer being selected as the group’s solerepresentative with certainty to the selection of any other group member whose ability isunknown.
Proof. For any realization of volunteering choices, let k be a random variable that denotesthe number of volunteers (other than i). (Although Pr(k) is a function of p−i, its exact formis immaterial to the proof.) Recall from the proof of Proposition 1 that for any numberof volunteers, i’s expected utility is µi. We can then write i’s expected utility from notvolunteering as
EU(vi = 0) =4∑
k=0
Pr(k)µi (5)
Since µi is a constant, the expected utility reduces to µi as before.If i volunteers, her expected utility is
EU(vi = 1) =4∑
k=0
Pr(k)
(u(3si) + kµi
k + 1
)(6)
Comparing these two expressions and rearranging the resulting inequality, i prefersto volunteer if
4∑k=0
Pr(k)
(u(3si)− µi
k + 1
)≥ 0 (7)
Because Pr(k) and k+ 1 are always positive, the sign of the sum on the left-hand side of theinequality depends only on the sign of u(3si) − µi. Thus, i prefers to volunteer if and onlyif u(3si)− µi, which is the condition identical to that in Proposition 1.
Running for Office
The decision to run for office (in the election treatment) is potentially more complicated. Thechoice may depend on the overall shape of the distribution f(s) (not just its mean), beliefsabout the number of other candidates who decide to run, and additional considerationsstemming from strategic campaigning. To make our initial analysis tractable, we makeseveral simplifying assumptions. We restrict our attention to the case of linear utility, u(x) =x. We also consider two alternative assumptions about the nature of campaigns with twoor more candidates. On one extreme, campaigns may be completely uninformative with
47
respect to candidates’ abilities. This would be the case if campaigning involves “babbling”messages. On the other extreme, campaigns may be informative in that group members maybe able to learn which candidate has the highest ability. This might be because candidatestruthfully reveal their abilities or, even if they exaggerate their abilities, they exaggerate byequal amounts.
In this section, we define the monetary payoff as x = 14si + 1
2sj + ν − 2, where ν is
the number of votes received by i in the election. We also let ri be an indicator denoting i’sdecision to run (ri = 1) or not (ri = 0). As we did in our initial analysis of volunteering,we restrict our attention to the analysis of i’s best response to pure strategies of the otherplayers. That is, we analyze i’s decision as if she knew exactly how many other membersvolunteered, which we denote by k =
∑j 6=i rj.
Running Alone
If there are fewer than two candidates, then it is irrelevant whether or not campaigns areinformative because there will be no campaign or election. If no candidates run, then therepresentative will be selected at random from the entire group (including i) but will receiveno electoral benefits. Thus, i’s expected utility if there are no candidates is
EUi(ri = 0|k = 0) =1
4si +
1
2
(1
5si +
4
5E[s]
)(8)
If i decides to run unopposed, she automatically receives 5 votes and wins for sure. In thiscase, her expected utility is
EUi(ri = 1|k = 0) =3
4si + 3 (9)
Solving for the cutoff rule, she runs for office if
si ≥ E[s]− 15
2(10)
The decision to run continues to take the form of a cutoff rule, but the cutoff is wellbelow the average ability. Not surprisingly, if there are no other candidates, the lure ofreceiving a lump sum of benefits from winning office looms large, drawing in a much poorerset of candidates than does a random selection rule. Only the worst candidates will stay outif they expect no one else to run.22
Uninformative Campaigns
If campaigns are uninformative, then we can treat the electoral process as one of purelyrandom selection. We would expect candidates who run to vote for themselves (to ensurethemselves a minimum benefit of ν = 1) and for other group members to randomize theirvotes uniformly over the set of candidates.
22Except in very unlikely groups where every member’s realized ability turns out to be below the cutoff,there clearly will not be a Nash equilibrium in which no one runs for office.
48
If k = 1 and i does not run, her expected utility is
EUi(ri = 0|k = 1) =1
4si +
1
2E[s] (11)
If she runs, she will receive 212
votes on average (one from herself and in expectation receives12
of the remaining 3 votes). Thus, i expects to win half the time. Her expected utility istherefore
EUi(ri = 1|k = 1) =1
4si +
1
2
(si + E[s]
2
)+
5
2− 2 (12)
It then follows that i prefers to run if
si ≥ E[s]− 2 (13)
As with the decision to run alone, the cutoff for running is below the mean E[s], butit is not as far below because competition with another candidate decreases the expectedbenefits from winning the spoils of office.
Note that introducing direct costs and benefits of running for office (ν and the fixedcost of 2) means that an individual’s decision to run can be thought of as comprising twocomponents. One is the effect of running on the quality of the representative that is selected.This is entirely what drives the decision to volunteer in the previous section. When campaignsare uninformative this component of the decision to run is indeed identical to that in thedecision to volunteer. The other is the expected benefits of winning office, which decreasesas the number of candidates increases.
Proposition 3. If campaigns are uninformative and i is risk neutral, then the minimumability of members willing to run is increasing in the number of other candidates.
Proof. For any k > 0, i’s expected utility of not running is 14si + 1
2E[s]. If i runs for office,
her expected utility is a function of k:
EUi(ri|k) =1
4si +
1
2
(si + kE[s]
k + 1
)+
4− kk + 1
− 1 (14)
The fraction 4−kk+1
is the expected number of votes i will receive from non-candidates.Setting up and rearranging the inequality implies that the cutoff rule is to prefer
running for office ifsi ≥ E[s] + 4k − 6 (15)
and it is apparent that the cutoff is increasing in k.
Informative Campaigns
When campaigns are informative, the highest ability candidate will receive all of the votesof non-candidates and win the election.23 Member i’s decision to run for office will depend,to some extent, on the probability of being the highest ability candidate as well as on the
23For simplicity, we ignore the possibility of ties for highest ability.
49
distribution of the highest ability candidates. The latter distribution will be conditional onthe number of candidates since more candidates implies more chances to select a candidatewith very high ability.
Consider the case with one other candidate, k = 1. If i does not run, her expectedutility is the same as in (11). If she does run for office, her expected utility can be decomposedinto the expected utility from winning and the expected utility from losing, each weighted bytheir respective probabilities, Pr(win)EU(win)+Pr(lose)EU(lose). With one other candidatej, the probability of winning is Pr(si ≥ sj), the probability that si is higher than a randomlydrawn score sj from f(s). This probability is F (si), where F (·) is the CDF of the distribution.Finally, if candidate j wins, the expected score must be conditional on sj being higher thansi. Taking these facts into consideration, i’s expected utility from running against a singlecandidate j can be written
EUi(vi = 1|k = 1) = F (si)
(3
4si + 2
)+ (1− F (si))
(1
4si +
1
2E[s|s ≥ si]− 1
)(16)
Setting up and rearranging the appropriate inequality, we obtain
(6F (si)− 2) + F (si)si + (1− F (si))E[s|s ≥ si]− E[s] ≥ 0 (17)
This expression cannot be simplified any further without specifying the functional form ofF (s). Nevertheless, we can gain some insight by analyzing the expression and establishingsufficient conditions for i to run.
Note that the first term in parentheses, 6F (si)−2, represents the expected net benefitsaccrued directly from the election. This term is positive if F (si) >
13. In other words, the
potential for winning office provides a strong incentive for running, even for low abilityindividuals. A member’s ability need only be higher than the lowest third of the distribution(thus needing only a 33% chance of winning) to expect positive direct benefits from running.This alone does not imply, however, that all such members will want to run if it is offset bythe effect of lowering the quality of the elected representative.
The remaining terms represent the net effect of i’s decision to run on the expectedability of the elected representative. Together, the middle two terms (those weighted byF (si) and 1 − F (si)) represent the expected ability of the elected representative; it is aweighted average of si and the expected value of all abilities greater than si. The terms inthe weighted average suggests that running for office in an informative campaign environmentcan be beneficial in two ways. First, by running, i sets the minimum ability for an electedrepresentative. Second, even if i loses the election, she benefits from the fact that a higherability group member is elected in her place. Whether or not this weighted average exceedsthe last term, E[s], then establishes whether running for office raises or lowers the ability ofthe elected representative. If f(s) is a symmetric distribution, si ≥ E[s] guarantees that ibenefits both from the potential prospective spoils from office as well as from ensuring thatthe elected representative will be above average. Furthermore, the level of ability for whichi is indifferent between the elected representative’s expected ability and the unconditionalexpected ability must be less than E[s], and from this it follows that the cutoff must also beless than E[s].
50
Proposition 4. If i expects only one other member to run, campaigns are informative, f(s)is symmetric, and i is risk neutral, then (i) above average ability si ≥ E[s] is a sufficientcondition for her to prefer running for office and (ii) the minimum ability for i to preferrunning is strictly less than E[s].
Constructing i’s expected utility for k > 1 proceeds in a similar fashion. Intuitively,because the highest ability candidate is always selected, the more candidates there are (themore draws of the random variable), the higher the expected ability of the representative.For example, if k = 2, then either i wins and the representative’s ability is si or i loses andthe representative’s ability is max{s1, s2}. This should have the effect of raising both i’sexpected utility from running and from not running, so it is unclear in general whether thisshould raise or lower the i’s threshold for running. To gain additional insight, it is useful toimpose an explicit functional form on f(s), which we do next.
Numerical Example
We can compute explicit cutoff values if we make explicit assumptions about the distribu-tion of ability f(s) and agents’ utility functions. Thus, for simplicity, we assume that s isuniformly distributed between 0 and 20. To analyze the possible effects of risk aversion, wecompare linear utility un(x) = x with negative quadratic utility ua(x) = −(x− 15)2. Table8 presents the computed cutoff values for both utility functions across the three scenarios:volunteering (random selection), running with uninformative campaigns, and running withinformative campaigns.
Uninformative Campaigns
If i does not run, then her expected utility is E[u(xj)], where xj = 14si +
12sj, just as in (2). If
k = 1, provided that non-candidates cast their votes randomly, i is equally likely to receiveany number of votes between 1 and 4. Her expected utility is
EUN(k = 1) =1
4u (xi + 2) +
1
4u (xi + 1) +
1
4E [u (xj)] +
1
4E [u (xj − 1)] (18)
where xi = 34si and xj = 1
4si + 1
2sj.
In general, if there are k other candidates, we must account for the possible ways inwhich the remaining group members vote for i. If k = 2 and assuming a random tie-breakingrule, there is a 1
9probability that i wins 3 votes, a 2
9chance i receives 2 votes and wins, a 2
9
that i receives 2 votes and loses, and a 49
chance that i receives only 1 vote. If k = 3 and iruns, then there is only 1 remaining vote and i has a 1
4probability of receiving 2 votes and a
34
probability of receiving only 1 vote (her own). Finally, if k = 4 and i runs, she will receiveone vote (again, her own) with certainty while her probability of winning is 1
5.
EUN(k = 2) =1
9u (xi + 1) +
2
9u (xi) +
2
9E [u (xj)] +
4
9E [u (xj − 1)] (19)
EUN(k = 3) =1
4u(xi) +
3
4E [u(xj − 1)] (20)
51
EUN(k = 4) =1
5u(xi − 1) +
4
5E [u(xj − 1)] (21)
Informative Campaigns
If campaigns are informative, computing i’s expected utility involves dividing the support ofthe joint random variable and integrating over the region where i wins and where the otherk candidates win. If k = 1, then the appropriate expressions for not running and runningare
EUA(r = 0|k = 1) =
∫ b
a
u(xj − 1)f(sj)dsj (22)
EUA(r = 1|k = 1) =
∫ si
a
u(xi + 2)f(sj)dsj +
∫ b
si
u(xj − 1)f(sj)dsj (23)
where a and b are the endpoints of the support of f(s).If k = 2, the expected utility of running is
EUA(r = 0|k = 2) = 2
∫ b
a
∫ sj
a
u(xj)f(sk)f(sj)dskdsj (24)
where the double integral accounts for values of sj for which sj ≥ sk; that is, we integrateover sk from a to sj and then over sj from a to b. Since f(s) is symmetric, the part ofthe expected utility due to j winning is identical to the expected from k winning, hence wemultiply by 2.
When i runs, this is modified to take into account the possibility that i might win aswell:
EUA(r = 1|k = 2) =
∫ si
a
∫ si
a
u(xi + 1)f(sk)f(sj)dskdsj
+ 2
∫ b
si
∫ sj
a
u(xj − 1)f(sk)f(sj)dskdsj (25)
For k > 2, the relevant expressions are:
EUA(r = 0|k = 3) = 3
∫ b
a
∫ sj
0
∫ sj
0
u(xj)f(s`)f(sk)f(sj)ds`dskdsj (26)
EUA(r = 1|k = 3) =
∫ si
a
∫ si
a
∫ si
a
u(xi)f(s`)f(sk)f(sj)ds`dskdsj
+ 3
∫ b
si
∫ sj
0
∫ sj
0
u(xj − 1)f(s`)f(sk)f(sj)ds`dskdsj (27)
EUA(r = 0|k = 4) = 4
∫ b
a
∫ sj
0
∫ sj
0
∫ sj
0
u(xj − 1)f(sm)f(s`)f(sk)f(sj)dsmds`dskdsj (28)
52
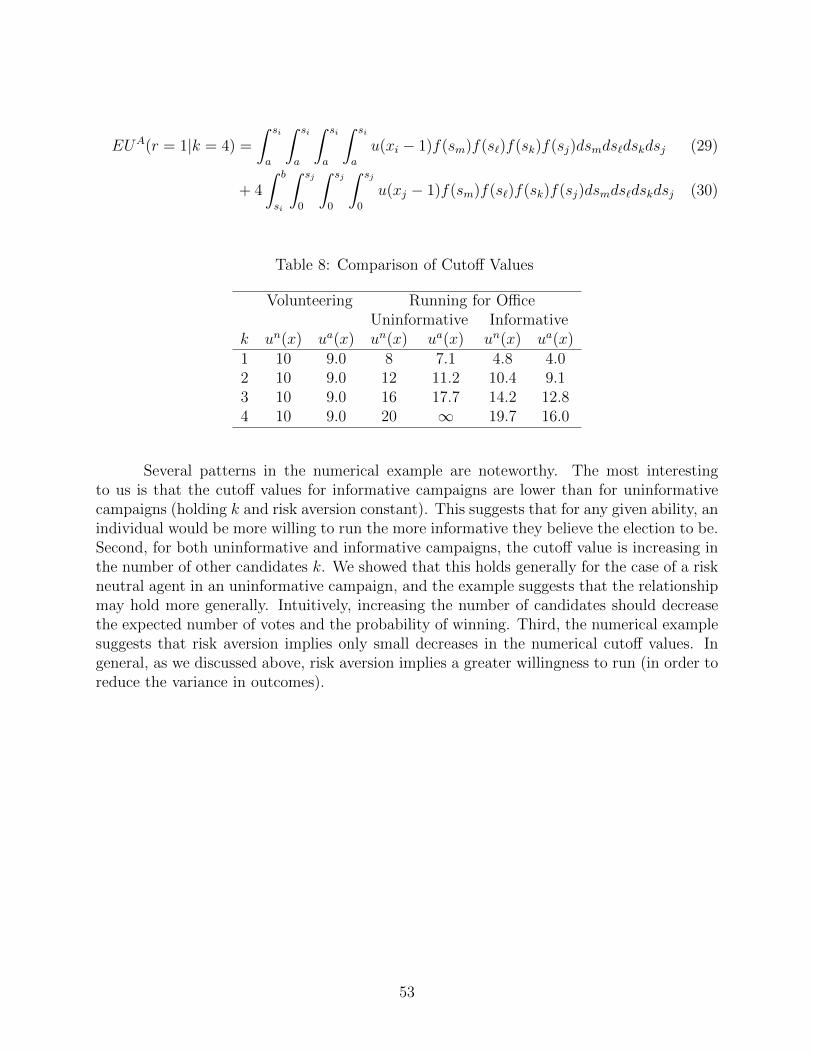
EUA(r = 1|k = 4) =
∫ si
a
∫ si
a
∫ si
a
∫ si
a
u(xi − 1)f(sm)f(s`)f(sk)f(sj)dsmds`dskdsj (29)
+ 4
∫ b
si
∫ sj
0
∫ sj
0
∫ sj
0
u(xj − 1)f(sm)f(s`)f(sk)f(sj)dsmds`dskdsj (30)
Table 8: Comparison of Cutoff Values
Volunteering Running for OfficeUninformative Informative
k un(x) ua(x) un(x) ua(x) un(x) ua(x)1 10 9.0 8 7.1 4.8 4.02 10 9.0 12 11.2 10.4 9.13 10 9.0 16 17.7 14.2 12.84 10 9.0 20 ∞ 19.7 16.0
Several patterns in the numerical example are noteworthy. The most interestingto us is that the cutoff values for informative campaigns are lower than for uninformativecampaigns (holding k and risk aversion constant). This suggests that for any given ability, anindividual would be more willing to run the more informative they believe the election to be.Second, for both uninformative and informative campaigns, the cutoff value is increasing inthe number of other candidates k. We showed that this holds generally for the case of a riskneutral agent in an uninformative campaign, and the example suggests that the relationshipmay hold more generally. Intuitively, increasing the number of candidates should decreasethe expected number of votes and the probability of winning. Third, the numerical examplesuggests that risk aversion implies only small decreases in the numerical cutoff values. Ingeneral, as we discussed above, risk aversion implies a greater willingness to run (in order toreduce the variance in outcomes).
53
Related Documents