SAMPLE MAT 1 Wind Heeling Moments on Very Large Ships. Some Insights through CFD Results Stefano Brizzolara and Enrico Rizzuto Dept. of Naval Architecture & Marine Technology, University of Genoa, Genoa, Italy ABSTRACT The present paper investigates by CFD methods the wind pressure field on typical superstructures geometries of large commercial ships. The focus is on the role of the suction area on the main deck induced by the presence of a negative pressure peak. Results are compared with forces and moments obtained by formulations based on the stability standards presently enforced for all types of ships, which relate the side wind heeling moment only to the pressure force applied on the windward side area. The comparison includes the initial values of force and heeling moments and the dependency of these actions on the heel angle and on the type of side-deck connection. Keywords: Wind Loads, CFD, Heeling Moment, Weather Criteria, VLCC. 1. INTRODUCTION Current weather criteria included in stability standards for merchant, passenger as well as naval ships relate the lateral wind heeling moment to the pressure force on the windward exposed lateral area and place the centre of such force in the geometric centre of the area. This implies to neglect the large asymmetric suction effect (due to a negative pressure peak) that the wind current exerts on a large portion of the main deck. The effect of the suction zone may be particularly strong in the case of large ships with regular shapes, featuring small superstructures and wide flat deck areas, like f.i. tankers and bulkers. On the contrary, a smaller impact of the phenomenon is envisaged for ships with superstructures of complicate shapes (naval vessels) or when the predominant part of the areas exposed to wind are vertical (i.e. normal to the wind), like in passenger vessels. It is noted that quite a different approach is adopted in the case of other structures with regular shapes exposed to wind actions. In the field of civil engineering, a detailed description of forces applied on the suction side of buildings is included in design codes (see e.g. EUROCODE, wind actions). This applies both to the case of side walls of tall buildings and to the roof of wide and low buildings (sheds), the latter geometry representing a situation pretty much similar to the one of the ship deck. The distribution of pressure coefficients along the transversal direction contained in the EUROCODE (Table 1) indicates that due account is given to a comparatively detailed description of the negative pressure field on the flat roof of short buildings. The load model there regards mainly verifications of local structures on the roof, but in the geometrically similar case of the ship deck, the same physical effect can give rise to important implications on the ship global stability, with a significant enhancement of the heeling moment generated

Welcome message from author
This document is posted to help you gain knowledge. Please leave a comment to let me know what you think about it! Share it to your friends and learn new things together.
Transcript
SAMPLE MAT
������������� ���� ���� ���� ��������������������� ����� ������ ����
����� ������ ������� 1
Wind Heeling Moments on Very Large Ships. Some Insights through CFD Results
Stefano Brizzolara and Enrico Rizzuto
Dept. of Naval Architecture & Marine Technology, University of Genoa, Genoa, Italy
ABSTRACT
The present paper investigates by CFD methods the wind pressure field on typical superstructures geometries of large commercial ships. The focus is on the role of the suction area on the main deck induced by the presence of a negative pressure peak. Results are compared with forces and moments obtained by formulations based on the stability standards presently enforced for all types of ships, which relate the side wind heeling moment only to the pressure force applied on the windward side area. The comparison includes the initial values of force and heeling moments and the dependency of these actions on the heel angle and on the type of side-deck connection.
Keywords: Wind Loads, CFD, Heeling Moment, Weather Criteria, VLCC.
1. INTRODUCTION
Current weather criteria included in stability standards for merchant, passenger as well as naval ships relate the lateral wind heeling moment to the pressure force on the windward exposed lateral area and place the centre of such force in the geometric centre of the area. This implies to neglect the large asymmetric suction effect (due to a negative pressure peak) that the wind current exerts on a large portion of the main deck.
The effect of the suction zone may be particularly strong in the case of large ships with regular shapes, featuring small superstructures and wide flat deck areas, like f.i. tankers and bulkers. On the contrary, a smaller impact of the phenomenon is envisaged for ships with superstructures of complicate shapes (naval vessels) or when the predominant part of the areas exposed to wind are vertical (i.e. normal to the wind), like in passenger vessels.
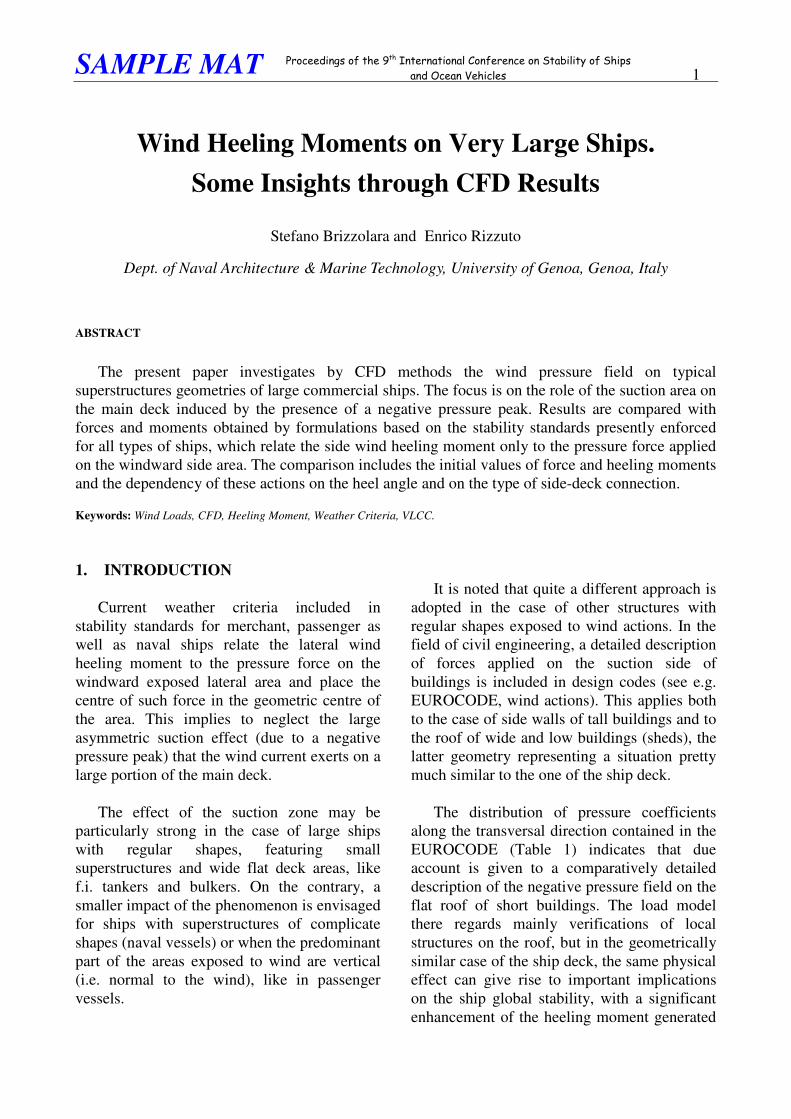
It is noted that quite a different approach is adopted in the case of other structures with regular shapes exposed to wind actions. In the field of civil engineering, a detailed description of forces applied on the suction side of buildings is included in design codes (see e.g. EUROCODE, wind actions). This applies both to the case of side walls of tall buildings and to the roof of wide and low buildings (sheds), the latter geometry representing a situation pretty much similar to the one of the ship deck.
The distribution of pressure coefficients along the transversal direction contained in the EUROCODE (Table 1) indicates that due account is given to a comparatively detailed description of the negative pressure field on the flat roof of short buildings. The load model there regards mainly verifications of local structures on the roof, but in the geometrically similar case of the ship deck, the same physical effect can give rise to important implications on the ship global stability, with a significant enhancement of the heeling moment generated
SAMPLE MAT
������������� ���� ���� ���� ��������������������� ����� ������ ����
����� ������ ������� 2
only by the overpressure on the exposed side of the vessel.
The above consideration has been recently corroborated by experimental tests (Deakin and Wright, 2005) performed at the wind tunnel on ship-like geometries (not specifically covering the case of large commercial ships, but dedicated to fast catamaran ferries). Results seem to indicate a significant deviation of the inclining arm from the simplified scheme adopted by the current regulations.
Figure 1 – Scheme adopted by Eurocode for
wind pressure on flat roofs
On the basis of what above reported, a first principles based investigation on wind actions on ship superstructures was decided. To this aim, a series of CFD calculations were systematically carried out on a simple 3D geometry, resembling the emerged part of a large ship hull (with different geometries of the deck-side connection).
Table 1. – Eurocode 1 (2006): External
pressure coefficient for flat roofs with curved or sharp eaves.
Results are presented in terms of pressure field contours, showing the onset and characteristics of the suction area on the deck, and in terms of total forces and heeling moments, compared with the values obtained by Rules. The effect of the ship lateral inclination is also considered, in order to assess its influence on the negative pressure field in the proximity of the deck. Results allow a comparison with typical curves of heeling moment vs. lateral inclination angle contained in standard stability criteria
2. INVESTIGATED GEOMETRIES
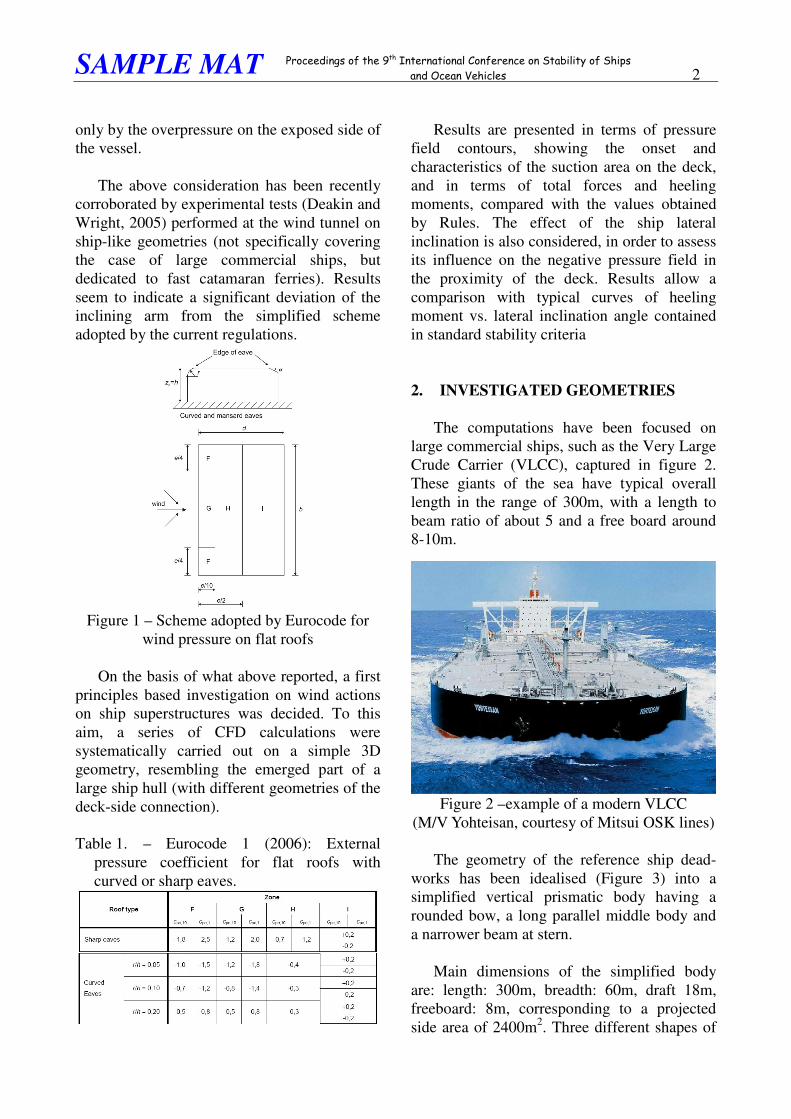
The computations have been focused on large commercial ships, such as the Very Large Crude Carrier (VLCC), captured in figure 2. These giants of the sea have typical overall length in the range of 300m, with a length to beam ratio of about 5 and a free board around 8-10m.
Figure 2 –example of a modern VLCC
(M/V Yohteisan, courtesy of Mitsui OSK lines)
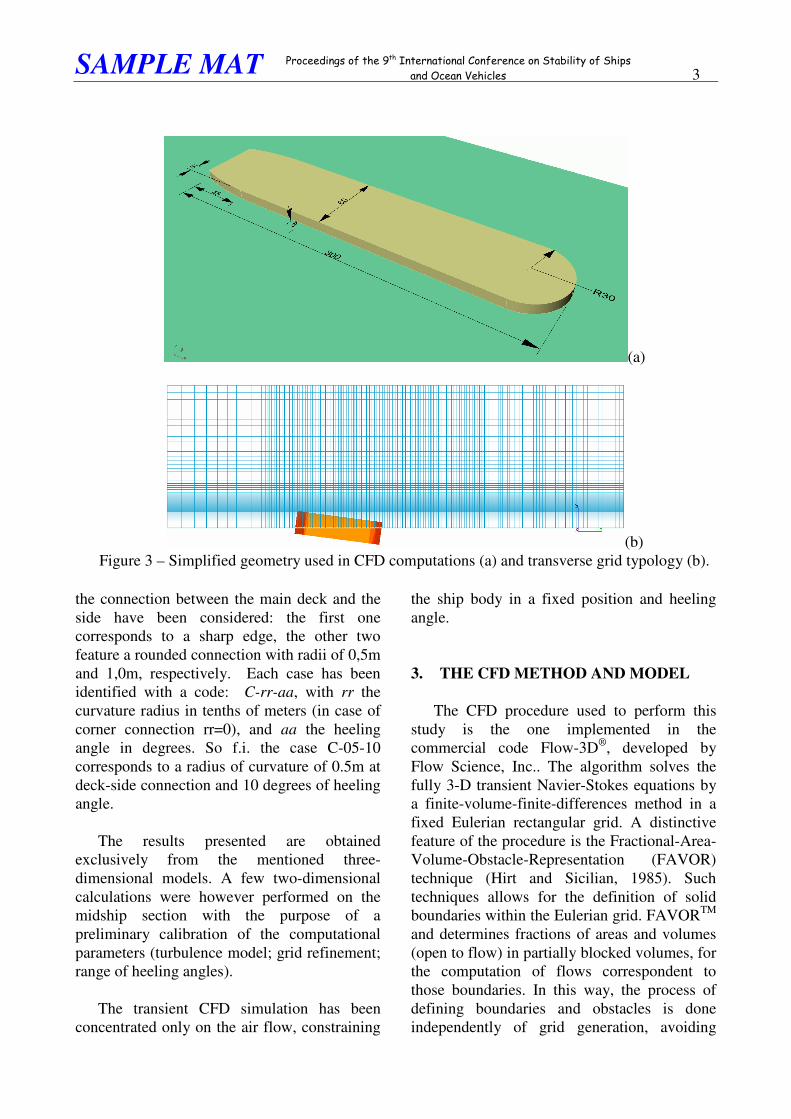
The geometry of the reference ship dead-works has been idealised (Figure 3) into a simplified vertical prismatic body having a rounded bow, a long parallel middle body and a narrower beam at stern.
Main dimensions of the simplified body are: length: 300m, breadth: 60m, draft 18m, freeboard: 8m, corresponding to a projected side area of 2400m2. Three different shapes of
SAMPLE MAT
������������� ���� ���� ���� ��������������������� ����� ������ ����
����� ������ ������� 3
the connection between the main deck and the side have been considered: the first one corresponds to a sharp edge, the other two feature a rounded connection with radii of 0,5m and 1,0m, respectively. Each case has been identified with a code: C-rr-aa, with rr the curvature radius in tenths of meters (in case of corner connection rr=0), and aa the heeling angle in degrees. So f.i. the case C-05-10 corresponds to a radius of curvature of 0.5m at deck-side connection and 10 degrees of heeling angle.
The results presented are obtained exclusively from the mentioned three-dimensional models. A few two-dimensional calculations were however performed on the midship section with the purpose of a preliminary calibration of the computational parameters (turbulence model; grid refinement; range of heeling angles).
The transient CFD simulation has been concentrated only on the air flow, constraining
the ship body in a fixed position and heeling angle.
3. THE CFD METHOD AND MODEL
The CFD procedure used to perform this study is the one implemented in the commercial code Flow-3D®, developed by Flow Science, Inc.. The algorithm solves the fully 3-D transient Navier-Stokes equations by a finite-volume-finite-differences method in a fixed Eulerian rectangular grid. A distinctive feature of the procedure is the Fractional-Area-Volume-Obstacle-Representation (FAVOR) technique (Hirt and Sicilian, 1985). Such techniques allows for the definition of solid boundaries within the Eulerian grid. FAVORTM
and determines fractions of areas and volumes (open to flow) in partially blocked volumes, for the computation of flows correspondent to those boundaries. In this way, the process of defining boundaries and obstacles is done independently of grid generation, avoiding
(a)
(b) Figure 3 – Simplified geometry used in CFD computations (a) and transverse grid typology (b).
SAMPLE MAT
������������� ���� ���� ���� ��������������������� ����� ������ ����
����� ������ ������� 4
saw-tooth representation or the use of body fitted grids. In fact, the geometry can be either defined using a built-in ‘solid modeler’, which includes quadratic functions representing objects, or it can be externally provided through STL formats. Once the geometry has been defined, the computational mesh is constructed independently, with the possibility of densification in zones of the domain of particular interest.
As regards the turbulence models it is possible, within Flow3D, to select between five choices: the Prandtl mixing length, one- or two-equation k-ε model, RNG scheme and a large eddy simulation model. Even though these turbulence models are nowadays standard in many commercial CFD codes, their formulation in Flow-3D® differs slightly in that the influence of the fractional areas/volumes of the FAVOR™ method is included and the turbulence production (or decay) associated with buoyancy forces has been formulated in a more general way. This implies, for example, to include buoyancy effects associated with non-inertial accelerations.
In the present study the Renormalization-Group (RNG) method (Yakhot & Smith) has been selected for the satisfactory balance between calculation time and accuracy. This approach applies statistical methods for the
quantification of the parameters entering the averaged equations for turbulence quantities, such as turbulent kinetic energy and its dissipation rate. The RNG-based models rely less on empirical constants while setting a framework for the derivation of a range of parameters to be used at different turbulence scales. The RNG model uses equations similar to the equations for the k-ε model. However, equation constants that are found empirically in the standard k-ε model are derived explicitly in the RNG model. Generally, the model has wider applicability than the standard k-ε one. In particular, it is known to describe more accurately low intensity turbulence flows and flows having strong shear regions or close to separation areas.
The grid (a typical transverse section is represented in figure 3) has been refined along the transversal and vertical directions close to the ship side and above the deck in order to accurately capture the development of the separated flow downstream the deck-side connection. A comparatively high resolution was selected for the grid also in the (ship) longitudinal direction to capture the secondary cross-flow and to keep the aspect ratio of the cells within acceptable limits, at least close to the body. A final structured Cartesian grid of about 1.5·106 cells has been used with slight variations in the case of the inclined models.
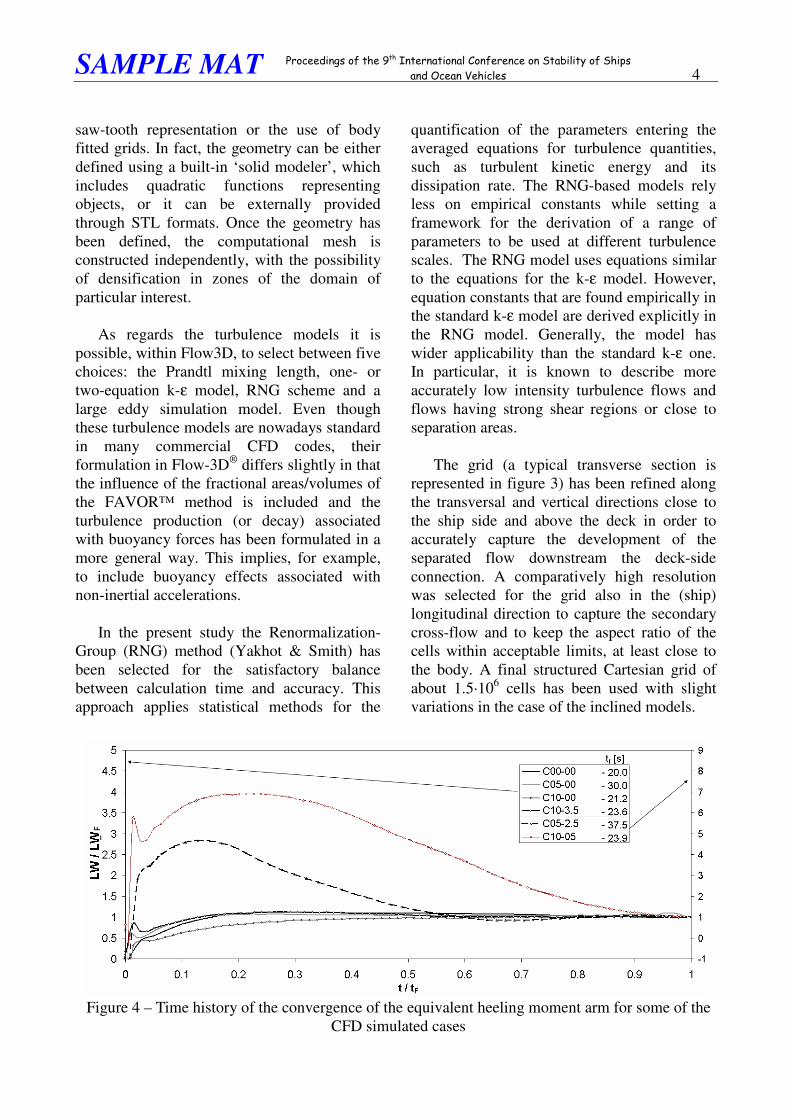
Figure 4 – Time history of the convergence of the equivalent heeling moment arm for some of the
CFD simulated cases
SAMPLE MAT
������������� ���� ���� ���� ��������������������� ����� ������ ����
����� ������ ������� 5
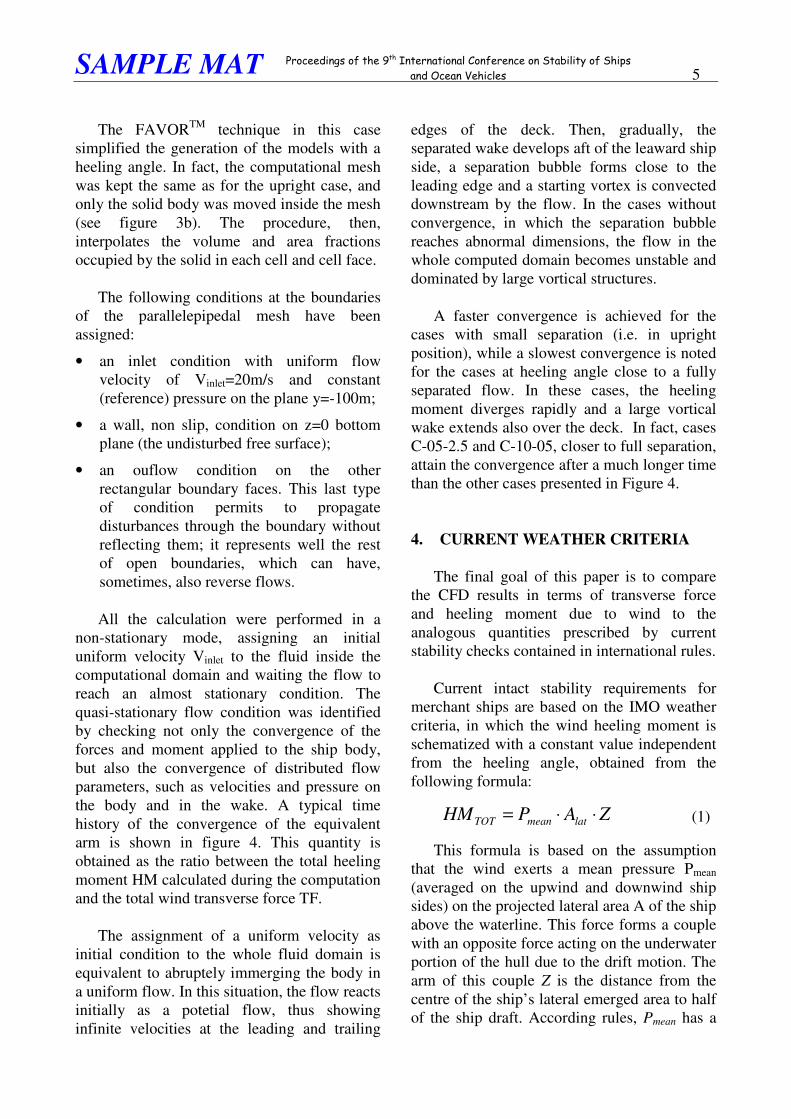
The FAVORTM technique in this case simplified the generation of the models with a heeling angle. In fact, the computational mesh was kept the same as for the upright case, and only the solid body was moved inside the mesh (see figure 3b). The procedure, then, interpolates the volume and area fractions occupied by the solid in each cell and cell face.
The following conditions at the boundaries of the parallelepipedal mesh have been assigned:
• an inlet condition with uniform flow velocity of Vinlet=20m/s and constant (reference) pressure on the plane y=-100m;
• a wall, non slip, condition on z=0 bottom plane (the undisturbed free surface);
• an ouflow condition on the other rectangular boundary faces. This last type of condition permits to propagate disturbances through the boundary without reflecting them; it represents well the rest of open boundaries, which can have, sometimes, also reverse flows.
All the calculation were performed in a non-stationary mode, assigning an initial uniform velocity Vinlet to the fluid inside the computational domain and waiting the flow to reach an almost stationary condition. The quasi-stationary flow condition was identified by checking not only the convergence of the forces and moment applied to the ship body, but also the convergence of distributed flow parameters, such as velocities and pressure on the body and in the wake. A typical time history of the convergence of the equivalent arm is shown in figure 4. This quantity is obtained as the ratio between the total heeling moment HM calculated during the computation and the total wind transverse force TF.
The assignment of a uniform velocity as initial condition to the whole fluid domain is equivalent to abruptely immerging the body in a uniform flow. In this situation, the flow reacts initially as a potetial flow, thus showing infinite velocities at the leading and trailing
edges of the deck. Then, gradually, the separated wake develops aft of the leaward ship side, a separation bubble forms close to the leading edge and a starting vortex is convected downstream by the flow. In the cases without convergence, in which the separation bubble reaches abnormal dimensions, the flow in the whole computed domain becomes unstable and dominated by large vortical structures.
A faster convergence is achieved for the cases with small separation (i.e. in upright position), while a slowest convergence is noted for the cases at heeling angle close to a fully separated flow. In these cases, the heeling moment diverges rapidly and a large vortical wake extends also over the deck. In fact, cases C-05-2.5 and C-10-05, closer to full separation, attain the convergence after a much longer time than the other cases presented in Figure 4.
4. CURRENT WEATHER CRITERIA
The final goal of this paper is to compare the CFD results in terms of transverse force and heeling moment due to wind to the analogous quantities prescribed by current stability checks contained in international rules.
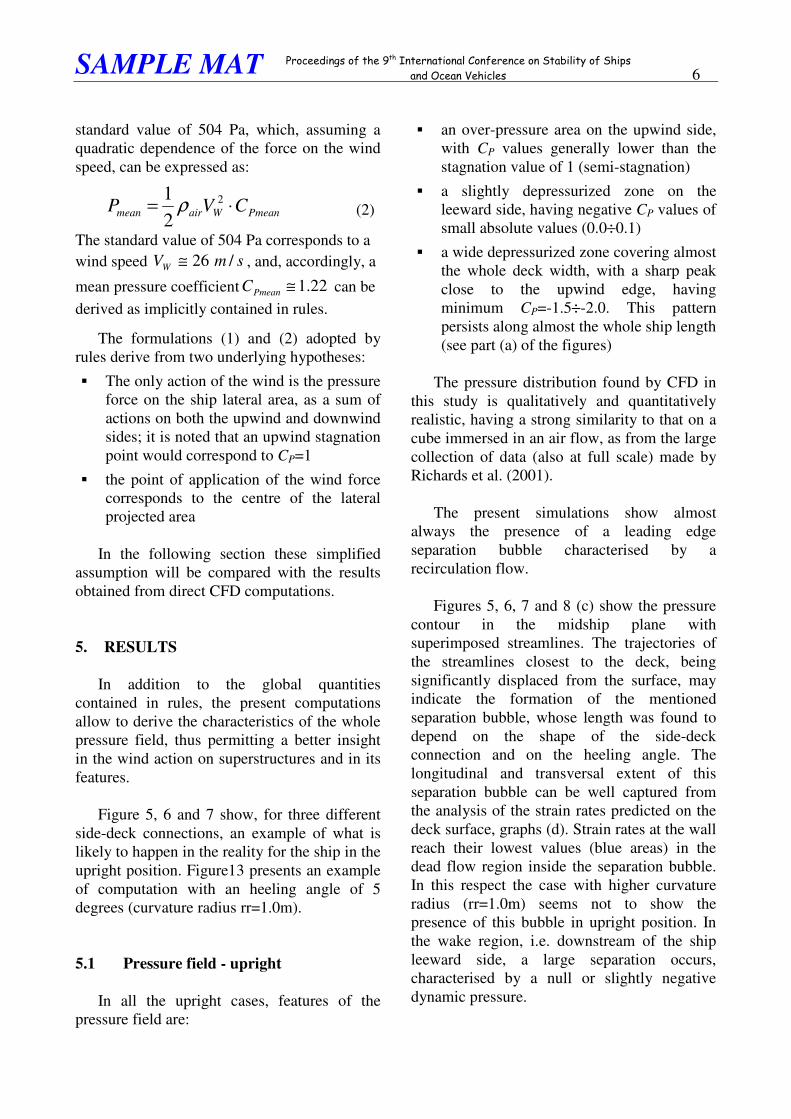
Current intact stability requirements for merchant ships are based on the IMO weather criteria, in which the wind heeling moment is schematized with a constant value independent from the heeling angle, obtained from the following formula:
ZAPHM latmeanTOT ⋅⋅= (1)
This formula is based on the assumption that the wind exerts a mean pressure Pmean (averaged on the upwind and downwind ship sides) on the projected lateral area A of the ship above the waterline. This force forms a couple with an opposite force acting on the underwater portion of the hull due to the drift motion. The arm of this couple Z is the distance from the centre of the ship’s lateral emerged area to half of the ship draft. According rules, Pmean has a
SAMPLE MAT
������������� ���� ���� ���� ��������������������� ����� ������ ����
����� ������ ������� 6
standard value of 504 Pa, which, assuming a quadratic dependence of the force on the wind speed, can be expressed as:
PmeanWairmean CVP ⋅= 2
21 ρ (2)
The standard value of 504 Pa corresponds to a wind speed smVW /26≅ , and, accordingly, a
mean pressure coefficient 22.1≅PmeanC can be derived as implicitly contained in rules.
The formulations (1) and (2) adopted by rules derive from two underlying hypotheses:
� The only action of the wind is the pressure force on the ship lateral area, as a sum of actions on both the upwind and downwind sides; it is noted that an upwind stagnation point would correspond to CP=1
� the point of application of the wind force corresponds to the centre of the lateral projected area
In the following section these simplified assumption will be compared with the results obtained from direct CFD computations.
5. RESULTS
In addition to the global quantities contained in rules, the present computations allow to derive the characteristics of the whole pressure field, thus permitting a better insight in the wind action on superstructures and in its features.
Figure 5, 6 and 7 show, for three different side-deck connections, an example of what is likely to happen in the reality for the ship in the upright position. Figure13 presents an example of computation with an heeling angle of 5 degrees (curvature radius rr=1.0m).
5.1 Pressure field - upright
In all the upright cases, features of the pressure field are:
� an over-pressure area on the upwind side, with CP values generally lower than the stagnation value of 1 (semi-stagnation)
� a slightly depressurized zone on the leeward side, having negative CP values of small absolute values (0.0÷0.1)
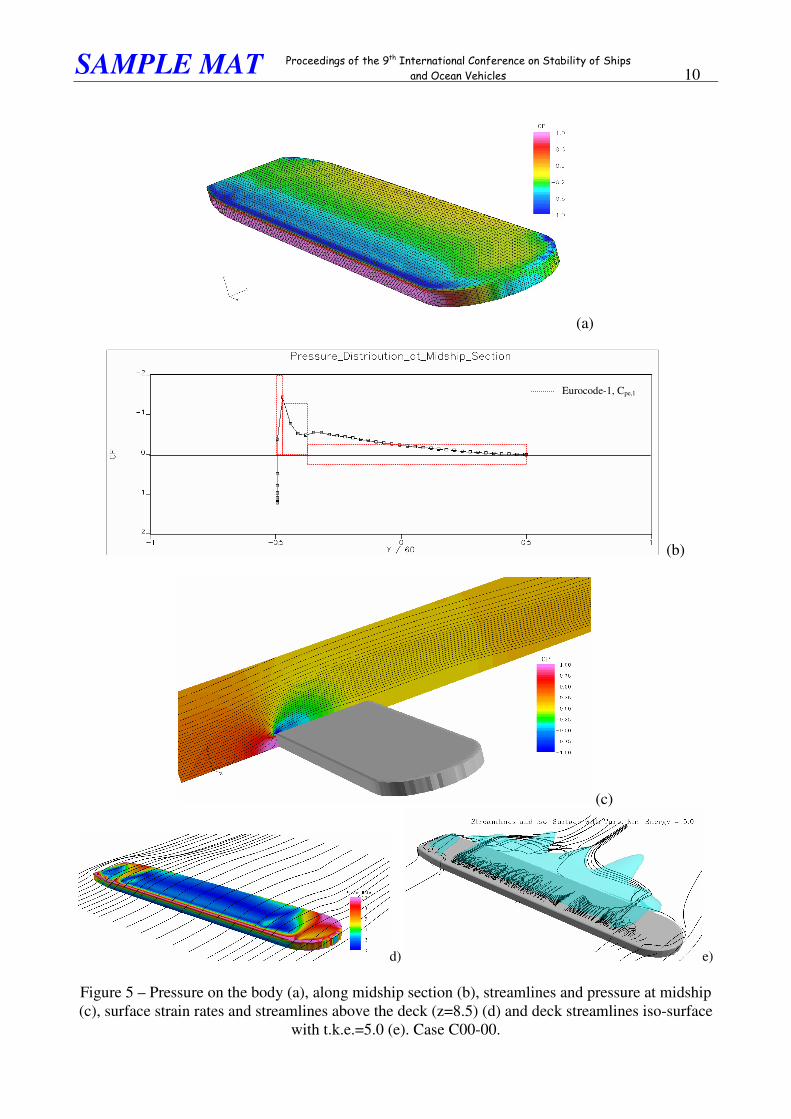
� a wide depressurized zone covering almost the whole deck width, with a sharp peak close to the upwind edge, having minimum CP=-1.5÷-2.0. This pattern persists along almost the whole ship length (see part (a) of the figures)
The pressure distribution found by CFD in this study is qualitatively and quantitatively realistic, having a strong similarity to that on a cube immersed in an air flow, as from the large collection of data (also at full scale) made by Richards et al. (2001).
The present simulations show almost always the presence of a leading edge separation bubble characterised by a recirculation flow.
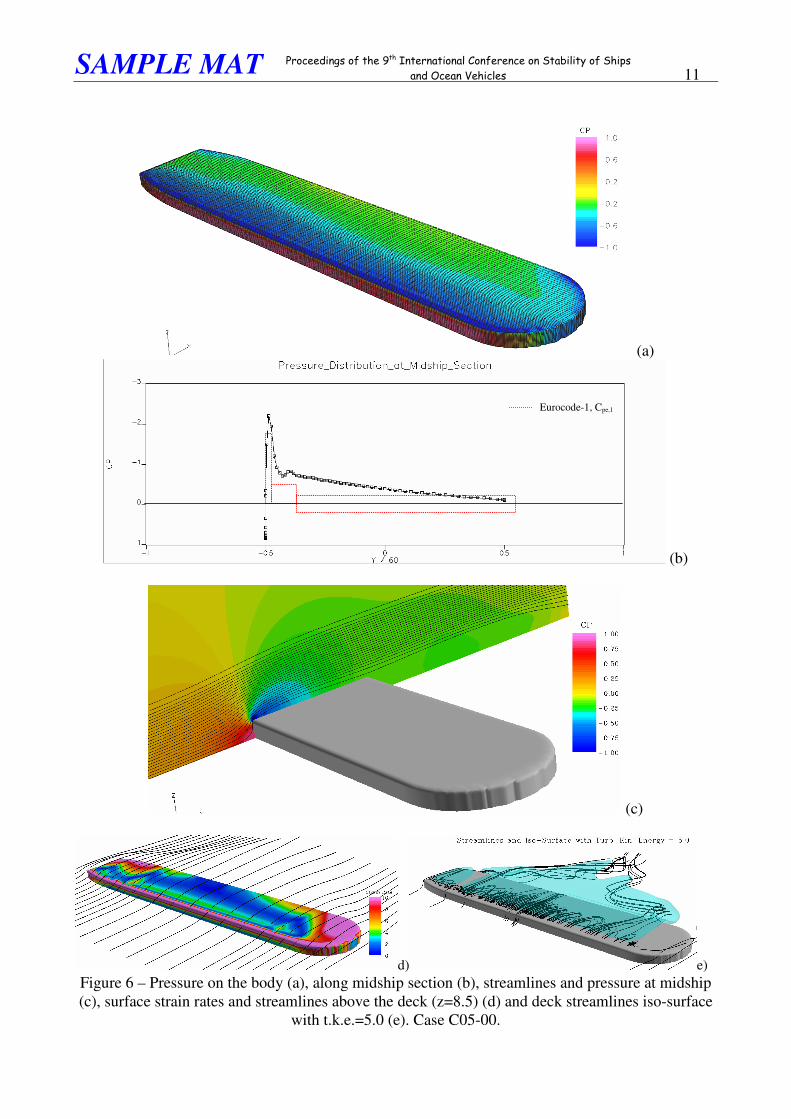
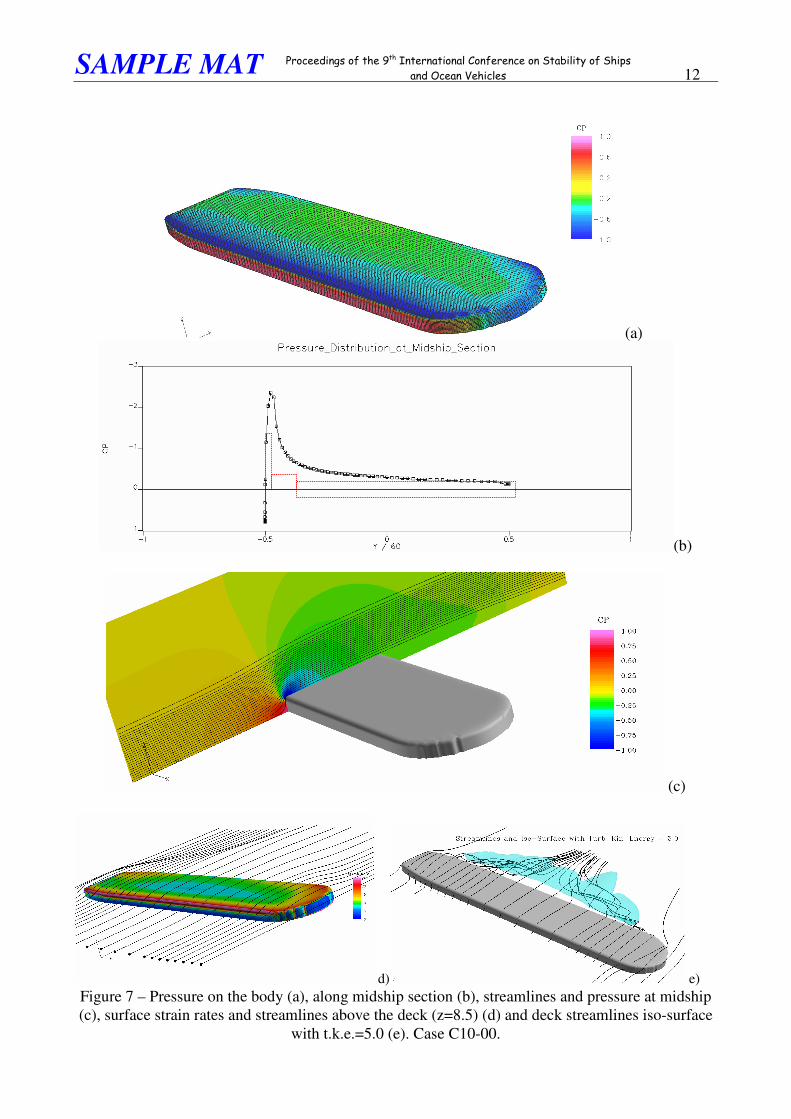
Figures 5, 6, 7 and 8 (c) show the pressure contour in the midship plane with superimposed streamlines. The trajectories of the streamlines closest to the deck, being significantly displaced from the surface, may indicate the formation of the mentioned separation bubble, whose length was found to depend on the shape of the side-deck connection and on the heeling angle. The longitudinal and transversal extent of this separation bubble can be well captured from the analysis of the strain rates predicted on the deck surface, graphs (d). Strain rates at the wall reach their lowest values (blue areas) in the dead flow region inside the separation bubble. In this respect the case with higher curvature radius (rr=1.0m) seems not to show the presence of this bubble in upright position. In the wake region, i.e. downstream of the ship leeward side, a large separation occurs, characterised by a null or slightly negative dynamic pressure.
SAMPLE MAT
������������� ���� ���� ���� ��������������������� ����� ������ ����
����� ������ ������� 7
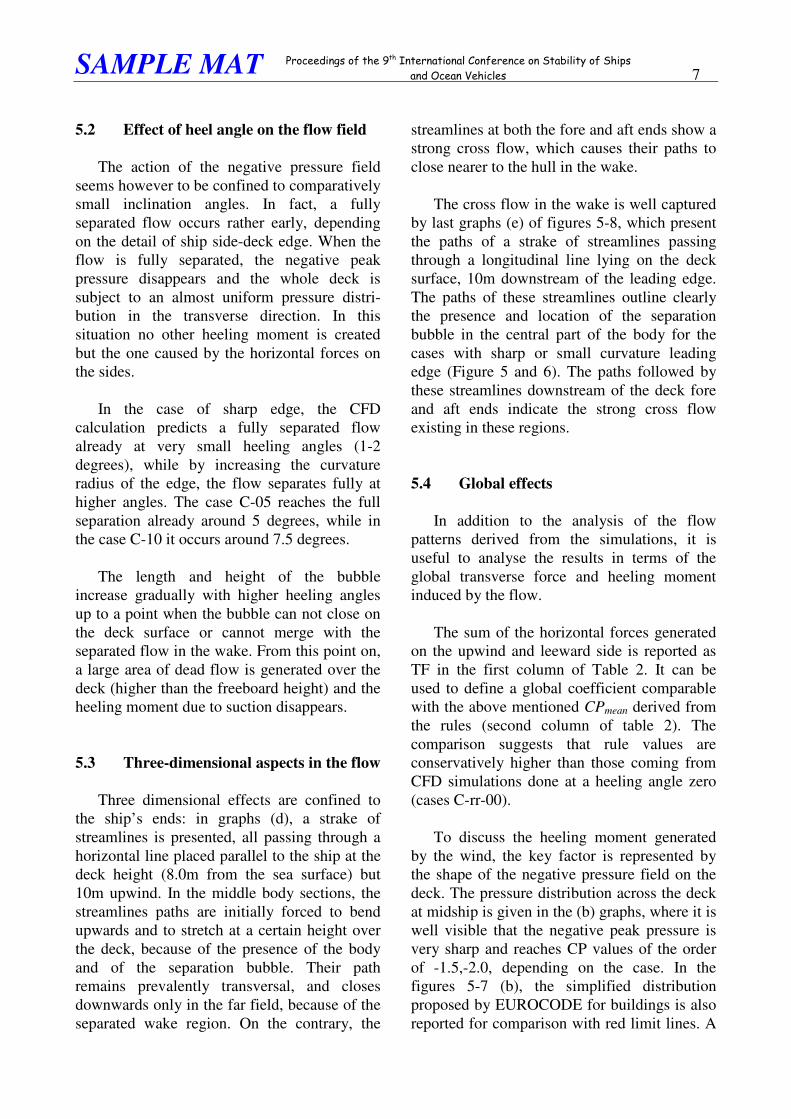
5.2 Effect of heel angle on the flow field
The action of the negative pressure field seems however to be confined to comparatively small inclination angles. In fact, a fully separated flow occurs rather early, depending on the detail of ship side-deck edge. When the flow is fully separated, the negative peak pressure disappears and the whole deck is subject to an almost uniform pressure distri-bution in the transverse direction. In this situation no other heeling moment is created but the one caused by the horizontal forces on the sides.
In the case of sharp edge, the CFD calculation predicts a fully separated flow already at very small heeling angles (1-2 degrees), while by increasing the curvature radius of the edge, the flow separates fully at higher angles. The case C-05 reaches the full separation already around 5 degrees, while in the case C-10 it occurs around 7.5 degrees.
The length and height of the bubble increase gradually with higher heeling angles up to a point when the bubble can not close on the deck surface or cannot merge with the separated flow in the wake. From this point on, a large area of dead flow is generated over the deck (higher than the freeboard height) and the heeling moment due to suction disappears.
5.3 Three-dimensional aspects in the flow
Three dimensional effects are confined to the ship’s ends: in graphs (d), a strake of streamlines is presented, all passing through a horizontal line placed parallel to the ship at the deck height (8.0m from the sea surface) but 10m upwind. In the middle body sections, the streamlines paths are initially forced to bend upwards and to stretch at a certain height over the deck, because of the presence of the body and of the separation bubble. Their path remains prevalently transversal, and closes downwards only in the far field, because of the separated wake region. On the contrary, the
streamlines at both the fore and aft ends show a strong cross flow, which causes their paths to close nearer to the hull in the wake.
The cross flow in the wake is well captured by last graphs (e) of figures 5-8, which present the paths of a strake of streamlines passing through a longitudinal line lying on the deck surface, 10m downstream of the leading edge. The paths of these streamlines outline clearly the presence and location of the separation bubble in the central part of the body for the cases with sharp or small curvature leading edge (Figure 5 and 6). The paths followed by these streamlines downstream of the deck fore and aft ends indicate the strong cross flow existing in these regions.
5.4 Global effects
In addition to the analysis of the flow patterns derived from the simulations, it is useful to analyse the results in terms of the global transverse force and heeling moment induced by the flow.
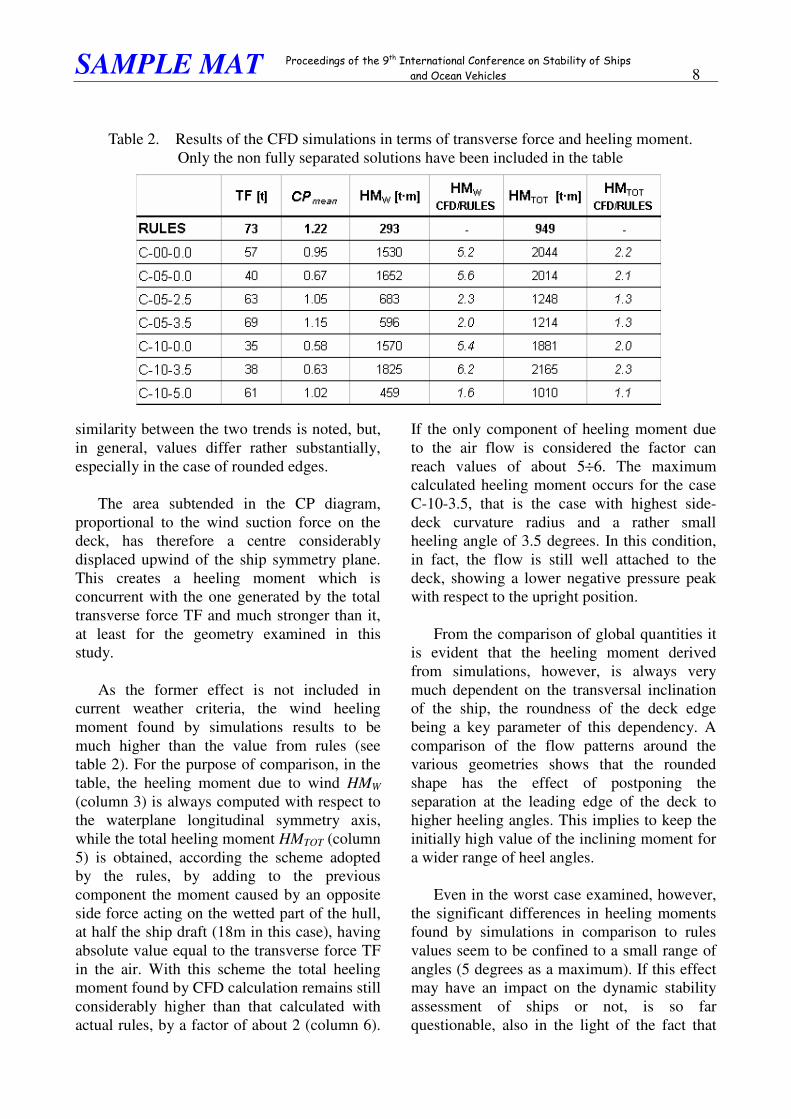
The sum of the horizontal forces generated on the upwind and leeward side is reported as TF in the first column of Table 2. It can be used to define a global coefficient comparable with the above mentioned CPmean derived from the rules (second column of table 2). The comparison suggests that rule values are conservatively higher than those coming from CFD simulations done at a heeling angle zero (cases C-rr-00).
To discuss the heeling moment generated by the wind, the key factor is represented by the shape of the negative pressure field on the deck. The pressure distribution across the deck at midship is given in the (b) graphs, where it is well visible that the negative peak pressure is very sharp and reaches CP values of the order of -1.5,-2.0, depending on the case. In the figures 5-7 (b), the simplified distribution proposed by EUROCODE for buildings is also reported for comparison with red limit lines. A
SAMPLE MAT
������������� ���� ���� ���� ��������������������� ����� ������ ����
����� ������ ������� 8
similarity between the two trends is noted, but, in general, values differ rather substantially, especially in the case of rounded edges.
The area subtended in the CP diagram, proportional to the wind suction force on the deck, has therefore a centre considerably displaced upwind of the ship symmetry plane. This creates a heeling moment which is concurrent with the one generated by the total transverse force TF and much stronger than it, at least for the geometry examined in this study.
As the former effect is not included in current weather criteria, the wind heeling moment found by simulations results to be much higher than the value from rules (see table 2). For the purpose of comparison, in the table, the heeling moment due to wind HMW (column 3) is always computed with respect to the waterplane longitudinal symmetry axis, while the total heeling moment HMTOT (column 5) is obtained, according the scheme adopted by the rules, by adding to the previous component the moment caused by an opposite side force acting on the wetted part of the hull, at half the ship draft (18m in this case), having absolute value equal to the transverse force TF in the air. With this scheme the total heeling moment found by CFD calculation remains still considerably higher than that calculated with actual rules, by a factor of about 2 (column 6).
If the only component of heeling moment due to the air flow is considered the factor can reach values of about 5÷6. The maximum calculated heeling moment occurs for the case C-10-3.5, that is the case with highest side-deck curvature radius and a rather small heeling angle of 3.5 degrees. In this condition, in fact, the flow is still well attached to the deck, showing a lower negative pressure peak with respect to the upright position.
From the comparison of global quantities it is evident that the heeling moment derived from simulations, however, is always very much dependent on the transversal inclination of the ship, the roundness of the deck edge being a key parameter of this dependency. A comparison of the flow patterns around the various geometries shows that the rounded shape has the effect of postponing the separation at the leading edge of the deck to higher heeling angles. This implies to keep the initially high value of the inclining moment for a wider range of heel angles.
Even in the worst case examined, however, the significant differences in heeling moments found by simulations in comparison to rules values seem to be confined to a small range of angles (5 degrees as a maximum). If this effect may have an impact on the dynamic stability assessment of ships or not, is so far questionable, also in the light of the fact that
Table 2. Results of the CFD simulations in terms of transverse force and heeling moment. Only the non fully separated solutions have been included in the table
SAMPLE MAT
������������� ���� ���� ���� ��������������������� ����� ������ ����
����� ������ ������� 9
the heel angle variation with time is actually a part of the transient situation.
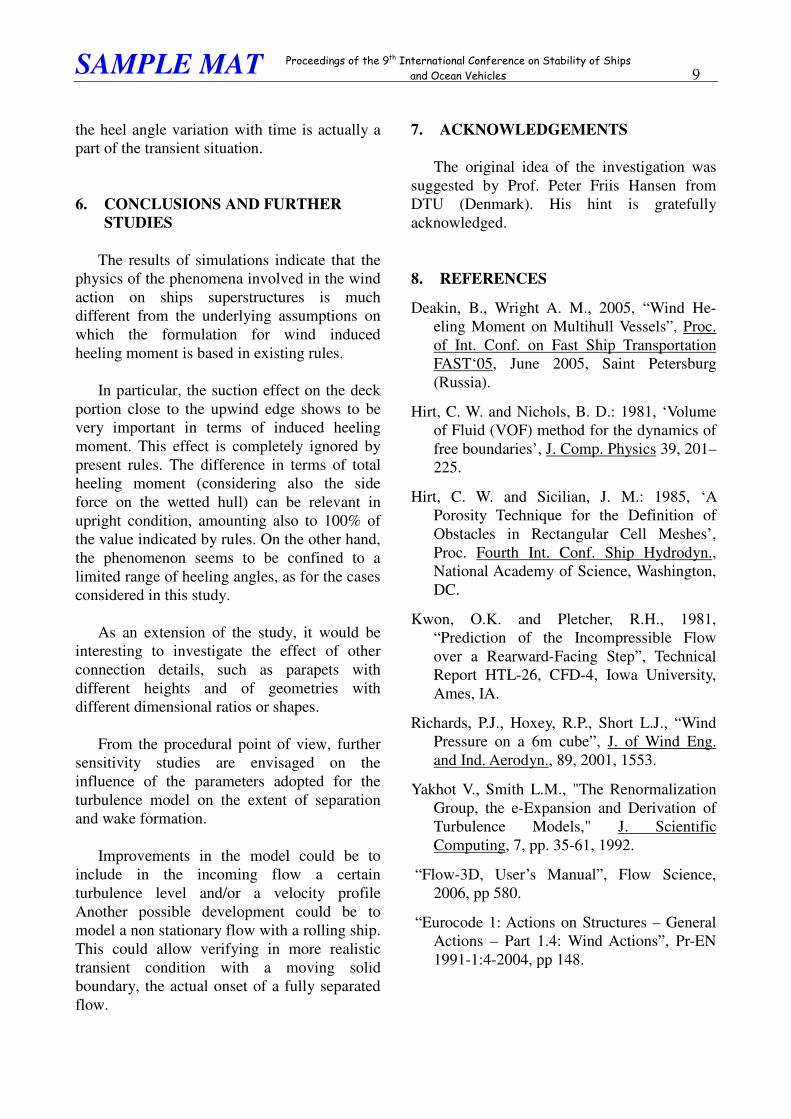
6. CONCLUSIONS AND FURTHER STUDIES
The results of simulations indicate that the physics of the phenomena involved in the wind action on ships superstructures is much different from the underlying assumptions on which the formulation for wind induced heeling moment is based in existing rules.
In particular, the suction effect on the deck portion close to the upwind edge shows to be very important in terms of induced heeling moment. This effect is completely ignored by present rules. The difference in terms of total heeling moment (considering also the side force on the wetted hull) can be relevant in upright condition, amounting also to 100% of the value indicated by rules. On the other hand, the phenomenon seems to be confined to a limited range of heeling angles, as for the cases considered in this study.
As an extension of the study, it would be interesting to investigate the effect of other connection details, such as parapets with different heights and of geometries with different dimensional ratios or shapes.
From the procedural point of view, further sensitivity studies are envisaged on the influence of the parameters adopted for the turbulence model on the extent of separation and wake formation.
Improvements in the model could be to include in the incoming flow a certain turbulence level and/or a velocity profile Another possible development could be to model a non stationary flow with a rolling ship. This could allow verifying in more realistic transient condition with a moving solid boundary, the actual onset of a fully separated flow.
7. ACKNOWLEDGEMENTS
The original idea of the investigation was suggested by Prof. Peter Friis Hansen from DTU (Denmark). His hint is gratefully acknowledged.
8. REFERENCES
Deakin, B., Wright A. M., 2005, “Wind He-eling Moment on Multihull Vessels”, Proc. of Int. Conf. on Fast Ship Transportation FAST‘05, June 2005, Saint Petersburg (Russia).
Hirt, C. W. and Nichols, B. D.: 1981, ‘Volume of Fluid (VOF) method for the dynamics of free boundaries’, J. Comp. Physics 39, 201–225.
Hirt, C. W. and Sicilian, J. M.: 1985, ‘A Porosity Technique for the Definition of Obstacles in Rectangular Cell Meshes’, Proc. Fourth Int. Conf. Ship Hydrodyn., National Academy of Science, Washington, DC.
Kwon, O.K. and Pletcher, R.H., 1981, “Prediction of the Incompressible Flow over a Rearward-Facing Step”, Technical Report HTL-26, CFD-4, Iowa University, Ames, IA.
Richards, P.J., Hoxey, R.P., Short L.J., “Wind Pressure on a 6m cube”, J. of Wind Eng. and Ind. Aerodyn., 89, 2001, 1553.
Yakhot V., Smith L.M., "The Renormalization Group, the e-Expansion and Derivation of Turbulence Models," J. Scientific Computing, 7, pp. 35-61, 1992.
“Flow-3D, User’s Manual”, Flow Science, 2006, pp 580.
“Eurocode 1: Actions on Structures – General Actions – Part 1.4: Wind Actions”, Pr-EN 1991-1:4-2004, pp 148.
SAMPLE MAT
������������� ���� ���� ���� ��������������������� ����� ������ ����
����� ������ ������� 10
(a)
(b)
(c)
d) e)
Figure 5 – Pressure on the body (a), along midship section (b), streamlines and pressure at midship (c), surface strain rates and streamlines above the deck (z=8.5) (d) and deck streamlines iso-surface
with t.k.e.=5.0 (e). Case C00-00.
Eurocode-1, Cpe,1
SAMPLE MAT
������������� ���� ���� ���� ��������������������� ����� ������ ����
����� ������ ������� 11
(a)
(b)
(c)
d) e) Figure 6 – Pressure on the body (a), along midship section (b), streamlines and pressure at midship (c), surface strain rates and streamlines above the deck (z=8.5) (d) and deck streamlines iso-surface
with t.k.e.=5.0 (e). Case C05-00.
Eurocode-1, Cpe,1
SAMPLE MAT
������������� ���� ���� ���� ��������������������� ����� ������ ����
����� ������ ������� 12
(a)
(b)
(c)
d) e) Figure 7 – Pressure on the body (a), along midship section (b), streamlines and pressure at midship (c), surface strain rates and streamlines above the deck (z=8.5) (d) and deck streamlines iso-surface
with t.k.e.=5.0 (e). Case C10-00.
SAMPLE MAT
������������� ���� ���� ���� ��������������������� ����� ������ ����
����� ������ ������� 13
(a)
(b)
(c)
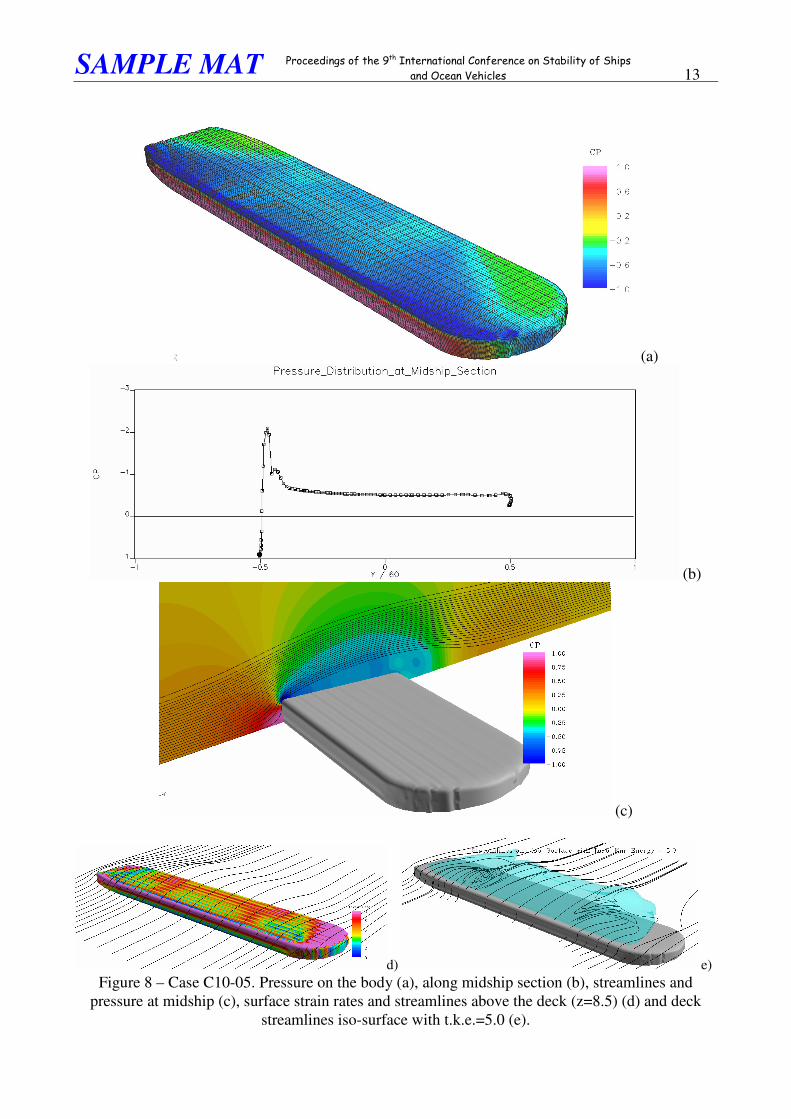
d) e) Figure 8 – Case C10-05. Pressure on the body (a), along midship section (b), streamlines and
pressure at midship (c), surface strain rates and streamlines above the deck (z=8.5) (d) and deck streamlines iso-surface with t.k.e.=5.0 (e).
Related Documents