1 Energy and Environment Short Course, Washington University Wind Basics Dr. David A. Peters January 2014

Welcome message from author
This document is posted to help you gain knowledge. Please leave a comment to let me know what you think about it! Share it to your friends and learn new things together.
Transcript

1
Energy and Environment
Short Course, Washington University
Wind Basics
Dr. David A. Peters
January 2014

2
Dr. David A. Peters
McDonnell Douglas Professor
of Engineering
Dept. of Mechanical Engineering
& Materials Science
Washington University in St. Louis
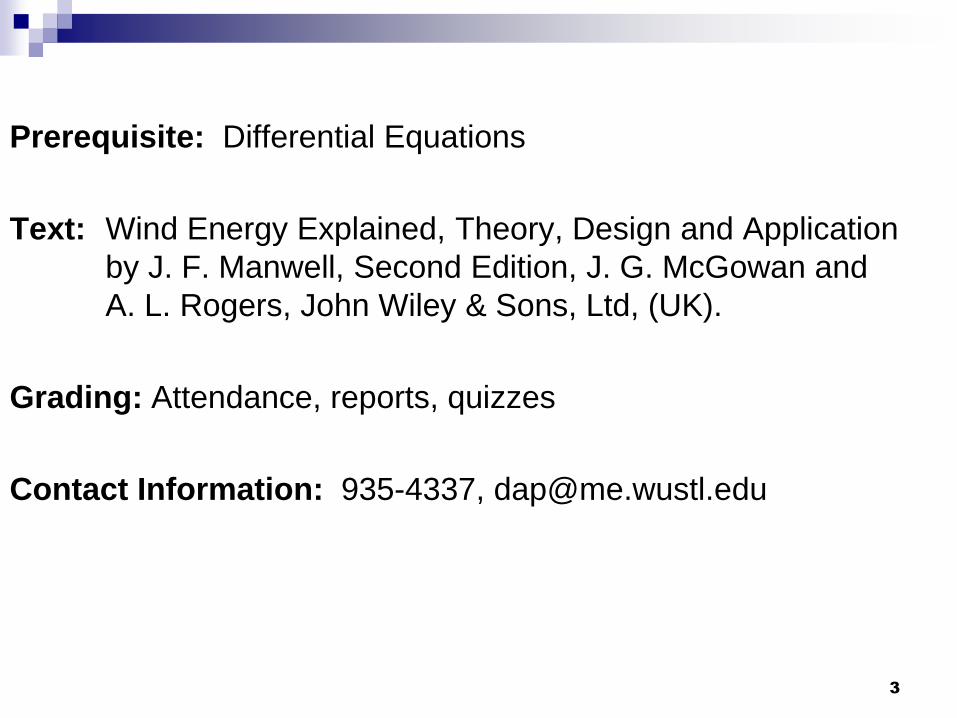
3
Prerequisite: Differential Equations
Text: Wind Energy Explained, Theory, Design and Application
by J. F. Manwell, Second Edition, J. G. McGowan and
A. L. Rogers, John Wiley & Sons, Ltd, (UK).
Grading: Attendance, reports, quizzes
Contact Information: 935-4337, [email protected]
4
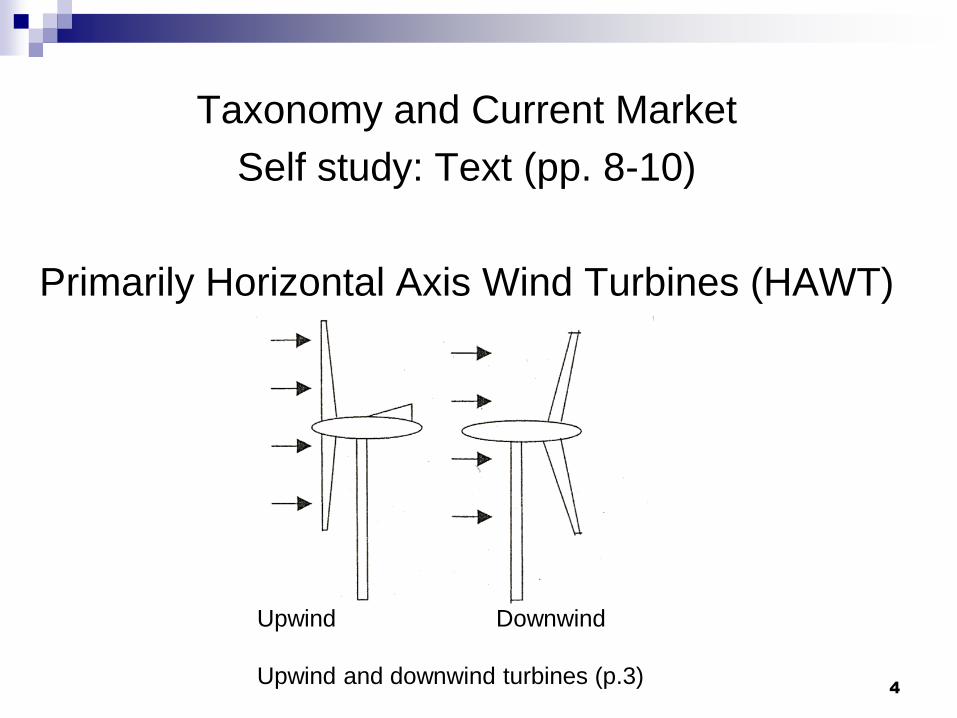
Taxonomy and Current Market
Self study: Text (pp. 8-10)
Primarily Horizontal Axis Wind Turbines (HAWT)
Upwind Downwind
Upwind and downwind turbines (p.3)
5
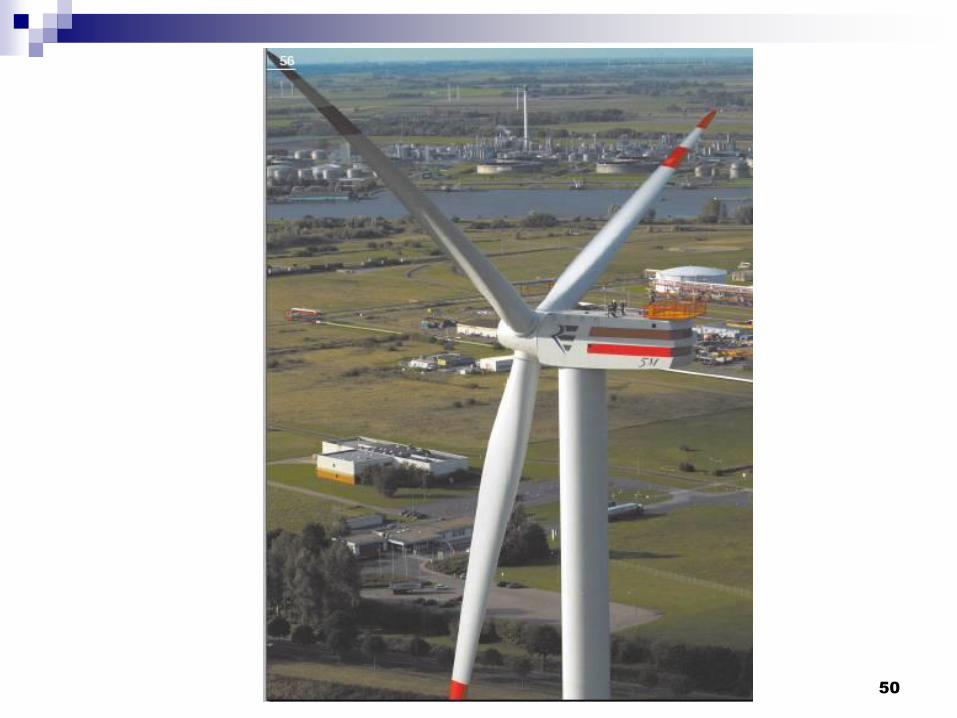
Horizontal Axis Windturbine (HAWT)
Current market ~ almost all are HAWTs
with two or three blades.
Three-blade machines are being slightly
favored. (Number of blades and other
design issues ~ to be treated later.)
Some machines now at 7 MW
(100,000 60-watt light bulbs).

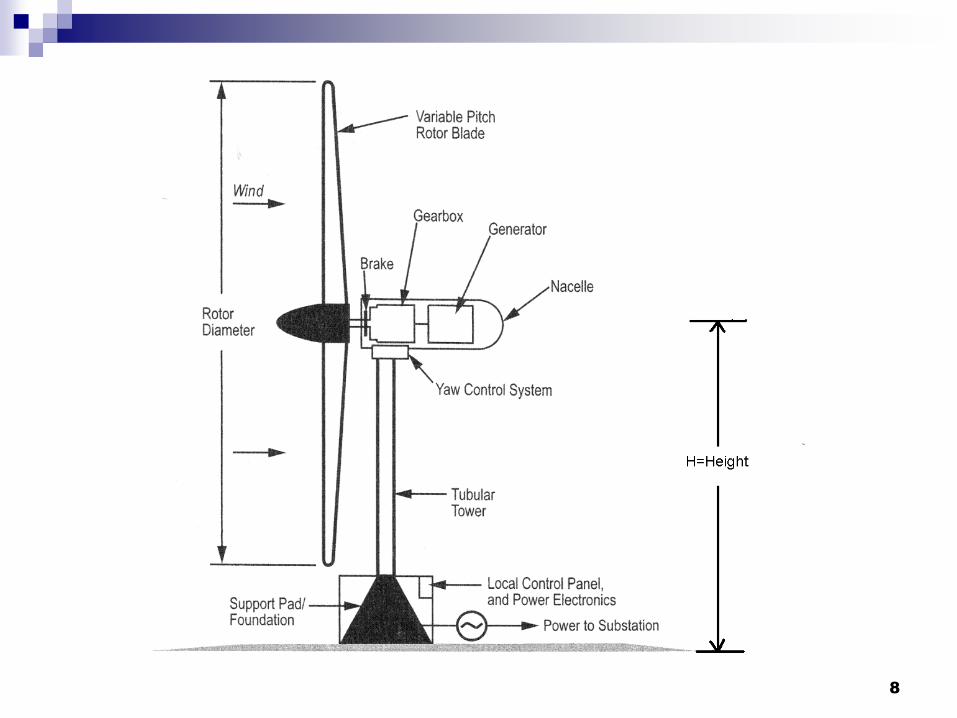
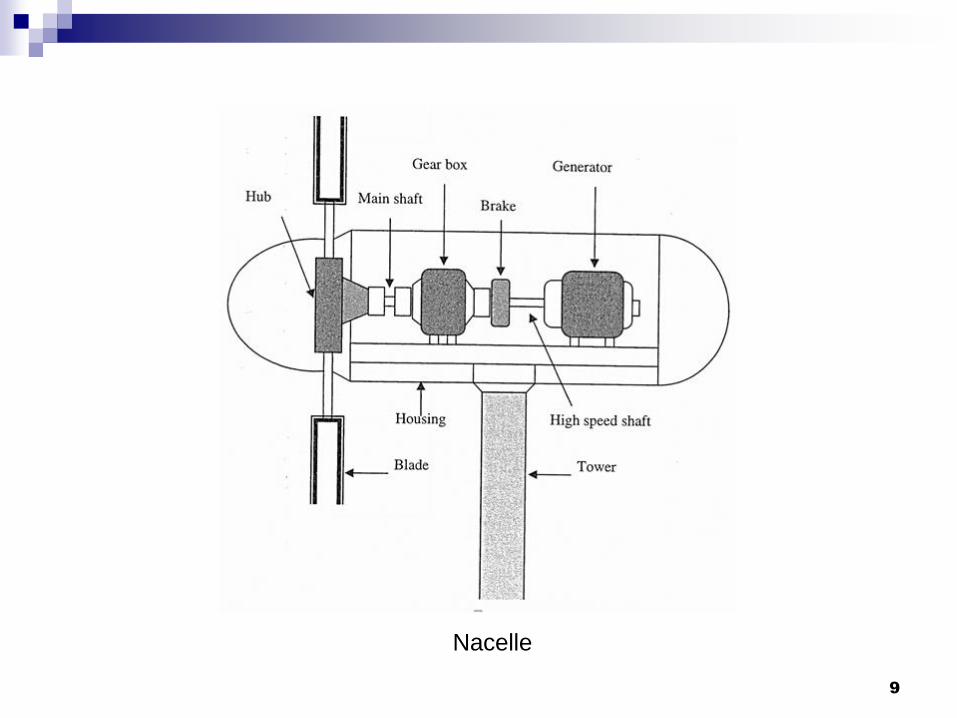
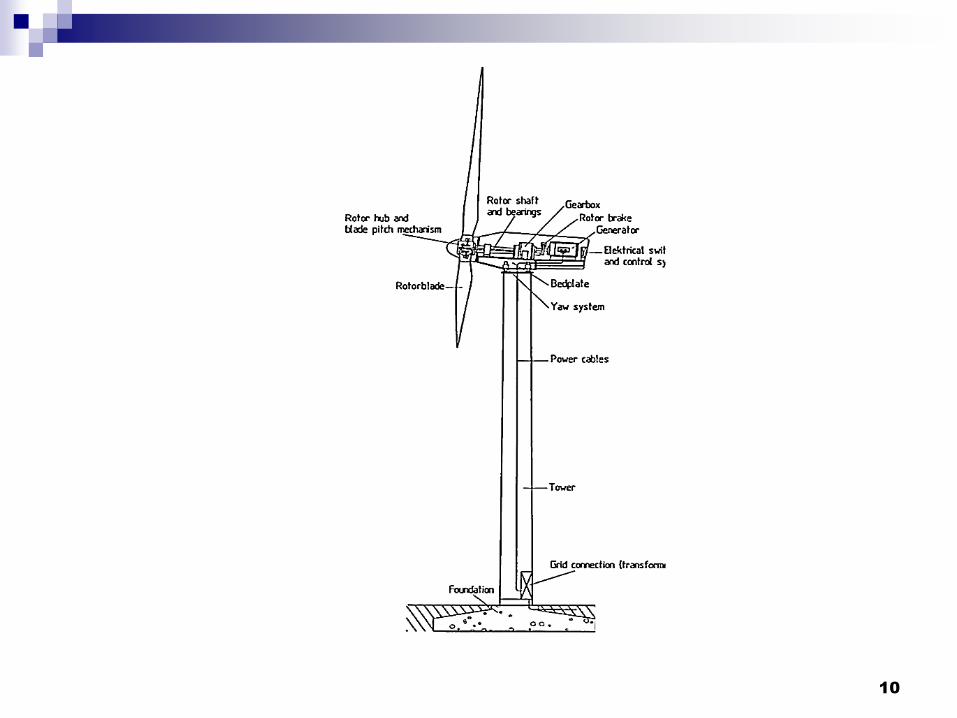
HAWT and its Components
6
(p. 4)
From aerodynamics considerations almost
all towers of current utility HAWTs have a
circular cross section
7
8
9
Nacelle
10

11
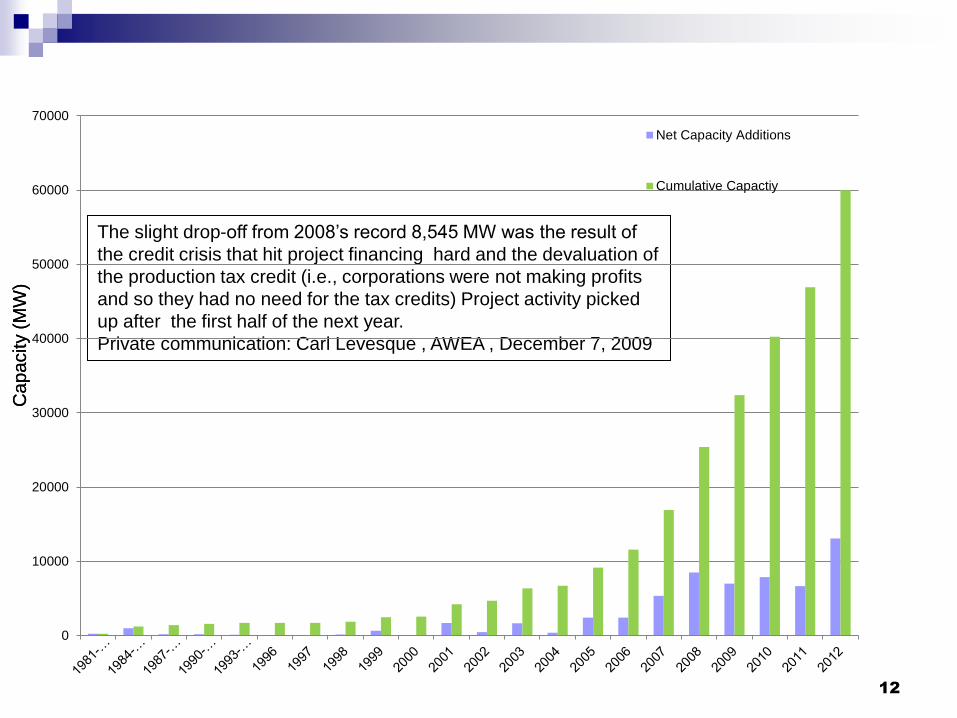
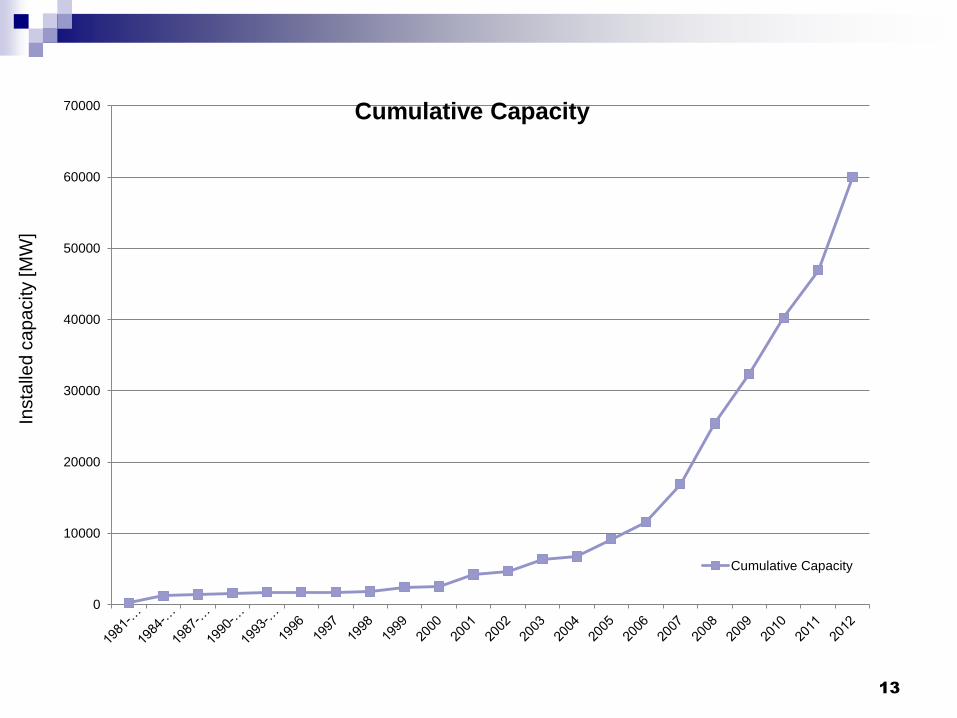
National Capacity Growth
The slight drop-off from 2008’s record 8,503 MW was the result of the credit crisis that hit project financing hard
and the devaluation of the production tax credit (i.e., corporations were not making profits and so they had no need
for the tax credits) Project activity picked up after the first half of the one year.
Source: US Department of Energy
Year Net Capacity
Additions
Cumulative
Capacity
1981-1933 240 240
1984-1986 982 1,222
1987-1989 181 1,403
1990-1992 181 1,584
1993-1995 119 1,703
1996 1 1,704
1997 8 1,712
1998 142 1,854
1999 659 2,472
2000 67 2,539
2001 1,692 4,231
2002 456 4,687
2003 1,662 6,349
2004 374 6,723
2005 2,424 9,147
2006 2,427 11,574
2007 5,333 16,907
2008 8,503 25,410
2009 6,988 32,398
2010 7,869 40,267
2011 6,649 46,916
2012 13,091 60,007
12
Ca
pa
city (
MW
)
The slight drop-off from 2008’s record 8,545 MW was the result of
the credit crisis that hit project financing hard and the devaluation of
the production tax credit (i.e., corporations were not making profits
and so they had no need for the tax credits) Project activity picked
up after the first half of the next year.
Private communication: Carl Levesque , AWEA , December 7, 2009
Ca
pa
city (
MW
)
0
10000
20000
30000
40000
50000
60000
70000
Net Capacity Additions
Cumulative Capactiy
13
Insta
lled c
ap
acity [M
W]
0
10000
20000
30000
40000
50000
60000
70000 Cumulative Capacity
Cumulative Capacity
14
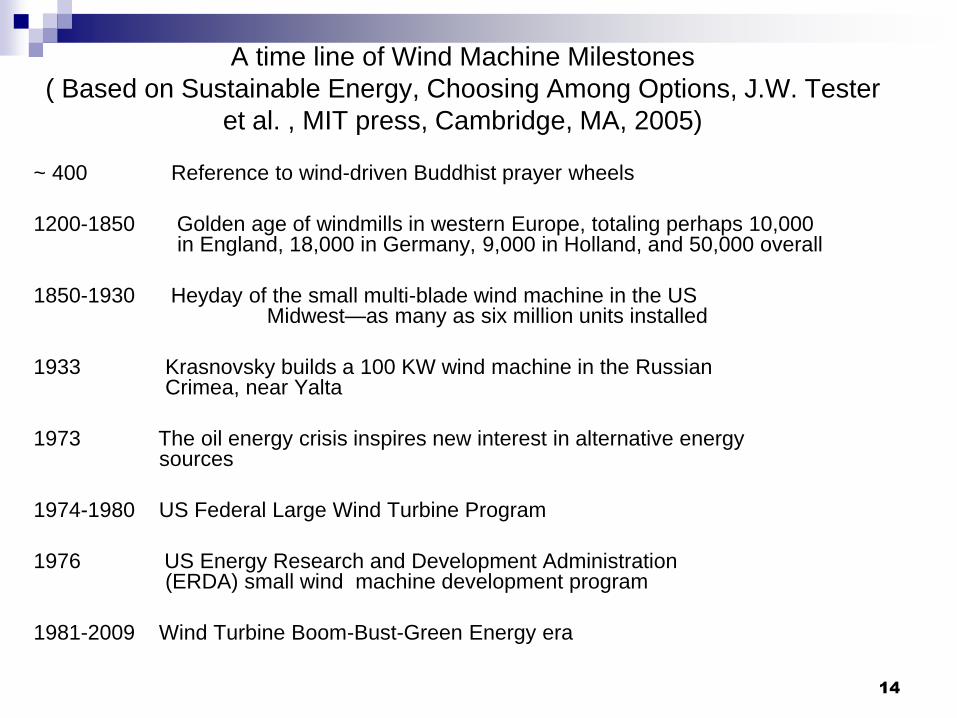
A time line of Wind Machine Milestones
( Based on Sustainable Energy, Choosing Among Options, J.W. Tester
et al. , MIT press, Cambridge, MA, 2005)
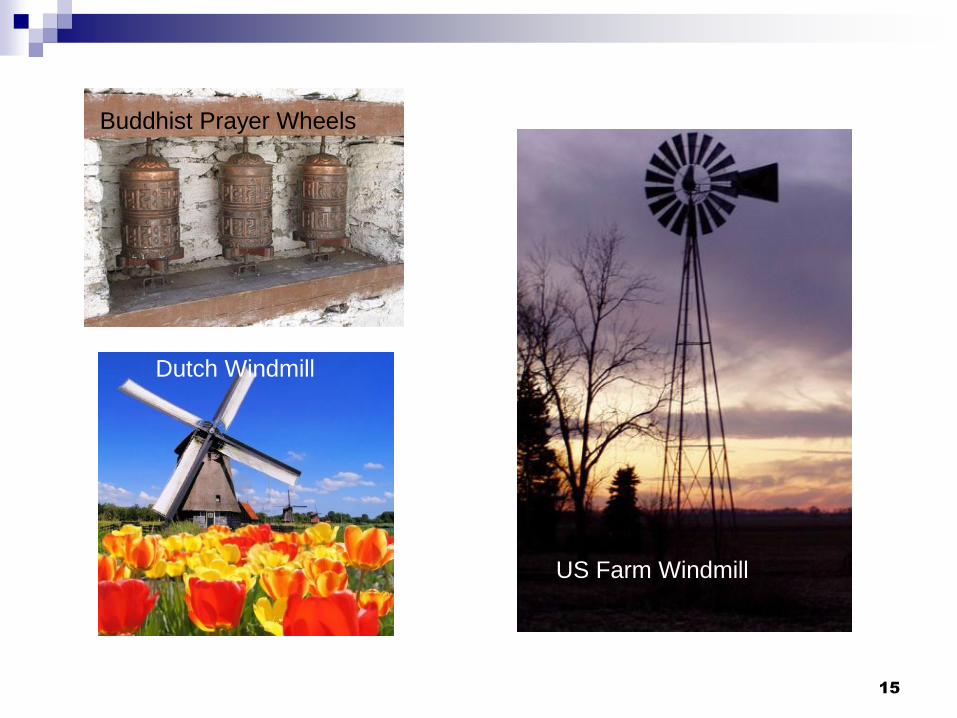
~ 400 Reference to wind-driven Buddhist prayer wheels
1200-1850 Golden age of windmills in western Europe, totaling perhaps 10,000 in England, 18,000 in Germany, 9,000 in Holland, and 50,000 overall
1850-1930 Heyday of the small multi-blade wind machine in the US Midwest—as many as six million units installed
1933 Krasnovsky builds a 100 KW wind machine in the Russian Crimea, near Yalta
1973 The oil energy crisis inspires new interest in alternative energy sources
1974-1980 US Federal Large Wind Turbine Program
1976 US Energy Research and Development Administration (ERDA) small wind machine development program
1981-2009 Wind Turbine Boom-Bust-Green Energy era
15
Dutch Windmill
US Farm Windmill
Buddhist Prayer Wheels
16
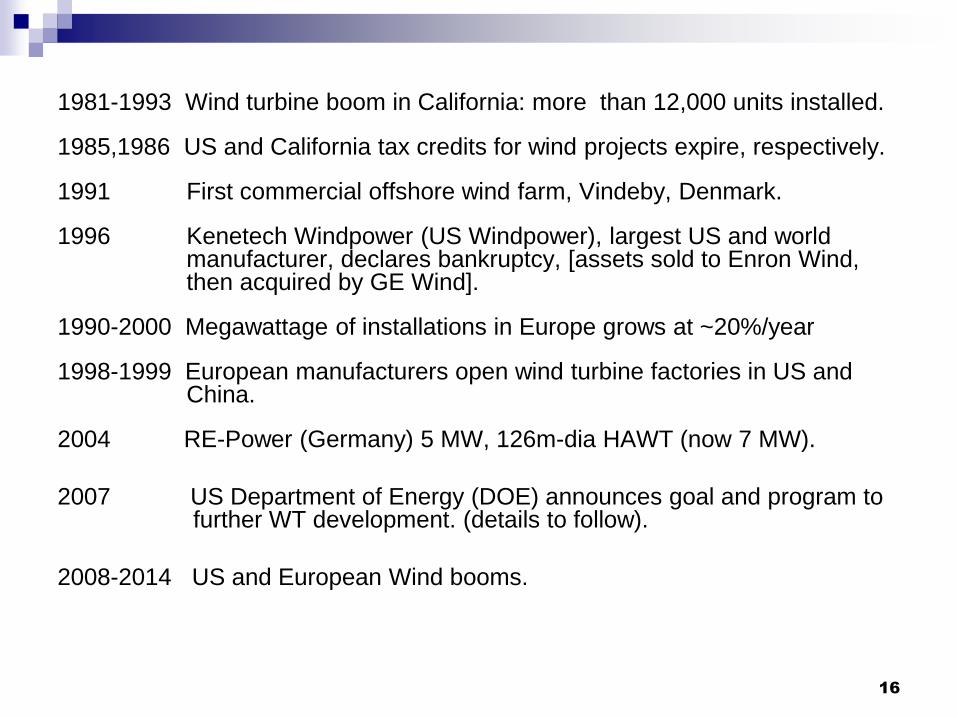
1981-1993 Wind turbine boom in California: more than 12,000 units installed.
1985,1986 US and California tax credits for wind projects expire, respectively.
1991 First commercial offshore wind farm, Vindeby, Denmark.
1996 Kenetech Windpower (US Windpower), largest US and world manufacturer, declares bankruptcy, [assets sold to Enron Wind, then acquired by GE Wind].
1990-2000 Megawattage of installations in Europe grows at ~20%/year
1998-1999 European manufacturers open wind turbine factories in US and China.
2004 RE-Power (Germany) 5 MW, 126m-dia HAWT (now 7 MW).
2007 US Department of Energy (DOE) announces goal and program to further WT development. (details to follow).
2008-2014 US and European Wind booms.
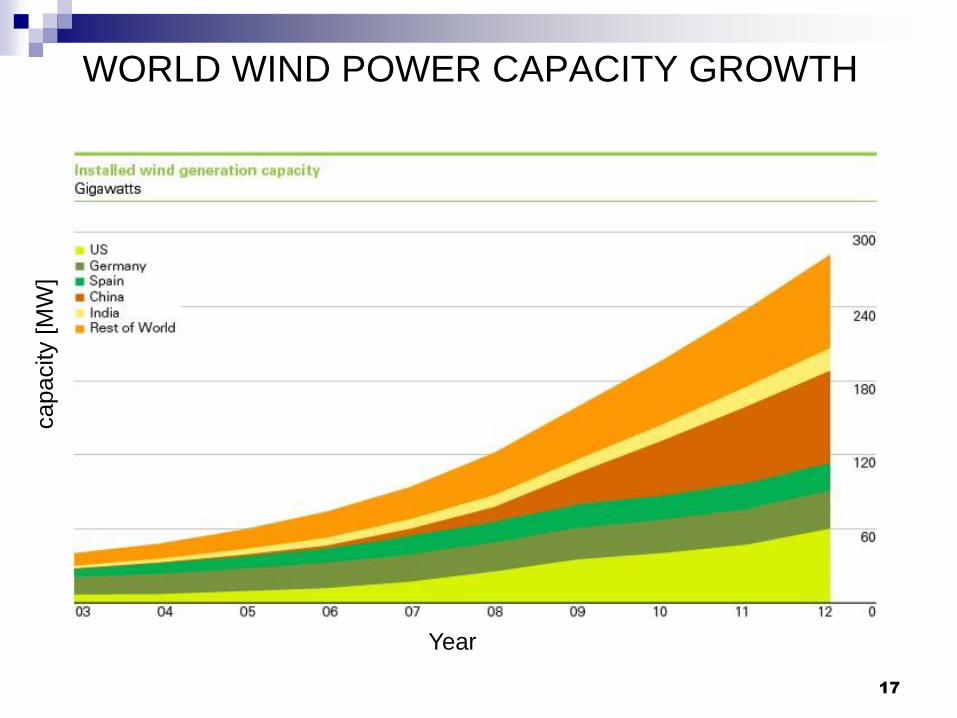
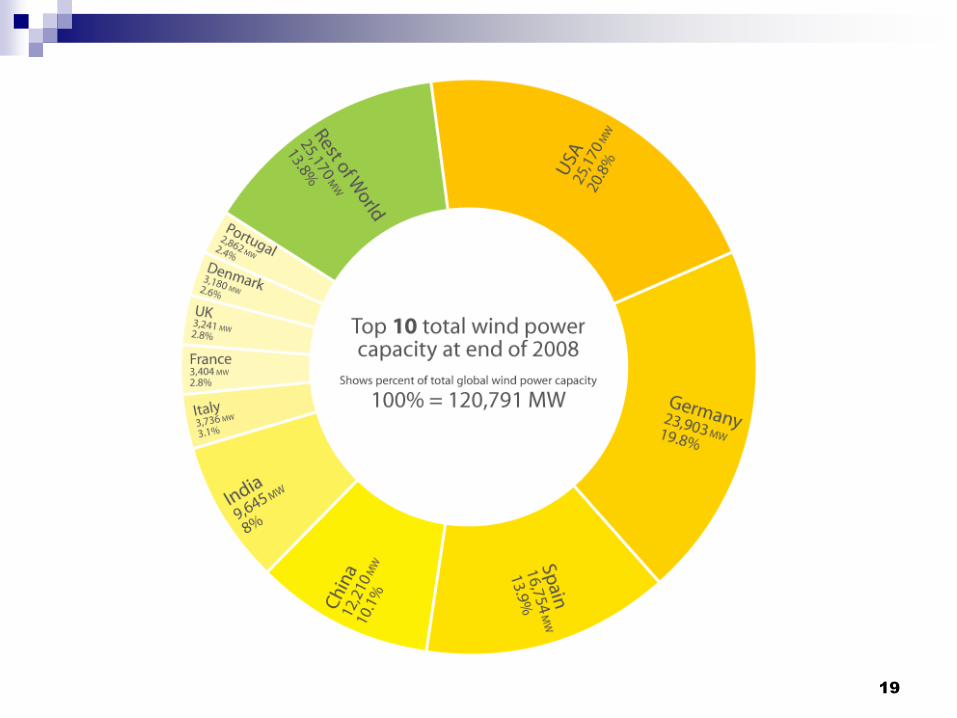
WORLD WIND POWER CAPACITY GROWTH
17
capacity [
MW
]
Year
18
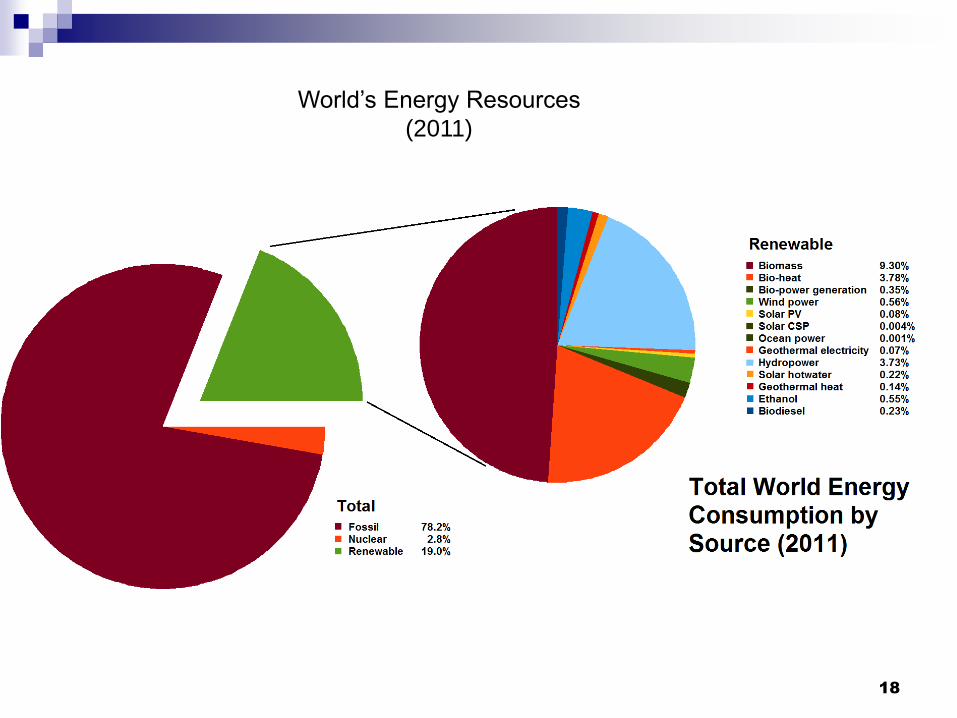
World’s Energy Resources
(2011)
19
Sun-Sentinel, August 26, 2007
In a recent report, the DOE said the
nation’s wind-power capacity increased by
27 percent in 2006, and that the United
States had the fastest-growing wind-power
capacity in the world in 2005 and 2006. Still,
despite wind farms now operating in 36
states, wind accounts for less than 1
percent of the U.S. power supply.
[Now up to 3.5%.]
20
2008 - 2014
Green Energy Era
WT boom times all over the world Europe, US, India,
China, Australia, New Zealand
In the US, unprecedented federal and state government
support to further WT development (tax credit, research
funding, development grants and loans to industries)
Emergence of WT- technician training programs through
community colleges
By end of 2012, U.S. had 60,000 MW installed power,
which is 3.8% of U.S. total. [Could be 20% by 2030,
25% by 2035, 30% by 2050.]
21

December 14, 2009 (Wall Street Journal)
DOE Outpaces Venture in Cleantech Investments
The federal government through DOE, has taken a large
role in the shaping of the clean energy sector. DOE plans
to either lend or grant more than $40 billion to companies
working on clean technology and, to that end, in the first
nine months of 2009, the agency has allocated $ 13 billion
to business developing everything from electric vehicle
and the batteries that power them, to wind turbines and
solar panels. In comparison, venture capital firms have
invested $ 2.68 million in clean energy technology in the
same period of time.
22
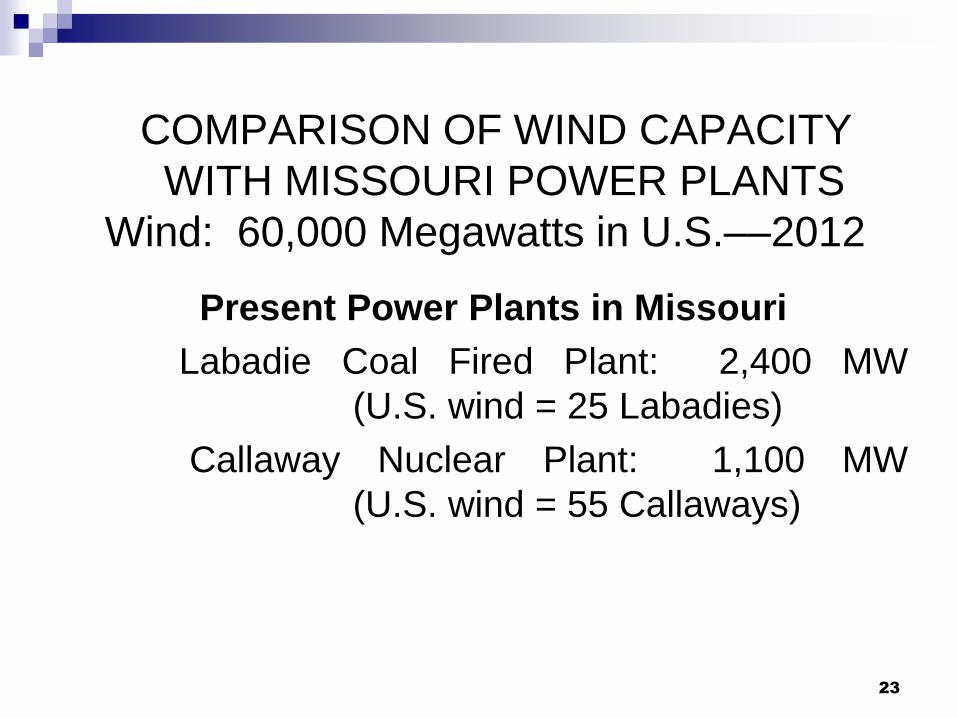
COMPARISON OF WIND CAPACITY
WITH MISSOURI POWER PLANTS
Wind: 60,000 Megawatts in U.S.––2012
Present Power Plants in Missouri
Labadie Coal Fired Plant: 2,400 MW
(U.S. wind = 25 Labadies)
Callaway Nuclear Plant: 1,100 MW
(U.S. wind = 55 Callaways)
23
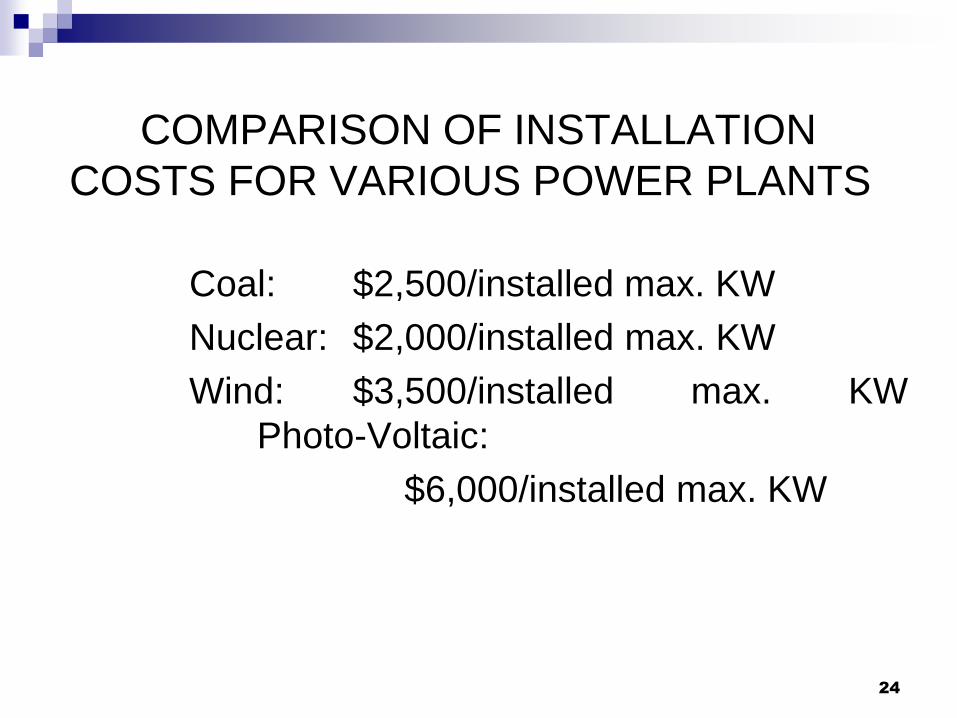
COMPARISON OF INSTALLATION
COSTS FOR VARIOUS POWER PLANTS
Coal: $2,500/installed max. KW
Nuclear: $2,000/installed max. KW
Wind: $3,500/installed max. KW
Photo-Voltaic:
$6,000/installed max. KW
24
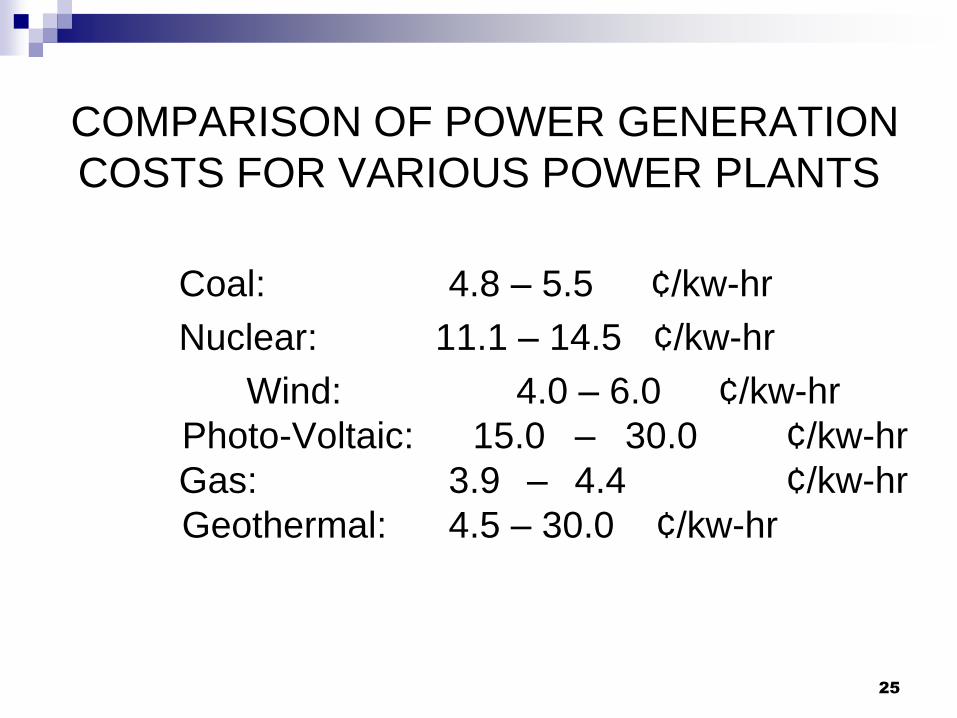
COMPARISON OF POWER GENERATION
COSTS FOR VARIOUS POWER PLANTS
Coal: 4.8 – 5.5 ¢/kw-hr
Nuclear: 11.1 – 14.5 ¢/kw-hr
Wind: 4.0 – 6.0 ¢/kw-hr
Photo-Voltaic: 15.0 – 30.0 ¢/kw-hr
Gas: 3.9 – 4.4 ¢/kw-hr
Geothermal: 4.5 – 30.0 ¢/kw-hr
25
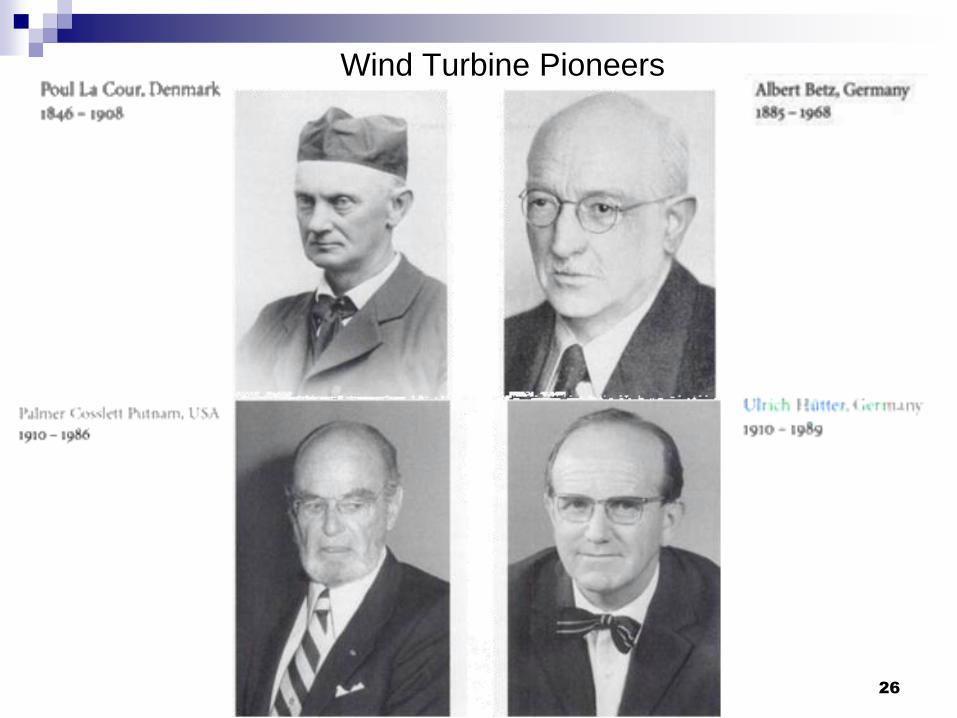
Wind Turbine Pioneers
26

Palmer Cosslett Putnam
The first to demonstrate the development of large wind
turbines and related applications to electricity grid, some
ten years before the rural electrical program.
Putman collaborated with Morgan Smith Company ( a
water turbine manufacturer in Pennsylvania) and with a
public service company In October 1941, the wind
turbine was installed on a hill of the state in Vermont
(Grandpa’s Knob).
27
Smith-Putman WT
53.3 m Rotor Dia
2 Stainless Steel blades with rotor flapping hinges
1.25 MW Rated Power
35.6 m Tower height
Operated for 4 years (1941-1945) and “fed electricity into
the utility grid of central Vermont Public Service Co.”
Generated 1250 kW of electrical power.
1945 rotor blade fracture due to lack of preventive
repair lack of funding, wartime
28

Putman Investigated large diameter (175-225 ft
or 53.3 – 68.5 m) wind turbines ; his results
(1942) are “remarkable when compared with
currently prevailing opinions.”
Text p.16 , last paragraph, “In the United States,
the most significant early large turbine was the
Smith Putman machine , built at Grandpa’s Knob
in Vermont in the late 1930 (1941?)
29
“In 1939 the directors of the S. Morgan Smith
Company, manufacturers of hydraulic turbines,
decided to explore the possibilities of large-scale
wind turbines as an additional source of power,
and as a means of diversifying their product. To
harness the power in the wind on a large scale
required a knowledge of the habit of the wind,
about which science had little to say to us. To
enter the field would require basic research.”
(Foreward, Putman Power of the Wind, G. W. Koeppl,
von Nostrand Rheinhold, 1982, Part 1(2nd Edition)) 30
“In six years of design and testing
of the 175-foot, 1250-kilowatt
experimental unit on Grandpa’s Knob
near Rutland Vermont, in winds up to
115 miles per hour, we have satisfied
ourselves that Putman’s ideas are
practical . . .”
31
November, 1946
(Foreword, Ibid)
In 1939, based on 1937 prices
Estimate: (Ten 1500 kW units)
Estimate :$ 190 /kW
Affordable: $125 /kW
Abandoned!
(Putman Power of the Wind, Ibid.)
32

33
(see text, p16)

34
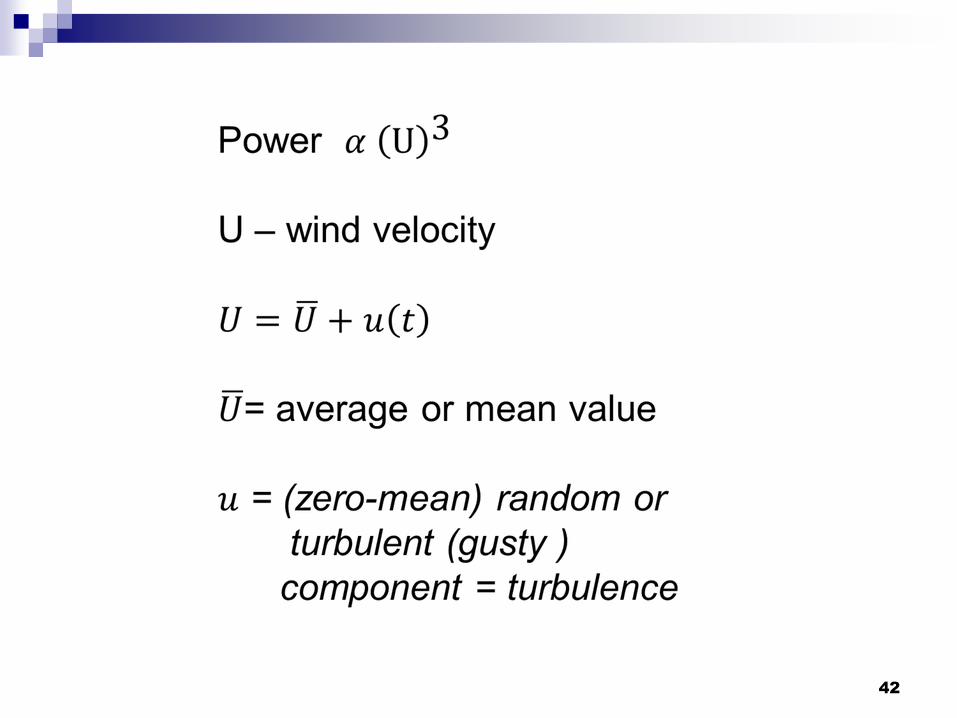
U = U (wind velocity)
(details to follow)
U = Assumed uniform, m/s
P = Available Power based on U
An air mass moving toward a HAWT
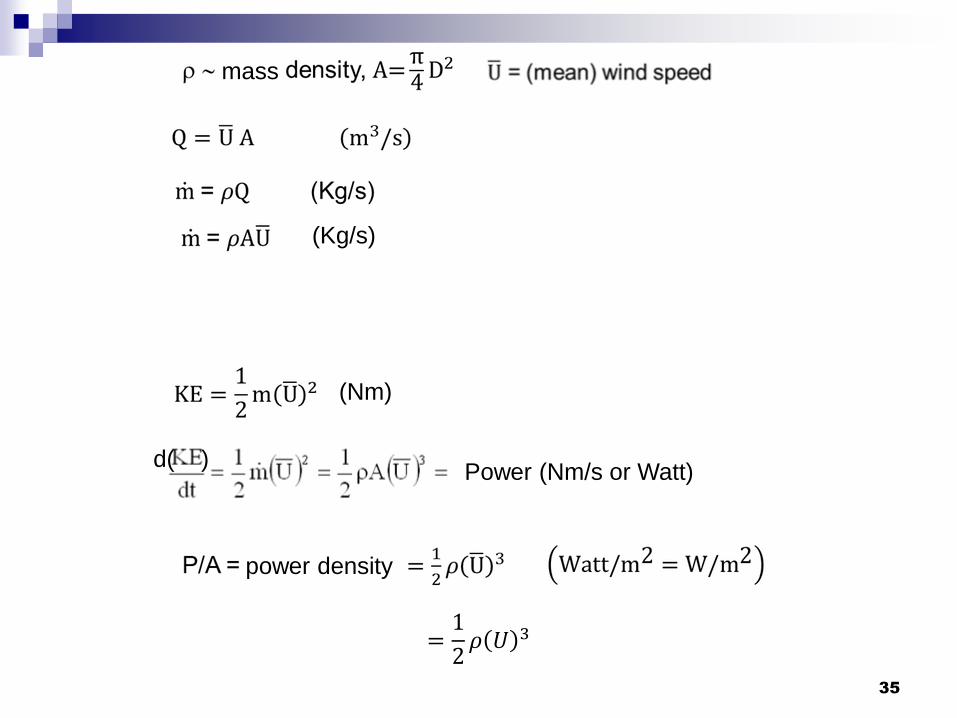
35
(Nm)
(Kg/s)
Power (Nm/s or Watt)
mass
power density
=1
2𝜌 𝑈 3
d( )
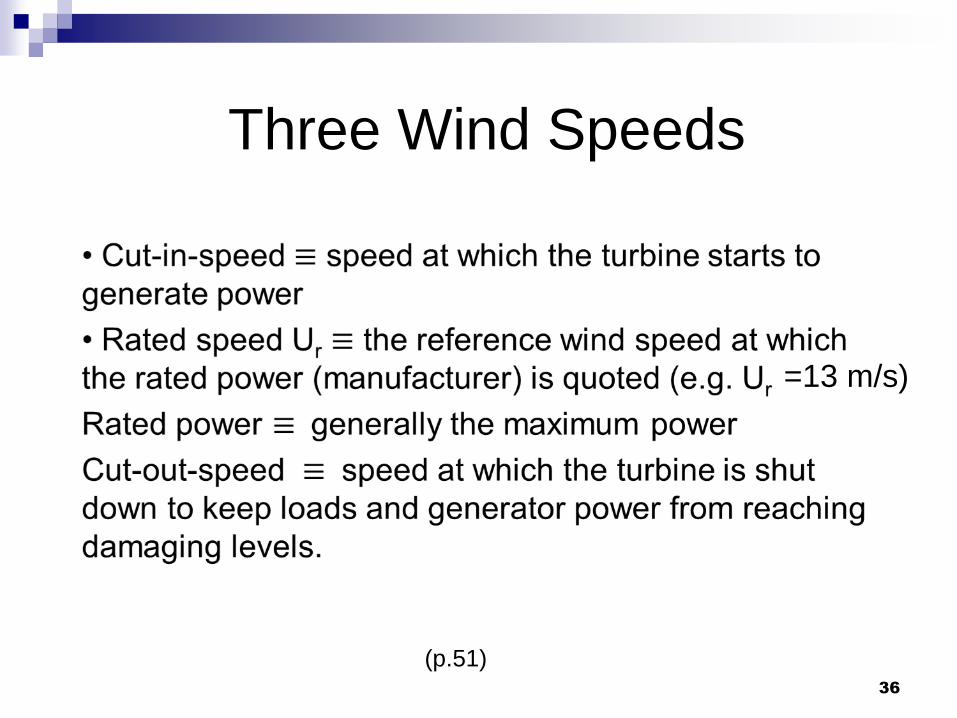
Three Wind Speeds
36
(p.51)
=13 m/s)
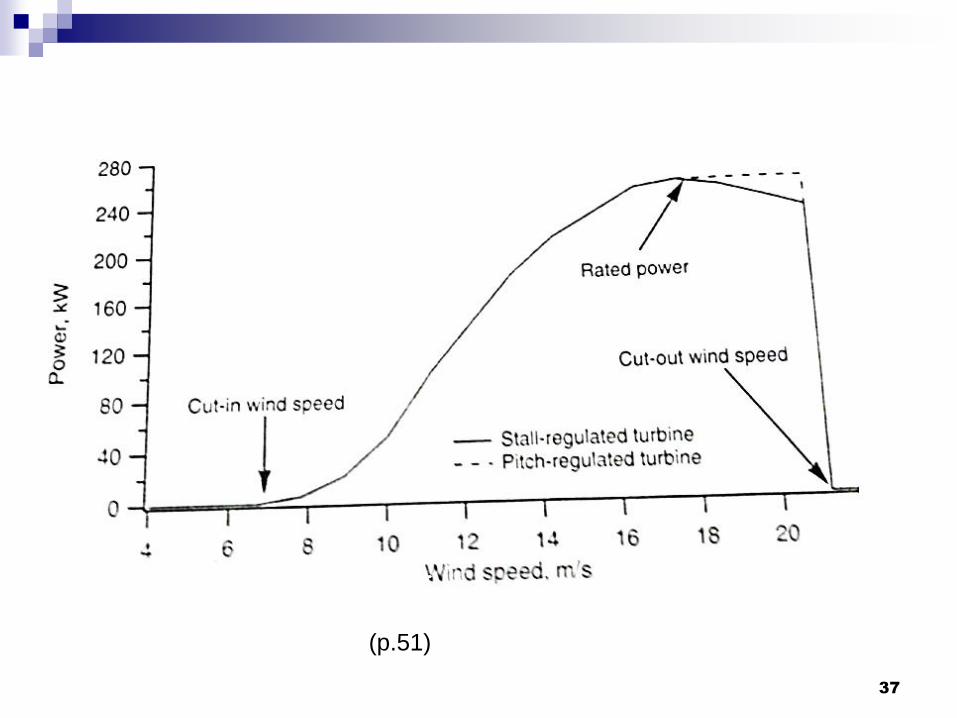
37
(p.51)
38
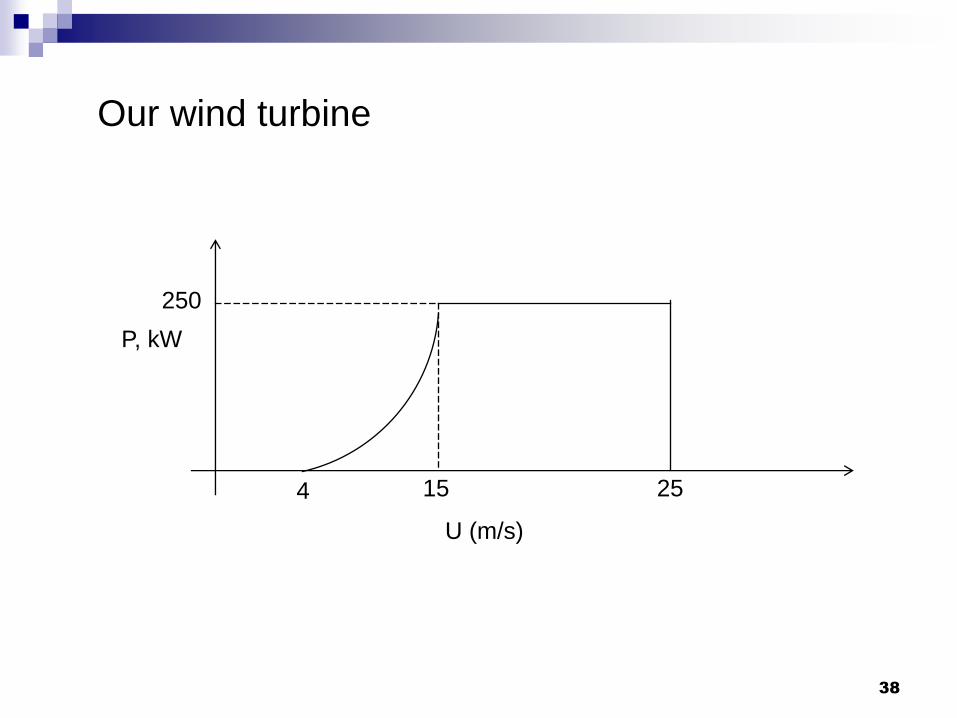
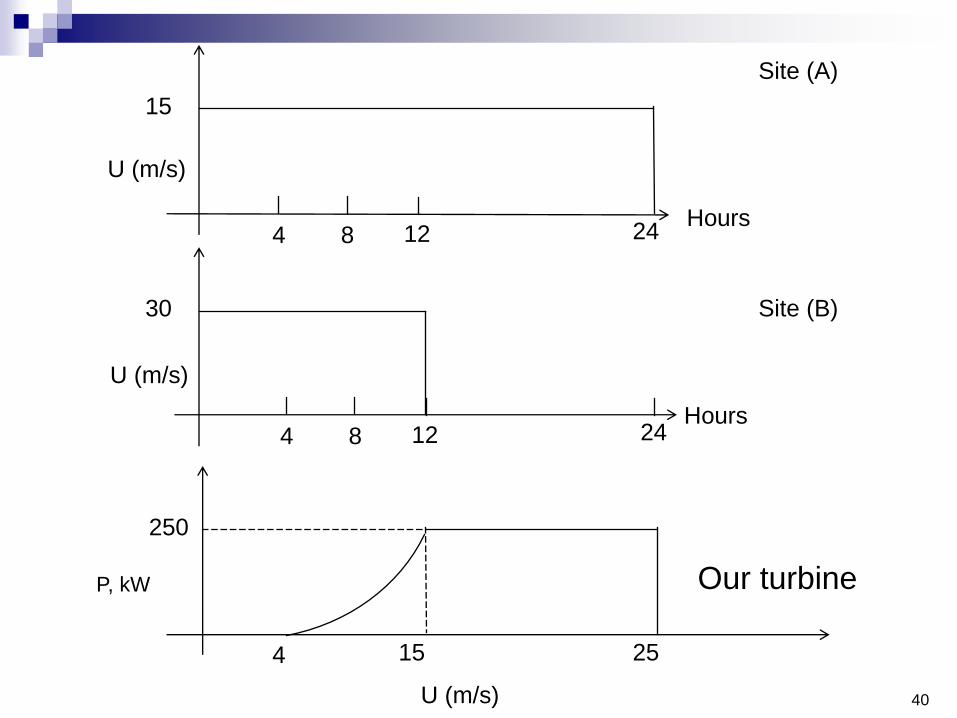
Our wind turbine
P, kW
4 15
250
25
U (m/s)
39
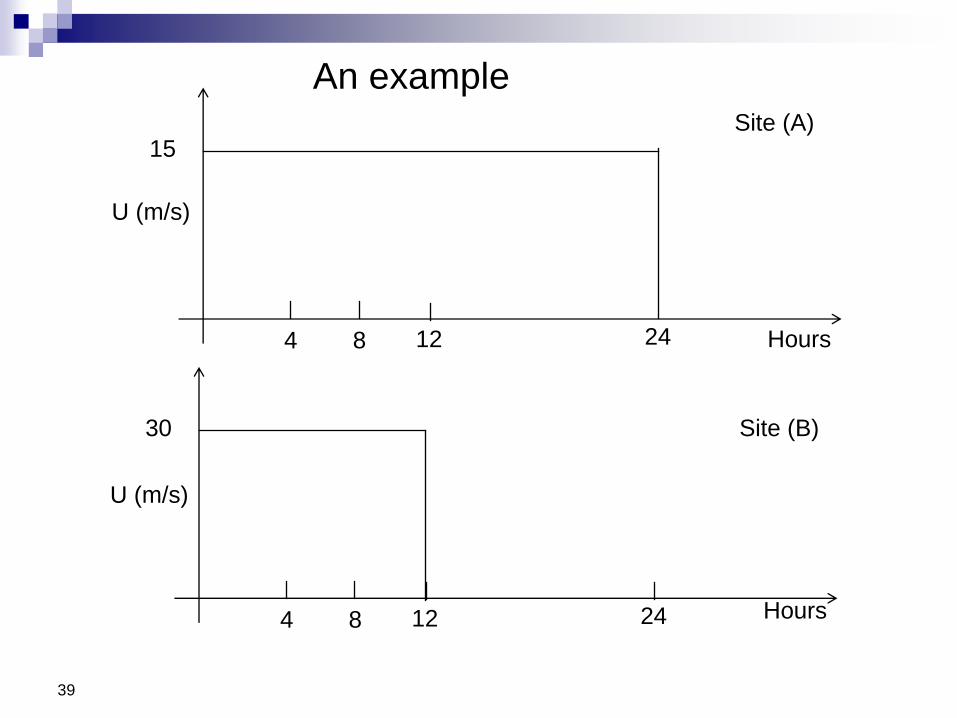
An example
4 8
15
24
U (m/s)
12 Hours
4 8
30
24 12 Hours
U (m/s)
Site (A)
Site (B)
40
4 8
15
24
U (m/s)
12 Hours
4 8
30
24 12 Hours
U (m/s)
Site (B)
Our turbine P, kW
4 15
250
25
U (m/s)
Site (A)
41
In one day, our turbine in site A will give
250 x 24 = 6000 kWh
And in site B it will give 0 (zero) units of
energy!
42
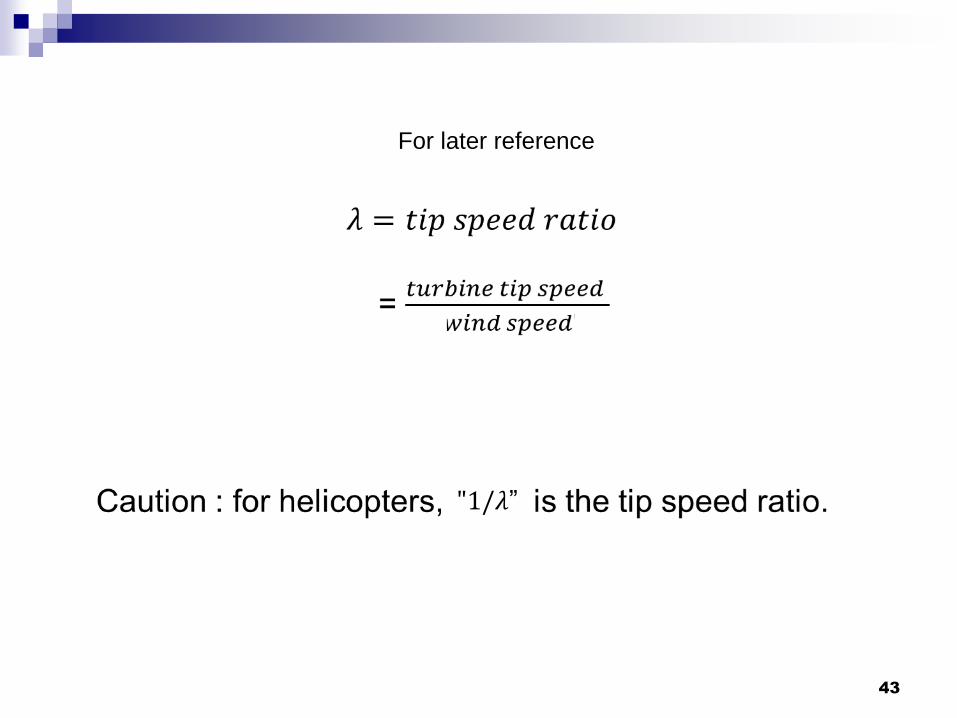
43
For later reference
"1/𝜆”
44

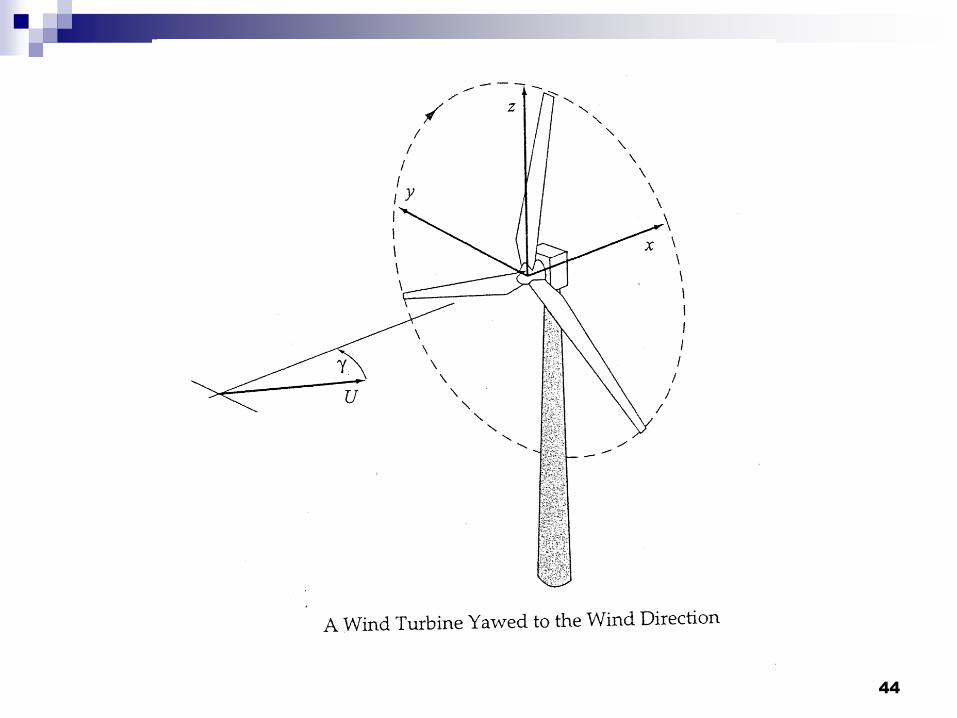
45
γ

MODERN ADVANCES
46

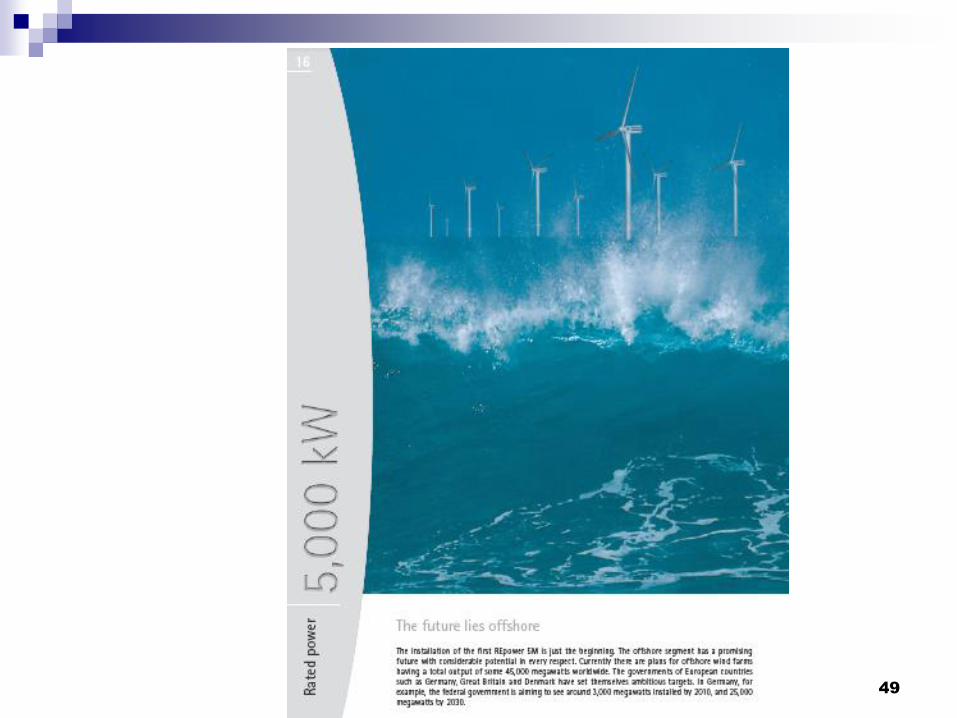
47
RE Model (October 2004)
Design
Technical Data
Rated Power 5,000 kW
Cut-in Wind Speed 3.5 m/s
Rated Wind Speed 13 m/s
Cut-Out Wind Speed
Offshore Version 30 m/s
Onshore Version 25 m/s
Rotor/Hub height
Diameter 126 m
Height 120 m
Speed Range, normal
operation
approx. 7-12 rpm
Mass
Rotor approx. 120 t
Nacelle (without rotor) approx. 290 t
48
49
50

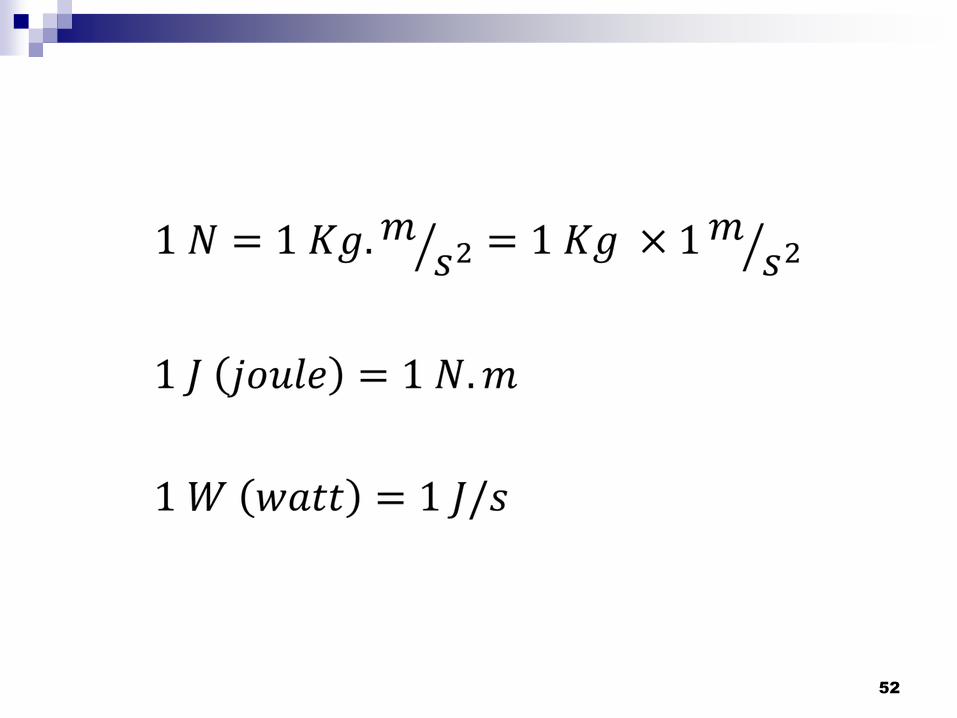
Energy Units
51
52

53
U.S. Customary SI (metric)
1 ft.lb (energy) 1.356 J
1 ft. lb/s (power) 4.448 kg.m/s
1 hp 745.7 W

54
A future of considerable promise
(Federal and State incentives)
120 m
Rated rapacity: 50 kW 300 kW 759kW 1000 kW 2000 kW 5000 kW 5000 k W Washington Post- 2010
Rotor diameter: 15m 34 m 48 m 60 m 72 m 112 m 126 m Monument 120 -150 m?
Tower Height: 25 m 40 m 60 m 70m 80 m 100m 120 m 170 m
(Based on Fig. 1.15, p.18)
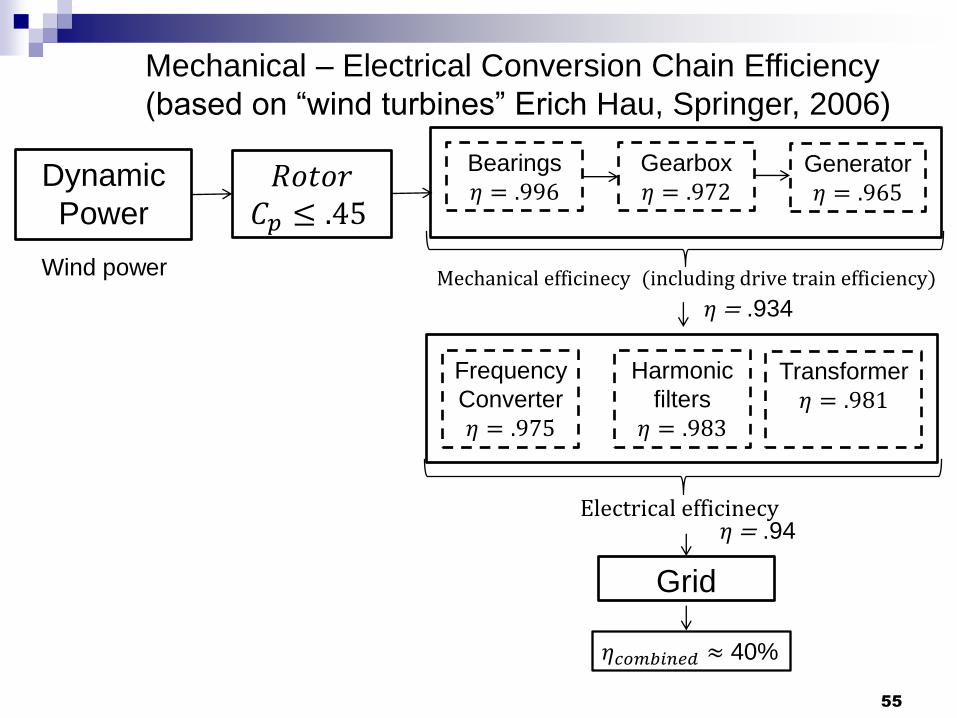
Dynamic
Power
55
𝑅𝑜𝑡𝑜𝑟 𝐶𝑝 ≤ .45
Bearings
𝜂 = .996
Gearbox
𝜂 = .972 Generator
𝜂 = .965
Wind power Mechanical efficinecy (including drive train efficiency)
Frequency
Converter
𝜂 = .975
Harmonic
filters
𝜂 = .983
Transformer
𝜂 = .981
𝜂𝑐𝑜𝑚𝑏𝑖𝑛𝑒𝑑 ≈ 40%
𝜂 = .934
Grid
Electrical efficinecy
Mechanical – Electrical Conversion Chain Efficiency
(based on “wind turbines” Erich Hau, Springer, 2006)
𝜂 = .94
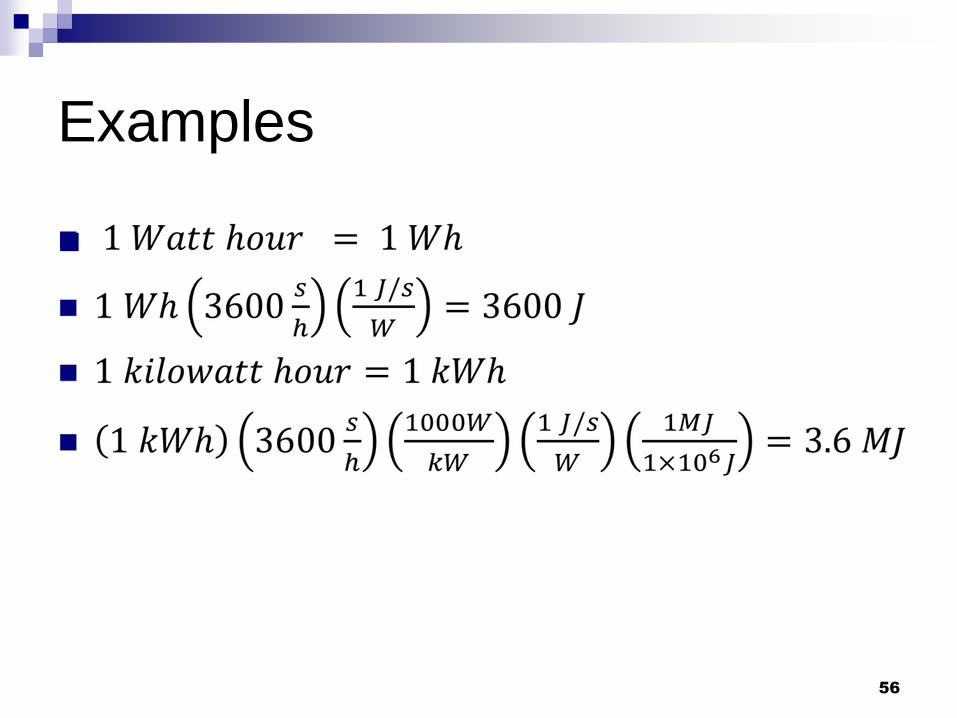
Examples
56
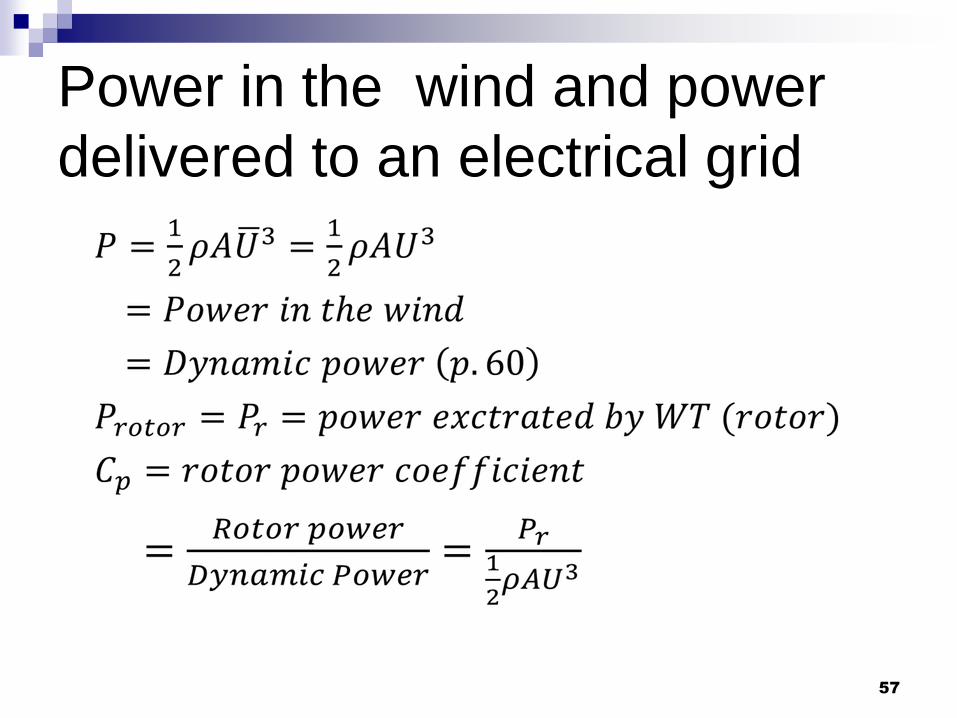
Power in the wind and power
delivered to an electrical grid
57
58
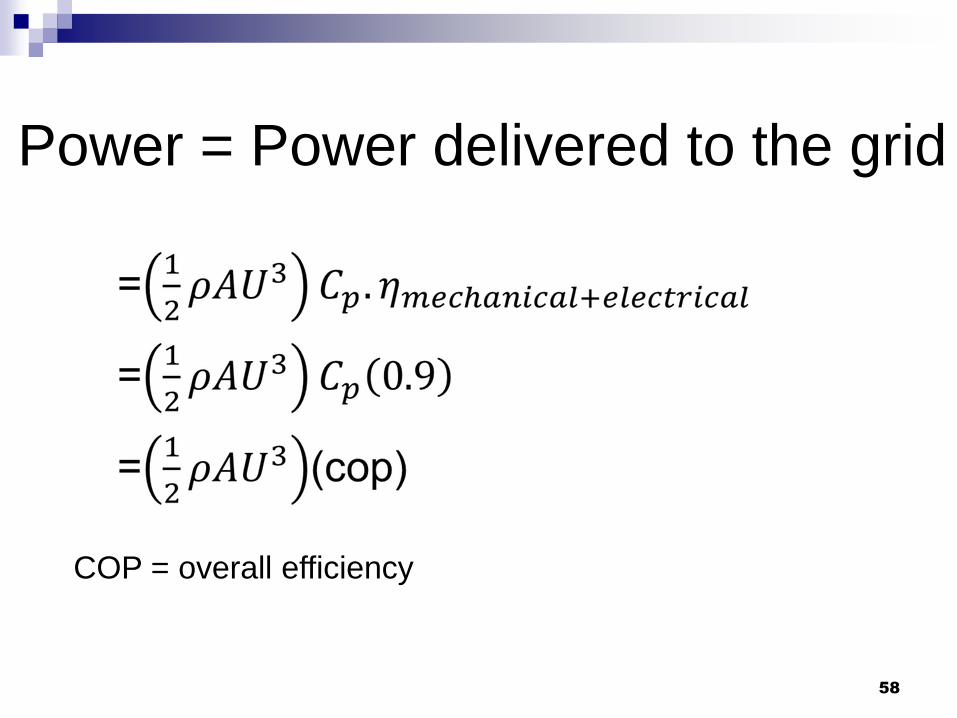
Power = Power delivered to the grid
COP = overall efficiency
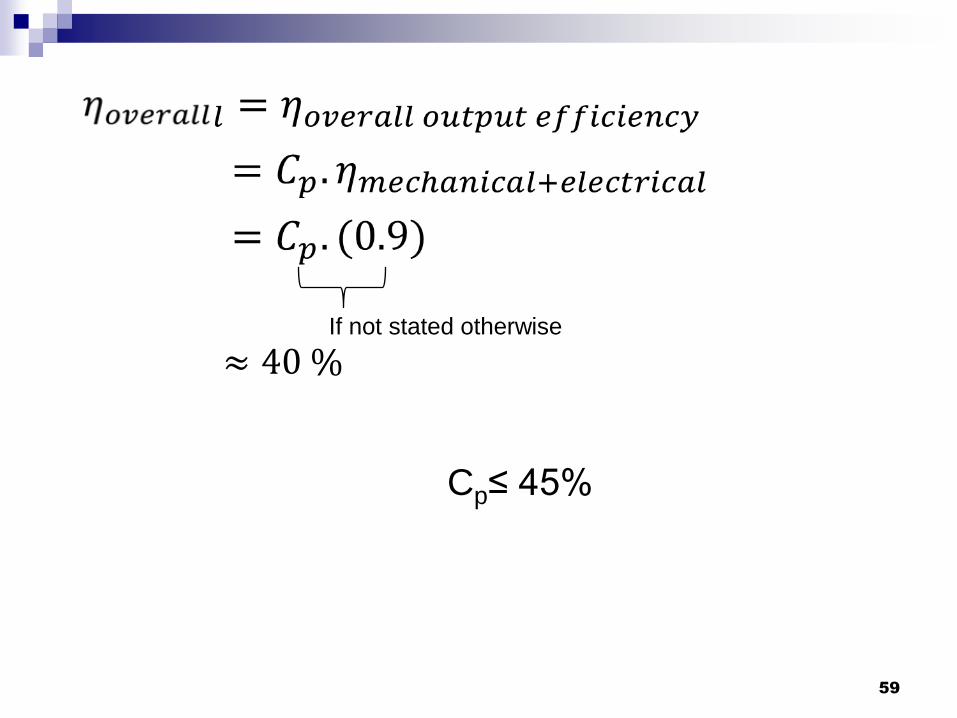
59
If not stated otherwise
≈ 40 %
Cp≤ 45%

Some Aspects of Construction
and Maintenance
60
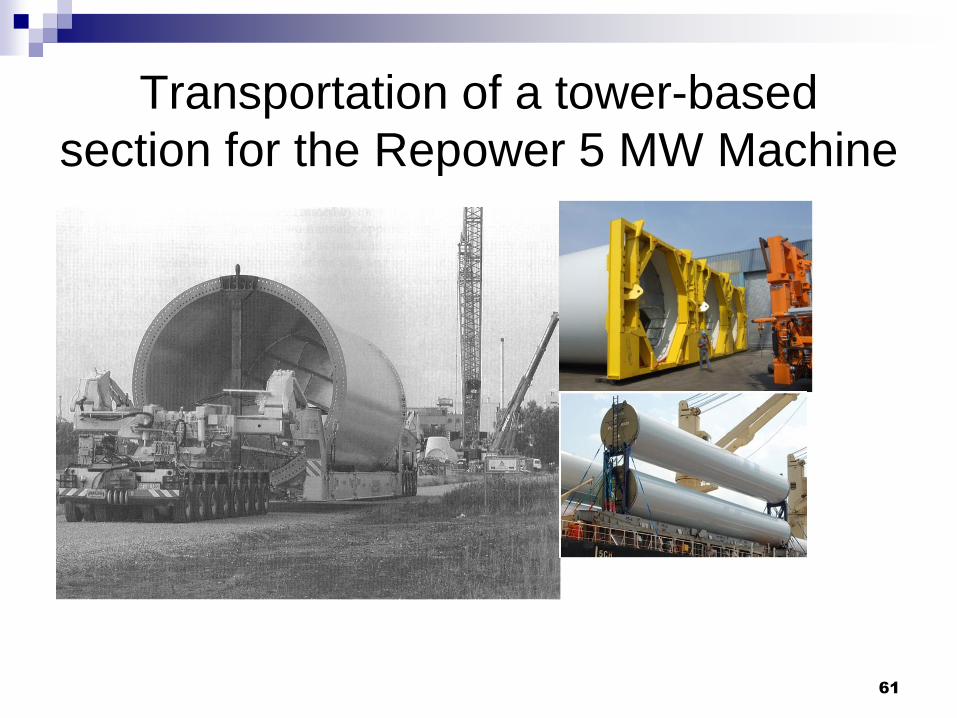
Transportation of a tower-based
section for the Repower 5 MW Machine
61

Offshore wind turbine with helicopter supply platform in the
Horns Rev wind farm
(Vestas)
62
63
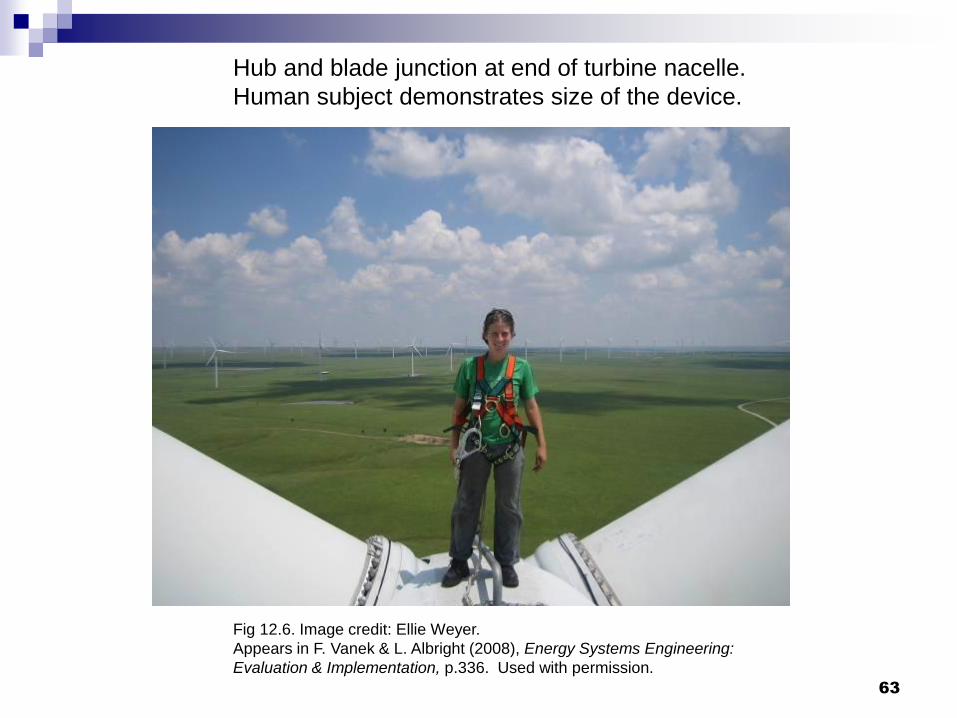
Hub and blade junction at end of turbine nacelle.
Human subject demonstrates size of the device.
Fig 12.6. Image credit: Ellie Weyer.
Appears in F. Vanek & L. Albright (2008), Energy Systems Engineering:
Evaluation & Implementation, p.336. Used with permission.

Access to the turbine nacelle via doorway and stairwell inside the tower
Fig 12.7. Image credit: Ellie Weyer.
Appears in F. Vanek & L. Albright (2008), Energy Systems Engineering:
Evaluation & Implementation, p.336. Used with permission.
65
Some Aspects of Air Density,
Mean Wind at Tower Height
66
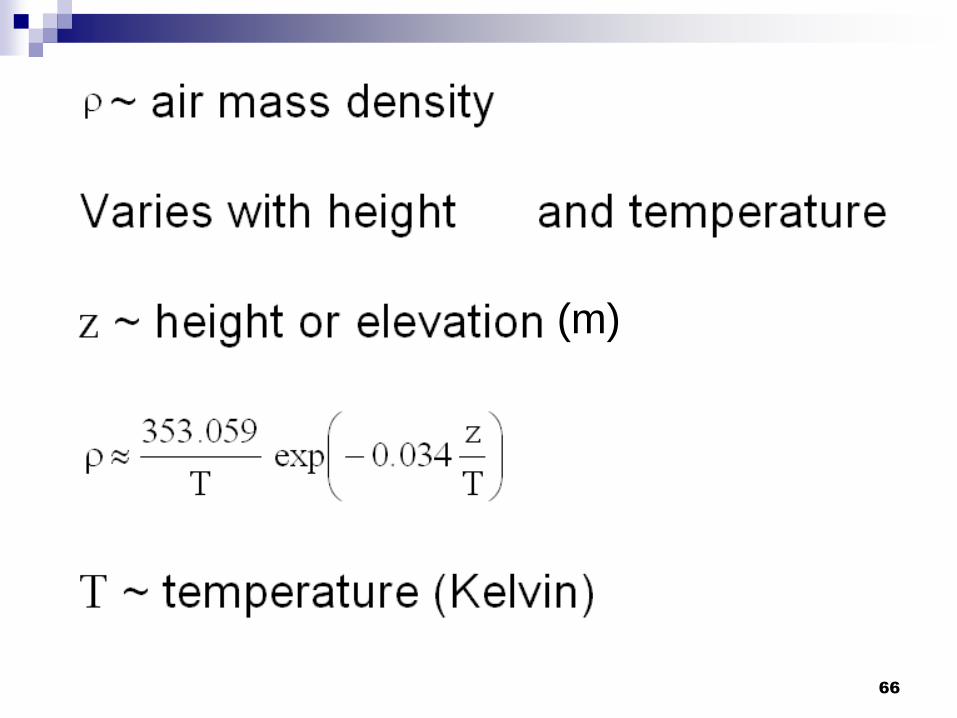
(m)
67
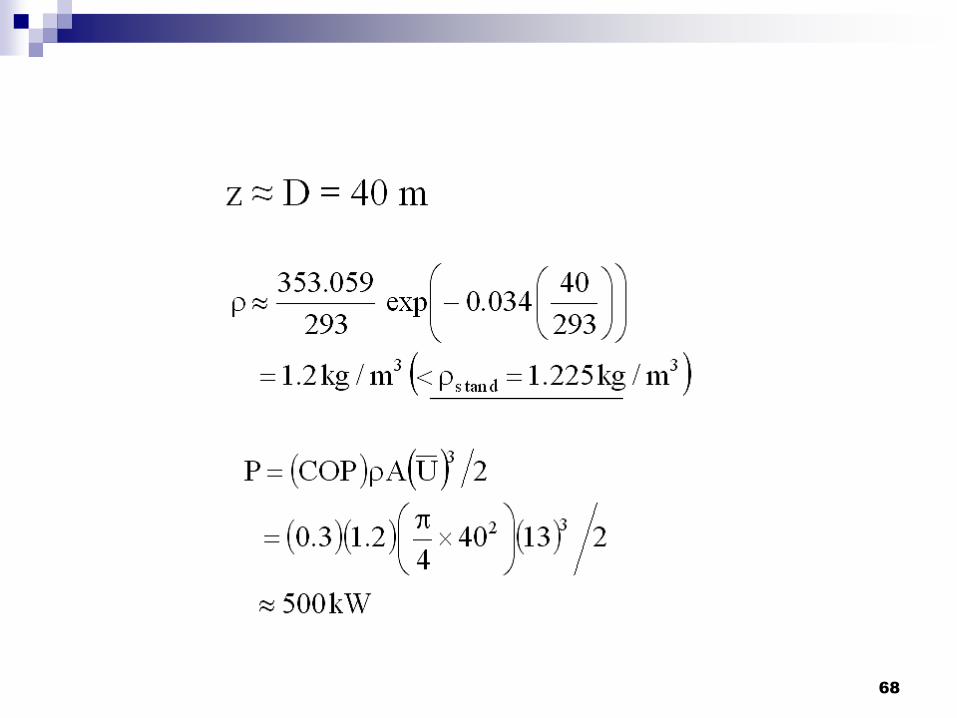
68

69
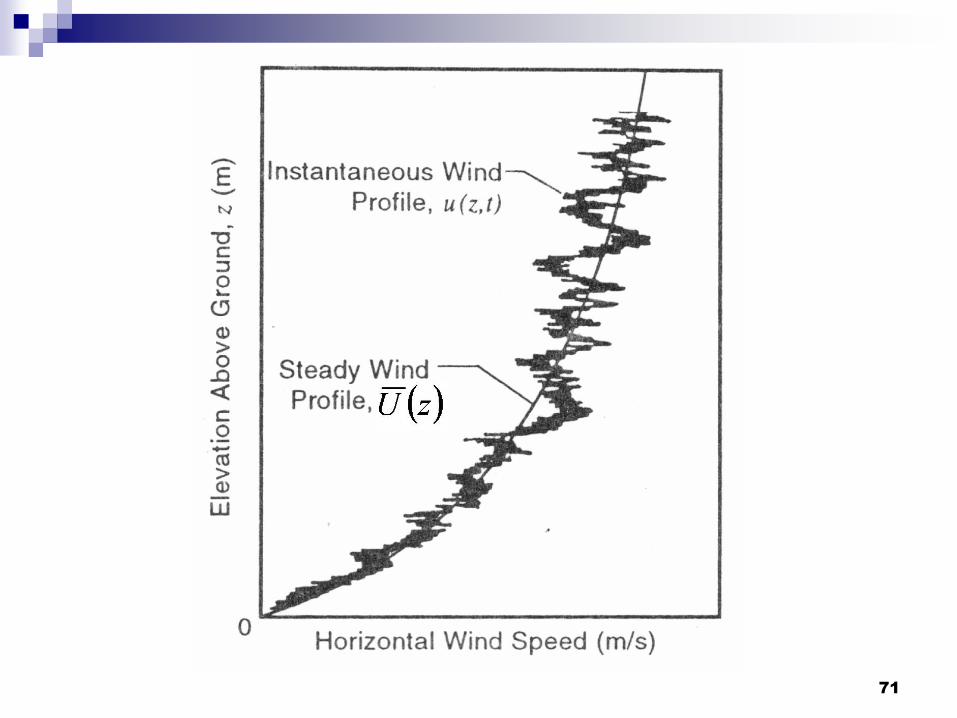
Revisiting Mean Wind Velocity U

70
(p. 39)
71

72
HIGH-ALTITUDE TETHERED WIND TURBINES
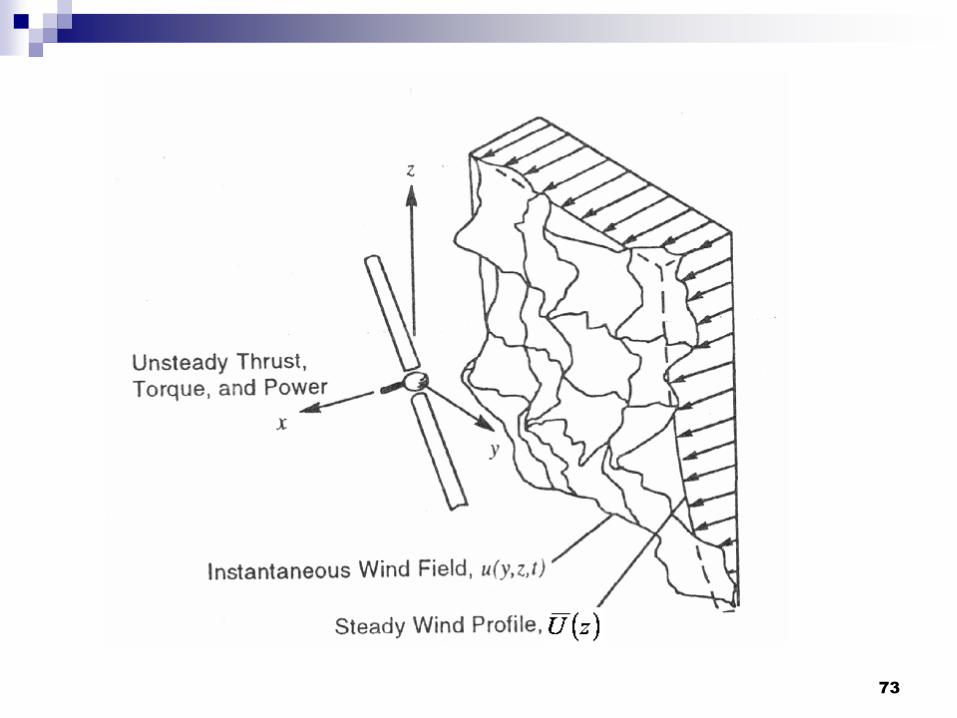
73
74
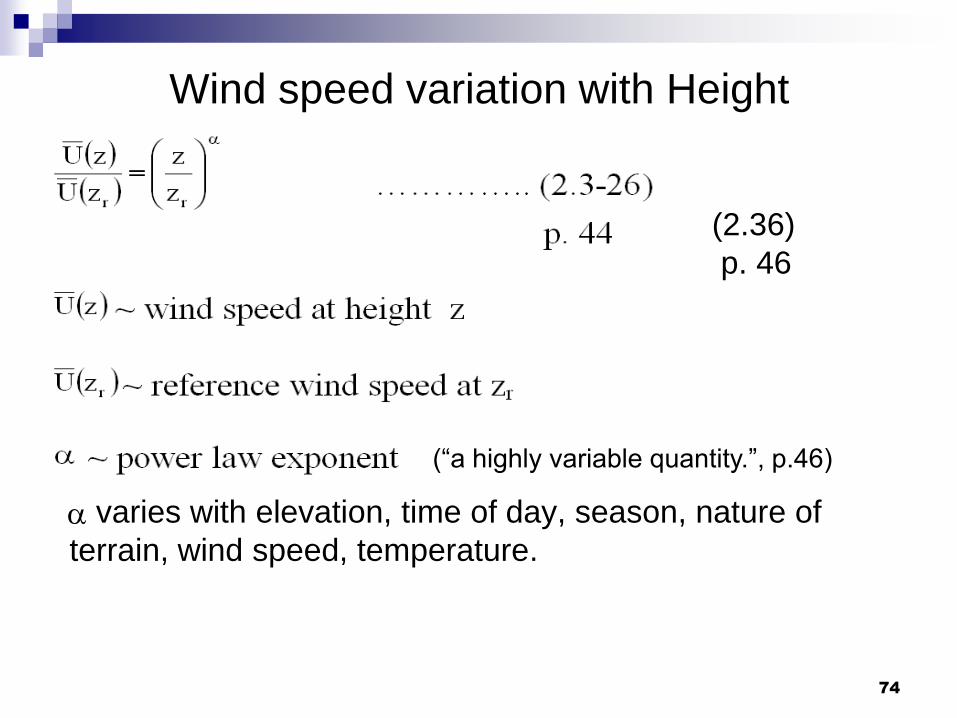
Wind speed variation with Height
varies with elevation, time of day, season, nature of
terrain, wind speed, temperature.
(“a highly variable quantity.”, p.46)
(2.36)
p. 46
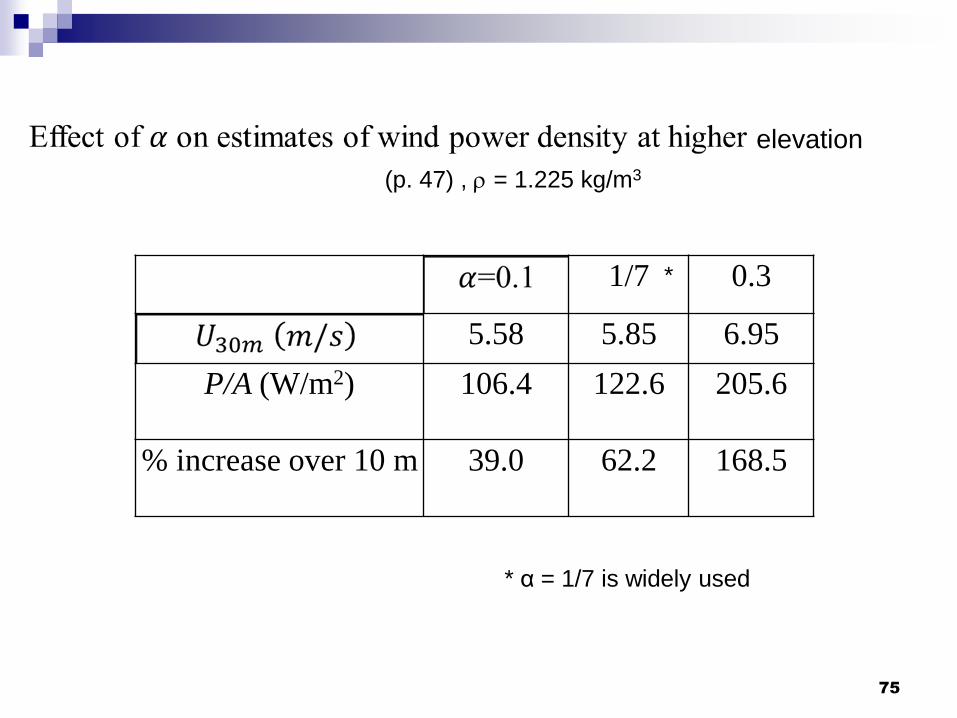
75
1/7 0.3
5.58 5.85 6.95
P/A (W/m2) 106.4 122.6 205.6
% increase over 10 m 39.0 62.2 168.5
(p. 47) , = 1.225 kg/m3
*
* α = 1/7 is widely used
elevation
76
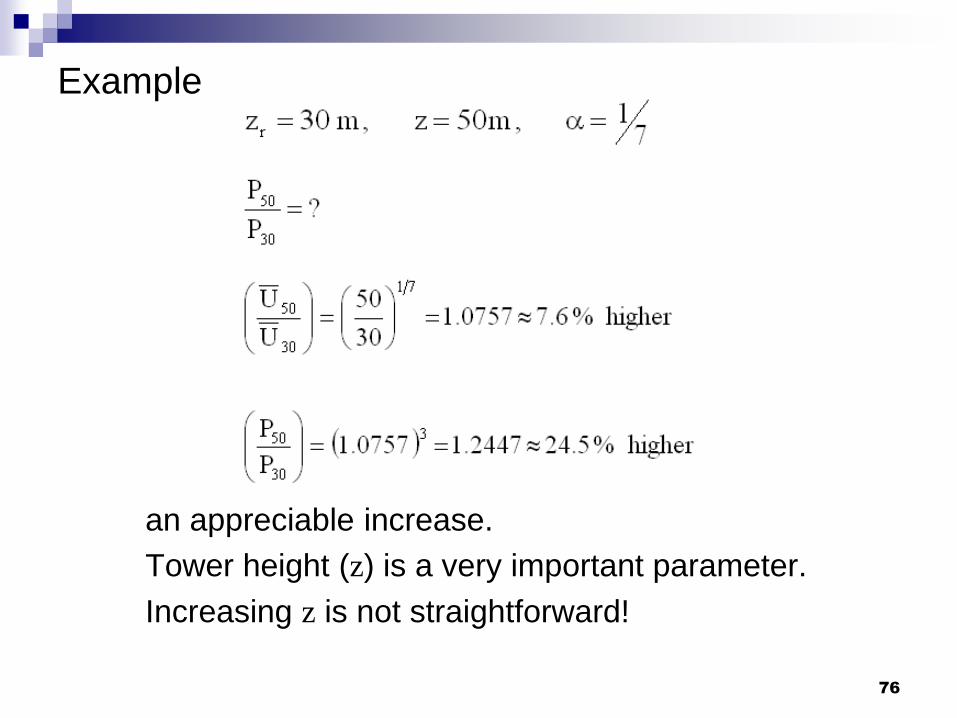
Example
an appreciable increase.
Tower height (z) is a very important parameter.
Increasing z is not straightforward!
Concluding Remarks on WE
and its Development
77

Sustainable Energy Development
We accept the well-known definition of
Brundtland, Chairman, World Commission of
Environment and Development :
Our Common Future, Oxford University Press,
New York, 1987.
“…development that meets the needs of the
present without compromising the ability of
future generations to meet their own needs.”
78
With the current and expected tax credits -- for directly
harnessing wind energy and reducing “greenhouse gas”
emissions -- electrical energy generation through wind
farms is the best candidate in providing at least 25% of
U.S. electricity by 2035.
Remarks :
- Large diameter (> 100 m) wind turbines have been
successfully developed on both offshore and on-land wind
farms (e.g. REpower 5 MW , 126m dia)
- Denmark generated 20% of its electricity by
harnessing wind energy in 2005. By 2012, the percentage
was up to 30%. This percentage has been steadily
increasing.
79
80
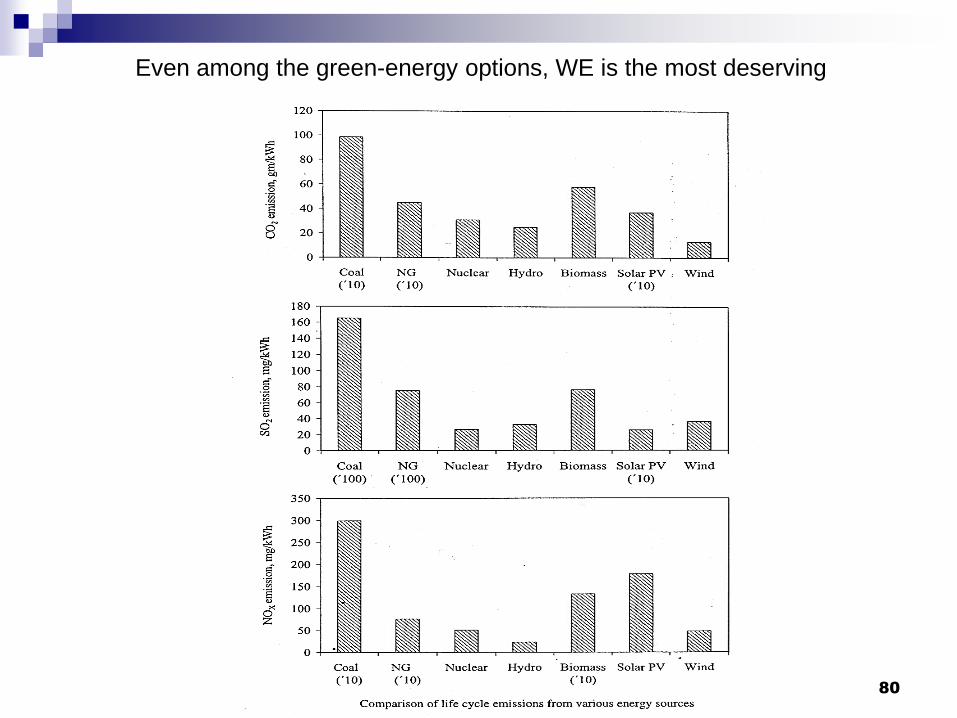
Even among the green-energy options, WE is the most deserving

Wind Out of Their Sails Opposition to a project off Cape Cod poses big questions
for offshore wind farms in the U.S.
“For nations such as Denmark, Germany, and the Netherlands, which depend
on wind power to supply an increasingly large fraction of their electricity
demand, the high winds in shallow waters offshore have become an attractive
resource. Indeed, according to the European Wind Energy Association, a trade
group based in Brussels, there is more than 600 megawatts of offshore wind
turbine capacity around Europe, including a 166 MW from off the southern
coast of Denmark.”
“The situation in the United States is quite different. At present, there are no
offshore wind farms and, unlike the sustained European commitment to wind
power, support from federal and state governments is much like the wind itself:
periodic and unreliable. Thanks to the frequently shifting tax and regulatory
environment, wind turbines are generally built in quick bursts. For instance,
2,424 MW of wind power capacity was built in 2005, but only 372 MW the year
before.” Ref. ASME Mechanical Engineering, vol. 128 , No.6 , June 2006
81
82
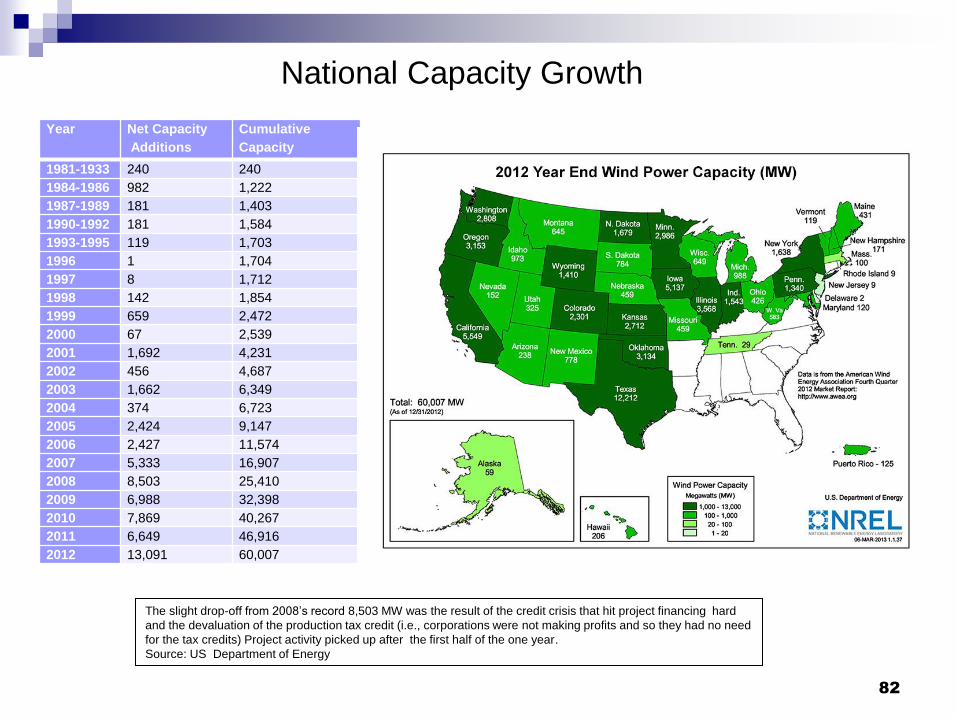
National Capacity Growth
The slight drop-off from 2008’s record 8,503 MW was the result of the credit crisis that hit project financing hard
and the devaluation of the production tax credit (i.e., corporations were not making profits and so they had no need
for the tax credits) Project activity picked up after the first half of the one year.
Source: US Department of Energy
Year Net Capacity
Additions
Cumulative
Capacity
1981-1933 240 240
1984-1986 982 1,222
1987-1989 181 1,403
1990-1992 181 1,584
1993-1995 119 1,703
1996 1 1,704
1997 8 1,712
1998 142 1,854
1999 659 2,472
2000 67 2,539
2001 1,692 4,231
2002 456 4,687
2003 1,662 6,349
2004 374 6,723
2005 2,424 9,147
2006 2,427 11,574
2007 5,333 16,907
2008 8,503 25,410
2009 6,988 32,398
2010 7,869 40,267
2011 6,649 46,916
2012 13,091 60,007
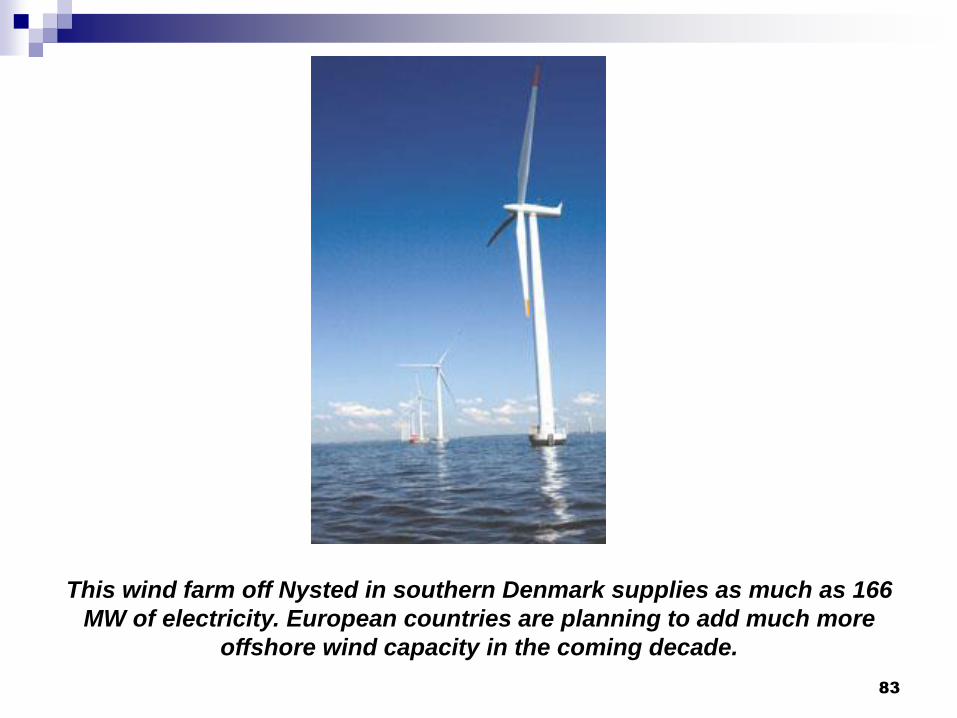
This wind farm off Nysted in southern Denmark supplies as much as 166
MW of electricity. European countries are planning to add much more
offshore wind capacity in the coming decade.
83
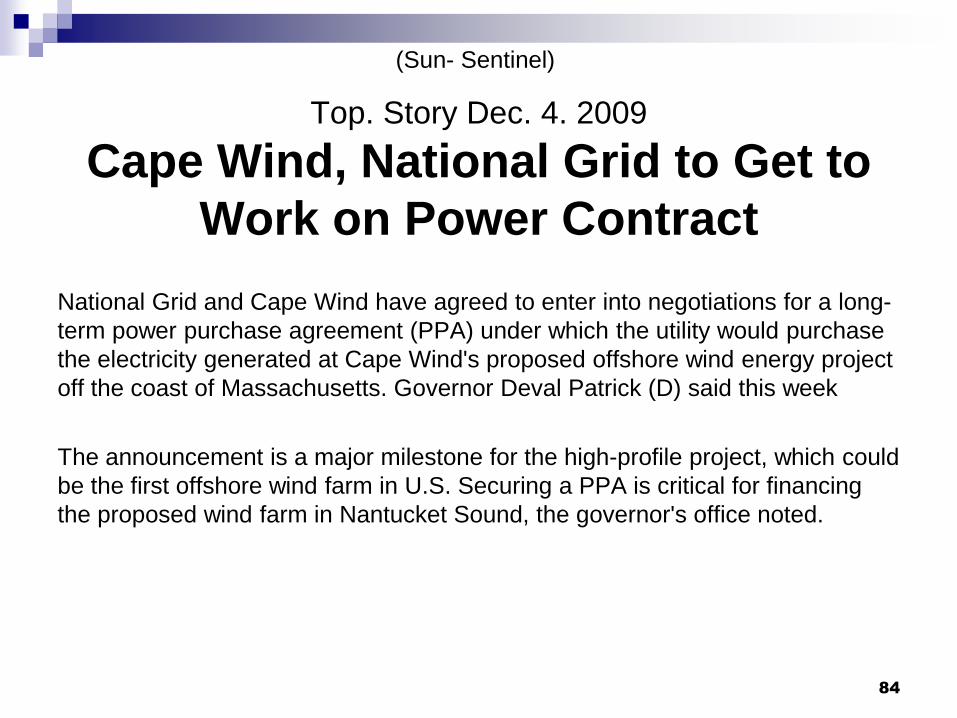
Top. Story Dec. 4. 2009
Cape Wind, National Grid to Get to
Work on Power Contract
National Grid and Cape Wind have agreed to enter into negotiations for a long-
term power purchase agreement (PPA) under which the utility would purchase
the electricity generated at Cape Wind's proposed offshore wind energy project
off the coast of Massachusetts. Governor Deval Patrick (D) said this week
The announcement is a major milestone for the high-profile project, which could
be the first offshore wind farm in U.S. Securing a PPA is critical for financing
the proposed wind farm in Nantucket Sound, the governor's office noted.
84
(Sun- Sentinel)
Wash U in St. Louis conducted basic
research on WT since the mid 70’s to 2001
85

Conclusions
By 2035 or 50, wind energy could supply at least 25 % –
30% of the U.S. electrical needs, a feat already
achieved by Denmark.
A much improved exploitation of offshore sites is a must
to achieve this feat.
Wind Farms on land as well as offshore with large wind
turbines (diameter ≥ 125 m) offer considerable promise.
For those turbines, the current predictive capabilities for
modeling turbulence, wake, turbine-to-turbine
interference and dynamic stall merit significant
improvements.
86
ASME Mechanical Engineering
Vol. 132, No 1 January 2010
Engineering to meet electricity needs is
shaping up as a big job, with plenty of
openings.
By Jack Thornton
87

ASME Mechanical Engineering
Vol. 132, No 1 January 2010 Eye-opening statistics were offered by Jeffrey S. Nelson. Head of
the Energy and Infrastructure Future Group at Sandia National
Laboratories in Albuquerque, N.M.:
World energy demand will double between now and 2030. That’s
only 20 years, half the span of an engineering career.
The amount of clean U.S. energy need by 2050 just to stabilize CO2
is 10 trillion watts. This is about ten times the Department of Energy’s
estimate of today’s total installed U.S. generating capacity.
Achieving these numbers will require a broad mix of energy sources,
including renewable, biofuels, and possibly fusion. Nelson said,
pointing out that all of these will require big, costly, and intensive
engineering and scientific programs.
88
ASME Mechanical Engineering
Vol. 132, No 1 January 2010
Another researcher in the power industry, Gary
Golden, senior project manager at the Electric
Power Research Institute, certainly sees
shortage. “ If you crunch all the numbers, the
power industry has about 10 percent of the
engineers we need,”
Nelson and Golden were keynote speakers at the
2009- July ASME Power Conference.
89
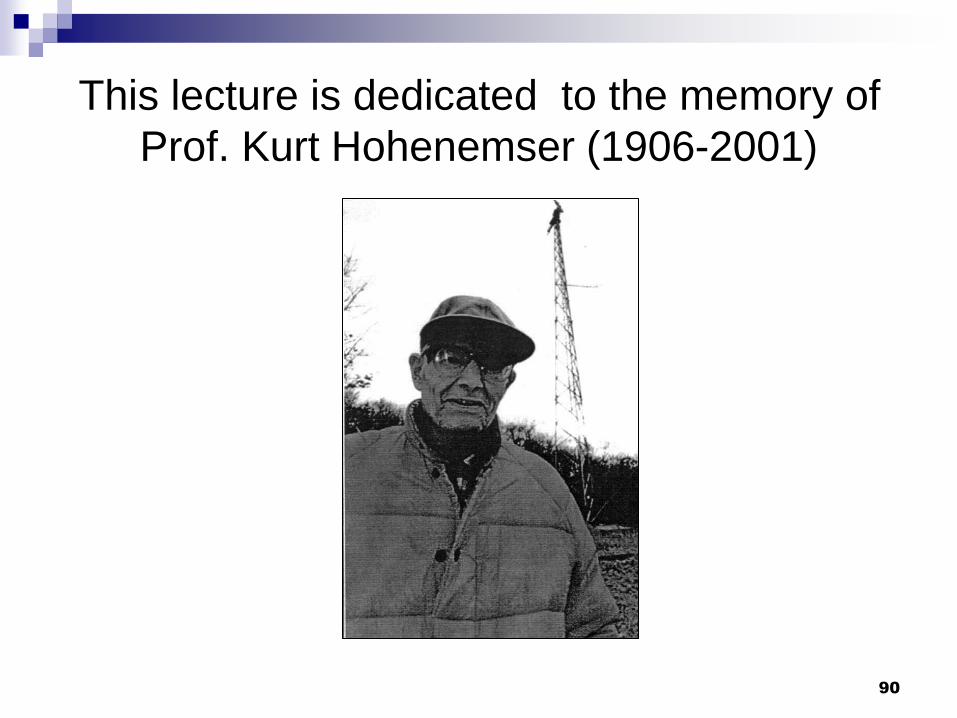
This lecture is dedicated to the memory of
Prof. Kurt Hohenemser (1906-2001)
90
Related Documents