Whole genome duplica0on and plant genome diversity Simon RennyByfield Department of Ecology, Evolu0on and Organismal Biology Iowa State University May 12 th 2014

Welcome message from author
This document is posted to help you gain knowledge. Please leave a comment to let me know what you think about it! Share it to your friends and learn new things together.
Transcript

Whole genome duplica0on and plant genome diversity
Simon Renny-‐Byfield Department of Ecology, Evolu0on and Organismal
Biology Iowa State University
May 12th 2014

Outline
• Brief Introduc0on • The role polyploidy in plant evolu0on • Repe00ve DNA evolu0on in polyploids • Evolu0on of gene duplicates in paleopolyploids • Genome diploidisa0on and frac0ona0on in paleopolyploids
• CoMon fiber transcriptomics and domes0ca0on

Introduc0on
• What is polyploidy (whole genome duplica0on; WGD)?
• More than a diploid set of chromosomes
• Allo vs auto • How to iden0fy polyploids?

Divergence 0me (mya)
Introduc0on
• Chromosome counts • Age es0mates of duplicated genes
• Syntenty analysis
Jiao et al., 2011 Science Schnable et al., 2011 PNAS

• The greatest realiza0on of the plant genomics era?
Introduc0on Stebbins (1950) – 35% Grant (1963,1981) – 47% GoldblaM (1980) – 70-‐80% Lewis (1980) – 70-‐80%
Current view – 100% of seed plants are polyploid

Three brief stories...
① Diversifica0on of polyploid genomes
② Diversifica0on of duplicated genes following ancient WGD.
③ How polyploids become more diploid-‐like again, and again.

1. Diversifica0on of polyploid genomes
• Polyploid genomes are highly dynamic – How do they vary? – Over what 0me scale? – Do different sub-‐genomes behave differently?

N. sylvestris x N. tomentosiformis
2n = 24 2n = 24
N. tabacum
Genome doubling
2n = 48
2650 MB per 1C 2650 MB per 1C
5200 MB per 1C
1. Diversifica0on of polyploid genomes

• Es0mate repeat content of progenitors and allopolyploid
– RepeatExplorer pipeline – Assess divergence of the allopolyploid from the diploids
Novak et al., 2010 BMC Genomics Renny-‐Byfield et al., 2011 MBE
1. Diversifica0on of polyploid genomes
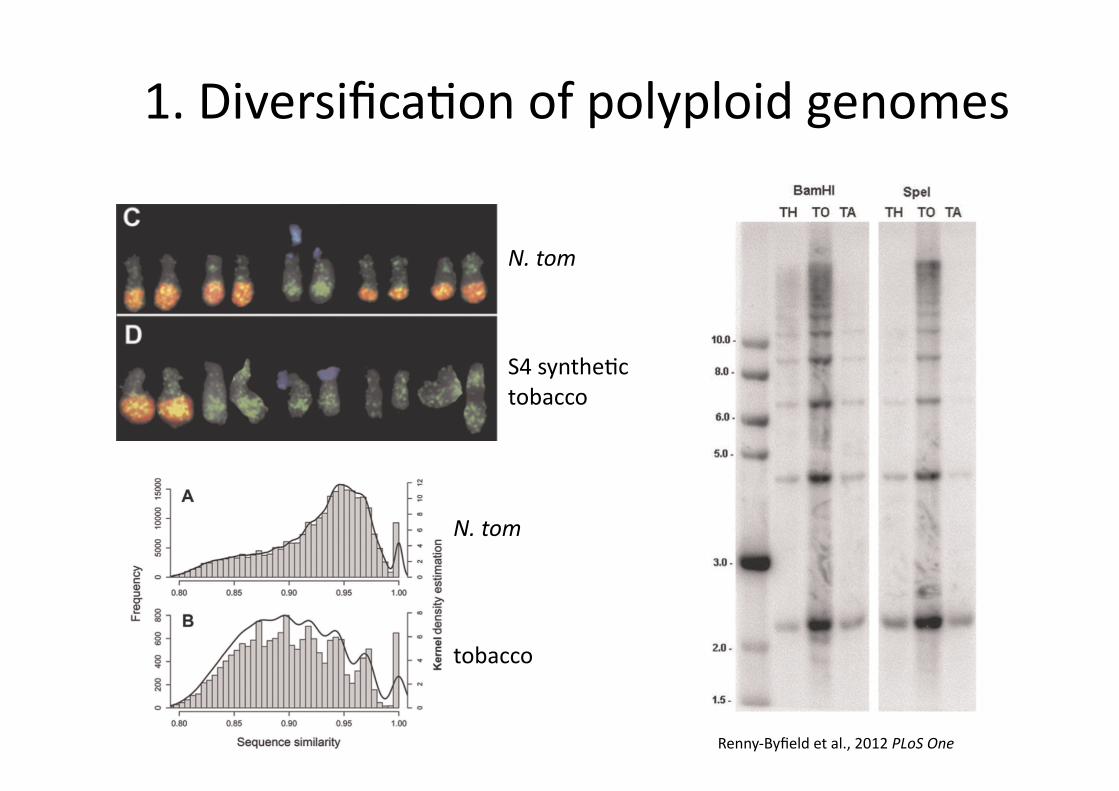
N. tom
S4 synthe0c tobacco
tobacco
N. tom
Renny-‐Byfield et al., 2012 PLoS One
1. Diversifica0on of polyploid genomes

WGDs and genome diversity
The paternal (N. tomentosiformis) genome appears to be underrepresented in tobacco
Renny-‐Byfield et al., 2012 MBE

2. Diversifica0on of duplicated genes following ancient WGD
S. C Harland, 1936

2. Diversifica0on of duplicated genes following ancient WGD
• Neofunc0onaliza0on (Ohno, 1970) • Subfunc0onaliza0on (Force, Lynch and others)
hMp://www.personal.psu.edu/rua15/Stage3.jpg

2. Diversifica0on of duplicated genes following ancient WGD

2. Diversifica0on of duplicated genes following ancient WGD
Dt 64 37 45 37 65 100 100 0 100 64 51 At 36 63 55 63 35 0 0 100 0 36 49
Adams et al., 2003

2. Diversifica0on of duplicated genes following ancient WGD

Renny-‐Byfield et al., 2014 GBE
2. Diversifica0on of duplicated genes following ancient WGD

2. Diversifica0on of duplicated genes following ancient WGD
Almost complete divergence in expression aier ca. 60 my
Renny-‐Byfield et al., 2014 GBE

2. Diversifica0on of duplicated genes following ancient WGD
Gene (G) effect Tissue (T) effect G x T interac0on
Renny-‐Byfield et al., 2014 GBE

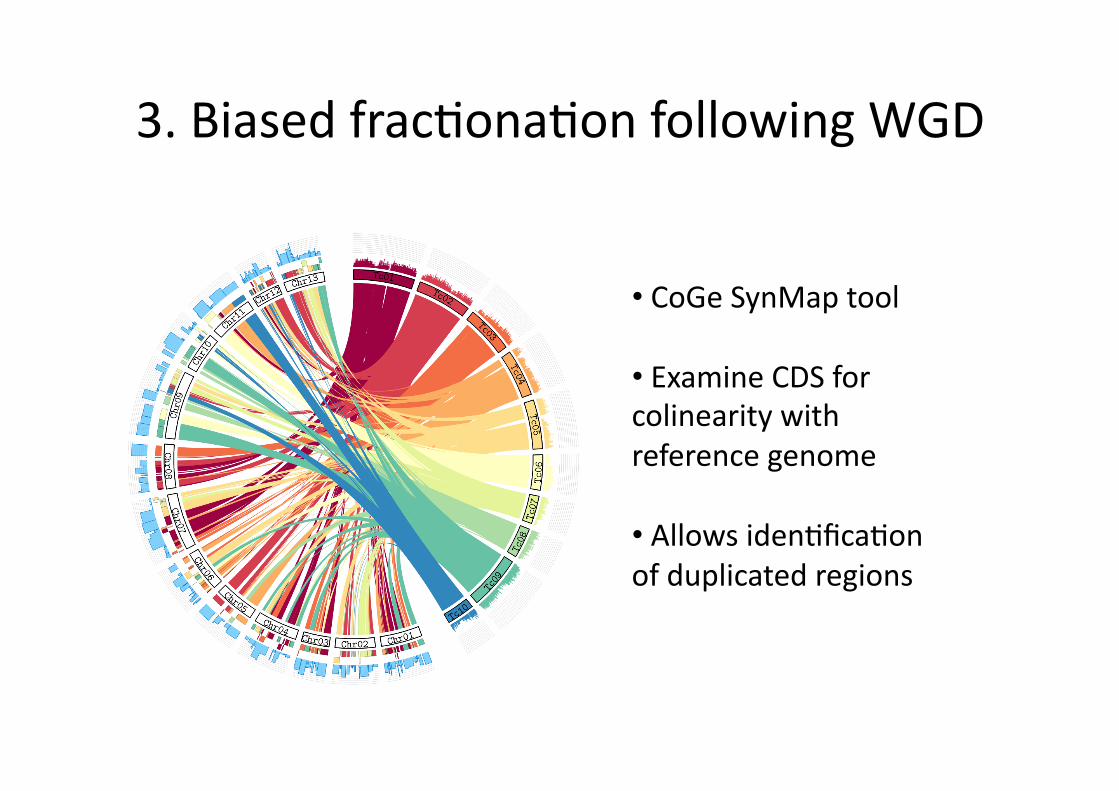
3. Biased frac0ona0on following WGD
• What happens to most genes following WGD..
Woodhouse et al., 2010 PloS Biology
3. Biased frac0ona0on following WGD
• CoGe SynMap tool
• Examine CDS for colinearity with reference genome
• Allows iden0fica0on of duplicated regions

3. Biased frac0ona0on following WGD

3. Biased frac0ona0on following WGD
• Ten chromosome level comparisons
• Significant bias in gene loss in all comparisons T. cacao chromosome
G. raimondii chromosome (block numbers)
observed predicted !2 p value
2 5 (137,138,139) 929 3641 8 (179,184,185) 642 3641
42.8072 6.1x10⁻¹¹
6 6 (149,150) 147 2637 9 (190) 580 2637
226.6415 <1x10-15
6 (149,150) 147 2637 10 (33,34,36) 227 2637
15.5573 8x10⁻⁵
9 (190) 580 2637 10 (33,34,36) 227 2637
133.4951 <1x10-15
7 2 (88,86,89) 420 1873 13 (76,75) 225 1873
49.7891 1.7x10⁻¹²
8 5 (133,132) 236 2040 9 (191) 608 2040
135.7528 <1x10-15
9 4 (113,114,130) 343 3599 9 (188,189) 981 3599
260.1665 <1x10-15
9 (188,189) 981 3599 13 (79,80,81,82) 400 3599
205.1855 <1x10-15
4 (113,114,130) 343 3599 13 (79,80,81,82) 400 3599
5.0709 0.0243
10 9 (195) 397 1873 11 (44) 170 1873
78.3511 <1x10-15
!"#$%#$%&'(%()*+#,)-%.$%*'*+/%0"(%/),1*"%0"#%$2%

3. Biased frac0ona0on following WGD
leaf petal seed
0
200
400
600
coun
t (nu
mbe
r of w
ins)
LFMF
Over expression of genes on LF chromosomes
leaf petal seed
−2.5
0.0
2.5
5.0
7.5
−5 0 5 −5 0 5 −5 0 5log(RPKM MF)
log(
RPK
M L
F)
0.02
0.04
0.06
density

3. Biased frac0ona0on following WGD
0
2
4
6
−1000 −500 0 500 1000distance from transcription start/stop site (bp)
mea
n nu
mbe
r of m
appe
d re
ads Most Frac0onated
Least Frac0onated
24nt siRNAs preferen0ally locate to the MF genome


Current project
• Two independent domes0ca0on events.
• One polyploid and one diploid

• RNAseq at Four development stages: – 5 , 10, 15, and 20 DPA
• Wild and domes0cated lines: – Three in each group
• Polyploid and diploid groups: – Wild A1, domes0cated A1
– Wild AD1, domes0cated AD1
Current project

• Gene expression architecture – How do transcrip0onal networks alter (i.e. similar to Swanson-‐Wagner et al.,2011)
– connec0vity, edge weight, movement of nodes.
– Superimposi0on of graphs to compare networks in wild and domes0cated (Lelandias al., 2006, Bioinforma0cs)
– Are there parallel changes in diploid vs polyploid groups
Current project
hMp://www.georgebassellab.com/wp-‐content/uploads/2012/01/seedNet.jpg

Conclusions
• WGD is ubiquitous in angiosperms
• Polyploid genomes are highly dynamic • Parental sub-‐genomes can behave differently • Gene duplica0on (via WGD) can result in biological novelty
• Processes of genome turnover and frac0ona0on result in diploidiza0on
• Bias frac0ona0on linked to expression and local TE coverage
Related Documents