GLOBAL TUBERCULOSIS REPORT 2016

Welcome message from author
This document is posted to help you gain knowledge. Please leave a comment to let me know what you think about it! Share it to your friends and learn new things together.
Transcript
GLOBAL
TUBERCULO
SIS
REPORT
2016
GLOBALTUBERCULOSIS
REPORT::
2016

WHO Library Cataloguing-in-Publication Data
Global tuberculosis report 2016.
1.Tuberculosis - epidemiology. 2.Tuberculosis, Pulmonary – prevention and control. 3.Tuberculosis – economics. 4.Tuberculosis, Multidrug-Resistant. 5.Annual Reports. I.World Health Organization.
ISBN 978 92 4 156539 4 (NLM classification: WF 300)
© World Health Organization 2016
All rights reserved. Publications of the World Health Organization are available on the WHO website (http://www.who.int) or can be purchased from WHO Press, World Health Organization, 20 Avenue Appia, 1211 Geneva 27, Switzerland (tel.: +41 22 791 3264; fax: +41 22 791 4857; email: [email protected]).
Requests for permission to reproduce or translate WHO publications – whether for sale or for non-commercial distribution – should be addressed to WHO Press through the WHO website (http://www.who.int/about/licensing/copyright_form/index.html).
The designations employed and the presentation of the material in this publication do not imply the expression of any opinion whatsoever on the part of the World Health Organization concerning the legal status of any country, territory, city or area or of its authorities, or concerning the delimitation of its frontiers or boundaries. Dotted and dashed lines on maps represent approximate border lines for which there may not yet be full agreement.
The mention of specific companies or of certain manufacturers’ products does not imply that they are endorsed or recommended by the World Health Organization in preference to others of a similar nature that are not mentioned. Errors and omissions excepted, the names of proprietary products are distinguished by initial capital letters.
All reasonable precautions have been taken by the World Health Organization to verify the information contained in this publication. However, the published material is being distributed without warranty of any kind, either expressed or implied. The responsibility for the interpretation and use of the material lies with the reader. In no event shall the World Health Organization be liable for damages arising from its use.
Designed by minimum graphicsCover designed by Irwin LawPrinted in Switzerland
WHO/HTM/TB/2016.13
GLOBAL TUBERCULOSIS REPORT 2016 :: iii
:: Contents
Abbreviations iv
Acknowledgements v
Executive summary 1
Chapter 1. Introduction 5
Chapter 2. A new era of global TB monitoring 6
Chapter 3. TB disease burden 15
Chapter 4. Diagnosis and treatment: TB, HIV-associated TB and drug-resistant TB 54
Chapter 5. TB prevention services 82
Chapter 6. Universal health coverage, social protection and addressing social determinants: Implications for TB 90
Chapter 7. TB financing 108
Chapter 8. TB research and development 122
Annexes
1. Access to the WHO global TB database 131
2. Country profiles for 30 high TB burden countries 137
3. Regional profiles for 6 WHO regions 171
4. TB burden estimates, notifications and treatment outcomes for individual countries and territories, WHO regions and the world 179
iv :: GLOBAL TUBERCULOSIS REPORT 2016
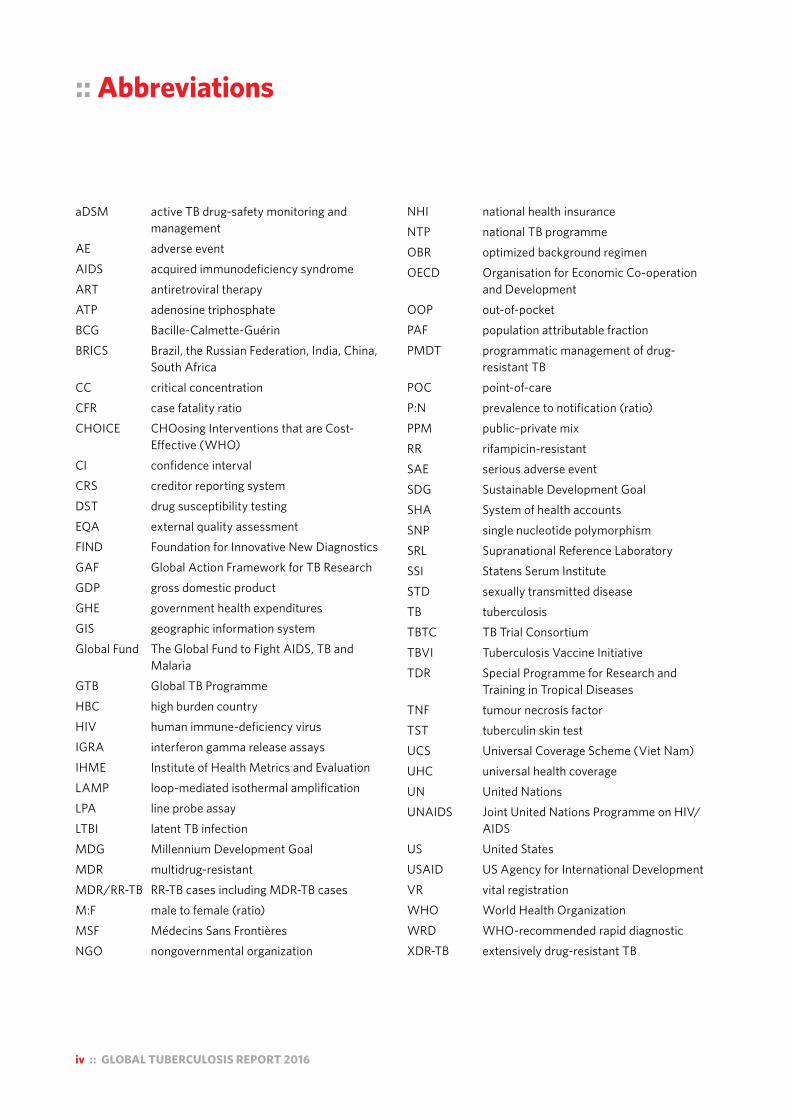
:: Abbreviations
aDSM active TB drug-safety monitoring and management
AE adverse eventAIDS acquired immunodeficiency syndrome ART antiretroviral therapy ATP adenosine triphosphateBCG Bacille-Calmette-GuérinBRICS Brazil, the Russian Federation, India, China,
South AfricaCC critical concentrationCFR case fatality ratioCHOICE CHOosing Interventions that are Cost-
Effective (WHO)CI confidence intervalCRS creditor reporting systemDST drug susceptibility testingEQA external quality assessmentFIND Foundation for Innovative New Diagnostics GAF Global Action Framework for TB Research GDP gross domestic productGHE government health expendituresGIS geographic information systemGlobal Fund The Global Fund to Fight AIDS, TB and
Malaria GTB Global TB ProgrammeHBC high burden countryHIV human immune-deficiency virusIGRA interferon gamma release assaysIHME Institute of Health Metrics and EvaluationLAMP loop-mediated isothermal amplificationLPA line probe assayLTBI latent TB infectionMDG Millennium Development GoalMDR multidrug-resistant MDR/RR-TB RR-TB cases including MDR-TB casesM:F male to female (ratio)MSF Médecins Sans FrontièresNGO nongovernmental organization
NHI national health insuranceNTP national TB programmeOBR optimized background regimenOECD Organisation for Economic Co-operation
and DevelopmentOOP out-of-pocketPAF population attributable fractionPMDT programmatic management of drug-
resistant TBPOC point-of-careP:N prevalence to notification (ratio)PPM public–private mixRR rifampicin-resistant SAE serious adverse eventSDG Sustainable Development GoalSHA System of health accountsSNP single nucleotide polymorphismSRL Supranational Reference LaboratorySSI Statens Serum InstituteSTD sexually transmitted diseaseTB tuberculosisTBTC TB Trial ConsortiumTBVI Tuberculosis Vaccine InitiativeTDR Special Programme for Research and
Training in Tropical DiseasesTNF tumour necrosis factorTST tuberculin skin testUCS Universal Coverage Scheme (Viet Nam)UHC universal health coverageUN United NationsUNAIDS Joint United Nations Programme on HIV/
AIDSUS United StatesUSAID US Agency for International DevelopmentVR vital registrationWHO World Health OrganizationWRD WHO-recommended rapid diagnosticXDR-TB extensively drug-resistant TB

GLOBAL TUBERCULOSIS REPORT 2016 :: v
:: Acknowledgements
This global TB report was produced by a core team of 18 people: Laura Anderson, Hannah Monica Dias, Dennis Fal-zon, Katherine Floyd, Inés Garcia Baena, Christopher Gilpin, Philippe Glaziou, Yohhei Hamada, Avinash Kanchar, Irwin Law, Christian Lienhardt, Andrew Siroka, Charalambos Sis-manidis, Lana Syed, Hazim Timimi, Wayne van Gemert, Diana Weil and Matteo Zignol. The team was led by Kath-erine Floyd. Overall guidance was provided by the Director of the WHO Global TB Programme, Mario Raviglione.
The data collection forms (long and short versions) were developed by Philippe Glaziou and Hazim Timimi, with in-put from staff throughout the WHO Global TB Programme. Hazim Timimi led and organized all aspects of data man-agement. The review and follow-up of data was done by a team of reviewers that included Anna Dean, Hannah Monica Dias, Dennis Falzon, Inés García Baena, Medea Gegia, Yohhei Hamada, Avinash Kanchar, Andrea Pantoja, Linh Nguyen, Andrew Siroka, Lana Syed, Hazim Timimi, Mukund Uplekar, Wayne van Gemert and Matteo Zignol.
Data for the European Region were collected and vali-dated jointly by the WHO Regional Office for Europe and the European Centre for Disease Prevention and Control (ECDC); we thank in particular Encarna Gimenez, Vahur Hollo and Csaba Ködmön from ECDC for providing vali-dated data files and Andrei Dadu from the WHO Regional Office for Europe for his substantial contribution to follow-up and validation of data for all European countries. Victo-ria Bendaud, Josephine Dy and Taavi Erkkola from UNAIDS managed the process of data collection from national AIDS programmes and provided access to their TB/HIV dataset. Review and validation of TB/HIV data was undertaken in collaboration with Victoria Bendaud from UNAIDS, along with UNAIDS regional and country strategic information advisers.
Many people contributed to the analyses, preparation of figures and tables, and writing required for the main chapters of the report. Chapter 1 (Introduction) and Chap-ter 2 (A new era of global TB monitoring) were prepared by Katherine Floyd. Chapter 3 (TB disease burden) was prepared by Katherine Floyd, Philippe Glaziou, Irwin Law, Charalambos Sismanidis and Matteo Zignol, with contribu-tions from Laura Anderson, Anna Dean, Peter Dodd and Helen Jenkins. The writing of Chapter 4 (Diagnosis and treatment of TB, HIV-associated TB and drug-resistant TB) was led by Dennis Falzon and Wayne van Gemert and the preparation of figures and tables was led by Hazim Timimi; other chapter contributors included Hannah Monica Dias, Katherine Floyd, Yohhei Hamada, Avinash Kanchar, Knut Lönnroth, Lana Syed and Mukund Uplekar. Chapter 5 (TB
prevention services) was prepared by Yohhei Hamada, Avi-nash Kanchar and Haileyesus Getahun, with contributions from Katherine Floyd and Philippe Glaziou. The production of Chapter 6 (Universal health coverage, social protection and social determinants) was led by Diana Weil, with con-tributions from Amy Collins, Jahnavi Curlin, Inés Garcia Baena, Cornelia Hennig, Knut Lönnroth, Andrew Siroka, Szabolcs Szigeti, Mukund Uplekar and Martin van den Boom. Chapter 7 (TB financing) was prepared by Kather-ine Floyd, Inés Garcia Baena and Andrew Siroka. Chapter 8 (TB research and development) was prepared by Christian Lienhardt (new TB drugs and new TB vaccines) and Chris-topher Gilpin (new TB diagnostics), with input from Kath-erine Floyd, Nebiat Gebreselassie and Karin Weyer. Irwin Law coordinated the finalization of figures and tables for all chapters and subsequent review of proofs, was the fo-cal point for communications with the graphic designer and designed the report cover.
The report team is grateful to various internal and exter-nal reviewers for their useful comments and suggestions on advanced drafts of the main chapters of the report. Par-ticular thanks are due to Cherise Scott and Mel Spigelman (new TB drugs) and Jonathan Daniels (new TB vaccines) for their reviews of and input to Chapter 8.
Annex 1, which explains how to use the online global TB database, was written by Hazim Timimi. The country profiles that appear in Annex 2, the regional profiles that appear in Annex 3 and the detailed tables showing data for key indicators for all countries in the latest year for which information is available (Annex 4) were also prepared by Hazim Timimi. The online technical appendix that explains the methods used to estimate the burden of disease caused by TB was prepared by Philippe Glaziou, Charalambos Sis-manidis and Matteo Zignol. We thank Colin Mathers and Daniel Hogan of the WHO Mortality and Burden of Disease team for their careful review.
We thank Valérie Robert in the Global TB Programme’s monitoring and evaluation unit for impeccable administra-tive support, Doris Ma Fat from the WHO Mortality and Burden of Disease team for providing TB mortality data extracted from the WHO Mortality Database, and Juliana Daher and Mary Mahy (UNAIDS) for providing epidemio-logical data that were used to estimate HIV-associated TB mortality.
The entire report was edited by Hilary Cadman, who we thank for her excellent work. We also thank, as usual, Sue Hobbs for her excellent work on the design and layout of this report. Her contribution, as always, was very highly ap-preciated.

vi :: GLOBAL TUBERCULOSIS REPORT 2016
The principal source of financial support for WHO’s work on global TB monitoring and evaluation is the United States Agency for International Development (USAID), without which it would be impossible to produce the Global Tuberculosis Report. Production of the report was also sup-ported by the governments of Japan and the Republic of Korea. We acknowledge with gratitude their support.
In addition to the core report team and those mentioned above, the report benefited from the input of many staff working in WHO regional and country offices and hun-dreds of people working for national TB programmes or within national surveillance systems who contributed to the reporting of data and to the review of report material
prior to publication. These people are listed below, organ-ized by WHO region. We thank them all for their invaluable contribution and collaboration, without which this report could not have been produced.
Among the WHO staff not already mentioned above, we thank in particular Samiha Baghdadi, Hendrik Bekedam, Mirtha Del Granado, Khurshid Alam Hyder, Daniel Kibuga, Rafael López Olarte, André Ndongosieme, Nobu Nishikiori, Martiani Oktavis, Kefas Samson, Karam Shah, Achuthan Nair Sreenivas, Anna Volz, Lungten Wangchuk and Henri-ette Wembanyama for their major contribution to data col-lection and validation, and review and clearance of report material by countries in advance of publication.
WHO staff in Regional and Country OfficesWHO African RegionBoubacar Abdel Aziz, Abdoulaye Mariama Baïssa, Esther Aceng-Dokotum, Harura Adamu, Samuel Hermas Andrianarisoa, Javier Aramburu, Augusto Da Cruz Claudina, Ayodele Awe, Nayé Bah, Marie Catherine Barouan, Babou Bazie, Siriman Camara, Malang Coly, Davi Kokou Mawule, Eva De Carvalho, Noel Djemadji, Sithembile Dlamini-Nqeketo, Ismael Hassen Endris, Louisa Ganda, Boingotlo Gasennelwe, Carolina Cardoso da Silva Gomes, Patrick Hazangwe, Cornelia Hennig, Télesphore Houansou, Jean Iragena, Moses Jeuronlon, Michael Jose, Joel Kangangi, Kassa Hailu, Nzuzi Katondi, Khelifi Houria, Daniel Kibuga, Hillary Kipruto, Aristide Désiré Komangoya Nzonzo, Katherine Lao, Sharmila Lareef-Jah, Mwendaweli Maboshe, Leonard Mbemba, Mbumba Ngimbi Richard, Julie Mugabekazi, Christine Musanhu, Ahmada NassuriI, Andre Ndongosieme, Denise Nkezimana, Wilfred Nkhoma, Nicolas Nkiere, Abel Nkolo, Ghislaine Nkone Asseko, Ishmael Nyasulu, Samuel Ogiri, Daniel Olusoti, Amos Omoniyi, Hermann Ongouo, Philip Onyebujoh, Chijioke Osakwe, Felicia Owusu-Antwi, Philip Patrobas, Kalpesh Rahevar, Richard Oleko Rehan, Kefas Samson, Babatunde Sanni, Simkoko Neema Gideon, Susan Zimba-Tembo, Traore Tieble, Desta Tiruneh, Hubert Wang, Henriette Wembanyama, Addisalem Yilma, Assefash Zehaie.
WHO Region of the AmericasJean Seme Fils Alexandre, Monica Alonso Gonzalez, Angel Manuel Alvarez, Miguel Angel Aragón, Denise Arakaki, Pedro Avedillo, Carlos Ayala, Eldonna Boisson, Gustavo Bretas, Margarette Bury, David Chavarri, Beatriz Cohenca, Mirtha Del Granado, Thais dos Santos, Marcos Espinal, Ingrid García, Yitades Gebre, Massimo Ghidinelli, Guillermo Gonzalvez, Percy Halkyer, Franklin Hernandez, Kathryn Vogel Johnston, Sandra Jones, Francisco Leon Bravo, Rafael Lopez Olarte, Fabio Moherdaui, Roberto Montoya, Romeo Montoya, Alina Perez, Enrique Perez, Soledad Pérez, Giovanni Ravasi, Katia Romero, Jean Marie Rwangabwoba, Hans Salas, Alba Lidia Sánchez, Alfonso Tenorio, Jorge Victoria, Marcelo Vila, Anna Volz.
WHO Eastern Mediterranean RegionMohamed Abdel Aziz, Rehab Abdelhai, Ali Akbar, Samiha Baghdadi, Mai Eltigany Mohammed, Qutbuddin Kakar, Ali Reza Aloudel, Sindani Ireneaus Sebit, Sayed Karam Shah, Bashir Suleiman, Rahim Taghizadeh.
WHO European RegionAndrei Dadu, Masoud Dara, Jamshid Gadoev, Saliya Karymbaeva, Valiantsin Rusovich, Bogdana Shcherbak-Verlan, Szabolcs Szigeti, Gazmend Zhuri.
WHO South-East Asia RegionMohammad Akhtar, Vikarunnesa Begum, Hendrik Bekedam, Maria Regina Christian, Anupama Hazarika, Md Khurshid Alam Hyder, Navaratnasingam Janakan, Setiawan Jati Laksono, Partha Pratim Mandal, Giampaolo Mezzabotta, O Hyang Song, Martiani Oktavia, Ikushi Onozaki, Pant Sushil Dev, Malik Parmar, Ranjani Ramachandran, Mukta Sharma, Achuthan Nair Sreenivas, Dadang Supriyadi, Ugyen Wangchuk, Keshav Yogi.
WHO Western Pacific RegionShalala Ahmadova, Lepaitai Hansell, Cornelia Hennig, Tom Hiatt, Tauhid Islam, Narantuya Jadambaa, Ridha Jebeniani, Nobuyuki Nishikiori, Katsunori Osuga, Khanh Pham, Fabio Scano, Jacques Sebert, Yanni Sun, Mathida Thongseng, Subhash Yadav, Rajendra-Prasad Yadav.

GLOBAL TUBERCULOSIS REPORT 2016 :: vii
National respondents who contributed to reporting and verification of data WHO African RegionAbderramane Abdelrahim, Jean Louis Abena Foe, Felix Kwami Afutu, Gabriel Akang, Arlindo Amaral, Anagonou Séverin, Rado Andrianasolo, Aw Boubacar, Martha Awet, Georges Bakaswa Ntambwe, Ballé Boubakar, Adama Marie Bangoura, Jorge Noel Barreto, Wilfried Bekou, Serge Bisuta Fueza, Frank Adae Bonsu, Chiaa Khattry, Evangelista Chisakaitwa, Catherine Thomas Cooper, Abdoul Karim Coulibaly, Coulibaly Adjobi Fatou Tiépé, Isaias Dambe, Abdoulaye Diallo, Awa Helene Diop, Marie Sarr Diouf, Sicelo Samuel Dlamini, Themba Dlamini, Antoine De Padoue Etoundi Evouna, Alfred Etwom, Juan Eyene Acuresila, Lelisa Fekadu, Lynda Foray, Gilberto Frota, Evariste Gasana, Rahwa Tekle Gebreyesus, Abu George, Ntahizaniye Gérard, Belaineh Girma, Boukoulmé Hainga, Georges Hermana, Hainikoye Aoua Hima Oumarou, Adama Jallow, Lou Joseph, Madou Kane, Kanyerere Henry Shardreck, Nathan Kapata, Clara Chola Kasapo, James Katta, Dedeh Kesselly, Botshelo Tebogo Kgwaadira, Sidney Kololo, Aristide Désiré Komangoya-Nzonzo, Bakary Konaté, Patrick Konwloh, Kouakou Jacquemin, Kuye Oluwatoyin Joseph, Joseph Lasu, Gertrude Lay Ofali, Llang Maama, Mahoumbou Jocelyn, Lerole David Mametja, Ivan Manhica, Tseliso Marata, Josue Martins, Masini Enos, Sanele Masuku, Farai Mavhunga, Amanuel Hadgu Mebrahtu, Agnès Pascaline Mezene, Patrick Migambi, Louine Morel, Isidore Moyenga, Mpunga James Upile, Frank Mugabe Rwabinumi, Clifford Munyandi, Beatrice Mutayoba, Lindiwe Mvusi, Fulgence Ndayikengurukiye, Euphrasie Ndihokubwayo, Thaddée Ndikumana, Jacques Ndion-Ngandziens, Norbert Ndjeka, Faith Ngari, Lourenço Nhocuana, Emmanuel Nkiligi, Okemba-OkombiI Franck Hardain, Seydou Mohamed Ouedraogo, Oumar Abdelhadi, Emile Rakotondramananana, Martin Rakotonjanahary, Thato Raleting, Adulai Gomes Rodrigues, Rujeedawa Mohammed Fezul, Samey Agbenyegan, Hamadi Samia, Charles Sandy, Kebba D Sanneh, Tandaogo Saouadogo, Siziba Nicholas, Alihalassa Sofiane, Addisalem Tefera, Celstino Francisco Teixeira, Albertina Thomas, Thusoyaone Titi Tsholofelo, Eric Ismaël Zoungrana.
WHO Region of the AmericasRosmond Adams, Sarita Aguirre García, Shalauddin Ahmed, Valentina Antonieta Alarcon Guizado, Xochil Alemán de Cruz, Mirian Alvarez, Aisha Andrewin, A. Alister Antoine, Denise Arakaki, Christopher Archibald, Carlos Alberto Marcos Ayala Luna, Patricia Bartholomay, Beltrame Soledad, Maria Bermudez, Martín Castellanos Joya, Jorge Castillo Carbajal, Cedeño Ugalde Annabell, Gemma Chery, Karolyn April Chong Castillo, Eric Commiesie, Mariela Contrera, Yaren Cruz, Carlos Vital Cruz Lesage, Ofelia Cuevas, Clara De la Cruz, Nilda De Romero, Dy-Juan DeRoza, Mercedes España Cedeño, Fernandez Hugo, Cecilia Ruth Figueroa Benites, Greta Franco, Victor Gallant, Julio Garay Ramos, Margarita Godoy, Roscio Gomez, Angela Graham, Tanya Green Douglas, Dorothea Hazel, Maria Henry, Tania Herrera, Olga T Joglar, Diana Khan, Adam Langer, Athelene Linton, Cecilia Lyons de Arango, Andrea Y Maldonado Saavedra, Marvin Manzanero, Belkys Marcelino, Antonio Marrero Figueroa, Ma. de Lourdes Martínez O, Timothy McLaughlin-Munroe, Angelica Medina, Mary Mercedes, Leilawati Mohammed, Jeetendra Mohanlall, Ernesto Moreno Naranjo, Francis Morey, Willy Morose, Denis Danny Mosqueira Salas, Slivia Yolanda Nazar, Alice Neymour, Cheryl Peek-Ball, Tomasa Portillo, Irad Potter, Robert Pratt, Manohar Singh Rajamanickam, Norma Lucrecia Ramirez Sagastume, Dottin Ramoutar, Anna Esther Reyes Godoy, Paul Ricketts, Andres Rincon, Ferosa Roache, Maria Rodriguez, Adalberto Rodriguez, Marcela Rojas Diaz, Myrian Román, Arelisabel Ruiz Guido, Hilda María Salazar Bolaños, Maritza Samayoa Peláez, Karla María Sánchez Mendoza, Nestor Segovia, Silva Tapia Guido Jonnathan, Joan Simon, Nicola Skyers, Natalia Sosa, Diana Sotto, Stijnberg Deborah, Suarez Alvarez Lourdes, Jackurlyn Sutton, Melissa Valdez, Daniel Vázquez, Ana María Vinueza, Dorothea Bergen Weichselberger, Iyanna Wellington, Samuel Williams, Oritta Zachariah.
WHO Eastern Mediterranean RegionTarig Abdalla Abdallrahim, Mohammad Abouzeid, Sonia Abu Loz, Nadia Abu Sabrah, Khawaja Laeeq Ahmad, Ahmadi Shahnaz, Al Hamdan Khlood, Mohamed Redha Al Lawati, Al Saidi Fatmah, Badar Alabri, Raafat Al-Hakeem, Abdulbari Al-Hammadi, Nada Almarzouqi, Esam Al-Saberi, Reem Alsaifi, Layth Al-Salihi, Kifah Alshaqeldi, Fatma Alyaquobi, Samer Amin, Wagdy Amin, Nagi Awad, Bahnasy Samir, Salah Ben Mansour, Molka Bouain, Sawsen Boussetta, Walid Daoud, Rachid Fourati, Mohamed Furjani, Amal Galal, Dhikrayet Gamara, Assia Haissama Mohamed, Hawa Hassan Guessod, Salma Haudi, Basharat Khan, Sayed Daoud Mahmoodi, Nasehi Mahshid, Piro Yassir, Ejaz Qadeer, Mohammad Khalid Seddiq, Sghiar Mohammed, Mohemmed Tabena, Yaacoub Hiam.
WHO European RegionNatavan Alikhanova, Salihdjan Alimov, Ekkehardt Altpeter, Sarah Anderson, Delphine Antoine, Trude Margrete Arnesen, Andrei Astrovko, Zaza Avaliani, Velimir Bereš, Yana Bestrashnova, Snježana Brčkalo, Bonita Brodhun, Rikke Bruun de Neergaard, Rosa Cano Portero, Daniel Chemtob, Domnica Ioana Chiotan, Ana Ciobanu, Nico Cioran, Thierry Comolet, Radmila Curcic, Stefania D’Amato, Edita Davidaviciene, Hayk Davtyan, Patrick De Smet, Gerard de Vries, Raquel Duarte, Mladen Duronjić, Lanfranco Fattorini, Lena Fiebig, Lyalya Gabbasova, Viktor Gasimov, Majlinda Gjocaj, Biljana Grbavčević, Gennady Gurevich, Jean Paul Guthmann, Walter Haas, Armen Hayrapetyan, Peter Helbling, Biljana Ilievska-Poposka,
viii :: GLOBAL TUBERCULOSIS REPORT 2016
Zhumagali Ismailov, Sarah Jackson, Andraz Jakelj, Jerker Jonsson, Erhan Kabasakal, Olim Kabirov, Kadyrov Abdullaat, Dzmitry Klimuk, Maria Korzeniewska-Koseła, Mitja Kosnik, Maeve Lalor, Yana Levin, Jean Lorenzi, Stevan Lucic, Maliukova Ekaterina, Kamal Mansinho, Francesco Maraglino, Liliia Masiuk, Donika Mema, Violeta Mihailovic-Vucinic, Vladimir Milanov, Alvard Mirzoyan, Ucha Nanava, Natalia Nizova, Zdenka Novakova, Joan O’Donnell, Analita Pace Asciak, Clara Palma Jordana, Nargiza Parpieva, Sabine Pfeiffer, Georgeta Gilda Popescu, Asliddin Radzabov, Jérôme Robert, Karin Rønning, Kazimierz Roszkowski-Śliż, Gérard Scheiden, Firuza Sharipova, Cathrine Slorbak, Erika Slump, Hanna Soini, Ivan Solovic, Petra Svetina Sorli, Sergey Sterlikov, Shahnoza Usmonova, Tonka Varleva, Piret Viiklepp, Jiri Wallenfels, Maryse Wanlin, Pierre Weicherding, Brita Askeland Winje, Aysegul Yildirim, Maja Zakoska, Hasan Žutić.
WHO South-East Asia RegionAminath Aroosha, Si Thu Aung, Ratna Bhattarai, Endang Budi Hastuti, Choe Tong Chol, Tshering Dorji, Devesh Gupta, Md. Quamrul Islam, Suksont Jittimanee, Sirinapha Jittimanee, Pusparaj Joshi, Ahmadul Hasan Khan, Bikash Lamichhane, Constantino Lopes, Md. Mojibur Rahman, Chawetsan Namwat, Nirupa Pallewatte, Kirankumar Rade, Chewang Rinzin, Priyadharshini Samarasinghe, SKM Sulistyo, Asik Surya, Phurpa Tenzin, Janaka Thilakaratne, Md. Ashraf Uddin, Dhammika Vidanagama, Htet Myet Win Maung.
WHO Western Pacific RegionMohd Rotpi Abdullah, Paul Aia, Kazunari Asanuma, Zirwatul Adilah Aziz, Rafidah Baharudin, Christina Bareja, Mohamed Naim bin Abdul Kadir, Uranchimeg Borgil, Sarah Brown, Bukbuk Risa, Jocelyn Cabarles, Kwok-chiu Chang, Phonenaly Chittamany, Chou Kuok Hei, Nese Ituaso Conway, Alice M. Cuenca, Jane Dowabobo, Mayleen Jack Ekiek, Jenny Eveni, Fanai Saen, Florence Flament, Ludovic Floury, Fonua Louise, Anna Marie Celina Garfin, Donna Mae Gaviola, Glynn-Robinson Anna, James Hofschneider, Daniel Houillon, Noel Itogo, Kang Hae-Young, Seiya Kato, Khin Mar Kyi Win, François Laudon, Chi-chiu Leung, Leo Lim, Liza Lopez, Henri-Pierre Mallet, Alice D. Manalo, Mao Tan Eang, Andrea McNeill, Mei Jian, Serafi Moa, Grizelda V. L. Mokoia, Nguyen Binh Hoa, Nguyen Viet Nhung, Nou Chanly, Connie Olikong, Josephine O’Mallan, Park Ok, Penitani Sosaia, Saia S. Penitani, Yanjindulam Purevsuren, Marcelina Rabauliman, Asmah Razali, Bereka Reiher, Bernard Rouchon, Fetaui Saelua, Salaamo, Lameka Sale, Temilo Seono, Hidekazu Shimada, Grant Storey, Phannasinh Sylavanh, Neti Tamarua, Edwina Tangaroa, Kyaw Thu, Tieng Sivanna, Alfred Tonganibeia, Kazuhiro Uchimura, Frank Underwood, Yee Tang Wang, Wang Lixia, Justin Wong, Du Xin, Laure Yen Kai Sun, Zhang Hui.

Global actions and investments fall far short of those needed to end the global TB epidemic.
GLOBAL TUBERCULOSIS REPORT 2016 :: 1
:: Executive Summary
BackgroundThe Sustainable Development Goals (SDGs) for 2030 were adopted by the United Nations in 2015. One of the targets is to end the global TB epidemic. The WHO End TB Strat-egy, approved by the World Health Assembly in 2014, calls for a 90% reduction in TB deaths and an 80% reduction in the TB incidence rate by 2030, compared with 2015.
This global TB report is the first to be produced in the era of the SDGs and the End TB Strategy. It provides an assessment of the TB epidemic and progress in TB diagnosis, treatment and prevention efforts, as well as an overview of TB-specific financing and research. It also discusses the broader agenda of universal health coverage, social protection and other SDGs that have an impact on health. Data were available for 202 countries and territories that account for over 99% of the world’s population and TB cases.
Main findings and messagesStatus of the TB epidemic and MDR-TB crisisThe TB epidemic is larger than previously estimated, reflecting new surveillance and survey data from India. However, the number of TB deaths and the TB incidence rate continue to fall globally and in India.
In 2015, there were an estimated 10.4 million new (in-cident) TB cases worldwide, of which 5.9 million (56%) were among men, 3.5 million (34%) among women and 1.0 million (10%) among children. People living with HIV accounted for 1.2 million (11%) of all new TB cases.
Six countries accounted for 60% of the new cases: India, Indonesia, China, Nigeria, Pakistan and South Africa.1 Glob-al progress depends on major advances in TB prevention and care in these countries. Worldwide, the rate of decline in TB incidence remained at only 1.5% from 2014 to 2015. This needs to accelerate to a 4–5% annual decline by 2020 to reach the first milestones of the End TB Strategy.
In 2015, there were an estimated 480 000 new cases of multidrug-resistant TB (MDR-TB) and an additional 100 000 people with rifampicin-resistant TB (RR-TB) who were also newly eligible for MDR-TB treatment.2 India, China and the Russian Federation accounted for 45% of the combined total of 580 000 cases.
There were an estimated 1.4 million TB deaths in 2015, and an additional 0.4 million deaths resulting from TB disease among people living with HIV.3 Although the number of TB deaths fell by 22% between 2000 and 2015, TB remained one of the top 10 causes of death worldwide in 2015.
TB care and prevention resultsTB treatment averted 49 million deaths globally between 2000 and 2015, but important diagnostic and treatment gaps persist.
In 2015, 6.1 million new TB cases were notified to national authorities and reported to WHO. Notified TB cases increased from 2013–2015, mostly due to a 34% increase in notifications in India. However, globally there was a 4.3 million gap4 between incident and notified cases, with India, Indonesia and Nigeria accounting for almost half of this gap.5
The crisis of MDR-TB detection and treatment con-tinues. In 2015, of the estimated 580 000 people newly eligible for MDR-TB treatment, only 125 000 (20%) were enrolled. Five countries accounted for more than 60% of the gap: India, China, the Russian Federation, Indonesia and Nigeria.5 Globally, the MDR-TB treatment success rate was 52% in 2013.6
In 2015, 55% of notified TB patients had a documented HIV test result. The proportion of HIV-positive TB patients on antiretroviral therapy (ART) was 78%.
Access to TB preventive treatment needs to be expand-ed. A total of 910 000 people living with HIV were started on such treatment in 2015, as well as 87 000 children under five (7% of those eligible).
TB financing, universal health coverage, social protection and social determinantsUS$ 6.6 billion was available for TB care and prevention in low and middle-income countries in 2016, of which 84% was from domestic sources. Nonetheless, national TB programmes (NTPs) in low-income countries continue to rely on international donors for almost 90% of their financing. Investments in low and middle-income countries fall almost US$ 2 billion short of the US$ 8.3 billion needed in 2016. This annual gap will widen to US$ 6 billion in 2020 if current funding levels do not increase.
Improvements are also needed in overall health financing. Government expenditures on health in 2014 were less than the WHO benchmark of at least 6% of gross domestic product (GDP) in 150 countries. Out-of-pocket expenditures exceeded 45% of total health expenditures in 46 countries, including 11 of the 30 high TB burden countries.
TB research and development Despite some progress in the pipeline for new diagnostics, drugs and regimens, and vaccines, TB research and devel-opment remains severely underfunded.

2 :: GLOBAL TUBERCULOSIS REPORT 2016
Additional highlights from the reportA new era of global TB monitoringThe End TB Strategy has three high-level indicators: the TB incidence rate, the absolute number of TB deaths and the percentage of TB patients and their households that expe-rience catastrophic costs as a result of TB disease. Targets for these indicators have been set for 2030 and 2035, with accompanying milestones for 2020 and 2025.
The 2020 milestones of the End TB Strategy are a 35% reduction in the absolute number of TB deaths and a 20% reduction in the TB incidence rate, compared with levels in 2015; and that no TB-affected households face catastrophic costs.
WHO has defined three lists of high burden countries for the period 2016–2020, for TB, TB/HIV and MDR-TB. Each list includes 30 countries.
TB disease burden Upward revisions to estimates of the burden of TB disease in India for the period 2000–2015 follow accumulating evi-dence that previous estimates were too low. This evidence includes household surveys, a state-wide TB prevalence survey, studies of anti-TB drug sales in the private sector, notification data and new analysis of mortality data. Since India accounts for more than one quarter of the world’s TB cases and deaths, these revisions have had a major impact on global estimates. Estimates for India are considered in-terim, pending a national TB prevalence survey scheduled for 2017/2018.
The proportion of TB cases living with HIV was highest in the WHO African Region (31%), and exceeded 50% in parts of southern Africa.
In addition to accelerating the annual decline in TB inci-dence, reaching the 2020 milestone for a 35% reduction in TB deaths requires reducing the global proportion of peo-ple with TB who die from the disease (the case fatality ratio or CFR) from 17% in 2015 to 10% by 2020.
The CFR in 2015 varied from under 5% in a few countries to more than 20% in most countries in the WHO African Region. This shows considerable inequalities among coun-tries in access to TB diagnosis and treatment that need to be addressed. If everyone with TB had a timely diagnosis and high-quality treatment, the CFR would be low in all countries.
National notification and vital registration systems (with standard coding of causes of death) of high coverage and quality are needed in all countries. In the interim, national TB prevalence surveys will continue to provide the best method for directly measuring the burden of TB disease and identifying actions required to reduce that burden in an important subset of countries. In recent years, there has been enormous progress in implementing such surveys, with 22 completed between 2009 and August 2016.
Diagnosis and treatment: TB, HIV-associated TB and drug-resistant TBThe global male:female (M:F) ratio for notifications was 1.7, varying from 1.0 in Pakistan to 3.1 in Viet Nam among the 30 high TB burden countries. Results from national TB prevalence surveys of adults show higher M:F ratios, indi-cating that notification data understate the share of the TB burden accounted for by men in some countries. Globally, children (aged <15 years) accounted for 6.3% of the new cases that were notified in 2015.
In 2015, 30% of the 3.4 million new bacteriologically confirmed and previously treated TB cases notified glob-ally were reported to have had drug susceptibility testing for rifampicin, with coverage of 24% for new TB patients and 53% for previously treated TB patients.
The only WHO-recommended rapid diagnostic test for detection of TB and rifampicin resistance currently avail-able is the Xpert MTB/RIF® assay. Of the 48 countries in at least one of the three new lists of high burden countries, 15 had adopted national algorithms positioning Xpert MTB/RIF as the initial diagnostic test for all people with signs and symptoms of pulmonary TB by the end of 2015. These countries accounted for 10% of the estimated global num-ber of incident TB cases in 2015.
In 2015, the gap of 4.3 million between notifications of new cases and the estimated number of incident cases4 reflects a mixture of underreporting of detected TB cases (especially in countries with large private sectors) and underdiagnosis (especially in countries where there are major geographic or financial barriers to accessing care). Ten countries accounted for 77% of the total estimated gap: India, Indonesia, Nigeria, Pakistan, South Africa, Bangladesh, the Democratic Republic of the Congo, China, the United Republic of Tanzania and Mozambique.5
In the African Region where the burden of HIV-associated TB is highest, 81% of notified TB patients had a documented HIV test result. The proportion of known HIV-positive TB patients on ART was above 90% in India, Kenya, Malawi, Mozambique, Namibia and Swaziland.
The latest treatment outcome data show a treatment success rate of 83% for TB (2014 cohort), 52% for MDR-TB (2013 cohort) and 28% for extensively drug-resistant TB (XDR-TB; 2013 cohort).
At least 23 countries in Africa and Asia have introduced shorter regimens for treatment of MDR-TB or RR-TB. These have achieved high treatment success rates (87–90%) under operational research conditions. A standardised regimen of 9–12 months is recommended by WHO for all patients (excluding pregnant women) with pulmonary MDR/RR-TB that is not resistant to second-line drugs.
As part of efforts to improve outcomes for MDR/XDR-TB, at least 70 countries had started using bedaquiline and 39 countries had introduced delamanid by the end of 2015.

GLOBAL TUBERCULOSIS REPORT 2016 :: 3
TB prevention servicesSouth Africa accounted for the largest share (45%) of peo-ple living with HIV who received TB preventive treatment for latent TB infection (LTBI) in 2015, followed by Malawi, Mozambique and Kenya. Ten countries reported data for the first time, including Kenya. Despite this progress, 21 of the 30 high TB/HIV burden countries did not report data.
The ratio of the TB notification rate among health-care workers to the TB notification rate in the general adult population is a good indicator of the impact of TB infection control in health facilities. In 16 countries, the number of TB cases per 100 000 health-care workers was more than double the notification rate in the general adult population in 2015.
BCG vaccination should be provided as part of national childhood immunization programmes according to a coun-try’s TB epidemiology. In 2015, 163 countries reported providing BCG vaccination as a standard part of these programmes; 102 reported coverage of above 90%.
Universal health coverage, social protection and addressing social determinants: Implications for TBIn some high TB burden settings, emerging health financing schemes, including national health insurance, could lead to major reductions in out-of-pocket expenditures in low-income populations. Thailand and a range of countries in the Region of the Americas are good pathfinding examples.
Building on established approaches to private engage-ment in TB care could help to address the burgeoning private sector in health-care delivery, especially in Asia. This includes a combination of provider incentives and reg-ulation, and application of innovative institutional interme-diaries and communications technologies. Such levers can help to assure the quality of services provided.
Social protection can be advanced through better models of care and social benefits. Many low- and middle-income countries have financed social and economic support for TB patients, but these support packages need to be better documented and evaluated. For overall impact and sustainability, using national social protection platforms is a priority.
WHO-recommended baseline national surveys are underway to assess the nature and severity of TB patient costs, and to improve service delivery and social protection accordingly. One country survey was conducted in 2015, eight began in 2016 and ten are planned for 2017–2018.
The available evidence about links between ending TB and ending poverty needs to be used to advocate for pov-erty elimination and action on related risk factors, such as noncommunicable disease prevention, food security, and housing.
TB financingThe BRICS countries (Brazil, the Russian Federation, India, China and South Africa), which collectively account for about 50% of the world’s TB cases, rely mostly or exclu-sively (the exception is India) on domestic funding.
In other countries with a high TB burden, international donor funding dominates, accounting for 75% of reported funding for NTPs in the group of 25 high TB burden coun-tries outside BRICS, 87% of funding in low-income coun-tries and 60% of funding in lower middle-income countries. The single largest source of international donor funding is the Global Fund to Fight AIDS, Tuberculosis and Malaria.
International donor funding for TB falls far short of donor contributions for HIV and malaria. The latest data from the Organisation for Economic Co-operation and Development (OECD) creditor reporting system show totals of US$ 5.4 billion for HIV/AIDS, US$ 1.7 billion for malaria and US$ 0.7 billion for TB in 2014.
The cost per patient treated is usually in the range of US$ 100–1000 for drug-susceptible TB and US$ 2000–20 000 for MDR-TB.
TB research and developmentAt least US$ 2 billion per year is needed for TB research and development. Funding during the decade 2005–2014 never exceeded US$ 0.7 billion per year.
In 2016, four diagnostic tests were reviewed and recom-mended by WHO: the loop-mediated isothermal ampli-fication test for TB (known as TB-LAMP), two line probe assays (LPAs) for the detection of resistance to the first-line anti-TB drugs isoniazid and rifampicin, and an LPA for the detection of resistance to second-line anti-TB drugs. A next-generation cartridge called Xpert Ultra and a new diagnostic platform called GeneXpert Omni are in devel-opment; assessment of both by WHO is expected in 2017.
There are nine drugs in advanced phases of clinical trials for the treatment of drug-susceptible TB, drug-resistant TB or LTBI. These are bedaquiline, delamanid, linezolid, PBTZ169, pretomanid, Q203, rifampicin (high-dose), rifapen tine and sutezolid.
There are 13 vaccine candidates in clinical trials, includ-ing candidates for prevention of TB infection and candi-dates for prevention of TB disease in people with LTBI.
1 Countries are listed in descending order of their number of cases. 2 MDR-TB is defined as resistance to rifampicin and isoniazid. WHO
recommends that all patients with rifampicin-resistant TB (RR-TB) are treated with a second-line MDR-TB regimen. Cases of MDR-TB and RR-TB are collectively referred to as MDR/RR-TB in this report.
3 When an HIV-positive person dies from TB disease, the underlying cause is classified as HIV in the International Classification of Diseases system (ICD-10).
4 i.e. 10.4 million minus 6.1 million. 5 Countries are listed in descending order of the size of their gap.6 This is the latest year for which treatment outcome data are currently
available.
4 :: GLOBAL TUBERCULOSIS REPORT 2016
:: Box 1.1 Basic facts about TB
TB is an infectious disease caused by the bacillus Mycobacterium tuberculosis. It typically affects the lungs (pulmonary TB) but can also affect other sites (extrapulmonary TB). The disease is spread when people who are sick with pulmonary TB expel bacteria into the air, for example by coughing. Overall, a relatively small proportion (5–15%) of the estimated 2–3 billion people infected with M. tuberculosis will develop TB disease during their lifetime. However, the probability of developing TB disease is much higher among people infected with HIV.
Diagnostic tests for TB disease include:
! sputum smear microscopy. This was developed more than 100 years ago. Sputum samples are examined under a microscope to see if bacteria are present. In the current case definitions recommended by WHO, one positive result is required for a diagnosis of smear-positive pulmonary TB;
! rapid molecular tests. The only rapid test for diagnosis of TB currently recommended by WHO is the Xpert® MTB/RIF assay (Cepheid, Sunnyvale USA). It was initially recommended (in 2010) for diagnosis of pulmonary TB in adults. Since 2013, it has also been recommended for children and specific forms of extrapulmonary TB. The test has much better accuracy than microscopy; and
! culture methods. These are the current reference standard but require more developed laboratory capacity and can take up to 12 weeks to provide results.
Globally, use of rapid molecular tests is increasing, and many countries are phasing out use of smear microscopy for diagnostic purposes (although microscopy and culture remain necessary for treatment monitoring). Despite advances in diagnostics, a considerable proportion of the TB cases reported to WHO are still clinically diagnosed rather than bacteriologically confirmed. In 2015, for example, 57% of the pulmonary cases reported to WHO were bacteriologically confirmed.
There are also tests for TB that is resistant to first and second-line anti-TB drugs. They include Xpert MTB/RIF, which simultaneously tests for TB and resistance to rifampicin (the most effective first-line anti-TB drug); rapid line probe assays (LPAs) that test for resistance to rifampicin and isoniazid (referred to as first-line LPAs); a rapid LPA that tests for resistance to fluoroquinolones and injectable anti-TB drugs (referred to as a second-line LPA); and sequencing technologies. First-line LPAs were first recommended by
WHO in 2008; the second-line LPA was first recommended in May 2016. Culture-based methods currently remain the reference standard for drug susceptibility testing.
Without treatment, the death rate from TB is high. Studies of the natural history of TB disease in the absence of treatment with anti-TB drugs (that were conducted before drug treatments became available) found that about 70% of people with sputum smear-positive pulmonary TB died within 10 years, as did about 20% of people with culture-positive (but smear-negative) pulmonary TB.a
Effective drug treatments were first developed in the 1940s. The currently recommended treatment for new cases of drug-susceptible TB is a 6-month regimen of four first-line drugs: isoniazid, rifampicin, ethambutol and pyrazinamide. The Global TB Drug Facility supplies a complete 6-month course for about US$ 40 per person. Treatment success rates of at least 85% for new cases of drug-susceptible TB are regularly reported to WHO by its 194 Member States. Treatment for rifampicin-resistant TB (RR-TB) and multidrug-resistant TB (MDR-TB)b is longer, and requires more expensive and more toxic drugs. Until early 2016, the treatment regimens recommended by WHO typically lasted for 20 months, and cost about US$ 2000–5000 per person. As a result of new evidence from several countries, WHO issued updated guidance in May 2016. A standardised shorter MDR-TB regimen of 9–12 months is now recommended for all patients (excluding pregnant women) with pulmonary MDR/RR-TB that is not resistant to second-line drugs. The cost of a shortened drug regimen is about US$ 1000 per person.
New TB drugs have begun to emerge from the pipeline, and combination regimens that include new compounds are being tested in clinical trials. The Bacille-Calmette-Guérin (BCG) vaccine, which was developed almost 100 years ago and has been shown to prevent severe forms of TB in children, is widely used. However, there is currently no vaccine that is effective in preventing TB disease in adults, either before or after exposure to TB infection. There are 13 TB vaccines in Phase I, Phase II or Phase III trials.
a Tiemersma EW, van der Werf MJ, Borgdorff MW, Williams BG, Nagelkerke NJ. Natural history of tuberculosis: duration and fatality of untreated pulmonary tuberculosis in HIV negative patients: a systematic review. PLoS One. 2011;6(4):e17601 (http://www.ncbi.nlm.nih.gov/pubmed/21483732, accessed 27 July 2016).
b Defined as resistance to isoniazid and rifampicin, the two most powerful anti-TB drugs.
GLOBAL TUBERCULOSIS REPORT 2016 :: 5
Chapter 1 :: Introduction
Tuberculosis (TB) has existed for millennia and remains a major global health problem. It causes ill-health in mil-lions of people each year and in 2015 was one of the top 10 causes of death worldwide, ranking above HIV/AIDS as one of the leading causes of death from an infectious disease.1 This is despite the fact that with a timely diagnosis and cor-rect treatment, most people who develop TB disease can be cured. Basic facts about TB are summarized in Box 1.1.
The best estimate is that there were 1.4 million TB deaths in 2015, and an additional 0.4 million deaths resulting from TB disease among HIV-positive people.2 In terms of cases, the best estimates for 2015 are that there were 10.4 million new TB cases (including 1.2 million among HIV-positive people), of which 5.9 million were among men, 3.5 mil-lion among women and 1.0 million among children. Over-all, 90% of cases were adults and 10% children, and the male:female ratio was 1.6:1.
WHO has published a global TB report every year since 1997. The main aim of the report is to provide a comprehen-sive and up-to-date assessment of the TB epidemic, and of progress in prevention, diagnosis and treatment of the disease at global, regional and country levels. This is done in the context of recommended global TB strategies and targets endorsed by WHO’s Member States and broader development goals set by the United Nations (UN).
As usual, the 2016 global TB report is based primarily on data gathered from countries and territories. WHO has im-plemented annual rounds of global TB data collection since 1996, with an online system3 used since 2009. In 2016, this system was opened for reporting at the end of March. Following the May deadline for reporting and subsequent review and follow-up of submitted data between June and August, data were available for 202 countries and territo-ries that account for more than 99% of the world’s popula-tion and estimated TB cases; this included 183 of WHO’s 194 Member States.
Other sources of data used in 2016 include the HIV de-partment in WHO and the Joint United Nations Programme on HIV/AIDS (UNAIDS), which collect information about the provision of TB preventive treatment to people living
1 In 2015, there were an estimated 1.1 million deaths due to HIV, including 0.4 million deaths from TB among HIV-positive people (see unaids.org).
2 When an HIV-positive person dies from TB disease, the underlying cause is classified as HIV in the international classification of diseases system.
3 https://extranet.who.int/tme
with HIV and about antiretroviral therapy for HIV-positive TB patients; the creditor reporting system of the Organisa-tion for Economic Co-operation and Development (OECD); the World Bank, for development indicators; and the WHO national health accounts database.
This is the first global TB report to be produced in the post-2015 era of the Sustainable Development Goals (SDGs) and the End TB Strategy, which have superseded the Millennium Development Goals (2000–2015) and the Stop TB Strategy (2006–2015), respectively. The SDGs were adopted by the UN in September 2015 and cover the period 2016–2030. The End TB Strategy spans a 20-year timeframe (2016–2035) and was unanimously endorsed by WHO’s Member States at the 2014 World Health As-sembly. The SDGs and the End TB Strategy share a com-mon aim: to end the global TB epidemic. Targets set in the End TB Strategy include a 90% reduction in TB deaths and an 80% reduction in TB incidence by 2030, compared with 2015.
In this new context, the structure and content of the global TB report have been reshaped. Chapter 2 provides an overview of the SDGs, the End TB Strategy and new lists of high burden countries (for TB, TB/HIV and drug-resist-ant TB) that will be given particular attention in the period 2016–2020. The remaining six chapters of the report cover TB disease burden; diagnosis and treatment of TB, HIV-as-sociated TB and drug-resistant TB; TB prevention services; universal health coverage, social protection and social de-terminants from the TB perspective; TB financing; and TB research and development.
The report also has four annexes. Annex 1 explains how to access the online WHO global TB database and provides further details about the 2016 round of global TB data col-lection. Annex 2 contains country profiles for the 30 high TB burden countries (profiles for other countries are avail-able online4) and Annex 3 contains profiles for WHO’s six regions. Annex 4 provides data tables that give details of key indicators for the most recent year for which data or estimates are available, for all countries.
4 www.who.int/tb/data
6 :: GLOBAL TUBERCULOSIS REPORT 2016
Chapter 2 :: A new era of global TB monitoring
From 2000 to 2015, global and national efforts to reduce the burden of tuberculosis (TB) disease were focused on achieving targets set within the context of the Millennium Development Goals (MDGs). The MDGs were established by the United Nations (UN) in 2000 and targets were set for 2015. Target 6c of MDG6 was to “halt and reverse” TB incidence. The Stop TB Partnership, established in 2001, adopted this target and set two additional targets: that TB prevalence and TB mortality rates should be halved by 2015 compared with their levels in 1990. The global TB strategy developed by WHO for the decade 2006–2015, the Stop TB Strategy, had the overall goal of reaching all three targets.
WHO published its assessment of whether the 2015 global TB targets for reductions in TB incidence, preva-lence and mortality were achieved in October 2015.1 The assessment indicated that the MDG target was achieved on a worldwide basis, in each of WHO’s six regions and in 16 of the 22 countries that were classified by WHO as high TB burden countries during the period 2002–2015. Glob-ally, the TB mortality rate fell by 47% between 1990 and 2015, with most of that improvement occurring after 2000. The target of a 50% reduction was met in four WHO re-gions – the Region of the Americas, the Eastern Mediterra-nean Region, the South-East Asia Region and the Western Pacific Region – and in 11 high TB burden countries. Glob-ally, TB prevalence fell by 42% between 1990 and 2015. The target of a 50% reduction was achieved in three WHO regions – the Region of the Americas, the South-East Asia Region and the Western Pacific Region – and in nine high TB burden countries.
The MDGs (2000–2015) have now been superseded by the Sustainable Development Goals (SDGs), which have an end date of 2030. Similarly, WHO’s Stop TB Strategy has been replaced by the End TB Strategy, which covers the period 2016–2035. With the Global tuberculosis report 2016 being the first such report in the post-2015 era, this chapter provides an overview of both the SDGs (Section 2.1) and the End TB Strategy (Section 2.2), including the indicators that will be used to monitor progress. For the first 5 years of this new era (2016–2020), WHO has also defined updated lists of high burden countries (HBCs) for TB, TB/HIV and multidrug-resistant TB (MDR-TB). The updated lists are presented and explained in Section 2.3.
1 World Health Organization. Global tuberculosis report 2015. Geneva: WHO; 2015 (http://apps.who.int/iris/bitstream/10665/191102/1/9789241565059_eng.pdf, accessed 27 July 2016).
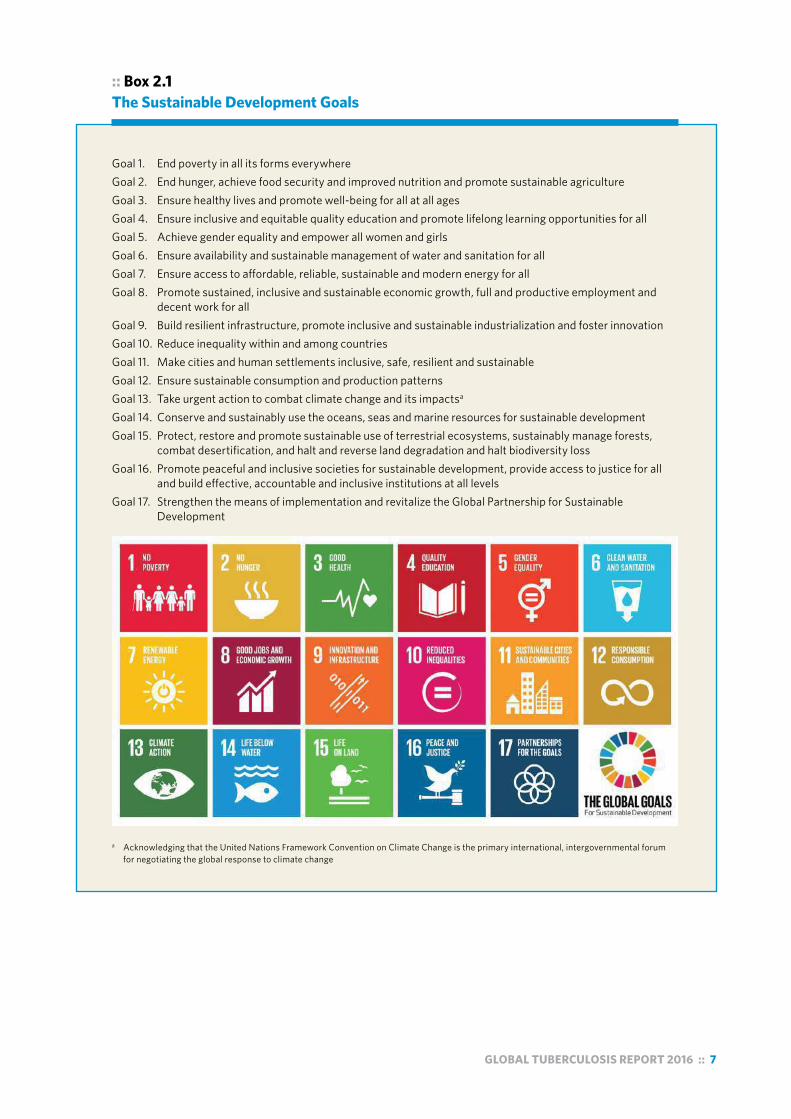
2.1 The Sustainable Development GoalsThe SDGs were adopted by all UN Member States in Sep-tember 2015, at the UN General Assembly.2 The 17 goals are shown in Box 2.1. Departures from the MDGs include a broader agenda (17 goals compared with the previous eight), one consolidated goal on health compared with three health-related MDGs, and a desire for universal rel-evance rather than a focus on issues mostly of concern to developing countries.
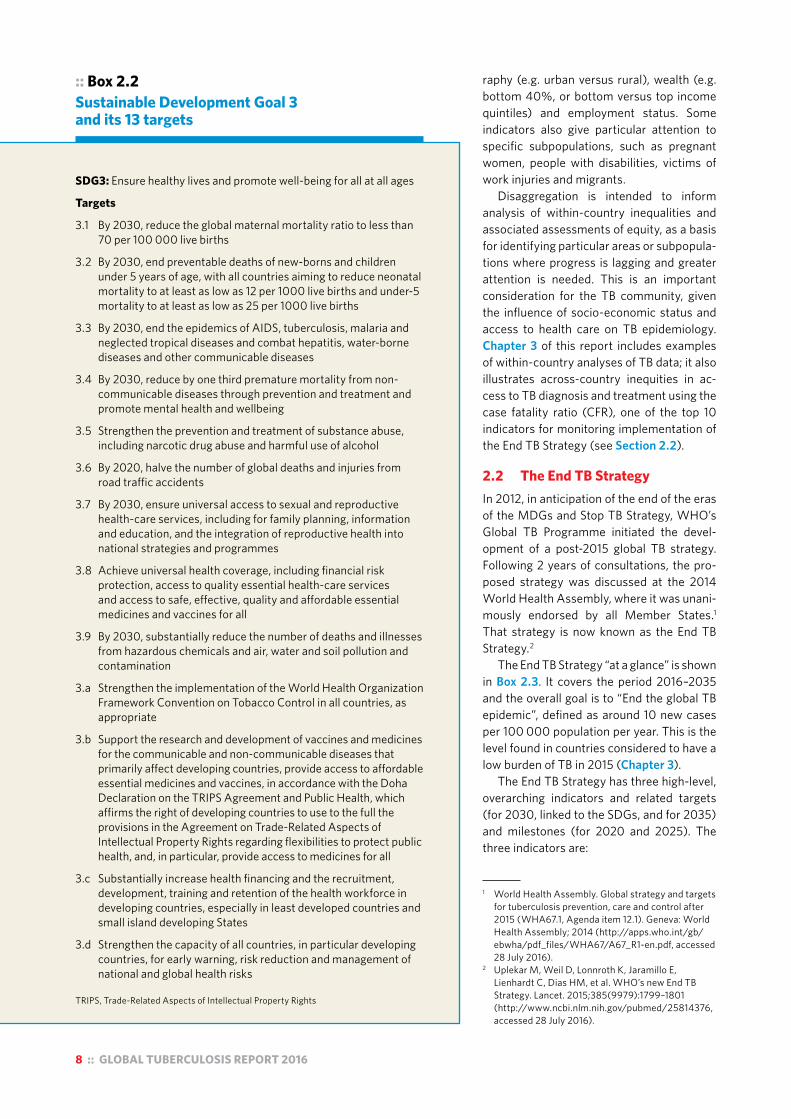
SDG3 is to “Ensure healthy lives and promote well-being for all at all ages”, and it includes 13 targets (Box 2.2). One of these targets, Target 3.3, explicitly mentions TB: “By 2030, end the epidemics of AIDS, tuberculosis, malaria and neglected tropical diseases, and combat hepatitis, water-borne diseases and other communicable diseases”. The language of “ending epidemics” is also now a prominent element of global health strategies developed by WHO and the Joint United Nations Programme on HIV/AIDS (UN-AIDS) for the post-2015 era,3 including the End TB Strategy (Section 2.2). Such language is much more ambitious than the MDG language of “halting and reversing” epidemics (or “stopping” them, as in the Stop TB Strategy). The TB indica-tor for Target 3.3 is TB incidence per 100 000 population.
SDG3 also includes a target (Target 3.8) related to uni-versal health coverage (UHC). The WHO/World Bank def-inition of UHC is that all people receive the health services they need, while at the same time ensuring that the use of these services does not expose the user to financial hard-ship.4 Indicators for Target 3.8 include coverage of tracer interventions for prevention and treatment (including TB treatment coverage),5 and financial coverage provided by health insurance or a public health system.
Across the SDG indicator framework as a whole, the definitions of many indicators include much greater em-phasis on within-country disaggregation compared with the MDGs. This includes disaggregation by age, sex, geog-
2 United Nations. Sustainable Development Goals (https://sustainabledevelopment.un.org/topics/sustainabledevelopmentgoals, accessed 27 July 2016).
3 World Health Organization. Accelerating progress on HIV, tuberculosis, malaria, hepatitis and neglected tropical diseases: A new agenda for 2016–2030. Geneva: WHO; 2015 (http://www.who.int/about/structure/organigram/htm/progress-hiv-tb-malaria-ntd/en/, accessed 27 July 2016).
4 World Health Organization/World Bank Group. Tracking universal health coverage: first global monitoring report. Geneva: WHO; 2015 (http://apps.who.int/iris/bitstream/10665/174536/1/9789241564977_eng.pdf?ua=1, accessed 28 July 2016).
5 There are many different prevention and treatment interventions. In this context, a few interventions are selected to act as tracers for progress towards UHC for all interventions.
GLOBAL TUBERCULOSIS REPORT 2016 :: 7
:: Box 2.1 The Sustainable Development Goals
Goal 1. End poverty in all its forms everywhereGoal 2. End hunger, achieve food security and improved nutrition and promote sustainable agricultureGoal 3. Ensure healthy lives and promote well-being for all at all agesGoal 4. Ensure inclusive and equitable quality education and promote lifelong learning opportunities for allGoal 5. Achieve gender equality and empower all women and girlsGoal 6. Ensure availability and sustainable management of water and sanitation for allGoal 7. Ensure access to affordable, reliable, sustainable and modern energy for allGoal 8. Promote sustained, inclusive and sustainable economic growth, full and productive employment and
decent work for allGoal 9. Build resilient infrastructure, promote inclusive and sustainable industrialization and foster innovationGoal 10. Reduce inequality within and among countriesGoal 11. Make cities and human settlements inclusive, safe, resilient and sustainableGoal 12. Ensure sustainable consumption and production patternsGoal 13. Take urgent action to combat climate change and its impactsa
Goal 14. Conserve and sustainably use the oceans, seas and marine resources for sustainable developmentGoal 15. Protect, restore and promote sustainable use of terrestrial ecosystems, sustainably manage forests,
combat desertification, and halt and reverse land degradation and halt biodiversity lossGoal 16. Promote peaceful and inclusive societies for sustainable development, provide access to justice for all
and build effective, accountable and inclusive institutions at all levelsGoal 17. Strengthen the means of implementation and revitalize the Global Partnership for Sustainable
Development
a Acknowledging that the United Nations Framework Convention on Climate Change is the primary international, intergovernmental forum for negotiating the global response to climate change
8 :: GLOBAL TUBERCULOSIS REPORT 2016
:: Box 2.2 Sustainable Development Goal 3 and its 13 targets
SDG3: Ensure healthy lives and promote well-being for all at all ages
Targets
3.1 By 2030, reduce the global maternal mortality ratio to less than 70 per 100 000 live births
3.2 By 2030, end preventable deaths of new-borns and children under 5 years of age, with all countries aiming to reduce neonatal mortality to at least as low as 12 per 1000 live births and under-5 mortality to at least as low as 25 per 1000 live births
3.3 By 2030, end the epidemics of AIDS, tuberculosis, malaria and neglected tropical diseases and combat hepatitis, water-borne diseases and other communicable diseases
3.4 By 2030, reduce by one third premature mortality from non-communicable diseases through prevention and treatment and promote mental health and wellbeing
3.5 Strengthen the prevention and treatment of substance abuse, including narcotic drug abuse and harmful use of alcohol
3.6 By 2020, halve the number of global deaths and injuries from road traffic accidents
3.7 By 2030, ensure universal access to sexual and reproductive health-care services, including for family planning, information and education, and the integration of reproductive health into national strategies and programmes
3.8 Achieve universal health coverage, including financial risk protection, access to quality essential health-care services and access to safe, effective, quality and affordable essential medicines and vaccines for all
3.9 By 2030, substantially reduce the number of deaths and illnesses from hazardous chemicals and air, water and soil pollution and contamination
3.a Strengthen the implementation of the World Health Organization Framework Convention on Tobacco Control in all countries, as appropriate
3.b Support the research and development of vaccines and medicines for the communicable and non-communicable diseases that primarily affect developing countries, provide access to affordable essential medicines and vaccines, in accordance with the Doha Declaration on the TRIPS Agreement and Public Health, which affirms the right of developing countries to use to the full the provisions in the Agreement on Trade-Related Aspects of Intellectual Property Rights regarding flexibilities to protect public health, and, in particular, provide access to medicines for all
3.c Substantially increase health financing and the recruitment, development, training and retention of the health workforce in developing countries, especially in least developed countries and small island developing States
3.d Strengthen the capacity of all countries, in particular developing countries, for early warning, risk reduction and management of national and global health risks
TRIPS, Trade-Related Aspects of Intellectual Property Rights
raphy (e.g. urban versus rural), wealth (e.g. bottom 40%, or bottom versus top income quintiles) and employment status. Some indicators also give particular attention to specific subpopulations, such as pregnant women, people with disabilities, victims of work injuries and migrants.
Disaggregation is intended to inform analysis of within-country inequalities and associated assessments of equity, as a basis for identifying particular areas or subpopula-tions where progress is lagging and greater attention is needed. This is an important consideration for the TB community, given the influence of socio-economic status and access to health care on TB epidemiology. Chapter 3 of this report includes examples of within-country analyses of TB data; it also illustrates across-country inequities in ac-cess to TB diagnosis and treatment using the case fatality ratio (CFR), one of the top 10 indicators for monitoring implementation of the End TB Strategy (see Section 2.2).
2.2 The End TB StrategyIn 2012, in anticipation of the end of the eras of the MDGs and Stop TB Strategy, WHO’s Global TB Programme initiated the devel-opment of a post-2015 global TB strategy. Following 2 years of consultations, the pro-posed strategy was discussed at the 2014 World Health Assembly, where it was unani-mously endorsed by all Member States.1 That strategy is now known as the End TB Strategy.2
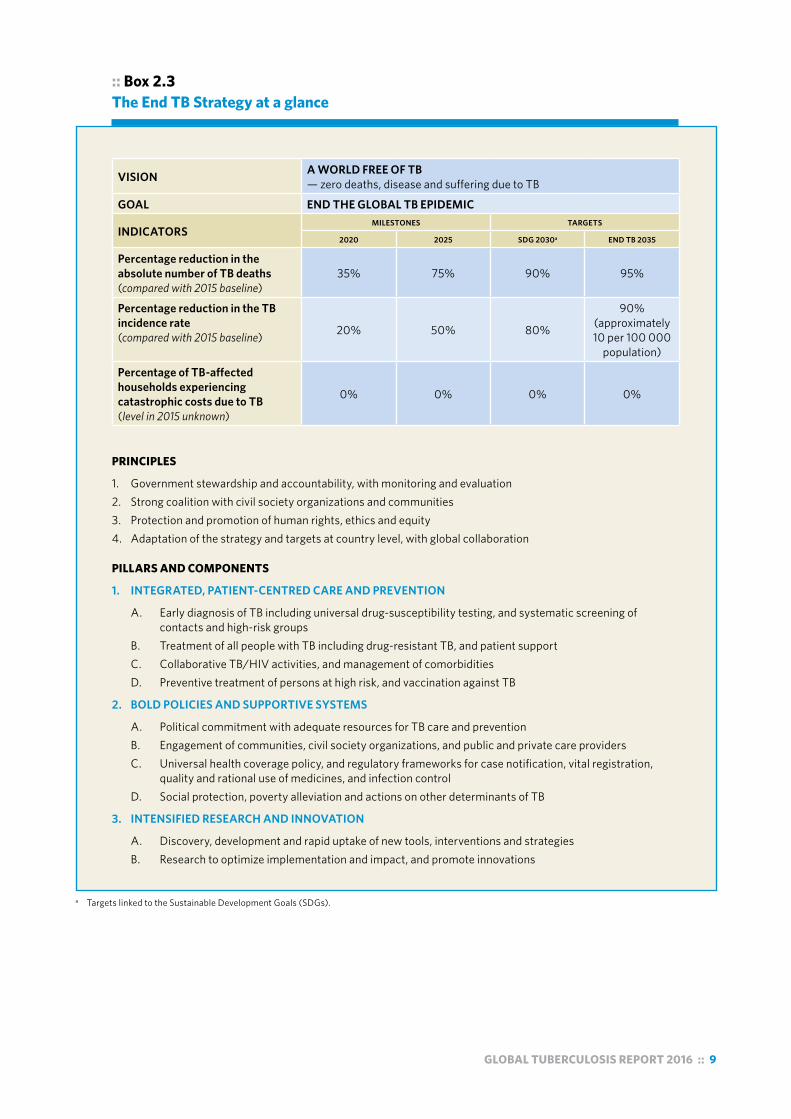
The End TB Strategy “at a glance” is shown in Box 2.3. It covers the period 2016–2035 and the overall goal is to “End the global TB epidemic”, defined as around 10 new cases per 100 000 population per year. This is the level found in countries considered to have a low burden of TB in 2015 (Chapter 3).
The End TB Strategy has three high-level, overarching indicators and related targets (for 2030, linked to the SDGs, and for 2035) and milestones (for 2020 and 2025). The three indicators are:
1 World Health Assembly. Global strategy and targets for tuberculosis prevention, care and control after 2015 (WHA67.1, Agenda item 12.1). Geneva: World Health Assembly; 2014 (http://apps.who.int/gb/ebwha/pdf_files/WHA67/A67_R1-en.pdf, accessed 28 July 2016).
2 Uplekar M, Weil D, Lonnroth K, Jaramillo E, Lienhardt C, Dias HM, et al. WHO’s new End TB Strategy. Lancet. 2015;385(9979):1799–1801 (http://www.ncbi.nlm.nih.gov/pubmed/25814376, accessed 28 July 2016).
GLOBAL TUBERCULOSIS REPORT 2016 :: 9
:: Box 2.3 The End TB Strategy at a glance
VISION A WORLD FREE OF TB— zero deaths, disease and suffering due to TB
GOAL END THE GLOBAL TB EPIDEMIC
INDICATORSMILESTONES TARGETS
2020 2025 SDG 2030a END TB 2035
Percentage reduction in the absolute number of TB deaths (compared with 2015 baseline)
35% 75% 90% 95%
Percentage reduction in the TB incidence rate (compared with 2015 baseline) 20% 50% 80%
90% (approximately 10 per 100 000
population)
Percentage of TB-affected households experiencing catastrophic costs due to TB (level in 2015 unknown)
0% 0% 0% 0%
PRINCIPLES
1. Government stewardship and accountability, with monitoring and evaluation2. Strong coalition with civil society organizations and communities3. Protection and promotion of human rights, ethics and equity4. Adaptation of the strategy and targets at country level, with global collaboration
PILLARS AND COMPONENTS
1. INTEGRATED, PATIENT-CENTRED CARE AND PREVENTION
A. Early diagnosis of TB including universal drug-susceptibility testing, and systematic screening of contacts and high-risk groups B. Treatment of all people with TB including drug-resistant TB, and patient support C. Collaborative TB/HIV activities, and management of comorbidities D. Preventive treatment of persons at high risk, and vaccination against TB
2. BOLD POLICIES AND SUPPORTIVE SYSTEMS
A. Political commitment with adequate resources for TB care and prevention B. Engagement of communities, civil society organizations, and public and private care providers C. Universal health coverage policy, and regulatory frameworks for case notification, vital registration, quality and rational use of medicines, and infection control D. Social protection, poverty alleviation and actions on other determinants of TB
3. INTENSIFIED RESEARCH AND INNOVATION
A. Discovery, development and rapid uptake of new tools, interventions and strategies B. Research to optimize implementation and impact, and promote innovations
a Targets linked to the Sustainable Development Goals (SDGs).
10 :: GLOBAL TUBERCULOSIS REPORT 2016
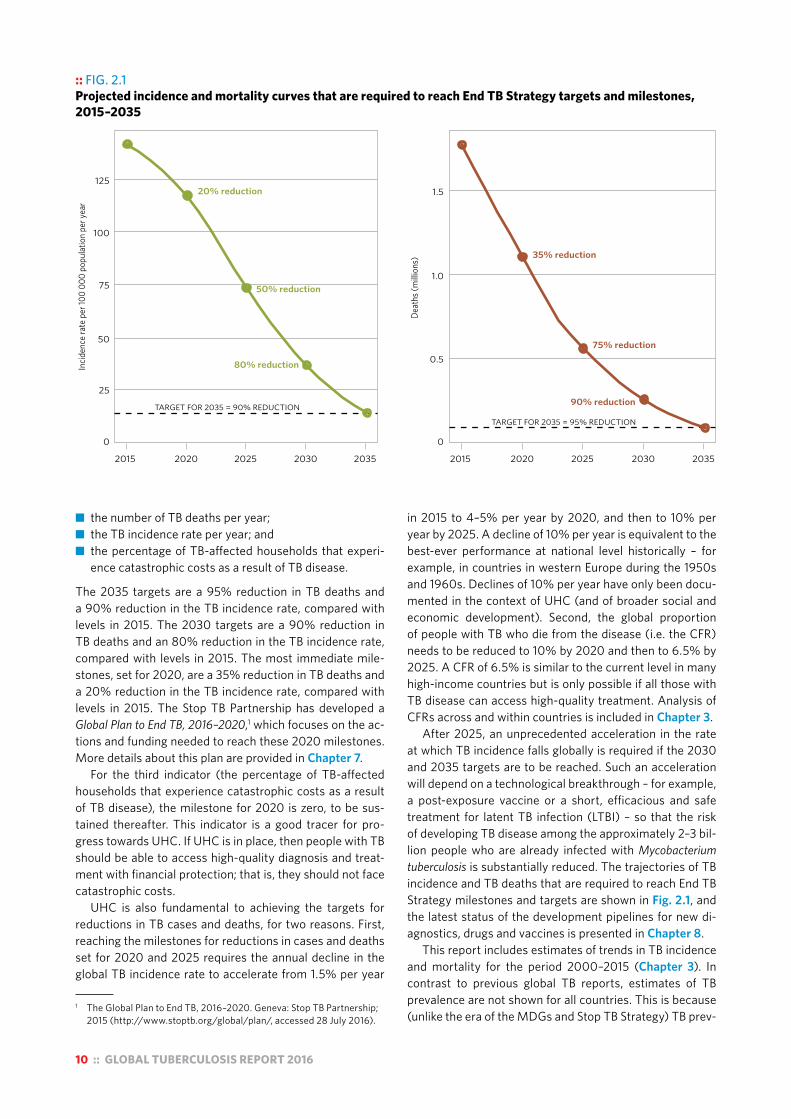
■ the number of TB deaths per year; ■ the TB incidence rate per year; and ■ the percentage of TB-affected households that experi-
ence catastrophic costs as a result of TB disease.
The 2035 targets are a 95% reduction in TB deaths and a 90% reduction in the TB incidence rate, compared with levels in 2015. The 2030 targets are a 90% reduction in TB deaths and an 80% reduction in the TB incidence rate, compared with levels in 2015. The most immediate mile-stones, set for 2020, are a 35% reduction in TB deaths and a 20% reduction in the TB incidence rate, compared with levels in 2015. The Stop TB Partnership has developed a Global Plan to End TB, 2016–2020,1 which focuses on the ac-tions and funding needed to reach these 2020 milestones. More details about this plan are provided in Chapter 7.
For the third indicator (the percentage of TB-affected households that experience catastrophic costs as a result of TB disease), the milestone for 2020 is zero, to be sus-tained thereafter. This indicator is a good tracer for pro-gress towards UHC. If UHC is in place, then people with TB should be able to access high-quality diagnosis and treat-ment with financial protection; that is, they should not face catastrophic costs.
UHC is also fundamental to achieving the targets for reductions in TB cases and deaths, for two reasons. First, reaching the milestones for reductions in cases and deaths set for 2020 and 2025 requires the annual decline in the global TB incidence rate to accelerate from 1.5% per year
1 The Global Plan to End TB, 2016–2020. Geneva: Stop TB Partnership; 2015 (http://www.stoptb.org/global/plan/, accessed 28 July 2016).
:: FIG. 2.1 Projected incidence and mortality curves that are required to reach End TB Strategy targets and milestones, 2015–2035
●
●
●
●
●
●
●
●
●
●
Incid
ence
rate
per
100
000
popu
latio
n pe
r yea
r
Deat
hs (m
illion
s)
2015 2020 2025 2030 2035 2015 2020 2025 2030 2035
25
50
75
100
125
0
0.5
1.0
1.520% reduction
50% reduction
80% reduction
TARGET FOR 2035 = 90% REDUCTION
35% reduction
75% reduction
90% reduction
TARGET FOR 2035 = 95% REDUCTION
0
in 2015 to 4–5% per year by 2020, and then to 10% per year by 2025. A decline of 10% per year is equivalent to the best-ever performance at national level historically – for example, in countries in western Europe during the 1950s and 1960s. Declines of 10% per year have only been docu-mented in the context of UHC (and of broader social and economic development). Second, the global proportion of people with TB who die from the disease (i.e. the CFR) needs to be reduced to 10% by 2020 and then to 6.5% by 2025. A CFR of 6.5% is similar to the current level in many high-income countries but is only possible if all those with TB disease can access high-quality treatment. Analysis of CFRs across and within countries is included in Chapter 3.
After 2025, an unprecedented acceleration in the rate at which TB incidence falls globally is required if the 2030 and 2035 targets are to be reached. Such an acceleration will depend on a technological breakthrough – for example, a post-exposure vaccine or a short, efficacious and safe treatment for latent TB infection (LTBI) – so that the risk of developing TB disease among the approximately 2–3 bil-lion people who are already infected with Mycobacterium tuberculosis is substantially reduced. The trajectories of TB incidence and TB deaths that are required to reach End TB Strategy milestones and targets are shown in Fig. 2.1, and the latest status of the development pipelines for new di-agnostics, drugs and vaccines is presented in Chapter 8.
This report includes estimates of trends in TB incidence and mortality for the period 2000–2015 (Chapter 3). In contrast to previous global TB reports, estimates of TB prevalence are not shown for all countries. This is because (unlike the era of the MDGs and Stop TB Strategy) TB prev-

GLOBAL TUBERCULOSIS REPORT 2016 :: 11
:: TABLE 2.1 Top 10 indicators (not ranked) for monitoring implementation of the End TB Strategy at global and national levels, with recommended target levels that apply to all countries. The target level is for 2025 at the latest.
INDICATOR RECOMMENDED TARGET LEVEL
MAIN RATIONALE FOR INCLUSION IN TOP 10
MAIN METHOD OF MEASUREMENT, AND CHAPTER OF THIS REPORT WHERE INDICATOR IS FEATURED
1 TB treatment coverage Number of new and relapse cases that were notified and treated, divided by the estimated number of incident TB cases in the same year, expressed as a percentage.
≥90%
High-quality TB care is essential to prevent suffering and death from TB and to cut transmission. High coverage of appropriate treatment is a fundamental requirement for achieving the milestones and targets of the End TB Strategy. In combination, it is likely that these two indicators will be used as tracer indicators for monitoring progress towards UHC within the SDGs.
Routinely collected notification data used in combination with estimate of TB incidence. Chapter 4
2 TB treatment success ratePercentage of notified TB patients who were successfully treated. The target is for drug-susceptible and drug-resistant TB combined, although outcomes should also be reported separately.
≥90%
Routinely collected data.Chapter 4
3 Percentage of TB-affected households that experience catastrophic costs due to TBa
Number of people treated for TB (and their households) who incur catastrophic costs (direct and indirect combined), divided by the total number of people treated for TB.
0%
One of the End TB Strategy’s three high-level indicators; a key marker of financial risk protection (one of the two key elements of UHC) and social protection for TB-affected households.
National survey of notified TB patients. Chapter 6
4 Percentage of new and relapse TB patients tested using a WHO-recommended rapid diagnostic (WRD) at the time of diagnosisNumber of new and relapse TB patients tested using a WRD at the time of diagnosis, divided by the total number of new and relapse TB patients, expressed as a percentage.
≥90%
Accurate diagnosis is a fundamental component of TB care. Rapid molecular diagnostic tests help to ensure early detection and prompt treatment.
Routinely collected data (as part of case-based surveillance), or national survey of medical records or patient cards of TB patients. Chapter 4
5 Latent TB infection (LTBI) treatment coverageNumber of people living with HIV newly enrolled in HIV care and the number of children aged <5 years who are household contacts of cases started on LTBI treatment, divided by the number eligible for treatment, expressed as a percentage (separately for each of the two groups).
≥90%
Treatment of LTBI is the main treatment intervention available to prevent development of active TB disease in those already infected with Mycobacterium tuberculosis.
Routinely collected data (as part of case-based surveillance), or national survey of medical records or patient cards of people living with HIV and TB patients. Chapter 5
6 Contact investigation coverageNumber of contacts of people with bacteriologically confirmed TB who were evaluated for TB, divided by the number eligible, expressed as a percentage.
≥90%
Contact tracing is a key component of TB prevention, especially in children.
As above for LTBI.
7 Drug-susceptibility testing (DST) coverage for TB patients Number of TB patients with DST results for at least rifampicin, divided by the total number of notified (new and retreatment) cases in the same year, expressed as a percentage. DST coverage includes results from molecular (e.g. Xpert MTB/RIF) as well as conventional phenotypic DST results.
100%
Testing for drug susceptibility for WHO-recommended drugs is essential to provide the right treatment for every person diagnosed with TB.
Routinely collected data (as part of case-based surveillance), or national survey of medical records or patient cards of TB patients. Chapter 4
8 Treatment coverage, new TB drugsNumber of TB patients treated with regimens that include new (endorsed after 2010) TB drugs, divided by the number of notified patients eligible for treatment with new TB drugs, expressed as a percentage.
≥90%
An indicator that is relevant to monitoring the adoption of innovations in all countries. The definition of which patients are eligible patients for treatment with new drugs may differ among countries.
As above for DST.
9 Documentation of HIV status among TB patients Number of new and relapse TB patients with documented HIV status, divided by the number of new and relapse TB patients notified in the same year, expressed as a percentage.
100%
One of the core global indicators used to monitor collaborative TB/HIV activities. Documentation of HIV status is essential to provide the best care for HIV-positive TB patients, including antiretroviral therapy.
Routinely collected data for all TB patients.Chapter 4
10 Case fatality ratio (CFR)Number of TB deaths divided by estimated number of incident cases in the same years, expressed as a percentage. ≤5%
This is a key indicator for monitoring progress towards the 2020 and 2025 milestones. A CFR of 6% is required to achieve the 2025 global milestone for reductions in TB deaths and cases.
Mortality divided by incidence. In countries with a high-performance surveillance system, notifications approximate incidence. Chapter 3, Chapter 6
CFR, case fatality ratio; DST, drug-susceptibility testing; HIV, human immunodeficiency virus; LTBI, latent TB infection; SDG, Sustainable Development Goal; TB, tuberculosis; UHC, universal health care; WHO, World Health Organization; WRD, WHO-recommended rapid diagnostic.a Catastrophic costs are provisionally defined as total costs that exceed 20% of annual household income.

12 :: GLOBAL TUBERCULOSIS REPORT 2016
alence is no longer a high-level indicator for which a global target has been set. However, national TB prevalence sur-veys remain important for assessing TB disease burden and trends (through repeat surveys) in many countries, and can also inform estimates of TB incidence. For these reasons, results from recent national TB prevalence surveys are in-cluded in Chapter 3.
To achieve the targets and milestones, the End TB Strat-egy has four underlying principles and three pillars. The principles are: government stewardship and accountability, with monitoring and evaluation; a strong coalition with civil society organizations and communities; protection and promotion of human rights, ethics and equity; and adapta-tion of the strategy and targets at country level, with global collaboration. The three pillars are: integrated, patient-cen-tred TB care and prevention; bold policies and supportive systems; and intensified research and innovation.
The 10 components of the three pillars are shown in Box 2.3 and the 10 priority indicators (defined in March 2015 in association with the publication of a journal article about the End TB Strategy)1 to monitor their implementation are
1 Uplekar M, Weil D, Lonnroth K, Jaramillo E, Lienhardt C, Dias HM, et al. WHO’s new End TB Strategy. Lancet. 2015;385(9979):1799–1801 (http://www.ncbi.nlm.nih.gov/pubmed/25814376, accessed 28 July 2016). The 10 indicators are defined and explained in an appendix.
shown in Table 2.1. The chapter of this report in which available data for each indicator can be found is also ex-plained in the table.
Data for 5 of the 10 indicators cannot be captured rou-tinely using the standard recording and reporting forms for paper-based systems that are included in the latest revision of WHO’s framework for TB case definitions and report-ing.2 Collection of data on the costs faced by TB patients and their households and assessment of whether these are catastrophic (indicator 3 in Table 2.1) requires periodic surveys of a representative sample of TB patients; further details are provided in Chapter 6. For the other four in-dicators (numbered 4, 5, 6 and 8 in Table 2.1), data may already be captured routinely in countries with electronic case-based systems for recording and reporting of data, or these systems can be adapted to do so. Alternatively, periodic surveys of the medical records or patient cards of a random sample of TB patients can be done. Further guidance is provided in WHO operational guidance on the
2 World Health Organization. Definitions and reporting framework for tuberculosis – 2013 revision (updated December 2014) (WHO/HTM/TB/2013.2). Geneva: WHO; 2013 (www.who.int/iris/bitstream/10665/79199/1/9789241505345_eng.pdf, accessed 15 August 2016).
:: FIG. 2.2 Countries in the three TB high-burden country lists that will be used by WHO during the period 2016–2020, and their areas of overlap
DPR Korea, Democratic People’s Republic of Korea; DR Congo, Democratic Republic of the Congo; HIV, human immunodeficiency virus; MDR, multidrug resistant; TB, tuberculosis; UR Tanzania, United Republic of Tanzania; WHO, World Health Organizationa Indicates countries that are included in the list of 30 high-burden countries for TB on the basis of the severity of their TB burden (i.e. TB incidence per 100 000
population), as opposed to the top 20, which are included on the basis of their absolute number of incident cases per year.
BotswanaCameroon
ChadGhana
Guinea-BissauMalawi
SwazilandUganda
TB
AngolaChina
DR CongoEthiopia
IndiaIndonesia
KenyaMozambique
MyanmarNigeria
Papua New Guineaa
South AfricaThailand
Zimbabwea
BrazilCentral African Republica
Congoa
Lesothoa
Liberiaa
Namibiaa
UR TanzaniaZambiaa
BangladeshDPR Korea
PakistanPhilippines
Russian FederationViet NamAzerbaijan
BelarusKazakhstanKyrgyzstan
PeruRepublic of Moldova
SomaliaTajikistanUkraine
Uzbekistan
MDR-TB TB/HIV
Cambodiaa
Sierra Leonea

GLOBAL TUBERCULOSIS REPORT 2016 :: 13
End TB Strategy.1 In addition, the Global TB Programme has begun working with a pilot group of countries in the African Region on collection of data using this approach.
For the first time, this report includes chapters related to TB prevention (Chapter 5) and UHC and social protec-tion (Chapter 6), reflecting the much greater prominence of these topics in the End TB Strategy compared with previ-ous global TB strategies.
1 World Health Organization. Implementing the end TB strategy: the essentials. Geneva: WHO, 2016 (http://www.who.int/tb/publications/2015/The_Essentials_to_End_TB/en/). See in particular part II, section 2.4.
2.3 Lists of high-burden countries to be used by WHO during the period 2016–2020
During the period 1998 to 2015, the concept of an HBC be-came familiar and widely used in the context of TB. In 2015, three lists – for TB, TB/HIV and MDR-TB – were in use. The TB HBC list (22 countries) had remained unchanged since 2002, and the HBC lists for TB/HIV (41 countries) and MDR-TB (27 countries) had not been updated since 2009 and 2008, respectively. With 2015 marking the end of the MDGs and their replacement with the SDGs, and the last year of the Stop TB Strategy and its replacement with the
TABLE 2.2 :: The three TB high-burden country lists that will be used by WHO during the period 2016–2020
LIST THE 30 HIGH TB BURDEN COUNTRIES THE 30 HIGH TB/HIV BURDEN COUNTRIES THE 30 HIGH MDR-TB BURDEN COUNTRIES
Purpose and target audience
To provide a focus for global action on TB in the countries where progress is most needed to achieve End TB Strategy and SDG targets and milestones, to help build and sustain national political commitment and funding in the countries with the highest burden in terms of absolute numbers or severity, and to promote global monitoring of progress in a well-defined set of countries.
To provide a focus for global action on HIV-associated TB in the countries where progress is most needed to achieve End TB Strategy, UNAIDS and SDG targets and milestones, to help build and sustain national political commitment and funding in the countries with the highest burden in terms of absolute numbers or severity, and to promote global monitoring of progress in a well-defined set of countries.
To provide a focus for global action on the MDR-TB crisis in the countries where progress is most needed to achieve End TB Strategy targets and milestones, to help build and sustain national political commitment and funding in the countries with the highest burden in terms of absolute numbers or severity, and to promote global monitoring of progress in a well-defined set of countries.
Definition The 20 countries with the highest estimated numbers of incident TB cases, plus the top 10 countries with the highest estimated TB incidence rate that are not in the top 20 by absolute number (threshold, >10 000 estimated incident TB cases per year).
The 20 countries with the highest estimated numbers of incident TB cases among people living with HIV, plus the top 10 countries with the highest estimated TB/HIV incidence rate that are not in the top 20 by absolute number (threshold, >1000 estimated incident TB/HIV cases per year).
The 20 countries with the highest estimated numbers of incident MDR-TB cases, plus the top 10 countries with the highest estimated MDR-TB incidence rate that are not in the top 20 by absolute number (threshold, >1000 estimated incident MDR-TB cases per year).
Countries in the list
The top 20 by estimated absolute number (in alphabetical order):
AngolaBangladeshBrazilChinaDPR KoreaDR CongoEthiopiaIndiaIndonesiaKenyaMozambiqueMyanmarNigeriaPakistanPhilippinesRussian FederationSouth AfricaThailandUR Tanzania Viet Nam
The additional 10 by estimated incidence rate per 100 000 population and with a minimum number of 10 000 cases per year (in alphabetical order):
CambodiaCentral African
RepublicCongoLesothoLiberiaNamibiaPapua New GuineaSierra LeoneZambiaZimbabwe
The top 20 by estimated absolute number (in alphabetical order):
AngolaBrazilCameroonChinaDR CongoEthiopiaIndiaIndonesiaKenyaLesothoMalawiMozambiqueMyanmarNigeriaSouth AfricaThailandUgandaUR TanzaniaZambiaZimbabwe
The additional 10 by estimated incidence rate per 100 000 population and with a minimum number of 1000 cases per year (in alphabetical order):
BotswanaCentral African
RepublicChadCongoGhanaGuinea-BissauLiberiaNamibiaPapua New GuineaSwaziland
The top 20 by estimated absolute number (in alphabetical order):
BangladeshChinaDPR KoreaDR CongoEthiopiaIndiaKazakhstanKenyaIndonesiaMozambiqueMyanmarNigeriaPakistanPhilippinesRussian FederationSouth AfricaThailandUkraineUzbekistanViet Nam
The additional 10 by estimated rate per 100 000 population and with a minimum number of 1000 cases per year (in alphabetical order):
AngolaAzerbaijanBelarusKyrgyzstanPapua New GuineaPeruRepublic of
MoldovaSomaliaTajikistanZimbabwe
% global total 84% 3.1% 87% 4.8% 84% 5.4%
Lifetime of list 5 years (review criteria and included countries in June 2020).
5 years (review criteria and included countries in June 2020).
5 years (review criteria and included countries in June 2020).
DPR Korea, Democratic People’s Republic of Korea; DR Congo, Democratic Republic of the Congo; HIV, human immunodeficiency virus; MDR, multidrug resistant; SDG, Sustainable Development Goal; TB, tuberculosis; UNAIDS, Joint United Nations Programme on HIV/AIDS; UR Tanzania, United Republic of Tanzania; WHO, World Health Organization
14 :: GLOBAL TUBERCULOSIS REPORT 2016
End TB Strategy, it was an ideal time to revisit these three HBC lists.
Following a wide consultation process,1 WHO has de-fined three new HBC lists for the period 2016–2020: one for TB, one for MDR-TB and one for TB/HIV (Fig. 2.2, Ta-ble 2.2).2 Each list contains 30 countries (Table 2.2). These are defined as the top 20 in terms of absolute numbers of cases, plus the additional 10 countries that have the most severe burden in terms of incidence rates per capita, do not appear in the top 20 and meet a minimum threshold in terms of absolute numbers of incident cases (10 000 per year for TB, and 1000 per year for TB/HIV and MDR-TB). The lists were defined using the latest estimates of TB dis-ease burden available in October 2015. Each list accounts for 87–92% of the global burden, with almost all of this ac-counted for by the top 20 countries in each list.
There is overlap among the three lists, but 48 coun-tries appear in at least one list. The 14 countries that are in all three lists (shown in the central diamond in Fig. 2.2) are: Angola, China, the Democratic Republic of the Congo,
1 World Health Organization Strategic and Technical Advisory Group for TB. Use of high burden country lists for TB by WHO in the post-2015 era (discussion paper). Geneva: WHO; 2015 (http://www.who.int/tb/publications/global_report/high_tb_burdencountrylists2016-2020.pdf?ua=1, accessed 28 July 2016).
2 As explained in the last row of Table 2.2, the three lists have a lifetime of 5 years, and the countries included in each list and the criteria used to define each list will be reviewed in June 2020.
Ethiopia, India, Indonesia, Kenya, Mozambique, Myanmar, Nigeria, Papua New Guinea, South Africa, Thailand and Zimbabwe.
The 30 high TB burden countries are given particular at-tention in the main body of this report. Where estimates of disease burden and assessment of progress in the re-sponse are for TB/HIV and MDR-TB specifically, the coun-tries in the TB/HIV and MDR-TB lists respectively are given particular attention. Annex 2 contains a one-page profile for each of the 30 high TB burden countries, with a clear demarcation between the 20 countries included on the ba-sis of absolute numbers of incident cases and the 10 addi-tional countries included on the basis of the incidence rate per capita.
As in the 2015 global TB report, data for all countries are included in Annex 4 and in WHO’s online global TB database. Country profiles for all countries (with the same content as those presented in Annex 2) are also available online.

GLOBAL TUBERCULOSIS REPORT 2016 :: 15
Chapter 3 :: TB disease burden
:: KEY FACTS AND MESSAGESnational TB prevalence survey scheduled for 2017/2018.
An estimated 11% of incident TB cases in 2015 were HIV-positive. The proportion was highest in countries in the WHO African Region, and exceeded 50% in parts of southern Africa. In addition to the 1.4 million TB deaths among HIV-negative people, there were 0.4 million deaths from TB among HIV-positive peopleb in 2015.
Variation in the CFR in 2015, from under 5% in a few countries to more than 20% in most countries in the WHO African Region, shows considerable inequalities among countries in access to TB diagnosis and treatment that need to be addressed. If everyone with TB had a timely diagnosis and access to high-quality treatment, the CFR would be low in all countries.
Following WHO guidance issued in May 2016, all cases of rifampicin-resistant TB (RR-TB), including those with multidrug-resistant TB (MDR-TB), should be treated with a second-line MDR-TB treatment regimen. Globally in 2015, there were an estimated 480 000 new cases of MDR-TB and an additional 100 000 people with rifampicin-resistant TB who were also newly eligible for MDR-TB treatment; India, China and the Russian Federation accounted for 45% of these cases.
Until national notification and vital registration systems (with standard coding of causes of death) of high coverage and quality are present in all countries, national TB prevalence surveys will continue to provide the best method for directly measuring the burden of TB disease and identifying actions required to reduce that burden in an important subset of countries. In recent years, there has been enormous progress in implementing such surveys, with 22 completed between 2009 and August 2016. In this report, estimates of TB incidence were derived from prevalence surveys for 20 countries with 62% of the world’s TB cases.
a The CFR can be approximated as the number of TB deaths divided by the number of incident cases in the same year.
b When an HIV-positive person dies from TB disease, the underlying cause is classified as HIV in the International Classification of Diseases system (ICD-10).
Global targets and milestones for reductions in the burden of TB disease in the period 2016–2035 have been set as part of the Sustainable Development Goals (SDGs) and WHO’s End TB Strategy.
The first milestones of the End TB Strategy, set for 2020, are a 35% reduction in the absolute number of TB deaths and a 20% reduction in the TB incidence rate, compared with levels in 2015. To reach these milestones, the TB incidence rate needs to be falling by 4–5% per year globally by 2020 and the proportion of people with TB who die from the disease (the case fatality ratio or CFR)a needs to be reduced to 10% globally by 2020.
A substantial acceleration in the current rate of progress in reducing the burden of TB disease, based on all elements of the End TB Strategy, is required to bring these milestones within reach.
Globally, the absolute number of TB deaths (excluding TB deaths among HIV-positive peopleb) and the TB incidence rate have fallen since 2000. The number of TB deaths fell from 1.8 million in 2000 to 1.4 million in 2015. However, the global rate of decline in the TB incidence rate was only 1.5% from 2014 to 2015 and the CFR in 2015 was 17%. TB is one of the top 10 causes of death worldwide and caused more deaths than HIV in 2015.
Worldwide in 2015, there were an estimated 10.4 million incident TB cases. An estimated 62% of these cases were male, and 90% of cases were adults. Six countries accounted for 60% of the global total: India, Indonesia, China, Nigeria, Pakistan and South Africa. The rate of progress in these countries will have a major influence on whether or not the 2020 global milestones are achieved.
Estimates of the burden of TB disease in India have been revised substantially upwards for the period 2000–2015, compared with those published in previous reports. This follows accumulating evidence from surveys and routinely collected TB notification data that previous estimates of cases and deaths were too low. As the country with the highest burden of TB disease in the world, these revisions have had a major impact on the global estimates. The estimates for India are still considered as interim, pending a
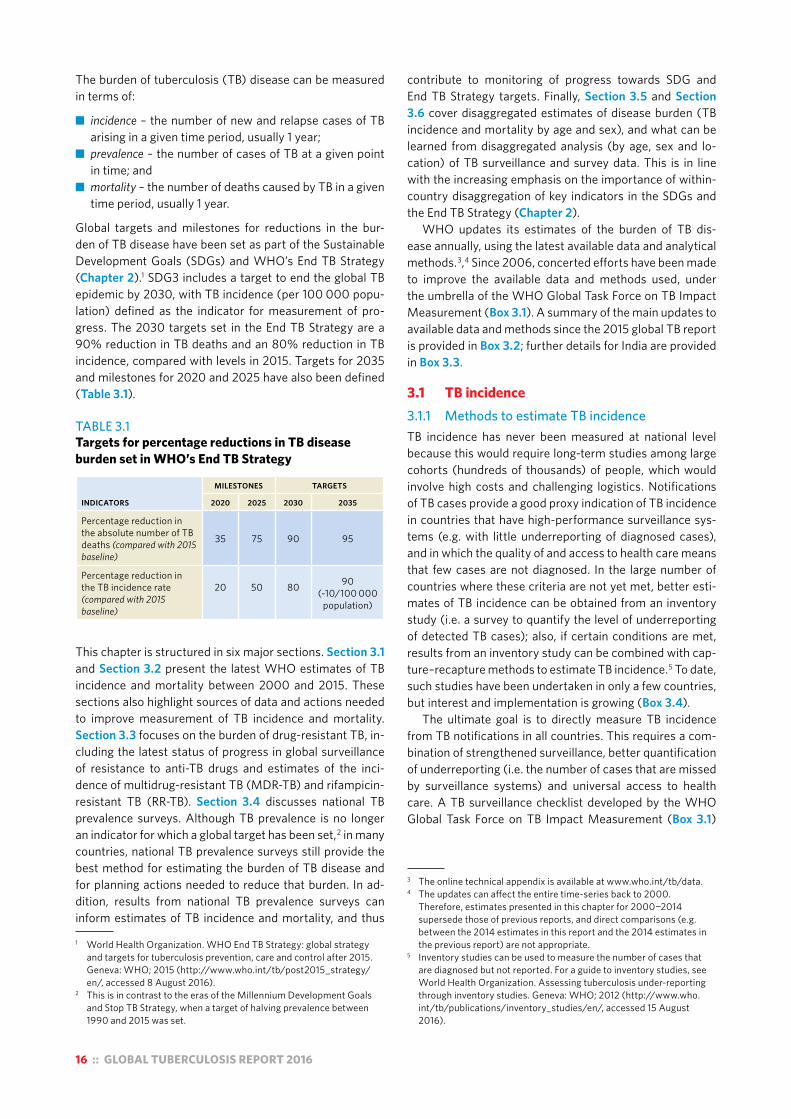
16 :: GLOBAL TUBERCULOSIS REPORT 2016
The burden of tuberculosis (TB) disease can be measured in terms of:
■ incidence – the number of new and relapse cases of TB arising in a given time period, usually 1 year;
■ prevalence – the number of cases of TB at a given point in time; and
■ mortality – the number of deaths caused by TB in a given time period, usually 1 year.
Global targets and milestones for reductions in the bur-den of TB disease have been set as part of the Sustainable Development Goals (SDGs) and WHO’s End TB Strategy (Chapter 2).1 SDG3 includes a target to end the global TB epidemic by 2030, with TB incidence (per 100 000 popu-lation) defined as the indicator for measurement of pro-gress. The 2030 targets set in the End TB Strategy are a 90% reduction in TB deaths and an 80% reduction in TB incidence, compared with levels in 2015. Targets for 2035 and milestones for 2020 and 2025 have also been defined (Table 3.1).
TABLE 3.1Targets for percentage reductions in TB disease burden set in WHO’s End TB Strategy
INDICATORS
MILESTONES TARGETS
2020 2025 2030 2035
Percentage reduction in the absolute number of TB deaths (compared with 2015 baseline)
35 75 90 95
Percentage reduction in the TB incidence rate (compared with 2015 baseline)
20 50 80 90 (~10/100 000
population)
This chapter is structured in six major sections. Section 3.1 and Section 3.2 present the latest WHO estimates of TB incidence and mortality between 2000 and 2015. These sections also highlight sources of data and actions needed to improve measurement of TB incidence and mortality. Section 3.3 focuses on the burden of drug-resistant TB, in-cluding the latest status of progress in global surveillance of resistance to anti-TB drugs and estimates of the inci-dence of multidrug-resistant TB (MDR-TB) and rifampicin-resistant TB (RR-TB). Section 3.4 discusses national TB prevalence surveys. Although TB prevalence is no longer an indicator for which a global target has been set,2 in many countries, national TB prevalence surveys still provide the best method for estimating the burden of TB disease and for planning actions needed to reduce that burden. In ad-dition, results from national TB prevalence surveys can inform estimates of TB incidence and mortality, and thus
1 World Health Organization. WHO End TB Strategy: global strategy and targets for tuberculosis prevention, care and control after 2015. Geneva: WHO; 2015 (http://www.who.int/tb/post2015_strategy/en/, accessed 8 August 2016).
2 This is in contrast to the eras of the Millennium Development Goals and Stop TB Strategy, when a target of halving prevalence between 1990 and 2015 was set.
contribute to monitoring of progress towards SDG and End TB Strategy targets. Finally, Section 3.5 and Section 3.6 cover disaggregated estimates of disease burden (TB incidence and mortality by age and sex), and what can be learned from disaggregated analysis (by age, sex and lo-cation) of TB surveillance and survey data. This is in line with the increasing emphasis on the importance of within-country disaggregation of key indicators in the SDGs and the End TB Strategy (Chapter 2).
WHO updates its estimates of the burden of TB dis-ease annually, using the latest available data and analytical methods.3,4 Since 2006, concerted efforts have been made to improve the available data and methods used, under the umbrella of the WHO Global Task Force on TB Impact Measurement (Box 3.1). A summary of the main updates to available data and methods since the 2015 global TB report is provided in Box 3.2; further details for India are provided in Box 3.3.
3.1 TB incidence 3.1.1 Methods to estimate TB incidenceTB incidence has never been measured at national level because this would require long-term studies among large cohorts (hundreds of thousands) of people, which would involve high costs and challenging logistics. Notifications of TB cases provide a good proxy indication of TB incidence in countries that have high-performance surveillance sys-tems (e.g. with little underreporting of diagnosed cases), and in which the quality of and access to health care means that few cases are not diagnosed. In the large number of countries where these criteria are not yet met, better esti-mates of TB incidence can be obtained from an inventory study (i.e. a survey to quantify the level of underreporting of detected TB cases); also, if certain conditions are met, results from an inventory study can be combined with cap-ture–recapture methods to estimate TB incidence.5 To date, such studies have been undertaken in only a few countries, but interest and implementation is growing (Box 3.4).
The ultimate goal is to directly measure TB incidence from TB notifications in all countries. This requires a com-bination of strengthened surveillance, better quantification of underreporting (i.e. the number of cases that are missed by surveillance systems) and universal access to health care. A TB surveillance checklist developed by the WHO Global Task Force on TB Impact Measurement (Box 3.1)
3 The online technical appendix is available at www.who.int/tb/data. 4 The updates can affect the entire time-series back to 2000.
Therefore, estimates presented in this chapter for 2000−2014 supersede those of previous reports, and direct comparisons (e.g. between the 2014 estimates in this report and the 2014 estimates in the previous report) are not appropriate.
5 Inventory studies can be used to measure the number of cases that are diagnosed but not reported. For a guide to inventory studies, see World Health Organization. Assessing tuberculosis under-reporting through inventory studies. Geneva: WHO; 2012 (http://www.who.int/tb/publications/inventory_studies/en/, accessed 15 August 2016).
GLOBAL TUBERCULOSIS REPORT 2016 :: 17
:: Box 3.1The WHO Global Task Force on TB Impact Measurement
Progress to dateThe WHO Global Task Force on TB Impact Measurement (hereafter referred to as the Task Force) was established in 2006 and is convened by the TB Monitoring and Evaluation unit of WHO’s Global TB Programme. Its aim was to ensure that WHO’s assessment of whether 2015 targets set in the context of the MDGs were achieved at global, regional and country levels was as rigorous, robust and consensus-based as possible. Three strategic areas of work were pursued:
! strengthening routine surveillance of TB cases (via national notification systems) and deaths (via national VR systems) in all countries;
! undertaking national TB prevalence surveys in 22 global focus countries; and
! periodically reviewing methods used to produce TB disease burden estimates.
Notification data are consistently reported to WHO by about 200 countries and territories each year. In 2015, direct measurements of TB mortality from national or sample VR systems were available for 128 countries. Between 2009 and the end of 2015, a total of 19 national TB prevalence surveys were completed. When surveys in the Philippines and Viet Nam in 2007 are included, 16 of the 22 global focus countries had competed a survey according to screening and diagnostic methods recommended by WHO by the end of 2015.
Comprehensive reviews of methods used by WHO to produce estimates of TB incidence, prevalence and mortality were undertaken between June 2008 and October 2010, and in a meeting of the Task Force dedicated to this topic in April 2015.a WHO published its assessment of whether 2015 global TB targets for reductions in TB incidence, prevalence and mortality were achieved in its 2015 global TB report, using the methods agreed in April 2015.
Looking forward: mandate and strategic areas of work, 2016–2020In the context of a new era of SDGs and WHO’s End TB Strategy, the Task Force met in April 2016 to review and reshape its mandate and strategic areas of work for the post-2015 era. An updated mandate and five strategic areas of work for the period 2016–2020 were agreed.b
The mandate was defined as follows:
! To ensure that assessments of progress towards End TB Strategy and SDG targets and milestones at global, regional and country levels are as rigorous, robust and consensus-based as possible.
! To guide, promote and support the analysis and use of TB data for policy, planning and programmatic action.
The five strategic areas of work are as follows:
1. Strengthening national notification systems for direct measurement of TB cases, including drug-resistant TB and HIV-associated TB specifically.
2. Strengthening national VR systems for direct measurement of TB deaths.
3. Priority studies to periodically measure TB disease burden, including: — national TB prevalence surveys— drug-resistance surveys— mortality surveys— surveys of costs faced by TB patients and their
households. 4. Periodic review of methods used by WHO to estimate the
burden of TB disease and latent TB infection. 5. Analysis and use of TB data at country level, including:
— disaggregated analyses (e.g. by age, sex, location) to assess inequalities and equity
— projections of disease burden— guidance, tools and capacity building.
The SDG and End TB Strategy targets and milestones referred to in the mandate are the targets (2030, 2035) and milestones (2020, 2025) set for the three high-level indicators; that is, TB incidence, the number of TB deaths and the percentage of TB-affected households that face catastrophic costs as a result of TB disease (Chapter 2).
Strategic areas of work 1–3 are focused on direct measurement of TB disease burden (epidemiological and, in the case of cost surveys, economic). The underlying principle for the Task Force’s work since 2006 has been that estimates of the level of and trends in disease burden should be based on direct measurements from routine surveillance and surveys as much as possible, as opposed to indirect estimates based on modelling and expert opinion. However, strategic area of work 4 does recognize that indirect estimates will continue to be required until all countries have the surveillance systems or the periodic studies required to provide direct measurements. Strategic area of work 5 recognizes the importance of analysing and using TB data at country level (as well as generating data, as in areas of work 1–3), including the disaggregated analyses that are now given much greater attention in the SDGs and End TB Strategy.
In the next 5 years, the top priorities for the Task Force are strengthening of national notification and VR systems as the basis for direct measurement of TB incidence and TB mortality.
Further details about the work of the Task Force are available online;c an up-to-date summary is provided in the latest brochure about its work.d
a World Health Organization Global Task Force on TB Impact Measurement. Methods to be used for WHO’s definitive assessment of whether 2015 global TB targets are met: report of the 3rd meeting of the TB estimates subgroup. Geneva: WHO; 2015 (www.who.int/tb/advisory_bodies/impact_measurement_taskforce/meetings/global_consultation_meeting_report.pdf, accessed 24 August 2016). All background documents are available at www.who.int/tb/advisory_bodies/impact_measurement_taskforce/meetings/consultation_april_2015_tb_estimates_subgroup/en/
b For further details, please see Background Document 1 that was prepared for the April 2016 meeting of the Task Force, available at www.who.int/tb/advisory_bodies/impact_measurement_taskforce/meetings/tf6_background_1_mandate_strategic_areas_work.pdf?ua=1
c www.who.int/tb/advisory_bodies/impact_measurement_taskforce/d www.who.int/tb/publications/factsheet_tb_impactmeasurement.
pdf?ua=1

18 :: GLOBAL TUBERCULOSIS REPORT 2016
:: Box 3.2Updates to estimates of TB disease burden in this report and anticipated updates
Updates in this report1. Interim update for IndiaEstimates for India have been updated following an accumulating body of evidence that indicated that previously published estimates were too low. The updated estimates are interim in nature. A more definitive assessment will follow the completion of a national TB prevalence survey scheduled for 2017/2018. Further details are provided in Box 3.3.
2. New data from national TB prevalence surveysBetween October 2014 and August 2015, final results from surveys in Mongolia and Uganda became available. The post-survey estimate of TB prevalence in Uganda was consistent with pre-survey estimates, but was more precise and had values located towards the upper end of the previously published uncertainty interval. In Mongolia, TB prevalence was higher than anticipated. More details are provided in Section 3.4.
3. Newly reported data and updated estimates from other agencies
New VR data were reported to WHO between mid-2015 and mid-2016, and some countries made corrections to historical data. Updated estimates of the burden of disease caused by HIV were obtained from UNAIDS in July 2016. In most instances, any resulting changes to TB burden estimates were well within the uncertainty intervals of previously published estimates, and trends were generally consistent.
For South Africa, estimates of TB mortality (HIV-negative) were based on estimates from the Institute of Health Metrics and Evaluation (IHME), Washington University, USA; these estimates use data from the national VR system, adjusted
for widespread miscoding of deaths caused by HIV and TB,a,b For India, estimates of TB mortality (HIV-negative) were also based on estimates from IHME, following the Institute’s extensive analysis of available mortality data (see also Box 3.3).
4. Deaths due to TB sequelae For the first time in 2016, deaths attributed to TB sequelae (ICD-10 codes B90.*) are included in HIV-negative TB mortality estimates for countries reporting VR data to WHO. The proportion of overall TB deaths that were classified as deaths from TB sequelae varies widely between countries (Fig. B3.2.1) as a result of variation in certification practices (i.e. what is written on death certificates) or coding (i.e. which code is selected).
5. In-depth epidemiological reviews at country levelA regional workshop on TB epidemiology and TB mortality was held in Lima, Peru in June 2016. Methods to estimate TB incidence were reviewed and altered in most countries, shifting to the high-income method based on a larger standard adjustment factor (using a factor of [1, 1.5] except in Brazil, where the standard factor already used for high-income countries was applied). A national TB epidemiology workshop was held in China in April 2016, to review options for estimating TB disease burden. Estimates of TB incidence in 2009–2015 are now based on notifications adjusted by a standard factor to account for underreporting and underdiagnosis, with the standard adjustment [1, 1.3] based on that already used for high-income countries (see also Section 3.1). Mortality estimates are derived from the sample VR system, as before.
:: FIG. B3.2.1 Deaths from TB sequelae as a proportion of the total number of reported TB deaths, countries reporting national VR data (using the most recent year of data reported to WHO)
Proportion of TB deaths from TB sequelae (%)
0–0.91–9.910–2425–49≥50No dataNot applicable
GLOBAL TUBERCULOSIS REPORT 2016 :: 19
6. Indirect prevalence estimates are no longer presentedNational TB prevalence surveys will continue to provide the best method for measuring the burden of TB disease and related assessment of actions needed to reduce that burden in a large number of countries – specifically, those with a high burden of TB that do not yet have health, national notification and VR systems of the quality and coverage required to provide reliable and routine measurements of the number of TB cases and deaths. Results from these surveys will continue to be featured in global TB reports. However, indirect estimates of prevalence for other countries are no longer presented. Prevalence is not an indicator in the SDGs or a high-level indicator of the End TB Strategy, and no global target has been set (in contrast to the era of the MDGs and Stop TB Strategy, when a target of halving prevalence between 1990 and 2015 was set). Furthermore, indirect estimates of prevalence suffer from considerable uncertainty, because they are derived from estimates of incidence and assumptions about disease duration.
7. Time series of TB burden estimates start with the year 2000Series of TB estimates published in this report start with the year 2000. In previous reports, estimates started in 1990, because this was the baseline for the 2015 global targets set in the context of the MDGs. TB data for the period 1990–2000 were of relatively poor quality in many countries, because standardized systems for recording and reporting cases were often introduced only after the mid-1990s, in association with the introduction of the DOTS strategy (WHO’s recommended global TB strategy from the mid-1990s until the end of 2005). The quality and coverage of TB data since 2000 are comparatively much improved, and estimates are generally more robust.
8. Estimates of the burden of drug-resistant TBPrevious WHO global TB reports have focused on the burden of MDR-TB. In this report, estimates are of the burden of RR-TB (TB resistant to rifampicin, with or without resistance to other drugs) including MDR-TB, and are referred to as MDR/RR-TB. This update is because the latest WHO guidance on treatment of drug-resistant TB (an update issued in May 2016, see Chapter 4, Box 4.3) recommends that all people with RR-TB (not only those with MDR-TB) should be treated with an MDR-TB treatment regimen. Estimates of the burden of MDR/RR-TB are thus needed to assess progress in detection and treatment coverage for drug-resistant TB. Global and national estimates of the incidence of MDR/RR-TB are presented in this chapter; in addition, Chapter 4 includes estimates of the number of cases of MDR/RR-TB among notified cases of pulmonary TB (i.e. the number of cases that could be detected if all notified TB cases were tested for drug resistance). Methods used to produce the estimates of the incidence of MDR/RR-TB featured in this report are those agreed following an expert review during the April 2016 meeting of the WHO Global Task Force on TB Impact Measurement.c
9. Country-level estimates of TB incidence disaggregated by age and sex
In line with the SDG and End TB Strategy requirements for higher levels of data granularity and corresponding estimates, country-level estimates of TB incidence disaggregated by age (children and adults) and sex are shown (see Annex 2 and 3). Estimates of TB incidence in children (aged <15 years) are based on methods previously used at a global level, in which estimates based on case notifications adjusted for underdetection and underreportingd are combined with estimates derived from dynamic modelling.e
Updates anticipated in the near futureUpdates to estimates of disease burden are expected towards the end of 2016 or in early 2017 for Bangladesh, Kenya and the Philippines, following the completion of national TB prevalence surveys. Estimates of TB incidence in Indonesia, the Philippines, Thailand and Viet Nam may be updated following the implementation of inventory studies to measure underreporting of detected TB cases. Estimates of TB burden in India will be further updated once results from the national TB prevalence survey are available.
Updates to childhood TB mortality (primarily for the 0–14 year age group and, where possible, further disaggregated for those aged 0–4 and 5–14 years) are expected by early 2017, based on a systematic review and meta-analysis to inform CFRs for childrenf and a mathematical model estimating TB mortality in children as a function of TB incidence and CFRs.g
a Murray CJ, Ortblad KF, Guinovart C, Lim SS, Wolock TM, Roberts DA et al. Global, regional, and national incidence and mortality for HIV, tuberculosis, and malaria during 1990–2013: a systematic analysis for the Global Burden of Disease Study 2013. Lancet. 2014;384(9947):1005–1070 (http://www.ncbi.nlm.nih.gov/pubmed/25059949, accessed 24 August 2016).
b Groenewald P, Nannan N, Bourne D, Laubscher R, Bradshaw D. Identifying deaths from AIDS in South Africa. AIDS. 2005;19(2):193–201 (http://www.ncbi.nlm.nih.gov/pubmed/15668545, accessed 24 August 2016).
c For further details, please see Background Document 3b prepared for the April 2016 meeting of the Task Force, available at www.who.int/tb/advisory_bodies/impact_measurement_taskforce/meetings/tf6_background_3b_drtb_burden.pdf?ua=1 /
d Jenkins HE, Tolman AW, Yuen CM, Parr JB, Keshavjee S, Pérez-Vélez CM et al. Incidence of multidrug-resistant tuberculosis disease in children: systematic review and global estimates. The Lancet. 2014;383(9928):1572–1579 (http://www.ncbi.nlm.nih.gov/pubmed/24671080, accessed 24 August 2016).
e Dodd PJ, Gardiner E, Coghlan R, Seddon JA. Burden of childhood tuberculosis in 22 high-burden countries: a mathematical modelling study. Lancet Glob Health. 2014;2(8):e453-459 (http://www.ncbi.nlm.nih.gov/pubmed/25103518, accessed 24 August 2016).
f Jenkins H et al. Mortality among children diagnosed with tuberculosis: Systematic review and meta-analysis. Submitted for publication.
g Dodd P et al. The global burden of tuberculosis mortality in children. Under development.
:: Box 3.2Updates to estimates of TB disease burden in this report and anticipated updates

20 :: GLOBAL TUBERCULOSIS REPORT 2016
:: Box 3.3Updated and interim estimates of TB disease burden in India and plans for a national TB prevalence survey in 2017/2018
The estimates of TB disease burden in India published in the 2011–2015 global TB reports were based on the outcomes of a national consensus workshop held in Delhi in April 2011. This report includes estimates for India that have been revised substantially upwards compared with those published in 2011–2015, following accumulating evidence that the TB disease burden in India is higher than was estimated at that time.
The revised estimates of TB incidence (absolute numbers) are based on extrapolation of the results from a prevalence survey in one state (Gujarat). This survey used methods recommended by WHO and is the largest as well as the only state-wide prevalence survey implemented in India to date. It was assumed that the national prevalence of TB disease is the same as the prevalence in Gujarat, with incidence then estimated using a standard methodological approach recently reviewed by the WHO Global Task Force on TB Impact Measurement.a The trend in TB incidence is estimated as in global reports published 2011–2015; that is, using results from repeat tuberculin surveys (2000, 2010) and (to a lesser extent) trends in TB notifications in the districts where the Revised National TB Control Programme first implemented the DOTS strategy.
The revised estimates of TB mortality are derived from those published by IHME,b after adjustment for differences between WHO and IHME estimates of the total number of deaths each year.
These updated estimates of TB burden in India are considered interim estimates, pending results from a national TB prevalence survey that is scheduled to start in 2017 (see also Section 3.4).
The revised estimates, and how they compare with those published in the 2015 global TB report, can be summarized as follows:
! The updated estimate of incidence (new TB cases per year) is 2.8 million cases in 2015 (217 per 100 000 population), and 2.9 million (223 per 100 000 population) in 2014. These figures can be compared with notifications of 1.7 million new and relapse cases in 2015 (127 per 100 000 population) and 1.6 million new and relapse cases in 2014 (124 per 100 000 population). These figures suggest that 56% of incident cases were officially reported in 2014 and 59% in 2015. In the 2015 global TB report, the estimate for 2014 was that there were 2.2 million incident cases (167 per 100 000 population), with an estimated 74% of incident cases officially reported.
! The updated estimate of the number of TB deaths (excluding those in HIV-positive people, which are classified as deaths due to HIV/AIDS in ICD-10) is 478 000 in 2015 (36 per 100 000 population), and 483 000 (37
per 100 000 population) in 2014. In the 2015 global TB report, the estimate for 2014 was 220 000 (17 per 100 000 population).
! Estimated trends in TB incidence and mortality remain similar to those published in previous years, with incidence falling by 2% per year over 2000–2015 and mortality falling by 3.3% per year over the same period.
The six sources of evidence that the burden of TB is higher than estimated in April 2011 are summarized below.
1. Household survey in 30 districts of numbers of people on TB treatment, 2011
Starting in 2011, a TB project that aimed to increase civil society’s support to the NTP in India and to engage communities and community-based care providers was implemented in 374 out of 650 districts.c The 374 districts were selected based on suspected low TB case detection or limited access of populations to health services. Funding for the project was from the Global Fund to Fight AIDS, Tuberculosis and Malaria (Global Fund).
In a sample of 30 of the 374 districts, the number of people on TB treatment based on self-reporting was assessed using a dataset compiled as part of a survey of knowledge, attitudes and practices conducted from January to March 2011. Of the self-reported cases, 54% had not been officially reported to national authorities. The number of undetected cases could not be assessed because of the study design. For comparison, the estimate published in the 2015 global TB report was that 59% of incident cases were officially reported in 2010 (with the gap of 41% including both unreported and undetected cases).
2. Results from a state-wide prevalence survey in Gujarat state
In 2011, a prevalence survey was conducted in Gujarat. This was the country’s first state-wide survey (other surveys have been conducted in districts that were not nationally representative). Results were shared with WHO in 2015, and indicated a prevalence (adjusted for all ages and all forms of TB) of 390 cases per 100 000 population. This is much higher than the national estimate published by WHO in the 2015 global TB report of 250 prevalent cases per 100 000 population. Gujarat is among the wealthiest states in India, and given the link between overall levels of income and the burden of TB disease it seems unlikely that TB prevalence in Gujarat would be higher than the national average.
3. A district level household and facility survey (DLHS-4)A survey in 2012–2013 estimated prevalence based on interview screening at 592 cases per 100 000. However, this method for estimating prevalence is not recommended in the WHO handbook on TB prevalence surveys.
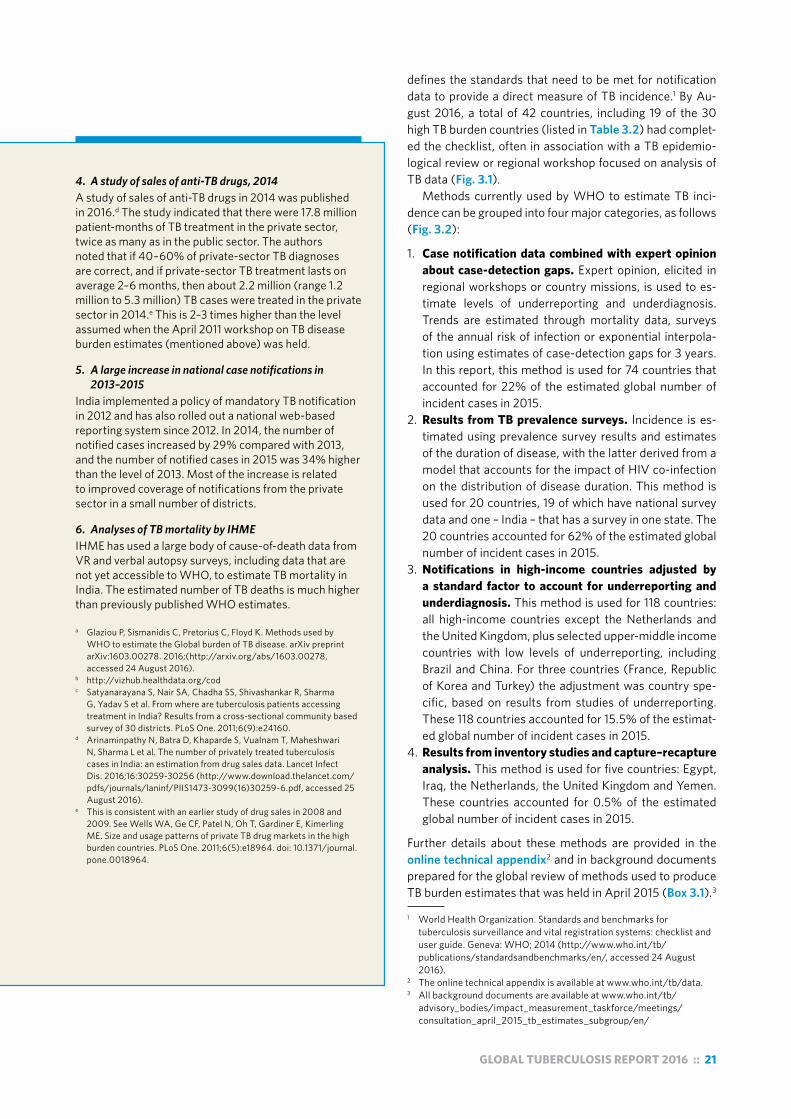
GLOBAL TUBERCULOSIS REPORT 2016 :: 21
defines the standards that need to be met for notification data to provide a direct measure of TB incidence.1 By Au-gust 2016, a total of 42 countries, including 19 of the 30 high TB burden countries (listed in Table 3.2) had complet-ed the checklist, often in association with a TB epidemio-logical review or regional workshop focused on analysis of TB data (Fig. 3.1).
Methods currently used by WHO to estimate TB inci-dence can be grouped into four major categories, as follows (Fig. 3.2):
1. Case notification data combined with expert opinion about case-detection gaps. Expert opinion, elicited in regional workshops or country missions, is used to es-timate levels of underreporting and underdiagnosis. Trends are estimated through mortality data, surveys of the annual risk of infection or exponential interpola-tion using estimates of case-detection gaps for 3 years. In this report, this method is used for 74 countries that accounted for 22% of the estimated global number of incident cases in 2015.
2. Results from TB prevalence surveys. Incidence is es-timated using prevalence survey results and estimates of the duration of disease, with the latter derived from a model that accounts for the impact of HIV co-infection on the distribution of disease duration. This method is used for 20 countries, 19 of which have national survey data and one – India – that has a survey in one state. The 20 countries accounted for 62% of the estimated global number of incident cases in 2015.
3. Notifications in high-income countries adjusted by a standard factor to account for underreporting and underdiagnosis. This method is used for 118 countries: all high-income countries except the Netherlands and the United Kingdom, plus selected upper-middle income countries with low levels of underreporting, including Brazil and China. For three countries (France, Republic of Korea and Turkey) the adjustment was country spe-cific, based on results from studies of underreporting. These 118 countries accounted for 15.5% of the estimat-ed global number of incident cases in 2015.
4. Results from inventory studies and capture–recapture analysis. This method is used for five countries: Egypt, Iraq, the Netherlands, the United Kingdom and Yemen. These countries accounted for 0.5% of the estimated global number of incident cases in 2015.
Further details about these methods are provided in the online technical appendix2 and in background documents prepared for the global review of methods used to produce TB burden estimates that was held in April 2015 (Box 3.1).3
1 World Health Organization. Standards and benchmarks for tuberculosis surveillance and vital registration systems: checklist and user guide. Geneva: WHO; 2014 (http://www.who.int/tb/publications/standardsandbenchmarks/en/, accessed 24 August 2016).
2 The online technical appendix is available at www.who.int/tb/data. 3 All background documents are available at www.who.int/tb/
advisory_bodies/impact_measurement_taskforce/meetings/consultation_april_2015_tb_estimates_subgroup/en/
4. A study of sales of anti-TB drugs, 2014A study of sales of anti-TB drugs in 2014 was published in 2016.d The study indicated that there were 17.8 million patient-months of TB treatment in the private sector, twice as many as in the public sector. The authors noted that if 40–60% of private-sector TB diagnoses are correct, and if private-sector TB treatment lasts on average 2–6 months, then about 2.2 million (range 1.2 million to 5.3 million) TB cases were treated in the private sector in 2014.e This is 2–3 times higher than the level assumed when the April 2011 workshop on TB disease burden estimates (mentioned above) was held.
5. A large increase in national case notifications in 2013–2015
India implemented a policy of mandatory TB notification in 2012 and has also rolled out a national web-based reporting system since 2012. In 2014, the number of notified cases increased by 29% compared with 2013, and the number of notified cases in 2015 was 34% higher than the level of 2013. Most of the increase is related to improved coverage of notifications from the private sector in a small number of districts.
6. Analyses of TB mortality by IHMEIHME has used a large body of cause-of-death data from VR and verbal autopsy surveys, including data that are not yet accessible to WHO, to estimate TB mortality in India. The estimated number of TB deaths is much higher than previously published WHO estimates.
a Glaziou P, Sismanidis C, Pretorius C, Floyd K. Methods used by WHO to estimate the Global burden of TB disease. arXiv preprint arXiv:1603.00278. 2016;(http://arxiv.org/abs/1603.00278, accessed 24 August 2016).
b http://vizhub.healthdata.org/codc Satyanarayana S, Nair SA, Chadha SS, Shivashankar R, Sharma
G, Yadav S et al. From where are tuberculosis patients accessing treatment in India? Results from a cross-sectional community based survey of 30 districts. PLoS One. 2011;6(9):e24160.
d Arinaminpathy N, Batra D, Khaparde S, Vualnam T, Maheshwari N, Sharma L et al. The number of privately treated tuberculosis cases in India: an estimation from drug sales data. Lancet Infect Dis. 2016;16:30259-30256 (http://www.download.thelancet.com/pdfs/journals/laninf/PIIS1473-3099(16)30259-6.pdf, accessed 25 August 2016).
e This is consistent with an earlier study of drug sales in 2008 and 2009. See Wells WA, Ge CF, Patel N, Oh T, Gardiner E, Kimerling ME. Size and usage patterns of private TB drug markets in the high burden countries. PLoS One. 2011;6(5):e18964. doi: 10.1371/journal.pone.0018964.
:: Box 3.3Updated and interim estimates of TB TB prevalence survey in 2017/2018

22 :: GLOBAL TUBERCULOSIS REPORT 2016
:: Box 3.4Inventory studies to measure the underreporting of detected TB cases: progress to date
The accurate understanding and measurement of TB incidence, one of the high-level indicators consistently used by the global health community since 2000, is pivotal to monitoring progress against international targets set for TB in the End TB Strategy and the SDGs, and for assessing whether investments in TB care and prevention actually work. Although the level of and trends in TB incidence could be directly measured through population cohort studies, national cohort studies are too expensive and impractical to implement. In settings with state-of-the-art routine surveillance systems where most, if not all, new TB cases are diagnosed and registered, TB cases notified to the NTP provide a good proxy for TB incidence. More often than not, however, case-detection gaps plague national TB surveillance systems at different stages in the patient cascade, including gaps in diagnosis, treatment and reporting. TB inventory studies are a customized and more cost-effective alternative to population cohort studies that could inform the extent of such gaps. TB inventory studies have two broad study objectives, one involving the direct measurement of TB underreporting and the other, under certain conditions, the estimation of TB incidence through capture–recapture analysis.a
There has been growing interest in and implementation of national inventory studies to measure TB underreporting in the past 10 years (Fig. B3.4.1) – often in combination with capture–recapture analysis – in countries including the Netherlands,b the United Kingdom,c French Guiana,d Egypt,e Yemen,f Iraq,g Pakistanh and Kenya.i Hypothesis-generating investigations to assess the level of TB case-detection gaps were also completed in India (cross-sectional survey of households),j Indonesiak and Viet Nam (nested within a national prevalence survey among adults).l Based on these studies, the level of TB underreporting found was context-dependent, and ranged from about 15% in European countries, 20% in Africa and 30% in the WHO Eastern
Mediterranean Region, to 50% in countries in Asia with a large private sector. These data have all informed national estimates of TB disease burden reported by WHO. Results from TB inventory studies provide the platform and evidence to make programmatic changes to better address the TB epidemic. The European Centre for Disease Prevention and Control acknowledges the value of inventory studies for providing evidence about the performance of surveillance systems in Europe, and UNITAID and the Global Fund are already supporting the implementation of national TB inventory studies in Asia, including some studies with a particular focus on children.
Strengthening national TB surveillance systems and the data they produce is the only credible way to ensure the robust and routine monitoring of progress towards global targets for TB. Inventory studies are an important tool, one of the few available today, for achieving that goal for TB surveillance. As countries begin working towards the new TB incidence targets set within the SDGs and the End TB Strategy, increased commitment from NTPs and funding agencies to conducting and funding TB inventory studies is required.
a World Health Organization. Assessing tuberculosis under-reporting through inventory studies. Geneva: WHO; 2012 (http://www.who.int/tb/publications/inventory_studies/en/, accessed 15 August 2016).
b van Hest NAH, Smit F, Baars HWM, De Vries G, De Haas PEW, Westenend PJ et al. Completeness of notification of tuberculosis in The Netherlands: how reliable is record-linkage and capture-recapture analysis? Epidemiology and Infection. 2007;135(6):1021–1029.
c van Hest NAH, Story A, Grant AD, Antoine D, Crofts JP, Watson JM. Record-linkage and capture-recapture analysis to estimate the incidence and completeness of reporting of tuberculosis in England 1999-2002. Epidemiology and Infection. 2008;136(12):1606–1616..
d Guernier V, Guegan J-F, Deparis X. An evaluation of the actual incidence of tuberculosis in French Guiana using a capture-recapture model. Microbes and Infection. 2006;8(3):721–727.
e Bassili A, Grant AD, El-Mohgazy E, Galal A, Glaziou P, Seita A et al. Estimating tuberculosis case detection rate in resource-limited countries: a capture-recapture study in Egypt. The International Journal of Tuberculosis and Lung Disease. 2010;14(6):727–732.
f Bassili A, Al-Hammadi A, Al-Absi A, Glaziou P, Seita A, Abubakar I et al. Estimating the tuberculosis burden in resource-limited countries: a capture-recapture study in Yemen. The International Journal of Tuberculosis and Lung Disease. 2013;17(4):456–461.
g Huseynova S, Hashim DS, Tbena MR, Harris R, Bassili A, Abubakar I et al. Estimating tuberculosis burden and reporting in resource-limited countries: a capture-recapture study in Iraq. The International Journal of Tuberculosis and Lung Disease. 2013;17(4):462–467.
h Fatima R, Harris RJ, Enarson DA, Hinderaker SG, Qadeer E, Ali K et al. Estimating tuberculosis burden and case detection in Pakistan. The International Journal of Tuberculosis and Lung Disease. 2014;18(1):55–60.
i Tollefson D, Ngari F, Ndisha M, Gethi D, Kipruto H, Cain K, Bloss E. Underreporting of sputum smear-positive tuberculosis cases in Kenya. International Journal of Tuberculosis and Lung Disease. (Under peer review).
j Satyanarayana S, Nair SA, Chadha SS, Shivashankar R, Sharma G, Yadav S et al. From where are tuberculosis patients accessing treatment in India? Results from a cross-sectional community based survey of 30 districts. PLoS One. 2011;6(9):e24160 (http://www.ncbi.nlm.nih.gov/pubmed/21912669, accessed 24 August 2016).
k Ministry of Health. Report of Indonesia National TB prevalence survey 2013–2014. Ministry of Health, Republic of Indonesia, Jakarta, 2015.
l Hoa NB, Cobelens FGJ, Sy DN, Nhung NV, Borgdorff MW, Tiemersma EW. Diagnosis and treatment of tuberculosis in the private sector, Vietnam. Emerging Infectious Diseases. 2011;17(3):562–564.
:: FIG. B3.4.1 Countries in which inventory studies of the underreporting of detected TB cases have been implemented since 2000 (status in August 2016)a,b
a Pakistan is currently undertaking a second inventory study focussing on children with TB.
b Nigeria is planning to undertake a subnational level study (in metropolitan Lagos).
At least one study completedStudy plannedStudy ongoingNot applicable

GLOBAL TUBERCULOSIS REPORT 2016 :: 23
:: FIG. 3.1 Strengthening national TB surveillance (status in August 2016)
Countries in which an epidemiological review has been undertaken since July 2012
Planned for 2016CompletedNot applicable
Countries covered by a regional or country-specific workshop focused on analysis and use of TB data since October 2015
Countries in which a checklist of standards and benchmarks has been completed since January 2013

24 :: GLOBAL TUBERCULOSIS REPORT 2016
:: FIG. 3.2 Main methods used to estimate TB incidencea
a In the first method, case notification data are combined with expert opinion about case detection gaps (under-reporting and under-diagnosis), and trends are estimated using either mortality data, repeat surveys of the annual risk of infection or exponential interpolation using estimates of case detection gaps for three years. For all high-income countries except the Netherlands and the United Kingdom, notifications are adjusted by a standard amount or measure of under-reporting from inventory studies, to account for case detection gaps. In India, results from a subnational prevalence survey for the state of Gujarat were used. For further details about all four methods, see text.
Main methodCase notifications, expert opinionPrevalence survey
Case notifications, standard adjustmentCapture–recapture
No data
Not applicable
3.1.2 Estimates of TB incidence in 2015Globally in 2015, there were an estimated 10.4 million inci-dent cases of TB (range, 8.7 million to 12.2 million),1 equiv-alent to 142 cases per 100 000 population (estimates of absolute numbers are shown in Table 3.2 and estimates of rates per capita are shown in Table 3.3). As explained in Box 3.2, estimates of TB incidence have been revised upwards for the period 2000–2015, compared with those published in the 2015 global TB report. This follows accu-mulating evidence that the burden of TB disease in India is considerably higher than previously estimated (Box 3.3), and more minor upward revisions for the Democratic Peo-ple’s Republic of Korea and the Philippines. The updated estimates for India should be considered interim in nature, pending a more definitive assessment that will follow com-pletion of a national TB prevalence survey, which is sched-uled to start in 2017.
Most of the estimated number of cases in 2015 occurred in Asia (61%)2 and the WHO African Region (26%); smaller proportions of cases occurred in the Eastern Mediterrane-an Region (7%), the European Region (3%) and the Region
1 Here and elsewhere in the report, “Range” refers to the 95% uncertainty interval.
2 “Asia” refers to the WHO regions of South-East Asia and the Western Pacific.
of the Americas (3%). The 30 high TB burden countries3 accounted for 87% of all estimated incident cases world-wide. The six countries that stood out as having the larg-est number of incident cases in 2015 were (in descending order) India, Indonesia, China, Nigeria, Pakistan and South Africa (combined, 60% of the global total). Of these, Chi-na, India and Indonesia alone accounted for 45% of global cases in 2015.
The annual number of incident TB cases relative to population size (the incidence rate) varied widely among countries in 2015, from under 10 per 100 000 population in most high-income countries to 150–300 in most of the 30 high TB burden countries (Fig. 3.3), and above 500 in a few countries including Lesotho, Mozambique and South Africa (Table 3.3).
An estimated 11% (range, 9–14%) of the incident TB cases in 2015 were among people living with HIV (Table 3.2, Table 3.3). The proportion of TB cases coinfected with HIV was highest in countries in the WHO African Region, and exceeded 50% in parts of southern Africa (Fig. 3.4).
Estimates of the incidence of zoonotic TB are shown in Box 3.5.
3 These countries are listed in Table 3.2 and Table 3.3. For an explanation of how the list of 30 high TB burden countries was defined, see Chapter 2.
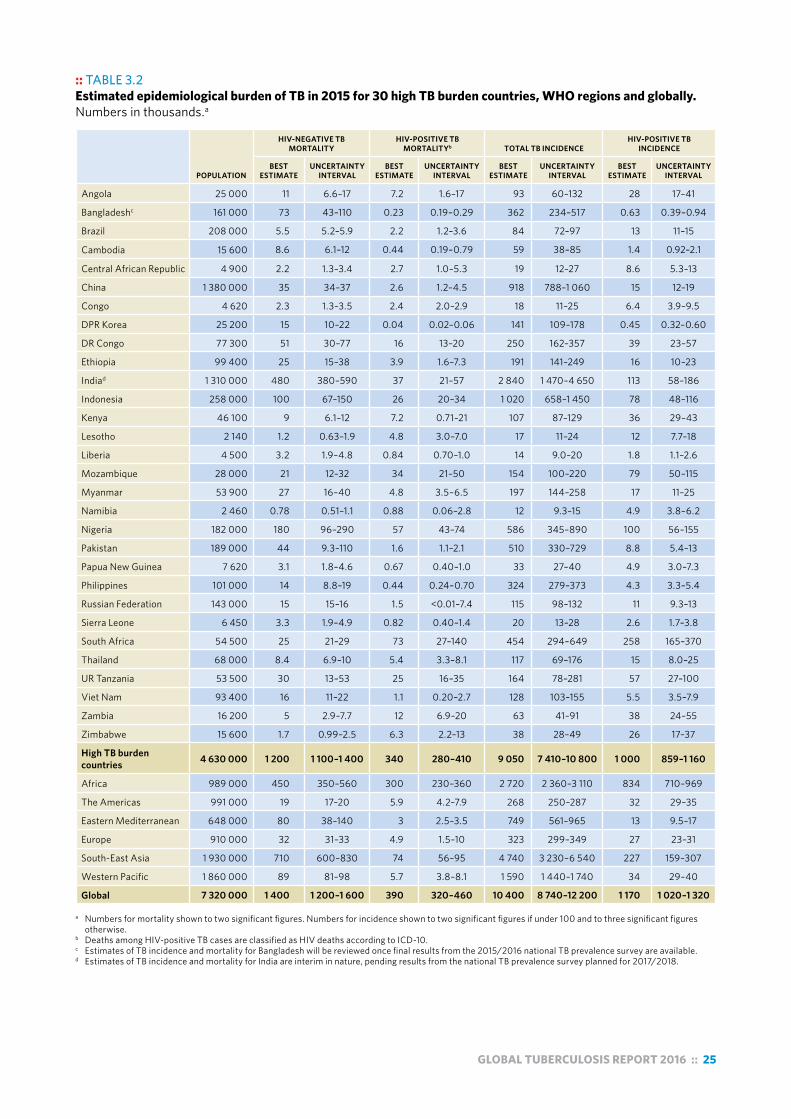
GLOBAL TUBERCULOSIS REPORT 2016 :: 25
:: TABLE 3.2Estimated epidemiological burden of TB in 2015 for 30 high TB burden countries, WHO regions and globally. Numbers in thousands.a
POPULATION
HIV-NEGATIVE TB MORTALITY
HIV-POSITIVE TB MORTALITYb TOTAL TB INCIDENCE
HIV-POSITIVE TB INCIDENCE
BEST ESTIMATE
UNCERTAINTY INTERVAL
BEST ESTIMATE
UNCERTAINTY INTERVAL
BEST ESTIMATE
UNCERTAINTY INTERVAL
BEST ESTIMATE
UNCERTAINTY INTERVAL
Angola 25 000 11 6.6–17 7.2 1.6–17 93 60–132 28 17–41
Bangladeshc 161 000 73 43–110 0.23 0.19–0.29 362 234–517 0.63 0.39–0.94
Brazil 208 000 5.5 5.2–5.9 2.2 1.2–3.6 84 72–97 13 11–15
Cambodia 15 600 8.6 6.1–12 0.44 0.19–0.79 59 38–85 1.4 0.92–2.1
Central African Republic 4 900 2.2 1.3–3.4 2.7 1.0–5.3 19 12–27 8.6 5.3–13
China 1 380 000 35 34–37 2.6 1.2–4.5 918 788–1 060 15 12–19
Congo 4 620 2.3 1.3–3.5 2.4 2.0–2.9 18 11–25 6.4 3.9–9.5
DPR Korea 25 200 15 10–22 0.04 0.02–0.06 141 109–178 0.45 0.32–0.60
DR Congo 77 300 51 30–77 16 13–20 250 162–357 39 23–57
Ethiopia 99 400 25 15–38 3.9 1.6–7.3 191 141–249 16 10–23
Indiad 1 310 000 480 380–590 37 21–57 2 840 1 470–4 650 113 58–186
Indonesia 258 000 100 67–150 26 20–34 1 020 658–1 450 78 48–116
Kenya 46 100 9 6.1–12 7.2 0.71–21 107 87–129 36 29–43
Lesotho 2 140 1.2 0.63–1.9 4.8 3.0–7.0 17 11–24 12 7.7–18
Liberia 4 500 3.2 1.9–4.8 0.84 0.70–1.0 14 9.0–20 1.8 1.1–2.6
Mozambique 28 000 21 12–32 34 21–50 154 100–220 79 50–115
Myanmar 53 900 27 16–40 4.8 3.5–6.5 197 144–258 17 11–25
Namibia 2 460 0.78 0.51–1.1 0.88 0.06–2.8 12 9.3–15 4.9 3.8–6.2
Nigeria 182 000 180 96–290 57 43–74 586 345–890 100 56–155
Pakistan 189 000 44 9.3–110 1.6 1.1–2.1 510 330–729 8.8 5.4–13
Papua New Guinea 7 620 3.1 1.8–4.6 0.67 0.40–1.0 33 27–40 4.9 3.0–7.3
Philippines 101 000 14 8.8–19 0.44 0.24–0.70 324 279–373 4.3 3.3–5.4
Russian Federation 143 000 15 15–16 1.5 <0.01–7.4 115 98–132 11 9.3–13
Sierra Leone 6 450 3.3 1.9–4.9 0.82 0.40–1.4 20 13–28 2.6 1.7–3.8
South Africa 54 500 25 21–29 73 27–140 454 294–649 258 165–370
Thailand 68 000 8.4 6.9–10 5.4 3.3–8.1 117 69–176 15 8.0–25
UR Tanzania 53 500 30 13–53 25 16–35 164 78–281 57 27–100
Viet Nam 93 400 16 11–22 1.1 0.20–2.7 128 103–155 5.5 3.5–7.9
Zambia 16 200 5 2.9–7.7 12 6.9–20 63 41–91 38 24–55
Zimbabwe 15 600 1.7 0.99–2.5 6.3 2.2–13 38 28–49 26 17–37
High TB burden countries 4 630 000 1 200 1 100–1 400 340 280–410 9 050 7 410–10 800 1 000 859–1 160
Africa 989 000 450 350–560 300 230–360 2 720 2 360–3 110 834 710–969
The Americas 991 000 19 17–20 5.9 4.2–7.9 268 250–287 32 29–35
Eastern Mediterranean 648 000 80 38–140 3 2.5–3.5 749 561–965 13 9.5–17
Europe 910 000 32 31–33 4.9 1.5–10 323 299–349 27 23–31
South-East Asia 1 930 000 710 600–830 74 56–95 4 740 3 230–6 540 227 159–307
Western Pacific 1 860 000 89 81–98 5.7 3.8–8.1 1 590 1 440–1 740 34 29–40
Global 7 320 000 1 400 1 200–1 600 390 320–460 10 400 8 740–12 200 1 170 1 020–1 320 a Numbers for mortality shown to two significant figures. Numbers for incidence shown to two significant figures if under 100 and to three significant figures
otherwise.b Deaths among HIV-positive TB cases are classified as HIV deaths according to ICD-10.c Estimates of TB incidence and mortality for Bangladesh will be reviewed once final results from the 2015/2016 national TB prevalence survey are available.d Estimates of TB incidence and mortality for India are interim in nature, pending results from the national TB prevalence survey planned for 2017/2018.

26 :: GLOBAL TUBERCULOSIS REPORT 2016
:: TABLE 3.3 Estimated epidemiological burden of TB in 2015 for 30 high TB burden countries, WHO regions and globally. Best estimates are followed by the lower and upper bounds of the 95% uncertainty interval. Rates per 100 000 population except where indicated.a
HIV-NEGATIVE TB MORTALITY HIV-POSITIVE TB MORTALITY TOTAL TB INCIDENCE HIV PREVALENCE IN INCIDENT TB %
BEST ESTIMATE
UNCERTAINTY INTERVAL
BEST ESTIMATE
UNCERTAINTY INTERVAL
BEST ESTIMATE
UNCERTAINTY INTERVAL
BEST ESTIMATE
UNCERTAINTY INTERVAL
Angola 45 27–67 29 6.5–67 370 240–529 30 24–36
Bangladeshb 45 27–68 0.14 0.12–0.18 225 146–321 0.18 0.14–0.21
Brazil 2.7 2.5–2.8 1.1 0.56–1.7 41 35–47 15 14–16
Cambodia 55 39–74 2.8 1.2–5.0 380 246–543 2.4 2.2–2.7
Central African Republic 45 26–70 55 20–107 391 253–558 45 36–54
China 2.6 2.5–2.7 0.19 0.09–0.33 67 57–77 1.7 1.4–2.0
Congo 49 29–75 53 44–63 379 246–542 36 29–44
DPR Korea 61 40–87 0.15 0.07–0.26 561 432–706 0.31 0.26–0.38
DR Congo 66 39–99 21 17–26 324 210–463 15 13–19
Ethiopia 26 15–38 4.0 1.6–7.4 192 142–250 8.3 7.6–9.1
Indiac 32 29–35 2.8 1.6–4.3 217 112–355 4.0 3.6–4.4
Indonesia 40 26–57 10 7.6–13 395 255–564 7.7 6.2–9.3
Kenya 20 13–27 16 1.5–45 233 189–281 33 32–35
Lesotho 55 29–89 223 139–328 788 510–1125 72 63–80
Liberia 70 41–107 19 16–22 308 199–440 13 11–15
Mozambique 74 43–115 120 73–178 551 356–787 52 45–58
Myanmar 49 30–74 9.0 6.4–12 365 267–479 8.9 7.9–9.8
Namibia 32 21–45 36 2.5–112 489 376–616 41 39–43
Nigeria 99 53–160 31 24–40 322 189–488 17 14–20
Pakistan 23 4.9–56 0.83 0.60–1.1 270 175–386 1.7 1.4–2.1
Papua New Guinea 41 24–61 8.8 5.2–13 432 352–521 15 12–18
Philippines 13 8.7–19 0.44 0.24–0.70 322 277–370 1.3 1.1–1.6
Russian Federation 11 10–11 1.0 0–5.2 80 69–92 9.9 8.8–11
Sierra Leone 51 30–76 13 6.2–21 307 198–438 13.3 12–15
South Africa 44 39–50 133 50–256 834 539–1190 57 52–61
Thailand 12 10–15 8.0 4.9–12 172 102–259 13 12–14
UR Tanzania 56 25–99 47 31–66 306 146–525 35 31–40
Viet Nam 17 12–23 1.1 0.21–2.8 137 110–166 4.3 4.0–4.6
Zambia 31 18–47 77 42–121 391 253–558 60 54–66
Zimbabwe 11 6.3–16 40 14–81 242 179–314 69 64–74
High TB burden countries 25 22–28 7.3 5.9–8.8 195 160–234 11 8.6–14
Africa 45 35–57 30 24–37 275 239–314 31 25–37
The Americas 1.9 1.8–2.0 0.59 0.42–0.79 27 25–29 12 10–13
Eastern Mediterranean 12 5.8–21 0.46 0.38–0.54 116 86–149 1.8 1.2–2.7
Europe 3.5 3.4–3.6 0.54 0.17–1.1 36 33–38 8.4 7.0–9.9
South-East Asia 37 31–43 3.9 2.9–4.9 246 167–339 4.9 2.8–7.6
Western Pacific 4.8 4.4–5.3 0.31 0.20–0.44 86 78–94 2.2 1.8–2.6
Global 19 17–21 5.3 4.4–6.3 142 119–166 11 9.1–14 a Deaths among HIV-positive TB cases are classified as HIV deaths according to ICD-10.b Estimates of TB incidence and mortality for Bangladesh will be reviewed once final results from the 2015/2016 national TB prevalence survey are available. c Estimates of TB incidence and mortality for India are interim in nature, pending results from the national TB prevalence survey planned for 2017/2018.

GLOBAL TUBERCULOSIS REPORT 2016 :: 27
Estimated new TB cases (all forms) per 100 000 population per year
0–24.925–99100–199200–299≥300No dataNot applicable
:: FIG. 3.3 Estimated TB incidence rates, 2015
HIV prevalencein new TB casesall ages (%)
0–4.95–9.910–1920–49≥50No dataNot applicable
:: FIG. 3.4 Estimated HIV prevalence in new and relapse TB cases, 2015

28 :: GLOBAL TUBERCULOSIS REPORT 2016
:: Box 3.5Incidence and mortality due to zoonotic TB
Mycobacterium bovis is the causal agent of bovine TB in cattle and zoonotic TB in people. Bovine TB has a major impact on livestock productivity, and on the livelihoods of poor and marginalised communities. The most common route of transmission to people is through the consumption of unpasteurized dairy products.
In 2015, there were an estimated 149 000 cases of zoonotic TB (Table B3.5.1). This was calculated by applying the regional proportions of all TB cases that are estimated to be caused by M. bovis to estimates of TB incidence in 2015. A standard deviation of 50% relative to the best estimate of each regional proportion was assumed when propagating uncertainty. Given the absence of routine reporting in most countries where bovine TB is endemic, these proportions were drawn from scientific studiesa,b that lack regional representativeness. As a result, estimates have a large uncertainty range. Mortality (excluding TB deaths in HIV-positive people) was similarly estimated based on the same proportions, but this time was applied to aggregated estimates of TB mortality by WHO region, and reduced by a factor of 20% to account for a higher proportion of extrapulmonary TB cases among those with M. bovis, and associated lower CFR.
There is a need to strengthen surveillance of zoonotic TB to better quantify the burden of disease. One of the major barriers for diagnosis is that the most commonly used laboratory procedures do not differentiate the M. tuberculosis complex into the species of M. bovis and M. tuberculosis. Zoonotic TB also presents a treatment challenge. It more often occurs in extrapulmonary sites and is inherently resistant to pyrazinamide, one of the drugs in the standard first-line anti-TB treatment regimen.
In the context of WHO’s End TB Strategy, which calls for diagnosis and treatment of every TB case, zoonotic TB must be better addressed. This requires a holistic approach that links the human and animal health sectors to reduce the risk of TB transmission at the human–animal interface.
:: TABLE B3.5.1Estimated incidence and mortality due to M. bovis TB. Best estimates (absolute numbers) are followed by the lower and upper bounds of the 95% uncertainty interval.
REGION INCIDENCE MORTALITY
Africa 76 300 (20 300–168 000) 10 000 (2570–22 500)
Americas 804 (218–1770) 46 (12–98)
Eastern Mediterranean 7490 (1883-16 900) 639 (113–1610)
Europe 1290 (350–2840) 103 (28–225)
South-East Asia 47 400 (11 300–109 000) 2280 (602–5050)
Western Pacific 15 900 (4290–34 900) 286 (77–630)
Global 149 000 (71 600–255 000) 13 400 (5050–25 700)
a World Health Organization. WHO estimates of the global burden of foodborne diseases. Geneva: WHO, Foodborne diseases burden epidemiology reference group 2007–2015; 2015 (http://www.who.int/foodsafety/publications/foodborne_disease/fergreport/en/, accessed 24 August 2016).
b Muller B, Durr S, Alonso S, Hattendorf J, Laisse CJ, Parsons SD et al. Zoonotic Mycobacterium bovis-induced tuberculosis in humans. Emerg Infect Dis. 2013;19(6):899–908 (http://www.ncbi.nlm.nih.gov/pubmed/23735540, accessed 24 August 2016).
3.1.3 Estimated trends in TB incidence, 2000–2015
Consistent with previous global TB reports, the number of incident cases is falling slowly, in both absolute terms and per capita (Fig. 3.5, Fig. 3.6). Globally, the average rate of decline in the TB incidence rate was 1.4% per year in 2000−2015, and 1.5% between 2014 and 2015. This needs to accelerate to 4–5% per year by 2020 to achieve the milestones for reductions in cases and deaths set in the End TB Strategy (Chapter 2).
Trends are shown for the six WHO regions in Fig. 3.7 and for the 30 high TB burden countries in Fig. 3.8. The fastest declines are in the WHO European Region (3.3% per year from 2014 to 2015). The estimated decline in the incidence rate since 2010 has exceeded 4% per year in sev-eral high TB burden countries, including Zimbabwe (11%), Lesotho (7%), the United Republic of Tanzania (6.8%), Ethiopia (6.7%), Namibia (6.2%), Kenya (5.0%) and the Russian Federation (4.2%).
3.2 TB mortalityDeaths from TB among HIV-negative people are classified as TB deaths in the most recent version of the International classification of diseases (ICD-10).1 When an HIV-positive person dies from TB, the underlying cause is classified as HIV. For consistency with these classifications, this sec-tion makes a clear distinction between TB deaths in HIV- negative people and TB deaths in HIV-positive people.
3.2.1 Methods to estimate TB mortalityTB mortality among HIV-negative people can be measured directly using data from national vital registration (VR) systems, provided that these systems have high cover-age and causes of death are accurately coded according to ICD-10. Sample VR systems covering representative areas
1 World Health Organization. International statistical classification of diseases and health related problems (The) ICD-10. Geneva: WHO; 2004.
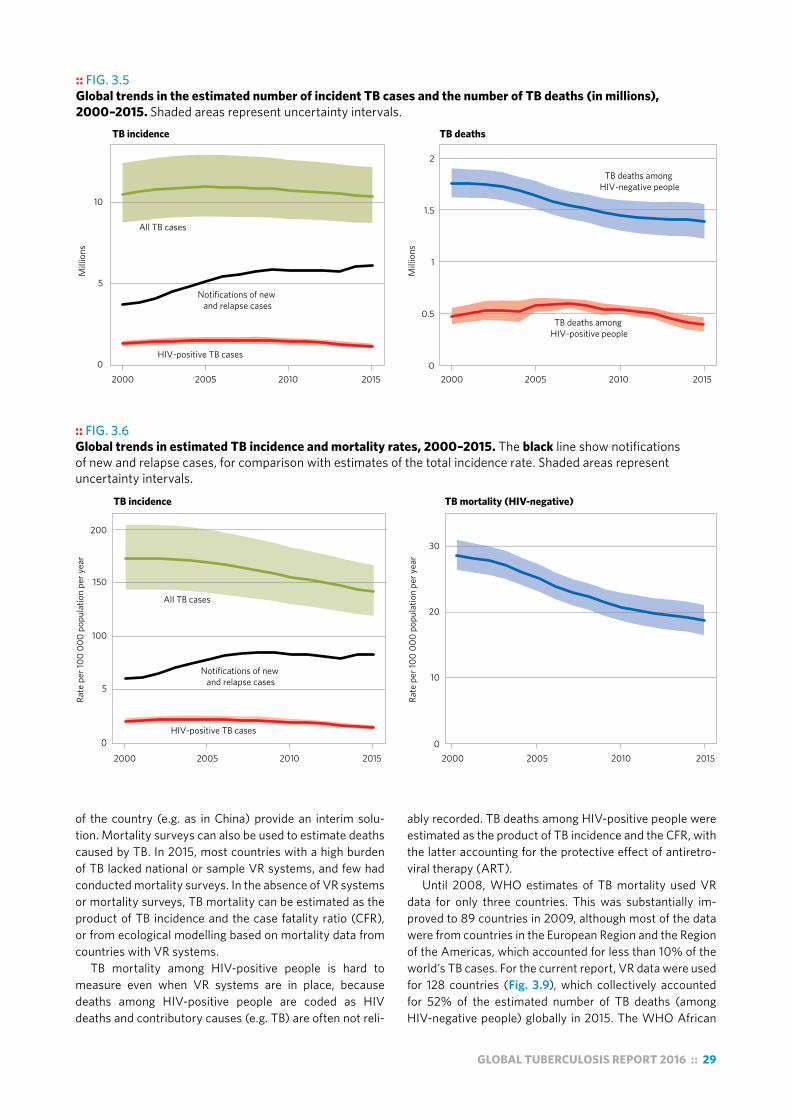
GLOBAL TUBERCULOSIS REPORT 2016 :: 29
of the country (e.g. as in China) provide an interim solu-tion. Mortality surveys can also be used to estimate deaths caused by TB. In 2015, most countries with a high burden of TB lacked national or sample VR systems, and few had conducted mortality surveys. In the absence of VR systems or mortality surveys, TB mortality can be estimated as the product of TB incidence and the case fatality ratio (CFR), or from ecological modelling based on mortality data from countries with VR systems.
TB mortality among HIV-positive people is hard to measure even when VR systems are in place, because deaths among HIV-positive people are coded as HIV deaths and contributory causes (e.g. TB) are often not reli-
ably recorded. TB deaths among HIV-positive people were estimated as the product of TB incidence and the CFR, with the latter accounting for the protective effect of antiretro-viral therapy (ART).
Until 2008, WHO estimates of TB mortality used VR data for only three countries. This was substantially im-proved to 89 countries in 2009, although most of the data were from countries in the European Region and the Region of the Americas, which accounted for less than 10% of the world’s TB cases. For the current report, VR data were used for 128 countries (Fig. 3.9), which collectively accounted for 52% of the estimated number of TB deaths (among HIV-negative people) globally in 2015. The WHO African
:: FIG. 3.5 Global trends in the estimated number of incident TB cases and the number of TB deaths (in millions), 2000–2015. Shaded areas represent uncertainty intervals.
All TB cases
Notifications of new and relapse cases
HIV-positive TB cases
TB deaths among HIV-negative people
TB deaths among HIV-positive people
TB incidence TB deaths
0
0.5
1
1.5
2
2000 2005 2010 2015
Mill
ions
0
5
10
2000 2005 2010 2015
Mill
ions
:: FIG. 3.6 Global trends in estimated TB incidence and mortality rates, 2000–2015. The black line show notifications of new and relapse cases, for comparison with estimates of the total incidence rate. Shaded areas represent uncertainty intervals.
All TB cases
Notifications of new and relapse cases
HIV-positive TB cases0
5
100
2000 2005 2010 20150
10
20
30
2000 2005 2010 2015
TB incidence TB mortality (HIV-negative)
Rate
per
100
000
popu
latio
n pe
r yea
r
Rate
per
100
000
popu
latio
n pe
r yea
r
150
200

30 :: GLOBAL TUBERCULOSIS REPORT 2016
Region is the part of the world in which there is the great-est need to introduce or strengthen a VR system in which causes of death are classified according to ICD-10.
Details about the methods used to produce estimates of TB mortality are provided in the online technical appendix1 and in background documents prepared for the global re-view of methods used to produce TB burden estimates that was held in April 2015 (Box 3.1).
3.2.2 Estimates of TB mortality in 2015Estimates of the number of deaths caused by TB are shown globally, for the six WHO regions and for the 30 high TB burden countries in Table 3.2. There were an estimated 1.4 million (range, 1.2 million to 1.6 million) deaths from TB among HIV-negative people in 2015 and an additional 0.39 million (range, 0.32 million to 0.46 million) deaths from TB among HIV-positive people. TB is one of the top 10 causes of death worldwide, and caused more deaths than HIV/AIDS in 2015 (Fig. 3.10, Fig. 3.11).2
About 84% of TB deaths among HIV-negative people occurred in the WHO African Region and South-East Asia Region in 2015; these regions accounted for 86% of the
1 The online technical appendix is available at www.who.int/tb/data. 2 WHO Global Health Observatory data repository, available at http://
apps.who.int/gho/data/node.main.GHECOD?lang=en (accessed 27 July 2016).
:: FIG. 3.7 Regional trends in estimated TB incidence rates (log scale) by WHO region, 2000−2015. Total TB incidence rates are shown in green and incidence rates of HIV-positive TB are shown in red. Shaded areas represent uncertainty intervals. The black lines show notifications of new and relapse cases for comparison with estimates of the total incidence rate.
Africa
Rate
per
100
000
popu
latio
n pe
r yea
r (lo
g sc
ale)
12
510203050
100200300
12
510203050
100200300
2000 2005 2010 2015 2000 2005 2010 2015 2000 2005 2010 2015
The Americas Eastern Mediterranean
Europe South-East Asia Western Pacific
combined total of TB deaths in HIV-negative and HIV-pos-itive people. India and Nigeria accounted for 48% of global TB deaths among HIV-negative people and for 43% of the combined total TB deaths in HIV-negative and HIV-positive people.
Estimates of TB mortality rates (per 100 000 popula-tion) are shown globally, for the six WHO regions and for the 30 high TB burden countries in Table 3.3. Globally, the number of TB deaths among HIV-negative people per 100 000 population was 19 in 2015, and 24 when TB deaths among HIV-positive people were included. There was con-siderable variation among countries (Fig. 3.12), ranging from less than one TB death per 100 000 population in many high-income countries to more than 40 deaths per 100 000 population in much of the WHO African Region and in five high TB burden countries in Asia (Bangladesh, Cambodia, the Democratic People’s Republic of Korea, Myanmar and Papua New Guinea).
Estimates of the number of deaths caused by zoonotic TB are shown in Box 3.5.
3.2.3 Estimated trends in TB mortality, 2000–2015
Globally, the absolute number of TB deaths among HIV-negative people has been falling since 2000, from 1.8 million in 2000 to 1.4 million in 2015 (Fig. 3.5). The TB
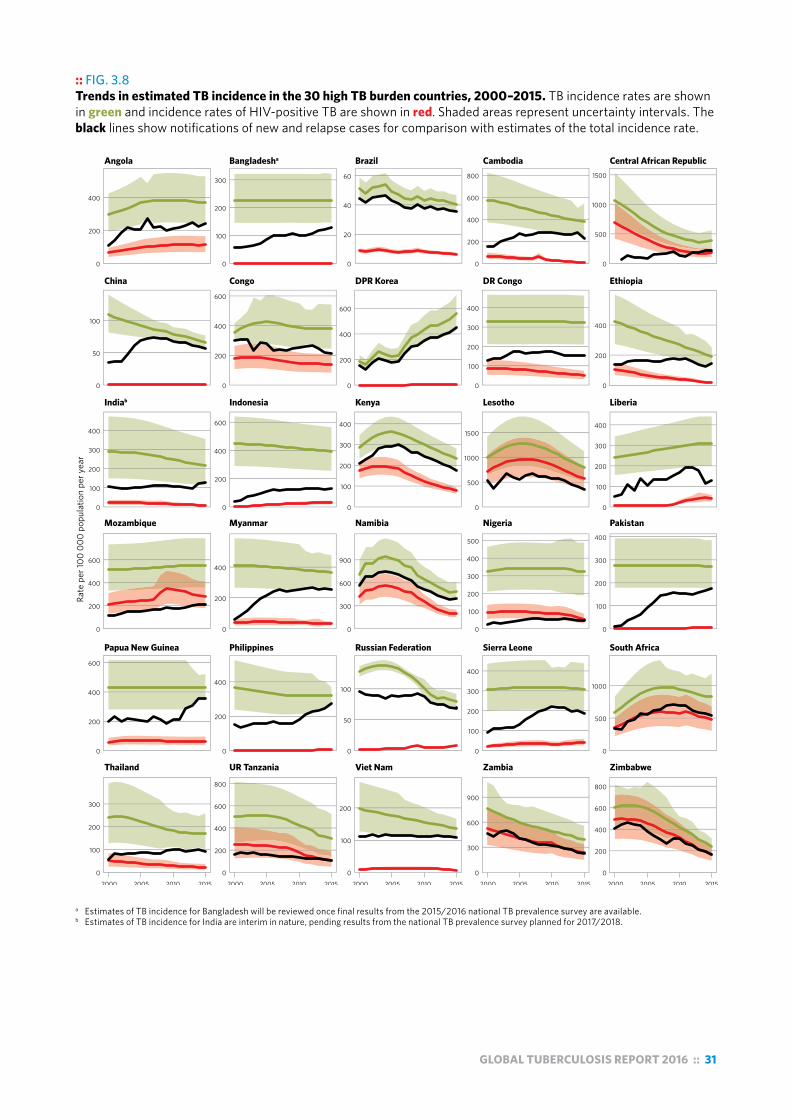
GLOBAL TUBERCULOSIS REPORT 2016 :: 31
:: FIG. 3.8 Trends in estimated TB incidence in the 30 high TB burden countries, 2000–2015. TB incidence rates are shown in green and incidence rates of HIV-positive TB are shown in red. Shaded areas represent uncertainty intervals. The black lines show notifications of new and relapse cases for comparison with estimates of the total incidence rate.
Rate
per
100
000
popu
latio
n pe
r yea
r
2000 2005 2010 2015 2000 2005 2010 2015 2000 2005 2010 2015 2000 2005 2010 2015 2000 2005 2010 2015
0
200
400
600
0
100
200
300
0
200
400
0
200
400
600
800
0
50
100
0
100
200
0
100
200
300
400
0
500
1000
0
300
600
900
0
200
400
600
800
0
100
200
300
400
0
200
400
600
0
100
200
300
400
0
500
1000
1500
0
100
200
300
400
0
200
400
600
0
200
400
0
300
600
900
0
100
200
300
400
500
0
100
200
300
400
0
200
400
0
100
200
300
0
20
40
60
0
200
400
600
800
0
500
1000
1500
0
50
100
0
200
400
600
0
200
400
600
0
100
200
300
400
0
200
400
Angola Bangladesha Brazil Cambodia Central African Republic
China Congo DPR Korea DR Congo Ethiopia
Indiab Indonesia Kenya Lesotho Liberia
Mozambique Myanmar Namibia Nigeria Pakistan
Papua New Guinea Philippines Russian Federation Sierra Leone South Africa
Thailand UR Tanzania Viet Nam Zambia Zimbabwe
a Estimates of TB incidence for Bangladesh will be reviewed once final results from the 2015/2016 national TB prevalence survey are available.b Estimates of TB incidence for India are interim in nature, pending results from the national TB prevalence survey planned for 2017/2018.

32 :: GLOBAL TUBERCULOSIS REPORT 2016
:: FIG. 3.9 Countries (in red) for which TB mortality in HIV-negative people is estimated using measurements from vital registration systems and/or a mortality survey
Not applicable
mortality rate (per 100 000 population) fell by 34% be-tween 2000 and 2015 (Fig. 3.6), and by 2.7% between 2014 and 2015. Rates have also been falling in all six of the WHO regions (Fig. 3.13). Since 2010, the fastest aver-age rates of decline in the mortality rate have been in the WHO Eastern Mediterranean and European regions (6.5% and 6.2% per year, respectively) and slowest in the WHO African Region (2.2% per year). Trends in mortality rates in the 30 high TB burden countries vary markedly (Fig. 3.14), ranging from substantial reductions since 2000 (e.g. China, Ethiopia, Myanmar, Pakistan the Philippines and the Russian Federation) to increases in Congo and the Demo-cratic People’s Republic of Korea.
3.2.4 The case fatality ratio and across-country equity
The CFR is the proportion of people with TB who die from the disease; it can be approximated as the number of TB deaths divided by TB incidence in the same year. The CFR allows assessment of variation in equity in terms of access to TB diagnosis and treatment among countries because, if everyone with TB had access to timely diagnosis and high-quality treatment, the CFR would be low in all countries. To achieve the milestones for reductions in TB deaths set for 2020 and 2025 in the End TB Strategy, the global CFR needs to fall to 10% by 2020 and to 6% by 2025 (Chapter 2).
In 2015, the global CFR (calculated as the combined number of TB deaths in HIV-negative people and HIV-
positive people divided by the total number of incident cas-es in both HIV-negative and HIV-positive people)1 was 17% and varied widely among countries (Fig. 3.15), from under 5% in a few countries to more than 20% in most countries in the WHO African Region. Intensified efforts are required to reduce the CFR to 10% globally by 2020.
1 The CFR was calculated based on the combined total of deaths in HIV-negative and HIV-positive people for the purpose of cross-country comparisons, in particular to illustrate the high CFRs in African countries that could be reduced by effective detection and care programmes. CFRs restricted to HIV-negative TB deaths and cases can also be calculated but are not shown. At the subnational level, CFRs can also be restricted to HIV-negative TB deaths, depending on the country and its HIV burden.
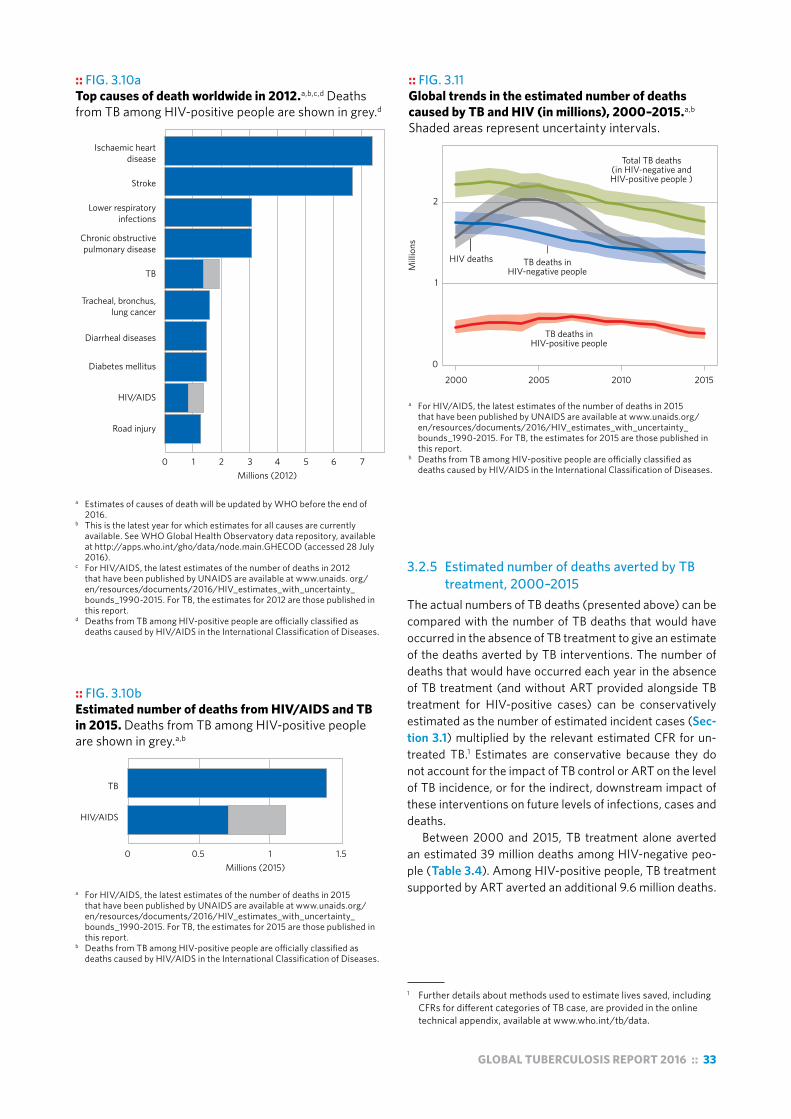
GLOBAL TUBERCULOSIS REPORT 2016 :: 33
:: FIG. 3.10a Top causes of death worldwide in 2012.a,b,c,d Deaths from TB among HIV-positive people are shown in grey.d
0
Ischaemic heart disease
Stroke
Lower respiratory infections
Chronic obstructive pulmonary disease
TB
Tracheal, bronchus, lung cancer
Diarrheal diseases
Diabetes mellitus
HIV/AIDS
Road injury
1 2 3 4 5 6 7Millions (2012)
a Estimates of causes of death will be updated by WHO before the end of 2016.
b This is the latest year for which estimates for all causes are currently available. See WHO Global Health Observatory data repository, available at http://apps.who.int/gho/data/node.main.GHECOD (accessed 28 July 2016).
c For HIV/AIDS, the latest estimates of the number of deaths in 2012 that have been published by UNAIDS are available at www.unaids. org/en/resources/documents/2016/HIV_estimates_with_uncertainty_ bounds_1990-2015. For TB, the estimates for 2012 are those published in this report.
d Deaths from TB among HIV-positive people are officially classified as deaths caused by HIV/AIDS in the International Classification of Diseases.
:: FIG. 3.10b Estimated number of deaths from HIV/AIDS and TB in 2015. Deaths from TB among HIV-positive people are shown in grey.a,b
a For HIV/AIDS, the latest estimates of the number of deaths in 2015 that have been published by UNAIDS are available at www.unaids.org/en/resources/documents/2016/HIV_estimates_with_uncertainty_ bounds_1990-2015. For TB, the estimates for 2015 are those published in this report.
b Deaths from TB among HIV-positive people are officially classified as deaths caused by HIV/AIDS in the International Classification of Diseases.
:: FIG. 3.11 Global trends in the estimated number of deaths caused by TB and HIV (in millions), 2000–2015.a,b Shaded areas represent uncertainty intervals.
a For HIV/AIDS, the latest estimates of the number of deaths in 2015 that have been published by UNAIDS are available at www.unaids.org/en/resources/documents/2016/HIV_estimates_with_uncertainty_ bounds_1990-2015. For TB, the estimates for 2015 are those published in this report.
b Deaths from TB among HIV-positive people are officially classified as deaths caused by HIV/AIDS in the International Classification of Diseases.
0
1
2
2000 2005 2010 2015
Mill
ions
Total TB deaths (in HIV-negative and HIV-positive people )
HIV deaths TB deaths in HIV-negative people
TB deaths in HIV-positive people
3.2.5 Estimated number of deaths averted by TB treatment, 2000–2015
The actual numbers of TB deaths (presented above) can be compared with the number of TB deaths that would have occurred in the absence of TB treatment to give an estimate of the deaths averted by TB interventions. The number of deaths that would have occurred each year in the absence of TB treatment (and without ART provided alongside TB treatment for HIV-positive cases) can be conservatively estimated as the number of estimated incident cases (Sec-tion 3.1) multiplied by the relevant estimated CFR for un-treated TB.1 Estimates are conservative because they do not account for the impact of TB control or ART on the level of TB incidence, or for the indirect, downstream impact of these interventions on future levels of infections, cases and deaths.
Between 2000 and 2015, TB treatment alone averted an estimated 39 million deaths among HIV-negative peo-ple (Table 3.4). Among HIV-positive people, TB treatment supported by ART averted an additional 9.6 million deaths.
1 Further details about methods used to estimate lives saved, including CFRs for different categories of TB case, are provided in the online technical appendix, available at www.who.int/tb/data.
TB
HIV/AIDS
0 0.5 1 1.5Millions (2015)
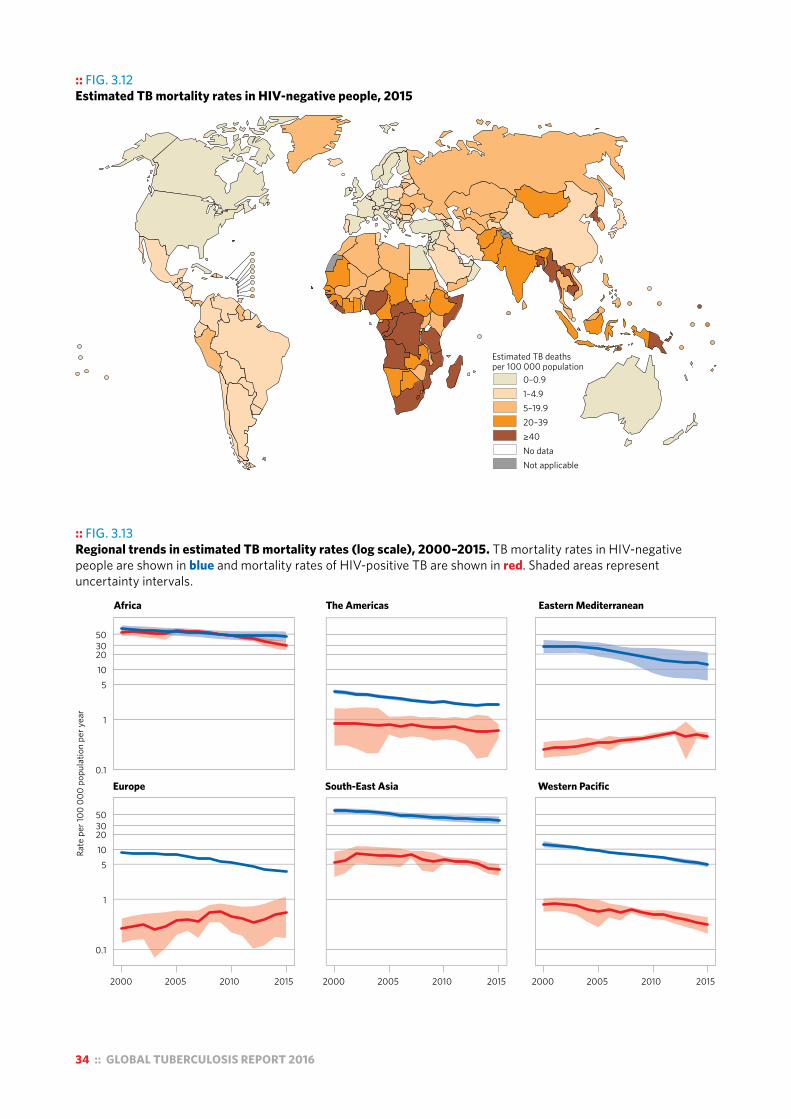
34 :: GLOBAL TUBERCULOSIS REPORT 2016
:: FIG. 3.12 Estimated TB mortality rates in HIV-negative people, 2015
Estimated TB deathsper 100 000 population
0–0.91–4.95–19.920–39≥40No dataNot applicable
:: FIG. 3.13 Regional trends in estimated TB mortality rates (log scale), 2000–2015. TB mortality rates in HIV-negative people are shown in blue and mortality rates of HIV-positive TB are shown in red. Shaded areas represent uncertainty intervals.
Rate
per
100
000
popu
latio
n pe
r yea
r
0.1
1
510203050
0.1
1
510203050
2000 2005 2010 2015 2000 2005 2010 2015 2000 2005 2010 2015
Africa The Americas Eastern Mediterranean
Europe South-East Asia Western Pacific
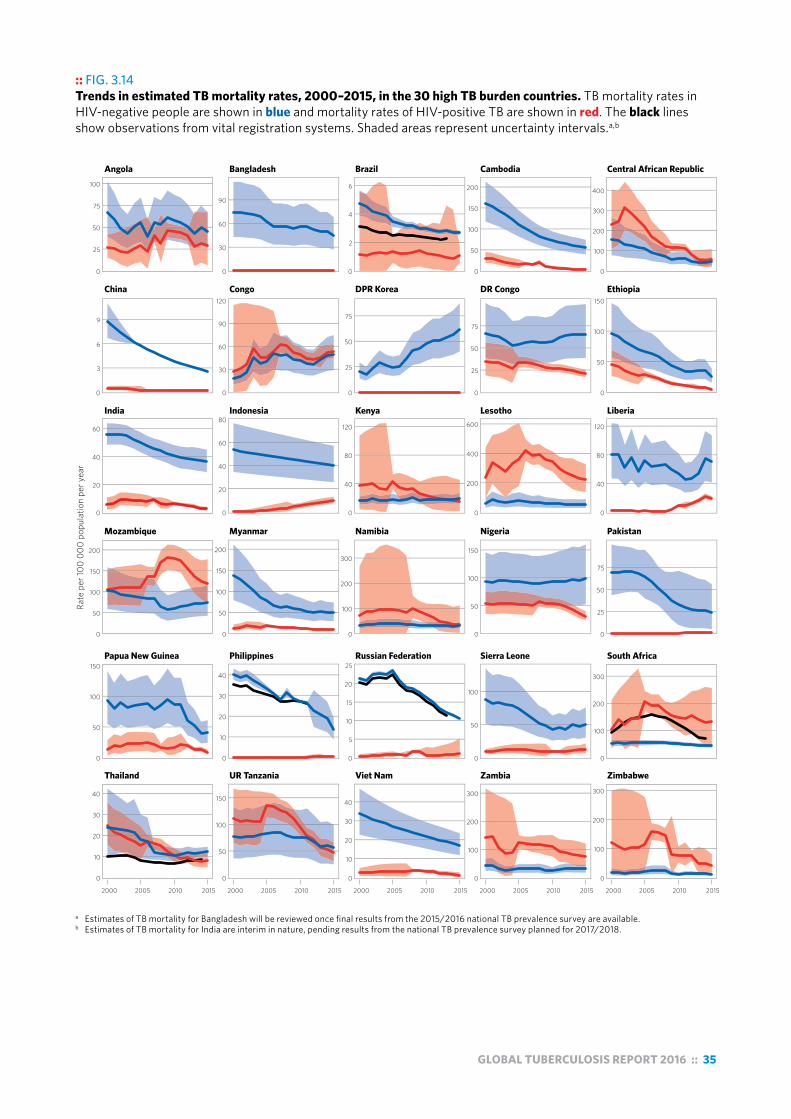
GLOBAL TUBERCULOSIS REPORT 2016 :: 35
:: FIG. 3.14 Trends in estimated TB mortality rates, 2000–2015, in the 30 high TB burden countries. TB mortality rates in HIV-negative people are shown in blue and mortality rates of HIV-positive TB are shown in red. The black lines show observations from vital registration systems. Shaded areas represent uncertainty intervals.a,b
Rate
per
100
000
popu
latio
n pe
r yea
r
0
25
50
75
100
0
3
6
9
0
20
40
60
0
50
100
150
200
0
50
100
150
0
10
20
30
40
0
30
60
90
0
30
60
90
120
0
20
40
60
80
0
50
100
150
200
0
10
20
30
40
0
50
100
150
0
2
4
6
0
25
50
75
0
40
80
120
0
100
200
300
0
5
10
15
20
25
0
10
20
30
40
0
50
100
150
200
0
25
50
75
0
200
400
600
0
50
100
150
0
50
100
0
100
200
300
0
100
200
300
400
0
50
100
150
0
40
80
120
0
25
50
75
0
100
200
300
0
100
200
300
2000 2005 2010 2015 2000 2005 2010 2015 2000 2005 2010 2015 2000 2005 2010 2015 2000 2005 2010 2015
Angola Bangladesh Brazil Cambodia Central African Republic
China Congo DPR Korea DR Congo Ethiopia
India Indonesia Kenya Lesotho Liberia
Mozambique Myanmar Namibia Nigeria Pakistan
Papua New Guinea Philippines Russian Federation Sierra Leone South Africa
Thailand UR Tanzania Viet Nam Zambia Zimbabwe
a Estimates of TB mortality for Bangladesh will be reviewed once final results from the 2015/2016 national TB prevalence survey are available. b Estimates of TB mortality for India are interim in nature, pending results from the national TB prevalence survey planned for 2017/2018.
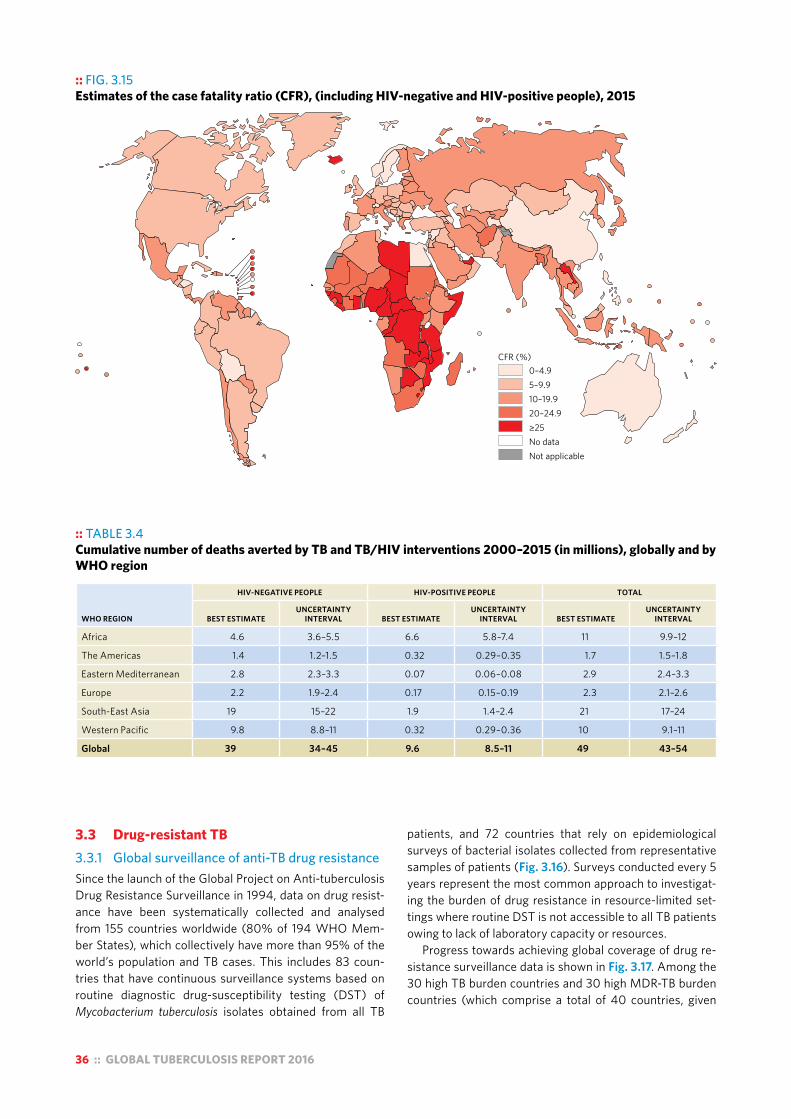
36 :: GLOBAL TUBERCULOSIS REPORT 2016
:: FIG. 3.15 Estimates of the case fatality ratio (CFR), (including HIV-negative and HIV-positive people), 2015
CFR (%)0–4.95–9.910–19.920–24.9≥25No dataNot applicable
:: TABLE 3.4 Cumulative number of deaths averted by TB and TB/HIV interventions 2000–2015 (in millions), globally and by WHO region
WHO REGION
HIV-NEGATIVE PEOPLE HIV-POSITIVE PEOPLE TOTAL
BEST ESTIMATEUNCERTAINTY
INTERVAL BEST ESTIMATEUNCERTAINTY
INTERVAL BEST ESTIMATEUNCERTAINTY
INTERVAL
Africa 4.6 3.6–5.5 6.6 5.8–7.4 11 9.9–12
The Americas 1.4 1.2–1.5 0.32 0.29–0.35 1.7 1.5–1.8
Eastern Mediterranean 2.8 2.3–3.3 0.07 0.06–0.08 2.9 2.4–3.3
Europe 2.2 1.9–2.4 0.17 0.15–0.19 2.3 2.1–2.6
South-East Asia 19 15–22 1.9 1.4–2.4 21 17–24
Western Pacific 9.8 8.8–11 0.32 0.29–0.36 10 9.1–11
Global 39 34–45 9.6 8.5–11 49 43–54
3.3 Drug-resistant TB 3.3.1 Global surveillance of anti-TB drug resistance Since the launch of the Global Project on Anti-tuberculosis Drug Resistance Surveillance in 1994, data on drug resist-ance have been systematically collected and analysed from 155 countries worldwide (80% of 194 WHO Mem-ber States), which collectively have more than 95% of the world’s population and TB cases. This includes 83 coun-tries that have continuous surveillance systems based on routine diagnostic drug-susceptibility testing (DST) of Mycobacterium tuberculosis isolates obtained from all TB
patients, and 72 countries that rely on epidemiological surveys of bacterial isolates collected from representative samples of patients (Fig. 3.16). Surveys conducted every 5 years represent the most common approach to investigat-ing the burden of drug resistance in resource-limited set-tings where routine DST is not accessible to all TB patients owing to lack of laboratory capacity or resources.
Progress towards achieving global coverage of drug re-sistance surveillance data is shown in Fig. 3.17. Among the 30 high TB burden countries and 30 high MDR-TB burden countries (which comprise a total of 40 countries, given
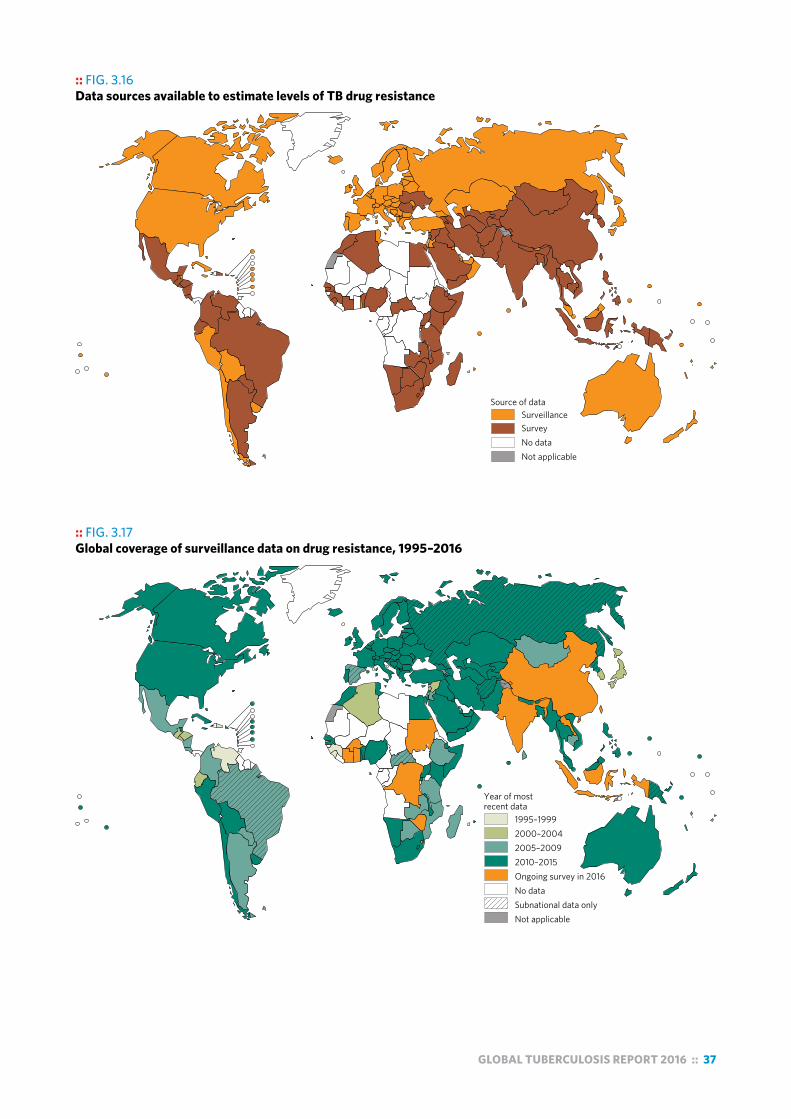
GLOBAL TUBERCULOSIS REPORT 2016 :: 37
:: FIG. 3.16 Data sources available to estimate levels of TB drug resistance
Source of dataSurveillanceSurveyNo dataNot applicable
:: FIG. 3.17 Global coverage of surveillance data on drug resistance, 1995–2016
Year of mostrecent data
1995–19992000–20042005–20092010–2015Ongoing survey in 2016No dataSubnational data onlyNot applicable

38 :: GLOBAL TUBERCULOSIS REPORT 2016
overlap between the two groups1), 37 have data on levels of drug resistance. The three countries that that have never conducted a drug resistance survey are Angola, Congo and Liberia. Among the other 37 high TB burden countries, the data for Sierra Leone are from before the year 2000, and five countries (Brazil, Central African Republic, Democratic People’s Republic of Korea, Papua New Guinea and the Russian Federation) rely on drug-resistance surveillance data gathered from subnational areas only.
In 2015, the first-ever drug resistance survey was com-pleted in Djibouti, and repeat surveys were completed in Kenya, Lesotho, Namibia, Romania, Rwanda and South Africa. In 2016, drug resistance surveys were ongoing in 11 countries, with the first nationwide surveys in seven coun-tries (Burkina Faso, the Democratic Republic of the Congo, Ghana, India, Indonesia, Lao People’s Democratic Republic and Sudan) and repeat surveys in four countries (China, Côte d’Ivoire, Swaziland and Zimbabwe).
3.3.2 Estimates of the disease burden caused by MDR/RR-TB
In previous global TB reports, estimates of the burden of drug-resistant TB have focused on MDR-TB (defined as resistance to rifampicin and isoniazid, the two most effec-tive anti-TB drugs). In May 2016, WHO issued guidance2 that people with TB resistant to rifampicin, with or without resistance to other drugs, should be treated with an MDR-TB treatment regimen. This includes patients with MDR-TB as well as any other patient with TB resistant to rifampicin (referred to in this report as MDR/RR-TB). Following that guidance, estimates of the burden of MDR/RR-TB are re-quired for assessing progress in detection of cases with drug-resistant TB and treatment coverage.
Globally in 2015, an estimated 3.9% (95% confidence interval [CI]: 2.7–5.1%) of new cases and 21% (95% CI: 15–28%) of previously treated cases had MDR/RR-TB (Table 3.5). The proportions of new and previously treated TB cases with MDR/RR-TB at the country level are shown in Fig. 3.18 and Fig. 3.19.
There were an estimated 580 000 (range, 520 000–640 000) incident cases of MDR/RR-TB in 2015, with cases of MDR-TB accounting for 83% of the total (Table 3.5). The number of MDR-TB incident cases (480 000) is in line with the estimate published in 2015. The countries with the largest numbers of MDR/RR-TB cases (45% of the global total) are China, India and the Russian Federa-tion (Fig. 3.20).
There were about 250 000 (range, 160 000–340 000) deaths from MDR/RR-TB in 2015. The best estimate is slight-ly higher than estimates of deaths from MDR-TB published in recent global TB reports, due to the inclusion of deaths from all cases with RR-TB (and not only those with MDR-TB).
1 For a full list of the high TB burden and high MDR-TB burden countries, see Chapter 2.
2 World Health Organization. WHO treatment guidelines for drug-resistant tuberculosis (2016 update) (WHO/HTM/TB/2016.04). Geneva: WHO; 2016 (http://www.who.int/tb/areas-of-work/drug-resistant-tb/MDRTBguidelines2016.pdf,).
Data compiled from surveys and continuous surveil-lance of drug resistance among TB patients also allow estimation of the number of MDR/RR-TB cases among no-tified TB patients with pulmonary TB. These are the MDR/RR-TB cases that could be detected if all notified patients were tested for drug resistance to rifampicin and isoniazid using WHO-recommended diagnostic tests. Globally in 2015, there were an estimated 340 000 (range, 320 000–350 000) MDR/RR-TB cases among notified TB patients. Country-specific estimates are presented and discussed in Chapter 4.
3.3.3 Trends in drug resistanceOf the 40 countries with a high TB or MDR-TB burden (or both), only 20 have repeated a survey at least once to evaluate trends in drug resistance. Among these countries, eight have at least 3 years of data: Belarus, Kazakhstan, Myanmar, Peru, Republic of Moldova, Tomsk Oblast in the Russian Federation, Thailand and Viet Nam. For these set-tings, trends in the number of new TB cases notified, the proportion of new TB cases with MDR, and per capita TB and MDR-TB rates are shown in Fig. 3.21. Based on these data, there is a slight trend for cases of MDR-TB to increase as a proportion of all TB cases in these countries, with the burden of MDR-TB either increasing faster or decreasing more slowly than the overall TB burden in each country.
3.3.4 Resistance to second-line anti-TB drugs and pyrazinamide
By the end of 2015, extensively drug-resistant TB (XDR-TB)3 had been reported by 117 WHO Member States. Of these, 88 countries and five territories reported repre-sentative data from continuous surveillance or surveys re-garding the proportion of MDR-TB cases that had XDR-TB. Combining their data, the average proportion of MDR-TB cases with XDR-TB was 9.5% (95% CI: 7.0–12.1%), similar to estimates for previous years (9.7% in 2014 and 9.0% in 2013).
Among the 40 countries with a high TB or MDR-TB burden, 21 have surveillance data on resistance to second-line anti-TB drugs, but only six have established a national continuous surveillance system for second-line drug re-sistance among patients with MDR-TB. The proportion of MDR-TB cases with resistance to any fluoroquinolone for which testing was done – including ofloxacin, levofloxacin and moxifloxacin – was 21.0% (95% CI: 8.8–33.3%). A total of 51% (30–70%) of patients with MDR-TB have re-sistance to a fluoroquinolone or a second-line injectable agent, or both. Levels of resistance to fluoroquinolones and pyrazinamide among all TB cases have been studied in a multicountry surveillance project; results are summarized in Box 3.6.
3 XDR-TB is defined as MDR-TB plus resistance to at least one fluoroquinoline and a second-line injectable agent.
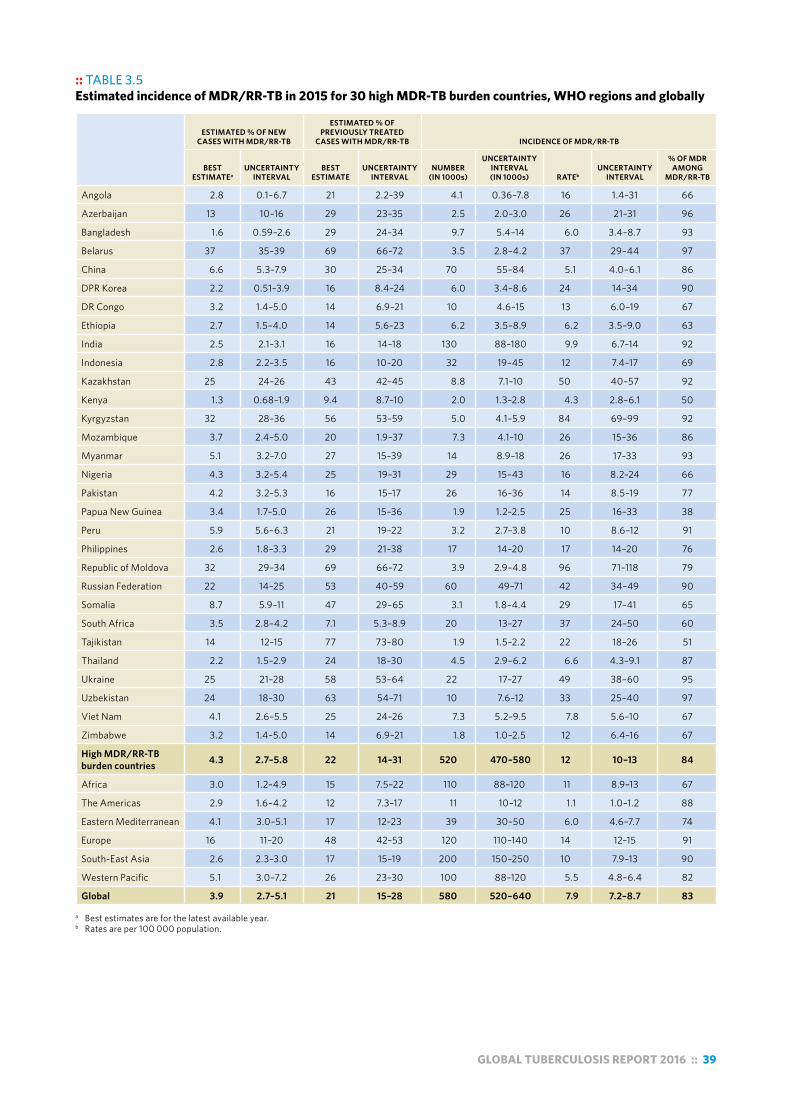
GLOBAL TUBERCULOSIS REPORT 2016 :: 39
:: TABLE 3.5 Estimated incidence of MDR/RR-TB in 2015 for 30 high MDR-TB burden countries, WHO regions and globally
ESTIMATED % OF NEW CASES WITH MDR/RR-TB
ESTIMATED % OF PREVIOUSLY TREATED
CASES WITH MDR/RR-TB INCIDENCE OF MDR/RR-TB
BEST ESTIMATEa
UNCERTAINTY INTERVAL
BEST ESTIMATE
UNCERTAINTY INTERVAL
NUMBER (IN 1000s)
UNCERTAINTY INTERVAL (IN 1000s) RATEb
UNCERTAINTY INTERVAL
% OF MDR AMONG
MDR/RR-TB
Angola 2.8 0.1–6.7 21 2.2–39 4.1 0.36–7.8 16 1.4–31 66
Azerbaijan 13 10–16 29 23–35 2.5 2.0–3.0 26 21–31 96
Bangladesh 1.6 0.59–2.6 29 24–34 9.7 5.4–14 6.0 3.4–8.7 93
Belarus 37 35–39 69 66–72 3.5 2.8–4.2 37 29–44 97
China 6.6 5.3–7.9 30 25–34 70 55–84 5.1 4.0–6.1 86
DPR Korea 2.2 0.51–3.9 16 8.4–24 6.0 3.4–8.6 24 14–34 90
DR Congo 3.2 1.4–5.0 14 6.9–21 10 4.6–15 13 6.0–19 67
Ethiopia 2.7 1.5–4.0 14 5.6–23 6.2 3.5–8.9 6.2 3.5–9.0 63
India 2.5 2.1–3.1 16 14–18 130 88–180 9.9 6.7–14 92
Indonesia 2.8 2.2–3.5 16 10–20 32 19–45 12 7.4–17 69
Kazakhstan 25 24–26 43 42–45 8.8 7.1–10 50 40–57 92
Kenya 1.3 0.68–1.9 9.4 8.7–10 2.0 1.3–2.8 4.3 2.8–6.1 50
Kyrgyzstan 32 28–36 56 53–59 5.0 4.1–5.9 84 69–99 92
Mozambique 3.7 2.4–5.0 20 1.9–37 7.3 4.1–10 26 15–36 86
Myanmar 5.1 3.2–7.0 27 15–39 14 8.9–18 26 17–33 93
Nigeria 4.3 3.2–5.4 25 19–31 29 15–43 16 8.2–24 66
Pakistan 4.2 3.2–5.3 16 15–17 26 16–36 14 8.5–19 77
Papua New Guinea 3.4 1.7–5.0 26 15–36 1.9 1.2–2.5 25 16–33 38
Peru 5.9 5.6–6.3 21 19–22 3.2 2.7–3.8 10 8.6–12 91
Philippines 2.6 1.8–3.3 29 21–38 17 14–20 17 14–20 76
Republic of Moldova 32 29–34 69 66–72 3.9 2.9–4.8 96 71–118 79
Russian Federation 22 14–25 53 40–59 60 49–71 42 34–49 90
Somalia 8.7 5.9–11 47 29–65 3.1 1.8–4.4 29 17–41 65
South Africa 3.5 2.8–4.2 7.1 5.3–8.9 20 13–27 37 24–50 60
Tajikistan 14 12–15 77 73–80 1.9 1.5–2.2 22 18–26 51
Thailand 2.2 1.5–2.9 24 18–30 4.5 2.9–6.2 6.6 4.3–9.1 87
Ukraine 25 21–28 58 53–64 22 17–27 49 38–60 95
Uzbekistan 24 18–30 63 54–71 10 7.6–12 33 25–40 97
Viet Nam 4.1 2.6–5.5 25 24–26 7.3 5.2–9.5 7.8 5.6–10 67
Zimbabwe 3.2 1.4–5.0 14 6.9–21 1.8 1.0–2.5 12 6.4–16 67
High MDR/RR-TB burden countries 4.3 2.7–5.8 22 14–31 520 470–580 12 10–13 84
Africa 3.0 1.2–4.9 15 7.5–22 110 88–120 11 8.9–13 67
The Americas 2.9 1.6–4.2 12 7.3–17 11 10–12 1.1 1.0–1.2 88
Eastern Mediterranean 4.1 3.0–5.1 17 12–23 39 30–50 6.0 4.6–7.7 74
Europe 16 11–20 48 42–53 120 110–140 14 12–15 91
South-East Asia 2.6 2.3–3.0 17 15–19 200 150–250 10 7.9–13 90
Western Pacific 5.1 3.0–7.2 26 23–30 100 88–120 5.5 4.8–6.4 82
Global 3.9 2.7–5.1 21 15–28 580 520–640 7.9 7.2–8.7 83 a Best estimates are for the latest available year. b Rates are per 100 000 population.
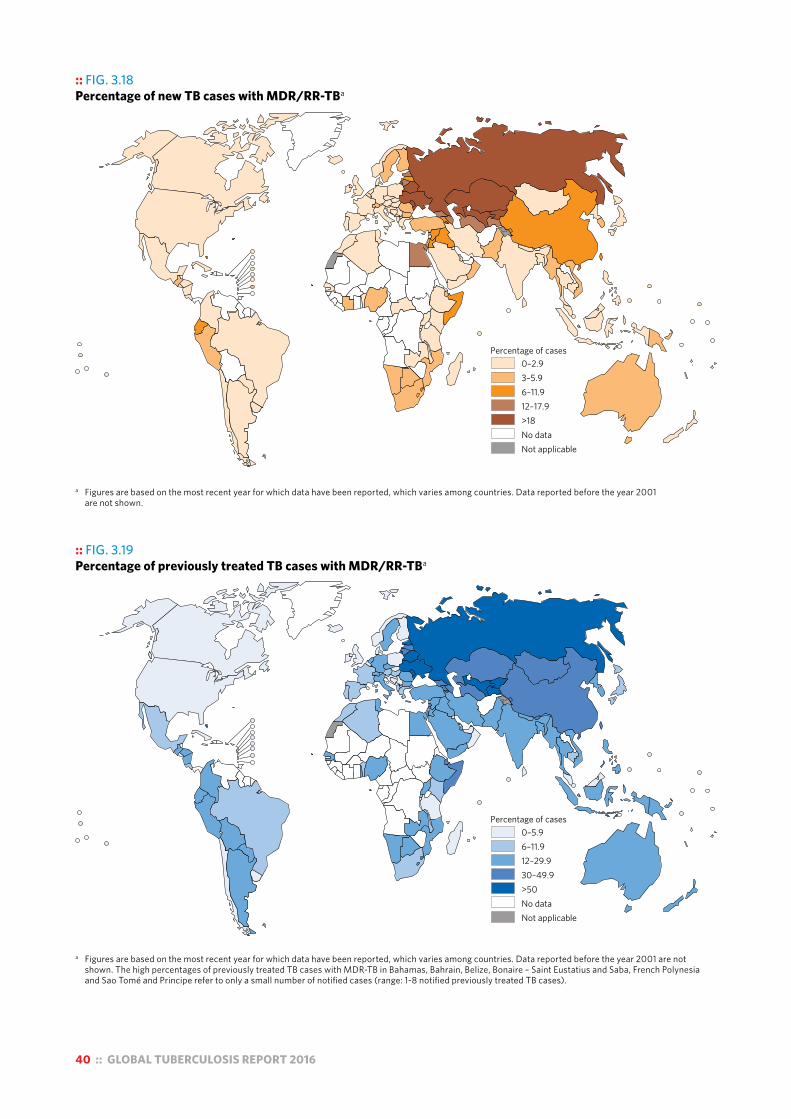
40 :: GLOBAL TUBERCULOSIS REPORT 2016
:: FIG. 3.18 Percentage of new TB cases with MDR/RR-TBa
Percentage of cases0–2.93–5.96–11.912–17.9>18No dataNot applicable
a Figures are based on the most recent year for which data have been reported, which varies among countries. Data reported before the year 2001 are not shown.
:: FIG. 3.19 Percentage of previously treated TB cases with MDR/RR-TBa
Percentage of cases0–5.96–11.912–29.930–49.9>50No dataNot applicable
a Figures are based on the most recent year for which data have been reported, which varies among countries. Data reported before the year 2001 are not shown. The high percentages of previously treated TB cases with MDR-TB in Bahamas, Bahrain, Belize, Bonaire – Saint Eustatius and Saba, French Polynesia and Sao Tomé and Principe refer to only a small number of notified cases (range: 1-8 notified previously treated TB cases).

GLOBAL TUBERCULOSIS REPORT 2016 :: 41
:: FIG. 3.20 Estimated incidence of MDR/RR-TB in 2015, for countries with at least 1000 incident cases. Areas that are not applicable are in grey.
Russian Federation60 000
India130 000
China70 000
1 0005 000
10 000
20 000
50 000
Number of incident cases
:: Box 3.6Resistance to pyrazinamide and fluoroquinolones: a summary of results from the first surveys in five countries
The combination of pyrazinamide plus a fourth-generation fluoroquinolone (moxifloxacin or gatifloxacin) is considered essential in novel rifampicin-sparing regimens for the treatment of TB and in shorter regimens for the treatment of MDR-TB. Understanding the background prevalence at population level of resistance to these drugs is important to assess the feasibility of introducing new and shorter regimens in TB control programmes.
Although levels of resistance to rifampicin and isoniazid are monitored in most TB-endemic countries through drug-resistance surveys, testing for susceptibility to fluoroquinolones and pyrazinamide is not routinely performed as part of surveillance efforts. Therefore, population-representative surveillance data on levels of resistance to these drugs are limited. To start to address this knowledge gap, a multicountry project was coordinated by WHO in five countries – Azerbaijan, Bangladesh, Belarus, Pakistan and South Africa – enrolling more than 5000 patients. Results from this project were published in May 2016a and a summary is provided here.
Levels of resistance varied substantially among settings (3.1–42.1%). In all settings, pyrazinamide resistance was significantly associated with rifampicin resistance (0.5–4.2% among rifampicin-susceptible cases and 36.7–81.3% among
rifampicin-resistant cases). Resistance ranged from 1.0% to 16.6% for ofloxacin, from 0.5% to 12.4% for levofloxacin and from 0.9% to 14.6% for moxifloxacin when tested at 0.5 µg/ml. High levels of ofloxacin resistance were found in Pakistan. Resistance to moxifloxacin and gatifloxacin when tested at 2 µg/ml was low in all countries. Cross-resistance was high between ofloxacin and levofloxacin (87%) and between ofloxacin and moxifloxacin (72%) when tested at 0.5 µg/ml. Cross-resistance was very low between ofloxacin and moxifloxacin and gatifloxacin when tested at 2 µg/ml.
The presence of rifampicin resistance, which currently is easily identified because of the wide availability of new rapid molecular technology, should prompt attention to the possibility of the simultaneous presence of resistance to pyrazinamide and, in some settings, the earlier generation fluoroquinolones. Resistance to the latest generation fluoroquinolones at the clinical breakpoint is still uncommon, a finding that supports current WHO recommendations to use moxifloxacin or gatifloxacin in the treatment of MDR-TB.
a Zignol M, Dean AS, Alikhanova N, Andres S, Cabibbe AM, Cirillo DM et al. Population-based resistance of Mycobacterium tuberculosis isolates to pyrazinamide and fluoroquinolones: results from a multicountry surveillance project. Lancet Infect Dis. 2016;16:30190–30196 (http://www.ncbi.nlm.nih.gov/pubmed/27397590, accessed 24 August 2016).
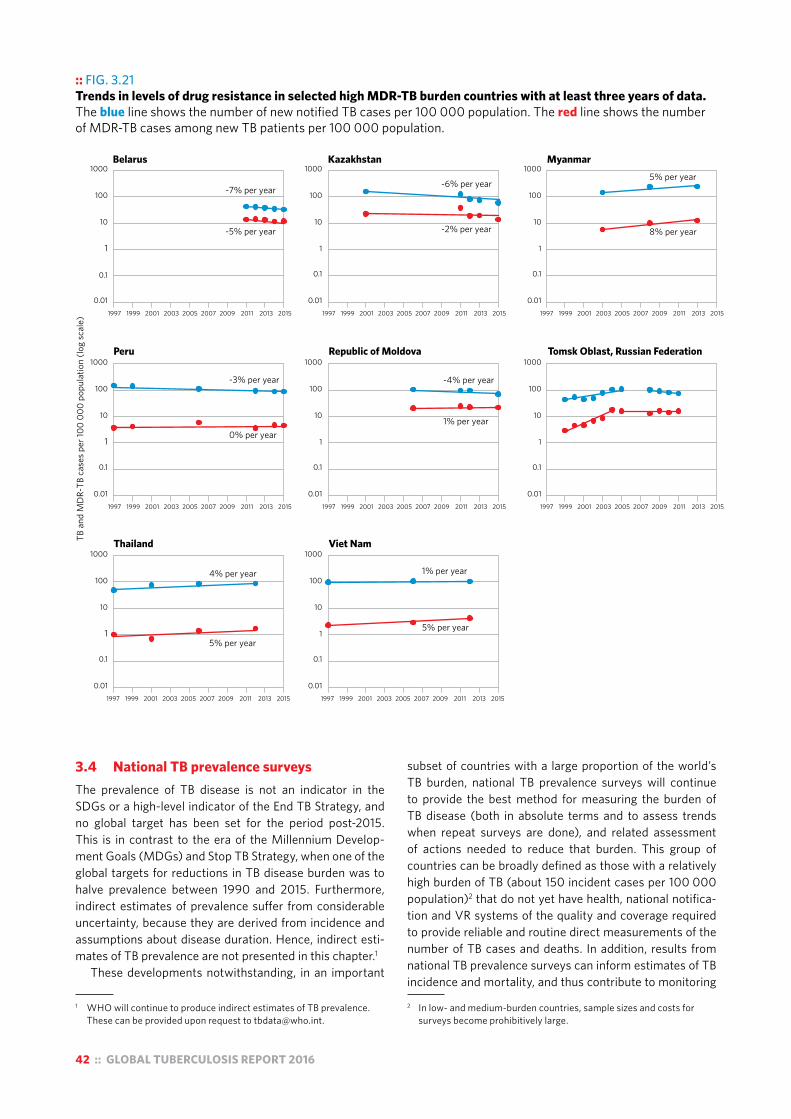
42 :: GLOBAL TUBERCULOSIS REPORT 2016
3.4 National TB prevalence surveys The prevalence of TB disease is not an indicator in the SDGs or a high-level indicator of the End TB Strategy, and no global target has been set for the period post-2015. This is in contrast to the era of the Millennium Develop-ment Goals (MDGs) and Stop TB Strategy, when one of the global targets for reductions in TB disease burden was to halve prevalence between 1990 and 2015. Furthermore, indirect estimates of prevalence suffer from considerable uncertainty, because they are derived from incidence and assumptions about disease duration. Hence, indirect esti-mates of TB prevalence are not presented in this chapter.1
These developments notwithstanding, in an important
1 WHO will continue to produce indirect estimates of TB prevalence. These can be provided upon request to [email protected].
subset of countries with a large proportion of the world’s TB burden, national TB prevalence surveys will continue to provide the best method for measuring the burden of TB disease (both in absolute terms and to assess trends when repeat surveys are done), and related assessment of actions needed to reduce that burden. This group of countries can be broadly defined as those with a relatively high burden of TB (about 150 incident cases per 100 000 population)2 that do not yet have health, national notifica-tion and VR systems of the quality and coverage required to provide reliable and routine direct measurements of the number of TB cases and deaths. In addition, results from national TB prevalence surveys can inform estimates of TB incidence and mortality, and thus contribute to monitoring
2 In low- and medium-burden countries, sample sizes and costs for surveys become prohibitively large.
:: FIG. 3.21 Trends in levels of drug resistance in selected high MDR-TB burden countries with at least three years of data. The blue line shows the number of new notified TB cases per 100 000 population. The red line shows the number of MDR-TB cases among new TB patients per 100 000 population.
Belarus Kazakhstan Myanmar
-7% per year
Peru Republic of Moldova Tomsk Oblast, Russian Federation
TB a
nd M
DR-
TB c
ases
per
100
000
popu
latio
n (lo
g sc
ale)
1997 1999 2001 2003 2005 2007 2009 2011 2013 2015
0.01
0.1
10
100
1000
1997 1999 2001 2003 2005 2007 2009 2011 2013 2015
0.01
0.1
10
100
1000
1997 1999 2001 2003 2005 2007 2009 2011 2013 2015
0.01
0.1
10
100
1000
1997 1999 2001 2003 2005 2007 2009 2011 2013 2015
0.01
0.1
10
100
1000
1997 1999 2001 2003 2005 2007 2009 2011 2013 2015
0.01
0.1
10
100
1000
1997 1999 2001 2003 2005 2007 2009 2011 2013 2015
0.01
0.1
10
100
1000
1997 1999 2001 2003 2005 2007 2009 2011 2013 2015
0.01
0.1
10
100
1000
1997 1999 2001 2003 2005 2007 2009 2011 2013 2015
0.01
0.1
10
100
1000
1
1
1
1 1
1 1
1
Thailand Viet Nam
-5% per year
-6% per year
-2% per year
5% per year
8% per year
-4% per year
1% per year
-3% per year
0% per year
4% per year
5% per year
1% per year
5% per year

GLOBAL TUBERCULOSIS REPORT 2016 :: 43
of progress towards SDG and End TB Strategy targets. For these reasons, the status of progress in implementation of national TB prevalence surveys, and summaries of key results, will continue to be featured in global TB reports.
There has already been substantial progress in the num-ber of countries that have implemented a national TB prev-alence survey. This was particularly the case during the period 2007–2015, when the WHO Global Task Force on TB Impact Measurement defined national TB prevalence surveys in 22 global focus countries as one of its three stra-tegic areas of work (Box 3.1). The Task Force has retained national TB prevalence surveys in selected countries1 with-in its strategic areas of work 2016–2020.
1 In the Task Force’s April 2016 meeting, epidemiological criteria for conducting a survey were defined for two groups of countries: a) those that implemented a survey in 2009–2015 and in which a repeat survey could be considered; and b) countries that have never conducted a survey. There were 24 countries in the first group and 33 in the second group. For any of these 57 countries, it was also emphasized that feasibility criteria must also be considered. In particular, the prerequisites for conducting a survey defined in the WHO handbook on national TB prevalence surveys (see next footnote) should be met.
Countries in which surveys have been implemented since 2000 or are planned in the near future are shown in Fig. 3.22 and Fig. 3.23. Between 2009 and August 2016, an unprecedented number of national TB prevalence surveys were completed: 22 in total, of which 12 were in African countries and 10 in Asian countries. A major development in 2016 was a decision to implement a national TB preva-lence survey in India (Box 3.3).
Results in terms of the number of cases detected in sur-veys and prevalence per 100 000 population are shown for surveys implemented since 2009 in Table 3.6. All of these surveys used the screening and diagnostic methods rec-ommended in WHO’s handbook on national TB prevalence surveys.2 A comparison of estimates of TB prevalence be-fore and after the implementation of a national survey is shown for the 19 countries that completed a survey (and finalized results) between 2009 and August 2016 in Fig. 3.24. Post-survey prevalence estimates were almost al-ways more precise (i.e. had narrow uncertainty intervals). For 12 countries, estimates were within the pre-survey un-certainty interval, whereas for the other seven countries the survey found a burden that was either significantly above (six countries) or below (one country) the burden that had been estimated in the absence of survey data. Estimates of TB incidence that have been derived from a prevalence survey are shown in Fig. 3.25. This comparison shows that post-survey estimates of TB incidence sometimes have wider uncertainty intervals. This occurred when pre-sur-vey estimates of incidence were based on case notification data and expert opinion (i.e. method 1 as explained in Sec-tion 3.1 and as shown in Fig. 3.1); in several countries, un-certainty (based on the range of plausible incidence values elicited from experts) was understated. This demonstrates and reinforces the importance of direct measurements of TB disease burden as opposed to indirect estimates that rely on expert opinion, as emphasized by the WHO Global Task Force on TB Impact Measurement since its establish-ment in 2006 (Box 3.1).
A recent and more detailed presentation and discussion of results and lessons learnt from national TB prevalence surveys 2009–2015 is available on the Task Force web-site.3 Examples of how survey data can provide important insights into the distribution of TB disease by age, sex and location, as well as differences in detection and reporting of cases by age and sex, are provided in Section 3.6.1.
2 World Health Organization. Tuberculosis prevalence surveys: a handbook (WHO/HTM/TB/2010.17). Geneva: WHO; 2011 (www.who.int/tb/advisory_bodies/impact_measurement_taskforce/resources_documents/thelimebook/, accessed 24 August 2016).
3 http://www.who.int/tb/advisory_bodies/impact_measurement_taskforce/meetings/tf6_p06_prevalence_surveys_2009_2015.pdf?ua=1
:: FIG. 3.22 Global progress in implementing national surveys of the prevalence of TB disease, actual (2000–2016) and expected (2017)a
a In 2007, the WHO Global Task Force on TB Impact Measurement defined national TB prevalence surveys in 22 global focus countries as one of its three strategic areas of work for the period up to the end of 2015. In Africa, these countries included Ethiopia, Ghana, Kenya, Malawi, Mali, Mozambique, Nigeria, Rwanda, Sierra Leone, South Africa, Uganda, UR Tanzania and Zambia. In Asia, these countries included Bangladesh, Cambodia, China, Indonesia, Myanmar, Pakistan, Philippines, Thailand and Viet Nam.
b The national survey in Bangladesh (2008) and Eritrea (2005) collected sputum samples from all individuals (aged ≥15 years), and did not use chest X-ray and/or a symptom questionnaire to screen individuals for sputum submission.
2000 China
2001
2002 Cambodia
2003 Malaysia
2004 Indonesia
2005 Eritreab
2006 Thailand
2007 Viet Nam Philippines
2008 Bangladeshb
2009 Myanmar
2010 China
2011 Pakistan Cambodia Ethiopia Lao PDR
2012 Thailand UR Tanzania Rwanda Nigeria Gambia
2013 Malawi Ghana Sudan
2014 Indonesia Zambia Zimbabwe
2015 Bangladesh Uganda Kenya Mongolia
2016 Philippines DPR Korea
2017 Viet Nam Myanmar South Africa Mozambique Nepal

44 :: GLOBAL TUBERCULOSIS REPORT 2016
Asia Africa
Myanmar
Pakistan
China
Thailand
Cambodia
Mongolia
Indonesia
Lao PDR
Gambia
Ethiopia
Zimbabwe
Sudan
Rwanda
Uganda
Zambia
Nigeria
Ghana
Malawi
UR Tanzania
25 50 100 200 500 1000 25 50 100 200 500 1000
Prevalence per 100 000 population (log scale)
:: FIG. 3.24 Estimates of TB prevalence (all ages, all forms of TB) for 19 countries, before (in blue) and after (in red) survey results from national TB prevalence surveys became available. Panels are ordered according to the before-after difference.
:: FIG. 3.23 Countries in which national population-based surveys of the prevalence of TB disease have been implemented using currently recommended screening and diagnostic methodsa since 2000 or are planned in the future (status in August 2016)
a Screening methods include field chest X-ray; culture is used to confirm diagnosis. For current surveys ongoing in Bangladesh, Kenya and the Philippines, culture and Xpert MTB/RIF are used to confirm diagnosis.
b A country has submitted at least a draft survey protocol and a budget plan to the WHO Global Task Force on TB Impact Measurement.c Countries were implementing field operations in August 2016 or were undertaking data cleaning and analysis.d A survey was conducted in accordance with WHO recommendations as outlined in “Tuberculosis prevalence surveys: a handbook (2011)” and at least a
preliminary report has been published. e A repeat national survey is one in which participants were screened with chest X-ray, and culture examination was used to diagnose TB cases.
No survey plannedSurvey plannedb
Survey ongoingc
One survey completedd
Repeat survey plannedRepeat survey ongoing≥1 repeat survey completede
Not applicable

GLOBAL TUBERCULOSIS REPORT 2016 :: 45
:: TABLE 3.6 Number of TB cases found in national TB prevalence surveys implemented 2009-2015, and associated estimates of the prevalence of pulmonary TB in adults (aged ≥15 years)
COUNTRYMAIN
YEAR(S) OF SURVEY
NUMBER OF SMEAR-
POSITIVE CASES
NUMBER OF BACTERIOLOGICALLY
CONFIRMED CASES
PREVALENCE PER 100 000 POPULATION: SMEAR-POSITIVE CASESa
PREVALENCE PER 100 000: BACTERIOLOGICALLY CONFIRMED CASESa
BEST ESTIMATE 95% CONFIDENCE INTERVAL BEST ESTIMATE 95% CONFIDENCE
INTERVAL
Cambodia 2011 103 314 271 212–348 831 707–978
China 2010 188 347 66 53–79 119 103–135
Ethiopia 2010–2011 47 110 108 73–143 277 208–347
Gambia 2012 34 77 90 53–127 212 152–272
Ghana 2013 64 202 111 76–145 356 288–425
Indonesia 2013–2014 165 426 257 210–303 759 590–961
Lao PDR 2010–2011 107 237 278 199–356 595 457–733
Malawi 2013 62 132 220 142–297 452 312–593
Mongolia 2014–2015 88 248 204 143–265 560 455–665
Myanmar 2009–2010 123 311 242 186–315 613 502–748
Nigeria 2012 107 144 318 225–412 524 378–670
Pakistan 2010–2011 233 341 270 217–322 398 333–463
Rwanda 2012 27 40 74 48–99 119 79–160
Sudan 2013–2014 57 112 87 54–118 180 128–233
UR Tanzaniab 2012 134 — 275 232–326 — —
Thailandc 2012 58 142 104 55–195 242 176–332
Uganda 2014–2015 66 160 174 111–238 401 292–509
Zambia 2013–2014 135 265 319 232–406 638 502–774
Zimbabwe 2014 23 107 82 53–128 344 275–430 a Estimates based upon the use of robust standard errors with missing value imputation and inverse probability weighting for all countries except for Cambodia,
Myanmar and UR Tanzania which used a cluster–level model of analysis without imputation.b Laboratory challenges meant that it was only possible to directly estimate the prevalence of smear-positive (as oppose to bacteriologically confirmed) TB.c Data excludes clusters from the capital city, Bangkok.
:: FIG. 3.25 Estimates of TB incidence (all ages, all forms of TB) for 13 countries that implemented a national TB prevalence survey in the period 2012–2015, before (in blue) and after (in red) survey results became available
50 100 200 500
Incidence per 100 000 population per year (log scale)
Mongolia
Thailand
Indonesia
Nigeria
UR Tanzania
Malawi
Ghana
Uganda
Zambia
Sudan
Rwanda
Gambia
Zimbabwe
Asia Africa
50 100 200 500
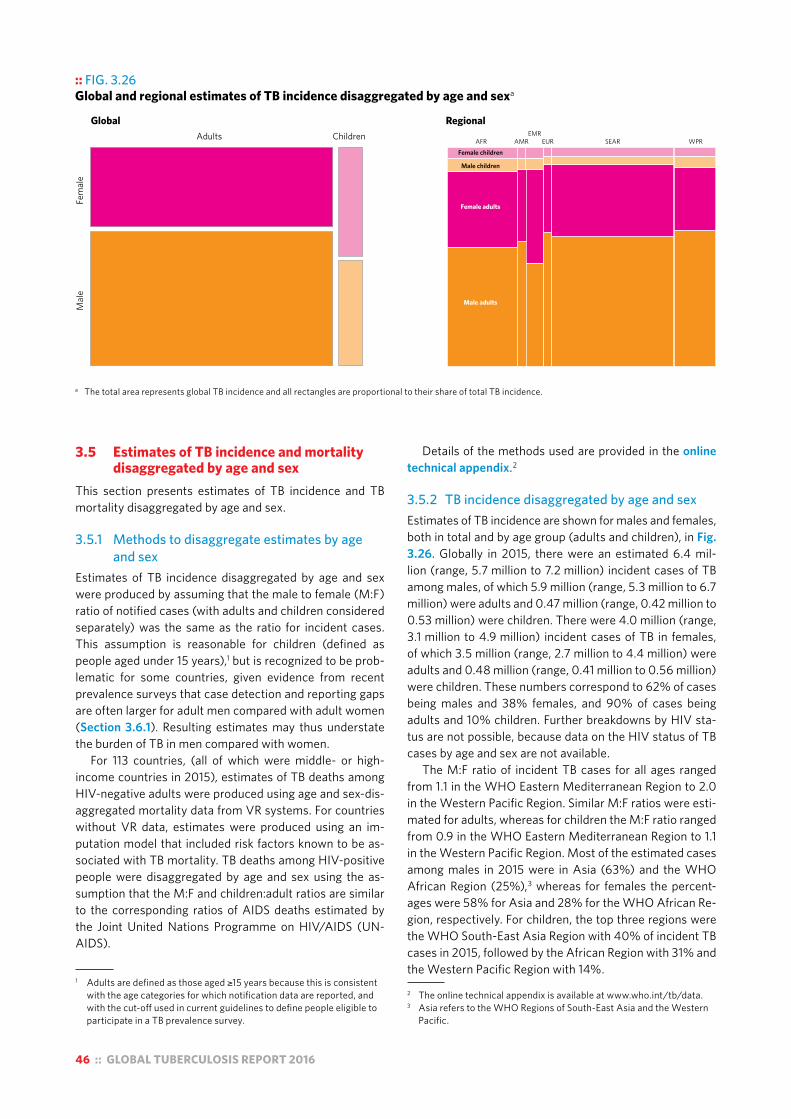
46 :: GLOBAL TUBERCULOSIS REPORT 2016
:: FIG. 3.26Global and regional estimates of TB incidence disaggregated by age and sexa
a The total area represents global TB incidence and all rectangles are proportional to their share of total TB incidence.
Global Regional
Fem
ale
Mal
e
ChildrenAdults AFR AMREMR
EUR SEAR WPRFemale children
Male children
Female adults
Male adults
3.5 Estimates of TB incidence and mortality disaggregated by age and sex
This section presents estimates of TB incidence and TB mortality disaggregated by age and sex.
3.5.1 Methods to disaggregate estimates by age and sex
Estimates of TB incidence disaggregated by age and sex were produced by assuming that the male to female (M:F) ratio of notified cases (with adults and children considered separately) was the same as the ratio for incident cases. This assumption is reasonable for children (defined as people aged under 15 years),1 but is recognized to be prob-lematic for some countries, given evidence from recent prevalence surveys that case detection and reporting gaps are often larger for adult men compared with adult women (Section 3.6.1). Resulting estimates may thus understate the burden of TB in men compared with women.
For 113 countries, (all of which were middle- or high-income countries in 2015), estimates of TB deaths among HIV-negative adults were produced using age and sex-dis-aggregated mortality data from VR systems. For countries without VR data, estimates were produced using an im-putation model that included risk factors known to be as-sociated with TB mortality. TB deaths among HIV-positive people were disaggregated by age and sex using the as-sumption that the M:F and children:adult ratios are similar to the corresponding ratios of AIDS deaths estimated by the Joint United Nations Programme on HIV/AIDS (UN-AIDS).
1 Adults are defined as those aged ≥15 years because this is consistent with the age categories for which notification data are reported, and with the cut-off used in current guidelines to define people eligible to participate in a TB prevalence survey.
Details of the methods used are provided in the online technical appendix.2
3.5.2 TB incidence disaggregated by age and sexEstimates of TB incidence are shown for males and females, both in total and by age group (adults and children), in Fig. 3.26. Globally in 2015, there were an estimated 6.4 mil-lion (range, 5.7 million to 7.2 million) incident cases of TB among males, of which 5.9 million (range, 5.3 million to 6.7 million) were adults and 0.47 million (range, 0.42 million to 0.53 million) were children. There were 4.0 million (range, 3.1 million to 4.9 million) incident cases of TB in females, of which 3.5 million (range, 2.7 million to 4.4 million) were adults and 0.48 million (range, 0.41 million to 0.56 million) were children. These numbers correspond to 62% of cases being males and 38% females, and 90% of cases being adults and 10% children. Further breakdowns by HIV sta-tus are not possible, because data on the HIV status of TB cases by age and sex are not available.
The M:F ratio of incident TB cases for all ages ranged from 1.1 in the WHO Eastern Mediterranean Region to 2.0 in the Western Pacific Region. Similar M:F ratios were esti-mated for adults, whereas for children the M:F ratio ranged from 0.9 in the WHO Eastern Mediterranean Region to 1.1 in the Western Pacific Region. Most of the estimated cases among males in 2015 were in Asia (63%) and the WHO African Region (25%),3 whereas for females the percent-ages were 58% for Asia and 28% for the WHO African Re-gion, respectively. For children, the top three regions were the WHO South-East Asia Region with 40% of incident TB cases in 2015, followed by the African Region with 31% and the Western Pacific Region with 14%.
2 The online technical appendix is available at www.who.int/tb/data. 3 Asia refers to the WHO Regions of South-East Asia and the Western
Pacific.
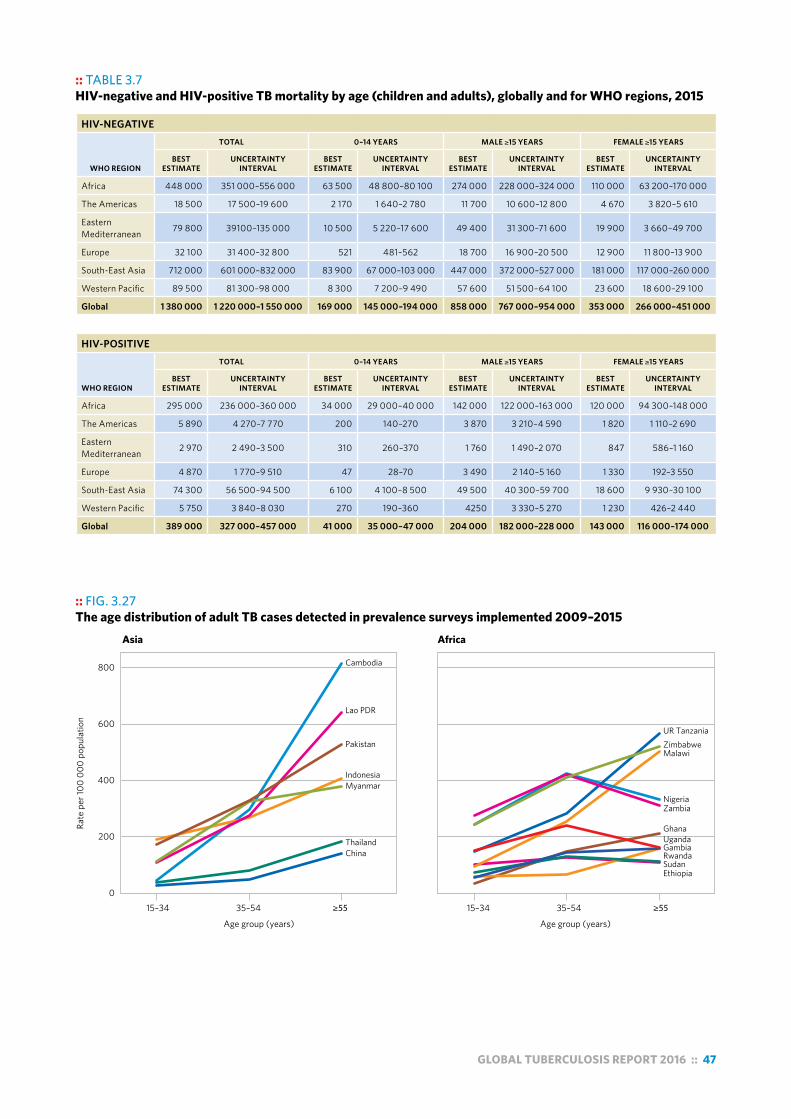
GLOBAL TUBERCULOSIS REPORT 2016 :: 47
:: FIG. 3.27 The age distribution of adult TB cases detected in prevalence surveys implemented 2009–2015
0
200
400
600
800
Rate
per
100
000
popu
latio
n
Age group (years)
ChinaThailand
MyanmarIndonesia
Pakistan
Lao PDR
Cambodia
EthiopiaSudan
GambiaUgandaGhana
ZambiaNigeria
MalawiZimbabweUR Tanzania
Rwanda
Asia Africa
15–34 35–54 ≥55 15–34 35–54 ≥55
Age group (years)
:: TABLE 3.7HIV-negative and HIV-positive TB mortality by age (children and adults), globally and for WHO regions, 2015
HIV-NEGATIVE
WHO REGION
TOTAL 0–14 YEARS MALE ≥15 YEARS FEMALE ≥15 YEARS
BEST ESTIMATE
UNCERTAINTY INTERVAL
BEST ESTIMATE
UNCERTAINTY INTERVAL
BEST ESTIMATE
UNCERTAINTY INTERVAL
BEST ESTIMATE
UNCERTAINTY INTERVAL
Africa 448 000 351 000–556 000 63 500 48 800–80 100 274 000 228 000–324 000 110 000 63 200–170 000
The Americas 18 500 17 500–19 600 2 170 1 640–2 780 11 700 10 600–12 800 4 670 3 820–5 610
Eastern Mediterranean 79 800 39100–135 000 10 500 5 220–17 600 49 400 31 300–71 600 19 900 3 660–49 700
Europe 32 100 31 400–32 800 521 481–562 18 700 16 900–20 500 12 900 11 800–13 900
South-East Asia 712 000 601 000–832 000 83 900 67 000–103 000 447 000 372 000–527 000 181 000 117 000–260 000
Western Pacific 89 500 81 300–98 000 8 300 7 200–9 490 57 600 51 500–64 100 23 600 18 600–29 100
Global 1 380 000 1 220 000–1 550 000 169 000 145 000–194 000 858 000 767 000–954 000 353 000 266 000–451 000
HIV-POSITIVE
WHO REGION
TOTAL 0–14 YEARS MALE ≥15 YEARS FEMALE ≥15 YEARS
BEST ESTIMATE
UNCERTAINTY INTERVAL
BEST ESTIMATE
UNCERTAINTY INTERVAL
BEST ESTIMATE
UNCERTAINTY INTERVAL
BEST ESTIMATE
UNCERTAINTY INTERVAL
Africa 295 000 236 000–360 000 34 000 29 000–40 000 142 000 122 000–163 000 120 000 94 300–148 000
The Americas 5 890 4 270–7 770 200 140–270 3 870 3 210–4 590 1 820 1 110–2 690
Eastern Mediterranean 2 970 2 490–3 500 310 260–370 1 760 1 490–2 070 847 586–1 160
Europe 4 870 1 770–9 510 47 28–70 3 490 2 140–5 160 1 330 192–3 550
South-East Asia 74 300 56 500–94 500 6 100 4 100–8 500 49 500 40 300–59 700 18 600 9 930–30 100
Western Pacific 5 750 3 840–8 030 270 190–360 4250 3 330–5 270 1 230 426–2 440
Global 389 000 327 000–457 000 41 000 35 000–47 000 204 000 182 000–228 000 143 000 116 000–174 000
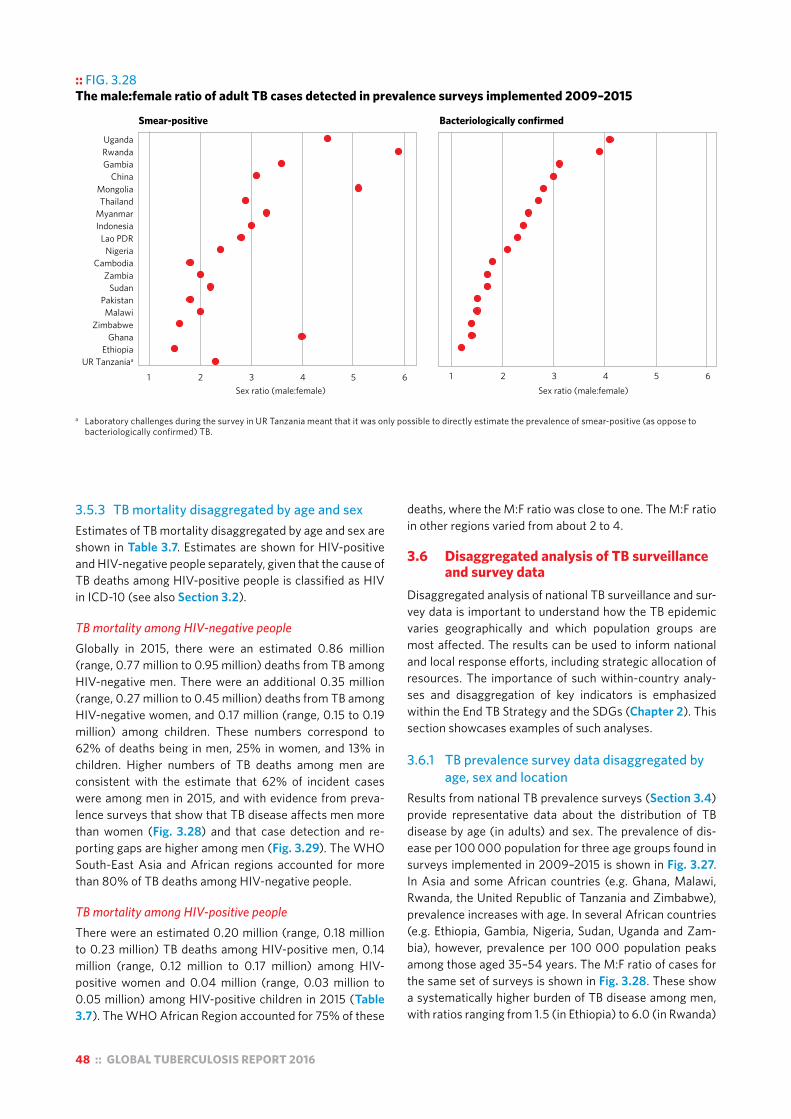
48 :: GLOBAL TUBERCULOSIS REPORT 2016
3.5.3 TB mortality disaggregated by age and sexEstimates of TB mortality disaggregated by age and sex are shown in Table 3.7. Estimates are shown for HIV-positive and HIV-negative people separately, given that the cause of TB deaths among HIV-positive people is classified as HIV in ICD-10 (see also Section 3.2).
TB mortality among HIV-negative peopleGlobally in 2015, there were an estimated 0.86 million (range, 0.77 million to 0.95 million) deaths from TB among HIV-negative men. There were an additional 0.35 million (range, 0.27 million to 0.45 million) deaths from TB among HIV-negative women, and 0.17 million (range, 0.15 to 0.19 million) among children. These numbers correspond to 62% of deaths being in men, 25% in women, and 13% in children. Higher numbers of TB deaths among men are consistent with the estimate that 62% of incident cases were among men in 2015, and with evidence from preva-lence surveys that show that TB disease affects men more than women (Fig. 3.28) and that case detection and re-porting gaps are higher among men (Fig. 3.29). The WHO South-East Asia and African regions accounted for more than 80% of TB deaths among HIV-negative people.
TB mortality among HIV-positive peopleThere were an estimated 0.20 million (range, 0.18 million to 0.23 million) TB deaths among HIV-positive men, 0.14 million (range, 0.12 million to 0.17 million) among HIV-positive women and 0.04 million (range, 0.03 million to 0.05 million) among HIV-positive children in 2015 (Table 3.7). The WHO African Region accounted for 75% of these
deaths, where the M:F ratio was close to one. The M:F ratio in other regions varied from about 2 to 4.
3.6 Disaggregated analysis of TB surveillance and survey data
Disaggregated analysis of national TB surveillance and sur-vey data is important to understand how the TB epidemic varies geographically and which population groups are most affected. The results can be used to inform national and local response efforts, including strategic allocation of resources. The importance of such within-country analy-ses and disaggregation of key indicators is emphasized within the End TB Strategy and the SDGs (Chapter 2). This section showcases examples of such analyses.
3.6.1 TB prevalence survey data disaggregated by age, sex and location
Results from national TB prevalence surveys (Section 3.4) provide representative data about the distribution of TB disease by age (in adults) and sex. The prevalence of dis-ease per 100 000 population for three age groups found in surveys implemented in 2009–2015 is shown in Fig. 3.27. In Asia and some African countries (e.g. Ghana, Malawi, Rwanda, the United Republic of Tanzania and Zimbabwe), prevalence increases with age. In several African countries (e.g. Ethiopia, Gambia, Nigeria, Sudan, Uganda and Zam-bia), however, prevalence per 100 000 population peaks among those aged 35–54 years. The M:F ratio of cases for the same set of surveys is shown in Fig. 3.28. These show a systematically higher burden of TB disease among men, with ratios ranging from 1.5 (in Ethiopia) to 6.0 (in Rwanda)
:: FIG. 3.28 The male:female ratio of adult TB cases detected in prevalence surveys implemented 2009–2015
a Laboratory challenges during the survey in UR Tanzania meant that it was only possible to directly estimate the prevalence of smear-positive (as oppose to bacteriologically confirmed) TB.
UgandaRwandaGambia
ChinaMongoliaThailand
MyanmarIndonesia
Lao PDRNigeria
CambodiaZambia
SudanPakistanMalawi
ZimbabweGhana
EthiopiaUR Tanzaniaa
1 2 3 4 5 6Sex ratio (male:female)
Smear-positive
1 2 3 4 5 6Sex ratio (male:female)
Bacteriologically confirmed
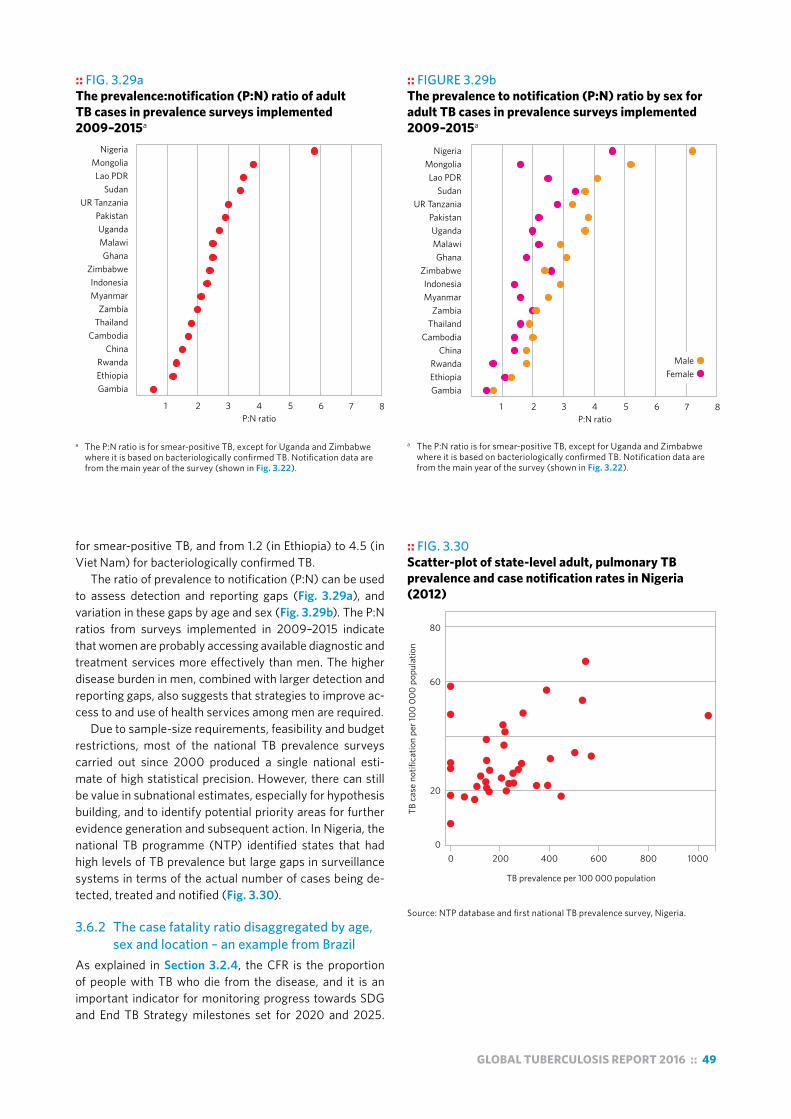
GLOBAL TUBERCULOSIS REPORT 2016 :: 49
:: FIG. 3.29a The prevalence:notification (P:N) ratio of adult TB cases in prevalence surveys implemented 2009–2015a
a The P:N ratio is for smear-positive TB, except for Uganda and Zimbabwe where it is based on bacteriologically confirmed TB. Notification data are from the main year of the survey (shown in Fig. 3.22).
:: FIG. 3.30 Scatter-plot of state-level adult, pulmonary TB prevalence and case notification rates in Nigeria (2012)
Source: NTP database and first national TB prevalence survey, Nigeria.
0 200 400 600 800
TB prevalence per 100 000 population
80
60
20
0
TB c
ase
notif
icat
ion
per 1
00 0
00 p
opul
atio
n
1000
for smear-positive TB, and from 1.2 (in Ethiopia) to 4.5 (in Viet Nam) for bacteriologically confirmed TB.
The ratio of prevalence to notification (P:N) can be used to assess detection and reporting gaps (Fig. 3.29a), and variation in these gaps by age and sex (Fig. 3.29b). The P:N ratios from surveys implemented in 2009–2015 indicate that women are probably accessing available diagnostic and treatment services more effectively than men. The higher disease burden in men, combined with larger detection and reporting gaps, also suggests that strategies to improve ac-cess to and use of health services among men are required.
Due to sample-size requirements, feasibility and budget restrictions, most of the national TB prevalence surveys carried out since 2000 produced a single national esti-mate of high statistical precision. However, there can still be value in subnational estimates, especially for hypothesis building, and to identify potential priority areas for further evidence generation and subsequent action. In Nigeria, the national TB programme (NTP) identified states that had high levels of TB prevalence but large gaps in surveillance systems in terms of the actual number of cases being de-tected, treated and notified (Fig. 3.30).
3.6.2 The case fatality ratio disaggregated by age, sex and location – an example from Brazil
As explained in Section 3.2.4, the CFR is the proportion of people with TB who die from the disease, and it is an important indicator for monitoring progress towards SDG and End TB Strategy milestones set for 2020 and 2025.
:: FIGURE 3.29bThe prevalence to notification (P:N) ratio by sex for adult TB cases in prevalence surveys implemented 2009–2015a
a The P:N ratio is for smear-positive TB, except for Uganda and Zimbabwe where it is based on bacteriologically confirmed TB. Notification data are from the main year of the survey (shown in Fig. 3.22).
P:N ratio
NigeriaMongoliaLao PDR
SudanUR Tanzania
PakistanUgandaMalawiGhana
ZimbabweIndonesiaMyanmar
ZambiaThailand
CambodiaChina
RwandaEthiopiaGambia
1 2 3 4 5 6 7 8
MaleFemale
NigeriaMongoliaLao PDR
SudanUR Tanzania
PakistanUgandaMalawiGhana
ZimbabweIndonesiaMyanmar
ZambiaThailand
CambodiaChina
RwandaEthiopiaGambia
P:N ratio1 2 3 4 5 6 7 8
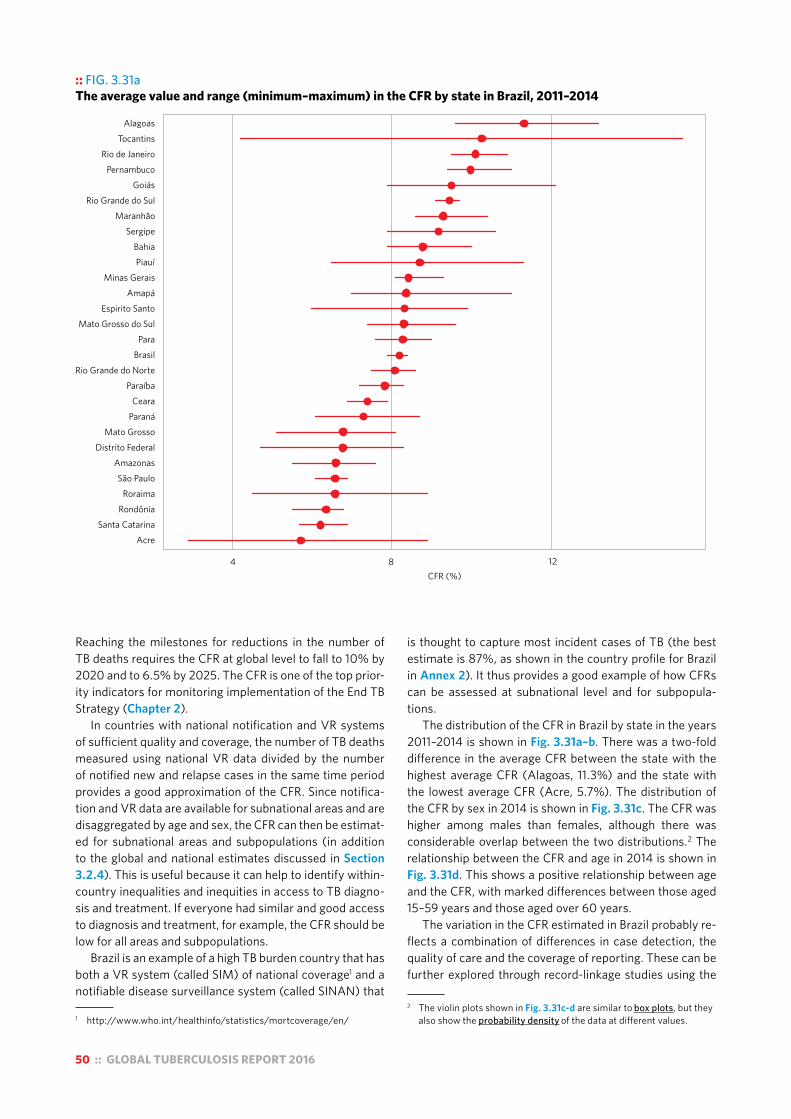
50 :: GLOBAL TUBERCULOSIS REPORT 2016
:: FIG. 3.31a The average value and range (minimum–maximum) in the CFR by state in Brazil, 2011–2014
AcreSanta Catarina
RondôniaRoraima
São PauloAmazonas
Distrito FederalMato Grosso
ParanáCeara
ParaíbaRio Grande do Norte
BrasilPara
Mato Grosso do SulEspirito Santo
AmapáMinas Gerais
PiauíBahia
SergipeMaranhão
Rio Grande do SulGoiás
PernambucoRio de Janeiro
TocantinsAlagoas
1284CFR (%)
Reaching the milestones for reductions in the number of TB deaths requires the CFR at global level to fall to 10% by 2020 and to 6.5% by 2025. The CFR is one of the top prior-ity indicators for monitoring implementation of the End TB Strategy (Chapter 2).
In countries with national notification and VR systems of sufficient quality and coverage, the number of TB deaths measured using national VR data divided by the number of notified new and relapse cases in the same time period provides a good approximation of the CFR. Since notifica-tion and VR data are available for subnational areas and are disaggregated by age and sex, the CFR can then be estimat-ed for subnational areas and subpopulations (in addition to the global and national estimates discussed in Section 3.2.4). This is useful because it can help to identify within-country inequalities and inequities in access to TB diagno-sis and treatment. If everyone had similar and good access to diagnosis and treatment, for example, the CFR should be low for all areas and subpopulations.
Brazil is an example of a high TB burden country that has both a VR system (called SIM) of national coverage1 and a notifiable disease surveillance system (called SINAN) that
1 http://www.who.int/healthinfo/statistics/mortcoverage/en/
is thought to capture most incident cases of TB (the best estimate is 87%, as shown in the country profile for Brazil in Annex 2). It thus provides a good example of how CFRs can be assessed at subnational level and for subpopula-tions.
The distribution of the CFR in Brazil by state in the years 2011–2014 is shown in Fig. 3.31a–b. There was a two-fold difference in the average CFR between the state with the highest average CFR (Alagoas, 11.3%) and the state with the lowest average CFR (Acre, 5.7%). The distribution of the CFR by sex in 2014 is shown in Fig. 3.31c. The CFR was higher among males than females, although there was considerable overlap between the two distributions.2 The relationship between the CFR and age in 2014 is shown in Fig. 3.31d. This shows a positive relationship between age and the CFR, with marked differences between those aged 15–59 years and those aged over 60 years.
The variation in the CFR estimated in Brazil probably re-flects a combination of differences in case detection, the quality of care and the coverage of reporting. These can be further explored through record-linkage studies using the
2 The violin plots shown in Fig. 3.31c-d are similar to box plots, but they also show the probability density of the data at different values.

GLOBAL TUBERCULOSIS REPORT 2016 :: 51
:: FIG. 3.31cThe distribution of state CFRs by sex in Brazil, 2014.a Horizontal segments denote the average.
4
8
12
Male Female
CFR
(%)
:: FIG. 3.31b The average CFR by state in Brazil, 2011–2014
CFR (%)0–5.96–6.97–7.98–8.99–9.9≥10
N
a These violin plots are used to visualise the distribution of the data and its probability density. It is a combination of a box plot and a density plot that is rotated and placed on each side, to show the distributional shape of the data.
:: FIG. 3.31d The distribution of state CFRs by age in Brazil, 2014.a Horizontal segments denote the average.
0
5
10
15
20
CFR
(%)
0−14 15−59 ≥60
Age group
a These violin plots are used to visualise the distribution of the data and its probability density. It is a combination of a box plot and a density plot that is rotated and placed on each side, to show the distributional shape of the data.
The boundaries and names shown and the designations used on this map do not imply the expression of any opinion whatsoever on the part of the World Health Organization concerning the legal status of any country, territory, city or area or of its authorities, or concerning the delimitation of its frontiers or boundaries.

52 :: GLOBAL TUBERCULOSIS REPORT 2016
:: FIG. B 3.7.1 Subnational TB notifications (new and relapse, 2015) from Ghana, Guinea, Nigeria and Sierra Leone
Nigeria
Guinea
Ghana
Sierra Leone
N
The boundaries and names shown and the designations used on this map do not imply the expression of any opinion whatsoever on the part of the World Health Organization concerning the legal status of any country, territory, city or area or of its authorities, or concerning the delimitation of its frontiers or boundaries.
:: Box 3.7Promoting the analysis and use of disaggregated data for policy, planning and programmatic action
Strong TB surveillance systems allow the TB epidemic to be tracked at national level, and for subnational areas and specific population groups, using routinely collected data. The results can be used to inform national and local response efforts, including strategic allocation of resources.
As part of efforts to improve the availability and facilitate the analysis of disaggregated TB surveillance data by age, sex and location, a pilot workshop was held in May 2016 with the NTPs of 16 countries in west Africa.a,b In TB epidemiological reviews (Fig. 3.1b), a common finding was that historical subnational data were stored in multiple separate spreadsheets that made it difficult to use the available data. In response to this finding, preparations for the workshop included the development of a standard platformc for safeguarding and analysing subnational notification and treatment outcome data. This platform was developed using the DHIS2 software,d which is open source and is already used for collecting, managing, visualizing and exploring health and other data in many countries. The standard platform was designed to be suitable for compilation of TB data from recording and reporting systems that use either the 2006 or the 2013 versions of the WHO reporting framework,e,f and can be used to conduct the analyses recommended in the WHO handbook for understanding and using TB data.g
For the pilot workshop in west Africa, data entry focused on the first administrative level (e.g. province). However, the platform can also capture data at lower levels, such as districts or individual health facilities. Subnational population estimates, if available disaggregated by age and sex, can also be entered. This requires coordination with national census agencies, unless already available (as may be the case in countries using DHIS as their health management information system). Geographic information system (GIS)
shape-files can also be imported into the platform, allowing for generation of maps for available surveillance indicators.
Examples of the analyses that can be generated are shown in Fig. B3.7.1.
The establishment of this DHIS2 platform could also provide the basis for prospective collection of aggregate-level data for countries still using a paper-based TB surveillance system or for countries that are in the process of transitioning to a national case-based TB surveillance solution.
The next multi-country workshop is scheduled for central and east African countries towards the end of 2016, and is expected to be followed by further workshops in other parts of the world.
a For further details, please see Background Document 2b prepared for the April 2016 meeting of the Task Force, available at www.who.int/tb/advisory_bodies/impact_measurement_taskforce/meetings/tf6_background_3b_drtb_burden.pdf?ua=1
b The 16 countries were Benin, Burkina Faso, Cape Verde, Gambia, Ghana, Guinea Conakry, Guinea Bissau, Ivory Coast, Liberia, Mali, Mauritania, Niger, Nigeria, Senegal, Sierra Leone and Togo. They are part of the West Africa Research Network for TB that has been established by the Special Programme for Research and Training in Tropical Diseases (TDR).
c https://tbhistoric.org d https://www.dhis2.org/e http://apps.who.int/iris/bitstream/10665/69608/1/WHO_HTM_
TB_2006.373_eng.pdff World Health Organization. Definitions and reporting framework
for tuberculosis – 2013 revision (updated December 2014) (WHO/HTM/TB/2013.2). Geneva: WHO; 2013 (www.who.int/iris/bitstream/10665/79199/1/9789241505345_eng.pdf, accessed 15 August 2015).
g World Health Organization. Understanding and using tuberculosis data. Geneva: WHO Global Task Force on TB Impact Measurement; 2014 (http://www.who.int/tb/publications/understanding_and_using_tb_data/en/, accessed 24 August 2016).
Notification rate per 100 000 population
0–19.920–39.940–59.960–79.980–99.9≥100
GLOBAL TUBERCULOSIS REPORT 2016 :: 53
SIM and SINAN case-based databases, followed by actions as appropriate to address gaps in detection, treatment or reporting.
3.6.3 TB case notification and treatment outcome data disaggregated by age, sex and location
Data on TB case notifications and the treatment outcomes of notified cases are routinely collected in most countries, and for the past decade about 200 countries and territories have reported national data to WHO in annual rounds of global TB data collection (Chapter 1 and Chapter 4). This has been facilitated by a standard recording and reporting framework that was first developed by WHO in the mid-1990s, with subsequent updates in 2006 and most re-cently in 2013.1 Most (98%) countries that reported 2015 notification data to WHO were able to disaggregate notifi-cations of new and relapse (incident) cases by age and sex; these data are shown in Chapter 4 (see in particular Fig. 4.2) as well as in Annex 2 and Annex 4.
Notification and treatment outcome data for sub-national areas are not routinely requested by WHO in
1 World Health Organization. Definitions and reporting framework for tuberculosis – 2013 revision (updated December 2014) (WHO/HTM/TB/2013.2). Geneva: WHO; 2013 (www.who.int/iris/bitstream/10665/79199/1/9789241505345_eng.pdf, accessed 15 August 2015). The document available online includes a few updates made in 2014.
annual rounds of global TB data collection. However, these data are usually available at country level and are a key source of information, including for TB epidemiological reviews and assessment of the performance of TB surveil-lance (Fig. 3.1). Moreover, as part of the WHO Global Task Force on TB Impact Measurement’s fifth strategic areas of work for 2016–2020 (Box 3.1), increased attention is being given to the analysis and use of subnational data. This has started with an initiative to provide a platform that allows safeguarding of subnational TB case notification and treat-ment outcome data for as many years as possible, while at the same time facilitating analysis and use of data to in-form policy, planning, budgeting and resource mobilization. The platform has been built using the open source DHIS2 software,2 and its use was piloted as part of the prepara-tions for and implementation of a regional workshop for 16 countries in West Africa in May 2016. Its use will be ex-panded to other countries later in 2016 and in 2017. Further details, including examples of the analyses that can be pro-duced, are provided in Box 3.7.
2 https://www.dhis2.org/

54 :: GLOBAL TUBERCULOSIS REPORT 2016
Chapter 4 :: Diagnosis and treatment: TB, HIV-associated TB and drug-resistant TB
:: KEY FACTS AND MESSAGESTB prevalence surveys of adults show higher M:F ratios, indicating that notification data understate the share of the TB burden accounted for by men in some countries. Globally, children (aged <15 years) accounted for 6.3% of the new and relapse cases that were notified in 2015.
Globally in 2015, 55% of notified TB patients had a documented HIV test result, an 18-fold increase in testing coverage since 2004. In the African Region where the burden of HIV-associated TB is highest, 81% of TB patients had a documented HIV test result. The proportion of known HIV-positive TB patients on antiretroviral therapy (ART) was 78% globally, and above 90% in India, Kenya, Malawi, Mozambique, Namibia and Swaziland.
The only WHO-recommended rapid diagnostic test for detection of TB and rifampicin resistance currently available is the Xpert MTB/RIF® assay. The number of cartridges procured by countries eligible for concessional prices was 6.2 million in 2015, up from 550 000 in 2011. Of the 48 countries in at least one of the new lists of high burden countries, 15 had adopted national algorithms positioning Xpert MTB/RIF as the initial diagnostic test for all people suspected of having pulmonary TB by the end of 2015. These countries accounted for 10% of the estimated global number of incident TB cases in 2015.
The latest treatment outcome data show treatment success rates of 83% for TB (2014 cohort), 52% for MDR/RR-TB (2013 cohort) and 28% for XDR-TB (2013 cohort).
At least 23 countries in Africa and Asia have introduced shorter regimens for treatment of MDR/RR-TB, which have achieved high treatment success rates (87–90%) under operational research conditions. A standardised shorter MDR-TB regimen of 9–12 months is now recommended in WHO guidance issued in May 2016 for all patients (excluding pregnant women) with pulmonary MDR/RR-TB that is not resistant to second-line drugs. As part of efforts to improve outcomes for MDR/XDR-TB, at least 70 countries had started using bedaquiline and 39 countries had used delamanid by the end of 2015.
In 2015, 6.4 million people with TB were notified to national TB programmes (NTPs) and reported to WHO. Of these, just over 6.1 million had an incident episode (new or relapse) of TB. The number of new and relapse TB cases notified and the notification rate per 100 000 population increased globally in 2013–2015, mostly explained by a 34% increase in notifications in India.
In 2015, 30% of the 3.4 million new bacteriologically confirmed and previously treated TB cases notified globally were reported to have had DST for rifampicin, with coverage of 24% for new TB patients and 53% for previously treated TB patients. Globally, 132 120 cases of multidrug-resistant TB or rifampicin-resistant TB (MDR/RR-TB) were detected and notified in 2015, and 124 990 were enrolled on treatment.
Despite increases in notifications of TB and MDR/RR-TB, big detection and treatment gaps remain. In 2015, the gap between notifications of new and relapse cases and the best estimate of the number of incident cases was 4.3 million, reflecting a mixture of underreporting of detected TB cases (especially in countries with large private sectors) and underdiagnosis (especially in countries where there are major geographic or financial barriers to accessing care). The gap between the number of MDR/RR-TB cases started on treatment and the number of notified cases estimated to have MDR/RR-TB was 205 000 (455 000 if compared with the estimated incidence of MDR/RR-TB).
From a global perspective, closing detection and treatment gaps requires progress in a particular subset of countries. Ten countries account for 77% of the total estimated gap between incidence and notifications, with India, Indonesia and Nigeria alone accounting for almost half of the total. Five countries account for over 60% of the gap between enrolments on MDR-TB treatment in 2015 and the estimated number of incident MDR/RR-TB cases in 2015: China, India, Indonesia, Nigeria and the Russian Federation.
The global male:female (M:F) sex ratio for notifications was 1.7, varying from 1.0 in Pakistan to 3.1 in Viet Nam among the high TB burden countries. Results from national
GLOBAL TUBERCULOSIS REPORT 2016 :: 55
Prompt and accurate diagnosis of tuberculosis (TB), HIV-associated TB and drug-resistant TB, followed by provision of treatment in line with international standards, prevents deaths and limits ill-health among people who develop the disease. It also prevents further transmission of infection to others. The 2020 and 2025 milestones for reductions in TB incidence and TB deaths set in the End TB Strategy (Chapter 2) require the case fatality ratio (the proportion of people with TB who die from the disease) to fall to 10% by 2020 and to 6.5% by 2025. The latter is only feasible if all those with TB are promptly diagnosed and effectively treated. Patient-centred care and prevention, backed by bold policies and supportive systems (including universal health coverage, UHC), are pillars one and two of the End TB Strategy (Box 4.1).
This chapter provides the latest data reported to WHO on the diagnosis and treatment of TB, HIV-associated TB and drug-resistant TB. Section 4.1 presents and discusses data for 2015 on notifications of TB cases and associated coverage of diagnostic testing, as well as trends since 2000. It includes data on the contribution of community engage-ment and public–public and public–private mix (PPM) ini-tiatives to case-finding efforts in 2015. Section 4.2 focuses on treatment coverage (and detection and treatment gaps) for patients with TB, HIV-associated TB and drug-resistant TB, comparing numbers detected and treated with under-lying estimates of disease burden (presented in more detail in Chapter 3). Section 4.3 provides the most recent data on treatment outcomes, for new and relapse TB patients, TB patients coinfected with HIV, and patients with multid-rug-resistant TB (MDR-TB)1 or rifampicin-resistant TB (RR-TB).2 It also contains information about the use of shorter MDR-TB regimens for treatment of MDR/RR-TB (i.e. RR-TB cases including those with MDR-TB) and the use of new anti-TB drugs for treatment of extensively drug-resistant TB (XDR-TB).3
Throughout the chapter, data are presented at global, re-gional and country levels, giving particular attention to high burden countries (HBCs).4 Further country-specific details for all of the indicators covered in this chapter are provided in Annex 2, Annex 4 and at http://www.who.int/tb/data.
4.1 Case notifications and testing coverage4.1.1 TB case notifications and bacteriological
confirmationIn 2015, 6.4 million people with TB were notified to national TB programmes (NTPs) and reported to WHO (Table 4.1).
1 MDR-TB is defined as resistance to at least isoniazid and rifampicin, the two most powerful first-line anti-TB medicines.
2 WHO recommends an MDR-TB treatment regimen for patients with RR-TB. This includes patients with MDR-TB as well as any other patient with TB resistant to rifampicin (MDR/RR-TB).
3 XDR-TB is defined as MDR-TB plus resistance to at least one fluoroquinolone and a second-line injectable agent, the two most important classes of medicines in the MDR-TB regimen.
4 For an explanation of how the three lists of HBCs (for TB, HIV-associated TB and MDR-TB) featured in this chapter were defined, see Chapter 2.
Of these, just over 6.1 million had a new (incident) episode of TB (shown as the total of new and relapse cases), and an additional 227 873 had been previously diagnosed with TB but their treatment was changed to a retreatment regi-men (and they were re-registered as a retreatment case). The number of new and relapse TB cases notified and the notification rate per 100 000 population increased between 2000 and 2009, then fell slowly until 2013, be-fore increasing in 2013–2015 (Fig. 4.1). The increase since 2013 is mostly explained by increased notifications in India (+34% between 2013 and 2015), following the introduc-tion of a national policy of mandatory notification, and the rollout of a nationwide web-based and case-based report-ing system (called “Nikshay”) that facilitates reporting of detected cases by care providers in the public and private sectors. Further details about trends in notifications and comparisons with underlying estimates of TB incidence are provided in Section 4.2.1.
:: Box 4.1Pillars one and two of the End TB Strategy
The first pillar of the End TB Strategy is “Integrated, patient-centred care and prevention”. It has four components:
! early diagnosis of TB including universal drug-susceptibility testing (DST), and systematic screening of contacts and high-risk groups;
! treatment of all people with TB including drug-resistant TB, and patient support;
! collaborative TB/HIV activities, and management of comorbidities; and
! preventive treatment of persons at high risk, and vaccination against TB.
The fourth component of the first pillar is the topic of Chapter 5.
The second pillar of the End TB Strategy is “bold policies and supportive systems”. It has four components:
! political commitment with adequate resources for TB care and prevention;
! engagement of communities, civil society organizations, and providers of public and private care;
! UHC policy, and regulatory frameworks for case notification, vital registration, quality and rational use of medicines, and infection control; and
! social protection, poverty alleviation and actions on other determinants of TB.
The components of the second pillar are primarily discussed in Chapter 6.
For an overview of all aspects of the End TB Strategy, see Chapter 2 (Box 2.3).
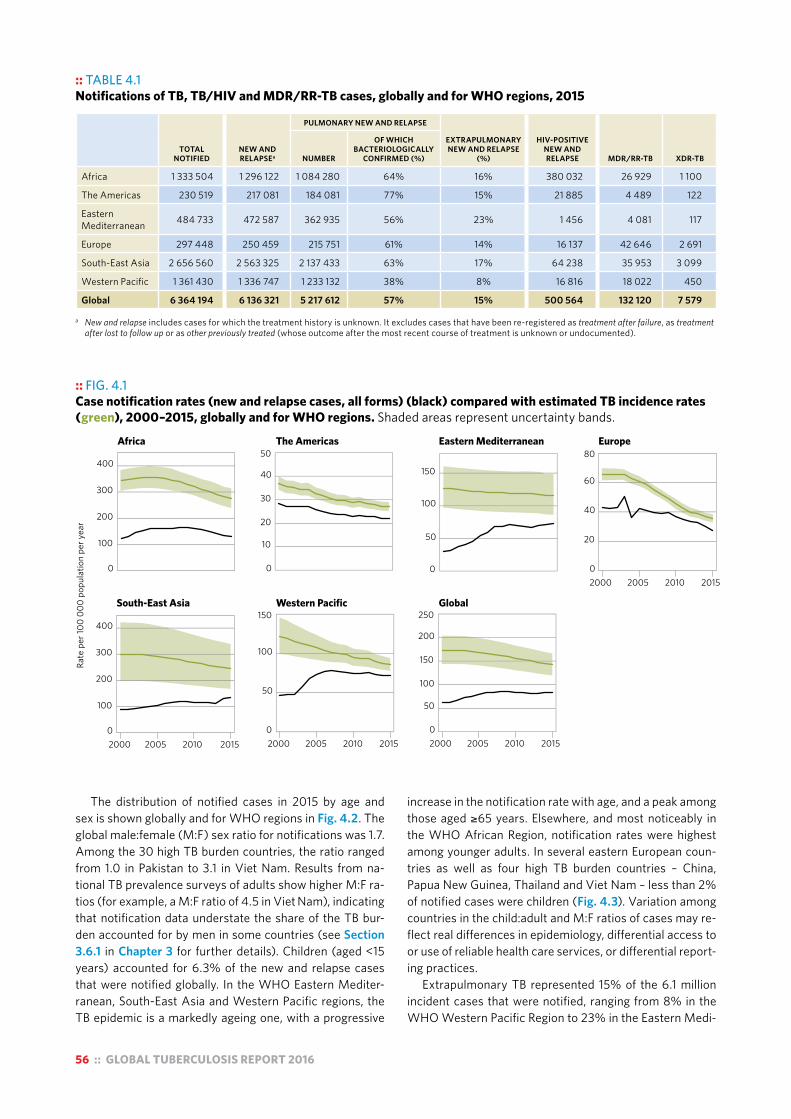
56 :: GLOBAL TUBERCULOSIS REPORT 2016
The distribution of notified cases in 2015 by age and sex is shown globally and for WHO regions in Fig. 4.2. The global male:female (M:F) sex ratio for notifications was 1.7. Among the 30 high TB burden countries, the ratio ranged from 1.0 in Pakistan to 3.1 in Viet Nam. Results from na-tional TB prevalence surveys of adults show higher M:F ra-tios (for example, a M:F ratio of 4.5 in Viet Nam), indicating that notification data understate the share of the TB bur-den accounted for by men in some countries (see Section 3.6.1 in Chapter 3 for further details). Children (aged <15 years) accounted for 6.3% of the new and relapse cases that were notified globally. In the WHO Eastern Mediter-ranean, South-East Asia and Western Pacific regions, the TB epidemic is a markedly ageing one, with a progressive
increase in the notification rate with age, and a peak among those aged ≥65 years. Elsewhere, and most noticeably in the WHO African Region, notification rates were highest among younger adults. In several eastern European coun-tries as well as four high TB burden countries – China, Papua New Guinea, Thailand and Viet Nam – less than 2% of notified cases were children (Fig. 4.3). Variation among countries in the child:adult and M:F ratios of cases may re-flect real differences in epidemiology, differential access to or use of reliable health care services, or differential report-ing practices.
Extrapulmonary TB represented 15% of the 6.1 million incident cases that were notified, ranging from 8% in the WHO Western Pacific Region to 23% in the Eastern Medi-
:: TABLE 4.1 Notifications of TB, TB/HIV and MDR/RR-TB cases, globally and for WHO regions, 2015
TOTAL NOTIFIED
NEW AND RELAPSEa
PULMONARY NEW AND RELAPSE
EXTRAPULMONARYNEW AND RELAPSE
(%)
HIV-POSITIVENEW AND RELAPSE MDR/RR-TB XDR-TBNUMBER
OF WHICHBACTERIOLOGICALLY
CONFIRMED (%)
Africa 1 333 504 1 296 122 1 084 280 64% 16% 380 032 26 929 1 100
The Americas 230 519 217 081 184 081 77% 15% 21 885 4 489 122
Eastern Mediterranean 484 733 472 587 362 935 56% 23% 1 456 4 081 117
Europe 297 448 250 459 215 751 61% 14% 16 137 42 646 2 691
South-East Asia 2 656 560 2 563 325 2 137 433 63% 17% 64 238 35 953 3 099
Western Pacific 1 361 430 1 336 747 1 233 132 38% 8% 16 816 18 022 450
Global 6 364 194 6 136 321 5 217 612 57% 15% 500 564 132 120 7 579
a New and relapse includes cases for which the treatment history is unknown. It excludes cases that have been re-registered as treatment after failure, as treatment after lost to follow up or as other previously treated (whose outcome after the most recent course of treatment is unknown or undocumented).
:: FIG. 4.1 Case notification rates (new and relapse cases, all forms) (black) compared with estimated TB incidence rates (green), 2000–2015, globally and for WHO regions. Shaded areas represent uncertainty bands.
Rate
per
100
000
popu
latio
n pe
r yea
r
0
100
200
300
400
0
100
200
300
400
0
10
20
30
40
50
0
50
100
150
0
50
100
150
0
50
100
150
200
250
20
40
60
80
2000 2005 2010 20150
2000 2005 2010 2015 2000 2005 2010 2015 2000 2005 2010 2015
South-East Asia Western Pacific Global
Africa The Americas Eastern Mediterranean Europe

GLOBAL TUBERCULOSIS REPORT 2016 :: 57
Age
gro
up (y
ears
)
Female
Male
Africa The Americas Eastern Mediterranean Europe
South-East Asia Western Pacific Global
0–14
15–24
25–34
35–44
45–54
55–64
≥65
0–14
15–24
25–34
35–44
45–54
55–64
≥65
200 100 0 100 200 300 400
200 100 0 100 200 300 400 200 100 0 100 200 300 400 200 100 0 100 200 300 400
TB case notification rate per 100 000 population per year
Africa The Americas Eastern Mediterranean
:: FIG. 4.2New and relapse TB case notification rates by age and sexa in 2015, globally and for WHO regions
a Countries not reporting cases in these categories are excluded. Cases included make up 85% of reported cases.
:: FIG. 4.3Percentage of new and relapse TB cases that were children (aged <15), 2015a
Percentage0–1.92–4.95–9.9≥10No dataNot applicable
a 2014 data were used for 17 countries.
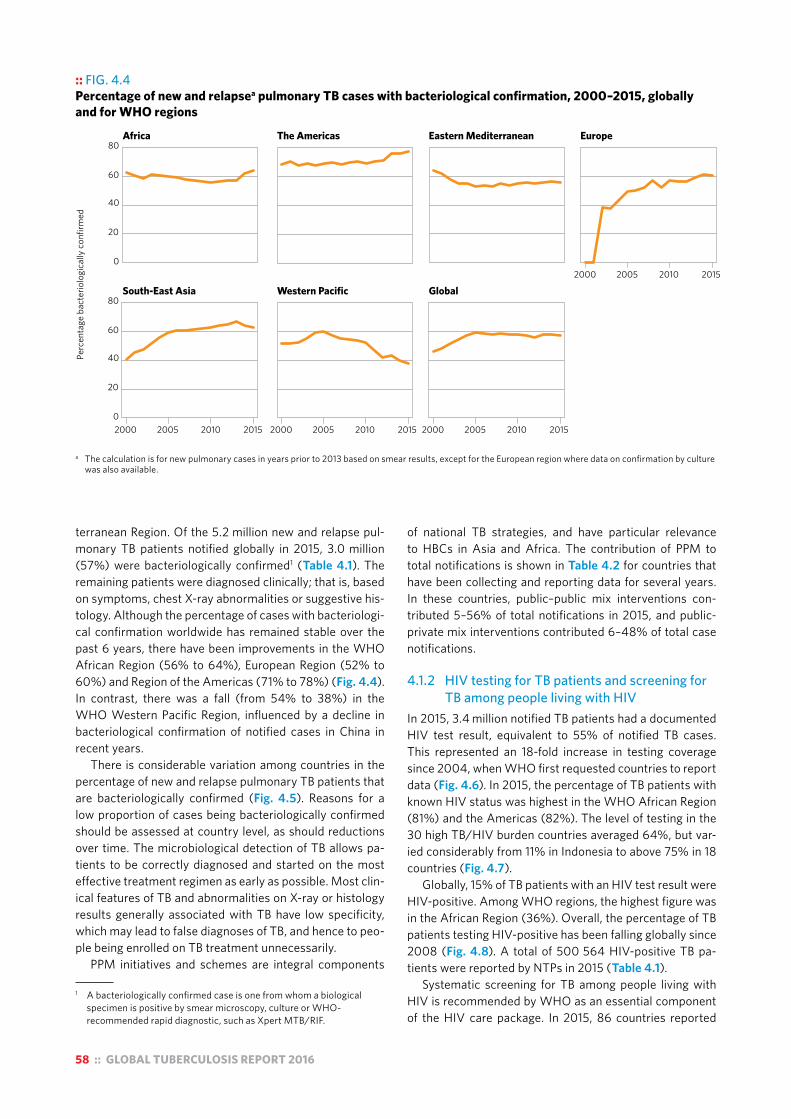
58 :: GLOBAL TUBERCULOSIS REPORT 2016
terranean Region. Of the 5.2 million new and relapse pul-monary TB patients notified globally in 2015, 3.0 million (57%) were bacteriologically confirmed1 (Table 4.1). The remaining patients were diagnosed clinically; that is, based on symptoms, chest X-ray abnormalities or suggestive his-tology. Although the percentage of cases with bacteriologi-cal confirmation worldwide has remained stable over the past 6 years, there have been improvements in the WHO African Region (56% to 64%), European Region (52% to 60%) and Region of the Americas (71% to 78%) (Fig. 4.4). In contrast, there was a fall (from 54% to 38%) in the WHO Western Pacific Region, influenced by a decline in bacteriological confirmation of notified cases in China in recent years.
There is considerable variation among countries in the percentage of new and relapse pulmonary TB patients that are bacteriologically confirmed (Fig. 4.5). Reasons for a low proportion of cases being bacteriologically confirmed should be assessed at country level, as should reductions over time. The microbiological detection of TB allows pa-tients to be correctly diagnosed and started on the most effective treatment regimen as early as possible. Most clin-ical features of TB and abnormalities on X-ray or histology results generally associated with TB have low specificity, which may lead to false diagnoses of TB, and hence to peo-ple being enrolled on TB treatment unnecessarily.
PPM initiatives and schemes are integral components
1 A bacteriologically confirmed case is one from whom a biological specimen is positive by smear microscopy, culture or WHO-recommended rapid diagnostic, such as Xpert MTB/RIF.
of national TB strategies, and have particular relevance to HBCs in Asia and Africa. The contribution of PPM to total notifications is shown in Table 4.2 for countries that have been collecting and reporting data for several years. In these countries, public–public mix interventions con-tributed 5–56% of total notifications in 2015, and public-private mix interventions contributed 6–48% of total case notifications.
4.1.2 HIV testing for TB patients and screening for TB among people living with HIV
In 2015, 3.4 million notified TB patients had a documented HIV test result, equivalent to 55% of notified TB cases. This represented an 18-fold increase in testing coverage since 2004, when WHO first requested countries to report data (Fig. 4.6). In 2015, the percentage of TB patients with known HIV status was highest in the WHO African Region (81%) and the Americas (82%). The level of testing in the 30 high TB/HIV burden countries averaged 64%, but var-ied considerably from 11% in Indonesia to above 75% in 18 countries (Fig. 4.7).
Globally, 15% of TB patients with an HIV test result were HIV-positive. Among WHO regions, the highest figure was in the African Region (36%). Overall, the percentage of TB patients testing HIV-positive has been falling globally since 2008 (Fig. 4.8). A total of 500 564 HIV-positive TB pa-tients were reported by NTPs in 2015 (Table 4.1).
Systematic screening for TB among people living with HIV is recommended by WHO as an essential component of the HIV care package. In 2015, 86 countries reported
:: FIG. 4.4Percentage of new and relapsea pulmonary TB cases with bacteriological confirmation, 2000–2015, globally and for WHO regions
Perc
enta
ge b
acte
riolo
gica
lly c
onfir
med
Africa The Americas Eastern Mediterranean Europe
South-East Asia Western Pacific Global
0
20
40
60
80
2000 2005 2010 2015
2000 2005 2010 20150
20
40
60
80
2000 2005 2010 2015 2000 2005 2010 2015
a The calculation is for new pulmonary cases in years prior to 2013 based on smear results, except for the European region where data on confirmation by culture was also available.
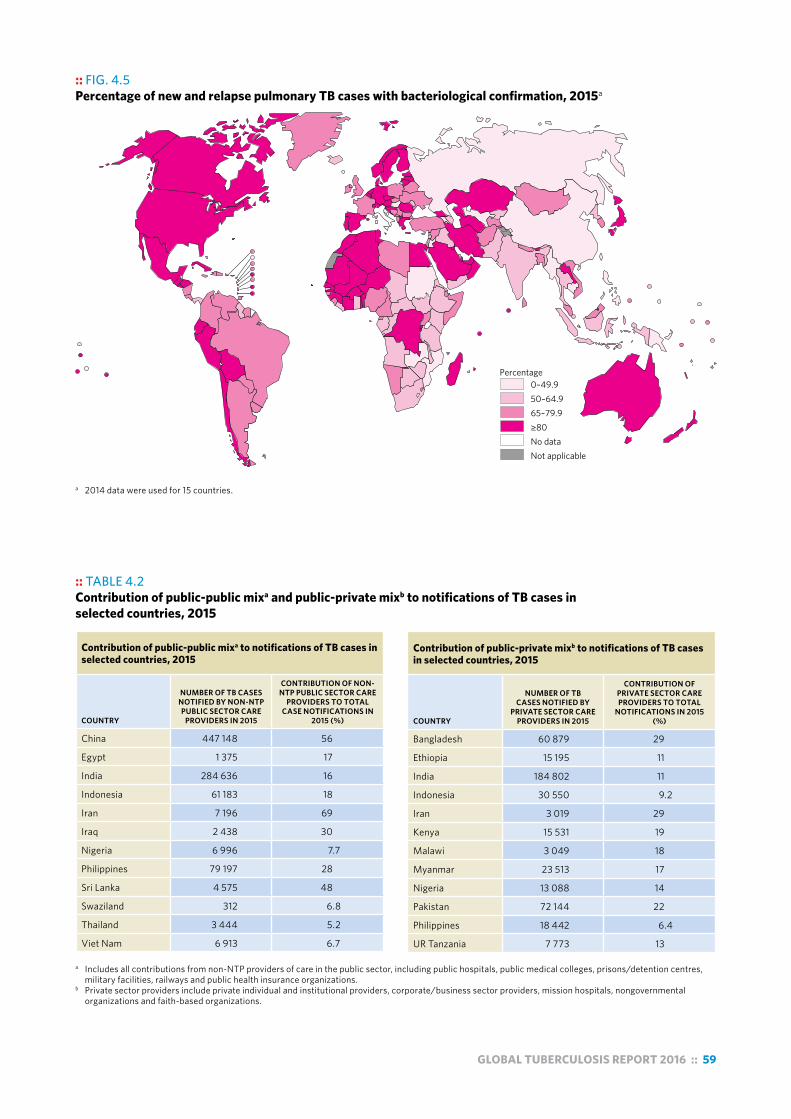
GLOBAL TUBERCULOSIS REPORT 2016 :: 59
:: FIG. 4.5 Percentage of new and relapse pulmonary TB cases with bacteriological confirmation, 2015a
Percentage0–49.950–64.965–79.9≥80No dataNot applicable
a 2014 data were used for 15 countries.
:: TABLE 4.2 Contribution of public-public mixa and public-private mixb to notifications of TB cases in selected countries, 2015
Contribution of public-public mixa to notifications of TB cases in selected countries, 2015
COUNTRY
NUMBER OF TB CASES NOTIFIED BY NON-NTP PUBLIC SECTOR CARE
PROVIDERS IN 2015
CONTRIBUTION OF NON-NTP PUBLIC SECTOR CARE
PROVIDERS TO TOTAL CASE NOTIFICATIONS IN
2015 (%)
China 447 148 56
Egypt 1 375 17
India 284 636 16
Indonesia 61 183 18
Iran 7 196 69
Iraq 2 438 30
Nigeria 6 996 7.7
Philippines 79 197 28
Sri Lanka 4 575 48
Swaziland 312 6.8
Thailand 3 444 5.2
Viet Nam 6 913 6.7
Contribution of public-private mixb to notifications of TB cases in selected countries, 2015
COUNTRY
NUMBER OF TB CASES NOTIFIED BY
PRIVATE SECTOR CARE PROVIDERS IN 2015
CONTRIBUTION OF PRIVATE SECTOR CARE PROVIDERS TO TOTAL
NOTIFICATIONS IN 2015 (%)
Bangladesh 60 879 29
Ethiopia 15 195 11
India 184 802 11
Indonesia 30 550 9.2
Iran 3 019 29
Kenya 15 531 19
Malawi 3 049 18
Myanmar 23 513 17
Nigeria 13 088 14
Pakistan 72 144 22
Philippines 18 442 6.4
UR Tanzania 7 773 13
a Includes all contributions from non-NTP providers of care in the public sector, including public hospitals, public medical colleges, prisons/detention centres, military facilities, railways and public health insurance organizations.
b Private sector providers include private individual and institutional providers, corporate/business sector providers, mission hospitals, nongovernmental organizations and faith-based organizations.

60 :: GLOBAL TUBERCULOSIS REPORT 2016
:: FIG. 4.6 Percentage of new and relapsea TB cases with documented HIV status, 2004–2015, globally and for WHO regions
Perc
enta
ge w
ith d
ocum
ente
d st
atus
Africa The Americas Eastern Mediterranean Europe
South-East Asia Western Pacific Global
0
20
40
60
80
100
0
20
40
60
80
100
2005 2010 2015
2005 2010 2015 2005 2010 2015 2005 2010 2015
a The calculation is for all cases in years prior to 2015.
:: FIG. 4.7 Percentage of new and relapse TB cases with documented HIV status, 2015a
Percentage0–24.925–49.950–74.9≥75No dataNot applicable
a Data for the Russian Federation are for new TB patients in the civilian sector only.

GLOBAL TUBERCULOSIS REPORT 2016 :: 61
data about the number of TB cases notified from among those newly enrolled in HIV care (up from 59 countries in 2013 and 76 in 2014). In total, 231 637 (10%) of the almost 2.3 million people who were newly enrolled in HIV care in 2015 were notified as TB cases during the same year; data for the 12 high TB/HIV burden countries that reported data are shown in Table 4.3. Improvements in the coverage and quality of data for this indicator are necessary to track the impact of HIV care, especially antiretroviral therapy (ART), on the burden of TB in people living with HIV.
4.1.3 Rapid testing for TBUse of rapid tests facilitates early detection of TB. One of the 10 priority indicators for monitoring implementation of the End TB Strategy (shown in Chapter 2, Table 2.1) is the percentage of new and relapse TB cases tested with a WHO-recommended rapid diagnostic (WRD) at the time of diagnosis. This and other indicators related to laboratory strengthening activities are part of the Framework of indica-tors and targets for laboratory strengthening under the End TB Strategy developed in 2016 (Box 4.2).
In this first year of reporting, 113 of 191 reporting coun-tries and territories indicated that their routine surveillance system captures data on the percentage of new and relapse TB cases tested with a WRD at the time of diagnosis. How-ever, further validation of the data as well as refinements to reporting systems are needed to improve data accuracy.
The only WRD currently available for detection of TB and rifampicin resistance is the Xpert MTB/RIF® assay (devel-oped by Cepheid, USA). The original WHO recommenda-tions in 2010 prioritized its use as the initial diagnostic test in individuals suspected of having MDR-TB or HIV-associ-ated TB, and most HBCs have adopted the original WHO recommendations into national policy (Table 4.4).
A policy update in 2013 expanded the recommended
uses of the assay, to include its use for the diagnosis of TB in children, on selected specimens for the diagnosis of extrapulmonary TB, and for all people suspected of hav-ing pulmonary TB as a replacement for microscopy (condi-tional recommendations). A growing number of countries have already adopted national algorithms positioning Xpert MTB/RIF as the initial diagnostic test for all people sus-pected of having pulmonary TB. Among the 48 countries in one or more of three new lists of HBCs, 15 had adopted such algorithms by the end of 2015 (Table 4.4). In 2015, these 15 countries accounted for 11% of global notifications of pulmonary TB cases and 10% of the estimated global number of incident TB cases.
Between 2010 and 2015, a cumulative total of 4672 GeneXpert instruments comprising 21 549 modules were procured in the public sector in 122 of the 145 countries eligible for concessional pricing. In 2015, 6.2 million test cartridges were procured by eligible countries, up from 550 000 in 2011. Of these, 45% (2.8 million) went to South Africa, but this percentage has fallen from a high of 63% in 2013, reflecting increasing adoption of the technology in other parts of the world. South Africa accounted for 20% of the total cumulative number of modules procured by the end of 2015.
Despite the significant scale-up in procurement of car-tridges globally, installed instruments are still underused in many countries. Outside South Africa, the number of procured cartridges in 2015 compared to the total number of instrument modules reflects an average ratio of only 1.0 test per module per working day.
:: FIG. 4.8 Global numbers of notified new and relapse casesa known to be HIV-positive (black), number started on antiretroviral therapy (blue) and estimated number of incident HIV-positive TB cases (red), 2004–2015. Shaded areas represent uncertainty bands.
0
0.5
1
1.5
2
2004 2006 2008 2010 2012 2014
New
and
rela
pse
case
s per
yea
r (m
illio
ns)
a The calculation is for all cases in years prior to 2015.
:: TABLE 4.3. Number of people newly enrolled in HIV care in 2015 who were also notified as a TB case in 2015, 12 high TB/HIV burden countries that reported data
NUMBER OF PEOPLE
NEWLY ENROLLED IN HIV CARE IN
2015 (A)
NUMBER NOTIFIED AS A TB CASE IN
2015 (B)
NOTIFIED TB CASES AS A
PERCENTAGE OF THOSE
NEWLY ENROLLED
IN HIV CARE (B÷A)
Central African Republic 33 891 1 963 5.8%
China 101 966 2 802 2.7%
DR Congo 130 829 4 329 3.3%
Ghana 24 203 2 662 11%
India 178 470 21 065 12%
Indonesia 29 914 6 974 23%
Kenya 171 453 26 261 15%
Liberia 3 706 548 15%
Malawi 165 131 16 716 10%
Mozambique 292 083 16 197 5.5%
Myanmar 33 415 4 329 13%
South Africa 1 091 549 127 791 12%
Total 2 256 610 231 637 10%
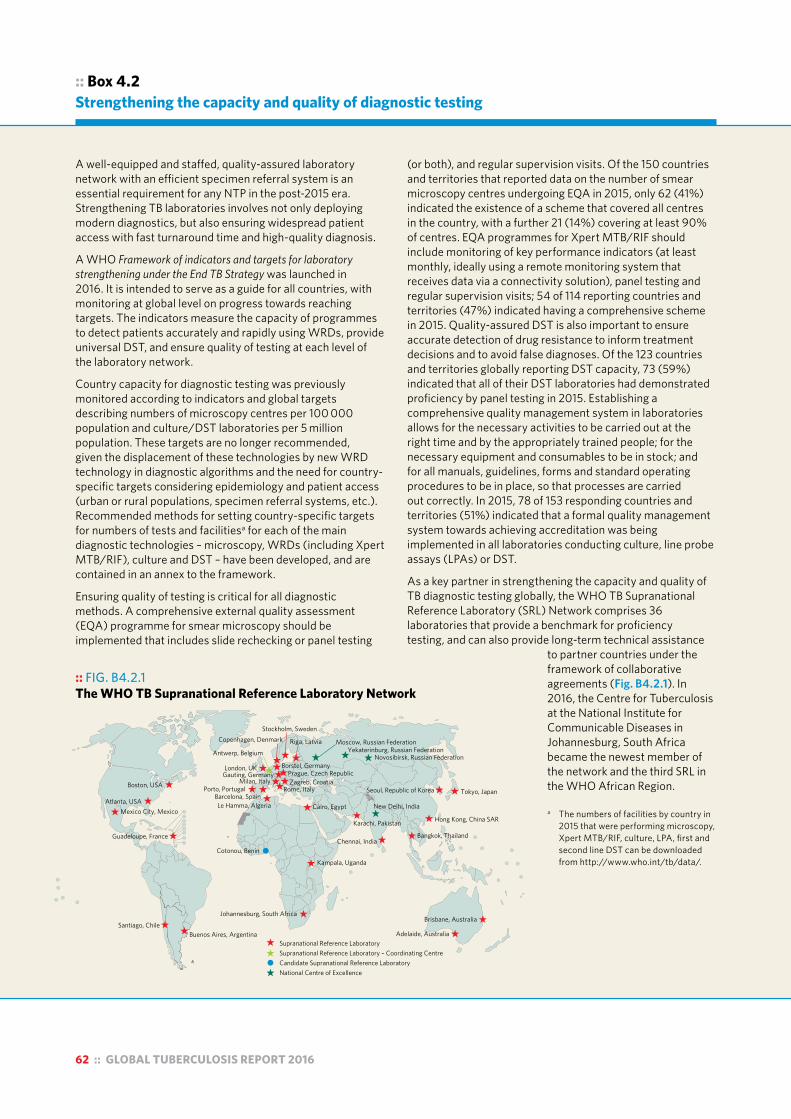
62 :: GLOBAL TUBERCULOSIS REPORT 2016
:: Box 4.2 Strengthening the capacity and quality of diagnostic testing
A well-equipped and staffed, quality-assured laboratory network with an efficient specimen referral system is an essential requirement for any NTP in the post-2015 era. Strengthening TB laboratories involves not only deploying modern diagnostics, but also ensuring widespread patient access with fast turnaround time and high-quality diagnosis.
A WHO Framework of indicators and targets for laboratory strengthening under the End TB Strategy was launched in 2016. It is intended to serve as a guide for all countries, with monitoring at global level on progress towards reaching targets. The indicators measure the capacity of programmes to detect patients accurately and rapidly using WRDs, provide universal DST, and ensure quality of testing at each level of the laboratory network.
Country capacity for diagnostic testing was previously monitored according to indicators and global targets describing numbers of microscopy centres per 100 000 population and culture/DST laboratories per 5 million population. These targets are no longer recommended, given the displacement of these technologies by new WRD technology in diagnostic algorithms and the need for country-specific targets considering epidemiology and patient access (urban or rural populations, specimen referral systems, etc.). Recommended methods for setting country-specific targets for numbers of tests and facilitiesa for each of the main diagnostic technologies – microscopy, WRDs (including Xpert MTB/RIF), culture and DST – have been developed, and are contained in an annex to the framework.
Ensuring quality of testing is critical for all diagnostic methods. A comprehensive external quality assessment (EQA) programme for smear microscopy should be implemented that includes slide rechecking or panel testing
(or both), and regular supervision visits. Of the 150 countries and territories that reported data on the number of smear microscopy centres undergoing EQA in 2015, only 62 (41%) indicated the existence of a scheme that covered all centres in the country, with a further 21 (14%) covering at least 90% of centres. EQA programmes for Xpert MTB/RIF should include monitoring of key performance indicators (at least monthly, ideally using a remote monitoring system that receives data via a connectivity solution), panel testing and regular supervision visits; 54 of 114 reporting countries and territories (47%) indicated having a comprehensive scheme in 2015. Quality-assured DST is also important to ensure accurate detection of drug resistance to inform treatment decisions and to avoid false diagnoses. Of the 123 countries and territories globally reporting DST capacity, 73 (59%) indicated that all of their DST laboratories had demonstrated proficiency by panel testing in 2015. Establishing a comprehensive quality management system in laboratories allows for the necessary activities to be carried out at the right time and by the appropriately trained people; for the necessary equipment and consumables to be in stock; and for all manuals, guidelines, forms and standard operating procedures to be in place, so that processes are carried out correctly. In 2015, 78 of 153 responding countries and territories (51%) indicated that a formal quality management system towards achieving accreditation was being implemented in all laboratories conducting culture, line probe assays (LPAs) or DST.
As a key partner in strengthening the capacity and quality of TB diagnostic testing globally, the WHO TB Supranational Reference Laboratory (SRL) Network comprises 36 laboratories that provide a benchmark for proficiency testing, and can also provide long-term technical assistance
to partner countries under the framework of collaborative agreements (Fig. B4.2.1). In 2016, the Centre for Tuberculosis at the National Institute for Communicable Diseases in Johannesburg, South Africa became the newest member of the network and the third SRL in the WHO African Region.
a The numbers of facilities by country in 2015 that were performing microscopy, Xpert MTB/RIF, culture, LPA, first and second line DST can be downloaded from http://www.who.int/tb/data/.
:: FIG. B4.2.1 The WHO TB Supranational Reference Laboratory Network
Mexico City, Mexico
Santiago, ChileBuenos Aires, Argentina
Guadeloupe, France
Atlanta, USA
Boston, USA
Johannesburg, South Africa
Kampala, Uganda
Cotonou, Benin
Adelaide, Australia
Brisbane, Australia
Chennai, IndiaBangkok, Thailand
Hong Kong, China SAR
Tokyo, JapanSeoul, Republic of Korea
Karachi, Pakistan
Cairo, EgyptLe Hamma, Algeria
Porto, PortugalBarcelona, Spain
Rome, ItalyMilan, Italy Zagreb, Croatia
Prague, Czech RepublicGauting, Germany
Riga, Latvia
Stockholm, Sweden
Borstel, GermanyLondon, UK
Antwerp, Belgium
Copenhagen, Denmark
New Delhi, India
Moscow, Russian FederationYekaterinburg, Russian Federation
Novosibirsk, Russian Federation
Supranational Reference LaboratorySupranational Reference Laboratory – Coordinating CentreCandidate Supranational Reference LaboratoryNational Centre of Excellence

GLOBAL TUBERCULOSIS REPORT 2016 :: 63
:: TABLE 4.4 National guidance in place on use of Xpert MTB/RIF in high burden countries, 2015a
YES " "NO #
HIGH TB
BURDEN
HIGH TB/HIV
BURDEN
HIGH MDR-TB BURDEN
NATIONAL POLICY STIPULATING XPERT MTB/RIF AS THE INITIAL DIAGNOSTIC TEST FOR:
ALL PEOPLE PRESUMED
TO HAVE TB
PEOPLE AT RISK OF HIV-ASSOCIATED
TB
PEOPLE AT RISK OF DRUG-
RESISTANT TB
CHILDREN PRESUMED
TO HAVE TB
EXTRA-PULMONARY
TB USING SELECTED
SPECIMENS
Angola " " " " " " " "Azerbaijan # # " " " " " "Bangladesh " # " # " " # "Belarus # # " " " " " "Botswana # " # " " " " "Brazil " " # " " " " "Cambodia " # # # " " # "Cameroon # " # # # " # #Central African Republic " " # # # " # #Chad # " # # # " # #China " " " # # " # #Congo " " # # " " " #DPR Korea " # " # # " " #DR Congo " " " # # " # #Ethiopia " " " # " " " "Ghana # " # # " " " #Guinea-Bissau # " # # " " " "India " " " # " " " "Indonesia " " " # " " " "Kazakhstan # # " " " " " "Kenya " " " # " " " "Kyrgyzstan # # " " " " " "Lesotho " " # " " " " "Liberia " " # # " # " #Malawi # " # # " " # #Mozambique " " " # " " " "Myanmar " " " # " " # "Namibia " " # # # " " "Nigeria " " " # " " " "Pakistan " # " # " " " "Papua New Guinea " " " # " " " #Peru # # " # # # # #Philippines " # " # " " " "Republic of Moldova # # " " " " " "Russian Federation " # " " " " " "Sierra Leone " # # # # # # #Somalia # # " # # " # #South Africa " " " " " " " "Swaziland # " # " " " " "Tajikistan # # " " " " " "Thailand " " " # " " " "Uganda # " # # " " " #Ukraine # # " # " " " #UR Tanzania " " # " " " " "Uzbekistan # # " " " " " "Viet Nam " # " # " " " "Zambia " " # # " " " #Zimbabwe " " " # " " " "High TB burden countries 20% 80% 93% 77% 70%High TB/HIV burden countries 23% 80% 97% 77% 60%
High MDR-TB burden countries 33% 83% 97% 80% 77%
a The 48 countries shown in the table are the countries that are in one or more of the three lists of high TB, TB/HIV and MDR-TB burden countries (see also Chapter 2, Figure 2.3 and Table 2.2).
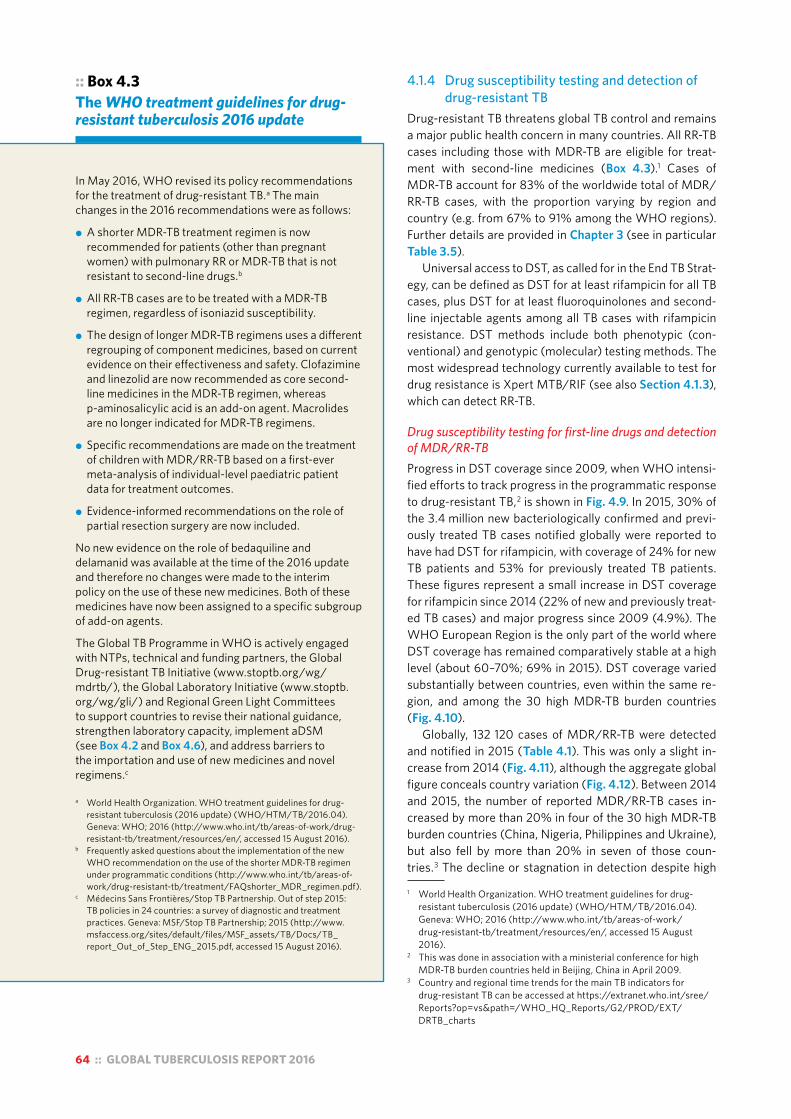
64 :: GLOBAL TUBERCULOSIS REPORT 2016
4.1.4 Drug susceptibility testing and detection of drug-resistant TB
Drug-resistant TB threatens global TB control and remains a major public health concern in many countries. All RR-TB cases including those with MDR-TB are eligible for treat-ment with second-line medicines (Box 4.3).1 Cases of MDR-TB account for 83% of the worldwide total of MDR/RR-TB cases, with the proportion varying by region and country (e.g. from 67% to 91% among the WHO regions). Further details are provided in Chapter 3 (see in particular Table 3.5).
Universal access to DST, as called for in the End TB Strat-egy, can be defined as DST for at least rifampicin for all TB cases, plus DST for at least fluoroquinolones and second-line injectable agents among all TB cases with rifampicin resistance. DST methods include both phenotypic (con-ventional) and genotypic (molecular) testing methods. The most widespread technology currently available to test for drug resistance is Xpert MTB/RIF (see also Section 4.1.3), which can detect RR-TB.
Drug susceptibility testing for first-line drugs and detection of MDR/RR-TBProgress in DST coverage since 2009, when WHO intensi-fied efforts to track progress in the programmatic response to drug-resistant TB,2 is shown in Fig. 4.9. In 2015, 30% of the 3.4 million new bacteriologically confirmed and previ-ously treated TB cases notified globally were reported to have had DST for rifampicin, with coverage of 24% for new TB patients and 53% for previously treated TB patients. These figures represent a small increase in DST coverage for rifampicin since 2014 (22% of new and previously treat-ed TB cases) and major progress since 2009 (4.9%). The WHO European Region is the only part of the world where DST coverage has remained comparatively stable at a high level (about 60–70%; 69% in 2015). DST coverage varied substantially between countries, even within the same re-gion, and among the 30 high MDR-TB burden countries (Fig. 4.10).
Globally, 132 120 cases of MDR/RR-TB were detected and notified in 2015 (Table 4.1). This was only a slight in-crease from 2014 (Fig. 4.11), although the aggregate global figure conceals country variation (Fig. 4.12). Between 2014 and 2015, the number of reported MDR/RR-TB cases in-creased by more than 20% in four of the 30 high MDR-TB burden countries (China, Nigeria, Philippines and Ukraine), but also fell by more than 20% in seven of those coun-tries.3 The decline or stagnation in detection despite high
1 World Health Organization. WHO treatment guidelines for drug-resistant tuberculosis (2016 update) (WHO/HTM/TB/2016.04). Geneva: WHO; 2016 (http://www.who.int/tb/areas-of-work/drug-resistant-tb/treatment/resources/en/, accessed 15 August 2016).
2 This was done in association with a ministerial conference for high MDR-TB burden countries held in Beijing, China in April 2009.
3 Country and regional time trends for the main TB indicators for drug-resistant TB can be accessed at https://extranet.who.int/sree/Reports?op=vs&path=/WHO_HQ_Reports/G2/PROD/EXT/DRTB_charts
:: Box 4.3 The WHO treatment guidelines for drug-resistant tuberculosis 2016 update
In May 2016, WHO revised its policy recommendations for the treatment of drug-resistant TB.a The main changes in the 2016 recommendations were as follows:
! A shorter MDR-TB treatment regimen is now recommended for patients (other than pregnant women) with pulmonary RR or MDR-TB that is not resistant to second-line drugs.b
! All RR-TB cases are to be treated with a MDR-TB regimen, regardless of isoniazid susceptibility.
! The design of longer MDR-TB regimens uses a different regrouping of component medicines, based on current evidence on their effectiveness and safety. Clofazimine and linezolid are now recommended as core second-line medicines in the MDR-TB regimen, whereas p-aminosalicylic acid is an add-on agent. Macrolides are no longer indicated for MDR-TB regimens.
! Specific recommendations are made on the treatment of children with MDR/RR-TB based on a first-ever meta-analysis of individual-level paediatric patient data for treatment outcomes.
! Evidence-informed recommendations on the role of partial resection surgery are now included.
No new evidence on the role of bedaquiline and delamanid was available at the time of the 2016 update and therefore no changes were made to the interim policy on the use of these new medicines. Both of these medicines have now been assigned to a specific subgroup of add-on agents.
The Global TB Programme in WHO is actively engaged with NTPs, technical and funding partners, the Global Drug-resistant TB Initiative (www.stoptb.org/wg/mdrtb/), the Global Laboratory Initiative (www.stoptb.org/wg/gli/) and Regional Green Light Committees to support countries to revise their national guidance, strengthen laboratory capacity, implement aDSM (see Box 4.2 and Box 4.6), and address barriers to the importation and use of new medicines and novel regimens.c
a World Health Organization. WHO treatment guidelines for drug-resistant tuberculosis (2016 update) (WHO/HTM/TB/2016.04). Geneva: WHO; 2016 (http://www.who.int/tb/areas-of-work/drug-resistant-tb/treatment/resources/en/, accessed 15 August 2016).
b Frequently asked questions about the implementation of the new WHO recommendation on the use of the shorter MDR-TB regimen under programmatic conditions (http://www.who.int/tb/areas-of-work/drug-resistant-tb/treatment/FAQshorter_MDR_regimen.pdf).
c Médecins Sans Frontières/Stop TB Partnership. Out of step 2015: TB policies in 24 countries: a survey of diagnostic and treatment practices. Geneva: MSF/Stop TB Partnership; 2015 (http://www.msfaccess.org/sites/default/files/MSF_assets/TB/Docs/TB_report_Out_of_Step_ENG_2015.pdf, accessed 15 August 2016).
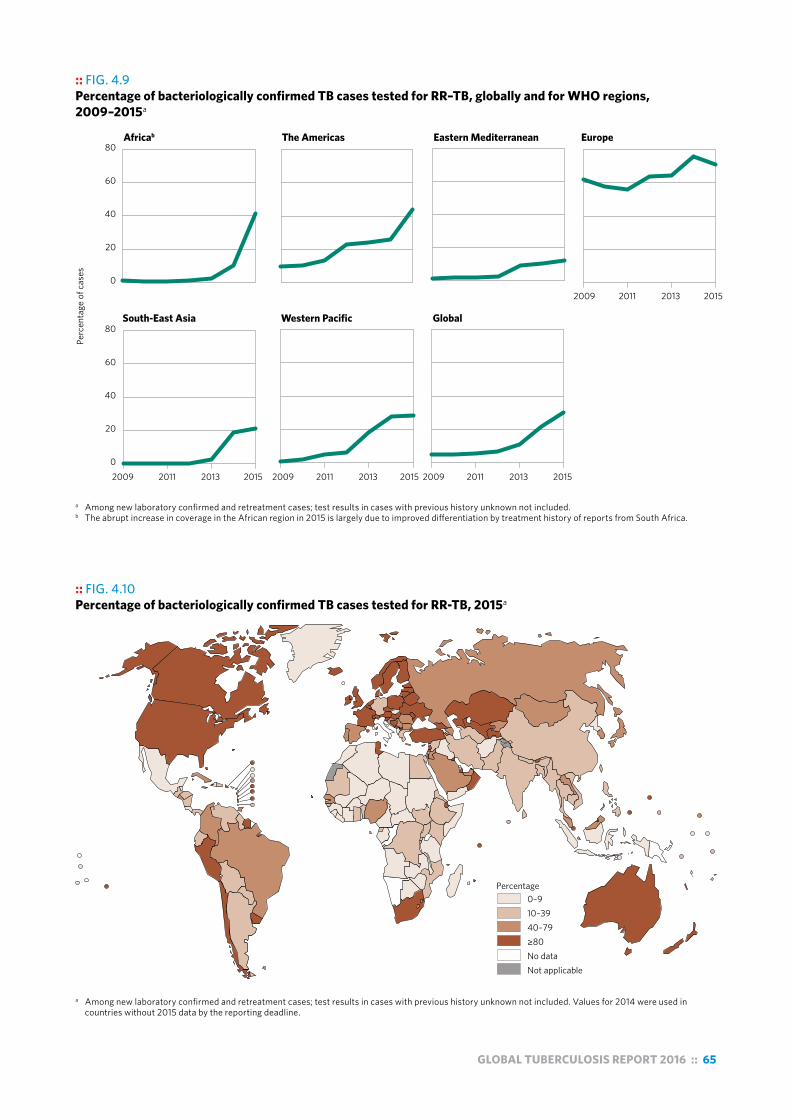
GLOBAL TUBERCULOSIS REPORT 2016 :: 65
:: FIG. 4.9Percentage of bacteriologically confirmed TB cases tested for RR–TB, globally and for WHO regions, 2009–2015a
a Among new laboratory confirmed and retreatment cases; test results in cases with previous history unknown not included.b The abrupt increase in coverage in the African region in 2015 is largely due to improved differentiation by treatment history of reports from South Africa.
Perc
enta
ge o
f cas
es
South-East Asia Western Pacific Global
Africab The Americas Eastern Mediterranean Europe
0
20
40
60
80
0
20
40
60
80
2009 2011 2013 2015
2009 2011 2013 2015
2009 2011 2013 2015 2009 2011 2013 2015
:: FIG. 4.10Percentage of bacteriologically confirmed TB cases tested for RR-TB, 2015a
Percentage 0–910–3940–79≥80No dataNot applicable
a Among new laboratory confirmed and retreatment cases; test results in cases with previous history unknown not included. Values for 2014 were used in countries without 2015 data by the reporting deadline.
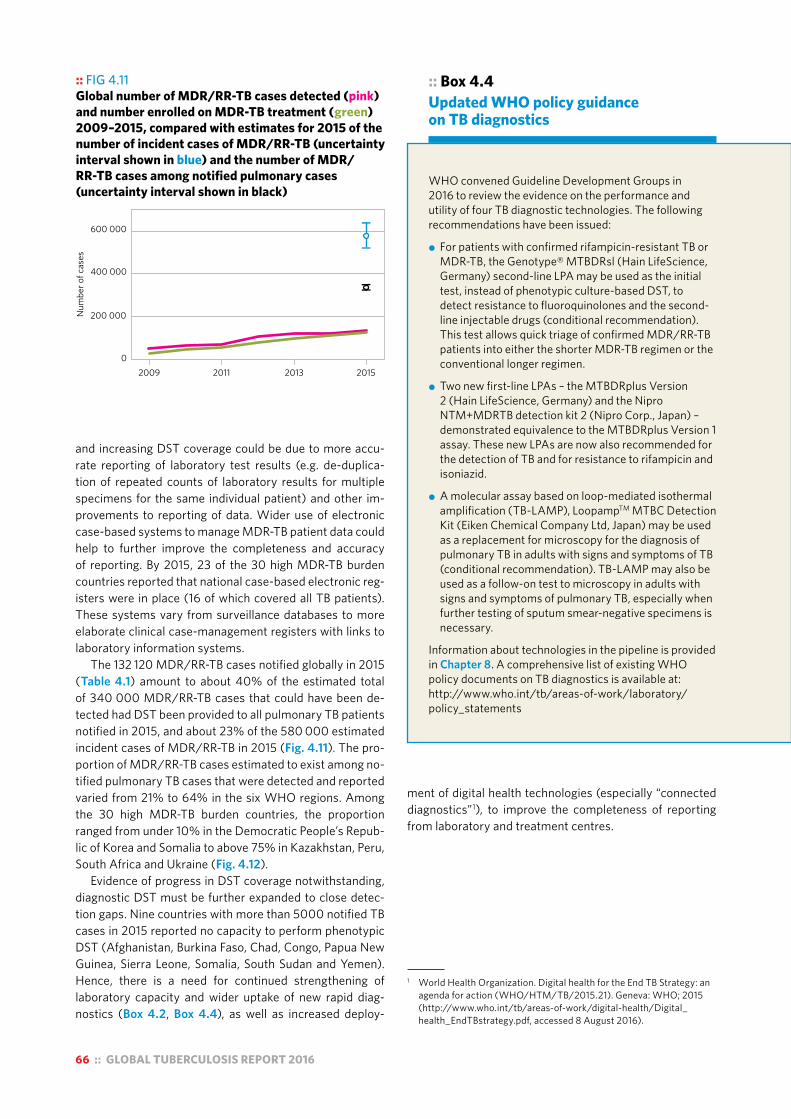
66 :: GLOBAL TUBERCULOSIS REPORT 2016
:: FIG 4.11 Global number of MDR/RR-TB cases detected (pink) and number enrolled on MDR-TB treatment (green) 2009–2015, compared with estimates for 2015 of the number of incident cases of MDR/RR-TB (uncertainty interval shown in blue) and the number of MDR/RR-TB cases among notified pulmonary cases (uncertainty interval shown in black)
Num
ber o
f cas
es
0
200 000
400 000
600 000
2009 2011 2013 2015
and increasing DST coverage could be due to more accu-rate reporting of laboratory test results (e.g. de-duplica-tion of repeated counts of laboratory results for multiple specimens for the same individual patient) and other im-provements to reporting of data. Wider use of electronic case-based systems to manage MDR-TB patient data could help to further improve the completeness and accuracy of reporting. By 2015, 23 of the 30 high MDR-TB burden countries reported that national case-based electronic reg-isters were in place (16 of which covered all TB patients). These systems vary from surveillance databases to more elaborate clinical case-management registers with links to laboratory information systems.
The 132 120 MDR/RR-TB cases notified globally in 2015 (Table 4.1) amount to about 40% of the estimated total of 340 000 MDR/RR-TB cases that could have been de-tected had DST been provided to all pulmonary TB patients notified in 2015, and about 23% of the 580 000 estimated incident cases of MDR/RR-TB in 2015 (Fig. 4.11). The pro-portion of MDR/RR-TB cases estimated to exist among no-tified pulmonary TB cases that were detected and reported varied from 21% to 64% in the six WHO regions. Among the 30 high MDR-TB burden countries, the proportion ranged from under 10% in the Democratic People’s Repub-lic of Korea and Somalia to above 75% in Kazakhstan, Peru, South Africa and Ukraine (Fig. 4.12).
Evidence of progress in DST coverage notwithstanding, diagnostic DST must be further expanded to close detec-tion gaps. Nine countries with more than 5000 notified TB cases in 2015 reported no capacity to perform phenotypic DST (Afghanistan, Burkina Faso, Chad, Congo, Papua New Guinea, Sierra Leone, Somalia, South Sudan and Yemen). Hence, there is a need for continued strengthening of laboratory capacity and wider uptake of new rapid diag-nostics (Box 4.2, Box 4.4), as well as increased deploy-
ment of digital health technologies (especially “connected diagnostics”1), to improve the completeness of reporting from laboratory and treatment centres.
1 World Health Organization. Digital health for the End TB Strategy: an agenda for action (WHO/HTM/TB/2015.21). Geneva: WHO; 2015 (http://www.who.int/tb/areas-of-work/digital-health/Digital_health_EndTBstrategy.pdf, accessed 8 August 2016).
:: Box 4.4 Updated WHO policy guidance on TB diagnostics
WHO convened Guideline Development Groups in 2016 to review the evidence on the performance and utility of four TB diagnostic technologies. The following recommendations have been issued:
! For patients with confirmed rifampicin-resistant TB or MDR-TB, the Genotype® MTBDRsl (Hain LifeScience, Germany) second-line LPA may be used as the initial test, instead of phenotypic culture-based DST, to detect resistance to fluoroquinolones and the second-line injectable drugs (conditional recommendation). This test allows quick triage of confirmed MDR/RR-TB patients into either the shorter MDR-TB regimen or the conventional longer regimen.
! Two new first-line LPAs – the MTBDRplus Version 2 (Hain LifeScience, Germany) and the Nipro NTM+MDRTB detection kit 2 (Nipro Corp., Japan) – demonstrated equivalence to the MTBDRplus Version 1 assay. These new LPAs are now also recommended for the detection of TB and for resistance to rifampicin and isoniazid.
! A molecular assay based on loop-mediated isothermal amplification (TB-LAMP), LoopampTM MTBC Detection Kit (Eiken Chemical Company Ltd, Japan) may be used as a replacement for microscopy for the diagnosis of pulmonary TB in adults with signs and symptoms of TB (conditional recommendation). TB-LAMP may also be used as a follow-on test to microscopy in adults with signs and symptoms of pulmonary TB, especially when further testing of sputum smear-negative specimens is necessary.
Information about technologies in the pipeline is provided in Chapter 8. A comprehensive list of existing WHO policy documents on TB diagnostics is available at: http://www.who.int/tb/areas-of-work/laboratory/policy_statements

GLOBAL TUBERCULOSIS REPORT 2016 :: 67
:: FIG. 4.12 Number of MDR/RR-TB cases detected (pink) and enrolled on MDR-TB treatment (green) 2009–2015 compared with estimated number of MDR/RR-TB cases among notified pulmonary TB cases in 2015 (uncertainty interval shown in red), 30 high MDR-TB burden countries
Num
ber o
f cas
es
2009 2011 2013 2015 2009 2011 2013 2015 2009 2011 2013 2015 2009 2011 2013 2015 2009 2011 2013 2015
0
1000
4000
5000
0
2000
4000
6000
3000
4000
6000
8000
400
800
1200
0
2000
4000
6000
0
500
1000
1500
0
2000
4000
6000
0
1000
2000
3000
4000
1000
2000
0
500
1000
1500
2000
0
25000
50000
75000
0
1000
2000
3000
0
20000
40000
60000
0
2500
5000
7500
10000
0
2500
5000
7500
10000
0
2000
4000
6000
500
1000
1500
0
1000
2000
3000
0
5000
10000
15000
10000
20000
30000
40000
2500
5000
7500
10000
12500
0
500
1000
1500
0
500
1000
1500
0
2000
4000
6000
1500
2000
2500
3000
10000
20000
0
2000
4000
6000
0
5000
10000
15000
0
500
1000
0
500
1000
1500
7000
50001500
2500
500
15000
25000
5000
2000
3000
1600
Angola Azerbaijan Bangladesh Belarus China
DPR Korea DR Congo Ethiopia India Indonesia
Kazakhstan Kenya Kyrgyzstan Mozambique Myanmar
Nigeria Pakistan Papua New Guinea Peru Philippines
Republic of Moldova Russian Federation Somalia South Africa Tajikistan
Thailand Ukraine Uzbekistan Viet Nam Zimbabwe
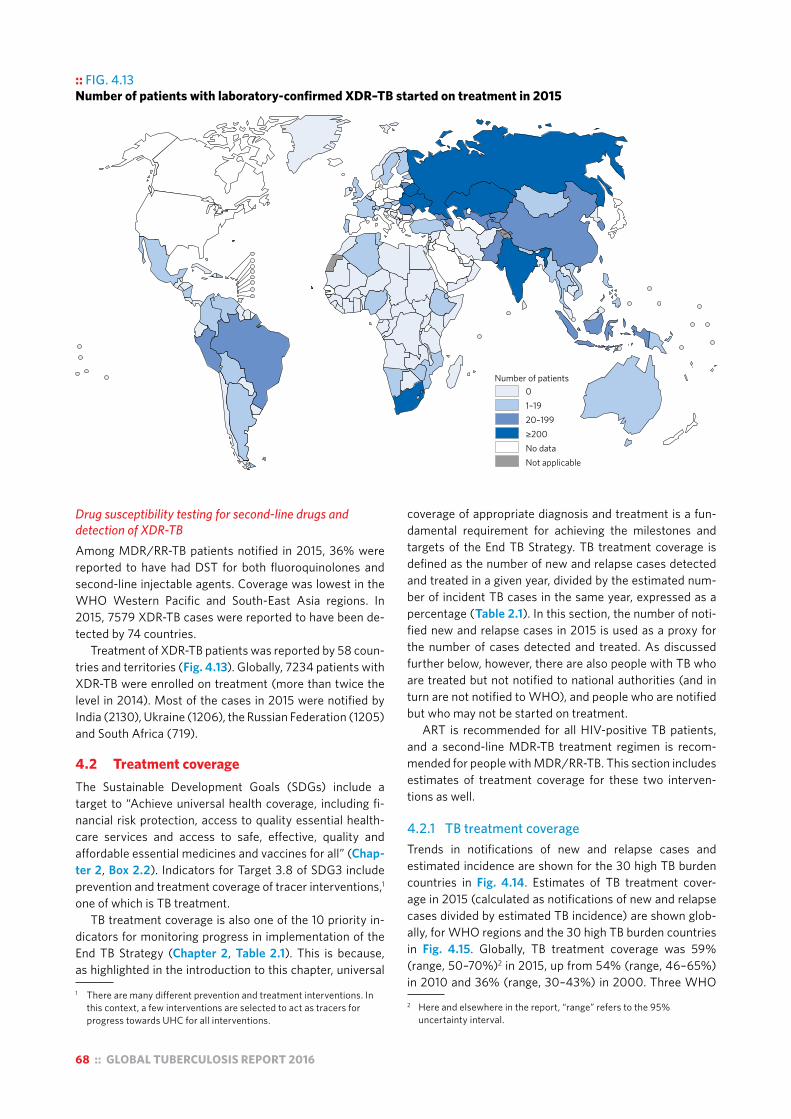
68 :: GLOBAL TUBERCULOSIS REPORT 2016
Drug susceptibility testing for second-line drugs and detection of XDR-TBAmong MDR/RR-TB patients notified in 2015, 36% were reported to have had DST for both fluoroquinolones and second-line injectable agents. Coverage was lowest in the WHO Western Pacific and South-East Asia regions. In 2015, 7579 XDR-TB cases were reported to have been de-tected by 74 countries.
Treatment of XDR-TB patients was reported by 58 coun-tries and territories (Fig. 4.13). Globally, 7234 patients with XDR-TB were enrolled on treatment (more than twice the level in 2014). Most of the cases in 2015 were notified by India (2130), Ukraine (1206), the Russian Federation (1205) and South Africa (719).
4.2 Treatment coverageThe Sustainable Development Goals (SDGs) include a target to “Achieve universal health coverage, including fi-nancial risk protection, access to quality essential health-care services and access to safe, effective, quality and affordable essential medicines and vaccines for all” (Chap-ter 2, Box 2.2). Indicators for Target 3.8 of SDG3 include prevention and treatment coverage of tracer interventions,1 one of which is TB treatment.
TB treatment coverage is also one of the 10 priority in-dicators for monitoring progress in implementation of the End TB Strategy (Chapter 2, Table 2.1). This is because, as highlighted in the introduction to this chapter, universal
1 There are many different prevention and treatment interventions. In this context, a few interventions are selected to act as tracers for progress towards UHC for all interventions.
coverage of appropriate diagnosis and treatment is a fun-damental requirement for achieving the milestones and targets of the End TB Strategy. TB treatment coverage is defined as the number of new and relapse cases detected and treated in a given year, divided by the estimated num-ber of incident TB cases in the same year, expressed as a percentage (Table 2.1). In this section, the number of noti-fied new and relapse cases in 2015 is used as a proxy for the number of cases detected and treated. As discussed further below, however, there are also people with TB who are treated but not notified to national authorities (and in turn are not notified to WHO), and people who are notified but who may not be started on treatment.
ART is recommended for all HIV-positive TB patients, and a second-line MDR-TB treatment regimen is recom-mended for people with MDR/RR-TB. This section includes estimates of treatment coverage for these two interven-tions as well.
4.2.1 TB treatment coverage Trends in notifications of new and relapse cases and estimated incidence are shown for the 30 high TB burden countries in Fig. 4.14. Estimates of TB treatment cover-age in 2015 (calculated as notifications of new and relapse cases divided by estimated TB incidence) are shown glob-ally, for WHO regions and the 30 high TB burden countries in Fig. 4.15. Globally, TB treatment coverage was 59% (range, 50–70%)2 in 2015, up from 54% (range, 46–65%) in 2010 and 36% (range, 30–43%) in 2000. Three WHO 2 Here and elsewhere in the report, “range” refers to the 95%
uncertainty interval.
:: FIG. 4.13Number of patients with laboratory-confirmed XDR–TB started on treatment in 2015
Number of patients01–1920–199≥200No dataNot applicable

GLOBAL TUBERCULOSIS REPORT 2016 :: 69
:: FIG. 4.14 Case notification rates (new and relapse cases, all forms) (black) compared with estimated TB incidence rates (green), 2000–2015, 30 high TB burden countries. Shaded areas represent uncertainty bands.
a Estimates of TB incidence for Bangladesh will be reviewed once final results from the 2015/2016 national TB prevalence survey are available.b Estimates of TB incidence for India are interim in nature, pending results from the national TB prevalence survey planned for 2017/2018.
0
200
400
0
100
200
300
0
20
40
60
0
200
400
600
800
0
500
1000
1500
0
50
100
0
200
400
600
0
200
400
600
0
100
200
300
400
0
200
400
600
0
100
200
300
400
0
200
400
600
0
100
200
300
400
0
500
1000
1500
0
100
200
300
400
Rate
per
100
000
popu
latio
n pe
r yea
r
0
200
400
600
800
0
200
400
600
0
300
600
900
1200
0
100
200
300
400
500
0
100
200
300
400
0
200
400
600
0
200
400
0
50
100
150
0
100
200
300
400
0
500
1000
0
100
200
300
400
0
200
400
600
800
0
100
200
0
300
600
900
0
200
400
600
800
2000 2005 2010 2015 2000 2005 2010 2015 2000 2005 2010 2015 2000 2005 2010 2015 2000 2005 2010 2015
Angola Bangladesha Brazil Cambodia Central African Republic
China Congo DPR Korea DR Congo Ethiopia
Indiab Indonesia Kenya Lesotho Liberia
Mozambique Myanmar Namibia Nigeria Pakistan
Papua New Guinea Philippines Russian Federation Sierra Leone South Africa
Thailand UR Tanzania ZambiaViet Nam Zimbabwe

70 :: GLOBAL TUBERCULOSIS REPORT 2016
regions achieved higher levels of above 75%: the Region of the Americas, and the European and Western Pacific re-gions. Among the 30 high TB burden countries, the high-est levels of treatment coverage in 2015 (>80%) were in Brazil, China, the Philippines and the Russian Federation. The lowest levels, with best estimates of 50% or less, were in the Democratic Republic of the Congo, Indonesia, Mo-zambique, Nigeria and the United Republic of Tanzania.
Globally in 2015, there was a gap of about 4.3 million cases between the 6.1 million new and relapse cases that were notified, and the estimated 10.4 million incident TB cases in the same year (Fig. 4.1). Although notifications have increased in recent years, especially in India (Section 4.1.1), the size of this gap is larger than indicated in previous global TB reports following an upward revision to estimat-ed TB incidence in India for 2015 and previous years (for further details, see Chapter 3 and in particular Box 3.3). However, using the entire updated time-series of estimates of TB incidence as shown in Fig. 4.1, the global gap has been narrowing, especially in the WHO Eastern Mediterra-nean and Western Pacific regions, and to a lesser extent in
the WHO South-East Asia Region.1 Ten countries account for 77% of the total estimated gap between incidence and notifications (Fig. 4.16a), and India, Indonesia and Nigeria alone account for almost half of the total.
There are three main reasons for a gap between notifi-cations and estimated incidence:
■ Underreporting of detected TB cases. In many coun-tries, especially those without policies on mandatory notification and other measures to ensure reporting of detected cases by all care providers and large private health sectors, levels of underreporting may be high.
■ Underdiagnosis of people with TB. This can occur for reasons such as poor geographical and financial access to health care; failure to recognize TB signs and symp-toms, and to test for TB when people do present to health facilities; and diagnostic tests that are not good enough to ensure accurate identification of all cases.
1 Time trends in countries and regions are shown in Annex 2 and Annex 3, respectively.
:: FIG. 4.15 Estimated TB treatment coverage (new and relapse patients as a percentage of estimated TB incidence) in 2015, 30 high TB burden countries, WHO regions and globally
a Estimates of TB incidence for India are interim in nature, pending results from the national TB prevalence survey planned for 2017/2018. b Estimates of TB incidence for Bangladesh will be reviewed once final results from the 2015/2016 national TB prevalence survey are available.
Russian FederationChinaBrazil
PhilippinesDPR Korea
NamibiaPapua New Guinea
Viet NamKenya
ZimbabweEthiopia
MyanmarAngola
PakistanSouth AfricaSierra Leone
CambodiaIndiaa
ZambiaBangladeshb
CongoCentral African Republic
ThailandDR Congo
LesothoLiberia
MozambiqueUR Tanzania
IndonesiaNigeria
Western PacificThe Americas
EuropeEastern Mediterranean
South-East AsiaAfrica
Global
0 30 60 90Treatment coverage (%)

GLOBAL TUBERCULOSIS REPORT 2016 :: 71
:: FIG. 4.16aThe ten countries with the largest gaps between notifications of new and relapse (incident) TB cases and the best estimates of TB incidence, 2015a
a The ten countries, ranked in order of the size of the gap between notified cases and the best estimate of TB incidence in 2015, are India, Indonesia, Nigeria, Pakistan, South Africa, Bangladesh, DR Congo, China, UR Tanzania and Mozambique. Estimates of TB incidence for India are interim in nature, pending results from the national TB prevalence survey planned for 2017/2018.
100 000
200 000
500 000
South Africa
DR Congo
UR Tanzania
Mozambique
ChinaBangladesh
Pakistan
India
Nigeria
Indonesia
:: FIG. 4.16bThe ten countries with the largest gaps between the number of patients started on treatment for MDR-TB and the best estimates of MDR/RR-TB incidence, 2015a
a The ten countries, ranked in order of the size of the gap between number of patients started on MDR-TB treatment and the best estimate of MDR/RR-TB incidence in 2015, are India, China, Russian Federation, Indonesia, Nigeria, Pakistan, Philippines, Ukraine, Myanmar and DR Congo.
10 000
25 000
50 000
100 000
Nigeria
Indonesia
ChinaMyanmar
Pakistan
DR Congo
India
Russian Federation
Philippines
Ukraine

72 :: GLOBAL TUBERCULOSIS REPORT 2016
■ Overestimation of the level of TB incidence. In this report, estimates of TB incidence for 74 countries with 22% of the world’s estimated cases are based on expert opinion about levels of underreporting and underdiag-nosis, as opposed to direct measurements from surveil-lance or survey data (Chapter 3). Also, the uncertainty intervals around the best estimates of TB incidence can be wide, and gaps may be lower or higher than the best estimates quoted in this section.
In some of the countries with the largest estimated gaps between notifications and TB incidence there is already evidence about the reasons for such gaps, and actions to address them are being taken or are planned. In India, vari-ous data sources point to large underreporting of detected TB cases (see also Chapter 3, Box 3.3). These include two studies of sales of anti-TB drugs in the private sector; the recent upsurge in notifications that followed a national policy of mandatory notification, as well as efforts to in-crease engagement with all care providers and to facilitate reporting via a national web-based reporting system; and comparison of household survey data on self-reported TB treatment with notification data in the same survey areas. In Indonesia, the 2013–2014 national TB prevalence survey showed high levels of underreporting of detected TB cases, leading to recommendations such as a mandatory policy on notification and intensified engagement with public and private hospitals where many people with TB were being treated.1 In Nigeria, the 2012 prevalence survey found that 75% of the smear-positive cases detected had symptoms that met national screening criteria, but had not been previously diagnosed, demonstrating high levels of under-diagnosis and a need to strengthen access to diagnostic and treatment services.2
In countries where underreporting is thought to exist, in-ventory studies in which electronic lists of notified cases are compared with electronic lists of TB cases detected by all care providers, ideally employing unique identifiers, can be used to quantify levels of underreporting.3 Such studies have already been used to inform estimates of TB incidence in several countries (Chapter 3), and are planned or under way in China, Indonesia (as a follow-on from the levels of underreporting indicated by the 2013–2014 national TB prevalence survey), Nigeria (metropolitan Lagos), the Phil-ippines and Viet Nam. When these studies are done pro-spectively (as opposed to retrospectively using electronic
1 For further details, see Box 2.4 in World Health Organization. Global tuberculosis report 2015 (WHO/HTM/TB/2015.22). Geneva: WHO; 2015 (http://apps.who.int/iris/bitstream/10665/191102/1/9789241565059_eng.pdf, accessed 27 July 2016).
2 For further details, see Box 2.2 in World Health Organization. Global tuberculosis report 2014 (WHO/HTM/TB/2014.08). Geneva: WHO; 2014 (http:// http://apps.who.int/iris/bitstream/10665/137094/1/9789241564809_eng.pdf, accessed 15 August 2016).
3 For a guide to inventory studies, see World Health Organization. Assessing tuberculosis under-reporting through inventory studies. Geneva: WHO; 2012 (http://www.who.int/tb/publications/inventory_studies/en/, accessed 15 August 2016).
databases that are already available), the mapping of pro-viders that is required at the beginning can subsequently help with efforts to engage all care providers, including in reporting.
Examples of mechanisms to ensure reporting of all de-tected cases include linking reimbursement from health in-surance schemes to notification of cases (as in the Republic of Korea), linking the supply of first-line drugs to notifica-tion of cases (as in Brazil), facilitating reporting via online web-based systems with limited data entry requirements (as in India), and wider implementation of PPM schemes and initiatives (Table 4.2). Even in the countries shown in Table 4.2, PPM implementation is often not nation-wide, and its contribution to notifications may come from a small proportion of providers that willingly collaborate with NTPs, or from parts of the country only. In India, for example, the big increase in notifications that occurred in 2013–2015 was from a small subset of districts. Chapter 6 provides further discussion of PPM, including the role of a whole-of-government approach, and innovative approach-es to engaging private practitioners that are being tested in Bangladesh, India, Indonesia, Pakistan and Myanmar.
Recent national TB prevalence surveys4 have also shown that, in both Africa and Asia, detection and reporting gaps are systematically higher for men than for women (for further details, see Section 3.6.2 in Chapter 3). This suggests that specific efforts are needed to improve access to TB diagnosis and treatment for men.
Systematic screening for active TB among specific pop-ulations can also help to ensure early diagnosis and reduce levels of underdiagnosis. WHO recommends such screen-ing for contacts of bacteriologically confirmed cases, peo-ple living with HIV and people exposed to silica dust (see also Chapter 5).5,6 Other individuals at risk should be con-sidered for systematic screening based on an assessment of TB epidemiology in each setting. To date, there have been few assessments of the implementation and outcomes of systematic screening in countries that are currently intro-ducing or scaling up systematic screening. However, this is expected to become a more prominent part of national programme monitoring and evaluation efforts in future. Engaging communities could also add value to efforts to improve case detection and patient support (Box 4.5).
4 www.who.int/tb/advisory_bodies/impact_measurement_taskforce/meetings/tf6_p06_prevalence_surveys_2009_2015.pdf
5 World Health Organization. Systematic screening for active tuberculosis: principles and recommendations (WHO/HTM/TB.2013.04). Geneva: WHO; 2013 (http://www.who.int/tb/tbscreening/en/, accessed 15 August 2016). The data requested in the global monitoring done by WHO focus on screening among people living with HIV and close contacts.
6 For this reason, the data requested in WHO’s annual round of global TB data collection focus on screening among people living with HIV and close contacts. These data are presented in Chapter 5.
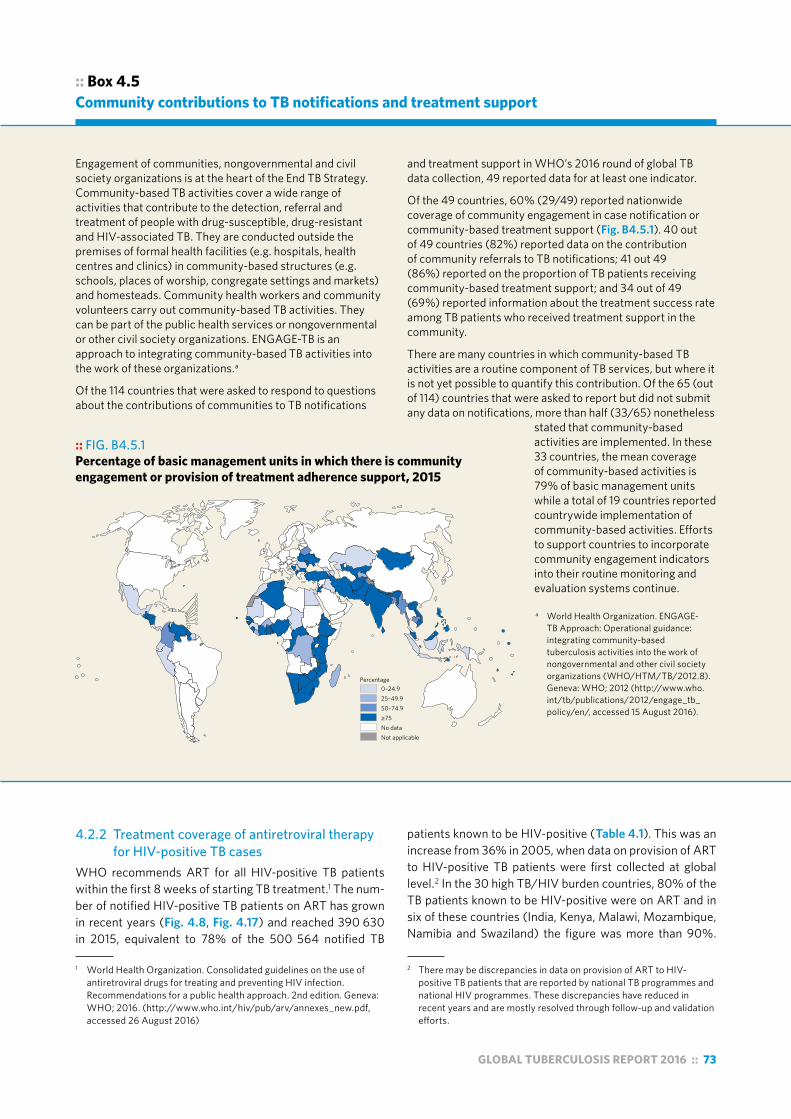
GLOBAL TUBERCULOSIS REPORT 2016 :: 73
:: Box 4.5 Community contributions to TB notifications and treatment support
Engagement of communities, nongovernmental and civil society organizations is at the heart of the End TB Strategy. Community-based TB activities cover a wide range of activities that contribute to the detection, referral and treatment of people with drug-susceptible, drug-resistant and HIV-associated TB. They are conducted outside the premises of formal health facilities (e.g. hospitals, health centres and clinics) in community-based structures (e.g. schools, places of worship, congregate settings and markets) and homesteads. Community health workers and community volunteers carry out community-based TB activities. They can be part of the public health services or nongovernmental or other civil society organizations. ENGAGE-TB is an approach to integrating community-based TB activities into the work of these organizations.a
Of the 114 countries that were asked to respond to questions about the contributions of communities to TB notifications
and treatment support in WHO’s 2016 round of global TB data collection, 49 reported data for at least one indicator.
Of the 49 countries, 60% (29/49) reported nationwide coverage of community engagement in case notification or community-based treatment support (Fig. B4.5.1). 40 out of 49 countries (82%) reported data on the contribution of community referrals to TB notifications; 41 out 49 (86%) reported on the proportion of TB patients receiving community-based treatment support; and 34 out of 49 (69%) reported information about the treatment success rate among TB patients who received treatment support in the community.
There are many countries in which community-based TB activities are a routine component of TB services, but where it is not yet possible to quantify this contribution. Of the 65 (out of 114) countries that were asked to report but did not submit any data on notifications, more than half (33/65) nonetheless
stated that community-based activities are implemented. In these 33 countries, the mean coverage of community-based activities is 79% of basic management units while a total of 19 countries reported countrywide implementation of community-based activities. Efforts to support countries to incorporate community engagement indicators into their routine monitoring and evaluation systems continue.
a World Health Organization. ENGAGE-TB Approach: Operational guidance: integrating community-based tuberculosis activities into the work of nongovernmental and other civil society organizations (WHO/HTM/TB/2012.8). Geneva: WHO; 2012 (http://www.who.int/tb/publications/2012/engage_tb_policy/en/, accessed 15 August 2016).
:: FIG. B4.5.1 Percentage of basic management units in which there is community engagement or provision of treatment adherence support, 2015
Percentage0–24.925–49.950–74.9≥75No dataNot applicable
4.2.2 Treatment coverage of antiretroviral therapy for HIV-positive TB cases
WHO recommends ART for all HIV-positive TB patients within the first 8 weeks of starting TB treatment.1 The num-ber of notified HIV-positive TB patients on ART has grown in recent years (Fig. 4.8, Fig. 4.17) and reached 390 630 in 2015, equivalent to 78% of the 500 564 notified TB
1 World Health Organization. Consolidated guidelines on the use of antiretroviral drugs for treating and preventing HIV infection. Recommendations for a public health approach. 2nd edition. Geneva: WHO; 2016. (http://www.who.int/hiv/pub/arv/annexes_new.pdf, accessed 26 August 2016)
patients known to be HIV-positive (Table 4.1). This was an increase from 36% in 2005, when data on provision of ART to HIV-positive TB patients were first collected at global level.2 In the 30 high TB/HIV burden countries, 80% of the TB patients known to be HIV-positive were on ART and in six of these countries (India, Kenya, Malawi, Mozambique, Namibia and Swaziland) the figure was more than 90%.
2 There may be discrepancies in data on provision of ART to HIV-positive TB patients that are reported by national TB programmes and national HIV programmes. These discrepancies have reduced in recent years and are mostly resolved through follow-up and validation efforts.

74 :: GLOBAL TUBERCULOSIS REPORT 2016
:: FIG. 4.17 Number of new and relapse casesa known to be HIV-positive (black) and number started on ART (blue) compared with estimated number of incident HIV-positive TB cases (red), 2004–2015, 30 high TB/HIV burden countries
a The calculation is for all cases in years prior to 2015.
New
and
rela
pse
case
s per
yea
r (th
ousa
nds)
0
10
20
30
40
0
2.5
5
7.5
10
0
5
10
15
20
0
10
20
0
5
10
15
0
10
20
30
40
0
5
10
15
0
5
10
15
20
0
1
2
3
4
0
1
2
3
0
50
100
150
200
0
20
40
60
80
0
5
10
15
20
0
2.5
5
7.5
0
100
200
300
400
0
20
40
60
0
2
4
6
0
50
100
150
0
10
20
30
0
20
40
60
0
30
60
90
120
0
25
50
75
100
125
0
100
200
300
400
0
20
40
60
0
10
20
0
20
40
60
80
0
20
40
60
80
0
10
20
30
0
5
10
15
0
25
50
75
2004 2007 2010 2013 2004 2007 2010 2013 2004 2007 2010 2013 2004 2007 2010 2013 2004 2007 2010 2013
Angola Botswana Brazil Cameroon Central African Republic
Chad China Congo DR Congo Ethiopia
Ghana Guinea-Bissau India Indonesia Kenya
Lesotho Liberia Malawi Mozambique Myanmar
Namibia Nigeria Papua New Guinea South Africa Swaziland
Thailand Uganda ZambiaUR Tanzania Zimbabwe
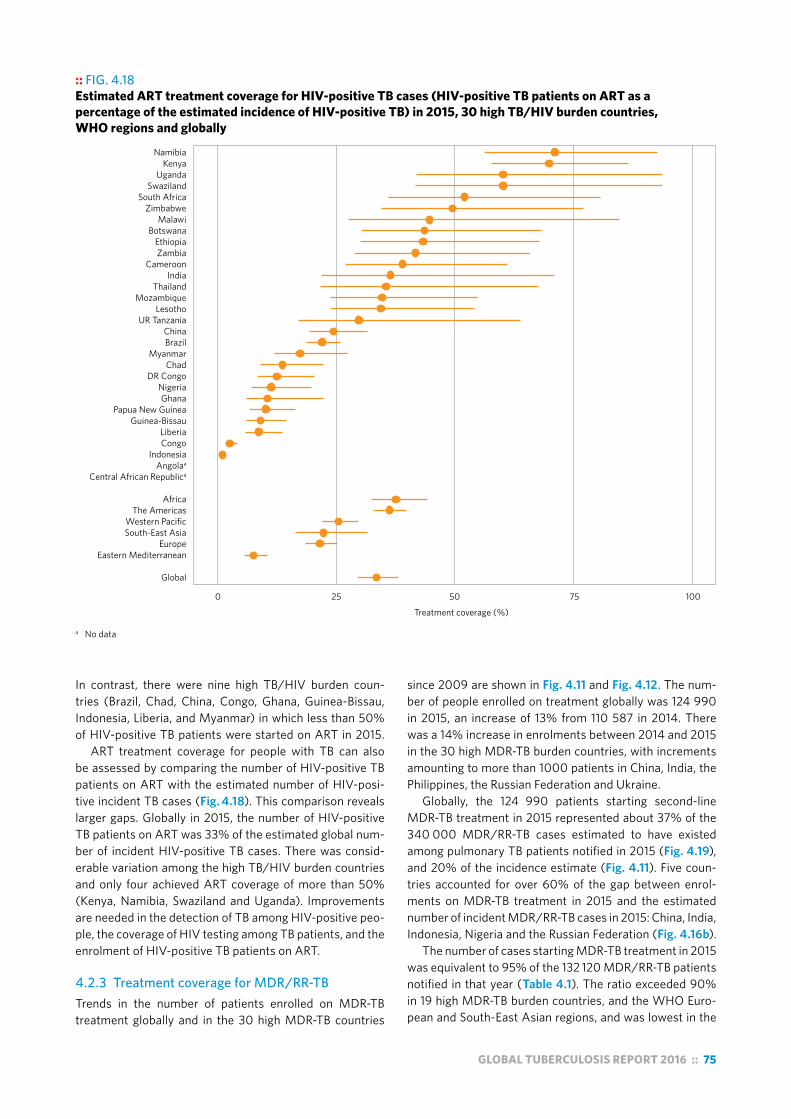
GLOBAL TUBERCULOSIS REPORT 2016 :: 75
:: FIG. 4.18 Estimated ART treatment coverage for HIV-positive TB cases (HIV-positive TB patients on ART as a percentage of the estimated incidence of HIV-positive TB) in 2015, 30 high TB/HIV burden countries, WHO regions and globally
a No data
Treatment coverage (%)
Global
Eastern MediterraneanEurope
South-East AsiaWestern Pacific
The AmericasAfrica
Central African RepublicaAngolaa
IndonesiaCongoLiberia
Guinea-BissauPapua New Guinea
GhanaNigeria
DR CongoChad
MyanmarBrazilChina
UR TanzaniaLesotho
MozambiqueThailand
IndiaCameroon
ZambiaEthiopia
BotswanaMalawi
ZimbabweSouth Africa
SwazilandUganda
KenyaNamibia
0 25 50 75 100
In contrast, there were nine high TB/HIV burden coun-tries (Brazil, Chad, China, Congo, Ghana, Guinea-Bissau, Indonesia, Liberia, and Myanmar) in which less than 50% of HIV-positive TB patients were started on ART in 2015.
ART treatment coverage for people with TB can also be assessed by comparing the number of HIV-positive TB patients on ART with the estimated number of HIV-posi-tive incident TB cases (Fig. 4.18). This comparison reveals larger gaps. Globally in 2015, the number of HIV-positive TB patients on ART was 33% of the estimated global num-ber of incident HIV-positive TB cases. There was consid-erable variation among the high TB/HIV burden countries and only four achieved ART coverage of more than 50% (Kenya, Namibia, Swaziland and Uganda). Improvements are needed in the detection of TB among HIV-positive peo-ple, the coverage of HIV testing among TB patients, and the enrolment of HIV-positive TB patients on ART.
4.2.3 Treatment coverage for MDR/RR-TBTrends in the number of patients enrolled on MDR-TB treatment globally and in the 30 high MDR-TB countries
since 2009 are shown in Fig. 4.11 and Fig. 4.12. The num-ber of people enrolled on treatment globally was 124 990 in 2015, an increase of 13% from 110 587 in 2014. There was a 14% increase in enrolments between 2014 and 2015 in the 30 high MDR-TB burden countries, with increments amounting to more than 1000 patients in China, India, the Philippines, the Russian Federation and Ukraine.
Globally, the 124 990 patients starting second-line MDR-TB treatment in 2015 represented about 37% of the 340 000 MDR/RR-TB cases estimated to have existed among pulmonary TB patients notified in 2015 (Fig. 4.19), and 20% of the incidence estimate (Fig. 4.11). Five coun-tries accounted for over 60% of the gap between enrol-ments on MDR-TB treatment in 2015 and the estimated number of incident MDR/RR-TB cases in 2015: China, India, Indonesia, Nigeria and the Russian Federation (Fig. 4.16b).
The number of cases starting MDR-TB treatment in 2015 was equivalent to 95% of the 132 120 MDR/RR-TB patients notified in that year (Table 4.1). The ratio exceeded 90% in 19 high MDR-TB burden countries, and the WHO Euro-pean and South-East Asian regions, and was lowest in the

76 :: GLOBAL TUBERCULOSIS REPORT 2016
:: FIG. 4.19Estimated MDR/RR-TB treatment coverage for MDR/RR-TB (patients started on treatment for MDR-TB as a percentage of the estimated number of MDR/RR-TB cases among notified pulmonary TB cases) in 2015, 30 high MDR−TB burden countries, WHO regions and globally
Global
Western PacificEastern Mediterranean
South-East AsiaAfrica
The AmericasEurope
DPR KoreaSomaliaAngola
ChinaDR Congo
NigeriaIndonesia
BangladeshEthiopiaPakistan
Papua New GuineaThailand
MozambiqueMyanmar
KenyaPhilippines
IndiaUzbekistanZimbabweViet Nam
KyrgyzstanTajikistan
Republic of MoldovaAzerbaijan
Russian FederationUkraine
PeruBelarus
South AfricaKazakhstan
0 50 100 150Treatment coverage (%)
African Region (Fig. 4.19). In 2015, enrolments outstripped notifications of MDR/RR-TB in eight high MDR-TB burden countries (Fig. 4.12). This may be caused by empirical treatment of TB patients considered at risk of having MDR/RR-TB but for whom a laboratory-confirmed diagnosis was missing, incomplete reporting of laboratory data, or enrol-ment of “waiting lists” of people with MDR/RR-TB who were detected before 2015.
The ratio of enrolled to diagnosed cases was below 60% in two high MDR-TB burden countries in 2015: China (59%) and Nigeria (53%). These low ratios show that progress in detection is far outstripping capacity to provide treatment; they may also reflect weaknesses in data collection sys-tems. Treatment coverage will not improve globally unless there is an intensification of efforts in the countries with the largest burden, particularly China and the Russian Federa-tion, but also India where the rate of increase in enrolments has slowed.
In many countries, one of the reasons for inadequate ac-cess to treatment of drug-resistant TB is that the network for the programmatic management of drug-resistant TB
(PMDT) is too centralized. Hospital-based models of care continue to dominate in many countries, and hold back wider use of decentralized ambulatory care, a change of di-rection that could expand population access to PMDT (see also Chapter 6). In addition, gaps for palliative and end-of-life care are evident. In 2015, only 34 countries (including 16 of the 30 high MDR-TB burden countries) reported that such services were provided within the scope of their NTPs.
4.3 Treatment outcomesThis section highlights the latest results of treatment for people who started TB treatment on a first-line regimen in 2014, and people that started a second-line regimen for MDR/RR-TB in 2013.
4.3.1 Treatment outcomes for new and relapse TB patients
The definitions of TB treatment outcomes for new and relapse cases of TB that are recommended by WHO are provided in an updated recording and reporting framework

GLOBAL TUBERCULOSIS REPORT 2016 :: 77
:: FIG. 4.20 Treatment outcomes for new and relapse TB cases in 2014, 30 high TB burden countries, WHO regions and globally
a Treatment outcomes are for new cases only.
Global
Western PacificSouth-East Asia
EuropeEastern Mediterranean
The AmericasAfrica
Zimbabwea
ZambiaViet Nam
UR TanzaniaThailand
South AfricaSierra Leone
Russian FederationPhilippines
Papua New Guineaa
PakistanNigeria
Namibiaa
MyanmarMozambique
LiberiaLesotho
KenyaIndonesia
IndiaEthiopiaa
DR Congoa
DPR KoreaCongoChina
Central African Republica
CambodiaBrazil
BangladeshAngola
0 20 40 60 80 100
Treatment success Failure Died Lost to follow-up
Not evaluated
Percentage of cohort (%)
3493
7193
7094
6991
8989
7484
8770
7489
878787
9370
9269
8578
8090
9185
81
8176
9176
7992
83
issued in March 2013 and updated in 2014.1 Most new and relapse cases do not have MDR/RR-TB; however, in some parts of the world, especially countries of the former So-viet Union, more than 20% of new and relapse cases do so (Chapter 3). Universal access to DST is required to ensure that all people with TB receive appropriate treatment, as discussed in Section 4.1.
Data on treatment outcomes in 2014 for new and re-lapse cases of TB are shown for the world, the six WHO regions and the 30 high TB burden countries in Fig. 4.20, and trends globally and in the six WHO regions since 2000 are shown in Fig. 4.21. Globally, the treatment success rate for the 5.9 million new and relapse cases that were treated in the 2014 cohort was 83%. This was a reduction from 87% for the 2013 cohort, which can be explained by data for India. From 2013 to 2014, there was a big increase in notifications of TB cases in India (see also Section 4.1.1) from the private sector. However, while the total number of TB patients reported as successfully treated also in-creased in India, there was an increase in the percentage of TB patients for whom the treatment outcome was cat-egorized as “not evaluated” (17%). As a consequence, the overall treatment success rate fell from 86% to 74%, and the impact is large enough to be evident in the aggregated data for 2014 for the world and the WHO South-East Asia Region (Fig 4.21). The NTP in India has been taking actions to improve reporting of treatment outcomes from private sector providers, including by facilitating reporting of out-comes via the national web-based reporting system known as Nikshay, and the aim is to achieve complete reporting of outcomes from the private sector by 2017. Of note, when the 2014 data for India are restricted to the same provid-ers/facilities, the treatment success rate remains compa-rable to 2013, at 87%. When India is excluded from global calculations, the treatment success rate is 86%.
Among the six WHO regions, the highest treatment success rates in 2014 were in the Western Pacific Region (92%) and the Eastern Mediterranean Region (91%), and the lowest (at 76%) were in the Region of the Americas (due to high levels of loss to follow up and missing data) and the European Region (due to high rates of treatment failure and death, influenced by the high frequency of MDR/RR-TB). Only eight of the 30 high TB burden countries had reached or exceeded a 90% treatment success rate, although the validity of treatment outcome data was not always ascer-tained. In several high TB burden countries, the complete-ness of outcome reporting was low. In the Central African Republic, Congo, Liberia and Papua New Guinea, loss to follow-up exceeded 15%, whereas in Angola, Congo, India and Lesotho more than 10% of cases were unevaluated. In Brazil (71% success), 21% of cases were either lost to follow-up or their treatment outcome was missing.
Despite the decrease in the overall treatment success
1 World Health Organization. Definitions and reporting framework for tuberculosis – 2013 revision (updated December 2014) (WHO/HTM/TB/2013.2). Geneva: WHO; 2013 (www.who.int/iris/bitstream/10665/79199/1/9789241505345_eng.pdf, accessed 15 August 2015).

78 :: GLOBAL TUBERCULOSIS REPORT 2016
rate, the absolute number of TB patients reported to have been successfully treated has continued to increase over time, both globally and in all WHO regions (Fig. 4.21).
4.3.2 Treatment outcomes for new and relapse TB patients coinfected with HIV
In the 2016 round of global TB data collection, 106 countries (which collectively accounted for 80% of the HIV-positive TB patients reported by NTPs in 2014) reported treatment outcomes for the 2014 patient cohort disaggregated by HIV status. This included 19 of the 30 high TB/HIV burden countries. Treatment outcomes for these countries, as well as the six WHO regions and globally, are shown in Fig. 4.22. Overall, the treatment success rate in 2014 was worse for HIV-positive TB patients (75%) than for HIV-negative TB patients (83%). There were particularly large differences in the Region of the Americas, the Eastern Mediterranean and the Western Pacific regions, where the treatment success rates for HIV-positive TB patients were 56%, 53% and 72% respectively, compared with 77%, 82% and 93% respec-tively among HIV-negative patients.
Globally, the proportion of TB patients who died during treatment was about four times higher among HIV-positive TB patients (11% versus 3%). In WHO regions the relative difference was lowest in the African Region (10% versus 5%) and highest in the Western Pacific Region (15% versus 2%).
Reasons for the comparatively poor outcomes of HIV-positive TB patients include late detection of HIV-asso-ciated TB and delays in starting ART or TB treatment. To reduce excessive TB mortality in HIV-positive people, WHO recommends routine HIV testing among presump-tive and diagnosed TB cases and TB screening among peo-ple living with HIV, early ART and provision of TB preventive treatment. WHO recently published a revised algorithm for clinical management of HIV-positive people who are seri-ously ill and suspected of having TB.1
4.3.3 Treatment outcomes for TB patients with MDR/RR-TB and XDR-TB
A total of 127 countries and territories reported treatment outcomes for people started on MDR-TB treatment in 2013. The number of cases reported in annual cohorts has steadily increased over time, reaching 86 936 cases glob-ally in the 2013 cohort, a 17% increase over the previous year (Fig. 4.23).
Overall, the proportion of MDR/RR-TB patients in the 2013 cohort who successfully completed treatment (i.e. cured or treatment completed) was 52%: 17% died, 15% were lost to follow-up, 9% were determined to be treat-ment failure and 7% had no outcome information. The treatment success rate was highest in the WHO Eastern
1 World Health Organization. Consolidated guidelines on the use of antiretroviral drugs for treating and preventing HIV infection. Recommendations for a public health approach. 2nd edition. Geneva: WHO; 2016. (http://www.who.int/hiv/pub/arv/annexes-5Sep2016.pdf, accessed 26 August 2016). See Annex 14.
:: FIG. 4.21Treatment outcomes for new and relapse TB casesa (absolute numbers), 2000–2014, globally and for WHO regions
2000 2002 2004 2006 2008 2010 2012 20140
1
2
3
4
5
6
Num
ber o
f cas
es (m
illio
ns)
Treatment success Failed/Died/Lost to follow-up
Not evaluated
Global
Africa The Americas
2002 2006 2010 20140
1
2
2002 2006 2010 20140
1
2
2002 2006 2010 20140
1
2
2002 2006 2010 20140
1
2
Eastern Mediterranean Europe
South-East Asia Western Pacific
2002 2006 2010 20140
1
2
2002 2006 2010 20140
1
2
Num
ber o
f cas
es (m
illio
ns)
Num
ber o
f cas
es (m
illio
ns)
Num
ber o
f cas
es (m
illio
ns)
a Cohorts before 2012 included new cases only.

GLOBAL TUBERCULOSIS REPORT 2016 :: 79
:: FIG. 4.22Treatment outcomes for new and relapse TB/HIV cases in 2014, 30 high TB/HIV burden countries, WHO regions and globally
:: FIG. 4.23 Treatment outcomes for rifampicin-resistant TB cases started on treatment in 2013, 30 high MDR–TB burden countries, WHO regions and globally
Percentage of cohort (%)
Global
Western PacificSouth-East Asia
EuropeEastern Mediterranean
The AmericasAfrica
ZimbabweViet Nam
UzbekistanUkraine
ThailandTajikistan
South AfricaSomalia
Russian FederationRepublic of Moldova
PhilippinesPeru
Papua New GuineaPakistanNigeria
MyanmarMozambique
KyrgyzstanKenya
KazakhstanIndonesia
IndiaEthiopia
DR CongoDPR Korea
ChinaBelarus
BangladeshAzerbaijan
Angola
0 20 40 60 80 100
7459
755455
8463
6846
5172
8257
5283
7769
5549
5748
7748
60
3953
6959
5455
6852
4957
52
Mediterranean Region (68%), and lowest in the South-East Asia Region (49%). In the 2013 cohort, treatment failure was highest in the WHO European Region (13%), and the death rate was highest in the African and South-East Asia regions (21%). Loss to follow-up was highest in the WHO Region of the Americas (25%).
Despite the low levels of treatment success, over 150 000 people who started MDR-TB treatment globally between 2007 and 2013 were reported to have completed their treatment successfully. Among the 30 high MDR-TB burden countries, the Democratic Republic of Korea, Ken-ya, Myanmar, Nigeria, and Somalia reported >75% treat-ment success among the MDR/RR-TB cohorts enrolled in
2013. Conversely, treatment success was <50% in coun-tries with the largest cohorts: India, the Philippines, the Russian Federation, South Africa and Ukraine. This was primarily due to high death rates in India, South Africa and Ukraine; high treatment failure rates in the Russian Fed-eration and Ukraine; and high rates of loss to follow up or missing data in India, the Philippines and South Africa. Data on treatment outcomes for MDR/RR-TB patients were not reported by Papua New Guinea and Thailand.
Among 4086 XDR-TB patients started on treatment in 2013 in 47 countries and for whom outcomes were re-ported, 28% completed treatment successfully, 27% died, treatment failed for 21%, and 23% were lost to follow-up or
Percentage of cohort (%)
Global
Western PacificSouth-East Asia
EuropeEastern Mediterranean
The AmericasAfrica
ZimbabweZambia
UR TanzaniaUganda
ThailandSwaziland
South AfricaPapua New Guinea
NigeriaNamibia
MyanmarMozambique
MalawiLiberia
LesothoKenya
IndonesiaIndia
Guinea-BissauGhana
EthiopiaDR Congo
CongoChinaChad
Central African RepublicCameroon
BrazilBotswana
Angola
0 20 40 60 80 100
7749
7868
86
76
7656
8269
708079
7678
6773
87
68
7756
5341
7472
75
Treatment success Failure Died Lost to follow-up Not evaluated No data reported
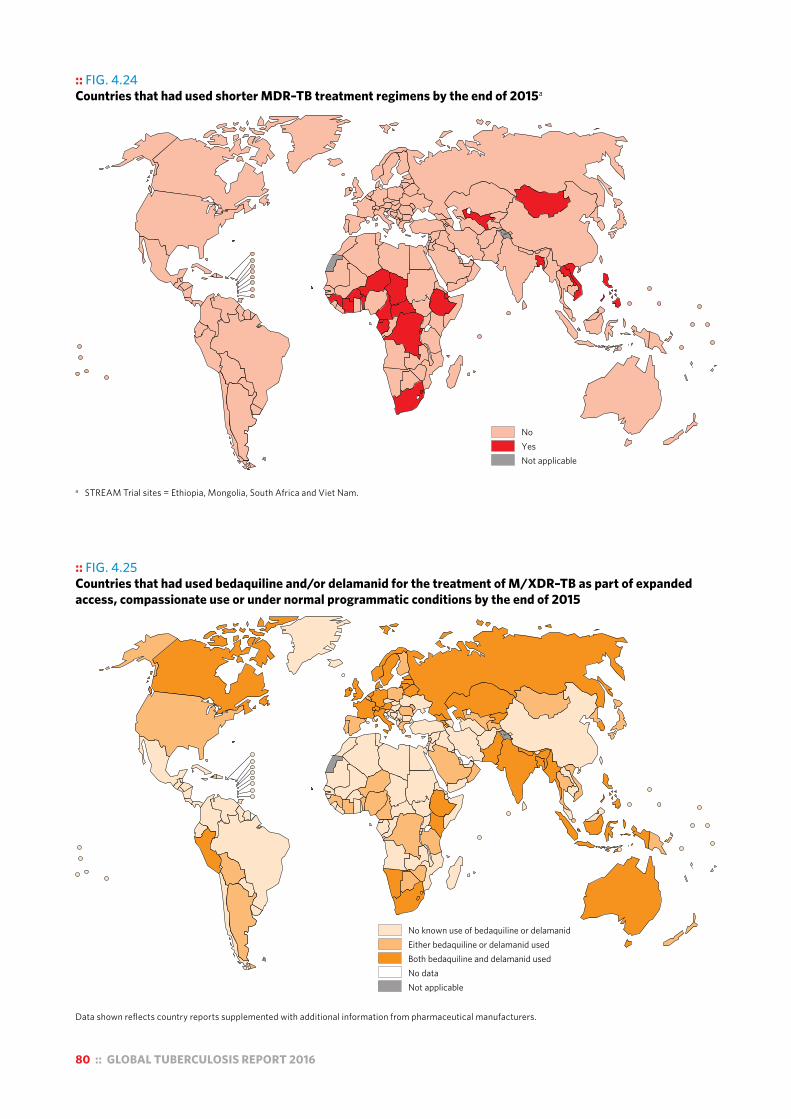
80 :: GLOBAL TUBERCULOSIS REPORT 2016
:: FIG. 4.24 Countries that had used shorter MDR–TB treatment regimens by the end of 2015a
a STREAM Trial sites = Ethiopia, Mongolia, South Africa and Viet Nam.
NoYesNot applicable
:: FIG. 4.25 Countries that had used bedaquiline and/or delamanid for the treatment of M/XDR–TB as part of expanded access, compassionate use or under normal programmatic conditions by the end of 2015
Data shown reflects country reports supplemented with additional information from pharmaceutical manufacturers.
No known use of bedaquiline or delamanidEither bedaquiline or delamanid usedBoth bedaquiline and delamanid usedNo dataNot applicable

GLOBAL TUBERCULOSIS REPORT 2016 :: 81
:: Box 4.6 Active TB drug-safety monitoring and management
aDSM is the active and systematic, clinical and laboratory assessment of patients on treatment with new anti-TB drugs, novel MDR-TB regimens, or XDR-TB regimens, to detect, manage and report suspected or confirmed drug toxicities.a The overall objectives of aDSM are to reduce risks from drug-related harms in patients on second-line treatment for drug-resistant TB and to generate standardized data to inform future policy updates on the use of such medicines.
aDSM includes three essential activities to achieve these objectives:
! Patients targeted for aDSM should undergo active and systematic clinical and laboratory assessment during treatment to detect drug toxicity and adverse events (AEs). Proposed schedules have been developed for use in patients on shorter regimens or on new medications.
! All AEs detected should be managed in a timely manner, to deliver the best possible patient care. Management of AEs is beyond the scope of this document, and further details are provided in other implementation documents.b
! Standardized data should be systematically collected and reported for any detected serious adverse event (SAE). These data will eventually be used to characterize the types of SAEs, assess the safety of the treatment, and inform future policy on the use of these medicines.
In 2015, 51 of the 140 countries that enrolled patients on MDR-TB treatment (including 15 of the 30 high MDR-TB burden countries) reported AEs in least one patient.
a World Health Organization. Active tuberculosis drug-safety monitoring and management (aDSM): framework for implementation (WHO/HTM/TB/2015.28). Geneva: WHO; 2015 (http://apps.who.int/iris/bitstream/10665/204465/1/WHO_HTM_TB_2015.28_eng.pdf, accessed 15 August 2016).
b World Health Organization. Companion handbook to the WHO guidelines for the programmatic management of drug-resistant tuberculosis (WHO/HTM/TB/2014.11). Geneva: WHO; 2014 (http://apps.who.int/iris/bitstream/10665/130918/1/9789241548809_eng.pdf, accessed 15 August 2016).
their treatment outcome was not evaluated. The Russian Federation accounted for nearly 50% of the XDR-TB pa-tients for whom outcomes were reported in 2013. Among six countries with XDR-TB cohorts of more than 100 indi-viduals, mortality was highest (>40%) in India and South Africa.
Treatment success rates in patients with drug-resistant TB remain unacceptably low. The wider use of shorter MDR-TB treatment regimens of 9–12 months (Box 4.3) and of new TB drugs (bedaquiline and delamanid) for patients with M/XDR-TB could help to improve this situation.
At least 23 countries in Africa and Asia have introduced shorter regimens as part of trials or observational studies under operational research conditions (Fig. 4.24). These regimens achieved high treatment success rates (87–90%) in selected MDR/RR-TB patients included in a pooled me-ta-analysis undertaken to inform the latest WHO policy
update for the treatment of drug-resistant TB (Box 4.3). As part of efforts to improve access to treatment and
treatment outcomes for MDR/XDR-TB, at least 70 coun-tries had imported or started using bedaquiline and 39 countries had used delamanid by the end of 2015 (Fig. 4.25). Most (75%) of the patients treated with bedaqui-line were reported by two countries: the Russian Federation and South Africa.
With the introduction of new drugs and regimens, ac-tive TB drug-safety monitoring and management (aDSM), defined as the active and systematic clinical and laboratory assessment of patients on treatment with new TB drugs, novel MDR-TB regimens or XDR-TB regimens to detect, manage and report suspected or confirmed drug toxicities,1 is required (Box 4.6).
Further details on research and development of new drugs and novel regimens are given in Chapter 8.
1 World Health Organization. Active TB drug-safety monitoring and management (aDSM). WHO. Available from: http://www.who.int/tb/areas-of-work/drug-resistant-tb/treatment/pharmacovigilance/en/

82 :: GLOBAL TUBERCULOSIS REPORT 2016
Chapter 5 :: TB prevention services
:: KEY FACTS AND MESSAGESThere is a need to improve initiation, completion and reporting of TB preventive treatment for other at-risk populations, including clinical risk groups such as patients with silicosis, patients starting anti-tumour necrosis factor (TNF) therapy and patients preparing for organ transplantation.
The ratio of the TB notification rate among health-care workers to the TB notification rate in the general adult population is a good indicator of the impact of TB infection control in health facilities. In 2015, 9977 health-care workers were reported with TB from 67 countries; China accounted for 30% of these cases and South Africa for 21%. In 16 countries, the number of TB cases per 100 000 health-care workers was more than double the notification rate in the general adult population.
BCG vaccination should be provided as part of national childhood immunization programmes according to a country’s TB epidemiology. In 2015, 163 countries reported providing BCG vaccination as a standard part of these programmes, of which 102 reported coverage of above 90%.
Monitoring and evaluation of TB prevention services is challenging given the lack of systems for recording and reporting data, and the involvement of multiple service providers. In 2016, WHO developed standard indicators to monitor and evaluate the provision of TB preventive treatment. Countries are encouraged to adopt these indicators and an electronic surveillance system that facilitates collection and analysis of the relevant data.
Development and expanded use of shorter regimens for TB preventive treatment, which require a smaller number of doses and are associated with fewer adverse events, will facilitate implementation at a larger scale. Innovative diagnostic tests with improved performance and predictive value are needed to target individuals who will benefit most from TB preventive treatment.
Prevention of new infections of Mycobacterium tuberculosis and their progression to tuberculosis (TB) disease is critical to reduce the burden of disease and death caused by TB, and to achieve the End TB Strategy targets set for 2030 and 2035.
Current health interventions for TB prevention are: treatment of latent TB infection (LTBI), with particular attention to children aged under 5 years who are household contacts of bacteriologically confirmed pulmonary TB cases, and people living with HIV; prevention of transmission of Mycobacterium tuberculosis through infection control; and vaccination of children with the Bacille-Calmette-Guérin (BCG) vaccine.
Globally in 2015, there were an estimated 1.2 million children aged under 5 years who were household contacts of bacteriologically confirmed pulmonary TB cases and who were eligible for TB preventive treatment according to current policy recommendations. In comparison, only 87 236 children in this age group (7.1%) were reported to have been started on TB preventive treatment in 2015, based on data from 88 countries.
A total of 910 124 people who were newly enrolled in HIV care were started on TB preventive treatment in 2015, based on data from 58 countries. This was a large increase from negligible levels in 2005, when WHO first requested data. South Africa accounted for the largest share (45%) of the total in 2015, as in previous years, followed by Malawi, Mozambique and Kenya. Ten countries reported data for the first time, including Kenya.
Despite progress in providing TB preventive treatment to people living with HIV, much more remains to be done. Of the 30 high TB/HIV burden countries, 21 did not report any provision of preventive treatment in 2015. In the nine high TB/HIV burden countries that did report data, coverage among people newly enrolled in HIV care ranged from 2% in Indonesia to 79% in Malawi.
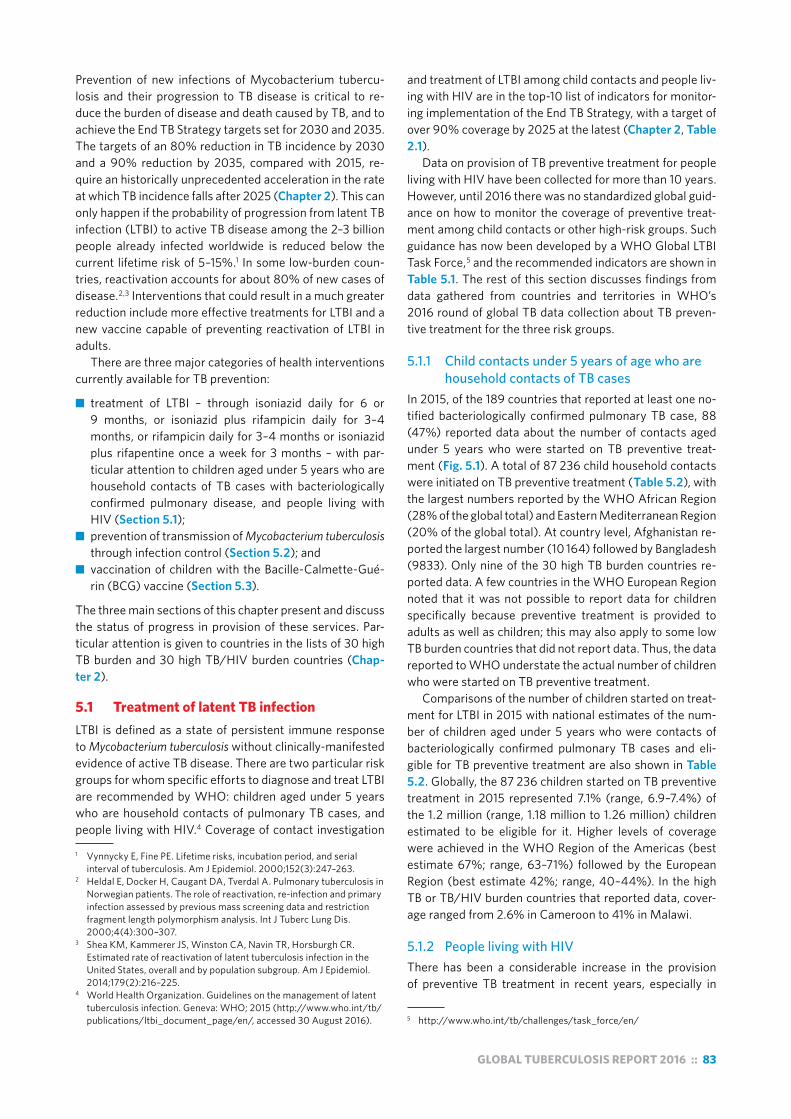
GLOBAL TUBERCULOSIS REPORT 2016 :: 83
Prevention of new infections of Mycobacterium tubercu-losis and their progression to TB disease is critical to re-duce the burden of disease and death caused by TB, and to achieve the End TB Strategy targets set for 2030 and 2035. The targets of an 80% reduction in TB incidence by 2030 and a 90% reduction by 2035, compared with 2015, re-quire an historically unprecedented acceleration in the rate at which TB incidence falls after 2025 (Chapter 2). This can only happen if the probability of progression from latent TB infection (LTBI) to active TB disease among the 2–3 billion people already infected worldwide is reduced below the current lifetime risk of 5–15%.1 In some low-burden coun-tries, reactivation accounts for about 80% of new cases of disease.2,3 Interventions that could result in a much greater reduction include more effective treatments for LTBI and a new vaccine capable of preventing reactivation of LTBI in adults.
There are three major categories of health interventions currently available for TB prevention:
■ treatment of LTBI – through isoniazid daily for 6 or 9 months, or isoniazid plus rifampicin daily for 3–4 months, or rifampicin daily for 3–4 months or isoniazid plus rifapentine once a week for 3 months – with par-ticular attention to children aged under 5 years who are household contacts of TB cases with bacteriologically confirmed pulmonary disease, and people living with HIV (Section 5.1);
■ prevention of transmission of Mycobacterium tuberculosis through infection control (Section 5.2); and
■ vaccination of children with the Bacille-Calmette-Gué-rin (BCG) vaccine (Section 5.3).
The three main sections of this chapter present and discuss the status of progress in provision of these services. Par-ticular attention is given to countries in the lists of 30 high TB burden and 30 high TB/HIV burden countries (Chap-ter 2).
5.1 Treatment of latent TB infectionLTBI is defined as a state of persistent immune response to Mycobacterium tuberculosis without clinically-manifested evidence of active TB disease. There are two particular risk groups for whom specific efforts to diagnose and treat LTBI are recommended by WHO: children aged under 5 years who are household contacts of pulmonary TB cases, and people living with HIV.4 Coverage of contact investigation
1 Vynnycky E, Fine PE. Lifetime risks, incubation period, and serial interval of tuberculosis. Am J Epidemiol. 2000;152(3):247–263.
2 Heldal E, Docker H, Caugant DA, Tverdal A. Pulmonary tuberculosis in Norwegian patients. The role of reactivation, re-infection and primary infection assessed by previous mass screening data and restriction fragment length polymorphism analysis. Int J Tuberc Lung Dis. 2000;4(4):300–307.
3 Shea KM, Kammerer JS, Winston CA, Navin TR, Horsburgh CR. Estimated rate of reactivation of latent tuberculosis infection in the United States, overall and by population subgroup. Am J Epidemiol. 2014;179(2):216–225.
4 World Health Organization. Guidelines on the management of latent tuberculosis infection. Geneva: WHO; 2015 (http://www.who.int/tb/publications/ltbi_document_page/en/, accessed 30 August 2016).
and treatment of LTBI among child contacts and people liv-ing with HIV are in the top-10 list of indicators for monitor-ing implementation of the End TB Strategy, with a target of over 90% coverage by 2025 at the latest (Chapter 2, Table 2.1).
Data on provision of TB preventive treatment for people living with HIV have been collected for more than 10 years. However, until 2016 there was no standardized global guid-ance on how to monitor the coverage of preventive treat-ment among child contacts or other high-risk groups. Such guidance has now been developed by a WHO Global LTBI Task Force,5 and the recommended indicators are shown in Table 5.1. The rest of this section discusses findings from data gathered from countries and territories in WHO’s 2016 round of global TB data collection about TB preven-tive treatment for the three risk groups.
5.1.1 Child contacts under 5 years of age who are household contacts of TB cases
In 2015, of the 189 countries that reported at least one no-tified bacteriologically confirmed pulmonary TB case, 88 (47%) reported data about the number of contacts aged under 5 years who were started on TB preventive treat-ment (Fig. 5.1). A total of 87 236 child household contacts were initiated on TB preventive treatment (Table 5.2), with the largest numbers reported by the WHO African Region (28% of the global total) and Eastern Mediterranean Region (20% of the global total). At country level, Afghanistan re-ported the largest number (10 164) followed by Bangladesh (9833). Only nine of the 30 high TB burden countries re-ported data. A few countries in the WHO European Region noted that it was not possible to report data for children specifically because preventive treatment is provided to adults as well as children; this may also apply to some low TB burden countries that did not report data. Thus, the data reported to WHO understate the actual number of children who were started on TB preventive treatment.
Comparisons of the number of children started on treat-ment for LTBI in 2015 with national estimates of the num-ber of children aged under 5 years who were contacts of bacteriologically confirmed pulmonary TB cases and eli-gible for TB preventive treatment are also shown in Table 5.2. Globally, the 87 236 children started on TB preventive treatment in 2015 represented 7.1% (range, 6.9–7.4%) of the 1.2 million (range, 1.18 million to 1.26 million) children estimated to be eligible for it. Higher levels of coverage were achieved in the WHO Region of the Americas (best estimate 67%; range, 63–71%) followed by the European Region (best estimate 42%; range, 40–44%). In the high TB or TB/HIV burden countries that reported data, cover-age ranged from 2.6% in Cameroon to 41% in Malawi.
5.1.2 People living with HIVThere has been a considerable increase in the provision of preventive TB treatment in recent years, especially in
5 http://www.who.int/tb/challenges/task_force/en/
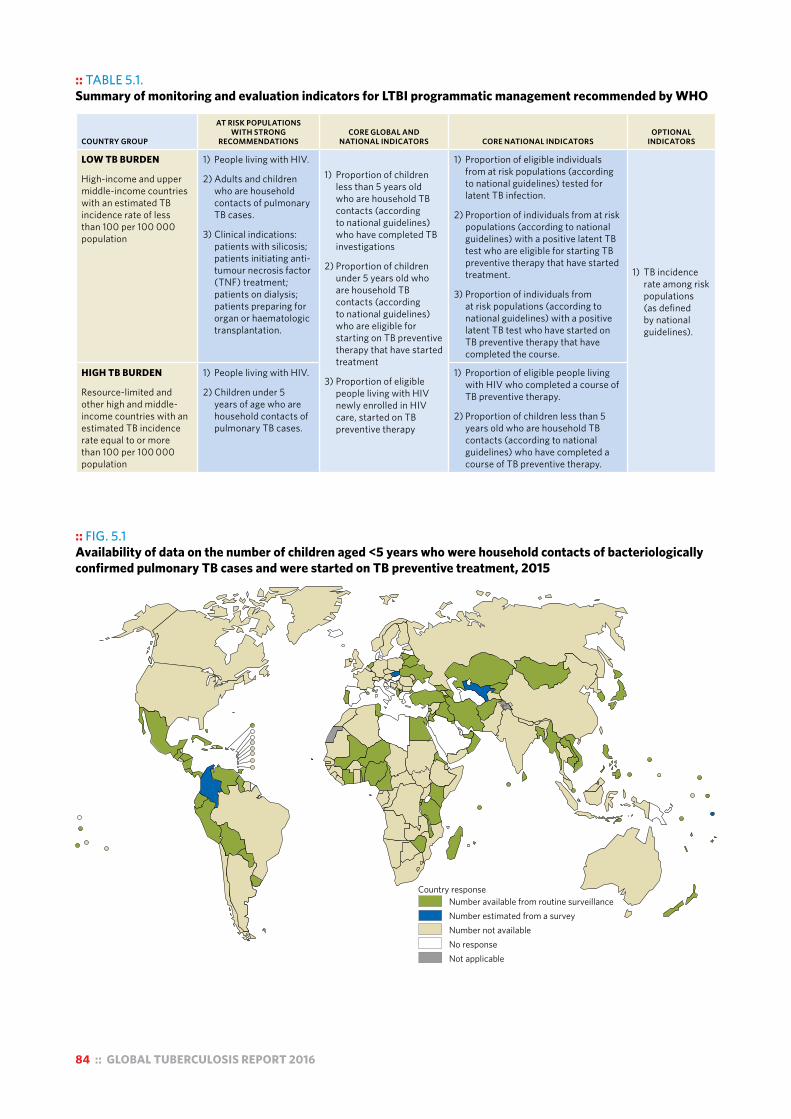
84 :: GLOBAL TUBERCULOSIS REPORT 2016
:: TABLE 5.1. Summary of monitoring and evaluation indicators for LTBI programmatic management recommended by WHO
COUNTRY GROUP
AT RISK POPULATIONS WITH STRONG
RECOMMENDATIONSCORE GLOBAL AND
NATIONAL INDICATORS CORE NATIONAL INDICATORSOPTIONAL
INDICATORS
LOW TB BURDEN
High-income and upper middle-income countries with an estimated TB incidence rate of less than 100 per 100 000 population
1) People living with HIV.
2) Adults and children who are household contacts of pulmonary TB cases.
3) Clinical indications: patients with silicosis; patients initiating anti-tumour necrosis factor (TNF) treatment; patients on dialysis; patients preparing for organ or haematologic transplantation.
1) Proportion of children less than 5 years old who are household TB contacts (according to national guidelines) who have completed TB investigations
2) Proportion of children under 5 years old who are household TB contacts (according to national guidelines) who are eligible for starting on TB preventive therapy that have started treatment
3) Proportion of eligible people living with HIV newly enrolled in HIV care, started on TB preventive therapy
1) Proportion of eligible individuals from at risk populations (according to national guidelines) tested for latent TB infection.
2) Proportion of individuals from at risk populations (according to national guidelines) with a positive latent TB test who are eligible for starting TB preventive therapy that have started treatment.
3) Proportion of individuals from at risk populations (according to national guidelines) with a positive latent TB test who have started on TB preventive therapy that have completed the course.
1) TB incidence rate among risk populations (as defined by national guidelines).
HIGH TB BURDEN
Resource-limited and other high and middle-income countries with an estimated TB incidence rate equal to or more than 100 per 100 000 population
1) People living with HIV.
2) Children under 5 years of age who are household contacts of pulmonary TB cases.
1) Proportion of eligible people living with HIV who completed a course of TB preventive therapy.
2) Proportion of children less than 5 years old who are household TB contacts (according to national guidelines) who have completed a course of TB preventive therapy.
:: FIG. 5.1 Availability of data on the number of children aged <5 years who were household contacts of bacteriologically confirmed pulmonary TB cases and were started on TB preventive treatment, 2015
Country responseNumber available from routine surveillanceNumber estimated from a surveyNumber not availableNo responseNot applicable

GLOBAL TUBERCULOSIS REPORT 2016 :: 85
:: TABLE 5.2TB preventive treatment in 2015 for people living with HIV and children under 5 years of age who were household contacts of a bacteriologically confirmed pulmonary TB case, 16 high TB or TB/HIV burden countries that reported data, WHO regions and globallya
NUMBER OF PEOPLE
LIVING WITH HIV NEWLY
ENROLLED IN CARE (A)b
PEOPLE NEWLY ENROLLED IN HIV CARE WHO WERE STARTED ON TB PREVENTIVE TREATMENT IN 2015
ESTIMATED NUMBER OF CHILDREN UNDER 5 YEARS OF AGE WHO WERE
HOUSEHOLD CONTACTS OF A NOTIFIED BACTERIOLOGICALLY CONFIRMED
PULMONARY TB CASE, AND ELIGIBLE FOR TB PREVENTIVE TREATMENT, IN 2015 (C)c
CHILDREN UNDER 5 YEARS OF AGE WHO WERE STARTED ON TB PREVENTIVE TREATMENT IN 2015
NUMBER (B)bCOVERAGE, %
(B÷A) NUMBER (D)COVERAGE, %
(D÷C)c
Bangladesh — — — 45 000 (41 000–49 000) 9 833 22 (20–24)
Cambodia 3475 868 25 5100 (4600–5500) 731 14 (13–16)
Cameroon — — — 11 000 (10 000–13 000) 298 2.6 (2.4–2.8)
Ethiopia 37 600 17 585 47 31 000 (28 000–34 000) — —
Indonesia 29 893 591 2.0 67 000 (61 000–73 000) — —
Kenya 258 763 85 392 33 23 000 (21 000–25 000) 1 256 5.5 (5.0–6.0)
Malawi 165 131 130 525 79 4800 (4400–5200) 1 947 41 (37–45)
Mozambique 292 083 130 420 45 17 000 (16 000–19 000) — —
Myanmar 33 415 3361 10 16 000 (14 000–17 000) 553 3.6 (3.3–3.9)
Nigeria 202 434 40 855 20 39 000 (35000–42000) 6 254 16 (15–18)
Philippines 2970 1278 43 45 000 (41 000–49 000) 6 337 14 (13–16)
Sierra Leone 14 041 1025 7.3 6300 (5700–6800) — —
South Africa 1 091 549 409 496 38 49 000 (45 000–53 000) — —
UR Tanzania — — — 19 000 (17 000–21 000) 1 314 6.9 (6.3–7.6)
Viet Nam — — — 16 000 (14 000–17 000) 1 774 11 (10–12)
Zimbabwe 125 740 38 489 31 7600 (6900–8300) 2 333 31 (28–34)
Africa 2 215 755 856 529 39 440 000 (430 000–450 000) 24 728 5.6 (5.5–5.7)
Americas 66 598 27 905 42 24 000 (23 000–25 000) 16 024 67 (63–71)
Eastern Mediterranean 4967 1992 40 150 000 (140 000–160 000) 17 203 12 (11–12)
Europe 28 130 10 037 36 16 000 (16 000–17 000) 6920 42 (40–44)
South-East Asia 65 756 5 859 8.9 510 000 (470 000–540 000) 11 498 2.3 (2.1–2.4)
Western Pacific 15 555 7 802 50 84 000 (78 000–90 000) 10 863 13 (12–14)
GLOBAL 2 396 761 910 124 38 1 220 000 (1180 000–1260 000) 87 236 7.1 (6.9–7.4)
— indicates data not available.a There were 22 other countries in the list of high TB or TB/HIV burden countries that did not report data for either risk group. These were Angola, Botswana,
Brazil, Central African Republic, Chad, China, Congo, Democratic People’s Republic of Korea, Democratic Republic of the Congo, Ghana, Guinea-Bissau, India, Lesotho, Liberia, Namibia, Pakistan, Papua New Guinea, Russian Federation, Swaziland, Thailand, Uganda and Zambia.
b In some countries due to data quality issues, the figures may not exclusively include number of people living with HIV who are newly enrolled in to HIV care.c Best estimates are followed by the uncertainty interval, and are shown to two significant figures.
:: FIG. 5.2 Provision of TB preventive treatment to people living with HIV, 2005–2015a
Num
ber o
f peo
ple
livin
g w
ith H
IV (t
hous
ands
)
2005 2007 2009 2011 2013 2015
0
200
400
600
800
1000
Global
SouthAfrica
Rest ofAfrica
Rest of world a Up to 2014, countries were requested to report data on the provision of isoniazid preventive therapy (IPT). In 2015, countries were requested to report data on the number of people treated for LTBI according to the new TB/HIV monitoring and evaluation guide published in 2015.

86 :: GLOBAL TUBERCULOSIS REPORT 2016
the WHO African Region (Fig. 5.2). In 2015, a total of 57 countries (representing 61% of the estimated global bur-den of HIV-associated TB) reported providing preventive TB treatment to people newly enrolled in HIV care, up from 49 countries in 2014. The total number of people started on preventive treatment globally was 910 124, similar to the level of 2014 and up from the very low levels in 2005 when WHO first requested data. Most of this progress has oc-curred since 2010, following definition of a four-symptom algorithm for screening for TB among people living with HIV and associated WHO guidance.1,2
As in previous years, South Africa accounted for the largest proportion (45%) of the global total in 2015 (Fig. 5.2), followed by Malawi, Mozambique and Kenya (Table 5.2). Ten countries reported data for the first time, includ-ing Kenya, and several other countries in the WHO African Region reported higher numbers in 2015 compared with 2014 (e.g. Ethiopia, Mozambique, Nigeria and Zimbabwe).
Despite this progress, much more remains to be done. Of the 30 high TB/HIV burden countries, 21 did not report any provision of preventive treatment in 2015, and in the nine that did report data, coverage among people newly enrolled in HIV care ranged from 2% in Indonesia to 79% in Malawi (Table 5.2).
1 Getahun H, Kittikraisak W, Heilig CM, Corbett EL, Ayles H, Cain KP et al. Development of a standardized screening rule for tuberculosis in people living with HIV in resource-constrained settings: individual participant data meta-analysis of observational studies. PLoS Med. 2011;8(1):e1000391 (http://www.ncbi.nlm.nih.gov/pubmed/21267059, accessed 30 August 2016).
2 World Health Organization. Guidelines for intensified tuberculosis case-finding and isoniazid preventive therapy for people living with HIV in resource-constrained settings. Geneva: WHO; 2015 (http://apps.who.int/iris/bitstream/10665/44472/1/9789241500708_eng.pdf, accessed 31 August 2016).
:: Box 5.1Enablers for establishing effective monitoring and evaluation of treatment for LTBI
In April 2016, WHO in collaboration with the Republic of Korea’s Centers for Disease Control and Prevention, and International Tuberculosis Research Center organized a global consultation on the programmatic management of LTBI. This was the first such consultation in the era of the End TB Strategy, and brought together participants from both high and low TB burden countries to discuss and identify challenges, opportunities and best practices in the programmatic management of LTBI.
Barriers to monitoring and evaluation of the provision of treatment for LTBI that were identified included the non-notifiable status of LTBI in many countries, the existence of multiple paper-based registers for recording of treatment, fragmentation due to the involvement of multiple service providers and lack of regulation of the private sector.
Examples of approaches that can facilitate effective monitoring and evaluation system were shared. These included:
! incorporating treatment of LTBI in the routine surveillance system for TB by making LTBI a notifiable condition (Japan);
! improving data management, including by using an electronic web-based register (the Netherlands) and linking data from multiple electronic databases (Norway); and
! establishing better relationships with the private sector (Republic of Korea), especially to improve the reporting of preventive treatment for people in clinical risk groups.
5.1.3 Other at-risk populations Data on provision of preventive treatment to other at-risk populations were reported by seven countries: France, Ja-pan, the Netherlands, Norway, Portugal, Republic of Korea and Slovakia (Table 5.3). Only four countries could report denominators, and then only for a subset of risk groups. All seven countries reported providing preventive treatment to adult contacts, and coverage was more than 50% in the four countries that reported denominators. Data for clinical risk groups such as patients starting anti-tumour necrosis factor (TNF) therapy and those preparing for transplanta-tion were reported by Norway, Portugal and Slovakia. The lack of routinely reported data, particularly for clinical risk groups, makes it difficult to monitor coverage levels. Better monitoring mechanisms need to be established; examples of how to do this are provided in Box 5.1.
5.2 TB infection controlTB infection control is one of the key components of the second pillar of the End TB Strategy (Chapter 2) and is also one of the collaborative TB/HIV activities that falls under pillar one. The risk of TB transmission is high in health-care and other congregate settings. This puts health-care work-ers at greater risk of TB infection and disease, and noso-comial outbreaks of multidrug-resistant TB (MDR-TB) and extensively drug-resistant TB (XDR-TB) among people liv-ing with HIV have been documented in the literature.3,4
TB infection control should be part of national infection
3 Gandhi NR, Weissman D, Moodley P, Ramathal M, Elson I, Kreiswirth BN et al. Nosocomial transmission of extensively drug-resistant tuberculosis in a rural hospital in South Africa. J Infec Dis. 2013;207(1):9–17.
4 Moro ML, Gori A, Errante I, Infuso A, Franzetti F, Sodano L et al. An outbreak of multidrug-resistant tuberculosis involving HIV-infected patients of two hospitals in Milan, Italy. AIDS. 1998;12(9):1095–1102.

GLOBAL TUBERCULOSIS REPORT 2016 :: 87
prevention and control policy, and TB and HIV programmes at national and subnational level should provide manage-rial direction to implement TB infection control measures. In health-care facilities and congregate settings, a com-prehensive set of infection control measures – compris-ing administrative, environmental and personal protection measures – should be implemented.1 Periodic assessment of TB infection control in health-care facilities is essential to ensure that appropriate measures are in place.2
In the latest revision of WHO guidance on monitoring and evaluation of collaborative TB/HIV activities,3 the risk of TB among health-care workers relative to the general adult population is an indicator recommended to measure the impact of TB infection control activities in health-care facilities. If effective TB infection control measures are in place, the relative risk of TB in health-care workers com-pared with the general adult population should be close to one.
In 2015, 9977 TB cases among health-care workers were reported from 67 countries; China accounted for 30% of these cases and South Africa for 21%. The notification rate among health-care workers could be calculated for 46 of the 67 countries; it ranged from zero in Belize, Gambia, Hai-ti, Jordan and Marshall Islands to 1565 cases per 100 000 1 World Health Organization. WHO policy on TB infection control in
health-care facilities. Geneva: WHO; 2009 (http://apps.who.int/iris/bitstream/10665/44148/1/9789241598323_eng.pdf, accessed 31 August 2016).
2 World Health Organization. Checklist for Periodic Evaluation of TB Infection Controlin Health-Care Facilities. Geneva. WHO; 2015 (http://www.who.int/tb/areas-of-work/preventive-care/checklist_for_periodic_evaluation_of_tb_infection_control_in_health_facilities.pdf, accessed 16 September 2016).
3 World Health Organization. A guide to monitoring and evaluation for collaborative TB/HIV activities: 2015 revision. Geneva: WHO; 2015 (http://www.who.int/tb/publications/monitoring-evaluation-collaborative-tb-hiv/en/, accessed 31 August 2016).
:: TABLE 5.3Provision of TB preventive therapy to other at-risk populations in 2015,for selected low TB burden countries for which data could be reporteda
NUMBER OF INDIVIDUALS AMONG AT RISK POPULATIONS ELIGIBLE AND STARTED ON TB PREVENTIVE TREATMENT
AT-RISK POPULATIONS FOR WHICH THERE IS A STRONG RECOMMENDATION TO PROVIDE PREVENTIVE TREATMENT
AT-RISK POPULATIONS FOR WHICH THERE IS A CONDITIONAL RECOMMENDATION TO PROVIDE PREVENTIVE TREATMENT
ADULT CONTACTS
OF TB CASES
PATIENTS INITIATING ANTI-TNF
TREATMENT
PATIENTS RECEIVING
DIALYSIS
PATIENTS PREPAR-ING FOR ORGAN OR HAEMATOLOGICAL TRANSPLANTATION
PATIENTSWITH
SILICOSIS
IMMIGRANTS FROM HIGH TB BURDEN COUNTRIES
HEALTH WORKERS PRISONERS
HOMELESS PEOPLE
ILLICIT DRUG USERS
France 1 224 — — — — — — — — —
Japan 4 063 — — — — 400 1785 — 20 —
Netherlands 595 — — — — 10 17 — — —
Norway 30 35 3 0 0 327 — — — —
Portugal 1 798 — 25 — 10 202 381 70 1 105
Republic of Korea 539 — — — — — 368 76 — —
Slovakia 1 400 252 354 — 31 3 — — — —
— indicates data not available.a Data for France and Norway are for 2014.
population in South Africa. The notification rate among the general adult population in each country was calculated based on the number of notified TB cases in adults and the estimated size of the adult populations from the United Na-tions (UN) population division (2015 revision). The ratios of the TB notification rate among health-care workers to the rate in the general adult population are shown in Fig. 5.3. The ratio was above 2 in 16 countries, including South Africa. In the other four high TB/HIV burden countries for which the ratio could be calculated, the ratio was between 1 and 2 in three countries (Botswana, the Russian Federation and Zimbabwe) and below 1 in one country (China).
5.3 TB vaccinationThere is a clear need for a vaccine that is more effective than BCG, especially to reduce the risk of infection with Mycobacterium tuberculosis and the risk of progression from infection to active TB disease in adults. Although there are 13 candidates in the TB vaccine pipeline, a new TB vaccine is not expected in the near future (Chapter 8).
BCG vaccination has been shown to prevent disseminat-ed disease; this category includes TB meningitis and mil-iary TB, which are associated with high mortality in infants and young children. Currently, WHO recommends that in countries with a high TB burden, a single dose of the BCG vaccine should be provided to all infants as soon as possible after birth, as part of childhood immunization programmes. In countries with low TB incidence rates, provision of BCG may be limited to neonates and infants in recognized high-risk groups, or to skin-test negative older children.
A summary of national policies on BCG vaccination4 is
4 Zwerling A, Behr MA, Verma A, Brewer TF, Menzies D, Pai M. The BCG World Atlas: a database of global BCG vaccination policies and practices. PLoS Medicine. 2011;8(3):e1001012.

88 :: GLOBAL TUBERCULOSIS REPORT 2016
:: FIG. 5.3 Notification rate ratio of TB among healthcare workers compared with the general adult population, 2015
Notification rate ratio
0–0.91–1.92–2.9≥3No dataNot applicable
:: FIG. 5.4 BCG vaccination policy by country
A. The country currently has a universal BCG vaccination programme.B. The country used to recommend BCG vaccination for everyone, but currently does not.C. The country never had universal BCG vaccination programmes.Source: Zwerling A, Behr MA, Verma A, Brewer TF, Menzies D, Pai M. The BCG World Atlas: A database of Global BCG Vaccination Policies and Practices. PLoS Med. 2011 Mar;8(3):e1001012. http://dx.doi.org/10.1371/journal.pmed.1001012. This is an open-access article distributed under the terms of the Creative Commons Attribution License, which permits unrestricted use, distribution, and reproduction in any medium.
BCG recommendation type
ABCNo dataNot applicable

GLOBAL TUBERCULOSIS REPORT 2016 :: 89
:: FIG. 5.5 Coverage of BCG vaccination, 2015a
a The target population of BCG coverage varies depending on national policy, but is typically for the number of live births in the year of reporting.
Percentage0–4950–8990–100No dataNot applicable
shown in Fig. 5.4. Among 180 countries for which data were collected, 157 recommended universal BCG vac-cination; the remaining countries had policies of selec-tive vaccination for at-risk individuals in high-risk groups.
The latest data on BCG coverage1 (for 2015) are shown in Fig. 5.5. In the 163 countries that reported data, 102 re-ported coverage of above 90%. Among the 30 high TB bur-den countries, coverage ranged from 56% in the Central African Republic to 99% in Bangladesh, Brazil, Cambodia, China, Thailand and the United Republic of Tanzania. A further 16 of these countries reported coverage of at least 90%. Coverage was below 80% in seven of the high TB burden countries: Angola, Central African Republic, Kenya, Lesotho, Liberia, Nigeria and Papua New Guinea.
1 http://apps.who.int/immunization_monitoring/globalsummary/timeseries/tscoveragebcg.html
90 :: GLOBAL TUBERCULOSIS REPORT 2016
Chapter 6 :: Universal health coverage, social protection and addressing social determinants: Implications for TB
:: KEY FACTS AND MESSAGESProgress towards universal health coverage (UHC) is essential for all of the health-related Sustainable Development Goals (SDGs), including ending the tuberculosis (TB) epidemic. UHC is also closely aligned with the goal of ending poverty.
Two regularly monitored UHC financing indicators reveal the health financing conditions that must change in many of the highest TB burden countries to enable UHC and meet the ambitious milestones on route to end TB. These are total government spending on health as a proportion of gross domestic product (GDP) and out-of-pocket (OOP) expenditures as a share of total health expenditures. In 2014, government expenditures on health were less than the WHO benchmark of at least 6% in 150 of 191 countries (79%) for which data were available. OOP expenditures represented over 45% of overall health expenditures in 46 countries in 2014, including 11 of the 30 highest TB burden countries.
There are opportunities for improving TB service coverage as part of wider efforts, and examples are highlighted in this chapter, including:
■ In some high TB burden settings, emerging UHC health financing schemes, including national health insurance, could lead to major reductions in OOP expenditures in low-income populations. Models need to explicitly include support for TB care and public health functions, and to address administrative and financing constraints that may otherwise hinder the impact of these schemes. More analysis is needed to inform their design and implementation but Thailand as well as countries in the Region of the Americas are good pathfinders.
■ In Asia, building on established approaches to private provider engagement in TB care could help to address the burgeoning private sector in health-care delivery. This includes a combination of provider incentives and regulation, and application of innovative institutional
intermediaries and communications technologies. Such levers can help to assure the quality of services provided.
■ In the context of humanitarian emergencies and post-emergency system rebuilding, such as in the Eastern Mediterranean and sub-Saharan Africa, drug-supply coordination and cross-programme use of common laboratory technology are enabling access to TB and MDR-TB care and prevention.
■ In Europe, modification of health system incentives is helping to improve patient-centred care, including by reducing costly hospitalization of patients with drug-susceptible TB and long stays for patients with MDR-TB, while expanding investments in outpatient care.
Social protection can be advanced through better models of care and social benefits. Many low- and middle-income countries have used international and community-level funds to finance social and economic support for TB and MDR-TB patients, but these support packages need to be better documented and evaluated. For overall impact and sustainability, using national social protection platforms is a priority.
The End TB Strategy includes a 2020 target to eliminate catastrophic costs for TB-affected households. WHO-recommended baseline national surveys are underway to assess the nature and severity of TB patient costs, and to improve service delivery and social protection accordingly. One country survey was conducted in 2015, eight began in 2016 and another ten are currently being planned for 2017–2018.
Ending TB and ending poverty are intertwined goals. Ministries of health, affected communities and partners can do more to use available evidence of the links in order to advocate for poverty elimination and action on related risk factors (e.g. noncommunicable disease prevention, food security, and housing).

GLOBAL TUBERCULOSIS REPORT 2016 :: 91
This chapter aims to provide a tuberculosis (TB) perspec-tive on what progress on universal health coverage (UHC) can mean for TB and for movement on other elements of the Sustainable Development Goal (SDG) agenda; for ex-ample, ending poverty, advancing social protection and re-ducing inequality.1
It covers six topics:
■ the definition and dimensions of UHC (Section 6.1); ■ monitoring progress towards UHC (Section 6.2); ■ opportunities for UHC and specifically for those af-
fected by TB that are provided by innovations in fi-nancing and systems (Section 6.3);
■ harnessing the benefits of social protection platforms (Section 6.4);
■ assessing total costs borne by TB patients and the re-lated occurrence of catastrophic total costs due to TB (Section 6.5); and
■ linking with poverty elimination efforts and action on other social determinants of TB (Section 6.6).
This chapter is in large part descriptive. It addresses some of the challenges faced as countries embark on new UHC-related policies and schemes; it also discusses the health financing, social protection and social development op-portunities that TB programmes and affected communities can build on in their efforts to end TB. Country experiences and epidemiological, policy and operational research in-form the discussion.
6.1 Definition of universal health coverageTo achieve all of the health-related SDGs, WHO promotes the need for accelerated progress towards SDG Target 3.8 i.e. UHC by 2030 (see also Box 2.2 in Chapter 2). Accord-ing to WHO and the World Bank, “UHC means all people receiving the health services they need, including health in-itiatives designed to promote better health, prevent illness, and to provide treatment, rehabilitation, and palliative care of sufficient quality to be effective, while at the same time ensuring that the use of these services does not expose the user to financial hardship”.2
UHC is a hugely ambitious aim and so far no country has fully achieved it; nevertheless, many countries have shown that dramatic gains are possible in low-, middle- and high-income settings. Furthermore, global health security depends on a commitment to UHC. As noted re-cently by Dr Margaret Chan, Director-General of WHO, “Well-functioning health systems that cover entire popula-tions are now regarded as the first line of defence against
1 United Nations. Transforming our world: The 2030 Agenda for Sustainable Development. New York: UN; 2015 (https://sustainabledevelopment.un.org/post2015/transformingourworld/publication, accessed 5 September 2016).
2 World Health Organization/World Bank. Tracking universal health coverage: first global monitoring report. Geneva: WHO; 2015 (http://www.who.int/healthinfo/universal_health_coverage/report/2015/en/, accessed 5 September 2016).
the threat from emerging and re-emerging diseases”.3
Ending the global TB epidemic and resolving the multi-drug-resistant TB (MDR-TB) crisis depend on major move-ment towards UHC before 2025. There is no rationale for discussing universal coverage for interventions against one health challenge in isolation from the movement for UHC in general.
The dimensions of UHC efforts are reflected in the “UHC cube”, which is shown in Fig. 6.1, and examples are given of how each dimension is relevant for serving those affected by TB.
■ The first dimension is expanding pooled funding to en-able coverage of more of the population (including, for example, specific groups who are especially vulnerable to poverty, ill-health or rights barriers). In TB, this can mean ensuring that the poorest communities and mar-ginalized groups (e.g. migrants, ethnic minorities) are covered by available social or national health insurance schemes and have better physical or legal access to ser-vices.
■ The second dimension is expanding the services in any essential package covered by pooled funding. For TB, this may mean covering the costs of initial consultations, X-rays, second-line drugs, treating adverse events, and management of comorbidities and TB sequelae. All these services are essential for effective TB care.
■ The third dimension is increasing the share of individual direct costs of care covered by pooled funds. Surveys of TB patient costs suggest that in many settings the fi-nancial burden is significant (on average equivalent to 50% of annual income), about half of which is incurred when using non-TB specific services in the public and/
3 Chan M. Keynote address at a high-level side event on universal health coverage in Africa at TICAD (Tokyo International Conference for African Development). (http://www.who.int/dg/speeches/2016/universal-health-africa/en/, accessed 5 September 2016).
:: FIG. 6.1 Three dimensions to consider when moving towards universal health coverage
Source: WHO. The world health report: health systems financing: the path to universal coverage. Geneva: World Health Organization, 2010.
Direct costs:proportion of the
costs covered
Population: who is covered?
Includeother
services
Extend to non-covered
Services: which services are
covered?
Current pooled funds
Reduce cost- sharing and fees

92 :: GLOBAL TUBERCULOSIS REPORT 2016
or private sector, before TB diagnosis is made and TB treatment starts.1
UHC efforts across all three dimensions could improve overall primary care service access and rapidly reduce the cost burden faced by patients.
6.2 Monitoring progress on universal health coverage
WHO and the World Bank have jointly proposed core in-dicators for monitoring progress towards UHC, addressing service access, health financing and financial protection.2
For measuring access, effective TB treatment coverage is among the proposed eight core service-access indicators that can be regularly monitored as “tracers” for overall UHC. Effective TB treatment coverage is defined as notifi-cations, divided by incidence, multiplied by the treatment success rate.3
For health financing, UHC calls for the absolute level of funding for health care to be sufficient to ensure that it is possible to provide essential health services to the whole population. In addition, the costs of using those services, once available, must not be prohibitive (i.e. using them should not result in financial hardship). The three health financing indicators proposed for annual monitoring of pro-gress towards UHC are:
■ Total government spending on health as a propor-tion of gross domestic product (GDP) – the suggested benchmark is at least 6%.4,5
■ Government health spending per capita in low-income countries – the suggested benchmark in the Millennium Development Goal (MDG) era was US$ 86 (in 2012 prices).2,4 A new benchmark for SDG-related health in-terventions for low and upper middle income countries will soon be recommended by WHO.
■ Out-of-pocket (OOP) expenditures as a proportion of total health expenditures – the suggested benchmark is at most 15%.6 The level of OOP payments provides a
1 Tanimura T, Jaramillo E, Weil D, Raviglione M, Lonnroth K. Financial burden for tuberculosis patients in low- and middle-income countries: a systematic review. Eur Respir J. 2014;43(6):1763-1775 (https://www.ncbi.nlm.nih.gov/pubmed/24525439, accessed 5 September 2016).
2 World Health Organization/World Bank Group. Monitoring progress towards universal health coverage at country and global levels: framework, measures and targets (WHO/HIS/HIA/14). Geneva: WHO; 2014 (http://apps.who.int/iris/bitstream/10665/112824/1/WHO_HIS_HIA_14.1_eng.pdf, accessed 5 September 2016).
3 See reporting in: World Health Organization/World Bank Group. Tracking universal health coverage: First global monitoring report. Geneva: WHO, 2015.
4 World Health Organization. Health systems financing: the path to universal coverage: world health report 2010. Geneva: WHO; 2010 (http://www.who.int/whr/2010/en/, accessed 5 September 2016).
5 This figure is determined by a combination of revenue generation and prioritization of health within government expenditures.
6 Xu K, Evans DB, Carrin G, Aguilar-Rivera AM, Musgrove P, Evans T. Protecting households from catastrophic health spending. Health Affairs. 2007;26(4):972–983.
proxy measure of the degree to which people lack finan-cial protection.7
Country reporting against these three indicators is avail-able in the WHO Global Health Expenditure Database.8
Two other indicators for assessing financial protection are proposed for periodic monitoring through population-based surveys:
■ The proportion of households experiencing catastroph-ic health expenditures. This occurs when household OOP expenditures crowd out consumption of other necessary goods and services. Catastrophic health ex-penditures are defined as health-care expenditures that exceed a given fraction of the household’s expenditure. The fraction used by WHO and the World Bank is cur-rently 25%.
■ The proportion of people experiencing impoverish-ing expenditures, defined as the extent to which OOP expenditures push people into poverty, given a pre-defined “poverty line”. Accepted poverty lines vary. The international poverty line used by the World Bank uses the consumption indicator of US$ 1.50 or US$ 2.00 per day per capita at purchasing power parity. WHO uses a relative poverty line, based on a subsistence level of food expenditure.
Fig. 6.2, Fig. 6.3 and Fig. 6.4 provide an indication of where the 30 high TB burden countries stand in relation to three of the core health financing indicators described above.
Fig. 6.2 shows the latest data (for 2014) on government health expenditures (GHE).9 GHE were less than 6% of GDP in most countries (150/191, 79%). In only 41 countries did GHE exceed 6% of GDP. Of these countries, only six are low or lower-middle income – Djibouti, Lesotho, Kiribati, Micronesia, Marshall Islands and Swaziland – and only one (Lesotho) is among the highest TB burden countries.
In 2014, government spending on health per capita was far below the suggested benchmark of US$ 86 per capita in all low-income countries (data not shown). Most coun-tries spent less than US$ 20 per capita. The country that was closest to this benchmark was Senegal, which spent US$ 26 per capita.
In 2014, OOP expenditures were less than 15% of to-tal health spending in 46 of the 190 countries for which data were available, including five of the 30 high TB bur-den countries: Mozambique, Namibia, Papua New Guinea, Thailand and South Africa (Fig. 6.3). There were 46 coun-tries where OOP expenditures accounted for at least 45% of total health expenditures, including 11 high TB burden countries: Bangladesh, Cambodia, Central African Repub-lic, India, Indonesia, Myanmar, Nigeria, Pakistan, Philip-pines, Russian Federation, Sierra Leone.
7 Note: OOP expenditures are defined as direct payments made to health-care providers by individuals at the time of health service use; therefore, they exclude prepayment.
8 http://apps.who.int/nha/database/Select/Indicators/en9 WHO National health accounts database, accessed July 2016 via
http://apps.who.int/nha/database
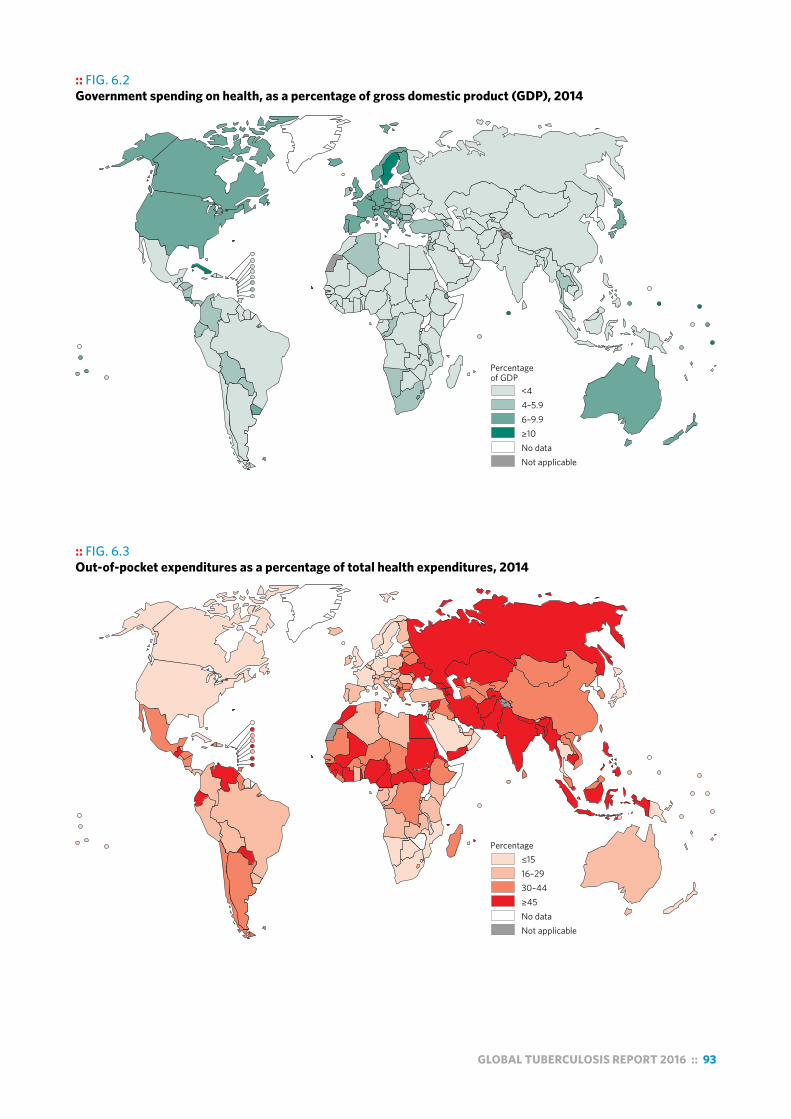
GLOBAL TUBERCULOSIS REPORT 2016 :: 93
:: FIG. 6.2 Government spending on health, as a percentage of gross domestic product (GDP), 2014
Percentage of GDP
<44–5.96–9.9≥10No dataNot applicable
:: FIG. 6.3 Out-of-pocket expenditures as a percentage of total health expenditures, 2014
Percentage≤1516–2930–44≥45No dataNot applicable
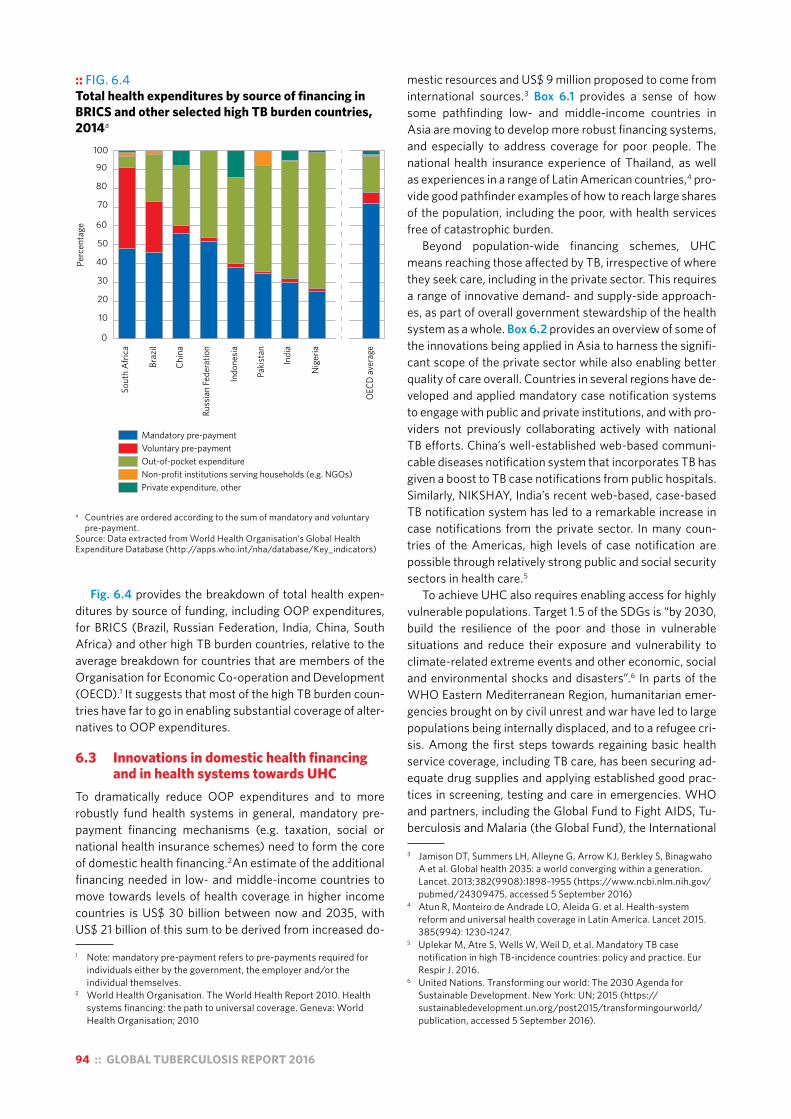
94 :: GLOBAL TUBERCULOSIS REPORT 2016
Fig. 6.4 provides the breakdown of total health expen-ditures by source of funding, including OOP expenditures, for BRICS (Brazil, Russian Federation, India, China, South Africa) and other high TB burden countries, relative to the average breakdown for countries that are members of the Organisation for Economic Co-operation and Development (OECD).1 It suggests that most of the high TB burden coun-tries have far to go in enabling substantial coverage of alter-natives to OOP expenditures.
6.3 Innovations in domestic health financing and in health systems towards UHC
To dramatically reduce OOP expenditures and to more robustly fund health systems in general, mandatory pre-payment financing mechanisms (e.g. taxation, social or national health insurance schemes) need to form the core of domestic health financing.2An estimate of the additional financing needed in low- and middle-income countries to move towards levels of health coverage in higher income countries is US$ 30 billion between now and 2035, with US$ 21 billion of this sum to be derived from increased do-
1 Note: mandatory pre-payment refers to pre-payments required for individuals either by the government, the employer and/or the individual themselves.
2 World Health Organisation. The World Health Report 2010. Health systems financing: the path to universal coverage. Geneva: World Health Organisation; 2010
:: FIG. 6.4 Total health expenditures by source of financing in BRICS and other selected high TB burden countries, 2014a
a Countries are ordered according to the sum of mandatory and voluntary pre-payment.
Source: Data extracted from World Health Organisation’s Global Health Expenditure Database (http://apps.who.int/nha/database/Key_indicators)
Perc
enta
ge
0
10
20
30
40
50
60
70
80
90
100
Sout
h Af
rica
Braz
il
Chin
a
Russ
ian
Fede
ratio
n
Indo
nesia
Paki
stan
Indi
a
Nig
eria
OEC
D av
erag
e
Mandatory pre-paymentVoluntary pre-paymentOut-of-pocket expenditureNon-profit institutions serving households (e.g. NGOs)Private expenditure, other
mestic resources and US$ 9 million proposed to come from international sources.3 Box 6.1 provides a sense of how some pathfinding low- and middle-income countries in Asia are moving to develop more robust financing systems, and especially to address coverage for poor people. The national health insurance experience of Thailand, as well as experiences in a range of Latin American countries,4 pro-vide good pathfinder examples of how to reach large shares of the population, including the poor, with health services free of catastrophic burden.
Beyond population-wide financing schemes, UHC means reaching those affected by TB, irrespective of where they seek care, including in the private sector. This requires a range of innovative demand- and supply-side approach-es, as part of overall government stewardship of the health system as a whole. Box 6.2 provides an overview of some of the innovations being applied in Asia to harness the signifi-cant scope of the private sector while also enabling better quality of care overall. Countries in several regions have de-veloped and applied mandatory case notification systems to engage with public and private institutions, and with pro-viders not previously collaborating actively with national TB efforts. China’s well-established web-based communi-cable diseases notification system that incorporates TB has given a boost to TB case notifications from public hospitals. Similarly, NIKSHAY, India’s recent web-based, case-based TB notification system has led to a remarkable increase in case notifications from the private sector. In many coun-tries of the Americas, high levels of case notification are possible through relatively strong public and social security sectors in health care.5
To achieve UHC also requires enabling access for highly vulnerable populations. Target 1.5 of the SDGs is “by 2030, build the resilience of the poor and those in vulnerable situations and reduce their exposure and vulnerability to climate-related extreme events and other economic, social and environmental shocks and disasters”.6 In parts of the WHO Eastern Mediterranean Region, humanitarian emer-gencies brought on by civil unrest and war have led to large populations being internally displaced, and to a refugee cri-sis. Among the first steps towards regaining basic health service coverage, including TB care, has been securing ad-equate drug supplies and applying established good prac-tices in screening, testing and care in emergencies. WHO and partners, including the Global Fund to Fight AIDS, Tu-berculosis and Malaria (the Global Fund), the International
3 Jamison DT, Summers LH, Alleyne G, Arrow KJ, Berkley S, Binagwaho A et al. Global health 2035: a world converging within a generation. Lancet. 2013;382(9908):1898–1955 (https://www.ncbi.nlm.nih.gov/pubmed/24309475, accessed 5 September 2016)
4 Atun R, Monteiro de Andrade LO, Aleida G. et al. Health-system reform and universal health coverage in Latin America. Lancet 2015. 385(994): 1230-1247.
5 Uplekar M, Atre S, Wells W, Weil D, et al. Mandatory TB case notification in high TB-incidence countries: policy and practice. Eur Respir J. 2016.
6 United Nations. Transforming our world: The 2030 Agenda for Sustainable Development. New York: UN; 2015 (https://sustainabledevelopment.un.org/post2015/transformingourworld/publication, accessed 5 September 2016).

GLOBAL TUBERCULOSIS REPORT 2016 :: 95
:: Box 6.1Implications for TB of evolving health financing schemes in selected Asian high TB burden countries
Innovative health financing schemes towards UHC, be they national health insurance (NHI) or other models, can potentially have profound and positive benefits for extending access to high quality health care to all those in need, including those affected by TB. This box provides some examples of the schemes and the main issues in assuring financing and coverage for TB and other services in selected high TB burden countries in Asia.
Indonesia is making strides towards UHC under its NHI programme or Jaminan Kesehatan Nasional (JKN), which was launched in 2014. The system is financed by premiums paid by employers, the employee and, for those with a low income, the national government. Beneficiaries can access a package of health services through public and selected private health-care providers, who are paid by capitation for primary health-care services and by reimbursement based on disease classification for hospital care. TB services covered include diagnosis and treatment services for drug-susceptible TB. In addition to the insurance scheme, there is also substantial budget-line support, including first-line TB drugs financed by the central government, and second-line drugs financed primarily by the Global Fund. High demand and costs, particularly in higher- level facilities, are challenging sustainability. Therefore, the government is in the process of reviewing the benefits package, including through cost–effectiveness analysis. The NTP is working with JKN, via Indonesia’s Centre for Health Financing and Health Security, to create TB service provision guidelines and monitoring tools for JKN. The government has announced its intention to shift financing of TB care and prevention to the NHI scheme, which is likely to lead to changes in access to TB medications and services. The mechanisms for financing public health functions are also in flux. A significant proportion of TB patients in Indonesia are treated in the private sector, and JKN may enable further leverage in promoting notification and quality care. By increasing investment in primary care, JKN may help to defray pre-TB diagnostic costs for patients.a
The Philippines is committed to achieving UHC via investment in PhilHealth, the country’s NHI programme. The scheme is financed by government revenue and per capita premium payments, for which the government subsidizes the contribution for those identified by local governments as indigent. Local government units have a supplementary mechanism, whereby the units aggregate additional funds to finance local service delivery operations. TB services (hospitalization, first-line drugs, and consultations) are provided free of charge by PhilHealth to patients served by accredited providers. The programme is particularly important in encouraging private practitioners and institutions to provide standardized TB care. A series of operational challenges persist with PhilHealth. For example:
! not all patients are educated about the PhilHealth benefits or the locations of PhilHealth-accredited facilities;
! not all providers are in the PhilHealth system due to the complex accreditation system;
! reimbursement processes can impede interest of providers to pursue the accreditation process; and
! currently, MDR-TB is not included in the benefits package but an expansion of the programme is being formulated.
Under the updated National Strategic Plan for the NTP, measures are proposed to resolve several of these bottlenecks.b
Viet Nam is expanding its social health insurance (SHI) system with the aim of achieving universal coverage by 2020. The scheme is financed by a combination of national revenue and employer–employee contributions. The government tax revenue subsidizes the premium for the poor and for ethnic minorities, with partial subsidies for the near-poor and students. Since May 2016, under the SHI, latent TB infection, TB diagnosis and treatment services are covered by the government, although users contribute a co-payment that ranges from 0% to 20%. The NTP has plans to establish a foundation that can cover co-payment of TB patients and the premium for TB patients who do not yet have a health insurance card. One area of concern is drug supply, which will shift under SHI financing. Currently, first-line TB drugs have been financed and distributed by the central government, and second-line TB drugs by the Global Fund. The NTP is now working with counterparts within the Ministry of Health and the SHI agency to ensure that financing is secure from central SHI resources, to maintain a full supply of quality-assured drugs to TB patients.c
Thailand has a robust and progressive NHI scheme in place. There are three schemes for Thai nationals: the Universal Coverage Scheme (UCS), the Social Security Scheme and the Civil Servants Medical Benefit Scheme. These schemes cover 99% of the Thai population. In 2013, the Ministry of Public Health initiated a scheme for migrants not covered under the social security scheme and, by the end of 2015, nearly 1.45 million migrants could purchase subsidized health insurance. The UCS currently covers about 75% of the Thai population. It is entirely tax-revenue financed, and is administered by the National Health Security Office (NHSO), an independent government agency that purchases and reimburses services. The Ministry of Public Health provides the quality standards, public health functions and consolidation of case reporting. Financing for TB services is channelled through the TB Fund within the NHSO. UCS provides free first-line and second-line TB and MDR-TB treatment, molecular diagnostics for certain groups and resistance monitoring. Overall, coverage for TB services appears to be high, with additional UHC efforts under way to cover previously uncovered populations, such as migrants – an important risk group for TB. The NHSO and NTP are in the process of addressing gaps and discrepancies in TB information flow by harmonizing systems. Improved information will enable further review of the quality of TB care provided.d
Continued

96 :: GLOBAL TUBERCULOSIS REPORT 2016
China has NHI schemes that are estimated to reach 95% of the population. The Basic Medical Insurance scheme is co-financed by government revenue and per capita premium payments. Under recent health-care reforms, China is moving towards a mixed source funding mechanism, whereby funds from multiple levels of government, individual beneficiaries and social assistance programmes will be pooled to improve financial sustainability. At the same time, reforms have altered the delivery model for TB care. Patients will no longer access care from TB dispensaries, and state-owned hospitals will be the primary TB service providers. Basic TB care in these hospitals is technically free, but a complicated reimbursement mechanism combined with benefit package limitations may result in high costs for drug-sensitive TB services.e
Enabling or expanding financing for MDR-TB treatment is among the ongoing challenges under all of the evolving schemes above.f
a Sources: Harimurti, Pandu; Pambudi, Eko; Pigazzini, Anna; Tandon, Ajay. 2013. The nuts and bolts of Jamkesmas – Indonesia’s government-financed health coverage program for the poor and near-poor. Universal Health Coverage (UNICO) studies series; no 8. Washington D.C.: The Worldbank. http://documents.worldbank.org/curated/en/430821468044119982/The-nuts-and-bolts-of-Jamkesmas-Indonesias-government-financed-health-coverage-program-for-the-poor-and-near-poor. Mukti, A. G., D. Mustikawati, D. Collins, F. Hafi, B. Setyaningsih, and H. Utami. Policy Options and Levers for Financing TB Services in Indonesia. USAID TB CARE I, 2013.
b Sources: Chakraborty, Sarbani. 2013. Philippines government sponsored health coverage program for poor households. Universal Health Coverage (UNICO) studies series; no. 22. Washington, DC: World Bank. http://documents.worldbank.org/curated/en/812011468092964098/Philippines-government-sponsored-health-coverage-program-for-poor-households.Holohan, M., F. Luelmo, R. Morfe, T. Ryan, and M. Voniatis. USAID/Philippines: External Evaluation of the Tuberculosis Portfolio (2006-2011). Report No. 12-01-041. USAID, 2012.Smith-Arthur A, Kak N, Matji R (2013) Synthesis report: inclusion of TB in national insurance programs. http://tbcare2.org/sites/tbcare2.org/files/Synthesis%20Report%20on%20Country%20%20Assessments%20on%20TB%20Insurance%20Study%20TB%20CARE%20II%20Final.pdf
c Sources: Kashi Barbara Carasso, Grace Chee, Altea Cico, Duong Hoang Quyen, Phan Cam Tu, Alexei Sitruk. August 2014. Options for Integrating Procurement and Supply Chain Systems for ARVs, Methadone, and anti-Tuberculosis Drugs in Vietnam. Bethesda, MD: Health Finance & Governance Project, Abt Associates Inc.
d Sources: Guinto RLLR Curran UZ, Suphanchaimat, R, Pocock, NS. (2015). Universal health coverage in “One ASEAN”: are migrants included? Global Health Action, 8, 10.3402/gha.v8.25749. http://doi.org/10.3402/gha.v8.25749. Hanvoravongchai, Piya. 2013. Thailand – Health financing reform in Thailand : toward universal coverage under fiscal constraints. UNICO study series ; no. 20. Washington, DC: World Bank. http://documents.worldbank.org/curated/en/476621468132279566/Thailand-Health-financing-reform-in-Thailand-toward-universal-coverage-under-fiscal-constraints.
e Sources: Yu H. “Universal Health Insurance Coverage for 1.3 Billion People: What Accounts for China’s Success?” Health Policy 119.9 (2015): 1145-152. Korolev, Alexander, China’s Healthcare: Developing a Universal Coverage Plan (January 27, 2013). Far Eastern Affairs. No. 1, 2012, pp. 45-76. Ministry of Health (2011) National Tuberculosis Control Programme (2011–2015). and Wei X, Yin J, Zou G et al. “Patient Care Pathways under the Model of Integrating Tuberculosis Service with General Hospitals in China.” Trop Med Int Health Tropical Medicine & International Health 18.11 (2013): 1392-399. Pan Y, Chen S, Chen M, et al. Disparity in reimbursement for tuberculosis care among different health insurance schemes: evidence from three counties in Central China. Infectious Diseases of Poverty Infect Dis Poverty 5.1 (2016): 1-9.
f See also: TB CARE II (2015) Exploring the promise of improving access and delivery of TB services through insurance-based financing reforms: Meeting report. http://tbcare2.org/sites/default/files/Bangkok%20Meeting%20Report%20415.pdf
Organization of Migration, the United Nations High Commission for Refugees and other organizations are supporting TB efforts in countries facing these emer-gencies, and collaborating with countries receiving migrants and refugees. New technical assistance, evi-dence generation, guidance and coordination mecha-nisms are emerging.1,2,3
Recently, the Ebola epidemic took an enormous toll in three countries in West Africa – Guinea, Liberia and Sierra Leone – all of which were still recovering from conflicts. The economic, social and health repercus-sions were severe. The TB response was affected, along with many public health priorities. Now, all three countries are using the opportunities that have come with broader investment in post-Ebola health systems and a focus on public health functions. Box 6.3 provides some examples related to extending TB diagnostic capacity.
In middle-income countries, UHC progress and better disease control often depend on reforming well-established health system institutions, manage-ment and financing mechanisms. Box 6.4 offers an example of the ramifications of health financing ap-proaches, specifically in Central and Eastern Europe, for patient care and cost burdens overall. It also high-lights efforts underway through research, policy dia-logue and collaboration to overcome the bottlenecks.
6.4 Harnessing the benefits available with social protection platforms
As has been well documented, and advocated for in the SDGs and the End TB Strategy, social protection can contribute to ending poverty and ending disease epidemics, including those of TB and HIV. Action for UHC is in itself a major lever for social protection. Ecological analysis suggests that there is an inverse association between government investment in so-cial protection and national TB incidence in countries worldwide.4
There are varying institutional definitions of social protection, but the broad concepts are clear. Social protection represents a system of policies and pro-grammes that seek to reduce poverty and support 1 The Global Fund to Fight AIDS, TB and Malaria. The challenging
operating environments policy, GF/B35/03. The Global Fund; 2016.
2 World Health Organization. Tuberculosis control in complex emergencies. WHO Regional Office for the Eastern Mediterranean; 2015 (http://applications.emro.who.int/dsaf/EMROPUB_2015_EN_1913.pdf, accessed 5 September 2016).
3 World Health Organization. Interregional workshop for tuberculosis control and care among refugees and migrant populations (2016). 10–11 May 2016. Catania, Italy. 2016(http://www.euro.who.int/en/health-topics/communicable-diseases/tuberculosis/publications/2016/interregional-workshop-for-tuberculosis-control-and-care-among-refugees-and-migrant-populations-2016, accessed 5 September 2016.
4 Siroka A, Ponce NA, Lonnroth K. Association between spending on social protection and tuberculosis burden: a global analysis. Lancet Infect Dis. 2016;16(4):473–479.
Box 6.1 continued
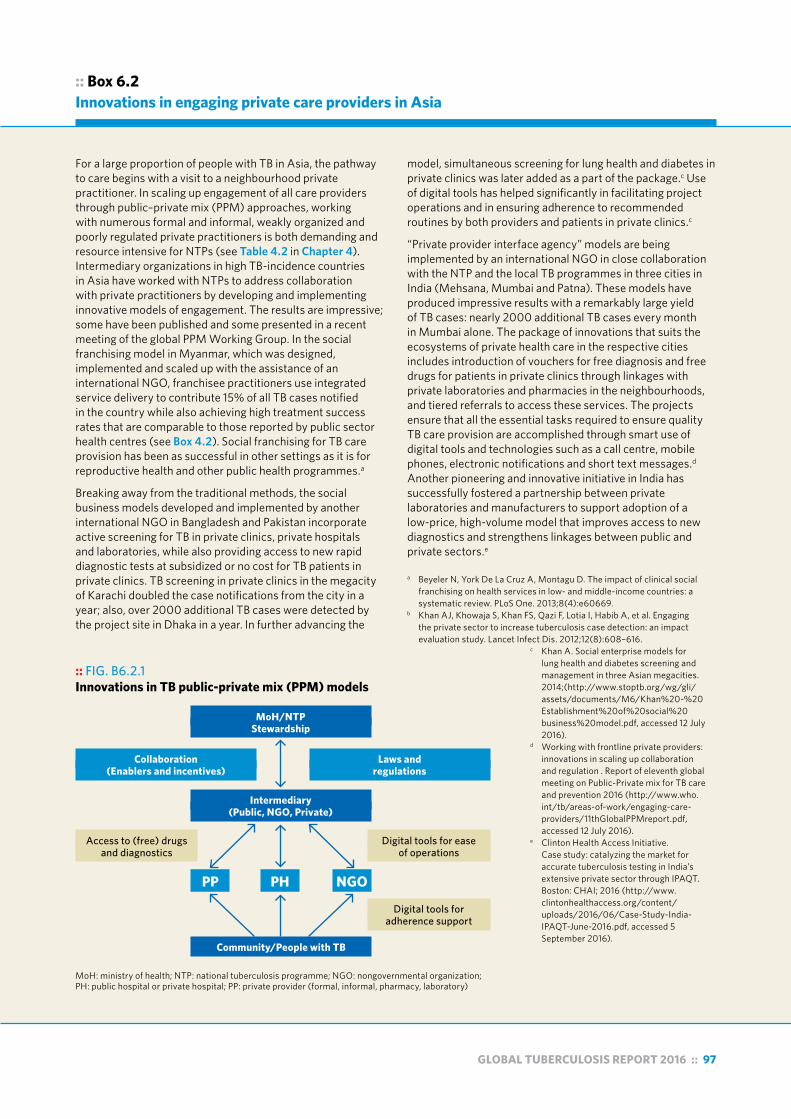
GLOBAL TUBERCULOSIS REPORT 2016 :: 97
:: Box 6.2Innovations in engaging private care providers in Asia
For a large proportion of people with TB in Asia, the pathway to care begins with a visit to a neighbourhood private practitioner. In scaling up engagement of all care providers through public–private mix (PPM) approaches, working with numerous formal and informal, weakly organized and poorly regulated private practitioners is both demanding and resource intensive for NTPs (see Table 4.2 in Chapter 4). Intermediary organizations in high TB-incidence countries in Asia have worked with NTPs to address collaboration with private practitioners by developing and implementing innovative models of engagement. The results are impressive; some have been published and some presented in a recent meeting of the global PPM Working Group. In the social franchising model in Myanmar, which was designed, implemented and scaled up with the assistance of an international NGO, franchisee practitioners use integrated service delivery to contribute 15% of all TB cases notified in the country while also achieving high treatment success rates that are comparable to those reported by public sector health centres (see Box 4.2). Social franchising for TB care provision has been as successful in other settings as it is for reproductive health and other public health programmes.a
Breaking away from the traditional methods, the social business models developed and implemented by another international NGO in Bangladesh and Pakistan incorporate active screening for TB in private clinics, private hospitals and laboratories, while also providing access to new rapid diagnostic tests at subsidized or no cost for TB patients in private clinics. TB screening in private clinics in the megacity of Karachi doubled the case notifications from the city in a year; also, over 2000 additional TB cases were detected by the project site in Dhaka in a year. In further advancing the
model, simultaneous screening for lung health and diabetes in private clinics was later added as a part of the package.c Use of digital tools has helped significantly in facilitating project operations and in ensuring adherence to recommended routines by both providers and patients in private clinics.c
“Private provider interface agency” models are being implemented by an international NGO in close collaboration with the NTP and the local TB programmes in three cities in India (Mehsana, Mumbai and Patna). These models have produced impressive results with a remarkably large yield of TB cases: nearly 2000 additional TB cases every month in Mumbai alone. The package of innovations that suits the ecosystems of private health care in the respective cities includes introduction of vouchers for free diagnosis and free drugs for patients in private clinics through linkages with private laboratories and pharmacies in the neighbourhoods, and tiered referrals to access these services. The projects ensure that all the essential tasks required to ensure quality TB care provision are accomplished through smart use of digital tools and technologies such as a call centre, mobile phones, electronic notifications and short text messages.d Another pioneering and innovative initiative in India has successfully fostered a partnership between private laboratories and manufacturers to support adoption of a low-price, high-volume model that improves access to new diagnostics and strengthens linkages between public and private sectors.e
a Beyeler N, York De La Cruz A, Montagu D. The impact of clinical social franchising on health services in low- and middle-income countries: a systematic review. PLoS One. 2013;8(4):e60669.
b Khan AJ, Khowaja S, Khan FS, Qazi F, Lotia I, Habib A, et al. Engaging the private sector to increase tuberculosis case detection: an impact evaluation study. Lancet Infect Dis. 2012;12(8):608–616.
c Khan A. Social enterprise models for lung health and diabetes screening and management in three Asian megacities. 2014;(http://www.stoptb.org/wg/gli/assets/documents/M6/Khan%20-%20Establishment%20of%20social%20business%20model.pdf, accessed 12 July 2016).
d Working with frontline private providers: innovations in scaling up collaboration and regulation . Report of eleventh global meeting on Public-Private mix for TB care and prevention 2016 (http://www.who.int/tb/areas-of-work/engaging-care-providers/11thGlobalPPMreport.pdf, accessed 12 July 2016).
e Clinton Health Access Initiative. Case study: catalyzing the market for accurate tuberculosis testing in India’s extensive private sector through IPAQT. Boston: CHAI; 2016 (http://www.clintonhealthaccess.org/content/uploads/2016/06/Case-Study-India-IPAQT-June-2016.pdf, accessed 5 September 2016).
:: FIG. B6.2.1 Innovations in TB public-private mix (PPM) models
MoH: ministry of health; NTP: national tuberculosis programme; NGO: nongovernmental organization; PH: public hospital or private hospital; PP: private provider (formal, informal, pharmacy, laboratory)
Community/People with TB
MoH/NTPStewardship
Intermediary(Public, NGO, Private)
Collaboration(Enablers and incentives)
Laws andregulations
Access to (free) drugs and diagnostics
Digital tools for ease of operations
Digital tools for adherence support
PP PH NGO

98 :: GLOBAL TUBERCULOSIS REPORT 2016
:: Box 6.3After Ebola: enhancing the capacity for TB and MDR-TB diagnosis
In 2015, some 29 809 TB cases were reported in the three post-Ebola West African countries: Guinea, Liberia and Sierra Leone. WHO estimates that Liberia and Sierra Leone are among the 10 countries with the highest TB rates per capita worldwide. Reported cases for the three countries represent only 42–60% of the estimated incident TB cases,a and population-based surveys are needed to improve estimates. With financing from the United States Agency for International Development (USAID) and from the Global Fund, WHO is supporting the strengthening of TB capacity accompanying other efforts to strengthen health systems.
During the Ebola outbreak, Guinea, Liberia and Sierra Leone all received support from partner agencies to introduce GeneXpert instruments for Ebola screening. As these countries transition from the outbreak response to routine disease surveillance, an opportunity has arisen for the integration of these instruments into the general laboratory network, including for testing for TB, rifampicin-resistant TB and HIV viral load. A review of the current placement of the machines will inform the best deployment to serve the multiple needs of the populations covered. The assessment is taking into consideration epidemiology, availability of other companion diagnostic tools, laboratory personnel and power supply. In all three countries, WHO is supporting the data managers of the TB programmes to map TB cases notified by prefecture or district, and to calculate needs for the rapid molecular diagnostic tool based on recommended diagnostic algorithms. The Foundation for Innovative New Diagnostics (FIND), a non-profit public–private partnership that helps to enable evidence generation and roll-out of new diagnostic tools, is providing training using the Global Laboratory Initiative-endorsed Xpert MTB/RIF training package.
Other health systems platforms that emerged in response to the Ebola outbreak can also improve timely TB diagnosis. For example, in 2015, the Ministry of Health and Social Welfare of Liberia invited Riders for Health (RfH), an NGO, to manage their fleet of 250 new vehicles and 200 new motorcycles donated during the Ebola outbreak. RfH offers transportation of medical samples to the nearest laboratory for testing. Planning is underway, with NTP and Global Fund financing, to enable transfer of sputum samples from anywhere in the country to Xpert MTB/RIF sites and the central TB laboratory.
a 42% estimated case detection coverage in Liberia, 55% in Guinea and 60% in Sierra Leone.
economic growth. Social protection can build resilience to risks and shocks, advance equity in assets and access to services, and improve economic and social opportunities.1 The International Labour Organization coordinates efforts to promote social protection “floors”; that is, “nationally de-fined sets of basic social security guarantees that should ensure, at a minimum that, over the life cycle, all in need have access to essential health care and to basic income security which together secure effective access to goods and services defined as necessary at the national level”.2 The SDGs include a social protection target (Target 1.3), which is to “implement nationally appropriate social pro-tection systems and measures for all, including floors, and by 2030 achieve substantial coverage of the poor and the vulnerable”.3
In TB care, patient economic support today may include (for at least some patients) cash transfers, food packag-es or nutritional support, toiletries or transport vouchers. Also, in fewer cases, it may include access to social ben-efits, sickness insurance or disability grants, and explicit protections of rights to work, housing and health-care ac-cess.
Both economic and nutritional support can be important for TB patients. Economic support is often critical as TB dis-ease is strongly related to poverty, and seeking and staying in TB care can be impoverishing. Nutritional care is needed to improve nutritional recovery for those TB patients who are undernourished before and/or during TB treatment.4
Few TB patient support packages are well documented and evaluated. Improved design, management and evalu-ation may help, but stand-alone TB-specific approaches may be hard to sustain. For greater coverage and impact, making more use of developed or nascent national social protection platforms is a priority.5 Review of documentation on cash transfer programmes by the WHO Global TB Pro-gramme suggests that at least 13 of the highest TB burden countries have experience with large-scale cash transfer schemes beyond TB,6 although many such schemes still have financial and administrative constraints. Table 6.1 il-lustrates the TB-specific and broader approaches available in some high TB burden countries.
With documentation from partners, WHO included pointers on effective social protection in Implementing the
1 World Bank. Managing risk, promoting growth: Developing systems for social protection in Africa. The World Bank’s Africa Social Protection Strategy, 2012-2012. Washington: World Bank, June 2012.
2 International Labour Organization. World social protection report 2014/15: building economic recovery, inclusive development and social justice. Geneva: ILO; 2014 (http://www.ilo.org/global/research/global-reports/world-social-security-report/2014/WCMS_245201/lang--en/index.htm, accessed 6 September 2016).
3 United Nations. Transforming our world: The 2030 Agenda for Sustainable Development. New York: UN; 2015. (https://sustainabledevelopment.un.org/post2015/transformingourworld/publication, accessed 5 September 2016).
4 World Health Organization. Nutritional care and support for people with tuberculosis. Geneva: WHO, 2013.
5 World Health Organization. Implementing the end TB strategy: the essentials. Geneva: WHO, 2015.
6 Brazil, China, Ethiopia, India, Indonesia, Kenya, Mozambique, Namibia, Nigeria, Pakistan, South Africa, Tanzania and Thailand.

GLOBAL TUBERCULOSIS REPORT 2016 :: 99
:: Box 6.4Reforming systems to expand people-centred outpatient care in high MDR-TB burden countries in Europe
MDR-TB poses a particular challenge in WHO’s European Region, which has nine of the world’s 30 high MDR-TB burden countries. For both patient-centered care and cost-effectiveness, TB care is best delivered in the community. Nevertheless, many of these high MDR-TB-burden countries still provide substantial inpatient care for patients with drug-susceptible and drug-resistant TB (see Fig. B6.4.1 and Fig. B6.4.2). Some historical systems of institutional staffing, payment and reimbursement created perverse incentives in many settings to hospitalize patients unnecessarily, or for much longer periods than required. These incentives often persist. Also, for lack of resources (and insufficient capacity), outpatient and primary care services have been ill-prepared to provide adequate TB and MDR-TB treatment and care. Major challenges to enable greater outpatient care include developing appropriate, country-specific TB care delivery models; creating sustainable financing mechanisms for TB care; ensuring adequate human resources; and providing social protection for TB patients. With technical support, many of these countries are increasing their efforts to
reduce hospitalization rates by improving patient-centred outpatient services, decreasing the number of TB beds and the unnecessarily long duration of hospital stays, reallocating TB budgets accordingly, and reassigning staff in hospitals to overall pulmonary and primary health care.
In a concerted effort to support countries to face their MDR-TB challenge and the necessary reform of systems, the Center for Health Policies and Studies (PAS) and the WHO Regional Office for Europe (EURO) conceived the Tuberculosis Regional Eastern European and Central Asian Project (TB-REP),a which is funded by the Global Fund. The aim of TB-REP is to use a systems-based approach to improve TB treatment outcomes and accelerate progress in ending the epidemic by removing health system barriers and scaling up health system reforms. The project complements country TB-specific and broader health reform efforts supported by
:: FIG. B6.4.1 Hospitalization of drug-susceptible cases in the WHO European region, 2015a
a Countries for which data are available.
30
30
49
5050
63
6565
6767
78
7880
80
80
8085
8590
9095
95
95
9898
Percentage hospitalized0 20 40 60 80 100
Portugal
Georgia
Ireland
SwedenTurkey
Tajikistan
Estonia
Russian Federation
The Former Yugoslav Republic of Macedonia
Republic of Moldova
Kyrgyzstan
UzbekistanFinland
Switzerland
Albania
Serbia
Romania
Kazakhstan
Slovakia
ArmeniaNorway
Slovenia
Czech Republic
Bosnia and Herzegovina
Montenegro
a Countries for which data are available.
28
30
45
50
60
70
70
82
85
90
90
120
144
150
180
180
180
200
210
240
240
240
Norway
Finland
Turkey
Switzerland
Estonia
Portugal
Sweden
Kyrgyzstan
Kazakhstan
Netherlands
Romania
Georgia
Republic of Moldova
The Former Yugoslav Republic of Macedonia
Bosnia and Herzegovina
Montenegro
Tajikistan
Slovakia
Russian Federation
Serbia
Czech Republic
Armenia
0 50 100 150 200 250Average length of hospitalization
(days)
:: FIG. B6.4.2Hospitalization of M/XDR-TB cases in the WHO European region, 2015a
Continued
a http://www.pas.md/en/TBRep

100 :: GLOBAL TUBERCULOSIS REPORT 2016
Box 6.4 continued
USAID, the World Bank and the German government-owned development bank, KfW, among others. It enables intercountry activities involving 11 eastern European and central Asian countriesb for the coming four years. Among the aims are minimizing TB patient hospitalization rates and average lengths of hospital stay by shifting resources towards more people-centred care, including outpatient services, and supporting other cost-effective solutions to local challenges.
The countries involved in TB-REP will be supported by PAS, as principal recipient for the project, WHO/EURO and other partners, including the TB Europe Coalition, the European Respiratory Society, the London School of Economics and Political Science, the London School of Hygiene and Tropical Medicine, and the Stop TB Partnership. Work will include analytic reviews, documentation and adaptation of good practices, operational research, development of human resources for health, capacity-building, advocacy and civil society engagement.
b The 11 countries addressed in TB-REP are Armenia, Azerbaijan, Belarus, Georgia, Kazakhstan, Kyrgyzstan, the Republic of Moldova, Tajikistan, Turkmenistan, Ukraine and Uzbekistan.
End TB Strategy: the essentials.1 These pointers include as-sessing needs; building collaboration with social protec-tion counterparts; determining clear terms of eligibility; making informed decision on interventions and level of support; enabling sustainable funding; and improving man-agement, monitoring, evaluation and research. There is some consensus that MDR-TB patients and low-income or undernourished patients with drug-susceptible TB should probably have higher priority than other TB patients for so-cial protection resources. WHO guidance on the role of nu-tritional care and support for TB patients suggests there is a need to more effectively differentiate nutritional need and economic needs in deciding on support.2 Updated WHO TB treatment guidelines now in development include a re-view of the evidence to determine which patient support interventions have a documented impact on treatment out-comes. Their impact on the cost burden faced by patients will not be covered in this guidance.
In conclusion, social support for TB patients must be-come more efficient and sustainable. National TB pro-grammes (NTPs), working with health and social sector partners and nongovernmental organizations (NGOs), can enable patient support to move from a project-based
1 World Health Organization. Implementing the End TB Strategy: the essentials. Geneva: WHO, 2015 (http://www.who.int/tb/publications/2015/end_tb_essential.pdf?ua=1, accessed 6 September 2016).
2 World Health Organization. Guideline: nutritional care and support for patients with tuberculosis. Geneva: WHO; 2014 (http://apps.who.int/iris/bitstream/10665/94836/1/9789241506410_eng.pdf, accessed 5 September 2016).
approach to a programmatic one, integrated with larger platforms. Good practices depend on context, but oppor-tunities exist in many high TB burden countries to extend the reach, depth and impact of social protection for those in need and for TB prevention overall.
6.5 Assessing the total costs borne by TB patients and determining the occurrence of catastrophic total costs due to TB
To inform policy and practices for improved social protec-tion of TB patients and affected households, and to reach the 2020 target of eliminating catastrophic costs for TB TB-affected households,3 WHO is supporting countries to design, implement and analyse TB patient cost surveys.
In 2015, the WHO Global TB Programme worked with a task force of experts to develop a field-testing version of a standardized methodology for this work, and produced a questionnaire and protocol for country adaptation.
The nationally representative patient surveys have both primary and secondary objectives. The primary objectives are:
■ To document costs and identify the main cost drivers to inform policy.
■ To monitor progress towards the End TB Strategy target that no (zero per cent) of TB-affected households face catastrophic total costs due to TB.
The secondary objectives are:
■ To enable subgroup analyses (e.g. for drug-susceptible TB and MDR-TB separately, and analyses by socioeco-nomic status, sex, and location such as urban or rural).
■ To determine the association between costs and treat-ment outcome (using routine cohort data).
A key indicator that can be derived from a survey is the pro-portion of patients with catastrophic total costs due to TB. This is defined for operational purposes as the number of TB patients (and their households) who experience cata-strophic total costs divided by the number of all TB patients treated in the NTP network.
Catastrophic total costs is defined as total costs (indirect and direct combined) incurred during illness and treatment that exceed a given threshold (e.g. 20%) of the household’s annual income. The numerator is the total direct and indi-rect costs incurred from the onset of symptoms to the end of TB treatment for the household, and the denominator is annual household income.
This TB-specific indicator of catastrophic total costs is distinct from the indicator that WHO uses to measure financial protection. WHO uses the share of the popula-tion incurring “catastrophic expenditures”, which, as noted above, refers to OOP expenditures for health care (for all
3 Lonnroth K, Glaziou P, Weil D, Floyd K, Uplekar M, Raviglione M. Beyond UHC: monitoring health and social protection coverage in the context of tuberculosis care and prevention. PLoS Med. 2014;11(9):e1001693 (https://www.ncbi.nlm.nih.gov/pubmed/25243782, accessed 5 September 2016).

GLOBAL TUBERCULOSIS REPORT 2016 :: 101
:: TABLE 6.1 TB patient social support in selected high TB or MDR-TB burden countries, and potential linkages with broader social protection platforms
COUNTRY INTERVENTIONS CHALLENGES MEASURES TAKEN TO IMPROVE EFFECTIVENESS SOCIAL PROTECTION PLATFORMS
Belarus In-kind food, transport and cash support to MDR-TB patients
Large MDR-TB patient population, many of whom have other social service needs (e.g. related to alcohol and drug use)
• Increased domestic budget for social support enables donor support transition
• Linkage with NHI• Direct bank cash transfers and in-kind support• Transportation support for prisoner release
liaison
Large scale: • NHI, sick leave and disability
coverage, social services
Brazil Food parcels and some discrete cash and transport support; targeted efforts for vulnerable groups
Resource constraints inhibit expansion; slow process to link formally with cash-transfer system
• NTP has prioritized the challenge• Documented link of improved TB treatment
outcomes with cash transfers• Further research is under way• Institutional and parliamentary discussions
on linking TB patients with cash-transfer programme
Large scale:• Bolsa Familia – cash transfer
programme for women and children
• Linkages with health services and education
India Range of interventions from food and vouchers, small facility payments to patients, social welfare payment access, prepayment cards, etc.
Limited patient coverage, wide variability across states and localities on TB specific support packages, and weaknesses in administration; NGOs play a role but not formally linked
• Stated concern of government • Operational research studies documenting
inputs and results • Sharing of state-specific experiences in TB
patient cash transfers, nutrition and social service linkages
• NGO engagement to help patients access benefits
• Efforts to link online TB register to the national unique identifier system used for other major social programmes
Large scale:• Food support, including:
— Antyodaya Anna Yojana— Food Security Act
• Financial support: state-level and national-level initiatives
• Disability and livelihood schemes
Kenya Food packages, targeting undernourished MDR-TB patients; food support and some cash transfers; transport
Financing limits extension and level of patient support
• NTP priority• Assessment of nutritional status of patient
cohorts, nutritional needs and district TB performance review
• Linkage to national nutrition programme and external donors for more coverage of MDR-TB patients
• Active link with national insurance subsidy programme
• Vision 2030 – national development agenda
• National social development policy and health sector services fund
• National insurance subsidy programme
• National nutrition programme
Myanmar Food packages and/or cash transfers for TB/MDR-TB patients from major project financing; additional NGO and community contributions
Different sources funding different levels of food support, even within single health facilities; financing limits coverage
• Supportive donor community• NTP-led effort for standardization of food
package levels and cash transfers for MDR-TB patients
• Social protection included in new National TB Strategic Plan
• National social protection strategy and programme under development
• UHC-oriented health policies including essential package of free services and service extension
Philippines Food and transport support, especially for MDR-TB patients, and piloting of conditional cash transfer
Financing limits coverage and administrative bottlenecks, with variability in practice
• Patient support advocated for in new legislation
• Donor support for related operational research
• Active system for inclusion of patients with PhiHealth, and outreach to conditional cash-transfer programme
Large scale:• Bridging Program for the
Filipino Family conditional cash transfer (4Ps)
• Listahanan – register of families living in poverty
• PhilHealth – NHI programme
South Africa
Food packages, or vouchers, and transport support for MDR-TB patients, other NGO and local area provided benefits; some disability grant and other grant recipients
Widely variable support elements for TB or MDR-TB patients in different states and facilities;variable application of disability grant access for hospitalized and needy ambulatory patients
• New collaboration across health, social development and benefits administration agency
• Research and patient costing efforts• Enhancement of information on disability
grants and other grants; strong opportunities for engagement with community organizations, and to expand TB linkages to range of social development
• Additional domestic TB financing mobilized
Large scale:• Child Support grant• Care Dependency grant• Disability grant• Social Relief of Distress grant• Workmen’s Compensation
Fund • NHI in process
Various low-income countries – nutrition focus
Food packages, vouchers or cash provided by the WFP, often with financing from The Global Fund and sometimes linked as part of HIV-targeted food assistance
Variability in defining beneficiaries and in documentation; financial constraints and sustainability issues
Potential for:• improved use of WHO nutrition and TB care
guidance;• improved assessment to determine
beneficiaries; and• increased monitoring and evaluation, and
engagement with national food or nutrition partners
National nutrition programmes vary in coverage – small scale in many low-income settings, except where supported by WFP, relief agencies, NGOs
The Global Fund, The Global Fund to Fight AIDS, Tuberculosis and Malaria; HIV, human immunodeficiency virus; MDR, multidrug resistant; NGO, nongovernmental organization; NHI, national health insurance; NTP, national TB programme; TB, tuberculosis; UHC, universal health coverage; WHO, World Health Organization; WFP, World Food Programme.Sources: Operational documents of NTPs, Ministries of Health and social welfare and development ministries, The Global Fund, World Food Programme.
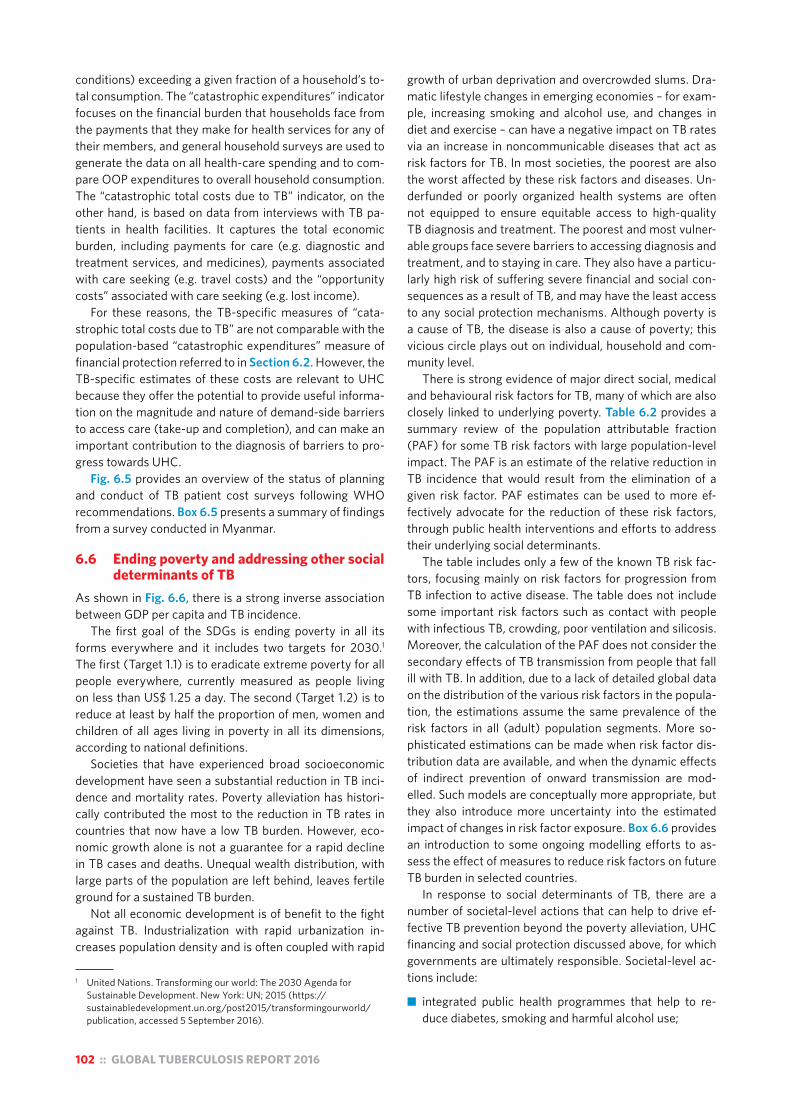
102 :: GLOBAL TUBERCULOSIS REPORT 2016
conditions) exceeding a given fraction of a household’s to-tal consumption. The “catastrophic expenditures” indicator focuses on the financial burden that households face from the payments that they make for health services for any of their members, and general household surveys are used to generate the data on all health-care spending and to com-pare OOP expenditures to overall household consumption. The “catastrophic total costs due to TB” indicator, on the other hand, is based on data from interviews with TB pa-tients in health facilities. It captures the total economic burden, including payments for care (e.g. diagnostic and treatment services, and medicines), payments associated with care seeking (e.g. travel costs) and the “opportunity costs” associated with care seeking (e.g. lost income).
For these reasons, the TB-specific measures of “cata-strophic total costs due to TB” are not comparable with the population-based “catastrophic expenditures” measure of financial protection referred to in Section 6.2. However, the TB-specific estimates of these costs are relevant to UHC because they offer the potential to provide useful informa-tion on the magnitude and nature of demand-side barriers to access care (take-up and completion), and can make an important contribution to the diagnosis of barriers to pro-gress towards UHC.
Fig. 6.5 provides an overview of the status of planning and conduct of TB patient cost surveys following WHO recommendations. Box 6.5 presents a summary of findings from a survey conducted in Myanmar.
6.6 Ending poverty and addressing other social determinants of TB
As shown in Fig. 6.6, there is a strong inverse association between GDP per capita and TB incidence.
The first goal of the SDGs is ending poverty in all its forms everywhere and it includes two targets for 2030.1 The first (Target 1.1) is to eradicate extreme poverty for all people everywhere, currently measured as people living on less than US$ 1.25 a day. The second (Target 1.2) is to reduce at least by half the proportion of men, women and children of all ages living in poverty in all its dimensions, according to national definitions.
Societies that have experienced broad socioeconomic development have seen a substantial reduction in TB inci-dence and mortality rates. Poverty alleviation has histori-cally contributed the most to the reduction in TB rates in countries that now have a low TB burden. However, eco-nomic growth alone is not a guarantee for a rapid decline in TB cases and deaths. Unequal wealth distribution, with large parts of the population are left behind, leaves fertile ground for a sustained TB burden.
Not all economic development is of benefit to the fight against TB. Industrialization with rapid urbanization in-creases population density and is often coupled with rapid
1 United Nations. Transforming our world: The 2030 Agenda for Sustainable Development. New York: UN; 2015 (https://sustainabledevelopment.un.org/post2015/transformingourworld/publication, accessed 5 September 2016).
growth of urban deprivation and overcrowded slums. Dra-matic lifestyle changes in emerging economies – for exam-ple, increasing smoking and alcohol use, and changes in diet and exercise – can have a negative impact on TB rates via an increase in noncommunicable diseases that act as risk factors for TB. In most societies, the poorest are also the worst affected by these risk factors and diseases. Un-derfunded or poorly organized health systems are often not equipped to ensure equitable access to high-quality TB diagnosis and treatment. The poorest and most vulner-able groups face severe barriers to accessing diagnosis and treatment, and to staying in care. They also have a particu-larly high risk of suffering severe financial and social con-sequences as a result of TB, and may have the least access to any social protection mechanisms. Although poverty is a cause of TB, the disease is also a cause of poverty; this vicious circle plays out on individual, household and com-munity level.
There is strong evidence of major direct social, medical and behavioural risk factors for TB, many of which are also closely linked to underlying poverty. Table 6.2 provides a summary review of the population attributable fraction (PAF) for some TB risk factors with large population-level impact. The PAF is an estimate of the relative reduction in TB incidence that would result from the elimination of a given risk factor. PAF estimates can be used to more ef-fectively advocate for the reduction of these risk factors, through public health interventions and efforts to address their underlying social determinants.
The table includes only a few of the known TB risk fac-tors, focusing mainly on risk factors for progression from TB infection to active disease. The table does not include some important risk factors such as contact with people with infectious TB, crowding, poor ventilation and silicosis. Moreover, the calculation of the PAF does not consider the secondary effects of TB transmission from people that fall ill with TB. In addition, due to a lack of detailed global data on the distribution of the various risk factors in the popula-tion, the estimations assume the same prevalence of the risk factors in all (adult) population segments. More so-phisticated estimations can be made when risk factor dis-tribution data are available, and when the dynamic effects of indirect prevention of onward transmission are mod-elled. Such models are conceptually more appropriate, but they also introduce more uncertainty into the estimated impact of changes in risk factor exposure. Box 6.6 provides an introduction to some ongoing modelling efforts to as-sess the effect of measures to reduce risk factors on future TB burden in selected countries.
In response to social determinants of TB, there are a number of societal-level actions that can help to drive ef-fective TB prevention beyond the poverty alleviation, UHC financing and social protection discussed above, for which governments are ultimately responsible. Societal-level ac-tions include:
■ integrated public health programmes that help to re-duce diabetes, smoking and harmful alcohol use;

GLOBAL TUBERCULOSIS REPORT 2016 :: 103
:: FIG. 6.5 Surveys of costs faced by TB patients and their households: progress and plans as of August 2016
CompletedStarting in 2016Planned for 2017–2018
Source: Global TB Programme survey monitoring up to August 2016.
:: Box 6.5Myanmar TB patient cost survey
In Myanmar, from December 2015 to February 2016, the Ministry of Health worked with a national research partner to conduct a nationally representative patient cost survey involving 996 eligible TB patients in health facilities. Myanmar is a low-income country with among the highest TB burdens in the WHO South-East Asia Region. The survey was the first to apply the new WHO-recommended protocol for TB patient cost surveys and to adapt its instrument. The cross-sectional survey included questions on the patient’s current treatment and retrospective questions on the costs incurred by patients for this illness episode before they were diagnosed as having TB. Current costs were extrapolated for the full treatment duration to estimate total costs (both direct and indirect) for the whole TB episode, as a percentage of household income. If total costs exceeded 20% of annual household income, the TB-affected household was deemed to have faced catastrophic total costs.
The survey results suggested that, in Myanmar, an estimated 65% of TB-affected households face catastrophic costs. On average, total TB-related costs were US$ 1178 per household and the largest proportion of this total was accounted for by foregone income (49%) followed by nutritional supplement costs (25%), and post-diagnosis medical costs (14%). Being
on MDR-TB treatment and in a lower household wealth quintile were both significant predictors of facing catastrophic costs.
The high proportion of TB-affected households experiencing catastrophic costs bolsters the need for effective, patient-centred health care free of charge, and the need for social protection. The large proportion of total spending attributable to lost wages and food or nutritional supplements suggests that efforts to reduce income loss (reduced time spent seeking care through decentralization and more patient-friendly service organization, as well as employment protection), income support and/or food support may need to be considered to reduce the burdensome costs faced by patients and their families. The NTP is convening a consultation to review the results, and to further discuss the probable dynamics behind the highest areas of spending and the income losses associated with TB and its treatment. The participants will consider the probable policy and practice implications, and further operational research that might be needed. The results should inform ongoing work on Myanmar’s first national social protection strategy, and its ongoing efforts to strengthen health services.
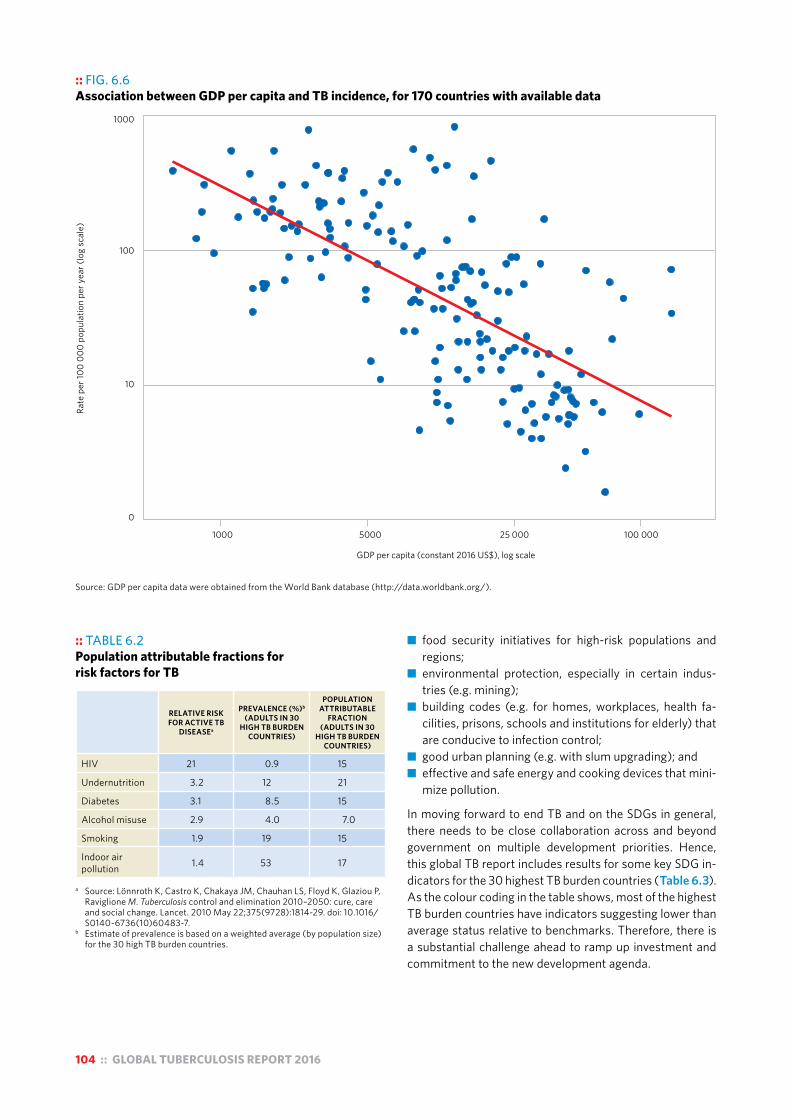
104 :: GLOBAL TUBERCULOSIS REPORT 2016
:: TABLE 6.2 Population attributable fractions for risk factors for TB
RELATIVE RISK FOR ACTIVE TB
DISEASEa
PREVALENCE (%)b
(ADULTS IN 30 HIGH TB BURDEN
COUNTRIES)
POPULATION ATTRIBUTABLE
FRACTION (ADULTS IN 30
HIGH TB BURDEN COUNTRIES)
HIV 21 0.9 15
Undernutrition 3.2 12 21
Diabetes 3.1 8.5 15
Alcohol misuse 2.9 4.0 7.0
Smoking 1.9 19 15
Indoor air pollution 1.4 53 17
a Source: Lönnroth K, Castro K, Chakaya JM, Chauhan LS, Floyd K, Glaziou P,
Raviglione M. Tuberculosis control and elimination 2010–2050: cure, care and social change. Lancet. 2010 May 22;375(9728):1814-29. doi: 10.1016/S0140-6736(10)60483-7.
b Estimate of prevalence is based on a weighted average (by population size) for the 30 high TB burden countries.
:: FIG. 6.6 Association between GDP per capita and TB incidence, for 170 countries with available data
0
10
100
1000
Rate
per
100
000
popu
latio
n pe
r yea
r (lo
g sc
ale)
1000 5000 25 000 100 000
GDP per capita (constant 2016 US$), log scale
Source: GDP per capita data were obtained from the World Bank database (http://data.worldbank.org/).
■ food security initiatives for high-risk populations and regions;
■ environmental protection, especially in certain indus-tries (e.g. mining);
■ building codes (e.g. for homes, workplaces, health fa-cilities, prisons, schools and institutions for elderly) that are conducive to infection control;
■ good urban planning (e.g. with slum upgrading); and ■ effective and safe energy and cooking devices that mini-
mize pollution.
In moving forward to end TB and on the SDGs in general, there needs to be close collaboration across and beyond government on multiple development priorities. Hence, this global TB report includes results for some key SDG in-dicators for the 30 highest TB burden countries (Table 6.3). As the colour coding in the table shows, most of the highest TB burden countries have indicators suggesting lower than average status relative to benchmarks. Therefore, there is a substantial challenge ahead to ramp up investment and commitment to the new development agenda.

GLOBAL TUBERCULOSIS REPORT 2016 :: 105
:: TABLE 6.3 Status of selected SDG indicators in August 2016, 30 high TB burden countriesa
COUNTRYSDG 1 INDICATOR
PROPORTION LIVING ON LESS THAN US$ 1.25 (PPP) PER DAY
SDG 2 INDICATORPROPORTION
OF POPULATION UNDERNOURISHED
SDG 10 INDICATORGINI COEFFICIENT (%)b
SDG 11 INDICATORPROPORTION OF URBAN POPULATIONS LIVING IN
SLUMS
Angola 43 14 43 56
Bangladesh 43 16 32 55
Brazil 3.8 5.0 53 22
Cambodia 10 14 31 55
Central African Republic 63 48 56 93
China 6.3 9.3 42 25
Congo 33 31 40 47
DPR Korea — 42 — —
DR Congo 88 — 42 75
Ethiopia 37 32 33 74
India 24 15 34 24
Indonesia 16 7.6 36 22
Kenya 43 21 — 56
Lesotho 56 11 54 51
Liberia 84 32 37 66
Mozambique 61 25 46 80
Myanmar — 14 — 41
Namibia 24 42 61 33
Nigeria 62 7.0 43 50
Pakistan 13 22 30 46
Papua New Guinea 36 — 44 —
Philippines 19 14 45 38
Russian Federation 0 — 27 —
Sierra Leone 57 22 34 76
South Africa 9.4 5.0 63 23
Thailand 0.3 7.4 38 25
UR Tanzania 44 32 38 51
Viet Nam 2.4 11 39 27
Zambia 74 48 56 54
Zimbabwe — 33 — 25
High-burden country average 35 22 42 48
Global average 18 11 36 33
— Indicates values that were not available. PPP, purchasing power parity. a Data come from the United Nations Statistics Division SDG indicator database. Individual data points are coloured pink if they are worse than the global
average and green if better than the global average.b The Gini coefficient is a measure of statistical dispersion intended to represent the income distribution of a country’s population and is the most commonly
used measure of inequality. Generally, the coefficient ranges from 0% to 100%; a value of 0% expresses complete equality between everyone in the population, and a value of 100% expresses maximum inequality in the population i.e. one person has all the income.
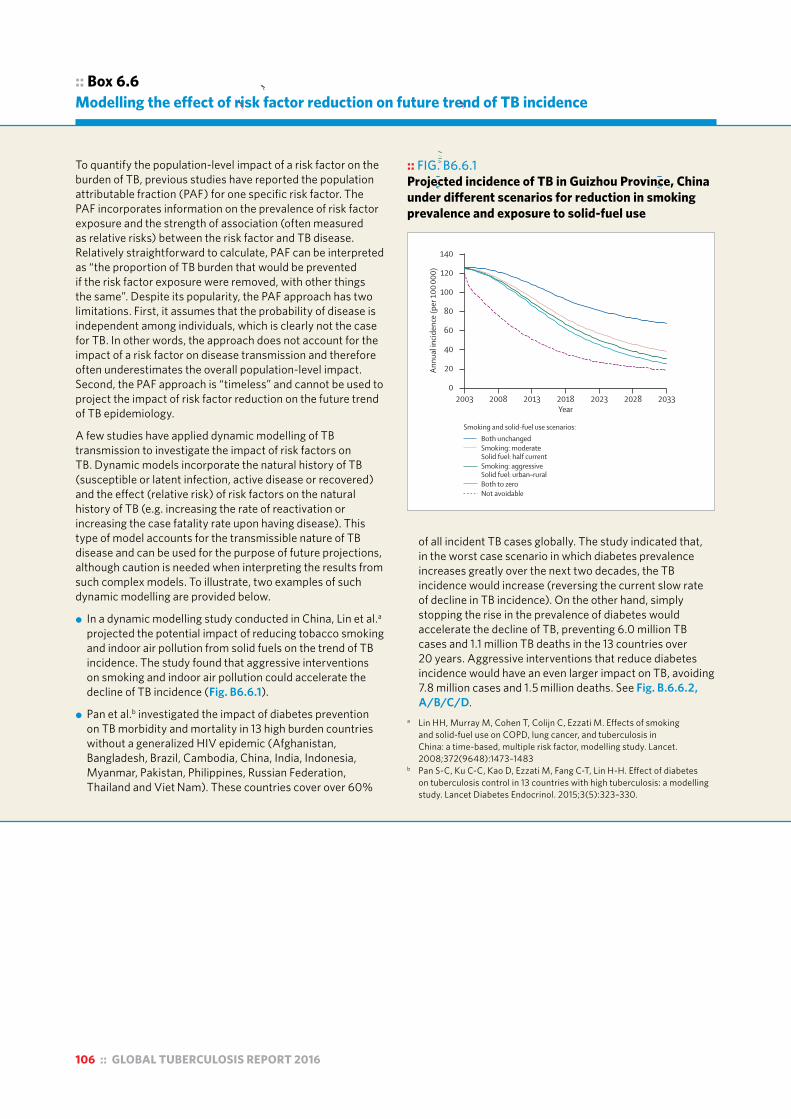
106 :: GLOBAL TUBERCULOSIS REPORT 2016
:: Box 6.6Modelling the effect of risk factor reduction on future trend of TB incidence
To quantify the population-level impact of a risk factor on the burden of TB, previous studies have reported the population attributable fraction (PAF) for one specific risk factor. The PAF incorporates information on the prevalence of risk factor exposure and the strength of association (often measured as relative risks) between the risk factor and TB disease. Relatively straightforward to calculate, PAF can be interpreted as “the proportion of TB burden that would be prevented if the risk factor exposure were removed, with other things the same”. Despite its popularity, the PAF approach has two limitations. First, it assumes that the probability of disease is independent among individuals, which is clearly not the case for TB. In other words, the approach does not account for the impact of a risk factor on disease transmission and therefore often underestimates the overall population-level impact. Second, the PAF approach is “timeless” and cannot be used to project the impact of risk factor reduction on the future trend of TB epidemiology.
A few studies have applied dynamic modelling of TB transmission to investigate the impact of risk factors on TB. Dynamic models incorporate the natural history of TB (susceptible or latent infection, active disease or recovered) and the effect (relative risk) of risk factors on the natural history of TB (e.g. increasing the rate of reactivation or increasing the case fatality rate upon having disease). This type of model accounts for the transmissible nature of TB disease and can be used for the purpose of future projections, although caution is needed when interpreting the results from such complex models. To illustrate, two examples of such dynamic modelling are provided below.
! In a dynamic modelling study conducted in China, Lin et al.a projected the potential impact of reducing tobacco smoking and indoor air pollution from solid fuels on the trend of TB incidence. The study found that aggressive interventions on smoking and indoor air pollution could accelerate the decline of TB incidence (Fig. B6.6.1).
! Pan et al.b investigated the impact of diabetes prevention on TB morbidity and mortality in 13 high burden countries without a generalized HIV epidemic (Afghanistan, Bangladesh, Brazil, Cambodia, China, India, Indonesia, Myanmar, Pakistan, Philippines, Russian Federation, Thailand and Viet Nam). These countries cover over 60%
of all incident TB cases globally. The study indicated that, in the worst case scenario in which diabetes prevalence increases greatly over the next two decades, the TB incidence would increase (reversing the current slow rate of decline in TB incidence). On the other hand, simply stopping the rise in the prevalence of diabetes would accelerate the decline of TB, preventing 6.0 million TB cases and 1.1 million TB deaths in the 13 countries over 20 years. Aggressive interventions that reduce diabetes incidence would have an even larger impact on TB, avoiding 7.8 million cases and 1.5 million deaths. See Fig. B.6.6.2, A/B/C/D.
a Lin HH, Murray M, Cohen T, Colijn C, Ezzati M. Effects of smoking and solid-fuel use on COPD, lung cancer, and tuberculosis in China: a time-based, multiple risk factor, modelling study. Lancet. 2008;372(9648):1473–1483
b Pan S-C, Ku C-C, Kao D, Ezzati M, Fang C-T, Lin H-H. Effect of diabetes on tuberculosis control in 13 countries with high tuberculosis: a modelling study. Lancet Diabetes Endocrinol. 2015;3(5):323–330.
:: FIG. B6.6.1 Projected incidence of TB in Guizhou Province, China under different scenarios for reduction in smoking prevalence and exposure to solid-fuel use
Articles
www.thelancet.com Published online October 4, 2008 DOI:10.1016/S0140-6736(08)61345-8 7
gradually eliminated between 2003 and 2033, an estimated 26 million COPD deaths (40% of all projected COPD deaths) and 6·3 million lung cancer deaths (34% of all projected lung cancer deaths) would be avoided (fi gures 2 and 3). The intermediate scenarios have the potential to reduce mortality from these diseases by an estimated 17–34% among men and 18–29% among women.
The prevalence of active tuberculosis declined between 1979 and 2000 in most provinces in China (webfi gure 1). If there is sustained 80% coverage of eff ective DOTS (webtable 2), the annual incidence of infectious tuberculosis in the three provinces presented here is estimated to decline after 2003, even if smoking and solid-fuel use remain at their current levels (fi gure 4). Nonetheless, reducing smoking and solid fuels would further reduce incidence of tuberculosis from projected
levels. The estimated reductions in 2033, under diff erent scenarios of smoking and solid-fuel use, range from 10% to 23% of the projected levels in Jiangsu, 35% to 52% in Guizhou (where prevalence has increased), and 5% to 14% in Shanghai (where prevalence has been lowest; fi gure 4).
Incidence of tuberculosis is projected to decline even when DOTS implementation is less eff ective. The decline in incidence in these three provinces will be 4–28% less under moderate DOTS than under optimum DOTS, and 11–79% smaller under minimum DOTS. This slower decline in tuberculosis incidence would, in turn, lead to smoking and solid-fuel interventions having larger relative and absolute benefi cial eff ects on trends in tuberculosis (fi gure 4). For example, in Jiangsu province, the relative reduction in projected incidence in 2033, under diff erent scenarios of smoking and
60
40
50
30
20
10
0
140
100
120
80
40
60
20
0
25
15
20
10
5
0
Annu
al in
ciden
ce (p
er 1
00 00
0)An
nual
incid
ence
(per
100
000)
Annu
al in
ciden
ce (p
er 1
00 00
0)
2003 2008 2013 2018 2023 2028 20332003 2008 2013 2018 2023 2028 2033
2003 2008 2013 2018 2023 2028 2033
Smoking and solid-fuel use scenarios:Both unchangedSmoking: moderate Solid fuel: half currentSmoking: aggressive Solid fuel: urban–ruralBoth to zeroNot avoidable
A
D
B
E
C
F
G
Year
Year Year
Figure 4: Annual incidence of infectious tuberculosis under combined eff ects of smoking and indoor air pollution scenarios by municipality and DOTS eff ectivenessDecreases in incidence with optimum, moderate, or minimum DOTS in Jiangsu (A, B, C, respectively) and Guizhou (D, E, F) and for Shanghai (G), which already has eff ective DOTS so non-optimum scenarios not shown.

GLOBAL TUBERCULOSIS REPORT 2016 :: 107
:: FIG. B6.6.2 Projected TB incidence/mortality/prevalence (B/C/D) under different scenarios of diabetes control (A) in 13 high TB burden countries, 2015–2035
Articles
www.thelancet.com/diabetes-endocrinology Vol 3 May 2015 325
Baker and colleagues6 noted that diabetes increased the risk of death in individuals with active tuberculosis (RR 1·89) and the risk of relapse after treatment
completion (RR 3·89). Finally, diabetes is associated with increased risk of all-cause mortality because it aff ects a number of other disorders (RR 3·48).22 We did not
Defi nition Average diabetes prevalence in 2035
Explanation
Large rise (worst case scenario)
Diabetes prevalence in 13 countries will reach 20·6% by 2035
20·6% The upper bound of diabetes prevalence in all scenarios; diabetes prevalence is expected to increase worldwide because of ageing, urbanisation, and increased prevalence of obesity, physical inactivity, smoking, and unhealthy diet;7,15 the diabetes prevalence of 20·6% is based on the fi nding in women in the Oceania region7
Continue current trend (base case scenario)
Diabetes prevalence will follow the present rising trend, with an upper bound of 20·6%
16·0% Without further intervention the age-specifi c prevalence of diabetes will continue its present trend in each country
Stop rise Diabetes prevalence will stop rising after 2015
9·4% Assume the new global non-communicable disease target for diabetes will be reached by 201516
Aggressive intervention
The incidence rate of diabetes will be reduced by 35% between 2015 and 2025
7·4% Findings of previous studies showed that diff erent intervention strategies can reduce the progression of pre-diabetes to diabetes17,18
To background level (best case scenario)
By 2035, diabetes prevalence will gradually decrease to the 1990 background level
2·2% The lower bound and ideal scenario of diabetes prevalence; the background prevalence in 1900 was derived from external prediction with recorded diabetes prevalence in 1980–20087
Table 1: Scenarios of diabetes used in the analysis
Diab
etes
pre
vale
nce (
%)
0
5
10
15
20
Tube
rcul
osis
incid
ence
(per
100
000)
0
50
100
150
200
Tube
rcul
osis
mor
talit
y (pe
r 100
000
peop
le)
2015 2020 2025 2030 20350
10
20
30
40
Tube
rcul
osis
prev
alen
ce (p
er 1
00 00
0)
2015 2020 2025 2030 20350
50
100
150
200
250
Year Year
A
C
B
D
Large riseContinue current trendStop riseAggressive interventionTo background level
Figure 2: Scenarios of diabetes prevalence aggregated for 13 countries with high tuberculosis burden (A) and projected tuberculosis incidence (B), mortality (C), and prevalence (D) in these countries under diff erent scenarios of diabetes, 2015–35The lines in panels B, C, and D represent the means of posterior simulations from the calibrated models. Table 1 shows defi nitions of diabetes scenarios. The appendix shows country-specifi c results.
:: Box 3.2Updates to estimates of TB disease burden in this report and anticipated updates
Source: Pan S-C, Ku C-C, Kao D, Ezzati M, Fang C-T, Lin H-H. Effect of diabetes on tuberculosis control in 13 countries with high tuberculosis: a modelling study. Lancet Diabetes Endocrinol. 2015;3(5):323–330.

108 :: GLOBAL TUBERCULOSIS REPORT 2016
Chapter 7 :: TB financing
:: KEY FACTS AND MESSAGESThe Stop TB Partnership’s Global Plan to End TB, 2016–2020a estimates that in low- and middle-income countries US$ 52 billion is required over 5 years to implement interventions that are currently available. The amount required will increase from US$ 8.3 billion in 2016 to US$ 12.3 billion in 2020. Most of this funding is for drug-susceptible tuberculosis (TB) (e.g. US$ 6.4 billion in 2016), but the amount for multidrug-resistant TB (MDR-TB) doubles from US$ 1.7 billion in 2016 to US$ 3.6 billion by 2020; the remainder is for TB/HIV interventions. Over the period 2016–2020, a further US$ 6 billion is needed for high-income countries, and an additional US$ 9 billion is needed for TB research and development.
Based on data reported to WHO by 126 countries with 97% of the world’s notified TB cases, US$ 6.6 billion was available for TB prevention, diagnosis and treatment in low- and middle-income countries in 2016. This is an increase from previous years, but is still about US$ 2 billion less than the estimated requirement for this group of countries in the Global Plan. Increased domestic and international donor commitments are needed to close the funding gaps.
Of the US$ 6.6 billion available in 2016, 84% was from domestic sources. However, this aggregate figure is strongly influenced by the BRICS countries (Brazil, the Russian Federation, India, China and South Africa), which collectively account for about 50% of the world’s TB cases, and rely mostly or exclusively (the exception is India) on
domestic funding. In other countries with a high TB burden, international donor funding dominates, accounting for 75% of reported funding in the group of 25 high TB burden countries outside BRICS, 87% of funding in low-income countries and 60% of funding in lower middle-income countries. The single largest source of international donor funding is the Global Fund to Fight AIDS, Tuberculosis and Malaria.
International donor funding for TB falls far short of donor contributions for HIV and malaria. The latest data from the Organisation for Economic Co-operation and Development (OECD) creditor reporting system show totals of US$ 5.4 billion for HIV/AIDS, US$ 1.7 billion for malaria and US$ 0.7 billion for TB in 2014. To provide some context for these amounts, the latest estimates (for 2013) of the burden of disease in terms of disability-adjusted life years (DALYs) lost due to illness and death are 69 million for HIV/AIDS, 50 million for malaria and 65 million for TB.
The cost per patient treated is usually in the range of US$ 100–1000 for drug-susceptible TB and US$ 2000–20 000 for MDR-TB.
Health financing data from national health accounts provide insights into the current status of progress towards universal health coverage, as discussed in Chapter 6.
a The Global Plan to End TB, 2016–2020. Geneva: Stop TB Partnership; 2015 (http://www.stoptb.org/global/plan/, accessed 28 July 2016).
Progress in tuberculosis (TB) prevention, diagnosis and treatment requires adequate funding sustained over many years. WHO began annual monitoring of funding for TB in 2002, with findings published in global TB reports and peer-reviewed publications.1
This chapter has four main sections. It starts with a summary of the most up-to-date estimates of financial resources required for a full response to the TB epidemic 2016–2020 (Section 7.1). It then presents and discusses trends in funding for TB prevention, diagnosis and treat-
1 The most recent publication is: Floyd K, Fitzpatrick C, Pantoja A, Raviglione M. Domestic and donor financing for tuberculosis care and control in low-income and middle-income countries: an analysis of trends, 2002–11, and requirements to meet 2015 targets. Lancet Glob Health. 2013;1(2):e105–115 (http://www.ncbi.nlm.nih.gov/pubmed/25104145, accessed 28 July 2016).
ment by category of expenditure and source of funding for the period 2006–2016, globally and for major country groupings (Section 7.2). The third part of the chapter anal-yses funding gaps reported by national TB programmes (NTPs) to WHO, with breakdowns by category of expendi-ture and country group (Section 7.3). The final section provides the latest estimates (for 2015) of the unit costs of treatment for drug-susceptible TB and multidrug-resistant TB (MDR-TB) (Section 7.4).
As highlighted in the financing chapter of the Global tuberculosis report 2015,2 analysis of health financing data
2 World Health Organization. Global tuberculosis report 2015. Geneva: WHO; 2015 (http://apps.who.int/iris/bitstream/10665/191102/1/9789241565059_eng.pdf, accessed 27 July 2016).

GLOBAL TUBERCULOSIS REPORT 2016 :: 109
can provide insights into progress towards universal health coverage (UHC), which is necessary to achieve the End TB Strategy milestones set for 2020 and 2025 (Chapter 2). Measurement of costs faced by TB patients and their households is also required to assess progress towards one of the three high-level indicators of the End TB Strategy; that is, the percentage of TB patients and their households who face catastrophic costs as a result of TB disease. The milestone of zero set for this indicator for 2020 requires progress in terms of both UHC and social protection (in-cluded under Pillar 2 of the End TB Strategy). These two topics – analysis of health financing data, and measure-ment of costs faced by TB patients and their households – are covered in Chapter 6.
Further country-specific data on TB financing can be found in finance profiles that are available online.1
7.1 Estimates of funding required for a full response to the global TB epidemic, 2016–2020
The latest estimates of the funding required for a full re-sponse to the global TB epidemic, to achieve the End TB Strategy milestones for 2020, have been set out in the Stop TB Partnership’s Global Plan to End TB, 2016–2020.2 World-wide, the amount for implementation of TB prevention, diagnostic and treatment interventions rises from almost US$ 9.5 billion in 2016 to US$ 14 billion in 2020 (Fig 7.1). Most of this total (75%) is for diagnosis and treatment of drug-susceptible TB, which grows from US$ 7.4 billion in 2016 (US$ 6.4 billion in low- and middle-income countries) to US$ 9.7 billion in 2020. However, the amount for drug-resistant TB doubles from US$ 1.8 billion in 2016 to US$ 3.6 billion in 2020.3 Relatively small amounts are needed for TB/HIV interventions, mainly because the figure does not include the funding needed for antiretroviral therapy for HIV-positive TB patients.4 An additional US$ 9 billion is needed for TB research and development over the 5-year period (data not shown; this topic is discussed further in Chapter 8).
Of the total of US$ 58 billion over 5 years (excluding re-search and development), US$ 52 billion was estimated to be required in low- and middle-income countries (growing from US$ 8.3 billion in 2016 to US$ 12.3 billion in 2020). Within this group of countries, estimates of the funding that could be mobilized from domestic and international donor sources were restricted to countries eligible to ap-
1 www.who.int/tb/data2 The Global Plan to End TB, 2016–2020. Geneva: Stop TB Partnership;
2015 (http://www.stoptb.org/global/plan/, accessed 28 July 2016).3 The burden of drug-resistant TB (in terms of cases per year) is not
projected to increase between 2016 and 2020. Increased funding is required to close detection and treatment gaps (see also Chapter 4).
4 Funding needs for ART for HIV-positive TB patients are part of HIV resource needs estimates, and are not included in the Global Plan to End TB, to avoid double counting. For details on resource needs estimates for HIV/AIDS, see Stover J, Bollinger L, Izazola JA, Loures L, DeLay P, Ghys PD et al. What is required to end the AIDS epidemic as a public health threat by 2030? The cost and impact of the fast-track approach. PLoS One. 2016;11(5):e0154893 (http://www.ncbi.nlm.nih.gov/pubmed/27159260, accessed 28 July 2016).
ply to the Global Fund to Fight AIDS, Tuberculosis and Ma-laria (the Global Fund).5 For eligible countries, the funding required over 5 years amounts to US$ 29 billion; it was es-timated that about US$ 16 billion of this amount could be mobilized from domestic sources and that the remainder (an average of US$ 2.6 billion per year) would need to come from international donors.
The Global Plan to End TB did not attempt to assess the broader investments required to increase the overall cov-erage and quality of health-care services, and to remove financial barriers to accessing care. Such investments are needed for many essential preventive, treatment and care interventions, not only for TB. Progress on these fronts is critical, as explained in Chapter 2, reflected in Pillar 2 of the End TB Strategy and discussed in Chapter 6. The cost-ings in the Global Plan can thus be seen as the financial resources required for Pillars 1 and 3 of the End TB Strategy.
7.2 TB funding, overall and by category of expenditure and source of funding, 2006–2016
Data reported by NTPs to WHO since 2006 were used to analyse funding trends over the period 2006–2016 in 126 countries (Table 7.1). These countries accounted for 97% of the global number of TB cases reported in 2015, and in-cluded 126 low- and middle-income countries. The meth-ods used to collect, review and analyse financial data are summarized in Box 7.1.
In these 126 countries, funding for TB prevention, diag-nosis and treatment reached US$ 6.6 billion in 2016, up from US$ 6 billion in 2015 and almost double the US$ 3.5 billion that was available in 2006 (all figures are in constant values for 2016, see Fig. 7.2). Of the total of US$ 6.6 bil-
5 Countries not eligible to apply to the Global Fund include Brazil, China, the Russian Federation and about half of the other 52 countries classified as upper middle income.
:: FIG. 7.1 Estimates of funding required globally for drug-susceptible TB, MDR-TB and TB/HIV in the Global Plan to End TB 2016—2020 (constant 2015 US$ billions)
2016 2017 2018 2019 20200
4
8
12
16
US$
bill
ions
Drug-susceptible TB MDR-TB TB/HIV
Source: Data from Stop TB Partnership Global Plan to End TB 2016-2020

110 :: GLOBAL TUBERCULOSIS REPORT 2016
:: TABLE 7.1 126 countries included in analyses of TB financing, by income group and WHO region, 2016a,b
LOW-INCOME (30/31 COUNTRIES REPRESENTING 13% OF NOTIFIED CASES GLOBALLY IN 2015)
LOWER-MIDDLE-INCOME (48/52 COUNTRIES REPRESENTING 58% OF NOTIFIED CASES GLOBALLY IN 2015)
UPPER-MIDDLE-INCOME (48/55 COUNTRIES REPRESENTING 26% OF NOTIFIED CASES GLOBALLY IN 2015)
BRICS (48% OF NOTIFIED CASES GLOBALLY IN 2015)
25 HIGH-BURDEN COUNTRIES EXCLUDING BRICS (37% OF NOTIFIED CASES GLOBALLY IN 2015)
African Benin, Burkina Faso, Burundi, Central African Republic, Chad, DR Congo, Eritrea, Ethiopia, Gambia, Guinea, Guinea-Bissau, Liberia, Madagascar, Malawi, Mali, Mozambique, Niger, Rwanda, Senegal, Sierra Leone, South Sudan, Togo, Uganda, UR Tanzania, Zimbabwe
Cabo Verde, Cameroon, Congo, Côte d’Ivoire, Ghana, Kenya, Lesotho, Mauritania, Nigeria, Sao Tomé and Principe, Swaziland, Zambia
Angola, Botswana, Gabon, Mauritius, Namibia, South Africa
South Africa Angola, Central African Republic, Congo, DR Congo, Ethiopia, Kenya, Lesotho, Liberia, Mozambique, Namibia, Nigeria, Sierra Leone, UR Tanzania, Zambia, Zimbabwe
Americas Haiti Bolivia, El Salvador, Guatemala, Honduras, Nicaragua
Belize, Brazil, Colombia, Cuba, Dominican Republic, Ecuador, Grenada, Guyana, Jamaica, Mexico, Panama, Paraguay, Peru, Saint Lucia, Saint Vincent and the Grenadines, Suriname, Venezuela (Bolivian Republic of)
Brazil
Eastern Mediterranean
Afghanistan, Somalia Djibouti, Morocco, Pakistan, Sudan, Syria, Tunisia, Yemen
Iran (Islamic Republic of), Iraq, Jordan, Lebanon
Pakistan
European Armenia, Kyrgyzstan, Republic of Moldova, Tajikistan, Ukraine, Uzbekistan
Azerbaijan, Belarus, Bosnia and Herzegovina, Bulgaria, Georgia, Kazakhstan, Montenegro, Romania, Russian Federation, Serbia, The Former Yugoslav Republic of Macedonia, Turkey
Russian Federation
South-East Asia Democratic People’s Republic of Korea, Nepal
Bangladesh, Bhutan, India, Indonesia, Myanmar, Sri Lanka, Timor-Leste
Maldives, Thailand India Bangladesh, Indonesia, Myanmar, Thailand
Western Pacific Cambodia, Kiribati, Lao People’s Democratic Republic, Mongolia, Papua New Guinea, Philippines, Samoa, Solomon Islands, Tonga, Vanuatu, Viet Nam
American Samoa, China, Fiji, Malaysia, Marshall Islands, Palau, Tuvalu
China Cambodia, Democratic People’s Republic of Korea, Papua New Guinea, Philippines, Viet Nam
Excluded Comoros Egypt, Kosovo, Micronesia (Federal States of), West Bank and Gaza Strip
Albania, Algeria, Costa Rica, Dominica, Equatorial Guinea, Libya, Turkmenistan
a Analyses focus on low and middle-income countries.b Additional countries included in trend analyses of TB financing compared with those included in previous global reports are shown in bold.
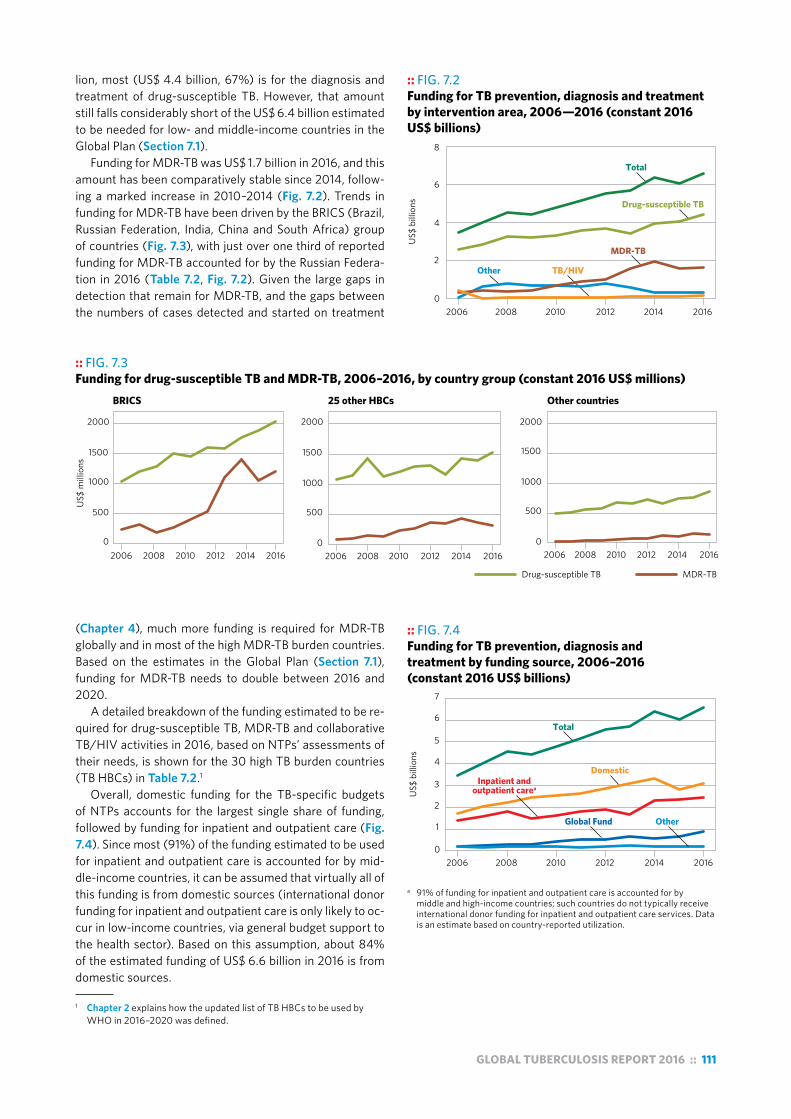
GLOBAL TUBERCULOSIS REPORT 2016 :: 111
:: FIG. 7.2 Funding for TB prevention, diagnosis and treatment by intervention area, 2006—2016 (constant 2016 US$ billions)
US$
bill
ions
MDR-TB
2006 2008 2010 2012 2014 20160
2
4
6
8
Total
Drug-susceptible TB
TB/HIVOther
lion, most (US$ 4.4 billion, 67%) is for the diagnosis and treatment of drug-susceptible TB. However, that amount still falls considerably short of the US$ 6.4 billion estimated to be needed for low- and middle-income countries in the Global Plan (Section 7.1).
Funding for MDR-TB was US$ 1.7 billion in 2016, and this amount has been comparatively stable since 2014, follow-ing a marked increase in 2010–2014 (Fig. 7.2). Trends in funding for MDR-TB have been driven by the BRICS (Brazil, Russian Federation, India, China and South Africa) group of countries (Fig. 7.3), with just over one third of reported funding for MDR-TB accounted for by the Russian Federa-tion in 2016 (Table 7.2, Fig. 7.2). Given the large gaps in detection that remain for MDR-TB, and the gaps between the numbers of cases detected and started on treatment
(Chapter 4), much more funding is required for MDR-TB globally and in most of the high MDR-TB burden countries. Based on the estimates in the Global Plan (Section 7.1), funding for MDR-TB needs to double between 2016 and 2020.
A detailed breakdown of the funding estimated to be re-quired for drug-susceptible TB, MDR-TB and collaborative TB/HIV activities in 2016, based on NTPs’ assessments of their needs, is shown for the 30 high TB burden countries (TB HBCs) in Table 7.2.1
Overall, domestic funding for the TB-specific budgets of NTPs accounts for the largest single share of funding, followed by funding for inpatient and outpatient care (Fig. 7.4). Since most (91%) of the funding estimated to be used for inpatient and outpatient care is accounted for by mid-dle-income countries, it can be assumed that virtually all of this funding is from domestic sources (international donor funding for inpatient and outpatient care is only likely to oc-cur in low-income countries, via general budget support to the health sector). Based on this assumption, about 84% of the estimated funding of US$ 6.6 billion in 2016 is from domestic sources.
1 Chapter 2 explains how the updated list of TB HBCs to be used by WHO in 2016–2020 was defined.
:: FIG. 7.3 Funding for drug-susceptible TB and MDR-TB, 2006–2016, by country group (constant 2016 US$ millions)
US$
mill
ions
2006 2008 2010 2012 2014 20162006 2008 2010 2012 2014 20160
500
1000
1500
2000
0
500
1000
1500
2000
0
500
1000
1500
2000
BRICS 25 other HBCs Other countries
Drug-susceptible TB MDR-TB
2006 2008 2010 2012 2014 2016
:: FIG. 7.4 Funding for TB prevention, diagnosis and treatment by funding source, 2006–2016 (constant 2016 US$ billions)
US$
bill
ions
2006 2008 2010 2012 2014 20160
1
2
3
4
5
6
7
Total
Domestic
Other
Inpatient and outpatient carea
Global Fund
a 91% of funding for inpatient and outpatient care is accounted for by middle and high-income countries; such countries do not typically receive international donor funding for inpatient and outpatient care services. Data is an estimate based on country-reported utilization.
112 :: GLOBAL TUBERCULOSIS REPORT 2016
:: Box 7.1 Methods use to compile, validate and analyse financial data reported to WHO
WHO began monitoring government and international donor financing for TB in 2002. All data are stored in the WHO global TB database. The standard methods used to compile, review, validate and analyse these have been described in detail elsewhere;a,b this box provides a summary.
Each year, WHO requests all low- and middle-income countries to report:
! the funding they estimate will be needed for TB prevention, diagnosis and treatment in their current fiscal year, by category of expenditure and source of funding; and
! expenditures for the most recently completed fiscal year, also by category of expenditure and source of funding.
In the 2016 round of global TB data collection, the fiscal years were 2016 and 2015. Consistency in categories of expenditure used to report budget and expenditure data has been maintained as far as possible to enable monitoring of trends. For low- and middle-income countries, the categories of expenditure for drug-susceptible TB used in the 2016 round of global TB data collection were laboratory infrastructure, equipment and supplies; NTP staff at central and subnational levels (e.g. NTP managers and provincial or district TB coordinators); first-line drugs; programme costs (e.g. management and supervision activities, training, policy development, meetings, purchase of office equipment and vehicles, recording and reporting of notifications and treatment outcomes, advocacy and communication, public–private mix activities and community engagement); and operational research, including surveys. For MDR-TB, two expenditure categories were used: second-line drugs, and programme costs specifically related to MDR-TB. Starting in 2015, a separate category for patient support was included, linked to the emphasis on financial and social protection in the End TB Strategy. There is also a separate category for collaborative TB/HIV activities. A breakdown of the total amount of available funding is requested in four categories: domestic funding excluding loans; external loans, also considered domestic funding; the Global Fund; and grant financing from sources other than the Global Fund.
As in previous years, all high-income countries were requested to report funding requirements and expenditures in total, without any breakdown by category of expenditure or source of funding.
All countries (irrespective of income level) were asked to report on the use of inpatient and outpatient care required for treatment of people with drug-susceptible and MDR-TB on a per-patient basis (i.e. the average number of days spent in hospital, and the average number of outpatient visits to a health facility). These data can be based on actual use data (preferable), or on the expected use based on the typical approach used to deliver treatment (which may be defined in national policy documents). They are combined with other data to estimate the financial resources used for TB treatment that are not reflected in NTP-reported budgets and expenditures (further details are provided below).
Core methods used to review and validate data have remained consistent since 2002. They include:
! routine checks for plausibility and consistency, including validation checks that are built into the online reporting system – examples of validation checks are checks for implausibly large year-to-year changes (e.g. in total reported funding by source and by category of expenditure), or implausibly high or low values of funding for drugs relative to the number of TB patients (that differ substantially from prices quoted by the Global TB Drug Facility);
! discussions with country respondents to resolve queries; and
! triangulation with other data sources – such sources include estimates of unit costs from independent economic evaluationsc and funding proposals (known as concept notes) submitted to the Global Fundd (Table B7.1.1); comprehensive budgets for national strategic plans are now an essential requirement for funding applications to the Global Fund.
Since 2014, an extra question about the average cost of drugs per patient treated has been asked, to allow reviewers to better assess the validity of budgets reported for first- and second-line drugs, and to identify whether reported budgets include funding for buffer stocks.
In 2016, additional efforts to improve the quality of financial data reported to WHO included presentations and discussions with NTP staff during workshops on the development of national strategic plans or TB modelling.
In review and validation of data, particular attention has always been given to HBCs. A summary of data validation methods used for the 30 TB HBCs is shown in Table B7.1.1.
Usually, TB funding reported by NTPs does not include the financial costs associated with the inpatient and outpatient care required during treatment. Since many detailed costing studies in a wide range of countries show that these costs account for a large share of the cost of treating someone with TB, WHO analyses of TB financing have always included estimates of the funding used for both inpatient and outpatient care.
WHO estimates the funding used for inpatient and outpatient care of TB patients by multiplying the number of outpatient visits and days of inpatient care per patient (reported by NTPs each year) by the cost per bed day and per clinic visit available from the WHO CHOosing Interventions that are Cost-Effective (WHO-CHOICE) database,e and then by the reported number of TB patients notified or projected to be notified. This is done separately for drug-susceptible TB and MDR-TB. Where possible, estimates are compared with hospital and clinic expenditure data for drug-susceptible and MDR-TB that are being tracked through the System of health accounts (SHA).f In 2016, SHA data were available for 27 countries (including the six HBCs shown in Table B7.1.1),g and were used in preference to estimates based on reported use
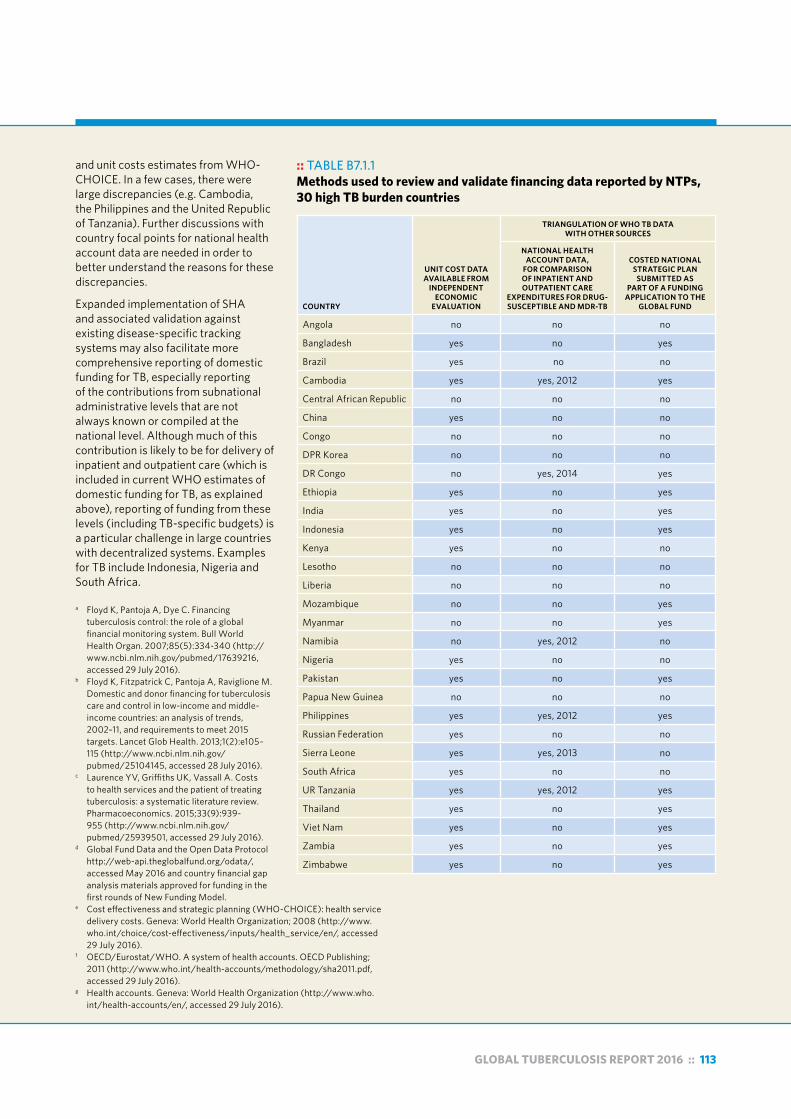
GLOBAL TUBERCULOSIS REPORT 2016 :: 113
and unit costs estimates from WHO-CHOICE. In a few cases, there were large discrepancies (e.g. Cambodia, the Philippines and the United Republic of Tanzania). Further discussions with country focal points for national health account data are needed in order to better understand the reasons for these discrepancies.
Expanded implementation of SHA and associated validation against existing disease-specific tracking systems may also facilitate more comprehensive reporting of domestic funding for TB, especially reporting of the contributions from subnational administrative levels that are not always known or compiled at the national level. Although much of this contribution is likely to be for delivery of inpatient and outpatient care (which is included in current WHO estimates of domestic funding for TB, as explained above), reporting of funding from these levels (including TB-specific budgets) is a particular challenge in large countries with decentralized systems. Examples for TB include Indonesia, Nigeria and South Africa.
a Floyd K, Pantoja A, Dye C. Financing tuberculosis control: the role of a global financial monitoring system. Bull World Health Organ. 2007;85(5):334-340 (http://www.ncbi.nlm.nih.gov/pubmed/17639216, accessed 29 July 2016).
b Floyd K, Fitzpatrick C, Pantoja A, Raviglione M. Domestic and donor financing for tuberculosis care and control in low-income and middle-income countries: an analysis of trends, 2002–11, and requirements to meet 2015 targets. Lancet Glob Health. 2013;1(2):e105–115 (http://www.ncbi.nlm.nih.gov/pubmed/25104145, accessed 28 July 2016).
c Laurence YV, Griffiths UK, Vassall A. Costs to health services and the patient of treating tuberculosis: a systematic literature review. Pharmacoeconomics. 2015;33(9):939-955 (http://www.ncbi.nlm.nih.gov/pubmed/25939501, accessed 29 July 2016).
d Global Fund Data and the Open Data Protocol http://web-api.theglobalfund.org/odata/, accessed May 2016 and country financial gap analysis materials approved for funding in the first rounds of New Funding Model.
e Cost effectiveness and strategic planning (WHO-CHOICE): health service delivery costs. Geneva: World Health Organization; 2008 (http://www.who.int/choice/cost-effectiveness/inputs/health_service/en/, accessed 29 July 2016).
f OECD/Eurostat/WHO. A system of health accounts. OECD Publishing; 2011 (http://www.who.int/health-accounts/methodology/sha2011.pdf, accessed 29 July 2016).
g Health accounts. Geneva: World Health Organization (http://www.who.int/health-accounts/en/, accessed 29 July 2016).
:: TABLE B7.1.1Methods used to review and validate financing data reported by NTPs, 30 high TB burden countries
COUNTRY
UNIT COST DATA AVAILABLE FROM
INDEPENDENT ECONOMIC
EVALUATION
TRIANGULATION OF WHO TB DATA WITH OTHER SOURCES
NATIONAL HEALTH ACCOUNT DATA,
FOR COMPARISON OF INPATIENT AND OUTPATIENT CARE
EXPENDITURES FOR DRUG-SUSCEPTIBLE AND MDR-TB
COSTED NATIONAL STRATEGIC PLAN
SUBMITTED AS PART OF A FUNDING
APPLICATION TO THE GLOBAL FUND
Angola no no no
Bangladesh yes no yes
Brazil yes no no
Cambodia yes yes, 2012 yes
Central African Republic no no no
China yes no no
Congo no no no
DPR Korea no no no
DR Congo no yes, 2014 yes
Ethiopia yes no yes
India yes no yes
Indonesia yes no yes
Kenya yes no no
Lesotho no no no
Liberia no no no
Mozambique no no yes
Myanmar no no yes
Namibia no yes, 2012 no
Nigeria yes no no
Pakistan yes no yes
Papua New Guinea no no no
Philippines yes yes, 2012 yes
Russian Federation yes no no
Sierra Leone yes yes, 2013 no
South Africa yes no no
UR Tanzania yes yes, 2012 yes
Thailand yes no yes
Viet Nam yes no yes
Zambia yes no yes
Zimbabwe yes no yes
:: Box 3.2Updates to estimates of TB disease burden in this report and anticipated updates
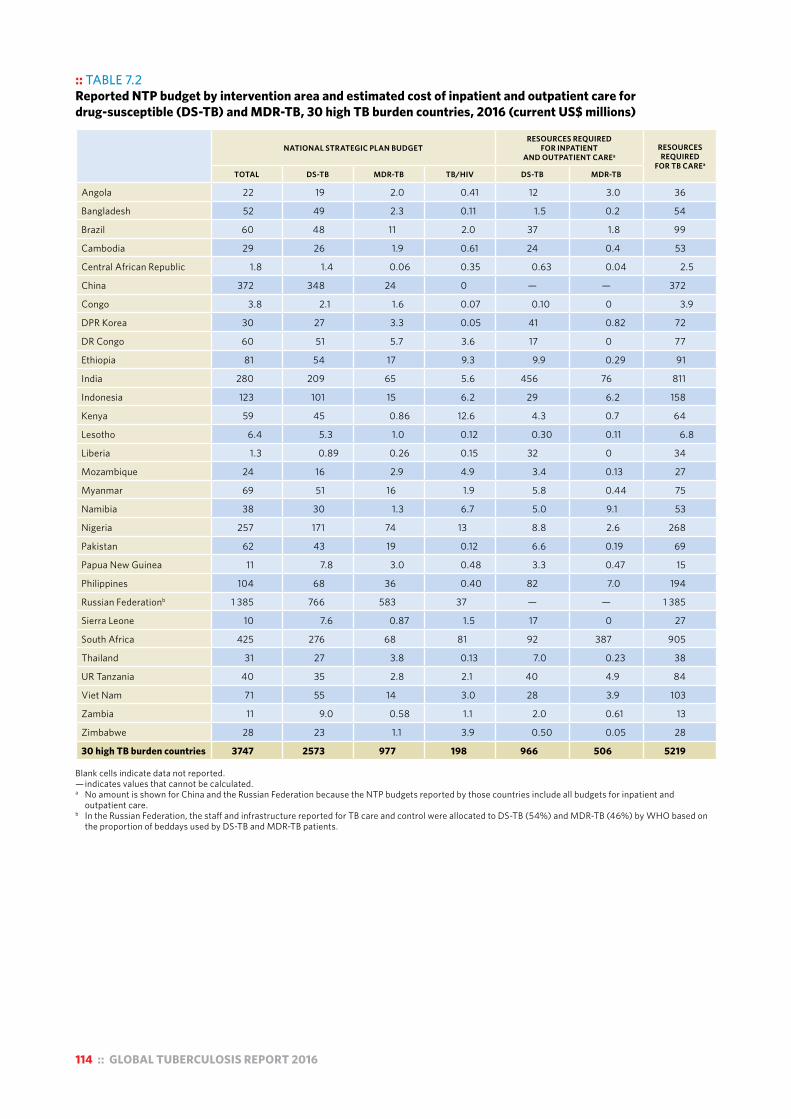
114 :: GLOBAL TUBERCULOSIS REPORT 2016
:: TABLE 7.2 Reported NTP budget by intervention area and estimated cost of inpatient and outpatient care for drug-susceptible (DS-TB) and MDR-TB, 30 high TB burden countries, 2016 (current US$ millions)
NATIONAL STRATEGIC PLAN BUDGETRESOURCES REQUIRED
FOR INPATIENT AND OUTPATIENT CAREa
RESOURCES REQUIRED
FOR TB CAREa
TOTAL DS-TB MDR-TB TB/HIV DS-TB MDR-TB
Angola 22 19 2.0 0.41 12 3.0 36
Bangladesh 52 49 2.3 0.11 1.5 0.2 54
Brazil 60 48 11 2.0 37 1.8 99
Cambodia 29 26 1.9 0.61 24 0.4 53
Central African Republic 1.8 1.4 0.06 0.35 0.63 0.04 2.5
China 372 348 24 0 — — 372
Congo 3.8 2.1 1.6 0.07 0.10 0 3.9
DPR Korea 30 27 3.3 0.05 41 0.82 72
DR Congo 60 51 5.7 3.6 17 0 77
Ethiopia 81 54 17 9.3 9.9 0.29 91
India 280 209 65 5.6 456 76 811
Indonesia 123 101 15 6.2 29 6.2 158
Kenya 59 45 0.86 12.6 4.3 0.7 64
Lesotho 6.4 5.3 1.0 0.12 0.30 0.11 6.8
Liberia 1.3 0.89 0.26 0.15 32 0 34
Mozambique 24 16 2.9 4.9 3.4 0.13 27
Myanmar 69 51 16 1.9 5.8 0.44 75
Namibia 38 30 1.3 6.7 5.0 9.1 53
Nigeria 257 171 74 13 8.8 2.6 268
Pakistan 62 43 19 0.12 6.6 0.19 69
Papua New Guinea 11 7.8 3.0 0.48 3.3 0.47 15
Philippines 104 68 36 0.40 82 7.0 194
Russian Federationb 1 385 766 583 37 — — 1 385
Sierra Leone 10 7.6 0.87 1.5 17 0 27
South Africa 425 276 68 81 92 387 905
Thailand 31 27 3.8 0.13 7.0 0.23 38
UR Tanzania 40 35 2.8 2.1 40 4.9 84
Viet Nam 71 55 14 3.0 28 3.9 103
Zambia 11 9.0 0.58 1.1 2.0 0.61 13
Zimbabwe 28 23 1.1 3.9 0.50 0.05 28
30 high TB burden countries 3747 2573 977 198 966 506 5219 Blank cells indicate data not reported. — indicates values that cannot be calculated. a No amount is shown for China and the Russian Federation because the NTP budgets reported by those countries include all budgets for inpatient and
outpatient care. b In the Russian Federation, the staff and infrastructure reported for TB care and control were allocated to DS-TB (54%) and MDR-TB (46%) by WHO based on
the proportion of beddays used by DS-TB and MDR-TB patients.
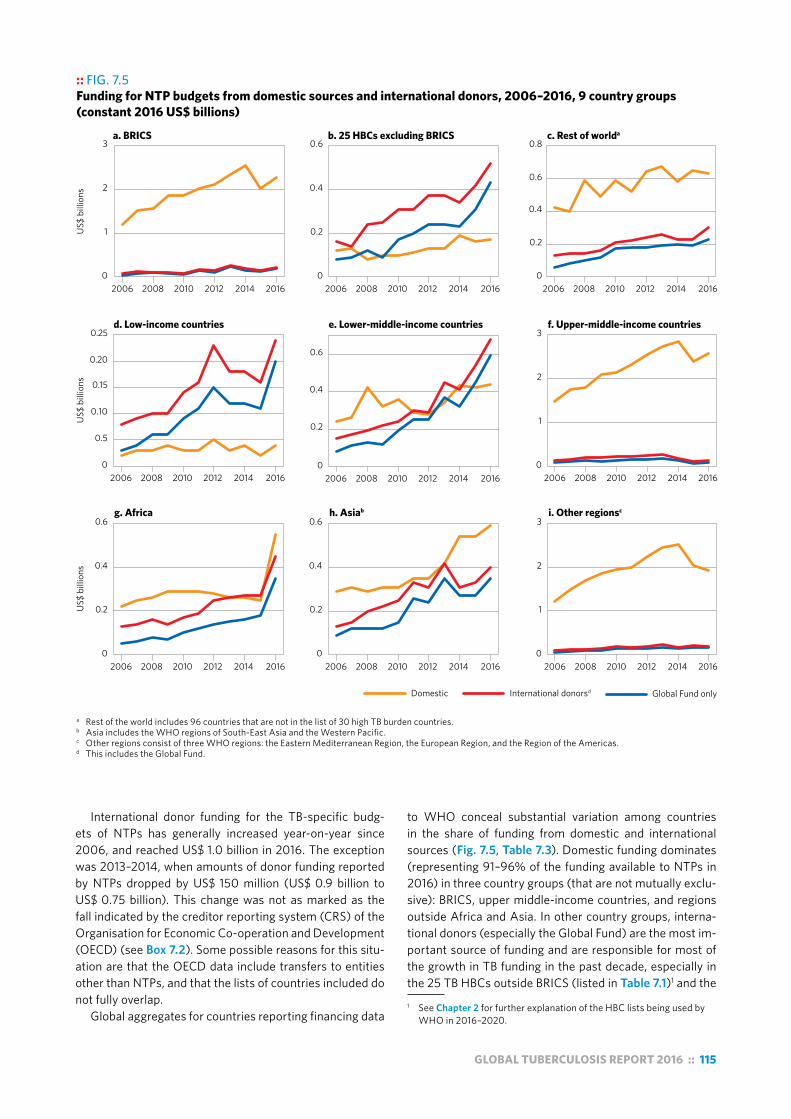
GLOBAL TUBERCULOSIS REPORT 2016 :: 115
International donor funding for the TB-specific budg-ets of NTPs has generally increased year-on-year since 2006, and reached US$ 1.0 billion in 2016. The exception was 2013–2014, when amounts of donor funding reported by NTPs dropped by US$ 150 million (US$ 0.9 billion to US$ 0.75 billion). This change was not as marked as the fall indicated by the creditor reporting system (CRS) of the Organisation for Economic Co-operation and Development (OECD) (see Box 7.2). Some possible reasons for this situ-ation are that the OECD data include transfers to entities other than NTPs, and that the lists of countries included do not fully overlap.
Global aggregates for countries reporting financing data
to WHO conceal substantial variation among countries in the share of funding from domestic and international sources (Fig. 7.5, Table 7.3). Domestic funding dominates (representing 91–96% of the funding available to NTPs in 2016) in three country groups (that are not mutually exclu-sive): BRICS, upper middle-income countries, and regions outside Africa and Asia. In other country groups, interna-tional donors (especially the Global Fund) are the most im-portant source of funding and are responsible for most of the growth in TB funding in the past decade, especially in the 25 TB HBCs outside BRICS (listed in Table 7.1)1 and the 1 See Chapter 2 for further explanation of the HBC lists being used by
WHO in 2016–2020.
:: FIG. 7.5 Funding for NTP budgets from domestic sources and international donors, 2006–2016, 9 country groups (constant 2016 US$ billions)
a Rest of the world includes 96 countries that are not in the list of 30 high TB burden countries.b Asia includes the WHO regions of South-East Asia and the Western Pacific.c Other regions consist of three WHO regions: the Eastern Mediterranean Region, the European Region, and the Region of the Americas.d This includes the Global Fund.
US$
bill
ions
a. BRICS b. 25 HBCs excluding BRICS c. Rest of worlda
Domestic International donorsd
2006 2008 2010 2012 2014 2016 2006 2008 2010 2012 2014 2016 2006 2008 2010 2012 2014 2016
2006 2008 2010 2012 2014 2016 2006 2008 2010 2012 2014 2016 2006 2008 2010 2012 2014 2016
2006 2008 2010 2012 2014 20162006 2008 2010 2012 2014 2016 2006 2008 2010 2012 2014 2016
0
1
2
3
0
0.5
0.10
0.15
0.20
0.25
0
0.2
0.4
0.6
0
0.2
0.4
0.6
0
0.2
0.4
0.6
0
0.2
0.4
0.6
0
0.2
0.4
0.6
0.8
0
1
2
3
0
1
2
3
d. Low-income countries e. Lower-middle-income countries f. Upper-middle-income countries
g. Africa h. Asiab i. Other regionsc
US$
bill
ions
US$
bill
ions
Global Fund only

116 :: GLOBAL TUBERCULOSIS REPORT 2016
:: Box 7.2International donor funding for TB prevention, diagnosis and treatment, based on donor reports to the OECD
Not all international donor funding that is provided for TB prevention, diagnosis and treatment is channelled through NTPs. The creditor reporting system (CRS) of the OECD is the most comprehensive source of information about international donor funding. Funding data (both commitments and disbursements) are provided by 31 multilateral donor organizations, the 26 countries that are members of the OECD’s Development Assistance Committee and a further two non-committee members (Kuwait and the United Arab Emirates).
Disbursement data include both direct transfers to countries and the provision of goods and services, such as in-kind transfers or technical assistance. Data on gross disbursementsa for TB (code 12263: Tuberculosis control) received by non-OECD countries over the period 2004–2014 were analysed. Funding for TB that flows from one OECD member to an institution or government within the OECD, such as grants from the United States (US) National Institutes for Health to the United Kingdom, is not captured in the CRS. Also, government contributions to multilateral organizations are not attributed to the government of origin but only to the multilateral organization.b
Fig. B7.2.1 shows trends in international donor funding between 2004 and 2014, for four major categories. The total from all sources in 2014 was US$ 0.7 billion, up from US$ 0.1 billion in 2004. In 2014, 57% of international TB donor funding was from the Global Fund (US $ 0.4 billion) and the next largest contributor was the US government (32%; US $ 247 million). Given that about one third of the contributions to the Global Fund are from the US government, about half of international donor funding globally
::FIG. B7.2.1 International donor funding for TB prevention, diagnosis and treatment by region, 2004–2014
US$
mill
ions
2004 2006 2008 2010 2012 20140
200
400
600
800
Other countries
Global Fund
United States
Othermultilaterals
originated from the US government in 2014.c The remaining funding came from other countries (9%) and multilateral organizations (2%), among which the largest donors were the governments of the United Kingdom (5%) and Japan (2%).
Throughout the period 2004–2014, the Global Fund was consistently the largest provider of international donor funding, but there was a striking drop of 44% from a peak of US$ 0.8 billion in 2013 to US$ 0.44 billion in 2014. This may reflect the transition to a new funding model that started in 2013, and some associated delays in approving and disbursing funds. Disbursements from the US government steadily increased over the period 2004–2014, reaching a peak of US$ 247 million in 2014.
Asia and Africa received the vast majority of international donor funding (Fig. B7.2.2), and the decline in funding from the Global Fund was evident in 2013–2014 in four geographical subregions. These reductions were partly mitigated by increased funding from the US government in Asia, Africa and Europe (but not the Americas).
A comparison of international donor funding for HIV/AIDS (coded as sexually transmitted disease [STD] control within the OECD reporting system), malaria and TB is shown in Fig. B7.2.3. In 2014, non-OECD countries received US$ 5.4 billion for HIV/AIDS, US$ 1.7 billion for malaria and US$ 0.7 billion for TB. To provide some context for these amounts, the latest estimates (for 2013) of the burden of disease in terms of disability adjusted life years (DALYs) lost due to illness and death are 69 million for HIV/AIDS, 50 million for malaria and 65 million for TB.d The decline in international donor funding observed for TB between 2013 and 2014 was also evident for HIV/AIDS, but not for malaria. The first- and second-ranking donors for TB and malaria are the Global Fund and the US government, whereas the order is reversed for HIV/AIDS (62% directly from the US government and 29% from the Global Fund).
a As opposed to commitments, which may not materialize. b An important example is funding from the Global Fund to non-OECD
countries, which is attributed to the Global Fund and not to the governments or other entities that contribute to the Global Fund.
c It should be noted that contributions from the United States government captured in the OECD database are lower than official allocations. In 2014, the official allocation for TB was US$ 243 million and an additional US$ 154 million was allocated for TB/HIV via the President’s Emergency Plan for AIDS Relief (PEPFAR).
d ghdx.healthdata.org/global-burden-disease-study-2013-gbd-2013-data-downloads
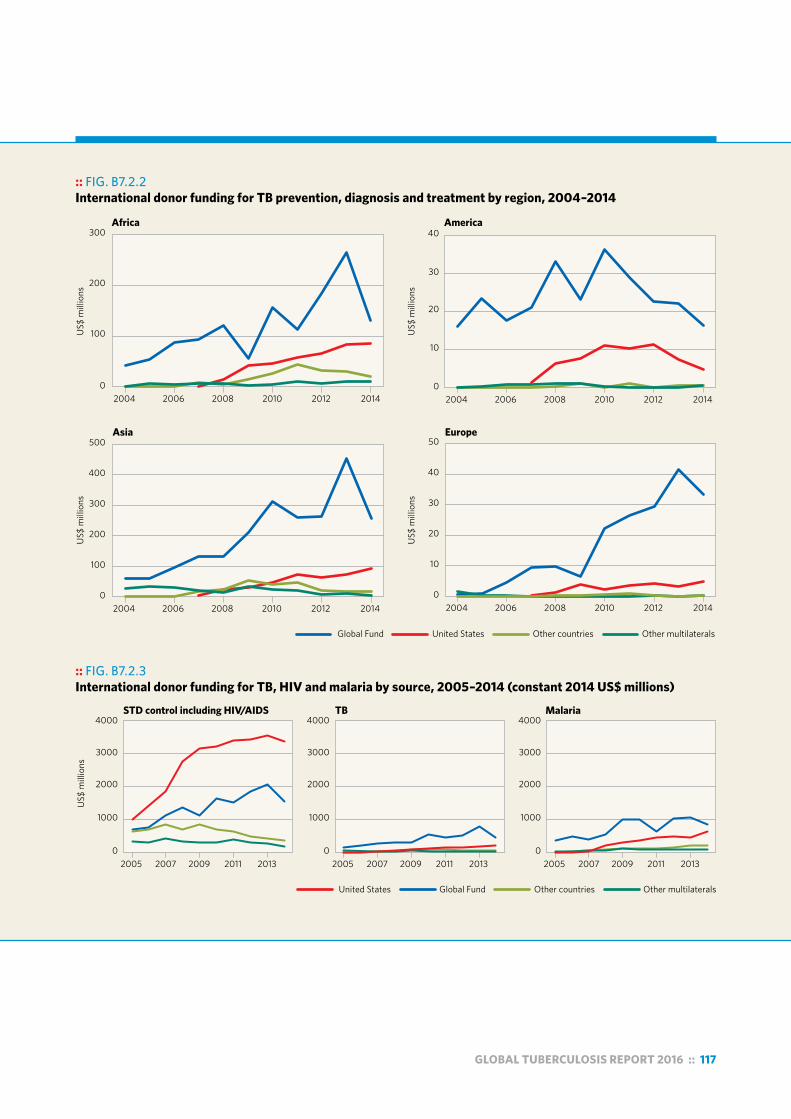
GLOBAL TUBERCULOSIS REPORT 2016 :: 117
:: FIG. B7.2.2 International donor funding for TB prevention, diagnosis and treatment by region, 2004–2014
US$
mill
ions
Africa
0
100
200
300
0
100
200
300
400
500
0
10
20
30
40
0
10
20
30
40
50
2004 2006 2008 2010 2012 2014 2004 2006 2008 2010 2012 2014
2004 2006 2008 2010 2012 2014 2004 2006 2008 2010 2012 2014
US$
mill
ions
US$
mill
ions
US$
mill
ions
America
Asia Europe
Global Fund United States Other countries Other multilaterals
:: Box 7.2International donor funding for TB prevention, diagnosis
US$
mill
ions
STD control including HIV/AIDS TB Malaria
0
1000
2000
3000
4000
0
1000
2000
3000
4000
0
1000
2000
3000
4000
2005 2007 2009 2011 2013 2005 2007 2009 2011 20132005 2007 2009 2011 2013
United States Global Fund Other countries Other multilaterals
:: FIG. B7.2.3 International donor funding for TB, HIV and malaria by source, 2005–2014 (constant 2014 US$ millions)

118 :: GLOBAL TUBERCULOSIS REPORT 2016
:: TABLE 7.3 Reported NTP budget, available funding for NTP budget from domestic and international donor sources, funding gap and share of NTP budget provided by domestic and international donor funding, 30 high TB burden countries, 2016 (current US$ millions)a
TOTAL NATIONAL
STRATEGIC PLAN BUDGET
DOMESTIC FUNDING
(A)
INTERNATIONAL DONOR FUNDING
(B)
SHARE OF AVAILABLE
FUNDING (A+B) PROVIDED FROM
DOMESTIC SOURCES(%)
SHARE OF AVAILABLE FUNDING (A+B) PROVIDED BY
INTERNATIONAL DONORS (%)
FUNDING GAP
Angola 22 8.4 0 100 0 13
Bangladesh 52 6.0 45 12 88 0.58
Brazil 60 46 0.55 99 1.2 13
Cambodia 29 2.3 11 18 82 16
Central African Republic 1.8 0.27 1.0 21 79 0.56
China 372 361 6.4 98 1.7 4.4
Congo 3.8 0.47 2.6 15 85 0.8
DPR Korea 30 5.7 8.1 41 59 16
DR Congo 60 1.7 36 5 95 23
Ethiopia 81 9.3 41 18 82 31
India 280 105 175 38 62 0
Indonesiab 123 39
Kenya 59 12 47 20 80 0
Lesotho 6.4 0.74 1.2 38 62 4.5
Liberia 1.3 0 1.3 0 100 0
Mozambique 24 1.0 17 6 94 5.7
Myanmar 69 14 36 29 71 19
Namibia 38 20 10 66 34 8.9
Nigeria 257 30 86 26 74 141
Pakistan 62 0.41 40 1.0 99 22
Papua New Guinea 11 11 100 0
Philippines 104 22 43 33 67 40
Russian Federation 1 385 1 385 0 100 0 0
Sierra Leone 10 0 10 0 100 0
South Africa 425 369 35 91 8.6 22
Thailand 31 11 2.9 79 21 17
UR Tanzania 40 1.9 16 11 89 22
Viet Nam 71 6.7 16 30 70 49
Zambia 11 1.0 5.5 15 85 4.3
Zimbabwe 28 15 100 13
30 high TB burden countries 3747 2421 758 76 24 484
Blank cells indicate data not reported.— indicates values that cannot be calculated.a Funding gap reflects the anticipated gap for the year at the time a country reported data in the 2016 round of global TB data collection.b For Indonesia, available funding from domestic sources data are not shown because the Government of Indonesia is currently reviewing contributions from
domestic sources.

GLOBAL TUBERCULOSIS REPORT 2016 :: 119
group of low-income and lower middle-income countries (Fig. 7.5). International donors account for 75% of the total funding in 2016 in the group of 25 TB HBCs outside BRICS, 87% of funding in low-income countries and 60% of fund-ing in lower middle-income countries. At the individual country level, international donors remain absolutely criti-cal to funding for NTPs in most of the 30 TB HBCs (Table 7.3).
As noted above, funding reported by NTPs does not capture all international donor funding for TB. Donor fund-ing is also provided to entities other than NTPs, including international and national governmental and nongovern-mental organizations. A more comprehensive analysis of international donor funding for TB, including comparisons with HIV and malaria, is provided in Box 7.2, based on do-nor reports to the OECD.1 Amounts for TB are much lower than donor contributions for HIV and malaria.
7.3 Funding gaps reported by national TB programmes, 2006–2016
Despite growth in funding from domestic and international donor sources, many NTPs continue to be unable to mobi-lize all the funding required for full implementation of their national strategic plans (Fig. 7.6). Funding gaps (i.e. the dif-ference between assessments by NTPs of funding needs for TB prevention, diagnosis and treatment, and the actual amount of funds mobilized) have persisted, and in 2016 they amounted to a total of US$ 0.8 billion. This is less than half of the gap of US$ 1.7 billion that exists between the US$ 8.3 billion estimated to be needed in low- and middle-income countries in 2016 according to the Global Plan (Sec-tion 7.1) and the US$ 6.6 billion available in 2016 (Section 7.2). The difference can be explained by the fact that, in
1 Out-of-pocket expenditures are also not included in NTP reports. These are discussed in more detail in Chapter 6.
:: FIG. 7.6 Reported funding gaps for TB prevention, diagnosis and treatment, by income group and WHO region, 2006–2016 (constant 2016 US$ millions)
0
100
200
300
400
500
600
700
2006 2008 2010 2012 2014 20160
100
200
300
400
500
600
2006 2008 2010 2012 2014 2016
US$
mill
ions
US$
mill
ions
Lower-middle-income countriesLow-income countriesUpper-middle-income countries
African regionRegion of the AmericasEastern Mediterranean regionEuropean regionSouth-East Asia regionWestern Pacific region
Total gap in 2016 = US$ 0.8 billionTotal gap in 2016 = US$ 0.8 billion
many countries, national strategic plans for TB are less am-bitious than the targets set in the Global Plan (Section 7.1).
Lower middle-income countries account for the largest reported funding gaps (almost US$ 0.5 billion in 2016). Ge-ographically, almost half of the total reported funding gap is accounted for by countries in the WHO African Region, with the largest gaps reported by Ethiopia and Nigeria (Ta-ble 7.3). Funding gaps were relatively small in upper mid-dle-income countries in 2016 (Fig. 7.6), and have fallen in recent years. This trend is mostly explained by large reduc-tions in the funding gaps reported by China, Kazakhstan and the Russian Federation, which reported funding gaps in 2006–2011 but negligible or zero gaps thereafter. Funding gaps reported by low-income countries have fallen since 2012, reflecting a transition of some countries out of the low-income country group and into the group of middle-income countries.
Of the US$ 0.8 billion funding gap reported by NTPs in 2016, US$ 0.63 billion is for drug-susceptible TB and US$ 0.14 billion is for MDR-TB. Relative to total funding needs, the funding gap is larger for drug-susceptible TB than for MDR-TB. Domestic funding accounts for a larger share of the funding for MDR-TB than for drug-susceptible TB: this is not surprising given that most of the high MDR-TB burden countries are middle- or high-income countries.
7.4 Unit costs of treatment for drug-susceptible and multidrug-resistant TB, 2015
The cost per patient treated in 2015 for drug-susceptible and MDR-TB was estimated for 117 countries and 82 coun-tries, respectively.2 All 30 countries in the lists of TB and
2 Analysis for drug-susceptible TB was limited to countries that notified at least 100 TB cases in 2015. For MDR-TB, estimates were restricted to countries that reported at least 10 patients on second-line treatment for MDR-TB.
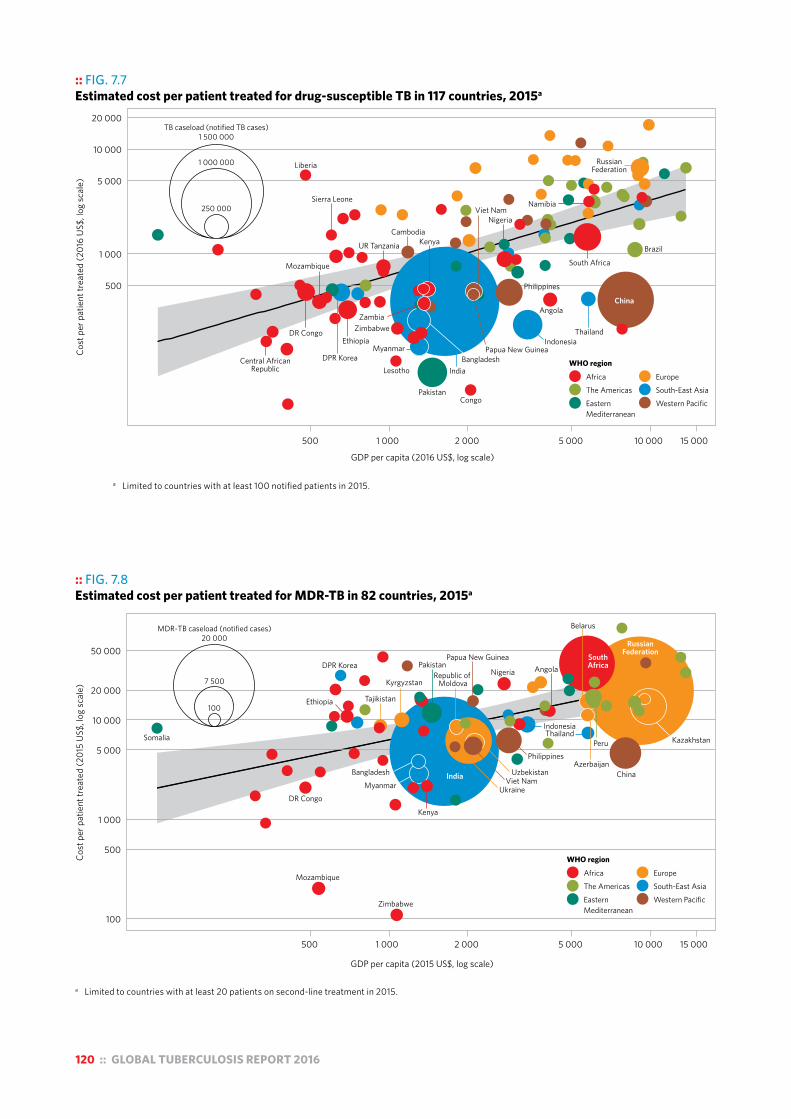
120 :: GLOBAL TUBERCULOSIS REPORT 2016
:: FIG. 7.7 Estimated cost per patient treated for drug-susceptible TB in 117 countries, 2015a
●
●
●
●
● ●
●●
●
●
●●
●●●
●
●
●
●● ●
●●
●●
●
●
●
●
●
●
●●
●
●●
●●
●
●
●
●
●●
●●
●
●●
● ●●
●
●
●
● ●
●
●
●
●
● ●
●
●
●
●
● ●●
●
●
●
● ●●
●
●●
●●
●
●
●
●●
●
●
●
●
●
●
●
●
●
●
●
●
●● ●
●
●
●
●
●
●
●●
●
EuropeSouth-East AsiaWestern Pacific
250 000
1 000 000
TB caseload (notified TB cases)1 500 000
WHO region
AfricaThe AmericasEasternMediterranean
Angola
Brazil
Central AfricanRepublic
China
DR Congo
Congo
Ethiopia Indonesia
Cambodia
Liberia
Lesotho
Myanmar
Mozambique
Namibia
Nigeria
Pakistan
Philippines
DPR Korea
RussianFederation
Sierra Leone
Thailand
UR Tanzania
South Africa
Zimbabwe
India
Kenya
Bangladesh
Zambia
Papua New Guinea
Viet Nam
500
1 000
5 000
10 000
20 000
Cost
per
pat
ient
trea
ted
(201
6 U
S$, l
og sc
ale)
500 1 000 2 000 5 000 10 000 15 000
GDP per capita (2016 US$, log scale)
a Limited to countries with at least 100 notified patients in 2015.
:: FIG. 7.8 Estimated cost per patient treated for MDR-TB in 82 countries, 2015a
●●●
●
●
●●
●●
●●● ●
●●
●●
●
●
●
●
●
●
●
●
●
●
●
●
●●
●●
●
●
●
●●
●
●
●
●
●
●
●
●
●●
●
●
●
●
●
●●
●
●●● ●●
●
●
●
●
●
●
●
●●
●
●●
●
●
EuropeSouth-East AsiaWestern Pacific
WHO region
AfricaThe AmericasEasternMediterranean
100
7 500
MDR-TB caseload (notified cases)20 000
Angola
AzerbaijanBangladesh
Belarus
DR Congo
Ethiopia
Kazakhstan
Kenya
KyrgyzstanRepublic of
Moldova
Mozambique
PakistanPapua New Guinea
DPR Korea
RussianFederation
Thailand
Tajikistan
UkraineViet Nam
SouthAfrica
Zimbabwe
China
Indonesia
Nigeria
PeruPhilippines
Uzbekistan
Somalia
IndiaMyanmar
500 1 000 2 000 5 000 10 000 15 000
GDP per capita (2015 US$, log scale)
100
500
1 000
5 000
10 000
20 000
50 000
Cost
per
pat
ient
trea
ted
(201
5 U
S$, l
og sc
ale)
a Limited to countries with at least 20 patients on second-line treatment in 2015.
GLOBAL TUBERCULOSIS REPORT 2016 :: 121
:: Box 7.3Methods used to estimate the cost per patient treated for drug-susceptible and MDR-TB
Two main data sources were used to estimate the cost per patient treated for drug-susceptible TB and MDR-TB. The first was the validated expenditure data reported by NTPs that are stored in the WHO global TB database. The second was country-specific estimates of the unit costs of bed days and outpatient visits available from the WHO-CHOICE modela and associated database (managed by the WHO Health Governance and Financing Department). In the few instances where no expenditure data could be reported, information about the total funding available was used as a proxy for expenditures. Also, for a few countries, WHO-CHOICE estimates were replaced with estimates of unit costs obtained directly from recent studies or discussions with experts.
Costs were calculated separately for drug-susceptible TB and MDR-TB. In each case, the numerator was the total estimated cost of treatment, which has two main parts: the national expenditures reported by the NTP, and the costs associated with the use of health services for TB patients.
As explained in Box 7.1, national NTP expenditures are reported annually to WHO using the online WHO global TB data collection system, and are then reviewed and validated. Categories of expenditure considered as costs for MDR-TB were second-line drugs and all other inputs or activities implemented for the programmatic management of MDR-TB. All other categories (with the exception of collaborative TB/HIV activities) were assumed to be for drug-susceptible TB.
For almost all countries, the total costs associated with use of inpatient and outpatient care were calculated using information about the typical number of days of inpatient care and outpatient visits required on a per-patient basis during treatment (reported separately for drug-susceptible TB and MDR-TB by NTPs) combined with WHO-CHOICE unit cost estimates, multiplied by the number of patients treated in a given year (based on notification data – see Chapter 4). Multiplying quantities of visits and bed days by their price estimates yields the total estimated cost of inpatient and outpatient services. For 27 countries (including six HBCs, see Box 7.1), TB inpatient and outpatient expenditures available from national health accountsb were used instead of the estimated cost from this ingredients-based approach.
Unit costs were then calculated as the sum of 2015 NTP expenditures and total costs for use of inpatient and outpatient care, divided by the reported number of patients treated. Again, this calculation was carried out separately for drug-susceptible TB and MDR-TB.
a Cost effectiveness and strategic planning (WHO-CHOICE): health service delivery costs. Geneva: World Health Organization; 2008 (http://www.who.int/choice/cost-effectiveness/inputs/health_service/en/, accessed 29 July 2016).
b Health accounts. Geneva: World Health Organization (http://www.who.int/health-accounts/en/, accessed 29 July 2016).
MDR-TB HBCs were included in this analysis. Unit cost es-timates are shown in Fig. 7.7 and Fig. 7.8, and analytical methods are summarized in Box 7.3.
7.4.1 Drug-susceptible TBThe cost per patient treated for drug-susceptible TB was generally in the range US$ 100−US$ 1000 (Fig. 7.7). In general, about 80% of this cost was accounted for by re-ported NTP expenditures, with the remainder being inpa-tient and outpatient care. There is a positive relationship between the cost per patient treated and gross domestic product (GDP) per capita, as well as the size of the patient caseload (indicating economies of scale, e.g. in China and India). In most (28/30) of the TB HBCs included in the analysis, the cost per patient treated for drug-susceptible TB was less than GDP per capita; the exceptions were Libe-ria and Sierra Leone.
The cost per patient treated was typically higher in coun-tries in the WHO European Region and the WHO Region of the Americas. In countries of the former Soviet Union, the higher cost is partly explained by relatively lengthy hospi-
talizations, with admissions lasting up to an average of 75 days and accounting for about 40–60% of the total cost per patient. However, there are some striking examples of reductions in reliance on hospitalization. For example, the Russian Federation reported hospitalization of about 65% of TB patients with drug-susceptible TB in 2016, compared with 93% in 2014, and in Georgia the figures were 30% and 83%, respectively.
7.4.2 Multidrug-resistant TBFor MDR-TB, the cost per patient treated ranges from about US$ 2000–20 000 in most countries (Fig. 7.8). As with drug-susceptible TB, the cost per patient treated is related to GDP per capita. Following new WHO recommendations that shortened regimens of 9–12 months can be used for patients (other than pregnant women) with rifampicin-re-sistant or MDR pulmonary TB who do not have resistance to second-line drugs,1 at a cost of about US$ 1000 per per-son for the drug regimen, there is scope for the unit cost of second-line treatment for MDR-TB to fall in the coming years.
1 For further details about the new recommendations, see Chapter 4.
122 :: GLOBAL TUBERCULOSIS REPORT 2016
Chapter 8 :: TB research and development
:: KEY FACTS AND MESSAGES“Intensified research and innovation” is the third pillar of the End TB Strategy.
WHO has developed a Global Action Framework for TB Research, to foster high-quality research to end the TB epidemic at both country and global levels.
In 2016, four diagnostic tests were reviewed and recommended by WHO: the loop-mediated isothermal amplification test for TB (known as TB-LAMP), two line probe assays (LPAs) for the detection of resistance to the first-line anti-TB drugs isoniazid and rifampicin, and an LPA for the detection of resistance to second-line anti-TB drugs.
A next-generation cartridge called Xpert Ultra, which may replace the Xpert MTB/RIF cartridge and could potentially replace conventional culture as the primary diagnostic tool for TB, will be assessed in 2017. The Xpert Ultra cartridge is designed to be used in existing GeneXpert instruments. A new diagnostic platform called the GeneXpert Omni is also in development. This is intended for point-of-care testing for TB and rifampicin-resistant TB using Xpert Ultra cartridges. Assessment of this new platform as an alternative to the GeneXpert instrument is expected in 2017.
Development of new drugs and regimens for the treatment of TB continues, with both advances and setbacks in 2015–2016. A new compound (Q203) entered a Phase I trial, but the development of AZD5847 by Astra-Zeneca was officially ended (due to lack of demonstrated anti-TB activity) and the development of TBA-354 was discontinued (due to signs of toxicity in the Phase I trial).
There are nine anti-TB drugs in advanced phases of clinical development for the treatment of drug-susceptible, multidrug-resistant TB or latent TB infection (LTBI), of which six are new and three are already approved or repurposed. The six new compounds are bedaquiline, delamanid, PBTZ169, pretomanid, Q203 and sutezolid. The three approved or repurposed drugs undergoing further testing are rifampicin, rifapentine and linezolid.
There are 13 vaccine candidates in clinical trials: eight in Phase II or Phase III trials, and five in Phase I trials. They include candidates for prevention of TB infection and candidates for prevention of TB disease in people with LTBI.
“Intensified research and innovation” is one of the three pillars of the WHO End TB Strategy.1 Its two main com-ponents are “discovery, development and rapid uptake of new tools, interventions and strategies” and “research to optimize implementation and impact, and promote inno-vations” (Chapter 2). The strategy sets targets for reduc-tions in TB incidence and TB mortality by 2030 and 2035. Reaching these targets will require a major technological breakthrough by 2025, so that the rate at which TB inci-dence falls can be dramatically accelerated compared with historic levels between 2025 and 2035 (Chapter 2). A substantial increase in investment in TB research and de-velopment will be needed to achieve such a breakthrough. The Stop TB Partnership’s Global Plan to End TB, 2016–20202 estimates that about US$ 2 billion per year is needed dur-
1 World Health Organization. WHO End TB Strategy: global strategy and targets for tuberculosis prevention, care and control after 2015. Geneva: WHO; 2015 (http://www.who.int/tb/post2015_strategy/en/, accessed 8 August 2016).
2 The Global Plan to End TB, 2016–2020. Geneva: Stop TB Partnership; 2015 (http://www.stoptb.org/global/plan/, accessed 28 July 2016).
ing the period 2016–2020, compared with funding lev-els during the decade 2005–2014 that never exceeded US$ 0.7 billion per year.3
This chapter provides an overview of progress in the de-velopment of new TB diagnostics, drugs and vaccines as of August 2016, based on recent publications and communi-cations with and contributions from the secretariats of the relevant working groups of the Stop TB Partnership, and various stakeholders.
The Global Action Framework for TB Research (GAF),4 which has been developed by WHO to foster high-quality TB research across the spectrum, is profiled in Box 8.1.
3 2015 Report on Tuberculosis Research Funding Trends, 2005–2014: A Decade of Data. New York: Treatment Action Group; 2015 (http://www.treatmentactiongroup.org/tbrd2015).
4 World Health Organization. A Global Action Framework for TB research in support of the third pillar of WHO’s End TB Strategy. Geneva: WHO; 2015 (http://www.who.int/tb/publications/global-framework-research/en/, accessed 8 August 2016).
GLOBAL TUBERCULOSIS REPORT 2016 :: 123
8.1 New diagnostics for TB8.1.1 An overview of the diagnostics pipelineThe diagnostic technology landscape, which consists mostly of molecular tests, continues to look promising. An overview of the diagnostic pipeline for rapid molecular tests in August 2016 is shown in Fig. 8.1. The list of technologies is not necessarily complete, but does reflect technologies that have been documented in a recent report published by the Treatment Action Group.1 Technologies under develop-ment include tests to detect TB, drug resistance or TB and drug resistance combined.
At least three new commercial technologies – Epistem Genedrive, Epistem, United Kingdom; EasyNAT, Ustar Bio-technologies, China; and Molbio TrueNAT, Molbio, India – are intended for use at the microscopy level. However, available performance data for these tests are limited and highly variable, and to date no multicentre evaluation or demonstration studies in different epidemiological set-tings have been conducted. Such studies are essential to generate the data required by WHO to assess and produce recommendations on their use, but funding and capacity to undertake the studies are limited. Several manufactur-ers have also indicated that they are developing centralized testing platforms suitable for high laboratory through-put. However, these platforms are not yet ready for field evaluation studies, and to be useful a large investment
1 Frick M, Lessem E, McKenna L. Pipeline report: Tuberculosis (TB) edition. London/New York: HIV i-Base/Treatment Action Group; 2016 (http://www.pipelinereport.org/sites/default/files/2016%20Pipeline%20TB%20Edition_0.pdf, accessed 8 August 2016).
in sample transportation systems would be required. Cepheid is developing a new platform called GeneXpert
Omni, which is intended for point-of-care (POC) testing for TB and rifampicin-resistant TB using Xpert MTB/RIF cartridges or the next-generation Xpert Ultra cartridges. The device is expected to be smaller, lighter and less ex-pensive than other currently available platforms for POC nucleic acid detection. The platform is expected to come with a built-in 4-hour battery and an auxiliary battery that provides an additional 12 hours of run time. Delays in the development of the GeneXpert Omni mean that the instru-ments are not likely to be available before the second half of 2017. The new platform will be assessed for equivalence to the current GeneXpert platform before its launch. The GeneXpert Omni is expected to be an alternative to and complement the existing multi-module instruments.
Major gaps that remain in the diagnostic pipeline in-clude tests for the diagnosis of TB in children, rapid drug susceptibility tests for drugs that may be part of new treat-ment regimens, tests that accurately predict progression from latent TB infection (LTBI) to active TB disease, and alternatives to TB microscopy and culture for treatment monitoring. In addition, experience with GeneXpert has made it clear that any new technology will need to be rolled out with an entire set of interventions, including compre-hensive training, quality assurance, implementation plans, data connectivity, and service and maintenance support.
:: Box 8.1WHO’s Global Action Framework for TB Research
WHO has developed Global Action Framework (GAF) to foster high-quality TB research across the spectrum (from basic science to implementation research), with the overall goal of ending the global TB epidemic. The GAF has two major dimensions: promoting research at country level and promoting research at global level, as summarized below.
Promoting research at country levelAt country level, WHO encourages the establishment of a national TB research network of stakeholders (individuals and organizations) that will drive research and innovation based on a shared desire to address the national TB epidemic. It is expected that the network will provide a systematic approach to addressing issues in TB prevention, diagnosis and treatment research. The approach should start with a situational analysis of the TB epidemic, and of the performance of the national TB control programme and wider health system, and mapping of research capacity. This should be followed by the development of a national TB
research agenda to address identified gaps, the outcomes of which should inform TB care policy and practice. To support the development of such plans for research, WHO’s Global TB Programme has developed a toolkit to assist high and medium TB burden countries with each of these steps. Early adopters of this approach include Brazil, Ethiopia, the Russian Federation, South Africa and Viet Nam.
Promoting research at global levelWHO is promoting TB research by sharing innovations, organizing a variety of knowledge-sharing platforms, and facilitating the development of regional and global networks for research and capacity-building. This approach involves partnering with countries, organizations and institutions. WHO is also encouraging international collaboration between technologically advanced countries and those with limited resources, and is providing technical support to regional and global networks of TB researchers.

124 :: GLOBAL TUBERCULOSIS REPORT 2016
8.1.2 TB diagnostic tests reviewed by WHO in 2016WHO reviewed three diagnostic technologies in 2016: the loop-mediated isothermal amplification test for TB (re-ferred to as TB-LAMP); line probe assays (LPAs) to test for resistance to first-line anti-TB drugs; and LPAs to test for resistance to second-line anti-TB drugs. These technolo-gies are discussed below.
Loop-mediated isothermal amplification test for TB TB-LAMP – developed by Eiken, Japan – is a manual test that takes less than 1 hour. Results can be read with the naked eye under ultraviolet light, and the TB-LAMP instrument can be used at the peripheral health centre level, which is where sputum smear microscopy is often performed. The level of training of staff required to perform the test is also similar to that needed for microscopy. TB-LAMP performs better than sputum smear microscopy, detecting at least 40% more patients with pulmonary TB; this is an increase comparable to other rapid tests that have been recom-mended by WHO in recent years. The test does not detect drug resistance and is therefore only suitable for testing of patients at low risk of multidrug-resistant TB (MDR-TB).
Following review of the latest evidence, WHO recom-mends that TB-LAMP can be used as a replacement for mi-croscopy for the diagnosis of pulmonary TB in adults with signs and symptoms of TB. It can also be considered as a follow-on test to microscopy in adults with signs and symp-toms of pulmonary TB, especially when further testing of sputum smear-negative specimens is necessary.
Line probe assays to test for resistance to first-line anti-TB drugs Two LPAs for the detection of resistance to the first-line drugs isoniazid and rifampicin have been developed, one by the Nipro Corporation, Japan and the other by Hain Lifes-ciences, Germany. These LPAs can provide results on drug resistance within days, compared with up to 4 weeks for phenotypic culture-based testing.
Following review of the latest evidence, WHO recom-mends that both these LPAs can be considered for use as an initial test to detect resistance to rifampicin and isonia-zid in smear-positive specimens. They can also be used to test cultured isolates of Mycobacterium tuberculosis. Direct testing of sputum smear-negative specimens is not recom-mended. Further details are available online.1
Line probe assay to test for resistance to second-line anti-TB drugs An LPA for the detection of resistance to second-line anti-TB drugs (fluoroquinolones and injectables) has been de-veloped by Hain Lifesciences, Germany. Following review of the latest evidence, WHO recommends that this LPA can be considered as an initial test for resistance to second-line anti-TB drugs, given its ability to provide rapid results, es-pecially when used for the direct testing of sputum speci-mens from patients with confirmed multidrug-resistant TB (MDR-TB) or rifampicin-resistant TB. The speed of testing
1 The use of molecular line probe assays for the detection of resistance to isoniazid and rifampicin. Policy Guidance. Geneva: World Health Organization; 2016 (WHO/HTM/TB 2016.12). Available at http://www.who.int/tb/areas-of-work/laboratory/policy_statements/en/
:: FIG. 8.1 An overview of progress in the development of molecular TB diagnostics, August 2016a
TECHNOLOGIES IN DEVELOPMENT FOR USE IN REFERENCE LEVEL LABORATORIES
■ m2000 RealTime MTB System, Abbott, USA
■ TruArray® MDR-TB, Akonni, USA■ INFINITI® System MDR-TB BioFilm
Chip® Microarray, AutoGenomics, USA■ BD ProbeTec® ET Direct TB assay, BD,
USA■ TB drug resistance array, Capital Bio,
China■ AMTD test, Hologic Genprobe, USA■ Cobas TaqMan MTB test, Roche,
Switzerland■ Anyplex™, Seegene, Korea■ Magicplex™ MTB, Seegene, Korea■ TRC Rapid®M.TB, Tosoh Bioscience,
Japan■ MeltPro®, Zeesan Biotech, China
TECHNOLOGIES IN DEVELOPMENT FOR USE IN INTERMEDIATE LEVEL LABORATORIES
■ FluoroType MTB/FluoroType MTB RNA, Hain Lifesciences, Germany
■ iCubate System, iCubate, USA ■ AdvanSure, LG Life sciences, Korea■ vereMTB, Veredus Laboratories,
Singapore■ SPEED-OLIGO®, Vircell, Spain■ MolecuTech REBA, YD Diagnostics,
Korea■ LATE-PCR, Brandeis University, USA■ GeneXpert XDR cartridge, Cepheid, USA■ Xpert Ultra, Cepheid, USA■ Enigma ML, Enigma Diagnostics, UK
TECHNOLOGIES IN DEVELOPMENT FOR USE IN PERIPHERAL LEVEL LABORATORIES
■ Genedrive MTB/RIF ID, Epistem, UK■ HYDRA, Insilixa Inc, USA■ Truelab/Truenat MTB, Molbio/bigtec
Diagnostics, India■ EasyNAT TB Diagnostic kit, Ustar
Biotechnologies, China■ GenePOC test, GenePOC, Canada■ Xpert Omni, Cepheid, USA
a This is not an exhaustive list of technologies in development. Those listed are the ones documented in publications by UNITAID and TAG. UNITAID. 2014. Tuberculosis Diagnostic Technology and Market Landscape, 3rd edition. Geneva: World Health Organization.
http://www.unitaid.eu/images/marketdynamics/publications/UNITAID_TB_Diagnostics_Landscape_3rd-edition.pdf Frick M., Lessem E., McKenna L., “2016 pipeline report. Tuberculosis (TB) Edition. Diagnostics, treatment, prevention and vaccines in development”,
HIV i-Base/Treatment Action Group. London/New York 2016. http://www.pipelinereport.org/sites/g/files/g575521/f/201507/2015%20Pipeline%20Report%20Full.pdf

GLOBAL TUBERCULOSIS REPORT 2016 :: 125
is critical to allow for the time-sensitive step of triaging pa-tients between the standardized short regimen for MDR-TB (which is recommended for use only in patients who do not have second-line drug resistance). If the LPA result is negative, WHO recommends that phenotypic culture-based testing may be necessary, especially in settings with a high pretest probability for resistance to fluoroquinolones or second-line injectable drugs, or both. Further details are available online.1
8.1.3 Technologies scheduled for evaluation in 2017Xpert UltraA new version of the Xpert MTB/RIF assay, called Xpert Ultra, is in development by Cepheid. The current assay has been modified with the aim of improving its sensitivity for the detection of TB and its specificity in the detection of re-sistance to rifampicin; it can be used in the Omni platform (described above).
In early 2017, WHO will initiate a two-step evaluation process of Xpert Ultra based on data from evaluations by the Foundation for Innovative New Diagnostics (FIND). The first step is a rapid noninferiority (i.e. equivalence) study that will compare the new Xpert Ultra assay with the current Xpert MTB/RIF assay. If noninferiority is demon-strated, the Xpert Ultra assay will be recommended as a replacement for the current Xpert MTB/RIF assay. Later in 2017, the second evaluation step will involve multicountry studies.
Updated critical concentrations for culture-based drug susceptibility testing Phenotypic methods to detect resistance to anti-TB drugs are based on assessment of the ability of the M. tuberculosis complex (MTBC) to grow in culture media containing criti-cal concentrations (CC) of specific anti-TB agents (which indicates resistance) or, conversely, its inability to grow in that media (which indicates susceptibility). Susceptibility is used as a proxy for successful treatment outcome, and resistance as a proxy for treatment failure.
New drugs for the treatment of MDR-TB have been recommended by WHO (Section 8.2), and other drugs are being repurposed (notably linezolid and clofazamine) in the shortened MDR-TB regimens. Methods for test-ing for susceptibility to these drugs are therefore needed. Other anti-TB agents – for example, the fluoroquinolones, second-line injectable agents, thioamides, cycloserine and pyrazinamide – are becoming increasingly important in the treatment of drug-resistant TB; hence, there is a need for the CCs of these anti-TB agents to be re-evaluated as well.
WHO has initiated a systematic approach to aggregat-ing and analysing data (published and unpublished) to assess the association of CC or minimal inhibitory concen-
1 World Health Organization. The use of molecular line probe assays for the detection of resistance to second-line anti-tuberculosis drugs (WHO/HTM/TB/2016.07). Geneva: WHO; 2016 (http://www.who.int/tb/areas-of-work/laboratory/policy_statements/en/, accessed 8 August 2016).
tration with epidemiological cut-offs and patient outcomes. Through this approach, WHO expects to be able to revise current CCs and validate new CCs, especially for the new and repurposed drugs.
Role of molecular sequencing as a reference standard for drug susceptibility testingDrug resistance in MTBC is, possibly exclusively, due to mutations affecting the bacterial genome. Rapid molecular diagnostic tests have been developed for the simultane-ous detection and identification of MTBC, and for the most common mutations causing resistance to specific drugs. However, for some anti-TB drugs, the association between the observed phenotypic resistance, mechanisms of resist-ance and the genetic basis of the phenotype are still poorly understood. Many new tools for sequencing and analysing the genome of MTBC have become widely accessible for the molecular detection of the mutations associated with drug resistance, but uncertainties remain about the cor-relation between specific single nucleotide polymorphisms (SNPs) and their expressed phenotypic resistance (as measured by both solid and liquid culture methods).
In 2017, WHO will evaluate the accuracy of genotypic drug susceptibility testing (DST) compared with the cur-rent phenotypic gold standards. WHO will also assess whether genotypic DST can replace phenotypic DST, at least for certain key drugs such as pyrazinamide and ri-fampicin.
8.1.4 Tests that predict progression from latent to active TB
Identifying and effectively treating people with LTBI who have no signs and symptoms of TB disease will be key to achieving the 2030 and 2035 targets of the End TB Strat-egy (Chapter 2). On average, 5–15% of those infected will develop active TB during their lifetime, typically within the first 2–5 years after the initial infection.
Current tests for LTBI are the interferon gamma release assays (IGRAs) and the tuberculin skin test (TST). These tests are immunity based, and have limited ability to pre-dict disease or to identify which individuals with TB infec-tion are likely to progress to active TB disease. They also have limited sensitivity in people with HIV infection, and cannot differentiate between recent and remote infection, or whether a person has been reinfected if re-exposed.
Current IGRA assays primarily detect a CD4 T-cell re-sponse. However, a new generation assay, the QuantiF-ERON-TB Plus (QFT-Plus, Qiagen, Hilden, Germany), has been developed to stimulate gamma interferon production by both CD4 and CD8 T-cells. First results indicate that the CD8 T-cell response may be able to identify people at greater risk of progression to active TB.2
2 Barcellini L, Borroni E, Brown J, Brunetti E, Campisi D, Castellotti PF et al. First evaluation of QuantiFERON-TB Gold Plus performance in contact screening. Eur Respir J. 2016:ERJ-00510-02016.
126 :: GLOBAL TUBERCULOSIS REPORT 2016
8.1.5 Diagnostic connectivityThe roll out of rapid diagnostic tools for TB patients allows for faster and more accurate testing. However, these ben-efits can be jeopardized if bottlenecks occur in the handling of samples and results. Streamlining the flow of data be-tween testing, storage and sending of results is a critical sequence of steps that must accompany the roll out of new tests. For diagnostic systems to make a measurable im-pact on patient care, they should be able to communicate through a standardized digital interface, using technologies that are feasible regardless of the income level of the coun-try or setting.1 Diagnostics connectivity solutions are now being monitored by WHO as a core indicator for laboratory strengthening under the End TB Strategy.
8.2 New drugs and drug regimens Development of new drugs and regimens for the treatment of TB continues, with both advances and setbacks in 2015–2016. A new compound (Q203) entered a Phase I trial, but the development of AZD5847 by Astra-Zeneca was offi-cially ended (due to lack of demonstrated anti-TB activity) and the development of TBA-354 was discontinued (due to signs of toxicity in the Phase I trial).2
The status of the pipeline for new anti-TB drugs in Au-gust 2016 is shown in Fig. 8.2. There are currently nine new or repurposed drugs in Phase I, II or III trials for the treat-ment of drug-susceptible TB, MDR-TB or LTBI. Of these, six are new compounds (bedaquiline, delamanid, PBTZ169, pretomanid, Q203 and sutezolid.) and three are drugs that have already been approved or have been repurposed and are undergoing further testing (linezolid, rifampicin and ri-fapentine). These drugs are discussed below.
8.2.1 New compounds in developmentBedaquilineAfter approval by the US Food and Drug Administration in December 2012 and WHO’s interim policy guidance on its use in June 2013,3 bedaquiline has been introduced in sev-eral countries for the treatment of severe forms of MDR-
1 World Health Organization. Digital health for the End TB Strategy: an agenda for action (WHO/HTM/TB/2015.21). Geneva: WHO; 2015 (http://www.who.int/tb/areas-of-work/digital-health/Digital_health_EndTBstrategy.pdf, accessed 8 August 2016).
2 TBA-354, belonging to the nitroimidazole class, was the first candidate to enter Phase 1 TB trials over the past 6 years. However, in a Phase 1 dose-escalating trial the drug was found to be associated with mild signs of neurotoxicity (repetitive uncontrolled eye movements and overactive reflexes, from which all affected study participants recovered). The TB Alliance announced the discontinuation of its development in March 2016. http://www.tballiance.org/news/phase-1-clinical-trial-tb-drug-candidate-tba-354-discontinued
3 World Health Organization. The use of bedaquiline in the treatment of multidrug-resistant tuberculosis: interim policy guidance (WHO/HTM/TB/2013.6). Geneva: WHO; 2013 (http://apps.who.int/iris/bitstream/10665/84879/1/9789241505482_eng.pdf, accessed 8 August 2016).
TB (Chapter 4).4,5 The safety and efficacy of bedaquiline as part of short MDR-TB regimens of 6 and 9 months dura-tion, compared with the current standard of care recom-mended by WHO, is now being investigated in the second stage of the Phase III STREAM trial that started recruit-ment in March 2016. The first results are expected towards the end of 2020.
DelamanidA conditional marketing authorization for delamanid was granted by the European Medicines Agency in April 2014. This was for the treatment of pulmonary MDR-TB in adult patients “when an effective treatment regimen cannot oth-erwise be composed for reasons of resistance or tolerabil-ity”. Interim guidance on the use of delamanid was issued by WHO in October 2014.6
The follow-up stage of a Phase III trial of the safety and efficacy of delamanid as an addition to an optimized back-ground regimen (OBR) for the treatment of MDR-TB in adults was recently completed. It is anticipated that results will be published in 2018.
The use of delamanid in addition to OBR for treatment of MDR-TB in children is being investigated in Phase I and II trials. Partial results were presented in 2015.7
PBTZ169A new series of piperazine-containing benzothiazinones (PBTZ) have shown highly potent activity against drug-susceptible and drug-resistant TB.8 PBTZ169 is compat-ible with all TB drugs and appears to have synergies with bedaquiline and clofazimine. A Phase I trial of PBTZ169 was completed in the Russian Federation in July 2016, and a second Phase I trial will be undertaken in Switzerland in 2017. A Phase IIa trial is expected to start towards the end of 2016 in the Russian Federation.
4 Guglielmetti L, Le Du D, Jachym M, Henry B, Martin D, Caumes E et al. Compassionate use of bedaquiline for the treatment of multidrug-resistant and extensively drug-resistant tuberculosis: interim analysis of a French cohort. Clin Infect Dis. 2015;60(2):188–194 (http://www.ncbi.nlm.nih.gov/pubmed/25320286, accessed 8 August 2016).
5 Ndjeka N, Conradie F, Schnippel K, Hughes J, Bantubani N, Ferreira H et al. Treatment of drug-resistant tuberculosis with bedaquiline in a high HIV prevalence setting: an interim cohort analysis. Int J Tuberc Lung Dis. 2015;19(8):979–985 (http://www.ncbi.nlm.nih.gov/pubmed/26162365, accessed 8 August 2016).
6 World Health Organization. The use of delamanid in the treatment of multidrug-resistant tuberculosis: interim policy guidance (WHO/HTM/TB/2014.23). Geneva: WHO; 2014. (http://apps.who.int/iris/bitstream/10665/137334/1/WHO_HTM_TB_2014.23_eng.pdf, accessed 8 August 2016).
7 Hafkin J, Frias M, Hesseling A, Garcia-Prats AJ, et al. Pharmacokinetics and safety of delamanid in pediatric MDR-TB patients: ages 6–17 years. Interscience Conference on Antimicrobial Agents and Chemotherapy (ICAAC). San Diego, California. 2015; and Hafkin J, Frias M, De Leon A, et al. Long-term safety, tolerability and pharmacokinetics of delamanid in pediatric MDR-TB patients, ages 12–17 years. 46th Union World Conference on Lung Health. Cape Town, South Africa. 2015.
8 Makarov V, Lechartier B, Zhang M et al. Towards a new combination therapy for tuberculosis with next generation benzothiazinones. EMBO Mol Med. 2014 Mar;6(3):372–83.

GLOBAL TUBERCULOSIS REPORT 2016 :: 127
:: FIG. 8.2 The global development pipeline for new anti-TB drugs, August 2016a
Discovery Preclinical development Clinical development
Lead optimization
Early stage development
Good Laboratory Practice toxicity
Phase I Phase II Phase III
CyclopeptidesDiarylquinolines DprE Inhibitors InhA Inhibitor, Ureas Macrolides, Azaindoles Mycobacterial Gyrase Inhibitors Pyrazinamide AnalogsRuthenium(II)Complexes Spectinamides Translocase-1 Inhibitors, Clp, Mmp13, Oxazolidinones, Pyrimidines DprE1, Aryl Sulfonamides, PKS13, Squaramides
TBI-166CPZEN-45*SQ609*1599*
Sutezolid (PNU-100480)Linezolid EBAc
High Dose Rifampicin for Drug-susceptible TBBedaquiline (TMC207)–Pretomanid (PA-824)Pyrazinamide RegimenLevofloxacin with OBRb for MDR-TB
Rifapentine–Moxifloxacin for Drug-susceptible TBDelamanid (OPC-67683) with OBRb for MDR-TBPretomanid-Moxifloxacin-Pyrazinamide Regimen (STAND)Bedaquiline–Pretomanid–Linezolid NiX-TB RegimenBedaquiline–STREAM MDR-TB Trial Stage 2 with oral OBRb (9 mo) or OBRb with injectables (6 mo)Bedaquiline–Linezolid with OBR for MDR-TB (NExT Trial)
Chemical classes: fluoroquinolone, rifamycin, oxazolidinone, nitroimidazole, diarylquinoline, benzothiazinone, imidazopyridine amide. * New chemical class
a Details for projects listed can be found at http://www.newtbdrugs.org/pipeline.php and ongoing projects without a lead compound series identified can be viewed at http://www.newtbdrugs.org/pipeline-discovery.php
b OBR = Optimized Background Regimenc EBA = Early Bactericidal ActivitySource: Working Group on New TB Drugs, 2016 – www.newtbdrugs.org
BTZ-043*TBA-7371*GSK-070*
Q203*PBTZ169*
Pretomanid Pretomanid is a nitroimidazole developed by the Global Alliance for TB drug development (TB Alliance). It is cur-rently being tested as part of three potential combination regimens for the treatment of both drug-susceptible and drug-resistant TB (further details in Section 8.2.2).
Q203 Q203 is a new compound of the imidazopyridine class de-veloped by Qurient. It blocks the growth of TB bacilli by tar-geting the respiratory cytochrome bc1 complex, inhibiting the synthesis and homeostasis of adenosine triphosphate (ATP).1 Different levels of a single dose are being tested in a Phase I trial.
SutelozidSutezolid (PNU-100480) is an oxazolidinone and an ana-logue of linezolid. Results from a study of early bactericidal activity presented in 2012 showed that this compound led to a significant reduction in counts of colony-forming units compared with the baseline level following 14 days of treatment. In August 2016, however, there was no further information available to WHO about its subsequent devel-opment.
1 Pethe K, Bifani P, Jang J, Kang S, Park S, Ahn S et al. Discovery of Q203, a potent clinical candidate for the treatment of tuberculosis. Nat. Med. 2013;19(9):1157–1160.
8.2.2 Approved or repurposed drugsRifapentine Investigation of the potential effectiveness of rifapentine in the treatment of drug-susceptible TB has continued, based on the encouraging results from TB Trial Consor-tium (TBTC) Studies 29 and 29X. TBTC Study 31/A5349 is investigating the possibility of shortening treatment of drug-susceptible pulmonary TB to 4 months by using rifap-entine, with or without moxifloxacin. Recruitment started in January 2016.
RifampicinA recent 2-month study testing the safety of high doses of rifampicin together with standard treatment for drug-susceptible TB showed no significant increase in adverse events at doses of 10 mg/kg, 15 mg/kg and 20 mg/kg.2
8.2.3 New regimens for the treatment of drug-susceptible or drug-resistant TB
Besides individual compounds, new combinations of drugs are being tested in several Phase II or Phase III trials.
The TB Alliance is investigating the efficacy, safety and tolerability of pretomanid in combination with moxi-floxacin and pyrazinamide (PaMZ). Following the encour-
2 Jindani A, Borgulya G, de Patino IW, Gonzales T, de Fernandes RA, Shrestha B et al. A randomised Phase II trial to evaluate the toxicity of high-dose rifampicin to treat pulmonary tuberculosis. Int. J. Tuberc. Lung Dis. 2016;20(6):832–838.

128 :: GLOBAL TUBERCULOSIS REPORT 2016
aging results of the 2-month NC-002 Phase IIb trial,1 the STAND trial was launched in February 2015. This is a Phase III trial of the safety and efficacy of Pa(100 mg)MZ for 4 months, Pa(200 mg)MZ for 4 months and Pa(200 mg)MZ for 6 months in patients with drug-susceptible TB; and of Pa(200 mg)MZ for 6 months in patients with drug- resistant TB. In late 2015, enrolment was temporarily sus-pended due to three deaths related to high liver toxicity. Subsequently, the TB Alliance has been working with regu-latory authorities and the trial’s data safety and monitoring committee to determine whether to restart enrolment, and if so, when to do so.
A Phase IIb trial (NC-005) to test all-oral combination regimens started in October 2014. The regimens being tested are bedaquiline (at two different doses), pretomanid and pyrazinamide for patients with drug-susceptible TB, and the same drugs in combination with moxifloxacin for patients with MDR-TB. Enrolment was completed towards the end of 2015, and results are expected in late 2016.
The NiX-TB trial is being implemented by the TB Alli-ance in South Africa. It is investigating the safety and effi-cacy of a 6-month combination of bedaquiline, pretomanid and linezolid in patients with extensively drug-resistant TB (XDR-TB). The primary end-point is the incidence of bac-teriologic failure (relapse or clinical failure) 6 months af-ter completion of treatment, with long-term follow-up for 24 months after the end of treatment. Alongside this trial, the efficacy of escalating doses of linezolid in patients with drug-susceptible TB over a period of 2 weeks is also being investigated. Results will inform adjustments to the dosing of linezolid in the NiX-TB trial as well as other regimens that include linezolid.
The endTB and TB-PRACTECAL trials are scheduled to start around the end of 2016. The former is a Phase III trial funded by UNITAID, and implemented by Partners in Health and Médecins Sans Frontières (MSF). It will com-pare several regimens for treatment of MDR-TB or XDR-TB with the current WHO standard of care. The regimens being tested contain bedaquiline or delamanid (or both), moxifloxacin or levofloxacin, and pyrazinamide plus line-zolid or clofazimine (or both), in various combinations. The TB-PRACTECAL trial is a Phase II/III adaptive trial to evalu-ate the safety and efficacy of 6-month regimens that con-tain bedaquiline, pretomanid and linezolid, with or without moxifloxacin or clofazimine, for the treatment of adults with MDR-TB or XDR-TB. The trial is funded by MSF and will be conducted in Belarus, Uzbekistan, and potentially in countries in southern Africa.
The NeXT study is an open label trial of a 6–9 month injection-free regimen containing bedaquiline, ethiona-mide or high-dose isoniazid, linezolid, levofloxacin, and pyrazinamide, compared with the WHO-recommended
1 Dawson R, Diacon AH, Everitt D, van Niekerk C, Donald PR, Burger DA et al. Efficiency and safety of the combination of moxifloxacin, pretomanid (PA-824), and pyrazinamide during the first 8 weeks of antituberculosis treatment: a Phase 2b, open-label, partly randomised trial in patients with drug-susceptible or drug-resistant pulmonary tuberculosis. Lancet. 2015;385(9979):1738–1747.
12-month shorter regimen for MDR-TB treatment. Recruit-ment started in South Africa in 2016.
8.2.4 Treatment of latent TB infection Several studies evaluating shorter regimens for LTBI are being implemented, particularly for prevention of LTBI in people living with HIV. ACTG A5279 is evaluating the safety and effectiveness of ultra-short-course rifapen-tine or isoniazid (or both) for the prevention of active TB in HIV-positive people with LTBI. Rifapentine (at a dosage based on weight) in combination with 300 mg of isoniazid for 1 month is being compared with 300 mg of isoniazid for 9 months. Results are expected in the last quarter of 2017.
The “Weekly High dose Isoniazid and rifapentine (P) Periodic Prophylaxis for TB” trial, known as WHIP3 TB, is due to start by the end of 2016. It will evaluate a 3-month regimen of high dose rifapentine plus isoniazid for people living with HIV, administered either as a single round or given annually. It will be implemented in South Africa, Mo-zambique and Ethiopia, in two parts. Part A will compare a single round of weekly high dose rifapentine plus isonia-zid for three months (3HP) to six months of daily isoniazid (6H); Part B will compare periodic 3HP (p3HP) to a single round of 3HP.
Two trials to investigate drugs or regimens for the pre-vention of TB in contacts of MDR-TB patients are being implemented or are planned. The V-QUIN MDR study is assessing 6 months of daily levofloxacin for household contacts of patients with MDR-TB. It is being conducted in Viet Nam and recruitment started in March 2016. The TB-CHAMP study is a multicentre trial to evaluate the efficacy of levofloxacin in children aged 0–5 years who are house-hold contacts of MDR-TB cases. It is due to start in South Africa in October 2016.
8.3 New vaccines to prevent TBBoth the slow decline in TB incidence globally and the persistent threat of MDR-TB highlight the critical need for new TB vaccines that are more effective than the Bacille-Calmette-Guérin (BCG) vaccine in preventing TB. The status of the pipeline for new vaccines in August 2016 is shown in Fig. 8.3. The pipeline includes recombinant BCGs, whole-cell derived vaccines, recombinant viral-vectored platforms, protein and adjuvant combinations, and myco-bacterial extracts. These vaccines aim either to prevent infection (pre-exposure) or to prevent primary progression to disease or reactivation of LTBI (post-exposure). Further details are provided below.
8.3.1 Phase II and Phase III clinical trialsThere are currently eight vaccines in Phase II or Phase III trials.
M72/AS01EM72/AS01E is made by GlaxoSmithKline (GSK) and is a re-combinant fusion protein of the M. tuberculosis antigens

GLOBAL TUBERCULOSIS REPORT 2016 :: 129
:: FIG. 8.3 The development pipeline for new TB vaccines, August 2015
Phase I Phase IIa Phase IIIPhase IIb
MTBVAC Biofabri, TBVI, Zaragosa
DAR-901 Dartmouth
VPM 1002 SII, Max Planck, VPM, TBVI
Vaccae™
Anhui Zhifei Longcom
Ad5 Ag85A McMaster, CanSino
RUTI Archivel Farma, S.L
M72 + AS01E GSK, Aeras
ChAdOx1.85A / MVA85A
Oxford, Birmingham
H1/H56: IC31 SSI, Valneva, Aeras
MVA85A / MVA85A (ID, Aerosol)
OxfordH4: IC31
Sanofi Pasteur, SSI, Aeras
TB / FLU-04LRIBSP
ID93 + GLA-SE IDRI, Wellcome Trust, Aeras
■ Viral Vector■ Protein/Adjuvant■ Mycobacterial – Whole Cell or Extract
Source: Aeras, 2016 – www.aeras.org; Working Group on New TB Vaccines, 2016 – www.newtbvaccines.org
32 A and 39 A with the AS01E adjuvant. A large randomized placebo-controlled Phase IIb trial, conducted by GSK and Aeras, is enrolling pulmonary TB-negative, IGRA-positive, HIV-negative adults in Kenya, South Africa and Zambia. The primary end-point is the protective efficacy of two doses of M72/AS01E against pulmonary TB disease. Sec-ondary end-points include safety and immunogenicity.
H4:IC31 and H56:IC31The H4:IC31 and H56:IC31vaccines are protein subunits with adjuvants, initially developed by the Statens Serum Institute (SSI) in Copenhagen, Denmark.
H4:IC31 is being developed as a booster vaccine to BCG with Sanofi Pasteur. The vaccine candidate contains a fusion protein of Ag85B and TB10.4, formulated with the IC31 adjuvant. It is being tested in South Africa in a Phase II pre-proof of concept TB prevention study among IGRA-negative, HIV-negative adolescents at high risk of acquir-ing M. tuberculosis infection; an intensive immunogenicity study is also being done in the same population. H4:IC31 is also being evaluated in a Phase I/II trial in infants.
H56:IC31 is an adjuvanted subunit vaccine that com-bines three M. tuberculosis antigens (Ag85B, ESAT-6 and Rv2660c) with Valneva’s IC31 adjuvant, developed by SSI and Aeras. A Phase I study to evaluate its safety and im-munogenicity in HIV-negative adults with and without LTBI and with no history or evidence of TB disease has been completed. Two Phase I trials have been completed to de-termine the safety and immunogenicity profile of H56:IC31 in HIV-negative, BCG-vaccinated adults with and without LTBI, and in patients who have recently been treated for pulmonary TB disease. These Phase I trials demonstrated an acceptable safety profile and found the vaccine to be immunogenic at all doses studied. A Phase II trial includ-
ing H4:IC31, H56:IC31 and BCG in 84 adolescents is now under way.
VPM 1002VPM 1002 is a live recombinant vaccine that was originally developed at the Max Planck Institute of Infection Biology, Germany, with further development by Vakzine Projekt Management, the Tuberculosis Vaccine Initiative and the Serum Institute of India. A Phase II trial is being implement-ed in South Africa to assess the safety and immunogenic-ity of the vaccine in HIV exposed and unexposed neonates. A Phase III trial for prevention of TB disease in adults is planned in India.
RUTI® RUTI® is a non-live and polyantigenic vaccine based on fragmented and detoxified M. tuberculosis bacteria. It is being developed by Archivel Farma as an immunotherapeutic vaccine, in conjunction with a short intensive antibiotic therapy. A Phase II trial in South Africa was completed recently, and other clinical trials are in the planning stages.
DAR-901 boosterThe DAR-901 booster vaccine is a whole-cell, heat- inactivated, non-tuberculous mycobacterial vaccine, devel-oped by Dartmouth and Aeras. It was shown to be effective in a Phase III trial in the United Republic of Tanzania among people who were HIV-positive. A Phase I booster trial in the United States of America among BCG-primed adults with and without HIV infection found that it was safe and well tolerated. With funding from GHIT-Japan, a 2-year Phase II trial among adolescents was initiated in April 2016 in the United Republic of Tanzania.

130 :: GLOBAL TUBERCULOSIS REPORT 2016
ID93 + GLA-SEThe ID93 + GLA-SE vaccine comprises three M. tuberculosis immune-dominant antigens (Rv2608, Rv3619 and Rv3620), one M. tuberculosis latency-associated antigen (Rv1813), and the adjuvant GLA-SE. It was developed by the Infectious Disease Research Institute in collaboration with Aeras. A Phase I trial in BCG-vaccinated, QuantiFERON-TB-Gold negative and positive healthy adults has been completed in South Africa. ID93 antigen (2 mg or 10 mg) in combination with GLA-SE adjuvant (2 mg or 5 mg), given as three doses, was found to have an acceptable safety profile in BCG-vaccinated health adults (both QuantiFERON negative and QuantiFERON positive). Overall, significantly higher CD4+ responses were seen in all three intervention arms when compared with a placebo. A Phase IIa trial in South Africa, with the support of the Wellcome Trust, is evaluating safety and immunogenicity in HIV-naive TB patients that have recently completed treatment for pulmonary TB disease.
Vaccae™The Vaccae™ vaccine is a specified lysate developed by the pharmaceutical company Anhui Zhifei Longcom Biologic Pharmacy Co., Ltd. It has been licensed by the China Food and Drug Administration as an immunotherapeutic agent to help shorten TB treatment for patients with drug-sus-ceptible TB. In collaboration with the Guangxi Center for Disease Control and Prevention in China, a Phase III trial is being implemented to assess its efficacy and safety in preventing TB disease in people with LTBI. It is the largest TB vaccine trial undertaken in the past decade, including 10 000 people aged 15–65 years with a TST >15 mm. The trial was scheduled to be completed by mid-2016.
8.3.2 Phase I trialsThere are five vaccines in Phase I trials.
MTBVACMTBVA is a live M. tuberculosis strain attenuated via dele-tions of the phoP and fadD26 genes. It was developed by the University of Zaragoza, Institut Pasteur and Biofabri, with the support of the TB Vaccine Initiative (TBVI). The primary target population is neonates (BCG replacement vaccine), with a secondary target being adolescents and adults (booster vaccine). In September 2015, MTBVAC moved into a Phase Ib trial in infants.
Ad5 Ag85AAd5 Ag85A is an adenovirus serotype 5 vector expressing Ag85A, which has been developed by McMaster Univer-sity with support from CanSino. It has been evaluated for safety and immunogenicity in 24 healthy human volun-teers (both BCG-naive and previously BCG-immunized) in Canada. Overall, it was found to be safe, well tolerated and immunogenic in both trial groups, stimulating polyfunc-tional T-cell responses. More potent immunogenicity was observed in the previously BCG-vaccinated volunteers. A safety and immunogenicity study of the aerosol adminis-tration of this vaccine was recently completed.
TB/FLU-04 LTB/FLU-04 L is a recombinant influenza vectored vaccine candidate that has been developed by the Research Insti-tute for Biological Safety Problems and the Research Insti-tute on Influenza in the Russian Federation. The influenza virus strain A/Puerto Rico/8/34 (H1N1) was used as a parent strain for construction of an attenuated replication-deficient vector expressing M. tuberculosis antigens Ag85A and ESAT-6. It was designed as a mucosal “boost” vaccine for infants, adolescents and adults. A Phase I trial in BCG-vaccinated QuantiFERON-TB-Gold negative healthy adult volunteers using intranasal administration was recently completed, and a Phase IIa trial is planned.
ChAdOx1.85 AChAdOx1.85 A is a simian adenovirus expressing antigen 85 A, which was developed at the University of Oxford to boost BCG induced protection. It is being evaluated in a Phase I trial in BCG-vaccinated adults, both alone and as part of a prime-boost strategy with MVA85A.
MVA85A (Aerosol)MVA85A (Aerosol) is an aerosolized vaccine MVA85A candidate that was developed at the University of Oxford. Its safety and immunogenicity has been tested in 24 BCG-vaccinated adults in the United Kingdom in a Phase I trial. The trial demonstrated that aerosol vaccination with MVA85A appears to be a safe and feasible compared with intradermal MVA85A, and produces a stronger CD4+ T-cell response than intradermal MVA85A. Further studies assessing the aerosol route are under way in people with LTBI.

Annex
1Access to
the WHO global TB database
::


GLOBAL TUBERCULOSIS REPORT 2016 :: 133
A.1 Database contentsThe 2016 global TB report is based on data collected annually from countries and territories, including 194 Member States. These data are stored in the global TB database.
In 2016, data were collected on the following topics: TB case notifications and treatment outcomes, including break-downs by TB case type, age, sex , HIV status and drug resistance; laboratory diagnostic services; monitoring and eval-uation, including surveillance and surveys specifically related to drug-resistant TB; TB preventive therapy; TB infection control; engagement of all public and private care providers in TB control; community engagement; the budgets of national TB control programmes (NTPs); utilization of general health services (hospitalization and outpatient visits) during treat-ment; and NTP expenditures. A shortened version of the online questionnaire was used for high-income countries (that is, countries with a gross national income per capita of ≥US$ 12 476 in 2015, as defined by the World Bank)1 and/or low-incidence countries (defined as countries with an incidence rate of <20 cases per 100 000 population or <10 cases in total).
Countries reported data using a dedicated website (https://extranet.who.int/tme), which was opened for reporting in early April 2016. Countries in the European Union submitted notification and treatment outcomes data to the TESSy system managed by the European Centre for Disease Prevention and Control (ECDC). Data from TESSy were uploaded into the global TB database.
Additional data about the provision of isoniazid preventive therapy (IPT) to people living with HIV and antiretroviral therapy (ART) for HIV-positive TB patients were collected by the Joint United Nations Programme on HIV/AIDS (UNAIDS) and the HIV department in WHO. These data were jointly validated by UNAIDS and the WHO’s Global TB Programme and HIV department, and uploaded into the global TB database.
Following review and follow-up with countries, the data used for the main part of this report were those data available on 15 August 2016. The number of countries and territories that had reported data by 15 August 2016 is shown in Table A1.1.
:: TABLE A1.1Reporting of data in the 2016 round of global TB data collection
WHO REGION OR SET OF COUNTRIES
COUNTRIES AND TERRITORIES WHO MEMBER STATES
NUMBER NUMBER THAT REPORTED DATA NUMBER NUMBER THAT REPORTED DATA
African Region 47 46 47 46
Region of the Americas 46 41 35 33
Eastern Mediterranean Region 22 20 21 19
European Region 54 48 53 47
South-East Asia Region 11 11 11 11
Western Pacific Region 36 36 27 27
Global 216 202 194 183a Countries that did not report by the deadline were mostly low-incidence countries in Western Europe.
A.2 Accessing TB data using the WHO Global TB Programme website You can find most of the data held in the global TB database by going to www.who.int/tb/data. This web page gives you access to country profiles, comma-separated value (CSV) data files and data visualisations.
A2.1 Country profilesProfiles can be viewed and downloaded for all 216 countries and territories that report TB data to WHO each year, and not just the 30 high burden countries shown in the printed version of the global TB report. The profiles can be generated on-demand directly from the global TB database and therefore may include updates received after publication of the global TB report.
TB financial profiles can be viewed and downloaded for over 100 countries and territories that report detailed TB finan-cial data to WHO.
A2.2 CSV data filesThese files are the primary resource for anyone interested in conducting their own analyses of the records in the global TB database. Data reported by countries, such as time series for case notifications and treatment outcomes and WHO’s estimates of TB disease burden, can be downloaded as comma-separated value (CSV) files covering all years for which data are available. These CSV files can be imported into many spreadsheet, statistical analysis and database packages.
1 http://data.worldbank.org/about/country-classifications
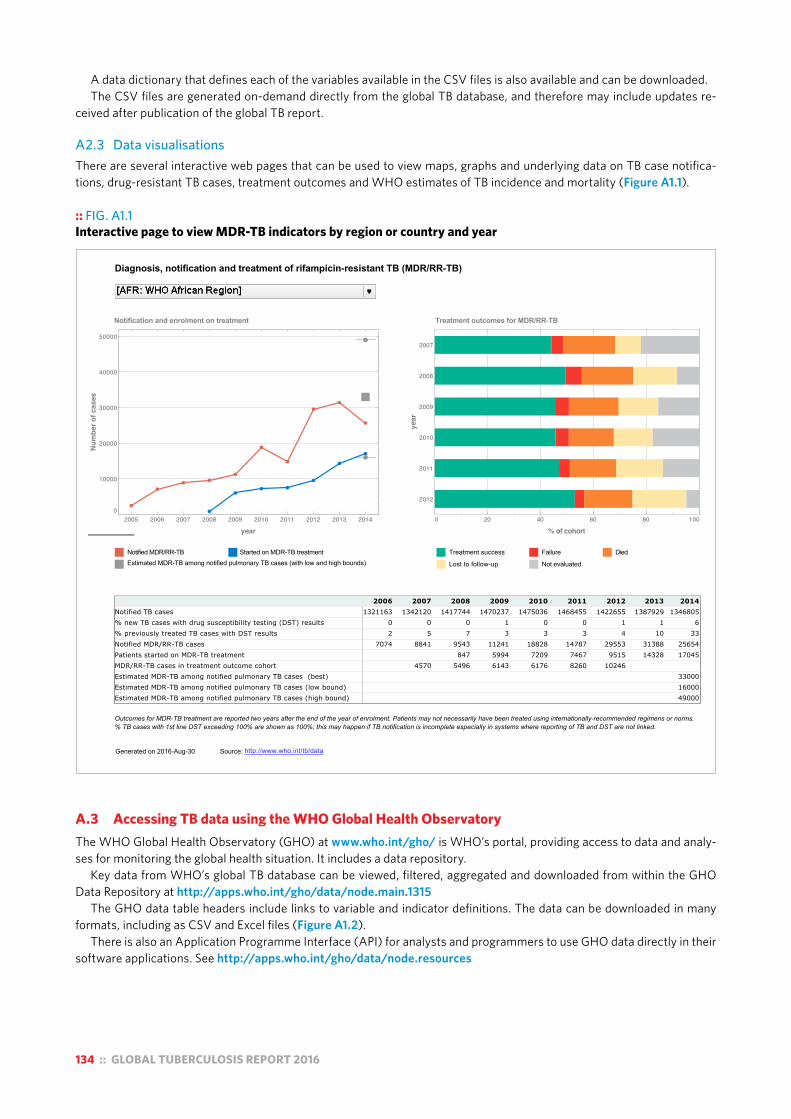
134 :: GLOBAL TUBERCULOSIS REPORT 2016
A data dictionary that defines each of the variables available in the CSV files is also available and can be downloaded.The CSV files are generated on-demand directly from the global TB database, and therefore may include updates re-
ceived after publication of the global TB report.
A2.3 Data visualisationsThere are several interactive web pages that can be used to view maps, graphs and underlying data on TB case notifica-tions, drug-resistant TB cases, treatment outcomes and WHO estimates of TB incidence and mortality (Figure A1.1).
:: FIG. A1.1Interactive page to view MDR-TB indicators by region or country and year
Diagnosis, notification and treatment of rifampicin-resistant TB (MDR/RR-TB)
% of cohort
year
2012
2011
2010
2009
2008
2007
0 20 40 60 80 100
Notification and enrolment on treatment Treatment outcomes for MDR/RR-TB
Outcomes for MDR-TB treatment are reported two years after the end of the year of enrolment. Patients may not necessarily have been treated using internationally-recommended regimens or norms.% TB cases with 1st line DST exceeding 100% are shown as 100%; this may happen if TB notification is incomplete especially in systems where reporting of TB and DST are not linked.
http://www.who.int/tb/dataGenerated on 2016-Aug-30
year
Num
ber o
f cas
es
2005 2006 2007 2008 2009 2010 2011 2012 2013 20140
10000
20000
30000
40000
50000
__ Treatment success __ Failure
__ Lost to follow-up __ Not evaluated
__ Died
Source:
__ Notified MDR/RR-TB __ Started on MDR-TB treatment
__ Estimated MDR-TB among notified pulmonary TB cases (with low and high bounds)
2006 2007 2008 2009 2010 2011 2012 2013 2014Notified TB cases 1321163 1342120 1417744 1470237 1475036 1468455 1422655 1387929 1346805
% new TB cases with drug susceptibility testing (DST) results 0 0 0 1 0 0 1 1 6
% previously treated TB cases with DST results 2 5 7 3 3 3 4 10 33
Notified MDR/RR-TB cases 7074 8841 9543 11241 18828 14787 29553 31388 25654
Patients started on MDR-TB treatment 847 5994 7209 7467 9515 14328 17045
MDR/RR-TB cases in treatment outcome cohort 4570 5496 6143 6176 8260 10246
Estimated MDR-TB among notified pulmonary TB cases (best) 33000
Estimated MDR-TB among notified pulmonary TB cases (low bound) 16000
Estimated MDR-TB among notified pulmonary TB cases (high bound) 49000
A.3 Accessing TB data using the WHO Global Health ObservatoryThe WHO Global Health Observatory (GHO) at www.who.int/gho/ is WHO’s portal, providing access to data and analy-ses for monitoring the global health situation. It includes a data repository.
Key data from WHO’s global TB database can be viewed, filtered, aggregated and downloaded from within the GHO Data Repository at http://apps.who.int/gho/data/node.main.1315
The GHO data table headers include links to variable and indicator definitions. The data can be downloaded in many formats, including as CSV and Excel files (Figure A1.2).
There is also an Application Programme Interface (API) for analysts and programmers to use GHO data directly in their software applications. See http://apps.who.int/gho/data/node.resources
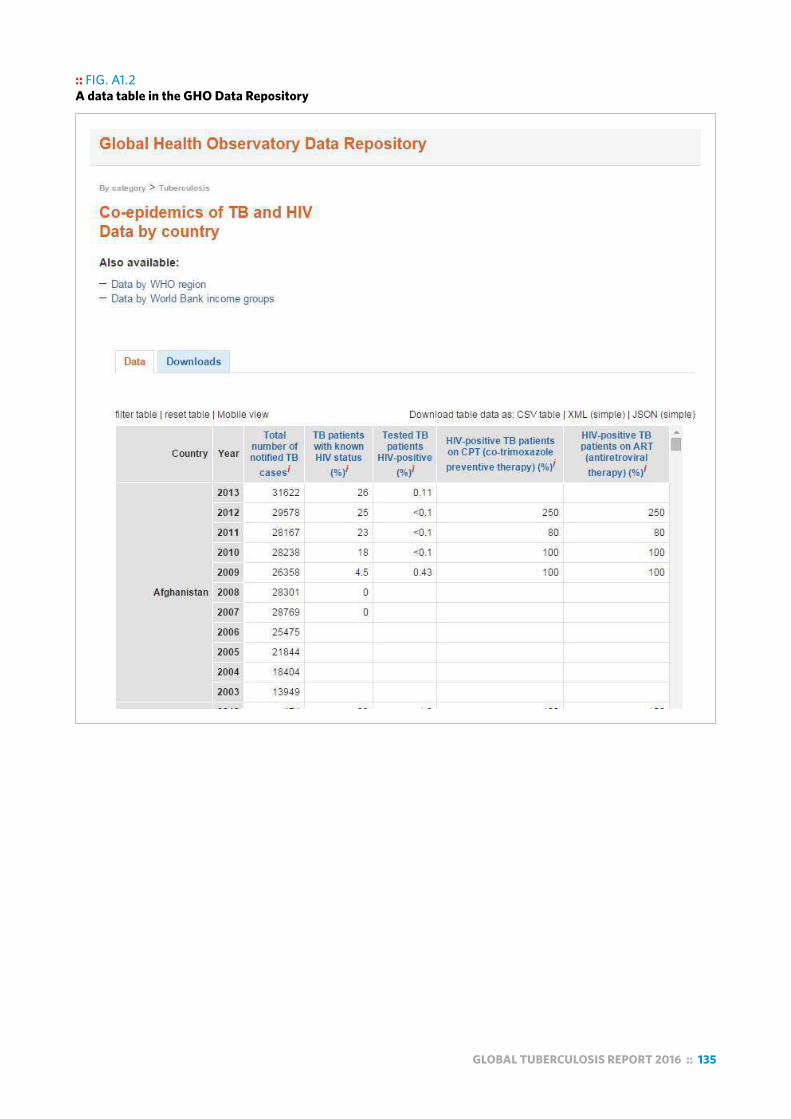
GLOBAL TUBERCULOSIS REPORT 2016 :: 135
:: FIG. A1.2A data table in the GHO Data Repository


Annex
2Country profiles
:: FOR
30 HIGH-BURDENCOUNTRIES
:: 20 high TB burden countries based on
absolute number of incident cases
10 high TB burden countries based on severity of disease burden
(incidence per capita)

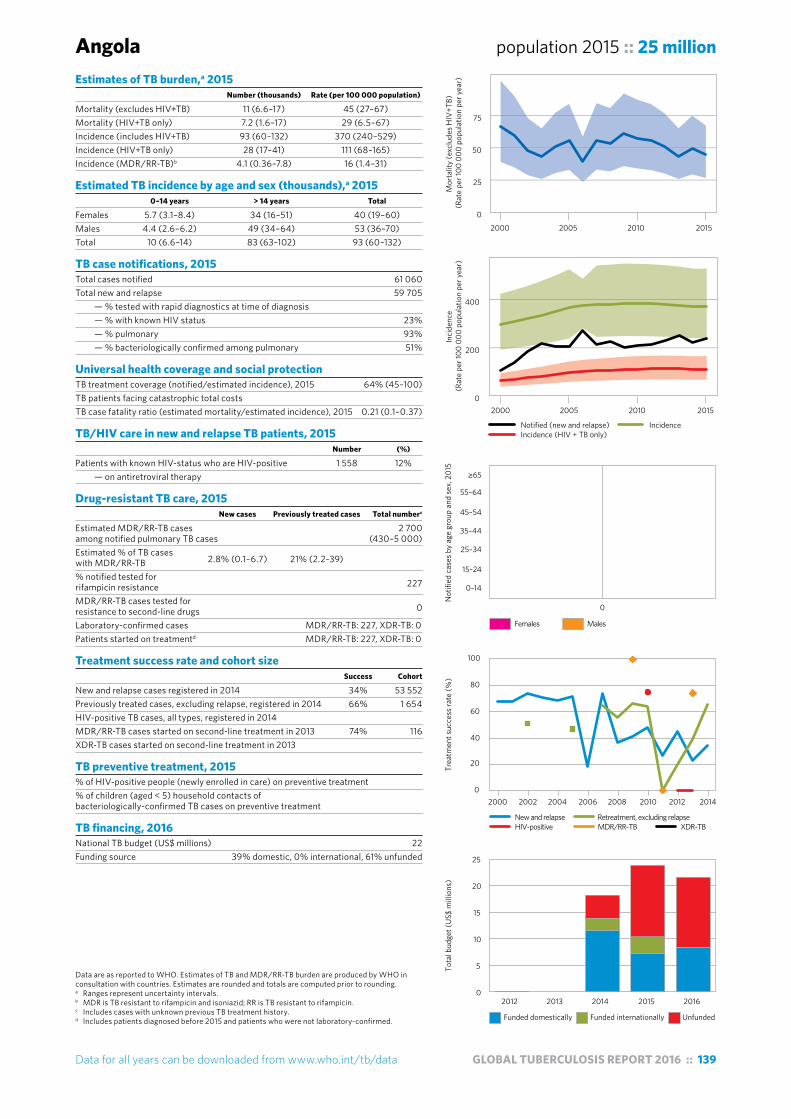
Data for all years can be downloaded from www.who.int/tb/data GLOBAL TUBERCULOSIS REPORT 2016 :: 139
Data are as reported to WHO. Estimates of TB and MDR/RR-TB burden are produced by WHO in consultation with countries. Estimates are rounded and totals are computed prior to rounding. a Ranges represent uncertainty intervals.b MDR is TB resistant to rifampicin and isoniazid; RR is TB resistant to rifampicin.c Includes cases with unknown previous TB treatment history.d Includes patients diagnosed before 2015 and patients who were not laboratory-confirmed.
Angola population 2015 :: 25 millionEstimates of TB burden,a 2015 Number (thousands) Rate (per 100 000 population)
Mortality (excludes HIV+TB) 11 (6.6–17) 45 (27–67)Mortality (HIV+TB only) 7.2 (1.6–17) 29 (6.5–67)Incidence (includes HIV+TB) 93 (60–132) 370 (240–529)Incidence (HIV+TB only) 28 (17–41) 111 (68–165)Incidence (MDR/RR-TB)b 4.1 (0.36–7.8) 16 (1.4–31)
Estimated TB incidence by age and sex (thousands),a 2015 0–14 years > 14 years Total
Females 5.7 (3.1–8.4) 34 (16–51) 40 (19–60)Males 4.4 (2.6–6.2) 49 (34–64) 53 (36–70)Total 10 (6.6–14) 83 (63–102) 93 (60–132)
TB case notifications, 2015 Total cases notified 61 060Total new and relapse 59 705 — % tested with rapid diagnostics at time of diagnosis — % with known HIV status 23% — % pulmonary 93% — % bacteriologically confirmed among pulmonary 51%
Universal health coverage and social protection TB treatment coverage (notified/estimated incidence), 2015 64% (45–100)TB patients facing catastrophic total costs TB case fatality ratio (estimated mortality/estimated incidence), 2015 0.21 (0.1–0.37)
TB/HIV care in new and relapse TB patients, 2015 Number (%)
Patients with known HIV-status who are HIV-positive 1 558 12% — on antiretroviral therapy
Drug-resistant TB care, 2015 New cases Previously treated cases Total numberc
Estimated MDR/RR-TB cases 2 700 among notified pulmonary TB cases (430–5 000)Estimated % of TB cases with MDR/RR-TB 2.8% (0.1–6.7) 21% (2.2–39) % notified tested for rifampicin resistance 227
MDR/RR-TB cases tested for resistance to second-line drugs 0
Laboratory-confirmed cases MDR/RR-TB: 227, XDR-TB: 0Patients started on treatmentd MDR/RR-TB: 227, XDR-TB: 0
Treatment success rate and cohort size Success Cohort
New and relapse cases registered in 2014 34% 53 552Previously treated cases, excluding relapse, registered in 2014 66% 1 654HIV-positive TB cases, all types, registered in 2014 MDR/RR-TB cases started on second-line treatment in 2013 74% 116XDR-TB cases started on second-line treatment in 2013
TB preventive treatment, 2015 % of HIV-positive people (newly enrolled in care) on preventive treatment % of children (aged < 5) household contacts of bacteriologically-confirmed TB cases on preventive treatment
TB financing, 2016 National TB budget (US$ millions) 22Funding source 39% domestic, 0% international, 61% unfunded
0
200
400
Inci
denc
e (R
ate
per 1
00 0
00 p
opul
atio
n pe
r yea
r)
2000 2005 2010 2015
Notified (new and relapse) IncidenceIncidence (HIV + TB only)
New and relapse Retreatment, excluding relapseHIV-positive MDR/RR-TB XDR-TB
2000 2002 2004 2006 2008 2010 2012 2014
Trea
tmen
t suc
cess
rate
(%)
0
20
40
60
80
100
Funded domestically Funded internationally Unfunded
2012 2013 2014 2015 2016
Tota
l bud
get (
US$
mill
ions
)
0
5
10
15
20
25
Females Males
0
Not
ified
cas
es b
y ag
e gr
oup
and
sex,
201
5
0–14
15–24
25–34
35–44
45–54
55–64
≥65
0
25
50
75
2000 2005 2010 2015
Mor
talit
y (e
xclu
des H
IV+T
B)
(Rat
e pe
r 100
000
pop
ulat
ion
per y
ear)
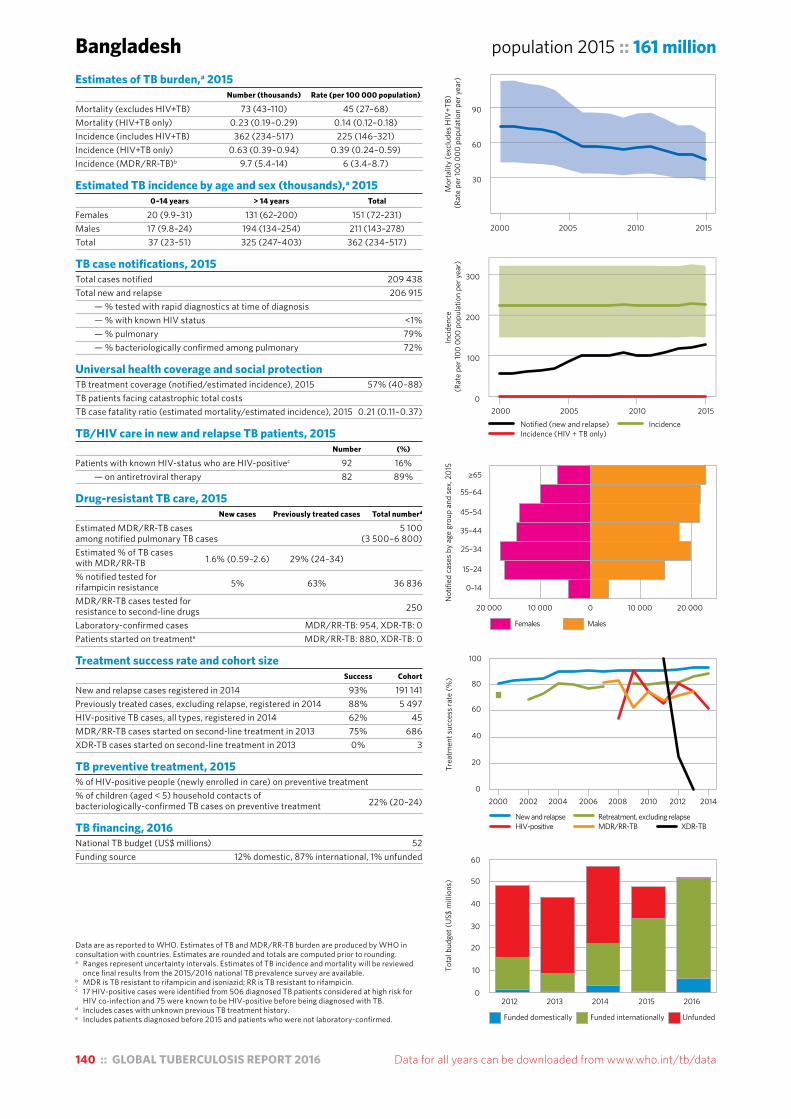
140 :: GLOBAL TUBERCULOSIS REPORT 2016 Data for all years can be downloaded from www.who.int/tb/data
Data are as reported to WHO. Estimates of TB and MDR/RR-TB burden are produced by WHO in consultation with countries. Estimates are rounded and totals are computed prior to rounding. a Ranges represent uncertainty intervals. Estimates of TB incidence and mortality will be reviewed
once final results from the 2015/2016 national TB prevalence survey are available. b MDR is TB resistant to rifampicin and isoniazid; RR is TB resistant to rifampicin.c 17 HIV-positive cases were identified from 506 diagnosed TB patients considered at high risk for
HIV co-infection and 75 were known to be HIV-positive before being diagnosed with TB.d Includes cases with unknown previous TB treatment history.e Includes patients diagnosed before 2015 and patients who were not laboratory-confirmed.
Bangladesh population 2015 :: 161 millionEstimates of TB burden,a 2015 Number (thousands) Rate (per 100 000 population)
Mortality (excludes HIV+TB) 73 (43–110) 45 (27–68)Mortality (HIV+TB only) 0.23 (0.19–0.29) 0.14 (0.12–0.18)Incidence (includes HIV+TB) 362 (234–517) 225 (146–321)Incidence (HIV+TB only) 0.63 (0.39–0.94) 0.39 (0.24–0.59)Incidence (MDR/RR-TB)b 9.7 (5.4–14) 6 (3.4–8.7)
Estimated TB incidence by age and sex (thousands),a 2015 0–14 years > 14 years Total
Females 20 (9.9–31) 131 (62–200) 151 (72–231)Males 17 (9.8–24) 194 (134–254) 211 (143–278)Total 37 (23–51) 325 (247–403) 362 (234–517)
TB case notifications, 2015 Total cases notified 209 438Total new and relapse 206 915 — % tested with rapid diagnostics at time of diagnosis — % with known HIV status <1% — % pulmonary 79% — % bacteriologically confirmed among pulmonary 72%
Universal health coverage and social protection TB treatment coverage (notified/estimated incidence), 2015 57% (40–88)TB patients facing catastrophic total costs TB case fatality ratio (estimated mortality/estimated incidence), 2015 0.21 (0.11–0.37)
TB/HIV care in new and relapse TB patients, 2015 Number (%)
Patients with known HIV-status who are HIV-positivec 92 16% — on antiretroviral therapy 82 89%
Drug-resistant TB care, 2015 New cases Previously treated cases Total numberd
Estimated MDR/RR-TB cases 5 100 among notified pulmonary TB cases (3 500–6 800)Estimated % of TB cases with MDR/RR-TB 1.6% (0.59–2.6) 29% (24–34) % notified tested for rifampicin resistance 5% 63% 36 836
MDR/RR-TB cases tested for resistance to second-line drugs 250
Laboratory-confirmed cases MDR/RR-TB: 954, XDR-TB: 0Patients started on treatmente MDR/RR-TB: 880, XDR-TB: 0
Treatment success rate and cohort size Success Cohort
New and relapse cases registered in 2014 93% 191 141Previously treated cases, excluding relapse, registered in 2014 88% 5 497HIV-positive TB cases, all types, registered in 2014 62% 45MDR/RR-TB cases started on second-line treatment in 2013 75% 686XDR-TB cases started on second-line treatment in 2013 0% 3
TB preventive treatment, 2015 % of HIV-positive people (newly enrolled in care) on preventive treatment % of children (aged < 5) household contacts of bacteriologically-confirmed TB cases on preventive treatment 22% (20–24)
TB financing, 2016 National TB budget (US$ millions) 52Funding source 12% domestic, 87% international, 1% unfunded
Not
ified
cas
es b
y ag
e gr
oup
and
sex,
201
5
0–14
15–24
25–34
35–44
45–54
55–64
≥65
20 000 10 000 0 10 000 20 000
Females Males
New and relapse Retreatment, excluding relapseHIV-positive MDR/RR-TB XDR-TB
Trea
tmen
t suc
cess
rate
(%)
0
20
40
60
80
100
2000 2002 2004 2006 2008 2010 2012 2014
Funded domestically Funded internationally Unfunded
2012 2013 2014 2015 2016
Tota
l bud
get (
US$
mill
ions
)
0
10
20
30
40
50
60
30
60
90
2000 2005 2010 2015
Mor
talit
y (e
xclu
des H
IV+T
B)
(Rat
e pe
r 100
000
pop
ulat
ion
per y
ear)
0
100
200
300
Inci
denc
e (R
ate
per 1
00 0
00 p
opul
atio
n pe
r yea
r)
2000 2005 2010 2015Notified (new and relapse) IncidenceIncidence (HIV + TB only)
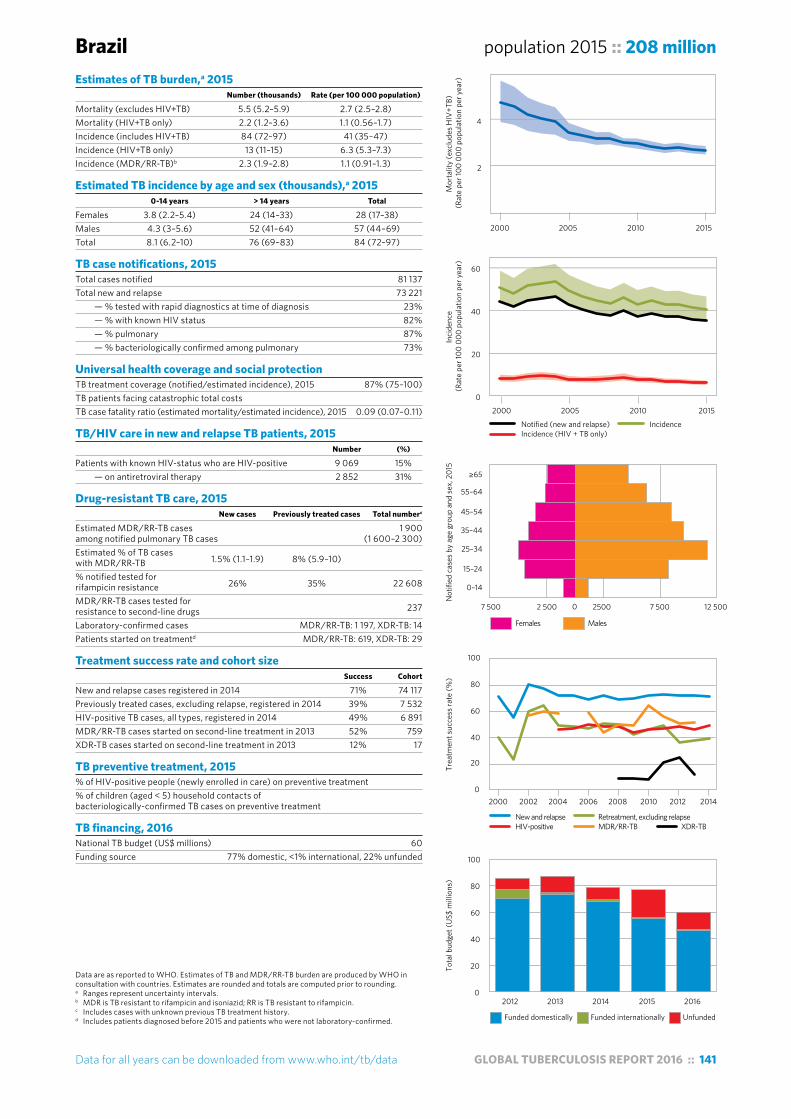
Data for all years can be downloaded from www.who.int/tb/data GLOBAL TUBERCULOSIS REPORT 2016 :: 141
Data are as reported to WHO. Estimates of TB and MDR/RR-TB burden are produced by WHO in consultation with countries. Estimates are rounded and totals are computed prior to rounding. a Ranges represent uncertainty intervals.b MDR is TB resistant to rifampicin and isoniazid; RR is TB resistant to rifampicin.c Includes cases with unknown previous TB treatment history.d Includes patients diagnosed before 2015 and patients who were not laboratory-confirmed.
Brazil population 2015 :: 208 millionEstimates of TB burden,a 2015 Number (thousands) Rate (per 100 000 population)
Mortality (excludes HIV+TB) 5.5 (5.2–5.9) 2.7 (2.5–2.8)Mortality (HIV+TB only) 2.2 (1.2–3.6) 1.1 (0.56–1.7)Incidence (includes HIV+TB) 84 (72–97) 41 (35–47)Incidence (HIV+TB only) 13 (11–15) 6.3 (5.3–7.3)Incidence (MDR/RR-TB)b 2.3 (1.9–2.8) 1.1 (0.91–1.3)
Estimated TB incidence by age and sex (thousands),a 2015 0-14 years > 14 years Total
Females 3.8 (2.2–5.4) 24 (14–33) 28 (17–38)Males 4.3 (3–5.6) 52 (41–64) 57 (44–69)Total 8.1 (6.2–10) 76 (69–83) 84 (72–97)
TB case notifications, 2015 Total cases notified 81 137Total new and relapse 73 221 — % tested with rapid diagnostics at time of diagnosis 23% — % with known HIV status 82% — % pulmonary 87% — % bacteriologically confirmed among pulmonary 73%
Universal health coverage and social protection TB treatment coverage (notified/estimated incidence), 2015 87% (75–100)TB patients facing catastrophic total costs TB case fatality ratio (estimated mortality/estimated incidence), 2015 0.09 (0.07–0.11)
TB/HIV care in new and relapse TB patients, 2015 Number (%)
Patients with known HIV-status who are HIV-positive 9 069 15% — on antiretroviral therapy 2 852 31%
Drug-resistant TB care, 2015 New cases Previously treated cases Total numberc
Estimated MDR/RR-TB cases 1 900 among notified pulmonary TB cases (1 600–2 300)Estimated % of TB cases with MDR/RR-TB 1.5% (1.1–1.9) 8% (5.9–10) % notified tested for rifampicin resistance 26% 35% 22 608
MDR/RR-TB cases tested for resistance to second-line drugs 237
Laboratory-confirmed cases MDR/RR-TB: 1 197, XDR-TB: 14Patients started on treatmentd MDR/RR-TB: 619, XDR-TB: 29
Treatment success rate and cohort size Success Cohort
New and relapse cases registered in 2014 71% 74 117Previously treated cases, excluding relapse, registered in 2014 39% 7 532HIV-positive TB cases, all types, registered in 2014 49% 6 891MDR/RR-TB cases started on second-line treatment in 2013 52% 759XDR-TB cases started on second-line treatment in 2013 12% 17
TB preventive treatment, 2015 % of HIV-positive people (newly enrolled in care) on preventive treatment % of children (aged < 5) household contacts of bacteriologically-confirmed TB cases on preventive treatment
TB financing, 2016 National TB budget (US$ millions) 60Funding source 77% domestic, <1% international, 22% unfunded
0
20
40
60
Inci
denc
e (R
ate
per 1
00 0
00 p
opul
atio
n pe
r yea
r)
2000 2005 2010 2015
Notified (new and relapse) IncidenceIncidence (HIV + TB only)
Females Males
7 500 2 500 2500 7 500 12 5000
Not
ified
cas
es b
y ag
e gr
oup
and
sex,
201
5
0–14
15–24
25–34
35–44
45–54
55–64
≥65
New and relapse Retreatment, excluding relapseHIV-positive MDR/RR-TB XDR-TB
2000 2002 2004 2006 2008 2010 2012 2014
Trea
tmen
t suc
cess
rate
(%)
0
20
40
60
80
100
Funded domestically Funded internationally Unfunded
2012 2013 2014 2015 2016
Tota
l bud
get (
US$
mill
ions
)
0
20
40
60
80
100
2
4
2000 2005 2010 2015
Mor
talit
y (e
xclu
des H
IV+T
B)
(Rat
e pe
r 100
000
pop
ulat
ion
per y
ear)

142 :: GLOBAL TUBERCULOSIS REPORT 2016 Data for all years can be downloaded from www.who.int/tb/data
Data are as reported to WHO. Estimates of TB and MDR/RR-TB burden are produced by WHO in consultation with countries. Estimates are rounded and totals are computed prior to rounding. a Ranges represent uncertainty intervals.b MDR is TB resistant to rifampicin and isoniazid; RR is TB resistant to rifampicin.c Includes cases with unknown previous TB treatment history.d Includes patients diagnosed before 2015 and patients who were not laboratory-confirmed.
China population 2015 :: 1 376 millionEstimates of TB burden,a 2015 Number (thousands) Rate (per 100 000 population)
Mortality (excludes HIV+TB) 35 (34–37) 2.6 (2.5–2.7)Mortality (HIV+TB only) 2.6 (1.2–4.5) 0.19 (0.09–0.33)Incidence (includes HIV+TB) 918 (788–1 060) 67 (57–77)Incidence (HIV+TB only) 15 (12–19) 1.1 (0.86–1.4)Incidence (MDR/RR-TB)b 70 (55–84) 5.1 (4–6.1)
Estimated TB incidence by age and sex (thousands),a 2015 0–14 years > 14 years Total
Females 37 (23–52) 258 (157–359) 296 (181–411)Males 38 (26–49) 585 (459–711) 622 (485–760)Total 75 (58–92) 843 (767–919) 918 (788–1 060)
TB case notifications, 2015 Total cases notified 804 163Total new and relapse 798 439 — % tested with rapid diagnostics at time of diagnosis — % with known HIV status 47% — % pulmonary 96% — % bacteriologically confirmed among pulmonary 31%
Universal health coverage and social protection TB treatment coverage (notified/estimated incidence), 2015 87% (75–100)TB patients facing catastrophic total costs TB case fatality ratio (estimated mortality/estimated incidence), 2015 0.04 (0.04–0.05)
TB/HIV care in new and relapse TB patients, 2015 Number (%)
Patients with known HIV-status who are HIV-positive 10 034 3% — on antiretroviral therapy 3 750 37%
Drug-resistant TB care, 2015 New cases Previously treated cases Total numberc
Estimated MDR/RR-TB cases 57 000among notified pulmonary TB cases (48 000–67 000)Estimated % of TB cases with MDR/RR-TB 6.6% (5.3–7.9) 30% (25–34) % notified tested for rifampicin resistance 8% 0% 93 593
MDR/RR-TB cases tested for resistance to second-line drugs Laboratory-confirmed cases MDR/RR-TB: 9 662, XDR-TB: 357Patients started on treatmentd MDR/RR-TB: 5 691, XDR-TB: 122
Treatment success rate and cohort size Success Cohort
New and relapse cases registered in 2014 94% 817 318Previously treated cases, excluding relapse, registered in 2014 88% 6 679HIV-positive TB cases, all types, registered in 2014 86% 2 169MDR/RR-TB cases started on second-line treatment in 2013 55% 2 184XDR-TB cases started on second-line treatment in 2013 22% 159
TB preventive treatment, 2015 % of HIV-positive people (newly enrolled in care) on preventive treatment % of children (aged < 5) household contacts of bacteriologically-confirmed TB cases on preventive treatment
TB financing, 2016 National TB budget (US$ millions) 372Funding source 97% domestic, 2% international, 1% unfunded
Mor
talit
y (e
xclu
des H
IV+T
B)
(Rat
e pe
r 100
000
pop
ulat
ion
per y
ear)
0
3
6
9
2000 2005 2010 2015
0
50
100
Inci
denc
e (R
ate
per 1
00 0
00 p
opul
atio
n pe
r yea
r)
2000 2005 2010 2015
Notified (new and relapse) IncidenceIncidence (HIV + TB only)
Females Males
60 000 20 000 20 000 60 000 100 0000
Not
ified
cas
es b
y ag
e gr
oup
and
sex,
201
5
0–14
15–24
25–34
35–44
45–54
55–64
≥65
New and relapse Retreatment, excluding relapseHIV-positive MDR/RR-TB XDR-TB
2000 2002 2004 2006 2008 2010 2012 2014
Trea
tmen
t suc
cess
rate
(%)
0
20
40
60
80
100
Funded domestically Funded internationally Unfunded
2012 2013 2014 2015 2016
Tota
l bud
get (
US$
mill
ions
)
0
100
200
300
400
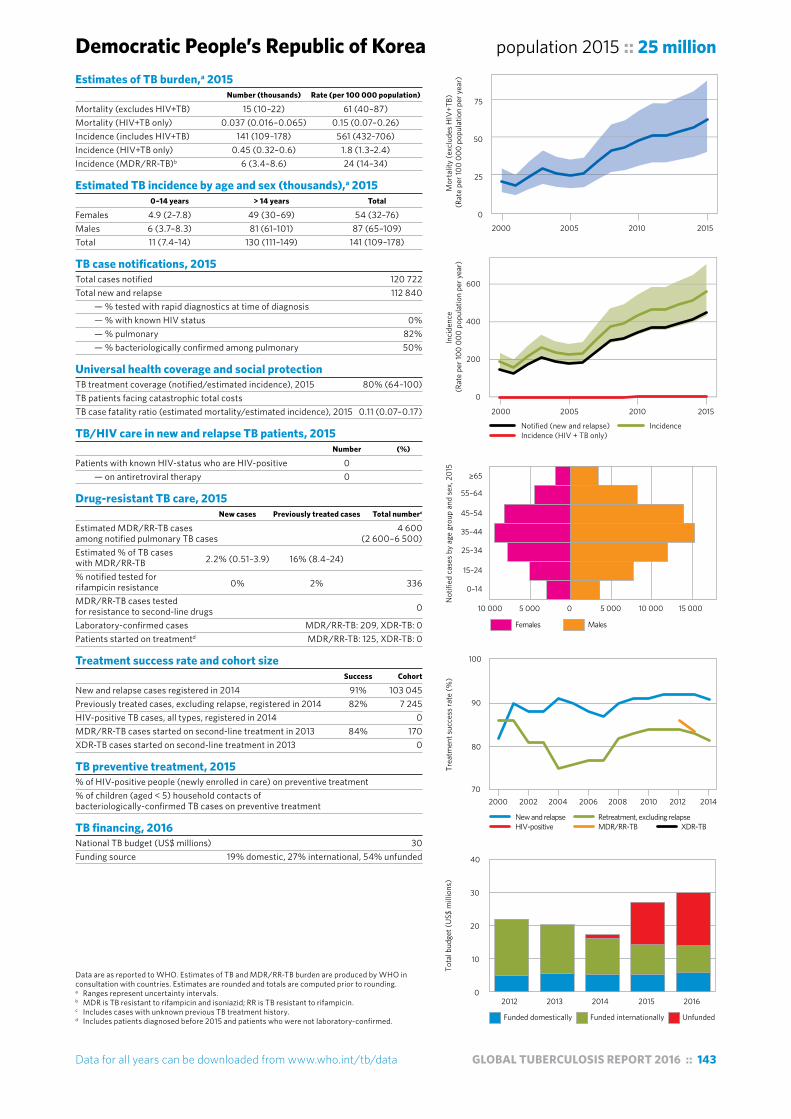
Data for all years can be downloaded from www.who.int/tb/data GLOBAL TUBERCULOSIS REPORT 2016 :: 143
Data are as reported to WHO. Estimates of TB and MDR/RR-TB burden are produced by WHO in consultation with countries. Estimates are rounded and totals are computed prior to rounding. a Ranges represent uncertainty intervals.b MDR is TB resistant to rifampicin and isoniazid; RR is TB resistant to rifampicin.c Includes cases with unknown previous TB treatment history.d Includes patients diagnosed before 2015 and patients who were not laboratory-confirmed.
Democratic People’s Republic of Korea population 2015 :: 25 millionEstimates of TB burden,a 2015 Number (thousands) Rate (per 100 000 population)
Mortality (excludes HIV+TB) 15 (10–22) 61 (40–87)Mortality (HIV+TB only) 0.037 (0.016–0.065) 0.15 (0.07–0.26)Incidence (includes HIV+TB) 141 (109–178) 561 (432–706)Incidence (HIV+TB only) 0.45 (0.32–0.6) 1.8 (1.3–2.4)Incidence (MDR/RR-TB)b 6 (3.4–8.6) 24 (14–34)
Estimated TB incidence by age and sex (thousands),a 2015 0–14 years > 14 years Total
Females 4.9 (2–7.8) 49 (30–69) 54 (32–76)Males 6 (3.7–8.3) 81 (61–101) 87 (65–109)Total 11 (7.4–14) 130 (111–149) 141 (109–178)
TB case notifications, 2015 Total cases notified 120 722Total new and relapse 112 840 — % tested with rapid diagnostics at time of diagnosis — % with known HIV status 0% — % pulmonary 82% — % bacteriologically confirmed among pulmonary 50%
Universal health coverage and social protection TB treatment coverage (notified/estimated incidence), 2015 80% (64–100)TB patients facing catastrophic total costs TB case fatality ratio (estimated mortality/estimated incidence), 2015 0.11 (0.07–0.17)
TB/HIV care in new and relapse TB patients, 2015 Number (%)
Patients with known HIV-status who are HIV-positive 0 — on antiretroviral therapy 0
Drug-resistant TB care, 2015 New cases Previously treated cases Total numberc
Estimated MDR/RR-TB cases 4 600 among notified pulmonary TB cases (2 600–6 500)Estimated % of TB cases with MDR/RR-TB 2.2% (0.51–3.9) 16% (8.4–24) % notified tested for rifampicin resistance 0% 2% 336
MDR/RR-TB cases tested for resistance to second-line drugs 0
Laboratory-confirmed cases MDR/RR-TB: 209, XDR-TB: 0Patients started on treatmentd MDR/RR-TB: 125, XDR-TB: 0
Treatment success rate and cohort size Success Cohort
New and relapse cases registered in 2014 91% 103 045Previously treated cases, excluding relapse, registered in 2014 82% 7 245HIV-positive TB cases, all types, registered in 2014 0MDR/RR-TB cases started on second-line treatment in 2013 84% 170XDR-TB cases started on second-line treatment in 2013 0
TB preventive treatment, 2015 % of HIV-positive people (newly enrolled in care) on preventive treatment % of children (aged < 5) household contacts of bacteriologically-confirmed TB cases on preventive treatment
TB financing, 2016 National TB budget (US$ millions) 30Funding source 19% domestic, 27% international, 54% unfunded
0
25
50
75
2000 2005 2010 2015
Mor
talit
y (e
xclu
des H
IV+T
B)
(Rat
e pe
r 100
000
pop
ulat
ion
per y
ear)
0
200
400
600
Inci
denc
e (R
ate
per 1
00 0
00 p
opul
atio
n pe
r yea
r)
2000 2005 2010 2015
Notified (new and relapse) IncidenceIncidence (HIV + TB only)
Females Males
10 000 5 000 0 5 000 10 000 15 000
Not
ified
cas
es b
y ag
e gr
oup
and
sex,
201
5
0–14
15–24
25–34
35–44
45–54
55–64
≥65
New and relapse Retreatment, excluding relapseHIV-positive MDR/RR-TB XDR-TB
2000 2002 2004 2006 2008 2010 2012 2014
Trea
tmen
t suc
cess
rate
(%)
70
80
90
100
Funded domestically Funded internationally Unfunded
2012 2013 2014 2015 2016
Tota
l bud
get (
US$
mill
ions
)
0
10
20
30
40
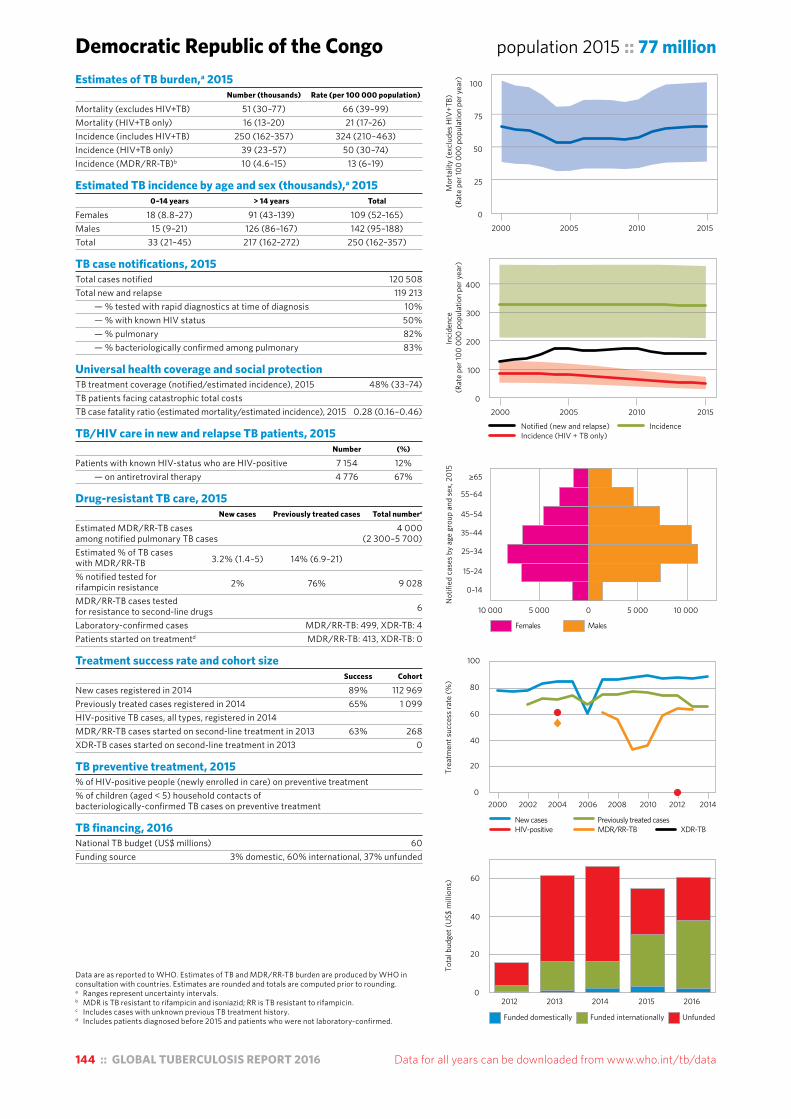
144 :: GLOBAL TUBERCULOSIS REPORT 2016 Data for all years can be downloaded from www.who.int/tb/data
Data are as reported to WHO. Estimates of TB and MDR/RR-TB burden are produced by WHO in consultation with countries. Estimates are rounded and totals are computed prior to rounding. a Ranges represent uncertainty intervals.b MDR is TB resistant to rifampicin and isoniazid; RR is TB resistant to rifampicin.c Includes cases with unknown previous TB treatment history.d Includes patients diagnosed before 2015 and patients who were not laboratory-confirmed.
Democratic Republic of the Congo population 2015 :: 77 millionEstimates of TB burden,a 2015 Number (thousands) Rate (per 100 000 population)
Mortality (excludes HIV+TB) 51 (30–77) 66 (39–99)Mortality (HIV+TB only) 16 (13–20) 21 (17–26)Incidence (includes HIV+TB) 250 (162–357) 324 (210–463)Incidence (HIV+TB only) 39 (23–57) 50 (30–74)Incidence (MDR/RR-TB)b 10 (4.6–15) 13 (6–19)
Estimated TB incidence by age and sex (thousands),a 2015 0–14 years > 14 years Total
Females 18 (8.8–27) 91 (43–139) 109 (52–165)Males 15 (9–21) 126 (86–167) 142 (95–188)Total 33 (21–45) 217 (162–272) 250 (162–357)
TB case notifications, 2015 Total cases notified 120 508Total new and relapse 119 213 — % tested with rapid diagnostics at time of diagnosis 10% — % with known HIV status 50% — % pulmonary 82% — % bacteriologically confirmed among pulmonary 83%
Universal health coverage and social protection TB treatment coverage (notified/estimated incidence), 2015 48% (33–74)TB patients facing catastrophic total costs TB case fatality ratio (estimated mortality/estimated incidence), 2015 0.28 (0.16–0.46)
TB/HIV care in new and relapse TB patients, 2015 Number (%)
Patients with known HIV-status who are HIV-positive 7 154 12% — on antiretroviral therapy 4 776 67%
Drug-resistant TB care, 2015 New cases Previously treated cases Total numberc
Estimated MDR/RR-TB cases 4 000among notified pulmonary TB cases (2 300–5 700)Estimated % of TB cases with MDR/RR-TB 3.2% (1.4–5) 14% (6.9–21) % notified tested for rifampicin resistance 2% 76% 9 028
MDR/RR-TB cases tested for resistance to second-line drugs 6
Laboratory-confirmed cases MDR/RR-TB: 499, XDR-TB: 4Patients started on treatmentd MDR/RR-TB: 413, XDR-TB: 0
Treatment success rate and cohort size Success Cohort
New cases registered in 2014 89% 112 969Previously treated cases registered in 2014 65% 1 099HIV-positive TB cases, all types, registered in 2014 MDR/RR-TB cases started on second-line treatment in 2013 63% 268XDR-TB cases started on second-line treatment in 2013 0
TB preventive treatment, 2015 % of HIV-positive people (newly enrolled in care) on preventive treatment % of children (aged < 5) household contacts of bacteriologically-confirmed TB cases on preventive treatment
TB financing, 2016 National TB budget (US$ millions) 60Funding source 3% domestic, 60% international, 37% unfunded
0
25
50
75
100
2000 2005 2010 2015
Mor
talit
y (e
xclu
des H
IV+T
B)
(Rat
e pe
r 100
000
pop
ulat
ion
per y
ear)
0
100
200
300
400
Inci
denc
e (R
ate
per 1
00 0
00 p
opul
atio
n pe
r yea
r)
2000 2005 2010 2015
Notified (new and relapse) IncidenceIncidence (HIV + TB only)
Females Males
10 000 5 000 0 5 000 10 000
Not
ified
cas
es b
y ag
e gr
oup
and
sex,
201
5
0–14
15–24
25–34
35–44
45–54
55–64
≥65
Funded domestically Funded internationally Unfunded
2012 2013 2014 2015 2016
Tota
l bud
get (
US$
mill
ions
)
0
20
40
60
New cases Previously treated casesHIV-positive MDR/RR-TB XDR-TB
2000 2002 2004 2006 2008 2010 2012 2014
Trea
tmen
t suc
cess
rate
(%)
0
20
40
60
80
100

Data for all years can be downloaded from www.who.int/tb/data GLOBAL TUBERCULOSIS REPORT 2016 :: 145
Data are as reported to WHO. Estimates of TB and MDR/RR-TB burden are produced by WHO in consultation with countries. Estimates are rounded and totals are computed prior to rounding. a Ranges represent uncertainty intervals.b MDR is TB resistant to rifampicin and isoniazid; RR is TB resistant to rifampicin.c Includes cases with unknown previous TB treatment history.d Includes patients diagnosed before 2015 and patients who were not laboratory-confirmed.
Ethiopia population 2015 :: 99 millionEstimates of TB burden,a 2015 Number (thousands) Rate (per 100 000 population)
Mortality (excludes HIV+TB) 25 (15–38) 26 (15–38)Mortality (HIV+TB only) 3.9 (1.6–7.3) 4 (1.6–7.4)Incidence (includes HIV+TB) 191 (141–249) 192 (142–250)Incidence (HIV+TB only) 16 (10–23) 16 (10–23)Incidence (MDR/RR-TB)b 6.2 (3.5–8.9) 6.2 (3.5–9)
Estimated TB incidence by age and sex (thousands),a 2015 0–14 years > 14 years Total
Females 7.3 (2.2–12) 77 (50–105) 85 (52–117)Males 11 (6.9–15) 95 (70–120) 106 (77–136)Total 18 (12–24) 173 (143–203) 191 (141–249)
TB case notifications, 2015 Total cases notified 137 960Total new and relapse 135 951 — % tested with rapid diagnostics at time of diagnosis 6% — % with known HIV status 77% — % pulmonary 70% — % bacteriologically confirmed among pulmonary 54%
Universal health coverage and social protection TB treatment coverage (notified/estimated incidence), 2015 71% (55–96)TB patients facing catastrophic total costs TB case fatality ratio (estimated mortality/estimated incidence), 2015 0.16 (0.09–0.25)
TB/HIV care in new and relapse TB patients, 2015 Number (%)
Patients with known HIV-status who are HIV-positive 8 625 8% — on antiretroviral therapy 6 848 79%
Drug-resistant TB care, 2015 New cases Previously treated cases Total numberc
Estimated MDR/RR-TB cases 3 300among notified pulmonary TB cases (2 100–4 600)Estimated % of TB cases with MDR/RR-TB 2.7% (1.5–4) 14% (5.6–23) % notified tested for rifampicin resistance 9% 75% 24 073
MDR/RR-TB cases tested for resistance to second-line drugs 113
Laboratory-confirmed cases MDR/RR-TB: 597, XDR-TB: 2Patients started on treatmentd MDR/RR-TB: 597, XDR-TB: 2
Treatment success rate and cohort size Success Cohort
New cases registered in 2014 89% 121 563Previously treated cases registered in 2014 HIV-positive TB cases, all types, registered in 2014 MDR/RR-TB cases started on second-line treatment in 2013 68% 397XDR-TB cases started on second-line treatment in 2013
TB preventive treatment, 2015 % of HIV-positive people (newly enrolled in care) on preventive treatment 47%% of children (aged < 5) household contacts of bacteriologically-confirmed TB cases on preventive treatment
TB financing, 2016 National TB budget (US$ millions) 81Funding source 11% domestic, 51% international, 38% unfunded
0
200
400
600
Inci
denc
e (R
ate
per 1
00 0
00 p
opul
atio
n pe
r yea
r)
2000 2005 2010 2015
Notified (new and relapse) IncidenceIncidence (HIV + TB only)
Females Males
20 000 10 000 0 10 000 20 000
Not
ified
cas
es b
y ag
e gr
oup
and
sex,
201
5
0–14
15–24
25–34
35–44
45–54
55–64
≥65
New cases Previously treated casesHIV-positive MDR/RR-TB XDR-TB
2000 2002 2004 2006 2008 2010 2012 2014
Trea
tmen
t suc
cess
rate
(%)
40
50
60
70
80
90
100
Funded domestically Funded internationally Unfunded
2012 2013 2014 2015 2016
Tota
l bud
get (
US$
mill
ions
)
0
50
100
150
0
50
100
150
2000 2005 2010 2015
Mor
talit
y (e
xclu
des H
IV+T
B)
(Rat
e pe
r 100
000
pop
ulat
ion
per y
ear)

146 :: GLOBAL TUBERCULOSIS REPORT 2016 Data for all years can be downloaded from www.who.int/tb/data
Data are as reported to WHO. Estimates of TB and MDR/RR-TB burden are produced by WHO in consultation with countries. Estimates are rounded and totals are computed prior to rounding.a Ranges represent uncertainty intervals. Estimates of TB incidence and mortality are interim in
nature, pending results from the national TB prevalence survey planned for 2017/2018.b MDR is TB resistant to rifampicin and isoniazid; RR is TB resistant to rifampicin.c Includes cases with unknown previous TB treatment history.d Includes patients diagnosed before 2015 and patients who were not laboratory-confirmed.
India population 2015 :: 1 311 millionEstimates of TB burden,a 2015 Number (thousands) Rate (per 100 000 population)
Mortality (excludes HIV+TB) 480 (380–590) 36 (29–45)Mortality (HIV+TB only) 37 (21–57) 2.8 (1.6–4.3)Incidence (includes HIV+TB) 2 840 (1 470–4 650) 217 (112–355)Incidence (HIV+TB only) 113 (58–186) 8.6 (4.4–14)Incidence (MDR/RR-TB)b 130 (88–180) 9.9 (6.7–14)
Estimated TB incidence by age and sex (thousands),a 2015 0–14 years > 14 years Total
Females 136 (78–193) 860 (112–1 610) 995 (191–1 800)Males 119 (78–161) 1 730 (1 070–2 380) 1 850 (1 150–2 540)Total 255 (181–328) 2 590 (1 750–3 420) 2 840 (1 470–4 650)
TB case notifications, 2015 Total cases notified 1 740 435Total new and relapse 1 667 136 — % tested with rapid diagnostics at time of diagnosis — % with known HIV status 67% — % pulmonary 82% — % bacteriologically confirmed among pulmonary 64%
Universal health coverage and social protection TB treatment coverage (notified/estimated incidence), 2015 59% (36–110)TB patients facing catastrophic total costs TB case fatality ratio (estimated mortality/estimated incidence), 2015 0.20 (0.11–0.36)
TB/HIV care in new and relapse TB patients, 2015 Number (%)
Patients with known HIV-status who are HIV-positive 44 652 4% — on antiretroviral therapy 40 925 92%
Drug-resistant TB care, 2015 New cases Previously treated cases Total numberc
Estimated MDR/RR-TB cases 79 000 among notified pulmonary TB cases (72 000–87 000)Estimated % of TB cases with MDR/RR-TB 2.5% (2.1–3.1) 16% (14–18) % notified tested for rifampicin resistance 6% 60% 275 321
MDR/RR-TB cases tested for resistance to second-line drugs 8 976
Laboratory-confirmed cases MDR/RR-TB: 28 876, XDR-TB: 3 048Patients started on treatmentd MDR/RR-TB: 26 966, XDR-TB: 2 130
Treatment success rate and cohort size Success Cohort
New and relapse cases registered in 2014 74% 1 609 547Previously treated cases, excluding relapse, registered in 2014 65% 74 368HIV-positive TB cases, all types, registered in 2014 76% 44 257MDR/RR-TB cases started on second-line treatment in 2013 46% 15 906XDR-TB cases started on second-line treatment in 2013 37% 248
TB preventive treatment, 2015 % of HIV-positive people (newly enrolled in care) on preventive treatment % of children (aged < 5) household contacts of bacteriologically-confirmed TB cases on preventive treatment
TB financing, 2016 National TB budget (US$ millions) 280Funding source 38% domestic, 62% international, 0% unfunded
0
20
40
60
2000 2005 2010 2015
Mor
talit
y (e
xclu
des H
IV+T
B)
(Rat
e pe
r 100
000
pop
ulat
ion
per y
ear)
0
100
200
300
400
Inci
denc
e (R
ate
per 1
00 0
00 p
opul
atio
n pe
r yea
r)
2000 2005 2010 2015
Notified (new and relapse) IncidenceIncidence (HIV + TB only)
Females Males
200 000 100 000 0 100 000 200 000
Not
ified
cas
es b
y ag
e gr
oup
and
sex,
201
5
0–14
15–24
25–34
35–44
45–54
55–64
≥65
New and relapse Retreatment, excluding relapseHIV-positive MDR/RR-TB XDR-TB
2000 2002 2004 2006 2008 2010 2012 2014
Trea
tmen
t suc
cess
rate
(%)
20
40
60
80
100
Funded domestically Funded internationally Unfunded
2012 2013 2014 2015 2016
Tota
l bud
get (
US$
mill
ions
)
0
100
200
300

Data for all years can be downloaded from www.who.int/tb/data GLOBAL TUBERCULOSIS REPORT 2016 :: 147
Data are as reported to WHO. Estimates of TB and MDR/RR-TB burden are produced by WHO in consultation with countries. Estimates are rounded and totals are computed prior to rounding.a Ranges represent uncertainty intervals.b MDR is TB resistant to rifampicin and isoniazid; RR is TB resistant to rifampicin.c Includes cases with unknown previous TB treatment history.d Includes patients diagnosed before 2015 and patients who were not laboratory-confirmed.e Finance data are not shown because the government of Indonesia is currently reviewing
contributions from domestic sources.
Indonesia population 2015 :: 258 millionEstimates of TB burden,a 2015 Number (thousands) Rate (per 100 000 population)
Mortality (excludes HIV+TB) 100 (67–150) 40 (26–57)Mortality (HIV+TB only) 26 (20–34) 10 (7.6–13)Incidence (includes HIV+TB) 1 020 (658–1 450) 395 (255–564)Incidence (HIV+TB only) 78 (48–116) 30 (18–45)Incidence (MDR/RR-TB)b 32 (19–45) 12 (7.4–17)
Estimated TB incidence by age and sex (thousands),a 2015 0–14 years > 14 years Total
Females 36 (16–57) 384 (194–573) 420 (210–630)Males 39 (23–54) 559 (391–726) 597 (415–780)Total 75 (49–100) 942 (730–1 150) 1 020 (658–1 450)
TB case notifications, 2015 Total cases notified 330 729Total new and relapse 328 895 — % tested with rapid diagnostics at time of diagnosis — % with known HIV status 11% — % pulmonary 93% — % bacteriologically confirmed among pulmonary 64%
Universal health coverage and social protection TB treatment coverage (notified/estimated incidence), 2015 32% (23–50)TB patients facing catastrophic total costs TB case fatality ratio (estimated mortality/estimated incidence), 2015 0.13 (0.08–0.21)
TB/HIV care in new and relapse TB patients, 2015 Number (%)
Patients with known HIV-status who are HIV-positive 3 523 10% — on antiretroviral therapy 757 21%
Drug-resistant TB care, 2015 New cases Previously treated cases Total numberc
Estimated MDR/RR-TB cases 10 000among notified pulmonary TB cases (8 000–12 000)Estimated % of TB cases with MDR/RR-TB 2.8% (2.2–3.5) 16% (10–20) % notified tested for rifampicin resistance <1% 80% 9 764
MDR/RR-TB cases tested for resistance to second-line drugs 895
Laboratory-confirmed cases MDR/RR-TB: 2 135, XDR-TB: 28Patients started on treatmentd MDR/RR-TB: 1 519, XDR-TB: 22
Treatment success rate and cohort size Success Cohort
New and relapse cases registered in 2014 84% 322 806Previously treated cases, excluding relapse, registered in 2014 63% 1 733HIV-positive TB cases, all types, registered in 2014 56% 2 548MDR/RR-TB cases started on second-line treatment in 2013 51% 809XDR-TB cases started on second-line treatment in 2013 40% 10
TB preventive treatment, 2015 % of HIV-positive people (newly enrolled in care) on preventive treatment 2%% of children (aged < 5) household contacts of bacteriologically-confirmed TB cases on preventive treatment
TB financing, 2016e
0
200
400
600
Inci
denc
e (R
ate
per 1
00 0
00 p
opul
atio
n pe
r yea
r)
2000 2005 2010 2015
Notified (new and relapse) IncidenceIncidence (HIV + TB only)
Females Males
30 000 15 000 0 15 000 30 000
Not
ified
cas
es b
y ag
e gr
oup
and
sex,
201
5
0–14
15–24
25–34
35–44
45–54
55–64
≥65
New and relapse Retreatment, excluding relapseHIV-positive MDR/RR-TB XDR-TB
2000 2002 2004 2006 2008 2010 2012 2014
Trea
tmen
t suc
cess
rate
(%)
20
40
60
80
100
0
20
40
60
80
2000 2005 2010 2015
Mor
talit
y (e
xclu
des H
IV+T
B)
(Rat
e pe
r 100
000
pop
ulat
ion
per y
ear)
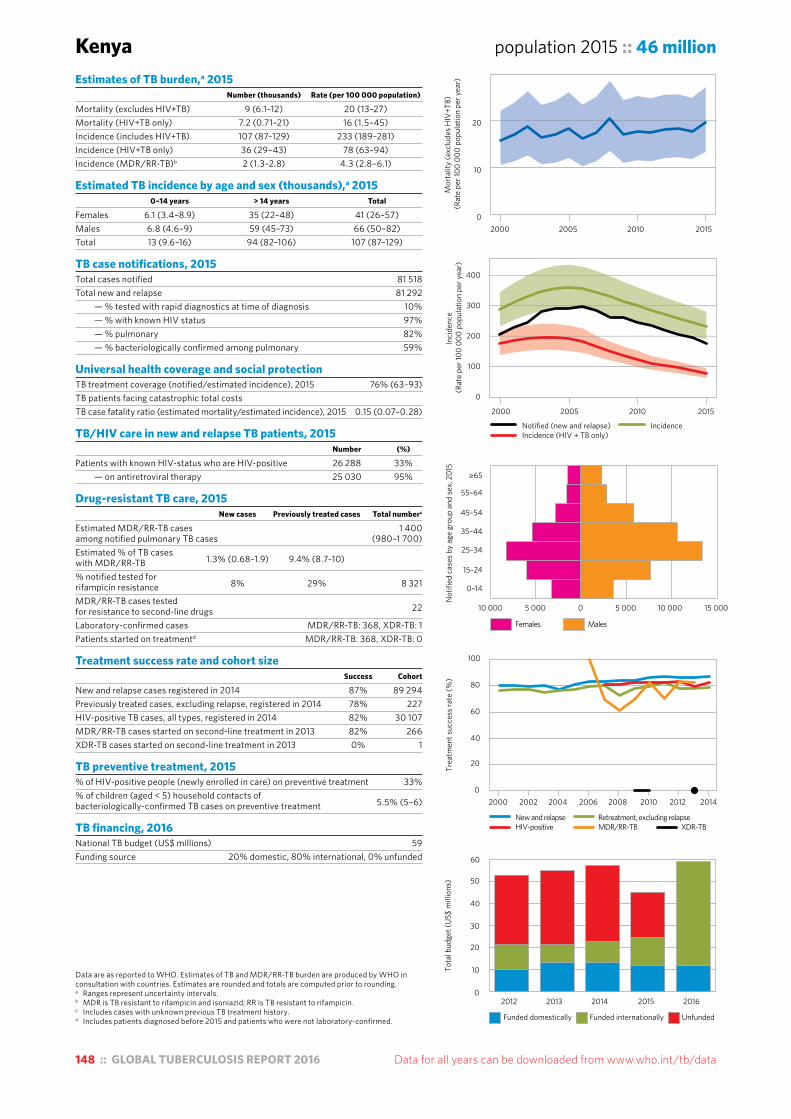
148 :: GLOBAL TUBERCULOSIS REPORT 2016 Data for all years can be downloaded from www.who.int/tb/data
Data are as reported to WHO. Estimates of TB and MDR/RR-TB burden are produced by WHO in consultation with countries. Estimates are rounded and totals are computed prior to rounding. a Ranges represent uncertainty intervals.b MDR is TB resistant to rifampicin and isoniazid; RR is TB resistant to rifampicin.c Includes cases with unknown previous TB treatment history.d Includes patients diagnosed before 2015 and patients who were not laboratory-confirmed.
Kenya population 2015 :: 46 millionEstimates of TB burden,a 2015 Number (thousands) Rate (per 100 000 population)
Mortality (excludes HIV+TB) 9 (6.1–12) 20 (13–27)Mortality (HIV+TB only) 7.2 (0.71–21) 16 (1.5–45)Incidence (includes HIV+TB) 107 (87–129) 233 (189–281)Incidence (HIV+TB only) 36 (29–43) 78 (63–94)Incidence (MDR/RR-TB)b 2 (1.3–2.8) 4.3 (2.8–6.1)
Estimated TB incidence by age and sex (thousands),a 2015 0–14 years > 14 years Total
Females 6.1 (3.4–8.9) 35 (22–48) 41 (26–57)Males 6.8 (4.6–9) 59 (45–73) 66 (50–82)Total 13 (9.6–16) 94 (82–106) 107 (87–129)
TB case notifications, 2015 Total cases notified 81 518Total new and relapse 81 292 — % tested with rapid diagnostics at time of diagnosis 10% — % with known HIV status 97% — % pulmonary 82% — % bacteriologically confirmed among pulmonary 59%
Universal health coverage and social protection TB treatment coverage (notified/estimated incidence), 2015 76% (63–93)TB patients facing catastrophic total costs TB case fatality ratio (estimated mortality/estimated incidence), 2015 0.15 (0.07–0.28)
TB/HIV care in new and relapse TB patients, 2015 Number (%)
Patients with known HIV-status who are HIV-positive 26 288 33% — on antiretroviral therapy 25 030 95%
Drug-resistant TB care, 2015 New cases Previously treated cases Total numberc
Estimated MDR/RR-TB cases 1 400among notified pulmonary TB cases (980–1 700)Estimated % of TB cases with MDR/RR-TB 1.3% (0.68–1.9) 9.4% (8.7–10) % notified tested for rifampicin resistance 8% 29% 8 321
MDR/RR-TB cases tested for resistance to second-line drugs 22
Laboratory-confirmed cases MDR/RR-TB: 368, XDR-TB: 1Patients started on treatmentd MDR/RR-TB: 368, XDR-TB: 0
Treatment success rate and cohort size Success Cohort
New and relapse cases registered in 2014 87% 89 294Previously treated cases, excluding relapse, registered in 2014 78% 227HIV-positive TB cases, all types, registered in 2014 82% 30 107MDR/RR-TB cases started on second-line treatment in 2013 82% 266XDR-TB cases started on second-line treatment in 2013 0% 1
TB preventive treatment, 2015 % of HIV-positive people (newly enrolled in care) on preventive treatment 33%% of children (aged < 5) household contacts of bacteriologically-confirmed TB cases on preventive treatment 5.5% (5–6)
TB financing, 2016 National TB budget (US$ millions) 59Funding source 20% domestic, 80% international, 0% unfunded
0
10
20
2000 2005 2010 2015
Mor
talit
y (e
xclu
des H
IV+T
B)
(Rat
e pe
r 100
000
pop
ulat
ion
per y
ear)
0
100
200
300
400
Inci
denc
e (R
ate
per 1
00 0
00 p
opul
atio
n pe
r yea
r)
2000 2005 2010 2015
Notified (new and relapse) IncidenceIncidence (HIV + TB only)
Females Males
10 000 5 000 0 5 000 10 000 15 000
Not
ified
cas
es b
y ag
e gr
oup
and
sex,
201
5
0–14
15–24
25–34
35–44
45–54
55–64
≥65
New and relapse Retreatment, excluding relapseHIV-positive MDR/RR-TB XDR-TB
2000 2002 2004 2006 2008 2010 2012 2014
Trea
tmen
t suc
cess
rate
(%)
0
20
40
60
80
100
Funded domestically Funded internationally Unfunded
2012 2013 2014 2015 2016
Tota
l bud
get (
US$
mill
ions
)
0
20
40
60
10
30
50
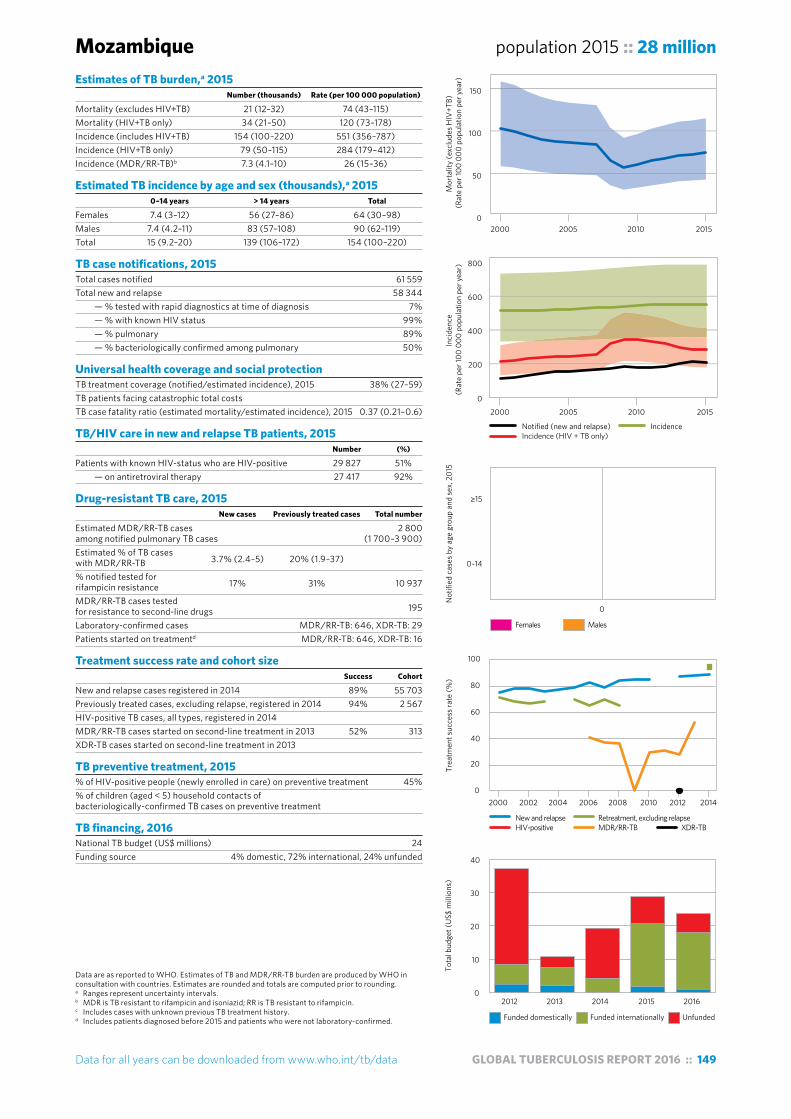
Data for all years can be downloaded from www.who.int/tb/data GLOBAL TUBERCULOSIS REPORT 2016 :: 149
Data are as reported to WHO. Estimates of TB and MDR/RR-TB burden are produced by WHO in consultation with countries. Estimates are rounded and totals are computed prior to rounding. a Ranges represent uncertainty intervals.b MDR is TB resistant to rifampicin and isoniazid; RR is TB resistant to rifampicin.c Includes cases with unknown previous TB treatment history.d Includes patients diagnosed before 2015 and patients who were not laboratory-confirmed.
Mozambique population 2015 :: 28 millionEstimates of TB burden,a 2015 Number (thousands) Rate (per 100 000 population)
Mortality (excludes HIV+TB) 21 (12–32) 74 (43–115)Mortality (HIV+TB only) 34 (21–50) 120 (73–178)Incidence (includes HIV+TB) 154 (100–220) 551 (356–787)Incidence (HIV+TB only) 79 (50–115) 284 (179–412)Incidence (MDR/RR-TB)b 7.3 (4.1–10) 26 (15–36)
Estimated TB incidence by age and sex (thousands),a 2015 0–14 years > 14 years Total
Females 7.4 (3–12) 56 (27–86) 64 (30–98)Males 7.4 (4.2–11) 83 (57–108) 90 (62–119)Total 15 (9.2–20) 139 (106–172) 154 (100–220)
TB case notifications, 2015 Total cases notified 61 559Total new and relapse 58 344 — % tested with rapid diagnostics at time of diagnosis 7% — % with known HIV status 99% — % pulmonary 89% — % bacteriologically confirmed among pulmonary 50%
Universal health coverage and social protection TB treatment coverage (notified/estimated incidence), 2015 38% (27–59)TB patients facing catastrophic total costs TB case fatality ratio (estimated mortality/estimated incidence), 2015 0.37 (0.21–0.6)
TB/HIV care in new and relapse TB patients, 2015 Number (%)
Patients with known HIV-status who are HIV-positive 29 827 51% — on antiretroviral therapy 27 417 92%
Drug-resistant TB care, 2015 New cases Previously treated cases Total number
Estimated MDR/RR-TB cases 2 800among notified pulmonary TB cases (1 700–3 900)Estimated % of TB cases with MDR/RR-TB 3.7% (2.4–5) 20% (1.9–37) % notified tested for rifampicin resistance 17% 31% 10 937
MDR/RR-TB cases tested for resistance to second-line drugs 195
Laboratory-confirmed cases MDR/RR-TB: 646, XDR-TB: 29Patients started on treatmentd MDR/RR-TB: 646, XDR-TB: 16
Treatment success rate and cohort size Success Cohort
New and relapse cases registered in 2014 89% 55 703Previously treated cases, excluding relapse, registered in 2014 94% 2 567HIV-positive TB cases, all types, registered in 2014 MDR/RR-TB cases started on second-line treatment in 2013 52% 313XDR-TB cases started on second-line treatment in 2013
TB preventive treatment, 2015 % of HIV-positive people (newly enrolled in care) on preventive treatment 45%% of children (aged < 5) household contacts of bacteriologically-confirmed TB cases on preventive treatment
TB financing, 2016 National TB budget (US$ millions) 24Funding source 4% domestic, 72% international, 24% unfunded
0
50
100
150
2000 2005 2010 2015
Mor
talit
y (e
xclu
des H
IV+T
B)
(Rat
e pe
r 100
000
pop
ulat
ion
per y
ear)
0
200
400
600
800
Inci
denc
e (R
ate
per 1
00 0
00 p
opul
atio
n pe
r yea
r)
2000 2005 2010 2015
Notified (new and relapse) IncidenceIncidence (HIV + TB only)
Females Males
0
0–14
≥15
Not
ified
cas
es b
y ag
e gr
oup
and
sex,
201
5
New and relapse Retreatment, excluding relapseHIV-positive MDR/RR-TB XDR-TB
2000 2002 2004 2006 2008 2010 2012 2014
Trea
tmen
t suc
cess
rate
(%)
0
20
40
60
80
100
Funded domestically Funded internationally Unfunded
2012 2013 2014 2015 2016
Tota
l bud
get (
US$
mill
ions
)
0
10
20
30
40
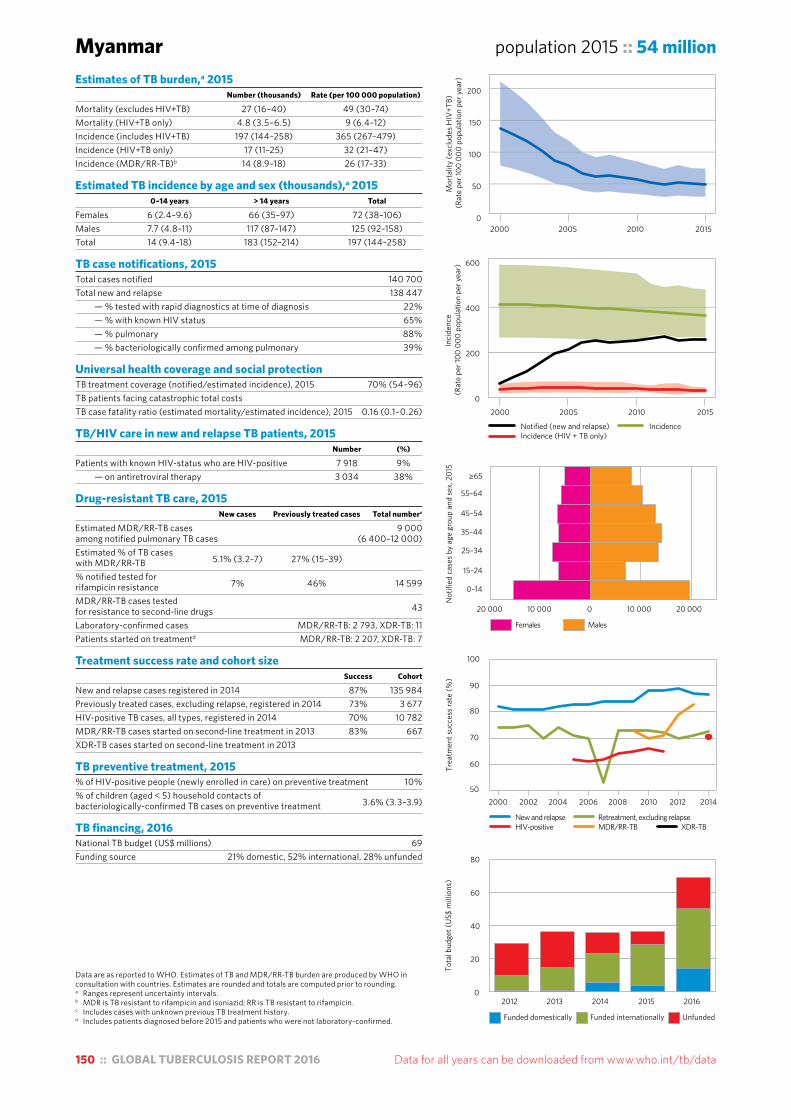
150 :: GLOBAL TUBERCULOSIS REPORT 2016 Data for all years can be downloaded from www.who.int/tb/data
Data are as reported to WHO. Estimates of TB and MDR/RR-TB burden are produced by WHO in consultation with countries. Estimates are rounded and totals are computed prior to rounding. a Ranges represent uncertainty intervals.b MDR is TB resistant to rifampicin and isoniazid; RR is TB resistant to rifampicin.c Includes cases with unknown previous TB treatment history.d Includes patients diagnosed before 2015 and patients who were not laboratory-confirmed.
Myanmar population 2015 :: 54 millionEstimates of TB burden,a 2015 Number (thousands) Rate (per 100 000 population)
Mortality (excludes HIV+TB) 27 (16–40) 49 (30–74)Mortality (HIV+TB only) 4.8 (3.5–6.5) 9 (6.4–12)Incidence (includes HIV+TB) 197 (144–258) 365 (267–479)Incidence (HIV+TB only) 17 (11–25) 32 (21–47)Incidence (MDR/RR-TB)b 14 (8.9–18) 26 (17–33)
Estimated TB incidence by age and sex (thousands),a 2015 0–14 years > 14 years Total
Females 6 (2.4–9.6) 66 (35–97) 72 (38–106)Males 7.7 (4.8–11) 117 (87–147) 125 (92–158)Total 14 (9.4–18) 183 (152–214) 197 (144–258)
TB case notifications, 2015 Total cases notified 140 700Total new and relapse 138 447 — % tested with rapid diagnostics at time of diagnosis 22% — % with known HIV status 65% — % pulmonary 88% — % bacteriologically confirmed among pulmonary 39%
Universal health coverage and social protection TB treatment coverage (notified/estimated incidence), 2015 70% (54–96)TB patients facing catastrophic total costs TB case fatality ratio (estimated mortality/estimated incidence), 2015 0.16 (0.1–0.26)
TB/HIV care in new and relapse TB patients, 2015 Number (%)
Patients with known HIV-status who are HIV-positive 7 918 9% — on antiretroviral therapy 3 034 38%
Drug-resistant TB care, 2015 New cases Previously treated cases Total numberc
Estimated MDR/RR-TB cases 9 000among notified pulmonary TB cases (6 400–12 000)Estimated % of TB cases with MDR/RR-TB 5.1% (3.2–7) 27% (15–39) % notified tested for rifampicin resistance 7% 46% 14 599
MDR/RR-TB cases tested for resistance to second-line drugs 43
Laboratory-confirmed cases MDR/RR-TB: 2 793, XDR-TB: 11Patients started on treatmentd MDR/RR-TB: 2 207, XDR-TB: 7
Treatment success rate and cohort size Success Cohort
New and relapse cases registered in 2014 87% 135 984Previously treated cases, excluding relapse, registered in 2014 73% 3 677HIV-positive TB cases, all types, registered in 2014 70% 10 782MDR/RR-TB cases started on second-line treatment in 2013 83% 667XDR-TB cases started on second-line treatment in 2013
TB preventive treatment, 2015 % of HIV-positive people (newly enrolled in care) on preventive treatment 10%% of children (aged < 5) household contacts of bacteriologically-confirmed TB cases on preventive treatment 3.6% (3.3–3.9)
TB financing, 2016 National TB budget (US$ millions) 69Funding source 21% domestic, 52% international, 28% unfunded
Females Males
20 000 10 000 0 10 000 20 000
Not
ified
cas
es b
y ag
e gr
oup
and
sex,
201
5
0–14
15–24
25–34
35–44
45–54
55–64
≥65
New and relapse Retreatment, excluding relapseHIV-positive MDR/RR-TB XDR-TB
2000 2002 2004 2006 2008 2010 2012 2014
Trea
tmen
t suc
cess
rate
(%)
50
60
70
80
90
100
Funded domestically Funded internationally Unfunded
2012 2013 2014 2015 2016
Tota
l bud
get (
US$
mill
ions
)
0
20
40
60
80
0
50
100
150
200
2000 2005 2010 2015
Mor
talit
y (e
xclu
des H
IV+T
B)
(Rat
e pe
r 100
000
pop
ulat
ion
per y
ear)
0
200
400
600
Inci
denc
e (R
ate
per 1
00 0
00 p
opul
atio
n pe
r yea
r)
2000 2005 2010 2015
Notified (new and relapse) IncidenceIncidence (HIV + TB only)

Data for all years can be downloaded from www.who.int/tb/data GLOBAL TUBERCULOSIS REPORT 2016 :: 151
Data are as reported to WHO. Estimates of TB and MDR/RR-TB burden are produced by WHO in consultation with countries. Estimates are rounded and totals are computed prior to rounding. a Ranges represent uncertainty intervals.b MDR is TB resistant to rifampicin and isoniazid; RR is TB resistant to rifampicin.c Includes cases with unknown previous TB treatment history.d Includes patients diagnosed before 2015 and patients who were not laboratory-confirmed.
Nigeria population 2015 :: 182 millionEstimates of TB burden,a 2015 Number (thousands) Rate (per 100 000 population)
Mortality (excludes HIV+TB) 180 (96–290) 99 (53–160)Mortality (HIV+TB only) 57 (43–74) 31 (24–40)Incidence (includes HIV+TB) 586 (345–890) 322 (189–488)Incidence (HIV+TB only) 100 (56–155) 55 (31–85)Incidence (MDR/RR-TB)b 29 (15–43) 16 (8.2–24)
Estimated TB incidence by age and sex (thousands),a 2015 0–14 years > 14 years Total
Females 33 (14–52) 198 (67–328) 231 (82–380)Males 34 (20–47) 322 (210–434) 355 (229–481)Total 67 (43–91) 519 (371–668) 586 (345–890)
TB case notifications, 2015 Total cases notified 90 584Total new and relapse 87 211 — % tested with rapid diagnostics at time of diagnosis 58% — % with known HIV status 100% — % pulmonary 94% — % bacteriologically confirmed among pulmonary 68%
Universal health coverage and social protection TB treatment coverage (notified/estimated incidence), 2015 15% (9.8–25)TB patients facing catastrophic total costs TB case fatality ratio (estimated mortality/estimated incidence), 2015 0.43 (0.22–0.77)
TB/HIV care in new and relapse TB patients, 2015 Number (%)
Patients with known HIV-status who are HIV-positive 14 846 17% — on antiretroviral therapy 11 141 75%
Drug-resistant TB care, 2015 New cases Previously treated cases Total numberc
Estimated MDR/RR-TB cases 4 700among notified pulmonary TB cases (3 700–5 700)Estimated % of TB cases with MDR/RR-TB 4.3% (3.2–5.4) 25% (19–31) % notified tested for rifampicin resistance 40% 64% 50 274
MDR/RR-TB cases tested for resistance to second-line drugs Laboratory-confirmed cases MDR/RR-TB: 1 241, XDR-TB: 1Patients started on treatmentd MDR/RR-TB: 656, XDR-TB: 1
Treatment success rate and cohort size Success Cohort
New and relapse cases registered in 2014 87% 86 464Previously treated cases, excluding relapse, registered in 2014 83% 4 890HIV-positive TB cases, all types, registered in 2014 79% 17 014MDR/RR-TB cases started on second-line treatment in 2013 77% 339XDR-TB cases started on second-line treatment in 2013 0% 2
TB preventive treatment, 2015 % of HIV-positive people (newly enrolled in care) on preventive treatment 20%% of children (aged < 5) household contacts of bacteriologically-confirmed TB cases on preventive treatment 16% (15–18)
TB financing, 2016 National TB budget (US$ millions) 257Funding source 12% domestic, 33% international, 55% unfunded
0
50
100
150
2000 2005 2010 2015
Mor
talit
y (e
xclu
des H
IV+T
B)
(Rat
e pe
r 100
000
pop
ulat
ion
per y
ear)
0
100
200
300
400
500
Inci
denc
e (R
ate
per 1
00 0
00 p
opul
atio
n pe
r yea
r)
2000 2005 2010 2015
Notified (new and relapse) IncidenceIncidence (HIV + TB only)
New and relapse Retreatment, excluding relapseHIV-positive MDR/RR-TB XDR-TB
2000 2002 2004 2006 2008 2010 2012 2014
Trea
tmen
t suc
cess
rate
(%)
0
20
40
60
80
100
Funded domestically Funded internationally Unfunded
2012 2013 2014 2015 2016
Tota
l bud
get (
US$
mill
ions
)
0
100
200
300
Females Males
10 000 5 000 0 5 000 10 000 15 000
Not
ified
cas
es b
y ag
e gr
oup
and
sex,
201
5
0–14
15–24
25–34
35–44
45–54
55–64
≥65

152 :: GLOBAL TUBERCULOSIS REPORT 2016 Data for all years can be downloaded from www.who.int/tb/data
Data are as reported to WHO. Estimates of TB and MDR/RR-TB burden are produced by WHO in consultation with countries. Estimates are rounded and totals are computed prior to rounding. a Ranges represent uncertainty intervals.b MDR is TB resistant to rifampicin and isoniazid; RR is TB resistant to rifampicin.c Includes cases with unknown previous TB treatment history.d Includes patients diagnosed before 2015 and patients who were not laboratory-confirmed.
Pakistan population 2015 :: 189 millionEstimates of TB burden,a 2015 Number (thousands) Rate (per 100 000 population)
Mortality (excludes HIV+TB) 44 (9.3–110) 23 (4.9–56)Mortality (HIV+TB only) 1.6 (1.1–2.1) 0.83 (0.6–1.1)Incidence (includes HIV+TB) 510 (330–729) 270 (175–386)Incidence (HIV+TB only) 8.8 (5.4–13) 4.6 (2.8–6.9)Incidence (MDR/RR-TB)b 26 (16–36) 14 (8.5–19)
Estimated TB incidence by age and sex (thousands),a 2015 0–14 years > 14 years Total
Females 25 (12–37) 231 (141–320) 255 (153–357)Males 21 (13–29) 234 (163–305) 255 (175–335)Total 46 (30–61) 465 (357–573) 510 (330–729)
TB case notifications, 2015 Total cases notified 331 809Total new and relapse 323 856 — % tested with rapid diagnostics at time of diagnosis — % with known HIV status 4% — % pulmonary 81% — % bacteriologically confirmed among pulmonary 51%
Universal health coverage and social protection TB treatment coverage (notified/estimated incidence), 2015 63% (44–98)TB patients facing catastrophic total costs TB case fatality ratio (estimated mortality/estimated incidence), 2015 0.09 (0.02–0.23)
TB/HIV care in new and relapse TB patients, 2015 Number (%)
Patients with known HIV-status who are HIV-positive 59 <1% — on antiretroviral therapy 59 100%
Drug-resistant TB care, 2015 New cases Previously treated cases Total numberc
Estimated MDR/RR-TB cases 14 000among notified pulmonary TB cases (11 000–16 000)Estimated % of TB cases with MDR/RR-TB 4.2% (3.2–5.3) 16% (15–17) % notified tested for rifampicin resistance 1% 84% 23 078
MDR/RR-TB cases tested for resistance to second-line drugs 2 292
Laboratory-confirmed cases MDR/RR-TB: 3 059, XDR-TB: 99Patients started on treatmentd MDR/RR-TB: 2 553, XDR-TB: 68
Treatment success rate and cohort size Success Cohort
New and relapse cases registered in 2014 93% 308 327Previously treated cases, excluding relapse, registered in 2014 82% 8 005HIV-positive TB cases, all types, registered in 2014 MDR/RR-TB cases started on second-line treatment in 2013 69% 1 484XDR-TB cases started on second-line treatment in 2013 30% 64
TB preventive treatment, 2015 % of HIV-positive people (newly enrolled in care) on preventive treatment % of children (aged < 5) household contacts of bacteriologically-confirmed TB cases on preventive treatment
TB financing, 2016 National TB budget (US$ millions) 62Funding source <1% domestic, 65% international, 35% unfunded
0
100
200
300
400
Inci
denc
e (R
ate
per 1
00 0
00 p
opul
atio
n pe
r yea
r)
2000 2005 2010 2015
Notified (new and relapse) IncidenceIncidence (HIV + TB only)
Females Males
50 000 30 000 10 000 10 000 30 0000
Not
ified
cas
es b
y ag
e gr
oup
and
sex,
201
5
0–14
15–24
25–34
35–44
45–54
55–64
≥65
New and relapse Retreatment, excluding relapseHIV-positive MDR/RR-TB XDR-TB
2000 2002 2004 2006 2008 2010 2012 2014
Trea
tmen
t suc
cess
rate
(%)
20
40
60
80
100
Funded domestically Funded internationally Unfunded
2012 2013 2014 2015 2016
Tota
l bud
get (
US$
mill
ions
)
0
50
100
0
25
50
75
100
2000 2005 2010 2015
Mor
talit
y (e
xclu
des H
IV+T
B)
(Rat
e pe
r 100
000
pop
ulat
ion
per y
ear)

Data for all years can be downloaded from www.who.int/tb/data GLOBAL TUBERCULOSIS REPORT 2016 :: 153
Data are as reported to WHO. Estimates of TB and MDR/RR-TB burden are produced by WHO in consultation with countries. Estimates are rounded and totals are computed prior to rounding. a Ranges represent uncertainty intervals.b MDR is TB resistant to rifampicin and isoniazid; RR is TB resistant to rifampicin.c Includes cases with unknown previous TB treatment history.d Includes patients diagnosed before 2015 and patients who were not laboratory-confirmed.
Philippines population 2015 :: 101 millionEstimates of TB burden,a 2015 Number (thousands) Rate (per 100 000 population)
Mortality (excludes HIV+TB) 14 (8.8–19) 13 (8.7–19)Mortality (HIV+TB only) 0.44 (0.24–0.7) 0.44 (0.24–0.7)Incidence (includes HIV+TB) 324 (279–373) 322 (277–370)Incidence (HIV+TB only) 4.3 (3.3–5.4) 4.3 (3.3–5.4)Incidence (MDR/RR-TB)b 17 (14–20) 17 (14–20)
Estimated TB incidence by age and sex (thousands),a 2015 0–14 years > 14 years Total
Females 14 (6.4–22) 100 (64–135) 114 (71–156)Males 17 (11–23) 194 (152–236) 211 (163–259)Total 31 (22–40) 294 (266–322) 324 (279–373)
TB case notifications, 2015 Total cases notified 286 544Total new and relapse 276 672 — % tested with rapid diagnostics at time of diagnosis 20% — % with known HIV status 13% — % pulmonary 97% — % bacteriologically confirmed among pulmonary 36%
Universal health coverage and social protection TB treatment coverage (notified/estimated incidence), 2015 85% (74–99)TB patients facing catastrophic total costs TB case fatality ratio (estimated mortality/estimated incidence), 2015 0.04 (0.03–0.06)
TB/HIV care in new and relapse TB patients, 2015 Number (%)
Patients with known HIV-status who are HIV-positive 255 <1% — on antiretroviral therapy 178 70%
Drug-resistant TB care, 2015 New cases Previously treated cases Total numberc
Estimated MDR/RR-TB cases 15 000among notified pulmonary TB cases (12 000–18 000)Estimated % of TB cases with MDR/RR-TB 2.6% (1.8–3.3) 29% (21–38) % notified tested for rifampicin resistance 1% 45% 17 351
MDR/RR-TB cases tested for resistance to second-line drugs 414
Laboratory-confirmed cases MDR/RR-TB: 3 788, XDR-TB: 2Patients started on treatmentd MDR/RR-TB: 4 142, XDR-TB: 12
Treatment success rate and cohort size Success Cohort
New and relapse cases registered in 2014 92% 219 737Previously treated cases, excluding relapse, registered in 2014 83% 6 062HIV-positive TB cases, all types, registered in 2014 52% 174MDR/RR-TB cases started on second-line treatment in 2013 49% 1 968XDR-TB cases started on second-line treatment in 2013 50% 6
TB preventive treatment, 2015 % of HIV-positive people (newly enrolled in care) on preventive treatment 43%% of children (aged < 5) household contacts of bacteriologically-confirmed TB cases on preventive treatment 14% (13–16)
TB financing, 2016 National TB budget (US$ millions) 104Funding source 21% domestic, 41% international, 38% unfunded
Females Males
20 000 10 000 0 10 000 20 000 30 000
Not
ified
cas
es b
y ag
e gr
oup
and
sex,
201
5
0–14
15–24
25–34
35–44
45–54
55–64
≥65
New and relapse Retreatment, excluding relapseHIV-positive MDR/RR-TB XDR-TB
2000 2002 2004 2006 2008 2010 2012 2014
Trea
tmen
t suc
cess
rate
(%)
0
20
40
60
80
100
Funded domestically Funded internationally Unfunded
2012 2013 2014 2015 2016
Tota
l bud
get (
US$
mill
ions
)
0
50
100
150
0
10
20
30
40
2000 2005 2010 2015
Mor
talit
y (e
xclu
des H
IV+T
B)
(Rat
e pe
r 100
000
pop
ulat
ion
per y
ear)
0
200
400
Inci
denc
e (R
ate
per 1
00 0
00 p
opul
atio
n pe
r yea
r)
2000 2005 2010 2015
Notified (new and relapse) IncidenceIncidence (HIV + TB only)
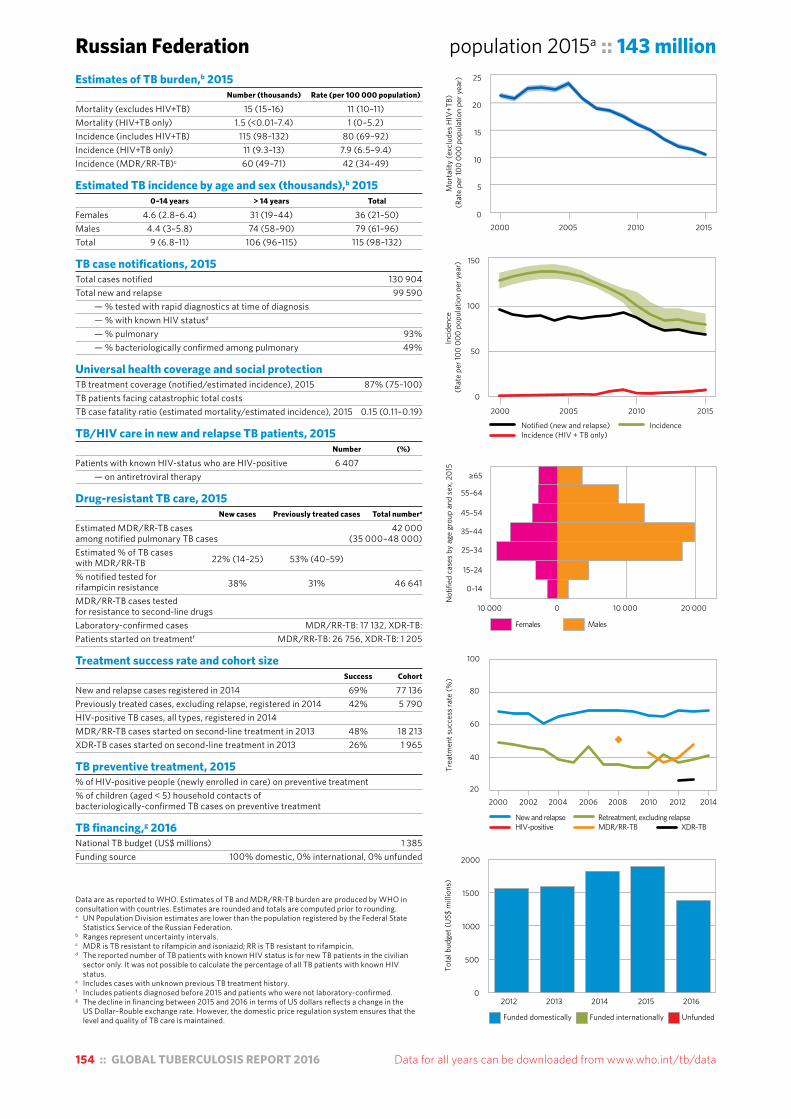
154 :: GLOBAL TUBERCULOSIS REPORT 2016 Data for all years can be downloaded from www.who.int/tb/data
Data are as reported to WHO. Estimates of TB and MDR/RR-TB burden are produced by WHO in consultation with countries. Estimates are rounded and totals are computed prior to rounding.a UN Population Division estimates are lower than the population registered by the Federal State
Statistics Service of the Russian Federation.b Ranges represent uncertainty intervals.c MDR is TB resistant to rifampicin and isoniazid; RR is TB resistant to rifampicin.d The reported number of TB patients with known HIV status is for new TB patients in the civilian
sector only. It was not possible to calculate the percentage of all TB patients with known HIV status.
e Includes cases with unknown previous TB treatment history.f Includes patients diagnosed before 2015 and patients who were not laboratory-confirmed.g The decline in financing between 2015 and 2016 in terms of US dollars reflects a change in the
US Dollar–Rouble exchange rate. However, the domestic price regulation system ensures that the level and quality of TB care is maintained.
Russian Federation population 2015a :: 143 millionEstimates of TB burden,b 2015 Number (thousands) Rate (per 100 000 population)
Mortality (excludes HIV+TB) 15 (15–16) 11 (10–11)Mortality (HIV+TB only) 1.5 (<0.01–7.4) 1 (0–5.2)Incidence (includes HIV+TB) 115 (98–132) 80 (69–92)Incidence (HIV+TB only) 11 (9.3–13) 7.9 (6.5–9.4)Incidence (MDR/RR-TB)c 60 (49–71) 42 (34–49)
Estimated TB incidence by age and sex (thousands),b 2015 0–14 years > 14 years Total
Females 4.6 (2.8–6.4) 31 (19–44) 36 (21–50)Males 4.4 (3–5.8) 74 (58–90) 79 (61–96)Total 9 (6.8–11) 106 (96–115) 115 (98–132)
TB case notifications, 2015 Total cases notified 130 904Total new and relapse 99 590 — % tested with rapid diagnostics at time of diagnosis — % with known HIV statusd — % pulmonary 93% — % bacteriologically confirmed among pulmonary 49%
Universal health coverage and social protection TB treatment coverage (notified/estimated incidence), 2015 87% (75–100)TB patients facing catastrophic total costs TB case fatality ratio (estimated mortality/estimated incidence), 2015 0.15 (0.11–0.19)
TB/HIV care in new and relapse TB patients, 2015 Number (%)
Patients with known HIV-status who are HIV-positive 6 407 — on antiretroviral therapy
Drug-resistant TB care, 2015 New cases Previously treated cases Total numbere
Estimated MDR/RR-TB cases 42 000among notified pulmonary TB cases (35 000–48 000)Estimated % of TB cases with MDR/RR-TB 22% (14–25) 53% (40–59) % notified tested for rifampicin resistance 38% 31% 46 641
MDR/RR-TB cases tested for resistance to second-line drugs Laboratory-confirmed cases MDR/RR-TB: 17 132, XDR-TB:Patients started on treatmentf MDR/RR-TB: 26 756, XDR-TB: 1 205
Treatment success rate and cohort size Success Cohort
New and relapse cases registered in 2014 69% 77 136Previously treated cases, excluding relapse, registered in 2014 42% 5 790HIV-positive TB cases, all types, registered in 2014 MDR/RR-TB cases started on second-line treatment in 2013 48% 18 213XDR-TB cases started on second-line treatment in 2013 26% 1 965
TB preventive treatment, 2015 % of HIV-positive people (newly enrolled in care) on preventive treatment % of children (aged < 5) household contacts of bacteriologically-confirmed TB cases on preventive treatment
TB financing,g 2016 National TB budget (US$ millions) 1 385Funding source 100% domestic, 0% international, 0% unfunded
0
50
100
150
Inci
denc
e (R
ate
per 1
00 0
00 p
opul
atio
n pe
r yea
r)
2000 2005 2010 2015
Notified (new and relapse) IncidenceIncidence (HIV + TB only)
Females Males
10 000 0 10 000 20 000
Not
ified
cas
es b
y ag
e gr
oup
and
sex,
201
5
0–14
15–24
25–34
35–44
45–54
55–64
≥65
New and relapse Retreatment, excluding relapseHIV-positive MDR/RR-TB XDR-TB
2000 2002 2004 2006 2008 2010 2012 2014
Trea
tmen
t suc
cess
rate
(%)
20
40
60
80
100
Funded domestically Funded internationally Unfunded
2012 2013 2014 2015 2016
Tota
l bud
get (
US$
mill
ions
)
0
500
1000
1500
2000
0
5
10
15
20
25
2000 2005 2010 2015
Mor
talit
y (e
xclu
des H
IV+T
B)
(Rat
e pe
r 100
000
pop
ulat
ion
per y
ear)
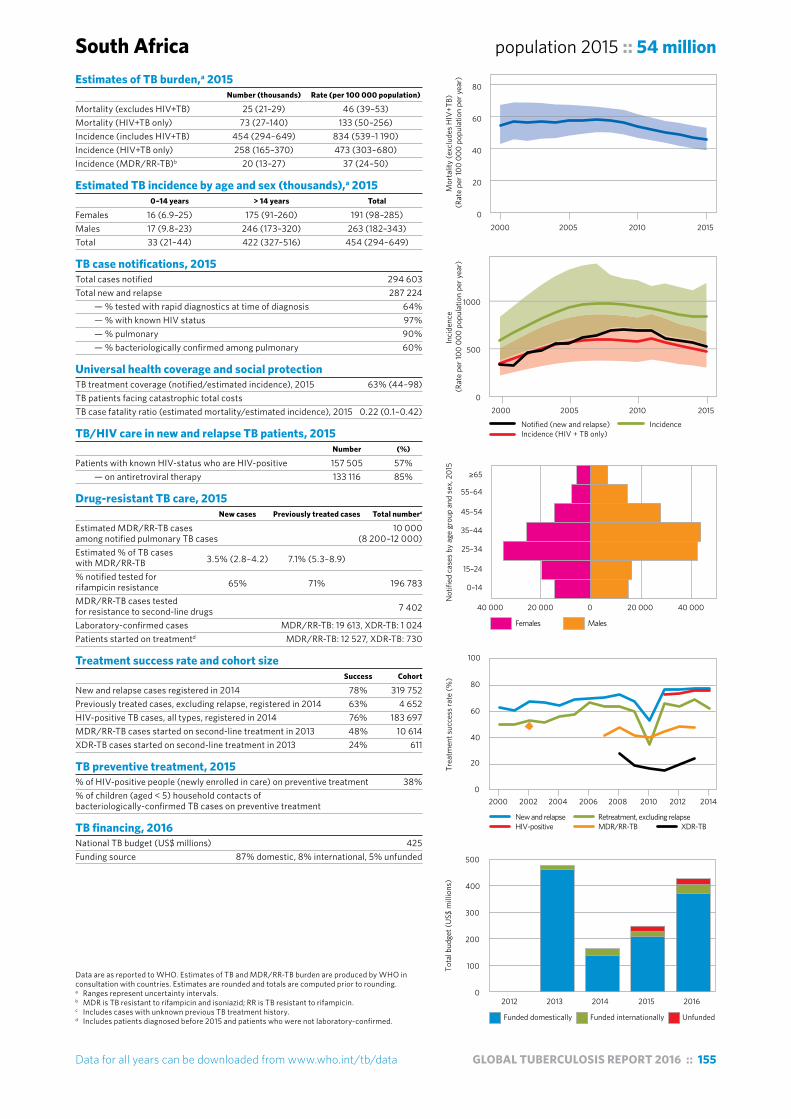
Data for all years can be downloaded from www.who.int/tb/data GLOBAL TUBERCULOSIS REPORT 2016 :: 155
Data are as reported to WHO. Estimates of TB and MDR/RR-TB burden are produced by WHO in consultation with countries. Estimates are rounded and totals are computed prior to rounding. a Ranges represent uncertainty intervals.b MDR is TB resistant to rifampicin and isoniazid; RR is TB resistant to rifampicin.c Includes cases with unknown previous TB treatment history.d Includes patients diagnosed before 2015 and patients who were not laboratory-confirmed.
South Africa population 2015 :: 54 millionEstimates of TB burden,a 2015 Number (thousands) Rate (per 100 000 population)
Mortality (excludes HIV+TB) 25 (21–29) 46 (39–53)Mortality (HIV+TB only) 73 (27–140) 133 (50–256)Incidence (includes HIV+TB) 454 (294–649) 834 (539–1 190)Incidence (HIV+TB only) 258 (165–370) 473 (303–680)Incidence (MDR/RR-TB)b 20 (13–27) 37 (24–50)
Estimated TB incidence by age and sex (thousands),a 2015 0–14 years > 14 years Total
Females 16 (6.9–25) 175 (91–260) 191 (98–285)Males 17 (9.8–23) 246 (173–320) 263 (182–343)Total 33 (21–44) 422 (327–516) 454 (294–649)
TB case notifications, 2015 Total cases notified 294 603Total new and relapse 287 224 — % tested with rapid diagnostics at time of diagnosis 64% — % with known HIV status 97% — % pulmonary 90% — % bacteriologically confirmed among pulmonary 60%
Universal health coverage and social protection TB treatment coverage (notified/estimated incidence), 2015 63% (44–98)TB patients facing catastrophic total costs TB case fatality ratio (estimated mortality/estimated incidence), 2015 0.22 (0.1–0.42)
TB/HIV care in new and relapse TB patients, 2015 Number (%)
Patients with known HIV-status who are HIV-positive 157 505 57% — on antiretroviral therapy 133 116 85%
Drug-resistant TB care, 2015 New cases Previously treated cases Total numberc
Estimated MDR/RR-TB cases 10 000among notified pulmonary TB cases (8 200–12 000)Estimated % of TB cases with MDR/RR-TB 3.5% (2.8–4.2) 7.1% (5.3–8.9) % notified tested for rifampicin resistance 65% 71% 196 783
MDR/RR-TB cases tested for resistance to second-line drugs 7 402
Laboratory-confirmed cases MDR/RR-TB: 19 613, XDR-TB: 1 024Patients started on treatmentd MDR/RR-TB: 12 527, XDR-TB: 730
Treatment success rate and cohort size Success Cohort
New and relapse cases registered in 2014 78% 319 752Previously treated cases, excluding relapse, registered in 2014 63% 4 652HIV-positive TB cases, all types, registered in 2014 76% 183 697MDR/RR-TB cases started on second-line treatment in 2013 48% 10 614XDR-TB cases started on second-line treatment in 2013 24% 611
TB preventive treatment, 2015 % of HIV-positive people (newly enrolled in care) on preventive treatment 38%% of children (aged < 5) household contacts of bacteriologically-confirmed TB cases on preventive treatment
TB financing, 2016 National TB budget (US$ millions) 425Funding source 87% domestic, 8% international, 5% unfunded
0
500
1000
Inci
denc
e (R
ate
per 1
00 0
00 p
opul
atio
n pe
r yea
r)
2000 2005 2010 2015
Notified (new and relapse) IncidenceIncidence (HIV + TB only)
Females Males
40 000 20 000 0 20 000 40 000
Not
ified
cas
es b
y ag
e gr
oup
and
sex,
201
5
0–14
15–24
25–34
35–44
45–54
55–64
≥65
New and relapse Retreatment, excluding relapseHIV-positive MDR/RR-TB XDR-TB
2000 2002 2004 2006 2008 2010 2012 2014
Trea
tmen
t suc
cess
rate
(%)
0
20
40
60
80
100
Funded domestically Funded internationally Unfunded
2012 2013 2014 2015 2016
Tota
l bud
get (
US$
mill
ions
)
0
100
200
300
400
500
0
20
40
60
80
2000 2005 2010 2015
Mor
talit
y (e
xclu
des H
IV+T
B)
(Rat
e pe
r 100
000
pop
ulat
ion
per y
ear)
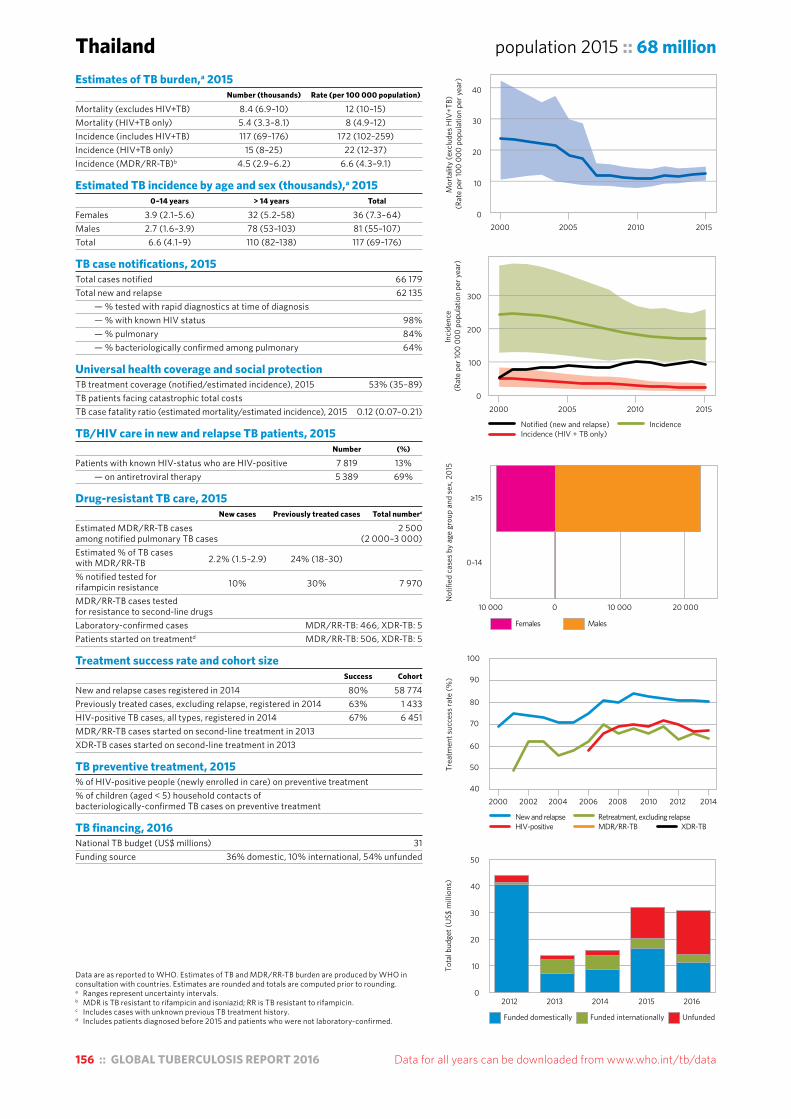
156 :: GLOBAL TUBERCULOSIS REPORT 2016 Data for all years can be downloaded from www.who.int/tb/data
Data are as reported to WHO. Estimates of TB and MDR/RR-TB burden are produced by WHO in consultation with countries. Estimates are rounded and totals are computed prior to rounding. a Ranges represent uncertainty intervals.b MDR is TB resistant to rifampicin and isoniazid; RR is TB resistant to rifampicin.c Includes cases with unknown previous TB treatment history.d Includes patients diagnosed before 2015 and patients who were not laboratory-confirmed.
Thailand population 2015 :: 68 millionEstimates of TB burden,a 2015 Number (thousands) Rate (per 100 000 population)
Mortality (excludes HIV+TB) 8.4 (6.9–10) 12 (10–15)Mortality (HIV+TB only) 5.4 (3.3–8.1) 8 (4.9–12)Incidence (includes HIV+TB) 117 (69–176) 172 (102–259)Incidence (HIV+TB only) 15 (8–25) 22 (12–37)Incidence (MDR/RR-TB)b 4.5 (2.9–6.2) 6.6 (4.3–9.1)
Estimated TB incidence by age and sex (thousands),a 2015 0–14 years > 14 years Total
Females 3.9 (2.1–5.6) 32 (5.2–58) 36 (7.3–64)Males 2.7 (1.6–3.9) 78 (53–103) 81 (55–107)Total 6.6 (4.1–9) 110 (82–138) 117 (69–176)
TB case notifications, 2015 Total cases notified 66 179Total new and relapse 62 135 — % tested with rapid diagnostics at time of diagnosis — % with known HIV status 98% — % pulmonary 84% — % bacteriologically confirmed among pulmonary 64%
Universal health coverage and social protection TB treatment coverage (notified/estimated incidence), 2015 53% (35–89)TB patients facing catastrophic total costs TB case fatality ratio (estimated mortality/estimated incidence), 2015 0.12 (0.07–0.21)
TB/HIV care in new and relapse TB patients, 2015 Number (%)
Patients with known HIV-status who are HIV-positive 7 819 13% — on antiretroviral therapy 5 389 69%
Drug-resistant TB care, 2015 New cases Previously treated cases Total numberc
Estimated MDR/RR-TB cases 2 500among notified pulmonary TB cases (2 000–3 000)Estimated % of TB cases with MDR/RR-TB 2.2% (1.5–2.9) 24% (18–30) % notified tested for rifampicin resistance 10% 30% 7 970
MDR/RR-TB cases tested for resistance to second-line drugs Laboratory-confirmed cases MDR/RR-TB: 466, XDR-TB: 5Patients started on treatmentd MDR/RR-TB: 506, XDR-TB: 5
Treatment success rate and cohort size Success Cohort
New and relapse cases registered in 2014 80% 58 774Previously treated cases, excluding relapse, registered in 2014 63% 1 433HIV-positive TB cases, all types, registered in 2014 67% 6 451MDR/RR-TB cases started on second-line treatment in 2013 XDR-TB cases started on second-line treatment in 2013
TB preventive treatment, 2015 % of HIV-positive people (newly enrolled in care) on preventive treatment % of children (aged < 5) household contacts of bacteriologically-confirmed TB cases on preventive treatment
TB financing, 2016 National TB budget (US$ millions) 31Funding source 36% domestic, 10% international, 54% unfunded
0
10
20
30
40
2000 2005 2010 2015
Mor
talit
y (e
xclu
des H
IV+T
B)
(Rat
e pe
r 100
000
pop
ulat
ion
per y
ear)
0
100
200
300
2000 2005 2010 2015
Inci
denc
e (R
ate
per 1
00 0
00 p
opul
atio
n pe
r yea
r)
Notified (new and relapse) IncidenceIncidence (HIV + TB only)
New and relapse Retreatment, excluding relapseHIV-positive MDR/RR-TB XDR-TB
2000 2002 2004 2006 2008 2010 2012 2014
Trea
tmen
t suc
cess
rate
(%)
40
50
60
70
80
90
100
Funded domestically Funded internationally Unfunded
2012 2013 2014 2015 2016
Tota
l bud
get (
US$
mill
ions
)
0
10
20
30
40
50
Females Males
10 000 10 000 20 0000
Not
ified
cas
es b
y ag
e gr
oup
and
sex,
201
5
0–14
≥15

Data for all years can be downloaded from www.who.int/tb/data GLOBAL TUBERCULOSIS REPORT 2016 :: 157
Data are as reported to WHO. Estimates of TB and MDR/RR-TB burden are produced by WHO in consultation with countries. Estimates are rounded and totals are computed prior to rounding.a Ranges represent uncertainty intervals. The main direct measurement of TB disease burden is
the 2012 national TB prevalence survey. Laboratory challenges during the survey meant that the prevalence of bacteriologically confirmed pulmonary TB could only be estimated with considerable uncertainty. This explains why estimates of TB incidence and mortality, which are informed by the prevalence survey, also have wide uncertainty intervals. A review of estimates of TB disease burden and how to improve their precision will be undertaken in early 2017.
b MDR is TB resistant to rifampicin and isoniazid; RR is TB resistant to rifampicin.c Includes cases with unknown previous TB treatment history.d Includes patients diagnosed before 2015 and patients who were not laboratory-confirmed.e Funding sources for 2015 were not reported.
United Republic of Tanzania population 2015 :: 53 millionEstimates of TB burden,a 2015 Number (thousands) Rate (per 100 000 population)
Mortality (excludes HIV+TB) 30 (13–53) 56 (25–99)Mortality (HIV+TB only) 25 (16–35) 47 (31–66)Incidence (includes HIV+TB) 164 (78–281) 306 (146–525)Incidence (HIV+TB only) 57 (27–100) 107 (50–186)Incidence (MDR/RR-TB)b 2.6 (0.56–4.7) 4.9 (1–8.8)
Estimated TB incidence by age and sex (thousands),a 2015 0–14 years > 14 years Total
Females 8.4 (2.9–14) 56 (9.2–102) 64 (12–116)Males 9.5 (5.4–14) 90 (52–129) 100 (57–142)Total 18 (11–25) 146 (91–201) 164 (78–281)
TB case notifications, 2015 Total cases notified 62 180Total new and relapse 60 895 — % tested with rapid diagnostics at time of diagnosis — % with known HIV status 93% — % pulmonary 79% — % bacteriologically confirmed among pulmonary 53%
Universal health coverage and social protection TB treatment coverage (notified/estimated incidence), 2015 37% (22–78)TB patients facing catastrophic total costs TB case fatality ratio (estimated mortality/estimated incidence), 2015 0.37 (0.17–0.76)
TB/HIV care in new and relapse TB patients, 2015 Number (%)
Patients with known HIV-status who are HIV-positive 20 117 36% — on antiretroviral therapy 17 063 85%
Drug-resistant TB care, 2015 New cases Previously treated cases Total numberc
Estimated MDR/RR-TB cases 730among notified pulmonary TB cases (320–1 100)Estimated % of TB cases with MDR/RR-TB 1.3% (0.47–2.1) 4.7% (0.37–9) % notified tested for rifampicin resistance <1% 3% 692
MDR/RR-TB cases tested for resistance to second-line drugs Laboratory-confirmed cases MDR/RR-TB: 178, XDR-TB: 0Patients started on treatmentd MDR/RR-TB: 123, XDR-TB: 0
Treatment success rate and cohort size Success Cohort
New and relapse cases registered in 2014 90% 61 573Previously treated cases, excluding relapse, registered in 2014 81% 1 578HIV-positive TB cases, all types, registered in 2014 87% 20 658MDR/RR-TB cases started on second-line treatment in 2013 68% 92XDR-TB cases started on second-line treatment in 2013 0
TB preventive treatment, 2015 % of HIV-positive people (newly enrolled in care) on preventive treatment % of children (aged < 5) household contacts of bacteriologically-confirmed TB cases on preventive treatment 6.9% (6.3–7.6)
TB financing, 2016 National TB budget (US$ millions) 40Funding source 5% domestic, 40% international, 55% unfunded
Inci
denc
e (R
ate
per 1
00 0
00 p
opul
atio
n pe
r yea
r)
Notified (new and relapse) IncidenceIncidence (HIV + TB only)
0
200
400
600
800
2000 2005 2010 2015
Females Males
7 500 2 500 2 500 7 5000
Not
ified
cas
es b
y ag
e gr
oup
and
sex,
201
5
0–14
15–24
25–34
35–44
45–54
55–64
≥65
New and relapse Retreatment, excluding relapseHIV-positive MDR/RR-TB XDR-TB
2000 2002 2004 2006 2008 2010 2012 2014
Trea
tmen
t suc
cess
rate
(%)
50
60
70
80
90
100
Funded domestically Funded internationally Unfunded
2012 2013 2014 2015e 2016
Tota
l bud
get (
US$
mill
ions
)
0
20
40
60
80
0
50
100
2000 2005 2010 2015
Mor
talit
y (e
xclu
des H
IV+T
B)
(Rat
e pe
r 100
000
pop
ulat
ion
per y
ear)

158 :: GLOBAL TUBERCULOSIS REPORT 2016 Data for all years can be downloaded from www.who.int/tb/data
Data are as reported to WHO. Estimates of TB and MDR/RR-TB burden are produced by WHO in consultation with countries. Estimates are rounded and totals are computed prior to rounding. a Ranges represent uncertainty intervals.b MDR is TB resistant to rifampicin and isoniazid; RR is TB resistant to rifampicin.c Includes cases with unknown previous TB treatment history.d Includes patients diagnosed before 2015 and patients who were not laboratory-confirmed.
Viet Nam population 2015 :: 93 millionEstimates of TB burden,a 2015 Number (thousands) Rate (per 100 000 population)
Mortality (excludes HIV+TB) 16 (11–22) 17 (12–23)Mortality (HIV+TB only) 1.1 (0.2–2.7) 1.1 (0.21–2.8)Incidence (includes HIV+TB) 128 (103–155) 137 (110–166)Incidence (HIV+TB only) 5.5 (3.5–7.9) 5.9 (3.8–8.4)Incidence (MDR/RR-TB)b 7.3 (5.2–9.5) 7.8 (5.6–10)
Estimated TB incidence by age and sex (thousands),a 2015 0–14 years > 14 years Total
Females 5.5 (2.6–8.3) 28 (10–46) 34 (13–54)Males 5.8 (3.6–8) 88 (67–109) 94 (71–117)Total 11 (7.7–15) 116 (101–131) 128 (103–155)
TB case notifications, 2015 Total cases notified 102 676Total new and relapse 100 780 — % tested with rapid diagnostics at time of diagnosis 11% — % with known HIV status 79% — % pulmonary 82% — % bacteriologically confirmed among pulmonary 69%
Universal health coverage and social protection TB treatment coverage (notified/estimated incidence), 2015 79% (65–98)TB patients facing catastrophic total costs TB case fatality ratio (estimated mortality/estimated incidence), 2015 0.14 (0.09–0.19)
TB/HIV care in new and relapse TB patients, 2015 Number (%)
Patients with known HIV-status who are HIV-positive 3 428 4% — on antiretroviral therapy 3 065 89%
Drug-resistant TB care, 2015 New cases Previously treated cases Total numberc
Estimated MDR/RR-TB cases 5 200among notified pulmonary TB cases (4 100–6 300)Estimated % of TB cases with MDR/RR-TB 4.1% (2.6–5.5) 25% (24–26) % notified tested for rifampicin resistance 8% 100% 15 841
MDR/RR-TB cases tested for resistance to second-line drugs 150
Laboratory-confirmed cases MDR/RR-TB: 2 602, XDR-TB: 28Patients started on treatmentd MDR/RR-TB: 2 131, XDR-TB: 3
Treatment success rate and cohort size Success Cohort
New and relapse cases registered in 2014 91% 100 349Previously treated cases, excluding relapse, registered in 2014 76% 1 738HIV-positive TB cases, all types, registered in 2014 75% 1 519MDR/RR-TB cases started on second-line treatment in 2013 69% 959XDR-TB cases started on second-line treatment in 2013
TB preventive treatment, 2015 % of HIV-positive people (newly enrolled in care) on preventive treatment % of children (aged < 5) household contacts of bacteriologically-confirmed TB cases on preventive treatment 11% (10–12)
TB financing, 2016 National TB budget (US$ millions) 71Funding source 9% domestic, 22% international, 69% unfunded
0
100
200
2000 2005 2010 2015
Inci
denc
e (R
ate
per 1
00 0
00 p
opul
atio
n pe
r yea
r)
Notified (new and relapse) IncidenceIncidence (HIV + TB only)
Females Males
4 000 2 000 0 2 000 4 000 6 000 8 000 10 000
Not
ified
cas
es b
y ag
e gr
oup
and
sex,
201
5
0–14
15–24
25–34
35–44
45–54
55–64
≥65
New and relapse Retreatment, excluding relapseHIV-positive MDR/RR-TB XDR-TB
2000 2002 2004 2006 2008 2010 2012 2014
Trea
tmen
t suc
cess
rate
(%)
0
20
40
60
80
100
Funded domestically Funded internationally Unfunded
2012 2013 2014 2015 2016
Tota
l bud
get (
US$
mill
ions
)
0
20
40
60
80
0
10
20
30
40
2000 2005 2010 2015
Mor
talit
y (e
xclu
des H
IV+T
B)
(Rat
e pe
r 100
000
pop
ulat
ion
per y
ear)

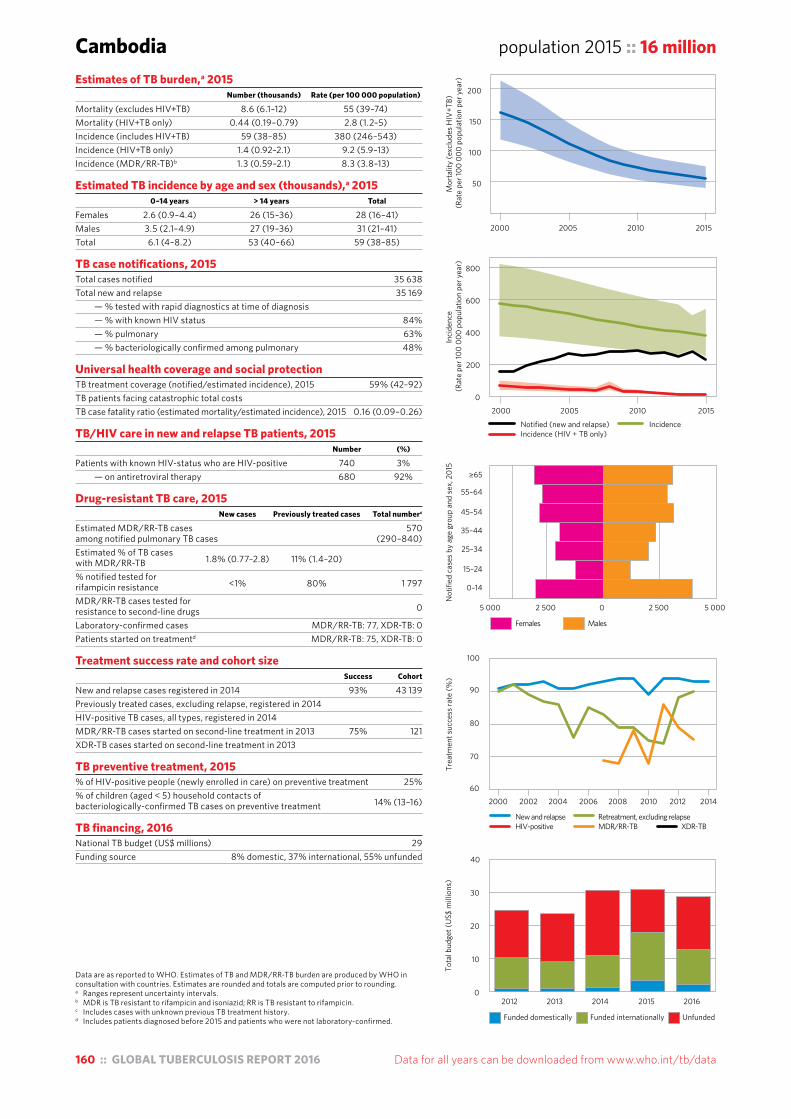
160 :: GLOBAL TUBERCULOSIS REPORT 2016 Data for all years can be downloaded from www.who.int/tb/data
Data are as reported to WHO. Estimates of TB and MDR/RR-TB burden are produced by WHO in consultation with countries. Estimates are rounded and totals are computed prior to rounding. a Ranges represent uncertainty intervals.b MDR is TB resistant to rifampicin and isoniazid; RR is TB resistant to rifampicin.c Includes cases with unknown previous TB treatment history.d Includes patients diagnosed before 2015 and patients who were not laboratory-confirmed.
Cambodia population 2015 :: 16 millionEstimates of TB burden,a 2015 Number (thousands) Rate (per 100 000 population)
Mortality (excludes HIV+TB) 8.6 (6.1–12) 55 (39–74)Mortality (HIV+TB only) 0.44 (0.19–0.79) 2.8 (1.2–5)Incidence (includes HIV+TB) 59 (38–85) 380 (246–543)Incidence (HIV+TB only) 1.4 (0.92–2.1) 9.2 (5.9–13)Incidence (MDR/RR-TB)b 1.3 (0.59–2.1) 8.3 (3.8–13)
Estimated TB incidence by age and sex (thousands),a 2015 0–14 years > 14 years Total
Females 2.6 (0.9–4.4) 26 (15–36) 28 (16–41)Males 3.5 (2.1–4.9) 27 (19–36) 31 (21–41)Total 6.1 (4–8.2) 53 (40–66) 59 (38–85)
TB case notifications, 2015 Total cases notified 35 638Total new and relapse 35 169 — % tested with rapid diagnostics at time of diagnosis — % with known HIV status 84% — % pulmonary 63% — % bacteriologically confirmed among pulmonary 48%
Universal health coverage and social protection TB treatment coverage (notified/estimated incidence), 2015 59% (42–92)TB patients facing catastrophic total costs TB case fatality ratio (estimated mortality/estimated incidence), 2015 0.16 (0.09–0.26)
TB/HIV care in new and relapse TB patients, 2015 Number (%)
Patients with known HIV-status who are HIV-positive 740 3% — on antiretroviral therapy 680 92%
Drug-resistant TB care, 2015 New cases Previously treated cases Total numberc
Estimated MDR/RR-TB cases 570among notified pulmonary TB cases (290–840)Estimated % of TB cases with MDR/RR-TB 1.8% (0.77–2.8) 11% (1.4–20) % notified tested for rifampicin resistance <1% 80% 1 797
MDR/RR-TB cases tested for resistance to second-line drugs 0
Laboratory-confirmed cases MDR/RR-TB: 77, XDR-TB: 0Patients started on treatmentd MDR/RR-TB: 75, XDR-TB: 0
Treatment success rate and cohort size Success Cohort
New and relapse cases registered in 2014 93% 43 139Previously treated cases, excluding relapse, registered in 2014 HIV-positive TB cases, all types, registered in 2014 MDR/RR-TB cases started on second-line treatment in 2013 75% 121XDR-TB cases started on second-line treatment in 2013
TB preventive treatment, 2015 % of HIV-positive people (newly enrolled in care) on preventive treatment 25%% of children (aged < 5) household contacts of bacteriologically-confirmed TB cases on preventive treatment 14% (13–16)
TB financing, 2016 National TB budget (US$ millions) 29Funding source 8% domestic, 37% international, 55% unfunded
0
200
400
600
800
Inci
denc
e (R
ate
per 1
00 0
00 p
opul
atio
n pe
r yea
r)
2000 2005 2010 2015
Notified (new and relapse) IncidenceIncidence (HIV + TB only)
Females Males
5 000 2 500 0 2 500 5 000
Not
ified
cas
es b
y ag
e gr
oup
and
sex,
201
5
0–14
15–24
25–34
35–44
45–54
55–64
≥65
New and relapse Retreatment, excluding relapseHIV-positive MDR/RR-TB XDR-TB
2000 2002 2004 2006 2008 2010 2012 2014
Trea
tmen
t suc
cess
rate
(%)
60
70
80
90
100
Funded domestically Funded internationally Unfunded
2012 2013 2014 2015 2016
Tota
l bud
get (
US$
mill
ions
)
0
10
20
30
40
50
100
150
200
2000 2005 2010 2015
Mor
talit
y (e
xclu
des H
IV+T
B)
(Rat
e pe
r 100
000
pop
ulat
ion
per y
ear)

Data for all years can be downloaded from www.who.int/tb/data GLOBAL TUBERCULOSIS REPORT 2016 :: 161
Data are as reported to WHO. Estimates of TB and MDR/RR-TB burden are produced by WHO in consultation with countries. Estimates are rounded and totals are computed prior to rounding. a Ranges represent uncertainty intervals.b MDR is TB resistant to rifampicin and isoniazid; RR is TB resistant to rifampicin.c Includes cases with unknown previous TB treatment history.d Includes patients diagnosed before 2015 and patients who were not laboratory-confirmed.
Central African Republic population 2015 :: 4.9 millionEstimates of TB burden,a 2015 Number (thousands) Rate (per 100 000 population)
Mortality (excludes HIV+TB) 2.2 (1.3–3.4) 45 (26–70)Mortality (HIV+TB only) 2.7 (1–5.3) 55 (20–107)Incidence (includes HIV+TB) 19 (12–27) 391 (253–558)Incidence (HIV+TB only) 8.6 (5.3–13) 176 (107–262)Incidence (MDR/RR-TB)b 0.21 (0–0.45) 4.3 (0–9.2)
Estimated TB incidence by age and sex (thousands),a 2015 0–14 years > 14 years Total
Females 1.3 (0.63–1.9) 7.2 (3.6–11) 8.4 (4.2–13)Males 1 (0.59–1.4) 9.7 (6.6–13) 11 (7.2–14)Total 2.3 (1.4–3.1) 17 (13–21) 19 (12–27)
TB case notifications, 2015 Total cases notified 10 799Total new and relapse 10 459 — % tested with rapid diagnostics at time of diagnosis 1% — % with known HIV status 48% — % pulmonary 82% — % bacteriologically confirmed among pulmonary 61%
Universal health coverage and social protection TB treatment coverage (notified/estimated incidence), 2015 55% (38–84)TB patients facing catastrophic total costs TB case fatality ratio (estimated mortality/estimated incidence), 2015 0.27 (0.13–0.48)
TB/HIV care in new and relapse TB patients, 2015 Number (%)
Patients with known HIV-status who are HIV-positive 1 963 39% — on antiretroviral therapy
Drug-resistant TB care, 2015 New cases Previously treated cases Total numberc
Estimated MDR/RR-TB cases 140among notified pulmonary TB cases (23–250)Estimated % of TB cases with MDR/RR-TB 0.4% (0–1.6) 14% (6.9–21) % notified tested for rifampicin resistance <1% 14% 105
MDR/RR-TB cases tested for resistance to second-line drugs 38
Laboratory-confirmed cases MDR/RR-TB: 62, XDR-TB: 2Patients started on treatmentd MDR/RR-TB: 38, XDR-TB: 0
Treatment success rate and cohort size Success Cohort
New cases registered in 2014 70% 9 209Previously treated cases registered in 2014 64% 476HIV-positive TB cases, all types, registered in 2014 68% 2 056MDR/RR-TB cases started on second-line treatment in 2013 81% 16XDR-TB cases started on second-line treatment in 2013 0
TB preventive treatment, 2015 % of HIV-positive people (newly enrolled in care) on preventive treatment % of children (aged < 5) household contacts of bacteriologically-confirmed TB cases on preventive treatment
TB financing, 2016 National TB budget (US$ millions) 1.8Funding source 15% domestic, 55% international, 31% unfunded
0
500
1000
1500
Inci
denc
e (R
ate
per 1
00 0
00 p
opul
atio
n pe
r yea
r)
2000 2005 2010 2015
Notified (new and relapse) IncidenceIncidence (HIV + TB only)
Females Males
1 000 750 500 250 0 250 500 750 1 000
Not
ified
cas
es b
y ag
e gr
oup
and
sex,
201
5
0–14
15–24
25–34
35–44
45–54
55–64
≥65
New cases Previously treated casesHIV-positive MDR/RR-TB XDR-TB
2000 2002 2004 2006 2008 2010 2012 2014
Trea
tmen
t suc
cess
rate
(%)
30
40
50
60
70
80
90
100
Funded domestically Funded internationally Unfunded
2012 2013 2014 2015 2016
Tota
l bud
get (
US$
mill
ions
)
0
1
2
3
4
5
100
200
2000 2005 2010 2015
Mor
talit
y (e
xclu
des H
IV+T
B)
(Rat
e pe
r 100
000
pop
ulat
ion
per y
ear)

162 :: GLOBAL TUBERCULOSIS REPORT 2016 Data for all years can be downloaded from www.who.int/tb/data
Data are as reported to WHO. Estimates of TB and MDR/RR-TB burden are produced by WHO in consultation with countries. Estimates are rounded and totals are computed prior to rounding. a Ranges represent uncertainty intervals.b MDR is TB resistant to rifampicin and isoniazid; RR is TB resistant to rifampicin.c Includes cases with unknown previous TB treatment history.d Includes patients diagnosed before 2015 and patients who were not laboratory-confirmed.
Congo population 2015 :: 4.6 millionEstimates of TB burden,a 2015 Number (thousands) Rate (per 100 000 population)
Mortality (excludes HIV+TB) 2.3 (1.3–3.5) 49 (29–75)Mortality (HIV+TB only) 2.4 (2–2.9) 53 (44–63)Incidence (includes HIV+TB) 18 (11–25) 379 (246–542)Incidence (HIV+TB only) 6.4 (3.9–9.5) 138 (84–205)Incidence (MDR/RR-TB)b 0.67 (0.29–1) 15 (6.3–22)
Estimated TB incidence by age and sex (thousands),a 2015 0–14 years > 14 years Total
Females 1 (0.5–1.5) 6.9 (3.6–10) 7.9 (4.1–12)Males 0.92 (0.55–1.3) 8.7 (6–11) 9.6 (6.5–13)Total 1.9 (1.3–2.6) 16 (12–19) 18 (11–25)
TB case notifications, 2015 Total cases notified 10 119Total new and relapse 9 937 — % tested with rapid diagnostics at time of diagnosis 3% — % with known HIV status 13% — % pulmonary 75% — % bacteriologically confirmed among pulmonary 51%
Universal health coverage and social protection TB treatment coverage (notified/estimated incidence), 2015 57% (40–88)TB patients facing catastrophic total costs TB case fatality ratio (estimated mortality/estimated incidence), 2015 0.28 (0.17–0.44)
TB/HIV care in new and relapse TB patients, 2015 Number (%)
Patients with known HIV-status who are HIV-positive 479 38% — on antiretroviral therapy 164 34%
Drug-resistant TB care, 2015 New cases Previously treated cases Total numberc
Estimated MDR/RR-TB cases 300among notified pulmonary TB cases (160–430)Estimated % of TB cases with MDR/RR-TB 3.2% (1.4–5) 14% (6.9–21) % notified tested for rifampicin resistance 9 469
MDR/RR-TB cases tested for resistance to second-line drugs 5
Laboratory-confirmed cases MDR/RR-TB: 41, XDR-TB: 0Patients started on treatmentd MDR/RR-TB: 13, XDR-TB: 0
Treatment success rate and cohort size Success Cohort
New and relapse cases registered in 2014 69% 4 108Previously treated cases, excluding relapse, registered in 2014 94% 182HIV-positive TB cases, all types, registered in 2014 MDR/RR-TB cases started on second-line treatment in 2013 XDR-TB cases started on second-line treatment in 2013
TB preventive treatment, 2015 % of HIV-positive people (newly enrolled in care) on preventive treatment % of children (aged < 5) household contacts of bacteriologically-confirmed TB cases on preventive treatment
TB financing, 2016 National TB budget (US$ millions) 3.8Funding source 12% domestic, 68% international, 20% unfunded
Females Males
1 000 500 0 500 1 000 1 500
Not
ified
cas
es b
y ag
e gr
oup
and
sex,
201
5
0–14
15–24
25–34
35–44
45–54
55–64
≥65
New and relapse Retreatment, excluding relapseHIV-positive MDR/RR-TB XDR-TB
2000 2002 2004 2006 2008 2010 2012 2014
Trea
tmen
t suc
cess
rate
(%)
0
20
40
60
80
100
Funded domestically Funded internationally Unfunded
2012 2013 2014 2015 2016
Tota
l bud
get (
US$
mill
ions
)
0
1
2
3
4
0
20
40
60
80
2000 2005 2010 2015
Mor
talit
y (e
xclu
des H
IV+T
B)
(Rat
e pe
r 100
000
pop
ulat
ion
per y
ear)
0
200
400
Inci
denc
e (R
ate
per 1
00 0
00 p
opul
atio
n pe
r yea
r)
2000 2005 2010 2015
Notified (new and relapse) IncidenceIncidence (HIV + TB only)
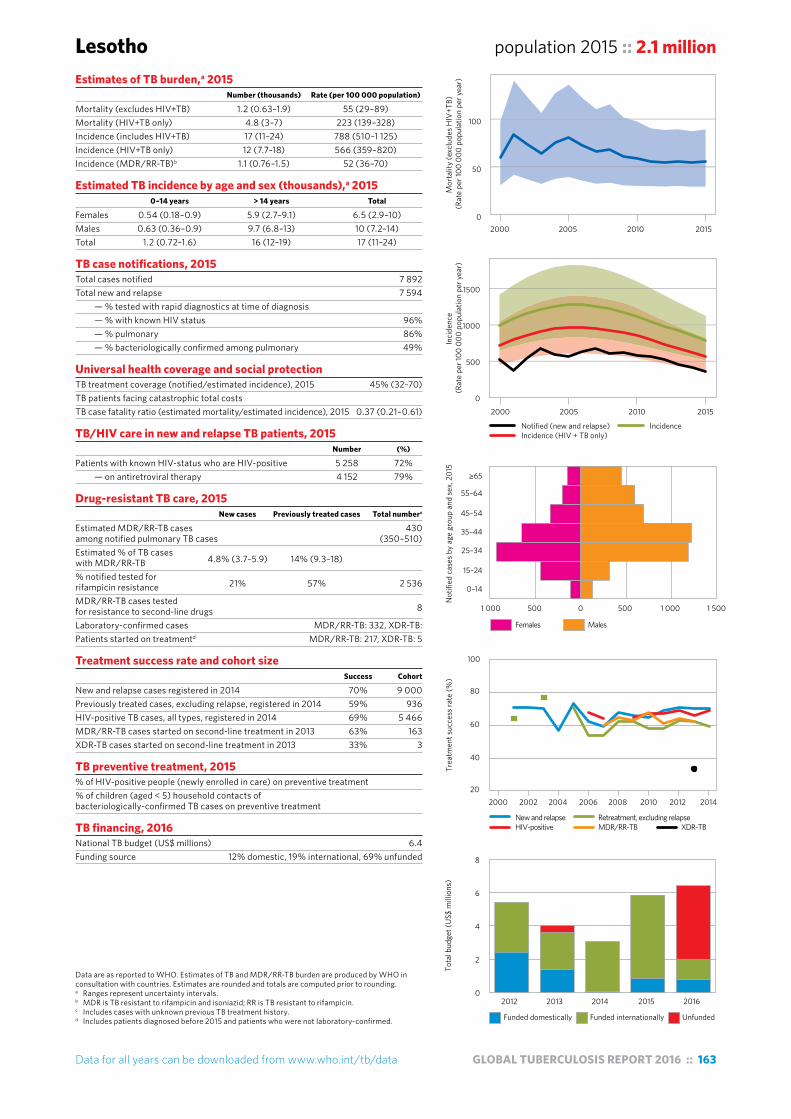
Data for all years can be downloaded from www.who.int/tb/data GLOBAL TUBERCULOSIS REPORT 2016 :: 163
Data are as reported to WHO. Estimates of TB and MDR/RR-TB burden are produced by WHO in consultation with countries. Estimates are rounded and totals are computed prior to rounding. a Ranges represent uncertainty intervals.b MDR is TB resistant to rifampicin and isoniazid; RR is TB resistant to rifampicin.c Includes cases with unknown previous TB treatment history.d Includes patients diagnosed before 2015 and patients who were not laboratory-confirmed.
Lesotho population 2015 :: 2.1 millionEstimates of TB burden,a 2015 Number (thousands) Rate (per 100 000 population)
Mortality (excludes HIV+TB) 1.2 (0.63–1.9) 55 (29–89)Mortality (HIV+TB only) 4.8 (3–7) 223 (139–328)Incidence (includes HIV+TB) 17 (11–24) 788 (510–1 125)Incidence (HIV+TB only) 12 (7.7–18) 566 (359–820)Incidence (MDR/RR-TB)b 1.1 (0.76–1.5) 52 (36–70)
Estimated TB incidence by age and sex (thousands),a 2015 0–14 years > 14 years Total
Females 0.54 (0.18–0.9) 5.9 (2.7–9.1) 6.5 (2.9–10)Males 0.63 (0.36–0.9) 9.7 (6.8–13) 10 (7.2–14)Total 1.2 (0.72–1.6) 16 (12–19) 17 (11–24)
TB case notifications, 2015 Total cases notified 7 892Total new and relapse 7 594 — % tested with rapid diagnostics at time of diagnosis — % with known HIV status 96% — % pulmonary 86% — % bacteriologically confirmed among pulmonary 49%
Universal health coverage and social protection TB treatment coverage (notified/estimated incidence), 2015 45% (32–70)TB patients facing catastrophic total costs TB case fatality ratio (estimated mortality/estimated incidence), 2015 0.37 (0.21–0.61)
TB/HIV care in new and relapse TB patients, 2015 Number (%)
Patients with known HIV-status who are HIV-positive 5 258 72% — on antiretroviral therapy 4 152 79%
Drug-resistant TB care, 2015 New cases Previously treated cases Total numberc
Estimated MDR/RR-TB cases 430among notified pulmonary TB cases (350–510)Estimated % of TB cases with MDR/RR-TB 4.8% (3.7–5.9) 14% (9.3–18) % notified tested for rifampicin resistance 21% 57% 2 536
MDR/RR-TB cases tested for resistance to second-line drugs 8
Laboratory-confirmed cases MDR/RR-TB: 332, XDR-TB:Patients started on treatmentd MDR/RR-TB: 217, XDR-TB: 5
Treatment success rate and cohort size Success Cohort
New and relapse cases registered in 2014 70% 9 000Previously treated cases, excluding relapse, registered in 2014 59% 936HIV-positive TB cases, all types, registered in 2014 69% 5 466MDR/RR-TB cases started on second-line treatment in 2013 63% 163XDR-TB cases started on second-line treatment in 2013 33% 3
TB preventive treatment, 2015 % of HIV-positive people (newly enrolled in care) on preventive treatment % of children (aged < 5) household contacts of bacteriologically-confirmed TB cases on preventive treatment
TB financing, 2016 National TB budget (US$ millions) 6.4Funding source 12% domestic, 19% international, 69% unfunded
0
500
1000
1500
Inci
denc
e (R
ate
per 1
00 0
00 p
opul
atio
n pe
r yea
r)
2000 2005 2010 2015
Notified (new and relapse) IncidenceIncidence (HIV + TB only)
Females Males
1 000 500 0 500 1 000 1 500
Not
ified
cas
es b
y ag
e gr
oup
and
sex,
201
5
0–14
15–24
25–34
35–44
45–54
55–64
≥65
New and relapse Retreatment, excluding relapseHIV-positive MDR/RR-TB XDR-TB
2000 2002 2004 2006 2008 2010 2012 2014
Trea
tmen
t suc
cess
rate
(%)
20
40
60
80
100
Funded domestically Funded internationally Unfunded
2012 2013 2014 2015 2016
Tota
l bud
get (
US$
mill
ions
)
0
2
4
6
8
0
50
100
2000 2005 2010 2015
Mor
talit
y (e
xclu
des H
IV+T
B)
(Rat
e pe
r 100
000
pop
ulat
ion
per y
ear)
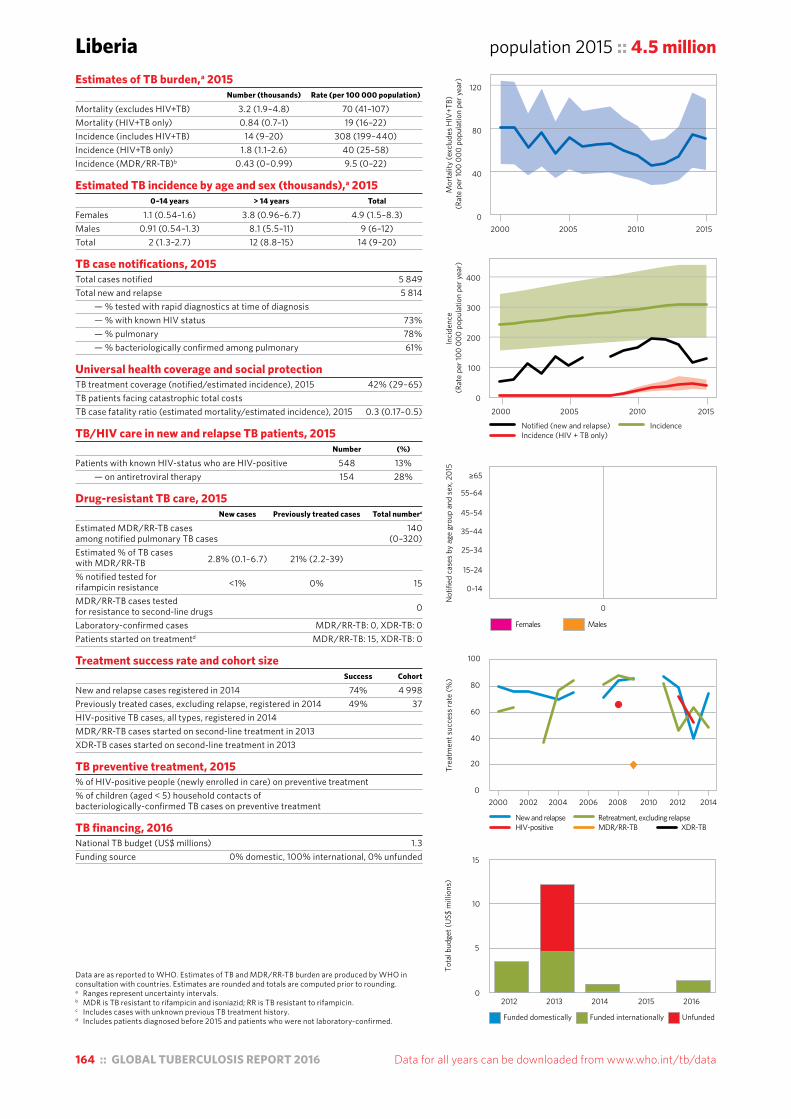
164 :: GLOBAL TUBERCULOSIS REPORT 2016 Data for all years can be downloaded from www.who.int/tb/data
Data are as reported to WHO. Estimates of TB and MDR/RR-TB burden are produced by WHO in consultation with countries. Estimates are rounded and totals are computed prior to rounding. a Ranges represent uncertainty intervals.b MDR is TB resistant to rifampicin and isoniazid; RR is TB resistant to rifampicin.c Includes cases with unknown previous TB treatment history.d Includes patients diagnosed before 2015 and patients who were not laboratory-confirmed.
Liberia population 2015 :: 4.5 millionEstimates of TB burden,a 2015 Number (thousands) Rate (per 100 000 population)
Mortality (excludes HIV+TB) 3.2 (1.9–4.8) 70 (41–107)Mortality (HIV+TB only) 0.84 (0.7–1) 19 (16–22)Incidence (includes HIV+TB) 14 (9–20) 308 (199–440)Incidence (HIV+TB only) 1.8 (1.1–2.6) 40 (25–58)Incidence (MDR/RR-TB)b 0.43 (0–0.99) 9.5 (0–22)
Estimated TB incidence by age and sex (thousands),a 2015 0–14 years > 14 years Total
Females 1.1 (0.54–1.6) 3.8 (0.96–6.7) 4.9 (1.5–8.3)Males 0.91 (0.54–1.3) 8.1 (5.5–11) 9 (6–12)Total 2 (1.3–2.7) 12 (8.8–15) 14 (9–20)
TB case notifications, 2015 Total cases notified 5 849Total new and relapse 5 814 — % tested with rapid diagnostics at time of diagnosis — % with known HIV status 73% — % pulmonary 78% — % bacteriologically confirmed among pulmonary 61%
Universal health coverage and social protection TB treatment coverage (notified/estimated incidence), 2015 42% (29–65)TB patients facing catastrophic total costs TB case fatality ratio (estimated mortality/estimated incidence), 2015 0.3 (0.17–0.5)
TB/HIV care in new and relapse TB patients, 2015 Number (%)
Patients with known HIV-status who are HIV-positive 548 13% — on antiretroviral therapy 154 28%
Drug-resistant TB care, 2015 New cases Previously treated cases Total numberc
Estimated MDR/RR-TB cases 140among notified pulmonary TB cases (0–320)Estimated % of TB cases with MDR/RR-TB 2.8% (0.1–6.7) 21% (2.2–39) % notified tested for rifampicin resistance <1% 0% 15
MDR/RR-TB cases tested for resistance to second-line drugs 0
Laboratory-confirmed cases MDR/RR-TB: 0, XDR-TB: 0Patients started on treatmentd MDR/RR-TB: 15, XDR-TB: 0
Treatment success rate and cohort size Success Cohort
New and relapse cases registered in 2014 74% 4 998Previously treated cases, excluding relapse, registered in 2014 49% 37HIV-positive TB cases, all types, registered in 2014 MDR/RR-TB cases started on second-line treatment in 2013 XDR-TB cases started on second-line treatment in 2013
TB preventive treatment, 2015 % of HIV-positive people (newly enrolled in care) on preventive treatment % of children (aged < 5) household contacts of bacteriologically-confirmed TB cases on preventive treatment
TB financing, 2016 National TB budget (US$ millions) 1.3Funding source 0% domestic, 100% international, 0% unfunded
0
100
200
300
400
Inci
denc
e (R
ate
per 1
00 0
00 p
opul
atio
n pe
r yea
r)
2000 2005 2010 2015
Notified (new and relapse) IncidenceIncidence (HIV + TB only)
Females Males
0
Not
ified
cas
es b
y ag
e gr
oup
and
sex,
201
5
0–14
15–24
25–34
35–44
45–54
55–64
≥65
New and relapse Retreatment, excluding relapseHIV-positive MDR/RR-TB XDR-TB
2000 2002 2004 2006 2008 2010 2012 2014
Trea
tmen
t suc
cess
rate
(%)
0
20
40
60
80
100
Funded domestically Funded internationally Unfunded
2012 2013 2014 2015 2016
Tota
l bud
get (
US$
mill
ions
)
0
5
10
15
0
40
80
120
2000 2005 2010 2015
Mor
talit
y (e
xclu
des H
IV+T
B)
(Rat
e pe
r 100
000
pop
ulat
ion
per y
ear)

Data for all years can be downloaded from www.who.int/tb/data GLOBAL TUBERCULOSIS REPORT 2016 :: 165
Data are as reported to WHO. Estimates of TB and MDR/RR-TB burden are produced by WHO in consultation with countries. Estimates are rounded and totals are computed prior to rounding. a Ranges represent uncertainty intervals.b MDR is TB resistant to rifampicin and isoniazid; RR is TB resistant to rifampicin.c Includes cases with unknown previous TB treatment history.d Includes patients diagnosed before 2015 and patients who were not laboratory-confirmed.
Namibia population 2015 :: 2.5 millionEstimates of TB burden,a 2015 Number (thousands) Rate (per 100 000 population)
Mortality (excludes HIV+TB) 0.78 (0.51–1.1) 32 (21–45)Mortality (HIV+TB only) 0.88 (0.062–2.8) 36 (2.5–112)Incidence (includes HIV+TB) 12 (9.3–15) 489 (376–616)Incidence (HIV+TB only) 4.9 (3.8–6.2) 199 (153–252)Incidence (MDR/RR-TB)b 1.1 (0.84–1.3) 45 (34–53)
Estimated TB incidence by age and sex (thousands),a 2015 0–14 years > 14 years Total
Females 0.57 (0.27–0.87) 4.4 (2.8–6) 5 (3–6.9)Males 0.63 (0.39–0.86) 6.4 (4.8–8) 7.1 (5.2–8.9)Total 1.2 (0.82–1.6) 11 (9.2–12) 12 (9.3–15)
TB case notifications, 2015 Total cases notified 9 944Total new and relapse 9 614 — % tested with rapid diagnostics at time of diagnosis — % with known HIV status 98% — % pulmonary 83% — % bacteriologically confirmed among pulmonary 76%
Universal health coverage and social protection TB treatment coverage (notified/estimated incidence), 2015 80% (64–100)TB patients facing catastrophic total costs TB case fatality ratio (estimated mortality/estimated incidence), 2015 0.14 (0.05–0.3)
TB/HIV care in new and relapse TB patients, 2015 Number (%)
Patients with known HIV-status who are HIV-positive 3 796 40% — on antiretroviral therapy 3 480 92%
Drug-resistant TB care, 2015 New cases Previously treated cases Total numberc
Estimated MDR/RR-TB cases 540among notified pulmonary TB cases (470–610)Estimated % of TB cases with MDR/RR-TB 5% (4.1–5.9) 12% (9.3–14) % notified tested for rifampicin resistance 320
MDR/RR-TB cases tested for resistance to second-line drugs Laboratory-confirmed cases MDR/RR-TB: 320, XDR-TB: 3Patients started on treatmentd MDR/RR-TB: 308, XDR-TB: 2
Treatment success rate and cohort size Success Cohort
New cases registered in 2014 87% 7 981Previously treated cases registered in 2014 78% 2 068HIV-positive TB cases, all types, registered in 2014 80% 3 112MDR/RR-TB cases started on second-line treatment in 2013 64% 184XDR-TB cases started on second-line treatment in 2013 0% 6
TB preventive treatment, 2015 % of HIV-positive people (newly enrolled in care) on preventive treatment % of children (aged < 5) household contacts of bacteriologically-confirmed TB cases on preventive treatment
TB financing, 2016 National TB budget (US$ millions) 38Funding source 51% domestic, 26% international, 23% unfunded
0
300
600
900
1200
Inci
denc
e (R
ate
per 1
00 0
00 p
opul
atio
n pe
r yea
r)
2000 2005 2010 2015
Notified (new and relapse) IncidenceIncidence (HIV + TB only)
Females Males
2 000 1 000 0 1 000 2 000
Not
ified
cas
es b
y ag
e gr
oup
and
sex,
201
5
0–14
15–24
25–34
35–44
45–54
55–64
≥65
New cases Previously treated casesHIV-positive MDR/RR-TB XDR-TB
2000 2002 2004 2006 2008 2010 2012 2014
Trea
tmen
t suc
cess
rate
(%)
0
20
40
60
80
100
Funded domestically Funded internationally Unfunded
2012 2013 2014 2015 2016
Tota
l bud
get (
US$
mill
ions
)
0
10
20
30
40
0
20
40
2000 2005 2010 2015
Mor
talit
y (e
xclu
des H
IV+T
B)
(Rat
e pe
r 100
000
pop
ulat
ion
per y
ear)
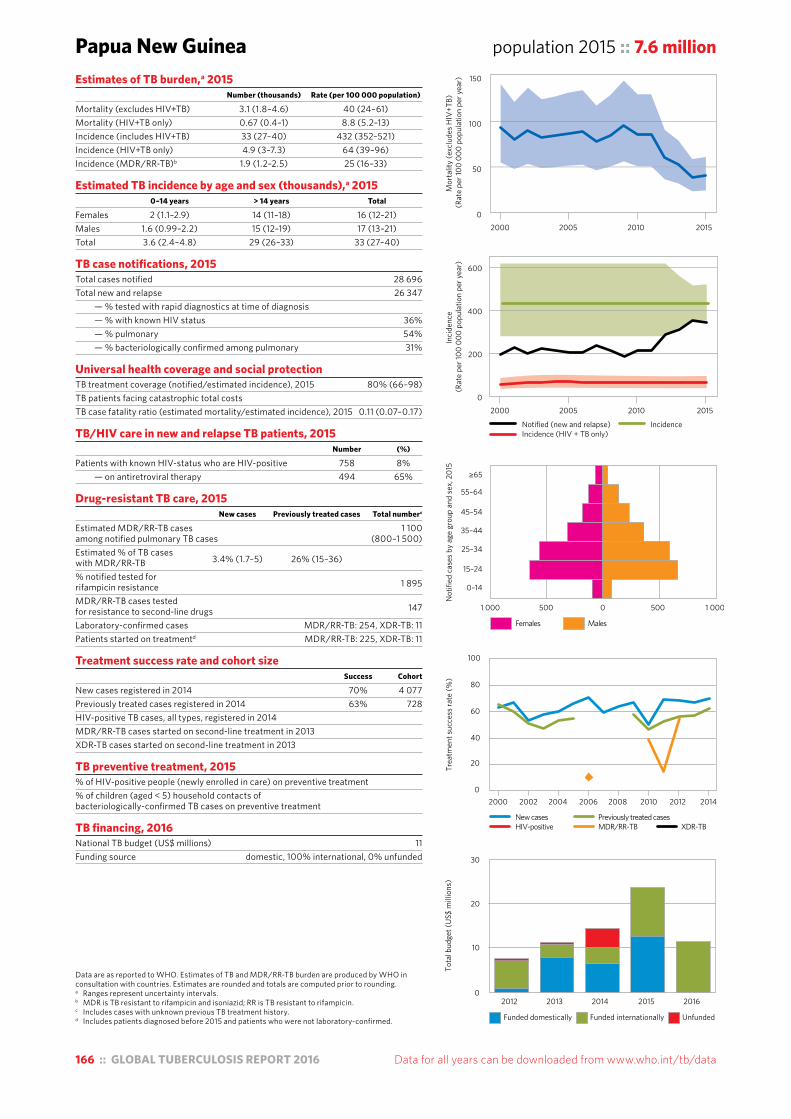
166 :: GLOBAL TUBERCULOSIS REPORT 2016 Data for all years can be downloaded from www.who.int/tb/data
Data are as reported to WHO. Estimates of TB and MDR/RR-TB burden are produced by WHO in consultation with countries. Estimates are rounded and totals are computed prior to rounding. a Ranges represent uncertainty intervals.b MDR is TB resistant to rifampicin and isoniazid; RR is TB resistant to rifampicin.c Includes cases with unknown previous TB treatment history.d Includes patients diagnosed before 2015 and patients who were not laboratory-confirmed.
Papua New Guinea population 2015 :: 7.6 millionEstimates of TB burden,a 2015 Number (thousands) Rate (per 100 000 population)
Mortality (excludes HIV+TB) 3.1 (1.8–4.6) 40 (24–61)Mortality (HIV+TB only) 0.67 (0.4–1) 8.8 (5.2–13)Incidence (includes HIV+TB) 33 (27–40) 432 (352–521)Incidence (HIV+TB only) 4.9 (3–7.3) 64 (39–96)Incidence (MDR/RR-TB)b 1.9 (1.2–2.5) 25 (16–33)
Estimated TB incidence by age and sex (thousands),a 2015 0–14 years > 14 years Total
Females 2 (1.1–2.9) 14 (11–18) 16 (12–21)Males 1.6 (0.99–2.2) 15 (12–19) 17 (13–21)Total 3.6 (2.4–4.8) 29 (26–33) 33 (27–40)
TB case notifications, 2015 Total cases notified 28 696Total new and relapse 26 347 — % tested with rapid diagnostics at time of diagnosis — % with known HIV status 36% — % pulmonary 54% — % bacteriologically confirmed among pulmonary 31%
Universal health coverage and social protection TB treatment coverage (notified/estimated incidence), 2015 80% (66–98)TB patients facing catastrophic total costs TB case fatality ratio (estimated mortality/estimated incidence), 2015 0.11 (0.07–0.17)
TB/HIV care in new and relapse TB patients, 2015 Number (%)
Patients with known HIV-status who are HIV-positive 758 8% — on antiretroviral therapy 494 65%
Drug-resistant TB care, 2015 New cases Previously treated cases Total numberc
Estimated MDR/RR-TB cases 1 100among notified pulmonary TB cases (800–1 500)Estimated % of TB cases with MDR/RR-TB 3.4% (1.7–5) 26% (15–36) % notified tested for rifampicin resistance 1 895
MDR/RR-TB cases tested for resistance to second-line drugs 147
Laboratory-confirmed cases MDR/RR-TB: 254, XDR-TB: 11Patients started on treatmentd MDR/RR-TB: 225, XDR-TB: 11
Treatment success rate and cohort size Success Cohort
New cases registered in 2014 70% 4 077Previously treated cases registered in 2014 63% 728HIV-positive TB cases, all types, registered in 2014 MDR/RR-TB cases started on second-line treatment in 2013 XDR-TB cases started on second-line treatment in 2013
TB preventive treatment, 2015 % of HIV-positive people (newly enrolled in care) on preventive treatment % of children (aged < 5) household contacts of bacteriologically-confirmed TB cases on preventive treatment
TB financing, 2016 National TB budget (US$ millions) 11Funding source domestic, 100% international, 0% unfunded
0
50
100
150
2000 2005 2010 2015
Mor
talit
y (e
xclu
des H
IV+T
B)
(Rat
e pe
r 100
000
pop
ulat
ion
per y
ear)
0
200
400
600
Inci
denc
e (R
ate
per 1
00 0
00 p
opul
atio
n pe
r yea
r)
2000 2005 2010 2015
Notified (new and relapse) IncidenceIncidence (HIV + TB only)
Females Males
1 000 500 0 500 1 000
Not
ified
cas
es b
y ag
e gr
oup
and
sex,
201
5
0–14
15–24
25–34
35–44
45–54
55–64
≥65
New cases Previously treated casesHIV-positive MDR/RR-TB XDR-TB
2000 2002 2004 2006 2008 2010 2012 2014
Trea
tmen
t suc
cess
rate
(%)
0
20
40
60
80
100
Funded domestically Funded internationally Unfunded
2012 2013 2014 2015 2016
Tota
l bud
get (
US$
mill
ions
)
0
10
20
30
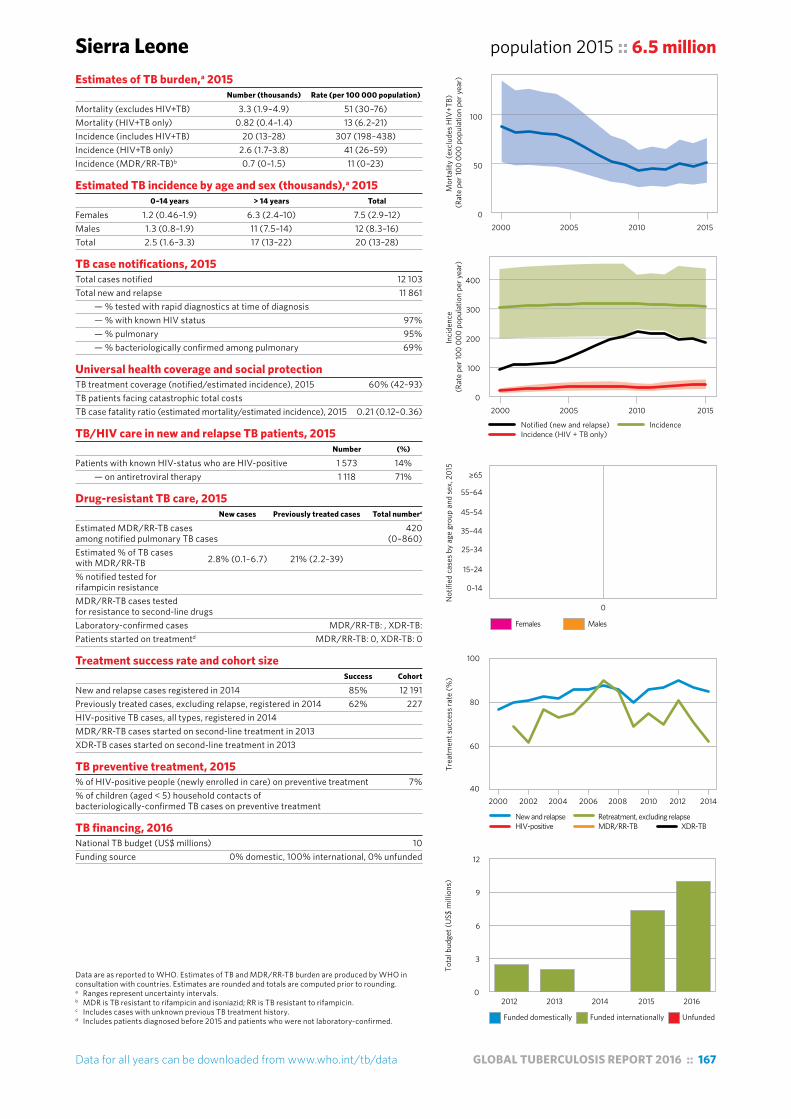
Data for all years can be downloaded from www.who.int/tb/data GLOBAL TUBERCULOSIS REPORT 2016 :: 167
Data are as reported to WHO. Estimates of TB and MDR/RR-TB burden are produced by WHO in consultation with countries. Estimates are rounded and totals are computed prior to rounding. a Ranges represent uncertainty intervals.b MDR is TB resistant to rifampicin and isoniazid; RR is TB resistant to rifampicin.c Includes cases with unknown previous TB treatment history.d Includes patients diagnosed before 2015 and patients who were not laboratory-confirmed.
Sierra Leone population 2015 :: 6.5 millionEstimates of TB burden,a 2015 Number (thousands) Rate (per 100 000 population)
Mortality (excludes HIV+TB) 3.3 (1.9–4.9) 51 (30–76)Mortality (HIV+TB only) 0.82 (0.4–1.4) 13 (6.2–21)Incidence (includes HIV+TB) 20 (13–28) 307 (198–438)Incidence (HIV+TB only) 2.6 (1.7–3.8) 41 (26–59)Incidence (MDR/RR-TB)b 0.7 (0–1.5) 11 (0–23)
Estimated TB incidence by age and sex (thousands),a 2015 0–14 years > 14 years Total
Females 1.2 (0.46–1.9) 6.3 (2.4–10) 7.5 (2.9–12)Males 1.3 (0.8–1.9) 11 (7.5–14) 12 (8.3–16)Total 2.5 (1.6–3.3) 17 (13–22) 20 (13–28)
TB case notifications, 2015 Total cases notified 12 103Total new and relapse 11 861 — % tested with rapid diagnostics at time of diagnosis — % with known HIV status 97% — % pulmonary 95% — % bacteriologically confirmed among pulmonary 69%
Universal health coverage and social protection TB treatment coverage (notified/estimated incidence), 2015 60% (42–93)TB patients facing catastrophic total costs TB case fatality ratio (estimated mortality/estimated incidence), 2015 0.21 (0.12–0.36)
TB/HIV care in new and relapse TB patients, 2015 Number (%)
Patients with known HIV-status who are HIV-positive 1 573 14% — on antiretroviral therapy 1 118 71%
Drug-resistant TB care, 2015 New cases Previously treated cases Total numberc
Estimated MDR/RR-TB cases 420among notified pulmonary TB cases (0–860)Estimated % of TB cases with MDR/RR-TB 2.8% (0.1–6.7) 21% (2.2–39) % notified tested for rifampicin resistance MDR/RR-TB cases tested for resistance to second-line drugs Laboratory-confirmed cases MDR/RR-TB: , XDR-TB:Patients started on treatmentd MDR/RR-TB: 0, XDR-TB: 0
Treatment success rate and cohort size Success Cohort
New and relapse cases registered in 2014 85% 12 191Previously treated cases, excluding relapse, registered in 2014 62% 227HIV-positive TB cases, all types, registered in 2014 MDR/RR-TB cases started on second-line treatment in 2013 XDR-TB cases started on second-line treatment in 2013
TB preventive treatment, 2015 % of HIV-positive people (newly enrolled in care) on preventive treatment 7%% of children (aged < 5) household contacts of bacteriologically-confirmed TB cases on preventive treatment
TB financing, 2016 National TB budget (US$ millions) 10Funding source 0% domestic, 100% international, 0% unfunded
0
50
100
2000 2005 2010 2015
Mor
talit
y (e
xclu
des H
IV+T
B)
(Rat
e pe
r 100
000
pop
ulat
ion
per y
ear)
0
100
200
300
400
Inci
denc
e (R
ate
per 1
00 0
00 p
opul
atio
n pe
r yea
r)
2000 2005 2010 2015
Notified (new and relapse) IncidenceIncidence (HIV + TB only)
Females Males
0
Not
ified
cas
es b
y ag
e gr
oup
and
sex,
201
5
0–14
15–24
25–34
35–44
45–54
55–64
≥65
New and relapse Retreatment, excluding relapseHIV-positive MDR/RR-TB XDR-TB
2000 2002 2004 2006 2008 2010 2012 2014
Trea
tmen
t suc
cess
rate
(%)
40
60
80
100
Funded domestically Funded internationally Unfunded
2012 2013 2014 2015 2016
Tota
l bud
get (
US$
mill
ions
)
0
3
6
9
12
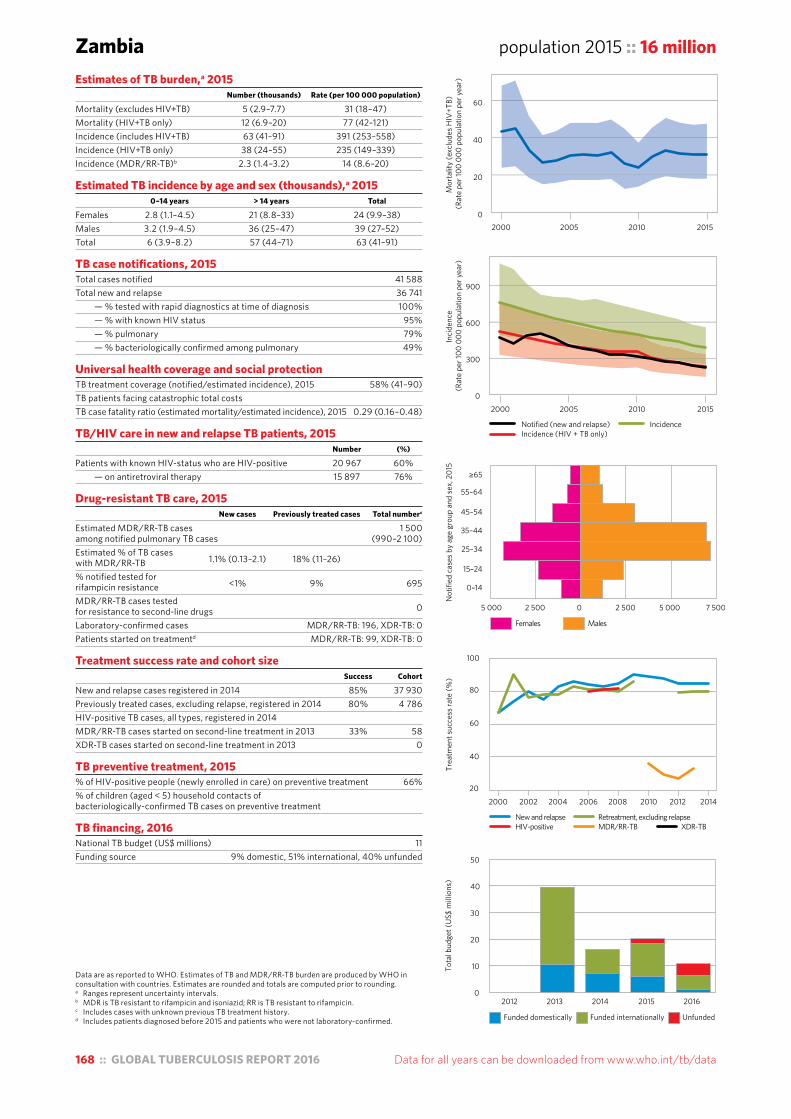
168 :: GLOBAL TUBERCULOSIS REPORT 2016 Data for all years can be downloaded from www.who.int/tb/data
Data are as reported to WHO. Estimates of TB and MDR/RR-TB burden are produced by WHO in consultation with countries. Estimates are rounded and totals are computed prior to rounding. a Ranges represent uncertainty intervals.b MDR is TB resistant to rifampicin and isoniazid; RR is TB resistant to rifampicin.c Includes cases with unknown previous TB treatment history.d Includes patients diagnosed before 2015 and patients who were not laboratory-confirmed.
Zambia population 2015 :: 16 millionEstimates of TB burden,a 2015 Number (thousands) Rate (per 100 000 population)
Mortality (excludes HIV+TB) 5 (2.9–7.7) 31 (18–47)Mortality (HIV+TB only) 12 (6.9–20) 77 (42–121)Incidence (includes HIV+TB) 63 (41–91) 391 (253–558)Incidence (HIV+TB only) 38 (24–55) 235 (149–339)Incidence (MDR/RR-TB)b 2.3 (1.4–3.2) 14 (8.6–20)
Estimated TB incidence by age and sex (thousands),a 2015 0–14 years > 14 years Total
Females 2.8 (1.1–4.5) 21 (8.8–33) 24 (9.9–38)Males 3.2 (1.9–4.5) 36 (25–47) 39 (27–52)Total 6 (3.9–8.2) 57 (44–71) 63 (41–91)
TB case notifications, 2015 Total cases notified 41 588Total new and relapse 36 741 — % tested with rapid diagnostics at time of diagnosis 100% — % with known HIV status 95% — % pulmonary 79% — % bacteriologically confirmed among pulmonary 49%
Universal health coverage and social protection TB treatment coverage (notified/estimated incidence), 2015 58% (41–90)TB patients facing catastrophic total costs TB case fatality ratio (estimated mortality/estimated incidence), 2015 0.29 (0.16–0.48)
TB/HIV care in new and relapse TB patients, 2015 Number (%)
Patients with known HIV-status who are HIV-positive 20 967 60% — on antiretroviral therapy 15 897 76%
Drug-resistant TB care, 2015 New cases Previously treated cases Total numberc
Estimated MDR/RR-TB cases 1 500among notified pulmonary TB cases (990–2 100)Estimated % of TB cases with MDR/RR-TB 1.1% (0.13–2.1) 18% (11–26) % notified tested for rifampicin resistance <1% 9% 695
MDR/RR-TB cases tested for resistance to second-line drugs 0
Laboratory-confirmed cases MDR/RR-TB: 196, XDR-TB: 0Patients started on treatmentd MDR/RR-TB: 99, XDR-TB: 0
Treatment success rate and cohort size Success Cohort
New and relapse cases registered in 2014 85% 37 930Previously treated cases, excluding relapse, registered in 2014 80% 4 786HIV-positive TB cases, all types, registered in 2014 MDR/RR-TB cases started on second-line treatment in 2013 33% 58XDR-TB cases started on second-line treatment in 2013 0
TB preventive treatment, 2015 % of HIV-positive people (newly enrolled in care) on preventive treatment 66%% of children (aged < 5) household contacts of bacteriologically-confirmed TB cases on preventive treatment
TB financing, 2016 National TB budget (US$ millions) 11Funding source 9% domestic, 51% international, 40% unfunded
0
20
40
60
2000 2005 2010 2015
Mor
talit
y (e
xclu
des H
IV+T
B)
(Rat
e pe
r 100
000
pop
ulat
ion
per y
ear)
0
300
600
900
2000 2005 2010 2015
Inci
denc
e (R
ate
per 1
00 0
00 p
opul
atio
n pe
r yea
r)
Notified (new and relapse) IncidenceIncidence (HIV + TB only)
Females Males
5 000 2 500 0 2 500 5 000 7 500
Not
ified
cas
es b
y ag
e gr
oup
and
sex,
201
5
0–14
15–24
25–34
35–44
45–54
55–64
≥65
New and relapse Retreatment, excluding relapseHIV-positive MDR/RR-TB XDR-TB
2000 2002 2004 2006 2008 2010 2012 2014
Trea
tmen
t suc
cess
rate
(%)
20
40
60
80
100
Funded domestically Funded internationally Unfunded
2012 2013 2014 2015 2016
Tota
l bud
get (
US$
mill
ions
)
0
10
20
30
40
50
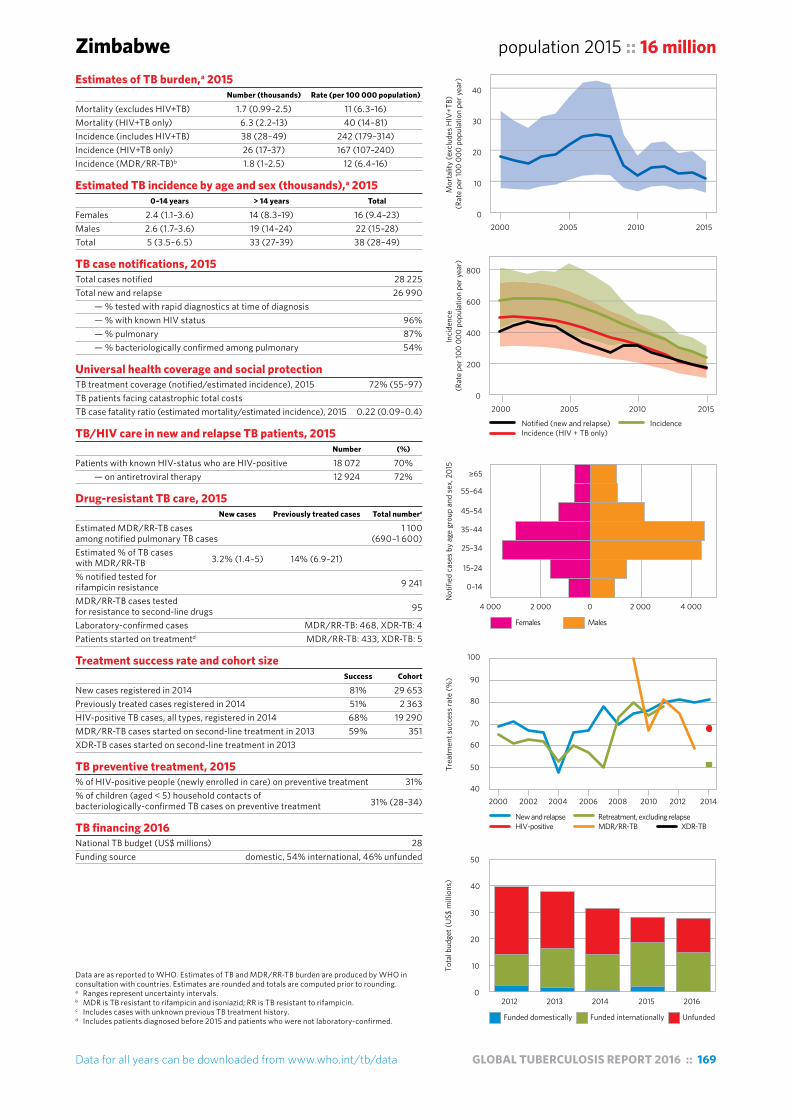
Data for all years can be downloaded from www.who.int/tb/data GLOBAL TUBERCULOSIS REPORT 2016 :: 169
Data are as reported to WHO. Estimates of TB and MDR/RR-TB burden are produced by WHO in consultation with countries. Estimates are rounded and totals are computed prior to rounding. a Ranges represent uncertainty intervals.b MDR is TB resistant to rifampicin and isoniazid; RR is TB resistant to rifampicin.c Includes cases with unknown previous TB treatment history.d Includes patients diagnosed before 2015 and patients who were not laboratory-confirmed.
Zimbabwe population 2015 :: 16 millionEstimates of TB burden,a 2015 Number (thousands) Rate (per 100 000 population)
Mortality (excludes HIV+TB) 1.7 (0.99–2.5) 11 (6.3–16)Mortality (HIV+TB only) 6.3 (2.2–13) 40 (14–81)Incidence (includes HIV+TB) 38 (28–49) 242 (179–314)Incidence (HIV+TB only) 26 (17–37) 167 (107–240)Incidence (MDR/RR-TB)b 1.8 (1–2.5) 12 (6.4–16)
Estimated TB incidence by age and sex (thousands),a 2015 0–14 years > 14 years Total
Females 2.4 (1.1–3.6) 14 (8.3–19) 16 (9.4–23)Males 2.6 (1.7–3.6) 19 (14–24) 22 (15–28)Total 5 (3.5–6.5) 33 (27–39) 38 (28–49)
TB case notifications, 2015 Total cases notified 28 225Total new and relapse 26 990 — % tested with rapid diagnostics at time of diagnosis — % with known HIV status 96% — % pulmonary 87% — % bacteriologically confirmed among pulmonary 54%
Universal health coverage and social protection TB treatment coverage (notified/estimated incidence), 2015 72% (55–97)TB patients facing catastrophic total costs TB case fatality ratio (estimated mortality/estimated incidence), 2015 0.22 (0.09–0.4)
TB/HIV care in new and relapse TB patients, 2015 Number (%)
Patients with known HIV-status who are HIV-positive 18 072 70% — on antiretroviral therapy 12 924 72%
Drug-resistant TB care, 2015 New cases Previously treated cases Total numberc
Estimated MDR/RR-TB cases 1 100among notified pulmonary TB cases (690–1 600)Estimated % of TB cases with MDR/RR-TB 3.2% (1.4–5) 14% (6.9–21) % notified tested for rifampicin resistance 9 241
MDR/RR-TB cases tested for resistance to second-line drugs 95
Laboratory-confirmed cases MDR/RR-TB: 468, XDR-TB: 4Patients started on treatmentd MDR/RR-TB: 433, XDR-TB: 5
Treatment success rate and cohort size Success Cohort
New cases registered in 2014 81% 29 653Previously treated cases registered in 2014 51% 2 363HIV-positive TB cases, all types, registered in 2014 68% 19 290MDR/RR-TB cases started on second-line treatment in 2013 59% 351XDR-TB cases started on second-line treatment in 2013
TB preventive treatment, 2015 % of HIV-positive people (newly enrolled in care) on preventive treatment 31%% of children (aged < 5) household contacts of bacteriologically-confirmed TB cases on preventive treatment 31% (28–34)
TB financing 2016 National TB budget (US$ millions) 28Funding source domestic, 54% international, 46% unfunded
0
200
400
600
800
2000 2005 2010 2015
Inci
denc
e (R
ate
per 1
00 0
00 p
opul
atio
n pe
r yea
r)
Notified (new and relapse) IncidenceIncidence (HIV + TB only)
Females Males
4 000 2 000 0 2 000 4 000
Not
ified
cas
es b
y ag
e gr
oup
and
sex,
201
5
0–14
15–24
25–34
35–44
45–54
55–64
≥65
New and relapse Retreatment, excluding relapseHIV-positive MDR/RR-TB XDR-TB
2000 2002 2004 2006 2008 2010 2012 2014
Trea
tmen
t suc
cess
rate
(%)
40
50
60
70
80
90
100
Funded domestically Funded internationally Unfunded
2012 2013 2014 2015 2016
Tota
l bud
get (
US$
mill
ions
)
0
10
20
30
40
50
0
10
20
30
40
2000 2005 2010 2015
Mor
talit
y (e
xclu
des H
IV+T
B)
(Rat
e pe
r 100
000
pop
ulat
ion
per y
ear)

Annex
3Regional profiles
:: FOR
6 WHO REGIONS


Data for all years can be downloaded from www.who.int/tb/data GLOBAL TUBERCULOSIS REPORT 2016 :: 173
WHO African Region population 2015 :: 989 millionWHO MEMBER STATES 47
Estimates of TB burden,a 2015 Number (thousands) Rate (per 100 000 population)
Mortality (excludes HIV+TB) 450 (350–560) 45 (35–57)Mortality (HIV+TB only) 300 (230–360) 30 (24–37)Incidence (includes HIV+TB) 2 720 (2 360–3 110) 275 (239–314)Incidence (HIV+TB only) 834 (710–969) 84 (72–98)Incidence (MDR/RR-TB)b 110 (88–120) 11 (8.9–13)
Estimated TB incidence by age and sex (thousands),a 2015 0–14 years > 14 years Total
Females 142 (118–169) 960 (790–1 150) 1 100 (908–1 310)Males 145 (127–164) 1 480 (1 330–1 630) 1 620 (1 450–1 800)Total 287 (256–320) 2 440 (2 240–2 640) 2 720 (2 360–3 110)
TB case notifications, 2015 Total cases notified 1 333 504Total new and relapse 1 296 122 — % with known HIV status 81% — % pulmonary 84% — % bacteriologically confirmed among pulmonary 64%
Universal health coverage and social protection TB treatment coverage (notified/estimated incidence), 2015 48% (42–55)TB patients facing catastrophic total costs TB case fatality ratio (estimated mortality/estimated incidence), 2015 0.27 (0.22–0.34)
TB/HIV care in new and relapse TB patients, 2015 Number (%)f
Patients with known HIV-status who are HIV-positive 380 032 36% — on antiretroviral therapy 376 511 83%
Drug-resistant TB care, 2015 New cases Previously treated cases Total numberc
Estimated MDR/RR-TB cases 42 000among notified pulmonary TB cases (38 000–47 000)Estimated % of TB cases with MDR/RR-TB 3% (1.2–4.9) 15% (7.5–22) % notified tested for rifampicin resistance 21% 51% 352 478
MDR/RR-TB cases tested for resistance to second-line drugs 8 795
Laboratory-confirmed cases MDR/RR-TB: 26 929, XDR-TB: 1 100Patients started on treatmentd MDR/RR-TB: 18 483, XDR-TB: 795
Treatment success rate and cohort size Success Cohort
New and relapsee cases registered in 2014 81% 1 274 882Previously treated cases, excluding relapse, registered in 2014 72% 40 347HIV-positive TB cases, all types, registered in 2014 77% 328 245MDR/RR-TB cases started on second-line treatment in 2013 54% 14 553XDR-TB cases started on second-line treatment in 2013 24% 630
TB preventive treatment, 2015 % of HIV-positive people (newly enrolled in care) on preventive treatment 39%% of children (aged < 5) household contacts of bacteriologically-confirmed TB cases on preventive treatment 5.6% (5.5–5.7)
TB financing (low- and middle-income countries),g,h 2016 National TB budget (US$ millions) 1 410Funding source 39% domestic, 32% international, 29% unfunded
Data are as reported to WHO. Estimates of TB and MDR/RR-TB burden are produced by WHO in consultation with countries. Estimates are rounded and totals are computed prior to rounding.a Ranges represent uncertainty intervals.b MDR is TB resistant to rifampicin and isoniazid; RR is TB resistant to rifampicin.c Includes cases with unknown previous TB treatment history.d Includes patients diagnosed before 2015 and patients who were not laboratory-confirmed.e Some countries reported on new cases only.f Calculations exclude countries with missing numerators or denominators.g Data are not collected from all Member States.h Financing indicators exclude funding for general healthcare services provided outside NTPs.
2000 2005 2010 2015
Mor
talit
y (e
xclu
des H
IV+T
B)
(Rat
e pe
r 100
000
pop
ulat
ion
per y
ear)
0
20
40
60
2000 2005 2010 2015
Inci
denc
e
(Rat
e pe
r 100
000
pop
ulat
ion
per y
ear)
Notified (new and relapse) IncidenceIncidence (HIV + TB only)
0
100
200
300
400
Females Males
Not
ified
cas
es b
y ag
e gr
oup
and
sex,
201
5
0–14
15–24
25–34
35–44
45–54
55–64
≥65
120 000 60 000 0 60 000 120 000 180 000
New and relapse Retreatment, excluding relapseHIV-positive MDR/RR-TB XDR-TB
2000 2002 2004 2006 2008 2010 2012 2014
Trea
tmen
t suc
cess
rate
(%)
0
20
40
60
80
100
Funded domestically Funded internationally Unfunded
2012 2013 2014 2015 2016
Tota
l bud
get (
US$
mill
ions
con
stan
t 201
6)
0
500
1000
1500

174 :: GLOBAL TUBERCULOSIS REPORT 2016 Data for all years can be downloaded from www.who.int/tb/data
WHO/PAHO Region of the Americas population 2015 :: 991 million
Data are as reported to WHO. Estimates of TB and MDR/RR-TB burden are produced by WHO in consultation with countries. Estimates are rounded and totals are computed prior to rounding.a Ranges represent uncertainty intervals.b MDR is TB resistant to rifampicin and isoniazid; RR is TB resistant to rifampicin.c Includes cases with unknown previous TB treatment history.d Includes patients diagnosed before 2015 and patients who were not laboratory-confirmed.e Some countries reported on new cases only.f Calculations exclude countries with missing numerators or denominators.g Data are not collected from all Member States.h Financing indicators exclude funding for general healthcare services provided outside NTPs.
WHO MEMBER STATES 35OTHER COUNTRIES AND TERRITORIES 11
Estimates of TB burden,a 2015 Number (thousands) Rate (per 100 000 population)
Mortality (excludes HIV+TB) 19 (17–20) 1.9 (1.8–2)Mortality (HIV+TB only) 6 (4–8) 0.59 (0.42–0.79)Incidence (includes HIV+TB) 268 (250–287) 27 (25–29)Incidence (HIV+TB only) 32 (29–35) 3.2 (2.9–3.5)Incidence (MDR/RR-TB)b 11 (10–12) 1.1 (1–1.2)
Estimated TB incidence by age and sex (thousands),a 2015 0–14 years > 14 years Total
Females 13 (11–15) 88 (76–100) 101 (87–115)Males 13 (11–15) 155 (141–169) 168 (152–183)Total 26 (23–28) 243 (232–253) 268 (250–287)
TB case notifications, 2015 Total cases notified 230 519Total new and relapse 217 081 — % with known HIV status 82% — % pulmonary 85% — % bacteriologically confirmed among pulmonary 77%
Universal health coverage and social protection TB treatment coverage (notified/estimated incidence), 2015 81% (76–87)TB patients facing catastrophic total costs TB case fatality ratio (estimated mortality/estimated incidence), 2015 0.09 (0.08–0.1)
TB/HIV care in new and relapse TB patients, 2015 Number (%)f
Patients with known HIV-status who are HIV-positive 21 885 12% — on antiretroviral therapy 20 601 55%
Drug-resistant TB care, 2015 New cases Previously treated cases Total numberc
Estimated MDR/RR-TB cases 7 700among notified pulmonary TB cases (7 200–8 200)Estimated % of TB cases with MDR/RR-TB 2.9% (1.6–4.2) 12% (7.3–17) % notified tested for rifampicin resistance 29% 45% 78 462
MDR/RR-TB cases tested for resistance to second-line drugs 1 764
Laboratory-confirmed cases MDR/RR-TB: 4 489, XDR-TB: 122Patients started on treatmentd MDR/RR-TB: 3 374, XDR-TB: 103
Treatment success rate and cohort size Success Cohort
New and relapsee cases registered in 2014 76% 195 507Previously treated cases, excluding relapse, registered in 2014 48% 14 487HIV-positive TB cases, all types, registered in 2014 56% 16 754MDR/RR-TB cases started on second-line treatment in 2013 55% 2 920XDR-TB cases started on second-line treatment in 2013 52% 90
TB preventive treatment, 2015 % of HIV-positive people (newly enrolled in care) on preventive treatment 42%% of children (aged < 5) household contacts of bacteriologically-confirmed TB cases on preventive treatment 67% (63–71)
TB financing (low- and middle-income countries),g,h 2016 National TB budget (US$ millions) 496Funding source 37% domestic, 42% international, 21% unfunded
2000 2005 2010 2015
Mor
talit
y (e
xclu
des H
IV+T
B)
(Rat
e pe
r 100
000
pop
ulat
ion
per y
ear)
0
1
2
3
4
2000 2005 2010 2015
Inci
denc
e (R
ate
per 1
00 0
00 p
opul
atio
n pe
r yea
r)
Notified (new and relapse) IncidenceIncidence (HIV + TB only)
0
10
20
30
40
Females Males
Not
ified
cas
es b
y ag
e gr
oup
and
sex,
201
5
0–14
15–24
25–34
35–44
45–54
55–64
≥65
20 000 10 000 0 10 000 20 000 30 000
New and relapse Retreatment, excluding relapseHIV-positive MDR/RR-TB XDR-TB
2000 2002 2004 2006 2008 2010 2012 2014
Trea
tmen
t suc
cess
rate
(%)
0
20
40
60
80
100
Funded domestically Funded internationally Unfunded
2012 2013 2014 2015 2016
Tota
l bud
get (
US$
mill
ions
con
stan
t 201
6)
0
200
400
600
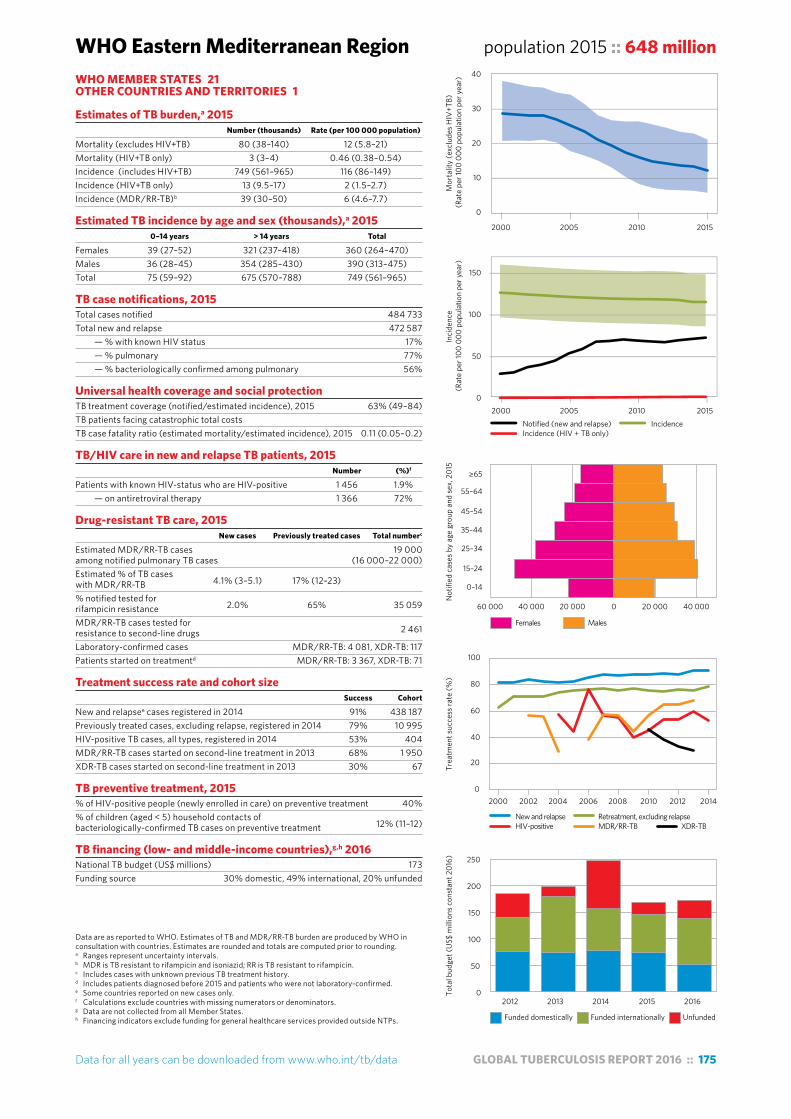
Data for all years can be downloaded from www.who.int/tb/data GLOBAL TUBERCULOSIS REPORT 2016 :: 175
WHO Eastern Mediterranean Region population 2015 :: 648 million
Data are as reported to WHO. Estimates of TB and MDR/RR-TB burden are produced by WHO in consultation with countries. Estimates are rounded and totals are computed prior to rounding.a Ranges represent uncertainty intervals.b MDR is TB resistant to rifampicin and isoniazid; RR is TB resistant to rifampicin.c Includes cases with unknown previous TB treatment history.d Includes patients diagnosed before 2015 and patients who were not laboratory-confirmed.e Some countries reported on new cases only.f Calculations exclude countries with missing numerators or denominators.g Data are not collected from all Member States.h Financing indicators exclude funding for general healthcare services provided outside NTPs.
WHO MEMBER STATES 21OTHER COUNTRIES AND TERRITORIES 1
Estimates of TB burden,a 2015 Number (thousands) Rate (per 100 000 population)
Mortality (excludes HIV+TB) 80 (38–140) 12 (5.8–21)Mortality (HIV+TB only) 3 (3–4) 0.46 (0.38–0.54)Incidence (includes HIV+TB) 749 (561–965) 116 (86–149)Incidence (HIV+TB only) 13 (9.5–17) 2 (1.5–2.7)Incidence (MDR/RR-TB)b 39 (30–50) 6 (4.6–7.7)
Estimated TB incidence by age and sex (thousands),a 2015 0–14 years > 14 years Total
Females 39 (27–52) 321 (237–418) 360 (264–470)Males 36 (28–45) 354 (285–430) 390 (313–475)Total 75 (59–92) 675 (570–788) 749 (561–965)
TB case notifications, 2015 Total cases notified 484 733Total new and relapse 472 587 — % with known HIV status 17% — % pulmonary 77% — % bacteriologically confirmed among pulmonary 56%
Universal health coverage and social protection TB treatment coverage (notified/estimated incidence), 2015 63% (49–84)TB patients facing catastrophic total costs TB case fatality ratio (estimated mortality/estimated incidence), 2015 0.11 (0.05–0.2)
TB/HIV care in new and relapse TB patients, 2015 Number (%)f
Patients with known HIV-status who are HIV-positive 1 456 1.9% — on antiretroviral therapy 1 366 72%
Drug-resistant TB care, 2015 New cases Previously treated cases Total numberc
Estimated MDR/RR-TB cases 19 000among notified pulmonary TB cases (16 000–22 000)Estimated % of TB cases with MDR/RR-TB 4.1% (3–5.1) 17% (12–23) % notified tested for rifampicin resistance 2.0% 65% 35 059
MDR/RR-TB cases tested for resistance to second-line drugs 2 461
Laboratory-confirmed cases MDR/RR-TB: 4 081, XDR-TB: 117Patients started on treatmentd MDR/RR-TB: 3 367, XDR-TB: 71
Treatment success rate and cohort size Success Cohort
New and relapsee cases registered in 2014 91% 438 187Previously treated cases, excluding relapse, registered in 2014 79% 10 995HIV-positive TB cases, all types, registered in 2014 53% 404MDR/RR-TB cases started on second-line treatment in 2013 68% 1 950XDR-TB cases started on second-line treatment in 2013 30% 67
TB preventive treatment, 2015 % of HIV-positive people (newly enrolled in care) on preventive treatment 40%% of children (aged < 5) household contacts of bacteriologically-confirmed TB cases on preventive treatment 12% (11–12)
TB financing (low- and middle-income countries),g,h 2016 National TB budget (US$ millions) 173Funding source 30% domestic, 49% international, 20% unfunded
2000 2005 2010 2015
Mor
talit
y (e
xclu
des H
IV+T
B)
(Rat
e pe
r 100
000
pop
ulat
ion
per y
ear)
0
10
20
30
40
2000 2005 2010 2015
Inci
denc
e (R
ate
per 1
00 0
00 p
opul
atio
n pe
r yea
r)
Notified (new and relapse) IncidenceIncidence (HIV + TB only)
0
50
100
150
Females Males
Not
ified
cas
es b
y ag
e gr
oup
and
sex,
201
5
0–14
15–24
25–34
35–44
45–54
55–64
≥65
60 000 40 000 20 000 0 20 000 40 000
New and relapse Retreatment, excluding relapseHIV-positive MDR/RR-TB XDR-TB
2000 2002 2004 2006 2008 2010 2012 2014
Trea
tmen
t suc
cess
rate
(%)
0
20
40
60
80
100
Funded domestically Funded internationally Unfunded
2012 2013 2014 2015 2016
Tota
l bud
get (
US$
mill
ions
con
stan
t 201
6)
0
50
100
150
200
250
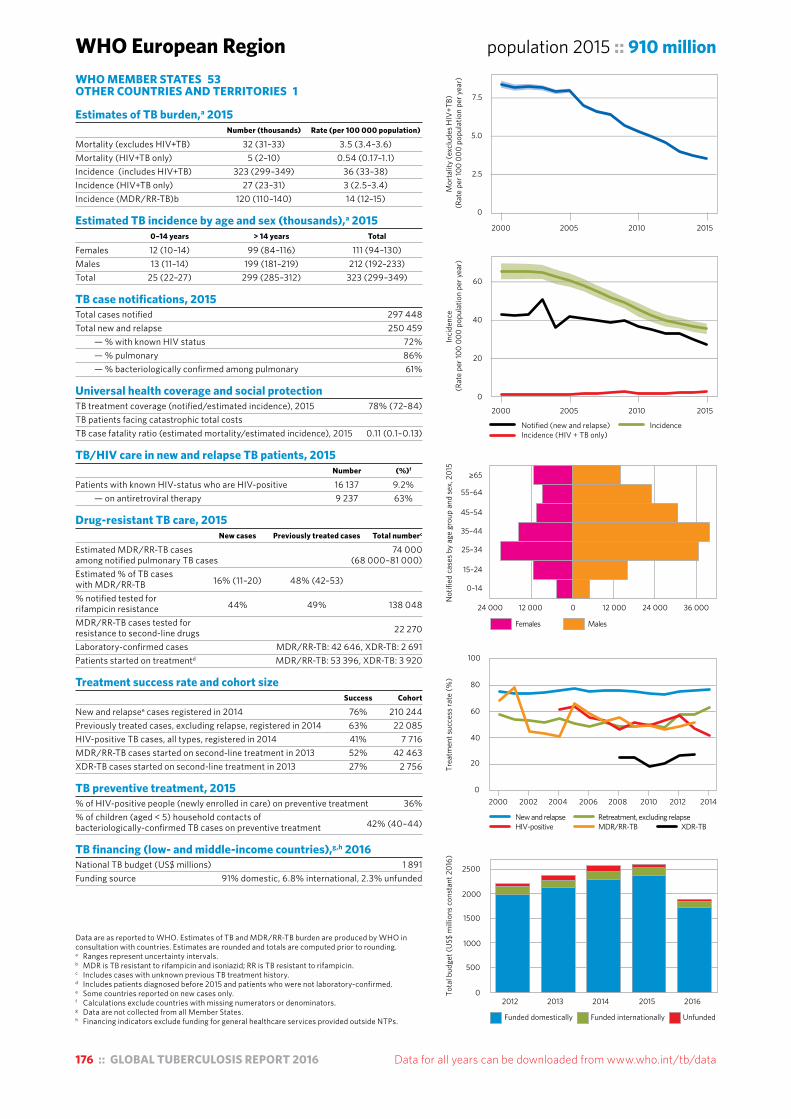
176 :: GLOBAL TUBERCULOSIS REPORT 2016 Data for all years can be downloaded from www.who.int/tb/data
WHO European Region population 2015 :: 910 million
Data are as reported to WHO. Estimates of TB and MDR/RR-TB burden are produced by WHO in consultation with countries. Estimates are rounded and totals are computed prior to rounding.a Ranges represent uncertainty intervals.b MDR is TB resistant to rifampicin and isoniazid; RR is TB resistant to rifampicin.c Includes cases with unknown previous TB treatment history.d Includes patients diagnosed before 2015 and patients who were not laboratory-confirmed.e Some countries reported on new cases only.f Calculations exclude countries with missing numerators or denominators.g Data are not collected from all Member States.h Financing indicators exclude funding for general healthcare services provided outside NTPs.
WHO MEMBER STATES 53OTHER COUNTRIES AND TERRITORIES 1
Estimates of TB burden,a 2015 Number (thousands) Rate (per 100 000 population)
Mortality (excludes HIV+TB) 32 (31–33) 3.5 (3.4–3.6)Mortality (HIV+TB only) 5 (2–10) 0.54 (0.17–1.1)Incidence (includes HIV+TB) 323 (299–349) 36 (33–38)Incidence (HIV+TB only) 27 (23–31) 3 (2.5–3.4)Incidence (MDR/RR-TB)b 120 (110–140) 14 (12–15)
Estimated TB incidence by age and sex (thousands),a 2015 0–14 years > 14 years Total
Females 12 (10–14) 99 (84–116) 111 (94–130)Males 13 (11–14) 199 (181–219) 212 (192–233)Total 25 (22–27) 299 (285–312) 323 (299–349)
TB case notifications, 2015 Total cases notified 297 448Total new and relapse 250 459 — % with known HIV status 72% — % pulmonary 86% — % bacteriologically confirmed among pulmonary 61%
Universal health coverage and social protection TB treatment coverage (notified/estimated incidence), 2015 78% (72–84)TB patients facing catastrophic total costs TB case fatality ratio (estimated mortality/estimated incidence), 2015 0.11 (0.1–0.13)
TB/HIV care in new and relapse TB patients, 2015 Number (%)f
Patients with known HIV-status who are HIV-positive 16 137 9.2% — on antiretroviral therapy 9 237 63%
Drug-resistant TB care, 2015 New cases Previously treated cases Total numberc
Estimated MDR/RR-TB cases 74 000among notified pulmonary TB cases (68 000–81 000)Estimated % of TB cases with MDR/RR-TB 16% (11–20) 48% (42–53) % notified tested for rifampicin resistance 44% 49% 138 048
MDR/RR-TB cases tested for resistance to second-line drugs 22 270
Laboratory-confirmed cases MDR/RR-TB: 42 646, XDR-TB: 2 691Patients started on treatmentd MDR/RR-TB: 53 396, XDR-TB: 3 920
Treatment success rate and cohort size Success Cohort
New and relapsee cases registered in 2014 76% 210 244Previously treated cases, excluding relapse, registered in 2014 63% 22 085HIV-positive TB cases, all types, registered in 2014 41% 7 716MDR/RR-TB cases started on second-line treatment in 2013 52% 42 463XDR-TB cases started on second-line treatment in 2013 27% 2 756
TB preventive treatment, 2015 % of HIV-positive people (newly enrolled in care) on preventive treatment 36%% of children (aged < 5) household contacts of bacteriologically-confirmed TB cases on preventive treatment 42% (40–44)
TB financing (low- and middle-income countries),g,h 2016 National TB budget (US$ millions) 1 891Funding source 91% domestic, 6.8% international, 2.3% unfunded
2000 2005 2010 2015
Mor
talit
y (e
xclu
des H
IV+T
B)
(Rat
e pe
r 100
000
pop
ulat
ion
per y
ear)
0
2.5
5.0
7.5
2000 2005 2010 2015
Inci
denc
e (R
ate
per 1
00 0
00 p
opul
atio
n pe
r yea
r)
Notified (new and relapse) IncidenceIncidence (HIV + TB only)
0
20
40
60
Females Males
Not
ified
cas
es b
y ag
e gr
oup
and
sex,
201
5
0–14
15–24
25–34
35–44
45–54
55–64
≥65
24 000 12 000 0 12 000 24 000 36 000
New and relapse Retreatment, excluding relapseHIV-positive MDR/RR-TB XDR-TB
2000 2002 2004 2006 2008 2010 2012 2014
Trea
tmen
t suc
cess
rate
(%)
0
20
40
60
80
100
Funded domestically Funded internationally Unfunded
2012 2013 2014 2015 2016
Tota
l bud
get (
US$
mill
ions
con
stan
t 201
6)
0
500
1000
1500
2000
2500
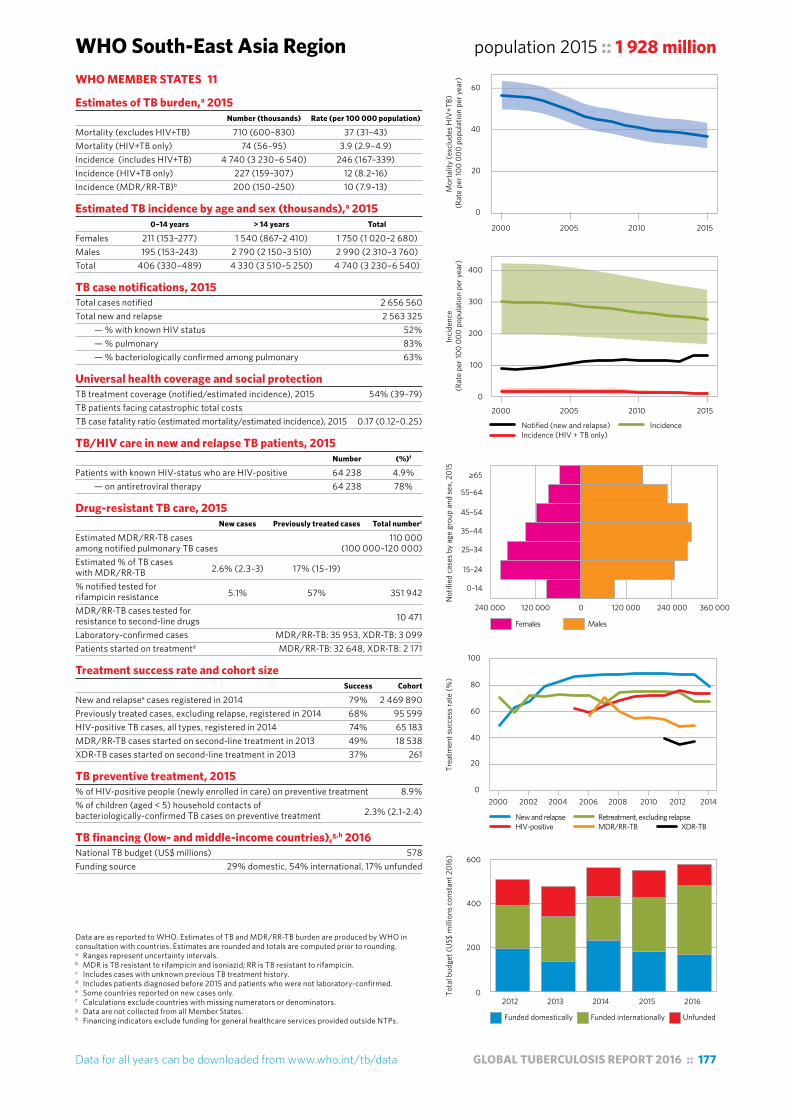
Data for all years can be downloaded from www.who.int/tb/data GLOBAL TUBERCULOSIS REPORT 2016 :: 177
WHO South-East Asia Region population 2015 :: 1 928 million
Data are as reported to WHO. Estimates of TB and MDR/RR-TB burden are produced by WHO in consultation with countries. Estimates are rounded and totals are computed prior to rounding.a Ranges represent uncertainty intervals.b MDR is TB resistant to rifampicin and isoniazid; RR is TB resistant to rifampicin.c Includes cases with unknown previous TB treatment history.d Includes patients diagnosed before 2015 and patients who were not laboratory-confirmed.e Some countries reported on new cases only.f Calculations exclude countries with missing numerators or denominators.g Data are not collected from all Member States.h Financing indicators exclude funding for general healthcare services provided outside NTPs.
WHO MEMBER STATES 11
Estimates of TB burden,a 2015 Number (thousands) Rate (per 100 000 population)
Mortality (excludes HIV+TB) 710 (600–830) 37 (31–43)Mortality (HIV+TB only) 74 (56–95) 3.9 (2.9–4.9)Incidence (includes HIV+TB) 4 740 (3 230–6 540) 246 (167–339)Incidence (HIV+TB only) 227 (159–307) 12 (8.2–16)Incidence (MDR/RR-TB)b 200 (150–250) 10 (7.9–13)
Estimated TB incidence by age and sex (thousands),a 2015 0–14 years > 14 years Total
Females 211 (153–277) 1 540 (867–2 410) 1 750 (1 020–2 680)Males 195 (153–243) 2 790 (2 150–3 510) 2 990 (2 310–3 760)Total 406 (330–489) 4 330 (3 510–5 250) 4 740 (3 230–6 540)
TB case notifications, 2015 Total cases notified 2 656 560Total new and relapse 2 563 325 — % with known HIV status 52% — % pulmonary 83% — % bacteriologically confirmed among pulmonary 63%
Universal health coverage and social protection TB treatment coverage (notified/estimated incidence), 2015 54% (39–79)TB patients facing catastrophic total costs TB case fatality ratio (estimated mortality/estimated incidence), 2015 0.17 (0.12–0.25)
TB/HIV care in new and relapse TB patients, 2015 Number (%)f
Patients with known HIV-status who are HIV-positive 64 238 4.9% — on antiretroviral therapy 64 238 78%
Drug-resistant TB care, 2015 New cases Previously treated cases Total numberc
Estimated MDR/RR-TB cases 110 000among notified pulmonary TB cases (100 000–120 000)Estimated % of TB cases with MDR/RR-TB 2.6% (2.3–3) 17% (15–19) % notified tested for rifampicin resistance 5.1% 57% 351 942
MDR/RR-TB cases tested for resistance to second-line drugs 10 471
Laboratory-confirmed cases MDR/RR-TB: 35 953, XDR-TB: 3 099Patients started on treatmentd MDR/RR-TB: 32 648, XDR-TB: 2 171
Treatment success rate and cohort size Success Cohort
New and relapsee cases registered in 2014 79% 2 469 890Previously treated cases, excluding relapse, registered in 2014 68% 95 599HIV-positive TB cases, all types, registered in 2014 74% 65 183MDR/RR-TB cases started on second-line treatment in 2013 49% 18 538XDR-TB cases started on second-line treatment in 2013 37% 261
TB preventive treatment, 2015 % of HIV-positive people (newly enrolled in care) on preventive treatment 8.9%% of children (aged < 5) household contacts of bacteriologically-confirmed TB cases on preventive treatment 2.3% (2.1–2.4)
TB financing (low- and middle-income countries),g,h 2016 National TB budget (US$ millions) 578Funding source 29% domestic, 54% international, 17% unfunded
2000 2005 2010 2015
Mor
talit
y (e
xclu
des H
IV+T
B)
(Rat
e pe
r 100
000
pop
ulat
ion
per y
ear)
0
20
40
60
2000 2005 2010 2015
Inci
denc
e (R
ate
per 1
00 0
00 p
opul
atio
n pe
r yea
r)
Notified (new and relapse) IncidenceIncidence (HIV + TB only)
0
100
200
300
400
Females Males
Not
ified
cas
es b
y ag
e gr
oup
and
sex,
201
5
0–14
15–24
25–34
35–44
45–54
55–64
≥65
240 000 120 000 0 120 000 240 000 360 000
New and relapse Retreatment, excluding relapseHIV-positive MDR/RR-TB XDR-TB
2000 2002 2004 2006 2008 2010 2012 2014
Trea
tmen
t suc
cess
rate
(%)
0
20
40
60
80
100
Funded domestically Funded internationally Unfunded
2012 2013 2014 2015 2016
Tota
l bud
get (
US$
mill
ions
con
stan
t 201
6)
0
200
400
600

178 :: GLOBAL TUBERCULOSIS REPORT 2016 Data for all years can be downloaded from www.who.int/tb/data
WHO Western Pacific Region population 2015 :: 1 856 million
Data are as reported to WHO. Estimates of TB and MDR/RR-TB burden are produced by WHO in consultation with countries. Estimates are rounded and totals are computed prior to rounding.a Ranges represent uncertainty intervals.b MDR is TB resistant to rifampicin and isoniazid; RR is TB resistant to rifampicin.c Includes cases with unknown previous TB treatment history.d Includes patients diagnosed before 2015 and patients who were not laboratory-confirmed.e Some countries reported on new cases only.f Calculations exclude countries with missing numerators or denominators.g Data are not collected from all Member States.h Financing indicators exclude funding for general healthcare services provided outside NTPs.
WHO MEMBER STATES 27OTHER COUNTRIES AND TERRITORIES 9
Estimates of TB burden,a 2015 Number (thousands) Rate (per 100 000 population)
Mortality (excludes HIV+TB) 89 (81–98) 4.8 (4.4–5.3)Mortality (HIV+TB only) 6 (4–8) 0.31 (0.2–0.44)Incidence (includes HIV+TB) 1 590 (1 440–1 740) 86 (78–94)Incidence (HIV+TB only) 34 (29–40) 1.8 (1.6–2.1)Incidence (MDR/RR-TB)b 100 (88–120) 5.5 (4.8–6.4)
Estimated TB incidence by age and sex (thousands),a 2015 0–14 years > 14 years Total
Females 67 (51–84) 471 (368–586) 537 (419–670)Males 72 (59–86) 979 (849–1 120) 1 050 (908–1 200)Total 138 (119–159) 1 450 (1 370–1 530) 1 590 (1 440–1 740)
TB case notifications, 2015 Total cases notified 1 361 430Total new and relapse 1 336 747 — % with known HIV status 43% — % pulmonary 92% — % bacteriologically confirmed among pulmonary 38%
Universal health coverage and social protection TB treatment coverage (notified/estimated incidence), 2015 84% (77–93)TB patients facing catastrophic total costs TB case fatality ratio (estimated mortality/estimated incidence), 2015 0.06 (0.05–0.07)
TB/HIV care in new and relapse TB patients, 2015 Number (%)f
Patients with known HIV-status who are HIV-positive 16 816 3.0% — on antiretroviral therapy 16 411 53%
Drug-resistant TB care, 2015 New cases Previously treated cases Total numberc
Estimated MDR/RR-TB cases 83 000among notified pulmonary TB cases (73 000–93 000)Estimated % of TB cases with MDR/RR-TB 5.1% (3–7.2) 26% (23–30) % notified tested for rifampicin resistance 8.8% 36% 180 648
MDR/RR-TB cases tested for resistance to second-line drugs 1 601
Laboratory-confirmed cases MDR/RR-TB: 18 022, XDR-TB: 450Patients started on treatmentd MDR/RR-TB: 13 722, XDR-TB: 196
Treatment success rate and cohort size Success Cohort
New and relapsee cases registered in 2014 92% 1 277 110Previously treated cases, excluding relapse, registered in 2014 80% 19 062HIV-positive TB cases, all types, registered in 2014 72% 5 700MDR/RR-TB cases started on second-line treatment in 2013 57% 6 512XDR-TB cases started on second-line treatment in 2013 37% 282
TB preventive treatment, 2015 % of HIV-positive people (newly enrolled in care) on preventive treatment 50%% of children (aged < 5) household contacts of bacteriologically-confirmed TB cases on preventive treatment 13% (12–14)
TB financing (low- and middle-income countries),g,h 2016 National TB budget (US$ millions) 684Funding source 71% domestic, 13% international, 16% unfunded
2000 2005 2010 2015
Mor
talit
y (e
xclu
des H
IV+T
B)
(Rat
e pe
r 100
000
pop
ulat
ion
per y
ear)
0
5
10
15
Females Males
Not
ified
cas
es b
y ag
e gr
oup
and
sex,
201
5
0–14
15–24
25–34
35–44
45–54
55–64
≥65
100 000 50 000 0 50 000 100 000 150 000 200 000
New and relapse Retreatment, excluding relapseHIV-positive MDR/RR-TB XDR-TB
2000 2002 2004 2006 2008 2010 2012 2014
Trea
tmen
t suc
cess
rate
(%)
0
20
40
60
80
100
Funded domestically Funded internationally Unfunded
2012 2013 2014 2015 2016
Tota
l bud
get (
US$
mill
ions
con
stan
t 201
6)
0
200
400
600
800
2000 2005 2010 2015
Inci
denc
e (R
ate
per 1
00 0
00 p
opul
atio
n pe
r yea
r)
Notified (new and relapse) IncidenceIncidence (HIV + TB only)
0
50
100
150
Annex
4TB burden estimates,
notifications and treatment
outcomes ::
FOR INDIVIDUAL COUNTRIES
AND TERRITORIES, WHO REGIONS AND
THE WORLD

GLOBAL TUBERCULOSIS REPORT 2016 :: 181
Estimates of incidence and mortalityEstimated values are shown as best estimates followed by lower and upper bounds. The lower and upper bounds are defined as the 2.5th and 97.5th centiles of outcome distributions produced in simulations. For details about the methods used to produce these estimates see the technical appendix at http://www.who.int/tb/publications/global_report/.
Estimated numbers are shown rounded to two significant figures. Estimated rates are shown rounded to three significant figures unless the value is under 100, in which case rates are shown rounded to two significant figures.
Data sourceData shown in this file were taken from the WHO global TB database on 21 September 2016. Data shown in the main part of the report were taken from the database on 15 August 2016. As a result, data in this annex may differ slightly from those in the main part of the report.
Downloadable dataThis annex is provided as a reference for looking up figures when needed. It is not suitable for conducting analyses or producing graphs and tables. Instead, download data for all countries and all years as comma-separated value (CSV) files from the WHO global TB database at www.who.int/tb/data/. See Annex 1 for more details.
Country notesBangladeshEstimates of TB incidence and mortality will be reviewed once final results from the 2015/2016 national TB prevalence survey are available.
Caribbean IslandsData collection from Caribbean Islands that are not Member States of WHO was resumed in 2011 after a break of a few years. This includes Aruba, Curaçao, Puerto Rico and Sint Maarten, which are Associate Members of the Pan American Health Organization, plus the territories of Anguilla, Bermuda, Bonaire, Saint Eustatius and Saba, British Virgin Islands, Cayman Islands, Montserrat and Turks and Caicos Islands. Data are not currently independently collected from the US Virgin Islands.
DenmarkData for Denmark exclude Greenland.
European Union/ European Economic Area countriesNotification and treatment outcome data for European Union and European Economic Area countries are provisional.
FranceData from France include data from 5 overseas departments (French Guiana, Guadeloupe, Martinique, Mayotte and Réunion) and exclude French territories of the Pacific.
IndiaEstimates of TB incidence and mortality are interim in nature, pending results from the national TB prevalence survey planned for 2017/2018.
Russian FederationUN Population Division estimates are lower than the population registered by the Federal State Statistics Service of the Russian Federation. The reported number of TB patients with known HIV status (Table A4.4) is for new TB patients in the civilian sector only. It was not possible to calculate the percentage of all TB patients with known HIV status.
United States of AmericaIn addition to the 51 reporting areas, the USA includes territories that report separately to WHO. The data for these territories are not included in the data reported by the USA. Definitions of case types and outcomes do not exactly match those used by WHO.
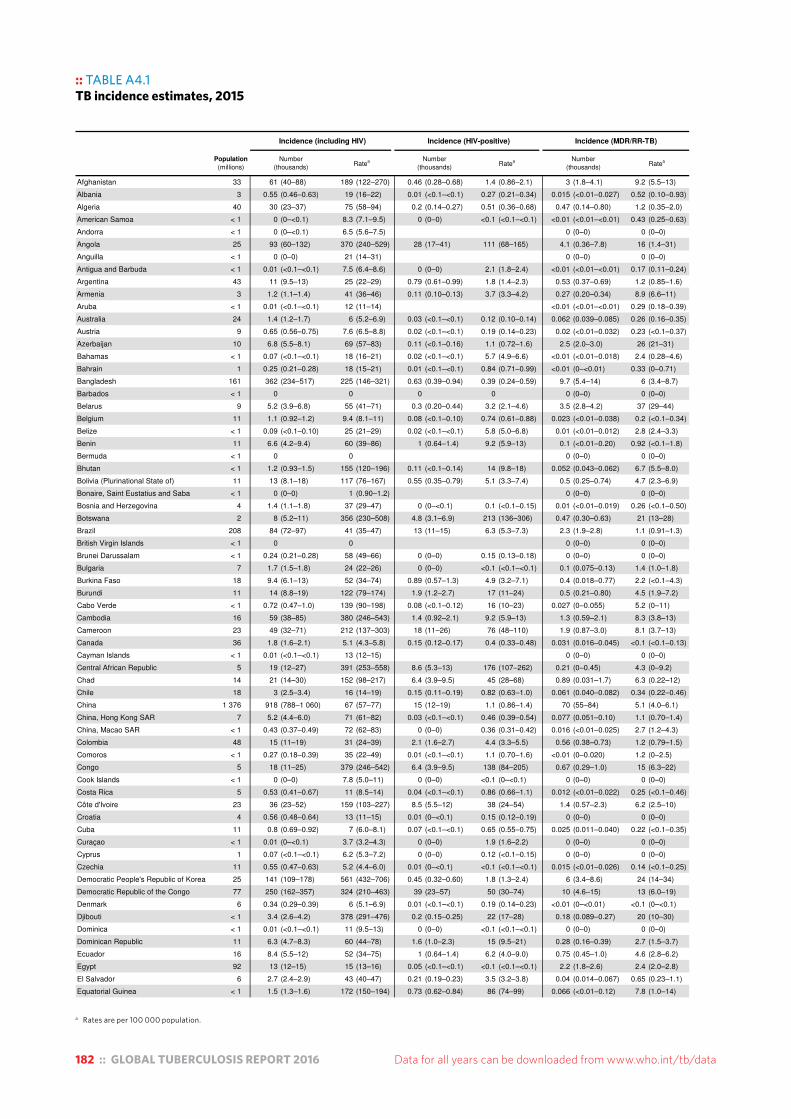
182 :: GLOBAL TUBERCULOSIS REPORT 2016 Data for all years can be downloaded from www.who.int/tb/data
a Rates are per 100 000 population.
:: TABLE A4.1TB incidence estimates, 2015Table A4.1TB incidence estimates, 2015
Incidence (including HIV) Incidence (HIV-positive) Incidence (MDR/RR-TB)
Population(millions)
Number(thousands)
Ratea Number(thousands)
Ratea Number(thousands)
Ratea
Afghanistan 33 61 (40–88) 189 (122–270) 0.46 (0.28–0.68) 1.4 (0.86–2.1) 3 (1.8–4.1) 9.2 (5.5–13)
Albania 3 0.55 (0.46–0.63) 19 (16–22) 0.01 (<0.1–<0.1) 0.27 (0.21–0.34) 0.015 (<0.01–0.027) 0.52 (0.10–0.93)
Algeria 40 30 (23–37) 75 (58–94) 0.2 (0.14–0.27) 0.51 (0.36–0.68) 0.47 (0.14–0.80) 1.2 (0.35–2.0)
American Samoa < 1 0 (0–<0.1) 8.3 (7.1–9.5) 0 (0–0) <0.1 (<0.1–<0.1) <0.01 (<0.01–<0.01) 0.43 (0.25–0.63)
Andorra < 1 0 (0–<0.1) 6.5 (5.6–7.5) 0 (0–0) 0 (0–0)
Angola 25 93 (60–132) 370 (240–529) 28 (17–41) 111 (68–165) 4.1 (0.36–7.8) 16 (1.4–31)
Anguilla < 1 0 (0–0) 21 (14–31) 0 (0–0) 0 (0–0)
Antigua and Barbuda < 1 0.01 (<0.1–<0.1) 7.5 (6.4–8.6) 0 (0–0) 2.1 (1.8–2.4) <0.01 (<0.01–<0.01) 0.17 (0.11–0.24)
Argentina 43 11 (9.5–13) 25 (22–29) 0.79 (0.61–0.99) 1.8 (1.4–2.3) 0.53 (0.37–0.69) 1.2 (0.85–1.6)
Armenia 3 1.2 (1.1–1.4) 41 (36–46) 0.11 (0.10–0.13) 3.7 (3.3–4.2) 0.27 (0.20–0.34) 8.9 (6.6–11)
Aruba < 1 0.01 (<0.1–<0.1) 12 (11–14) <0.01 (<0.01–<0.01) 0.29 (0.18–0.39)
Australia 24 1.4 (1.2–1.7) 6 (5.2–6.9) 0.03 (<0.1–<0.1) 0.12 (0.10–0.14) 0.062 (0.039–0.085) 0.26 (0.16–0.35)
Austria 9 0.65 (0.56–0.75) 7.6 (6.5–8.8) 0.02 (<0.1–<0.1) 0.19 (0.14–0.23) 0.02 (<0.01–0.032) 0.23 (<0.1–0.37)
Azerbaijan 10 6.8 (5.5–8.1) 69 (57–83) 0.11 (<0.1–0.16) 1.1 (0.72–1.6) 2.5 (2.0–3.0) 26 (21–31)
Bahamas < 1 0.07 (<0.1–<0.1) 18 (16–21) 0.02 (<0.1–<0.1) 5.7 (4.9–6.6) <0.01 (<0.01–0.018) 2.4 (0.28–4.6)
Bahrain 1 0.25 (0.21–0.28) 18 (15–21) 0.01 (<0.1–<0.1) 0.84 (0.71–0.99) <0.01 (0–<0.01) 0.33 (0–0.71)
Bangladesh 161 362 (234–517) 225 (146–321) 0.63 (0.39–0.94) 0.39 (0.24–0.59) 9.7 (5.4–14) 6 (3.4–8.7)
Barbados < 1 0 0 0 0 0 (0–0) 0 (0–0)
Belarus 9 5.2 (3.9–6.8) 55 (41–71) 0.3 (0.20–0.44) 3.2 (2.1–4.6) 3.5 (2.8–4.2) 37 (29–44)
Belgium 11 1.1 (0.92–1.2) 9.4 (8.1–11) 0.08 (<0.1–0.10) 0.74 (0.61–0.88) 0.023 (<0.01–0.038) 0.2 (<0.1–0.34)
Belize < 1 0.09 (<0.1–0.10) 25 (21–29) 0.02 (<0.1–<0.1) 5.8 (5.0–6.8) 0.01 (<0.01–0.012) 2.8 (2.4–3.3)
Benin 11 6.6 (4.2–9.4) 60 (39–86) 1 (0.64–1.4) 9.2 (5.9–13) 0.1 (<0.01–0.20) 0.92 (<0.1–1.8)
Bermuda < 1 0 0 0 (0–0) 0 (0–0)
Bhutan < 1 1.2 (0.93–1.5) 155 (120–196) 0.11 (<0.1–0.14) 14 (9.8–18) 0.052 (0.043–0.062) 6.7 (5.5–8.0)
Bolivia (Plurinational State of) 11 13 (8.1–18) 117 (76–167) 0.55 (0.35–0.79) 5.1 (3.3–7.4) 0.5 (0.25–0.74) 4.7 (2.3–6.9)
Bonaire, Saint Eustatius and Saba < 1 0 (0–0) 1 (0.90–1.2) 0 (0–0) 0 (0–0)
Bosnia and Herzegovina 4 1.4 (1.1–1.8) 37 (29–47) 0 (0–<0.1) 0.1 (<0.1–0.15) 0.01 (<0.01–0.019) 0.26 (<0.1–0.50)
Botswana 2 8 (5.2–11) 356 (230–508) 4.8 (3.1–6.9) 213 (136–306) 0.47 (0.30–0.63) 21 (13–28)
Brazil 208 84 (72–97) 41 (35–47) 13 (11–15) 6.3 (5.3–7.3) 2.3 (1.9–2.8) 1.1 (0.91–1.3)
British Virgin Islands < 1 0 0 0 (0–0) 0 (0–0)
Brunei Darussalam < 1 0.24 (0.21–0.28) 58 (49–66) 0 (0–0) 0.15 (0.13–0.18) 0 (0–0) 0 (0–0)
Bulgaria 7 1.7 (1.5–1.8) 24 (22–26) 0 (0–0) <0.1 (<0.1–<0.1) 0.1 (0.075–0.13) 1.4 (1.0–1.8)
Burkina Faso 18 9.4 (6.1–13) 52 (34–74) 0.89 (0.57–1.3) 4.9 (3.2–7.1) 0.4 (0.018–0.77) 2.2 (<0.1–4.3)
Burundi 11 14 (8.8–19) 122 (79–174) 1.9 (1.2–2.7) 17 (11–24) 0.5 (0.21–0.80) 4.5 (1.9–7.2)
Cabo Verde < 1 0.72 (0.47–1.0) 139 (90–198) 0.08 (<0.1–0.12) 16 (10–23) 0.027 (0–0.055) 5.2 (0–11)
Cambodia 16 59 (38–85) 380 (246–543) 1.4 (0.92–2.1) 9.2 (5.9–13) 1.3 (0.59–2.1) 8.3 (3.8–13)
Cameroon 23 49 (32–71) 212 (137–303) 18 (11–26) 76 (48–110) 1.9 (0.87–3.0) 8.1 (3.7–13)
Canada 36 1.8 (1.6–2.1) 5.1 (4.3–5.8) 0.15 (0.12–0.17) 0.4 (0.33–0.48) 0.031 (0.016–0.045) <0.1 (<0.1–0.13)
Cayman Islands < 1 0.01 (<0.1–<0.1) 13 (12–15) 0 (0–0) 0 (0–0)
Central African Republic 5 19 (12–27) 391 (253–558) 8.6 (5.3–13) 176 (107–262) 0.21 (0–0.45) 4.3 (0–9.2)
Chad 14 21 (14–30) 152 (98–217) 6.4 (3.9–9.5) 45 (28–68) 0.89 (0.031–1.7) 6.3 (0.22–12)
Chile 18 3 (2.5–3.4) 16 (14–19) 0.15 (0.11–0.19) 0.82 (0.63–1.0) 0.061 (0.040–0.082) 0.34 (0.22–0.46)
China 1 376 918 (788–1 060) 67 (57–77) 15 (12–19) 1.1 (0.86–1.4) 70 (55–84) 5.1 (4.0–6.1)
China, Hong Kong SAR 7 5.2 (4.4–6.0) 71 (61–82) 0.03 (<0.1–<0.1) 0.46 (0.39–0.54) 0.077 (0.051–0.10) 1.1 (0.70–1.4)
China, Macao SAR < 1 0.43 (0.37–0.49) 72 (62–83) 0 (0–0) 0.36 (0.31–0.42) 0.016 (<0.01–0.025) 2.7 (1.2–4.3)
Colombia 48 15 (11–19) 31 (24–39) 2.1 (1.6–2.7) 4.4 (3.3–5.5) 0.56 (0.38–0.73) 1.2 (0.79–1.5)
Comoros < 1 0.27 (0.18–0.39) 35 (22–49) 0.01 (<0.1–<0.1) 1.1 (0.70–1.6) <0.01 (0–0.020) 1.2 (0–2.5)
Congo 5 18 (11–25) 379 (246–542) 6.4 (3.9–9.5) 138 (84–205) 0.67 (0.29–1.0) 15 (6.3–22)
Cook Islands < 1 0 (0–0) 7.8 (5.0–11) 0 (0–0) <0.1 (0–<0.1) 0 (0–0) 0 (0–0)
Costa Rica 5 0.53 (0.41–0.67) 11 (8.5–14) 0.04 (<0.1–<0.1) 0.86 (0.66–1.1) 0.012 (<0.01–0.022) 0.25 (<0.1–0.46)
Côte d'Ivoire 23 36 (23–52) 159 (103–227) 8.5 (5.5–12) 38 (24–54) 1.4 (0.57–2.3) 6.2 (2.5–10)
Croatia 4 0.56 (0.48–0.64) 13 (11–15) 0.01 (0–<0.1) 0.15 (0.12–0.19) 0 (0–0) 0 (0–0)
Cuba 11 0.8 (0.69–0.92) 7 (6.0–8.1) 0.07 (<0.1–<0.1) 0.65 (0.55–0.75) 0.025 (0.011–0.040) 0.22 (<0.1–0.35)
Curaçao < 1 0.01 (0–<0.1) 3.7 (3.2–4.3) 0 (0–0) 1.9 (1.6–2.2) 0 (0–0) 0 (0–0)
Cyprus 1 0.07 (<0.1–<0.1) 6.2 (5.3–7.2) 0 (0–0) 0.12 (<0.1–0.15) 0 (0–0) 0 (0–0)
Czechia 11 0.55 (0.47–0.63) 5.2 (4.4–6.0) 0.01 (0–<0.1) <0.1 (<0.1–<0.1) 0.015 (<0.01–0.026) 0.14 (<0.1–0.25)
Democratic People's Republic of Korea 25 141 (109–178) 561 (432–706) 0.45 (0.32–0.60) 1.8 (1.3–2.4) 6 (3.4–8.6) 24 (14–34)
Democratic Republic of the Congo 77 250 (162–357) 324 (210–463) 39 (23–57) 50 (30–74) 10 (4.6–15) 13 (6.0–19)
Denmark 6 0.34 (0.29–0.39) 6 (5.1–6.9) 0.01 (<0.1–<0.1) 0.19 (0.14–0.23) <0.01 (0–<0.01) <0.1 (0–<0.1)
Djibouti < 1 3.4 (2.6–4.2) 378 (291–476) 0.2 (0.15–0.25) 22 (17–28) 0.18 (0.089–0.27) 20 (10–30)
Dominica < 1 0.01 (<0.1–<0.1) 11 (9.5–13) 0 (0–0) <0.1 (<0.1–<0.1) 0 (0–0) 0 (0–0)
Dominican Republic 11 6.3 (4.7–8.3) 60 (44–78) 1.6 (1.0–2.3) 15 (9.5–21) 0.28 (0.16–0.39) 2.7 (1.5–3.7)
Ecuador 16 8.4 (5.5–12) 52 (34–75) 1 (0.64–1.4) 6.2 (4.0–9.0) 0.75 (0.45–1.0) 4.6 (2.8–6.2)
Egypt 92 13 (12–15) 15 (13–16) 0.05 (<0.1–<0.1) <0.1 (<0.1–<0.1) 2.2 (1.8–2.6) 2.4 (2.0–2.8)
El Salvador 6 2.7 (2.4–2.9) 43 (40–47) 0.21 (0.19–0.23) 3.5 (3.2–3.8) 0.04 (0.014–0.067) 0.65 (0.23–1.1)
Equatorial Guinea < 1 1.5 (1.3–1.6) 172 (150–194) 0.73 (0.62–0.84) 86 (74–99) 0.066 (<0.01–0.12) 7.8 (1.0–14)
a Rates are per 100 000 population.

Data for all years can be downloaded from www.who.int/tb/data GLOBAL TUBERCULOSIS REPORT 2016 :: 183
a Rates are per 100 000 population.
:: TABLE A4.1TB incidence estimates, 2015Table A4.1TB incidence estimates, 2015
Incidence (including HIV) Incidence (HIV-positive) Incidence (MDR/RR-TB)
Population(millions)
Number(thousands)
Ratea Number(thousands)
Ratea Number(thousands)
Ratea
Eritrea 5 3.4 (1.6–5.9) 65 (30–113) 0.18 (<0.1–0.32) 3.5 (1.6–6.1) 0.14 (0–0.29) 2.7 (0–5.5)
Estonia 1 0.24 (0.20–0.27) 18 (15–21) 0.02 (<0.1–<0.1) 1.8 (1.6–2.1) 0.071 (0.050–0.092) 5.4 (3.8–7.0)
Ethiopia 99 191 (141–249) 192 (142–250) 16 (10–23) 16 (10–23) 6.2 (3.5–8.9) 6.2 (3.5–9.0)
Fiji < 1 0.45 (0.35–0.57) 51 (39–64) 0.01 (<0.1–<0.1) 0.93 (0.71–1.2) 0 (0–0) 0 (0–0)
Finland 6 0.31 (0.26–0.35) 5.6 (4.8–6.4) 0.01 (0–<0.1) 0.1 (<0.1–0.13) 0.017 (<0.01–0.028) 0.31 (0.11–0.51)
France 64 5.3 (4.7–6.0) 8.2 (7.2–9.3) 0.41 (0.32–0.50) 0.63 (0.49–0.78) 0.088 (0.063–0.11) 0.14 (<0.1–0.17)
French Polynesia < 1 0.05 (<0.1–<0.1) 19 (16–22) <0.01 (<0.01–<0.01) 1.7 (0.39–3.0)
Gabon 2 8 (5.9–10) 465 (344–604) 0.25 (0.15–0.37) 14 (8.8–21) 0.4 (0.23–0.56) 23 (13–32)
Gambia 2 3.5 (2.6–4.4) 174 (131–223) 0.6 (0.39–0.86) 30 (19–43) 0.12 (0–0.25) 6 (0–13)
Georgia 4 4 (3.2–4.8) 99 (80–120) 0.26 (0.16–0.38) 6.4 (3.9–9.5) 0.98 (0.81–1.1) 25 (20–28)
Germany 81 6.5 (5.6–7.5) 8.1 (6.9–9.3) 0.2 (0.15–0.25) 0.24 (0.19–0.30) 0.23 (0.11–0.34) 0.29 (0.14–0.42)
Ghana 27 44 (21–75) 160 (77–273) 9.9 (4.6–17) 36 (17–62) 1.5 (0–3.4) 5.5 (0–12)
Greece 11 0.49 (0.42–0.56) 4.5 (3.8–5.1) 0.02 (<0.1–<0.1) 0.18 (0.14–0.22) 0.011 (0–0.028) 0.1 (0–0.26)
Greenland < 1 0.09 (<0.1–0.11) 164 (141–189) <0.01 (<0.01–<0.01) 5.5 (4.1–6.9)
Grenada < 1 0.01 (0–<0.1) 5.4 (4.6–6.2) 0 (0–0) 2.2 (1.8–2.5) <0.01 (<0.01–<0.01) 0.16 (<0.1–0.25)
Guam < 1 0.09 (<0.1–0.10) 51 (44–59) 0 (0–0) <0.1 (<0.1–<0.1) 0 (0–0) 0 (0–0)
Guatemala 16 4.2 (3.2–5.2) 25 (20–32) 0.27 (0.21–0.34) 1.7 (1.3–2.1) 0.23 (0.15–0.31) 1.4 (0.92–1.9)
Guinea 13 22 (14–32) 177 (114–252) 5.4 (3.5–7.9) 43 (27–63) 0.78 (0–1.7) 6.2 (0–13)
Guinea-Bissau 2 6.9 (4.5–9.8) 373 (241–533) 1.8 (1.1–2.6) 97 (60–142) 0.21 (0–0.49) 11 (0–27)
Guyana < 1 0.71 (0.55–0.90) 93 (72–117) 0.17 (0.13–0.22) 22 (17–28) 0.043 (0.029–0.058) 5.6 (3.8–7.6)
Haiti 11 21 (17–25) 194 (156–235) 3.4 (2.2–4.9) 32 (21–46) 0.79 (0.45–1.1) 7.4 (4.2–10)
Honduras 8 3.5 (2.9–4.1) 43 (36–51) 0.36 (0.23–0.52) 4.5 (2.9–6.5) 0.11 (0.058–0.17) 1.4 (0.72–2.1)
Hungary 10 0.92 (0.79–1.1) 9.3 (8.0–11) 0.01 (<0.1–<0.1) 0.12 (<0.1–0.15) 0.037 (0.023–0.052) 0.38 (0.23–0.53)
Iceland < 1 0.01 (<0.1–<0.1) 2.4 (2.1–2.8) 0 (0–0) 0 (0–0) 0 (0–0) 0 (0–0)
India 1 311 2 840 (1 470–4 650) 217 (112–355) 113 (58–186) 8.6 (4.4–14) 130 (88–180) 9.9 (6.7–14)
Indonesia 258 1 020 (658–1 450) 395 (255–564) 78 (48–116) 30 (18–45) 32 (19–45) 12 (7.4–17)
Iran (Islamic Republic of) 79 13 (9.8–16) 16 (12–20) 0.35 (0.25–0.46) 0.44 (0.31–0.58) 0.25 (0.15–0.35) 0.32 (0.19–0.44)
Iraq 36 16 (14–18) 43 (38–49) 0.02 (<0.1–<0.1) <0.1 (<0.1–<0.1) 1.2 (0.88–1.5) 3.3 (2.4–4.1)
Ireland 5 0.34 (0.29–0.39) 7.2 (6.2–8.3) 0.01 (<0.1–<0.1) 0.31 (0.24–0.39) <0.01 (0–0.011) <0.1 (0–0.23)
Israel 8 0.32 (0.28–0.37) 4 (3.4–4.6) 0.02 (<0.1–<0.1) 0.23 (0.20–0.27) 0.032 (0.017–0.048) 0.4 (0.21–0.60)
Italy 60 3.5 (3.0–4.0) 5.8 (5.0–6.7) 0.21 (0.16–0.26) 0.35 (0.27–0.44) 0.12 (0.074–0.16) 0.2 (0.12–0.27)
Jamaica 3 0.13 (0.10–0.16) 4.6 (3.5–5.8) 0.03 (<0.1–<0.1) 1.1 (0.83–1.4) <0.01 (0–<0.01) <0.1 (0–0.24)
Japan 127 21 (18–24) 17 (14–19) 0.09 (<0.1–0.11) <0.1 (<0.1–<0.1) 0.27 (0.18–0.36) 0.21 (0.14–0.28)
Jordan 8 0.53 (0.41–0.67) 7 (5.4–8.8) 0 (0–0) <0.1 (0–<0.1) 0.039 (0.012–0.067) 0.51 (0.16–0.88)
Kazakhstan 18 16 (14–17) 89 (80–99) 0.5 (0.32–0.72) 2.8 (1.8–4.1) 8.8 (7.1–10) 50 (40–57)
Kenya 46 107 (87–129) 233 (189–281) 36 (29–43) 78 (63–94) 2 (1.3–2.8) 4.3 (2.8–6.1)
Kiribati < 1 0.62 (0.48–0.78) 551 (425–695) 0 (0–0) 2.3 (1.7–3.0) 0.041 (0.025–0.056) 36 (22–50)
Kuwait 4 0.86 (0.74–0.99) 22 (19–25) 0 (0–0) <0.1 (<0.1–<0.1) 0.014 (<0.01–0.024) 0.36 (0.13–0.62)
Kyrgyzstan 6 8.5 (7.1–10) 144 (120–170) 0.26 (0.17–0.37) 4.4 (2.8–6.3) 5 (4.1–5.9) 84 (69–99)
Lao People's Democratic Republic 7 12 (8.0–18) 182 (118–260) 0.59 (0.36–0.88) 8.7 (5.3–13) 0.76 (0.39–1.1) 11 (5.7–16)
Latvia 2 0.8 (0.69–0.92) 41 (35–47) 0.21 (0.17–0.24) 10 (8.8–12) 0.099 (0.075–0.12) 5 (3.8–6.1)
Lebanon 6 0.75 (0.65–0.87) 13 (11–15) 0.01 (<0.1–<0.1) 0.15 (0.12–0.19) 0.028 (<0.01–0.049) 0.48 (0.12–0.84)
Lesotho 2 17 (11–24) 788 (510–1 120) 12 (7.7–18) 566 (359–820) 1.1 (0.76–1.5) 52 (36–70)
Liberia 5 14 (9.0–20) 308 (199–440) 1.8 (1.1–2.6) 40 (25–58) 0.43 (0–0.99) 9.5 (0–22)
Libya 6 2.5 (1.6–3.6) 40 (26–57) 0.05 (<0.1–<0.1) 0.87 (0.55–1.3) 0.12 (0.069–0.16) 1.9 (1.1–2.5)
Lithuania 3 1.6 (1.4–1.8) 56 (48–64) 0.06 (<0.1–<0.1) 2 (1.7–2.4) 0.36 (0.30–0.41) 13 (10–14)
Luxembourg < 1 0.03 (<0.1–<0.1) 6.1 (5.2–7.0) 0 (0–0) 0.51 (0.40–0.65) 0 (0–0) 0 (0–0)
Madagascar 24 57 (37–82) 236 (153–337) 3.6 (2.2–5.4) 15 (9.1–22) 0.46 (0.12–0.81) 1.9 (0.50–3.3)
Malawi 17 33 (18–53) 193 (104–310) 18 (9.4–29) 104 (55–168) 0.44 (0.12–0.75) 2.6 (0.70–4.4)
Malaysia 30 27 (23–31) 89 (77–103) 1.5 (1.2–1.7) 4.8 (4.1–5.6) 0.53 (0.41–0.64) 1.7 (1.4–2.1)
Maldives < 1 0.19 (0.15–0.24) 53 (41–66) 0 (0–0) <0.1 (<0.1–<0.1) <0.01 (<0.01–<0.01) 1.6 (1.2–2.0)
Mali 18 10 (6.5–14) 57 (37–81) 1.4 (0.85–2.0) 7.7 (4.8–11) 0.61 (0.14–1.1) 3.5 (0.80–6.3)
Malta < 1 0.04 (<0.1–<0.1) 8.8 (7.5–10) 0.01 (<0.1–<0.1) 1.6 (1.4–1.9) 0 (0–0) 0 (0–0)
Marshall Islands < 1 0.18 (0.15–0.22) 344 (281–413) 0 (0–0) 0.67 (0.50–0.86) 0 (0–0) 0 (0–0)
Mauritania 4 4.3 (2.8–6.2) 107 (69–152) 0.44 (0.27–0.66) 11 (6.6–16) 0.15 (0–0.32) 3.7 (0–7.9)
Mauritius 1 0.28 (0.18–0.39) 22 (14–31) 0.03 (<0.1–<0.1) 2.7 (1.7–3.9) <0.01 (0–0.012) 0.39 (0–0.94)
Mexico 127 27 (22–32) 21 (17–25) 3 (1.9–4.3) 2.3 (1.5–3.4) 0.91 (0.75–1.1) 0.72 (0.59–0.87)
Micronesia (Federated States of) < 1 0.13 (0.10–0.16) 124 (96–157) <0.01 (<0.01–0.011) 7.8 (4.6–11)
Monaco < 1 0 0 0 (0–0) 0 (0–0)
Mongolia 3 13 (6.5–21) 428 (220–703) 0.01 (<0.1–<0.1) 0.34 (0.26–0.44) 0.63 (0.37–0.89) 21 (13–30)
Montenegro < 1 0.13 (<0.1–0.19) 21 (13–30) 0 (0–0) 0.17 (0.11–0.25) <0.01 (0–<0.01) 0.5 (0–1.2)
Montserrat < 1 0 0 0 (0–0) 0 (0–0)
Morocco 34 37 (34–40) 107 (98–117) 0.79 (0.63–0.96) 2.3 (1.8–2.8) 0.58 (0.32–0.84) 1.7 (0.93–2.4)
Mozambique 28 154 (100–220) 551 (356–787) 79 (50–115) 284 (179–412) 7.3 (4.1–10) 26 (15–36)
Myanmar 54 197 (144–258) 365 (267–479) 17 (11–25) 32 (21–47) 14 (8.9–18) 26 (17–33)
Namibia 2 12 (9.3–15) 489 (376–616) 4.9 (3.8–6.2) 199 (153–252) 1.1 (0.84–1.3) 45 (34–53)
a Rates are per 100 000 population.

184 :: GLOBAL TUBERCULOSIS REPORT 2016 Data for all years can be downloaded from www.who.int/tb/data
a Rates are per 100 000 population.
:: TABLE A4.1TB incidence estimates, 2015Table A4.1TB incidence estimates, 2015
Incidence (including HIV) Incidence (HIV-positive) Incidence (MDR/RR-TB)
Population(millions)
Number(thousands)
Ratea Number(thousands)
Ratea Number(thousands)
Ratea
Nauru < 1 0.01 (<0.1–<0.1) 113 (97–130) <0.01 (<0.01–<0.01) 16 (13–18)
Nepal 29 44 (39–50) 156 (137–176) 1.9 (1.5–2.4) 6.7 (5.3–8.4) 1.5 (0.95–2.1) 5.3 (3.3–7.4)
Netherlands 17 0.98 (0.84–1.1) 5.8 (5.0–6.7) 0.07 (<0.1–<0.1) 0.42 (0.35–0.50) 0.023 (0.010–0.036) 0.14 (<0.1–0.21)
New Caledonia < 1 0.06 (<0.1–<0.1) 24 (21–28) 0 (0–0) 0 (0–0)
New Zealand 5 0.34 (0.29–0.39) 7.4 (6.4–8.5) 0 (0–0) <0.1 (<0.1–<0.1) 0.01 (<0.01–0.019) 0.22 (<0.1–0.42)
Nicaragua 6 3.1 (2.4–3.9) 51 (39–64) 0.15 (0.12–0.20) 2.5 (1.9–3.2) 0.078 (0.034–0.12) 1.3 (0.56–2.0)
Niger 20 19 (12–27) 95 (62–136) 1 (0.65–1.5) 5.2 (3.3–7.5) 0.71 (0–1.5) 3.6 (0–7.5)
Nigeria 182 586 (345–890) 322 (189–488) 100 (56–155) 55 (31–85) 29 (15–43) 16 (8.2–24)
Niue < 1 0 (0–0) 8.1 (5.2–12) 0 (0–0) 0 (0–0)
Northern Mariana Islands < 1 0.03 (<0.1–<0.1) 58 (50–67) 0 (0–0) <0.1 (<0.1–<0.1) <0.01 (0–<0.01) 3.6 (0–9.3)
Norway 5 0.33 (0.28–0.38) 6.3 (5.4–7.3) 0.01 (<0.1–<0.1) 0.15 (0.12–0.19) 0.01 (<0.01–0.019) 0.19 (<0.1–0.36)
Oman 4 0.38 (0.32–0.43) 8.4 (7.2–9.7) 0 (0–0) <0.1 (<0.1–0.10) 0.015 (<0.01–0.024) 0.33 (0.13–0.53)
Pakistan 189 510 (330–729) 270 (175–386) 8.8 (5.4–13) 4.6 (2.8–6.9) 26 (16–36) 14 (8.5–19)
Palau < 1 0.02 (<0.1–<0.1) 76 (65–87) 0 (0–0) <0.1 (<0.1–<0.1) 0 (0–0) 0 (0–0)
Panama 4 2 (1.5–2.5) 50 (38–63) 0.23 (0.17–0.29) 5.7 (4.3–7.3) 0.089 (0.055–0.12) 2.3 (1.4–3.1)
Papua New Guinea 8 33 (27–40) 432 (352–521) 4.9 (3.0–7.3) 64 (39–96) 1.9 (1.2–2.5) 25 (16–33)
Paraguay 7 2.7 (2.3–3.1) 41 (35–47) 0.24 (0.20–0.28) 3.6 (3.0–4.2) 0.087 (0.044–0.13) 1.3 (0.66–2.0)
Peru 31 37 (29–47) 119 (92–150) 2.3 (1.7–2.9) 7.2 (5.5–9.1) 3.2 (2.7–3.8) 10 (8.6–12)
Philippines 101 324 (279–373) 322 (277–370) 4.3 (3.3–5.4) 4.3 (3.3–5.4) 17 (14–20) 17 (14–20)
Poland 39 7.2 (6.2–8.3) 19 (16–21) 0.14 (0.11–0.18) 0.37 (0.28–0.46) 0.07 (0.049–0.091) 0.18 (0.13–0.24)
Portugal 10 2.4 (2.1–2.8) 23 (20–27) 0.35 (0.29–0.41) 3.4 (2.8–3.9) 0.033 (0.019–0.047) 0.32 (0.18–0.45)
Puerto Rico 4 0.06 (<0.1–<0.1) 1.6 (1.4–1.9) 0.01 (<0.1–<0.1) 0.28 (0.24–0.32) 0 (0–0) 0 (0–0)
Qatar 2 0.76 (0.65–0.87) 34 (29–39) 0 (0–0) <0.1 (<0.1–<0.1) 0.01 (0–0.024) 0.45 (0–1.1)
Republic of Korea 50 40 (37–43) 80 (74–85) 0.48 (0.38–0.58) 0.95 (0.76–1.2) 2.9 (2.4–3.4) 5.8 (4.8–6.8)
Republic of Moldova 4 6.2 (4.0–8.8) 152 (98–217) 0.55 (0.35–0.79) 13 (8.5–19) 3.9 (2.9–4.8) 96 (71–118)
Romania 20 16 (14–19) 84 (72–97) 0.42 (0.35–0.50) 2.2 (1.8–2.5) 0.94 (0.73–1.1) 4.8 (3.7–5.6)
Russian Federation 143 115 (98–132) 80 (69–92) 11 (9.3–13) 7.9 (6.5–9.4) 60 (49–71) 42 (34–49)
Rwanda 12 6.6 (5.6–7.6) 56 (48–65) 1.8 (1.1–2.5) 15 (9.8–22) 0.16 (0.10–0.21) 1.4 (0.86–1.8)
Saint Kitts and Nevis < 1 0 (0–0) 5.1 (4.4–5.9) 0 (0–0) 0.7 (0.54–0.87) <0.01 (<0.01–<0.01) 0.31 (0.16–0.45)
Saint Lucia < 1 0.02 (<0.1–<0.1) 8.8 (7.6–10) 0 (0–0) 1.4 (0.89–2.0) 0 (0–0) 0 (0–0)
Saint Vincent and the Grenadines < 1 0.01 (<0.1–<0.1) 7.4 (6.3–8.5) 0 (0–0) 1.1 (0.90–1.2) <0.01 (<0.01–<0.01) 0.22 (0.10–0.34)
Samoa < 1 0.02 (<0.1–<0.1) 11 (9.7–13) 0 (0–0) 0 (0–0)
San Marino < 1 0 (0–0) 2.5 (2.1–2.8) 0 (0–0) 0 (0–0)
Sao Tome and Principe < 1 0.18 (0.18–0.19) 97 (94–100) 0.03 (<0.1–<0.1) 15 (9.7–21) 0.036 (0.026–0.046) 19 (14–24)
Saudi Arabia 32 3.8 (3.3–4.4) 12 (10–14) 0.14 (0.11–0.16) 0.43 (0.36–0.51) 0.15 (0.12–0.18) 0.48 (0.38–0.57)
Senegal 15 21 (14–30) 139 (90–198) 1.4 (0.92–2.1) 9.5 (6.1–14) 0.41 (0.25–0.57) 2.7 (1.7–3.8)
Serbia 9 1.9 (1.6–2.1) 21 (19–24) 0.03 (<0.1–<0.1) 0.33 (0.26–0.41) 0.028 (0.013–0.043) 0.32 (0.15–0.49)
Seychelles < 1 0.01 (<0.1–<0.1) 9.5 (8.2–11) 0 (0–0) <0.1 (<0.1–<0.1) 0 (0–0) 0 (0–0)
Sierra Leone 6 20 (13–28) 307 (198–438) 2.6 (1.7–3.8) 41 (26–59) 0.7 (0–1.5) 11 (0–23)
Singapore 6 2.5 (2.1–2.9) 44 (38–51) 0.05 (<0.1–<0.1) 0.81 (0.69–0.94) 0.034 (0.018–0.050) 0.61 (0.32–0.89)
Sint Maarten (Dutch part) < 1 0 (0–0) 5.9 (5.1–6.8) <0.01 (<0.01–<0.01) 0.14 (<0.1–0.19)
Slovakia 5 0.35 (0.30–0.41) 6.5 (5.6–7.5) 0 (0–0) <0.1 (0–<0.1) <0.01 (<0.01–<0.01) <0.1 (<0.1–<0.1)
Slovenia 2 0.15 (0.13–0.17) 7.2 (6.2–8.3) 0 (0–0) <0.1 (0–<0.1) 0 (0–0) 0 (0–0)
Solomon Islands < 1 0.52 (0.40–0.65) 89 (69–112) 0.032 (0.019–0.045) 5.5 (3.3–7.7)
Somalia 11 30 (19–42) 274 (177–391) 0.53 (0.33–0.77) 4.9 (3.1–7.1) 3.1 (1.8–4.4) 29 (17–41)
South Africa 54 454 (294–649) 834 (539–1 190) 258 (165–370) 473 (303–680) 20 (13–27) 37 (24–50)
South Sudan 12 18 (12–26) 146 (95–209) 2.1 (1.3–3.0) 17 (11–24) 0.76 (0.37–1.2) 6.2 (3.0–9.7)
Spain 46 5.5 (4.7–6.4) 12 (10–14) 0.4 (0.34–0.48) 0.87 (0.73–1.0) 0.042 (0.016–0.069) <0.1 (<0.1–0.15)
Sri Lanka 21 13 (9.7–18) 65 (47–86) 0.04 (<0.1–<0.1) 0.21 (0.13–0.30) 0.089 (0–0.19) 0.43 (0–0.92)
Sudan 40 35 (21–53) 88 (52–133) 1.6 (0.84–2.6) 4 (2.1–6.5) 1.6 (0.089–3.0) 4 (0.22–7.5)
Suriname < 1 0.18 (0.14–0.23) 33 (26–42) 0.05 (<0.1–<0.1) 10 (7.8–13) 0.024 (0.011–0.037) 4.4 (2.0–6.8)
Swaziland 1 7.3 (4.7–10) 565 (366–807) 5.2 (3.4–7.5) 408 (261–586) 0.89 (0.46–1.3) 69 (36–101)
Sweden 10 0.9 (0.77–1.0) 9.2 (7.9–11) 0.03 (<0.1–<0.1) 0.27 (0.21–0.34) 0.045 (0.026–0.064) 0.46 (0.27–0.65)
Switzerland 8 0.61 (0.52–0.70) 7.4 (6.3–8.5) 0.03 (<0.1–<0.1) 0.39 (0.30–0.50) 0.029 (0.013–0.045) 0.35 (0.16–0.54)
Syrian Arab Republic 19 3.6 (2.8–4.6) 20 (15–25) 0.34 (0.21–0.47) 1.8 (1.1–2.5)
Tajikistan 8 7.4 (5.7–9.3) 87 (67–109) 0.2 (0.15–0.25) 2.4 (1.8–3.0) 1.9 (1.5–2.2) 22 (18–26)
Thailand 68 117 (69–176) 172 (102–259) 15 (8.0–25) 22 (12–37) 4.5 (2.9–6.2) 6.6 (4.3–9.1)
The Former Yugoslav Republic of Macedonia
2 0.27 (0.26–0.28) 13 (12–14) 0 (0–0) <0.1 (<0.1–<0.1) <0.01 (<0.01–0.016) 0.44 (0.12–0.77)
Timor-Leste 1 5.9 (3.8–8.4) 498 (322–712) 0.09 (<0.1–0.13) 7.3 (4.5–11) 0.22 (0.15–0.29) 19 (13–24)
Togo 7 3.8 (2.7–5.1) 52 (37–69) 0.82 (0.53–1.2) 11 (7.2–16) 0.13 (0–0.28) 1.8 (0–3.8)
Tokelau < 1 0 0 0 (0–0) 0 (0–0)
Tonga < 1 0.02 (<0.1–<0.1) 15 (13–17) 0 (0–0) <0.1 (<0.1–<0.1) <0.01 (<0.01–<0.01) 0.79 (0.44–1.1)
Trinidad and Tobago 1 0.23 (0.19–0.26) 17 (14–19) 0.04 (<0.1–<0.1) 2.9 (2.4–3.3) 0.01 (<0.01–0.012) 0.74 (0.59–0.88)
Tunisia 11 4.2 (3.2–5.3) 37 (29–47) 0.03 (<0.1–<0.1) 0.26 (0.18–0.34) 0.025 (<0.01–0.043) 0.22 (<0.1–0.38)
Turkey 79 14 (12–17) 18 (16–21) 0.1 (<0.1–0.11) 0.12 (0.10–0.15) 0.71 (0.60–0.83) 0.9 (0.76–1.1)
Turkmenistan 5 3.8 (2.9–4.8) 70 (54–88) 0.85 (0.67–1.0) 16 (12–19)
a Rates are per 100 000 population.

Data for all years can be downloaded from www.who.int/tb/data GLOBAL TUBERCULOSIS REPORT 2016 :: 185
a Rates are per 100 000 population.
:: TABLE A4.1TB incidence estimates, 2015Table A4.1TB incidence estimates, 2015
Incidence (including HIV) Incidence (HIV-positive) Incidence (MDR/RR-TB)
Population(millions)
Number(thousands)
Ratea Number(thousands)
Ratea Number(thousands)
Ratea
Turks and Caicos Islands < 1 0 (0–0) 6.7 (5.7–7.7) 0 (0–0) 6.7 (5.5–8.0) <0.01 (<0.01–<0.01) 0.15 (<0.1–0.21)
Tuvalu < 1 0.02 (<0.1–<0.1) 232 (199–267) 0 (0–0) 0.23 (0.18–0.29) <0.01 (<0.01–<0.01) 12 (6.9–17)
Uganda 39 79 (47–119) 202 (120–304) 26 (16–37) 66 (42–94) 1.9 (1.0–2.8) 4.9 (2.6–7.2)
Ukraine 45 41 (26–58) 91 (59–130) 9 (5.7–13) 20 (13–29) 22 (17–27) 49 (38–60)
United Arab Emirates 9 0.14 (<0.1–0.21) 1.6 (1.0–2.2) 0.01 (0–<0.1) <0.1 (<0.1–<0.1) <0.01 (<0.01–<0.01) <0.1 (<0.1–<0.1)
United Kingdom of Great Britain and Northern Ireland
65 6.6 (6.0–7.2) 10 (9.2–11) 0.31 (0.25–0.38) 0.48 (0.38–0.59) 0.11 (0.072–0.15) 0.17 (0.11–0.23)
United Republic of Tanzania 53 164 (78–281) 306 (146–525) 57 (27–100) 107 (50–186) 2.6 (0.56–4.7) 4.9 (1.0–8.8)
United States of America 322 10 (8.9–12) 3.2 (2.8–3.7) 0.58 (0.49–0.67) 0.18 (0.15–0.21) 0.18 (0.14–0.23) <0.1 (<0.1–<0.1)
Uruguay 3 1 (0.89–1.2) 30 (26–35) 0.16 (0.14–0.19) 4.7 (4.0–5.5) <0.01 (<0.01–0.014) 0.21 (<0.1–0.41)
US Virgin Islands < 1 0.01 (<0.1–<0.1) 7.7 (6.8–8.7) 0 (0–0) 0 (0–0)
Uzbekistan 30 24 (17–31) 79 (57–105) 1.2 (0.74–1.7) 3.9 (2.5–5.7) 10 (7.6–12) 33 (25–40)
Vanuatu < 1 0.17 (0.14–0.20) 63 (52–74) 0 (0–0) 0 (0–0)
Venezuela (Bolivarian Republic of) 31 8.9 (6.9–11) 29 (22–36) 0.96 (0.73–1.2) 3.1 (2.3–3.9) 0.34 (0.19–0.49) 1.1 (0.61–1.6)
Viet Nam 93 128 (103–155) 137 (110–166) 5.5 (3.5–7.9) 5.9 (3.8–8.4) 7.3 (5.2–9.5) 7.8 (5.6–10)
Wallis and Futuna Islands < 1 0 0 0 (0–0) 0 (0–0)
West Bank and Gaza Strip 5 0.05 (<0.1–<0.1) 1.1 (0.85–1.4) 0 (0–0) 0 (0–0) <0.01 (<0.01–<0.01) <0.1 (<0.1–<0.1)
Yemen 27 13 (11–15) 48 (42–54) 0.15 (0.11–0.18) 0.55 (0.42–0.68) 0.34 (0.16–0.52) 1.3 (0.60–1.9)
Zambia 16 63 (41–91) 391 (253–558) 38 (24–55) 235 (149–339) 2.3 (1.4–3.2) 14 (8.6–20)
Zimbabwe 16 38 (28–49) 242 (179–314) 26 (17–37) 167 (107–240) 1.8 (1.0–2.5) 12 (6.4–16)
WHO regions
African Region 989 2 720 (2 360–3 110) 275 (239–314) 834 (710–969) 84 (72–98) 110 (88–120) 11 (8.9–13)
Region of the Americas 991 268 (250–287) 27 (25–29) 32 (29–35) 3.2 (2.9–3.5) 11 (10–12) 1.1 (1.0–1.2)
Eastern Mediterranean Region 648 749 (561–965) 116 (86–149) 13 (9.5–17) 2 (1.5–2.7) 39 (30–50) 6 (4.6–7.7)
European Region 910 323 (299–349) 36 (33–38) 27 (23–31) 3 (2.5–3.4) 120 (110–140) 14 (12–15)
South-East Asia Region 1 928 4 740 (3 230–6 540) 246 (167–339) 227 (159–307) 12 (8.2–16) 200 (150–250) 10 (7.9–13)
Western Pacific Region 1 856 1 590 (1 440–1 740) 86 (78–94) 34 (29–40) 1.8 (1.6–2.1) 100 (88–120) 5.5 (4.8–6.4)
Global 7 323 10 400 (8 740–12 200) 142 (119–166) 1 170 (1 020–1 320) 16 (14–18) 580 (520–640) 7.9 (7.2–8.7)
a Rates are per 100 000 population.
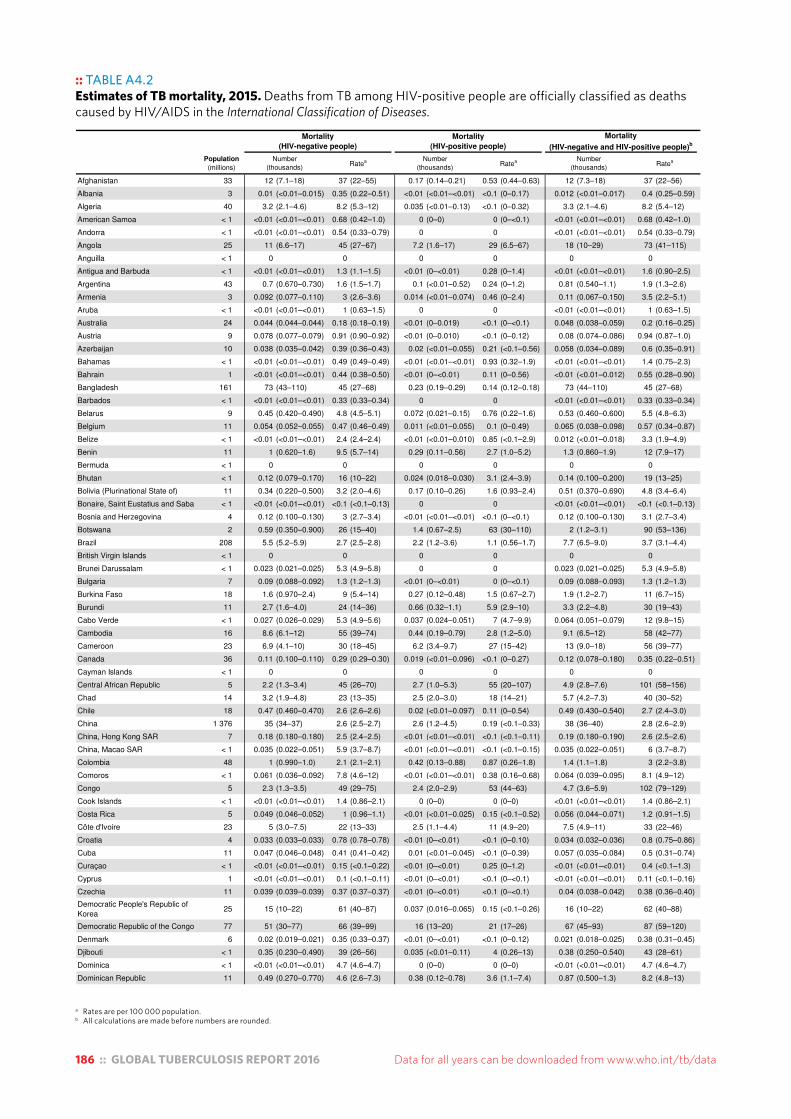
186 :: GLOBAL TUBERCULOSIS REPORT 2016 Data for all years can be downloaded from www.who.int/tb/data
a Rates are per 100 000 population.b All calculations are made before numbers are rounded.
:: TABLE A4.2Estimates of TB mortality, 2015. Deaths from TB among HIV-positive people are officially classified as deaths caused by HIV/AIDS in the International Classification of Diseases.
Table A4.2Estimates of TB mortality, 2015. Deaths from TB among HIV-positive people are officially classified as deaths caused by HIV/AIDS in the International Classification of Diseases .
Population
(millions) Number
(thousands)Ratea Number
(thousands)Ratea Number
(thousands)Ratea
Afghanistan 33 12 (7.1–18) 37 (22–55) 0.17 (0.14–0.21) 0.53 (0.44–0.63) 12 (7.3–18) 37 (22–56)
Albania 3 0.01 (<0.01–0.015) 0.35 (0.22–0.51) <0.01 (<0.01–<0.01) <0.1 (0–0.17) 0.012 (<0.01–0.017) 0.4 (0.25–0.59)
Algeria 40 3.2 (2.1–4.6) 8.2 (5.3–12) 0.035 (<0.01–0.13) <0.1 (0–0.32) 3.3 (2.1–4.6) 8.2 (5.4–12)
American Samoa < 1 <0.01 (<0.01–<0.01) 0.68 (0.42–1.0) 0 (0–0) 0 (0–<0.1) <0.01 (<0.01–<0.01) 0.68 (0.42–1.0)
Andorra < 1 <0.01 (<0.01–<0.01) 0.54 (0.33–0.79) 0 0 <0.01 (<0.01–<0.01) 0.54 (0.33–0.79)
Angola 25 11 (6.6–17) 45 (27–67) 7.2 (1.6–17) 29 (6.5–67) 18 (10–29) 73 (41–115)
Anguilla < 1 0 0 0 0 0 0
Antigua and Barbuda < 1 <0.01 (<0.01–<0.01) 1.3 (1.1–1.5) <0.01 (0–<0.01) 0.28 (0–1.4) <0.01 (<0.01–<0.01) 1.6 (0.90–2.5)
Argentina 43 0.7 (0.670–0.730) 1.6 (1.5–1.7) 0.1 (<0.01–0.52) 0.24 (0–1.2) 0.81 (0.540–1.1) 1.9 (1.3–2.6)
Armenia 3 0.092 (0.077–0.110) 3 (2.6–3.6) 0.014 (<0.01–0.074) 0.46 (0–2.4) 0.11 (0.067–0.150) 3.5 (2.2–5.1)
Aruba < 1 <0.01 (<0.01–<0.01) 1 (0.63–1.5) 0 0 <0.01 (<0.01–<0.01) 1 (0.63–1.5)
Australia 24 0.044 (0.044–0.044) 0.18 (0.18–0.19) <0.01 (0–0.019) <0.1 (0–<0.1) 0.048 (0.038–0.059) 0.2 (0.16–0.25)
Austria 9 0.078 (0.077–0.079) 0.91 (0.90–0.92) <0.01 (0–0.010) <0.1 (0–0.12) 0.08 (0.074–0.086) 0.94 (0.87–1.0)
Azerbaijan 10 0.038 (0.035–0.042) 0.39 (0.36–0.43) 0.02 (<0.01–0.055) 0.21 (<0.1–0.56) 0.058 (0.034–0.089) 0.6 (0.35–0.91)
Bahamas < 1 <0.01 (<0.01–<0.01) 0.49 (0.49–0.49) <0.01 (<0.01–<0.01) 0.93 (0.32–1.9) <0.01 (<0.01–<0.01) 1.4 (0.75–2.3)
Bahrain 1 <0.01 (<0.01–<0.01) 0.44 (0.38–0.50) <0.01 (0–<0.01) 0.11 (0–0.56) <0.01 (<0.01–0.012) 0.55 (0.28–0.90)
Bangladesh 161 73 (43–110) 45 (27–68) 0.23 (0.19–0.29) 0.14 (0.12–0.18) 73 (44–110) 45 (27–68)
Barbados < 1 <0.01 (<0.01–<0.01) 0.33 (0.33–0.34) 0 0 <0.01 (<0.01–<0.01) 0.33 (0.33–0.34)
Belarus 9 0.45 (0.420–0.490) 4.8 (4.5–5.1) 0.072 (0.021–0.15) 0.76 (0.22–1.6) 0.53 (0.460–0.600) 5.5 (4.8–6.3)
Belgium 11 0.054 (0.052–0.055) 0.47 (0.46–0.49) 0.011 (<0.01–0.055) 0.1 (0–0.49) 0.065 (0.038–0.098) 0.57 (0.34–0.87)
Belize < 1 <0.01 (<0.01–<0.01) 2.4 (2.4–2.4) <0.01 (<0.01–0.010) 0.85 (<0.1–2.9) 0.012 (<0.01–0.018) 3.3 (1.9–4.9)
Benin 11 1 (0.620–1.6) 9.5 (5.7–14) 0.29 (0.11–0.56) 2.7 (1.0–5.2) 1.3 (0.860–1.9) 12 (7.9–17)
Bermuda < 1 0 0 0 0 0 0
Bhutan < 1 0.12 (0.079–0.170) 16 (10–22) 0.024 (0.018–0.030) 3.1 (2.4–3.9) 0.14 (0.100–0.200) 19 (13–25)
Bolivia (Plurinational State of) 11 0.34 (0.220–0.500) 3.2 (2.0–4.6) 0.17 (0.10–0.26) 1.6 (0.93–2.4) 0.51 (0.370–0.690) 4.8 (3.4–6.4)
Bonaire, Saint Eustatius and Saba < 1 <0.01 (<0.01–<0.01) <0.1 (<0.1–0.13) 0 0 <0.01 (<0.01–<0.01) <0.1 (<0.1–0.13)
Bosnia and Herzegovina 4 0.12 (0.100–0.130) 3 (2.7–3.4) <0.01 (<0.01–<0.01) <0.1 (0–<0.1) 0.12 (0.100–0.130) 3.1 (2.7–3.4)
Botswana 2 0.59 (0.350–0.900) 26 (15–40) 1.4 (0.67–2.5) 63 (30–110) 2 (1.2–3.1) 90 (53–136)
Brazil 208 5.5 (5.2–5.9) 2.7 (2.5–2.8) 2.2 (1.2–3.6) 1.1 (0.56–1.7) 7.7 (6.5–9.0) 3.7 (3.1–4.4)
British Virgin Islands < 1 0 0 0 0 0 0
Brunei Darussalam < 1 0.023 (0.021–0.025) 5.3 (4.9–5.8) 0 0 0.023 (0.021–0.025) 5.3 (4.9–5.8)
Bulgaria 7 0.09 (0.088–0.092) 1.3 (1.2–1.3) <0.01 (0–<0.01) 0 (0–<0.1) 0.09 (0.088–0.093) 1.3 (1.2–1.3)
Burkina Faso 18 1.6 (0.970–2.4) 9 (5.4–14) 0.27 (0.12–0.48) 1.5 (0.67–2.7) 1.9 (1.2–2.7) 11 (6.7–15)
Burundi 11 2.7 (1.6–4.0) 24 (14–36) 0.66 (0.32–1.1) 5.9 (2.9–10) 3.3 (2.2–4.8) 30 (19–43)
Cabo Verde < 1 0.027 (0.026–0.029) 5.3 (4.9–5.6) 0.037 (0.024–0.051) 7 (4.7–9.9) 0.064 (0.051–0.079) 12 (9.8–15)
Cambodia 16 8.6 (6.1–12) 55 (39–74) 0.44 (0.19–0.79) 2.8 (1.2–5.0) 9.1 (6.5–12) 58 (42–77)
Cameroon 23 6.9 (4.1–10) 30 (18–45) 6.2 (3.4–9.7) 27 (15–42) 13 (9.0–18) 56 (39–77)
Canada 36 0.11 (0.100–0.110) 0.29 (0.29–0.30) 0.019 (<0.01–0.096) <0.1 (0–0.27) 0.12 (0.078–0.180) 0.35 (0.22–0.51)
Cayman Islands < 1 0 0 0 0 0 0
Central African Republic 5 2.2 (1.3–3.4) 45 (26–70) 2.7 (1.0–5.3) 55 (20–107) 4.9 (2.8–7.6) 101 (58–156)
Chad 14 3.2 (1.9–4.8) 23 (13–35) 2.5 (2.0–3.0) 18 (14–21) 5.7 (4.2–7.3) 40 (30–52)
Chile 18 0.47 (0.460–0.470) 2.6 (2.6–2.6) 0.02 (<0.01–0.097) 0.11 (0–0.54) 0.49 (0.430–0.540) 2.7 (2.4–3.0)
China 1 376 35 (34–37) 2.6 (2.5–2.7) 2.6 (1.2–4.5) 0.19 (<0.1–0.33) 38 (36–40) 2.8 (2.6–2.9)
China, Hong Kong SAR 7 0.18 (0.180–0.180) 2.5 (2.4–2.5) <0.01 (<0.01–<0.01) <0.1 (<0.1–0.11) 0.19 (0.180–0.190) 2.6 (2.5–2.6)
China, Macao SAR < 1 0.035 (0.022–0.051) 5.9 (3.7–8.7) <0.01 (<0.01–<0.01) <0.1 (<0.1–0.15) 0.035 (0.022–0.051) 6 (3.7–8.7)
Colombia 48 1 (0.990–1.0) 2.1 (2.1–2.1) 0.42 (0.13–0.88) 0.87 (0.26–1.8) 1.4 (1.1–1.8) 3 (2.2–3.8)
Comoros < 1 0.061 (0.036–0.092) 7.8 (4.6–12) <0.01 (<0.01–<0.01) 0.38 (0.16–0.68) 0.064 (0.039–0.095) 8.1 (4.9–12)
Congo 5 2.3 (1.3–3.5) 49 (29–75) 2.4 (2.0–2.9) 53 (44–63) 4.7 (3.6–5.9) 102 (79–129)
Cook Islands < 1 <0.01 (<0.01–<0.01) 1.4 (0.86–2.1) 0 (0–0) 0 (0–0) <0.01 (<0.01–<0.01) 1.4 (0.86–2.1)
Costa Rica 5 0.049 (0.046–0.052) 1 (0.96–1.1) <0.01 (<0.01–0.025) 0.15 (<0.1–0.52) 0.056 (0.044–0.071) 1.2 (0.91–1.5)
Côte d'Ivoire 23 5 (3.0–7.5) 22 (13–33) 2.5 (1.1–4.4) 11 (4.9–20) 7.5 (4.9–11) 33 (22–46)
Croatia 4 0.033 (0.033–0.033) 0.78 (0.78–0.78) <0.01 (0–<0.01) <0.1 (0–0.10) 0.034 (0.032–0.036) 0.8 (0.75–0.86)
Cuba 11 0.047 (0.046–0.048) 0.41 (0.41–0.42) 0.01 (<0.01–0.045) <0.1 (0–0.39) 0.057 (0.035–0.084) 0.5 (0.31–0.74)
Curaçao < 1 <0.01 (<0.01–<0.01) 0.15 (<0.1–0.22) <0.01 (0–<0.01) 0.25 (0–1.2) <0.01 (<0.01–<0.01) 0.4 (<0.1–1.3)
Cyprus 1 <0.01 (<0.01–<0.01) 0.1 (<0.1–0.11) <0.01 (0–<0.01) <0.1 (0–<0.1) <0.01 (<0.01–<0.01) 0.11 (<0.1–0.16)
Czechia 11 0.039 (0.039–0.039) 0.37 (0.37–0.37) <0.01 (0–<0.01) <0.1 (0–<0.1) 0.04 (0.038–0.042) 0.38 (0.36–0.40)
Democratic People's Republic of Korea
25 15 (10–22) 61 (40–87) 0.037 (0.016–0.065) 0.15 (<0.1–0.26) 16 (10–22) 62 (40–88)
Democratic Republic of the Congo 77 51 (30–77) 66 (39–99) 16 (13–20) 21 (17–26) 67 (45–93) 87 (59–120)
Denmark 6 0.02 (0.019–0.021) 0.35 (0.33–0.37) <0.01 (0–<0.01) <0.1 (0–0.12) 0.021 (0.018–0.025) 0.38 (0.31–0.45)
Djibouti < 1 0.35 (0.230–0.490) 39 (26–56) 0.035 (<0.01–0.11) 4 (0.26–13) 0.38 (0.250–0.540) 43 (28–61)
Dominica < 1 <0.01 (<0.01–<0.01) 4.7 (4.6–4.7) 0 (0–0) 0 (0–0) <0.01 (<0.01–<0.01) 4.7 (4.6–4.7)
Dominican Republic 11 0.49 (0.270–0.770) 4.6 (2.6–7.3) 0.38 (0.12–0.78) 3.6 (1.1–7.4) 0.87 (0.500–1.3) 8.2 (4.8–13)
Mortality
(HIV-negative people)
Mortality
(HIV-positive people)
Mortality
(HIV-negative and HIV-positive people)b
a Rates are per 100 000 population.b All calculations are made before numbers are rounded.
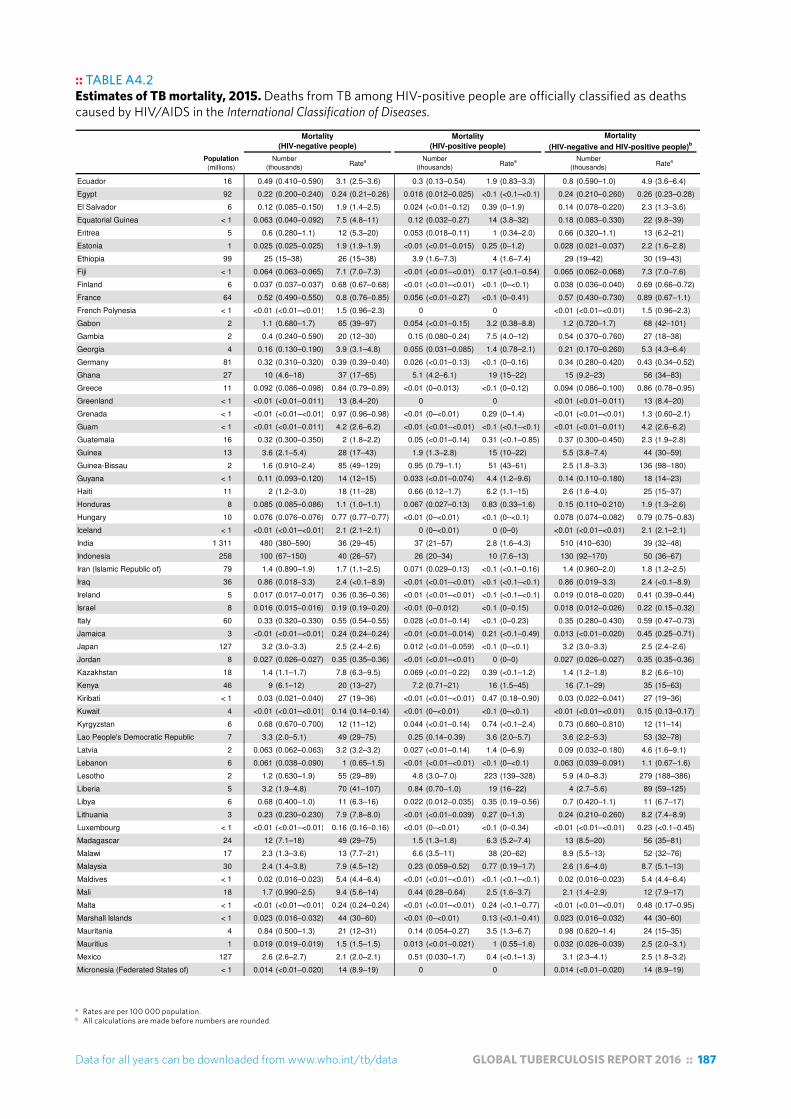
Data for all years can be downloaded from www.who.int/tb/data GLOBAL TUBERCULOSIS REPORT 2016 :: 187
a Rates are per 100 000 population.b All calculations are made before numbers are rounded.
:: TABLE A4.2Estimates of TB mortality, 2015. Deaths from TB among HIV-positive people are officially classified as deaths caused by HIV/AIDS in the International Classification of Diseases.
Table A4.2Estimates of TB mortality, 2015. Deaths from TB among HIV-positive people are officially classified as deaths caused by HIV/AIDS in the International Classification of Diseases .
Population
(millions) Number
(thousands)Ratea Number
(thousands)Ratea Number
(thousands)Ratea
Mortality
(HIV-negative people)
Mortality
(HIV-positive people)
Mortality
(HIV-negative and HIV-positive people)b
Ecuador 16 0.49 (0.410–0.590) 3.1 (2.5–3.6) 0.3 (0.13–0.54) 1.9 (0.83–3.3) 0.8 (0.590–1.0) 4.9 (3.6–6.4)
Egypt 92 0.22 (0.200–0.240) 0.24 (0.21–0.26) 0.018 (0.012–0.025) <0.1 (<0.1–<0.1) 0.24 (0.210–0.260) 0.26 (0.23–0.28)
El Salvador 6 0.12 (0.085–0.150) 1.9 (1.4–2.5) 0.024 (<0.01–0.12) 0.39 (0–1.9) 0.14 (0.078–0.220) 2.3 (1.3–3.6)
Equatorial Guinea < 1 0.063 (0.040–0.092) 7.5 (4.8–11) 0.12 (0.032–0.27) 14 (3.8–32) 0.18 (0.083–0.330) 22 (9.8–39)
Eritrea 5 0.6 (0.280–1.1) 12 (5.3–20) 0.053 (0.018–0.11) 1 (0.34–2.0) 0.66 (0.320–1.1) 13 (6.2–21)
Estonia 1 0.025 (0.025–0.025) 1.9 (1.9–1.9) <0.01 (<0.01–0.015) 0.25 (0–1.2) 0.028 (0.021–0.037) 2.2 (1.6–2.8)
Ethiopia 99 25 (15–38) 26 (15–38) 3.9 (1.6–7.3) 4 (1.6–7.4) 29 (19–42) 30 (19–43)
Fiji < 1 0.064 (0.063–0.065) 7.1 (7.0–7.3) <0.01 (<0.01–<0.01) 0.17 (<0.1–0.54) 0.065 (0.062–0.068) 7.3 (7.0–7.6)
Finland 6 0.037 (0.037–0.037) 0.68 (0.67–0.68) <0.01 (<0.01–<0.01) <0.1 (0–<0.1) 0.038 (0.036–0.040) 0.69 (0.66–0.72)
France 64 0.52 (0.490–0.550) 0.8 (0.76–0.85) 0.056 (<0.01–0.27) <0.1 (0–0.41) 0.57 (0.430–0.730) 0.89 (0.67–1.1)
French Polynesia < 1 <0.01 (<0.01–<0.01) 1.5 (0.96–2.3) 0 0 <0.01 (<0.01–<0.01) 1.5 (0.96–2.3)
Gabon 2 1.1 (0.680–1.7) 65 (39–97) 0.054 (<0.01–0.15) 3.2 (0.38–8.8) 1.2 (0.720–1.7) 68 (42–101)
Gambia 2 0.4 (0.240–0.590) 20 (12–30) 0.15 (0.080–0.24) 7.5 (4.0–12) 0.54 (0.370–0.760) 27 (18–38)
Georgia 4 0.16 (0.130–0.190) 3.9 (3.1–4.8) 0.055 (0.031–0.085) 1.4 (0.78–2.1) 0.21 (0.170–0.260) 5.3 (4.3–6.4)
Germany 81 0.32 (0.310–0.320) 0.39 (0.39–0.40) 0.026 (<0.01–0.13) <0.1 (0–0.16) 0.34 (0.280–0.420) 0.43 (0.34–0.52)
Ghana 27 10 (4.6–18) 37 (17–65) 5.1 (4.2–6.1) 19 (15–22) 15 (9.2–23) 56 (34–83)
Greece 11 0.092 (0.086–0.098) 0.84 (0.79–0.89) <0.01 (0–0.013) <0.1 (0–0.12) 0.094 (0.086–0.100) 0.86 (0.78–0.95)
Greenland < 1 <0.01 (<0.01–0.011) 13 (8.4–20) 0 0 <0.01 (<0.01–0.011) 13 (8.4–20)
Grenada < 1 <0.01 (<0.01–<0.01) 0.97 (0.96–0.98) <0.01 (0–<0.01) 0.29 (0–1.4) <0.01 (<0.01–<0.01) 1.3 (0.60–2.1)
Guam < 1 <0.01 (<0.01–0.011) 4.2 (2.6–6.2) <0.01 (<0.01–<0.01) <0.1 (<0.1–<0.1) <0.01 (<0.01–0.011) 4.2 (2.6–6.2)
Guatemala 16 0.32 (0.300–0.350) 2 (1.8–2.2) 0.05 (<0.01–0.14) 0.31 (<0.1–0.85) 0.37 (0.300–0.450) 2.3 (1.9–2.8)
Guinea 13 3.6 (2.1–5.4) 28 (17–43) 1.9 (1.3–2.8) 15 (10–22) 5.5 (3.8–7.4) 44 (30–59)
Guinea-Bissau 2 1.6 (0.910–2.4) 85 (49–129) 0.95 (0.79–1.1) 51 (43–61) 2.5 (1.8–3.3) 136 (98–180)
Guyana < 1 0.11 (0.093–0.120) 14 (12–15) 0.033 (<0.01–0.074) 4.4 (1.2–9.6) 0.14 (0.110–0.180) 18 (14–23)
Haiti 11 2 (1.2–3.0) 18 (11–28) 0.66 (0.12–1.7) 6.2 (1.1–15) 2.6 (1.6–4.0) 25 (15–37)
Honduras 8 0.085 (0.085–0.086) 1.1 (1.0–1.1) 0.067 (0.027–0.13) 0.83 (0.33–1.6) 0.15 (0.110–0.210) 1.9 (1.3–2.6)
Hungary 10 0.076 (0.076–0.076) 0.77 (0.77–0.77) <0.01 (0–<0.01) <0.1 (0–<0.1) 0.078 (0.074–0.082) 0.79 (0.75–0.83)
Iceland < 1 <0.01 (<0.01–<0.01) 2.1 (2.1–2.1) 0 (0–<0.01) 0 (0–0) <0.01 (<0.01–<0.01) 2.1 (2.1–2.1)
India 1 311 480 (380–590) 36 (29–45) 37 (21–57) 2.8 (1.6–4.3) 510 (410–630) 39 (32–48)
Indonesia 258 100 (67–150) 40 (26–57) 26 (20–34) 10 (7.6–13) 130 (92–170) 50 (36–67)
Iran (Islamic Republic of) 79 1.4 (0.890–1.9) 1.7 (1.1–2.5) 0.071 (0.029–0.13) <0.1 (<0.1–0.16) 1.4 (0.960–2.0) 1.8 (1.2–2.5)
Iraq 36 0.86 (0.018–3.3) 2.4 (<0.1–8.9) <0.01 (<0.01–<0.01) <0.1 (<0.1–<0.1) 0.86 (0.019–3.3) 2.4 (<0.1–8.9)
Ireland 5 0.017 (0.017–0.017) 0.36 (0.36–0.36) <0.01 (<0.01–<0.01) <0.1 (<0.1–<0.1) 0.019 (0.018–0.020) 0.41 (0.39–0.44)
Israel 8 0.016 (0.015–0.016) 0.19 (0.19–0.20) <0.01 (0–0.012) <0.1 (0–0.15) 0.018 (0.012–0.026) 0.22 (0.15–0.32)
Italy 60 0.33 (0.320–0.330) 0.55 (0.54–0.55) 0.028 (<0.01–0.14) <0.1 (0–0.23) 0.35 (0.280–0.430) 0.59 (0.47–0.73)
Jamaica 3 <0.01 (<0.01–<0.01) 0.24 (0.24–0.24) <0.01 (<0.01–0.014) 0.21 (<0.1–0.49) 0.013 (<0.01–0.020) 0.45 (0.25–0.71)
Japan 127 3.2 (3.0–3.3) 2.5 (2.4–2.6) 0.012 (<0.01–0.059) <0.1 (0–<0.1) 3.2 (3.0–3.3) 2.5 (2.4–2.6)
Jordan 8 0.027 (0.026–0.027) 0.35 (0.35–0.36) <0.01 (<0.01–<0.01) 0 (0–0) 0.027 (0.026–0.027) 0.35 (0.35–0.36)
Kazakhstan 18 1.4 (1.1–1.7) 7.8 (6.3–9.5) 0.069 (<0.01–0.22) 0.39 (<0.1–1.2) 1.4 (1.2–1.8) 8.2 (6.6–10)
Kenya 46 9 (6.1–12) 20 (13–27) 7.2 (0.71–21) 16 (1.5–45) 16 (7.1–29) 35 (15–63)
Kiribati < 1 0.03 (0.021–0.040) 27 (19–36) <0.01 (<0.01–<0.01) 0.47 (0.18–0.90) 0.03 (0.022–0.041) 27 (19–36)
Kuwait 4 <0.01 (<0.01–<0.01) 0.14 (0.14–0.14) <0.01 (0–<0.01) <0.1 (0–<0.1) <0.01 (<0.01–<0.01) 0.15 (0.13–0.17)
Kyrgyzstan 6 0.68 (0.670–0.700) 12 (11–12) 0.044 (<0.01–0.14) 0.74 (<0.1–2.4) 0.73 (0.660–0.810) 12 (11–14)
Lao People's Democratic Republic 7 3.3 (2.0–5.1) 49 (29–75) 0.25 (0.14–0.39) 3.6 (2.0–5.7) 3.6 (2.2–5.3) 53 (32–78)
Latvia 2 0.063 (0.062–0.063) 3.2 (3.2–3.2) 0.027 (<0.01–0.14) 1.4 (0–6.9) 0.09 (0.032–0.180) 4.6 (1.6–9.1)
Lebanon 6 0.061 (0.038–0.090) 1 (0.65–1.5) <0.01 (<0.01–<0.01) <0.1 (0–<0.1) 0.063 (0.039–0.091) 1.1 (0.67–1.6)
Lesotho 2 1.2 (0.630–1.9) 55 (29–89) 4.8 (3.0–7.0) 223 (139–328) 5.9 (4.0–8.3) 279 (188–386)
Liberia 5 3.2 (1.9–4.8) 70 (41–107) 0.84 (0.70–1.0) 19 (16–22) 4 (2.7–5.6) 89 (59–125)
Libya 6 0.68 (0.400–1.0) 11 (6.3–16) 0.022 (0.012–0.035) 0.35 (0.19–0.56) 0.7 (0.420–1.1) 11 (6.7–17)
Lithuania 3 0.23 (0.230–0.230) 7.9 (7.8–8.0) <0.01 (<0.01–0.039) 0.27 (0–1.3) 0.24 (0.210–0.260) 8.2 (7.4–8.9)
Luxembourg < 1 <0.01 (<0.01–<0.01) 0.16 (0.16–0.16) <0.01 (0–<0.01) <0.1 (0–0.34) <0.01 (<0.01–<0.01) 0.23 (<0.1–0.45)
Madagascar 24 12 (7.1–18) 49 (29–75) 1.5 (1.3–1.8) 6.3 (5.2–7.4) 13 (8.5–20) 56 (35–81)
Malawi 17 2.3 (1.3–3.6) 13 (7.7–21) 6.6 (3.5–11) 38 (20–62) 8.9 (5.5–13) 52 (32–76)
Malaysia 30 2.4 (1.4–3.8) 7.9 (4.5–12) 0.23 (0.059–0.52) 0.77 (0.19–1.7) 2.6 (1.6–4.0) 8.7 (5.1–13)
Maldives < 1 0.02 (0.016–0.023) 5.4 (4.4–6.4) <0.01 (<0.01–<0.01) <0.1 (<0.1–<0.1) 0.02 (0.016–0.023) 5.4 (4.4–6.4)
Mali 18 1.7 (0.990–2.5) 9.4 (5.6–14) 0.44 (0.28–0.64) 2.5 (1.6–3.7) 2.1 (1.4–2.9) 12 (7.9–17)
Malta < 1 <0.01 (<0.01–<0.01) 0.24 (0.24–0.24) <0.01 (<0.01–<0.01) 0.24 (<0.1–0.77) <0.01 (<0.01–<0.01) 0.48 (0.17–0.95)
Marshall Islands < 1 0.023 (0.016–0.032) 44 (30–60) <0.01 (0–<0.01) 0.13 (<0.1–0.41) 0.023 (0.016–0.032) 44 (30–60)
Mauritania 4 0.84 (0.500–1.3) 21 (12–31) 0.14 (0.054–0.27) 3.5 (1.3–6.7) 0.98 (0.620–1.4) 24 (15–35)
Mauritius 1 0.019 (0.019–0.019) 1.5 (1.5–1.5) 0.013 (<0.01–0.021) 1 (0.55–1.6) 0.032 (0.026–0.039) 2.5 (2.0–3.1)
Mexico 127 2.6 (2.6–2.7) 2.1 (2.0–2.1) 0.51 (0.030–1.7) 0.4 (<0.1–1.3) 3.1 (2.3–4.1) 2.5 (1.8–3.2)
Micronesia (Federated States of) < 1 0.014 (<0.01–0.020) 14 (8.9–19) 0 0 0.014 (<0.01–0.020) 14 (8.9–19)
a Rates are per 100 000 population.b All calculations are made before numbers are rounded.

188 :: GLOBAL TUBERCULOSIS REPORT 2016 Data for all years can be downloaded from www.who.int/tb/data
:: TABLE A4.2Estimates of TB mortality, 2015. Deaths from TB among HIV-positive people are officially classified as deaths caused by HIV/AIDS in the International Classification of Diseases.
Table A4.2Estimates of TB mortality, 2015. Deaths from TB among HIV-positive people are officially classified as deaths caused by HIV/AIDS in the International Classification of Diseases .
Population
(millions) Number
(thousands)Ratea Number
(thousands)Ratea Number
(thousands)Ratea
Mortality
(HIV-negative people)
Mortality
(HIV-positive people)
Mortality
(HIV-negative and HIV-positive people)b
Monaco < 1 0 0 0 0 0 0
Mongolia 3 0.64 (0.420–0.910) 22 (14–31) <0.01 (<0.01–<0.01) <0.1 (<0.1–0.17) 0.64 (0.420–0.920) 22 (14–31)
Montenegro < 1 <0.01 (<0.01–<0.01) 0.41 (0.38–0.44) <0.01 (<0.01–<0.01) <0.1 (<0.1–0.10) <0.01 (<0.01–<0.01) 0.46 (0.40–0.52)
Montserrat < 1 <0.01 (<0.01–<0.01) 21 (20–22) 0 0 <0.01 (<0.01–<0.01) 21 (20–22)
Morocco 34 3.2 (0.043–13) 9.4 (0.13–37) 0.14 (0.044–0.30) 0.42 (0.13–0.88) 3.4 (0.062–13) 9.8 (0.18–38)
Mozambique 28 21 (12–32) 74 (43–115) 34 (21–50) 120 (73–178) 54 (38–74) 194 (136–263)
Myanmar 54 27 (16–40) 49 (30–74) 4.8 (3.5–6.5) 9 (6.4–12) 31 (21–45) 58 (38–83)
Namibia 2 0.78 (0.510–1.1) 32 (21–45) 0.88 (0.062–2.8) 36 (2.5–112) 1.7 (0.550–3.4) 68 (22–138)
Nauru < 1 <0.01 (<0.01–<0.01) 9.2 (5.7–14) 0 0 <0.01 (<0.01–<0.01) 9.2 (5.7–14)
Nepal 29 5.6 (3.9–7.5) 20 (14–26) 0.5 (0.39–0.62) 1.7 (1.4–2.2) 6.1 (4.4–8.0) 21 (15–28)
Netherlands 17 0.034 (0.033–0.035) 0.2 (0.20–0.21) <0.01 (<0.01–0.047) <0.1 (0–0.28) 0.044 (0.022–0.073) 0.26 (0.13–0.43)
New Caledonia < 1 <0.01 (<0.01–<0.01) 2 (1.3–2.9) 0 0 <0.01 (<0.01–<0.01) 2 (1.3–2.9)
New Zealand 5 0.01 (0.010–0.010) 0.22 (0.22–0.22) <0.01 (0–<0.01) 0 (0–<0.1) 0.01 (<0.01–0.011) 0.23 (0.22–0.24)
Nicaragua 6 0.15 (0.120–0.190) 2.5 (1.9–3.1) 0.028 (<0.01–0.086) 0.46 (<0.1–1.4) 0.18 (0.130–0.240) 3 (2.1–4.0)
Niger 20 3.8 (2.3–5.7) 19 (11–29) 0.37 (0.25–0.51) 1.9 (1.2–2.6) 4.2 (2.6–6.1) 21 (13–31)
Nigeria 182 180 (96–290) 99 (53–160) 57 (43–74) 31 (24–40) 240 (150–350) 130 (82–190)
Niue < 1 <0.01 (<0.01–<0.01) 3.5 (2.0–5.4) 0 0 <0.01 (<0.01–<0.01) 3.5 (2.0–5.4)
Northern Mariana Islands < 1 <0.01 (<0.01–<0.01) 4.8 (3.0–7.0) 0 (0–<0.01) <0.1 (<0.1–<0.1) <0.01 (<0.01–<0.01) 4.8 (3.0–7.0)
Norway 5 0.011 (0.011–0.011) 0.21 (0.20–0.22) <0.01 (0–<0.01) <0.1 (0–0.10) 0.012 (<0.01–0.015) 0.23 (0.18–0.29)
Oman 4 0.024 (0.015–0.034) 0.52 (0.33–0.76) <0.01 (0–<0.01) <0.1 (0–<0.1) 0.024 (0.015–0.035) 0.54 (0.34–0.77)
Pakistan 189 44 (9.3–110) 23 (4.9–56) 1.6 (1.1–2.1) 0.83 (0.60–1.1) 46 (10–110) 24 (5.5–57)
Palau < 1 <0.01 (<0.01–<0.01) 6.2 (3.9–9.1) 0 (0–0) <0.1 (<0.1–<0.1) <0.01 (<0.01–<0.01) 6.2 (3.9–9.1)
Panama 4 0.24 (0.220–0.250) 6.1 (5.6–6.5) 0.039 (<0.01–0.14) 1 (<0.1–3.5) 0.28 (0.210–0.360) 7 (5.3–9.1)
Papua New Guinea 8 3.1 (1.8–4.6) 40 (24–61) 0.67 (0.40–1.0) 8.8 (5.2–13) 3.7 (2.4–5.3) 49 (32–70)
Paraguay 7 0.26 (0.220–0.310) 4 (3.3–4.7) 0.035 (<0.01–0.11) 0.53 (<0.1–1.7) 0.3 (0.230–0.380) 4.5 (3.4–5.7)
Peru 31 2 (1.6–2.4) 6.2 (4.9–7.7) 0.49 (0.34–0.67) 1.6 (1.1–2.2) 2.5 (2.0–2.9) 7.8 (6.4–9.4)
Philippines 101 14 (8.8–19) 13 (8.7–19) 0.44 (0.24–0.70) 0.44 (0.24–0.70) 14 (9.2–20) 14 (9.1–20)
Poland 39 0.54 (0.520–0.570) 1.4 (1.4–1.5) 0.019 (<0.01–0.093) <0.1 (0–0.24) 0.56 (0.510–0.620) 1.5 (1.3–1.6)
Portugal 10 0.21 (0.210–0.220) 2.1 (2.0–2.1) 0.046 (<0.01–0.23) 0.45 (0–2.2) 0.26 (0.150–0.400) 2.5 (1.4–3.9)
Puerto Rico 4 <0.01 (<0.01–0.010) 0.27 (0.27–0.27) <0.01 (<0.01–<0.01) <0.1 (0–0.13) 0.011 (<0.01–0.014) 0.31 (0.25–0.38)
Qatar 2 <0.01 (<0.01–0.011) 0.32 (0.19–0.49) <0.01 (0–<0.01) 0 (0–<0.1) <0.01 (<0.01–0.011) 0.32 (0.19–0.49)
Republic of Korea 50 2.6 (2.4–2.7) 5.1 (4.8–5.4) 0.046 (0–0.33) <0.1 (0–0.65) 2.6 (2.4–2.9) 5.2 (4.7–5.7)
Republic of Moldova 4 0.31 (0.300–0.330) 7.7 (7.3–8.1) 0.18 (0.11–0.27) 4.5 (2.8–6.6) 0.49 (0.420–0.580) 12 (10–14)
Romania 20 1.1 (1.1–1.1) 5.5 (5.5–5.6) 0.063 (<0.01–0.20) 0.32 (<0.1–1.0) 1.1 (1.0–1.2) 5.8 (5.3–6.4)
Russian Federation 143 15 (15–16) 11 (10–11) 1.5 (<0.01–7.4) 1 (0–5.2) 17 (13–21) 12 (8.9–15)
Rwanda 12 0.44 (0.260–0.670) 3.8 (2.2–5.8) 0.28 (0.010–0.97) 2.4 (<0.1–8.3) 0.72 (0.280–1.4) 6.2 (2.4–12)
Saint Kitts and Nevis < 1 <0.01 (<0.01–<0.01) 2.5 (2.1–2.9) <0.01 (0–<0.01) <0.1 (0–0.46) <0.01 (<0.01–<0.01) 2.6 (2.2–3.1)
Saint Lucia < 1 <0.01 (<0.01–<0.01) 0.74 (0.67–0.82) <0.01 (<0.01–<0.01) 0.22 (<0.1–0.50) <0.01 (<0.01–<0.01) 0.97 (0.74–1.2)
Saint Vincent and the Grenadines < 1 <0.01 (<0.01–<0.01) 1.5 (1.5–1.5) <0.01 (0–<0.01) 0.14 (0–0.69) <0.01 (<0.01–<0.01) 1.6 (1.3–2.0)
Samoa < 1 <0.01 (<0.01–<0.01) 0.93 (0.58–1.4) 0 0 <0.01 (<0.01–<0.01) 0.93 (0.58–1.4)
San Marino < 1 0 0 0 0 0 0
Sao Tome and Principe < 1 <0.01 (<0.01–0.013) 3.6 (1.4–6.9) <0.01 (0–0.015) 1.3 (0–8.0) <0.01 (<0.01–0.022) 5 (1.1–12)
Saudi Arabia 32 0.66 (0.210–1.4) 2.1 (0.66–4.3) 0.018 (<0.01–0.090) <0.1 (0–0.28) 0.68 (0.220–1.4) 2.2 (0.71–4.4)
Senegal 15 3.4 (2.1–5.2) 23 (14–34) 0.41 (0.16–0.77) 2.7 (1.0–5.1) 3.8 (2.4–5.6) 25 (16–37)
Serbia 9 0.11 (0.099–0.120) 1.2 (1.1–1.3) <0.01 (<0.01–<0.01) <0.1 (<0.1–<0.1) 0.11 (0.100–0.120) 1.3 (1.2–1.4)
Seychelles < 1 0 0 0 (0–0) 0 (0–0) 0 (0–0) 0 (0–0)
Sierra Leone 6 3.3 (1.9–4.9) 51 (30–76) 0.82 (0.40–1.4) 13 (6.2–21) 4.1 (2.7–5.8) 63 (41–90)
Singapore 6 0.07 (0.058–0.083) 1.2 (1.0–1.5) <0.01 (<0.01–0.030) 0.11 (0–0.53) 0.076 (0.057–0.098) 1.4 (1.0–1.7)
Sint Maarten (Dutch part) < 1 <0.01 (<0.01–<0.01) 0.49 (0.30–0.72) 0 0 <0.01 (<0.01–<0.01) 0.49 (0.30–0.72)
Slovakia 5 0.032 (0.031–0.032) 0.59 (0.58–0.59) <0.01 (<0.01–<0.01) 0 (0–0) 0.032 (0.032–0.032) 0.59 (0.58–0.59)
Slovenia 2 0.016 (0.015–0.016) 0.75 (0.75–0.76) <0.01 (<0.01–<0.01) 0 (0–0) 0.016 (0.015–0.016) 0.75 (0.75–0.76)
Solomon Islands < 1 0.057 (0.037–0.081) 9.8 (6.4–14) 0 0 0.057 (0.037–0.081) 9.8 (6.4–14)
Somalia 11 7 (4.1–11) 65 (38–98) 0.21 (0.15–0.28) 2 (1.4–2.6) 7.2 (4.3–11) 67 (40–100)
South Africa 54 25 (21–29) 46 (39–53) 73 (27–140) 133 (50–256) 97 (49–160) 179 (90–297)
South Sudan 12 3.4 (2.0–5.2) 28 (17–42) 0.76 (0.50–1.1) 6.1 (4.1–8.6) 4.2 (2.7–5.9) 34 (22–48)
Spain 46 0.26 (0.260–0.270) 0.57 (0.57–0.58) 0.054 (<0.01–0.27) 0.12 (0–0.58) 0.32 (0.190–0.480) 0.69 (0.41–1.0)
Sri Lanka 21 1.2 (0.930–1.4) 5.6 (4.5–6.9) 0.011 (<0.01–0.020) <0.1 (<0.1–<0.1) 1.2 (0.940–1.4) 5.7 (4.5–7.0)
Sudan 40 7.3 (3.8–12) 18 (9.5–30) 0.64 (0.52–0.76) 1.6 (1.3–1.9) 8 (4.4–13) 20 (11–31)
Suriname < 1 0.014 (0.014–0.015) 2.6 (2.5–2.8) 0.011 (<0.01–0.024) 2 (0.54–4.4) 0.025 (0.016–0.037) 4.6 (2.9–6.8)
Swaziland 1 0.4 (0.230–0.610) 31 (18–48) 1.5 (0.52–3.1) 120 (41–242) 1.9 (0.850–3.5) 151 (66–271)
Sweden 10 0.027 (0.027–0.028) 0.28 (0.28–0.28) <0.01 (0–0.017) <0.1 (0–0.18) 0.031 (0.022–0.041) 0.32 (0.23–0.42)
Switzerland 8 0.016 (0.016–0.017) 0.2 (0.19–0.20) <0.01 (<0.01–0.022) <0.1 (0–0.26) 0.021 (0.011–0.034) 0.25 (0.13–0.41)
a Rates are per 100 000 population.b All calculations are made before numbers are rounded.a Rates are per 100 000 population.b All calculations are made before numbers are rounded.
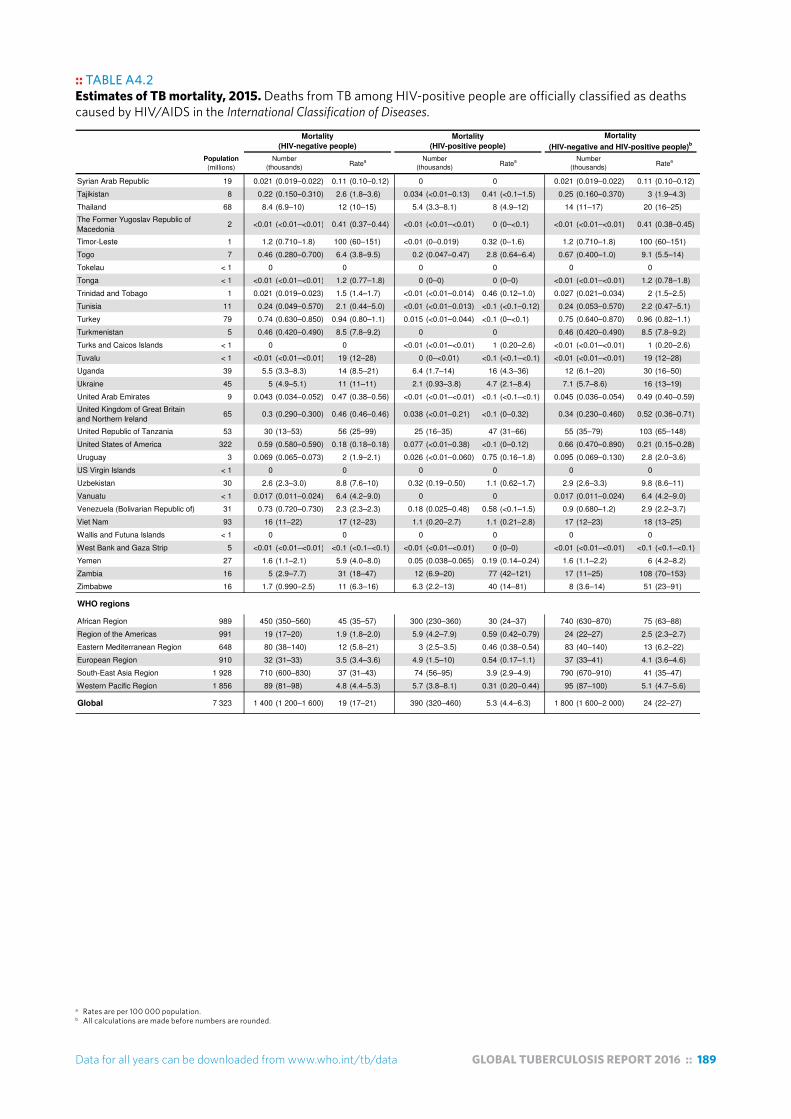
Data for all years can be downloaded from www.who.int/tb/data GLOBAL TUBERCULOSIS REPORT 2016 :: 189
:: TABLE A4.2Estimates of TB mortality, 2015. Deaths from TB among HIV-positive people are officially classified as deaths caused by HIV/AIDS in the International Classification of Diseases.
Table A4.2Estimates of TB mortality, 2015. Deaths from TB among HIV-positive people are officially classified as deaths caused by HIV/AIDS in the International Classification of Diseases .
Population
(millions) Number
(thousands)Ratea Number
(thousands)Ratea Number
(thousands)Ratea
Mortality
(HIV-negative people)
Mortality
(HIV-positive people)
Mortality
(HIV-negative and HIV-positive people)b
Syrian Arab Republic 19 0.021 (0.019–0.022) 0.11 (0.10–0.12) 0 0 0.021 (0.019–0.022) 0.11 (0.10–0.12)
Tajikistan 8 0.22 (0.150–0.310) 2.6 (1.8–3.6) 0.034 (<0.01–0.13) 0.41 (<0.1–1.5) 0.25 (0.160–0.370) 3 (1.9–4.3)
Thailand 68 8.4 (6.9–10) 12 (10–15) 5.4 (3.3–8.1) 8 (4.9–12) 14 (11–17) 20 (16–25)
The Former Yugoslav Republic of Macedonia
2 <0.01 (<0.01–<0.01) 0.41 (0.37–0.44) <0.01 (<0.01–<0.01) 0 (0–<0.1) <0.01 (<0.01–<0.01) 0.41 (0.38–0.45)
Timor-Leste 1 1.2 (0.710–1.8) 100 (60–151) <0.01 (0–0.019) 0.32 (0–1.6) 1.2 (0.710–1.8) 100 (60–151)
Togo 7 0.46 (0.280–0.700) 6.4 (3.8–9.5) 0.2 (0.047–0.47) 2.8 (0.64–6.4) 0.67 (0.400–1.0) 9.1 (5.5–14)
Tokelau < 1 0 0 0 0 0 0
Tonga < 1 <0.01 (<0.01–<0.01) 1.2 (0.77–1.8) 0 (0–0) 0 (0–0) <0.01 (<0.01–<0.01) 1.2 (0.78–1.8)
Trinidad and Tobago 1 0.021 (0.019–0.023) 1.5 (1.4–1.7) <0.01 (<0.01–0.014) 0.46 (0.12–1.0) 0.027 (0.021–0.034) 2 (1.5–2.5)
Tunisia 11 0.24 (0.049–0.570) 2.1 (0.44–5.0) <0.01 (<0.01–0.013) <0.1 (<0.1–0.12) 0.24 (0.053–0.570) 2.2 (0.47–5.1)
Turkey 79 0.74 (0.630–0.850) 0.94 (0.80–1.1) 0.015 (<0.01–0.044) <0.1 (0–<0.1) 0.75 (0.640–0.870) 0.96 (0.82–1.1)
Turkmenistan 5 0.46 (0.420–0.490) 8.5 (7.8–9.2) 0 0 0.46 (0.420–0.490) 8.5 (7.8–9.2)
Turks and Caicos Islands < 1 0 0 <0.01 (<0.01–<0.01) 1 (0.20–2.6) <0.01 (<0.01–<0.01) 1 (0.20–2.6)
Tuvalu < 1 <0.01 (<0.01–<0.01) 19 (12–28) 0 (0–<0.01) <0.1 (<0.1–<0.1) <0.01 (<0.01–<0.01) 19 (12–28)
Uganda 39 5.5 (3.3–8.3) 14 (8.5–21) 6.4 (1.7–14) 16 (4.3–36) 12 (6.1–20) 30 (16–50)
Ukraine 45 5 (4.9–5.1) 11 (11–11) 2.1 (0.93–3.8) 4.7 (2.1–8.4) 7.1 (5.7–8.6) 16 (13–19)
United Arab Emirates 9 0.043 (0.034–0.052) 0.47 (0.38–0.56) <0.01 (<0.01–<0.01) <0.1 (<0.1–<0.1) 0.045 (0.036–0.054) 0.49 (0.40–0.59)
United Kingdom of Great Britain and Northern Ireland
65 0.3 (0.290–0.300) 0.46 (0.46–0.46) 0.038 (<0.01–0.21) <0.1 (0–0.32) 0.34 (0.230–0.460) 0.52 (0.36–0.71)
United Republic of Tanzania 53 30 (13–53) 56 (25–99) 25 (16–35) 47 (31–66) 55 (35–79) 103 (65–148)
United States of America 322 0.59 (0.580–0.590) 0.18 (0.18–0.18) 0.077 (<0.01–0.38) <0.1 (0–0.12) 0.66 (0.470–0.890) 0.21 (0.15–0.28)
Uruguay 3 0.069 (0.065–0.073) 2 (1.9–2.1) 0.026 (<0.01–0.060) 0.75 (0.16–1.8) 0.095 (0.069–0.130) 2.8 (2.0–3.6)
US Virgin Islands < 1 0 0 0 0 0 0
Uzbekistan 30 2.6 (2.3–3.0) 8.8 (7.6–10) 0.32 (0.19–0.50) 1.1 (0.62–1.7) 2.9 (2.6–3.3) 9.8 (8.6–11)
Vanuatu < 1 0.017 (0.011–0.024) 6.4 (4.2–9.0) 0 0 0.017 (0.011–0.024) 6.4 (4.2–9.0)
Venezuela (Bolivarian Republic of) 31 0.73 (0.720–0.730) 2.3 (2.3–2.3) 0.18 (0.025–0.48) 0.58 (<0.1–1.5) 0.9 (0.680–1.2) 2.9 (2.2–3.7)
Viet Nam 93 16 (11–22) 17 (12–23) 1.1 (0.20–2.7) 1.1 (0.21–2.8) 17 (12–23) 18 (13–25)
Wallis and Futuna Islands < 1 0 0 0 0 0 0
West Bank and Gaza Strip 5 <0.01 (<0.01–<0.01) <0.1 (<0.1–<0.1) <0.01 (<0.01–<0.01) 0 (0–0) <0.01 (<0.01–<0.01) <0.1 (<0.1–<0.1)
Yemen 27 1.6 (1.1–2.1) 5.9 (4.0–8.0) 0.05 (0.038–0.065) 0.19 (0.14–0.24) 1.6 (1.1–2.2) 6 (4.2–8.2)
Zambia 16 5 (2.9–7.7) 31 (18–47) 12 (6.9–20) 77 (42–121) 17 (11–25) 108 (70–153)
Zimbabwe 16 1.7 (0.990–2.5) 11 (6.3–16) 6.3 (2.2–13) 40 (14–81) 8 (3.6–14) 51 (23–91)
WHO regions
African Region 989 450 (350–560) 45 (35–57) 300 (230–360) 30 (24–37) 740 (630–870) 75 (63–88)
Region of the Americas 991 19 (17–20) 1.9 (1.8–2.0) 5.9 (4.2–7.9) 0.59 (0.42–0.79) 24 (22–27) 2.5 (2.3–2.7)
Eastern Mediterranean Region 648 80 (38–140) 12 (5.8–21) 3 (2.5–3.5) 0.46 (0.38–0.54) 83 (40–140) 13 (6.2–22)
European Region 910 32 (31–33) 3.5 (3.4–3.6) 4.9 (1.5–10) 0.54 (0.17–1.1) 37 (33–41) 4.1 (3.6–4.6)
South-East Asia Region 1 928 710 (600–830) 37 (31–43) 74 (56–95) 3.9 (2.9–4.9) 790 (670–910) 41 (35–47)
Western Pacific Region 1 856 89 (81–98) 4.8 (4.4–5.3) 5.7 (3.8–8.1) 0.31 (0.20–0.44) 95 (87–100) 5.1 (4.7–5.6)
Global 7 323 1 400 (1 200–1 600) 19 (17–21) 390 (320–460) 5.3 (4.4–6.3) 1 800 (1 600–2 000) 24 (22–27)
a Rates are per 100 000 population.b All calculations are made before numbers are rounded.a Rates are per 100 000 population.b All calculations are made before numbers are rounded.

190 :: GLOBAL TUBERCULOSIS REPORT 2016 Data for all years can be downloaded from www.who.int/tb/data
a Empty rows indicate an absence of high-quality survey or surveillance data. In the absence of high-quality national data, high-quality sub-national data are used.
:: TABLE A4.3Measured percentage of TB cases with MDR/RR-TB,a most recent year availableTable A4.3
Measured percentage of TB cases with MDR/RR-TBa, most recent year available
Year Source Coverage Percentage Year Source Coverage Percentage
Afghanistan
Albania 2012 Surveillance National 2.3 (0.64–5.8) 2012 Surveillance National 6.7 (0.17–32)
Algeria 2002 Survey National 1.4 (0.33–2.5) 2002 Survey National 9.1 (0–23)
American Samoa
Andorra 2015 Surveillance National 0 (0–84) 2015 Surveillance National 0 (0–0)
Angola
Anguilla
Antigua and Barbuda
Argentina 2005 Survey National 2.3 (1.1–3.6) 2005 Survey National 18 (11–25)
Armenia 2007 Survey National 11 (8.0–14) 2007 Survey National 47 (41–53)
Aruba
Australia 2015 Surveillance National 3.6 (2.2–5.4) 2015 Surveillance National 24 (9.4–45)
Austria 2015 Surveillance National 2.3 (0.84–4.9) 2015 Surveillance National 17 (2.1–48)
Azerbaijan 2013 Survey National 13 (10–16) 2013 Survey National 29 (23–35)
Bahamas 2012 Surveillance National 11 (2.4–29) 2015 Surveillance National 50 (1.3–99)
Bahrain 2012 Surveillance National 1.9 (0.39–5.4) 2012 Surveillance National 100 (2.5–100)
Bangladesh 2011 Survey National 1.6 (0.59–2.6) 2011 Survey National 29 (24–34)
Barbados 2014 Surveillance National 0 (0–71) 2014 Surveillance National 0 (0–0)
Belarus 2015 Surveillance National 37 (35–39) 2015 Surveillance National 69 (66–72)
Belgium 2015 Surveillance National 1.6 (0.66–3.3) 2015 Surveillance National 8.8 (1.9–24)
Belize 2013 Surveillance National 100 (29–100)
Benin 2010 Survey National 1.2 (0–2.6) 2014 Surveillance National 8.1 (4.6–13)
Bermuda 2012 Surveillance National 0 (0–84) 2012 Surveillance National 0 (0–0)
Bhutan 2015 Surveillance National 38 (19–59)
Bolivia (Plurinational State of) 2015 Surveillance National 12 (9.5–16)
Bonaire, Saint Eustatius and Saba 2011 Surveillance National 100 (2.5–100)
Bosnia and Herzegovina 2015 Surveillance National 0.51 (0.11–1.5) 2013 Surveillance National 1.6 (<0.1–8.5)
Botswana 2008 Survey National 3.6 (2.4–4.8) 2008 Survey National 13 (7.4–19)
Brazil 2008 Survey Sub-national 1.5 (1.1–1.9) 2008 Survey Sub-national 8 (5.9–10)
British Virgin Islands
Brunei Darussalam 2015 Surveillance National 0 (0–2.3) 2015 Surveillance National 0 (0–37)
Bulgaria 2012 Surveillance National 3.3 (2.1–5.0) 2012 Surveillance National 25 (18–33)
Burkina Faso
Burundi
Cabo Verde
Cambodia 2007 Survey National 1.8 (0.77–2.8) 2007 Survey National 11 (1.4–20)
Cameroon
Canada 2014 Surveillance National 1.4 (0.72–2.4) 2014 Surveillance National 1.8 (<0.1–9.6)
Cayman Islands 2013 Surveillance National 0 (0–71) 2013 Surveillance National 0 (0–0)
Central African Republic 2009 Survey Sub-national 0.4 (0–1.6)
Chad
Chile 2015 Surveillance National 1.5 (0.88–2.3) 2015 Surveillance National 5.6 (2.6–10)
China 2007 Survey National 6.6 (5.3–7.9) 2007 Survey National 30 (25–34)
China, Hong Kong SAR 2011 Surveillance National 1.2 (0.73–1.7) 2011 Surveillance National 3.4 (1.4–6.8)
China, Macao SAR 2015 Surveillance National 2.5 (0.91–5.3) 2015 Surveillance National 16 (4.5–36)
Colombia 2005 Survey National 2.4 (1.4–3.4) 2012 Surveillance National 14 (11–18)
Comoros
Congo
Cook Islands 2015 Surveillance National 0 (0–98) 2015 Surveillance National 0 (0–0)
Costa Rica 2006 Survey National 1.9 (0–3.9) 2012 Surveillance National 9.1 (1.1–29)
Côte d'Ivoire 2006 Survey National 3.1 (1.0–5.3)
Croatia 2015 Surveillance National 0 (0–1.4) 2015 Surveillance National 0 (0–16)
Cuba 2012 Surveillance National 2.2 (0.82–4.8) 2014 Surveillance National 4.2 (0.51–14)
Curaçao 2014 Surveillance National 0 (0–60) 2014 Surveillance National 0 (0–0)
Cyprus 2015 Surveillance National 0 (0–10) 2015 Surveillance National 0 (0–0)
Czechia 2014 Surveillance National 1.7 (0.56–4.0) 2014 Surveillance National 13 (1.7–40)
Democratic People's Republic of Korea 2014 Survey Sub-national 2.2 (0.51–3.9) 2014 Survey Sub-national 16 (8.4–24)
Democratic Republic of the Congo
Denmark 2014 Surveillance National 0.51 (<0.1–2.8) 2014 Surveillance National 0 (0–19)
New TB cases Previously treated TB cases
a Empty rows indicate an absence of high-quality survey or surveillance data. In the absence of high-quality national data, high-quality sub-national data are used.

Data for all years can be downloaded from www.who.int/tb/data GLOBAL TUBERCULOSIS REPORT 2016 :: 191
a Empty rows indicate an absence of high-quality survey or surveillance data. In the absence of high-quality national data, high-quality sub-national data are used.
:: TABLE A4.3Measured percentage of TB cases with MDR/RR-TB,a most recent year availableTable A4.3
Measured percentage of TB cases with MDR/RR-TBa, most recent year available
Year Source Coverage Percentage Year Source Coverage Percentage
New TB cases Previously treated TB cases
Djibouti 2015 Survey National 4.3 (1.8–6.8) 2015 Survey National 34 (21–46)
Dominica 2013 Surveillance National 0 (0–98) 2013 Surveillance National 0 (0–0)
Dominican Republic
Ecuador 2002 Survey National 7.3 (5.4–9.2) 2012 Surveillance National 28 (25–31)
Egypt 2011 Survey National 14 (12–16) 2015 Surveillance National 23 (20–27)
El Salvador 2001 Survey National 1.1 (0.17–2.1) 2014 Surveillance National 4.1 (1.3–9.2)
Equatorial Guinea
Eritrea
Estonia 2015 Surveillance National 16 (10–23) 2015 Surveillance National 54 (37–71)
Ethiopia 2005 Survey National 2.7 (1.5–4.0) 2005 Survey National 14 (5.6–23)
Fiji 2006 Surveillance National 0 (0–8.2) 2006 Surveillance National 0 (0–98)
Finland 2015 Surveillance National 5.1 (2.2–9.8) 2015 Surveillance National 0 (0–60)
France 2014 Surveillance National 1 (0.65–1.5) 2014 Surveillance National 10 (7.1–15)
French Polynesia 2015 Surveillance National 0 (0–11) 2015 Surveillance National 50 (1.3–99)
Gabon
Gambia
Georgia 2015 Surveillance National 12 (11–14) 2015 Surveillance National 33 (29–37)
Germany 2015 Surveillance National 2.2 (0.82–4.8) 2015 Surveillance National 23 (16–30)
Ghana 2015 Surveillance National 7.2 (5.7–9.0)
Greece 2010 Surveillance National 1.5 (<0.1–8.0) 2010 Surveillance National 9.1 (0.23–41)
Greenland
Grenada
Guam 2012 Surveillance National 0 (0–11) 2012 Surveillance National 0 (0–0)
Guatemala 2002 Survey National 4.2 (2.6–5.8) 2002 Survey National 29 (21–37)
Guinea
Guinea-Bissau
Guyana
Haiti
Honduras 2004 Survey National 2.2 (0.69–3.7) 2004 Survey National 21 (10–31)
Hungary 2010 Surveillance National 2.9 (1.6–4.8) 2010 Surveillance National 8.1 (3.3–16)
Iceland 2015 Surveillance National 0 (0–71) 2015 Surveillance National 0 (0–0)
India
2001,
2004,
2006,
2009
Multiple surveys 2.5 (2.1–3.1)2006,
2009Multiple surveys 16 (14–18)
Indonesia2004,
2006,
2010
Multiple surveys 2.8 (2.2–3.5)2006,
2010Multiple surveys 16 (10–20)
Iran (Islamic Republic of) 2014 Survey National 1.3 (0.60–2.0) 2014 Survey National 12 (6.1–19)
Iraq 2013 Survey National 6.1 (4.4–7.8) 2013 Survey National 24 (16–32)
Ireland 2015 Surveillance National 1.1 (<0.1–5.8) 2015 Surveillance National 0 (0–31)
Israel 2015 Surveillance National 8.8 (4.8–15) 2015 Surveillance National 33 (4.3–78)
Italy 2015 Surveillance National 2.8 (1.8–4.3) 2015 Surveillance National 13 (7.7–21)
Jamaica 2013 Surveillance National 1.7 (<0.1–9.1) 2013 Surveillance National 0 (0–0)
Japan 2002 Surveillance National 1 (0.69–1.5) 2002 Surveillance National 11 (8.2–14)
Jordan 2009 Surveillance National 6.3 (2.4–13) 2009 Surveillance National 29 (3.7–71)
Kazakhstan 2015 Surveillance National 25 (24–26) 2015 Surveillance National 43 (42–45)
Kenya 2014 Survey National 1.3 (0.68–1.9) 2014 Surveillance National 9.4 (8.7–10)
Kiribati
Kuwait 2015 Surveillance National 1.7 (0.76–3.1) 2015 Surveillance National 0 (0–0)
Kyrgyzstan 2011 Survey National 32 (28–36) 2013 Surveillance National 56 (53–59)
Lao People's Democratic Republic
Latvia 2015 Surveillance National 7.9 (5.6–11) 2015 Surveillance National 30 (21–41)
Lebanon 2003 Survey National 2.6 (0–5.4) 2013 Surveillance National 43 (9.9–82)
Lesotho 2014 Survey National 4.8 (3.7–5.9) 2014 Survey National 14 (9.3–18)
Liberia
Libya
Lithuania 2015 Surveillance National 12 (10–15) 2015 Surveillance National 47 (41–53)
Luxembourg 2014 Surveillance National 0 (0–0) 2014 Surveillance National 0 (0–0)
Madagascar 2007 Survey National 0.49 (0–1.1) 2007 Survey National 5.9 (0–14)
Malawi 2011 Survey National 0.75 (0–1.6) 2011 Survey National 6.4 (3.8–8.9)
a Empty rows indicate an absence of high-quality survey or surveillance data. In the absence of high-quality national data, high-quality sub-national data are used.

192 :: GLOBAL TUBERCULOSIS REPORT 2016 Data for all years can be downloaded from www.who.int/tb/data
:: TABLE A4.3Measured percentage of TB cases with MDR/RR-TB,a most recent year available
a Empty rows indicate an absence of high-quality survey or surveillance data. In the absence of high-quality national data, high-quality sub-national data are used.
Table A4.3
Measured percentage of TB cases with MDR/RR-TBa, most recent year available
Year Source Coverage Percentage Year Source Coverage Percentage
New TB cases Previously treated TB cases
Malaysia 2014 Surveillance National 1.5 (1.2–1.9) 2014 Surveillance National 3.1 (1.3–5.9)
Maldives 2015 Surveillance National 0 (0–52)
Mali
Malta 2015 Surveillance National 0 (0–25) 2015 Surveillance National 0 (0–0)
Marshall Islands 2014 Surveillance National 0 (0–4.4) 2015 Surveillance National 0 (0–41)
Mauritania
Mauritius 2015 Surveillance National 1.7 (0.20–5.9) 2015 Surveillance National 0 (0–71)
Mexico 2009 Survey National 2.6 (2.3–2.9) 2009 Survey National 11 (9.2–13)
Micronesia (Federated States of)
Monaco
Mongolia 2007 Survey National 2.2 (1.1–3.3) 2013 Surveillance National 33 (29–38)
Montenegro 2015 Surveillance National 1.9 (<0.1–10) 2015 Surveillance National 0 (0–60)
Montserrat
Morocco 2014 Survey National 1 (0.30–1.7) 2014 Survey National 8.7 (4.8–13)
Mozambique 2007 Survey National 3.7 (2.4–5.0) 2007 Survey National 20 (1.9–37)
Myanmar 2013 Survey National 5.1 (3.2–7.0) 2013 Survey National 27 (15–39)
Namibia 2015 Survey National 5 (4.1–5.9) 2015 Survey National 12 (9.3–14)
Nauru
Nepal 2011 Survey National 2.2 (0.98–3.4) 2011 Survey National 15 (9.2–22)
Netherlands 2015 Surveillance National 1.6 (0.60–3.5) 2015 Surveillance National 18 (5.2–40)
New Caledonia 2014 Surveillance National 0 (0–28) 2014 Surveillance National 0 (0–84)
New Zealand 2014 Surveillance National 2.6 (0.70–6.4) 2014 Surveillance National 20 (0.51–72)
Nicaragua 2006 Survey National 0.94 (0–2.3) 2010 Surveillance National 12 (7.3–18)
Niger
Nigeria 2010 Survey National 4.3 (3.2–5.4) 2010 Survey National 25 (19–31)
Niue
Northern Mariana Islands 2014 Surveillance National 5.3 (0.13–26) 2014 Surveillance National 0 (0–98)
Norway 2015 Surveillance National 2.6 (0.86–6.0) 2015 Surveillance National 4.8 (0.12–24)
Oman 2014 Surveillance National 3.5 (1.5–6.7) 2015 Surveillance National 0 (0–37)
Pakistan 2013 Survey National 4.2 (3.2–5.3) 2015 Surveillance National 16 (15–17)
Palau 2013 Surveillance National 0 (0–41) 2013 Surveillance National 0 (0–0)
Panama
Papua New Guinea 2014 Survey Sub-national 3.4 (1.7–5.0) 2014 Survey Sub-national 26 (15–36)
Paraguay 2008 Survey National 0.9 (0–2.2) 2008 Survey National 15 (4.0–25)
Peru 2015 Surveillance National 5.9 (5.6–6.3) 2015 Surveillance National 21 (19–22)
Philippines 2012 Survey National 2.6 (1.8–3.3) 2012 Survey National 29 (21–38)
Poland 2015 Surveillance National 0.66 (0.42–0.98) 2015 Surveillance National 3.7 (2.1–5.9)
Portugal 2012 Surveillance National 0.98 (0.51–1.7) 2012 Surveillance National 6.9 (2.8–14)
Puerto Rico 2014 Surveillance National 0 (0–9.3) 2015 Surveillance National 0 (0–98)
Qatar 2014 Surveillance National 1.3 (0.16–4.7)
Republic of Korea 2004 Survey National 3.7 (3.0–4.5) 2004 Survey National 17 (12–22)
Republic of Moldova 2015 Surveillance National 32 (29–34) 2015 Surveillance National 69 (66–72)
Romania 2015 Survey National 3 (2.1–3.9) 2015 Survey National 12 (9.3–15)
Russian Federation 2013 Oblasts 22 (14–25) 2013 Oblasts 53 (40–59)
Rwanda 2015 Survey National 1.5 (0.77–2.2) 2015 Survey National 11 (3.3–18)
Saint Kitts and Nevis
Saint Lucia 2013 Surveillance National 0 (0–52) 2013 Surveillance National 0 (0–0)
Saint Vincent and the Grenadines 2014 Surveillance National 0 (0–98)
Samoa 2013 Surveillance National 0 (0–28) 2013 Surveillance National 0 (0–0)
San Marino
Sao Tome and Principe 2012 Surveillance National 88 (47–100)
Saudi Arabia 2010 Survey National 2.6 (2.0–3.2) 2010 Survey National 20 (16–25)
Senegal 2014 Survey National 0.9 (0.24–1.6) 2014 Survey National 19 (12–25)
Serbia 2013 Surveillance National 1.1 (0.49–2.2) 2013 Surveillance National 4.7 (1.3–11)
Seychelles 2015 Surveillance National 0 (0–46) 2015 Surveillance National 0 (0–0)
Sierra Leone
Singapore 2015 Surveillance National 1 (0.52–1.8) 2015 Surveillance National 0.99 (<0.1–5.4)
Sint Maarten (Dutch part)
Slovakia 2012 Surveillance National 0 (0–2.6) 2012 Surveillance National 3.7 (<0.1–19)
a Empty rows indicate an absence of high-quality survey or surveillance data. In the absence of high-quality national data, high-quality sub-national data are used.

Data for all years can be downloaded from www.who.int/tb/data GLOBAL TUBERCULOSIS REPORT 2016 :: 193
:: TABLE A4.3Measured percentage of TB cases with MDR/RR-TB,a most recent year available
a Empty rows indicate an absence of high-quality survey or surveillance data. In the absence of high-quality national data, high-quality sub-national data are used.
Table A4.3
Measured percentage of TB cases with MDR/RR-TBa, most recent year available
Year Source Coverage Percentage Year Source Coverage Percentage
New TB cases Previously treated TB cases
Slovenia 2015 Surveillance National 0 (0–4.1) 2015 Surveillance National 0 (0–41)
Solomon Islands 2013 Surveillance National 0 (0–41)
Somalia 2011 Survey National 8.7 (5.9–11) 2011 Survey National 47 (29–65)
South Africa 2014 Survey National 3.5 (2.8–4.2) 2014 Survey National 7.1 (5.3–8.9)
South Sudan
Spain 2001, 2005 Multiple surveys 0.44 (0.12–1.1) 2001, 2005 Multiple surveys 7.1 (3.3–13)
Sri Lanka 2006 Survey National 0.54 (0–1.3) 2013 Surveillance National 1.7 (0.64–3.7)
Sudan
Suriname 2015 Surveillance National 9.9 (4.1–19) 2015 Surveillance National 25 (0.63–81)
Swaziland 2009 Survey National 8 (3.1–13) 2009 Survey National 36 (31–42)
Sweden 2015 Surveillance National 4 (2.3–6.3) 2015 Surveillance National 18 (3.8–43)
Switzerland 2015 Surveillance National 3.2 (1.3–6.4) 2015 Surveillance National 26 (9.1–51)
Syrian Arab Republic 2003 Survey National 8 (4.9–11) 2015 Surveillance National 18 (11–27)
Tajikistan 2014 Surveillance National 14 (12–15) 2014 Surveillance National 77 (73–80)
Thailand 2012 Survey National 2.2 (1.5–2.9) 2012 Survey National 24 (18–30)
The Former Yugoslav Republic of
Macedonia2015 Surveillance National 2.4 (0.65–6.0) 2015 Surveillance National 6.7 (0.17–32)
Timor-Leste
Togo 2013 Surveillance National 12 (7.0–19)
Tokelau
Tonga
Trinidad and Tobago
Tunisia 2015 Surveillance National 0.54 (0.20–1.2) 2015 Surveillance National 17 (7.2–32)
Turkey 2015 Surveillance National 3.6 (3.1–4.2) 2015 Surveillance National 21 (17–24)
Turkmenistan 2013 Survey National 14 (11–17) 2013 Survey National 38 (31–46)
Turks and Caicos Islands
Tuvalu
Uganda 2011 Survey National 1.6 (0.78–2.4) 2011 Survey National 12 (5.9–18)
Ukraine 2014 Survey National 25 (21–28) 2014 Survey National 58 (53–64)
United Arab Emirates 2013 Surveillance National 0 (0–52)
United Kingdom of Great Britain and
Northern Ireland2015 Surveillance National 1.4 (0.98–2.0) 2015 Surveillance National 3.4 (1.1–7.9)
United Republic of Tanzania 2007 Survey National 1.3 (0.47–2.1) 2007 Survey National 4.7 (0.37–9.0)
United States of America 2015 Surveillance National 1.5 (1.2–1.8) 2015 Surveillance National 5.5 (3.2–8.8)
Uruguay 2015 Surveillance National 0.55 (0.11–1.6) 2015 Surveillance National 0 (0–17)
US Virgin Islands
Uzbekistan 2011 Survey National 24 (18–30) 2011 Survey National 63 (54–71)
Vanuatu 2006 Surveillance National 0 (0–12)
Venezuela (Bolivarian Republic of)
Viet Nam 2012 Survey National 4.1 (2.6–5.5) 2015 Surveillance National 25 (24–26)
Wallis and Futuna Islands
West Bank and Gaza Strip
Yemen 2011 Survey National 2.3 (0.92–3.7) 2011 Survey National 18 (11–25)
Zambia 2008 Survey National 1.1 (0.13–2.1) 2008 Survey National 18 (11–26)
Zimbabwe
a Empty rows indicate an absence of high-quality survey or surveillance data. In the absence of high-quality national data, high-quality sub-national data are used.

194 :: GLOBAL TUBERCULOSIS REPORT 2016 Data for all years can be downloaded from www.who.int/tb/data
a Includes cases for which the treatment history is unknown.
:: TABLE A4.4TB case notifications, 2015Table A4.4TB case notifications, 2015
Total cases
notified Notified
% tested with rapid
diagnostics at time
of diagnosis
% with known HIV
status % pulmonary
% bacteriologically
confirmed among
pulmonary
Afghanistan 37 001 35 878 39 75 66
Albania 415 415 44 72 71
Algeria 23 879 23 705 1 36 85
American Samoa 4 4 100 100
Andorra 4 4 75 0 50 100
Angola 61 060 59 705 23 93 51
Anguilla 0 0
Antigua and Barbuda
Argentina 10 506 9 601 19 86 70
Armenia 1 104 1 090 18 100 72 45
Aruba
Australia 1 254 1 254 79 63 88
Austria 583 564 53 78 87
Azerbaijan 7 501 5 456 43 128 80 60
Bahamas 62 62 90 90 54
Bahrain
Bangladesh 209 438 206 915 0 79 72
Barbados 0 0
Belarus 4 177 3 765 72 99 92 78
Belgium 988 928 0 46 70 85
Belize 84 78 90 91 59
Benin 4 092 3 985 101 91 91
Bermuda 0 0
Bhutan 975 963 67 52 89
Bolivia (Plurinational State of) 7 893 7 789 83 79 91
Bonaire, Saint Eustatius and Saba
Bosnia and Herzegovina 1 095 1 092 100 19 89 70
Botswana 5 073 4 972 91 81 52
Brazil 81 137 73 221 23 82 87 73
British Virgin Islands 0 0
Brunei Darussalam 212 212 100 83 96
Bulgaria 1 660 1 619 1 74 65
Burkina Faso 5 808 5 594 2 97 85 84
Burundi 6 969 6 892 8 95 70 88
Cabo Verde 272 269 100 90 82
Cambodia 35 638 35 169 84 63 48
Cameroon 26 570 26 117 2 92 84 74
Canada 1 640 1 640 44 70 80
Cayman Islands 7 7 0 100 100
Central African Republic 10 799 10 459 1 48 82 61
Chad 12 026 11 471 1 69 85 54
Chile 2 657 2 569 1 63 80 86
China 804 163 798 439 47 96 31
China, Hong Kong SAR 4 498 4 498 73 77 61
China, Macao SAR 372 370 25 88 87 82
Colombia 12 749 11 895 3 93 81 79
Comoros
Congo 10 119 9 937 3 13 75 51
Cook Islands 1 1 100 100 100
Costa Rica 424 424 98 86 75
Côte d'Ivoire 22 879 22 458 95 78 84
Croatia 486 484 0 93 85
Cuba 753 698 7 100 90 82
Curaçao
Cyprus 63 63 8 87 78
Czechia 518 508 46 36 87 85
Democratic People's Republic of Korea 120 722 112 840 0 82 50
Democratic Republic of the Congo 120 508 119 213 10 50 82 83
Denmark 357 320 0 81 82
New and relapse casesa
a Includes cases for which the treatment history is unknown.

Data for all years can be downloaded from www.who.int/tb/data GLOBAL TUBERCULOSIS REPORT 2016 :: 195
a Includes cases for which the treatment history is unknown.
:: TABLE A4.4TB case notifications, 2015Table A4.4TB case notifications, 2015
Total cases
notified Notified
% tested with rapid
diagnostics at time
of diagnosis
% with known HIV
status % pulmonary
% bacteriologically
confirmed among
pulmonary
New and relapse casesa
Djibouti 2 692 2 686 51 90 57 78
Dominica 7 7 100 100 71
Dominican Republic 4 690 4 504 79 88 69
Ecuador 5 215 5 097 93 82 93
Egypt 8 155 7 860 10 23 63 82
El Salvador 2 461 2 452 15 97 86 90
Equatorial Guinea 1 286 1 242 17 73 91 72
Eritrea 2 094 2 060 100 65 59
Estonia 217 206 73 96 91 87
Ethiopia 137 960 135 951 6 77 70 54
Fiji 371 363 30 90 65 67
Finland 271 267 31 76 82
France
French Polynesia 51 46 0 83 87
Gabon 6 293 5 727 49 92 54
Gambia 2 551 2 531 90 93 63
Georgia 3 611 3 152 64 89 79 83
Germany 5 865 5 671 54 77 81
Ghana 14 999 14 460 11 83 92 62
Greece 482 438 43 88 85
Greenland 80 80 89 45 88 76
Grenada 5 5 0 100 60 100
Guam 76 76 46 93 97 55
Guatemala 3 381 3 325 5 92 93 83
Guinea 12 242 12 154 1 79 78 84
Guinea-Bissau 2 141 2 133 70 95 74
Guyana 668 571 8 85 93 60
Haiti 16 431 16 431 6 90 90 78
Honduras 2 919 2 906 88 89 84
Hungary 906 858 0 97 49
Iceland 7 7 43 71 60
India 1 740 435 1 667 136 67 82 64
Indonesia 330 729 328 895 11 93 64
Iran (Islamic Republic of) 10 399 10 215 37 72 80
Iraq 8 255 8 183 51 61 59
Ireland 312 295 0 25 67 73
Israel 280 280 100 72 79
Italy 3 769 3 476 0 72 80
Jamaica 103 103 38 64 98 66
Japan 18 280 18 280 8 77 87
Jordan 437 424 39 85 64 35
Kazakhstan 14 631 14 006 83 99 88 81
Kenya 81 518 81 292 10 97 82 59
Kiribati 516 496 42 86 68
Kuwait 748 748 72 100 75 97
Kyrgyzstan 7 833 7 027 21 96 74 61
Lao People's Democratic Republic 4 638 4 534 37 90 91 85
Latvia 721 697 0 63 93 85
Lebanon 666 656 36 27 60 63
Lesotho 7 892 7 594 96 86 49
Liberia 5 849 5 814 73 78 61
Libya 1 014 966 100 63 76
Lithuania 1 507 1 395 0 71 90 85
Luxembourg 30 30 0 80 83
Madagascar 29 939 29 464 33 78 89
Malawi 17 104 15 737 6 93 75 58
Malaysia 24 220 23 565 2 98 87 75
Maldives 153 153 14 100 73 100
Mali 7 015 5 998 67 79 100
a Includes cases for which the treatment history is unknown.
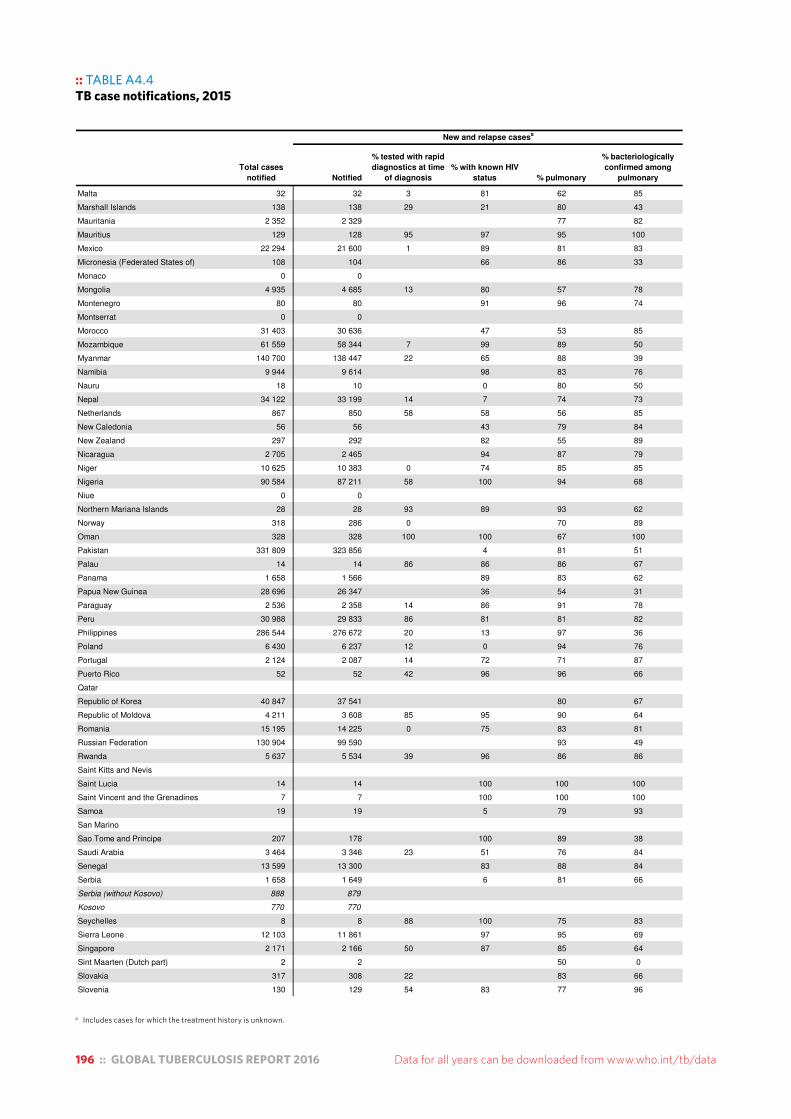
196 :: GLOBAL TUBERCULOSIS REPORT 2016 Data for all years can be downloaded from www.who.int/tb/data
a Includes cases for which the treatment history is unknown.
:: TABLE A4.4TB case notifications, 2015Table A4.4TB case notifications, 2015
Total cases
notified Notified
% tested with rapid
diagnostics at time
of diagnosis
% with known HIV
status % pulmonary
% bacteriologically
confirmed among
pulmonary
New and relapse casesa
Malta 32 32 3 81 62 85
Marshall Islands 138 138 29 21 80 43
Mauritania 2 352 2 329 77 82
Mauritius 129 128 95 97 95 100
Mexico 22 294 21 600 1 89 81 83
Micronesia (Federated States of) 108 104 66 86 33
Monaco 0 0
Mongolia 4 935 4 685 13 80 57 78
Montenegro 80 80 91 96 74
Montserrat 0 0
Morocco 31 403 30 636 47 53 85
Mozambique 61 559 58 344 7 99 89 50
Myanmar 140 700 138 447 22 65 88 39
Namibia 9 944 9 614 98 83 76
Nauru 18 10 0 80 50
Nepal 34 122 33 199 14 7 74 73
Netherlands 867 850 58 58 56 85
New Caledonia 56 56 43 79 84
New Zealand 297 292 82 55 89
Nicaragua 2 705 2 465 94 87 79
Niger 10 625 10 383 0 74 85 85
Nigeria 90 584 87 211 58 100 94 68
Niue 0 0
Northern Mariana Islands 28 28 93 89 93 62
Norway 318 286 0 70 89
Oman 328 328 100 100 67 100
Pakistan 331 809 323 856 4 81 51
Palau 14 14 86 86 86 67
Panama 1 658 1 566 89 83 62
Papua New Guinea 28 696 26 347 36 54 31
Paraguay 2 536 2 358 14 86 91 78
Peru 30 988 29 833 86 81 81 82
Philippines 286 544 276 672 20 13 97 36
Poland 6 430 6 237 12 0 94 76
Portugal 2 124 2 087 14 72 71 87
Puerto Rico 52 52 42 96 96 66
Qatar
Republic of Korea 40 847 37 541 80 67
Republic of Moldova 4 211 3 608 85 95 90 64
Romania 15 195 14 225 0 75 83 81
Russian Federation 130 904 99 590 93 49
Rwanda 5 637 5 534 39 96 86 86
Saint Kitts and Nevis
Saint Lucia 14 14 100 100 100
Saint Vincent and the Grenadines 7 7 100 100 100
Samoa 19 19 5 79 93
San Marino
Sao Tome and Principe 207 178 100 89 38
Saudi Arabia 3 464 3 346 23 51 76 84
Senegal 13 599 13 300 83 88 84
Serbia 1 658 1 649 6 81 66
Serbia (without Kosovo) 888 879
Kosovo 770 770
Seychelles 8 8 88 100 75 83
Sierra Leone 12 103 11 861 97 95 69
Singapore 2 171 2 166 50 87 85 64
Sint Maarten (Dutch part) 2 2 50 0
Slovakia 317 308 22 83 66
Slovenia 130 129 54 83 77 96
a Includes cases for which the treatment history is unknown.
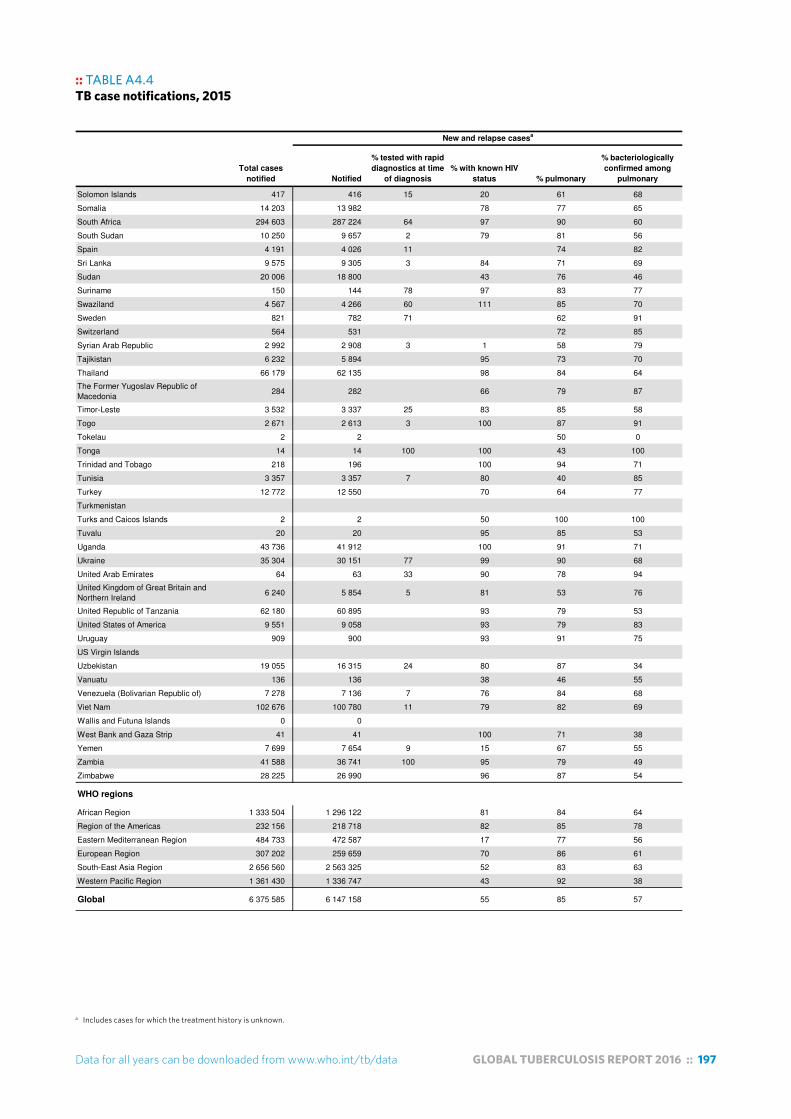
Data for all years can be downloaded from www.who.int/tb/data GLOBAL TUBERCULOSIS REPORT 2016 :: 197
a Includes cases for which the treatment history is unknown.
:: TABLE A4.4TB case notifications, 2015Table A4.4TB case notifications, 2015
Total cases
notified Notified
% tested with rapid
diagnostics at time
of diagnosis
% with known HIV
status % pulmonary
% bacteriologically
confirmed among
pulmonary
New and relapse casesa
Solomon Islands 417 416 15 20 61 68
Somalia 14 203 13 982 78 77 65
South Africa 294 603 287 224 64 97 90 60
South Sudan 10 250 9 657 2 79 81 56
Spain 4 191 4 026 11 74 82
Sri Lanka 9 575 9 305 3 84 71 69
Sudan 20 006 18 800 43 76 46
Suriname 150 144 78 97 83 77
Swaziland 4 567 4 266 60 111 85 70
Sweden 821 782 71 62 91
Switzerland 564 531 72 85
Syrian Arab Republic 2 992 2 908 3 1 58 79
Tajikistan 6 232 5 894 95 73 70
Thailand 66 179 62 135 98 84 64
The Former Yugoslav Republic of
Macedonia284 282 66 79 87
Timor-Leste 3 532 3 337 25 83 85 58
Togo 2 671 2 613 3 100 87 91
Tokelau 2 2 50 0
Tonga 14 14 100 100 43 100
Trinidad and Tobago 218 196 100 94 71
Tunisia 3 357 3 357 7 80 40 85
Turkey 12 772 12 550 70 64 77
Turkmenistan
Turks and Caicos Islands 2 2 50 100 100
Tuvalu 20 20 95 85 53
Uganda 43 736 41 912 100 91 71
Ukraine 35 304 30 151 77 99 90 68
United Arab Emirates 64 63 33 90 78 94
United Kingdom of Great Britain and
Northern Ireland6 240 5 854 5 81 53 76
United Republic of Tanzania 62 180 60 895 93 79 53
United States of America 9 551 9 058 93 79 83
Uruguay 909 900 93 91 75
US Virgin Islands
Uzbekistan 19 055 16 315 24 80 87 34
Vanuatu 136 136 38 46 55
Venezuela (Bolivarian Republic of) 7 278 7 136 7 76 84 68
Viet Nam 102 676 100 780 11 79 82 69
Wallis and Futuna Islands 0 0
West Bank and Gaza Strip 41 41 100 71 38
Yemen 7 699 7 654 9 15 67 55
Zambia 41 588 36 741 100 95 79 49
Zimbabwe 28 225 26 990 96 87 54
WHO regions
African Region 1 333 504 1 296 122 81 84 64
Region of the Americas 232 156 218 718 82 85 78
Eastern Mediterranean Region 484 733 472 587 17 77 56
European Region 307 202 259 659 70 86 61
South-East Asia Region 2 656 560 2 563 325 52 83 63
Western Pacific Region 1 361 430 1 336 747 43 92 38
Global 6 375 585 6 147 158 55 85 57
a Includes cases for which the treatment history is unknown.
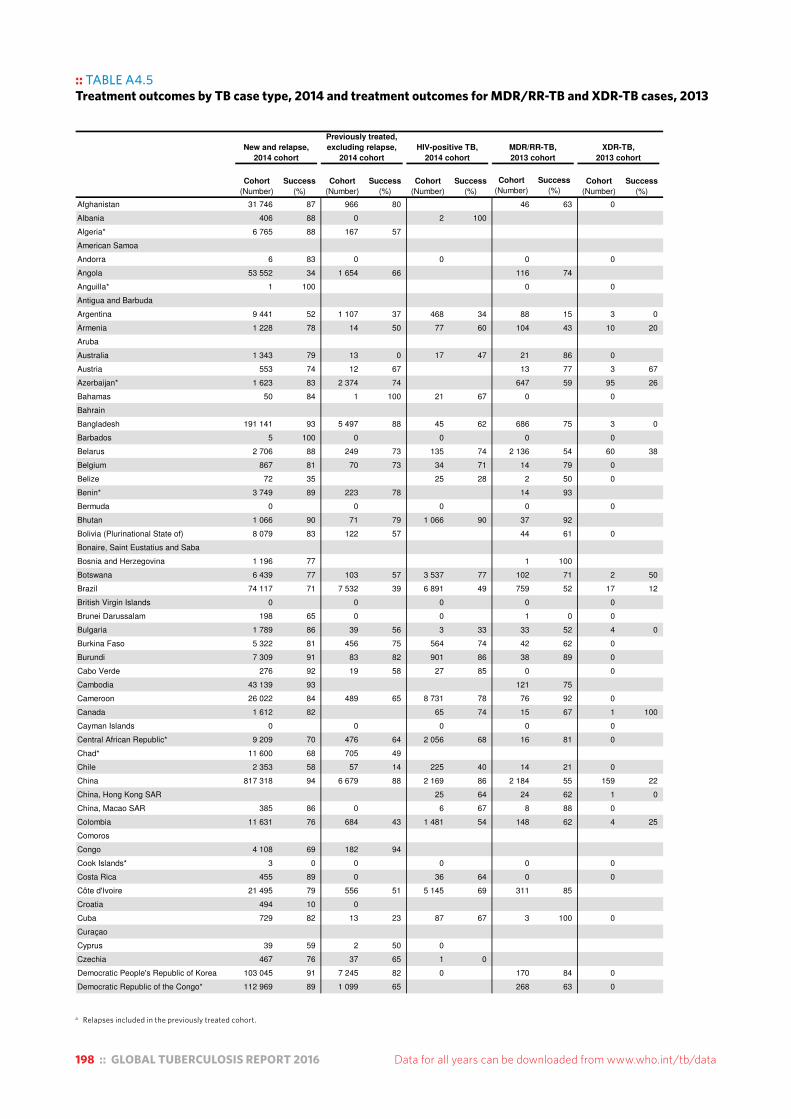
198 :: GLOBAL TUBERCULOSIS REPORT 2016 Data for all years can be downloaded from www.who.int/tb/data
a Relapses included in the previously treated cohort.
:: TABLE A4.5Treatment outcomes by TB case type, 2014 and treatment outcomes for MDR/RR-TB and XDR-TB cases, 2013Table A4.5Treatment outcomes by TB case type, 2014 and treatment outcomes for MDR/RR-TB and XDR-TB cases, 2013
Cohort
(Number)
Success
(%)
Afghanistan 31 746 87 966 80 46 63 0
Albania 406 88 0 2 100
Algeria* 6 765 88 167 57
American Samoa
Andorra 6 83 0 0 0 0
Angola 53 552 34 1 654 66 116 74
Anguilla* 1 100 0 0
Antigua and Barbuda
Argentina 9 441 52 1 107 37 468 34 88 15 3 0
Armenia 1 228 78 14 50 77 60 104 43 10 20
Aruba
Australia 1 343 79 13 0 17 47 21 86 0
Austria 553 74 12 67 13 77 3 67
Azerbaijan* 1 623 83 2 374 74 647 59 95 26
Bahamas 50 84 1 100 21 67 0 0
Bahrain
Bangladesh 191 141 93 5 497 88 45 62 686 75 3 0
Barbados 5 100 0 0 0 0
Belarus 2 706 88 249 73 135 74 2 136 54 60 38
Belgium 867 81 70 73 34 71 14 79 0
Belize 72 35 25 28 2 50 0
Benin* 3 749 89 223 78 14 93
Bermuda 0 0 0 0 0
Bhutan 1 066 90 71 79 1 066 90 37 92
Bolivia (Plurinational State of) 8 079 83 122 57 44 61 0
Bonaire, Saint Eustatius and Saba
Bosnia and Herzegovina 1 196 77 1 100
Botswana 6 439 77 103 57 3 537 77 102 71 2 50
Brazil 74 117 71 7 532 39 6 891 49 759 52 17 12
British Virgin Islands 0 0 0 0 0
Brunei Darussalam 198 65 0 0 1 0 0
Bulgaria 1 789 86 39 56 3 33 33 52 4 0
Burkina Faso 5 322 81 456 75 564 74 42 62 0
Burundi 7 309 91 83 82 901 86 38 89 0
Cabo Verde 276 92 19 58 27 85 0 0
Cambodia 43 139 93 121 75
Cameroon 26 022 84 489 65 8 731 78 76 92 0
Canada 1 612 82 65 74 15 67 1 100
Cayman Islands 0 0 0 0 0
Central African Republic* 9 209 70 476 64 2 056 68 16 81 0
Chad* 11 600 68 705 49
Chile 2 353 58 57 14 225 40 14 21 0
China 817 318 94 6 679 88 2 169 86 2 184 55 159 22
China, Hong Kong SAR 25 64 24 62 1 0
China, Macao SAR 385 86 0 6 67 8 88 0
Colombia 11 631 76 684 43 1 481 54 148 62 4 25
Comoros
Congo 4 108 69 182 94
Cook Islands* 3 0 0 0 0 0
Costa Rica 455 89 0 36 64 0 0
Côte d'Ivoire 21 495 79 556 51 5 145 69 311 85
Croatia 494 10 0
Cuba 729 82 13 23 87 67 3 100 0
Curaçao
Cyprus 39 59 2 50 0
Czechia 467 76 37 65 1 0
Democratic People's Republic of Korea 103 045 91 7 245 82 0 170 84 0
Democratic Republic of the Congo* 112 969 89 1 099 65 268 63 0
Cohort
(Number)
Success
(%)
Cohort
(Number)
Success
(%)
XDR-TB,
2013 cohort
Cohort
(Number)
Success
(%)
New and relapse,
2014 cohort
MDR/RR-TB,
2013 cohort
Previously treated,
excluding relapse,
2014 cohort
HIV-positive TB,
2014 cohort
Success
(%)
Cohort
(Number)
* Relapses included in the previously treated cohort.

Data for all years can be downloaded from www.who.int/tb/data GLOBAL TUBERCULOSIS REPORT 2016 :: 199
a Relapses included in the previously treated cohort.
:: TABLE A4.5Treatment outcomes by TB case type, 2014 and treatment outcomes for MDR/RR-TB and XDR-TB cases, 2013Table A4.5Treatment outcomes by TB case type, 2014 and treatment outcomes for MDR/RR-TB and XDR-TB cases, 2013
Cohort
(Number)
Success
(%)Cohort
(Number)
Success
(%)
Cohort
(Number)
Success
(%)
XDR-TB,
2013 cohort
Cohort
(Number)
Success
(%)
New and relapse,
2014 cohort
MDR/RR-TB,
2013 cohort
Previously treated,
excluding relapse,
2014 cohort
HIV-positive TB,
2014 cohort
Success
(%)
Cohort
(Number)
Denmark 291 52 27 63 4 25 0 1 100
Djibouti 1 240 81
Dominica 1 100 0 1 100 0 0
Dominican Republic 2 770 83 200 58 291 69 94 73 4 75
Ecuador 5 072 77 176 52 132 45 0
Egypt 7 177 84 290 56 0 60 57 0
El Salvador 2 206 91 14 43 203 75 10 90 0
Equatorial Guinea 551 58 78 14 287 28
Eritrea 2 389 91 34 88 128 83 6 83 0
Estonia 194 84 1 100 14 71 44 70 10 40
Ethiopia* 121 563 89 397 68
Fiji 315 87 8 88 11 91 0 0
Finland 250 45 5 40
France
French Polynesia 58 76 2 100 0 0 0
Gabon 4 843 58 479 50
Gambia* 1 475 88
Georgia 2 862 83 509 69 21 76 411 43 70 21
Germany 4 283 63 143 64 105 39 0
Ghana 14 662 85 614 81 2 753 76 26 69 0
Greece
Greenland 99 68 0 1 100 0 0
Grenada 0 0 0 0 0
Guam 56 89 4 75 0 0 0
Guatemala 2 756 85 55 53 194 71 27 78 0
Guinea 11 117 83 270 66 2 067 77 53 58 0
Guinea-Bissau 2 234 81 1 100 15 40
Guyana 545 69 103 38 111 59 0 0
Haiti 15 779 78 157 52 2 588 67 81 83
Honduras 1 810 89 180 68 256 63 4 75 0
Hungary 795 73 52 50 2 100 10 40 1 0
Iceland 9 89 0 0
India 1 609 547 74 74 368 65 44 257 76 21 093 46 392 33
Indonesia 322 806 84 1 733 63 2 548 56 809 51 10 40
Iran (Islamic Republic of) 10 172 87 202 76 265 63 54 74 1 100
Iraq 8 268 92 73 79 0 84 58
Ireland 288 56 21 48 17 47 3 33 0
Israel 322 89 0 22 73 7 57 1 0
Italy
Jamaica 89 18 0 19 5
Japan* 15 130 53 26 38
Jordan 385 88 20 90 0 13 77 0
Kazakhstan 12 473 90 330 77 381 71 6 527 72 360 30
Kenya 89 294 87 227 78 30 107 82 266 82 1 0
Kiribati 415 87 17 88 1 0 0 0
Kuwait 734 97 0 1 100 7 100 0
Kyrgyzstan 5 731 84 915 79 1 064 57 43 28
Lao People's Democratic Republic 4 198 86 23 61 292 57 7 71 0
Latvia 675 83 15 67 74 66 64 67 15 73
Lebanon 671 76 10 80 3 33 7 86 0
Lesotho 9 000 70 936 59 5 466 69 163 63 3 33
Liberia 4 998 74 37 49
Libya 1 153 57 33 48 54 26
Lithuania 1 282 81 46 46 25 72 227 40 47 0
Luxembourg
Madagascar* 18 822 83 1 949 78 14 64 0
Malawi 16 267 85 1 456 75 19 53 0
Malaysia 23 982 78 637 58 1 400 52 68 62 1
* Relapses included in the previously treated cohort.

200 :: GLOBAL TUBERCULOSIS REPORT 2016 Data for all years can be downloaded from www.who.int/tb/data
a Relapses included in the previously treated cohort.
:: TABLE A4.5Treatment outcomes by TB case type, 2014 and treatment outcomes for MDR/RR-TB and XDR-TB cases, 2013Table A4.5Treatment outcomes by TB case type, 2014 and treatment outcomes for MDR/RR-TB and XDR-TB cases, 2013
Cohort
(Number)
Success
(%)Cohort
(Number)
Success
(%)
Cohort
(Number)
Success
(%)
XDR-TB,
2013 cohort
Cohort
(Number)
Success
(%)
New and relapse,
2014 cohort
MDR/RR-TB,
2013 cohort
Previously treated,
excluding relapse,
2014 cohort
HIV-positive TB,
2014 cohort
Success
(%)
Cohort
(Number)
Maldives 126 37 0 0 0 0
Mali 5 177 73 789 70 240 57 12 42 0
Malta 1 100 0
Marshall Islands 152 86 1 0 0 1 100 0
Mauritania 2 420 70 13 62 0 7 43 0
Mauritius 126 90 1 100 15 60 0 0
Mexico 21 193 80 685 53 1 318 48 167 60 4 75
Micronesia (Federated States of) 166 94 8 0 0 0
Monaco 0 0 0 0 3 100
Mongolia 4 483 86 288 74 8 75 181 56 0
Montenegro 113 89 0 0 0 0
Montserrat
Morocco 29 992 86 881 63 65 42 0
Mozambique 55 703 89 2 567 94 313 52
Myanmar 135 984 87 3 677 73 10 782 70 667 83
Namibia* 7 981 87 2 068 78 3 112 80 184 64 6 0
Nauru 8 100 4 100 0 0 0
Nepal 34 764 92 1 286 87 15 73 257 71
Netherlands 796 85 10 70 21 76 17 100 0
New Caledonia 30 20 0 0
New Zealand 296 82 6 33 2 100 3 100 0
Nicaragua 1 577 85 77 78 9 78 0
Niger 10 815 79 251 63 490 62 31 81 0
Nigeria 86 464 87 4 890 83 17 014 79 339 77 2 0
Niue* 0 0 0 0 0
Northern Mariana Islands 26 62 0 0 0 0
Norway 293 84 20 80 13 77 6 83 0
Oman 358 96 0 3 100 2 100 0
Pakistan 308 327 93 8 005 82 1 484 69 64 30
Palau 14 57 0 0 0 0
Panama 1 483 79 97 49 178 68 4 50 0
Papua New Guinea* 4 077 70 728 62
Paraguay 2 240 71 164 51 179 39 6 33 0
Peru* 15 171 87 2 363 74 996 68 1 261 55 53 66
Philippines 219 737 92 6 062 83 174 52 1 968 49 6 50
Poland 6 500 58 149 49 46 22 1 0
Portugal 2 198 72 52 60 210 57 14 57 4 50
Puerto Rico* 44 66 0 6 50 1 100 0
Qatar
Republic of Korea 38 654 81 2 841 69 951 59 113 56
Republic of Moldova 3 459 79 292 47 241 53 943 57
Romania 14 525 85 752 45 270 69 601 41 56 16
Russian Federation 77 136 69 5 790 42 18 213 48 1 965 26
Rwanda 5 846 86 94 80 43 81 0
Saint Kitts and Nevis
Saint Lucia
Saint Vincent and the Grenadines 0 0
Samoa 23 78 1 0 0 0 0
San Marino
Sao Tome and Principe 149 74 9 56 24 54 6 83 0
Saudi Arabia 3 248 62 88 33 63 27
Senegal 13 226 87 264 79 481 71
Serbia 1 281 81 14 50 9 78 13 77 0
Seychelles 13 69 0 1 0 0 0
Sierra Leone 12 191 85 227 62
Singapore 2 143 78 0 50 82 15 27 0
Sint Maarten (Dutch part)* 7 100 0
Slovakia 318 88 14 71 0 2 0 0
* Relapses included in the previously treated cohort.

Data for all years can be downloaded from www.who.int/tb/data GLOBAL TUBERCULOSIS REPORT 2016 :: 201
a Relapses included in the previously treated cohort.
:: TABLE A4.5Treatment outcomes by TB case type, 2014 and treatment outcomes for MDR/RR-TB and XDR-TB cases, 2013Table A4.5Treatment outcomes by TB case type, 2014 and treatment outcomes for MDR/RR-TB and XDR-TB cases, 2013
Cohort
(Number)
Success
(%)Cohort
(Number)
Success
(%)
Cohort
(Number)
Success
(%)
XDR-TB,
2013 cohort
Cohort
(Number)
Success
(%)
New and relapse,
2014 cohort
MDR/RR-TB,
2013 cohort
Previously treated,
excluding relapse,
2014 cohort
HIV-positive TB,
2014 cohort
Success
(%)
Cohort
(Number)
Slovenia 142 77 2 50 0
Solomon Islands 345 91 1 0 0 0 0
Somalia 12 903 86 227 59 30 77 0
South Africa 319 752 78 4 652 63 183 697 76 10 614 48 611 24
South Sudan 8 335 71 521 69 859 71
Spain 4 689 58 228 52 200 39
Sri Lanka 8 980 84 168 62 19 63 4 50 0
Sudan 5 769 82 73 64 2
Suriname 146 77 12 33 37 68 0 0
Swaziland 5 455 78 381 66 3 925 78 331 60 5 60
Sweden 610 87 31 84 8 75 2 50
Switzerland
Syrian Arab Republic 3 390 70 95 69 2 100 0
Tajikistan 5 149 89 355 82 625 60 4 75
Thailand 58 774 80 1 433 63 6 451 67
The Former Yugoslav Republic of
Macedonia281 87 1 100 1 0 2 50 0
Timor-Leste 3 657 84 121 66 2 50 0
Togo* 2 415 88 162 76 16 56 0
Tokelau
Tonga 13 100 0 0 0 0
Trinidad and Tobago 251 64 42 29 63 44 7 71 0
Tunisia 3 134 91 39 64 12 100 14 79 0
Turkey 12 933 87 192 50 41 66 228 65 3 33
Turkmenistan
Turks and Caicos Islands 1 0 0 1 0 0 0
Tuvalu 15 47 0 0 0 0
Uganda 43 628 75 2 438 67 16 670 73 214 73 0
Ukraine 22 294 72 5 269 66 6 104 35 7 633 39
United Arab Emirates 40 80 1 0 3 0 0 0
United Kingdom of Great Britain and
Northern Ireland6 512 81 450 72 77 65 3 33
United Republic of Tanzania 61 573 90 1 578 81 20 658 87 92 68 0
United States of America 8 237 85 397 79 467 80 39 79 1 100
Uruguay 843 75 26 88 130 51 1 100 0
US Virgin Islands
Uzbekistan 16 328 87 3 947 81 2 647 53
Vanuatu 39 87 1 100 0 0 0
Venezuela (Bolivarian Republic of) 6 353 80 223 73 482 79 19 53 4 50
Viet Nam 100 349 91 1 738 76 1 519 75 959 69
Wallis and Futuna Islands* 0 0 0 0 2 100
West Bank and Gaza Strip 43 91 0 0 0 0
Yemen 9 437 86 65 66 9 67
Zambia 37 930 85 4 786 80 58 33 0
Zimbabwe* 29 653 81 2 363 51 19 290 68 351 59
WHO regions
African Region 1 274 882 81 40 347 72 328 245 77 14 553 54 630 24
Region of the Americas 197 119 76 14 487 48 16 819 56 2 935 55 91 53
Eastern Mediterranean Region 438 187 91 10 995 79 404 53 1 950 68 67 30
European Region 216 485 76 22 429 63 7 923 41 42 486 52 2 761 27
South-East Asia Region 2 469 890 79 95 599 68 65 183 74 23 725 49 405 33
Western Pacific Region 1 277 110 92 19 062 80 5 700 72 6 512 57 282 37
Global 5 873 673 83 202 919 69 424 274 75 92 161 52 4 236 28
* Relapses included in the previously treated cohort.


Ending TB by 2030www.who.int/tb/data
ISBN 9 789241 5653946539
Related Documents