79 OECD 2000 OECD Economic Studies No. 30, 2000/I WHAT WORKS AMONG ACTIVE LABOUR MARKET POLICIES: EVIDENCE FROM OECD COUNTRIES’ EXPERIENCES John P. Martin TABLE OF CONTENTS Introduction................................................................................................................................ 80 Recent trends in public spending on labour market programmes..................................... 81 Indicators of the spending effort on active labour market policies................................ 81 Has there been a shift from passive to active measures? ............................................... 88 Active policies: what works and what does not ..................................................................... 89 Macroeconomic evaluations ................................................................................................ 89 The literature on evaluation of individual programmes .................................................. 89 Caveats to bear in mind when assessing the literature on programme evaluation ..... 90 Findings from the evaluation literature.............................................................................. 91 Assessment ............................................................................................................................ 98 Interactions between active and passive policies ................................................................ 99 Gross and net replacement rates in OECD countries....................................................... 100 Actions taken by OECD countries to curb unemployment traps .................................... 102 The importance of integrated management of benefit systems and active labour market policies ...................................................................................................................... 104 Assessment ............................................................................................................................ 105 Conclusions ................................................................................................................................ 106 Bibliography............................................................................................................................... 111 Deputy Director, Directorate for Education, Employment, Labour and Social Affairs. This paper is an updated and extended version of a paper which was presented at a conference on “Unemployment and the Australian Labour Market” which was organised by the Reserve Bank of Australia and the Centre for Economic Policy Research at the ANU, Sydney, 9-10 June 1998. I am grateful to the Reserve Bank and the Centre for Economic Policy Research for agreeing to allow me to reproduce this work in this paper. Thanks are due to Andrew Dean, Robert Fay, Michael Feiner, David Grubb, Peter Schwanse and Hannes Suppanz for helpful comments on an earlier version of the paper, to Maxime Ladaique and Glenn Cooper for statistical assistance, and to Léa Duboscq for secretarial assistance. The views expressed in this paper are my own and cannot be held to represent those of the OECD or its Member Governments.

Welcome message from author
This document is posted to help you gain knowledge. Please leave a comment to let me know what you think about it! Share it to your friends and learn new things together.
Transcript

79
OECD 2000
OECD Economic Studies No. 30, 2000/I
WHAT WORKS AMONG ACTIVE LABOUR MARKET POLICIES:EVIDENCE FROM OECD COUNTRIES’ EXPERIENCES
John P. Martin
TABLE OF CONTENTS
Introduction................................................................................................................................ 80
Recent trends in public spending on labour market programmes..................................... 81Indicators of the spending effort on active labour market policies................................ 81Has there been a shift from passive to active measures? ............................................... 88
Active policies: what works and what does not..................................................................... 89Macroeconomic evaluations ................................................................................................ 89The literature on evaluation of individual programmes .................................................. 89Caveats to bear in mind when assessing the literature on programme evaluation ..... 90Findings from the evaluation literature.............................................................................. 91Assessment ............................................................................................................................ 98
Interactions between active and passive policies................................................................ 99Gross and net replacement rates in OECD countries....................................................... 100Actions taken by OECD countries to curb unemployment traps .................................... 102The importance of integrated management of benefit systems and active labourmarket policies...................................................................................................................... 104Assessment ............................................................................................................................ 105
Conclusions ................................................................................................................................ 106
Bibliography............................................................................................................................... 111
Deputy Director, Directorate for Education, Employment, Labour and Social Affairs. This paper is anupdated and extended version of a paper which was presented at a conference on “Unemployment andthe Australian Labour Market” which was organised by the Reserve Bank of Australia and the Centre forEconomic Policy Research at the ANU, Sydney, 9-10 June 1998. I am grateful to the Reserve Bank and theCentre for Economic Policy Research for agreeing to allow me to reproduce this work in this paper.Thanks are due to Andrew Dean, Robert Fay, Michael Feiner, David Grubb, Peter Schwanse and HannesSuppanz for helpful comments on an earlier version of the paper, to Maxime Ladaique and Glenn Cooperfor statistical assistance, and to Léa Duboscq for secretarial assistance. The views expressed in thispaper are my own and cannot be held to represent those of the OECD or its Member Governments.

80
OECD 2000
INTRODUCTION
High and persistent unemployment has been a major blot on the economicand social record of most OECD countries since the early 1970s: the OECD averagestandardised unemployment rate rose from just over 3 per cent in 1973 to 7.1 percent in 1998. In response to growing political concerns about the seemingly inexo-rable rise in unemployment, OECD Ministers gave the Organisation a mandate in1992 to analyse the causes and consequences of high and persistent unemploy-ment and propose effective remedies to deal with the problem.
The first fruits of this work, published in 1994 under the title The OECD JobsStudy, included a list of more than 60 detailed policy recommendations backed upby two volumes of research – see OECD (1994a, b). Ministers then mandated theOrganisation to pursue its analytical work in certain areas, including an examinationof how to make active labour market policies a more effective weapon in the fightagainst high and persistent unemployment. They also asked the Organisation totake the detailed policy recommendations and match them to the needs and cir-cumstances of each individual OECD country, and to monitor progress in the imple-mentation of these recommendations and their impacts on labour marketperformance.
This paper does not report on progress in the implementation of the OECDJobs Strategy recommendations by individual OECD countries1 and the effects onlabour market outcomes. Instead, it confines its remit to a narrower topic: what isthe potential contribution which active labour market policies can make as part ofa strategy to combat high and persistent unemployment and the problems of lowpay and poverty among the working-age population? In order to answer this ques-tion, it is vital to know what works among active labour market policies and in what cir-cumstances. The OECD Secretariat has been working intensively on these questionsin recent years and this paper summarises the main results of our work to date.2
The structure of the paper is as follows. The second section provides some fac-tual background on public spending on labour market policies in OECD countriesover the past decade, drawing on an internationally comparable data set which theOECD has developed to monitor trends in this field of public spending. The bulk ofthe paper then summarises the main results of on-going OECD research into theeffectiveness of active labour market policies. This review mainly exploits twosources: i) the recent literature on the evaluation of labour market programmes and

What works among active labour market policies
81
OECD 2000
ii) in-depth country reviews which the OECD has conducted over the past sevenyears on the interactions between active and passive labour market policies. Thefinal section draws some conclusions.
RECENT TRENDS IN PUBLIC SPENDING ON LABOUR MARKET PROGRAMMES
Public spending on labour market programmes absorbs significant shares ofnational resources in many OECD countries, these policies being expected toachieve a variety of economic and social objectives. For analytical and policy pur-poses, the OECD splits this spending into so-called “active” and “passive” mea-sures where the former comprise a wide range of policies aimed at improving theaccess of the unemployed to the labour market and jobs, job-related skills and thefunctioning of the labour market while the latter relate to spending on income trans-fers (see Box 1)
The OECD has been collecting comparable data on public spending on labourmarket measures since 1985. Figure 1 shows that the typical OECD country spentover 2¼ per cent of its GDP on active and passive labour market measures in 1997.There is also a wide variation across countries in the share of public spending onlabour market measures, ranging in 1997 from a low of under 0.5 per cent of GDP inthe Czech Republic, Japan, Korea and the United States to a high of almost 6 percent in Denmark.
Indicators of the spending effort on active labour market policies
Within the total public spending on labour market policies, the main focus ofthis paper is on the fraction devoted to active measures. Using the OECD data set, itis possible to compute three different indicators of the “spending effort” whichcountries devote to active policies: i) the share of public spending on active mea-sures as a percentage of GDP; ii) spending on active measures per person unem-ployed relative to average earnings; and iii) the number of participants on activeprogrammes relative to the size of the labour force. The three indicators in questionare all highly correlated with each other (see Box 2).
Data on the first indicator are shown in Table 1. These data show a wide dispar-ity in spending on active measures in 1997, ranging from a low of 0.2 per cent of GDPor less in the Czech Republic, Japan, Korea and the United States to a high of over2 per cent in Sweden. There has been almost no trend since 1985 in the OECD aver-age spending devoted to active measures, compared with a slight upward trend inthe EU.

OECD Economic Studies No. 30, 2000/I
82
OECD 2000
Box 1. The OECD data base on labour market programmes
The OECD data base covers five main categories of “active labour market pro-grammes” (ALMPs) as follows:
– Public employment services and administration. This includes the activitiesof job placement, administering unemployment benefits, and referring job-seekers to available slots on labour market programmes.
– Labour market training is divided into two categories: a) spending on voca-tional and remedial training for the unemployed; and b) training foremployed adults for labour market reasons.
– Youth measures include: a) training and employment programmes targetedto the young unemployed; and b) apprenticeship training, which is mainly forschool leavers, not the unemployed.
– Subsidised employment is divided into three categories: a) hiring subsidies,i.e. subsidies paid to private-sector employers to encourage them to hire unem-ployed workers; b) assistance to unemployed persons who wish to start their ownbusiness; and c) direct job creation for the unemployed in the public or non-profit sectors.
– Measures for the disabled include both vocational rehabilitation – trainingand related measures to make the disabled more employable – and shel-tered work programmes which directly employ disabled people.
While the data base mainly provides annual time-series data on public spend-ing on all these separate labour market programmes from 1985 onwards, it alsoincludes data on the numbers who participate on the programmes.
The data base also includes two categories of “passive” spending on labourmarket programmes:
– unemployment benefits;– early retirement pensions paid for labour market reasons.While the data base is very useful for comparing trends in public spending on
labour market programmes across OECD countries, some caveats about its cover-age should be noted. First, it only covers public spending on labour market poli-cies. For example, private-sector spending on apprenticeship and training which isvery substantial in countries such as Austria, Denmark, Germany and Switzerland, is notincluded. Second, only spending for labour market reasons is included. Hence, trainingorganised along industrial lines and financed by special payroll taxes is often excluded.Third, spending on labour market policies by sub-national levels of government maysometimes not be fully captured in the data. Finally, the data on participant numbersrelate to annual inflows to slots on various labour market programmes. They do not tellus anything about the average length of time which a participant spends on the pro-gramme nor do they provide any information on repeat spells on programmes. Danishdata for 1997, reported in Madsen (1999), show that the average participant on an ALMPspent just over four months on the programme.
The OECD is co-operating with Eurostat and DG V of the European Commissionin an effort to extend the range of information available on public spending onALMPs and participants on programmes and to improve its comparability.

What works among active labour market policies
83
OECD 2000
0 1 2 3 4 5 6%
Figure 1. Public spending on total labour market measures, 19971
Percentage of GDP
. . Data not available.1. Data refer to 1996 for Ireland, Italy, Poland and Portugal.2. Unweighted average, excluding Italy.3. Unweighted average, excluding Czech Republic, Hungary, Italy, Korea and Poland.4. Data refer to 1986 for Denmark and Portugal, to 1987 for Japan. Germany refers to Western Germany.Source: OECD Database on labour market programmes.
Denmark
Netherlands
Finland
Sweden
Ireland
Belgium
Germany
France
Spain
New Zealand
Switzerland
Poland
Italy
Portugal
Austria
Australia
Norway
Canada
United Kingdom
Hungary
Luxembourg
Greece
Japan
United States
Czech Republic
Korea
EU 2
Total OECD 3
Total
Share of expenditures on activemeasures in total public expenditure
on labour market measures 19854 19971
23 31
25 31
41 33
71 49
30 41
28 33
36 33
22 42
11 23
58 33
42 35
. . 15
. . 55
50 49
23 26
25 31
56 58
26 31
26 31
. . 41
35 31
33 42
33 17
33 41
. . 36
. . 88
34 36
35 35

OECD Economic Studies No. 30, 2000/I
84
OECD 2000
The second indicator measures public spending on active measures per per-son unemployed relative to the earnings of an average production worker (APW) inthe manufacturing sector. This indicator is a crude proxy for the average compensa-tion paid to participants on active labour market programmes relative to theirexpected earnings in work, i.e. it is equivalent to the replacement rate for unem-ployment benefits.3 However, the data in Table 2 are less than ideal for this pur-pose since they do not relate to that fraction of the unemployed who participate onactive measures, but instead relate active spending to the total stock of the unem-ployed in a given year irrespective of whether they participated in a programme ornot. In addition, the spending data include items other than the compensation ortraining allowances paid to programme participants. Be that as it may, the data inTable 2 reveal a high disparity in spending effort per person unemployed relativeto APW earnings across countries in 1997, ranging from around 5 per cent or less in
Box 2. Correlations between the three indicators of spending efforton ALMPs
Looking at all three indicators together, it is clear that there is a strong positivecorrelation in the country rankings. This is confirmed by computing Spearman rankcorrelation coefficients between the indicators using 1997 data:
where ALMP/GDP = spending on ALMPs as a proportion of GDP; ALMP/RR = average spending on ALMPs per person unemployed relative
to APW earnings;PART/LF = participants on ALMPs as a percentage of the labour force;NNR = net replacement rates.*
It is also interesting to note from the final column that all three indicators of thespending effort on ALMPs are positively and significantly correlated with a sum-mary measure of the net replacement rate, an indicator of the generosity of unem-ployment and related welfare benefit systems in OECD countries.
* The data refer to the OECD summary measure of benefit entitlements which is an averageof net (i.e. after-tax) replacement rates for two earnings levels, three family situations and threedurations of unemployment. The data refer to 1994/95. For further details, see Martin (1996).
ALMP/GDP ALMP/RR NRR
ALMP/GDP – 0.72* 060*ALMP/RR 0.72* – 0.66*PART/LF 0.85* 0.68* 0.61**
* = correlation significant at the 1 per cent level.** = correlation significant at the 5 per cent level.

What works among active labour market policies
85
OECD 2000
the Czech Republic, Japan, Poland and Spain to a high of over 50 per cent in Sweden.Given that the average participant on an ALMP may well spend only a fraction of ayear on the programme in question (see Box 1), it is likely that these data underes-timate significantly the replacement rate which programme participants face.
Table 1. Spending on active labour market policies, 1985-97Percentage of GDP
1985 1990 1994 1997
Australia 0.4 0.3 0.7 0.5Austria 0.3 0.3 0.4 0.4Belgium 1.3 1.2 1.4 1.3
Canada 0.6 0.5 0.6 0.5Czech Republic .. 0.2 4 0.2 0.1Denmark 1.1 2 1.1 1.8 1.8
Finland 0.9 1.0 1.7 1.6France 0.7 0.8 1.3 1.4Germany1 0.8 1.0 1.4 1.2
Greece 0.2 0.4 0.3 0.4Hungary .. 0.6 0.6 0.4Ireland 1.5 1.4 5 1.6 1.7 6
Italy .. 1.4 4 1.4 1.1 6
Japan 0.2 3 0.1 0.1 0.1Korea .. 0.1 0.1 0.1
Luxembourg 0.5 0.3 0.2 0.3Netherlands 1.2 1.3 1.6 1.7New Zealand 0.9 0.9 0.7 0.7
Norway 0.6 0.9 1.3 1.0Poland .. 0.3 5 0.4 0.3 6
Portugal 0.4 2 0.6 0.7 0.9 6
Spain 0.3 0.9 0.6 0.6Sweden 2.1 1.7 3.0 2.1Switzerland 0.2 0.2 0.4 0.8
United Kingdom 0.8 0.6 0.5 0.4United States 0.3 0.2 0.2 0.2
EU7 0.9 0.9 1.2 1.1Total OECD8 0.7 0.7 0.9 0.8
.. Data not available.1. Data are for Western Germany only, prior to 1990; they are for the whole of Germany from 1991 onwards.2. 1986.3. 1987.4. 1991.5. 1992.6. 1996.7. Unweighted average excluding Italy.8. Unweighted average of above countries excluding Czech Republic, Hungary, Italy, Korea and Poland.Source: OECD Database on labour market programmes.

OECD Economic Studies No. 30, 2000/I
86
OECD 2000
Table 2. Spending on active labour market policies per person unemployed,1
1985-97Percentage of APW earnings
1985 1990 1994 1997
Australia 8.8 5.9 11.6 9.7Austria 16.3 20.5 20.5 22.9Belgium 16.7 24.9 18.7 18.8
Canada 9.8 10.9 9.6 8.3Czech Republic .. .. 10.1 5.7Denmark 29.5 3 18.8 33.4 42.8
Finland 33.7 56.3 15.4 19.0France 15.6 23.7 26.6 26.3Germany 2 16.8 29.5 25.7 20.1
Greece 5.1 12.4 7.8 8.5Hungary .. 17.1 15.0 6 19.5Ireland 13.8 19.2 5 20.0 28.9 7
Italy .. 28.2 4 26.9 20.1 7
Japan 10.4 11.5 6.3 4.6Korea .. .. 5.2 6 7.1
Luxembourg 58.6 65.3 18.9 31.8Netherlands 20.8 26.7 36.1 46.4New Zealand 38.4 18.1 14.8 17.5
Norway 49.8 33.6 49.5 46.7Poland .. .. 5.1 6 5.1 7
Portugal 8.8 3 32.9 25.7 31.9 7
Spain 3.1 11.6 5.5 5.7Sweden 146.8 205.1 76.5 50.8Switzerland .. 18.9 4 18.0 29.0
United Kingdom 9.8 17.5 9.0 8.6United States 7.0 8.5 7.0 7.8
EU 8 28.2 39.5 24.4 25.5Total OECD 9 26.0 32.6 21.9 22.9
.. Data not available.1. This variable measures spending on ALMPs per person unemployed as a percentage of the average production
worker (APW) earnings.2. Data are for Western Germany only, prior to 1990; they are for the whole of Germany from 1991 onwards.3. 1986.4. 1991.5. 1992.6. 1995.7. 1996.8. Unweighted average excluding Italy.9. Unweighted average of above countries excluding Czech Republic, Hungary, Italy, Korea, Poland and Switzerland.Source: OECD Database on labour market programmes for data on spending, GDP and labour force; OECD Labour
Force Statistics for data on unemployment; OECD The Tax/Benefit Position of Employees for APW earnings.

What works among active labour market policies
87
OECD 2000
The third indicator reports data on the numbers engaged in labour marketprogrammes (Table 3). Over 8 per cent of the labour force in the typical OECDcountry participated in these programmes in 1997, up from 5 per cent in 1990.Data on inflow rates reveal a similar wide disparity across countries to that
Table 3. Participant inflows to active labour market programmes, 1986-97Percentage of the total labour force
1986 1990 1994 1997
Australia 3.6 3.2 8.0 5.3Austria .. 2.4 .. ..Belgium .. 10.9 13.5 15.1
Canada 2.4 2.5 3.2 2.7 6
Czech Republic .. 1.3 3 0.9 0.6Denmark 9.5 11.0 18.4 24.5
Finland 4.5 5.3 12.0 13.1France 6.1 7.7 11.5 10.1Germany 1 3.8 2 4.0 4.1 3.5
Greece .. 2.5 2.5 ..Hungary .. 3.8 4 4.2 4.8Ireland 7.8 2 6.9 11.5 11.3 6
Italy .. .. .. ..Japan .. .. .. ..Korea .. 0.2 0.6 2.7
Luxembourg .. .. .. ..Netherlands 2.3 3.2 4.1 5.8New Zealand .. 8.4 10.4 5 ..
Norway .. .. .. ..Poland .. .. 4.6 3.9 6
Portugal 1.5 4.7 4.7 10.0 6
Spain 6.6 7.6 2.0 4.4Sweden 4.7 2 3.7 14.4 13.4Switzerland 0.4 0.5 2.1 ..
United Kingdom .. 2.2 2.6 2.1United States 3.0 2 2.7 .. ..
EU 7 .. 6.1 9.0 10.3Total OECD 8 .. 4.9 7.2 8.1
.. Data not available.1. Data are for Western Germany only, prior to 1990; they are for the whole of Germany from 1991 onwards.2. 1987.3. 1991.4. 1992.5. 1995.6. 1996.7. Unweighted average excluding Austria, Greece, Italy and Luxembourg.8. Unweighted average excluding Austria, Greece, Italy, Japan, Luxembourg, New Zealand, Norway, Poland,
Switzerland and the United States.Source: OECD Database on labour market programmes.

OECD Economic Studies No. 30, 2000/I
88
OECD 2000
shown by the other indicators, ranging from 3 per cent or less of the labour forcein 1997 in Canada, the Czech Republic, Korea and the United Kingdom to almost25 per cent in Denmark.4
Has there been a shift from passive to active measures?
In recent years, it has become a common theme in the political debate on rem-edies to tackle the unemployment problem that Governments should shift thebalance of public spending on labour market policies away from passive incomesupport towards more active measures designed to get the unemployed backinto work. At first sight, this seems an eminently sensible proposal: why should our soci-eties pay the unemployed to be idle when the public funds in question could be usedinstead to supply them with a range of labour market services which should raise theirchances of getting a job and their future earnings prospects?
The basic principle of shifting public resources from income support toactive labour market policies has been endorsed on several occasions in recentyears by OECD Labour Ministers, most recently at their meeting in Paris on the14-15 October 1997.5 The same principle also forms part of the EU EmploymentGuidelines, which were formulated following the Amsterdam Summit in 1997.
Have countries managed to switch resources into active measures in linewith the principle endorsed by Ministers? Progress has been extremely limitedin terms of this goal: for the typical OECD country, Table 1 shows that spendingon active measures rose only from 0.7 per cent of GDP in 1985 to 0.8 per cent in1997. More disappointingly, the share of spending on active measures as a pro-portion of total public spending on labour market programmes was stable ordeclined between 1985 and 1997 in over one-third of the countries (seeFigure 1).6 Furthermore, Italy, Norway, Portugal, and Sweden were the onlyOECD countries where spending on active measures was equal to or exceededspending on passive measures in 1997.
One obvious reason for the very limited success in switching resources intoactive measures over the past decade is the rising trend in unemployment inmany countries. As unemployment and related welfare benefits are entitlementprogrammes, increases in unemployment bring in their wake an automaticincrease in public spending on passive income support. Spending on activelabour market programmes, on the other hand, is discretionary. In addition, asthe next section makes clear, the track record of many active programmes ispatchy in terms of achieving their stated objectives. This has led many policy-makers to be wary of authorising large spending increases on new or existingprogrammes.7

What works among active labour market policies
89
OECD 2000
ACTIVE POLICIES: WHAT WORKS AND WHAT DOES NOT
Macroeconomic evaluations
Since the ultimate aim of active policies is to cut overall unemployment and/or raise earnings, an obvious approach to assessing their effectiveness is to seek toestablish robust econometric relationships between key macroeconomic aggre-gates such as unemployment or real wages and various measures of the spendingeffort on active policies. There is, indeed, a small but growing empirical literatureon this approach: Calmfors (1994, 1995), Calmfors and Skedinger (1995), DanishMinistry of Finance (1999), Forslund and Krueger (1994), Jackman et al. (1990),Jackman (1994), Layard et al. (1991), Nickell (1997), Nickell and Layard (1997), haveall published articles on this topic recently. The OECD Secretariat has also contrib-uted to this literature – see Chapter 2 in the 1993 edition of the OECD EmploymentOutlook and recent articles by Scarpetta (1996) and Elmeskov et al. (1998).
This literature is not reviewed here. However, it is fair to conclude that the juryis still out on the matter: the results of the various econometric analyses are incon-clusive, some studies appearing to show robust effects of active policies in terms oflowering the natural or equilibrium rate of unemployment or real wage pressures,others appearing to show zero or insignificant correlations. This literature is bedev-illed by a number of data and technical difficulties, notably simultaneity bias sincecross-country comparisons reveal that the amount of spending on active pro-grammes is positively related to the unemployment rate.8 Because of these uncer-tainties, the rest of this section concentrates on the main findings from theevaluations of individual labour market programmes.
The literature on evaluation of individual programmes
There is a large literature, which seeks to evaluate the outcomes of individualprogrammes. These evaluations can be divided into two main types. The first typeseeks to measure the impact of programme participation on individuals’ employ-ment and earnings after they have left the programme, judging the outcomesagainst the experiences of a benchmark or control group of similar individuals whodid not participate in the programme. This type of evaluation makes sense forthose active programmes which attempt to make participants more productive andcompetitive in the open labour market, e.g. training and job-search assistance.
The second type of evaluation attempts to measure the net effects of pro-grammes on aggregate employment and unemployment by estimating what arecalled in economists’ jargon “dead-weight”, “substitution” and “displacement”effects. These evaluations are mostly relevant for employment programmes,i.e. programmes that attempt to stimulate job creation in the private sector (includ-ing self-employment), as well as direct job creation in the public sector. Since sub-

OECD Economic Studies No. 30, 2000/I
90
OECD 2000
sidised employment programmes have the explicit objective of increasing thenumber of jobs in the economy at large and/or raising the employment prospectsof the target group, evaluations must determine whether the subsidised jobs wouldhave been created anyway in the absence of the subsidy (so-called dead-weighteffects). They must also seek to quantify whether improved employment prospectsfor the target group come at the expense of worsened employment prospects forother non-subsidised workers (so-called substitution effects), or whether the sub-sidised jobs have displaced, or have been substituted for, unsubsidised jobs else-where in the economy (so-called displacement effects).
Caveats to bear in mind when assessing the literature on programme evaluation
Before turning to the main findings from the recent evaluation literature, it isimportant to stress some caveats concerning the reliability and generality of theconclusions that can be drawn from this literature.
First, much of the evaluation literature relates to the United States and Canadawhere there is a long-standing tradition of evaluating labour market programmes.Indeed, in both countries, there is effectively a mandatory requirement on the pub-lic authorities to evaluate their programmes. Few European countries have carriedout rigorous evaluations until recently. This unsatisfactory situation is changingslowly, as tight fiscal constraints make it imperative to get better value for publicspending on active labour market policies. As a result, some European countries(I would single out Norway, Sweden and the United Kingdom in this regard) andAustralia are beginning to undertake rigorous evaluations of their labour marketprogrammes. However, in other countries, the most common method of “evalua-tion” consists of simply monitoring the labour market status and earnings of partic-ipants for a brief period following their spell on a programme. While this sort ofexercise provides useful information, it cannot answer the vital question of whetherthe programme in question “worked” or not for participants.9
Second, one must recognise that there is almost never a stable set of active pro-grammes to evaluate. Countries are continuously chopping and changing the mix ofprogrammes. For example, Grubb (1995) highlights the strong tendency on the partof the US Congress to respond to specific new problems with a specific new pro-gramme rather than to incorporate new purposes into existing programmes.10 Thisleads to a proliferation of programmes, many of which are overlapping, may tend tocancel each other out, are costly to administer and confusing to both employers andthe unemployed they are supposed to assist. Such programme “innovation” com-plicates the task of the evaluator greatly.
Third, there is very little evidence on the long-run effects of active programmes.The vast majority of rigorous evaluations only provide evidence on short-run out-comes, covering at best one to two years after the person has participated in the

What works among active labour market policies
91
OECD 2000
programme.11 This may well be too short a period for a full assessment of the pri-vate and social returns to public investment in many active measures.
Fourth, “outcomes”, in the evaluation literature, are invariably expressed interms of programme impacts on future earnings and/or re-employment prospectsof participants, and this stress is reflected in this paper. There is little or no evi-dence available on potential social benefits which could flow from programme par-ticipation such as reduced crime, less drug abuse or better health.
Fifth, there is an issue about the scale of programmes, even those which appearto work. Many programmes, which have been evaluated rigorously, tend to besmall-scale programmes – sometimes called “demonstration” programmes. Even ifsuch programmes “work” in terms of producing statistically significant outcomes forparticipants, it is unclear from the existing literature how cost-effective they would be ifthey were greatly extended in terms of scale of participation or geographic coverage.
Sixth, many evaluations are undertaken by public sector agencies. Whilethere are good reasons for this, it does give rise to concerns about indepen-dence of findings. Therefore, where evaluations are undertaken by public sectoragencies, it is important to check whether there has been any external validationof the evaluation results in question.
Finally, while the evaluation literature tells us quite a lot about what works,it is not very instructive in answering other equally important and related ques-tions, such as why do certain programmes work for some groups and not for oth-ers (see below), and in what circumstances? It is not helpful in explaining whatcombination of employment services is likely to work. For example, there isalmost no evidence on which types and content of training programmes workbest. Do skill-enhancing activities e.g. via classroom training and/or on-the-jobtraining, work best or must they be combined with personal counselling, job-search assistance and mentoring services in order to work? Policy-makers wantto know the answers to such questions, but the evidence is simply not there forthe moment.
Findings from the evaluation literature
The OECD has reviewed the available evaluation literature in OECD (1993a)and this review was updated in Fay (1996).12 What does this latest OECD review ofthe evaluation literature tell us about what works and what does not? Table 4 sum-marises the main lessons in terms of what works for which groups.13
Public training programmes
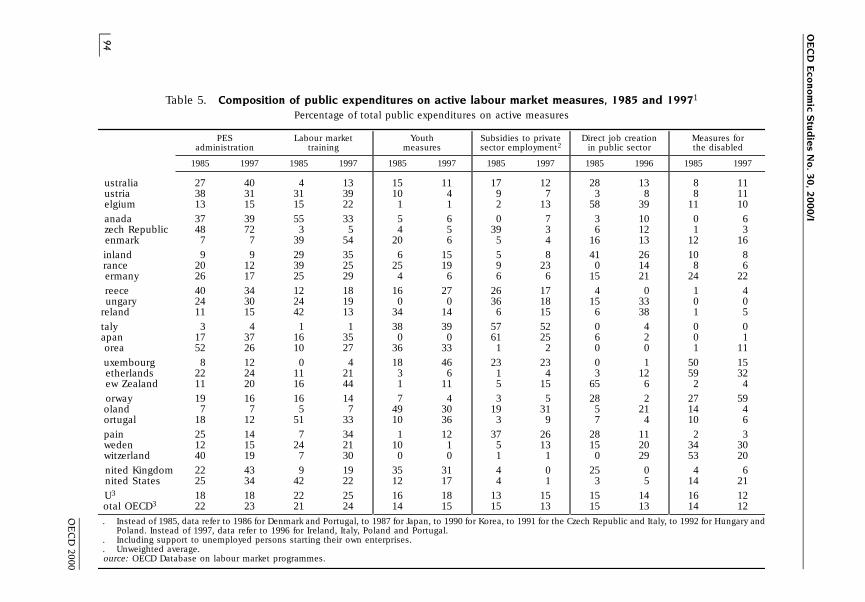
Training usually accounts for the largest share of spending on active measures:on average, OECD countries devoted 24 per cent of their total public spending on

OE
CD
Eco
no
mic S
tud
ies N
o. 3
0, 2
00
0/I
92
OE
CD
2000
Table 4. Lessons from the evaluation literature
rogrammes Appears to help Appears not to help General observations on effectiveness
ormal classroom training Women re-entrants Prime-age men and older Important that courses signal strong labour marketworkers with low initial relevance, or signal ‘‘high’’ quality to employers. Keepeducation programmes relatively small in scale.
n-the-job training Women re-entrants; single Prime-age men (?) Must directly meet labour market needs. Hence, needmothers to establish strong links with local employers, but this
increases the risk of displacement.ob-search assistance (job Most unemployed but in Must be combined with increased monitoring of the
clubs, individual particular, women and sole job-search behaviour of the unemployed andcounselling, etc.) parents enforcement of work tests.
f which: Most adult unemployed Requires careful monitoring and controls on bothre-employment bonuses recipients and their former employers.
pecial youth measures Disadvantaged youths Effective programmes need to combine an appropriate(training, employment and integrated mix of education, occupational skills,subsidies, direct job work-based learning and supportive services to youngcreation measures) people and their families. Early and sustained
interventions are likely to be most effective. Need todeal with inappropriate attitudes to work on the part ofyouths. Adult mentors can help.
ubsidies to employment Long-term unemployed; Require careful targeting and adequate controls towomen re-entrants maximise net employment gains, but there is a trade-
off with employer take-up.
f which: Men (below 40, relatively Only works for a small subset of the population.Aid to unemployed better educated).starting enterprises
irect job creation Severely disadvantaged Most adult unemployed Typically provides few long-run benefits and principle oflabour market groups (?) additionality usually implies low marginal-product jobs.
ource: The above table was filled out based on evaluation results presented in DOL (1995), Fay (1996), Friedlander et al. (1997), Grubb (1995, 1999), HRDC (1997),Lerman (1997), OECD (1993c) and Stanley et al. (1998).

What works among active labour market policies
93
OECD 2000
active measures to training programmes in 1997, up from 21 per cent in 1985 (seeTable 5). But evaluations of public training programmes in OECD countries suggesta very mixed track record. Some programmes in Canada, Sweden and the UnitedStates have yielded low or even negative rates of return for participants when theestimated programme effects on earnings or employment are compared with thecost of achieving those effects.14
However, some public training programmes do work. Recent comprehensivereviews of public training programmes for disadvantaged groups in the UnitedStates by Friedlander et al. (1997) and Stanley et al. (1998) highlight quite a numberof successful programmes in terms of earnings gains and positive rates of return forparticipants. It is noticeable that the most consistently positive results wererecorded for adult women. The findings were less optimistic with regard to adultmen: some programmes gave positive results, others not. The most dismal pictureemerged with respect to out-of-school youths: almost no training programmeworked for them. Two further findings are noteworthy. First, most of the gains tookthe form of improved employment opportunities rather than higher hourly earn-ings. Second, even for those groups for whom participation in the programmesyielded a positive rate of return, the estimated annual earnings gains were typicallynot large enough to lift most families out of poverty.
As noted above, the available evaluation literature can tell us whether trainingprogrammes work for particular disadvantaged groups or not. However, it does notprovide satisfactory answers as to why they appear to work for some target groups(e.g. adult women) and not for others. Until we have answers to this question, it isgoing to be extremely difficult to design effective public training programmes.
Such evidence as exists highlights three crucial features in the design of publictraining programmes in order to enhance their effectiveness: i) the need for tighttargeting on participants; ii) the need to keep the programmes relatively small inscale; and iii) the need to have a strong on-the-job component in the programme,and hence to establish strong links with local employers. At the same time, training pro-grammes which foster strong links with local employers are likely to encourage dis-placement, an outcome which arises when those who participate on the programme getjobs at the expense of individuals who did not participate on the programme.15
Job-search assistance
Unfortunately, it is not possible in the OECD data base at the moment to sep-arate out spending on job-search assistance from the administrative costs of run-ning the public employment service (PES): in 1997, the average OECD countrydevoted 23 per cent of active spending to PES administration, but much of thiscomprises the fixed costs of running the service. Job-search assistance comprisesmany different types of services, for example initial interviews at the PES offices,
OE
CD
Eco
no
mic S
tud
ies N
o. 3
0, 2
00
0/I
94
OE
CD
2000
Table 5. Composition of public expenditures on active labour market measures, 1985 and 19971
Percentage of total public expenditures on active measures
PES Labour market Youth Subsidies to private Direct job creation Measures foradministration training measures sector employment2 in public sector the disabled
1985 1997 1985 1997 1985 1997 1985 1997 1985 1996 1985 1997
ustralia 27 40 4 13 15 11 17 12 28 13 8 11ustria 38 31 31 39 10 4 9 7 3 8 8 11elgium 13 15 15 22 1 1 2 13 58 39 11 10
anada 37 39 55 33 5 6 0 7 3 10 0 6zech Republic 48 72 3 5 4 5 39 3 6 12 1 3enmark 7 7 39 54 20 6 5 4 16 13 12 16
inland 9 9 29 35 6 15 5 8 41 26 10 8rance 20 12 39 25 25 19 9 23 0 14 8 6ermany 26 17 25 29 4 6 6 6 15 21 24 22
reece 40 34 12 18 16 27 26 17 4 0 1 4ungary 24 30 24 19 0 0 36 18 15 33 0 0
reland 11 15 42 13 34 14 6 15 6 38 1 5
taly 3 4 1 1 38 39 57 52 0 4 0 0apan 17 37 16 35 0 0 61 25 6 2 0 1orea 52 26 10 27 36 33 1 2 0 0 1 11
uxembourg 8 12 0 4 18 46 23 23 0 1 50 15etherlands 22 24 11 21 3 6 1 4 3 12 59 32ew Zealand 11 20 16 44 1 11 5 15 65 6 2 4
orway 19 16 16 14 7 4 3 5 28 2 27 59oland 7 7 5 7 49 30 19 31 5 21 14 4ortugal 18 12 51 33 10 36 3 9 7 4 10 6
pain 25 14 7 34 1 12 37 26 28 11 2 3weden 12 15 24 21 10 1 5 13 15 20 34 30witzerland 40 19 7 30 0 0 1 1 0 29 53 20
nited Kingdom 22 43 9 19 35 31 4 0 25 0 4 6nited States 25 34 42 22 12 17 4 1 3 5 14 21
U3 18 18 22 25 16 18 13 15 15 14 16 12otal OECD3 22 23 21 24 14 15 15 13 15 13 14 12
. Instead of 1985, data refer to 1986 for Denmark and Portugal, to 1987 for Japan, to 1990 for Korea, to 1991 for the Czech Republic and Italy, to 1992 for Hungary andPoland. Instead of 1997, data refer to 1996 for Ireland, Italy, Poland and Portugal.
. Including support to unemployed persons starting their own enterprises.
. Unweighted average.ource: OECD Database on labour market programmes.

What works among active labour market policies
95
OECD 2000
in-depth counselling at some stage during an unemployment spell, re-employmentbonuses, jobs clubs, etc. Such services may also be combined with increased mon-itoring and enforcement of the job-search requirements for receipt of unemploy-ment benefits.
Job-search assistance is usually the least costly active labour market pro-gramme. Evaluations from several countries show consistently positive outcomesfor this form of active measure.16 It seems that investment in active placementefforts and raising the motivation of the unemployed, as well as taking steps toencourage and monitor their job-search behaviour, pay dividends in terms of get-ting the unemployed back into work faster.17 While the optimal combination ofadditional job-placement services and increased monitoring of job seekers andenforcement of work tests is unclear, the evidence suggests that both are requiredto produce benefits to unemployment insurance claimants and society.
One particularly interesting form of job-search assistance is re-employmentbonuses, i.e. cash payments to unemployment insurance recipients who find a jobquickly and keep it for a specified length of time. Such a scheme exists in Japan andKorea and has been experimented with in several US States. The US evaluationsshow that the bonus payments did reduce the average duration of unemploymentbenefit receipt significantly. Hence, this form of incentive to the unemployed tofind a job quickly is worthy of consideration as part of an arsenal of job-search assis-tance measures. However, such bonuses can give rise to negative effects too. Theirexistence may have an effect on the size of the group claiming the bonus. In partic-ular, they may induce workers with a high probability of finding a new job quickly toarrange with their employers to be laid off so as to collect the bonus. In order tominimise such abuse, Japan has several safeguards and controls in place, monitor-ing the behaviour of both the bonus claimant and his or her former employer.
Special youth measures
On average, OECD countries devoted 15 per cent of spending on active poli-cies to special youth measures in 1997. One of the most disappointing conclusionsfrom the evaluation literature is that almost all evaluations show that special mea-sures are not effective for disadvantaged youths. This holds not only for publictraining programmes (see above), but also for targeted wage subsidy measures too.Given the depth of public concern about youth unemployment and the large publicspending devoted to special youth measures, a high priority must be assigned todiscovering the reasons for the dismal track record of such measures and designingand implementing more effective programmes.
Among the large number of negative evaluation results, there are a few hopefulsigns. Job Corps in the United States did yield statistically significant earningsgains for disadvantaged youths. However, it had to rely on savings from reduced

OECD Economic Studies No. 30, 2000/I
96
OECD 2000
criminal activity among the target group to produce a net social benefit, given thatit is a high-cost programme.18 In addition, within national demonstrations such asJOBSTART in the United States, it is possible to identify specific sites where theprogramme appeared to work for disadvantaged youths. One such example of a sitethat appeared to deliver large gains is the Center for Employment Training (CET) inSan José, California; it was the only one of the 13 JOBSTART sites which deliveredstatistically significant earnings gains for youths. However, we do not know preciselywhat factors distinguished the CET site from the other sites or how feasible it wouldbe to replicate their positive results elsewhere.
Grubb (1999) has reviewed the evidence on the few successful education andtraining programmes for disadvantaged youths in the United States and distilledfrom it the following five precepts for success:
i) effective programmes have a close link to the local labour market and tar-get jobs with relatively high earnings, strong employment growth andgood opportunities for advancement;
ii) they contain an appropriate mix of academic education, occupationalskills and on-the-job training, ideally in an integrated manner;
iii) they provide youths with pathways to further education so that they cancontinue to develop their skills and competencies;
iv) they provide a range of supporting services, tailored to the needs of theyoung people and their families; and
v) they monitor their results and use this information to improve the qualityof the programme.
In addition to these precepts, the evidence from Canadian and US evaluationssuggests that the biggest pay-offs for disadvantaged youths come from early and sus-tained interventions. This involves not only intensive efforts to boost their perfor-mance in primary and secondary schooling and reduce drop-out rates, it alsoreaches back to early childhood including the pre-school period. The limitedempirical evidence that is available suggests that early childhood interventions ofhigh quality can have lasting effects on the employment and earnings prospects ofdisadvantaged children, especially if they are sustained over time and not limitedto one-shot interventions.19 It is also important to target support not only at theyoungsters themselves but also at their families and local communities. It cannotbe over-emphasised that if young people leave the schooling system without qual-ifications and a good grounding in the 3Rs, it is well nigh impossible for labour mar-ket programmes to overcome these handicaps later on.
Finally, several authors, e.g. Lerman (1997), highlight the importance of poorattitudes towards work among disadvantaged youths as a major factor in explainingthe dismal record of special youth measures. It is not easy for many programmes to

What works among active labour market policies
97
OECD 2000
influence attitudes in ways that improve the jobs and earnings prospects of disad-vantaged youths. But mentoring programmes, by providing for both on-going contactswith an adult over an extended period of time and elements of monitoring thebehaviour of the young people themselves as well as providing support, can helpovercome negative attitudes to work.
Subsidies to private-sector employment
Employment subsidies accounted for 13 per cent of total spending on activemeasures in the typical OECD country in 1997. Subsidies to private-sector jobs mayhave a number of objectives other than creating additional jobs. They may seek toenhance effective labour supply by helping individuals to keep in contact with theworld of work, thereby maintaining their motivation and skills.20 For equity reasonsthey may also be intended to provide the long-term unemployed with jobs, even ifthis happens largely at the expense of the short-term unemployed. These othergoals of wage-subsidy schemes may still be important even if the net employmentgains of these programmes are very small or zero.
Indeed, most evaluations show that subsidies to private-sector employmenthave both large dead-weight and substitution effects. As a result, most suchschemes yield small net employment gains, particularly in the short term whenaggregate demand and vacancies are fixed. For instance, evaluations of wage sub-sidies in Australia, Belgium, Ireland and the Netherlands have suggested combineddead-weight and substitution effects amounting to around 90 per cent, implyingthat for every 100 jobs subsidised by these schemes only ten were net gains inemployment.
The evaluation evidence also suggests it may be possible to raise the size ofnet employment gains associated with private-sector wage subsidies to 20-30 percent or more via tight targeting of the measures to particular groups among theunemployed and close monitoring of employer behaviour in order to curb abuses.However, there is a difficult trade-off for policy-makers here: the evidence also sug-gests that the more controls are multiplied in order to curb abuse and maximise thenet employment gains from wage subsidies, the less willing are firms to participatein such programmes and employer take-up drops off sharply, defeating the ulti-mate goal of the exercise. In addition, the more tightly the programme is tied tocharacteristics of “disadvantage”, the greater the risk of so-called “stigma” whichmay discourage the unemployed from availing of such schemes or convey a nega-tive signal to potential employers concerning the expected productivity and moti-vation of the individual job-seeker in question.
One specific form of wage subsidy that appears to be successful for a smallgroup of unemployed individuals is aid to starting a small business. Controlledexperiments in the United States suggest that such schemes result in employment

OECD Economic Studies No. 30, 2000/I
98
OECD 2000
gains for men, primarily between the ages of 30 and 40, who have relatively highlevels of education. Evidence from less rigorous evaluations of such schemes inother countries such as Australia, Ireland, Norway and the United Kingdom tends toconfirm longer-term survivability, but only for a relatively small share of all enter-prises started up in this manner.
Direct job creation in the public sector
Spending on direct public sector job creation accounts for relatively similaramounts to public spending on subsidies to private-sector jobs in many countries:on average, the typical OECD country devoted 13 per cent of its spending on activemeasures to public-sector job creation measures in 1997. The evaluation literatureshows fairly conclusively that this measure has been of little success in helpingunemployed people get permanent jobs in the open labour market. As a result,there has been a trend away from this type of intervention in recent years, but itappears to be making a comeback now in some OECD countries, especially inEurope, usually as part of a “reciprocal obligation” on the unemployed in return forcontinued receipt of benefits (see below).
However, OECD countries continue to spend large amounts on public-sectorjob creation programmes and the policy debate about the utility of this interven-tion is still alive. Temporary employment programmes in the public sector can beused as a work test for unemployment benefit claimants and as a means of helpingthe unemployed maintain contact with the labour market, particularly in a recessionwhen aggregate demand is depressed and vacancies are scarce. But since mostjobs provided through direct job creation schemes typically have a low marginalproduct, they should be short in duration and not become a disguised form ofheavily subsidised permanent employment.
Assessment
In sum, our review of the evaluation research highlights the following five prin-ciples which should guide the selection of active policies in order to maximise theireffectiveness:
First, rely as much as possible on in-depth counselling, job-finding incentives(e.g. re-employment bonuses) and job-search assistance programmes. But it is vitalto ensure that such measures are combined with increased monitoring of the job-search activity of the unemployed and enforcement of the work test.
Second, keep public training programmes small in scale and well targeted tothe specific needs of both job seekers and local employers.
Third, early interventions, reaching back to pre-school, can pay dividends fordisadvantaged youths, but they must be sustained. This should include steps to

What works among active labour market policies
99
OECD 2000
reduce early school-leaving targeted on at-risk students combined with policies toensure that they leave the schooling system equipped with basic skills and compe-tencies that are recognised and valued by employers. It is also important toimprove poor attitudes to work on the part of such young people and adult mentorscan help in this regard.
Fourth, as the duration of unemployment spells lengthens, various forms ofemployment subsidies may serve to maintain workers’ attachment to the labourforce. However, employment subsidies should be of short duration, targeted andclosely monitored.
Fifth, use subsidised business start-ups for the minority among the unem-ployed who have entrepreneurial skills and the motivation to survive in a compet-itive environment.
Finally, if we are to expand the range of international knowledge on “whatworks” and “why” among active labour market policies, it is vital that more countriesbegin to evaluate their labour market programmes systematically. Indeed, evalua-tion should be built into the design of programmes at the beginning rather thanbeing viewed as an ex-post exercise. Evaluations should also be undertaken in a rig-orous way that allows one to draw useful inferences about the effectiveness of theinterventions in terms of their impacts on the employment and earnings prospectsof the programme participants and that cover a sufficiently long period so that onecan assess whether the programme yields any long-term private or social benefits.
INTERACTIONS BETWEEN ACTIVE AND PASSIVE POLICIES
Recent OECD research also suggests that it is vital to focus on the interactionsbetween active and passive labour market policies if one seeks to enhance theeffectiveness of active labour market policies. This research draws heavily onreviews of labour market policies in 17 OECD countries (Austria, Belgium, Denmark,Finland, Germany, Greece, Ireland, Italy, Japan, the Netherlands, Portugal, Norway,Spain, Sweden, Switzerland, the United Kingdom and the United States).21
Why is this an important topic? Unemployment and related welfare benefitsprovide income support to the unemployed while they are searching for jobs. It iswell known that such benefits can have significant effects on work incentives for theunemployed and on the wage-setting behaviour of workers and employers. Activelabour market policies aim to help the unemployed get back into work and raisetheir future earnings prospects by providing them with a range of employment ser-vices. But they also provide income support to the unemployed while they partici-pate in an active programme and such participation can affect future entitlementsto unemployment benefits, thereby influencing the behaviour of labour market

OECD Economic Studies No. 30, 2000/I
100
OECD 2000
actors.22 For this reason, it is important to pay attention to the interactions betweenactive measures and unemployment benefit systems.
Gross and net replacement rates in OECD countries
An obvious starting point to analysing these interactions is the relative gener-osity of income support to the unemployed via unemployment benefits or the com-pensation paid while they participate on an active programme. Unfortunately, wedo not have data on the latter, only on the former. But it is likely (see Box 2 above)that both forms of income support are highly correlated. Indeed, it seems to be thecase in many countries that participants on some active measures are paid unem-ployment benefits, sometimes with a small top-up. Hence, trends in the generosityof unemployment benefit systems are likely to be mirrored closely in the averagecompensation paid to programme participants.
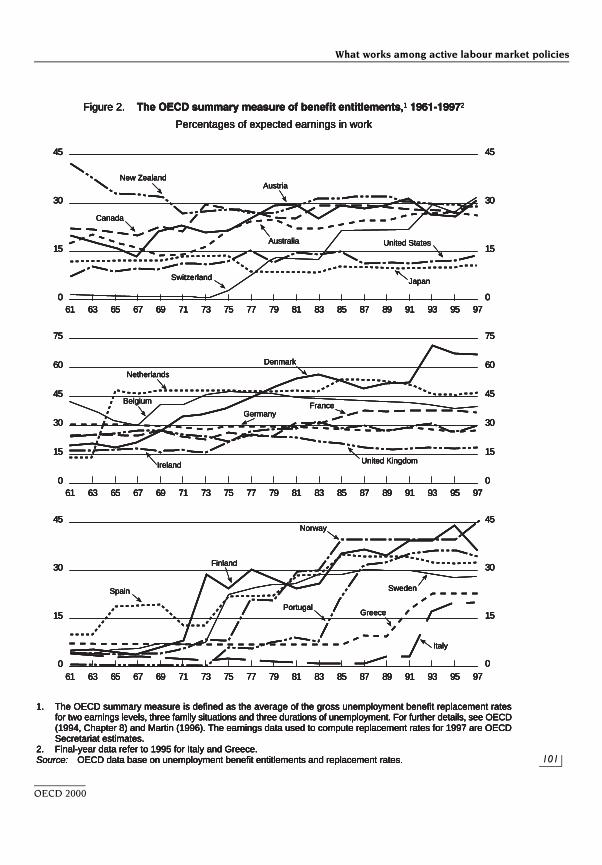
The standard indicator of the generosity of an unemployment benefit systemis the so-called “replacement rate”, i.e. the proportion of expected income fromwork which is replaced by unemployment and related welfare benefits. The OECDhas devoted much effort in recent years to developing a range of gross and net(i.e. after-tax) replacement rates for the purposes of international comparisons.
Figure 2 presents time-series data on the OECD summary measure of unem-ployment and related welfare benefit entitlements over the period 1961-97. Thesummary measure in Figure 2 is an average of 18 separate gross replacement ratescovering a variety of household types, a range of earnings possibilities and differentdurations of an unemployment spell.23 It shows that few OECD countries have takensteps to roll back the generosity of their benefit systems in recent years in terms ofcutting benefit levels and/or reducing the average duration of benefit payments:the OECD average of the summary measure doubled from 16 per cent in 1961 to31 per cent in 1997.
At the same time, net replacement rates are typically much higher than grossrates for a variety of reasons described in Martin (1996). Table 6 shows a selec-tion of net replacement rates from the OECD data base for three different earn-ings levels: i) the earnings of an average production worker (APW); ii) two-thirdsof the APW level; and iii) the first decile of the earnings distribution. These datashow that net replacement rates in excess of 80 per cent are quite common inmany OECD countries once social assistance benefits, housing benefits and theeffect of the tax system are taken into account. While we do not have time-seriesdata on net replacement rates to parallel the data in Figure 2, it seems likelythat they too have tended to drift upwards in many OECD countries over thepast three decades.
In sum, the available evidence suggests that replacement rates, whetherprovided through unemployment and related welfare benefit systems or active
What works among active labour market policies
101
OECD 2000
61 63 65 67 69 71 73 75 77 79 81 83 85 87 89 91 93 95 97
61 63 65 67 69 71 73 75 77 79 81 83 85 87 89 91 93 95 97
61 63 65 67 69 71 73 75 77 79 81 83 85 87 89 91 93 95 97
45
30
15
0
45
30
15
0
75
45
30
0
60
15
75
45
15
0
60
30
45
30
15
0
45
30
15
0
Figure 2. The OECD summary measure of benefit entitlements,1 1961-19972
Percentages of expected earnings in work
1. The OECD summary measure is defined as the average of the gross unemployment benefit replacement ratesfor two earnings levels, three family situations and three durations of unemployment. For further details, see OECD(1994, Chapter 8) and Martin (1996). The earnings data used to compute replacement rates for 1997 are OECDSecretariat estimates.
2. Final-year data refer to 1995 for Italy and Greece.Source: OECD data base on unemployment benefit entitlements and replacement rates.
New ZealandAustria
Australia United States
Japan
Canada
Switzerland
Netherlands
Denmark
Belgium FranceGermany
Ireland United Kingdom
Spain
Finland
Norway
Portugal
Sweden
Greece
Italy
61 63 65 67 69 71 73 75 77 79 81 83 85 87 89 91 93 95 97
61 63 65 67 69 71 73 75 77 79 81 83 85 87 89 91 93 95 97
61 63 65 67 69 71 73 75 77 79 81 83 85 87 89 91 93 95 97
45
30
15
0
45
30
15
0
75
45
30
0
60
15
75
45
15
0
60
30
45
30
15
0
45
30
15
0
Figure 2. The OECD summary measure of benefit entitlements,1 1961-19972
Percentages of expected earnings in work
1. The OECD summary measure is defined as the average of the gross unemployment benefit replacement ratesfor two earnings levels, three family situations and three durations of unemployment. For further details, see OECD(1994, Chapter 8) and Martin (1996). The earnings data used to compute replacement rates for 1997 are OECDSecretariat estimates.
2. Final-year data refer to 1995 for Italy and Greece.Source: OECD data base on unemployment benefit entitlements and replacement rates.
New ZealandAustria
Australia United States
Japan
Canada
Switzerland
Netherlands
Denmark
Belgium FranceGermany
Ireland United Kingdom
Spain
Finland
Norway
Portugal
Sweden
Greece
Italy

OECD Economic Studies No. 30, 2000/I
102
OECD 2000
programmes, are sufficiently large to have potentially significant effects on workincentives and on wage-setting behaviour. This, in turn, has led to attempts inrecent years to curb the so-called “unemployment trap”.
Actions taken by OECD countries to curb unemployment traps
The most direct step to curb the unemployment trap is to cut replacementrates. However, where actions were taken to cut replacement rates, they were usu-ally motivated by budget considerations rather than out of concern about the pos-sible emergence of benefit dependency or work disincentives. Given the politicaldifficulties with dismantling benefit entitlements, the preferred approach to curb-ing the unemployment trap in the majority of OECD countries has been to makeonly marginal cuts in the generosity of benefit entitlements, but to tighten up oneligibility conditions for receipt of benefits and to develop “activation” strategiesfor the unemployed.24
Table 6. Net replacement rates at different earnings levels1
1996-1997
Initial unemployment Long-term unemployed2
APW 2/3 APW 1st decile APW 2/3 APW 1st decileearnings earnings earnings earnings earnings earnings
Australia 74 86 86 74 86 86Belgium 60 76 77 63 90 91Canada 69 69 80 77 77 77Denmark 77 96 96 96 96 96Finland 84 94 94 97 97 97France 74 86 85 50 60 60Germany 74 74 73 52 61 61Ireland 62 73 75 62 73 75Italy 54 52 52 18 22 23Japan 56 64 69 65 95 95Netherlands 85 90 90 79 94 94New Zealand3 63 78 86 63 78 86Norway 73 74 74 55 73 69Spain 74 78 81 43 61 71Sweden 84 90 90 100 100 100Switzerland 84 84 84 90 93 91United Kingdom 64 83 87 74 89 89United States 61 51 51 48 61 61
1. It is assumed that the worker is 40 years old, has a dependent spouse and 2 children, and started to work at 18.The figures represent replacement rates for newly and long-term unemployed persons. Housing costs are assumedto be 20 per cent of gross APW earnings.
2. Replacement rates for the long-term unemployed relate to persons in the 60th month of their unemploymentspell.
3. Data refer to 1995.Source: OECD data base on taxation and benefit entitlements.

What works among active labour market policies
103
OECD 2000
The aim of activation strategies is to encourage the unemployed to be moreactive in job search and keep more in touch with the labour market. Such strategiesrange from attempts to provide more effective job-search assistance to the unem-ployed and monitoring their search activity at one end of the spectrum to making itobligatory on the unemployed to satisfy work tests or participate in active pro-grammes or in education and training if they are to continue to draw benefits. Suchactivation strategies are becoming quite common for young people in OECD coun-tries (e.g. Australia, Denmark, Ireland, United Kingdom), and they are even beingextended to other groups of the unemployed in some countries.25 The recent USwelfare reform, with its emphasis on work requirements, time limits for benefits andsanctions for non-compliance, can be viewed as an extreme example of thisapproach.
The role of active labour market policies changes subtly in the context of anactivation strategy. They can then be viewed as a vehicle for enforcing a work teston the unemployed, especially in cases where the supply of job vacancies is low. Insuch cases, continued receipt of unemployment benefits becomes conditional onprogramme participation, as is the case in Denmark or Switzerland, and/or by offer-ing a sufficiently wide range of programmes so that a maximum number of theunemployed will choose to enter them voluntarily. In a related manner, there is agrowing interest in many countries in the potential role which the rules used to controljob-search behaviour and curb benefit abuse by claimants of unemployment ben-efits can play as part of an effective activation strategy. As noted in the previous sec-tion, the evaluation literature suggests that these rules, if used intelligently andsupported by effective sanctions, can help stimulate job search and serve to keepbenefit claimants in touch with the labour market.26
Of course, the key question concerns the effectiveness of such activation strat-egies. It is impossible at this stage to draw any definitive conclusions since most ofthe initiatives taken by countries are relatively recent and there are almost no rig-orous evaluations of them available yet.
However, some scattered evidence does suggest that activation strategies,combining elements of carrots and sticks, can work in terms of producing betterlabour market outcomes for the unemployed. The UK Restart programme, whichwas started in 1987, can be viewed as a prototype for such strategies. Under thisprogramme, all persons unemployed for six months were obliged to attend aRestart interview at the PES. The interview assessed the individuals’ job-searchbehaviour and motivation and assisted them with availing of other services andprogrammes to help them find a job. A rigorous evaluation indicated that Restartdid work and, as a result, the periodicity of Restart interviews was increased duringthe 1990s.27 The recent steps taken in Denmark to introduce activation strategieshave been evaluated by the Danish authorities. Madsen (1998) argues that the pre-liminary evidence from the evaluations suggests that the activation strategies have

OECD Economic Studies No. 30, 2000/I
104
OECD 2000
been successful in terms of improving employment prospects for the unemployed,especially for the young unemployed.
Finally, many workfare experiments were designed and operated by individu-als US states in the 1980s and 1990s in advance of the 1996 welfare reform. Solow(1998) reviews the rigorous evaluation evidence on the effectiveness of these work-fare initiatives and concludes that they did have statistically significant effects inraising the employment and earnings prospects of welfare recipients, but theeffects were not large. Of course, as Solow recognises, one cannot generalise fromthe results of these individual workfare experiments to draw conclusions about thelikely effects of the 1996 welfare reform. There has been a sharp drop in welfare rollssince the reform, but there is an on-going debate as to how much of this decline isdue to the booming US economy and how much to the policy changes. Research bythe Administration, summarised in OECD (1999c), suggests that almost one-third ofthe decline in welfare rolls since 1996 can be attributed to the reform, with most ofthe policy-induced effect being the result of sanctions for non-compliance.
In sum, while it is too early to judge the effectiveness of the range of activationstrategies that have been introduced by some OECD countries in recent years, theearly signs are quite promising.28 It seems that a mix of carrot-and-stick elements insuch strategies, combining use of active labour market policies and benefit sanc-tions in case of non-compliance, may well contribute to better labour market out-comes for benefit recipients.
The importance of integrated management of benefit systems and active labour market policies
There is a close interaction between active and passive measures which is cen-tral to the trade-off between equity and efficiency. If the unemployment benefitsystem is generous and poorly managed, it is very difficult to operate active pro-grammes in ways that increase labour market efficiency and reduce structuralunemployment. Conversely, if active measures are used on a large scale and mainlyserve to re-establish benefit entitlements, they risk becoming a de facto passivemeasure. They thus need to be better managed and linked more closely to the ben-efits system.
OECD research suggests that the public employment service has a central roleto play in achieving this better management. It can play this role most effectively ifit operates as a fully integrated agency combining the three core functions of jobplacement, benefit payments and placing participants on active programmes. Suchintegration is desirable for the following reasons:
– A close co-ordination between placement and benefit work is needed inorder to apply work tests effectively and hence to fulfil one of the key pre-conditions for benefit entitlement;

What works among active labour market policies
105
OECD 2000
– A close co-ordination between job broking and ALMPs is needed in order toensure that the unemployed can acquire the attributes necessary to fill avail-able job vacancies; and
– A close co-operation between benefit administration and referral to ALMPsis needed in order to avoid long-term dependency on benefit receipt andprogramme participation for the sole purpose of renewing benefit entitle-ments.
However, it should be noted that many OECD countries do not have a fullyintegrated public employment service in this sense, though Australia has taken alarge step in this direction recently with the establishment of Centrelink, and NewZealand has fully integrated the delivery of income support with the delivery ofemployment services in a single agency.
Assessment
The recent history of active and passive labour market policies in the 17 OECDcountries which have been reviewed suggests the following eight lessons for thedesign of future policies in order to make them more effective:
First, integrate the referral to active programmes as closely as possible withbenefit and placement work. Ideally, all three basic functions should be providedby the same front-line public employment office (so-called “one-stop” labouroffices).
Second, use “profiling” for new benefit claimants to identify those at risk ofbecoming long-term unemployed; provide the latter (but not the others) immedi-ately with counselling and job-search assistance.29
Third, make passive income support as “active” as possible by using instru-ments like re-employment bonuses, in-work benefits, regular contacts of claimantswith the public employment service, job clubs, etc.
Fourth, use “availability for work” (to be controlled by work tests) and “job-search initiatives” (to be confirmed by employers) as independent criteria whichmust be met in order to qualify for continued benefit receipt (e.g. both criteria haveto be fulfilled in Switzerland).
Fifth, make continued receipt of income support conditional on accepting toparticipate in active programmes after a certain minimum duration of an unemploy-ment spell (say after six or eight months); do not, however, guarantee a slot in a pro-gramme by that time, but handle the referral flexibly in accordance with theavailability of slots which correspond to the needs of the job seeker in question.
Sixth, ensure that participants in training and public sector employment pro-grammes continue to be available for work in the open labour market; encouragethem to engage actively in job search.

OECD Economic Studies No. 30, 2000/I
106
OECD 2000
Seventh, ensure that participation in training and public-sector employmentprogrammes does not serve mainly to establish new benefit entitlements. One wayto ensure this is by making the duration of employment subsidies to the privatesector shorter than the minimum contribution period required for benefit entitle-ments. These steps will minimise the so-called “carousel effect”, whereby a consid-erable number of the long-term unemployed move between spells of benefitreceipt and programme participation. OECD research has shown that the carouseleffect is a significant problem in many European countries. Some countries,e.g. Denmark, Finland, Norway and Switzerland, have taken steps recently to curbthis possibility.
Finally, explore ways of making the public employment service more effectiveby giving greater play to the role of market signals. For example, many active mea-sures, particularly training programmes, are provided by the public sector and thismay not be the most efficient form of provision. Some countries are beginning toexperiment in this area with a range of initiatives designed to give greater play toprivate sector agencies in the provision of active measures.30
Australia has gone further in this direction than any other OECD country withits recent initiative designed to make the market for job placements fully contest-able, with specific incentives for both private and public employment services tocompete to place the most at-risk job-seekers. However, it will be several yearsbefore it is possible to evaluate whether the new Employment Services Market inAustralia improves significantly the employment and earnings prospects of at-riskjob seekers compared with other, more traditional active measures.
CONCLUSIONS
At first sight, the bottom line from recent OECD research on the effectivenessof active labour market policies is not terribly encouraging. The track record ofmany active measures is mixed in terms of raising the future employment and earn-ings prospects of job seekers and producing benefits to society. In addition, littleprogress has been made to date in shifting public spending from passive to activelabour market measures in most OECD countries, despite the widespread endorse-ment of this goal by politicians.
While we cannot ignore the undoubted problems with active measures, itwould be wrong to draw a pessimistic conclusion about their potential role in thefight against high and persistent unemployment and the problems of low pay andpoverty. We now know a great deal more about what works and what does not workamong the large array of active measures currently in use across OECD countries.We are also much more aware nowadays of the crucial nature of the various inter-actions between active and passive measures. Recent OECD research suggests

What works among active labour market policies
107
OECD 2000
several practical steps which can be taken to enhance the effectiveness of activemeasures. At the same time, there is a crying need to expand the quantity and qual-ity of evaluations of labour market programmes in a wider range of OECD countriesso that countries can learn from each other’s experiences.
However, even if all these steps were to be implemented, it is important to berealistic about their likely impacts on unemployment; one should not oversell thecase for active labour market policies. More effective active labour market policies,as Lars Calmfors has rightly warned, are not a magic bullet on their own to solve theunemployment problem. Since one of the main objectives of active measures is toassist the unemployed to get back into work, they require a reasonably buoyantsupply of job vacancies in order to be effective. If an economy is generating fewvacancies, one should not be surprised if active measures prove to be relativelyineffective. Aggregate demand matters too. As The OECD Jobs Study has stressed,more effective active policies are only one element in a comprehensive strategy ofmacroeconomic and microeconomic measures required to cut unemployment sig-nificantly. Nonetheless, they remain a potentially important weapon in the fightagainst unemployment.

OECD Economic Studies No. 30, 2000/I
108
OECD 2000
NOTES
1. For detailed reviews of progress in the implementation of the country-specific recommenda-tions, see OECD (1997d, 1998c, and 1999a).
2. This work is presented in OECD (1996a, 1997c).
3. Calmfors (1994) stresses the importance of the compensation levels paid to participants onactive labour market programmes as one crucial design feature in assessing the effectiveness ofactive policies.
4. The data on inflow rates cover public training for employed adults as well as the unemployed. Ina few countries, e.g. Denmark, Belgium, Ireland, Korea and Portugal, this accounts for a largeproportion of the total inflow rate to all active measures, ranging from 20 per cent in Ireland to40 to 50 per cent in Denmark, Korea and Portugal in 1997.
5. The relevant extract from the Press Communiqué issued at the end of the Ministerial meetingreads as follows: “When they last met in 1992, OECD Ministers of Employment and Labourstressed the need to shift public spending on labour market policies from passive to active mea-sures. In most countries, more progress is needed in achieving this objective. Today, Ministersreiterate this policy objective while at the same time underlining the need to enhance the effec-tiveness of active labour market policies and to design and manage unemployment and relatedwelfare benefits fairly, but tightly. Active measures must not become inadvertently “passive” inthat they simply provide parking slots for the unemployed or serve to re-establish benefit enti-tlements. At the same time, so-called passive measures should be designed and rigorously man-aged so that active job search by benefit claimants is rewarded, thereby ensuring that they donot become overly dependent on income support”.
6. However, the fact that inflow rates to programmes increased between 1986 and 1997 in manymore countries than did spending/GDP ratios suggests that there was a shift to shorter-durationprogrammes over the period.
7. There is a nice illustration of this in recent US experience. When the national evaluation of theJob Training Partnership Act (JTPA) revealed that it had failed to provide earnings gains to disad-vantaged youths, the US Congress eliminated nearly all of the funds for JTPA.
8. See Calmfors and Skedinger (1995) for a discussion of these problems.
9. There is a large literature on the appropriate methodology to use in evaluating labour marketprogrammes. See Friedlander et al. (1997) for a good review of the issues.
10. OECD (1999b) points out that in 1995 there were 163 federal employment and training pro-grammes for adults and out-of-school youths in the United States, administered by 15 federalagencies, compared with 125 programmes in 1991. These totals did not include the very largenumber of similar programmes at state level.

What works among active labour market policies
109
OECD 2000
11. There are a few US evaluations that cover longer time periods, following individuals up to five tosix years after their participation on the programme. See Grubb (1995, 1999) and Stanley et al.(1998) for reviews of these studies. Grubb (1999) argues that these studies show that any ben-efits from programme participation tend to evaporate after four or five years.
12. See Stanley et al. (1998) for a good review of the recent US literature.
13. Special employment measures for the disabled are not covered here since the OECD has notreviewed the recent evaluation literature in this field. Measures for the disabled accounted, onaverage, for 12 per cent of total public spending on ALMPs in 1997 (see Table 5).
14. See Forslund and Krueger (1994) for a review of the Swedish evaluation evidence on trainingprogrammes; Friedlander et al. (1997), Grubb (1995) and Stanley et al. (1998) for reviews of theUS literature; and Park et al. (1996) for a review of some Canadian programmes.
15. Friedlander et al. (1997) point out that there is no evidence in the rigorous evaluation literaturequantifying the size of displacement associated with training programmes for disadvantaged groups.
16. See Meyer (1995) for a review of the US evidence and Human Resources Development Canada(1997) for a review of the Canadian evidence.
17. However, Canadian evidence, summarised in Human Resources Development Canada (1997),suggests that any earnings gains from job-search assistance are likely to be transitory.
18. The evaluation results supporting this positive assessment of Job Corps were based on non-experimental methods and were done almost 20 years ago. A rigorous nationwide evaluation ofJob Corps is now underway to try to settle the issue of whether it works or not.
19. See Heckman (1994) and Human Resources Development Canada (1997).
20. See Richardson (1998) for evidence, using a panel of Australian youths, that participation in sub-sidised jobs improved their employability.
21. See OECD (1993b, 1993c, 1996b, 1996c, 1996d, 1997b, 1998b, 1999b).
22. See Calmfors (1994) for a detailed exposition of this argument.
23. See Martin (1996) for a detailed discussion of these data.
24. It should be noted that the replacement rates in Figure 2 refer to a 40-year-old worker with along contributions history since this case was considered a good approximation to the averagesituation of an unemployed worker in most countries. However, this assumption means thatmost changes in eligibility conditions for receipt of unemployment benefits will not show up inthe OECD summary measure.
25. New Zealand has recently decided to work test not only the unemployed but also all other wel-fare beneficiaries of working age.
26. Abbring et al. (1996) is one of the few rigorous evaluations of the effect of unemployment insur-ance sanctions on the transition rate from unemployment to employment. They use a micro dataset covering the population of individuals who started collecting benefits in the Netherlands in1992. Their results show that the transition rates to employment are increased significantly bythe imposition of a benefit sanction.
27. For details on the evaluation results, see Schmid (1997).
28. There is also macroeconometric evidence to back the argument that activation strategies canwork. The Danish Ministry of Finance has developed a set of indicators for eligibility conditionsto receive unemployment benefits and the availability criteria which benefit recipients must sat-isfy in order to continue receiving benefits. They have used these indicators as regressors in across-country regression designed to quantify the determinants of structural unemploymentrates in 19 OECD countries. Their results indicate that tighter administration of unemployment

OECD Economic Studies No. 30, 2000/I
110
OECD 2000
benefits/more stringent activation strategies served to lower the structural unemployment ratewhereas higher net replacement rates tended to raise it. For details, see Danish Ministry ofFinance (1998, 1999).
29. See OECD (1998a) for a review of experiences with different profiling approaches in Australia,Canada, the United Kingdom and the United States. It should be noted that there are strong dif-ferences of view about the relevance and reliability of formal profiling methods, and how centrala role profiling can play in making active labour market programmes more effective.
30. See Fay (1997) for a review of these issues.

What works among active labour market policies
111
OECD 2000
BIBLIOGRAPHY
ABBRING, J., G. VAN DEN BERG and J. VAN OURS (1996), “The effect of unemployment insur-ance sanctions on the transition rate from unemployment to employment”, paper presented tothe Canadian International Labour Network Conference, Burlington, Ontario, 4-7 September.
CALMFORS, L. (1994), “Active labour market policies and unemployment: a framework for the anal-ysis of crucial design features”, OECD Economic Studies, 22, pp. 7-49.
CALMFORS, L. (1995), “What can we expect from active labour market policy?” Konjunkturpolitik,43, pp. 1-30.
CALMFORS, L. and P. SKEDINGER (1995), “Does active labour market policy increase employment?Theoretical consideration and some empirical evidence from Sweden”, Oxford Review of EconomicPolicy, 11(1), pp. 91-109.
DANISH MINISTRY OF FINANCE (1998), “Availability criteria in selected OECD countries”, WorkingPaper No. 6, November.
DANISH MINISTRY OF FINANCE (1999), The Danish Economy: Medium-Term Economic Survey,Ministry of Finance, Copenhagen, March.
ELMESKOV, J., J.P. MARTIN and S. SCARPETTA (1998), “Key lessons for labour market reforms: evi-dence from OECD countries’ experiences”, Swedish Economic Policy Review, 5(2), pp. 205-252.
FAY, R.G. (1996), “Enhancing the effectiveness of active labour market policies: evidence from pro-gramme evaluations in OECD countries”, Labour Market and Social Policy Occasional PapersNo. 18, OECD, Paris.
FAY, R.G. (1997), “Making the public employment service more effective through the introductionof market signals”, Labour Market and Social Policy Occasional Papers No. 26, OECD, Paris.
FORSLUND, A. and A. KRUEGER (1994), “An evaluation of the Swedish active labor market policy:new and received wisdom”, NBER Working Paper No. 4802.
FRIEDLANDER, D., D.H. GREENBERG and P.K. ROBINS (1997), “Evaluating government trainingprogrammes for the economically disadvantaged’, Journal of Economic Literature, 35(4),pp. 1809-1855.
GRUBB, W.N. (1995), “Evaluating job training programmes in the United States: evidence and expla-nations”, University of California at Berkley National Center for Research in Vocational Educa-tion, Technical Assistance Report, May.
GRUBB, W.N. (1999), “Lessons from education and training for youth: five precepts”, in PreparingYouth for the 21st Century: the Transition from Education to the Labour Market, OECD, Paris.
HECKMAN, J.J. (1994), “Commentary: active labor market policies to expand employment andopportunity”, in Reducing Unemployment: Current Issues and Policy Options, Federal Reserve Bankof Kansas City, Kansas City, Missouri, pp. 291-311.
OECD Economic Studies No. 30, 2000/I
112
OECD 2000
HUMAN RESOURCES DEVELOPMENT CANADA (1997), Lessons Learned: Effectiveness of Employ-ment-Related Programmes for Youth, Human Resources Development Canada, Ottawa, June.
JACKMAN, R., C. PISSARIDES and S. SAVOURI (1990), “Labour market policies and unemploymentin the OECD”, Economic Policy, 11, pp. 449-490.
JACKMAN, R. (1994), “What can active labour market policy do?” Swedish Economic Policy Review,1(1–2), pp. 221-257.
LAYARD, R., S. NICKELL and R. JACKMAN (1991), Unemployment: Macroeconomic Performance andthe Labour Market, Oxford University Press, Oxford.
LERMAN, R.I. (1997), “Employment and training programmes for out-of-school youth”, Urban Insti-tute, Washington, D.C., mimeo.
MADSEN, P.K. (1999), “Country employment policy reviews: Denmark”, paper presented to an ILOSymposium on “Social Dialogue and Employment Success”, Geneva, 2-3 March.
MARTIN, J.P. (1996), “Measures of replacement rates for the purposes of international comparisons:a note”, OECD Economic Studies, 26, pp. 99-116.
MEYER, B.D. (1995), “Lessons from the US unemployment insurance experiments”, Journal of Eco-nomic Literature, 33(1), pp. 91-131.
NICKELL, S.J. (1997), “Unemployment and labor market rigidities: Europe versus North America”,Journal of Economic Perspectives, 11(3), pp. 55-74.
NICKELL, S.J. and R. LAYARD (1997), “Labour market institutions and economic performance”,Oxford University Institute of Economics and Statistics Discussion Paper No. 23.
OECD (1993a), Employment Outlook, Paris.
OECD (1993b), The Labour Market in the Netherlands, OECD, Paris.
OECD (1993c), The Public Employment Service in Japan, Norway, Spain and the United Kingdom, OECD,Paris.
OECD (1994a), The OECD Jobs Study: Facts, Analysis, Strategies, OECD, Paris.
OECD (1994b), The OECD Jobs Study: Evidence and Explanations, Volumes I and II, OECD, Paris.OECD (1996a), The OECD Jobs Strategy: Enhancing the Effectiveness of Active Labour Market Policies,
OECD, Paris.
OECD (1996b), The Public Employment Service: Denmark, Finland, Italy, OECD, Paris.
OECD (1996c), The Public Employment Service: Austria, Germany, Sweden, OECD, Paris.OECD (1996d), Labour Market Policies in Switzerland, OECD, Paris.
OECD (1997a), Employment Outlook, OECD, Paris.
OECD (1997b), The Public Employment Service: Belgium, OECD, Paris.
OECD (1997c), Enhancing the Effectiveness of Active Labour Market Policies: a Streamlined Public Employ-ment Service, OECD, Paris.
OECD (1997d), Implementing the OECD Jobs Strategy: Member Countries’ Experience, OECD, Paris.
OECD (1998a), Early Identification of Jobs Seekers at Risk of Long-term Unemployment: The Role of Pro-filing, OECD, Paris.
OECD (1998b), The Public Employment Service: Greece, Ireland, Portugal, OECD, Paris.
OECD (1998c), Implementing the OECD Jobs Strategy: Progress Report, OECD, Paris.
OECD (1999a), The OECD Jobs Strategy: Assessing Performance and Policy, OECD, Paris.
OECD (1999b), The Public Employment Service in the United States, OECD, Paris.

What works among active labour market policies
113
OECD 2000
OECD (1999c), Economic Survey of the United States, OECD, Paris.PARK, N., B. POWER, W.C. RIDDELL and G. WONG (1996), “An assessment of the impact of gov-
ernment-sponsored training”, Canadian Journal of Economics, 29 (Special issue), Part 1,pp. S93-S98.
RICHARDSON, J. (1998), “Do wage subsidies enhance employability? Evidence from Australianyouth”, London School of Economics, Centre for Economic Performance Discussion PaperNo. 387, April.
SCARPETTA, S. (1996), “Assessing the role of labour market policies and institutional settings onunemployment: a cross-country study”, OECD Economic Studies, 26, pp. 43-48.
SCHMID, G. (1997), “The evaluation of labour market policy: notes on the state of the art”, Evalua-tion, 3(4), October, pp. 409-434.
STANLEY, M., L. KATZ and A. KRUEGER (1998), “Developing skills: what we know about the impacts ofAmerican employment and training programmes on employment, earnings and educational out-comes”, Malcolm Weiner Center for Social Policy Working Paper H-98-02, John F. Kennedy Schoolof Government, Harvard University, October.
SOLOW, R.M. (1998), Work and Welfare, Princeton University Press, Princeton, N.J.
Related Documents


