What to make of steel in 2009 Presentation to SMA Annual Members Conference Washington DC May 19, 2009

What to make of steel in 2009 Presentation to SMA Annual Members Conference Washington DC May 19, 2009.
Dec 27, 2015
Welcome message from author
This document is posted to help you gain knowledge. Please leave a comment to let me know what you think about it! Share it to your friends and learn new things together.
Transcript
What to make of steel in 2009
Presentation to
SMA Annual Members Conference
Washington DC
May 19, 2009
www.first-river.com2
What to make of steel in 2009
A dangerous place for forecasting
Plenty to worry about Pursuing unhappiness Some confident
predictions

A dangerous place for forecasting

www.first-river.com4
• Rare (highly improbable)• Hard to predict (except in retrospect)• Consequential
Last year’s message…Black swan events are:
www.first-river.com5
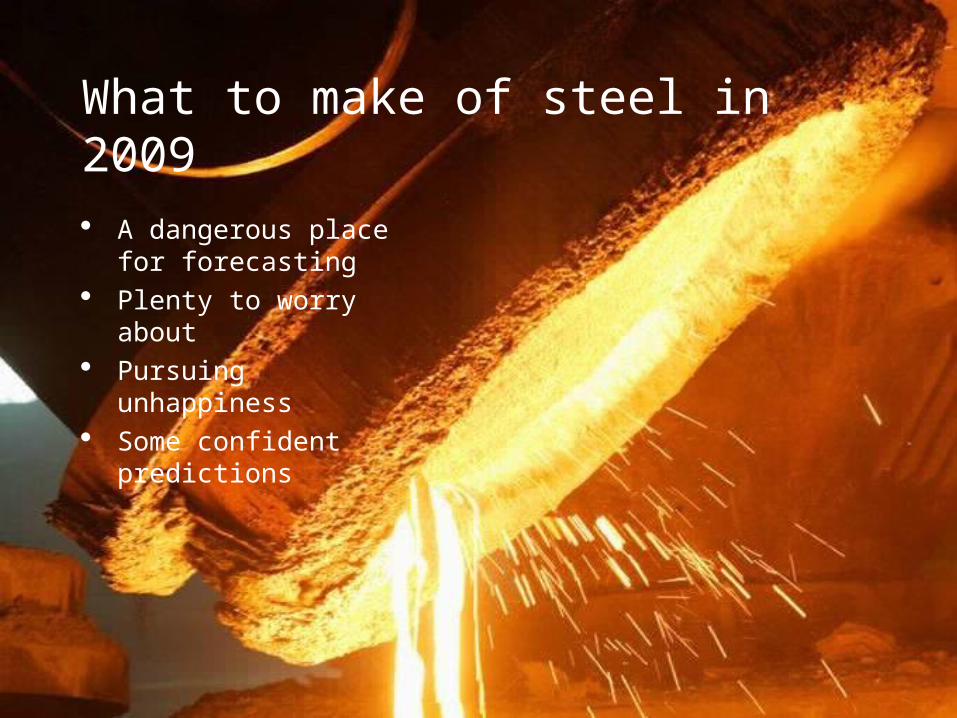
Other forecasting miseries
Missed 2008 – in September! Recalibrated 2009 several times Q1 6 reasons why it won’t be so bad this
time (October 2008)
– Global economic growth (3% to -2.8%)
– Industrialization
– Capacity management
– Chinese industry rationalization
– Renewed consolidation
– Growth, Environment & Energy
A man who predicts the future is lying – even if he’s right Arab proverb

www.first-river.com6
What to do/think?
Avoid too much emotional commitment to one outcome
Avoid to much organizational commitment to one outcome
Consider all outcomes equally possible
Be ready

Plenty to Worry About

www.first-river.com8
World steel forecastApparent steel use forecast & y-o-y change 2008 to 2009
NAFTA
Europe
CIS
Dev. Asia
Brazil
China ME&A
India
-35%
-30%
-25%
-20%
-15%
-10%
-5%
0%
5%
Y-o
n-Y
ch
ang
e
0
100
200
300
400
500
600
700
800
900
Developed Developing
M T
on
ne
s A
pp
are
nt
Ste
el U
se
2008 2009
-27%
-8%
2008: 1,197MT to 2009: 1,019MT ~15% decline
Developed world consumption from 36% to 31% of total

www.first-river.com9
2009 in a long term contextGlobal steel annual production changes
Year Decline
1 1921 -38%
2 1932 -27%
3 1931 -27%
4 1945 -25%
5 1919 -24%
6 1908 -22%
7 1930 -21%
8 1914 -21%
9 1938 -19%
10 2009F
-15%
11 1982 -9%
12 1975 -9%
13 1958 -7%
14 1918 -6%
15 1944 -5%Source: worldsteel, First River
-50%
-40%
-30%
-20%
-10%
0%
10%
20%
30%
40%
50%
60%
1900
1905
1910
1915
1920
1925
1930
1935
1940
1945
1950
1955
1960
1965
1970
1975
1980
1985
1990
1995
2000
2005
2010
Ye
ar
on
Ye
ar
Ch
an
ge
in P
rod
uc
tio
n
www.first-river.com10
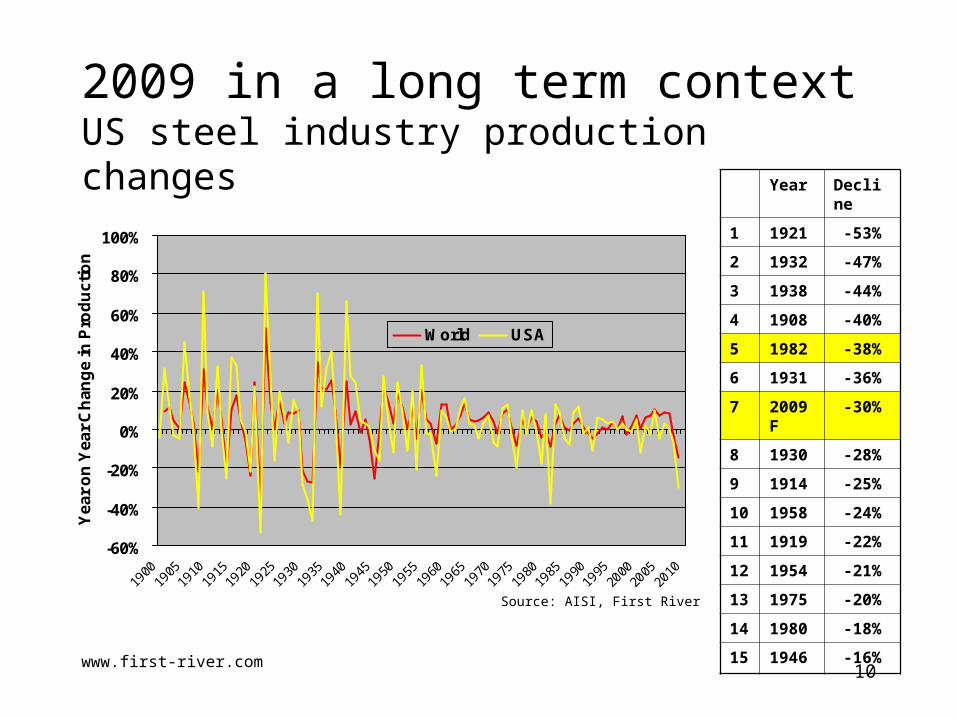
2009 in a long term contextUS steel industry production changes
Year Decline
1 1921 -53%
2 1932 -47%
3 1938 -44%
4 1908 -40%
5 1982 -38%
6 1931 -36%
7 2009F
-30%
8 1930 -28%
9 1914 -25%
10 1958 -24%
11 1919 -22%
12 1954 -21%
13 1975 -20%
14 1980 -18%
15 1946 -16%
Source: AISI, First River
-60%
-40%
-20%
0%
20%
40%
60%
80%
100%
1900
1905
1910
1915
1920
1925
1930
1935
1940
1945
1950
1955
1960
1965
1970
1975
1980
1985
1990
1995
2000
2005
2010
Ye
ar
on
Ye
ar
Ch
an
ge
in P
rod
uc
tio
n
World USA

www.first-river.com11
-30%
-25%
-20%
-15%
-10%
-5%
0%
5%
10%
15%
20%
25%
-3% -2% -1% 0% 1% 2% 3% 4% 5% 6% 7% 8%
Change in GDP (%)
Ch
an
ge
in S
tee
l De
ma
nd
%GDP forecast indicates 20-25% drop in US finished steel demand
Sources: AISI, US BEA, IMF, First River
2008
1980
1982
1975
IMF World Economic Outlook April 2009
US 2009 GDP Forecast: -2.8%
2009
www.first-river.com12
0
25
50
75
100
125
150
1970 1972 1974 1976 1978 1980 1982 1984 1986 1988 1990 1992 1994 1996 1998 2000 2002 2004 2006 2008
Mill
ion
To
ns
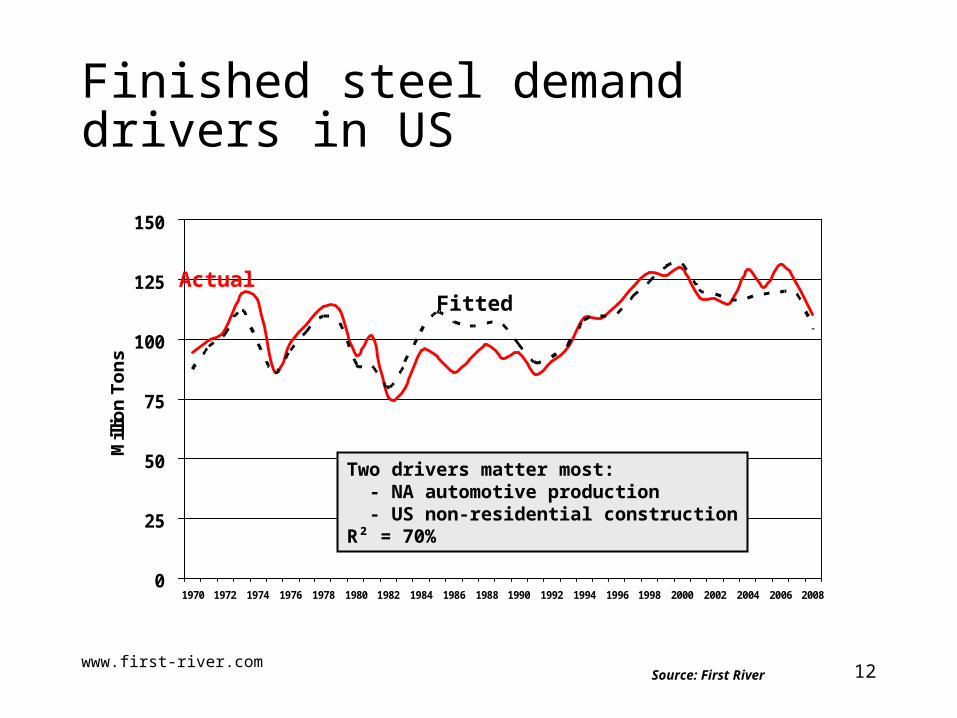
Finished steel demand drivers in US
ActualFitted
Two drivers matter most: - NA automotive production - US non-residential constructionR² = 70%
Source: First River

www.first-river.com13
14.7
13.7
12.3
10.0
12.6
8.2
4
8
12
16
20
1990 1992 1994 1996 1998 2000 2002 2004 2006 2008 2010F 2012F
Mill
ion
Veh
icle
s
NA automotive production forecastBelow 15 million thru 2013
Source: CSM Worldwide (March 2009)
35% drop this yearAverage 11.8 2009-2013

www.first-river.com14
Big 3 participation in car productionBig 3, Others units & share 1985-2008, US only
Source: Ward’s automotive, FRC
0
1,000
2,000
3,000
4,000
5,000
6,000
7,000
8,000
9,00019
85
1986
1987
1988
1989
1990
1991
1992
1993
1994
1995
1996
1997
1998
1999
2000
2001
2002
2003
2004
2005
2006
2007
2008
'000
's o
f U
nit
s
30%
40%
50%
60%
70%
80%
90%
100%
%
Big 3 Others Big 3 Share - rhs

www.first-river.com15
1,467
1,505
1,246
1,0941,131
1,397
0
500
1,000
1,500
2,000
2,500
1990 1992 1994 1996 1998 2000 2002 2004 2006 2008 2010F 2012F
Mill
ion
Sq
uar
e F
eet
US non-residential construction No return to level of late 1990s thru 2013
Source: FW Dodge (Spring 2009)
22% drop 2008 to 2010Average 1,300 2009-2013

www.first-river.com16
115
110
100
90
80
0
25
50
75
100
125
150
1990 1992 1994 1996 1998 2000 2002 2004 2006 2008 2010F 2012F
Mill
ion
To
ns
US finished steel demand forecastWeak throughout forecast period
Actual ADC
Forecast
Source: CSM, FW Dodge, WSA, First River
30-40% drop this year
110
68 (WSA)

www.first-river.com17
Operating rates for rest of 2009
Million TonsFull Year
2009Q1 Est. Q2-Q4
US ADC all steel products 75.0 16.5 58.5
- Net Imports 12.0 3.5 8.5
Finished Steel Production 63.0 13.0 50.0
Finished steel production as % of peak shipments (110 MT)
57% 47% 61%
Source: AISI, MSCI, First River
Risk is to the downside

www.first-river.com18
0
20
40
60
80
100
120
140
2004-08 2009-13 2015
Mill
ion
To
ns
ADC Finished Steel Production Net Finished Imports
Average US demand & production2009-2013
~20% average decline Recovery by 2015?
www.first-river.com19
0%
10%
20%
30%
40%
50%
60%
70%
80%
90%
100%
1915 1920 1925 1930 1935 1940 1945 1950 1955 1960 1965 1970 1975 1980 1985 1990 1995 2000 2005
Cap
acity
Util
izat
ion
0%
10%
20%
30%
40%
50%
60%
70%
80%
90%
100%
1915 1920 1925 1930 1935 1940 1945 1950 1955 1960 1965 1970 1975 1980 1985 1990 1995 2000 2005
Cap
acity
Util
izat
ion
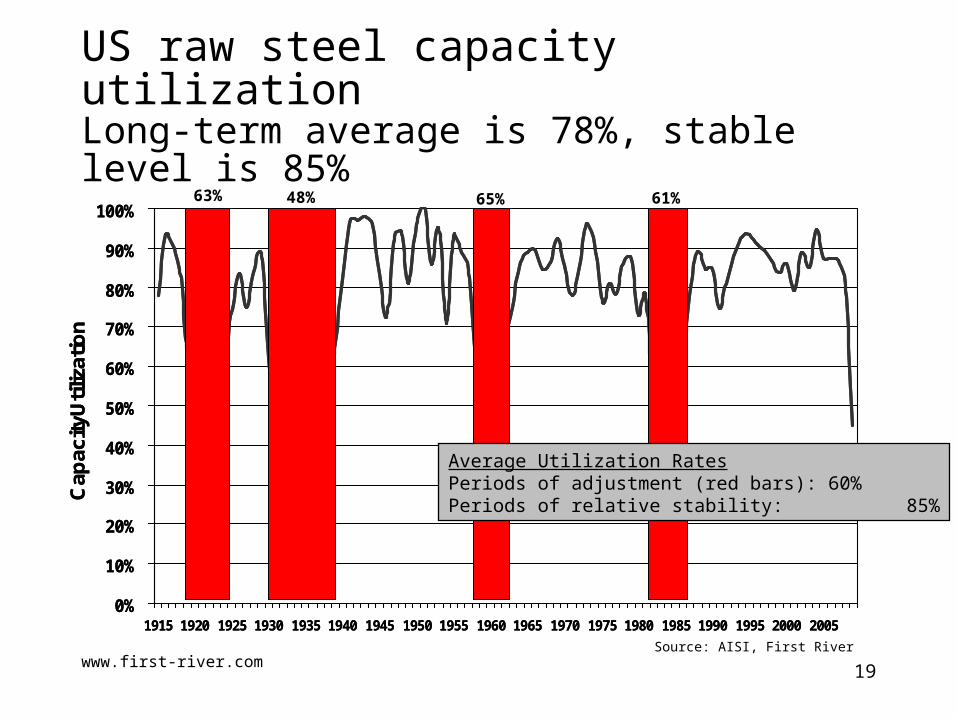
US raw steel capacity utilizationLong-term average is 78%, stable level is 85%
Source: AISI, First River
63% 48% 65% 61%
Average Utilization RatesPeriods of adjustment (red bars): 60%Periods of relative stability: 85%

www.first-river.com20
Future raw steel capacity requirementA 30 MT issue?
2009-2013
Raw Steel Production 85.0
Capacity utilization “stable periods” 85%
= Target raw steel capacity 100.0
2008 raw steel capacity incl. additions
132
= “Excess” Capacity 32Source: First River

www.first-river.com21
2009 – Part of a notable recession
(4)
(2)
0
2
4
6
8
10
12
14
16
18
20
Mo
nth
s
Duration GDP Recovery to Prior GDP
Source: NBER, First River
GD
P L
os
s (
%)
1973-1975 1981-1982 1990-1991 2001 2007-2009?
Thru Q1 2009
1980
Thru May 2009
www.first-river.com22
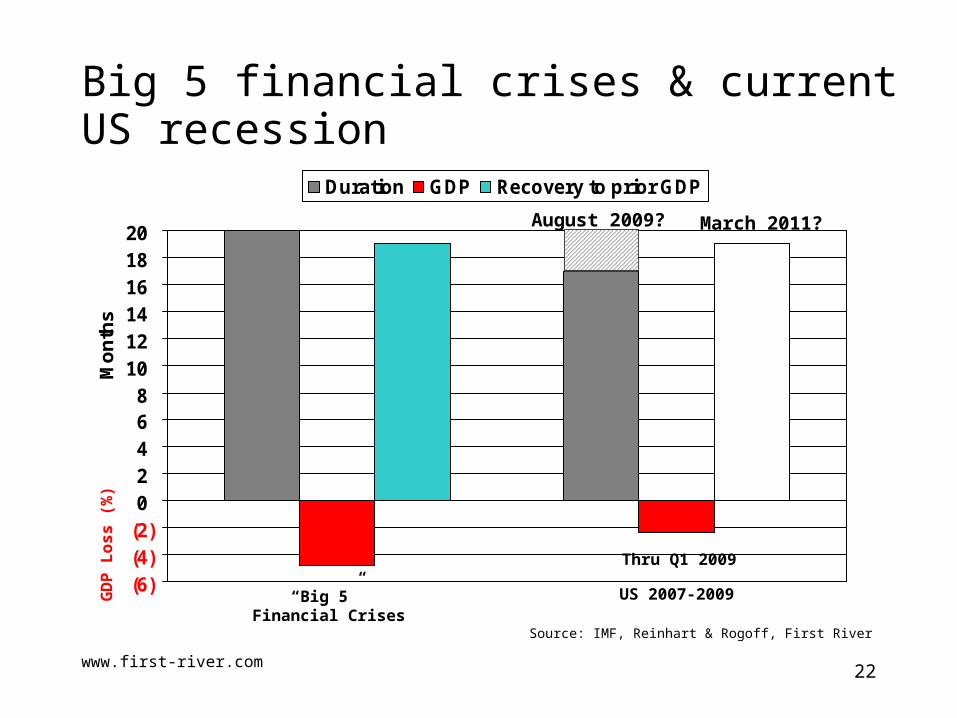
Big 5 financial crises & current US recession
(6)(4)(2)02468
101214161820
Mo
nth
s
Duration GDP Recovery to prior GDP
Source: IMF, Reinhart & Rogoff, First River
GD
P L
os
s (
%)
“Big 5” Financial Crises
US 2007-2009
August 2009?
Thru Q1 2009
March 2011?

Pursuing unhappiness

www.first-river.com24
THE YEAR THE BOTTOM FELL OUT FOR STEEL
STEEL MILLS COMPLAIN ON
EXPORTS OF SCRAP
Not since 1959, when the steel industry was in the middle of a 15-month slump, have steel executives gathered… for their annual meeting under worse circumstances. Seven out of 10 steel companies operated in the red during the first quarter, and losses are expected to mount in the second quarter. Nearly 30 percent of the nation's steelworkers have been laid off, and industry analysts, who just a month ago were quibbling over whether shipments for the year would slide below 80 million tons, now expect them to be under 70 million tons…
FORECASTS WORSENING FOR STEEL
Industry economists who had predicted as recently as January that steel shipments would equal last year's level of 87 million tons, have scaled back those forecasts to about 80 million tons - the low reached in the severe sales slump that developed after the 1974-75 recession. Some even say that shipments will drop below 80 million tons for the first time since 1963, when the industry shipped 75.5 million tons.
UNUSUAL ALLIANCE
SEEKING TO POSTPONE
POLLUTION CURBS ON
STEEL INDUSTRY

www.first-river.com25
THE YEAR THE BOTTOM FELL OUT FOR STEEL
STEEL MILLS COMPLAIN ON
EXPORTS OF SCRAP
Not since 1959, when the steel industry was in the middle of a 15-month slump, have steel executives gathered… for their annual meeting under worse circumstances. Seven out of 10 steel companies operated in the red during the first quarter, and losses are expected to mount in the second quarter. Nearly 30 percent of the nation's steelworkers have been laid off, and industry analysts, who just a month ago were quibbling over whether shipments for the year would slide below 80 million tons, now expect them to be under 70 million tons…
FORECASTS WORSENING FOR STEEL
Industry economists who had predicted as recently as January that steel shipments would equal last year's level of 87 million tons, have scaled back those forecasts to about 80 million tons - the low reached in the severe sales slump that developed after the 1974-75 recession. Some even say that shipments will drop below 80 million tons for the first time since 1963, when the industry shipped 75.5 million tons.
UNUSUAL ALLIANCE
SEEKING TO POSTPONE
POLLUTION CURBS ON
STEEL INDUSTRY
1982

www.first-river.com26
No déjà vu all over again
No functional union agreement or relationship Unconsolidated industry Poorly invested, inefficient facilities Unfocused industry diversified outside steel Lots of government ownership around the world No prospects for industrialization among 2Bn+ people Little transparency in prices, inputs, costs, production & demand
Far fewer prospects for recovery in 1982 than 2009

www.first-river.com27
The pursuit of unhappinessThe situation is hopeless, but not serious
Glorification of the past– Nothing worthy in the present
Obsession with precedents for unprecedented times– Nothing worth learning from the present
The Fatal Glass of Beer– No escaping the sins of too much leverage
General paranoia & fatalism– They’re out to get us– Nothing we do will make any difference
www.first-river.com28
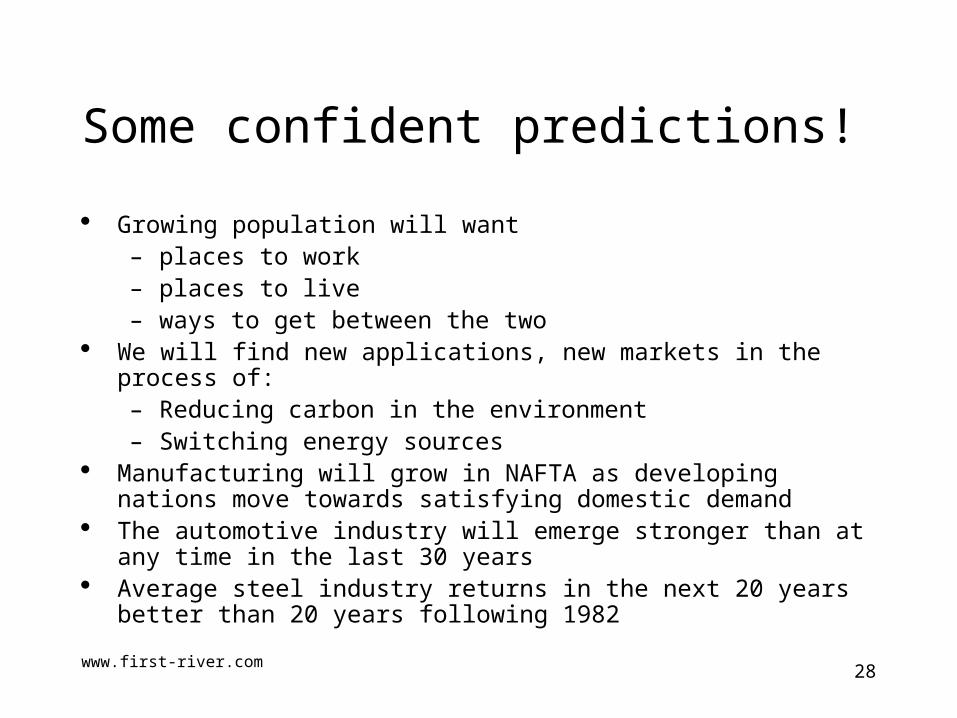
Some confident predictions!
Growing population will want– places to work– places to live– ways to get between the two
We will find new applications, new markets in the process of:– Reducing carbon in the environment– Switching energy sources
Manufacturing will grow in NAFTA as developing nations move towards satisfying domestic demand
The automotive industry will emerge stronger than at any time in the last 30 years
Average steel industry returns in the next 20 years better than 20 years following 1982

www.first-river.com29
What to make of steel in 2009?
A scary ride to the bottom?
A turning point A wake-up call for
the developed world Strategies
reconsidered Some retrenchment
Related Documents