What is Value-at-Risk, and Is It Appropriate for Property/Liability Insurers? Neil D. Pearson Associate Professor of Finance University of Illinois at Urbana-Champaign 12-13 April 1999

What is Value-at-Risk, and Is It Appropriate for Property/Liability Insurers? Neil D. Pearson Associate Professor of Finance University of Illinois at.
Dec 31, 2015
Welcome message from author
This document is posted to help you gain knowledge. Please leave a comment to let me know what you think about it! Share it to your friends and learn new things together.
Transcript

What is Value-at-Risk, and Is It Appropriate for Property/Liability
Insurers?Neil D. Pearson
Associate Professor of Finance
University of Illinois at Urbana-Champaign
12-13 April 1999

What is Value-at-Risk?
0
5
10
15
20
25
P/L
< -
130
-11
0 <
P/L
<-9
0
-70
< P
/L <
-50
-30
< P
/L <
-10
10
< P
/L <
30
50
< P
/L <
70
90
< P
/L <
110
P/L
> 1
30
Hypothetical Daily Mark-to-Market Profit/Loss on Forward Contract (in $thousands)
Fre
quen
cy
value at risk(using x=5%)

If You Like the Normal Distribution
0.0
-150,000 -75,000 0 75,000 150,000
Mark-to-Market Portfolio Profit/Loss
Freq
uenc
y
5% 1.65 std. dev.
Value at risk: $86,625

What is Value-at-Risk?• Notation:
V change in portfolio value
f(V) density of V
x specified probability, e.g. 0.05
• Value-at-risk (VaR) satisfies
orx f V d V
( )
VaR
VaR
1
x f V d V( )

What is Value-at-Risk?
• Value-at-risk (for a probability of x percent) is the x percent critical value
• If you like the normal distribution, it is proportional to the portfolio standard deviation
What is Value-at-Risk?
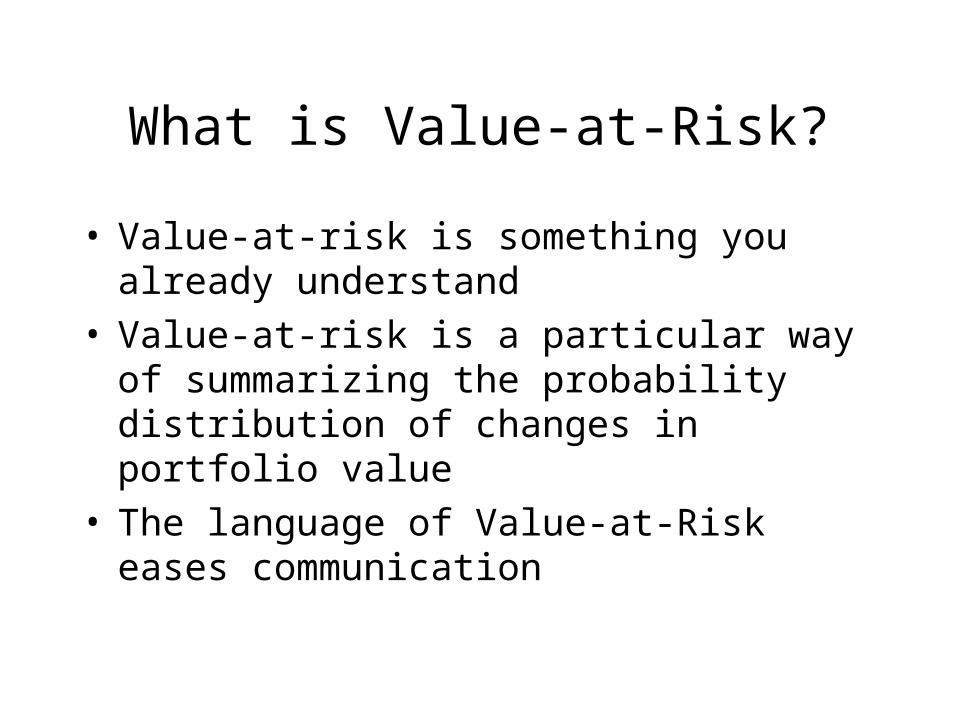
• Value-at-risk is something you already understand• Value-at-risk is a particular way of summarizing
the probability distribution of changes in portfolio value
• The language of Value-at-Risk eases communication

If Value-at-Risk Isn’t New, Why Is It So Fashionable?
• It provides some information about a firm’s risks• It is a simple, aggregate measure of risk• It is easy to understand• “Value” and “risk” are business words

Basic Value-at-Risk Methodologies
• 3 methodologies:– Historical simulation
– Variance-covariance/Delta-Normal/Analytic
– Monte Carlo simulation
• Illustrate these using a forward contract– current date is 20 May 1996
– in 91 days (19 August)• receive 10 million
• pay $15 million

First step: Identify market factors
USD mark - to - market value =GBP million
1 +
USD million
1 +GBP USD
Sr r
10
91 360
15
91 360( / ) ( / )
Market factors: S, rGBP, and rUSD
PositionCurrent $ Value ofPosition
Cash Flow onDelivery Date
Long position in 91 day denominatedzero coupon bond with face value of 10million
S+r ( / )
GBP million
GBP
10
1 91360
Receive 10million
Short position in 91 day $ denominatedzero coupon bond with face value of $15million
USD 15 million
USD1 91360+r ( / )
Pay $15 million

Historical Simulation
• Start with current situation:– date: 20 May 1996– portfolio: 1 forward contract
– market factors: S=1.54, rGBP=6.06%, and rUSD=5.47%
• Obtain values of market factors over last N days• Use changes in market factors to:
– simulate values of market factors on 21 May– compute mark-to-market values of forward contract on 21
May– compute hypothetical profit/loss

Historical simulation: P/LTable 1: Calculation of Hypothetical 5/21/96 Mark-to-Market Profit/Loss on aForward Contract Using Market Factors from 5/20/96 and Changes in Market Factorsfrom the First Business Day of 1996
Market FactorsMark-to-Market Value
$ Interest Rate(% per year)
Interest Rate(% per year)
ExchangeRate($/ )
of ForwardContract($)
Start with actual values ofmarket factors and forwardcontract as of close of businesson 5/20/96:
(1) Actual values on 5/20/96 5.469 6.063 1.536 327,771
Compute actual past changesin market factors:
(2) Actual values on 12/29/95 5.688 6.500 1.553
(3) Actual values on 1/2/96 5.688 6.563 1.557
(4) Percentage change from12/29/95 to 1/2/96
0.000 0.962 0.243
Use these to computehypothetical future values ofthe market factors and themark-to-market value of theforward contract:
(5) Actual values on 5/20/96 5.469 6.063 1.536 327,771
(6) Hypothetical future valuescalculated using rates from5/20/96 and percentage changesfrom 12/29/95 to 1/2/96
5.469 6.121 1.539 362,713
(7) Hypothetical mark-to-marketprofit/loss on forward contract
34,942

Repeat N timesTable 2: Historical Simulation of 100 Hypothetical Daily Mark-to-Market Profits andLosses on a Forward Contract
Market FactorsHypothetical
Mark-to-MarketChange in Mark-
to-Market
Number
$ Interest Rate(% per year)
InterestRate
(% per year)ExchangeRate($/ )
Value ofForward
Contract ($)
Value of ForwardContract ($)
1 5.469 6.121 1.539 362,713 34,942
2 5.379 6.063 1.531 278,216 -49,555
3 5.469 6.005 1.529 270,141 -57,630
4 5.469 6.063 1.542 392,571 64,800
5 5.469 6.063 1.534 312,796 -14,975
6 5.469 6.063 1.532 294,836 -32,935
7 5.469 6.063 1.534 309,795 -17,976
8 5.469 6.063 1.534 311,056 -16,715
9 5.469 6.063 1.541 379,357 51,586
10 5.438 6.063 1.533 297,755 -30,016.
.
.
91 5.469 6.063 1.541 378,442 50,671
92 5.469 6.063 1.545 425,982 98,211
93 5.469 6.063 1.535 327,439 -332
94 5.500 6.063 1.536 331,727 3,956
95 5.469 6.063 1.528 249,295 -78,476
96 5.438 6.063 1.536 332,140 4,369
97 5.438 6.063 1.534 310,766 -17,005
98 5.469 6.125 1.536 325,914 -1,857
99 5.469 6.001 1.536 338,368 10,597
100 5.469 6.063 1.557 539,821 212,050

SortTable 3: Historical Simulation of 100 Hypothetical Daily Mark-to-Market Profits andLosses on a Forward Contract, Ordered From Largest Profit to Largest Loss
Market FactorsHypothetical
Mark-to-MarketChange in Mark-
to-Market
Number
$ Interest Rate(% per year)
Interest Rate(% per year) Exchange
Rate($/ )
Value of ForwardContract ($)
Value of ForwardContract ($)
1 5.469 6.063 1.557 539,821 212,050
2 5.469 6.063 1.551 480,897 153,126
3 5.469 6.063 1.546 434,228 106,457
4 5.469 6.063 1.545 425,982 98,211
5 5.532 6.063 1.544 413,263 85,492
6 5.532 6.126 1.543 398,996 71,225
7 5.469 6.063 1.542 396,685 68,914
8 5.469 6.063 1.542 392,978 65,207
9 5.469 6.063 1.542 392,571 64,800
10 5.469 6.063 1.541 385,563 57,792...
91 5.469 6.005 1.529 270,141 -57,630
92 5.500 6.063 1.529 269,264 -58,507
93 5.531 6.063 1.529 267,692 -60,079
94 5.469 6.004 1.528 255,632 -72,139
95 5.469 6.063 1.528 249,295 -78,476
96 5.469 6.063 1.526 230,541 -97,230
97 5.438 6.063 1.526 230,319 -97,452
98 5.438 6.063 1.523 203,798 -123,973
99 5.438 6.063 1.522 196,208 -131,563
100 5.407 6.063 1.521 184,564 -143,207

Variance-covariance method
value at risk standard deviation of
change in portfolio value
165.
0.0
-150,000 -75,000 0 75,000 150,000
Mark-to-Market Portfolio Profit/Loss
Freq
uenc
y
5% 1.65 std. dev.
Value at risk: $86,625

Portfolio standard deviation
• Portfolio standard deviation
• Portfolio variance
Xi = dollar investment in i-th instrument
i = standard deviation of returns of i-th instrument
ij = correlation coefficient
portfolio portfolio 2
21
21
22
22
23
23
21 2 12 1 2
1 3 13 1 3 2 3 23 2 3
2
2 2
portfolio
X X X X X
X X X X

Risk mapping: Main idea
0
2
4
6
16 18 20 22 24
crude oil price
option price
option price
Delta is the slope of thetangent, approximately .5

Risk mapping: Main idea
• The option price change resulting from a change in the oil price is:
• In this sense the option “acts like” barrels of oil• The option is “mapped” to barrels of oil
option price change change in oil price

Risk mapping: Interpret forward as portfolio of standardized positions
• Change in m-t-m value of forward:
• Find a portfolio of simpler (“standardized”) instruments that has same risk as the forward contract
• “Same risk” means same factor sensitivities
etc.
VV
rr
V
rr
V
SSF
F F F
USD
USDGBP
GBP
Vr
F
USD
,

Risk mapping: Interpret forward as portfolio of standardized positions
• Let V = X1 + X2 + X3 denote value of portfolio of standardized instruments– each standardized instrument depends on only 1 factor
• Change in V is
• Choose X1, X2, X3 so that:
VX
rr
X
rr
X
SS
1 2 3
USDUSD
GBPGBP
X
r
V
rF1
USD USD
,
X
r
V
rF2
GBP GBP
and ,
X
S
V
SF3

Choice of X1, X2, X3
• Recall that the m-t-m value of the forward is
• This implies
VF
Sr r
GBP million
1 +
USD million
1 +GBP USD
10
91 360
15
91 360( / ) ( / )
Xr
Xr
X S
1
2
3
15
1 91 360
15355 10
1 91 360
10
1 06063 91 360
USD million
USD / GBP GBP million
USD / GBPGBP million
USD
GBP
( / ),
( . )
( / ),
( ). ( / )
.

Compute variance of portfolio of standardized instruments
• Variance of portfolio of standardized instruments:
where
and USD is the standard deviation of % changes in the $ interest rate.
21
21
22
22
23
23
21 2 12 1 2
1 3 13 1 3 2 3 23 2 3
2
2 2
portfolio
X X X X X
X X X X
11
1
Xr
rXUSD
USDUSD

Compute value-at-risk
• Portfolio standard deviation
• Value-at-risk
portfolio portfolio 2
Value - at - risk = portfoliok

Variance-covariance method
value at risk standard deviation of
change in portfolio value
165.
0.0
-150,000 -75,000 0 75,000 150,000
Mark-to-Market Portfolio Profit/Loss
Freq
uenc
y
5% 1.65 std. dev.
Value at risk: $86,625

Monte Carlo simulation
• Like historical simulation• Use psuedo-random changes in the factors rather
than actual past changes• Psuedo-random changes in the factors are drawn
from an assumed multivariate distribution

What Is VaR, Again
• One need not focus on change in portfolio value over the next day, month, or quarter
• Instead, one could estimate the distribution of:– cash flow
– net income
– surplus
– or almost anything else one cares about
• VaR (broadly defined) DFA

Is VaR Appropriate for Property/Liability Insurers?
• Do property/liability insurers have investment portfolios?
• Do they care about the possible future values of things like:– Cash flow?
– Net income?
– Surplus?

What is Value-at-Risk?
0
5
10
15
20
25
P/L
< -
130
-11
0 <
P/L
<-9
0
-70
< P
/L <
-50
-30
< P
/L <
-10
10
< P
/L <
30
50
< P
/L <
70
90
< P
/L <
110
P/L
> 1
30
Hypothetical Daily Mark-to-Market Profit/Loss on Forward Contract (in $thousands)
Fre
quen
cy
value at risk(using x=5%)

Limitations of VaR
• VaR DFA– it is a particular, limited summary of the distribution
• VaR is an estimate of the x percent critical value– based on various assumptions
– sampling variation
• VaR doesn’t indicate what circumstances will lead to the loss– 2 portfolios with opposite interest rate exposure could
have same VaR
Related Documents