Economics for your Classroom Ed Dolan’s Econ Blog What Ever Happened to the Phillips Curve? May 12, 2014 Terms of Use: These slides are provided under Creative Commons License Attribution—Share Alike 3.0 . You are free to use these slides as a resource for your economics classes together with whatever textbook you are using. If you like the slides, you may also want to take a look at my textbook, Introduction to Economics , from BVT Publishing.

What Ever Happened to the Phillips Curve
Jan 29, 2015
The Phillips curve has been a staple of economics for more than 50 years, but recently it no longer seems to be working. In fact, it appears to be dead.
Welcome message from author
This document is posted to help you gain knowledge. Please leave a comment to let me know what you think about it! Share it to your friends and learn new things together.
Transcript
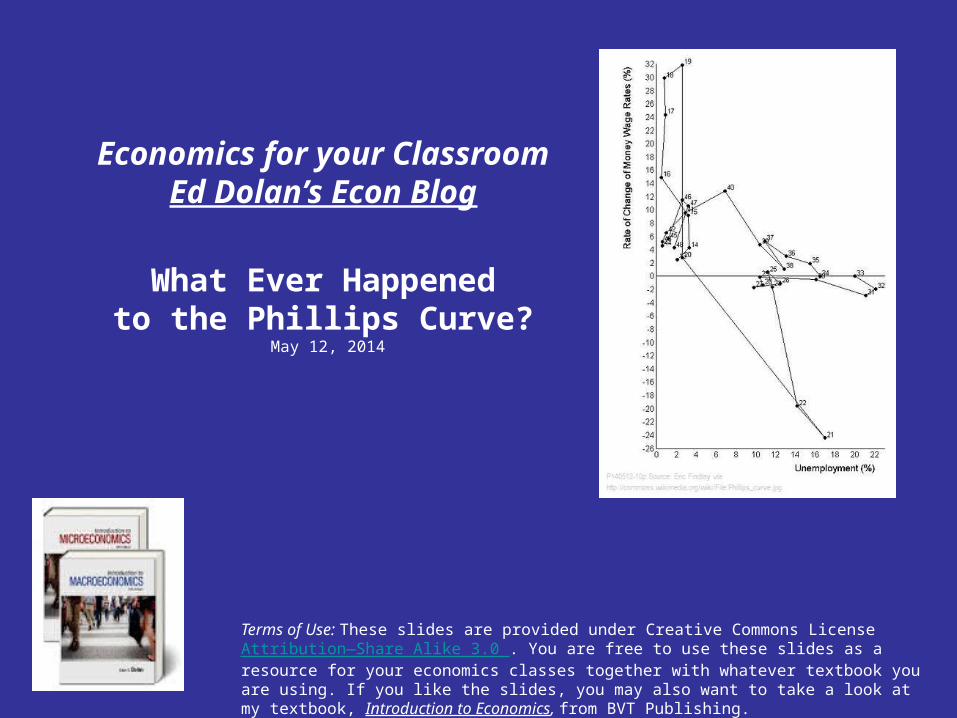
Economics for your ClassroomEd Dolan’s Econ Blog
What Ever Happenedto the Phillips Curve?
May 12, 2014
Terms of Use: These slides are provided under Creative Commons License Attribution—Share Alike 3.0 . You are free to use these slides as a resource for your economics classes together with whatever textbook you are using. If you like the slides, you may also want to take a look at my textbook, Introduction to Economics, from BVT Publishing.
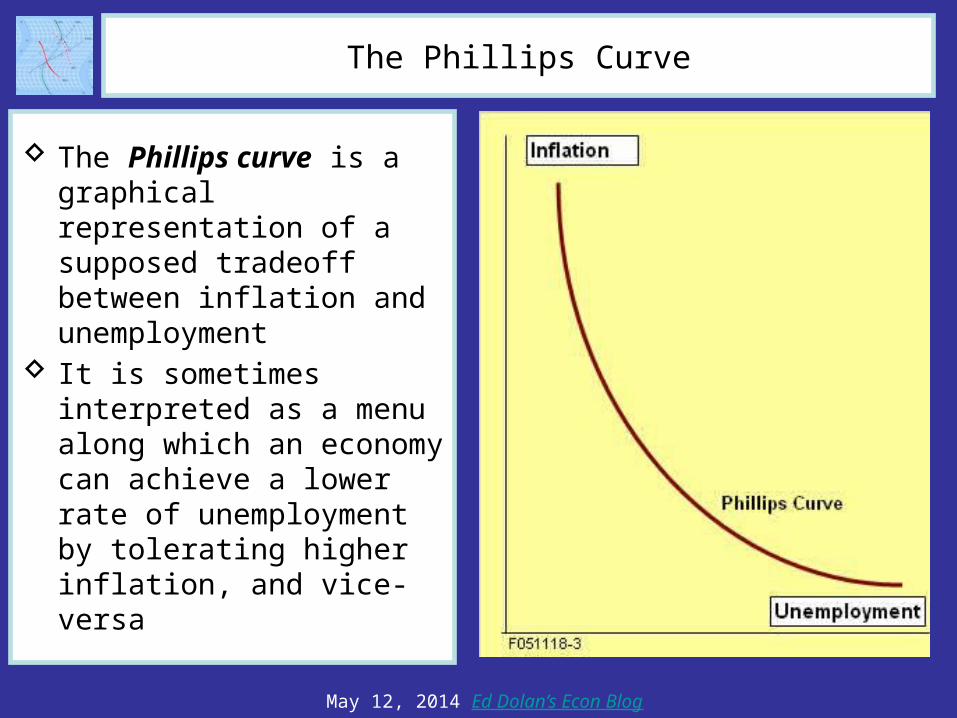
The Phillips Curve
The Phillips curve is a graphical representation of a supposed tradeoff between inflation and unemployment
It is sometimes interpreted as a menu along which an economy can achieve a lower rate of unemployment by tolerating higher inflation, and vice-versa
May 12, 2014 Ed Dolan’s Econ Blog
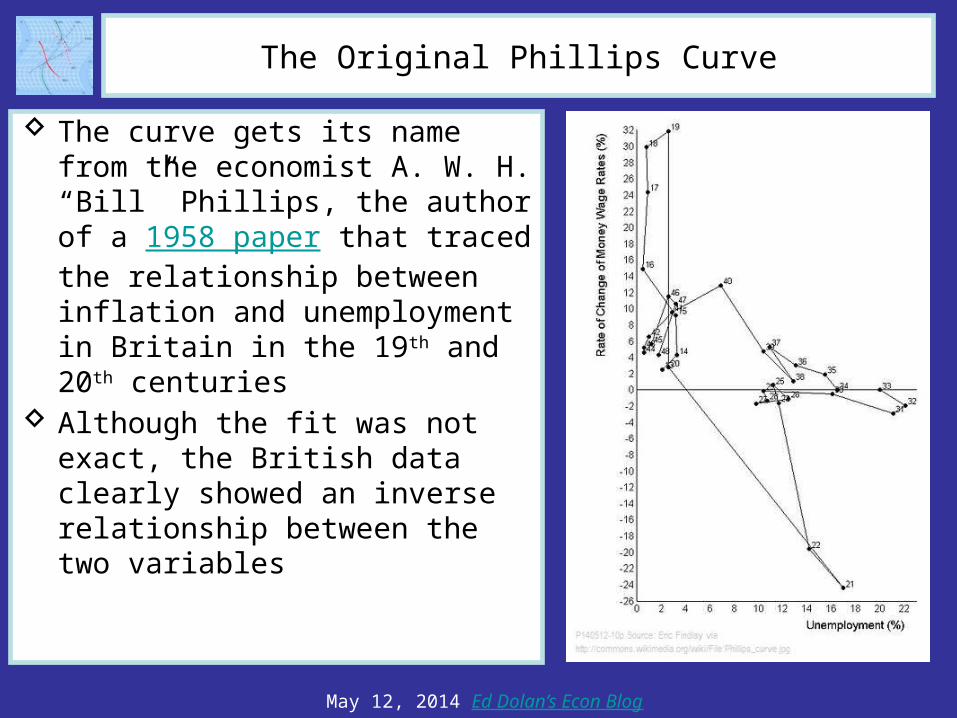
The Original Phillips Curve
The curve gets its name from the economist A. W. H. “Bill” Phillips, the author of a 1958 paper that traced the relationship between inflation and unemployment in Britain in the 19th and 20th centuries
Although the fit was not exact, the British data clearly showed an inverse relationship between the two variables
May 12, 2014 Ed Dolan’s Econ Blog
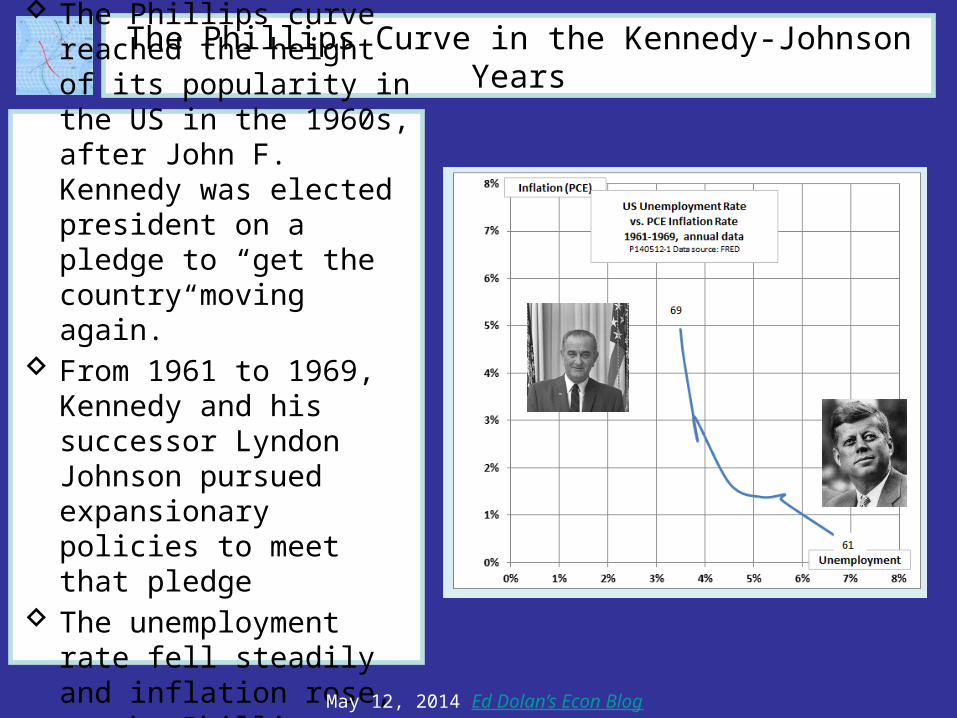
The Phillips Curve in the Kennedy-Johnson Years
The Phillips curve reached the height of its popularity in the US in the 1960s, after John F. Kennedy was elected president on a pledge to “get the country moving again.”
From 1961 to 1969, Kennedy and his successor Lyndon Johnson pursued expansionary policies to meet that pledge
The unemployment rate fell steadily and inflation rose, as the Phillips curve predicted
May 12, 2014 Ed Dolan’s Econ Blog
Early Criticism of the Phillips Curve
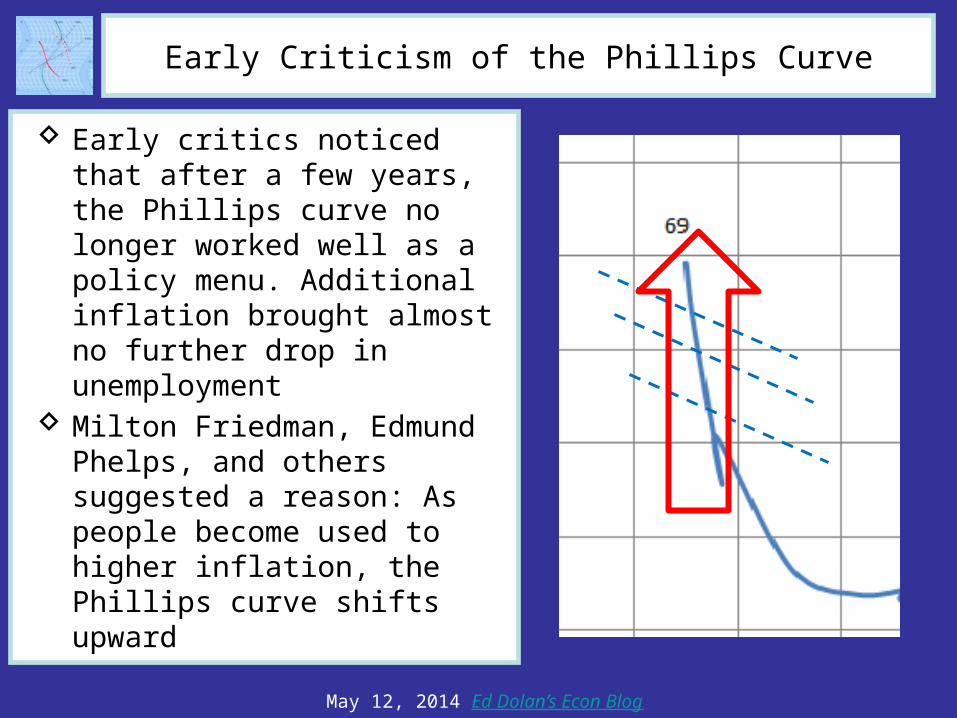
Early critics noticed that after a few years, the Phillips curve no longer worked well as a policy menu. Additional inflation brought almost no further drop in unemployment
Milton Friedman, Edmund Phelps, and others suggested a reason: As people become used to higher inflation, the Phillips curve shifts upward
May 12, 2014 Ed Dolan’s Econ Blog
The Shifting Phillips Curve Model (1)
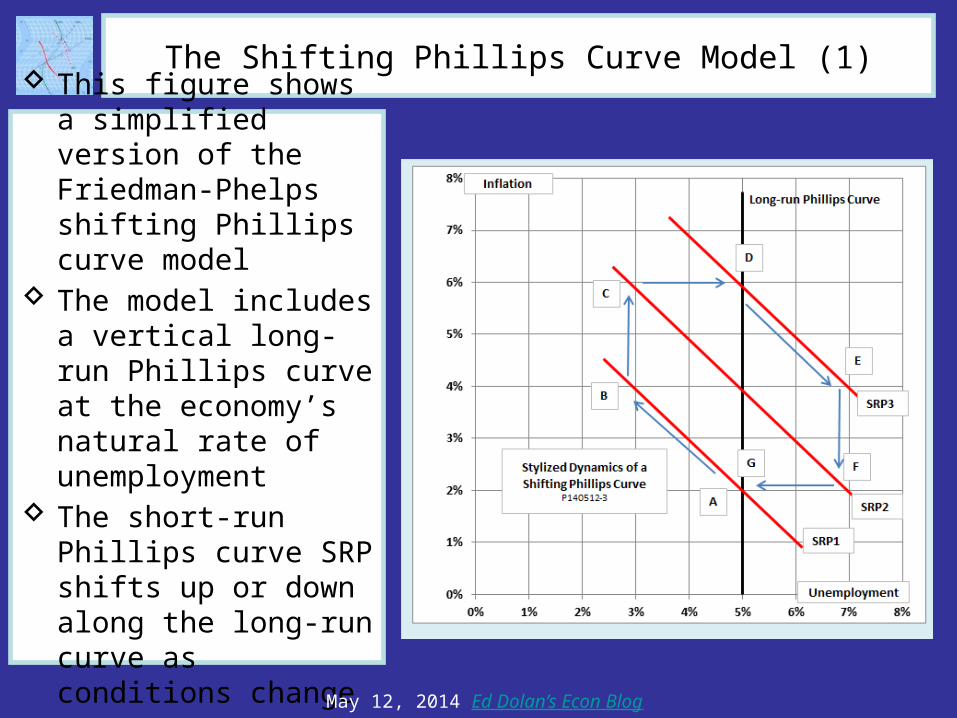
This figure shows a simplified version of the Friedman-Phelps shifting Phillips curve model
The model includes a vertical long-run Phillips curve at the economy’s natural rate of unemployment
The short-run Phillips curve SRP shifts up or down along the long-run curve as conditions change
May 12, 2014 Ed Dolan’s Econ Blog
The Shifting Phillips Curve Model (2)
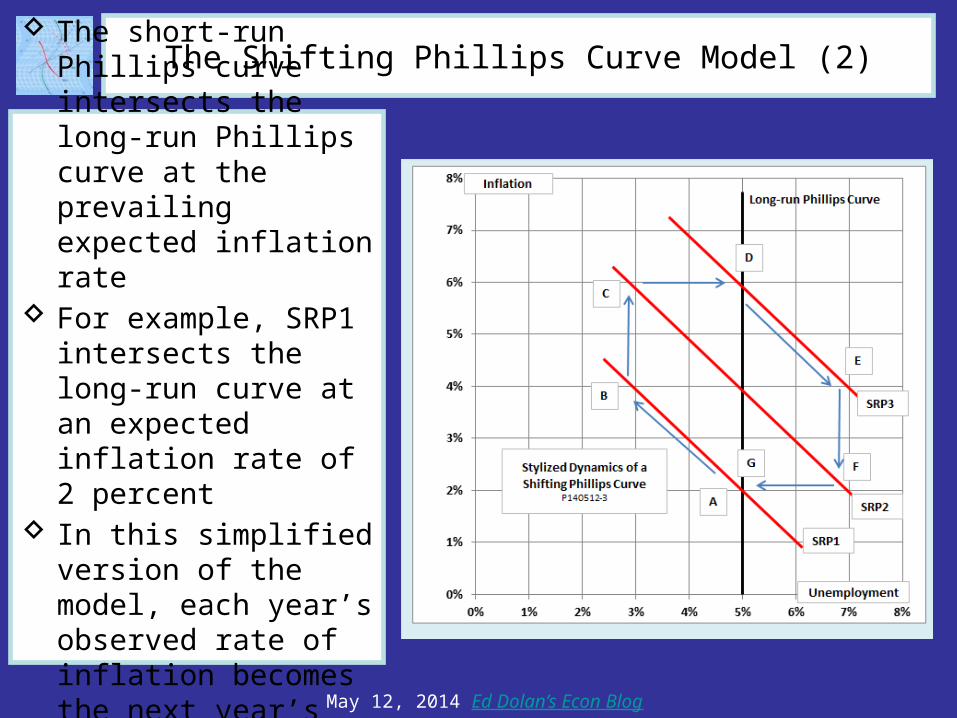
The short-run Phillips curve intersects the long-run Phillips curve at the prevailing expected inflation rate
For example, SRP1 intersects the long-run curve at an expected inflation rate of 2 percent
In this simplified version of the model, each year’s observed rate of inflation becomes the next year’s expected rate
May 12, 2014 Ed Dolan’s Econ Blog
Inflationary Dynamics in the Shifting Phillips Curve Model (1)
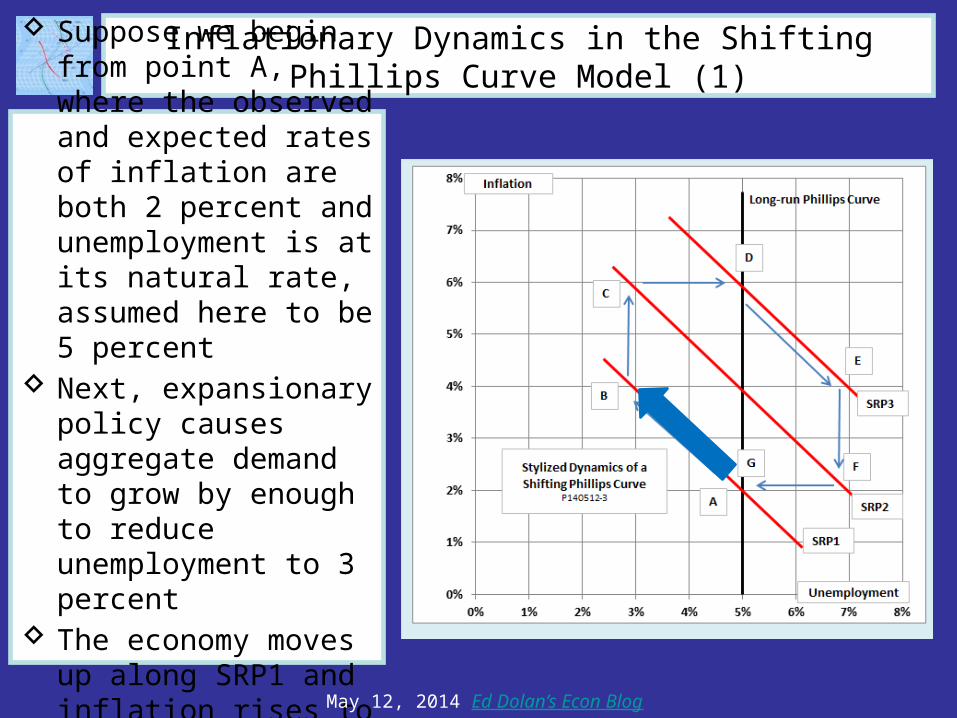
Suppose we begin from point A, where the observed and expected rates of inflation are both 2 percent and unemployment is at its natural rate, assumed here to be 5 percent
Next, expansionary policy causes aggregate demand to grow by enough to reduce unemployment to 3 percent
The economy moves up along SRP1 and inflation rises to 4 percent
May 12, 2014 Ed Dolan’s Econ Blog
Inflationary Dynamics in the Shifting Phillips Curve Model (2)
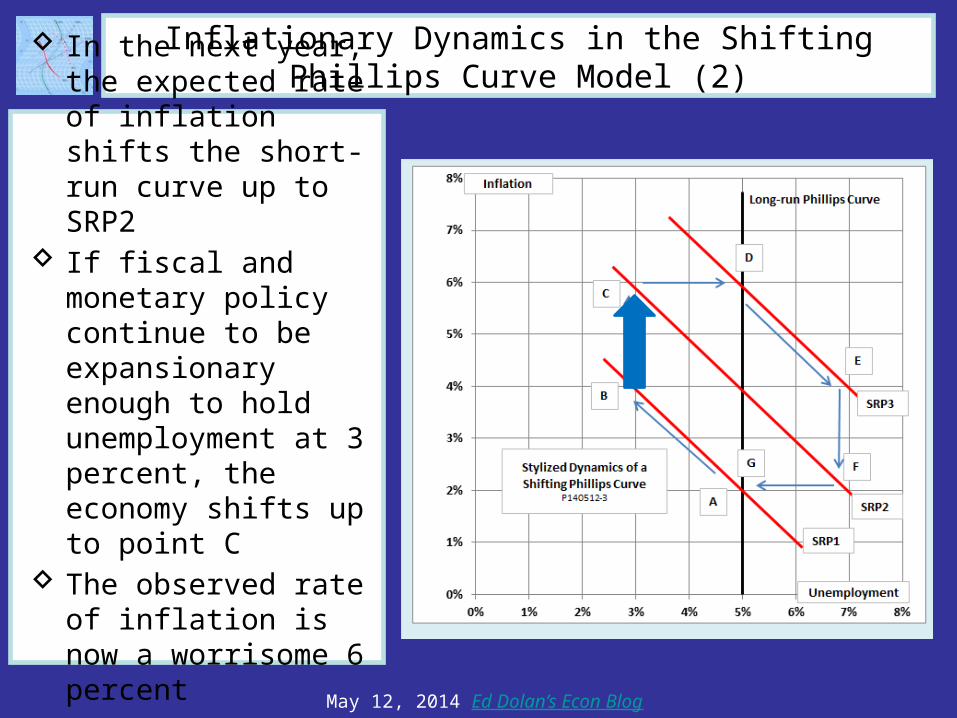
In the next year, the expected rate of inflation shifts the short-run curve up to SRP2
If fiscal and monetary policy continue to be expansionary enough to hold unemployment at 3 percent, the economy shifts up to point C
The observed rate of inflation is now a worrisome 6 percent
May 12, 2014 Ed Dolan’s Econ Blog
Inflationary Dynamics in the Shifting Phillips Curve Model (3)
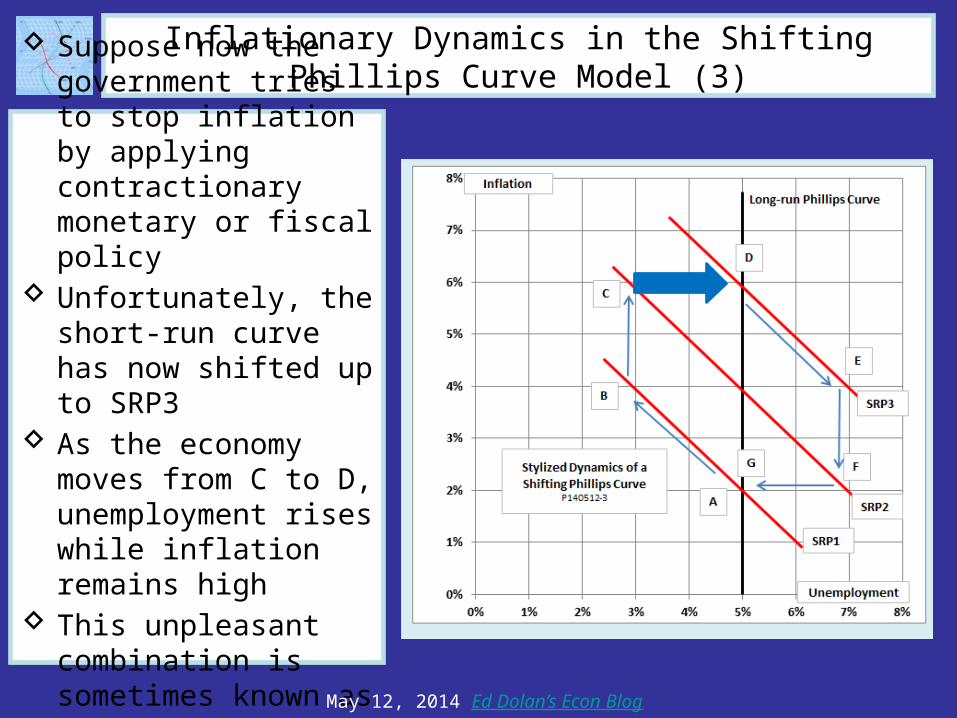
Suppose now the government tries to stop inflation by applying contractionary monetary or fiscal policy
Unfortunately, the short-run curve has now shifted up to SRP3
As the economy moves from C to D, unemployment rises while inflation remains high
This unpleasant combination is sometimes known as stagflation
May 12, 2014 Ed Dolan’s Econ Blog
Inflationary Dynamics in the Shifting Phillips Curve Model (4)
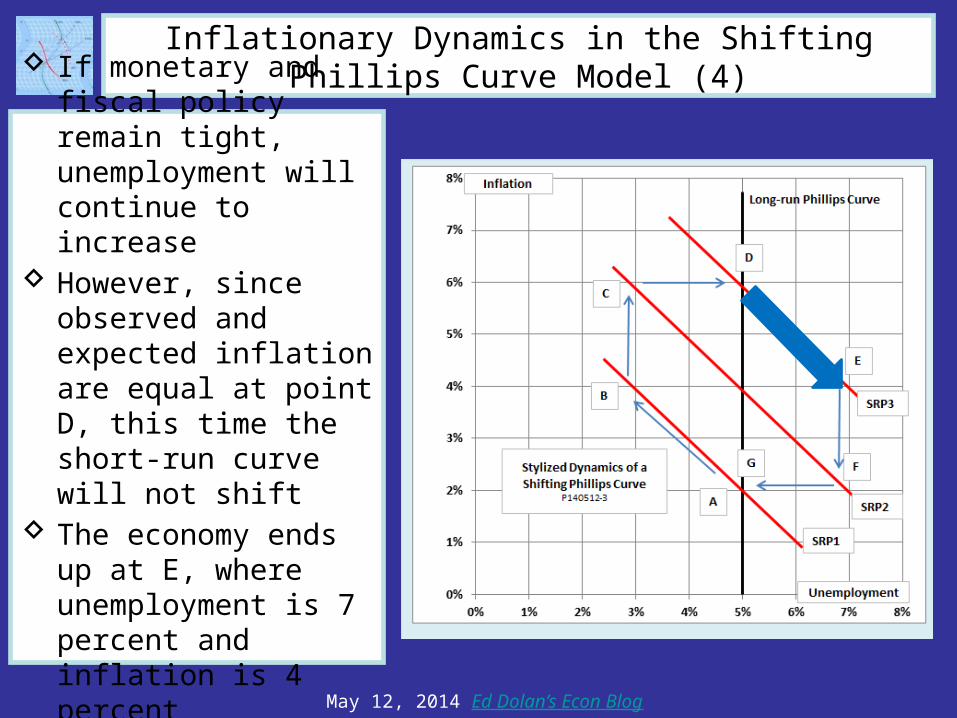
If monetary and fiscal policy remain tight, unemployment will continue to increase
However, since observed and expected inflation are equal at point D, this time the short-run curve will not shift
The economy ends up at E, where unemployment is 7 percent and inflation is 4 percent
May 12, 2014 Ed Dolan’s Econ Blog
Inflationary Dynamics in the Shifting Phillips Curve Model (5)
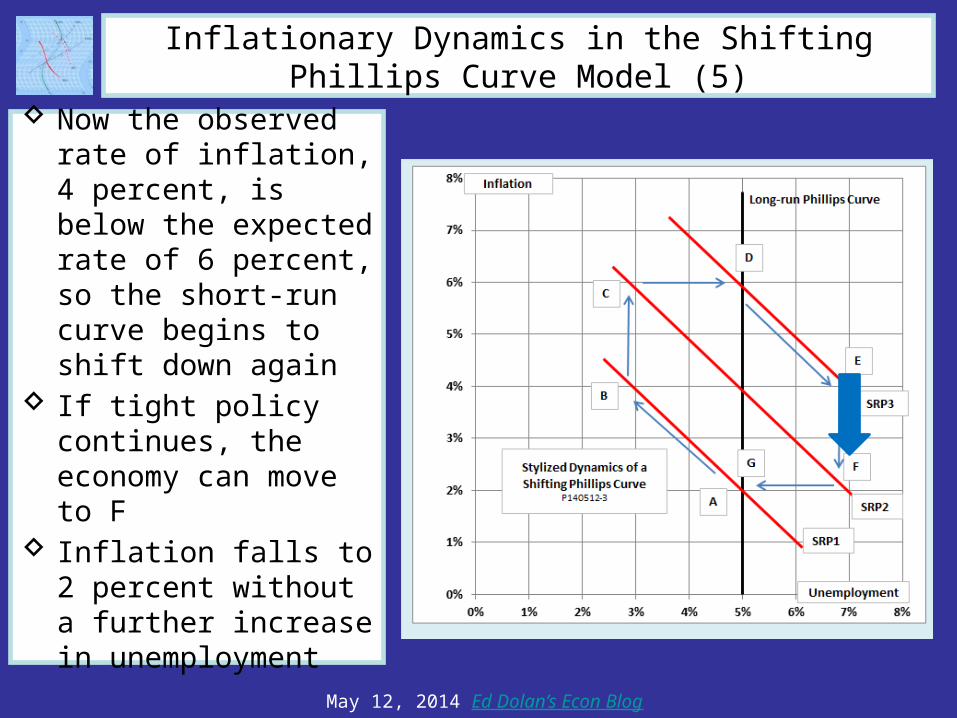
Now the observed rate of inflation, 4 percent, is below the expected rate of 6 percent, so the short-run curve begins to shift down again
If tight policy continues, the economy can move to F
Inflation falls to 2 percent without a further increase in unemployment
May 12, 2014 Ed Dolan’s Econ Blog
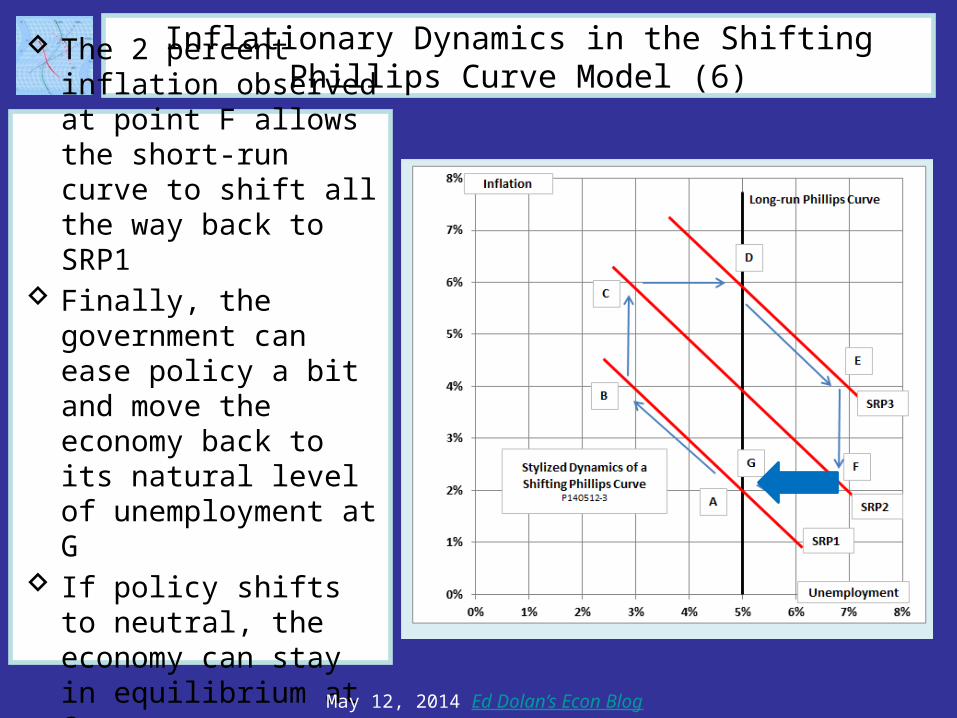
Inflationary Dynamics in the Shifting Phillips Curve Model (6)
The 2 percent inflation observed at point F allows the short-run curve to shift all the way back to SRP1
Finally, the government can ease policy a bit and move the economy back to its natural level of unemployment at G
If policy shifts to neutral, the economy can stay in equilibrium at G
May 12, 2014 Ed Dolan’s Econ Blog
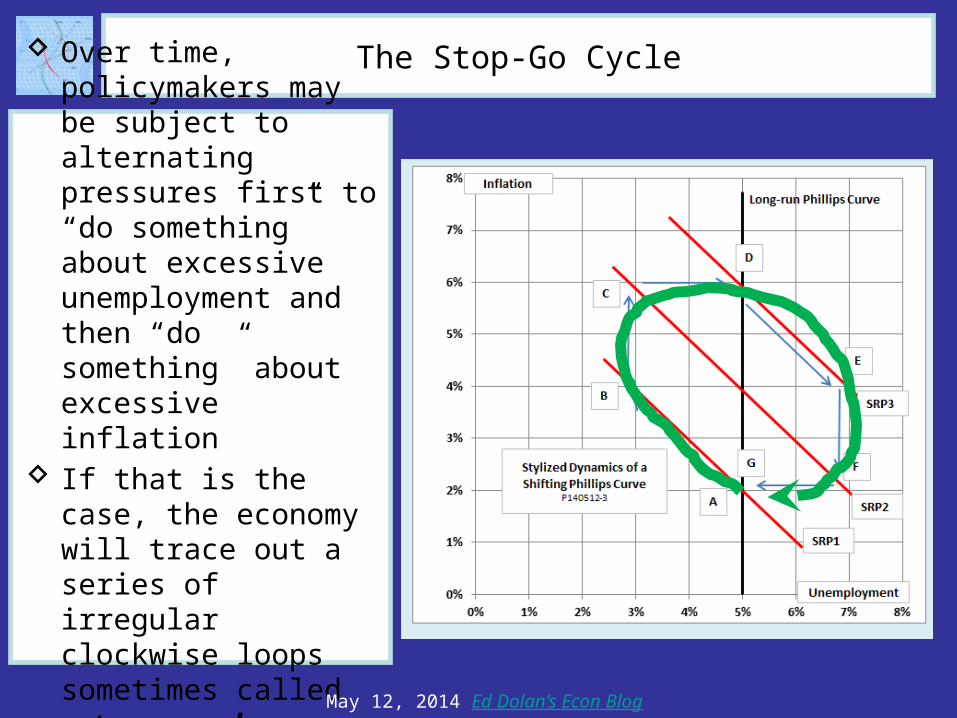
The Stop-Go Cycle
Over time, policymakers may be subject to alternating pressures first to “do something” about excessive unemployment and then “do something” about excessive inflation
If that is the case, the economy will trace out a series of irregular clockwise loops sometimes called stop-go cycles
May 12, 2014 Ed Dolan’s Econ Blog
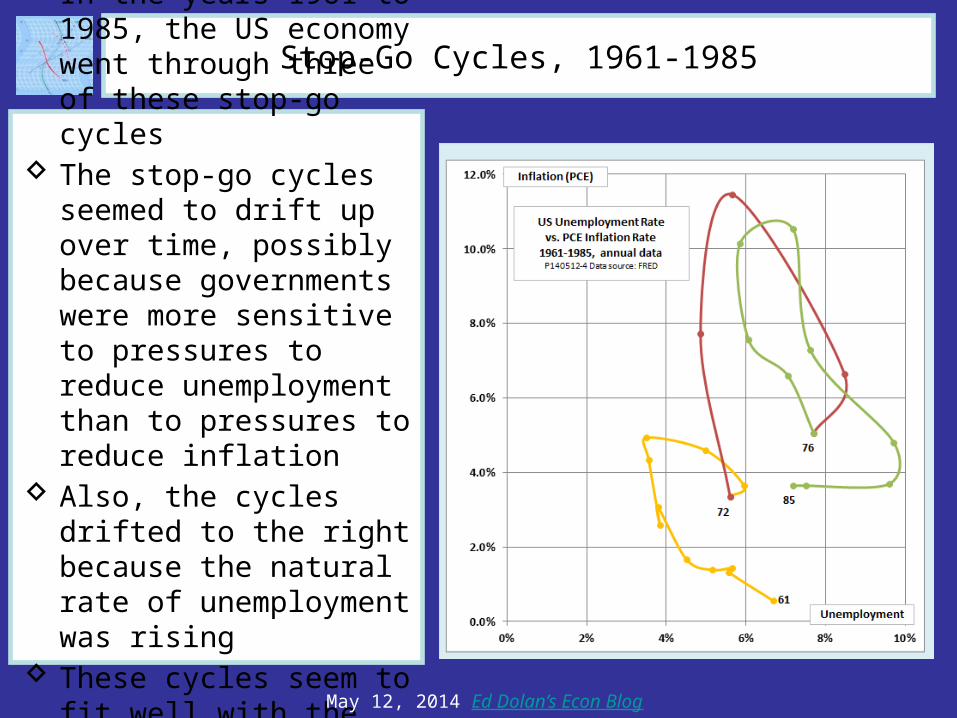
Stop-Go Cycles, 1961-1985
In the years 1961 to 1985, the US economy went through three of these stop-go cycles
The stop-go cycles seemed to drift up over time, possibly because governments were more sensitive to pressures to reduce unemployment than to pressures to reduce inflation
Also, the cycles drifted to the right because the natural rate of unemployment was rising
These cycles seem to fit well with the shifting Phillips curve model
May 12, 2014 Ed Dolan’s Econ Blog
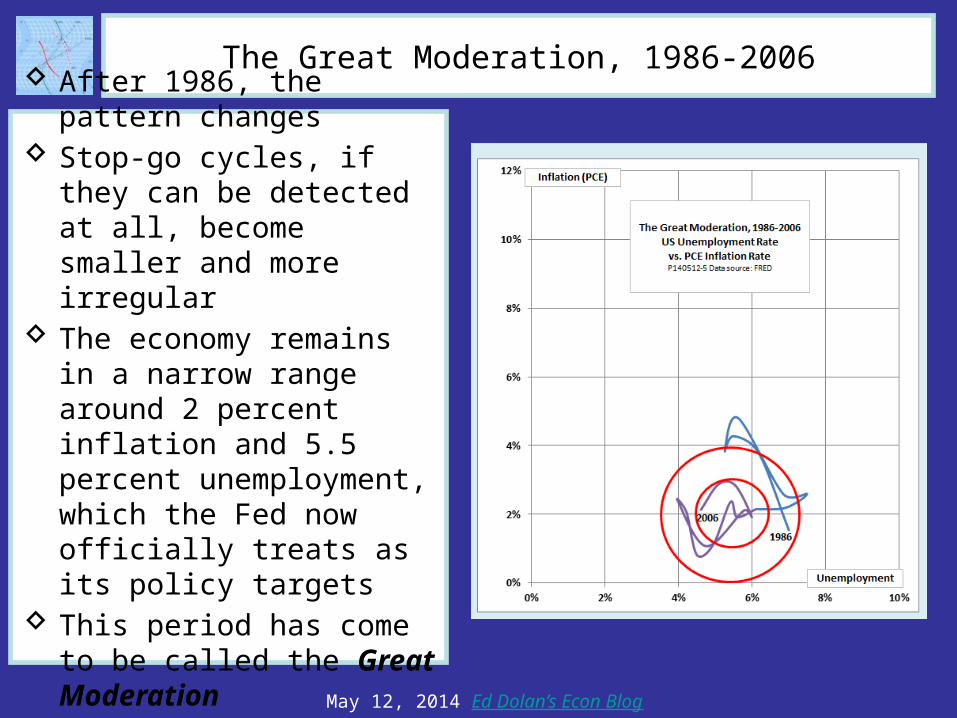
The Great Moderation, 1986-2006
After 1986, the pattern changes Stop-go cycles, if they can be
detected at all, become smaller and more irregular
The economy remains in a narrow range around 2 percent inflation and 5.5 percent unemployment, which the Fed now officially treats as its policy targets
This period has come to be called the Great Moderation
May 12, 2014 Ed Dolan’s Econ Blog
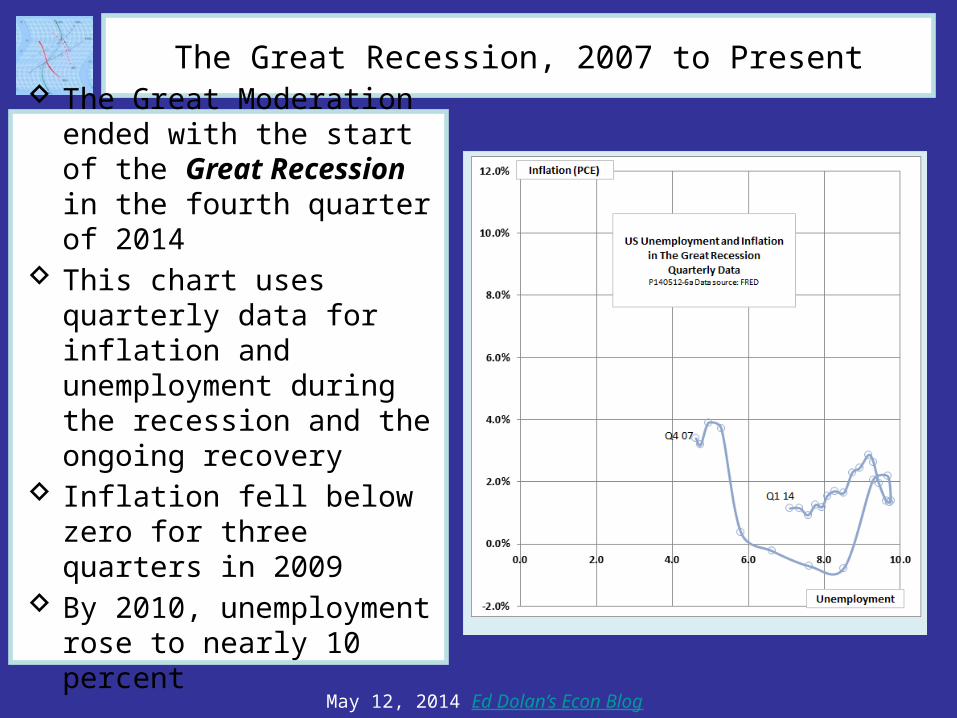
The Great Recession, 2007 to Present
The Great Moderation ended with the start of the Great Recession in the fourth quarter of 2014
This chart uses quarterly data for inflation and unemployment during the recession and the ongoing recovery
Inflation fell below zero for three quarters in 2009
By 2010, unemployment rose to nearly 10 percent
May 12, 2014 Ed Dolan’s Econ Blog
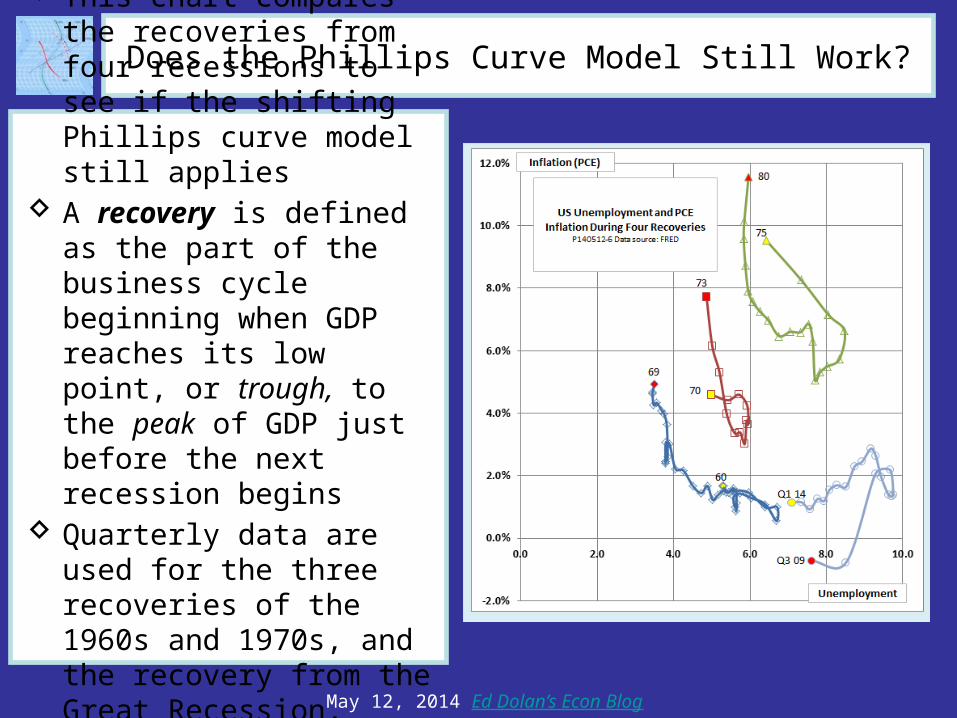
Does the Phillips Curve Model Still Work?
This chart compares the recoveries from four recessions to see if the shifting Phillips curve model still applies
A recovery is defined as the part of the business cycle beginning when GDP reaches its low point, or trough, to the peak of GDP just before the next recession begins
Quarterly data are used for the three recoveries of the 1960s and 1970s, and the recovery from the Great Recession, which is still incomplete
May 12, 2014 Ed Dolan’s Econ Blog
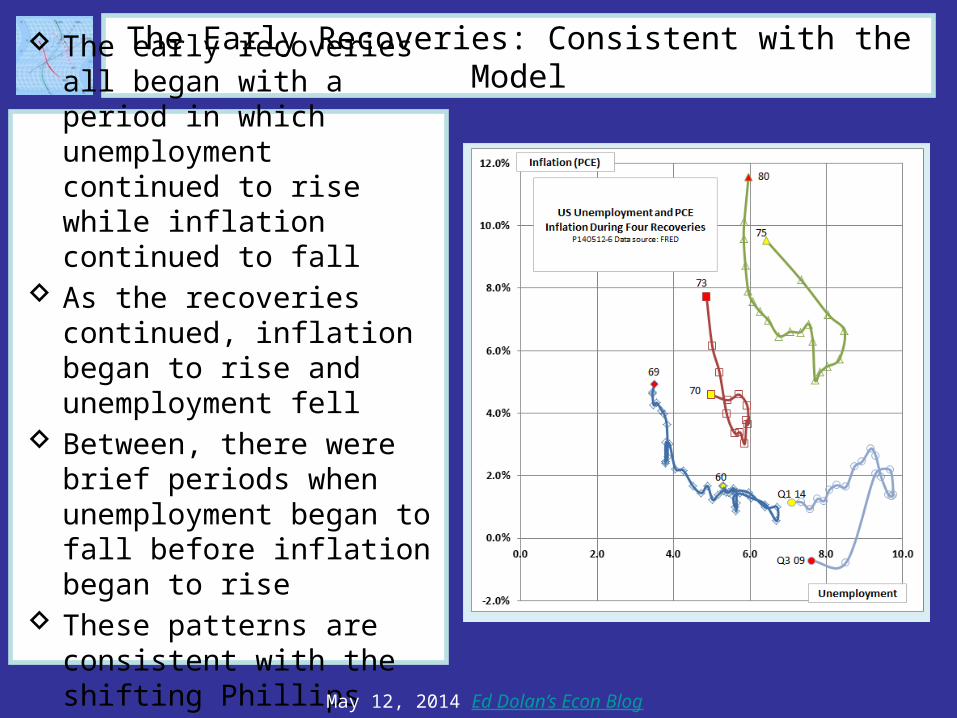
The Early Recoveries: Consistent with the Model
The early recoveries all began with a period in which unemployment continued to rise while inflation continued to fall
As the recoveries continued, inflation began to rise and unemployment fell
Between, there were brief periods when unemployment began to fall before inflation began to rise
These patterns are consistent with the shifting Phillips curve model
May 12, 2014 Ed Dolan’s Econ Blog
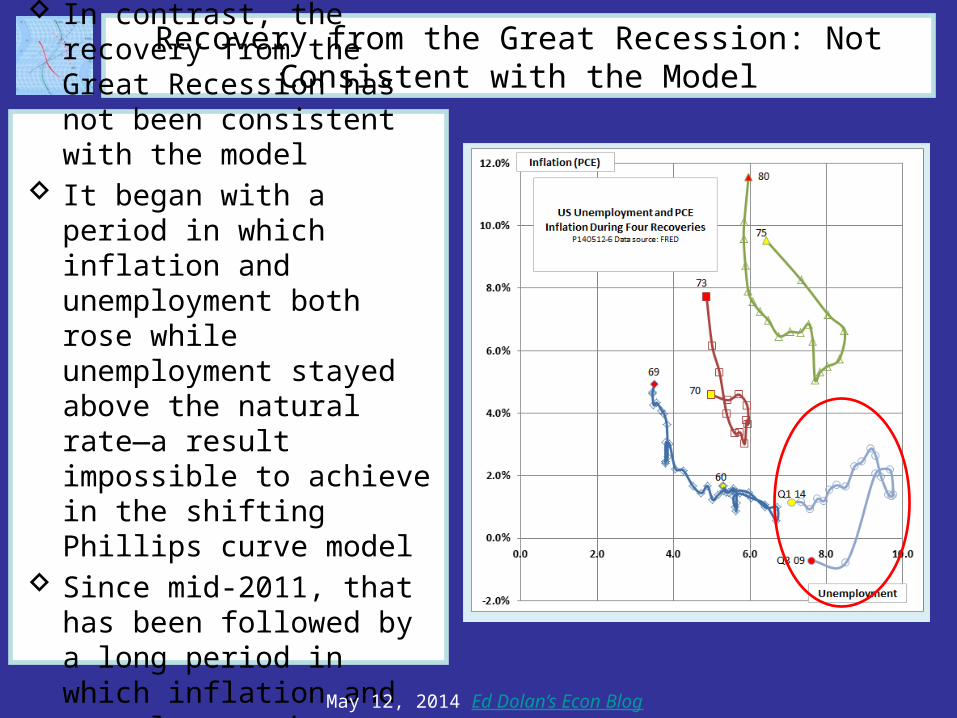
Recovery from the Great Recession: Not Consistent with the Model
In contrast, the recovery from the Great Recession has not been consistent with the model
It began with a period in which inflation and unemployment both rose while unemployment stayed above the natural rate—a result impossible to achieve in the shifting Phillips curve model
Since mid-2011, that has been followed by a long period in which inflation and unemployment have both decreased
May 12, 2014 Ed Dolan’s Econ Blog
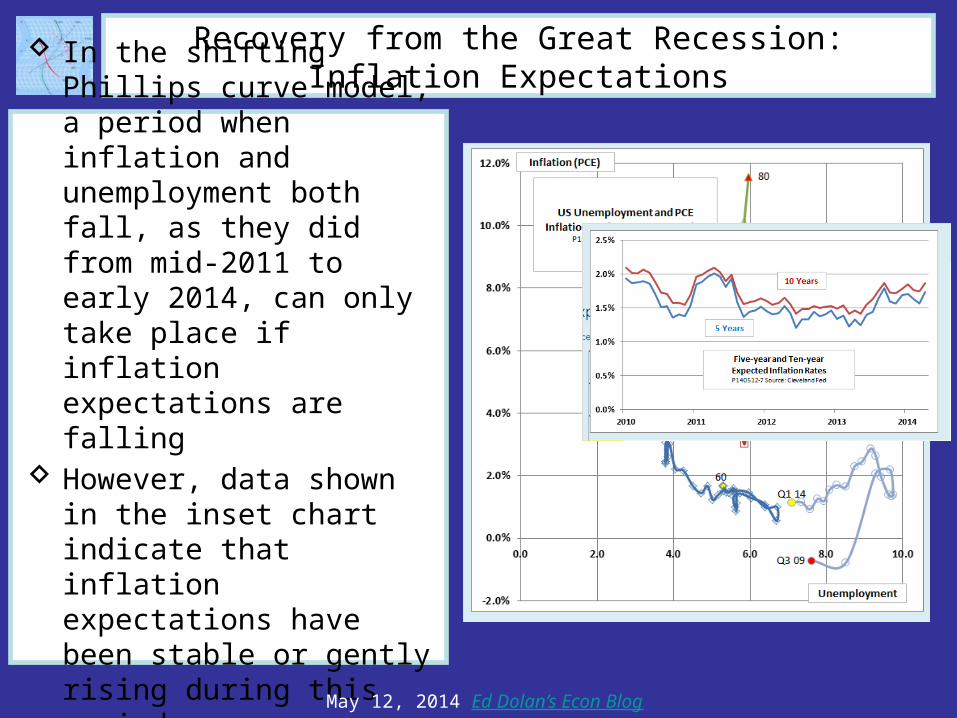
Recovery from the Great Recession: Inflation Expectations
In the shifting Phillips curve model, a period when inflation and unemployment both fall, as they did from mid-2011 to early 2014, can only take place if inflation expectations are falling
However, data shown in the inset chart indicate that inflation expectations have been stable or gently rising during this period
May 12, 2014 Ed Dolan’s Econ Blog
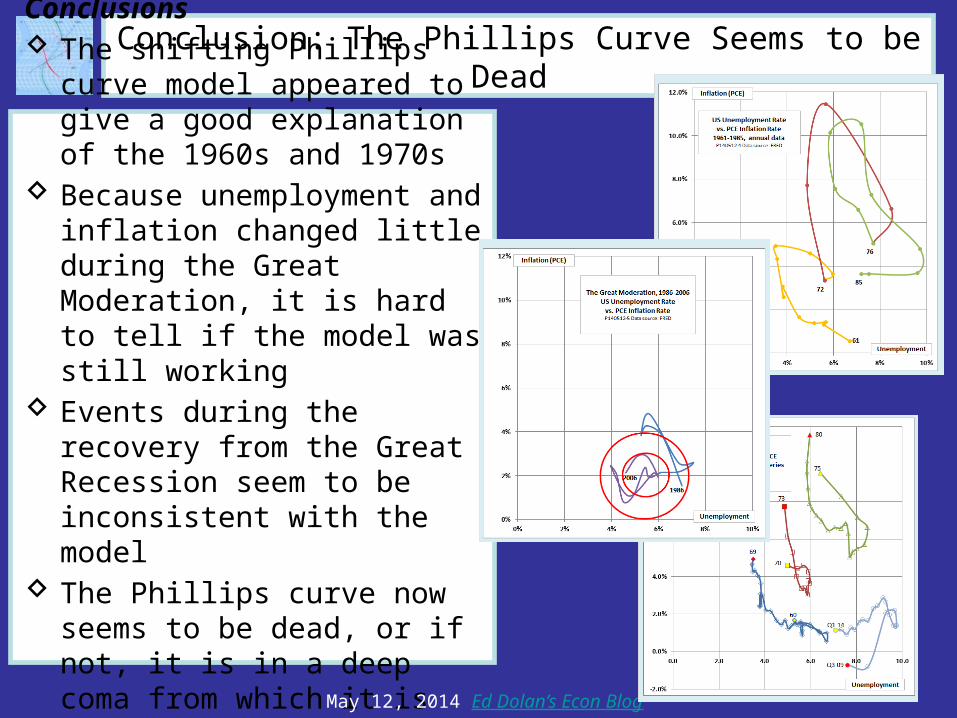
Conclusion: The Phillips Curve Seems to be Dead
Conclusions The shifting Phillips curve model
appeared to give a good explanation of the 1960s and 1970s
Because unemployment and inflation changed little during the Great Moderation, it is hard to tell if the model was still working
Events during the recovery from the Great Recession seem to be inconsistent with the model
The Phillips curve now seems to be dead, or if not, it is in a deep coma from which it is not likely to awaken soon
May 12, 2014 Ed Dolan’s Econ Blog
Click here to learn more about Ed Dolan’s Econ texts or visit www.bvtpublishing.com
For more slideshows, follow Ed Dolan’s Econ Blog
Follow @DolanEcon on Twitter
Related Documents