WORKING PAPER SERIES NO 825 / OCTOBER 2007 WHAT CAN PROBABILITY FORECASTS TELL US ABOUT INFLATION RISKS? and Andrés Manzanares by Juan Angel García

Welcome message from author
This document is posted to help you gain knowledge. Please leave a comment to let me know what you think about it! Share it to your friends and learn new things together.
Transcript
WORKING PAPER SER IESNO 825 / OCTOBER 2007
WHAT CAN PROBABILITYFORECASTS TELL USABOUT INFLATIONRISKS?
and Andrés Manzanares
Date: 12 Oct, 2007 17:42:54;Format: (420.00 x 297.00 mm);Output Profile: SPOT IC300;Preflight: Failed!
by Juan Angel García
Working PaPer Ser ie Sno 825 / october 2007
In 2007 all ECB publications
feature a motif taken from the
20 banknote.
WHat can ProbabiLitY ForecaStS teLL US
aboUt inFLation riSkS? 1
by Juan Angel García 2 and Andrés Manzanares 3
This paper can be downloaded without charge from http : //www.ecb.europa.eu or from the Social Science Research Network
electronic library at http : //ssrn.com/abstract_id=1020964.
organized by the Federal Reserve Banks of Dallas and Cleveland in Dallas, May 2007, for useful comments and suggestions. We are particularly indebted to Paul Söderlind for many fruitful discussions in the early stages of this project, and to
Ken Wallis for very detailed suggestions. Excellent research assistance by Renate Dreiskena is also gratefully acknowledged. Any remaining errors are our responsibility. The views expressed in this paper are those
of the authors and do not necessarily reflect the views of the European Central Bank.2 Capital Markets and Financial Structure Division, DG-E, European Central Bank, Kaiserstrasse 29,
60311 Frankfurt am Main, Germany; e-mail: [email protected] Risk Management Division, DG-H, European Central Bank, Kaiserstrasse 29,
60311 Frankfurt am Main, Germany; e-mail: [email protected]
1 We are very grateful to Geert Bekaert, Gonzalo Camba-Méndez, Refet Gürkaynak, Gabriel Perez-Quirós, Thomas Werner, an anonymous referee and seminar participants at the ECB and in the conference “Price Stability and Monetary Policy”

© European Central Bank, 2007
Address Kaiserstrasse 29 60311 Frankfurt am Main, Germany
Postal address Postfach 16 03 19 60066 Frankfurt am Main, Germany
Telephone +49 69 1344 0
Website http://www.ecb.europa.eu
Fax +49 69 1344 6000
Telex 411 144 ecb d
All rights reserved.
Any reproduction, publication and reprint in the form of a different publication, whether printed or produced electronically, in whole or in part, is permitted only with the explicit written authorisation of the ECB or the author(s).
The views expressed in this paper do not necessarily reflect those of the European Central Bank.
The statement of purpose for the ECB Working Paper Series is available from the ECB website, http://www.ecb.europa.eu/pub/scientific/wps/date/html/index.en.html
ISSN 1561-0810 (print) ISSN 1725-2806 (online)
3ECB
Working Paper Series No 825October 2007
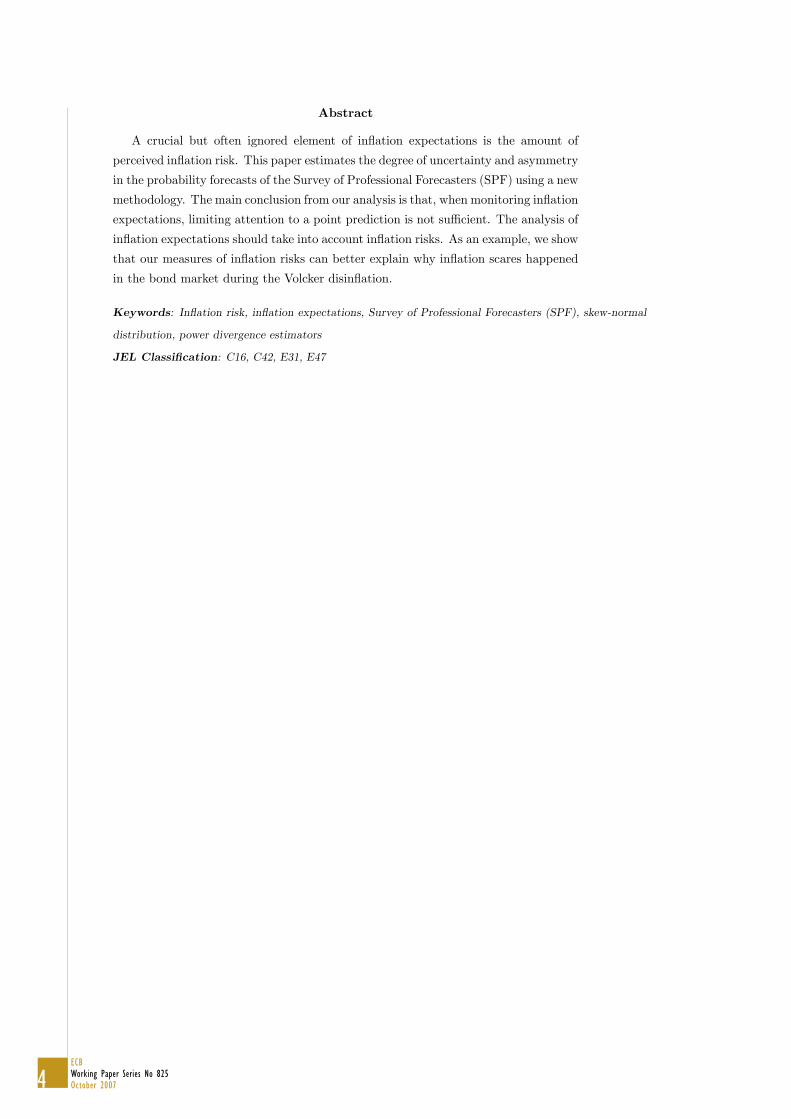
Abstract 4
Non-technical summary 5
1 Introduction
2 A new methodology to analyze the SPF histograms 10 2.1 Thechoiceoffittingcriterion 11 2.2 The choice of theoretical density function 13
3 Assessing our methodology 14 3.1 Accuracy gains 14 3.2 Fitting densities to the SPF histograms: practical considerations 16
4 Fourdecadesofinflationrisks:stylizedfacts 17 4.1 Measuringinflationuncertainty 18 4.2 Asymmetriesininflationrisks 19 4.3 Inflationrisksandthecentraltendency 20
5 Inflationscaresandinflationrisksinthe1980s 21
6 Inflationrisksandthemacroeconomy 24
7 Concluding remarks 26
Annexes 27 A Ontheoptimalfittingcriterionfor
the SPF histograms 27 B Decomposing the skewness
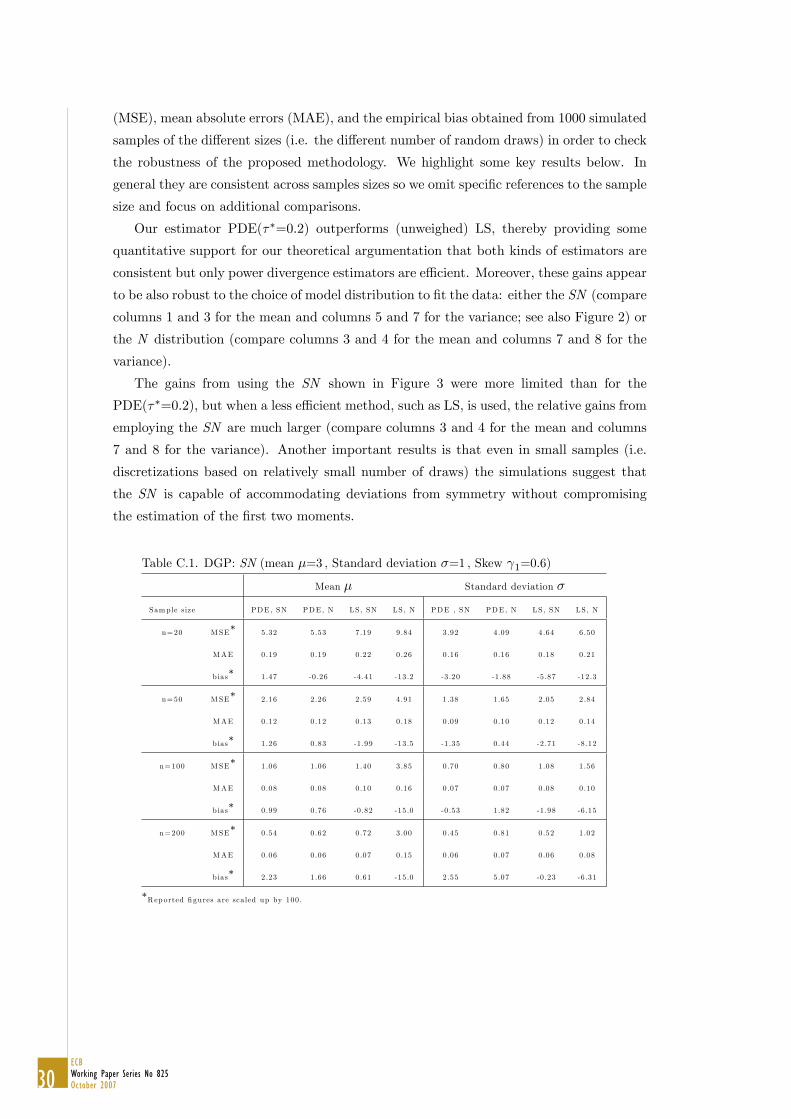
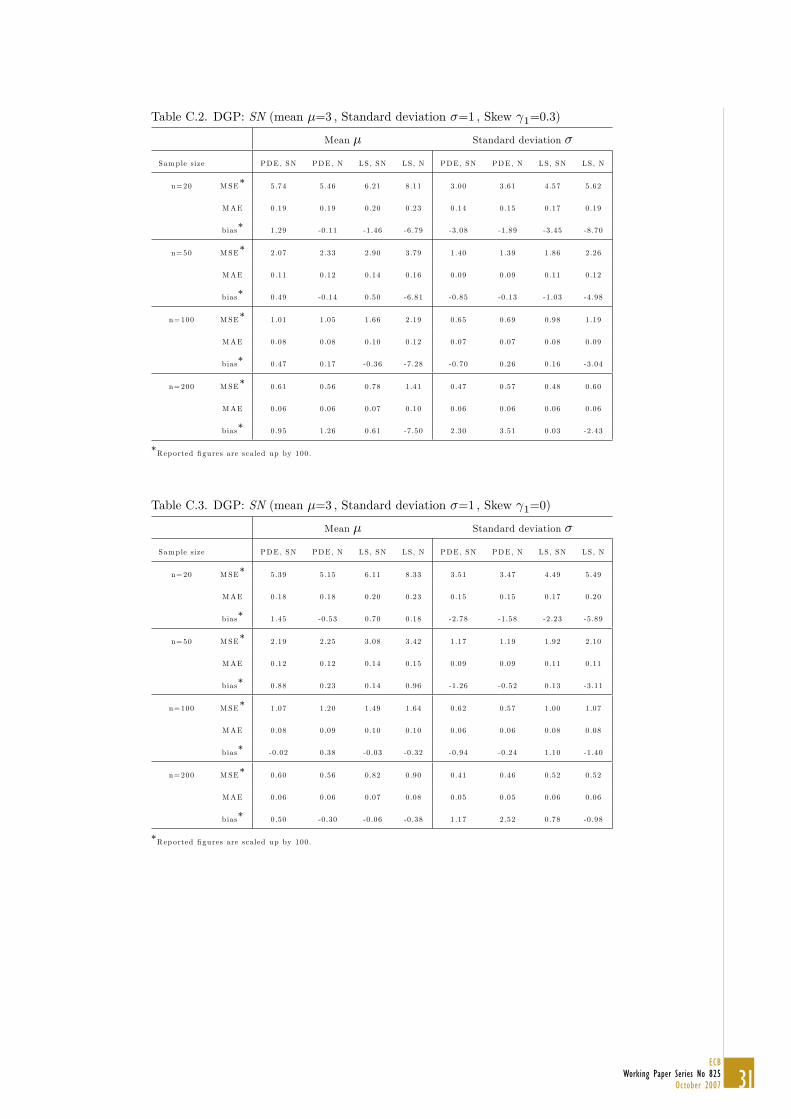
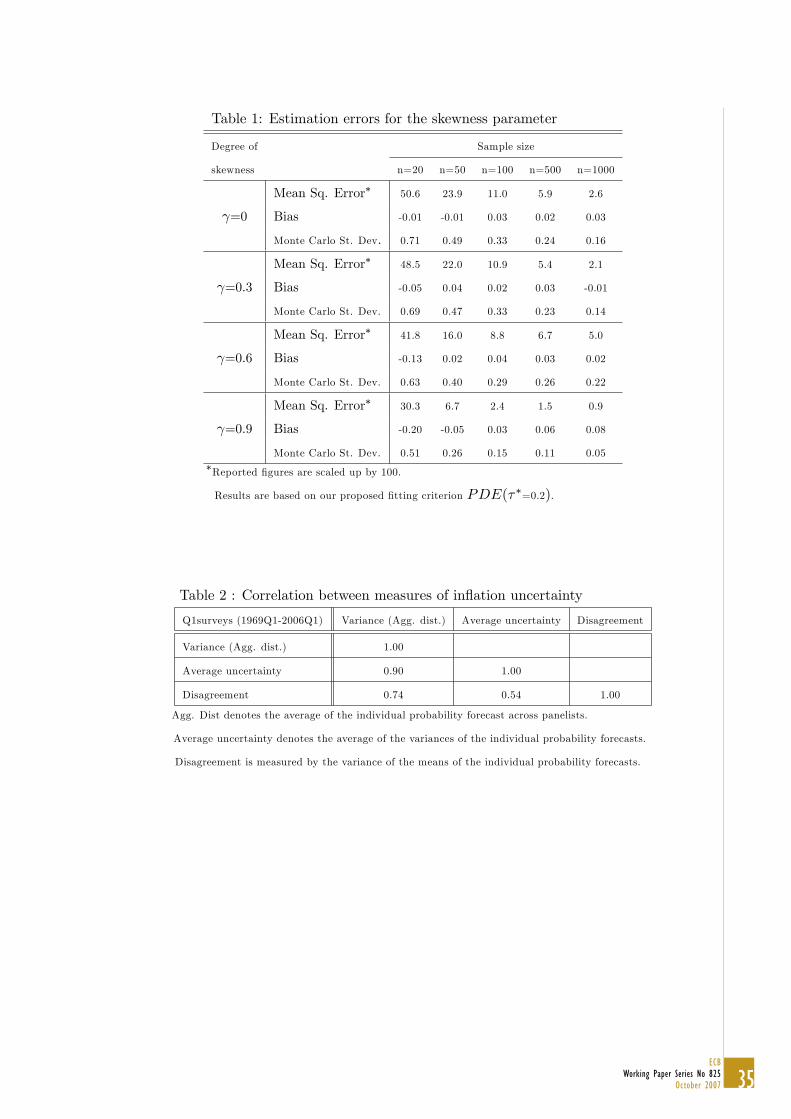
of the combined forecast 29 C Monte Carlo evidence 29
References 32
35
European Central Bank Working Paper Series 45
contentS
Tables and figures
ofinflationexpectations
7
4ECBWorking Paper Series No 825October 2007
5ECB
Working Paper Series No 825October 2007
6ECBWorking Paper Series No 825October 2007
7ECB
Working Paper Series No 825October 2007
8ECBWorking Paper Series No 825October 2007
9ECB
Working Paper Series No 825October 2007
10ECBWorking Paper Series No 825October 2007
11ECB
Working Paper Series No 825October 2007
12ECBWorking Paper Series No 825October 2007
13ECB
Working Paper Series No 825October 2007
14ECBWorking Paper Series No 825October 2007
15ECB
Working Paper Series No 825October 2007
16ECBWorking Paper Series No 825October 2007
17ECB
Working Paper Series No 825October 2007
18ECBWorking Paper Series No 825October 2007
19ECB
Working Paper Series No 825October 2007
20ECBWorking Paper Series No 825October 2007
21ECB
Working Paper Series No 825October 2007

22ECBWorking Paper Series No 825October 2007
23ECB
Working Paper Series No 825October 2007
24ECBWorking Paper Series No 825October 2007
25ECB
Working Paper Series No 825October 2007
26ECBWorking Paper Series No 825October 2007
27ECB
Working Paper Series No 825October 2007
28ECBWorking Paper Series No 825October 2007
29ECB
Working Paper Series No 825October 2007
30ECBWorking Paper Series No 825October 2007
31ECB
Working Paper Series No 825October 2007
32ECBWorking Paper Series No 825October 2007
33ECB
Working Paper Series No 825October 2007
34ECBWorking Paper Series No 825October 2007
35ECB
Working Paper Series No 825October 2007
36ECBWorking Paper Series No 825October 2007
37ECB
Working Paper Series No 825October 2007
38ECBWorking Paper Series No 825October 2007
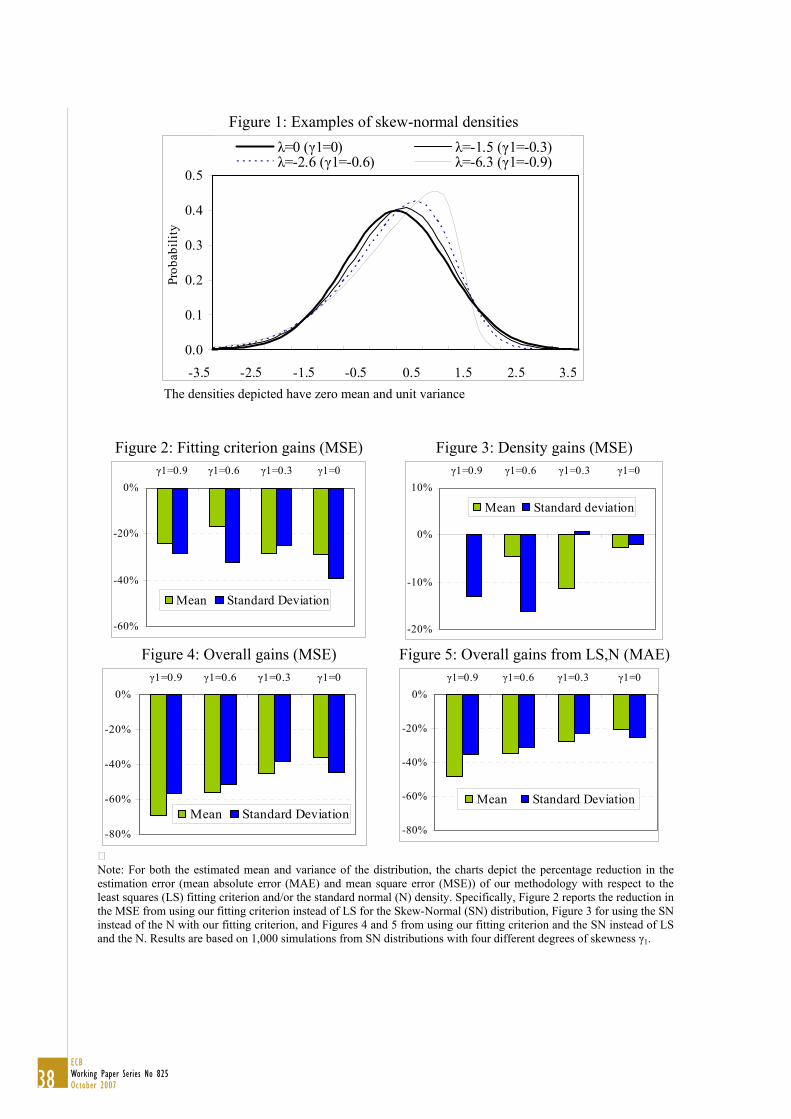
Figure 1: Examples of skew-normal densities
0.0
0.1
0.2
0.3
0.4
0.5
-3.5 -2.5 -1.5 -0.5 0.5 1.5 2.5 3.5
Prob
abili
ty
=0 ( 1=0) =-1.5 ( 1=-0.3)=-2.6 ( 1=-0.6) =-6.3 ( 1=-0.9)
The densities depicted have zero mean and unit variance
Figure 2: Fitting criterion gains (MSE) Figure 3: Density gains (MSE)
-60%
-40%
-20%
0%1=0.9 1=0.6 1=0.3 1=0
Mean Standard Deviation
-20%
-10%
0%
10%1=0.9 1=0.6 1=0.3 1=0
Mean Standard deviation
Figure 4: Overall gains (MSE) Figure 5: Overall gains from LS,N (MAE)
-80%
-60%
-40%
-20%
0%1=0.9 1=0.6 1=0.3 1=0
Mean Standard Deviation
-80%
-60%
-40%
-20%
0%1=0.9 1=0.6 1=0.3 1=0
Mean Standard Deviation
�Note: For both the estimated mean and variance of the distribution, the charts depict the percentage reduction in the estimation error (mean absolute error (MAE) and mean square error (MSE)) of our methodology with respect to the least squares (LS) fitting criterion and/or the standard normal (N) density. Specifically, Figure 2 reports the reduction in the MSE from using our fitting criterion instead of LS for the Skew-Normal (SN) distribution, Figure 3 for using the SN instead of the N with our fitting criterion, and Figures 4 and 5 from using our fitting criterion and the SN instead of LS and the N. Results are based on 1,000 simulations from SN distributions with four different degrees of skewness 1.
39ECB
Working Paper Series No 825October 2007
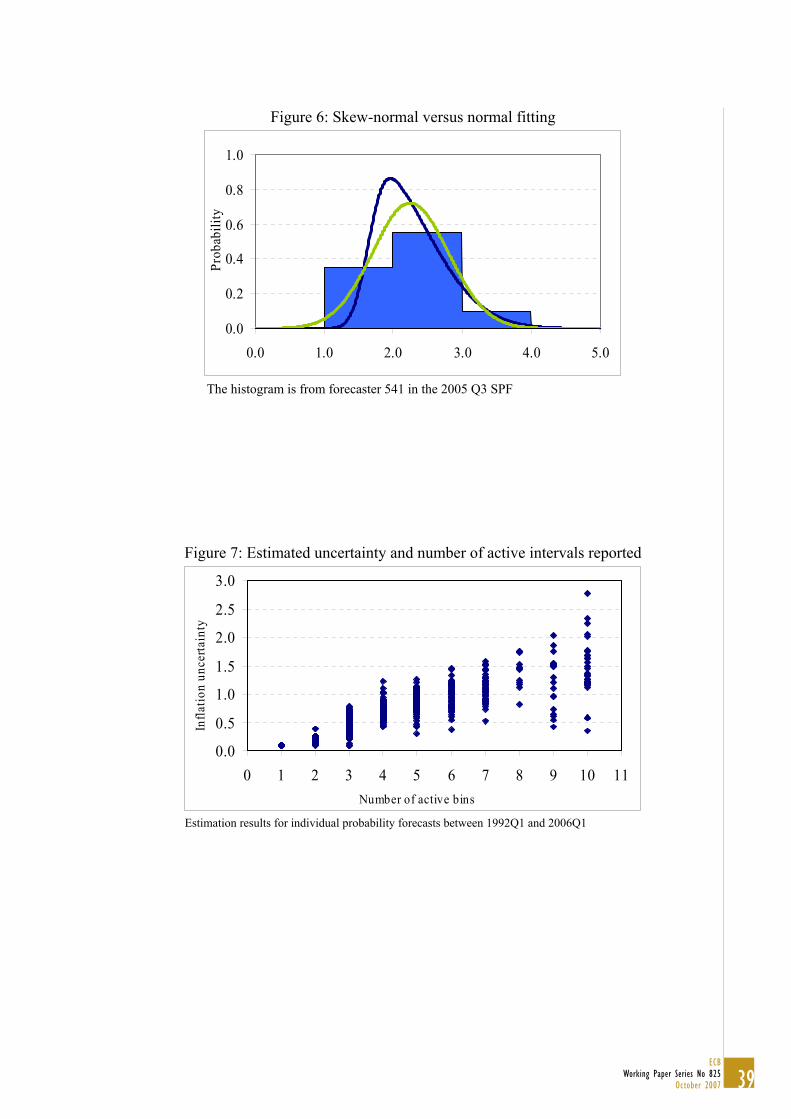
Figure 6: Skew-normal versus normal fitting
0.0
0.2
0.4
0.6
0.8
1.0
0.0 1.0 2.0 3.0 4.0 5.0
Prob
abili
ty
The histogram is from forecaster 541 in the 2005 Q3 SPF
Figure 7: Estimated uncertainty and number of active intervals reported
0.0
0.5
1.0
1.5
2.0
2.5
3.0
0 1 2 3 4 5 6 7 8 9 10 11Number of active bins
Infla
tion
unce
rtain
ty
Estimation results for individual probability forecasts between 1992Q1 and 2006Q1
40ECBWorking Paper Series No 825October 2007
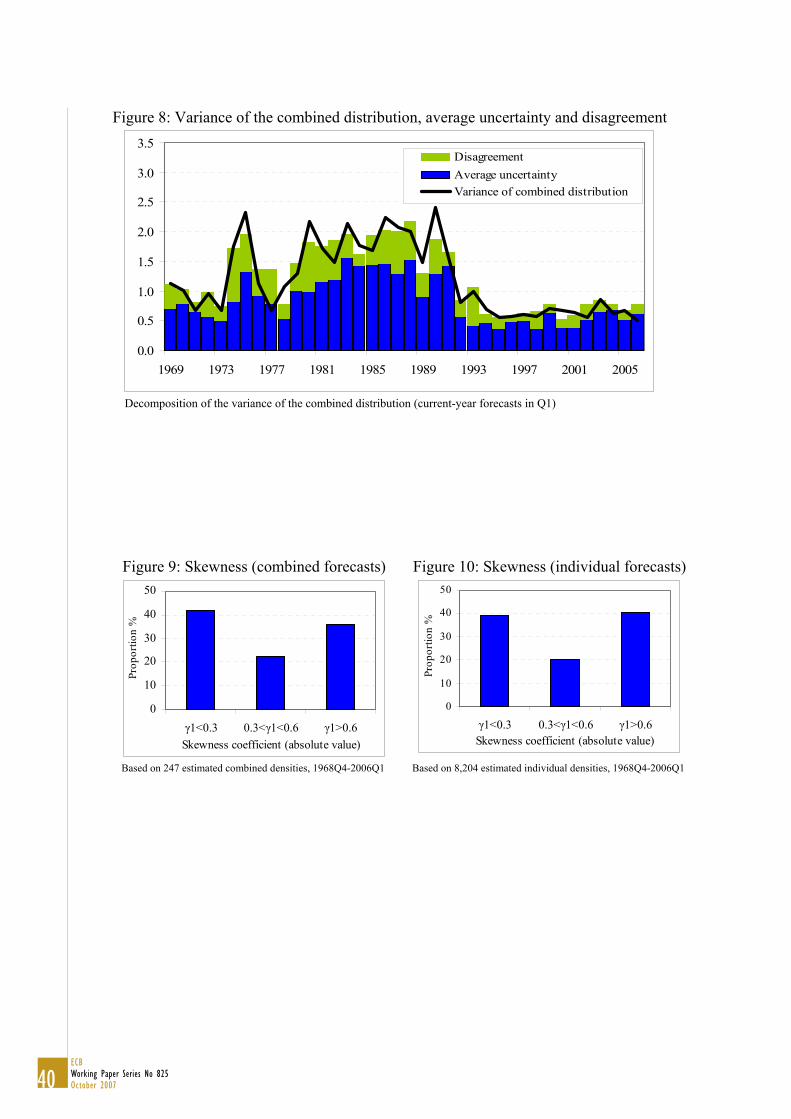
Figure 8: Variance of the combined distribution, average uncertainty and disagreement
0.0
0.5
1.0
1.5
2.0
2.5
3.0
3.5
1969 1973 1977 1981 1985 1989 1993 1997 2001 2005
DisagreementAverage uncertaintyVariance of combined distribution
Decomposition of the variance of the combined distribution (current-year forecasts in Q1)
Figure 9: Skewness (combined forecasts) Figure 10: Skewness (individual forecasts)
0
10
20
30
40
50
1<0.3 0.3< 1<0.6 1>0.6Skewness coefficient (absolute value)
Prop
ortio
n %
0
10
20
30
40
50
1<0.3 0.3< 1<0.6 1>0.6Skewness coefficient (absolute value)
Prop
ortio
n %
Based on 247 estimated combined densities, 1968Q4-2006Q1 Based on 8,204 estimated individual densities, 1968Q4-2006Q1
41ECB
Working Paper Series No 825October 2007
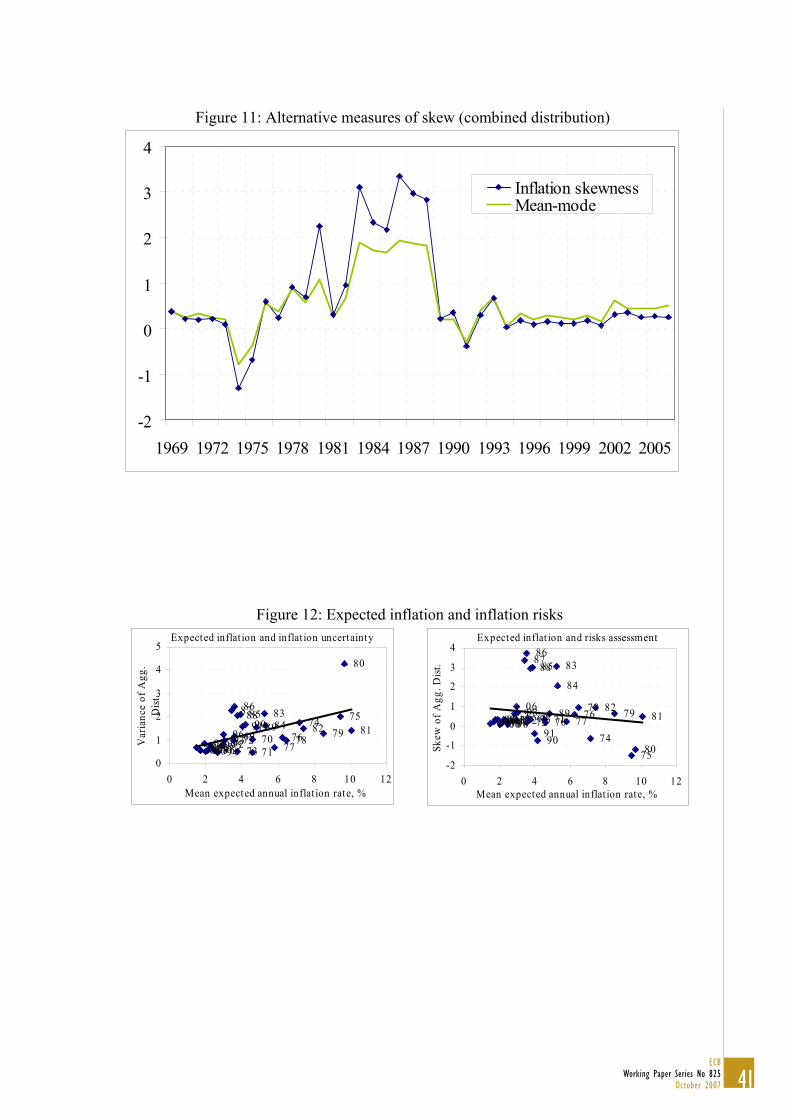
Figure 11: Alternative measures of skew (combined distribution)
-2
-1
0
1
2
3
4
1969 1972 1975 1978 1981 1984 1987 1990 1993 1996 1999 2002 2005
Inflation skewnessMean-mode
Figure 12: Expected inflation and inflation risks Expected inflat ion and inflat ion uncertainty
06050403020100999897969594
9392919089
88878685
8483
82 81
80
79787776
7574
7372
717069
0
1
2
3
4
5
0 2 4 6 8 10 1Mean expected annual inflat ion rate, %
Var
ianc
e of
Agg
. D
ist.
2
Expected inflat ion and risks assessment
0605040302010099989796
95949392
9190
89
888786
85
84
83
8281
80
79787776
7574
7372 717069
-2
-1
0
1
2
3
4
0 2 4 6 8 10 12Mean expected annual inflat ion rate, %
Skew
of A
gg. D
ist.
42ECBWorking Paper Series No 825October 2007
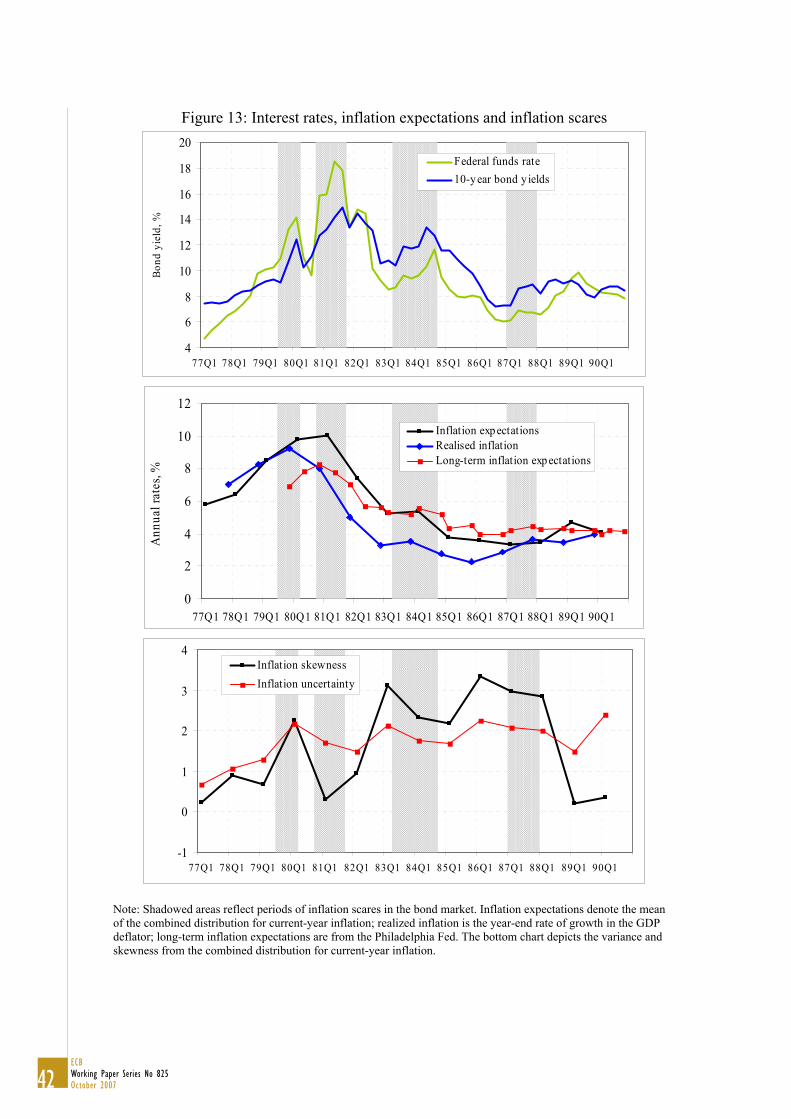
Figure 13: Interest rates, inflation expectations and inflation scares
4
6
8
10
12
14
16
18
20
77Q1 78Q1 79Q1 80Q1 81Q1 82Q1 83Q1 84Q1 85Q1 86Q1 87Q1 88Q1 89Q1 90Q1
Bond
yie
ld, %
Federal funds rate10-y ear bond y ields
0
2
4
6
8
10
12
77Q1 78Q1 79Q1 80Q1 81Q1 82Q1 83Q1 84Q1 85Q1 86Q1 87Q1 88Q1 89Q1 90Q1
Ann
ual r
ates
, %
Inflation exp ectationsRealised inflationLong-term inflation exp ectations
-1
0
1
2
3
4
77Q1 78Q1 79Q1 80Q1 81Q1 82Q1 83Q1 84Q1 85Q1 86Q1 87Q1 88Q1 89Q1 90Q1
Inflation skewnessInflation uncertainty
Note: Shadowed areas reflect periods of inflation scares in the bond market. Inflation expectations denote the mean of the combined distribution for current-year inflation; realized inflation is the year-end rate of growth in the GDP deflator; long-term inflation expectations are from the Philadelphia Fed. The bottom chart depicts the variance and skewness from the combined distribution for current-year inflation.
43ECB
Working Paper Series No 825October 2007
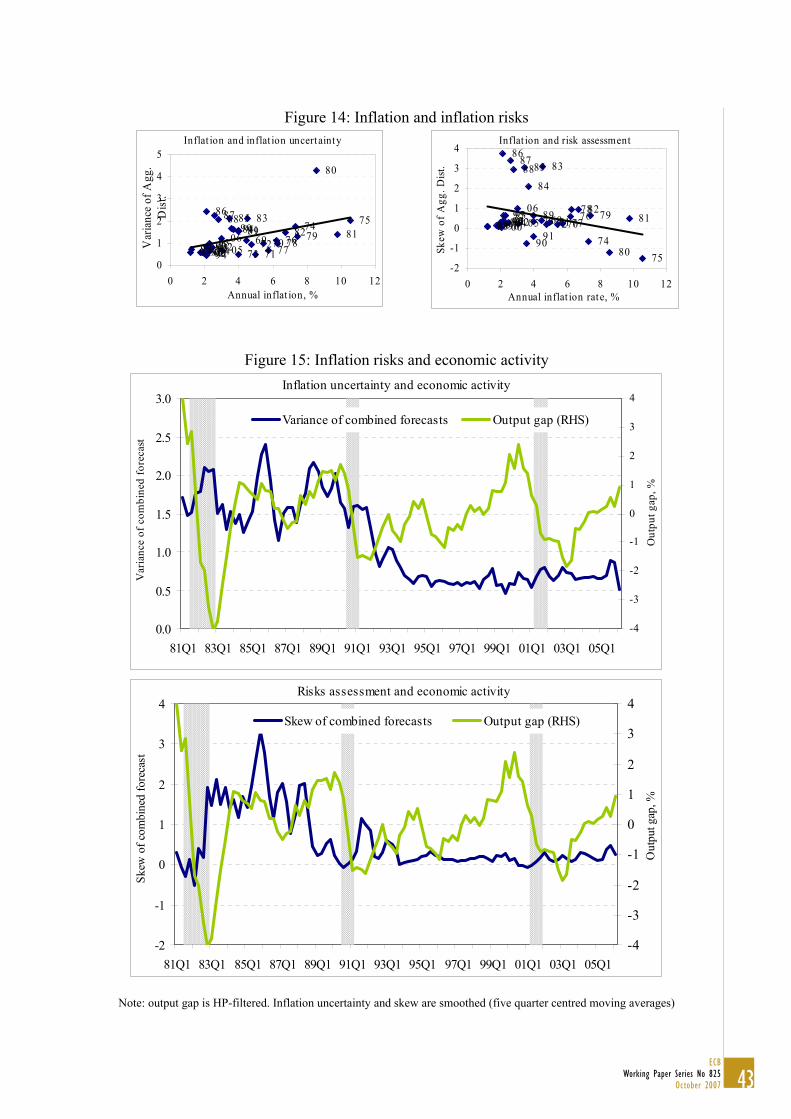
Figure 14: Inflation and inflation risks
Inflat ion and inflat ion uncertainty
69 7071
7273
74 75
767778 79
80
818283
8485868788
8990919293
949596979899 0001020304 0506
0
1
2
3
4
5
0 2 4 6 8 10 1Annual inflat ion, %
Var
ianc
e of
Agg
. D
ist.
2
Inflat ion and risk assessment
69 70717273
7475
767778 79
80
8182
83
84
858687
88
89
909192939495
96979899 0001020304 0506
-2
-1
0
1
2
3
4
0 2 4 6 8 10 12Annual inflat ion rate, %
Skew
of A
gg. D
ist.
Figure 15: Inflation risks and economic activity
Inflation uncertainty and economic activity
0.0
0.5
1.0
1.5
2.0
2.5
3.0
81Q1 83Q1 85Q1 87Q1 89Q1 91Q1 93Q1 95Q1 97Q1 99Q1 01Q1 03Q1 05Q1
Var
ianc
e of
com
bine
d fo
reca
st
-4
-3
-2
-1
0
1
2
3
4
Out
put g
ap, %
Variance of combined forecasts Output gap (RHS)
Risks assessment and economic activity
-2
-1
0
1
2
3
4
81Q1 83Q1 85Q1 87Q1 89Q1 91Q1 93Q1 95Q1 97Q1 99Q1 01Q1 03Q1 05Q1
Skew
of c
ombi
ned
fore
cast
-4
-3
-2
-1
0
1
2
3
4
Out
put g
ap, %
Skew of combined forecasts Output gap (RHS)
Note: output gap is HP-filtered. Inflation uncertainty and skew are smoothed (five quarter centred moving averages)
44ECBWorking Paper Series No 825October 2007
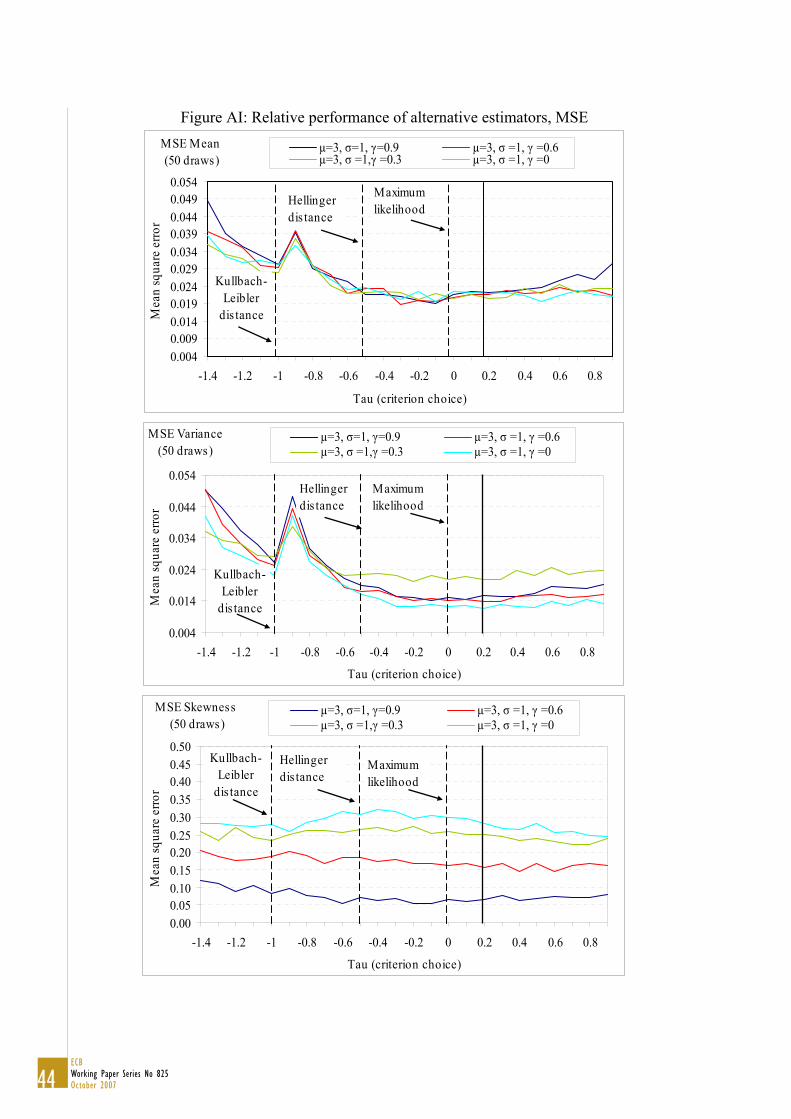
Figure AI: Relative performance of alternative estimators, MSE
MSE Mean (50 draws)
0.0040.0090.0140.0190.0240.0290.0340.0390.0440.0490.054
-1.4 -1.2 -1 -0.8 -0.6 -0.4 -0.2 0 0.2 0.4 0.6 0.8
Tau (criterion choice)
Mea
n sq
uare
erro
rµ=3, =1, =0.9 µ=3, =1, =0.6µ=3, =1, =0.3 µ=3, =1, =0
Maximumlikelihood
Hellingerdis tance
Kullbach-Leibler
dis tance
MSE Variance
(50 draws)
0.004
0.014
0.024
0.034
0.044
0.054
-1.4 -1.2 -1 -0.8 -0.6 -0.4 -0.2 0 0.2 0.4 0.6 0.8
Tau (criterion choice)
Mea
n sq
uare
erro
r
µ=3, =1, =0.9 µ=3, =1, =0.6µ=3, =1, =0.3 µ=3, =1, =0
Maximumlikelihood
Hellingerdis tance
Kullbach-Leibler
dis tance
MSE Skewness
(50 draws)
0.000.050.100.150.200.250.300.350.400.450.50
-1.4 -1.2 -1 -0.8 -0.6 -0.4 -0.2 0 0.2 0.4 0.6 0.8
Tau (criterion choice)
Mea
n sq
uare
erro
r
µ=3, =1, =0.9 µ=3, =1, =0.6µ=3, =1, =0.3 µ=3, =1, =0
Maximumlikelihood
Hellingerdis tance
Kullbach-Leibler
dis tance
45ECB
Working Paper Series No 825October 2007
European Central Bank Working Paper Series
For a complete list of Working Papers published by the ECB, please visit the ECB’s website (http://www.ecb.europa.eu)
773 “Exchange rate volatility and growth in small open economies at the EMU periphery” by G. Schnabl, July 2007.
774 “Shocks, structures or monetary policies? The euro area and US after 2001” by L. Christiano, R. Motto and M. Rostagno, July 2007.
775 “The dynamic behaviour of budget components and output” by A. Afonso and P. Claeys, July 2007.
776 “Insights gained from conversations with labor market decision makers” by T. F. Bewley, July 2007.
777 “Downward nominal wage rigidity in the OECD” by S. Holden and F. Wulfsberg, July 2007.
778 “Employment protection legislation and wages” by M. Leonardi and G. Pica, July 2007.
779 “On-the-job search and the cyclical dynamics of the labor market” by M. U. Krause and T. A. Lubik, July 2007.
780 “Dynamics and monetary policy in a fair wage model of the business cycle” by D. de la Croix, G. de Walque and R. Wouters, July 2007.
781 “Wage inequality in Spain: recent developments” by M. Izquierdo and A. Lacuesta, July 2007.
782 “Panel data estimates of the production function and product and labor market imperfections” by S. Dobbelaere and J. Mairesse, July 2007.
783 “The cyclicality of effective wages within employer-employee matches: evidence from German panel data” by S. Anger, July 2007.
784 “Understanding the dynamics of labor shares and inflation” by M. Lawless and K. Whelan, July 2007.
785 “Aggregating Phillips curves” by J. Imbs, E. Jondeau and F. Pelgrin, July 2007.
786 “The economic impact of merger control: what is special about banking?” by E. Carletti, P. Hartmann and S. Ongena, July 2007.
787 “Finance and growth: a macroeconomic assessment of the evidence from a European angle” by E. Papaioannou, July 2007.
788 “Evaluating the real effect of bank branching deregulation: comparing contiguous counties across U.S. state borders” by R. R. Huang, July 2007.
789 “Modeling the impact of external factors on the euro area’s HICP and real economy: a focus on pass-through and the trade balance” by L. Landolfo, July 2007.
790 “Asset prices, exchange rates and the current account” by M. Fratzscher, L. Juvenal and L. Sarno, August 2007.
791 “Inquiries on dynamics of transition economy convergence in a two-country model” by J. Brůha and J. Podpiera, August 2007.
46ECBWorking Paper Series No 825October 2007
792 “Euro area market reactions to the monetary developments press release” by J. Coffinet and S. Gouteron, August 2007.
793 “Structural econometric approach to bidding in the main refinancing operations of the Eurosystem” by N. Cassola, C. Ewerhart and C. Morana, August 2007.
794 “(Un)naturally low? Sequential Monte Carlo tracking of the US natural interest rate” by M. J. Lombardi and S. Sgherri, August 2007.
795 “Assessing the impact of a change in the composition of public spending: a DSGE approach” by R. Straub and I. Tchakarov, August 2007.
796 “The impact of exchange rate shocks on sectoral activity and prices in the euro area” by E. Hahn, August 2007.
797 “Joint estimation of the natural rate of interest, the natural rate of unemployment, expected inflation, and potential output” by L. Benati and G. Vitale, August 2007.
798 “The transmission of US cyclical developments to the rest of the world” by S. Dées and I. Vansteenkiste, August 2007.
799 “Monetary policy shocks in a two-sector open economy: an empirical study” by R. Llaudes, August 2007.
800 “Is the corporate bond market forward looking?” by J. Hilscher, August 2007.
801 “Uncovered interest parity at distant horizons: evidence on emerging economies & nonlinearities” by A. Mehl and L. Cappiello, August 2007.
802 “Investigating time-variation in the marginal predictive power of the yield spread” by L. Benati and C. Goodhart, August 2007.
803 “Optimal monetary policy in an estimated DSGE for the euro area” by S. Adjemian, M. Darracq Pariès and S. Moyen, August 2007.
804 “Growth accounting for the euro area: a structural approach” by T. Proietti and A. Musso, August 2007.
805 “The pricing of risk in European credit and corporate bond markets” by A. Berndt and I. Obreja, August 2007.
806 “State-dependency and firm-level optimization: a contribution to Calvo price staggering” by P. McAdam and A. Willman, August 2007.
807 “Cross-border lending contagion in multinational banks” by A. Derviz and J. Podpiera, September 2007.
808 “Model misspecification, the equilibrium natural interest rate and the equity premium” by O. Tristani, September 2007.
809 “Is the New Keynesian Phillips curve flat?” by K. Kuester, G. J. Müller and S. Stölting, September 2007.
810 “Inflation persistence: euro area and new EU Member States” by M. Franta, B. Saxa and K. Šmídková, September 2007.
811 “Instability and nonlinearity in the euro area Phillips curve” by A. Musso, L. Stracca and D. van Dijk, September 2007.
812 “The uncovered return parity condition” by L. Cappiello and R. A. De Santis, September 2007.
47ECB
Working Paper Series No 825October 2007
813 “The role of the exchange rate for adjustment in boom and bust episodes” by R. Martin, L. Schuknecht and I. Vansteenkiste, September 2007.
814 “Choice of currency in bond issuance and the international role of currencies” by N. Siegfried, E. Simeonova and C. Vespro, September 2007.
815 “Do international portfolio investors follow firms’ foreign investment decisions?” by R. A. De Santis and P. Ehling, September 2007.
816 “The role of credit aggregates and asset prices in the transmission mechanism: a comparison between the euro area and the US” by S. Kaufmann and M. T. Valderrama, September 2007.
817 “Convergence and anchoring of yield curves in the euro area” by M. Ehrmann, M. Fratzscher, R. S. Gürkaynak and E. T. Swanson, October 2007.
818 “Is time ripe for price level path stability?” by V. Gaspar, F. Smets and D. Vestin, October 2007.
819 “Proximity and linkages among coalition participants: a new voting power measure applied to the International Monetary Fund” by J. Reynaud, C. Thimann and L. Gatarek, October 2007.
820 “What do we really know about fiscal sustainability in the EU? A panel data diagnostic” by A. Afonso and C. Rault, October 2007.
821 “Social value of public information: testing the limits to transparency” by M. Ehrmann and M. Fratzscher, October 2007.
822 “Exchange rate pass-through to trade prices: the role of non-linearities and asymmetries” by M. Bussière, October 2007.
823 “Modelling Ireland’s exchange rates: from EMS to EMU” by D. Bond, M. J. Harrison and E. J. O’Brien, October 2007.
824 “Evolving U.S. monetary policy and the decline of inflation predictability” by L. Benati and P. Surico, October 2007.
825 “What can probability forecasts tell us about inflation risks?” by J. A. García and A. Manzanares, October 2007.

WORKING PAPER SER IESNO 825 / OCTOBER 2007
WHAT CAN PROBABILITYFORECASTS TELL USABOUT INFLATIONRISKS?
by Juan Angel Garcíaand Andrés Manzanares
Date: 12 Oct, 2007 17:42:54;Format: (420.00 x 297.00 mm);Output Profile: SPOT IC300;Preflight: Failed!
Related Documents