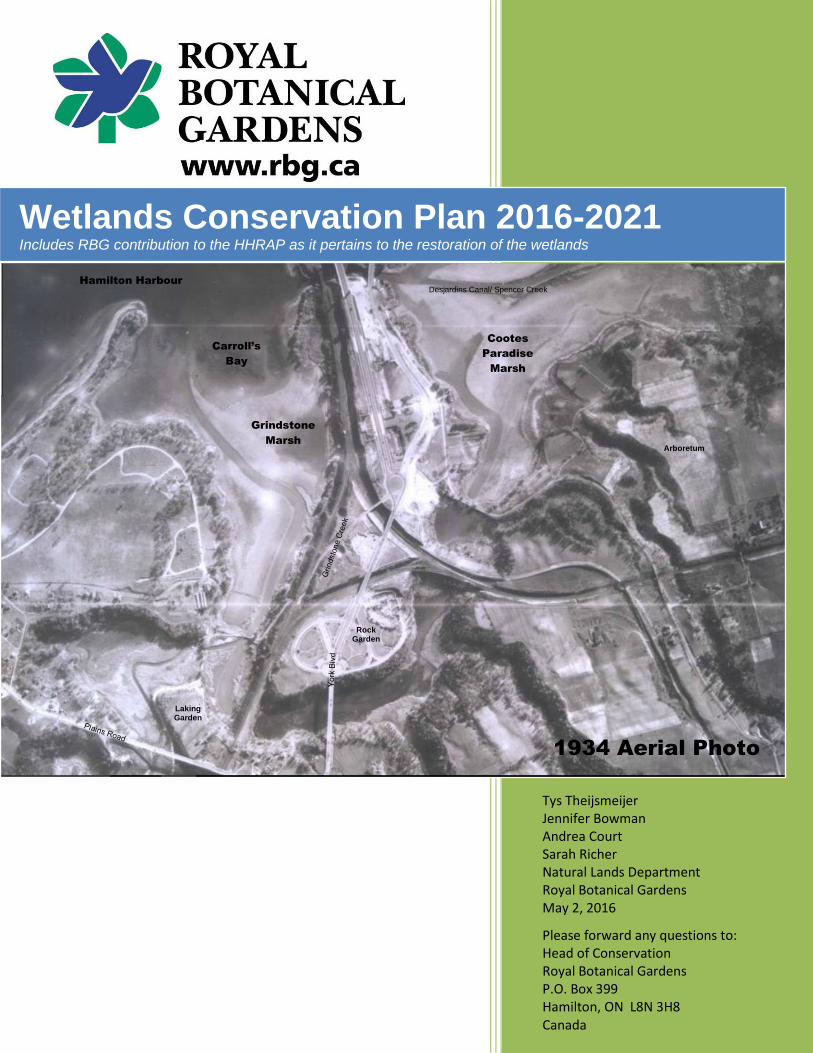
Tys Theijsmeijer Jennifer Bowman Andrea Court Sarah Richer Natural Lands Department Royal Botanical Gardens May 2, 2016 Please forward any questions to: Head of Conservation Royal Botanical Gardens P.O. Box 399 Hamilton, ON L8N 3H8 Canada Wetlands Conservation Plan 2016-2021 Includes RBG contribution to the HHRAP as it pertains to the restoration of the wetlands Grindstone Marsh Cootes Paradise Marsh 1934 Aerial Photo Desjardins Canal/ Spencer Creek Hamilton Harbour Carroll’s Bay Arboretum Laking Garden Rock Garden

Welcome message from author
This document is posted to help you gain knowledge. Please leave a comment to let me know what you think about it! Share it to your friends and learn new things together.
Transcript
Tys Theijsmeijer Jennifer Bowman Andrea Court Sarah Richer Natural Lands Department Royal Botanical Gardens May 2, 2016
Please forward any questions to: Head of Conservation Royal Botanical Gardens P.O. Box 399 Hamilton, ON L8N 3H8 Canada
Wetlands Conservation Plan 2016-2021 Includes RBG contribution to the HHRAP as it pertains to the restoration of the wetlands
Grindstone
Marsh
Cootes
Paradise
Marsh
1934 Aerial Photo
Desjardins Canal/ Spencer Creek Hamilton Harbour
Carroll’s
Bay
Arboretum
Laking Garden
Rock Garden
2
Recommended Citation:
Theijsmeijer T., J. Bowman, A. Court & S. Richer. 2016. Wetlands Conservation Plan 2016-2021. Natural
Lands Department. Internal Report No. 2016-1. Royal Botanical Gardens. Hamilton, Ontario.
Document Description:
This document summarizes operating strategies, projects, and needed resources for RBG marsh restoration and
management between 2016 and 2021. Recommendations and an action plan are included, which will be
pursued by RBG pending relevant approvals, compatibility with broader RBG strategies, funding, and support
from outside organizations and the public.
3
Executive Summary
Wetland Restoration Goal: While maintaining system connectivity restore the underlying conditions for
biodiversity recovery and sustainability, quantified as a mesoeutrophic environment in the deltas and a
mesotrophic environments in the sheltered bays.
The 2010-2015 Wetland Restoration plan activities (Project Paradise) advanced the recovery of Cootes
Paradise and Grindstone Marsh significantly. Aquatic vegetation doubled to 131 hectares (target 270ha.), and
water clarity in Cootes Paradise Marsh improved from an average of 35cm to 60cm (target 100cm). However,
fish and wildlife populations have not responded in relation to the improved marsh conditions. For example
fish counted at the Fishway have only slightly increased from an already extremely impaired level. Research
projects have been initiated with partners to assess potential unknown sources (i.e. pesticides and
pharmaceuticals). Also for fish, the adjacent harbour’s summer loss of oxygen in the deeper water, and recent
research that found loss of oxygen under the ice in the western basin during the last two winters clearly
impacts the fish populations. The cause of this problem is expected to be resolved once the Hamilton Waste
Water Treatment Plant (WWTP) upgrades are completed (2021). Similar research in the western Desjardin
Canal in Cootes Paradise (below the King St. WWTP), found this area also loses its oxygen under ice cover.
These low oxygen conditions favour a system dominated by low-oxygen-tolerant carp and goldfish.
This restoration plan summarizes items including the role of RBG in the HHRAP, the strategy looking forward
independent of the HHRAP, resources required, partnerships, research opportunities, specific projects and
locations. The plan is in parallel with the 2021 expected completion of the Hamilton Harbour Remedial Action
Plan (HHRAP), bringing the wetlands to a recovered state. An important role for RBG in this process is
providing water quality-based communications on the state of the wetlands, and the most important factor for
wetland sustainability – supporting the partner initiatives to improve inflowing waters.
In summary, the Wetland Restoration Plan addresses large-scale degradation, Species at Risk protection and
recovery, and invasive species management. These themes (below) align with provincial and federal
biodiversity strategies. RBG’s planned wetland management actions between 2016 and 2021 are dominated by
four principle themes that are threaded through 13 separate project initiatives; their associated summaries are
found in the Project Descriptions section. In addition to these themes, specific partner projects in the western
section of the Desjardins Canal upstream of West Pond (owned by the City of Hamilton), and the wastewater
treatment at the head of the canal, will be key steps on the road to achieving wetland sustainability.
Wetland Restoration Themes 2016-2021
1. Exclusion and removal of Common Carp from the marsh areas.
2. Emergent marsh planting to ameliorate Lake Ontario water level regulation.
3. Removal and repair of historically armoured shorelines in Cootes Paradise Marsh.
4. Meadow Marsh restoration through invasive plant management with potential alignment with pollinators.
To complete the plan, staff compliment is forecasted to be the same as current. The most significant expense
after staffing will be plants for restoration work, estimated at $500,000 total (220,000 plants). There is also
potential for RBG volunteers to assist with propagation. This volunteer contribution can be helpful in
leveraging partner funding, with this already noted to both the volunteers and RBG propagation. Basic
infrastructure of boats, the boathouse and vehicles (x2) will need to be renewed.
Financial contributions to RBG between 2010 and 2015 to support the HHRAP work within the marshes by
the lead agencies Environment Canada and Ministry of Environment and Climate Change were a critical
partnership in advancing the projects. Partnerships with both these agencies are expected to continue going
forward to the completion of the HHRAP. Partnerships with the Ontario Ministry of Natural Resources and
Forestry are expected to grow under the Species at Risk and invasive species management themes. RBGs
Project Paradise Fund still holds $240,000 but will be depleted within the next couple years. Notable RBG
funding raising opportunities will occur in the coming years including, the Cootes Paradise Fishway 20th
anniversary celebration (2017), and supporting the propagation of plants. Opportunities will also present
themselves as restoration success with individual wetland species such as turtles, eagles and wild rice occurs.
4
Table of Contents
RBG 2016-2021 Strategic Plan ............................................................................................................................. 6 Natural Lands Biodiversity Goal ...................................................................................................................... 6 Wetland Restoration Goal ................................................................................................................................ 6 Key Partner Water Quality Related Plans ........................................................................................................ 6 Looking Forward .............................................................................................................................................. 6 The Primary Restoration Issue.......................................................................................................................... 7
Secondary Issues ........................................................................................................................................... 8 Issues Summary ................................................................................................................................................ 8 The Key Performance Indicators for RBG Wetlands ....................................................................................... 8
Integration with the HHRAP ................................................................................................................................ 9 HHRAP Targets ................................................................................................................................................ 9
Background Summary & Status .......................................................................................................................... 11 Current Wetland Status ................................................................................................................................... 12
Invasive Species .................................................................................................................................................. 14 Species at Risk .................................................................................................................................................... 16 Restoration Strategies and Actions ..................................................................................................................... 19
Actions ............................................................................................................................................................ 19 Staffing ........................................................................................................................................................... 20 Capital Projects and Items .............................................................................................................................. 20
Restoration of Plant Community......................................................................................................................... 22 Wetland Types ................................................................................................................................................ 22 Restoration Activities ..................................................................................................................................... 23 Planting Plan ................................................................................................................................................... 25 Shoreline Stabilization .................................................................................................................................... 26
Water Quality and HHRAP Partners .................................................................................................................. 29 Monitoring .......................................................................................................................................................... 32
Hamilton Harbour Remedial Action Plan Linkages ....................................................................................... 33 Ongoing Planning ............................................................................................................................................... 35 Research Projects ................................................................................................................................................ 36 Outreach and Education ...................................................................................................................................... 37
Community Involvement ................................................................................................................................ 37 Education ........................................................................................................................................................ 37
Project Descriptions ............................................................................................................................................ 38 1. The Cootes Paradise Fishway ............................................................................................................. 38 2. The Spencer Creek Delta Project ........................................................................................................ 38 3. Cootes Paradise Shoreline Repair ....................................................................................................... 38 4. Cootes Paradise Inner Bay Project ...................................................................................................... 39 5. Wild Rice and Deep Water Plants ....................................................................................................... 39 6. Meadow Marsh Invasive Plant Management ...................................................................................... 39 7. Stream Habitat Improvement .............................................................................................................. 40 8. RBG Centre Urban Runoff Management ............................................................................................ 40 9. Sunfish Pond & Long Pond Project .................................................................................................... 40 10. Chedoke Bay Project ........................................................................................................................... 41 11. Grindstone Marsh Delta (the elbow) ................................................................................................... 41 12. Hendrie Valley Floodplain Ponds ....................................................................................................... 42 13. Carroll’s Bay Marsh ............................................................................................................................ 42 14. Community Involvement .................................................................................................................... 42
Key Reference Background Monitoring Documents .......................................................................................... 43 Research Papers Inventory .................................................................................................................................. 44 Appendix A ......................................................................................................................................................... 50
Watersheds of RBG Marshes.......................................................................................................................... 50
5
Coastal Marsh Meadow Marsh Areas of RBG ............................................................................................... 51 Great Lakes Health Environmental Indicators ............................................................................................... 55
Related Strategies of Partners ............................................................................................................................. 57 Appendix B – Preliminary Work Plan ................................................................................................................ 58
List of Figures
Figure 1. Map of RBG properties with Cootes Paradise Marsh as the central water feature.............................. 11 Figure 2. Cootes Paradise’s Rat Island in the Spencer Creek delta, 2011 (lower photo) and 2015 (upper photo)
............................................................................................................................................................................ 13 Figure 3. Trends in carp abundance at Cootes Paradise from August electrofishing monitoring (22 transects).
............................................................................................................................................................................ 15 Figure 4. Projects Overview Map depicting 2016-2021 wetland project description locations. ........................ 21 Figure 5. Future planting areas, existing emergent and meadow marsh, and predicted plant community zones
based on current Lake Ontario water cycles. ...................................................................................................... 23 Figure 6. Shoreline condition of Cootes Paradise Marsh. Shoreline restoration planting priorities will focus on
gabion basket and stone removal, and island shoreline stabilization between 2016 and 2021. .......................... 28 Figure 7. Site specific areas of issue (lacking plants) within Cootes Paradise and Grindstone Marshes
downstream of independent watersheds. ............................................................................................................ 31 Figure 8. Meadow Marsh location (bright green) in RBG wetlands as derived from 2011-2013 RBG
Ecological Lands Classification projects. ........................................................................................................... 51 Figure 9. Bathymetry of Cootes Paradise Marsh and associated stream, by stream order size. Average spring
high water level in Cootes Paradise is 75.15 msl and average winter low is 74.45 msl (from Water levels
Implications RBG 2004). Peak spring water level generally occurs mid May to mid June. .............................. 54
List of Tables
Table 1. HHRAP delisting targets for RBG wetlands......................................................................................... 10 Table 2. Identified factors contributing to the historical success of Common Carp (Cyprinus carpio). ............ 14 Table 3. Summary of abundant invasive species found within RBG wetlands. ................................................. 15 Table 4. Wetland-related Species at Risk at RBG, and their current wetland use status. ................................... 17 Table 5. Wetland project titles and timelines ...................................................................................................... 19 Table 6. Wetland Project Estimated Plant Needs 2016-2021 ............................................................................. 25 Table 7: Prioritization of shoreline repair issues at Cootes Paradise Marsh and Grindstone Marsh. ................. 27 Table 8. Summary chart of issues, associated areas affected, shown in Figure 7, and action themes to delist the
wetland portion of the HHRAP. .......................................................................................................................... 30 Table 9 Anticipated Monitoring Activities of RBG Wetlands related to RBG’s wetland restoration goals....... 32 Table 10. Anticipated monitoring activities related to HHRAP ......................................................................... 33 Table 11. HHRAP Related Committees ............................................................................................................. 35 Table 12. List of planned RBG reports and the anticipated year of completion. ................................................ 35 Table 13. Summary of Research topics of interest for the RBG wetlands, the anticipated lead and partner
agencies, and an anticipated year of completion. (EC = Environment Canada, DFO = Fisheries & Oceans) ... 36 Table 14. RBG meadow marsh priority sites and associated summary information. This information is used to
prioritize restoration efforts. ............................................................................................................................... 52 Table 15. Comparison chart of the International Joint Commission (IJC) Ecosystem Indicators and the State of
the Lakes Ecosystem Conference (SOLEC) indicators. Chart is taken from “Great Lakes Ecosystem Indicators
Report – A report of the IJC priority assessment of progress towards restoring the Great Lakes” IJC June 2014.
A total of 23 of the 41 measure outlined by the IJC are defined differently from the SOLEC indicators (there
are highlighted with an *). .................................................................................................................................. 55 Table 16.Comparison of the effect of the Current Lake Ontario Water Level Regulation Plan (1958DD) versus
the unregulated situation and the proposed water level regulation Bv7 (essential Plan 2014) on key
Environmental Performance Indicators. Chart is taken from the IJC website. ................................................... 56
6
RBG 2016-2021 Strategic Plan ACHIEVING EXCELLENCE IN:
1. THE RBG GUEST EXPERIENCE
2. FINANCIAL SUSTAINABILITY
3. ENVIRONMENTAL LEADERSHIP
4. GOVERNANCE AND LEADERSHIP
In the natural areas, we will continue to align with the provincial Biodiversity Strategy undertaking projects to
inventory and protect endangered species, as well as developing and implementing plans to manage invasive
species. Our wetlands restoration initiatives will continue to be our flagship environmental management
project, working with local and government partners to monitor and recover the health of two of the largest
remaining Lake Ontario coastal wetlands, Cootes Paradise and Grindstone Marsh. These marshes represent a
third of RBG natural areas and the project aligns exactly with the objectives of the new Great Lakes Protection
Act. Complementing the environmental projects, trail system infrastructure renewal will continue, ensuring
trails remain open, safe, inspiring, and facilitate environmental protection and educational programming.
Natural Lands Biodiversity Goal
To manage Royal Botanical Gardens’ conservation lands as integrated sanctuaries in the context of their
international and local significance, both ecologically and culturally by enhancing, restoring, and maintaining
habitats and linkages in balance with the public’s need for spiritual renewal and exploration.
Wetland Restoration Goal
While maintaining system connectivity, restore the underlying conditions for biodiversity recovery and
sustainability, quantified as a mesoeutrophic environment in the deltas & mesotrophic in the sheltered bays.
Longer Term Objectives
1. with partners, recover inflowing water quality to meet provincial/federal water quality objectives
2. restore natural water cycle patterns of Spencer Creek and Lake Ontario
3. remove non-native species dominating the system
Key Partner Water Quality Related Plans
Great Lakes Water Quality Agreement
City of Hamilton Stormwater Master Plan
City of Hamilton Wastewater Master Plan
Conservation Authorities Watershed Plans – various
As noted in the previous 2010-2015 wetland restoration plan, a significant driver of the success of the
dominant harbour fish, Common Carp (Cyprinus carpio), and the overall unbalanced fish populations is the
ability to survive anoxia in Hamilton Harbour. This anoxia is a direct result of the Woodward Ave.
Wastewater Treatment Wastewater Plant, and so despite the fact its water does not flow directly into RBG
wetlands, upgrade of this plant is critical for the long term sustainability of the marshes.
Looking Forward
During the period of this plan, a transition from RBG activities driven by the Great Lakes Recovery initiative
(HHRAP) to the Great Lakes Biodiversity Strategy will occur as the HHRAP and the wetlands are to be
delisted by 2021. At RBG, this transition began during the course of the previous five years with initiatives
specific to both Species at Risk and Invasive Species (other than carp) being undertaken. This was highlighted
by the completion of an RBG Turtle Site Specific Plan and a Phragmites Management Plan. Given the biota of
the wetlands, there are in excess of 20 partner level strategies RBG could align with (Appendix A). Moving
forward, both Species at Risk and invasive species will become dominant drivers of future activities, with
pollinators currently emerging as a potential new dimension. In addition, local cooperation will shift from the
7
HHRAP to the Lake Ontario Management Plan, Cootes to Escarpment Ecopark System, and Niagara
Escarpment World Biosphere Initiatives.
Key Partner Plans
Great Lakes Water Quality Agreement (State of
the Lake Ecosystem Conference - SOLEC)
Federal and Provincial Biodiversity Strategies
with focus on Species at Risk, invasive species &
pollinators
Provincial Great Lakes Protection Act and Lake
Ontario Management Plan (LaMP)
Federal North American Migratory Waterfowl &
Shorebird Management Plans
Great Lakes Wetlands Conservation Action Plan
Nature Conservancy Great Lakes Conservation
Blue Print
Lake Ontario Water Level Regulation Plan 2014
Ontario Invasive Species Strategy / Act
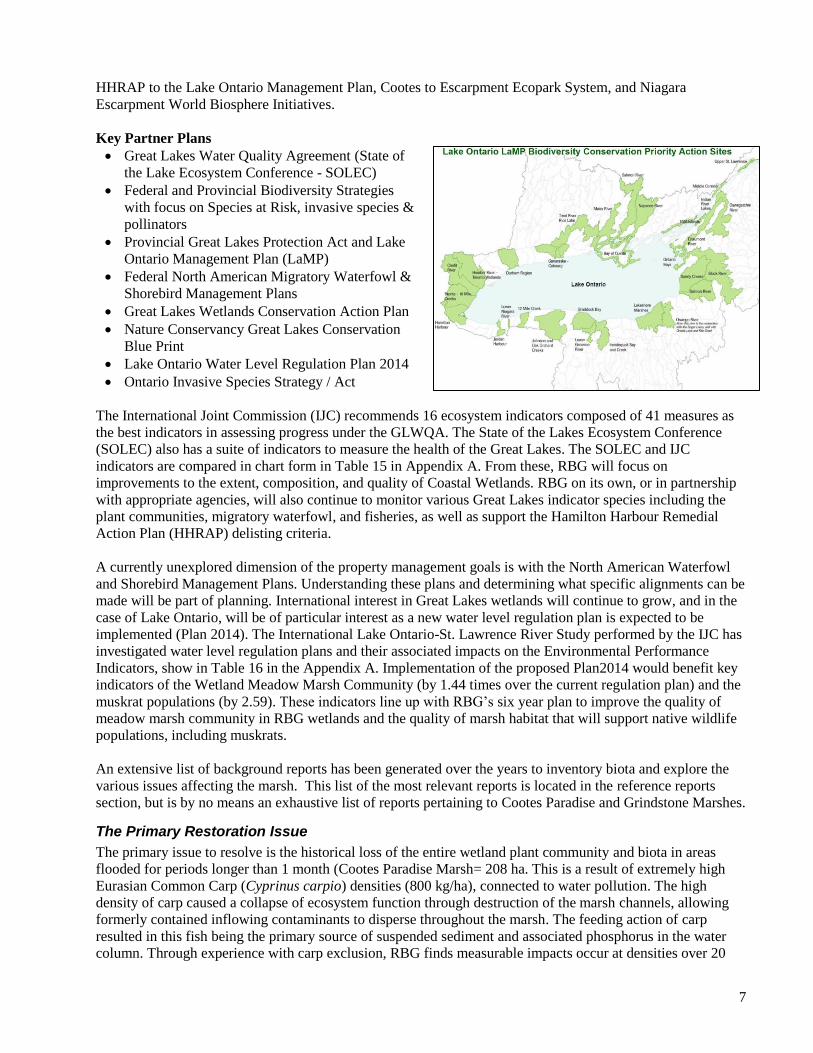
The International Joint Commission (IJC) recommends 16 ecosystem indicators composed of 41 measures as
the best indicators in assessing progress under the GLWQA. The State of the Lakes Ecosystem Conference
(SOLEC) also has a suite of indicators to measure the health of the Great Lakes. The SOLEC and IJC
indicators are compared in chart form in Table 15 in Appendix A. From these, RBG will focus on
improvements to the extent, composition, and quality of Coastal Wetlands. RBG on its own, or in partnership
with appropriate agencies, will also continue to monitor various Great Lakes indicator species including the
plant communities, migratory waterfowl, and fisheries, as well as support the Hamilton Harbour Remedial
Action Plan (HHRAP) delisting criteria.
A currently unexplored dimension of the property management goals is with the North American Waterfowl
and Shorebird Management Plans. Understanding these plans and determining what specific alignments can be
made will be part of planning. International interest in Great Lakes wetlands will continue to grow, and in the
case of Lake Ontario, will be of particular interest as a new water level regulation plan is expected to be
implemented (Plan 2014). The International Lake Ontario-St. Lawrence River Study performed by the IJC has
investigated water level regulation plans and their associated impacts on the Environmental Performance
Indicators, show in Table 16 in the Appendix A. Implementation of the proposed Plan2014 would benefit key
indicators of the Wetland Meadow Marsh Community (by 1.44 times over the current regulation plan) and the
muskrat populations (by 2.59). These indicators line up with RBG’s six year plan to improve the quality of
meadow marsh community in RBG wetlands and the quality of marsh habitat that will support native wildlife
populations, including muskrats.
An extensive list of background reports has been generated over the years to inventory biota and explore the
various issues affecting the marsh. This list of the most relevant reports is located in the reference reports
section, but is by no means an exhaustive list of reports pertaining to Cootes Paradise and Grindstone Marshes.
The Primary Restoration Issue
The primary issue to resolve is the historical loss of the entire wetland plant community and biota in areas
flooded for periods longer than 1 month (Cootes Paradise Marsh= 208 ha. This is a result of extremely high
Eurasian Common Carp (Cyprinus carpio) densities (800 kg/ha), connected to water pollution. The high
density of carp caused a collapse of ecosystem function through destruction of the marsh channels, allowing
formerly contained inflowing contaminants to disperse throughout the marsh. The feeding action of carp
resulted in this fish being the primary source of suspended sediment and associated phosphorus in the water
column. Through experience with carp exclusion, RBG finds measurable impacts occur at densities over 20
8
kg/ha. The success of the carp is a product of multiple factors noted under the section “Invasive Species” later
in the document.
Secondary Issues
Degraded inflowing water supplies, water level regulation, and system dominance by various non-native
species comprise fundamental challenges for RBG wetlands. Inflowing water quality issues are highlighted by
bacteria, phosphorus, sediment, nitrogen compounds, and potentially pesticides. This has resulted in 3 areas of
sediment impairment including the interior of Westdale Inlet, the Desjardins Canal upstream of West Pond,
and Chedoke Bay. Outer Carroll’s Bay shows metal contaminants impairment, but it is unknown if this is
limiting biodiversity and is in need of further study. In 1994, non-native species represented >90% of the
biological system with the chief invaders comprised of Common Carp, Eurasian Manna Grass (Glyceria
maxima), Common Reed (Phragmites australis), and Mute Swan (Cygnus olor). In addition, water level
regulation of Lake Ontario has maintained summer water levels high enough to prevent natural emergent
marsh reestablishment from seedlings (nursery conditions) since the inception of the restoration. As a result,
11.5 km of shoreline within the marshes remains without emergent plants and virtually all new vegetation sites
are a result of active planting by RBG staff and volunteers.
Issues Summary
Physical destruction of plant communities and impairment of water quality by carp
Turbidity preventing light penetration to the bottom for plant growth derived from carp, urban and
rural runoff, and eutrophication
Hypereutrophic inflowing phosphorus water sources, well exceeding guidelines for aquatic life
Localized sediment contamination from sewage and urban watersheds
Modified water cycles - both Lake Ontario and inflowing rivers
Historical Ditching of Lower Spencer Creek and Chedoke Creek
Dominance of several Eurasian non-native species
Extirpation of native species
Localized accumulation of inflowing litter and debris smothering and trapping biota
The Key Performance Indicators for RBG Wetlands
Measurement of the following list of topics will be used to track the state of the wetlands and the rate of
progress of recovery. More details on the monitoring programs are provided in the monitoring section.
Area of submergent marsh
Area of emergent marsh
Area of meadow marsh
% wetland native plants
Water clarity or water quality index
Biomass of common carp
Winter muskrat lodges present
Yellow Perch population
9
Integration with the HHRAP The HHRAP is triggered by the Great Lakes Water Quality Agreement, with both pre-dating federal and
provincial Biodiversity Strategies. The HHRAP does not pertain to the entire area of RBG wetlands, focusing
only on the highly impaired area as identified in1992 HHRAP Stage 1 Report. These areas included the
seasonally flooded habitats of meadow marsh and emergent marsh, and the permanently flooded submergent
marsh. The initial habitat targets for Cootes Paradise and Grindstone Marshes were never actually calculated,
but the spirit was to restore the missing wetland and aquatic vegetation back to historical conditions (with no
reference to species makeup). As such, target numbers originally identified to be restored have since been
refined by RBG with detailed Geographic Information System mapping (ARCGIS).
The current HHRAP targets for the marshes are;
Cootes Paradise Marsh - 230 hectares of vegetation
Grindstone Marsh – 40 hectares of vegetation
The Grindstone Marsh habitat target has proven to be challenging as total area of habitat lost in Grindstone
Marsh continued to increase following the onset of the initial HHRAP. This was further confounded by the
lack of initial habitat measurements of the area, resulting in a HHRAP target that under represented the
missing vegetation by 1999. As of 1999 the missing vegetation had reached 46 ha.
Significant progress has been made during the course of the HHRAP, such that meadow marsh restoration is
no longer part of the HHRAP (based on HHRAP criterion that is solely based on area of vegetation and not
species composition). However, all HHRAP reporting will still include this area since it is still contributing
area towards the habitat delisting target. The current challenge in the meadow marsh areas is that it is almost
entirely composed of a Eurasian plant species making the habitat quite ineffective in supporting native insects
and wildlife. Meadow marsh management now falls under federal and provincial biodiversity strategies linked
with both Invasive Species and Species at Risk.
HHRAP Targets
Within the HHRAP there are 11 Beneficial Use Impairments (BUIs), for which 5 are directly measured within
RBG properties and several that rely on the health of the properties. One of the 12, BUI v, is currently listed as
requiring further assessment to properly summarize its condition.
v - Bird or Animal Deformities or Reproduction Problems (measured by Environment Canada – reassessment)
vi - Degradation of Benthos (marsh criteria currently not established, no lead assigned)
viii - Eutrophication or Undesirable Algae
xi - Degradation of Aesthetics (no criteria currently established)
xiv - Loss of Fish and Wildlife Habitat
HHRAP BUIs with a direct link to RBG marshes.
iii - Degradation of Fish Population (measured by DFO in the harbour)
iii - Degradation of Wildlife Populations (measured by EC – colonial waterbird populations)
x- Beach closing and water contact sports (restricted to beach measurement)
The objectives pertaining to RBG marshes and the BUIs under the HHRAP can be summarized as:
1. Achievement of water quality targets through restoration of inflowing water and exclusion of Common
Carp (Cyprinus carpio).
2. Restoration of plant coverage through elimination of Common Carp and rebalancing of Canada goose
population.
3. Remediate onsite physical/chemical damages of historical impairment, including collapsing shorelines and
localized sediment impairments at the western Desjardins Canal, Chedoke Bay, and Westdale Inlet.
To measure the progress towards recovery of the HHRAP each of the BUIs has targets (delisting targets). The
delisting targets, as available, are listed in Table 1. Several of the delisting targets are relative to comparison
10
sites, while the measure of aesthetics has yet to be resolved. Both benthos and wildlife deformities have
baseline data available; however, the actual HHRAP target is not chosen. In addition, RBG strives to achieve
environmental conditions consistent with provincial and federal guidelines and in support of biodiversity. Two
challenges have risen as RBG targets and alignment with federal and provincial guidelines/objectives do not
always align with the initial HHRAP targets laid out in 1992. The challenges are two fold;
1. The HHRAP water quality targets for the marshes are not reflective of current federal and provincial
guidelines/objectives for aquatic life, while the harbour targets are.
2. Several factors (i.e. pesticides, pharmaceuticals, and nitrates) have no HHRAP measures and yet are
negatively affecting the marsh ecosystem.
The above two factors have confounded the City of Hamilton’s ability to determine capital infrastructure
needs to mitigate wastewater and urban runoff pollution. Resolving the HHRAP water quality targets are
currently the subject of the Cootes Paradise-Grindstone Marsh Water Quality Subcommittee.
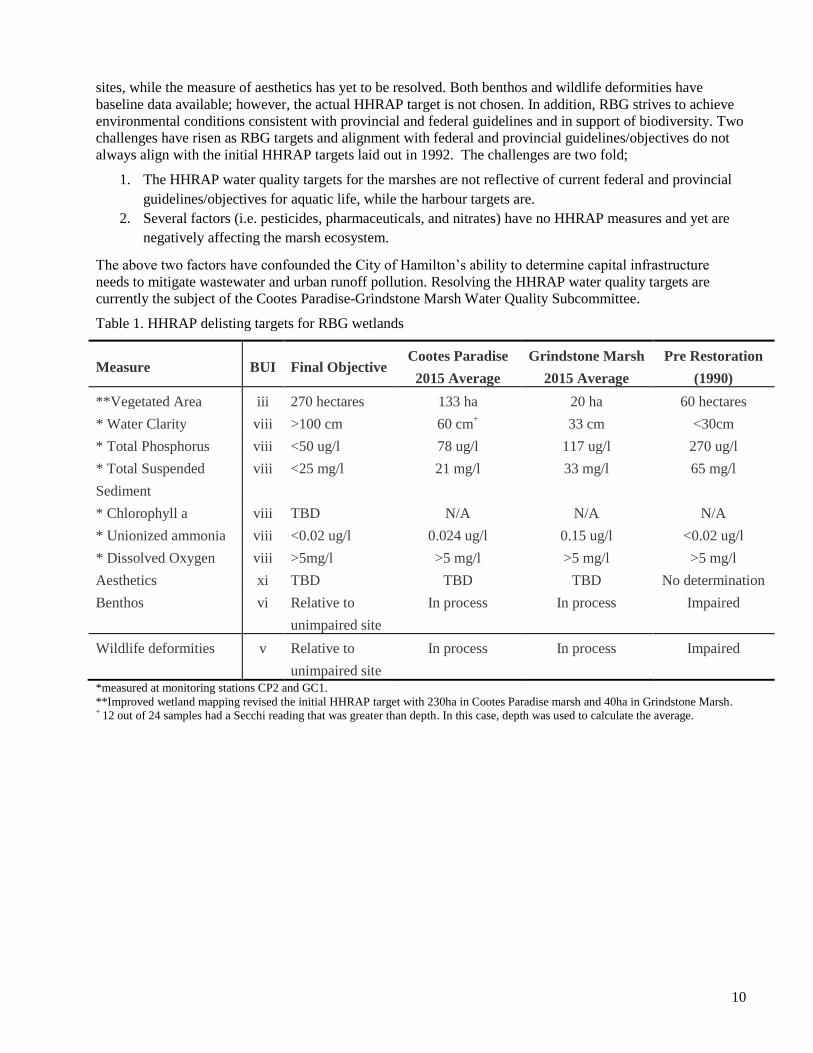
Table 1. HHRAP delisting targets for RBG wetlands
Measure Current 1990 – Pre Restoration BUI Final Objective Cootes Paradise
2015 Average
Grindstone Marsh
2015 Average
Pre Restoration
(1990)
**Vegetated Area iii 270 hectares 133 ha 20 ha 60 hectares
* Water Clarity viii >100 cm 60 cm+
33 cm <30cm
* Total Phosphorus viii <50 ug/l 78 ug/l 117 ug/l 270 ug/l
* Total Suspended
Sediment
viii <25 mg/l 21 mg/l 33 mg/l 65 mg/l
* Chlorophyll a viii TBD N/A N/A N/A
* Unionized ammonia viii <0.02 ug/l 0.024 ug/l 0.15 ug/l <0.02 ug/l
* Dissolved Oxygen viii >5mg/l >5 mg/l >5 mg/l >5 mg/l
Aesthetics xi TBD TBD TBD No determination
Benthos vi Relative to
unimpaired site
In process In process Impaired
Wildlife deformities v Relative to
unimpaired site
In process In process Impaired
*measured at monitoring stations CP2 and GC1.
**Improved wetland mapping revised the initial HHRAP target with 230ha in Cootes Paradise marsh and 40ha in Grindstone Marsh. + 12 out of 24 samples had a Secchi reading that was greater than depth. In this case, depth was used to calculate the average.
11
Background Summary & Status Royal Botanical Gardens has been providing protection, stewardship, and restoration of its wetland holdings
since the 1940’s. This has included many projects from wetland planting programs, to hydrological
manipulations, to carp exclusion, and to species re-introduction. Inflowing water quality has also always been
at the forefront. Local municipalities that discharge wastewater into the properties have always maintained the
highest quality effluent standards in the region. Under the Great Lakes Water Quality Agreement of 1970s, the
two remaining wetlands retained within RBG property holdings gained additional interest with the formation
of the HHRAP and the unveiling of Project Paradise in 1993. Project Paradise was structured to set a
restoration course and generate funds for RBG to contribute to projects. Project Paradise will discontinue as
part of this plan and the restoration project will be rebranded as an RBG wetland biodiversity conservation
project and part of the Niagara Escarpment World Biosphere. Focus will be placed on recovery of rare species,
meadow marsh invasive plant species, migratory birds, and fish.
The goal of the Hamilton Harbour Remedial Action Plan (HHRAP) is the restoration of a degraded Great
Lakes area (Area of Concern) as identified by the International Joint Commission (IJC) under the Great Lakes
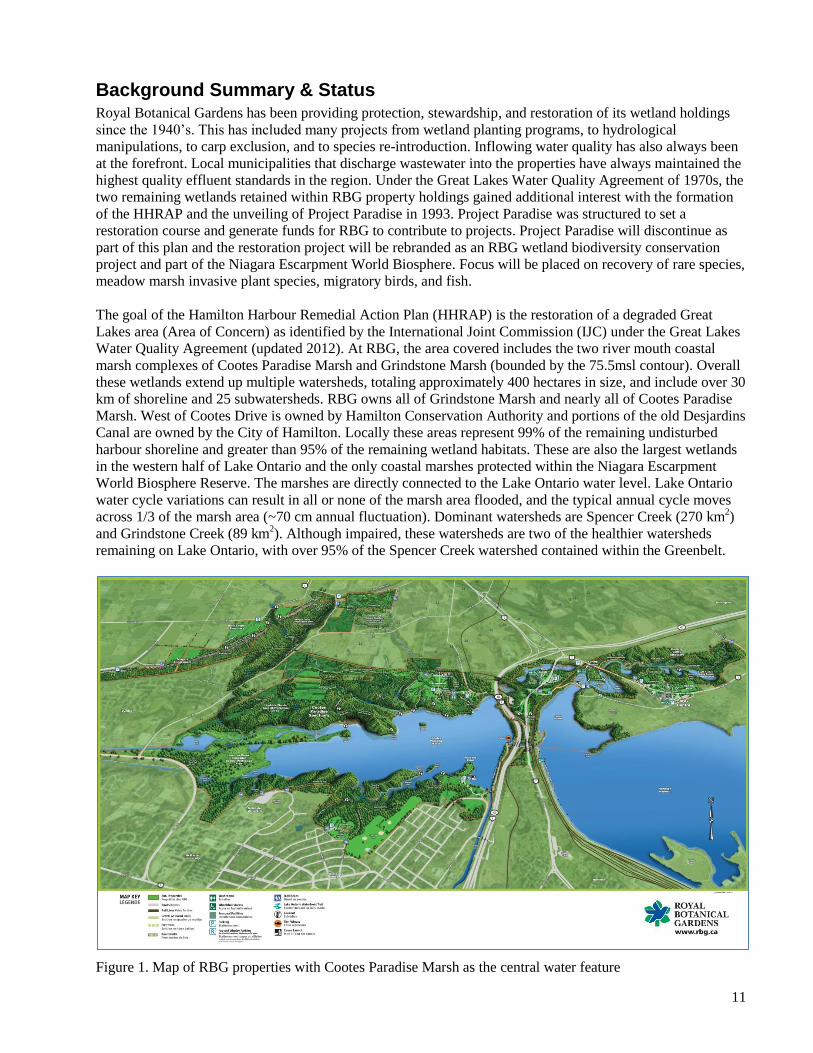
Water Quality Agreement (updated 2012). At RBG, the area covered includes the two river mouth coastal
marsh complexes of Cootes Paradise Marsh and Grindstone Marsh (bounded by the 75.5msl contour). Overall
these wetlands extend up multiple watersheds, totaling approximately 400 hectares in size, and include over 30
km of shoreline and 25 subwatersheds. RBG owns all of Grindstone Marsh and nearly all of Cootes Paradise
Marsh. West of Cootes Drive is owned by Hamilton Conservation Authority and portions of the old Desjardins
Canal are owned by the City of Hamilton. Locally these areas represent 99% of the remaining undisturbed
harbour shoreline and greater than 95% of the remaining wetland habitats. These are also the largest wetlands
in the western half of Lake Ontario and the only coastal marshes protected within the Niagara Escarpment
World Biosphere Reserve. The marshes are directly connected to the Lake Ontario water level. Lake Ontario
water cycle variations can result in all or none of the marsh area flooded, and the typical annual cycle moves
across 1/3 of the marsh area (~70 cm annual fluctuation). Dominant watersheds are Spencer Creek (270 km2)
and Grindstone Creek (89 km2). Although impaired, these watersheds are two of the healthier watersheds
remaining on Lake Ontario, with over 95% of the Spencer Creek watershed contained within the Greenbelt.
Figure 1. Map of RBG properties with Cootes Paradise Marsh as the central water feature
12
Current Wetland Status
By the end of 2015, significant progress had been made toward restoration goals. Water quality and clarity in
Cootes Paradise Marsh improved from an annual average off 35cm (2009) to 60cm clarity (2015). Emergent
plants expanded each year and from 2010 to 2015, complimented by planting, added an additional 4.5 ha. No
emergent seedlings naturally established during this period due to above average summer water levels. The
total area missing at the onset of the HHRAP was 208ha. and is now less than 100ha. In 2012, low fall water
levels allowed for almost all remaining carp to be removed triggering subsequent wetland improvements. Wild
Rice and submergent plants responded to the increased water clarity, with submergent plants increasing
annually to now cover more than half the marsh surface area. Carp continue to be a challenge, and since the
end of 2012 when the marsh was temporarily drained by low water, an additional 3,250 have been removed
from the marsh. These carp are a result of their reluctance to leave the shallow cold marsh for the winter
holding in water <15cm deep, and combined with ongoing carp from reproductive success in the marsh. Their
reproductive success reflects the lack of other native predators and competitors. Overall the marsh continues to
be eutrophic and annually, in late summer, declines to hypereutrophic conditions resulting in extensive algae
blooms and considerable collapse of the submergent plant community. Fish and wildlife populations which
are mostly based in Hamilton Harbour have not responded in accordance with the improvements in marsh
habitat, with studies currently underway to further understand the situation. As an example, less fish passed
through the Fishway in 2015 than 2009, with only native Bluegill populations improving and Eurasian
Goldfish and Rudd also increasing.
In Grindstone Marsh (58 hectares) conditions have also improved with total vegetation 2009 = 14 ha and 2015
= 20 ha. At the outset of the HHRAP an estimated 40 ha of marsh vegetation was missing and worsened to 46
ha by 1999. The original 40 ha is only estimated from aerial photos and the experience of one of the authors
(Theysmeyer pers. obs.) as it was not quantified in the field in the early 1990s. While more than half is still
missing, the vegetated area has increased in the carp protected areas and deceased in Carroll’s Bay (not carp
protected). During the past 5 years, relocation and rebuild of carp exclusion berms reclaimed 0.75 ha of
additional marsh area from the creek for restoration. Pond 1, although small in area, shows a measurably
improved plant community and Ponds 2-4 remain in an essentially restored condition, but require ongoing carp
removal. Issues with flooding (poor quality water) of restoration areas and carp exclusion are slowing
recovering, with multiple projects implemented to improve the situation. Long Pond, the second largest area
after Carroll’s Bay Marsh, remains a challenge to access to complete work, while Carroll’s Bay Marsh
continues to be overrun with carp. Inflowing Grindstone Creek water quality is improved, a result of two
major projects in the watershed by the municipalities. The outer bay area of Carroll’s Bay (the actual location
of the bay historically) does contain some aquatic vegetation but currently is not quantified.
RBG projects in the previous 5 years also included a variety of public access and aesthetic improvements;
public education programs; public education signage; extensive wetland replanting; carp barrier and carp
removal operations; and goose management. In Cootes Paradise, a total of 57,000 cattails and 1,500 water
lilies were planted as well as an annual program to re-establish wild rice. Newly planted reeds are currently
protected with 1.5 km of temporary fencing. In Grindstone Marsh, three of the four carp exclusion berms have
been rebuilt, and four of the five carp exclusion structures have been upgraded from temporary experimental
structures to more permanent metal barriers. In addition, the wetlands were mapped in detail providing RBG
with high quality base maps and historical aquatic plant community data. Databases continue to be updated for
the various monitoring programs; the Fishway database the most extensive, containing over 84,000 records.
RBG worked with multiple partners to complete projects on site and supported major capital projects to
improve water flowing into the property. In partnership with the Bay Area Restoration Council, annual
volunteer planting contributing 2,000+ new emergent plants to Cootes Paradise Marsh every year, plants
which continue to multiply and expand and now cover about a half a hectare. Within Grindstone Marsh, the
City of Burlington rebuilt a broken storm drain leading from Plains Road to one of the marshes, redirecting the
flow to the creek and improving the water quality with an updated storm scepter. Grindstone Creek was
measurably improved as the City of Hamilton closed down the Waterdown Wastewater Plant (WWTP),
ending a long history of discharge to the creek; the water is now redirected to the main Woodward Ave plant.
13
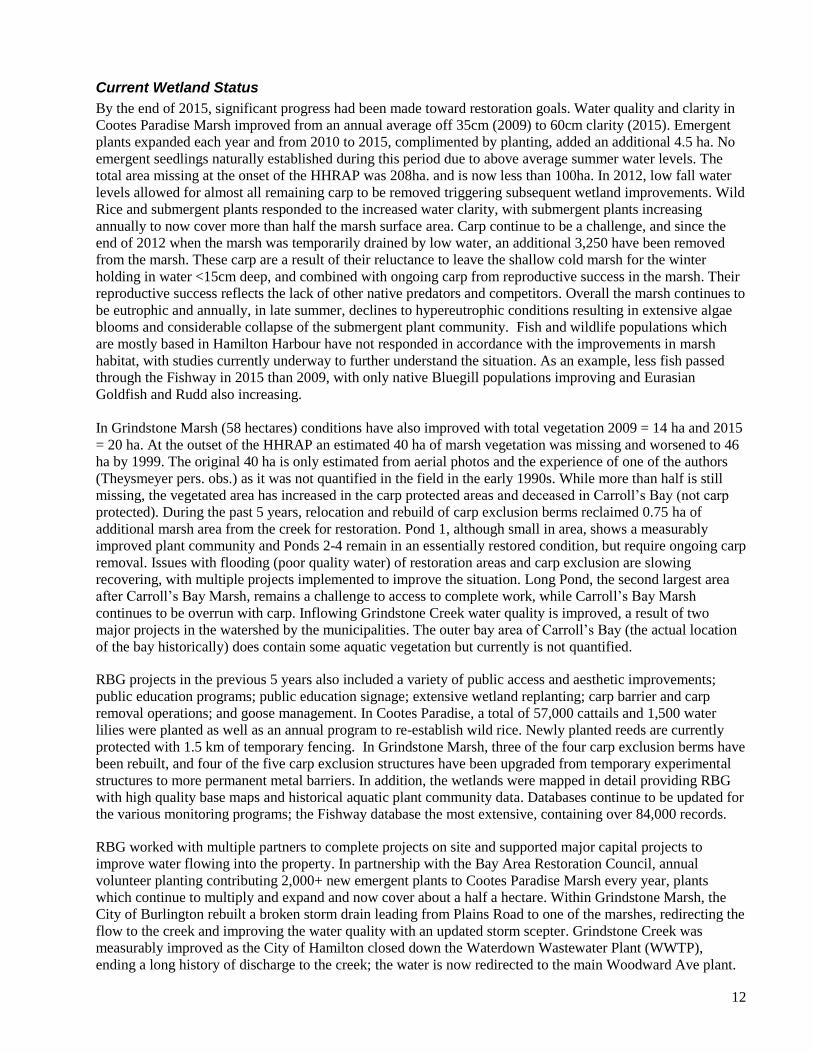
The City of Hamilton began operating the McMaster CSO tank, located on Ancaster Creek (a tributary of
Spencer Creek), dramatically improving inflowing water quality to the back of Cootes Paradise. The operation
of the Main/King and Royal CSO tanks was improved dramatically reducing the number of overflows. Also,
the King Street WWTP (located in Dundas) had the sand filters replaced restoring effluent quality to the
original characteristics achieved in the 1980s, although still at levels that create hypereutrophic conditions in
West Pond. On Spencer Creek, the Hamilton Conservation Authority removed Crooks Hollow Dam, a
historical mill dam which created an algae filled impoundment flowing to Cootes Paradise Marsh.
Figure 2. Cootes Paradise’s Rat Island in the Spencer Creek delta, 2011 (lower photo) and 2015 (upper photo)
14
Invasive Species Eurasian invasive species are a significant challenge in the RBG natural areas. During the period of 2010-
2015, the invasive species dimension of the provincial biodiversity strategy emerged as a significant provincial
priority, culminating in the passage of the Ontario Invasive Species Act in 2015. Federally aquatic invasive
species also emerged as a priority with the management work expanded to include Asian Carp (excluding
Common Carp). Prior to 2010, Common Carp was the species of focus through the HHRAP. However,
between 2010 and 2015, initiatives for several other species have occurred, particularly in relation to Species
at Risk protection. The implications of the new legislation for RBG are yet to be determined, but it can be
anticipated as a future source of funding support both on the management and monitoring front. In recognition
of this RBG is drafting an invasive species management strategy to summarize the top priorities going
forward. As of 2015, Common Carp and Phragmites have RBG management plans, with Eurasian Manna
Grass (Glyceria maxima) soon to follow. Both Phragmites and European Manna Grass principally occupy the
meadow marsh habitat, a habitat that is also a Lake Ontario Health wetland health indicator. The list of non-
native invasive species of concern identified in the RBG wetlands is found in Table 3 below. Of the listed
species, mute swans, goldfish, rudd, and flowering rush are identified as emerging issues adding to the already
challenging list of species. As part of the invasive species strategy, a target threshold level triggering
management action for non-native species abundance will need to be established.
In theory, Eurasian species such as the Common Carp would not be expected to out-compete native species,
unless the habitat was altered to disfavour the native species or a suitable natural predator did not exist in
North America. This is demonstrated elsewhere on the Great Lakes were unpolluted wetlands are not
dominated by carp. Altered/impaired water quality allowed Common Carp to reached 90% of the fish biomass,
equivalent to an estimated 800 kg/ha in Cootes Paradise. This resulted in the loss of most native species across
all biological community levels, including plants, invertebrates, fish, birds, mammals, and multiple Species at
Risk. RBG has found that associated issues begin at densities of over 20 kg/ha. Carp arrived in the late 1800’s
and were locally established as a dominant species by the 1940’s. Most of RBG wetland loss occurred between
1937 and 1950. Key drivers of carp population include eutrophication of the marsh, anoxia and ammonia
issues adjacent Hamilton Harbour, watershed sediment input, and alteration of the natural marsh water cycle.
Table 2. Identified factors contributing to the historical success of Common Carp (Cyprinus carpio).
Life History Issue Strategy
Reproduction Favoured by the regulation of Lake
Ontario – typical regulated peak
seasonal shoreline flooding aligns with
reproductive habitats
(June spawning – flooded vegetation)
1. Long term - Return variability to seasonal
water level peak, and return peak period
to May.
2. Short term - Exclude carp from
reproductive habitats
Summer Habitat Favoured by turbid open water river
mouth marshes and backwaters.
1. Reduce turbidity of inflowing water,
nutrients and fine particulate.
2. Short term – exclude carp from river
mouth habitats with barriers and by
returning of Old Desjardins Canal
remnant to wetland depth
Wintering habitat Favoured through tolerance to elevated
ammonia and depressed dissolved
oxygen levels in Hamilton harbour.
1. Address ammonia and dissolved oxygen
issues in harbour.
Feedback loop 1
– Vacant niche
Open niche created by loss of wetland
vegetation in the wetland areas.
1. Exclude carp from wetlands
2. Restore inflowing water quality
3. Reestablish natural water cycle patterns
Feedback loop 2
–
Lack of
Predators
Lack of predators to maintain a
balanced system.
1. Restore wetland fish habitat, with marsh
species expect to eat young carp.
2. Bald Eagle, Mink, Northern Pike &
Muskellunge for moderate sized carp.
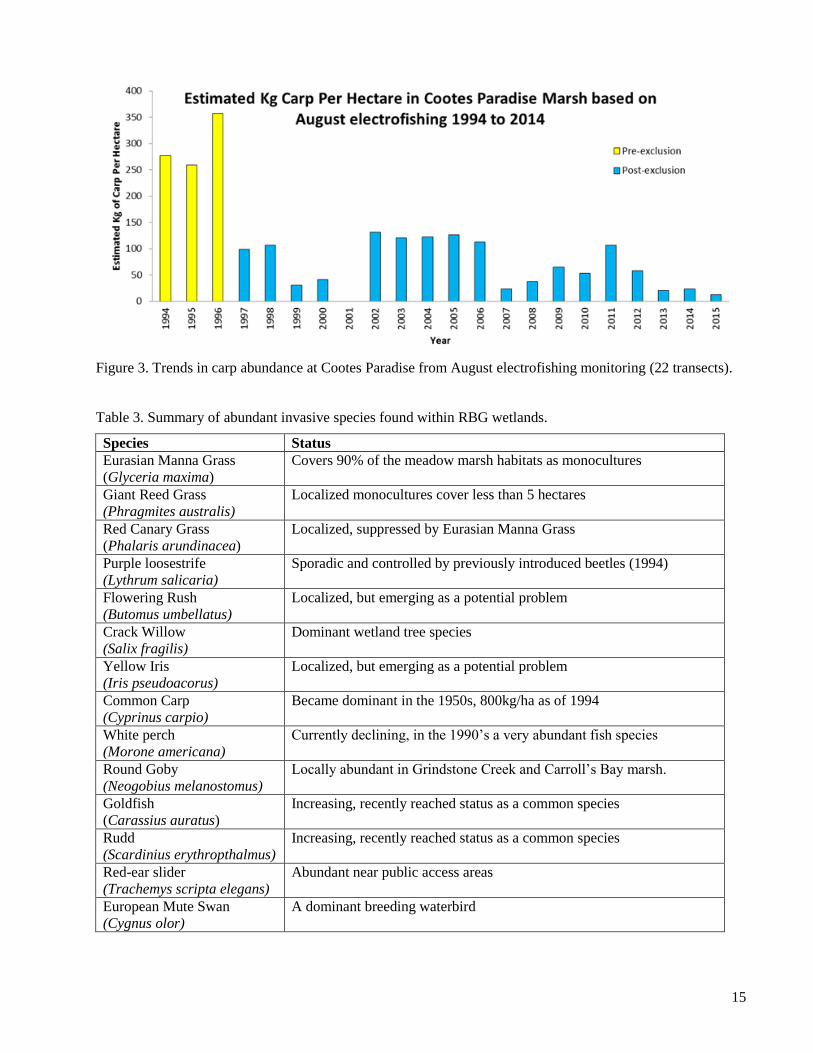
15
Figure 3. Trends in carp abundance at Cootes Paradise from August electrofishing monitoring (22 transects).
Table 3. Summary of abundant invasive species found within RBG wetlands.
Species Status
Eurasian Manna Grass
(Glyceria maxima)
Covers 90% of the meadow marsh habitats as monocultures
Giant Reed Grass
(Phragmites australis)
Localized monocultures cover less than 5 hectares
Red Canary Grass
(Phalaris arundinacea)
Localized, suppressed by Eurasian Manna Grass
Purple loosestrife
(Lythrum salicaria)
Sporadic and controlled by previously introduced beetles (1994)
Flowering Rush
(Butomus umbellatus)
Localized, but emerging as a potential problem
Crack Willow
(Salix fragilis)
Dominant wetland tree species
Yellow Iris
(Iris pseudoacorus)
Localized, but emerging as a potential problem
Common Carp
(Cyprinus carpio)
Became dominant in the 1950s, 800kg/ha as of 1994
White perch
(Morone americana)
Currently declining, in the 1990’s a very abundant fish species
Round Goby
(Neogobius melanostomus)
Locally abundant in Grindstone Creek and Carroll’s Bay marsh.
Goldfish
(Carassius auratus)
Increasing, recently reached status as a common species
Rudd
(Scardinius erythropthalmus)
Increasing, recently reached status as a common species
Red-ear slider
(Trachemys scripta elegans)
Abundant near public access areas
European Mute Swan
(Cygnus olor)
A dominant breeding waterbird
16
Species at Risk RBG’s Species at Risk (SAR) program objectives include providing regular status updates (every 3-5 years)
for all SAR species that occur on RBG lands. This process is evolving with the ever-increasing list of species
under threat. As of the end of 2015, 28 listed SAR have been observed in association with the wetlands in the
preceding decade (see Table 4). With the transition away from the Hamilton Harbour Remedial Action Plan,
efforts supporting SAR biodiversity strategies in the wetlands will emerge as significant. This process has
started with the creation of the Site Specific Plan for SAR turtles and with background research on SAR
freshwater mussels. In the past, funding was secured for Prothonotary Warbler and Least Bittern habitat
projects, as well as most recently for aerial insectivore bird surveys. In addition, the populations of two SAR
at Royal Botanical Gardens (Red Mulberry and Few-flowered Club-rush) represent the critical remaining
populations in Canada, and as such are the focus of research and management initiatives. The status updates
identify issues to focus future management actions, which subsequently feed into the creation of Site Specific
Plans. To provide additional protection for concentrations of SAR, RBG has branded specific off-trail areas as
Special Protection Areas. This further minimizes off-trail activities and emphasizes the unique nature of the
property. The areas currently include two locations in Cootes Paradise Sanctuary and one location in Hendrie
Valley Sanctuary, with two consisting primarily of wetland habitat.
Key Species at Risk that we anticipate will assist with obtaining funding support include:
Northern Map Turtle and Blanding’s Turtle (general wetland habitat)
Lilliput Mussel, potential for Eastern Pondmussel and Mapleleaf Mussel (aquatic habitat)
Least Bittern (emergent marsh habitat)
Prothonotary Warbler (swamp forest habitat)
Eastern Ribbonsnake (wetland and swamp forest habitat)
We anticipate Southern Wild Rice (Zizania aquatica), a dominant plant in the restored RBG wetlands, will be
added to the Species at Risk list within the next six years, following COSWEIC/COSARO assessment. Royal
Botanical Gardens appears to be the province’s primary information organization on this species, with only
Lakehead University also taking an interest in the past. Southern Wild Rice spontaneously reappeared in
Grindstone Marsh in 1998, and has since generated reintroduction research and projects.
Reintroducing SAR species extirpated from RBG has the potential to strategically align with similar efforts for
currently extirpated, but listed, species. If other agencies undertake related initiatives, and wetland and overall
aquatic conditions recover to a stable healthy environment, current opportunities can include:
Grass Pickerel (potential for natural recolonization) (Special Concern federally and provincially)
Redside Dace (Special Concern federally, Endangered provincially)
Bridle Shiner (Special Concern federally and provincially)
Lake Sturgeon (current subject of OMNRF reintroduction work in Lake Ontario) (Great Lakes
population assessed by COSEWIC as Threatened federally, Threatened provincially)
Jefferson Salamander (can potentially naturally recolonize from nearby/upstream populations)
Hills Pondweed (potential for natural recolonization) (Special Concern federally and provincially)
Aerial insectivore birds are also of rising interest in biodiversity protection; population trends showing rapid
decline have resulted in several recently being added to the Species at Risk list. Due to the migratory bird
staging significance for these species at RBG, they are relevant as breeding residents, foraging area residents,
and as staging migrants (which currently occur in the thousands). These birds are also connected to the
marsh’s invertebrate populations, which in turn also support other insectivorous SAR birds, namely the
Acadian Flycatcher, Olive-sided Flycatcher, and Canada Warbler. Aerial insectivore birds relevant to the
marsh include:
Chimney Swift (Threatened federally and provincially)
17
Bank Swallow (assessed as Threatened by COSEWIC, Threatened provincially)
Barn Swallow (assessed as Threatened by COSEWIC, Threatened provincially)
Common Nighthawk (Threatened federally, Special Concern provincially)
Eastern Whip-poor-will (Threatened federally and provincially)
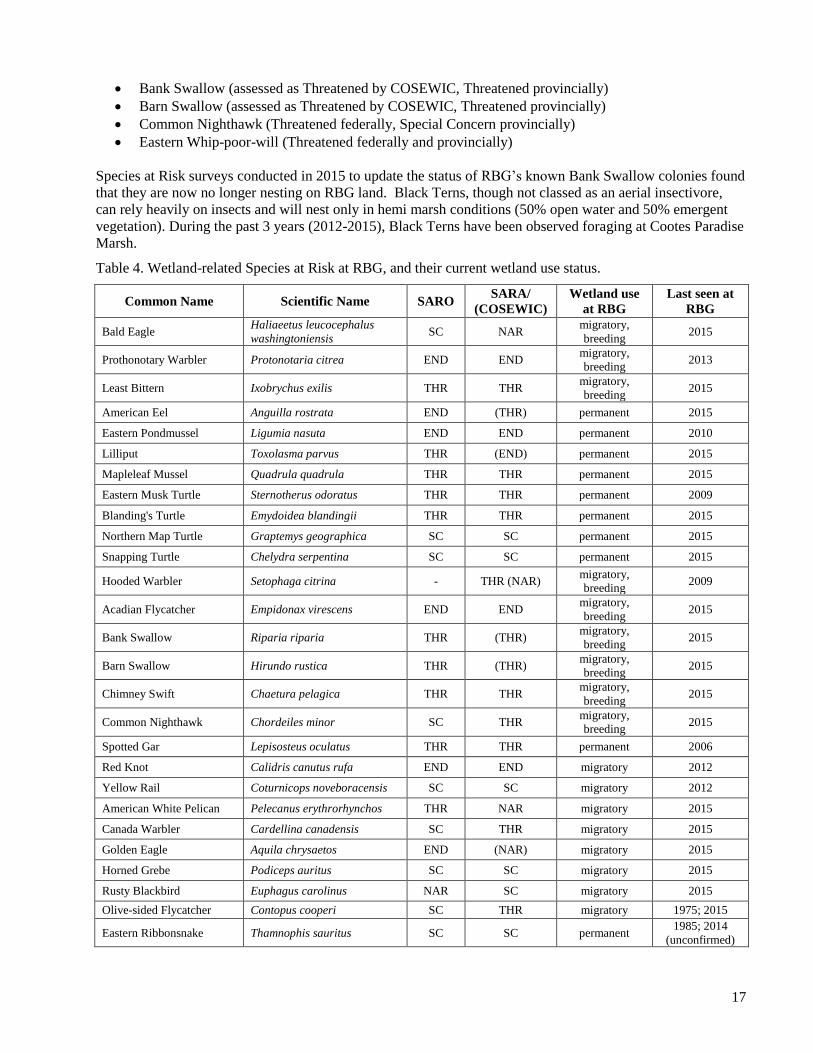
Species at Risk surveys conducted in 2015 to update the status of RBG’s known Bank Swallow colonies found
that they are now no longer nesting on RBG land. Black Terns, though not classed as an aerial insectivore,
can rely heavily on insects and will nest only in hemi marsh conditions (50% open water and 50% emergent
vegetation). During the past 3 years (2012-2015), Black Terns have been observed foraging at Cootes Paradise
Marsh.
Table 4. Wetland-related Species at Risk at RBG, and their current wetland use status.
Common Name Scientific Name SARO SARA/
(COSEWIC)
Wetland use
at RBG
Last seen at
RBG
Bald Eagle Haliaeetus leucocephalus
washingtoniensis SC NAR
migratory,
breeding 2015
Prothonotary Warbler Protonotaria citrea END END migratory,
breeding 2013
Least Bittern Ixobrychus exilis THR THR migratory,
breeding 2015
American Eel Anguilla rostrata END (THR) permanent 2015
Eastern Pondmussel Ligumia nasuta END END permanent 2010
Lilliput Toxolasma parvus THR (END) permanent 2015
Mapleleaf Mussel Quadrula quadrula THR THR permanent 2015
Eastern Musk Turtle Sternotherus odoratus THR THR permanent 2009
Blanding's Turtle Emydoidea blandingii THR THR permanent 2015
Northern Map Turtle Graptemys geographica SC SC permanent 2015
Snapping Turtle Chelydra serpentina SC SC permanent 2015
Hooded Warbler Setophaga citrina - THR (NAR) migratory,
breeding 2009
Acadian Flycatcher Empidonax virescens END END migratory,
breeding 2015
Bank Swallow Riparia riparia THR (THR) migratory,
breeding 2015
Barn Swallow Hirundo rustica THR (THR) migratory,
breeding 2015
Chimney Swift Chaetura pelagica THR THR migratory,
breeding 2015
Common Nighthawk Chordeiles minor SC THR migratory,
breeding 2015
Spotted Gar Lepisosteus oculatus THR THR permanent 2006
Red Knot Calidris canutus rufa END END migratory 2012
Yellow Rail Coturnicops noveboracensis SC SC migratory 2012
American White Pelican Pelecanus erythrorhynchos THR NAR migratory 2015
Canada Warbler Cardellina canadensis SC THR migratory 2015
Golden Eagle Aquila chrysaetos END (NAR) migratory 2015
Horned Grebe Podiceps auritus SC SC migratory 2015
Rusty Blackbird Euphagus carolinus NAR SC migratory 2015
Olive-sided Flycatcher Contopus cooperi SC THR migratory 1975; 2015
Eastern Ribbonsnake Thamnophis sauritus SC SC permanent 1985; 2014
(unconfirmed)
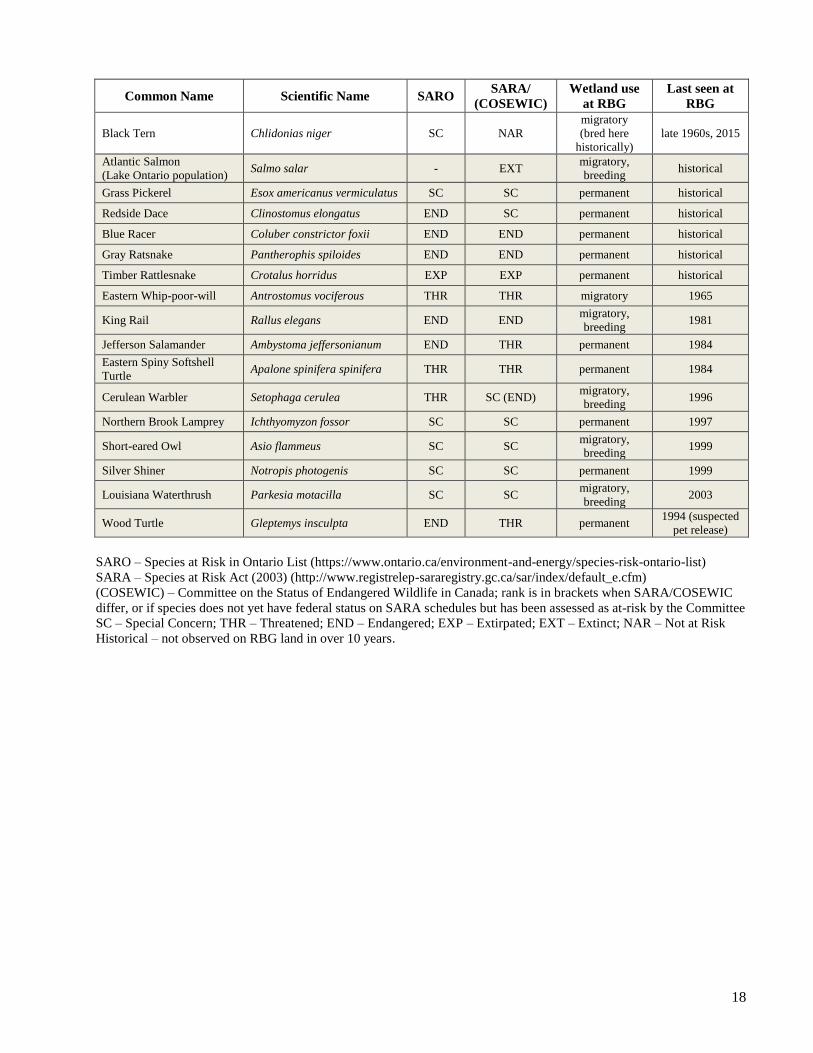
18
Common Name Scientific Name SARO SARA/
(COSEWIC)
Wetland use
at RBG
Last seen at
RBG
Black Tern Chlidonias niger SC NAR
migratory
(bred here
historically)
late 1960s, 2015
Atlantic Salmon
(Lake Ontario population) Salmo salar - EXT
migratory,
breeding historical
Grass Pickerel Esox americanus vermiculatus SC SC permanent historical
Redside Dace Clinostomus elongatus END SC permanent historical
Blue Racer Coluber constrictor foxii END END permanent historical
Gray Ratsnake Pantherophis spiloides END END permanent historical
Timber Rattlesnake Crotalus horridus EXP EXP permanent historical
Eastern Whip-poor-will Antrostomus vociferous THR THR migratory 1965
King Rail Rallus elegans END END migratory,
breeding 1981
Jefferson Salamander Ambystoma jeffersonianum END THR permanent 1984
Eastern Spiny Softshell
Turtle Apalone spinifera spinifera THR THR permanent 1984
Cerulean Warbler Setophaga cerulea THR SC (END) migratory,
breeding 1996
Northern Brook Lamprey Ichthyomyzon fossor SC SC permanent 1997
Short-eared Owl Asio flammeus SC SC migratory,
breeding 1999
Silver Shiner Notropis photogenis SC SC permanent 1999
Louisiana Waterthrush Parkesia motacilla SC SC migratory,
breeding 2003
Wood Turtle Gleptemys insculpta END THR permanent 1994 (suspected
pet release)
SARO – Species at Risk in Ontario List (https://www.ontario.ca/environment-and-energy/species-risk-ontario-list)
SARA – Species at Risk Act (2003) (http://www.registrelep-sararegistry.gc.ca/sar/index/default_e.cfm)
(COSEWIC) – Committee on the Status of Endangered Wildlife in Canada; rank is in brackets when SARA/COSEWIC
differ, or if species does not yet have federal status on SARA schedules but has been assessed as at-risk by the Committee
SC – Special Concern; THR – Threatened; END – Endangered; EXP – Extirpated; EXT – Extinct; NAR – Not at Risk
Historical – not observed on RBG land in over 10 years.
19
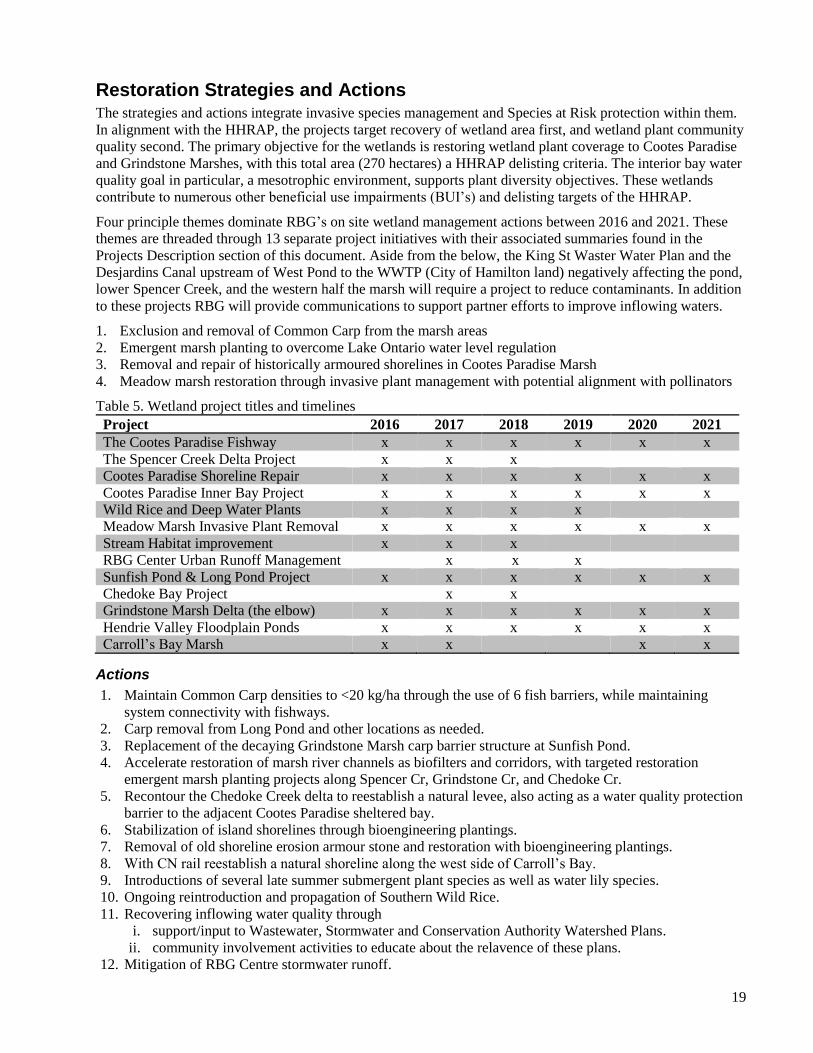
Restoration Strategies and Actions The strategies and actions integrate invasive species management and Species at Risk protection within them.
In alignment with the HHRAP, the projects target recovery of wetland area first, and wetland plant community
quality second. The primary objective for the wetlands is restoring wetland plant coverage to Cootes Paradise
and Grindstone Marshes, with this total area (270 hectares) a HHRAP delisting criteria. The interior bay water
quality goal in particular, a mesotrophic environment, supports plant diversity objectives. These wetlands
contribute to numerous other beneficial use impairments (BUI’s) and delisting targets of the HHRAP.
Four principle themes dominate RBG’s on site wetland management actions between 2016 and 2021. These
themes are threaded through 13 separate project initiatives with their associated summaries found in the
Projects Description section of this document. Aside from the below, the King St Waster Water Plan and the
Desjardins Canal upstream of West Pond to the WWTP (City of Hamilton land) negatively affecting the pond,
lower Spencer Creek, and the western half the marsh will require a project to reduce contaminants. In addition
to these projects RBG will provide communications to support partner efforts to improve inflowing waters.
1. Exclusion and removal of Common Carp from the marsh areas
2. Emergent marsh planting to overcome Lake Ontario water level regulation
3. Removal and repair of historically armoured shorelines in Cootes Paradise Marsh
4. Meadow marsh restoration through invasive plant management with potential alignment with pollinators
Table 5. Wetland project titles and timelines
Project 2016 2017 2018 2019 2020 2021
The Cootes Paradise Fishway x x x x x x
The Spencer Creek Delta Project x x x
Cootes Paradise Shoreline Repair x x x x x x
Cootes Paradise Inner Bay Project x x x x x x
Wild Rice and Deep Water Plants x x x x
Meadow Marsh Invasive Plant Removal x x x x x x
Stream Habitat improvement x x x
RBG Center Urban Runoff Management x x x
Sunfish Pond & Long Pond Project x x x x x x
Chedoke Bay Project x x
Grindstone Marsh Delta (the elbow) x x x x x x
Hendrie Valley Floodplain Ponds x x x x x x
Carroll’s Bay Marsh x x x x
Actions
1. Maintain Common Carp densities to <20 kg/ha through the use of 6 fish barriers, while maintaining
system connectivity with fishways.
2. Carp removal from Long Pond and other locations as needed.
3. Replacement of the decaying Grindstone Marsh carp barrier structure at Sunfish Pond.
4. Accelerate restoration of marsh river channels as biofilters and corridors, with targeted restoration
emergent marsh planting projects along Spencer Cr, Grindstone Cr, and Chedoke Cr.
5. Recontour the Chedoke Creek delta to reestablish a natural levee, also acting as a water quality protection
barrier to the adjacent Cootes Paradise sheltered bay.
6. Stabilization of island shorelines through bioengineering plantings.
7. Removal of old shoreline erosion armour stone and restoration with bioengineering plantings.
8. With CN rail reestablish a natural shoreline along the west side of Carroll’s Bay.
9. Introductions of several late summer submergent plant species as well as water lily species.
10. Ongoing reintroduction and propagation of Southern Wild Rice.
11. Recovering inflowing water quality through
i. support/input to Wastewater, Stormwater and Conservation Authority Watershed Plans.
ii. community involvement activities to educate about the relavence of these plans.
12. Mitigation of RBG Centre stormwater runoff.
20
13. Creation of the Cootes Paradise Marsh Inner Bay migratory waterfowl protection area.
14. Management of invasive species including, Phragmites, Eurasian Manna Grass, and Mute Swans.
15. Integration Species at Risk habitat projects with focus on Presidents Pond (Cootes Paradise).
16. Training young professionals in the field of environmental stewardship.
17. Monitoring to provide the evidential basis for remedial action efforts of both RBG and partner agencies
undertaking activities on the waters that flow into our wetlands.
18. Monitoring – to provide updates on the status of the delisting criteria.
19. Recovery of natural water cycles through direct input to the St. Lawrence Board of Control.
20. Supporting organizations implementing projects that improve water quality flowing into our wetlands.
21. Providing support to partner agency research and monitoring programs.
22. Community engagement and education focused at the Fishway, Nature Centre programs, public speaking
engagements, and volunteer opportunities.
23. Volunteer opportunities to allow citizens to experience the wetlands, as well as better understand the
issues affecting the wetlands.
24. Educational opportunities through wetland school programs, interpretive signage, RBG website, open
houses, and communication of monitoring results.
25. Participation of selected HHRAP technical committees.
26. Continue to implement and support trash cleanup programs on the shorelines of RBG watersheds, with
groups such as the Stewards of Cootes Watershed and McMaster student clubs.
Staffing
To execute the plan RBG will continue to require the existing staff complement as well as volunteers
Head of Natural Lands
Aquatic Ecologist
Monitoring Ecologist
Species at Risk Biologist
Biotechnician
Aquatic Intern
Summer Students (x2)
Short term contract assistance as individual
projects demand.
Volunteer Assistance
Seed collection and plant propagation
Wetland planting projects
Spring marsh bird and amphibian monitoring
Fall migratory bird monitoring
Capital Projects and Items
Anticipated capital projects to support and advance the wetland restoration include;
1. Wetland Plants (~$500,000)
2. New Boathouse ($100,000)
3. Blackbird Marsh berm and structure relocation ($6,000)
4. Sunfish Pond berm relocation and structure replacement ($25,000)
5. Chedoke Bay berm creation ($30,000)
6. Access path improvement to Long Pond ($6,000)
7. Fishway boat gate repairs ($2,500)
8. Cootes Paradise Fishway basket repairs ($2,500)
9. Cootes Paradise Marsh gabion basket/rock removal (TBD)
10. Pond 3 collapsing creek bank restoration ($5,000)
11. RBG Main Centre storm water pond ($100,000)
12. Replacement boats and outboard motor. ($15,000)
13. Replacement fleet vehicles (x2 - $80,000)
14. Replacement electrofisher unit ($10,000)
Potential reset of all carp control barriers and berms would be required if the Lake Ontario water level control
plan is updated as high water levels would be anticipated to rise from75.6msl to 75.8msl.
21
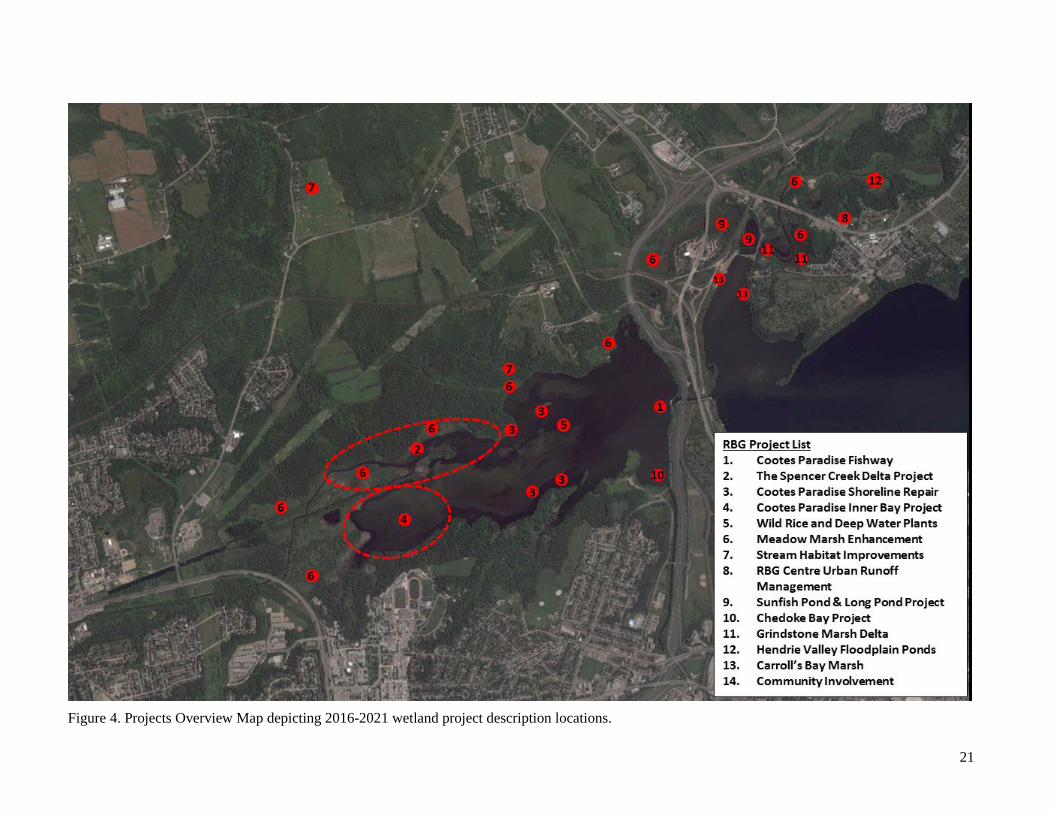
Figure 4. Projects Overview Map depicting 2016-2021 wetland project description locations.
22
Restoration of Plant Community
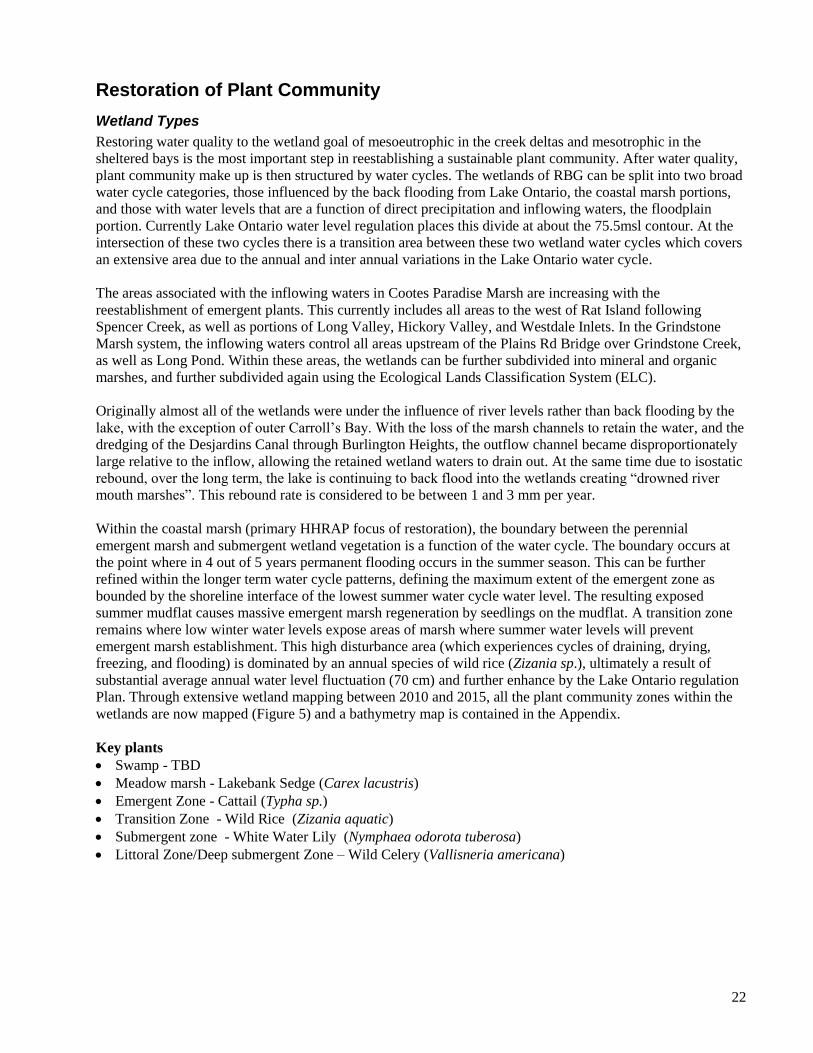
Wetland Types
Restoring water quality to the wetland goal of mesoeutrophic in the creek deltas and mesotrophic in the
sheltered bays is the most important step in reestablishing a sustainable plant community. After water quality,
plant community make up is then structured by water cycles. The wetlands of RBG can be split into two broad
water cycle categories, those influenced by the back flooding from Lake Ontario, the coastal marsh portions,
and those with water levels that are a function of direct precipitation and inflowing waters, the floodplain
portion. Currently Lake Ontario water level regulation places this divide at about the 75.5msl contour. At the
intersection of these two cycles there is a transition area between these two wetland water cycles which covers
an extensive area due to the annual and inter annual variations in the Lake Ontario water cycle.
The areas associated with the inflowing waters in Cootes Paradise Marsh are increasing with the
reestablishment of emergent plants. This currently includes all areas to the west of Rat Island following
Spencer Creek, as well as portions of Long Valley, Hickory Valley, and Westdale Inlets. In the Grindstone
Marsh system, the inflowing waters control all areas upstream of the Plains Rd Bridge over Grindstone Creek,
as well as Long Pond. Within these areas, the wetlands can be further subdivided into mineral and organic
marshes, and further subdivided again using the Ecological Lands Classification System (ELC).
Originally almost all of the wetlands were under the influence of river levels rather than back flooding by the
lake, with the exception of outer Carroll’s Bay. With the loss of the marsh channels to retain the water, and the
dredging of the Desjardins Canal through Burlington Heights, the outflow channel became disproportionately
large relative to the inflow, allowing the retained wetland waters to drain out. At the same time due to isostatic
rebound, over the long term, the lake is continuing to back flood into the wetlands creating “drowned river
mouth marshes”. This rebound rate is considered to be between 1 and 3 mm per year.
Within the coastal marsh (primary HHRAP focus of restoration), the boundary between the perennial
emergent marsh and submergent wetland vegetation is a function of the water cycle. The boundary occurs at
the point where in 4 out of 5 years permanent flooding occurs in the summer season. This can be further
refined within the longer term water cycle patterns, defining the maximum extent of the emergent zone as
bounded by the shoreline interface of the lowest summer water cycle water level. The resulting exposed
summer mudflat causes massive emergent marsh regeneration by seedlings on the mudflat. A transition zone
remains where low winter water levels expose areas of marsh where summer water levels will prevent
emergent marsh establishment. This high disturbance area (which experiences cycles of draining, drying,
freezing, and flooding) is dominated by an annual species of wild rice (Zizania sp.), ultimately a result of
substantial average annual water level fluctuation (70 cm) and further enhance by the Lake Ontario regulation
Plan. Through extensive wetland mapping between 2010 and 2015, all the plant community zones within the
wetlands are now mapped (Figure 5) and a bathymetry map is contained in the Appendix.
Key plants
Swamp - TBD
Meadow marsh - Lakebank Sedge (Carex lacustris)
Emergent Zone - Cattail (Typha sp.)
Transition Zone - Wild Rice (Zizania aquatic)
Submergent zone - White Water Lily (Nymphaea odorota tuberosa)
Littoral Zone/Deep submergent Zone – Wild Celery (Vallisneria americana)
23
Figure 5. Future planting areas, existing emergent and meadow marsh, and predicted plant community zones
based on current Lake Ontario water cycles.
Restoration Activities
Swamp – Keystone plant: TBD
Assess ELC data and map to determine if data gaps exist and resolve
Determine future management options
Follow the Eurasian Manna Grass (Glyceria maxima) Management Strategy such that Manna Grass is no
longer the dominant herbaceous species
Develop a management plan for the dominant woody invasive non-native species, Crack willow (Salix
fragilis)
Meadow Marsh - Keystone plant: Lakebank Sedge (Carex lacustris)
Assess ELC data and GIS map to determine if data gaps exist and if so update the information
Develop a monitoring protocol using 1x1 m plots randomly selected throughout the habitat
Follow the Phragmites Management Plan with the objective to maintain Phragmites at less than 1% of the
meadow marsh/shallow marsh (ELC community series) area by the end of 5 years
Complete the Eurasian Manna Grass (Glyceria maxima) Management Strategy with the following
objectives:
Protect the (<1% of total) intact native meadow marsh and lake bank sedge habitat in Borer’s Creek
floodplain, Marshwalk (Coastal wetland), and South Pasture Swamp (floodplain wetland).
Eliminate along the steep shorelines in the shallow marsh habitats
Maintain Manna Grass at less than 1% of the meadow marsh/shallow marsh (ELC community series) at
Boathouse area, Kingfisher Bay, Princess Point, Pine Point Inlet, Osprey Marsh, North Grindstone Creek
(Plains Rd bridge to Snowberry Island)
24
Manage Manna Grass such that it is no longer the dominant species around President’s Pond (see site map)
Manna Grass control options include drowning, herbicide, and smothering.
Emergent Marsh – Keystone plant: Cattail (Typha sp.)
Water Quality – support watershed water quality improvements by partners to restore trophic status
Common carp control through operation of carp barriers and fishways to protect reeds from being crushed
during spawning activities
Canada goose and mute swan control through egg oiling and habitat modification, and the reestablishment
of natural predators
Fencing of marsh plantings and emergent seedlings in low water years
Removal of gabion baskets and armour stone along formerly wind-blown shores
Implementing the Phragmites Management Plan with the objective to maintain Phragmites at less than 1%
of the meadow marsh/shallow marsh (ELC community series) area by the end of 5 years
Be vigilant to identify new invasive species and keep a close eye on existing non-native species that may
require management actions
Support improvements to the King Street Wastewater Treatment Plant that will minimize algae growth
which smothers aquatic vegetation
Marsh plantings to help establish healthy populations of Hardstem & Softem Bulrush (Schoenoplectus sp.),
Prairie Cordgrass (Spartina pectinata), River Bulrush (Scirpus fluviatilis), and cattail
Transition marsh - Keystone plant: Wild Rice (Zizania sp.)
Common carp control through operation of carp barriers and Fishway to protect seedlings from uprooting,
and to maintain good water clarity
Marsh river channel restoration using cattail planting and natural sedimentation processes to facilitate
restoration of marsh river channels to protect habitat from damaging inflowing waters
Canada goose and mute swan control through egg oiling and habitat modification, and the reestablishment
of natural predators
Create a seed bank in various locations through seeding and seedling planting of southern wild rice in inlet
areas as conditions become appropriate. Inlets in Cootes Paradise Marsh include Mac Landing, Double
Marsh, Westdale Inlet, Princess Point Bays, Hickory Bay; Pond 1, Pond 2, South Pasture Swamp, and
Blackbird and Osprey Marshes in the Grindstone System.
Rebuild two tanks in the aquatic nursery to maintain captive population of wild rice
Water Quality - support improvements to the King Street Wastewater Treatment Plant and urban runoff to l
minimize filamentous algal growth and sediment inputs currently smothering aquatic vegetation.
Submergent Marsh - Keystone plant: White Water Lily (Nymphaea odorota)
Common carp control through operation of carp barriers and Fishway to protect seedlings from uprooting
and to maintain good water clarity
Carp removal to maintain a population <20 kg/ha
Marsh river channel restoration using cattail planting (bioengineering) and natural sedimentation processes
to protect interior bay habitat from damaging inflowing waters
Restoration planting of late season submergent plants including Tape Grass (Vallisnaria americana) and
floating-leaved pondweeds (Potamogeton nodosus/natas), with new propagation tanks to support project.
White water lilies added to inlet areas as conditions become appropriate, such as the inner bay of Cootes
Paradise Marsh, Princess Point Bay, and Hickory Bay
Water Quality - support water quality improvements by partners throughout the rural watershed
Water Quality - support improvements to the King Street Wastewater Treatment Plant and urban runoff to l
minimize filamentous algal growth and sediment inputs currently smothering aquatic vegetation.
Support mitigation of the impaired Desjardins Canal sediments to eliminate smothering filamentous algae.
25
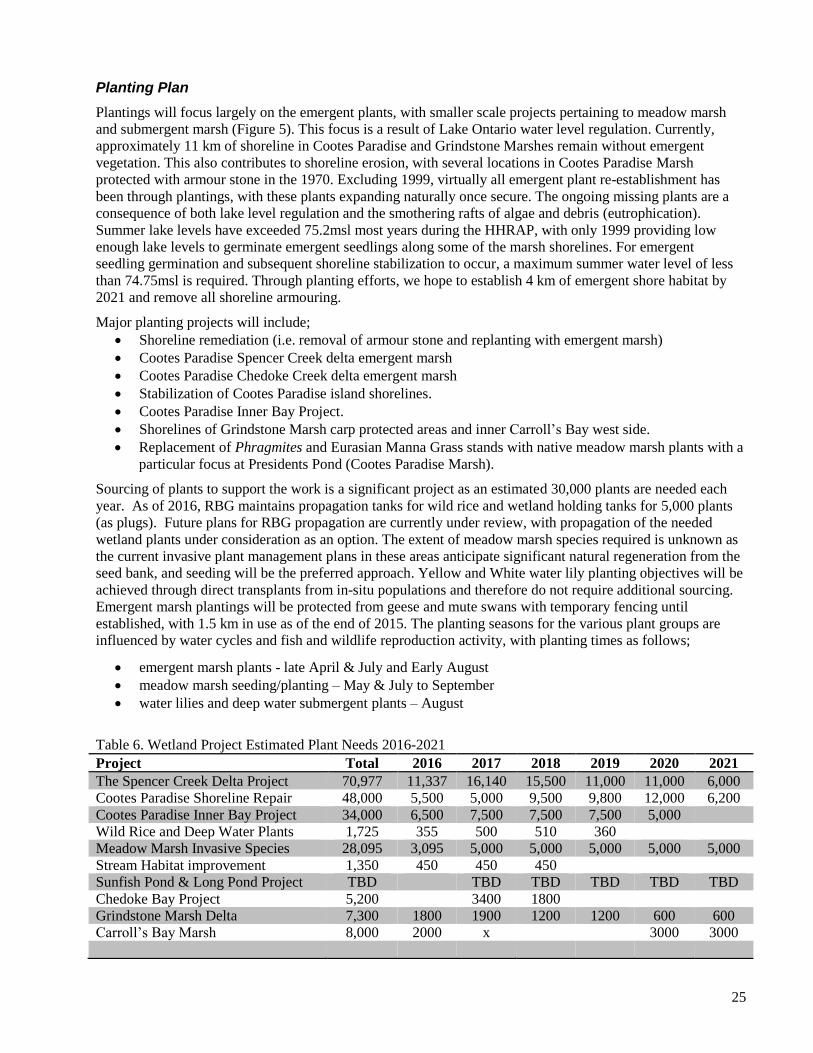
Planting Plan
Plantings will focus largely on the emergent plants, with smaller scale projects pertaining to meadow marsh
and submergent marsh (Figure 5). This focus is a result of Lake Ontario water level regulation. Currently,
approximately 11 km of shoreline in Cootes Paradise and Grindstone Marshes remain without emergent
vegetation. This also contributes to shoreline erosion, with several locations in Cootes Paradise Marsh
protected with armour stone in the 1970. Excluding 1999, virtually all emergent plant re-establishment has
been through plantings, with these plants expanding naturally once secure. The ongoing missing plants are a
consequence of both lake level regulation and the smothering rafts of algae and debris (eutrophication).
Summer lake levels have exceeded 75.2msl most years during the HHRAP, with only 1999 providing low
enough lake levels to germinate emergent seedlings along some of the marsh shorelines. For emergent
seedling germination and subsequent shoreline stabilization to occur, a maximum summer water level of less
than 74.75msl is required. Through planting efforts, we hope to establish 4 km of emergent shore habitat by
2021 and remove all shoreline armouring.
Major planting projects will include;
Shoreline remediation (i.e. removal of armour stone and replanting with emergent marsh)
Cootes Paradise Spencer Creek delta emergent marsh
Cootes Paradise Chedoke Creek delta emergent marsh
Stabilization of Cootes Paradise island shorelines.
Cootes Paradise Inner Bay Project.
Shorelines of Grindstone Marsh carp protected areas and inner Carroll’s Bay west side.
Replacement of Phragmites and Eurasian Manna Grass stands with native meadow marsh plants with a
particular focus at Presidents Pond (Cootes Paradise Marsh).
Sourcing of plants to support the work is a significant project as an estimated 30,000 plants are needed each
year. As of 2016, RBG maintains propagation tanks for wild rice and wetland holding tanks for 5,000 plants
(as plugs). Future plans for RBG propagation are currently under review, with propagation of the needed
wetland plants under consideration as an option. The extent of meadow marsh species required is unknown as
the current invasive plant management plans in these areas anticipate significant natural regeneration from the
seed bank, and seeding will be the preferred approach. Yellow and White water lily planting objectives will be
achieved through direct transplants from in-situ populations and therefore do not require additional sourcing.
Emergent marsh plantings will be protected from geese and mute swans with temporary fencing until
established, with 1.5 km in use as of the end of 2015. The planting seasons for the various plant groups are
influenced by water cycles and fish and wildlife reproduction activity, with planting times as follows;
emergent marsh plants - late April & July and Early August
meadow marsh seeding/planting – May & July to September
water lilies and deep water submergent plants – August
Table 6. Wetland Project Estimated Plant Needs 2016-2021
Project Total 2016 2017 2018 2019 2020 2021
The Spencer Creek Delta Project 70,977 11,337 16,140 15,500 11,000 11,000 6,000
Cootes Paradise Shoreline Repair 48,000 5,500 5,000 9,500 9,800 12,000 6,200
Cootes Paradise Inner Bay Project 34,000 6,500 7,500 7,500 7,500 5,000
Wild Rice and Deep Water Plants 1,725 355 500 510 360
Meadow Marsh Invasive Species 28,095 3,095 5,000 5,000 5,000 5,000 5,000
Stream Habitat improvement 1,350 450 450 450
Sunfish Pond & Long Pond Project TBD TBD TBD TBD TBD TBD
Chedoke Bay Project 5,200 3400 1800
Grindstone Marsh Delta 7,300 1800 1900 1200 1200 600 600
Carroll’s Bay Marsh 8,000 2000 x 3000 3000
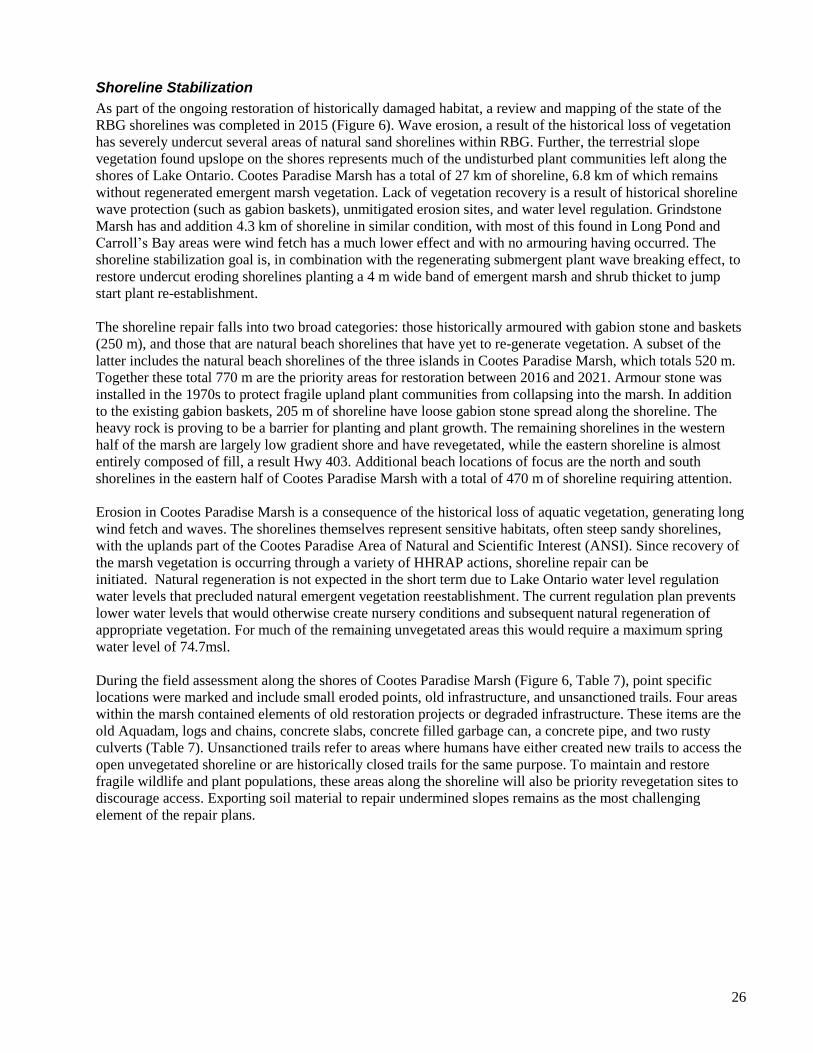
26
Shoreline Stabilization
As part of the ongoing restoration of historically damaged habitat, a review and mapping of the state of the
RBG shorelines was completed in 2015 (Figure 6). Wave erosion, a result of the historical loss of vegetation
has severely undercut several areas of natural sand shorelines within RBG. Further, the terrestrial slope
vegetation found upslope on the shores represents much of the undisturbed plant communities left along the
shores of Lake Ontario. Cootes Paradise Marsh has a total of 27 km of shoreline, 6.8 km of which remains
without regenerated emergent marsh vegetation. Lack of vegetation recovery is a result of historical shoreline
wave protection (such as gabion baskets), unmitigated erosion sites, and water level regulation. Grindstone
Marsh has and addition 4.3 km of shoreline in similar condition, with most of this found in Long Pond and
Carroll’s Bay areas were wind fetch has a much lower effect and with no armouring having occurred. The
shoreline stabilization goal is, in combination with the regenerating submergent plant wave breaking effect, to
restore undercut eroding shorelines planting a 4 m wide band of emergent marsh and shrub thicket to jump
start plant re-establishment.
The shoreline repair falls into two broad categories: those historically armoured with gabion stone and baskets
(250 m), and those that are natural beach shorelines that have yet to re-generate vegetation. A subset of the
latter includes the natural beach shorelines of the three islands in Cootes Paradise Marsh, which totals 520 m.
Together these total 770 m are the priority areas for restoration between 2016 and 2021. Armour stone was
installed in the 1970s to protect fragile upland plant communities from collapsing into the marsh. In addition
to the existing gabion baskets, 205 m of shoreline have loose gabion stone spread along the shoreline. The
heavy rock is proving to be a barrier for planting and plant growth. The remaining shorelines in the western
half of the marsh are largely low gradient shore and have revegetated, while the eastern shoreline is almost
entirely composed of fill, a result Hwy 403. Additional beach locations of focus are the north and south
shorelines in the eastern half of Cootes Paradise Marsh with a total of 470 m of shoreline requiring attention.
Erosion in Cootes Paradise Marsh is a consequence of the historical loss of aquatic vegetation, generating long
wind fetch and waves. The shorelines themselves represent sensitive habitats, often steep sandy shorelines,
with the uplands part of the Cootes Paradise Area of Natural and Scientific Interest (ANSI). Since recovery of
the marsh vegetation is occurring through a variety of HHRAP actions, shoreline repair can be
initiated. Natural regeneration is not expected in the short term due to Lake Ontario water level regulation
water levels that precluded natural emergent vegetation reestablishment. The current regulation plan prevents
lower water levels that would otherwise create nursery conditions and subsequent natural regeneration of
appropriate vegetation. For much of the remaining unvegetated areas this would require a maximum spring
water level of 74.7msl.
During the field assessment along the shores of Cootes Paradise Marsh (Figure 6, Table 7), point specific
locations were marked and include small eroded points, old infrastructure, and unsanctioned trails. Four areas
within the marsh contained elements of old restoration projects or degraded infrastructure. These items are the
old Aquadam, logs and chains, concrete slabs, concrete filled garbage can, a concrete pipe, and two rusty
culverts (Table 7). Unsanctioned trails refer to areas where humans have either created new trails to access the
open unvegetated shoreline or are historically closed trails for the same purpose. To maintain and restore
fragile wildlife and plant populations, these areas along the shoreline will also be priority revegetation sites to
discourage access. Exporting soil material to repair undermined slopes remains as the most challenging
element of the repair plans.
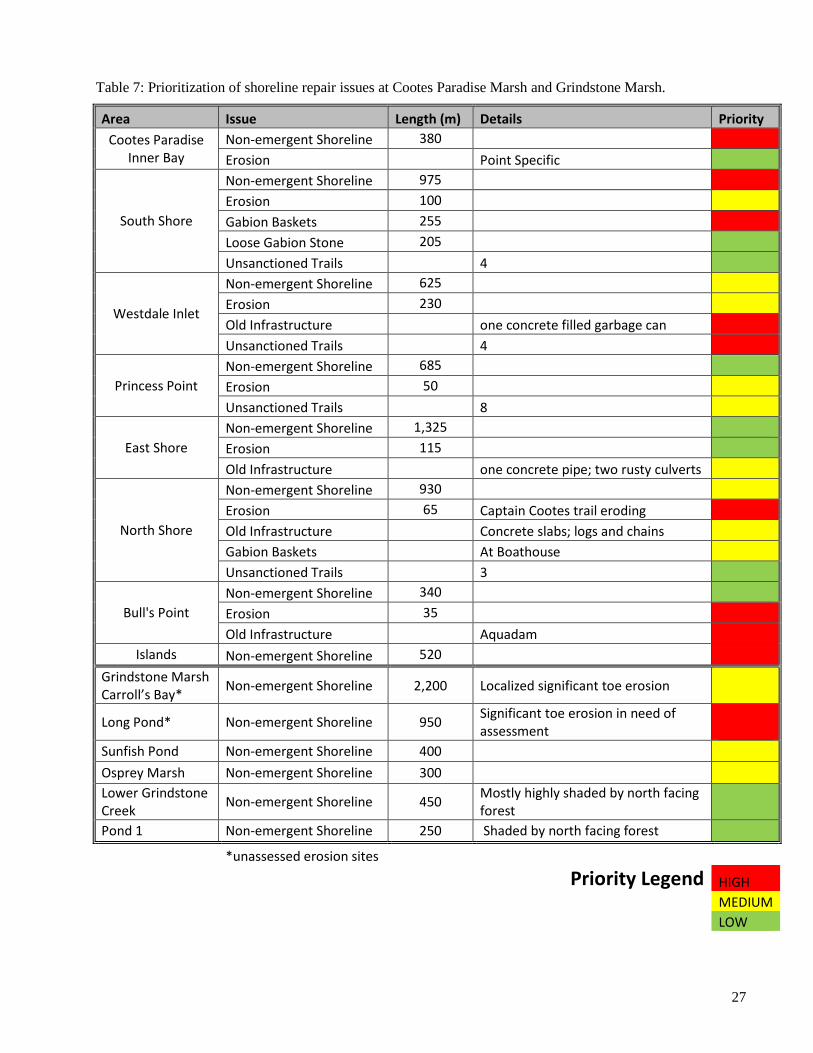
27
Table 7: Prioritization of shoreline repair issues at Cootes Paradise Marsh and Grindstone Marsh.
Area Issue Length (m) Details Priority
Cootes Paradise Inner Bay
Non-emergent Shoreline 380
Erosion
Point Specific
South Shore
Non-emergent Shoreline 975
Erosion 100
Gabion Baskets 255
Loose Gabion Stone 205
Unsanctioned Trails
4
Westdale Inlet
Non-emergent Shoreline 625
Erosion 230
Old Infrastructure
one concrete filled garbage can
Unsanctioned Trails
4
Princess Point
Non-emergent Shoreline 685
Erosion 50
Unsanctioned Trails
8
East Shore
Non-emergent Shoreline 1,325
Erosion 115
Old Infrastructure
one concrete pipe; two rusty culverts
North Shore
Non-emergent Shoreline 930
Erosion 65 Captain Cootes trail eroding
Old Infrastructure
Concrete slabs; logs and chains
Gabion Baskets
At Boathouse
Unsanctioned Trails
3
Bull's Point
Non-emergent Shoreline 340
Erosion 35
Old Infrastructure
Aquadam
Islands Non-emergent Shoreline 520
Grindstone Marsh Carroll’s Bay*
Non-emergent Shoreline 2,200 Localized significant toe erosion
Long Pond* Non-emergent Shoreline 950 Significant toe erosion in need of assessment
Sunfish Pond Non-emergent Shoreline 400
Osprey Marsh Non-emergent Shoreline 300
Lower Grindstone Creek
Non-emergent Shoreline 450 Mostly highly shaded by north facing forest
Pond 1 Non-emergent Shoreline 250 Shaded by north facing forest
*unassessed erosion sites
Priority Legend HIGH
MEDIUM
LOW
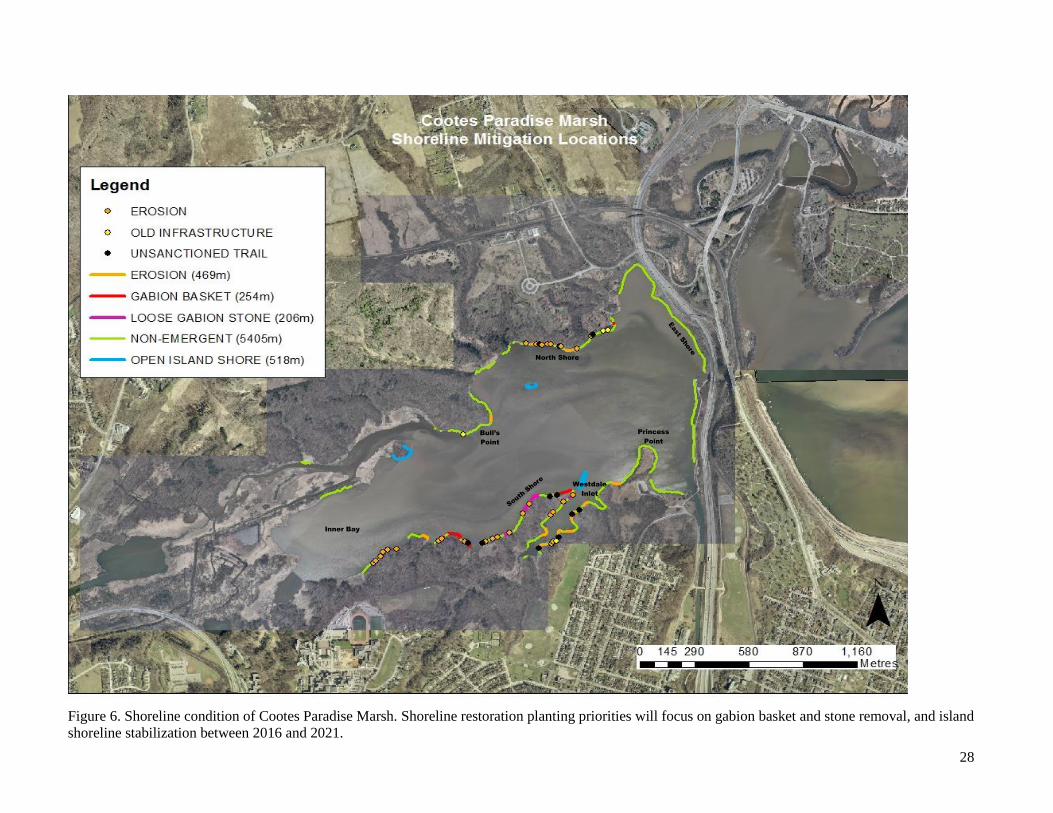
28
Figure 6. Shoreline condition of Cootes Paradise Marsh. Shoreline restoration planting priorities will focus on gabion basket and stone removal, and island
shoreline stabilization between 2016 and 2021.
Westdale
Inlet
Inner Bay
North Shore
Bull’s
Point
Princess
Point
29
Water Quality and HHRAP Partners
The work completed by RBG in the marsh is focused on recovering and measuring wetland/marsh plant
communities. These plant communities are the bases of the food web, supporting many dimensions of the
Hamilton Harbour ecosystem, most significantly fish reproductions. Within the marshes the areas of issues are
portrayed in the Figure 7 aerial photo. In this photo, the June 2015 plant coverage is visible, both in areas of
recovery and in missing areas associated with specific watersheds of the marshes (Table 8). Virtually all
issues limiting plant recovery at this point are related to impaired quality of inflowing water. Overall 80% of
Hamilton Harbour watershed surface waters enter the system through these two marshes. Based on our
HHRAP committee experience, RBG considers most source locations are known by the partners. In the
specific case of urban runoff from the old urban areas of Dundas, Waterdown, and Ancaster, the specific
stormwater outfall points in need of remediation have yet to be summarized.
Recovering inflowing water quality limiting the recovery of biota in marsh is the most important step in
sustainability delisting the Hamilton Harbour AOC. The summary chart and map (Table 8, Figure 7)
highlights current impaired marsh subareas, the watershed based issues, and important actions required to
recover the inflowing water quality. The issues fall into three major themes.
1. Sewage and sewage related treatment
2. Urban runoff quality and quantity
3. Localized rural issues particularly in Grindstone Marsh
These issues are expected to figure prominently in the 2016-2021 HHRAP Bay Area Implementation Team
workplan in order to reach delisting.
RBG also emphasizes that water quality in the harbour is also of great importance to the sustainability of the
marsh. It is expected that as long as the harbour continues to be seasonally anoxic in large areas, the fish
community will continue to be dominated by low oxygen tolerant species, such as the non-native Common
Carp and Goldfish, and native catfish. This results in an ongoing obligation for fish community management
that at a minimum consists of management of Common Carp through the use of carp barriers and fishways.
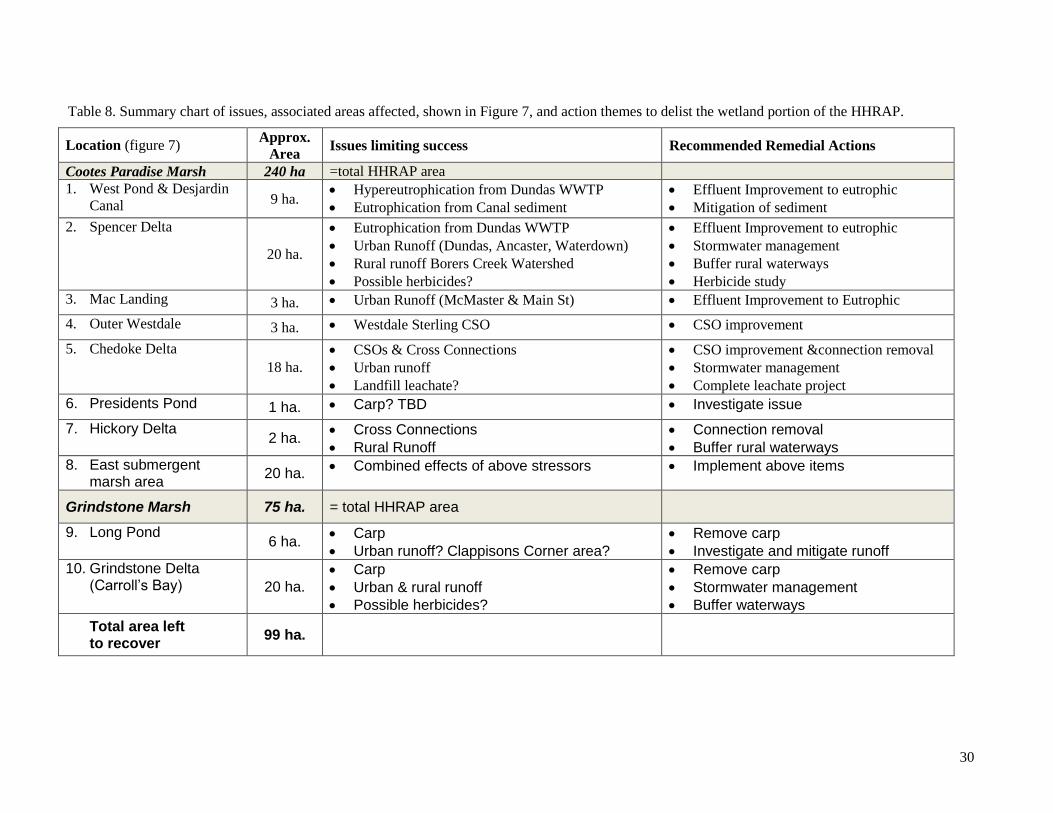
30
Table 8. Summary chart of issues, associated areas affected, shown in Figure 7, and action themes to delist the wetland portion of the HHRAP.
Location (figure 7) Approx.
Area Issues limiting success Recommended Remedial Actions
Cootes Paradise Marsh 240 ha =total HHRAP area
1. West Pond & Desjardin
Canal 9 ha. Hypereutrophication from Dundas WWTP
Eutrophication from Canal sediment
Effluent Improvement to eutrophic
Mitigation of sediment
2. Spencer Delta
20 ha.
Eutrophication from Dundas WWTP
Urban Runoff (Dundas, Ancaster, Waterdown)
Rural runoff Borers Creek Watershed
Possible herbicides?
Effluent Improvement to eutrophic
Stormwater management
Buffer rural waterways
Herbicide study
3. Mac Landing 3 ha. Urban Runoff (McMaster & Main St) Effluent Improvement to Eutrophic
4. Outer Westdale 3 ha. Westdale Sterling CSO CSO improvement
5. Chedoke Delta
18 ha.
CSOs & Cross Connections
Urban runoff
Landfill leachate?
CSO improvement &connection removal
Stormwater management
Complete leachate project
6. Presidents Pond 1 ha. Carp? TBD Investigate issue
7. Hickory Delta 2 ha.
Cross Connections
Rural Runoff
Connection removal
Buffer rural waterways
8. East submergent marsh area
20 ha. Combined effects of above stressors Implement above items
Grindstone Marsh 75 ha. = total HHRAP area
9. Long Pond 6 ha.
Carp
Urban runoff? Clappisons Corner area?
Remove carp
Investigate and mitigate runoff
10. Grindstone Delta (Carroll’s Bay) 20 ha.
Carp
Urban & rural runoff
Possible herbicides?
Remove carp
Stormwater management
Buffer waterways
Total area left to recover
99 ha.
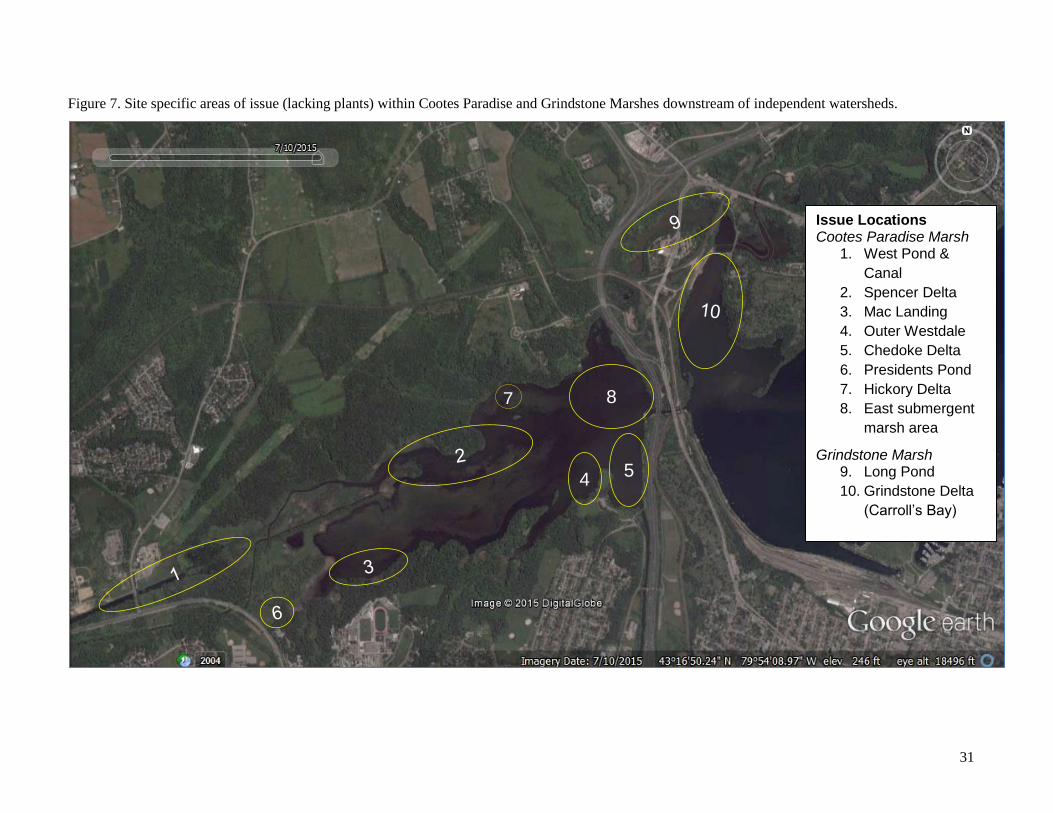
31
Figure 7. Site specific areas of issue (lacking plants) within Cootes Paradise and Grindstone Marshes downstream of independent watersheds.
5 4
Issue Locations Cootes Paradise Marsh
1. West Pond &
Canal
2. Spencer Delta
3. Mac Landing
4. Outer Westdale
5. Chedoke Delta
6. Presidents Pond
7. Hickory Delta
8. East submergent
marsh area
Grindstone Marsh 9. Long Pond
10. Grindstone Delta
(Carroll’s Bay)
7 8
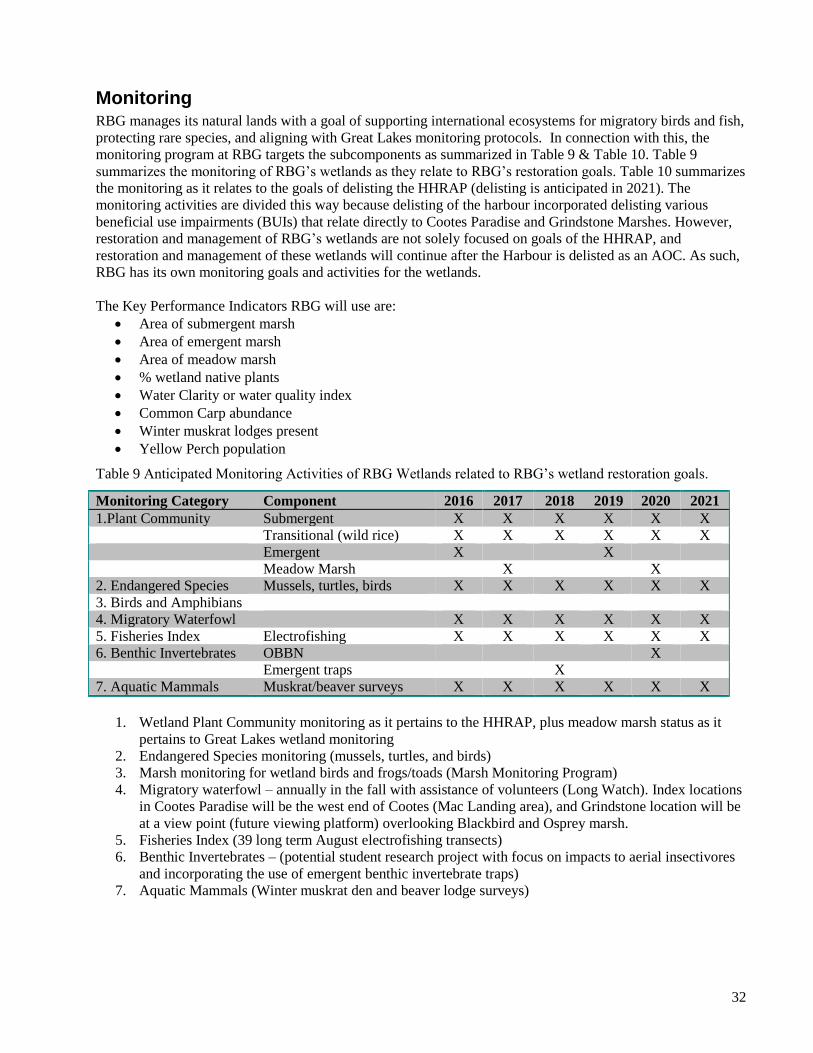
32
Monitoring RBG manages its natural lands with a goal of supporting international ecosystems for migratory birds and fish,
protecting rare species, and aligning with Great Lakes monitoring protocols. In connection with this, the
monitoring program at RBG targets the subcomponents as summarized in Table 9 & Table 10. Table 9
summarizes the monitoring of RBG’s wetlands as they relate to RBG’s restoration goals. Table 10 summarizes
the monitoring as it relates to the goals of delisting the HHRAP (delisting is anticipated in 2021). The
monitoring activities are divided this way because delisting of the harbour incorporated delisting various
beneficial use impairments (BUIs) that relate directly to Cootes Paradise and Grindstone Marshes. However,
restoration and management of RBG’s wetlands are not solely focused on goals of the HHRAP, and
restoration and management of these wetlands will continue after the Harbour is delisted as an AOC. As such,
RBG has its own monitoring goals and activities for the wetlands.
The Key Performance Indicators RBG will use are:
Area of submergent marsh
Area of emergent marsh
Area of meadow marsh
% wetland native plants
Water Clarity or water quality index
Common Carp abundance
Winter muskrat lodges present
Yellow Perch population
Table 9 Anticipated Monitoring Activities of RBG Wetlands related to RBG’s wetland restoration goals.
Monitoring Category Component 2016 2017 2018 2019 2020 2021
1.Plant Community Submergent X X X X X X
Transitional (wild rice) X X X X X X
Emergent X X
Meadow Marsh X X
2. Endangered Species Mussels, turtles, birds X X X X X X
3. Birds and Amphibians
4. Migratory Waterfowl X X X X X X
5. Fisheries Index Electrofishing X X X X X X
6. Benthic Invertebrates OBBN X
Emergent traps X
7. Aquatic Mammals Muskrat/beaver surveys X X X X X X
1. Wetland Plant Community monitoring as it pertains to the HHRAP, plus meadow marsh status as it
pertains to Great Lakes wetland monitoring
2. Endangered Species monitoring (mussels, turtles, and birds)
3. Marsh monitoring for wetland birds and frogs/toads (Marsh Monitoring Program)
4. Migratory waterfowl – annually in the fall with assistance of volunteers (Long Watch). Index locations
in Cootes Paradise will be the west end of Cootes (Mac Landing area), and Grindstone location will be
at a view point (future viewing platform) overlooking Blackbird and Osprey marsh.
5. Fisheries Index (39 long term August electrofishing transects)
6. Benthic Invertebrates – (potential student research project with focus on impacts to aerial insectivores
and incorporating the use of emergent benthic invertebrate traps)
7. Aquatic Mammals (Winter muskrat den and beaver lodge surveys)
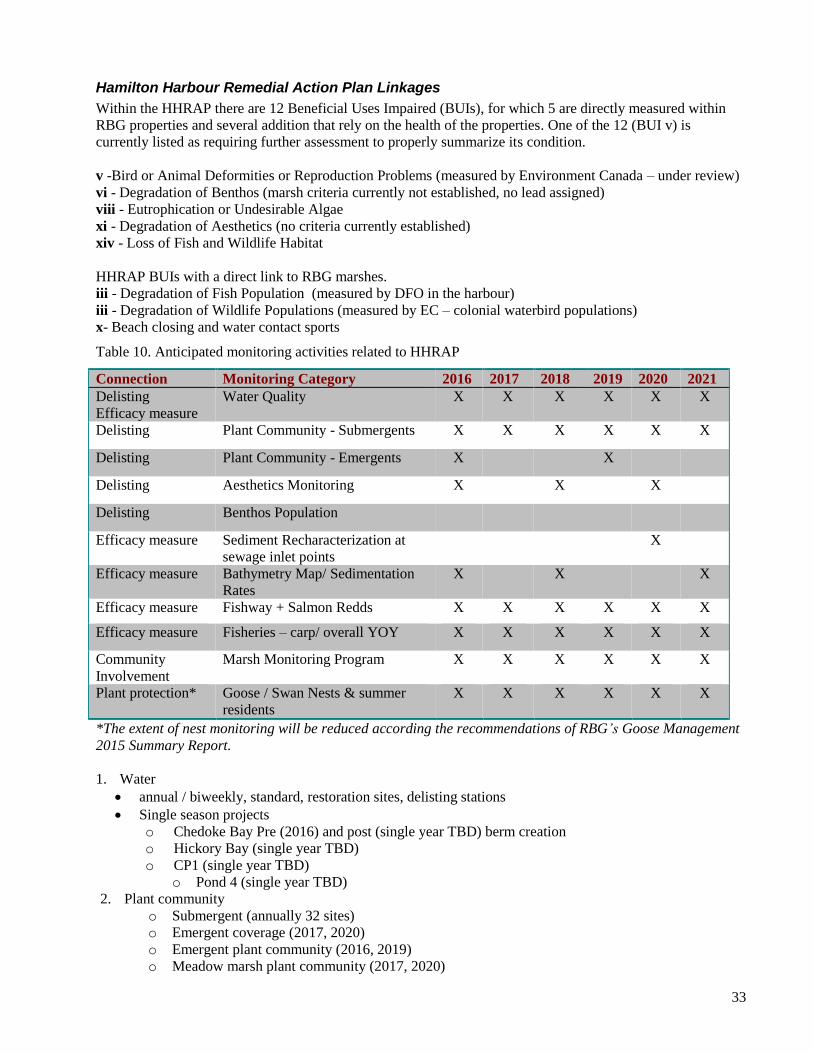
33
Hamilton Harbour Remedial Action Plan Linkages
Within the HHRAP there are 12 Beneficial Uses Impaired (BUIs), for which 5 are directly measured within
RBG properties and several addition that rely on the health of the properties. One of the 12 (BUI v) is
currently listed as requiring further assessment to properly summarize its condition.
v -Bird or Animal Deformities or Reproduction Problems (measured by Environment Canada – under review)
vi - Degradation of Benthos (marsh criteria currently not established, no lead assigned)
viii - Eutrophication or Undesirable Algae
xi - Degradation of Aesthetics (no criteria currently established)
xiv - Loss of Fish and Wildlife Habitat
HHRAP BUIs with a direct link to RBG marshes.
iii - Degradation of Fish Population (measured by DFO in the harbour)
iii - Degradation of Wildlife Populations (measured by EC – colonial waterbird populations)
x- Beach closing and water contact sports
Table 10. Anticipated monitoring activities related to HHRAP
Connection Monitoring Category 2016 2017 2018 2019 2020 2021
Delisting
Efficacy measure
Water Quality X X X X X X
Delisting Plant Community - Submergents X X X X X X
Delisting Plant Community - Emergents X X
Delisting Aesthetics Monitoring X X X
Delisting Benthos Population
Efficacy measure Sediment Recharacterization at
sewage inlet points
X
Efficacy measure Bathymetry Map/ Sedimentation
Rates
X X X
Efficacy measure Fishway + Salmon Redds X X X X X X
Efficacy measure Fisheries – carp/ overall YOY X X X X X X
Community
Involvement
Marsh Monitoring Program X X X X X X
Plant protection* Goose / Swan Nests & summer
residents
X X X X X X
*The extent of nest monitoring will be reduced according the recommendations of RBG’s Goose Management
2015 Summary Report.
1. Water
annual / biweekly, standard, restoration sites, delisting stations
Single season projects
o Chedoke Bay Pre (2016) and post (single year TBD) berm creation
o Hickory Bay (single year TBD)
o CP1 (single year TBD)
o Pond 4 (single year TBD)
2. Plant community
o Submergent (annually 32 sites)
o Emergent coverage (2017, 2020)
o Emergent plant community (2016, 2019)
o Meadow marsh plant community (2017, 2020)
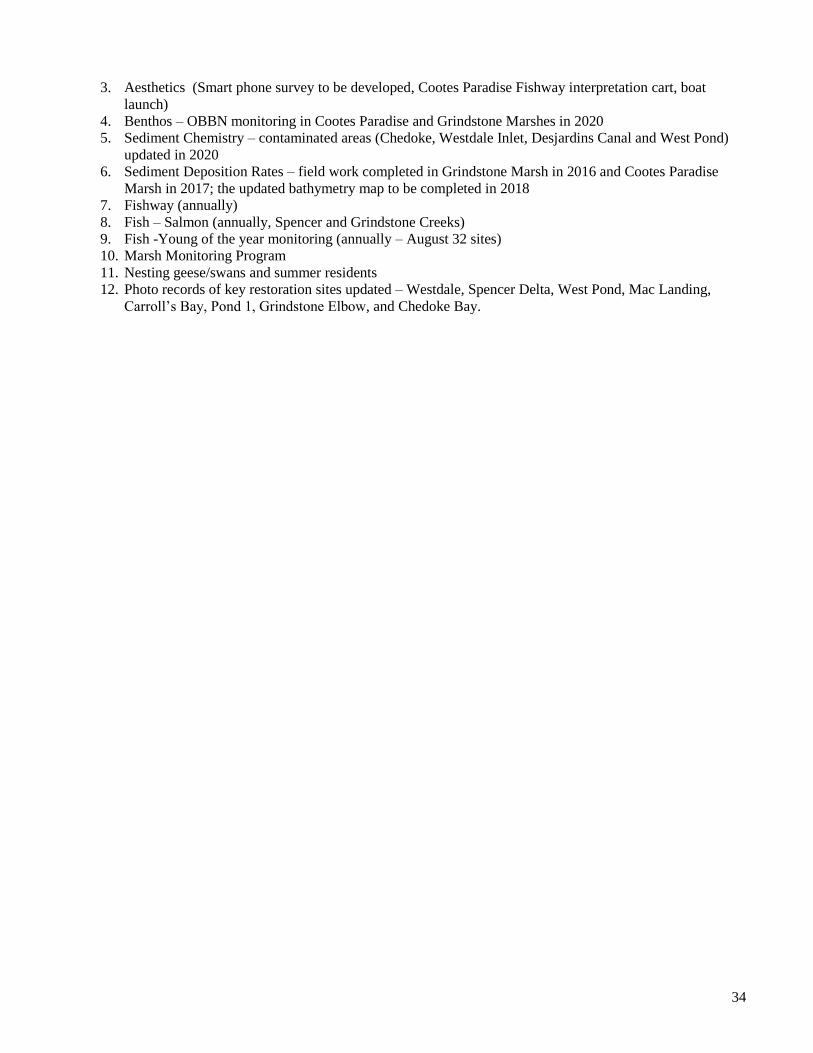
34
3. Aesthetics (Smart phone survey to be developed, Cootes Paradise Fishway interpretation cart, boat
launch)
4. Benthos – OBBN monitoring in Cootes Paradise and Grindstone Marshes in 2020
5. Sediment Chemistry – contaminated areas (Chedoke, Westdale Inlet, Desjardins Canal and West Pond)
updated in 2020
6. Sediment Deposition Rates – field work completed in Grindstone Marsh in 2016 and Cootes Paradise
Marsh in 2017; the updated bathymetry map to be completed in 2018
7. Fishway (annually)
8. Fish – Salmon (annually, Spencer and Grindstone Creeks)
9. Fish -Young of the year monitoring (annually – August 32 sites)
10. Marsh Monitoring Program
11. Nesting geese/swans and summer residents
12. Photo records of key restoration sites updated – Westdale, Spencer Delta, West Pond, Mac Landing,
Carroll’s Bay, Pond 1, Grindstone Elbow, and Chedoke Bay.
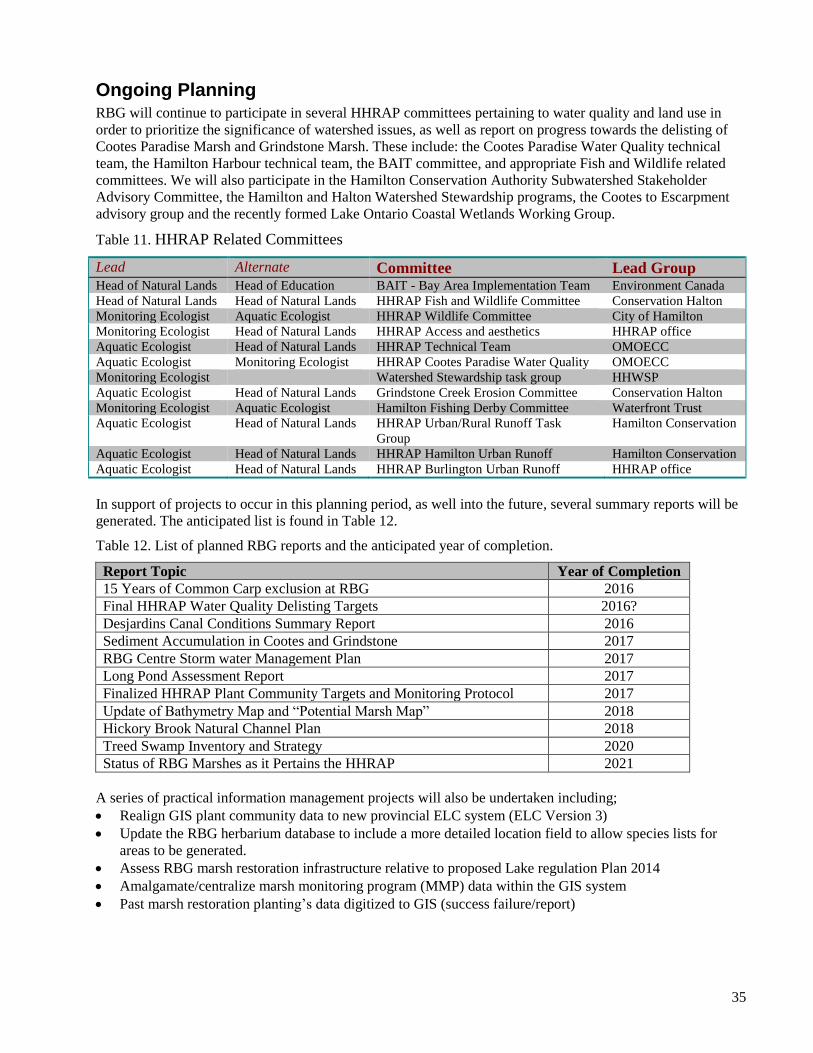
35
Ongoing Planning RBG will continue to participate in several HHRAP committees pertaining to water quality and land use in
order to prioritize the significance of watershed issues, as well as report on progress towards the delisting of
Cootes Paradise Marsh and Grindstone Marsh. These include: the Cootes Paradise Water Quality technical
team, the Hamilton Harbour technical team, the BAIT committee, and appropriate Fish and Wildlife related
committees. We will also participate in the Hamilton Conservation Authority Subwatershed Stakeholder
Advisory Committee, the Hamilton and Halton Watershed Stewardship programs, the Cootes to Escarpment
advisory group and the recently formed Lake Ontario Coastal Wetlands Working Group.
Table 11. HHRAP Related Committees
Lead Alternate Committee Lead Group Head of Natural Lands Head of Education BAIT - Bay Area Implementation Team Environment Canada
Head of Natural Lands Head of Natural Lands HHRAP Fish and Wildlife Committee Conservation Halton
Monitoring Ecologist Aquatic Ecologist HHRAP Wildlife Committee City of Hamilton
Monitoring Ecologist Head of Natural Lands HHRAP Access and aesthetics HHRAP office
Aquatic Ecologist Head of Natural Lands HHRAP Technical Team OMOECC
Aquatic Ecologist Monitoring Ecologist HHRAP Cootes Paradise Water Quality OMOECC
Monitoring Ecologist Watershed Stewardship task group HHWSP
Aquatic Ecologist Head of Natural Lands Grindstone Creek Erosion Committee Conservation Halton
Monitoring Ecologist Aquatic Ecologist Hamilton Fishing Derby Committee Waterfront Trust
Aquatic Ecologist Head of Natural Lands HHRAP Urban/Rural Runoff Task
Group
Hamilton Conservation
Aquatic Ecologist Head of Natural Lands HHRAP Hamilton Urban Runoff Hamilton Conservation
Aquatic Ecologist Head of Natural Lands HHRAP Burlington Urban Runoff HHRAP office
In support of projects to occur in this planning period, as well into the future, several summary reports will be
generated. The anticipated list is found in Table 12.
Table 12. List of planned RBG reports and the anticipated year of completion.
Report Topic Year of Completion
15 Years of Common Carp exclusion at RBG 2016
Final HHRAP Water Quality Delisting Targets 2016?
Desjardins Canal Conditions Summary Report 2016
Sediment Accumulation in Cootes and Grindstone 2017
RBG Centre Storm water Management Plan 2017
Long Pond Assessment Report 2017
Finalized HHRAP Plant Community Targets and Monitoring Protocol 2017
Update of Bathymetry Map and “Potential Marsh Map” 2018
Hickory Brook Natural Channel Plan 2018
Treed Swamp Inventory and Strategy 2020
Status of RBG Marshes as it Pertains the HHRAP 2021
A series of practical information management projects will also be undertaken including;
Realign GIS plant community data to new provincial ELC system (ELC Version 3)
Update the RBG herbarium database to include a more detailed location field to allow species lists for
areas to be generated.
Assess RBG marsh restoration infrastructure relative to proposed Lake regulation Plan 2014
Amalgamate/centralize marsh monitoring program (MMP) data within the GIS system
Past marsh restoration planting’s data digitized to GIS (success failure/report)
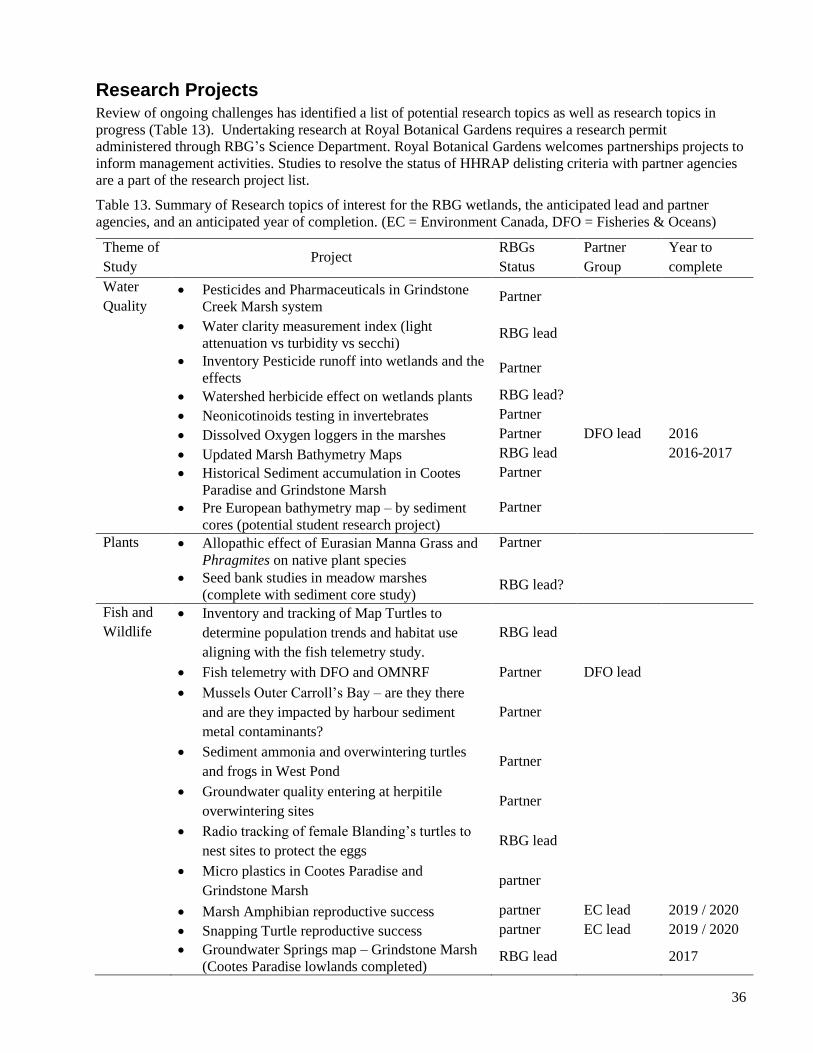
36
Research Projects Review of ongoing challenges has identified a list of potential research topics as well as research topics in
progress (Table 13). Undertaking research at Royal Botanical Gardens requires a research permit
administered through RBG’s Science Department. Royal Botanical Gardens welcomes partnerships projects to
inform management activities. Studies to resolve the status of HHRAP delisting criteria with partner agencies
are a part of the research project list.
Table 13. Summary of Research topics of interest for the RBG wetlands, the anticipated lead and partner
agencies, and an anticipated year of completion. (EC = Environment Canada, DFO = Fisheries & Oceans)
Theme of
Study Project
RBGs
Status
Partner
Group
Year to
complete
Water
Quality Pesticides and Pharmaceuticals in Grindstone
Creek Marsh system Partner
Water clarity measurement index (light
attenuation vs turbidity vs secchi) RBG lead
Inventory Pesticide runoff into wetlands and the
effects Partner
Watershed herbicide effect on wetlands plants RBG lead?
Neonicotinoids testing in invertebrates Partner
Dissolved Oxygen loggers in the marshes Partner DFO lead 2016
Updated Marsh Bathymetry Maps RBG lead 2016-2017
Historical Sediment accumulation in Cootes
Paradise and Grindstone Marsh
Partner
Pre European bathymetry map – by sediment
cores (potential student research project)
Partner
Plants Allopathic effect of Eurasian Manna Grass and
Phragmites on native plant species
Partner
Seed bank studies in meadow marshes
(complete with sediment core study) RBG lead?
Fish and
Wildlife
Inventory and tracking of Map Turtles to
determine population trends and habitat use
aligning with the fish telemetry study.
RBG lead
Fish telemetry with DFO and OMNRF Partner DFO lead
Mussels Outer Carroll’s Bay – are they there
and are they impacted by harbour sediment
metal contaminants?
Partner
Sediment ammonia and overwintering turtles
and frogs in West Pond Partner
Groundwater quality entering at herpitile
overwintering sites Partner
Radio tracking of female Blanding’s turtles to
nest sites to protect the eggs RBG lead
Micro plastics in Cootes Paradise and
Grindstone Marsh partner
Marsh Amphibian reproductive success partner EC lead 2019 / 2020
Snapping Turtle reproductive success partner EC lead 2019 / 2020
Groundwater Springs map – Grindstone Marsh
(Cootes Paradise lowlands completed) RBG lead 2017
37
Outreach and Education
Community Involvement
Public involvement is essential and the Gardens partners with groups such as the Bay Area Restoration
Council (BARC) and RBG Auxiliary. These partnerships are to engage the community to participate and learn
how they can be involved in the stakeholder plans that affect inflowing water and are fundamental to the
recovery and sustainability of the wetlands. In addition monitoring results of the ongoing wetland recovery are
presented each February at an open house at RBG Centre. Other opportunities to involve the public include
marsh replanting events, monitoring of amphibians, shoreline and stream cleanups, TurtleWatch, and the
Cootes Paradise Fishway. In addition, 2016 and 2021 will be important years within the recovery project with
2016 being the 15th anniversary of the Cootes Paradise Fishway and 2021 the 20
th anniversary and delisting
target date of the HHRAP.
Education
RBG will continue to work closely with BARC to provide outreach and volunteer opportunities with the local
community. The Classroom Mini-Marsh program allows young students to actively participate in the
restoration of Cootes Paradise Marsh. Marsh plants are grown at school and later returned to RBG to be
planted in Cootes Paradise Marsh. RBG also coordinates multiple volunteer marsh plantings with BARC to
accelerate plant regeneration in the marsh.
At the Nature Interpretive Centre (NIC), RBG will deliver three educational programs themed on the
restoration of the wetlands at both the primary and secondary school levels. Programs offered each year
include Biodiversity/Project Paradise, Fishway Demonstration, and Interactions in the
Environment/Conservation and Stewardship, with several thousand school children expected to attend. As
well, RBG will host a senior student symposium entitled “Plant Challenge” which allows students learn about
the function of plants in the natural environment, both negative and positive.
Additional ways in which RBG plans to disseminate project information include: building modifications and
redevelopment of the main display at RBG’s Nature Interpretive Centre on the history of the wetland and its
restoration, developing a downloadable data package for school project use, a mobile phone trail experience
linking with our current GEOTRAILs package, and updating several interpretive signs along RBG trails at the
marsh. A short promotional video will also be created and used as a marketing tool for the marsh restoration
programs. This will target teachers to spark otherwise unknown interest in the available programs. A new in-
class learning unit will be developed with the support of multiple school boards for grade 7 teachers which
incorporates cross-curriculum learning of geography, history, and science for their students. In addition, RBG
will continue to support post-secondary projects and field trips and will further develop these tours with
specific themes pertaining to both Invasive Species and Species at Risk.
Points of Engagement
1. Fishway interpretation and signage
2. Hamilton Harbour fishing derby
3. RBG educational school programs
4. Nature Interpretive Centre and RBG Centre displays
5. Trail interpretive signage
6. Webpage for project information, water quality data, and summary reports
7. Restoration planting enclosure fence signs
8. Turtle nesting signs
9. Annual open house
10. Annual workshop
Available RBG Factsheets that will be updated
Cootes Paradise Fishway, Coastal Marshes Natural Fish Hatcheries, Grindstone Marshes, Amphibians,
Waterbirds, Mussels, Breeding Birds, and Reptiles.
38
Project Descriptions
1. The Cootes Paradise Fishway
The goal of the project is to exclude non-native Common Carp (Cyprinus carpio), while maintaining free
passage for other fish species. The Fishway was built in 1996, beginning operation in 1997. It utilizes 5cm
wide grates to allow free passage of water and smaller fish, while screening out larger adult carp. Six fishway
cages are seasonally operating to move native fish species in and out of the marsh in association with
spawning migrations. Aside from the carp exclusion function, the operation provides valuable monitoring
information of water quality and fish populations, a primary visitor contact point, rich public educational
experiences, and the elimination of harbour powerboats from the sensitive and shallow habitats of Cootes
Paradise Marsh. Over time the excluded carp population is expected to dramatically decline as Cootes Paradise
Marsh also represents the primary spawning location for carp at the western end of Lake Ontario. Ongoing
maintenance items are expected to increase, as the structure is now over 15 years old.
Common Carp historically reached 90% of the marsh biomass, equivalent to an estimated 800 kg/ha, resulting
in loss of most native species across all biological community levels, including plants, invertebrates, fish,
birds, mammals, and multiple species at risk. Ongoing carp exclusion experience at RBG indicates that
associated issues begin at densities of over 20kg/ha. Common carp arrived in North America the late 1800’s
and were established as a dominant species at RBG by the 1940’s. Most of the wetland loss occurred between
1937 and 1950. The first carp management project at RBG was initiated in 1951. Key drivers of carp
population include eutrophication of the marsh, anoxia and ammonia issues of the hypolimnetic zone of the
harbour, excessive inputs of watershed sediment, and alteration of the natural marsh water cycle.
2. The Spencer Creek Delta Project
The primary goal of the project is the re-establishment of emergent marsh along the Spencer Creek channel to
Bull’s Point. This is to create a cattail biofilter for inflowing contaminants and sediment protecting the
sensitive marsh habitat to the south east. Secondarily the project helps re-establish a migratory corridor for
various fish and wildlife species, as well as people and their canoes. Overall Cootes Paradise Marsh represents
the river mouth of Hamilton Harbour’s main tributary Spencer Creek, with Spencer Creek connected to
slightly more than half of all lands draining to the harbour. This project involves the re-establishment of the
missing emergent marsh portion through Cootes Paradise Marsh through emergent marsh replanting. Channel
loss was a result of a variety of activities. In the 1800’s, the lower reaches were ditched, first behind a now
abandoned rail line (1852), and then into the Desjardins Canal (1870’s). Subsequently the last 4-5 km of
channel just upstream of Hamilton Harbour was completely lost with the loss of the wetland plants in Cootes
Paradise Marsh. With the exclusion of carp in 1997, these plants are returning, helping to provide a framework
for channel formation. In addition, in 2001 the creek channel was shifted out of the Desjardins Canal, through
removal of debris at an old channel crossing point along the canal edge. This allowed the creek to begin
channel reformation through natural sediment depositional processes and plant growth.
This project moves at the rate of natural processes, but continues to be enhanced through strategic wetland
plantings at the mouth of the ever lengthening channel. As of 2015, about 1.4 km of new channel had reformed
and 50,000 plants had been planted (2010-20115). Smaller scale patches of invasive plants including
Phragmites and Eurasian Manna Grass are also targeted for further management in the upper delta, with
management in progress and the species partially removed as of the end of 2015. Subsequent planting of the
patches cleared of invasive species will take place in the coming years. Species at Risk associated with this
habitat area currently include Least Bittern, turtles, mussels, Spotted Gar, American Eel, and Bald Eagles.
3. Cootes Paradise Shoreline Repair
Cootes Paradise Marsh has a total of 27 km of shoreline, 6.8 km of which remains without vegetation, while
Grindstone marsh has 4km without vegetation. The goal is to restore undercut eroding shorelines by naturally
stabilizing the shore with a 4 m starting band of emergent marsh and shrub thicket plants. From the 6.8km
with vegetation in Cootes Paradise 770m will also require physical repairs prior to planting. The shoreline for
39
physical repair falls into two broad categories, including shorelines historically armoured with gabion basket
and armour stone (250 m) and unregenerated natural beach shorelines. Armour stone shorelines and the islands
(520 m) are the priority areas for restoration between 2016 and 2021. Beach locations of focus are the north
and south shorelines in the eastern half of Cootes Paradise Marsh. The armour stone was installed in the 1970s
to protect fragile upland plant communities from collapsing into the marsh. The remaining shorelines in the
western half of the marsh are largely low gradient shore and revegetated, while the eastern shoreline is almost
entirely composed of fill, a result Hwy 403.
The erosion is a consequence of the historical loss of aquatic vegetation, generating long wind fetch and
waves. The shorelines themselves represent sensitive habitats, often steep sandy shorelines, with the lands part
of the Cootes Paradise Area of Natural and Scientific Interest (ANSI). As recovery of the marsh vegetation is
occurring through a variety of HHRAP actions, shoreline repair can be initiated. Natural regeneration is not
expected in the short term due to Lake Ontario Regulation, which currently prevents low water nursery
conditions from along natural reestablishment of appropriated vegetation.
4. Cootes Paradise Inner Bay Project
The Cootes Paradise Inner Bay Project is a new initiative to facilitate the protection of migratory waterfowl
and Species at Risk. The project location is west Cootes Paradise Marsh, south of the Old Desjardins Canal,
with an area covering 20 hectares. The project goal is to create an interior sheltered marsh area with emergent
plants, separating the area from watershed water quality impairments and reducing human disturbance.
Planting emergent plants is necessary to overcome the limiting natural seedling regeneration effect of Lake
Ontario water regulation. The large planting areas at the bays eastern end incorporates natural bathymetric
contours providing a pinch point to define the bay (south side shoreline point, and the north side Spencer
Creek Delta – 100m already completed as of 2015). Emergent plantings will also be completed along the
shoreline lengths still lacking in emergent marsh vegetation (380 m). Smaller scale patches of invasive plants
including Phragmites and Eurasian Manna Grass are also targets of management in the bay, to be removed
prior to replanting with native species. The project may ultimately include potential signage at the eastern end
entrance of the bay to help manage human activity. Species at Risk associated with the area include all aerial
insectivores, Bald Eagles, Least Bittern, American White Pelican, and various turtle and mussel species.
5. Wild Rice and Deep Water Plants
The goal of this project is the re-establishment of wild rice, water lily species, floating leaf pondweed, and
tape grass as dominant species in the deeper water areas of the marsh. These species exist at very low
population levels currently due to poor late summer environmental conditions and small seed bank. Ongoing
projects are underway to improve environmental growing conditions to the point where the species can again
be abundant. Wild rice, an annual (starting from seed each spring), is considered one of the cornerstone plants
of the Gardens’ wetlands. To ensure this short lived species is not extirpated again, a captive population is
maintained within the Gardens’ plant propagation area.
Historically, wild rice (Zizania sp.) dominated the local wetlands, with this species ideally suited to the highly
variable water level regime of Lake Ontario. The variability places extensive disturbance on the wetland
through regular flooding, drying, and freezing, favouring “annual plants” such as wild rice. This species was
lost from the areas many decades previous, however only a few years into the current restoration process, a
few individual plants spontaneously appeared in the recovering Hendrie Valley Ponds. These plants were
Southern Wild Rice (Zizania aquatic), a species nearly extirpated from Canada. This inspired a project
focused on re-establishing the species in 2001.
6. Meadow Marsh Invasive Plant Management
Meadow marsh is a priority habitat for recovery in Lake Ontario coastal marshes, and is used as an
environmental indicator for Lake Ontario water level regulation. The RBG goal for this habitat is to restore a
plant community dominated by native plants. The combined total area of this habitat at RBG is mapped at 45
ha. Although much of the potential meadow marsh zone is vegetated, the plant community present is almost
entirely non-native and thus not of useful character to most insect and wildlife species. Two highly aggressive
non-native plant species dominate RBG’s meadow marsh areas, Common Reed (Phragmites australis) and
40
Eurasian Manna Grass (Glyceria maxima). RBG started managing Phragmites in 2013 and has had great
success. Management of Glyceria maxima is still in the initial stages with a management strategy being
formulated and only preliminary results available from management trials. Several small scale attempts to
eliminate Eurasian Manna Grass have been made over the past 15 years.
Preliminary mapping of the meadow marsh zone has identified 31 areas containing meadow marsh in Cootes
Paradise Marsh and 14 in Grindstone Marsh (water boundaries and peninsulas were used to identify separate
meadow marsh areas from one another, Appendix A). In Cootes Paradise Marsh, the 31 meadow marsh areas
(which either currently contain meadow marsh vegetation or have potential to) make up a total area of 36 ha.
In Grindstone Marsh, the 14 sites consist of about 6 ha of meadow marsh area. Future enhancement projects of
the meadow marsh zone will include management of these two invasive species as well as native planting
efforts. Overall efforts will be prioritized based on the quality of the existing habitat and thus the inclusion of
native species (more pristine habitats will be prioritized over impaired areas); area made up of invasive species
(both area of the invasive species and proximity to other invasive stands will be considered and small stands
which are more isolated will be given greater priority); existing efforts to remove invasive species (areas for
example that contain areas cleared of Phragmites will be given priority over areas without previous invasive
species management); areas supporting species at risk will be given higher priority. A priority area of focus is
around President’s Pond in Cootes Paradise Marsh, and where Species at Risk including turtles and
Prothonotary Warbler occur. Given the diversity of wildflower species that would occupy the meadow marsh
and its large area, its restoration would significantly contribute to the provincial pollinator strategy.
7. Stream Habitat Improvement
The goal of the project is to improve water quality and stream habitat within RBG properties. Multiple north
shore tributaries of Cootes Paradise Marsh, including Mink Brook, Long Valley Brook, and Hickory Brook are
the target. The Hickory Brook project focuses on unditching the lower 150 m of stream and recreating a
natural channel. The details of the project will be summarized in a planning document yet to be completed.
Extensive meadow marsh area and Eurasian Manna Grass management will be associated with the project.
The remaining tributaries represent agricultural stream buffering and riparian habitat re-establishment projects.
No Species at Risk are currently associated with these project areas.
In December 2015, Royal Botanical Gardens purchased a 42.5 acre farmed property in the Niagara
Escarpment Plan area, targeted for acquisition under multiple strategies. The property is one of a number of
fields below the escarpment still farmed, with the headwater tributaries of Mink and Long Valley Brooks
farmed through (i.e. no stream buffers and row crops through the stream bed). While the ultimate RBG
conservation goals for this property have yet to be fully defined, at a minimum row crop farming will cease
within 3 years over the entire property, and in year 1 (2016) existing stream corridors will be buffered. As part
of the lease agreement between RBG and the farmer, the farmer will contribute equipment to assist in re-
naturalization.
8. RBG Centre Urban Runoff Management
The goal of this project is to provide water quality and quantity improvements to RBG Centre’s stormwater
runoff before the waters reach the natural environment. RBG Centre and parking lot impervious surface runoff
largely through a large storm drain under Plains Road, discharging through a pipe located in the Woodland
Garden of Hendrie Park Garden. This water then follows a spring fed ravine to Pond 2 of the Hendrie Valley
Ponds. The large volumes of flow are causing significant slope erosion in the Woodland Garden and in the
spring fed ravine, with the resulting impaired water quality negatively affecting the Pond 2 wetland system.
The larger flows have also resulted in the flooding of the marsh carp exclusion structure found at the
connecting point between Pond 2 and Grindstone Creek. A similar issue is emerging associated with a Plains
Road a stormwater outfall (City of Burlington), located at the upper end (south east corner) of Pond 4 and will
require monitoring and ultimately mitigation. Species at Risk associated with the project are turtles.
9. Sunfish Pond & Long Pond Project
The goal of this project is the recovery of clear clean marsh water habitat. Sunfish Pond and Long Pond are
part of the historical outflow channel of Cootes Paradise Marsh. Construction of rail lines in the 1850s reset
41
the outflow to an alternated location, leaving this area a 7 hectare, distinct marsh area within the Grindstone
Marsh complex. The system is impaired by remnant carp populations and watershed suspended sediment.
Exclusion of the Harbour’s Common Carp is at Sunfish Pond using an early version of an experimental carp
barrier, and a deteriorating Christmas tree berm. Long Pond is distinctly named as it is partially separated from
Sunfish Pond by a rail line berm. Aside from being coastal marsh habitat, it is the primary location for
endangered mussel species at RBG. Actions to recover the water start with an inventory of conditions report
and recommendations. Recommendations are expected to include reconstruction of the carp barrier system in
Sunfish Pond, removal of all remaining carp from Long Pond, repair of a section of Sunfish Pond and Long
Pond shorelines, and partnering with other agencies to improve inflowing water quality. The removal of carp
from Long Pond requires improved access to the pond as the pond is surrounded by 25m high steep slopes.
Long Pond contains the only meadow marsh area not dominated by Eurasian plant species. Multiple mussel
and turtle Species at Risk are associated with the site.
10. Chedoke Bay Project
Chedoke Bay is located in the south east corner of Cootes Paradise Marsh at the mouth of Chedoke Creek. The
principle goal of the Chedoke Bay project is to prevent sewage from dispersing through the wetland habitat
and wetland public access location (Princess Point). Chedoke Creek continues to provide untreated sewage
into Cootes Paradise Marsh, with the City of Hamilton undertaking ongoing projects to find and repair the
sources. Hamilton Conservation Authority currently undertakes monitoring illustrating creek conditions with
information shared at the HHRAP Cootes Paradise and Grindstone Marsh water quality technical team.
Secondarily, the project will also recreate a bank for the creek channel for creek habitat purposes.
The original creek channel was historically filled, ditched, and relocated through the creation of the Kaydrage
landfill, Hwy 403, and Macklin Ave, as well as through the loss of wetland vegetation via water pollution and
high densities of Common Carp. The creek is currently attempting to reform its channel on the current
sediment delta in the bay. The delta area contains no wetland vegetation due to the ongoing water pollution.
The project will involve re-contouring the delta to create a natural riverbank level, followed by replanting with
cattails. Species at Risk associated with the site currently include aerial insectivores and multiple turtle
species.
11. Grindstone Marsh Delta (the elbow)
This project is located at the mouth of Grindstone Creek in Hendrie Valley Sanctuary and adjacent to the
RBG’s Laking Garden. The goal of this project is to exclude carp and watershed pollution through
reconstructed riverbanks and carp barriers and reestablish shoreline emergent vegetation through planting. As
with Cootes Paradise Marsh, the loss of wetland plants resulted in the loss of the last several kilometers of
wetland river channel in the Grindstone Creek Delta. In January of 2000, following the success of the previous
years’ smaller-scale pilot projects, the Gardens implemented an innovative experimental wetland restoration
project, re-establishing a portion of the channel as well as creating carp barriers to protect a portion of the
wetland. Used Christmas trees collected by local municipalities formed the riverbanks, helping to recreate 1
km of natural channel and redefine the wetland areas. These areas are called Osprey Marsh and Blackbird
Marsh, an area historically called the “elbow”.
Blackbird & Osprey Marshes contain four small carp barrier structures inserted into the rebuilt riverbanks
blocking carp access to the wetlands while maintaining the natural flow of water and movement of organisms.
The experimental structures were replaced with upgraded metal versions in 2013 & 2014 and significant
portions of the riverbanks were relocated, expanding the marsh areas. As with the other carp exclusion
projects, the restriction of carp from their reproductive areas is expected to result in the collapse of the overall
carp population. Over time, the Christmas trees naturally biodegrade, leaving a build-up of sediment and reeds
as a riverbank. As the height of the riverbanks must be maintained above the lakes maximum level to prevent
carp access, the riverbanks are regularly augmented with additional trees until sufficient sediment has
accumulated. Other invasive species, including Phragmites and Eurasian Manna Grass, are also targets of
management as is the re-establishment of emergent plants along the newly formed riverbanks and interior
open shorelines. In addition, the most downstream 100 m of Blackbird Marsh berm will be relocated and
42
rebuilt to match the actual edge of Grindstone Creek. Species at Risk associated with the area include multiple
turtle and mussel species, with several other species candidates to return with the improving habitat.
12. Hendrie Valley Floodplain Ponds
The goal of this project will be to maintain the integrity of the ponds through invasive species management
and repair of Grindstone Creek bank at Pond 3. The ponds are a 15 hectare oxbow pond system located along
the floodplain of lower Grindstone Creek, within the Gardens’ Hendrie Valley Sanctuary. Restoration of three
of the four ponds were the first projects initiated (1994) within the Remedial Action Plan, as the wetlands were
the primary remaining spawning location of northern pike. They are also the primary location of the remaining
Species at Risk population of Blanding’s Turtle. The inflowing waters are of good quality, maintained by
several large springs; however, the wetland plants and flooding patterns were significantly degraded and
impacted by carp. Once the carp were successfully excluded in 1999, the ponds rapidly recovered clear water
and the associated plants community, and are now among the finest examples of oxbow wetland habitat at the
western end of Lake Ontario. Also, the ponds no longer provide new carp to the broader system. Restoration
of the fourth pond – closest to the lake and not spring feed – was initiated in 2001, with the berm rebuilt and a
new structure installed in 2013. This pond has proven more challenging to maintain carp exclusion; however,
with ongoing efforts it continues to recovery its vegetation naturally. As with the other harbour connected
wetlands, this area requires ongoing management to ensure carp are excluded while maintaining native fish
migrations, such as that of the pike.
13. Carroll’s Bay Marsh
Carroll’s Bay Marsh represents a unique situation within RBG wetlands and the HHRAP. It is associated with
several delisting targets including water quality and plants. In relation to the plants, it represents the bulk of
the target total area of potential aquatic vegetation area (split into marsh (22 ha) and littoral zone aquatic
vegetation targets (17 ha)). The key stressors are inflowing watershed sediment and the carp of the harbour.
The marsh is currently near devoid of aquatic vegetation. This marsh remains independent of the carp control
initiatives being applied to the remainder of RBG marshes due to large open connection to the harbour.
Within the HHRAP the area currently serves as the measure of marsh sustainability (a marsh restoration
experimental control), reflecting if underlying stressor are mitigated.
Carroll’s Bay Marsh, due to the loss of aquatic vegetation, has become synonymous with the term Carroll’s
Bay, a term historically applied to the deeper open water at the south end of the inlet. The inlet is located in the
North West corner of Hamilton Harbour at the mouth of Grindstone Creek with the entire inlet to the high
water mark owned by RBG. Grindstone Creek watershed is 89km2, with the creek mouth marsh extending 2/3
of the way to the end the harbour inlet of Carroll’s Bay. The total area of Grindstone Marsh is 62 hectares with
22 hectares in inlet that is Carroll’s Bay. In support of this, actions that will occur include monitoring of water
quality, birds, fish, benthos, and aquatic plants as per the monitoring schedule. RBG Species at Risk related
activities will involve turtles and freshwater mussels. Shoreline restoration work is intended to occur in the
north east and west shorelines in partnership with the land owning agencies (City of Burlington and CN Rail).
Floating buoy signage will be seasonally installed at the outer edge of the marsh to inform harbour boaters of
the shallow water and the sensitive species still present.
14. Community Involvement
Public involvement is essential and the Gardens partners with groups such as the Bay Area Restoration
Council, Stewards of Cootes Watershed, Hamilton Naturalist Club, and RBG Auxiliary to engage the
community to participate and learn how they can be involved in the stakeholder plans that affect inflowing
water. In addition, monitoring results of the ongoing wetland recovery are presented each February at an open
house at RBG Centre. Other opportunities to involve the public include marsh replanting events, monitoring of
amphibians and marsh birds through the Marsh Monitoring Program, monitoring of migratory waterfowl,
shoreline and stream cleanups, Turtlewatch, and the Cootes Paradise Fishway. The scale and diversity of
activities merits the creation of a volunteer coordinator position at RBG, however until this occurs the contacts
at RBG will include the staff implementing the projects and the RBG Nature Interpretive Centre.
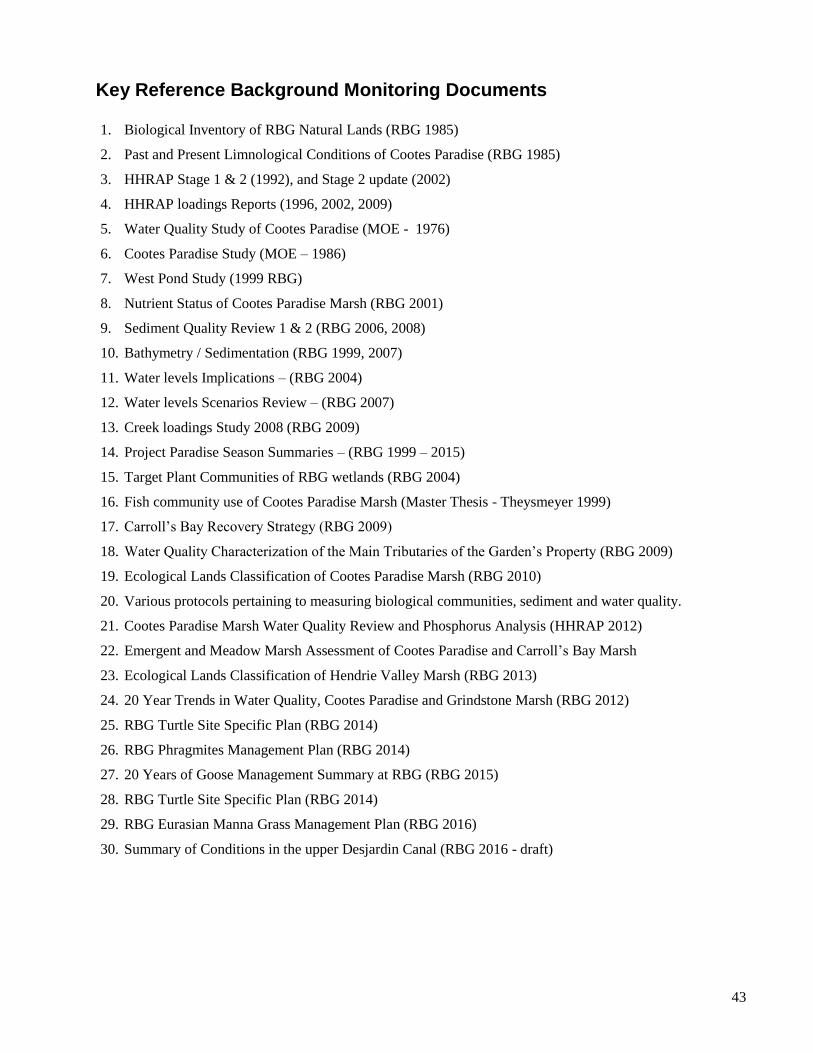
43
Key Reference Background Monitoring Documents
1. Biological Inventory of RBG Natural Lands (RBG 1985)
2. Past and Present Limnological Conditions of Cootes Paradise (RBG 1985)
3. HHRAP Stage 1 & 2 (1992), and Stage 2 update (2002)
4. HHRAP loadings Reports (1996, 2002, 2009)
5. Water Quality Study of Cootes Paradise (MOE - 1976)
6. Cootes Paradise Study (MOE – 1986)
7. West Pond Study (1999 RBG)
8. Nutrient Status of Cootes Paradise Marsh (RBG 2001)
9. Sediment Quality Review 1 & 2 (RBG 2006, 2008)
10. Bathymetry / Sedimentation (RBG 1999, 2007)
11. Water levels Implications – (RBG 2004)
12. Water levels Scenarios Review – (RBG 2007)
13. Creek loadings Study 2008 (RBG 2009)
14. Project Paradise Season Summaries – (RBG 1999 – 2015)
15. Target Plant Communities of RBG wetlands (RBG 2004)
16. Fish community use of Cootes Paradise Marsh (Master Thesis - Theysmeyer 1999)
17. Carroll’s Bay Recovery Strategy (RBG 2009)
18. Water Quality Characterization of the Main Tributaries of the Garden’s Property (RBG 2009)
19. Ecological Lands Classification of Cootes Paradise Marsh (RBG 2010)
20. Various protocols pertaining to measuring biological communities, sediment and water quality.
21. Cootes Paradise Marsh Water Quality Review and Phosphorus Analysis (HHRAP 2012)
22. Emergent and Meadow Marsh Assessment of Cootes Paradise and Carroll’s Bay Marsh
23. Ecological Lands Classification of Hendrie Valley Marsh (RBG 2013)
24. 20 Year Trends in Water Quality, Cootes Paradise and Grindstone Marsh (RBG 2012)
25. RBG Turtle Site Specific Plan (RBG 2014)
26. RBG Phragmites Management Plan (RBG 2014)
27. 20 Years of Goose Management Summary at RBG (RBG 2015)
28. RBG Turtle Site Specific Plan (RBG 2014)
29. RBG Eurasian Manna Grass Management Plan (RBG 2016)
30. Summary of Conditions in the upper Desjardin Canal (RBG 2016 - draft)
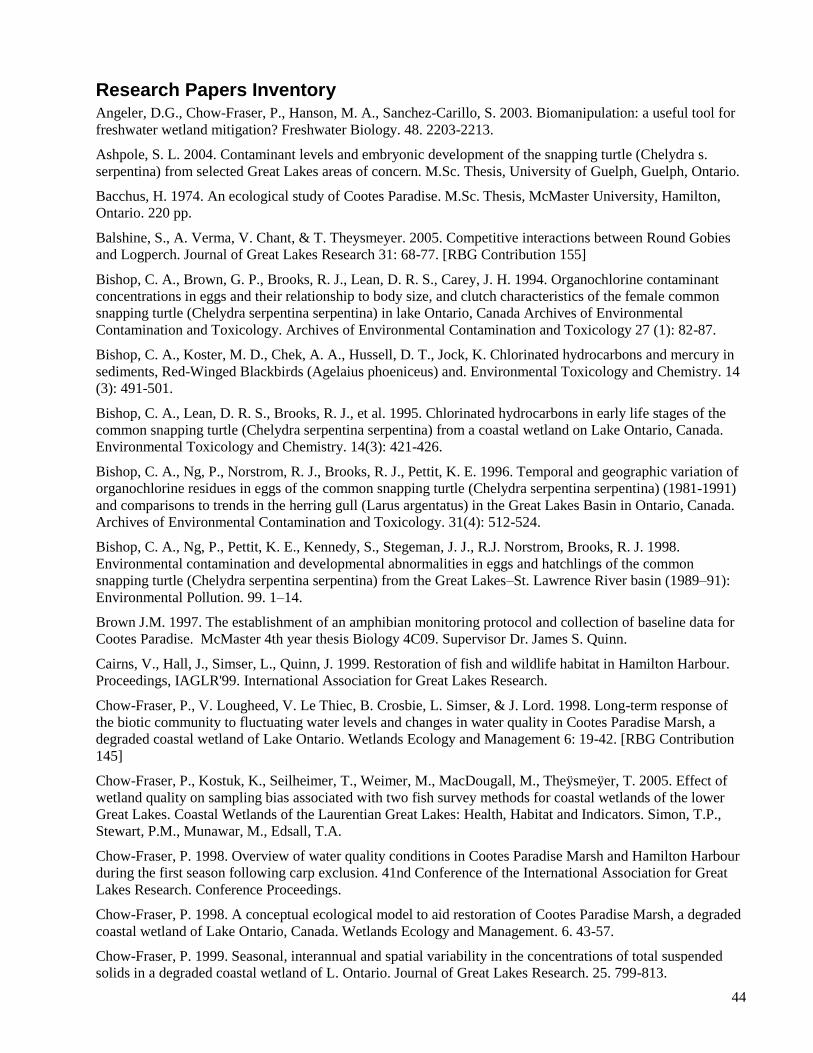
44
Research Papers Inventory Angeler, D.G., Chow-Fraser, P., Hanson, M. A., Sanchez-Carillo, S. 2003. Biomanipulation: a useful tool for
freshwater wetland mitigation? Freshwater Biology. 48. 2203-2213.
Ashpole, S. L. 2004. Contaminant levels and embryonic development of the snapping turtle (Chelydra s.
serpentina) from selected Great Lakes areas of concern. M.Sc. Thesis, University of Guelph, Guelph, Ontario.
Bacchus, H. 1974. An ecological study of Cootes Paradise. M.Sc. Thesis, McMaster University, Hamilton,
Ontario. 220 pp.
Balshine, S., A. Verma, V. Chant, & T. Theysmeyer. 2005. Competitive interactions between Round Gobies
and Logperch. Journal of Great Lakes Research 31: 68-77. [RBG Contribution 155]
Bishop, C. A., Brown, G. P., Brooks, R. J., Lean, D. R. S., Carey, J. H. 1994. Organochlorine contaminant
concentrations in eggs and their relationship to body size, and clutch characteristics of the female common
snapping turtle (Chelydra serpentina serpentina) in lake Ontario, Canada Archives of Environmental
Contamination and Toxicology. Archives of Environmental Contamination and Toxicology 27 (1): 82-87.
Bishop, C. A., Koster, M. D., Chek, A. A., Hussell, D. T., Jock, K. Chlorinated hydrocarbons and mercury in
sediments, Red-Winged Blackbirds (Agelaius phoeniceus) and. Environmental Toxicology and Chemistry. 14
(3): 491-501.
Bishop, C. A., Lean, D. R. S., Brooks, R. J., et al. 1995. Chlorinated hydrocarbons in early life stages of the
common snapping turtle (Chelydra serpentina serpentina) from a coastal wetland on Lake Ontario, Canada.
Environmental Toxicology and Chemistry. 14(3): 421-426.
Bishop, C. A., Ng, P., Norstrom, R. J., Brooks, R. J., Pettit, K. E. 1996. Temporal and geographic variation of
organochlorine residues in eggs of the common snapping turtle (Chelydra serpentina serpentina) (1981-1991)
and comparisons to trends in the herring gull (Larus argentatus) in the Great Lakes Basin in Ontario, Canada.
Archives of Environmental Contamination and Toxicology. 31(4): 512-524.
Bishop, C. A., Ng, P., Pettit, K. E., Kennedy, S., Stegeman, J. J., R.J. Norstrom, Brooks, R. J. 1998.
Environmental contamination and developmental abnormalities in eggs and hatchlings of the common
snapping turtle (Chelydra serpentina serpentina) from the Great Lakes–St. Lawrence River basin (1989–91):
Environmental Pollution. 99. 1–14.
Brown J.M. 1997. The establishment of an amphibian monitoring protocol and collection of baseline data for
Cootes Paradise. McMaster 4th year thesis Biology 4C09. Supervisor Dr. James S. Quinn.
Cairns, V., Hall, J., Simser, L., Quinn, J. 1999. Restoration of fish and wildlife habitat in Hamilton Harbour.
Proceedings, IAGLR'99. International Association for Great Lakes Research.
Chow-Fraser, P., V. Lougheed, V. Le Thiec, B. Crosbie, L. Simser, & J. Lord. 1998. Long-term response of
the biotic community to fluctuating water levels and changes in water quality in Cootes Paradise Marsh, a
degraded coastal wetland of Lake Ontario. Wetlands Ecology and Management 6: 19-42. [RBG Contribution
145]
Chow-Fraser, P., Kostuk, K., Seilheimer, T., Weimer, M., MacDougall, M., Theÿsmeÿer, T. 2005. Effect of
wetland quality on sampling bias associated with two fish survey methods for coastal wetlands of the lower
Great Lakes. Coastal Wetlands of the Laurentian Great Lakes: Health, Habitat and Indicators. Simon, T.P.,
Stewart, P.M., Munawar, M., Edsall, T.A.
Chow-Fraser, P. 1998. Overview of water quality conditions in Cootes Paradise Marsh and Hamilton Harbour
during the first season following carp exclusion. 41nd Conference of the International Association for Great
Lakes Research. Conference Proceedings.
Chow-Fraser, P. 1998. A conceptual ecological model to aid restoration of Cootes Paradise Marsh, a degraded
coastal wetland of Lake Ontario, Canada. Wetlands Ecology and Management. 6. 43-57.
Chow-Fraser, P. 1999. Seasonal, interannual and spatial variability in the concentrations of total suspended
solids in a degraded coastal wetland of L. Ontario. Journal of Great Lakes Research. 25. 799-813.
45
Chow-Fraser, P. 1999. Volunteer-based experimental planting program to restore Cootes Paradise Marsh, an
urban coastal wetland of Lake Ontario. LakeLine. 19: 1.
Chow-Fraser, P. 2005. Ecosystem response to changes in water level of Lake Ontario marshes: lessons from
the restoration of Cootes Paradise Marsh. Hydrobiologia. 539. 189-204.
Chow-Fraser, P. 1998. Long-term response of the biotic community to changes in water level and water
quality in Cootes Paradise Marsh, Hamilton, Ontario, Canada. 41st Conference of the International
Association for Great Lakes Research. 86-87.
Chow-Fraser, P., Albert, D. 1999. Identification of Eco-Reaches of Great Lakes Coastal Wetlands that have
high biodiversity values. Discussion paper for SOLEC ’98. Env Canada-USEPA Publication, 88 pp.+
appendices.
Chow-Fraser, P., Crosbie, B., Bryant, D., McCarry, B. 1996. Potential contribution of nutrients and polycyclic
aromatic hydrocarbons from the creeks of Cootes Paradise Marsh. Water Quality Research Journal of Canada.
31(3): 485-503.
Chow-Fraser, P., Lukasik, L. 1995. Cootes Paradise Marsh: community participation in the restoration of a
Great Lakes coastal wetland. Restoration and Management Notes. 13(2): 183-189.
Chow-Fraser, P., Simon, T., Stewart, T. P. 2006. Development of the wetland water quality index for assessing
the quality of Great Lakes coastal wetlands. Coastal wetlands of the Laurentian Great Lakes: health, habitat
and indicators. 137-166 pp.
Corrigan, J.E., D.L. Mackenzie, & L. Simser. 1998. Field observations of non-target feeding by Galerucella
calmariensis (Coleoptera: Chrysomelidae), an introduced biological control agent of purple loosestrife,
Lythrum Salicaria (Lythraceae). Proceedings of the Entomological Society of Ontario 129: 99-106. [RBG
Contribution 144]
Croft, M. V., Chow-Fraser, P. 2007. Use and development of the Wetland Macrophyte Index to detect water
quality impairment in fish habitat of Great Lakes Coastal Marshes. Journal of Great Lakes Research. 33(3):
172-197.
Croft, M., Chow-Fraser, P. 2006. Development of a Wetland Macrophyte Index (WMI) for Great Lakes
Coastal Marshes. Annual Conference on Great Lakes Research. 49. [np].
Crosbie, B., Chow-Fraser, P. 1999. Percent land use in the watershed determines the water- and sediment-
quality of 21 wetlands in the Great Lakes basin. Canadian Journal of Fisheries and Aquatic Sciences. 56.
1781-1791.
Davis, A. M., Finkelstein, S. A., Peros, M. C. 2003. A Diatom and Pollen Record of Paleoenvironmental
Change at Cootes Paradise Marsh, Southern Ontario, Canada. Joint meeting of the AASP, the CAP, and the
NAMS, St. Catharines, Ontario. Conference Proceedings.
Davis, A. M., Peros, M. C., Smith, D. G., Poaps, S. 2002. Prehistoric use of Wild Rice at Cootes Paradise
Marsh, Hamilton Harbour, Ontario. Annual meeting of the Canadian Association of Geographers, Toronto.
Conference Proceedings.
DeSolla, S. R., Bishop, C. A., Brooks, R. J. 2002. Sexually dimorphic morphology of hatchling snapping
turtles (Chelydra serpentina) from contaminated and reference sites in the Great Lakes and St. Lawrence River
basin, North America Environmental Toxicology and Chemistry. Environmental Toxicology and Chemistry
21 (5): 922–929.
DeSolla, S. R., Bishop, C. A., van der Kraak, G., Brooks, R. J. 1998. Impact of organochlorine contamination
on levels of sex hormones and external morphology of common snapping turtles
DeSolla, S. R., Bonduriansky, R., R. Brooks, R. J. 1999. Eliminating autocorrelation reduces biological
relevance of home range estimates. Journal of Animal Ecology. 68: 221–234. doi: 10.1046/j.1365-
2656.1999.00279.x.
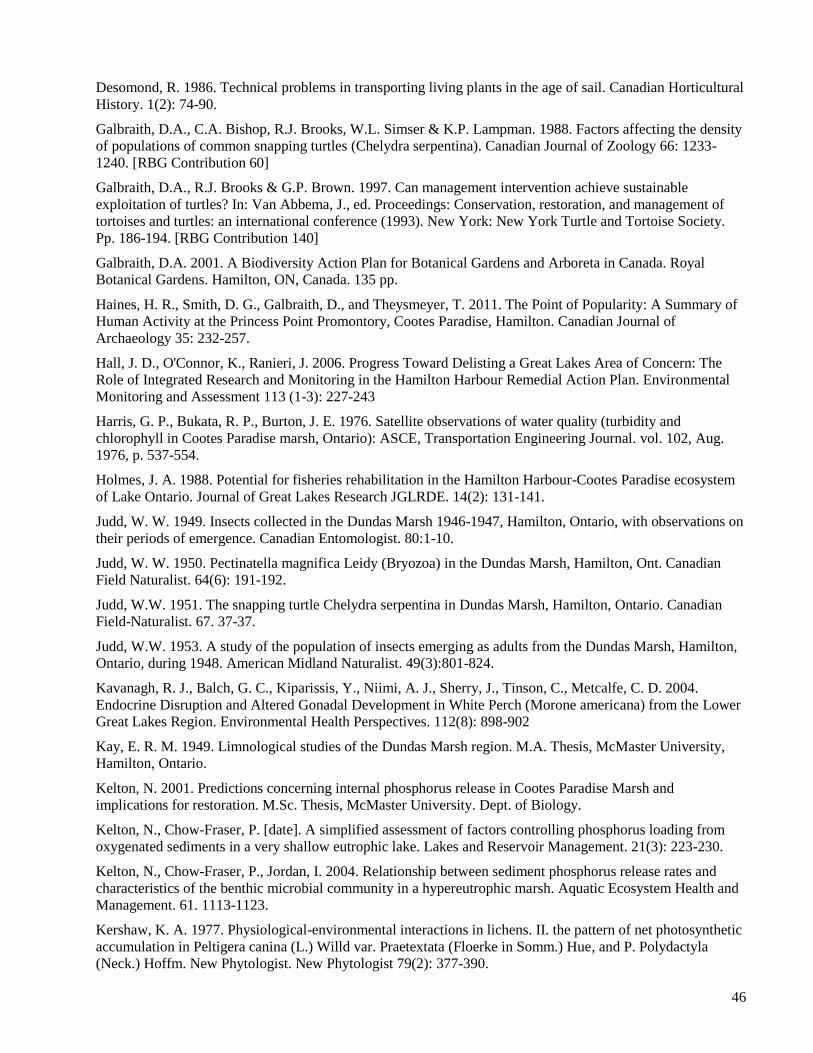
46
Desomond, R. 1986. Technical problems in transporting living plants in the age of sail. Canadian Horticultural
History. 1(2): 74-90.
Galbraith, D.A., C.A. Bishop, R.J. Brooks, W.L. Simser & K.P. Lampman. 1988. Factors affecting the density
of populations of common snapping turtles (Chelydra serpentina). Canadian Journal of Zoology 66: 1233-
1240. [RBG Contribution 60]
Galbraith, D.A., R.J. Brooks & G.P. Brown. 1997. Can management intervention achieve sustainable
exploitation of turtles? In: Van Abbema, J., ed. Proceedings: Conservation, restoration, and management of
tortoises and turtles: an international conference (1993). New York: New York Turtle and Tortoise Society.
Pp. 186-194. [RBG Contribution 140]
Galbraith, D.A. 2001. A Biodiversity Action Plan for Botanical Gardens and Arboreta in Canada. Royal
Botanical Gardens. Hamilton, ON, Canada. 135 pp.
Haines, H. R., Smith, D. G., Galbraith, D., and Theysmeyer, T. 2011. The Point of Popularity: A Summary of
Human Activity at the Princess Point Promontory, Cootes Paradise, Hamilton. Canadian Journal of
Archaeology 35: 232-257.
Hall, J. D., O'Connor, K., Ranieri, J. 2006. Progress Toward Delisting a Great Lakes Area of Concern: The
Role of Integrated Research and Monitoring in the Hamilton Harbour Remedial Action Plan. Environmental
Monitoring and Assessment 113 (1-3): 227-243
Harris, G. P., Bukata, R. P., Burton, J. E. 1976. Satellite observations of water quality (turbidity and
chlorophyll in Cootes Paradise marsh, Ontario): ASCE, Transportation Engineering Journal. vol. 102, Aug.
1976, p. 537-554.
Holmes, J. A. 1988. Potential for fisheries rehabilitation in the Hamilton Harbour-Cootes Paradise ecosystem
of Lake Ontario. Journal of Great Lakes Research JGLRDE. 14(2): 131-141.
Judd, W. W. 1949. Insects collected in the Dundas Marsh 1946-1947, Hamilton, Ontario, with observations on
their periods of emergence. Canadian Entomologist. 80:1-10.
Judd, W. W. 1950. Pectinatella magnifica Leidy (Bryozoa) in the Dundas Marsh, Hamilton, Ont. Canadian
Field Naturalist. 64(6): 191-192.
Judd, W.W. 1951. The snapping turtle Chelydra serpentina in Dundas Marsh, Hamilton, Ontario. Canadian
Field-Naturalist. 67. 37-37.
Judd, W.W. 1953. A study of the population of insects emerging as adults from the Dundas Marsh, Hamilton,
Ontario, during 1948. American Midland Naturalist. 49(3):801-824.
Kavanagh, R. J., Balch, G. C., Kiparissis, Y., Niimi, A. J., Sherry, J., Tinson, C., Metcalfe, C. D. 2004.
Endocrine Disruption and Altered Gonadal Development in White Perch (Morone americana) from the Lower
Great Lakes Region. Environmental Health Perspectives. 112(8): 898-902
Kay, E. R. M. 1949. Limnological studies of the Dundas Marsh region. M.A. Thesis, McMaster University,
Hamilton, Ontario.
Kelton, N. 2001. Predictions concerning internal phosphorus release in Cootes Paradise Marsh and
implications for restoration. M.Sc. Thesis, McMaster University. Dept. of Biology.
Kelton, N., Chow-Fraser, P. [date]. A simplified assessment of factors controlling phosphorus loading from
oxygenated sediments in a very shallow eutrophic lake. Lakes and Reservoir Management. 21(3): 223-230.
Kelton, N., Chow-Fraser, P., Jordan, I. 2004. Relationship between sediment phosphorus release rates and
characteristics of the benthic microbial community in a hypereutrophic marsh. Aquatic Ecosystem Health and
Management. 61. 1113-1123.
Kershaw, K. A. 1977. Physiological-environmental interactions in lichens. II. the pattern of net photosynthetic
accumulation in Peltigera canina (L.) Willd var. Praetextata (Floerke in Somm.) Hue, and P. Polydactyla
(Neck.) Hoffm. New Phytologist. New Phytologist 79(2): 377-390.
47
Kremer, D., Stabentheiner, E., Borzan, Z. 2005. Pollen traits of some American ashes investigated by a
scanning electron microscope. Acta Botanica Croatica. 64(1): 47-55.
Lamoureax, W.J. 1957. Aquatic plants for fish and wildlife. Royal Botanical Gardens Technical Bulletin
Number 1. Royal Botanical Gardens, Hamilton, Ontario.
Lamoureax, W.J. 1963. Aquatic plants for fish and wildlife. First Revision. Royal Botanical Gardens
Technical Bulletin Number 1. Royal Botanical Gardens, Hamilton, Ontario.
Lamoureax, W.J. 1970. Aquatic plants for fish and wildlife. Second Revision. Royal Botanical Gardens
Technical Bulletin Number 1. Royal Botanical Gardens, Hamilton, Ontario.
Lamoureax, John. 1979. Aquatic Plants for Fish and Wildlife. Royal Botanical Gardens Technical Bulletin. 1
(3rd Ed).
Lavender, B. 1987. Historical geography of Cootes Paradise, Ontario. Senior Honours Thesis, Dept. of
Geography, University of Waterloo, Waterloo, Ontario.
Lee, G. A., Davis, A. M., Smith, D. G., McAndrews, J. H. 2004. Identifying fossil Wild Rice (Zizania) pollen
from Cootes Paradise, Ontario: a new approach using scanning electron microscopy. Journal of
Archaeological Science. 31. 411-421.
Lougheed, V. L. 2001. A study of water quality, zooplankton and macrophytes in wetlands of the Canadian
Great Lakes Basin : implications for the restoration of Cootes Paradise Marsh. Ph.D. Thesis, McMaster
University. Dept. of Biology. xiv, 285 leaves : ill. 28 cm.
Lougheed, V. L., Chow-Fraser, P. 1998. Factors that regulate the zooplankton community structure of a turbid,
hypereutrophic Great Lakes wetland. Canadian Journal of Fisheries and Aquatic Sciences. 55. 150-161.
Lougheed, V. L., Chow-Fraser, P. 2001. Spatial variability in the response of lower trophic levels after carp
exclusion from a freshwater marsh. Journal of Aquatic Ecosystem Stress and Recovery. 9. 21-34.
Lougheed, V. L., Chow-Fraser, P. 2002. Development and use of a zooplankton index to monitor wetland
quality in Canadian marshes of the Great Lakes basin. Ecological Applications. 12(2): 474-486.
Lougheed, V. L., Crosbie, B., Chow-Fraser, P. 1998. Predictions on the effect of common carp (Cyprinus
carpio) exclusion on water quality, zooplankton and submergent macropytes in a Great Lakes wetland.
Canadian Journal of Fisheries and Aquatic Sciences. 55. 1189-1197.
Lougheed, V. L., Theÿsmeÿer, T., Smith, T., Chow-Fraser, P. 2004. Carp exclusion, food-web interactions,
and the restoration of Cootes Paradise Marsh. Journal of Great Lakes Research. 30(1): 44-57.
Lundholm, J.T., & W.L. Simser. 1999. Revegetation of submerged macrophyte populations in a disturbed
Lake Ontario coastal marsh. Journal of Great Lakes Research 25: 395-400. [RBG Contribution 146]
Mayer, T. Rosa, F., and Charlton, M. 2005. Effect of sediment geochemistry on the nutrient release rates in
Cootes Paradise Marsh, Ontario, Canada. Aquatic Ecosystem Health & Management 8(2): 133-145
DOI:10.1080/14634980590954986T.
Mayer, T., Rosa, F., Charlton, M. 2005. Relationship between the sediment geochemistry and internal
phosphorus loadings in a Great Lakes coastal marsh, Cootes Paradise, ON, Canada. Materials and
Geoenvironment. (reprinted as citation below in book form)
Mayer, T., Rosa, F., Mayer, R., Charlton, M. 2006. Relationship between the sediment geochemistry and
phosphorus fluxes in a Great Lakes Coastal Marsh, Cootes Paradise, ON, Canada. IN Kronvang, B., Faganeli,
J., Ogrinc, N. (Eds.)The Interactions Between Sediments and Water. Pp. 131-139. Springer. The Netherlands.
McCarthy, L. H., Thomas, R. L., Mayfield, C. I. 2004. Assessing the toxicity of chemically fractionated
Hamilton Harbour (Lake Ontario) sediment using selected aquatic organisms. Lakes & Reservoirs: Research
and Management 9 (1) 89–102.
48
McNair, S. A., Chow-Fraser, P. 2003. Change in biomass of benthic and planktonic algae along a disturbance
gradient for 24 Great Lakes coastal wetlands. Canadian Journal of Fisheries and Aquatic Sciences. 60. 676-
689.
Naoum, S., Tsanis, I. K. 2004. A hydroinformatic approach to assess interpolation techniques in high spatial
and temporal resolution. Canadian Water Resources Journal 29(1): 23–46.
Painter, D.S., K.J. McCabe & W.L. Simser. 1989. Past and present limnological conditions in Cootes Paradise
affecting aquatic vegetation. Royal Botanical Gardens Technical Bulletin Number 13. Royal Botanical
Gardens, Hamilton, Ontario.
Pringle, J.S. 1969. Checklist of the spontaneous vascular flora of the Royal Botanical Gardens, Hamilton,
Ontario, Canada. Royal Botanical Gardens Technical Bulletin Number 4. Royal Botanical Gardens, Hamilton,
Ontario.
Pringle, J.S. 1995. Prior history of floristic exploration in the Hamilton-Wentworth Region. In: Goodban, A.G.
The Vascular Plant Flora of the Regional Municipality of Hamilton-Wentworth, Ontario. Ancaster: Hamilton
Region Conservation Authority. Pp. 8-15. [RBG Contribution 133]
Prescott, K. 1996. The application of mass balance and hydrodynamic/pollutant transport models for wetland
restoration. M. Eng. Thesis, McMaster University. Dept. of Civil Engineering.
Prescott, K. L., Doka, S. E., Minns, C. K., et al. 1997. An ecosystem model for Cootes Paradise Marsh II:
Model implementation and gaps . 40th Conference of the International Association for Great Lakes Research.
Prescott, K. L., Doka, S. E., Minns, C. K., et al. 1997. An ecosystem model for Cootes Paradise Marsh I:
Overall approach and management implications. 40th Conference of the International Association for Great
Lakes Research.
Reddick D. & Theysmeyer, T. 2012: 20 year trends in water quality, Cootes Paradise and Grindstone Marsh.
RBG technical bullentin, ISBN# 978-0-9921264-1-4
Reid, S. M., Fox, M. G., Whillans, T. H. 1999. Influence of turbidity on piscivory in largemouth bass
(Micropterus salmoides) . Canadian Journal of Fisheries and Aquatic Sciences. 56(8): 1362-1369
Sadek, N. T. 1990. The Dunington-Grubb and Stensson Collection at the University of Guelph Library.
Seilheimer, T., Chow-Fraser, P. 2006. Development and validation of the wetland fish index to assess the
quality of coastal wetlands in the Laurentian Great Lakes. Canadian Journal of Fisheries and Aquatic Sciences.
63. 354-366.
Semkin, R. G., Craig, D., McLarty, A. W. 1976. A water quality study of Cootes Paradise: [summary and
conclusions]. Ontario Ministry of the Environment, West Central Region.
Sims, R. A. 1949. Phytoplankton studies of Cootes Paradise Marsh, Royal Botanical Gardens, Hamilton. M.A.
Thesis, McMaster University, Hamilton, Ontario.
Simser, W.L. 1982. Changes in the aquatic biota of Cootes Paradise Marsh. Royal Botanical Gardens
Technical Bulletin Number 12. Royal Botanical Gardens, Hamilton, Ontario.
Sirdevan, J. E., Quinn, J. S. 1997. Foraging patterns of Caspian Terns (Sterna caspia) determined using radio-
telemetry. Colonial Waterbirds. 20: 429-435.
Skafel, M. G. 2000. Exchange flow between Hamilton Harbour and Cootes Paradise. Journal of Great Lakes
Research 26(1): 120-125.
Smith, T., J. Lundholm, & L. Simser. 2001. Wetland vegetation monitoring in Cootes Paradise: Measuring the
response of a fishway/carp barrier. Ecological Restoration 19: 145-154. [RBG Contribution 149]
Smith, T. 2003. Checklist of the vascular flora of Royal Botanical Gardens. Hamilton. Electronic Publication.
Royal Botanical Gardens. [RBG Contribution 113]
49
Stevens, K. J., Peterson, R. L. 1996. The effect of a water gradient on the vesicular-arbuscular mycorrhizal
status of Lythrum salicaria L. (purple loosestrife). Mycorrhiza 6: 99-104.
Stirrup, M., Vitasovic, Z. , Strand, E. 1997. Real-time control of combined sewer overflows in Hamilton-
Wentworth region. Water Quality Research Journal of Canada. 32(1): 155-168.
Theÿsmeÿer, T. 1998. The Cootes Paradise fishway/carp barrier, and its effect on the fish community. 41rd
Conference of the International Association for Great Lakes Research.
Theÿsmeÿer, T. 1999. The ecological relationship between Cootes Paradise Marsh and the fish community.
M.Sc. Thesis, McMaster University, Hamilton, Ontario. 220 pp.
Theÿsmeÿer, T. 2007. Cootes Paradise Restoration - Adopt a creek. BARC Newsletter. No. 58. pg 6 (Fall
2007)
Trehane, P., Brickell, C. D., Baum, B. R., Hetterscheid, W. L. A., Leslie, A. C., McNeil, J., Spongberg, S. A.,
Vrugtman, F. (eds): 1995. International Code of Nomenclature for Cultivated Plants-1995. Quarterjack
Publishing, Hampreston Manor, Wimborne, Dorset, U.K. RBG Contribution 136.
Tsanis, I. K., Prescott K. L., Shen H. 1998. Modelling of phosphorus and suspended solids in Cootes Paradise
marsh. Ecological Modelling. 114: 1-17.
Turner, R. E. 1948. The fish population of the Dundas Marsh, Ontario. B.A. Thesis, Department of Biology,
McMaster University, Hamilton, Ontario.
Warren, A. E. 1950. The fauna of the Royal Botanical Gardens, Hamilton, Ontario. Canadian Field-Naturalist.
64(4): 130-133
Wei, A. 2007. Forecasting the response of coastal wetlands to declining water levels and environmental
disturbances in the Great Lakes. Ph.D. Thesis, Biology Department, McMaster University.
Wei, A. H., Chow-Fraser, P. 2006. Synergistic impact of water level fluctuation and invasion of Glyceria on
Typha in a freshwater marsh of Lake Ontario. Aquatic Botany. 84(1): 63-69.
Wei, A., Chow-Fraser, P. 2005. Untangling the confounding effects of urbanization and high water level on
the cover of emergent vegetation in Cootes Paradise Marsh, a degraded coastal wetland of Lake Ontario.
Hydrobiologia. 544. 1-9.
Wei, A., Chow-Fraser, P. 2008. Testing the transferability of a marsh-inundation model across two landscapes.
Hydrobiologia. 600. 41-47.
Whillans, T. H. 1996. Historic and comparative perspectives on rehabilitation of marshes as habitat for fish in
the lower Great Lakes basin . Canadian Journal of Fisheries and Aquatic Sciences. 53 (supp 1): 58-66.
Wilcox, D. A., Whillans, T. H. 1999. Techniques for restoration of disturbed coastal wetlands of the Great
Lakes…. Wetlands 19: 835-857.
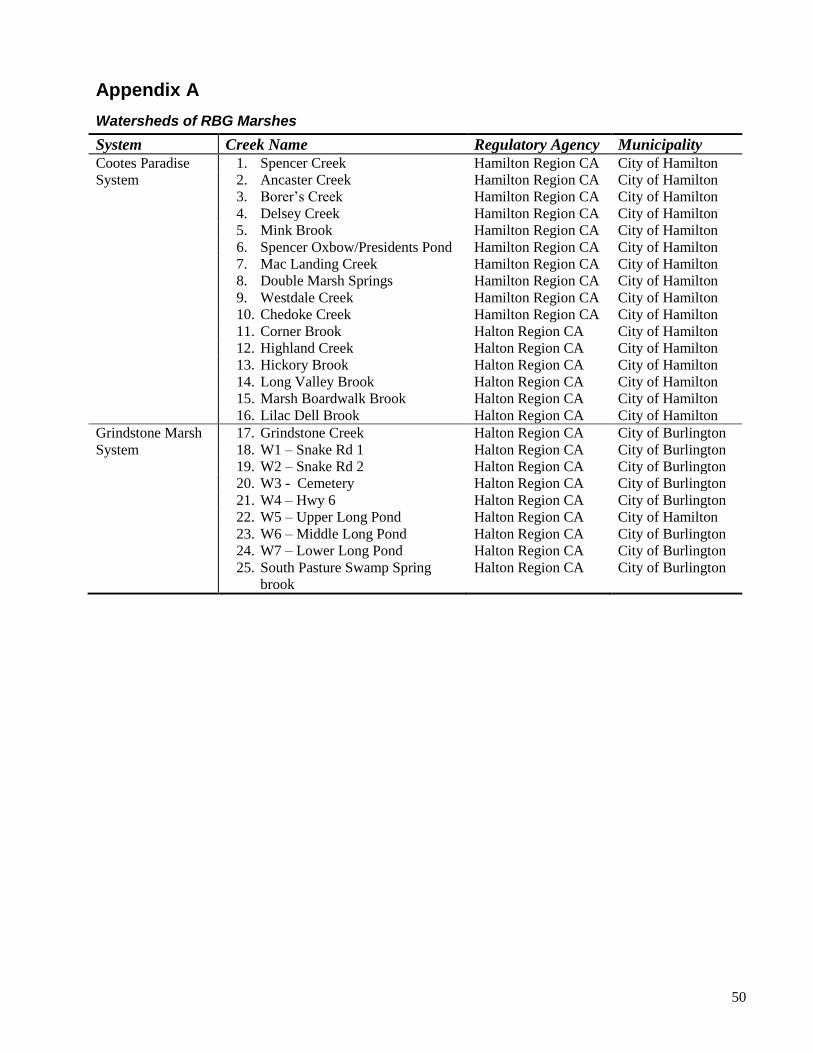
50
Appendix A
Watersheds of RBG Marshes
System Creek Name Regulatory Agency Municipality
Cootes Paradise 1. Spencer Creek Hamilton Region CA City of Hamilton
System 2. Ancaster Creek Hamilton Region CA City of Hamilton
3. Borer’s Creek Hamilton Region CA City of Hamilton
4. Delsey Creek Hamilton Region CA City of Hamilton
5. Mink Brook Hamilton Region CA City of Hamilton
6. Spencer Oxbow/Presidents Pond Hamilton Region CA City of Hamilton
7. Mac Landing Creek Hamilton Region CA City of Hamilton
8. Double Marsh Springs Hamilton Region CA City of Hamilton
9. Westdale Creek Hamilton Region CA City of Hamilton
10. Chedoke Creek Hamilton Region CA City of Hamilton
11. Corner Brook Halton Region CA City of Hamilton
12. Highland Creek Halton Region CA City of Hamilton
13. Hickory Brook Halton Region CA City of Hamilton
14. Long Valley Brook Halton Region CA City of Hamilton
15. Marsh Boardwalk Brook Halton Region CA City of Hamilton
16. Lilac Dell Brook Halton Region CA City of Hamilton
Grindstone Marsh 17. Grindstone Creek Halton Region CA City of Burlington
System 18. W1 – Snake Rd 1 Halton Region CA City of Burlington
19. W2 – Snake Rd 2 Halton Region CA City of Burlington
20. W3 - Cemetery Halton Region CA City of Burlington
21. W4 – Hwy 6 Halton Region CA City of Burlington
22. W5 – Upper Long Pond Halton Region CA City of Hamilton
23. W6 – Middle Long Pond Halton Region CA City of Burlington
24. W7 – Lower Long Pond Halton Region CA City of Burlington
25. South Pasture Swamp Spring
brook
Halton Region CA City of Burlington
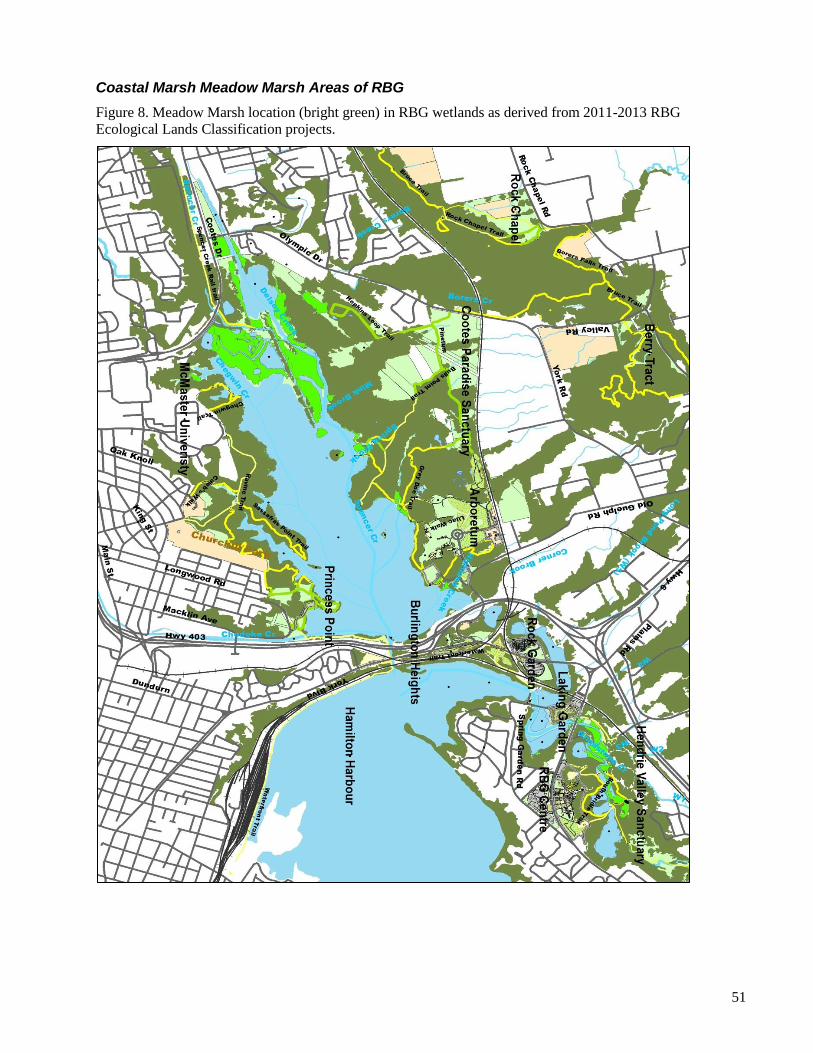
51
Coastal Marsh Meadow Marsh Areas of RBG
Figure 8. Meadow Marsh location (bright green) in RBG wetlands as derived from 2011-2013 RBG
Ecological Lands Classification projects.
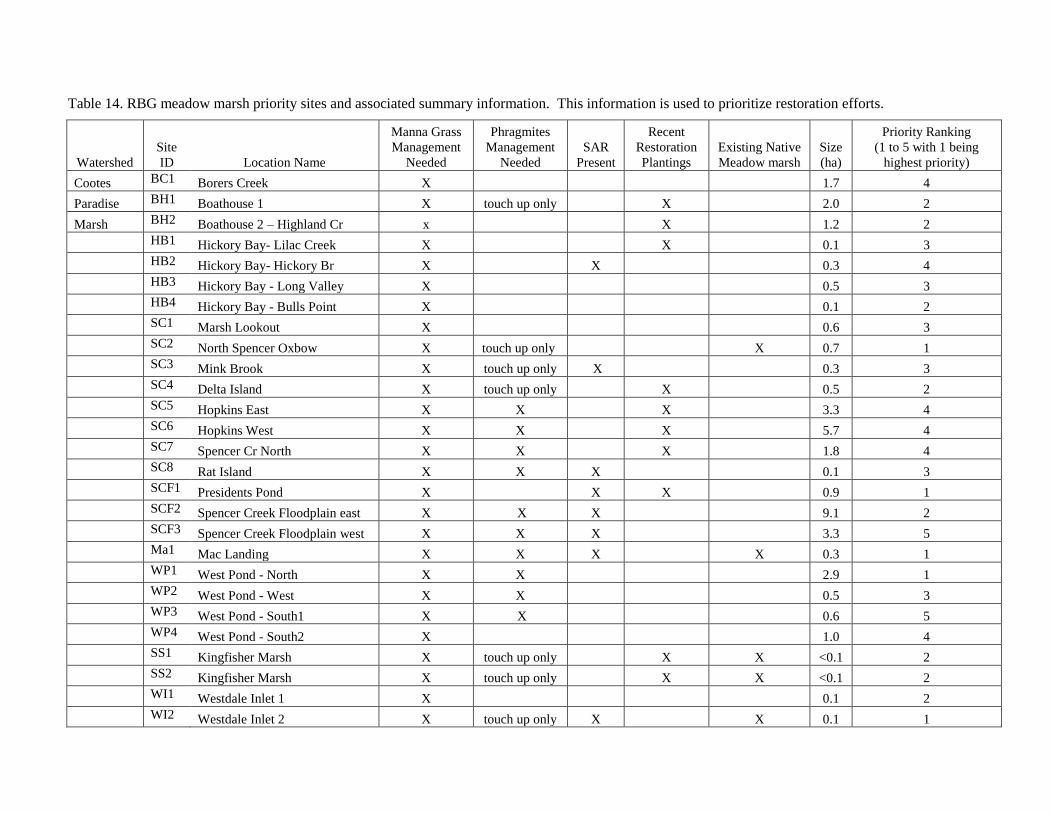
Table 14. RBG meadow marsh priority sites and associated summary information. This information is used to prioritize restoration efforts.
Watershed
Site
ID Location Name
Manna Grass
Management
Needed
Phragmites
Management
Needed
SAR
Present
Recent
Restoration
Plantings
Existing Native
Meadow marsh
Size
(ha)
Priority Ranking
(1 to 5 with 1 being
highest priority)
Cootes BC1 Borers Creek X 1.7 4
Paradise BH1 Boathouse 1 X touch up only X 2.0 2
Marsh BH2 Boathouse 2 – Highland Cr x X 1.2 2
HB1 Hickory Bay- Lilac Creek X X 0.1 3
HB2 Hickory Bay- Hickory Br X X 0.3 4
HB3 Hickory Bay - Long Valley X 0.5 3
HB4 Hickory Bay - Bulls Point X 0.1 2
SC1 Marsh Lookout X 0.6 3
SC2 North Spencer Oxbow X touch up only X 0.7 1
SC3 Mink Brook X touch up only X 0.3 3
SC4 Delta Island X touch up only X 0.5 2
SC5 Hopkins East X X X 3.3 4
SC6 Hopkins West X X X 5.7 4
SC7 Spencer Cr North X X X 1.8 4
SC8 Rat Island X X X 0.1 3
SCF1 Presidents Pond X X X 0.9 1
SCF2 Spencer Creek Floodplain east X X X 9.1 2
SCF3 Spencer Creek Floodplain west X X X 3.3 5
Ma1 Mac Landing X X X X 0.3 1
WP1 West Pond - North X X 2.9 1
WP2 West Pond - West X X 0.5 3
WP3 West Pond - South1 X X 0.6 5
WP4 West Pond - South2 X
1.0 4
SS1 Kingfisher Marsh X touch up only X X <0.1 2
SS2 Kingfisher Marsh X touch up only X X <0.1 2
WI1 Westdale Inlet 1 X 0.1 2
WI2 Westdale Inlet 2 X touch up only X X 0.1 1
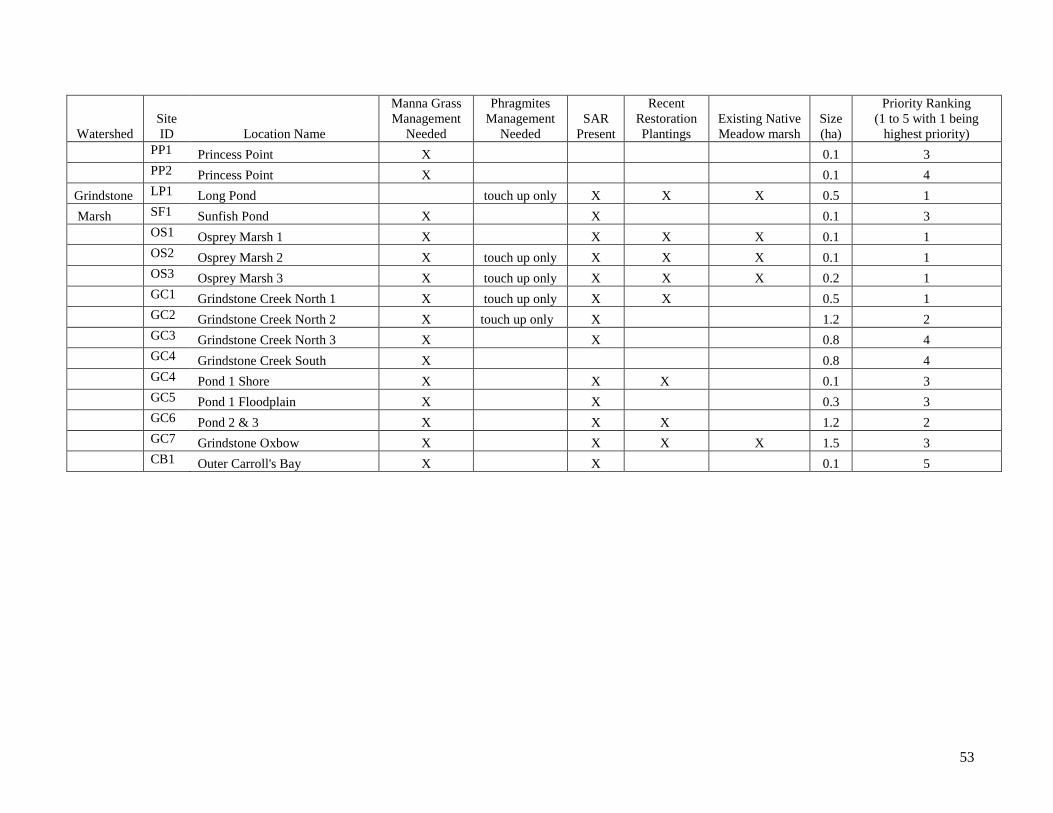
53
Watershed
Site
ID Location Name
Manna Grass
Management
Needed
Phragmites
Management
Needed
SAR
Present
Recent
Restoration
Plantings
Existing Native
Meadow marsh
Size
(ha)
Priority Ranking
(1 to 5 with 1 being
highest priority)
PP1 Princess Point X 0.1 3
PP2 Princess Point X 0.1 4
Grindstone LP1 Long Pond touch up only X X X 0.5 1
Marsh SF1 Sunfish Pond X X 0.1 3
OS1 Osprey Marsh 1 X
X X X 0.1 1
OS2 Osprey Marsh 2 X touch up only X X X 0.1 1
OS3 Osprey Marsh 3 X touch up only X X X 0.2 1
GC1 Grindstone Creek North 1 X touch up only X X 0.5 1
GC2 Grindstone Creek North 2 X touch up only X 1.2 2
GC3 Grindstone Creek North 3 X X 0.8 4
GC4 Grindstone Creek South X 0.8 4
GC4 Pond 1 Shore X X X 0.1 3
GC5 Pond 1 Floodplain X X 0.3 3
GC6 Pond 2 & 3 X X X 1.2 2
GC7 Grindstone Oxbow X X X X 1.5 3
CB1 Outer Carroll's Bay X X 0.1 5

54
Figure 9. Bathymetry of Cootes Paradise Marsh and associated stream, by stream order size. Average spring high water level in Cootes Paradise is 75.15
msl and average winter low is 74.45 msl (from Water levels Implications RBG 2004). Peak spring water level generally occurs mid May to mid June.
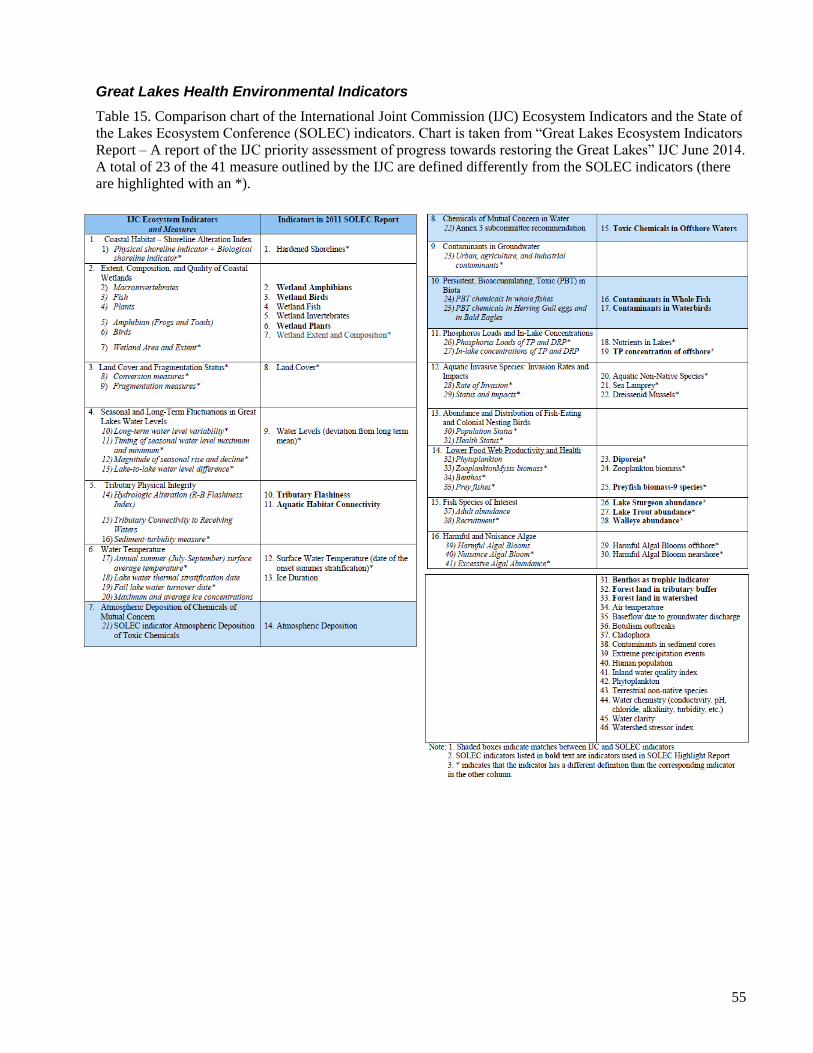
55
Great Lakes Health Environmental Indicators
Table 15. Comparison chart of the International Joint Commission (IJC) Ecosystem Indicators and the State of
the Lakes Ecosystem Conference (SOLEC) indicators. Chart is taken from “Great Lakes Ecosystem Indicators
Report – A report of the IJC priority assessment of progress towards restoring the Great Lakes” IJC June 2014.
A total of 23 of the 41 measure outlined by the IJC are defined differently from the SOLEC indicators (there
are highlighted with an *).
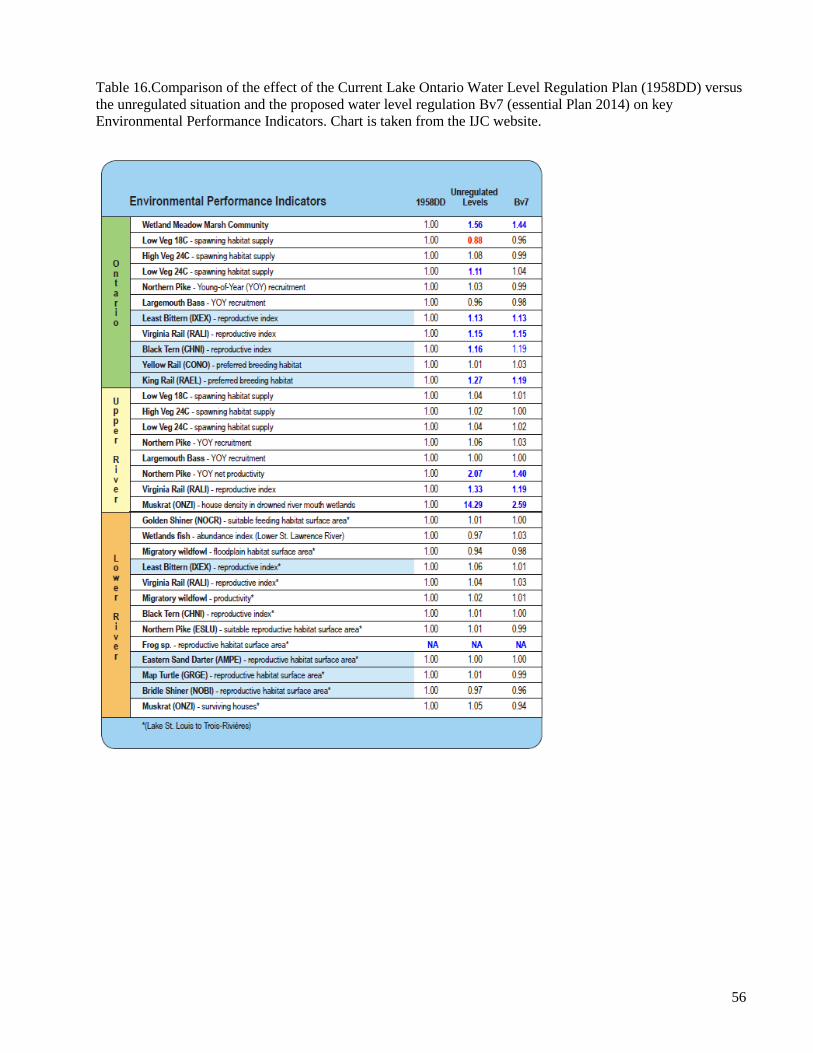
56
Table 16.Comparison of the effect of the Current Lake Ontario Water Level Regulation Plan (1958DD) versus
the unregulated situation and the proposed water level regulation Bv7 (essential Plan 2014) on key
Environmental Performance Indicators. Chart is taken from the IJC website.
57
Related Strategies of Partners In planning for the future, Royal Botanical Gardens has identified a number of Strategies and Plans that align with the
mandate of Gardens, and may help guide stakeholders in relation to their involvement.
1. Great Lakes Water Quality Agreement
2. Canada-Ontario Water Quality agreement
3. Federal Biodiversity Strategy
4. Lake Ontario Binational Biodiversity Conservation Strategy
5. Federal Invasive alien Species Strategy
6. Federal Great Lakes Wetlands Conservation Action Plan.
7. Species at Risk Recovery Strategies – various
8. Provincial Biodiversity Strategy
9. Provincial Great Lakes Protection Act
10. Provincial Invasive Species Act
11. Provincial Lake Ontario Management Plan
12. Provincial Pollinator Strategy
13. City of Hamilton Storm water Master Plan
14. City of Hamilton Wastewater Master Plan
15. Grindstone Creek Watershed Plan
16. Hamilton CA Subwatershed Plans - various
17. MNR Hamilton Area Fisheries Management Plan
18. North American Waterfowl Management Plan
19. North American Shorebird Management Plan
20. Niagara Escarpment Plan
21. The Greenbelt Plan
22. Cootes to Escarpment Ecopark System
23. Canadian Biosphere Network
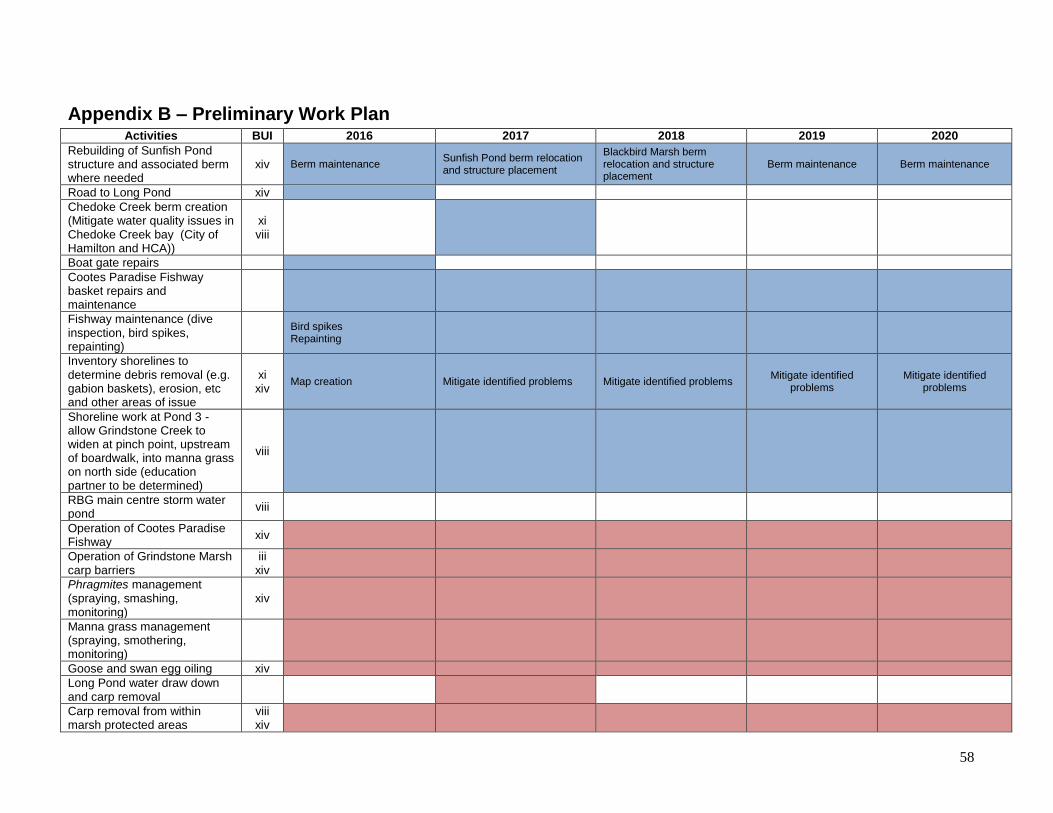
58
Appendix B – Preliminary Work Plan Activities BUI 2016 2017 2018 2019 2020
Rebuilding of Sunfish Pond structure and associated berm where needed
xiv Berm maintenance Sunfish Pond berm relocation and structure placement
Blackbird Marsh berm relocation and structure placement
Berm maintenance Berm maintenance
Road to Long Pond xiv
Chedoke Creek berm creation (Mitigate water quality issues in Chedoke Creek bay (City of Hamilton and HCA))
xi viii
Boat gate repairs
Cootes Paradise Fishway basket repairs and maintenance
Fishway maintenance (dive inspection, bird spikes, repainting)
Bird spikes Repainting
Inventory shorelines to determine debris removal (e.g. gabion baskets), erosion, etc and other areas of issue
xi xiv
Map creation Mitigate identified problems Mitigate identified problems Mitigate identified
problems Mitigate identified
problems
Shoreline work at Pond 3 - allow Grindstone Creek to widen at pinch point, upstream of boardwalk, into manna grass on north side (education partner to be determined)
viii
RBG main centre storm water pond
viii
Operation of Cootes Paradise Fishway
xiv
Operation of Grindstone Marsh carp barriers
iii xiv
Phragmites management (spraying, smashing, monitoring)
xiv
Manna grass management (spraying, smothering, monitoring)
Goose and swan egg oiling xiv
Long Pond water draw down and carp removal
Carp removal from within marsh protected areas
viii xiv
59
Activities BUI 2016 2017 2018 2019 2020
New invasive species inventories
Extend Spencer Creek Channel
viii xiv
Build Chedoke Creek channel
Shoreline Stabilization
Meadow Marsh restoration
Cootes Paradise Marsh north shore oxbow creation
Creation of Cootes inner bay
Bull’s Point Planting
Island plantings
Submergent vegetation plantings
Shoreline Stabilization in Carroll’s Bay (CN)
xiv iii
Inner Carroll’s Bay shoreline stabilization
Grindstone Creek channel stabilization
Yellow Pond lily establishment xiv
Wild rice seeding and seedling planting from aquatic nursery to establish sustainable populations in Cootes Paradise Marsh and Grindstone Marshes
xiv
Fishway Monitoring
SAV monitoring xiv
Emergent vegetation monitoring
xiv Field survey Aerial photographs Field Survey Aerial photographs
Meadow Marsh Monitoring Field Survey Field Survey
Water Quality monitoring viii
Aesthetics
Sediment characterization
Canal/West Pond, Princess Point, back of Westdale Inlet, Outer
Carroll’s Bay
YOY fish monitoring iii
Salmon survey
MMP – amphibians and birds iii
Migratory Birds
Benthic invertebrate sampling vi Emerging insects RAP related
Wetland Mammal
60
Activities BUI 2016 2017 2018 2019 2020
Updated bathymetry maps of Cootes Paradise and Grindstone Marshes
viii Grindstone Marshes Cootes Paradise Marsh Map completed Grindstone Marshes
Long Pond seasonal flow monitoring
Dundas WWTP upgrade consultation
Desjardins Canal sediment contamination remediation
viii Report
Review plans for a Carroll’s Bay recovery plan with the Fish Management Sub-committee
iii xiv
Amphibian studies in West Pond and Boathouse Bay (EC)
Water level study with respect to Fishway and berms and associated mitigation
xiv
Fish telemetry study in Cootes/Hamilton Harbour/Grindstone (DFO)
iii xiv
DO and temp loggers in marsh (DFO)
iii
Freshwater mussel work habitat characterization (RBG)
vi Report
Aerial insectivore health/decline (EC)
iii viii
Marsh aesthetics measurements
xi
Develop post-secondary wetland programming
Signage update and new – 4 locations (Fishway, Boathouse, Chegwin Boardwalk, NIC)
Update interpretive information at the Nature Centre
Dismantle current interpretive display in Nature Interpretive Centre. Create new display/foyer space for Year 2 interpretive display.
Create interpretive signage package and display for Nature Interpretive Centre. Seasonal signs focusing on marsh info and natural history.
Mobile phone experience – 2 trails (i.e. geotrails or app.)
Work with local school board to create a Grade 7 based local program to be integrated into local school curriculum
Establish commitments/partnerships from local school board consultants and teachers.
Creation of Grade 7 "place-based" unit on Cootes Paradise Marsh and Bay area. Cross-curricular unit touching on geography, science, history.
61
Activities BUI 2016 2017 2018 2019 2020
Update and deliver the Wetland Restoration and Fishway school programs with new information; programs available at two curriculum levels
Update/refresh marsh-focused school programs with new and/or updated data. Programs to update include: Biodiversity, Interactions in the Environment, Fishway Demonstration, Conservation & Stewardship, Project Paradise.
Deliver all programs Deliver all programs
Deliver 10 canoe public programs
Create a school project package for download from our website, including data and intro video to Cootes Paradise and learning opportunities
School Projects webpage linked to existing Teacher Portal (www.rbg.ca/schools). Direct students and teachers to list of potential projects including real-world data from Cootes Paradise Marsh and RBG Fishway/Project Paradise.
Create short promotional video featuring Cootes Paradise Marsh, marsh restoration info. Use as marketing tool for school programs and in existing partnership with BARC mini-marsh program.
Create promotional video (contractor)
Work with BARC for Mini-marsh and volunteer plantings; provide a follow up destination for BARC outreach programs
xiv TBD
Establish new working relationship with BARC
Related Documents