UC Irvine Western Journal of Emergency Medicine: Integrating Emergency Care with Population Health Title WestJEM Full-Text Issue Permalink https://escholarship.org/uc/item/02j0c53j Journal Western Journal of Emergency Medicine: Integrating Emergency Care with Population Health, 23(3) ISSN 1936-900X Authors Do, Nathan Saucedo, Cassandra Publication Date 2022 DOI 10.5811/westjem.2022.5.57425 Copyright Information Copyright 2022 by the author(s).This work is made available under the terms of a Creative Commons Attribution License, available at https://creativecommons.org/licenses/by/4.0/ Peer reviewed eScholarship.org Powered by the California Digital Library University of California

Welcome message from author
This document is posted to help you gain knowledge. Please leave a comment to let me know what you think about it! Share it to your friends and learn new things together.
Transcript

UC IrvineWestern Journal of Emergency Medicine: Integrating Emergency Care with Population Health
TitleWestJEM Full-Text Issue
Permalinkhttps://escholarship.org/uc/item/02j0c53j
JournalWestern Journal of Emergency Medicine: Integrating Emergency Care with Population Health, 23(3)
ISSN1936-900X
AuthorsDo, NathanSaucedo, Cassandra
Publication Date2022
DOI10.5811/westjem.2022.5.57425
Copyright InformationCopyright 2022 by the author(s).This work is made available under the terms of a Creative Commons Attribution License, available at https://creativecommons.org/licenses/by/4.0/ Peer reviewed
eScholarship.org Powered by the California Digital LibraryUniversity of California
Volume 23, Number 3, May 2022 Open Access at WestJEM.com ISSN 1936-900X
West
A Peer-Reviewed, International Professional Journal
Western Journal of Em
ergency Medicine
VO
LUM
E 23, NU
MB
ER 3, M
ay 2022 PA
GES 292-442
Western Journal of Emergency Medicine:Integrating Emergency Care with Population Health
Indexed in MEDLINE
Contents continued on page iii
Endemic Infections292 Emergency Department Patients’ COVID-19 Vaccination Status and Self-Reported Barriers
BW Harvey, KJ Kelleran, H Suffoletto, C Ma, N Nan, MD Penque, EB Lerner
303 Bamlanivimab Reduces ED Returns and Hospitalizations and May Reduce COVID-19 Burden on Low-resource Border Hospitals FC Quenzer, AT Lafree, L Grey, S Singh, C Smyers, B Balog, H Montilla Guedez, K Mclntyre, S Wulfovich, J Ramirez, T Saikhon, C Tomaszewski
312 Comparing Hepatitis C Virus Screening in Clinics Versus the Emergency Department R Hluhanich, JS Ford, D Bruce, T Chechi, S Voong, S Sarkar, P Poole, N Tran, L May
318 Simulation-BasedMasteryLearningImprovesthePerformanceofDonningandDoffingofPersonalProtective Equipment by Medical Students DT Miller, N Pokrajac, J Ngo, M Gallegos, W Dixon, KN Roszczynialski, K Ng, N Taleghani, MA Gisondi
Trauma324 Computed Tomography of the Chest in Younger Pediatric Patients with Thoracic Blunt Trauma
Rarely Changes Surgical Management IT Ugalde, HK Chan, D Mendez, HE Wang
334 Trauma-informed Care Interventions in Emergency Medicine: A Systematic Review T Brown, H Ashworth, M Bass, E Rittenberg, N Levy-Carrick, S Grossman, A Lewis-O’Connor, H Stokloaa
Medical Education 345 Holistic Review, Mitigating Bias, and Other Strategies in Residency Recruitment for Diversity,
Equity, and Inclusion: An Evidence-based Guide to Best Practices from the Council of Residency Directors in Emergency Medicine M Gallegos, A Landry, A Alvarez, D Davenport, MT Caldwell, M Parsons, M Gottlieb, S Natesan
ACOEP stands with all emergency physicians and providers on the front line. We thank you for your
tireless work and effort.
www.acoep.org
Championing individual physician rights
and workplace fairness
JOIN
CAL/AAEM!
BENEFITS- Western Journal of Emergency Medicine Subscription- CAL/AAEM News Service email updates- Free and discounted registration to CAL/AAEM events- And more!
CAL/AAEM NEWS SERVICE- Healthcare industry news- Public policy- Government issues- Legal cases and court decisions
In collaboration with our official journal
Join the CAL/AAEM Facebook Group to stay up-to-date: www.facebook.com/groups/calaaem
www.aaem.org/calaaemAAEM-0720-255
Volume 23, no. 3: May 2022 i Western Journal of Emergency Medicine
Available in MEDLINE, PubMed, PubMed Central, CINAHL, SCOPUS, Google Scholar, eScholarship, Melvyl, DOAJ, EBSCO, EMBASE, Medscape, HINARI, and MDLinx Emergency Med. Members of OASPA.
Editorial and Publishing Office: WestJEM/Depatment of Emergency Medicine, UC Irvine Health, 333 City Blvd, West, Rt 128-01, Orange, CA 92868, USA Office: 1-714-456-6389; Email: [email protected]
Official Journal of the California Chapter of the American College of Emergency Physicians, the America College of Osteopathic Emergency Physicians, and the California Chapter of the American Academy of Emergency Medicine
Western Journal of Emergency Medicine:Integrating Emergency Care with Population Health
Indexed in MEDLINE, PubMed, and Clarivate Web of Science, Science Citation Index Expanded
Resident EditorsAAEM/RSAJohn J. Campo, MDHarbor-University of California, Los Angeles Medical Center
Tehreem Rehman, MDAdvocate Christ Medical Center
ACOEPJustina Truong, DOKingman Regional Medical Center
Section EditorsBehavioral EmergenciesErin Dehon, PhDUniversity of Mississippi Medical Center
Leslie Zun, MD, MBAChicago Medical School
Marc L. Martel, MDHennepin County Medical Center
Cardiac CareFred A. Severyn, MDUniversity of Colorado School of Medicine
Michael C. Kurz, MDUniversity of Alabama at Birmingham
Sam S. Torbati, MDCedars-Sinai Medical Center
Clinical PracticeCortlyn W. Brown, MDCarolinas Medical Center
Casey Clements, MD, PhD Mayo Clinic
Patrick Meloy, MDEmory University
Nicholas Pettit, DO, PhDIndiana University
Eric Snoey, MDAlameda County Medical Center
David Thompson, MDUniversity of California, San Francisco
Kenneth S. Whitlow, DOKaweah Delta Medical Center
Critical CareChristopher “Kit” Tainter, MDUniversity of California, San Diego
Gabriel Wardi, MDUniversity of California, San Diego
Joseph Shiber, MDUniversity of Florida-College of Medicine
Matt Prekker MD, MPHHennepin County Medical Center
David Page, MDUniversity of Alabama
Erik Melnychuk, MDGeisinger Health
Quincy Tran, MD, PhDUniversity of Maryland
Disaster MedicineChristopher Kang, MDMadigan Army Medical Center
EducationDanya Khoujah, MBBS University of Maryland School of Medicine
Jeffrey Druck, MDUniversity of Colorado
John Burkhardt, MD, MAUniversity of Michigan Medical School
Michael Epter, DOMaricopa Medical Center
ED Administration, Quality, SafetyDavid C. Lee, MDNorthshore University Hospital
Gary Johnson, MDUpstate Medical University
Brian J. Yun, MD, MBA, MPHHarvard Medical School
Laura Walker, MDMayo Clinic
León D. Sánchez, MD, MPHBeth Israel Deaconess Medical Center
William Fernandez, MD, MPHUniversity of Texas Health-San Antonio
Emergency Medical Services Daniel Joseph, MDYale University
Joshua B. Gaither, MDUniversity of Arizona, Tuscon
Julian MappUniversity of Texas, San Antonio
Shira A. Schlesinger, MD, MPH Harbor-UCLA Medical Center
GeriatricsCameron Gettel, MDYale School of Medicine
Stephen Meldon, MDCleveland Clinic
Luna Ragsdale, MD, MPHDuke University
Health EquityEmily C. Manchanda, MD, MPHBoston University School of Medicine
Mandy J. Hill, DrPH, MPHUT Health McGovern Medical School
Infectious DiseaseElissa Schechter-Perkins, MD, MPHBoston University School of Medicine
Ioannis Koutroulis, MD, MBA, PhDDrexel University College of Medicine
Kevin Lunney, MD, MHS, PhDUniversity of Maryland School of Medicine
Robert Derlet, MDFounding Editor, California Journal of Emergency MedicineUniversity of California, Davis
Stephen Liang, MD, MPHSWashington University School of Medicine
Injury PreventionMark Faul, PhD, MACenters for Disease Control and Prevention
Wirachin Hoonpongsimanont, MD, MSBATSEisenhower Medical Center
International MedicineHeather A.. Brown, MD, MPHPrisma Health Richland
Taylor Burkholder, MD, MPHKeck School of Medicine of USC
Christopher Greene, MD, MPHUniversity of Alabama
Chris Mills, MD, MPHSanta Clara Valley Medical Center
Shada Rouhani, MDBrigham and Women’s Hospital
Legal MedicineMelanie S. Heniff, MD, JDIndiana University School of Medicine
Greg P. Moore, MD, JDMadigan Army Medical Center
Statistics and MethodologyShu B. Chan MD, MSResurrection Medical Center
Stormy M. Morales Monks, PhD, MPHTexas Tech Health Science University
Soheil Saadat, MD, MPH, PhDUniversity of California, Irvine
James A. Meltzer, MD, MSAlbert Einstein College of Medicine
MusculoskeletalJuan F. Acosta DO, MSPacific Northwest University
NeurosciencesAntonio Siniscalchi, MDAnnunziata Hospital
Rick Lucarelli, MDMedical City Dallas Hospital
William D. Whetstone, MDUniversity of California, San Francisco
Pediatric Emergency MedicinePaul Walsh, MD, MScUniversity of California, Davis
Muhammad Waseem, MDLincoln Medical & Mental Health Center
Deena Berkowitz, MD, MPHChildren’s National Hospital
Cristina M. Zeretzke-Bien, MDUniversity of Florida
Public HealthJeremy Hess, MD, MPHUniversity of Washington Medical Center
Jacob Manteuffel, MDHenry Ford Hospital
John Ashurst, DOLehigh Valley Health Network
Tony Zitek, MDKendall Regional Medical Center
Trevor Mills, MD, MPHNorthern California VA Health Care
Erik S. Anderson, MDAlameda Health System-Highland Hospital
Technology in Emergency MedicineNikhil Goyal, MDHenry Ford Hospital
Phillips Perera, MDStanford University Medical Center
TraumaPierre Borczuk, MDMassachusetts General Hospital/Havard Medical School
ToxicologyBrandon Wills, DO, MSVirginia Commonwealth University
Jeffrey R. Suchard, MDUniversity of California, IrvineUltrasoundJ. Matthew Fields, MD Thomas Jefferson University Shane Summers, MD Brooke Army Medical Center
Robert R. EhrmanWayne State University
Mark I. Langdorf, MD, MHPE, Editor-in-Chief University of California, Irvine School of Medicine- Irvine, California
Rick A. McPheeters, DO, Associate Editor Kern Medical- Bakersfield, California
Shahram Lotfipour, MD, MPH, Managing EditorUniversity of California, Irvine School of Medicine- Irvine, California
Niels K. Rathlev, MD, Associate Editor Tufts University School of Medicine-Boston, Massachusetts
Edward Michelson, MD, Associate Editor Texas Tech University- El Paso, Texas
Michael Gottlieb, MD, Associate EditorRush Medical Center-Chicago, Illinois
Shadi Lahham, MD, MS, Deputy EditorKaiser Permanente- Irvine, California
Susan R. Wilcox, MD, Associate EditorMassachusetts General Hospital- Boston, Massachusetts
Andrew W. Phillips, MD, Associate EditorDHR Health-Edinburg, Texas
Dan Mayer, MD, Associate EditorRetired from Albany Medical College- Niskayuna, New York
Elizabeth Burner, MD, MPH, Associate EditorUniversity of Southern California- Los Angeles, California
Patrick Joseph Maher, MD, MS, Associate EditorIchan School of Medicine at Mount Sinai- New York, New York
Wendy Macias-Konstantopoulos, MD, MPH, Associate EditorMassachusetts General Hospital- Boston, Massachusetts
Yanina Purim-Shem-Tov, MD, MS, Associate EditorRush University Medical Center-Chicago, Illinois
Donna Mendez, MD, EdD, Associate EditorUniversity of Texas-Houston/McGovern Medical School- Houston Texas
Gayle Galletta, MD, Associate EditorUniversity of Massachusetts Medical School- Worcester, Massachusetts
Danya Khoujah, MBBS, Associate EditorUniversity of Maryland School of Medicine- Baltimore, MarylandGentry Wilkerson, MD, Associate Editor
University of Maryland
Ryan C. Gibbons, MDTemple Health
Western Journal of Emergency Medicine ii Volume 23, no. 3: May 2022
Available in MEDLINE, PubMed, PubMed Central, Europe PubMed Central, PubMed Central Canada, CINAHL, SCOPUS, Google Scholar, eScholarship, Melvyl, DOAJ, EBSCO, EMBASE, Medscape, HINARI, and MDLinx Emergency Med. Members of OASPA.
Editorial and Publishing Office: WestJEM/Depatment of Emergency Medicine, UC Irvine Health, 333 City Blvd, West, Rt 128-01, Orange, CA 92866, USAOffice: 1-714-456-6389; Email: [email protected]
Official Journal of the California Chapter of the American College of Emergency Physicians, the America College of Osteopathic Emergency Physicians, and the California Chapter of the American Academy of Emergency Medicine
Editorial Staff Advisory Board
Western Journal of Emergency Medicine:Integrating Emergency Care with Population Health
Indexed in MEDLINE, PubMed, and Clarivate Web of Science, Science Citation Index Expanded
Amin A. Kazzi, MD, MAAEM The American University of Beirut, Beirut, Lebanon
Anwar Al-Awadhi, MDMubarak Al-Kabeer Hospital, Jabriya, Kuwait
Arif A. Cevik, MDUnited Arab Emirates UniversityCollege of Medicine and Health Sciences, Al Ain, United Arab Emirates
Abhinandan A.Desai, MDUniversity of Bombay Grant Medical College, Bombay, India
Bandr Mzahim, MDKing Fahad Medical City, Riyadh, Saudi Arabia
Brent King, MD, MMMUniversity of Texas, Houston
Christopher E. San Miguel, MDOhio State University Wexner Medical Center
Daniel J. Dire, MD University of Texas Health Sciences Center San Antonio
David F.M. Brown, MDMassachusetts General Hospital/Harvard Medical School
Douglas Ander, MDEmory University
Edward Michelson, MDTexas Tech University
Edward Panacek, MD, MPHUniversity of South Alabama
Francesco Della Corte, MDAzienda Ospedaliera Universitaria “Maggiore della Carità,” Novara, Italy
Francis Counselman, MDEastern Virginia Medical School
Gayle Galleta, MDSørlandet Sykehus HF, Akershus Universitetssykehus, Lorenskog, Norway
Hjalti Björnsson, MDIcelandic Society of Emergency Medicine
Jacob (Kobi) Peleg, PhD, MPHTel-Aviv University, Tel-Aviv, Israel
Jaqueline Le, MDDesert Regional Medical Center
Jeffrey Love, MDThe George Washington University School of Medicine and Health Sciences
Jonathan Olshaker, MDBoston University
Katsuhiro Kanemaru, MDUniversity of Miyazaki Hospital, Miyazaki, Japan
Kenneth V. Iserson, MD, MBAUniversity of Arizona, Tucson
Khrongwong Musikatavorn, MDKing Chulalongkorn Memorial Hospital, Chulalongkorn University, Bangkok, Thailand
Leslie Zun, MD, MBAChicago Medical School
Linda S. Murphy, MLISUniversity of California, Irvine School of Medicine Librarian
Nadeem Qureshi, MDSt. Louis University, USAEmirates Society of Emergency Medicine, United Arab Emirates
Niels K. Rathlev, MDTufts University School of Medicine
Pablo Aguilera Fuenzalida, MDPontificia Universidad Catolica de Chile, Región Metropolitana, Chile
Peter A. Bell, DO, MBABaptist Health Sciences University
Peter Sokolove, MDUniversity of California, San Francisco
Rachel A. Lindor, MD, JDMayo Clinic
Robert M. Rodriguez, MD University of California, San Francisco
Robert Suter, DO, MHAUT Southwestern Medical Center
Robert W. Derlet, MDUniversity of California, Davis
Rosidah Ibrahim, MDHospital Serdang, Selangor, Malaysia
Samuel J. Stratton, MD, MPHOrange County, CA, EMS Agency
Scott Rudkin, MD, MBAUniversity of California, Irvine
Scott Zeller, MDUniversity of California, Riverside
Steven H. Lim, MDChangi General Hospital, Simei, Singapore
Terry Mulligan, DO, MPH, FIFEMACEP Ambassador to the Netherlands Society of Emergency Physicians
Vijay Gautam, MBBSUniversity of London, London, England
Wirachin Hoonpongsimanont, MD, MSBATSSiriraj Hospital, Mahidol University, Bangkok, Thailand
Amal Khalil, MBAUC Irvine Health School of Medicine
Brian Potts, MD, MBACalifornia Chapter Division of AAEM Alta Bates Summit Medical Center
Elena Lopez-Gusman, JDCalifornia ACEPAmerican College of Emergency Physicians
Lori Winston, MDCalifornia ACEPAmerican College of Emergency PhysiciansKaweah Delta Healthcare District
Mark I. Langdorf, MD, MHPEUC Irvine Health School of Medicine
Peter A. Bell, DO, MBAAmerican College of Osteopathic Emergency Physicians
Robert Suter, DO, MHAAmerican College of Osteopathic Emergency PhysiciansUT Southwestern Medical Center
Shahram Lotfipour, MD, MPHUC Irvine Health School of Medicine
Trevor Mills, MD, MPHCalifornia Chapter Division of AAEMNorthern California VA Health Care
Jorge Fernandez, MDUC San Diego Health School of Medicine
Editorial Board
Isabelle Nepomuceno, BSExecutive Editorial Director
Shreya Gupta, BSWestJEM Editorial Director
Associate Marketing Director
Sohrab Kharabaf, BSCPC-EM Editorial Director
Associate Marketing Director
Stephanie Burmeister, MLISWestJEM Staff Liaison
June Casey, BACopy Editor
Cassandra Saucedo, BSExecutive Publishing Director
Nathan Do, BSWestJEM Publishing Director
Trina Nguyen, BSCPC-EM Publishing Director
Paul Abdo, BSWestJEM Associate Publishing Director
Executive Marketing Director

Volume 23, no. 3: May 2022 iii Western Journal of Emergency Medicine
Policies for peer review, author instructions, conflicts of interest and human and animal subjects protections can be found online at www.westjem.com.
JOURNAL FOCUSEmergency medicine is a specialty which closely reflects societal challenges and consequences of public policy decisions. The emergency department specifically deals with social injustice, health and economic disparities, violence, substance abuse, and disaster preparedness and response. This journal focuses on how emergency care affects the health of the community and population, and conversely, how these societal challenges affect the composition of the patient population who seek care in the emergency department. The development of better systems to provide emergency care, including technology solutions, is critical to enhancing population health.
Table of Contents353 Just-in-Time Procedure Guides in Emergency Medicine
T Fennessy, K Parekh, R Walsh
Critical Care 358 Discrepancy Between Invasive and Noninvasive Blood Pressure Measurements in Patients with Sepsis
by Vasopressor Status QK Tran, D Gelmann, Z Alam, R Beher, E Engelbrecht-Wiggans, M Fairchild, E Hard, G Hollis, A Karwoski, J Palmer, A Raffman, DJ Haase
Emergency Department Access368 EffectofanEmergencyDepartmentClosureonHomelessPatientsandAdjacentHospitals
S Gummerson, M Smith, O Warren
Geriatrics375 Falls in Older Adults Requiring Emergency Services: Mortality, Use of Healthcare Resources, and
Prognostication at One Year CD Newgard, A Lin, AB Caughey, KJ McConnell, E Bulger, S Malveau, K Staudenmayer, E Eckstrom
Behavioral Health386 Attitudes on Methadone Utilization in the Emergency Department: A Physician Cross-sectional Study
J Heil, VS Ganetsky, MS Salzman, K Hunter, KE Baston, G Carroll, E Ketcham, R Haroz
Emergency Medical Services396 FactorsInfluencingUseofPersonalProtectiveEquipmentAmongEmergencyMedicalServices
Responders During the COVID-19 Pandemic: A Retrospective Chart Review M McCann-Pineo, T Li, B Levinsky, J Berkowitz
Women’s Health 408 Vaginal Swabs Are Non-inferior to Endocervical Swabs for Sexually Transmitted Infection testing
in the Emergency Department A Krause, JB Miller, L Samuel, JJ Manteuffel
Ethical and Legal Medicine412 Charting Practices to Protect Against Malpractice: Case Reviews and Learning Points
S Ghaith, GP Moore, KM Colbenson, RA Lindor
Emergency Medicine Workforce 418 Emergency Medicine History and Expansion into the Future: A Narrative Review
MR Huecker, J Shreffler, M Platt, D O’Brien, R Stanton, T Mulligan, J Thomas
Western Journal of Emergency Medicine:Integrating Emergency Care with Population Health
Indexed in MEDLINE, PubMed, and Clarivate Web of Science, Science Citation Index Expanded

Volume 23, no. 3: May 2022 iv Western Journal of Emergency Medicine
Table of Contents continuedPediatrics424 Visits to the Pediatric Emergency Department for Eye Conditions Before and During the
COVID-19 PandemicJ Jin, L Bules, K Doctor, D Hendricks, K Callaghan, JE Reid, J Salvin, S Lehman, A Fasiuddin, J Piatt
Research Publishing432 COVID-19 Literature Published in Emergency Medicine Journals in 2020
C Lee
Cardiology439 Adoption of High-sensitivity Troponin Testing and Emergency Physician Ordering Behavior
NR Hodgson, KL Kunze, ES Lim, SA Maher, SJ Traub
Western Journal of Emergency Medicine:Integrating Emergency Care with Population Health
Indexed in MEDLINE, PubMed, and Clarivate Web of Science, Science Citation Index Expanded

Western Journal of Emergency Medicine vii Volume 23, no. 3: May 2022
International Society Partners
Arizona Chapter Division of theAmerican Academy of Emergency MedicineCalifornia Chapter Division of theAmerican Academy of Emergency MedicineFlorida Chapter Division of theAmerican Academy of Emergency Medicine
Great Lakes Chapter Division of theAmerican Academy of Emergency MedicineTennessee Chapter Division of the
Professional Society Sponsors
State Chapter Subscriber
American College of Osteopathic Emergency PhysiciansCalifornia ACEP
California Chapter Division of American Academy of Emergency Medicine
This open access publication would not be possible without the generous and continual financial support of our society sponsors, department and chapter subscribers.
Stephanie BurmeisterWestJEM Staff LiaisonPhone: 1-800-884-2236Email: [email protected]
To become a WestJEM departmental sponsor, waive article processing fee, receive print and copies for all faculty and electronic for faculty/residents, and free CME and faculty/fellow position advertisement space, please go to http://westjem.com/subscribe or contact:
Emergency Medicine Association of TurkeyLebanese Academy of Emergency MedicineMediterranean Academy of Emergency Medicine
Norwegian Society for Emergency MedicineSociedad Argentina de Emergencias
Sociedad Chileno Medicina UrgenciaThai Association for Emergency Medicine
American Academy of Emergency Medicine Uniformed Services Chapter Division of the American Academy of Emergency Medicine
Virginia Chapter Division of the American Academy of Emergency Medicine
Western Journal of Emergency Medicine:Integrating Emergency Care with Population Health
Indexed in MEDLINE, PubMed, and Clarivate Web of Science, Science Citation Index Expanded
Academic Department of Emergency Medicine SubscriberAlbany Medical CollegeAlbany, NY
Allegheny Health Network Pittsburgh, PA
American University of Beirut Beirut, Lebanon
AMITA Health Resurrection Medical CenterChicago, IL
Arrowhead Regional Medical Center Colton, CA
Baystate Medical CenterSpringfield, MA
Bellevue Hospital CenterNew York, NY
Beth Israel Deaconess Medical CenterBoston, MA
Boston Medical CenterBoston, MA
Brigham and Women’s HospitalBoston, MA
Brown UniversityProvidence, RI
Carl R. Darnall Army Medical CenterFort Hood, TX
Conemaugh Memorial Medical CenterJohnstown, PA
Crozer-Chester Medical CenterUpland, PA
Desert Regional Medical CenterPalm Springs, CA
Eastern Virginia Medical SchoolNorfolk, VA
Einstein Healthcare NetworkPhiladelphia, PA
Eisenhower Medical CenterRancho Mirage, CA
Emory UniversityAtlanta, GA
Geisinger Medical CenterDanville, PA
Grand State Medical Center Allendale, MI
Hennepin County Medical CenterMinneapolis, MN
Henry Ford Medical Center Detroit, MI
INTEGRIS HealthOklahoma City, OK
Kaiser Permenante Medical CenterSan Diego, CA
Kaweah Delta Health Care DistrictVisalia, CA
Kennedy University HospitalsTurnersville, NJ
Kent Emergency Medical Residency Program Warwick, RI
Kern MedicalBakersfield, CA
Lakeland HealthCareSt. Joseph, MI
Lehigh Valley Hospital and Health NetworkAllentown, PA
Loma Linda University Medical CenterLoma Linda, CA
Louisiana State University Health Sciences CenterNew Orleans, LA
Madigan Army Medical CenterTacoma, WA
Maimonides Medical CenterBrooklyn, NY
Maine Medical CenterPortland, ME
Massachusetts General HospitalBoston, MA
Mayo Clinic College of MedicineRochester, MN
Mercy Health - Hackley CampusMuskegon, MI
Merit Health WesleyHattiesburg, MS
Midwestern University Glendale, AZ
New York University Langone HealthNew York, NY
North Shore University HospitalManhasset, NY
Northwestern Medical GroupChicago, IL
Ohio State University Medical CenterColumbus, OH
Ohio Valley Medical CenterWheeling, WV
Oregon Health and Science UniversityPortland, OR
Penn State Milton S. Hershey Medical CenterHershey, PA
Regions Hospital Emergency Medicine Residency ProgramSt. Paul, MN
Rhode Island HospitalProvidence, RI
Robert Wood Johnson University HospitalNew Brunswick, NJ
Rush University Medical CenterChicago, IL
St. Luke’s University Health NetworkBethlehem, PA
Spectrum Health Lakeland St. Joseph, MI
StanfordStanford, CA
SUNY Upstate Medical UniversitySyracuse, NY
Temple UniversityPhiladelphia, PA
Texas Tech University Health Sciences Center El Paso, TX
University of Alabama, BirminghamBirmingham, AL
University of California, Davis Medical CenterSacramento, CA
University of California, IrvineOrange, CA
University of California, Los AngelesLos Angeles, CA
University of California, San DiegoLa Jolla, CA
University of California, San FranciscoSan Francisco, CA
UCSF Fresno CenterFresno, CA
University of ChicagoChicago, IL
University of FloridaGainesville, FL
University of Florida, JacksonvilleJacksonville, FL
University of Illinois at Chicago Chicago, IL
University of IowaIowa City, IA
University of LouisvilleLouisville, KY
University of MarylandBaltimore, MD
University of MassachusettsAmherst, MA
University of MichiganAnn Arbor, MI
University of Missouri, ColumbiaColumbia, MO
University of Nebraska Medical CenterOmaha, NE
University of Nevada, Las VegasLas Vegas, NV
University of Southern AlabamaMobile, AL
University of Southern CaliforniaLos Angeles, CA
University of Tennessee, MemphisMemphis, TN
University of Texas, HoustonHouston, TX
University of WashingtonSeattle, WA
University of Wisconsin Hospitals and ClinicsMadison, WI
Virginia Commonwealth University Medical Center Richmond, VA
Wake Forest UniversityWinston-Salem, NC
Wake Technical Community CollegeRaleigh, NC
Wayne State Detroit, MI
Wright State UniversityDayton, OH
York HosptialYork, ME


Western Journal of Emergency Medicine 292 Volume 23, no. 3: May 2022
Original Research
Emergency Department Patients’ COVID-19 Vaccination Status and Self-Reported Barriers
Bethany W. Harvey, MD*Kyle J. Kelleran, PhD†
Heidi Suffoletto, MD†‡
Changxing Ma, PhD§
Nan Nan, MA§
Michelle D. Penque, MD¶
E. Brooke Lerner, PhD†¶
Section Editor: Erik Anderson, MD Submission history: Submitted September 3, 2021; Revision received December 2, 2021; Accepted January 27, 2022 Electronically published March 18, 2022Full text available through open access at http://escholarship.org/uc/uciem_westjem DOI: 10.5811/westjem.2022.1.54615
INTRODUCTIONEmergency departments (ED) have long acted as a safety net
for the medical needs of many in modern society and, as such,
Jacobs School of Medicine and Biomedical Sciences, Department of Surgery, Buffalo, New YorkJacobs School of Medicine and Biomedical Sciences, Department of Emergency Medicine, Buffalo, New YorkJacobs School of Medicine and Biomedical Sciences, Department of Orthopedics, Buffalo, New YorkState University of New York at Buffalo, School of Public Health and Health Professions, Department of Biostatistics, Buffalo, New YorkJacobs School of Medicine and Biomedical Sciences, Department of Pediatrics, Buffalo, New York
*
†
‡
§
¶
Introduction: This study surveyed adult emergency department (ED) patients and the adult companions of pediatric patients to determine whether rates of coronavirus disease 2019 (COVID-19) vaccination were comparable to that of the general population in the region. This study also sought to identify self-reported barriers to vaccination and possible areas for intervention.
Methods: A survey was administered to 607 adult ED patients or the adult companions of pediatric patients from three different regional hospitals to assess their COVID-19 vaccination status, COVID-19 vaccine barriers, and demographic information.
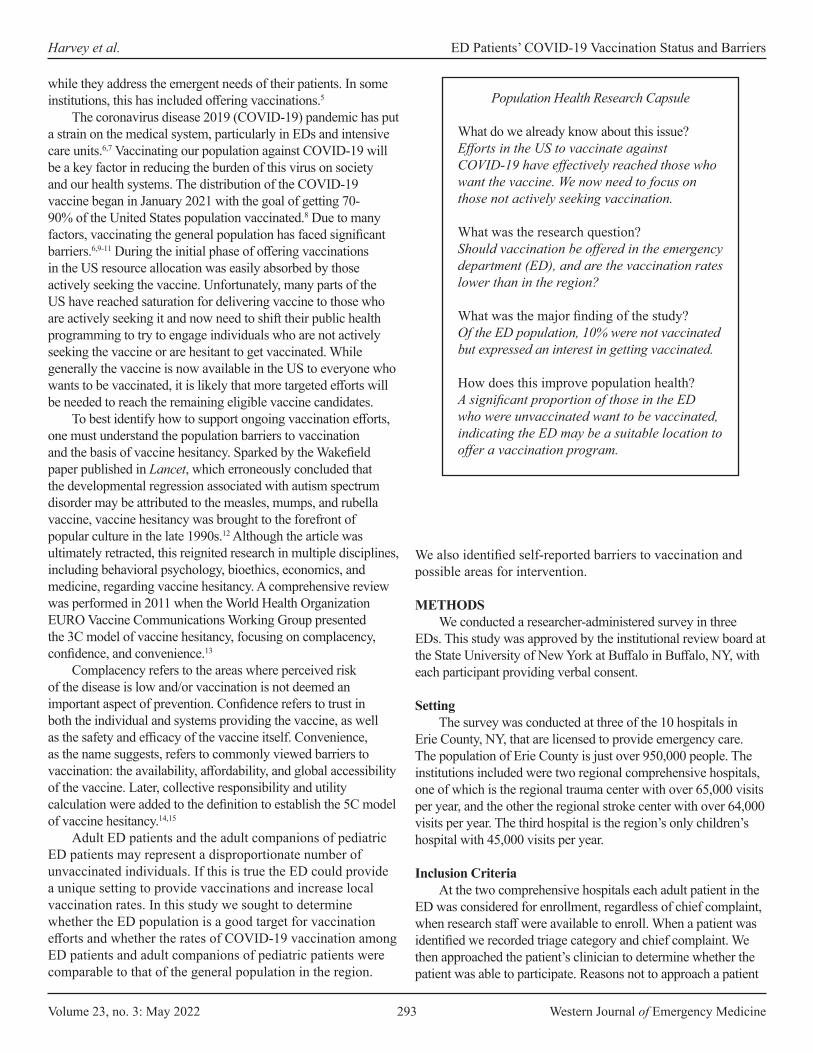
Results: Of the 2,267 adult patients/companions considered for enrollment, we approached 730 individuals about participating in the study. Of the individuals approached, 607 (41% male; mean age 47.0+17.4 years) consented to participate. A total of 403 (66.4%) participants had received at least one vaccine dose as compared to 70% of the adult population in the county where the three hospitals were located. Of those, 382 (94.8%) were fully vaccinated and among the individuals who were partially vaccinated the majority (17 of 21) had an appointment for their second dose. Of those approached, 204 (33.6%) were not vaccinated, with 66 (10.9% of the total population) expressing an interest in becoming vaccinated while the remaining 138 did not want to be vaccinated. Of those who wanted to be vaccinated 32% were waiting for more safety data, and of those who did not want to be vaccinated 26% were concerned about side effects and risks and 28% were waiting for more safety data.
Conclusion: Adult ED patients and adult companions of pediatric ED patients were vaccinated at a slightly lower rate than the general population in our county. A small but significant proportion of those who were unvaccinated expressed the desire to be vaccinated, indicating that the ED may be a suitable location to introduce a COVID-19 vaccination program. [West J Emerg Med. 2022;23(3)292–301.]
EDs are often used by those who are considered to be at risk or disadvantaged.1-4 Because of this, emergency physicians have a unique opportunity to discuss and/or offer preventative services
Volume 23, no. 3: May 2022 293 Western Journal of Emergency Medicine
Harvey et al. ED Patients’ COVID-19 Vaccination Status and Barriers
Population Health Research Capsule
What do we already know about this issue?Efforts in the US to vaccinate against COVID-19 have effectively reached those who want the vaccine. We now need to focus on those not actively seeking vaccination.
What was the research question?Should vaccination be offered in the emergency department (ED), and are the vaccination rates lower than in the region?
What was the major finding of the study?Of the ED population, 10% were not vaccinated but expressed an interest in getting vaccinated.
How does this improve population health?A significant proportion of those in the ED who were unvaccinated want to be vaccinated, indicating the ED may be a suitable location to offer a vaccination program.
while they address the emergent needs of their patients. In some institutions, this has included offering vaccinations.5
The coronavirus disease 2019 (COVID-19) pandemic has put a strain on the medical system, particularly in EDs and intensive care units.6,7 Vaccinating our population against COVID-19 will be a key factor in reducing the burden of this virus on society and our health systems. The distribution of the COVID-19 vaccine began in January 2021 with the goal of getting 70-90% of the United States population vaccinated.8 Due to many factors, vaccinating the general population has faced significant barriers.6,9-11 During the initial phase of offering vaccinations in the US resource allocation was easily absorbed by those actively seeking the vaccine. Unfortunately, many parts of the US have reached saturation for delivering vaccine to those who are actively seeking it and now need to shift their public health programming to try to engage individuals who are not actively seeking the vaccine or are hesitant to get vaccinated. While generally the vaccine is now available in the US to everyone who wants to be vaccinated, it is likely that more targeted efforts will be needed to reach the remaining eligible vaccine candidates.
To best identify how to support ongoing vaccination efforts, one must understand the population barriers to vaccination and the basis of vaccine hesitancy. Sparked by the Wakefield paper published in Lancet, which erroneously concluded that the developmental regression associated with autism spectrum disorder may be attributed to the measles, mumps, and rubella vaccine, vaccine hesitancy was brought to the forefront of popular culture in the late 1990s.12 Although the article was ultimately retracted, this reignited research in multiple disciplines, including behavioral psychology, bioethics, economics, and medicine, regarding vaccine hesitancy. A comprehensive review was performed in 2011 when the World Health Organization EURO Vaccine Communications Working Group presented the 3C model of vaccine hesitancy, focusing on complacency, confidence, and convenience.13
Complacency refers to the areas where perceived risk of the disease is low and/or vaccination is not deemed an important aspect of prevention. Confidence refers to trust in both the individual and systems providing the vaccine, as well as the safety and efficacy of the vaccine itself. Convenience, as the name suggests, refers to commonly viewed barriers to vaccination: the availability, affordability, and global accessibility of the vaccine. Later, collective responsibility and utility calculation were added to the definition to establish the 5C model of vaccine hesitancy.14,15
Adult ED patients and the adult companions of pediatric ED patients may represent a disproportionate number of unvaccinated individuals. If this is true the ED could provide a unique setting to provide vaccinations and increase local vaccination rates. In this study we sought to determine whether the ED population is a good target for vaccination efforts and whether the rates of COVID-19 vaccination among ED patients and adult companions of pediatric patients were comparable to that of the general population in the region.
We also identified self-reported barriers to vaccination and possible areas for intervention.
METHODSWe conducted a researcher-administered survey in three
EDs. This study was approved by the institutional review board at the State University of New York at Buffalo in Buffalo, NY, with each participant providing verbal consent.
SettingThe survey was conducted at three of the 10 hospitals in
Erie County, NY, that are licensed to provide emergency care. The population of Erie County is just over 950,000 people. The institutions included were two regional comprehensive hospitals, one of which is the regional trauma center with over 65,000 visits per year, and the other the regional stroke center with over 64,000 visits per year. The third hospital is the region’s only children’s hospital with 45,000 visits per year.
Inclusion CriteriaAt the two comprehensive hospitals each adult patient in the
ED was considered for enrollment, regardless of chief complaint, when research staff were available to enroll. When a patient was identified we recorded triage category and chief complaint. We then approached the patient’s clinician to determine whether the patient was able to participate. Reasons not to approach a patient

Western Journal of Emergency Medicine 294 Volume 23, no. 3: May 2022
ED Patients’ COVID-19 Vaccination Status and Barriers Harvey et al.
included being too ill to participate, not capable of providing consent, actively receiving care, non-English speaking, being subject to infectious precautions, or sleeping. At the pediatric hospital the same procedures were followed, but the targets of the survey were the adult companions of pediatric patients. If an adult patient or the adult companion of a pediatric patient was deemed capable of being approached the researcher entered the room and obtained verbal consent.
Data CollectionOnce ability to participate and consent was established,
the survey was verbally administered and the answers recorded on an iPad tablet (Apple Inc., Cupertino, CA) using Research Electronic Data Capture data management platform software 10.3.3 (REDCap, Vanderbilt University, Nashville, TN). Both categorical and open-ended questions were included. Any question that asked the participant for a reason was read as open-ended. The research assistants would listen to the subject’s open-ended response and record the answers based upon set categories. For responses that did not fit one of the given categories the research assistant documented the response. One of the authors then reviewed these answers and classified them. These classifications were then reviewed and verified by the other authors. If a general category could not be defined the response was coded as “other” for the analysis.
Data AnalysisOnce data collection was completed it was exported from
REDCap and analyzed using Excel (Microsoft Corporation, Redmond, WA), SPSS (IBM Corp., Armonk, NY), and SAS 9.4
(SAS Institute Inc, Cary, NC). We used descriptive statistics, chi-square test (Fisher’s exact test), and logistic regression model to analyze the responses. There was no consideration of power for this descriptive study; however, a goal of 200 surveys at each institution was set, and enrollment continued at each site until that goal was reached. Enrollment began May 27, 2021, and ended July 11, 2021. We compared the vaccination rates in our subjects to the county-documented vaccination rate for the population 18 years and older as of July 11, 2021.16
We performed Pearson’s chi-square tests (Fisher’s exact tests for small group size) to compare the differences in COVID-19 vaccine status across participants of different characteristics (race, age group, education). A logistic regression model was developed to assess the effects of race, gender, ethnicity, age group, education level, insurance status, hospital site, and flu-vaccine status on the outcome variable. We categorized the outcome variable based on participants’ COVID-19 vaccine status with participants who did not receive and did not want the COVID-19 vaccine categorized as the cohort “declining vaccine,” while participants who were fully/partially vaccinated or had not yet received the vaccine but wanted to be vaccinated categorized as the group “not declining vaccine.”
RESULTSA total of 2267 adult patients/companions were
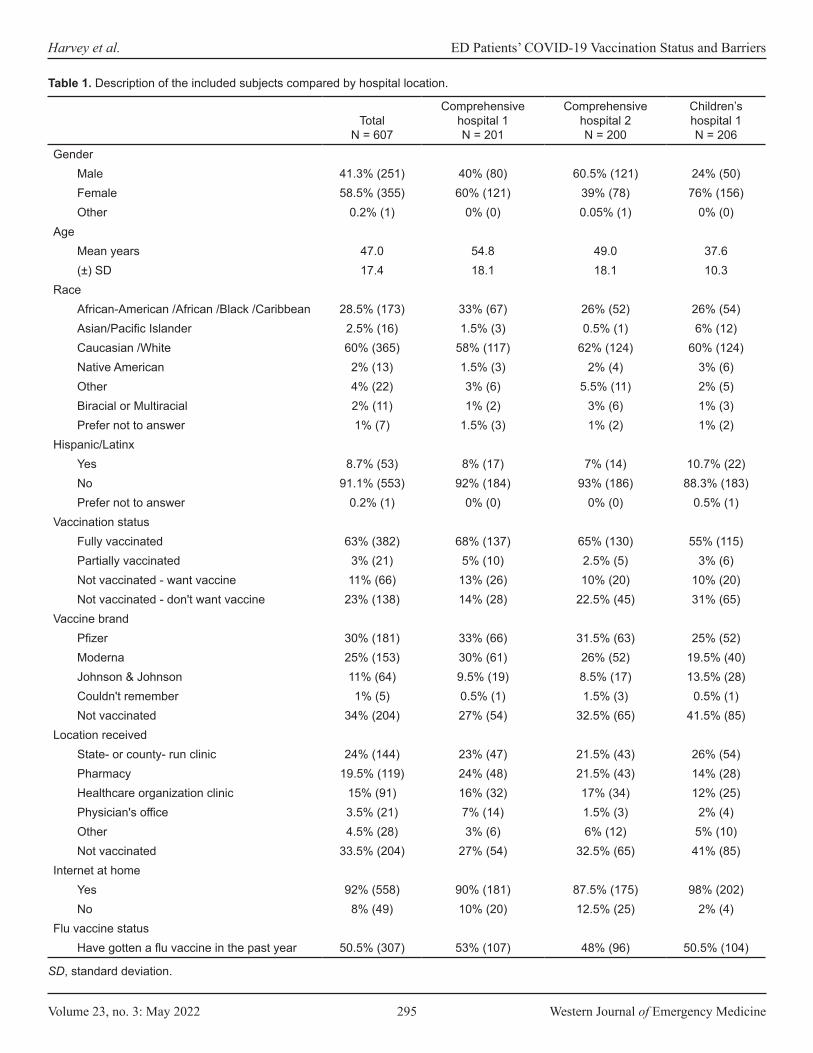
considered for enrollment. We approached 730, and 607 consented to participate (Figure 1). The majority of participants were female (58%) with a mean age 47.0±17.4 years (Table 1). When compared across study sites we were not surprised to find differences in demographics since those
Figure 1. Description of study populations.
Volume 23, no. 3: May 2022 295 Western Journal of Emergency Medicine
Harvey et al. ED Patients’ COVID-19 Vaccination Status and Barriers
TotalN = 607
Comprehensive hospital 1N = 201
Comprehensive hospital 2N = 200
Children’s hospital 1N = 206
GenderMale 41.3% (251) 40% (80) 60.5% (121) 24% (50)Female 58.5% (355) 60% (121) 39% (78) 76% (156)Other 0.2% (1) 0% (0) 0.05% (1) 0% (0)
AgeMean years 47.0 54.8 49.0 37.6(±) SD 17.4 18.1 18.1 10.3
RaceAfrican-American /African /Black /Caribbean 28.5% (173) 33% (67) 26% (52) 26% (54)Asian/Pacific Islander 2.5% (16) 1.5% (3) 0.5% (1) 6% (12)Caucasian /White 60% (365) 58% (117) 62% (124) 60% (124)Native American 2% (13) 1.5% (3) 2% (4) 3% (6)Other 4% (22) 3% (6) 5.5% (11) 2% (5)Biracial or Multiracial 2% (11) 1% (2) 3% (6) 1% (3)Prefer not to answer 1% (7) 1.5% (3) 1% (2) 1% (2)
Hispanic/LatinxYes 8.7% (53) 8% (17) 7% (14) 10.7% (22)No 91.1% (553) 92% (184) 93% (186) 88.3% (183)Prefer not to answer 0.2% (1) 0% (0) 0% (0) 0.5% (1)
Vaccination statusFully vaccinated 63% (382) 68% (137) 65% (130) 55% (115)Partially vaccinated 3% (21) 5% (10) 2.5% (5) 3% (6)Not vaccinated - want vaccine 11% (66) 13% (26) 10% (20) 10% (20)Not vaccinated - don't want vaccine 23% (138) 14% (28) 22.5% (45) 31% (65)
Vaccine brandPfizer 30% (181) 33% (66) 31.5% (63) 25% (52)Moderna 25% (153) 30% (61) 26% (52) 19.5% (40)Johnson & Johnson 11% (64) 9.5% (19) 8.5% (17) 13.5% (28)Couldn't remember 1% (5) 0.5% (1) 1.5% (3) 0.5% (1)Not vaccinated 34% (204) 27% (54) 32.5% (65) 41.5% (85)
Location receivedState- or county- run clinic 24% (144) 23% (47) 21.5% (43) 26% (54)Pharmacy 19.5% (119) 24% (48) 21.5% (43) 14% (28)Healthcare organization clinic 15% (91) 16% (32) 17% (34) 12% (25)Physician's office 3.5% (21) 7% (14) 1.5% (3) 2% (4)Other 4.5% (28) 3% (6) 6% (12) 5% (10)Not vaccinated 33.5% (204) 27% (54) 32.5% (65) 41% (85)
Internet at homeYes 92% (558) 90% (181) 87.5% (175) 98% (202)No 8% (49) 10% (20) 12.5% (25) 2% (4)
Flu vaccine statusHave gotten a flu vaccine in the past year 50.5% (307) 53% (107) 48% (96) 50.5% (104)
Table 1. Description of the included subjects compared by hospital location.
SD, standard deviation.

Western Journal of Emergency Medicine 296 Volume 23, no. 3: May 2022
ED Patients’ COVID-19 Vaccination Status and Barriers Harvey et al.
TotalN = 607
Comprehensive hospital 1N = 201
Comprehensive hospital 2N = 200
Children’s hospital 1N = 206
Have not gotten a flu vaccine in the last year but have in the past
32.5% (196) 33% (67) 31.5% (63) 32% (66)
Have never gotten a flu vaccine 17% (104) 13% (27) 20.5% (41) 17.5% (36)Education level
Some high school 7% (44) 10.5% (21) 6.5% (13) 5% (10)High school graduate 36.5% (221) 33% (66) 46.5% (93) 30% (62)Some college 23% (137) 22% (44) 19.5% (39) 26% (54)Associate’s degree 2% (13) 3.5% (7) 0.5% (1) 2% (5)Bachelor’s degree 20% (123) 20% (40) 19.5% (39) 21% (44)Postgraduate degree 8% (49) 7.5% (15) 4.5% (9) 12% (25)Technical/trade/vocational training 2.5% (15) 3.5% (7) 2% (4) 2% (4)Other 1% (5) 0.5% (1) 1% (2) 1% (2)
Insurance typePrivate 51.5% (313) 45% (90) 50% (100) 60% (123)Medicare 18.5% (113) 27% (55) 24% (48) 5% (10)Medicaid 26% (156) 25% (50) 22.5% (45) 30% (61)Uninsured 3% (18) 2% (4) 3% (6) 4% (8)Other 1% (7) 1% (2) 0.5% (1) 2% (4)
Sources of information (Multiple selections allowed; percent based on total respondents)
Friend/family 18% (243) 20% (92) 18% (87) 15% (64)Social media 13% (182) 10% (47) 12% (60) 18% (75)Primary care doctor /clinician 13% (185) 18% (82) 13% (65) 9% (38)Newspaper 7% (97) 5% (23) 7% (34) 10% (40)TV 21% (288) 21% (96) 24% (117) 18% (75)Radio 4% (56) 4% (19) 5% (23) 3% (14)Personal research 12% (163) 16% (73) 11% (56) 8% (34)Workplace 6% (82) 3% (14) 4% (19) 12% (49)Religious leaders 1% (14) 1% (5) 1% (6) 1% (3)Other 4% (53) 2% (9) 4% (22) 5% (22)
Table 1. Continued.
generally aligned with the individual hospital’s catchment areas (Table 1). The adult companions of pediatric patients had the lowest vaccination rate (55%), even though the flu vaccination rates were relatively similar across all three sites. The percent of subjects who were not vaccinated but wanted to be was consistent across all sites at approximately 10%.
Of those surveyed, 403 (66.4%) had received at least one dose of vaccine, with 382 (63%) completely vaccinated. This number was slightly lower than the COVID-19 vaccination rate reported for adults in the study county, which was 70% who had received at least one dose and 65.3% who completed
the series. There were 21 people who still needed a second vaccine dose to complete the series; most (80.9%) had an appointment for the second dose, while the remaining four stated they’d had side effects that kept them from getting the second shot (N = 2) or they had time or mobility issues (N = 2) that kept them from getting the second shot.
Of the 204 (33.6%) participants who were not vaccinated, 66 (10.9% of the total population surveyed) expressed interest in becoming vaccinated, while 138 (22.7% of the total population surveyed) stated they did not want to be vaccinated. The primary reasons for not getting vaccinated

Volume 23, no. 3: May 2022 297 Western Journal of Emergency Medicine
Harvey et al. ED Patients’ COVID-19 Vaccination Status and Barriers
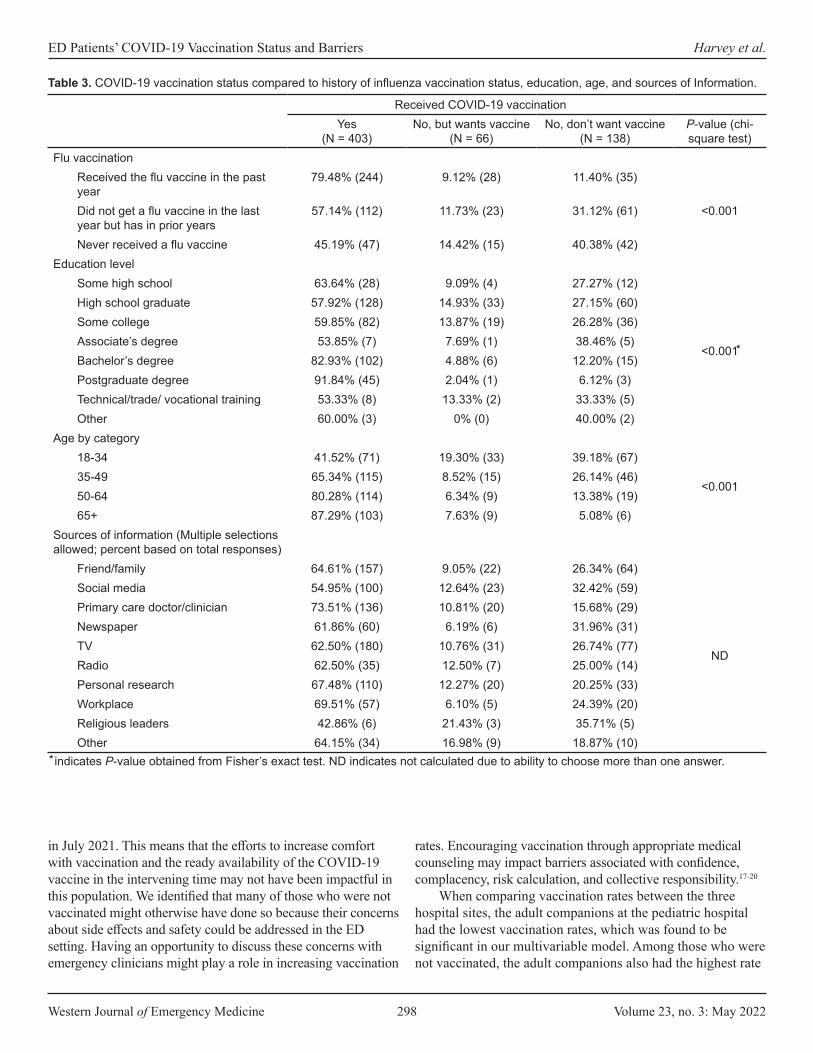
were that they were waiting for more safety data or they had concern with risks and side effects (Table 2). Four of the unvaccinated individuals mentioned that their reason for not getting vaccinated stemmed from a conversation with their doctor, which supported this decision. Two who wanted the vaccine but were not yet vaccinated reported that they had recently been diagnosed with COVID-19 and their doctor said to wait to get the vaccine. Two who did not want the vaccine stated they were advised against it by their physician due to medical concerns and medication issues. The chi-square test (Fisher’s exact test) results showed significant associations between age group, education level, flu-vaccine status, and COVID-19 vaccine status. Comparing those who were vaccinated to those who were not we found that those who were vaccinated tended to be older, more educated, and had previously gotten a flu vaccine (Table 3).
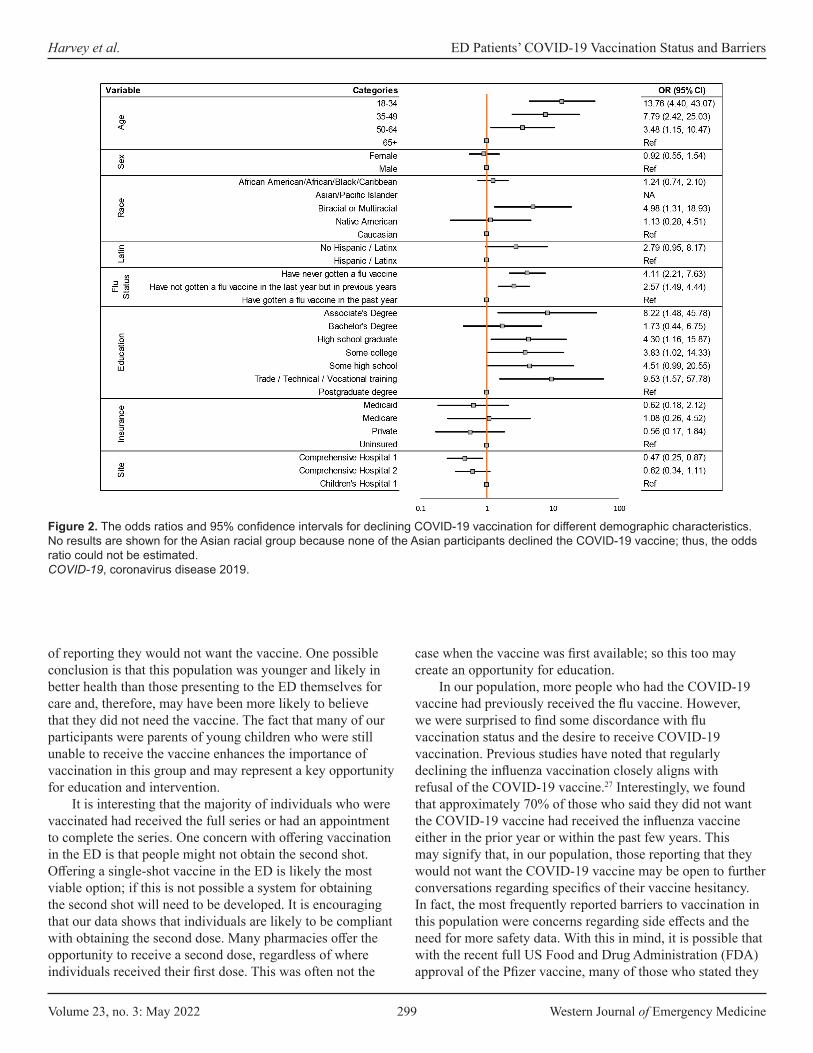
The logistic regression model found that age, race, flu vaccination status, education level, and study site were all associated with declining the COVID-19 vaccine (Figure 2). Specifically, the age group 18-34 years was found to be most strongly associated with increased odds of declining the COVID-19 vaccination when compared with those over age 65 (odds ratio [OR] 13.76; 95% confidence interval [CI]: 4.40 - 43.07). Individuals who identified as biracial or multiracial had an increased odds of declining COVID-19 vaccination when compared with those who identified as White (OR 4.98; 95% CI: 1.31 -18.93). Participants who had never received the flu vaccine had an increased odds of declining COVID-19 vaccination when compared to participants who had received flu vaccine the prior year (OR 4.11; 95% CI: 2.21 - 7.63).
Compared with those with a postgraduate education, the odds of declining the COVID-19 vaccination were 9.53 times higher among those with trade, technical, or vocational training (95% CI: 1.57 - 57.78). Lastly, the adult patients interviewed were less likely to decline vaccination when compared to the adult companions of the pediatric patients (OR 0.47; 95% CI: 0.25 - 0.87).
DISCUSSIONThis study found that while a majority of adult ED
patients and the adult companions of pediatric patients have been vaccinated for COVID-19 there was a small but not insignificant proportion of the ED population that wanted to be vaccinated but had not yet been vaccinated. Just over 10% of those surveyed expressed interest in getting vaccinated. This could be enough to consider offering the vaccine in the ED. Previous research has found that convenience plays a large role in human behavior and compliance17-20; so. it seems possible that such a program might be successful. In June 2021, the American College of Emergency Physicians developed and published toolkits for patient education21 and for ED implementation of vaccination programs.22 While EDs have given tetanus vaccines in great numbers over a long period of time,23 prior studies have also shown the efficacy of offering the influenza vaccine in both general and pediatric EDs. 5,24
Our finding that 37% of the ED population was not fully vaccinated aligns with two earlier studies that found 39% and 32% of ED patient population were vaccine-hesitant when asked if they would receive the vaccine.25,26 These prior studies ended in March and May 2021, respectively, while ours began
Barrier to vaccination Wish to get the vaccine (N = 66) Don’t wish to get the vaccine (N = 138)Already had COVID-19 5% (3) 4% (6)Can't get an appointment 6% (4) -Can't get it at my desired location 2% (1) -Can't get to the vaccination site 5% (3) -Don't think it works - 18% (25)“Let others get it first” - 3% (4)Opposed to vaccines/medical care - 4% (5)Pregnancy/breastfeeding 5% (3) 3% (4)Scheduled 3% (2) -Side effects / risks 18% (12) 26% (36)Time 11% (7) -Waiting for more safety data 32% (21) 28% (38)Other 15% (10) 14% (20)
Table 2. Self-reported barriers to COVID-19 vaccination in unvaccinated by desire to obtain vaccine.
COVID-19, coronavirus disease 2019.
Western Journal of Emergency Medicine 298 Volume 23, no. 3: May 2022
ED Patients’ COVID-19 Vaccination Status and Barriers Harvey et al.
in July 2021. This means that the efforts to increase comfort with vaccination and the ready availability of the COVID-19 vaccine in the intervening time may not have been impactful in this population. We identified that many of those who were not vaccinated might otherwise have done so because their concerns about side effects and safety could be addressed in the ED setting. Having an opportunity to discuss these concerns with emergency clinicians might play a role in increasing vaccination
rates. Encouraging vaccination through appropriate medical counseling may impact barriers associated with confidence, complacency, risk calculation, and collective responsibility.17-20
When comparing vaccination rates between the three hospital sites, the adult companions at the pediatric hospital had the lowest vaccination rates, which was found to be significant in our multivariable model. Among those who were not vaccinated, the adult companions also had the highest rate
Received COVID-19 vaccinationYes
(N = 403)No, but wants vaccine
(N = 66)No, don’t want vaccine
(N = 138)P-value (chi-square test)
Flu vaccinationReceived the flu vaccine in the past year
79.48% (244) 9.12% (28) 11.40% (35)
<0.001Did not get a flu vaccine in the last year but has in prior years
57.14% (112) 11.73% (23) 31.12% (61)
Never received a flu vaccine 45.19% (47) 14.42% (15) 40.38% (42)Education level
Some high school 63.64% (28) 9.09% (4) 27.27% (12)
<0.001
High school graduate 57.92% (128) 14.93% (33) 27.15% (60)Some college 59.85% (82) 13.87% (19) 26.28% (36)Associate’s degree 53.85% (7) 7.69% (1) 38.46% (5)Bachelor’s degree 82.93% (102) 4.88% (6) 12.20% (15)Postgraduate degree 91.84% (45) 2.04% (1) 6.12% (3)Technical/trade/ vocational training 53.33% (8) 13.33% (2) 33.33% (5)Other 60.00% (3) 0% (0) 40.00% (2)
Age by category18-34 41.52% (71) 19.30% (33) 39.18% (67)
<0.00135-49 65.34% (115) 8.52% (15) 26.14% (46)50-64 80.28% (114) 6.34% (9) 13.38% (19)65+ 87.29% (103) 7.63% (9) 5.08% (6)
Sources of information (Multiple selections allowed; percent based on total responses)
Friend/family 64.61% (157) 9.05% (22) 26.34% (64)
ND
Social media 54.95% (100) 12.64% (23) 32.42% (59)Primary care doctor/clinician 73.51% (136) 10.81% (20) 15.68% (29)Newspaper 61.86% (60) 6.19% (6) 31.96% (31)TV 62.50% (180) 10.76% (31) 26.74% (77)Radio 62.50% (35) 12.50% (7) 25.00% (14)Personal research 67.48% (110) 12.27% (20) 20.25% (33)Workplace 69.51% (57) 6.10% (5) 24.39% (20)Religious leaders 42.86% (6) 21.43% (3) 35.71% (5)Other 64.15% (34) 16.98% (9) 18.87% (10)
Table 3. COVID-19 vaccination status compared to history of influenza vaccination status, education, age, and sources of Information.
indicates P-value obtained from Fisher’s exact test. ND indicates not calculated due to ability to choose more than one answer.
Volume 23, no. 3: May 2022 299 Western Journal of Emergency Medicine
Harvey et al. ED Patients’ COVID-19 Vaccination Status and Barriers
of reporting they would not want the vaccine. One possible conclusion is that this population was younger and likely in better health than those presenting to the ED themselves for care and, therefore, may have been more likely to believe that they did not need the vaccine. The fact that many of our participants were parents of young children who were still unable to receive the vaccine enhances the importance of vaccination in this group and may represent a key opportunity for education and intervention.
It is interesting that the majority of individuals who were vaccinated had received the full series or had an appointment to complete the series. One concern with offering vaccination in the ED is that people might not obtain the second shot. Offering a single-shot vaccine in the ED is likely the most viable option; if this is not possible a system for obtaining the second shot will need to be developed. It is encouraging that our data shows that individuals are likely to be compliant with obtaining the second dose. Many pharmacies offer the opportunity to receive a second dose, regardless of where individuals received their first dose. This was often not the
case when the vaccine was first available; so this too may create an opportunity for education.
In our population, more people who had the COVID-19 vaccine had previously received the flu vaccine. However, we were surprised to find some discordance with flu vaccination status and the desire to receive COVID-19 vaccination. Previous studies have noted that regularly declining the influenza vaccination closely aligns with refusal of the COVID-19 vaccine.27 Interestingly, we found that approximately 70% of those who said they did not want the COVID-19 vaccine had received the influenza vaccine either in the prior year or within the past few years. This may signify that, in our population, those reporting that they would not want the COVID-19 vaccine may be open to further conversations regarding specifics of their vaccine hesitancy. In fact, the most frequently reported barriers to vaccination in this population were concerns regarding side effects and the need for more safety data. With this in mind, it is possible that with the recent full US Food and Drug Administration (FDA) approval of the Pfizer vaccine, many of those who stated they
Figure 2. The odds ratios and 95% confidence intervals for declining COVID-19 vaccination for different demographic characteristics. No results are shown for the Asian racial group because none of the Asian participants declined the COVID-19 vaccine; thus, the odds ratio could not be estimated. COVID-19, coronavirus disease 2019.

Western Journal of Emergency Medicine 300 Volume 23, no. 3: May 2022
ED Patients’ COVID-19 Vaccination Status and Barriers Harvey et al.
would not want to get the vaccine may now be more open to COVID-19 vaccination.
Self-reported barriers to vaccination and factors contributing to vaccine hesitancy in our population focused primarily on side effects/risks, desire for more data, and believing the vaccine “does not work,” or vaccine hesitancy due to lack of confidence. A smaller percentage of our population, primarily in those who had not been vaccinated but wished to receive the vaccine, reported difficulty obtaining the vaccine or vaccine hesitancy due to convenience. There were no reported barriers regarding complacency or collective responsibility, and only four participants noted utility calculation (“let others get it first”) as a determinant in deciding not to get the vaccine. As previously noted, providing single-dose vaccinations in the ED can be a viable option to target vaccine hesitancy due to convenience.
Overcoming vaccine hesitancy secondary to confidence in both the vaccine itself and the medical/scientific community is more difficult to overcome.9 This is complicated by variable advice given to patients by different healthcare clinicians. One possible avenue is to focus on improving the quality of information available where it is most commonly accessed. For our population the reported top four places vaccine information was obtained was television, friends and family, physicians, and social media, in that order. Unfortunately, our population mirrors a national trend of physicians being underused as a primary source of medical information. Public health experts and the medical community need to continue to speak publicly about the safety and efficacy of vaccination to reach patients through other mediums (such as television) as well as reaching out to patients, family, and friends personally. Likewise, enhanced efforts to educate physicians and non-physician healthcare personnel in evidence-based information on the vaccine may also be important, given that four of our participants stated that their personal physicians played a role in their decision not to get vaccinated. This, in conjunction with the full FDA approval of COVID-19 vaccines, will hopefully help move the vaccine hesitant to vaccine accepting.
LIMITATIONSThis study may be limited by the high rate of exclu-
sions resulting in our data not representing all ED patients, especially those who could not be accessed due to infectious symptoms. Many of these patients could have had COVID-19 and been less likely to be vaccinated. However, we conducted this study when transmission in our area was low, and in fact only 4.9% of patients were excluded due to infectious symp-toms. Further, given that the majority of those excluded were too sick or cognitively incapable of participation, it could be argued that the patients we captured are those most likely to be capable of considering and discussing vaccination during the course of their ED care. Nonetheless, our finding that 10% of the interviewed patients were not vaccinated but wanted to be, may not directly translate to 10% of the ED population.
It is also of concern that 123 of the individuals whom we approached to participate in the study declined. Given the contentious nature of some discussions around vaccination it is possible that those who were vaccine-averse may have been less likely to agree to discuss their vaccination status for our survey. However, if a vaccine program were started in our ED it is likely that these individuals would also decline to partici-pate. Further, we did not ask those individuals whether they would be willing to be vaccinated if it was offered in the ED. However, these findings could be supportive for programs that want to further investigate providing COVID-19 vaccination in the ED setting.
Finally, it is important to note that vaccination can be an emotional topic for many individuals. We trained our staff and wrote our questions to be as non-judgmental as possible and to encourage individuals to share their true opinions, but it is possible that some respondents did not feel comfortable providing honest opinions.
CONCLUSIONAdult ED patients and adult companions of pediatric
ED patients were vaccinated at a slightly lower rate than the general population in our county. A small but not insignificant proportion of those who had not yet been vaccinated wanted to be vaccinated, indicating that the ED may be a suitable location to offer the COVID-19 vaccine.
Address for Correspondence: E. Brooke Lerner, PhD, University of Buffalo, Department of Emergency Medicine, 77 Goodell Street – Suite 340, Buffalo, NY 14203. Email: [email protected].
Conflicts of Interest: By the WestJEM article submission agreement, all authors are required to disclose all affiliations, funding sources and financial or management relationships that could be perceived as potential sources of bias. No author has professional or financial relationships with any companies that are relevant to this study. There are no conflicts of interest or sources of funding to declare.
Copyright: © 2022 Harvey et al. This is an open access article distributed in accordance with the terms of the Creative Commons Attribution (CC BY 4.0) License. See: http://creativecommons.org/licenses/by/4.0/
REFERENCES1. Gordon JA. The hospital emergency department as a social welfare
institution. Ann Emerg Med. 1999;33(3):321-5. 2. Gordon JA, Billings J, Asplin BR, et al. Safety net research in
emergency medicine: proceedings of the Academic Emergency Medicine Consensus Conference on “The Unraveling Safety Net.” Acad Emerg Med. 2001;8(11):1024-9.
3. Henderson S, Stacey CL, Dohan D. Social stigma and the dilemmas of providing care to substance users in a safety-

Volume 23, no. 3: May 2022 301 Western Journal of Emergency Medicine
Harvey et al. ED Patients’ COVID-19 Vaccination Status and Barriers
net emergency department. J Health Care Poor Underserved. 2008;19(4):1336-1349.
4. Ong Eng Hock M, Ornato JP, Cosby C, et al. Should the emergency department be society’s health safety net? J Public Health Policy. 2005;26(3):269-81.
5. Rimple D, Weiss SJ, Brett M, et al. An emergency department-based vaccination program: overcoming the barriers for adults at high risk for vaccine-preventable diseases. Acad Emerg Med. 2006;13(9):922-30.
6. Fisk RJ. Barriers to vaccination for COVID-19 control—experience from the United States. Globe Health J. 2021;5(1):51-5.
7. Singer AJ, Morley EJ, Meyers K, et al. Cohort of four thousand four hundred four persons under investigation for COVID-19 in a New York hospital and predictors of ICU care and ventilation. Ann Emerg Med. 2020;76(4):394-404.
8. Randolph HE, Barreiro LB. Herd immunity: understanding COVID-19. Immunity. 2020;52(5):737-41.
9. Dror AA, Eisenbach N, Taiber S, et al. Vaccine hesitancy: the next challenge in the fight against COVID-19. Eur J Epidemiol. 2020;35(8):775-9.
10. Solís Arce JS, Warren SS, Meriggi NF, et al. COVID-19 vaccine acceptance and hesitancy in low- and middle-income countries. Nat Med. 2021;27(8):1385-94.
11. Viswanath K, Bekalu M, Dhawan D, et al. Individual and social determinants of COVID-19 vaccine uptake. BMC Public Health. 2021;21(1):818.
12. Wakefield AJ. MMR vaccination and autism. Lancet. 1999;354(9182):949-50.
13. MacDonald NE, SAGE Working Group on Vaccine Hesitancy. Vaccine hesitancy: definition, scope and determinants. Vaccine. 2015;33(34):4161-4.
14. Al-Sanafi M, Sallam M. Psychological determinants of COVID-19 vaccine acceptance among healthcare workers in Kuwait: a cross-sectional study using the 5C and vaccine conspiracy beliefs scales. Vaccines (Basel). 2021;9(7):701.
15. Betsch C, Schmid P, Heinemeier D, et al. Beyond confidence: development of a measure assessing the 5C psychological antecedents of vaccination. PLoS One. 2018;13(12):e0208601.
16. Centers for Disease Control and Prevention. COVID-19 vaccina-tions in the United States, County. 2021. Available at: https://data.cdc.gov/Vaccinations/COVID-19-Vaccinations-in-the-United-States-County/8xkx-amqh. Accessed July 2021.
17. Bedford H, Attwell K, Danchin M, et al. Vaccine hesitancy, refusal and access barriers: the need for clarity in terminology. Vaccine. 2018;36(44):6556-8.
18. Bertoncello C, Ferro A, Fonzo M, et al. Socioeconomic determinants in vaccine hesitancy and vaccine refusal in Italy. Vaccines (Basel). 2020;8(2):276.
19. Dorman C, Perera A, Condon C, et al. Factors associated with willingness to be vaccinated against COVID-19 in a large convenience sample. J Community Health. 2021;46(5):1013-9.
20. Machingaidze S, Wiysonge CS. Understanding COVID-19 vaccine hesitancy. Nat Med. 2021;27(8):1338-9.
21. American College of Emergency Physicians. COVID-19 Vaccination Toolkit. 2021. Available at: https://www.acep.org/corona/COVID-19-alert/covid-19-articles/covid-19-vaccination-toolkit. Accessed January 27, 2022.
22. American College of Emergency Physicians. Setting Up Vaccination Programs in the ED. 2021. Available at: https://www.acep.org/corona/COVID-19-alert/covid-19-articles/vaccination-programs-in-the-ed/. Accessed January 27, 2022.
23. Pallin DJ, Muennig PA, Emond JA, et al. Vaccination practices in U.S. emergency departments, 1992-2000. Vaccine. 2005;23(8):1048-52.
24. Baumer-Mouradian SH, Kleinschmidt A, Servi A, et al. Vaccinating in the emergency department, a novel approach to improve influenza vaccination rates via a quality improvement initiative. Pediatr Qual Saf. 2020;5(4):e322.
25. Fernández-Penny FE, Jolkovsky EL, Shofer FS, et al. COVID-19 vaccine hesitancy among patients in two urban emergency departments. Acad Emerg Med. 2021;28(10):1100-7.
26. Rodriguez RM, Torres JR, Chang AM, et al. The rapid evaluation of COVID-19 vaccination in emergency departments for underserved patients study. Ann Emerg Med. 2021;78(4):502-10.
27. Fridman A, Gershon R, Gneezy A. COVID-19 and vaccine hesitancy: a longitudinal study. PLoS One. 2021;16(4):e0250123.

Western Journal of Emergency Medicine 302 Volume 23, no. 3: May 2022
Original Research
Bamlanivimab Reduces ED Returns and Hospitalizations and May Reduce COVID-19 Burden on Low-resource
Border HospitalsFaith C. Quenzer, DO MPH*†‡
Andrew T. Lafree, MD†‡
Londyn Grey, BS, MPH§
Sukhdeep Singh, MD†‡
Cameron Smyers, MD†‡
Bruce Balog, PharmD‡
Henry Montilla Guedez, MD†
Kaitlin McIntyre, MD†
Sharon Wulfovich, MD†
Juli Ramirez, BS‡
Talia Saikhon, PA-C‡
Christian Tomaszewski, MD MBA†‡
Section Editor: Ioannis Koutroulis, MD, MBA, PhD Submission history: Submitted April 14, 2021; Revision received September 8, 2021; Accepted October 16, 2021 Electronically published March 17, 2022 Full text available through open access at http://escholarship.org/uc/uciem_westjem
San Diego State University School of Public Health, San Diego, CaliforniaUniversity of California – San Diego, School of Medicine, Department of Emergency Medicine, San Diego, CaliforniaEl Centro Regional Medical Center, Department of Emergency Medicine, El Centro, CaliforniaLouisiana State University Health Sciences Center, School of Medicine, Shreveport, Louisiana
*†
‡
§
Introduction: To evaluate the effectiveness of bamlanivimab at reducing return emergency department (ED) visits in primarily Latinx/Hispanic patients with mild or moderate coronavirus disease 2019 (COVID-19). Secondary aims were to evaluate the prevention of subsequent hospitalizations and deaths in a resource-limited United States (U.S.)-Mexico border hospital.
Methods: We conducted a retrospective, open-label interventional study on 270 eligible adult patients diagnosed with mild-moderate severe acute respiratory syndrome coronavirus 2 (SARS-CoV-2) infection who met criteria for receiving bamlanivimab from November 1, 2020 to January 31, 2021. The main outcomes of 14-day return visits to the ED and hospitalizations due to COVID-19 were compared between two groups – those who received bamlanivimab (exposed group) and those who did not receive bamlanivimab (unexposed group). Outcomes were analyzed through chi-square tests followed by multivariate regression modeling to adjust for patient demographics, characteristics, and comorbidities.
Results: There were 136 COVID-19 patients who received bamlanivimab in the ED prior to discharge and an unexposed group of 134 COVID-19 patients who were evaluated and discharged from the ED without receiving bamlanivimab. Overall, mean age was 61.7 (S.D. +/-13.9) years, mean body mass index (BMI) 31.0 (S.D. +/-6.6) kg/m2, 91.5% identified as Latinx/Hispanic, 51.9% male, and 80.7% reported at least one comorbidity. Most commonly reported comorbidities were obesity (22.6%), hypertension (59.6%), and diabetes (41.1%). The bamlanivimab group had a 22.8% (mean estimate = 0.7717, 95% CI [0.6482, 0.8611]) risk reduction or 84.4% (0.3030, 95% CI = 0.166, 0.554, p=.0001) absolute reduction of ED return visits within 14 days compared to controls after adjusting for chronic kidney disease. The bamlanivimab group had 19.0% (mean estimate=0.8097, 95% CI [0.6451, 0.9087]) risk reduction or 96.2% (0.235, 95% CI 0.100, 0.550, p=0.0008) absolute reduction of subsequent hospitalizations compared to unexposed patients after adjusting for diabetes status.
Conclusion: Bamlanivimab infusions for high-risk COVID-19 patients in the ED substantially reduced the risk of return visits to the ED and hospitalizations in our primarily Latinx/Hispanic population. Monoclonal antibody infusions may help reduce hospital utilization during COVID-19 surges at U.S.-Mexico border hospitals. [West J Emerg Med. 2022;22(3)302–311.]

Volume 23, no. 3: May 2022 303 Western Journal of Emergency Medicine
Quenzer et al. Bamlanivimab Reduces Return Visits to the ED and Subsequent Hospitalizations
Population Health Research Capsule
What do we already know about this issue?Latinx patients have the worst COVID-19 outcomes. Bamlanivimab, an outpatient monoclonal antibody treatment, can help prevent COVID hospitalizations and improve outcomes.
What was the research question?Could bamlanivimab prevent ED return visits and hospitalizations in high-risk Latinx COVID-19 patients at a border hospital?
What was the major finding of the study?Bamlanivimab given to high-risk, Latinx COVID-19 patients at a border hospital ED decreased ED return visits and hospitalizations.
How does this improve population health?Monoclonal antibodies administered in a low-resource ED may help decrease ED return visits in high-risk Latinx patients and hospitalizations during a surge.
DOI: 10.5811/westjem.2021.10.52668INTRODUCTION
Severe acute respiratory syndrome coronavirus 2 (SARS-CoV-2), which is responsible for the current coronavirus disease 2019 (COVID-19) pandemic, has burdened healthcare systems across the United States to their breaking point because of rapid influxes of critically ill patients who require weeks of hospitalization, intensive care resources, and healthcare personnel.1 Hospitals have been forced to admit patients beyond maximum capacity and have stretched healthcare personnel responsibilities beyond what are normally considered safe levels.1 Hospitals near the US-Mexico border are particularly vulnerable to these problems because of inadequate healthcare infrastructure, healthcare resources, and healthcare workers at baseline.2 As a result, COVID-19 has disproportionately impacted low-resourced and rural hospitals compared to their urban counterparts, and COVID-19 mortality is as much as three times higher in hospitals with fewer intensive care unit (ICU) beds available.1,3
Resource challenges are further compounded by cross-border traffic that makes populations at the US-Mexico border more vulnerable to surges of communicable diseases such as COVID-19.2,4 Additionally, border populations, which are predominantly Latinx/Hispanic, are more likely to have underlying chronic conditions such as diabetes, hypertension, coronary artery disease, chronic kidney disease, and chronic lung disease.2,5 These comorbidities make these populations more susceptible to severe COVID-19 complications such as hospitalization, invasive ventilation, and death.6-7 Compared to White non-Hispanics, Latinx/Hispanics account for four times the hospitalizations and nearly three times the deaths due to COVID-19 in the US.2,6-7
Our study was performed at the El Centro Regional Medical Center (ECRMC), which is located 12 miles north of the US-Mexico border in Imperial County, California, and serves a predominantly Latinx/Hispanic patient population. Imperial County has the second-highest number of COVID-19 cases and the highest COVID-19 death rate per population (374 people per 100,000) in the entire state of California by the summer of 2020.8 Over the course of the year the ECRMC emergency department (ED) saw 3,876 COVID-19 patients, with 1,342 hospital admissions and 336 deaths (ECRMC internal hospital data, 2020). According to the internal, unpublished ECRMC data, the peak of the 2020 COVID-19 pandemic demonstrated ECRMC’s patient load rose to nearly two times the normal patient census and 10 times the normal ICU census. In December 2020 alone, over 40 patients were on ventilators, most in routine medical-surgical rooms. From March–July 2020, during the first COVID-19 surge in Imperial County, 18.7% of the 497 COVID-19 patients who were admitted to ECRMC expired; during the second surge from November 2020–January 2021 mortality of admitted COVID-19 patients increased to 37.0% (ECRMC, internal hospital data, 2020). This increased mortality rate
may partly reflect the resources available to the local hospital system relative to the burden of COVID-19 faced during the significantly worse second surge and the indirect effects of hospital saturation on patient outcomes.
The response to the COVID-19 pandemic in limited-resource border hospitals such as ECRMC has highlighted major challenges. With the possibility of new surges from more variants there is still a need for innovative, rapidly operationalized solutions. In conjunction with the state and local public health authorities, ECRMC has been using monoclonal antibody treatment for high-risk, non-hospitalized patients with mild-to-moderate COVID-19 since November 2020. The primary goal was to reduce subsequent hospitalizations in high-risk patients and alleviate further pressure on a resource-scarce healthcare system. Its use has been predicated on the Emergency Use Authorization (EUA) from the US Food and Drug Administration (FDA).9
There have been several strategies using passive immunity to enable the humoral immune response against SARS-CoV-2, some of which include convalescent plasma, immune globulin, and monoclonal antibodies.10 Monoclonal antibodies are very specific and highly concentrated antibodies that are laboratory developed to bind and neutralize viruses such as Ebola and rabies.11,12 For SARS-CoV-2, the first two
Western Journal of Emergency Medicine 304 Volume 23, no. 3: May 2022
Bamlanivimab Reduces Return Visits to the ED and Subsequent Hospitalizations Quenzer et al.
monoclonal antibody treatments initially available were bamlanivimab and the combination of casirivimab and imdevimab (Regeneron [Regeneron Pharmaceuticals, Inc., Eastview/Tarrytown, NY).9,11 These monoclonal antibodies are specifically made to attach and neutralize the SARS-CoV-2 surface spike glycoprotein, which binds to the angiotensin-converting enzyme 2 receptors to gain access to cells.11,13
There is limited evidence from ongoing randomized control trials that these monoclonal antibodies may decrease viral load and the progression of COVID-19 disease in high-risk, non-hospitalized patients with mild or moderate symptoms.11,14 However, when given to hospitalized patients with severe COVID-19, no significant difference in complications and disease progression has been shown.11 On November 9, 2020, the FDA gave these monoclonal antibodies EUA.9 Some preliminary trial data suggests that the use of monoclonal antibodies in outpatient treatment of COVID-19 may prevent hospitalization, invasive ventilation/intubation, and death.13 More research evaluating how these monoclonal antibodies could impact ED and hospital utilization is needed, especially in the setting of rural or border hospitals with limited resources and a high-risk of increased COVID-19 burden.
The purpose of our study was to evaluate the effectiveness of bamlanivimab in preventing return ED visits, hospitalizations, and mortality within the Latinx/Hispanic population in a border community hospital. Emergency departments can rapidly and easily operationalize systems for early distribution of monoclonal antibodies to SARS-CoV-2 patients who are at high risk for developing severe COVID-19 disease early in the course of their illness. Aside from the costs associated with monoclonal antibodies themselves, infusing monoclonal antibodies early in COVID-19 disease is not personnel or resource intensive. If even modest reductions in subsequent return ED visits and hospitalizations could be demonstrated, targeted, large-scale monoclonal antibody infusions may significantly reduce the burden on these EDs and healthcare systems.
METHODSStudy Design
We performed a retrospective, cohort study of the monoclonal antibody bamlanivimab (Eli Lilly and Company, Indianapolis, IN) in non-hospitalized, adult ED patients diagnosed with COVID-19 at a border hospital. The primary outcomes of interest were return visit to the ED within 14 days and subsequent hospitalization in patients who did not receive bamlanivimab (unexposed) vs patients who received bamlanivimab (exposed). Mortality outcomes were also described. We selected the 14-day outcome based on observational reports demonstrating that on average, patients were hospitalized for dyspnea 7-10 days after initial symptoms.15 Therefore, after 14 days from initial diagnosis, the likelihood of deterioration should be lessened substantially and the majority of patients ultimately requiring hospitalization would already have
been hospitalized. For patients who returned to the ED and were hospitalized we reviewed the entire clinical course.
Per Bledsoe and Worster, we accessed the electronic health records (EHR) database to identify ED visits and hospitalizations. Abstractors were trained in obtaining the necessary data from these various EHR, and cases were selected by criteria that had defined inclusion and exclusion criteria. Quality control of the data was done throughout the data collection by three of the investigators from this study.16 This study was institutional review board (IRB #200558) exempt. Patients who were interested in treatment were informed of the risks and benefits of receiving bamlanivimab as outlined in the FDA EUA, and consent for treatment was obtained.
InclusionIncluded within this study were adult patients
(>18 years) with a laboratory-confirmed diagnosis of COVID-19 detected in our ED or patients who had tested positive at an outside healthcare facility and presented to our ED requesting treatment with monoclonal antibodies. All patients from outside facilities were required to have documentation of a newly positive COVID-19 test within seven days. Screening for inclusion criteria were required prior to treatment for all patients. Eligible ED patients who were diagnosed with COVID-19 in the ED were offered treatment immediately if monoclonal antibodies were available. Patients who had been discharged prior to receiving COVID-19 test results were called back the following day with results. If monoclonal antibodies were available at that time and the patient met eligibility criteria they were invited to return to the ED for infusion.
To meet eligibility requirements for bamlanivimab infusion, patients must have had fewer than 10 days of symptoms, mild or moderate disease with no oxygen requirement, and were considered high risk for progression to severe disease based on the following criteria:
• ≥65 years of age or• ≥55 years of age AND with one of the following:
• Cardiovascular disease, hypertension, or chronic obstructive pulmonary disease/other chronic respiratory disease such as asthma.
• Body mass index (BMI) ≥35 • Chronic kidney disease • Diabetes mellitus type 2• Immunosuppressive disease or taking
immunosuppressive medication.
ExclusionExcluded from the study were patients who did not
consent for treatment, pregnant women, patients who did not meet the above inclusion criteria, and patients who upon initial presentation already had an oxygen requirement or required

Volume 23, no. 3: May 2022 305 Western Journal of Emergency Medicine
Quenzer et al. Bamlanivimab Reduces Return Visits to the ED and Subsequent Hospitalizations
immediate admission to the hospital. Study Setting
As part of the response to the large influx of COVID-19 positive patients, ECRMC erected an emergent, tent-based COVID-19 hospital and monoclonal antibody infusion center in the ED parking lot where patients were treated from November 2020–January 2021. Eligible patients diagnosed with SARS-CoV-2 infection were either referred by their primary care physician within the 10-day symptom onset for monoclonal antibody infusions or were diagnosed at our COVID-19 tent hospital within the same time frame. During this surge, the county health department initially allocated a very limited supply of bamlanivimab for the hospital. Bamlanivimab was at times randomly distributed due to demand exceeding supply on a given day. The ECRMC pharmacists were also required to verify medications on site and prepare the monoclonal antibody infusions during business hours only. Therefore, bamlanivimab was available on a first-come first-served basis during business hours.
ProcedureEmergency department patients were consented and given
information regarding bamlanivimab and the risks and benefits of treatment in their preferred language, which was primarily Spanish. The treatment was unblinded to the patient and the associated healthcare workers. Patients in the treatment group received bamlanivimab (700 milligrams per 20 milliliters [mL]) mixed with 250 mL normal saline and infused over one hour. After approval by ECRMC hospital pharmacist, an infusion would be sent to the ED. An observation time of one hour was performed by the patient’s nurse and physician following infusion to observe for any serious hypersensitivity reaction and anaphylaxis. If patients tolerated medication and had no adverse response after one hour they were discharged from the ED.
Data Collection We performed a retrospective chart review from November
1, 2020–January 31, 2021 of patients diagnosed with mild to moderate SARS-CoV-2 infection who presented to ECRMC ED or were referred from community primary care physicians. A convenience sample consisted of eligible patients who received treatment with bamlanivimab (exposed patients) and eligible unexposed patients who tested positive for COVID-19 in the ED during this time same period. We collected data directly through a retrospective review of the hospital’s EHR. We then performed a search of the patient’s chief complaint and the International Classification of Diseases, 10th revision, billing codes in the ED EHR using MedHost information management software (MedHost, Inc., Franklin, TN), and we reviewed documentation by the treating emergency clinician and the pharmacy infusion records. Patient characteristics from both exposed group and unexposed group were recorded on a password-protected, patient-deidentified Microsoft Excel spreadsheet (Microsoft Corporation, Redmond, WA). These
specific characteristics included age, gender, BMI, ethnicity, and comorbidities including cardiovascular disease/hyperlipidemia, hypertension, chronic obstructive pulmonary disease (COPD) or other chronic respiratory disease such as asthma, chronic kidney disease, diabetes mellitus, or current disease state of immunosuppression or currently taking immunosuppressive medication (eg, immunotherapy, anticancer drugs, etc.) and reported COVID-19 symptom onset (days).
Using Cerner healthcare technology services (Cerner, North Kansas City, MO), we assessed patient outcomes at 14 days post treatment through health records for inpatient care and for return visits. We additionally reviewed severe COVID-19 complications including repeat ED visits, hospitalization, transfer to outside hospitals, and complications such as intubation and death. We performed follow up on these patients with San Diego Health Connect (San Diego, CA) to ensure that the patients had not beem seen or admitted at a different county hospital.
Statistical AnalysisWe used frequencies and percentages to express categorical
data such as ethnicity, gender, age ≥ 55 years or older, BMI ≥ 35, and the presence of at least one comorbidity (coronary artery disease, hypertension, diabetes, cancer/lymphoma, current use of immunosuppressive drug therapy, chronic kidney disease/dialysis, or chronic respiratory disease). Additionally, these factors (variables) along with the exposure to bamlanivimab or absence of exposure were examined to see whether there were associations with the following outcomes within 14 days: ED visit, hospitalization, and mortality.
Means and standard deviations were used to express continuous data such as age, BMI, and time since onset of COVID-19 symptoms. We used t-tests to examine whether there was a statistically significant difference between the unexposed groups and the bamlanivimab group. Chi-square tests and bivariate analyses were used to find an association between the exposure to bamlanivimab and patients’ characteristics and outcomes variables. Using bivariate analysis, factors that were significant to α level of 0.10 were then entered in the full multivariate regression models for ED return visits in 14 days and hospitalizations. The factors that were significant to α level of 0.05 or less were then kept and entered into the final, reduced multivariate regression models. We used the variables that reached to α level of 0.05 in the final, reduced models to calculate reduction of the outcome – ED return visits in 14 days and hospitalizations. All analyses were performed using SAS© Studio Release 3.8 (Cary, North Carolina, USA).
RESULTSThe ECRMC ED with an annual volume of 46,000
patients had a total of 7,735 patients within the three-month period, November 1, 2020–January 31, 2021. To detect a 15% different in treatment effect and using a confidence level of 95%, α of 0.05, and 80% power, we determined that a total
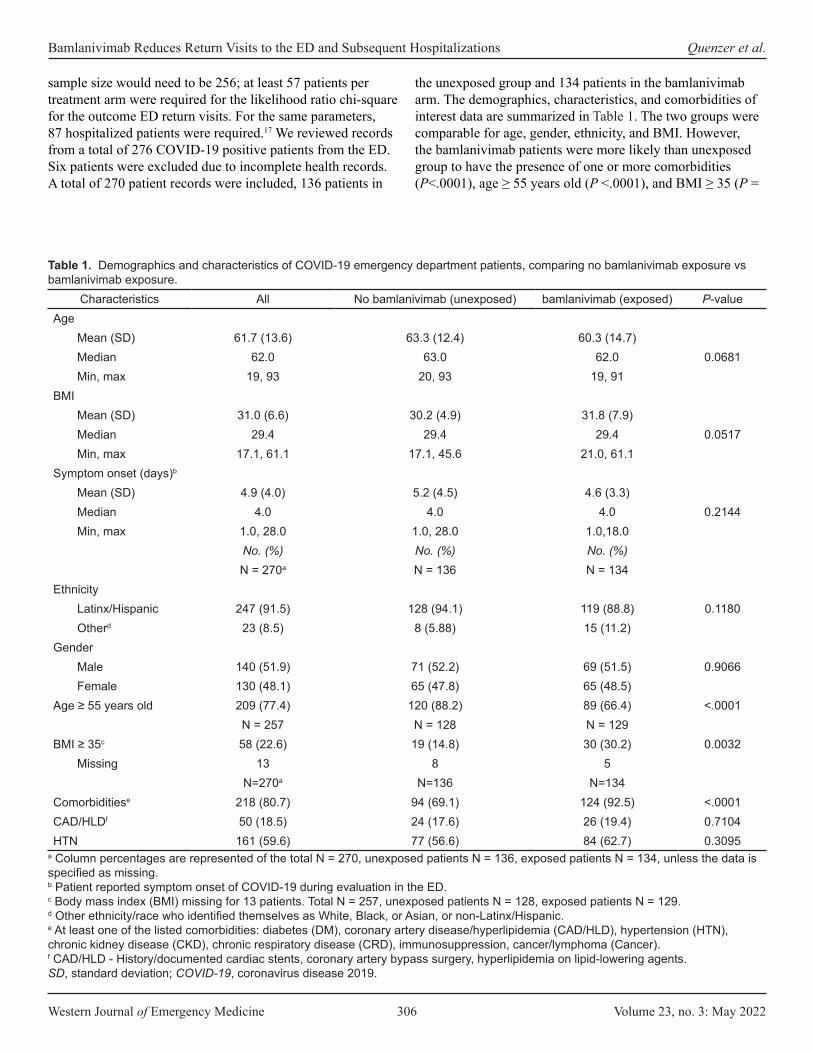
Western Journal of Emergency Medicine 306 Volume 23, no. 3: May 2022
Bamlanivimab Reduces Return Visits to the ED and Subsequent Hospitalizations Quenzer et al.
sample size would need to be 256; at least 57 patients per treatment arm were required for the likelihood ratio chi-square for the outcome ED return visits. For the same parameters, 87 hospitalized patients were required.17 We reviewed records from a total of 276 COVID-19 positive patients from the ED. Six patients were excluded due to incomplete health records. A total of 270 patient records were included, 136 patients in
the unexposed group and 134 patients in the bamlanivimab arm. The demographics, characteristics, and comorbidities of interest data are summarized in Table 1. The two groups were comparable for age, gender, ethnicity, and BMI. However, the bamlanivimab patients were more likely than unexposed group to have the presence of one or more comorbidities (P<.0001), age ≥ 55 years old (P <.0001), and BMI ≥ 35 (P =
Characteristics All No bamlanivimab (unexposed) bamlanivimab (exposed) P-valueAge
Mean (SD) 61.7 (13.6) 63.3 (12.4) 60.3 (14.7)Median 62.0 63.0 62.0 0.0681Min, max 19, 93 20, 93 19, 91
BMIMean (SD) 31.0 (6.6) 30.2 (4.9) 31.8 (7.9)Median 29.4 29.4 29.4 0.0517Min, max 17.1, 61.1 17.1, 45.6 21.0, 61.1
Symptom onset (days)b
Mean (SD) 4.9 (4.0) 5.2 (4.5) 4.6 (3.3)Median 4.0 4.0 4.0 0.2144Min, max 1.0, 28.0 1.0, 28.0 1.0,18.0
No. (%) No. (%) No. (%)N = 270a N = 136 N = 134
EthnicityLatinx/Hispanic 247 (91.5) 128 (94.1) 119 (88.8) 0.1180Otherd 23 (8.5) 8 (5.88) 15 (11.2)
GenderMale 140 (51.9) 71 (52.2) 69 (51.5) 0.9066Female 130 (48.1) 65 (47.8) 65 (48.5)
Age ≥ 55 years old 209 (77.4) 120 (88.2) 89 (66.4) <.0001N = 257 N = 128 N = 129
BMI ≥ 35c 58 (22.6) 19 (14.8) 30 (30.2) 0.0032Missing 13 8 5
N=270a N=136 N=134Comorbiditiese 218 (80.7) 94 (69.1) 124 (92.5) <.0001CAD/HLDf 50 (18.5) 24 (17.6) 26 (19.4) 0.7104HTN 161 (59.6) 77 (56.6) 84 (62.7) 0.3095
Table 1. Demographics and characteristics of COVID-19 emergency department patients, comparing no bamlanivimab exposure vs bamlanivimab exposure.
a Column percentages are represented of the total N = 270, unexposed patients N = 136, exposed patients N = 134, unless the data is specified as missing. b Patient reported symptom onset of COVID-19 during evaluation in the ED.c Body mass index (BMI) missing for 13 patients. Total N = 257, unexposed patients N = 128, exposed patients N = 129. d Other ethnicity/race who identified themselves as White, Black, or Asian, or non-Latinx/Hispanic.e At least one of the listed comorbidities: diabetes (DM), coronary artery disease/hyperlipidemia (CAD/HLD), hypertension (HTN), chronic kidney disease (CKD), chronic respiratory disease (CRD), immunosuppression, cancer/lymphoma (Cancer).f CAD/HLD - History/documented cardiac stents, coronary artery bypass surgery, hyperlipidemia on lipid-lowering agents.SD, standard deviation; COVID-19, coronavirus disease 2019.

Volume 23, no. 3: May 2022 307 Western Journal of Emergency Medicine
Quenzer et al. Bamlanivimab Reduces Return Visits to the ED and Subsequent Hospitalizations
0.0032). Overall, 80.7% patients reported at least one of the comorbidities. The frequencies of each of the comorbidities in both the unexposed and exposed groups are summarized in Table 1. There was a statistically significant difference in the proportion of patients with chronic respiratory disease (P = 0.0094) and cancer (P = 0.0422) within the exposed group being higher.
Outcomes of both unexposed patients, exposed bamlanivimab patients, and the differences in their proportions between groups are reported in Table 2.
Using an α of 0.05 for significance, we found there was a statistically significant difference between the two groups in the 14-day outcomes of return visit to the ED (P < .0001), hospitalization (P = 0.0011), and death (P = 0.0235). In building the multivariate regression models of outcomes of ED visits within 14 days (Appendix i) and subsequent hospitalizations (Appendix ii), we used bivariate associations from the patient demographics, comorbidities, and exposure to
bamlanivimab infusions. Due to lack of data on the outcomes of ventilator requirement and death, the variables (factors) and bamlanivimab exposure could not be analyzed through regression modeling (Appendix iii).
OutcomesOverall, the unstratified unexposed patient had a 2.00
(95% confidence interval [CI]: 1.340, 2.977) increased risk of an ED return visit in 14 days and a 2.27 (95% CI: 1.224, 4.208) increased risk of hospitalization compared to those who received bamlanivimab (exposed group). There were no deaths in the exposed group and five deaths overall in the unexposed group. We placed the variables into a bivariate analysis to build various regression models of ED return visits in 14 days and hospitalizations (Appendix iv-ix). The bivariate associations that were used in producing the full models were made by removing those variables that did not reach α level of 0.10. These variables are
Characteristics All No bamlanivimab (unexposed) bamlanivimab (exposed) P-valueDM 111 (41.1) 48 (35.3) 63 (47.0) 0.0503CKDg 12 (4.4) 6 (4.48) 6 (4.41) 0.9791Immunocompromisedh 17 (6.3) 6 (4.41) 11 (8.21) 0.1990Cancer 16 (5.9) 12 (8.82) 4 (3.00) 0.0422CRDi 29 (10.7) 8 (5.9) 21 (15.7) 0.0094
Table 1. Continued.
g History/documented renal failure, peritoneal or hemodialysis. h Current immunosuppressive therapy such as steroids, anti-cancer, protein drugs, among others.i CRD includes asthma, pulmonary fibrosis, or chronic obstructive pulmonary disease (COPD), among other chronic lung diseases
Outcomesa All patients No Bamlanivimab (Unexposed) Bamlanivimab (Exposed) P-valueN=270No. (%)
N = 136No. (%)
N = 134No. (%)
Return visit to ED in 14 days 67 (24.8) 48 (35.3) 19 (14.2) <0.0001Hospitalization in 14 days 34 (12.6) 26 (19.1) 8 (6.0) 0.0011Endotracheal intubationb,d 3 (1.13) 3 (2.22) 0 (0) 0.0862
Missing 4 4 0Mortalityc,d 0.0235
Survived 262 (98.2) 128 (96.2) 134 (100.0)Died 5 (1.9) 5 (3.76) 0 (0.0)Missing 3 3 0
Table 2. Clinical outcomes of COVID-19 patients no bamlanivimab exposure vs bamlanivimab exposure.
a Column percents presented.b Endotracheal intubation data missing from 4 patients. Total N = 266, unexposed patients N = 132, exposed patients N = 134. c Mortality data is missing outcomes of three patients, with total N = 267, unexposed patients N = 132, exposed patients N = 134. d Chi-square analysis is unreliable due to >25% of the data missing in cells. ED, emergency department.
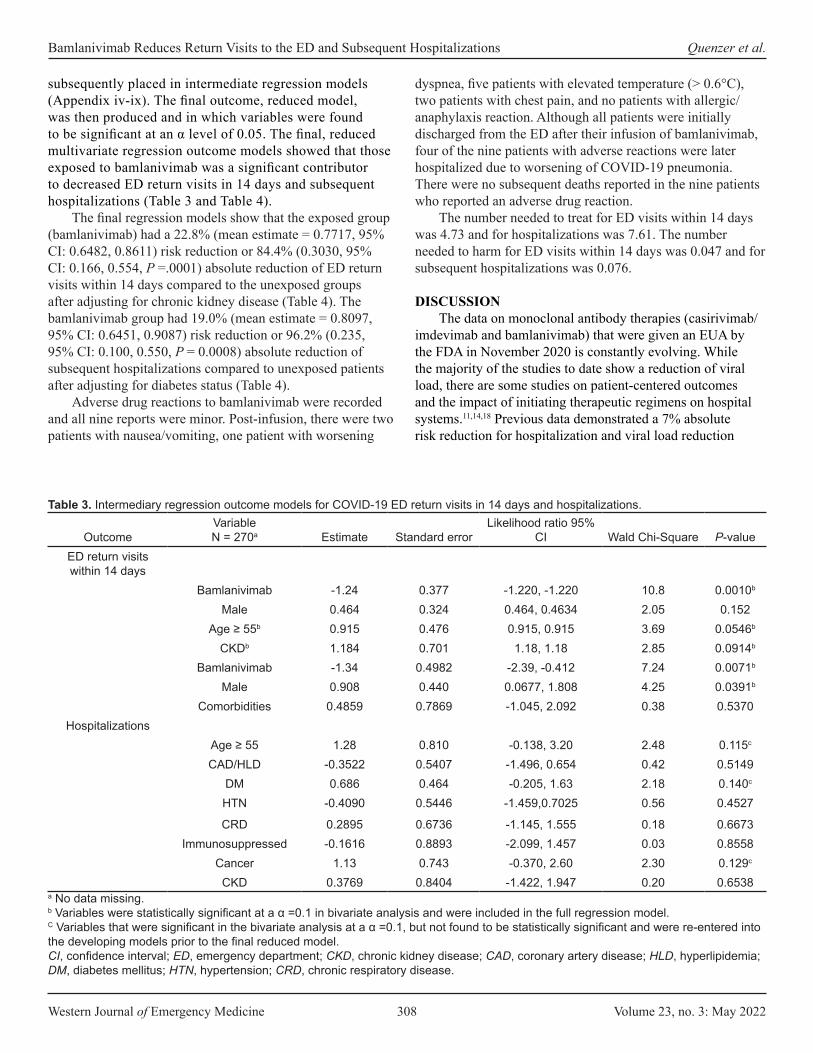
Western Journal of Emergency Medicine 308 Volume 23, no. 3: May 2022
Bamlanivimab Reduces Return Visits to the ED and Subsequent Hospitalizations Quenzer et al.
subsequently placed in intermediate regression models (Appendix iv-ix). The final outcome, reduced model, was then produced and in which variables were found to be significant at an α level of 0.05. The final, reduced multivariate regression outcome models showed that those exposed to bamlanivimab was a significant contributor to decreased ED return visits in 14 days and subsequent hospitalizations (Table 3 and Table 4).
The final regression models show that the exposed group (bamlanivimab) had a 22.8% (mean estimate = 0.7717, 95% CI: 0.6482, 0.8611) risk reduction or 84.4% (0.3030, 95% CI: 0.166, 0.554, P =.0001) absolute reduction of ED return visits within 14 days compared to the unexposed groups after adjusting for chronic kidney disease (Table 4). The bamlanivimab group had 19.0% (mean estimate = 0.8097, 95% CI: 0.6451, 0.9087) risk reduction or 96.2% (0.235, 95% CI: 0.100, 0.550, P = 0.0008) absolute reduction of subsequent hospitalizations compared to unexposed patients after adjusting for diabetes status (Table 4).
Adverse drug reactions to bamlanivimab were recorded and all nine reports were minor. Post-infusion, there were two patients with nausea/vomiting, one patient with worsening
dyspnea, five patients with elevated temperature (> 0.6°C), two patients with chest pain, and no patients with allergic/anaphylaxis reaction. Although all patients were initially discharged from the ED after their infusion of bamlanivimab, four of the nine patients with adverse reactions were later hospitalized due to worsening of COVID-19 pneumonia. There were no subsequent deaths reported in the nine patients who reported an adverse drug reaction.
The number needed to treat for ED visits within 14 days was 4.73 and for hospitalizations was 7.61. The number needed to harm for ED visits within 14 days was 0.047 and for subsequent hospitalizations was 0.076.
DISCUSSIONThe data on monoclonal antibody therapies (casirivimab/
imdevimab and bamlanivimab) that were given an EUA by the FDA in November 2020 is constantly evolving. While the majority of the studies to date show a reduction of viral load, there are some studies on patient-centered outcomes and the impact of initiating therapeutic regimens on hospital systems.11,14,18 Previous data demonstrated a 7% absolute risk reduction for hospitalization and viral load reduction
OutcomeVariable N = 270a Estimate Standard error
Likelihood ratio 95% CI Wald Chi-Square P-value
ED return visits within 14 days
Bamlanivimab -1.24 0.377 -1.220, -1.220 10.8 0.0010b Male 0.464 0.324 0.464, 0.4634 2.05 0.152
Age ≥ 55b 0.915 0.476 0.915, 0.915 3.69 0.0546b
CKDb 1.184 0.701 1.18, 1.18 2.85 0.0914b
Bamlanivimab -1.34 0.4982 -2.39, -0.412 7.24 0.0071b
Male 0.908 0.440 0.0677, 1.808 4.25 0.0391b
Comorbidities 0.4859 0.7869 -1.045, 2.092 0.38 0.5370Hospitalizations
Age ≥ 55 1.28 0.810 -0.138, 3.20 2.48 0.115c
CAD/HLD -0.3522 0.5407 -1.496, 0.654 0.42 0.5149DM 0.686 0.464 -0.205, 1.63 2.18 0.140c
HTN -0.4090 0.5446 -1.459,0.7025 0.56 0.4527
CRD 0.2895 0.6736 -1.145, 1.555 0.18 0.6673Immunosuppressed -0.1616 0.8893 -2.099, 1.457 0.03 0.8558
Cancer 1.13 0.743 -0.370, 2.60 2.30 0.129c
CKD 0.3769 0.8404 -1.422, 1.947 0.20 0.6538
Table 3. Intermediary regression outcome models for COVID-19 ED return visits in 14 days and hospitalizations.
a No data missing.b Variables were statistically significant at a α =0.1 in bivariate analysis and were included in the full regression model.C Variables that were significant in the bivariate analysis at a α =0.1, but not found to be statistically significant and were re-entered into the developing models prior to the final reduced model. CI, confidence interval; ED, emergency department; CKD, chronic kidney disease; CAD, coronary artery disease; HLD, hyperlipidemia; DM, diabetes mellitus; HTN, hypertension; CRD, chronic respiratory disease.
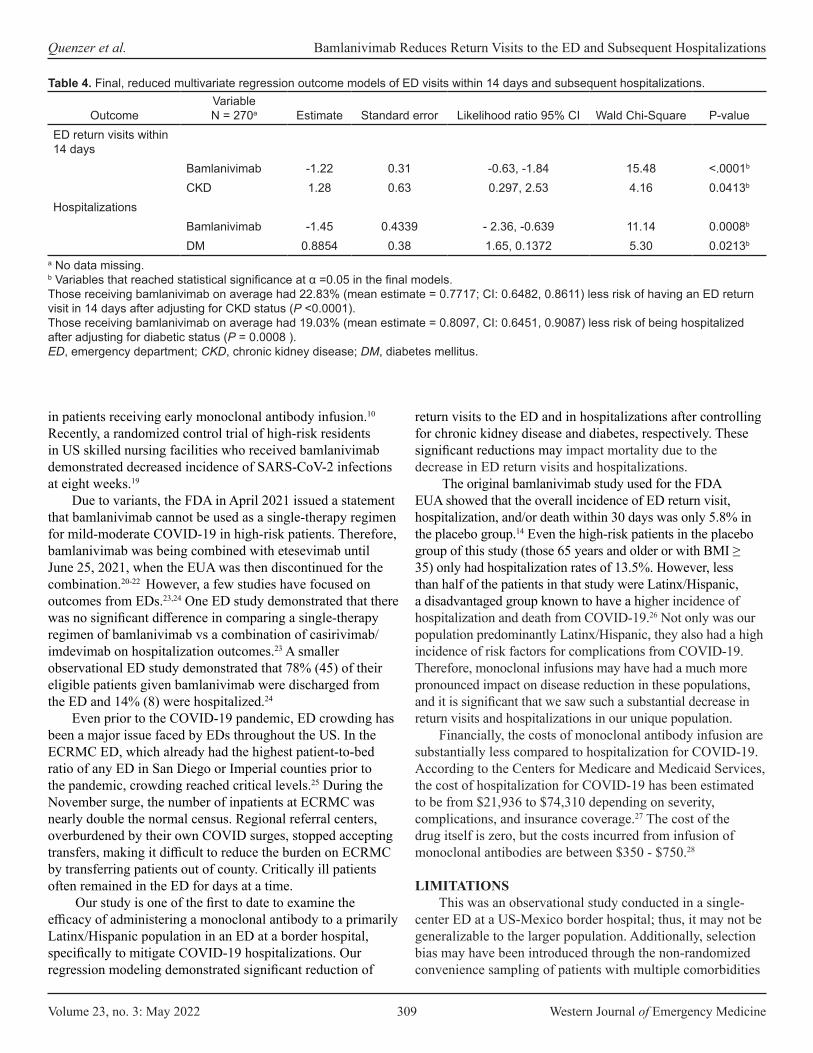
Volume 23, no. 3: May 2022 309 Western Journal of Emergency Medicine
Quenzer et al. Bamlanivimab Reduces Return Visits to the ED and Subsequent Hospitalizations
in patients receiving early monoclonal antibody infusion.10 Recently, a randomized control trial of high-risk residents in US skilled nursing facilities who received bamlanivimab demonstrated decreased incidence of SARS-CoV-2 infections at eight weeks.19
Due to variants, the FDA in April 2021 issued a statement that bamlanivimab cannot be used as a single-therapy regimen for mild-moderate COVID-19 in high-risk patients. Therefore, bamlanivimab was being combined with etesevimab until June 25, 2021, when the EUA was then discontinued for the combination.20-22 However, a few studies have focused on outcomes from EDs.23,24 One ED study demonstrated that there was no significant difference in comparing a single-therapy regimen of bamlanivimab vs a combination of casirivimab/imdevimab on hospitalization outcomes.23 A smaller observational ED study demonstrated that 78% (45) of their eligible patients given bamlanivimab were discharged from the ED and 14% (8) were hospitalized.24
Even prior to the COVID-19 pandemic, ED crowding has been a major issue faced by EDs throughout the US. In the ECRMC ED, which already had the highest patient-to-bed ratio of any ED in San Diego or Imperial counties prior to the pandemic, crowding reached critical levels.25 During the November surge, the number of inpatients at ECRMC was nearly double the normal census. Regional referral centers, overburdened by their own COVID surges, stopped accepting transfers, making it difficult to reduce the burden on ECRMC by transferring patients out of county. Critically ill patients often remained in the ED for days at a time.
Our study is one of the first to date to examine the efficacy of administering a monoclonal antibody to a primarily Latinx/Hispanic population in an ED at a border hospital, specifically to mitigate COVID-19 hospitalizations. Our regression modeling demonstrated significant reduction of
return visits to the ED and in hospitalizations after controlling for chronic kidney disease and diabetes, respectively. These significant reductions may impact mortality due to the decrease in ED return visits and hospitalizations.
The original bamlanivimab study used for the FDA EUA showed that the overall incidence of ED return visit, hospitalization, and/or death within 30 days was only 5.8% in the placebo group.14 Even the high-risk patients in the placebo group of this study (those 65 years and older or with BMI ≥ 35) only had hospitalization rates of 13.5%. However, less than half of the patients in that study were Latinx/Hispanic, a disadvantaged group known to have a higher incidence of hospitalization and death from COVID-19.26 Not only was our population predominantly Latinx/Hispanic, they also had a high incidence of risk factors for complications from COVID-19. Therefore, monoclonal infusions may have had a much more pronounced impact on disease reduction in these populations, and it is significant that we saw such a substantial decrease in return visits and hospitalizations in our unique population.
Financially, the costs of monoclonal antibody infusion are substantially less compared to hospitalization for COVID-19. According to the Centers for Medicare and Medicaid Services, the cost of hospitalization for COVID-19 has been estimated to be from $21,936 to $74,310 depending on severity, complications, and insurance coverage.27 The cost of the drug itself is zero, but the costs incurred from infusion of monoclonal antibodies are between $350 - $750.28
LIMITATIONSThis was an observational study conducted in a single-
center ED at a US-Mexico border hospital; thus, it may not be generalizable to the larger population. Additionally, selection bias may have been introduced through the non-randomized convenience sampling of patients with multiple comorbidities
OutcomeVariable N = 270a Estimate Standard error Likelihood ratio 95% CI Wald Chi-Square P-value
ED return visits within 14 days
Bamlanivimab -1.22 0.31 -0.63, -1.84 15.48 <.0001b
CKD 1.28 0.63 0.297, 2.53 4.16 0.0413b
HospitalizationsBamlanivimab -1.45 0.4339 - 2.36, -0.639 11.14 0.0008b
DM 0.8854 0.38 1.65, 0.1372 5.30 0.0213b
Table 4. Final, reduced multivariate regression outcome models of ED visits within 14 days and subsequent hospitalizations.
a No data missing.b Variables that reached statistical significance at α =0.05 in the final models.Those receiving bamlanivimab on average had 22.83% (mean estimate = 0.7717; CI: 0.6482, 0.8611) less risk of having an ED return visit in 14 days after adjusting for CKD status (P <0.0001).Those receiving bamlanivimab on average had 19.03% (mean estimate = 0.8097, CI: 0.6451, 0.9087) less risk of being hospitalized after adjusting for diabetic status (P = 0.0008 ).ED, emergency department; CKD, chronic kidney disease; DM, diabetes mellitus.

Western Journal of Emergency Medicine 310 Volume 23, no. 3: May 2022
Bamlanivimab Reduces Return Visits to the ED and Subsequent Hospitalizations Quenzer et al.
and mild symptoms of SARS-CoV-2 infection. Because the researchers were aware of the treatment allocation, this could have also biased their assessment.
The distribution of bamlanivimab was unpredictable due to the surging prevalence of COVID-19 in the community. This created a lack of predictability in who ultimately received treatment with bamlanivimab, and eligible patients may or may not have received treatment in a timely manner. However, this may have been minimized by an ongoing active campaign to inform patients and physicians within the community regarding bamlanivimab infusions in the ED such that patients did come during designated hours of infusion, which would have enabled us to include as many potential eligible patients as possible. Although some may question the reliability of the ED return visit outcome, the patients in our study were followed in detail and the data appears to support a substantial decrease in preventing subsequent hospitalizations for the exposed group. Additionally, the endotracheal intubation/ventilator and mortality outcomes were too small to allow for comparisons. These outcomes were likely confounded because some patients who expired had been placed on comfort care prior to being intubated.
Given concerns that COVID-19 surges are imminent, we decided that these results should be submitted for publication in hopes that the data could be used to quickly operationalize in areas most vulnerable to overwhelming COVID-19 surges. It is noteworthy that the November and December surge was prior to the discovery of the several COVID-19 variants now known to be spreading across the country. There is evidence to suggest that bamlanivimab alone may not have similar effectiveness against variants.29 This may be likely due to the decreased predominance of more virulent and/or transmissible variants that are not susceptible to neutralization and the rise of these variants of concern that can escape neutralization of monoclonal antibody treatment. Therefore, FDA protocols are now for other combination monoclonal antibody treatment.21-23
Future studies may focus on how monoclonal antibody infusions could efficiently be operationalized as these ED visits could potentially increase the number of patients seeking monoclonal antibody treatment, which could be a potential confounder in surges. Additionally of value would be a multicenter, randomized, and placebo-controlled study with a large proportion of patients who belong to vulnerable populations such as Latinx/Hispanics in order to observe whether or not monoclonal antibodies do have a similar effect, especially with the advent of variants of SARS-CoV-2.
CONCLUSION
Our study found a 22.8% risk reduction in return ED visits and 19.0% risk reduction of subsequent hospitalizations in high-risk COVID-19 patients who received bamlanivimab compared to those who did not receive bamlanivimab. We believe that operationalizing monoclonal antibody infusions in high-risk COVID-19 patients could be made into an effective strategy for mitigating the COVID-19 surges at lower-
REFERENCES1. Shammas B, Cha A, Guarino B. Record numbers of COVID-19
patients push hospitals and staff to the limit. 2020. Available at: https://www.washingtonpost.com/health/2020/12/16/hospitals-covid-overwhelmed/. Accessed March 16, 2021.
2. Health and Human Services. U.S.-Mexico Border Health Commission. Healthy Border 2020: A Prevention & Health Promotion Initiative. 2020. Available at: https://www.hhs.gov/sites/default/files/res_2805.pdf. Accessed November 11, 2020.
3. Gupta S, Hayek SS, Wang W, et al. Factors associated with death in critically ill patients with coronavirus disease 2019 in the US. JAMA Intern Med. 2020;180(11):1436-47.
4. Bureau of Transportation Statistics. Border Crossing Data for 2019. 2019. Available at: https://explore.dot.gov/views/BorderCrossingData/CrossingRank?:isGuestRedirectFromVizportal=y&:embed=y. Accessed November 11, 2020.
5. de Heer HD, Balcázar HG, Morera OF, et al. Barriers to care and comorbidities along the U.S.-Mexico border. Public Health Rep. 2013;128(6):480-88.
6. Centers for Disease Control and Prevention. People with Certain Medical Conditions. 2021. Available at: https://www.cdc.gov/coronavirus/2019-ncov/need-extra-precautions/people-with-medical-conditions.html. Accessed February 22, 2021.
7. Centers for Disease Control and Prevention. Coronavirus Disease 2019 (COVID-19)-Associated Hospitalization Surveillance Network (COVID-NET). 2021. Available at: https://www.cdc.gov/coronavirus/2019-ncov/covid-data/covid-net/purpose-methods.html. Accessed February 22, 2021.
8. New York Times. California Coronavirus Map and Case Count. 2020. Available at: https://www.nytimes.com/interactive/2020/us/california-coronavirus-cases.html. Accessed March 13, 2021.
9. U.S. Food and Drug Administration. Coronavirus (COVID-19) Update: FDA authorizes monoclonal antibody for treatment of COVID-19. 2020. Available at: https://www.fda.gov/news-events/press-announcements/coronavirus-covid-19-update-fda-authorizes-monoclonal-antibody-
resourced US-Mexico border hospitals.
Address for Correspondence: Faith C. Quenzer, DO, MPH, San Diego State University, School of Public Health, Division of Epidemiology, Hardy Tower Room 119, 5500 Campanile Drive, San Diego, CA 92182-4162. Email: [email protected].
Conflicts of Interest: By the WestJEM article submission agreement, all authors are required to disclose all affiliations, funding sources and financial or management relationships that could be perceived as potential sources of bias. No author has professional or financial relationships with any companies that are relevant to this study. There are no conflicts of interest or sources of funding to declare.
Copyright: © 2022 Quenzer et al. This is an open access article distributed in accordance with the terms of the Creative Commons Attribution (CC BY 4.0) License. See: http://creativecommons.org/licenses/by/4.0/

Volume 23, no. 3: May 2022 311 Western Journal of Emergency Medicine
Quenzer et al. Bamlanivimab Reduces Return Visits to the ED and Subsequent Hospitalizations
treatment-covid-19. Accessed February 2, 2021.10. ACTIV-3/TICO LY-CoV555 Study Group, Lundgren JD, Grund B, et
al. A neutralizing monoclonal antibody for hospitalized patients with Covid-19. N Engl J Med. 2021;384(10):905-14.
11. Chen P, Nirula A, Heller B, et al. SARS-CoV-2 neutralizing antibody LY-CoV555 in outpatients with Covid-19. N Engl J Med. 2021;384(3):229-37.
12. Lloyd EC, Gandhi TN, Petty LA. Monoclonal antibodies for COVID-19. JAMA. 2021;325(10):1015.
13. Marovich M, Mascola JR, Cohen MS. Monoclonal antibodies for prevention and treatment of COVID-19. JAMA. 2020;324(2):131-2.
14. Gottlieb RL, Nirula A, Chen P, et al. Effect of bamlanivimab as monotherapy or in combination with etesevimab on viral load in patients with mild to moderate COVID-19: a randomized clinical trial. JAMA. 2021;325(7):632-44.
15. Huang C, Wang Y, Li X, et al. Clinical features of patients infected with 2019 novel coronavirus in Wuhan, China [published correction appears in Lancet]. Lancet. 2020;395(10223):497-506.
16. Worster A, Bledsoe RD, Cleve P, et al. Reassessing the methods of medical record review studies in emergency medicine research. Ann Emerg Med. 2005;45(4):448-51.
17. Wang H, Shein-Chung C. Sample size calculation for comparing proportions. 2007. Wiley Encyclopedia of Clinical Trials. December 14, 2007.
18. Weinreich DM, Sivapalasingam S, Norton T, et al. REGN-COV2, a neutralizing antibody cocktail, in outpatients with Covid-19. N Engl J Med. 2021;384(3):238-51.
19. Cohen MS, Nirula A, Mulligan MJ, et al. Effect of bamlanivimab vs placebo on incidence of COVID-19 among residents and staff of skilled nursing and assisted living facilities: a randomized clinical trial. JAMA. 2021;326(1):46-55.
20. Coronavirus (COVID-19) Update: FDA revokes emergency use authorization for monoclonal antibody bamlanivimab. Food and Drug Administration (FDA). 2021. Available at: https://www.fda.gov/news-events/press-announcements/coronavirus-covid-19-update-fda-revokes-emergency-use-authorization-monoclonal-antibody-
bamlanivimab. Accessed May 1, 2021.21. Dougan M, Nirula A, Azizad M, et al. Bamlanivimab plus etesevimab
in mild or moderate Covid-19. N Engl J Med. 2021;NEJMoa2102685.22. U.S. Department of Health and Human Services. Pause in the
distribution of bamlanivimab/etesevimab. 2021. Available at: https://www.phe.gov/emergency/events/COVID19/investigation-MCM/Bamlanivimab-etesevimab/Pages/bamlanivimab-etesevimab-distribution-pause.aspx. Accessed August 5, 2021.
23. Farcy DA, Dalley MT, Miro G, et al. A comparison of SARS-COV-2 neutralizing antibody therapies in high-risk patients with mild to moderate COVID-19 disease at a single academic hospital. J Emerg Med. 2021;S0736-4679(21)00564-3.
24. Yoo MJ, Long BJ, Schauer SG. Bamlanivimab infusion experience at one academic emergency department. Am J Emerg Med. 2021;S0735-6757(21)00565-9.
25. Lev R. 2018 San Diego Emergency Departments Survey Results. Platform presentation presented at: Emergency Care “By the Bay” Conference - California Emergency Nurses Association, San Diego Emergency Medicine Oversight Commission, and The Doctor’s Company; 2018 Nov 8; San Diego, CA.
26. Izzy S, Tahir Z, Cote DJ, et al. Characteristics and outcomes of Latinx patients with COVID-19 in comparison with other ethnic and racial groups. Open Forum Infect Dis. 2020;7(10):ofaa401.
27. FAIRHealth. The projected economic impact of the COVID-19 pandemic on the US healthcare system. 2020. Available at: https://s3.amazonaws.com/media2.fairhealth.org/brief/asset/COVID-19%20-%20The%20Projected%20Economic%20Impact%20of%20the%20COVID-19%20Pandemic%20on%20the%20US%20Healthcare%20System.pdf. Accessed July 25, 2021.
28. Centers for Medicare and Medicaid Services (CMS). COVID-19 Vaccines and Monoclonal Antibodies. 2021. Available at: https://www.cms.gov/covid-19-vaccines-and-monoclonal-antibodies. Accessed July 25, 2021
29. Widera M, Wilhelm A, Hoehl S, et al. Limited neutralization of authentic severe acute respiratory syndrome coronavirus 2 variants carrying E484K In vitro. J Infect Dis. 2021;224(7):1109-14.

Western Journal of Emergency Medicine 312 Volume 23, no. 3: May 2022
Original Research
Comparing Hepatitis C Virus Screening in Clinics Versus the Emergency Department
Rebecca Hluhanich, PharmD*°James S. Ford, MD†°Devin Bruce, BS†
Tasleem Chechi, MPH†
Stephanie Voong, BS†
Souvik Sarkar, MD, PhD‡
Patricia Poole, PharmD§
Nam Tran, PhD, MS¶
Larissa May, MD, MSPH†
Section Editor: Tony Zitek, MDSubmission history: Submitted June 26, 2021; Revision received October 12, 2021; Accepted November 15, 2021Electronically published March 17, 2022Full text available through open access at http://escholarship.org/uc/uciem_westjemDOI: 10.5811/westjem.2021.11.53870
INTRODUCTIONThere are an estimated 150 million people with chronic
hepatitis C virus (HCV) globally.1 In the United States (US), HCV is the most common bloodborne infection, and it is re-sponsible for more deaths than any other chronic infectious disease in the country, largely because of its association with cirrhosis and hepatocellular carcinoma.2,3 For reasons that are unclear, HCV-related mortality has increased in recent decades, while mortality rates for 60 other notable infectious diseases,
UC Davis Health, Hepatology and Infectious Diseases Clinical Pharmacy, Sacramento, CaliforniaUC Davis Health, Department of Emergency Medicine, Sacramento, CaliforniaUC Davis Health, Department of Internal Medicine, Division of Gastroenterology, Sacramento, CaliforniaUC Davis Health, Department of Pharmacy, Sacramento, CaliforniaUC Davis Health, Department of Pathology and Laboratory Medicine, Sacramento, CaliforniaRebecca Hluhanich and James Ford contributed equally to the production of this manuscript and share first-authorship
*
†
‡
§
¶
°
Introduction: New evidence suggests that emergency department (ED)-based infectious diseases screening programs have utility. We aimed to compare clinic-based and ED-based hepatitis C virus (HCV) screening programs within a single health system, to identify key differences in HCV antibody (Ab) positivity and chronic HCV, as well as population demographics.
Methods: In the clinic-based program, adults in the birth cohort (born 1945-1965) were screened for HCV. In the ED-based program, non-targeted HCV screening of all adults was conducted. We included patients screened between June 2019–June 2020. Patients were screened for anti-HCV Ab, and positive results were followed by HCV viral load (VL) testing. Our primary outcomes were seroprevalence of HCV Ab and HCV VL.
Results: There were 1,296 and 12,778 patients screened for HCV in the clinics and the ED, respectively. In the clinic setting, 13 patients (1%) screened positive for HCV Ab and nine (69%) completed VL testing, which was positive in one patient (11%). In the ED, 1,053 patients (8%) screened positive for HCV Ab and 847 (80%) underwent reflex VL testing, which was positive in 381 patients (45%). In an ED birth cohort sub-analysis, Hepatitis C virus Ab seroprevalence was 15% (675/4521).
Conclusion: In this study of patients in a single healthcare system, ED-based HCV screening was higher yield than clinic-based screening. [West J Emerg Med. 2022;22(3)312–317.]
including human immunodeficiency virus (HIV) and hepatitis B virus (HBV), have decreased.2 In 2020 the US Centers for Dis-ease Control and Prevention (CDC) released guidelines recom-mending HCV screening in all adults 18 years and older.4 With curative treatments becoming more accessible and affordable, systematic approaches to identifying infected individuals could drastically reduce the burden of disease.5,6
While screening for infectious diseases has historically been viewed as a primary care service, a growing body of
Volume 23, no. 3: May 2022 313 Western Journal of Emergency Medicine
Hluhanich et al. Hepatitis C Screening in Clinics Versus the ED
Population Health Research Capsule
What do we already know about this issue?Hepatitis C virus (HCV) screening is typically performed in clinic, but new data suggest that emergency departments (ED) are an important setting for screening.
What was the research question?Is HCV antibody prevalence different between ED and clinic populations within the same health system?
What was the major finding of the study?HCV antibody prevalence was 8-fold higher in the ED (8%) compared to the clinics (1%).
How does this improve population health?Screening for HCV in the ED is high yield and can complement traditional clinic-based screening.
evidence has emerged suggesting that emergency department (ED)-based screening protocols have utility, given the tendency for EDs to care for medically underserved and behaviorally high-risk populations.7,8 Screening programs based in EDs have demonstrated success in screening for infectious diseases including HCV, HIV, and HBV.7,9-14 However, using the ED as a setting for delivery of public health interventions remains controversial.15 There is limited data comparing HCV screen-ing practices between ambulatory and ED settings; therefore, it remains unclear whether ED-based HCV screening programs provide utility, relative to traditional clinic-based programs.
Our health system implemented an ED-based HCV screening program in November 2018 and a clinic-based program in May 2019. In this study our goal was to compare clinic-based and ED-based HCV screening programs within a single health system to identify key differences in HCV anti-body (Ab) positivity and chronic HCV, as well as population demographics and risk profiles.
METHODS Overview
This was a retrospective cohort analysis comparing HCV screening initiatives between the ED and clinic setting within the University of California Davis Health system. On November 27, 2018, the health system implemented a non-targeted, ED-based HCV screening program of all adults undergoing phlebotomy as part of their ED workup. On May 7, 2019, our institution implemented an HCV screening program in its ambulatory care clinic (ACC) network for all individuals born between 1945-1965. The ACC-based screening program was pharmacist-driven, and we characterize the implementation of this program. The study institution’s ED-based HCV screening program has been previously described.16 These HCV screening programs are the result of a collaboration between the ED, primary care clinics, specialty pharmacy, the Division of Gastroenterology and Hepatology, the Sacramento County Health Department, and the local Federally Qualified Health Centers (FQHC). All authors had access to the study data and reviewed and approved the final manuscript. This study was determined not to be human subjects research by the UC Davis Institutional Review Board Quality Improvement Self-Certification Tool.
Study Setting and Population UC Davis Health is a quaternary referral, academic health
system in northern California. The study ED is a Level I adult and pediatric trauma center that services a mixed urban and rural population and has more than 80,000 patient visits annually. Six primary care clinics from the ACC network were included in the study.
Program Implementation Pharmacist-Driven HCV Screening Program Design
Hepatology and infectious diseases clinical pharmacists
collaborated with primary care clinics to conduct HCV screening. Education on HCV screening and management was provided to all practicing physicians at each site, and they were given the opportunity to opt into the pharmacist screening program. The screening initiative was implemented in six primary care clinics out of a total of 13 internal medicine primary care clinics in our health system. A total of 41 staff physicians and 58 medical residents opted into the program. The screening program consisted of a pharmacist and a patient navigator and used a report that identified patients who had an overdue Best Practice Advisory (BPA) for HCV screening based on birth years 1945–1965. Individual patient health records were reviewed for documentation of previous HCV Ab testing in outside records accessible via the Epic Care Everywhere interoperability platform (Epic Systems Corporation, Verona, WI) and were excluded if a result was present. Eligible patients were then notified by either Epic Mychart electronic messaging or a written letter 30 days prior to ordering HCV Ab testing. A phone number was provided to allow for patients to opt out of HCV screening. After the 30-day waiting period, pharmacists placed the HCV Ab order, which remained active for one year. For positive HCV Ab results, pharmacists reviewed results with patients by phone and placed orders for the HCV viral load (VL) and HCV genotype. Patients with negative HCV Ab tests were notified by either Mychart or written letter. The pharmacist

Western Journal of Emergency Medicine 314 Volume 23, no. 3: May 2022
Hepatitis C Screening in Clinics Versus the ED Hluhanich et al.
notified physicians of positive HCV VL results and discussed the plan to disclose new diagnoses to patients, as well as to refer patients to hepatology clinic for treatment. If HCV VL testing was negative, the pharmacist discussed results with the patient via phone.
Brief Summary of ED Screening Program Design
All ED patients ≥18 years and born after 1945, who were having blood drawn for any clinical purpose and did not have a positive HCV RNA test result in the electronic health record (EHR) within the prior six months, were eligible for opt-out HCV screening. Upon entering any laboratory order into the EHR, a BPA notified the emergency clinician that the patient met screening criteria; at that point, clinicians were required to respond to continue with the order entry. Complete details of the ED-based program have been previously described.16
Hepatitis C Virus Laboratory Testing Protocol
HCV screening was conducted by testing blood samples with a chemiluminescent immunoassay that detects HCV Ab (Architect i1000, Abbott Laboratories, Abbott Park, IL). Positive HCV-Ab tests underwent diagnostic confirmation by measuring HCV RNA viral load (Cobas AmpliPrep/TaqMan, Roche Diagnostics, Basel, Switzerland). Results of HCV-Ab testing were typically available within 1-3 days. The results of VL testing were typically available within four days.
Study Design
We performed a retrospective cohort analysis comparing outcomes between HCV screening settings (ACC vs ED), over a 12-month study period. We consecutively included all patients who received HCV testing as part of the ACC or ED screening programs, between June 6, 2019–June 5, 2020. We excluded from our analysis patients who were tested for HCV by emergency clinicians (unprompted by BPA). Data were abstracted directly from the EHR using computer-generated reports; ancillary research staff who procured the reports were not involved with the study and were blinded to the study aims and hypotheses. No manual chart review was performed. The ED data abstracted included age, gender, ethnicity/race, ED visit date, ED chief complaint, clinic HCV testing date, insurance type (Medicare, Medicaid/other public, self-insured/uninsured) and results of HCV testing. Data were stored in de-identified datasets, and each patient was given a unique identifier to maintain patient confidentiality. To prevent duplicate data, only a patient’s first ED visit where they received HCV testing was included in our analysis.
Outcomes The primary outcomes were HCV-Ab
seropositivity (number positive/number tested) and the number of confirmed chronic HCV cases (defined as detectable HCV RNA viral load).
Analysis Data were described with simple descriptive statistics.
Categorical variables were expressed as percentages and proportions, and continuous variables were expressed as means or medians (Q1-Q3). We provided 95% confidence intervals (CI) where appropriate. Comparisons between groups were made using Fischer’s exact test. We performed statistical analysis using Stata 15.1 (StataCorp LLC, College Station, TX).
RESULTS Characteristics of Study SubjectsA total of 1,296 patients were screened in the ACC, and a total of 12,778 patients were screened in the ED during the study period. In the ACC, 3,569 patients were notified of their eligibility for HCV screening; 52 (2%) patients opted out, 1,296 (36%) patients completed screening, and 2,221 (62%) of patients did not complete screening within the study timeframe. The ED-based BPA was accepted by clinicians in 47% (12,778/27,270) of patient visits in which it fired. Patients screened in the ED were younger than those screened in outpatient clinics (mean age: 46 ± 16 years vs 66 ± 6 years). Gender data was similar between study cohorts. Most patients screened in the ACC were White, whereas race was more evenly distributed among patients screened in the ED (White: ACC = 72%; ED = 43%). Full patient characteristics are described in Table 1.
Screening Results HCV-Ab screening was reactive in 1% (13/1296, 95%
CI: 0.4, 1.6) of patients screened in the ACC, compared to 8% (1,053/12,778, 95% CI: 7.8, 8.8) of patients screened in the ED. Follow-up VL testing was performed in 69% (9/13) of HCV-Ab reactive patients in the ACC, and in 80% (847 /1,053) of HCV-Ab reactive patients in the ED. Viral load was positive in 11% (1/9, 95% CI: 0.2, 48.2) of patients tested in the ACC and 45% (381/847, 95% CI: 42, 48) of patients tested in the ED. The HCV-Ab seropositivity of ED patients tested in the birth cohort age 55-74 was 15-fold higher compared to those tested in the ACC (Table 2).
Most patients who screened positive for HCV Ab in the ED were in the birth cohort 55-74 years: 675/1,053 (64%); however, VL was more likely to be reactive in patients 18-54 years compared to those a 55-74 years old (50% [155/308, 95% CI: 45, 56] vs 42% [226/539, 95% CI: 38, 46), P = 0.02]. In the ED, no patients over 75 screened positive for HBV Ab (N = 14).
DISCUSSION
Screening for HCV in the ED was higher yield than clinic-based screening. Disparities in HCV seropositivity suggest that ED-based infectious disease screening programs can complement traditional outpatient screening programs.
An estimated 2.4 million people in the United States are

Volume 23, no. 3: May 2022 315 Western Journal of Emergency Medicine
Hluhanich et al. Hepatitis C Screening in Clinics Versus the ED
Table 1. Patient characteristics stratified by screening settingCharacteristic ED (N = 12,778) ACC (N = 1296) Difference (95% CI)
Age (years)1 46 ± 16 66 ± 6 20 (19, 21)Female Gender 51% (6,502/12,776) 52% (674/1,296) 1 (-2 to 4)Race
White 43% (5,391/12,589) 72% (902/1,256) 29 (26, 32)Black 18% (2,332/12,589) 8% (99/1,256) 11 (9, 12)Asian 8% (970/12,589) 10% (121/1,256) 2 (0.3, 3.7)Other/Mixed 31% (3,896/12,589) 10% (124/1,256) 21 (19, 23)
Undomiciled 8% (984/12,115) <1% (1/1,296) 8 (7, 9)Insurance Type Private 59% (7,587/12,778) 60% (781/1,296) 1 (-2 to 4)
Medicare 18% (2,324/12,778) 39% (506/1,296) 21 (18, 24)Medicaid/Other Public 17% (2,216/12,778) 1% (9/1,296) 16 (15, 17)Self/Uninsured 5% (651/12,778) 0% (0/1,296) 5 (5, 5)
1Only patients between the ages of 55-74 years were eligible for screening in the ACC, whereas all patients ≥18 years in the ED were eligible for screening. ACC, acute care clinics; ED, emergency department; CI, confidence interval.
ED1 ACC Age 18-54 Age 55-74 Age 55-74
HCV-Ab Reactive
378/8243 (5%) 675/4521 (15%) 13/1296 (1%)
HCV-VL Positive
155/308 (50%) 226/539 (42%) 1/9 (11%)
Table 2. Hepatitis C virus results stratified by screening setting and age group.
1No patients over 75 years tested positive for HCV Ab (N = 14). Ab, antibody; ACC, acute care clinic; ED, emergency department; HCV, hepatitis C virus; VL, viral load.
living with hepatitis C, and it is estimated that only half are aware of their HCV-positive status.3,17 Risk of contracting HCV has been shown to be especially high in individuals who are undomiciled, engage in high-risk sexual practices, share needles and other drug injection equipment, or have been incarcerated.18 These individuals also have lower rates of health insurance coverage and often have limited access to primary care services, contributing to frequent visits to the ED.18 In this study we found that patients who were tested for HCV in the ED were more likely to have had previous exposure to HCV (detectable HCV Ab) and were more likely to have chronic HCV (detectable HCV VL) than those who were tested as part of clinic-based initiatives.
The ED and ACC cohorts differed substantively in many key domains. These differences can be partially ascribed to the patient populations who were selected for screening. It is unsurprising that patients tested in the ACC setting were older, given that the ACC conducted birth cohort screening of patients born between 1945-1965, whereas the ED conducted non-targeted screening
of adults. Historically, the birth-cohort age group has been classified as the highest risk population, due to iatrogenic exposures such as blood transfusions pre-1992 and dialysis, as well as lifestyle factors such as injection drug use.19 However, recent data has caused experts to question these risk profiles, leading the US CDC to extend its screening recommendations to all adults ≥ 18 years.4
The seroprevalence of HCV Ab in the ACC (1%) was similar to the national average of patients within a similar birth cohort (1.6%).20 The overall seroprevalence of HCV Ab in the entire ED cohort was 8%, which is similar to that reported by other ED-based, non-targeted HCV screening studies (6-13.2%).13,21-23 Interestingly, the seroprevalence of HCV Ab in the ED birth cohort (15%) was higher than what has been reported previously by other ED-based, birth cohort, HCV screening studies (6.3-9.9%).12,22,24 In our study, birth-cohort patients tested in the ED were 15-fold more likely to have had exposure to HCV (HCV-Ab seropositive), and nearly fourfold more likely to have active hepatitis C (HCV-VL seropositive), when compared to patients tested in the ACC. Patients tested in the ED were more likely to be non-White or of mixed ancestry, undomiciled, and uninsured/self-pay. This data implies a stark socioeconomic and demographic divide between ED and ACC patients, suggesting that lifestyle risk factors may be driving disparities in health outcomes. Future ED-based, HCV risk-factor studies could assist in identifying high-risk patients.
As the public health needs of communities continue to outpace the capacity of clinicians and public health authorities, the role of the pharmacist in leading screening initiatives has expanded to meet these needs. Pharmacist-driven public health initiatives have demonstrated success in myriad settings.25-31 In

Western Journal of Emergency Medicine 316 Volume 23, no. 3: May 2022
Hepatitis C Screening in Clinics Versus the ED Hluhanich et al.
our study an outpatient HCV testing program led by a single pharmacist and program navigator was able to screen over 1,200 patients for HCV in one year. While the ACC screening program diagnosed only one new case of HCV, this modest result is likely attributable to the fact that screening was limited to the birth cohort; one would expect a higher yield of new HCV diagnoses if a universal screening protocol of all adult patients was adopted.
LIMITATIONSThe results of our study must be interpreted in light of its
limitations. This was a study from a single health system; so our findings may not be generalizable to all settings. The ED and ACC HCV screening programs differed in many ways. While the ACC employed a birth-cohort screening protocol, the ED universally screened all adults, which logically led to substantive differences in study populations. However, to account for this difference, we included a sub-analysis that compared only patients screened in the birth cohort in the ED to those screened in the ACC, which demonstrated an even more profound difference in HCV-Ab reactivity in the ED population. While the ED used an automated BPA that was integrated into the EHR, which would automatically initiate HCV orders (with clinician approval) on any patient undergoing phlebotomy, orders for HCV screening had to be manually entered by study pharmacists. While automated HCV test orders were accepted in only 47% of patients in the ED, this was still numerically greater than the 36% of eligible patients who completed testing in the ACC.
There may be several reasons why HCV testing uptake was low in the ACC. In the ACC, patients had one year from the time the HCV order was placed to go to the laboratory to complete testing; however, if they had no other reason to access laboratory services during that time, they were unlikely to receive HCV testing. Additionally, patients who may have had their testing done after the end date of the study period (June 5, 2020), would not have had this testing counted as part of this study. Since the ED cares for substantially more patients annually than the ACC, the ED cohort was much larger than the ACC cohort. Limited data were available with respect to the patient characteristics of study cohorts; future studies should further explore important population-level differences between testing settings, such as socioeconomic status, history of HIV, history of illicit drug use, and other potential risk factors for HCV infection. Linkage-to-care data were not available for this study. Since only a patient’s first HCV testing encounter was included in our analysis, the effect of frequent ED visits (and frequent HCV testing) from high utilizing individuals was not accounted for, which may have led to an overestimation of true ED testing yields.
CONCLUSIONEmergency department-based screening for hepatitis C virus was higher yield than clinic-based screening. Disparities in
HCV seropositivity highlight key demographic differences between settings and marked risk differences between these populations. Overall, these results contest the long-held dogma that infectious disease screening should be conducted only in the outpatient setting. Emergency department-based screening strategies complement traditional clinic-based screening strategies and may help provide these services to populations that otherwise would not be able to access them.
Address for Correspondence: Larissa May, MD, MSPH, UC Davis Health, Department of Emergency Medicine, 2315 Stockton Blvd, Sacramento, CA 95817. Email: [email protected]
Conflicts of Interest: By the WestJEM article submission agreement, all authors are required to disclose all affiliations, funding sources and financial or management relationships that could be perceived as potential sources of bias. No author has professional or financial relationships with any companies that are relevant to this study. This work was supported by Gilead-funded Frontlines of Communities in the United States (FOCUS) and the clinic-based Local Elimination Programs Leading to Global Action in HCV. The FOCUS Program is a public health initiative that enables partners to develop and share best practices in routine bloodborne virus (HIV, HCV, HBV) screening, diagnosis, and linkage to care in accordance with screening guidelines promulgated by the US Centers for Disease Control and Prevention, the US Preventive Services Task Force, and state and local public health departments. FOCUS funding supports HIV, HCV, and HBV screening and linkage to the first medical appointment after diagnosis. FOCUS partners do not use FOCUS awards for activities beyond linkage to the first medical appointment.
Copyright: © 2022 Hluhanich et al. This is an open access article distributed in accordance with the terms of the Creative Commons Attribution (CC BY 4.0) License. See: http://creativecommons.org/licenses/by/4.0/
REFERENCES1. World Health Organization. Global Health Sector Strategy on Viral
Hepatitis, 2016-2021: Towards Ending Viral Hepatitis. 2021. Available at: https://apps.who.int/iris/handle/10665/246177. Accessed May 1, 2021.
2. Ly KN, Hughes EM, Jiles RB, et al. Rising mortality associated with hepatitis C virus in the United States, 2003-2013. Clin Infect Dis. 2016;62(10):1287-8.
3. US Centers for Disease Control and Prevention. Hepatitis C Ques-tions and Answers for Health Professionals. 2020. Available at: https://www.cdc.gov/hepatitis/hcv/hcvfaq.htm. Accessed May 1, 2021.
4. Schillie S, Wester C, Osborne M, et al. CDC recommendations for hepatitis C screening among adults - United States, 2020. MMWR Recomm Rep. 2020;69(2):1-17.
5. European Association for the Study of the Liver. EASL recommenda-tions on treatment of hepatitis C 2016. J Hepatol. 2017;66(1):153-194.
6. Kohli A, Shaffer A, Sherman A, et al. Treatment of hepatitis C: a sys-tematic review. JAMA. 2014;312(6):631-40.
7. Ford JS, Marianelli LG, Frassone N, et al. Hepatitis B screening in an Argentine emergency department: pilot study to increase vaccination

Volume 23, no. 3: May 2022 317 Western Journal of Emergency Medicine
Hluhanich et al. Hepatitis C Screening in Clinics Versus the ED
in a resource-limited setting. Am J Emerg Med. 2020;38(2):296-9.8. Stanford KA, Hazra A, Schneider J. Routine opt-out syphilis screen-
ing in the emergency department: a public health imperative. Acad Emerg Med. 2020;27(5):437-8.
9. Cowan E, Herman HS, Rahman S, et al. Bundled HIV and hepatitis C testing in the emergency department: a randomized controlled trial. West J Emerg Med. 2018;19(6):1049-56.
10. Bielen R, Kremer C, Koc Ö M, et al. Screening for hepatitis C at the emergency department: Should babyboomers also be screened in Belgium? Liver Int. 2019;39(4):667-75.
11. White DAE, Todorovic T, Petti ML, et al. A comparative effective-ness study of two nontargeted HIV and hepatitis C virus screening algorithms in an urban emergency department. Ann Emerg Med. 2018;72(4):438-48.
12. Cornett JK, Bodiwala V, Razuk V, et al. Results of a hepatitis C virus screening program of the 1945-1965 birth cohort in a large emergency department in new jersey. Open Forum Infect Dis. 2018;5(4):ofy065.
13. White DA, Anderson ES, Pfeil SK, et al. Results of a rapid hepatitis C virus screening and diagnostic testing program in an urban emer-gency department. Ann Emerg Med. 2016;67(1):119-28.
14. Ragan K, Pandya A, Holotnak T, et al. Hepatitis C virus screening of high-risk patients in a Canadian emergency department. Can J Gas-troenterol Hepatol. 2020;2020:5258289.
15. Bibbins-Domingo K, Grossman DC, Curry SJ, et al. Screening for syphilis infection in nonpregnant adults and adolescents: US Pre-ventive Services Task Force Recommendation Statement. JAMA. 2016;315(21):2321-7.
16. Ford J CT, Toosi K, Meehleis D, Otmar M, Tran N, May L. Universal screening for hepatitis C virus in the ED using a Best Practice Advi-sory. West J Emerg Med. 2021;22(3):719-25.
17. Denniston MM, Klevens RM, McQuillan GM, et al. Awareness of in-fection, knowledge of hepatitis C, and medical follow-up among indi-viduals testing positive for hepatitis C: National Health and Nutrition Examination Survey 2001-2008. Hepatology. 2012;55(6):1652-61.
18. Anderson ES, Russell C, Basham K, et al. High prevalence of injec-tion drug use and blood-borne viral infections among patients in an urban emergency department. PLoS One. 2020;15(6):e0233927.
19. Smith BD, Morgan RL, Beckett GA, et al. Recommendations for the identification of chronic hepatitis C virus infection among persons
born during 1945-1965. MMWR Recomm Rep. 2012;61(Rr-4):1-32.20. Bradley H, Hall EW, Rosenthal EM, et al. Hepatitis C virus preva-
lence in 50 U.S. states and D.C. by sex, birth cohort, and race: 2013-2016. Hepatol Commun. 2020;4(3):355-70.
21. Schechter-Perkins EM, Miller NS, Hall J, et al. Implementation and preliminary results of an emergency department nontargeted, opt-out hepatitis C virus screening program. Acad Emerg Med. 2018;25(11):1216-26.
22. Hoenigl M, Mathur K, Blumenthal J, et al. Universal HIV and birth cohort HCV screening in San Diego emergency departments. Sci Rep. 2019;9(1):14479.
23. Cowan EA, Dinani A, Brandspiegel S, et al. Nontargeted hepatitis C screening in an urban emergency department in New York City. J Emerg Med. 2021;60(3):299-309.
24. Allison WE, Chiang W, Rubin A, et al. Hepatitis C virus infection in the 1945-1965 birth cohort (baby boomers) in a large urban ED. Am J Emerg Med. 2016;34(4):697-701.
25. Isho NY, Kachlic MD, Marcelo JC, et al. Pharmacist-initiated hepatitis C virus screening in a community pharmacy to increase awareness and link to care at the medical center. J Am Pharm Assoc (2003). 2017;57(3s):S259-s64.
26. Llayton CK, Harlow CP, Burris JN, et al. Implementation of hepatitis C screening within a pharmacist-managed medication-assisted therapy opioid use disorder protocol program. J Am Pharm Assoc (2003). 2020;60(6):e307-e311.
27. Wilson C, Twigg G. Pharmacist-led depression screening and inter-vention in an underserved, rural, and multi-ethnic diabetic population. J Am Pharm Assoc (2003). 2018;58(2):205-9.
28. Whitner JB, Mueller LA, Valentino AS. Pharmacist-driven spirometry screening to target high-risk patients in a primary care setting. J Prim Care Community Health. 2019;10:2150132719889715.
29. Salvig BE, Gulum AH, Walters SA, et al. Pharmacist screen-ing for risk of osteoporosis in elderly veterans. Consult Pharm. 2016;31(8):440-9.
30. Elliott JP, Harrison C, Konopka C, et al. Pharmacist-led screening program for an inner-city pediatric population. J Am Pharm Assoc (2003). 2015;55(4):413-8.
31. Sparkman A, Brookhart AL, Goode JKR. The impact of an immunization check-up at a pharmacist-provided employee health screening. J Am Pharm Assoc (2003). 2017;57(3s):S274-s8.
Western Journal of Emergency Medicine 318 Volume 23, no. 3: May 2022
Original Research
Simulation-Based Mastery Learning Improves the Performance of Donning and Doffing of Personal Protective
Equipment by Medical Students Danielle T. Miller, MD, MEd*Nicholas Pokrajac, MD†
Jessica Ngo, MD†
Moises Gallegos, MD, MPH†
William Dixon, MD, MSEd†
Kelly N. Roszczynialski, MD†
Kristen Ng, MD†
Nounou Taleghani, MD, PhD†
Michael A. Gisondi, MD†
Section Editor: John Burkhardt, MD, MA Submission history: Submitted September 14, 2021; Accepted February 28, 2022 Electronically published May 2, 2022 Full text available through open access at http://escholarship.org/uc/uciem_westjem DOI: 10.5811/westjem.2022.2.54748
INTRODUCTIONStudents are routinely exposed to blood, bodily fluids, and
other potentially infectious agents during clinical rotations.1,2,3
University of Colorado School of Medicine, Department of Emergency Medicine, Denver, ColoradoStanford University School of Medicine, Department of Emergency Medicine, Palo Alto, California
*
†
Introduction: Medical students lack adequate training on how to correctly don and doff personal protective equipment (PPE). Simulation-based mastery learning (SBML) is an effective technique for procedural education. The aim of this study was to determine whether SBML improves proper PPE donning and doffing by medical students. Methods: This was a prospective, pre-test/post-test study of 155 medical students on demonstration of correct PPE use before and after a SBML intervention. Subjects completed standard hospital training by viewing a US Centers for Disease Control and Prevention training video on proper PPE use prior to the intervention. They then participated in a SBML training session that included baseline testing, deliberate practice with expert feedback, and post-testing until mastery was achieved. Students were assessed using a previously developed 21-item checklist on donning and doffing PPE with a minimum passing standard (MPS) of 21/21 items. We analyzed differences between pre-test and post-test scores using paired t-tests. Students at preclinical and clinical levels of training were compared with an independent t-test.
Results: Two participants (1.3%) met the MPS on pre-test. Of the remaining 153 subjects who participated in the intervention, 151 (98.7%) reached mastery. Comparison of mean scores from pre-test to final post-test significantly improved from an average raw score of 12.55/21 (standard deviation [SD] = 2.86), to 21/21(SD = 0), t(150) = 36.3, P <0.001. There was no difference between pre-test scores of pre-clinical and clinical students.
Conclusion: Simulation-based mastery learning improves medical student performance in PPE donning and doffing in a simulated environment. This approach standardizes PPE training for students in advance of clinical experiences. [West J Emerg Med. 2022;22(3)318–323.]
To prevent dangerous occupational exposures, students must learn the proper technique for donning and doffing personal protective equipment (PPE).4 Recently, the coronavirus 2019
Volume 23, no. 3: May 2022 319 Western Journal of Emergency Medicine
Miller et al. Simulation-Based Learning Improves Donning and Doffing of PPE by Medical Students
Population Health Research Capsule
What do we already know about this issue?Medical students lack adequate training on how to correctly don and doff personal protective equipment (PPE).
What was the research question?Is simulation-based mastery learning (SBML) an effective instructional technique for improving performance in donning and doffing of PPE by medical students?
What was the major finding of the study?98.7% of students (151/153) achieved mastery in donning and doffing PPE after SBML.
How does this improve population health?Medical schools should consider SBML when training students to don and doff PPE to better protect them prior to clinical experiences.
(COVID-19) pandemic placed further demands on medical schools and teaching hospitals to standardize PPE training for students ahead of their clinical experiences.
Despite these mandates, research shows that medical students receive inadequate training in PPE use, hand hygiene, and universal precautions.5-8 Moreover, PPE training programs commonly lack requirements for demonstration of technical proficiency.9 A study of PPE donning and doffing skills found that 92.5% of medical students had one or more lapses in procedural technique.5 Traditional teaching modalities such as computer-based modules, videos, lectures, and other PPE training approaches used by occupational health services have been found to not adequately prepare medical students for the clinical environment.5,10,11
Simulation-based mastery learning (SBML) is an instructional method that may address these training gaps. Mastery learning is an educational model that ensures all trainees meet a high, pre-defined standard for the learning.12
The SBML programs feature seven standard components including clearly defined learning objectives; a minimum passing standard (MPS) for proficiency; baseline skills testing using a standardized assessment; engagement in an educational activity with deliberate practice of a skill with expert feedback; post-testing to determine whether the MPS for mastery was achieved; continued practice until the mastery standard is reached; and advancement to the next educational activity only once the mastery standard is reached.12 Using SBML improves medical student performance of a wide range of procedural skills including peripheral intravenous catheter insertion, chest tube thoracostomy, laceration repair, chest compressions, and bag-valve-mask ventilation.13-16 To date, there have been no studies examining the use of SBML to teach PPE donning and doffing procedures to medical students.
In this study our aim was to determine whether SBML is an effective instructional technique for donning and doffing of PPE by medical students. The primary outcome was student performance of the procedure following a SBML intervention as assessed by a previously developed checklist. Secondary outcomes included a comparison of performance by students with and without previous clinical exposure.
METHODSStudy Design
This was a prospective, pre-test/post-test study of medical student subjects before and after a mastery learning educational intervention with a simulated clinical encounter. This study was deemed exempt by the institutional review board.
Study Population and SettingEligible subjects included pre-clinical, second-year medical
students enrolled in a Practice of Medicine (POM) course and clinical third- and fourth-year medical students completing a required emergency medicine (EM) clerkship. The study was
conducted at a university-based teaching hospital (Stanford University School of Medicine) between July-December 2020. Students provided verbal informed consent prior to participation, and those who declined to participate in the research study still received the educational intervention.
Study Protocol
We assessed subject performance of PPE donning and doffing techniques necessary for a clinical exposure to an airborne pathogen using a two-glove technique. Training occurred in a classroom space designed to simulate a medical examination room with a door and no anteroom. Students were asked to demonstrate donning and doffing of PPE for a patient under airborne precautions. We provided subjects standard PPE including a gown, two sets of non-sterile gloves, disposable goggles, and a simulated N-95 mask. Due to a national shortage of N95 face masks, we constructed simulated N95 masks using elastic bands stapled to an 8-ounce paper bowl, as described in a study by Pokrajac et al.17
The assessment tool was a previously published 21-item checklist of proper PPE use in a similar clinical training program.17 The checklist was created using PPE guidelines from the US Centers for Disease Control and Prevention (CDC) and Stanford Health Care Infection Control. The MPS was 21/21 items performed correctly, which was determined by a Mastery Angoff standard setting in the previous study.17 We similarly used this passing standard in our study,
Western Journal of Emergency Medicine 320 Volume 23, no. 3: May 2022
Simulation-Based Learning Improves Donning and Doffing of PPE by Medical Students Miller et al.
with one point awarded for items performed correctly and zero points for omitted or incorrectly performed items. Seven emergency medicine (EM) faculty members (four women, three men) completed asynchronous rater training using a 30-minute training video on administration of the mastery learning curriculum, expert demonstration of correct PPE use, checklist review, and mock assessments. To calibrate scoring, raters spent an additional 30 minutes using the checklist to score three standardized videos, and their responses were then compared. The seven EM faculty members also served as facilitators for the SBML session. All had completed a faculty-based SBML session on donning and doffing PPE, and all had experience facilitating simulation cases with medical students. Within the 30-minute training video, 10 minutes were dedicated to facilitator training specifically on the administration of the mastery learning curriculum.
Prior to the educational intervention, subjects completed standard hospital training on PPE donning and doffing by asynchronously viewing a CDC video on hand hygiene and PPE donning-and-doffing sequence. This video corresponded to the checklist items. Subjects had access to the video from three months to immediately before their session and were required to attest to viewing the video as part of a hospital-wide protocol. We scheduled two-hour sessions, with two facilitators who also served as raters and a maximum of 16 students. During the students’ scheduled PPE mastery learning session, they underwent baseline testing, deliberate practice with feedback, and post-testing. Baseline testing occurred after students asynchronously watched the CDC training video but before the mastery learning intervention. During the mastery learning session, all students had time for deliberate practice, including at least one demonstration of donning and doffing of PPE with targeted feedback, prior to post-testing. Deliberate practice occurred until the student felt comfortable with the procedure and that no more practice was required. Students who did not meet the MPS were provided additional deliberate practice until mastery was achieved.
Data CollectionOne trained faculty member rated students using the 21-
item checklist during baseline and post-testing assessments. Prior to baseline testing, students completed a pre-survey that included demographic information and any additional PPE training beyond the required video viewing.
Data AnalysisWe performed statistical analysis using SPSS Statistics for
Windows, version 26, (IBM Corp., Armonk, NY). Baseline test scores and final post-test scores were analyzed using two-tailed paired t-test. We analyzed within-group differences for POM, and EM subjects were analyzed using a two-sample t-test. We used central tendency metrics to summarize demographic and survey data.
Characteristic Students (N = 155) Male 61 (39.4%)Female 88 (56.7%)Other 1 (0.6%)Declined to answer 5 (3.2%)POM (preclinical) 101 (65.2%)EM (clinical) 54 (34.8%)
Table. Demographics of participants.
POM, pre-clinical Practice of Medicine course; EM, emergency medicine clerkship.
RESULTSOf 168 eligible subjects, 155 completed baseline testing
(Table), and 13 students did not due to schedule conflicts; 73 (62.9%) reported previous PPE training in addition to the hospital-required videos. Two students met the MPS at
baseline assessment, leaving 153 students to participate in the mastery learning session. Of these, 151 subjects achieved mastery in post-testing, and two did not. Performance improved from a mean baseline testing score of 12.55/21 (standard deviation [SD] = 2.86), to a post-test mean score of 21/21(SD = 0), t(150) = 36.3, P <0.001) (Figure). There were no significant differences in mean baseline scores for pre-clinical students (POM, M = 12.64, SD = 3.15) and clinical students (EM, M = 12.80, SD = 2.76) t(153) = 0.30, P = 0.77). We calculated percent agreement on checklist rating of the three standardized videos for the seven raters (four women, three men), which was determined to be 96%.
DISCUSSIONThis study demonstrates the effectiveness of SBML to
teach PPE donning and doffing technique to medical students with a standardized measure of skill proficiency in a simulated clinical environment. Student subjects in our study achieved the same mastery standards for the procedure as resident and attending physicians in a previously published SBML study.17 This suggests that SBML effectively trains individuals to properly use PPE, regardless of the degree of their prior clinical experience. This study adds to the growing body of literature supporting the use of mastery learning as the gold standard for teaching bedside skills and procedures in preparation for clinical practice.13-16
All but two subjects failed to meet the MPS at baseline testing for proper PPE use despite the usual medical school and hospital infection control training, ad-hoc clinical instruction on the wards, and mandatory viewing of a CDC video that mirrored our assessment checklist. This failure rate is similar to that in a 2016 study by John et al in which 98.9% of student subjects had one or more lapses in required PPE technique.5 Students in that study had similar rates of prior PPE training experiences to our study subjects and, importantly, none had
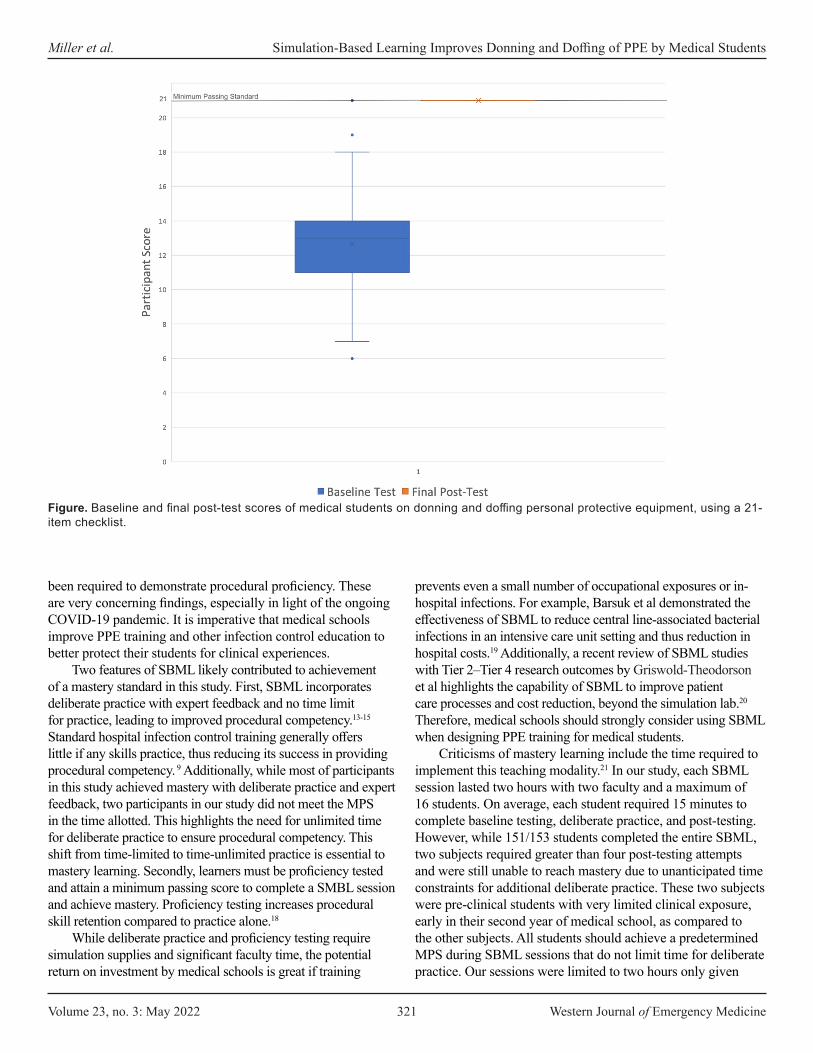
Volume 23, no. 3: May 2022 321 Western Journal of Emergency Medicine
Miller et al. Simulation-Based Learning Improves Donning and Doffing of PPE by Medical Students
been required to demonstrate procedural proficiency. These are very concerning findings, especially in light of the ongoing COVID-19 pandemic. It is imperative that medical schools improve PPE training and other infection control education to better protect their students for clinical experiences.
Two features of SBML likely contributed to achievement of a mastery standard in this study. First, SBML incorporates deliberate practice with expert feedback and no time limit for practice, leading to improved procedural competency.13-15 Standard hospital infection control training generally offers little if any skills practice, thus reducing its success in providing procedural competency. 9 Additionally, while most of participants in this study achieved mastery with deliberate practice and expert feedback, two participants in our study did not meet the MPS in the time allotted. This highlights the need for unlimited time for deliberate practice to ensure procedural competency. This shift from time-limited to time-unlimited practice is essential to mastery learning. Secondly, learners must be proficiency tested and attain a minimum passing score to complete a SMBL session and achieve mastery. Proficiency testing increases procedural skill retention compared to practice alone.18
While deliberate practice and proficiency testing require simulation supplies and significant faculty time, the potential return on investment by medical schools is great if training
prevents even a small number of occupational exposures or in-hospital infections. For example, Barsuk et al demonstrated the effectiveness of SBML to reduce central line-associated bacterial infections in an intensive care unit setting and thus reduction in hospital costs.19 Additionally, a recent review of SBML studies with Tier 2–Tier 4 research outcomes by Griswold-Theodorson et al highlights the capability of SBML to improve patient care processes and cost reduction, beyond the simulation lab.20 Therefore, medical schools should strongly consider using SBML when designing PPE training for medical students.
Criticisms of mastery learning include the time required to implement this teaching modality.21 In our study, each SBML session lasted two hours with two faculty and a maximum of 16 students. On average, each student required 15 minutes to complete baseline testing, deliberate practice, and post-testing. However, while 151/153 students completed the entire SBML, two subjects required greater than four post-testing attempts and were still unable to reach mastery due to unanticipated time constraints for additional deliberate practice. These two subjects were pre-clinical students with very limited clinical exposure, early in their second year of medical school, as compared to the other subjects. All students should achieve a predetermined MPS during SBML sessions that do not limit time for deliberate practice. Our sessions were limited to two hours only given
Figure. Baseline and final post-test scores of medical students on donning and doffing personal protective equipment, using a 21-item checklist.

Western Journal of Emergency Medicine 322 Volume 23, no. 3: May 2022
Simulation-Based Learning Improves Donning and Doffing of PPE by Medical Students Miller et al.
institutional constraints, likely contributing to the incomplete performance of the two study subjects. We recommend scheduling SBML sessions with ample time to accommodate all learners and offering additional training sessions for some learners as needed.
LIMITATIONSOur findings have several limitations. We conducted this
study at a single medical school associated with a university-based teaching hospital, which may limit generalizability. Additionally, the study used a pre-test/post-test design without randomization. Participants received standard hospital PPE training; thus, students’ baseline testing served as the control for the study. Subjects viewed preparatory videos asynchrony-ously, with unclear time between preparation and the intervention; this may have contributed to variations in pre-test scores. While student completion of viewing the assigned videos was not recorded in this study, viewing the videos was a hospital-wide protocol that required attestation. It should be further be noted that we only evaluated students donning and doffing PPE for airborne precautions; other variations in PPE donning and doffing were not evaluated. Scheduling constraints prevented 13 students from fully participating in the study, and two students lacked the deliberate practice time necessary to achieve mastery. Additionally, we conducted this study in a simulated clinical environment. Further studies are required to confirm that PPE donning and doffing skills translate to the clinical environment and to demonstrate skill retention in clinical practice. Lastly, further studies are required to determine the effectiveness of other teaching interventions compared with SBML methodology.
CONCLUSIONSimulation-based mastery learning improves medical
student performance of standard PPE use in a simulated clinical environment. It is an effective instructional method that should be considered by medical schools. Further studies are necessary to demonstrate skill retention in clinical practice.
Address for Correspondence: Danielle T. Miller, MD, University of Colorado School of Medicine, Department of Emergency Medicine, Leprino Building, 7th Floor, Campus Box B215, 12401 E. 17th Avenue, Aurora, CO 80045. Email: [email protected].
Conflicts of Interest: By the WestJEM article submission agreement, all authors are required to disclose all affiliations, funding sources and financial or management relationships that could be perceived as potential sources of bias. No author has professional or financial relationships with any companies that are relevant to this study. There are no conflicts of interest or sources of funding to declare.
Copyright: © 2022 Miller et al. This is an open access article distributed in accordance with the terms of the Creative Commons Attribution (CC BY 4.0) License. See: http://creativecommons.org/licenses/by/4.0/
REFERENCES1. Birenbaum D, Wohl A, Duda B, et al. Medical students’
occupational exposures to potentially infectious agents. Acad Med. 2002;77(2):185-9.
2. Askew SM. Occupational exposures to blood and body fluid: a study of medical students and health professions students in Virginia. AAOHN J. 2007;55(9):361-71.
3. Osborn EH, Papadakis MA, Gerberding JL. Occupational exposures to body fluids among medical students. A seven-year longitudinal study. Ann Intern Med. 1999;130(1):45-51.
4. Verbeek JH, Rajamaki B, Ijaz S, et al. Personal protective equipment for preventing highly infectious diseases due to exposure to contaminated body fluids in healthcare staff. Cochrane Database Syst Rev. 2020;5:CD011621.
5. John A, Tomas ME, Hari A, et al. Do medical students receive training in correct use of personal protective equipment? Med Educ Online. 2017;22(1):1264125.
6. Mann CM, Wood A. How much do medical students know about infection control? J Hosp Infect. 2006;64(4):366-70.
7. Wong T-W, Tam WW-S. Handwashing practice and the use of personal protective equipment among medical students after the SARS epidemic in Hong Kong. Am J Infect Control. 2005;33(10):580-6.
8. Amin TT, Al Noaim KI, Bu Saad MA, et al. Standard precautions and infection control, medical students’ knowledge and behavior at a Saudi university: the need for change. Glob J Health Sci. 2013;5(4):114-25.
9. John A, Tomas ME, Cadnum JL, et al. Are health care personnel trained in correct use of personal protective equipment? Am J Infect Control. 2016;44(7):840-2.
10. Bryce E, Yassi A, Maultsaid D, et al. E-learning of infection control: It’s contagious. Can J Infect Control. 2008;23(4):228-32.
11. Suppan L, Abbas M, Stuby L, et al. Effect of an e-learning module on personal protective equipment proficiency among prehospital personnel: web-based randomized controlled trial. J Med Internet Res. 2020;22(8):e21265.
12. McGaghie W, Barsuk J, Wayne D. (2020). Comprehensive Healthcare Simulation: Mastery Learning in Health Professions Education. New York, NY: Springer Publishing.
13. Friederichs H, Brouwer B, Marschall B, et al. Mastery learning improves students’ skills in inserting intravenous access: a pre-post-study. GMS J Med Educ 2016;33(4):56.
14. Liepert AE, Velic AJ, Rademacher B, et al. Proficiency development for graduating medical students, using skills-level-appropriate mastery learning versus traditional learning for chest tube placement: assessing anxiety, confidence, and performance. Surgery 2019;165(6):1075-81.
15. Reed T, Pirotte M, McHugh M, et al. Simulation-based mastery learning improves medical student performance and retention of core clinical skills. Simul Healthc, 2016;11(3):173-80.
16. McGaghie WC, Siddall VJ, Mazmanian PE, et al. Lessons for continuing medical education from simulation research in
Volume 23, no. 3: May 2022 323 Western Journal of Emergency Medicine
Miller et al. Simulation-Based Learning Improves Donning and Doffing of PPE by Medical Students
undergraduate and graduate medical education: American College of Chest Physicians Evidence-Based Educational Guidelines. Chest. 2009;135(3 Suppl):62S-68S.
17. Pokrajac N, Schertzer K, Poffenberger CM, et al. Mastery learning ensures correct personal protective equipment use in simulated clinical encounters of COVID-19. West J Emerg Med. 2020;21(5):1089-94.
18. Kromann CB, Jensen ML, Ringsted C. The effect of testing on skills learning. Med Educ. 2009;43(1):21-7.
19. Barsuk JH, Cohen ER, Feinglass J, et al. Use of simulation-based education to reduce catheter-related bloodstream infections. Arch Intern Med. 2009;169(15):1420-3.
20. Griswold-Theodorson S, Ponnuru S, Dong C, et al. Beyond the simulation laboratory: a realist synthesis review of clinical outcomes of simulation-based mastery learning. Acad Med. 2015;90(11):1553-60.
21. Cook DA, Brydges R, Zendejas B, et al. Mastery learning for health professionals using technology-enhanced simulation: a systematic review and meta-analysis. Acad Med. 2013;88(8):1178-86.

Western Journal of Emergency Medicine 324 Volume 23, no. 3: May 2022
Original Research
Computed Tomography of the Chest in Younger Pediatric Patients with Thoracic Blunt Trauma Rarely Changes
Surgical Management Irma T. Ugalde, MD*Hei Kit Chan, MS*Donna Mendez, MD*Henry E. Wang, MD, MS†
Section Editor: Muhammad Waseem, MD Submission history: Submitted July 10, 2021; Revision received January 24, 2022; Accepted February 6, 2022 Electronically published May 2, 2022 Full text available through open access at http://escholarship.org/uc/uciem_westjem DOI: 10.5811/westjem.2022.2.54094
INTRODUCTIONTrauma is the leading cause of morbidity and mortality
in children. While thoracic trauma occurs in about 5-12% of
McGovern Medical School at UTHealth Houston, Department of Emergency Medicine, Houston, TexasThe Ohio State University, Department of Emergency Medicine, Columbus, Ohio
*
†
Introduction: Thoracic trauma is the second leading cause of death after traumatic brain injury in children presenting with blunt chest trauma, which represents 80% of thoracic trauma in children. We hypothesized that older children undergo more clinical and surgical changes in management than younger children screened for intrathoracic injury at a single, urban, pediatric Level I trauma center.
Methods: In this retrospective observational study, we determined the frequencies and types of lesions diagnosed only by chest computed tomography (CCT) and resulting changes of clinical and surgical management among different age groups in a pediatric cohort examined for blunt trauma with chest radiograph and CCT. We used logistic regression to quantify variations in CCT diagnoses and changes in clinical and surgical management across age groups. For each age category, we determined the odds ratio for diagnosis made only on CCT and subsequent changes in all clinical management and, specifically, surgical management. We performed the test of trend to determine the relationship across age with changes in management resulting from additional diagnoses made by CCT.
Results: We analyzed data on 1,235 patients screened for intrathoracic injury. We found the following overall clinical management and surgical management changes, respectively, per age group: 0-2 years, 5/128 (3.9) and 0/128 (0.0); 3-6 years, 11/212 (5.2) and 1/212 (0.5); 7-10 years, 16/175 (9.1) and 2/175 (1.1); 11-13 years, 17/188 (9.0) and 3/188 (1.6); 14-17 years, 58/532 (10.9) and 25/532 (4.7). There were no observed surgical management changes in the 0-2 age group and, thus, no estimated odds ratio could be calculated. The adjusted odds ratios for the occurrence of surgical change in management (14-17 age group as reference) was 0.1 (0.0-0.9) for 3-6 years, 0.3 (0.1-1.3) for 7-10 years, and 0.3 (0.1- 1.1) for 11-13 years. The trend of odds ratios across ages showed that with every subsequent year of life there was a 10% increase in management change and a 30% increase in surgical management change.
Conclusion: Chest computed tomography plays a limited role in younger children and seldom significantly changes management albeit making additional diagnoses. [West J Emerg Med. 2022;22(3)324–333.]
children admitted to the hospital with trauma, it has a high morbidity and mortality.1 Advanced Trauma Life Support guidelines recommend chest radiograph (CXR) as the initial
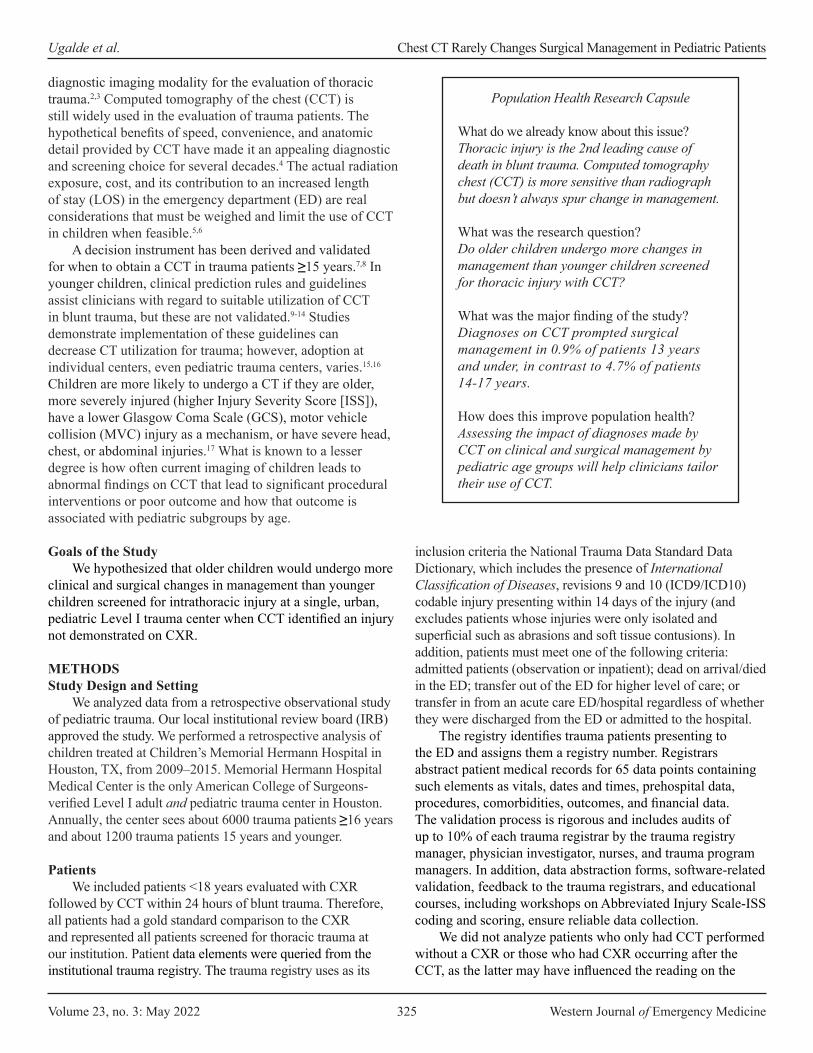
Volume 23, no. 3: May 2022 325 Western Journal of Emergency Medicine
Ugalde et al. Chest CT Rarely Changes Surgical Management in Pediatric Patients
Population Health Research Capsule
What do we already know about this issue?Thoracic injury is the 2nd leading cause of death in blunt trauma. Computed tomography chest (CCT) is more sensitive than radiograph but doesn’t always spur change in management.
What was the research question?Do older children undergo more changes in management than younger children screened for thoracic injury with CCT?
What was the major finding of the study?Diagnoses on CCT prompted surgical management in 0.9% of patients 13 years and under, in contrast to 4.7% of patients 14-17 years.
How does this improve population health?Assessing the impact of diagnoses made by CCT on clinical and surgical management by pediatric age groups will help clinicians tailor their use of CCT.
diagnostic imaging modality for the evaluation of thoracic trauma.2,3 Computed tomography of the chest (CCT) is still widely used in the evaluation of trauma patients. The hypothetical benefits of speed, convenience, and anatomic detail provided by CCT have made it an appealing diagnostic and screening choice for several decades.4 The actual radiation exposure, cost, and its contribution to an increased length of stay (LOS) in the emergency department (ED) are real considerations that must be weighed and limit the use of CCT in children when feasible.5,6
A decision instrument has been derived and validated for when to obtain a CCT in trauma patients ≥15 years.7,8 In younger children, clinical prediction rules and guidelines assist clinicians with regard to suitable utilization of CCT in blunt trauma, but these are not validated.9-14 Studies demonstrate implementation of these guidelines can decrease CT utilization for trauma; however, adoption at individual centers, even pediatric trauma centers, varies.15,16 Children are more likely to undergo a CT if they are older, more severely injured (higher Injury Severity Score [ISS]), have a lower Glasgow Coma Scale (GCS), motor vehicle collision (MVC) injury as a mechanism, or have severe head, chest, or abdominal injuries.17 What is known to a lesser degree is how often current imaging of children leads to abnormal findings on CCT that lead to significant procedural interventions or poor outcome and how that outcome is associated with pediatric subgroups by age.
Goals of the StudyWe hypothesized that older children would undergo more
clinical and surgical changes in management than younger children screened for intrathoracic injury at a single, urban, pediatric Level I trauma center when CCT identified an injury not demonstrated on CXR.
METHODSStudy Design and Setting
We analyzed data from a retrospective observational study of pediatric trauma. Our local institutional review board (IRB) approved the study. We performed a retrospective analysis of children treated at Children’s Memorial Hermann Hospital in Houston, TX, from 2009–2015. Memorial Hermann Hospital Medical Center is the only American College of Surgeons-verified Level I adult and pediatric trauma center in Houston. Annually, the center sees about 6000 trauma patients ≥16 years and about 1200 trauma patients 15 years and younger.
PatientsWe included patients <18 years evaluated with CXR
followed by CCT within 24 hours of blunt trauma. Therefore, all patients had a gold standard comparison to the CXR and represented all patients screened for thoracic trauma at our institution. Patient data elements were queried from the institutional trauma registry. The trauma registry uses as its
inclusion criteria the National Trauma Data Standard Data Dictionary, which includes the presence of International Classification of Diseases, revisions 9 and 10 (ICD9/ICD10) codable injury presenting within 14 days of the injury (and excludes patients whose injuries were only isolated and superficial such as abrasions and soft tissue contusions). In addition, patients must meet one of the following criteria: admitted patients (observation or inpatient); dead on arrival/died in the ED; transfer out of the ED for higher level of care; or transfer in from an acute care ED/hospital regardless of whether they were discharged from the ED or admitted to the hospital.
The registry identifies trauma patients presenting to the ED and assigns them a registry number. Registrars abstract patient medical records for 65 data points containing such elements as vitals, dates and times, prehospital data, procedures, comorbidities, outcomes, and financial data. The validation process is rigorous and includes audits of up to 10% of each trauma registrar by the trauma registry manager, physician investigator, nurses, and trauma program managers. In addition, data abstraction forms, software-related validation, feedback to the trauma registrars, and educational courses, including workshops on Abbreviated Injury Scale-ISS coding and scoring, ensure reliable data collection.
We did not analyze patients who only had CCT performed without a CXR or those who had CXR occurring after the CCT, as the latter may have influenced the reading on the
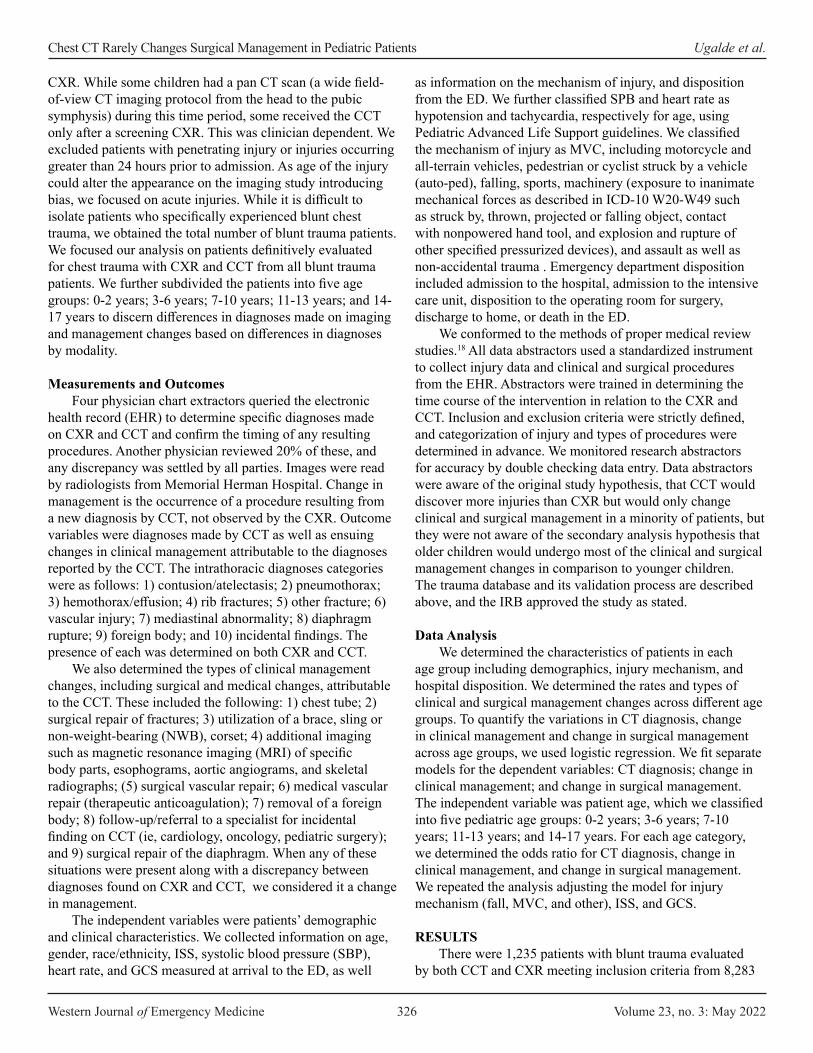
Western Journal of Emergency Medicine 326 Volume 23, no. 3: May 2022
Chest CT Rarely Changes Surgical Management in Pediatric Patients Ugalde et al.
CXR. While some children had a pan CT scan (a wide field-of-view CT imaging protocol from the head to the pubic symphysis) during this time period, some received the CCT only after a screening CXR. This was clinician dependent. We excluded patients with penetrating injury or injuries occurring greater than 24 hours prior to admission. As age of the injury could alter the appearance on the imaging study introducing bias, we focused on acute injuries. While it is difficult to isolate patients who specifically experienced blunt chest trauma, we obtained the total number of blunt trauma patients. We focused our analysis on patients definitively evaluated for chest trauma with CXR and CCT from all blunt trauma patients. We further subdivided the patients into five age groups: 0-2 years; 3-6 years; 7-10 years; 11-13 years; and 14-17 years to discern differences in diagnoses made on imaging and management changes based on differences in diagnoses by modality.
Measurements and OutcomesFour physician chart extractors queried the electronic
health record (EHR) to determine specific diagnoses made on CXR and CCT and confirm the timing of any resulting procedures. Another physician reviewed 20% of these, and any discrepancy was settled by all parties. Images were read by radiologists from Memorial Herman Hospital. Change in management is the occurrence of a procedure resulting from a new diagnosis by CCT, not observed by the CXR. Outcome variables were diagnoses made by CCT as well as ensuing changes in clinical management attributable to the diagnoses reported by the CCT. The intrathoracic diagnoses categories were as follows: 1) contusion/atelectasis; 2) pneumothorax; 3) hemothorax/effusion; 4) rib fractures; 5) other fracture; 6) vascular injury; 7) mediastinal abnormality; 8) diaphragm rupture; 9) foreign body; and 10) incidental findings. The presence of each was determined on both CXR and CCT.
We also determined the types of clinical management changes, including surgical and medical changes, attributable to the CCT. These included the following: 1) chest tube; 2) surgical repair of fractures; 3) utilization of a brace, sling or non-weight-bearing (NWB), corset; 4) additional imaging such as magnetic resonance imaging (MRI) of specific body parts, esophograms, aortic angiograms, and skeletal radiographs; (5) surgical vascular repair; 6) medical vascular repair (therapeutic anticoagulation); 7) removal of a foreign body; 8) follow-up/referral to a specialist for incidental finding on CCT (ie, cardiology, oncology, pediatric surgery); and 9) surgical repair of the diaphragm. When any of these situations were present along with a discrepancy between diagnoses found on CXR and CCT, we considered it a change in management.
The independent variables were patients’ demographic and clinical characteristics. We collected information on age, gender, race/ethnicity, ISS, systolic blood pressure (SBP), heart rate, and GCS measured at arrival to the ED, as well
as information on the mechanism of injury, and disposition from the ED. We further classified SPB and heart rate as hypotension and tachycardia, respectively for age, using Pediatric Advanced Life Support guidelines. We classified the mechanism of injury as MVC, including motorcycle and all-terrain vehicles, pedestrian or cyclist struck by a vehicle (auto-ped), falling, sports, machinery (exposure to inanimate mechanical forces as described in ICD-10 W20-W49 such as struck by, thrown, projected or falling object, contact with nonpowered hand tool, and explosion and rupture of other specified pressurized devices), and assault as well as non-accidental trauma . Emergency department disposition included admission to the hospital, admission to the intensive care unit, disposition to the operating room for surgery, discharge to home, or death in the ED.
We conformed to the methods of proper medical review studies.18 All data abstractors used a standardized instrument to collect injury data and clinical and surgical procedures from the EHR. Abstractors were trained in determining the time course of the intervention in relation to the CXR and CCT. Inclusion and exclusion criteria were strictly defined, and categorization of injury and types of procedures were determined in advance. We monitored research abstractors for accuracy by double checking data entry. Data abstractors were aware of the original study hypothesis, that CCT would discover more injuries than CXR but would only change clinical and surgical management in a minority of patients, but they were not aware of the secondary analysis hypothesis that older children would undergo most of the clinical and surgical management changes in comparison to younger children. The trauma database and its validation process are described above, and the IRB approved the study as stated.
Data AnalysisWe determined the characteristics of patients in each
age group including demographics, injury mechanism, and hospital disposition. We determined the rates and types of clinical and surgical management changes across different age groups. To quantify the variations in CT diagnosis, change in clinical management and change in surgical management across age groups, we used logistic regression. We fit separate models for the dependent variables: CT diagnosis; change in clinical management; and change in surgical management. The independent variable was patient age, which we classified into five pediatric age groups: 0-2 years; 3-6 years; 7-10 years; 11-13 years; and 14-17 years. For each age category, we determined the odds ratio for CT diagnosis, change in clinical management, and change in surgical management. We repeated the analysis adjusting the model for injury mechanism (fall, MVC, and other), ISS, and GCS.
RESULTSThere were 1,235 patients with blunt trauma evaluated
by both CCT and CXR meeting inclusion criteria from 8,283

Volume 23, no. 3: May 2022 327 Western Journal of Emergency Medicine
Ugalde et al. Chest CT Rarely Changes Surgical Management in Pediatric Patients
similarly aged patients presenting with blunt trauma over the study time period. Table 1 shows the total number of blunt trauma patients seen at our facility per age group and the percentages of those scanned with both CCT and CXR for intrathoracic injury.
Table 2 shows the patient demographics of those screened with both imaging modalities. Gender, race/ethnicity, disposition from ED, and ISS were relatively stable across age groups.
Mechanism of injury shifted across age groups with falls/sporting injuries occurring most commonly in the youngest two age groups and assaults in the oldest age group (P = <0.01.) The MVC/motorcycle injuries were most common in the two oldest age groups. A GCS ≤ 12 and hypotension for age were present in the highest percentages in the youngest age groups, but only GCS ≤ 12 was statistically significant (P = < 0.01). Tachycardia was most common in the two oldest age groups (P = < 0.01).
Ages 0-2 Ages 3-6 Ages 7-10 Ages 11-13 Ages 14-17 TotalAll blunt trauma patients, N 1,744 1,826 1,228 883 1,364 8,283All blunt trauma patients undergoing CXR and CCT, N (%)
128 (7.3) 212 (11.6) 175 (14.3) 188 (21.0) 532 (39.0) 1,235 (15.0)
Table 1. Proportion of pediatric blunt trauma patients undergoing screening for intrathoracic injury.
CXR, chest radiograph; CCT, chest computed tomography.
Age group0–2 yearsN = 128
median (IQR)
3–6 yearsN = 212
median (IQR)
7–10 yearsN = 175
median (IQR)
11–13 yearsN = 188
median (IQR)
14–17 yearsN = 532
median (IQR) P-value a
1.7 (1.1 – 2.0) 4.0 (4.0 – 6.0) 8.0 (7.0 – 9.0) 12.0 (12.0 – 13.0) 16.0 (15.0 – 17.0)Gender, N (%) 0.44
Female 58 (45.3) 91 (42.9) 71 (40.6) 72 (38.3) 200 (37.6)Male 70 (54.7) 121 (57.1) 104 (59.4) 116 (61.7) 332 (62.4)
Race, N (%) 0.10Asian 0 (0.0) 6 (2.8) 6 (3.4) 4 (2.1) 8 (1.5)Black 34 (26.6) 31 (14.6) 35 (20.0) 33 (17.6) 91 (17.1)Hispanic 57 (44.5) 80 (37.7) 61 (34.9) 67 (35.6) 193 (36.3)Other 2 (1.6) 5 (2.4) 3 (1.7) 2 (1.1) 9 (1.7)White 35 (27.3) 90 (42.5) 70 (40.0) 82 (43.6) 231 (43.4)
Mechanism, N (%) < 0.01Assault/non-accidental
0 (0.0) 0 (0.0) 0 (0.0) 0 (0.0) 12 (2.3)
Fall, sporting, machine
43 (33.6) 30 (14.2) 15 (8.6) 10 (5.3) 47 (8.8)
Motor vehicle, motorcycle
54 (42.2) 140 (66.0) 115 (65.7) 132 (70.2) 387 (72.7)
Pedestrian/bicycle 31 (24.2) 42 (19.8) 44 (25.1) 46 (24.5) 86 (16.2)Disposition, N (%) 0.11
Admitted to hospital 49 (38.3) 92 (43.4) 80 (45.7) 80 (42.6) 238 (44.7)Admitted to ICU 65 (50.8) 93 (43.9) 65 (37.1) 74 (39.4) 194 (36.5)Death 0 (0.0) 0 (0.0) 0 (0.0) 2 (1.1) 1 (0.2)Home 0 (0.0) 0 (0.0) 0 (0.0) 0 (0.0) 3 (0.6)Surgery 14 (10.9) 27 (12.7) 30 (17.1) 32 (17.0) 96 (18.0)
aP-value for hypotension was derived from Fisher’s exact test. All other p-values were derived from Pearson’s chi-square test.IQR, interquartile range; ICU, intensive care unit.
Table 2. Patient characteristics by age group.
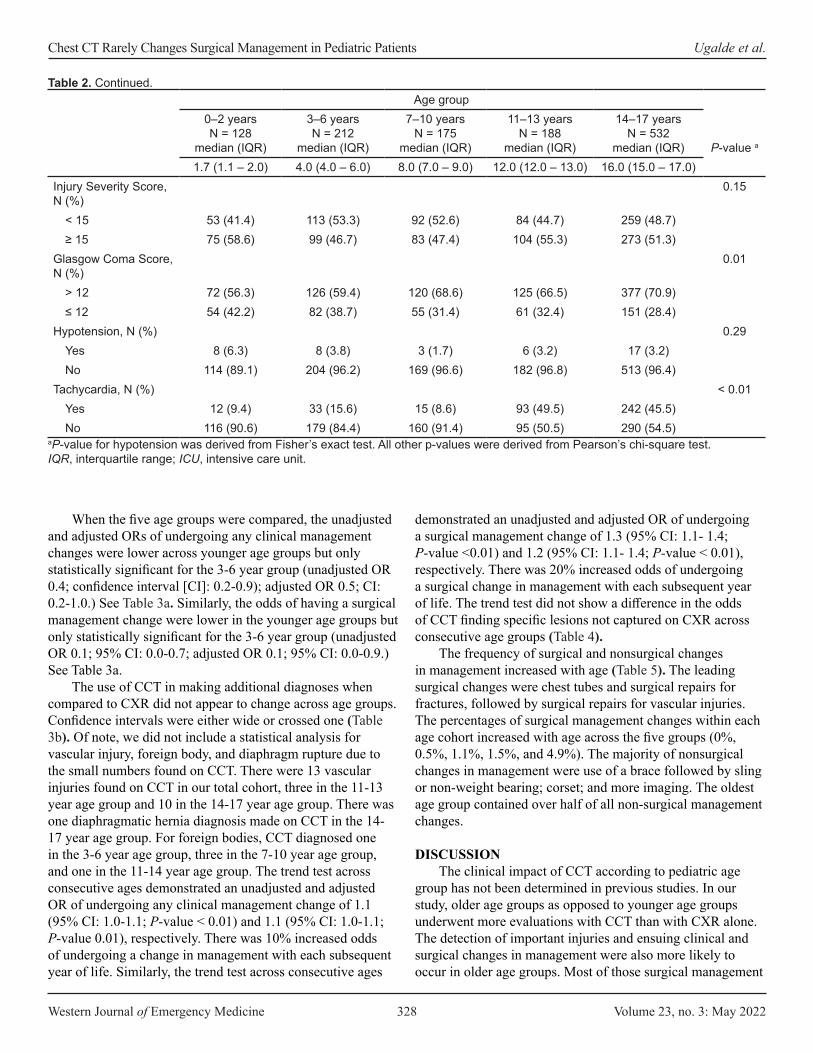
Western Journal of Emergency Medicine 328 Volume 23, no. 3: May 2022
Chest CT Rarely Changes Surgical Management in Pediatric Patients Ugalde et al.
When the five age groups were compared, the unadjusted and adjusted ORs of undergoing any clinical management changes were lower across younger age groups but only statistically significant for the 3-6 year group (unadjusted OR 0.4; confidence interval [CI]: 0.2-0.9); adjusted OR 0.5; CI: 0.2-1.0.) See Table 3a. Similarly, the odds of having a surgical management change were lower in the younger age groups but only statistically significant for the 3-6 year group (unadjusted OR 0.1; 95% CI: 0.0-0.7; adjusted OR 0.1; 95% CI: 0.0-0.9.) See Table 3a.
The use of CCT in making additional diagnoses when compared to CXR did not appear to change across age groups. Confidence intervals were either wide or crossed one (Table 3b). Of note, we did not include a statistical analysis for vascular injury, foreign body, and diaphragm rupture due to the small numbers found on CCT. There were 13 vascular injuries found on CCT in our total cohort, three in the 11-13 year age group and 10 in the 14-17 year age group. There was one diaphragmatic hernia diagnosis made on CCT in the 14-17 year age group. For foreign bodies, CCT diagnosed one in the 3-6 year age group, three in the 7-10 year age group, and one in the 11-14 year age group. The trend test across consecutive ages demonstrated an unadjusted and adjusted OR of undergoing any clinical management change of 1.1 (95% CI: 1.0-1.1; P-value < 0.01) and 1.1 (95% CI: 1.0-1.1; P-value 0.01), respectively. There was 10% increased odds of undergoing a change in management with each subsequent year of life. Similarly, the trend test across consecutive ages
demonstrated an unadjusted and adjusted OR of undergoing a surgical management change of 1.3 (95% CI: 1.1- 1.4; P-value <0.01) and 1.2 (95% CI: 1.1- 1.4; P-value < 0.01), respectively. There was 20% increased odds of undergoing a surgical change in management with each subsequent year of life. The trend test did not show a difference in the odds of CCT finding specific lesions not captured on CXR across consecutive age groups (Table 4).
The frequency of surgical and nonsurgical changes in management increased with age (Table 5). The leading surgical changes were chest tubes and surgical repairs for fractures, followed by surgical repairs for vascular injuries. The percentages of surgical management changes within each age cohort increased with age across the five groups (0%, 0.5%, 1.1%, 1.5%, and 4.9%). The majority of nonsurgical changes in management were use of a brace followed by sling or non-weight bearing; corset; and more imaging. The oldest age group contained over half of all non-surgical management changes.
DISCUSSIONThe clinical impact of CCT according to pediatric age
group has not been determined in previous studies. In our study, older age groups as opposed to younger age groups underwent more evaluations with CCT than with CXR alone. The detection of important injuries and ensuing clinical and surgical changes in management were also more likely to occur in older age groups. Most of those surgical management
Age group0–2 yearsN = 128
median (IQR)
3–6 yearsN = 212
median (IQR)
7–10 yearsN = 175
median (IQR)
11–13 yearsN = 188
median (IQR)
14–17 yearsN = 532
median (IQR) P-value a
1.7 (1.1 – 2.0) 4.0 (4.0 – 6.0) 8.0 (7.0 – 9.0) 12.0 (12.0 – 13.0) 16.0 (15.0 – 17.0)Injury Severity Score, N (%)
0.15
< 15 53 (41.4) 113 (53.3) 92 (52.6) 84 (44.7) 259 (48.7)≥ 15 75 (58.6) 99 (46.7) 83 (47.4) 104 (55.3) 273 (51.3)
Glasgow Coma Score, N (%)
0.01
> 12 72 (56.3) 126 (59.4) 120 (68.6) 125 (66.5) 377 (70.9)≤ 12 54 (42.2) 82 (38.7) 55 (31.4) 61 (32.4) 151 (28.4)
Hypotension, N (%) 0.29Yes 8 (6.3) 8 (3.8) 3 (1.7) 6 (3.2) 17 (3.2)No 114 (89.1) 204 (96.2) 169 (96.6) 182 (96.8) 513 (96.4)
Tachycardia, N (%) < 0.01Yes 12 (9.4) 33 (15.6) 15 (8.6) 93 (49.5) 242 (45.5)No 116 (90.6) 179 (84.4) 160 (91.4) 95 (50.5) 290 (54.5)
Table 2. Continued.
aP-value for hypotension was derived from Fisher’s exact test. All other p-values were derived from Pearson’s chi-square test.IQR, interquartile range; ICU, intensive care unit.
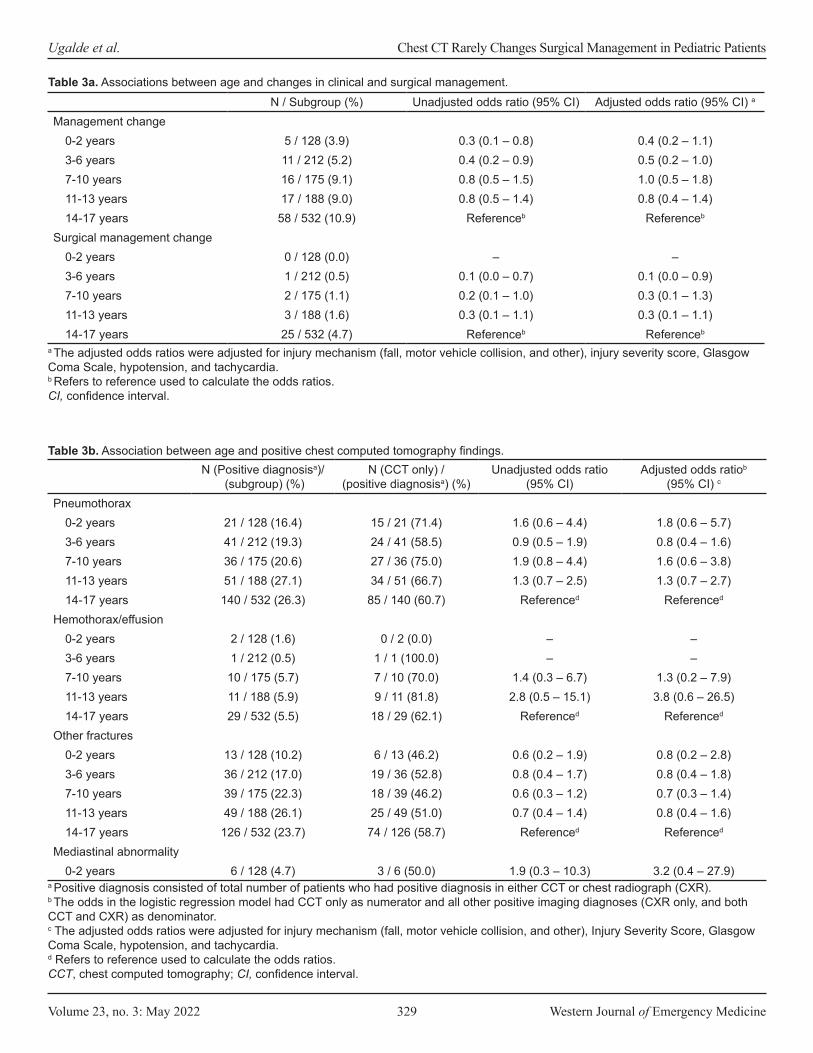
Volume 23, no. 3: May 2022 329 Western Journal of Emergency Medicine
Ugalde et al. Chest CT Rarely Changes Surgical Management in Pediatric Patients
N / Subgroup (%) Unadjusted odds ratio (95% CI) Adjusted odds ratio (95% CI) a
Management change0-2 years 5 / 128 (3.9) 0.3 (0.1 – 0.8) 0.4 (0.2 – 1.1)3-6 years 11 / 212 (5.2) 0.4 (0.2 – 0.9) 0.5 (0.2 – 1.0)7-10 years 16 / 175 (9.1) 0.8 (0.5 – 1.5) 1.0 (0.5 – 1.8)11-13 years 17 / 188 (9.0) 0.8 (0.5 – 1.4) 0.8 (0.4 – 1.4)14-17 years 58 / 532 (10.9) Referenceb Referenceb
Surgical management change0-2 years 0 / 128 (0.0) – –3-6 years 1 / 212 (0.5) 0.1 (0.0 – 0.7) 0.1 (0.0 – 0.9)7-10 years 2 / 175 (1.1) 0.2 (0.1 – 1.0) 0.3 (0.1 – 1.3)11-13 years 3 / 188 (1.6) 0.3 (0.1 – 1.1) 0.3 (0.1 – 1.1)14-17 years 25 / 532 (4.7) Referenceb Referenceb
Table 3a. Associations between age and changes in clinical and surgical management.
a The adjusted odds ratios were adjusted for injury mechanism (fall, motor vehicle collision, and other), injury severity score, Glasgow Coma Scale, hypotension, and tachycardia.b Refers to reference used to calculate the odds ratios.CI, confidence interval.
N (Positive diagnosisa)/ (subgroup) (%)
N (CCT only) / (positive diagnosisa) (%)
Unadjusted odds ratio (95% CI)
Adjusted odds ratiob
(95% CI) c
Pneumothorax0-2 years 21 / 128 (16.4) 15 / 21 (71.4) 1.6 (0.6 – 4.4) 1.8 (0.6 – 5.7)3-6 years 41 / 212 (19.3) 24 / 41 (58.5) 0.9 (0.5 – 1.9) 0.8 (0.4 – 1.6)7-10 years 36 / 175 (20.6) 27 / 36 (75.0) 1.9 (0.8 – 4.4) 1.6 (0.6 – 3.8)11-13 years 51 / 188 (27.1) 34 / 51 (66.7) 1.3 (0.7 – 2.5) 1.3 (0.7 – 2.7)14-17 years 140 / 532 (26.3) 85 / 140 (60.7) Referenced Referenced
Hemothorax/effusion0-2 years 2 / 128 (1.6) 0 / 2 (0.0) – –3-6 years 1 / 212 (0.5) 1 / 1 (100.0) – –7-10 years 10 / 175 (5.7) 7 / 10 (70.0) 1.4 (0.3 – 6.7) 1.3 (0.2 – 7.9)11-13 years 11 / 188 (5.9) 9 / 11 (81.8) 2.8 (0.5 – 15.1) 3.8 (0.6 – 26.5)14-17 years 29 / 532 (5.5) 18 / 29 (62.1) Referenced Referenced
Other fractures0-2 years 13 / 128 (10.2) 6 / 13 (46.2) 0.6 (0.2 – 1.9) 0.8 (0.2 – 2.8)3-6 years 36 / 212 (17.0) 19 / 36 (52.8) 0.8 (0.4 – 1.7) 0.8 (0.4 – 1.8)7-10 years 39 / 175 (22.3) 18 / 39 (46.2) 0.6 (0.3 – 1.2) 0.7 (0.3 – 1.4)11-13 years 49 / 188 (26.1) 25 / 49 (51.0) 0.7 (0.4 – 1.4) 0.8 (0.4 – 1.6)14-17 years 126 / 532 (23.7) 74 / 126 (58.7) Referenced Referenced
Mediastinal abnormality0-2 years 6 / 128 (4.7) 3 / 6 (50.0) 1.9 (0.3 – 10.3) 3.2 (0.4 – 27.9)
Table 3b. Association between age and positive chest computed tomography findings.
a Positive diagnosis consisted of total number of patients who had positive diagnosis in either CCT or chest radiograph (CXR). b The odds in the logistic regression model had CCT only as numerator and all other positive imaging diagnoses (CXR only, and both CCT and CXR) as denominator.c The adjusted odds ratios were adjusted for injury mechanism (fall, motor vehicle collision, and other), Injury Severity Score, Glasgow Coma Scale, hypotension, and tachycardia.d Refers to reference used to calculate the odds ratios.CCT, chest computed tomography; CI, confidence interval.
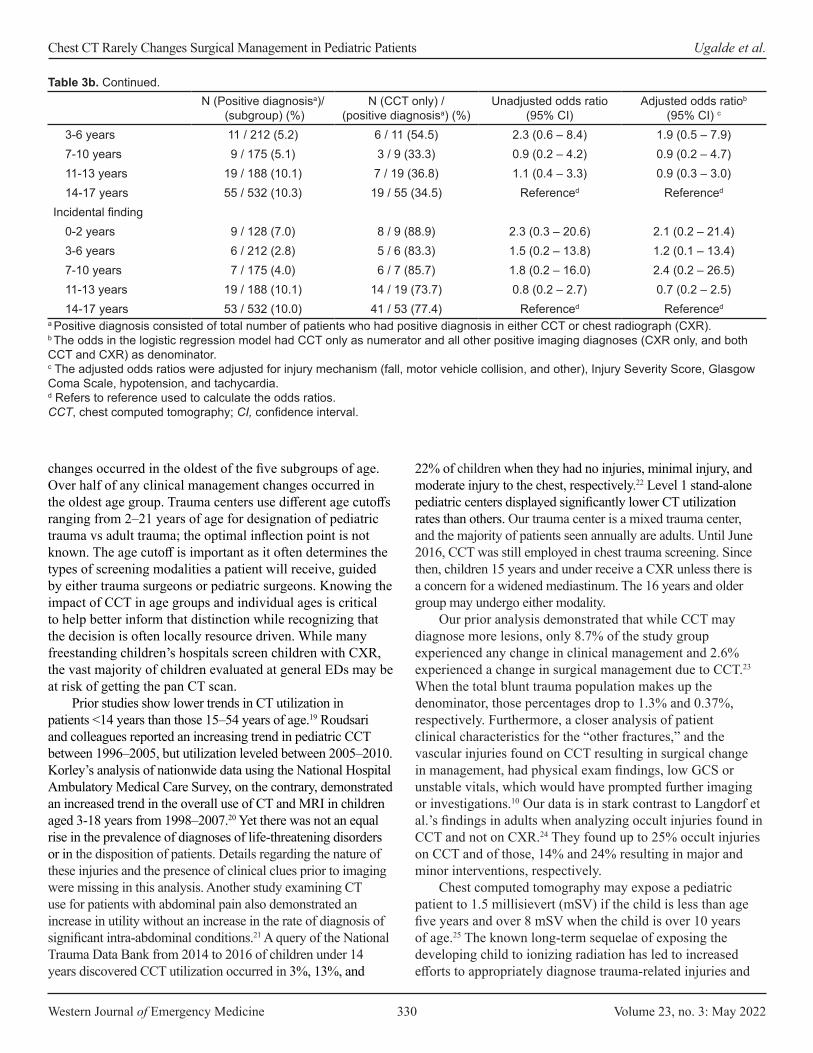
Western Journal of Emergency Medicine 330 Volume 23, no. 3: May 2022
Chest CT Rarely Changes Surgical Management in Pediatric Patients Ugalde et al.
changes occurred in the oldest of the five subgroups of age. Over half of any clinical management changes occurred in the oldest age group. Trauma centers use different age cutoffs ranging from 2–21 years of age for designation of pediatric trauma vs adult trauma; the optimal inflection point is not known. The age cutoff is important as it often determines the types of screening modalities a patient will receive, guided by either trauma surgeons or pediatric surgeons. Knowing the impact of CCT in age groups and individual ages is critical to help better inform that distinction while recognizing that the decision is often locally resource driven. While many freestanding children’s hospitals screen children with CXR, the vast majority of children evaluated at general EDs may be at risk of getting the pan CT scan.
Prior studies show lower trends in CT utilization in patients <14 years than those 15–54 years of age.19 Roudsari and colleagues reported an increasing trend in pediatric CCT between 1996–2005, but utilization leveled between 2005–2010. Korley’s analysis of nationwide data using the National Hospital Ambulatory Medical Care Survey, on the contrary, demonstrated an increased trend in the overall use of CT and MRI in children aged 3-18 years from 1998–2007.20 Yet there was not an equal rise in the prevalence of diagnoses of life-threatening disorders or in the disposition of patients. Details regarding the nature of these injuries and the presence of clinical clues prior to imaging were missing in this analysis. Another study examining CT use for patients with abdominal pain also demonstrated an increase in utility without an increase in the rate of diagnosis of significant intra-abdominal conditions.21 A query of the National Trauma Data Bank from 2014 to 2016 of children under 14 years discovered CCT utilization occurred in 3%, 13%, and
22% of children when they had no injuries, minimal injury, and moderate injury to the chest, respectively.22 Level 1 stand-alone pediatric centers displayed significantly lower CT utilization rates than others. Our trauma center is a mixed trauma center, and the majority of patients seen annually are adults. Until June 2016, CCT was still employed in chest trauma screening. Since then, children 15 years and under receive a CXR unless there is a concern for a widened mediastinum. The 16 years and older group may undergo either modality.
Our prior analysis demonstrated that while CCT may diagnose more lesions, only 8.7% of the study group experienced any change in clinical management and 2.6% experienced a change in surgical management due to CCT.23 When the total blunt trauma population makes up the denominator, those percentages drop to 1.3% and 0.37%, respectively. Furthermore, a closer analysis of patient clinical characteristics for the “other fractures,” and the vascular injuries found on CCT resulting in surgical change in management, had physical exam findings, low GCS or unstable vitals, which would have prompted further imaging or investigations.10 Our data is in stark contrast to Langdorf et al.’s findings in adults when analyzing occult injuries found in CCT and not on CXR.24 They found up to 25% occult injuries on CCT and of those, 14% and 24% resulting in major and minor interventions, respectively.
Chest computed tomography may expose a pediatric patient to 1.5 millisievert (mSV) if the child is less than age five years and over 8 mSV when the child is over 10 years of age.25 The known long-term sequelae of exposing the developing child to ionizing radiation has led to increased efforts to appropriately diagnose trauma-related injuries and
N (Positive diagnosisa)/ (subgroup) (%)
N (CCT only) / (positive diagnosisa) (%)
Unadjusted odds ratio (95% CI)
Adjusted odds ratiob
(95% CI) c
3-6 years 11 / 212 (5.2) 6 / 11 (54.5) 2.3 (0.6 – 8.4) 1.9 (0.5 – 7.9)7-10 years 9 / 175 (5.1) 3 / 9 (33.3) 0.9 (0.2 – 4.2) 0.9 (0.2 – 4.7)11-13 years 19 / 188 (10.1) 7 / 19 (36.8) 1.1 (0.4 – 3.3) 0.9 (0.3 – 3.0)14-17 years 55 / 532 (10.3) 19 / 55 (34.5) Referenced Referenced
Incidental finding0-2 years 9 / 128 (7.0) 8 / 9 (88.9) 2.3 (0.3 – 20.6) 2.1 (0.2 – 21.4)3-6 years 6 / 212 (2.8) 5 / 6 (83.3) 1.5 (0.2 – 13.8) 1.2 (0.1 – 13.4)7-10 years 7 / 175 (4.0) 6 / 7 (85.7) 1.8 (0.2 – 16.0) 2.4 (0.2 – 26.5)11-13 years 19 / 188 (10.1) 14 / 19 (73.7) 0.8 (0.2 – 2.7) 0.7 (0.2 – 2.5)14-17 years 53 / 532 (10.0) 41 / 53 (77.4) Referenced Referenced
Table 3b. Continued.
a Positive diagnosis consisted of total number of patients who had positive diagnosis in either CCT or chest radiograph (CXR). b The odds in the logistic regression model had CCT only as numerator and all other positive imaging diagnoses (CXR only, and both CCT and CXR) as denominator.c The adjusted odds ratios were adjusted for injury mechanism (fall, motor vehicle collision, and other), Injury Severity Score, Glasgow Coma Scale, hypotension, and tachycardia.d Refers to reference used to calculate the odds ratios.CCT, chest computed tomography; CI, confidence interval.
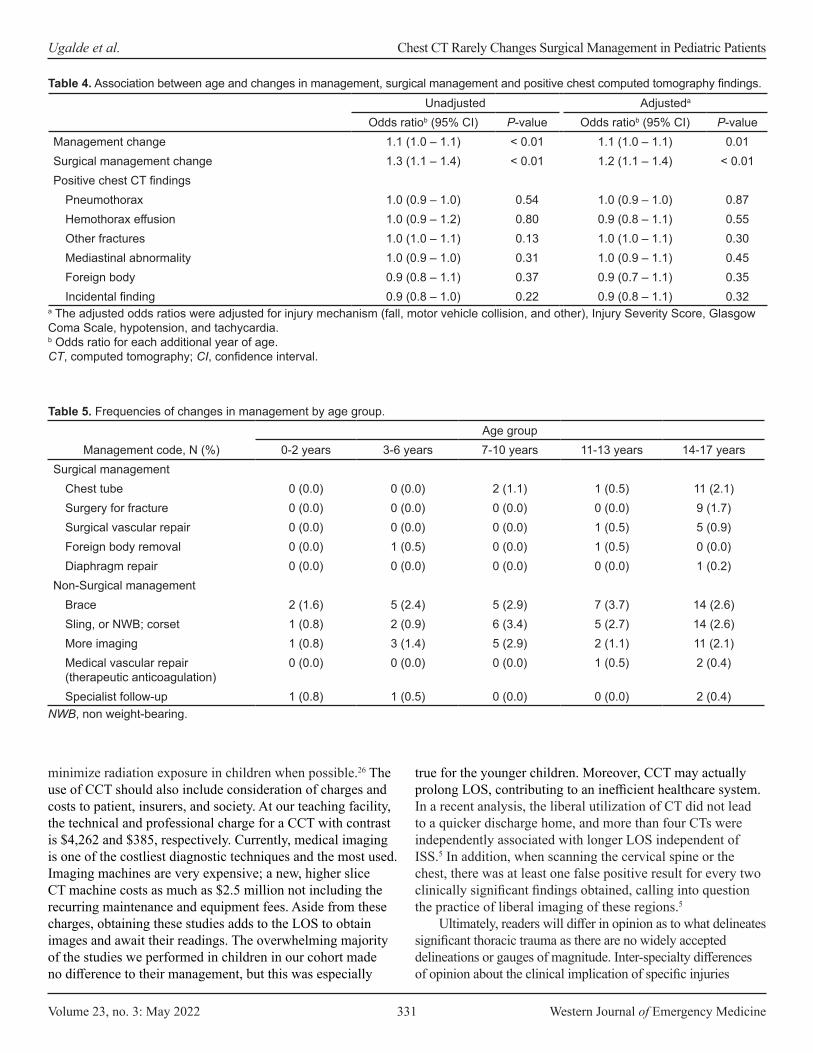
Volume 23, no. 3: May 2022 331 Western Journal of Emergency Medicine
Ugalde et al. Chest CT Rarely Changes Surgical Management in Pediatric Patients
minimize radiation exposure in children when possible.26 The use of CCT should also include consideration of charges and costs to patient, insurers, and society. At our teaching facility, the technical and professional charge for a CCT with contrast is $4,262 and $385, respectively. Currently, medical imaging is one of the costliest diagnostic techniques and the most used. Imaging machines are very expensive; a new, higher slice CT machine costs as much as $2.5 million not including the recurring maintenance and equipment fees. Aside from these charges, obtaining these studies adds to the LOS to obtain images and await their readings. The overwhelming majority of the studies we performed in children in our cohort made no difference to their management, but this was especially
true for the younger children. Moreover, CCT may actually prolong LOS, contributing to an inefficient healthcare system. In a recent analysis, the liberal utilization of CT did not lead to a quicker discharge home, and more than four CTs were independently associated with longer LOS independent of ISS.5 In addition, when scanning the cervical spine or the chest, there was at least one false positive result for every two clinically significant findings obtained, calling into question the practice of liberal imaging of these regions.5
Ultimately, readers will differ in opinion as to what delineates significant thoracic trauma as there are no widely accepted delineations or gauges of magnitude. Inter-specialty differences of opinion about the clinical implication of specific injuries
Unadjusted Adjusteda
Odds ratiob (95% CI) P-value Odds ratiob (95% CI) P-valueManagement change 1.1 (1.0 – 1.1) < 0.01 1.1 (1.0 – 1.1) 0.01Surgical management change 1.3 (1.1 – 1.4) < 0.01 1.2 (1.1 – 1.4) < 0.01Positive chest CT findings
Pneumothorax 1.0 (0.9 – 1.0) 0.54 1.0 (0.9 – 1.0) 0.87Hemothorax effusion 1.0 (0.9 – 1.2) 0.80 0.9 (0.8 – 1.1) 0.55Other fractures 1.0 (1.0 – 1.1) 0.13 1.0 (1.0 – 1.1) 0.30Mediastinal abnormality 1.0 (0.9 – 1.0) 0.31 1.0 (0.9 – 1.1) 0.45Foreign body 0.9 (0.8 – 1.1) 0.37 0.9 (0.7 – 1.1) 0.35Incidental finding 0.9 (0.8 – 1.0) 0.22 0.9 (0.8 – 1.1) 0.32
Table 4. Association between age and changes in management, surgical management and positive chest computed tomography findings.
a The adjusted odds ratios were adjusted for injury mechanism (fall, motor vehicle collision, and other), Injury Severity Score, Glasgow Coma Scale, hypotension, and tachycardia. b Odds ratio for each additional year of age.CT, computed tomography; CI, confidence interval.
Management code, N (%)Age group
0-2 years 3-6 years 7-10 years 11-13 years 14-17 yearsSurgical management
Chest tube 0 (0.0) 0 (0.0) 2 (1.1) 1 (0.5) 11 (2.1)Surgery for fracture 0 (0.0) 0 (0.0) 0 (0.0) 0 (0.0) 9 (1.7)Surgical vascular repair 0 (0.0) 0 (0.0) 0 (0.0) 1 (0.5) 5 (0.9)Foreign body removal 0 (0.0) 1 (0.5) 0 (0.0) 1 (0.5) 0 (0.0)Diaphragm repair 0 (0.0) 0 (0.0) 0 (0.0) 0 (0.0) 1 (0.2)
Non-Surgical managementBrace 2 (1.6) 5 (2.4) 5 (2.9) 7 (3.7) 14 (2.6)Sling, or NWB; corset 1 (0.8) 2 (0.9) 6 (3.4) 5 (2.7) 14 (2.6)More imaging 1 (0.8) 3 (1.4) 5 (2.9) 2 (1.1) 11 (2.1)Medical vascular repair (therapeutic anticoagulation)
0 (0.0) 0 (0.0) 0 (0.0) 1 (0.5) 2 (0.4)
Specialist follow-up 1 (0.8) 1 (0.5) 0 (0.0) 0 (0.0) 2 (0.4)
Table 5. Frequencies of changes in management by age group.
NWB, non weight-bearing.
Western Journal of Emergency Medicine 332 Volume 23, no. 3: May 2022
Chest CT Rarely Changes Surgical Management in Pediatric Patients Ugalde et al.
exist.27 While minor missed injuries may heal on their own, ones that are more critical may become evident with repeated exams and observation, strict return precautions, and appropriate follow-up. In the pursuit of a zero missed-injury rate, we must weigh the risk beyond cost, time, and resources with the threat of iatrogenic cancer and contrast-induced nephropathy. Clear and respectful communication with patients and families and shared decision-making with proper documentation are key to balancing the risks and benefits of trauma imaging.
The American College of Surgeons has historically used age 15 as the cutoff between adult and pediatric trauma designation based upon physiological and anatomic estimates. The age cutoff may vary depending on local resources within a hospital system. This is important as imaging protocols are often developed separately for pediatric and adult patients. Information about the outcomes associated with CCT is pivotal in judicious imaging practices and limiting radiation exposure to more vulnerable populations.
LIMITATIONSFirst, because our study was retrospective some
information from the EHR and trauma registry may have been more susceptible to misclassification and bias compared to prospective studies. Our study represents pediatric patients treated at our mixed trauma facility in Houston, Texas, which sees both adults and children. Our results may not be generalizable to other institutions locally or nationally with differing proportions of age groups in their centers. However, we do have the influence of both general trauma surgeons as well as pediatric surgeons, as experienced at different centers. Studies have shown higher rates of CT usage at adult and mixed trauma centers vs pediatric trauma centers.28-30
Our categories of changes in management secondary to CCT may not encompass factors that other clinicians may deem important. Some would add to our list and include admission to hospital for observation, as a significant change in management. Furthermore, we defined a change in management resulting from a procedure performed after the CCT in the setting of a discordance of diagnoses between the two imaging modalities. This has the inherent risk of overselling the impact of CCT. It is also possible there was a bias toward change in management given the overdependence on CCT. None of the 128 patients in the 0-2 years age group who received a CCT had a surgical change in management. However, there were far fewer patients in this category than in the older age groups, limiting the power of the observation. These limitations naturally occur with retrospective studies.
CONCLUSIONWe demonstrate that young children seldom undergo
management changes when additional diagnoses occur on chest computed tomography in pediatric trauma. Practitioners should be thoughtful about automatically obtaining a CCT on the young, multi-trauma patient.
Address for Correspondence: Irma T. Ugalde, MD, McGovern Medical School UT Health, Department of Emergency Medicine, 6431 Fannin, JJL 451, Houston, TX 77030. Email: [email protected].
Conflicts of Interest: By the WestJEM article submission agreement, all authors are required to disclose all affiliations, funding sources and financial or management relationships that could be perceived as potential sources of bias. No author has professional or financial relationships with any companies that are relevant to this study. There are no conflicts of interest or sources of funding to declare.
Copyright: © 2022 Ugalde et al. This is an open access article distributed in accordance with the terms of the Creative Commons Attribution (CC BY 4.0) License. See: http://creativecommons.org/licenses/by/4.0/
REFERENCES1. Sartorelli KH, Vane DW. The diagnosis and management of
children with blunt injury of the chest. Semin Pediatr Surg. 2004;13(2):98-105.
2. Kool DR, Blickman JG. Advanced Trauma Life Support. ABCDE from a radiological point of view. Emerg Radiol. 2007;14(3):135-41.
3. Holmes JF, Sokolove PE, Brant WE, et al. A clinical decision rule for identifying children with thoracic injuries after blunt torso trauma. Ann Emerg Med. 2002;39(5):492-9.
4. Brenner DJ, Hall EJ. Computed tomography--an increasing source of radiation exposure. N Engl J Med. 2007;357(22):2277-84.
5. Edwards MJ, Jenkel T, Weller B, et al. Computed tomography scan utilization in pediatric trauma: impact on length of stay and incidence of false positive findings. Pediatr Emerg Care. 2021;37(12):e1478-e81.
6. Mueller DL, Hatab M, Al-Senan R, et al. Pediatric radiation exposure during the initial evaluation for blunt trauma. J Trauma. 2011;70(3):724-31.
7. Rodriguez RM, Langdorf MI, Nishijima D, et al. Derivation and validation of two decision instruments for selective chest CT in blunt trauma: a multicenter prospective observational study (NEXUS Chest CT). PLoS Med. 2015;12(10):e1001883.
8. Rodriguez RM, Hendey GW, Mower W, et al. Derivation of a decision instrument for selective chest radiography in blunt trauma. J Trauma. 2011;71(3):549-53.
9. Golden J, Isani M, Bowling J, et al. Limiting chest computed tomography in the evaluation of pediatric thoracic trauma. J Trauma Acute Care Surg. 2016;81(2):271-7.
10. Ugalde IT, Prater S, Cardenas-Turanzas M, et al. Chest x-ray vs. computed tomography of the chest in pediatric blunt trauma. J Pediatr Surg. 2021;56(5):1039-46.
11. Hershkovitz Y, Zoarets I, Stepansky A, et al. Computed tomography is not justified in every pediatric blunt trauma patient with a suspicious mechanism of injury. Am J Emerg Med. 2014;32(7):697-9.
12. Holscher CM, Faulk LW, Moore EE, et al. Chest computed tomography imaging for blunt pediatric trauma: not worth the

Volume 23, no. 3: May 2022 333 Western Journal of Emergency Medicine
Ugalde et al. Chest CT Rarely Changes Surgical Management in Pediatric Patients
radiation risk. J Surg Res. 2013;184(1):352-7.13. Markel TA, Kumar R, Koontz NA, et al. The utility of computed
tomography as a screening tool for the evaluation of pediatric blunt chest trauma. J Trauma. 2009;67(1):23-8.
14. Stephens CQ, Boulos MC, Connelly CR, et al. Limiting thoracic CT: a rule for use during initial pediatric trauma evaluation. J Pediatr Surg. 2017;52(12):2031-7.
15. Leeper CM, Nasr I, Koff A, et al. Implementation of clinical effectiveness guidelines for solid organ injury after trauma: 10-year experience at a Level 1 pediatric trauma center. J Pediatr Surg. 2018;53(4):775-9.
16. Halaweish I, Riebe-Rodgers J, Randall A, et al. Compliance with evidence-based guidelines for computed tomography of children with head and abdominal trauma. J Pediatr Surg. 2018;53(4):748-51.
17. Sathya C, Alali AS, Wales PW, et al. Computed tomography rates and estimated radiation-associated cancer risk among injured children treated at different trauma center types. Injury. 2019;50(1):142-8.
18. Worster A, Bledsoe RD, Cleve P, et al. Reassessing the methods of medical record review studies in emergency medicine research. Ann Emerg Med. 2005;45(4):448-51.
19. Roudsari BS, Psoter KJ, Vavilala MS, et al. CT use in hospitalized pediatric trauma patients: 15-year trends in a Level I pediatric and adult trauma center. Radiology. 2013;267(2):479-86.
20. Korley FK, Pham JC, Kirsch TD. Use of advanced radiology during visits to US emergency departments for injury-related conditions, 1998-2007. JAMA. 2010;304(13):1465-71.
21. Pines JM. Trends in the rates of radiography use and important diagnoses in emergency department patients with abdominal pain. Med Care. 2009;47(7):782-6.
22. Strait L, Sussman R, Ata A, et al. Utilization of CT imaging in minor
pediatric head, thoracic, and abdominal trauma in the United States. J Pediatr Surg. 2020;55(9):1766-72.
23. Ugalde IT, Prater S, Cardenas-Turanzas M, et al. Chest x-ray vs. computed tomography of the chest in pediatric blunt trauma. J Pediatr Surg. 2021;56(5):1039-46.
24. Langdorf MI, Medak AJ, Hendey GW, et al. Prevalence and clinical import of thoracic injury identified by chest computed tomography but not chest radiography in blunt trauma: multicenter prospective cohort study. Ann Emerg Med. 2015;66(6):589-600.
25. Brady Z, Ramanauskas F, Cain T, et al. Assessment of paediatric CT dose indicators for the purpose of optimisation. Brit J Radiol. 2012;85:1488-98.
26. Moore MA, Wallace EC, Westra SJ. The imaging of paediatric thoracic trauma. Pediatr Radiol. 2009;39(5):485-96.
27. Barrett TW, Rising KL, Bellolio MF, et al. The 2016 Academic Emergency Medicine Consensus Conference, “Shared Decision Making in the Emergency Department: Development of a Policy-relevant Patient-centered Research Agenda” Diagnostic Testing Breakout Session Report. Acad Emerg Med. 2016;23(12):1354-61.
28. Stylianos S, Nathens AB. Comparing processes of pediatric trauma care at children’s hospitals versus adult hospitals. J Trauma. 2007;63(6 Suppl):S96-100; discussion S106-112.
29. Walther AE, Pritts TA, Falcone RA, et al. Teen trauma without the drama: outcomes of adolescents treated at Ohio adult versus pediatric trauma centers. J Trauma Acute Care Surg. 2014;77(1):109-16; discussion 116.
30. Matsushima K, Kulaylat AN, Won EJ, et al. Variation in the management of adolescent patients with blunt abdominal solid organ injury between adult versus pediatric trauma centers: an analysis of a statewide trauma database. J Surg Res. 2013;183(2):808-13.
Western Journal of Emergency Medicine 334 Volume 23, no. 3: May 2022
Systematic Review
Trauma-informed Care Interventions in Emergency Medicine: A Systematic Review
Taylor Brown, MD*Henry Ashworth, MPH†
Michelle Bass, PhD, MSI‡
Eve Rittenberg, MD§
Nomi Levy-Carrick, MD, MPhil¶
Samara Grossman, LICSW¶
Annie Lewis-O’Connor, NP, PhD, MPH§
Hanni Stoklosa, MD, MPH||
Section Editor: Leslie Zun, MD, MBA Submission history: Submitted June 15, 2021; Revision received January 24, 2022; Accepted January 17, 2022Electronically published April 13, 2022Full text available through open access at http://escholarship.org/uc/uciem_westjemDOI: 10.5811/westjem.2022.1.53674
INTRODUCTIONBackground
Trauma exposure is a highly prevalent experience in the emergency department (ED) for both patients and clinicians.1–6
Beth Israel Deaconess Medical Center, Department of Emergency Medicine, Boston, MassachusettsHarvard Medical School, Boston, MassachusettsHarvard Medical School, Countway Library, Boston, MassachusettsBrigham and Women’s Hospital, Department of Medicine, Boston, MassachusettsBrigham and Women’s Hospital, Department of Psychiatry, Boston, MassachusettsBrigham and Women’s Hospital, Department of Emergency Medicine, Boston, Massachusetts
Introduction: Trauma exposure is a highly prevalent experience for patients and clinicians in emergency medicine (EM). Trauma-informed care (TIC) is an effective framework to mitigate the negative health impacts of trauma. This systematic review synthesizes the range of TIC interventions in EM, with a focus on patient and clinician outcomes, and identifies gaps in the current research on implementing TIC.
Methods: The study was registered with PROSPERO (CRD42020205182). We systematically searched peer-reviewed journals and abstracts in the PubMed, EMBASE (Elsevier), PsycINFO (EBSCO), Social Services Abstract (ProQuest), and CINAHL (EBSCO) databases from 1990 onward on August 12, 2020. We analyzed studies describing explicit TIC interventions in the ED setting using inductive qualitative content analysis to identify recurrent themes and identify unique trauma-informed interventions in each study. Studies not explicitly citing TIC were excluded. Studies were assessed for bias using the Newcastle-Ottawa criteria and Critical Appraisal Skills Programme (CASP) Checklist.
Results: We identified a total of 1,372 studies and abstracts, with 10 meeting inclusion criteria for final analysis. Themes within TIC interventions that emerged included educational interventions, collaborations with allied health professionals and community organizations, and patient and clinician safety interventions. Educational interventions included lectures, online modules, and standardized patient exercises. Collaborations with community organizations focused on addressing social determinants of health. All interventions suggested a positive impact from TIC on either clinicians or patients, but outcomes data remain limited.
Conclusion: Trauma-informed care is a nascent field in EM with limited operationalization of TIC approaches. Future studies with patient and clinician outcomes analyzing universal TIC precautions and systems-level interventions are needed. [West J Emerg Med. 2022;22(3)334–344.]
*
†
‡
§
¶
||
The Substance Abuse and Mental Health Services Administration (SAMHSA) defines trauma as “an event, series of events, or set of circumstances that is experienced by an individual as physically or emotionally harmful or life-threatening and that

Volume 23, no. 3: May 2022 335 Western Journal of Emergency Medicine
Brown et al. Trauma-informed Care Interventions in EM: A Systematic Review
has lasting adverse effects on the individual’s functioning and mental, physical, social, emotional, or spiritual well-being.”7 This definition of trauma encompasses experiences that range from individual (eg, car accident, death of a loved one), to interpersonal (eg, interpersonal violence [IPV], discrimination, abuse), to societal (eg, natural disasters, pandemics, terrorist attacks). Newer publications have expanded this definition to explicitly address structural trauma (eg, racism, sexism).8
Patients frequently present to the ED with the types of trauma defined above: individual (medical traumas/injuries); IPV; and societal traumas (gun violence and community violence). In the United States, the yearly incidence of these events range from 1.7 million ED visits for assault-related injury1 to 88,000 due to firearm-related injuries,2 and over 28,000 ED visits attributed to IPV.3 Patients presenting with acute trauma often are survivors of previous traumatic experiences; a survey of survivors of community violence participating in a hospital-based violence intervention program found that 100% of participants reported at least one adverse childhood experience.9 These previous traumatic experiences are not equally distributed, with those self-identified as female, American Indian/Alaskan Native, and Black being more likely to experience several types of adverse childhood experience than those self-identified as male or White.10
For some survivors of trauma, the experience of the ED may be re-traumatizing or trigger past experiences.11 Survivors of trauma may experience emotional dysregulation (ie, trouble controlling strong emotions) or hypervigilance (ie, increased threat perception and reactivity).12 The close interplay between executive functioning and emotional regulation may impact both the patient and the care team’s navigation of the encounter.12 Similarly, hypervigilance could make the often-hectic environment of the ED, as well as interventional procedures, harder to tolerate.12
The ED setting, by virtue of its emergency-level care, presents multiple potential sources for both direct and secondary trauma (ie, indirect exposure to traumatic events) to clinicians and non-clinical staff. The COVID-19 pandemic demonstrated the toll secondary trauma exposure can have on frontline healthcare workers and staff.4 Staff practicing in the ED also experience high rates of workplace violence (ie, direct trauma). 5,6 The combination of direct trauma and secondary trauma likely contributes to the high rates of post-traumatic stress disorder (PTSD) and secondary traumatic stress (STS) experienced by emergency clinicians. About 11.9-16.8% of emergency physicians screen positive for PTSD and STS symptoms at any one time,13–18 and these rates may be even higher in emergency nurses with 33-64% of nursing staff screening positive for at least one symptom of STS.19–21 There is evidence to suggest that non-clinical staff also experience STS from witnessing acute care.22
Importance Trauma-informed care (TIC) is a framework that aims
to prevent re-traumatization in the healthcare setting and
promote resilience for both patient and clinicians.23 It is based on six principles: 1) safety; 2) trustworthiness and transparency; 3) peer support; 4) collaboration and mutuality; 5) empowerment, voice, and choice; and 6) cultural, historical, and gender issues.7 Trauma-informed care is increasingly being adopted as an approach to clinical care in both primary and specialty care, including emergency medicine (EM).23–28 In 2012, the US Attorney General National Task Force on Children Exposed to Violence called for all EDs to provide TIC, and for all clinicians interacting with patients experiencing trauma to be trained in TIC.29 Trauma-informed care has been shown to be a cost-effective intervention with clinical benefits to patients and job satisfaction benefits to staff.30–33 However, despite the immense burden of trauma seen in the ED and the benefits of TIC for patients and clinicians, TIC remains a nascent field within EM.
Goals of This Investigation This review will synthesize evidence on TIC interventions
in EM to describe the following research aims: the breadth of TIC interventions being pursued in the physical ED setting; the potential benefits to patients of TIC interventions in the ED; the potential benefits to clinicians and non-clinical staff of TIC interventions in the ED; and to identify gaps in the current research on implementing TIC interventions in the ED.
METHODSSearch Strategy
We searched peer-reviewed journals and abstracts by searching the databases PubMed, EMBASE (Elsevier), PsycINFO (EBSCO), Social Services Abstract (ProQuest), and CINAHL (EBSCO). The searches included keywords and controlled vocabulary terms for the following concepts: the physical space of the ED; clinicians and staff in the ED; and TIC. A full description of search terms can be found in Appendix 1. The final protocol was registered with PROSPERO (CRD42020205182).
Study SelectionSince TIC as a framework was developed in the 1990s,
we included studies from 1990 onward to August 12, 2020, when databases were queried. We included any study that involved emergency clinicians (eg, physicians, nurses, nurse practitioners, and physician assistants) and non-clinical staff (eg, administrative staff, security staff, and environmental services staff). We included studies that examined the physical setting of the ED. The review included studies that reported on TIC interventions. Our study focused on TIC as a framework; therefore, studies had to mention TIC explicitly to be included. Studies that mentioned one element of TIC without referencing the framework were not included. A more detailed explanation of the TIC framework is included in Appendix 2. We defined the criteria for intervention broadly to include any explicit application of TIC. This included TIC related
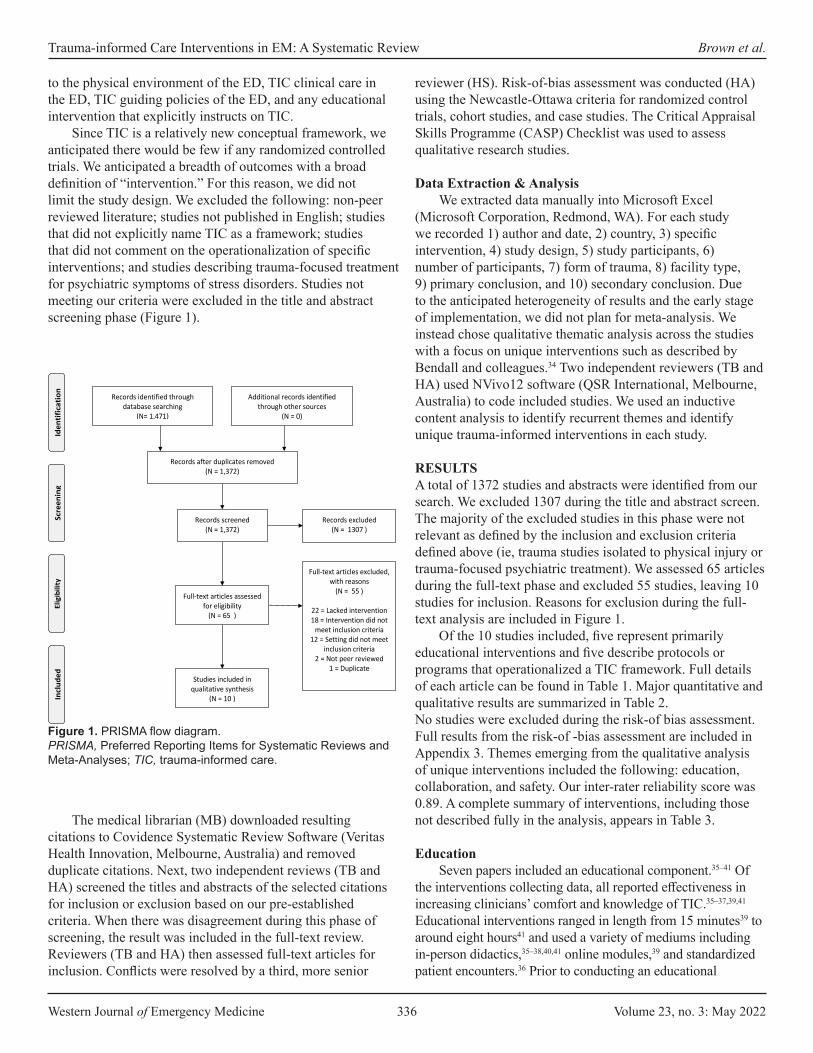
Western Journal of Emergency Medicine 336 Volume 23, no. 3: May 2022
Trauma-informed Care Interventions in EM: A Systematic Review Brown et al.
to the physical environment of the ED, TIC clinical care in the ED, TIC guiding policies of the ED, and any educational intervention that explicitly instructs on TIC.
Since TIC is a relatively new conceptual framework, we anticipated there would be few if any randomized controlled trials. We anticipated a breadth of outcomes with a broad definition of “intervention.” For this reason, we did not limit the study design. We excluded the following: non-peer reviewed literature; studies not published in English; studies that did not explicitly name TIC as a framework; studies that did not comment on the operationalization of specific interventions; and studies describing trauma-focused treatment for psychiatric symptoms of stress disorders. Studies not meeting our criteria were excluded in the title and abstract screening phase (Figure 1).
reviewer (HS). Risk-of-bias assessment was conducted (HA) using the Newcastle-Ottawa criteria for randomized control trials, cohort studies, and case studies. The Critical Appraisal Skills Programme (CASP) Checklist was used to assess qualitative research studies.
Data Extraction & AnalysisWe extracted data manually into Microsoft Excel
(Microsoft Corporation, Redmond, WA). For each study we recorded 1) author and date, 2) country, 3) specific intervention, 4) study design, 5) study participants, 6) number of participants, 7) form of trauma, 8) facility type, 9) primary conclusion, and 10) secondary conclusion. Due to the anticipated heterogeneity of results and the early stage of implementation, we did not plan for meta-analysis. We instead chose qualitative thematic analysis across the studies with a focus on unique interventions such as described by Bendall and colleagues.34 Two independent reviewers (TB and HA) used NVivo12 software (QSR International, Melbourne, Australia) to code included studies. We used an inductive content analysis to identify recurrent themes and identify unique trauma-informed interventions in each study.
RESULTS A total of 1372 studies and abstracts were identified from our search. We excluded 1307 during the title and abstract screen. The majority of the excluded studies in this phase were not relevant as defined by the inclusion and exclusion criteria defined above (ie, trauma studies isolated to physical injury or trauma-focused psychiatric treatment). We assessed 65 articles during the full-text phase and excluded 55 studies, leaving 10 studies for inclusion. Reasons for exclusion during the full-text analysis are included in Figure 1.
Of the 10 studies included, five represent primarily educational interventions and five describe protocols or programs that operationalized a TIC framework. Full details of each article can be found in Table 1. Major quantitative and qualitative results are summarized in Table 2.No studies were excluded during the risk-of bias assessment. Full results from the risk-of -bias assessment are included in Appendix 3. Themes emerging from the qualitative analysis of unique interventions included the following: education, collaboration, and safety. Our inter-rater reliability score was 0.89. A complete summary of interventions, including those not described fully in the analysis, appears in Table 3.
EducationSeven papers included an educational component.35–41 Of
the interventions collecting data, all reported effectiveness in increasing clinicians’ comfort and knowledge of TIC.35–37,39,41 Educational interventions ranged in length from 15 minutes39 to around eight hours41 and used a variety of mediums including in-person didactics,35–38,40,41 online modules,39 and standardized patient encounters.36 Prior to conducting an educational
Figure 1. PRISMA flow diagram. PRISMA, Preferred Reporting Items for Systematic Reviews and Meta-Analyses; TIC, trauma-informed care.
The medical librarian (MB) downloaded resulting citations to Covidence Systematic Review Software (Veritas Health Innovation, Melbourne, Australia) and removed duplicate citations. Next, two independent reviews (TB and HA) screened the titles and abstracts of the selected citations for inclusion or exclusion based on our pre-established criteria. When there was disagreement during this phase of screening, the result was included in the full-text review. Reviewers (TB and HA) then assessed full-text articles for inclusion. Conflicts were resolved by a third, more senior
Figure 1: PRISMA Flow Diagram
Records identified through database searching
(N= 1,471)
Scre
enin
g In
clude
d El
igib
ility
Id
entif
icat
ion
Additional records identified through other sources
(N = 0)
Records after duplicates removed (N = 1,372)
Records screened (N = 1,372)
Records excluded (N = 1307 )
Full-text articles assessed for eligibility
(N = 65 )
Full-text articles excluded, with reasons
(N = 55 )
22 = Lacked intervention 18 = Intervention did not
meet inclusion criteria 12 = Setting did not meet
inclusion criteria 2 = Not peer reviewed
1 = Duplicate Studies included in
qualitative synthesis (N = 10 )
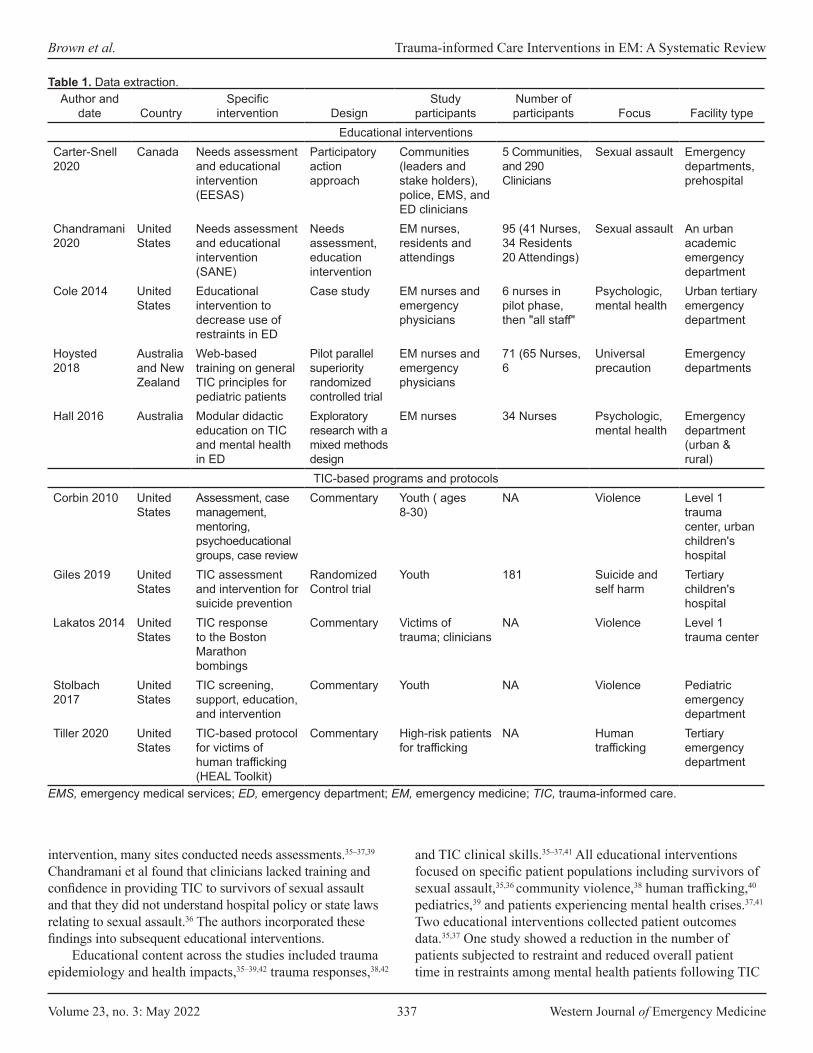
Volume 23, no. 3: May 2022 337 Western Journal of Emergency Medicine
Brown et al. Trauma-informed Care Interventions in EM: A Systematic Review
Table 1. Data extraction.Author and
date CountrySpecific
intervention DesignStudy
participantsNumber of participants Focus Facility type
Educational interventionsCarter-Snell 2020
Canada Needs assessment and educational intervention (EESAS)
Participatory action approach
Communities (leaders and stake holders), police, EMS, and ED clinicians
5 Communities, and 290 Clinicians
Sexual assault Emergency departments, prehospital
Chandramani 2020
United States
Needs assessment and educational intervention (SANE)
Needs assessment, education intervention
EM nurses, residents and attendings
95 (41 Nurses, 34 Residents 20 Attendings)
Sexual assault An urban academic emergency department
Cole 2014 United States
Educational intervention to decrease use of restraints in ED
Case study EM nurses and emergency physicians
6 nurses in pilot phase, then "all staff"
Psychologic, mental health
Urban tertiary emergency department
Hoysted 2018
Australia and New Zealand
Web-based training on general TIC principles for pediatric patients
Pilot parallel superiority randomized controlled trial
EM nurses and emergency physicians
71 (65 Nurses, 6
Universal precaution
Emergency departments
Hall 2016 Australia Modular didactic education on TIC and mental health in ED
Exploratory research with a mixed methods design
EM nurses 34 Nurses Psychologic, mental health
Emergency department (urban & rural)
TIC-based programs and protocolsCorbin 2010 United
StatesAssessment, case management, mentoring, psychoeducational groups, case review
Commentary Youth ( ages 8-30)
NA Violence Level 1 trauma center, urban children's hospital
Giles 2019 United States
TIC assessment and intervention for suicide prevention
Randomized Control trial
Youth 181 Suicide and self harm
Tertiary children's hospital
Lakatos 2014 United States
TIC response to the Boston Marathon bombings
Commentary Victims of trauma; clinicians
NA Violence Level 1 trauma center
Stolbach 2017
United States
TIC screening, support, education, and intervention
Commentary Youth NA Violence Pediatric emergency department
Tiller 2020 United States
TIC-based protocol for victims of human trafficking (HEAL Toolkit)
Commentary High-risk patients for trafficking
NA Human trafficking
Tertiary emergency department
EMS, emergency medical services; ED, emergency department; EM, emergency medicine; TIC, trauma-informed care.
intervention, many sites conducted needs assessments.35–37,39 Chandramani et al found that clinicians lacked training and confidence in providing TIC to survivors of sexual assault and that they did not understand hospital policy or state laws relating to sexual assault.36 The authors incorporated these findings into subsequent educational interventions.
Educational content across the studies included trauma epidemiology and health impacts,35–39,42 trauma responses,38,42
and TIC clinical skills.35–37,41 All educational interventions focused on specific patient populations including survivors of sexual assault,35,36 community violence,38 human trafficking,40 pediatrics,39 and patients experiencing mental health crises.37,41 Two educational interventions collected patient outcomes data.35,37 One study showed a reduction in the number of patients subjected to restraint and reduced overall patient time in restraints among mental health patients following TIC

Western Journal of Emergency Medicine 338 Volume 23, no. 3: May 2022
Trauma-informed Care Interventions in EM: A Systematic Review Brown et al.
Table 2. Major quantitative and qualitative findings for included studies.Author and date Specific intervention Quantitative findings Qualitative findings
EducationCarter-Snell 2020 Needs assessment
and educational intervention (EESAS)
- Comfort providing sexual assault services significantly improved even at 6-month surveys (P <0.01) in emergency clinicians- Knowledge of consequences of sexual assault, mental health considerations, healthcare interventions, and legal considerations improved post training (P < 0.01)
- Enhanced collaboration across services and issues with ongoing turnover of personnel- Subjective quality of service ratings improved
Chandramani 2020 Needs assessment and educational intervention (SANE)
- Significant improvement in knowledge of elements of assault history 67% to 93% (P < 0.05) and comfort in ability to take history 41% to 86% (P <0.01) in ED residents. -Significant improvement in comfort performing a forensic examination 44% to 87% (P < 0.01) in ED residents.
- In pre-intervention free response, nine participants mentioned a lack of training and education as a barrier to providing better care- Post survey participants expressed that the educational intervention was very helpful to their ability to care for survivors.
Cole 2014 Educational Intervention to decrease use of restraints in ED
- Initially, 15 to 20 episodes of restraints being used per month, which decreased to no episodes by the end of the intervention. - Overall, ED behavioral health seclusion and restraint hours were reduced from 38.5 h/mo to 0 h/mo after 2 years of the program.
-Changing the culture through staff understanding of trauma-informed care was key in improving the patient outcomes.-Success of the program depended upon relationship between ED and behavior health department working together.
Hoysted 2018 Web-based training on general TIC principles for pediatric patients
- Training group had significantly greater knowledge following training and at follow-upthan the control (P <.001) - Most participants (74.2%) indicated that the training would be useful in their role in the ED
- Participants liked the online format, found the training to be interesting and informative, and felt the training increased their insight and awareness- Participants stated that there should be more interactive program with the opportunity to practice learned skills
Hall 2016 Modular didactic education on TIC and mental health in ED
- ED nurses reported more confidence in their ability to talk to patients about traumatic experiences (P = 0.001, r = 0.41), respond to disclosures of family violence (P = 0.001, r = 0.41), and understand how their current nursing practice is trauma informed (P = 0.001, r = 0.53)
- Participants had an increased openness to ask questions about trauma and listen to patients’ responses- Participants found the neurobiology component of the education assisted their understanding of trauma
TIC-based programs and protocolsCorbin 2010 Assessment, case
management, mentoring, psychoeducational groups, case review
N/A Authors concluded a combination of In-hospital peer counseling starting in the ED, outpatient follow-up with home visits to address educational, employment, and behavioral health needs, leads to better all- around care and preventing of future incidents of community violence
Giles 2019 TIC assessment and intervention for suicide prevention
- Patients who received the intervention were significantly more likely to attend outpatient treatment compared with usual care; 79 families (88.8%) received at least one care linkage contact compared to zero in the non-intervention group
- Authors concluded that adding the trauma screening helped to provide trauma-informed care and to link youth directly to trauma- specific, evidenced-based treatments from the ED.
TIC, trauma-informed care; EMS, emergency medical services; ED, emergency department; EESAS, Enhanced Emergency Sexual Assault Services; SANE, Sexual Assault Nurse Examiners.
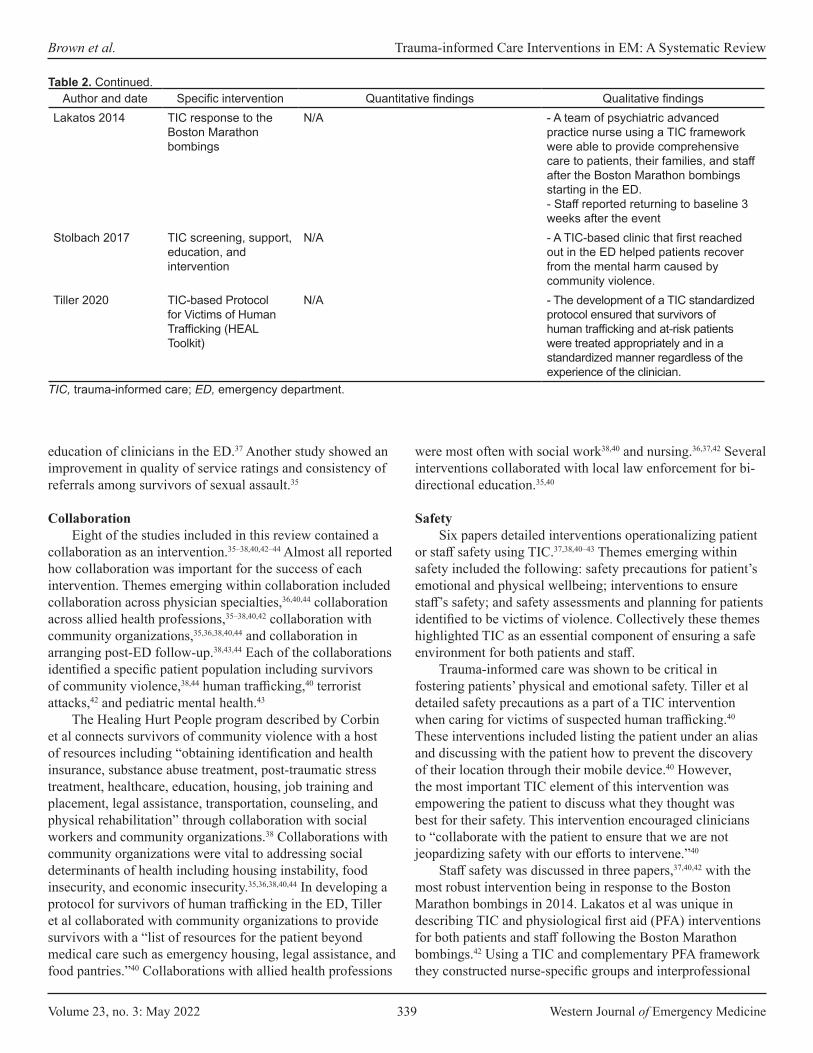
Volume 23, no. 3: May 2022 339 Western Journal of Emergency Medicine
Brown et al. Trauma-informed Care Interventions in EM: A Systematic Review
Author and date Specific intervention Quantitative findings Qualitative findingsLakatos 2014 TIC response to the
Boston Marathon bombings
N/A - A team of psychiatric advanced practice nurse using a TIC framework were able to provide comprehensive care to patients, their families, and staff after the Boston Marathon bombings starting in the ED. - Staff reported returning to baseline 3 weeks after the event
Stolbach 2017 TIC screening, support, education, and intervention
N/A - A TIC-based clinic that first reached out in the ED helped patients recover from the mental harm caused by community violence.
Tiller 2020 TIC-based Protocol for Victims of Human Trafficking (HEAL Toolkit)
N/A - The development of a TIC standardized protocol ensured that survivors of human trafficking and at-risk patients were treated appropriately and in a standardized manner regardless of the experience of the clinician.
Table 2. Continued.
TIC, trauma-informed care; ED, emergency department.
education of clinicians in the ED.37 Another study showed an improvement in quality of service ratings and consistency of referrals among survivors of sexual assault.35
CollaborationEight of the studies included in this review contained a
collaboration as an intervention.35–38,40,42–44 Almost all reported how collaboration was important for the success of each intervention. Themes emerging within collaboration included collaboration across physician specialties,36,40,44 collaboration across allied health professions,35–38,40,42 collaboration with community organizations,35,36,38,40,44 and collaboration in arranging post-ED follow-up.38,43,44 Each of the collaborations identified a specific patient population including survivors of community violence,38,44 human trafficking,40 terrorist attacks,42 and pediatric mental health.43
The Healing Hurt People program described by Corbin et al connects survivors of community violence with a host of resources including “obtaining identification and health insurance, substance abuse treatment, post-traumatic stress treatment, healthcare, education, housing, job training and placement, legal assistance, transportation, counseling, and physical rehabilitation” through collaboration with social workers and community organizations.38 Collaborations with community organizations were vital to addressing social determinants of health including housing instability, food insecurity, and economic insecurity.35,36,38,40,44 In developing a protocol for survivors of human trafficking in the ED, Tiller et al collaborated with community organizations to provide survivors with a “list of resources for the patient beyond medical care such as emergency housing, legal assistance, and food pantries.”40 Collaborations with allied health professions
were most often with social work38,40 and nursing.36,37,42 Several interventions collaborated with local law enforcement for bi-directional education.35,40
SafetySix papers detailed interventions operationalizing patient
or staff safety using TIC.37,38,40–43 Themes emerging within safety included the following: safety precautions for patient’s emotional and physical wellbeing; interventions to ensure staff’s safety; and safety assessments and planning for patients identified to be victims of violence. Collectively these themes highlighted TIC as an essential component of ensuring a safe environment for both patients and staff.
Trauma-informed care was shown to be critical in fostering patients’ physical and emotional safety. Tiller et al detailed safety precautions as a part of a TIC intervention when caring for victims of suspected human trafficking.40 These interventions included listing the patient under an alias and discussing with the patient how to prevent the discovery of their location through their mobile device.40 However, the most important TIC element of this intervention was empowering the patient to discuss what they thought was best for their safety. This intervention encouraged clinicians to “collaborate with the patient to ensure that we are not jeopardizing safety with our efforts to intervene.”40
Staff safety was discussed in three papers,37,40,42 with the most robust intervention being in response to the Boston Marathon bombings in 2014. Lakatos et al was unique in describing TIC and physiological first aid (PFA) interventions for both patients and staff following the Boston Marathon bombings.42 Using a TIC and complementary PFA framework they constructed nurse-specific groups and interprofessional
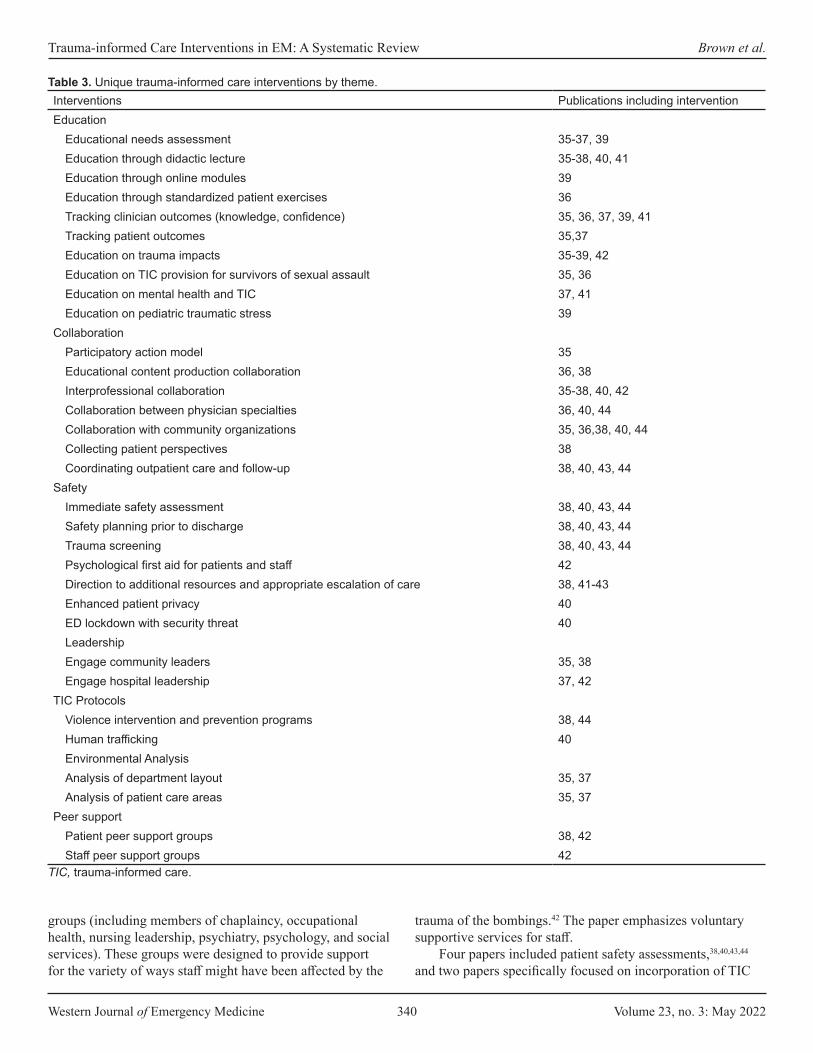
Western Journal of Emergency Medicine 340 Volume 23, no. 3: May 2022
Trauma-informed Care Interventions in EM: A Systematic Review Brown et al.
Interventions Publications including interventionEducation
Educational needs assessment 35-37, 39Education through didactic lecture 35-38, 40, 41Education through online modules 39Education through standardized patient exercises 36Tracking clinician outcomes (knowledge, confidence) 35, 36, 37, 39, 41Tracking patient outcomes 35,37Education on trauma impacts 35-39, 42 Education on TIC provision for survivors of sexual assault 35, 36Education on mental health and TIC 37, 41Education on pediatric traumatic stress 39
CollaborationParticipatory action model 35Educational content production collaboration 36, 38Interprofessional collaboration 35-38, 40, 42Collaboration between physician specialties 36, 40, 44Collaboration with community organizations 35, 36,38, 40, 44Collecting patient perspectives 38Coordinating outpatient care and follow-up 38, 40, 43, 44
SafetyImmediate safety assessment 38, 40, 43, 44Safety planning prior to discharge 38, 40, 43, 44Trauma screening 38, 40, 43, 44 Psychological first aid for patients and staff 42Direction to additional resources and appropriate escalation of care 38, 41-43Enhanced patient privacy 40ED lockdown with security threat 40LeadershipEngage community leaders 35, 38Engage hospital leadership 37, 42
TIC ProtocolsViolence intervention and prevention programs 38, 44Human trafficking 40Environmental AnalysisAnalysis of department layout 35, 37Analysis of patient care areas 35, 37
Peer supportPatient peer support groups 38, 42Staff peer support groups 42
Table 3. Unique trauma-informed care interventions by theme.
TIC, trauma-informed care.
groups (including members of chaplaincy, occupational health, nursing leadership, psychiatry, psychology, and social services). These groups were designed to provide support for the variety of ways staff might have been affected by the
trauma of the bombings.42 The paper emphasizes voluntary supportive services for staff.
Four papers included patient safety assessments,38,40,43,44 and two papers specifically focused on incorporation of TIC
Volume 23, no. 3: May 2022 341 Western Journal of Emergency Medicine
Brown et al. Trauma-informed Care Interventions in EM: A Systematic Review
principles into these assessments.38,43 Giles et al described how using a TIC framework was foundational in effectively assessing youths at risk for suicide by engaging with them to discuss their hopes, strengths, family support, and ability to practice a safety plan.43 As previously discussed, Corbin et al’s work on the Safety, Emotions, Loss, Future model for youths who have experienced violence includes safety as one of the four foundational concepts.38
Additional ThemesAdditional interventions emerging from our analysis
included the following: conducting trauma screening and assessment38,40,43,44; securing leadership buy-in from both hospital and community leaders35,37,38,4; developing standardized TIC protocols and programs for vulnerable patient populations36,38,40,44; and environmental analysis of the ED.35,37
DISCUSSIONTrauma-informed care remains an emerging field in EM
with limited operationalization despite positive emergency clinician perceptions of TIC.45–48 The concepts formally studied that are related to TIC have shown benefit based on initial, but limited, data.30–32 Our review found 10 studies demonstrating ED interventions explicitly operationalizing a TIC framework. The majority of interventions focused on clinician education and care protocols for historically vulnerable populations (eg, persons impacted by structural racism and oppression). While the data is still preliminary, all included studies showed a positive impact of TIC on either patients or clinicians. Patients reported increased quality of care and increased outpatient referral follow-up rates,35 and when experiencing mental health crises spent less time in restraints.37 Clinicians reported greater clinical knowledge and comfort when providing care for historically vulnerable patient populations.35–37,41,47
Numerous guidelines and best practices for TIC in the ED setting have been published, as we describe in our “Limitations” section. However, operationalization of these best practices and outcomes data remains limited. It may be that the studies are ongoing. For example, the educational interventions included in this review were published between 2014-2020. Most papers included only level 1 and level 2 Kirkpatrick assessments (ie, attitude changes and knowledges gains), and only two included level 3 and level 4 outcomes (ie, clinical practice change and patient outcomes).49 The timing of our review may have been insufficient for most groups to collect patient-centered outcomes. Future studies are needed to establish clinician and patient outcomes related to educational TIC interventions in EM.
Our review identified several gaps in the current interventions: lack of universal precautions education; lack of outcomes data; lack of staff-focused interventions; and lack of cost-effectiveness analysis. Across all interventions,
both education- and protocol-driven, there was little to no adoption of TIC as a universal precaution for all patients. All interventions captured in our review rely on a population-specific approach (ie, human trafficking, sexual assault, community violence survivors). While this approach may increase clinicians’ awareness of trauma in specific populations, it does not address needs of patients who do not present with “red flags” or who do not present with trauma-related complaints.
Clinicians cannot always predict which patients have experienced adversity; therefore, future educational and programmatic interventions should emphasize TIC as a universal precaution for all-comers.23 Education should emphasize that TIC offers the opportunity to avoid trauma related to medical care and interventions itself.23 Additionally, only one intervention focused on specifically applying TIC principles to ED staff.42 As detailed in the introduction, both clinical and non-clinical ED staff are at high risk for traumatization and re-traumatization based on their work environment.4,5,22 This remains a key area for application of the TIC framework within EM. An increasingly urgent research need is developing in the wake of the COVID-19 pandemic. Future studies with TIC staff-focused interventions would benefit from outcomes data such as validated measures of burnout, PTSD, and STS screening tools.
This review also uncovered a lack of process analysis and environmental analysis of the ED itself. Only two interventions evaluated how the physical space of the ED could be evaluated and improved using a TIC framework.35,37 None of the interventions examined cost effectiveness or return on investment when TIC models are used, representing another gap in the research. The original studies developing TIC showed no additional cost when the model was employed.32 To fully advocate for TIC interventions, especially operational interventions, future studies must include a cost-effectiveness analysis.
The SAMHSA guidelines on TIC include steps for creating trauma-informed institutions and organziations.12 Many sectors have adopted these guidelines including social work,50 elementary education,51 and juvenile justice.52 Future studies are needed that analyze the ED from an operational level using a TIC framework. These studies should also include non-clinical ED staff.
LIMITATIONS Our paper has several limitations that warrant discussion.
Most importantly, by requiring the explicit reference to TIC, we excluded interventions that used principles of TIC without explicitly naming the theory. For example, Cheng et al describe a peer support-based ED violence intervention program in their 2008 paper, and although peer support is one of the six principles of TIC, we did not include the paper in our review as it did not explicitly mention TIC as a guiding framework.53 Other violence intervention programs similarly

Western Journal of Emergency Medicine 342 Volume 23, no. 3: May 2022
Trauma-informed Care Interventions in EM: A Systematic Review Brown et al.
were not included, even though referred to in the literature as “trauma-informed,” because their original publications do not mention TIC.54,55 Additionally, many papers were excluded due to lack of operationalization of TIC. Many publications described best practices without describing interventions. Guidelines and best practices for TIC care of ED patients experiencing mental health crises,56,57 sexual assault survivors,58–60 survivors of community violence,28 victims of human trafficking,61–64 and pediatric patients experiencing trauma65 were all excluded due to lack of operationalization. Finally, our search excluded non-English language studies. and we did not conduct a hand search; therefore, we may not have captured all available interventions.
CONCLUSIONThis paper represents the first systematic review of trauma-informed care interventions in the ED setting. The results of the review show that TIC is a small but growing field in the clinical practice of EM. However, an urgent need remains for additional studies to evaluate potential benefits for patients and clinician in the field of EM. With wider adoption of TIC interventions, the ED can be a place of healing for patients and clinicians.
Address for Correspondence: Taylor Brown, MD, Beth Israel Deaconess Medical Center, Department of Emergency Medicine, 330 Brookline Ave., Boston, MA 02115. Email: [email protected].
Conflicts of Interest: By the WestJEM article submission agreement, all authors are required to disclose all affiliations, funding sources and financial or management relationships that could be perceived as potential sources of bias. This work was funded by the Robert Wood Johnson Foundation Clinical Scholars Program. There are no conflicts of interest to declare.
Copyright: © 2022 Brown et al. This is an open access article distributed in accordance with the terms of the Creative Commons Attribution (CC BY 4.0) License. See: http://creativecommons.org/licenses/by/4.0/
REFERENCES 1. Centers for Disease Control and Prevention. Violence Prevention at
CDC. 2020. Available at: https://www.cdc.gov/violenceprevention/publichealthissue/index.html. Accessed July 15, 2020.
2. Gani F, Sakran JV, Canner JK. Emergency department visits for firearm-related injuries in the United States, 2006–14. Health Affairs. 2017;36(10):1729-38.
3. Davidov DM, Larrabee H, Davis SM. United States emergency department visits coded for intimate partner violence. J Emerg Med. 2015;48(1):94-100.
4. Lai J, Ma S, Wang Y, et al. Factors associated with mental health
outcomes among health care workers exposed to coronavirus disease 2019. JAMA Netw Open. 2020;3(3):e203976.
5. Marketing General Incorporated. ACEP Emergency Department Violence Poll Research Results. 2018. Available at: https://www.emergencyphysicians.org/globalassets/files/pdfs/2018acep-emergency-department-violence-pollresults-2.pdf. Accessed July 15, 2020.
6. Emergency Nurses Association. Emergency Department Violence Surveillance Study. 2011. Available at: http://www.ncdsv.org/images/ENA_EmergencyDeptViolenceSurveillanceStudy_November2011.pdf. Accessed July 15, 2020.
7. SAMHSA’s Trauma and Justice Strategic Initiative. SAMHSA’s Concept of Trauma and Guidance for a Trauma-informed Approach. 2014. Available at: https://ncsacw.samhsa.gov/userfiles/files/SAMHSA_Trauma.pdf. Accessed June 1, 2020.
8. Lewis-O’Connor A, Warren A, Lee JV, et al. The state of the science on trauma inquiry. Womens Health (Lond Engl). 2019;15:174550651986123.
9. Corbin TJ, Purtle J, Rich LJ, et al. The prevalence of trauma and childhood adversity in an urban, hospital-based violence intervention program. J Health Care Poor Underserved. 2013;24(3):1021-30.
10. Merrick MT, Ford DC, Ports KA, et al. Vital signs: estimated proportion of adult health problems attributable to adverse childhood experiences and implications for prevention — 25 States, 2015–2017. MMWR Morb Mortal Wkly Rep. 2019;68(44):999-1005.
11. Purkey E, Davison C, MacKenzie M, et al. Experience of emergency department use among persons with a history of adverse childhood experiences. BMC Health Serv Res. 2020;20(1):455.
12. Substance Abuse and Mental Health Services Administration. Trauma-informed care in behavioral health services. 2014. Available at: https://store.samhsa.gov/product/TIP-57-Trauma-Informed-Care-in-Behavioral-Health-Services/SMA14-4816. Accessed July 15, 2020.
13. DeLucia JA, Bitter C, Fitzgerald J, et al. Prevalence of post-traumatic stress disorder in emergency physicians in the United States. West J Emerg Med. 2019;20(5):740-6.
14. Roden-Foreman JW, Bennett MM, Rainey EE, et al. Secondary traumatic stress in emergency medicine clinicians. Cognitive Behaviour Therapy. 2017;46(6):522-32.
15. Mills LD, Mills TJ. Symptoms of post-traumatic stress disorder among emergency medicine residents. J Emerg Med. 2005;28(1):1-4.
16. Pajonk F-GB, Cransac P, Müller V, et al. Trauma and stress-related disorders in German emergency physicians: the predictive role of personality factors. Int J Emerg Ment Health. 2012;14(4):257-68.
17. Zafar W, Khan UR, Siddiqui SA, et al. Workplace violence and self-reported psychological health: coping with post-traumatic stress, mental distress, and burnout among physicians working in the emergency departments compared to other specialties in Pakistan. J Emerg Med. 2016;50(1):167-77.e1.
18. Somville FJ, De Gucht V, Maes S. The impact of occupational hazards and traumatic events among Belgian emergency physicians. Scand J Trauma Resusc Emerg Med. 2016;24:59.
19. Duffy E, Avalos G, Dowling M. Secondary traumatic stress among emergency nurses: a cross-sectional study. Int Emerg Nurs.

Volume 23, no. 3: May 2022 343 Western Journal of Emergency Medicine
Brown et al. Trauma-informed Care Interventions in EM: A Systematic Review
2015;23(2):53-8. 20. Morrison LE, Joy JP. Secondary traumatic stress in the emergency
department. J Adv Nurs. 2016;72(11):2894-906. 21. Dominguez-Gomez E, Rutledge DN. Prevalence of secondary
traumatic stress among emergency nurses. J Emerg Nurs. 2009;35(3):199-204.
22. Chesham B, Dawber C. The “All of Us” study – Non-clinical staff members’ experience of performing cardiopulmonary resuscitation in acute care settings. Australasian Emergency Care. 2019;22(4):243-8.
23. Raja S, Hasnain M, Hoersch M, et al. Trauma informed care in medicine: current knowledge and future research directions. Fam Community Health. 2015;38(3):216-26.
24. Machtinger EL, Cuca YP, Khanna N, et al. From treatment to healing: the promise of trauma-informed primary care. Women’s Health Issues. 2015;25(3):193-7.
25. Marsac ML, Kassam-Adams N, Hildenbrand AK, et al. Implementing a trauma-informed approach in pediatric health care networks. JAMA Pediatr. 2016;170(1):70.
26. Kimberg L, Wheeler M. 2019. Trauma and trauma-informed care. In: Gerber MR, ed. Trauma-Informed Healthcare Approaches. Springer International Publishing; 2019:25-56.
27. Raja S, Hoersch M, Rajagopalan CF, et al. Treating patients with traumatic life experiences. J Am Dent Assoc. 2014;145(3):238-45.
28. Fischer KR, Bakes KM, Corbin TJ, et al. Trauma-informed care for violently injured patients in the emergency department. Ann Emerg Med. 2019;73(2):193-202.
29. Listenbee R, Torre J, Boyle G, et al. Report of the Attorney General’s National Task Force on Children Exposed to Violence. 2012. Available at: https://www.justice.gov/defendingchildhood/cev-rpt-full.pdf. Accessed January 29, 2021.
30. Shibru D, Zahnd E, Becker M, et al. Benefits of a hospital-based peer intervention program for violently injured youth. J Am Coll Surg. 2007;205(5):684-9.
31. Purtle J, Dicker R, Cooper C, et al. Hospital-based violence intervention programs save lives and money. J Trauma Acute Surg. 2013;75(2):331-333.
32. Cocozza JJ, Jackson EW, Hennigan K, et al. Outcomes for women with co-occurring disorders and trauma: program-level effects. J Subst Abuse Treat. 2005;28(2):109-19.
33. Hales TW, Nochajski TH, Green SA, et al. An association between implementing trauma-informed care and staff satisfaction. ASW. 2017;18(1):300-12.
34. Bendall S, Eastwood O, Cox G, et al. A systematic review and synthesis of trauma-informed care within outpatient and counseling health settings for young people. Child Maltreat. 2021;26(3):313-24.
35. Carter-Snell C, Jakubec S, Hagen B. Collaboration with rural and remote communities to improve sexual assault services. J Community Health. 2020;45(2):377-87.
36. Chandramani A, Dussault N, Parameswaran R, et al. A needs assessment and educational intervention addressing the care of sexual assault patients in the emergency department. J Forens Nurs. 2020;16(2):73-82.
37. Cole R. Reducing restraint use in a trauma center emergency room. Nurs Clin North Am. 2014;49(3):371-81.
38. Corbin TJ, Rich JA, Bloom SL, et al. Developing a trauma-informed, emergency department–based intervention for victims of urban violence. J Trauma Dissociation. 2011;12(5):510-25.
39. Hoysted C, Jobson L, Alisic E. A pilot randomized controlled trial evaluating a web-based training program on pediatric medical traumatic stress and trauma-informed care for emergency department staff. Psychol Serv. 2019;16(1):38-47.
40. Tiller J, Reynolds S. Human trafficking in the emergency department: improving our response to a vulnerable population. West J Emerg Med. 2020;21(3):549-54.
41. Hall A, McKenna B, Dearie V, et al. Educating emergency department nurses about trauma informed care for people presenting with mental health crisis: a pilot study. BMC Nurs. 2016;15(1):21.
42. Lakatos BE, Delisle L, Mitchell M, et al. Psychiatric advanced practice nurses’ contributions to supporting survivors and caregivers affected by the Boston Marathon bombings. Clin Nurse Spec. 2014;28(2):92-6.
43. Giles L. Utilizing a trauma-informed therapeutic intervention in the emergency department for risk assessment. J Am Acad Child Adolesc Psychiatry. 2019;58(10):S305-S306.
44. Stolbach B. The University of Chicago Medicine React Program: recovery and empowerment after community trauma. J Am Acad Child Adolesc Psychiatry. 2017;56(10):S29.
45. Gerace A, Muir-Cochrane E. Perceptions of nurses working with psychiatric consumers regarding the elimination of seclusion and restraint in psychiatric inpatient settings and emergency departments: An Australian survey. Int J Ment Health Nurs. 2019;28(1):209-25.
46. Kassam-Adams N, Rzucidlo S, Campbell M, et al. Nurses’ views and current practice of trauma-informed pediatric nursing care. J Pediatr Nurs. 2015;30(3):478-84.
47. Hoysted C, Babl FE, Kassam-Adams N, et al. Perspectives of hospital emergency department staff on trauma-informed care for injured children: An Australian and New Zealand analysis: perspectives on trauma-informed care. J Paediatr Child Health. 2017;53(9):862-9.
48. Bruce MM, Kassam-Adams N, Rogers M, et al. Trauma providersʼ knowledge, views, and practice of trauma-informed care. J Trauma Nurs. 2018;25(2):131-8.
49. Kirkpatrick DL, Kirkpatrick JD. 2010. Evaluating Training Programs: The Four Levels. Syndey, AUS: ReadHowYouWant.
50. Levenson J. Trauma-Informed Social Work Practice. Soc Work. 2017;62(2):105-13.
51. Walkley M, Cox TL. Building trauma-informed schools and communities. Children & Schools. 2013;35(2):123-6.
52. Griffin G, Germain EJ, Wilkerson RG. Using a trauma-informed approach in juvenile justice institutions. Journ Child Adol Trauma. 2012;5(3):271-83.
53. Cheng TL, Haynie D, Brenner R, et al. Effectiveness of a mentor-implemented, violence prevention intervention for assault-injured youths presenting to the emergency department: results of a

Western Journal of Emergency Medicine 344 Volume 23, no. 3: May 2022
Trauma-informed Care Interventions in EM: A Systematic Review Brown et al.
randomized trial. Pediatrics. 2008;122(5):938-46. 54. Becker MG, Hall JS, Ursic CM, et al. Caught in the crossfire: the
effects of a peer-based intervention program for violently injured youth. J Adolesc Health. 2004;34(3):177-83.
55. James TL, Bibi S, Langlois BK, et al. Boston Violence Intervention Advocacy Program: a qualitative study of client experiences and perceived effect. Acad Emerg Med. 2014;21(7):742-51.
56. Molloy L, Fields L, Trostian B, et al. Trauma-informed care for people presenting to the emergency department with mental health issues. Emerg Nurse. 2020;28(2):30-5.
57. Heppell PJ, Rao S. Social services and behavioral emergencies. Child Adolesc Psychiatr Clin N Am. 2018;27(3):455-65.
58. Banvard-Fox C, Linger M, Paulson DJ, et al. Sexual assault in adolescents. Prim Care. 2020;47(2):331-49.
59. Alpert EJ. A just outcome, or ‘just’ an outcome? Towards trauma-informed and survivor-focused emergency responses to sexual assault. Emerg Med J. 2018;35(12):753-4.
60. Smith T, Chauvin-Kimoff L, Baird B, et al. The medical evaluation of
prepubertal children with suspected sexual abuse. Paediatr Child Health. 2020;25(3):180-6.
61. Macias-Konstantopoulos W. Human trafficking: the role of medicine in interrupting the cycle of abuse and violence. Ann Intern Med. 2016;165(8):582-8.
62. Hachey LM, Phillippi JC. Identification and management of human trafficking victims in the emergency department. Adv Emerg Nurs J. 2017;39(1):31-51.
63. Greenbaum J. Identifying victims of human trafficking in the emergency department. Clin Pediatr Emerg Med. 2016;17(4):241-8.
64. Nichols A, Edmond T, Heil E, eds. 2018. Identification, assessment, and outreach. In: Social Work Practice with Survivors of Sex Trafficking and Commercial Sexual Exploitation. 18-32. New York, NY: Columbia University Press.
65. Jordan KS. Minimizing pediatric traumatic stress through a trauma-informed approach in the emergency department. J Emerg Nurs. 2019;45(3):319-22.

Volume 23, no. 3: May 2022 345 Western Journal of Emergency Medicine
CORD Best Practices
Holistic Review, Mitigating Bias, and Other Strategies in Residency Recruitment for Diversity, Equity, and Inclusion:
An Evidence-based Guide to Best Practices from the Council of Residency Directors in Emergency Medicine
Moises Gallegos, MD, MPH*Adaira Landry, MD, MEd†
Al’ai Alvarez, MD*Dayle Davenport, MD‡
Martina T. Caldwell, MD, MS§
Melissa Parsons, MD¶
Michael Gottlieb, MD‡
Sreeja Natesan, MD||
Section Editor: Jeffrey Druck, MD Submission history: Submitted August 13, 2021; Revision received March 30, 2022; Accepted March 15, 2022Electronically published May 10, 2022Full text available through open access at http://escholarship.org/uc/uciem_westjemDOI: 10.5811/westjem.2022.3.54419
BACKGROUNDEfforts to advance diversity, equity, and inclusion
(DEI) in medicine are dependent on deliberate attention toward residency recruitment.1,2 The benefits of diversity in medicine are well known, including cultural sensitivity and competence, expanded delivery of healthcare in low-resource settings, and improved intellectual discussion within
Stanford University School of Medicine, Department of Emergency Medicine, Palo Alto, CaliforniaHarvard Medical School, Department of Emergency Medicine, Boston, MassachusettsRush University Medical Center, Department of Emergency Medicine, Chicago, IllinoisHenry Ford Health System, Department of Emergency Medicine, Detroit, MichiganUniversity of Florida College of Medicine – Jacksonville, Department of Emergency Medicine, Jacksonville, FloridaDuke University School of Medicine, Department of Emergency Medicine, Durham, North Carolina
Advancement of diversity, equity, and inclusion (DEI) in emergency medicine can only occur with intentional recruitment of residency applicants underrepresented in medicine (UIM). Shared experiences from undergraduate and graduate medical education highlight considerations and practices that can contribute to improved diversity in the resident pool, such as holistic review and mitigating bias in the recruitment process. This review, written by members of the Council of Residency Directors in Emergency Medicine (CORD) Best Practices Subcommittee, offers best practice recommendations for the recruitment of UIM applicants. Recommendations address pre-interview readiness, interview approach, and post-interview strategies that residency leadership may use to implement holistic review and mitigate bias for recruitment of a diverse class. [West J Emerg Med. 2022;22(3)345–352.]
*
†
‡
§
¶
||
training cohorts.3 It is important to develop pipeline pathways for racial/ethnic UIM groupsa to increase the number of residency candidates.4 A study of the 20 largest Accreditation Council for Graduate Medical Education (ACGME) resident specialties observed that no residency program represented Black or Latino populations at comparable rates to the United States population.5 For emergency medicine (EM), it was
aDefined by the Association of American Medical Colleges (AAMC), under-represented minority (URM) was a term reflecting the racial groups of Black, Mexican-American, mainland Puerto Rican, and Native American. (American Indian and natives of Alaska and Hawaii). This was expanded to “underrepresented in medicine”(URiM or UIM) in 2003 to encompass the racial and ethnic populations within medicine who are underrepresented when compared to their respective numbers in the context of the greater population. For this article, although we recognize the use of URiM or UIM interchangeably, for consistency, we use the term UIM.
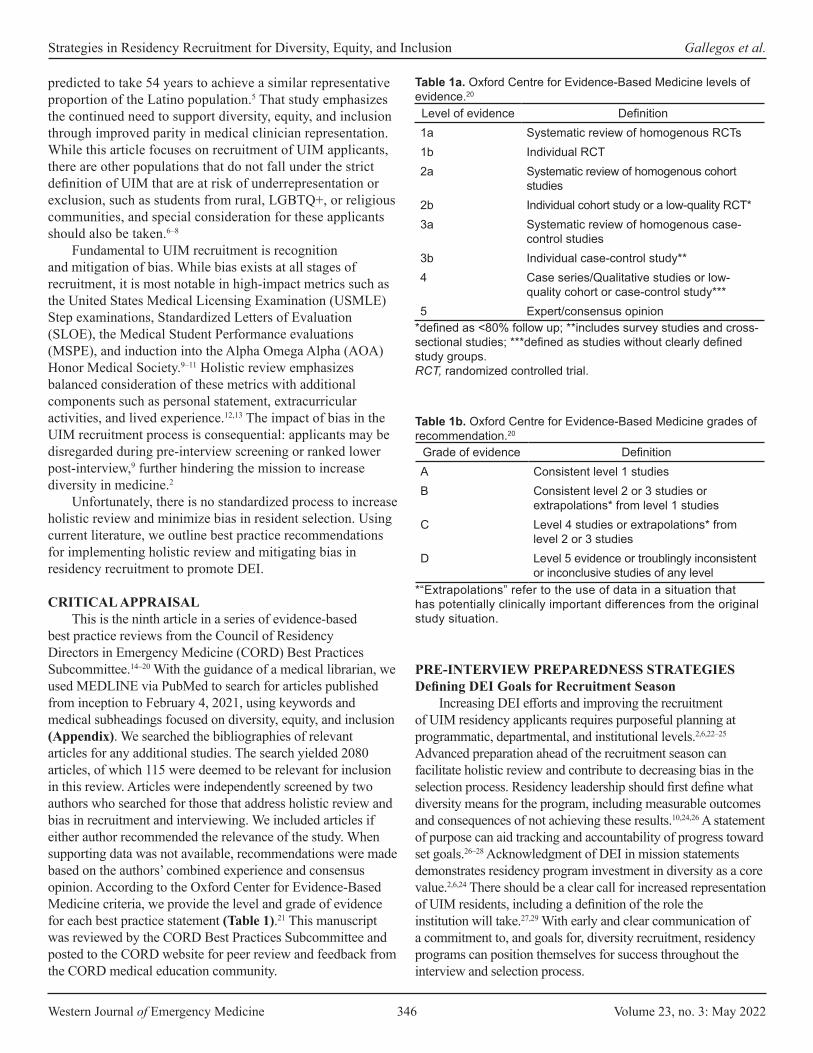
Western Journal of Emergency Medicine 346 Volume 23, no. 3: May 2022
Strategies in Residency Recruitment for Diversity, Equity, and Inclusion Gallegos et al.
predicted to take 54 years to achieve a similar representative proportion of the Latino population.5 That study emphasizes the continued need to support diversity, equity, and inclusion through improved parity in medical clinician representation. While this article focuses on recruitment of UIM applicants, there are other populations that do not fall under the strict definition of UIM that are at risk of underrepresentation or exclusion, such as students from rural, LGBTQ+, or religious communities, and special consideration for these applicants should also be taken.6–8
Fundamental to UIM recruitment is recognition and mitigation of bias. While bias exists at all stages of recruitment, it is most notable in high-impact metrics such as the United States Medical Licensing Examination (USMLE) Step examinations, Standardized Letters of Evaluation (SLOE), the Medical Student Performance evaluations (MSPE), and induction into the Alpha Omega Alpha (AOA) Honor Medical Society.9–11 Holistic review emphasizes balanced consideration of these metrics with additional components such as personal statement, extracurricular activities, and lived experience.12,13 The impact of bias in the UIM recruitment process is consequential: applicants may be disregarded during pre-interview screening or ranked lower post-interview,9 further hindering the mission to increase diversity in medicine.2
Unfortunately, there is no standardized process to increase holistic review and minimize bias in resident selection. Using current literature, we outline best practice recommendations for implementing holistic review and mitigating bias in residency recruitment to promote DEI.
CRITICAL APPRAISAL This is the ninth article in a series of evidence-based
best practice reviews from the Council of Residency Directors in Emergency Medicine (CORD) Best Practices Subcommittee.14–20 With the guidance of a medical librarian, we used MEDLINE via PubMed to search for articles published from inception to February 4, 2021, using keywords and medical subheadings focused on diversity, equity, and inclusion (Appendix). We searched the bibliographies of relevant articles for any additional studies. The search yielded 2080 articles, of which 115 were deemed to be relevant for inclusion in this review. Articles were independently screened by two authors who searched for those that address holistic review and bias in recruitment and interviewing. We included articles if either author recommended the relevance of the study. When supporting data was not available, recommendations were made based on the authors’ combined experience and consensus opinion. According to the Oxford Center for Evidence-Based Medicine criteria, we provide the level and grade of evidence for each best practice statement (Table 1).21 This manuscript was reviewed by the CORD Best Practices Subcommittee and posted to the CORD website for peer review and feedback from the CORD medical education community.
Table 1a. Oxford Centre for Evidence-Based Medicine levels of evidence.20
Level of evidence Definition1a Systematic review of homogenous RCTs1b Individual RCT2a Systematic review of homogenous cohort
studies2b Individual cohort study or a low-quality RCT*3a Systematic review of homogenous case-
control studies3b Individual case-control study**4 Case series/Qualitative studies or low-
quality cohort or case-control study***5 Expert/consensus opinion
*defined as <80% follow up; **includes survey studies and cross-sectional studies; ***defined as studies without clearly defined study groups.RCT, randomized controlled trial.
Table 1b. Oxford Centre for Evidence-Based Medicine grades of recommendation.20
Grade of evidence DefinitionA Consistent level 1 studiesB Consistent level 2 or 3 studies or
extrapolations* from level 1 studiesC Level 4 studies or extrapolations* from
level 2 or 3 studiesD Level 5 evidence or troublingly inconsistent
or inconclusive studies of any level*“Extrapolations” refer to the use of data in a situation that has potentially clinically important differences from the original study situation.
PRE-INTERVIEW PREPAREDNESS STRATEGIESDefining DEI Goals for Recruitment Season
Increasing DEI efforts and improving the recruitment of UIM residency applicants requires purposeful planning at programmatic, departmental, and institutional levels.2,6,22–25 Advanced preparation ahead of the recruitment season can facilitate holistic review and contribute to decreasing bias in the selection process. Residency leadership should first define what diversity means for the program, including measurable outcomes and consequences of not achieving these results.10,24,26 A statement of purpose can aid tracking and accountability of progress toward set goals.26–28 Acknowledgment of DEI in mission statements demonstrates residency program investment in diversity as a core value.2,6,24 There should be a clear call for increased representation of UIM residents, including a definition of the role the institution will take.27,29 With early and clear communication of a commitment to, and goals for, diversity recruitment, residency programs can position themselves for success throughout the interview and selection process.

Volume 23, no. 3: May 2022 347 Western Journal of Emergency Medicine
Gallegos et al. Strategies in Residency Recruitment for Diversity, Equity, and Inclusion
Assess Program Readiness Commitment to increasing the number of UIM residents
is defined by the internal discussions and actions that address the value of diversity, not simply match results.12 Recruiting diverse residents should be included as part of a program’s strategic plan.24,31 Support from the department chair and organizational leadership is key to the success of diversity initiatives.2,22,24,30,32,33 Programs should undergo an internal review process of current culture toward and readiness to enact targeted recruitment efforts for DEI.6,7 To achieve meaningful success for DEI in recruitment and departmental attitudes, programs need to embrace and foster an environment of change.31,34 The Association of American Medical Colleges (AAMC) presents a four-step process for assessing institutional culture and climate (Table 2).35
higher resident diversity.38–40 Committee members should be included in all planning phases of recruitment and should include UIM and non-UIM faculty, residents, and staff.11,25,50,51
The formation of a diversity recruitment committee can be impactful.23,25 In just one year, the Denver Health Emergency Medicine residency program doubled the number of UIM applicants interviewed, relying on a diversity committee to inform recruitment practices.50 Similarly, the Highland Emergency Medicine residency program in Oakland, CA, experienced a doubling of diversity representation in their residency group after implementation of recruitment initiatives spearheaded by a diversity committee.52 A diversity committee can have immediate and measurable impacts on UIM recruitment. It should be reiterated, however, that success in recruiting UIM candidates is most predicated upon the creation of a welcoming, supportive, and inclusive culture at the program, not just match statistics.
Representation of UIM faculty is integral to recruiting UIM resident applicants.20,38-40 Recruitment and retention of UIM faculty are discussed in a separate review as part of the CORD Best Practices series.20 Mindful attention should be made to not assign UIM faculty with work that is unaligned with their personal interests, underrecognized by promotions committee, and uncompensated despite the time investment. It is important to recognize the potential for UIM individuals to experience a “minority tax,” or disproportionate burden of work.1
Accessing UIM ApplicantsIt is difficult to recruit diverse candidates, however, if
they do not exist within the applicant pool. Recruitment can take on a variety of forms depending on the target populations and the desired messaging.44,53 Dedicated outreach to UIM students can lead to increased interest in a given program.6,29,54–56 Reaching UIM applicants requires more than just simple communication as programs need to demonstrate a commitment to diversity and service.29,57,60 Programs should display their commitment, efforts, and successes with DEI efforts on their websites,2,6,25 and should provide contact information for a point person, faculty or staff, to address questions about DEI within the program.
Recruitment can be enhanced through early enrichment and pathway programming.57–59 In addition to medical school interest groups, there may be a benefit to connecting with pre-medical organizations at the university level,23 and creating enrichment programs as early as the elementary and high school levels.2,29 The UIM applicants may not have personal or professional networks to initially steer them toward medical school and subsequently assist with residency applications.60 Early outreach can occur by way of faculty presence at dedicated conferences sponsored by UIM student organizations, and faculty volunteering as mentors through sponsored programs.2,6,25,29,51
An underused tool in UIM recruitment is a formal collaboration with minority medical student organizations,61
Table 2. Key steps to assessing culture and climate comprehensively.*
Step ApplicationReflection Reflective questions for personal
exploration on relevant criteriaData Collection Data collection processes and tools
to capture the determinants of the culture of diversity and inclusion
Synthesis and Analysis Synthesis and analysis to identify areas of strength and opportunities
Leverage Findings Leverage findings to translate assessment findings into institutional outcomes
*Adapted from the Association of American Medical Colleges.35
Programs can also complete diversity engagement surveys to assess an institution’s level of engagement and inclusion, and perceptions within the group.6–8 Programs should work to increase awareness, interest, and engagement in DEI efforts through department-wide educational sessions.2,33 Programs should highlight how they will foster the career and academic interests of UIM trainees.36,37 Support should be proactive, such as assigning resident mentors early, asking UIM trainees about individual needs, and providing early in-service exam preparation for all matriculating residents with marginal USMLE and other assessment scores.2 Programs should avoid blindly targeting UIM trainees with services such as test prep, however, as this can reinforce bias and stereotypes.
Formation of Diversity CommitteesPrograms should create diversity committees with
an understanding of program goals and objectives for the recruitment of UIM applicants. Valuing UIM status during interview screening and selection and greater UIM faculty representation is a program characteristic associated with
Western Journal of Emergency Medicine 348 Volume 23, no. 3: May 2022
Strategies in Residency Recruitment for Diversity, Equity, and Inclusion Gallegos et al.
It should be clear, however, that a lack of attendance or participation with these groups should not affect the applicant’s consideration or rank-list position. The Student National Medical Association proposes a five-phase recruitment strategy using minority medical student organizations to increase the number of UIM students entering medical school. Increased matriculation of UIM medical students will directly contribute to the applicant pool for residency and the strategies suggested can be adapted to residency recruitment.61
is no universal approach to holistic review, it is important to recognize that the process is subject to bias as program leadership determines its implementation.13,24
Holistic review has more readily made its way into undergraduate medical education.66 Residency recruitment continues to rely heavily on performance and assessment metrics.67,68 Principles of holistic review in medical school admissions can be extrapolated to inform residency recruitment. The AAMC offers a holistic review primer for program directors to identify experiences, attributes, competencies, and metrics grounded in a program’s mission.69,70 The AAMC Advancing Holistic Principles Advisory Committee promotes core principles for holistic review (Figure 1).69
Best Practice Recommendations:1. Define clear and prioritized goals for diversity-related
residency recruitment. (Level 5, Grade D)2. Assess program readiness to implement diversity-related
recruitment and support UIM trainees that match. (Level 4, Grade C)
3. Mitigate bias through inclusion of bias training and predetermined scoring rubrics for screening, interviews, and ranking. (Level 3, Grade B)
4. Create DEI committees to inform and steer diversity-related recruitment. (Level 3, Grade B)
5. Ensure representation of UIM faculty in the screening, interview, and selection process but avoiding tasking UIM faculty with too much during the recruitment cycle. (Level 5, Grade D) (Level 4, Grade C)
6. Begin recruitment of UIM applicants early through directed and expanded efforts such as enrichment, outreach, and pathway programming. (Level 5, Grade D)
7. Collaborate with minority student groups in early mentorship and advisory programs for UIM applicants. (Level 5, Grade D)
INVITATION AND INTERVIEW STRATEGIESAt every step of the process, programs should approach
recruitment with a lens to promote diversity, ensure inclusion, support equity, and uncover and address biased and racist practices.62 Programs should go beyond simply recognizing bias, aiming to actively mitigate it, aligning with the ACGME Common Program Requirements to improve diversity.63 Individuals involved in recruitment, interviewing, and ranking should complete implicit bias training,10,30,33,40–43 and programs should conduct sensitivity discussions and self-reflection to promote learning about biases.44 Interviewers should undergo training and preparation as a group to decrease variability and bias in applicant evaluations.48
Approach to Holistic ReviewA standardized holistic review process that aligns with
each institution’s mission, vision, and values will shift the focus away from a traditionally metrics-driven selection process to a more inclusive process. Holistic review focuses on the importance of the applicant and their stories, rather than achieving certain demographic numbers.2,12,28,62,64,65 As there
Figure 1. Core principles for holistic review.*1. Selection criteria should be broad, linked to program
mission and goals, and promote diversity as essential to excellence.
2. Selection criteria should include experiences and attributes as well as academic performance.
3. Selection criteria should assess applicants in light of their unique backgrounds and with the intent of creating a richly diverse interview and selection pool as well as residency class.
4. Selection criteria should be applied equitably across the entire candidate pool.
5. Selection criteria should be supported by performance data that show experiences or characteristics are linked to that individual’s likelihood of success.
6. Programs should consider each applicant’s potential contribution to the program and the field of medicine, allowing them the flexibility to weigh and balance the range of criteria needed in a class to achieve their institutional mission and goals.
7. Race and ethnicity may be considered as factors when making admission-related decisions aligned with mission-related educational interests and goals associated with program diversity, and when considered as a broader mix of factors, which may include personal attributes, experiential factors, demographics, or other considerations (as permitted by federal law).
Holistic review addresses the need to balance personal attributes with performance and aptitude.6,7,12,71 It shifts the practice of preferentially valuing academic achievement-based metrics to considering the entire application.2,6,7,10,64,71 In this approach, numerical benchmarks, such as test scores and class rank, do not prematurely eliminate or accelerate applicants prior to the evaluation of the entire application.25 There have been different models of holistic review suggested in the medical education literature.1,2,43,48,55,62 Review committees should begin with a self-audit of current practices and make appropriate changes that best fit the program’s goals.6 Notably, the search for applicants who “align well” with a program, a concept
*Adapted from Holistic Review-Core Principles, AAMC.69
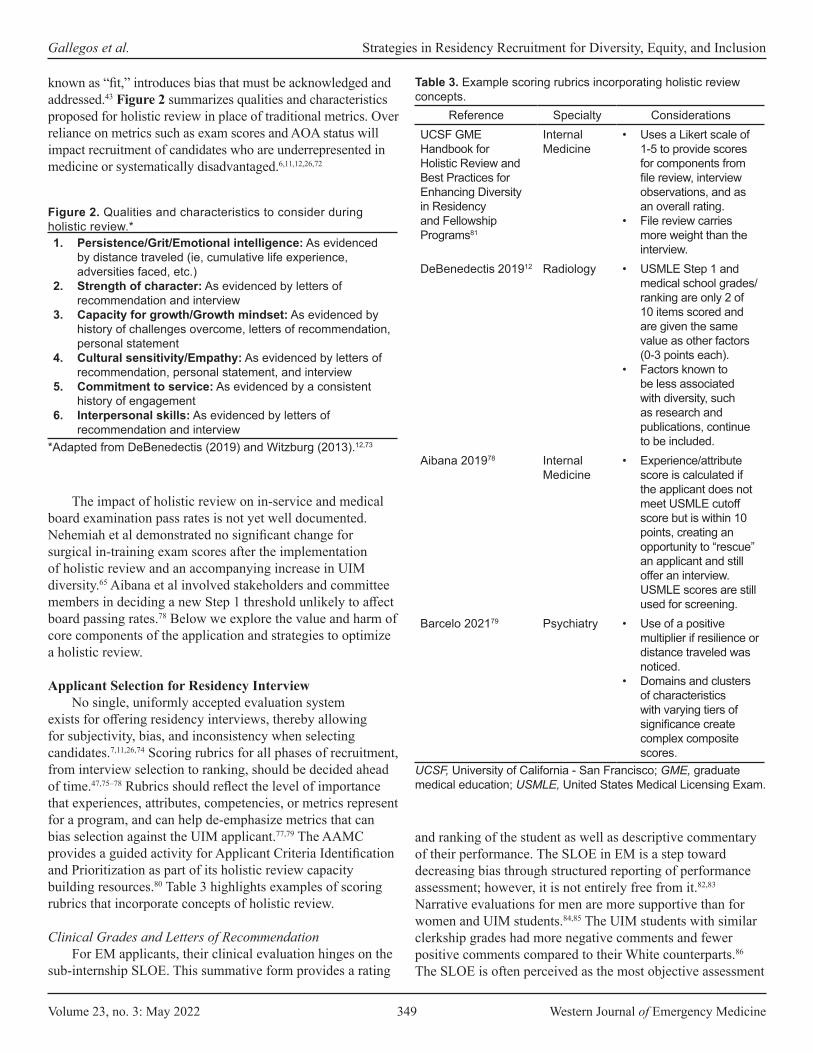
Volume 23, no. 3: May 2022 349 Western Journal of Emergency Medicine
Gallegos et al. Strategies in Residency Recruitment for Diversity, Equity, and Inclusion
known as “fit,” introduces bias that must be acknowledged and addressed.43 Figure 2 summarizes qualities and characteristics proposed for holistic review in place of traditional metrics. Over reliance on metrics such as exam scores and AOA status will impact recruitment of candidates who are underrepresented in medicine or systematically disadvantaged.6,11,12,26,72
Figure 2. Qualities and characteristics to consider during holistic review.*1. Persistence/Grit/Emotional intelligence: As evidenced
by distance traveled (ie, cumulative life experience, adversities faced, etc.)
2. Strength of character: As evidenced by letters of recommendation and interview
3. Capacity for growth/Growth mindset: As evidenced by history of challenges overcome, letters of recommendation, personal statement
4. Cultural sensitivity/Empathy: As evidenced by letters of recommendation, personal statement, and interview
5. Commitment to service: As evidenced by a consistent history of engagement
6. Interpersonal skills: As evidenced by letters of recommendation and interview
*Adapted from DeBenedectis (2019) and Witzburg (2013).12,73
The impact of holistic review on in-service and medical board examination pass rates is not yet well documented. Nehemiah et al demonstrated no significant change for surgical in-training exam scores after the implementation of holistic review and an accompanying increase in UIM diversity.65 Aibana et al involved stakeholders and committee members in deciding a new Step 1 threshold unlikely to affect board passing rates.78 Below we explore the value and harm of core components of the application and strategies to optimize a holistic review.
Applicant Selection for Residency InterviewNo single, uniformly accepted evaluation system
exists for offering residency interviews, thereby allowing for subjectivity, bias, and inconsistency when selecting candidates.7,11,26,74 Scoring rubrics for all phases of recruitment, from interview selection to ranking, should be decided ahead of time.47,75–78 Rubrics should reflect the level of importance that experiences, attributes, competencies, or metrics represent for a program, and can help de-emphasize metrics that can bias selection against the UIM applicant.77,79 The AAMC provides a guided activity for Applicant Criteria Identification and Prioritization as part of its holistic review capacity building resources.80 Table 3 highlights examples of scoring rubrics that incorporate concepts of holistic review.
Clinical Grades and Letters of RecommendationFor EM applicants, their clinical evaluation hinges on the
sub-internship SLOE. This summative form provides a rating
Table 3. Example scoring rubrics incorporating holistic review concepts.
Reference Specialty ConsiderationsUCSF GME Handbook for Holistic Review and Best Practices for Enhancing Diversity in Residency and Fellowship Programs81
Internal Medicine
• Uses a Likert scale of 1-5 to provide scores for components from file review, interview observations, and as an overall rating.
• File review carries more weight than the interview.
DeBenedectis 201912 Radiology • USMLE Step 1 and medical school grades/ranking are only 2 of 10 items scored and are given the same value as other factors (0-3 points each).
• Factors known to be less associated with diversity, such as research and publications, continue to be included.
Aibana 201978 Internal Medicine
• Experience/attribute score is calculated if the applicant does not meet USMLE cutoff score but is within 10 points, creating an opportunity to “rescue” an applicant and still offer an interview. USMLE scores are still used for screening.
Barcelo 202179 Psychiatry • Use of a positive multiplier if resilience or distance traveled was noticed.
• Domains and clusters of characteristics with varying tiers of significance create complex composite scores.
UCSF, University of California - San Francisco; GME, graduate medical education; USMLE, United States Medical Licensing Exam.
and ranking of the student as well as descriptive commentary of their performance. The SLOE in EM is a step toward decreasing bias through structured reporting of performance assessment; however, it is not entirely free from it.82,83 Narrative evaluations for men are more supportive than for women and UIM students.84,85 The UIM students with similar clerkship grades had more negative comments and fewer positive comments compared to their White counterparts.86
The SLOE is often perceived as the most objective assessment
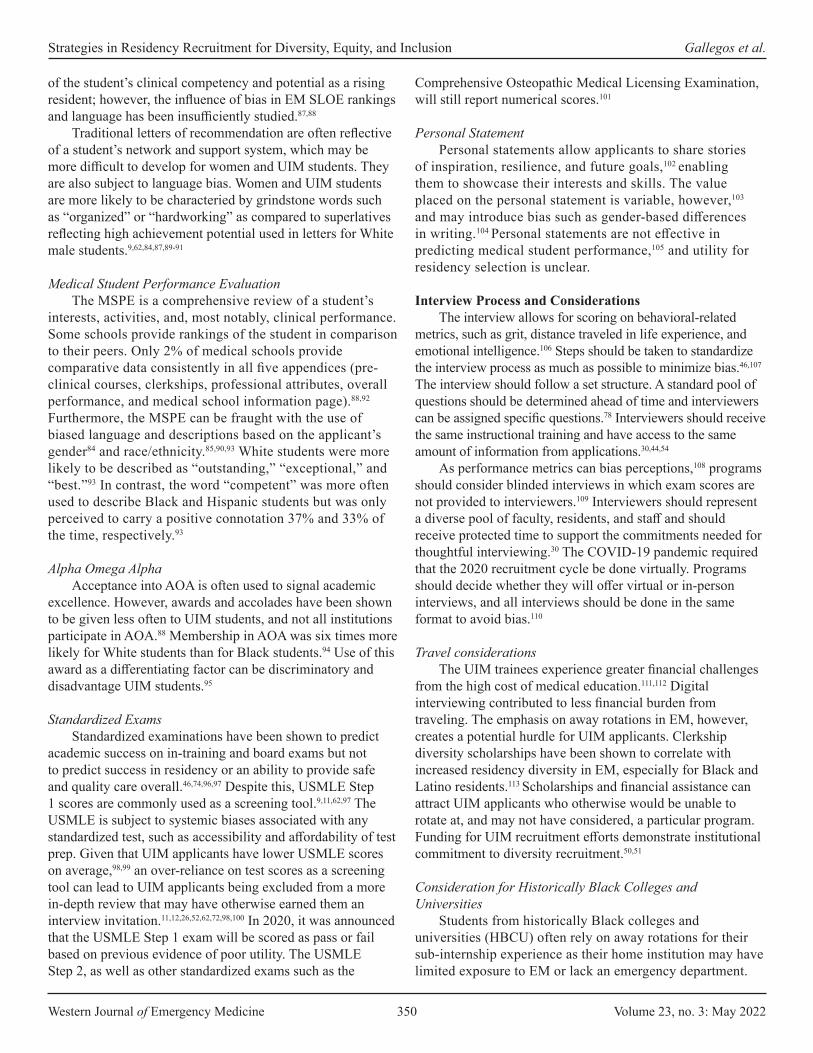
Western Journal of Emergency Medicine 350 Volume 23, no. 3: May 2022
Strategies in Residency Recruitment for Diversity, Equity, and Inclusion Gallegos et al.
of the student’s clinical competency and potential as a rising resident; however, the influence of bias in EM SLOE rankings and language has been insufficiently studied.87,88
Traditional letters of recommendation are often reflective of a student’s network and support system, which may be more difficult to develop for women and UIM students. They are also subject to language bias. Women and UIM students are more likely to be characteried by grindstone words such as “organized” or “hardworking” as compared to superlatives reflecting high achievement potential used in letters for White male students.9,62,84,87,89-91
Medical Student Performance EvaluationThe MSPE is a comprehensive review of a student’s
interests, activities, and, most notably, clinical performance. Some schools provide rankings of the student in comparison to their peers. Only 2% of medical schools provide comparative data consistently in all five appendices (pre-clinical courses, clerkships, professional attributes, overall performance, and medical school information page).88,92 Furthermore, the MSPE can be fraught with the use of biased language and descriptions based on the applicant’s gender84 and race/ethnicity.85,90,93 White students were more likely to be described as “outstanding,” “exceptional,” and “best.”93 In contrast, the word “competent” was more often used to describe Black and Hispanic students but was only perceived to carry a positive connotation 37% and 33% of the time, respectively.93
Alpha Omega AlphaAcceptance into AOA is often used to signal academic
excellence. However, awards and accolades have been shown to be given less often to UIM students, and not all institutions participate in AOA.88 Membership in AOA was six times more likely for White students than for Black students.94 Use of this award as a differentiating factor can be discriminatory and disadvantage UIM students.95
Standardized ExamsStandardized examinations have been shown to predict
academic success on in-training and board exams but not to predict success in residency or an ability to provide safe and quality care overall.46,74,96,97 Despite this, USMLE Step 1 scores are commonly used as a screening tool.9,11,62,97 The USMLE is subject to systemic biases associated with any standardized test, such as accessibility and affordability of test prep. Given that UIM applicants have lower USMLE scores on average,98,99 an over-reliance on test scores as a screening tool can lead to UIM applicants being excluded from a more in-depth review that may have otherwise earned them an interview invitation.11,12,26,52,62,72,98,100 In 2020, it was announced that the USMLE Step 1 exam will be scored as pass or fail based on previous evidence of poor utility. The USMLE Step 2, as well as other standardized exams such as the
Comprehensive Osteopathic Medical Licensing Examination, will still report numerical scores.101
Personal StatementPersonal statements allow applicants to share stories
of inspiration, resilience, and future goals,102 enabling them to showcase their interests and skills. The value placed on the personal statement is variable, however,103 and may introduce bias such as gender-based differences in writing.104 Personal statements are not effective in predicting medical student performance,105 and utility for residency selection is unclear.
Interview Process and ConsiderationsThe interview allows for scoring on behavioral-related
metrics, such as grit, distance traveled in life experience, and emotional intelligence.106 Steps should be taken to standardize the interview process as much as possible to minimize bias.46,107 The interview should follow a set structure. A standard pool of questions should be determined ahead of time and interviewers can be assigned specific questions.78 Interviewers should receive the same instructional training and have access to the same amount of information from applications.30,44,54
As performance metrics can bias perceptions,108 programs should consider blinded interviews in which exam scores are not provided to interviewers.109 Interviewers should represent a diverse pool of faculty, residents, and staff and should receive protected time to support the commitments needed for thoughtful interviewing.30 The COVID-19 pandemic required that the 2020 recruitment cycle be done virtually. Programs should decide whether they will offer virtual or in-person interviews, and all interviews should be done in the same format to avoid bias.110
Travel considerationsThe UIM trainees experience greater financial challenges
from the high cost of medical education.111,112 Digital interviewing contributed to less financial burden from traveling. The emphasis on away rotations in EM, however, creates a potential hurdle for UIM applicants. Clerkship diversity scholarships have been shown to correlate with increased residency diversity in EM, especially for Black and Latino residents.113 Scholarships and financial assistance can attract UIM applicants who otherwise would be unable to rotate at, and may not have considered, a particular program. Funding for UIM recruitment efforts demonstrate institutional commitment to diversity recruitment.50,51
Consideration for Historically Black Colleges and Universities
Students from historically Black colleges and universities (HBCU) often rely on away rotations for their sub-internship experience as their home institution may have limited exposure to EM or lack an emergency department.

Volume 23, no. 3: May 2022 351 Western Journal of Emergency Medicine
Gallegos et al. Strategies in Residency Recruitment for Diversity, Equity, and Inclusion
The ability to fund travel and lodging limits the options of rotation location.112 If students are unable to travel due to financial restrictions, their opportunity to be exposed to new clinical environments and potential mentors is limited.50,51,113 Partnerships between HBCUs and neighboring EM residency programs can help promote diversity.114
Best Practice Recommendations:1. Apply an equity lens to each step of the recruitment
process to expose existing bias and allow for correction. (Level 5, Grade D)
2. Holistic review should be applied equitably across all applicants. (Level 4, Grade C)
3. Identify characteristics for holistic review that align with a program’s mission, vision, values. (Level 4, Grade C)
4. Avoid screening applicants solely on standardized examination scores or grades. (Level 3b, Grade C)
5. Standardize the structure of interviews in terms of logistics and questions asked. (Level 4. Grade C)
6. Ensure UIM faculty visibility and allow networking during the interview day or through structured asynchronous opportunities to engage with DEI topics. (Level 4, Grade C)
7. Partner with HBCUs and neighboring EM residency programs to help further promote diversity within the specialty. (Level 4, Grade C)
POST-INTERVIEW STRATEGIESRanking Considerations
The ranking process should be collaborative and conducted in a safe space with limited external influence from those not involved in the recruitment process.115 Members of the ranking group should be diverse in interests and backgrounds and often include the residency leadership team as well as additional core faculty, residents, and administrative staff. Individuals participating in rank meetings should be informed about characteristics identified of value to the residency program and used throughout the selection process.11,25,50,51 One voice should not dominate, and there should be group discussion prior to deciding a rank position. A temporary ranking meeting might occur immediately following the day of an interview. For fairness to all candidates, the final ranking should begin at the conclusion of the interview season.12,116
Second-look Opportunities and Post-interview Communication
There should be increased visibility and opportunity to network with faculty (both UIM and non-UIM) involved in recruitment and retention of UIM applicants.25,50 If UIM recruitment faculty are not available during scheduled interview dates, asynchronous opportunities to discuss DEI within the program should be offered.51 A second-look visit can be organized to facilitate this.23,50
Targeted recruitment of UIM applicants may benefit from ongoing dialogue throughout the interview process. Communication such as “thank you” emails should be done with heavy consideration of the potential to mislead or falsely assure an applicant. Caution should be taken when reaching out to UIM applicants to not breach National Resident Matching Program regulations. Programs should be clear about expectations for post-interview communication and should designate a pointperson for ongoing communication.
Best Practice Recommendations:1. Select diverse members for the rank committee. (Level 4,
Grade C)2. Conduct the rank meeting in a safe, private space with
collaborative discussion. (Level 4, Grade C)3. Inform committee members about the characteristics
identified as valuable to the program before the ranking process. (Level 5, Grade D)
4. Ensure ranking is done based on scores from the predefined rubrics for screening and interviewing. (Level 5, Grade D)
5. Offer second look visits (on-site or virtually) to network with UIM faculty and discuss DEI within the program. (Level 4, Grade C)
6. Define clear expectations for follow up and designate a point person for communication. (Level 4, Grade C)
LIMITATIONSThe scope of this article was limited to holistic
review and the impact of bias on recruitment in residency training. There are other topics (eg, pipeline/pathway efforts, faculty recruitment and retention) regarding DEI that will be covered in other reviews. While we performed a comprehensive search guided by a medical librarian in conjunction with expert consultation and bibliographic review, it is possible that we may have missed pertinent articles. In several instances, high-quality data was limited or lacking. In these instances, we relied upon expert opinion and group consensus for the best practice recommendations. Literature specific to EM and within graduate medical education is more limited; therefore, we included relevant articles from other medical specialties and health-related professions. We believe that EM, as a specialty, can learn from other colleagues across many disciplines.
CONCLUSIONHolistic review and the mitigation of bias are essential
steps in the purposeful recruitment and selection of applicants who are underrepresented in medicine. Our article presents best practice recommendations for residency programs to prepare for and implement application review, applicant interviewing, and trainee selection in support of diversity, equity, and inclusion.

Western Journal of Emergency Medicine 352 Volume 23, no. 3: May 2022
Strategies in Residency Recruitment for Diversity, Equity, and Inclusion Gallegos et al.
ACKNOWLEDGMENTSWe would like to thank the Council of Residency Directors
in Emergency Medicine for its support of our committee and this project. We would also like to thank Samantha Kaplan, PhD, for her assistance with the literature search.
CORD Best Practice Committee 2020-2021
Michael Gottlieb, MD – Co-Chair Rush University Medical Center
Sreeja Natesan, MD – Co-ChairDuke University
John Bailitz, MDNorthwestern University, Feinberg School of Medicine
Brian Barbas, MDLoyola University Medical Center
Jennie Buchanan, MDDenver Health Medical Center
Richard Byyny, MDDenver Health Medical Center
Guy Carmelli, MDUniversity of Massachusetts Medical School
Molly Estes, MDLoma Linda University
Katja Goldflam, MDYale University
Andrew Grock, MDUniversity of California - Los Angeles
Jaime Jordan, MDUniversity of California - Los Angeles
Andrew King, MDThe Ohio State University
Krystin Miller, MDThe Ohio State University
Melissa Parsons, MD University of Florida - Jacksonville
Alexander Sheng, MD Boston Medical Center
Brian Wood, MD St. Joseph’s Medical Center
Address for Correspondence: Moises Gallegos, MD, MPH, Stanford University School of Medicine, Department of Emergency Medicine, 900 Welch Road Suite 350, Palo Alto, CA 94304. Email: [email protected].
Conflicts of Interest: By the WestJEM article submission agreement, all authors are required to disclose all affiliations, funding sources and financial or management relationships that could be perceived as potential sources of bias. No author has professional or financial relationships with any companies that are relevant to this study. There are no conflicts of interest or sources of funding to declare.
Copyright: © 2022 Gallegos et al. This is an open access article distributed in accordance with the terms of the Creative Commons Attribution (CC BY 4.0) License. See: http://creativecommons.org/licenses/by/4.0/
REFERENCESPlease see supplemental file.
Volume 23, no. 3: May 2022 353 Western Journal of Emergency Medicine
Educational Advances
Just-in-time Procedure Guides in Emergency Medicine Tracy Fennessy, MDKendra Parekh, MDRyan Walsh, MD
Section Editor: Jeffrey Love, MDSubmission history: Submitted June 14, 2021; Revision received January 7, 2022; Accepted February 28, 2022Electronically published May 10, 2022Full text available through open access at http://escholarship.org/uc/uciem_westjemDOI: 10.5811/westjem.2022.2.53655[West J Emerg Med. 2022;22(3)353–357.]
BACKGROUNDThe practice of emergency medicine (EM) requires that
physicians be proficient in a vast array of procedures no matter how frequently or rarely they occur. The Accreditation Council for Graduate Medical Education and the American Board of Emergency Medicine have established a series of milestones regarding procedural performance in order to establish a minimum level of physician competency in the field of EM.1 Procedural skills inevitably degrade over time if not practiced regularly and, thus, maintenance of these skills requires continued practice in the clinical or simulated setting.2
A previously conducted needs assessment looked at current procedural skill practices by emergency physicians (EP) and found a significantly positive correlation between the frequency at which a skill was performed and the perceived confidence by physicians performing that particular skill. Additionally, they found that the vast majority of physicians would like to attend procedural training sessions if offered by their institution.3
In addition to a procedural skills curriculum, “just-in-time” (JIT) refresher training can be particularly useful for procedures that occur rarely in the emergency department (ED). A previous study indicated that JIT training led to improved trainee skills and confidence in performing procedures, from both the resident and supervisor perspective.4 A randomized controlled trial that evaluated transvenous pacemaker placement by EPs in a simulated setting found that a JIT intervention, which included both a refresher video and a step-by-step interactive checklist, significantly improved performance.5
OBJECTIVESTo our knowledge, there is no currently published
literature on the use of JIT procedural training guides in EM. Our first objective was to perform a needs assessment of EPs’ current JIT procedural resource usage. Our second objective was to examine the impact of creating a repository of easily accessible JIT procedural training guides with institution-specific information. Specifically, we sought to evaluate the effectiveness of the guides as a tool to increase knowledge
Vanderbilt University Medical Center, Department of Emergency Medicine, Nashville, Tennessee
and teach procedures, as well as the impact of the guides on physician confidence and procedural practice.
CURRICULAR DESIGNAll EM faculty, fellows, and residents in the department were
eligible to participate in this study.
Survey Development We used consensus decision-making to create a 12-question
needs assessment focused on JIT resource utilization (Appendix A). Questions collected information regarding current resource use on shift to learn and teach procedures, barriers to using particular resources, frequency of specialty consultations for procedures due to lack of physician comfort in performing the procedure, and ideas for new resources. A five-point Likert scale was used to assess the degree to which physicians believed that their comfort level in performing procedures would change if they were provided with a detailed guide for a given procedure.
Five months after the implementation of the JIT procedure guides, we created a 14-question post-intervention survey (Appendix B) to assess the effectiveness of the guides as a tool to increase knowledge and teach procedures, as well as the impact of the guides on physician confidence and procedural practice. Five-point Likert scales were used to assess on average how often physicians required a JIT refresher prior to performing or teaching a given procedure, how often they used the JIT procedure guides, and how helpful they found these guides for both learning and teaching purposes. Physicians were also queried whether their procedural practice patterns had changed after the implementation of the guides. They were asked not only how their confidence had changed in performing procedures in the ED, but also whether their behavior had changed in terms of their decision to consult a specialist for a given procedure. We also assessed the quality of the procedure guides, most helpful features, and suggestions for improvement.
Study Procedure The study was granted an exemption by the medical center’s
institutional review board. The online cross-sectional anonymous
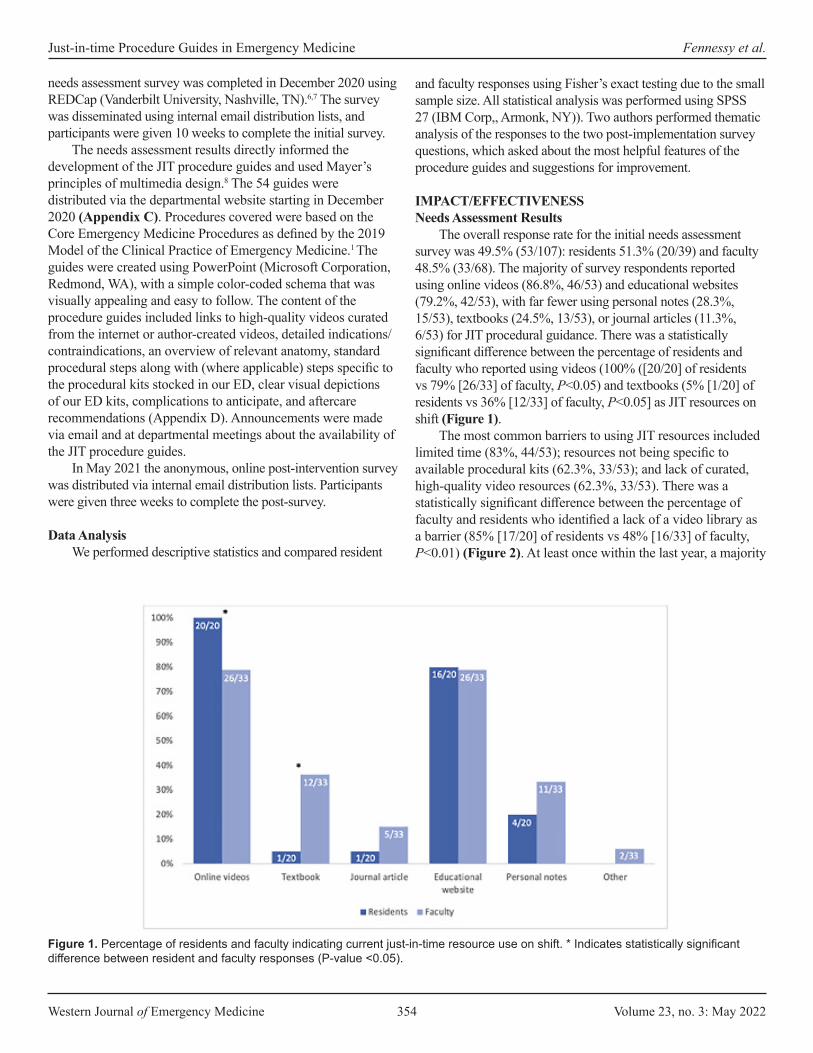
Western Journal of Emergency Medicine 354 Volume 23, no. 3: May 2022
Just-in-time Procedure Guides in Emergency Medicine Fennessy et al.
needs assessment survey was completed in December 2020 using REDCap (Vanderbilt University, Nashville, TN).6,7 The survey was disseminated using internal email distribution lists, and participants were given 10 weeks to complete the initial survey.
The needs assessment results directly informed the development of the JIT procedure guides and used Mayer’s principles of multimedia design.8 The 54 guides were distributed via the departmental website starting in December 2020 (Appendix C). Procedures covered were based on the Core Emergency Medicine Procedures as defined by the 2019 Model of the Clinical Practice of Emergency Medicine.1 The guides were created using PowerPoint (Microsoft Corporation, Redmond, WA), with a simple color-coded schema that was visually appealing and easy to follow. The content of the procedure guides included links to high-quality videos curated from the internet or author-created videos, detailed indications/contraindications, an overview of relevant anatomy, standard procedural steps along with (where applicable) steps specific to the procedural kits stocked in our ED, clear visual depictions of our ED kits, complications to anticipate, and aftercare recommendations (Appendix D). Announcements were made via email and at departmental meetings about the availability of the JIT procedure guides.
In May 2021 the anonymous, online post-intervention survey was distributed via internal email distribution lists. Participants were given three weeks to complete the post-survey.
Data AnalysisWe performed descriptive statistics and compared resident
and faculty responses using Fisher’s exact testing due to the small sample size. All statistical analysis was performed using SPSS 27 (IBM Corp,, Armonk, NY)). Two authors performed thematic analysis of the responses to the two post-implementation survey questions, which asked about the most helpful features of the procedure guides and suggestions for improvement.
IMPACT/EFFECTIVENESS Needs Assessment Results
The overall response rate for the initial needs assessment survey was 49.5% (53/107): residents 51.3% (20/39) and faculty 48.5% (33/68). The majority of survey respondents reported using online videos (86.8%, 46/53) and educational websites (79.2%, 42/53), with far fewer using personal notes (28.3%, 15/53), textbooks (24.5%, 13/53), or journal articles (11.3%, 6/53) for JIT procedural guidance. There was a statistically significant difference between the percentage of residents and faculty who reported using videos (100% ([20/20] of residents vs 79% [26/33] of faculty, P<0.05) and textbooks (5% [1/20] of residents vs 36% [12/33] of faculty, P<0.05] as JIT resources on shift (Figure 1).
The most common barriers to using JIT resources included limited time (83%, 44/53); resources not being specific to available procedural kits (62.3%, 33/53); and lack of curated, high-quality video resources (62.3%, 33/53). There was a statistically significant difference between the percentage of faculty and residents who identified a lack of a video library as a barrier (85% [17/20] of residents vs 48% [16/33] of faculty, P<0.01) (Figure 2). At least once within the last year, a majority
Figure 1. Percentage of residents and faculty indicating current just-in-time resource use on shift. * Indicates statistically significant difference between resident and faculty responses (P-value <0.05).

Volume 23, no. 3: May 2022 355 Western Journal of Emergency Medicine
Fennessy et al. Just-in-time Procedure Guides in Emergency Medicine
of respondents (58.5%, 31/53) thought about performing a core EM procedure but ultimately did not do so due to lack of comfort in performing the procedure, and 88.7% (47/53) indicated their comfort level in performing a procedure would increase or significantly increase if detailed online procedure guides were available.
Post-Implementation Survey ResultsThe overall response rate for the post-intervention survey
was 29% (31/107): residents 31% (12/39), and faculty 28% (19/68). The majority (58.3%, 14/24) indicated that they sometimes needed a refresher during their clinical shift prior to performing a procedure. When they required a refresher, 25% (6/24) of faculty and residents always used the developed JIT procedure guides: 37.5% (9/24) often used them; 29.2% (7/24) sometimes used them; and only 8.3% (2/24) rarely or never used them. Most respondents used the guides to improve general procedural knowledge (83.3%, 20/24) and to teach procedures in the ED (75%, 18/24).
The vast majority of respondents (95.8%, 23/24) found the procedure guides to be very helpful in increasing their procedural knowledge, while one respondent (4.2%), found them to be somewhat helpful; (faculty 100% [15/15] very helpful; residents 88.9% [8/9] very helpful, and 11.1% [1/9] somewhat helpful). The majority of faculty also found the guides to be very helpful for teaching procedures (86.7%, 13/15), with the remainder neutral (13.3% (2/15). Rating the quality of the guides, faculty unanimously found them to be excellent (100%, 15/15), while the majority of residents (75%, 6/8) found them to be excellent, and
some (25%, 2/8) found them to be very good. A minority (22.6%, 7/31) of survey respondents indicated that they had not yet used the procedure guides, and of those respondents 85.7% (6/7) had not yet needed a JIT refresher. Only one respondent (14.2%, 1/7) indicated they had difficulty accessing the guides on the website.
The Table displays all themes, theme frequency, and representative comments to the questions “What are the most helpful (or best) features of the procedure guides?” and “What suggestions do you have for improving the procedure guides?”
Since the implementation of the guides, the majority of residents (75%, 9/12) and faculty (68%, 13/19) felt their confidence in performing procedures had increased or significantly increased. Importantly, 16% (5/31) of respondents indicated they had changed their procedural practice pattern and performed a core EM procedure, covered by our JIT procedure guides, that they previously would have asked a consultant to perform.
DISCUSSIONOur needs assessment indicated there is a clear need to
have a readily accessible resource available for the purpose of JIT learning and teaching of EM procedures. While most physicians surveyed use online videos and educational websites, we found that a higher proportion of faculty use textbooks as a JIT resource relative to resident trainees (Figure 1). This could represent a broader pattern between different generations of learners and reinforces that educational interventions need to be targeted to the populations that are going to be using the resources provided.
Figure 2. Percentage of residents and faculty indicating barriers to just-in-time resource utilization on shift. * Indicates statistically significant difference between resident and faculty responses (P-value <0.05).ED, emergency department.
Western Journal of Emergency Medicine 356 Volume 23, no. 3: May 2022
Just-in-time Procedure Guides in Emergency Medicine Fennessy et al.
Theme Theme Frequency Representative CommentsBest FeaturesClear format 42.3% (11/26) “Very clear”
“Very organized and straightforward”Just-in-time access 26.9% (7/26) “Are not hard to find”
“Easily accessible”High-yield details 23.1% (6/26) “Focus on the high impact details”
“The comprehensiveness of them”Institution-specific 7.7% (2/26) “Utilize supplies we are all familiar with in our own department”Suggestions for ImprovementFurther improve ease of access 55.6% (5/9) “Mobile app version”
“The Emergency Medicine website could be optimized to make the guides more quickly accessible”
More guides 44.4% (4/9) “Would love even more”“Focusing on more common procedures”
Table. Thematic analysis of respondent comments on the best features of the procedure guides and suggestions for improvement.
We attempted to tackle the fact that different groups of learners not only have different learning needs when it comes to JIT procedural refreshers, but they also perceive different barriers. The procedure guides were an attempt to bridge this gap and meet the needs of multiple groups of learners by pulling useful aspects of each type of resource, including succinct text, clear visual depictions, and links to online videos.
One recurring theme that we found from respondents was that the guides were clear and concise. In the interest of keeping these guides concise, we chose to highlight only the primary procedural techniques and not make the guides all-inclusive. An additional theme from respondents was that it was helpful that we displayed and photographed, when applicable, the procedural kits specific to our ED. In some instances, we videotaped how to perform the procedure using our site-specific kits and included links to these videos in the guides. We believe that the ability to make these guides as specific to the institution as possible helped to increase their usefulness.
LIMITATIONS Limitations of the study include a low survey response
rate and a short, five-month intervention period. This decision was made to ensure we maintained the same cohort of faculty, fellows, and residents prior to graduation. We felt, however, that the benefit of keeping the same cohort of physicians in the pre- and post-surveys justified the short implementation timeline. In addition, the project was conducted at a single academic institution, which may limit the generalizability of the results to other institutions. Further helpful areas of study would include data collection on procedure performance and procedural numbers to measure change in practice patterns of individual EPs, as well as consideration of patient outcomes data after the implementation of the JIT procedure guides.
CONCLUSIONThere is a clear need to have a readily accessible resource
available for the purpose of just-in-time learning and teaching of EM procedures. Our results indicate that having clear, concise, readily accessible, and institution-specific JIT procedure guides can not only increase physicians’ confidence in their ability to perform core EM procedures in the ED, but also change physician behavior by potentially leading to reduced specialist consultation for these procedures, which may lead to a reduction in overall ED length of stay. Our guides represent an innovative resource that may appeal to multiple generations of emergency physicians, as they combine the most useful aspects of multiple resources including textbooks with more modern digital resources such as online videos.
Address for Correspondence: Kendra Parekh, MD, Vanderbilt University School of Medicine, Department of Emergency Medicine, 1313 21st Avenue South, 703 Oxford House, Nashville, TN 37232. Email: [email protected].
Conflicts of Interest: By the WestJEM article submission agreement, all authors are required to disclose all affiliations, funding sources and financial or management relationships that could be perceived as potential sources of bias. No author has professional or financial relationships with any companies that are relevant to this study. There are no conflicts of interest or sources of funding to declare.
Copyright: © 2022 Fennessy et al. This is an open access article distributed in accordance with the terms of the Creative Commons Attribution (CC BY 4.0) License. See: http://creativecommons.org/licenses/by/4.0/

Volume 23, no. 3: May 2022 357 Western Journal of Emergency Medicine
Fennessy et al. Just-in-time Procedure Guides in Emergency Medicine
REFERENCES1. Beeson MS, Ankel F, Bhat R, et al. The 2019 Model of the Clinical
Practice of Emergency Medicine. J Emerg Med. 2020;59(1):96-120.2. Sawyer T, White M, Zaveri P, et al. Learn, see, practice, prove, do,
maintain: an evidence-based pedagogical framework for procedural skill training in medicine. Academic Medicine. 2015;90(8):1025-33.
3. Schonnop R, Stauffer B, Gauri A, et al. Procedural skills training in emergency medicine physicians within the edmonton zone: a needs assessment. AEM Education and Training. 2021;5(2):p.e10495-n/a
4. Thomas AA, Uspal NG, Oron AP, et al. Perceptions on the impact of a just-in-time room on trainees and supervising physicians in a pediatric emergency department. J Grad Med Educ. 2016;8(5):754–8.
5. Branzetti JB, Adedipe AA, Gittinger MJ, et al. Randomised controlled trial to assess the effect of a just-in-time training on procedural performance: a proof-of-concept study to address procedural skill decay. BMJ Qual Saf. 2017;26(11):881-91.
6. Harris PA, Taylor R, Thielke R, et al. Research Electronic Data Capture (REDCap) – A metadata-driven methodology and workflow process for providing translational research informatics support. J Biomed Inform. 2009;42(2):377-81.
7. Harris PA, Taylor R, Minor BL, et al. The REDCap consortium: building an international community of software platform partners. J Biomed Inform. 2019;95:103208-103208.
8. Mayer RE. Applying the science of learning to medical education. Medical Education. 2010;44(6):543-9.
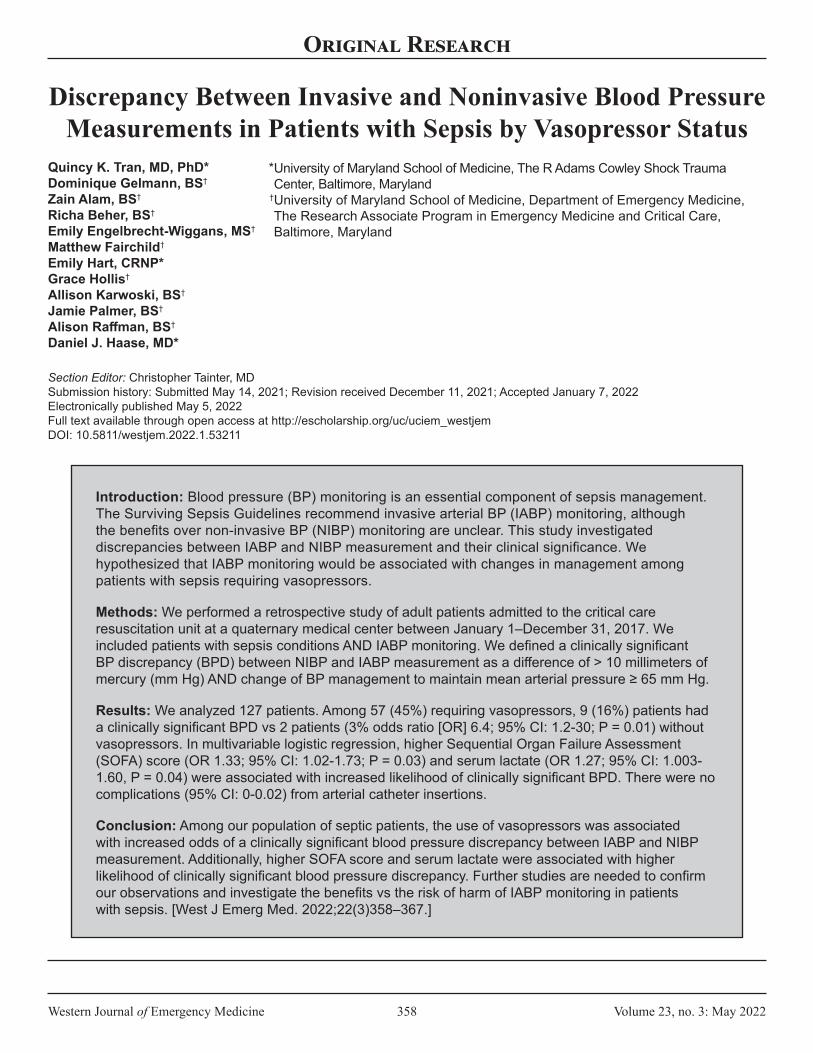
Western Journal of Emergency Medicine 358 Volume 23, no. 3: May 2022
Original Research
Discrepancy Between Invasive and Noninvasive Blood Pressure Measurements in Patients with Sepsis by Vasopressor Status
Quincy K. Tran, MD, PhD*Dominique Gelmann, BS†
Zain Alam, BS†
Richa Beher, BS†
Emily Engelbrecht-Wiggans, MS†
Matthew Fairchild†
Emily Hart, CRNP*Grace Hollis†
Allison Karwoski, BS†
Jamie Palmer, BS†
Alison Raffman, BS†
Daniel J. Haase, MD*
Section Editor: Christopher Tainter, MD Submission history: Submitted May 14, 2021; Revision received December 11, 2021; Accepted January 7, 2022Electronically published May 5, 2022Full text available through open access at http://escholarship.org/uc/uciem_westjemDOI: 10.5811/westjem.2022.1.53211
University of Maryland School of Medicine, The R Adams Cowley Shock Trauma Center, Baltimore, MarylandUniversity of Maryland School of Medicine, Department of Emergency Medicine, The Research Associate Program in Emergency Medicine and Critical Care, Baltimore, Maryland
*
†
Introduction: Blood pressure (BP) monitoring is an essential component of sepsis management. The Surviving Sepsis Guidelines recommend invasive arterial BP (IABP) monitoring, although the benefits over non-invasive BP (NIBP) monitoring are unclear. This study investigated discrepancies between IABP and NIBP measurement and their clinical significance. We hypothesized that IABP monitoring would be associated with changes in management among patients with sepsis requiring vasopressors.
Methods: We performed a retrospective study of adult patients admitted to the critical care resuscitation unit at a quaternary medical center between January 1–December 31, 2017. We included patients with sepsis conditions AND IABP monitoring. We defined a clinically significant BP discrepancy (BPD) between NIBP and IABP measurement as a difference of > 10 millimeters of mercury (mm Hg) AND change of BP management to maintain mean arterial pressure ≥ 65 mm Hg.
Results: We analyzed 127 patients. Among 57 (45%) requiring vasopressors, 9 (16%) patients had a clinically significant BPD vs 2 patients (3% odds ratio [OR] 6.4; 95% CI: 1.2-30; P = 0.01) without vasopressors. In multivariable logistic regression, higher Sequential Organ Failure Assessment (SOFA) score (OR 1.33; 95% CI: 1.02-1.73; P = 0.03) and serum lactate (OR 1.27; 95% CI: 1.003-1.60, P = 0.04) were associated with increased likelihood of clinically significant BPD. There were no complications (95% CI: 0-0.02) from arterial catheter insertions.
Conclusion: Among our population of septic patients, the use of vasopressors was associated with increased odds of a clinically significant blood pressure discrepancy between IABP and NIBP measurement. Additionally, higher SOFA score and serum lactate were associated with higher likelihood of clinically significant blood pressure discrepancy. Further studies are needed to confirm our observations and investigate the benefits vs the risk of harm of IABP monitoring in patients with sepsis. [West J Emerg Med. 2022;22(3)358–367.]
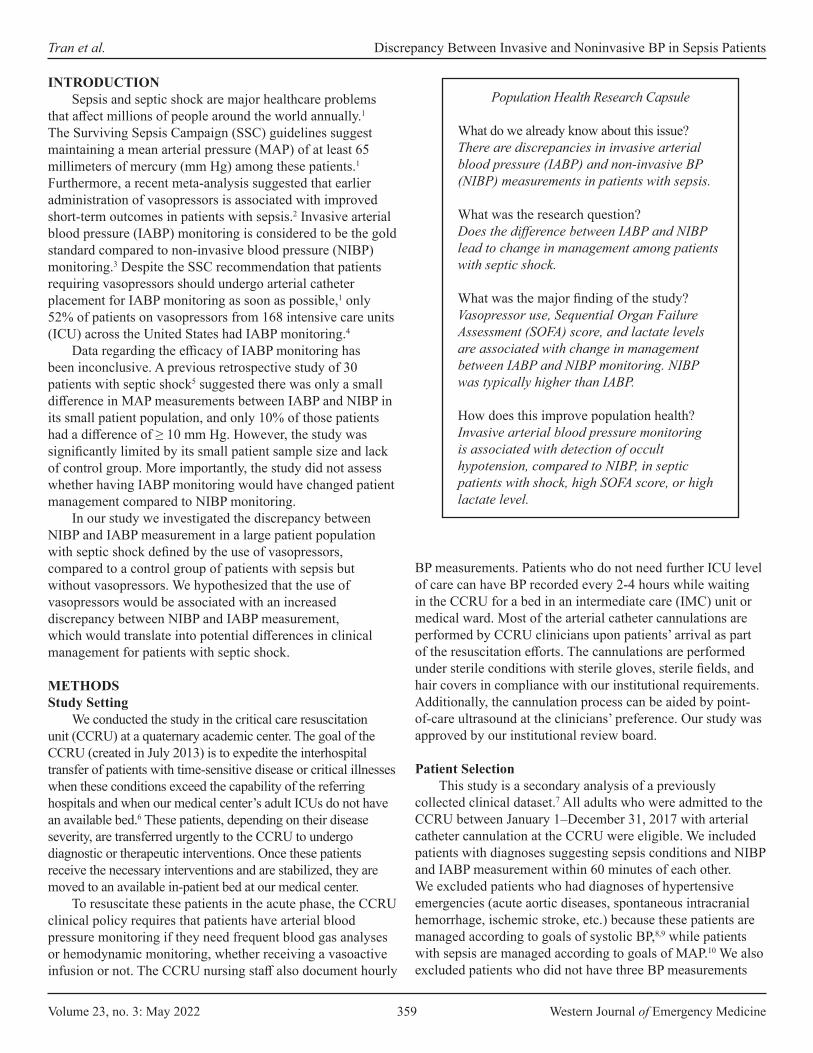
Volume 23, no. 3: May 2022 359 Western Journal of Emergency Medicine
Tran et al. Discrepancy Between Invasive and Noninvasive BP in Sepsis Patients
Population Health Research Capsule
What do we already know about this issue?There are discrepancies in invasive arterial blood pressure (IABP) and non-invasive BP (NIBP) measurements in patients with sepsis.
What was the research question?Does the difference between IABP and NIBP lead to change in management among patients with septic shock.
What was the major finding of the study?Vasopressor use, Sequential Organ Failure Assessment (SOFA) score, and lactate levels are associated with change in management between IABP and NIBP monitoring. NIBP was typically higher than IABP.
How does this improve population health?Invasive arterial blood pressure monitoring is associated with detection of occult hypotension, compared to NIBP, in septic patients with shock, high SOFA score, or high lactate level.
INTRODUCTIONSepsis and septic shock are major healthcare problems
that affect millions of people around the world annually.1 The Surviving Sepsis Campaign (SSC) guidelines suggest maintaining a mean arterial pressure (MAP) of at least 65 millimeters of mercury (mm Hg) among these patients.1 Furthermore, a recent meta-analysis suggested that earlier administration of vasopressors is associated with improved short-term outcomes in patients with sepsis.2 Invasive arterial blood pressure (IABP) monitoring is considered to be the gold standard compared to non-invasive blood pressure (NIBP) monitoring.3 Despite the SSC recommendation that patients requiring vasopressors should undergo arterial catheter placement for IABP monitoring as soon as possible,1 only 52% of patients on vasopressors from 168 intensive care units (ICU) across the United States had IABP monitoring.4
Data regarding the efficacy of IABP monitoring has been inconclusive. A previous retrospective study of 30 patients with septic shock5 suggested there was only a small difference in MAP measurements between IABP and NIBP in its small patient population, and only 10% of those patients had a difference of ≥ 10 mm Hg. However, the study was significantly limited by its small patient sample size and lack of control group. More importantly, the study did not assess whether having IABP monitoring would have changed patient management compared to NIBP monitoring.
In our study we investigated the discrepancy between NIBP and IABP measurement in a large patient population with septic shock defined by the use of vasopressors, compared to a control group of patients with sepsis but without vasopressors. We hypothesized that the use of vasopressors would be associated with an increased discrepancy between NIBP and IABP measurement, which would translate into potential differences in clinical management for patients with septic shock.
METHODSStudy Setting
We conducted the study in the critical care resuscitation unit (CCRU) at a quaternary academic center. The goal of the CCRU (created in July 2013) is to expedite the interhospital transfer of patients with time-sensitive disease or critical illnesses when these conditions exceed the capability of the referring hospitals and when our medical center’s adult ICUs do not have an available bed.6 These patients, depending on their disease severity, are transferred urgently to the CCRU to undergo diagnostic or therapeutic interventions. Once these patients receive the necessary interventions and are stabilized, they are moved to an available in-patient bed at our medical center.
To resuscitate these patients in the acute phase, the CCRU clinical policy requires that patients have arterial blood pressure monitoring if they need frequent blood gas analyses or hemodynamic monitoring, whether receiving a vasoactive infusion or not. The CCRU nursing staff also document hourly
BP measurements. Patients who do not need further ICU level of care can have BP recorded every 2-4 hours while waiting in the CCRU for a bed in an intermediate care (IMC) unit or medical ward. Most of the arterial catheter cannulations are performed by CCRU clinicians upon patients’ arrival as part of the resuscitation efforts. The cannulations are performed under sterile conditions with sterile gloves, sterile fields, and hair covers in compliance with our institutional requirements. Additionally, the cannulation process can be aided by point-of-care ultrasound at the clinicians’ preference. Our study was approved by our institutional review board.
Patient SelectionThis study is a secondary analysis of a previously
collected clinical dataset.7 All adults who were admitted to the CCRU between January 1–December 31, 2017 with arterial catheter cannulation at the CCRU were eligible. We included patients with diagnoses suggesting sepsis conditions and NIBP and IABP measurement within 60 minutes of each other. We excluded patients who had diagnoses of hypertensive emergencies (acute aortic diseases, spontaneous intracranial hemorrhage, ischemic stroke, etc.) because these patients are managed according to goals of systolic BP,8,9 while patients with sepsis are managed according to goals of MAP.10 We also excluded patients who did not have three BP measurements
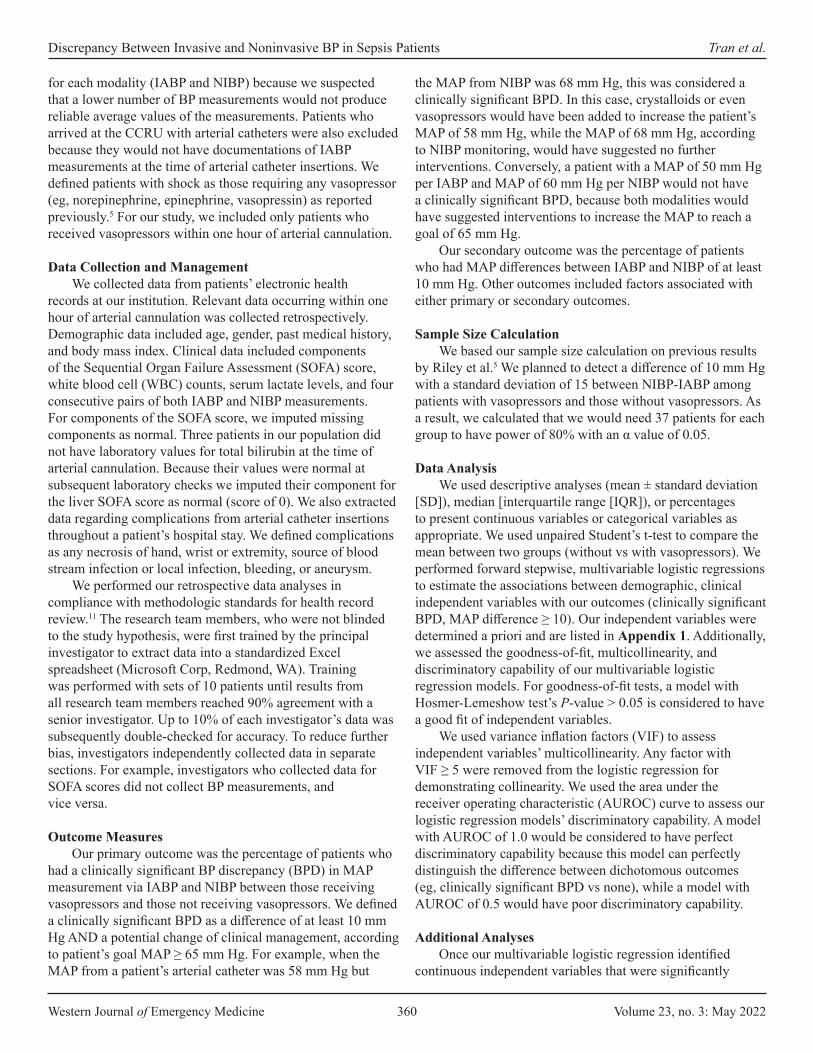
Western Journal of Emergency Medicine 360 Volume 23, no. 3: May 2022
Discrepancy Between Invasive and Noninvasive BP in Sepsis Patients Tran et al.
for each modality (IABP and NIBP) because we suspected that a lower number of BP measurements would not produce reliable average values of the measurements. Patients who arrived at the CCRU with arterial catheters were also excluded because they would not have documentations of IABP measurements at the time of arterial catheter insertions. We defined patients with shock as those requiring any vasopressor (eg, norepinephrine, epinephrine, vasopressin) as reported previously.5 For our study, we included only patients who received vasopressors within one hour of arterial cannulation.
Data Collection and ManagementWe collected data from patients’ electronic health
records at our institution. Relevant data occurring within one hour of arterial cannulation was collected retrospectively. Demographic data included age, gender, past medical history, and body mass index. Clinical data included components of the Sequential Organ Failure Assessment (SOFA) score, white blood cell (WBC) counts, serum lactate levels, and four consecutive pairs of both IABP and NIBP measurements. For components of the SOFA score, we imputed missing components as normal. Three patients in our population did not have laboratory values for total bilirubin at the time of arterial cannulation. Because their values were normal at subsequent laboratory checks we imputed their component for the liver SOFA score as normal (score of 0). We also extracted data regarding complications from arterial catheter insertions throughout a patient’s hospital stay. We defined complications as any necrosis of hand, wrist or extremity, source of blood stream infection or local infection, bleeding, or aneurysm.
We performed our retrospective data analyses in compliance with methodologic standards for health record review.11 The research team members, who were not blinded to the study hypothesis, were first trained by the principal investigator to extract data into a standardized Excel spreadsheet (Microsoft Corp, Redmond, WA). Training was performed with sets of 10 patients until results from all research team members reached 90% agreement with a senior investigator. Up to 10% of each investigator’s data was subsequently double-checked for accuracy. To reduce further bias, investigators independently collected data in separate sections. For example, investigators who collected data for SOFA scores did not collect BP measurements, and vice versa.
Outcome MeasuresOur primary outcome was the percentage of patients who
had a clinically significant BP discrepancy (BPD) in MAP measurement via IABP and NIBP between those receiving vasopressors and those not receiving vasopressors. We defined a clinically significant BPD as a difference of at least 10 mm Hg AND a potential change of clinical management, according to patient’s goal MAP ≥ 65 mm Hg. For example, when the MAP from a patient’s arterial catheter was 58 mm Hg but
the MAP from NIBP was 68 mm Hg, this was considered a clinically significant BPD. In this case, crystalloids or even vasopressors would have been added to increase the patient’s MAP of 58 mm Hg, while the MAP of 68 mm Hg, according to NIBP monitoring, would have suggested no further interventions. Conversely, a patient with a MAP of 50 mm Hg per IABP and MAP of 60 mm Hg per NIBP would not have a clinically significant BPD, because both modalities would have suggested interventions to increase the MAP to reach a goal of 65 mm Hg.
Our secondary outcome was the percentage of patients who had MAP differences between IABP and NIBP of at least 10 mm Hg. Other outcomes included factors associated with either primary or secondary outcomes.
Sample Size CalculationWe based our sample size calculation on previous results
by Riley et al.5 We planned to detect a difference of 10 mm Hg with a standard deviation of 15 between NIBP-IABP among patients with vasopressors and those without vasopressors. As a result, we calculated that we would need 37 patients for each group to have power of 80% with an α value of 0.05.
Data AnalysisWe used descriptive analyses (mean ± standard deviation
[SD]), median [interquartile range [IQR]), or percentages to present continuous variables or categorical variables as appropriate. We used unpaired Student’s t-test to compare the mean between two groups (without vs with vasopressors). We performed forward stepwise, multivariable logistic regressions to estimate the associations between demographic, clinical independent variables with our outcomes (clinically significant BPD, MAP difference ≥ 10). Our independent variables were determined a priori and are listed in Appendix 1. Additionally, we assessed the goodness-of-fit, multicollinearity, and discriminatory capability of our multivariable logistic regression models. For goodness-of-fit tests, a model with Hosmer-Lemeshow test’s P-value > 0.05 is considered to have a good fit of independent variables.
We used variance inflation factors (VIF) to assess independent variables’ multicollinearity. Any factor with VIF ≥ 5 were removed from the logistic regression for demonstrating collinearity. We used the area under the receiver operating characteristic (AUROC) curve to assess our logistic regression models’ discriminatory capability. A model with AUROC of 1.0 would be considered to have perfect discriminatory capability because this model can perfectly distinguish the difference between dichotomous outcomes (eg, clinically significant BPD vs none), while a model with AUROC of 0.5 would have poor discriminatory capability.
Additional AnalysesOnce our multivariable logistic regression identified
continuous independent variables that were significantly

Volume 23, no. 3: May 2022 361 Western Journal of Emergency Medicine
Tran et al. Discrepancy Between Invasive and Noninvasive BP in Sepsis Patients
associated with a clinically significant BP discrepancy in IABP and NIBP measurement between patients with and without vasopressors, we applied those continuous independent variables in probit analyses. The probit analyses would enable us to predict the probability of clinically significant BPD at certain values of the continuous independent variables. We used the Bland-Altman plot to graphically present the discrepancy between NIBP and IABP. We performed our statistical analyses with Minitab version 19 (Minitab Corp, State College, PA). We considered all tests with two-tailed P-value < 0.05 as statistically significant.
RESULTSPatient Characteristics
We electronically identified 570 patients who underwent arterial catheter placement at the CCRU during the study period (Figure 1). Among 271 patients with non-hypertensive conditions, we included 127 patients with sepsis conditions (list of diagnoses is included in Appendix 2) based on their admission diagnoses. Among the included patients, 57
P< 0.001) (Table 2). In other words, IABP monitoring was associated with a 5.3-times higher likelihood of detecting MAP level less than the recommended level of 65 mm Hg in sepsis patients requiring vasopressors.
The median IQR of catheter days was 3 (1-5). The total number of catheter days for our patient population was 639, with no complications (95% CI: 0-0.02) from arterial catheter insertion (Table 2).
Primary Outcome: Clinically Significant Discrepancy Between NIBP And IABP
Among 57 patients requiring vasopressors, nine patients (16%) had a clinically significant BP discrepancy, compared to two patients (3%) without vasopressor requirement (OR 6.4; 95% CI: 1.2-30; P = 0.01) (Table 2).
The Bland-Altman plot of patients with sepsis but not requiring vasopressors (Figure 2A) showed that the [NIBP-IABP] discrepancy was distributed evenly throughout the X-axis, which suggested that the difference between the two modalities was distributed evenly when patients were hypotensive or normotensive. Additionally, in this patient population, the discrepancy between NIBP and IABP (denoted as [NIBP-IABP] on the Y-axis) was mostly concentrated between the level of -10 mm Hg (IABP measurements > NIBP measurements) and level of +10 mm Hg (NIBP measurements > IABP measurements) (Figure 2A). This distribution suggested that there was similar likelihood for IABP to be higher than NIBP, and vice versa, among patients with sepsis not requiring vasopressors.
Among patients with sepsis requiring vasopressors, the NIBP and IABP difference was also distributed evenly along the X-axis (Figure 2B). However, most values for the NIBP and IABP difference for this group were above the level of +10, suggesting that NIBP measurements were in general greater than IABP in patients with sepsis requiring vasopressors.
Table 3 shows the results of the multivariable logistic regressions measuring the association between clinical factors and the primary outcome of clinically significant BP discrepancy between NIBP and IABP measurement. Four factors were associated with a clinically significant BPD between NIBP and IABP. Each unit increase in SOFA score was associated with increased odds of having a clinically significant difference in management when comparing NIBP and IABP (OR 1.33; 95% CI: 1.02-1.73; P = 0.034). Similarly, each increase in millimoles per liter (mmol/L) of serum lactate was associated with increased odds of having a clinically significant BP discrepancy when an arterial catheter was inserted (OR 1.27; CI: 1.003-1.60; P = 0.047). The model showed good fit of data (Homes-Lemeshow test’s P = 0.81), low multicollinearity (all factors had VIF < 5), and very good discriminatory capability (AUROC = 0.92).
Probit logit analyses demonstrated that for patients with a mean SOFA score of 8 (approximately 5% of all patients with sepsis, regardless of vasopressor status) had a clinically significant BP discrepancy causing change in management when
Figure 1. Patient selection diagram. We included 127 patients with sepsis conditions in our analysis.
(45%) required vasopressors and 70 (55%) did not require vasopressors (Table 1).
The average (SD) age for the population was 55 (16) years (Table 1), and there was no age difference between patients without vasopressors or those with vasopressors. Compared to those without vasopressor use, patients who required vasopressors had significantly higher WBC counts, serum lactate levels, and SOFA scores (Table 1). Other clinical factors were similar between both groups. Of the patients requiring vasopressors, 19 (33%) had MAP of less than or equal to 64 mm Hg by IABP monitoring, compared to 6 (9%) of those without vasopressors (OR 5.3; 95% CI:1.9-14.5;

Western Journal of Emergency Medicine 362 Volume 23, no. 3: May 2022
Discrepancy Between Invasive and Noninvasive BP in Sepsis Patients Tran et al.
Variables All patients (N = 127) Without vasopressor (N = 70) With vasopressor (N = 57) PAge, years (mean, SD) 55 (16) 54 (16) 56 (16) 0.3Gender, N (%)
Male 78 (61) 42 (60) 36 (63) 0.7Female 49 (39) 28 (40) 21 (37) 0.7
BMI, mean (SD) 32.4 (11.9) 32.1 (10.7) 32.8 (13.3) 0.6Past medical history, N (%)
Diabetes 42 (33) 23 (33) 19 (33) 0.9HTN 57 (45) 31 (44) 26 (46) 0.9CAD 20 (16) 13 (19) 7 (12) 0.3PAD 9 (7) 4 (6) 5 (9) 0.5Any kidney disease 63 (50) 28 (40) 35 (61) 0.02
Mechanical ventilation, N (%) 47 (37) 18 (26) 29 (51) 0.049Location of arterial catheter, N (%)
Radial 113 (89) 67 (96) 46 (81) 0.007Femoral 14 (11) 3 (4) 11 (19) 0.007Left 54 (43) 28 (40) 26 (46) 0.5Right 73 (57) 42 (60) 31 (54) 0.5
SOFA score, median (IQR) 8 (4-11) 5 (2-8) 11 (8.5-14.5) < 0.001Diagnoses, N (%)
Bowel obstruction 5 (4) 3 (4) 2 (4) 0.8Endocarditis 4 (3) 2 (3) 2 (4) 0.8Incarcerated organs 4 (3) 4(6) 0 (0) 0.3Ischemic organs 2 (2) 0 (0) 2 (4) N/ALiver failure 6 (5) 3 (4) 3 (5) 0.8Pancreatitis 6 (5) 4(6) 2 (4) 0.6Perforated viscus 12 (9) 4 (6) 8 (14) 0.1Postoperative infection 11 (9) 6 (9) 5 (9) 0.9Respiratory failure 9 (7) 7 (10) 2 (4) 0.2Sepsis, unspecified 21 (17) 7 (10) 14 (57) 0.028Soft tissue infection 46 (36) 29 (41) 17 (30) 0.2Other 1 (1) 1 (1) 0 (0) N/A
Time intervals between NIBP and IABP (minutes), median (IQR)
10 (0-15) 12 (0-16) 8 (0-11) 0.018
White blood cell counts (per microliter), mean (SD)
16.0 (10.8) 14.2 (9.7) 18.3 (11.7) 0.001
Serum lactate (mmol/L), mean (SD) 3.1 (3.1) 2.1 (1.8) 4.3 (3.9) < 0.001Hospital disposition, N (%)
Discharge home 40 (32) 26 (37) 14 (25) 0.1Acute rehabilitation facility 36 (28) 17(24) 19 (33) 0.3Skilled nursing home 22 (17) 16 (23) 6 (11) 0.7Dead/hospice 29 (23) 11 (16) 18 (32) 0.03
Table 1. Characteristics of patients with sepsis conditions and arterial pressure monitoring in the critical care resuscitation unit who were included in the study. Patients who required vasopressors were more likely to have higher SOFA* scores, serum lactate levels.
BMI, body mass index; HTN, hypertension; CAD, coronary artery disease; PAD, peripheral arterial disease; IABP, invasive arterial blood pressure; NIBP, non-invasive blood pressure; mm Hg, millimeters mercury; PAD, peripheral artery disease; IQR, interquartile range; SOFA, Sequential Organ Failure Assessment; SD, standard deviation; mmol/L, millimoles per liter.
Volume 23, no. 3: May 2022 363 Western Journal of Emergency Medicine
Tran et al. Discrepancy Between Invasive and Noninvasive BP in Sepsis Patients
Variables All patients (N = 127) Without vasopressor (N = 70) With vasopressor (N = 57) PCatheter-days (days), median [IQR] 3 [1-5] 2 [1-4] 4 [2-8.5] <0.001Type of vasopressor, N (%)1
Norepinephrine 54 (43) 0 (0) 54 (95) N/AEpinephrine 11 (9) 0 (0) 11 (19) N/AVasopressin 16 (13) 0 (0) 16 (28) N/A
Mean arterial pressure of NIBP (mm Hg), mean (SD)
82 (19) 87 (20) 76 (16) <0.001
Mean arterial pressure of IABP (mm Hg), mean (SD)
79 (19) 84 (19) 73 (16) <0.001
Difference in Mean Arterial Pressure Between IABP and NIBP (mm Hg), mean (SD)
11 (12) 10 (10) 12 (15) 0.08
Number of patients MAP of NIBP ≤ 64 mm Hg, N (%)
12 (9) 5 (7) 7 (12) 0.3
Number of patients with a clinically significant discrepancy in MAP2
11 (9) 2 (3) 9 (16)3 0.01
Number of patients with MAP of IABP ≤ 64 mm Hg, N (%)3
25 (20) 6 (9) 19 (33)4 <0.001
Number of any complications, N (%)5 0 (0) 0 (0) 0 (0) N/A
Table 2. Comparison between blood pressure from IABP and NIBP monitoring modalities for septic patients. Patients requiring vasopressors had a greater likelihood of clinically significant discrepancy between IABP and NIBP compared to patients without vasopressor requirement. Arterial blood pressure monitoring was more likely to detect MAP ≤ 64 mm Hg among sepsis patients with vasopressors.
1Patients were eligible to receive more than one vasopressor. 2Clinically significant discrepancy was defined as Mean Arterial Pressure Difference ≥ 10 mm Hg and either NIBP’s or IABP’s reading was ≤ 64 mm Hg.3OR 6.4, 95% CI 1.2-30, P = 0.01.4OR 5.3, 95% CI 1.9-14.5, P < 0.001.5Complications from arterial catheters were defined as necrosis, source for blood stream infection, local infection, infiltration, bleeding, aneurysm. The 95% confidence interval (CI) for complications was 0 (95% CI 0-0.02).NIBP, non-invasive blood pressure; IABP, invasive arterial blood pressure; IQR, interquartile range; MAP, mean arterial pressure; mm Hg, millimeters of mercury; OR, odds ratio; SD, standard deviation.
an arterial catheter was inserted (Figure 2C). Similarly, when a patient’s serum lactate level was 2 mmol/L (approximately 6% of all patients with sepsis, regardless of vasopressor status), IABP monitoring resulted in a change in clinical management (Figure 2D). Approximately 9% of patients had a change in clinical management when their serum lactate was 4 mmol/L.
Secondary Outcome: MAP Difference ≥ 10 mmHg Between NIBP And IABP
Three factors were significantly associated with high likelihood of patients having a MAP difference ≥ 10 mm Hg between the two modalities (Table 3). These three factors were higher SOFA score (OR 1.27; 95% CI: 1.03-1.3; P = 0.012), having peripheral artery disease (OR 6.7; 95% CI: 1.3-22.5; P = 0.021), and the diagnosis of incarcerated organs (OR 16.4; 95% CI: 1.4 to +100; P = 0.027).
DISCUSSIONThe use of vasopressors was associated with an
increased incidence of clinically significant BP discrepancy
between IABP and NIBP in our population of patients with sepsis. Among all patients with sepsis (both those requiring vasopressors and those not on vasopressors), a few clinical factors were associated with increased odds of change in BP management when arterial catheters were inserted. Higher SOFA score and higher serum lactate levels were both associated with higher likelihood of clinically significant BP discrepancy between NIBP and IABP monitoring modalities. Higher SOFA score, history of peripheral artery disease, and the diagnosis of incarcerated organs were associated with higher likelihood of larger MAP difference between NIBP and IABP.
Our study provides support for the use of IABP monitoring in patients requiring vasopressors, as clinically significant BP changes may be missed with NIBP monitoring. Findings from our study population showed that IABP monitoring in patients with sepsis requiring vasopressors was significantly associated with higher likelihood of detecting MAP ≤ 64 mm Hg (Table 2). Similarly, IABP values were more frequently lower than

Western Journal of Emergency Medicine 364 Volume 23, no. 3: May 2022
Discrepancy Between Invasive and Noninvasive BP in Sepsis Patients Tran et al.
A. B.
C. D.
Figure 2. (A)Bland-Altman plot displaying blood pressure differences among septic patients without vasopressors. The noninvasive blood pressure (NIBP) and invasive arterial (IA) BP discrepancy was distributed evenly throughout the X-axis, demonstrating that the difference between the two modalities occurred when patients were hypotensive or normotensive. Additionally, the difference between NIBP and IABP on the Y-axis was mostly concentrated between the level of -10 mm Hg and +10 mm Hg, demonstrating that the NIBP modality has equal likelihood to be higher or lower than IABP. (B) Bland-Altman plot displaying blood pressure differences among septic patients with vasopressors. There were even distributions of NIBP-IABP* discrepancies along the X-axis, demonstrating that the difference between the two modalities occurred when patients were hypotensive or normotensive. However, most values for [NIBP-IABP] difference were above the level of +10 mm Hg, demonstrating that NIBP measurements were usually greater than IABP in our patient population with sepsis requiring vasopressors. (C) Probit logit analysis showing probability of having clinically significant discrepancy between noninvasive and intra-arterial blood pressure (Y-axis) and its association with SOFA score (X-axis). Patients who had a SOFA* score of 20 (X-axis) would have 50% probability (Y-axis) of requiring change in clinical management when arterial catheters were inserted. (D) Probit logit analysis showing probability of having a clinically significant discrepancy between noninvasive and intra-arterial blood pressure (Y-axis) and its association with serum lactate level. Patients who had serum lactate of 4 mmol/L (X-axis) would be associated with approximately 9% probability (Y-axis) of having change of clinical management when arterial catheters were present. IABP, invasive arterial blood pressure; LOA, limit of agreement; mm Hg, millimeter of mercury; NIBP, non-invasive blood pressure; SOFA, Sequential Organ Failure Assessment; mmol/L, millimoles per liter.
NIBP among patients with sepsis on vasopressors (Figure 2B). Although the mechanism for the difference is still unknown, this observation may have important clinical implications. Patients who require vasopressors may have unrecognized hypotension when they arrive at a resuscitation or ICU due to the use of NIBP monitoring. Additionally, NIBP measurements are typically taken intermittently, while IABP measurement provides the additional benefit of
real-time continuous monitoring. For both reasons, IABP monitoring would enable clinicians to detect MAP < 65 mm Hg sooner and intervene early. This has important implications for patient outcomes, as previous studies suggested that hypotension may lead to significant morbidity for patients.12,13
In a patient population that is similar to ours, inserting an arterial catheter would be associated with a change in

Volume 23, no. 3: May 2022 365 Western Journal of Emergency Medicine
Tran et al. Discrepancy Between Invasive and Noninvasive BP in Sepsis Patients
Variables OR 95% CI P VIFOutcome: Clinically Significant Blood Pressure Discrepancy1
SOFA – each unit 1.33 1.02-1.73 0.034 2.0Serum lactate – each mmol/L 1.27 1.003-1.60 0.047 2.1Any kidney disease 0.03 0.002-0.51 0.015 2.6Bowel obstruction 34 1.2-100+ 0.035 1.4
Secondary outcome: MAP difference ≥ 10 mm Hg2
SOFA – each unit 1.17 1.03-1.3 0.012 1.9Peripheral artery disease 6.7 1.3-33.5 0.021 1.1Incarcerated organs 16.4 1.4-100+ 0.027 1.1
Table 3. Results from forward stepwise multivariable logistic regression measuring association between clinical factors and the likelihood of clinically significant discrepancy between NIBP and IABP*. All predetermined factors were entered into the models and only factors with significant association were reported. The models for each outcome measure showed both good fit of the independent variables and good discriminatory capability (higher AUROC**).
1Homes-Lemeshow test chi-square 4.5, D(f) = 8; P = 0.81; AUROC: 0.92.2Homes-Lemeshow test chi-square 6.5, D(f) = 8, P = 0.59; AUROC: 0.72.AUROC, area under the receiver operating characteristic curve; OR, odds ratio; CI, confidence interval; D(f), degree of freedom; mmol/L, millimoles per liter; IABP, invasive arterial blood pressure; NIBP, non-invasive blood pressure; SOFA, Sequential Organ Failure Assessment score; VIF, variance inflation factor.
BP management in 9% of all patients with sepsis regardless of vasopressor status, and in 16% of patients with sepsis requiring vasopressors. In other words, for every 11 septic patients with IABP monitoring regardless of vasopressor use, one patient would be identified as requiring change in clinical management. For patients with sepsis requiring vasopressors, IABP monitoring would detect one need for change in management for every seven patients. Within our population of patients with sepsis, the probability of change in management when arterial catheter was inserted was approximately 5% for patients whose SOFA score was 8, for an estimated change in one of every 20 patients. For those with a SOFA score of 16, IABP monitoring was associated with management change in one of every two patients (Figure 2C). Our probit logit analysis suggested that IABP monitoring would detect one change in management for approximately every 17 patients with a serum lactate level of 2 mmol/L, and one change in management for every 11 patients with a serum lactate level of 4 mmol/L.
The baseline differences in patients with sepsis requiring vasopressors and those not requiring vasopressors may have influenced our findings of an increased rate of BP discrepancy in the former group. Patients with higher SOFA scores indicating increased illness severity may undergo more vasodilatory changes that may contribute to a higher prevalence of BP discrepancy between the two measurement modalities. While our patient population was not large enough for propensity score matching of these groups, further studies should explore such factors potentially influencing outcomes.
Although our study was not designed to investigate the economics of IABP monitoring, we calculated the cost required to detect change in clinical management via arterial line BP measurement for patients with septic shock. The one-time supply cost to set up IABP monitoring at our institution is approximately $55 US dollars (USD) per patient. The prevalence of clinically significant BP discrepancy was 16% among patients with sepsis on vasopressors, which equates to one change in management for approximately every seven patients with IABP monitoring. Therefore, the total cost of IABP monitoring would be approximately $385 USD to detect clinical change in management for every seven patients with sepsis requiring vasopressors. Further analysis is necessary to investigate whether the cost for IABP will offset the cost of patients’ hospitalization if they develop acute kidney injuries or other comorbidities.
Other authors have questioned the need for arterial catheters among critically ill patients because of the associated risks and unclear benefit of ABP.14 Results from our study suggest that IABP monitoring offers the benefit of potential change in clinical management due to early detection of hypotension, and with low cost and low complication rates. We found no complications from arterial catheter cannulation in our patient population. Our findings agreed with the previously reported low arterial cannulation risk of less than 1%.15 This suggests that early insertion of an arterial catheter is a low-risk procedure that enables clinicians to detect and remedy hypotension effectively, thus reducing the likelihood of hypotension-

Western Journal of Emergency Medicine 366 Volume 23, no. 3: May 2022
Discrepancy Between Invasive and Noninvasive BP in Sepsis Patients Tran et al.
related complications. As a result, we presented information suggesting that arterial catheters are associated with a high benefit-to-harm ratio in patients with sepsis, especially those requiring vasopressors. Further studies are necessary to confirm our observations.
LIMITATIONSOur exploratory study has several limitations. First,
patients with sepsis requiring vasopressors are not similar to those without vasopressors, but the small sample size prevented us from performing propensity score matching. However, by including the group of patients without vasopressors, we provided a glimpse of the potential discrepancy between NIBP and IABP in both groups of patients with sepsis. Additionally, we could not retrospectively identify whether the BP cuff was on the same or opposite arm as the arterial catheters, as our nursing staff usually does not document the location of the BP cuffs. Further, we based our outcome on the potential change of clinical management, according to MAP ≥ 65 mm Hg, but we could not ascertain what types of interventions were given to the patients. Finally, our multivariable logistic regressions showed wide 95% CIs for a few clinical factors (past medical history of kidney disease, diagnosis of bowel obstructions, and incarcerated organs) due to the very small sample sizes of these variables from a population with various causes of sepsis. Although our results suggest there may be an association between these factors and clinically significant BP discrepancy, the sample size was too small to draw meaningful conclusions.
Despite these limitations, our exploratory study had strength over the previous study by Riley et al.5 We included a larger number of patients requiring vasopressors along with a group of patients without vasopressors. We demonstrated relevant clinical benefits from IABP, not just the existence of discrepancy between NIBP and IABP measurements. Additionally, we identified a few clinical factors that may help clinicians practicing in the acute phase, such as in an emergency department, resuscitation unit, or ICU, to decide whether IABP is indicated.
CONCLUSIONIn patients with sepsis conditions requiring
vasopressors, there was an increased likelihood of clinical change in blood pressure management with the use of invasive arterial blood pressure monitoring. There were no complications from arterial catheter insertion observed. Higher Sequential Organ Failure Assesment score and higher serum lactate levels were both associated with a higher likelihood of a blood pressure discrepancy leading to clinical change in management. Further studies are necessary to confirm our observation and investigate the risks of arterial catheter cannulations.
REFERENCES1. Rhodes A, Evans LE, Alhazzani W, et al. Surviving Sepsis Campaign:
International Guidelines for Management of Sepsis and Septic Shock: 2016. Intensive Care Med. 2017;43(3):304-77.
2. Li Y, Li H, Zhang D. Timing of norepinephrine initiation in patients with septic shock: a systematic review and meta-analysis. Crit Care. 2020;24(1):488.
3. Lakhal K, Macq C, Ehrmann S, et al. Noninvasive monitoring of blood pressure in the critically ill: reliability according to the cuff site (arm, thigh, or ankle). Crit Care Med. 2012;40(4):1207-13.
4. Gershengorn HB, Wunsch H, Scales DC, et al. Association between arterial catheter use and hospital mortality in intensive care units. JAMA Intern Med. 2014;174(11):1746-54.
5. Riley LE, Chen GJ, Latham HE. Comparison of noninvasive blood pressure monitoring with invasive arterial pressure monitoring in medical ICU patients with septic shock. Blood Press Monit. 2017;22(4):202-7.
6. Scalea TM, Rubinson L, Tran Q, et al. Critical care resuscitation unit: an innovative solution to expedite transfer of patients with time-sensitive critical illness. J Am Coll Surg. 2016;222(4):614-21.
7. Keville MP, Gelmann D, Hollis G, et al. Arterial or cuff pressure: clinical predictors among patients in shock in a critical care resuscitation unit. Am J Emerg Med. 2021;46:109-15.
8. Hiratzka LF, Bakris GL, Beckman JA, et al. 2010 ACCF/AHA/AATS/ACR/ASA/SCA/SCAI/SIR/STS/SVM Guidelines for the Diagnosis and Management of Patients with Thoracic Aortic Disease: a report of the American College of Cardiology Foundation/American Heart Association Task Force on Practice Guidelines, American Association for Thoracic Surgery, American College of Radiology, American Stroke Association, Society of Cardiovascular Anesthesiologists, Society for Cardiovascular Angiography and Interventions, Society of Interventional Radiology, Society of Thoracic Surgeons, and Society for Vascular Medicine. Circulation. 2010;121(13):e266-369.
9. Hemphill JC, Greenberg SM, Anderson CS, et al. Guidelines for the Management of Spontaneous Intracerebral Hemorrhage: A Guideline for Healthcare Professionals from the American Heart Association/American
Address for Correspondence: Quincy K. Tran, MD, University of Maryland School of Medicine, The R. Adams Cowley Shock Trauma Center, 22 South Greene Street, Suite T3N45, Baltimore, MD 21201. Email: [email protected].
Conflicts of Interest: By the WestJEM article submission agreement, all authors are required to disclose all affiliations, funding sources and financial or management relationships that could be perceived as potential sources of bias. No author has professional or financial relationships with any companies that are relevant to this study. There are no conflicts of interest or sources of funding to declare.
Copyright: © 2022 Tran et al. This is an open access article distributed in accordance with the terms of the Creative Commons Attribution (CC BY 4.0) License. See: http://creativecommons.org/licenses/by/4.0/

Volume 23, no. 3: May 2022 367 Western Journal of Emergency Medicine
Tran et al. Discrepancy Between Invasive and Noninvasive BP in Sepsis Patients
Stroke Association. Stroke. 2015;46(7):2032-60. 10. Dellinger RP, Levy MM, Carlet JM, et al. Surviving Sepsis Campaign:
international guidelines for management of severe sepsis and septic shock: 2008. Crit Care Med. 2008;36(1):296-327.
11. Worster A, Bledsoe RD, Cleve P, et al. Reassessing the methods of medical record review studies in emergency medicine research. Ann Emerg Med. 2005;45(4):448-51.
12. Walsh M, Devereaux PJ, Garg AX, et al. Relationship between intraoperative mean arterial pressure and clinical outcomes after noncardiac surgery: toward an empirical definition of hypotension.
Anesthesiology. 2013;119(3):507-15. 13. Asfar P, Meziani F, Hamel J-F, et al. High versus low blood-
pressure target in patients with septic shock. N Engl J Med. 2014;370(17):1583-93.
14. Garland A. Arterial lines in the ICU: a call for rigorous controlled trials. Chest. 2014;146(5):1155-8.
15. Scheer BV, Perel A, Pfeiffer UJ. Clinical review: complications and risk factors of peripheral arterial catheters used for haemodynamic monitoring in anaesthesia and intensive care medicine. Crit Care. 2002;6(3):199-204.
Western Journal of Emergency Medicine 368 Volume 23, no. 3: May 2022
Original Research
Effect of an Emergency Department Closure on Homeless Patients and Adjacent Hospitals
Scott Gummerson, MD, ScM*Megan Smith, MSW†
Otis Warren, MD‡
Section Editor: Tom Xu, MD, PhD Submission history: Submitted June 29, 2021; Revision received November 28, 2021; Accepted December 13, 2021 Electronically published April 5, 2022 Full text available through open access at http://escholarship.org/uc/uciem_westjem DOI: 10.5811/westjem.2021.12.53918
INTRODUCTION Annual emergency department (ED) utilization has
increased dramatically in the past two decades, growing from approximately 107.5 million visits in 2001 to over 145.5 million in 2016.1 As hospitals strain to keep up with increases
Johns Hopkins Hospital, Department of Emergency Medicine, Baltimore, MarylandBoston University School of Social Work, Boston, MassachusettsThe Miriam Hospital, Department of Emergency Medicine, Providence, Rhode Island
*†
‡
Introduction: Homeless and housed patients differ on several emergency department (ED) metrics (emergency medical services [EMS] use, chief complaints, admission rates, etc.). On January 1, 2018, Memorial Hospital (MH), a safety-net hospital in Pawtucket, Rhode Island, closed. We studied the impact of this closure by analyzing homeless patient utilization of the two closest EDs before and after MH closed.
Methods: A retrospective chart review compared the ED records of The Miriam Hospital (TMH), (1.8 miles from MH) and Rhode Island Hospital (RIH), (4.3 miles from MH). We analyzed visits between January 1, 2017–December 30, 2018. (MH closed on 1/1/2018). Patients were identified as homeless if their address listed was either “homeless” or a shelter/ homeless service provider. All other patients were assumed to be housed. We removed from the analysis visits without an address listed or visits missing other key study variables (1.6% of the total).
Results: A total of 113,925 unique patients visited the RIH and TMH EDs in 2017, as well as 117,167 in 2018. Homeless patients accounted for 1.18% of patients seen in 2017 and 1.32% in 2018. Between 2017 and 2018, this represents an increase of individual homeless patients of 15.46% (1553-1345), while the number of unique housed patients increased by 2.69% (115,614-112,580). The closer hospital, TMH, saw a 43.72% increase in homeless visits, while RIH saw an 8% increase. Homeless patients were discharged significantly more often than housed patients (74% vs 65%) and had significantly longer time to admission (466.0 vs 304.0 minutes) and discharge (397.9 vs 263.7 minutes) compared to housed patients. Homeless patients presented with suicidality (8.61% of visits) and alcohol-related concerns (29.88% of visits) significantly more than housed patients (1.43% and 2.94%, respectively).
Conclusion: When a local ED closes, other EDs are impacted. We found visits made by homeless patients increased more than those made by housed patients and skewed significantly toward the closer hospital. We also found that homeless patients spend significantly more time in the ED and presented with behavioral health complaints more frequently. This impact of hospital closure on patterns of ED utilization by homeless patients has implications for ED management and homeless services both in the ED and the community. [West J Emerg Med. 2022;22(3)368–374.]
in demand, EDs across the country continue to experience greater wait times, lengths of stay, and difficulty adjusting to increased utilization.2–5 Compounding these issues, EDs are being closed faster than they are being opened, resulting in a decreasing number of EDs tasked with an increasingly larger
Volume 23, no. 3: May 2022 369 Western Journal of Emergency Medicine
Gummerson et al. ED Closure of Local Hospital Shifts Care of Homeless Patients to Nearby Hospitals
Population Health Research Capsule
What do we already know about this issue?Memorial Hospital (MH) cared for many vulnerable patients before closing. These patients were more likely to be poor or uninsured compared to the rest of Rhode Island.
What was the research question?How did MH’s closure affect emergency department (ED) utilization by homeless individuals at nearby EDs that remained open?
What was the major finding of the study?Nearby EDs saw a disproportionate increase in visits by homeless individuals compared to the non-homeless.
How does this improve population health?When safety-net hospitals close, nearby EDs absorb their patients and should consider increasing social services to account for increases in homeless visits.
population of patients.6,7 Additionally, hospitals that care for uninsured and impoverished patients are more likely to close than others, leading to disproportionately adverse health outcomes for vulnerable populations.6-9
Homeless individuals are one such population that disproportionately shoulders the detrimental effects of local ED closure. Hospitals that care for uninsured and vulnerable people are at a greater risk of closing, and homeless individuals are known to access emergency services at higher rates (per capita) than non-homeless individuals.7,10,11 As local hospitals close, homeless individuals may also face greater logistical issues when attempting to access care at EDs that remain open, which may be geographically farther away and require transportation to access.8,9,12 This introduces additional challenges for a population that already faces substantial barriers to care, and may ultimately lead to poor health outcomes.9,13–15 Given that this population historically has higher psychiatric and substance use-related health needs, increasing these services at remaining hospitals would be an important adaptation to a changing patient population. Nevertheless, the effect of local ED closure on homeless individuals has not been explicitly or adequately explored in recent literature. Here we study the implications of ED closure for homeless populations and their effect on remaining hospitals. METHODS
We conducted a retrospective chart review to examine the impact of a naturally occurring experiment to examine the differences in the frequency and characteristics of ED visits by homeless patients at two hospitals before and after a third local hospital closed. Study Settings
Memorial Hospital, which ceased operations on January 1, 2018, was a community hospital located in the city of Pawtucket, RI. It had a single, family medicine residency program. While the ED and inpatient units closed, the outpatient family medicine clinic remained open. From 2011-2017, MH was responsible for 37% of all ED visits in its service area, as well as 6.22% of all ED visits in the state.16 A report published by the RI Department of Health showed that the MH ED cared for a large portion of the state’s vulnerable population, and that its closure may have detrimentally affected the local population and remaining operational EDs.16,17 Memorial Hospital did not have any specific housing resources, and there were no significant changes in the available housing or social services in the area after its closure.
This report found that MH’s patient population was more chronically ill, more impoverished, less educated, more likely to be a racial minority, more likely to use ED services, and more likely to be uninsured than patients in the rest of the state.16 Moreover, they were less likely to own a car or have access to transportation.16 The catchment area of MH was predominantly from the cities of Pawtucket and Central Falls,
RI. These cities are lower income areas with higher poverty rates compared with the rest of the state. According to 2020 census data, Pawtucket had a median household income of $50,476, and 15.6% of the population lived below the poverty level. Central Falls had a mean household income of $32,982, and 30.2% of the population lived below the poverty level.
We analyzed data of the two closest hospitals before and after MH’s closure; the Miriam Hospital (TMH) (1.8 miles from MH) and Rhode Island Hospital (4.3 miles from MH). Both these hospitals are in the neighboring city of Providence, RI. The Miriam Hospital, located in the East Side neighborhood of Providence, is a 247-bed academic/community hospital affiliated with a medical school and trains medical students, residents, and fellows in multiple specialties. It does not have a specialized area in the ED for care of psychiatric or intoxicated patients, nor does it have an inpatient psychiatric or detoxification unit. The East Side neighborhood has a significantly higher median household income level of $100,631. Rhode Island Hospital (4.3 miles from MH) is a 719-bed, Level I trauma center that trains medical students, residents, and fellows in multiple specialties; RIH has a specialized psychiatric and intoxication unit within the ED and an inpatient psychiatric unit. It is located in South Providence, which has a lower median household income level of $34,053.
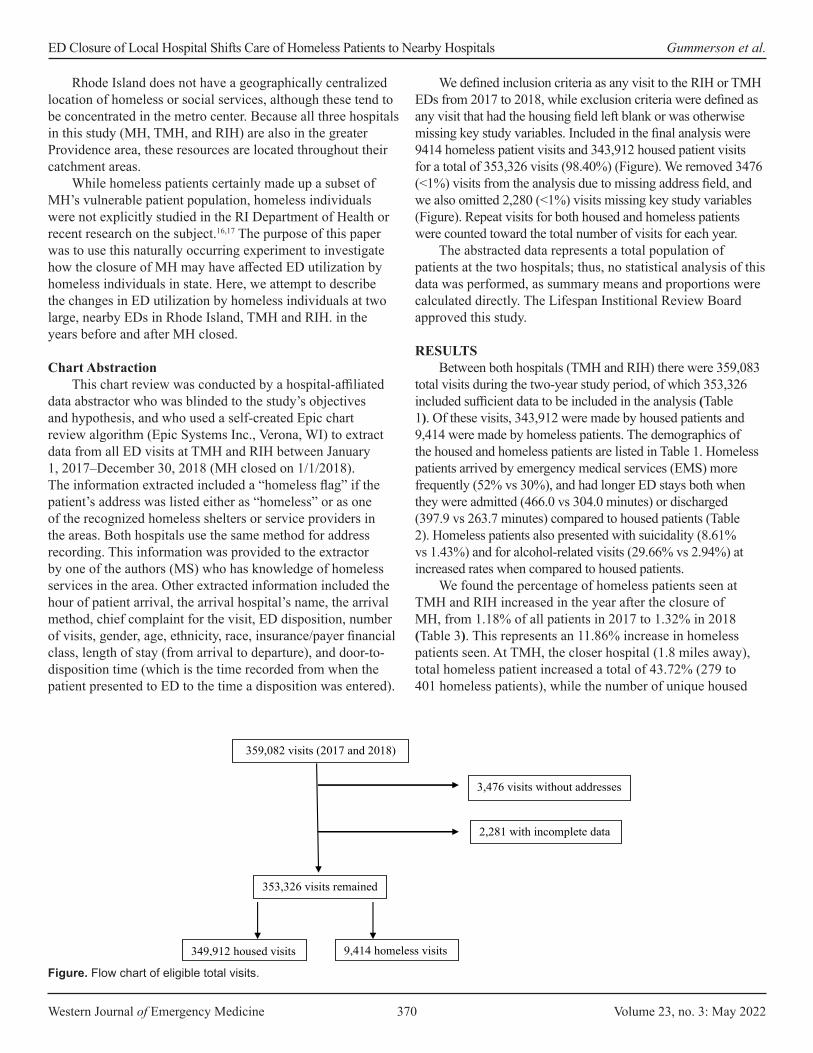
Western Journal of Emergency Medicine 370 Volume 23, no. 3: May 2022
ED Closure of Local Hospital Shifts Care of Homeless Patients to Nearby Hospitals Gummerson et al.
Rhode Island does not have a geographically centralized location of homeless or social services, although these tend to be concentrated in the metro center. Because all three hospitals in this study (MH, TMH, and RIH) are also in the greater Providence area, these resources are located throughout their catchment areas.
While homeless patients certainly made up a subset of MH’s vulnerable patient population, homeless individuals were not explicitly studied in the RI Department of Health or recent research on the subject.16,17 The purpose of this paper was to use this naturally occurring experiment to investigate how the closure of MH may have affected ED utilization by homeless individuals in state. Here, we attempt to describe the changes in ED utilization by homeless individuals at two large, nearby EDs in Rhode Island, TMH and RIH. in the years before and after MH closed.
Chart AbstractionThis chart review was conducted by a hospital-affiliated
data abstractor who was blinded to the study’s objectives and hypothesis, and who used a self-created Epic chart review algorithm (Epic Systems Inc., Verona, WI) to extract data from all ED visits at TMH and RIH between January 1, 2017–December 30, 2018 (MH closed on 1/1/2018). The information extracted included a “homeless flag” if the patient’s address was listed either as “homeless” or as one of the recognized homeless shelters or service providers in the areas. Both hospitals use the same method for address recording. This information was provided to the extractor by one of the authors (MS) who has knowledge of homeless services in the area. Other extracted information included the hour of patient arrival, the arrival hospital’s name, the arrival method, chief complaint for the visit, ED disposition, number of visits, gender, age, ethnicity, race, insurance/payer financial class, length of stay (from arrival to departure), and door-to-disposition time (which is the time recorded from when the patient presented to ED to the time a disposition was entered).
We defined inclusion criteria as any visit to the RIH or TMH EDs from 2017 to 2018, while exclusion criteria were defined as any visit that had the housing field left blank or was otherwise missing key study variables. Included in the final analysis were 9414 homeless patient visits and 343,912 housed patient visits for a total of 353,326 visits (98.40%) (Figure). We removed 3476 (<1%) visits from the analysis due to missing address field, and we also omitted 2,280 (<1%) visits missing key study variables (Figure). Repeat visits for both housed and homeless patients were counted toward the total number of visits for each year.
The abstracted data represents a total population of patients at the two hospitals; thus, no statistical analysis of this data was performed, as summary means and proportions were calculated directly. The Lifespan Institional Review Board approved this study.
RESULTSBetween both hospitals (TMH and RIH) there were 359,083
total visits during the two-year study period, of which 353,326 included sufficient data to be included in the analysis (Table 1). Of these visits, 343,912 were made by housed patients and 9,414 were made by homeless patients. The demographics of the housed and homeless patients are listed in Table 1. Homeless patients arrived by emergency medical services (EMS) more frequently (52% vs 30%), and had longer ED stays both when they were admitted (466.0 vs 304.0 minutes) or discharged (397.9 vs 263.7 minutes) compared to housed patients (Table 2). Homeless patients also presented with suicidality (8.61% vs 1.43%) and for alcohol-related visits (29.66% vs 2.94%) at increased rates when compared to housed patients.
We found the percentage of homeless patients seen at TMH and RIH increased in the year after the closure of MH, from 1.18% of all patients in 2017 to 1.32% in 2018 (Table 3). This represents an 11.86% increase in homeless patients seen. At TMH, the closer hospital (1.8 miles away), total homeless patient increased a total of 43.72% (279 to 401 homeless patients), while the number of unique housed
Figure. Flow chart of eligible total visits.
359,082 visits (2017 and 2018)
353,326 visits remained
3,476 visits without addresses
9,414 homeless visits 349,912 housed visits
2,281 with incomplete data

Volume 23, no. 3: May 2022 371 Western Journal of Emergency Medicine
Gummerson et al. ED Closure of Local Hospital Shifts Care of Homeless Patients to Nearby Hospitals
patients increased by 8.82% (47,055 to 51,203). At RIH, the homeless patients increased 8.07% over this period of time, while the number of unique housed patients decreased by -1.70%. During the study period, unique housed patients made an average of 1.5 visits per year at both hospitals combined, while homeless patients made an average of 2.25 visits.
DISCUSSION Our study demonstrates homeless patients were
disproportionately affected by the closing of a local hospital.
As the homeless population in Rhode Island did not significantly change between 2018 to 2019 and there were no significant changes in housing or primary care resources, our findings of disproportionate increases of homeless visits at the remaining hospitals were directly related to MH’s closure rather than to any other factors.18
This study evaluates 1) how the presence of a local ED affects the surrounding homeless population, and 2) how a local homeless population affects the operations of an ED. We used a hospital’s closure to examine the effect on homeless patients and their impact on the closest remaining hospitals. A naturally occurring experiment in Rhode Island happened when MH closed on January 1, 2018. Our data shows that while the volume at the two closest remaining EDs increased modestly, the number of homeless patients increased drastically, particularly at the closer facility. The extent and the nuances of this increased volume is critically dependent on specific local factors, including proximity of other hospitals, patient makeup, and resources.
We found that homeless patients were disproportionately affected compared to housed patients. Specifically, the number of homeless patients seen at the remaining hospitals increased 11.86%%, while the number of housed patients increased only 2.69%. Our data speaks to the important role a local ED has in the life of a homeless person. We found the admission rates to be significantly less for homeless patients, suggesting that an ED acts as a critical access point for homeless patients.
Our data also suggests that when a local hospital closed, the number of homeless patients seen increased proportionately more at the next closest hospital (TMH), even if it is only marginally closer than others and does not have specialized care areas for psychiatric and substance use-related disorders. However, homeless patients seen increased by a greater absolute number at the larger, Level I trauma center that offered more specialized care in substance use and psychiatry. We found that compared to housed patients, homeless patients are more reliant on EMS. Perhaps going to the closest hospital is not a choice that the homeless person is making but is a decision made for them by the EMS personnel in the ambulance that takes them, or by what facilities are in walking distance or accessible via city bus lines. Moreover, our data suggests that a local ED functions as a necessary resource for homeless patients, and decisions about where to receive healthcare is made for them by local infrastructure.
We found homeless patients have longer ED lengths of stay, a higher rate of repeat visits, and higher rates of suicidality and alcohol-related visits, which is consistent with prior work.19–22 Therefore, when a hospital sees an increase in the proportion of homeless patients, we can expect many metrics of ED processes to be affected (patient flow, and psychiatric and substance use disorder resources). This is exactly what happened. Lawrence et al described overall increases in ED utilization, wait times, lengths of stay, and patients who left without being seen at TMH and
DemographicsHoused
(N = 343,912)Homeless
(N = 9,414)Age (years) 50.03 (21.08) 45.14 (12.49)Male 47.00% 73.15%Race
White 63.61% 54.90%Black 13.98% 27.35%Other 22.41% 17.75%
Hispanic/Latino 21.69% 16.19%Health insurance
Managed Medicaid 46.44% 67.62%RI Medicaid 1.93% 6.86%Medicare 16.97% 13.63%Private insurance 19.68% 1.02%Other 14.98% 10.87%
Table 1. Demographic information for housed vs homeless participants at The Miriam Hospital and Rhode Island Hospital.
RI, Rhode Island.
Housed (N = 343,912)
Homeless (N = 9,414)
Arrival by EMS 30.42% 52.61%Frequency of disposition
Admission 27.70% 13.77%Discharge 64.68% 74.03%
Average minutes to dispositionAdmission 304.0 466.0Discharge 263.7 397.9
Chief complaintAbdominal pain 11.16% 4.73%Chest pain 8.95% 5.39%Back pain 4.69% 3.25%Alcohol-related 2.94% 29.66%Suicidal 1.43% 8.61%
Table 2. Emergency department visit characteristics for housed vs homeless patients at Rhode Island Hospital and The Miriam Hospital.
EMS, emergency medical services.

Western Journal of Emergency Medicine 372 Volume 23, no. 3: May 2022
ED Closure of Local Hospital Shifts Care of Homeless Patients to Nearby Hospitals Gummerson et al.
RIH, in the year after MH’s closure.17 While these changes may be due to overall increases in non-homeless patients (2.69%), it more likely represents an increased burden from a disproportionately greater number of homeless patients (a 11.86% increase).
The two remaining hospitals (TMH and RIH), while both teaching hospitals of the same medical school and run by the same parent organization, saw distinct changes after MH closed. The Miriam Hospital, the closer hospital to the closed MH, is in an affluent neighborhood. Our data indicates that MH acted as a buffer of sorts for TMH. When MH closed, TMH saw a 43.72% increase in the number of homeless patients in the year after this buffer was lifted. The RIH also saw an increase in the number of homeless patients. While the percentage increase in homeless patients was less than TMH, RIH saw a greater absolute number of homeless patients after MH closed.
These two remaining hospitals were different to begin with. The RIH, which is Rhode Island’s only Level I trauma center, is located in a neighborhood with high poverty rates and saw a large number of homeless patients even before MH closed. By contrast, TMH saw comparatively fewer homeless patients. Our findings suggest that when a hospital closes, a smaller hospital that sees fewer homeless patients should expect the greatest percentage of change, particularly if that hospital is closer to the closing hospital. However, hospitals that already treat higher numbers of homeless patients should expect these numbers to increase. Additionally, smaller hospitals without inpatient psychiatry or substance use services should anticipate the greater need for these services, more than larger hospitals where these services already exist.
As hospital closures across the country are increasing in frequency, our data can serve as a case example for the remaining local hospitals, demonstrating that they should expect to see increased patient volume and ought to adjust for the likely disproportionately increased numbers of homeless patients.6,7 We found that overall this could mean implementing increased social services at the remaining hospitals, including housing first and substance use services, which have been shown to decrease ED and EMS utilization.23–26 Furthermore, coordination of services provided at the city and state level should consider these findings, as these hospital closures will likely have a downstream effect on local healthcare and social service utilizations in general.
LIMITATIONSLimitations of our study include the local nature of our
assessment, and the fact that the unique circumstances of any state’s hospital system, political makeup, or particular homeless population make it difficult to generalize. Additionally, as the influence of EMS diversion on ED volumes was not explored, it is unclear how EMS protocols may have influenced the distribution of homeless patients to local hospitals—especially as this population was shown to use EMS services at greater rates.
We used a given address as a proxy for housing status in our retrospective work. This likely led to an undercounting of homeless patients, as they would not have been captured using this methodology if they gave a former address or that of a friend or family member. Additionally, we found a number of patients had blank address fields. While the overall percentage of these visits was small, we could not verify the housing
2017 2018 % ChangeCombined
Total unique patients 113,925 117,167 2.85%Unique homeless patients 1,345 1,553 15.46%Unique housed patients 112,580 115,614 2.69%Homeless as % of total 1.18% 1.32% 11.86%
Rhode Island HospitalTotal unique patients 66,591 65,563 -1.54%Unique homeless patients 1,066 1,152 8.07%Unique housed patients 65,525 64,411 -1.70Homeless as % of total 1.60% 1.76% 10.00%
The Miriam HospitalTotal unique patients 47,334 51,604 9.02%Unique homeless patients 279 401 43.72%Unique housed patients 47,055 51,203 8.82%Homeless as % of total 0.59% 0.78% 32.30%
Table 3. Total unique patients seen in Rhode Island Hospital and The Miriam Hospital emergency departments in 2017 and 2018, showing percent change after closure of Memorial Hospital.

Volume 23, no. 3: May 2022 373 Western Journal of Emergency Medicine
Gummerson et al. ED Closure of Local Hospital Shifts Care of Homeless Patients to Nearby Hospitals
status of visits based upon the retrospective design of our study. Furthermore, homeless patients who listed the address of family or a friend would be considered as not homeless in our study, further undercounting our homeless patients.
We reviewed records from the two closest remaining hospitals (TMH and RIH) that shared an electronic health record. We did not review records from other hospitals that could have also been affected because there was no access to this data and these hospitals were further away from the closed hospital (MH). Additionally, we only followed trends one year after the hospital closure. There may be trends that are longer or more sustained that this study did not evaluate. Future research should study the effects of local ED closures on homeless populations in other areas of the country, and in different hospital systems to determine whether our findings are replicated elsewhere. Additional investigation is also needed to see whether increased services for homeless individuals at remaining operational EDs (and from city and state governments) could preemptively alleviate the effect of local ED closure on homeless individuals and surrounding hospitals.
CONCLUSIONWhen a hospital and its ED closes, homeless patients
are disproportionately affected. Local hospitals were found to experience significantly increased volumes of homeless patients when compared to housed patients, with the marginally closer hospital more affected by this change.
Address for Correspondence: Scott Gummerson, MD, ScM, Johns Hopkins Department of Emergency Medicine, 1830 E. Monument St., Suite 6-100, Baltimore, MD 21287. Email: [email protected].
Conflicts of Interest: By the WestJEM article submission agreement, all authors are required to disclose all affiliations, funding sources and financial or management relationships that could be perceived as potential sources of bias. No author has professional or financial relationships with any companies that are relevant to this study. There are no conflicts of interest or sources of funding to declare.
Copyright: © 2022 Gummerson et al. This is an open access article distributed in accordance with the terms of the Creative Commons Attribution (CC BY 4.0) License. See: http://creativecommons.org/licenses/by/4.0/
3. Sun BC, Hsia RY, Weiss RE, et al. Effect of emergency department crowding on outcomes of admitted patients. Ann Emerg Med. 2013;61(6):605-11.e6.
4. Horwitz LI, Green J, Bradley EH. US emergency department performance on wait time and length of visit. Ann Emerg Med. 2010;55(2):133-41.
5. Lee DC, Carr BG, Smith TE, Tran VC, Branas CC, Polsky DE. Explaining variations in emergency department volume: hospital-specific characteristics, hospital closures, and other relevant factors. Ann Emerg Med. 2013;62(4).
6. Hsia RY, Kellermann AL, Shen YC. Factors associated with closures of emergency departments in the United States. JAMA. 2011;305(19):1978-85.
7. Lee DC, Carr BG, Smith TE, et al. The impact of hospital closures and hospital and population characteristics on increasing emergency department volume: a geographic analysis. Popul Health Manag. 2015;18(6):459-66.
8. Shen YC, Hsia RY. Changes in emergency department access between 2001 and 2005 among general and vulnerable populations. Am J Public Health. 2010;100(8):1462-9.
9. Hsia RY, Shen YC. Rising closures of hospital trauma centers disproportionately burden vulnerable populations. Health Aff (Millwood). 2011;30(10):1912-20.
10. McLafferty S. Neighborhood characteristics and hospital closures. A comparison of the public private and voluntary hospital systems. Soc Sci Med. 1982;16(19):1667-74.
11. Hsia RY, Srebotnjak T, Kanzaria HK, et al. System-level health disparities in California emergency departments: minorities and Medicaid patients are at higher risk of losing their emergency departments. Ann Emerg Med. 2012;59(5):358-65.
12. Bazzoli GJ, Lee W, Hsieh HM, et al. The effects of safety net hospital closures and conversions on patient travel distance to hospital services. Health Serv Res. 2012;47(1 Pt 1):129-150.
13. Crandall M, Sharp D, Wei X, et al. Effects of closure of an urban Level I trauma centre on adjacent hospitals and local injury mortality: a retrospective, observational study. BMJ Open. 2016;6(5):e011700.
14. Hsia RY, Srebotnjak T, Maselli J, et al. The association of trauma center closures with increased inpatient mortality for injured patients. J Trauma Acute Care Surg. 2014;76(4):1048-54.
15. Liu C, Srebotnjak T, Hsia RY. California emergency department closures are associated with increased inpatient mortality at nearby hospitals. Health Aff (Millwood). 2014;33(8):1323-9.
16. John Snow Inc. Community Health and Health Systems Impact Assessment Related to the Closure of Memorial Hospital of Rhode Island (MHRI) Report. 2020. Available at: http://www.pawtucketri.com/sites/default/files/uploads/MHRI_Community%20Health%20and%20Health%20Systems%20Impact%20Assessment%20Final%20Report%20JSI%2002.05.2020.pdf. Accessed April 19, 2020.
17. Lawrence AC, Burke C, Brister J, et al. Evaluating the impact of hospital closure on local emergency department operations. R I Med J (2013). 2019;102(5):37-42.
REFERENCES 1. Rui P, Kang K, Ashman J. National Hospital Ambulatory Medical
Care Survey: 2016 emergency department summary tables. 2016. Available at: https://www.cdc.gov/nchs/data/nhamcs/web_tables/2016_ed_web_tables.pdf. Accessed February 5, 2019.
2. Hoot NR, Aronsky D. Systematic review of emergency department crowding: causes, effects, and solutions. Ann Emerg Med. 2008;52(2):126-36.
Western Journal of Emergency Medicine 374 Volume 23, no. 3: May 2022
ED Closure of Local Hospital Shifts Care of Homeless Patients to Nearby Hospitals Gummerson et al.
18. U.S. Department of Housing and Urban Development (HUD). 2019 AHAR: Part 1 - PIT Estimates of Homelessness in the U.S. 2020. Available at: https://www.hudexchange.info/resource/5948/2019-ahar-part-1-pit-estimates-of-homelessness-in-the-us/. Accessed April 17, 2020.
19. Salhi BA, White MH, Pitts SR, et al. Homelessness and emergency medicine: a review of the literature. Acad Emerg Med. 2018;25(5):577-93.
20. Hwang SW, Chambers C, Chiu S, et al. A comprehensive assessment of health care utilization among homeless adults under a system of universal health insurance. Am J Public Health. 2013;103 Suppl 2(Suppl 2):S294-S301.
21. Tadros A, Layman SM, Brewer MP, et al. A 5-year comparison of ED visits by homeless and nonhomeless patients. Am J Emerg Med. 2016;34(5):805-8.
22. Rodriguez RM, Fortman J, Chee C, et al. Food, shelter and safety
needs motivating homeless persons’ visits to an urban emergency department. Ann Emerg Med. 2009;53(5):598-602.
23. Mackelprang JL, Collins SE, Clifasefi SL. Housing First is associated with reduced use of emergency medical services. Prehosp Emerg Care. 2014;18(4):476-82.
24. Lin WC, Bharel M, Zhang J, et al. Frequent Emergency Department Visits and Hospitalizations Among Homeless People With Medicaid: Implications for Medicaid Expansion. Am J Public Health. 2015;105 Suppl 5(Suppl 5):S716-S722.
25. Moore DT, Rosenheck RA. Comprehensive services delivery and emergency department use among chronically homeless adults. Psychol Serv. 2017;14(2):184-92.
26. Sadowski LS, Kee RA, VanderWeele TJ, et al. Effect of a housing and case management program on emergency department visits and hospitalizations among chronically ill homeless adults: a randomized trial. JAMA. 2009;301(17):1771-8.
Volume 23, no. 3: May 2022 375 Western Journal of Emergency Medicine
Original Research
Falls in Older Adults Requiring Emergency Services: Mortality, Use of Healthcare Resources, and Prognostication to One Year
Craig D. Newgard, MD, MPH*Amber Lin, MS*Aaron B. Caughey, MD, PhD†
K. John McConnell, PhD‡
Eileen Bulger, MD§
Susan Malveau, MS*Kristan Staudenmayer, MD, MS¶
Denies Griffiths, BS*Elizabeth Eckstrom, MD, MPH||
Section Editor: Cameron Gettel, MD, MHS Submission history: Submitted August 3, 2021; Revision received September 10, 2021; Accepted November 19, 2021 Electronically published May 14, 2022 Full text available through open access at http://escholarship.org/uc/uciem_westjem DOI: 10.5811/westjem.2021.11.54327
INTRODUCTIONIn the United States 25% of older adults fall each
year,1,2 a portion of whom require ambulance transport to
Oregon Health & Science University, Center for Policy and Research in Emergency Medicine, Department of Emergency Medicine, Portland, OregonOregon Health & Science University, Department of Obstetrics and Gynecology, Portland, OregonOregon Health & Science University, Center for Health Systems Effectiveness, Department of Emergency Medicine, Portland, OregonUniversity of Washington, Department of Surgery, Seattle, WashingtonStanford University Medical Center, Department of Surgery, Palo Alto, CaliforniaOregon Health & Science University, Division of General Internal Medicine & Geriatrics, Portland, Oregon
*
†
‡
§
¶
||
Introduction: Older adults who fall commonly require emergency services, but research on long-term outcomes and prognostication is sparse. We evaluated older adults transported by ambulance after a fall in the Northwestern United States (US) and longitudinally tracked subsequent healthcare use, transitions to skilled nursing, hospice, mortality, and prognostication to one year.
Methods: This was a planned secondary analysis of a cohort study of community-dwelling older adults enrolled from January 1–December 31, 2011, with follow-up through December 31, 2012. We included all adults ≥ 65 years transported by 44 emergency medical services agencies in seven Northwest counties to 51 hospitals after a fall. We matched Medicare claims, state inpatient data, state trauma registry data, and death records. Outcomes included mortality, healthcare use, and new claims for skilled nursing and hospice to one year.
Results: There were 3,159 older adults, with 147 (4.7%) deaths within 30 days and 665 (21.1%) deaths within one year. There was an initial spike in inpatient days, followed by increases in skilled nursing and hospice. We identified four predictors of mortality: respiratory diagnosis; serious brain injury; baseline disability; and Charlson Comorbidity Index ≥ 2. Having any of these predictors was 96.6% sensitive (95% confidence interval [CI]: 95.7, 97.5%) and 21.4% specific (95% CI: 19.9, 22.9%) for 30-day mortality, and 91.6% sensitive (95% CI: 89.5, 93.8%). and 23.8% specific (95% CI: 22.1, 25.5%) for one-year mortality.
Conclusion: Community-dwelling older adults requiring ambulance transport after a fall have marked increases in healthcare use, institutionalized living, and mortality over the subsequent year. Most deaths occur following the acute care period and can be identified with high sensitivity at the time of the index visit, yet with low specificity. [West J Emerg Med. 2022;22(3)375–385.]
an emergency department (ED). Whether a fall requiring an ambulance represents a marker of declining health (eg, due to increasing comorbidity burden, cognitive impairment, or
Western Journal of Emergency Medicine 376 Volume 23, no. 3: May 2022
Falls in Older Adults Requiring Emergency Services Newgard et al.
Population Health Research Capsule
What do we already know about this issue?Although falls among older adults are common and frequently require emergency services, research on long-term outcomes and prognostication is sparse.
What was the research question?Among older adults who fall, what is healthcare use and mortality to one year? Can mortality be predicted during the index visit?
What was the major finding of the study?There was a large increase in healthcare services and death after a fall and mortality can be predicted during the index visit.
How does this improve population health?These findings provide practical information to guide clinicians, patients, and families about expectations in the year after a fall requiring ambulance transport.
progressive physical limitations) or a sentinel event indicating a more rapid downward trajectory (possibly from the fall itself) remains unclear. There is a growing body of research and guidelines on fall prevention,3,4 yet prognostication and the practical implications after a fall are not well understood. Guidance on these topics using real-world data would be useful to acute care physicians, primary care clinicians, patients, and families.
Among older adults injured by a variety of mechanisms and requiring ambulance transport, a fall mechanism was independently associated with death within one year.5 Other research has described the management and outcomes of older adults incurring a hip fracture from a fall.6 However, the effect of a fall on subsequent healthcare use, long-term mortality, and methods for risk-stratifying patients remain poorly described. We hypothesized that a fall requiring ambulance transport represents a sentinel event among older adults, portending increased need for healthcare resources, transitions in living environment, and high mortality. We also hypothesized that information available at the time of the index visit could be used to identify patients with high short- and long-term mortality risk.
In this study we analyzed a cohort of community-dwelling older adults requiring ambulance transport after a fall to evaluate subsequent healthcare use (ambulance transports, ED visits, inpatient days, skilled nursing days, and hospice), mortality, and mortality prognostication using information available during the index ED/hospital visit. We sought to generate practical information to guide clinicians, patients, and families about what to expect in the year after a fall requiring ambulance transport.
METHODSStudy Design
This was a planned secondary analysis of a retrospective cohort study5 reviewed and approved by institutional review boards in all study sites, with waiver of the requirement for informed consent. We used the Strengthening the Reporting of Observational Studies in Epidemiology (STROBE) cohort study guidelines.7
Study SettingWe conducted the study in seven counties in the
Northwestern US, including two major metropolitan areas Portland, Oregon and Seattle, Washington and two rural counties. Forty-four emergency medical services (EMS) agencies serve these counties and transport to 51 acute care hospitals. We included six additional hospitals after tracking interhospital transfers from the initial receiving facility. The 57 hospitals have varying capabilities and services, and included the following: three Level I trauma centers; seven Level II trauma centers; 10 Level III trauma hospitals; nine Level IV hospitals; one Level V hospital; and 27 non-trauma hospitals. In US trauma systems, Level I hospitals are equipped to care for
the most complex trauma patients. Level II, III, and IV hospitals each have sequentially fewer comprehensive resources and capacity to care for trauma patients.
Patient PopulationWe included consecutive, community-dwelling adults
≥ 65 years with Medicare fee-for-service coverage with a fall requiring ambulance transport to an acute care hospital from January 1–December 31, 2011, with follow-up through December 31, 2012. We required that patients had continuous Medicare fee-for-service coverage for one year before and after transport (or until death) to provide comprehensive information about baseline function, comorbidities, frailty, and healthcare utilization. Medicare patients without fee-for-service coverage (ie, Medicare Advantage) function under a different payment model that generates different claims data, which are less useful for research. We included patients regardless of the receiving hospital, their injury severity, or admission status. We restricted the sample to community-dwelling older adults to minimize the effect of patients with different goals of care (eg, institutionalized patients). We excluded patients with any of the following in the year prior to ambulance transport: skilled nursing facility (SNF) claim; hospice claim; or Provider Order for Life Sustaining Treatment (POLST) form specifying “limited interventions” or “comfort measures only” (Oregon only).

Volume 23, no. 3: May 2022 377 Western Journal of Emergency Medicine
Newgard et al. Falls in Older Adults Requiring Emergency Services
Data ProcessingWe collected EMS data as part of a prospective, all-
age cohort study evaluating field trauma-triage processes in the seven counties.8 We then used probabilistic linkage9 (LinkSolv, v.9.0.0190, Strategic Matching, Inc., Morrisonville, NY) to match the EMS data to state trauma registries (two), state hospital discharge databases (two), state death certificate data (two), and the Oregon electronic POLST registry. An external contractor for the Centers for Medicare and Medicaid Services deterministically matched the EMS data to Medicare claims data for one year before and after the date of 9-1-1 contact. We have validated the electronic data processing methods used in the study, including probabilistic linkage, multiple imputation, and development of key variables.10
VariablesWe included the following variables: age; gender; field
trauma-triage status; initial prehospital physiologic measures (Glasgow Coma Scale score, systolic blood pressure, respiratory rate, and heart rate); prehospital procedures; mode of transport (ground vs air); and initial receiving hospital. We calculated baseline health measures using Medicare claims and other record sources available for the year prior to ambulance transport, including the following: Charlson Comorbidity Index (CCI)11; individual comorbidities; modified Frailty Index;12 and a claims-based measure of functional disability.13,14 The claims-based disability measure was derived and validated in a Medicare population and represents the probability (from 0 to 1) of serious disability, with a threshold of 0.11 indicating limited self-care (confined to a bed or chair more than 50% of waking hours), or completely disabled.13,14 Finally, we quantified baseline healthcare use for the year prior to transport (ambulance transports, ED visits, and inpatient days).
We considered the initial ED visit associated with ambulance transport after the fall to be the “index” visit, whether or not a patient required admission. Variables from the index visit included the following: Abbreviated Injury Scale (AIS) score for different body regions;15 Injury Severity Score (ISS)15,16; International Classification of Diseases, 9th Rev, Clinical Modification (ICD-9-CM) diagnosis codes; ICD-9-CM procedure codes, categorized using the Agency for Healthcare Research and Quality Clinical Classification System (CCS);17 and interhospital transfer. Because AIS and ISS are not available in administrative data sources, we used a mapping function, the ICDPIC module for Stata v11 (StataCorp, College Station, TX) to convert ICD-9-CM diagnosis codes into injury severity measures,17 which has been validated.18 We also mapped ICD-9-CM diagnosis codes from the index visit to characterize common fracture patterns among older adults, including the following: femoral neck fractures; other femur fractures; pelvic fractures; tibia and fibula fractures; humerus fractures; and radius or ulna fractures. For hospital procedures, we combined CCS
categories into major non-orthopedic surgery (brain, spine, neck, chest, and abdominal-pelvic operations), orthopedic surgery, and blood transfusion.
OutcomesThe primary outcomes were mortality and healthcare
use from the date of ambulance transport to one year. We measured the following types of healthcare use: inpatient days; ambulance transports; ED visits; SNF days; and hospice days. Among patients who died within one year, we evaluated causes of death (including the primary cause and contributing factors) using ICD-9-CM diagnosis codes from matched death certificates and the location of death.
Data AnalysisWe used descriptive statistics to characterize patients,
diagnoses, procedures, healthcare use, and mortality. The percent missingness for variables ranged from 0– 28.4%, with most variables having less than 4% missing values and mortality with 0% missing (Supplemental eTable 1). To handle missing values and minimize bias, we used multiple imputation.19 We generated 10 multiple imputed datasets using flexible chains regression models21 (IVEware v0.1, University of Michigan, MI), and then combined the results using Rubin’s rules to account for overall variance.19
To derive a prognostication tool for short-term (30-day) and long-term (one-year) mortality, we used classification and regression tree (CART) analysis, v8.022 (Salford Systems, San Diego, CA). The CART analysis is a non-parametric method of binary recursive partitioning23 well suited for the development of clinical decision rules that classifies observations based on many possible predictor variables, including the identification of higher level interactions.22 It also allows for data-driven selection of cut-points for continuous variables, rather than reliance on pre-selected, arbitrary values. We selected misclassification costs and Gini splitting functions22 to derive a decision rule with a sensitivity ≥ 95%. The CART analysis uses the “cost-complexity” method for pruning decision trees, which prunes terminal nodes (lower branches) if the additional accuracy gained by the branch is minimal in comparison to tree complexity.22 We selected parameters for tree complexity that facilitated development of a practical and sensible decision tree that would be feasible for clinical use.
To reduce the potential for overfitting the dataset and to minimize bias, we used 10-fold cross-validation methods to select the final decision tree.24,25 Cross validation is a process that uses approximately 90% of the sample to derive the rule and 10% of the sample for validation, and then replicates this process until every patient has been used at least once to both derive and validate the decision tool. The CART analysis included 51 predictor variables with a goal of identifying 95% of patients dying within 30 days and (separately) within one year. We included all available predictors with known
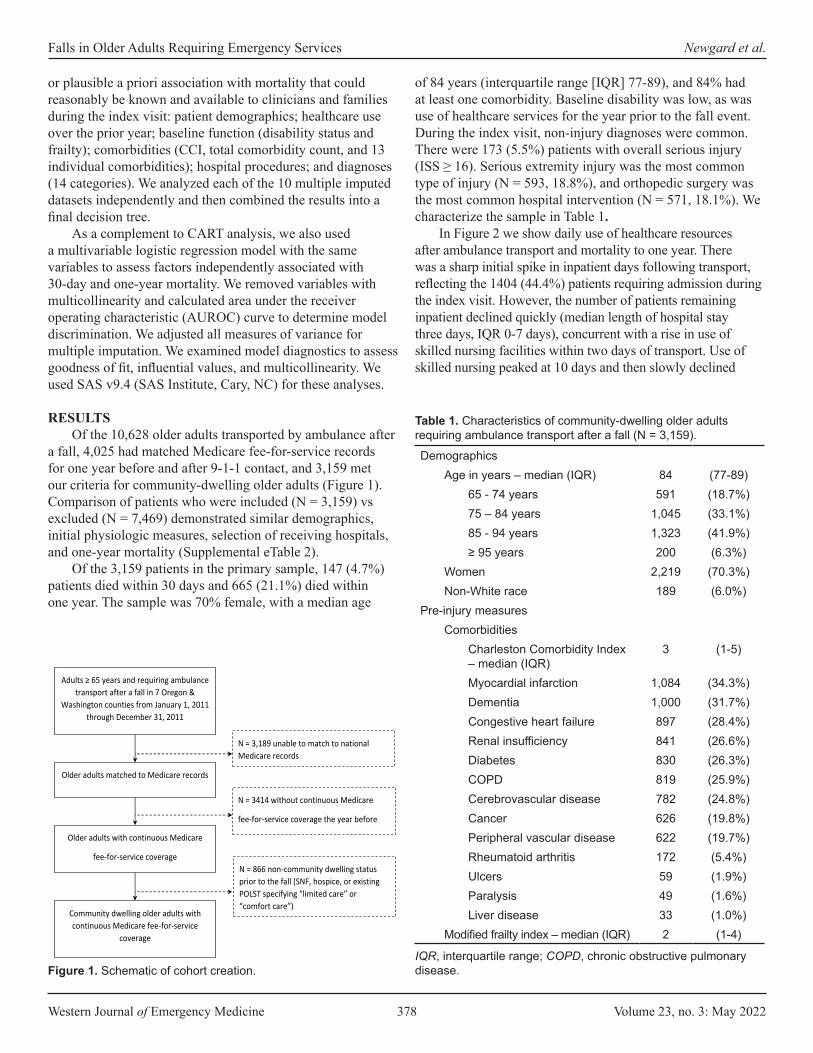
Western Journal of Emergency Medicine 378 Volume 23, no. 3: May 2022
Falls in Older Adults Requiring Emergency Services Newgard et al.
or plausible a priori association with mortality that could reasonably be known and available to clinicians and families during the index visit: patient demographics; healthcare use over the prior year; baseline function (disability status and frailty); comorbidities (CCI, total comorbidity count, and 13 individual comorbidities); hospital procedures; and diagnoses (14 categories). We analyzed each of the 10 multiple imputed datasets independently and then combined the results into a final decision tree.
As a complement to CART analysis, we also used a multivariable logistic regression model with the same variables to assess factors independently associated with 30-day and one-year mortality. We removed variables with multicollinearity and calculated area under the receiver operating characteristic (AUROC) curve to determine model discrimination. We adjusted all measures of variance for multiple imputation. We examined model diagnostics to assess goodness of fit, influential values, and multicollinearity. We used SAS v9.4 (SAS Institute, Cary, NC) for these analyses.
RESULTSOf the 10,628 older adults transported by ambulance after
a fall, 4,025 had matched Medicare fee-for-service records for one year before and after 9-1-1 contact, and 3,159 met our criteria for community-dwelling older adults (Figure 1). Comparison of patients who were included (N = 3,159) vs excluded (N = 7,469) demonstrated similar demographics, initial physiologic measures, selection of receiving hospitals, and one-year mortality (Supplemental eTable 2).
Of the 3,159 patients in the primary sample, 147 (4.7%) patients died within 30 days and 665 (21.1%) died within one year. The sample was 70% female, with a median age
of 84 years (interquartile range [IQR] 77-89), and 84% had at least one comorbidity. Baseline disability was low, as was use of healthcare services for the year prior to the fall event. During the index visit, non-injury diagnoses were common. There were 173 (5.5%) patients with overall serious injury (ISS ≥ 16). Serious extremity injury was the most common type of injury (N = 593, 18.8%), and orthopedic surgery was the most common hospital intervention (N = 571, 18.1%). We characterize the sample in Table 1.
In Figure 2 we show daily use of healthcare resources after ambulance transport and mortality to one year. There was a sharp initial spike in inpatient days following transport, reflecting the 1404 (44.4%) patients requiring admission during the index visit. However, the number of patients remaining inpatient declined quickly (median length of hospital stay three days, IQR 0-7 days), concurrent with a rise in use of skilled nursing facilities within two days of transport. Use of skilled nursing peaked at 10 days and then slowly declined
Figure 1. Schematic of cohort creation.
DemographicsAge in years – median (IQR) 84 (77-89)
65 - 74 years 591 (18.7%)75 – 84 years 1,045 (33.1%)85 - 94 years 1,323 (41.9%)≥ 95 years 200 (6.3%)
Women 2,219 (70.3%)Non-White race 189 (6.0%)
Pre-injury measuresComorbidities
Charleston Comorbidity Index – median (IQR)
3 (1-5)
Myocardial infarction 1,084 (34.3%)Dementia 1,000 (31.7%)Congestive heart failure 897 (28.4%)Renal insufficiency 841 (26.6%)Diabetes 830 (26.3%)COPD 819 (25.9%)Cerebrovascular disease 782 (24.8%)Cancer 626 (19.8%)Peripheral vascular disease 622 (19.7%)Rheumatoid arthritis 172 (5.4%)Ulcers 59 (1.9%)Paralysis 49 (1.6%)Liver disease 33 (1.0%)
Modified frailty index – median (IQR) 2 (1-4)
Table 1. Characteristics of community-dwelling older adults requiring ambulance transport after a fall (N = 3,159).
IQR, interquartile range; COPD, chronic obstructive pulmonary disease.
Adults ≥ 65 years and requiring ambulance
transport after a fall in 7 Oregon & Washington counties from January 1, 2011
through December 31, 2011
N = 10,628 N = 3,189 unable to match to national Medicare records
Older adults matched to Medicare records
N = 7,439
Older adults with continuous Medicare
fee-for-service coverage
Community dwelling older adults with continuous Medicare fee-for-service
coverage
N = 3,159
N = 3414 without continuous Medicare
fee-for-service coverage the year before and after the fall (or until death)
N = 866 non-community dwelling status prior to the fall (SNF, hospice, or existing POLST specifying “limited care” or “comfort care”)
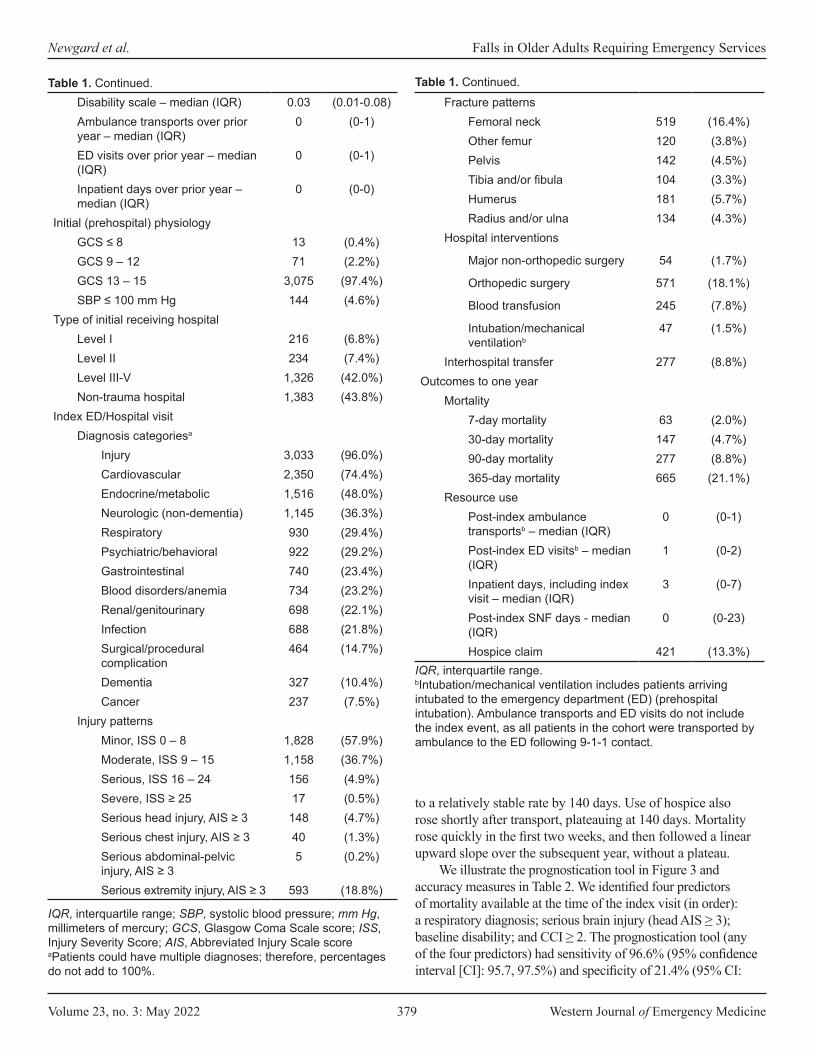
Volume 23, no. 3: May 2022 379 Western Journal of Emergency Medicine
Newgard et al. Falls in Older Adults Requiring Emergency Services
to a relatively stable rate by 140 days. Use of hospice also rose shortly after transport, plateauing at 140 days. Mortality rose quickly in the first two weeks, and then followed a linear upward slope over the subsequent year, without a plateau.
We illustrate the prognostication tool in Figure 3 and accuracy measures in Table 2. We identified four predictors of mortality available at the time of the index visit (in order): a respiratory diagnosis; serious brain injury (head AIS ≥ 3); baseline disability; and CCI ≥ 2. The prognostication tool (any of the four predictors) had sensitivity of 96.6% (95% confidence interval [CI]: 95.7, 97.5%) and specificity of 21.4% (95% CI:
Disability scale – median (IQR) 0.03 (0.01-0.08)Ambulance transports over prior year – median (IQR)
0 (0-1)
ED visits over prior year – median (IQR)
0 (0-1)
Inpatient days over prior year – median (IQR)
0 (0-0)
Initial (prehospital) physiologyGCS ≤ 8 13 (0.4%)GCS 9 – 12 71 (2.2%)GCS 13 – 15 3,075 (97.4%)SBP ≤ 100 mm Hg 144 (4.6%)
Type of initial receiving hospitalLevel I 216 (6.8%)Level II 234 (7.4%)Level III-V 1,326 (42.0%)Non-trauma hospital 1,383 (43.8%)
Index ED/Hospital visitDiagnosis categoriesa
Injury 3,033 (96.0%)Cardiovascular 2,350 (74.4%)Endocrine/metabolic 1,516 (48.0%)Neurologic (non-dementia) 1,145 (36.3%)Respiratory 930 (29.4%)Psychiatric/behavioral 922 (29.2%)Gastrointestinal 740 (23.4%)Blood disorders/anemia 734 (23.2%)Renal/genitourinary 698 (22.1%)Infection 688 (21.8%)Surgical/procedural complication
464 (14.7%)
Dementia 327 (10.4%)Cancer 237 (7.5%)
Injury patternsMinor, ISS 0 – 8 1,828 (57.9%)Moderate, ISS 9 – 15 1,158 (36.7%)Serious, ISS 16 – 24 156 (4.9%)Severe, ISS ≥ 25 17 (0.5%)Serious head injury, AIS ≥ 3 148 (4.7%)Serious chest injury, AIS ≥ 3 40 (1.3%)Serious abdominal-pelvic injury, AIS ≥ 3
5 (0.2%)
Serious extremity injury, AIS ≥ 3 593 (18.8%)
Fracture patternsFemoral neck 519 (16.4%)Other femur 120 (3.8%)Pelvis 142 (4.5%)Tibia and/or fibula 104 (3.3%)Humerus 181 (5.7%)Radius and/or ulna 134 (4.3%)
Hospital interventions
Major non-orthopedic surgery 54 (1.7%)
Orthopedic surgery 571 (18.1%)
Blood transfusion 245 (7.8%)
Intubation/mechanical ventilationb
47 (1.5%)
Interhospital transfer 277 (8.8%)Outcomes to one year
Mortality7-day mortality 63 (2.0%)30-day mortality 147 (4.7%)90-day mortality 277 (8.8%)365-day mortality 665 (21.1%)
Resource usePost-index ambulance transportsb – median (IQR)
0 (0-1)
Post-index ED visitsb – median (IQR)
1 (0-2)
Inpatient days, including index visit – median (IQR)
3 (0-7)
Post-index SNF days - median (IQR)
0 (0-23)
Hospice claim 421 (13.3%)
Table 1. Continued.
IQR, interquartile range; SBP, systolic blood pressure; mm Hg, millimeters of mercury; GCS, Glasgow Coma Scale score; ISS, Injury Severity Score; AIS, Abbreviated Injury Scale scoreaPatients could have multiple diagnoses; therefore, percentages do not add to 100%.
Table 1. Continued.
IQR, interquartile range.bIntubation/mechanical ventilation includes patients arriving intubated to the emergency department (ED) (prehospital intubation). Ambulance transports and ED visits do not include the index event, as all patients in the cohort were transported by ambulance to the ED following 9-1-1 contact.
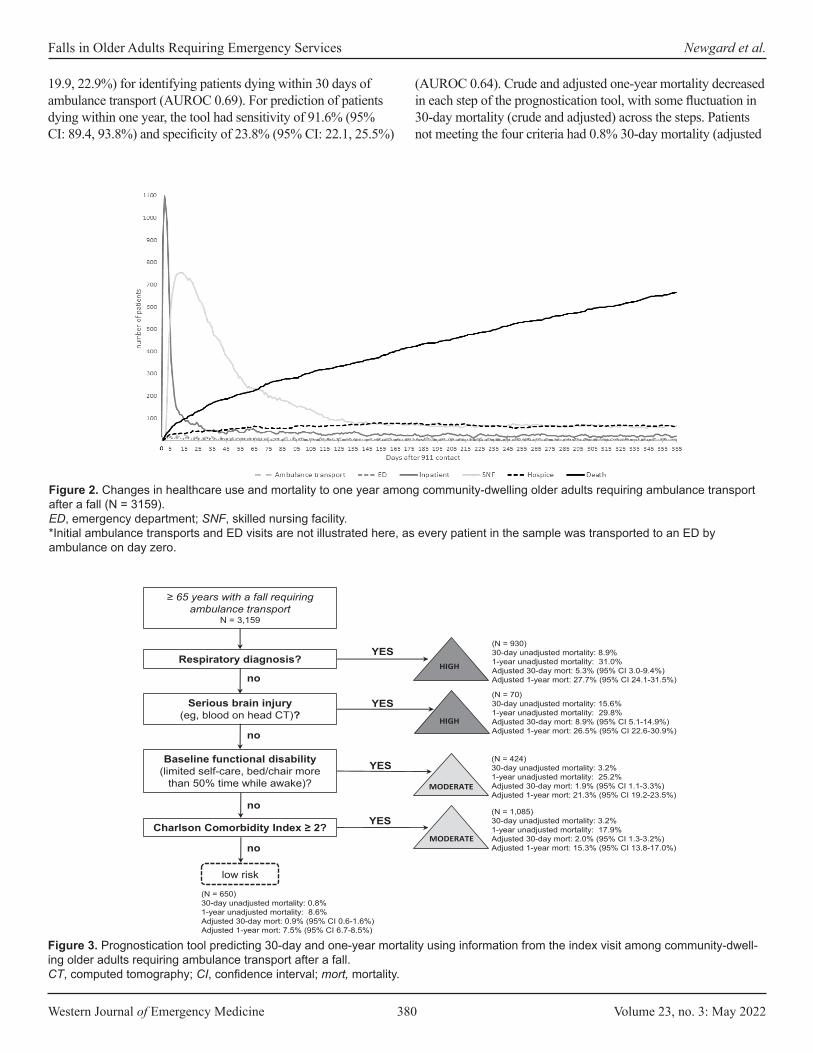
Western Journal of Emergency Medicine 380 Volume 23, no. 3: May 2022
Falls in Older Adults Requiring Emergency Services Newgard et al.
19.9, 22.9%) for identifying patients dying within 30 days of ambulance transport (AUROC 0.69). For prediction of patients dying within one year, the tool had sensitivity of 91.6% (95% CI: 89.4, 93.8%) and specificity of 23.8% (95% CI: 22.1, 25.5%)
(AUROC 0.64). Crude and adjusted one-year mortality decreased in each step of the prognostication tool, with some fluctuation in 30-day mortality (crude and adjusted) across the steps. Patients not meeting the four criteria had 0.8% 30-day mortality (adjusted
Figure 2. Changes in healthcare use and mortality to one year among community-dwelling older adults requiring ambulance transport after a fall (N = 3159).ED, emergency department; SNF, skilled nursing facility.*Initial ambulance transports and ED visits are not illustrated here, as every patient in the sample was transported to an ED by ambulance on day zero.
Figure 3. Prognostication tool predicting 30-day and one-year mortality using information from the index visit among community-dwell-ing older adults requiring ambulance transport after a fall.CT, computed tomography; CI, confidence interval; mort, mortality.
no
≥ 65 years with a fall requiring ambulance transport
N = 3,159
no
no
no
low risk
(N = 650)30-day unadjusted mortality: 0.8%1-year unadjusted mortality: 8.6%Adjusted 30-day mort: 0.9% (95% CI 0.6-1.6%)Adjusted 1-year mort: 7.5% (95% CI 6.7-8.5%)
Respiratory diagnosis?YES
(N = 930)30-day unadjusted mortality: 8.9%1-year unadjusted mortality: 31.0%Adjusted 30-day mort: 5.3% (95% CI 3.0-9.4%)Adjusted 1-year mort: 27.7% (95% CI 24.1-31.5%)
HIGH
YESSerious brain injury (eg, blood on head CT)?
(N = 70)30-day unadjusted mortality: 15.6%1-year unadjusted mortality: 29.8%Adjusted 30-day mort: 8.9% (95% CI 5.1-14.9%)Adjusted 1-year mort: 26.5% (95% CI 22.6-30.9%)
HIGH
Baseline functional disability (limited self-care, bed/chair more
than 50% time while awake)?
YES(N = 424)30-day unadjusted mortality: 3.2%1-year unadjusted mortality: 25.2%Adjusted 30-day mort: 1.9% (95% CI 1.1-3.3%)Adjusted 1-year mort: 21.3% (95% CI 19.2-23.5%)
MODERATE
Charlson Comorbidity Index ≥ 2? YES(N = 1,085)30-day unadjusted mortality: 3.2%1-year unadjusted mortality: 17.9%Adjusted 30-day mort: 2.0% (95% CI 1.3-3.2%)Adjusted 1-year mort: 15.3% (95% CI 13.8-17.0%)
MODERATE
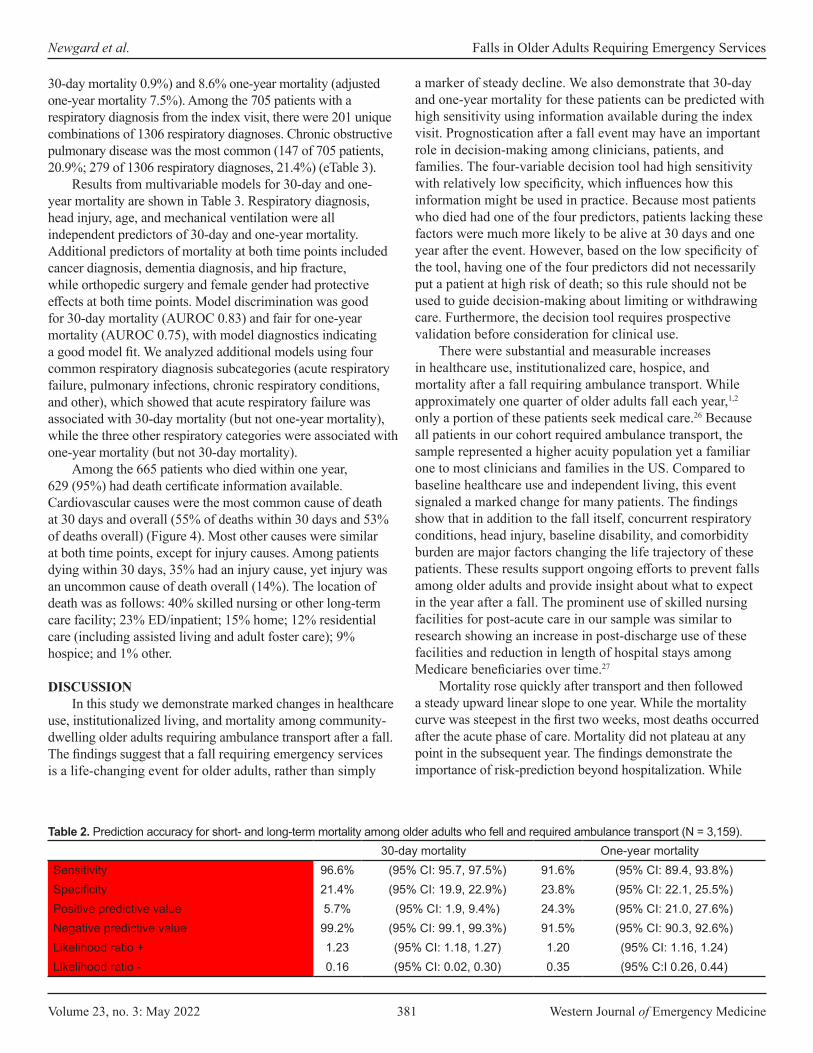
Volume 23, no. 3: May 2022 381 Western Journal of Emergency Medicine
Newgard et al. Falls in Older Adults Requiring Emergency Services
30-day mortality 0.9%) and 8.6% one-year mortality (adjusted one-year mortality 7.5%). Among the 705 patients with a respiratory diagnosis from the index visit, there were 201 unique combinations of 1306 respiratory diagnoses. Chronic obstructive pulmonary disease was the most common (147 of 705 patients, 20.9%; 279 of 1306 respiratory diagnoses, 21.4%) (eTable 3).
Results from multivariable models for 30-day and one-year mortality are shown in Table 3. Respiratory diagnosis, head injury, age, and mechanical ventilation were all independent predictors of 30-day and one-year mortality. Additional predictors of mortality at both time points included cancer diagnosis, dementia diagnosis, and hip fracture, while orthopedic surgery and female gender had protective effects at both time points. Model discrimination was good for 30-day mortality (AUROC 0.83) and fair for one-year mortality (AUROC 0.75), with model diagnostics indicating a good model fit. We analyzed additional models using four common respiratory diagnosis subcategories (acute respiratory failure, pulmonary infections, chronic respiratory conditions, and other), which showed that acute respiratory failure was associated with 30-day mortality (but not one-year mortality), while the three other respiratory categories were associated with one-year mortality (but not 30-day mortality).
Among the 665 patients who died within one year, 629 (95%) had death certificate information available. Cardiovascular causes were the most common cause of death at 30 days and overall (55% of deaths within 30 days and 53% of deaths overall) (Figure 4). Most other causes were similar at both time points, except for injury causes. Among patients dying within 30 days, 35% had an injury cause, yet injury was an uncommon cause of death overall (14%). The location of death was as follows: 40% skilled nursing or other long-term care facility; 23% ED/inpatient; 15% home; 12% residential care (including assisted living and adult foster care); 9% hospice; and 1% other.
DISCUSSIONIn this study we demonstrate marked changes in healthcare
use, institutionalized living, and mortality among community-dwelling older adults requiring ambulance transport after a fall. The findings suggest that a fall requiring emergency services is a life-changing event for older adults, rather than simply
a marker of steady decline. We also demonstrate that 30-day and one-year mortality for these patients can be predicted with high sensitivity using information available during the index visit. Prognostication after a fall event may have an important role in decision-making among clinicians, patients, and families. The four-variable decision tool had high sensitivity with relatively low specificity, which influences how this information might be used in practice. Because most patients who died had one of the four predictors, patients lacking these factors were much more likely to be alive at 30 days and one year after the event. However, based on the low specificity of the tool, having one of the four predictors did not necessarily put a patient at high risk of death; so this rule should not be used to guide decision-making about limiting or withdrawing care. Furthermore, the decision tool requires prospective validation before consideration for clinical use.
There were substantial and measurable increases in healthcare use, institutionalized care, hospice, and mortality after a fall requiring ambulance transport. While approximately one quarter of older adults fall each year,1,2 only a portion of these patients seek medical care.26 Because all patients in our cohort required ambulance transport, the sample represented a higher acuity population yet a familiar one to most clinicians and families in the US. Compared to baseline healthcare use and independent living, this event signaled a marked change for many patients. The findings show that in addition to the fall itself, concurrent respiratory conditions, head injury, baseline disability, and comorbidity burden are major factors changing the life trajectory of these patients. These results support ongoing efforts to prevent falls among older adults and provide insight about what to expect in the year after a fall. The prominent use of skilled nursing facilities for post-acute care in our sample was similar to research showing an increase in post-discharge use of these facilities and reduction in length of hospital stays among Medicare beneficiaries over time.27
Mortality rose quickly after transport and then followed a steady upward linear slope to one year. While the mortality curve was steepest in the first two weeks, most deaths occurred after the acute phase of care. Mortality did not plateau at any point in the subsequent year. The findings demonstrate the importance of risk-prediction beyond hospitalization. While
30-day mortality One-year mortalitySensitivity 96.6% (95% CI: 95.7, 97.5%) 91.6% (95% CI: 89.4, 93.8%)Specificity 21.4% (95% CI: 19.9, 22.9%) 23.8% (95% CI: 22.1, 25.5%)Positive predictive value 5.7% (95% CI: 1.9, 9.4%) 24.3% (95% CI: 21.0, 27.6%)Negative predictive value 99.2% (95% CI: 99.1, 99.3%) 91.5% (95% CI: 90.3, 92.6%)Likelihood ratio + 1.23 (95% CI: 1.18, 1.27) 1.20 (95% CI: 1.16, 1.24)Likelihood ratio - 0.16 (95% CI: 0.02, 0.30) 0.35 (95% C:I 0.26, 0.44)
Table 2. Prediction accuracy for short- and long-term mortality among older adults who fell and required ambulance transport (N = 3,159).
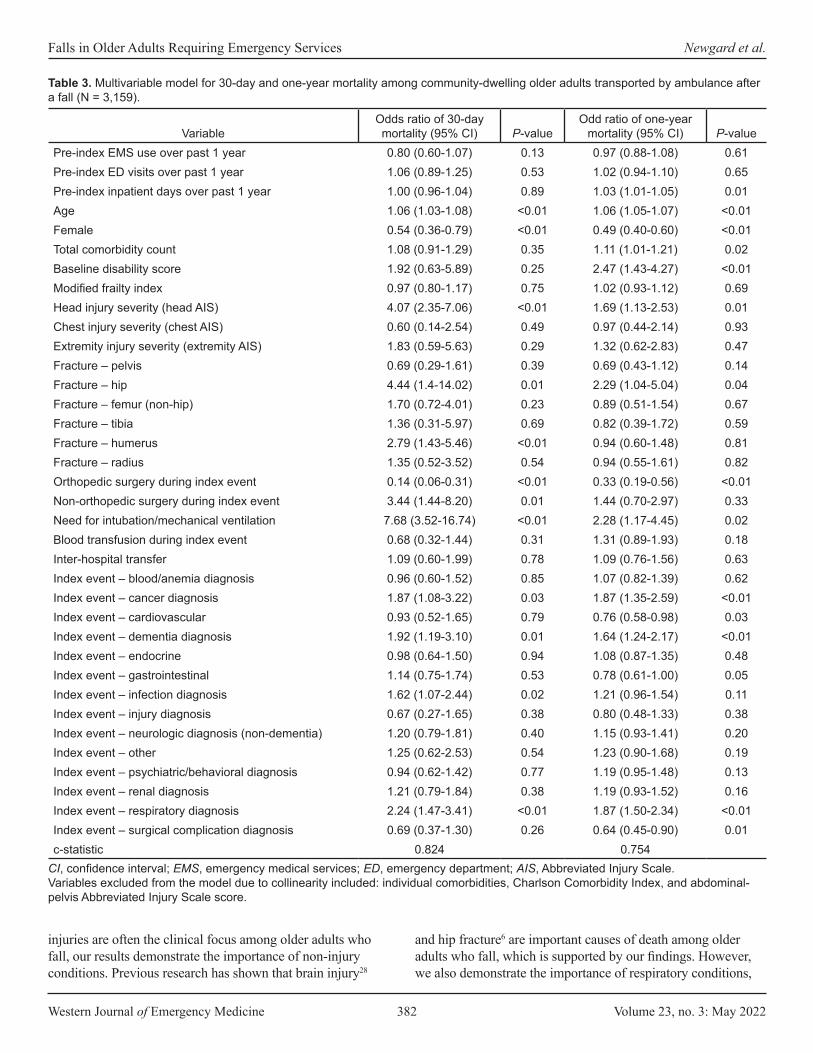
Western Journal of Emergency Medicine 382 Volume 23, no. 3: May 2022
Falls in Older Adults Requiring Emergency Services Newgard et al.
injuries are often the clinical focus among older adults who fall, our results demonstrate the importance of non-injury conditions. Previous research has shown that brain injury28
and hip fracture6 are important causes of death among older adults who fall, which is supported by our findings. However, we also demonstrate the importance of respiratory conditions,
VariableOdds ratio of 30-day mortality (95% CI) P-value
Odd ratio of one-year mortality (95% CI) P-value
Pre-index EMS use over past 1 year 0.80 (0.60-1.07) 0.13 0.97 (0.88-1.08) 0.61Pre-index ED visits over past 1 year 1.06 (0.89-1.25) 0.53 1.02 (0.94-1.10) 0.65Pre-index inpatient days over past 1 year 1.00 (0.96-1.04) 0.89 1.03 (1.01-1.05) 0.01Age 1.06 (1.03-1.08) <0.01 1.06 (1.05-1.07) <0.01Female 0.54 (0.36-0.79) <0.01 0.49 (0.40-0.60) <0.01Total comorbidity count 1.08 (0.91-1.29) 0.35 1.11 (1.01-1.21) 0.02Baseline disability score 1.92 (0.63-5.89) 0.25 2.47 (1.43-4.27) <0.01Modified frailty index 0.97 (0.80-1.17) 0.75 1.02 (0.93-1.12) 0.69Head injury severity (head AIS) 4.07 (2.35-7.06) <0.01 1.69 (1.13-2.53) 0.01Chest injury severity (chest AIS) 0.60 (0.14-2.54) 0.49 0.97 (0.44-2.14) 0.93Extremity injury severity (extremity AIS) 1.83 (0.59-5.63) 0.29 1.32 (0.62-2.83) 0.47Fracture – pelvis 0.69 (0.29-1.61) 0.39 0.69 (0.43-1.12) 0.14Fracture – hip 4.44 (1.4-14.02) 0.01 2.29 (1.04-5.04) 0.04Fracture – femur (non-hip) 1.70 (0.72-4.01) 0.23 0.89 (0.51-1.54) 0.67Fracture – tibia 1.36 (0.31-5.97) 0.69 0.82 (0.39-1.72) 0.59Fracture – humerus 2.79 (1.43-5.46) <0.01 0.94 (0.60-1.48) 0.81Fracture – radius 1.35 (0.52-3.52) 0.54 0.94 (0.55-1.61) 0.82Orthopedic surgery during index event 0.14 (0.06-0.31) <0.01 0.33 (0.19-0.56) <0.01Non-orthopedic surgery during index event 3.44 (1.44-8.20) 0.01 1.44 (0.70-2.97) 0.33Need for intubation/mechanical ventilation 7.68 (3.52-16.74) <0.01 2.28 (1.17-4.45) 0.02Blood transfusion during index event 0.68 (0.32-1.44) 0.31 1.31 (0.89-1.93) 0.18Inter-hospital transfer 1.09 (0.60-1.99) 0.78 1.09 (0.76-1.56) 0.63Index event – blood/anemia diagnosis 0.96 (0.60-1.52) 0.85 1.07 (0.82-1.39) 0.62Index event – cancer diagnosis 1.87 (1.08-3.22) 0.03 1.87 (1.35-2.59) <0.01Index event – cardiovascular 0.93 (0.52-1.65) 0.79 0.76 (0.58-0.98) 0.03Index event – dementia diagnosis 1.92 (1.19-3.10) 0.01 1.64 (1.24-2.17) <0.01Index event – endocrine 0.98 (0.64-1.50) 0.94 1.08 (0.87-1.35) 0.48Index event – gastrointestinal 1.14 (0.75-1.74) 0.53 0.78 (0.61-1.00) 0.05Index event – infection diagnosis 1.62 (1.07-2.44) 0.02 1.21 (0.96-1.54) 0.11Index event – injury diagnosis 0.67 (0.27-1.65) 0.38 0.80 (0.48-1.33) 0.38Index event – neurologic diagnosis (non-dementia) 1.20 (0.79-1.81) 0.40 1.15 (0.93-1.41) 0.20Index event – other 1.25 (0.62-2.53) 0.54 1.23 (0.90-1.68) 0.19Index event – psychiatric/behavioral diagnosis 0.94 (0.62-1.42) 0.77 1.19 (0.95-1.48) 0.13Index event – renal diagnosis 1.21 (0.79-1.84) 0.38 1.19 (0.93-1.52) 0.16Index event – respiratory diagnosis 2.24 (1.47-3.41) <0.01 1.87 (1.50-2.34) <0.01Index event – surgical complication diagnosis 0.69 (0.37-1.30) 0.26 0.64 (0.45-0.90) 0.01c-statistic 0.824 0.754
Table 3. Multivariable model for 30-day and one-year mortality among community-dwelling older adults transported by ambulance after a fall (N = 3,159).
CI, confidence interval; EMS, emergency medical services; ED, emergency department; AIS, Abbreviated Injury Scale.Variables excluded from the model due to collinearity included: individual comorbidities, Charlson Comorbidity Index, and abdominal-pelvis Abbreviated Injury Scale score.
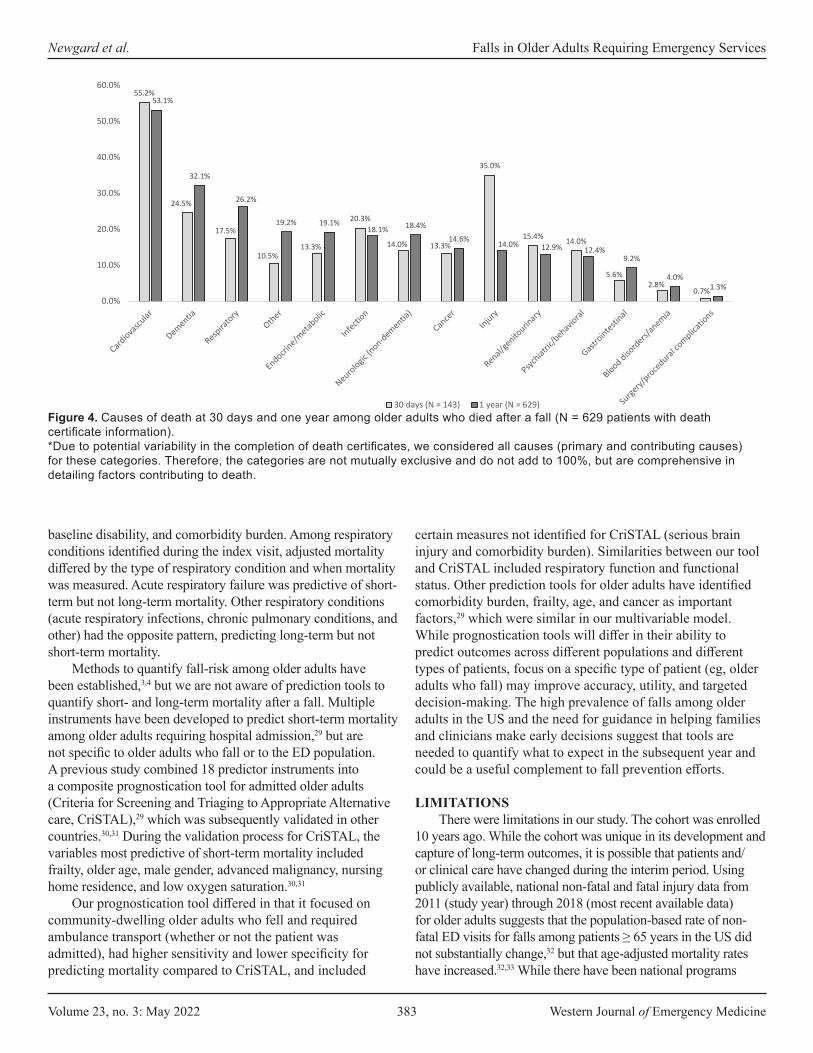
Volume 23, no. 3: May 2022 383 Western Journal of Emergency Medicine
Newgard et al. Falls in Older Adults Requiring Emergency Services
baseline disability, and comorbidity burden. Among respiratory conditions identified during the index visit, adjusted mortality differed by the type of respiratory condition and when mortality was measured. Acute respiratory failure was predictive of short-term but not long-term mortality. Other respiratory conditions (acute respiratory infections, chronic pulmonary conditions, and other) had the opposite pattern, predicting long-term but not short-term mortality.
Methods to quantify fall-risk among older adults have been established,3,4 but we are not aware of prediction tools to quantify short- and long-term mortality after a fall. Multiple instruments have been developed to predict short-term mortality among older adults requiring hospital admission,29 but are not specific to older adults who fall or to the ED population. A previous study combined 18 predictor instruments into a composite prognostication tool for admitted older adults (Criteria for Screening and Triaging to Appropriate Alternative care, CriSTAL),29 which was subsequently validated in other countries.30,31 During the validation process for CriSTAL, the variables most predictive of short-term mortality included frailty, older age, male gender, advanced malignancy, nursing home residence, and low oxygen saturation.30,31
Our prognostication tool differed in that it focused on community-dwelling older adults who fell and required ambulance transport (whether or not the patient was admitted), had higher sensitivity and lower specificity for predicting mortality compared to CriSTAL, and included
certain measures not identified for CriSTAL (serious brain injury and comorbidity burden). Similarities between our tool and CriSTAL included respiratory function and functional status. Other prediction tools for older adults have identified comorbidity burden, frailty, age, and cancer as important factors,29 which were similar in our multivariable model. While prognostication tools will differ in their ability to predict outcomes across different populations and different types of patients, focus on a specific type of patient (eg, older adults who fall) may improve accuracy, utility, and targeted decision-making. The high prevalence of falls among older adults in the US and the need for guidance in helping families and clinicians make early decisions suggest that tools are needed to quantify what to expect in the subsequent year and could be a useful complement to fall prevention efforts.
LIMITATIONSThere were limitations in our study. The cohort was enrolled
10 years ago. While the cohort was unique in its development and capture of long-term outcomes, it is possible that patients and/or clinical care have changed during the interim period. Using publicly available, national non-fatal and fatal injury data from 2011 (study year) through 2018 (most recent available data) for older adults suggests that the population-based rate of non-fatal ED visits for falls among patients ≥ 65 years in the US did not substantially change,32 but that age-adjusted mortality rates have increased.32,33 While there have been national programs
Figure 4. Causes of death at 30 days and one year among older adults who died after a fall (N = 629 patients with death certificate information).*Due to potential variability in the completion of death certificates, we considered all causes (primary and contributing causes) for these categories. Therefore, the categories are not mutually exclusive and do not add to 100%, but are comprehensive in detailing factors contributing to death.
55.2%
24.5%
17.5%
10.5%13.3%
20.3%
14.0% 13.3%
35.0%
15.4% 14.0%
5.6%2.8%
0.7%
53.1%
32.1%
26.2%
19.2% 19.1%18.1% 18.4%
14.6% 14.0% 12.9% 12.4%9.2%
4.0%1.3%
0.0%
10.0%
20.0%
30.0%
40.0%
50.0%
60.0%
30 days (N = 143) 1 year (N = 629)

Western Journal of Emergency Medicine 384 Volume 23, no. 3: May 2022
Falls in Older Adults Requiring Emergency Services Newgard et al.
implemented during this time to prevent falls (eg, the Stopping Elderly Accidents, Deaths & Injuries program4), we are unaware of widespread changes in the clinical care of older adults after a fall. We limited the sample to patients with matched Medicare fee-for-service records, which was necessary to evaluate baseline healthcare use, comorbidities, frailty, and functional status. However, restricting the sample in this way eliminated the population-based sampling used for the original cohort and may have introduced selection bias.
Comparison of patients included vs excluded from the sample demonstrated similar demographics, initial physiology, ambulance transport patterns, and one-year mortality. In addition, we used the mechanism of injury recorded by EMS at the time of the event, but the fall mechanism was not separated by ground-level, fall from height (eg, a ladder), or fall down stairs, and did not detail the type of landing surface. The sample was drawn largely from two metropolitan areas in the Northwestern US. It is possible that older adults in other regions or countries with differing demographics, baseline disability, or comorbidity burden may have different trajectories and prognostication after a fall. Finally, other analytic approaches (eg, machine learning) may be able to derive a tool with higher predictive performance and prospective validation of our prognosti-cation tool will be important before these results are considered for clinical care.
CONCLUSIONOur results show that a fall requiring ambulance transport
represents a major shift in the lives of many older adults, with increased use of healthcare services, need for institutionalized living, hospice, and high mortality in the following year. We also demonstrate that patients dying within 30 days and one year can be identified with high sensitivity using information available during the index visit, but with low specificity, which affects how such information might be used in practice. An abstract of the findings of this research was published for the Society for Academic Emergency Medicine Annual Meeting (May 2020).
Address for Correspondence: Craig D. Newgard, MD, MPH, Oregon Health & Science University, Department of Emergency Medicine, 3181 SW Sam Jackson Park Road, Mail code CR-114, Portland, OR 97239-3098. Email: [email protected].
Conflicts of Interest: By the WestJEM article submission agreement, all authors are required to disclose all affiliations, funding sources and financial or management relationships that could be perceived as potential sources of bias. The authors have no conflicts of interest. The study was funded by an AHRQ R01 grant (#R01HS023796, 5/1/2015-4/30/2019).
Copyright: © 2022 Newgard et al. This is an open access article distributed in accordance with the terms of the Creative Commons Attribution (CC BY 4.0) License. See: http://creativecommons.org/licenses/by/4.0/
REFERENCES1. Bergen G, Stevens MR, Burns ER. Falls and fall injuries among
adults aged >/=65 years - United States, 2014. MMWR Morb Mortal Wkly Rep. 2016;65(37):993-8.
2. Florence CS, Bergen G, Atherly A, et al. Medical costs of fatal and nonfatal falls in older adults. J Am Geriatr Soc. 2018;66(4):693-8.
3. Panel on Prevention of Falls in Older Persons AGS, British Geriatrics S. Summary of the updated American Geriatrics Society/British Geriatrics Society clinical practice guideline for prevention of falls in older persons. J Am Geriatr Soc. 2011;59(1):148-57.
4. Centers for Disease Control and Prevention. STEADI - Stopping Elderly Accidents, Deaths & Injuries, Older Adult Fall Prevention. Available at: https://www.cdc.gov/steadi/index.html. Accessed October 23, 2020.
5. Newgard CD, Lin A, Yanez ND, et al. Long-term outcomes among injured older adults transported by emergency medical services. Injury. 2019;50(6):1175-85.
6. Bhandari M, Swiontkowski M. Management of acute hip fracture. N Engl J Med. 2017;377(21):2053-62.
7. von Elm E, Altman DG, Egger M, et al. The Strengthening the Reporting of Observational Studies in Epidemiology (STROBE) statement: guidelines for reporting observational studies. J Clin Epidemiol. 2008;61(4):344-9.
8. Newgard CD, Fu R, Zive D, et al. Prospective validation of the National Field Triage Guidelines for Identifying Seriously Injured Persons. J Am Coll Surg. 2016;222(2):146-58.
9. Dean JM, Vernon DD, Cook L, et al. Probabilistic linkage of computerized ambulance and inpatient hospital discharge records: a potential tool for evaluation of emergency medical services. Ann Emerg Med. 2001;37(6):616-26.
10. Newgard CD, Malveau S, Zive D, et al. Building a longitudinal cohort from 9-1-1 to 1-year using existing data sources, probabilistic linkage, and multiple imputation: a validation study. Acad Emerg Med. 2018;25(11):1268-83.
11. Charlson ME, Pompei P, Ales KL, et al. A new method of classifying prognostic comorbidity in longitudinal studies: development and validation. J Chronic Dis. 1987;40(5):373-83.
12. Farhat JS, Velanovich V, Falvo AJ, et al. Are the frail destined to fail? Frailty index as predictor of surgical morbidity and mortality in the elderly. J Trauma Acute Care Surg. 2012;72(6):1526-31.
13. Davidoff AJ, Gardner LD, Zuckerman IH, et al. Validation of disability status, a claims-based measure of functional status for cancer treatment and outcomes studies. Med Care. 2014;52(6):500-10.
14. Davidoff AJ, Zuckerman IH, Pandya N, et al. A novel approach to improve health status measurement in observational claims-based studies of cancer treatment and outcomes. J Geriatr Oncol. 2013;4(2):157-65.
15. AAAM. The Abbreviated Injury Scale, 2005 Revision, Update 200816. Baker SP, O’Neill B, Haddon W Jr, et al. The Injury Severity Score: a
method for describing patients with multiple injuries and evaluating emergency care. J Trauma. 1974;14(3):187-96.
17. Agency for Healthcare Research and Quality. HCUP Clinical
Volume 23, no. 3: May 2022 385 Western Journal of Emergency Medicine
Newgard et al. Falls in Older Adults Requiring Emergency Services
Classifications Software (CCS) for ICD-9-CM. Available at: https://www.hcup-us.ahrq.gov/toolssoftware/ccs/ccs.jsp. Published 2017. Accessed January 8, 2018.
18. Fleischman RJ, Mann NC, Dai M, et al. Validating the use of ICD-9 Code mapping to generate Injury Severity Scores. J Trauma Nurs. 2017;24(1):4-14.
19. Rubin D. (1987). Multiple Imputation for Nonresponse in Surveys. Hoboken, NJ: John Wiley & Sons, Inc.
20. Newgard CD. The validity of using multiple imputation for missing out-of-hospital data in a state trauma registry. Acad Emerg Med. 2006;13(3):314-24.
21. Raghunathan T, Lepkowski, Van Hoewyk J, et al. A multivariate technique for multiply imputing missing values using a sequence of regression models. Surv Methodol. 2001;27:85-95.
22. Breiman L FJ, Stone CJ, Olshen RA. (1984). Classification and Regression Trees. New York: Chapman and Hall.
23. Hothorn THK, Zeileis A. Unbiased recursive partitioning: a conditional inference framework. J Comput Graphi Stat. 2006;15(3):651-74.
24. Efron B. (1982). The Jackknife, the Bootstrap and Other Resampling Plans. Philadelphia: Society for Industrial and Applied Mathematics.
25. Stone M. Cross-validatory choice and the assessment of statistical predictions. J Roy Stat Soc B. 1974;36:111-47.
26. Stevens JA, Ballesteros MF, Mack KA, et al. Gender differences in
seeking care for falls in the aged Medicare population. Am J Prev Med. 2012;43(1):59-62.
27. Werner RM, Konetzka RT. Trends in post-acute care use among Medicare beneficiaries: 2000 to 2015. JAMA. 2018;319(15):1616-7.
28. Chisholm KM, Harruff RC. Elderly deaths due to ground-level falls. Am J Forensic Med Pathol. 2010;31(4):350-4.
29. Cardona-Morrell M, Hillman K. Development of a tool for defining and identifying the dying patient in hospital: Criteria for Screening and Triaging to Appropriate aLternative care (CriSTAL). BMJ Support Palliat Care. 2015;5(1):78-90.
30. Cardona M, Lewis ET, Kristensen MR, et al. Predictive validity of the CriSTAL tool for short-term mortality in older people presenting at Emergency Departments: a prospective study. Eur Geriatr Med. 2018;9(6):891-901.
31. Cardona M, O’Sullivan M, Lewis ET, et al. Prospective validation of a checklist to predict short-term death in older patients after emergency department admission in Australia and Ireland. Acad Emerg Med. 2019;26(6):610-20.
32. Centers for Disease Control and Prevention. WISQARS - Web-based Injury Statistics Query and Reporting System. Available at: https://www.cdc.gov/injury/wisqars/index.html. Accessed April 9, 2021.
33. Burns E, Kakara R. Deaths from falls among persons aged >/=65 years - United States, 2007-2016. MMWR Morb Mortal Wkly Rep. 2018;67(18):509-14.
Western Journal of Emergency Medicine 386 Volume 23, no. 3: May 2022
Original Research
Attitudes on Methadone Utilization in the Emergency Department: A Physician Cross-sectional Study
Jessica Heil, MS*†
Valerie S. Ganetsky, PharmD, MSc†
Matthew S. Salzman, MD†‡
Krystal Hunter, PhD*Kaitlan E. Baston, MD, MSc†
Gerard Carroll, MD, EMT-P‡
Eric Ketcham, MD, MBA§
Rachel Haroz, MD†‡
Section Editor: Nicholas Pettit, DO, PhD Submission history: Submitted September 14, 2021; Revision received January 26, 2022; Accepted February 13, 2022 Electronically published April 4, 2022 Full text available through open access at http://escholarship.org/uc/uciem_westjem DOI: 10.5811/westjem.2022.2.54681
INTRODUCTIONThe opioid epidemic in the United States (US) continues
to be a major public health crisis, claiming lives at an alarming rate. In 2019 there were more than 70,000 drug overdose deaths in the US. Of these fatalities, nearly 70% involved opioids.1 In 2020 overall drug overdose mortality increased by nearly 30% from 2019.2 In addition to the substantial human toll of the opioid epidemic, the associated healthcare, criminal justice, and other societal costs were estimated to be almost $820 billion in 2019.3 The economic and human
Cooper University Health Care, Cooper Research Institute, Camden, New JerseyCooper University Health Care, Center for Healing, Division of Addiction Medicine, Camden, New JerseyCooper University Health Care, Department of Emergency Medicine, Division of Addiction Medicine and Medical Toxicology, Camden, New JerseyPresbyterian Healthcare System, Departments of Emergency Medicine and Behavioral Health, Albuquerque, New Mexico
*†
‡
§
Introduction: Like buprenorphine, methadone is a life-saving medication that can be initiated in the emergency department (ED) to treat patients with an opioid use disorder (OUD). The purpose of this study was to better understand the attitudes of emergency physicians (EP) on offering methadone compared to buprenorphine to patients with OUD in the ED.
Methods: We distributed a perception survey to emergency physicians through a national professional network.
Results: In this study, the response rate was 18.4% (N = 141), with nearly 70% of the EPs having ordered either buprenorphine or methadone. 75% of EPs strongly or somewhat agreed that buprenorphine was an appropriate treatment for opioid withdrawal and craving, while only 28% agreed that methadone was an appropriate treatment. The perceived barriers to using buprenorphine and methadone in the ED were similar.
Conclusion: It is essential to create interventions for EPs to overcome stigma and barriers to methadone initiation in the ED for patients with opioid use disorder. Doing so will offer additional opportunities and pathways for initiation of multiple effective medications for OUD in the ED. Subsequent outpatient treatment linkage may lead to improved treatment retention and decreased morbidity and mortality from ongoing use. [West J Emerg Med. 2022;22(3)386–395.]
loss is devastating in light of available Food and Drug Administration-approved, evidence-based medications for opioid use disorder (MOUD), including buprenorphine and methadone. However, over 70% of patients with opioid use disorder (OUD) are not receiving these treatments.4
The emergency department (ED) remains the safety net and point of entry into the healthcare system for many patients struggling with substance use disorders (SUD). Visits to the ED for opioid overdoses continue to increase. Between 1999–2012, opioid-related encounters in US EDs increased by 170%.5

Volume 23, no. 3: May 2022 387 Western Journal of Emergency Medicine
Heil et al. Attitudes on Methadone Utilization in the ED
Population Health Research Capsule
What do we already know about this issue?Buprenorphine and methadone are effective medications to treat opioid use disorder (OUD), but only buprenorphine has been studied in the Emergency Department (ED).
What was the research question?Do emergency physicians (EP) prefer to treat OUD in the ED with buprenorphine over methadone?
What was the major finding of the study?Seventy-five percent of EP’s agreed that buprenorphine was an appropriate treatment for OUD, while only 28% agreed that methadone was an appropriate treatment.
How does this improve population health?Using this data, interventions could be created to increase methadone initiation in the ED, thus creating more treatment pathways for people with OUD.
Mortality rates after ED visits for nonfatal opioid overdoses are high; greater than 5% of patients die within one year, with the highest risk period being the first month post-overdose.6 As the ED is often the only point of entry into the healthcare system for patients with OUD, there is a tremendous opportunity to reduce treatment gaps through ED-based MOUD initiation and early referral to long-term treatment. 7
Buprenorphine and methadone are both evidence-based treatments for OUD that effectively treat opioid withdrawal symptoms, decrease illicit opioid use, and reduce opioid overdose-related mortality.8-11 Buprenorphine, a partial μ-opioid agonist with high receptor affinity, is the most common form of MOUD used to initiate treatment in the ED. 12 Buprenorphine initiation in the ED and referral to outpatient treatment has been shown to be safe and effective, with increased addiction-treatment engagement at 30 days after discharge compared to brief intervention with referral or referral-only interventions.13 Although adoption of this practice has been slow, recently published surveys found substantial support for ED-initiated buprenorphine among emergency physicians (EP).14-16 Likewise, the American College of Emergency Physicians (ACEP) and the American Academy of Emergency Medicine published position statements recommending that EPs initiate patients on buprenorphine in the ED and offer linkage to outpatient follow-up treatment.12,17
Methadone, a full μ-opioid agonist, is the most studied MOUD and has been used for over 50 years to treat OUD.18 The number of facilities offering buprenorphine increased by an average of 9% annually between 2009–2018, while the number of facilities that offered methadone only increased by an average of 2% per year.19 Although methadone is associated with higher treatment retention rates than buprenorphine, methadone carries a considerable social stigma among clinicians because patients treated with methadone are perceived to be more medically complex and therefore difficult to treat.11,20 In addition to stigma, access to methadone is more difficult because it must be obtained daily and in person at an opioid treatment program (OTP), while buprenorphine can be prescribed in an office-based setting by an X-waivered physician.18
Whereas ED-based buprenorphine initiation with long-term treatment linkage has been previously described, data is lacking on methadone initiation in the ED.13 To date, there is only one study evaluating low-dose intramuscular administration of methadone to treat opioid withdrawal syndrome in the ED.21 While buprenorphine is more commonly initiated in the ED, methadone is a life-saving alternative treatment option that may be preferred by patients who have not been successful with buprenorphine in managing their OUD. 22 Creating more opportunities and pathways for initiation of multiple effective forms of MOUD in the ED and subsequent outpatient treatment linkage may lead to improved treatment retention, as well as decreased morbidity and mortality associated with ongoing opioid
use. Thus, it is vital to get EPs’ perspectives on ED-based methadone initiation for patients with OUD.
The purpose of this study was to better understand the attitudes of EPs on offering methadone compared to buprenorphine to patients with OUD in the ED. We tested the hypothesis that EP survey respondents would express preferences for buprenorphine over methadone.
METHODSOverview
We conducted a cross-sectional survey of EPs to quantify their opinions, using a five-point Likert scale, regarding the prescribing of buprenorphine and the dosing of methadone in the ED. We did this by creating a survey based on similar work that measured EPs’ willingness to initiate buprenorphine in the ED.14 We sent our survey via email to all members of the ACEP Emergency Medicine Practice Research Network (EMPRN), which during the past several years has had approximately 700 to 1200 members. Our institutional review board approved this study and waived informed consent.
SubjectsMembers of ACEP EMPRN are board-certified EPs
who represent a cross-section of EPs in the US. Members of EMPRN are asked to participate in surveys distributed via email several times per year.
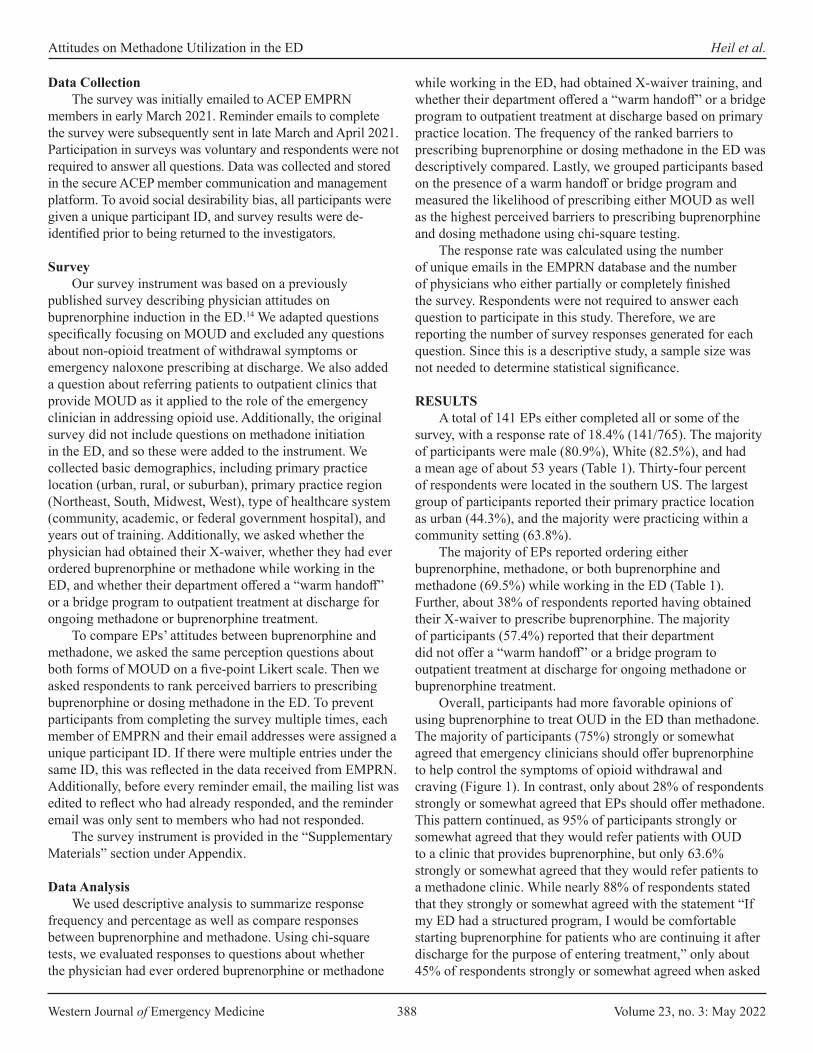
Western Journal of Emergency Medicine 388 Volume 23, no. 3: May 2022
Attitudes on Methadone Utilization in the ED Heil et al.
Data CollectionThe survey was initially emailed to ACEP EMPRN
members in early March 2021. Reminder emails to complete the survey were subsequently sent in late March and April 2021. Participation in surveys was voluntary and respondents were not required to answer all questions. Data was collected and stored in the secure ACEP member communication and management platform. To avoid social desirability bias, all participants were given a unique participant ID, and survey results were de-identified prior to being returned to the investigators.
SurveyOur survey instrument was based on a previously
published survey describing physician attitudes on buprenorphine induction in the ED.14 We adapted questions specifically focusing on MOUD and excluded any questions about non-opioid treatment of withdrawal symptoms or emergency naloxone prescribing at discharge. We also added a question about referring patients to outpatient clinics that provide MOUD as it applied to the role of the emergency clinician in addressing opioid use. Additionally, the original survey did not include questions on methadone initiation in the ED, and so these were added to the instrument. We collected basic demographics, including primary practice location (urban, rural, or suburban), primary practice region (Northeast, South, Midwest, West), type of healthcare system (community, academic, or federal government hospital), and years out of training. Additionally, we asked whether the physician had obtained their X-waiver, whether they had ever ordered buprenorphine or methadone while working in the ED, and whether their department offered a “warm handoff” or a bridge program to outpatient treatment at discharge for ongoing methadone or buprenorphine treatment.
To compare EPs’ attitudes between buprenorphine and methadone, we asked the same perception questions about both forms of MOUD on a five-point Likert scale. Then we asked respondents to rank perceived barriers to prescribing buprenorphine or dosing methadone in the ED. To prevent participants from completing the survey multiple times, each member of EMPRN and their email addresses were assigned a unique participant ID. If there were multiple entries under the same ID, this was reflected in the data received from EMPRN. Additionally, before every reminder email, the mailing list was edited to reflect who had already responded, and the reminder email was only sent to members who had not responded.
The survey instrument is provided in the “Supplementary Materials” section under Appendix.
Data AnalysisWe used descriptive analysis to summarize response
frequency and percentage as well as compare responses between buprenorphine and methadone. Using chi-square tests, we evaluated responses to questions about whether the physician had ever ordered buprenorphine or methadone
while working in the ED, had obtained X-waiver training, and whether their department offered a “warm handoff” or a bridge program to outpatient treatment at discharge based on primary practice location. The frequency of the ranked barriers to prescribing buprenorphine or dosing methadone in the ED was descriptively compared. Lastly, we grouped participants based on the presence of a warm handoff or bridge program and measured the likelihood of prescribing either MOUD as well as the highest perceived barriers to prescribing buprenorphine and dosing methadone using chi-square testing.
The response rate was calculated using the number of unique emails in the EMPRN database and the number of physicians who either partially or completely finished the survey. Respondents were not required to answer each question to participate in this study. Therefore, we are reporting the number of survey responses generated for each question. Since this is a descriptive study, a sample size was not needed to determine statistical significance.
RESULTSA total of 141 EPs either completed all or some of the
survey, with a response rate of 18.4% (141/765). The majority of participants were male (80.9%), White (82.5%), and had a mean age of about 53 years (Table 1). Thirty-four percent of respondents were located in the southern US. The largest group of participants reported their primary practice location as urban (44.3%), and the majority were practicing within a community setting (63.8%).
The majority of EPs reported ordering either buprenorphine, methadone, or both buprenorphine and methadone (69.5%) while working in the ED (Table 1). Further, about 38% of respondents reported having obtained their X-waiver to prescribe buprenorphine. The majority of participants (57.4%) reported that their department did not offer a “warm handoff” or a bridge program to outpatient treatment at discharge for ongoing methadone or buprenorphine treatment.
Overall, participants had more favorable opinions of using buprenorphine to treat OUD in the ED than methadone. The majority of participants (75%) strongly or somewhat agreed that emergency clinicians should offer buprenorphine to help control the symptoms of opioid withdrawal and craving (Figure 1). In contrast, only about 28% of respondents strongly or somewhat agreed that EPs should offer methadone. This pattern continued, as 95% of participants strongly or somewhat agreed that they would refer patients with OUD to a clinic that provides buprenorphine, but only 63.6% strongly or somewhat agreed that they would refer patients to a methadone clinic. While nearly 88% of respondents stated that they strongly or somewhat agreed with the statement “If my ED had a structured program, I would be comfortable starting buprenorphine for patients who are continuing it after discharge for the purpose of entering treatment,” only about 45% of respondents strongly or somewhat agreed when asked
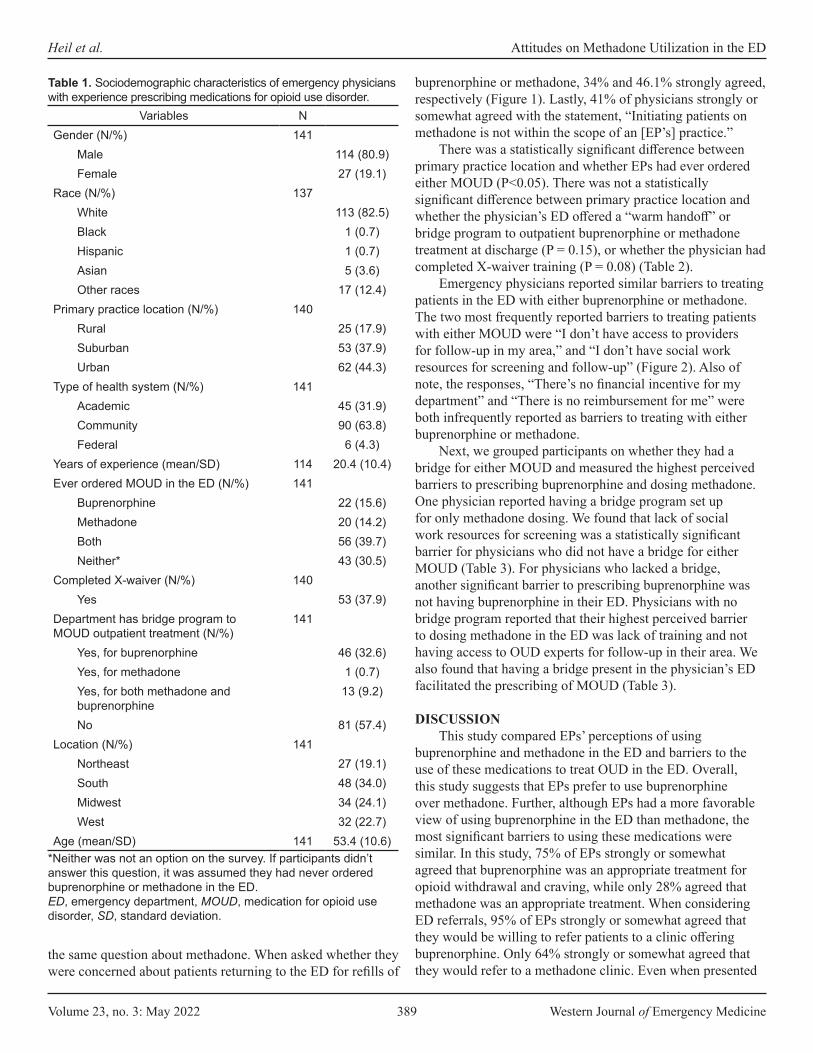
Volume 23, no. 3: May 2022 389 Western Journal of Emergency Medicine
Heil et al. Attitudes on Methadone Utilization in the ED
buprenorphine or methadone, 34% and 46.1% strongly agreed, respectively (Figure 1). Lastly, 41% of physicians strongly or somewhat agreed with the statement, “Initiating patients on methadone is not within the scope of an [EP’s] practice.”
There was a statistically significant difference between primary practice location and whether EPs had ever ordered either MOUD (P<0.05). There was not a statistically significant difference between primary practice location and whether the physician’s ED offered a “warm handoff” or bridge program to outpatient buprenorphine or methadone treatment at discharge (P = 0.15), or whether the physician had completed X-waiver training (P = 0.08) (Table 2).
Emergency physicians reported similar barriers to treating patients in the ED with either buprenorphine or methadone. The two most frequently reported barriers to treating patients with either MOUD were “I don’t have access to providers for follow-up in my area,” and “I don’t have social work resources for screening and follow-up” (Figure 2). Also of note, the responses, “There’s no financial incentive for my department” and “There is no reimbursement for me” were both infrequently reported as barriers to treating with either buprenorphine or methadone.
Next, we grouped participants on whether they had a bridge for either MOUD and measured the highest perceived barriers to prescribing buprenorphine and dosing methadone. One physician reported having a bridge program set up for only methadone dosing. We found that lack of social work resources for screening was a statistically significant barrier for physicians who did not have a bridge for either MOUD (Table 3). For physicians who lacked a bridge, another significant barrier to prescribing buprenorphine was not having buprenorphine in their ED. Physicians with no bridge program reported that their highest perceived barrier to dosing methadone in the ED was lack of training and not having access to OUD experts for follow-up in their area. We also found that having a bridge present in the physician’s ED facilitated the prescribing of MOUD (Table 3).
DISCUSSIONThis study compared EPs’ perceptions of using
buprenorphine and methadone in the ED and barriers to the use of these medications to treat OUD in the ED. Overall, this study suggests that EPs prefer to use buprenorphine over methadone. Further, although EPs had a more favorable view of using buprenorphine in the ED than methadone, the most significant barriers to using these medications were similar. In this study, 75% of EPs strongly or somewhat agreed that buprenorphine was an appropriate treatment for opioid withdrawal and craving, while only 28% agreed that methadone was an appropriate treatment. When considering ED referrals, 95% of EPs strongly or somewhat agreed that they would be willing to refer patients to a clinic offering buprenorphine. Only 64% strongly or somewhat agreed that they would refer to a methadone clinic. Even when presented
Variables NGender (N/%) 141
Male 114 (80.9)Female 27 (19.1)
Race (N/%) 137White 113 (82.5)Black 1 (0.7)Hispanic 1 (0.7)Asian 5 (3.6)Other races 17 (12.4)
Primary practice location (N/%) 140Rural 25 (17.9)Suburban 53 (37.9)Urban 62 (44.3)
Type of health system (N/%) 141Academic 45 (31.9)Community 90 (63.8)Federal 6 (4.3)
Years of experience (mean/SD) 114 20.4 (10.4)Ever ordered MOUD in the ED (N/%) 141
Buprenorphine 22 (15.6)Methadone 20 (14.2)Both 56 (39.7)Neither* 43 (30.5)
Completed X-waiver (N/%) 140Yes 53 (37.9)
Department has bridge program to MOUD outpatient treatment (N/%)
141
Yes, for buprenorphine 46 (32.6)Yes, for methadone 1 (0.7)Yes, for both methadone and buprenorphine
13 (9.2)
No 81 (57.4)Location (N/%) 141
Northeast 27 (19.1)South 48 (34.0)Midwest 34 (24.1)West 32 (22.7)
Age (mean/SD) 141 53.4 (10.6)
Table 1. Sociodemographic characteristics of emergency physicians with experience prescribing medications for opioid use disorder.
*Neither was not an option on the survey. If participants didn’t answer this question, it was assumed they had never ordered buprenorphine or methadone in the ED.ED, emergency department, MOUD, medication for opioid use disorder, SD, standard deviation.
the same question about methadone. When asked whether they were concerned about patients returning to the ED for refills of
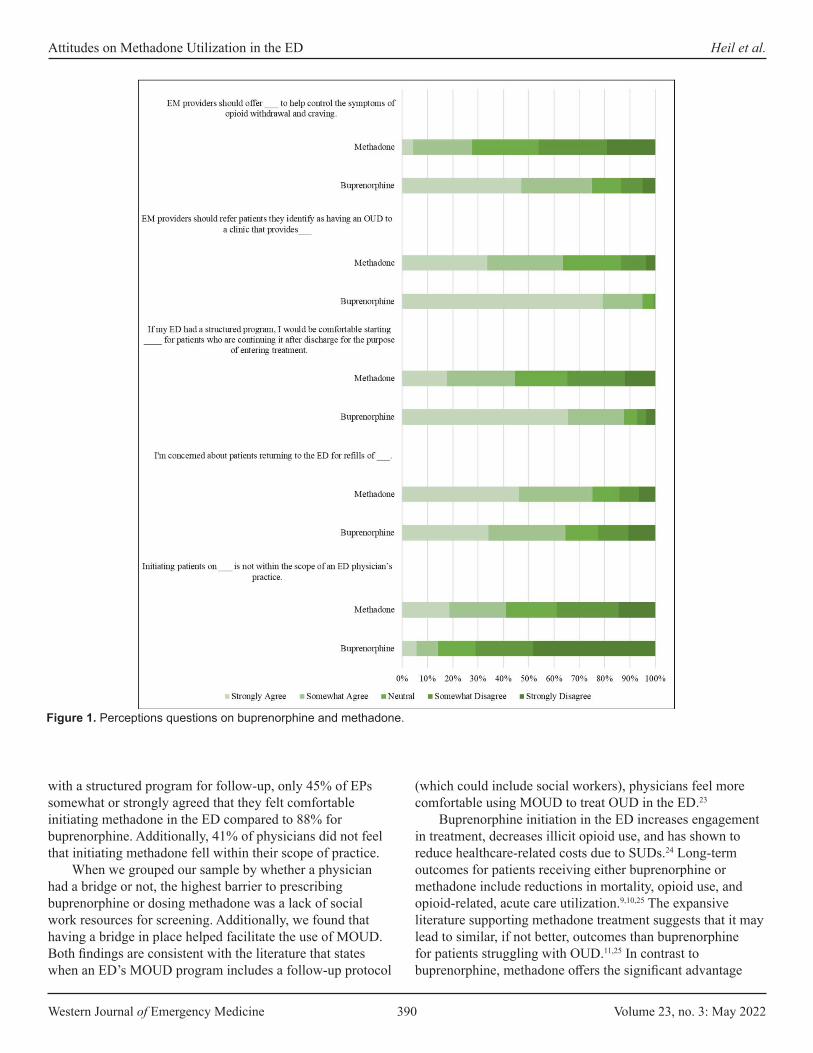
Western Journal of Emergency Medicine 390 Volume 23, no. 3: May 2022
Attitudes on Methadone Utilization in the ED Heil et al.
with a structured program for follow-up, only 45% of EPs somewhat or strongly agreed that they felt comfortable initiating methadone in the ED compared to 88% for buprenorphine. Additionally, 41% of physicians did not feel that initiating methadone fell within their scope of practice.
When we grouped our sample by whether a physician had a bridge or not, the highest barrier to prescribing buprenorphine or dosing methadone was a lack of social work resources for screening. Additionally, we found that having a bridge in place helped facilitate the use of MOUD. Both findings are consistent with the literature that states when an ED’s MOUD program includes a follow-up protocol
(which could include social workers), physicians feel more comfortable using MOUD to treat OUD in the ED.23
Buprenorphine initiation in the ED increases engagement in treatment, decreases illicit opioid use, and has shown to reduce healthcare-related costs due to SUDs.24 Long-term outcomes for patients receiving either buprenorphine or methadone include reductions in mortality, opioid use, and opioid-related, acute care utilization.9,10,25 The expansive literature supporting methadone treatment suggests that it may lead to similar, if not better, outcomes than buprenorphine for patients struggling with OUD.11,25 In contrast to buprenorphine, methadone offers the significant advantage
Figure 1. Perceptions questions on buprenorphine and methadone.
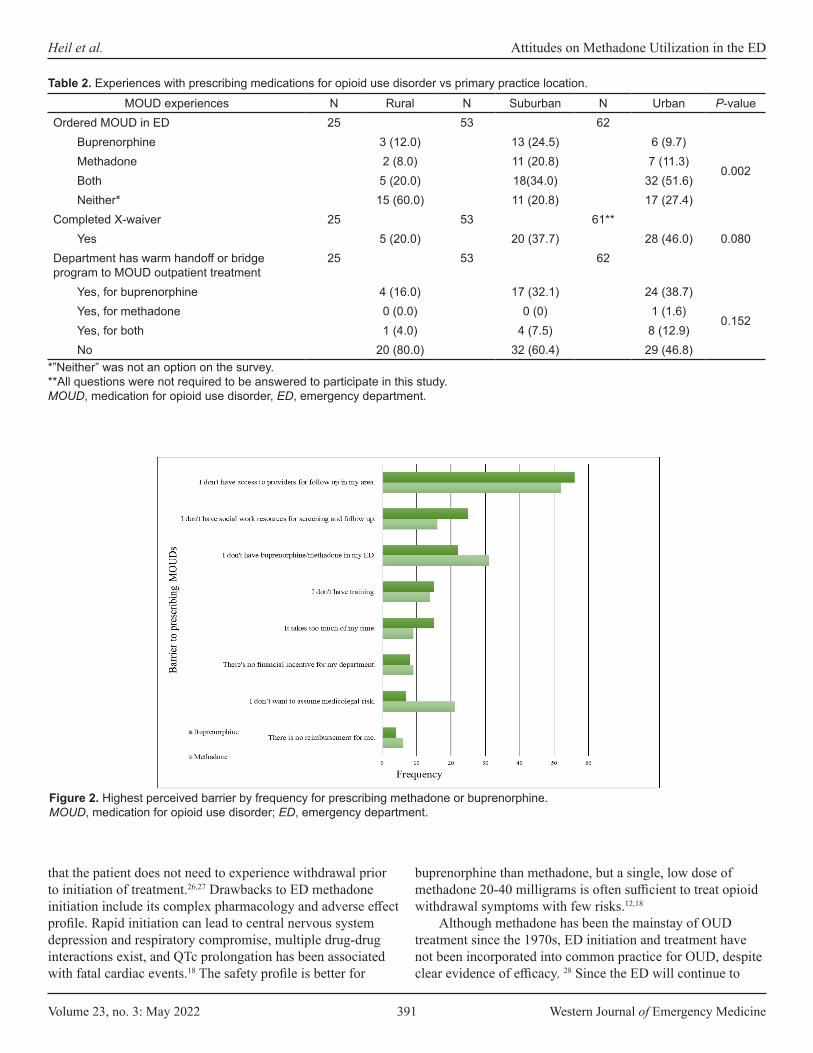
Volume 23, no. 3: May 2022 391 Western Journal of Emergency Medicine
Heil et al. Attitudes on Methadone Utilization in the ED
that the patient does not need to experience withdrawal prior to initiation of treatment.26,27 Drawbacks to ED methadone initiation include its complex pharmacology and adverse effect profile. Rapid initiation can lead to central nervous system depression and respiratory compromise, multiple drug-drug interactions exist, and QTc prolongation has been associated with fatal cardiac events.18 The safety profile is better for
buprenorphine than methadone, but a single, low dose of methadone 20-40 milligrams is often sufficient to treat opioid withdrawal symptoms with few risks.12,18
Although methadone has been the mainstay of OUD treatment since the 1970s, ED initiation and treatment have not been incorporated into common practice for OUD, despite clear evidence of efficacy. 28 Since the ED will continue to
MOUD experiences N Rural N Suburban N Urban P-valueOrdered MOUD in ED 25 53 62
Buprenorphine 3 (12.0) 13 (24.5) 6 (9.7)
0.002Methadone 2 (8.0) 11 (20.8) 7 (11.3)Both 5 (20.0) 18(34.0) 32 (51.6)Neither* 15 (60.0) 11 (20.8) 17 (27.4)
Completed X-waiver 25 53 61**Yes 5 (20.0) 20 (37.7) 28 (46.0) 0.080
Department has warm handoff or bridge program to MOUD outpatient treatment
25 53 62
Yes, for buprenorphine 4 (16.0) 17 (32.1) 24 (38.7)
0.152Yes, for methadone 0 (0.0) 0 (0) 1 (1.6)Yes, for both 1 (4.0) 4 (7.5) 8 (12.9)No 20 (80.0) 32 (60.4) 29 (46.8)
Table 2. Experiences with prescribing medications for opioid use disorder vs primary practice location.
*”Neither” was not an option on the survey. **All questions were not required to be answered to participate in this study.MOUD, medication for opioid use disorder, ED, emergency department.
Figure 2. Highest perceived barrier by frequency for prescribing methadone or buprenorphine.MOUD, medication for opioid use disorder; ED, emergency department.

Western Journal of Emergency Medicine 392 Volume 23, no. 3: May 2022
Attitudes on Methadone Utilization in the ED Heil et al.
serve as a critical access point for patients with OUD, adding methadone to an emergency clinician’s toolkit to treat OUD may present a valuable opportunity to reduce treatment gaps through MOUD initiation and subsequent referral to treatment. Inclusion of methadone as a treatment option is particularly critical as the country continues to grapple with a surge in high potency synthetic opioid (HPSO) use, including fentanyl and fentanyl analogs.29 Patients using HPSOs have an increased risk of precipitated withdrawal during buprenorphine induction, thus creating a major barrier to buprenorphine initiation.30,31 Therefore, methadone will increasingly need to be considered as part of the treatment algorithm for those dependent on HPSOs.
Two recent studies reported that lack of familiarity with induction methods in the ED and time constraints were significant barriers to buprenorphine induction in the ED.20,32
This was not consistent with our study, which found that the main barriers to using either MOUD were a lack of access to follow-up addiction experts or social worker resources. The
reason for this difference may be a result of both state and national education programs on buprenorphine utilization, as well as professional organization position statements, which led to the rapid acceptance and uptake of buprenorphine in the ED over the past few years.33 Emergency departments have worked to create community relationships with clinics that offer buprenorphine and these same relation-ships can be cultivated with local methadone clinics.34 Linkage to methadone clinics has been successful in the past when vouchers for methadone treatment were provided to patients discharged from the ED.35
Furthermore, published best practices for adopting buprenorphine programs in the ED can be adapted to facilitate ED-based methadone initiation. Examples include using a clinician champion to train colleagues and address administrative barriers and a trained substance-use patient navigator to facilitate linkage to outpatient methadone treatment and assist patients with social determinants of health-related barriers to long-term treatment engagement
Has bridge No bridgeP-value
N n N nHighest ranked barriers for prescribing buprenorphine
There is no reimbursement for me. 53 2 (3.8) 76 2 (2.6) 1.000I don't have access to providers for follow up in my area. 53 9 (17.0 78 14 (17.9) 0.886There's no financial incentive for my department. 52 3 (5.8) 76 5 (6.6) 1.000It takes too much of my time. 53 8 (15.1) 78 7 (9.0) 0.280I don't have social work resources for screening and follow up. 54 4 (7.4) 77 21 (27.3) 0.004I don't have training. 53 3 (5.7) 77 12 (15.6) 0.082I don't have buprenorphine in my ED. 52 4 (7.7) 79 18 (22.8) 0.024I don’t want to assume medicolegal risk. 54 1 (1.9) 78 6 (7.7) 0.239
Highest ranked barriers for dosing methadoneThere is no reimbursement for me. 53 1 (1.9) 66 5 (7.6) 0.224I don't have access to providers for follow-up in my area. 55 11 (20.0) 67 41 (61.2) < 0.001There's no financial incentive for my department. 52 4 (7.7) 66 5 (7.6) 1.000It takes too much of my time. 53 6 (11.3) 66 3 (4.5) 0.185I don't have social work resources for screening and follow-up. 51 2 (3.9) 67 14 (20.9) 0.008I don't have training. 53 2 (3.8) 67 12 (17.9) 0.017I don't have buprenorphine in my ED. 54 11 (20.4) 68 20 (29.4) 0.255I don’t want to assume medicolegal risk. 54 8 (14.8) 67 13 (19.4) 0.508
Has ever prescribed 60 81Buprenorphine 12 (20.0) 10 (12.3)
<0.001Methadone 6 (10.0) 14 (17.3)Both 36 (60.0) 20 (24.7)Neither* 6 (10.0) 37 (45.7)
Table 3. Highest perceived barrier and experience with medications for opioid use disorder by access to a bridge.
*”Neither” was not an option on the survey **All questions were not required to be answered to participate in this study.MOUD, medication for opioid use disorder; ED, emergency department.

Volume 23, no. 3: May 2022 393 Western Journal of Emergency Medicine
Heil et al. Attitudes on Methadone Utilization in the ED
(eg, unreliable transportation).36 Additionally, a protocol for methadone dosing in the ED setting should be created, and all emergency clinicians should be trained in its use. A protocol may be particularly useful to overcome clinicians’ hesitation concerning methadone use in the EM setting, given its interindividual variability in pharmacokinetics and potential for dose accumulation.
Despite ED-based efforts to increase post-discharge treatment engagement, patients face pre-existing access challenges to receipt of methadone in the community. Unlike buprenorphine, which may be prescribed by any waivered clinician, methadone can only be dispensed at federally certified opioid treatment programs that require supervised daily on-site medication dosing. These regulations limit access and increase the stigma associated with methadone treatment for OUD.37 COVID-19 era regulations relaxed the requirements for on-site methadone dosing, allowing up to 28 days of take-home doses with no evidence of negative out-comes.38,39,40 As states move to retain relaxed methadone regulations beyond the pandemic, establishing pathways for linkage to outpatient methadone treatment will be even more critical.41
Given that the perceived barriers to buprenorphine and methadone initiation in the ED were similar in this study, we postulate that stigma may play a role in EPs’ choice of MOUD. Previous studies seem to support this theory and demonstrate clear bias against patients receiving methadone and the clinics that provide methadone.20,42 To combat the stigma of methadone initiation in the ED, the same tools used to reduce the stigma of treating patients with a SUD in other healthcare settings can be used. Interventions include the following: integrating MOUD training into medical school curriculums; having specialty addiction consult services in hospitals; and providing continuing education that focuses on increasing awareness of the benefits of MOUD and highlights the barriers to OUD treatment.43-46
In addition to increased education and structural support, more research must be completed to assess methadone initiation in the ED. Research topics include conducting basic epidemiological studies on methadone initiation in the ED, establishing and evaluating an ED methadone initiation protocol, and monitoring the rate of successful linkage to follow-up care after methadone initiation in the ED. Additional studies on interventions to reduce the stigma of methadone and other MOUD treatments among EPs should also be conducted.
LIMITATIONSThis study had several limitations. The low response
rate (18.4%) may have created some nonresponse bias in our results. This is similar to prior research reporting response rates of surveys distributed through a professional organization.47-49 Additionally, participants had to be members of ACEP to be invited to participate in this study. Response bias, specifically social desirability bias, could have led
some EPs to select more supportive answers to adopting buprenorphine or methadone in the ED. Our study had a similar gender and race distribution of EPs in the US as reported elsewhere, although it is important to note that the majority of respondents identified as White males.50 Even though the demographic distribution of this study matches national patterns, they may not be generalizable to all EPs as the percentage of physicians who had completed their X-waiver in our study (38%) vastly differs from national estimates. A prior study reported that only 1% of EPs were X-waivered nationally.51 Another limitation of the study is that there was no way to control for multiple respondents from the same institution because this study’s survey and EMPRN did not collect institution-specific data. Lastly, it is important to note that our research team assumed that the EP had not ordered either MOUD if the participant did not answer the question of whether they had ordered buprenorphine or methadone while working in the ED.
CONCLUSIONOur cross-sectional study demonstrates that, despite more
than 50 years of data demonstrating methadone’s efficacy, emergency physicians are not comfortable using methadone for patients with opioid use disorder. Buprenorphine has been embraced by EPs, largely as a result of ongoing local, regional, and national education efforts, as well as widely publicized and distributed statements by influential professional organizations.12,17,52 Similar efforts should now be undertaken to educate and support emergtency physicians to increase methadone utilization and decrease the stigma frequently associated with this life-saving medication.
Address for Correspondence: Jessica Heil, MS, Cooper University Health Care, Cooper Research Institute, 102 17th St SE, Washington, DC 20003. Email: [email protected].
Conflicts of Interest: By the WestJEM article submission agreement, all authors are required to disclose all affiliations, funding sources and financial or management relationships that could be perceived as potential sources of bias. No author has professional or financial relationships with any companies that are relevant to this study. There are no conflicts of interest or sources of funding to declare.
Copyright: © 2022 Heil et al. This is an open access article distributed in accordance with the terms of the Creative Commons Attribution (CC BY 4.0) License. See: http://creativecommons.org/licenses/by/4.0/
REFERENCES1. Mattson CL, Tanz LJ, Quinn K, et al. Trends and geographic patterns
in drug and synthetic opioid overdose deaths - United States, 2013-2019. MMWR Morb Mortal Wkly Rep. 2021;70(6):202-7.
2. Ahmad FB, Rossen LM, Spencer MR, et al. Provisional drug

Western Journal of Emergency Medicine 394 Volume 23, no. 3: May 2022
Attitudes on Methadone Utilization in the ED Heil et al.
overdose death counts. National Center for Health Statistics. 2021. Available at: https://www.cdc.gov/nchs/nvss/vsrr/drug-overdose-data.htm. Accessed May 5, 2021.
3. Davenport S, Weaver A, Caverly M. Economic impact of non-medical opioid use in the United States: Annual estimates and projections for 2015 through 2019. 2019. Available at: https://www soa org/globalassets/assets/files/resources/research-report/2019/econ-impact-non-medical-opioid-use pdf. Accessed on January 25, 2021.
4. SAMHSA. Key substance use and mental health indicators in the United States: Results from the 2019 National Survey on Drug Use and Health 2020. 2020. Available at: https://www.samhsa.gov/data/sites/default/files/reports/rpt29393/2019NSDUHFFRPDFWHTML/2019NSDUHFFR1PDFW090120.pdf. Accessed May 5, 2021.
5. Salzman M, Jones CW, Rafeq R, et al. Epidemiology of opioid-related visits to US emergency departments, 1999-2013: A retrospective study from the NHAMCS (National Hospital Ambulatory Medical Care Survey). Am J Emerg Med. 2020;38(1):23-7.
6. Weiner SG, Baker O, Bernson D, et al. One-year mortality of patients after emergency department treatment for nonfatal opioid overdose. Ann Emerg Med. 2020;75(1):13-7.
7. SAMHSA. Use of medication-assisted treatment in emergency departments (No. PEP21-PL-Guide-5). 2021. Available at: https://store.samhsa.gov/sites/default/files/SAMHSA_Digital_Download/pep21-pl-guide-5.pdf. Accessed January 25 2021.
8. Herring AA, Perrone J, Nelson LS. Managing opioid withdrawal in the emergency department with buprenorphine. Ann Emerg Med. 2019;73(5):481-7.
9. Sordo L, Barrio G, Bravo MJ, et al. Mortality risk during and after opioid substitution treatment: systematic review and meta-analysis of cohort studies. BMJ. 2017;357:j1550.
10. Larochelle MR, Bernson D, Land T, et al. Medication for opioid use disorder after nonfatal opioid overdose and association with mortality: a cohort study. Ann Intern Med. 2018;169(3):137-45.
11. Mattick RP, Breen C, Kimber J, et al. Buprenorphine maintenance versus placebo or methadone maintenance for opioid dependence. Cochrane database of systematic reviews. 2014;(2):CD002207.
12. Strayer RJ, Hawk K, Hayes BD, et al. Management of opioid use disorder in the emergency department: a white paper prepared for the American Academy of Emergency Medicine. J Emerg Med. 2020;58(3):522-46.
13. D’Onofrio G, O’Connor PG, Pantalon MV, et al. Emergency department–initiated buprenorphine/naloxone treatment for opioid dependence: a randomized clinical trial. JAMA. 2015;313(16):1636-44.
14. Zuckerman M, Kelly T, Heard K, et al. Physician attitudes on buprenorphine induction in the emergency department: results from a multistate survey. Clin Toxicol (Phila). 2021;59(4):279-85.
15. Duber HC, Barata IA, Cioè-Peña E, et al. Identification, management, and transition of care for patients with opioid use disorder in the emergency department. Ann Emerg Med. 2018;72(4):420-31.
16. Martin A, Mitchell A, Wakeman S, et al. Emergency department treatment of opioid addiction: an opportunity to lead. Acad Emerg Med. 2018;25(5):601-4.
17. Hawk K, Hoppe J, Ketcham E, et al. Consensus recommendations on the treatment of opioid use disorder in the emergency department. Ann Emerg Med. 2021;78(3):534-42.
18. SAMHSA. Medications for opioid use disorder TIP 63 treatment improvement protocol for healthcare and addiction professionals, policymakers, patients, and families. 2018. Available at: https://store.samhsa.gov/product/TIP-63-Medications-for-Opioid-Use-Disorder-Full-Document/PEP21-02-01-002. Accessed January 25, 2021.
19. SAMHSA. National Survey of Substance Abuse Treatment Services (N-SSATS): 2019. Data on Substance Abuse Treatment Facilities. 2020. Available at: https://www.samhsa.gov/data/sites/default/files/reports/rpt35313/2020_NSSATS_FINAL.pdf. Accessed January 25, 2021.
20. Cioe K, Biondi BE, Easly R, et al. A systematic review of patients’ and providers’ perspectives of medications for treatment of opioid use disorder. J Subst Abuse Treat. 2020:108146.
21. Su MK, Lopez JH, Crossa A, et al. Low dose intramuscular methadone for acute mild to moderate opioid withdrawal syndrome. Am J Emerg Med. 2018;36(11):1951-6.
22. ASAM. The American Society of Addiction Medicine National Practice Guideline for the Treatment of Opioid Use Disorder: 2020 focused update. J Addict Med. 2020;14(2S):1-91.
23. Mackey K, Veazie S, Anderson J, et al. Barriers and facilitators to the use of medications for opioid use disorder: a rapid review. J Gen Intern Med. 2020;35(Suppl 3):1-10.
24. Clemans-Cope L, Benatar S, Epstein M, et al. Potential cost savings associated with providing screening, brief intervention, and referral to treatment for substance use disorder in emergency departments. 2018. Available at: https://www.urban.org/sites/default/files/publication/98535/2001854-_potential_cost_savings_associated_with_sbirt_in_emergency_departments_rapid_review_finalized_2.pdf. Accessed January 25, 2021.
25. Wakeman SE, Larochelle MR, Ameli O, et al. Comparative effectiveness of different treatment pathways for opioid use disorder. JAMA Netw Open. 2020;3(2):e1920622-e1920622.
26. Mannelli P, S Peindl K, Lee T, et al. Buprenorphine-mediated transition from opioid agonist to antagonist treatment: state of the art and new perspectives. Curr Drug Abuse Rev. 2012;5(1):52-63.
27. Whitley SD, Sohler NL, Kunins HV, et al. Factors associated with complicated buprenorphine inductions. J Subst Abuse Treat. 2010;39(1):51-7.
28. Dole VP, Nyswander M. A medical treatment for diacetylmorphine (heroin) addiction: a clinical trial with methadone hydrochloride. JAMA. 1965;193(8):646-50.
29. Ciccarone D. The triple wave epidemic: supply and demand drivers of the US opioid overdose crisis. Int J Drug Policy. 2019;71:183-8.
30. Varshneya NB, Thakrar AP, Hobelmann JG, et al. Evidence of buprenorphine-precipitated withdrawal in persons who use fentanyl. J Addict Med. 2021.
31. Silverstein SM, Daniulaityte R, Martins SS, et al. “Everything is not right anymore”: Buprenorphine experiences in an era of illicit fentanyl. Int J Drug Policy. 2019;74:76-83.
32. Hawk KF, D’Onofrio G, Chawarski MC, et al. Barriers and facilitators
Volume 23, no. 3: May 2022 395 Western Journal of Emergency Medicine
Heil et al. Attitudes on Methadone Utilization in the ED
to clinician readiness to provide emergency department–initiated buprenorphine. JAMA Netw Open. 2020;3(5):e204561-e204561.
33. Rhee TG, D’Onofrio G, Fiellin DA. Trends in the use of buprenorphine in US emergency departments, 2002-2017. JAMA Netw Open. 2020;3(10):e2021209-e2021209.
34. Martin A, Butler K, Chavez T, et al. Beyond buprenorphine: models of follow-up care for patients with opioid use disorder in the ED. West J Emerg Med. 2020;21(6):257-63.
35. Barnett PG, Masson CL, Sorensen JL, et al. Linking opioid-dependent hospital patients to drug treatment: health care use and costs 6 months after randomization. Addiction. 2006;101(12):1797-804.
36. Snyder H, Kalmin MM, Moulin A, et al. Rapid adoption of low-threshold buprenorphine treatment at California emergency departments participating in the CA bridge program. Ann Emerg Med. 2021;78(6):759-72.
37. Tsai AC, Kiang MV, Barnett ML, et al. Stigma as a fundamental hindrance to the United States opioid overdose crisis response. PLoS Med. 2019;16(11):e1002969.
38. Figgatt MC, Salazar Z, Day E, et al. Take-home dosing experiences among persons receiving methadone maintenance treatment during COVID-19. J Subst Abuse Treat. 2021;123:108276.
39. Amram O, Amiri S, Panwala V, et al. The impact of relaxation of methadone take-home protocols on treatment outcomes in the COVID-19 era. Am J Drug Alcohol Abuse. 2021;47(6):1-8.
40. SAMHSA. Opioid Treatment Program (OTP) Guidance. 2020. Available at: https://www.samhsa.gov/sites/default/files/otp-guidance-20200316.pdf. Accessed January 25, 2021
41. Opioid Treatment Access Act of 2022, H.R.6279, House of Representatives, 117th session (Norcross D 2021).
42. Kennedy-Hendricks A, Barry CL, Stone E, et al. Comparing perspectives on medication treatment for opioid use disorder between national samples of primary care trainee physicians and attending physicians. Drug Alcohol Depend. 2020;216:108217.
43. Kennedy-Hendricks A, McGinty EE, Barry CL. Effects of competing narratives on public perceptions of opioid pain reliever addiction during pregnancy. J Health Polit Policy Law. 2016;41(5):873-916.
44. Livingston JD, Milne T, Fang ML, et al. The effectiveness of interventions for reducing stigma related to substance use disorders: a systematic review. Addiction. 2012;107(1):39-50.
45. Wakeman SE, Kanter GP, Donelan K. Institutional substance use disorder intervention improves general internist preparedness, attitudes, and clinical practice. J Addict Med. 2017;11(4):308-14.
46. McGinty E, Pescosolido B, Kennedy-Hendricks A, et al. Communication strategies to counter stigma and improve mental illness and substance use disorder policy. Psychiatr Serv. 2018;69(2):136-46.
47. Nguyen J, Liu A, McKenney M, et al. Impacts and challenges of the COVID-19 pandemic on emergency medicine physicians in the United States. Am J Emerg Med. 2021;48:38-47.
48. Abir M, Moore M, Chamberlin M, et al. Using timely survey-based information networks to collect data on best practices for public health emergency preparedness and response: illustrative case from the American College of Emergency Physicians’ Ebola surveys. Disaster Med Public Health Prep. 2016;10(4):681-90.
49. Brody A, Twiner M, Kumar A, et al. Survey of emergency physician approaches to management of asymptomatic hypertension. Journal Clin Hypertens (Greenwich). 2017;19(3):265-9.
50. AAMC. Diversity in medicine: facts and figures 2019. 2019. Available at: https://www.aamc.org/data-reports/workforce/report/diversity-medicine-facts-and-figures-2019. Accessed August 1, 2021.
51. Rosenblatt RA, Andrilla CHA, Catlin M, et al. Geographic and specialty distribution of US physicians trained to treat opioid use disorder. Ann of Fam Med. 2015;13(1):23-6.
52. Wax PM, Stolbach AI, Schwarz ES, et al. ACMT position statement: buprenorphine administration in the emergency department. J Med Toxicol. 2019;15(3):215-6.

Western Journal of Emergency Medicine 396 Volume 23, no. 3: May 2022
Original Research
Factors Influencing Use of Personal Protective Equipment Among Emergency Medical Services Responders During the
COVID-19 Pandemic: A Retrospective Chart ReviewMolly McCann-Pineo, PhD, MS*†‡
Timmy Li, PhD†‡
Paul Barbara, MD†§¶
Brian Levinsky, MA, EMT-P, EMD-Q§
Jonathan Berkowitz, MD†§
Section Editor: Joshua Gaither, MD Submission history: Submitted October 25, 2021; Revision received February 15, 2022; Accepted February 27, 2022 Electronically published May 5, 2022 Full text available through open access at http://escholarship.org/uc/uciem_westjem DOI: 10.5811/westjem.2022.2.55217
Center for Disaster Health, Trauma and Resilience at Mount Sinai, Stony Brook University and Northwell Health, Great Neck, New YorkDonald and Barbara Zucker School of Medicine at Hofstra/Northwell, Department of Emergency Medicine, Hempstead, New YorkNorthwell Health, North Shore University Hospital, Department of Emergency Medicine, Manhasset, New YorkNorthwell Health, Center for Emergency Medical Services, Syosset, New YorkNorthwell Health, Staten Island University Hospital, Department of Emergency Medicine, Staten Island, New York
*
†
‡
§
¶
Introduction: The use of personal protective equipment (PPE) is a salient component of reducing occupational risk in many fields. Emergency medical services (EMS) personnel use PPE to reduce risk of exposure and defend against various pathogens they come in contact with while providing patient care. Currently, the understanding of factors that predict the use of PPE by an EMS responder during a pandemic is limited. In this study our objective was to identify factors that influenced PPE use by EMS responders during the coronavirus disease 2019 (COVID-19) pandemic, which may guide future planning for responders in similar austere or personal risk situations.
Methods: We conducted a retrospective chart review among all EMS encounters across an EMS agency affiliated with a large New York health system from March 16–June 30, 2020. All adult, emergency encounters with available prehospital record data were analyzed. We assessed patient- and EMS encounter-level data as possible factors that influence PPE utilization. The use of PPE was defined and guided by the literature as being either full or partial PPE, or “not documented.” We used multinomial logistic regression to identify factors that influence PPE use among EMS responders.
Results: We identified 28,693 eligible EMS encounters during the study period; 54.2% of patients were male, the median patient age was 58 years, and 66.9% of patients had at least one chronic medical condition. The use of PPE was documented in 92.8% of encounters, with full PPE used in 17.8% of these encounters. Full PPE utilization, relative to partial, was most strongly influenced by dispatch codes indicative of “breathing problems” (odds ratio [OR] 4.89; 95% confidence interval [CI]: 4.40, 5.46) and “cardiac/respiratory arrest” (OR 3.82; 95% CI: 2.99, 4.88), in addition to a patient’s positive screening for COVID-19 on 9-1-1 dispatch (OR 3.97; 95% CI: 3.66, 4.32).
Conclusion: Emergency medical services responders more frequently used full PPE for calls with dispatch codes indicative of respiratory distress or cardiac arrest. Understanding factors that influence PPE use among EMS personnel, particularly during times of public health emergencies, is essential to mitigate exposure and ensure the safety of frontline responders. [West J Emerg Med. 2022;22(3)396–407.]
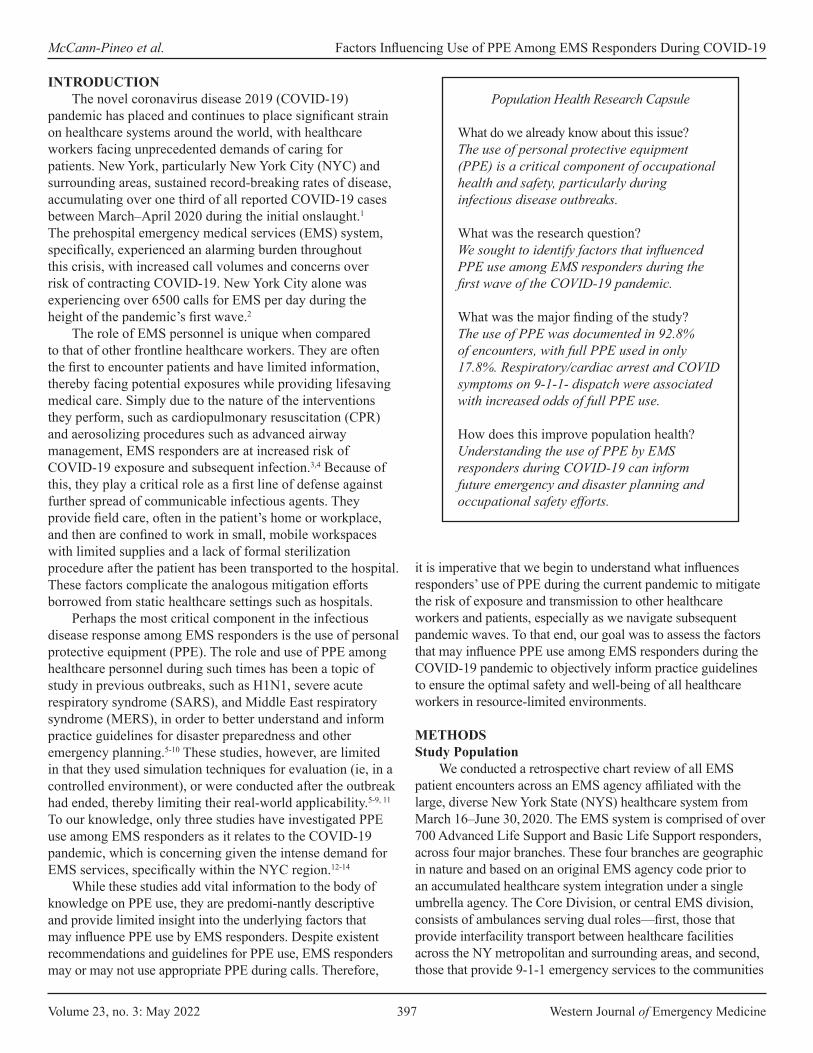
Volume 23, no. 3: May 2022 397 Western Journal of Emergency Medicine
McCann-Pineo et al. Factors Influencing Use of PPE Among EMS Responders During COVID-19
Population Health Research Capsule
What do we already know about this issue?The use of personal protective equipment (PPE) is a critical component of occupational health and safety, particularly during infectious disease outbreaks.
What was the research question?We sought to identify factors that influenced PPE use among EMS responders during the first wave of the COVID-19 pandemic. What was the major finding of the study?The use of PPE was documented in 92.8% of encounters, with full PPE used in only 17.8%. Respiratory/cardiac arrest and COVID symptoms on 9-1-1- dispatch were associated with increased odds of full PPE use.
How does this improve population health?Understanding the use of PPE by EMS responders during COVID-19 can inform future emergency and disaster planning and occupational safety efforts.
INTRODUCTIONThe novel coronavirus disease 2019 (COVID-19)
pandemic has placed and continues to place significant strain on healthcare systems around the world, with healthcare workers facing unprecedented demands of caring for patients. New York, particularly New York City (NYC) and surrounding areas, sustained record-breaking rates of disease, accumulating over one third of all reported COVID-19 cases between March–April 2020 during the initial onslaught.1 The prehospital emergency medical services (EMS) system, specifically, experienced an alarming burden throughout this crisis, with increased call volumes and concerns over risk of contracting COVID-19. New York City alone was experiencing over 6500 calls for EMS per day during the height of the pandemic’s first wave.2
The role of EMS personnel is unique when compared to that of other frontline healthcare workers. They are often the first to encounter patients and have limited information, thereby facing potential exposures while providing lifesaving medical care. Simply due to the nature of the interventions they perform, such as cardiopulmonary resuscitation (CPR) and aerosolizing procedures such as advanced airway management, EMS responders are at increased risk of COVID-19 exposure and subsequent infection.3,4 Because of this, they play a critical role as a first line of defense against further spread of communicable infectious agents. They provide field care, often in the patient’s home or workplace, and then are confined to work in small, mobile workspaces with limited supplies and a lack of formal sterilization procedure after the patient has been transported to the hospital. These factors complicate the analogous mitigation efforts borrowed from static healthcare settings such as hospitals.
Perhaps the most critical component in the infectious disease response among EMS responders is the use of personal protective equipment (PPE). The role and use of PPE among healthcare personnel during such times has been a topic of study in previous outbreaks, such as H1N1, severe acute respiratory syndrome (SARS), and Middle East respiratory syndrome (MERS), in order to better understand and inform practice guidelines for disaster preparedness and other emergency planning.5-10 These studies, however, are limited in that they used simulation techniques for evaluation (ie, in a controlled environment), or were conducted after the outbreak had ended, thereby limiting their real-world applicability.5-9, 11 To our knowledge, only three studies have investigated PPE use among EMS responders as it relates to the COVID-19 pandemic, which is concerning given the intense demand for EMS services, specifically within the NYC region.12-14
While these studies add vital information to the body of knowledge on PPE use, they are predomi-nantly descriptive and provide limited insight into the underlying factors that may influence PPE use by EMS responders. Despite existent recommendations and guidelines for PPE use, EMS responders may or may not use appropriate PPE during calls. Therefore,
it is imperative that we begin to understand what influences responders’ use of PPE during the current pandemic to mitigate the risk of exposure and transmission to other healthcare workers and patients, especially as we navigate subsequent pandemic waves. To that end, our goal was to assess the factors that may influence PPE use among EMS responders during the COVID-19 pandemic to objectively inform practice guidelines to ensure the optimal safety and well-being of all healthcare workers in resource-limited environments.
METHODSStudy Population
We conducted a retrospective chart review of all EMS patient encounters across an EMS agency affiliated with the large, diverse New York State (NYS) healthcare system from March 16–June 30, 2020. The EMS system is comprised of over 700 Advanced Life Support and Basic Life Support responders, across four major branches. These four branches are geographic in nature and based on an original EMS agency code prior to an accumulated healthcare system integration under a single umbrella agency. The Core Division, or central EMS division, consists of ambulances serving dual roles—first, those that provide interfacility transport between healthcare facilities across the NY metropolitan and surrounding areas, and second, those that provide 9-1-1 emergency services to the communities
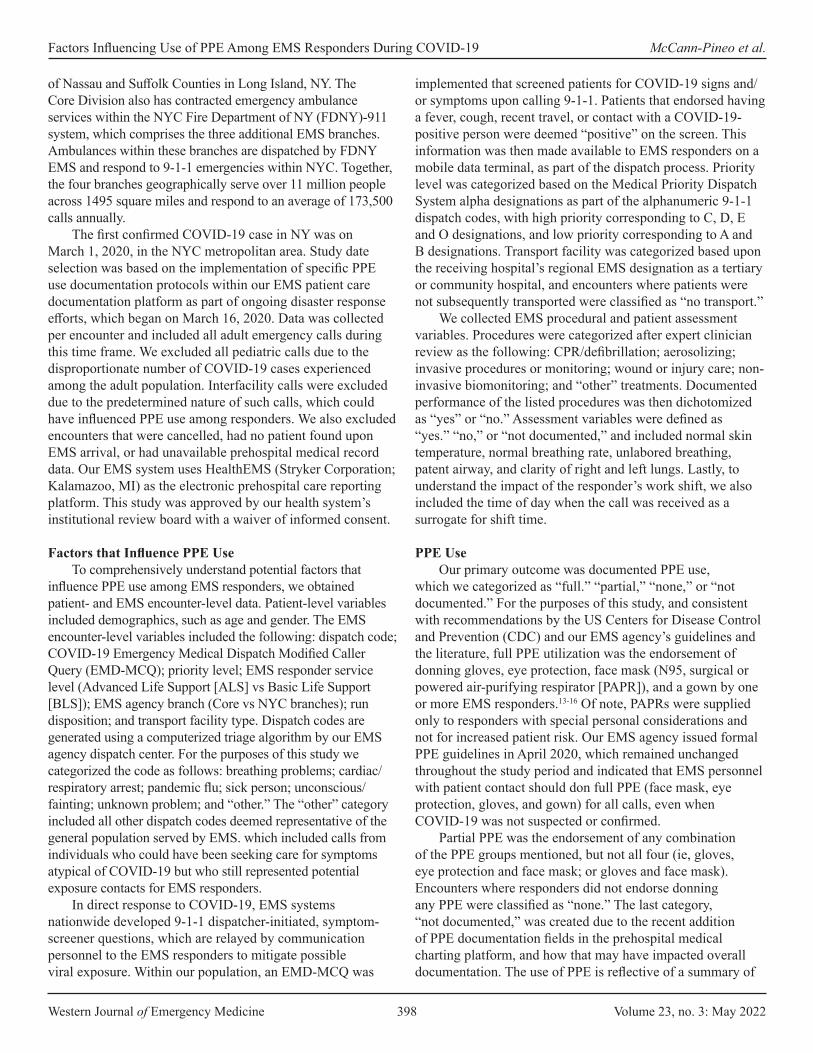
Western Journal of Emergency Medicine 398 Volume 23, no. 3: May 2022
Factors Influencing Use of PPE Among EMS Responders During COVID-19 McCann-Pineo et al.
of Nassau and Suffolk Counties in Long Island, NY. The Core Division also has contracted emergency ambulance services within the NYC Fire Department of NY (FDNY)-911 system, which comprises the three additional EMS branches. Ambulances within these branches are dispatched by FDNY EMS and respond to 9-1-1 emergencies within NYC. Together, the four branches geographically serve over 11 million people across 1495 square miles and respond to an average of 173,500 calls annually.
The first confirmed COVID-19 case in NY was on March 1, 2020, in the NYC metropolitan area. Study date selection was based on the implementation of specific PPE use documentation protocols within our EMS patient care documentation platform as part of ongoing disaster response efforts, which began on March 16, 2020. Data was collected per encounter and included all adult emergency calls during this time frame. We excluded all pediatric calls due to the disproportionate number of COVID-19 cases experienced among the adult population. Interfacility calls were excluded due to the predetermined nature of such calls, which could have influenced PPE use among responders. We also excluded encounters that were cancelled, had no patient found upon EMS arrival, or had unavailable prehospital medical record data. Our EMS system uses HealthEMS (Stryker Corporation; Kalamazoo, MI) as the electronic prehospital care reporting platform. This study was approved by our health system’s institutional review board with a waiver of informed consent.
Factors that Influence PPE UseTo comprehensively understand potential factors that
influence PPE use among EMS responders, we obtained patient- and EMS encounter-level data. Patient-level variables included demographics, such as age and gender. The EMS encounter-level variables included the following: dispatch code; COVID-19 Emergency Medical Dispatch Modified Caller Query (EMD-MCQ); priority level; EMS responder service level (Advanced Life Support [ALS] vs Basic Life Support [BLS]); EMS agency branch (Core vs NYC branches); run disposition; and transport facility type. Dispatch codes are generated using a computerized triage algorithm by our EMS agency dispatch center. For the purposes of this study we categorized the code as follows: breathing problems; cardiac/respiratory arrest; pandemic flu; sick person; unconscious/fainting; unknown problem; and “other.” The “other” category included all other dispatch codes deemed representative of the general population served by EMS. which included calls from individuals who could have been seeking care for symptoms atypical of COVID-19 but who still represented potential exposure contacts for EMS responders.
In direct response to COVID-19, EMS systems nationwide developed 9-1-1 dispatcher-initiated, symptom-screener questions, which are relayed by communication personnel to the EMS responders to mitigate possible viral exposure. Within our population, an EMD-MCQ was
implemented that screened patients for COVID-19 signs and/or symptoms upon calling 9-1-1. Patients that endorsed having a fever, cough, recent travel, or contact with a COVID-19-positive person were deemed “positive” on the screen. This information was then made available to EMS responders on a mobile data terminal, as part of the dispatch process. Priority level was categorized based on the Medical Priority Dispatch System alpha designations as part of the alphanumeric 9-1-1 dispatch codes, with high priority corresponding to C, D, E and O designations, and low priority corresponding to A and B designations. Transport facility was categorized based upon the receiving hospital’s regional EMS designation as a tertiary or community hospital, and encounters where patients were not subsequently transported were classified as “no transport.”
We collected EMS procedural and patient assessment variables. Procedures were categorized after expert clinician review as the following: CPR/defibrillation; aerosolizing; invasive procedures or monitoring; wound or injury care; non-invasive biomonitoring; and “other” treatments. Documented performance of the listed procedures was then dichotomized as “yes” or “no.” Assessment variables were defined as “yes.” “no,” or “not documented,” and included normal skin temperature, normal breathing rate, unlabored breathing, patent airway, and clarity of right and left lungs. Lastly, to understand the impact of the responder’s work shift, we also included the time of day when the call was received as a surrogate for shift time.
PPE UseOur primary outcome was documented PPE use,
which we categorized as “full.” “partial,” “none,” or “not documented.” For the purposes of this study, and consistent with recommendations by the US Centers for Disease Control and Prevention (CDC) and our EMS agency’s guidelines and the literature, full PPE utilization was the endorsement of donning gloves, eye protection, face mask (N95, surgical or powered air-purifying respirator [PAPR]), and a gown by one or more EMS responders.13-16 Of note, PAPRs were supplied only to responders with special personal considerations and not for increased patient risk. Our EMS agency issued formal PPE guidelines in April 2020, which remained unchanged throughout the study period and indicated that EMS personnel with patient contact should don full PPE (face mask, eye protection, gloves, and gown) for all calls, even when COVID-19 was not suspected or confirmed.
Partial PPE was the endorsement of any combination of the PPE groups mentioned, but not all four (ie, gloves, eye protection and face mask; or gloves and face mask). Encounters where responders did not endorse donning any PPE were classified as “none.” The last category, “not documented,” was created due to the recent addition of PPE documentation fields in the prehospital medical charting platform, and how that may have impacted overall documentation. The use of PPE is reflective of a summary of
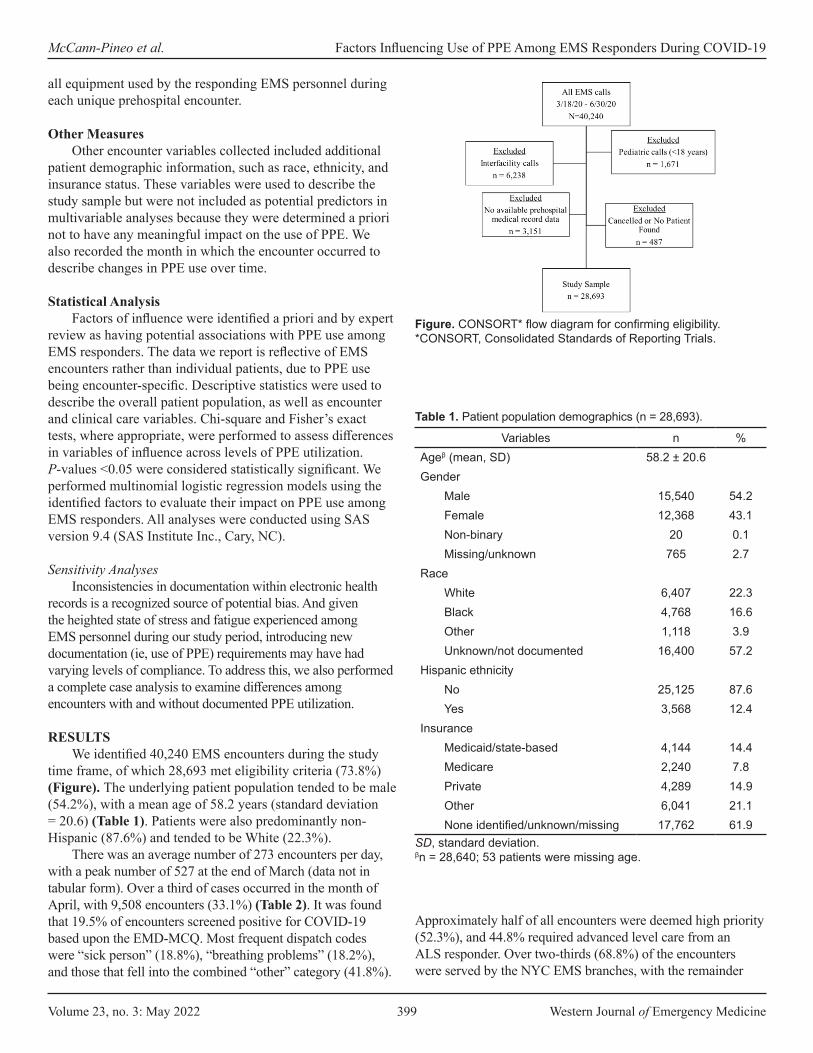
Volume 23, no. 3: May 2022 399 Western Journal of Emergency Medicine
McCann-Pineo et al. Factors Influencing Use of PPE Among EMS Responders During COVID-19
all equipment used by the responding EMS personnel during each unique prehospital encounter.
Other MeasuresOther encounter variables collected included additional
patient demographic information, such as race, ethnicity, and insurance status. These variables were used to describe the study sample but were not included as potential predictors in multivariable analyses because they were determined a priori not to have any meaningful impact on the use of PPE. We also recorded the month in which the encounter occurred to describe changes in PPE use over time.
Statistical AnalysisFactors of influence were identified a priori and by expert
review as having potential associations with PPE use among EMS responders. The data we report is reflective of EMS encounters rather than individual patients, due to PPE use being encounter-specific. Descriptive statistics were used to describe the overall patient population, as well as encounter and clinical care variables. Chi-square and Fisher’s exact tests, where appropriate, were performed to assess differences in variables of influence across levels of PPE utilization. P-values <0.05 were considered statistically significant. We performed multinomial logistic regression models using the identified factors to evaluate their impact on PPE use among EMS responders. All analyses were conducted using SAS version 9.4 (SAS Institute Inc., Cary, NC).
Sensitivity AnalysesInconsistencies in documentation within electronic health
records is a recognized source of potential bias. And given the heighted state of stress and fatigue experienced among EMS personnel during our study period, introducing new documentation (ie, use of PPE) requirements may have had varying levels of compliance. To address this, we also performed a complete case analysis to examine differences among encounters with and without documented PPE utilization.
RESULTSWe identified 40,240 EMS encounters during the study
time frame, of which 28,693 met eligibility criteria (73.8%) (Figure). The underlying patient population tended to be male (54.2%), with a mean age of 58.2 years (standard deviation = 20.6) (Table 1). Patients were also predominantly non-Hispanic (87.6%) and tended to be White (22.3%).
There was an average number of 273 encounters per day, with a peak number of 527 at the end of March (data not in tabular form). Over a third of cases occurred in the month of April, with 9,508 encounters (33.1%) (Table 2). It was found that 19.5% of encounters screened positive for COVID-19 based upon the EMD-MCQ. Most frequent dispatch codes were “sick person” (18.8%), “breathing problems” (18.2%), and those that fell into the combined “other” category (41.8%).
Approximately half of all encounters were deemed high priority (52.3%), and 44.8% required advanced level care from an ALS responder. Over two-thirds (68.8%) of the encounters were served by the NYC EMS branches, with the remainder
Figure. CONSORT* flow diagram for confirming eligibility.*CONSORT, Consolidated Standards of Reporting Trials.
Variables n %Ageβ (mean, SD) 58.2 ± 20.6Gender
Male 15,540 54.2Female 12,368 43.1Non-binary 20 0.1Missing/unknown 765 2.7
RaceWhite 6,407 22.3Black 4,768 16.6Other 1,118 3.9Unknown/not documented 16,400 57.2
Hispanic ethnicityNo 25,125 87.6Yes 3,568 12.4
InsuranceMedicaid/state-based 4,144 14.4Medicare 2,240 7.8Private 4,289 14.9Other 6,041 21.1None identified/unknown/missing 17,762 61.9
Table 1. Patient population demographics (n = 28,693).
SD, standard deviation.βn = 28,640; 53 patients were missing age.

Western Journal of Emergency Medicine 400 Volume 23, no. 3: May 2022
Factors Influencing Use of PPE Among EMS Responders During COVID-19 McCann-Pineo et al.
EMS encounter variablesδTotal
(n = 28,693)Full PPE
(n = 5,089)Partial PPE(n = 21,496)
None(n = 39)
Not documented(n = 2,069)
n %¥ n %€ n %€ n %€ n %€
MonthMarch 2020 5,754 20.1 1,908 33.2 3,823 66.4 19 0.3 4 0.1April 2020 9,508 33.1 3,180 33.5 4,633 48.7 20 0.2 1,675 17.6May 2020 6,381 22.2 0 0.0 6,234 97.7 0 0.0 147 2.3June 2020 7,050 24.6 1 0.0 6,806 96.5 0 0.0 243 3.5
Time of day00:00-07:59 5,967 20.8 865 14.5 4,661 78.1 14 0.2 427 7.208:00-15:59 12,672 44.2 2,533 20.0 9,147 31.9 12 0.1 980 7.716:00-23:59 10,054 34.0 1,691 16.8 7,688 76.5 19 0.1 662 6.6
Dispatch codeSick person 5,407 18.8 1,092 20.2 4,025 74.4 8 0.2 282 5.2Breathing problems 5,234 18.2 1,969 37.6 3,005 57.4 2 0.0 258 4.9Unknown problem 1,807 6.3 123 6.8 1,511 83.6 5 0.3 168 9.3Pandemic flu 1,776 6.2 491 27.7 1,071 60.3 0 0.0 214 12.1Unconscious/fainting 1,494 5.2 303 20.3 1,078 72.2 0 0.0 113 7.6Cardiac/respiratory arrest 981 3.4 367 37.4 427 43.5 4 0.4 182 18.7Other 11,994 41.8 744 6.2 10,380 86.5 20 0.2 851 7.1
COVID-19 EMD-MCQ screen positive
Yes 5,607 19.5 2,339 41.7 2,801 50.0 1 0.0 466 8.3No 23,086 80.5 2,750 11.9 18,695 81.0 38 0.2 1,603 6.9
Priority levelHigh 15,007 52.3 3,576 23.8 10,196 67.9 19 0.1 1,216 8.1Low 13,686 47.7 1,513 11.1 11,300 82.6 20 0.2 853 6.2
Service levelALS 12,855 44.8 3,442 26.8 8,390 65.3 14 0.1 1,007 7.9BLS 15,838 55.2 1,647 10.4 13,105 82.6 25 0.2 1,060 6.7
EMS agencyNYC 19,737 68.8 573 13.8 4,299 78.8 6 0.2 337 7.3Core 8,956 31.2 2,373 26.5 5,949 66.4 5 0.1 629 7.0
Run dispositionAssist 418 1.5 68 16.3 308 73.7 0 0.0 42 10.1Dead after arrival 454 1.6 225 49.6 187 41.2 0 0.0 42 9.3Dead prior to arrival 477 1.7 152 31.9 151 31.7 4 0.8 170 35.6No transport/refused care 2,640 9.2 289 11.0 2,111 80.0 18 0.7 222 8.4Treated and transferred care 505 1.8 67 13.3 409 81.0 0 0.0 29 5.7Treated/no transport 2,900 10.1 615 21.2 2,036 70.2 1 0.0 248 8.6Treated/transported 21,299 74.2 3,673 17.2 16,294 76.5 16 0.1 1,316 6.2
EMS, emergency medical services; PPE, personal protective equipment; COVID-19, coronavirus disease 2019; EMD-MCQ, emergency medical dispatch modified caller query; ALS, advanced life support; BLS, basic life support.δ All P-values <0.001.¥ Reflects column %.€ Reflects row %.
Table 2. Emergency medical services encounter variables by level of documented use of personal protective equipment.
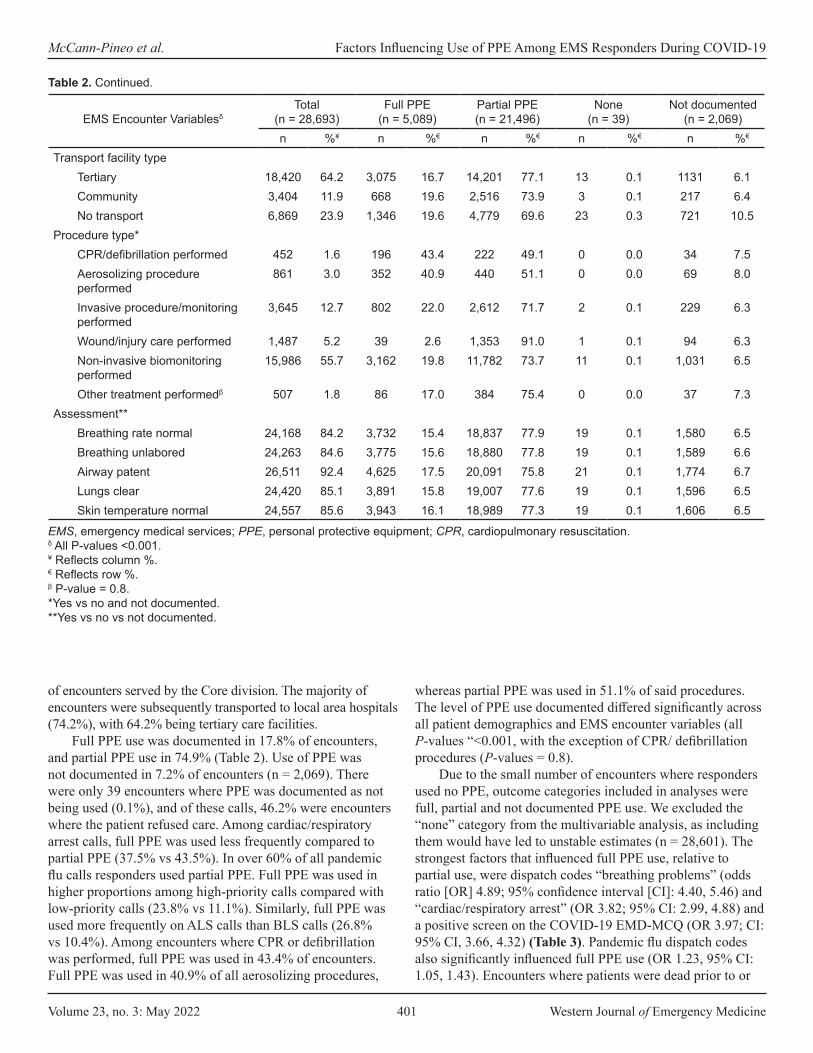
Volume 23, no. 3: May 2022 401 Western Journal of Emergency Medicine
McCann-Pineo et al. Factors Influencing Use of PPE Among EMS Responders During COVID-19
of encounters served by the Core division. The majority of encounters were subsequently transported to local area hospitals (74.2%), with 64.2% being tertiary care facilities.
Full PPE use was documented in 17.8% of encounters, and partial PPE use in 74.9% (Table 2). Use of PPE was not documented in 7.2% of encounters (n = 2,069). There were only 39 encounters where PPE was documented as not being used (0.1%), and of these calls, 46.2% were encounters where the patient refused care. Among cardiac/respiratory arrest calls, full PPE was used less frequently compared to partial PPE (37.5% vs 43.5%). In over 60% of all pandemic flu calls responders used partial PPE. Full PPE was used in higher proportions among high-priority calls compared with low-priority calls (23.8% vs 11.1%). Similarly, full PPE was used more frequently on ALS calls than BLS calls (26.8% vs 10.4%). Among encounters where CPR or defibrillation was performed, full PPE was used in 43.4% of encounters. Full PPE was used in 40.9% of all aerosolizing procedures,
whereas partial PPE was used in 51.1% of said procedures. The level of PPE use documented differed significantly across all patient demographics and EMS encounter variables (all P-values “<0.001, with the exception of CPR/ defibrillation procedures (P-values = 0.8).
Due to the small number of encounters where responders used no PPE, outcome categories included in analyses were full, partial and not documented PPE use. We excluded the “none” category from the multivariable analysis, as including them would have led to unstable estimates (n = 28,601). The strongest factors that influenced full PPE use, relative to partial use, were dispatch codes “breathing problems” (odds ratio [OR] 4.89; 95% confidence interval [CI]: 4.40, 5.46) and “cardiac/respiratory arrest” (OR 3.82; 95% CI: 2.99, 4.88) and a positive screen on the COVID-19 EMD-MCQ (OR 3.97; CI: 95% CI, 3.66, 4.32) (Table 3). Pandemic flu dispatch codes also significantly influenced full PPE use (OR 1.23, 95% CI: 1.05, 1.43). Encounters where patients were dead prior to or
EMS Encounter VariablesδTotal
(n = 28,693)Full PPE
(n = 5,089)Partial PPE(n = 21,496)
None(n = 39)
Not documented(n = 2,069)
n %¥ n %€ n %€ n %€ n %€
Transport facility typeTertiary 18,420 64.2 3,075 16.7 14,201 77.1 13 0.1 1131 6.1Community 3,404 11.9 668 19.6 2,516 73.9 3 0.1 217 6.4No transport 6,869 23.9 1,346 19.6 4,779 69.6 23 0.3 721 10.5
Procedure type*CPR/defibrillation performed 452 1.6 196 43.4 222 49.1 0 0.0 34 7.5Aerosolizing procedure performed
861 3.0 352 40.9 440 51.1 0 0.0 69 8.0
Invasive procedure/monitoring performed
3,645 12.7 802 22.0 2,612 71.7 2 0.1 229 6.3
Wound/injury care performed 1,487 5.2 39 2.6 1,353 91.0 1 0.1 94 6.3Non-invasive biomonitoring performed
15,986 55.7 3,162 19.8 11,782 73.7 11 0.1 1,031 6.5
Other treatment performedβ 507 1.8 86 17.0 384 75.4 0 0.0 37 7.3Assessment**
Breathing rate normal 24,168 84.2 3,732 15.4 18,837 77.9 19 0.1 1,580 6.5Breathing unlabored 24,263 84.6 3,775 15.6 18,880 77.8 19 0.1 1,589 6.6Airway patent 26,511 92.4 4,625 17.5 20,091 75.8 21 0.1 1,774 6.7Lungs clear 24,420 85.1 3,891 15.8 19,007 77.6 19 0.1 1,596 6.5Skin temperature normal 24,557 85.6 3,943 16.1 18,989 77.3 19 0.1 1,606 6.5
Table 2. Continued.
EMS, emergency medical services; PPE, personal protective equipment; CPR, cardiopulmonary resuscitation.δ All P-values <0.001.¥ Reflects column %.€ Reflects row %.β P-value = 0.8.*Yes vs no and not documented.**Yes vs no vs not documented.
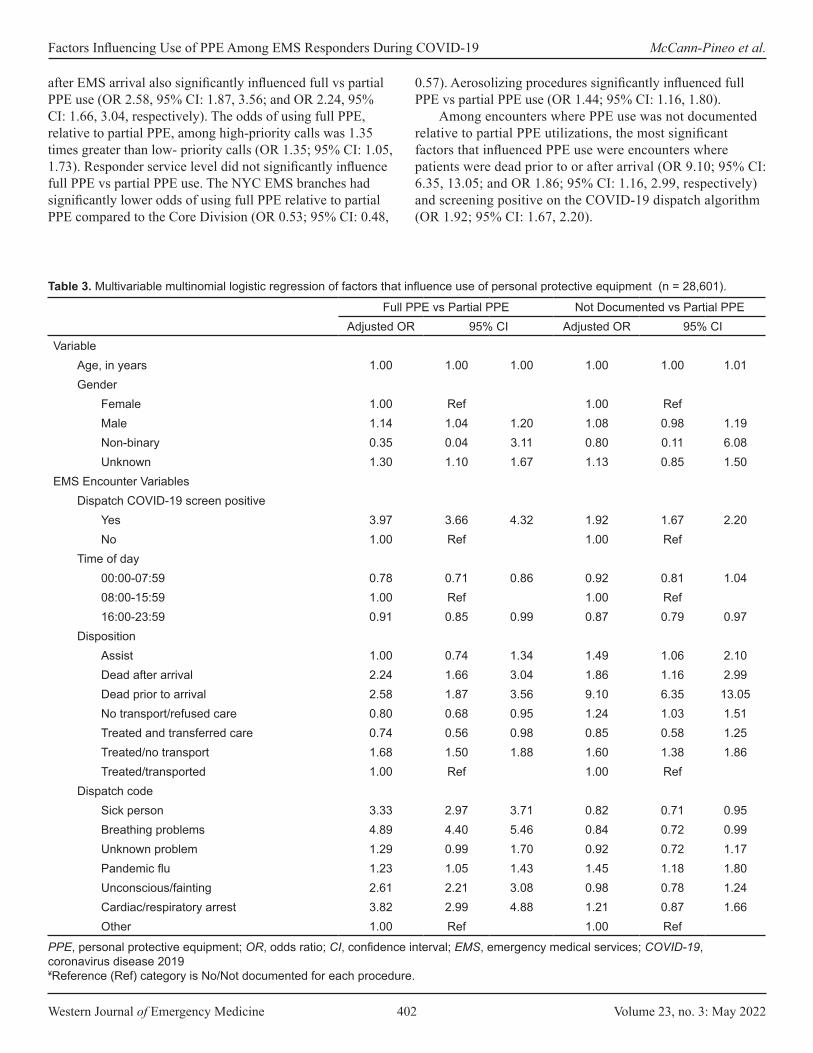
Western Journal of Emergency Medicine 402 Volume 23, no. 3: May 2022
Factors Influencing Use of PPE Among EMS Responders During COVID-19 McCann-Pineo et al.
after EMS arrival also significantly influenced full vs partial PPE use (OR 2.58, 95% CI: 1.87, 3.56; and OR 2.24, 95% CI: 1.66, 3.04, respectively). The odds of using full PPE, relative to partial PPE, among high-priority calls was 1.35 times greater than low- priority calls (OR 1.35; 95% CI: 1.05, 1.73). Responder service level did not significantly influence full PPE vs partial PPE use. The NYC EMS branches had significantly lower odds of using full PPE relative to partial PPE compared to the Core Division (OR 0.53; 95% CI: 0.48,
0.57). Aerosolizing procedures significantly influenced full PPE vs partial PPE use (OR 1.44; 95% CI: 1.16, 1.80).
Among encounters where PPE use was not documented relative to partial PPE utilizations, the most significant factors that influenced PPE use were encounters where patients were dead prior to or after arrival (OR 9.10; 95% CI: 6.35, 13.05; and OR 1.86; 95% CI: 1.16, 2.99, respectively) and screening positive on the COVID-19 dispatch algorithm (OR 1.92; 95% CI: 1.67, 2.20).
Full PPE vs Partial PPE Not Documented vs Partial PPEAdjusted OR 95% CI Adjusted OR 95% CI
VariableAge, in years 1.00 1.00 1.00 1.00 1.00 1.01Gender
Female 1.00 Ref 1.00 RefMale 1.14 1.04 1.20 1.08 0.98 1.19Non-binary 0.35 0.04 3.11 0.80 0.11 6.08Unknown 1.30 1.10 1.67 1.13 0.85 1.50
EMS Encounter VariablesDispatch COVID-19 screen positive
Yes 3.97 3.66 4.32 1.92 1.67 2.20No 1.00 Ref 1.00 Ref
Time of day00:00-07:59 0.78 0.71 0.86 0.92 0.81 1.0408:00-15:59 1.00 Ref 1.00 Ref16:00-23:59 0.91 0.85 0.99 0.87 0.79 0.97
DispositionAssist 1.00 0.74 1.34 1.49 1.06 2.10Dead after arrival 2.24 1.66 3.04 1.86 1.16 2.99Dead prior to arrival 2.58 1.87 3.56 9.10 6.35 13.05No transport/refused care 0.80 0.68 0.95 1.24 1.03 1.51Treated and transferred care 0.74 0.56 0.98 0.85 0.58 1.25Treated/no transport 1.68 1.50 1.88 1.60 1.38 1.86Treated/transported 1.00 Ref 1.00 Ref
Dispatch codeSick person 3.33 2.97 3.71 0.82 0.71 0.95Breathing problems 4.89 4.40 5.46 0.84 0.72 0.99Unknown problem 1.29 0.99 1.70 0.92 0.72 1.17Pandemic flu 1.23 1.05 1.43 1.45 1.18 1.80Unconscious/fainting 2.61 2.21 3.08 0.98 0.78 1.24Cardiac/respiratory arrest 3.82 2.99 4.88 1.21 0.87 1.66Other 1.00 Ref 1.00 Ref
Table 3. Multivariable multinomial logistic regression of factors that influence use of personal protective equipment (n = 28,601).
PPE, personal protective equipment; OR, odds ratio; CI, confidence interval; EMS, emergency medical services; COVID-19, coronavirus disease 2019¥Reference (Ref) category is No/Not documented for each procedure.

Volume 23, no. 3: May 2022 403 Western Journal of Emergency Medicine
McCann-Pineo et al. Factors Influencing Use of PPE Among EMS Responders During COVID-19
Sensitivity Analyses Proportions of demographic and EMS encounter variables
among those with documented PPE compared to those without
documented PPE are displayed in Table 4. Use of PPE was not documented in higher proportions among calls where the patient died prior to arrival (8.2% vs 1.2%), and when no
Full PPE vs partial PPE Not documented vs partial PPEAdjusted OR 95% CI Adjusted OR 95% CI
Priority levelHigh 1.35 1.05 1.73 1.49 1.19 1.86Low 1.00 Ref 1.00 Ref
Service levelALS 1.05 0.81 1.36 0.76 0.59 0.96BLS 1.00 Ref 1.00 Ref
EMS agencyNYC 0.53 0.48 0.57 0.97 0.85 1.10Core 1.00 Ref 1.00 Ref
Procedure type*CPR/defibrillation performed 1.07 0.78 1.46 0.69 0.42 1.14Aerosolizing procedure performed 1.44 1.16 1.80 1.41 0.99 2.00Invasive procedure/monitoring performed 0.80 0.71 0.89 0.87 0.74 1.02Wound/injury care performed 0.38 0.27 0.53 0.90 0.72 1.13Non-invasive biomonitoring performed 0.89 0.82 0.96 0.89 0.80 0.99Other treatment performed 0.62 0.47 0.81 0.90 0.63 1.28
AssessmentBreathing rate normal
Yes 1.00 Ref 1.00 RefNo 2.02 1.45 2.83 1.53 0.90 2.60Not documented 1.23 1.01 1.50 1.02 0.74 1.40
Breathing unlaboredYes 1.00 Ref 1.00 RefNo 1.02 0.70 1.48 1.06 0.58 1.93Not documented 1.28 1.05 1.56 1.13 0.82 1.57
Airway patentYes 1.00 Ref 1.00 RefNo 0.72 0.52 0.98 0.81 0.51 1.26Not documented 0.60 0.49 0.73 0.77 0.59 1.00
Skin temperature normalYes 1.00 Ref 1.00 RefNo 2.20 1.57 3.09 1.63 0.96 2.79Not documented 1.30 1.13 1.50 1.14 0.91 1.44
Lungs clearYes 1.00 Ref 1.00 RefNo 1.19 0.91 1.54 1.21 0.91 1.54Not documented 1.15 0.98 1.35 1.23 0.95 1.58
Table 3. Continued.
PPE, personal protective equipment; OR, odds ratio; CI, confidence interval; EMS, emergency medical services; ALS, Advanced Life Support; BLS, Basic Life Support; CPR, cardiopulmonary resuscitation.¥Reference (Ref) category is No/Not documented for each procedure.
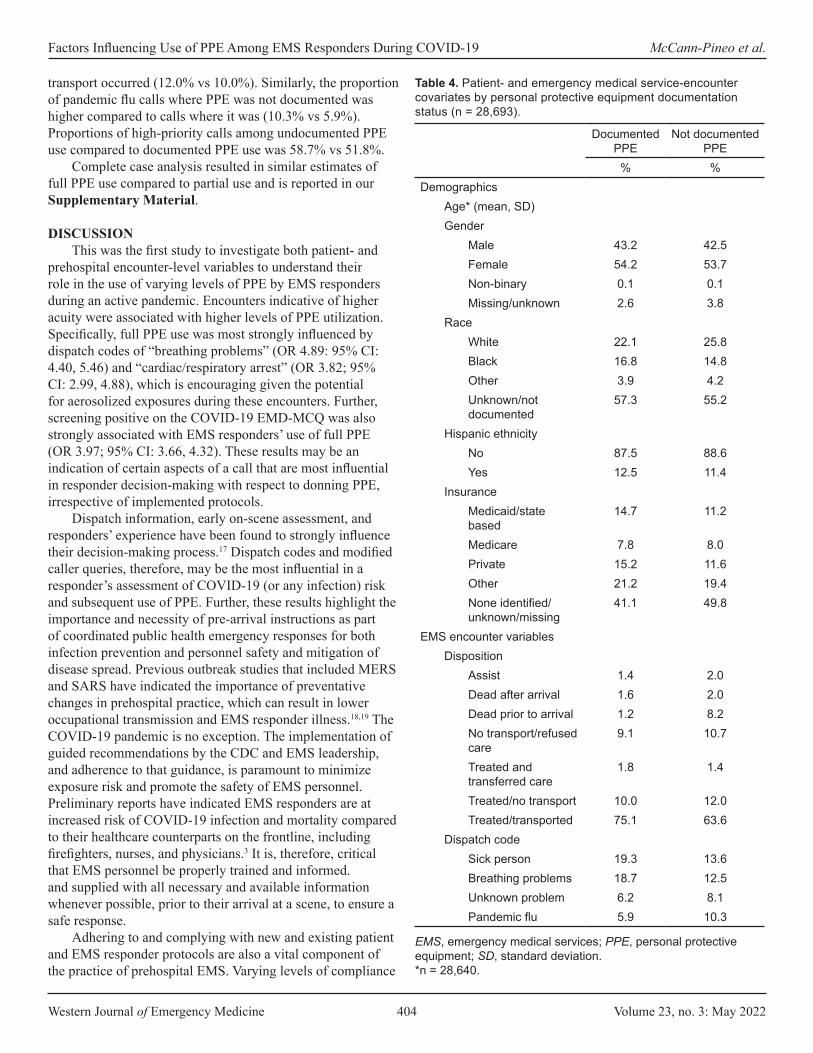
Western Journal of Emergency Medicine 404 Volume 23, no. 3: May 2022
Factors Influencing Use of PPE Among EMS Responders During COVID-19 McCann-Pineo et al.
transport occurred (12.0% vs 10.0%). Similarly, the proportion of pandemic flu calls where PPE was not documented was higher compared to calls where it was (10.3% vs 5.9%). Proportions of high-priority calls among undocumented PPE use compared to documented PPE use was 58.7% vs 51.8%.
Complete case analysis resulted in similar estimates of full PPE use compared to partial use and is reported in our Supplementary Material.
DISCUSSIONThis was the first study to investigate both patient- and
prehospital encounter-level variables to understand their role in the use of varying levels of PPE by EMS responders during an active pandemic. Encounters indicative of higher acuity were associated with higher levels of PPE utilization. Specifically, full PPE use was most strongly influenced by dispatch codes of “breathing problems” (OR 4.89: 95% CI: 4.40, 5.46) and “cardiac/respiratory arrest” (OR 3.82; 95% CI: 2.99, 4.88), which is encouraging given the potential for aerosolized exposures during these encounters. Further, screening positive on the COVID-19 EMD-MCQ was also strongly associated with EMS responders’ use of full PPE (OR 3.97; 95% CI: 3.66, 4.32). These results may be an indication of certain aspects of a call that are most influential in responder decision-making with respect to donning PPE, irrespective of implemented protocols.
Dispatch information, early on-scene assessment, and responders’ experience have been found to strongly influence their decision-making process.17 Dispatch codes and modified caller queries, therefore, may be the most influential in a responder’s assessment of COVID-19 (or any infection) risk and subsequent use of PPE. Further, these results highlight the importance and necessity of pre-arrival instructions as part of coordinated public health emergency responses for both infection prevention and personnel safety and mitigation of disease spread. Previous outbreak studies that included MERS and SARS have indicated the importance of preventative changes in prehospital practice, which can result in lower occupational transmission and EMS responder illness.18,19 The COVID-19 pandemic is no exception. The implementation of guided recommendations by the CDC and EMS leadership, and adherence to that guidance, is paramount to minimize exposure risk and promote the safety of EMS personnel. Preliminary reports have indicated EMS responders are at increased risk of COVID-19 infection and mortality compared to their healthcare counterparts on the frontline, including firefighters, nurses, and physicians.3 It is, therefore, critical that EMS personnel be properly trained and informed. and supplied with all necessary and available information whenever possible, prior to their arrival at a scene, to ensure a safe response.
Adhering to and complying with new and existing patient and EMS responder protocols are also a vital component of the practice of prehospital EMS. Varying levels of compliance
Documented PPE
Not documented PPE
% %Demographics
Age* (mean, SD)Gender
Male 43.2 42.5Female 54.2 53.7Non-binary 0.1 0.1Missing/unknown 2.6 3.8
RaceWhite 22.1 25.8Black 16.8 14.8Other 3.9 4.2Unknown/not documented
57.3 55.2
Hispanic ethnicityNo 87.5 88.6Yes 12.5 11.4
InsuranceMedicaid/state based
14.7 11.2
Medicare 7.8 8.0Private 15.2 11.6Other 21.2 19.4None identified/unknown/missing
41.1 49.8
EMS encounter variablesDisposition
Assist 1.4 2.0Dead after arrival 1.6 2.0Dead prior to arrival 1.2 8.2No transport/refused care
9.1 10.7
Treated and transferred care
1.8 1.4
Treated/no transport 10.0 12.0Treated/transported 75.1 63.6
Dispatch codeSick person 19.3 13.6Breathing problems 18.7 12.5Unknown problem 6.2 8.1Pandemic flu 5.9 10.3
Table 4. Patient- and emergency medical service-encounter covariates by personal protective equipment documentation status (n = 28,693).
EMS, emergency medical services; PPE, personal protective equipment; SD, standard deviation. *n = 28,640.

Volume 23, no. 3: May 2022 405 Western Journal of Emergency Medicine
McCann-Pineo et al. Factors Influencing Use of PPE Among EMS Responders During COVID-19
to standard infection control guidelines have been previously reported among EMS responders.20,21 Bledsoe and colleagues20 found that only a little over half (56.9%) of EMS responders
who arrived to receiving emergency facilities were wearing gloves. Another study found that the donning of certain PPE, such as gowns and face shields, did not occur in considerable proportions among EMS responders when it was deemed necessary (64% and 36%, respectively).21 Although our study did not include real-time observations of PPE use, it still offers great insight into adherence to infection control guidelines, specifically during a pandemic.
Despite EMS agency guidelines, full PPE was used in only 17.8% of encounters. Among encounters where patients had screened positive as a potential COVID-19 exposure, only 41.7% of responders documented using full PPE. Further, of all encounters with dispatch codes indicative of pandemic flu, full PPE was documented in only 27.7% of said encounters. Even more surprisingly, 85.8% of these calls had also screened positive on the 9-1-1 dispatch.
The proportions of full PPE use were significantly lower than anticipated, particularly in light of the CDC and agency recommendations advising the use of such levels of PPE.16 We offer potential explanations for such suboptimal compliance, beginning first with risk assessment by EMS responders. Encounters where risk of COVID-19 exposure was higher, as in potentially aerosolizing scenarios such as cardiac arrest or respiratory/breathing problem calls, the odds of using full PPE was almost four- to five-fold higher. Responders may have assessed that these encounters were the most hazardous, thus warranting the use of higher levels of PPE. Alternatively, encounters where potential exposure may have been deemed lower, particularly among calls that did not screen positive on the EMD-MCQ, responders may have decided to use less PPE from a resource-conservation standpoint.
Secondly, in the attempt to reduce treatment delays, responders may have neglected to don all equipment constituting full PPE. Particularly in our EMS agency, where full PPE was recommended on all calls, and not just those of suspected COVID-19, the donning process may have been too lengthy or cumbersome and disrupted the delivery of patient care. This may have become even more exaggerated in higher acuity calls, resulting in lower levels of PPE use. Lastly, we observed a considerable proportion of encounters that did not have any PPE documented (7.2%). The new documentation fields that captured responders’ PPE use was implemented across our EMS agencies within days upon the declaration of the state of public health emergency on March 13.4 Responders who may not have been previously documenting their PPE use were now asked to make it part of routine practice, while experiencing rapidly increasing workloads and call volumes. It is plausible that our responders did use full PPE when necessary but did not accurately or thoroughly document its use within the documentation platform.
Current reports of PPE use among EMS responders during the pandemic have been limited since they temporally reflect the initial outbreak or were conducted only among COVID-19-positive patients. Murphy et al. found that
Documented PPE
Not documented PPE
% %
Unconscious/fainting 6.2 5.5Cardiac/respiratory arrest
3.0 8.8
Other 41.9 41.1Priority level, high vs low
High 51.8 58.7Low 48.2 41.3
Service level, ALS vs BLS
ALS 44.5 48.7BLS 55.5 51.3
EMS agencyNYC 68.7 69.6Core 32.3 30.4
Transport facility typeTertiary 64.9 54.7Community 12.0 10.5No transport 23.1 34.9
Procedure typeCPR/defibrillation performed
1.6 1.6
Aerosolizing procedure performed
3.0 3.3
Invasive procedure/monitoring performed
12.8 11.1
Wound/injury care performed
5.2 4.5
Non-invasive biomonitoring performed
56.2 49.8
Other treatment performed
1.8 1.8
AssessmentBreathing rate normal 84.8 76.4Breathing unlabored 85.2 76.8Airway patent 92.9 85.7Lungs clear 86.1 76.9Skin temperature normal 85.8 77.6
Table 4. Continued.
EMS, emergency medical services; PPE, personal protective equipment; SD, standard deviation; ALS, Advanced Life Support; BLS, Basic Life Support; CPR, cardiopulmonary resuscitation. *n = 28,640.

Western Journal of Emergency Medicine 406 Volume 23, no. 3: May 2022
Factors Influencing Use of PPE Among EMS Responders During COVID-19 McCann-Pineo et al.
among their sample, 67% of EMS responder encounters documented donning full PPE (gloves, eye protection, mask, and gown).18 However, PPE use by more than one responder per encounter could have been included in this proportion, which differs from our summative reporting. Further, among a small subset of general EMS encounters from March 20-26, Murphy and colleagues also report that full PPE was used in 34% of EMS responder encounters.18 During the same time frame in our study, full PPE was documented in 28.9% of EMS encounters, which is comparable given the aforementioned differences in documentation between our two studies. Further, it was reported by Fernandez et al. that only 40.4% of EMS encounters had documented use of any face mask (surgical, N95, PAPR).19 In our study, we found that of encounters occurring during the same study time frame, use of a face mask was documented in 91.5% of encounters, which is encouraging given the significant disease burden geographically experienced among our sample. Although there are many differences across our studies, these results highlight that PPE use among EMS responders is influenced by a multitude of factors, some of which may go beyond recommendations and guidelines.
LIMITATIONSOur study is not without limitations. The first is the
retrospective nature of our design. We were reliant on the completeness and accuracy of what was documented within the prehospital health record. There-fore, there is a potential for misclassification with respect to our outcome – PPE utilization – with responders potentially under- or over-reporting their PPE use. However, given the focus and necessity of COVID-19 infection mitigation among EMS responders during our study period, we do not believe this occurred in a significant proportion. Secondly, as reported, there was a considerable proportion of missing outcome data, with sensitivity analyses indicating significant differences in both patient and prehospital variable proportions among encounters with and without documented PPE. Specifically, encounters where patients had died prior to or after arrival were more likely to have undocumented PPE. Responders may not have documented PPE use during such calls, for they may not have physically come in contact with the deceased patient. Although this is speculative, we do not believe that the encounters where PPE use was not documented have any statistically meaningful influence on the predictors of full PPE use because our complete case analysis did not indicate this across multivariable models.
Thirdly, PPE was collected as a summative utilization measure documented across two individuals. There is the possibility that we underestimated the true proportions of full PPE used, for we could not discern the specific numbers of equipment actually used (ie, two face masks, one gown, etc.). Two individuals could have used full PPE, but we were only able to report per encounter. We were also unable to determine
whether the level of PPE use was driven by individual decision-making in the field or implemented per CDC/agency protocols. Responders could have used their own judgment of perceived risk to guide the donning of PPE, which could have occurred irrespective of current guidelines. This could have influenced our results in either direction; however, we were unable to account for this analytically. Lastly, our results are reflective of an EMS system in a region that was hit especially hard by the pandemic and, therefore, may not be representative of all EMS agency experiences.
CONCLUSIONDispatch codes indicative of respiratory illness or cardiac/
respiratory arrest were the strongest factors that influenced full PPE use among EMS responders during the first wave of the COVID-19 pandemic. Screening positive on 9-1-1 caller queries was also a strong factor of full PPE utilization, highlighting its purpose in emergency and disaster planning. However, despite the CDC’s national PPE guidelines, not all responders used full PPE when encountering a suspected COVID-19 patient. Being able to ascertain the reasons behind a responder’s decision-making with respect to complying with emergency protocols should be the subject of future research.
Address for Correspondence: Molly McCann-Pineo, PhD, MS, North Shore University Hospital, Department of Emergency Medicine, 300 Community Drive, Manhasset NY 11030. Email: [email protected].
Conflicts of Interest: By the WestJEM article submission agreement, all authors are required to disclose all affiliations, funding sources and financial or management relationships that could be perceived as potential sources of bias. No author has professional or financial relationships with any companies that are relevant to this study. There are no conflicts of interest or sources of funding to declare.
Copyright: © 2022 McCann-Pineo et al. This is an open access article distributed in accordance with the terms of the Creative Commons Attribution (CC BY 4.0) License. See: http://creativecommons.org/licenses/by/4.0/
REFERENCES1. New York State Department of Health. Workbook: NYS-COVID-19
Tracker. 2020. Available at: https://covid19tracker.health.ny.gov/views/NYS-COVID19-Tracker/NYSDOHCOVID-19Tracker-Map?%3Aembed=yes&%3Atoolbar=no&%3Atabs=n. Accessed January 19, 2020.
2. Shahrigian S. NYC sees decline in 911 calls after record high due to coronavirus outbreak. 2020. Available at: https://www.nydailynews.com/coronavirus/ny-coronavirus-new-york-city-911-calls-20200420-rx3r7hyg6vhhrflh4daxzb4one-story.html. Accessed December 17, 2020.
Volume 23, no. 3: May 2022 407 Western Journal of Emergency Medicine
McCann-Pineo et al. Factors Influencing Use of PPE Among EMS Responders During COVID-19
3. Maguire BJ, O’Neill BJ, Phelps S, et al. COVID-19 fatalities among EMS clinicians. EMS1. 2020. Available at: https://www.ems1.com/ems-products/personal-protective-equipment-ppe/articles/covid-19-fatalities-among-ems-clinicians-BMzHbuegIn1xNLrP/. Accessed December 17, 2020.
4. Assistant Secretary for Preparedness and Response. EMS Infectious Disease Playbook. 2017. Available at: https://www.ems.gov/pdf/ASPR-EMS-Infectious-Disease-Playbook-June-2017.pdf. Accessed December 17, 2020.
5. Watson CM, Duval-Arnould JM, McCrory MC, et al. Simulated pediatric resuscitation use for personal protective equipment adherence measurement and training during the 2009 influenza (H1N1) pandemic. Jt Comm J Qual Saf. 2011;37(11):515-23.
6. Abrahamson SD, Canzian S, Brunet F. Using simulation for training and to change protocol during the outbreak of severe acute respiratory syndrome. Crit Care. 2005;10(1):1-6.
7. Turner AK, Wages RK, Nadeau K, et al. The Infectious Disease Network (IDN): development and use for evaluation of potential Ebola cases in Georgia. Disaster Med Public Health Prep. 2018;12(6):765-71.
8. Kang J, Kim EJ, Choi JH, et al. Difficulties in using personal protective equipment: training experiences with the 2015 outbreak of Middle East respiratory syndrome in Korea. Am Journal Infec Control. 2018;46(2):235-7.
9. Oh HS, Uhm D. Occupational exposure to infection risk and use of personal protective equipment by emergency medical personnel in the Republic of Korea. Am Journal Infec Control. 2016;44(6):647-51.
10. Isakov A, Miles W, Gibbs S, et al. Transport and management of patients with confirmed or suspected Ebola virus disease. Ann Emerg Med. 2015;66(3):297-305.
11. Le AB, Buehler SA, Maniscalco PM, et al. Determining training and education needs pertaining to highly infectious disease preparedness and response: a gap analysis survey of US emergency medical services practitioners. Am Journal Infec Control. 2018;46(3):246-52.
12. Ventura C, Gibson C, Collier GD. Emergency medical services resource capacity and competency amid COVID-19 in the United
States: preliminary findings from a national survey. Heliyon. 2020;6(5):e03900.
13. Murphy DL, Barnard LM, Drucker CJ, et al. Occupational exposures and programmatic response to COVID-19 pandemic: an emergency medical services experience. Emerg Med J. 2020;37(11):707-13
14. Fernandez AR, Crowe RP, Bourn S, et al. COVID-19 preliminary case series: characteristics of EMS encounters with linked hospital diagnoses. Prehosp Emerg Care. 2020:25(1):16-27.
15. Tan GS, Linn KZ, Soon MM, et al. Effect of extended use N95 respirators and eye protection on personal protective equipment (PPE) utilization during SARS-CoV-2 outbreak in Singapore. Antimicrob Resist Infect Control. 2020;9(1):1-3.
16. Centers for Disease Control and Prevention. Interim Guidance for Emergency Medical Services (EMS) System and 911 Public Safety Answering Points (PSAPs) for COVID-19 in the United States. 2020. Available at: https://www.cdc.gov/coronavirus/2019-ncov/hcp/guidance-for-ems.html. Accessed Dec 17 2020.
17. Newgard CD, Nelson MJ, Kampp M, et al. Out-of-hospital decision-making and factors influencing the regional distribution of injured patients in a trauma system. J Trauma. 2011;70(6):1345.
18. Chow-In Ko P, Chen WJ, Huei-Ming Ma M, et al. Emergency medical services utilization during an outbreak of severe acute respiratory syndrome (SARS) and the incidence of SARS-associated coronavirus infection among emergency medical technicians. Acad Emerg Med. 2004;11(9):903-11.
19. Alabdali A, Almakhalas K, Alhusain F, et al. The Middle East Respiratory syndrome coronavirus (MERS-CoV) outbreak at King Abdul-Aziz Medical City-Riyadh from emergency medical services perspective. Prehosp Disaster Med. 2020:1-8.
20. Bledsoe BE, Sweeney RJ, Berkeley RP, et al. EMS provider compliance with infection control recommendations is suboptimal. Prehosp Emerg Care. 2014;18(2):290-4.
21. Alshammari AD, Bail JB, Parillo SJ. PPE misuse and its effect on infectious disease among EMS in Saudi Arabia. J Stud Res. 2019;8(1):51-8.

Western Journal of Emergency Medicine 408 Volume 23, no. 3: May 2022
Brief Research Report
Vaginal Swabs Are Non-inferior to Endocervical Swabs for Sexually Transmitted Infection testing in the
Emergency Department Andrew Krause, MD*Joseph B. Miller, MD*Linoj Samuel, PhD†
Jacob J. Manteuffel, MD*
Section Editor: Casey Clements, MD, PhD Submission history: Submitted June 23, 2021; Revision received March 9, 2022; Accepted March 12, 2022 Electronically published May 2, 2022 Full text available through open access at http://escholarship.org/uc/uciem_westjem DOI: 10.5811/westjem.2022.3.53812
INTRODUCTIONBackground
Treatment for newly acquired sexually transmitted infections (STI) was estimated to cost $16 billion in the United States in 2018, with the treatment of Chlamydia trachomatis and Neisseria gonorrhoeae totaling almost $100 million.1 The US Centers for Disease Control and Prevention (CDC) reported that C trachomatis rates in the US increased by 11.4% in women from 2014 to 2018, while N. gonorrhoeae infection
Henry Ford Hospital, Department of Emergency Medicine, Detroit, MichiganHenry Ford Hospital, Department of Pathology, Detroit, Michigan
Study Objective: Emergency department (ED) testing for sexually transmitted infections (STI) in women is typically performed with a pelvic examination and an endocervical swab. However, vaginal swabs are effective for STI testing and the preferred specimen type according to the US Centers for Disease Control and Prevention. The utility of using vaginal swabs in the ED for STI screening has not been thoroughly investigated. Our objective was to assess detection rates for two bacterial STIs before and after implementing a screening protocol using vaginal swabs.
Methods: We conducted a quasi-experimental, pre-post study using standardized data from electronic health records across nine metropolitan Detroit hospital EDs. Patients included women who were tested for Chlamydia trachomatis or Neisseria gonorrhoeae in the ED between April 2018– December 2019. Pre-implementation tests from April 2018-February 2019 were done using endo-cervical swabs, and post-implementation tests from February 2019-December 2019 were done with vaginal swabs. We used non-inferiority testing for proportion with a non-inferiority margin of one percentage point absolute difference in detection rates of STI.
Results: The study included 22,291 encounters with 11,732 in the pre-implementation and 10,559 in the post-implementation phases. The C. trachomatis detection rates were 7.5% pre-implementation and 7.6% post-implementation (between-group difference, 0.1 percentage points; 95% confidence interval [CI]: -0.7, 0.4; p<.01 for non-inferiority). The N. gonorrhoeae detection rates were 3.1% pre-implementation and 3.6% post-implementation (between-group difference, 0.5 percentage points; 95% CI: -0.8, 0.04; p<.01 for non-inferiority).
Conclusion: Using vaginal swabs for STI testing in the ED may be a non-inferior alternative to using endocervical swabs. [West J Emerg Med. 2022;22(3)408–411.]
*†
rates in women increased by 3.6% from 2017 to 2018.2 Infection with these organisms puts women at risk for infertility, ectopic pregnancy, pelvic inflammatory disease, and increased risk for human immunodeficiency virus infection.3 Expanding screening approaches may help to reduce STI rates.
The CDC recommends vaginal swabs as an appropriate sample type when testing for many STIs, even when a pelvic exam is performed.4 The US Food and Drug Administration has approved both endocervical and intravaginal swabs as

Volume 23, no. 3: May 2022 409 Western Journal of Emergency Medicine
Krause et al. Vaginal Swabs Are a Non-inferior to Endocervical Swabs for STI testing in the ED
screening methods for C. trachomatis and N. gonorrhoeae.5 For STI screening in women, self-collected vaginal swabs have been shown to have a similar sensitivity and specificity to those collected by a clinician.6 Endocervical samples for C. trachomatis testing in young adult women have shown sensitivities ranging from 75-100%, with some reports of sensitivities greater than 90%.4,7 Self-collected vaginal swabs from young women have shown nucleic acid amplification technique sensitivities ranging from 75-100% for the detection of C. trachomatis.7 In addition, results from nucleic acid amplification technique tests for N. gonorrhoeae have been reported to be similar to those for C trachomatis, with endocervical sample sensitivities of 89-97% and vaginal sample sensitivities of greater than 90%.4,7 Other studies have even found that C. trachomatis and N. gonorrhoeae detection rates are higher from patient-performed vaginal swabs than from endocervical swabs.7
ImportanceFew studies have investigated the use of vaginal swabs in
the emergency department (ED) for STI testing.8 One small previous study demonstrated that patient self-collected vaginal swabs were not inferior for detecting C. trachomatis and N. gonorrhoeae in a single ED.9 The use of vaginal swabs for STI testing in the ED provides an option for a patient-collected sample in appropriate situations. This can reduce the need for the more invasive procedure of a pelvic exam, saving time and resources, and perhaps promoting patient autonomy and reducing patient stress.
Goals of This InvestigationWe implemented a protocol for using vaginal swabs,
rather than endocervical swabs, to test for two bacterial STIs in women in EDs within a multihospital health system. We hypothesized that STI detection rates using vaginal swabs in the ED would be equivalent to the pre-implementation protocol that used only endo-cervical swabs collected by clnicians.
METHODSEthics Approval
Approval for this study was obtained from the Henry Ford Health System Institutional Review Board prior to the start of this study.
Study Design and SettingThis was a quasi-experimental, retrospective pre-post
study using standardized data from the electronic health record (EHR) across the Henry Ford Health System. We assessed 10 months of data before (pre-implementation phase from April 2018-February 2019) and 10 months of data after (post-implementation phase from February 2019-December 2019) the implementation of an ED STI vaginal swab screening intervention. The study period included records of STI tests that were done in nine EDs in the metropolitan Detroit,
Michigan, area. Eligible patients included any woman who received testing for C. trachomatis or N. gonorrhoeae in the nine EDs during the study period. Retrospective chart review for data collection was obtained following recommendations by Worster et al to reduce bias and adhere to methodologic standards for medical record review.10
Because this was a retrospective study clinicians were blinded to the study during the data collection period. Abstractors were properly trained on data collection and analysis for data from our EHR system prior to analysis. Multiple trained abstractors reviewed the same data to ensure data results were correct and accurate. Abstractors were blinded to the goals of the study during the analysis stage of this study. We excluded duplicate patient visits from data analysis. If data was missing from a specific patient, that patient was removed from the data set prior to analysis.
Selection of ParticipantsWomen included in this study were in the ED for
symptomatic STIs such as pelvic pain, unusual or foul-smelling discharge, or lower abdominal pain, had screened positive for possible STI exposure during history-taking, or were asymptomatic but had asked to be tested for STIs. Pregnant patients or patients with vaginal bleeding were not excluded from data collection. Men were excluded from this study.
InterventionsThe intervention consisted of a new ED protocol
that introduced vaginal swabs to test for STIs rather than endocervical swabs. In the pre-implementation phase, endocervical swabs were collected using the Aptima Unisex Swab Specimen Collection Kit (Hologic, Inc., Marlborough, MA). At the time of the intervention, use of endocervical swabs was discontinued in all nine EDs and only vaginal swabs were available for testing. All patients who would have been previously swabbed using the endocervical swabs were swabbed using intravaginal swabs in the post-implementation phase. Following Michigan Department of Health and Human Services (MDHHS) and CDC policies, if patients reported no unusual or foul-smelling discharge, pelvic pain, or dyspareunia, they were offered the opportunity to self-collect the swab during the post-implementation phase.11
In the post-implementation phase, swabs were collected by clinicians or self-collected by the patient. Clinicians would perform the vaginal swabs if the patient had any of the above symptoms, if asymptomatic patients requested that the clinician collect the swabs, or if the patient was unable to perform the swab herself. Patients who collected their own vaginal swabs were provided instructions on how to perform the intravaginal swabs per MDHHS and CDC policies prior to collection by either a nurse or clinician. The intravaginal swabs were collected by carefully introducing the swab about two inches past the introitus. The swab was moved circumferentially around the intravaginal canal for 10-30
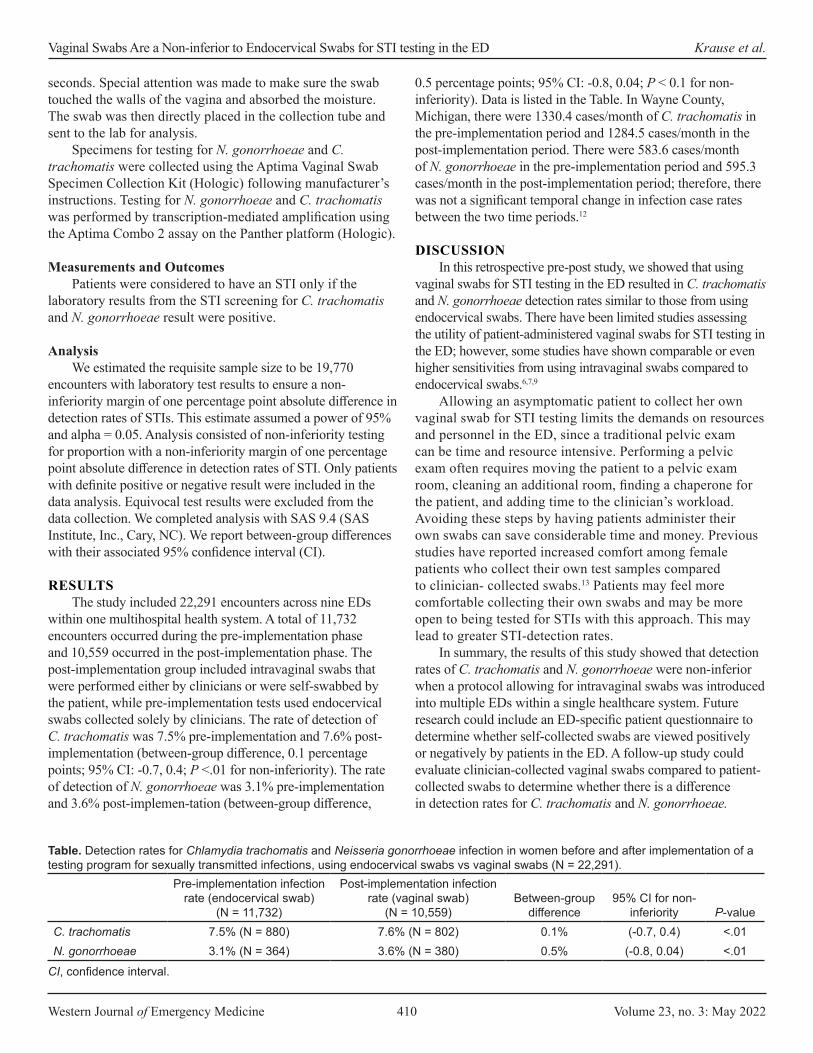
Western Journal of Emergency Medicine 410 Volume 23, no. 3: May 2022
Vaginal Swabs Are a Non-inferior to Endocervical Swabs for STI testing in the ED Krause et al.
seconds. Special attention was made to make sure the swab touched the walls of the vagina and absorbed the moisture. The swab was then directly placed in the collection tube and sent to the lab for analysis.
Specimens for testing for N. gonorrhoeae and C. trachomatis were collected using the Aptima Vaginal Swab Specimen Collection Kit (Hologic) following manufacturer’s instructions. Testing for N. gonorrhoeae and C. trachomatis was performed by transcription-mediated amplification using the Aptima Combo 2 assay on the Panther platform (Hologic).
Measurements and OutcomesPatients were considered to have an STI only if the
laboratory results from the STI screening for C. trachomatis and N. gonorrhoeae result were positive.
AnalysisWe estimated the requisite sample size to be 19,770
encounters with laboratory test results to ensure a non-inferiority margin of one percentage point absolute difference in detection rates of STIs. This estimate assumed a power of 95% and alpha = 0.05. Analysis consisted of non-inferiority testing for proportion with a non-inferiority margin of one percentage point absolute difference in detection rates of STI. Only patients with definite positive or negative result were included in the data analysis. Equivocal test results were excluded from the data collection. We completed analysis with SAS 9.4 (SAS Institute, Inc., Cary, NC). We report between-group differences with their associated 95% confidence interval (CI).
RESULTSThe study included 22,291 encounters across nine EDs
within one multihospital health system. A total of 11,732 encounters occurred during the pre-implementation phase and 10,559 occurred in the post-implementation phase. The post-implementation group included intravaginal swabs that were performed either by clinicians or were self-swabbed by the patient, while pre-implementation tests used endocervical swabs collected solely by clinicians. The rate of detection of C. trachomatis was 7.5% pre-implementation and 7.6% post-implementation (between-group difference, 0.1 percentage points; 95% CI: -0.7, 0.4; P <.01 for non-inferiority). The rate of detection of N. gonorrhoeae was 3.1% pre-implementation and 3.6% post-implemen-tation (between-group difference,
0.5 percentage points; 95% CI: -0.8, 0.04; P < 0.1 for non-inferiority). Data is listed in the Table. In Wayne County, Michigan, there were 1330.4 cases/month of C. trachomatis in the pre-implementation period and 1284.5 cases/month in the post-implementation period. There were 583.6 cases/month of N. gonorrhoeae in the pre-implementation period and 595.3 cases/month in the post-implementation period; therefore, there was not a significant temporal change in infection case rates between the two time periods.12
DISCUSSIONIn this retrospective pre-post study, we showed that using
vaginal swabs for STI testing in the ED resulted in C. trachomatis and N. gonorrhoeae detection rates similar to those from using endocervical swabs. There have been limited studies assessing the utility of patient-administered vaginal swabs for STI testing in the ED; however, some studies have shown comparable or even higher sensitivities from using intravaginal swabs compared to endocervical swabs.6,7,9
Allowing an asymptomatic patient to collect her own vaginal swab for STI testing limits the demands on resources and personnel in the ED, since a traditional pelvic exam can be time and resource intensive. Performing a pelvic exam often requires moving the patient to a pelvic exam room, cleaning an additional room, finding a chaperone for the patient, and adding time to the clinician’s workload. Avoiding these steps by having patients administer their own swabs can save considerable time and money. Previous studies have reported increased comfort among female patients who collect their own test samples compared to clinician- collected swabs.13 Patients may feel more comfortable collecting their own swabs and may be more open to being tested for STIs with this approach. This may lead to greater STI-detection rates.
In summary, the results of this study showed that detection rates of C. trachomatis and N. gonorrhoeae were non-inferior when a protocol allowing for intravaginal swabs was introduced into multiple EDs within a single healthcare system. Future research could include an ED-specific patient questionnaire to determine whether self-collected swabs are viewed positively or negatively by patients in the ED. A follow-up study could evaluate clinician-collected vaginal swabs compared to patient-collected swabs to determine whether there is a difference in detection rates for C. trachomatis and N. gonorrhoeae.
Pre-implementation infection rate (endocervical swab)
(N = 11,732)
Post-implementation infection rate (vaginal swab)
(N = 10,559)Between-group
difference95% CI for non-
inferiority P-valueC. trachomatis 7.5% (N = 880) 7.6% (N = 802) 0.1% (-0.7, 0.4) <.01N. gonorrhoeae 3.1% (N = 364) 3.6% (N = 380) 0.5% (-0.8, 0.04) <.01
Table. Detection rates for Chlamydia trachomatis and Neisseria gonorrhoeae infection in women before and after implementation of a testing program for sexually transmitted infections, using endocervical swabs vs vaginal swabs (N = 22,291).
CI, confidence interval.

Volume 23, no. 3: May 2022 411 Western Journal of Emergency Medicine
Krause et al. Vaginal Swabs Are a Non-inferior to Endocervical Swabs for STI testing in the ED
Additional studies might investigate whether there is a difference in detection rates for other STIs such as Trichomonas vaginalis or bacterial vaginosis.
LIMITATIONSLimitations of this study include inter-reliability of
clinicians collecting true endocervical swabs vs possible intravaginal swabs in the pre-implementation study phase. Although clinicians and nurses gave patients instructions on how to perform the intravaginal swabs per MDHHS and CDC policies prior to collection in the post-implementation study phase, certain patients may not have collected true intravaginal swabs, which may have lowered the detection rates for STIs. Due to the retrospective nature of the study and absence of documentation, we were unable to extract whether a patient’s sample was self-collected. Most of our patients undergoing testing for STI are symptomatic requiring a pelvic exam, but the precise proportion of self-collected swabs is unknown. This was an observational study within a single healthcare system; thus, results are not generalizable.
CONCLUSIONAn ED protocol using vaginal swabs for C. trachomatis
and N. gonorrhoeae testing for women may be non-inferior to the use of endocervical swabs for STI detection rates for these bacterial pathogens.
ACKNOWLEDGMENTSThe authors would like to thank Karla Passalacqua, PhD,
of Henry Ford Hospital Graduate Medical Education for her extensive editorial support. We would also like to thank Stephanie Stebens of Henry Ford Hospital Sladen Library for her expertise in formatting this manuscript.
This work was presented as a virtual oral presentation at the May 2020 Society of Academic Emergency Medicine Annual Meeting in Denver, CO.
Address for Correspondence: Andrew Krause, MD, Henry Ford Hospital, Department of Emergency Medicine, 2799 W. Grand Blvd., CFP 1, Detroit, MI 48202. Email: [email protected].
Conflicts of Interest: By the WestJEM article submission agreement, all authors are required to disclose all affiliations, funding sources and financial or management relationships that could be perceived as potential sources of bias. No author has professional or financial relationships with any companies that are relevant to this study. There are no conflicts of interest or sources of funding to declare.
Copyright: © 2022 Krause et al. This is an open access article distributed in accordance with the terms of the Creative Commons Attribution (CC BY 4.0) License. See: http://creativecommons.org/licenses/by/4.0/
REFERENCES1. Centers for Disease Control and Prevention. Sexually transmitted
infections prevalence, incidence, and cost estimates in the United States. 2021. Available at: https://www.cdc.gov/std/statistics/prevalence-2020-at-a-glance.htm. Accessed March 10, 2021.
2. Centers for Disease Control and Prevention. Sexually Transmitted Disease Surveillance 2018. 2019. Available at: https://www.cdc.gov/std/stats18/natoverview.html. Accessed March 22, 2021.
3. Centers for Disease Control and Prevention. Pelvic Inflammatory Disease (PID) – CDC Fact Sheet. 2021. Available at: https://www.cdc.gov/std/pid/stdfact-pid-detailed.html. Accessed March 13, 2021.
4. Centers for Disease Control and Prevention. Detection of genitourinary C. trachomatis and N. gonorrhoeae infections in women. 2014. Available at: https://www.cdc.gov/std/laboratory/2014labrec/recommendations2.html. Accessed March 13, 2021.
5. US Food and Drug Administration. FDA clears first diagnostic tests for extragenital testing for chlamydia and gonorrhea. 2019. Available at: https://www.fda.gov/news-events/press-announcements/fda-clears-first-diagnostic-tests-extragenital-testing-chlamydia-and-gonorrhea. Accessed March 13, 2021.
6. Schachter J, McCormack WM, Chernesky MA, et al. Vaginal swabs are appropriate specimens for diagnosis of genital tract infection with Chlamydia trachomatis. J Clin Microbiol. 2003;41(8):3784-9.
7. Shafer MA, Moncada J, Boyer CB, et al. Comparing first-void urine specimens, self-collected vaginal swabs, and endocervical specimens to detect Chlamydia trachomatis and Neisseria gonorrhoeae by a nucleic acid amplification test. J Clin Microbiol. 2003;41(9):4395-9.
8. Berwald N, Cheng S, Augenbraun M, et al. Self-administered vaginal swabs are a feasible alternative to physician-assisted cervical swabs for sexually transmitted infection screening in the emergency department. Acad Emerg Med. 2009;16(4):360-3.
9. Chinnock B, Yore M, Mason J, et al. Self-obtained vaginal swabs are not inferior to provider-performed endocervical sampling for emergency department diagnosis of Neisseria gonorrhoeae and Chlamydia trachomatis. Acad Emerg Med. 2021;28(6):612-20.
10. Worster A BR, Cleve P, Fernandes CM, et al. Reassessing the methods of medical record review studies in emergency medicine research. Ann Emerg Med. 2005;45(4):448-51.
11. Jensen TP, Soni NJ, Tierney DM, et al. Hospital privileging practices for bedside procedures: a survey of hospitalist experts. J Hosp Med. 2017;12(10):836-9.
12. Michigan Department of Health & Human Services. Sexually Transmitted Infections. 2021. Available at: https://www.michigan.gov/mdhhs/0,5885,7-339-73970_2944_5320_5332---,00.html. Accessed December 3, 2021.
13. Fielder RL, Carey KB, Carey MP. Acceptability of sexually transmitted infection testing using self-collected vaginal swabs among college women. J Am Coll Health. 2013;61(1):46-53.
Western Journal of Emergency Medicine 412 Volume 23, no. 3: May 2022
Review Article
Charting Practices to Protect Against Malpractice: Case Reviews and Learning Points
Summer Ghaith, BS*Gregory P. Moore, MD, JD†
Kristina M. Colbenson, MD‡
Rachel A. Lindor, MD, JD†
Section Editor: David Lee, MD Submission history: Submitted June 28, 2021; Revision received December 21, 2021; Accepted January 24, 2022 Electronically published April 28, 2022 Full text available through open access at http://escholarship.org/uc/uciem_westjem DOI: 10.5811/westjem.2022.1.53894
INTRODUCTIONMore than 75% of emergency physicians will be named in
a malpractice lawsuit at least once throughout their careers.1 Documentation issues are thought to play a role in up to 20% of these lawsuits.2 Previous studies of malpractice claims involving documentation indicate that these cases most commonly revolve around missing documentation (70%), inaccurate content (22%), or poor mechanics (18%).3 Poor mechanics includes errors in transcribed order, illegible entries, and delays in documentation.3 Physicians often focus on documentation as a means of communicating with other
Mayo Clinic Alix School of Medicine, Phoenix, ArizonaMayo Clinic, Department of Emergency Medicine, Phoenix, ArizonaMayo Clinic, Department of Emergency Medicine, Rochester, Minnesota
Introduction: Medical documentation issues play a role in 10-20% of medical malpractice lawsuits. Inaccurate, incomplete, or generic records undermine a physician’s defense and make a plaintiff’s lawyer more likely to take on a case. Despite the frequency of documentation errors in malpractice suits, physicians receive very little education or feedback on their documentation. Our objective in this case series was to evaluate malpractice cases related to documentation to help improve physicians’ documentation and minimize their liability risks.
Methods: We used Thomson Reuters Westlaw legal database to identify malpractice cases related to documentation. Common issues related to documentation and themes in the cases were identified and highlighted.
Results: We classified cases into the following categories: incomplete documentation; inaccurate text; transcription errors; judgmental language; and alteration of documentation. By evaluating real cases, physicians can better understand common errors of other practitioners and avoid these in their own practice.
Conclusion: Emergency physicians can reduce their liability risks by relying less on forms and templates and making a habit of documenting discussions with the patients, recording others’ involvement in patient care (chaperones, consultants, trainees, etc.), addressing others’ notes (triage staff, nurses, residents, etc.), paying attention to accuracy of transcribed or dictated information, avoiding judgmental language, and refraining from altering patient charts. [West J Emerg Med. 2022;23(3)412–417.]
*†
‡
physicians and billing for their services, but it is also crucial to communicate with the patient and provide a legal record of the care provided. Often, malpractice lawyers decide whether to pursue litigation cases based solely on the quality of documentation. In malpractice cases, inaccurate, incomplete, or careless records undermine a physician’s defense and make a plaintiff’s lawyer more likely to take on a case.2
Despite the frequency of documentation issues in malpractice suits, physicians receive very little education on this topic through training and very little feedback on their documentation once in practice. The Accreditation Council

Volume 23, no. 3: May 2022 413 Western Journal of Emergency Medicine
Ghaith et al. Charting Practices to Protect Against Malpractice
for Graduate Medical Education does not specifically address or require medicolegal education, lending to varying levels of exposure and training on these topics. When surveyed, residents and physicians across multiple specialties reported receiving no medicolegal training at all, let alone training that is specific to documentation, and rated their knowledge as poor.4,5,6 Emergency physicians are particularly at high risk of documentation malpractice liability due to the large number of high-risk patients and fast-paced environment. The objective of this case series was to evaluate malpractice cases related to documentation errors and practices to help improve physicians’ documentation and minimize their liability risks. By evaluating real cases, physicians can better understand practices and common errors of other practitioners and avoid these errors in their own practice.
METHODSWe used Thomson Reuters Westlaw, an online legal
database, to search for medical malpractice cases related to documentation. Cases were classified into the following categories: missing documentation; inaccurate text; transcription errors; judgmental language; and alteration of documentation. Illustrative examples are provided below.
RESULTS AND DISCUSSIONMissing Documentation
Cases that involve missing documentation comprise a broad range of clinical circumstances.2 Common scenarios identified included lack of documentation about informed consent discussions, patients acting against medical advice (AMA), specialist consultations, and communication with patients regarding return precautions or post-discharge care. The cases below highlight situations in which missing documentation contributed to the physicians’ liability risks.
Informed Consent Physicians generally recognize the need to obtain
informed consent and the risks of failing to do so, yet cases revolving around this issue remain common. Often in these cases, a standardized informed consent form is used, but the documentation is still deemed inadequate by the courts. For example, in Brown v St. Clair Anesthesia, Ltd., a patient provided written consent for placement of a central venous catheter during a bypass procedure.7 However, the physician determined during the procedure that the patient needed a Swan-Ganz catheter instead. Unfortunately, when insertion was attempted, he perforated the vein and the patient died. The patient’s family alleged that the two types of catheters were different enough to warrant a separate and specific consent form. The hospital settled privately, and the physician took the case to court believing the initial form would protect him; he was found responsible for $1 million in damages.
In Alaimo, Estate of v Berman, a woman underwent a cosmetic breast surgery and developed a complication that
was listed clearly on the informed consent form she had signed prior to the procedure.8 The patient argued that she was given the informed consent form just minutes before being wheeled to the operating room, and, therefore, her consent was rushed and not valid. Although the physicians involved in the case argued that she had been given the form much earlier, there was no timestamp on the actual form, and the court ruled in favor of the patient for a $3.5 million award. Although clinicians often assume that a signed, informed consent form protects them from procedural complications, especially those explicitly listed on the forms, these cases suggest that the forms’ protections are limited, and courts may expect more of a detailed conversation than a standardized form conveys.
Patient Acting Against Medical Advice While patients who leave AMA are widely recognized to be
high risk when it comes to liability, we identified several cases in which physicians’ documentation of the encounter failed to protect them from liability. For example, in McHone v Swedish Covenant Hospital, emergency physicians recommended that a child with abdominal pain be transferred to a pediatric center for additional diagnostic studies.9 However, the mother wanted to drive the child herself. She signed an AMA form prior to discharge and was given instructions to present at the nearby children’s hospital. Rather than going right to the hospital, the mother stopped at her house, delaying her arrival at the referral center for several hours, and the child died due to sepsis from a ruptured appendix. Although the AMA form was signed and documented, the accompanying discussion was not. Other than the signed form, there was no evidence that the original physician really tried to ensure the mother understood the risks to her child or worked with her to come up with a safer plan, and the court found the physician partially liable for the child’s death.
Similarly, in Parker v FL Emergency Physicians, a patient arrived at the emergency department (ED) complaining of a headache concerning for a subarachnoid hemorrhage.10 Before the workup was completed, the patient left AMA and signed a form documenting this decision, his awareness of the risks, and his acceptance of those risks. Several days later, he died due to a ruptured aneurysm. Again, the AMA form itself did not convince the court that the physician adequately conveyed the risks to the patient or put sufficient effort into convincing him to stay, and the court issued a $9 million verdict. Finally, in Tracy v Freund, a patient went to the hospital with chest pain but chose to leave before his evaluation was complete.11 The patient signed an AMA form and had a fatal myocardial infarction a week later. This case occurred in a state in which the jury could apportion comparative fault for the parties involved. Comparative fault allocates negligence when both parties are at least somewhat at fault. They decided that the AMA form lessened the physician’s role but did not absolve him entirely, and they ultimately found him to be responsible for 50% of the damages, or $2.7 million.

Western Journal of Emergency Medicine 414 Volume 23, no. 3: May 2022
Charting Practices to Protect Against Malpractice Ghaith et al.
These cases demonstrate that a signed AMA form is not sufficient protection from future liability and physicians should ensure that appropriate attention is directed toward this class of high-risk patients, both in encouraging them to stay and in fully documenting any efforts to convince them to do so. Additionally, physicians should document an assessment of a patient’s decision-making capacity in every AMA case, ideally with reference to the four elements of capacity, understanding, appreciation, reasoning, and communication.
Discussions with ConsultantsConsultations originating in the ED are another source
of potential liability if not documented appropriately. In an anonymous case in New York, a patient presented to the ED with a headache.12 After an initial workup, the resident physician reported consulting a neurologist who recommended against additional diagnostic studies. The patient subsequently suffered a brainstem herniation from an undiagnosed subarachnoid hemorrhage and died in the ED. When the patient’s family brought suit, the resident defended himself by saying he was following the neurologist’s advice. The neurologist denied any recollection of the conversation, and there was no documentation to support that it had occurred. The jury felt that either the resident or the neurologist was being dishonest and awarded the patient’s family $44 million in damages.
Cases like this can be avoided by following a clear pathway for formal consultations, in which the consultant’s name is recorded, along with the time and content of the discussion, and consultants are made aware that their recommendations will be relied on and incorporated into the medical record. This does not preclude informal consultations, or “curbside consults,” in which a specialist’s advice is sought in an off-the-record fashion. In fact, instituting a clear pathway for formal consultations and being upfront about intention to document recommendations may alleviate consultants’ fears of being unknowingly named in the medical record and increase their willingness to provide informal input.
Communicating with Patients at and After Discharge While physicians’ documentation efforts tend to focus
on the content of the clinical encounter, communication with patients at the time of and after discharge is equally important for minimizing liability. Lawsuits related to this issue may involve unclear referrals, inaccurate discharge instructions, incomplete return precautions, or failure to follow up on outstanding testing. For example, in Hooten v Pediatrix Medical Group, a newborn baby with retinopathy of prematurity was discharged after a prolonged hospital stay and referred to a local ophthalmologist for close follow-up.13 When the mother tried to follow up, she was told that physician was no longer available, and she was scheduled for an appointment a month later at a different practice. By the time she followed up, her child was blind. She argued that no one had told her about the importance of timely follow-up,
and there was no documentation contradicting this, leading the court to issue a $9.25 million judgment in her favor.
In Estate of Kimble, poorly documented discharge instructions resulted in liability for a primary care physician.14 In this case, a woman presented to an outpatient clinic with shortness of breath and an elevated D-dimer. The physician instructed her to go to the ED and assumed the patient would do so but did not document this recommendation. When the patient instead went home and died from a massive pulmonary embolism, the physician settled for $2 million since she could not provide any evidence that there had been referral to the ED. Taking the time to discuss and document recommendations for post-discharge care minimizes physicians’ risks from these types of lawsuits.
Finally, test results that change or return after ED discharge can create liability risks for emergency physicians. Common scenarios requiring post-discharge follow-up include radiology reports that are later revised or tests that result after discharge, such as blood cultures or urine culture susceptibilities. The ED must have a process to provide these results to patients in a timely fashion, and emergency physicians should understand that they maintain ultimate responsibility for the efficacy of these processes. In scenarios in which attempts to contact patients are unsuccessful, all attempts to do so should be thoroughly documented. Maintaining an awareness of these processes and potential pitfalls can reduce physicians’ liability risks for discharged patients.
Inaccurate DocumentationSeparate from the issue of missing documentation,
inaccurate documentation makes up the second most common category of documentation-related malpractice cases. Common issues in this category include using inaccurate templates, copying and pasting from other notes, and providing information that conflicts with other clinicians for the same encounter. Each of these issues has become more problematic with the shift to electronic health records (EHR).
Reliance on templates that automatically populate a normal physical exam or review of systems is a commonly used but risky practice. Examples of this include a review-of-systems template that records “no chest pain” for a patient with a chief complaint of chest pain, or a templated physical exam saying “moves all 4 extremities” when a patient has an amputation. Even if these mistakes have no impact the outcome of a patient’s care, they can be used to discredit the physician by persuading a jury that the physician was careless, rushed, and ultimately negligent in their care of the patient, based simply on one obvious mistake like this.
Inaccuracies in documentation also arise when physicians’ notes conflict with those of other healthcare personnel involved in the same encounter, such as triage nurses, non-physician staff such as physician assistants or advanced practice providers, or trainees. For example, in Plaintiff v Defendant, a patient presented to the ED with right-sided

Volume 23, no. 3: May 2022 415 Western Journal of Emergency Medicine
Ghaith et al. Charting Practices to Protect Against Malpractice
chest pain, had an unremarkable subsequent evaluation in the ED, and was admitted for pain control.15 In the hospital, he was eventually diagnosed with a spontaneous chest wall hemorrhage but unfortunately died of hemorrhagic shock. The family sued the physicians involved for not recognizing the acuity of the patient’s condition earlier. The emergency physician argued that the patient did not appear ill while in the ED, and referred to his own documented physical exam, which was normal. However, the patient’s family highlighted the nurse’s triage note, which described the patient as “cool, moist, and mottled” at arrival. They used this to argue that the physician’s exam was inaccurate and that the patient had shown signs of shock on arrival. The court agreed with the family, and they were awarded $800,000.
Similarly, in Prager v Campbell Memorial Hospital, a patient presented after involvement in a motor vehicle collision, and the triage nurse noted his chief complaint as neck pain.16 The physician’s chart indicated the patient complained only of upper back pain with a normal neck exam, and he discharged the patient after the imaging of his head and thoracic spine was reassuring. The patient woke up the next day with paralysis of one arm, was re-evaluated, and found to have an unstable cervical spine fracture, resulting in permanent arm weakness. The court ruled in favor of the patient for a $9 million verdict, based on the nurse’s note that documented the presence of neck pain at his initial visit.
The use of other healthcare professionals’ notes to cast doubt on the accuracy of physicians’ evaluations, as illustrated above, is actually a frequent strategy for lawyers. In comparing a physician note to a nurse’s note, trial lawyers teach, “the value of recognizing the difference between a brief note of a busy physician and the more time allowing leisurely and more explicit account of a nurse in a closer and more exposed encounter with a given patient. Cast in the proper light, the nurse’s notes may well be given more credence by a jury when confronted with a conflict reflecting significantly on either the client’s injury or the question of liability.”2 This observation highlights the need to be aware of what others have written about your patients and be proactive about addressing any inconsistencies.2 This risk is magnified for physicians overseeing non-physician personnel or trainees and highlights the risks of the common practice of signing off on charts after patient discharge or without full review.
Transcription Errors Transcription errors are a major source of liability for
physicians and have become increasingly common with the shift to EHRs. The most common transcription errors include enunciation errors (53.9%), deletions (18.0%), and insertions (11.7%).17 Studies have found an average of seven errors per 100 words in electronic records, and a clinically significant error every 250 words.17 In the ED, 15% of notes have a clinically significant transcription error.17
Enunciation errors generally involve transcription or dictation systems misinterpreting spoken orders. For example, in Juno v Amare, insulin dosing provided in a patient’s discharge summary was transcribed by an outside transcription service as 80 units rather than 8 units, leading to the death of a patient.18 Despite the obvious technical fault in this case, rather than any impairment or deliberate negligence on the part of the physician, the court awarded the patient’s family $140 million. In Madigan v Makavana, a hospitalized patient with a known seizure history was receiving 150 milligrams (mg) of Keppra rather than 1500 mg due to a similar error, resulting in a seizure that caused a permanent neurologic deficit.19 The court ruled in favor of the patient for an $11.2 million verdict. The routine use of facial coverings in healthcare settings has the potential to significantly exacerbate these enunciation issues.
The use of EHRs also increases the risk of other types of errors, such as placing orders for the wrong patient or choosing the wrong options from a drop-down menu. In Estate, for example, a 91-year-old man who was in the ED for a mechanical fall was given high-dose chlorpromazine meant for a different patient.20 This error caused the patient’s death and resulted in a $750,000 settlement. In Walrath v Smith, a patient with hypokalemia was given discharge instructions for hyperkalemia.21 Despite verbal instructions to increase her potassium supplement, she followed her discharge instructions, decreased her potassium supplement, and arrested at home, resulting in a $100,000 settlement. Despite the role of technology in these cases, the physicians involved can be held accountable in the same way as if they had missed a diagnosis or chosen the wrong treatment.
Judgmental LanguageUse of judgmental language represents another potential
documentation pitfall for physicians. In Young v. Women’s Health, a physician documented that a patient had a history of substance abuse, despite her denying this and providing proof for her claims.22 However, the information was left in the chart, and the patient was denied life insurance coverage based on this information. She was able to demonstrate that the information was false, and the courts sided with the patient for a verdict of $1.5 million. Judgmental language also comes in the form of providing unnecessary quotations that highlight the vernacular of a patient or clinically irrelevant details. For example, a chart that quotes a patient as reporting she has “the sugars” is unnecessary, creates a mocking tone, and will make it easy for an attorney to paint a picture that a physician feels superior to the patient. Similarly, a chart that alludes to a patient’s appearance, religion, or political party, if not otherwise relevant, can easily be used by a trial attorney to suggest the physician was biased against the patient. In addition, studies have shown that physicians’ use of negative details and quotations in patients’ charts tends to negatively bias downstream clinicians.23, 24 Keeping unnecessary details and quotations out
Western Journal of Emergency Medicine 416 Volume 23, no. 3: May 2022
Charting Practices to Protect Against Malpractice Ghaith et al.
of the record can shield physicians from this this type of claim and protect patients from unnecessary bias.
Alterations in Charting
Another common issue is the alteration of previously recorded documentation. In Perry v United States, a five-week-old patient was brought to the ED twice in the same day with a fever, was seen by the same physician and discharged without appropriate testing.25 On the third visit, the patient was diagnosed with meningitis and suffered a permanent neurologic deficit. The physician altered the charts from previous visits to obscure the fact that the patient had a fever, but this was easily identified in court proceedings, and the court levied a $20 million verdict against him.
In Lei, a 21-month-old patient died after a delayed diagnosis of an incarcerated hernia.26 While the delay in diagnosis may have been reasonable, the documentation was changed prior to trial to delete a note about the patient’s “bilious vomiting,” contributing to a $3.28 million verdict in favor of the patient. Lastly, in Buchanan v Metrolina Medical Associates, a patient presented to the ED with shortness of breath and chest pressure that originated during prolonged travel.27 The physician ordered a chest radiograph, which was negative, and discharged the patient on an antibiotic. The patient died the next day due to a pulmonary embolus. During the trial, the metadata was used to prove that the physician went into the patient’s chart after his death to indicate that the patient had declined an electrocardiogram, that the cough was productive, and that a calf exam had been performed. While these notes may have been true, their entry after the fact raised the specter of a cover-up and forced the physician into a $3 million settlement.
Documentation alteration is relatively easy to identify because EHRs contain meta-data that can demonstrate timestamps for nearly every change and review of a page in the record. The best way to avoid this situation is to document fully at the initial patient encounter; however, if it is necessary to go into a chart and document at a later date, especially in patients with a known bad outcome, physicians should acknowledge that they are doing so by documenting the date and why the changes are being made to the chart. While this may still lead to some loss of credibility by the readers, it is the only way to addend a patient’s chart without casting doubt on one’s intentions.
Besides looking dishonest, alteration of documentation can have several other consequences. For example, many states can revoke physicians’ licensure if they are found to have altered a record. In addition, some malpractice insurance companies will not provide coverage for physicians if they altered records, leaving them vulnerable to the entirety of a verdict or settlement. Similarly, in some states where punitive damages have been banned or capped as a form of tort reform, these limits do not apply in cases of document alteration. Finally, in some courts, document alteration reverses the
evidentiary burden, meaning that patients no longer have to prove that a physician harmed them, but rather the physicians have to prove that they did not. The myriad of consequences associated with alteration of documentation emphasizes the danger of this practice and the importance of documenting appropriately at the initial encounter.
LIMITATIONSThe above content provides qualitative information
designed to highlight potential areas of vulnerability for clinicians. Due to the nature of the database, it is not possible to provide a quantitative assessment of risk for each of the areas described. Similarly, the case examples provided may not be representative of the most common cases in each category. These limitations notwithstanding, we feel the examples included here provide valuable insight into several areas in which documentation issues can heighten physicians’ liability risks, guided by previous studies on this topic.
CONCLUSIONRisk of malpractice cases involving documentation can be
minimized by understanding common errors and practices that lead to lawsuits. These errors are relatively easy to commit; recognizing these potential pitfalls will not only decrease the likelihood of a malpractice lawsuit but also decrease the risk of contributing to an adverse patient outcome. Emergency physicians can reduce their liability risks by relying less on forms and templates and making a habit of documenting discussions with the patient, recording others’ involvement in patient care (a chaperone, consultant, trainee, etc.), addressing other caregivers’ notes (triage, nursing, residents, etc.), paying attention to accuracy of transcribed or dictated information, avoiding judgmental language, and refraining from altering patient charts. This case series is not meant to encourage physicians to document more but rather more effectively, highlighting specific parts of the chart that have historically been problematic and may warrant more attention.
Address for Correspondence: Summer Ghaith, BS, Mayo Clinic Alix School of Medicine, 5777 E. Mayo Blvd., Phoenix, AZ 85054. Email: [email protected].
Conflicts of Interest: By the WestJEM article submission agreement, all authors are required to disclose all affiliations, funding sources and financial or management relationships that could be perceived as potential sources of bias. No author has professional or financial relationships with any companies that are relevant to this study. There are no conflicts of interest or sources of funding to declare.
Copyright: © 2022 Ghaith et al. This is an open access article distributed in accordance with the terms of the Creative Commons Attribution (CC BY 4.0) License. See: http://creativecommons.org/licenses/by/4.0/
Volume 23, no. 3: May 2022 417 Western Journal of Emergency Medicine
Ghaith et al. Charting Practices to Protect Against Malpractice
REFERENCES1. Jena AB, Seabury S, Lakdawalla D, et al. Malpractice risk according
to physician specialty. N Engl J Med. 2011;365(7):629-36.2. Cohn S. 1997. Medical Malpractice - Use of Hospital Records.
In: American Jurisprudence Proof of Facts 2d. Rochester, NY: Lawyers Cooperative Publishing.
3. Risk Management Tools & Resources. The role of documentation in diagnosis-related malpractice allegations | MedPro Group. Available at: https://www.medpro.com/documentation-in-dx-malpractice-cases. Accessed April 14, 2021.
4. Mathew S, Samant N, Cooksey C, et al. Knowledge, attitudes, and perceptions about medicolegal education: a survey of OB/GYN Residents. Perm J. 2020;24:1-7.
5. Evans A, Refrow-Rutala D. Medico-legal education: a pilot curriculum to fill the identified knowledge gap. J Grad Med Educ. 2010;2(4):595-9.
6. Imanzadeh A, Pourjabbar S, Mezrich J. Medicolegal training in radiology; an overlooked component of the non-interpretive skills curriculum. Clin Imaging. 2020;65:138-42.
7. Brown v. St. Clair Anesthesia, Ltd., 2015 IL App (5th) 140251-U8. Alaimo, Estate of v. Berman, M.D. PC; Berman, M.D., JVR No.
519525, 2010 WL 3045233 (N.Y.Sup.)9. Mchone June v. Swedish Covenant Hospital, 1997-L-010503
10. Parker v. Fla. Emergency Physicians - Kang & Assocs., 821 So. 2d 299 (Fla. 2002)
11. Tracy v. Freund, 2005 WL 367153312. Medical malpractice – failure to appreciate signs of impending
subarachnoid hemorrhage and ruptured aneurysm. Jury Verdict Review and Analysis. 2000. Available at: https://www.jvra.com/verdict_trak/article.aspx?id=33722. Accessed May 26, 2021.
13. Hooten v. Pediatrix Med. Grp. of Fla., Inc., 263 So. 3d 1110 (Fla. Dist. Ct. App. 2019)
14. Estate of Kimble, NE, 2010.15. Plaintiff v. Defendant, MA, 200616. Prager v. Campbell Cnty. Mem’l Hosp., No. 10-CV-202-J, 2011 U.S.
Dist. LEXIS 160594 (D. Wyo. Sep. 1, 2011)17. Goss FR, Zhou L, Weiner SG. Incidence of speech recognition errors
in the emergency department. Int J Med Inform. 2016;93:70-3.18. Bradley M. JUNO, as Administrator and Personal Representative
of the Estate of Sharron Juno, Deceased, Plaintiff, v. Douglas A. AMARE, M.D. et al., Defendants., 2010 WL 9069306 (Ala.Cir.Ct.)
19. Madigan v. Makavana, 2018, 36 NY. J.V.R.A. 6:C220. Estate, MA, 201821. Walrath v. Smith, 2010 WL 666290622. Young v. Women’s Health, NC23. P Goddu A, O’Conor KJ, Lanzkron S, et al. Do words matter? Stigma-
tizing language and the transmission of bias in the medical record. J Gen Intern Med. 2018;33(5):685-91.
24. Kelly JF, Westerhoff CM. Does it matter how we refer to individuals with substance-related conditions? A randomized study of two com-monly used terms. Int J Drug Policy. 2010;21(3):202-7.
25. Perry Austin, Jr., by and through Tiffanie Bennett vs. The United States, 02 ACTR 11-35
26. Shutang Lei, et al, v. Jeffrey Ettinger, M.D., et al., 2019 WL 9092970 (Pa.Com.PI.)
27. Maureen BUCHANAN, Personal Representative for the Estate of Eugene Terrance Seward, Deceased, Plaintiff, v. METROLINA MEDICAL ASSOCIATES, PA, Jenny Saleeby, Pa-C, and Rajesh H. Keder, MD, Defendants., 2014 WL 12731910 (S.C.Com.Pl.).

Western Journal of Emergency Medicine 418 Volume 23, no. 3: May 2022
Expert Commentary
Emergency Medicine History and Expansion into the Future: A Narrative Review
Martin R. Huecker, MD*Jacob Shreffler, PhD*Melissa Platt, MD*Dan O’Brien, MD*Ryan Stanton, MD†
Terrence Mulligan, DO, MPH‡
Jeremy Thomas, MD*
Section Editor: Leon Sanchez, MD, MPH Submission history: Submitted October 19, 2021; Revision received October 19, 2021; Accepted February 19, 2022 Electronically published April 4, 2022 Full text available through open access at http://escholarship.org/uc/uciem_westjem DOI: 10.5811/westjem.2022.2.55108[West J Emerg Med. 2022;22(3)418–423.]
INTRODUCTIONEmergency medicine (EM) has advanced profoundly since
its specialty recognition in 1979. As diagnosis and treatment changes, payment restructures and best practices evolve.1 We drive these changes, impacting hospital throughput and revenue to ensure quality emergency care. Our impact on the practice of medicine depends on a body of knowledge, the “biology” of emergency medicine.2 From 2000 to 2010 the number of emergency physicians (EP) increased more than in any other specialty.3 With estimates of over 48,000 EPs practicing in the United States currently and continued opening of new residency programs, multiple sources expect a 20-30% surplus of board-certified emergency physicians by 2030.4,5 Presciently, a 1997 paper by Holliman et al predicted that the supply of emergency doctors would equal demand in about 2020.6
In 2020, multiple EM organizations created a taskforce to study the projected EM workforce oversupply.4 The
University of Louisville School of Medicine, Department of Emergency Medicine, Louisville, KentuckyCentral Emergency PhysiciansUniversity of Maryland School of Medicine, Department of Emergency Medicine, Baltimore, Maryland
*
†
‡
considerations address issues related to who practices emergency medicine (advanced practice providers, non-board-certified physicians) and who manages emergency clinicians (contract management groups, academic and hospital systems). Only two offer non-zero sum approaches: broaden the umbrella to expand emergency physician scope of practice and expand the reach of emergency medicine to ensure that no community is left behind.4 This review aims to provide context for the workforce dilemma by describing the evolution of the scope of EM and possible future directions.
EMERGENCY MEDICINE PAST AND PRESENTCare for the acutely ill and injured patient traces its roots
back thousands of years, but organized emergency medical care blossomed in the late 20th century (Figure). Emergency medicine became a medical specialty in response to several factors, chief among them the presence of patients with increased mobility
Figure. A timeline of Emergency Medicine Milestones.

Volume 23, no. 3: May 2022 419 Western Journal of Emergency Medicine
Huecker et al. EM History and Future Expansion: A Narrative Review
who required unscheduled care that the current system could not accommodate (and increased financial support for these visits). A group of pioneers founded the Emergency College of American Physicians in 1968 in response to the need for physicians skilled in managing emergency patients.7 In 1970 Cincinnati opened the first EM residency. In 1976, the American Board of Emergency Medicine (ABEM) and the Society for Academic Emergency Medicine originated. After the American Board of Medical Specialties (ABMS) first voted 100 to 5 against our application for specialty status (1977), emergency medicine was approved as the 23rd specialty in 1979.8,9
Leaders in EM have displayed innovation in approaching challenges related to patient care and organizational structure. The Rape of Emergency Medicine (1992) brought light onto the problem of patient and physician harm by management abuses.10 Decades later we contend with business interests often superseding patient care and education, with the explosion of hospitals and residency programs run by for-profit entities. We have struggled to maintain the commitment to quality training and patient care in a world of financial and economic motivation.
The field of EM adapted to medical and technological advances, resulting in diverse areas of focus that developed from the bottom-up into ABEM subspecialities: 1990s, Pediatric Emergency Medicine, Sports Medicine and Medical Toxicology; 2000s, Undersea and Hyperbaric Medicine, and Hospice and Palliative Care Medicine; 2010s, Anesthesiology Critical Care Medicine, Emergency Medical Services (EMS), Internal Medicine-Critical Care Medicine, Pain Medicine, and the focused practice designation in Advanced EM Ultrasonography.11 Subspecialities available to ABEM-certified physicians via other ABMS boards include Addiction Medicine, Brain Injury Medicine, Clinical Informatics, and Surgical Critical Care.
As the scope of EM continues to expand, our leaders can directly modulate the trajectory of the specialty. In 2011, Brian Zink wrote that EM “does not manage a specific disease, but the time dependent exploration of and intervention in the acute physical and/or psychological crises of humans.”9 Emergency physicians have increasingly become the expert acute diagnosticians. As the Model of the Clinical Practice of EM has expanded, from 2212 pages to 42,13 we retain our focus on the full spectrum of patient acuity, treating (a) critical, (b) emergent, and (c) lower acuity patients.13
Many factors have driven the successful growth of EM: the rise of hospital medicine; medical advances; improved transport; specialization of workforce; effective emergency treatments; efficiency and safety; and evidence-based medicine.14 Emergency medicine is now practiced in greater than 50 countries using many different models.15 Where our specialty has strong representation, outcomes improve for many illnesses: cardiac arrest; stroke; early analgesia; geriatric care; substance use treatment; psychiatric emergency care; and overall system efficiency.14,16 As Peter Cameron asserts, “EM is a specialty for the 21st century14” because of our strengths in
systems thinking and evidence-based medicine.
FUTURE OF EMERGENCY MEDICINEWe agree with the ACEP Taskforce regarding the potential
to “broaden the umbrella” and “expand the reach” – not to solve a workforce issue, but to embrace and deliberately shape the natural history of our specialty. Emergency physicians should continue to leverage our unique training to take ownership of undifferentiated patients. This includes “owning more of what we already do” (observation medicine, critical care, sports medicine, emergency psychiatric care, ultrasound, pediatrics, EMS, public health, etc) while also entering into new realms (proceduralist medicine, correctional care, pandemic preparedness, disaster medicine, rural medicine, pain/addiction, informatics and more).4 Below we offer a brief selection of possibilities for expansion and new frontiers in EM (Table 1).
Education and ResearchOne cannot understate the importance of the academic
development of EM with residency education, clinical quality assurance, and research. To discover and engage new frontiers, we need qualified individuals, valued as educators and researchers rather than solely for clinical revenue generation. Although EM researchers gain a small percentage of overall National Institutes of Health awards, our principal investigators received almost $90 billion from 2008 to 2017.17 Beyond growing and ensuring quality education in EM, academic emergency physicians should use their skills to educate and lead research in undergraduate and graduate medical education. We can participate in preclinical course instruction, simulation, academic administration, and clerkships to provide foundational EM knowledge to future physicians. Academic leaders in international EM devote time and energy to the development of EM training programs and health systems around the world.
Public HealthEmergency physicians represent the first and sometimes only
point of contact for large numbers of vulnerable individuals in the US healthcare system. The ED’s original role as the safety net in a complex medical system has sadly become more prominent and important. Simple public-health interventions in the ED include the standard screening for depression,18 domestic violence,19 and sex and human trafficking.20 The ED has for years attempted to reach individuals in need of immunization,21 and now can play a key role in COVID-19 vaccination.22
A 2009 EM publication called for more research, removal of barriers, innovation based on local needs, and legislation to improve incentives for large-scale community changes.23 Since then, research has covered screening for frailty and fall risk in the elderly,24 hypertension (with counseling/education),25 and motivation to provide the many material needs to address social determinants of health and disease (housing, food insecurity, unemployment, etc.).26

Western Journal of Emergency Medicine 420 Volume 23, no. 3: May 2022
EM History and Future Expansion: A Narrative Review Huecker et al.
Current accredited subspecialties Current unaccredited subspecialties New frontiersABEM Subspecialties
• Anesthesiology Critical Care Medicine• Emergency Medical Services• Hospice and Palliative Care Medicine• Internal Medicine-Critical Care Medicine• Medical Toxicology• Pain medicine• Pediatric Emergency Medicine• Sports Medicine• Undersea and Hyperbaric Medicine
Subspecialties other ABMS Boards• Addiction Medicine• Brain Injury Medicine• Clinical Informatics• Surgical Critical Care
EM Focused Practice Designation• Emergency Medicine Ultrasonography
• Administration/Operations/ Quality and Safety• Austere/Disaster medicine• Emergency Imaging• Geriatric Emergency Medicine• Global/Population Health and Social Medicine• Forensic Medicine• Health Policy / Public Health• Injury Control• International Emergency Medicine• Medical Education• Neurovascular and Stroke• Observation Medicine• Occupational and Environmental Medicine• Research• Resuscitation• Simulation Medicine• Tactical Medicine• Telemedicine• Wilderness Medicine• Women’s Health
• Correctional Medicine• Emergency Hospitalist
Medicine• Emergency Psychiatric
Medicine• Event Medicine• Healthcare Innovation• Patient Advocacy/Activism• EM Proceduralist• Rural Medicine• Substance Use Medicine• Wellness/Lifestyle Medicine
Table 1. Emergency Medicine Subspecialties and New Frontiers.
ABEM, American Board of Emergency Medicine; ABMS, American Board of Medical Specialties; EM, emergency medicine.
In the US, preventive healthcare in general receives embarrassingly scant incentives ($1 of preventive care for every $4 of treatment care).27 Focused training in public health represents an EM niche with almost unlimited value and reach. The COVID-19 pandemic has shown the potential for emergency physicians to successfully influence the public with health messaging and advising of government officials.
Telehealth
The COVID-19 pandemic has brought telehealth to the forefront of medical innovation. Emergency medicine will continue to embrace new technology both in clinical practice and in training future physicians.28 Telehealth improves access to medical services and has rapidly increased in EDs throughout the US.29 While cost barriers exist, investment in these technologies will have clear downstream benefits to patients.30 Specific telehealth certification for EPs would help confront the legislative and litigative challenges. A 2015 systematic review of telehealth applications in the ED found “overwhelmingly positive” results in outcomes of technical quality, user satisfaction, clinical processes, throughput, and disposition.31
AdministrationEmergency physicians thrive in stressful clinical
environments, managing unpredictability and making important decisions with limited data. We work closely with other physicians, understand patient flow into and out of the hospital, implement strategies for efficient patient care, understand technology and informatics, and can rapidly determine what does and does not work at individual and organizational levels. Who better to serve as leaders in
healthcare than those with knowledge and experiences from the ground floor?
Emergency Geriatric MedicineAs the number of US residents aged 65 years and
older continues to grow, geriatric ED visits will continue to increase.32,33 Development and optimization of guidelines, physician training programs, and standards aimed at improving care for geriatric patients must be prioritized.33 Special training in Geriatric Emergency Medicine would incorporate clinical skills related to injury prevention/fall assessment, indwelling devices, medication management, delirium and dementia, and palliative care.34
Emergency Medical ServicesWell-established in medical direction roles with EMS,
EPs now experiment with paramedicine to reach patients (for vaccination, buprenorphine treatment, preventive medicine) who have difficulty obtaining transport to healthcare services that are often completely absent in their communities. The role of EMS in addressing geographical healthcare disparities and social determinants of disease will expand in the next 10 years.
Emergency Hospitalist Medicine
Internal Medicine-trained hospitalists manage hospital observation units, which optimize resource utilization.35 Despite overlap in clinical duties, internal medicine hospitalists and EM physicians do not regularly collaborate, missing the potential for enhanced patient care and even revenue generation.36 Emergency physicians and hospitalists could collaborate to manage short-stay patients and even train EM residents who have interest

Volume 23, no. 3: May 2022 421 Western Journal of Emergency Medicine
Huecker et al. EM History and Future Expansion: A Narrative Review
in observation or inpatient medicine.37 By improving patient care quality and streamlining hospital flow, we could solve the crowding issue from within our specialty.
Rural MedicineThe physician oversupply issue predominates in urban areas,
where 92% of EPs are employed, leaving rural EDs still largely underserved.38 Rural hospitals are closing at an alarming rate, potentially leaving 60 million people without adequate care.39 As clinicians who manage rural EDs age and retire, more rural areas will become “emergency physician deserts.”38 One-fifth of the US population resides in rural areas, but EM residents receive very little dedicated training.40 As Hill et al noted in the Journal of Emergency Medicine, “It is commonplace for programs not based in a Level I trauma center to send residents to an off-site rotation for trauma education. Why aren’t we doing the same for rural education?”40 Emergency medicine-primary care partnership models could address rural populations’ health needs.41 Increased presence of EPs in rural communities could alleviate our workforce concerns and treat the impending shortage of primary care physicians.
Substance Use Disorder and HomelessnessAs the healthcare gateway and often only point of contact,
EPs should have optimal training to identify, treat, and refer patients with substance use disorder.42 Facing all-time highs in overdose deaths,43 EPs well connected with addiction services can combat the opioid and polysubstance use crises. Current fellowships in toxicology, pain control, and addiction medicine provide training for proficiency. The over three million homeless US residents44 are under-recognized in the ED and have unique needs unmet within the current models of emergency care.45 Having frequent encounters with homeless individuals,44 EPs can manage medical concerns while attempting to connect them with community resources.
Wellness/Lifestyle MedicineEmergency physicians are satirically portrayed as the
“healthy doctors,” with multiple, often physically demanding habits and hobbies. We may be the ideal specialty to practice Lifestyle Medicine (which now has an active American Board of Lifestyle Medicine46). Entrepreneurial EPs already provide health optimization care in many locations in the country. Patients lost in the US “sick-care system” crave physicians who take care of their own health. Emergency physicians are clear candidates to assume wellness leadership roles in organizations (eg, Chief Wellness Officer).
OBSTACLESWe were voted down on our first application for board
status and our first application for primary board status. As EM continues its expansion, leaders will meet more challenges. Medicine represents a “wicked domain” where, unlike predictable rule-based domains (golf, chess), there is
no causal structure, and we encounter tradeoffs. Generalists or “integrators” can step outside of the model more easily, grafting insights from one domain to use in another.47
Emergency medicine was not created by individual physicians, scientists, or health professionals. It was pulled into existence by the public itself and by the pathologies that for decades had fallen through the cracks in our system. Our success in the past 50 years reveals that EM is truly a different paradigm in medical practice and scientific thinking. Every new paradigm emerges from the pressure of unexplained, untreated, undescribed phenomena that the old one cannot explain.
We have now become the safety net not just for patients, not just for specialists, not just for the holes in our medical system, not just for the holes in our entire socioeconomic model, but also for the holes in our entire medical philosophy. By thoughtfully expanding into new niches, we broaden, rather than narrow, our scope. We discover obstacles to quality patient care and provide the missing components. As we overcome challenges, we must maintain balance: expand our abilities but on the foundation of fundamentals. It would be a mistake to let economics and workforce oversupply drive the evolution of our specialty.
CONCLUSIONA career in EM provides a rewarding balance of risk,
decision-making, and compassionate care for patients.48 As integrators constructing the future of EM, we can recognize limitations and look ahead with hope to an intelligent expansion. An early critic of EM said, “Emergency medicine is not a specialty, it is a location.”49 Let’s prove him wrong with a willingness to define ourselves not by the location in which we practice, but by the special, generalist care we deliver. While we contemplate expansion beyond the department, we must call for increased resources within the walls of the ED, with optimal staffing, reimbursement, and empowerment. Years ago, another critic said, “Emergency medicine is pointing in a very wrong direction which is bound to fail.”49 Whatever direction we are heading, let’s work together to guarantee success.
Address for Correspondence: Martin Huecker, MD, University of Louisville, Department of Emergency Medicine, 530 South Jackson Street #C1H17, Louisville, KY 40202. Email: [email protected].
Conflicts of Interest: By the WestJEM article submission agreement, all authors are required to disclose all affiliations, funding sources and financial or management relationships that could be perceived as potential sources of bias. No author has professional or financial relationships with any companies that are relevant to this study. There are no conflicts of interest or sources of funding to declare.
Copyright: © 2022 Huecker et al. This is an open access article distributed in accordance with the terms of the Creative Commons Attribution (CC BY 4.0) License. See: http://creativecommons.org/licenses/by/4.0/

Western Journal of Emergency Medicine 422 Volume 23, no. 3: May 2022
EM History and Future Expansion: A Narrative Review Huecker et al.
REFERENCES1. Platts-Mills TF, Nagurney JM, Melnick ER. Tolerance of uncertainty
and the practice of emergency medicine. Ann Emerg Med. 2020;75(6):715-20.
2. Rosen P. The biology of emergency medicine. JACEP. 1979;8(7):280-3.
3. Reiter M, Wen LS, Allen BW. the emergency medicine workforce: profile and projections. J Emerg Med. 2016;50(4):690-3.
4. Directors ABo. Workforce considerations: ACEP’s commitment to you and emergency medicine. 2021. Available at: https://www.acepnow.com/article/workforce-considerations-aceps-commitment-to-you-and-emergency-medicine. Accessed May 17, 2021.
5. Reiter M, Allen BW. The emergency medicine workforce: shortage resolving, future surplus expected. J Emerg Med. 2020;58(2):198-202.
6. Holliman CJ, Wuerz RC, Chapman DM, et al. Workforce projections for emergency medicine: how many emergency physicians does the United States need? Acad Emerg Med. 1997;4(7):725-30.
7. Merritt AK. The rise of emergency medicine in the sixties: paving a new entrance to the house of medicine. J Hist Med Allied Sci. 2014;69(2):251-93.
8. Wiegenstein J. What, another milestone? The first steps in the founding of a specialty. Ann Emerg Med. 1997;30(3):329-33.
9. Zink BJ. The biology of emergency medicine: What have 30 years meant for Rosen’s original concepts? Acad Emerg Med. 2011;18(3):301-4.
10. AAEM. History. Available at: https://www.aaem.org/about-us/our-values/history. Accessed May 7, 2021.
11. American Board of Emergency Medicine. Subspecialties at a Glance ~ January 2018. 2021. Available at: https://www.abem.org/public/docs/default-source/default-document-library/subspecialties-at-a-glanceb75aa38dbac16abf82f2ff00003bf1c6.pdf?sfvrsn=f49bc9f4_0. Accessed May 7, 2021.
12. Hockberger RS, Binder LS, Graber MA, et al. The model of the clinical practice of emergency medicine. Ann Emerg Med. 2001;37(6):745-70.
13. Beeson MS, Ankel F, Bhat R, et al. The 2019 Model of the Clinical Practice of Emergency Medicine. J Emerg Med. 2020;59(1):96-120.
14. Cameron PA. International emergency medicine: past and future. Emerg Med Australas. 2014;26(1):50-5.
15. Arnold JL. International emergency medicine and the recent development of emergency medicine worldwide. Ann Emerg Med. 1999;33(1):97-103.
16. Holliman CJ, Mulligan TM, Suter RE, et al. The efficacy and value of emergency medicine: a supportive literature review. Int J Emerg Med. 2011;4(1):44.
17. Jang DH, Levy PD, Shofer FS, et al. A comparative analysis of National Institutes of Health research support for emergency medicine - 2008 to 2017. Am J Emerg Med. 2019;37(10):1850-4.
18. Babeva K, Hughes JL, Asarnow J. Emergency department screening for suicide and mental health risk. Curr Psychiatry Rep. 2016;18(11):100.
19. Karnitschnig L, Bowker S. Intimate partner violence screening in
the emergency department: a quality improvement project. J Emerg Nurs. 2020;46(3):345-53.
20. Kaltiso SO, Greenbaum VJ, Moran TP, et al. Feasibility of a screening tool for sex trafficking in an adult emergency department. Acad Emerg Med. 2021;28(12):1399-408.
21. Baumer-Mouradian SH, Kleinschmidt A, Servi A, et al. Vaccinating in the emergency department, a novel approach to improve influenza vaccination rates via a quality improvement initiative. Pediatr Qual Saf. 2020;5(4):e322.
22. Waxman MJ, Moschella P, Duber HC, et al. Emergency department-based COVID-19 vaccination: Where do we stand? Acad Emerg Med. 2021;28(6):707-9.
23. McKay MP, Vaca FE, Field C, et al. Public health in the emergency department: overcoming barriers to implementation and dissemination. Acad Emerg Med. 2009;16(11):1132-7.
24. Jørgensen R, Brabrand M. Screening of the frail patient in the emergency department: a systematic review. Eur J Intern Med. 2017;45:71-3.
25. Brody A, Janke A, Sharma V, et al. Public health, hypertension, and the emergency department. Curr Hypertens Rep. 2016;18(6):50.
26. Malecha PW, Williams JH, Kunzler NM, et al. Material needs of emergency department patients: a systematic review. Acad Emerg Med. 2018;25(3):330-59.
27. Heath D. (2020). Upstream: How to Solve Problems Before They Happen. London, UK: Bantam Press
28. Carley S, Laing S. How can emergency physicians harness the power of new technologies in clinical practice and education? Emerg Med J. 2018;35(3):156-8.
29. Emergency Medicine Telemedicine. Emergency medicine telemedicine. Ann Emerg Med. 2016;67(5):687-9.
30. Zachrison KS, Boggs KM, Hayden EM, et al. Understanding barriers to telemedicine implementation in rural emergency departments. Ann Emerg Med. 2020;75(3):392-9.
31. Ward MM, Jaana M, Natafgi N. Systematic review of telemedicine applications in emergency rooms. Int J Med Inform. 2015;84(9):601-16.
32. Kahn JH, Magauran BG Jr, Olshaker JS, et al. Current trends in geriatric emergency medicine. Emerg Med Clin North Am. 2016;34(3):435-52.
33. Magidson PD, Carpenter CR. Trends in geriatric emergency medicine. Emerg Med Clin North Am. 2021;39(2):243-55.
34. Häseler-Ouart K, Arefian H, Hartmann M, et al. Geriatric assessment for older adults admitted to the emergency department: a systematic review and meta-analysis. Exp Gerontol. 2021;144:111184.
35. Ross MA, Granovsky M. History. Principles, and policies of observation medicine. Emerg Med Clin North Am. 2017;35(3):503-18.
36. Pollack CV Jr, Amin A, Talan DA. Emergency medicine and hospital medicine: a call for collaboration. J Emerg Med. 2012;43(2):328-34.
37. Shreffler J, McGee S, Wojcik J, et al. Stakeholder insight into the creation, implementation, and current practices of an emergency department hospitalist team. Am J Emerg Med. 2021;S0735-

Volume 23, no. 3: May 2022 423 Western Journal of Emergency Medicine
Huecker et al. EM History and Future Expansion: A Narrative Review
6757(21)00691-4. 38. Bennett CL, Sullivan AF, Ginde AA, et al. National study of
the emergency physician workforce, 2020. Ann Emerg Med. 2020;76(6):695-708.
39. Diaz A, Pawlik TM. Rural surgery and status of the rural workplace: hospital survival and economics. Surg Clin North Am. 2020;100(5):835-47.
40. Hill AD. Emergency medicine residencies are failing Main Street America. J Emerg Med. 2018;55(4):534-6.
41. Greenwood-Ericksen MB, Tipirneni R, Abir M. An emergency medicine-primary care partnership to improve rural population health: expanding the role of emergency medicine. Ann Emerg Med. 2017;70(5):640-7.
42. Hawk KF, Glick RL, Jey AR, et al. Emergency medicine research priorities for early intervention for substance use disorders. West J Emerg Med. 2019;20(2):386-92.
43. Kuehn BM. Accelerated overdose deaths linked with COVID-19. JAMA. 2021;325(6):523.
44. Amato S, Nobay F, Amato DP, et al. Sick and unsheltered: homelessness as a major risk factor for emergency care utilization. Am J Emerg Med. 2019;37(3):415-20.
45. Salhi BA, White MH, Pitts SR, et al. Homelessness and emergency medicine: a review of the literature. Acad Emerg Med. 2018;25(5):577-93.
46. Lianov L, Johnson M. Physician competencies for prescribing lifestyle medicine. JAMA. 2010;304(2):202-3.
47. Epstein D. (2019). Range Why Generalists Triumph in a Specialized World. New York, NY: Riverhead Books.
48. Hassan TB. Looking back and forward: emergency medicine in its 50th year. Emerg Med J. 2018;35(3):137-8.
49. Williams DJ. Brief history of the specialty of emergency medicine. Emerg Med J. 2018;35(3):139-41.

Western Journal of Emergency Medicine 424 Volume 23, no. 3: May 2022
Original Research
Visits to the Pediatric Emergency Department for Eye Conditions Before and During the COVID-19 Pandemic
Jing Jin, MD, PhD*Lauren Bules, BS†
Kaynan Doctor, MD‡
Dorothy Hendricks, MD*Katherine Callaghan, MD§
Julia E. Reid, MD¶
Jonathan Salvin, MD*Sharon Lehman, MD*Airaj Fasiuddin, MD||
Joseph Piatt, MD, MAS#
Section Editor: Cristina Zeretzke, MD Submission history: Submitted May 26, 2021; Revision received January 24, 2022; Accepted January 21, 2022 Electronically published March 24, 2022 Full text available through open access at http://escholarship.org/uc/uciem_westjem DOI: 10.5811/westjem.2022.1.53392
Nemours Children’s Hospital, Division of Ophthalmology, Wilmington, DelawareLewis Katz School of Medicine at Temple University, Philadelphia, PennsylvaniaNemours Children’s Hospital, Division of Emergency Services, Wilmington, DelawareNemours Children’s Hospital, Department of Pediatrics, Wilmington, Delaware Children’s Hospital of Philadelphia, Division of Ophthalmology, Philadelphia, Pennsylvania Nemours Children’s Hospital, Division of Ophthalmology, Orlando, Florida Nemours Children’s Hospital, Division of Neurosurgery, Wilmington, Delaware
*†
‡
§
¶
||
#
Introduction: The use of the emergency department (ED) has been increasing, and many visits occur for non-urgent conditions. A similar trend was found among adult visits to the ED for ocular conditions. In this study we analyzed the impact of sociodemographic factors, presentation timing, and the COVID-19 pandemic on pediatric ED (PED) encounters for ophthalmologic conditions. It is important to identify the multifold factors associated with overutilization of the ED for non-urgent conditions. Caring for these patients in an outpatient clinical setting is safe and effective and could decrease ED crowding; it would also prevent delays in the care of other patients with more urgent medical problems and lower healthcare costs.
Methods: We retrospectively reviewed electronic health records of PED ocular-related encounters at two children’s hospitals before (January 2014-May 2018) and during the COVID-19 pandemic (March 2020-February 2021). Encounters were categorized based on the International Classification of Diseases codes into “emergent,” “urgent,” and non-urgent” groups. We analyzed associations between sociodemographic factors and degrees of visit urgency. We also compared visit frequencies, degrees of urgency, and diagnoses between pre-pandemic and pandemic data.
Results: Pre-pandemic ocular-related PED encounters averaged 1,738 per year. There were highly significant sociodemographic associations with degrees of urgency in PED utilization. During the 12-month pandemic timeframe, encounter frequency contracted to 183. Emergent visits decreased from 21% to 11%, while the proportions of urgent and non-urgent encounters were mostly unchanged. The most common pre-pandemic urgent diagnosis was corneal abrasion (50%), while visual disturbance was most common during the pandemic (92%). During both time periods, eye trauma was the most frequent emergent encounter and conjunctivitis was the most common non-urgent encounter.
Conclusion: Sociodemographic factors may be associated with different types of PED utilization for ocular conditions. Unnecessary visits constitute major inefficiency from a healthcare-systems standpoint. The marked decrease in PED utilization and differing proportions of ocular conditions encountered during the pandemic may reflect a decrease in incidence of many of those conditions by social distancing; these changes may also reflect altered parental decisions about seeking care. [West J Emerg Med. 2022;22(3)424–431.]

Volume 23, no. 3: May 2022 425 Western Journal of Emergency Medicine
Jin et al. Pediatric ED Visits for Eye Conditions Before and During COVID-19
Population Health Research Capsule
What do we already know about this issue?Emergency department (ED) visits have been increasing, and many are for non-urgent conditions. A similar trend was found among adults visiting EDs for eye diseases.
What was the research question?What are the factors related to pediatric ED visits for non-urgent ophthalmic conditions before and during the COVID-19 pandemic?
What was the major finding of the study?ED visits for eye complaints declined 89.5% during the pandemic year period.
How does this improve population health?Caring for non-urgent conditions at outpatient clinics is safe and effective. It may prevent ED crowding and delayed care for urgent conditions, and decrease healthcare costs.
INTRODUCTIONEmergency departments (ED) provide acute and after-
hours care to millions of Americans each year. Patients’ use of EDs has risen rapidly from 108 million visits in 2000 to 130 million in 2010.1 In 2015, over 16% of children in the United States visited an ED at least once.2,3 A 2013 systematic review by Uscher-Pines et al reported that nearly 40% of all ED visits occurred for non-urgent medical conditions.4 Studies demonstrate several characteristics associated with this type of ED use including younger age, Black race, and lower patient income.4
Channa et al reported a similar trend within the field of ophthalmology. Using the US Nationwide Emergency Department Sample, they found that over 40% of ED visits for ocular conditions were non-urgent.5 Additionally, Stagg et al investigated factors affecting adult patient visits to several EDs for ocular conditions,6 concluding that nearly one-quarter presented for non-urgent ocular problems. These encounters shared similarities with non-ophthalmological, non-urgent medical conditions, as they were more commonly associated with younger age groups, Black and Hispanic populations, lower income, and male gender.
There is no robust literature describing the characteristics of pediatric patients receiving emergency eye care, based on electronic health records (EHR) data for ocular conditions. When our study was nearing completion, an unanticipated event presented a unique opportunity. First identified in December 2019, coronavirus disease 2019 (COVID-19) rapidly spread across the globe. Implementation of stay-at-home orders along with school and workplace closures significantly altered families’ daily routines. Given this situation, we extended our study to examine whether the COVID-19 pandemic affected the etiologies of ocular conditions and perceptions of urgency leading to PED visits.
METHODSData Source
The EHR dataset of our institution contains information on ED encounters including ≥ 1 International Classification of Diseases, 9th and 10th revisions, Clinical Modification (ICD-9-CM and ICD-10-CM) as the primary diagnosis for ED visits. We included in the pre-pandemic dataset all patients < 21 years who presented to our PEDs in Delaware and Florida between January 1, 2014–May 31, 2018, while March 1, 2020–February 28, 2021 constituted the pandemic dataset. We searched records using ICD-9-CM and ICD-10-CM codes denoting diseases of the eye and adnexa, and eye trauma. For each patient encounter, we had access to medical records for ocular and non-ocular conditions as well as sociodemographic information including age, gender, race, ethnicity, and insurance type. We stratified patient age groups according to parameters described in recent literature7 with adjustment as follows: neonates (less than
one month); infants (one month up to one year); preschool (one year up to five years); school age (5 -13 years); and teen (13 years or greater).
The institutional review board of our institution approved this study.
Reasons for Visits to the Emergency Department for Ocular Conditions
Recently, Stagg and colleagues classified ocular conditions with ICD-9-CM codes into three categories: “non-urgent;” “urgent;” or “other.”6 Prior to data analysis, our panel of pediatric ophthalmologists modified these criteria and defined ophthalmological diagnoses as “non-urgent,” “urgent,” or “emergent.” “Non-urgent” conditions were unlikely to affect visual acuity or cause considerable discomfort necessitating urgent medical attention. Patients with non-urgent conditions could seek care safely in outpatient office settings. “Emergent” ocular conditions (ie, eye trauma) were sight- or life-threatening and associated with decreased visual acuity, caused severe pain, or constituted an indication for immediate surgical intervention. This definition was synonymous with the “urgent” classification found in the Stagg study. We classified the remaining ocular conditions as “urgent,” a group similar to Stagg’s “other” category. An example diagnosis within this group is corneal abrasion, which, despite quick healing without sequelae, causes intense

Western Journal of Emergency Medicine 426 Volume 23, no. 3: May 2022
Pediatric ED Visits for Eye Conditions Before and During COVID-19 Jin et al.
pain and occasional blurred vision that may reasonably justify a visit to the ED.
Table 1 lists the most frequent ocular diagnoses and associated ICD-9-CM and ICD-10-CM codes captured in this study. When an encounter had multiple diagnoses, it was classified by that of highest acuity. Finally, for those with multiple visits we classified each visit for that patient individually based on diagnoses. We also explored other variables including encounter date and time to assess whether accessibility to outpatient care and seasonal variations affected our data.
Data AnalysesFor the pre-pandemic data, we analyzed univariate
associations of demographic factors with the urgency of the PED visits by cross-tabulation and the Pearson chi square test. Multivariate associations were assessed by multinomial logistic regression. We developed two models: 1) comparing urgent visits with non-urgent visits; and 2) comparing emergent visits with non-urgent visits. The following covariates were included initially in both models: age group; gender; payer; race/ethnicity; state; and all their second-order interactions. Final models were constructed after excluding covariates and interactions that did not retain significance at the P < 0.05 level. We calculated adjusted odds ratios (aOR) and 95% confidence intervals (CI). Hypothesis testing was performed using a Type III Wald chi-squared statistic. Model fit was analyzed with
the Hosmer-Lemeshow test, and model discrimination was determined with the C-statistic. We performed a complete-case analysis. Only first visits for each patient were analyzed to maintain independence of observations.
Only descriptive data are presented for the pandemic dataset due to the small number of observations. Data were securely compiled in Excel (Microsoft Corporation, Redmond, WA) and analyzed using RStudio (R Foundation for Statistical Computing, Vienna, Austria).
RESULTSIn the pre-pandemic epoch, 7077 patients visited our
PEDs 7675 times with ophthalmologic complaints, comprising 1.9% of total PED visits (Figure A). During this period, the total number of visits to the PED increased year by year; however, visits due to ocular conditions remained constant at approximately 2%. Throughout the pandemic period, the total number of PED visits decreased to 60% of the pre-pandemic average annual PED visit rate (Figure B). Visits due to ocular conditions decreased to 0.34% (P = 0.002).
Pre-Pandemic Characteristics of Enrollees Seeking Care in a Peds ED for Ocular Conditions
Sample characteristics and their univariate associations with visit urgency are presented in Table 2. All factors were highly associated with certain levels of urgency except office hours. Urgency increased with patient age. White children had
Ocular diagnosis ICD-9-CM ICD-10-CMEmergent
Eyebrow laceration 873.42 S01.81XAEye injury/trauma 871.9
918.9S05.90XA
Eyelid laceration 870.0870.2
S01.119A
UrgentCorneal abrasion 918.1 S05.00XAEye pain 379.91 H57.10Visual disturbance 368.8 H53.8Contusion of eye area 921.0
921.1S00.10XD
Non-urgentConjunctivitis 372.30
372.39H10.9
H10.89Hordeolum 373.11 H00.01 Edema of eye area 374.82 H02.849
ICD-9-CM, International Classification of Diseases, 9th Revision, Clinical Modification; ICD-10-CM, International Classification of Diseases, 10th Revision, Clinical Modification.
Table 1. International Classification of Diseases codes used to define urgency categories of ocular diagnoses made during emergency department visits.

Volume 23, no. 3: May 2022 427 Western Journal of Emergency Medicine
Jin et al. Pediatric ED Visits for Eye Conditions Before and During COVID-19
proportionately more urgent visits. Males had more urgent visits than females. Commercially insured children were far more likely to visit for urgent and emergent indications compared with children who had public insurance or no insurance. Visits to the Delaware ED were generally more urgent than visits in Florida.
To learn whether our study population differed from the residents of the communities surrounding our hospitals, we compared our dataset with local population race/ethnicity information in the US Census Bureau database. Our patients in the non-urgent visit category had a lower proportion of White patients (35.6%) than the proportion of White inhabitants seen within the catchment areas (49.8%). The proportions of patients who self-identified as Black (32.8%) and Hispanic (24.2%) were greater than those of the local populations (26.1% and 20.2%, respectively).
Multivariate Analysis of Pre-Pandemic Encounter Urgency Multivariate associations of demographic factors with
urgent and emergent visits are presented in Table 3. Table 3a compares urgent encounters with non-urgent encounters. Table 3b compares emergent encounters with encounters of lesser urgency. All factors significantly associated with encounter urgency in the univariate analysis retained significance in the multivariate models. The urgency of ED encounters increased in a monotonic fashion with patient age. Urgent encounters were most frequent for commercially insured patients. White patients from Delaware were much more likely to visit for urgent and emergent reasons than patients of other races/ethnicities in Delaware and all patients in Florida. Black patients in Florida
had more frequent urgent and emergent visits than Black patients in Delaware. The opposite was true for Hispanic patients. Patient gender did not retain a significant association with visit urgency in multivariate analysis.
Pre-Pandemic Repeat Peds Emergency Department Visits for Ocular Conditions
Of the 7,077 patients who visited the PED for ocular problems in the pre-pandemic period, 500 (7.1%) visited the PED more than once for ophthalmologic conditions (Table 4). First and second visits for patients who frequented the ED often shared the same ophthalmological diagnosis if the duration between visits was less than 14 days. As a group, rapid second return visits were associated with lower acuity compared with first visits. Second visits occurring after a longer interval (>14 days) were more likely to be associated with higher acuity/urgency compared with corresponding first visits.
Comparison of Ocular Conditions in PED Encounters Before and During the Pandemic
Rates of PED encounters for ocular conditions during the pandemic were far lower than pre-pandemic rates, but not all conditions were equally affected. In Table 5, average annual pre-pandemic rates are compared with actual encounters during the pandemic year for each of the more common conditions. The differences between pre-pandemic averages and actual pandemic encounters are tabulated as “missing encounters.” Emergent ocular conditions were all comparably decreased. Urgent encounters were almost eliminated except for encounters for visual disturbances, which appeared unaffected. Observations regarding non-urgent conditions were mixed: encounters for conjunctivitis were greatly diminished and disappeared entirely for eye area edema. Encounters for hordeolum were not affected.
DISCUSSIONThe COVID-19 pandemic presented an unprecedented
circumstance affecting all Americans, altering the types and frequencies of ocular conditions presenting to our PEDs. Marked reductions in overall PED encounters were observed once the declaration of national emergency occurred. Our detailed characterization of pre-pandemic ocular-related PED visits serves as a basis for discussion on the effects of the pandemic. In the pre-pandemic epoch, there were over 7000 encounters within our PEDs for ocular problems, which increased in both locations year by year. These represented 2% of all PED visits throughout the study period. Approximately 60% of these encounters were classified for non-urgent ophthalmological conditions.
Sociodemographic Factors and Urgency of Pediatric Emergency Department Encounters
In multivariate analysis, demographic factors including younger age, Black race, Hispanic ethnicity, and use of public
Figure. Visits to the pediatric emergency departments (PED). Number of visits January 1, 2014–May 31, 2018 (A), and March 1, 2020–February 28, 2021 (B).
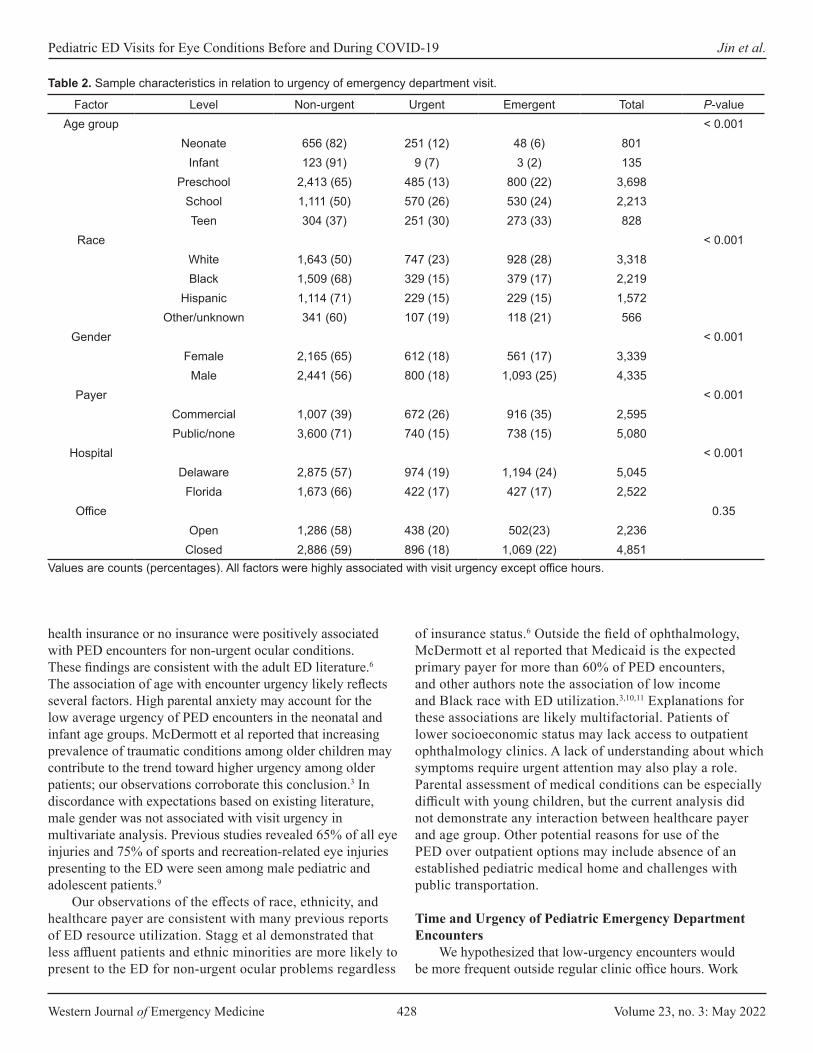
Western Journal of Emergency Medicine 428 Volume 23, no. 3: May 2022
Pediatric ED Visits for Eye Conditions Before and During COVID-19 Jin et al.
health insurance or no insurance were positively associated with PED encounters for non-urgent ocular conditions. These findings are consistent with the adult ED literature.6 The association of age with encounter urgency likely reflects several factors. High parental anxiety may account for the low average urgency of PED encounters in the neonatal and infant age groups. McDermott et al reported that increasing prevalence of traumatic conditions among older children may contribute to the trend toward higher urgency among older patients; our observations corroborate this conclusion.3 In discordance with expectations based on existing literature, male gender was not associated with visit urgency in multivariate analysis. Previous studies revealed 65% of all eye injuries and 75% of sports and recreation-related eye injuries presenting to the ED were seen among male pediatric and adolescent patients.9
Our observations of the effects of race, ethnicity, and healthcare payer are consistent with many previous reports of ED resource utilization. Stagg et al demonstrated that less affluent patients and ethnic minorities are more likely to present to the ED for non-urgent ocular problems regardless
of insurance status.6 Outside the field of ophthalmology, McDermott et al reported that Medicaid is the expected primary payer for more than 60% of PED encounters, and other authors note the association of low income and Black race with ED utilization.3,10,11 Explanations for these associations are likely multifactorial. Patients of lower socioeconomic status may lack access to outpatient ophthalmology clinics. A lack of understanding about which symptoms require urgent attention may also play a role. Parental assessment of medical conditions can be especially difficult with young children, but the current analysis did not demonstrate any interaction between healthcare payer and age group. Other potential reasons for use of the PED over outpatient options may include absence of an established pediatric medical home and challenges with public transportation.
Time and Urgency of Pediatric Emergency Department Encounters
We hypothesized that low-urgency encounters would be more frequent outside regular clinic office hours. Work
Factor Level Non-urgent Urgent Emergent Total P-valueAge group < 0.001
Neonate 656 (82) 251 (12) 48 (6) 801Infant 123 (91) 9 (7) 3 (2) 135
Preschool 2,413 (65) 485 (13) 800 (22) 3,698School 1,111 (50) 570 (26) 530 (24) 2,213Teen 304 (37) 251 (30) 273 (33) 828
Race < 0.001White 1,643 (50) 747 (23) 928 (28) 3,318Black 1,509 (68) 329 (15) 379 (17) 2,219
Hispanic 1,114 (71) 229 (15) 229 (15) 1,572Other/unknown 341 (60) 107 (19) 118 (21) 566
Gender < 0.001Female 2,165 (65) 612 (18) 561 (17) 3,339
Male 2,441 (56) 800 (18) 1,093 (25) 4,335Payer < 0.001
Commercial 1,007 (39) 672 (26) 916 (35) 2,595Public/none 3,600 (71) 740 (15) 738 (15) 5,080
Hospital < 0.001Delaware 2,875 (57) 974 (19) 1,194 (24) 5,045
Florida 1,673 (66) 422 (17) 427 (17) 2,522Office 0.35
Open 1,286 (58) 438 (20) 502(23) 2,236Closed 2,886 (59) 896 (18) 1,069 (22) 4,851
Table 2. Sample characteristics in relation to urgency of emergency department visit.
Values are counts (percentages). All factors were highly associated with visit urgency except office hours.

Volume 23, no. 3: May 2022 429 Western Journal of Emergency Medicine
Jin et al. Pediatric ED Visits for Eye Conditions Before and During COVID-19
Covariate Levels aOR (95% CI) P-valueIntercept 1.040 (0.833 – 1.299) 0.73
AgeNeonate 0.191 (0.144 – 0.253) < 0.001
Infant 0.095 (0.047 – 0.192) < 0.001Preschool 0.262 (0.215 – 0.321) < 0.001
School 0.618 (0.505 – 0.758) < 0.001Teen reference
PayerPublic/none referenceCommercial 2.289 (1.989 – 2.634) < 0.001
Race-stateWhite – DE referenceBlack – DE 0.454 (0.378 – 0.545) < 0.001
Hispanic – DE 0.451 (0.353 – 0.574) < 0.001Other/unknown – DE 0.545 (0.393 – 0.756) < 0.001
White – FL 0.553 (0.453 – 0.674) < 0.001Black – FL 0.632 (0.437 – 0.915) 0.015
Hispanic – FL 0.379 (0.295 – 0.487) < 0.001Other/unknown – FL 0.521 (0.363 – 0.748) < 0.001
Covariate Levels aOR (95% CI) P-valueIntercept 1.019 (0.818 – 1.269) 0.87
AgeNeonate 0.090 (0.064 – 0.128) < 0.001
Infant 0.031 (0.010 – 0.100) < 0.001Preschool 0.409 (0.367 – 0.496) < 0.001
School 0.539 (0.439 – 0.662) < 0.001Teen reference
PayerPublic/none referenceCommercial 3.091 (2.704 – 3.534) < 0.001
Race-stateWhite – DE referenceBlack – DE 0.432 (0.363 – 0.514) < 0.001
Hispanic – DE 0.405 (0.319 – 0.513) < 0.001Other/unknown – DE 0.455 (0.332 – 0.623) < 0.001
White – FL 0.466 (0.385 – 0.565) < 0.001
Black – FL 0.524 (0.362 – 0.758) < 0.001Hispanic – FL 0.319 (0.249 – 0.409) < 0.001
Other/unknown – FL 0.412 (0.287 – 0.591) < 0.001
Table 3a. Multinomial logistic regression modeling the probability of “urgent” visits.
Hosmer Lemeshow χ2 = 7.9872, df = 8; P = 0.435; c-statistic = 0.66 (0.65-0.68). CI, confidence interval; DE, Delaware; FL, Florida; aOR, adjusted odds ratio.
Table 3b. Multinomial logistic regression modeling the probability of “emergent” visits.
Hosmer Lemeshow χ2 = 5.1897, df = 8; P = 0.737; c-statistic = 0.70 (0.69-0.72). CI, confidence interval; DE, Delaware; FL, Florida; aOR, adjusted odds ratio.
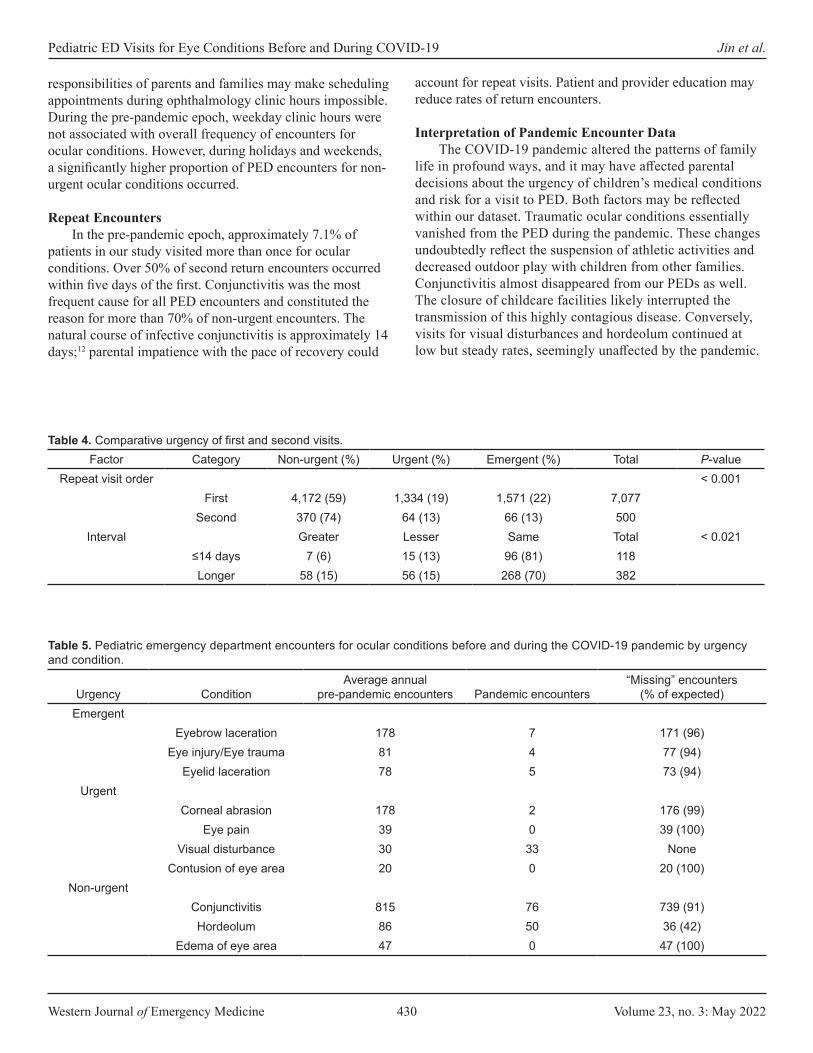
Western Journal of Emergency Medicine 430 Volume 23, no. 3: May 2022
Pediatric ED Visits for Eye Conditions Before and During COVID-19 Jin et al.
responsibilities of parents and families may make scheduling appointments during ophthalmology clinic hours impossible. During the pre-pandemic epoch, weekday clinic hours were not associated with overall frequency of encounters for ocular conditions. However, during holidays and weekends, a significantly higher proportion of PED encounters for non-urgent ocular conditions occurred.
Repeat EncountersIn the pre-pandemic epoch, approximately 7.1% of
patients in our study visited more than once for ocular conditions. Over 50% of second return encounters occurred within five days of the first. Conjunctivitis was the most frequent cause for all PED encounters and constituted the reason for more than 70% of non-urgent encounters. The natural course of infective conjunctivitis is approximately 14 days;12 parental impatience with the pace of recovery could
account for repeat visits. Patient and provider education may reduce rates of return encounters.
Interpretation of Pandemic Encounter DataThe COVID-19 pandemic altered the patterns of family
life in profound ways, and it may have affected parental decisions about the urgency of children’s medical conditions and risk for a visit to PED. Both factors may be reflected within our dataset. Traumatic ocular conditions essentially vanished from the PED during the pandemic. These changes undoubtedly reflect the suspension of athletic activities and decreased outdoor play with children from other families. Conjunctivitis almost disappeared from our PEDs as well. The closure of childcare facilities likely interrupted the transmission of this highly contagious disease. Conversely, visits for visual disturbances and hordeolum continued at low but steady rates, seemingly unaffected by the pandemic.
Factor Category Non-urgent (%) Urgent (%) Emergent (%) Total P-valueRepeat visit order < 0.001
First 4,172 (59) 1,334 (19) 1,571 (22) 7,077Second 370 (74) 64 (13) 66 (13) 500
Interval Greater Lesser Same Total < 0.021≤14 days 7 (6) 15 (13) 96 (81) 118Longer 58 (15) 56 (15) 268 (70) 382
Table 4. Comparative urgency of first and second visits.
Urgency ConditionAverage annual
pre-pandemic encounters Pandemic encounters“Missing” encounters
(% of expected)Emergent
Eyebrow laceration 178 7 171 (96)Eye injury/Eye trauma 81 4 77 (94)
Eyelid laceration 78 5 73 (94)Urgent
Corneal abrasion 178 2 176 (99)Eye pain 39 0 39 (100)
Visual disturbance 30 33 NoneContusion of eye area 20 0 20 (100)
Non-urgentConjunctivitis 815 76 739 (91)Hordeolum 86 50 36 (42)
Edema of eye area 47 0 47 (100)
Table 5. Pediatric emergency department encounters for ocular conditions before and during the COVID-19 pandemic by urgency and condition.
Volume 23, no. 3: May 2022 431 Western Journal of Emergency Medicine
Jin et al. Pediatric ED Visits for Eye Conditions Before and During COVID-19
Operational ImplicationsMost of the urgent and non-urgent conditions tabulated
in this study could have been managed in the ophthalmology office with better stewardship of material and personnel resources. Stagg et al suggests incentivizing eye care physicians to offer after-hours eye care clinics as a possible solution.6 Utilization of teleophthalmology for triage of patients with eye conditions could reduce the number of unnecessary ED visits for ocular problems. Multidisciplinary case management efforts directed at frequent ED visitors may also reduce low-acuity encounters. Unnecessary PED visits for conjunctivitis, by far the most common diagnosis in this study, might be addressed by education to enhance the confidence of parents and primary care physicians in the management of this condition.
LIMITATIONSOur study, the first of its kind, was based on the EHR of
a large, geographically diverse children’s healthcare system. Clinical as well as administrative data were accessible, and our observations are likely generalizable. The large sample size for the pre-pandemic epoch allowed for modeling to account for associations between encounter urgency and a variety of covariates.
The highly significant interaction between race/ethnicity and state in the pre-pandemic epoch is unexplained. It likely reflects referral patterns and local availability of alternative sources of care. The Delaware ED has a fairly distinct catchment area between Philadelphia and Baltimore. The Florida ED is relatively close to two other institutions offering pediatric emergency services. Further exploration of this interaction might reveal important disparities in access to primary and specialty care, but a population-based study of regional demographics and clinicians was far beyond the scope of the current project.
The decrement in PED encounters for ocular conditions during the pandemic precluded statistical analysis. Only qualitative comparisons with our extensive pre-pandemic dataset were possible. The data for our study was identified by diagnosis codes generated by clinicians in the ED. Most cases were not confirmed by eye care professionals, and full medical records were not reviewed in detail.
CONCLUSIONBefore and during the COVID-19 pandemic,
approximately 60% of patients visiting our pediatric emergency departments for ocular complaints received non-urgent diagnoses. Our analyses indicated that younger age groups, Black patients, Hispanic patients, and families with public health insurance or no insurance were more likely to visit the PED for a non-urgent eye condition. Policymakers, insurers, healthcare administrators, and clinicians should focus future efforts on directing patients with non-urgent ocular diagnoses to other settings besides the PED.
Address for Correspondence: Jing Jin, MD, PhD, Nemours Children’s Hospital, Division of Ophthalmology, P.O. Box 296, Wilmington, DE 19899. Email: [email protected].
Conflicts of Interest: By the WestJEM article submission agreement, all authors are required to disclose all affiliations, funding sources and financial or management relationships that could be perceived as potential sources of bias. Lauren Bules was supported by Nemours Departments of Biomedical Research through the Nemours Summer Undergraduate Research Program and Division of Ophthalmology. There are no conflicts of interest to declare.
Copyright: © 2022 Jin et al. This is an open access article distributed in accordance with the terms of the Creative Commons Attribution (CC BY 4.0) License. See: http://creativecommons.org/licenses/by/4.0/
REFERENCES1. Cummingham P. Nonurgent use of hospital emergency department.
2011. Center for Studying Health System Change. Available at: http://www.hschange.org/CONTENT/1204/1204.pdf. Accessed February 15, 2020.
2. National Center for Health Statistics (US). Health, United States, 2016: With Chartbook on Long-term Trends in Health. Hyattsville (MD): National Center for Health Statistics (US). 2017. Available at: https://www.cdc.gov/nchs/data/hus/hus16.pdf. Accessed February 15, 2020.
3. McDermott KW, Stocks C, Freeman WJ. Overview of pediatric emergency department visits, 2015: Statistical Brief #242. In: Healthcare Cost and Utilization Project (HCUP) Statistical Briefs. Rockville (MD): Agency for Healthcare Research and Quality (US); August 7, 2018.
4. Uscher-Pines L, Pines J, Kellermann A, et al. Emergency department visits for nonurgent conditions: systematic literature review. Am J Manag Care. 2013;19(1):47-59.
5. Channa R, Zafar SN, Canner JK, et al. Epidemiology of eye-related emergency department visits. JAMA Ophthalmol. 2016;134(3):312-9.
6. Stagg BC, Shah MM, Talwar N, et al. Factors affecting visits to the emergency department for urgent and nonurgent ocular conditions. Ophthalmology. 2017;124(5):720-9.
7. Williams K, Thomson D, Seto I, et al. Standard 6: age groups for pediatric trials. Pediatrics. 2012;129 Suppl 3:S153-S160.
8. Kuhn F, Morris R, Witherspoon CD, et al. Epidemiology of blinding trauma in the United States Eye Injury Registry. Ophthalmic Epidemiol. 2006;13(3):209-16.
9. Armstrong GW, Kim JG, Linakis JG, et al. Pediatric eye injuries presenting to United States emergency departments: 2001-2007. Graefes Arch Clin Exp Ophthalmol. 2013;251(3):629-36.
10. Sarver JH, Cydulka RK, Baker DW. Usual source of care and nonurgent emergency department use. Acad Emerg Med. 2002;9(9):916-23.
11. Vivier PM, Rogers ML, Gjelsvik A, et al. Frequent emergency department use by children. Pediatr Emerg Care. 2021;37(12):e995-e1000.
12. Azari AA, Barney NP. Conjunctivitis: a systematic review of diagnosis and treatment. JAMA. 2013;310(16):1721-9.

Western Journal of Emergency Medicine 432 Volume 23, no. 3: May 2022
Original Research
COVID-19 Literature Published in Emergency Medicine Journals in 2020
Ching-Hsing Lee, MD
Section Editor: James Meltzer, MD Submission history: Submitted October 11, 2021; Revision received October 11, 2021; Accepted January 5, 2022 Electronically published May 5, 2022 Full text available through open access at http://escholarship.org/uc/uciem_westjem DOI: 10.5811/westjem.2022.1.55029
INTRODUCTIONThe World Health Organization (WHO) issued a media
statement on cases of “viral pneumonia” reported by the Municipal Health Commission of Wuhan, People’s Republic of China, on December 31, 2019.1 The WHO Director-General declared the coronavirus disease 2019 (COVID-19)
Chang Gung University College of Medicine, Chang Gung Memorial Hospital, Department of Emergency Medicine, Keelung, Taiwan
Introduction: Coronavirus disease 2019 (COVID-19)-related articles published in emergency medicine (EM) journals provide insight into the responses of EM researchers and journal editors globally to a newly emerging infectious disease. We studied trends in the number, types, and national origins of COVID-19 literature published in EM journals to investigate knowledge transmission via scientific publication during the pandemic.
Methods: This was a retrospective observational study. The EM journal list was adopted from the 2019 Journal Citation Reports. We retrieved data from the SCOPUS database, limited to publication year 2020, and identified COVID-19 publications when the title, abstract, or keywords included “COVID” or “SARS.” The outcome measurements were as follows: 1) monthly COVID-19 publication numbers in EM journals; 2) the percentage of COVID-19 published literature in terms of total journal publications; 3) the countries, affiliations, and authors of COVID-19-related publications; 4) the differences in the proportions of “Articles” and “Letters” between COVID-19 and non-COVID-19 publications; and 5) the total, average, and maximum number of times cited for different types of COVID-19-related scientific literature.
Results: We retrieved a total of 7,457 published papers from 31 EM journals. There were 765 (10.26%) COVID-19-related publications in 27 journals contributed by 67 countries; the first authors were from 49 countries. The monthly COVID-19 publication numbers in the categories of “Letters” and “Articles” were nearly equal before July 2020. The yearly proportions of COVID-19-focused articles and letters were 48.8% and 29.9%, respectively, while non-COVID-19 proportions were 72.1% and 9.8%, respectively. The chi-squared statistic of the differences between the numbers of articles and letters in COVID-19 and non-COVID-19 published research was significant (P < .001).
Conclusion: An analysis of COVID-19 publications in EM journals indicated that, in the early stage of a newly emerging infectious disease, the number of letters and articles increased simultaneously. The proportion of COVID-19-focused letters was higher than those published on other topics. The “Article” and “Review” category of COVID-19 research was cited more times than that of “Letters.” [West J Emerg Med. 2022;22(3)432–438.]
outbreak a public health emergency of international concern (PHEIC), the highest level of alarm, on January 30, 2020.1 One year after the PHEIC declaration, the global number of COVID-19 cases exceeded 100 million on January 28, 2021. 2 The COVID-19 pandemic has imposed an enormous strain on global healthcare systems, especially on frontline workers in
Volume 23, no. 3: May 2022 433 Western Journal of Emergency Medicine
Lee COVID-19 Literature in EM Journals in 2020
Population Health Research Capsule
What do we already know about this issue?The COVID-19 pandemic has affected many aspects of the medical community, including clinical practice, medical education, and published research.
What was the research question?What were the impacts of COVID-19 on published scientific literature in EM journals in 2020?
What was the major finding of the study?We identified trends in the number and types of publications, authorship, and citations.
How does this improve population health?This study guides researchers on how to facilitate knowledge transfer via scientific publication during a pandemic.
emergency departments (ED).3,4 The pandemic affects clinical practice, medical education, and academic publications.5,6 COVID-19-related publications in emergency medicine (EM) journals provide insights into the responses of EM journals and researchers to a newly emerging infectious disease. Interactions between the emerging disease, EM researchers, and journal editorial boards revealed the process of knowledge transmission from the perspective of the scientific publication format during the COVID-19 pandemic. This will be of interest to future researchers and journal editors.
In this study we investigated trends of COVID-19-related publications in EM journals in 2020 by evaluating the publication numbers, type, country of authorship, affiliation, authors, and the number of times cited. Our goal was to facilitate knowledge transfer by guiding researchers who aim to submit COVID-19-related research.
METHODSStudy Design and Setting
This was a retrospective observational study. As no human subjects were involved, we received a waiver from our institutional review board. The EM journal list was adopted from that of the 2019 Journal Citation Reports (JCR) (Appendix 1).7 We retrieved the publication data from the SCOPUS database.8 Journals that were not indexed in the SCOPUS database were accessed via PubMed.9
Publication SelectionWe defined COVID-19-related publications as those in
which the title, abstract, or keywords included “COVID” or “SARS.” The EM journals were those categorized in the 2019 JCR, and the publication year was limited to 2020. The publication types were adopted from the classification of the SCOPUS database. We defined the country of origin by the nationality of the first author. Author affiliations and details were retrieved by searching SCOPUS.
We retrieved all EM journal publications and COVID-19-focused publications from the SCOPUS database on December 25, 2020, using each journal’s International Standard Serial Number (ISSN). The search terms for COVID-19-related publications and total EM journal publications are listed in Appendix 2. Information on the journals, first-author nationalities, number of times cited, and publication types were recorded.
Outcome MeasurementsThe primary outcomes of this study were the
chronological trends in COVID-19 commentary and research of different types, which indicated the response times of researchers and EM journals to a newly emerging infectious disease from the perspective of academic research. The secondary outcome measurements were as follows: 1) monthly COVID-19 publication numbers in EM journals; 2) percentages of COVID-19-focused publications in terms
of total journal publications; 3) the leading countries, affiliations, and authors in terms of COVID-19 publication numbers; 4) differences between the proportions of “Articles” and “Letters” in COVID-19 and non-COVID-19 published literature; and (5) total, average, and the maximum number of times cited for the different types of COVID-19 publications.
AnalysisWe analyzed the distributions of publication numbers
and the number of times cited using descriptive statistics. The differences between the numbers of “Articles” and “Letters” of COVID-19-focused and non- COVID-19 publications were analyzed with the chi-squared statistic. We performed all analyses using SAS statistical software version 9.2 (SAS Institute, Cary, NC).
Patient and Public InvolvementNo patients were involved in this study.
RESULTSWe retrieved a total of 7,457 publications in 2020 from 31
EM journals. There were 765 COVID-19- related publications in 27 journals (10.26% of a total of 31 EM journal publications, 10.63% of 27 journals publishing COVID-19 publications). The monthly COVID-19 publication numbers in 27 EM journals are shown in Table 1. The American Journal of Emergency Medicine (AJEM) published the most COVID-

Western Journal of Emergency Medicine 434 Volume 23, no. 3: May 2022
COVID-19 Literature in EM Journals in 2020 Lee
Journals Jan. Feb. Mar. Apr. May Jun. Jul. Aug. Sep. Oct. Nov. Dec.In
Press Total
Journal total
publica-tions
% of total
publica-tion
Academic Emergency Medicine
0 0 0 4 2 5 4 9 5 3 7 4 1 44 309 14.2%
American Journal of Emergency Medicine
0 0 0 0 0 1 25 1 6 20 10 9 111 183 1165 15.7%
Annals of Emergency Medicine
0 0 0 0 0 5 3 0 4 13 3 5 4 37 421 8.8%
BMC Emergency Medicine
0 0 0 0 0 0 0 0 0 1 0 2 0 3 95 3.2%
Canadian Journal of Emergency Medicine
0 0 0 0 0 0 13 0 15 0 7 0 4 39 193 20.2%
EMA - Emergency Medicine Australasia
0 0 0 0 0 2 0 8 0 11 0 9 9 39 280 13.9%
Emergencias 0 0 0 0 0 5 0 14 0 5 0 10 0 34 131 26.0%
Emergency Medicine Journal
0 0 0 0 0 4 11 5 4 5 5 3 12 49 239 20.5%
European Journal of Emergency Medicine
0 0 0 0 0 7 0 0 0 0 0 0 8 15 138 10.9%
European Journal of Trauma and Emergency Surgery
0 0 0 0 0 3 0 4 0 1 0 0 5 13 405 3.2%
Hong Kong Journal of Emergency Medicine
0 0 0 0 0 0 0 0 2 0 1 0 2 5 129 3.9%
Injury 0 0 0 1 1 2 5 3 0 7 1 6 3 29 840 3.5%
Journal of Emergency Medicine
0 0 0 0 1 0 2 0 2 2 7 5 7 26 512 5.1%
Journal of Emergency Nursing
0 0 0 0 0 0 0 0 2 0 5 0 1 8 164 4.9%
Notarzt 0 0 0 0 0 1 0 1 0 2 0 0 0 4 64 6.3%
Notfall und Rettungsmedizin
0 0 0 0 2 8 0 4 2 0 1 3 5 25 155 16.1%
Pediatric Emergency Care
0 0 0 0 0 2 0 1 0 4 4 0 0 11 251 4.4%
Jan., January; Feb., February; Mar., March; Apr., April; Jun., June; Jul., July; Aug., August; Sep., September; Oct., October; Nov., November; Dec., December; BMC, Boston Medical Center.
Table 1. Monthly COVID-19 publication numbers in 2020 in emergency medicine journals (listed in alphabetical order).

Volume 23, no. 3: May 2022 435 Western Journal of Emergency Medicine
Lee COVID-19 Literature in EM Journals in 2020
19-related research (183, 23.9% of the total) followed by the Western Journal of Emergency Medicine (WJEM) (66, 8.6%) and Resuscitation (57, 7.5%). The WJEM published the highest proportion of COVID-19-related publications (30.4%), followed by Emergencias (26.0%) and the Emergency Medicine Journal (20.5%). COVID-19-related publications were contributed by 67 countries and the first authors were from 49 countries.
The leading countries, affiliations, and authors of COVID-19-related publications are listed in Table 2. The publication numbers and percentages of COVID-19 publication types are shown in Figure 1. The three leading types of COVID-19- and non-COVID-19-related publications were identical. Of the 6,692 non-COVID-19 publications, 4825 (72.1%) were articles,
658 (9.8%) were letters, and 510 (7.6%) were reviews. The chi-squared statistic of the differences between the proportions of articles and letters for COVID-19 and non-COVID-19 publications (X2 = 295.3) was significant (P < .001).
The monthly numbers of articles, letters, and reviews, and total COVID-19-related publications are shown in Figure 2. The monthly numbers of COVID-19-related letters and articles were nearly equal before July 2020. Then, the number of letters decreased gradually and the number of articles increased steadily after August 2020. The analysis of the number of times COVID-19 publications were cited is shown in Table 3. The most highly cited publications were articles and reviews, which were cited 118 times. The publication type with the highest average number of times cited was review, followed by article.
Journals Jan. Feb. Mar. Apr. May Jun. Jul. Aug. Sep. Oct. Nov. Dec.In
Press Total
Journal total
publica-tions
% of total
publica-tion
Prehospital and Disaster Medicine
0 0 0 1 0 1 0 13 0 0 0 6 6 27 149 18.1%
Prehospital Emergency Care
0 0 0 0 0 0 0 0 0 0 0 0 8 8 189 4.2%
Resuscitation 0 0 0 0 0 10 10 8 5 4 10 6 4 57 515 11.1%
Scandinavian Journal of Trauma, Resuscitation and Emergency Medicine
0 0 0 0 3 1 1 2 1 2 1 3 0 14 117 12.0%
Signa Vitae 0 0 0 0 0 8 0 0 0 0 0 5 0 13 64 20.3%
Ulusal Travma ve Acil Cerrahi Dergisi
0 0 0 0 1 0 0 0 1 0 0 0 0 2 150 1.3%
Unfallchirurg 0 0 0 0 0 0 1 0 0 0 0 0 2 3 194 1.5%
Western Journal of Emergency Medicine
0 0 1 0 15 0 20 0 15 0 15 0 0 66 217 30.4%
World Journal of Emergency Medicine
0 0 0 0 0 0 0 0 1 0 0 2 0 3 50 6.0%
World Journal of Emergency Surgery
0 0 0 3 2 2 1 0 0 0 0 0 0 8 59 13.6%
Subtotal 0 0 1 9 27 67 96 73 65 80 77 78 192 765 7,195 10.6%
Table 1. Continued.
Jan., January; Feb., February; Mar., March; Apr., April; Jun., June; Jul., July; Aug., August; Sep., September; Oct., October; Nov., November; Dec., December.

Western Journal of Emergency Medicine 436 Volume 23, no. 3: May 2022
COVID-19 Literature in EM Journals in 2020 Lee
Nearly 60% of review and more than 40% of article and letter publications were cited within one year of publication.
DISCUSSIONCorrect, efficient, and timely knowledge transmission is
crucial to healthcare clinicians. In the COVID-19 pandemic era, these components led to high-quality patient care and the enhanced safety of healthcare workers. In addition to peer-reviewed scientific publications, a variety of methods is available to communicate scientific knowledge during a pandemic, including social media, virtual conferencing, and free, open-access medical education.10-12 Our study focused on the response of EM journals to a newly emerging infectious disease pandemic from the perspective of publications.
The first COVID-19-related publications appeared in March 2020, three months after the emergence of COVID-19, and more than 10% of all EM journal publications in 2020 were related to COVID-19, suggesting that COVID-19 is a rapidly emerging field in EM scientific publication. Twenty-seven of 31 journals (87.1%) published COVID-19-related publications, indicating that the preferences and scope of EM journals are diverse; not all journals publish COVID-19-related research. The majority of the editorial boards of EM journals responded rapidly and were willing to accept newly emerging, important topics. The errata and withdrawal of COVID-19-related publications in these journals will be
continuously evaluated in the coming years to clarify the effect of the rapid publishing process on reporting inaccurate, inappropriate, or potentially harmful information.
In the analysis of authorship, the first authors of COVID-19-related publications in EM journals were from 49 countries. The leading five countries (5/49, 10.2%) accounted for 62% of all COVID-19-related publications. The United States was the major contributor of COVID-19 research to EM journals. The five leading affiliations were in the United States, Canada, and Australia. These results suggest that these three countries, their affiliations, and researchers responded rapidly on research design, execution, and publication.
Our analysis of publication type showed that almost 30% of COVID-19-related publications were in the category “Letters” and that the proportion of letters in non-COVID-19-related publications was 9.8%. The difference may reflect the fact that our early understanding of a newly important emerging disease was limited, and there was not enough time, research resources, or clinical cases to conduct an original study. When there are enough resources, cases, and time to allow studies, the proportion of articles would be expected to increase, and that of letters would tend to decrease to baseline. This phenomenon may be due to the response of medical journals to a rapidly emerging new field with a high disease burden. Whether this is true of other specialty journals deserves further study.
Country Affiliation Author1 United States (286) Harvard Medical School (27) Elkbuli, A. (17)2 Italy (50) University of Toronto (24) McKenney, M. (17)3 Canada (46) Massachusetts General Hospital (19) Long, B. (12)4 United Kingdom (45) Kendall Regional Medical Center (18) Gottlieb, M. (11)4 Spain (44) Monash University (18) Mitchell, R.D. (10)
Table 2. Leading countries, affiliations, and authors of coronavirus disease 2019 publications (publication numbers in brackets).
Publication types Publication numbers Total cited times Average cited times Maximum cited times Publications cited (%)Article 373 1,170 3.137 118 175 (46.9)Letter 229 435 1.900 45 98 (42.8)Review 67 418 6.239 118 39 (58.2)Note 59 148 2.508 23 26 (44.1)Editorial 32 46 1.438 10 14 (43.8)Short Survey 3 0 0.000 0 0 (0)Erratum 2 0 0.000 0 0 (0)Total 765 2,217 2.898 352 (46.0)
Table 3. Times-cited analysis of coronavirus disease 2019 publications.
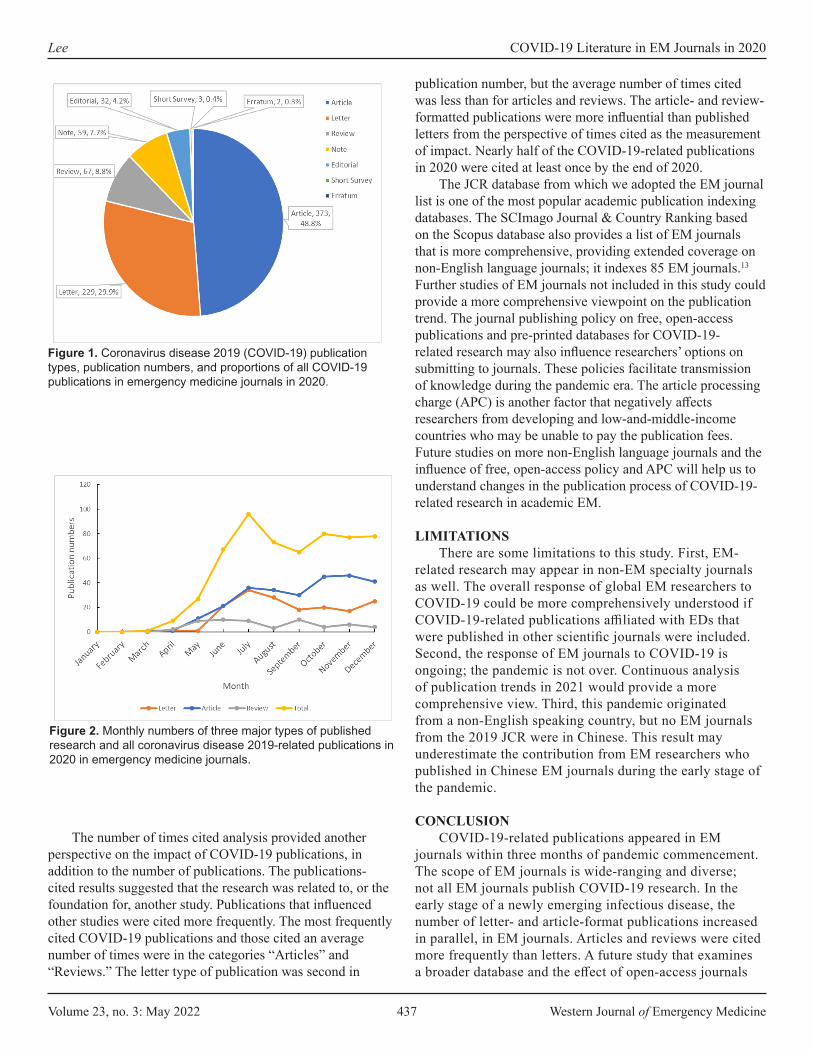
Volume 23, no. 3: May 2022 437 Western Journal of Emergency Medicine
Lee COVID-19 Literature in EM Journals in 2020
The number of times cited analysis provided another perspective on the impact of COVID-19 publications, in addition to the number of publications. The publications-cited results suggested that the research was related to, or the foundation for, another study. Publications that influenced other studies were cited more frequently. The most frequently cited COVID-19 publications and those cited an average number of times were in the categories “Articles” and “Reviews.” The letter type of publication was second in
publication number, but the average number of times cited was less than for articles and reviews. The article- and review-formatted publications were more influential than published letters from the perspective of times cited as the measurement of impact. Nearly half of the COVID-19-related publications in 2020 were cited at least once by the end of 2020.
The JCR database from which we adopted the EM journal list is one of the most popular academic publication indexing databases. The SCImago Journal & Country Ranking based on the Scopus database also provides a list of EM journals that is more comprehensive, providing extended coverage on non-English language journals; it indexes 85 EM journals.13 Further studies of EM journals not included in this study could provide a more comprehensive viewpoint on the publication trend. The journal publishing policy on free, open-access publications and pre-printed databases for COVID-19-related research may also influence researchers’ options on submitting to journals. These policies facilitate transmission of knowledge during the pandemic era. The article processing charge (APC) is another factor that negatively affects researchers from developing and low-and-middle-income countries who may be unable to pay the publication fees. Future studies on more non-English language journals and the influence of free, open-access policy and APC will help us to understand changes in the publication process of COVID-19-related research in academic EM.
LIMITATIONSThere are some limitations to this study. First, EM-
related research may appear in non-EM specialty journals as well. The overall response of global EM researchers to COVID-19 could be more comprehensively understood if COVID-19-related publications affiliated with EDs that were published in other scientific journals were included. Second, the response of EM journals to COVID-19 is ongoing; the pandemic is not over. Continuous analysis of publication trends in 2021 would provide a more comprehensive view. Third, this pandemic originated from a non-English speaking country, but no EM journals from the 2019 JCR were in Chinese. This result may underestimate the contribution from EM researchers who published in Chinese EM journals during the early stage of the pandemic.
CONCLUSIONCOVID-19-related publications appeared in EM
journals within three months of pandemic commencement. The scope of EM journals is wide-ranging and diverse; not all EM journals publish COVID-19 research. In the early stage of a newly emerging infectious disease, the number of letter- and article-format publications increased in parallel, in EM journals. Articles and reviews were cited more frequently than letters. A future study that examines a broader database and the effect of open-access journals
Figure 1. Coronavirus disease 2019 (COVID-19) publication types, publication numbers, and proportions of all COVID-19 publications in emergency medicine journals in 2020.
Figure 2. Monthly numbers of three major types of published research and all coronavirus disease 2019-related publications in 2020 in emergency medicine journals.

Western Journal of Emergency Medicine 438 Volume 23, no. 3: May 2022
COVID-19 Literature in EM Journals in 2020 Lee
and article processing charges on publications in newly emerging fields from developing and low-and-middle-income countries may enhance our understanding of publication trends in EM journals.
Address for Correspondence: Ching-Hsing Lee, MD, Chang Gung University College of Medicine, Chang Gung Memorial Hospital, Department of Emergency Medicine, No.222, Maijin Rd., Anle Dist., Keelung City 204, Taiwan. Email: [email protected].
Conflicts of Interest: By the WestJEM article submission agreement, all authors are required to disclose all affiliations, funding sources and financial or management relationships that could be perceived as potential sources of bias. No author has professional or financial relationships with any companies that are relevant to this study. There are no conflicts of interest or sources of funding to declare.
Copyright: © 2022 Lee. This is an open access article distributed in accordance with the terms of the Creative Commons Attribution (CC BY 4.0) License. See: http://creativecommons.org/licenses/by/4.0/
REFERENCES1. World Health Organization. Timeline: WHO’s COVID-19 response.
2020. Available at: https://www.who.int/emergencies/diseases/novel-coronavirus-2019/interactive-timeline. Accessed February 2, 2021.
2. World Health Organization. WHO Coronavirus Disease (COVID-19) Dashboard. 2020. Available at: https://covid19.who.int/. Accessed February 2, 2021.
3. Schreyer KE, Del Portal DA, King LJL, et al. Emergency
department management of the Covid-19 pandemic. J Emerg Med. 2020;59(6):946-51.
4. Rodriguez RM, Medak AJ, Baumann BM, et al. Academic emergency medicine physicians’ anxiety levels, stressors, and potential stress mitigation measures during the acceleration phase of the COVID-19 pandemic. Acad Emerg Med. 2020;27(8):700-7.
5. Alsoufi A, Alsuyihili A, Msherghi A, et al. Impact of the COVID-19 pandemic on medical education: medical students’ knowledge, attitudes, and practices regarding electronic learning. PLoS One. 2020;15(11):e0242905.
6. Shah SS, Kulkarni N, Mahant S. Rapid publication, knowledge sharing, and our responsibility during the COVID-19 pandemic. J Hosp Med. 2020;15(5):261.
7. Clarivate. Journal Citation Reports. 2019. Available at: https://clarivate.com/webofsciencegroup/solutions/journal-citation-reports/. Accessed February 2, 2021.
8. Scopus. Scopus database. Available at: https://www.scopus.com/home.uri. Accessed February 2, 2021.
9. PubMed. PubMed database. Available at: https://pubmed.ncbi.nlm.nih.gov/. Accessed February 2, 2021.
10. Margus C, Brown N, Hertelendy A, et al. Social media and the surge: emergency physician Twitter use in the Covid-19 pandemic as a potential predictor of impending surge. J Med Internet Res. 2021;23(7):e28615.
11. Rose CC, Haas MRC, Yilmaz Y, et al. ALiEM connect: large-scale, interactive virtual residency programming in response to COVID-19. Acad Med. 2021;96(10):1419-24.
12. Rashid MA, Yip SWL, Gill D, et al. Sharing is caring: an analysis of #FOAMed Twitter posts during the COVID-19 pandemic. Postgrad Med J. 2022;98(1157):199-204.
13. Scimago. SCImago Journal & Country Ranking database. Available at: https://www.scimagojr.com/ . Accessed October 11, 2021.

Volume 23, no. 3: May 2022 439 Western Journal of Emergency Medicine
Brief Research Report
Adoption of High-sensitivity Troponin Testing and Emergency Physician Ordering Behavior
Nicole R. Hodgson, MD*Katie L. Kunze, PhD†
Elisabeth S. Lim, MPH†
Steven A. Maher, MD*Stephen J. Traub, MD‡
Section Editor: Sam Torbati, MD Submission history: Submitted July 24, 2021; Revision received December 8, 2021; Accepted February 15, 2022 Electronically published April 4, 2022 Full text available through open access at http://escholarship.org/uc/uciem_westjem DOI: 10.5811/westjem.2022.2.54242
INTRODUCTIONIntroducing high-sensitivity cardiac troponin (hs-cTn) in
emergency departments (ED) often improves ED length of stay1,2 and can lead to lower stress-test utilization.1 However, age, renal dysfunction, hypertension, peripheral artery disease, prior myocardial infarction, and use of diuretics are associated with elevated hs-cTn outside of acute coronary syndrome (ACS).3,4 Decreased specificity of hs-cTn compared to conventional assays along with results in the indeterminate range for ACS may lead to emergency physician (EP) uncertainty, altering EP heuristic pathways. We sought to evaluate EP utilization of troponin tests before and after hs-cTn introduction in our ED.
Mayo Clinic Arizona, Department of Emergency Medicine, Phoenix, ArizonaMayo Clinic Arizona, Department of Quantitative Health Sciences, Phoenix, ArizonaBrown Alpert School of Medicine, Department of Emergency Medicine, Providence, Rhode Island
Introduction: Emergency departments (ED) are rapidly replacing conventional troponin assays with high-sensitivity troponin tests. We sought to evaluate emergency physician utilization of troponin tests before and after high-sensitivity troponin introduction in our ED.
Methods: We retrospectively examined 9,477 ED encounters, identifying the percentage in which physicians ordered a serum troponin both before and after our institution adopted a high-sensitivity troponin test.
Results: After introduction of high-sensitivity troponin testing, the percentage of ED encountersin which physicians ordered troponin studies decreased (28.3% before vs 22% after; P <.001),with the drop most pronounced in admitted patients (decrease of 10.9% [95% confidenceinterval [CI]: 7.3%- 14.5%] in admitted patients vs decrease of 3.6% [95% CI: 1.7%- 5.4%]in discharged patients; P<.001)
Conclusion: Introduction of high-sensitivity troponin testing was associated with a decrease in troponin ordering. While the reasons for this are unclear, it is possible that physicians became more selective in their ordering behavior because of the lower specificity of high-sensitivity troponin. [West J Emerg Med. 2022;22(3)439–442.]
*†
‡
METHODSWe performed a retrospective analysis of ED operational
data. Our institutional review board provided an exemption from full review.
The Mayo Clinic Arizona ED is a tertiary care facility serving approximately 34,000 patients yearly with 26 rooms and up to nine hallway spaces in Phoenix, AZ, staffed by residency-trained EPs. There is no fast track or ED observation unit. Our EPs acquire patients on a rotational assignment basis, with no practical discretion as to which patients they evaluate. As EPs receive patients to individual queues when patients arrive in triage, we employ no triage physicians. The EPs place triage orders on their assigned

Western Journal of Emergency Medicine 440 Volume 23, no. 3: May 2022
Adoption of High-sensitivity Troponin Testing and Physician Ordering Behavior Hodgson et al.
patients to expedite care prior to physical assessment. Due to this front-end workflow, we rarely use nursing-initiated order sets outside of protocol activations such as acute stroke or ST-elevation myocardial infarction. Residents rotate through the ED and see approximately 5% of patients. No nurse practitioners or physician assistants work in our department.
Our ED replaced conventional Roche fourth generation troponin T with Roche fifth generation hs-cTn on July 17, 2018. We reviewed all ED encounters seen by full-time EPs from July 17–September 16, 2018 (the “after” period). We chose this end date as it coincided with the rollout of a new electronic health record (EHR), which we believed would introduce additional confounders to our analysis. To account for seasonal variability, we matched this timeframe with a similar period one year prior, examining all ED encounters staffed by full-time EPs from July 17–September 16, 2017 (the “before” period). To limit the influence of different EP ordering practices,5 we excluded patients seen by part-time EPs (who work inconsistent clinical hours), EPs employed during only one of the assessment periods, and encounters missing an assigned physician.
We obtained general characteristics of patient encounters in both groups including age, gender, race, Emergency Severity Index (ESI), ED length of stay (LOS), and admission rates. We examined the percentage of encounters receiving ED orders for a troponin test, either conventional troponin T before or hs-cTn after. We determined this percentage for all ED patients and then split the data to separately examine discharged and admitted (including hospital observation)
patients. To determine whether overall EP testing behavior changed, we performed this same analysis for hemoglobin, a common ED test. We selected hemoglobin since the data was readily available in our operational database.
We used descriptive statistics (counts, percentages, means, and standard deviations), chi-square tests, and Kruskal-Wallis test by ranks where appropriate to examine differences in demographics in the before and after groups, as well as rates of troponin and hemoglobin ordered before and after hs-cTn overall and by type of encounter (discharge vs admission). Confidence intervals (CI) for the differences in rates of testing between groups were constructed using the Chan-Zhang exact method for calculating CIs for differences of binomial proportions.6 All analyses were performed using SAS version 9.4 (SAS Institute Inc., Cary, NC, USA) and R via Rstudio (Boston, MA) and the arsenal package.
RESULTSAppendix 1 details excluded encounters. We report
demographic characteristics of the before and after hs-cTn groups in Table 1.
We report counts and rates of ED encounters receiving a troponin test in the before and after hs-cTn groups in Table 2. Encounters with an order for a troponin test decreased after introduction of hs-cTn (28.3% before vs 22% after; P<.001), with the drop appearing most pronounced in admitted patients (decrease of 10.9%, 95% CI: 7.3-14.5% in admitted vs 3.6%, 95% CI: 1.7-5.4% in discharged patients; P<.001).
Characteristic Before hs-cTn After hs-cTn P-valueGender
Female (%) 2,774 (53.7%) 2,298 (53.3%) 0.7031
Mean age in years (SD) 57.5 (20.9) 56.4 (21.0) 0.020²Race
White (%) 4,600 (89.7%) 3,799 (89.3%) 0.548¹ESI (%) 0.017¹
1 59 (1.1%) 51 (1.2%)2 1,405 (27.3%) 1,274 (29.6%)3 3,116 (60.5%) 2,512 (58.4%)4 520 (10.1%) 440 (10.2%)5 50 (1.0%) 23 (0.5%)Missing 16 11
ED length of stay in minutes (SD) 227.2 (161.2) 225.3 (136.8) 0.238²Inpatient length of stay in hours (SD) 80.3 (102.0) 85.3 (99.9) 0.071²Admission Status
Discharged (%) 3,491 (67.6%) 2,982 (69.2%) 0.097¹
Table 1. Encounter characteristics before and after hs-cTn introduction.
hs-cTn, high-sensitivity cardiac troponin; SD, standard deviation; ESI, Emergency Severity Index; ED, emergency department. ¹chi-square p-value; ²Kruskal-Wallis P-value.

Volume 23, no. 3: May 2022 441 Western Journal of Emergency Medicine
Hodgson et al. Adoption of High-sensitivity Troponin Testing and Physician Ordering Behavior
of these elevations were due to factors other than ACS (most frequently sepsis) and none of the patients received reperfusion therapy.10 After the institution of hs-cTN, physicians at our ED may have deferred troponin evaluations of these patients, either using gestalt alone or in conjunction with an electrocardiogram (ECG).
If so, this approach may have pitfalls. Although the above method may be safe in geriatric patients with nonspecific complaints, ED patients presenting with chest pain are another matter. In a separate study, physician gestalt, even combined with an ECG, did not identify all ACS cases.11 Reducing testing in this group of patients may prove dangerous.
LIMITATIONSOur study suffers from several limitations. The first is the
capability of our EHR: the free-text nature of chief complaints at the time of data collection limited our ability to determine the percentage of ED visits with chest pain and potential ACS equivalents. Fewer patients with chief complaints suspected to be ACS equivalents may have presented to our ED in the after period. However, Table 1 suggests that our patient population remained similar on most demographic and other patient characteristics such as admission rate, suggesting similar severity of illness in the before and after periods.
Patients in the after group were more likely to be labeled ESI 1 and 2, which we believe would typically prompt more orders for troponins, the opposite of our observed trend. Hemoglobin ordering, unlike troponin ordering, did not decrease after introduction of hs-cTn, suggesting that overall resource utilization remained similar before and after hs-cTn. We believe that matching the time of year when selecting the comparison period mitigated any effect of seasonal variability of complaints, and excluding encounters seen by part-time physicians and physicians employed during only one time period mitigated individual physician-ordering variability. We performed no specific interventions or community outreach programs during this time which would have changed the nature of presenting complaints.
A second limitation is that ours is a single center, retrospective review; thus, we can comment on correlation but not causation. However, our findings do align with other studies noting a decrease in percentage of ED encounters receiving a troponin study after introduction of hs-cTn.7 Due to the change in our EHR, we only examined a two-month period post hs-cTn; the decrease in ordering behavior may represent a period of acclimation and not long-term behavior. We hope our study prompts additional investigation into whether these findings persist.
CONCLUSIONAfter introduction of hs-cTn, the percentage of ED
patients receiving troponin studies decreased. We suspect that emergency physicians became more selective in their ordering behavior to account for the lower specificity of hs-cTn.
Encounter type Before hs-cTn After hs-cTn P-value*All encounters 1,463 (28.3%) 948 (22.0%) <.001Discharged 657 (18.8%) 454 (15.2%) <.001Admitted 806 (48.1%) 494 (37.2%) <.001
Table 2. Number (%) of ED encounters with troponin ordered before and after hs-cTn introduction.
hs-cTn, high-sensitivity cardiac troponin.*P-values from chi-square analyses.
Unlike troponin ordering, hemoglobin ordering did not change after hs-cTn introduction (70.2% before vs 69.5% after; P = .48). Hemoglobin ordering behavior remained the same when examining subcategories of discharged (56.8% before versus 56.8% after, P = .98) and admitted (98.1% before versus 98.0% after, P = .83) encounters.
DISCUSSIONOur results demonstrate a significant decrease in ED
encounters receiving a troponin test after introduction of hs-cTn. We believe our EPs became more selective in their troponin ordering behavior. One study examining conversion to hs-cTn’s impact on laboratory workload noted a decrease in troponin tests after conversion to hs-cTn, with a decline in test orders of over 10% despite an increase in total ED visits, with an overall decrease in percentage of ED encounters receiving a troponin study.7 Although the authors did not speculate as to the cause, we suspect EPs consciously or unconsciously adjusted their ordering behavior to accommodate the decreased specificity of hs-cTn in their diagnostic heuristics. This is supported by informal discussions with several of our physicians, who expressed frustration when having to navigate indeterminate hs-cTn results.
Decisions made by EPs change throughout a shift, with EPs picking up fewer patients and making more decisions that shorten ED LOS near end of shift (EOS).8 As our EPs are automatically assigned patents, they do not have the ability to cherry-pick easier patients or take fewer patients near EOS. Anticipation of an indeterminate troponin requiring repeat for trending near EOS may lead EPs to be more discriminant in their hs-cTn orders. Emergency department managers employing patient assignment models should be aware of this possibility when incorporating hs-cTn and make operational adjustments to ensure that all patients continue to receive high quality care.
Increased ED troponin-ordering selectivity may be harmful or beneficial to patients. Although classic teaching recommends maintaining high suspicion for ACS, especially in patient groups who present atypically, some evidence suggests that EPs may overtest.9 One study of ED patients over age 65 presenting with nonspecific complaints (such as generalized weakness, fatigue and dizziness) found that although 20% of these patients had positive troponins, 93.8%

Western Journal of Emergency Medicine 442 Volume 23, no. 3: May 2022
Adoption of High-sensitivity Troponin Testing and Physician Ordering Behavior Hodgson et al.
Address for Correspondence: Nicole R. Hodgson, MD, Mayo Clinic Arizona, Department of Emergency Medicine, 5777 E. Mayo Blvd., Phoenix, AZ 85054. Email: [email protected].
Conflicts of Interest: By the WestJEM article submission agreement, all authors are required to disclose all affiliations, funding sources and financial or management relationships that could be perceived as potential sources of bias. No author has professional or financial relationships with any companies that are relevant to this study. There are no conflicts of interest or sources of funding to declare.
Copyright: © 2022 Hodgson et al. This is an open access article distributed in accordance with the terms of the Creative Commons Attribution (CC BY 4.0) License. See: http://creativecommons.org/licenses/by/4.0/
REFERENCES1. Twerenbold R, Jaeger C, Rubini Gimenez M, et al. Impact of high-
sensitivity cardiac troponin on use of coronary angiography, cardiac stress testing, and time to discharge in suspected acute myocardial infarction. Eur Heart J. 2016;37(44):3324-32.
2. Crowder KR, Jones TD, Lang ES, et al. The impact of high-sensitivity troponin implementation on hospital operations and patient outcomes in 3 tertiary care centers. Am J Emerg Med. 2015;33(12):1790-4.
3. Irfan A, Twerenbold R, Reiter M, et al. Determinants of high-sensitivity troponin T among patients with a noncardiac cause of
chest pain. Am J Med. 2012;125(5):491-8.e1. 4. Kumar N, Michelis MF, DeVita MV, et al. Troponin I levels in
asymptomatic patients on haemodialysis using a high-sensitivity assay. Nephrol Dial Transplant. 2011;26(2):665-70.
5. Hodgson NR, Saghafian S, Mi L, et al. Are testers also admitters? Comparing emergency physician resource utilization and admitting practices. Am J Emerg Med. 2018;36(10):1865-9.
6. Chan IS, Zhang Z. Test-based exact confidence intervals for the difference of two binomial proportions. Biometrics. 1999;55(4):1202-9.
7. Aloe R, Lippi G, Di Pietro M, et al. Improved efficiency and cost reduction in the emergency department by replacing contemporary sensitive with high-sensitivity cardiac troponin immunoassay. Acta Biomed. 2019;90(4):614-20.
8. Chan, D. The efficiency of slacking off: evidence from the emergency department. Econometrica. 2018;86(3):997-1030.
9. Sandoval Y, Gunsolus IL, Smith SW, et al. Appropriateness of cardiac troponin testing: insights from the use of TROPonin in acute coronary syndromes (UTROPIA) Study. Am J Med. 2019;132(7):869-74.
10. Wang AZ, Schaffer JT, Holt DB, et al. Troponin testing and coronary syndrome in geriatric patients with nonspecific complaints: Are we overtesting?. Acad Emerg Med. 2020;27(1):6-14.
11. Oliver G, Reynard C, Morris N, et al. Can emergency physician gestalt “rule in” or “rule out” acute coronary syndrome: validation in a multicenter prospective diagnostic cohort study. Acad Emerg Med. 2020;27(1):24-30.

JETem is an online, open access, peer- reviewed journal- repository for EM educators.
VISIT JETem.org to learn more about submissions or if you’re interested in being a JETem reviewer.
CALL FOR SUBMISSIONS
CALL FOR REVIEWERS
Team Based Learning Podcasts Lectures Small Group Learning and Workshops Oral Boards Simulation Curricula Innovations

ACOEP stands with all emergency physicians and providers on the front line. We thank you for your
tireless work and effort.
www.acoep.org
Championing individual physician rights
and workplace fairness
JOIN
CAL/AAEM!
BENEFITS- Western Journal of Emergency Medicine Subscription- CAL/AAEM News Service email updates- Free and discounted registration to CAL/AAEM events- And more!
CAL/AAEM NEWS SERVICE- Healthcare industry news- Public policy- Government issues- Legal cases and court decisions
In collaboration with our official journal
Join the CAL/AAEM Facebook Group to stay up-to-date: www.facebook.com/groups/calaaem
www.aaem.org/calaaemAAEM-0720-255

Western Journal of Em
ergency Medicine
V
OLU
ME 23, N
UM
BER
3, May 2022
PA
GES 292-442
50
CALIFORNIA ACEP
ANNIVERSARY
Related Documents