gva.co.uk/planning WESTERN BERKSHIRE AUTHORITIES | RETAIL & COMMERCIAL LEISURE ASSESSMENT 2016 | FINAL REPORT | APRIL 2017 Western Berkshire Retail & Commercial Leisure Assessment 2016 Volume 1 — Main Report Final Report April 2017 GVA on behalf of Bracknell Forest Council | Reading Borough Council | West Berkshire Council | Wokingham Borough Council

Welcome message from author
This document is posted to help you gain knowledge. Please leave a comment to let me know what you think about it! Share it to your friends and learn new things together.
Transcript
gva.co.uk/planning
WESTERN BERKSHIRE AUTHORITIES | RETAIL & COMMERCIAL LEISURE ASSESSMENT 2016 | FINAL REPORT | APRIL 2017
Western Berkshire Retail & Commercial Leisure Assessment 2016 Volume 1 — Main Report Final Report April 2017
GVA on behalf of Bracknell Forest Council | Reading Borough Council | West Berkshire Council | Wokingham Borough Council
WESTERN BERKSHIRE AUTHORITIES | RETAIL & COMMERCIAL LEISURE ASSESSMENT 2017 | FINAL REPORT | APRIL 2017
2 | gva.co.uk/planning
Contents VOLUME 1
Introduction & Structure of Report .............................................................................................................................................................................................................. 3 1
Planning Policy Context ............................................................................................................................................................................................................................... 5 2
The Existing Retail Evidence Base .............................................................................................................................................................................................................. 14 3
Retail & Leisure Market Review .................................................................................................................................................................................................................. 16 4
The Sub-Regional Context ........................................................................................................................................................................................................................... 21 5
Survey Area, Shopping Patterns and Population & Expenditure Growth .............................................................................................................................................. 31 6
Shopping Patterns and Identification of Need — Reading Borough .................................................................................................................................................... 36 7
Shopping Patterns and Identification of Need — Bracknell Forest ......................................................................................................................................................... 43 8
Shopping Patterns and Identification of Need — West Berkshire ........................................................................................................................................................... 49 9
Shopping Patterns and Identification of Need — Wokingham Borough ............................................................................................................................................... 54 10
Commercial Leisure Assessment .................................................................................................................................................................................................................. 60 11
Conclusions ..................................................................................................................................................................................................................................................... 68 12
VOLUME 2 – PLANS & APPENDICES
VOLUME 3 – NEMS HOUSEHOLD SURVEY RESULTS (NEMS MARKET RESEARCH)
VOLUME 4 – BRACKNELL IN-CENTRE SURVEY RESULTS (NEMS MARKET RESEARCH)
Issue: Final Report
Issue Date: April 2017
Caroline Marginson, Director | DD: 020 7911 2551 / M: 07818 001 658 | [email protected]
Adam Bunn, Associate DD: 020 7911 2209 / M: 07757 202 784 | [email protected]
Switchboard: 0844 902 0304
For and on behalf of GVA Grimley Ltd
WESTERN BERKSHIRE AUTHORITIES | RETAIL & COMMERCIAL LEISURE ASSESSMENT 2017 | FINAL REPORT | APRIL 2017
3 | gva.co.uk/planning
Introduction & Structure of Report 1
1.1 GVA have been instructed by the authorities of Bracknell Forest Council, Reading Borough Council, West Berkshire Council and Wokingham Borough Council (we collectively refer to these four Councils as the ‘Western Berkshire’ authorities) to undertake a study to plan for each authority’s future retail and commercial leisure needs.
1.2 In particular, the study seeks to:
• Identify the changes in national trends in retailing and commercial leisure; • Identify current convenience (food) and comparison ( n o n - f o o d ) shopping
and commercial leisure visitation patterns, across the study area; • Provide a robust assessment of future quantitative and qualitative capacity for
additional retail (convenience and comparison goods) and commercial leisure needs within each authority area for the period to 2036.
1.3 Our study provides a robust evidence base which is fully compliant with the National Planning Policy Framework (NPPF), which the West Berkshire authorities will be able to use to inform policy development and land use allocations. We also expect that the study will be used by the authorities to assist in the determination of applications for new retail development within their respective authority areas. The study is designed to cover the period 2016 to 2036, but we advise that all findings and recommendations covering the second half of this period (i.e. beyond 2026) are considered indicative and should be further reviewed through the Councils’ respective Local Plan periods.
Objectives of the study
1.4 The detailed objectives of the study are to provide:
• a brief review of the national and local planning policy context. • an analysis of national trends in retailing and commercial leisure (for example, format
of units, online shopping, click and collect, out of centre retailing, coffee culture, cinemas, pubs, health and fitness facilities) and how such uses are expected to develop over the plan period.
• the current and projected catchment areas of each of the principal centres in each authority area;
• a baseline figure for existing retail and commercial floorspace in the study area and for each local Authority, including taking account of existing extant permissions and other commitments;
• a baseline figure for existing turnover for retail and commercial floorspace in the study area and for each Authority, including taking account of any over or under trading;
• an assessment of all specified centres in the study area, assessing their role, function and relationships to one another;
• an assessment of existing and future spending patterns and trends for retail (comparison, and convenience uses) and commercial leisure uses and identify the expenditure capacity for the main centres;
• an assessment of the need, scope and capacity for further comparison and convenience goods floorspace and commercial leisure over the plan period (identifying degrees of certainty over time) for the study area and for each Authority;
• Having regard to the above and trends in usage, identification of any shortfalls in the existing qualitative and quantitative retail and commercial leisure offer in the study area and for each Authority;
• a strong reality check of the quantitative need in terms of market interest in providing such floorspace in both the study area as a whole and for each Authority;
• The influence of relevant centres beyond the study area should be taken into account in carrying out the study.
1.5 Our study has been informed by a household telephone survey of shopping and leisure patterns across the Western Berkshire authority areas, (referred to as the ‘study area’) and adjacent surrounding areas in which residents may look towards facilities in West Berkshire to meet their shopping and leisure needs (referred to as ‘the survey area’). A wide survey area has been adopted to reflect the sub-regional role which Reading town centre plays as a comparison goods shopping destination. The results of the household telephone survey can also be used to understand the extent to which surrounding centres — such as High Wycombe, Basingstoke, Slough, Windsor, Camberley, Woking and Guildford — are competing for spending with the network of centres within the four Western Berkshire authority areas.
1.6 The extent of the survey area was agreed with the West Berkshire authorities at the initial stage of preparation of this study. A plan of the survey area is provided at Plan I of Volume 2 (and is also set out at Figure 6.1 of this report).
WESTERN BERKSHIRE AUTHORITIES | RETAIL & COMMERCIAL LEISURE ASSESSMENT 2016 | FINAL REPORT | APRIL 2017
4 | gva.co.uk/planning
Structure of report
1.7 Our report is split into four volumes. This report forms Volume 1 to the study; Volume 2 sets out supporting plans and appendices; Volume 3 provides the household telephone survey data (prepared by NEMS Market Research); Volume 4 sets out results of in-centre surveys undertaken in Bracknell town centre (also prepared by NEMS Market Research).
1.8 The remainder of this report (Volume 1) is structured as follows:
• Section 2 sets out our review of national, strategic and local planning policies relevant to town centre retail and commercial leisure planning;
• Section 3 provides a brief review of the existing evidence base studies of the four Western Berkshire authorities;
• Section 4 considers national trends in the retail sector, and in particular the implications of recent economic growth and technological advances which are impacting on shopping habits;
• Section 5 considers the wider study context, identifying the most popular shopping destinations for residents in the survey area, the key competing centres surrounding the survey area, and the extent to which they influence the shopping patterns of residents;
• Section 6 sets out our approach to calculating retail capacity, including definition of the household telephone survey area and discussion of approach to the household telephone survey;
• Sections 7, 8, 9 and 10 set out the quantitative ‘need’ for additional convenience (food) and comparison (non-food) retail floorspace over the study period to 2036 for Reading Borough, Bracknell Forest, West Berkshire and Wokingham Borough respectively;
• Section 11 sets out our analysis of commercial leisure visit patterns and growth in the commercial leisure sector; and
• Section 12 draws our analysis together and sets out conclusions.
Key terms
1.9 A glossary of terms can be found appended to the rear of Volume I of the report.
WESTERN BERKSHIRE AUTHORITIES | RETAIL & COMMERCIAL LEISURE ASSESSMENT 2016 | FINAL REPORT | APRIL 2017
5 | gva.co.uk/planning
Planning Policy Context2
In this section we summarise the key features of national and local planning policy guidance (discussed for each of the four Western Berkshire authorities) which provide the context and framework under which this study has been prepared.
THE NATIONAL POLICY CONTEXT
National Planning Policy Framework (NPPF), 2012 2.1 The National Planning Policy Framework (NPPF), published on 27 March 2012 sets out the
Government’s planning policies for England and replaces the suite of national Planning Policy Statements, Planning Policy Guidance and Circulars with a single document.
2.2 The NPPF continues to recognise that the planning system is plan-led and therefore Local Plans, incorporating neighbourhood plans where relevant, are the starting point for the determination of any planning application (paragraph 12). In line with the Government’s aim to streamline the planning process, each Local Planning Authority (LPA) should produce a single Local Plan for its area with any additional documents to be used only where clearly justified.
2.3 The NPPF maintains the general thrust of previous policy set out in PPS4 – Planning for Sustainable Economic Growth (2009). It advocates a ‘town centres first’ approach, and requires planning policies to positively promote competitive town centre environments and manage the growth of centres over the plan period. In planning for town centres LPAs should (paragraph 23):
• Recognise town centres as the heart of their communities and pursue policies to support their viability and vitality;
• Define a network and hierarchy of centres that is resilient to anticipated future economic changes;
• Define the extent of town centres and primary shopping areas, based on a clear definition of primary and secondary shopping frontages in designated centres and set policies that make clear which uses will be permitted in such locations;
• Promote competitive town centres that provide customer choice and a diverse retail offer which reflect the individuality of town centres;
• Retain and enhance existing markets and, where appropriate, re-introduce or
create new ones, ensuring that markets remain attractive and competitive;
• Allocate a range of suitable sites to meet the scale and type of economic development needed in town centres. Where town centre sites are not available, LPAs should adopt a sequential approach to allocate appropriate edge of centre sites;
• Set policies for the consideration of proposals for main town centre uses which cannot be accommodated in or adjacent to town centres;
• Recognise that residential development can play an important role in ensuring the vitality of centres; and
• Where town centres are in decline, plan positively for their future to encourage economic activity.
2.4 LPAs should ensure that the Local Plan is based on adequate, up-to-date and relevant evidence about the economic, social and environmental characteristics and prospects of the area (paragraph 158). These assessments should be integrated and take full account of relevant market and economic signals. LPAs should use the evidence base to assess, inter alia (paragraph 161);
• The needs for land or floorspace for economic development, taking account of both quantitative and qualitative requirements for all foreseeable types of economic activity over the plan period, including retail and commercial leisure development;
• The existing and future supply of land available for economic development and its sufficiency and suitability to meet the identified needs;
• The role and function of town centres and the relationship between them, including any trends in the performance of centres; and
• The capacity of existing centres to accommodate new town centre development.
2.5 The Local Plan will be examined by an independent inspector whose role it is to assess whether the plan is sound. In order to be found sound the Plan should be (paragraph 182):
• ‘Positively prepared’ i.e. based on a strategy which seeks to meet objectively
WESTERN BERKSHIRE AUTHORITIES | RETAIL & COMMERCIAL LEISURE ASSESSMENT 2016 | FINAL REPORT | APRIL 2017
6 | gva.co.uk/planning
assessed development and infrastructure requirements
• Justified i.e. the most appropriate strategy, when considered against the alternatives;
• Effective i.e. deliverable over its plan period and based on effective joint working; and
• Consistent with national policy i.e. enable the delivery of sustainable development
2.6 Overall, the NPPF adopts a positive approach, with a presumption in favour of sustainable development (paragraph 14) and support for economic growth (paragraph 18). In terms of decision-making, applications for planning permission must be determined in accordance with the development plan unless material considerations indicate otherwise (paragraph 150). The NPPF is a material consideration in planning decisions.
National Planning Policy Guidance (NPPG) (2014)
2.7 In March 2014 the Department for Communities and Local Government (DCLG) launched the online planning practice guidance, which cancelled a number of previous planning practice guidance documents, including the Practice Guidance on Need, Impact and the Sequential Approach (2009). The document is a ‘live’ web-based resource that is updated as necessary. Although it does not constitute a statement of Government policy, it provides technical guidance on how to prepare a robust evidence base and how to assess the impact of proposals for main town centre uses. The web-based resource provides guidance on how to assess and plan to meet the needs of main town centre uses in full through production of a positive vision or strategy for town centres.
THE LOCAL POLICY CONTEXT 2.8 In the remainder of this section we provide a high-level summary of the relevant local
planning policy context which frames the remainder of the study.
Reading Borough Local Policy Context
2.9 The adopted development plan for Reading Borough Council consists of the Core Strategy (adopted January 2008 with alterations adopted January 2015), the Reading Central Area Action Plan (adopted January 2009), Sites and Detailed Policies (adopted October 2012) and the Proposals Map (adopted October 2012). The New Local Plan is currently in the early stages of consultation with consultation on the issues and options document having been undertaken between January and March 2016.
Reading Borough Council Core Strategy (adopted 2008, with alterations adopted 2015)
2.10 The Reading Spatial Strategy (Core Strategy, 2008) identifies the Reading Central Area and District/Local Centres as being sustainable locations for future development. With regards to the location and scale of retail, leisure and culture development, Policy CS25 states that this type of development should take place within or as an extension to the centre of Reading. CS25 states that ‘where a need for additional development has been identified, and no sites are available in or adjoining the centre of Reading, a sequential approach should be adopted to identifying alternative sites’- this is reflective of the policy tests as set out in the NPPF.
2.11 Policy CS26 ‘Network and Hierarchy of Centres’ identifies Reading Centre as being a ‘Regional Centre’. ‘Major local centres’ are identified at Whitley Street and Wokingham Road. ‘Local Centres’ are identified at Basingstoke Road North, Chirstchurch Road, Coronation Road, Erleigh Road, Dee Park, Northumberland Avenue North, Wensley Road and Whitley Wood. CS26 goes on to state that the vitality and viability of the centres should be maintained and enhanced, the range of uses widened, environmental enhancements and improvements made to access.
2.12 Policy CS27 ‘Maintaining the Retail Character of Centres’ states that ‘a strong retail character will be maintained in the centres identified as being part of the network. Significant groupings of non-retail uses in one part of a centre will not be allowed’.
Reading Borough Council Sites and Detailed Policies (2012)
2.13 Reading Borough Council’s Sites and Detailed Policies Document (adopted 2012) provides further policies on Retail, Leisure and Culture. Of particular relevance to this study are the following policies:
• Policy DM13 (‘Vitality and Viability of Smaller Centres’) details where the loss of A1 retail to other centres will be permitted.
• Policy DM14 relates to the ‘Impact of Main Town Centre Uses’; this is broadly reflective of the retail impact policy tests as set out at paragraph 26 of the NPPF. Policy DM15 protects leisure facilities and public houses outside of the Central Area.
• Policy SA3 details the retail, leisure and cultural uses in South Reading. This policy states that the main focus for additional development within South Reading will be an extension to Whitley District Centre. This policy has now partly been delivered through the opening of a new Aldi foodstore, gym and public house on former employment land. The policy goes on to state that there is no identified need for
WESTERN BERKSHIRE AUTHORITIES | RETAIL & COMMERCIAL LEISURE ASSESSMENT 2016 | FINAL REPORT | APRIL 2017
7 | gva.co.uk/planning
additional District or Local Centres in South Reading.
Reading Central Area Action Plan (2009)
2.14 The Reading Central Area Action Plan (adopted January 2009) identifies the major land uses within the Centre of Reading (RCAAP) including retail and leisure. The plan identifies three ‘Major Opportunity Areas’- Station / River, East Side and West Side. Additionally the plan identifies nineteen ‘Other Opportunity Areas’. There are a number of retail allocations within the identified Opportunity Areas, mostly within the Station / River Major Opportunity Area. Paragraph 5.13 of the RCAAP states that:
‘The best location for an extension to the Primary Shopping Area is the area around the station. This has sufficient redevelopment potential to provide for this quantum of development, would assist in developing the key north-south movement corridor through the centre, and would retain the compact nature of the core.’
2.15 A number of other areas, including Station Hill and land to the north of Reading Station, are also identified as being suitable for retail uses.
2.16 Policy RC7 of the RCAAP relates to ‘Leisure, Culture and Tourism in the Centre’. This policy builds on Policy CS25 of the Core Strategy - it states that there should be no net loss of the Centre’s overall leisure provision and encourages innovative solutions to leisure provision.
2.17 Policy RC11 of the RCAAP relates to ‘Small Shop Units’. This policy recognises the importance of small shops to the diversity of the centre. The Arcades, Cross Street, Queen Victoria Street and Union Street are specifically referenced as locations currently supporting small shop units. Part II of the policy states that ‘major new retail development (more than 2,500 sq.m) for multiple units in the Primary Shopping Area should include some provision for a range of small shop units.’
Bracknell Forest Local Policy Context
Bracknell Forest Core Strategy (2008)
2.18 Policies in the Core Strategy establish the overall strategy for the development and use of land in the Borough up to 2026, including the broad locations for future development.
2.19 The Core Strategy identifies the function of Bracknell town centre as a major town which needs to serve the residents and workers in, and the visitors to, the Borough. Policy CS3 states that in Bracknell town centre, development that contributes to the vision and function of the centre in one or more of the specified ways will be permitted. This includes development that provides a mix of uses including retail, housing, employment,
recreational, leisure, cultural and health facilities. Development will also be supported that provides for the comparison and specialist shopping needs of the Borough, or provides for the convenience shopping needs of the resident population in and adjoining the centre.
2.20 With regards to retail, the Core Strategy identifies Bracknell town centre as the largest and most accessible centre in the Borough. The town centre will continue to be the Borough’s main retail centre, with uses appropriate to this role. Other centres have different roles and will accordingly have a different retail offer. Policy CS21 states that retail development will be directed to the identified town centres. The scale and nature of the retail uses will be consistent with the role and function of the centre.
2.21 The hierarchy of retail centres is set out in Policy E5 of the Bracknell Forest Borough Local Plan (discussed separately below) but is referred to in paragraphs 229 to 232 of the supporting text to Policies CS21 and CS22 in the Core Strategy. A summary of the hierarchy of centres in the Borough is shown in Table 2.1.
Table 2.1: Retail hierarchy, Bracknell Forest Centre Role
Bracknell Town Centre
Bracknell town centre will contain the main comparison shopping offer in the Borough, and will be a focus for a range of retail and complementary uses.
Crowthorne and Sandhurst (West of Swan Lane) centres
These centres will contain comparison shopping of a scale appropriate to their role as small town centres, and convenience shopping to serve their local area.
Smaller centres (Village and neighbourhood centres and local parades) will be defined in a DPD and are listed below:
Other, smaller centres (listed below) will fulfil a district or neighbourhood role, providing for day-to-day needs. To ensure that development is consistent with their scale and function, expansion of their comparison shopping offer by more than 500m2 will be resisted.
Village and neighbourhood centres:
Terrace Road South, Binfield; Bullbrook; Crown Wood; Easthampstead; Great Hollands; Hanworth; Harmans Water; Priestwood; Wildridings; Whitegrove; Forest Park; Martins Heron; Birch Hill
Local parades:
Station Parade, Dukes Ride, Crowthorne; Yorktown Road, College Town, Sandhurst; Yorktown Road (East of Swan Lane), Sandhurst Old Mills Parade, High Street, Sandhurst; Yeovil Road, Sandhurst; Fernbank Road, Ascot; Warren Row, Ascot
Source: Bracknell Forest Core Strategy (as amended by Site Allocations Local Plan)
2.22 Paragraph 235 of the supporting text states ‘Many retail uses are hubs of the community.
WESTERN BERKSHIRE AUTHORITIES | RETAIL & COMMERCIAL LEISURE ASSESSMENT 2016 | FINAL REPORT | APRIL 2017
8 | gva.co.uk/planning
They are important for community cohesion and have a valuable role to play in social inclusion. Units that perform an important community role including post offices, convenience stores, chemists and pubs will be protected. Planning applications involving the loss of retail by redevelopment or change of use will not be allowed unless exceptional circumstances have been proven and an equivalent or better replacement facility has been secured.’ This is reflected in Policy CS21.
2.23 Policy CS21 (retail development in town centres) also sets out the sequential requirements for retail provision, directing new retail development to in-centre locations in the first instance (in line with the approach in the NPPF), followed by edge-of-centre sites. If no in-centre or edge of centre sites are suitable, viable and available, out of centre sites will be considered in accordance with Policy CS22 (Out of Town Centre Retail Development), which requires development to demonstrate a quantitative and qualitative need and to follow a sequential approach to location of the development. It should be noted that Policy CS22 and other references to ‘need’ in the Core Strategy are inconsistent with the NPPF, and accordingly carry no weight (the NPPF does not require applications for development not within a defined centre to demonstrate ‘need’). Other aspects of Policy CS22 are however considered to be consistent.
Site Allocations Local Plan (2013)
2.24 The Site Allocations Local Plan helps implement the adopted Core Strategy. It identifies sites for future housing and other development and ensures that appropriate infrastructure is identified and delivered alongside new development. It also revises some designations on the policies map, updating the boundaries of retail centres and the identification of primary and secondary frontages.
Bracknell Town Centre
2.25 Under Policy SA11, land in Bracknell Town Centre is allocated for a mixed use development including retail, business, residential, leisure and other ancillary development. Any proposals must accord with the principles, development zones and schedules set out in the adopted masterplan, or any subsequently agreed amendments, framework and strategies. Redevelopment of part of the area allocated under policy SA11 has been granted planning permission and is currently under construction; we discuss this further in section 5. It is scheduled to open in September 2017.
The Peel Centre
2.26 Policy SA12 defines the Peel Centre as an edge-of-centre retail park. Under Policy SA12, development at the Peel Centre will only be permitted if it does not adversely affect the retail warehouse character or function of the park. Any applications will need to be
supported by information relating to the sequential test (as the site is in an edge-of-centre location), and will require an impact assessment. A development proposal should have no serious effect (either on its own or cumulatively with other similar permissions) upon the vitality and viability of Bracknell Town Centre as a whole.
Bracknell Forest Borough Local Plan (2002)
2.27 A number of the policies from the Local Plan have been superseded. Below details the ‘saved’ policies relevant to retail provision. Chiefly, Policy E5 (Hierarchy of shopping centres) identifies Bracknell Town Centre as a focus for the Borough that contains a wide range of shopping facilities but also a number of other uses such as community, recreation, entertainment, municipal and other business uses, all of which are highly accessible to the community. For reasons of accessibility, the town centre should be the focus for retail and leisure developments within the Borough that attract many trips. However, the retail function should remain the main focus for the vitality and viability of the town centre and should continue to underpin the economy of the town centre.
2.28 Smaller town centres act as providers of local services which are easily accessible to everyone, such as post offices and pharmacists. Neighbourhood centres, village centres and local parades provide a wide range of services which reduce the need to travel to other areas. These centres should be promoted and maintained.
2.29 Policy E5 states that proposals for shopping development should generally be consistent with the role of each of the centres and parades having regard to the following hierarchy of shopping centres and parades: Major Town Centres, Small Town Centres, Village and Neighbourhood Centres and Local Parades. It should be noted that the definition of the hierarchy of centres in the Bracknell Forest Borough Local Plan pre-dates the definitions set out in the glossary to the NPPF.
Emerging Comprehensive Local Plan
2.30 The Council is currently producing a Local Plan which will set the long-term spatial vision and development strategy for the borough up to 2036. Once adopted, it will replace many of the saved policies in the Bracknell Forest Borough Local Plan (2002) and the Core Strategy (2008). This study will form part of the evidence base for the new Local Plan.
West Berkshire Local Policy Context
2.31 The West Berkshire Development Plan is made up of the Core Strategy Development Plan document (2006-2026) and the Saved Policies of the West Berkshire District Local Plan (Saved 2007) The emerging Housing Site Allocations Document is at an advanced stage of preparation with adoption likely early in 2017.
WESTERN BERKSHIRE AUTHORITIES | RETAIL & COMMERCIAL LEISURE ASSESSMENT 2016 | FINAL REPORT | APRIL 2017
9 | gva.co.uk/planning
West Berkshire Core Strategy (2006-2026) Development Plan Document (2012)
2.32 The West Berkshire Core Strategy was adopted in 2012. It sets out the long term vision for the Borough in spatial terms, setting policy which will guide development to 2026. One of the stated Strategic Objectives is to achieve growth in retail activity and increase the vitality and vibrancy of town centres. The Objective is to provide for local shopping need in Town, District and Local Centres to serve the needs of existing and future residents.
2.33 Area Delivery Plan Policy 1 sets out the broad spatial areas of the District and the District settlement hierarchy. The policy states that West Berkshire’s urban areas will be the focus for most development.
2.34 Area Delivery Plan Policy 2 identifies that Newbury town centre will provide 28,400 sq.m of retail floorspace through the Parkway development, which has subsequently commenced trading. This is stated as meeting the demand for retail floorspace during the Core Strategy period identified through the Retail Study 2010. The retail capacity forecasts set out in this study update these capacity requirements.
2.35 Thatcham town centre will be a focus for regeneration, enabling the town to fulfil its role within the Hierarchy of Centres by improving the retail offer and streetscape; this is detailed further within Area Delivery Plan Policy 3.
2.36 Area Delivery Plan Policy 4 is for the Eastern Area of Western Berkshire, which is identified as accommodating approximately 1,400 new homes during the plan period. The retail park at Pincents Lane, Calcot is identified as being retained and enhanced as an important retail centre, particularly for serving Calcot, Tilehurst and Theale. It goes on to state that the retail and service offer in the district centre of Theale will be protected and enhanced, with the district centre boundary and primary shopping frontage being reviewed at a later point in the Site Allocations and Delivery DPD document.
2.37 Hungerford is identified within paragraph 4.39 as having an enhanced role as a tourist destination within the North Wessex Downs AONB, based on its reputation for a strong retail offer in the form of independent stores and the range of local produce. Area Delivery Plan Policy 5 states that Hungerford should further promote its diverse retail offer. The final section of this policy goes on to state that the retail offer in Hungerford should be developed, whilst preserving the unique character and local independent businesses.
2.38 Pangbourne is identified as a ‘thriving district centre’ with a good range of retail and leisure facilities. The final section of Area Delivery Plan Policy 5 states that the retail and service offer in the district centre of Pangbourne will be protected and enhanced.
2.39 Section 5 of the Core Strategy contains the Core Policies which aim to deliver the spatial strategy set out in the preceding chapters, including those concerning retail. In terms of Site Allocations, Policy CS 2 states that Newbury Racecourse will provide the phased delivery of up to 1,500 homes with appropriate retail facilities. Policy CS 3 identifies Sandleford as being a suitable location for the phased delivery of up to 2,000 dwellings, with the provision of retail facilities in the form of a local centre.
2.40 Policy CS 11 deals with Town Centres, setting out a hierarchy of centres. It is stated within this policy that as no capacity for additional retail convenience and comparison floorspace on top of that which is already committed has been identified through the 2010 Retail Study, any retail development during the Core Strategy period will be mainly focused on the implementation of current schemes such as Parkway, Newbury (which has subsequently been completed and is now trading) along with regeneration and other qualitative improvements and schemes. The Kingsland Centre at Thatcham is identified as needing regeneration and has the potential to strengthen the town’s retail offer.
2.41 Whilst the Core Strategy states that new local centres will be identified through a Site Allocations and Delivery DPD, we understand that the Council’s intentions are that town centre and retail issues will be addressed through the preparation of the Council’s new Local Plan.
West Berkshire District Local Plan 1991-2006 (Saved Policies 2007)
2.42 The Secretary of State confirmed on 25th September 2007 that a number of policies from the Local Plan 1991-2006 were ‘saved’ and would continue to apply. A number of these policies were replaced following the adoption of the Core Strategy in 2012, though a number of Local Plan 1991-2006 policies remain in force.
2.43 Three policies with relevance to retail and town centres remain extant. These are policies SHOP1, SHOP3 and SHOP5:
• Policy SHOP1 relates to the proposals for changes of use to non-A1 uses in primary frontages. This policy states that the Council will refuse planning applications for the change of use from A1 to other purposed within the primary shopping frontages of Newbury, Hungerford, Thatcham, Theale and Pangbourne where it would result in a concentration of non-retail uses which would be harmful to the vitality of the shopping centre.
• Policy SHOP3 relates to retail warehousing, and the designation of retail areas where changes of use to nonretail/ leisure uses will normally be refused. These retail areas include London Road (between Newbury and Thatcham) and in the
WESTERN BERKSHIRE AUTHORITIES | RETAIL & COMMERCIAL LEISURE ASSESSMENT 2016 | FINAL REPORT | APRIL 2017
10 | gva.co.uk/planning
Pincents Lane Commercial Area to the north east of Theale. The Council will permit non-food, bulky goods retail warehousing only where there will be no impacts upon amenity, the application can easily be accessed from the main road network and where proposals either by themselves or cumulatively will have no significant detrimental impact on the vitality and viability of Newbury Town Centre or other nearby shopping centres.
• Policy SHOP5 deals with local and village shops. It states that the Council will encourage the provision and retention of local shops within both new and existing residential areas and in village settlements.
Wokingham Borough Local Policy Context
2.44 The key policy documents which guide development at the local level in Wokingham Borough are the adopted Core Strategy (2010), the Managing Development Delivery Local Plan (2014) and the Wokingham Town Centre Masterplan SPD (2010). We consider these documents in turn below.
Wokingham Core Strategy (2010)
2.45 The Core Strategy determines the future vision for how Wokingham borough will develop until March 2026. The document includes 21 policies and strategies to provide new housing, schools, roads, places to work and other services. The strategy has an overarching aim to support communities across the borough by ensuring that community facilities, services and infrastructure are protected and enhanced to encourage sustainable growth.
2.46 To deliver and enhance overall sustainability of the environment, new development will comply with Core Policy 1 and follow the Community Strategy and Spatial Objectives within the borough. Wokingham’s Spatial Vision states that in order to manage growth, development will be located in towns and villages that already or are soon to have implemented facilities and services that can support new development.
2.47 In determining applications, Core Policy 13 states that, in principle Wokingham and Woodley town centres, Lower Earley district centre, Shinfield Road centre, Twyford village centre and Winnersh centre are suitable to accommodate town centre uses (defined as retailing, entertainment, arts and culture, indoor recreation, leisure, health, community and office uses). The policy seeks to protect existing and new retail centres as well as the local shopping centres and parades which meet the needs of the local community. Net loss of retail from primary retail frontages will not be permitted so as to protect the vitality and viability of these centres.
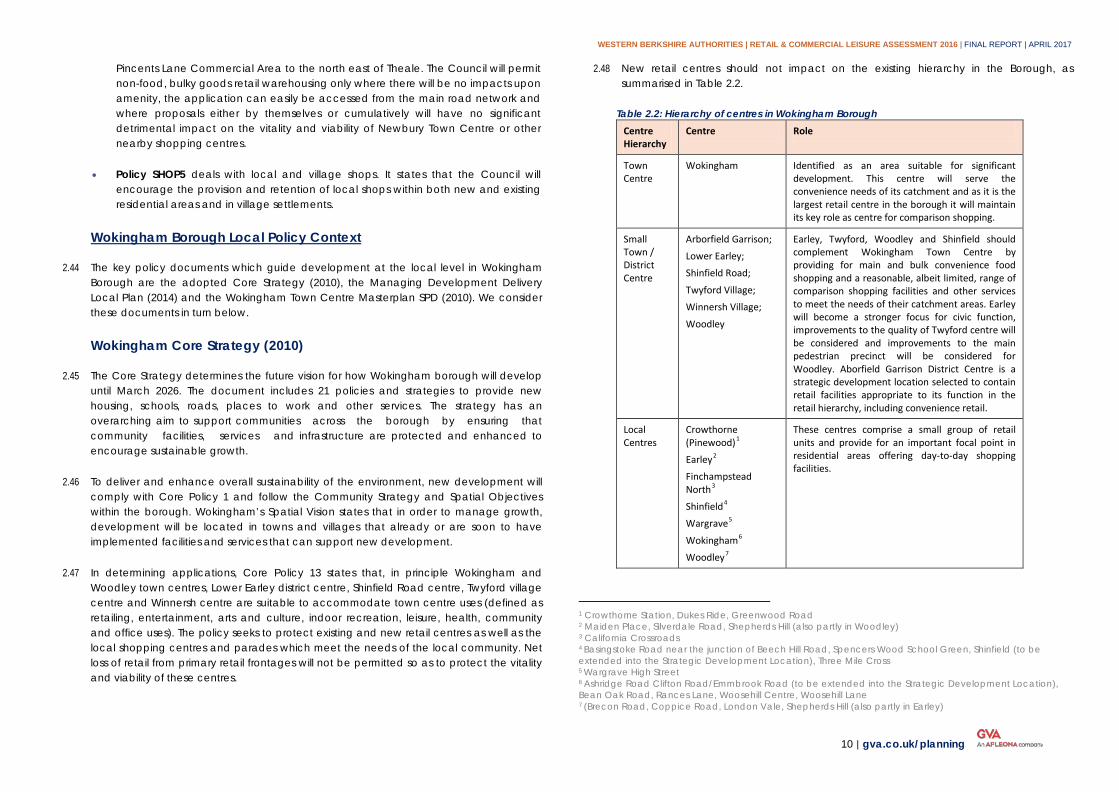
2.48 New retail centres should not impact on the existing hierarchy in the Borough, as summarised in Table 2.2.
Table 2.2: Hierarchy of centres in Wokingham Borough Centre Hierarchy
Centre Role
Town Centre
Wokingham Identified as an area suitable for significant development. This centre will serve the convenience needs of its catchment and as it is the largest retail centre in the borough it will maintain its key role as centre for comparison shopping.
Small Town / District Centre
Arborfield Garrison;
Lower Earley;
Shinfield Road;
Twyford Village;
Winnersh Village;
Woodley
Earley, Twyford, Woodley and Shinfield should complement Wokingham Town Centre by providing for main and bulk convenience food shopping and a reasonable, albeit limited, range of comparison shopping facilities and other services to meet the needs of their catchment areas. Earley will become a stronger focus for civic function, improvements to the quality of Twyford centre will be considered and improvements to the main pedestrian precinct will be considered for Woodley. Aborfield Garrison District Centre is a strategic development location selected to contain retail facilities appropriate to its function in the retail hierarchy, including convenience retail.
Local Centres
Crowthorne (Pinewood)1
Earley2
Finchampstead North3
Shinfield4
Wargrave5
Wokingham6
Woodley7
These centres comprise a small group of retail units and provide for an important focal point in residential areas offering day-to-day shopping facilities.
1 Crowthorne Station, Dukes Ride, Greenwood Road 2 Maiden Place, Silverdale Road, Shepherds Hill (also partly in Woodley) 3 California Crossroads
4 Basingstoke Road near the junction of Beech Hill Road, Spencers Wood School Green, Shinfield (to be extended into the Strategic Development Location), Three Mile Cross
5 Wargrave High Street
6 Ashridge Road Clifton Road/Emmbrook Road (to be extended into the Strategic Development Location), Bean Oak Road, Rances Lane, Woosehill Centre, Woosehill Lane
7 (Brecon Road, Coppice Road, London Vale, Shepherds Hill (also partly in Earley)
WESTERN BERKSHIRE AUTHORITIES | RETAIL & COMMERCIAL LEISURE ASSESSMENT 2016 | FINAL REPORT | APRIL 2017
11 | gva.co.uk/planning
2.49 Wokingham is identified as a ‘major town centre’ offering a significant provision of facilities for comparison shopping. The other centres in the borough function according to their position in the town centre hierarchy.
2.50 In accordance with Core Policy 14, proposals in Wokingham town centre will retain and enhance the historic market town character to maintain its position in the Berkshire retail hierarchy and status as a major town centre. Retail uses will be strengthened, however office, leisure, housing and community and tourist facilities will also be promoted in the centre. Improving existing public spaces and utilisation of compulsory purchase powers to facilitate site assembly and regeneration schemes will also be supported in order to deliver growth and renewal of the centre.
2.51 Policies CP18 to CP21 of the Core Strategy allocate four Strategic Development Locations (SDLs) in Wokingham Borough. These four SDLs are called Arborfield Garrison, South of the M4, North Wokingham and South Wokingham. Each of these SDLs will include new neighbourhood/district centres which will include retail facilities of an appropriate scale to support these new communities.
Managing Development Delivery Local Plan (MDD LP) (2014)
2.52 This document develops the objectives and overarching policies set out in the Core Strategy (2010) to ensure delivery of sustainable development. It also provides strategic guidance for specific allocated sites.
2.53 In determining planning applications, Policy TB15 (development in major town and small town/ district centres) states that permission will only be granted where the scale and form complements the retail character of the centre and its defined role within the retail centre hierarchy. Class A1 (shops) use in primary shopping frontages will need to be protected and proposals will need to demonstrate the retention or increased provision of this use. A1, A2 (financial and professional services), A3 (restaurants and cafes), A4 (drinking establishments) and A5 (hot food takeaways) will be allowed in secondary shopping frontages. Any development will also be required to demonstrate how it contributes to existing day and evening uses and the vitality and viability of the existing centre.
2.54 The council will encourage a diversity of uses including office, live-work units and self- contained dwellings, providing active town centre frontages are retained. Proposals must be consistent with the Wokingham Town Centre Masterplan SPD (2010) and also comply with CP14 of the Core Strategy.
2.55 Policy TB16 (Development for Town Centre Uses) identifies that a sequential test is required for proposals for retail and main town centre uses over 500 sq.m and outside of the
relevant defined shopping/ retail areas in order to demonstrate there are no alternative available sites within surrounding town centres. A retail impact assessment will be needed for those proposals which include retail and leisure uses (including extensions) of 500 sq.m or above outside areas defined in the retail hierarchy.
2.56 Policy TB17 (Local Centres and Neighbourhood and Village Shops) states that the retention and enhancement of day-to-day shopping facilities of local centres, neighbourhood and village shops will be supported by the Council. A1 uses will be protected unless it can be demonstrated that the existing retail use is no longer viable and that there are suitable existing day-to-day shopping facilities (post offices, newsagents, convenience stores selling food items, pharmacies and petrol stations) within reasonable walking distance (defined for this policy as being 300 metres).
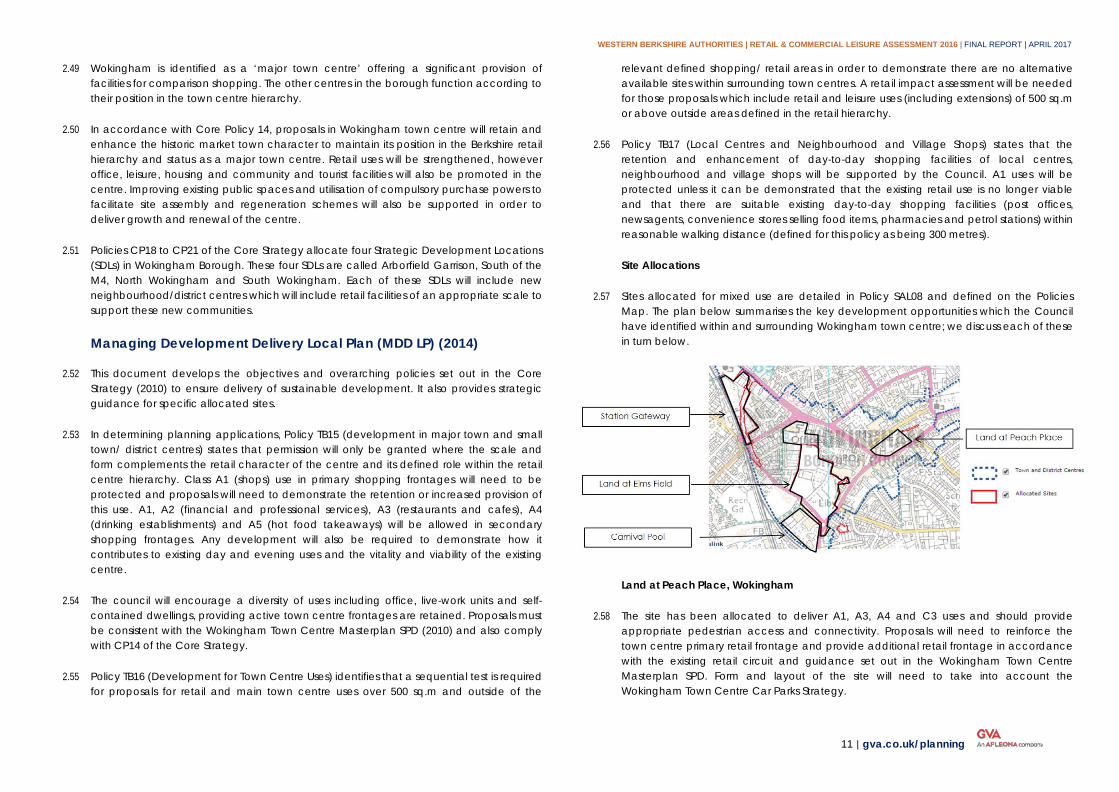
Site Allocations
2.57 Sites allocated for mixed use are detailed in Policy SAL08 and defined on the Policies Map. The plan below summarises the key development opportunities which the Council have identified within and surrounding Wokingham town centre; we discuss each of these in turn below.
Land at Peach Place, Wokingham
2.58 The site has been allocated to deliver A1, A3, A4 and C3 uses and should provide appropriate pedestrian access and connectivity. Proposals will need to reinforce the town centre primary retail frontage and provide additional retail frontage in accordance with the existing retail circuit and guidance set out in the Wokingham Town Centre Masterplan SPD. Form and layout of the site will need to take into account the Wokingham Town Centre Car Parks Strategy.
WESTERN BERKSHIRE AUTHORITIES | RETAIL & COMMERCIAL LEISURE ASSESSMENT 2016 | FINAL REPORT | APRIL 2017
12 | gva.co.uk/planning
2.59 Planning permission was granted (Ref no. F/2014/2637) in March 2015 for the redevelopment of Peach Place, which supports the objectives of the masterplan by making provisions for mixed use development town centre uses including shops, financial and professional services, restaurants and cafes, A4 drinking establishments, hot food takeaways and a new public square, plus 26 dwellings. Phase one of the development was completed in August 2014, and work is expected to start on the remainder of site at Peach Place in January 2017, completing in 2018.
Land at Elms Field, Wokingham
2.60 Considered an important gateway to the town centre, the Masterplan suggests that the scale, layout and form of the development contribute to the active frontage to the retail circuit. A1, A3, A4, D1, C1 and C3 uses are appropriate for this site and an anchor store (food/ non-food not specified) of approximately 3,000 sq.m has been identified to be appropriate in this location.
2.61 The masterplan identifies the possibility of the site to become a new leisure and (possible) business heart of the town to complement the more retail-dominated heart centred round the Market Place and Peach Street. Through integrating open space with retail and commercial uses the site has potential to be the focal point for socialising, leisure, and community activity. As with Peach Place, development will need to be sensitive to the adjacent Town Centre Conservation Area.
2.62 A planning application (Ref no. 153125) for a mixed use development was granted permission on in April 2016. The scheme proposed for this site includes new shops and a medium sized food store (1,631m² GEA), financial and professional services, cafes and restaurants, drinking establishments and A5 floorspace, a boutique cinema, a hotel, 126 new homes and a town park and play area. Improved vehicular access routes are also proposed which are more pedestrian friendly and improves connectivity. Work is expected to start on site in spring 2017 and be completed by 2019/2020.
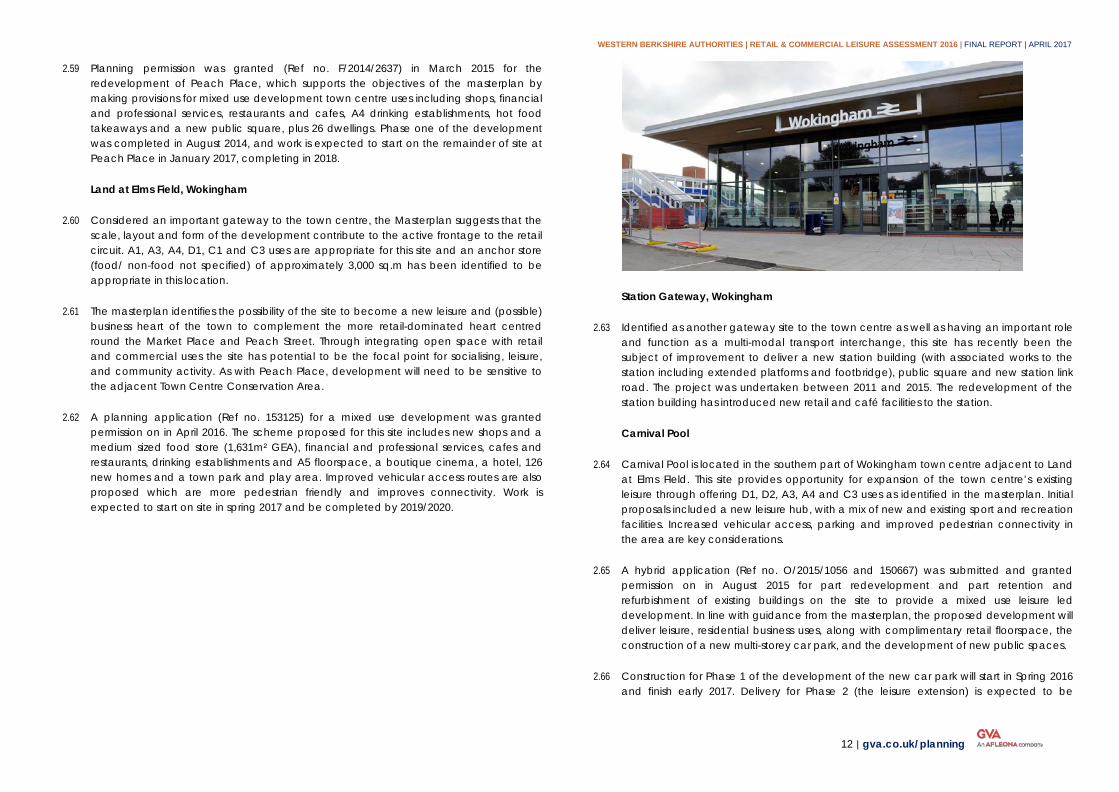
Station Gateway, Wokingham
2.63 Identified as another gateway site to the town centre as well as having an important role and function as a multi-modal transport interchange, this site has recently been the subject of improvement to deliver a new station building (with associated works to the station including extended platforms and footbridge), public square and new station link road. The project was undertaken between 2011 and 2015. The redevelopment of the station building has introduced new retail and café facilities to the station.
Carnival Pool
2.64 Carnival Pool is located in the southern part of Wokingham town centre adjacent to Land at Elms FIeld. This site provides opportunity for expansion of the town centre’s existing leisure through offering D1, D2, A3, A4 and C3 uses as identified in the masterplan. Initial proposals included a new leisure hub, with a mix of new and existing sport and recreation facilities. Increased vehicular access, parking and improved pedestrian connectivity in the area are key considerations.
2.65 A hybrid application (Ref no. O/2015/1056 and 150667) was submitted and granted permission on in August 2015 for part redevelopment and part retention and refurbishment of existing buildings on the site to provide a mixed use leisure led development. In line with guidance from the masterplan, the proposed development will deliver leisure, residential business uses, along with complimentary retail floorspace, the construction of a new multi-storey car park, and the development of new public spaces.
2.66 Construction for Phase 1 of the development of the new car park will start in Spring 2016 and finish early 2017. Delivery for Phase 2 (the leisure extension) is expected to be
WESTERN BERKSHIRE AUTHORITIES | RETAIL & COMMERCIAL LEISURE ASSESSMENT 2016 | FINAL REPORT | APRIL 2017
13 | gva.co.uk/planning
2019/2020.
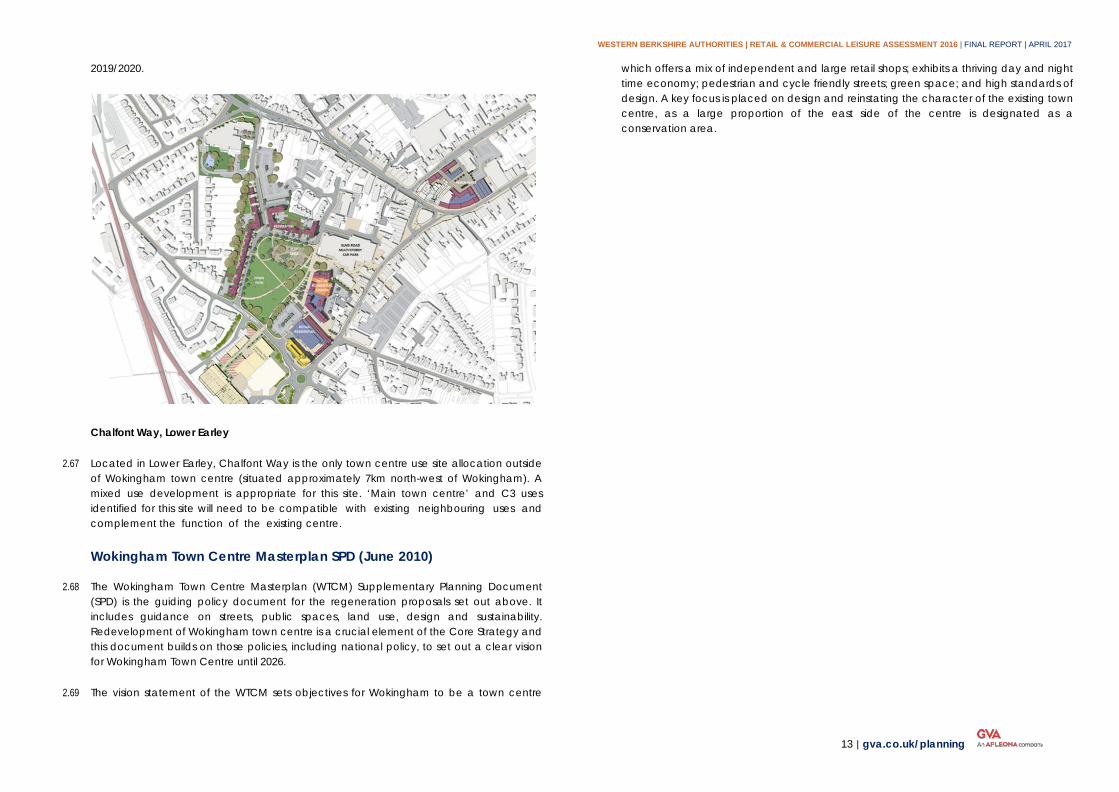
Chalfont Way, Lower Earley
2.67 Located in Lower Earley, Chalfont Way is the only town centre use site allocation outside of Wokingham town centre (situated approximately 7km north-west of Wokingham). A mixed use development is appropriate for this site. ‘Main town centre’ and C3 uses identified for this site will need to be compatible with existing neighbouring uses and complement the function of the existing centre.
Wokingham Town Centre Masterplan SPD (June 2010)
2.68 The Wokingham Town Centre Masterplan (WTCM) Supplementary Planning Document (SPD) is the guiding policy document for the regeneration proposals set out above. It includes guidance on streets, public spaces, land use, design and sustainability. Redevelopment of Wokingham town centre is a crucial element of the Core Strategy and this document builds on those policies, including national policy, to set out a clear vision for Wokingham Town Centre until 2026.
2.69 The vision statement of the WTCM sets objectives for Wokingham to be a town centre
which offers a mix of independent and large retail shops; exhibits a thriving day and night time economy; pedestrian and cycle friendly streets; green space; and high standards of design. A key focus is placed on design and reinstating the character of the existing town centre, as a large proportion of the east side of the centre is designated as a conservation area.
WESTERN BERKSHIRE AUTHORITIES | RETAIL & COMMERCIAL LEISURE ASSESSMENT 2016 | FINAL REPORT | APRIL 2017
14 | gva.co.uk/planning
The Existing Retail Evidence Base 3
In this section, in order to help contextualise the findings of the remainder of the study, we present a brief overview of each of the four Western Berkshire authorities’ existing retail capacity evidence base studies, which have previously been prepared at the individual authority level. The key findings from these studies, in terms of the quantum of comparison and convenience goods floorspace which each authority should plan for, are updated by the findings of this study.
Reading Retail Study (2005)
3.1 Reading Borough’s retail evidence base dates from 2005 and is therefore considerably out of date. The study provides an objective assessment of the quantitative need for additional retail floorspace in Reading Borough until 2016 and the study has also helped provide a context for the Council in determining policy and proposals in the Local Development Framework.
3.2 The study forecasts a growth in Borough-wide quantitative need for additional non-bulky comparison goods retail floorspace of 30,803 sq.m (net) and bulky comparison goods retail floorspace of 29,504 sq.m (net) within the Borough until 2016, reflected by the significant levels of over-trading of floorspace identified at the time of preparation of the study. The study identifies this need to be directed towards Reading town centre, with limited scope for additional comparison retail floorspace in the district and local centres of Reading. The study states that these figures suggest a likely capacity for provision of another ‘large shopping centre’ in Reading town centre within the Plan period, which may be necessary for Reading to retain its comparison goods expenditure market share until 2016/2017. No development of this nature has subsequently come forward.
3.3 In terms of convenience goods, the report identifies the need for additional convenience goods retail floorspace provision within the Borough of 4,474 sq.m (net) by 2016. The study recognises that this provision equates, in broad terms, to a single large superstore which could deliver this need, however the report also notes that in planning terms, a larger number of smaller stores may be more acceptable in planning terms. The quantitative need assessment for both types of retail type assumes a constant market share.
3.4 Based on a qualitative assessment, the study also identifies the need for a new swimming pool/ leisure centre, an ice rink and other commercial leisure facilities, including additional hotel floorspace in the Reading area.
Bracknell Forest Retail Study (2008)
3.5 Bracknell Forest’s retail evidence base dates from 2008, and was prepared by GVA. The study predates the opening of developments which are likely to have influenced shopping patterns of residents of parts of the Borough, such as The Atrium in Camberley.
3.6 The study’s qualitative analysis indicated that Bracknell was only performing adequately in a number of vitality and viability indicators. It did not have a modern town centre convenience superstore (a Waitrose store has subsequently opened in the town centre); and whilst the amount of comparison floorspace was at average levels, there was a lack of mid-market and higher quality fashion multiples. National multiple retailers were mainly limited to lower-mid range operators and charity shops. There was also a poor leisure offer particularly cafes, bars and restaurants and a weak evening economy. Many of the issues identified are likely to be, at least in part, addressed by the scheme currently being constructed and future projects in the town centre.
3.7 Sub-regional analysis indicated strong competition from Reading. Other centres competing with Bracknell included Guildford, Slough, Staines, Windsor, Woking and Camberley.
3.8 The study considered Bracknell to be performing adequately in terms of its comparison goods offer, but only identified limited surplus expenditure to support new comparison goods floorspace in Bracknell. The study estimated capacity for 1,545 sq.m net comparison goods floorspace by 2011, increasing to 15,045 sq.m net by 2026 — however these forecasts were based on a ‘no development’ scenario, not taking into account the current town centre redevelopment scheme. The study found that factoring in this scheme would result in a requirement for additional comparison goods floorspace of 10,275 sq.m net comparison goods floorspace by 2021 and 21,012 sq.m net by 2026, on account of the uplift to the comparison goods ‘retention rate’ which would arise as a result of the improved attractiveness of Bracknell as a shopping destination.
3.9 In terms of other centres in the Borough, analysis indicated that Crowthorne was a healthy centre, with its own distinctive character and retail offer. The study did not identify any capacity to support new convenience goods floorspace in Crowthorne based upon existing market shares and given recent investment in the centre. There was therefore considered no need to identify further retail development sites over the plan period. Sandhurst was considered to be performing well with a strong service offer. Based upon the existing market the study concluded that there was little capacity to support new retail development in the centre.
WESTERN BERKSHIRE AUTHORITIES | RETAIL & COMMERCIAL LEISURE ASSESSMENT 2016 | FINAL REPORT | APRIL 2017
15 | gva.co.uk/planning
West Berkshire Retail Study (2010 Update)
3.10 This study was instructed by West Berkshire Council to update the retail planning matters covered by the 2003 West Berkshire Retail & Leisure Study (‘WBRLS’) and to provide an evidence base to inform the preparation of the Council’s Core Strategy as a part of the Council’s new Local Plan.. The updated retail study focuses predominantly on the period 2011-2026 but also takes into account the period up to 2031.
3.11 The study focuses primarily on identifying the need for additional retail floorspace in Newbury, however it also provides guidance on identified need across the smaller District centres in the Borough. The report suggests that for both comparison and convenience goods retailing in the Borough, there is no capacity for new floorspace until 2026. This projection is based on the forecast growth in the total available expenditure up to 2031 and the take-up of this expenditure by existing floorspace and new commitments.
3.12 Between 2026 and 2031, the study identifies a ‘need’ of 5,450 sq. m net of supermarket / “deep discounter” floorspace, or 2,480 sq. m (net) of superstore floorspace for West Berkshire District. The study identifies a ‘need’ fir 6,170 sq. net comparison goods floorspace by 2031.
3.13 Although the study recognises ‘gaps’ in the overall scale and quality of retail offer in the centres of Newbury and Thatcham, prompting a resultant loss of trade to other competing shopping locations, it concludes that retail floorspace ‘need’ would be met through retail floorspace commitments in the form of the Parkway scheme and the Kingsland Shopping Centre (in Thatcham) redevelopment. Subsequent to completion of the 2010 Report, the Parkway scheme has commenced trading, although no redevelopment of the Kingsland Shopping Centre has come forward.
3.14 In terms of out-of-centre retailing the study reports that the District is well served by foodstores and non-food retail floorspace and therefore there is no demonstrable need for new retail floorspace in out-of-centre locations. The study recognises a need to protect existing and planned retail floorspace within the main town centres from competing out-of-centre provision.
Wokingham Retail Study (2014 Update)
3.15 This retail study commissioned by Wokingham Borough Council provided an updated Borough wide needs assessment for retail development in Wokingham following the previously published Retail Study Refresh (2010).
3.16 The study states that based on 2014 trading levels, the Borough could support 3,500 sq.m net of additional convenience goods floorspace, increasing to 4,200 sq.m (net) by 2016.
The figures suggest that existing convenience retail floorspace in the Borough at the time of assessment was trading less well than at the time of the 2010 study, with trading 16% above national average levels in 2014, compared with 18% above average estimated beforehand.
3.17 At the time of the 2014 study there was capacity for 800 sq.m net new convenience goods sales floorspace until 2021 when taking into account new food store proposals, leading to a requirement of up to 3,500 sq.m net additional convenience goods floorspace by 2026 as a result of forecast population growth. The report states that longer term development for Wokingham could include new neighbourhood facilities to support major new residential development at Lower Earley.
3.18 The study suggests that new major development within Wokingham will strengthen and increase comparison goods expenditure retention in this area, which suffers from expenditure leakage to other areas particularly on account of its proximity to Reading. The 2014 study suggests that there is scope for 1,900 Sq.m net additional of comparison floorspace until 2021. This takes into account development proposals in Wokingham town centre, new centres in Aborfield and Shinfield and expenditure growth during the period 2016 to 2021. The report predicts an increase in ‘need’ to 5,800 sq.m net by 2026, over and above the development proposals.
WESTERN BERKSHIRE AUTHORITIES | RETAIL & COMMERCIAL LEISURE ASSESSMENT 2016 | FINAL REPORT | APRIL 2017
16 | gva.co.uk/planning
Retail & Leisure Market Review 4
In this section we set out a summary of current national trends in respect of the retail and commercial leisure sectors, which can have implications for future growth of centres and demand for new floorspace. As part of our assessment, we consider the potential implications of these trends on centres in the study area.
A return to growth
4.1 Analysis published by Experian (Retail Planner 2015) identified that following several years of subdued performance, including a period of recession; a ‘strong economic upswing’ took place in early 2013, driven by increases in consumer spending and business investment. Experian expect the UK economic upswing to continue, although at a slower pace than seen during 2014. In the short-to-medium term, Experian expect progress to be ‘restrained’ due to government finances remaining under pressure, and weaker exports to the Eurozone. The EU referendum result, could also potentially impact growth due to the uncertainties created by the UK leaving the EU, and this will need to be closely monitored in the short term.
4.2 Experian also point to the fact that whilst retail sales have prospered between 2013 and 2015 due to the ‘exceptional buoyancy’ of consumer spending (because of low inflation and stronger earnings growth), this buoyancy is only true in terms of volumes of sales. Experian state that the value of goods have ‘been depressed by heavy discounting and persistent deflation of goods prices’. This has been particularly noticeable in the convenience (food) goods sector; again, it is expected that the result of the EU referendum could act as a brake on the deflation of prices of goods seen in recent years.
4.3 There has therefore been a return in confidence to consumer spending since 2013, which offers potential for strongly-performing town centres to capitalise on, although this is tempered by other changes in the retail sector which we discuss below.
Changing Retailer Space Requirements
4.4 During the recession retailers’ margins were squeezed, whilst other costs have continued to rise and a raft of multiple and independent retailers have either collapsed or significantly shrunk their store portfolios in recent years. The growth of the internet means that retailers no longer need stores in every town to achieve national coverage, and many are therefore focusing their development programmes on the provision of large flagship stores in strategic locations, supported by smaller satellite stores and transactional websites. Many operators are closing stores in less-profitable, smaller locations as leases
expire.
4.5 The larger flagships accommodate full product ranges whilst smaller stores offer more select ranges, sometimes supplemented by internet kiosks allowing access to the full range. This offers many advantages to retailers including lower property costs, more efficient logistics and being able to open stores where there is a high level of demand despite there being space restrictions. This ‘polarisation’ of retailing is enabling larger dominant centres to continue to attract key flagship formats, and Reading is an example of a centre which continues to represent an attractive comparison goods shopping destination for many retailers. This can pose a particular challenge to smaller and medium-sized centres, especially where there are higher order centres in close proximity.
4.6 An often inevitable consequence is that smaller and medium-sized centres become home to more, value-orientated retailers – Poundland, Wilko, Primark and so on – who are more reluctant to pay the rental costs associated with higher-order centres, and, much in the same way that Woolworths previously did, are developing a comprehensive network of coverage in smaller towns, often by being able to acquire prime retail sites at relatively competitive rates. Many centres across the Western Berkshire area contain strong representation from the discount/value retail sector, and whilst this is balanced by a more ‘mainstream’ offer in Reading and Newbury town centres (and also Bracknell town centre, once the Lexicon development commences trading), some smaller centres have settled into a more downmarket profile.
4.7 The exception to the above trend is smaller centres which have an existing upmarket / specialist retail offer which was less affected by the economic downturn, and therefore fewer opportunities for value retailers to take space have materialised. This enables centres such as Marlow, Henley-on-Thames, Windsor and Farnham, for example, to continue to perform strongly throughout the economic downturn, by offering a curated, specialist retail offer often centred around an upmarket clothing, homewares, and casual dining offer. Typically these centres also offer a strong historical setting and environmental quality which increases their attractiveness as ‘destinations’ (a point we discuss further below).
Internet Growth & Multichannel Retailing
4.8 Future growth in the online market is likely to come from increased spend driven by new technology (and in particular mobile technology), a better ‘browsing’ experience and improved delivery options. The growth in online sales has previously raised concerns about the continued need for bricks and mortar stores; however trends indicate that online and in-store shopping channels are becoming increasingly blurred and the two sectors are able to co-exist.
4.9 The ‘Click and Collect’ market is the largest on-line growth sector in the UK at the current
WESTERN BERKSHIRE AUTHORITIES | RETAIL & COMMERCIAL LEISURE ASSESSMENT 2016 | FINAL REPORT | APRIL 2017
17 | gva.co.uk/planning
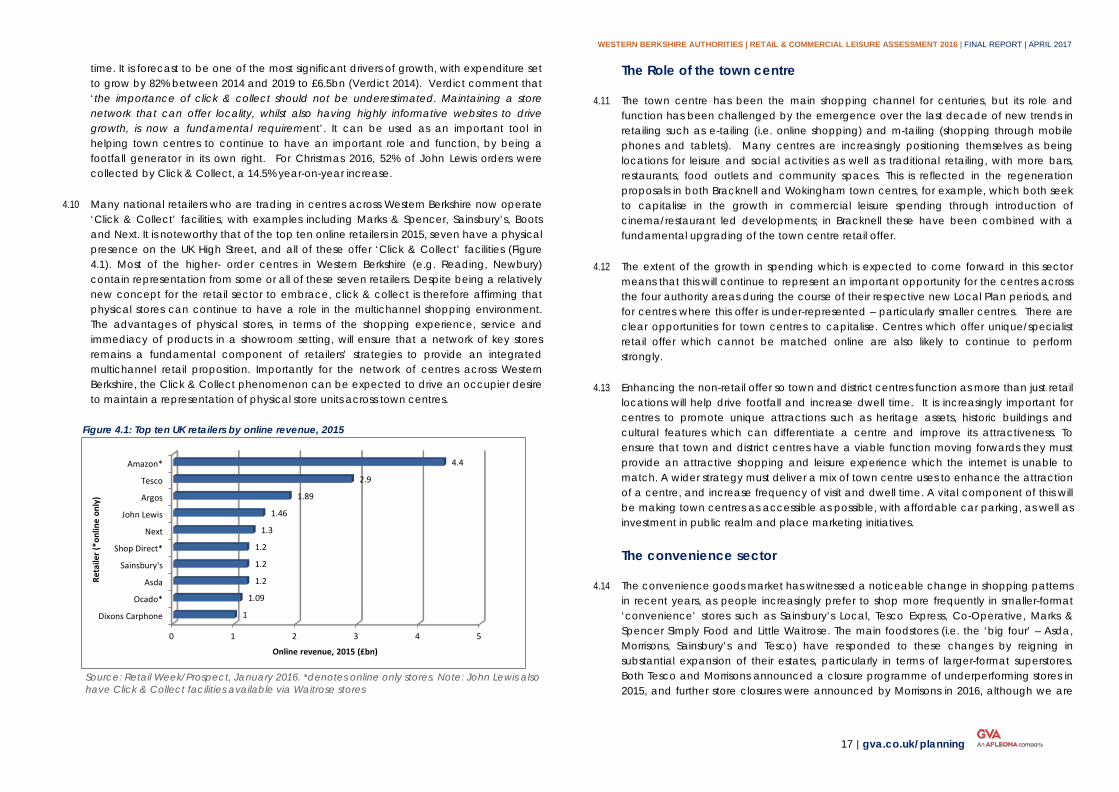
time. It is forecast to be one of the most significant drivers of growth, with expenditure set to grow by 82% between 2014 and 2019 to £6.5bn (Verdict 2014). Verdict comment that ‘the importance of click & collect should not be underestimated. Maintaining a store network that can offer locality, whilst also having highly informative websites to drive growth, is now a fundamental requirement’. It can be used as an important tool in helping town centres to continue to have an important role and function, by being a footfall generator in its own right. For Christmas 2016, 52% of John Lewis orders were collected by Click & Collect, a 14.5% year-on-year increase.
4.10 Many national retailers who are trading in centres across Western Berkshire now operate ‘Click & Collect’ facilities, with examples including Marks & Spencer, Sainsbury’s, Boots and Next. It is noteworthy that of the top ten online retailers in 2015, seven have a physical presence on the UK High Street, and all of these offer ‘Click & Collect’ facilities (Figure 4.1). Most of the higher- order centres in Western Berkshire (e.g. Reading, Newbury) contain representation from some or all of these seven retailers. Despite being a relatively new concept for the retail sector to embrace, click & collect is therefore affirming that physical stores can continue to have a role in the multichannel shopping environment. The advantages of physical stores, in terms of the shopping experience, service and immediacy of products in a showroom setting, will ensure that a network of key stores remains a fundamental component of retailers’ strategies to provide an integrated multichannel retail proposition. Importantly for the network of centres across Western Berkshire, the Click & Collect phenomenon can be expected to drive an occupier desire to maintain a representation of physical store units across town centres.
Figure 4.1: Top ten UK retailers by online revenue, 2015
Source: Retail Week/Prospect, January 2016. *denotes online only stores. Note: John Lewis also have Click & Collect facilities available via Waitrose stores
The Role of the town centre
4.11 The town centre has been the main shopping channel for centuries, but its role and function has been challenged by the emergence over the last decade of new trends in retailing such as e-tailing (i.e. online shopping) and m-tailing (shopping through mobile phones and tablets). Many centres are increasingly positioning themselves as being locations for leisure and social activities as well as traditional retailing, with more bars, restaurants, food outlets and community spaces. This is reflected in the regeneration proposals in both Bracknell and Wokingham town centres, for example, which both seek to capitalise in the growth in commercial leisure spending through introduction of cinema/restaurant led developments; in Bracknell these have been combined with a fundamental upgrading of the town centre retail offer.
4.12 The extent of the growth in spending which is expected to come forward in this sector means that this will continue to represent an important opportunity for the centres across the four authority areas during the course of their respective new Local Plan periods, and for centres where this offer is under-represented – particularly smaller centres. There are clear opportunities for town centres to capitalise. Centres which offer unique/specialist retail offer which cannot be matched online are also likely to continue to perform strongly.
4.13 Enhancing the non-retail offer so town and district centres function as more than just retail locations will help drive footfall and increase dwell time. It is increasingly important for centres to promote unique attractions such as heritage assets, historic buildings and cultural features which can differentiate a centre and improve its attractiveness. To ensure that town and district centres have a viable function moving forwards they must provide an attractive shopping and leisure experience which the internet is unable to match. A wider strategy must deliver a mix of town centre uses to enhance the attraction of a centre, and increase frequency of visit and dwell time. A vital component of this will be making town centres as accessible as possible, with affordable car parking, as well as investment in public realm and place marketing initiatives.
The convenience sector
4.14 The convenience goods market has witnessed a noticeable change in shopping patterns in recent years, as people increasingly prefer to shop more frequently in smaller-format ‘convenience’ stores such as Sainsbury’s Local, Tesco Express, Co-Operative, Marks & Spencer Simply Food and Little Waitrose. The main foodstores (i.e. the ‘big four’ – Asda, Morrisons, Sainsbury’s and Tesco) have responded to these changes by reigning in substantial expansion of their estates, particularly in terms of larger-format superstores. Both Tesco and Morrisons announced a closure programme of underperforming stores in 2015, and further store closures were announced by Morrisons in 2016, although we are
0 1 2 3 4 5
Dixons Carphone
Ocado*
Asda
Sainsbury's
Shop Direct*
Next
John Lewis
Argos
Tesco
Amazon*
1
1.09
1.2
1.2
1.2
1.3
1.46
1.89
2.9
4.4
Online revenue, 2015 (£bn)
Reta
iler (
*onl
ine
only
)
WESTERN BERKSHIRE AUTHORITIES | RETAIL & COMMERCIAL LEISURE ASSESSMENT 2016 | FINAL REPORT | APRIL 2017
18 | gva.co.uk/planning
not aware of any foodstores in the study area which have been affected by these scaling back of operations.
4.15 The combined spread of convenience store openings, online grocery sales, and the expansion of ‘deep discount’ retailers such as Aldi and Lidl (who have both opened a number of new stores across the study area in recent years) has fundamentally changed how people undertake their convenience goods shopping. Both Aldi and Lidl have gained market share for a number of consecutive years, largely at the expense of the ‘big four’, and are pursuing ambitious development programmes of opening new stores as well as refurbishing older stores. There has also been growth at the ‘premium’ end of the convenience goods market, with both Waitrose and M&S Food growing store numbers.
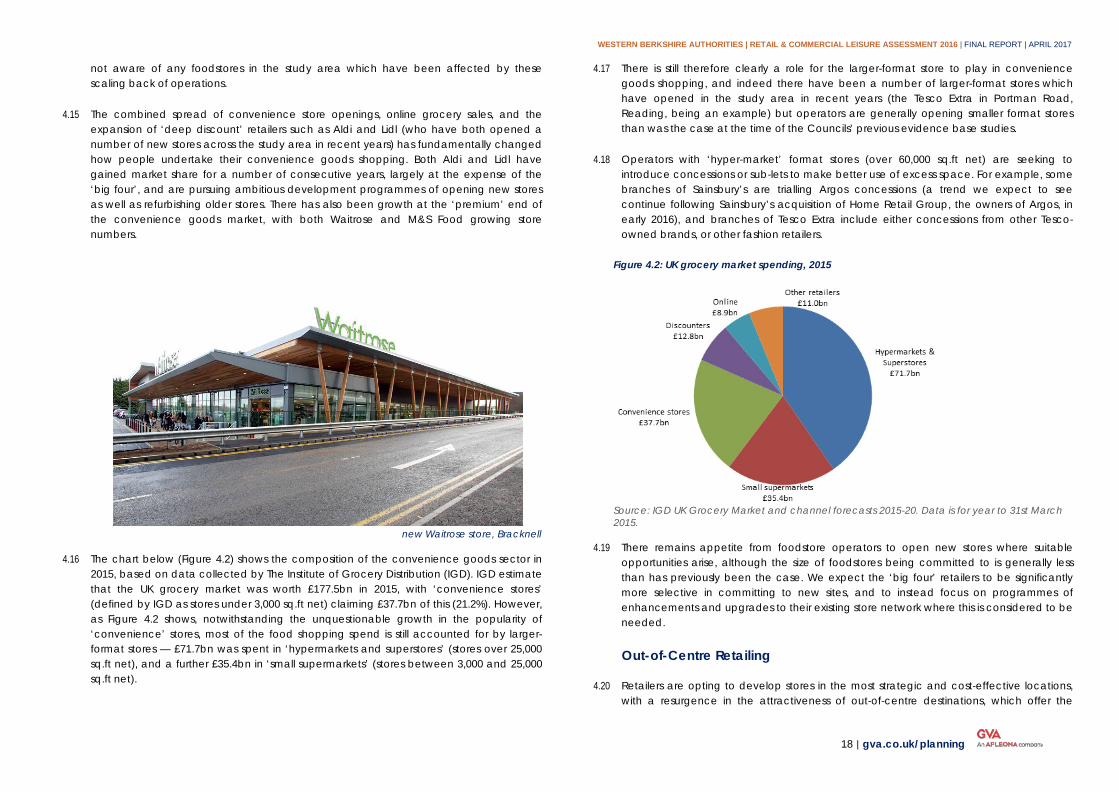
new Waitrose store, Bracknell
4.16 The chart below (Figure 4.2) shows the composition of the convenience goods sector in 2015, based on data collected by The Institute of Grocery Distribution (IGD). IGD estimate that the UK grocery market was worth £177.5bn in 2015, with ‘convenience stores’ (defined by IGD as stores under 3,000 sq.ft net) claiming £37.7bn of this (21.2%). However, as Figure 4.2 shows, notwithstanding the unquestionable growth in the popularity of ‘convenience’ stores, most of the food shopping spend is still accounted for by larger-format stores — £71.7bn was spent in ‘hypermarkets and superstores’ (stores over 25,000 sq.ft net), and a further £35.4bn in ‘small supermarkets’ (stores between 3,000 and 25,000 sq.ft net).
4.17 There is still therefore clearly a role for the larger-format store to play in convenience goods shopping, and indeed there have been a number of larger-format stores which have opened in the study area in recent years (the Tesco Extra in Portman Road, Reading, being an example) but operators are generally opening smaller format stores than was the case at the time of the Councils’ previous evidence base studies.
4.18 Operators with ‘hyper-market’ format stores (over 60,000 sq.ft net) are seeking to introduce concessions or sub-lets to make better use of excess space. For example, some branches of Sainsbury’s are trialling Argos concessions (a trend we expect to see continue following Sainsbury’s acquisition of Home Retail Group, the owners of Argos, in early 2016), and branches of Tesco Extra include either concessions from other Tesco-owned brands, or other fashion retailers.
Figure 4.2: UK grocery market spending, 2015
Source: IGD UK Grocery Market and channel forecasts 2015-20. Data is for year to 31st March 2015.
4.19 There remains appetite from foodstore operators to open new stores where suitable opportunities arise, although the size of foodstores being committed to is generally less than has previously been the case. We expect the ‘big four’ retailers to be significantly more selective in committing to new sites, and to instead focus on programmes of enhancements and upgrades to their existing store network where this is considered to be needed.
Out-of-Centre Retailing
4.20 Retailers are opting to develop stores in the most strategic and cost-effective locations, with a resurgence in the attractiveness of out-of-centre destinations, which offer the
WESTERN BERKSHIRE AUTHORITIES | RETAIL & COMMERCIAL LEISURE ASSESSMENT 2016 | FINAL REPORT | APRIL 2017
19 | gva.co.uk/planning
benefits of lower rents, larger retail units and in most cases, free car parking. According to Verdict, out-of-town retailing is the only form of retailing which has seen store numbers increase consistently since 2000.
4.21 The recovery of market confidence which has taken place since 2013 is benefitting out-of-town retailing. Vacancy rates have fallen, footfall has increased, and many retailers are seeking expansion in out-of-centre locations. A number of these are traditional town centre retailers which have developed out-of-town store formats, including John Lewis, which now operates a number of ‘At Home’ stores in out-of-centre locations (as well as town centre locations, such as the store at Parkway in Newbury) as well as other traditionally ‘high street’-focussed retailers such as Debenhams, Next (who operate two large ‘Home & Garden’ format stores at High Wycombe and Camberley/Sandhurst), Primark and H&M. All the larger urban areas across Western Berkshire – with the exception of Wokingham – have a considerable amount of retail warehouse-format floorspace, and Reading in particular is well provided for in this respect. A large Ikea store has recently opened near Calcot, on the western edge of the Reading urban area (but administratively falling within West Berkshire) , one of only a handful of store openings the company has made in the UK in recent years.
4.22 Another trend is the evolution of traditional retail ‘box’ warehouse developments into retail parks, sub-dividing units, expanding the product offer, and developing beyond just retail to introduce food and beverage, encouraging longer dwell times. Retail park owners are also refurbishing their retail parks; i.e. public realm, walkways, car parks, signage, landscaping and seating to enhance the visitor experience.
Commercial Leisure
4.23 The term ‘commercial leisure’ is a wide-ranging term which covers visits to cafes, restaurants, pubs and bars, plus cinema and theatre visits; the health and fitness sector; entertainment facilities such as bowling and ice skating; and children’s soft play. As the nature of retail and high-street shopping continues to change over time, the commercial leisure sector is becoming an increasingly important contributor to the vitality and viability of town centres. Leisure time is a precious commodity to consumers and in order to maximise free time, research suggests that town centre visitors often combine leisure activities as part of an overall going out experience. Reflecting this trend, leisure is becoming an increasingly important component in town centre regeneration schemes, particularly in smaller towns which, reflecting the wider trends in the retail sector previously identified, are in some cases becoming less attractive as retail destinations.
4.24 The recession brought mixed fortunes for the restaurant sector. The main casualties were from the more exclusive end of the market, as well as smaller companies with less established brands. Many companies owning multiple brands expanded throughout the economic downturn and continue to trade well, often by offering heavy promotions and discounts. In recent years, expansion in the restaurant sector has been driven by ‘casual dining’ operators such as Byron, Giraffe, GBK, Wagamama, Carluccios, Pizza Express and so on. These are well represented in many of the higher-order centres across Western Berkshire, with Reading having a particularly strong range of operators, largely focussed on the Oracle Centre.
4.25 The coffee shop sector remains buoyant; there are now approximately 16,500 coffee shops across the country. Recent analysis shows that the UK’s coffee shop sector remains one of the most successful in the nation’s economy and will continue to expand. Operators such as Costa are now a High Street staple whilst the independent coffee shop sector is also growing store numbers.
4.26 The pub industry suffered during the recession with a record number of pub closures across the UK as a direct consequence of a decline in both drinks sales and rental revenues. This decline continues today, at a rate of approximately 30 pub closures per week across the country. Many pubs have in recent years been converted to small-format convenience stores. Additional factors such as competition from supermarkets, changes to licensing legislation and the smoking ban have further compounded the problems faced by many operators. Similar to the foodstores, however, value led brands such as JD Wetherspoon have achieved sales growth in recent years, but now are scaling back on expansion.
4.27 The health and fitness sector continues to perform strongly as the social trend involving the maintenance of personal health and fitness shows no sign of abating. The health and fitness market is currently being expanded through investment by value and budget operators such as Easy Gym, Gymbox and Pure Gym. This new breed of venues aims to appeal to a wider market with flexible, low cost monthly or ‘pay as you go’ subscriptions. These facilities are usually located in high-footfall, in or edge of centre locations, often as part of a wider leisure offer.
4.28 The cinema market is also continuing to perform strongly, and in recent years has overtaken foodstores as a typical ‘anchor’ to new town centre development schemes. As of June 2016, there are 316 cinema multiplexes operational in the UK.
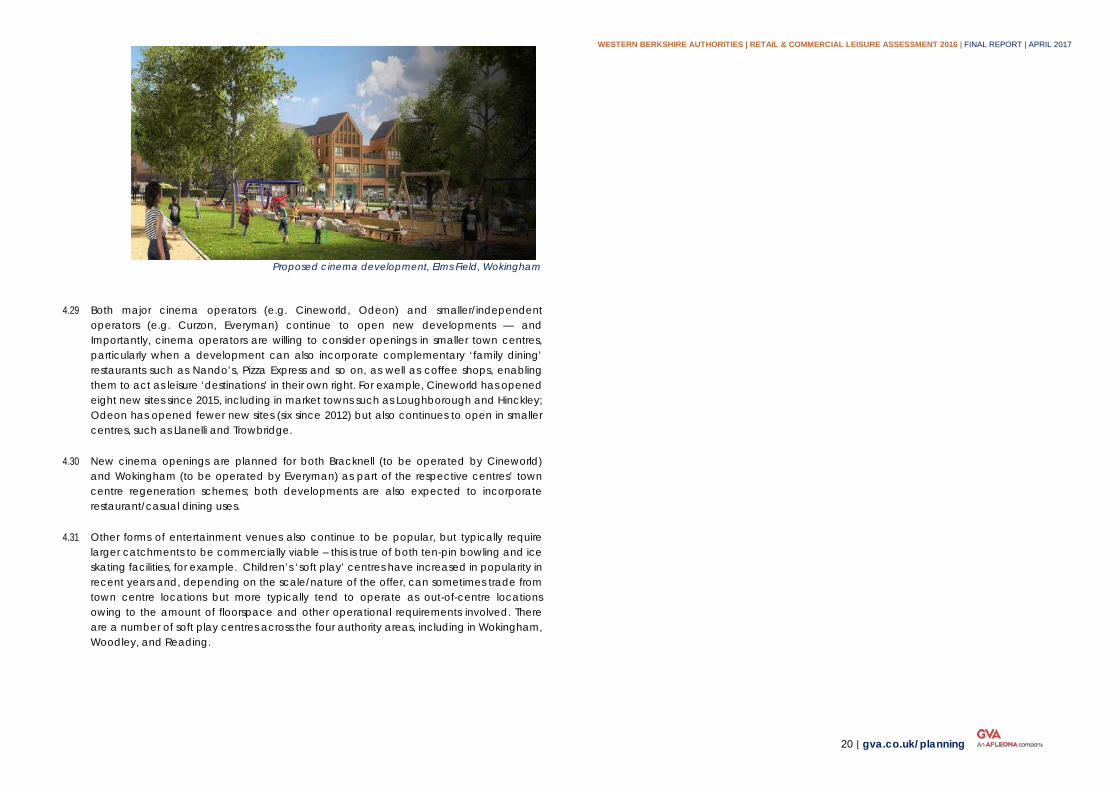
WESTERN BERKSHIRE AUTHORITIES | RETAIL & COMMERCIAL LEISURE ASSESSMENT 2016 | FINAL REPORT | APRIL 2017
20 | gva.co.uk/planning
Proposed cinema development, Elms Field, Wokingham
4.29 Both major cinema operators (e.g. Cineworld, Odeon) and smaller/independent operators (e.g. Curzon, Everyman) continue to open new developments — and Importantly, cinema operators are willing to consider openings in smaller town centres, particularly when a development can also incorporate complementary ‘family dining’ restaurants such as Nando’s, Pizza Express and so on, as well as coffee shops, enabling them to act as leisure ‘destinations’ in their own right. For example, Cineworld has opened eight new sites since 2015, including in market towns such as Loughborough and Hinckley; Odeon has opened fewer new sites (six since 2012) but also continues to open in smaller centres, such as Llanelli and Trowbridge.
4.30 New cinema openings are planned for both Bracknell (to be operated by Cineworld) and Wokingham (to be operated by Everyman) as part of the respective centres’ town centre regeneration schemes; both developments are also expected to incorporate restaurant/casual dining uses.
4.31 Other forms of entertainment venues also continue to be popular, but typically require larger catchments to be commercially viable – this is true of both ten-pin bowling and ice skating facilities, for example. Children’s ‘soft play’ centres have increased in popularity in recent years and, depending on the scale/nature of the offer, can sometimes trade from town centre locations but more typically tend to operate as out-of-centre locations owing to the amount of floorspace and other operational requirements involved. There are a number of soft play centres across the four authority areas, including in Wokingham, Woodley, and Reading.
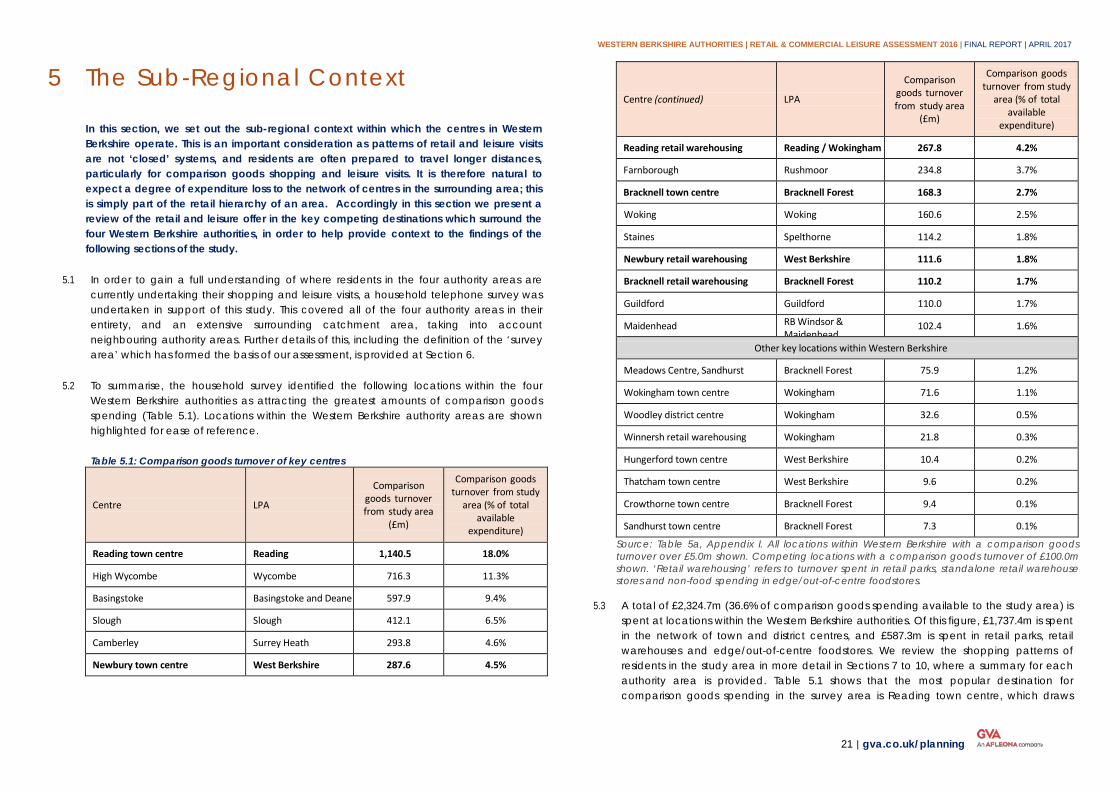
WESTERN BERKSHIRE AUTHORITIES | RETAIL & COMMERCIAL LEISURE ASSESSMENT 2016 | FINAL REPORT | APRIL 2017
21 | gva.co.uk/planning
The Sub-Regional Context 5
In this section, we set out the sub-regional context within which the centres in Western Berkshire operate. This is an important consideration as patterns of retail and leisure visits are not ‘closed’ systems, and residents are often prepared to travel longer distances, particularly for comparison goods shopping and leisure visits. It is therefore natural to expect a degree of expenditure loss to the network of centres in the surrounding area; this is simply part of the retail hierarchy of an area. Accordingly in this section we present a review of the retail and leisure offer in the key competing destinations which surround the four Western Berkshire authorities, in order to help provide context to the findings of the following sections of the study.
5.1 In order to gain a full understanding of where residents in the four authority areas are currently undertaking their shopping and leisure visits, a household telephone survey was undertaken in support of this study. This covered all of the four authority areas in their entirety, and an extensive surrounding catchment area, taking into account neighbouring authority areas. Further details of this, including the definition of the ‘survey area’ which has formed the basis of our assessment, is provided at Section 6.
5.2 To summarise, the household survey identified the following locations within the four Western Berkshire authorities as attracting the greatest amounts of comparison goods spending (Table 5.1). Locations within the Western Berkshire authority areas are shown highlighted for ease of reference.
Table 5.1: Comparison goods turnover of key centres
Centre LPA
Comparison goods turnover from study area
(£m)
Comparison goods turnover from study
area (% of total available
expenditure)
Reading town centre Reading 1,140.5 18.0%
High Wycombe Wycombe 716.3 11.3%
Basingstoke Basingstoke and Deane 597.9 9.4%
Slough Slough 412.1 6.5%
Camberley Surrey Heath 293.8 4.6%
Newbury town centre West Berkshire 287.6 4.5%
Centre (continued) LPA
Comparison goods turnover from study area
(£m)
Comparison goods turnover from study
area (% of total available
expenditure)
Reading retail warehousing Reading / Wokingham 267.8 4.2%
Farnborough Rushmoor 234.8 3.7%
Bracknell town centre Bracknell Forest 168.3 2.7%
Woking Woking 160.6 2.5%
Staines Spelthorne 114.2 1.8%
Newbury retail warehousing West Berkshire 111.6 1.8%
Bracknell retail warehousing Bracknell Forest 110.2 1.7%
Guildford Guildford 110.0 1.7%
Maidenhead RB Windsor & Maidenhead
102.4 1.6%
Other key locations within Western Berkshire
Meadows Centre, Sandhurst Bracknell Forest 75.9 1.2%
Wokingham town centre Wokingham 71.6 1.1%
Woodley district centre Wokingham 32.6 0.5%
Winnersh retail warehousing Wokingham 21.8 0.3%
Hungerford town centre West Berkshire 10.4 0.2%
Thatcham town centre West Berkshire 9.6 0.2%
Crowthorne town centre Bracknell Forest 9.4 0.1%
Sandhurst town centre Bracknell Forest 7.3 0.1%
Source: Table 5a, Appendix I. All locations within Western Berkshire with a comparison goods turnover over £5.0m shown. Competing locations with a comparison goods turnover of £100.0m shown. ‘Retail warehousing’ refers to turnover spent in retail parks, standalone retail warehouse stores and non-food spending in edge/out-of-centre foodstores.
5.3 A total of £2,324.7m (36.6% of comparison goods spending available to the study area) is
spent at locations within the Western Berkshire authorities. Of this figure, £1,737.4m is spent in the network of town and district centres, and £587.3m is spent in retail parks, retail warehouses and edge/out-of-centre foodstores. We review the shopping patterns of residents in the study area in more detail in Sections 7 to 10, where a summary for each authority area is provided. Table 5.1 shows that the most popular destination for comparison goods spending in the survey area is Reading town centre, which draws
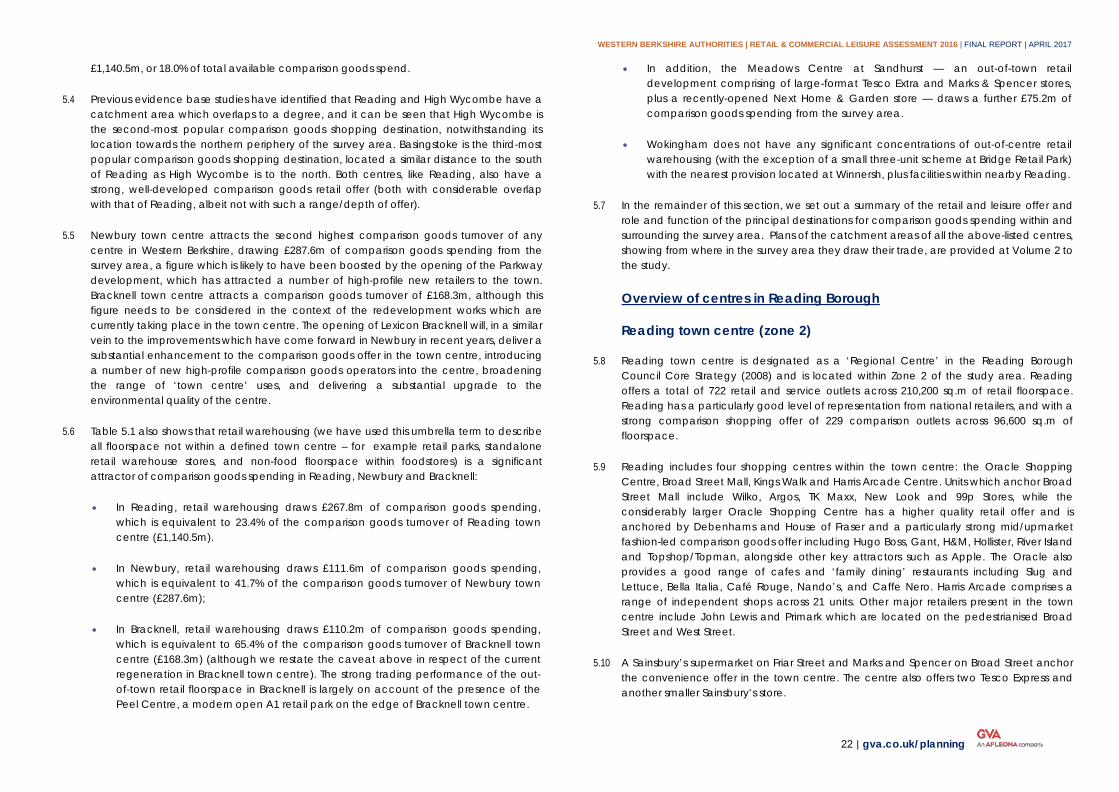
WESTERN BERKSHIRE AUTHORITIES | RETAIL & COMMERCIAL LEISURE ASSESSMENT 2016 | FINAL REPORT | APRIL 2017
22 | gva.co.uk/planning
£1,140.5m, or 18.0% of total available comparison goods spend.
5.4 Previous evidence base studies have identified that Reading and High Wycombe have a catchment area which overlaps to a degree, and it can be seen that High Wycombe is the second-most popular comparison goods shopping destination, notwithstanding its location towards the northern periphery of the survey area. Basingstoke is the third-most popular comparison goods shopping destination, located a similar distance to the south of Reading as High Wycombe is to the north. Both centres, like Reading, also have a strong, well-developed comparison goods retail offer (both with considerable overlap with that of Reading, albeit not with such a range/depth of offer).
5.5 Newbury town centre attracts the second highest comparison goods turnover of any centre in Western Berkshire, drawing £287.6m of comparison goods spending from the survey area, a figure which is likely to have been boosted by the opening of the Parkway development, which has attracted a number of high-profile new retailers to the town. Bracknell town centre attracts a comparison goods turnover of £168.3m, although this figure needs to be considered in the context of the redevelopment works which are currently taking place in the town centre. The opening of Lexicon Bracknell will, in a similar vein to the improvements which have come forward in Newbury in recent years, deliver a substantial enhancement to the comparison goods offer in the town centre, introducing a number of new high-profile comparison goods operators into the centre, broadening the range of ‘town centre’ uses, and delivering a substantial upgrade to the environmental quality of the centre.
5.6 Table 5.1 also shows that retail warehousing (we have used this umbrella term to describe all floorspace not within a defined town centre – for example retail parks, standalone retail warehouse stores, and non-food floorspace within foodstores) is a significant attractor of comparison goods spending in Reading, Newbury and Bracknell:
• In Reading, retail warehousing draws £267.8m of comparison goods spending, which is equivalent to 23.4% of the comparison goods turnover of Reading town centre (£1,140.5m).
• In Newbury, retail warehousing draws £111.6m of comparison goods spending, which is equivalent to 41.7% of the comparison goods turnover of Newbury town centre (£287.6m);
• In Bracknell, retail warehousing draws £110.2m of comparison goods spending, which is equivalent to 65.4% of the comparison goods turnover of Bracknell town centre (£168.3m) (although we restate the caveat above in respect of the current regeneration in Bracknell town centre). The strong trading performance of the out-of-town retail floorspace in Bracknell is largely on account of the presence of the Peel Centre, a modern open A1 retail park on the edge of Bracknell town centre.
• In addition, the Meadows Centre at Sandhurst — an out-of-town retail development comprising of large-format Tesco Extra and Marks & Spencer stores, plus a recently-opened Next Home & Garden store — draws a further £75.2m of comparison goods spending from the survey area.
• Wokingham does not have any significant concentrations of out-of-centre retail warehousing (with the exception of a small three-unit scheme at Bridge Retail Park) with the nearest provision located at Winnersh, plus facilities within nearby Reading.
5.7 In the remainder of this section, we set out a summary of the retail and leisure offer and role and function of the principal destinations for comparison goods spending within and surrounding the survey area. Plans of the catchment areas of all the above-listed centres, showing from where in the survey area they draw their trade, are provided at Volume 2 to the study.
Overview of centres in Reading Borough
Reading town centre (zone 2)
5.8 Reading town centre is designated as a ‘Regional Centre’ in the Reading Borough Council Core Strategy (2008) and is located within Zone 2 of the study area. Reading offers a total of 722 retail and service outlets across 210,200 sq.m of retail floorspace. Reading has a particularly good level of representation from national retailers, and with a strong comparison shopping offer of 229 comparison outlets across 96,600 sq.m of floorspace.
5.9 Reading includes four shopping centres within the town centre: the Oracle Shopping Centre, Broad Street Mall, Kings Walk and Harris Arcade Centre. Units which anchor Broad Street Mall include Wilko, Argos, TK Maxx, New Look and 99p Stores, while the considerably larger Oracle Shopping Centre has a higher quality retail offer and is anchored by Debenhams and House of Fraser and a particularly strong mid/upmarket fashion-led comparison goods offer including Hugo Boss, Gant, H&M, Hollister, River Island and Topshop/Topman, alongside other key attractors such as Apple. The Oracle also provides a good range of cafes and ‘family dining’ restaurants including Slug and Lettuce, Bella Italia, Café Rouge, Nando’s, and Caffe Nero. Harris Arcade comprises a range of independent shops across 21 units. Other major retailers present in the town centre include John Lewis and Primark which are located on the pedestrianised Broad Street and West Street.
5.10 A Sainsbury’s supermarket on Friar Street and Marks and Spencer on Broad Street anchor the convenience offer in the town centre. The centre also offers two Tesco Express and another smaller Sainsbury’s store.
WESTERN BERKSHIRE AUTHORITIES | RETAIL & COMMERCIAL LEISURE ASSESSMENT 2016 | FINAL REPORT | APRIL 2017
23 | gva.co.uk/planning
Reading town centre
District Centres in Reading (zones 1 and 2)
5.11 Reading also has a number of district centres which serve a more localised catchment and enable day-to-day shopping needs to be met. These are as follows:
• Caversham is located north of Reading. It has a Waitrose store and a smaller Tesco Express to meet the convenience needs of the local community. The centre offers a number of retail service and business and financial service retail outlets including a pharmacy and opticians. There are a limited number of comparison retail outlets. Multiple retailers include Superdrug and Costa, located on Church Street.
• Cemetery Junction is located at the junction of London Road and Wokingham Road, west of Reading Old Cemetery. The centre includes a Tesco Express and Co-operative foodstore. London Road is dominated by takeaway food and lower-quality retail outlets however across the rest of the centre there is a reasonable offer of comparison, financial and professional services and a pub and post office.
• Emmer Green is a small centre located north of Reading, which has a Budgens supermarket, two drinking establishments a number of local restaurants and
takeaways, butcher, post office, florist, charity shop, betting shop and a hairdresser.
• Meadway comprises the Meadway Shopping Centre and an Asda Supermarket. The shopping centre has approximately thirty retail and leisure outlets including Boots and a Simply Gym. There is car parking to the side and rear of the shopping centre and Asda. There is a pending planning application (ref no. 150945) submitted in June 2015 for redevelopment of the Meadway shopping centre to provide new additional retail floorspace (use classes A1, A2, A3, A4, A5), 14 residential flats, car park and landscaping. Proposed retail floorspace totals approximately 3,029 sq.m and extended floorspace to existing retail units totals approximately 933 sq.m. The application responds to a development brief which the Council published in 2013 to provide planning guidance on the regeneration of the centre.
• Oxford Road West comprises retail outlets which stretch the length of Oxford Road. A large 24 hour Tesco Extra is a relatively recent addition to the centre, as part of a mixed use development which has also introduced residential uses. Generally, the retail offer in Oxford Road West Centre is towards the lower end of the market, with a noticeable proportion of retail outlets occupied by hot food takeaways and small independent convenience stores and shops.
• Shinfield Road is located north of the M4 and south of Reading. The centre is anchored by a Sainsbury’s Local and Tesco Express. Carphone Warehouse is also present in the centre and again there appears to be a significant number of hot food takeaway outlets.
• Tilehurst Triangle town centre stretches from Norcot Road to Downing Road along School Road. The centre includes a Co-operative Supermarket located adjacent to Recreation Road and a smaller Mid Counties Co-operative store located on The Triangle. Other shops include a vet, pharmacy, two florists, dry cleaner, estate agents and a jeweller, as well as a number of banks.
• Whitley is split into two components — the eastern part of the centre includes a number of hot food takeaways and also offers a Costcutter, Premier newsagent and a Library. The more substantial western part is anchored by a Morrisons supermarket and has recently been enhanced by an extension which has delivered a new Aldi supermarket, alongside a gym and a public house.
Edge/Out of Centre Retailing in Reading (zones 1 and 2)
5.12 There is a significant amount of retail warehousing and retail park provision located in the Reading urban area, including:
WESTERN BERKSHIRE AUTHORITIES | RETAIL & COMMERCIAL LEISURE ASSESSMENT 2016 | FINAL REPORT | APRIL 2017
24 | gva.co.uk/planning
• Brunel Retail Park is predominantly a ‘bulky goods’ furniture/ electrical goods and car servicing retail park which is anchored by Morrisons supermarket.
• Forbury Retail Park has no particular anchor and offers mainly furniture shopping.
• Reading Gate includes a large B&Q store.
• Reading Link Retail Park is anchored by Matalan, and we understand Iceland and Poundworld are shortly due to move to the retail park.
• Reading Retail Park is anchored by Wickes and includes other stores such as Curry’s and Halfords.
• There is a further concentration of retail warehousing on the western edge of Reading in the vicinity of Calcot, close to the junction with the M4. A 32,000 sq.m Ikea store opened in this location in summer 2016. Other retailers trading in the area include Dunelm Mill and a large Sainsbury’s store (although these developments form part of the Reading urban area, they fall within West Berkshire district).
Planned Development in Reading
5.13 As part of a £850 million investment to improve transport infrastructure in Reading, the Station Hill development proposes demolition of existing buildings (including the abandoned Friars Walk Shopping Mall) and provision 13,935 sq.m of retail floorspace at ground level in addition to office and residential use. Station Hill will be located north of Friar Street and stretch towards Reading Station. Outline planning permission was granted in January 2015 and it is envisaged that it will be a few years before a detailed application is submitted. The development will build on the recently completed redevelopment of Reading Station which was completed in July 2014. Network Rail delivered the development which saw the station rebuilt and the railway upgraded with five new platforms and a new pedestrian footbridge on the western side of the station.
Overview of centres in Bracknell Forest Borough
Bracknell town centre (zone 10)
5.14 Bracknell town centre is a ‘Major Centre’ according to the Bracknell Forest Borough Local Plan (2008) and is located in Zone 10 of the study area. It lies at the heart of Bracknell Forest and is the main shopping destination for residents in the borough.
5.15 The Experian Goad Category Report May 2015 for Bracknell town centre identifies 40,200 sq.m total retail and service floorspace and a total outlet count of 135; the low outlet
count reflecting the fact that demolition had recently taken place in the town centre. In terms of convenience retailing, Bracknell is anchored by a Sainsbury’s supermarket and a new Waitrose supermarket. Total convenience floorspace in the town centre equates to 6,800 sq. m.
5.16 Bracknell has a significant amount of comparison retailing floorspace (17,600 sq. m). There is a reasonable representation from major retailers and names include Burton, Dorothy Perkins, Topshop and Moss. Some larger stores include Boots and Argos located within the Princess Square Shopping Centre, which is anchored by a Bentalls department store (owned by Fenwick). There are a small number of coffee shops including Café Nero and Costa, while restaurant offer is limited to mainly fast food takeaway restaurants. The retail offer in the existing centre is predominantly limited to lower and mid-market operation, although the opening of the Lexicon Bracknell (discussed below) will deliver an uplift to both the overall quantum and the quality of the retail offer in the centre.
Edge/Out of Centre Retailing in Bracknell (zone 10)
5.17 The Peel Centre is located directly west and adjacent to Bracknell town centre (in an edge-of-centre location in sequential terms) and offers 16 units including a Morrisons, and a mixture of ‘high street’ stores and bulky goods retail warehousing, alongside an Odeon cinema, tenpin bowling facility and a Frankie & Benny’s restaurant.
Planned Development in Bracknell
5.18 A new town centre development is currently under construction called Lexicon Bracknell. The development will see the introduction of a new Marks & Spencer store, enlarged Fenwick department store, and other mainstream comparison goods operators such as H&M, Topshop/Topman, and River Island. The development will also include a 12-screen Cineworld cinema and restaurant operators including Pizza Express, Gourmet Burger Kitchen, Ziizzi, Las Iguanas and Coast to Coast — reflecting the trends set out in the previous section that restaurant operators and new cinema developments are increasingly seeking to trade in close proximity to one another.
5.19 Overall, approximately 53,900 sq.m of new shopping, eating and leisure floorspace will be delivered across covered and open pedestrianised areas, with approximately 45,000 sq.m of this to be class A1 retail use. Proposals include planned refurbishment to the High Street car park and construction of a multi-storey car park (approximately 1,300 spaces), which is already under construction. Public realm improvements are proposed in the form of new public squares (Bond Square, Bull Square and Union Square.) The new development is currently under construction and is due to open in September 2017.
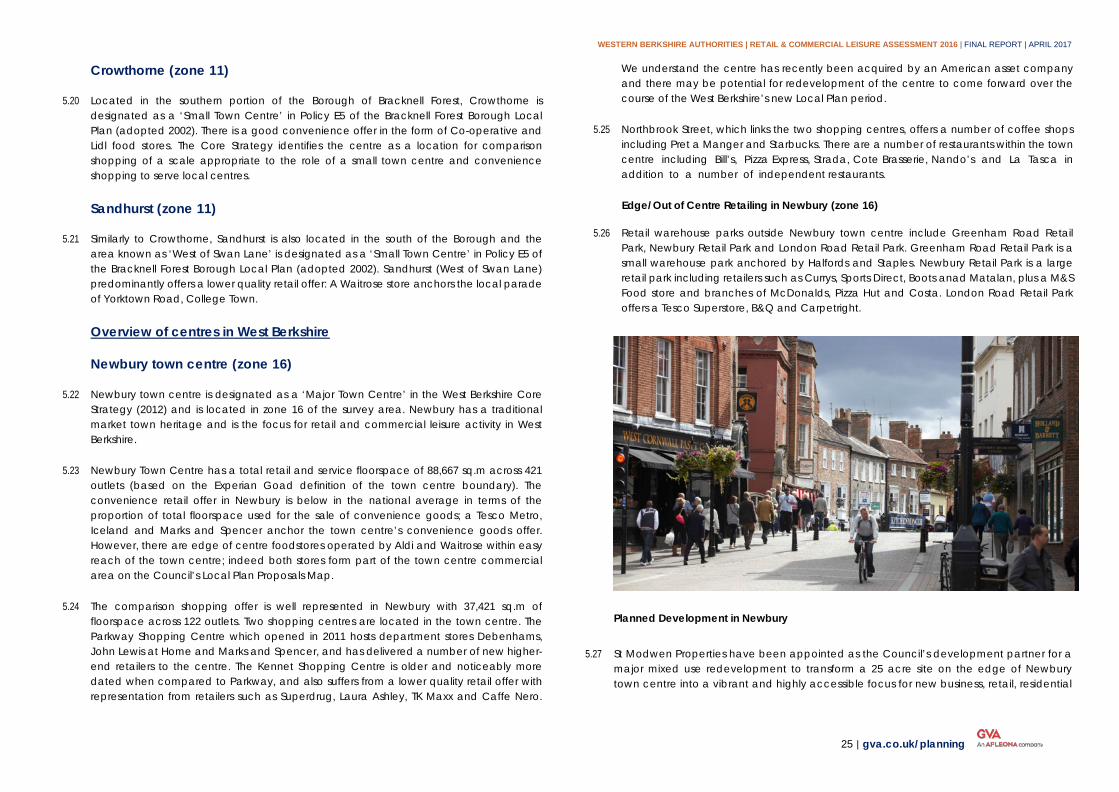
WESTERN BERKSHIRE AUTHORITIES | RETAIL & COMMERCIAL LEISURE ASSESSMENT 2016 | FINAL REPORT | APRIL 2017
25 | gva.co.uk/planning
Crowthorne (zone 11)
5.20 Located in the southern portion of the Borough of Bracknell Forest, Crowthorne is designated as a ‘Small Town Centre’ in Policy E5 of the Bracknell Forest Borough Local Plan (adopted 2002). There is a good convenience offer in the form of Co-operative and Lidl food stores. The Core Strategy identifies the centre as a location for comparison shopping of a scale appropriate to the role of a small town centre and convenience shopping to serve local centres.
Sandhurst (zone 11)
5.21 Similarly to Crowthorne, Sandhurst is also located in the south of the Borough and the area known as ‘West of Swan Lane’ is designated as a ‘Small Town Centre’ in Policy E5 of the Bracknell Forest Borough Local Plan (adopted 2002). Sandhurst (West of Swan Lane) predominantly offers a lower quality retail offer: A Waitrose store anchors the local parade of Yorktown Road, College Town.
Overview of centres in West Berkshire
Newbury town centre (zone 16)
5.22 Newbury town centre is designated as a ‘Major Town Centre’ in the West Berkshire Core Strategy (2012) and is located in zone 16 of the survey area. Newbury has a traditional market town heritage and is the focus for retail and commercial leisure activity in West Berkshire.
5.23 Newbury Town Centre has a total retail and service floorspace of 88,667 sq.m across 421 outlets (based on the Experian Goad definition of the town centre boundary). The convenience retail offer in Newbury is below in the national average in terms of the proportion of total floorspace used for the sale of convenience goods; a Tesco Metro, Iceland and Marks and Spencer anchor the town centre’s convenience goods offer. However, there are edge of centre foodstores operated by Aldi and Waitrose within easy reach of the town centre; indeed both stores form part of the town centre commercial area on the Council’s Local Plan Proposals Map.
5.24 The comparison shopping offer is well represented in Newbury with 37,421 sq.m of floorspace across 122 outlets. Two shopping centres are located in the town centre. The Parkway Shopping Centre which opened in 2011 hosts department stores Debenhams, John Lewis at Home and Marks and Spencer, and has delivered a number of new higher-end retailers to the centre. The Kennet Shopping Centre is older and noticeably more dated when compared to Parkway, and also suffers from a lower quality retail offer with representation from retailers such as Superdrug, Laura Ashley, TK Maxx and Caffe Nero.
We understand the centre has recently been acquired by an American asset company and there may be potential for redevelopment of the centre to come forward over the course of the West Berkshire’s new Local Plan period.
5.25 Northbrook Street, which links the two shopping centres, offers a number of coffee shops including Pret a Manger and Starbucks. There are a number of restaurants within the town centre including Bill’s, Pizza Express, Strada, Cote Brasserie, Nando’s and La Tasca in addition to a number of independent restaurants.
Edge/Out of Centre Retailing in Newbury (zone 16)
5.26 Retail warehouse parks outside Newbury town centre include Greenham Road Retail Park, Newbury Retail Park and London Road Retail Park. Greenham Road Retail Park is a small warehouse park anchored by Halfords and Staples. Newbury Retail Park is a large retail park including retailers such as Currys, Sports Direct, Boots anad Matalan, plus a M&S Food store and branches of McDonalds, Pizza Hut and Costa. London Road Retail Park offers a Tesco Superstore, B&Q and Carpetright.
Planned Development in Newbury
5.27 St Modwen Properties have been appointed as the Council’s development partner for a major mixed use redevelopment to transform a 25 acre site on the edge of Newbury town centre into a vibrant and highly accessible focus for new business, retail, residential
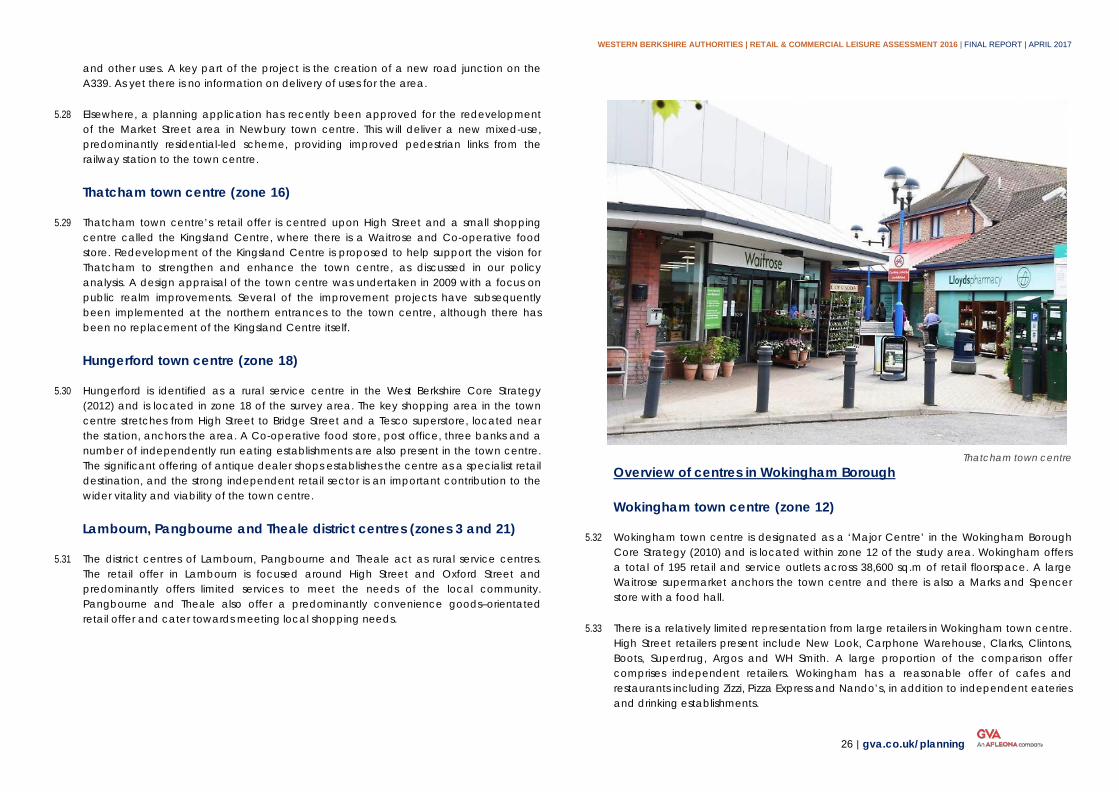
WESTERN BERKSHIRE AUTHORITIES | RETAIL & COMMERCIAL LEISURE ASSESSMENT 2016 | FINAL REPORT | APRIL 2017
26 | gva.co.uk/planning
and other uses. A key part of the project is the creation of a new road junction on the A339. As yet there is no information on delivery of uses for the area.
5.28 Elsewhere, a planning application has recently been approved for the redevelopment of the Market Street area in Newbury town centre. This will deliver a new mixed-use, predominantly residential-led scheme, providing improved pedestrian links from the railway station to the town centre.
Thatcham town centre (zone 16)
5.29 Thatcham town centre’s retail offer is centred upon High Street and a small shopping centre called the Kingsland Centre, where there is a Waitrose and Co-operative food store. Redevelopment of the Kingsland Centre is proposed to help support the vision for Thatcham to strengthen and enhance the town centre, as discussed in our policy analysis. A design appraisal of the town centre was undertaken in 2009 with a focus on public realm improvements. Several of the improvement projects have subsequently been implemented at the northern entrances to the town centre, although there has been no replacement of the Kingsland Centre itself.
Hungerford town centre (zone 18)
5.30 Hungerford is identified as a rural service centre in the West Berkshire Core Strategy (2012) and is located in zone 18 of the survey area. The key shopping area in the town centre stretches from High Street to Bridge Street and a Tesco superstore, located near the station, anchors the area. A Co-operative food store, post office, three banks and a number of independently run eating establishments are also present in the town centre. The significant offering of antique dealer shops establishes the centre as a specialist retail destination, and the strong independent retail sector is an important contribution to the wider vitality and viability of the town centre.
Lambourn, Pangbourne and Theale district centres (zones 3 and 21)
5.31 The district centres of Lambourn, Pangbourne and Theale act as rural service centres. The retail offer in Lambourn is focused around High Street and Oxford Street and predominantly offers limited services to meet the needs of the local community. Pangbourne and Theale also offer a predominantly convenience goods–orientated retail offer and cater towards meeting local shopping needs.
Thatcham town centre Overview of centres in Wokingham Borough
Wokingham town centre (zone 12)
5.32 Wokingham town centre is designated as a ‘Major Centre’ in the Wokingham Borough Core Strategy (2010) and is located within zone 12 of the study area. Wokingham offers a total of 195 retail and service outlets across 38,600 sq.m of retail floorspace. A large Waitrose supermarket anchors the town centre and there is also a Marks and Spencer store with a food hall.
5.33 There is a relatively limited representation from large retailers in Wokingham town centre. High Street retailers present include New Look, Carphone Warehouse, Clarks, Clintons, Boots, Superdrug, Argos and WH Smith. A large proportion of the comparison offer comprises independent retailers. Wokingham has a reasonable offer of cafes and restaurants including Zizzi, Pizza Express and Nando’s, in addition to independent eateries and drinking establishments.
WESTERN BERKSHIRE AUTHORITIES | RETAIL & COMMERCIAL LEISURE ASSESSMENT 2016 | FINAL REPORT | APRIL 2017
27 | gva.co.uk/planning
Edge/Out of Centre Retailing in Wokingham (zone 12)
5.34 Bridge Retail Park is a small retail park located south of Wokingham town centre, containing stores operated by Pets at Home, Carpetright and Majestic Wine. A Tesco supermarket and adjoining car park is also located out of centre on Finchampstead Road, west of Emm Brook Park.
Planned Development in Wokingham
5.35 As set out in previous sections of this report, regeneration works are underway in Wokingham town centre. Refurbishment has already taken place at Market Place and Rose Street and permission has been granted for redevelopment of Peach Place and mixed use developments at Carnival Pool and Elms Field. These developments will see a mix of shopping and leisure facilities introduced to the town centre including a 1,631 sq.m medium-sized food store at Elms Field which we understand will be operated by Aldi. A full discussion of the planned developments in Wokingham town centre in set out in Section 2, as part of our policy context analysis; work on all of the planned developments is expected to be complete by 2020.
Woodley town centre (zone 1)
5.36 Although Woodley town centre is intended to predominantly serve local convenience shopping needs of local area, the centre has a generally strong retail offer set within a pedestrianised shopping precinct. Waitrose anchors the southern portion of the precinct, while a Lidl supermarket, located on Headley Road, anchors the northern end of the town centre. There is also an Iceland food store and a handful of high street retailers such as New Look and Boots.
Lower Earley district centre (zone 1)
5.37 Shopping in Lower Earley district centre is spread across two shopping areas, Maiden Place and Chalfront Way. Maiden Place includes a Sainsbury’s Local, fitness studio, hairdresser, pharmacy, pub and estate agents. Chalfront Way offers a large Asda supermarket, a branch of Iceland and a Toby Carvery pub / restaurant.
Winnersh village centre (zone 1)
5.38 Winnersh is identified as a village centre in the Council’s Core Strategy. The centre is anchored by a large Sainsbury’s supermarket, alongside a small retail / service offer along Reading Road.
Twyford village centre (zone 6)
5.39 Twyford is also identified as a village centre in the Core Strategy it offers a good retail offer for the site and role of the centre, including specialist independent retailers including lighting, interiors and antiques shops. A Waitrose supermarket anchors the town centre and a Tesco Express provides for convenience shopping needs. There is also a florist, post office, estate agent, barbers, vet clinic, Costa, NatWest and a number of independent restaurants.
Competing centres
Competing centres in the survey area
Henley on Thames (zone 4)
5.40 The South Oxfordshire Core Strategy (2012) defines Henley-on-Thames (in common with Didcot) as a ‘town centre serving a local and wider catchment area’. It is located in zone 4 of the survey area. The centre provides a relatively broad retail offer including a range of multiple and independent retailers, and caters almost entirely to a mid to high-end market. There is also a cinema, museum, theatre and a number of galleries. A Waitrose supermarket anchors the retail offer of the centre.
High Wycombe (zone 5)
5.41 High Wycombe is identified as a sub-regional town centre within the Wycombe Core Strategy (2008) and it sits within zone 5 of the survey area. High Wycombe functions well as a centre offering both convenience and comparison shopping and generally falls in line with the national average. Total retail and service floorspace equates to 113,267 sq.m which is spread across 418 outlets.
5.42 The Eden Centre opened in 2008 and offers 127 stores and leisure facilities including a multiplex Cineworld Cinema and Hollywood Bowling. A Marks & Spencer and House of Fraser anchor the centre and overall the centre provides a good range of high street retailers. The older Chilterns shopping centre opened in 1987 and is anchored by Primark and Wilko. The majority of units within the Chilterns Shopping Centre are, however, currently vacant.
5.43 There is a significant amount of out of centre retailing in High Wycombe. Holmers Farm Retail & Leisure Park offers a John Lewis with concessions including Jo Malone, Whistles and Benefit. An Asda supermarket is located to the west of the retail park and leisure facilities include a Badminton Club and Empire Cinema. Wycombe Retail Park offers a
WESTERN BERKSHIRE AUTHORITIES | RETAIL & COMMERCIAL LEISURE ASSESSMENT 2016 | FINAL REPORT | APRIL 2017
28 | gva.co.uk/planning
Marks and Spencer. A Next Home and Garden store offering 7,261 sq. m of retail floorspace opened in Cressex Island in April 2015.
Marlow (zone 6)
5.44 Marlow is defined in the Wycombe Core Strategy (2008) as a ‘tier 2’ town centre, functioning to serve its rural catchment area and it is located in zone 6 of the survey area. The town centre is focused around West Street, High Street and Spittal Street. A Sainsbury’s Supermarket and Waitrose store meet the convenience needs of the local community and the town centre offers a good range of predominantly high end retailers. There is a noticeably strong offer of restaurants and bars with approximately twenty establishments in the town centre.
Slough (zone 7)
5.45 Slough is a ‘Primary Regional Centre’ as identified in the Slough Core Strategy (2008) and is located in zone 7 of the survey area. The Observatory Shopping Centre provides a good comparison offer, hosting 126 stores which include tenants such as Primark, Marks and Spencer and Debenhams. Planning permission was granted for an extension to the Observatory Shopping Centre to add 6,000 sq. m of additional retail floorspace. The High Street serves a predominantly convenience and independent retail service function.
Windsor (zone 7)
5.46 Windsor is identified as a Sub-regional Centre in the Windsor and Maidenhead Local Plan (2003) and is located within zone 7 of the survey zone area. The town centre comprises the King Edward Court Shopping Centre and Windsor Royal Shopping Centre. King Edward offers over 30 retailers and presents a good selection of high street brands, including Fenwick, Zara, Topshop, Next, Lakeland and Benefit. There is a Waitrose supermarket and a number of coffee shops. Windsor Royal is an upmarket covered shopping area and also has a craft market. The town centre offers a wide range of restaurants and cafes/ coffee shops along St. Leonard’s Road and Thames Street.
Camberley (zone 9)
5.47 Located in the Borough of Surrey Heath, Camberley is located in zone 9 of the survey area. The Surrey Heath Core Strategy (2012) determines Camberley town centre to be a ‘Secondary Regional Centre’. The town centre comprises The Mall Shopping Centre (built 1980s), The Atrium (opened 2008) and the High Street. The Mall has over 100 stores, is anchored by House of Fraser and also offers a Sainsbury’s. The Atrium includes a Lidl,
Pure Gym, Vue Cinema and offers a good range of eating establishments. The High Street offers a variety of independent and high street shops.
Farnborough (zone 13)
5.48 Farnborough town centre is the largest town within Rushmoor Borough and is located in zone 9 of the survey area. It is identified as a ‘secondary regional centre’ in the Rushmoor Core Strategy (2011). The centre is focused around a purpose built pedestrianised shopping environment and has two indoor shopping centres, Princes Mead and The Meads. Major retailers trading in Farnborough include Debenhams, Cargo, Sainsbury's, New Look and Boots.
5.49 £150 million has already been invested in regeneration (‘The Meads' project) at the northern end of the town centre since 2008 which delivered approximately 17,600 sq. m of retail floorspace and refurbishment of the Kingsmead Centre which now offers a Vue cinema (opened May 2015). A further 18,580 sq. m of new shopping space is now proposed. In addition to new retail floorspace, proposals include new business space, hotel and leisure uses, improved parking and residential units.
Fleet (zone 13)
5.50 Fleet is recognised as the primary shopping centre in Hart District and it is located in Zone 13 of the survey area. The shopping offer in Fleet town centre follows a linear arrangement along Fleet Road, stretching from St James’ Road to Kings Road. A Sainsbury’s Superstore anchors the town centre and there is also a Marks and Spencer Simply Food. The town centre includes The Hart Shopping Centre (opened 1991) which hosts a Waitrose and a limited range of high street chain retailers. There is a good range of restaurants and coffee shops including Prezzo, Starbucks and Pizza Express as well as independently run establishments.
Basingstoke (zone 14)
5.51 Basingstoke is identified as a Town Centre in the Basingstoke and Deane Core Strategy (2006) and Emerging Local Plan submission document (2015). Basingstoke is located within zone 14 of the survey area. Basingstoke offers 109,050 sq. m of retail and service floorspace across 403 outlets and presents a strong comparison shopping offer, well above the national average as a proportion of total units in the centre.
5.52 Basingstoke town centre includes The Malls Shopping Centre, Festival Place Shopping Centre and a retail offer south of these shopping centres focused around Market Place. Festival Place opened in 2002 and hosts over 200 shops which equates to approximately 102,000 sq.m total retail floorspace. The shopping centre is anchored by Marks and
WESTERN BERKSHIRE AUTHORITIES | RETAIL & COMMERCIAL LEISURE ASSESSMENT 2016 | FINAL REPORT | APRIL 2017
29 | gva.co.uk/planning
Spencer, TX Maxx and Debenhams alongside a ten screen Vue Cinema. The Malls Shopping Centre is anchored by Primark, Sainsbury’s and Wilko and offers a more limited range of high street chains.
5.53 In terms of planned development, Basing View is a major £200 million regeneration project led by Muse Developers which is under construction. A business-led destination, it will deliver retail, office and residential across 60,387 sq. m of floorspace west of Basingstoke town centre. The first phase of the development has been completed comprising a 10,219 sq. m combined John Lewis Home and Waitrose store (ref no. 13/01985/FUL) which opened November 2015. The ‘midtown’ quarter of the development will comprise a mixed-use plaza with hotels, residential units, stores and offices. The target end date for the total project is 2020.
5.54 Plans are being developed for a £200 million transformation of Basingstoke Leisure Park to include a new aquadrome, ice-rink and velodrome to replace the existing 1980s/90s Worthing Road Park. As yet there is no planning application.
Wantage (zone 19)
5.55 Wantage is a small market town in Oxfordshire and it is located in zone 19 of the survey area. The Vale of White Horse District Local Plan (2011) identifies Wantage as a main town centre. Wantage has a strong retail offer and in terms of convenience shopping, the town centre is anchored by a Sainsbury’s supermarket (circa. 5,110 sq. m and approximately 600 car parking spaces) and a Waitrose Supermarket. There are a small number of smaller convenience food shops. The comparison shopping retail offer, like the convenience offer, is above national levels in terms of floorspace. Large multiple retailers who occupy the units in the town centre include Boots, Costa Coffee, Fat Face and Dorothy Perkins.
Didcot (zone 20)
5.56 Didcot is identified in the South Oxfordshire Core Strategy (2012) as a centre serving a local and wider catchment area and it is located in zone 20 of the survey area. It is likely Didcot will be a ‘Major Centre’ following regeneration of its central area, particularly east of the Orchard Centre, the Broadway and the station, and the construction of new greenfield neighbourhoods. The South Oxfordshire Core Strategy (2012) confirms that a total of 6,300 new dwellings will be constructed in Didcot over the period to 2027. In July 2015 permission was granted for a £50 million expansion of the Orchard Centre to include 10,848 sq. m of additional A1 retail floorspace (including Marks and Spencer Foodhall anchor store), 1,874 sq. m of flexible A1/A3 retail floorspace, 709 sq. m of new restaurant (A3) floorspace and a new gym.
Wallingford (zone 20)
5.57 Wallingford town centre performs a convenience function as opposed to non-food shopping and therefore the South Oxfordshire Core Strategy (2012) defines it as a town centre which serves its local catchment area. The primary retail area stretches from High Street southwards along St Martin’s and St Mary’s Street offering a good variety of shops with a large Waitrose supermarket (2,400 sq. m) anchoring the northern end of St. Martins Street. The convenience goods offer is supplemented by a number of smaller convenience stores dispersed throughout the town centre.
Competing centres outside the survey area
Woking
5.58 Woking is recognised as the Primary Retail Centre and principal employment, retail and leisure centre within the Woking Borough Core Strategy (2012). The primary shopping areas in the town centre comprise Wolsey Place and Peacocks shopping centres, Gloucester Walk, Town Square and Commercial Way. Woking has a relatively strong representation of national retailers with a strong comparison offer. Major retail tenants include Debenhams, Primark and Top Shop. In addition, the centre includes a strong selection of cafés and restaurants, two theatres, and a cinema.
5.59 There is planning consent for a mixed-use retail-led redevelopment at Victoria Square to create approximately 11,600 sq. m of new retail floorspace anchored by Marks & Spencer; a 190-bed four-star hotel with conference facilities, spa and gym in a 21-storey tower; 392 residential apartments in two towers of 28 and 34 storeys; space for a medical centre; 380 additional car parking spaces, and two new public plazas.
Guildford
5.60 Guildford town centre is the focus for retail activity in the Borough and generally comprises an upscale-oriented retail offer. In addition to shopping provision along the High Street, the centre has three covered shopping centres; The Friary Centre, White Lion Walk and Tunsgate Square. Key retail areas include the High Street, North Street, and Chapel Street which is characterised by boutiques and specialist shops. The comparison offer is significantly above that of the national average, with a high representation of both independent stores and national retailers, particularly along the High Street and North Street. The centre offers a selection of designer stores, including Jo Malone, LK Bennett and Jaeger; department stores include Debenhams and House of Fraser, as well as a number of high street shops such as Monsoon, Marks and Spencer, and Gap. M&G
WESTERN BERKSHIRE AUTHORITIES | RETAIL & COMMERCIAL LEISURE ASSESSMENT 2016 | FINAL REPORT | APRIL 2017
30 | gva.co.uk/planning
Investments (owners of the Friary Centre) put forward proposals in late 2015 to redevelop North Street, to include an anchor John Lewis store.
Staines
5.61 Staines is a major shopping centre in the Borough of Spelthorne. The town centre’s core shopping area is primarily located around the High Street and in the two shopping centres: Two Rivers Shopping Centre and Elmsleigh Shopping Centre. The town centre has a strong retail offer and is the largest centre for non-food shopping within Spelthorne. Major high street retailers present in the town centre include H&M, New Look and Topshop, Debenhams and Marks & Spencer.
Uxbridge
5.62 Uxbridge is identified as a Metropolitan Centre in the London Borough of Hillingdon Local Plan (2012). The centre performs a strong comparison retail function and offers a good convenience shopping offer. The primary retail area includes two shopping centres —Pavilions (which opened in 1973) and Intu Uxbridge (which opened in 2001), plus a traditional High Street. The centre has a good, if fairly typical, range of retailers trading including Next, Marks & Spencer, Debenhams, H&M, Topshop/Topman and so on. There is an Odeon cinema located within the Intu Uxbridge centre.
Oxford
5.63 Oxford city centre is an established comparison goods-focussed shopping location. Retailers in the city centre include Marks and Spencer, Swarovski, Primark, New Look, French Connection and L’Occitane. The centre has two covered shopping centres, the Clarendon Centre and the Westgate Centre, the latter of which is currently being redeveloped (see below). There is also a Covered Market on Market Street which houses specialist independent retailers and cafes. Oxford also plays an impotant role as a cultural destination, with facilities such as the Ashmolean Museum, Modern Art Oxford and the New Theatre. The centre also acts as an important tourism destination.
5.64 Oxford has a number of major current and proposed development schemes as part of the wider regeneration of Oxford City Centre. Permission was granted in December 2014 (ref no. 14/02402/RES) for the redevelopment of Westgate Shopping Centre due for completion in autumn 2017. The proposals are for the creation of a new shopping and leisure destination, with approximately 100 new shops, including a John Lewis anchor store, cafes and restaurants, a cinema, a two storey car park and public realm improvements.
Andover
5.65 Andover is identified as a ‘major’ town centre in the Test Valley Local Plan (2016) which serves the town and the surrounding rural catchment area. The town centre offers a good range of comparison goods retailing particularly around the areas of High Street, Bridge Street and the Chantry Centre. High street retailers present in these areas include Marks and Spencer, Boots, Sports Direct, New Look and Dorothy Perkins, while the Chantry Centre houses a mix of high street tenants and smaller specialist retailers.
Swindon
5.66 Swindon is the main town centre in the borough, as identified in the Swindon Borough Local Plan (2015). The comparison and convenience offer of the town centre is lower when compared to the national average, however the town centre presents a good shopping offer overall. The town centre hosts the Brunel Shopping Centre and the Arcade. The Brunel Shopping Centre has retail tenants such as Boots, Lush, H. Samuel, Marks and Spencer and Costa, while the Arcade is anchored by House of Fraser and occupiers including homeware, furnishing and electrical goods outlets. Other well-known retailers are situated along Regent Street and The Parade and include Debenhams, Topshop, Primark and New Look.
5.67 Approximately £350 million is currently being invested in the regeneration of Swindon town centre. Recent development includes Regent Circus, a retail and leisure destination, which opened in late 2014. The new scheme is anchored by a Morrison’s supermarket and there are a number of restaurants, bars and a Cineworld. Proposals for the redevelopment of the Oasis Leisure Centre Site will deliver an entertainment arena, indoor ski centre, cinema, hotel, retail (12,000 sq. m), restaurants and cafes, and parking.
5.68 Redevelopment is also proposed for Kimmerfields, to deliver a mixed use scheme comprising approximately 450 residential units, 55,740 sq. m office floorspace, 11,600 sq.m retail and leisure floorspace, 120 bed hotel and 1,300 parking spaces. Kimmerfield Court apartments (phase 1) is complete and the wider scheme is due for completion in 2017.
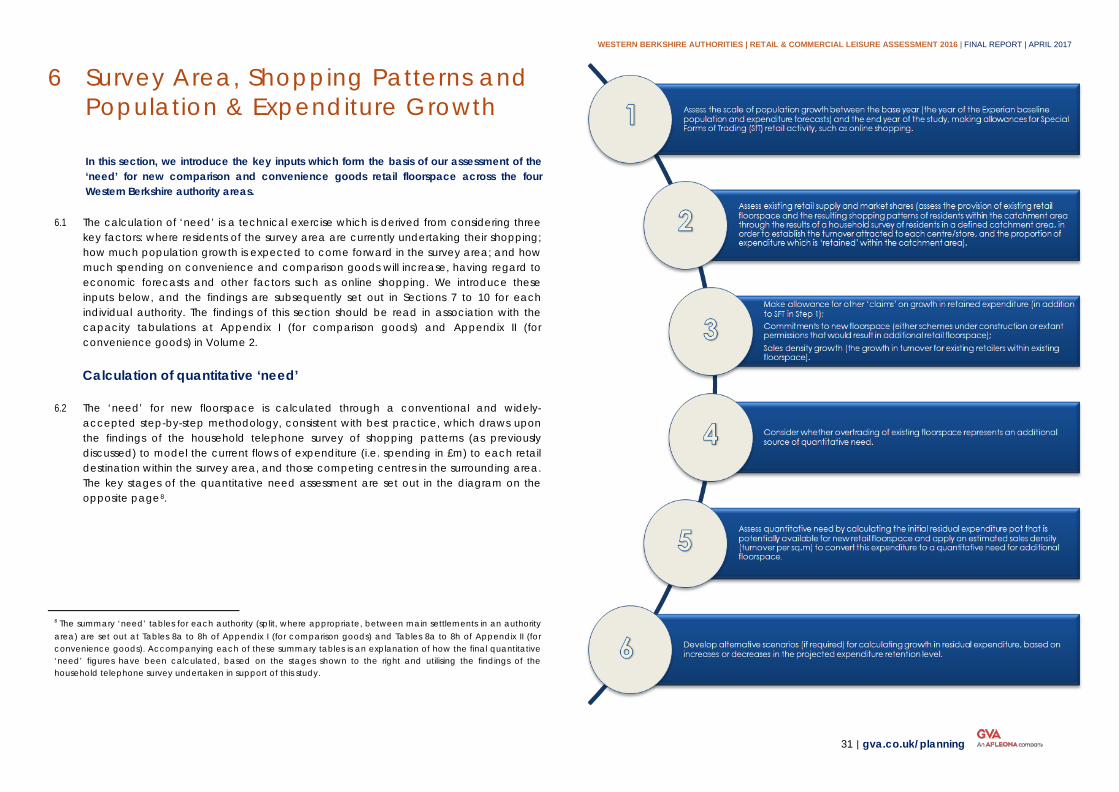
WESTERN BERKSHIRE AUTHORITIES | RETAIL & COMMERCIAL LEISURE ASSESSMENT 2016 | FINAL REPORT | APRIL 2017
31 | gva.co.uk/planning
Survey Area, Shopping Patterns and 6Population & Expenditure Growth
In this section, we introduce the key inputs which form the basis of our assessment of the ‘need’ for new comparison and convenience goods retail floorspace across the four Western Berkshire authority areas.
6.1 The calculation of ‘need’ is a technical exercise which is derived from considering three key factors: where residents of the survey area are currently undertaking their shopping; how much population growth is expected to come forward in the survey area; and how much spending on convenience and comparison goods will increase, having regard to economic forecasts and other factors such as online shopping. We introduce these inputs below, and the findings are subsequently set out in Sections 7 to 10 for each individual authority. The findings of this section should be read in association with the capacity tabulations at Appendix I (for comparison goods) and Appendix II (for convenience goods) in Volume 2.
Calculation of quantitative ‘need’
6.2 The ‘need’ for new floorspace is calculated through a conventional and widely-accepted step-by-step methodology, consistent with best practice, which draws upon the findings of the household telephone survey of shopping patterns (as previously discussed) to model the current flows of expenditure (i.e. spending in £m) to each retail destination within the survey area, and those competing centres in the surrounding area. The key stages of the quantitative need assessment are set out in the diagram on the opposite page8.
8 The summary ‘need’ tables for each authority (split, where appropriate, between main settlements in an authority area) are set out at Tables 8a to 8h of Appendix I (for comparison goods) and Tables 8a to 8h of Appendix II (for convenience goods). Accompanying each of these summary tables is an explanation of how the final quantitative ‘need’ figures have been calculated, based on the stages shown to the right and utilising the findings of the household telephone survey undertaken in support of this study.
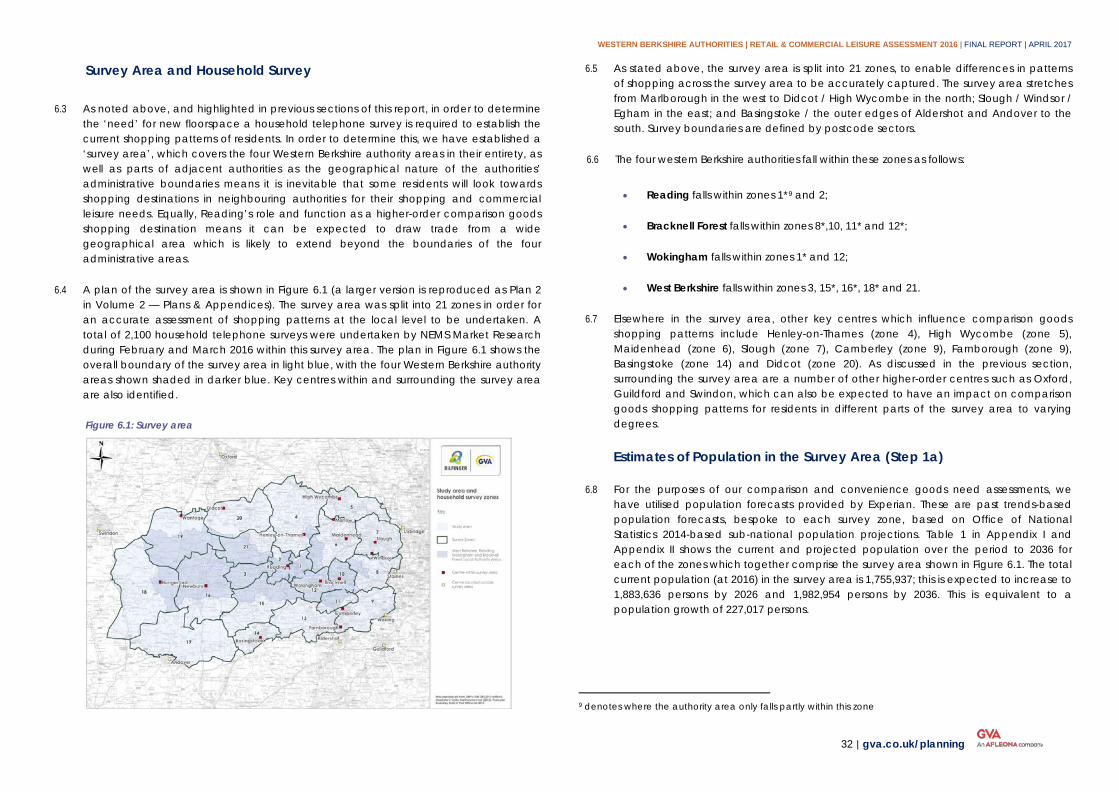
WESTERN BERKSHIRE AUTHORITIES | RETAIL & COMMERCIAL LEISURE ASSESSMENT 2016 | FINAL REPORT | APRIL 2017
32 | gva.co.uk/planning
Survey Area and Household Survey
6.3 As noted above, and highlighted in previous sections of this report, in order to determine the ‘need’ for new floorspace a household telephone survey is required to establish the current shopping patterns of residents. In order to determine this, we have established a ‘survey area’, which covers the four Western Berkshire authority areas in their entirety, as well as parts of adjacent authorities as the geographical nature of the authorities’ administrative boundaries means it is inevitable that some residents will look towards shopping destinations in neighbouring authorities for their shopping and commercial leisure needs. Equally, Reading’s role and function as a higher-order comparison goods shopping destination means it can be expected to draw trade from a wide geographical area which is likely to extend beyond the boundaries of the four administrative areas.
6.4 A plan of the survey area is shown in Figure 6.1 (a larger version is reproduced as Plan 2 in Volume 2 — Plans & Appendices). The survey area was split into 21 zones in order for an accurate assessment of shopping patterns at the local level to be undertaken. A total of 2,100 household telephone surveys were undertaken by NEMS Market Research during February and March 2016 within this survey area. The plan in Figure 6.1 shows the overall boundary of the survey area in light blue, with the four Western Berkshire authority areas shown shaded in darker blue. Key centres within and surrounding the survey area are also identified.
Figure 6.1: Survey area
6.5 As stated above, the survey area is split into 21 zones, to enable differences in patterns of shopping across the survey area to be accurately captured. The survey area stretches from Marlborough in the west to Didcot / High Wycombe in the north; Slough / Windsor / Egham in the east; and Basingstoke / the outer edges of Aldershot and Andover to the south. Survey boundaries are defined by postcode sectors.
6.6 The four western Berkshire authorities fall within these zones as follows:
• Reading falls within zones 1*9 and 2;
• Bracknell Forest falls within zones 8*,10, 11* and 12*;
• Wokingham falls within zones 1* and 12;
• West Berkshire falls within zones 3, 15*, 16*, 18* and 21.
6.7 Elsewhere in the survey area, other key centres which influence comparison goods shopping patterns include Henley-on-Thames (zone 4), High Wycombe (zone 5), Maidenhead (zone 6), Slough (zone 7), Camberley (zone 9), Farnborough (zone 9), Basingstoke (zone 14) and Didcot (zone 20). As discussed in the previous section, surrounding the survey area are a number of other higher-order centres such as Oxford, Guildford and Swindon, which can also be expected to have an impact on comparison goods shopping patterns for residents in different parts of the survey area to varying degrees.
Estimates of Population in the Survey Area (Step 1a)
6.8 For the purposes of our comparison and convenience goods need assessments, we have utilised population forecasts provided by Experian. These are past trends-based population forecasts, bespoke to each survey zone, based on Office of National Statistics 2014-based sub-national population projections. Table 1 in Appendix I and Appendix II shows the current and projected population over the period to 2036 for each of the zones which together comprise the survey area shown in Figure 6.1. The total current population (at 2016) in the survey area is 1,755,937; this is expected to increase to 1,883,636 persons by 2026 and 1,982,954 persons by 2036. This is equivalent to a population growth of 227,017 persons.
9 denotes where the authority area only falls partly within this zone
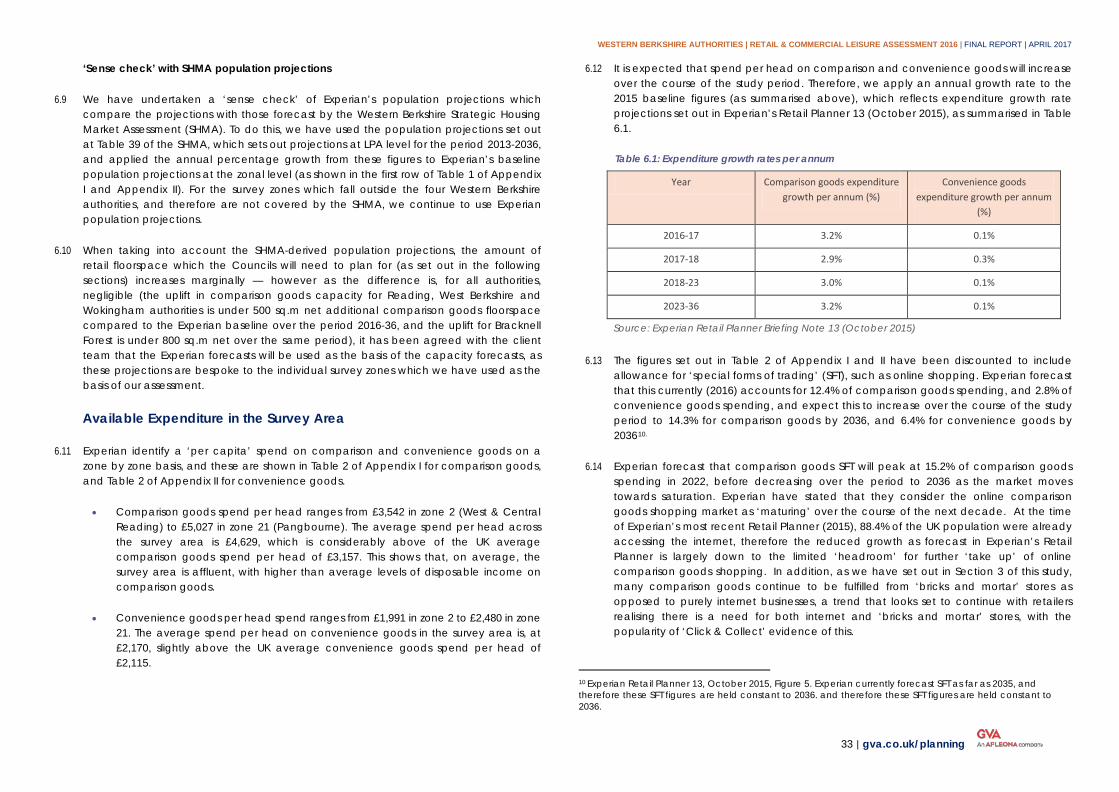
WESTERN BERKSHIRE AUTHORITIES | RETAIL & COMMERCIAL LEISURE ASSESSMENT 2016 | FINAL REPORT | APRIL 2017
33 | gva.co.uk/planning
‘Sense check’ with SHMA population projections
6.9 We have undertaken a ‘sense check’ of Experian’s population projections which compare the projections with those forecast by the Western Berkshire Strategic Housing Market Assessment (SHMA). To do this, we have used the population projections set out at Table 39 of the SHMA, which sets out projections at LPA level for the period 2013-2036, and applied the annual percentage growth from these figures to Experian’s baseline population projections at the zonal level (as shown in the first row of Table 1 of Appendix I and Appendix II). For the survey zones which fall outside the four Western Berkshire authorities, and therefore are not covered by the SHMA, we continue to use Experian population projections.
6.10 When taking into account the SHMA-derived population projections, the amount of retail floorspace which the Councils will need to plan for (as set out in the following sections) increases marginally — however as the difference is, for all authorities, negligible (the uplift in comparison goods capacity for Reading, West Berkshire and Wokingham authorities is under 500 sq.m net additional comparison goods floorspace compared to the Experian baseline over the period 2016-36, and the uplift for Bracknell Forest is under 800 sq.m net over the same period), it has been agreed with the client team that the Experian forecasts will be used as the basis of the capacity forecasts, as these projections are bespoke to the individual survey zones which we have used as the basis of our assessment.
Available Expenditure in the Survey Area
6.11 Experian identify a ‘per capita’ spend on comparison and convenience goods on a zone by zone basis, and these are shown in Table 2 of Appendix I for comparison goods, and Table 2 of Appendix II for convenience goods.
• Comparison goods spend per head ranges from £3,542 in zone 2 (West & Central Reading) to £5,027 in zone 21 (Pangbourne). The average spend per head across the survey area is £4,629, which is considerably above of the UK average comparison goods spend per head of £3,157. This shows that, on average, the survey area is affluent, with higher than average levels of disposable income on comparison goods.
• Convenience goods per head spend ranges from £1,991 in zone 2 to £2,480 in zone 21. The average spend per head on convenience goods in the survey area is, at £2,170, slightly above the UK average convenience goods spend per head of £2,115.
6.12 It is expected that spend per head on comparison and convenience goods will increase over the course of the study period. Therefore, we apply an annual growth rate to the 2015 baseline figures (as summarised above), which reflects expenditure growth rate projections set out in Experian’s Retail Planner 13 (October 2015), as summarised in Table 6.1.
Table 6.1: Expenditure growth rates per annum
Year Comparison goods expenditure growth per annum (%)
Convenience goods expenditure growth per annum
(%)
2016-17 3.2% 0.1%
2017-18 2.9% 0.3%
2018-23 3.0% 0.1%
2023-36 3.2% 0.1%
Source: Experian Retail Planner Briefing Note 13 (October 2015)
6.13 The figures set out in Table 2 of Appendix I and II have been discounted to include allowance for ‘special forms of trading’ (SFT), such as online shopping. Experian forecast that this currently (2016) accounts for 12.4% of comparison goods spending, and 2.8% of convenience goods spending, and expect this to increase over the course of the study period to 14.3% for comparison goods by 2036, and 6.4% for convenience goods by 203610.
6.14 Experian forecast that comparison goods SFT will peak at 15.2% of comparison goods spending in 2022, before decreasing over the period to 2036 as the market moves towards saturation. Experian have stated that they consider the online comparison goods shopping market as ‘maturing’ over the course of the next decade. At the time of Experian’s most recent Retail Planner (2015), 88.4% of the UK population were already accessing the internet, therefore the reduced growth as forecast in Experian’s Retail Planner is largely down to the limited ‘headroom’ for further ‘take up’ of online comparison goods shopping. In addition, as we have set out in Section 3 of this study, many comparison goods continue to be fulfilled from ‘bricks and mortar’ stores as opposed to purely internet businesses, a trend that looks set to continue with retailers realising there is a need for both internet and ‘bricks and mortar’ stores, with the popularity of ‘Click & Collect’ evidence of this.
10 Experian Retail Planner 13, October 2015, Figure 5. Experian currently forecast SFT as far as 2035, and therefore these SFT figures are held constant to 2036. and therefore these SFT figures are held constant to 2036.
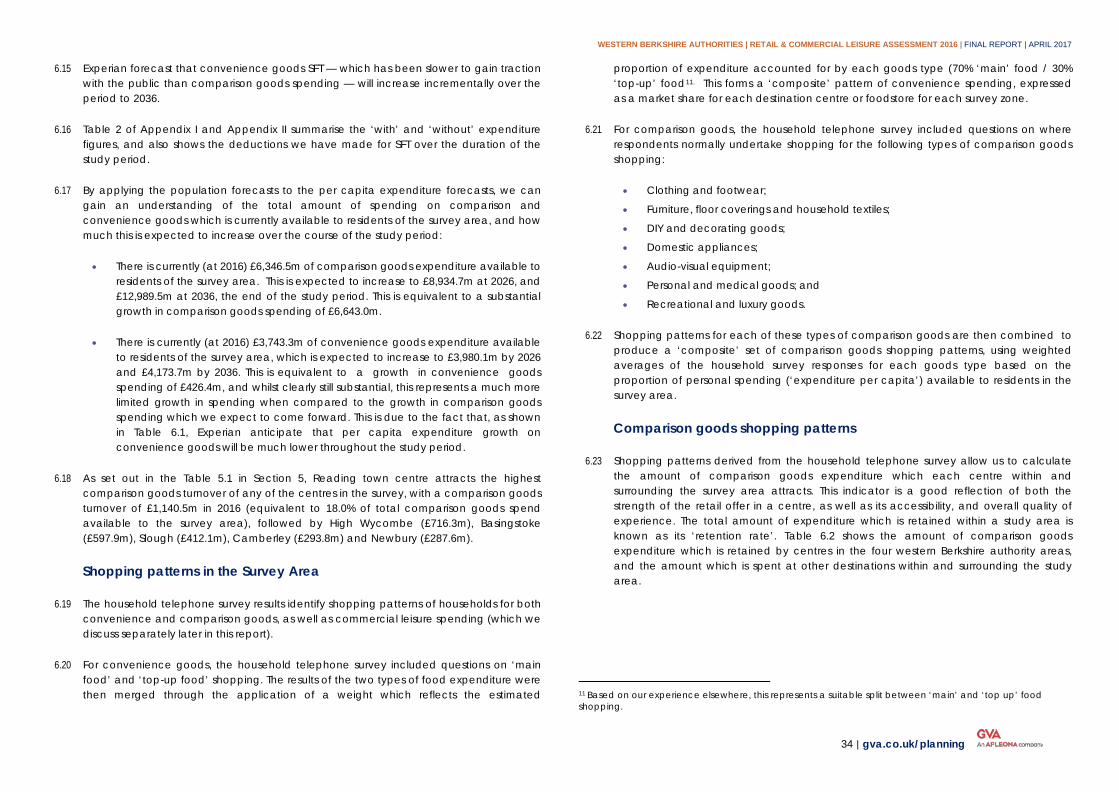
WESTERN BERKSHIRE AUTHORITIES | RETAIL & COMMERCIAL LEISURE ASSESSMENT 2016 | FINAL REPORT | APRIL 2017
34 | gva.co.uk/planning
6.15 Experian forecast that convenience goods SFT — which has been slower to gain traction with the public than comparison goods spending — will increase incrementally over the period to 2036.
6.16 Table 2 of Appendix I and Appendix II summarise the ‘with’ and ‘without’ expenditure figures, and also shows the deductions we have made for SFT over the duration of the study period.
6.17 By applying the population forecasts to the per capita expenditure forecasts, we can gain an understanding of the total amount of spending on comparison and convenience goods which is currently available to residents of the survey area, and how much this is expected to increase over the course of the study period:
• There is currently (at 2016) £6,346.5m of comparison goods expenditure available to residents of the survey area. This is expected to increase to £8,934.7m at 2026, and £12,989.5m at 2036, the end of the study period. This is equivalent to a substantial growth in comparison goods spending of £6,643.0m.
• There is currently (at 2016) £3,743.3m of convenience goods expenditure available to residents of the survey area, which is expected to increase to £3,980.1m by 2026 and £4,173.7m by 2036. This is equivalent to a growth in convenience goods spending of £426.4m, and whilst clearly still substantial, this represents a much more limited growth in spending when compared to the growth in comparison goods spending which we expect to come forward. This is due to the fact that, as shown in Table 6.1, Experian anticipate that per capita expenditure growth on convenience goods will be much lower throughout the study period.
6.18 As set out in the Table 5.1 in Section 5, Reading town centre attracts the highest comparison goods turnover of any of the centres in the survey, with a comparison goods turnover of £1,140.5m in 2016 (equivalent to 18.0% of total comparison goods spend available to the survey area), followed by High Wycombe (£716.3m), Basingstoke (£597.9m), Slough (£412.1m), Camberley (£293.8m) and Newbury (£287.6m).
Shopping patterns in the Survey Area
6.19 The household telephone survey results identify shopping patterns of households for both convenience and comparison goods, as well as commercial leisure spending (which we discuss separately later in this report).
6.20 For convenience goods, the household telephone survey included questions on ‘main food’ and ‘top-up food’ shopping. The results of the two types of food expenditure were then merged through the application of a weight which reflects the estimated
proportion of expenditure accounted for by each goods type (70% ‘main’ food / 30% ‘top-up’ food11. This forms a ‘composite’ pattern of convenience spending, expressed as a market share for each destination centre or foodstore for each survey zone.
6.21 For comparison goods, the household telephone survey included questions on where respondents normally undertake shopping for the following types of comparison goods shopping:
• Clothing and footwear;
• Furniture, floor coverings and household textiles;
• DIY and decorating goods;
• Domestic appliances;
• Audio-visual equipment;
• Personal and medical goods; and
• Recreational and luxury goods.
6.22 Shopping patterns for each of these types of comparison goods are then combined to produce a ‘composite’ set of comparison goods shopping patterns, using weighted averages of the household survey responses for each goods type based on the proportion of personal spending (‘expenditure per capita’) available to residents in the survey area.
Comparison goods shopping patterns
6.23 Shopping patterns derived from the household telephone survey allow us to calculate the amount of comparison goods expenditure which each centre within and surrounding the survey area attracts. This indicator is a good reflection of both the strength of the retail offer in a centre, as well as its accessibility, and overall quality of experience. The total amount of expenditure which is retained within a study area is known as its ‘retention rate’. Table 6.2 shows the amount of comparison goods expenditure which is retained by centres in the four western Berkshire authority areas, and the amount which is spent at other destinations within and surrounding the study area.
11 Based on our experience elsewhere, this represents a suitable split between ‘main’ and ‘top up’ food shopping.
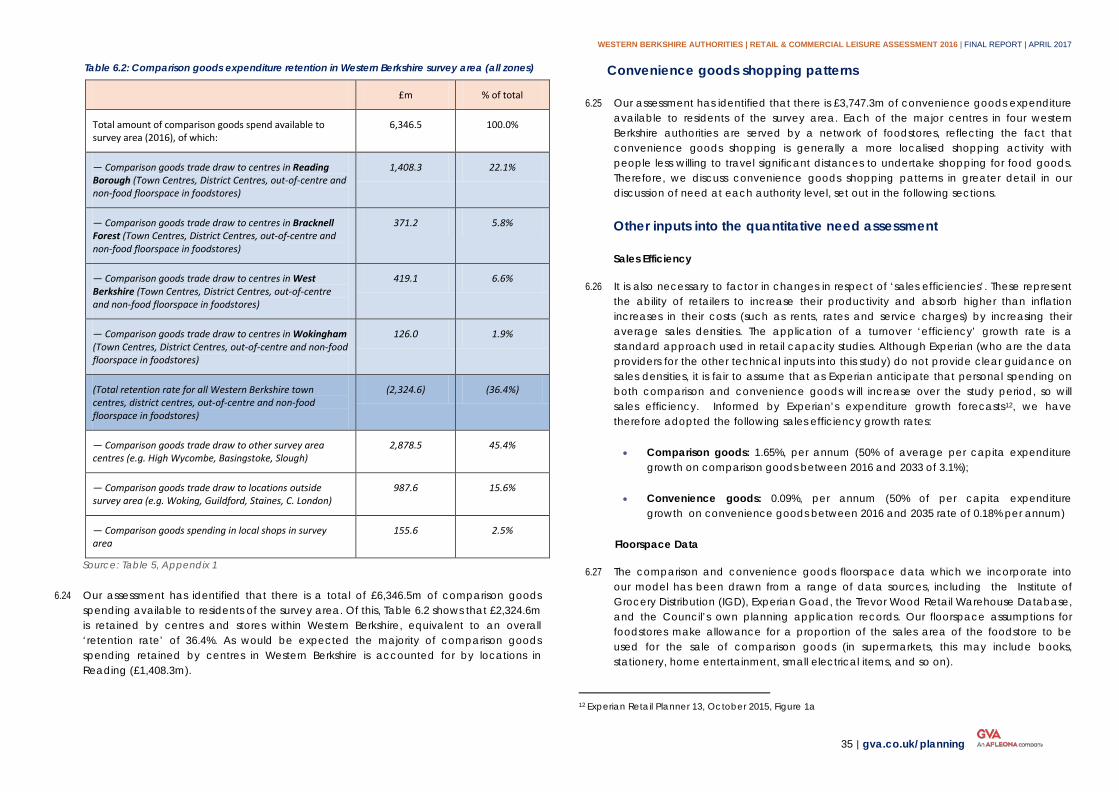
WESTERN BERKSHIRE AUTHORITIES | RETAIL & COMMERCIAL LEISURE ASSESSMENT 2016 | FINAL REPORT | APRIL 2017
35 | gva.co.uk/planning
Table 6.2: Comparison goods expenditure retention in Western Berkshire survey area (all zones)
£m % of total
Total amount of comparison goods spend available to survey area (2016), of which:
6,346.5 100.0%
— Comparison goods trade draw to centres in Reading Borough (Town Centres, District Centres, out-of-centre and non-food floorspace in foodstores)
1,408.3 22.1%
— Comparison goods trade draw to centres in Bracknell Forest (Town Centres, District Centres, out-of-centre and non-food floorspace in foodstores)
371.2 5.8%
— Comparison goods trade draw to centres in West Berkshire (Town Centres, District Centres, out-of-centre and non-food floorspace in foodstores)
419.1 6.6%
— Comparison goods trade draw to centres in Wokingham (Town Centres, District Centres, out-of-centre and non-food floorspace in foodstores)
126.0 1.9%
(Total retention rate for all Western Berkshire town centres, district centres, out-of-centre and non-food floorspace in foodstores)
(2,324.6) (36.4%)
— Comparison goods trade draw to other survey area centres (e.g. High Wycombe, Basingstoke, Slough)
2,878.5 45.4%
— Comparison goods trade draw to locations outside survey area (e.g. Woking, Guildford, Staines, C. London)
987.6 15.6%
— Comparison goods spending in local shops in survey area
155.6 2.5%
Source: Table 5, Appendix 1
6.24 Our assessment has identified that there is a total of £6,346.5m of comparison goods spending available to residents of the survey area. Of this, Table 6.2 shows that £2,324.6m is retained by centres and stores within Western Berkshire, equivalent to an overall ‘retention rate’ of 36.4%. As would be expected the majority of comparison goods spending retained by centres in Western Berkshire is accounted for by locations in Reading (£1,408.3m).
Convenience goods shopping patterns
6.25 Our assessment has identified that there is £3,747.3m of convenience goods expenditure available to residents of the survey area. Each of the major centres in four western Berkshire authorities are served by a network of foodstores, reflecting the fact that convenience goods shopping is generally a more localised shopping activity with people less willing to travel significant distances to undertake shopping for food goods. Therefore, we discuss convenience goods shopping patterns in greater detail in our discussion of need at each authority level, set out in the following sections.
Other inputs into the quantitative need assessment
Sales Efficiency
6.26 It is also necessary to factor in changes in respect of ‘sales efficiencies’. These represent the ability of retailers to increase their productivity and absorb higher than inflation increases in their costs (such as rents, rates and service charges) by increasing their average sales densities. The application of a turnover ‘efficiency’ growth rate is a standard approach used in retail capacity studies. Although Experian (who are the data providers for the other technical inputs into this study) do not provide clear guidance on sales densities, it is fair to assume that as Experian anticipate that personal spending on both comparison and convenience goods will increase over the study period, so will sales efficiency. Informed by Experian’s expenditure growth forecasts12, we have therefore adopted the following sales efficiency growth rates:
• Comparison goods: 1.65%, per annum (50% of average per capita expenditure growth on comparison goods between 2016 and 2033 of 3.1%);
• Convenience goods: 0.09%, per annum (50% of per capita expenditure growth on convenience goods between 2016 and 2035 rate of 0.18% per annum)
Floorspace Data
6.27 The comparison and convenience goods floorspace data which we incorporate into our model has been drawn from a range of data sources, including the Institute of Grocery Distribution (IGD), Experian Goad, the Trevor Wood Retail Warehouse Database, and the Council’s own planning application records. Our floorspace assumptions for foodstores make allowance for a proportion of the sales area of the foodstore to be used for the sale of comparison goods (in supermarkets, this may include books, stationery, home entertainment, small electrical items, and so on).
12 Experian Retail Planner 13, October 2015, Figure 1a
WESTERN BERKSHIRE AUTHORITIES | RETAIL & COMMERCIAL LEISURE ASSESSMENT 2016 | FINAL REPORT | APRIL 2017
36 | gva.co.uk/planning
Shopping Patterns and Identification 7of Need — Reading Borough In the previous section we have set out the key inputs into our quantitative ‘need’ assessment. In the following sections, we now proceed to identify the quantitative ‘need’ for new comparison and convenience goods floorspace at Borough level, in order to inform each Borough’s respective Local Plan preparation. In the remainder of this section, we identify the quantitative need for new floorspace in Reading Borough; the need assessment for Bracknell Forest follows in Section 8, West Berkshire is set out in Section 9 and Wokingham Borough is set out in Section 10.
7.1 In each instance, the discussion should be read in conjunction with the data tables in Appendix I (for comparison goods) and II (for convenience goods) of Volume 2 to the study, and in particular the summary ‘need’ Tables 8a to 8h in Appendix I and Appendix II. Below these summary ‘need’ tables we provide an explanation of how the final quantitative ‘need’ has been calculated.
Comparison goods shopping
Reading town centre
7.2 As set out in Section 5, Reading town centre has the highest comparison goods turnover of any of the centres in the survey area, drawing £1,140.5m of comparison goods spend from the survey area, equivalent to 18.0% of total available comparison goods spending. This reflects the fact that Reading has one of the strongest comparison goods offers of any centre in the south east, and in particular has an extensive clothing and fashion goods offer, which is a key driver of footfall in a centre, with representation from a wide spectrum of fashion / department store operators such as John Lewis, House of Fraser, Debenhams, Marks & Spencer, Zara and Primark, for example.
7.3 Reading town centre draws a market share from 19 of the 21 survey zones. An area from where Reading no longer pulls trade is High Wycombe (zone 5); it can be concluded that the enhancements which have come forward to the retail offer in High Wycombe in recent years, following the opening of the Eden Centre, have resulted in very few residents in the High Wycombe area now travelling to Reading to undertake their comparison goods shopping. Reading also draws no market share from zone 17, where residents generally look towards Basingstoke and Andover for their comparison goods shopping.
7.4 Reading draws a comparison goods market share of over 25% from zones 1 and 2 (which cover the Reading urban area), as well as zones 3, 4, 10, 15, 20 and 21, and we would therefore consider these zones to represent Reading town centre’s ‘core catchment area’. Beyond this, its market share diminishes as residents are closer or more equally placed to other higher order comparison goods shopping locations – High Wycombe curtails the centre’s catchment to the north, Newbury performs a similar role to the west, with Slough and Basingstoke also acting as popular comparison goods shopping locations to the south and east. Reading town centre’s comparison goods market share is shown visually in Figure 7.1.
Figure 7.1: Reading town centre comparison goods market share
Source: Table 4, Appendix I
7.5 When looking at the market shares at a zonal level, Reading town centre is doing a good job at retaining comparison goods expenditure from local residents. Reading town centre falls within zone 2, and the ‘local retention rate’ from this zone is 69.3%. In other words, Reading town centre accounts for £7 in every £10 spent on comparison goods shopping for residents in zone 2; for neighbouring zone 1 (which covers the eastern part of the Reading urban area), the equivalent retention rate is 62.9%. In both cases, the majority of the remaining market share is accounted for by the various retail parks across the Reading urban area, and when these market shares are combined it can be seen that over 80% of available comparison goods spending available to residents in the Reading
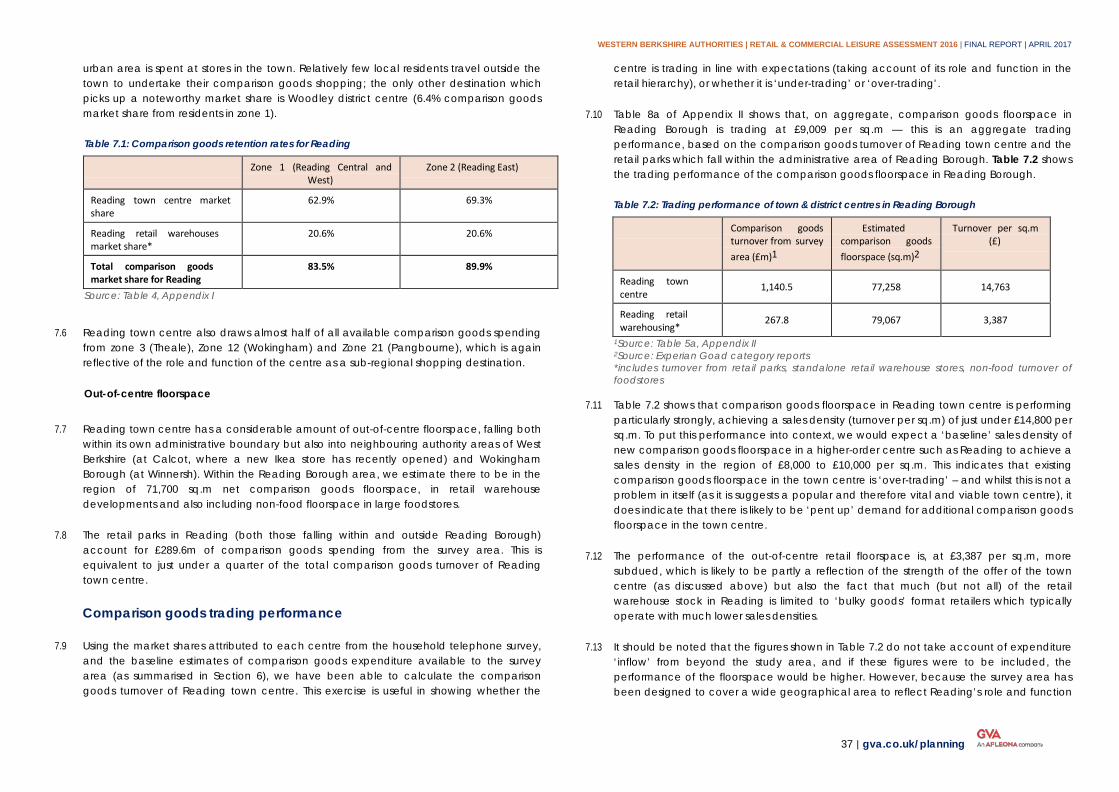
WESTERN BERKSHIRE AUTHORITIES | RETAIL & COMMERCIAL LEISURE ASSESSMENT 2016 | FINAL REPORT | APRIL 2017
37 | gva.co.uk/planning
urban area is spent at stores in the town. Relatively few local residents travel outside the town to undertake their comparison goods shopping; the only other destination which picks up a noteworthy market share is Woodley district centre (6.4% comparison goods market share from residents in zone 1).
Table 7.1: Comparison goods retention rates for Reading
Zone 1 (Reading Central and West)
Zone 2 (Reading East)
Reading town centre market share
62.9% 69.3%
Reading retail warehouses market share*
20.6% 20.6%
Total comparison goods market share for Reading
83.5% 89.9%
Source: Table 4, Appendix I
7.6 Reading town centre also draws almost half of all available comparison goods spending from zone 3 (Theale), Zone 12 (Wokingham) and Zone 21 (Pangbourne), which is again reflective of the role and function of the centre as a sub-regional shopping destination.
Out-of-centre floorspace
7.7 Reading town centre has a considerable amount of out-of-centre floorspace, falling both within its own administrative boundary but also into neighbouring authority areas of West Berkshire (at Calcot, where a new Ikea store has recently opened) and Wokingham Borough (at Winnersh). Within the Reading Borough area, we estimate there to be in the region of 71,700 sq.m net comparison goods floorspace, in retail warehouse developments and also including non-food floorspace in large foodstores.
7.8 The retail parks in Reading (both those falling within and outside Reading Borough) account for £289.6m of comparison goods spending from the survey area. This is equivalent to just under a quarter of the total comparison goods turnover of Reading town centre.
Comparison goods trading performance
7.9 Using the market shares attributed to each centre from the household telephone survey, and the baseline estimates of comparison goods expenditure available to the survey area (as summarised in Section 6), we have been able to calculate the comparison goods turnover of Reading town centre. This exercise is useful in showing whether the
centre is trading in line with expectations (taking account of its role and function in the retail hierarchy), or whether it is ‘under-trading’ or ‘over-trading’.
7.10 Table 8a of Appendix II shows that, on aggregate, comparison goods floorspace in Reading Borough is trading at £9,009 per sq.m — this is an aggregate trading performance, based on the comparison goods turnover of Reading town centre and the retail parks which fall within the administrative area of Reading Borough. Table 7.2 shows the trading performance of the comparison goods floorspace in Reading Borough.
Table 7.2: Trading performance of town & district centres in Reading Borough
Comparison goods turnover from survey area (£m)1
Estimated comparison goods floorspace (sq.m)2
Turnover per sq.m (£)
Reading town centre
1,140.5 77,258 14,763
Reading retail warehousing*
267.8 79,067 3,387
1Source: Table 5a, Appendix II 2Source: Experian Goad category reports *includes turnover from retail parks, standalone retail warehouse stores, non-food turnover of foodstores
7.11 Table 7.2 shows that comparison goods floorspace in Reading town centre is performing particularly strongly, achieving a sales density (turnover per sq.m) of just under £14,800 per sq.m. To put this performance into context, we would expect a ‘baseline’ sales density of new comparison goods floorspace in a higher-order centre such as Reading to achieve a sales density in the region of £8,000 to £10,000 per sq.m. This indicates that existing comparison goods floorspace in the town centre is ‘over-trading’ – and whilst this is not a problem in itself (as it is suggests a popular and therefore vital and viable town centre), it does indicate that there is likely to be ‘pent up’ demand for additional comparison goods floorspace in the town centre.
7.12 The performance of the out-of-centre retail floorspace is, at £3,387 per sq.m, more subdued, which is likely to be partly a reflection of the strength of the offer of the town centre (as discussed above) but also the fact that much (but not all) of the retail warehouse stock in Reading is limited to ‘bulky goods’ format retailers which typically operate with much lower sales densities.
7.13 It should be noted that the figures shown in Table 7.2 do not take account of expenditure ‘inflow’ from beyond the study area, and if these figures were to be included, the performance of the floorspace would be higher. However, because the survey area has been designed to cover a wide geographical area to reflect Reading’s role and function
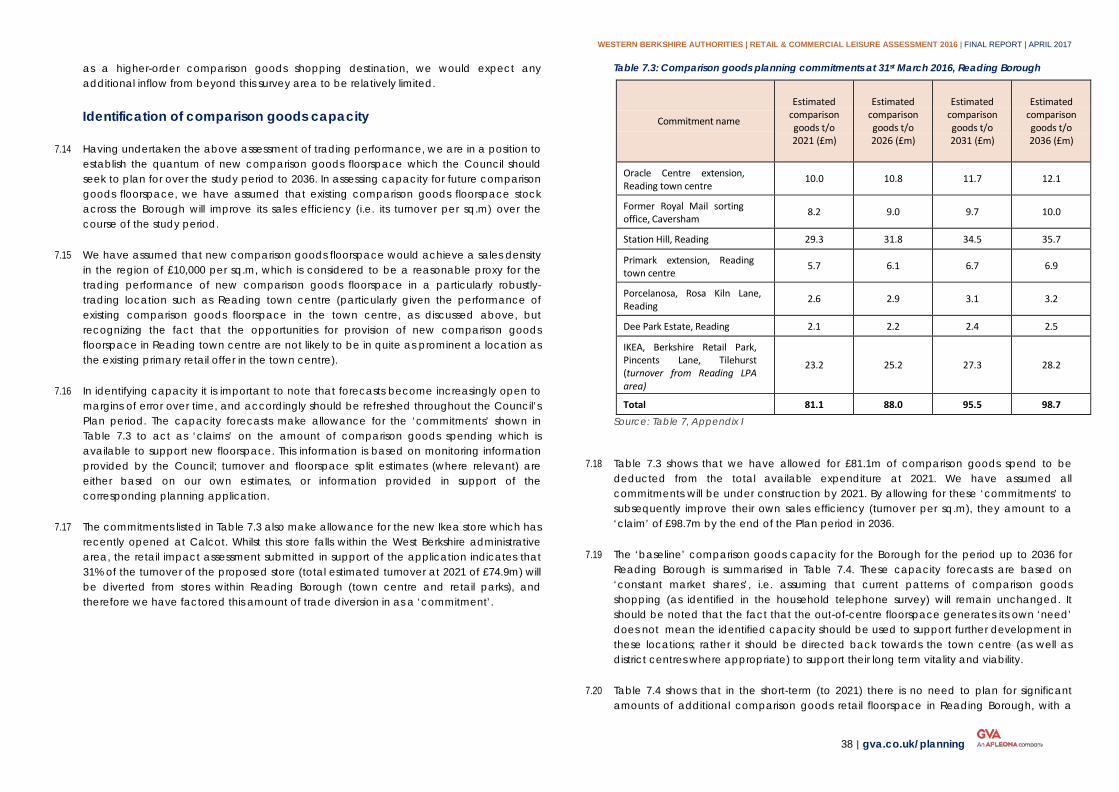
WESTERN BERKSHIRE AUTHORITIES | RETAIL & COMMERCIAL LEISURE ASSESSMENT 2016 | FINAL REPORT | APRIL 2017
38 | gva.co.uk/planning
as a higher-order comparison goods shopping destination, we would expect any additional inflow from beyond this survey area to be relatively limited.
Identification of comparison goods capacity
7.14 Having undertaken the above assessment of trading performance, we are in a position to establish the quantum of new comparison goods floorspace which the Council should seek to plan for over the study period to 2036. In assessing capacity for future comparison goods floorspace, we have assumed that existing comparison goods floorspace stock across the Borough will improve its sales efficiency (i.e. its turnover per sq.m) over the course of the study period.
7.15 We have assumed that new comparison goods floorspace would achieve a sales density in the region of £10,000 per sq.m, which is considered to be a reasonable proxy for the trading performance of new comparison goods floorspace in a particularly robustly-trading location such as Reading town centre (particularly given the performance of existing comparison goods floorspace in the town centre, as discussed above, but recognizing the fact that the opportunities for provision of new comparison goods floorspace in Reading town centre are not likely to be in quite as prominent a location as the existing primary retail offer in the town centre).
7.16 In identifying capacity it is important to note that forecasts become increasingly open to margins of error over time, and accordingly should be refreshed throughout the Council’s Plan period. The capacity forecasts make allowance for the ‘commitments’ shown in Table 7.3 to act as ‘claims’ on the amount of comparison goods spending which is available to support new floorspace. This information is based on monitoring information provided by the Council; turnover and floorspace split estimates (where relevant) are either based on our own estimates, or information provided in support of the corresponding planning application.
7.17 The commitments listed in Table 7.3 also make allowance for the new Ikea store which has recently opened at Calcot. Whilst this store falls within the West Berkshire administrative area, the retail impact assessment submitted in support of the application indicates that 31% of the turnover of the proposed store (total estimated turnover at 2021 of £74.9m) will be diverted from stores within Reading Borough (town centre and retail parks), and therefore we have factored this amount of trade diversion in as a ‘commitment’.
Table 7.3: Comparison goods planning commitments at 31st March 2016, Reading Borough
Commitment name
Estimated comparison goods t/o 2021 (£m)
Estimated comparison goods t/o 2026 (£m)
Estimated comparison goods t/o 2031 (£m)
Estimated comparison goods t/o 2036 (£m)
Oracle Centre extension, Reading town centre
10.0 10.8 11.7 12.1
Former Royal Mail sorting office, Caversham
8.2 9.0 9.7 10.0
Station Hill, Reading 29.3 31.8 34.5 35.7
Primark extension, Reading town centre
5.7 6.1 6.7 6.9
Porcelanosa, Rosa Kiln Lane, Reading
2.6 2.9 3.1 3.2
Dee Park Estate, Reading 2.1 2.2 2.4 2.5
IKEA, Berkshire Retail Park, Pincents Lane, Tilehurst (turnover from Reading LPA area)
23.2 25.2 27.3 28.2
Total 81.1 88.0 95.5 98.7
Source: Table 7, Appendix I
7.18 Table 7.3 shows that we have allowed for £81.1m of comparison goods spend to be
deducted from the total available expenditure at 2021. We have assumed all commitments will be under construction by 2021. By allowing for these ‘commitments’ to subsequently improve their own sales efficiency (turnover per sq.m), they amount to a ‘claim’ of £98.7m by the end of the Plan period in 2036.
7.19 The ‘baseline’ comparison goods capacity for the Borough for the period up to 2036 for Reading Borough is summarised in Table 7.4. These capacity forecasts are based on ‘constant market shares’, i.e. assuming that current patterns of comparison goods shopping (as identified in the household telephone survey) will remain unchanged. It should be noted that the fact that the out-of-centre floorspace generates its own ‘need’ does not mean the identified capacity should be used to support further development in these locations; rather it should be directed back towards the town centre (as well as district centres where appropriate) to support their long term vitality and viability.
7.20 Table 7.4 shows that in the short-term (to 2021) there is no need to plan for significant amounts of additional comparison goods retail floorspace in Reading Borough, with a
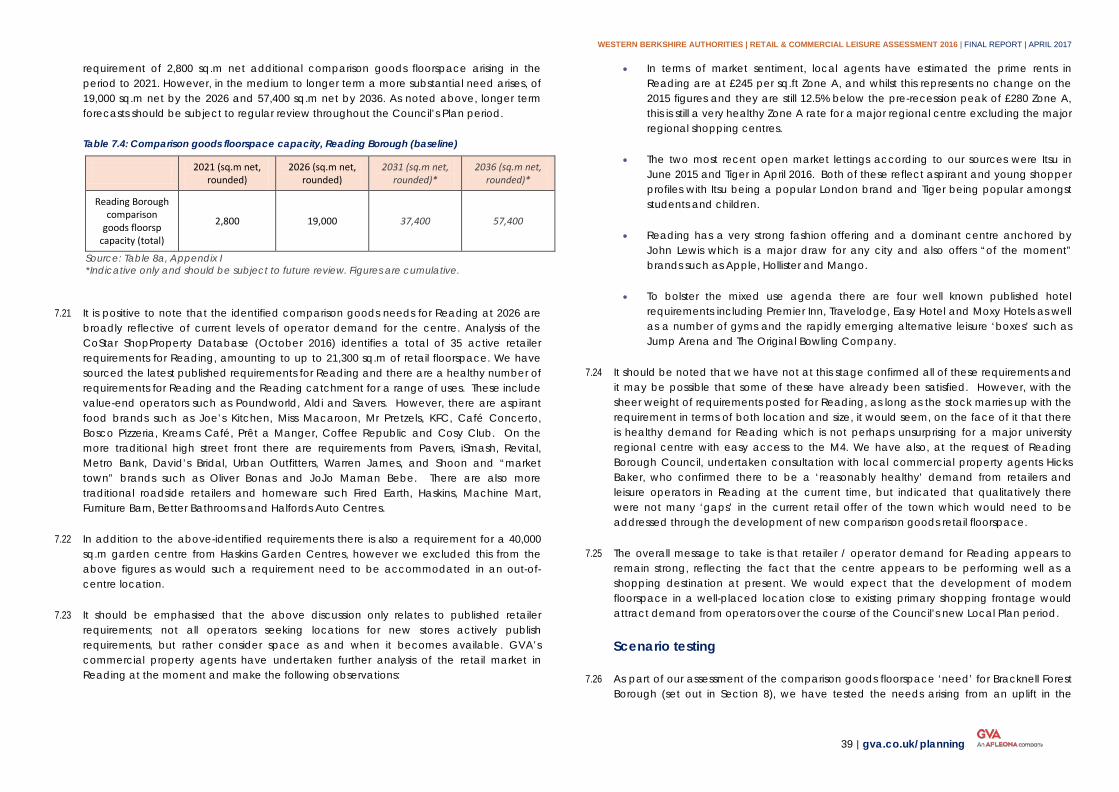
WESTERN BERKSHIRE AUTHORITIES | RETAIL & COMMERCIAL LEISURE ASSESSMENT 2016 | FINAL REPORT | APRIL 2017
39 | gva.co.uk/planning
requirement of 2,800 sq.m net additional comparison goods floorspace arising in the period to 2021. However, in the medium to longer term a more substantial need arises, of 19,000 sq.m net by the 2026 and 57,400 sq.m net by 2036. As noted above, longer term forecasts should be subject to regular review throughout the Council’s Plan period.
Table 7.4: Comparison goods floorspace capacity, Reading Borough (baseline)
2021 (sq.m net, rounded)
2026 (sq.m net, rounded)
2031 (sq.m net, rounded)*
2036 (sq.m net, rounded)*
Reading Borough comparison
goods floorsp capacity (total)
2,800 19,000 37,400 57,400
Source: Table 8a, Appendix I *Indicative only and should be subject to future review. Figures are cumulative.
7.21 It is positive to note that the identified comparison goods needs for Reading at 2026 are broadly reflective of current levels of operator demand for the centre. Analysis of the CoStar ShopProperty Database (October 2016) identifies a total of 35 active retailer requirements for Reading, amounting to up to 21,300 sq.m of retail floorspace. We have sourced the latest published requirements for Reading and there are a healthy number of requirements for Reading and the Reading catchment for a range of uses. These include value-end operators such as Poundworld, Aldi and Savers. However, there are aspirant food brands such as Joe’s Kitchen, Miss Macaroon, Mr Pretzels, KFC, Café Concerto, Bosco Pizzeria, Kreams Café, Prêt a Manger, Coffee Republic and Cosy Club. On the more traditional high street front there are requirements from Pavers, iSmash, Revital, Metro Bank, David’s Bridal, Urban Outfitters, Warren James, and Shoon and “market town” brands such as Oliver Bonas and JoJo Maman Bebe. There are also more traditional roadside retailers and homeware such Fired Earth, Haskins, Machine Mart, Furniture Barn, Better Bathrooms and Halfords Auto Centres.
7.22 In addition to the above-identified requirements there is also a requirement for a 40,000 sq.m garden centre from Haskins Garden Centres, however we excluded this from the above figures as would such a requirement need to be accommodated in an out-of-centre location.
7.23 It should be emphasised that the above discussion only relates to published retailer requirements; not all operators seeking locations for new stores actively publish requirements, but rather consider space as and when it becomes available. GVA’s commercial property agents have undertaken further analysis of the retail market in Reading at the moment and make the following observations:
• In terms of market sentiment, local agents have estimated the prime rents in Reading are at £245 per sq.ft Zone A, and whilst this represents no change on the 2015 figures and they are still 12.5% below the pre-recession peak of £280 Zone A, this is still a very healthy Zone A rate for a major regional centre excluding the major regional shopping centres.
• The two most recent open market lettings according to our sources were Itsu in June 2015 and Tiger in April 2016. Both of these reflect aspirant and young shopper profiles with Itsu being a popular London brand and Tiger being popular amongst students and children.
• Reading has a very strong fashion offering and a dominant centre anchored by John Lewis which is a major draw for any city and also offers “of the moment” brands such as Apple, Hollister and Mango.
• To bolster the mixed use agenda there are four well known published hotel requirements including Premier Inn, Travelodge, Easy Hotel and Moxy Hotels as well as a number of gyms and the rapidly emerging alternative leisure ‘boxes’ such as Jump Arena and The Original Bowling Company.
7.24 It should be noted that we have not at this stage confirmed all of these requirements and it may be possible that some of these have already been satisfied. However, with the sheer weight of requirements posted for Reading, as long as the stock marries up with the requirement in terms of both location and size, it would seem, on the face of it that there is healthy demand for Reading which is not perhaps unsurprising for a major university regional centre with easy access to the M4. We have also, at the request of Reading Borough Council, undertaken consultation with local commercial property agents Hicks Baker, who confirmed there to be a ‘reasonably healthy’ demand from retailers and leisure operators in Reading at the current time, but indicated that qualitatively there were not many ‘gaps’ in the current retail offer of the town which would need to be addressed through the development of new comparison goods retail floorspace.
7.25 The overall message to take is that retailer / operator demand for Reading appears to remain strong, reflecting the fact that the centre appears to be performing well as a shopping destination at present. We would expect that the development of modern floorspace in a well-placed location close to existing primary shopping frontage would attract demand from operators over the course of the Council’s new Local Plan period.
Scenario testing
7.26 As part of our assessment of the comparison goods floorspace ‘need’ for Bracknell Forest Borough (set out in Section 8), we have tested the needs arising from an uplift in the
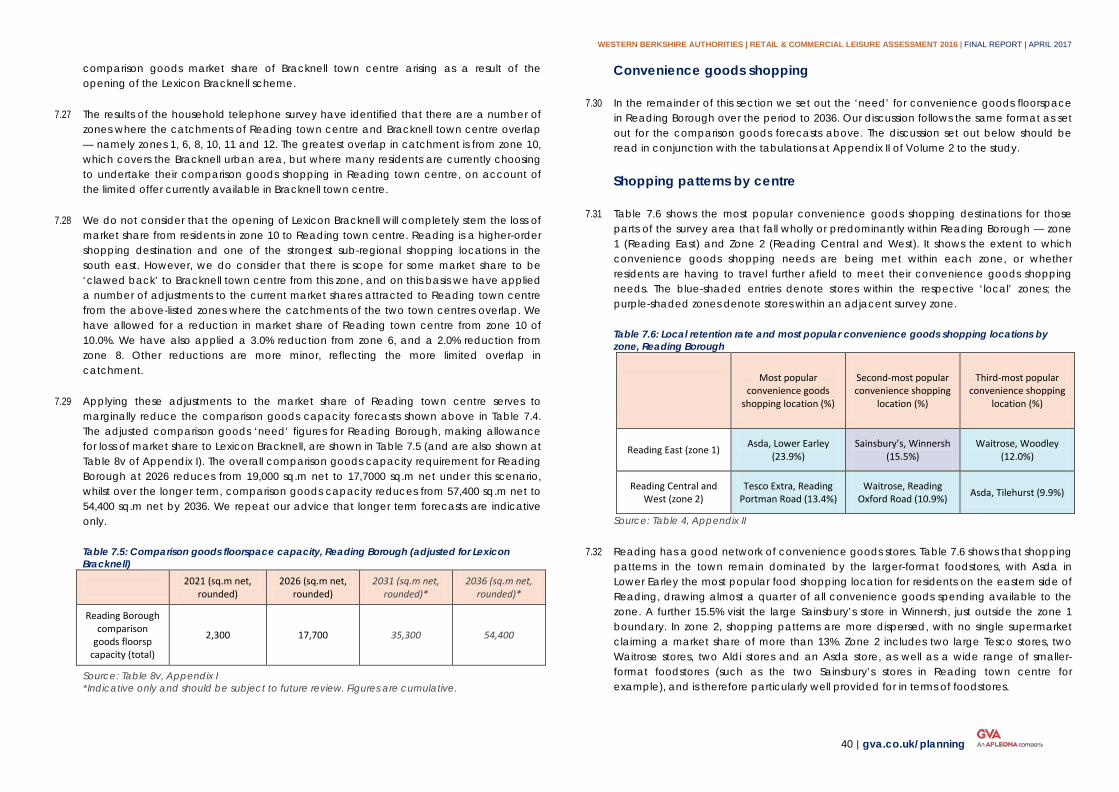
WESTERN BERKSHIRE AUTHORITIES | RETAIL & COMMERCIAL LEISURE ASSESSMENT 2016 | FINAL REPORT | APRIL 2017
40 | gva.co.uk/planning
comparison goods market share of Bracknell town centre arising as a result of the opening of the Lexicon Bracknell scheme.
7.27 The results of the household telephone survey have identified that there are a number of zones where the catchments of Reading town centre and Bracknell town centre overlap — namely zones 1, 6, 8, 10, 11 and 12. The greatest overlap in catchment is from zone 10, which covers the Bracknell urban area, but where many residents are currently choosing to undertake their comparison goods shopping in Reading town centre, on account of the limited offer currently available in Bracknell town centre.
7.28 We do not consider that the opening of Lexicon Bracknell will completely stem the loss of market share from residents in zone 10 to Reading town centre. Reading is a higher-order shopping destination and one of the strongest sub-regional shopping locations in the south east. However, we do consider that there is scope for some market share to be ‘clawed back’ to Bracknell town centre from this zone, and on this basis we have applied a number of adjustments to the current market shares attracted to Reading town centre from the above-listed zones where the catchments of the two town centres overlap. We have allowed for a reduction in market share of Reading town centre from zone 10 of 10.0%. We have also applied a 3.0% reduction from zone 6, and a 2.0% reduction from zone 8. Other reductions are more minor, reflecting the more limited overlap in catchment.
7.29 Applying these adjustments to the market share of Reading town centre serves to marginally reduce the comparison goods capacity forecasts shown above in Table 7.4. The adjusted comparison goods ‘need’ figures for Reading Borough, making allowance for loss of market share to Lexicon Bracknell, are shown in Table 7.5 (and are also shown at Table 8v of Appendix I). The overall comparison goods capacity requirement for Reading Borough at 2026 reduces from 19,000 sq.m net to 17,7000 sq.m net under this scenario, whilst over the longer term, comparison goods capacity reduces from 57,400 sq.m net to 54,400 sq.m net by 2036. We repeat our advice that longer term forecasts are indicative only.
Table 7.5: Comparison goods floorspace capacity, Reading Borough (adjusted for Lexicon Bracknell)
2021 (sq.m net, rounded)
2026 (sq.m net, rounded)
2031 (sq.m net, rounded)*
2036 (sq.m net, rounded)*
Reading Borough comparison
goods floorsp capacity (total)
2,300 17,700 35,300 54,400
Source: Table 8v, Appendix I *Indicative only and should be subject to future review. Figures are cumulative.
Convenience goods shopping
7.30 In the remainder of this section we set out the ‘need’ for convenience goods floorspace in Reading Borough over the period to 2036. Our discussion follows the same format as set out for the comparison goods forecasts above. The discussion set out below should be read in conjunction with the tabulations at Appendix II of Volume 2 to the study.
Shopping patterns by centre
7.31 Table 7.6 shows the most popular convenience goods shopping destinations for those parts of the survey area that fall wholly or predominantly within Reading Borough — zone 1 (Reading East) and Zone 2 (Reading Central and West). It shows the extent to which convenience goods shopping needs are being met within each zone, or whether residents are having to travel further afield to meet their convenience goods shopping needs. The blue-shaded entries denote stores within the respective ‘local’ zones; the purple-shaded zones denote stores within an adjacent survey zone.
Table 7.6: Local retention rate and most popular convenience goods shopping locations by zone, Reading Borough
Most popular
convenience goods shopping location (%)
Second-most popular convenience shopping
location (%)
Third-most popular convenience shopping
location (%)
Reading East (zone 1) Asda, Lower Earley (23.9%)
Sainsbury’s, Winnersh (15.5%)
Waitrose, Woodley (12.0%)
Reading Central and West (zone 2)
Tesco Extra, Reading Portman Road (13.4%)
Waitrose, Reading Oxford Road (10.9%) Asda, Tilehurst (9.9%)
Source: Table 4, Appendix II
7.32 Reading has a good network of convenience goods stores. Table 7.6 shows that shopping patterns in the town remain dominated by the larger-format foodstores, with Asda in Lower Earley the most popular food shopping location for residents on the eastern side of Reading, drawing almost a quarter of all convenience goods spending available to the zone. A further 15.5% visit the large Sainsbury’s store in Winnersh, just outside the zone 1 boundary. In zone 2, shopping patterns are more dispersed, with no single supermarket claiming a market share of more than 13%. Zone 2 includes two large Tesco stores, two Waitrose stores, two Aldi stores and an Asda store, as well as a wide range of smaller-format foodstores (such as the two Sainsbury’s stores in Reading town centre for example), and is therefore particularly well provided for in terms of foodstores.
WESTERN BERKSHIRE AUTHORITIES | RETAIL & COMMERCIAL LEISURE ASSESSMENT 2016 | FINAL REPORT | APRIL 2017
41 | gva.co.uk/planning
7.33 Looking at overall convenience goods expenditure retention rates, it can be seen that from Table 4 in Appendix II that 78.0% of convenience goods expenditure is retained within the Reading urban area for residents in zone 1, and 87.0% in zone 2. This reflects the fact that the western side of Reading is generally more strongly provided for in terms of foodstores (as discussed above), and residents in zone 1 tend to rely on local/smaller foodstores to a greater extent than those in zone 2.
Performance assessment
7.34 In Tables 6 and 8 of Appendix II, we have undertaken a review of the trading performance of the convenience goods floorspace in the Borough, to establish whether the floorspace is trading in line with ‘benchmark’ levels (i.e. company averages for national operators, or typical sales densities for independent retailers). On average, convenience goods floorspace in Reading Borough is trading at £11,325 per sq.m, which represents a relatively high sales density, and one which reflects the fact that the majority of convenience goods shopping by residents in the Borough takes place in large-format foodstores.
7.35 When analysing the performance of convenience goods floorspace in Reading it needs to be remembered that parts of the Reading urban area are served by foodstores which fall within the neighbouring authority area of Wokingham, and indeed many of the strongest performing stores in the Reading urban area fall outside the Council’s administrative boundary. For example, Table 6 of Appendix II shows that:
• The Asda store at Lower Earley, which falls within the Wokingham Borough, is trading at +£48.3m above company average levels;
• The Lidl store at Woodley, which falls within the Wokingham Borough, is trading at +£17.4m above company average levels; and
• The Waitrose store at Woodley, which also falls within the Wokingham Borough, is trading at +£14.8m above company average levels.
7.36 The household survey results confirm that these stores are well used by residents in eastern Reading (zone 1), and they therefore clearly form part of the town’s convenience goods offer. However, in order to provide each authority with a clear indication of the needs which it should plan for, the strong trading performance of these centres is factored are factored into the capacity requirements for Wokingham Borough, which are set out in Section 10 of this report.
7.37 Elsewhere in the Reading urban area, the performance of foodstores is generally more mixed, and none of the foodstores are over-trading to the extent of the foodstores listed above. Certain foodstores appear to be trading strongly however, most notably:
• Aldi at Bath Road, Reading, which is trading at +£12.9m above company average levels;
• Waitrose at Oxford Road, Reading, which is trading at +£9.1m above company average levels; and
• Co-Operative in Tilehurst district centre which is trading at +£8.9m above company average levels.
7.38 Aside from these, the performance of most foodstores is more closely aligned to the expected ‘benchmark’ trading levels. However our analysis shows that two large stores in the Reading area appear to be trading less strongly — the Morrisons store at Basingstoke Road and the Tesco Extra store at Napier Road are both shows as considerably ‘under-trading’ against ‘benchmark’ levels. The extent of the under-trading of these stores means that, on aggregate, existing stores in the Reading Borough are under-trading — but when including those foodstores that fall outside the Borough boundaries, the position is one of considerable over-trading, on aggregate +£125.1m against company ‘benchmark’ levels.
Identification of convenience goods capacity
7.39 Having set out the population and expenditure growth expected to come forward in the convenience goods sector (Section 6) and undertaken the analysis of shopping patterns (above), Table 7.8 shows the capacity for convenience goods floorspace in Reading Borough over the period to 2036. As with the comparison goods capacity forecasts which we have set out above, it is important to note that forecasts become increasingly open to margins of error over time, and accordingly should be refreshed throughout the Council’s Plan period.
7.40 The capacity forecasts make allowance for the ‘commitments’ shown in Table 7.7 to act as ‘claims’ on the amount of convenience goods spending which is available to support new floorspace. This information is based on monitoring information provided by the Council; turnover estimates are either based on our own estimates, or information provided in support of the corresponding planning application.
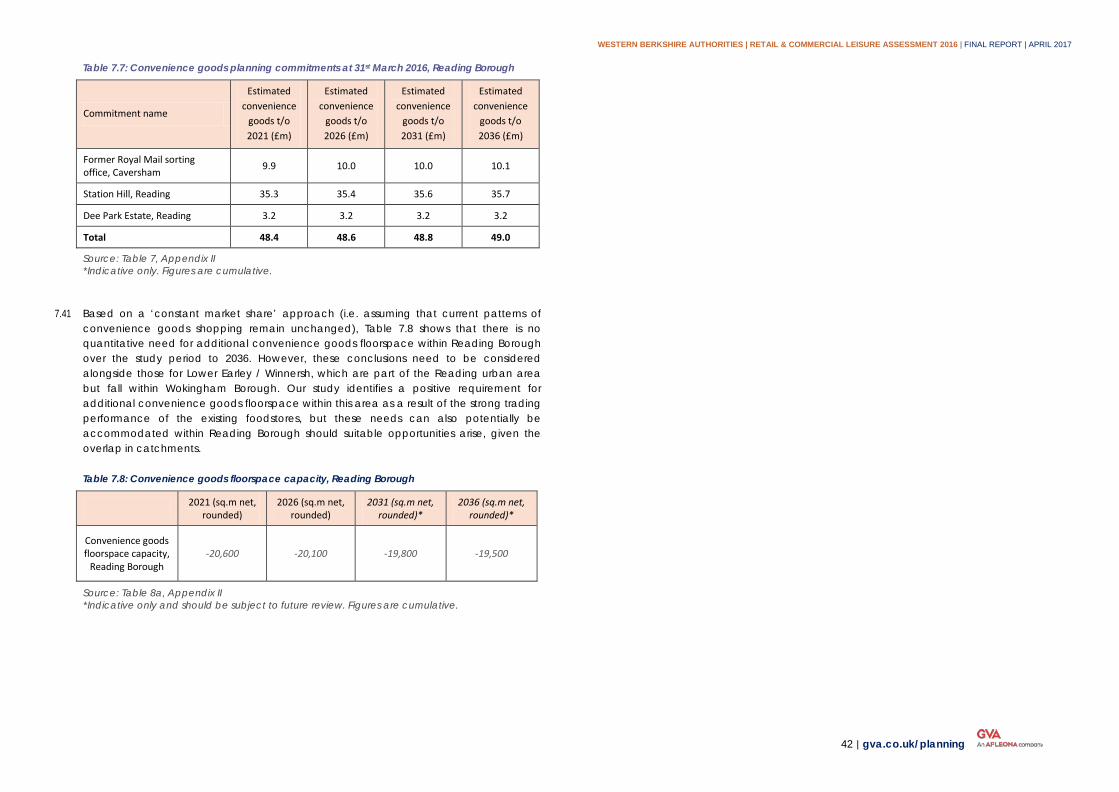
WESTERN BERKSHIRE AUTHORITIES | RETAIL & COMMERCIAL LEISURE ASSESSMENT 2016 | FINAL REPORT | APRIL 2017
42 | gva.co.uk/planning
Table 7.7: Convenience goods planning commitments at 31st March 2016, Reading Borough
Commitment name
Estimated convenience
goods t/o 2021 (£m)
Estimated convenience
goods t/o 2026 (£m)
Estimated convenience
goods t/o 2031 (£m)
Estimated convenience
goods t/o 2036 (£m)
Former Royal Mail sorting office, Caversham 9.9 10.0 10.0 10.1
Station Hill, Reading 35.3 35.4 35.6 35.7
Dee Park Estate, Reading 3.2 3.2 3.2 3.2
Total 48.4 48.6 48.8 49.0
Source: Table 7, Appendix II *Indicative only. Figures are cumulative.
7.41 Based on a ‘constant market share’ approach (i.e. assuming that current patterns of convenience goods shopping remain unchanged), Table 7.8 shows that there is no quantitative need for additional convenience goods floorspace within Reading Borough over the study period to 2036. However, these conclusions need to be considered alongside those for Lower Earley / Winnersh, which are part of the Reading urban area but fall within Wokingham Borough. Our study identifies a positive requirement for additional convenience goods floorspace within this area as a result of the strong trading performance of the existing foodstores, but these needs can also potentially be accommodated within Reading Borough should suitable opportunities arise, given the overlap in catchments.
Table 7.8: Convenience goods floorspace capacity, Reading Borough
2021 (sq.m net, rounded)
2026 (sq.m net, rounded)
2031 (sq.m net, rounded)*
2036 (sq.m net, rounded)*
Convenience goods floorspace capacity,
Reading Borough -20,600 -20,100 -19,800 -19,500
Source: Table 8a, Appendix II *Indicative only and should be subject to future review. Figures are cumulative.
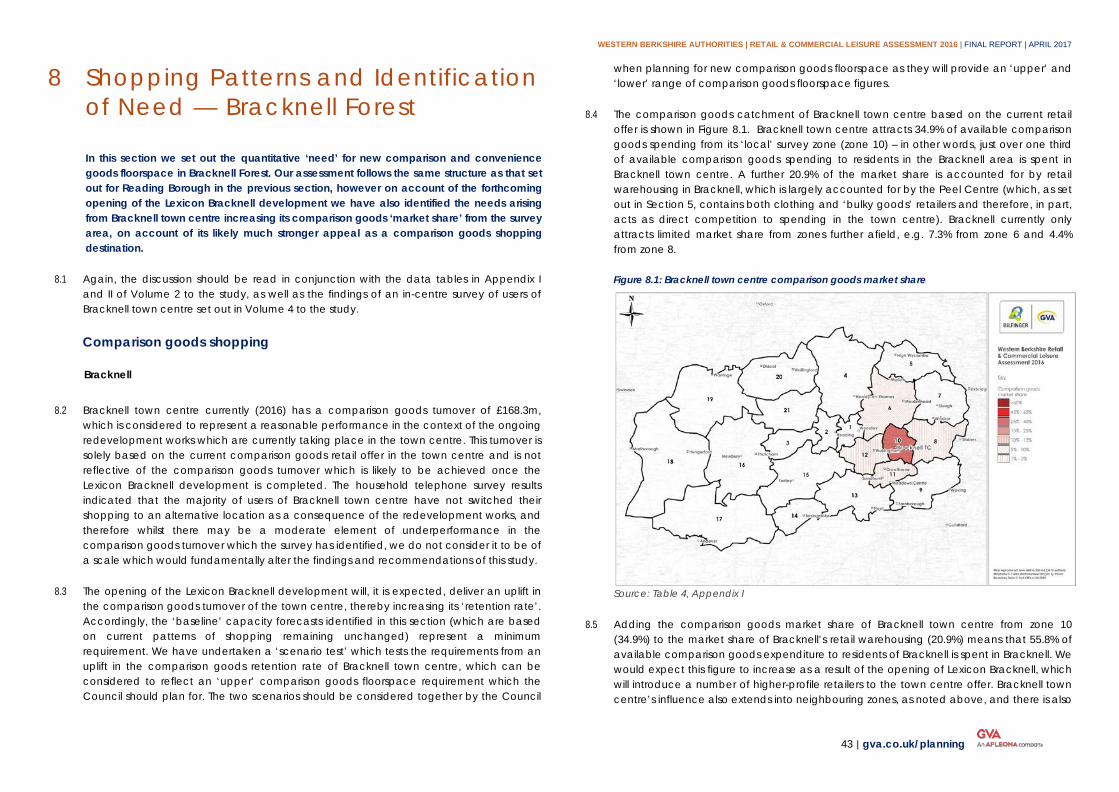
WESTERN BERKSHIRE AUTHORITIES | RETAIL & COMMERCIAL LEISURE ASSESSMENT 2016 | FINAL REPORT | APRIL 2017
43 | gva.co.uk/planning
Shopping Patterns and Identification 8of Need — Bracknell Forest
In this section we set out the quantitative ‘need’ for new comparison and convenience goods floorspace in Bracknell Forest. Our assessment follows the same structure as that set out for Reading Borough in the previous section, however on account of the forthcoming opening of the Lexicon Bracknell development we have also identified the needs arising from Bracknell town centre increasing its comparison goods ‘market share’ from the survey area, on account of its likely much stronger appeal as a comparison goods shopping destination.
8.1 Again, the discussion should be read in conjunction with the data tables in Appendix I and II of Volume 2 to the study, as well as the findings of an in-centre survey of users of Bracknell town centre set out in Volume 4 to the study.
Comparison goods shopping
Bracknell
8.2 Bracknell town centre currently (2016) has a comparison goods turnover of £168.3m, which is considered to represent a reasonable performance in the context of the ongoing redevelopment works which are currently taking place in the town centre. This turnover is solely based on the current comparison goods retail offer in the town centre and is not reflective of the comparison goods turnover which is likely to be achieved once the Lexicon Bracknell development is completed. The household telephone survey results indicated that the majority of users of Bracknell town centre have not switched their shopping to an alternative location as a consequence of the redevelopment works, and therefore whilst there may be a moderate element of underperformance in the comparison goods turnover which the survey has identified, we do not consider it to be of a scale which would fundamentally alter the findings and recommendations of this study.
8.3 The opening of the Lexicon Bracknell development will, it is expected, deliver an uplift in the comparison goods turnover of the town centre, thereby increasing its ‘retention rate’. Accordingly, the ‘baseline’ capacity forecasts identified in this section (which are based on current patterns of shopping remaining unchanged) represent a minimum requirement. We have undertaken a ‘scenario test’ which tests the requirements from an uplift in the comparison goods retention rate of Bracknell town centre, which can be considered to reflect an ‘upper’ comparison goods floorspace requirement which the Council should plan for. The two scenarios should be considered together by the Council
when planning for new comparison goods floorspace as they will provide an ‘upper’ and ‘lower’ range of comparison goods floorspace figures.
8.4 The comparison goods catchment of Bracknell town centre based on the current retail offer is shown in Figure 8.1. Bracknell town centre attracts 34.9% of available comparison goods spending from its ‘local’ survey zone (zone 10) – in other words, just over one third of available comparison goods spending to residents in the Bracknell area is spent in Bracknell town centre. A further 20.9% of the market share is accounted for by retail warehousing in Bracknell, which is largely accounted for by the Peel Centre (which, as set out in Section 5, contains both clothing and ‘bulky goods’ retailers and therefore, in part, acts as direct competition to spending in the town centre). Bracknell currently only attracts limited market share from zones further afield, e.g. 7.3% from zone 6 and 4.4% from zone 8.
Figure 8.1: Bracknell town centre comparison goods market share
Source: Table 4, Appendix I
8.5 Adding the comparison goods market share of Bracknell town centre from zone 10 (34.9%) to the market share of Bracknell’s retail warehousing (20.9%) means that 55.8% of available comparison goods expenditure to residents of Bracknell is spent in Bracknell. We would expect this figure to increase as a result of the opening of Lexicon Bracknell, which will introduce a number of higher-profile retailers to the town centre offer. Bracknell town centre’s influence also extends into neighbouring zones, as noted above, and there is also
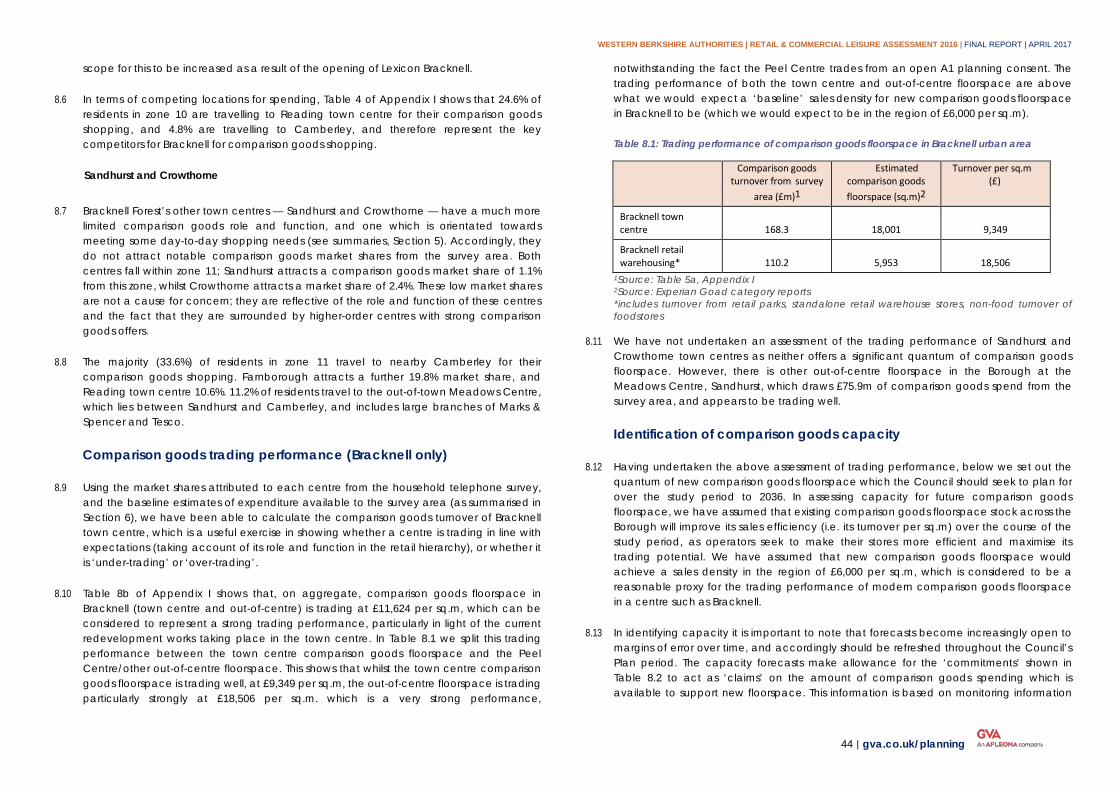
WESTERN BERKSHIRE AUTHORITIES | RETAIL & COMMERCIAL LEISURE ASSESSMENT 2016 | FINAL REPORT | APRIL 2017
44 | gva.co.uk/planning
scope for this to be increased as a result of the opening of Lexicon Bracknell.
8.6 In terms of competing locations for spending, Table 4 of Appendix I shows that 24.6% of residents in zone 10 are travelling to Reading town centre for their comparison goods shopping, and 4.8% are travelling to Camberley, and therefore represent the key competitors for Bracknell for comparison goods shopping.
Sandhurst and Crowthorne
8.7 Bracknell Forest’s other town centres — Sandhurst and Crowthorne — have a much more limited comparison goods role and function, and one which is orientated towards meeting some day-to-day shopping needs (see summaries, Section 5). Accordingly, they do not attract notable comparison goods market shares from the survey area. Both centres fall within zone 11; Sandhurst attracts a comparison goods market share of 1.1% from this zone, whilst Crowthorne attracts a market share of 2.4%. These low market shares are not a cause for concern; they are reflective of the role and function of these centres and the fact that they are surrounded by higher-order centres with strong comparison goods offers.
8.8 The majority (33.6%) of residents in zone 11 travel to nearby Camberley for their comparison goods shopping. Farnborough attracts a further 19.8% market share, and Reading town centre 10.6%. 11.2% of residents travel to the out-of-town Meadows Centre, which lies between Sandhurst and Camberley, and includes large branches of Marks & Spencer and Tesco.
Comparison goods trading performance (Bracknell only)
8.9 Using the market shares attributed to each centre from the household telephone survey, and the baseline estimates of expenditure available to the survey area (as summarised in Section 6), we have been able to calculate the comparison goods turnover of Bracknell town centre, which is a useful exercise in showing whether a centre is trading in line with expectations (taking account of its role and function in the retail hierarchy), or whether it is ‘under-trading’ or ‘over-trading’.
8.10 Table 8b of Appendix I shows that, on aggregate, comparison goods floorspace in Bracknell (town centre and out-of-centre) is trading at £11,624 per sq.m, which can be considered to represent a strong trading performance, particularly in light of the current redevelopment works taking place in the town centre. In Table 8.1 we split this trading performance between the town centre comparison goods floorspace and the Peel Centre/other out-of-centre floorspace. This shows that whilst the town centre comparison goods floorspace is trading well, at £9,349 per sq.m, the out-of-centre floorspace is trading particularly strongly at £18,506 per sq.m. which is a very strong performance,
notwithstanding the fact the Peel Centre trades from an open A1 planning consent. The trading performance of both the town centre and out-of-centre floorspace are above what we would expect a ‘baseline’ sales density for new comparison goods floorspace in Bracknell to be (which we would expect to be in the region of £6,000 per sq.m).
Table 8.1: Trading performance of comparison goods floorspace in Bracknell urban area
Comparison goods turnover from survey
area (£m)1
Estimated comparison goods floorspace (sq.m)2
Turnover per sq.m (£)
Bracknell town centre
168.3
18,001
9,349
Bracknell retail warehousing*
110.2
5,953
18,506
1Source: Table 5a, Appendix I 2Source: Experian Goad category reports *includes turnover from retail parks, standalone retail warehouse stores, non-food turnover of foodstores
8.11 We have not undertaken an assessment of the trading performance of Sandhurst and Crowthorne town centres as neither offers a significant quantum of comparison goods floorspace. However, there is other out-of-centre floorspace in the Borough at the Meadows Centre, Sandhurst, which draws £75.9m of comparison goods spend from the survey area, and appears to be trading well.
Identification of comparison goods capacity
8.12 Having undertaken the above assessment of trading performance, below we set out the quantum of new comparison goods floorspace which the Council should seek to plan for over the study period to 2036. In assessing capacity for future comparison goods floorspace, we have assumed that existing comparison goods floorspace stock across the Borough will improve its sales efficiency (i.e. its turnover per sq.m) over the course of the study period, as operators seek to make their stores more efficient and maximise its trading potential. We have assumed that new comparison goods floorspace would achieve a sales density in the region of £6,000 per sq.m, which is considered to be a reasonable proxy for the trading performance of modern comparison goods floorspace in a centre such as Bracknell.
8.13 In identifying capacity it is important to note that forecasts become increasingly open to margins of error over time, and accordingly should be refreshed throughout the Council’s Plan period. The capacity forecasts make allowance for the ‘commitments’ shown in Table 8.2 to act as ‘claims’ on the amount of comparison goods spending which is available to support new floorspace. This information is based on monitoring information
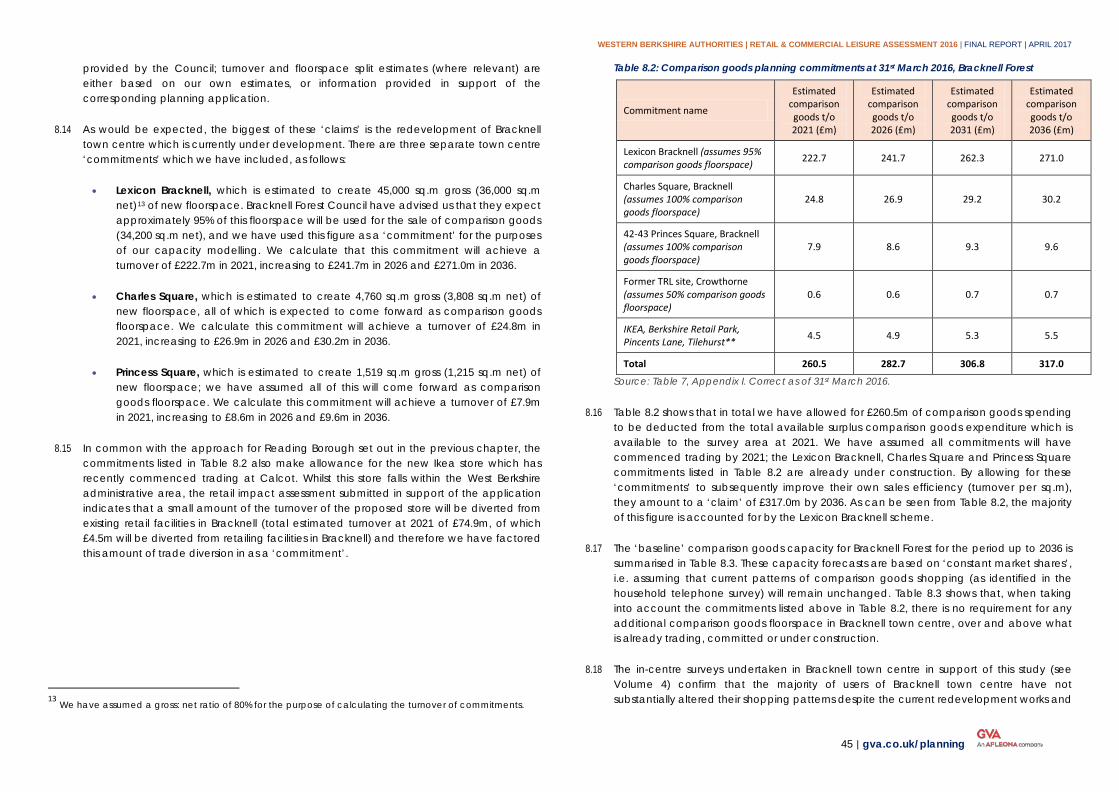
WESTERN BERKSHIRE AUTHORITIES | RETAIL & COMMERCIAL LEISURE ASSESSMENT 2016 | FINAL REPORT | APRIL 2017
45 | gva.co.uk/planning
provided by the Council; turnover and floorspace split estimates (where relevant) are either based on our own estimates, or information provided in support of the corresponding planning application.
8.14 As would be expected, the biggest of these ‘claims’ is the redevelopment of Bracknell town centre which is currently under development. There are three separate town centre ‘commitments’ which we have included, as follows:
• Lexicon Bracknell, which is estimated to create 45,000 sq.m gross (36,000 sq.m net)13 of new floorspace. Bracknell Forest Council have advised us that they expect approximately 95% of this floorspace will be used for the sale of comparison goods (34,200 sq.m net), and we have used this figure as a ‘commitment’ for the purposes of our capacity modelling. We calculate that this commitment will achieve a turnover of £222.7m in 2021, increasing to £241.7m in 2026 and £271.0m in 2036.
• Charles Square, which is estimated to create 4,760 sq.m gross (3,808 sq.m net) of new floorspace, all of which is expected to come forward as comparison goods floorspace. We calculate this commitment will achieve a turnover of £24.8m in 2021, increasing to £26.9m in 2026 and £30.2m in 2036.
• Princess Square, which is estimated to create 1,519 sq.m gross (1,215 sq.m net) of new floorspace; we have assumed all of this will come forward as comparison goods floorspace. We calculate this commitment will achieve a turnover of £7.9m in 2021, increasing to £8.6m in 2026 and £9.6m in 2036.
8.15 In common with the approach for Reading Borough set out in the previous chapter, the commitments listed in Table 8.2 also make allowance for the new Ikea store which has recently commenced trading at Calcot. Whilst this store falls within the West Berkshire administrative area, the retail impact assessment submitted in support of the application indicates that a small amount of the turnover of the proposed store will be diverted from existing retail facilities in Bracknell (total estimated turnover at 2021 of £74.9m, of which £4.5m will be diverted from retailing facilities in Bracknell) and therefore we have factored this amount of trade diversion in as a ‘commitment’.
13 We have assumed a gross: net ratio of 80% for the purpose of calculating the turnover of commitments.
Table 8.2: Comparison goods planning commitments at 31st March 2016, Bracknell Forest
Commitment name
Estimated comparison goods t/o 2021 (£m)
Estimated comparison goods t/o 2026 (£m)
Estimated comparison goods t/o 2031 (£m)
Estimated comparison goods t/o 2036 (£m)
Lexicon Bracknell (assumes 95% comparison goods floorspace) 222.7 241.7 262.3 271.0
Charles Square, Bracknell (assumes 100% comparison goods floorspace)
24.8 26.9 29.2 30.2
42-43 Princes Square, Bracknell (assumes 100% comparison goods floorspace)
7.9 8.6 9.3 9.6
Former TRL site, Crowthorne (assumes 50% comparison goods floorspace)
0.6 0.6 0.7 0.7
IKEA, Berkshire Retail Park, Pincents Lane, Tilehurst** 4.5 4.9 5.3 5.5
Total 260.5 282.7 306.8 317.0
Source: Table 7, Appendix I. Correct as of 31st March 2016.
8.16 Table 8.2 shows that in total we have allowed for £260.5m of comparison goods spending to be deducted from the total available surplus comparison goods expenditure which is available to the survey area at 2021. We have assumed all commitments will have commenced trading by 2021; the Lexicon Bracknell, Charles Square and Princess Square commitments listed in Table 8.2 are already under construction. By allowing for these ‘commitments’ to subsequently improve their own sales efficiency (turnover per sq.m), they amount to a ‘claim’ of £317.0m by 2036. As can be seen from Table 8.2, the majority of this figure is accounted for by the Lexicon Bracknell scheme.
8.17 The ‘baseline’ comparison goods capacity for Bracknell Forest for the period up to 2036 is summarised in Table 8.3. These capacity forecasts are based on ‘constant market shares’, i.e. assuming that current patterns of comparison goods shopping (as identified in the household telephone survey) will remain unchanged. Table 8.3 shows that, when taking into account the commitments listed above in Table 8.2, there is no requirement for any additional comparison goods floorspace in Bracknell town centre, over and above what is already trading, committed or under construction.
8.18 The in-centre surveys undertaken in Bracknell town centre in support of this study (see Volume 4) confirm that the majority of users of Bracknell town centre have not substantially altered their shopping patterns despite the current redevelopment works and
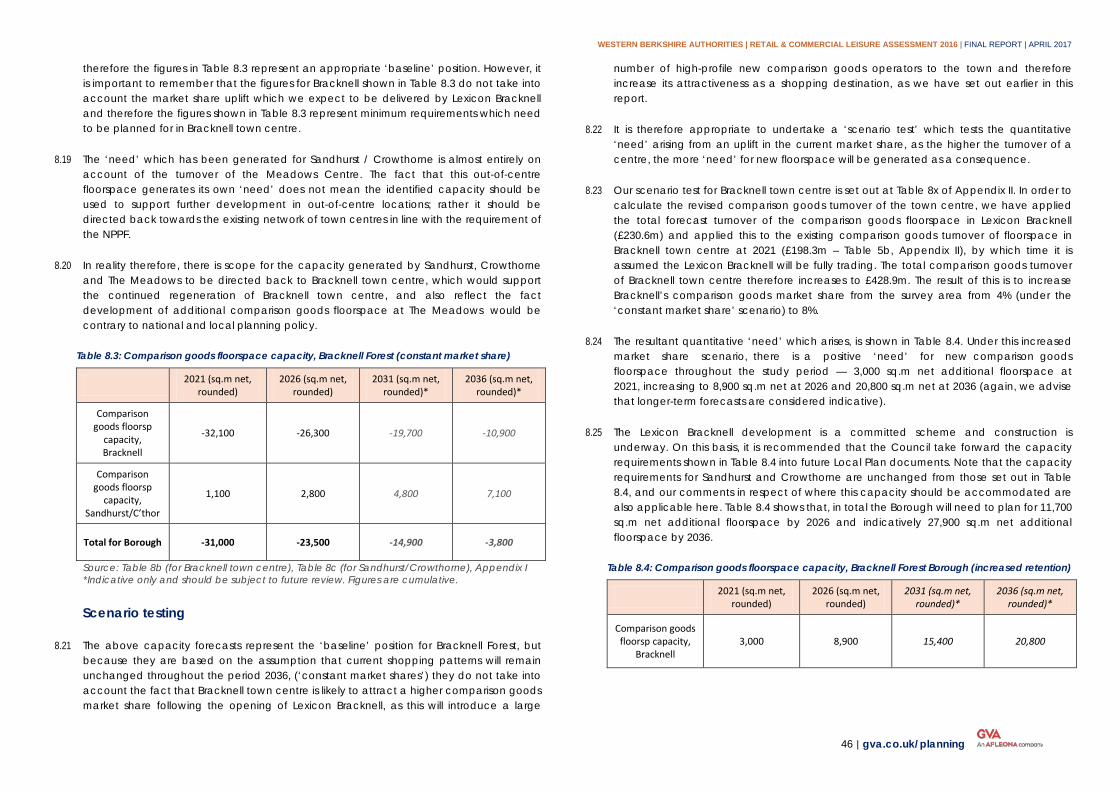
WESTERN BERKSHIRE AUTHORITIES | RETAIL & COMMERCIAL LEISURE ASSESSMENT 2016 | FINAL REPORT | APRIL 2017
46 | gva.co.uk/planning
therefore the figures in Table 8.3 represent an appropriate ‘baseline’ position. However, it is important to remember that the figures for Bracknell shown in Table 8.3 do not take into account the market share uplift which we expect to be delivered by Lexicon Bracknell and therefore the figures shown in Table 8.3 represent minimum requirements which need to be planned for in Bracknell town centre.
8.19 The ‘need’ which has been generated for Sandhurst / Crowthorne is almost entirely on account of the turnover of the Meadows Centre. The fact that this out-of-centre floorspace generates its own ‘need’ does not mean the identified capacity should be used to support further development in out-of-centre locations; rather it should be directed back towards the existing network of town centres in line with the requirement of the NPPF.
8.20 In reality therefore, there is scope for the capacity generated by Sandhurst, Crowthorne and The Meadows to be directed back to Bracknell town centre, which would support the continued regeneration of Bracknell town centre, and also reflect the fact development of additional comparison goods floorspace at The Meadows would be contrary to national and local planning policy.
Table 8.3: Comparison goods floorspace capacity, Bracknell Forest (constant market share)
2021 (sq.m net, rounded)
2026 (sq.m net, rounded)
2031 (sq.m net, rounded)*
2036 (sq.m net, rounded)*
Comparison goods floorsp
capacity, Bracknell
-32,100 -26,300 -19,700 -10,900
Comparison goods floorsp
capacity, Sandhurst/C’thor
1,100 2,800 4,800 7,100
Total for Borough -31,000 -23,500 -14,900 -3,800
Source: Table 8b (for Bracknell town centre), Table 8c (for Sandhurst/Crowthorne), Appendix I *Indicative only and should be subject to future review. Figures are cumulative.
Scenario testing
8.21 The above capacity forecasts represent the ‘baseline’ position for Bracknell Forest, but because they are based on the assumption that current shopping patterns will remain unchanged throughout the period 2036, (‘constant market shares’) they do not take into account the fact that Bracknell town centre is likely to attract a higher comparison goods market share following the opening of Lexicon Bracknell, as this will introduce a large
number of high-profile new comparison goods operators to the town and therefore increase its attractiveness as a shopping destination, as we have set out earlier in this report.
8.22 It is therefore appropriate to undertake a ‘scenario test’ which tests the quantitative ‘need’ arising from an uplift in the current market share, as the higher the turnover of a centre, the more ‘need’ for new floorspace will be generated as a consequence.
8.23 Our scenario test for Bracknell town centre is set out at Table 8x of Appendix II. In order to calculate the revised comparison goods turnover of the town centre, we have applied the total forecast turnover of the comparison goods floorspace in Lexicon Bracknell (£230.6m) and applied this to the existing comparison goods turnover of floorspace in Bracknell town centre at 2021 (£198.3m – Table 5b, Appendix II), by which time it is assumed the Lexicon Bracknell will be fully trading. The total comparison goods turnover of Bracknell town centre therefore increases to £428.9m. The result of this is to increase Bracknell’s comparison goods market share from the survey area from 4% (under the ‘constant market share’ scenario) to 8%.
8.24 The resultant quantitative ‘need’ which arises, is shown in Table 8.4. Under this increased market share scenario, there is a positive ‘need’ for new comparison goods floorspace throughout the study period — 3,000 sq.m net additional floorspace at 2021, increasing to 8,900 sq.m net at 2026 and 20,800 sq.m net at 2036 (again, we advise that longer-term forecasts are considered indicative).
8.25 The Lexicon Bracknell development is a committed scheme and construction is underway. On this basis, it is recommended that the Council take forward the capacity requirements shown in Table 8.4 into future Local Plan documents. Note that the capacity requirements for Sandhurst and Crowthorne are unchanged from those set out in Table 8.4, and our comments in respect of where this capacity should be accommodated are also applicable here. Table 8.4 shows that, in total the Borough will need to plan for 11,700 sq.m net additional floorspace by 2026 and indicatively 27,900 sq.m net additional floorspace by 2036.
Table 8.4: Comparison goods floorspace capacity, Bracknell Forest Borough (increased retention)
2021 (sq.m net, rounded)
2026 (sq.m net, rounded)
2031 (sq.m net, rounded)*
2036 (sq.m net, rounded)*
Comparison goods floorsp capacity,
Bracknell 3,000 8,900 15,400 20,800
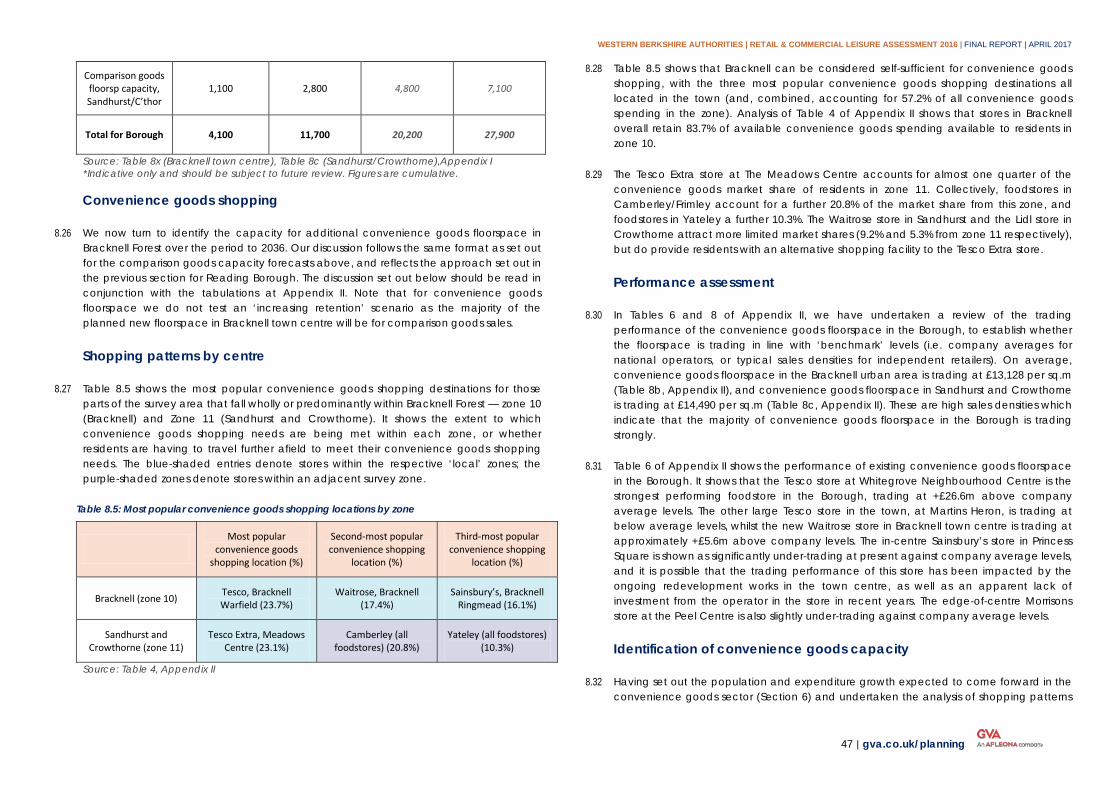
WESTERN BERKSHIRE AUTHORITIES | RETAIL & COMMERCIAL LEISURE ASSESSMENT 2016 | FINAL REPORT | APRIL 2017
47 | gva.co.uk/planning
Comparison goods floorsp capacity, Sandhurst/C’thor
1,100 2,800 4,800 7,100
Total for Borough 4,100 11,700 20,200 27,900
Source: Table 8x (Bracknell town centre), Table 8c (Sandhurst/Crowthorne),Appendix I *Indicative only and should be subject to future review. Figures are cumulative. Convenience goods shopping
8.26 We now turn to identify the capacity for additional convenience goods floorspace in Bracknell Forest over the period to 2036. Our discussion follows the same format as set out for the comparison goods capacity forecasts above, and reflects the approach set out in the previous section for Reading Borough. The discussion set out below should be read in conjunction with the tabulations at Appendix II. Note that for convenience goods floorspace we do not test an ‘increasing retention’ scenario as the majority of the planned new floorspace in Bracknell town centre will be for comparison goods sales.
Shopping patterns by centre
8.27 Table 8.5 shows the most popular convenience goods shopping destinations for those parts of the survey area that fall wholly or predominantly within Bracknell Forest — zone 10 (Bracknell) and Zone 11 (Sandhurst and Crowthorne). It shows the extent to which convenience goods shopping needs are being met within each zone, or whether residents are having to travel further afield to meet their convenience goods shopping needs. The blue-shaded entries denote stores within the respective ‘local’ zones; the purple-shaded zones denote stores within an adjacent survey zone.
Table 8.5: Most popular convenience goods shopping locations by zone
Most popular
convenience goods shopping location (%)
Second-most popular convenience shopping
location (%)
Third-most popular convenience shopping
location (%)
Bracknell (zone 10) Tesco, Bracknell Warfield (23.7%)
Waitrose, Bracknell (17.4%)
Sainsbury’s, Bracknell Ringmead (16.1%)
Sandhurst and Crowthorne (zone 11)
Tesco Extra, Meadows Centre (23.1%)
Camberley (all foodstores) (20.8%)
Yateley (all foodstores) (10.3%)
Source: Table 4, Appendix II
8.28 Table 8.5 shows that Bracknell can be considered self-sufficient for convenience goods shopping, with the three most popular convenience goods shopping destinations all located in the town (and, combined, accounting for 57.2% of all convenience goods spending in the zone). Analysis of Table 4 of Appendix II shows that stores in Bracknell overall retain 83.7% of available convenience goods spending available to residents in zone 10.
8.29 The Tesco Extra store at The Meadows Centre accounts for almost one quarter of the convenience goods market share of residents in zone 11. Collectively, foodstores in Camberley/Frimley account for a further 20.8% of the market share from this zone, and foodstores in Yateley a further 10.3%. The Waitrose store in Sandhurst and the Lidl store in Crowthorne attract more limited market shares (9.2% and 5.3% from zone 11 respectively), but do provide residents with an alternative shopping facility to the Tesco Extra store.
Performance assessment
8.30 In Tables 6 and 8 of Appendix II, we have undertaken a review of the trading performance of the convenience goods floorspace in the Borough, to establish whether the floorspace is trading in line with ‘benchmark’ levels (i.e. company averages for national operators, or typical sales densities for independent retailers). On average, convenience goods floorspace in the Bracknell urban area is trading at £13,128 per sq.m (Table 8b, Appendix II), and convenience goods floorspace in Sandhurst and Crowthorne is trading at £14,490 per sq.m (Table 8c, Appendix II). These are high sales densities which indicate that the majority of convenience goods floorspace in the Borough is trading strongly.
8.31 Table 6 of Appendix II shows the performance of existing convenience goods floorspace in the Borough. It shows that the Tesco store at Whitegrove Neighbourhood Centre is the strongest performing foodstore in the Borough, trading at +£26.6m above company average levels. The other large Tesco store in the town, at Martins Heron, is trading at below average levels, whilst the new Waitrose store in Bracknell town centre is trading at approximately +£5.6m above company levels. The in-centre Sainsbury’s store in Princess Square is shown as significantly under-trading at present against company average levels, and it is possible that the trading performance of this store has been impacted by the ongoing redevelopment works in the town centre, as well as an apparent lack of investment from the operator in the store in recent years. The edge-of-centre Morrisons store at the Peel Centre is also slightly under-trading against company average levels.
Identification of convenience goods capacity
8.32 Having set out the population and expenditure growth expected to come forward in the convenience goods sector (Section 6) and undertaken the analysis of shopping patterns
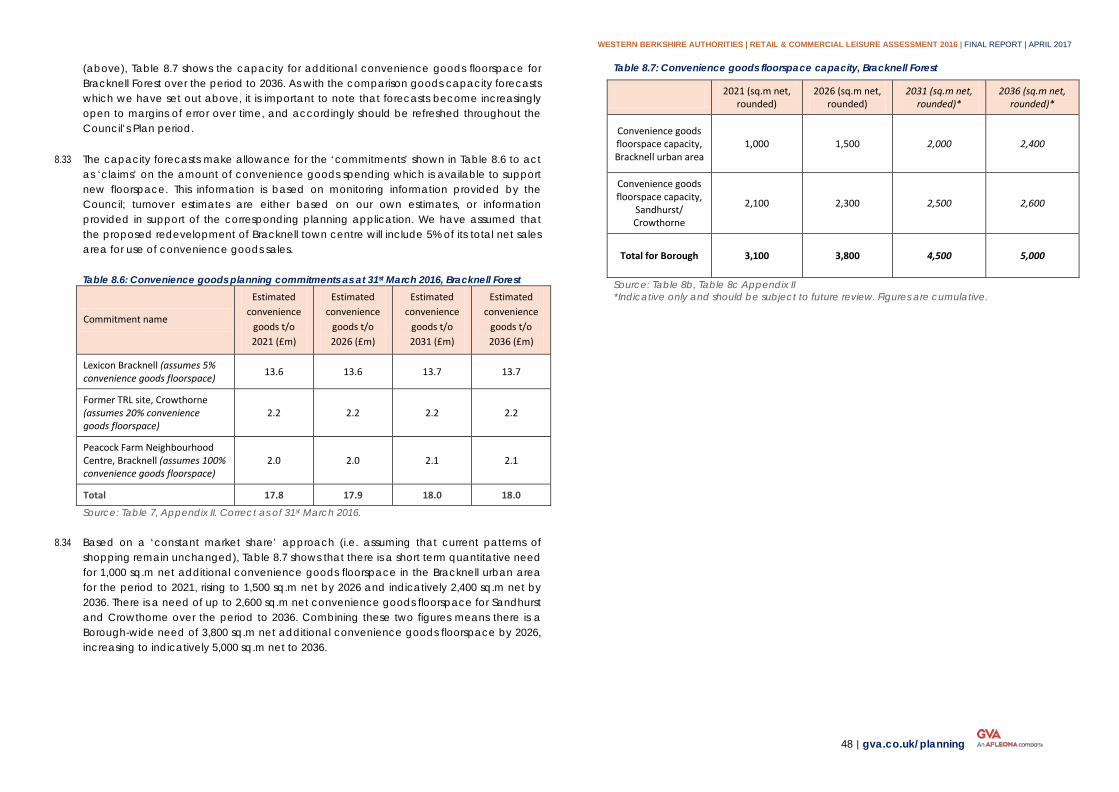
WESTERN BERKSHIRE AUTHORITIES | RETAIL & COMMERCIAL LEISURE ASSESSMENT 2016 | FINAL REPORT | APRIL 2017
48 | gva.co.uk/planning
(above), Table 8.7 shows the capacity for additional convenience goods floorspace for Bracknell Forest over the period to 2036. As with the comparison goods capacity forecasts which we have set out above, it is important to note that forecasts become increasingly open to margins of error over time, and accordingly should be refreshed throughout the Council’s Plan period.
8.33 The capacity forecasts make allowance for the ‘commitments’ shown in Table 8.6 to act as ‘claims’ on the amount of convenience goods spending which is available to support new floorspace. This information is based on monitoring information provided by the Council; turnover estimates are either based on our own estimates, or information provided in support of the corresponding planning application. We have assumed that the proposed redevelopment of Bracknell town centre will include 5% of its total net sales area for use of convenience goods sales.
Table 8.6: Convenience goods planning commitments as at 31st March 2016, Bracknell Forest
Commitment name
Estimated convenience
goods t/o 2021 (£m)
Estimated convenience
goods t/o 2026 (£m)
Estimated convenience
goods t/o 2031 (£m)
Estimated convenience
goods t/o 2036 (£m)
Lexicon Bracknell (assumes 5% convenience goods floorspace) 13.6 13.6 13.7 13.7
Former TRL site, Crowthorne (assumes 20% convenience goods floorspace)
2.2 2.2 2.2 2.2
Peacock Farm Neighbourhood Centre, Bracknell (assumes 100% convenience goods floorspace)
2.0 2.0 2.1 2.1
Total 17.8 17.9 18.0 18.0
Source: Table 7, Appendix II. Correct as of 31st March 2016.
8.34 Based on a ‘constant market share’ approach (i.e. assuming that current patterns of shopping remain unchanged), Table 8.7 shows that there is a short term quantitative need for 1,000 sq.m net additional convenience goods floorspace in the Bracknell urban area for the period to 2021, rising to 1,500 sq.m net by 2026 and indicatively 2,400 sq.m net by 2036. There is a need of up to 2,600 sq.m net convenience goods floorspace for Sandhurst and Crowthorne over the period to 2036. Combining these two figures means there is a Borough-wide need of 3,800 sq.m net additional convenience goods floorspace by 2026, increasing to indicatively 5,000 sq.m net to 2036.
Table 8.7: Convenience goods floorspace capacity, Bracknell Forest
2021 (sq.m net, rounded)
2026 (sq.m net, rounded)
2031 (sq.m net, rounded)*
2036 (sq.m net, rounded)*
Convenience goods floorspace capacity, Bracknell urban area
1,000 1,500 2,000 2,400
Convenience goods floorspace capacity,
Sandhurst/ Crowthorne
2,100 2,300 2,500 2,600
Total for Borough 3,100 3,800 4,500 5,000
Source: Table 8b, Table 8c Appendix II *Indicative only and should be subject to future review. Figures are cumulative.
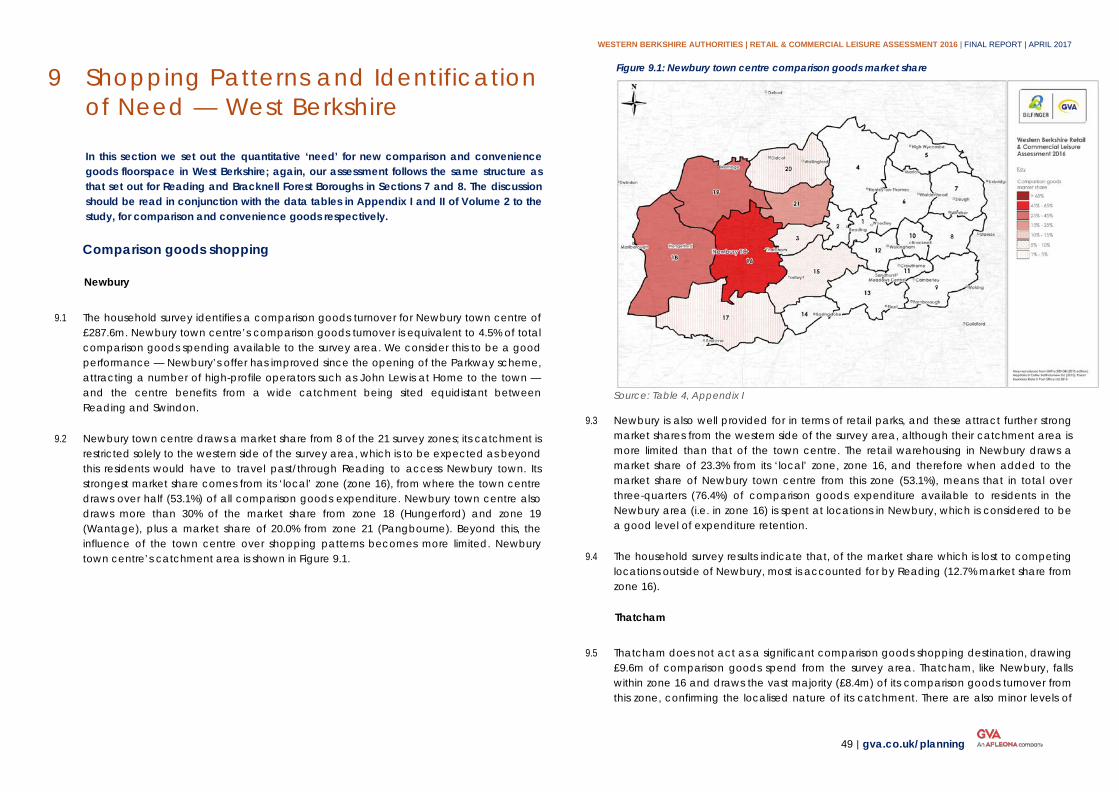
WESTERN BERKSHIRE AUTHORITIES | RETAIL & COMMERCIAL LEISURE ASSESSMENT 2016 | FINAL REPORT | APRIL 2017
49 | gva.co.uk/planning
Shopping Patterns and Identification 9of Need — West Berkshire In this section we set out the quantitative ‘need’ for new comparison and convenience goods floorspace in West Berkshire; again, our assessment follows the same structure as that set out for Reading and Bracknell Forest Boroughs in Sections 7 and 8. The discussion should be read in conjunction with the data tables in Appendix I and II of Volume 2 to the study, for comparison and convenience goods respectively.
Comparison goods shopping
Newbury
9.1 The household survey identifies a comparison goods turnover for Newbury town centre of £287.6m. Newbury town centre’s comparison goods turnover is equivalent to 4.5% of total comparison goods spending available to the survey area. We consider this to be a good performance — Newbury’s offer has improved since the opening of the Parkway scheme, attracting a number of high-profile operators such as John Lewis at Home to the town — and the centre benefits from a wide catchment being sited equidistant between Reading and Swindon.
9.2 Newbury town centre draws a market share from 8 of the 21 survey zones; its catchment is restricted solely to the western side of the survey area, which is to be expected as beyond this residents would have to travel past/through Reading to access Newbury town. Its strongest market share comes from its ‘local’ zone (zone 16), from where the town centre draws over half (53.1%) of all comparison goods expenditure. Newbury town centre also draws more than 30% of the market share from zone 18 (Hungerford) and zone 19 (Wantage), plus a market share of 20.0% from zone 21 (Pangbourne). Beyond this, the influence of the town centre over shopping patterns becomes more limited. Newbury town centre’s catchment area is shown in Figure 9.1.
Figure 9.1: Newbury town centre comparison goods market share
Source: Table 4, Appendix I
9.3 Newbury is also well provided for in terms of retail parks, and these attract further strong market shares from the western side of the survey area, although their catchment area is more limited than that of the town centre. The retail warehousing in Newbury draws a market share of 23.3% from its ‘local’ zone, zone 16, and therefore when added to the market share of Newbury town centre from this zone (53.1%), means that in total over three-quarters (76.4%) of comparison goods expenditure available to residents in the Newbury area (i.e. in zone 16) is spent at locations in Newbury, which is considered to be a good level of expenditure retention.
9.4 The household survey results indicate that, of the market share which is lost to competing locations outside of Newbury, most is accounted for by Reading (12.7% market share from zone 16).
Thatcham
9.5 Thatcham does not act as a significant comparison goods shopping destination, drawing £9.6m of comparison goods spend from the survey area. Thatcham, like Newbury, falls within zone 16 and draws the vast majority (£8.4m) of its comparison goods turnover from this zone, confirming the localised nature of its catchment. There are also minor levels of
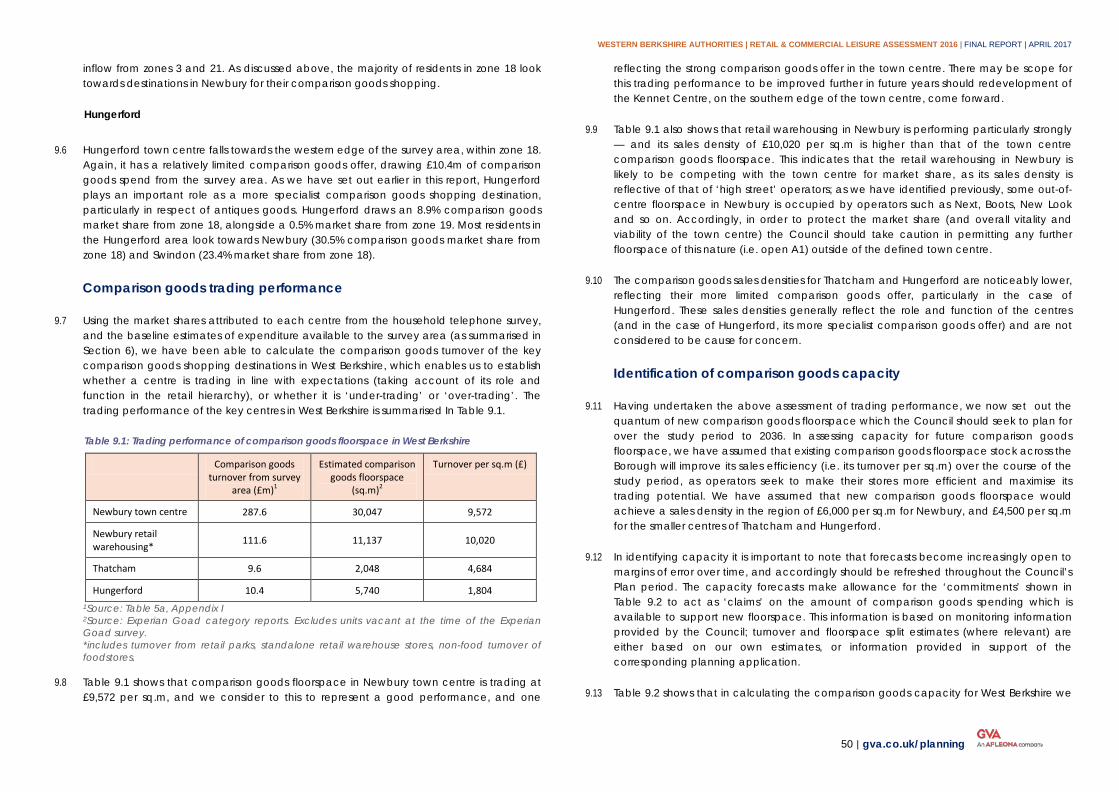
WESTERN BERKSHIRE AUTHORITIES | RETAIL & COMMERCIAL LEISURE ASSESSMENT 2016 | FINAL REPORT | APRIL 2017
50 | gva.co.uk/planning
inflow from zones 3 and 21. As discussed above, the majority of residents in zone 18 look towards destinations in Newbury for their comparison goods shopping.
Hungerford
9.6 Hungerford town centre falls towards the western edge of the survey area, within zone 18. Again, it has a relatively limited comparison goods offer, drawing £10.4m of comparison goods spend from the survey area. As we have set out earlier in this report, Hungerford plays an important role as a more specialist comparison goods shopping destination, particularly in respect of antiques goods. Hungerford draws an 8.9% comparison goods market share from zone 18, alongside a 0.5% market share from zone 19. Most residents in the Hungerford area look towards Newbury (30.5% comparison goods market share from zone 18) and Swindon (23.4% market share from zone 18).
Comparison goods trading performance
9.7 Using the market shares attributed to each centre from the household telephone survey, and the baseline estimates of expenditure available to the survey area (as summarised in Section 6), we have been able to calculate the comparison goods turnover of the key comparison goods shopping destinations in West Berkshire, which enables us to establish whether a centre is trading in line with expectations (taking account of its role and function in the retail hierarchy), or whether it is ‘under-trading’ or ‘over-trading’. The trading performance of the key centres in West Berkshire is summarised In Table 9.1.
Table 9.1: Trading performance of comparison goods floorspace in West Berkshire
Comparison goods turnover from survey
area (£m)1
Estimated comparison goods floorspace
(sq.m)2
Turnover per sq.m (£)
Newbury town centre 287.6 30,047 9,572
Newbury retail warehousing* 111.6 11,137 10,020
Thatcham 9.6 2,048 4,684
Hungerford 10.4 5,740 1,804 1Source: Table 5a, Appendix I 2Source: Experian Goad category reports. Excludes units vacant at the time of the Experian Goad survey. *includes turnover from retail parks, standalone retail warehouse stores, non-food turnover of foodstores.
9.8 Table 9.1 shows that comparison goods floorspace in Newbury town centre is trading at £9,572 per sq.m, and we consider to this to represent a good performance, and one
reflecting the strong comparison goods offer in the town centre. There may be scope for this trading performance to be improved further in future years should redevelopment of the Kennet Centre, on the southern edge of the town centre, come forward.
9.9 Table 9.1 also shows that retail warehousing in Newbury is performing particularly strongly — and its sales density of £10,020 per sq.m is higher than that of the town centre comparison goods floorspace. This indicates that the retail warehousing in Newbury is likely to be competing with the town centre for market share, as its sales density is reflective of that of ‘high street’ operators; as we have identified previously, some out-of-centre floorspace in Newbury is occupied by operators such as Next, Boots, New Look and so on. Accordingly, in order to protect the market share (and overall vitality and viability of the town centre) the Council should take caution in permitting any further floorspace of this nature (i.e. open A1) outside of the defined town centre.
9.10 The comparison goods sales densities for Thatcham and Hungerford are noticeably lower, reflecting their more limited comparison goods offer, particularly in the case of Hungerford. These sales densities generally reflect the role and function of the centres (and in the case of Hungerford, its more specialist comparison goods offer) and are not considered to be cause for concern.
Identification of comparison goods capacity
9.11 Having undertaken the above assessment of trading performance, we now set out the quantum of new comparison goods floorspace which the Council should seek to plan for over the study period to 2036. In assessing capacity for future comparison goods floorspace, we have assumed that existing comparison goods floorspace stock across the Borough will improve its sales efficiency (i.e. its turnover per sq.m) over the course of the study period, as operators seek to make their stores more efficient and maximise its trading potential. We have assumed that new comparison goods floorspace would achieve a sales density in the region of £6,000 per sq.m for Newbury, and £4,500 per sq.m for the smaller centres of Thatcham and Hungerford.
9.12 In identifying capacity it is important to note that forecasts become increasingly open to margins of error over time, and accordingly should be refreshed throughout the Council’s Plan period. The capacity forecasts make allowance for the ‘commitments’ shown in Table 9.2 to act as ‘claims’ on the amount of comparison goods spending which is available to support new floorspace. This information is based on monitoring information provided by the Council; turnover and floorspace split estimates (where relevant) are either based on our own estimates, or information provided in support of the corresponding planning application.
9.13 Table 9.2 shows that in calculating the comparison goods capacity for West Berkshire we
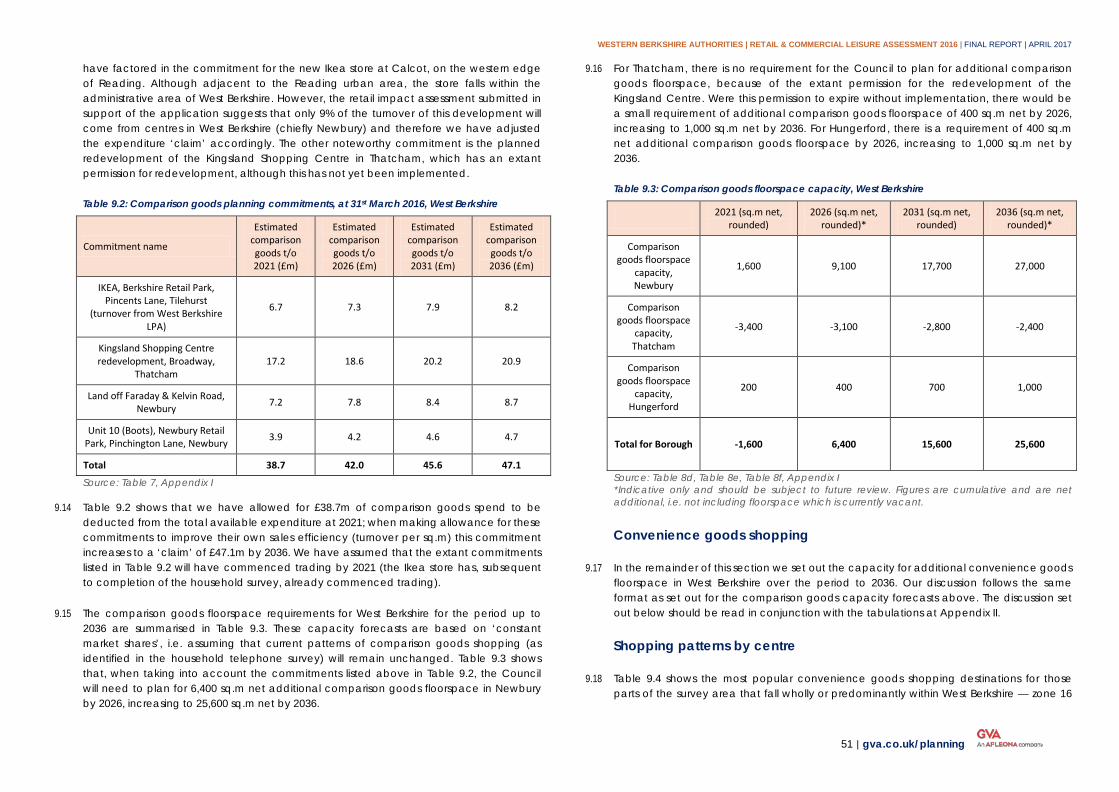
WESTERN BERKSHIRE AUTHORITIES | RETAIL & COMMERCIAL LEISURE ASSESSMENT 2016 | FINAL REPORT | APRIL 2017
51 | gva.co.uk/planning
have factored in the commitment for the new Ikea store at Calcot, on the western edge of Reading. Although adjacent to the Reading urban area, the store falls within the administrative area of West Berkshire. However, the retail impact assessment submitted in support of the application suggests that only 9% of the turnover of this development will come from centres in West Berkshire (chiefly Newbury) and therefore we have adjusted the expenditure ‘claim’ accordingly. The other noteworthy commitment is the planned redevelopment of the Kingsland Shopping Centre in Thatcham, which has an extant permission for redevelopment, although this has not yet been implemented.
Table 9.2: Comparison goods planning commitments, at 31st March 2016, West Berkshire
Commitment name
Estimated comparison goods t/o 2021 (£m)
Estimated comparison goods t/o 2026 (£m)
Estimated comparison goods t/o 2031 (£m)
Estimated comparison goods t/o 2036 (£m)
IKEA, Berkshire Retail Park, Pincents Lane, Tilehurst
(turnover from West Berkshire LPA)
6.7 7.3 7.9 8.2
Kingsland Shopping Centre redevelopment, Broadway,
Thatcham 17.2 18.6 20.2 20.9
Land off Faraday & Kelvin Road, Newbury 7.2 7.8 8.4 8.7
Unit 10 (Boots), Newbury Retail Park, Pinchington Lane, Newbury 3.9 4.2 4.6 4.7
Total 38.7 42.0 45.6 47.1
Source: Table 7, Appendix I
9.14 Table 9.2 shows that we have allowed for £38.7m of comparison goods spend to be deducted from the total available expenditure at 2021; when making allowance for these commitments to improve their own sales efficiency (turnover per sq.m) this commitment increases to a ‘claim’ of £47.1m by 2036. We have assumed that the extant commitments listed in Table 9.2 will have commenced trading by 2021 (the Ikea store has, subsequent to completion of the household survey, already commenced trading).
9.15 The comparison goods floorspace requirements for West Berkshire for the period up to 2036 are summarised in Table 9.3. These capacity forecasts are based on ‘constant market shares’, i.e. assuming that current patterns of comparison goods shopping (as identified in the household telephone survey) will remain unchanged. Table 9.3 shows that, when taking into account the commitments listed above in Table 9.2, the Council will need to plan for 6,400 sq.m net additional comparison goods floorspace in Newbury by 2026, increasing to 25,600 sq.m net by 2036.
9.16 For Thatcham, there is no requirement for the Council to plan for additional comparison goods floorspace, because of the extant permission for the redevelopment of the Kingsland Centre. Were this permission to expire without implementation, there would be a small requirement of additional comparison goods floorspace of 400 sq.m net by 2026, increasing to 1,000 sq.m net by 2036. For Hungerford, there is a requirement of 400 sq.m net additional comparison goods floorspace by 2026, increasing to 1,000 sq.m net by 2036.
Table 9.3: Comparison goods floorspace capacity, West Berkshire
2021 (sq.m net, rounded)
2026 (sq.m net, rounded)*
2031 (sq.m net, rounded)
2036 (sq.m net, rounded)*
Comparison goods floorspace
capacity, Newbury
1,600 9,100 17,700 27,000
Comparison goods floorspace
capacity, Thatcham
-3,400 -3,100 -2,800 -2,400
Comparison goods floorspace
capacity, Hungerford
200 400 700 1,000
Total for Borough -1,600 6,400 15,600 25,600
Source: Table 8d, Table 8e, Table 8f, Appendix I *Indicative only and should be subject to future review. Figures are cumulative and are net additional, i.e. not including floorspace which is currently vacant.
Convenience goods shopping
9.17 In the remainder of this section we set out the capacity for additional convenience goods floorspace in West Berkshire over the period to 2036. Our discussion follows the same format as set out for the comparison goods capacity forecasts above. The discussion set out below should be read in conjunction with the tabulations at Appendix II.
Shopping patterns by centre
9.18 Table 9.4 shows the most popular convenience goods shopping destinations for those parts of the survey area that fall wholly or predominantly within West Berkshire — zone 16
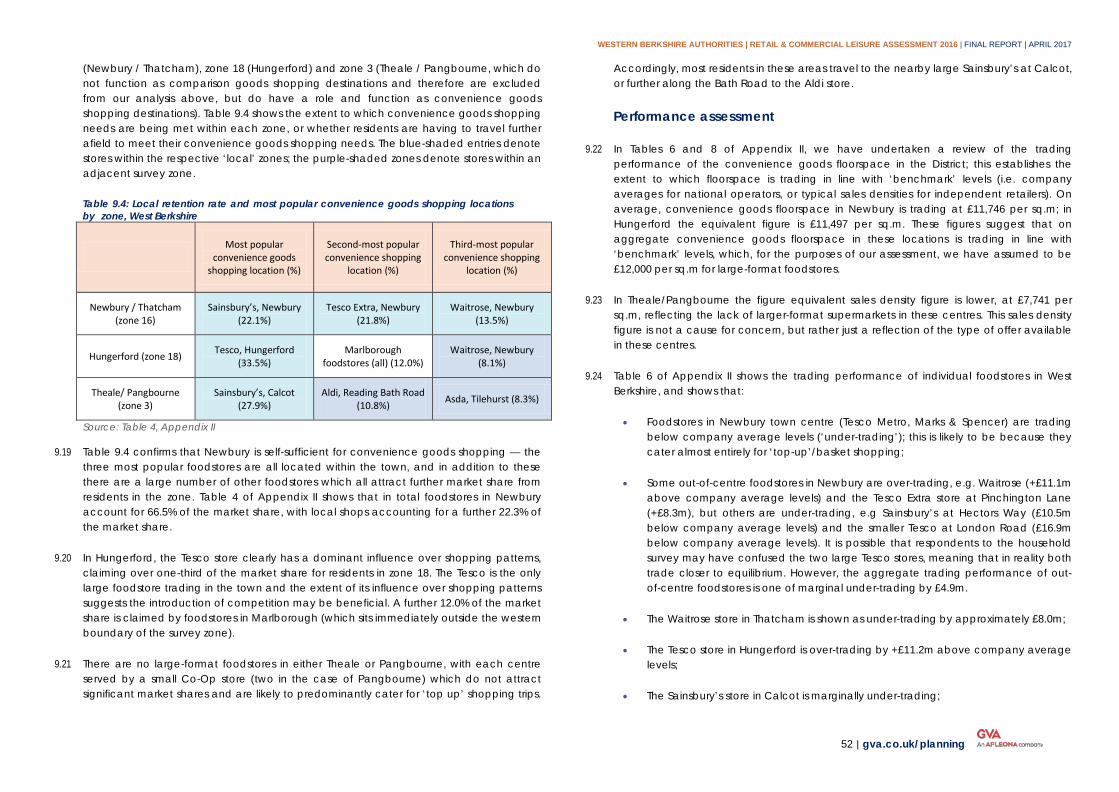
WESTERN BERKSHIRE AUTHORITIES | RETAIL & COMMERCIAL LEISURE ASSESSMENT 2016 | FINAL REPORT | APRIL 2017
52 | gva.co.uk/planning
(Newbury / Thatcham), zone 18 (Hungerford) and zone 3 (Theale / Pangbourne, which do not function as comparison goods shopping destinations and therefore are excluded from our analysis above, but do have a role and function as convenience goods shopping destinations). Table 9.4 shows the extent to which convenience goods shopping needs are being met within each zone, or whether residents are having to travel further afield to meet their convenience goods shopping needs. The blue-shaded entries denote stores within the respective ‘local’ zones; the purple-shaded zones denote stores within an adjacent survey zone.
Table 9.4: Local retention rate and most popular convenience goods shopping locations by zone, West Berkshire
Most popular
convenience goods shopping location (%)
Second-most popular convenience shopping
location (%)
Third-most popular convenience shopping
location (%)
Newbury / Thatcham (zone 16)
Sainsbury’s, Newbury (22.1%)
Tesco Extra, Newbury (21.8%)
Waitrose, Newbury (13.5%)
Hungerford (zone 18) Tesco, Hungerford (33.5%)
Marlborough foodstores (all) (12.0%)
Waitrose, Newbury (8.1%)
Theale/ Pangbourne (zone 3)
Sainsbury’s, Calcot (27.9%)
Aldi, Reading Bath Road (10.8%) Asda, Tilehurst (8.3%)
Source: Table 4, Appendix II
9.19 Table 9.4 confirms that Newbury is self-sufficient for convenience goods shopping — the three most popular foodstores are all located within the town, and in addition to these there are a large number of other foodstores which all attract further market share from residents in the zone. Table 4 of Appendix II shows that in total foodstores in Newbury account for 66.5% of the market share, with local shops accounting for a further 22.3% of the market share.
9.20 In Hungerford, the Tesco store clearly has a dominant influence over shopping patterns, claiming over one-third of the market share for residents in zone 18. The Tesco is the only large foodstore trading in the town and the extent of its influence over shopping patterns suggests the introduction of competition may be beneficial. A further 12.0% of the market share is claimed by foodstores in Marlborough (which sits immediately outside the western boundary of the survey zone).
9.21 There are no large-format foodstores in either Theale or Pangbourne, with each centre served by a small Co-Op store (two in the case of Pangbourne) which do not attract significant market shares and are likely to predominantly cater for ‘top up’ shopping trips.
Accordingly, most residents in these areas travel to the nearby large Sainsbury’s at Calcot, or further along the Bath Road to the Aldi store.
Performance assessment
9.22 In Tables 6 and 8 of Appendix II, we have undertaken a review of the trading performance of the convenience goods floorspace in the District; this establishes the extent to which floorspace is trading in line with ‘benchmark’ levels (i.e. company averages for national operators, or typical sales densities for independent retailers). On average, convenience goods floorspace in Newbury is trading at £11,746 per sq.m; in Hungerford the equivalent figure is £11,497 per sq.m. These figures suggest that on aggregate convenience goods floorspace in these locations is trading in line with ‘benchmark’ levels, which, for the purposes of our assessment, we have assumed to be £12,000 per sq.m for large-format foodstores.
9.23 In Theale/Pangbourne the figure equivalent sales density figure is lower, at £7,741 per sq.m, reflecting the lack of larger-format supermarkets in these centres. This sales density figure is not a cause for concern, but rather just a reflection of the type of offer available in these centres.
9.24 Table 6 of Appendix II shows the trading performance of individual foodstores in West Berkshire, and shows that:
• Foodstores in Newbury town centre (Tesco Metro, Marks & Spencer) are trading below company average levels (‘under-trading’); this is likely to be because they cater almost entirely for ‘top-up’/basket shopping;
• Some out-of-centre foodstores in Newbury are over-trading, e.g. Waitrose (+£11.1m above company average levels) and the Tesco Extra store at Pinchington Lane (+£8.3m), but others are under-trading, e.g Sainsbury’s at Hectors Way (£10.5m below company average levels) and the smaller Tesco at London Road (£16.9m below company average levels). It is possible that respondents to the household survey may have confused the two large Tesco stores, meaning that in reality both trade closer to equilibrium. However, the aggregate trading performance of out-of-centre foodstores is one of marginal under-trading by £4.9m.
• The Waitrose store in Thatcham is shown as under-trading by approximately £8.0m;
• The Tesco store in Hungerford is over-trading by +£11.2m above company average levels;
• The Sainsbury’s store in Calcot is marginally under-trading;
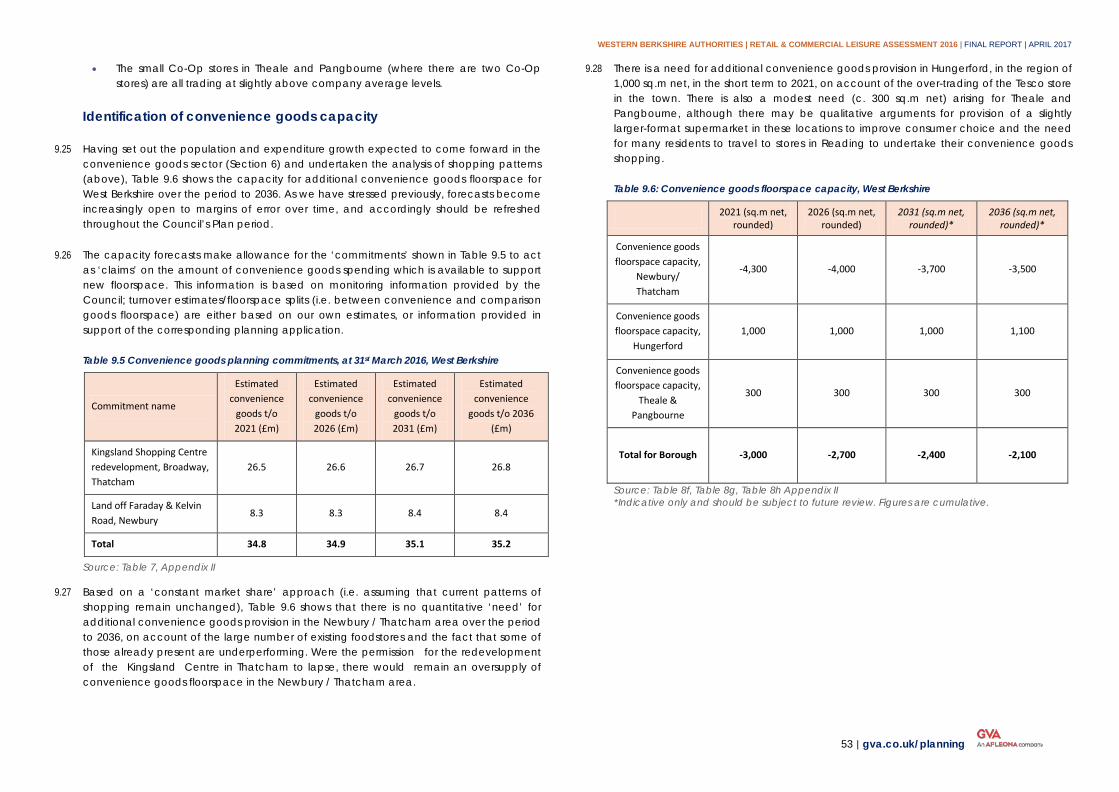
WESTERN BERKSHIRE AUTHORITIES | RETAIL & COMMERCIAL LEISURE ASSESSMENT 2016 | FINAL REPORT | APRIL 2017
53 | gva.co.uk/planning
• The small Co-Op stores in Theale and Pangbourne (where there are two Co-Op stores) are all trading at slightly above company average levels.
Identification of convenience goods capacity
9.25 Having set out the population and expenditure growth expected to come forward in the convenience goods sector (Section 6) and undertaken the analysis of shopping patterns (above), Table 9.6 shows the capacity for additional convenience goods floorspace for West Berkshire over the period to 2036. As we have stressed previously, forecasts become increasingly open to margins of error over time, and accordingly should be refreshed throughout the Council’s Plan period.
9.26 The capacity forecasts make allowance for the ‘commitments’ shown in Table 9.5 to act as ‘claims’ on the amount of convenience goods spending which is available to support new floorspace. This information is based on monitoring information provided by the Council; turnover estimates/floorspace splits (i.e. between convenience and comparison goods floorspace) are either based on our own estimates, or information provided in support of the corresponding planning application.
Table 9.5 Convenience goods planning commitments, at 31st March 2016, West Berkshire
Commitment name
Estimated convenience
goods t/o 2021 (£m)
Estimated convenience
goods t/o 2026 (£m)
Estimated convenience
goods t/o 2031 (£m)
Estimated convenience
goods t/o 2036 (£m)
Kingsland Shopping Centre redevelopment, Broadway, Thatcham
26.5 26.6 26.7 26.8
Land off Faraday & Kelvin Road, Newbury
8.3 8.3 8.4 8.4
Total 34.8 34.9 35.1 35.2
Source: Table 7, Appendix II
9.27 Based on a ‘constant market share’ approach (i.e. assuming that current patterns of shopping remain unchanged), Table 9.6 shows that there is no quantitative ‘need’ for additional convenience goods provision in the Newbury / Thatcham area over the period to 2036, on account of the large number of existing foodstores and the fact that some of those already present are underperforming. Were the permission for the redevelopment of the Kingsland Centre in Thatcham to lapse, there would remain an oversupply of convenience goods floorspace in the Newbury / Thatcham area.
9.28 There is a need for additional convenience goods provision in Hungerford, in the region of 1,000 sq.m net, in the short term to 2021, on account of the over-trading of the Tesco store in the town. There is also a modest need (c. 300 sq.m net) arising for Theale and Pangbourne, although there may be qualitative arguments for provision of a slightly larger-format supermarket in these locations to improve consumer choice and the need for many residents to travel to stores in Reading to undertake their convenience goods shopping.
Table 9.6: Convenience goods floorspace capacity, West Berkshire
2021 (sq.m net, rounded)
2026 (sq.m net, rounded)
2031 (sq.m net, rounded)*
2036 (sq.m net, rounded)*
Convenience goods floorspace capacity,
Newbury/ Thatcham
-4,300 -4,000 -3,700 -3,500
Convenience goods floorspace capacity,
Hungerford 1,000 1,000 1,000 1,100
Convenience goods floorspace capacity,
Theale & Pangbourne
300 300 300 300
Total for Borough -3,000 -2,700 -2,400 -2,100
Source: Table 8f, Table 8g, Table 8h Appendix II *Indicative only and should be subject to future review. Figures are cumulative.
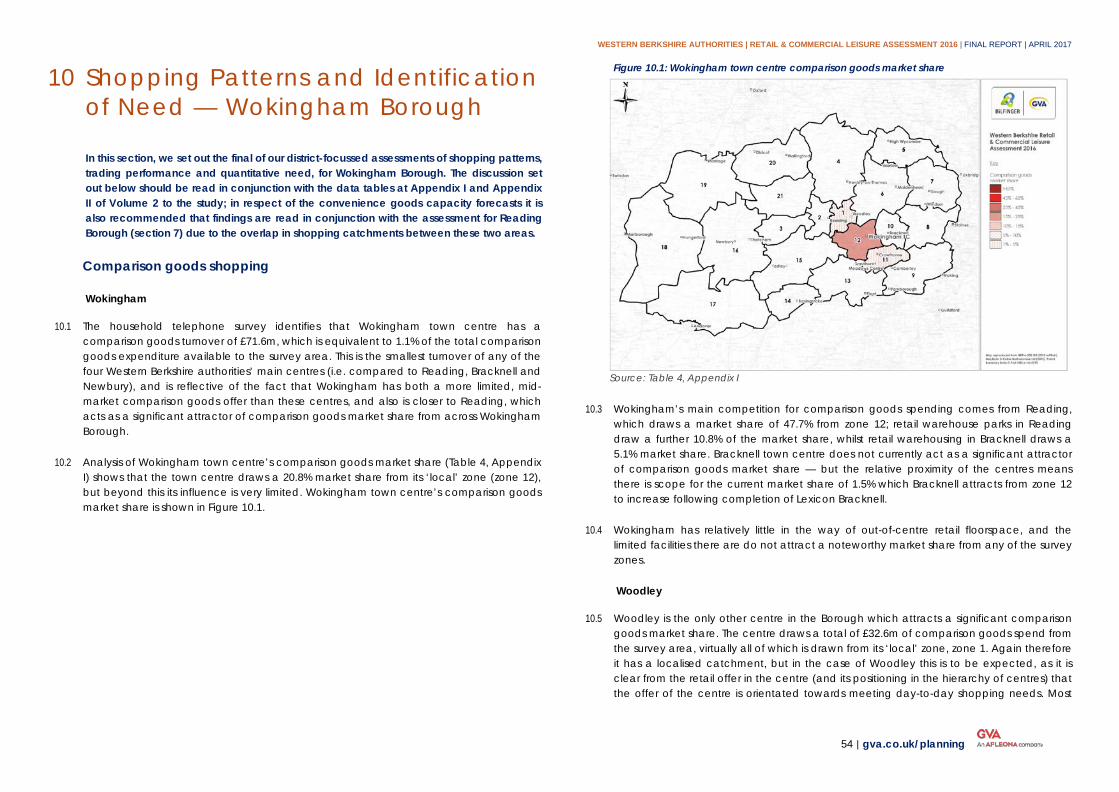
WESTERN BERKSHIRE AUTHORITIES | RETAIL & COMMERCIAL LEISURE ASSESSMENT 2016 | FINAL REPORT | APRIL 2017
54 | gva.co.uk/planning
Shopping Patterns and Identification 10of Need — Wokingham Borough
In this section, we set out the final of our district-focussed assessments of shopping patterns, trading performance and quantitative need, for Wokingham Borough. The discussion set out below should be read in conjunction with the data tables at Appendix I and Appendix II of Volume 2 to the study; in respect of the convenience goods capacity forecasts it is also recommended that findings are read in conjunction with the assessment for Reading Borough (section 7) due to the overlap in shopping catchments between these two areas.
Comparison goods shopping
Wokingham
10.1 The household telephone survey identifies that Wokingham town centre has a comparison goods turnover of £71.6m, which is equivalent to 1.1% of the total comparison goods expenditure available to the survey area. This is the smallest turnover of any of the four Western Berkshire authorities’ main centres (i.e. compared to Reading, Bracknell and Newbury), and is reflective of the fact that Wokingham has both a more limited, mid-market comparison goods offer than these centres, and also is closer to Reading, which acts as a significant attractor of comparison goods market share from across Wokingham Borough.
10.2 Analysis of Wokingham town centre’s comparison goods market share (Table 4, Appendix I) shows that the town centre draws a 20.8% market share from its ‘local’ zone (zone 12), but beyond this its influence is very limited. Wokingham town centre’s comparison goods market share is shown in Figure 10.1.
Figure 10.1: Wokingham town centre comparison goods market share
Source: Table 4, Appendix I
10.3 Wokingham’s main competition for comparison goods spending comes from Reading, which draws a market share of 47.7% from zone 12; retail warehouse parks in Reading draw a further 10.8% of the market share, whilst retail warehousing in Bracknell draws a 5.1% market share. Bracknell town centre does not currently act as a significant attractor of comparison goods market share — but the relative proximity of the centres means there is scope for the current market share of 1.5% which Bracknell attracts from zone 12 to increase following completion of Lexicon Bracknell.
10.4 Wokingham has relatively little in the way of out-of-centre retail floorspace, and the limited facilities there are do not attract a noteworthy market share from any of the survey zones.
Woodley
10.5 Woodley is the only other centre in the Borough which attracts a significant comparison goods market share. The centre draws a total of £32.6m of comparison goods spend from the survey area, virtually all of which is drawn from its ‘local’ zone, zone 1. Again therefore it has a localised catchment, but in the case of Woodley this is to be expected, as it is clear from the retail offer in the centre (and its positioning in the hierarchy of centres) that the offer of the centre is orientated towards meeting day-to-day shopping needs. Most
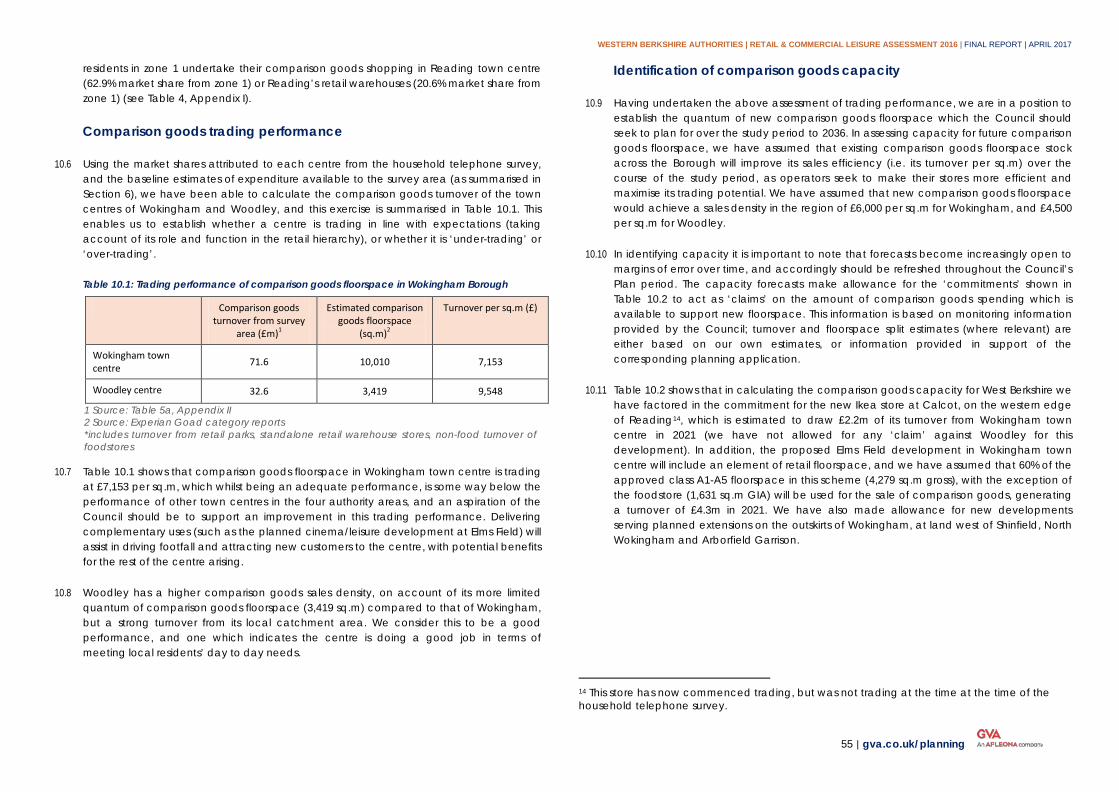
WESTERN BERKSHIRE AUTHORITIES | RETAIL & COMMERCIAL LEISURE ASSESSMENT 2016 | FINAL REPORT | APRIL 2017
55 | gva.co.uk/planning
residents in zone 1 undertake their comparison goods shopping in Reading town centre (62.9% market share from zone 1) or Reading’s retail warehouses (20.6% market share from zone 1) (see Table 4, Appendix I).
Comparison goods trading performance
10.6 Using the market shares attributed to each centre from the household telephone survey, and the baseline estimates of expenditure available to the survey area (as summarised in Section 6), we have been able to calculate the comparison goods turnover of the town centres of Wokingham and Woodley, and this exercise is summarised in Table 10.1. This enables us to establish whether a centre is trading in line with expectations (taking account of its role and function in the retail hierarchy), or whether it is ‘under-trading’ or ‘over-trading’.
Table 10.1: Trading performance of comparison goods floorspace in Wokingham Borough
Comparison goods turnover from survey
area (£m)1
Estimated comparison goods floorspace
(sq.m)2
Turnover per sq.m (£)
Wokingham town centre 71.6 10,010 7,153
Woodley centre 32.6 3,419 9,548
1 Source: Table 5a, Appendix II 2 Source: Experian Goad category reports *includes turnover from retail parks, standalone retail warehouse stores, non-food turnover of foodstores
10.7 Table 10.1 shows that comparison goods floorspace in Wokingham town centre is trading at £7,153 per sq.m, which whilst being an adequate performance, is some way below the performance of other town centres in the four authority areas, and an aspiration of the Council should be to support an improvement in this trading performance. Delivering complementary uses (such as the planned cinema/leisure development at Elms Field) will assist in driving footfall and attracting new customers to the centre, with potential benefits for the rest of the centre arising.
10.8 Woodley has a higher comparison goods sales density, on account of its more limited quantum of comparison goods floorspace (3,419 sq.m) compared to that of Wokingham, but a strong turnover from its local catchment area. We consider this to be a good performance, and one which indicates the centre is doing a good job in terms of meeting local residents’ day to day needs.
Identification of comparison goods capacity
10.9 Having undertaken the above assessment of trading performance, we are in a position to establish the quantum of new comparison goods floorspace which the Council should seek to plan for over the study period to 2036. In assessing capacity for future comparison goods floorspace, we have assumed that existing comparison goods floorspace stock across the Borough will improve its sales efficiency (i.e. its turnover per sq.m) over the course of the study period, as operators seek to make their stores more efficient and maximise its trading potential. We have assumed that new comparison goods floorspace would achieve a sales density in the region of £6,000 per sq.m for Wokingham, and £4,500 per sq.m for Woodley.
10.10 In identifying capacity it is important to note that forecasts become increasingly open to margins of error over time, and accordingly should be refreshed throughout the Council’s Plan period. The capacity forecasts make allowance for the ‘commitments’ shown in Table 10.2 to act as ‘claims’ on the amount of comparison goods spending which is available to support new floorspace. This information is based on monitoring information provided by the Council; turnover and floorspace split estimates (where relevant) are either based on our own estimates, or information provided in support of the corresponding planning application.
10.11 Table 10.2 shows that in calculating the comparison goods capacity for West Berkshire we have factored in the commitment for the new Ikea store at Calcot, on the western edge of Reading14, which is estimated to draw £2.2m of its turnover from Wokingham town centre in 2021 (we have not allowed for any ‘claim’ against Woodley for this development). In addition, the proposed Elms Field development in Wokingham town centre will include an element of retail floorspace, and we have assumed that 60% of the approved class A1-A5 floorspace in this scheme (4,279 sq.m gross), with the exception of the foodstore (1,631 sq.m GIA) will be used for the sale of comparison goods, generating a turnover of £4.3m in 2021. We have also made allowance for new developments serving planned extensions on the outskirts of Wokingham, at land west of Shinfield, North Wokingham and Arborfield Garrison.
14 This store has now commenced trading, but was not trading at the time at the time of the household telephone survey.
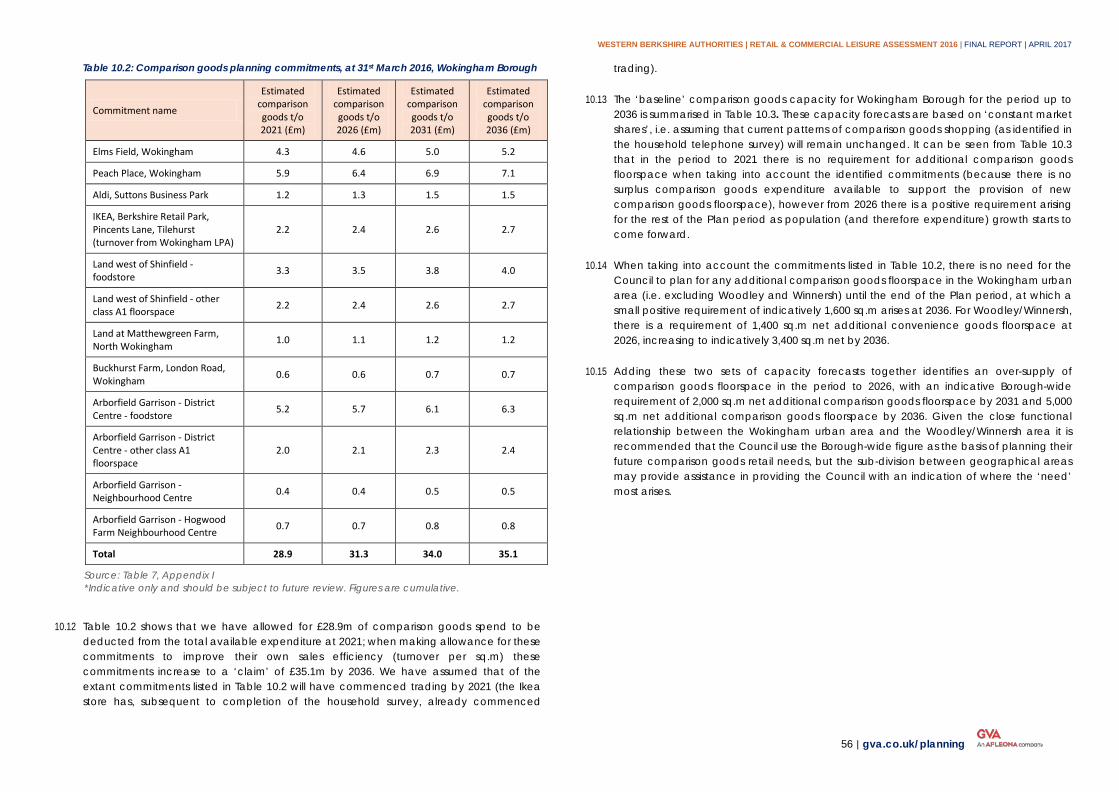
WESTERN BERKSHIRE AUTHORITIES | RETAIL & COMMERCIAL LEISURE ASSESSMENT 2016 | FINAL REPORT | APRIL 2017
56 | gva.co.uk/planning
Table 10.2: Comparison goods planning commitments, at 31st March 2016, Wokingham Borough
Commitment name
Estimated comparison goods t/o 2021 (£m)
Estimated comparison goods t/o 2026 (£m)
Estimated comparison goods t/o 2031 (£m)
Estimated comparison goods t/o 2036 (£m)
Elms Field, Wokingham 4.3 4.6 5.0 5.2
Peach Place, Wokingham 5.9 6.4 6.9 7.1
Aldi, Suttons Business Park 1.2 1.3 1.5 1.5
IKEA, Berkshire Retail Park, Pincents Lane, Tilehurst (turnover from Wokingham LPA)
2.2 2.4 2.6 2.7
Land west of Shinfield - foodstore 3.3 3.5 3.8 4.0
Land west of Shinfield - other class A1 floorspace 2.2 2.4 2.6 2.7
Land at Matthewgreen Farm, North Wokingham 1.0 1.1 1.2 1.2
Buckhurst Farm, London Road, Wokingham 0.6 0.6 0.7 0.7
Arborfield Garrison - District Centre - foodstore 5.2 5.7 6.1 6.3
Arborfield Garrison - District Centre - other class A1 floorspace
2.0 2.1 2.3 2.4
Arborfield Garrison - Neighbourhood Centre 0.4 0.4 0.5 0.5
Arborfield Garrison - Hogwood Farm Neighbourhood Centre 0.7 0.7 0.8 0.8
Total 28.9 31.3 34.0 35.1
Source: Table 7, Appendix I *Indicative only and should be subject to future review. Figures are cumulative.
10.12 Table 10.2 shows that we have allowed for £28.9m of comparison goods spend to be deducted from the total available expenditure at 2021; when making allowance for these commitments to improve their own sales efficiency (turnover per sq.m) these commitments increase to a ‘claim’ of £35.1m by 2036. We have assumed that of the extant commitments listed in Table 10.2 will have commenced trading by 2021 (the Ikea store has, subsequent to completion of the household survey, already commenced
trading).
10.13 The ‘baseline’ comparison goods capacity for Wokingham Borough for the period up to 2036 is summarised in Table 10.3. These capacity forecasts are based on ‘constant market shares’, i.e. assuming that current patterns of comparison goods shopping (as identified in the household telephone survey) will remain unchanged. It can be seen from Table 10.3 that in the period to 2021 there is no requirement for additional comparison goods floorspace when taking into account the identified commitments (because there is no surplus comparison goods expenditure available to support the provision of new comparison goods floorspace), however from 2026 there is a positive requirement arising for the rest of the Plan period as population (and therefore expenditure) growth starts to come forward.
10.14 When taking into account the commitments listed in Table 10.2, there is no need for the Council to plan for any additional comparison goods floorspace in the Wokingham urban area (i.e. excluding Woodley and Winnersh) until the end of the Plan period, at which a small positive requirement of indicatively 1,600 sq.m arises at 2036. For Woodley/Winnersh, there is a requirement of 1,400 sq.m net additional convenience goods floorspace at 2026, increasing to indicatively 3,400 sq.m net by 2036.
10.15 Adding these two sets of capacity forecasts together identifies an over-supply of comparison goods floorspace in the period to 2026, with an indicative Borough-wide requirement of 2,000 sq.m net additional comparison goods floorspace by 2031 and 5,000 sq.m net additional comparison goods floorspace by 2036. Given the close functional relationship between the Wokingham urban area and the Woodley/Winnersh area it is recommended that the Council use the Borough-wide figure as the basis of planning their future comparison goods retail needs, but the sub-division between geographical areas may provide assistance in providing the Council with an indication of where the ‘need’ most arises.
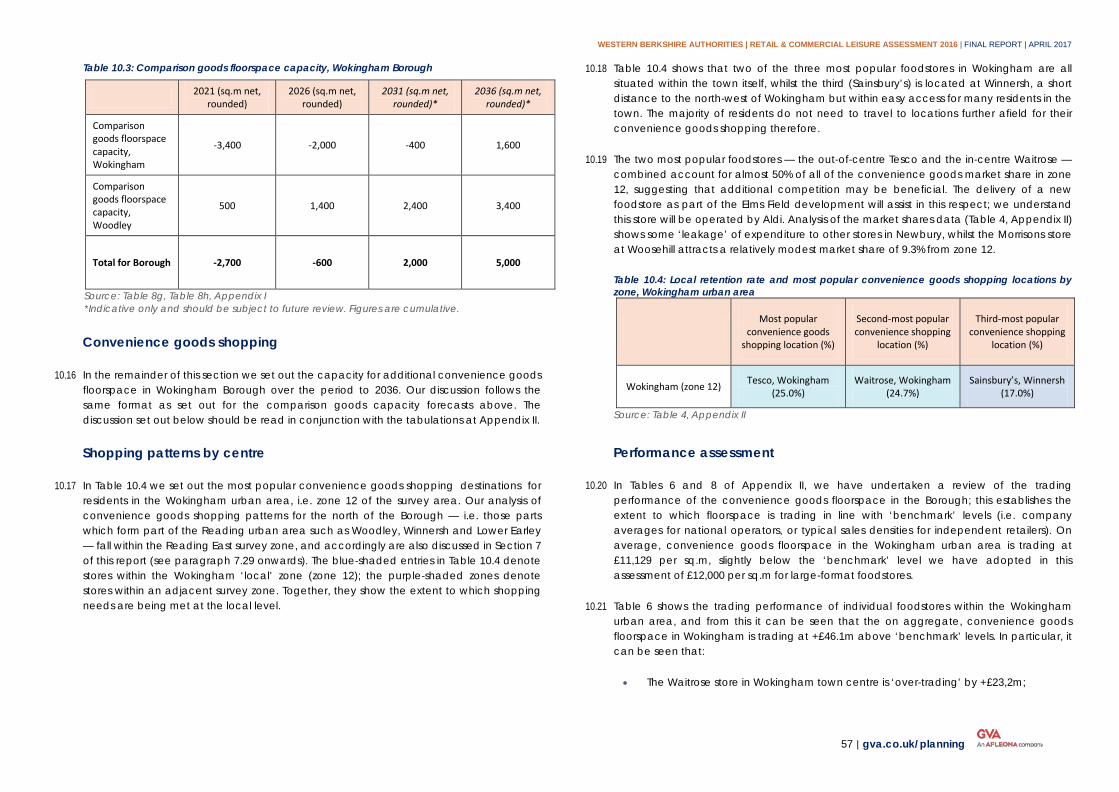
WESTERN BERKSHIRE AUTHORITIES | RETAIL & COMMERCIAL LEISURE ASSESSMENT 2016 | FINAL REPORT | APRIL 2017
57 | gva.co.uk/planning
Table 10.3: Comparison goods floorspace capacity, Wokingham Borough
2021 (sq.m net, rounded)
2026 (sq.m net, rounded)
2031 (sq.m net, rounded)*
2036 (sq.m net, rounded)*
Comparison goods floorspace capacity, Wokingham
-3,400 -2,000 -400 1,600
Comparison goods floorspace capacity, Woodley
500 1,400 2,400 3,400
Total for Borough -2,700 -600 2,000 5,000
Source: Table 8g, Table 8h, Appendix I *Indicative only and should be subject to future review. Figures are cumulative.
Convenience goods shopping
10.16 In the remainder of this section we set out the capacity for additional convenience goods floorspace in Wokingham Borough over the period to 2036. Our discussion follows the same format as set out for the comparison goods capacity forecasts above. The discussion set out below should be read in conjunction with the tabulations at Appendix II.
Shopping patterns by centre
10.17 In Table 10.4 we set out the most popular convenience goods shopping destinations for residents in the Wokingham urban area, i.e. zone 12 of the survey area. Our analysis of convenience goods shopping patterns for the north of the Borough — i.e. those parts which form part of the Reading urban area such as Woodley, Winnersh and Lower Earley — fall within the Reading East survey zone, and accordingly are also discussed in Section 7 of this report (see paragraph 7.29 onwards). The blue-shaded entries in Table 10.4 denote stores within the Wokingham ‘local’ zone (zone 12); the purple-shaded zones denote stores within an adjacent survey zone. Together, they show the extent to which shopping needs are being met at the local level.
10.18 Table 10.4 shows that two of the three most popular foodstores in Wokingham are all situated within the town itself, whilst the third (Sainsbury’s) is located at Winnersh, a short distance to the north-west of Wokingham but within easy access for many residents in the town. The majority of residents do not need to travel to locations further afield for their convenience goods shopping therefore.
10.19 The two most popular foodstores — the out-of-centre Tesco and the in-centre Waitrose — combined account for almost 50% of all of the convenience goods market share in zone 12, suggesting that additional competition may be beneficial. The delivery of a new foodstore as part of the Elms Field development will assist in this respect; we understand this store will be operated by Aldi. Analysis of the market shares data (Table 4, Appendix II) shows some ‘leakage’ of expenditure to other stores in Newbury, whilst the Morrisons store at Woosehill attracts a relatively modest market share of 9.3% from zone 12.
Table 10.4: Local retention rate and most popular convenience goods shopping locations by zone, Wokingham urban area
Most popular
convenience goods shopping location (%)
Second-most popular convenience shopping
location (%)
Third-most popular convenience shopping
location (%)
Wokingham (zone 12) Tesco, Wokingham (25.0%)
Waitrose, Wokingham (24.7%)
Sainsbury’s, Winnersh (17.0%)
Source: Table 4, Appendix II
Performance assessment
10.20 In Tables 6 and 8 of Appendix II, we have undertaken a review of the trading performance of the convenience goods floorspace in the Borough; this establishes the extent to which floorspace is trading in line with ‘benchmark’ levels (i.e. company averages for national operators, or typical sales densities for independent retailers). On average, convenience goods floorspace in the Wokingham urban area is trading at £11,129 per sq.m, slightly below the ‘benchmark’ level we have adopted in this assessment of £12,000 per sq.m for large-format foodstores.
10.21 Table 6 shows the trading performance of individual foodstores within the Wokingham urban area, and from this it can be seen that the on aggregate, convenience goods floorspace in Wokingham is trading at +£46.1m above ‘benchmark’ levels. In particular, it can be seen that:
• The Waitrose store in Wokingham town centre is ‘over-trading’ by +£23,2m;
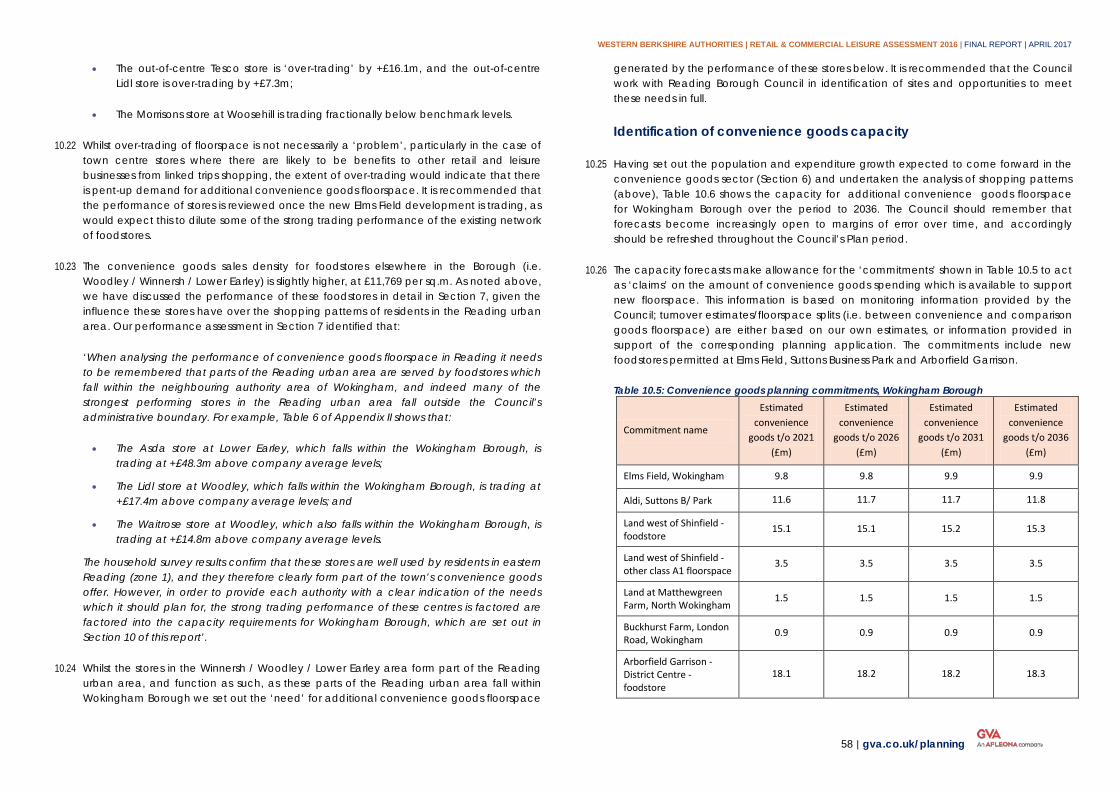
WESTERN BERKSHIRE AUTHORITIES | RETAIL & COMMERCIAL LEISURE ASSESSMENT 2016 | FINAL REPORT | APRIL 2017
58 | gva.co.uk/planning
• The out-of-centre Tesco store is ‘over-trading’ by +£16.1m, and the out-of-centre Lidl store is over-trading by +£7.3m;
• The Morrisons store at Woosehill is trading fractionally below benchmark levels.
10.22 Whilst over-trading of floorspace is not necessarily a ‘problem’, particularly in the case of town centre stores where there are likely to be benefits to other retail and leisure businesses from linked trips shopping, the extent of over-trading would indicate that there is pent-up demand for additional convenience goods floorspace. It is recommended that the performance of stores is reviewed once the new Elms Field development is trading, as would expect this to dilute some of the strong trading performance of the existing network of foodstores.
10.23 The convenience goods sales density for foodstores elsewhere in the Borough (i.e. Woodley / Winnersh / Lower Earley) is slightly higher, at £11,769 per sq.m. As noted above, we have discussed the performance of these foodstores in detail in Section 7, given the influence these stores have over the shopping patterns of residents in the Reading urban area. Our performance assessment in Section 7 identified that:
‘When analysing the performance of convenience goods floorspace in Reading it needs to be remembered that parts of the Reading urban area are served by foodstores which fall within the neighbouring authority area of Wokingham, and indeed many of the strongest performing stores in the Reading urban area fall outside the Council’s administrative boundary. For example, Table 6 of Appendix II shows that:
• The Asda store at Lower Earley, which falls within the Wokingham Borough, is trading at +£48.3m above company average levels;
• The Lidl store at Woodley, which falls within the Wokingham Borough, is trading at +£17.4m above company average levels; and
• The Waitrose store at Woodley, which also falls within the Wokingham Borough, is trading at +£14.8m above company average levels.
The household survey results confirm that these stores are well used by residents in eastern Reading (zone 1), and they therefore clearly form part of the town’s convenience goods offer. However, in order to provide each authority with a clear indication of the needs which it should plan for, the strong trading performance of these centres is factored are factored into the capacity requirements for Wokingham Borough, which are set out in Section 10 of this report’.
10.24 Whilst the stores in the Winnersh / Woodley / Lower Earley area form part of the Reading urban area, and function as such, as these parts of the Reading urban area fall within Wokingham Borough we set out the ‘need’ for additional convenience goods floorspace
generated by the performance of these stores below. It is recommended that the Council work with Reading Borough Council in identification of sites and opportunities to meet these needs in full.
Identification of convenience goods capacity
10.25 Having set out the population and expenditure growth expected to come forward in the convenience goods sector (Section 6) and undertaken the analysis of shopping patterns (above), Table 10.6 shows the capacity for additional convenience goods floorspace for Wokingham Borough over the period to 2036. The Council should remember that forecasts become increasingly open to margins of error over time, and accordingly should be refreshed throughout the Council’s Plan period.
10.26 The capacity forecasts make allowance for the ‘commitments’ shown in Table 10.5 to act as ‘claims’ on the amount of convenience goods spending which is available to support new floorspace. This information is based on monitoring information provided by the Council; turnover estimates/floorspace splits (i.e. between convenience and comparison goods floorspace) are either based on our own estimates, or information provided in support of the corresponding planning application. The commitments include new foodstores permitted at Elms Field, Suttons Business Park and Arborfield Garrison.
Table 10.5: Convenience goods planning commitments, Wokingham Borough
Commitment name
Estimated convenience
goods t/o 2021 (£m)
Estimated convenience
goods t/o 2026 (£m)
Estimated convenience
goods t/o 2031 (£m)
Estimated convenience
goods t/o 2036 (£m)
Elms Field, Wokingham 9.8 9.8 9.9 9.9
Aldi, Suttons B/ Park 11.6 11.7 11.7 11.8
Land west of Shinfield - foodstore
15.1 15.1 15.2 15.3
Land west of Shinfield - other class A1 floorspace
3.5 3.5 3.5 3.5
Land at Matthewgreen Farm, North Wokingham
1.5 1.5 1.5 1.5
Buckhurst Farm, London Road, Wokingham
0.9 0.9 0.9 0.9
Arborfield Garrison - District Centre - foodstore
18.1 18.2 18.2 18.3
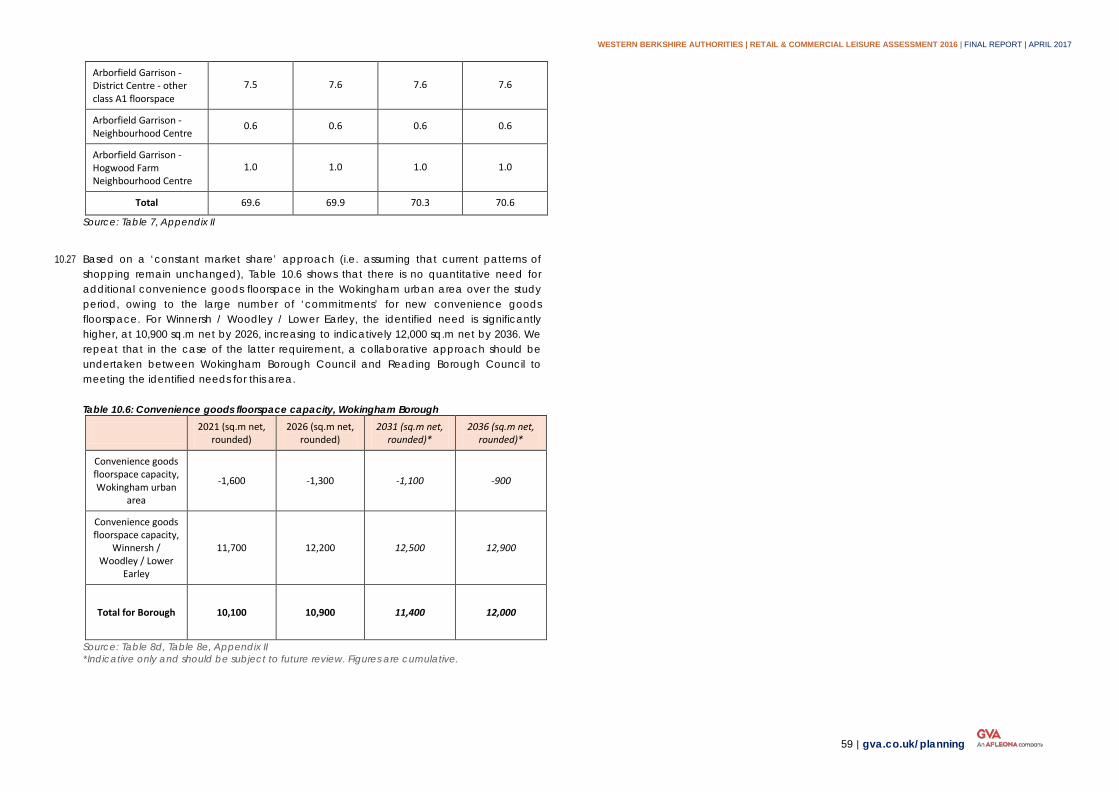
WESTERN BERKSHIRE AUTHORITIES | RETAIL & COMMERCIAL LEISURE ASSESSMENT 2016 | FINAL REPORT | APRIL 2017
59 | gva.co.uk/planning
Arborfield Garrison - District Centre - other class A1 floorspace
7.5 7.6 7.6 7.6
Arborfield Garrison - Neighbourhood Centre
0.6 0.6 0.6 0.6
Arborfield Garrison - Hogwood Farm Neighbourhood Centre
1.0 1.0 1.0 1.0
Total 69.6 69.9 70.3 70.6
Source: Table 7, Appendix II
10.27 Based on a ‘constant market share’ approach (i.e. assuming that current patterns of shopping remain unchanged), Table 10.6 shows that there is no quantitative need for additional convenience goods floorspace in the Wokingham urban area over the study period, owing to the large number of ‘commitments’ for new convenience goods floorspace. For Winnersh / Woodley / Lower Earley, the identified need is significantly higher, at 10,900 sq.m net by 2026, increasing to indicatively 12,000 sq.m net by 2036. We repeat that in the case of the latter requirement, a collaborative approach should be undertaken between Wokingham Borough Council and Reading Borough Council to meeting the identified needs for this area.
Table 10.6: Convenience goods floorspace capacity, Wokingham Borough
2021 (sq.m net, rounded)
2026 (sq.m net, rounded)
2031 (sq.m net, rounded)*
2036 (sq.m net, rounded)*
Convenience goods floorspace capacity, Wokingham urban
area
-1,600 -1,300 -1,100 -900
Convenience goods floorspace capacity,
Winnersh / Woodley / Lower
Earley
11,700 12,200 12,500 12,900
Total for Borough 10,100 10,900 11,400 12,000
Source: Table 8d, Table 8e, Appendix II *Indicative only and should be subject to future review. Figures are cumulative.
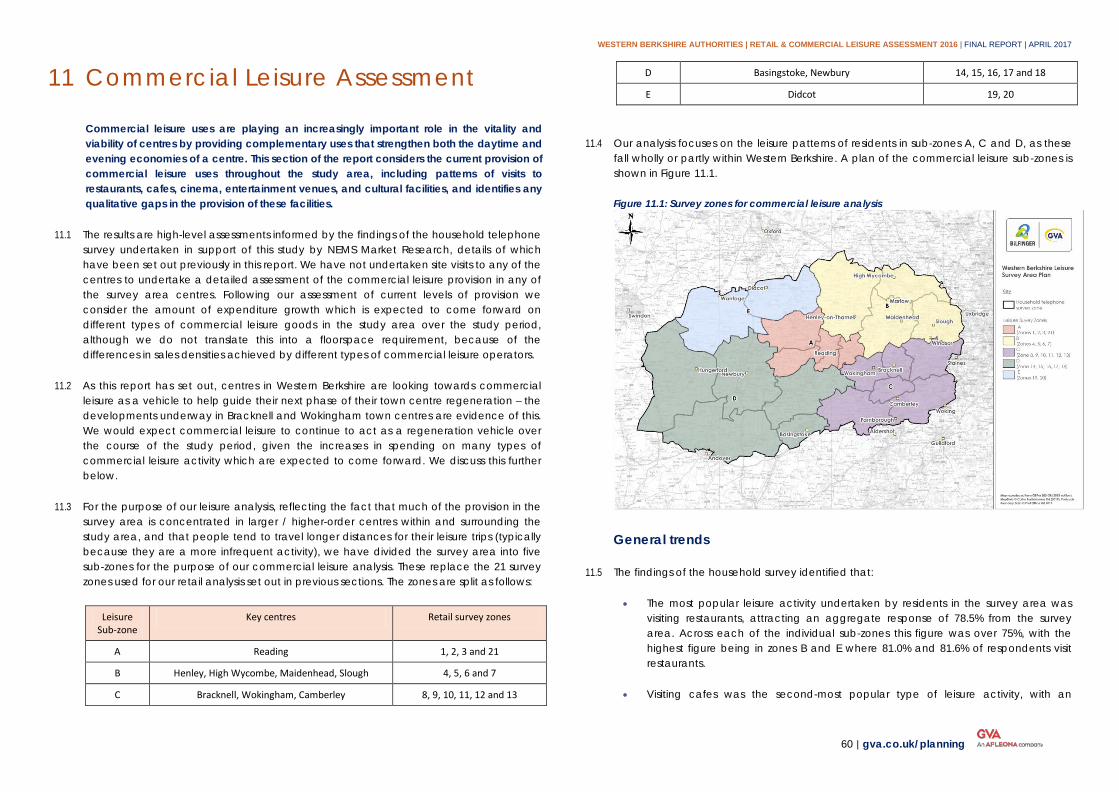
WESTERN BERKSHIRE AUTHORITIES | RETAIL & COMMERCIAL LEISURE ASSESSMENT 2016 | FINAL REPORT | APRIL 2017
60 | gva.co.uk/planning
Commercial Leisure Assessment 11
Commercial leisure uses are playing an increasingly important role in the vitality and viability of centres by providing complementary uses that strengthen both the daytime and evening economies of a centre. This section of the report considers the current provision of commercial leisure uses throughout the study area, including patterns of visits to restaurants, cafes, cinema, entertainment venues, and cultural facilities, and identifies any qualitative gaps in the provision of these facilities.
11.1 The results are high-level assessments informed by the findings of the household telephone survey undertaken in support of this study by NEMS Market Research, details of which have been set out previously in this report. We have not undertaken site visits to any of the centres to undertake a detailed assessment of the commercial leisure provision in any of the survey area centres. Following our assessment of current levels of provision we consider the amount of expenditure growth which is expected to come forward on different types of commercial leisure goods in the study area over the study period, although we do not translate this into a floorspace requirement, because of the differences in sales densities achieved by different types of commercial leisure operators.
11.2 As this report has set out, centres in Western Berkshire are looking towards commercial leisure as a vehicle to help guide their next phase of their town centre regeneration – the developments underway in Bracknell and Wokingham town centres are evidence of this. We would expect commercial leisure to continue to act as a regeneration vehicle over the course of the study period, given the increases in spending on many types of commercial leisure activity which are expected to come forward. We discuss this further below.
11.3 For the purpose of our leisure analysis, reflecting the fact that much of the provision in the survey area is concentrated in larger / higher-order centres within and surrounding the study area, and that people tend to travel longer distances for their leisure trips (typically because they are a more infrequent activity), we have divided the survey area into five sub-zones for the purpose of our commercial leisure analysis. These replace the 21 survey zones used for our retail analysis set out in previous sections. The zones are split as follows:
Leisure Sub-zone
Key centres Retail survey zones
A Reading 1, 2, 3 and 21
B Henley, High Wycombe, Maidenhead, Slough 4, 5, 6 and 7
C Bracknell, Wokingham, Camberley 8, 9, 10, 11, 12 and 13
D Basingstoke, Newbury 14, 15, 16, 17 and 18
E Didcot 19, 20
11.4 Our analysis focuses on the leisure patterns of residents in sub-zones A, C and D, as these fall wholly or partly within Western Berkshire. A plan of the commercial leisure sub-zones is shown in Figure 11.1.
Figure 11.1: Survey zones for commercial leisure analysis
General trends
11.5 The findings of the household survey identified that:
• The most popular leisure activity undertaken by residents in the survey area was visiting restaurants, attracting an aggregate response of 78.5% from the survey area. Across each of the individual sub-zones this figure was over 75%, with the highest figure being in zones B and E where 81.0% and 81.6% of respondents visit restaurants.
• Visiting cafes was the second-most popular type of leisure activity, with an
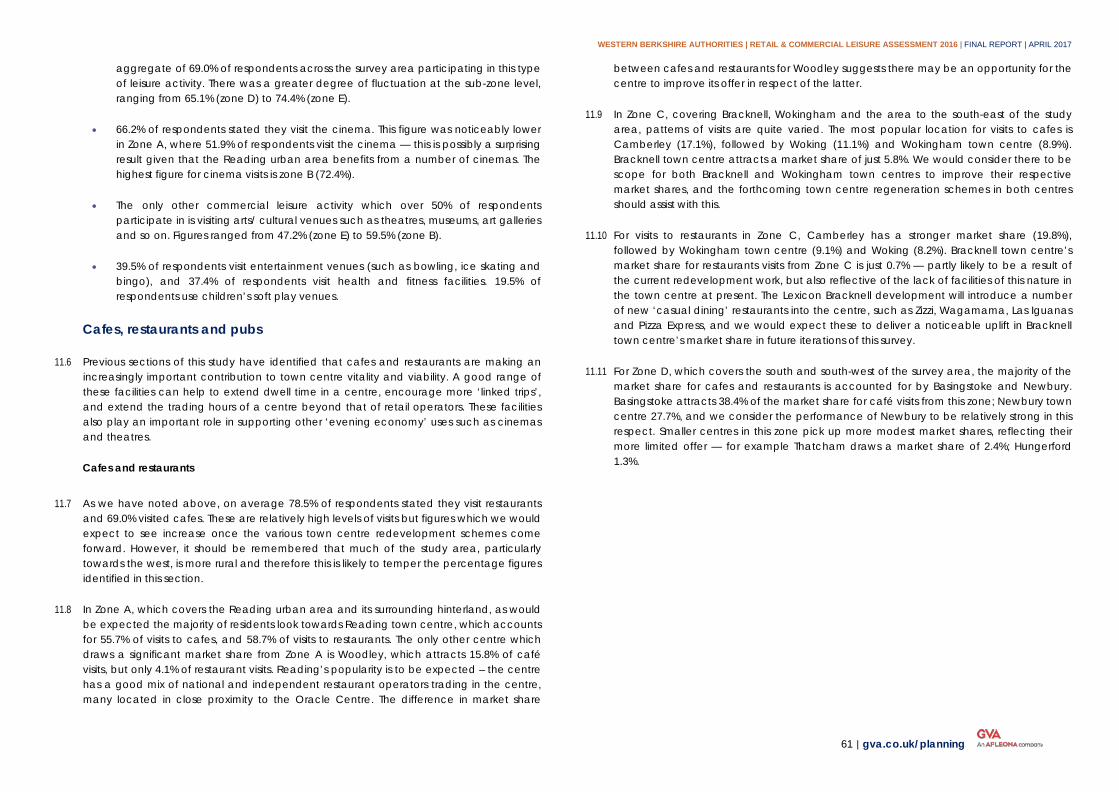
WESTERN BERKSHIRE AUTHORITIES | RETAIL & COMMERCIAL LEISURE ASSESSMENT 2016 | FINAL REPORT | APRIL 2017
61 | gva.co.uk/planning
aggregate of 69.0% of respondents across the survey area participating in this type of leisure activity. There was a greater degree of fluctuation at the sub-zone level, ranging from 65.1% (zone D) to 74.4% (zone E).
• 66.2% of respondents stated they visit the cinema. This figure was noticeably lower in Zone A, where 51.9% of respondents visit the cinema — this is possibly a surprising result given that the Reading urban area benefits from a number of cinemas. The highest figure for cinema visits is zone B (72.4%).
• The only other commercial leisure activity which over 50% of respondents participate in is visiting arts/ cultural venues such as theatres, museums, art galleries and so on. Figures ranged from 47.2% (zone E) to 59.5% (zone B).
• 39.5% of respondents visit entertainment venues (such as bowling, ice skating and bingo), and 37.4% of respondents visit health and fitness facilities. 19.5% of respondents use children’s soft play venues.
Cafes, restaurants and pubs
11.6 Previous sections of this study have identified that cafes and restaurants are making an increasingly important contribution to town centre vitality and viability. A good range of these facilities can help to extend dwell time in a centre, encourage more ‘linked trips’, and extend the trading hours of a centre beyond that of retail operators. These facilities also play an important role in supporting other ‘evening economy’ uses such as cinemas and theatres.
Cafes and restaurants
11.7 As we have noted above, on average 78.5% of respondents stated they visit restaurants and 69.0% visited cafes. These are relatively high levels of visits but figures which we would expect to see increase once the various town centre redevelopment schemes come forward. However, it should be remembered that much of the study area, particularly towards the west, is more rural and therefore this is likely to temper the percentage figures identified in this section.
11.8 In Zone A, which covers the Reading urban area and its surrounding hinterland, as would be expected the majority of residents look towards Reading town centre, which accounts for 55.7% of visits to cafes, and 58.7% of visits to restaurants. The only other centre which draws a significant market share from Zone A is Woodley, which attracts 15.8% of café visits, but only 4.1% of restaurant visits. Reading’s popularity is to be expected – the centre has a good mix of national and independent restaurant operators trading in the centre, many located in close proximity to the Oracle Centre. The difference in market share
between cafes and restaurants for Woodley suggests there may be an opportunity for the centre to improve its offer in respect of the latter.
11.9 In Zone C, covering Bracknell, Wokingham and the area to the south-east of the study area, patterns of visits are quite varied. The most popular location for visits to cafes is Camberley (17.1%), followed by Woking (11.1%) and Wokingham town centre (8.9%). Bracknell town centre attracts a market share of just 5.8%. We would consider there to be scope for both Bracknell and Wokingham town centres to improve their respective market shares, and the forthcoming town centre regeneration schemes in both centres should assist with this.
11.10 For visits to restaurants in Zone C, Camberley has a stronger market share (19.8%), followed by Wokingham town centre (9.1%) and Woking (8.2%). Bracknell town centre’s market share for restaurants visits from Zone C is just 0.7% — partly likely to be a result of the current redevelopment work, but also reflective of the lack of facilities of this nature in the town centre at present. The Lexicon Bracknell development will introduce a number of new ‘casual dining’ restaurants into the centre, such as Zizzi, Wagamama, Las Iguanas and Pizza Express, and we would expect these to deliver a noticeable uplift in Bracknell town centre’s market share in future iterations of this survey.
11.11 For Zone D, which covers the south and south-west of the survey area, the majority of the market share for cafes and restaurants is accounted for by Basingstoke and Newbury. Basingstoke attracts 38.4% of the market share for café visits from this zone; Newbury town centre 27.7%, and we consider the performance of Newbury to be relatively strong in this respect. Smaller centres in this zone pick up more modest market shares, reflecting their more limited offer — for example Thatcham draws a market share of 2.4%; Hungerford 1.3%.
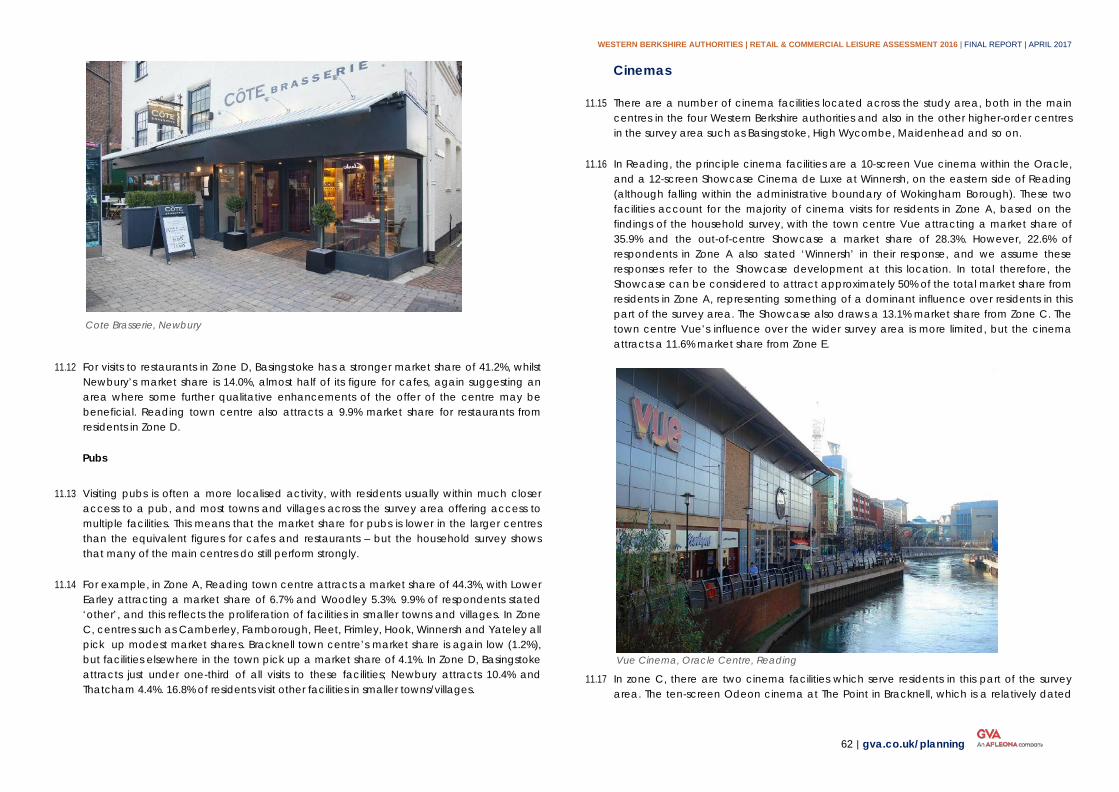
WESTERN BERKSHIRE AUTHORITIES | RETAIL & COMMERCIAL LEISURE ASSESSMENT 2016 | FINAL REPORT | APRIL 2017
62 | gva.co.uk/planning
Cote Brasserie, Newbury
11.12 For visits to restaurants in Zone D, Basingstoke has a stronger market share of 41.2%, whilst
Newbury’s market share is 14.0%, almost half of its figure for cafes, again suggesting an area where some further qualitative enhancements of the offer of the centre may be beneficial. Reading town centre also attracts a 9.9% market share for restaurants from residents in Zone D.
Pubs
11.13 Visiting pubs is often a more localised activity, with residents usually within much closer access to a pub, and most towns and villages across the survey area offering access to multiple facilities. This means that the market share for pubs is lower in the larger centres than the equivalent figures for cafes and restaurants – but the household survey shows that many of the main centres do still perform strongly.
11.14 For example, in Zone A, Reading town centre attracts a market share of 44.3%, with Lower Earley attracting a market share of 6.7% and Woodley 5.3%. 9.9% of respondents stated ‘other’, and this reflects the proliferation of facilities in smaller towns and villages. In Zone C, centres such as Camberley, Farnborough, Fleet, Frimley, Hook, Winnersh and Yateley all pick up modest market shares. Bracknell town centre’s market share is again low (1.2%), but facilities elsewhere in the town pick up a market share of 4.1%. In Zone D, Basingstoke attracts just under one-third of all visits to these facilities; Newbury attracts 10.4% and Thatcham 4.4%. 16.8% of residents visit other facilities in smaller towns/villages.
Cinemas
11.15 There are a number of cinema facilities located across the study area, both in the main centres in the four Western Berkshire authorities and also in the other higher-order centres in the survey area such as Basingstoke, High Wycombe, Maidenhead and so on.
11.16 In Reading, the principle cinema facilities are a 10-screen Vue cinema within the Oracle, and a 12-screen Showcase Cinema de Luxe at Winnersh, on the eastern side of Reading (although falling within the administrative boundary of Wokingham Borough). These two facilities account for the majority of cinema visits for residents in Zone A, based on the findings of the household survey, with the town centre Vue attracting a market share of 35.9% and the out-of-centre Showcase a market share of 28.3%. However, 22.6% of respondents in Zone A also stated ‘Winnersh’ in their response, and we assume these responses refer to the Showcase development at this location. In total therefore, the Showcase can be considered to attract approximately 50% of the total market share from residents in Zone A, representing something of a dominant influence over residents in this part of the survey area. The Showcase also draws a 13.1% market share from Zone C. The town centre Vue’s influence over the wider survey area is more limited, but the cinema attracts a 11.6% market share from Zone E.
Vue Cinema, Oracle Centre, Reading
11.17 In zone C, there are two cinema facilities which serve residents in this part of the survey area. The ten-screen Odeon cinema at The Point in Bracknell, which is a relatively dated
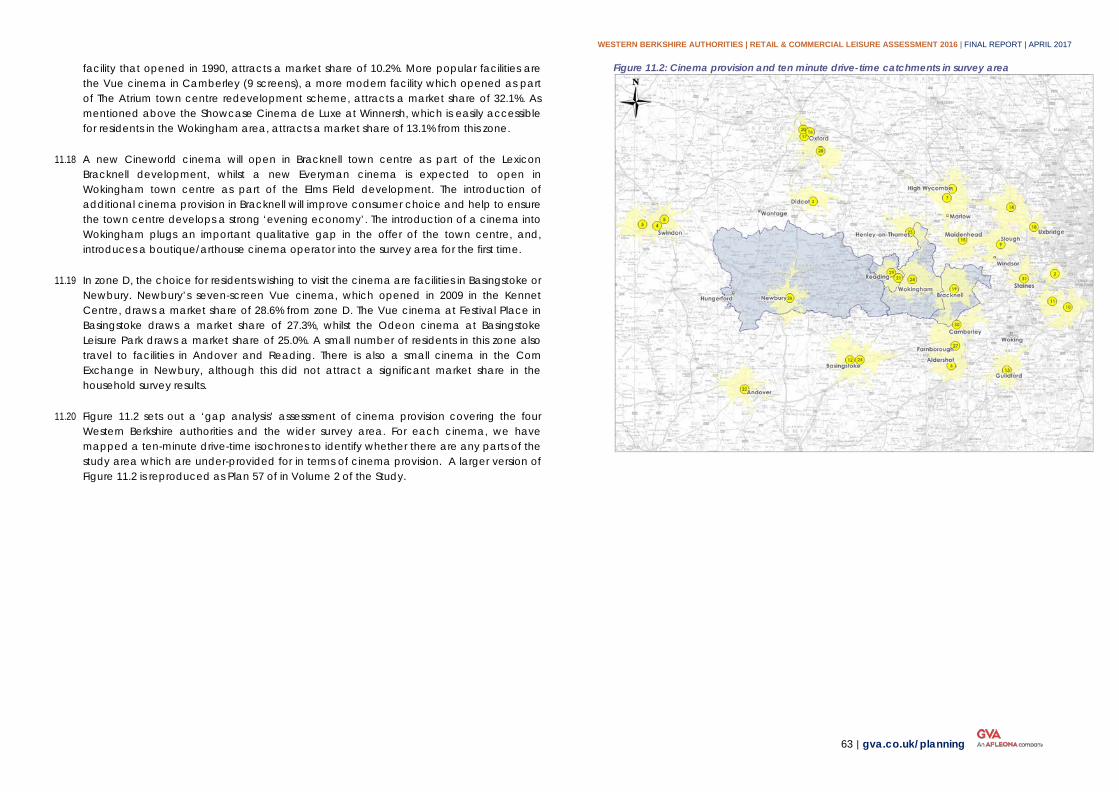
WESTERN BERKSHIRE AUTHORITIES | RETAIL & COMMERCIAL LEISURE ASSESSMENT 2016 | FINAL REPORT | APRIL 2017
63 | gva.co.uk/planning
facility that opened in 1990, attracts a market share of 10.2%. More popular facilities are the Vue cinema in Camberley (9 screens), a more modern facility which opened as part of The Atrium town centre redevelopment scheme, attracts a market share of 32.1%. As mentioned above the Showcase Cinema de Luxe at Winnersh, which is easily accessible for residents in the Wokingham area, attracts a market share of 13.1% from this zone.
11.18 A new Cineworld cinema will open in Bracknell town centre as part of the Lexicon Bracknell development, whilst a new Everyman cinema is expected to open in Wokingham town centre as part of the Elms Field development. The introduction of additional cinema provision in Bracknell will improve consumer choice and help to ensure the town centre develops a strong ‘evening economy’. The introduction of a cinema into Wokingham plugs an important qualitative gap in the offer of the town centre, and, introduces a boutique/arthouse cinema operator into the survey area for the first time.
11.19 In zone D, the choice for residents wishing to visit the cinema are facilities in Basingstoke or Newbury. Newbury’s seven-screen Vue cinema, which opened in 2009 in the Kennet Centre, draws a market share of 28.6% from zone D. The Vue cinema at Festival Place in Basingstoke draws a market share of 27.3%, whilst the Odeon cinema at Basingstoke Leisure Park draws a market share of 25.0%. A small number of residents in this zone also travel to facilities in Andover and Reading. There is also a small cinema in the Corn Exchange in Newbury, although this did not attract a significant market share in the household survey results.
11.20 Figure 11.2 sets out a ‘gap analysis’ assessment of cinema provision covering the four Western Berkshire authorities and the wider survey area. For each cinema, we have mapped a ten-minute drive-time isochrones to identify whether there are any parts of the study area which are under-provided for in terms of cinema provision. A larger version of Figure 11.2 is reproduced as Plan 57 of in Volume 2 of the Study.
Figure 11.2: Cinema provision and ten minute drive-time catchments in survey area
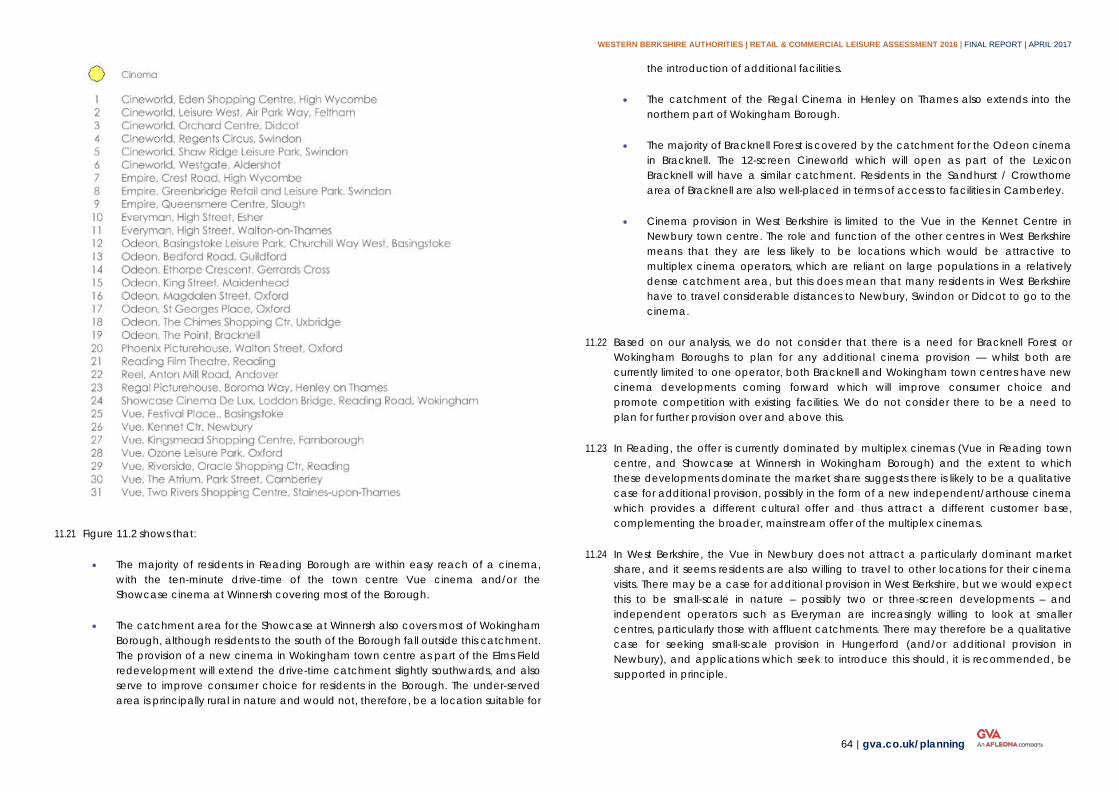
WESTERN BERKSHIRE AUTHORITIES | RETAIL & COMMERCIAL LEISURE ASSESSMENT 2016 | FINAL REPORT | APRIL 2017
64 | gva.co.uk/planning
11.21 Figure 11.2 shows that:
• The majority of residents in Reading Borough are within easy reach of a cinema, with the ten-minute drive-time of the town centre Vue cinema and/or the Showcase cinema at Winnersh covering most of the Borough.
• The catchment area for the Showcase at Winnersh also covers most of Wokingham Borough, although residents to the south of the Borough fall outside this catchment. The provision of a new cinema in Wokingham town centre as part of the Elms Field redevelopment will extend the drive-time catchment slightly southwards, and also serve to improve consumer choice for residents in the Borough. The under-served area is principally rural in nature and would not, therefore, be a location suitable for
the introduction of additional facilities.
• The catchment of the Regal Cinema in Henley on Thames also extends into the northern part of Wokingham Borough.
• The majority of Bracknell Forest is covered by the catchment for the Odeon cinema in Bracknell. The 12-screen Cineworld which will open as part of the Lexicon Bracknell will have a similar catchment. Residents in the Sandhurst / Crowthorne area of Bracknell are also well-placed in terms of access to facilities in Camberley.
• Cinema provision in West Berkshire is limited to the Vue in the Kennet Centre in Newbury town centre. The role and function of the other centres in West Berkshire means that they are less likely to be locations which would be attractive to multiplex cinema operators, which are reliant on large populations in a relatively dense catchment area, but this does mean that many residents in West Berkshire have to travel considerable distances to Newbury, Swindon or Didcot to go to the cinema.
11.22 Based on our analysis, we do not consider that there is a need for Bracknell Forest or Wokingham Boroughs to plan for any additional cinema provision — whilst both are currently limited to one operator, both Bracknell and Wokingham town centres have new cinema developments coming forward which will improve consumer choice and promote competition with existing facilities. We do not consider there to be a need to plan for further provision over and above this.
11.23 In Reading, the offer is currently dominated by multiplex cinemas (Vue in Reading town centre, and Showcase at Winnersh in Wokingham Borough) and the extent to which these developments dominate the market share suggests there is likely to be a qualitative case for additional provision, possibly in the form of a new independent/arthouse cinema which provides a different cultural offer and thus attract a different customer base, complementing the broader, mainstream offer of the multiplex cinemas.
11.24 In West Berkshire, the Vue in Newbury does not attract a particularly dominant market share, and it seems residents are also willing to travel to other locations for their cinema visits. There may be a case for additional provision in West Berkshire, but we would expect this to be small-scale in nature – possibly two or three-screen developments – and independent operators such as Everyman are increasingly willing to look at smaller centres, particularly those with affluent catchments. There may therefore be a qualitative case for seeking small-scale provision in Hungerford (and/or additional provision in Newbury), and applications which seek to introduce this should, it is recommended, be supported in principle.
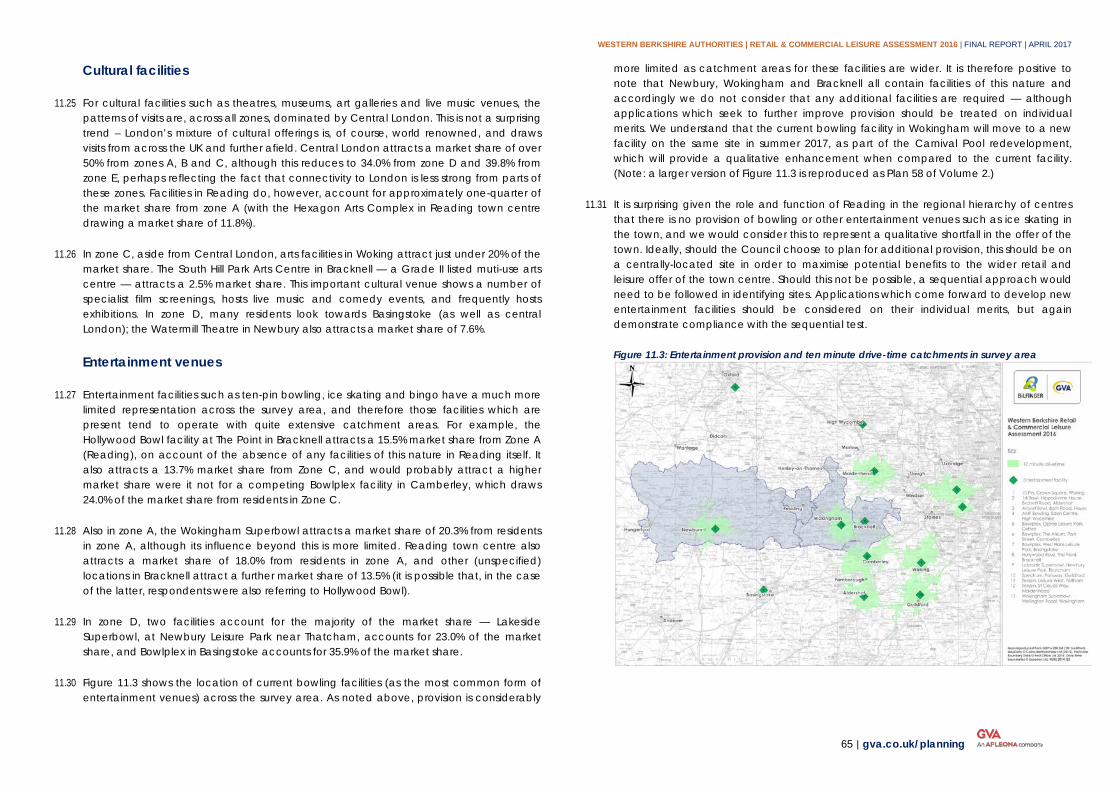
WESTERN BERKSHIRE AUTHORITIES | RETAIL & COMMERCIAL LEISURE ASSESSMENT 2016 | FINAL REPORT | APRIL 2017
65 | gva.co.uk/planning
Cultural facilities
11.25 For cultural facilities such as theatres, museums, art galleries and live music venues, the patterns of visits are, across all zones, dominated by Central London. This is not a surprising trend – London’s mixture of cultural offerings is, of course, world renowned, and draws visits from across the UK and further afield. Central London attracts a market share of over 50% from zones A, B and C, although this reduces to 34.0% from zone D and 39.8% from zone E, perhaps reflecting the fact that connectivity to London is less strong from parts of these zones. Facilities in Reading do, however, account for approximately one-quarter of the market share from zone A (with the Hexagon Arts Complex in Reading town centre drawing a market share of 11.8%).
11.26 In zone C, aside from Central London, arts facilities in Woking attract just under 20% of the market share. The South Hill Park Arts Centre in Bracknell — a Grade II listed muti-use arts centre — attracts a 2.5% market share. This important cultural venue shows a number of specialist film screenings, hosts live music and comedy events, and frequently hosts exhibitions. In zone D, many residents look towards Basingstoke (as well as central London); the Watermill Theatre in Newbury also attracts a market share of 7.6%.
Entertainment venues
11.27 Entertainment facilities such as ten-pin bowling, ice skating and bingo have a much more limited representation across the survey area, and therefore those facilities which are present tend to operate with quite extensive catchment areas. For example, the Hollywood Bowl facility at The Point in Bracknell attracts a 15.5% market share from Zone A (Reading), on account of the absence of any facilities of this nature in Reading itself. It also attracts a 13.7% market share from Zone C, and would probably attract a higher market share were it not for a competing Bowlplex facility in Camberley, which draws 24.0% of the market share from residents in Zone C.
11.28 Also in zone A, the Wokingham Superbowl attracts a market share of 20.3% from residents in zone A, although its influence beyond this is more limited. Reading town centre also attracts a market share of 18.0% from residents in zone A, and other (unspecified) locations in Bracknell attract a further market share of 13.5% (it is possible that, in the case of the latter, respondents were also referring to Hollywood Bowl).
11.29 In zone D, two facilities account for the majority of the market share — Lakeside Superbowl, at Newbury Leisure Park near Thatcham, accounts for 23.0% of the market share, and Bowlplex in Basingstoke accounts for 35.9% of the market share.
11.30 Figure 11.3 shows the location of current bowling facilities (as the most common form of entertainment venues) across the survey area. As noted above, provision is considerably
more limited as catchment areas for these facilities are wider. It is therefore positive to note that Newbury, Wokingham and Bracknell all contain facilities of this nature and accordingly we do not consider that any additional facilities are required — although applications which seek to further improve provision should be treated on individual merits. We understand that the current bowling facility in Wokingham will move to a new facility on the same site in summer 2017, as part of the Carnival Pool redevelopment, which will provide a qualitative enhancement when compared to the current facility. (Note: a larger version of Figure 11.3 is reproduced as Plan 58 of Volume 2.)
11.31 It is surprising given the role and function of Reading in the regional hierarchy of centres that there is no provision of bowling or other entertainment venues such as ice skating in the town, and we would consider this to represent a qualitative shortfall in the offer of the town. Ideally, should the Council choose to plan for additional provision, this should be on a centrally-located site in order to maximise potential benefits to the wider retail and leisure offer of the town centre. Should this not be possible, a sequential approach would need to be followed in identifying sites. Applications which come forward to develop new entertainment facilities should be considered on their individual merits, but again demonstrate compliance with the sequential test.
Figure 11.3: Entertainment provision and ten minute drive-time catchments in survey area
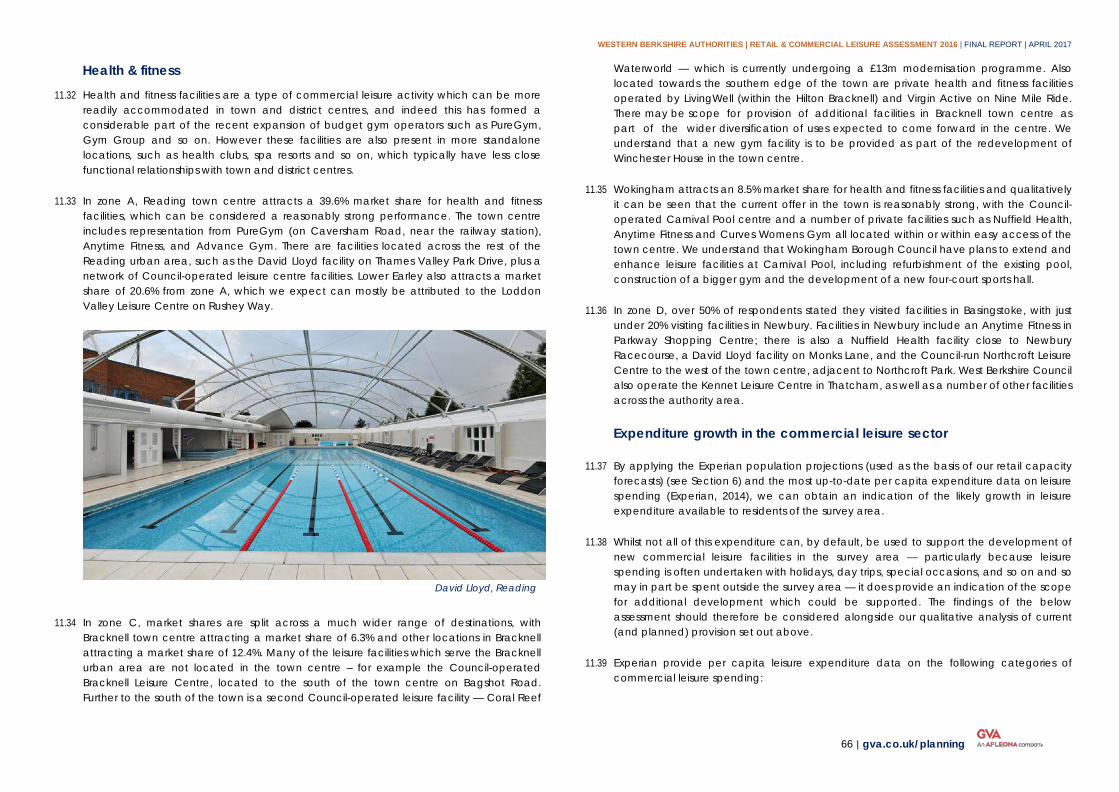
WESTERN BERKSHIRE AUTHORITIES | RETAIL & COMMERCIAL LEISURE ASSESSMENT 2016 | FINAL REPORT | APRIL 2017
66 | gva.co.uk/planning
Health & fitness
11.32 Health and fitness facilities are a type of commercial leisure activity which can be more readily accommodated in town and district centres, and indeed this has formed a considerable part of the recent expansion of budget gym operators such as PureGym, Gym Group and so on. However these facilities are also present in more standalone locations, such as health clubs, spa resorts and so on, which typically have less close functional relationships with town and district centres.
11.33 In zone A, Reading town centre attracts a 39.6% market share for health and fitness facilities, which can be considered a reasonably strong performance. The town centre includes representation from PureGym (on Caversham Road, near the railway station), Anytime Fitness, and Advance Gym. There are facilities located across the rest of the Reading urban area, such as the David Lloyd facility on Thames Valley Park Drive, plus a network of Council-operated leisure centre facilities. Lower Earley also attracts a market share of 20.6% from zone A, which we expect can mostly be attributed to the Loddon Valley Leisure Centre on Rushey Way.
David Lloyd, Reading
11.34 In zone C, market shares are split across a much wider range of destinations, with Bracknell town centre attracting a market share of 6.3% and other locations in Bracknell attracting a market share of 12.4%. Many of the leisure facilities which serve the Bracknell urban area are not located in the town centre – for example the Council-operated Bracknell Leisure Centre, located to the south of the town centre on Bagshot Road. Further to the south of the town is a second Council-operated leisure facility — Coral Reef
Waterworld — which is currently undergoing a £13m modernisation programme. Also located towards the southern edge of the town are private health and fitness facilities operated by LivingWell (within the Hilton Bracknell) and Virgin Active on Nine Mile Ride. There may be scope for provision of additional facilities in Bracknell town centre as part of the wider diversification of uses expected to come forward in the centre. We understand that a new gym facility is to be provided as part of the redevelopment of Winchester House in the town centre.
11.35 Wokingham attracts an 8.5% market share for health and fitness facilities and qualitatively it can be seen that the current offer in the town is reasonably strong, with the Council-operated Carnival Pool centre and a number of private facilities such as Nuffield Health, Anytime Fitness and Curves Womens Gym all located within or within easy access of the town centre. We understand that Wokingham Borough Council have plans to extend and enhance leisure facilities at Carnival Pool, including refurbishment of the existing pool, construction of a bigger gym and the development of a new four-court sports hall.
11.36 In zone D, over 50% of respondents stated they visited facilities in Basingstoke, with just under 20% visiting facilities in Newbury. Facilities in Newbury include an Anytime Fitness in Parkway Shopping Centre; there is also a Nuffield Health facility close to Newbury Racecourse, a David Lloyd facility on Monks Lane, and the Council-run Northcroft Leisure Centre to the west of the town centre, adjacent to Northcroft Park. West Berkshire Council also operate the Kennet Leisure Centre in Thatcham, as well as a number of other facilities across the authority area.
Expenditure growth in the commercial leisure sector
11.37 By applying the Experian population projections (used as the basis of our retail capacity forecasts) (see Section 6) and the most up-to-date per capita expenditure data on leisure spending (Experian, 2014), we can obtain an indication of the likely growth in leisure expenditure available to residents of the survey area.
11.38 Whilst not all of this expenditure can, by default, be used to support the development of new commercial leisure facilities in the survey area — particularly because leisure spending is often undertaken with holidays, day trips, special occasions, and so on and so may in part be spent outside the survey area — it does provide an indication of the scope for additional development which could be supported. The findings of the below assessment should therefore be considered alongside our qualitative analysis of current (and planned) provision set out above.
11.39 Experian provide per capita leisure expenditure data on the following categories of commercial leisure spending:
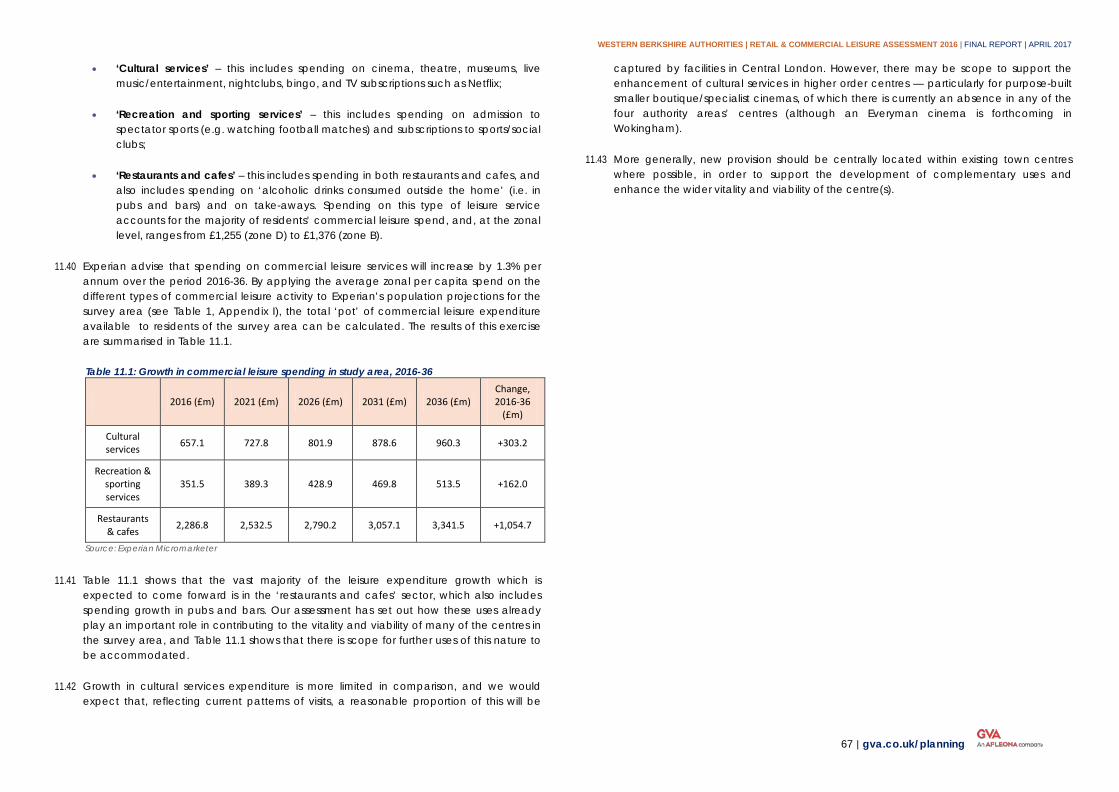
WESTERN BERKSHIRE AUTHORITIES | RETAIL & COMMERCIAL LEISURE ASSESSMENT 2016 | FINAL REPORT | APRIL 2017
67 | gva.co.uk/planning
• ‘Cultural services’ – this includes spending on cinema, theatre, museums, live music/entertainment, nightclubs, bingo, and TV subscriptions such as Netflix;
• ‘Recreation and sporting services’ – this includes spending on admission to spectator sports (e.g. watching football matches) and subscriptions to sports/social clubs;
• ‘Restaurants and cafes’ – this includes spending in both restaurants and cafes, and also includes spending on ‘alcoholic drinks consumed outside the home’ (i.e. in pubs and bars) and on take-aways. Spending on this type of leisure service accounts for the majority of residents’ commercial leisure spend, and, at the zonal level, ranges from £1,255 (zone D) to £1,376 (zone B).
11.40 Experian advise that spending on commercial leisure services will increase by 1.3% per annum over the period 2016-36. By applying the average zonal per capita spend on the different types of commercial leisure activity to Experian’s population projections for the survey area (see Table 1, Appendix I), the total ‘pot’ of commercial leisure expenditure available to residents of the survey area can be calculated. The results of this exercise are summarised in Table 11.1.
Table 11.1: Growth in commercial leisure spending in study area, 2016-36
2016 (£m) 2021 (£m) 2026 (£m) 2031 (£m) 2036 (£m) Change, 2016-36
(£m)
Cultural services 657.1 727.8 801.9 878.6 960.3 +303.2
Recreation & sporting services
351.5 389.3 428.9 469.8 513.5 +162.0
Restaurants & cafes 2,286.8 2,532.5 2,790.2 3,057.1 3,341.5 +1,054.7
Source: Experian Micromarketer
11.41 Table 11.1 shows that the vast majority of the leisure expenditure growth which is expected to come forward is in the ‘restaurants and cafes’ sector, which also includes spending growth in pubs and bars. Our assessment has set out how these uses already play an important role in contributing to the vitality and viability of many of the centres in the survey area, and Table 11.1 shows that there is scope for further uses of this nature to be accommodated.
11.42 Growth in cultural services expenditure is more limited in comparison, and we would expect that, reflecting current patterns of visits, a reasonable proportion of this will be
captured by facilities in Central London. However, there may be scope to support the enhancement of cultural services in higher order centres — particularly for purpose-built smaller boutique/specialist cinemas, of which there is currently an absence in any of the four authority areas’ centres (although an Everyman cinema is forthcoming in Wokingham).
11.43 More generally, new provision should be centrally located within existing town centres where possible, in order to support the development of complementary uses and enhance the wider vitality and viability of the centre(s).
WESTERN BERKSHIRE AUTHORITIES | RETAIL & COMMERCIAL LEISURE ASSESSMENT 2016 | FINAL REPORT | APRIL 2017
68 | gva.co.uk/planning
Conclusions 12
In this report we have provided an update assessment of the retail needs of the four ‘Western Berkshire’ authorities of Bracknell Forest Council, Reading Borough Council, West Berkshire Council and Wokingham Borough Council. We have set out the changes in national retail and commercial leisure trends, identified current patterns of shopping and leisure trips, and set out the quantitative retail ‘need’ which each authority should plan for over the period of the study to 2036, for both comparison (non-food) and convenience (food) floorspace.
12.1 Our study provides a robust evidence base which is fully compliant with the NPPF, which the Councils will be able to use to inform policy development and land use allocations. We also expect that the study will be used by the Councils to assist in the determination of applications for new retail and commercial leisure development within their respective Boroughs.
12.2 Our study has been informed by a household telephone survey of shopping and leisure patterns across the four Western Berkshire authority areas, and adjacent surrounding areas in which residents may look towards facilities in these authority areas to meet their shopping and leisure needs (‘the survey area’). A wide survey area has been adopted for the purposes of this study to reflect the sub-regional role which Reading town centre plays as a comparison goods shopping destination. The results of the survey can also be used to understand the extent to which surrounding centres — such as High Wycombe, Basingstoke, Slough, Windsor, Camberley, Woking and Guildford — are competing for spending with the network of centres within the four Western Berkshire authority areas. The extent of the survey area was agreed with the Councils at the initial stage of preparation of this study.
National and Local Planning Policy Framework
12.3 The NPPF was adopted in March 2012 and replaces the suite of national planning policy statements, including PPS4. The NPPF maintains the general thrust of PPS4 and advocates a ‘town centres first’ approach. It requires planning policies to positively promote competitive town centre environments and manage the growth of centres over the plan period. It also requires local planning authorities to define the extent of the town centres and primary shopping areas, based on a clear definition of primary and secondary frontages.
12.4 In Section 2 of the study we provide a comprehensive review of the adopted and emerging development plans for each of the four authority areas which provides the
context for the remainder of the study.
National retail and leisure market trends
12.5 Our study has set out that the ‘traditional’ high street continues to face a number of challenges stemming from the impacts of the recent economic downturn, the tightening of retail spending in recent years, and continued significant changes in consumer shopping behaviour. The growth in online shopping, including multi-channel retailing, acts as tough competition for the high street, but also presents an opportunity for the high street to capitalise, by maximising the opportunities arising from services like ‘Click & Collect’, and retailers moving towards a seamless transition between store-based and virtual shopping experiences. Many retailers who are represented across the survey area now offer ‘Click & Collect’ facilities, including Boots, Waitrose, John Lewis, Marks & Spencer, Sainsbury’s and Tesco.
12.6 The convenience goods sector is in the middle of a considerable period of change. The main foodstores (i.e. the ‘big four’ - Sainsbury’s, Tesco, Asda, Morrisons) have reigned in substantial expansion and the roll-out of super-sized stores. The combined spread of convenience store openings, online grocery sales, and the expansion of ‘deep discount’ retailers such as Aldi and Lidl has fundamentally changed consumer shopping behaviour. The results of the household survey have confirmed that many ‘deep discount’ foodstores across the survey area are trading strongly. These trends have encouraged repetitive top-up shopping that in turn diminishes main grocery sales and renders large-format stores less profitable. However, it is important to note that these large-format stores continue to account for the majority of convenience goods shopping trips, and the evidence from this study suggests that the majority of larger-format stores in the survey area are continuing to perform well.
12.7 Although national planning policy continues to direct retail and other ‘main town centre uses’ towards town centres in the first instance, out-of-centre retailing remains an ever-present source of competition. Market evidence suggests that many retail parks performed well during the economic downturn, and are becoming increasingly attractive to ‘high street’ retailers. Many out-of-centre developments are seeking to increase footfall through a greater product offer and mix of uses (including introduction of coffee shops and casual dining) to encourage footfall and longer dwell times.
12.8 As the nature of retail and high-street shopping continues to change over time, the commercial leisure sector is becoming an increasingly important contributor to the vitality and viability of town centres, and this is reflected in the fact that the planned town centre regeneration schemes in Bracknell and Wokingham town centres both include a
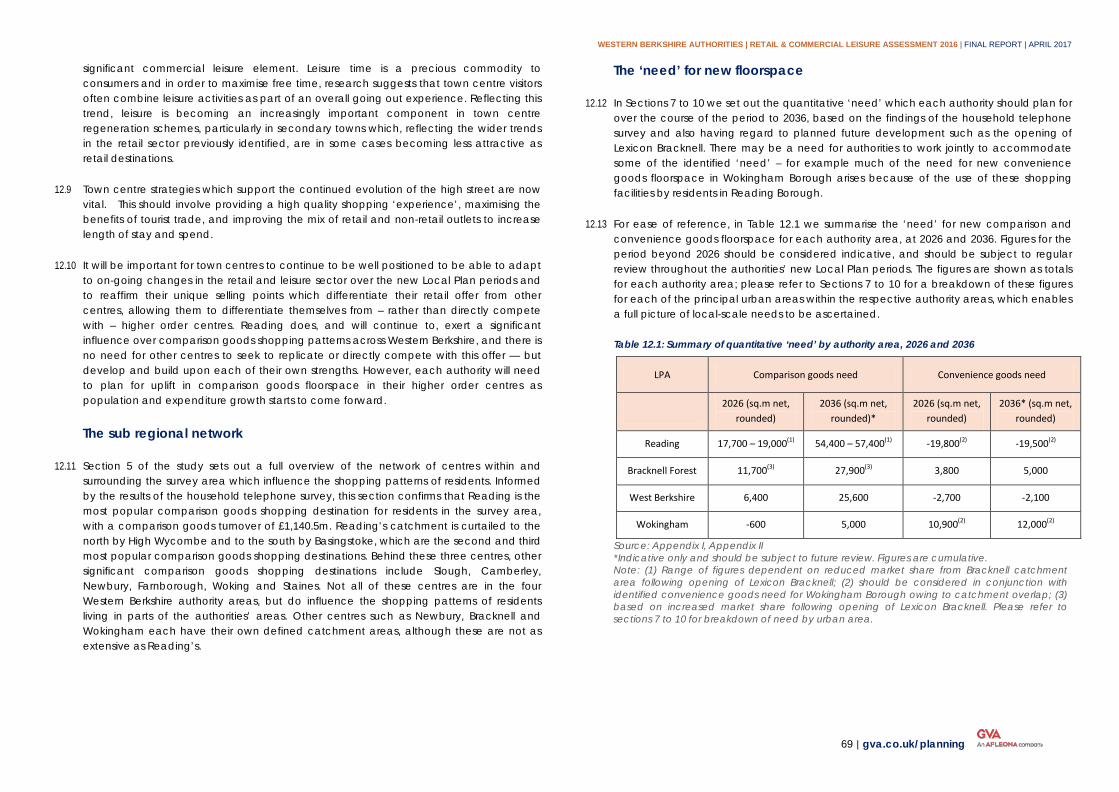
WESTERN BERKSHIRE AUTHORITIES | RETAIL & COMMERCIAL LEISURE ASSESSMENT 2016 | FINAL REPORT | APRIL 2017
69 | gva.co.uk/planning
significant commercial leisure element. Leisure time is a precious commodity to consumers and in order to maximise free time, research suggests that town centre visitors often combine leisure activities as part of an overall going out experience. Reflecting this trend, leisure is becoming an increasingly important component in town centre regeneration schemes, particularly in secondary towns which, reflecting the wider trends in the retail sector previously identified, are in some cases becoming less attractive as retail destinations.
12.9 Town centre strategies which support the continued evolution of the high street are now vital. This should involve providing a high quality shopping ‘experience’, maximising the benefits of tourist trade, and improving the mix of retail and non-retail outlets to increase length of stay and spend.
12.10 It will be important for town centres to continue to be well positioned to be able to adapt to on-going changes in the retail and leisure sector over the new Local Plan periods and to reaffirm their unique selling points which differentiate their retail offer from other centres, allowing them to differentiate themselves from – rather than directly compete with – higher order centres. Reading does, and will continue to, exert a significant influence over comparison goods shopping patterns across Western Berkshire, and there is no need for other centres to seek to replicate or directly compete with this offer — but develop and build upon each of their own strengths. However, each authority will need to plan for uplift in comparison goods floorspace in their higher order centres as population and expenditure growth starts to come forward.
The sub regional network
12.11 Section 5 of the study sets out a full overview of the network of centres within and surrounding the survey area which influence the shopping patterns of residents. Informed by the results of the household telephone survey, this section confirms that Reading is the most popular comparison goods shopping destination for residents in the survey area, with a comparison goods turnover of £1,140.5m. Reading’s catchment is curtailed to the north by High Wycombe and to the south by Basingstoke, which are the second and third most popular comparison goods shopping destinations. Behind these three centres, other significant comparison goods shopping destinations include Slough, Camberley, Newbury, Farnborough, Woking and Staines. Not all of these centres are in the four Western Berkshire authority areas, but do influence the shopping patterns of residents living in parts of the authorities’ areas. Other centres such as Newbury, Bracknell and Wokingham each have their own defined catchment areas, although these are not as extensive as Reading’s.
The ‘need’ for new floorspace
12.12 In Sections 7 to 10 we set out the quantitative ‘need’ which each authority should plan for over the course of the period to 2036, based on the findings of the household telephone survey and also having regard to planned future development such as the opening of Lexicon Bracknell. There may be a need for authorities to work jointly to accommodate some of the identified ‘need’ – for example much of the need for new convenience goods floorspace in Wokingham Borough arises because of the use of these shopping facilities by residents in Reading Borough.
12.13 For ease of reference, in Table 12.1 we summarise the ‘need’ for new comparison and convenience goods floorspace for each authority area, at 2026 and 2036. Figures for the period beyond 2026 should be considered indicative, and should be subject to regular review throughout the authorities’ new Local Plan periods. The figures are shown as totals for each authority area; please refer to Sections 7 to 10 for a breakdown of these figures for each of the principal urban areas within the respective authority areas, which enables a full picture of local-scale needs to be ascertained.
Table 12.1: Summary of quantitative ‘need’ by authority area, 2026 and 2036
LPA Comparison goods need Convenience goods need
2026 (sq.m net,
rounded) 2036 (sq.m net,
rounded)* 2026 (sq.m net,
rounded) 2036* (sq.m net,
rounded)
Reading 17,700 – 19,000(1) 54,400 – 57,400(1) -19,800(2) -19,500(2)
Bracknell Forest 11,700(3) 27,900(3) 3,800 5,000
West Berkshire 6,400 25,600 -2,700 -2,100
Wokingham -600 5,000 10,900(2) 12,000(2)
Source: Appendix I, Appendix II *Indicative only and should be subject to future review. Figures are cumulative. Note: (1) Range of figures dependent on reduced market share from Bracknell catchment area following opening of Lexicon Bracknell; (2) should be considered in conjunction with identified convenience goods need for Wokingham Borough owing to catchment overlap; (3) based on increased market share following opening of Lexicon Bracknell. Please refer to sections 7 to 10 for breakdown of need by urban area.
WESTERN BERKSHIRE AUTHORITIES | RETAIL & COMMERCIAL LEISURE ASSESSMENT 2016 | FINAL REPORT | APRIL 2017
70 | gva.co.uk/planning
Commercial leisure
12.14 In Section 8 we have presented a review of commercial leisure provision across the four authority areas. Our analysis has demonstrated that a significant growth in commercial leisure expenditure can be expected to come forward in the survey area over the period to 2036, particularly in the food and drink sector. We have also undertaken a ‘gap analysis’ assessment, identifying which parts of the survey area are underprovided for in terms of cinema and family entertainment provision.
12.15 Our analysis has shown that the highest-order centres are, for the most part, well provided for. Where qualitative gaps exist, these can often be expected to be met by schemes which are in the process of coming forward – for example the absence of a cinema in Wokingham will be met by the forthcoming Everyman cinema, which may also have the effect of reducing the dominance of the Showcase multiplex at Winnersh on current visit patterns in this part of the catchment. Similarly, Bracknell’s only cinema facility is a relatively dated Odeon which contributes little to the vitality and viability of the town centre — but the proposed new Cineworld opening as part of Lexicon Bracknell will provide a new facility and enhance consumer choice. There is a lack of smaller-scale/boutique cinemas across the four authority areas (with the exception of the aforementioned forthcoming Everyman in Wokingham), with most provision accounted for by multiplexes, often in out of town leisure parks, and applications which diversify the range and quality of the cinema offer should generally be supported.
12.16 In addition to the expenditure growth forecast across all the key commercial leisure sectors which we have set out above, our analysis has demonstrated that there is a qualitative need for the following additional commercial leisure provision in the Western Berkshire authorities:
• Reading: additional cinema facilities (ideally independent/arts-focussed); entertainment (bowling/ice skating) venue;
• West Berkshire: potential for small-scale ‘boutique’ cinema provision in Newbury and/or Hungerford;
• Bracknell Forest: no additional requirements
• Wokingham: no additional requirements
12.17 For restaurants/cafes, again many of the current locations which are underprovided for are expected to see improvements in the short-to-medium term. The almost total absence of these facilities in Bracknell town centre means that the centre currently has a noticeably limited evening economy, but the opening of Lexicon Bracknell will introduce
a range of new restaurant operators to the town. Given the level of expenditure growth in this sector which is expected to come forward, all four authorities will need to plan for additional provision of this nature over the course of their Local Plan periods.
12.18 As a general strategic approach, reflecting the trends seen at the national level, proposals to enhance commercial leisure provision in the authorities’ network of higher order centres should be supported, provided they are of an appropriate scale. Applications for development of commercial leisure uses on sites which are not within a defined centre will need to demonstrate compliance with the relevant national and local policy requirements in terms of compliance with the sequential test.
Monitoring and next steps
12.19 The Councils should seek to continue to promote and enhance their network of centres throughout their new Local Plan periods. The Councils should ensure the retail capacity forecasts identified in this study remain up to date throughout their new Local Plan periods by refreshing the evidence base to take into account changes in population and expenditure projections, ‘special forms of trading’ forecasts, ‘commitments’ for new retail development and so on.
12.20 In particular, there will be a need to refresh the evidence once the new town centre scheme in Bracknell has commenced trading (allowing for a period of time for shopping patterns to ‘bed down’), to establish the extent to which the centre’s catchment area has changed as a result of the development, in terms of the extent of uplift in market share which has ultimately been achieved.
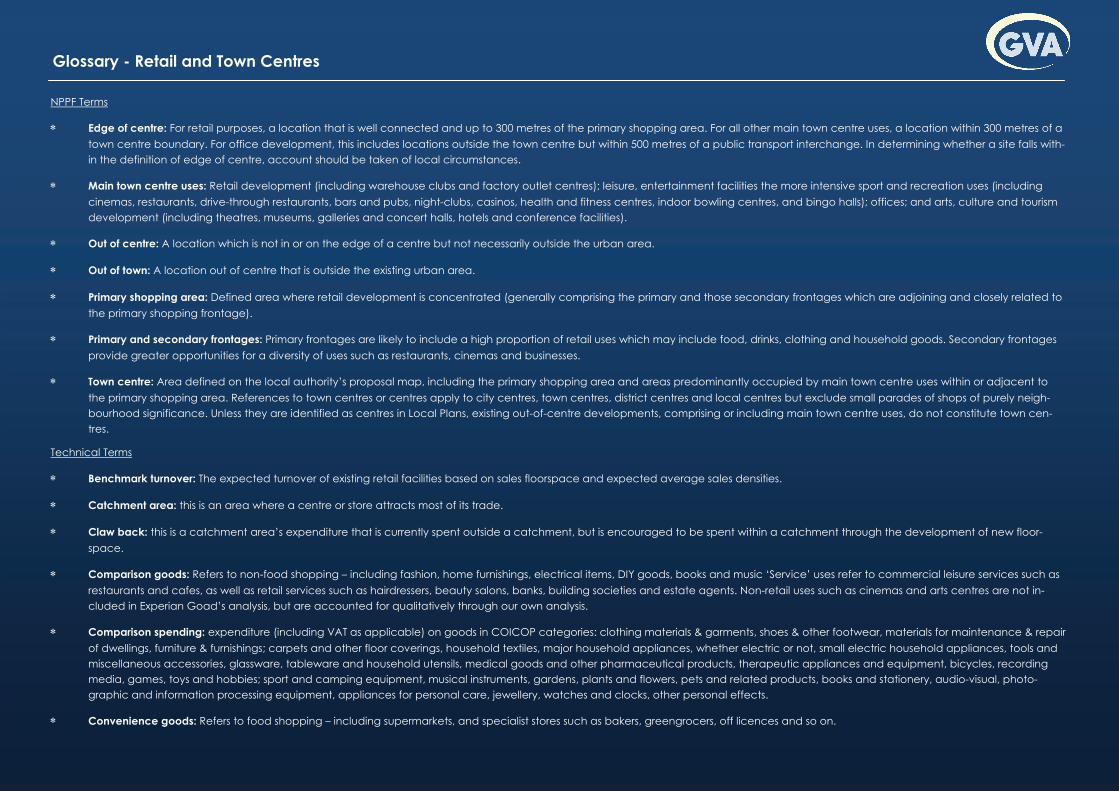
Glossary - Retail and Town Centres
NPPF Terms
Edge of centre: For retail purposes, a location that is well connected and up to 300 metres of the primary shopping area. For all other main town centre uses, a location within 300 metres of a town centre boundary. For office development, this includes locations outside the town centre but within 500 metres of a public transport interchange. In determining whether a site falls with-in the definition of edge of centre, account should be taken of local circumstances.
Main town centre uses: Retail development (including warehouse clubs and factory outlet centres); leisure, entertainment facilities the more intensive sport and recreation uses (including cinemas, restaurants, drive-through restaurants, bars and pubs, night-clubs, casinos, health and fitness centres, indoor bowling centres, and bingo halls); offices; and arts, culture and tourism development (including theatres, museums, galleries and concert halls, hotels and conference facilities).
Out of centre: A location which is not in or on the edge of a centre but not necessarily outside the urban area.
Out of town: A location out of centre that is outside the existing urban area.
Primary shopping area: Defined area where retail development is concentrated (generally comprising the primary and those secondary frontages which are adjoining and closely related to the primary shopping frontage).
Primary and secondary frontages: Primary frontages are likely to include a high proportion of retail uses which may include food, drinks, clothing and household goods. Secondary frontages provide greater opportunities for a diversity of uses such as restaurants, cinemas and businesses.
Town centre: Area defined on the local authority’s proposal map, including the primary shopping area and areas predominantly occupied by main town centre uses within or adjacent to the primary shopping area. References to town centres or centres apply to city centres, town centres, district centres and local centres but exclude small parades of shops of purely neigh-bourhood significance. Unless they are identified as centres in Local Plans, existing out-of-centre developments, comprising or including main town centre uses, do not constitute town cen-tres.
Technical Terms
Benchmark turnover: The expected turnover of existing retail facilities based on sales floorspace and expected average sales densities.
Catchment area: this is an area where a centre or store attracts most of its trade.
Claw back: this is a catchment area’s expenditure that is currently spent outside a catchment, but is encouraged to be spent within a catchment through the development of new floor-space.
Comparison goods: Refers to non-food shopping – including fashion, home furnishings, electrical items, DIY goods, books and music ‘Service’ uses refer to commercial leisure services such as restaurants and cafes, as well as retail services such as hairdressers, beauty salons, banks, building societies and estate agents. Non-retail uses such as cinemas and arts centres are not in-cluded in Experian Goad’s analysis, but are accounted for qualitatively through our own analysis.
Comparison spending: expenditure (including VAT as applicable) on goods in COICOP categories: clothing materials & garments, shoes & other footwear, materials for maintenance & repair of dwellings, furniture & furnishings; carpets and other floor coverings, household textiles, major household appliances, whether electric or not, small electric household appliances, tools and miscellaneous accessories, glassware, tableware and household utensils, medical goods and other pharmaceutical products, therapeutic appliances and equipment, bicycles, recording media, games, toys and hobbies; sport and camping equipment, musical instruments, gardens, plants and flowers, pets and related products, books and stationery, audio-visual, photo-graphic and information processing equipment, appliances for personal care, jewellery, watches and clocks, other personal effects.
Convenience goods: Refers to food shopping – including supermarkets, and specialist stores such as bakers, greengrocers, off licences and so on.
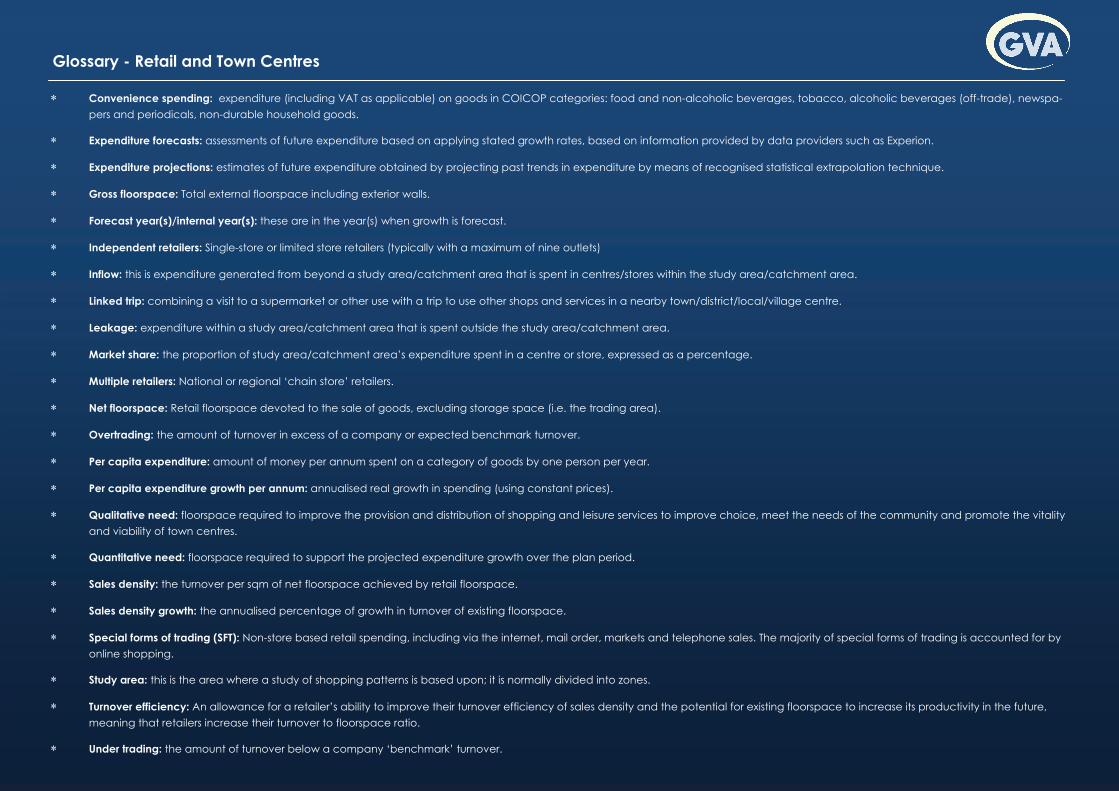
Glossary - Retail and Town Centres
Convenience spending: expenditure (including VAT as applicable) on goods in COICOP categories: food and non-alcoholic beverages, tobacco, alcoholic beverages (off-trade), newspa-pers and periodicals, non-durable household goods.
Expenditure forecasts: assessments of future expenditure based on applying stated growth rates, based on information provided by data providers such as Experion.
Expenditure projections: estimates of future expenditure obtained by projecting past trends in expenditure by means of recognised statistical extrapolation technique.
Gross floorspace: Total external floorspace including exterior walls.
Forecast year(s)/internal year(s): these are in the year(s) when growth is forecast.
Independent retailers: Single-store or limited store retailers (typically with a maximum of nine outlets)
Inflow: this is expenditure generated from beyond a study area/catchment area that is spent in centres/stores within the study area/catchment area.
Linked trip: combining a visit to a supermarket or other use with a trip to use other shops and services in a nearby town/district/local/village centre.
Leakage: expenditure within a study area/catchment area that is spent outside the study area/catchment area.
Market share: the proportion of study area/catchment area’s expenditure spent in a centre or store, expressed as a percentage.
Multiple retailers: National or regional ‘chain store’ retailers.
Net floorspace: Retail floorspace devoted to the sale of goods, excluding storage space (i.e. the trading area).
Overtrading: the amount of turnover in excess of a company or expected benchmark turnover.
Per capita expenditure: amount of money per annum spent on a category of goods by one person per year.
Per capita expenditure growth per annum: annualised real growth in spending (using constant prices).
Qualitative need: floorspace required to improve the provision and distribution of shopping and leisure services to improve choice, meet the needs of the community and promote the vitality and viability of town centres.
Quantitative need: floorspace required to support the projected expenditure growth over the plan period.
Sales density: the turnover per sqm of net floorspace achieved by retail floorspace.
Sales density growth: the annualised percentage of growth in turnover of existing floorspace.
Special forms of trading (SFT): Non-store based retail spending, including via the internet, mail order, markets and telephone sales. The majority of special forms of trading is accounted for by online shopping.
Study area: this is the area where a study of shopping patterns is based upon; it is normally divided into zones.
Turnover efficiency: An allowance for a retailer’s ability to improve their turnover efficiency of sales density and the potential for existing floorspace to increase its productivity in the future, meaning that retailers increase their turnover to floorspace ratio.
Under trading: the amount of turnover below a company ‘benchmark’ turnover.
gva.co.uk/planning
WESTERN BERKSHIRE AUTHORITIES | RETAIL & COMMERCIAL LEISURE ASSESSMENT 2016 | FINAL REPORT | APRIL 2017
Western Berkshire Retail & Commercial Leisure Assessment 2016 Volume 2 — Plans & Appendices Final Report April 2017
GVA on behalf of Bracknell Forest Council | Reading Borough Council | West Berkshire Council | Wokingham Borough Council

STUDY AREA & MARKET SHARE PLANS
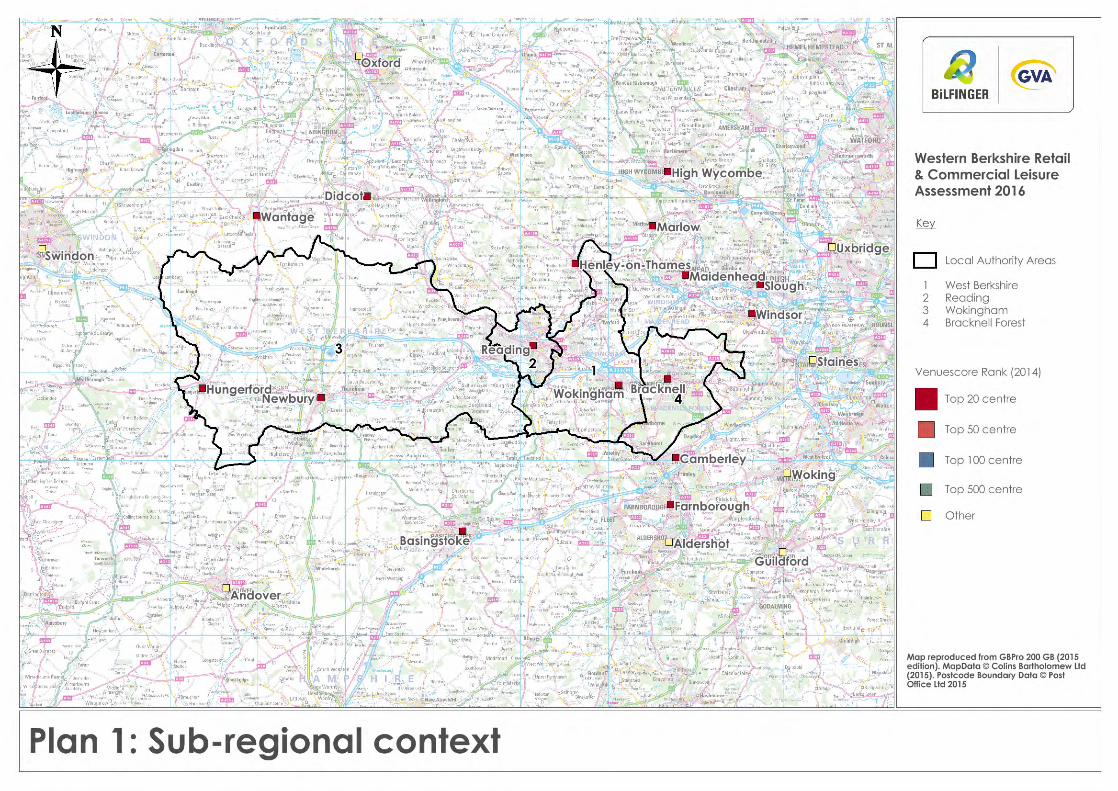
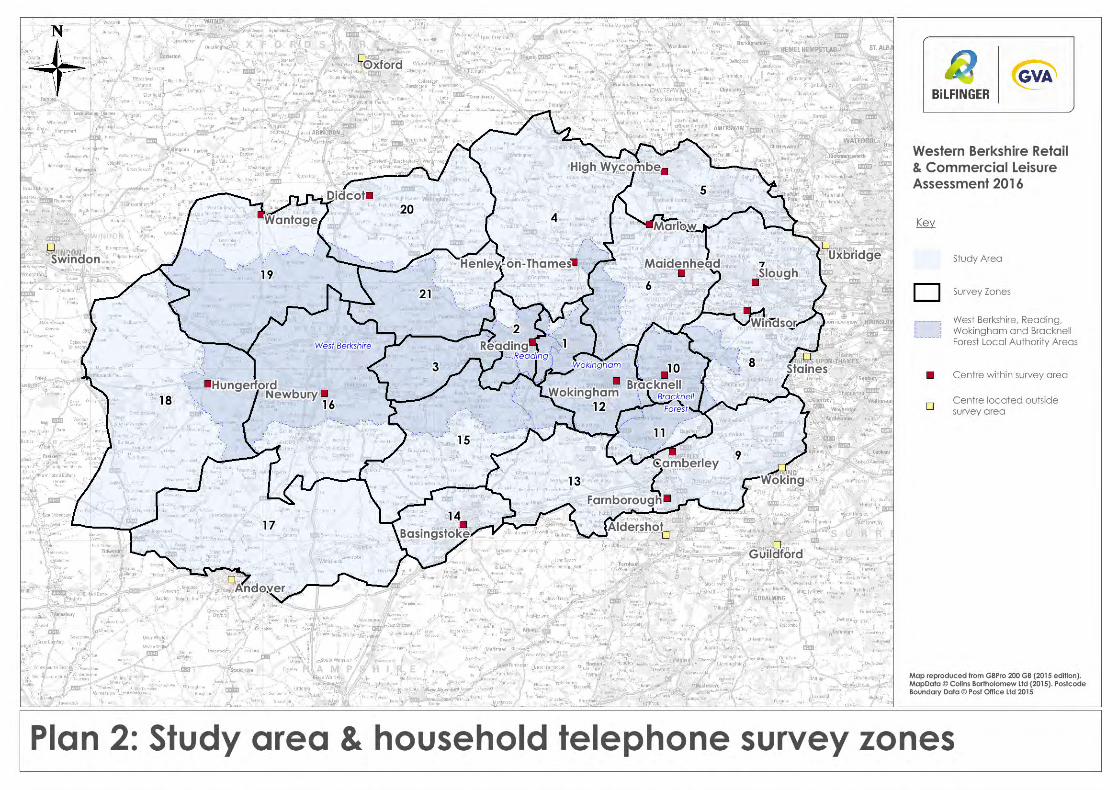
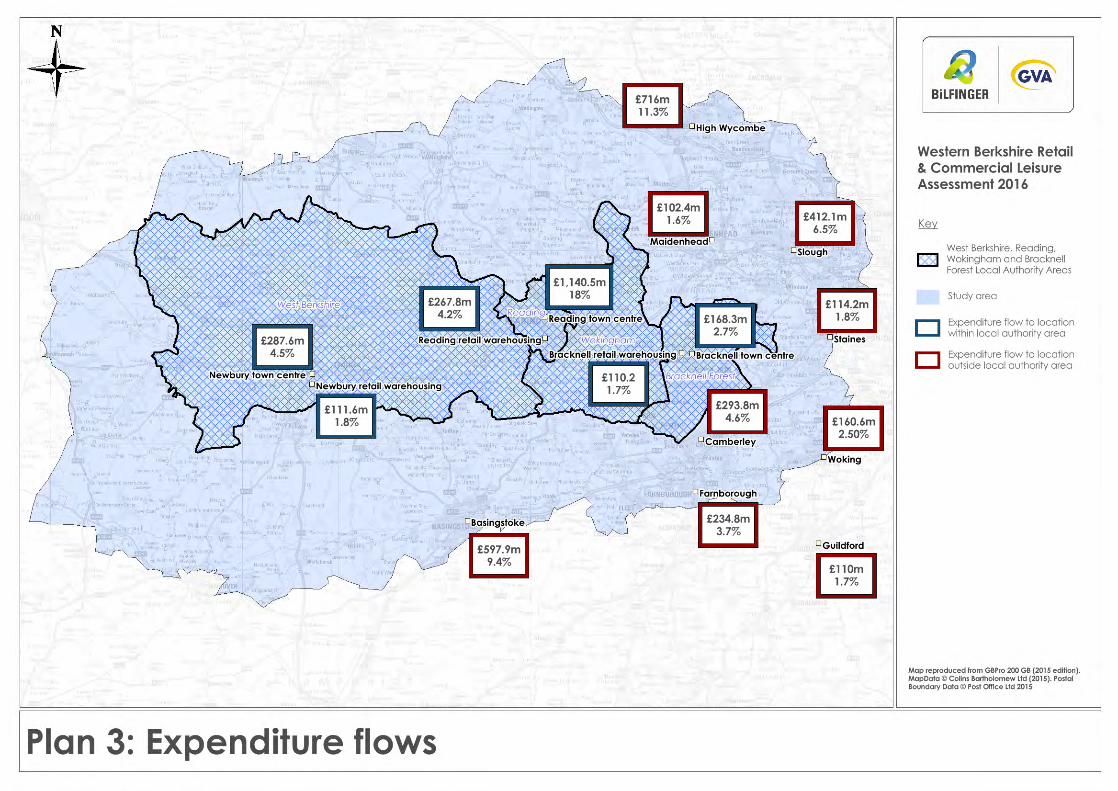
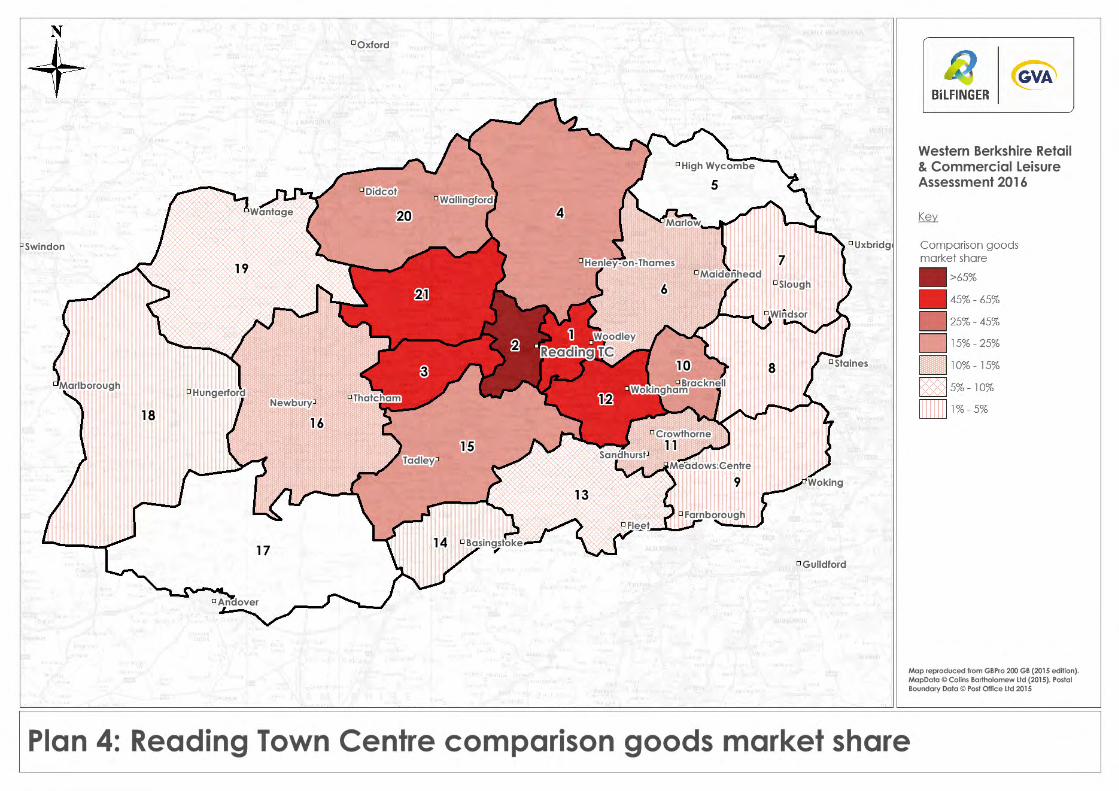
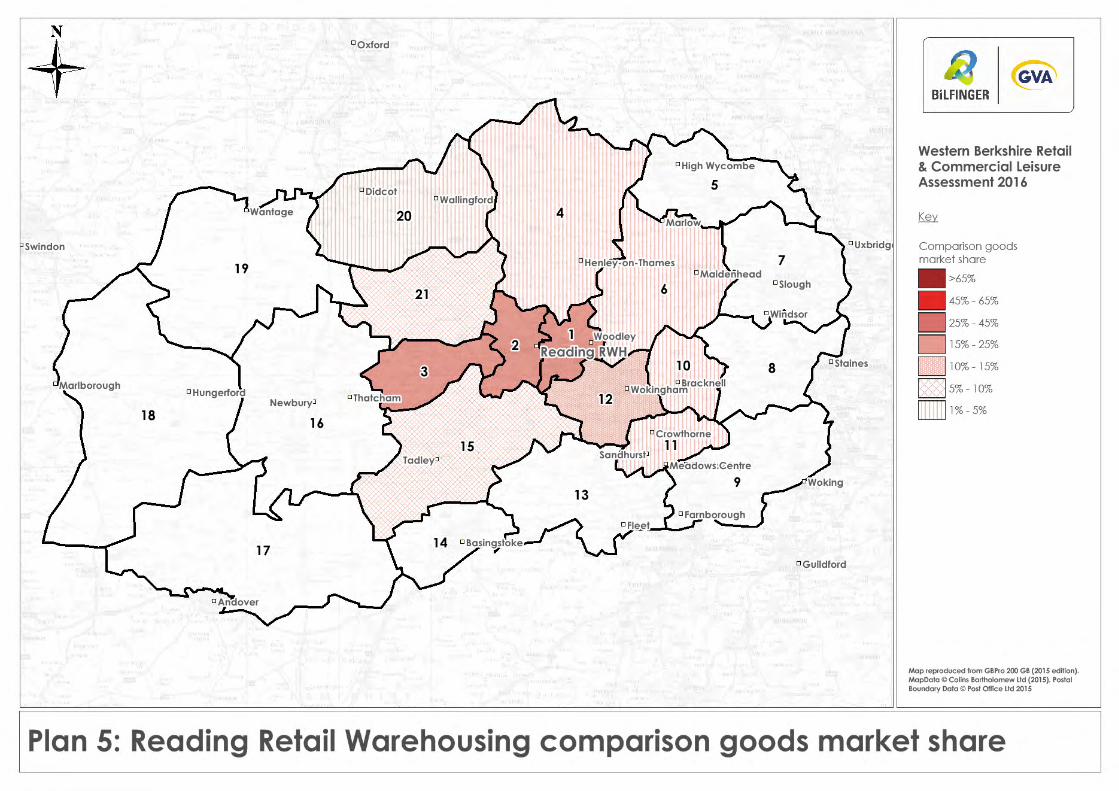
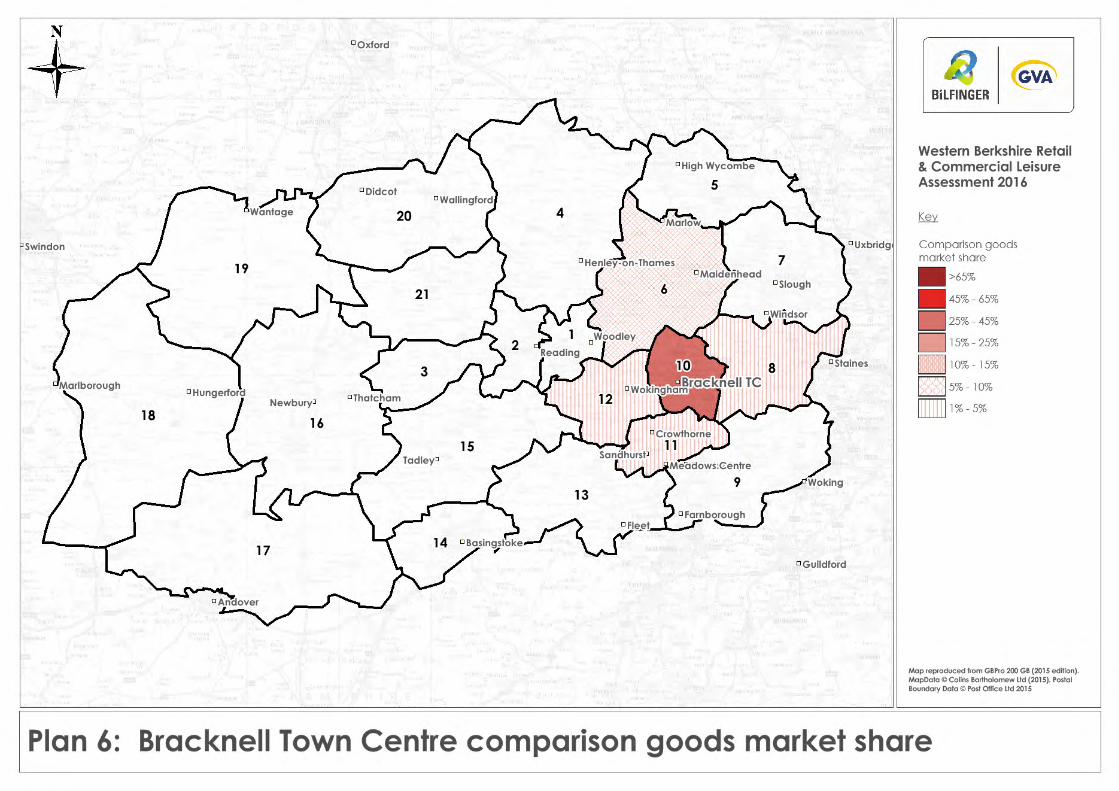
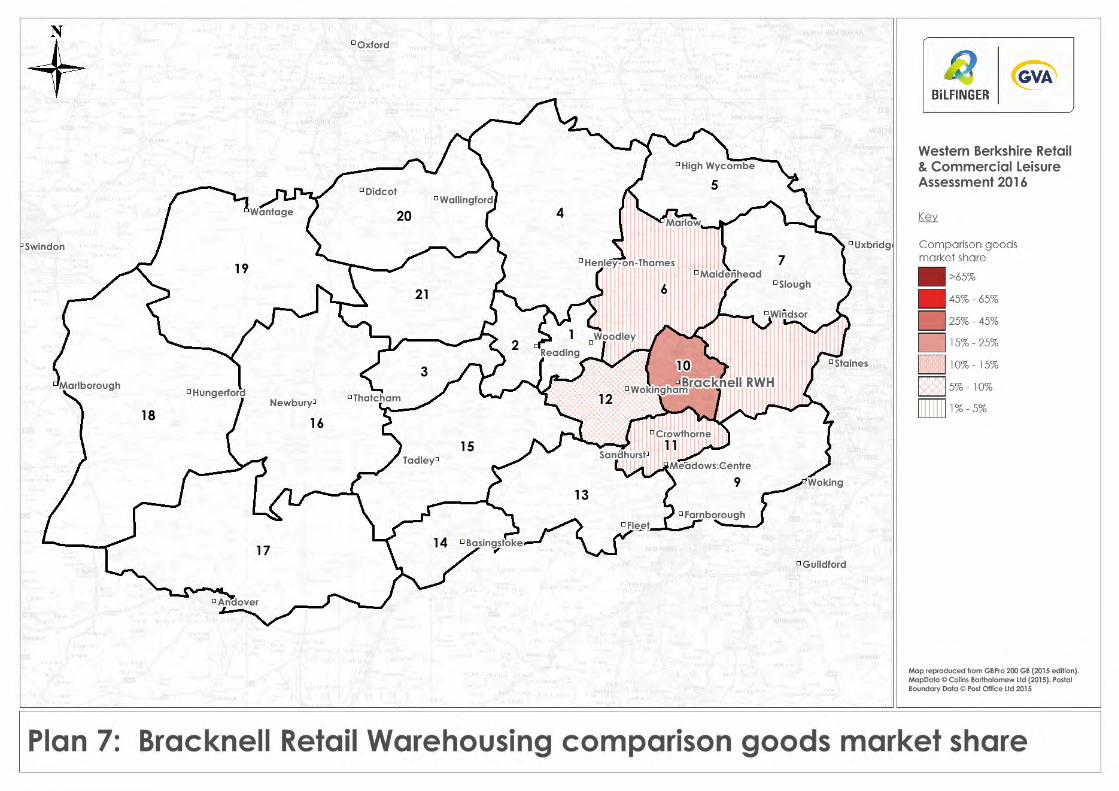
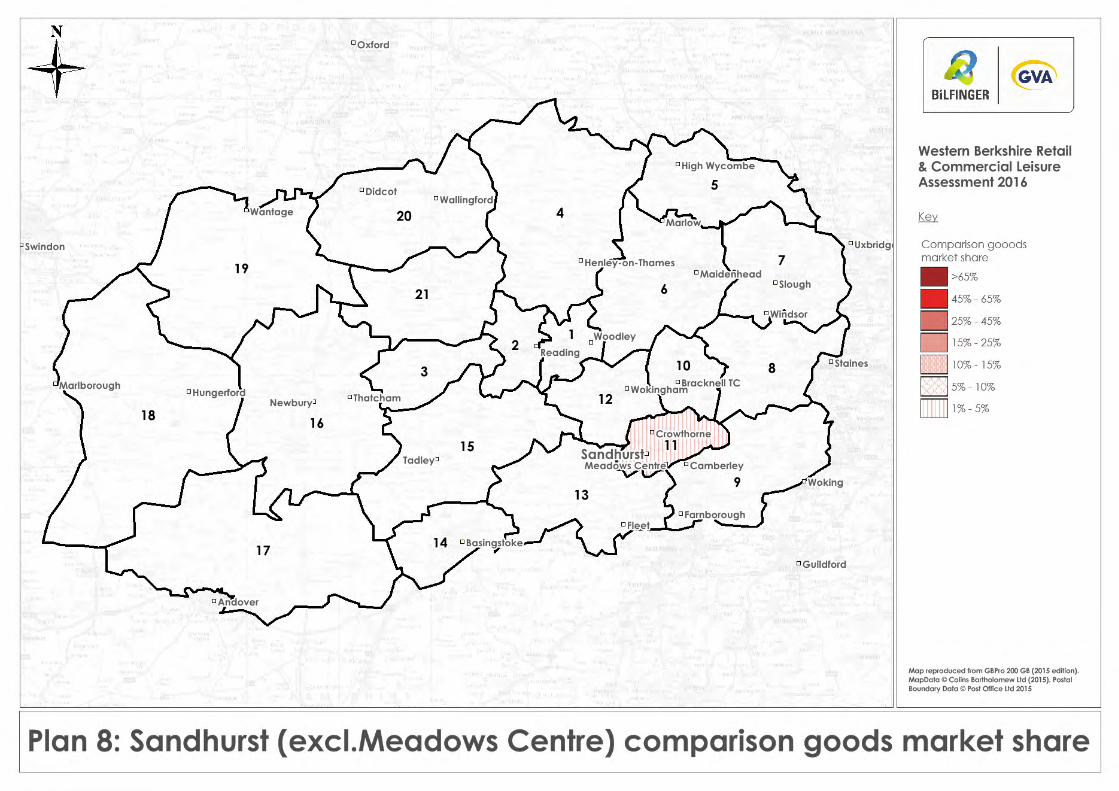
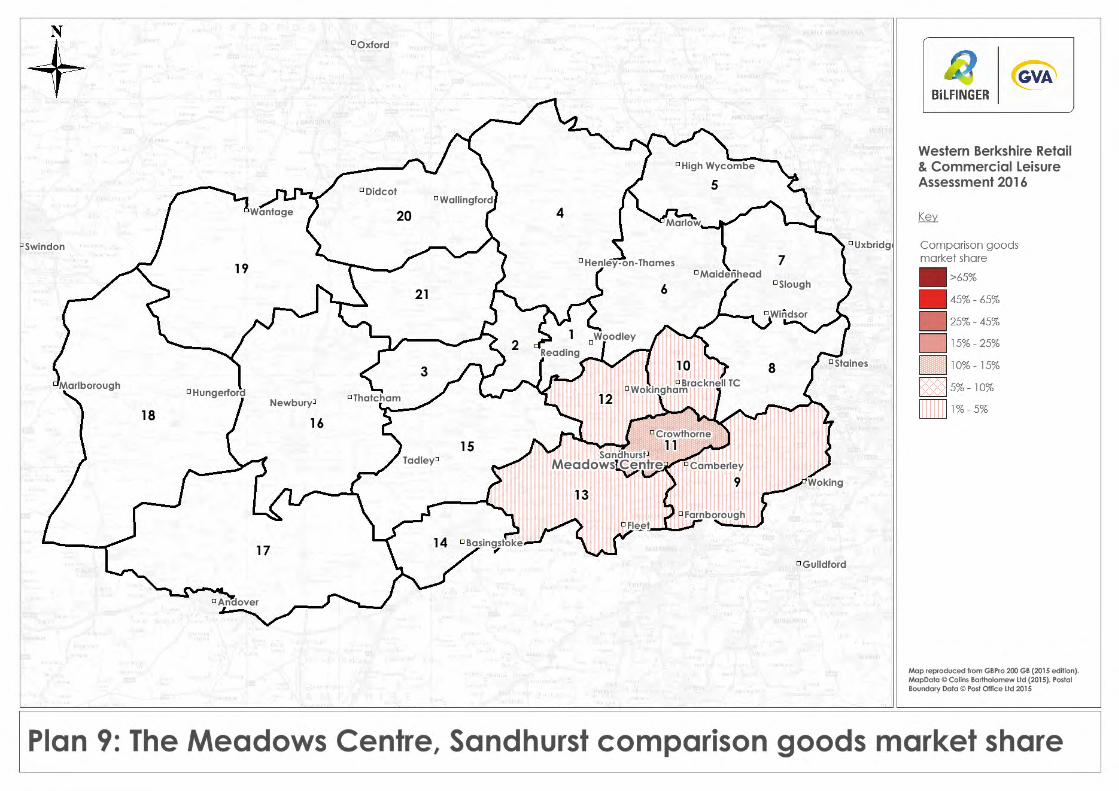
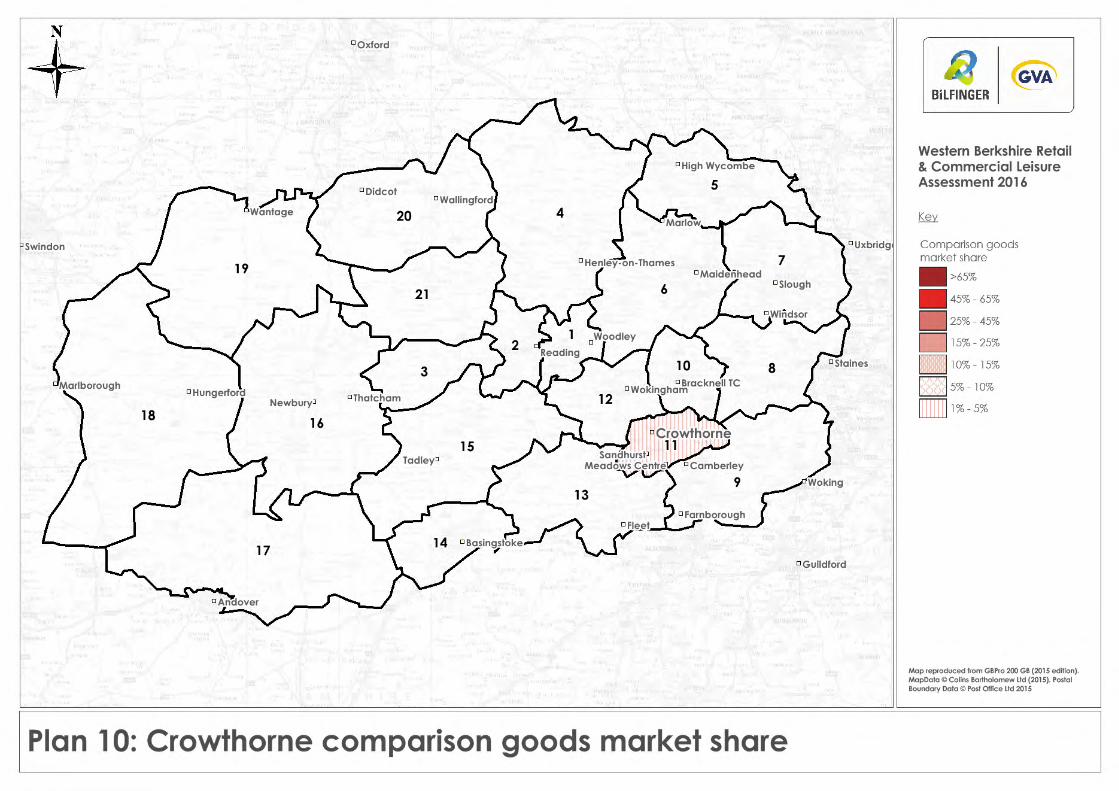
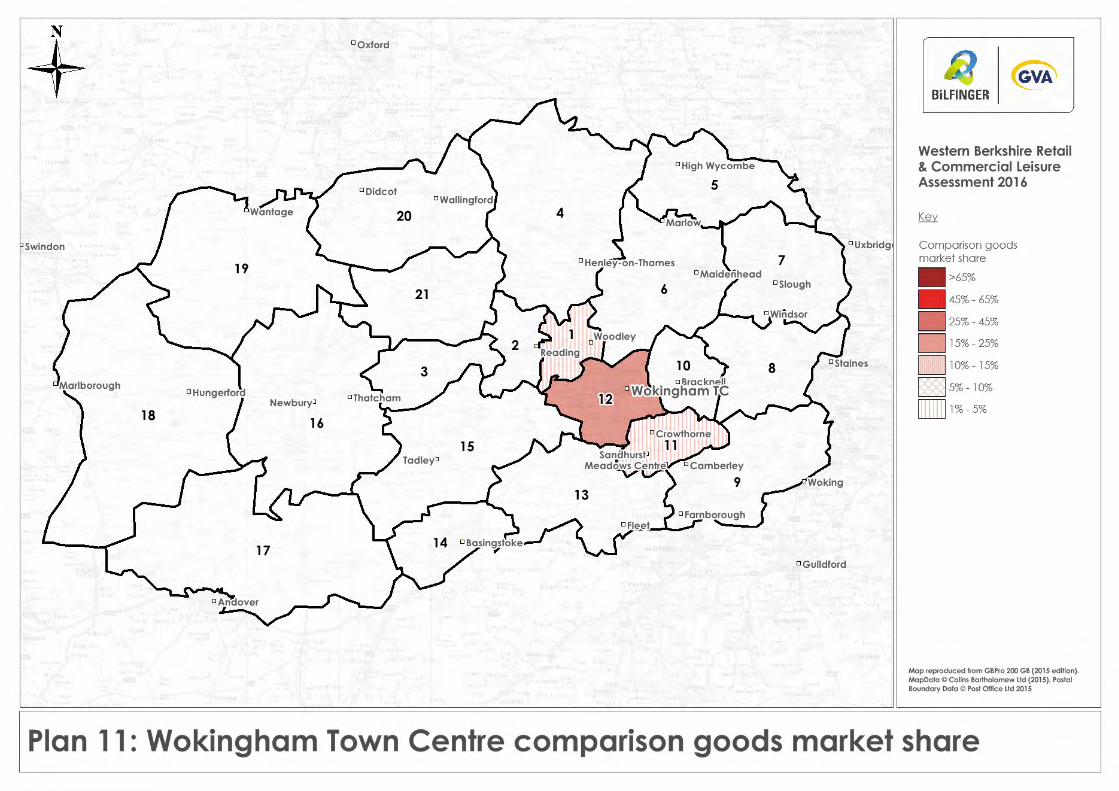
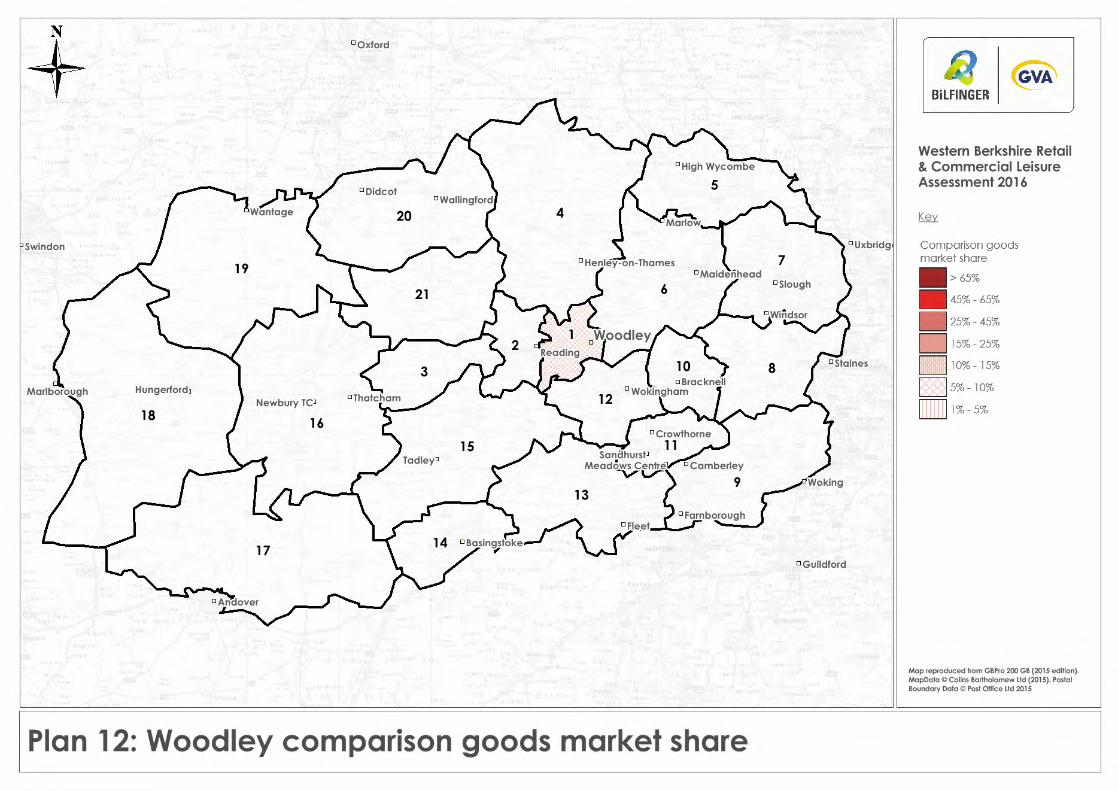
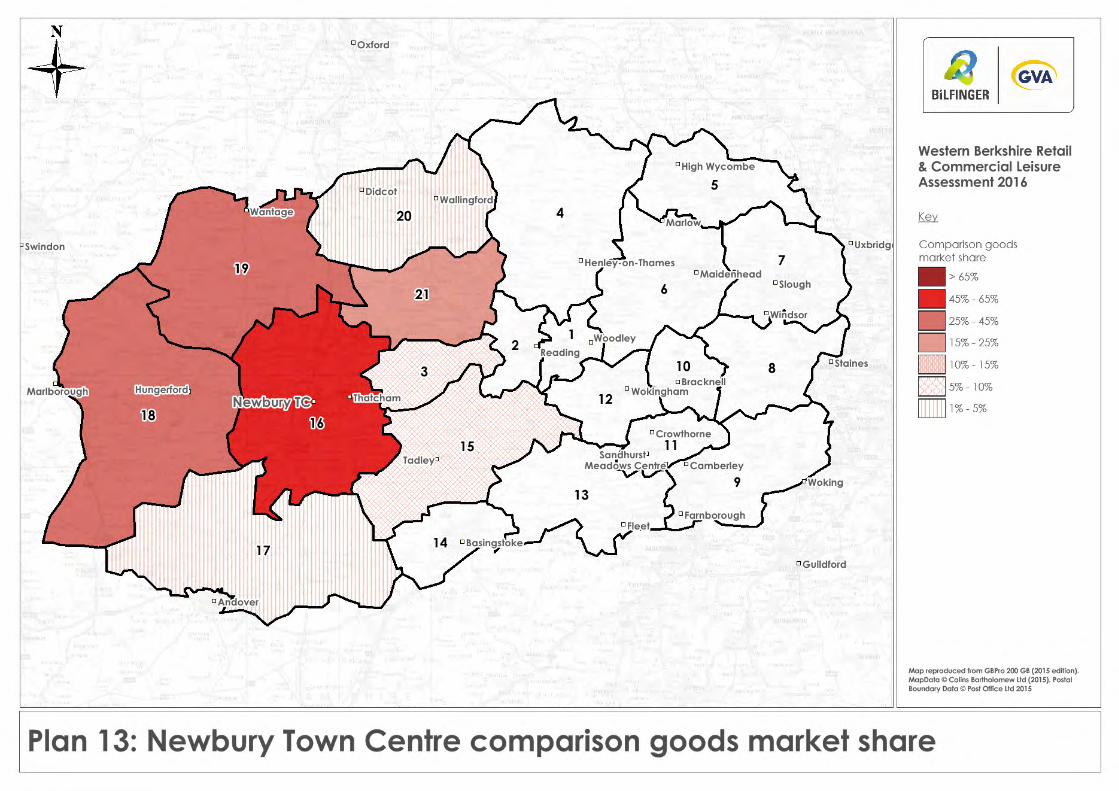
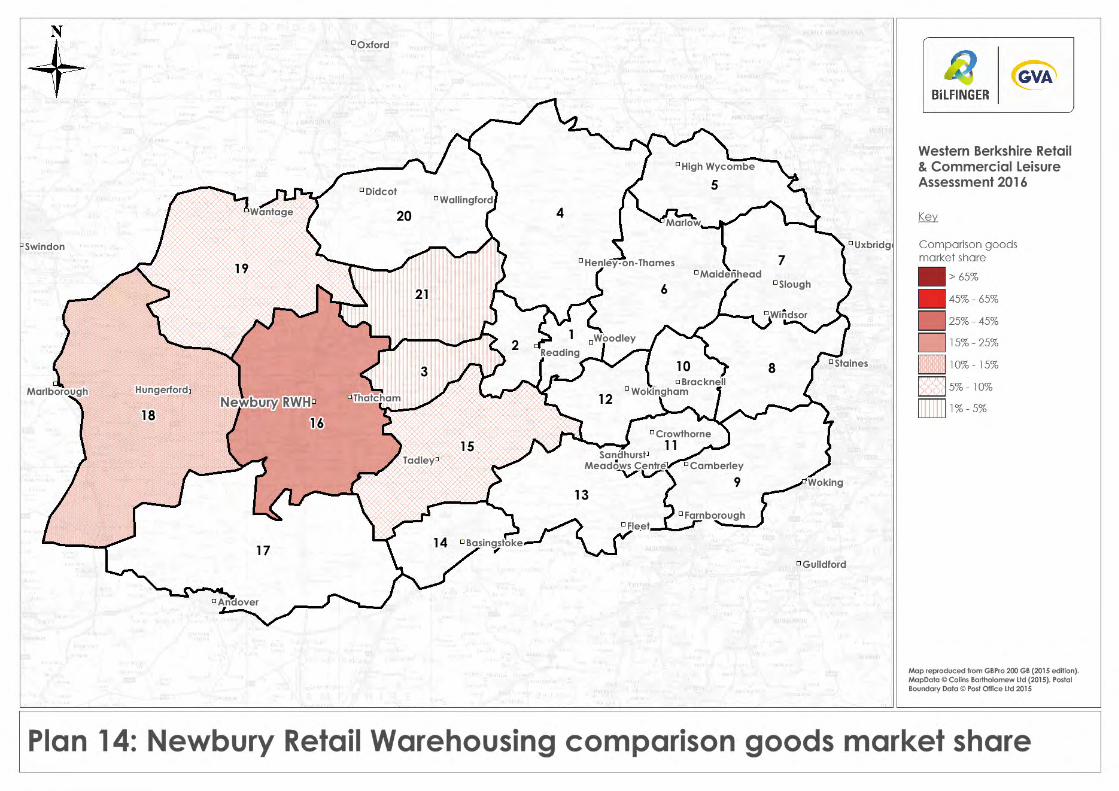
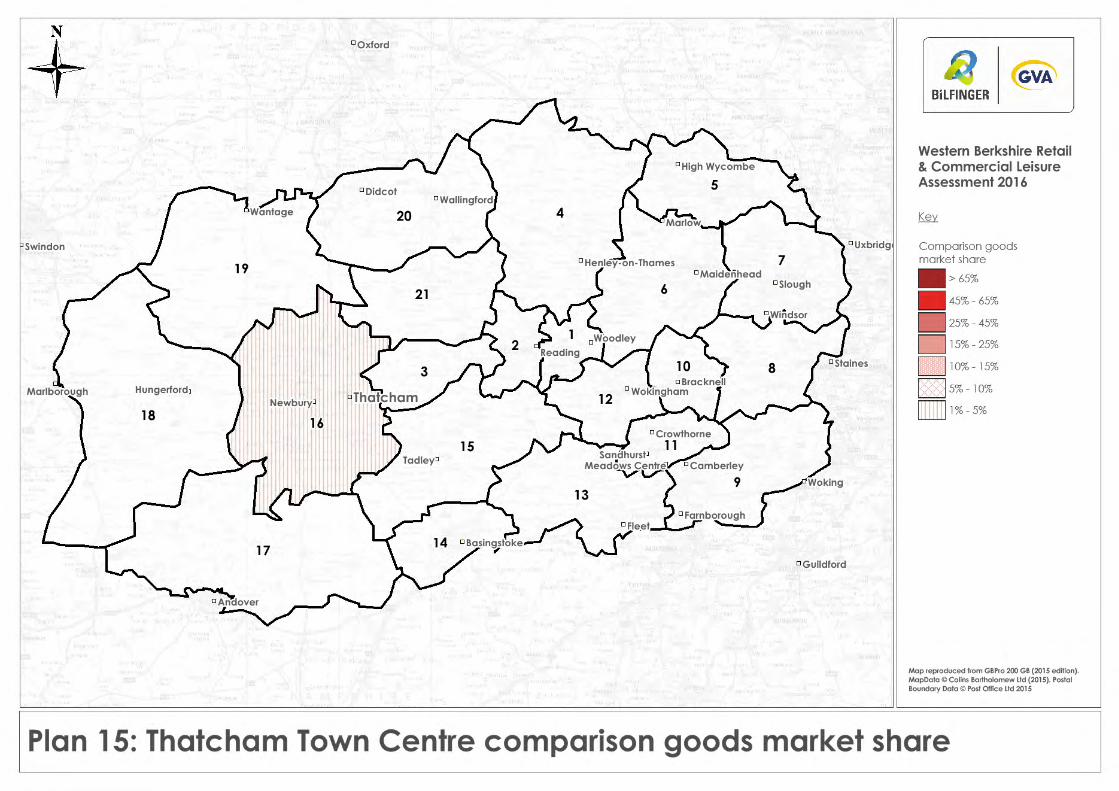
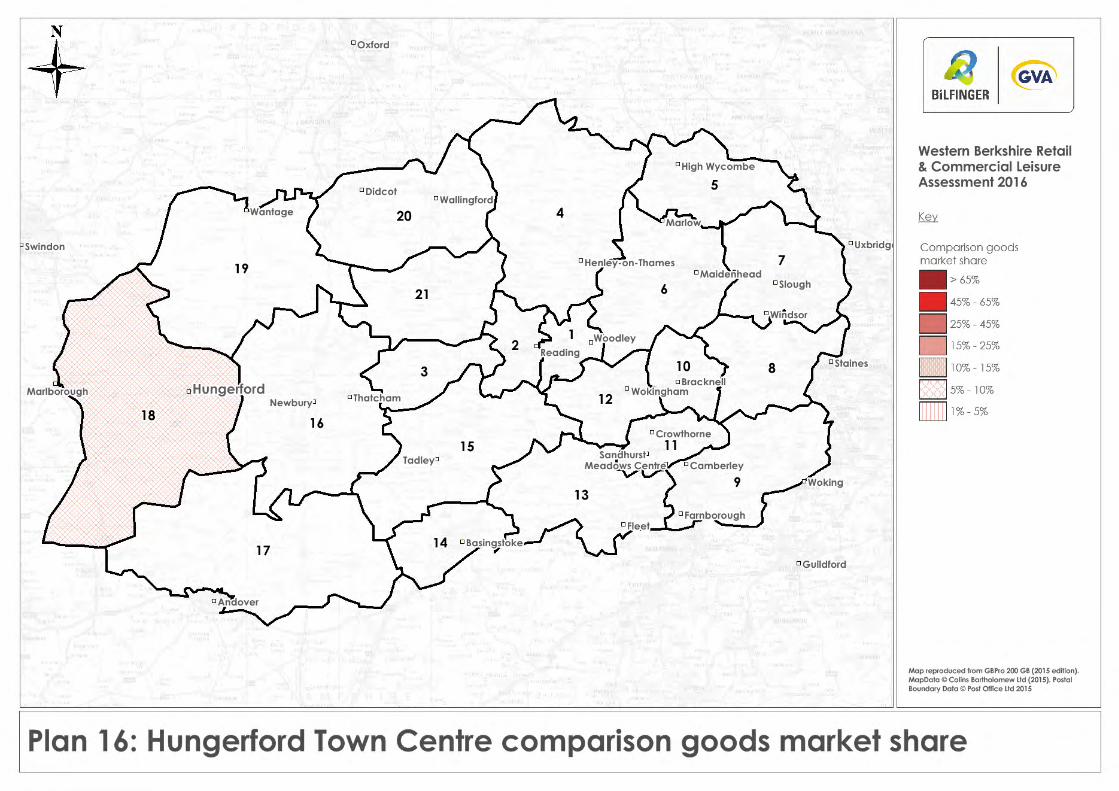
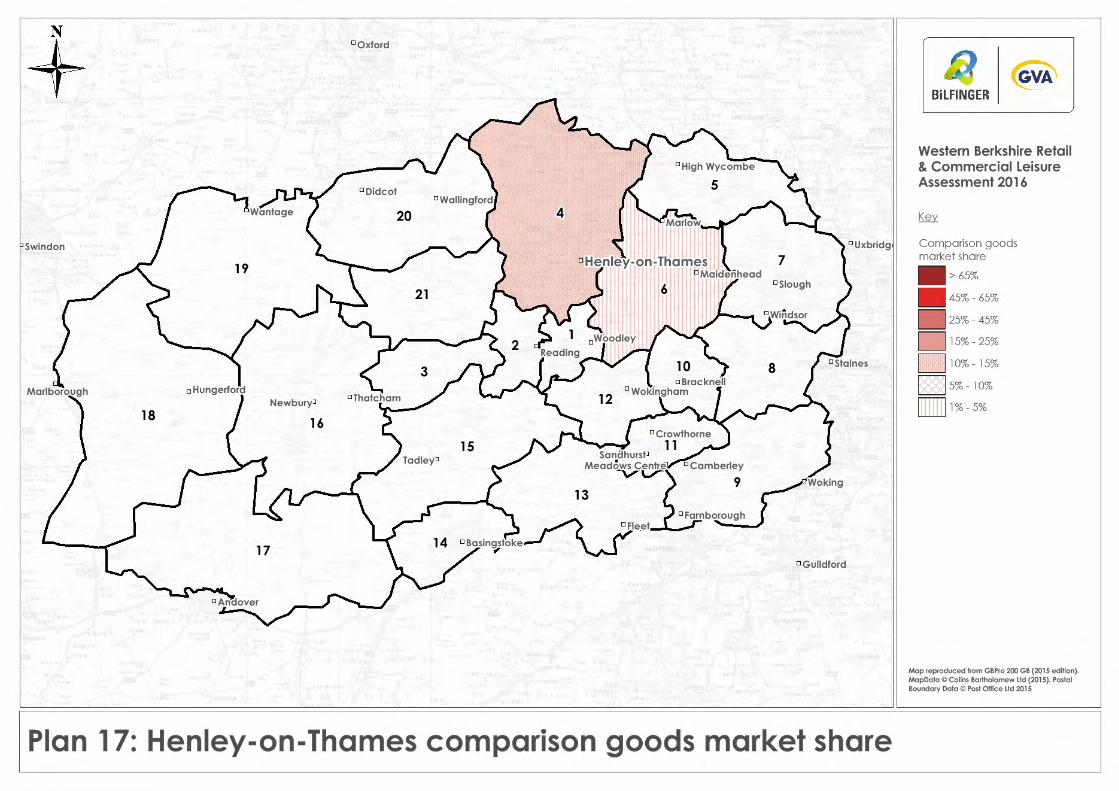
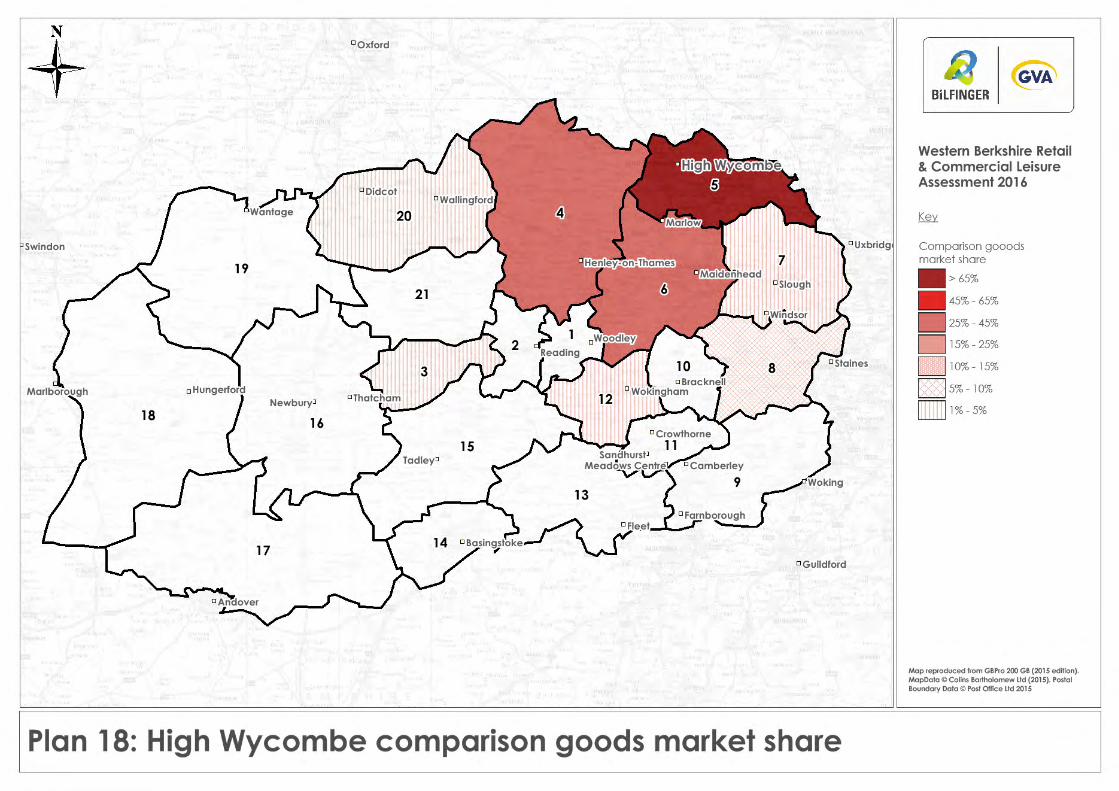
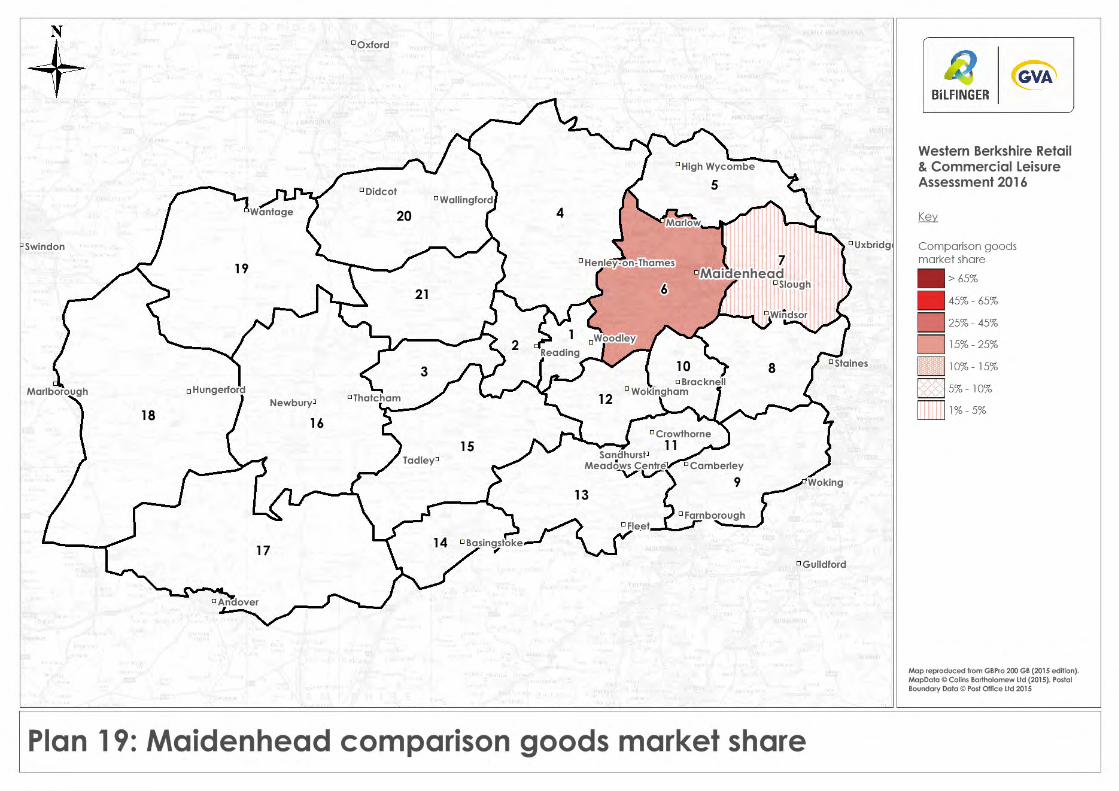
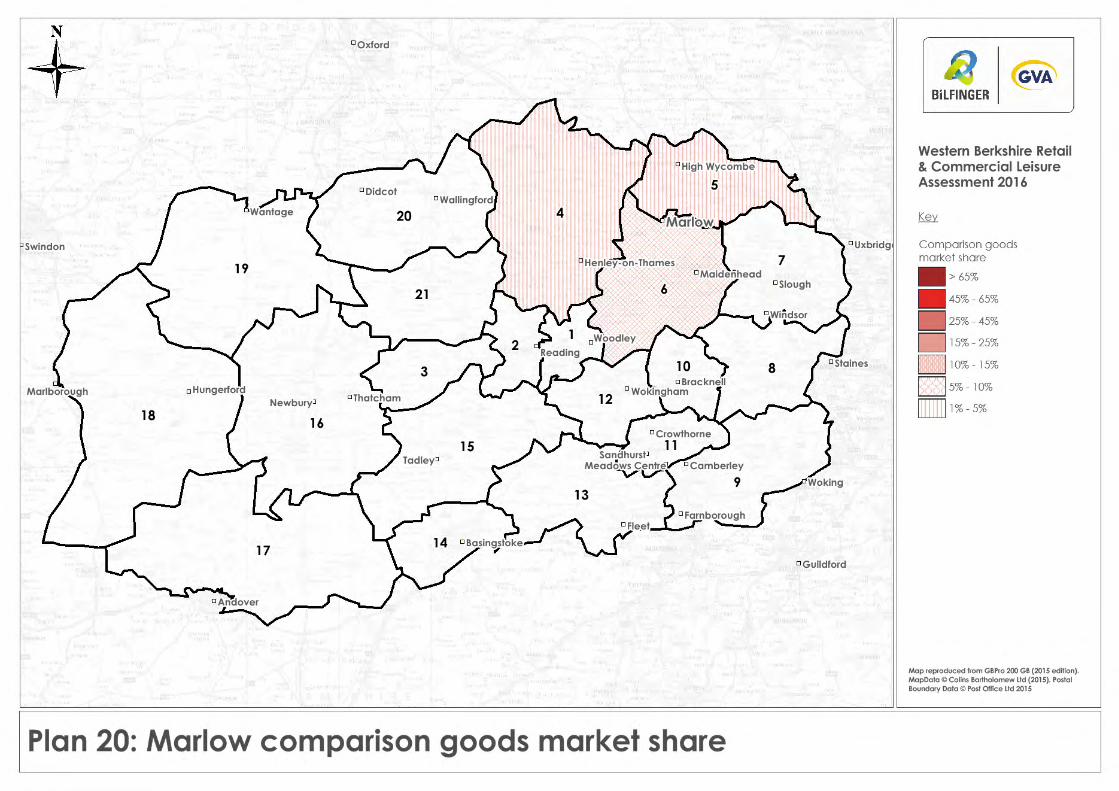
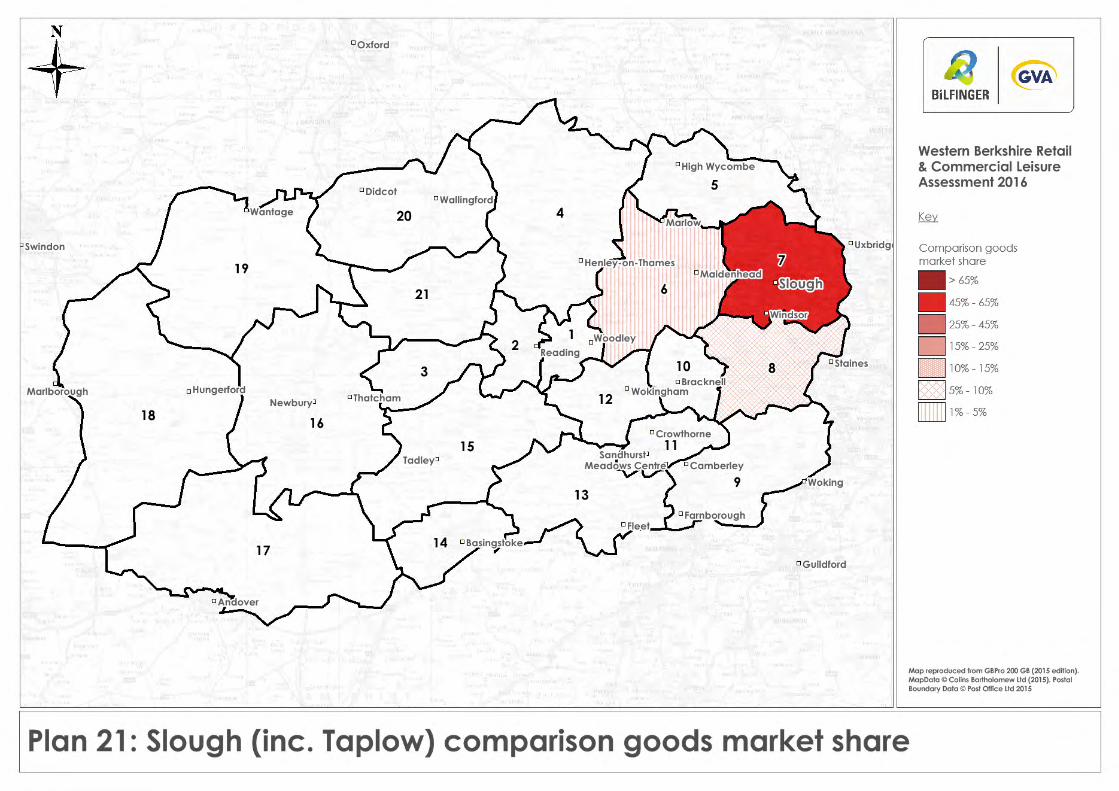
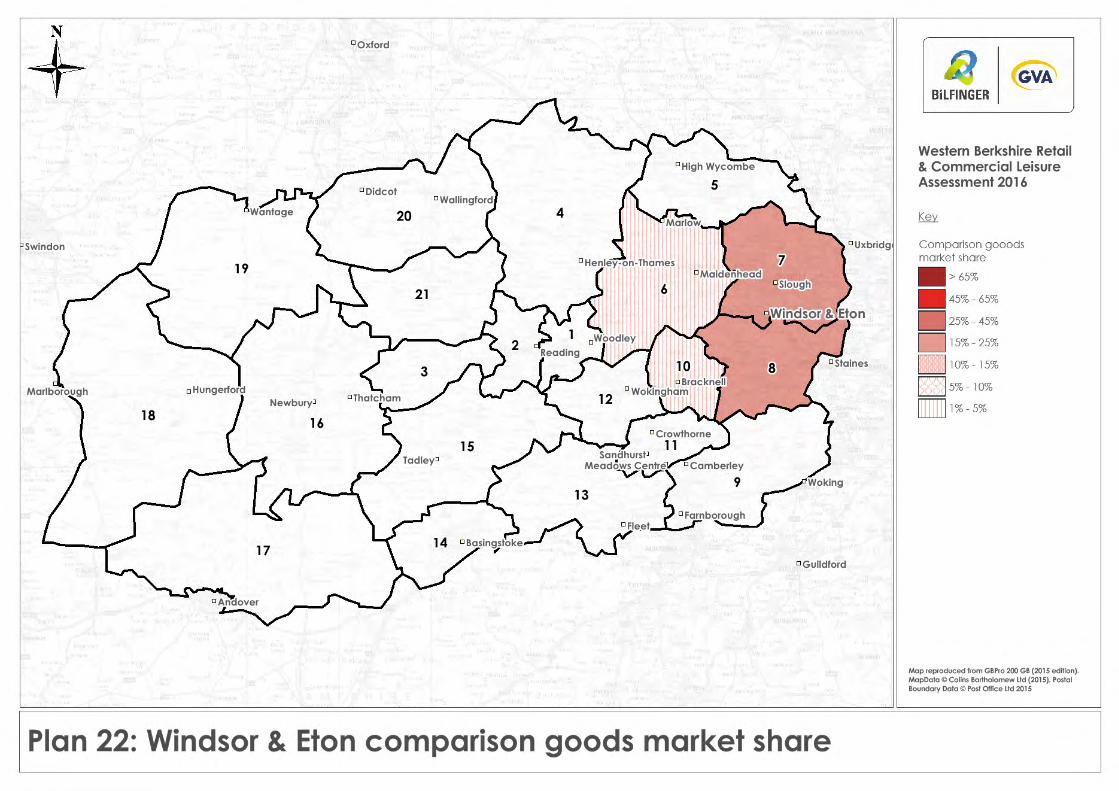
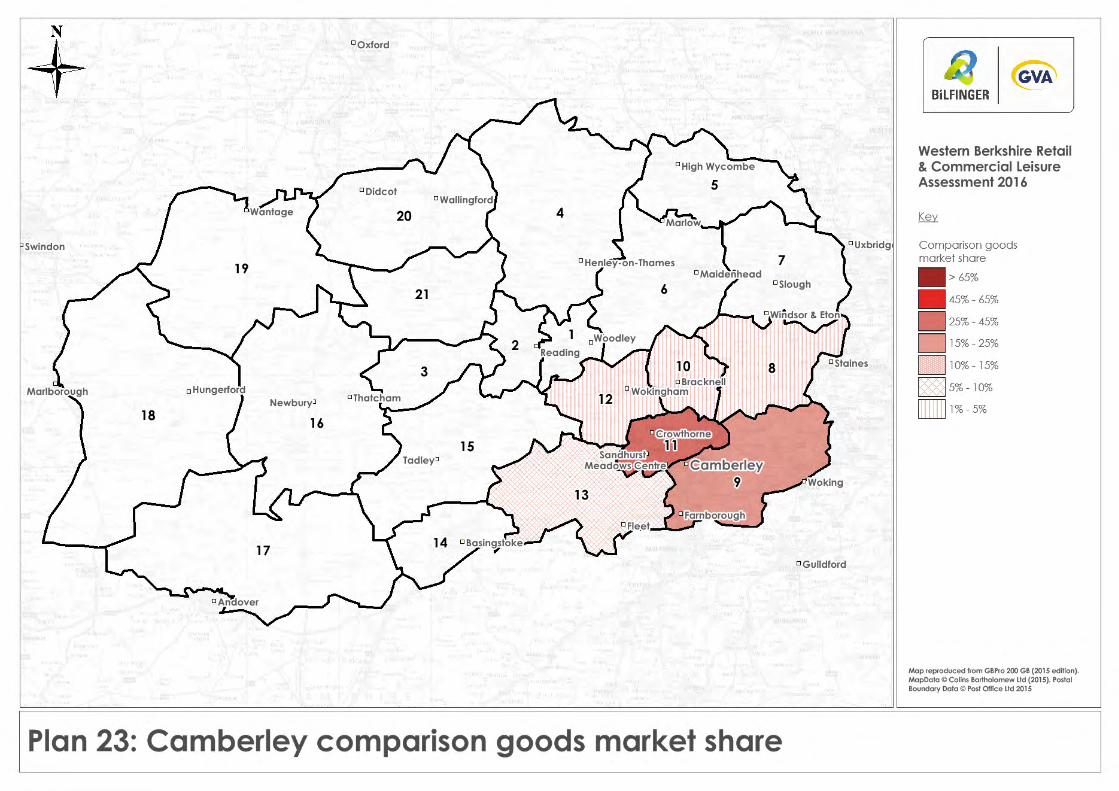
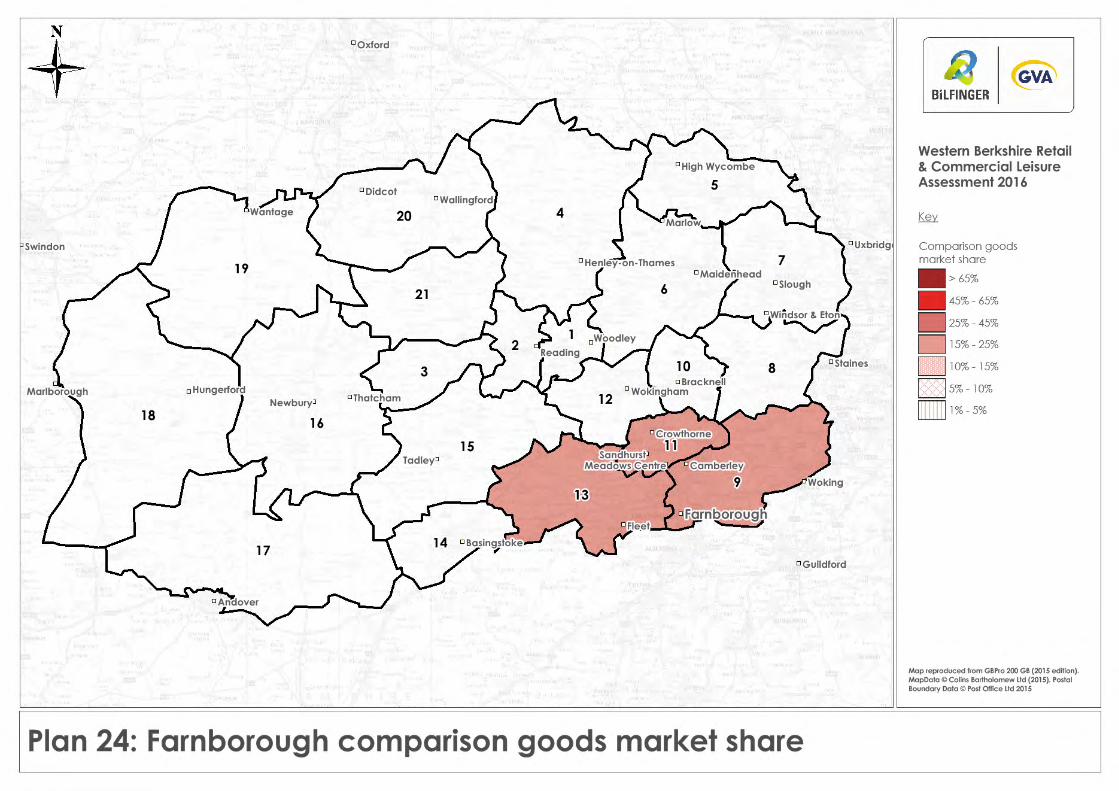
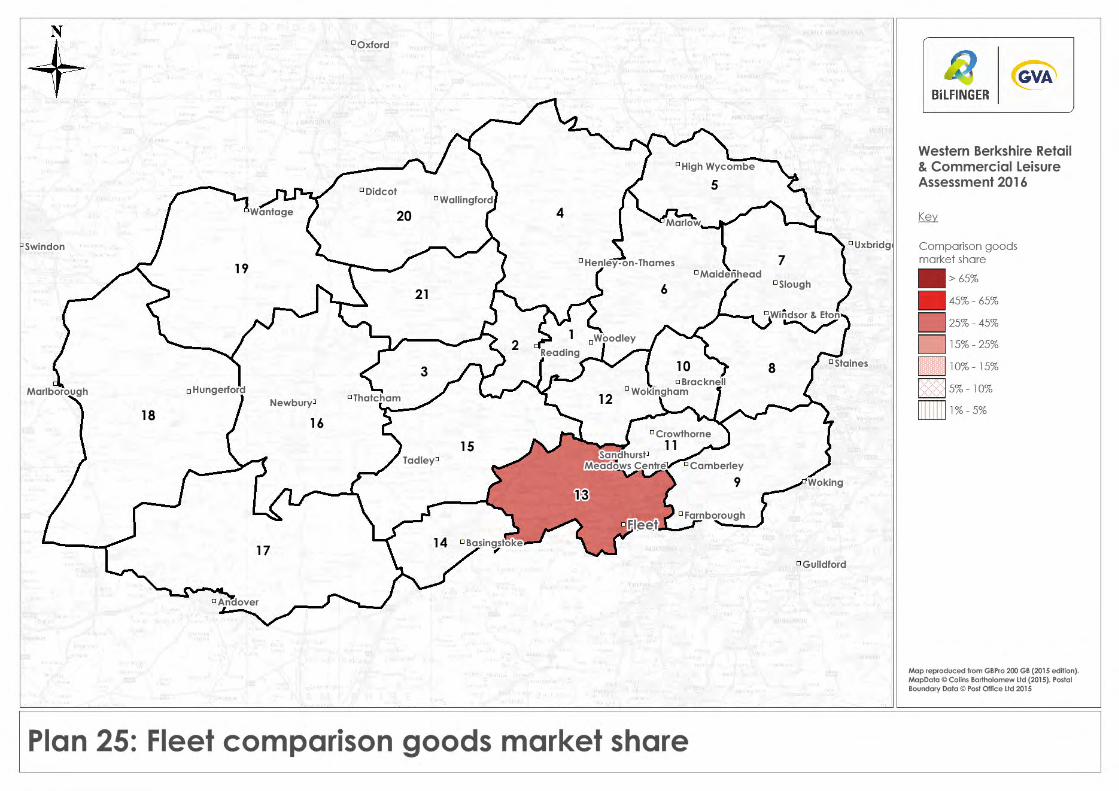
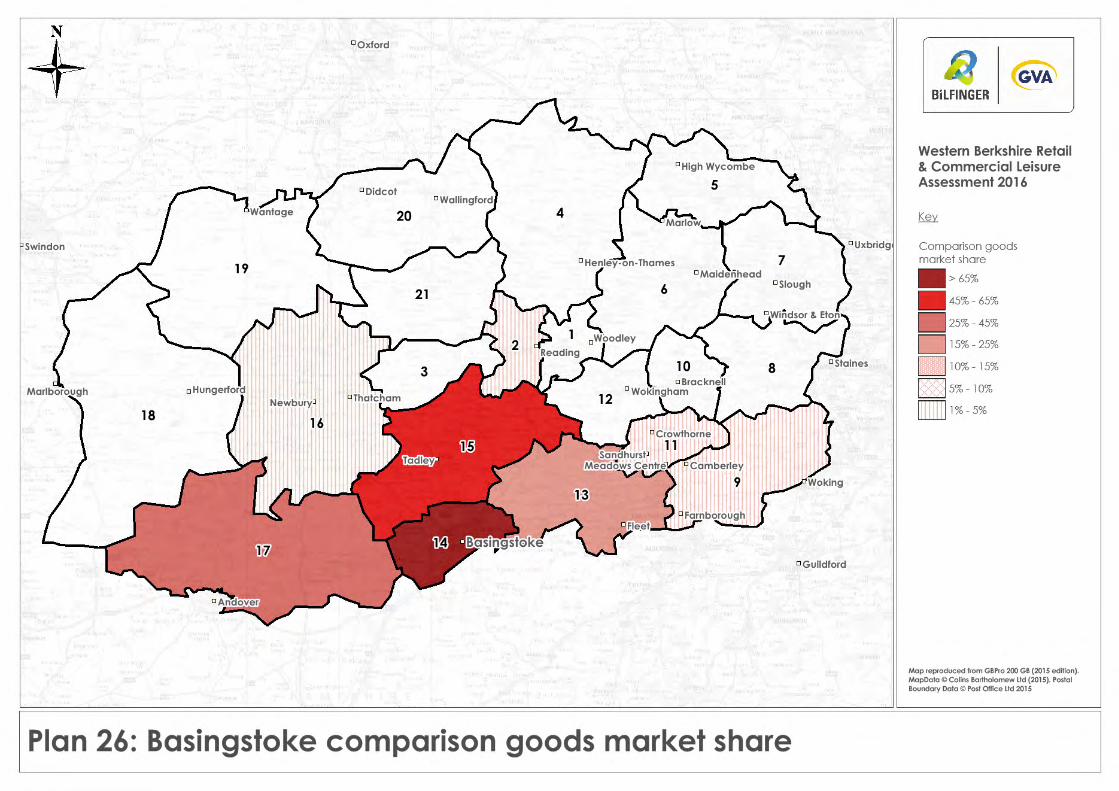
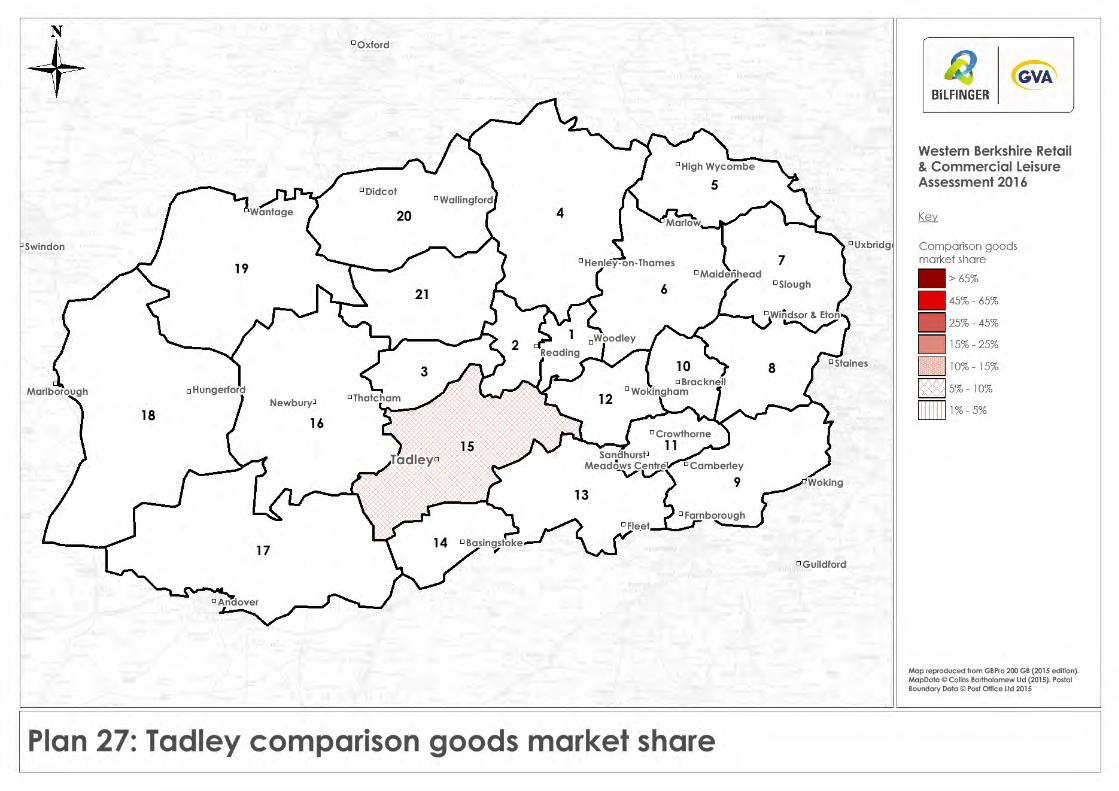
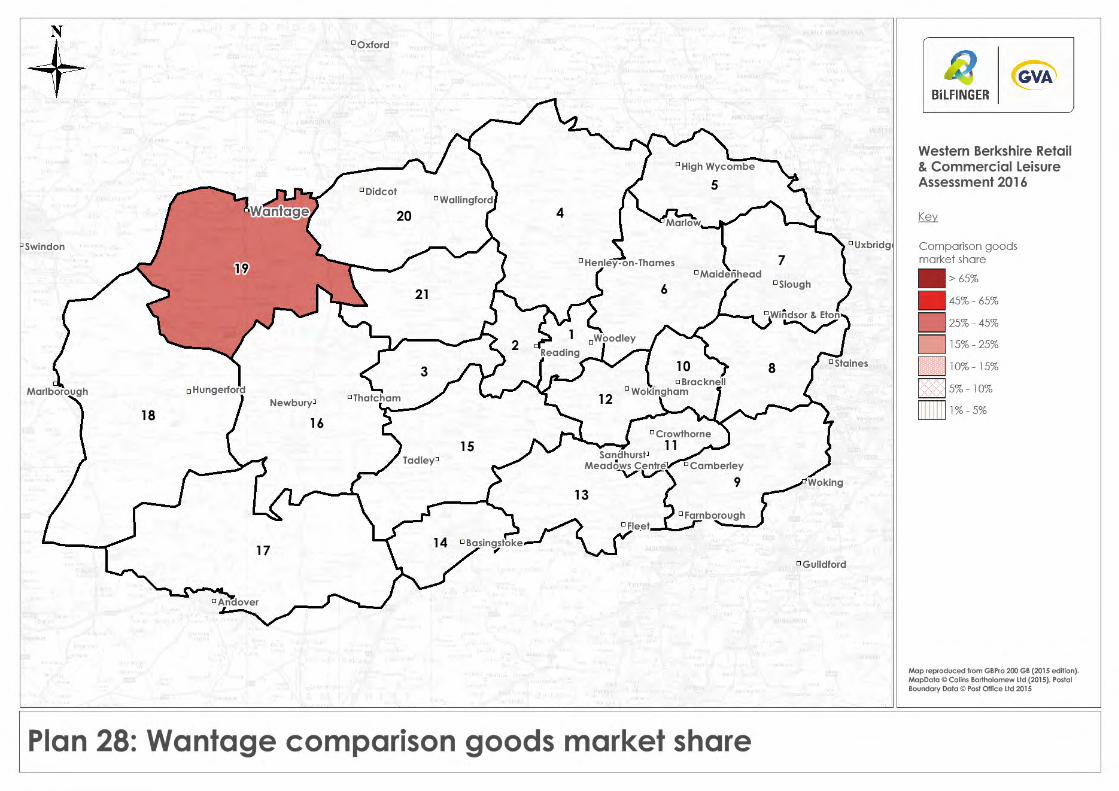
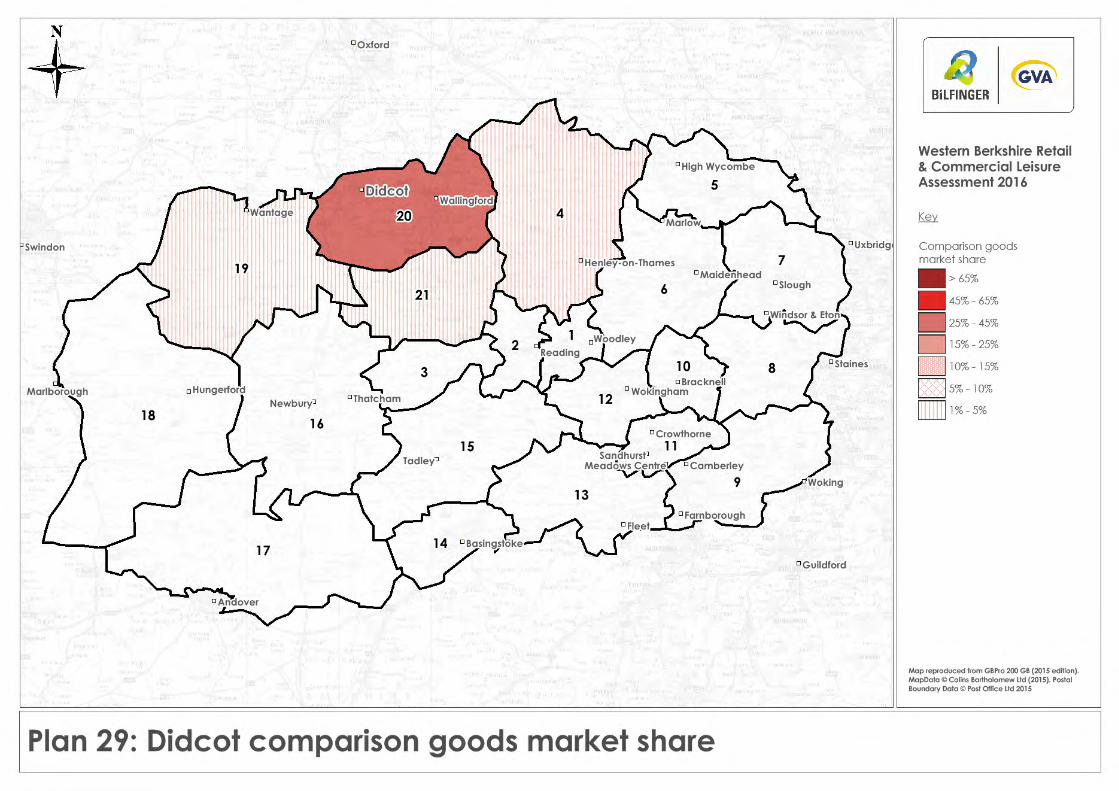
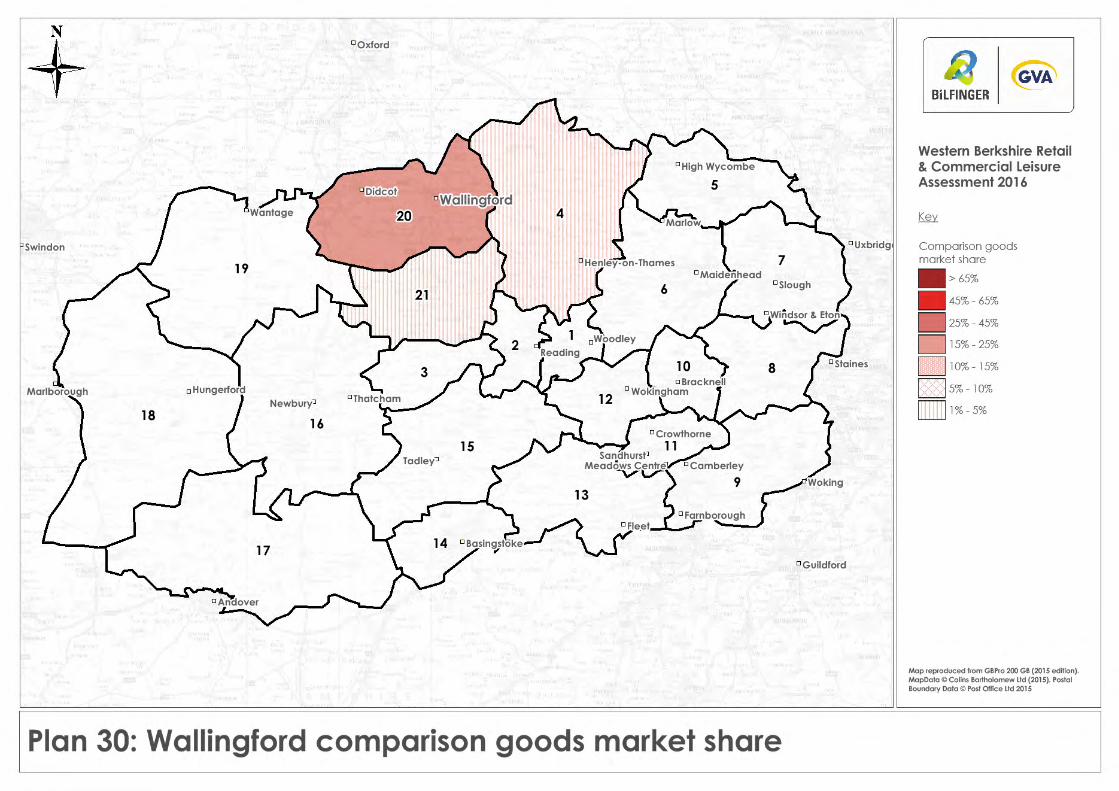
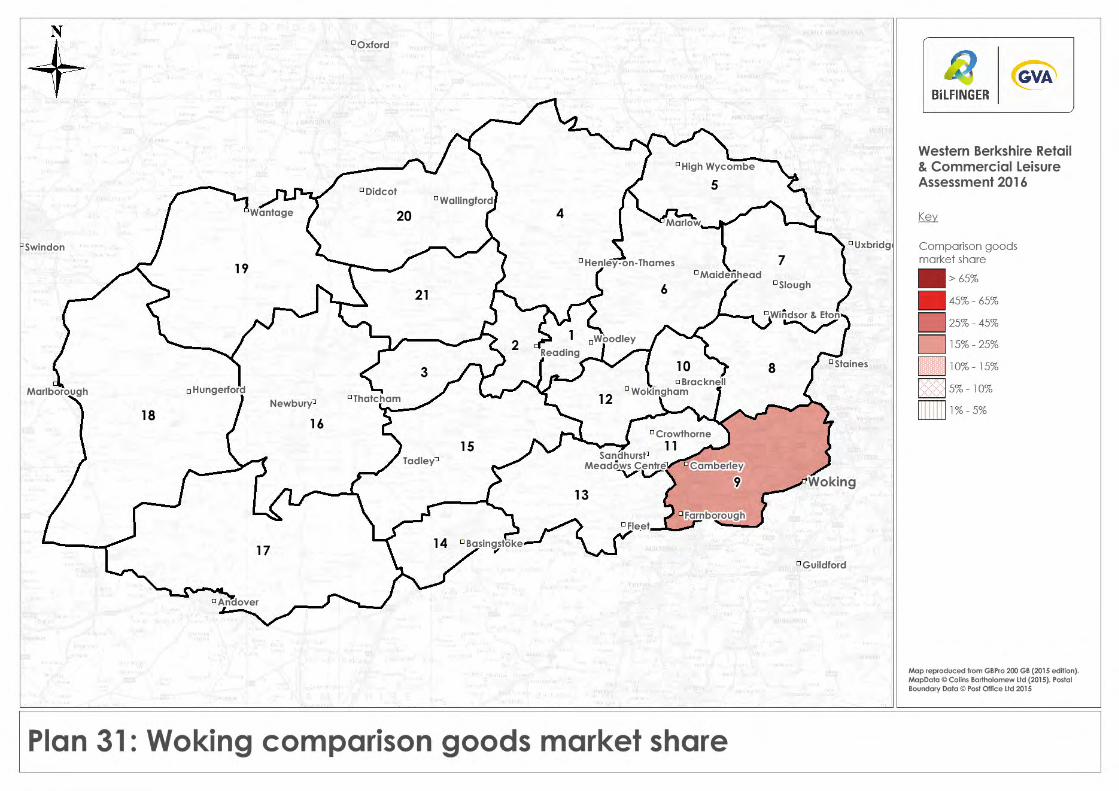
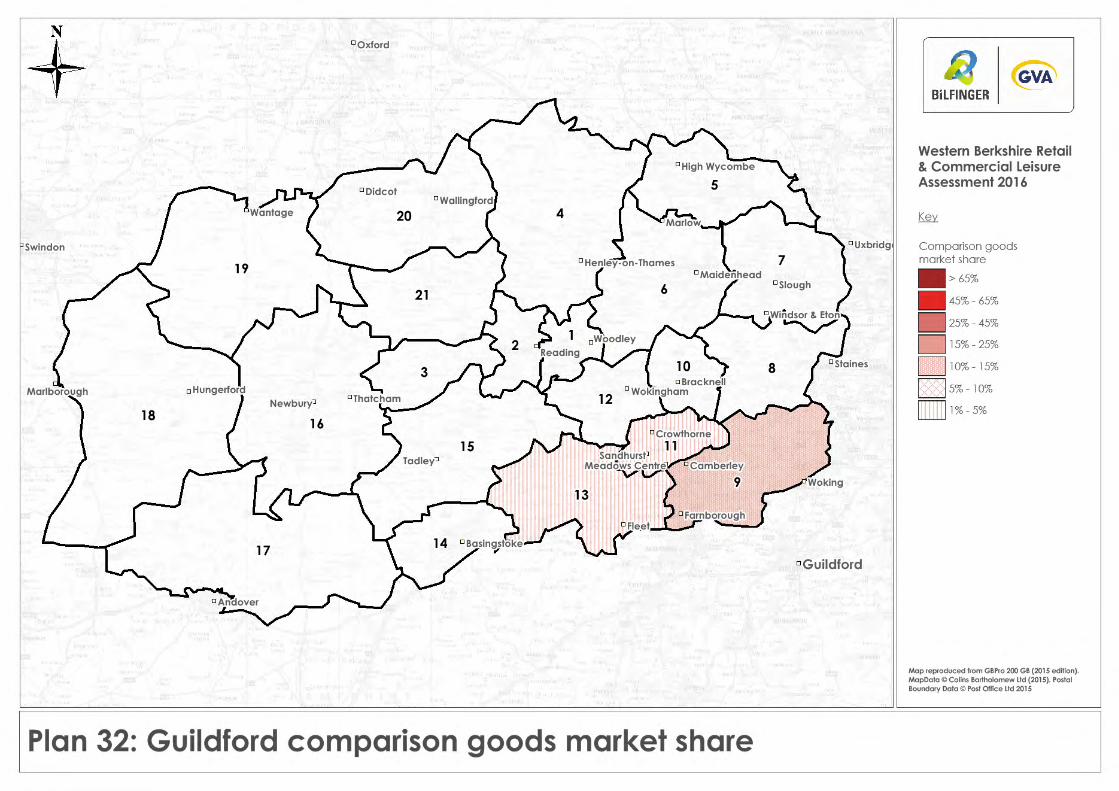
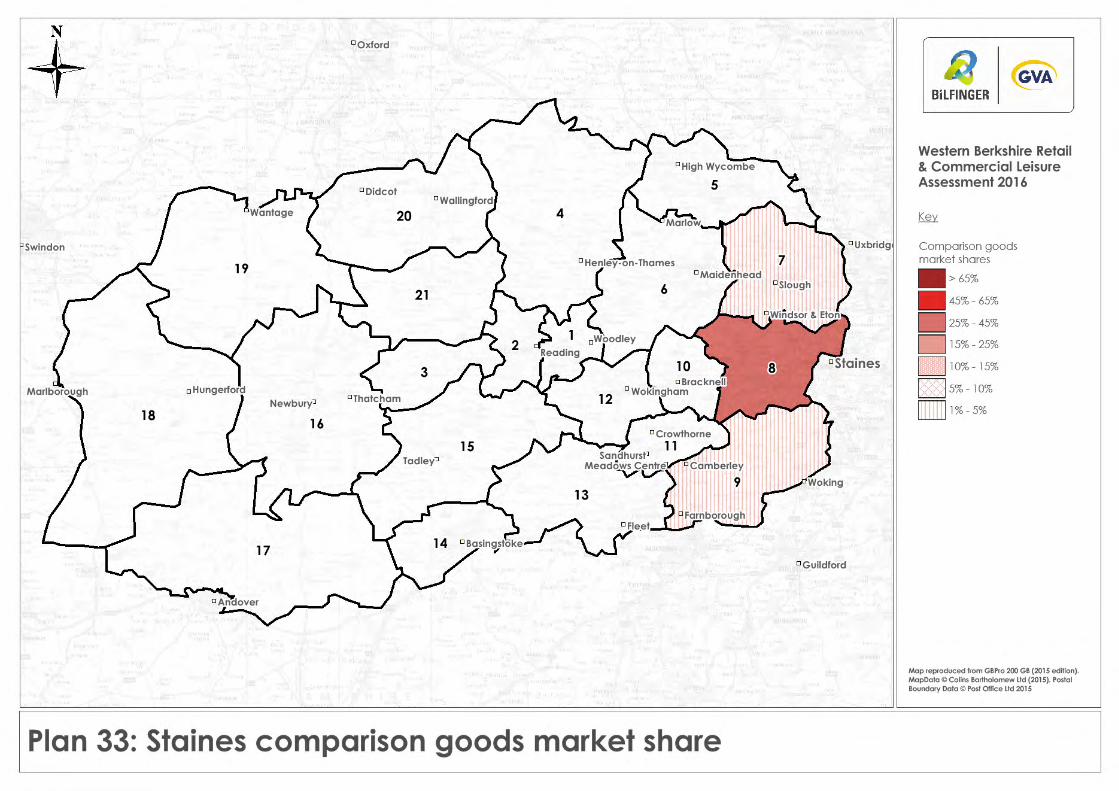
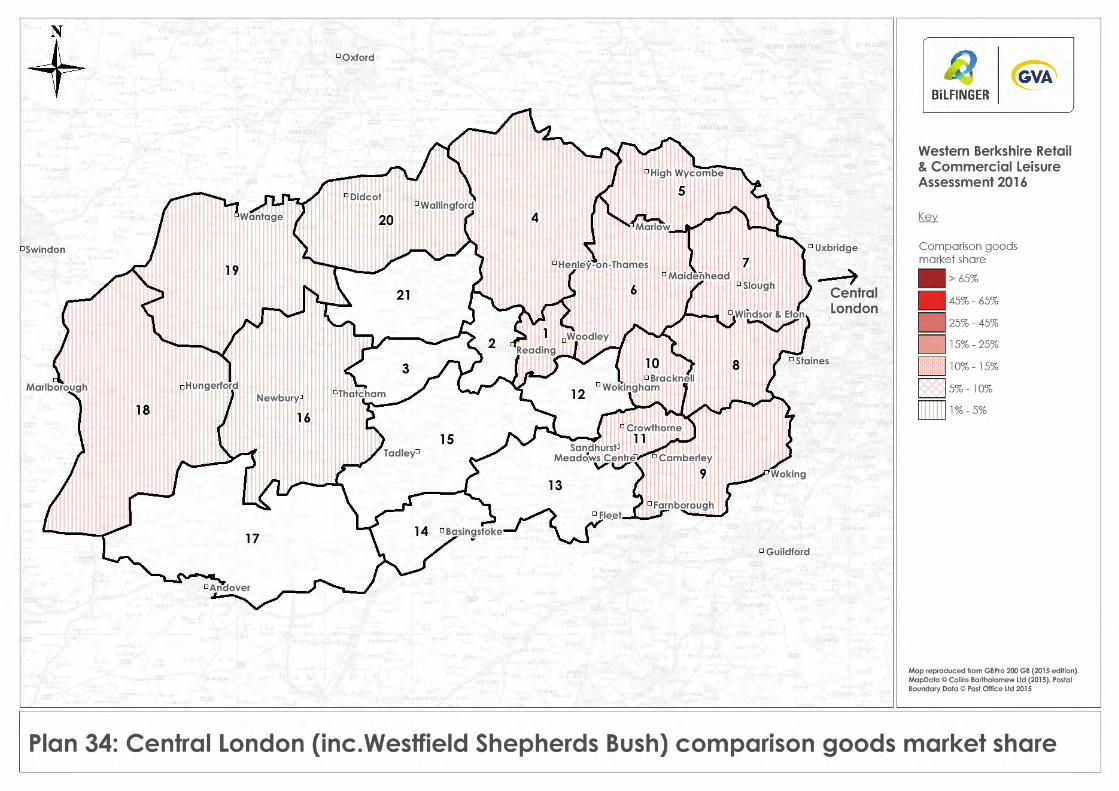
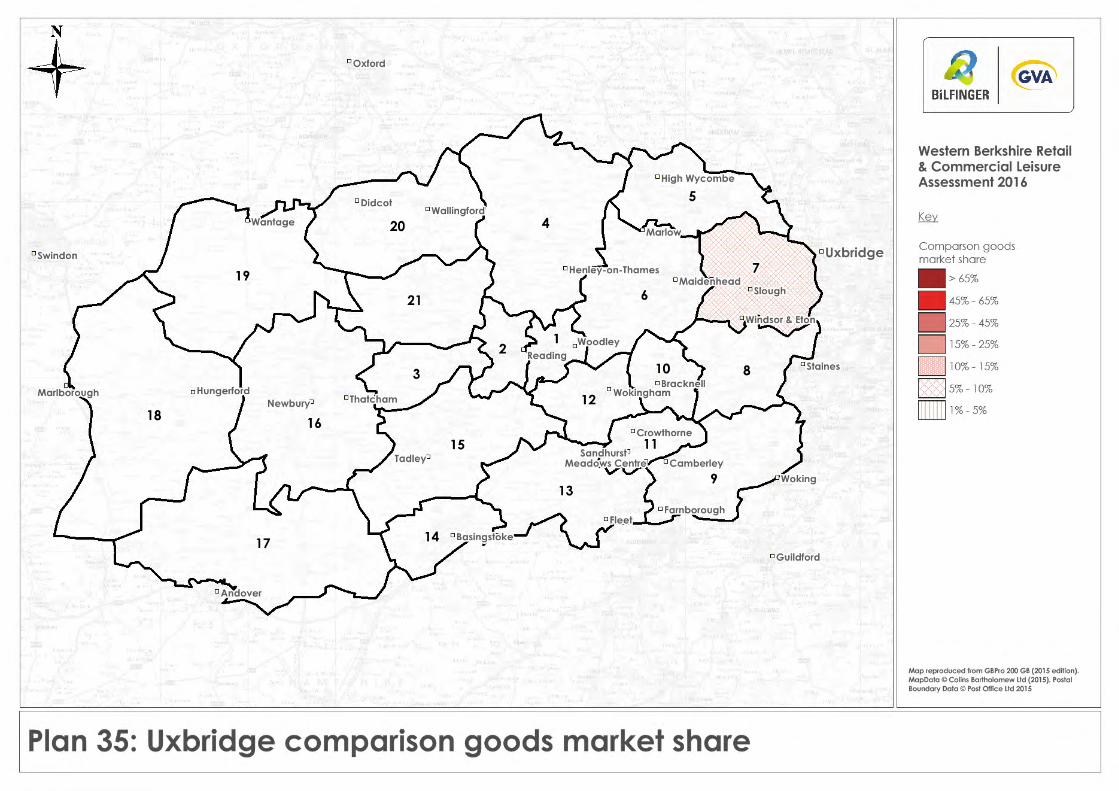
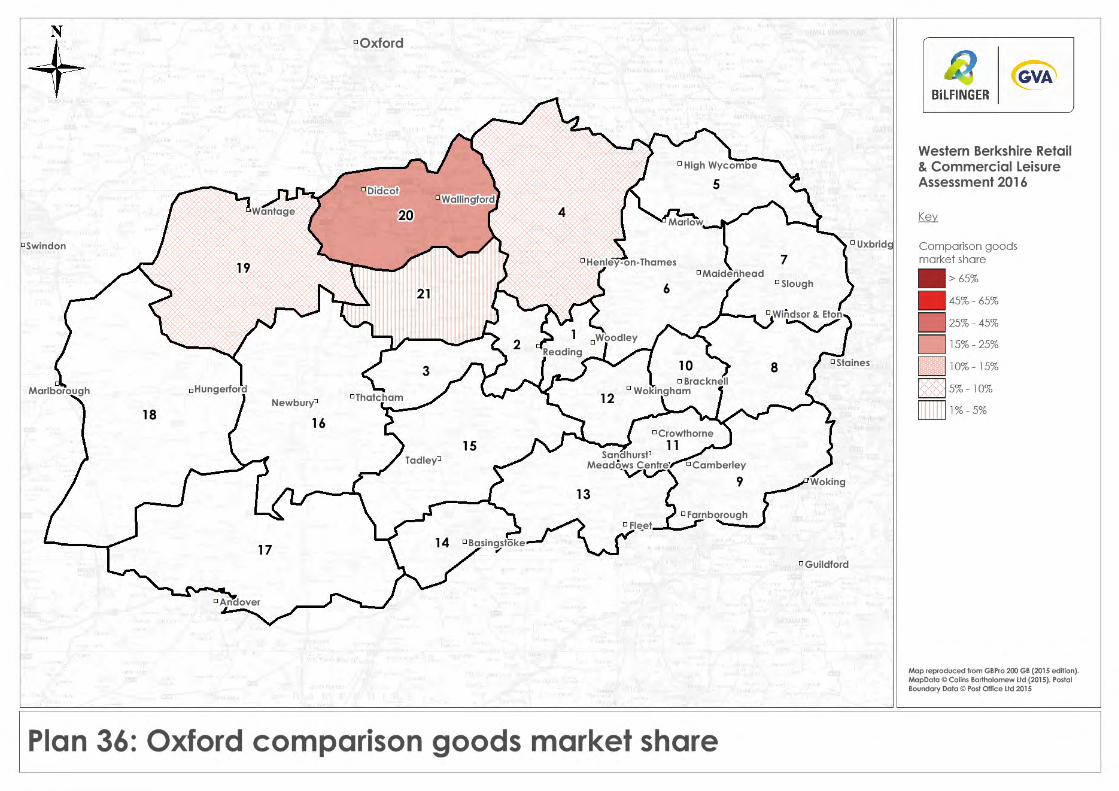
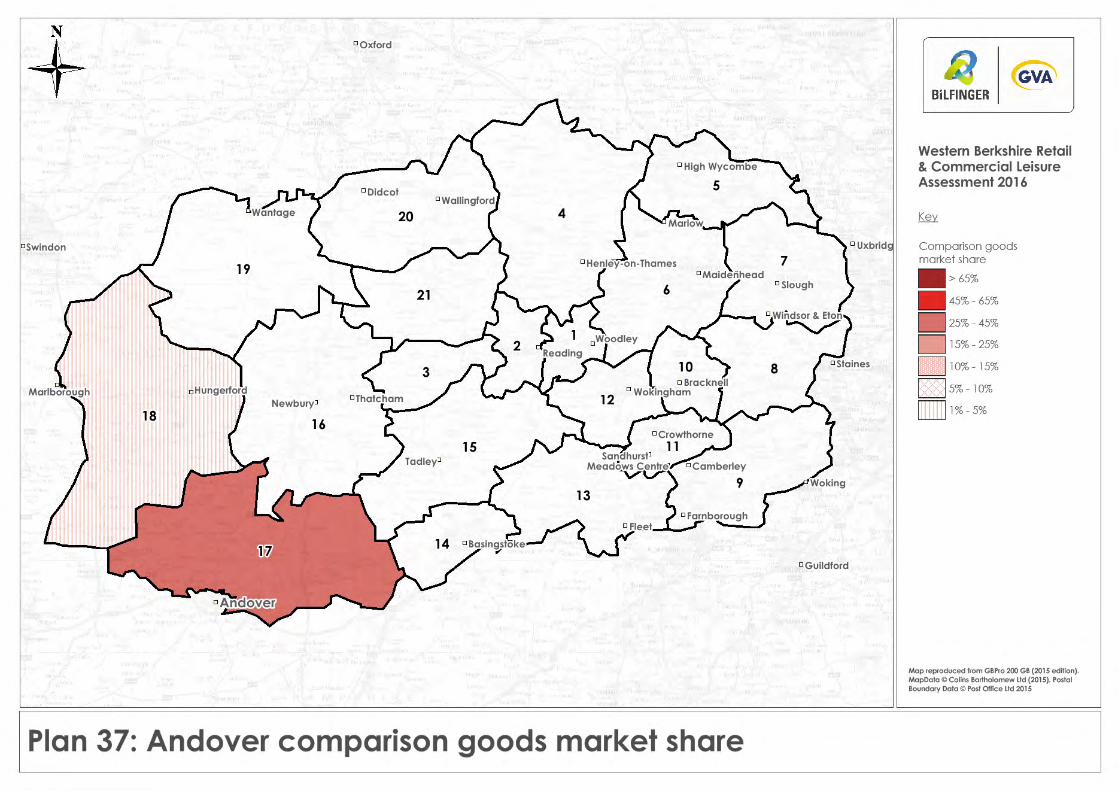
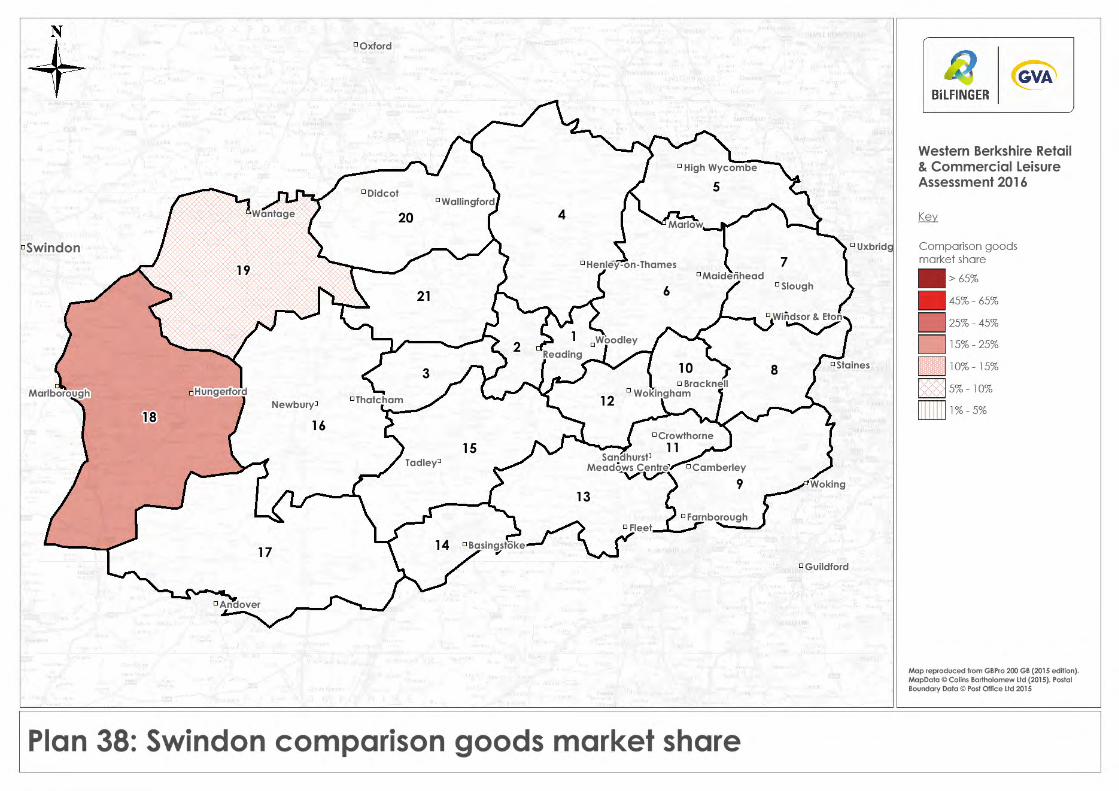
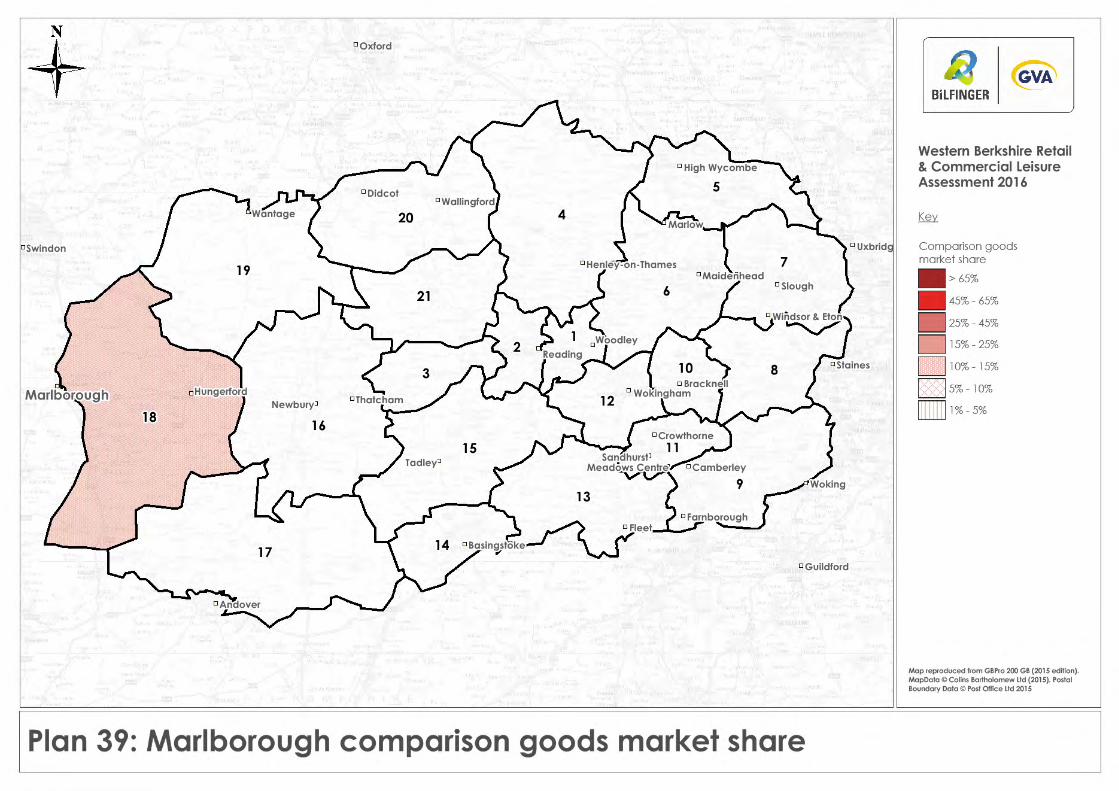
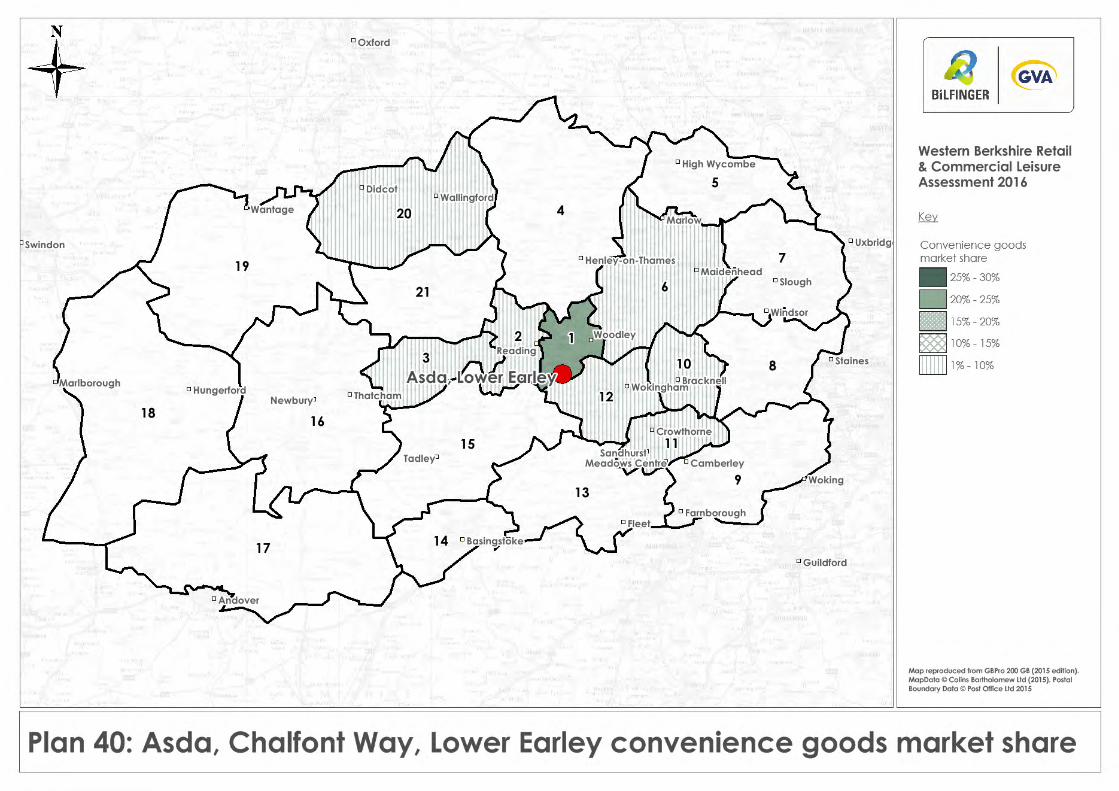
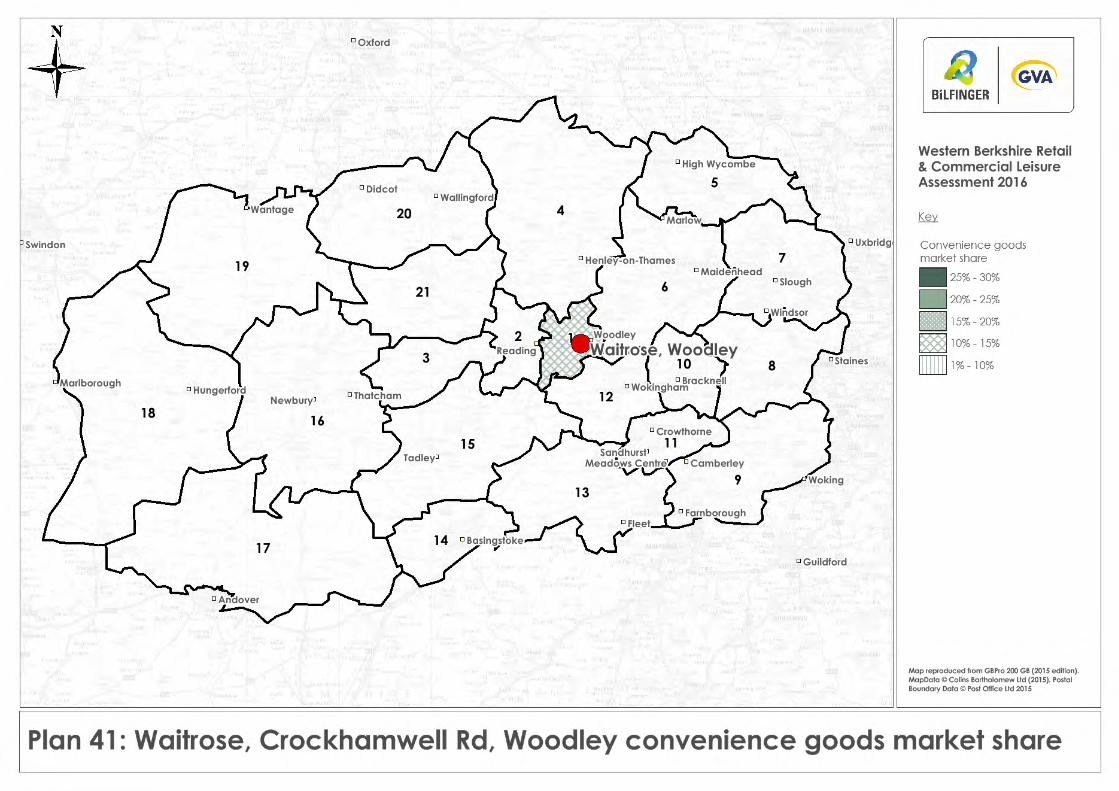
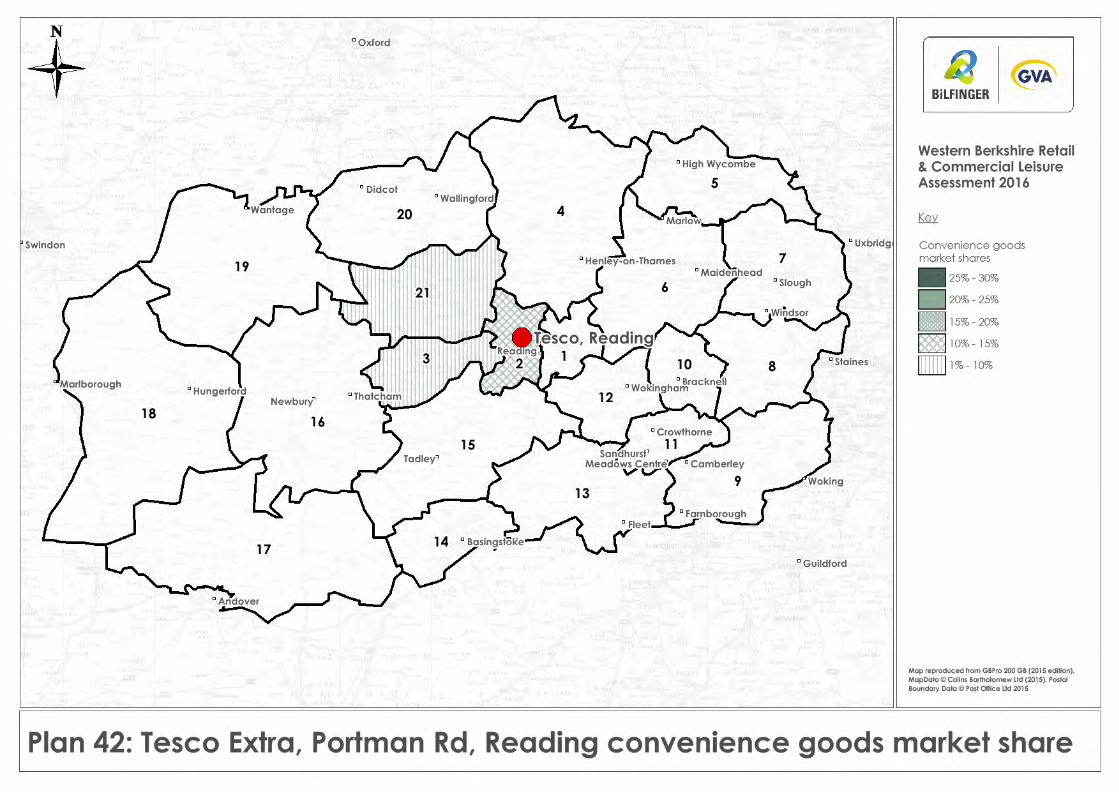
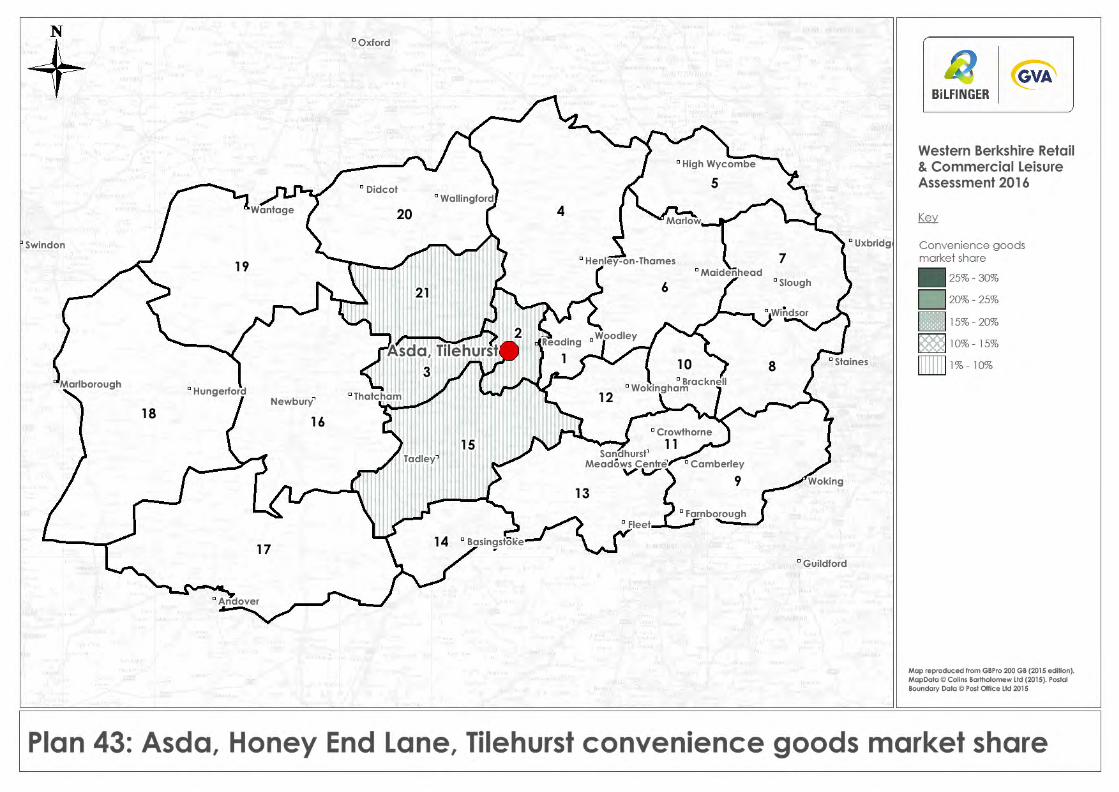
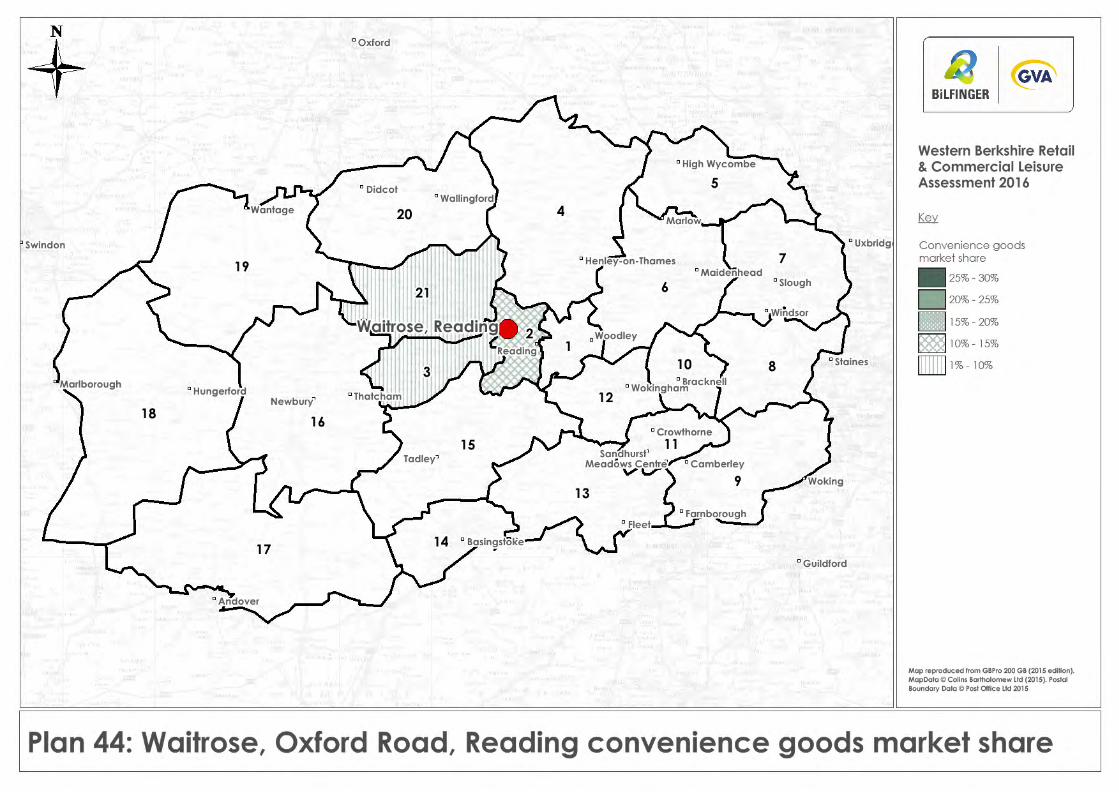
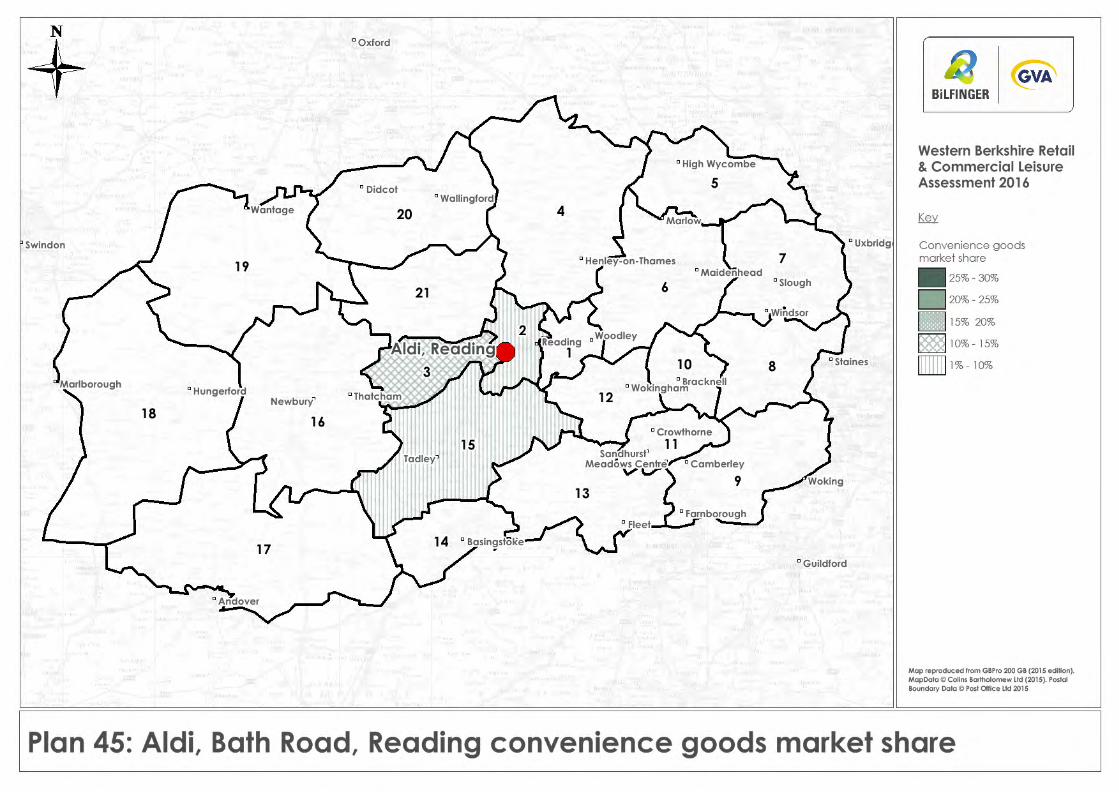
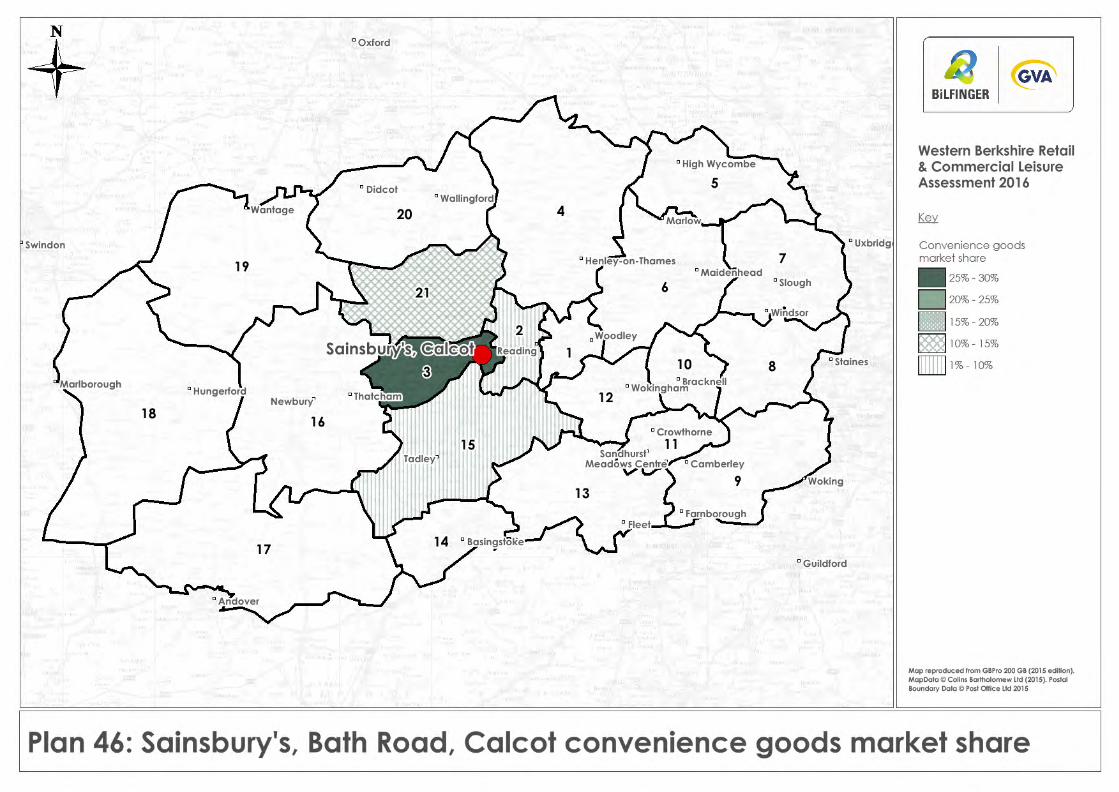
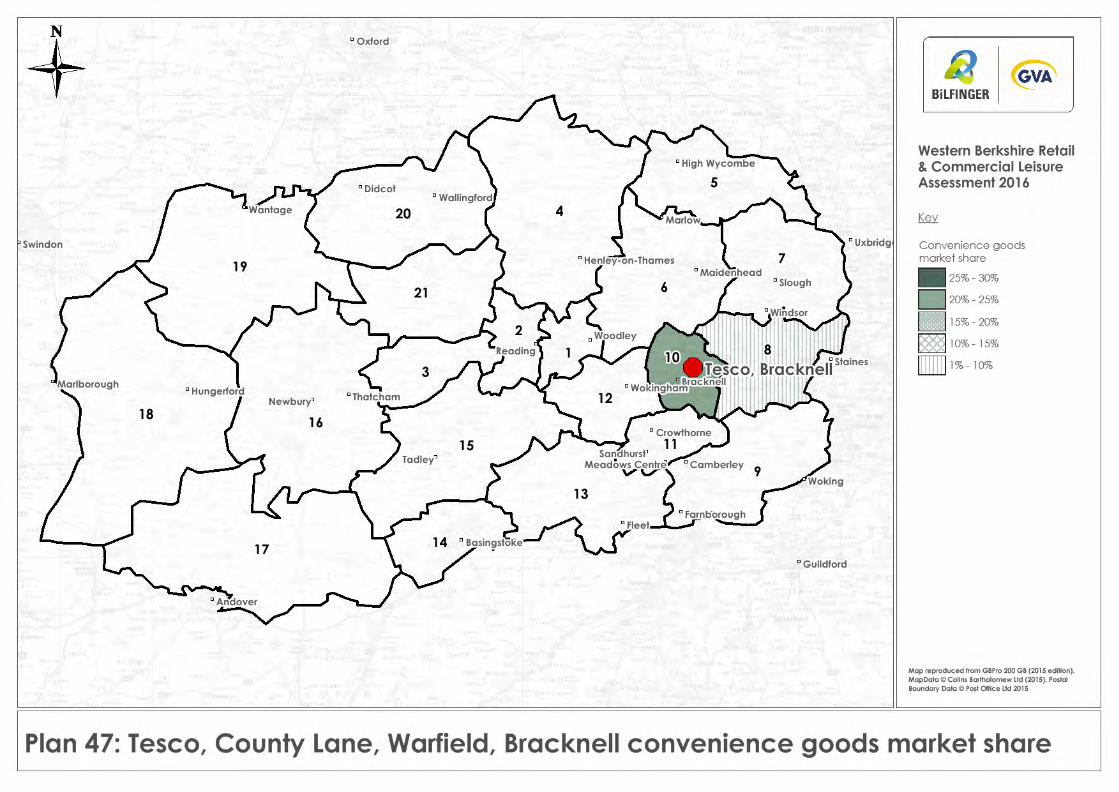
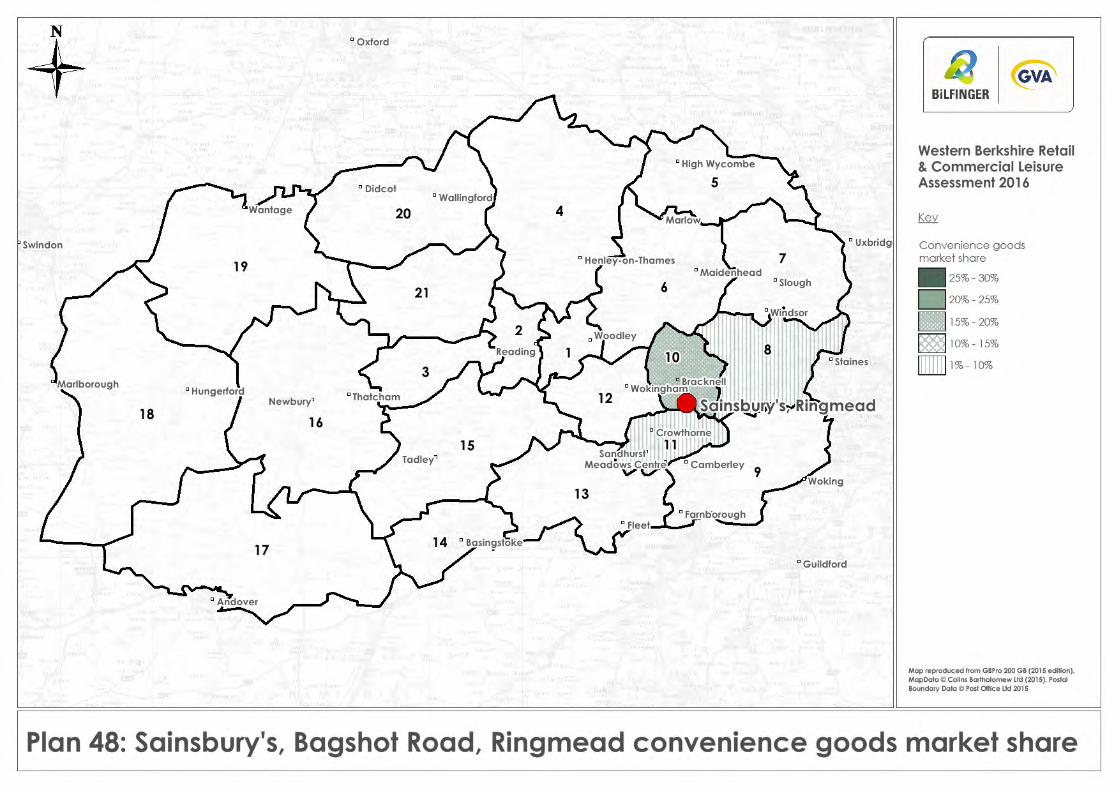
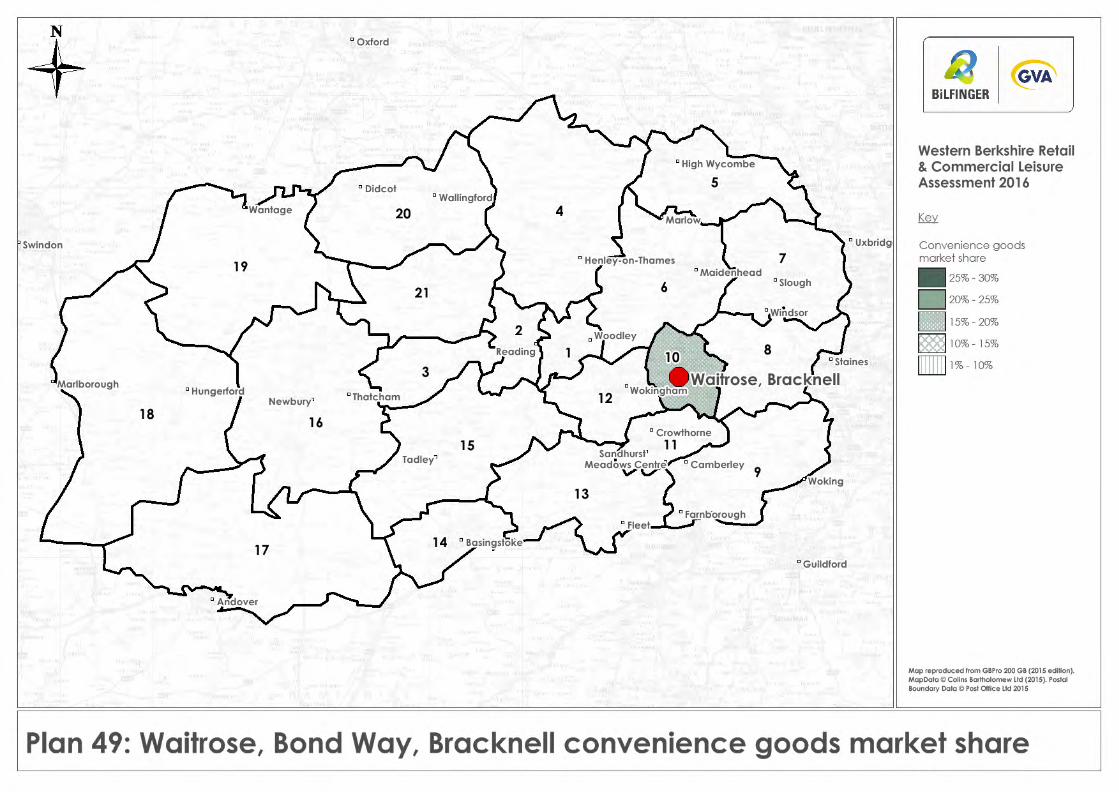
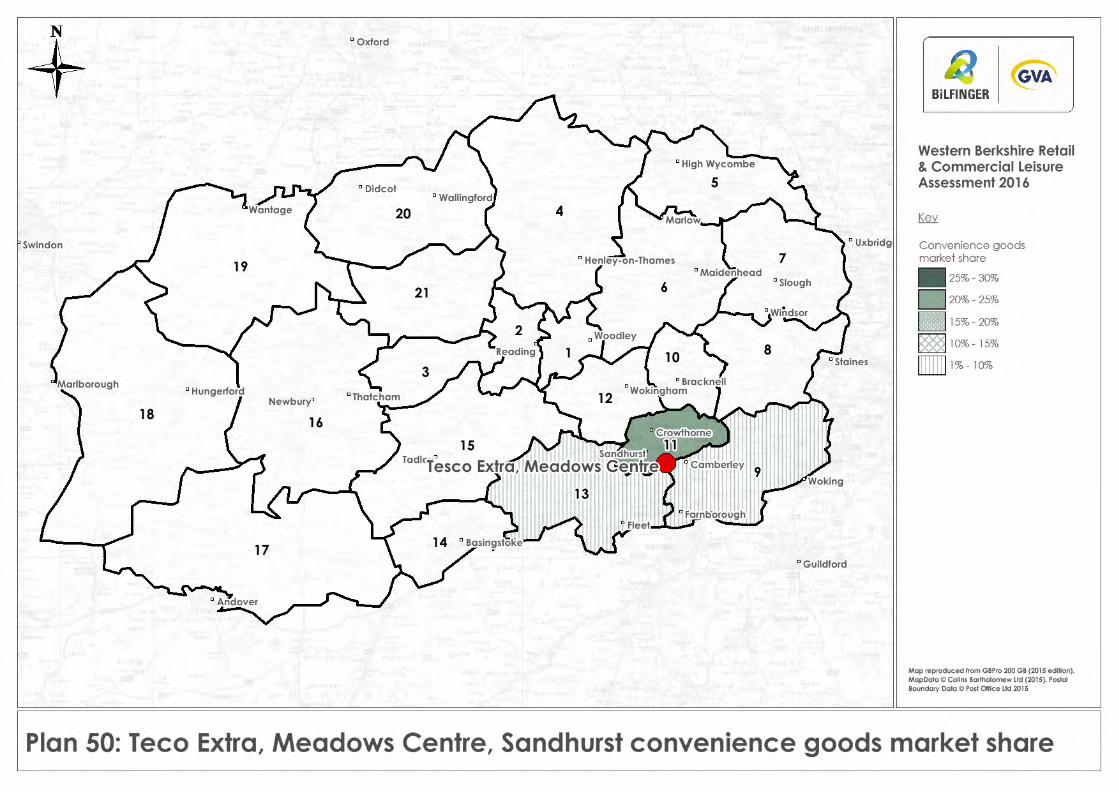
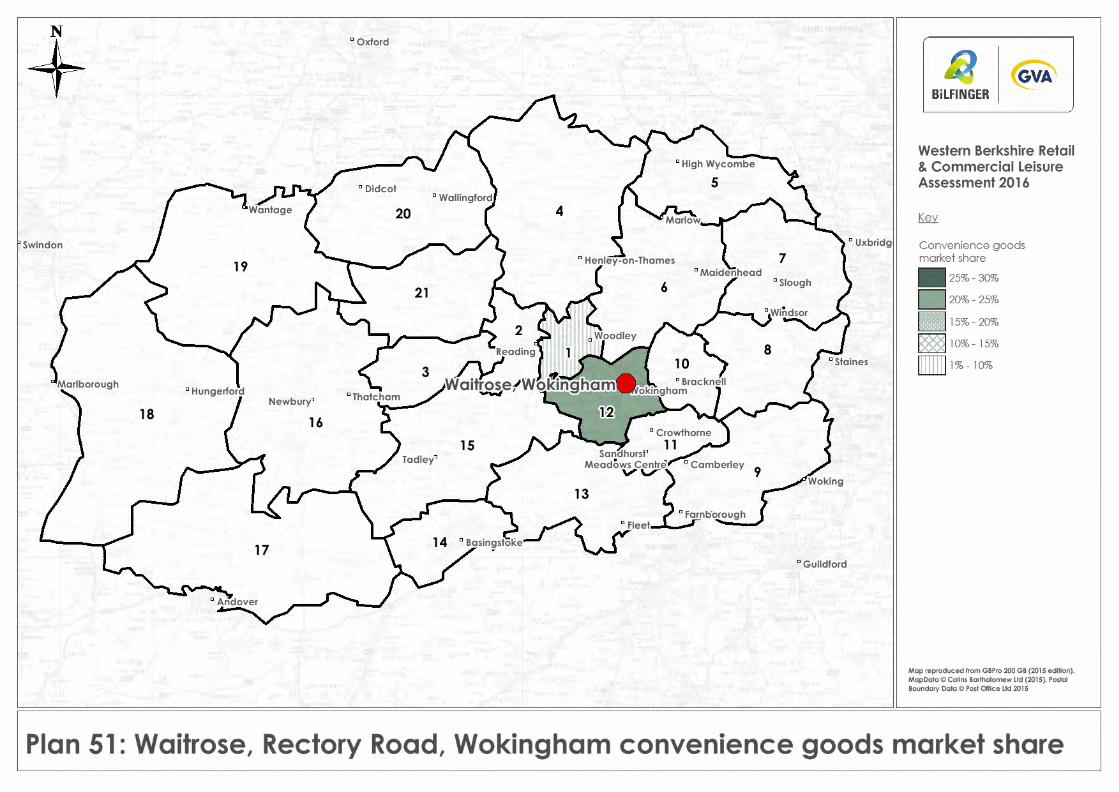
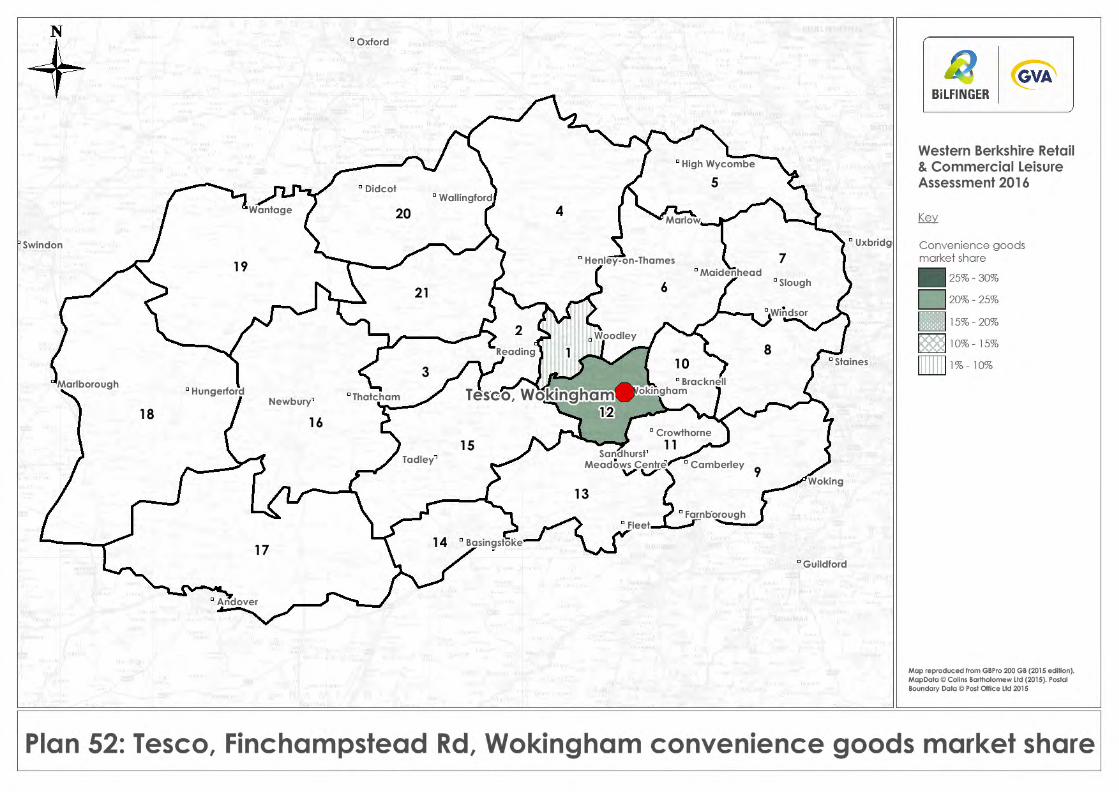
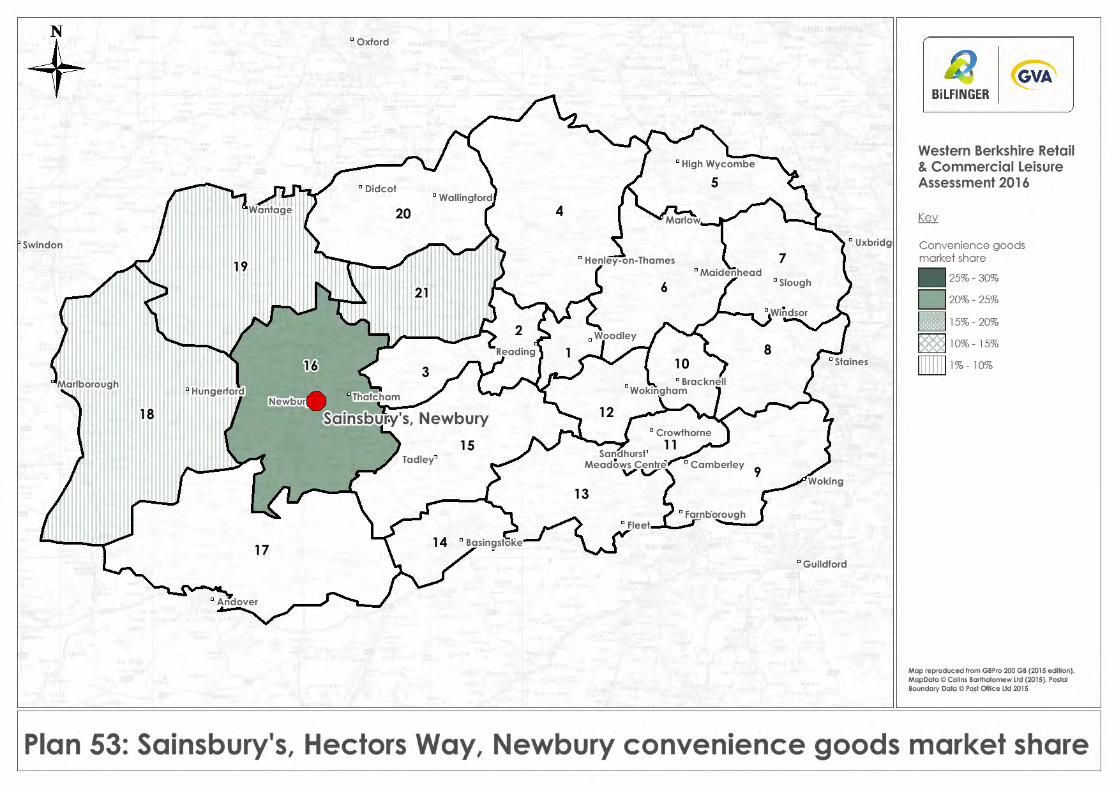
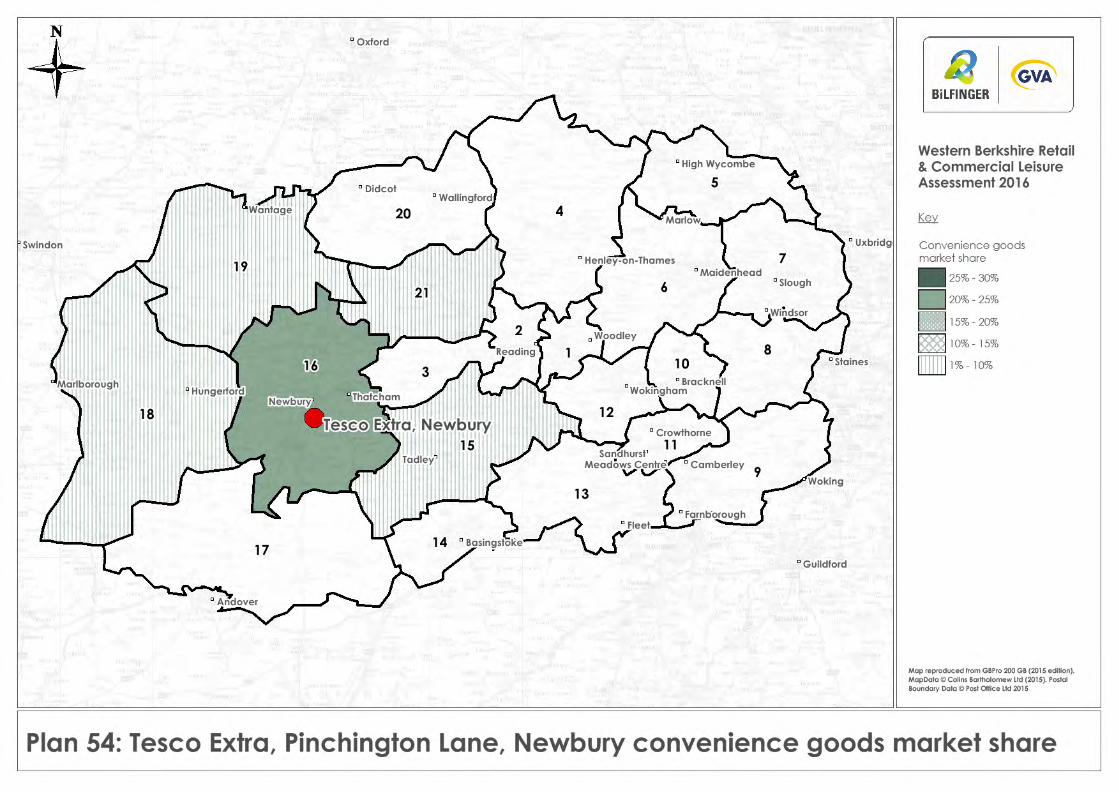
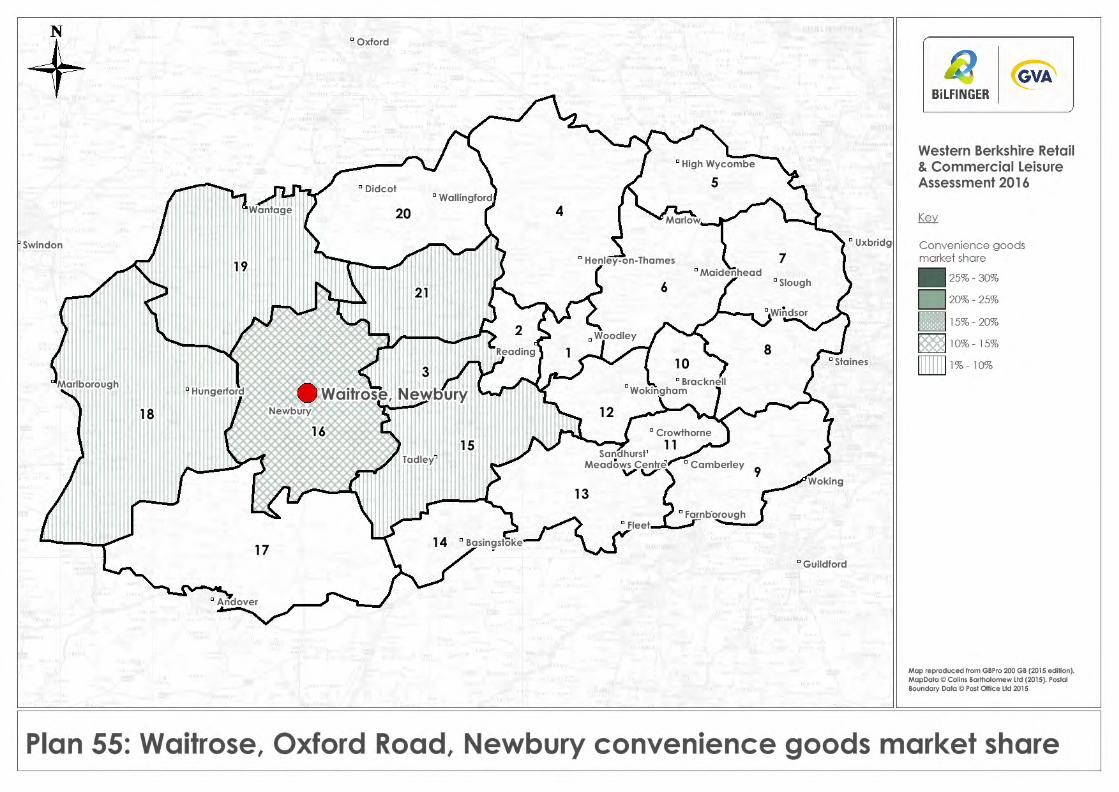

COMMERCIAL LEISURE PLANS
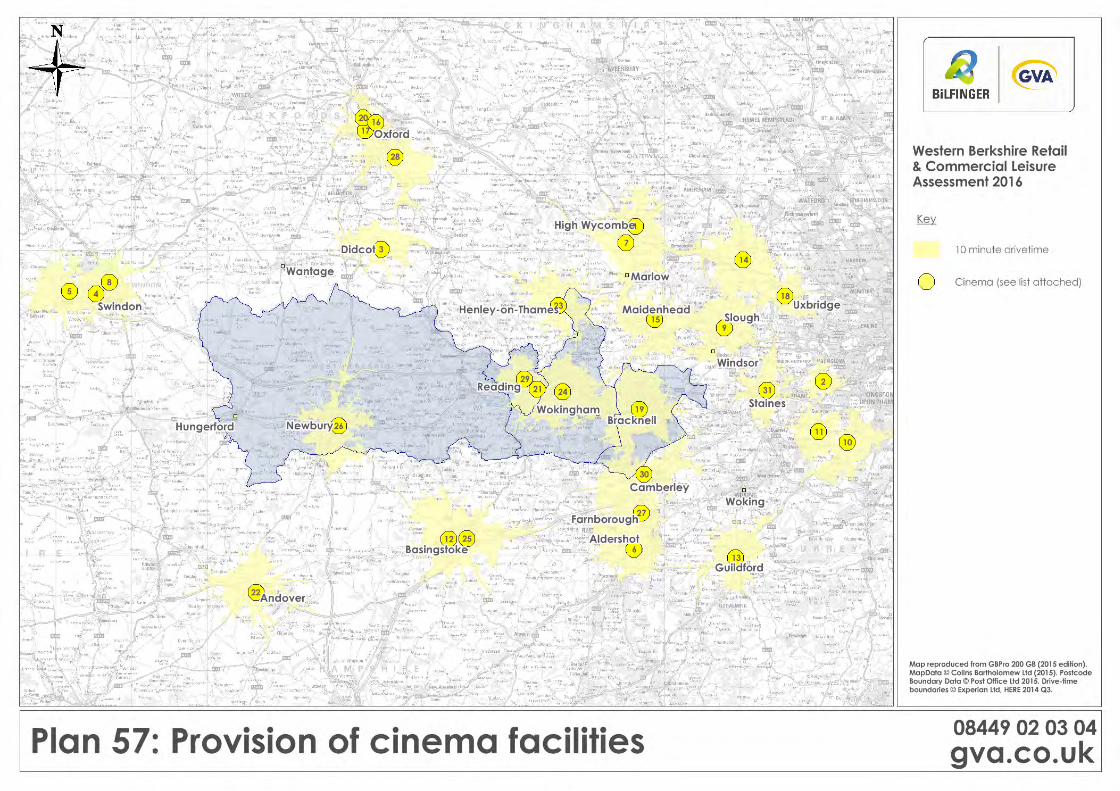
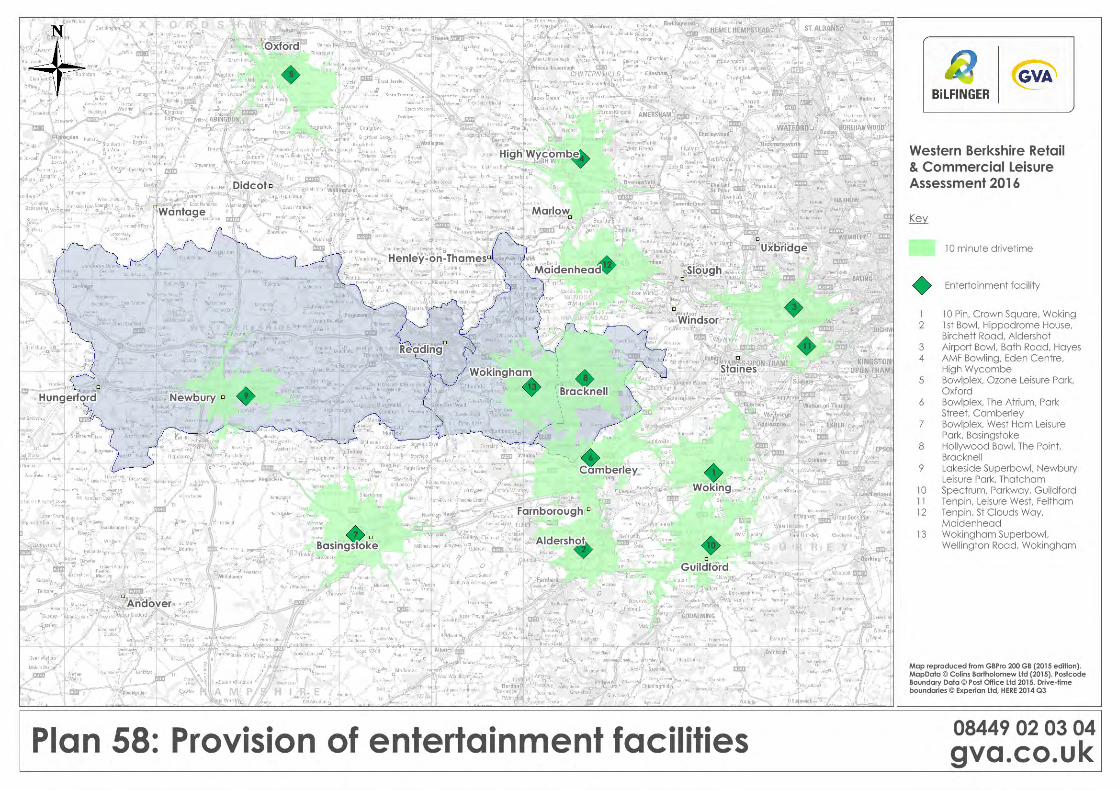
APPENDIX I
COMPARISON GOODS MODELLING
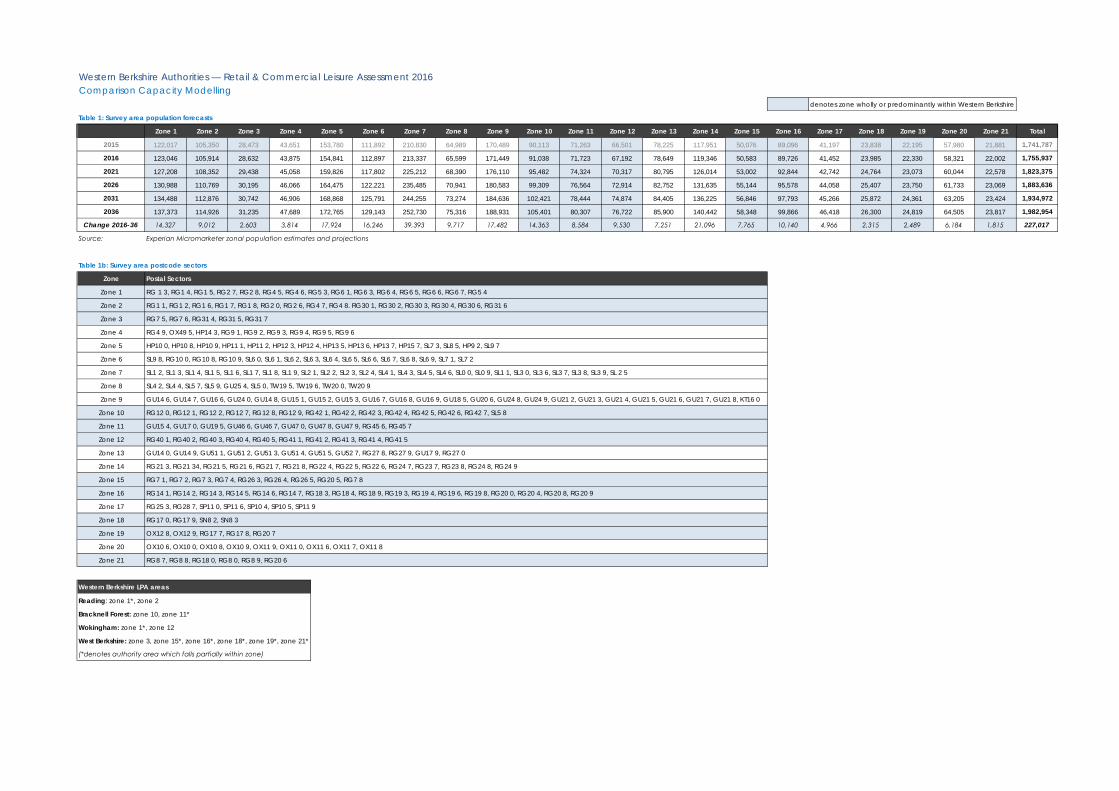
denotes zone wholly or predominantly within Western Berkshire
Table 1: Survey area population forecasts
Zone 1 Zone 2 Zone 3 Zone 4 Zone 5 Zone 6 Zone 7 Zone 8 Zone 9 Zone 10 Zone 11 Zone 12 Zone 13 Zone 14 Zone 15 Zone 16 Zone 17 Zone 18 Zone 19 Zone 20 Zone 21 Total
2015 122,017 105,350 28,473 43,651 153,780 111,892 210,830 64,989 170,489 90,113 71,263 66,501 78,225 117,951 50,076 89,096 41,197 23,838 22,195 57,980 21,881 1,741,787
2016 123,046 105,914 28,632 43,875 154,841 112,897 213,337 65,599 171,449 91,038 71,723 67,192 78,649 119,346 50,583 89,726 41,452 23,985 22,330 58,321 22,002 1,755,937
2021 127,208 108,352 29,438 45,058 159,826 117,802 225,212 68,390 176,110 95,482 74,324 70,317 80,795 126,014 53,002 92,844 42,742 24,764 23,073 60,044 22,578 1,823,375
2026 130,988 110,769 30,195 46,066 164,475 122,221 235,485 70,941 180,583 99,309 76,564 72,914 82,752 131,635 55,144 95,578 44,058 25,407 23,750 61,733 23,069 1,883,636
2031 134,488 112,876 30,742 46,906 168,868 125,791 244,255 73,274 184,636 102,421 78,444 74,874 84,405 136,225 56,846 97,793 45,266 25,872 24,361 63,205 23,424 1,934,972
2036 137,373 114,926 31,235 47,689 172,765 129,143 252,730 75,316 188,931 105,401 80,307 76,722 85,900 140,442 58,348 99,866 46,418 26,300 24,819 64,505 23,817 1,982,954
Change 2016-36 14,327 9,012 2,603 3,814 17,924 16,246 39,393 9,717 17,482 14,363 8,584 9,530 7,251 21,096 7,765 10,140 4,966 2,315 2,489 6,184 1,815 227,017
Source: Experian Micromarketer zonal population estimates and projections
Table 1b: Survey area postcode sectors
Zone Postal Sectors
Zone 1 RG 1 3, RG1 4, RG1 5, RG2 7, RG2 8, RG4 5, RG4 6, RG5 3, RG6 1, RG6 3, RG6 4, RG6 5, RG6 6, RG6 7, RG5 4
Zone 2 RG1 1, RG1 2, RG1 6, RG1 7, RG1 8, RG2 0, RG2 6, RG4 7, RG4 8. RG30 1, RG30 2, RG30 3, RG30 4, RG30 6, RG31 6
Zone 3 RG7 5, RG7 6, RG31 4, RG31 5, RG31 7
Zone 4 RG4 9, OX49 5, HP14 3, RG9 1, RG9 2, RG9 3, RG9 4, RG9 5, RG9 6
Zone 5 HP10 0, HP10 8, HP10 9, HP11 1, HP11 2, HP12 3, HP12 4, HP13 5, HP13 6, HP13 7, HP15 7, SL7 3, SL8 5, HP9 2, SL9 7
Zone 6 SL9 8, RG10 0, RG10 8, RG10 9, SL6 0, SL6 1, SL6 2, SL6 3, SL6 4, SL6 5, SL6 6, SL6 7, SL6 8, SL6 9, SL7 1, SL7 2
Zone 7 SL1 2, SL1 3, SL1 4, SL1 5, SL1 6, SL1 7, SL1 8, SL1 9, SL2 1, SL2 2, SL2 3, SL2 4, SL4 1, SL4 3, SL4 5, SL4 6, SL0 0, SL0 9, SL1 1, SL3 0, SL3 6, SL3 7, SL3 8, SL3 9, SL 2 5
Zone 8 SL4 2, SL4 4, SL5 7, SL5 9, GU25 4, SL5 0, TW19 5, TW19 6, TW20 0, TW20 9
Zone 9 GU14 6, GU14 7, GU16 6, GU24 0, GU14 8, GU15 1, GU15 2, GU15 3, GU16 7, GU16 8, GU16 9, GU18 5, GU20 6, GU24 8, GU24 9, GU21 2, GU21 3, GU21 4, GU21 5, GU21 6, GU21 7, GU21 8, KT16 0
Zone 10 RG12 0, RG12 1, RG12 2, RG12 7, RG12 8, RG12 9, RG42 1, RG42 2, RG42 3, RG42 4, RG42 5, RG42 6, RG42 7, SL5 8
Zone 11 GU15 4, GU17 0, GU19 5, GU46 6, GU46 7, GU47 0, GU47 8, GU47 9, RG45 6, RG45 7
Zone 12 RG40 1, RG40 2, RG40 3, RG40 4, RG40 5, RG41 1, RG41 2, RG41 3, RG41 4, RG41 5
Zone 13 GU14 0, GU14 9, GU51 1, GU51 2, GU51 3, GU51 4, GU51 5, GU52 7, RG27 8, RG27 9, GU17 9, RG27 0
Zone 14 RG21 3, RG21 34, RG21 5, RG21 6, RG21 7, RG21 8, RG22 4, RG22 5, RG22 6, RG24 7, RG23 7, RG23 8, RG24 8, RG24 9
Zone 15 RG7 1, RG7 2, RG7 3, RG7 4, RG26 3, RG26 4, RG26 5, RG20 5, RG7 8
Zone 16 RG14 1, RG14 2, RG14 3, RG14 5, RG14 6, RG14 7, RG18 3, RG18 4, RG18 9, RG19 3, RG19 4, RG19 6, RG19 8, RG20 0, RG20 4, RG20 8, RG20 9
Zone 17 RG25 3, RG28 7, SP11 0, SP11 6, SP10 4, SP10 5, SP11 9
Zone 18 RG17 0, RG17 9, SN8 2, SN8 3
Zone 19 OX12 8, OX12 9, RG17 7, RG17 8, RG20 7
Zone 20 OX10 6, OX10 0, OX10 8, OX10 9, OX11 9, OX11 0, OX11 6, OX11 7, OX11 8
Zone 21 RG8 7, RG8 8, RG18 0, RG8 0, RG8 9, RG20 6
Western Berkshire LPA areas
Reading: zone 1*, zone 2
Bracknell Forest: zone 10, zone 11*
Wokingham: zone 1*, zone 12
West Berkshire: zone 3, zone 15*, zone 16*, zone 18*, zone 19*, zone 21*
(*denotes authority area which falls partially within zone)
Western Berkshire Authorities — Retail & Commercial Leisure Assessment 2016Comparison Capacity Modelling
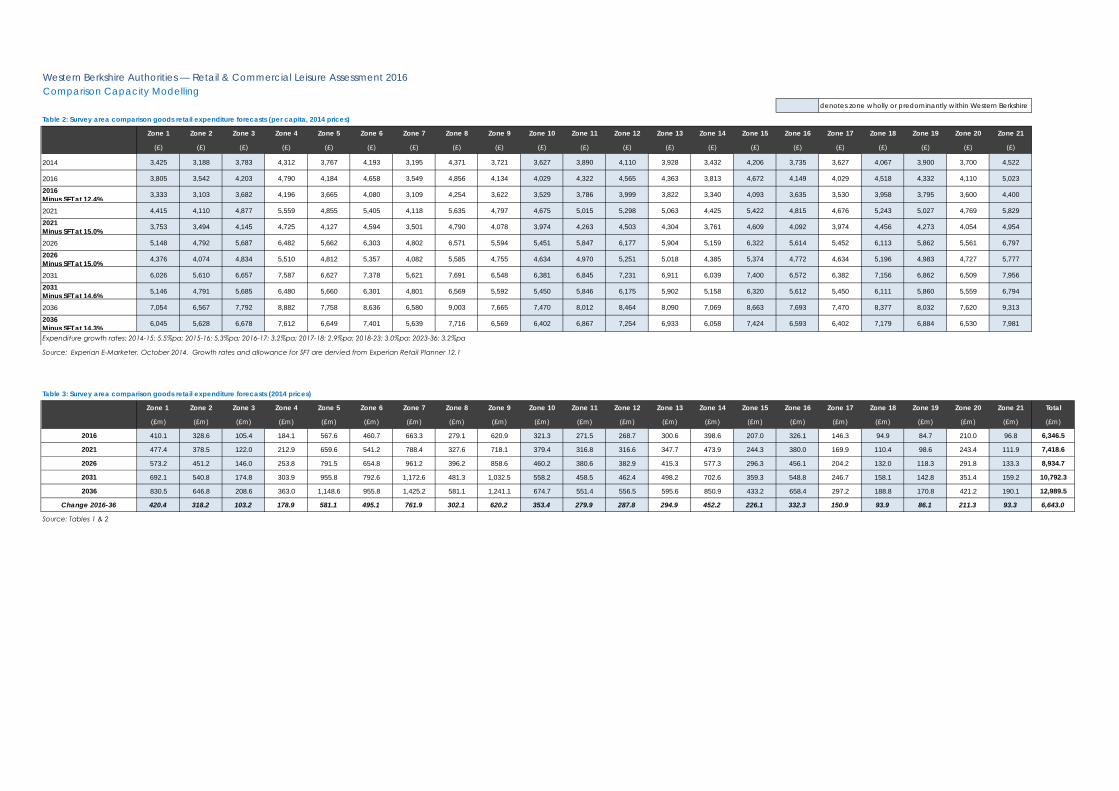
denotes zone wholly or predominantly within Western Berkshire
Table 2: Survey area comparison goods retail expenditure forecasts (per capita, 2014 prices)
Zone 1 Zone 2 Zone 3 Zone 4 Zone 5 Zone 6 Zone 7 Zone 8 Zone 9 Zone 10 Zone 11 Zone 12 Zone 13 Zone 14 Zone 15 Zone 16 Zone 17 Zone 18 Zone 19 Zone 20 Zone 21
(£) (£) (£) (£) (£) (£) (£) (£) (£) (£) (£) (£) (£) (£) (£) (£) (£) (£) (£) (£) (£)
2014 3,425 3,188 3,783 4,312 3,767 4,193 3,195 4,371 3,721 3,627 3,890 4,110 3,928 3,432 4,206 3,735 3,627 4,067 3,900 3,700 4,522
2016 3,805 3,542 4,203 4,790 4,184 4,658 3,549 4,856 4,134 4,029 4,322 4,565 4,363 3,813 4,672 4,149 4,029 4,518 4,332 4,110 5,023
2016Minus SFT at 12.4% 3,333 3,103 3,682 4,196 3,665 4,080 3,109 4,254 3,622 3,529 3,786 3,999 3,822 3,340 4,093 3,635 3,530 3,958 3,795 3,600 4,400
2021 4,415 4,110 4,877 5,559 4,855 5,405 4,118 5,635 4,797 4,675 5,015 5,298 5,063 4,425 5,422 4,815 4,676 5,243 5,027 4,769 5,829
2021Minus SFT at 15.0% 3,753 3,494 4,145 4,725 4,127 4,594 3,501 4,790 4,078 3,974 4,263 4,503 4,304 3,761 4,609 4,092 3,974 4,456 4,273 4,054 4,954
2026 5,148 4,792 5,687 6,482 5,662 6,303 4,802 6,571 5,594 5,451 5,847 6,177 5,904 5,159 6,322 5,614 5,452 6,113 5,862 5,561 6,797
2026Minus SFT at 15.0% 4,376 4,074 4,834 5,510 4,812 5,357 4,082 5,585 4,755 4,634 4,970 5,251 5,018 4,385 5,374 4,772 4,634 5,196 4,983 4,727 5,777
2031 6,026 5,610 6,657 7,587 6,627 7,378 5,621 7,691 6,548 6,381 6,845 7,231 6,911 6,039 7,400 6,572 6,382 7,156 6,862 6,509 7,956
2031Minus SFT at 14.6% 5,146 4,791 5,685 6,480 5,660 6,301 4,801 6,569 5,592 5,450 5,846 6,175 5,902 5,158 6,320 5,612 5,450 6,111 5,860 5,559 6,794
2036 7,054 6,567 7,792 8,882 7,758 8,636 6,580 9,003 7,665 7,470 8,012 8,464 8,090 7,069 8,663 7,693 7,470 8,377 8,032 7,620 9,313
2036Minus SFT at 14.3% 6,045 5,628 6,678 7,612 6,649 7,401 5,639 7,716 6,569 6,402 6,867 7,254 6,933 6,058 7,424 6,593 6,402 7,179 6,884 6,530 7,981
Source: Experian E-Marketer, October 2014. Growth rates and allowance for SFT are dervied from Experian Retail Planner 12.1
Table 3: Survey area comparison goods retail expenditure forecasts (2014 prices)
Zone 1 Zone 2 Zone 3 Zone 4 Zone 5 Zone 6 Zone 7 Zone 8 Zone 9 Zone 10 Zone 11 Zone 12 Zone 13 Zone 14 Zone 15 Zone 16 Zone 17 Zone 18 Zone 19 Zone 20 Zone 21 Total
(£m) (£m) (£m) (£m) (£m) (£m) (£m) (£m) (£m) (£m) (£m) (£m) (£m) (£m) (£m) (£m) (£m) (£m) (£m) (£m) (£m) (£m)
2016 410.1 328.6 105.4 184.1 567.6 460.7 663.3 279.1 620.9 321.3 271.5 268.7 300.6 398.6 207.0 326.1 146.3 94.9 84.7 210.0 96.8 6,346.5
2021 477.4 378.5 122.0 212.9 659.6 541.2 788.4 327.6 718.1 379.4 316.8 316.6 347.7 473.9 244.3 380.0 169.9 110.4 98.6 243.4 111.9 7,418.6
2026 573.2 451.2 146.0 253.8 791.5 654.8 961.2 396.2 858.6 460.2 380.6 382.9 415.3 577.3 296.3 456.1 204.2 132.0 118.3 291.8 133.3 8,934.7
2031 692.1 540.8 174.8 303.9 955.8 792.6 1,172.6 481.3 1,032.5 558.2 458.5 462.4 498.2 702.6 359.3 548.8 246.7 158.1 142.8 351.4 159.2 10,792.3
2036 830.5 646.8 208.6 363.0 1,148.6 955.8 1,425.2 581.1 1,241.1 674.7 551.4 556.5 595.6 850.9 433.2 658.4 297.2 188.8 170.8 421.2 190.1 12,989.5
Change 2016-36 420.4 318.2 103.2 178.9 581.1 495.1 761.9 302.1 620.2 353.4 279.9 287.8 294.9 452.2 226.1 332.3 150.9 93.9 86.1 211.3 93.3 6,643.0
Source: Tables 1 & 2
Expenditure growth rates: 2014-15: 5.5%pa; 2015-16: 5.3%pa; 2016-17: 3.2%pa; 2017-18: 2.9%pa; 2018-23: 3.0%pa; 2023-36: 3.2%pa
Western Berkshire Authorities — Retail & Commercial Leisure Assessment 2016Comparison Capacity Modelling
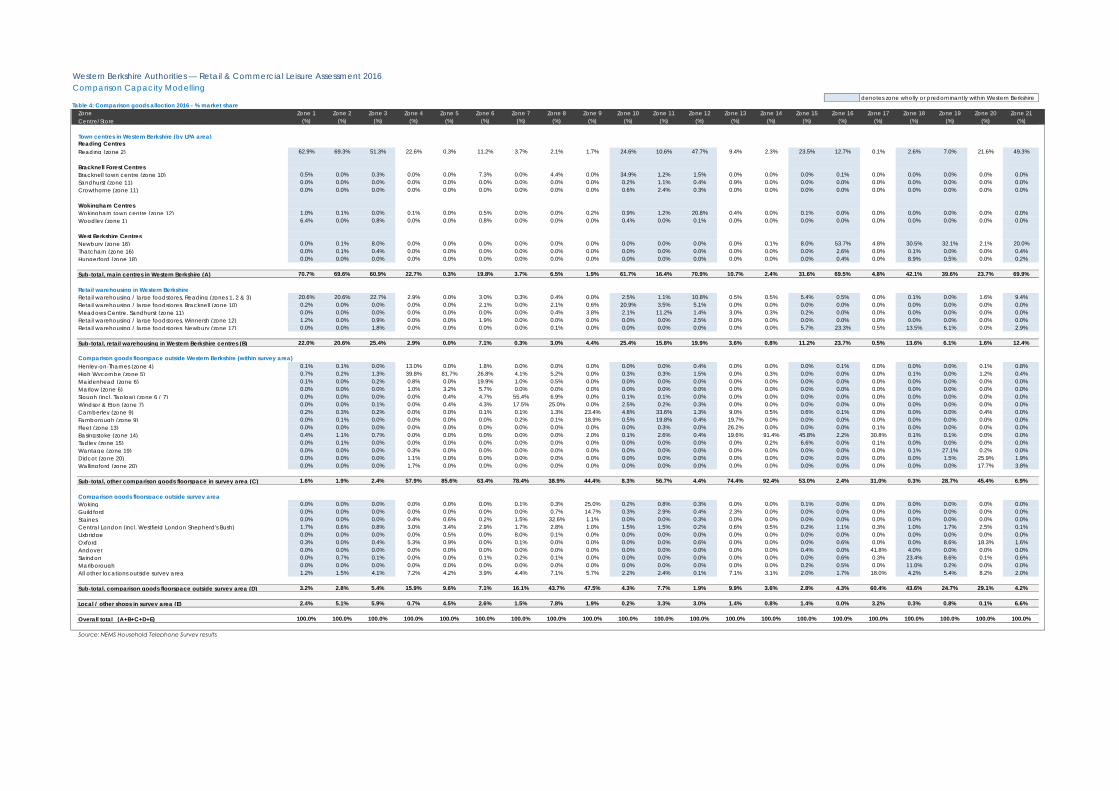
denotes zone wholly or predominantly within Western BerkshireTable 4: Comparison goods alloction 2016 - % market share
Zone Zone 1 Zone 2 Zone 3 Zone 4 Zone 5 Zone 6 Zone 7 Zone 8 Zone 9 Zone 10 Zone 11 Zone 12 Zone 13 Zone 14 Zone 15 Zone 16 Zone 17 Zone 18 Zone 19 Zone 20 Zone 21Centre/Store (%) (%) (%) (%) (%) (%) (%) (%) (%) (%) (%) (%) (%) (%) (%) (%) (%) (%) (%) (%) (%)
Town centres in Western Berkshire (by LPA area)Reading CentresReading (zone 2) 62.9% 69.3% 51.3% 22.6% 0.3% 11.2% 3.7% 2.1% 1.7% 24.6% 10.6% 47.7% 9.4% 2.3% 23.5% 12.7% 0.1% 2.6% 7.0% 21.6% 49.3%
Bracknell Forest CentresBracknell town centre (zone 10) 0.5% 0.0% 0.3% 0.0% 0.0% 7.3% 0.0% 4.4% 0.0% 34.9% 1.2% 1.5% 0.0% 0.0% 0.0% 0.1% 0.0% 0.0% 0.0% 0.0% 0.0%Sandhurst (zone 11) 0.0% 0.0% 0.0% 0.0% 0.0% 0.0% 0.0% 0.0% 0.0% 0.2% 1.1% 0.4% 0.9% 0.0% 0.0% 0.0% 0.0% 0.0% 0.0% 0.0% 0.0%Crowthorne (zone 11) 0.0% 0.0% 0.0% 0.0% 0.0% 0.0% 0.0% 0.0% 0.0% 0.6% 2.4% 0.3% 0.0% 0.0% 0.0% 0.0% 0.0% 0.0% 0.0% 0.0% 0.0%
Wokingham CentresWokingham town centre (zone 12) 1.0% 0.1% 0.0% 0.1% 0.0% 0.5% 0.0% 0.0% 0.2% 0.9% 1.2% 20.8% 0.4% 0.0% 0.1% 0.0% 0.0% 0.0% 0.0% 0.0% 0.0%Woodley (zone 1) 6.4% 0.0% 0.8% 0.0% 0.0% 0.8% 0.0% 0.0% 0.0% 0.4% 0.0% 0.1% 0.0% 0.0% 0.0% 0.0% 0.0% 0.0% 0.0% 0.0% 0.0%
West Berkshire CentresNewbury (zone 16) 0.0% 0.1% 8.0% 0.0% 0.0% 0.0% 0.0% 0.0% 0.0% 0.0% 0.0% 0.0% 0.0% 0.1% 8.0% 53.7% 4.8% 30.5% 32.1% 2.1% 20.0%Thatcham (zone 16) 0.0% 0.1% 0.4% 0.0% 0.0% 0.0% 0.0% 0.0% 0.0% 0.0% 0.0% 0.0% 0.0% 0.0% 0.0% 2.6% 0.0% 0.1% 0.0% 0.0% 0.4%Hungerford (zone 18) 0.0% 0.0% 0.0% 0.0% 0.0% 0.0% 0.0% 0.0% 0.0% 0.0% 0.0% 0.0% 0.0% 0.0% 0.0% 0.4% 0.0% 8.9% 0.5% 0.0% 0.2%
Sub-total, main centres in Western Berkshire (A) 70.7% 69.6% 60.9% 22.7% 0.3% 19.8% 3.7% 6.5% 1.9% 61.7% 16.4% 70.9% 10.7% 2.4% 31.6% 69.5% 4.8% 42.1% 39.6% 23.7% 69.9%
Retail warehousing in Western BerkshireRetail warehousing / large foodstores, Reading (zones 1, 2 & 3) 20.6% 20.6% 22.7% 2.9% 0.0% 3.0% 0.3% 0.4% 0.0% 2.5% 1.1% 10.8% 0.5% 0.5% 5.4% 0.5% 0.0% 0.1% 0.0% 1.6% 9.4%Retail warehousing / large foodstores, Bracknell (zone 10) 0.2% 0.0% 0.0% 0.0% 0.0% 2.1% 0.0% 2.1% 0.6% 20.9% 3.5% 5.1% 0.0% 0.0% 0.0% 0.0% 0.0% 0.0% 0.0% 0.0% 0.0%Meadows Centre, Sandhurst (zone 11) 0.0% 0.0% 0.0% 0.0% 0.0% 0.0% 0.0% 0.4% 3.8% 2.1% 11.2% 1.4% 3.0% 0.3% 0.2% 0.0% 0.0% 0.0% 0.0% 0.0% 0.0%Retail warehousing / large foodstores, Winnersh (zone 12) 1.2% 0.0% 0.9% 0.0% 0.0% 1.9% 0.0% 0.0% 0.0% 0.0% 0.0% 2.5% 0.0% 0.0% 0.0% 0.0% 0.0% 0.0% 0.0% 0.0% 0.0%Retail warehousing / large foodstores, Newbury (zone 17) 0.0% 0.0% 1.8% 0.0% 0.0% 0.0% 0.0% 0.1% 0.0% 0.0% 0.0% 0.0% 0.0% 0.0% 5.7% 23.3% 0.5% 13.5% 6.1% 0.0% 2.9%
Sub-total, retail warehousing in Western Berkshire centres (B) 22.0% 20.6% 25.4% 2.9% 0.0% 7.1% 0.3% 3.0% 4.4% 25.4% 15.8% 19.9% 3.6% 0.8% 11.2% 23.7% 0.5% 13.6% 6.1% 1.6% 12.4%
Henley-on-Thames (zone 4) 0.1% 0.1% 0.0% 13.0% 0.0% 1.8% 0.0% 0.0% 0.0% 0.0% 0.0% 0.4% 0.0% 0.0% 0.0% 0.1% 0.0% 0.0% 0.0% 0.1% 0.8%High Wycombe (zone 5) 0.7% 0.2% 1.3% 39.8% 81.7% 26.8% 4.1% 5.2% 0.0% 0.3% 0.3% 1.5% 0.0% 0.3% 0.0% 0.0% 0.0% 0.1% 0.0% 1.2% 0.4%Maidenhead (zone 6) 0.1% 0.0% 0.2% 0.8% 0.0% 19.9% 1.0% 0.5% 0.0% 0.0% 0.0% 0.0% 0.0% 0.0% 0.0% 0.0% 0.0% 0.0% 0.0% 0.0% 0.0%Marlow (zone 6) 0.0% 0.0% 0.0% 1.0% 3.2% 5.7% 0.0% 0.0% 0.0% 0.0% 0.0% 0.0% 0.0% 0.0% 0.0% 0.0% 0.0% 0.0% 0.0% 0.0% 0.0%Slough (incl. Taplow) (zone 6 / 7) 0.0% 0.0% 0.0% 0.0% 0.4% 4.7% 55.4% 6.9% 0.0% 0.1% 0.1% 0.0% 0.0% 0.0% 0.0% 0.0% 0.0% 0.0% 0.0% 0.0% 0.0%Windsor & Eton (zone 7) 0.0% 0.0% 0.1% 0.0% 0.4% 4.3% 17.5% 25.0% 0.0% 2.5% 0.2% 0.3% 0.0% 0.0% 0.0% 0.0% 0.0% 0.0% 0.0% 0.0% 0.0%Camberley (zone 9) 0.2% 0.3% 0.2% 0.0% 0.0% 0.1% 0.1% 1.3% 23.4% 4.8% 33.6% 1.3% 9.0% 0.5% 0.6% 0.1% 0.0% 0.0% 0.0% 0.4% 0.0%Farnborough (zone 9) 0.0% 0.1% 0.0% 0.0% 0.0% 0.0% 0.2% 0.1% 18.9% 0.5% 19.8% 0.4% 19.7% 0.0% 0.0% 0.0% 0.0% 0.0% 0.0% 0.0% 0.0%Fleet (zone 13) 0.0% 0.0% 0.0% 0.0% 0.0% 0.0% 0.0% 0.0% 0.0% 0.0% 0.3% 0.0% 26.2% 0.0% 0.0% 0.0% 0.1% 0.0% 0.0% 0.0% 0.0%Basingstoke (zone 14) 0.4% 1.1% 0.7% 0.0% 0.0% 0.0% 0.0% 0.0% 2.0% 0.1% 2.6% 0.4% 19.6% 91.4% 45.8% 2.2% 30.8% 0.1% 0.1% 0.0% 0.0%Tadley (zone 15) 0.0% 0.1% 0.0% 0.0% 0.0% 0.0% 0.0% 0.0% 0.0% 0.0% 0.0% 0.0% 0.0% 0.2% 6.6% 0.0% 0.1% 0.0% 0.0% 0.0% 0.0%Wantage (zone 19) 0.0% 0.0% 0.0% 0.3% 0.0% 0.0% 0.0% 0.0% 0.0% 0.0% 0.0% 0.0% 0.0% 0.0% 0.0% 0.0% 0.0% 0.1% 27.1% 0.2% 0.0%Didcot (zone 20) 0.0% 0.0% 0.0% 1.1% 0.0% 0.0% 0.0% 0.0% 0.0% 0.0% 0.0% 0.0% 0.0% 0.0% 0.0% 0.0% 0.0% 0.0% 1.5% 25.9% 1.9%Wallingford (zone 20) 0.0% 0.0% 0.0% 1.7% 0.0% 0.0% 0.0% 0.0% 0.0% 0.0% 0.0% 0.0% 0.0% 0.0% 0.0% 0.0% 0.0% 0.0% 0.0% 17.7% 3.8%
Sub-total, other comparison goods floorspace in survey area (C) 1.6% 1.9% 2.4% 57.9% 85.6% 63.4% 78.4% 38.9% 44.4% 8.3% 56.7% 4.4% 74.4% 92.4% 53.0% 2.4% 31.0% 0.3% 28.7% 45.4% 6.9%
Comparison goods floorspace outside survey areaWoking 0.0% 0.0% 0.0% 0.0% 0.0% 0.0% 0.1% 0.3% 25.0% 0.2% 0.8% 0.3% 0.0% 0.0% 0.1% 0.0% 0.0% 0.0% 0.0% 0.0% 0.0%Guildford 0.0% 0.0% 0.0% 0.0% 0.0% 0.0% 0.0% 0.7% 14.7% 0.3% 2.9% 0.4% 2.3% 0.0% 0.0% 0.0% 0.0% 0.0% 0.0% 0.0% 0.0%Staines 0.0% 0.0% 0.0% 0.4% 0.6% 0.2% 1.5% 32.6% 1.1% 0.0% 0.0% 0.3% 0.0% 0.0% 0.0% 0.0% 0.0% 0.0% 0.0% 0.0% 0.0%Central London (incl. Westfield London Shepherd's Bush) 1.7% 0.6% 0.8% 3.0% 3.4% 2.9% 1.7% 2.8% 1.0% 1.5% 1.5% 0.2% 0.6% 0.5% 0.2% 1.1% 0.3% 1.0% 1.7% 2.5% 0.1%Uxbridge 0.0% 0.0% 0.0% 0.0% 0.5% 0.0% 8.0% 0.1% 0.0% 0.0% 0.0% 0.0% 0.0% 0.0% 0.0% 0.0% 0.0% 0.0% 0.0% 0.0% 0.0%Oxford 0.3% 0.0% 0.4% 5.3% 0.9% 0.0% 0.1% 0.0% 0.0% 0.0% 0.0% 0.6% 0.0% 0.0% 0.0% 0.6% 0.0% 0.0% 8.6% 18.3% 1.6%Andover 0.0% 0.0% 0.0% 0.0% 0.0% 0.0% 0.0% 0.0% 0.0% 0.0% 0.0% 0.0% 0.0% 0.0% 0.4% 0.0% 41.8% 4.0% 0.0% 0.0% 0.0%Swindon 0.0% 0.7% 0.1% 0.0% 0.0% 0.1% 0.2% 0.1% 0.0% 0.0% 0.0% 0.0% 0.0% 0.0% 0.0% 0.6% 0.3% 23.4% 8.6% 0.1% 0.6%Marlborough 0.0% 0.0% 0.0% 0.0% 0.0% 0.0% 0.0% 0.0% 0.0% 0.0% 0.0% 0.0% 0.0% 0.0% 0.2% 0.5% 0.0% 11.0% 0.2% 0.0% 0.0%All other locations outside survey area 1.2% 1.5% 4.1% 7.2% 4.2% 3.9% 4.4% 7.1% 5.7% 2.2% 2.4% 0.1% 7.1% 3.1% 2.0% 1.7% 18.0% 4.2% 5.4% 8.2% 2.0%
Sub-total, comparison goods floorspace outside survey area (D) 3.2% 2.8% 5.4% 15.9% 9.6% 7.1% 16.1% 43.7% 47.5% 4.3% 7.7% 1.9% 9.9% 3.6% 2.8% 4.3% 60.4% 43.6% 24.7% 29.1% 4.2%
Local / other shops in survey area (E) 2.4% 5.1% 5.9% 0.7% 4.5% 2.6% 1.5% 7.8% 1.9% 0.2% 3.3% 3.0% 1.4% 0.8% 1.4% 0.0% 3.2% 0.3% 0.8% 0.1% 6.6%
Overall total (A+B+C+D+E) 100.0% 100.0% 100.0% 100.0% 100.0% 100.0% 100.0% 100.0% 100.0% 100.0% 100.0% 100.0% 100.0% 100.0% 100.0% 100.0% 100.0% 100.0% 100.0% 100.0% 100.0%
Source: NEMS Household Telephone Survey results
Western Berkshire Authorities — Retail & Commercial Leisure Assessment 2016Comparison Capacity Modelling
Comparison goods floorspace outside Western Berkshire (within survey area)
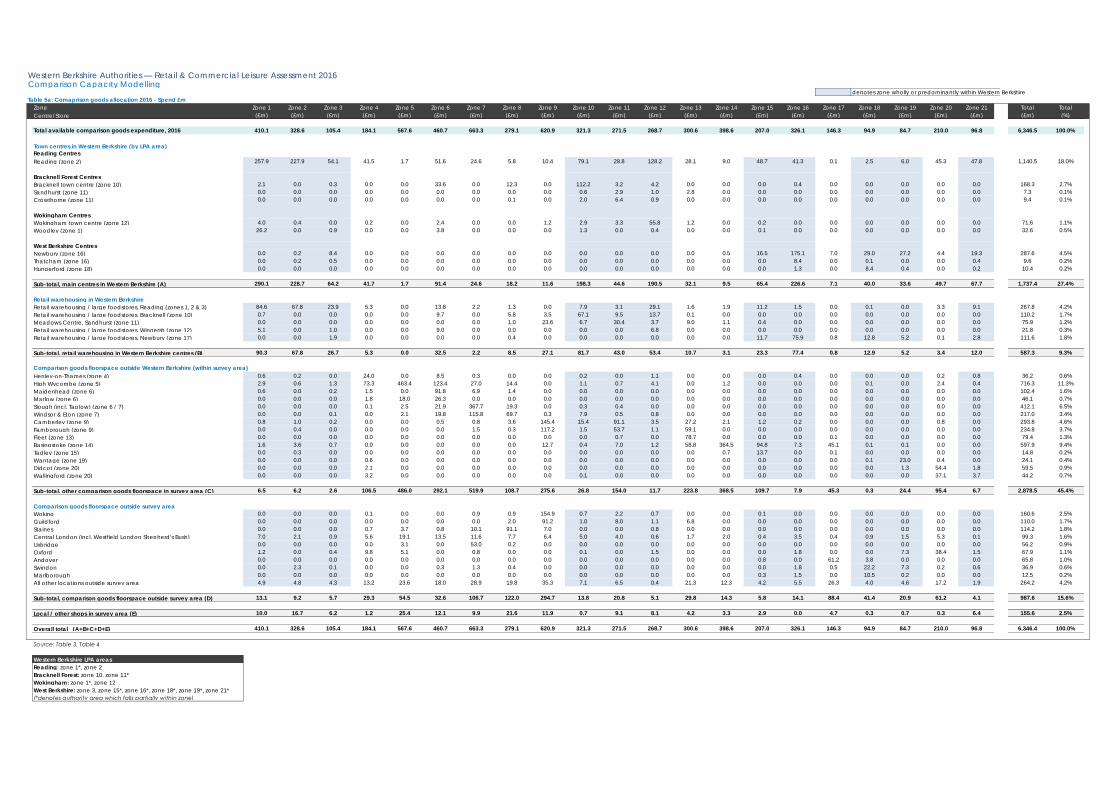
denotes zone wholly or predominantly within Western BerkshireTable 5a: Comaprison goods allocation 2016 - Spend £m
Zone Zone 1 Zone 2 Zone 3 Zone 4 Zone 5 Zone 6 Zone 7 Zone 8 Zone 9 Zone 10 Zone 11 Zone 12 Zone 13 Zone 14 Zone 15 Zone 16 Zone 17 Zone 18 Zone 19 Zone 20 Zone 21 Total TotalCentre/Store (£m) (£m) (£m) (£m) (£m) (£m) (£m) (£m) (£m) (£m) (£m) (£m) (£m) (£m) (£m) (£m) (£m) (£m) (£m) (£m) (£m) (£m) (%)
Total available comparison goods expenditure, 2016 410.1 328.6 105.4 184.1 567.6 460.7 663.3 279.1 620.9 321.3 271.5 268.7 300.6 398.6 207.0 326.1 146.3 94.9 84.7 210.0 96.8 6,346.5 100.0%
Town centres in Western Berkshire (by LPA area)Reading CentresReading (zone 2) 257.9 227.9 54.1 41.5 1.7 51.6 24.6 5.8 10.4 79.1 28.8 128.2 28.1 9.0 48.7 41.3 0.1 2.5 6.0 45.3 47.8 1,140.5 18.0%
Bracknell Forest CentresBracknell town centre (zone 10) 2.1 0.0 0.3 0.0 0.0 33.6 0.0 12.3 0.0 112.2 3.2 4.2 0.0 0.0 0.0 0.4 0.0 0.0 0.0 0.0 0.0 168.3 2.7%Sandhurst (zone 11) 0.0 0.0 0.0 0.0 0.0 0.0 0.0 0.0 0.0 0.6 2.9 1.0 2.8 0.0 0.0 0.0 0.0 0.0 0.0 0.0 0.0 7.3 0.1%Crowthorne (zone 11) 0.0 0.0 0.0 0.0 0.0 0.0 0.0 0.1 0.0 2.0 6.4 0.9 0.0 0.0 0.0 0.0 0.0 0.0 0.0 0.0 0.0 9.4 0.1%
Wokingham CentresWokingham town centre (zone 12) 4.0 0.4 0.0 0.2 0.0 2.4 0.0 0.0 1.2 2.9 3.3 55.8 1.2 0.0 0.2 0.0 0.0 0.0 0.0 0.0 0.0 71.6 1.1%Woodley (zone 1) 26.2 0.0 0.9 0.0 0.0 3.8 0.0 0.0 0.0 1.3 0.0 0.4 0.0 0.0 0.1 0.0 0.0 0.0 0.0 0.0 0.0 32.6 0.5%
West Berkshire CentresNewbury (zone 16) 0.0 0.2 8.4 0.0 0.0 0.0 0.0 0.0 0.0 0.0 0.0 0.0 0.0 0.5 16.5 175.1 7.0 29.0 27.2 4.4 19.3 287.6 4.5%Thatcham (zone 16) 0.0 0.2 0.5 0.0 0.0 0.0 0.0 0.0 0.0 0.0 0.0 0.0 0.0 0.0 0.0 8.4 0.0 0.1 0.0 0.0 0.4 9.6 0.2%Hungerford (zone 18) 0.0 0.0 0.0 0.0 0.0 0.0 0.0 0.0 0.0 0.0 0.0 0.0 0.0 0.0 0.0 1.3 0.0 8.4 0.4 0.0 0.2 10.4 0.2%
Sub-total, main centres in Western Berkshire (A) 290.1 228.7 64.2 41.7 1.7 91.4 24.6 18.2 11.6 198.3 44.6 190.5 32.1 9.5 65.4 226.6 7.1 40.0 33.6 49.7 67.7 1,737.4 27.4%
Retail warehousing in Western BerkshireRetail warehousing / large foodstores, Reading (zones 1, 2 & 3) 84.6 67.8 23.9 5.3 0.0 13.8 2.2 1.3 0.0 7.9 3.1 29.1 1.6 1.9 11.2 1.5 0.0 0.1 0.0 3.3 9.1 267.8 4.2%Retail warehousing / large foodstores, Bracknell (zone 10) 0.7 0.0 0.0 0.0 0.0 9.7 0.0 5.8 3.5 67.1 9.5 13.7 0.1 0.0 0.0 0.0 0.0 0.0 0.0 0.0 0.0 110.2 1.7%Meadows Centre, Sandhurst (zone 11) 0.0 0.0 0.0 0.0 0.0 0.0 0.0 1.0 23.6 6.7 30.4 3.7 9.0 1.1 0.4 0.0 0.0 0.0 0.0 0.0 0.0 75.9 1.2%Retail warehousing / large foodstores, Winnersh (zone 12) 5.1 0.0 1.0 0.0 0.0 9.0 0.0 0.0 0.0 0.0 0.0 6.8 0.0 0.0 0.0 0.0 0.0 0.0 0.0 0.0 0.0 21.8 0.3%Retail warehousing / large foodstores, Newbury (zone 17) 0.0 0.0 1.9 0.0 0.0 0.0 0.0 0.4 0.0 0.0 0.0 0.0 0.0 0.0 11.7 75.9 0.8 12.8 5.2 0.1 2.8 111.6 1.8%
Sub-total, retail warehousing in Western Berkshire centres (B) 90.3 67.8 26.7 5.3 0.0 32.5 2.2 8.5 27.1 81.7 43.0 53.4 10.7 3.1 23.3 77.4 0.8 12.9 5.2 3.4 12.0 587.3 9.3%
Henley-on-Thames (zone 4) 0.6 0.2 0.0 24.0 0.0 8.5 0.3 0.0 0.0 0.2 0.0 1.1 0.0 0.0 0.0 0.4 0.0 0.0 0.0 0.2 0.8 36.2 0.6%High Wycombe (zone 5) 2.9 0.6 1.3 73.3 463.4 123.4 27.0 14.4 0.0 1.1 0.7 4.1 0.0 1.2 0.0 0.0 0.0 0.1 0.0 2.4 0.4 716.3 11.3%Maidenhead (zone 6) 0.6 0.0 0.2 1.5 0.0 91.8 6.9 1.4 0.0 0.0 0.0 0.0 0.0 0.0 0.0 0.0 0.0 0.0 0.0 0.0 0.0 102.4 1.6%Marlow (zone 6) 0.0 0.0 0.0 1.8 18.0 26.3 0.0 0.0 0.0 0.0 0.0 0.0 0.0 0.0 0.0 0.0 0.0 0.0 0.0 0.0 0.0 46.1 0.7%Slough (incl. Taplow) (zone 6 / 7) 0.0 0.0 0.0 0.1 2.5 21.9 367.7 19.3 0.0 0.3 0.4 0.0 0.0 0.0 0.0 0.0 0.0 0.0 0.0 0.0 0.0 412.1 6.5%Windsor & Eton (zone 7) 0.0 0.0 0.1 0.0 2.1 19.8 115.8 69.7 0.3 7.9 0.5 0.8 0.0 0.0 0.0 0.0 0.0 0.0 0.0 0.0 0.0 217.0 3.4%Camberley (zone 9) 0.8 1.0 0.2 0.0 0.0 0.5 0.8 3.6 145.4 15.4 91.1 3.5 27.2 2.1 1.2 0.2 0.0 0.0 0.0 0.8 0.0 293.8 4.6%Farnborough (zone 9) 0.0 0.4 0.0 0.0 0.0 0.0 1.5 0.3 117.2 1.5 53.7 1.1 59.1 0.0 0.0 0.0 0.0 0.0 0.0 0.0 0.0 234.8 3.7%Fleet (zone 13) 0.0 0.0 0.0 0.0 0.0 0.0 0.0 0.0 0.0 0.0 0.7 0.0 78.7 0.0 0.0 0.0 0.1 0.0 0.0 0.0 0.0 79.4 1.3%Basingstoke (zone 14) 1.6 3.6 0.7 0.0 0.0 0.0 0.0 0.0 12.7 0.4 7.0 1.2 58.8 364.5 94.8 7.3 45.1 0.1 0.1 0.0 0.0 597.9 9.4%Tadley (zone 15) 0.0 0.3 0.0 0.0 0.0 0.0 0.0 0.0 0.0 0.0 0.0 0.0 0.0 0.7 13.7 0.0 0.1 0.0 0.0 0.0 0.0 14.8 0.2%Wantage (zone 19) 0.0 0.0 0.0 0.6 0.0 0.0 0.0 0.0 0.0 0.0 0.0 0.0 0.0 0.0 0.0 0.0 0.0 0.1 23.0 0.4 0.0 24.1 0.4%Didcot (zone 20) 0.0 0.0 0.0 2.1 0.0 0.0 0.0 0.0 0.0 0.0 0.0 0.0 0.0 0.0 0.0 0.0 0.0 0.0 1.3 54.4 1.8 59.5 0.9%Wallingford (zone 20) 0.0 0.0 0.0 3.2 0.0 0.0 0.0 0.0 0.0 0.1 0.0 0.0 0.0 0.0 0.0 0.0 0.0 0.0 0.0 37.1 3.7 44.2 0.7%
Sub-total, other comparison goods floorspace in survey area (C) 6.5 6.2 2.6 106.5 486.0 292.1 519.9 108.7 275.6 26.8 154.0 11.7 223.8 368.5 109.7 7.9 45.3 0.3 24.4 95.4 6.7 2,878.5 45.4%
Comparison goods floorspace outside survey areaWoking 0.0 0.0 0.0 0.1 0.0 0.0 0.9 0.9 154.9 0.7 2.2 0.7 0.0 0.0 0.1 0.0 0.0 0.0 0.0 0.0 0.0 160.6 2.5%Guildford 0.0 0.0 0.0 0.0 0.0 0.0 0.0 2.0 91.2 1.0 8.0 1.1 6.8 0.0 0.0 0.0 0.0 0.0 0.0 0.0 0.0 110.0 1.7%Staines 0.0 0.0 0.0 0.7 3.7 0.8 10.1 91.1 7.0 0.0 0.0 0.8 0.0 0.0 0.0 0.0 0.0 0.0 0.0 0.0 0.0 114.2 1.8%Central London (incl. Westfield London Shepherd's Bush) 7.0 2.1 0.9 5.6 19.1 13.5 11.6 7.7 6.4 5.0 4.0 0.6 1.7 2.0 0.4 3.5 0.4 0.9 1.5 5.3 0.1 99.3 1.6%Uxbridge 0.0 0.0 0.0 0.0 3.1 0.0 53.0 0.2 0.0 0.0 0.0 0.0 0.0 0.0 0.0 0.0 0.0 0.0 0.0 0.0 0.0 56.2 0.9%Oxford 1.2 0.0 0.4 9.8 5.1 0.0 0.8 0.0 0.0 0.1 0.0 1.5 0.0 0.0 0.0 1.8 0.0 0.0 7.3 38.4 1.5 67.9 1.1%Andover 0.0 0.0 0.0 0.0 0.0 0.0 0.0 0.0 0.0 0.0 0.0 0.0 0.0 0.0 0.8 0.0 61.2 3.8 0.0 0.0 0.0 65.8 1.0%Swindon 0.0 2.3 0.1 0.0 0.0 0.3 1.3 0.4 0.0 0.0 0.0 0.0 0.0 0.0 0.0 1.8 0.5 22.2 7.3 0.2 0.6 36.9 0.6%Marlborough 0.0 0.0 0.0 0.0 0.0 0.0 0.0 0.0 0.0 0.0 0.0 0.0 0.0 0.0 0.3 1.5 0.0 10.5 0.2 0.0 0.0 12.5 0.2%All other locations outside survey area 4.9 4.8 4.3 13.2 23.6 18.0 28.9 19.8 35.3 7.1 6.5 0.4 21.3 12.3 4.2 5.5 26.3 4.0 4.6 17.2 1.9 264.2 4.2%
Sub-total, comparison goods floorspace outside survey area (D) 13.1 9.2 5.7 29.3 54.5 32.6 106.7 122.0 294.7 13.8 20.8 5.1 29.8 14.3 5.8 14.1 88.4 41.4 20.9 61.2 4.1 987.6 15.6%
Local / other shops in survey area (E) 10.0 16.7 6.2 1.2 25.4 12.1 9.9 21.6 11.9 0.7 9.1 8.1 4.2 3.3 2.9 0.0 4.7 0.3 0.7 0.3 6.4 155.6 2.5%
Overall total (A+B+C+D+E) 410.1 328.6 105.4 184.1 567.6 460.7 663.3 279.1 620.9 321.3 271.5 268.7 300.6 398.6 207.0 326.1 146.3 94.9 84.7 210.0 96.8 6,346.4 100.0%
Source: Table 3, Table 4
Western Berkshire LPA areasReading: zone 1*, zone 2Bracknell Forest: zone 10, zone 11*Wokingham: zone 1*, zone 12West Berkshire: zone 3, zone 15*, zone 16*, zone 18*, zone 19*, zone 21*(*denotes authority area which falls partially within zone)
Western Berkshire Authorities — Retail & Commercial Leisure Assessment 2016Comparison Capacity Modelling
Comparison goods floorspace outside Western Berkshire (within survey area)
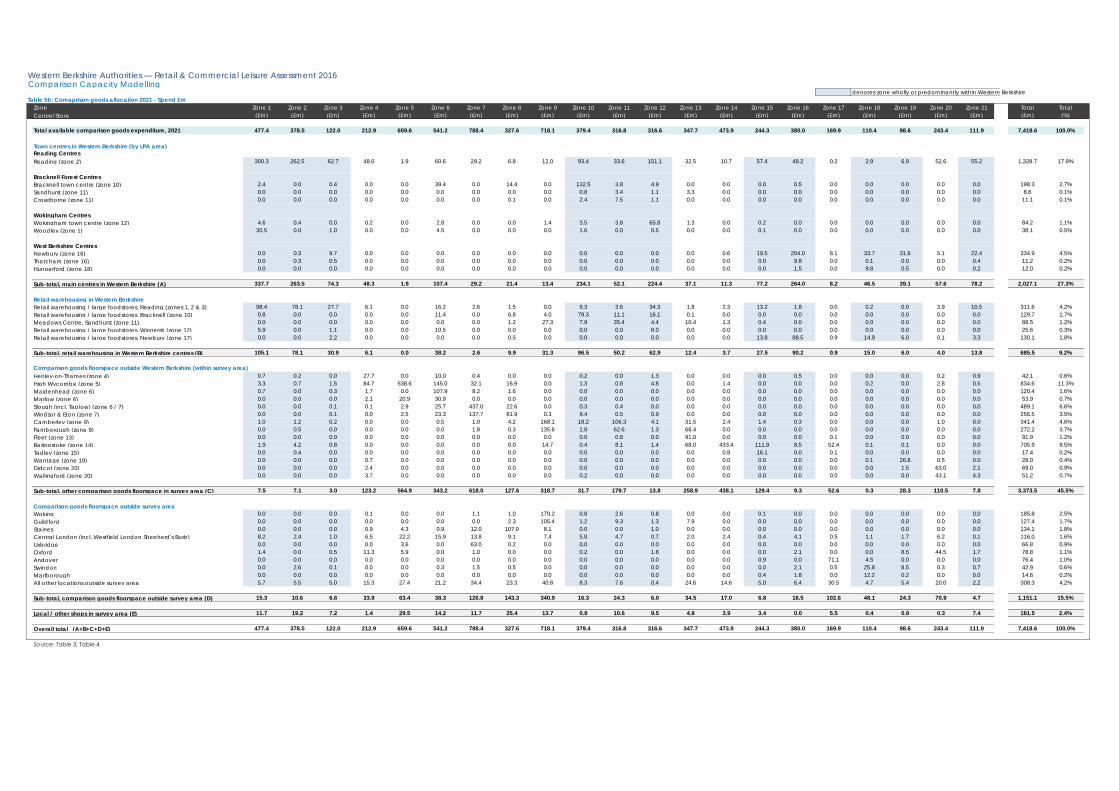
denotes zone wholly or predominantly within Western BerkshireTable 5b: Comaprison goods allocation 2021 - Spend £m
Zone Zone 1 Zone 2 Zone 3 Zone 4 Zone 5 Zone 6 Zone 7 Zone 8 Zone 9 Zone 10 Zone 11 Zone 12 Zone 13 Zone 14 Zone 15 Zone 16 Zone 17 Zone 18 Zone 19 Zone 20 Zone 21 Total TotalCentre/Store (£m) (£m) (£m) (£m) (£m) (£m) (£m) (£m) (£m) (£m) (£m) (£m) (£m) (£m) (£m) (£m) (£m) (£m) (£m) (£m) (£m) (£m) (%)
Total available comparison goods expenditure, 2021 477.4 378.5 122.0 212.9 659.6 541.2 788.4 327.6 718.1 379.4 316.8 316.6 347.7 473.9 244.3 380.0 169.9 110.4 98.6 243.4 111.9 7,418.6 100.0%
Town centres in Western Berkshire (by LPA area)Reading CentresReading (zone 2) 300.3 262.5 62.7 48.0 1.9 60.6 29.2 6.8 12.0 93.4 33.6 151.1 32.5 10.7 57.4 48.2 0.2 2.9 6.9 52.6 55.2 1,328.7 17.9%
Bracknell Forest CentresBracknell town centre (zone 10) 2.4 0.0 0.4 0.0 0.0 39.4 0.0 14.4 0.0 132.5 3.8 4.9 0.0 0.0 0.0 0.5 0.0 0.0 0.0 0.0 0.0 198.3 2.7%Sandhurst (zone 11) 0.0 0.0 0.0 0.0 0.0 0.0 0.0 0.0 0.0 0.8 3.4 1.1 3.3 0.0 0.0 0.0 0.0 0.0 0.0 0.0 0.0 8.6 0.1%Crowthorne (zone 11) 0.0 0.0 0.0 0.0 0.0 0.0 0.0 0.1 0.0 2.4 7.5 1.1 0.0 0.0 0.0 0.0 0.0 0.0 0.0 0.0 0.0 11.1 0.1%
Wokingham CentresWokingham town centre (zone 12) 4.6 0.4 0.0 0.2 0.0 2.8 0.0 0.0 1.4 3.5 3.8 65.8 1.3 0.0 0.2 0.0 0.0 0.0 0.0 0.0 0.0 84.2 1.1%Woodley (zone 1) 30.5 0.0 1.0 0.0 0.0 4.5 0.0 0.0 0.0 1.6 0.0 0.5 0.0 0.0 0.1 0.0 0.0 0.0 0.0 0.0 0.0 38.1 0.5%
West Berkshire CentresNewbury (zone 16) 0.0 0.3 9.7 0.0 0.0 0.0 0.0 0.0 0.0 0.0 0.0 0.0 0.0 0.6 19.5 204.0 8.1 33.7 31.6 5.1 22.4 334.9 4.5%Thatcham (zone 16) 0.0 0.3 0.5 0.0 0.0 0.0 0.0 0.0 0.0 0.0 0.0 0.0 0.0 0.0 0.0 9.8 0.0 0.1 0.0 0.0 0.4 11.2 0.2%Hungerford (zone 18) 0.0 0.0 0.0 0.0 0.0 0.0 0.0 0.0 0.0 0.0 0.0 0.0 0.0 0.0 0.0 1.5 0.0 9.8 0.5 0.0 0.2 12.0 0.2%
Sub-total, main centres in Western Berkshire (A) 337.7 263.5 74.3 48.3 1.9 107.4 29.2 21.4 13.4 234.1 52.1 224.4 37.1 11.3 77.2 264.0 8.2 46.5 39.1 57.6 78.2 2,027.1 27.3%
Retail warehousing in Western BerkshireRetail warehousing / large foodstores, Reading (zones 1, 2 & 3) 98.4 78.1 27.7 6.1 0.0 16.2 2.6 1.5 0.0 9.3 3.6 34.3 1.8 2.3 13.2 1.8 0.0 0.2 0.0 3.9 10.5 311.6 4.2%Retail warehousing / large foodstores, Bracknell (zone 10) 0.8 0.0 0.0 0.0 0.0 11.4 0.0 6.8 4.0 79.3 11.1 16.1 0.1 0.0 0.0 0.0 0.0 0.0 0.0 0.0 0.0 129.7 1.7%Meadows Centre, Sandhurst (zone 11) 0.0 0.0 0.0 0.0 0.0 0.0 0.0 1.2 27.3 7.9 35.4 4.4 10.4 1.3 0.4 0.0 0.0 0.0 0.0 0.0 0.0 88.5 1.2%Retail warehousing / large foodstores, Winnersh (zone 12) 5.9 0.0 1.1 0.0 0.0 10.5 0.0 0.0 0.0 0.0 0.0 8.0 0.0 0.0 0.0 0.0 0.0 0.0 0.0 0.0 0.0 25.6 0.3%Retail warehousing / large foodstores, Newbury (zone 17) 0.0 0.0 2.2 0.0 0.0 0.0 0.0 0.5 0.0 0.0 0.0 0.0 0.0 0.0 13.8 88.5 0.9 14.9 6.0 0.1 3.3 130.1 1.8%
Sub-total, retail warehousing in Western Berkshire centres (B) 105.1 78.1 30.9 6.1 0.0 38.2 2.6 9.9 31.3 96.5 50.2 62.9 12.4 3.7 27.5 90.2 0.9 15.0 6.0 4.0 13.8 685.5 9.2%
Henley-on-Thames (zone 4) 0.7 0.2 0.0 27.7 0.0 10.0 0.4 0.0 0.0 0.2 0.0 1.3 0.0 0.0 0.0 0.5 0.0 0.0 0.0 0.2 0.9 42.1 0.6%High Wycombe (zone 5) 3.3 0.7 1.5 84.7 538.6 145.0 32.1 16.9 0.0 1.3 0.8 4.8 0.0 1.4 0.0 0.0 0.0 0.2 0.0 2.8 0.5 834.6 11.3%Maidenhead (zone 6) 0.7 0.0 0.3 1.7 0.0 107.9 8.2 1.6 0.0 0.0 0.0 0.0 0.0 0.0 0.0 0.0 0.0 0.0 0.0 0.0 0.0 120.4 1.6%Marlow (zone 6) 0.0 0.0 0.0 2.1 20.9 30.9 0.0 0.0 0.0 0.0 0.0 0.0 0.0 0.0 0.0 0.0 0.0 0.0 0.0 0.0 0.0 53.9 0.7%Slough (incl. Taplow) (zone 6 / 7) 0.0 0.0 0.1 0.1 2.9 25.7 437.0 22.6 0.0 0.3 0.4 0.0 0.0 0.0 0.0 0.0 0.0 0.0 0.0 0.0 0.0 489.1 6.6%Windsor & Eton (zone 7) 0.0 0.0 0.1 0.0 2.5 23.3 137.7 81.9 0.3 9.4 0.5 0.9 0.0 0.0 0.0 0.0 0.0 0.0 0.0 0.0 0.0 256.5 3.5%Camberley (zone 9) 1.0 1.2 0.2 0.0 0.0 0.5 1.0 4.2 168.1 18.2 106.3 4.1 31.5 2.4 1.4 0.3 0.0 0.0 0.0 1.0 0.0 341.4 4.6%Farnborough (zone 9) 0.0 0.5 0.0 0.0 0.0 0.0 1.8 0.3 135.6 1.8 62.6 1.3 68.4 0.0 0.0 0.0 0.0 0.0 0.0 0.0 0.0 272.2 3.7%Fleet (zone 13) 0.0 0.0 0.0 0.0 0.0 0.0 0.0 0.0 0.0 0.0 0.8 0.0 91.0 0.0 0.0 0.0 0.1 0.0 0.0 0.0 0.0 91.9 1.2%Basingstoke (zone 14) 1.9 4.2 0.8 0.0 0.0 0.0 0.0 0.0 14.7 0.4 8.1 1.4 68.0 433.4 111.9 8.5 52.4 0.1 0.1 0.0 0.0 705.9 9.5%Tadley (zone 15) 0.0 0.4 0.0 0.0 0.0 0.0 0.0 0.0 0.0 0.0 0.0 0.0 0.0 0.8 16.1 0.0 0.1 0.0 0.0 0.0 0.0 17.4 0.2%Wantage (zone 19) 0.0 0.0 0.0 0.7 0.0 0.0 0.0 0.0 0.0 0.0 0.0 0.0 0.0 0.0 0.0 0.0 0.0 0.1 26.8 0.5 0.0 28.0 0.4%Didcot (zone 20) 0.0 0.0 0.0 2.4 0.0 0.0 0.0 0.0 0.0 0.0 0.0 0.0 0.0 0.0 0.0 0.0 0.0 0.0 1.5 63.0 2.1 69.0 0.9%Wallingford (zone 20) 0.0 0.0 0.0 3.7 0.0 0.0 0.0 0.0 0.0 0.2 0.0 0.0 0.0 0.0 0.0 0.0 0.0 0.0 0.0 43.1 4.3 51.2 0.7%
Sub-total, other comparison goods floorspace in survey area (C) 7.5 7.1 3.0 123.2 564.9 343.2 618.0 127.6 318.7 31.7 179.7 13.8 258.9 438.1 129.4 9.3 52.6 0.3 28.3 110.5 7.8 3,373.5 45.5%
Comparison goods floorspace outside survey areaWoking 0.0 0.0 0.0 0.1 0.0 0.0 1.1 1.0 179.2 0.8 2.6 0.8 0.0 0.0 0.1 0.0 0.0 0.0 0.0 0.0 0.0 185.8 2.5%Guildford 0.0 0.0 0.0 0.0 0.0 0.0 0.0 2.3 105.4 1.2 9.3 1.3 7.9 0.0 0.0 0.0 0.0 0.0 0.0 0.0 0.0 127.4 1.7%Staines 0.0 0.0 0.0 0.9 4.3 0.9 12.0 107.0 8.1 0.0 0.0 1.0 0.0 0.0 0.0 0.0 0.0 0.0 0.0 0.0 0.0 134.1 1.8%Central London (incl. Westfield London Shepherd's Bush) 8.2 2.4 1.0 6.5 22.2 15.9 13.8 9.1 7.4 5.8 4.7 0.7 2.0 2.4 0.4 4.1 0.5 1.1 1.7 6.2 0.1 116.0 1.6%Uxbridge 0.0 0.0 0.0 0.0 3.6 0.0 63.0 0.2 0.0 0.0 0.0 0.0 0.0 0.0 0.0 0.0 0.0 0.0 0.0 0.0 0.0 66.8 0.9%Oxford 1.4 0.0 0.5 11.3 5.9 0.0 1.0 0.0 0.0 0.2 0.0 1.8 0.0 0.0 0.0 2.1 0.0 0.0 8.5 44.5 1.7 78.8 1.1%Andover 0.0 0.0 0.0 0.0 0.0 0.0 0.0 0.0 0.0 0.0 0.0 0.0 0.0 0.0 0.9 0.0 71.1 4.5 0.0 0.0 0.0 76.4 1.0%Swindon 0.0 2.6 0.1 0.0 0.0 0.3 1.5 0.5 0.0 0.0 0.0 0.0 0.0 0.0 0.0 2.1 0.5 25.8 8.5 0.3 0.7 42.9 0.6%Marlborough 0.0 0.0 0.0 0.0 0.0 0.0 0.0 0.0 0.0 0.0 0.0 0.0 0.0 0.0 0.4 1.8 0.0 12.2 0.2 0.0 0.0 14.6 0.2%All other locations outside survey area 5.7 5.5 5.0 15.3 27.4 21.2 34.4 23.3 40.8 8.3 7.6 0.4 24.6 14.6 5.0 6.4 30.5 4.7 5.4 20.0 2.2 308.3 4.2%
Sub-total, comparison goods floorspace outside survey area (D) 15.3 10.6 6.6 33.9 63.4 38.3 126.8 143.3 340.9 16.3 24.3 6.0 34.5 17.0 6.8 16.5 102.6 48.1 24.3 70.9 4.7 1,151.1 15.5%
Local / other shops in survey area (E) 11.7 19.2 7.2 1.4 29.5 14.2 11.7 25.4 13.7 0.8 10.6 9.5 4.8 3.9 3.4 0.0 5.5 0.4 0.8 0.3 7.4 181.5 2.4%
Overall total (A+B+C+D+E) 477.4 378.5 122.0 212.9 659.6 541.2 788.4 327.6 718.1 379.4 316.8 316.6 347.7 473.9 244.3 380.0 169.9 110.4 98.6 243.4 111.9 7,418.6 100.0%
Source: Table 3, Table 4
Western Berkshire Authorities — Retail & Commercial Leisure Assessment 2016Comparison Capacity Modelling
Comparison goods floorspace outside Western Berkshire (within survey area)
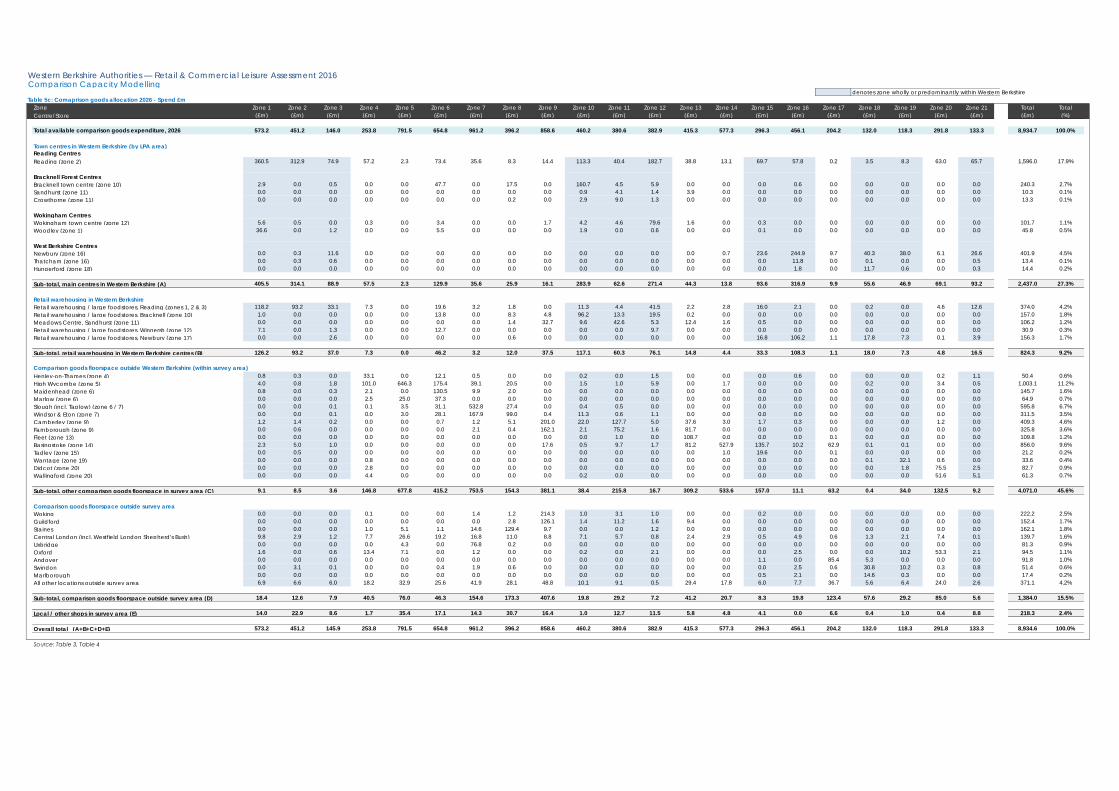
denotes zone wholly or predominantly within Western BerkshireTable 5c: Comaprison goods allocation 2026 - Spend £m
Zone Zone 1 Zone 2 Zone 3 Zone 4 Zone 5 Zone 6 Zone 7 Zone 8 Zone 9 Zone 10 Zone 11 Zone 12 Zone 13 Zone 14 Zone 15 Zone 16 Zone 17 Zone 18 Zone 19 Zone 20 Zone 21 Total TotalCentre/Store (£m) (£m) (£m) (£m) (£m) (£m) (£m) (£m) (£m) (£m) (£m) (£m) (£m) (£m) (£m) (£m) (£m) (£m) (£m) (£m) (£m) (£m) (%)
Total available comparison goods expenditure, 2026 573.2 451.2 146.0 253.8 791.5 654.8 961.2 396.2 858.6 460.2 380.6 382.9 415.3 577.3 296.3 456.1 204.2 132.0 118.3 291.8 133.3 8,934.7 100.0%
Town centres in Western Berkshire (by LPA area)Reading CentresReading (zone 2) 360.5 312.9 74.9 57.2 2.3 73.4 35.6 8.3 14.4 113.3 40.4 182.7 38.8 13.1 69.7 57.8 0.2 3.5 8.3 63.0 65.7 1,596.0 17.9%
Bracknell Forest CentresBracknell town centre (zone 10) 2.9 0.0 0.5 0.0 0.0 47.7 0.0 17.5 0.0 160.7 4.5 5.9 0.0 0.0 0.0 0.6 0.0 0.0 0.0 0.0 0.0 240.3 2.7%Sandhurst (zone 11) 0.0 0.0 0.0 0.0 0.0 0.0 0.0 0.0 0.0 0.9 4.1 1.4 3.9 0.0 0.0 0.0 0.0 0.0 0.0 0.0 0.0 10.3 0.1%Crowthorne (zone 11) 0.0 0.0 0.0 0.0 0.0 0.0 0.0 0.2 0.0 2.9 9.0 1.3 0.0 0.0 0.0 0.0 0.0 0.0 0.0 0.0 0.0 13.3 0.1%
Wokingham CentresWokingham town centre (zone 12) 5.6 0.5 0.0 0.3 0.0 3.4 0.0 0.0 1.7 4.2 4.6 79.6 1.6 0.0 0.3 0.0 0.0 0.0 0.0 0.0 0.0 101.7 1.1%Woodley (zone 1) 36.6 0.0 1.2 0.0 0.0 5.5 0.0 0.0 0.0 1.9 0.0 0.6 0.0 0.0 0.1 0.0 0.0 0.0 0.0 0.0 0.0 45.8 0.5%
West Berkshire CentresNewbury (zone 16) 0.0 0.3 11.6 0.0 0.0 0.0 0.0 0.0 0.0 0.0 0.0 0.0 0.0 0.7 23.6 244.9 9.7 40.3 38.0 6.1 26.6 401.9 4.5%Thatcham (zone 16) 0.0 0.3 0.6 0.0 0.0 0.0 0.0 0.0 0.0 0.0 0.0 0.0 0.0 0.0 0.0 11.8 0.0 0.1 0.0 0.0 0.5 13.4 0.1%Hungerford (zone 18) 0.0 0.0 0.0 0.0 0.0 0.0 0.0 0.0 0.0 0.0 0.0 0.0 0.0 0.0 0.0 1.8 0.0 11.7 0.6 0.0 0.3 14.4 0.2%
Sub-total, main centres in Western Berkshire (A) 405.5 314.1 88.9 57.5 2.3 129.9 35.6 25.9 16.1 283.9 62.6 271.4 44.3 13.8 93.6 316.9 9.9 55.6 46.9 69.1 93.2 2,437.0 27.3%
Retail warehousing in Western BerkshireRetail warehousing / large foodstores, Reading (zones 1, 2 & 3) 118.2 93.2 33.1 7.3 0.0 19.6 3.2 1.8 0.0 11.3 4.4 41.5 2.2 2.8 16.0 2.1 0.0 0.2 0.0 4.6 12.6 374.0 4.2%Retail warehousing / large foodstores, Bracknell (zone 10) 1.0 0.0 0.0 0.0 0.0 13.8 0.0 8.3 4.8 96.2 13.3 19.5 0.2 0.0 0.0 0.0 0.0 0.0 0.0 0.0 0.0 157.0 1.8%Meadows Centre, Sandhurst (zone 11) 0.0 0.0 0.0 0.0 0.0 0.0 0.0 1.4 32.7 9.6 42.6 5.3 12.4 1.6 0.5 0.0 0.0 0.0 0.0 0.0 0.0 106.2 1.2%Retail warehousing / large foodstores, Winnersh (zone 12) 7.1 0.0 1.3 0.0 0.0 12.7 0.0 0.0 0.0 0.0 0.0 9.7 0.0 0.0 0.0 0.0 0.0 0.0 0.0 0.0 0.0 30.9 0.3%Retail warehousing / large foodstores, Newbury (zone 17) 0.0 0.0 2.6 0.0 0.0 0.0 0.0 0.6 0.0 0.0 0.0 0.0 0.0 0.0 16.8 106.2 1.1 17.8 7.3 0.1 3.9 156.3 1.7%
Sub-total, retail warehousing in Western Berkshire centres (B) 126.2 93.2 37.0 7.3 0.0 46.2 3.2 12.0 37.5 117.1 60.3 76.1 14.8 4.4 33.3 108.3 1.1 18.0 7.3 4.8 16.5 824.3 9.2%
Henley-on-Thames (zone 4) 0.8 0.3 0.0 33.1 0.0 12.1 0.5 0.0 0.0 0.2 0.0 1.5 0.0 0.0 0.0 0.6 0.0 0.0 0.0 0.2 1.1 50.4 0.6%High Wycombe (zone 5) 4.0 0.8 1.8 101.0 646.3 175.4 39.1 20.5 0.0 1.5 1.0 5.9 0.0 1.7 0.0 0.0 0.0 0.2 0.0 3.4 0.5 1,003.1 11.2%Maidenhead (zone 6) 0.8 0.0 0.3 2.1 0.0 130.5 9.9 2.0 0.0 0.0 0.0 0.0 0.0 0.0 0.0 0.0 0.0 0.0 0.0 0.0 0.0 145.7 1.6%Marlow (zone 6) 0.0 0.0 0.0 2.5 25.0 37.3 0.0 0.0 0.0 0.0 0.0 0.0 0.0 0.0 0.0 0.0 0.0 0.0 0.0 0.0 0.0 64.9 0.7%Slough (incl. Taplow) (zone 6 / 7) 0.0 0.0 0.1 0.1 3.5 31.1 532.8 27.4 0.0 0.4 0.5 0.0 0.0 0.0 0.0 0.0 0.0 0.0 0.0 0.0 0.0 595.8 6.7%Windsor & Eton (zone 7) 0.0 0.0 0.1 0.0 3.0 28.1 167.9 99.0 0.4 11.3 0.6 1.1 0.0 0.0 0.0 0.0 0.0 0.0 0.0 0.0 0.0 311.5 3.5%Camberley (zone 9) 1.2 1.4 0.2 0.0 0.0 0.7 1.2 5.1 201.0 22.0 127.7 5.0 37.6 3.0 1.7 0.3 0.0 0.0 0.0 1.2 0.0 409.3 4.6%Farnborough (zone 9) 0.0 0.6 0.0 0.0 0.0 0.0 2.1 0.4 162.1 2.1 75.2 1.6 81.7 0.0 0.0 0.0 0.0 0.0 0.0 0.0 0.0 325.8 3.6%Fleet (zone 13) 0.0 0.0 0.0 0.0 0.0 0.0 0.0 0.0 0.0 0.0 1.0 0.0 108.7 0.0 0.0 0.0 0.1 0.0 0.0 0.0 0.0 109.8 1.2%Basingstoke (zone 14) 2.3 5.0 1.0 0.0 0.0 0.0 0.0 0.0 17.6 0.5 9.7 1.7 81.2 527.9 135.7 10.2 62.9 0.1 0.1 0.0 0.0 856.0 9.6%Tadley (zone 15) 0.0 0.5 0.0 0.0 0.0 0.0 0.0 0.0 0.0 0.0 0.0 0.0 0.0 1.0 19.6 0.0 0.1 0.0 0.0 0.0 0.0 21.2 0.2%Wantage (zone 19) 0.0 0.0 0.0 0.8 0.0 0.0 0.0 0.0 0.0 0.0 0.0 0.0 0.0 0.0 0.0 0.0 0.0 0.1 32.1 0.6 0.0 33.6 0.4%Didcot (zone 20) 0.0 0.0 0.0 2.8 0.0 0.0 0.0 0.0 0.0 0.0 0.0 0.0 0.0 0.0 0.0 0.0 0.0 0.0 1.8 75.5 2.5 82.7 0.9%Wallingford (zone 20) 0.0 0.0 0.0 4.4 0.0 0.0 0.0 0.0 0.0 0.2 0.0 0.0 0.0 0.0 0.0 0.0 0.0 0.0 0.0 51.6 5.1 61.3 0.7%
Sub-total, other comparison goods floorspace in survey area (C) 9.1 8.5 3.6 146.8 677.8 415.2 753.5 154.3 381.1 38.4 215.8 16.7 309.2 533.6 157.0 11.1 63.2 0.4 34.0 132.5 9.2 4,071.0 45.6%
Comparison goods floorspace outside survey areaWoking 0.0 0.0 0.0 0.1 0.0 0.0 1.4 1.2 214.3 1.0 3.1 1.0 0.0 0.0 0.2 0.0 0.0 0.0 0.0 0.0 0.0 222.2 2.5%Guildford 0.0 0.0 0.0 0.0 0.0 0.0 0.0 2.8 126.1 1.4 11.2 1.6 9.4 0.0 0.0 0.0 0.0 0.0 0.0 0.0 0.0 152.4 1.7%Staines 0.0 0.0 0.0 1.0 5.1 1.1 14.6 129.4 9.7 0.0 0.0 1.2 0.0 0.0 0.0 0.0 0.0 0.0 0.0 0.0 0.0 162.1 1.8%Central London (incl. Westfield London Shepherd's Bush) 9.8 2.9 1.2 7.7 26.6 19.2 16.8 11.0 8.8 7.1 5.7 0.8 2.4 2.9 0.5 4.9 0.6 1.3 2.1 7.4 0.1 139.7 1.6%Uxbridge 0.0 0.0 0.0 0.0 4.3 0.0 76.8 0.2 0.0 0.0 0.0 0.0 0.0 0.0 0.0 0.0 0.0 0.0 0.0 0.0 0.0 81.3 0.9%Oxford 1.6 0.0 0.6 13.4 7.1 0.0 1.2 0.0 0.0 0.2 0.0 2.1 0.0 0.0 0.0 2.5 0.0 0.0 10.2 53.3 2.1 94.5 1.1%Andover 0.0 0.0 0.0 0.0 0.0 0.0 0.0 0.0 0.0 0.0 0.0 0.0 0.0 0.0 1.1 0.0 85.4 5.3 0.0 0.0 0.0 91.8 1.0%Swindon 0.0 3.1 0.1 0.0 0.0 0.4 1.9 0.6 0.0 0.0 0.0 0.0 0.0 0.0 0.0 2.5 0.6 30.8 10.2 0.3 0.8 51.4 0.6%Marlborough 0.0 0.0 0.0 0.0 0.0 0.0 0.0 0.0 0.0 0.0 0.0 0.0 0.0 0.0 0.5 2.1 0.0 14.6 0.3 0.0 0.0 17.4 0.2%All other locations outside survey area 6.9 6.6 6.0 18.2 32.9 25.6 41.9 28.1 48.8 10.1 9.1 0.5 29.4 17.8 6.0 7.7 36.7 5.6 6.4 24.0 2.6 371.1 4.2%
Sub-total, comparison goods floorspace outside survey area (D) 18.4 12.6 7.9 40.5 76.0 46.3 154.6 173.3 407.6 19.8 29.2 7.2 41.2 20.7 8.3 19.8 123.4 57.6 29.2 85.0 5.6 1,384.0 15.5%
Local / other shops in survey area (E) 14.0 22.9 8.6 1.7 35.4 17.1 14.3 30.7 16.4 1.0 12.7 11.5 5.8 4.8 4.1 0.0 6.6 0.4 1.0 0.4 8.8 218.3 2.4%
Overall total (A+B+C+D+E) 573.2 451.2 145.9 253.8 791.5 654.8 961.2 396.2 858.6 460.2 380.6 382.9 415.3 577.3 296.3 456.1 204.2 132.0 118.3 291.8 133.3 8,934.6 100.0%
Source: Table 3, Table 4
Western Berkshire Authorities — Retail & Commercial Leisure Assessment 2016Comparison Capacity Modelling
Comparison goods floorspace outside Western Berkshire (within survey area)
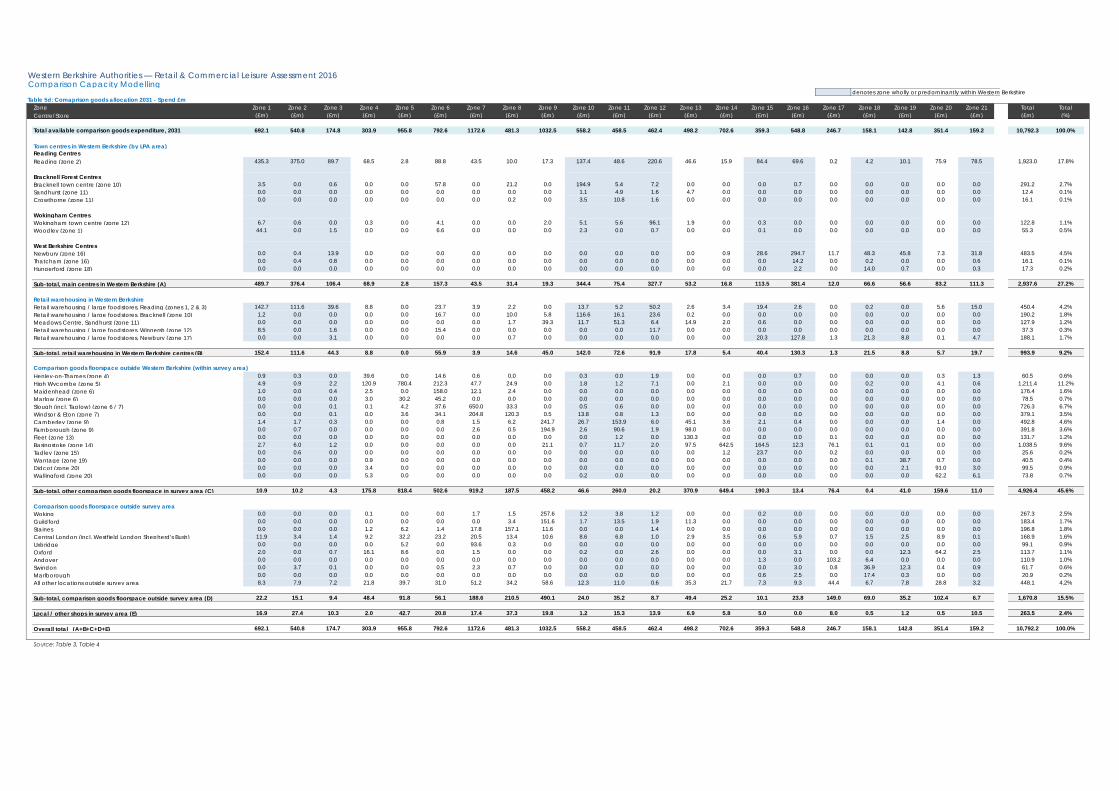
denotes zone wholly or predominantly within Western BerkshireTable 5d: Comaprison goods allocation 2031 - Spend £m
Zone Zone 1 Zone 2 Zone 3 Zone 4 Zone 5 Zone 6 Zone 7 Zone 8 Zone 9 Zone 10 Zone 11 Zone 12 Zone 13 Zone 14 Zone 15 Zone 16 Zone 17 Zone 18 Zone 19 Zone 20 Zone 21 Total TotalCentre/Store (£m) (£m) (£m) (£m) (£m) (£m) (£m) (£m) (£m) (£m) (£m) (£m) (£m) (£m) (£m) (£m) (£m) (£m) (£m) (£m) (£m) (£m) (%)
Total available comparison goods expenditure, 2031 692.1 540.8 174.8 303.9 955.8 792.6 1172.6 481.3 1032.5 558.2 458.5 462.4 498.2 702.6 359.3 548.8 246.7 158.1 142.8 351.4 159.2 10,792.3 100.0%
Town centres in Western Berkshire (by LPA area)Reading CentresReading (zone 2) 435.3 375.0 89.7 68.5 2.8 88.8 43.5 10.0 17.3 137.4 48.6 220.6 46.6 15.9 84.4 69.6 0.2 4.2 10.1 75.9 78.5 1,923.0 17.8%
Bracknell Forest CentresBracknell town centre (zone 10) 3.5 0.0 0.6 0.0 0.0 57.8 0.0 21.2 0.0 194.9 5.4 7.2 0.0 0.0 0.0 0.7 0.0 0.0 0.0 0.0 0.0 291.2 2.7%Sandhurst (zone 11) 0.0 0.0 0.0 0.0 0.0 0.0 0.0 0.0 0.0 1.1 4.9 1.6 4.7 0.0 0.0 0.0 0.0 0.0 0.0 0.0 0.0 12.4 0.1%Crowthorne (zone 11) 0.0 0.0 0.0 0.0 0.0 0.0 0.0 0.2 0.0 3.5 10.8 1.6 0.0 0.0 0.0 0.0 0.0 0.0 0.0 0.0 0.0 16.1 0.1%
Wokingham CentresWokingham town centre (zone 12) 6.7 0.6 0.0 0.3 0.0 4.1 0.0 0.0 2.0 5.1 5.6 96.1 1.9 0.0 0.3 0.0 0.0 0.0 0.0 0.0 0.0 122.8 1.1%Woodley (zone 1) 44.1 0.0 1.5 0.0 0.0 6.6 0.0 0.0 0.0 2.3 0.0 0.7 0.0 0.0 0.1 0.0 0.0 0.0 0.0 0.0 0.0 55.3 0.5%
West Berkshire CentresNewbury (zone 16) 0.0 0.4 13.9 0.0 0.0 0.0 0.0 0.0 0.0 0.0 0.0 0.0 0.0 0.9 28.6 294.7 11.7 48.3 45.8 7.3 31.8 483.5 4.5%Thatcham (zone 16) 0.0 0.4 0.8 0.0 0.0 0.0 0.0 0.0 0.0 0.0 0.0 0.0 0.0 0.0 0.0 14.2 0.0 0.2 0.0 0.0 0.6 16.1 0.1%Hungerford (zone 18) 0.0 0.0 0.0 0.0 0.0 0.0 0.0 0.0 0.0 0.0 0.0 0.0 0.0 0.0 0.0 2.2 0.0 14.0 0.7 0.0 0.3 17.3 0.2%
Sub-total, main centres in Western Berkshire (A) 489.7 376.4 106.4 68.9 2.8 157.3 43.5 31.4 19.3 344.4 75.4 327.7 53.2 16.8 113.5 381.4 12.0 66.6 56.6 83.2 111.3 2,937.6 27.2%
Retail warehousing in Western BerkshireRetail warehousing / large foodstores, Reading (zones 1, 2 & 3) 142.7 111.6 39.6 8.8 0.0 23.7 3.9 2.2 0.0 13.7 5.2 50.2 2.6 3.4 19.4 2.6 0.0 0.2 0.0 5.6 15.0 450.4 4.2%Retail warehousing / large foodstores, Bracknell (zone 10) 1.2 0.0 0.0 0.0 0.0 16.7 0.0 10.0 5.8 116.6 16.1 23.6 0.2 0.0 0.0 0.0 0.0 0.0 0.0 0.0 0.0 190.2 1.8%Meadows Centre, Sandhurst (zone 11) 0.0 0.0 0.0 0.0 0.0 0.0 0.0 1.7 39.3 11.7 51.3 6.4 14.9 2.0 0.6 0.0 0.0 0.0 0.0 0.0 0.0 127.9 1.2%Retail warehousing / large foodstores, Winnersh (zone 12) 8.5 0.0 1.6 0.0 0.0 15.4 0.0 0.0 0.0 0.0 0.0 11.7 0.0 0.0 0.0 0.0 0.0 0.0 0.0 0.0 0.0 37.3 0.3%Retail warehousing / large foodstores, Newbury (zone 17) 0.0 0.0 3.1 0.0 0.0 0.0 0.0 0.7 0.0 0.0 0.0 0.0 0.0 0.0 20.3 127.8 1.3 21.3 8.8 0.1 4.7 188.1 1.7%
Sub-total, retail warehousing in Western Berkshire centres (B) 152.4 111.6 44.3 8.8 0.0 55.9 3.9 14.6 45.0 142.0 72.6 91.9 17.8 5.4 40.4 130.3 1.3 21.5 8.8 5.7 19.7 993.9 9.2%
Henley-on-Thames (zone 4) 0.9 0.3 0.0 39.6 0.0 14.6 0.6 0.0 0.0 0.3 0.0 1.9 0.0 0.0 0.0 0.7 0.0 0.0 0.0 0.3 1.3 60.5 0.6%High Wycombe (zone 5) 4.9 0.9 2.2 120.9 780.4 212.3 47.7 24.9 0.0 1.8 1.2 7.1 0.0 2.1 0.0 0.0 0.0 0.2 0.0 4.1 0.6 1,211.4 11.2%Maidenhead (zone 6) 1.0 0.0 0.4 2.5 0.0 158.0 12.1 2.4 0.0 0.0 0.0 0.0 0.0 0.0 0.0 0.0 0.0 0.0 0.0 0.0 0.0 176.4 1.6%Marlow (zone 6) 0.0 0.0 0.0 3.0 30.2 45.2 0.0 0.0 0.0 0.0 0.0 0.0 0.0 0.0 0.0 0.0 0.0 0.0 0.0 0.0 0.0 78.5 0.7%Slough (incl. Taplow) (zone 6 / 7) 0.0 0.0 0.1 0.1 4.2 37.6 650.0 33.3 0.0 0.5 0.6 0.0 0.0 0.0 0.0 0.0 0.0 0.0 0.0 0.0 0.0 726.3 6.7%Windsor & Eton (zone 7) 0.0 0.0 0.1 0.0 3.6 34.1 204.8 120.3 0.5 13.8 0.8 1.3 0.0 0.0 0.0 0.0 0.0 0.0 0.0 0.0 0.0 379.1 3.5%Camberley (zone 9) 1.4 1.7 0.3 0.0 0.0 0.8 1.5 6.2 241.7 26.7 153.9 6.0 45.1 3.6 2.1 0.4 0.0 0.0 0.0 1.4 0.0 492.8 4.6%Farnborough (zone 9) 0.0 0.7 0.0 0.0 0.0 0.0 2.6 0.5 194.9 2.6 90.6 1.9 98.0 0.0 0.0 0.0 0.0 0.0 0.0 0.0 0.0 391.8 3.6%Fleet (zone 13) 0.0 0.0 0.0 0.0 0.0 0.0 0.0 0.0 0.0 0.0 1.2 0.0 130.3 0.0 0.0 0.0 0.1 0.0 0.0 0.0 0.0 131.7 1.2%Basingstoke (zone 14) 2.7 6.0 1.2 0.0 0.0 0.0 0.0 0.0 21.1 0.7 11.7 2.0 97.5 642.5 164.5 12.3 76.1 0.1 0.1 0.0 0.0 1,038.5 9.6%Tadley (zone 15) 0.0 0.6 0.0 0.0 0.0 0.0 0.0 0.0 0.0 0.0 0.0 0.0 0.0 1.2 23.7 0.0 0.2 0.0 0.0 0.0 0.0 25.6 0.2%Wantage (zone 19) 0.0 0.0 0.0 0.9 0.0 0.0 0.0 0.0 0.0 0.0 0.0 0.0 0.0 0.0 0.0 0.0 0.0 0.1 38.7 0.7 0.0 40.5 0.4%Didcot (zone 20) 0.0 0.0 0.0 3.4 0.0 0.0 0.0 0.0 0.0 0.0 0.0 0.0 0.0 0.0 0.0 0.0 0.0 0.0 2.1 91.0 3.0 99.5 0.9%Wallingford (zone 20) 0.0 0.0 0.0 5.3 0.0 0.0 0.0 0.0 0.0 0.2 0.0 0.0 0.0 0.0 0.0 0.0 0.0 0.0 0.0 62.2 6.1 73.8 0.7%
Sub-total, other comparison goods floorspace in survey area (C) 10.9 10.2 4.3 175.8 818.4 502.6 919.2 187.5 458.2 46.6 260.0 20.2 370.9 649.4 190.3 13.4 76.4 0.4 41.0 159.6 11.0 4,926.4 45.6%
Comparison goods floorspace outside survey areaWoking 0.0 0.0 0.0 0.1 0.0 0.0 1.7 1.5 257.6 1.2 3.8 1.2 0.0 0.0 0.2 0.0 0.0 0.0 0.0 0.0 0.0 267.3 2.5%Guildford 0.0 0.0 0.0 0.0 0.0 0.0 0.0 3.4 151.6 1.7 13.5 1.9 11.3 0.0 0.0 0.0 0.0 0.0 0.0 0.0 0.0 183.4 1.7%Staines 0.0 0.0 0.0 1.2 6.2 1.4 17.8 157.1 11.6 0.0 0.0 1.4 0.0 0.0 0.0 0.0 0.0 0.0 0.0 0.0 0.0 196.8 1.8%Central London (incl. Westfield London Shepherd's Bush) 11.9 3.4 1.4 9.2 32.2 23.2 20.5 13.4 10.6 8.6 6.8 1.0 2.9 3.5 0.6 5.9 0.7 1.5 2.5 8.9 0.1 168.9 1.6%Uxbridge 0.0 0.0 0.0 0.0 5.2 0.0 93.6 0.3 0.0 0.0 0.0 0.0 0.0 0.0 0.0 0.0 0.0 0.0 0.0 0.0 0.0 99.1 0.9%Oxford 2.0 0.0 0.7 16.1 8.6 0.0 1.5 0.0 0.0 0.2 0.0 2.6 0.0 0.0 0.0 3.1 0.0 0.0 12.3 64.2 2.5 113.7 1.1%Andover 0.0 0.0 0.0 0.0 0.0 0.0 0.0 0.0 0.0 0.0 0.0 0.0 0.0 0.0 1.3 0.0 103.2 6.4 0.0 0.0 0.0 110.9 1.0%Swindon 0.0 3.7 0.1 0.0 0.0 0.5 2.3 0.7 0.0 0.0 0.0 0.0 0.0 0.0 0.0 3.0 0.8 36.9 12.3 0.4 0.9 61.7 0.6%Marlborough 0.0 0.0 0.0 0.0 0.0 0.0 0.0 0.0 0.0 0.0 0.0 0.0 0.0 0.0 0.6 2.5 0.0 17.4 0.3 0.0 0.0 20.9 0.2%All other locations outside survey area 8.3 7.9 7.2 21.8 39.7 31.0 51.2 34.2 58.6 12.3 11.0 0.6 35.3 21.7 7.3 9.3 44.4 6.7 7.8 28.8 3.2 448.1 4.2%
Sub-total, comparison goods floorspace outside survey area (D) 22.2 15.1 9.4 48.4 91.8 56.1 188.6 210.5 490.1 24.0 35.2 8.7 49.4 25.2 10.1 23.8 149.0 69.0 35.2 102.4 6.7 1,670.8 15.5%
Local / other shops in survey area (E) 16.9 27.4 10.3 2.0 42.7 20.8 17.4 37.3 19.8 1.2 15.3 13.9 6.9 5.8 5.0 0.0 8.0 0.5 1.2 0.5 10.5 263.5 2.4%
Overall total (A+B+C+D+E) 692.1 540.8 174.7 303.9 955.8 792.6 1172.6 481.3 1032.5 558.2 458.5 462.4 498.2 702.6 359.3 548.8 246.7 158.1 142.8 351.4 159.2 10,792.2 100.0%
Source: Table 3, Table 4
Western Berkshire Authorities — Retail & Commercial Leisure Assessment 2016Comparison Capacity Modelling
Comparison goods floorspace outside Western Berkshire (within survey area)

denotes zone wholly or predominantly within Western BerkshireTable 5e: Comaprison goods allocation 2036 - Spend £m
Zone Zone 1 Zone 2 Zone 3 Zone 4 Zone 5 Zone 6 Zone 7 Zone 8 Zone 9 Zone 10 Zone 11 Zone 12 Zone 13 Zone 14 Zone 15 Zone 16 Zone 17 Zone 18 Zone 19 Zone 20 Zone 21 Total TotalCentre/Store (£m) (£m) (£m) (£m) (£m) (£m) (£m) (£m) (£m) (£m) (£m) (£m) (£m) (£m) (£m) (£m) (£m) (£m) (£m) (£m) (£m) (£m) (%)
Total available comparison goods expenditure, 2036 830.5 646.8 208.6 363.0 1148.6 955.8 1425.2 581.1 1241.1 674.7 551.4 556.5 595.6 850.9 433.2 658.4 297.2 188.8 170.8 421.2 190.1 12,989.5 100.0%
Town centres in Western Berkshire (by LPA area)Reading CentresReading (zone 2) 522.4 448.5 107.1 81.9 3.3 107.1 52.8 12.1 20.8 166.2 58.5 265.5 55.7 19.3 101.8 83.4 0.3 5.0 12.0 90.9 93.8 2,308.4 17.8%
Bracknell Forest CentresBracknell town centre (zone 10) 4.2 0.0 0.7 0.0 0.0 69.7 0.0 25.6 0.0 235.6 6.5 8.6 0.0 0.0 0.0 0.9 0.0 0.0 0.0 0.0 0.0 351.8 2.7%Sandhurst (zone 11) 0.0 0.0 0.0 0.0 0.0 0.0 0.0 0.0 0.0 1.3 6.0 2.0 5.6 0.0 0.0 0.0 0.0 0.0 0.0 0.0 0.0 14.9 0.1%Crowthorne (zone 11) 0.0 0.0 0.0 0.0 0.0 0.0 0.0 0.2 0.0 4.2 13.0 1.9 0.0 0.0 0.0 0.0 0.0 0.0 0.0 0.0 0.0 19.3 0.1%
Wokingham CentresWokingham town centre (zone 12) 8.0 0.7 0.0 0.4 0.0 5.0 0.0 0.0 2.5 6.2 6.7 115.6 2.3 0.0 0.4 0.0 0.0 0.0 0.0 0.0 0.0 147.8 1.1%Woodley (zone 1) 53.0 0.0 1.7 0.0 0.0 8.0 0.0 0.0 0.0 2.8 0.0 0.8 0.0 0.0 0.1 0.0 0.0 0.0 0.0 0.0 0.0 66.4 0.5%
West Berkshire CentresNewbury (zone 16) 0.0 0.5 16.6 0.0 0.0 0.0 0.0 0.0 0.0 0.0 0.0 0.0 0.0 1.1 34.5 353.6 14.1 57.6 54.8 8.8 38.0 579.6 4.5%Thatcham (zone 16) 0.0 0.5 0.9 0.0 0.0 0.0 0.0 0.0 0.0 0.0 0.0 0.0 0.0 0.0 0.0 17.0 0.0 0.2 0.0 0.0 0.8 19.3 0.1%Hungerford (zone 18) 0.0 0.0 0.0 0.0 0.0 0.0 0.0 0.0 0.0 0.0 0.0 0.0 0.0 0.0 0.0 2.6 0.0 16.8 0.9 0.0 0.4 20.6 0.2%
Sub-total, main centres in Western Berkshire (A) 587.5 450.2 127.0 82.3 3.3 189.7 52.8 37.9 23.2 416.3 90.7 394.5 63.6 20.3 136.8 457.5 14.4 79.6 67.7 99.8 132.9 3,528.1 27.2%
Retail warehousing in Western BerkshireRetail warehousing / large foodstores, Reading (zones 1, 2 & 3) 171.2 133.5 47.3 10.5 0.0 28.6 4.7 2.6 0.0 16.5 6.3 60.4 3.2 4.2 23.4 3.1 0.0 0.3 0.0 6.7 17.9 540.3 4.2%Retail warehousing / large foodstores, Bracknell (zone 10) 1.4 0.0 0.0 0.0 0.0 20.2 0.0 12.1 6.9 141.0 19.3 28.4 0.2 0.0 0.0 0.0 0.0 0.0 0.0 0.0 0.0 229.5 1.8%Meadows Centre, Sandhurst (zone 11) 0.0 0.0 0.0 0.0 0.0 0.0 0.0 2.1 47.2 14.1 61.7 7.7 17.9 2.4 0.8 0.0 0.0 0.0 0.0 0.0 0.0 153.8 1.2%Retail warehousing / large foodstores, Winnersh (zone 12) 10.2 0.0 1.9 0.0 0.0 18.6 0.0 0.0 0.0 0.0 0.0 14.1 0.0 0.0 0.0 0.0 0.0 0.0 0.0 0.0 0.0 44.9 0.3%Retail warehousing / large foodstores, Newbury (zone 17) 0.0 0.0 3.7 0.0 0.0 0.0 0.0 0.8 0.0 0.0 0.0 0.0 0.0 0.0 24.5 153.3 1.6 25.4 10.5 0.2 5.6 225.5 1.7%
Sub-total, retail warehousing in Western Berkshire centres (B) 182.9 133.5 52.9 10.5 0.0 67.4 4.7 17.6 54.1 171.7 87.3 110.6 21.2 6.6 48.7 156.3 1.6 25.7 10.5 6.9 23.5 1,194.1 9.2%
Henley-on-Thames (zone 4) 1.1 0.4 0.0 47.3 0.0 17.6 0.7 0.0 0.0 0.3 0.0 2.3 0.0 0.0 0.0 0.8 0.0 0.0 0.0 0.3 1.6 72.5 0.6%High Wycombe (zone 5) 5.8 1.1 2.6 144.4 937.9 256.0 57.9 30.0 0.0 2.2 1.5 8.5 0.0 2.5 0.0 0.0 0.0 0.3 0.1 4.9 0.8 1,456.6 11.2%Maidenhead (zone 6) 1.2 0.0 0.5 3.0 0.0 190.6 14.7 2.9 0.0 0.0 0.0 0.0 0.0 0.0 0.0 0.0 0.0 0.0 0.0 0.0 0.0 212.8 1.6%Marlow (zone 6) 0.0 0.0 0.0 3.6 36.3 54.5 0.0 0.0 0.0 0.0 0.0 0.0 0.0 0.0 0.0 0.0 0.0 0.0 0.0 0.0 0.0 94.5 0.7%Slough (incl. Taplow) (zone 6 / 7) 0.0 0.0 0.1 0.2 5.0 45.4 790.0 40.2 0.0 0.6 0.7 0.0 0.0 0.0 0.0 0.0 0.0 0.0 0.0 0.0 0.0 882.1 6.8%Windsor & Eton (zone 7) 0.0 0.0 0.1 0.0 4.3 41.1 248.9 145.2 0.6 16.6 0.9 1.6 0.0 0.0 0.0 0.0 0.0 0.0 0.0 0.0 0.0 459.3 3.5%Camberley (zone 9) 1.7 2.0 0.4 0.0 0.0 1.0 1.8 7.5 290.5 32.3 185.1 7.2 53.9 4.4 2.5 0.4 0.0 0.0 0.0 1.7 0.0 592.4 4.6%Farnborough (zone 9) 0.0 0.8 0.0 0.0 0.0 0.0 3.2 0.6 234.3 3.1 109.0 2.3 117.1 0.0 0.0 0.0 0.0 0.0 0.0 0.0 0.0 470.4 3.6%Fleet (zone 13) 0.0 0.0 0.0 0.0 0.0 0.0 0.0 0.0 0.0 0.0 1.4 0.0 155.8 0.0 0.0 0.0 0.2 0.0 0.0 0.0 0.0 157.4 1.2%Basingstoke (zone 14) 3.3 7.1 1.5 0.0 0.0 0.0 0.0 0.0 25.4 0.8 14.1 2.4 116.5 778.1 198.4 14.8 91.6 0.1 0.1 0.0 0.0 1,254.2 9.7%Tadley (zone 15) 0.0 0.7 0.0 0.0 0.0 0.0 0.0 0.0 0.0 0.0 0.0 0.0 0.0 1.4 28.6 0.0 0.2 0.0 0.0 0.0 0.0 30.9 0.2%Wantage (zone 19) 0.0 0.0 0.0 1.1 0.0 0.0 0.0 0.0 0.0 0.0 0.0 0.0 0.0 0.0 0.0 0.0 0.0 0.2 46.4 0.8 0.0 48.5 0.4%Didcot (zone 20) 0.0 0.0 0.0 4.1 0.0 0.0 0.0 0.0 0.0 0.0 0.0 0.0 0.0 0.0 0.0 0.0 0.0 0.0 2.6 109.0 3.6 119.2 0.9%Wallingford (zone 20) 0.0 0.0 0.0 6.3 0.0 0.0 0.0 0.0 0.0 0.3 0.0 0.0 0.0 0.0 0.0 0.0 0.0 0.0 0.0 74.5 7.3 88.4 0.7%
Sub-total, other comparison goods floorspace in survey area (C) 13.1 12.2 5.1 210.0 983.6 606.1 1117.2 226.3 550.8 56.3 312.7 24.3 443.4 786.5 229.5 16.0 92.0 0.5 49.1 191.3 13.2 5,939.3 45.7%
Comparison goods floorspace outside survey areaWoking 0.0 0.0 0.0 0.1 0.0 0.0 2.0 1.8 309.7 1.4 4.6 1.5 0.0 0.0 0.3 0.0 0.0 0.0 0.0 0.0 0.0 321.4 2.5%Guildford 0.0 0.0 0.0 0.0 0.0 0.0 0.0 4.1 182.2 2.1 16.3 2.3 13.5 0.0 0.0 0.0 0.0 0.0 0.0 0.0 0.0 220.4 1.7%Staines 0.0 0.0 0.0 1.5 7.4 1.6 21.7 189.7 14.0 0.0 0.0 1.7 0.0 0.0 0.0 0.0 0.0 0.0 0.0 0.0 0.0 237.6 1.8%Central London (incl. Westfield London Shepherd's Bush) 14.3 4.1 1.7 11.0 38.6 28.0 24.9 16.1 12.8 10.4 8.2 1.2 3.4 4.3 0.8 7.0 0.9 1.8 3.0 10.7 0.1 203.3 1.6%Uxbridge 0.0 0.0 0.0 0.0 6.3 0.0 113.8 0.4 0.0 0.0 0.0 0.0 0.0 0.0 0.0 0.0 0.0 0.0 0.0 0.0 0.0 120.4 0.9%Oxford 2.4 0.0 0.8 19.2 10.3 0.0 1.8 0.0 0.0 0.3 0.0 3.1 0.0 0.0 0.0 3.7 0.0 0.0 14.7 77.0 3.0 136.3 1.0%Andover 0.0 0.0 0.0 0.0 0.0 0.0 0.0 0.0 0.0 0.0 0.0 0.0 0.0 0.0 1.6 0.0 124.3 7.6 0.0 0.0 0.0 133.5 1.0%Swindon 0.0 4.5 0.1 0.0 0.0 0.6 2.8 0.8 0.0 0.0 0.0 0.0 0.0 0.0 0.0 3.7 0.9 44.1 14.8 0.5 1.1 73.8 0.6%Marlborough 0.0 0.0 0.0 0.0 0.0 0.0 0.0 0.0 0.0 0.0 0.0 0.0 0.0 0.0 0.7 3.0 0.0 20.8 0.4 0.0 0.0 25.0 0.2%All other locations outside survey area 10.0 9.5 8.5 26.0 47.7 37.4 62.2 41.3 70.5 14.8 13.2 0.8 42.2 26.2 8.8 11.1 53.4 8.0 9.3 34.6 3.8 539.3 4.2%
Sub-total, comparison goods floorspace outside survey area (D) 26.6 18.0 11.2 57.9 110.4 67.6 229.2 254.2 589.1 29.0 42.3 10.5 59.1 30.5 12.1 28.5 179.5 82.4 42.1 122.7 8.0 2,011.0 15.5%
Local / other shops in survey area (E) 20.3 32.8 12.3 2.4 51.3 25.0 21.2 45.1 23.7 1.4 18.5 16.7 8.3 7.0 6.0 0.0 9.6 0.6 1.4 0.6 12.6 316.9 2.4%
Overall total (A+B+C+D+E) 830.5 646.8 208.5 363.0 1148.6 955.8 1425.2 581.1 1241.1 674.7 551.4 556.5 595.6 850.9 433.2 658.4 297.2 188.8 170.8 421.2 190.1 12,989.4 100.0%
Source: Table 3, Table 4
Western Berkshire Authorities — Retail & Commercial Leisure Assessment 2016Comparison Capacity Modelling
Comparison goods floorspace outside Western Berkshire (within survey area)
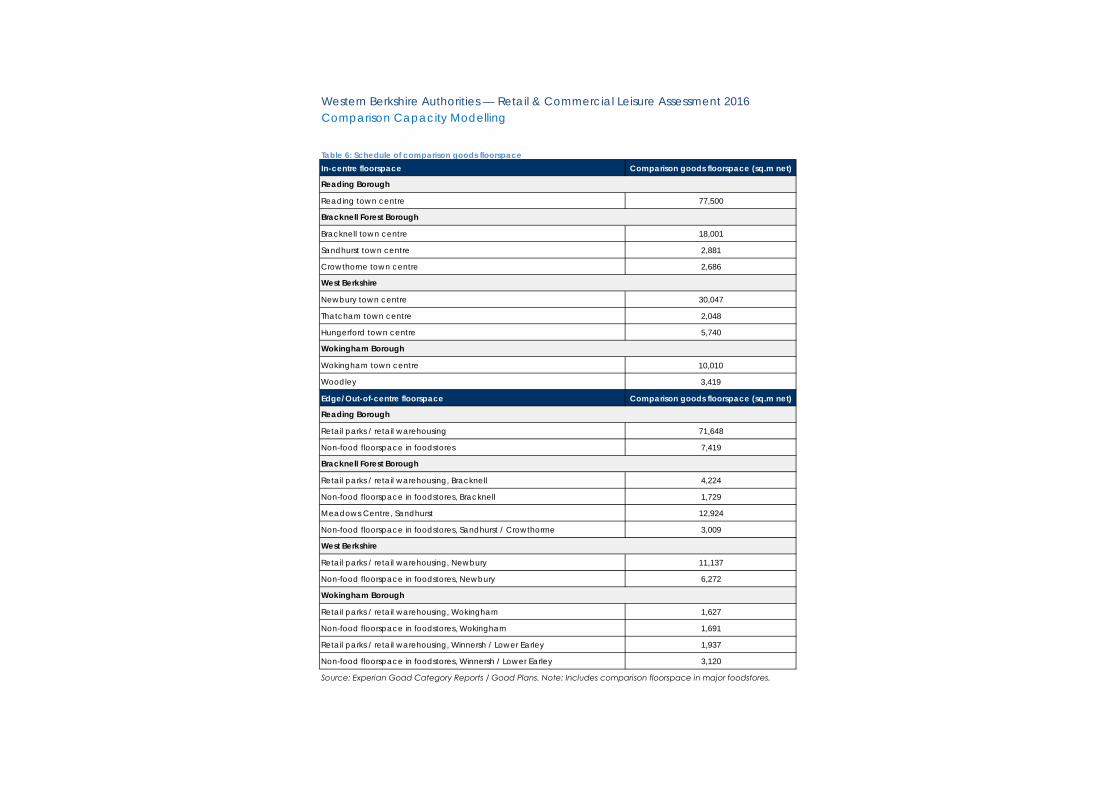
Table 6: Schedule of comparison goods floorspaceIn-centre floorspace Comparison goods floorspace (sq.m net)
Reading town centre 77,500
Bracknell town centre 18,001
Sandhurst town centre 2,881
Crowthorne town centre 2,686
Newbury town centre 30,047
Thatcham town centre 2,048
Hungerford town centre 5,740
Wokingham town centre 10,010
Woodley 3,419
Edge/Out-of-centre floorspace Comparison goods floorspace (sq.m net)
Retail parks / retail warehousing 71,648
Non-food floorspace in foodstores 7,419
Retail parks / retail warehousing, Bracknell 4,224
Non-food floorspace in foodstores, Bracknell 1,729
Meadows Centre, Sandhurst 12,924
Non-food floorspace in foodstores, Sandhurst / Crowthorrne 3,009
Retail parks / retail warehousing, Newbury 11,137
Non-food floorspace in foodstores, Newbury 6,272
Retail parks / retail warehousing, Wokingham 1,627
Non-food floorspace in foodstores, Wokingham 1,691
Retail parks / retail warehousing, Winnersh / Lower Earley 1,937
Non-food floorspace in foodstores, Winnersh / Lower Earley 3,120
Source: Experian Goad Category Reports / Goad Plans. Note: Includes comparison floorspace in major foodstores.
Wokingham Borough
Western Berkshire Authorities — Retail & Commercial Leisure Assessment 2016Comparison Capacity Modelling
West Berkshire
Wokingham Borough
Reading Borough
Bracknell Forest Borough
West Berkshire
Reading Borough
Bracknell Forest Borough
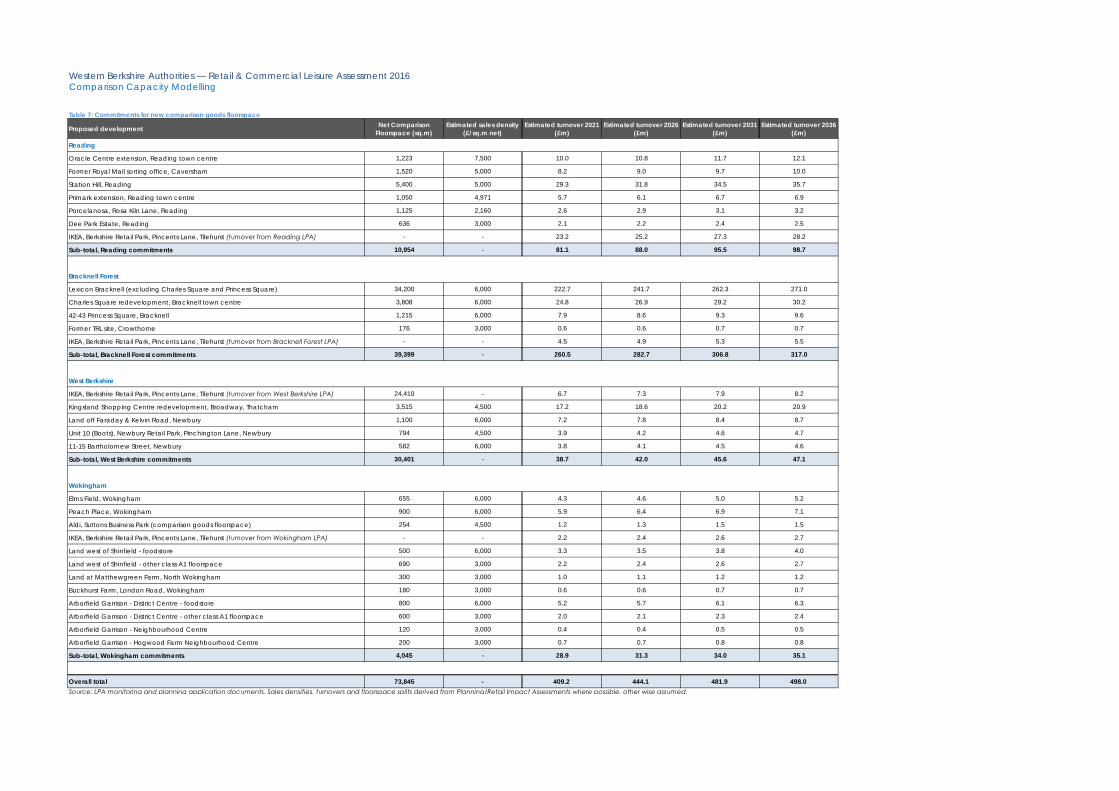
Table 7: Commitments for new comparison goods floorspace
Proposed development Net Comparison Floorspace (sq.m)
Estimated sales density (£/sq.m net)
AvEstimated turnover 2021
(£m)Estimated turnover 2026
(£m)Estimated turnover 2031
(£m)Estimated turnover 2036
(£m)
Reading
Oracle Centre extension, Reading town centre 1,223 7,500 10.0 10.8 11.7 12.1
Former Royal Mail sorting office, Caversham 1,520 5,000 8.2 9.0 9.7 10.0
Station Hill, Reading 5,400 5,000 29.3 31.8 34.5 35.7
Primark extension, Reading town centre 1,050 4,971 5.7 6.1 6.7 6.9
Porcelanosa, Rosa Kiln Lane, Reading 1,125 2,160 2.6 2.9 3.1 3.2
Dee Park Estate, Reading 636 3,000 2.1 2.2 2.4 2.5
IKEA, Berkshire Retail Park, Pincents Lane, Tilehurst (turnover from Reading LPA) - - 23.2 25.2 27.3 28.2
Sub-total, Reading commitments 10,954 - 81.1 88.0 95.5 98.7
Bracknell Forest
Lexicon Bracknell (excluding Charles Square and Princess Square) 34,200 6,000 222.7 241.7 262.3 271.0
Charles Square redevelopment, Bracknell town centre 3,808 6,000 24.8 26.9 29.2 30.2
42-43 Princess Square, Bracknell 1,215 6,000 7.9 8.6 9.3 9.6
Former TRL site, Crowthorne 176 3,000 0.6 0.6 0.7 0.7
IKEA, Berkshire Retail Park, Pincents Lane, Tilehurst (turnover from Bracknell Forest LPA) - - 4.5 4.9 5.3 5.5
Sub-total, Bracknell Forest commitments 39,399 - 260.5 282.7 306.8 317.0
West Berkshire
IKEA, Berkshire Retail Park, Pincents Lane, Tilehurst (turnover from West Berkshire LPA) 24,410 - 6.7 7.3 7.9 8.2
Kingsland Shopping Centre redevelopment, Broadway, Thatcham 3,515 4,500 17.2 18.6 20.2 20.9
Land off Faraday & Kelvin Road, Newbury 1,100 6,000 7.2 7.8 8.4 8.7
Unit 10 (Boots), Newbury Retail Park, Pinchington Lane, Newbury 794 4,500 3.9 4.2 4.6 4.7
11-15 Bartholomew Street, Newbury 582 6,000 3.8 4.1 4.5 4.6
Sub-total, West Berkshire commitments 30,401 - 38.7 42.0 45.6 47.1
Wokingham
Elms Field, Wokingham 655 6,000 4.3 4.6 5.0 5.2
Peach Place, Wokingham 900 6,000 5.9 6.4 6.9 7.1
Aldi, Suttons Business Park (comparison goods floorspace) 254 4,500 1.2 1.3 1.5 1.5
IKEA, Berkshire Retail Park, Pincents Lane, Tilehurst (turnover from Wokingham LPA) - - 2.2 2.4 2.6 2.7
Land west of Shinfield - foodstore 500 6,000 3.3 3.5 3.8 4.0
Land west of Shinfield - other class A1 floorspace 690 3,000 2.2 2.4 2.6 2.7
Land at Matthewgreen Farm, North Wokingham 300 3,000 1.0 1.1 1.2 1.2
Buckhurst Farm, London Road, Wokingham 180 3,000 0.6 0.6 0.7 0.7
Arborfield Garrison - District Centre - foodstore 800 6,000 5.2 5.7 6.1 6.3
Arborfield Garrison - District Centre - other class A1 floorspace 600 3,000 2.0 2.1 2.3 2.4
Arborfield Garrison - Neighbourhood Centre 120 3,000 0.4 0.4 0.5 0.5
Arborfield Garrison - Hogwood Farm Neighbourhood Centre 200 3,000 0.7 0.7 0.8 0.8
Sub-total, Wokingham commitments 4,045 - 28.9 31.3 34.0 35.1
Overall total 73,845 - 409.2 444.1 481.9 498.0Source: LPA monitoring and planning application documents. Sales densities, turnovers and floorspace splits derived from Planning/Retail Impact Assessments where possible, other wise assumed.
Western Berkshire Authorities — Retail & Commercial Leisure Assessment 2016Comparison Capacity Modelling
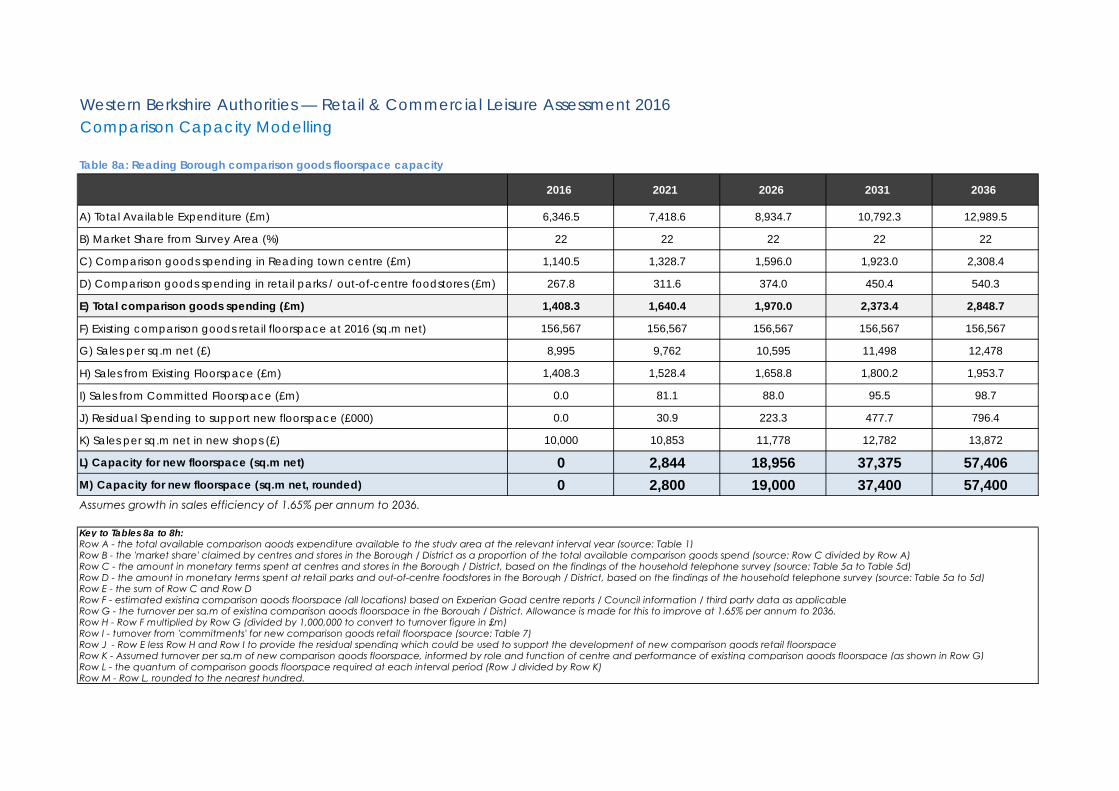
Table 8a: Reading Borough comparison goods floorspace capacity
2016 2021 2026 2031 2036
A) Total Available Expenditure (£m) 6,346.5 7,418.6 8,934.7 10,792.3 12,989.5
B) Market Share from Survey Area (%) 22 22 22 22 22
C) Comparison goods spending in Reading town centre (£m) 1,140.5 1,328.7 1,596.0 1,923.0 2,308.4
D) Comparison goods spending in retail parks / out-of-centre foodstores (£m) 267.8 311.6 374.0 450.4 540.3
E) Total comparison goods spending (£m) 1,408.3 1,640.4 1,970.0 2,373.4 2,848.7
F) Existing comparison goods retail floorspace at 2016 (sq.m net) 156,567 156,567 156,567 156,567 156,567
G) Sales per sq.m net (£) 8,995 9,762 10,595 11,498 12,478
H) Sales from Existing Floorspace (£m) 1,408.3 1,528.4 1,658.8 1,800.2 1,953.7
I) Sales from Committed Floorspace (£m) 0.0 81.1 88.0 95.5 98.7
J) Residual Spending to support new floorspace (£000) 0.0 30.9 223.3 477.7 796.4
K) Sales per sq.m net in new shops (£) 10,000 10,853 11,778 12,782 13,872
L) Capacity for new floorspace (sq.m net) 0 2,844 18,956 37,375 57,406M) Capacity for new floorspace (sq.m net, rounded) 0 2,800 19,000 37,400 57,400
Key to Tables 8a to 8h:Row A - the total available comparison goods expenditure available to the study area at the relevant interval year (source: Table 1)Row B - the 'market share' claimed by centres and stores in the Borough / District as a proportion of the total available comparison goods spend (source: Row C divided by Row A)Row C - the amount in monetary terms spent at centres and stores in the Borough / District, based on the findings of the household telephone survey (source: Table 5a to Table 5d)Row D - the amount in monetary terms spent at retail parks and out-of-centre foodstores in the Borough / District, based on the findings of the household telephone survey (source: Table 5a to 5d)Row E - the sum of Row C and Row DRow F - estimated existing comparison goods floorspace (all locations) based on Experian Goad centre reports / Council information / third party data as applicableRow G - the turnover per sq.m of existing comparison goods floorspace in the Borough / District. Allowance is made for this to improve at 1.65% per annum to 2036.Row H - Row F multiplied by Row G (divided by 1,000,000 to convert to turnover figure in £m)Row I - turnover from 'commitments' for new comparison goods retail floorspace (source: Table 7)Row J - Row E less Row H and Row I to provide the residual spending which could be used to support the development of new comparison goods retail floorspaceRow K - Assumed turnover per sq.m of new comparison goods floorspace, informed by role and function of centre and performance of existing comparison goods floorspace (as shown in Row G)Row L - the quantum of comparison goods floorspace required at each interval period (Row J divided by Row K)Row M - Row L, rounded to the nearest hundred.
Assumes growth in sales efficiency of 1.65% per annum to 2036.
Western Berkshire Authorities — Retail & Commercial Leisure Assessment 2016Comparison Capacity Modelling

Table 8b: Bracknell comparison goods floorspace capacity
2016 2021 2026 2031 2036
A) Total Available Expenditure (£m) 6,346.5 7,418.6 8,934.7 10,792.3 12,989.5
B) Market Share from Survey Area (%) 4 4 4 4 4
C) Comparison goods spending in Bracknell town centre (£m) 168.3 198.3 240.3 291.2 351.8
D) Comparison goods spending in retail parks / out-of-centre foodstores (£m) 110.2 129.7 157.0 190.2 229.5
E) Total comparison goods spending (£m) 278.5 328.1 397.3 481.4 581.3
F) Existing comparison goods retail floorspace at 2016 (sq.m net) 23,954 23,954 23,954 23,954 23,954
G) Sales per sq.m net (£) 11,624 12,616 13,691 14,859 16,126
H) Sales from Existing Floorspace (£m) 278.5 302.2 328.0 355.9 386.3
I) Sales from Committed Floorspace (£m) 0.0 235.1 255.1 276.9 286.1
J) Residual Spending to support new floorspace (£000) 0.0 -209.2 -185.8 -151.4 -91.1
K) Sales per sq.m net in new shops (£) 6,000 6,512 7,067 7,669 8,323
L) Capacity for new floorspace (sq.m net) 0 -32,132 -26,297 -19,745 -10,945M) Capacity for new floorspace (sq.m net, rounded) 0 -32,100 -26,300 -19,700 -10,900
Key to Tables 8a to 8h:Row A - the total available comparison goods expenditure available to the study area at the relevant interval year (source: Table 1)Row B - the 'market share' claimed by centres and stores in the Borough / District as a proportion of the total available comparison goods spend (source: Row C divided by Row A)Row C - the amount in monetary terms spent at centres and stores in the Borough / District, based on the findings of the household telephone survey (source: Table 5a to Table 5d)Row D - the amount in monetary terms spent at retail parks and out-of-centre foodstores in the Borough / District, based on the findings of the household telephone survey (source: Table 5a to 5d)Row E - the sum of Row C and Row DRow F - estimated existing comparison goods floorspace (all locations) based on Experian Goad centre reports / Council information / third party data as applicableRow G - the turnover per sq.m of existing comparison goods floorspace in the Borough / District. Allowance is made for this to improve at 1.65% per annum to 2036.Row H - Row F multiplied by Row G (divided by 1,000,000 to convert to turnover figure in £m)Row I - turnover from 'commitments' for new comparison goods retail floorspace (source: Table 7)Row J - Row E less Row H and Row I to provide the residual spending which could be used to support the development of new comparison goods retail floorspaceRow K - Assumed turnover per sq.m of new comparison goods floorspace, informed by role and function of centre and performance of existing comparison goods floorspace (as shown in Row G)Row L - the quantum of comparison goods floorspace required at each interval period (Row J divided by Row K)Row M - Row L, rounded to the nearest hundred.
Assumes growth in sales efficiency of 1.65% per annum to 2036.
Western Berkshire Authorities — Retail & Commercial Leisure Assessment 2016Comparison Capacity Modelling
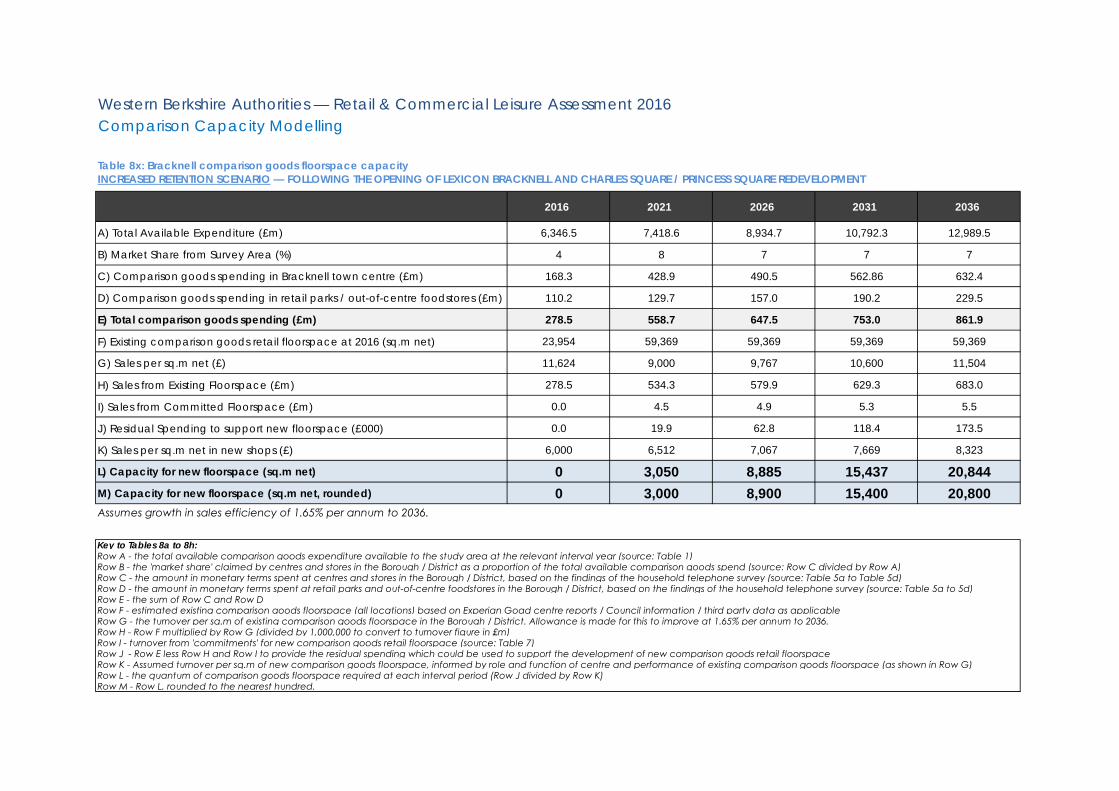
2016 2021 2026 2031 2036
A) Total Available Expenditure (£m) 6,346.5 7,418.6 8,934.7 10,792.3 12,989.5
B) Market Share from Survey Area (%) 4 8 7 7 7
C) Comparison goods spending in Bracknell town centre (£m) 168.3 428.9 490.5 562.86 632.4
D) Comparison goods spending in retail parks / out-of-centre foodstores (£m) 110.2 129.7 157.0 190.2 229.5
E) Total comparison goods spending (£m) 278.5 558.7 647.5 753.0 861.9
F) Existing comparison goods retail floorspace at 2016 (sq.m net) 23,954 59,369 59,369 59,369 59,369
G) Sales per sq.m net (£) 11,624 9,000 9,767 10,600 11,504
H) Sales from Existing Floorspace (£m) 278.5 534.3 579.9 629.3 683.0
I) Sales from Committed Floorspace (£m) 0.0 4.5 4.9 5.3 5.5
J) Residual Spending to support new floorspace (£000) 0.0 19.9 62.8 118.4 173.5
K) Sales per sq.m net in new shops (£) 6,000 6,512 7,067 7,669 8,323
L) Capacity for new floorspace (sq.m net) 0 3,050 8,885 15,437 20,844M) Capacity for new floorspace (sq.m net, rounded) 0 3,000 8,900 15,400 20,800
Key to Tables 8a to 8h:Row A - the total available comparison goods expenditure available to the study area at the relevant interval year (source: Table 1)Row B - the 'market share' claimed by centres and stores in the Borough / District as a proportion of the total available comparison goods spend (source: Row C divided by Row A)Row C - the amount in monetary terms spent at centres and stores in the Borough / District, based on the findings of the household telephone survey (source: Table 5a to Table 5d)Row D - the amount in monetary terms spent at retail parks and out-of-centre foodstores in the Borough / District, based on the findings of the household telephone survey (source: Table 5a to 5d)Row E - the sum of Row C and Row DRow F - estimated existing comparison goods floorspace (all locations) based on Experian Goad centre reports / Council information / third party data as applicableRow G - the turnover per sq.m of existing comparison goods floorspace in the Borough / District. Allowance is made for this to improve at 1.65% per annum to 2036.Row H - Row F multiplied by Row G (divided by 1,000,000 to convert to turnover figure in £m)Row I - turnover from 'commitments' for new comparison goods retail floorspace (source: Table 7)Row J - Row E less Row H and Row I to provide the residual spending which could be used to support the development of new comparison goods retail floorspaceRow K - Assumed turnover per sq.m of new comparison goods floorspace, informed by role and function of centre and performance of existing comparison goods floorspace (as shown in Row G)Row L - the quantum of comparison goods floorspace required at each interval period (Row J divided by Row K)Row M - Row L, rounded to the nearest hundred.
Western Berkshire Authorities — Retail & Commercial Leisure Assessment 2016Comparison Capacity Modelling
Assumes growth in sales efficiency of 1.65% per annum to 2036.
Table 8x: Bracknell comparison goods floorspace capacityINCREASED RETENTION SCENARIO — FOLLOWING THE OPENING OF LEXICON BRACKNELL AND CHARLES SQUARE / PRINCESS SQUARE REDEVELOPMENT

Table 8c: Sandhurst & Crowthorne comparison goods floorspace capacity
2016 2021 2026 2031 2036
A) Total Available Expenditure (£m) 6,346.5 7,418.6 8,934.7 10,792.3 12,989.5
B) Market Share from Survey Area (%) 1 1 1 1 1
C) Comparison goods spending in other Bracknell Forest centres (£m) 16.8 19.6 23.6 28.4 34.2
D) Comparison goods spending in retail parks / out-of-centre foodstores (£m) 75.9 88.5 106.2 127.9 153.8
E) Total comparison goods spending (£m) 92.7 108.1 129.8 156.4 188.0
F) Existing comparison goods retail floorspace at 2016 (sq.m net) 21,501 21,501 21,501 21,501 21,501
G) Sales per sq.m net (£) 4,313 4,681 5,080 5,513 5,983
H) Sales from Existing Floorspace (£m) 92.7 100.6 109.2 118.5 128.6
I) Sales from Committed Floorspace (£m) 0.0 0.6 0.6 0.7 0.7
J) Residual Spending to support new floorspace (£000) 0.0 6.9 19.9 37.2 58.7
K) Sales per sq.m net in new shops (£) 6,000 6,512 7,067 7,669 8,323
L) Capacity for new floorspace (sq.m net) 0 1,053 2,822 4,848 7,053M) Capacity for new floorspace (sq.m net, rounded) 0 1,100 2,800 4,800 7,100
Key to Tables 8a to 8h:Row A - the total available comparison goods expenditure available to the study area at the relevant interval year (source: Table 1)Row B - the 'market share' claimed by centres and stores in the Borough / District as a proportion of the total available comparison goods spend (source: Row C divided by Row A)Row C - the amount in monetary terms spent at centres and stores in the Borough / District, based on the findings of the household telephone survey (source: Table 5a to Table 5d)Row D - the amount in monetary terms spent at retail parks and out-of-centre foodstores in the Borough / District, based on the findings of the household telephone survey (source: Table 5a to 5d)Row E - the sum of Row C and Row DRow F - estimated existing comparison goods floorspace (all locations) based on Experian Goad centre reports / Council information / third party data as applicableRow G - the turnover per sq.m of existing comparison goods floorspace in the Borough / District. Allowance is made for this to improve at 1.65% per annum to 2036.Row H - Row F multiplied by Row G (divided by 1,000,000 to convert to turnover figure in £m)Row I - turnover from 'commitments' for new comparison goods retail floorspace (source: Table 7)Row J - Row E less Row H and Row I to provide the residual spending which could be used to support the development of new comparison goods retail floorspaceRow K - Assumed turnover per sq.m of new comparison goods floorspace, informed by role and function of centre and performance of existing comparison goods floorspace (as shown in Row G)Row L - the quantum of comparison goods floorspace required at each interval period (Row J divided by Row K)Row M - Row L, rounded to the nearest hundred.
Western Berkshire Authorities — Retail & Commercial Leisure Assessment 2016Comparison Capacity Modelling
Assumes growth in sales efficiency of 1.65% per annum to 2036.
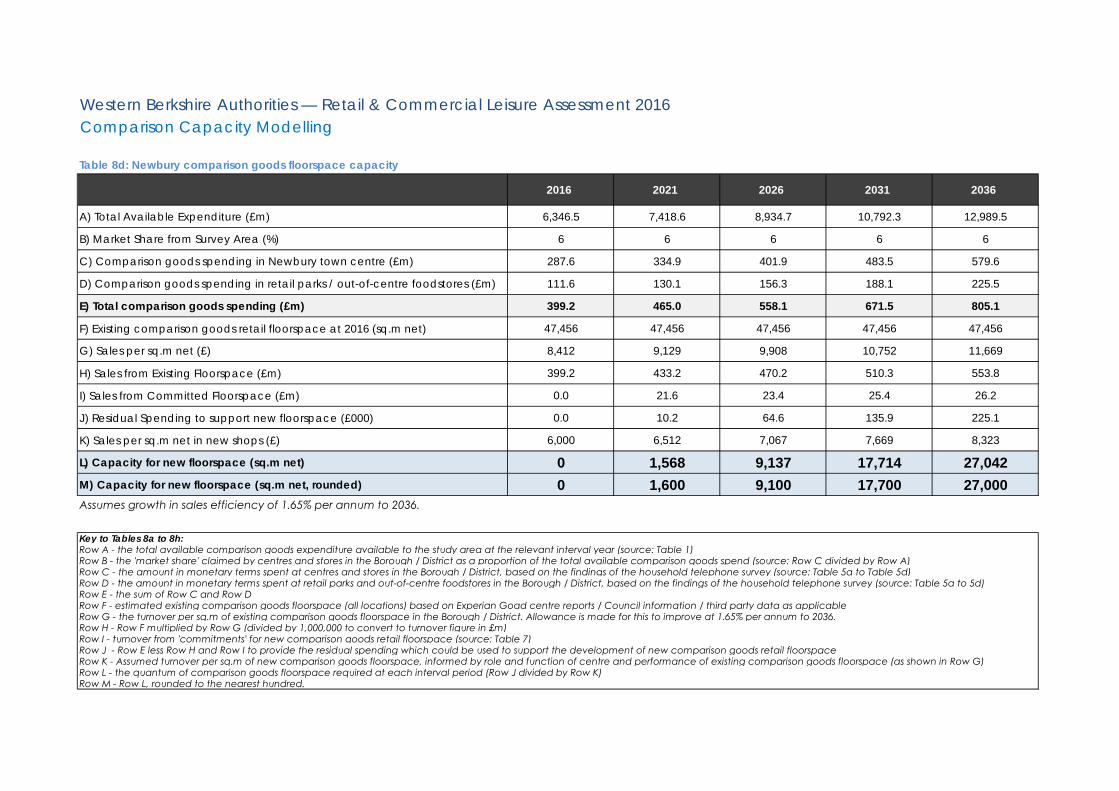
Table 8d: Newbury comparison goods floorspace capacity
2016 2021 2026 2031 2036
A) Total Available Expenditure (£m) 6,346.5 7,418.6 8,934.7 10,792.3 12,989.5
B) Market Share from Survey Area (%) 6 6 6 6 6
C) Comparison goods spending in Newbury town centre (£m) 287.6 334.9 401.9 483.5 579.6
D) Comparison goods spending in retail parks / out-of-centre foodstores (£m) 111.6 130.1 156.3 188.1 225.5
E) Total comparison goods spending (£m) 399.2 465.0 558.1 671.5 805.1
F) Existing comparison goods retail floorspace at 2016 (sq.m net) 47,456 47,456 47,456 47,456 47,456
G) Sales per sq.m net (£) 8,412 9,129 9,908 10,752 11,669
H) Sales from Existing Floorspace (£m) 399.2 433.2 470.2 510.3 553.8
I) Sales from Committed Floorspace (£m) 0.0 21.6 23.4 25.4 26.2
J) Residual Spending to support new floorspace (£000) 0.0 10.2 64.6 135.9 225.1
K) Sales per sq.m net in new shops (£) 6,000 6,512 7,067 7,669 8,323
L) Capacity for new floorspace (sq.m net) 0 1,568 9,137 17,714 27,042M) Capacity for new floorspace (sq.m net, rounded) 0 1,600 9,100 17,700 27,000
Key to Tables 8a to 8h:Row A - the total available comparison goods expenditure available to the study area at the relevant interval year (source: Table 1)Row B - the 'market share' claimed by centres and stores in the Borough / District as a proportion of the total available comparison goods spend (source: Row C divided by Row A)Row C - the amount in monetary terms spent at centres and stores in the Borough / District, based on the findings of the household telephone survey (source: Table 5a to Table 5d)Row D - the amount in monetary terms spent at retail parks and out-of-centre foodstores in the Borough / District, based on the findings of the household telephone survey (source: Table 5a to 5d)Row E - the sum of Row C and Row DRow F - estimated existing comparison goods floorspace (all locations) based on Experian Goad centre reports / Council information / third party data as applicableRow G - the turnover per sq.m of existing comparison goods floorspace in the Borough / District. Allowance is made for this to improve at 1.65% per annum to 2036.Row H - Row F multiplied by Row G (divided by 1,000,000 to convert to turnover figure in £m)Row I - turnover from 'commitments' for new comparison goods retail floorspace (source: Table 7)Row J - Row E less Row H and Row I to provide the residual spending which could be used to support the development of new comparison goods retail floorspaceRow K - Assumed turnover per sq.m of new comparison goods floorspace, informed by role and function of centre and performance of existing comparison goods floorspace (as shown in Row G)Row L - the quantum of comparison goods floorspace required at each interval period (Row J divided by Row K)Row M - Row L, rounded to the nearest hundred.
Assumes growth in sales efficiency of 1.65% per annum to 2036.
Western Berkshire Authorities — Retail & Commercial Leisure Assessment 2016Comparison Capacity Modelling
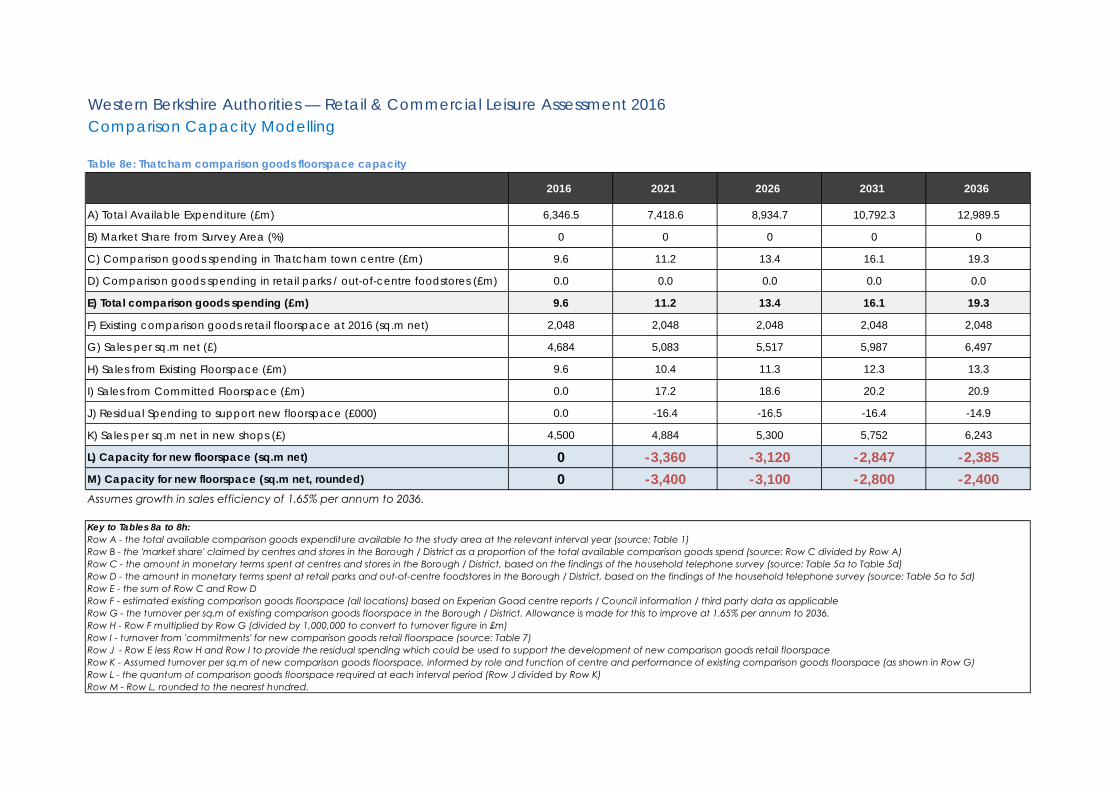
Table 8e: Thatcham comparison goods floorspace capacity
2016 2021 2026 2031 2036
A) Total Available Expenditure (£m) 6,346.5 7,418.6 8,934.7 10,792.3 12,989.5
B) Market Share from Survey Area (%) 0 0 0 0 0
C) Comparison goods spending in Thatcham town centre (£m) 9.6 11.2 13.4 16.1 19.3
D) Comparison goods spending in retail parks / out-of-centre foodstores (£m) 0.0 0.0 0.0 0.0 0.0
E) Total comparison goods spending (£m) 9.6 11.2 13.4 16.1 19.3
F) Existing comparison goods retail floorspace at 2016 (sq.m net) 2,048 2,048 2,048 2,048 2,048
G) Sales per sq.m net (£) 4,684 5,083 5,517 5,987 6,497
H) Sales from Existing Floorspace (£m) 9.6 10.4 11.3 12.3 13.3
I) Sales from Committed Floorspace (£m) 0.0 17.2 18.6 20.2 20.9
J) Residual Spending to support new floorspace (£000) 0.0 -16.4 -16.5 -16.4 -14.9
K) Sales per sq.m net in new shops (£) 4,500 4,884 5,300 5,752 6,243
L) Capacity for new floorspace (sq.m net) 0 -3,360 -3,120 -2,847 -2,385M) Capacity for new floorspace (sq.m net, rounded) 0 -3,400 -3,100 -2,800 -2,400
Key to Tables 8a to 8h:Row A - the total available comparison goods expenditure available to the study area at the relevant interval year (source: Table 1)Row B - the 'market share' claimed by centres and stores in the Borough / District as a proportion of the total available comparison goods spend (source: Row C divided by Row A)Row C - the amount in monetary terms spent at centres and stores in the Borough / District, based on the findings of the household telephone survey (source: Table 5a to Table 5d)Row D - the amount in monetary terms spent at retail parks and out-of-centre foodstores in the Borough / District, based on the findings of the household telephone survey (source: Table 5a to 5d)Row E - the sum of Row C and Row DRow F - estimated existing comparison goods floorspace (all locations) based on Experian Goad centre reports / Council information / third party data as applicableRow G - the turnover per sq.m of existing comparison goods floorspace in the Borough / District. Allowance is made for this to improve at 1.65% per annum to 2036.Row H - Row F multiplied by Row G (divided by 1,000,000 to convert to turnover figure in £m)Row I - turnover from 'commitments' for new comparison goods retail floorspace (source: Table 7)Row J - Row E less Row H and Row I to provide the residual spending which could be used to support the development of new comparison goods retail floorspaceRow K - Assumed turnover per sq.m of new comparison goods floorspace, informed by role and function of centre and performance of existing comparison goods floorspace (as shown in Row G)Row L - the quantum of comparison goods floorspace required at each interval period (Row J divided by Row K)Row M - Row L, rounded to the nearest hundred.
Western Berkshire Authorities — Retail & Commercial Leisure Assessment 2016Comparison Capacity Modelling
Assumes growth in sales efficiency of 1.65% per annum to 2036.
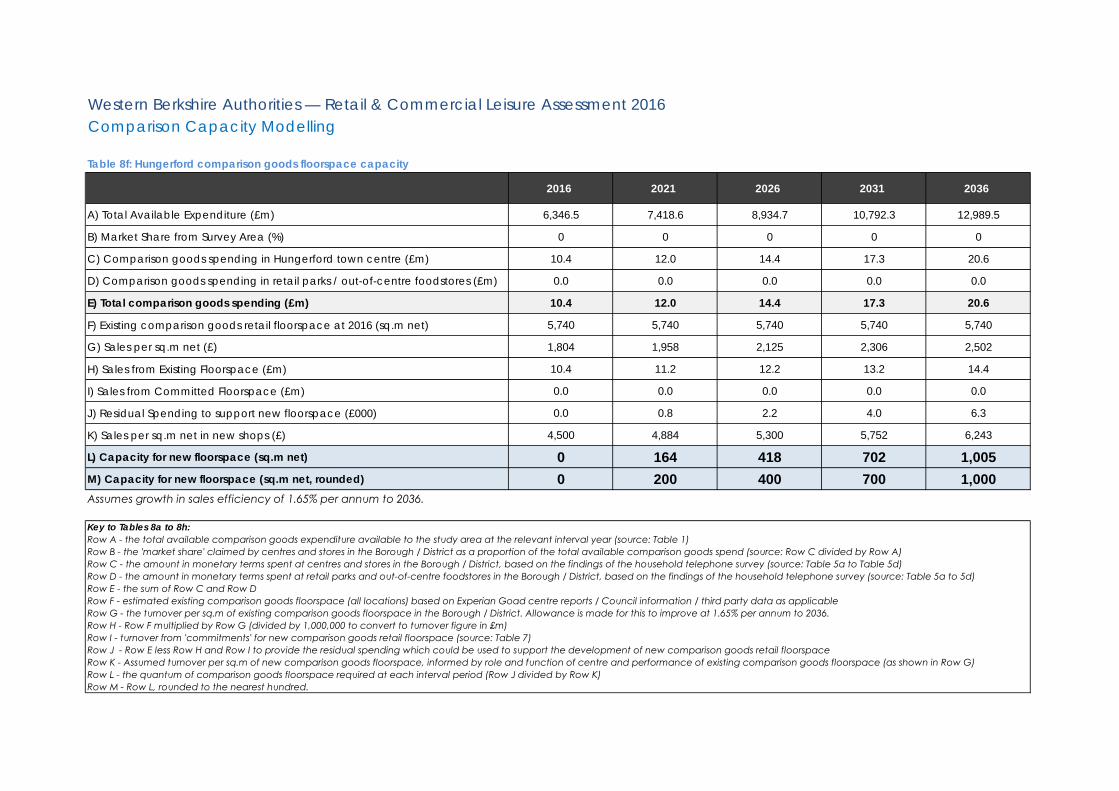
Table 8f: Hungerford comparison goods floorspace capacity
2016 2021 2026 2031 2036
A) Total Available Expenditure (£m) 6,346.5 7,418.6 8,934.7 10,792.3 12,989.5
B) Market Share from Survey Area (%) 0 0 0 0 0
C) Comparison goods spending in Hungerford town centre (£m) 10.4 12.0 14.4 17.3 20.6
D) Comparison goods spending in retail parks / out-of-centre foodstores (£m) 0.0 0.0 0.0 0.0 0.0
E) Total comparison goods spending (£m) 10.4 12.0 14.4 17.3 20.6
F) Existing comparison goods retail floorspace at 2016 (sq.m net) 5,740 5,740 5,740 5,740 5,740
G) Sales per sq.m net (£) 1,804 1,958 2,125 2,306 2,502
H) Sales from Existing Floorspace (£m) 10.4 11.2 12.2 13.2 14.4
I) Sales from Committed Floorspace (£m) 0.0 0.0 0.0 0.0 0.0
J) Residual Spending to support new floorspace (£000) 0.0 0.8 2.2 4.0 6.3
K) Sales per sq.m net in new shops (£) 4,500 4,884 5,300 5,752 6,243
L) Capacity for new floorspace (sq.m net) 0 164 418 702 1,005M) Capacity for new floorspace (sq.m net, rounded) 0 200 400 700 1,000
Key to Tables 8a to 8h:Row A - the total available comparison goods expenditure available to the study area at the relevant interval year (source: Table 1)Row B - the 'market share' claimed by centres and stores in the Borough / District as a proportion of the total available comparison goods spend (source: Row C divided by Row A)Row C - the amount in monetary terms spent at centres and stores in the Borough / District, based on the findings of the household telephone survey (source: Table 5a to Table 5d)Row D - the amount in monetary terms spent at retail parks and out-of-centre foodstores in the Borough / District, based on the findings of the household telephone survey (source: Table 5a to 5d)Row E - the sum of Row C and Row DRow F - estimated existing comparison goods floorspace (all locations) based on Experian Goad centre reports / Council information / third party data as applicableRow G - the turnover per sq.m of existing comparison goods floorspace in the Borough / District. Allowance is made for this to improve at 1.65% per annum to 2036.Row H - Row F multiplied by Row G (divided by 1,000,000 to convert to turnover figure in £m)Row I - turnover from 'commitments' for new comparison goods retail floorspace (source: Table 7)Row J - Row E less Row H and Row I to provide the residual spending which could be used to support the development of new comparison goods retail floorspaceRow K - Assumed turnover per sq.m of new comparison goods floorspace, informed by role and function of centre and performance of existing comparison goods floorspace (as shown in Row G)Row L - the quantum of comparison goods floorspace required at each interval period (Row J divided by Row K)Row M - Row L, rounded to the nearest hundred.
Western Berkshire Authorities — Retail & Commercial Leisure Assessment 2016Comparison Capacity Modelling
Assumes growth in sales efficiency of 1.65% per annum to 2036.
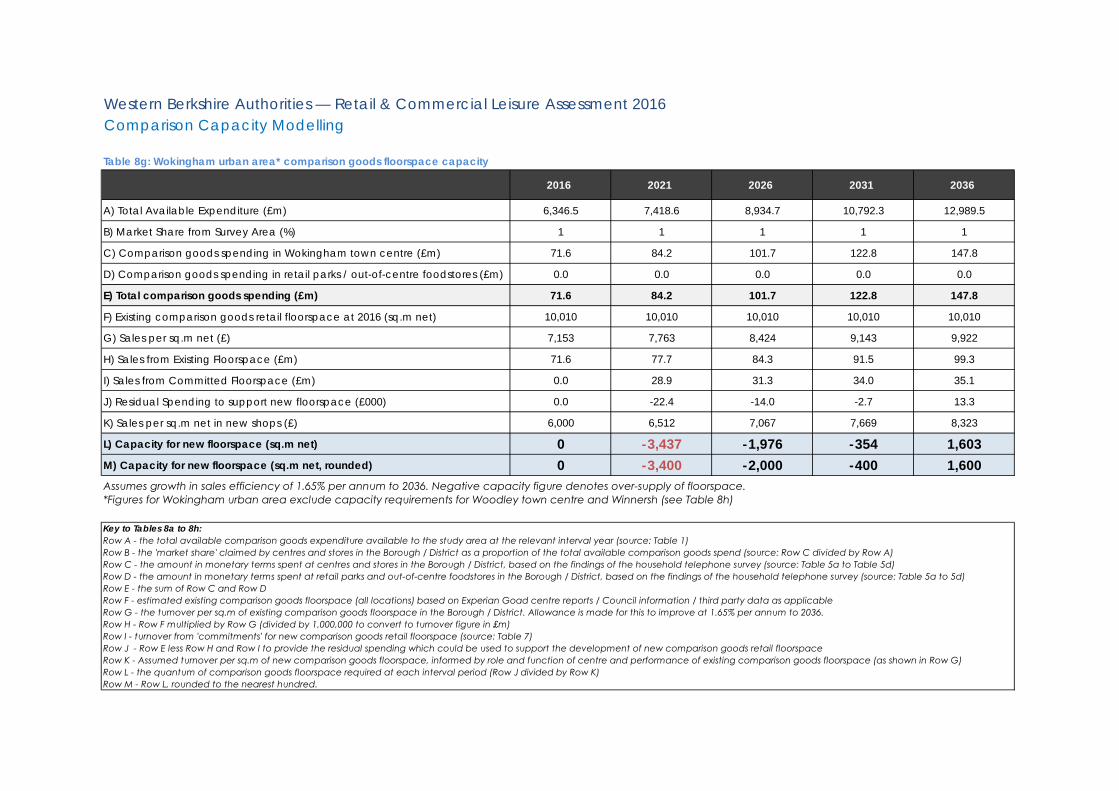
Table 8g: Wokingham urban area* comparison goods floorspace capacity
2016 2021 2026 2031 2036
A) Total Available Expenditure (£m) 6,346.5 7,418.6 8,934.7 10,792.3 12,989.5
B) Market Share from Survey Area (%) 1 1 1 1 1
C) Comparison goods spending in Wokingham town centre (£m) 71.6 84.2 101.7 122.8 147.8
D) Comparison goods spending in retail parks / out-of-centre foodstores (£m) 0.0 0.0 0.0 0.0 0.0
E) Total comparison goods spending (£m) 71.6 84.2 101.7 122.8 147.8
F) Existing comparison goods retail floorspace at 2016 (sq.m net) 10,010 10,010 10,010 10,010 10,010
G) Sales per sq.m net (£) 7,153 7,763 8,424 9,143 9,922
H) Sales from Existing Floorspace (£m) 71.6 77.7 84.3 91.5 99.3
I) Sales from Committed Floorspace (£m) 0.0 28.9 31.3 34.0 35.1
J) Residual Spending to support new floorspace (£000) 0.0 -22.4 -14.0 -2.7 13.3
K) Sales per sq.m net in new shops (£) 6,000 6,512 7,067 7,669 8,323
L) Capacity for new floorspace (sq.m net) 0 -3,437 -1,976 -354 1,603M) Capacity for new floorspace (sq.m net, rounded) 0 -3,400 -2,000 -400 1,600
Key to Tables 8a to 8h:Row A - the total available comparison goods expenditure available to the study area at the relevant interval year (source: Table 1)Row B - the 'market share' claimed by centres and stores in the Borough / District as a proportion of the total available comparison goods spend (source: Row C divided by Row A)Row C - the amount in monetary terms spent at centres and stores in the Borough / District, based on the findings of the household telephone survey (source: Table 5a to Table 5d)Row D - the amount in monetary terms spent at retail parks and out-of-centre foodstores in the Borough / District, based on the findings of the household telephone survey (source: Table 5a to 5d)Row E - the sum of Row C and Row DRow F - estimated existing comparison goods floorspace (all locations) based on Experian Goad centre reports / Council information / third party data as applicableRow G - the turnover per sq.m of existing comparison goods floorspace in the Borough / District. Allowance is made for this to improve at 1.65% per annum to 2036.Row H - Row F multiplied by Row G (divided by 1,000,000 to convert to turnover figure in £m)Row I - turnover from 'commitments' for new comparison goods retail floorspace (source: Table 7)Row J - Row E less Row H and Row I to provide the residual spending which could be used to support the development of new comparison goods retail floorspaceRow K - Assumed turnover per sq.m of new comparison goods floorspace, informed by role and function of centre and performance of existing comparison goods floorspace (as shown in Row G)Row L - the quantum of comparison goods floorspace required at each interval period (Row J divided by Row K)Row M - Row L, rounded to the nearest hundred.
Assumes growth in sales efficiency of 1.65% per annum to 2036. Negative capacity figure denotes over-supply of floorspace. *Figures for Wokingham urban area exclude capacity requirements for Woodley town centre and Winnersh (see Table 8h)
Western Berkshire Authorities — Retail & Commercial Leisure Assessment 2016Comparison Capacity Modelling
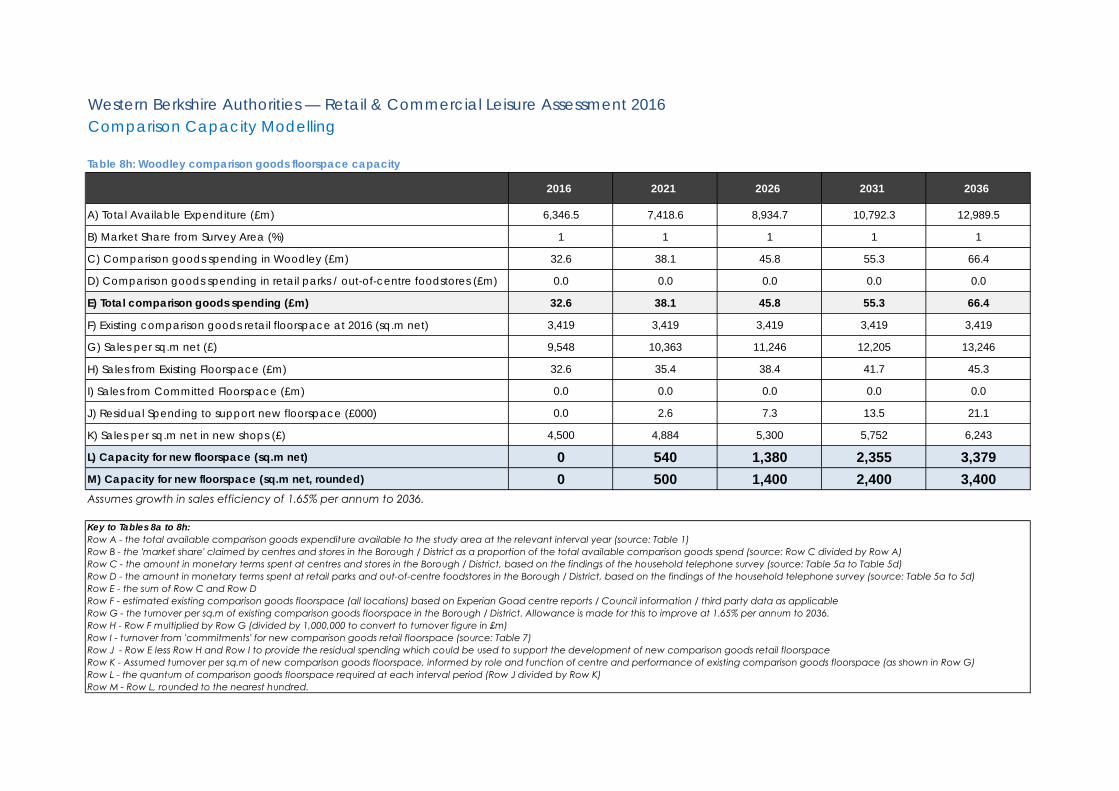
Table 8h: Woodley comparison goods floorspace capacity
2016 2021 2026 2031 2036
A) Total Available Expenditure (£m) 6,346.5 7,418.6 8,934.7 10,792.3 12,989.5
B) Market Share from Survey Area (%) 1 1 1 1 1
C) Comparison goods spending in Woodley (£m) 32.6 38.1 45.8 55.3 66.4
D) Comparison goods spending in retail parks / out-of-centre foodstores (£m) 0.0 0.0 0.0 0.0 0.0
E) Total comparison goods spending (£m) 32.6 38.1 45.8 55.3 66.4
F) Existing comparison goods retail floorspace at 2016 (sq.m net) 3,419 3,419 3,419 3,419 3,419
G) Sales per sq.m net (£) 9,548 10,363 11,246 12,205 13,246
H) Sales from Existing Floorspace (£m) 32.6 35.4 38.4 41.7 45.3
I) Sales from Committed Floorspace (£m) 0.0 0.0 0.0 0.0 0.0
J) Residual Spending to support new floorspace (£000) 0.0 2.6 7.3 13.5 21.1
K) Sales per sq.m net in new shops (£) 4,500 4,884 5,300 5,752 6,243
L) Capacity for new floorspace (sq.m net) 0 540 1,380 2,355 3,379M) Capacity for new floorspace (sq.m net, rounded) 0 500 1,400 2,400 3,400
Key to Tables 8a to 8h:Row A - the total available comparison goods expenditure available to the study area at the relevant interval year (source: Table 1)Row B - the 'market share' claimed by centres and stores in the Borough / District as a proportion of the total available comparison goods spend (source: Row C divided by Row A)Row C - the amount in monetary terms spent at centres and stores in the Borough / District, based on the findings of the household telephone survey (source: Table 5a to Table 5d)Row D - the amount in monetary terms spent at retail parks and out-of-centre foodstores in the Borough / District, based on the findings of the household telephone survey (source: Table 5a to 5d)Row E - the sum of Row C and Row DRow F - estimated existing comparison goods floorspace (all locations) based on Experian Goad centre reports / Council information / third party data as applicableRow G - the turnover per sq.m of existing comparison goods floorspace in the Borough / District. Allowance is made for this to improve at 1.65% per annum to 2036.Row H - Row F multiplied by Row G (divided by 1,000,000 to convert to turnover figure in £m)Row I - turnover from 'commitments' for new comparison goods retail floorspace (source: Table 7)Row J - Row E less Row H and Row I to provide the residual spending which could be used to support the development of new comparison goods retail floorspaceRow K - Assumed turnover per sq.m of new comparison goods floorspace, informed by role and function of centre and performance of existing comparison goods floorspace (as shown in Row G)Row L - the quantum of comparison goods floorspace required at each interval period (Row J divided by Row K)Row M - Row L, rounded to the nearest hundred.
Western Berkshire Authorities — Retail & Commercial Leisure Assessment 2016Comparison Capacity Modelling
Assumes growth in sales efficiency of 1.65% per annum to 2036.
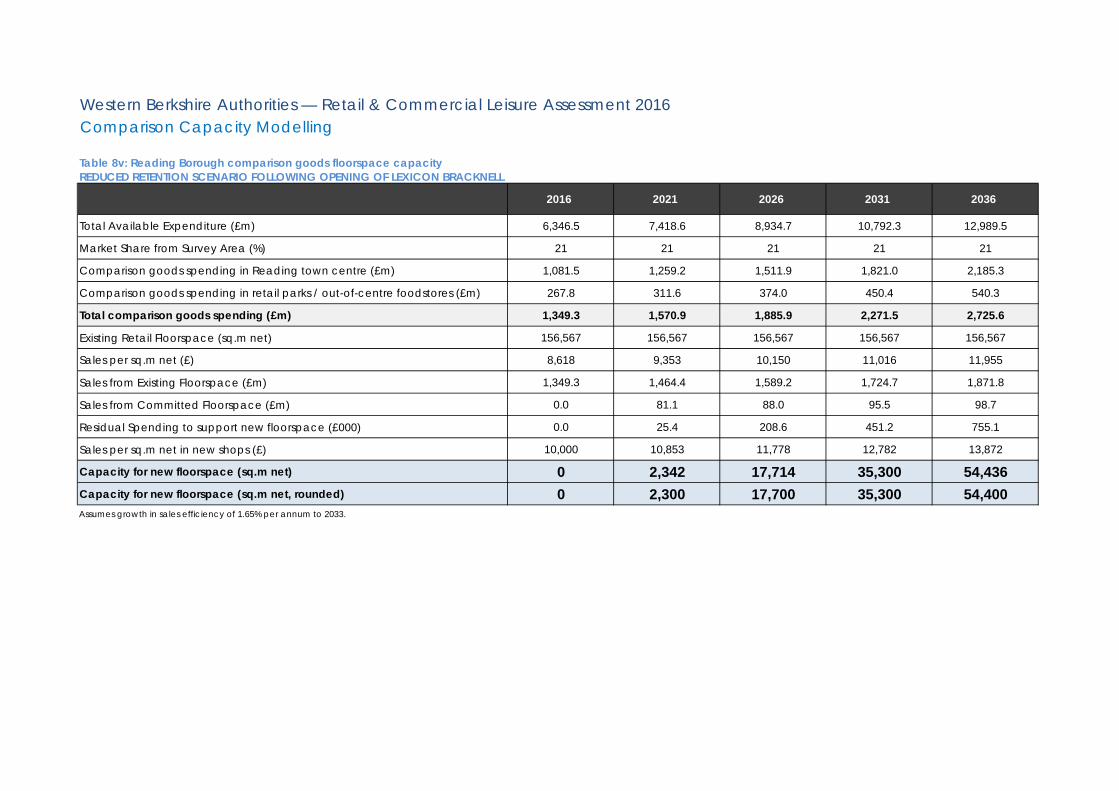
Table 8v: Reading Borough comparison goods floorspace capacity REDUCED RETENTION SCENARIO FOLLOWING OPENING OF LEXICON BRACKNELL
2016 2021 2026 2031 2036
Total Available Expenditure (£m) 6,346.5 7,418.6 8,934.7 10,792.3 12,989.5
Market Share from Survey Area (%) 21 21 21 21 21
Comparison goods spending in Reading town centre (£m) 1,081.5 1,259.2 1,511.9 1,821.0 2,185.3
Comparison goods spending in retail parks / out-of-centre foodstores (£m) 267.8 311.6 374.0 450.4 540.3
Total comparison goods spending (£m) 1,349.3 1,570.9 1,885.9 2,271.5 2,725.6
Existing Retail Floorspace (sq.m net) 156,567 156,567 156,567 156,567 156,567
Sales per sq.m net (£) 8,618 9,353 10,150 11,016 11,955
Sales from Existing Floorspace (£m) 1,349.3 1,464.4 1,589.2 1,724.7 1,871.8
Sales from Committed Floorspace (£m) 0.0 81.1 88.0 95.5 98.7
Residual Spending to support new floorspace (£000) 0.0 25.4 208.6 451.2 755.1
Sales per sq.m net in new shops (£) 10,000 10,853 11,778 12,782 13,872
Capacity for new floorspace (sq.m net) 0 2,342 17,714 35,300 54,436Capacity for new floorspace (sq.m net, rounded) 0 2,300 17,700 35,300 54,400Assumes growth in sales efficiency of 1.65% per annum to 2033.
Western Berkshire Authorities — Retail & Commercial Leisure Assessment 2016Comparison Capacity Modelling

APPENDIX II
CONVENIENCE GOODS MODELLING
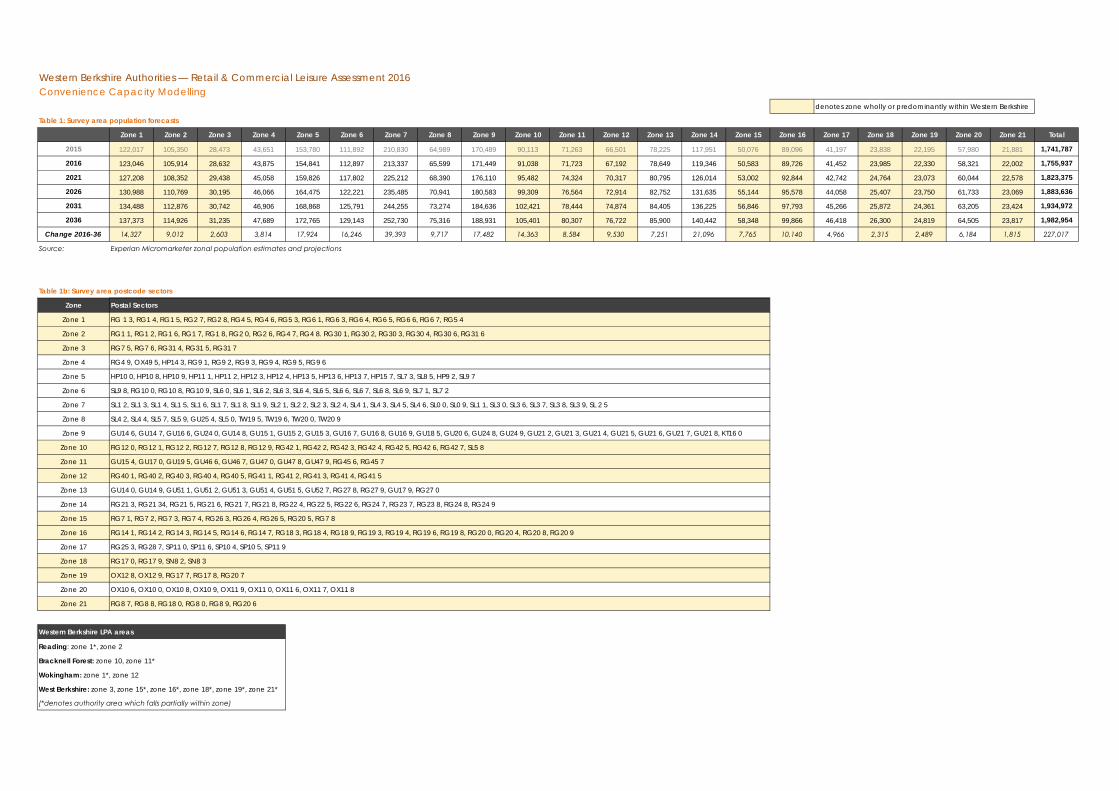
denotes zone wholly or predominantly within Western Berkshire
Table 1: Survey area population forecasts
Zone 1 Zone 2 Zone 3 Zone 4 Zone 5 Zone 6 Zone 7 Zone 8 Zone 9 Zone 10 Zone 11 Zone 12 Zone 13 Zone 14 Zone 15 Zone 16 Zone 17 Zone 18 Zone 19 Zone 20 Zone 21 Total
2015 122,017 105,350 28,473 43,651 153,780 111,892 210,830 64,989 170,489 90,113 71,263 66,501 78,225 117,951 50,076 89,096 41,197 23,838 22,195 57,980 21,881 1,741,787
2016 123,046 105,914 28,632 43,875 154,841 112,897 213,337 65,599 171,449 91,038 71,723 67,192 78,649 119,346 50,583 89,726 41,452 23,985 22,330 58,321 22,002 1,755,937
2021 127,208 108,352 29,438 45,058 159,826 117,802 225,212 68,390 176,110 95,482 74,324 70,317 80,795 126,014 53,002 92,844 42,742 24,764 23,073 60,044 22,578 1,823,375
2026 130,988 110,769 30,195 46,066 164,475 122,221 235,485 70,941 180,583 99,309 76,564 72,914 82,752 131,635 55,144 95,578 44,058 25,407 23,750 61,733 23,069 1,883,636
2031 134,488 112,876 30,742 46,906 168,868 125,791 244,255 73,274 184,636 102,421 78,444 74,874 84,405 136,225 56,846 97,793 45,266 25,872 24,361 63,205 23,424 1,934,972
2036 137,373 114,926 31,235 47,689 172,765 129,143 252,730 75,316 188,931 105,401 80,307 76,722 85,900 140,442 58,348 99,866 46,418 26,300 24,819 64,505 23,817 1,982,954
Change 2016-36 14,327 9,012 2,603 3,814 17,924 16,246 39,393 9,717 17,482 14,363 8,584 9,530 7,251 21,096 7,765 10,140 4,966 2,315 2,489 6,184 1,815 227,017
Source: Experian Micromarketer zonal population estimates and projections
Table 1b: Survey area postcode sectors
Zone Postal Sectors Zone Name
Zone 1 RG 1 3, RG1 4, RG1 5, RG2 7, RG2 8, RG4 5, RG4 6, RG5 3, RG6 1, RG6 3, RG6 4, RG6 5, RG6 6, RG6 7, RG5 4
Zone 2 RG1 1, RG1 2, RG1 6, RG1 7, RG1 8, RG2 0, RG2 6, RG4 7, RG4 8. RG30 1, RG30 2, RG30 3, RG30 4, RG30 6, RG31 6
Zone 3 RG7 5, RG7 6, RG31 4, RG31 5, RG31 7
Zone 4 RG4 9, OX49 5, HP14 3, RG9 1, RG9 2, RG9 3, RG9 4, RG9 5, RG9 6
Zone 5 HP10 0, HP10 8, HP10 9, HP11 1, HP11 2, HP12 3, HP12 4, HP13 5, HP13 6, HP13 7, HP15 7, SL7 3, SL8 5, HP9 2, SL9 7
Zone 6 SL9 8, RG10 0, RG10 8, RG10 9, SL6 0, SL6 1, SL6 2, SL6 3, SL6 4, SL6 5, SL6 6, SL6 7, SL6 8, SL6 9, SL7 1, SL7 2
Zone 7 SL1 2, SL1 3, SL1 4, SL1 5, SL1 6, SL1 7, SL1 8, SL1 9, SL2 1, SL2 2, SL2 3, SL2 4, SL4 1, SL4 3, SL4 5, SL4 6, SL0 0, SL0 9, SL1 1, SL3 0, SL3 6, SL3 7, SL3 8, SL3 9, SL 2 5
Zone 8 SL4 2, SL4 4, SL5 7, SL5 9, GU25 4, SL5 0, TW19 5, TW19 6, TW20 0, TW20 9
Zone 9 GU14 6, GU14 7, GU16 6, GU24 0, GU14 8, GU15 1, GU15 2, GU15 3, GU16 7, GU16 8, GU16 9, GU18 5, GU20 6, GU24 8, GU24 9, GU21 2, GU21 3, GU21 4, GU21 5, GU21 6, GU21 7, GU21 8, KT16 0
Zone 10 RG12 0, RG12 1, RG12 2, RG12 7, RG12 8, RG12 9, RG42 1, RG42 2, RG42 3, RG42 4, RG42 5, RG42 6, RG42 7, SL5 8
Zone 11 GU15 4, GU17 0, GU19 5, GU46 6, GU46 7, GU47 0, GU47 8, GU47 9, RG45 6, RG45 7
Zone 12 RG40 1, RG40 2, RG40 3, RG40 4, RG40 5, RG41 1, RG41 2, RG41 3, RG41 4, RG41 5
Zone 13 GU14 0, GU14 9, GU51 1, GU51 2, GU51 3, GU51 4, GU51 5, GU52 7, RG27 8, RG27 9, GU17 9, RG27 0
Zone 14 RG21 3, RG21 34, RG21 5, RG21 6, RG21 7, RG21 8, RG22 4, RG22 5, RG22 6, RG24 7, RG23 7, RG23 8, RG24 8, RG24 9
Zone 15 RG7 1, RG7 2, RG7 3, RG7 4, RG26 3, RG26 4, RG26 5, RG20 5, RG7 8
Zone 16 RG14 1, RG14 2, RG14 3, RG14 5, RG14 6, RG14 7, RG18 3, RG18 4, RG18 9, RG19 3, RG19 4, RG19 6, RG19 8, RG20 0, RG20 4, RG20 8, RG20 9
Zone 17 RG25 3, RG28 7, SP11 0, SP11 6, SP10 4, SP10 5, SP11 9
Zone 18 RG17 0, RG17 9, SN8 2, SN8 3
Zone 19 OX12 8, OX12 9, RG17 7, RG17 8, RG20 7
Zone 20 OX10 6, OX10 0, OX10 8, OX10 9, OX11 9, OX11 0, OX11 6, OX11 7, OX11 8
Zone 21 RG8 7, RG8 8, RG18 0, RG8 0, RG8 9, RG20 6
Western Berkshire LPA areas
Reading: zone 1*, zone 2
Bracknell Forest: zone 10, zone 11*
Wokingham: zone 1*, zone 12
West Berkshire: zone 3, zone 15*, zone 16*, zone 18*, zone 19*, zone 21*
(*denotes authority area which falls partially within zone)
Western Berkshire Authorities — Retail & Commercial Leisure Assessment 2016Convenience Capacity Modelling
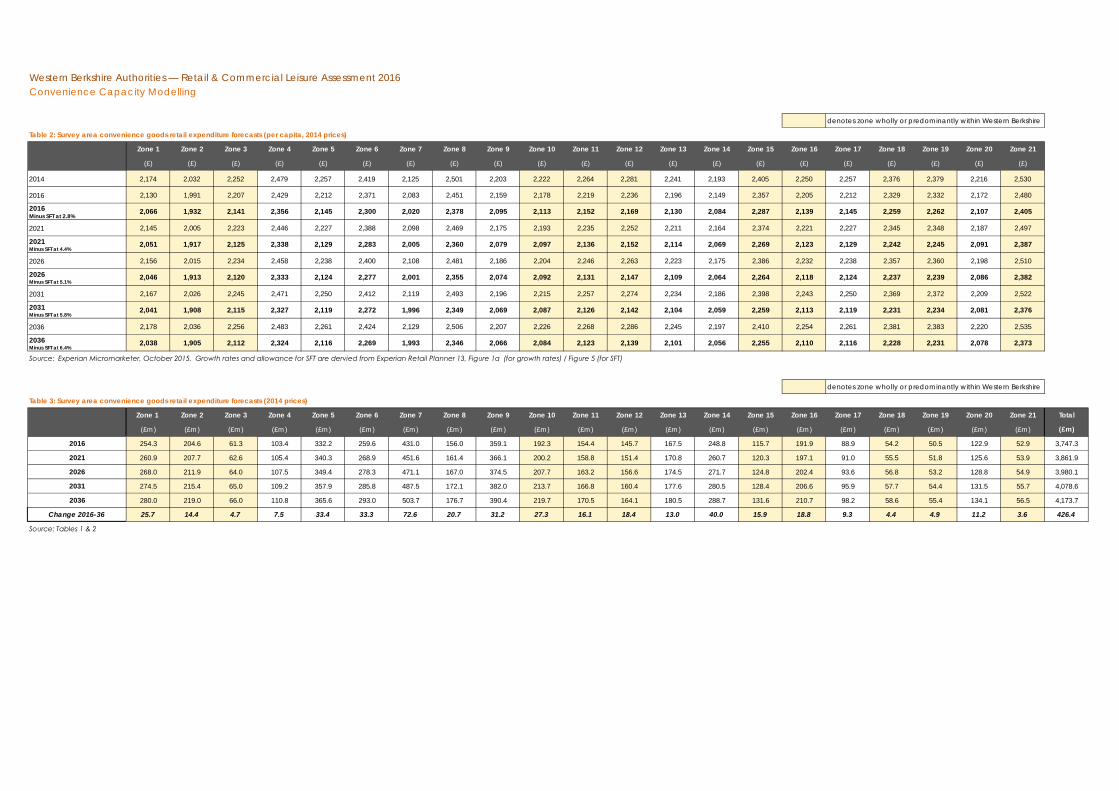
denotes zone wholly or predominantly within Western Berkshire
Table 2: Survey area convenience goods retail expenditure forecasts (per capita, 2014 prices)
Zone 1 Zone 2 Zone 3 Zone 4 Zone 5 Zone 6 Zone 7 Zone 8 Zone 9 Zone 10 Zone 11 Zone 12 Zone 13 Zone 14 Zone 15 Zone 16 Zone 17 Zone 18 Zone 19 Zone 20 Zone 21
(£) (£) (£) (£) (£) (£) (£) (£) (£) (£) (£) (£) (£) (£) (£) (£) (£) (£) (£) (£) (£)
2014 2,174 2,032 2,252 2,479 2,257 2,419 2,125 2,501 2,203 2,222 2,264 2,281 2,241 2,193 2,405 2,250 2,257 2,376 2,379 2,216 2,530
2016 2,130 1,991 2,207 2,429 2,212 2,371 2,083 2,451 2,159 2,178 2,219 2,236 2,196 2,149 2,357 2,205 2,212 2,329 2,332 2,172 2,480
2016Minus SFT at 2.8%
2,066 1,932 2,141 2,356 2,145 2,300 2,020 2,378 2,095 2,113 2,152 2,169 2,130 2,084 2,287 2,139 2,145 2,259 2,262 2,107 2,405
2021 2,145 2,005 2,223 2,446 2,227 2,388 2,098 2,469 2,175 2,193 2,235 2,252 2,211 2,164 2,374 2,221 2,227 2,345 2,348 2,187 2,497
2021Minus SFT at 4.4%
2,051 1,917 2,125 2,338 2,129 2,283 2,005 2,360 2,079 2,097 2,136 2,152 2,114 2,069 2,269 2,123 2,129 2,242 2,245 2,091 2,387
2026 2,156 2,015 2,234 2,458 2,238 2,400 2,108 2,481 2,186 2,204 2,246 2,263 2,223 2,175 2,386 2,232 2,238 2,357 2,360 2,198 2,510
2026Minus SFT at 5.1%
2,046 1,913 2,120 2,333 2,124 2,277 2,001 2,355 2,074 2,092 2,131 2,147 2,109 2,064 2,264 2,118 2,124 2,237 2,239 2,086 2,382
2031 2,167 2,026 2,245 2,471 2,250 2,412 2,119 2,493 2,196 2,215 2,257 2,274 2,234 2,186 2,398 2,243 2,250 2,369 2,372 2,209 2,522
2031Minus SFT at 5.8%
2,041 1,908 2,115 2,327 2,119 2,272 1,996 2,349 2,069 2,087 2,126 2,142 2,104 2,059 2,259 2,113 2,119 2,231 2,234 2,081 2,376
2036 2,178 2,036 2,256 2,483 2,261 2,424 2,129 2,506 2,207 2,226 2,268 2,286 2,245 2,197 2,410 2,254 2,261 2,381 2,383 2,220 2,535
2036Minus SFT at 6.4%
2,038 1,905 2,112 2,324 2,116 2,269 1,993 2,346 2,066 2,084 2,123 2,139 2,101 2,056 2,255 2,110 2,116 2,228 2,231 2,078 2,373
Source: Experian Micromarketer, October 2015. Growth rates and allowance for SFT are dervied from Experian Retail Planner 13, Figure 1a (for growth rates) / Figure 5 (for SFT)
denotes zone wholly or predominantly within Western Berkshire
Table 3: Survey area convenience goods retail expenditure forecasts (2014 prices)
Zone 1 Zone 2 Zone 3 Zone 4 Zone 5 Zone 6 Zone 7 Zone 8 Zone 9 Zone 10 Zone 11 Zone 12 Zone 13 Zone 14 Zone 15 Zone 16 Zone 17 Zone 18 Zone 19 Zone 20 Zone 21 Total
(£m) (£m) (£m) (£m) (£m) (£m) (£m) (£m) (£m) (£m) (£m) (£m) (£m) (£m) (£m) (£m) (£m) (£m) (£m) (£m) (£m) (£m)
2016 254.3 204.6 61.3 103.4 332.2 259.6 431.0 156.0 359.1 192.3 154.4 145.7 167.5 248.8 115.7 191.9 88.9 54.2 50.5 122.9 52.9 3,747.3
2021 260.9 207.7 62.6 105.4 340.3 268.9 451.6 161.4 366.1 200.2 158.8 151.4 170.8 260.7 120.3 197.1 91.0 55.5 51.8 125.6 53.9 3,861.9
2026 268.0 211.9 64.0 107.5 349.4 278.3 471.1 167.0 374.5 207.7 163.2 156.6 174.5 271.7 124.8 202.4 93.6 56.8 53.2 128.8 54.9 3,980.1
2031 274.5 215.4 65.0 109.2 357.9 285.8 487.5 172.1 382.0 213.7 166.8 160.4 177.6 280.5 128.4 206.6 95.9 57.7 54.4 131.5 55.7 4,078.6
2036 280.0 219.0 66.0 110.8 365.6 293.0 503.7 176.7 390.4 219.7 170.5 164.1 180.5 288.7 131.6 210.7 98.2 58.6 55.4 134.1 56.5 4,173.7
Change 2016-36 25.7 14.4 4.7 7.5 33.4 33.3 72.6 20.7 31.2 27.3 16.1 18.4 13.0 40.0 15.9 18.8 9.3 4.4 4.9 11.2 3.6 426.4
Source: Tables 1 & 2
Western Berkshire Authorities — Retail & Commercial Leisure Assessment 2016Convenience Capacity Modelling
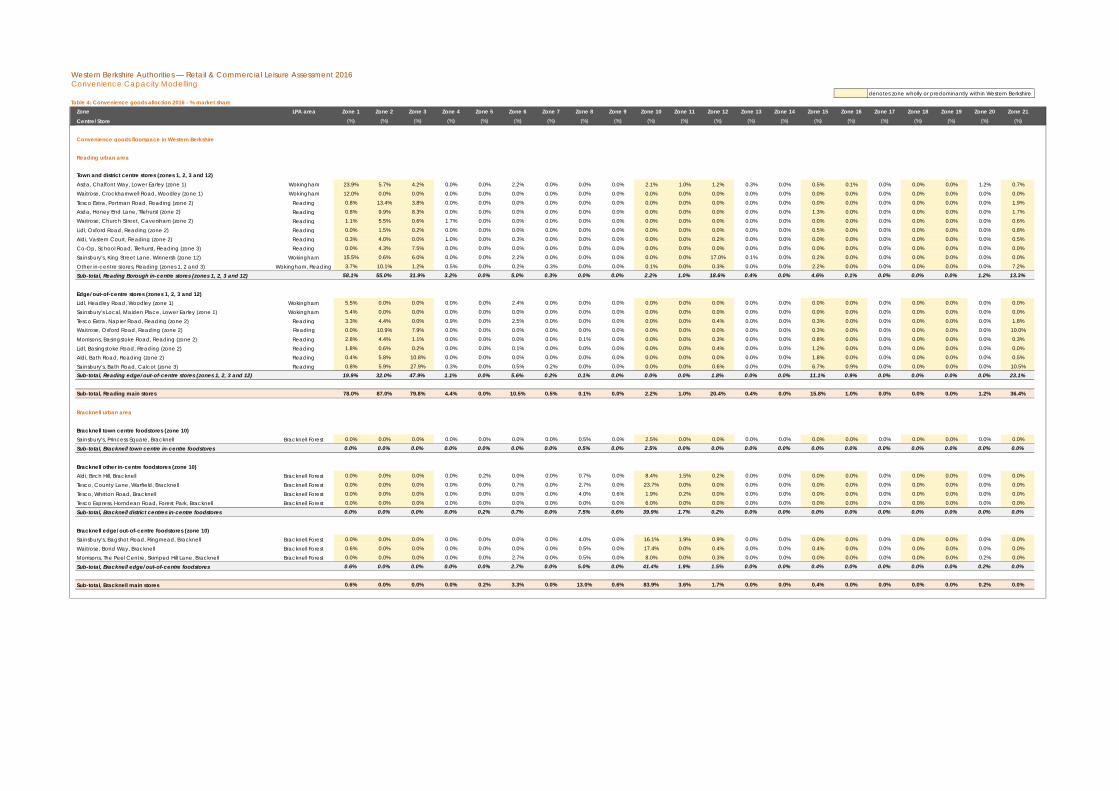
denotes zone wholly or predominantly within Western BerkshireTable 4: Convenience goods alloction 2016 - % market share
Zone LPA area Zone 1 Zone 2 Zone 3 Zone 4 Zone 5 Zone 6 Zone 7 Zone 8 Zone 9 Zone 10 Zone 11 Zone 12 Zone 13 Zone 14 Zone 15 Zone 16 Zone 17 Zone 18 Zone 19 Zone 20 Zone 21
Centre/Store (%) (%) (%) (%) (%) (%) (%) (%) (%) (%) (%) (%) (%) (%) (%) (%) (%) (%) (%) (%) (%)
Convenience goods floorspace in Western Berkshire
Reading urban area
Town and district centre stores (zones 1, 2, 3 and 12)Asda, Chalfont Way, Lower Earley (zone 1) Wokingham 23.9% 5.7% 4.2% 0.0% 0.0% 2.2% 0.0% 0.0% 0.0% 2.1% 1.0% 1.2% 0.3% 0.0% 0.5% 0.1% 0.0% 0.0% 0.0% 1.2% 0.7%Waitrose, Crockhamwell Road, Woodley (zone 1) Wokingham 12.0% 0.0% 0.0% 0.0% 0.0% 0.0% 0.0% 0.0% 0.0% 0.0% 0.0% 0.0% 0.0% 0.0% 0.0% 0.0% 0.0% 0.0% 0.0% 0.0% 0.0%
Tesco Extra, Portman Road, Reading (zone 2) Reading 0.8% 13.4% 3.8% 0.0% 0.0% 0.0% 0.0% 0.0% 0.0% 0.0% 0.0% 0.0% 0.0% 0.0% 0.0% 0.0% 0.0% 0.0% 0.0% 0.0% 1.9%Asda, Honey End Lane, Tilehurst (zone 2) Reading 0.8% 9.9% 8.3% 0.0% 0.0% 0.0% 0.0% 0.0% 0.0% 0.0% 0.0% 0.0% 0.0% 0.0% 1.3% 0.0% 0.0% 0.0% 0.0% 0.0% 1.7%Waitrose, Church Street, Caversham (zone 2) Reading 1.1% 5.5% 0.6% 1.7% 0.0% 0.0% 0.0% 0.0% 0.0% 0.0% 0.0% 0.0% 0.0% 0.0% 0.0% 0.0% 0.0% 0.0% 0.0% 0.0% 0.6%
Lidl, Oxford Road, Reading (zone 2) Reading 0.0% 1.5% 0.2% 0.0% 0.0% 0.0% 0.0% 0.0% 0.0% 0.0% 0.0% 0.0% 0.0% 0.0% 0.5% 0.0% 0.0% 0.0% 0.0% 0.0% 0.8%
Aldi, Vastern Court, Reading (zone 2) Reading 0.3% 4.0% 0.0% 1.0% 0.0% 0.3% 0.0% 0.0% 0.0% 0.0% 0.0% 0.2% 0.0% 0.0% 0.0% 0.0% 0.0% 0.0% 0.0% 0.0% 0.5%
Co-Op, School Road, Tilehurst, Reading (zone 3) Reading 0.0% 4.3% 7.5% 0.0% 0.0% 0.0% 0.0% 0.0% 0.0% 0.0% 0.0% 0.0% 0.0% 0.0% 0.0% 0.0% 0.0% 0.0% 0.0% 0.0% 0.0%
Sainsbury's, King Street Lane, Winnersh (zone 12) Wokingham 15.5% 0.6% 6.0% 0.0% 0.0% 2.2% 0.0% 0.0% 0.0% 0.0% 0.0% 17.0% 0.1% 0.0% 0.2% 0.0% 0.0% 0.0% 0.0% 0.0% 0.0%
Other in-centre stores, Reading (zones 1, 2 and 3) Wokingham, Reading 3.7% 10.1% 1.2% 0.5% 0.0% 0.2% 0.3% 0.0% 0.0% 0.1% 0.0% 0.3% 0.0% 0.0% 2.2% 0.0% 0.0% 0.0% 0.0% 0.0% 7.2%
Sub-total, Reading Borough in-centre stores (zones 1, 2, 3 and 12) 58.1% 55.0% 31.9% 3.2% 0.0% 5.0% 0.3% 0.0% 0.0% 2.2% 1.0% 18.6% 0.4% 0.0% 4.6% 0.1% 0.0% 0.0% 0.0% 1.2% 13.3%
Edge/out-of-centre stores (zones 1, 2, 3 and 12)Lidl, Headley Road, Woodley (zone 1) Wokingham 5.5% 0.0% 0.0% 0.0% 0.0% 2.4% 0.0% 0.0% 0.0% 0.0% 0.0% 0.0% 0.0% 0.0% 0.0% 0.0% 0.0% 0.0% 0.0% 0.0% 0.0%
Sainsbury's Local, Maiden Place, Lower Earley (zone 1) Wokingham 5.4% 0.0% 0.0% 0.0% 0.0% 0.0% 0.0% 0.0% 0.0% 0.0% 0.0% 0.0% 0.0% 0.0% 0.0% 0.0% 0.0% 0.0% 0.0% 0.0% 0.0%
Tesco Extra, Napier Road, Reading (zone 2) Reading 3.3% 4.4% 0.0% 0.9% 0.0% 2.5% 0.0% 0.0% 0.0% 0.0% 0.0% 0.4% 0.0% 0.0% 0.3% 0.0% 0.0% 0.0% 0.0% 0.0% 1.8%Waitrose, Oxford Road, Reading (zone 2) Reading 0.0% 10.9% 7.9% 0.0% 0.0% 0.0% 0.0% 0.0% 0.0% 0.0% 0.0% 0.0% 0.0% 0.0% 0.3% 0.0% 0.0% 0.0% 0.0% 0.0% 10.0%
Morrisons, Basingstoke Road, Reading (zone 2) Reading 2.8% 4.4% 1.1% 0.0% 0.0% 0.0% 0.0% 0.1% 0.0% 0.0% 0.0% 0.3% 0.0% 0.0% 0.8% 0.0% 0.0% 0.0% 0.0% 0.0% 0.3%
Lidl, Basingstoke Road, Reading (zone 2) Reading 1.8% 0.6% 0.2% 0.0% 0.0% 0.1% 0.0% 0.0% 0.0% 0.0% 0.0% 0.4% 0.0% 0.0% 1.2% 0.0% 0.0% 0.0% 0.0% 0.0% 0.0%
Aldi, Bath Road, Reading (zone 2) Reading 0.4% 5.8% 10.8% 0.0% 0.0% 0.0% 0.0% 0.0% 0.0% 0.0% 0.0% 0.0% 0.0% 0.0% 1.8% 0.0% 0.0% 0.0% 0.0% 0.0% 0.5%
Sainsbury's, Bath Road, Calcot (zone 3) Reading 0.8% 5.9% 27.9% 0.3% 0.0% 0.5% 0.2% 0.0% 0.0% 0.0% 0.0% 0.6% 0.0% 0.0% 6.7% 0.9% 0.0% 0.0% 0.0% 0.0% 10.5%Sub-total, Reading edge/out-of-centre stores (zones 1, 2, 3 and 12) 19.9% 32.0% 47.9% 1.1% 0.0% 5.6% 0.2% 0.1% 0.0% 0.0% 0.0% 1.8% 0.0% 0.0% 11.1% 0.9% 0.0% 0.0% 0.0% 0.0% 23.1%
Sub-total, Reading main stores 78.0% 87.0% 79.8% 4.4% 0.0% 10.5% 0.5% 0.1% 0.0% 2.2% 1.0% 20.4% 0.4% 0.0% 15.8% 1.0% 0.0% 0.0% 0.0% 1.2% 36.4%
Bracknell urban area
Bracknell town centre foodstores (zone 10)Sainsbury's, Princess Square, Bracknell Bracknell Forest 0.0% 0.0% 0.0% 0.0% 0.0% 0.0% 0.0% 0.5% 0.0% 2.5% 0.0% 0.0% 0.0% 0.0% 0.0% 0.0% 0.0% 0.0% 0.0% 0.0% 0.0%
Sub-total, Bracknell town centre in-centre foodstores 0.0% 0.0% 0.0% 0.0% 0.0% 0.0% 0.0% 0.5% 0.0% 2.5% 0.0% 0.0% 0.0% 0.0% 0.0% 0.0% 0.0% 0.0% 0.0% 0.0% 0.0%
Bracknell other in-centre foodstores (zone 10)Aldi, Birch Hill, Bracknell Bracknell Forest 0.0% 0.0% 0.0% 0.0% 0.2% 0.0% 0.0% 0.7% 0.0% 8.4% 1.5% 0.2% 0.0% 0.0% 0.0% 0.0% 0.0% 0.0% 0.0% 0.0% 0.0%
Tesco, County Lane, Warfield, Bracknell Bracknell Forest 0.0% 0.0% 0.0% 0.0% 0.0% 0.7% 0.0% 2.7% 0.0% 23.7% 0.0% 0.0% 0.0% 0.0% 0.0% 0.0% 0.0% 0.0% 0.0% 0.0% 0.0%
Tesco, Whitton Road, Bracknell Bracknell Forest 0.0% 0.0% 0.0% 0.0% 0.0% 0.0% 0.0% 4.0% 0.6% 1.9% 0.2% 0.0% 0.0% 0.0% 0.0% 0.0% 0.0% 0.0% 0.0% 0.0% 0.0%
Tesco Express, Horndean Road, Forest Park, Bracknell Bracknell Forest 0.0% 0.0% 0.0% 0.0% 0.0% 0.0% 0.0% 0.0% 0.0% 6.0% 0.0% 0.0% 0.0% 0.0% 0.0% 0.0% 0.0% 0.0% 0.0% 0.0% 0.0%
Sub-total, Bracknell district centres in-centre foodstores 0.0% 0.0% 0.0% 0.0% 0.2% 0.7% 0.0% 7.5% 0.6% 39.9% 1.7% 0.2% 0.0% 0.0% 0.0% 0.0% 0.0% 0.0% 0.0% 0.0% 0.0%
Bracknell edge/out-of-centre foodstores (zone 10)Sainsbury's, Bagshot Road, Ringmead, Bracknell Bracknell Forest 0.0% 0.0% 0.0% 0.0% 0.0% 0.0% 0.0% 4.0% 0.0% 16.1% 1.9% 0.9% 0.0% 0.0% 0.0% 0.0% 0.0% 0.0% 0.0% 0.0% 0.0%
Waitrose, Bond Way, Bracknell Bracknell Forest 0.6% 0.0% 0.0% 0.0% 0.0% 0.0% 0.0% 0.5% 0.0% 17.4% 0.0% 0.4% 0.0% 0.0% 0.4% 0.0% 0.0% 0.0% 0.0% 0.0% 0.0%
Morrisons, The Peel Centre, Skimped Hill Lane, Bracknell Bracknell Forest 0.0% 0.0% 0.0% 0.0% 0.0% 2.7% 0.0% 0.5% 0.0% 8.0% 0.0% 0.3% 0.0% 0.0% 0.0% 0.0% 0.0% 0.0% 0.0% 0.2% 0.0%
Sub-total, Bracknell edge/out-of-centre foodstores 0.6% 0.0% 0.0% 0.0% 0.0% 2.7% 0.0% 5.0% 0.0% 41.4% 1.9% 1.5% 0.0% 0.0% 0.4% 0.0% 0.0% 0.0% 0.0% 0.2% 0.0%
Sub-total, Bracknell main stores 0.6% 0.0% 0.0% 0.0% 0.2% 3.3% 0.0% 13.0% 0.6% 83.9% 3.6% 1.7% 0.0% 0.0% 0.4% 0.0% 0.0% 0.0% 0.0% 0.2% 0.0%
Western Berkshire Authorities — Retail & Commercial Leisure Assessment 2016Convenience Capacity Modelling
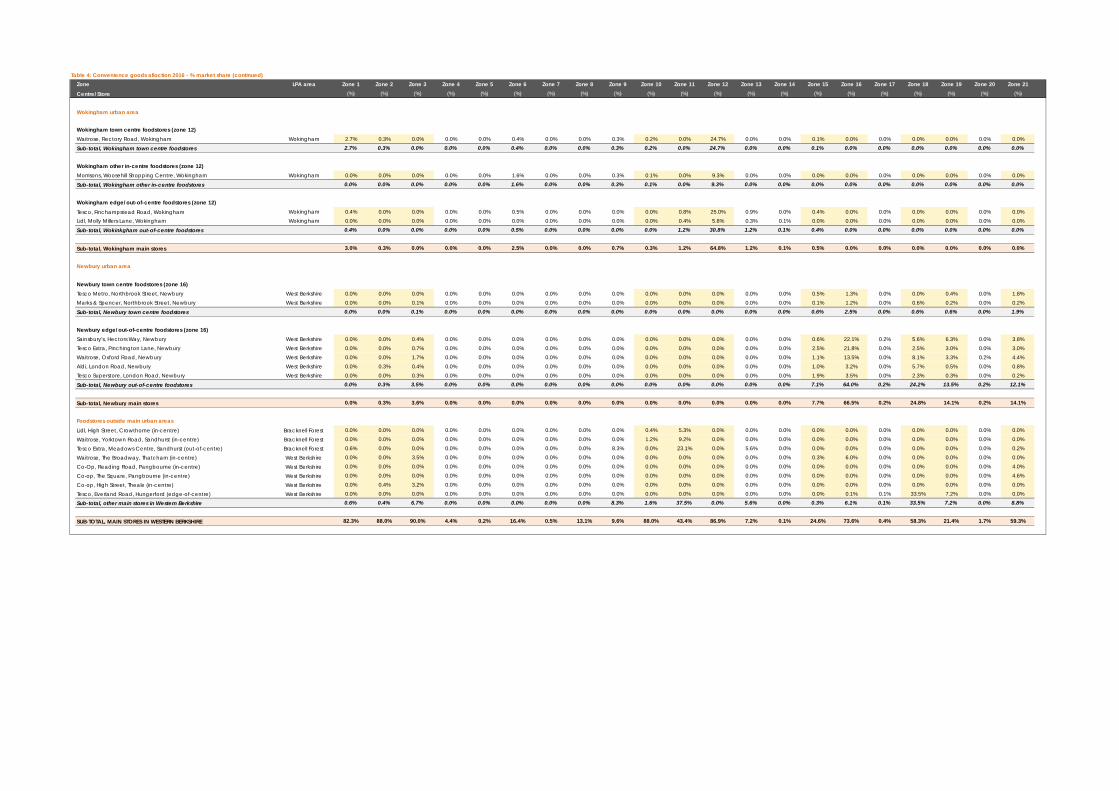
Table 4: Convenience goods alloction 2016 - % market share (continued)Zone LPA area Zone 1 Zone 2 Zone 3 Zone 4 Zone 5 Zone 6 Zone 7 Zone 8 Zone 9 Zone 10 Zone 11 Zone 12 Zone 13 Zone 14 Zone 15 Zone 16 Zone 17 Zone 18 Zone 19 Zone 20 Zone 21
Centre/Store (%) (%) (%) (%) (%) (%) (%) (%) (%) (%) (%) (%) (%) (%) (%) (%) (%) (%) (%) (%) (%)
Wokingham urban area
Wokingham town centre foodstores (zone 12)Waitrose, Rectory Road, Wokingham Wokingham 2.7% 0.3% 0.0% 0.0% 0.0% 0.4% 0.0% 0.0% 0.3% 0.2% 0.0% 24.7% 0.0% 0.0% 0.1% 0.0% 0.0% 0.0% 0.0% 0.0% 0.0%
Sub-total, Wokingham town centre foodstores 2.7% 0.3% 0.0% 0.0% 0.0% 0.4% 0.0% 0.0% 0.3% 0.2% 0.0% 24.7% 0.0% 0.0% 0.1% 0.0% 0.0% 0.0% 0.0% 0.0% 0.0%
Wokingham other in-centre foodstores (zone 12)Morrisons, Woosehill Shopping Centre, Wokingham Wokingham 0.0% 0.0% 0.0% 0.0% 0.0% 1.6% 0.0% 0.0% 0.3% 0.1% 0.0% 9.3% 0.0% 0.0% 0.0% 0.0% 0.0% 0.0% 0.0% 0.0% 0.0%
Sub-total, Wokingham other in-centre foodstores 0.0% 0.0% 0.0% 0.0% 0.0% 1.6% 0.0% 0.0% 0.3% 0.1% 0.0% 9.3% 0.0% 0.0% 0.0% 0.0% 0.0% 0.0% 0.0% 0.0% 0.0%
Wokingham edge/out-of-centre foodstores (zone 12)Tesco, Finchampstead Road, Wokingham Wokingham 0.4% 0.0% 0.0% 0.0% 0.0% 0.5% 0.0% 0.0% 0.0% 0.0% 0.8% 25.0% 0.9% 0.0% 0.4% 0.0% 0.0% 0.0% 0.0% 0.0% 0.0%Lidl, Molly Millers Lane, Wokingham Wokingham 0.0% 0.0% 0.0% 0.0% 0.0% 0.0% 0.0% 0.0% 0.0% 0.0% 0.4% 5.8% 0.3% 0.1% 0.0% 0.0% 0.0% 0.0% 0.0% 0.0% 0.0%
Sub-total, Wokinkgham out-of-centre foodstores 0.4% 0.0% 0.0% 0.0% 0.0% 0.5% 0.0% 0.0% 0.0% 0.0% 1.2% 30.8% 1.2% 0.1% 0.4% 0.0% 0.0% 0.0% 0.0% 0.0% 0.0%
Sub-total, Wokingham main stores 3.0% 0.3% 0.0% 0.0% 0.0% 2.5% 0.0% 0.0% 0.7% 0.3% 1.2% 64.8% 1.2% 0.1% 0.5% 0.0% 0.0% 0.0% 0.0% 0.0% 0.0%
Newbury urban area
Newbury town centre foodstores (zone 16)Tesco Metro, Northbrook Street, Newbury West Berkshire 0.0% 0.0% 0.0% 0.0% 0.0% 0.0% 0.0% 0.0% 0.0% 0.0% 0.0% 0.0% 0.0% 0.0% 0.5% 1.3% 0.0% 0.0% 0.4% 0.0% 1.8%Marks & Spencer, Northbrook Street, Newbury West Berkshire 0.0% 0.0% 0.1% 0.0% 0.0% 0.0% 0.0% 0.0% 0.0% 0.0% 0.0% 0.0% 0.0% 0.0% 0.1% 1.2% 0.0% 0.6% 0.2% 0.0% 0.2%
Sub-total, Newbury town centre foodstores 0.0% 0.0% 0.1% 0.0% 0.0% 0.0% 0.0% 0.0% 0.0% 0.0% 0.0% 0.0% 0.0% 0.0% 0.6% 2.5% 0.0% 0.6% 0.6% 0.0% 1.9%
Newbury edge/out-of-centre foodstores (zone 16)Sainsbury's, Hectors Way, Newbury West Berkshire 0.0% 0.0% 0.4% 0.0% 0.0% 0.0% 0.0% 0.0% 0.0% 0.0% 0.0% 0.0% 0.0% 0.0% 0.6% 22.1% 0.2% 5.6% 6.3% 0.0% 3.8%Tesco Extra, Pinchington Lane, Newbury West Berkshire 0.0% 0.0% 0.7% 0.0% 0.0% 0.0% 0.0% 0.0% 0.0% 0.0% 0.0% 0.0% 0.0% 0.0% 2.5% 21.8% 0.0% 2.5% 3.0% 0.0% 3.0%Waitrose, Oxford Road, Newbury West Berkshire 0.0% 0.0% 1.7% 0.0% 0.0% 0.0% 0.0% 0.0% 0.0% 0.0% 0.0% 0.0% 0.0% 0.0% 1.1% 13.5% 0.0% 8.1% 3.3% 0.2% 4.4%Aldi, London Road, Newbury West Berkshire 0.0% 0.3% 0.4% 0.0% 0.0% 0.0% 0.0% 0.0% 0.0% 0.0% 0.0% 0.0% 0.0% 0.0% 1.0% 3.2% 0.0% 5.7% 0.5% 0.0% 0.8%Tesco Superstore, London Road, Newbury West Berkshire 0.0% 0.0% 0.3% 0.0% 0.0% 0.0% 0.0% 0.0% 0.0% 0.0% 0.0% 0.0% 0.0% 0.0% 1.9% 3.5% 0.0% 2.3% 0.3% 0.0% 0.2%
Sub-total, Newbury out-of-centre foodstores 0.0% 0.3% 3.5% 0.0% 0.0% 0.0% 0.0% 0.0% 0.0% 0.0% 0.0% 0.0% 0.0% 0.0% 7.1% 64.0% 0.2% 24.2% 13.5% 0.2% 12.1%
Sub-total, Newbury main stores 0.0% 0.3% 3.6% 0.0% 0.0% 0.0% 0.0% 0.0% 0.0% 0.0% 0.0% 0.0% 0.0% 0.0% 7.7% 66.5% 0.2% 24.8% 14.1% 0.2% 14.1%
Foodstores outside main urban areasLidl, High Street, Crowthorne (in-centre) Bracknell Forest 0.0% 0.0% 0.0% 0.0% 0.0% 0.0% 0.0% 0.0% 0.0% 0.4% 5.3% 0.0% 0.0% 0.0% 0.0% 0.0% 0.0% 0.0% 0.0% 0.0% 0.0%
Waitrose, Yorktown Road, Sandhurst (in-centre) Bracknell Forest 0.0% 0.0% 0.0% 0.0% 0.0% 0.0% 0.0% 0.0% 0.0% 1.2% 9.2% 0.0% 0.0% 0.0% 0.0% 0.0% 0.0% 0.0% 0.0% 0.0% 0.0%
Tesco Extra, Meadows Centre, Sandhurst (out-of-centre) Bracknell Forest 0.6% 0.0% 0.0% 0.0% 0.0% 0.0% 0.0% 0.0% 8.3% 0.0% 23.1% 0.0% 5.6% 0.0% 0.0% 0.0% 0.0% 0.0% 0.0% 0.0% 0.2%
Waitrose, The Broadway, Thatcham (in-centre) West Berkshire 0.0% 0.0% 3.5% 0.0% 0.0% 0.0% 0.0% 0.0% 0.0% 0.0% 0.0% 0.0% 0.0% 0.0% 0.3% 6.0% 0.0% 0.0% 0.0% 0.0% 0.0%
Co-Op, Reading Road, Pangbourne (in-centre) West Berkshire 0.0% 0.0% 0.0% 0.0% 0.0% 0.0% 0.0% 0.0% 0.0% 0.0% 0.0% 0.0% 0.0% 0.0% 0.0% 0.0% 0.0% 0.0% 0.0% 0.0% 4.0%
Co-op, The Square, Pangbourne (in-centre) West Berkshire 0.0% 0.0% 0.0% 0.0% 0.0% 0.0% 0.0% 0.0% 0.0% 0.0% 0.0% 0.0% 0.0% 0.0% 0.0% 0.0% 0.0% 0.0% 0.0% 0.0% 4.6%
Co-op, High Street, Theale (in-centre) West Berkshire 0.0% 0.4% 3.2% 0.0% 0.0% 0.0% 0.0% 0.0% 0.0% 0.0% 0.0% 0.0% 0.0% 0.0% 0.0% 0.0% 0.0% 0.0% 0.0% 0.0% 0.0%
Tesco, Everland Road, Hungerford (edge-of-centre) West Berkshire 0.0% 0.0% 0.0% 0.0% 0.0% 0.0% 0.0% 0.0% 0.0% 0.0% 0.0% 0.0% 0.0% 0.0% 0.0% 0.1% 0.1% 33.5% 7.2% 0.0% 0.0%
Sub-total, other main stores in Western Berkshire 0.6% 0.4% 6.7% 0.0% 0.0% 0.0% 0.0% 0.0% 8.3% 1.6% 37.5% 0.0% 5.6% 0.0% 0.3% 6.1% 0.1% 33.5% 7.2% 0.0% 8.8%
SUB-TOTAL, MAIN STORES IN WESTERN BERKSHIRE 82.3% 88.0% 90.0% 4.4% 0.2% 16.4% 0.5% 13.1% 9.6% 88.0% 43.4% 86.9% 7.2% 0.1% 24.6% 73.6% 0.4% 58.3% 21.4% 1.7% 59.3%
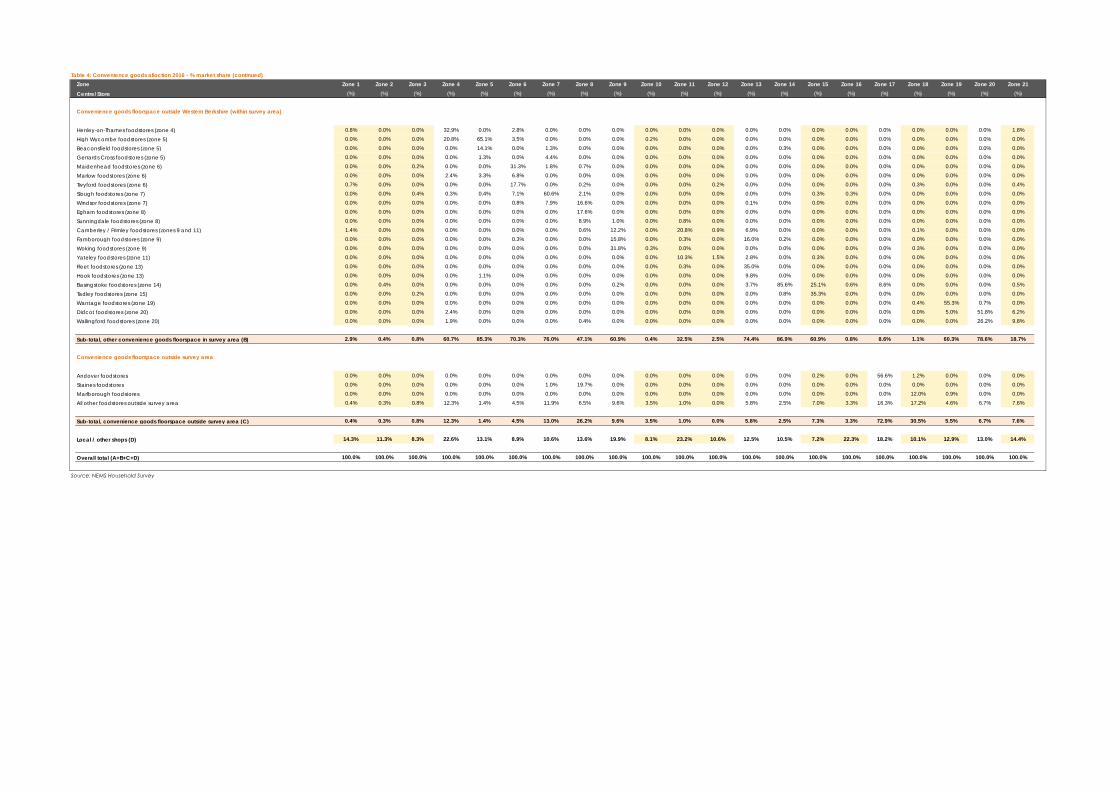
Table 4: Convenience goods alloction 2016 - % market share (continued)Zone Zone 1 Zone 2 Zone 3 Zone 4 Zone 5 Zone 6 Zone 7 Zone 8 Zone 9 Zone 10 Zone 11 Zone 12 Zone 13 Zone 14 Zone 15 Zone 16 Zone 17 Zone 18 Zone 19 Zone 20 Zone 21
Centre/Store (%) (%) (%) (%) (%) (%) (%) (%) (%) (%) (%) (%) (%) (%) (%) (%) (%) (%) (%) (%) (%)
Convenience goods floorspace outside Western Berkshire (within survey area)
Henley-on-Thames foodstores (zone 4) 0.8% 0.0% 0.0% 32.9% 0.0% 2.8% 0.0% 0.0% 0.0% 0.0% 0.0% 0.0% 0.0% 0.0% 0.0% 0.0% 0.0% 0.0% 0.0% 0.0% 1.8%
High Wycombe foodstores (zone 5) 0.0% 0.0% 0.0% 20.8% 65.1% 3.5% 0.0% 0.0% 0.0% 0.2% 0.0% 0.0% 0.0% 0.0% 0.0% 0.0% 0.0% 0.0% 0.0% 0.0% 0.0%
Beaconsfield foodstores (zone 5) 0.0% 0.0% 0.0% 0.0% 14.1% 0.0% 1.3% 0.0% 0.0% 0.0% 0.0% 0.0% 0.0% 0.3% 0.0% 0.0% 0.0% 0.0% 0.0% 0.0% 0.0%
Gerrards Cross foodstores (zone 5) 0.0% 0.0% 0.0% 0.0% 1.3% 0.0% 4.4% 0.0% 0.0% 0.0% 0.0% 0.0% 0.0% 0.0% 0.0% 0.0% 0.0% 0.0% 0.0% 0.0% 0.0%
Maidenhead foodstores (zone 6) 0.0% 0.0% 0.2% 0.0% 0.0% 31.3% 1.8% 0.7% 0.0% 0.0% 0.0% 0.0% 0.0% 0.0% 0.0% 0.0% 0.0% 0.0% 0.0% 0.0% 0.0%
Marlow foodstores (zone 6) 0.0% 0.0% 0.0% 2.4% 3.3% 6.8% 0.0% 0.0% 0.0% 0.0% 0.0% 0.0% 0.0% 0.0% 0.0% 0.0% 0.0% 0.0% 0.0% 0.0% 0.0%
Twyford foodstores (zone 6) 0.7% 0.0% 0.0% 0.0% 0.0% 17.7% 0.0% 0.2% 0.0% 0.0% 0.0% 0.2% 0.0% 0.0% 0.0% 0.0% 0.0% 0.3% 0.0% 0.0% 0.4%
Slough foodstores (zone 7) 0.0% 0.0% 0.4% 0.3% 0.4% 7.1% 60.6% 2.1% 0.0% 0.0% 0.0% 0.0% 0.0% 0.0% 0.3% 0.3% 0.0% 0.0% 0.0% 0.0% 0.0%
Windsor foodstores (zone 7) 0.0% 0.0% 0.0% 0.0% 0.0% 0.8% 7.9% 16.6% 0.0% 0.0% 0.0% 0.0% 0.1% 0.0% 0.0% 0.0% 0.0% 0.0% 0.0% 0.0% 0.0%
Egham foodstores (zone 8) 0.0% 0.0% 0.0% 0.0% 0.0% 0.0% 0.0% 17.6% 0.0% 0.0% 0.0% 0.0% 0.0% 0.0% 0.0% 0.0% 0.0% 0.0% 0.0% 0.0% 0.0%
Sunningdale foodstores (zone 8) 0.0% 0.0% 0.0% 0.0% 0.0% 0.0% 0.0% 8.9% 1.0% 0.0% 0.8% 0.0% 0.0% 0.0% 0.0% 0.0% 0.0% 0.0% 0.0% 0.0% 0.0%
Camberley / Frimley foodstores (zones 9 and 11) 1.4% 0.0% 0.0% 0.0% 0.0% 0.0% 0.0% 0.6% 12.2% 0.0% 20.8% 0.9% 6.9% 0.0% 0.0% 0.0% 0.0% 0.1% 0.0% 0.0% 0.0%
Farnborough foodstores (zone 9) 0.0% 0.0% 0.0% 0.0% 0.0% 0.3% 0.0% 0.0% 15.8% 0.0% 0.3% 0.0% 16.0% 0.2% 0.0% 0.0% 0.0% 0.0% 0.0% 0.0% 0.0%
Woking foodstores (zone 9) 0.0% 0.0% 0.0% 0.0% 0.0% 0.0% 0.0% 0.0% 31.8% 0.3% 0.0% 0.0% 0.0% 0.0% 0.0% 0.0% 0.0% 0.3% 0.0% 0.0% 0.0%
Yateley foodstores (zone 11) 0.0% 0.0% 0.0% 0.0% 0.0% 0.0% 0.0% 0.0% 0.0% 0.0% 10.3% 1.5% 2.8% 0.0% 0.3% 0.0% 0.0% 0.0% 0.0% 0.0% 0.0%
Fleet foodstores (zone 13) 0.0% 0.0% 0.0% 0.0% 0.0% 0.0% 0.0% 0.0% 0.0% 0.0% 0.3% 0.0% 35.0% 0.0% 0.0% 0.0% 0.0% 0.0% 0.0% 0.0% 0.0%
Hook foodstores (zone 13) 0.0% 0.0% 0.0% 0.0% 1.1% 0.0% 0.0% 0.0% 0.0% 0.0% 0.0% 0.0% 9.8% 0.0% 0.0% 0.0% 0.0% 0.0% 0.0% 0.0% 0.0%
Basingstoke foodstores (zone 14) 0.0% 0.4% 0.0% 0.0% 0.0% 0.0% 0.0% 0.0% 0.2% 0.0% 0.0% 0.0% 3.7% 85.6% 25.1% 0.6% 8.6% 0.0% 0.0% 0.0% 0.5%
Tadley foodstores (zone 15) 0.0% 0.0% 0.2% 0.0% 0.0% 0.0% 0.0% 0.0% 0.0% 0.0% 0.0% 0.0% 0.0% 0.8% 35.3% 0.0% 0.0% 0.0% 0.0% 0.0% 0.0%
Wantage foodstores (zone 19) 0.0% 0.0% 0.0% 0.0% 0.0% 0.0% 0.0% 0.0% 0.0% 0.0% 0.0% 0.0% 0.0% 0.0% 0.0% 0.0% 0.0% 0.4% 55.3% 0.7% 0.0%
Didcot foodstores (zone 20) 0.0% 0.0% 0.0% 2.4% 0.0% 0.0% 0.0% 0.0% 0.0% 0.0% 0.0% 0.0% 0.0% 0.0% 0.0% 0.0% 0.0% 0.0% 5.0% 51.8% 6.2%
Wallingford foodstores (zone 20) 0.0% 0.0% 0.0% 1.9% 0.0% 0.0% 0.0% 0.4% 0.0% 0.0% 0.0% 0.0% 0.0% 0.0% 0.0% 0.0% 0.0% 0.0% 0.0% 26.2% 9.8%
Sub-total, other convenience goods floorspace in survey area (B) 2.9% 0.4% 0.8% 60.7% 85.3% 70.3% 76.0% 47.1% 60.9% 0.4% 32.5% 2.5% 74.4% 86.9% 60.9% 0.8% 8.6% 1.1% 60.3% 78.6% 18.7%
Convenience goods floorspace outside survey area
Andover foodstores 0.0% 0.0% 0.0% 0.0% 0.0% 0.0% 0.0% 0.0% 0.0% 0.0% 0.0% 0.0% 0.0% 0.0% 0.2% 0.0% 56.6% 1.2% 0.0% 0.0% 0.0%
Staines foodstores 0.0% 0.0% 0.0% 0.0% 0.0% 0.0% 1.0% 19.7% 0.0% 0.0% 0.0% 0.0% 0.0% 0.0% 0.0% 0.0% 0.0% 0.0% 0.0% 0.0% 0.0%
Marlborough foodstores 0.0% 0.0% 0.0% 0.0% 0.0% 0.0% 0.0% 0.0% 0.0% 0.0% 0.0% 0.0% 0.0% 0.0% 0.0% 0.0% 0.0% 12.0% 0.9% 0.0% 0.0%
All other foodstores outside survey area 0.4% 0.3% 0.8% 12.3% 1.4% 4.5% 11.9% 6.5% 9.6% 3.5% 1.0% 0.0% 5.8% 2.5% 7.0% 3.3% 16.3% 17.2% 4.6% 6.7% 7.6%
Sub-total, convenience goods floorspace outside survey area (C) 0.4% 0.3% 0.8% 12.3% 1.4% 4.5% 13.0% 26.2% 9.6% 3.5% 1.0% 0.0% 5.8% 2.5% 7.3% 3.3% 72.9% 30.5% 5.5% 6.7% 7.6%
Local / other shops (D) 14.3% 11.3% 8.3% 22.6% 13.1% 8.9% 10.6% 13.6% 19.9% 8.1% 23.2% 10.6% 12.5% 10.5% 7.2% 22.3% 18.2% 10.1% 12.9% 13.0% 14.4%
Overall total (A+B+C+D) 100.0% 100.0% 100.0% 100.0% 100.0% 100.0% 100.0% 100.0% 100.0% 100.0% 100.0% 100.0% 100.0% 100.0% 100.0% 100.0% 100.0% 100.0% 100.0% 100.0% 100.0%
Source: NEMS Household Survey

denotes zone wholly or predominantly within Western BerkshireTable 5a: Convenience goods alloction 2016 - Spend (£m, 2014 prices)
Zone LPA area Zone 1 Zone 2 Zone 3 Zone 4 Zone 5 Zone 6 Zone 7 Zone 8 Zone 9 Zone 10 Zone 11 Zone 12 Zone 13 Zone 14 Zone 15 Zone 16 Zone 17 Zone 18 Zone 19 Zone 20 Zone 21 Total Total
Centre/Store (%) (%) (%) (%) (%) (%) (%) (%) (%) (%) (%) (%) (%) (%) (%) (%) (%) (%) (%) (%) (%) (£m) (%)
Total Available Spend - 2016 254.3 204.6 61.3 103.4 332.2 259.6 431.0 156.0 359.1 192.3 154.4 145.7 167.5 248.8 115.7 191.9 88.9 54.2 50.5 122.9 52.9 3747.3 100.0
Convenience goods floorspace in Western Berkshire
Reading urban area
Reading in-centre stores (zones 1, 2, 3 and 12)Asda, Chalfont Way, Lower Earley (zone 1) Wokingham 60.8 11.7 2.6 0.0 0.0 5.7 0.0 0.0 0.0 3.9 1.6 1.7 0.5 0.0 0.6 0.3 0.0 0.0 0.0 1.5 0.4 91.4 2.4%Waitrose, Crockhamwell Road, Woodley (zone 1) Wokingham 30.4 0.0 0.0 0.0 0.0 0.0 0.0 0.0 0.0 0.0 0.0 0.0 0.0 0.0 0.0 0.0 0.0 0.0 0.0 0.0 0.0 30.4 0.8%Tesco Extra, Portman Road, Reading (zone 2) Reading 2.1 27.5 2.3 0.0 0.0 0.0 0.0 0.0 0.0 0.0 0.0 0.0 0.0 0.0 0.0 0.0 0.0 0.0 0.0 0.0 1.0 32.9 0.9%Asda, Honey End Lane, Tilehurst (zone 2) Reading 2.0 20.3 5.1 0.0 0.0 0.0 0.0 0.0 0.0 0.0 0.0 0.0 0.0 0.0 1.5 0.0 0.0 0.0 0.0 0.0 0.9 29.8 0.8%Waitrose, Church Street, Caversham (zone 2) Reading 2.7 11.3 0.4 1.8 0.0 0.0 0.0 0.0 0.0 0.0 0.0 0.0 0.0 0.0 0.0 0.0 0.0 0.0 0.0 0.0 0.3 16.5 0.4%Lidl, Oxford Road, Reading (zone 2) Reading 0.0 3.0 0.1 0.0 0.0 0.0 0.0 0.0 0.0 0.0 0.0 0.0 0.0 0.0 0.6 0.0 0.0 0.0 0.0 0.0 0.4 4.2 0.1%Aldi, Vastern Court, Reading (zone 2) Reading 0.8 8.1 0.0 1.1 0.0 0.8 0.0 0.0 0.0 0.0 0.0 0.2 0.0 0.0 0.0 0.0 0.0 0.0 0.0 0.0 0.2 11.3 0.3%Co-Op, School Road, Tilehurst, Reading (zone 3) Reading 0.0 8.7 4.6 0.0 0.0 0.0 0.0 0.0 0.0 0.0 0.0 0.0 0.0 0.0 0.0 0.0 0.0 0.0 0.0 0.0 0.0 13.3 0.4%Sainsbury's, King Street Lane, Winnersh (zone 12) Wokingham 39.4 1.2 3.7 0.0 0.0 5.7 0.0 0.0 0.0 0.0 0.0 24.7 0.2 0.0 0.2 0.0 0.0 0.0 0.0 0.0 0.0 75.3 2.0%Other in-centre stores, Reading (zones 1, 2 and 3) Wokingham, Reading 9.5 20.6 0.8 0.5 0.0 0.6 1.5 0.0 0.0 0.2 0.0 0.4 0.0 0.0 2.5 0.0 0.0 0.0 0.0 0.0 3.8 40.4 1.1%Sub-total, Reading Borough in-centre stores (zones 1, 2, 3 and 12) 147.8 112.5 19.5 3.4 0.0 12.9 1.5 0.0 0.0 4.2 1.6 27.1 0.7 0.0 5.4 0.3 0.0 0.0 0.0 1.5 7.1 345.4 9.2%
Reading edge/out-of-centre stores (zones 1, 2, 3 and 12)Lidl, Headley Road, Woodley (zone 1) Wokingham 13.9 0.0 0.0 0.0 0.0 6.2 0.0 0.0 0.0 0.0 0.0 0.0 0.0 0.0 0.0 0.0 0.0 0.0 0.0 0.0 0.0 20.1 0.5%Sainsbury's Local, Maiden Place, Lower Earley (zone 1) Wokingham 13.8 0.0 0.0 0.0 0.0 0.0 0.0 0.0 0.0 0.0 0.0 0.0 0.0 0.0 0.0 0.0 0.0 0.0 0.0 0.0 0.0 13.8 0.4%Tesco Extra, Napier Road, Reading (zone 2) Reading 8.3 9.0 0.0 0.9 0.0 6.6 0.0 0.0 0.0 0.0 0.0 0.6 0.0 0.0 0.4 0.0 0.0 0.0 0.0 0.0 0.9 26.7 0.7%Waitrose, Oxford Road, Reading (zone 2) Reading 0.0 22.3 4.8 0.0 0.0 0.0 0.0 0.0 0.0 0.0 0.0 0.0 0.0 0.0 0.4 0.0 0.0 0.0 0.0 0.0 5.3 32.8 0.9%Morrisons, Basingstoke Road, Reading (zone 2) Reading 7.1 8.9 0.7 0.0 0.0 0.0 0.0 0.2 0.0 0.0 0.0 0.5 0.0 0.0 1.0 0.0 0.0 0.0 0.0 0.0 0.2 18.5 0.5%Lidl, Basingstoke Road, Reading (zone 2) Reading 4.6 1.3 0.1 0.0 0.0 0.3 0.0 0.0 0.0 0.0 0.0 0.6 0.0 0.0 1.4 0.0 0.0 0.0 0.0 0.0 0.0 8.4 0.2%Aldi, Bath Road, Reading (zone 2) Reading 1.1 11.8 6.6 0.0 0.0 0.0 0.0 0.0 0.0 0.0 0.0 0.0 0.0 0.0 2.1 0.0 0.0 0.0 0.0 0.0 0.3 21.9 0.6%Sainsbury's, Bath Road, Calcot (zone 3) Reading 2.0 12.1 17.1 0.3 0.0 1.3 0.7 0.0 0.0 0.0 0.0 0.9 0.0 0.0 7.7 1.6 0.0 0.0 0.0 0.0 5.6 49.3 1.3%Sub-total, Reading edge/out-of-centre stores (zones 1, 2, 3 and 12) 50.7 65.5 29.4 1.2 0.0 14.4 0.7 0.2 0.0 0.0 0.0 2.6 0.0 0.0 12.8 1.6 0.0 0.0 0.0 0.0 12.2 191.4 5.1%
Sub-total, Reading main stores 198.5 177.9 48.9 4.5 0.0 27.3 2.2 0.2 0.0 4.2 1.6 29.8 0.7 0.0 18.2 1.9 0.0 0.0 0.0 1.5 19.3 536.8 14.3%
Bracknell urban area
Bracknell town centre foodstores (zone 10)Sainsbury's, Princess Square, Bracknell Bracknell Forest 0.0 0.0 0.0 0.0 0.0 0.0 0.0 0.7 0.0 4.9 0.0 0.0 0.0 0.0 0.0 0.0 0.0 0.0 0.0 0.0 0.0 5.6 0.1%Sub-total, Bracknell town centre in-centre foodstores 0.0 0.0 0.0 0.0 0.0 0.0 0.0 0.7 0.0 4.9 0.0 0.0 0.0 0.0 0.0 0.0 0.0 0.0 0.0 0.0 0.0 5.6 0.1%
Bracknell other in-centre foodstores (zone 10)Aldi, Birch Hill, Bracknell Bracknell Forest 0.0 0.0 0.0 0.0 0.7 0.0 0.0 1.2 0.0 16.2 2.4 0.3 0.0 0.0 0.0 0.0 0.0 0.0 0.0 0.0 0.0 20.6 0.6%Tesco, County Lane, Warfield, Bracknell Bracknell Forest 0.0 0.0 0.0 0.0 0.0 1.8 0.0 4.3 0.0 45.5 0.0 0.0 0.0 0.0 0.0 0.0 0.0 0.0 0.0 0.0 0.0 51.5 1.4%Tesco, Whitton Road, Bracknell Bracknell Forest 0.0 0.0 0.0 0.0 0.0 0.0 0.0 6.3 2.1 3.6 0.2 0.0 0.0 0.0 0.0 0.0 0.0 0.0 0.0 0.0 0.0 12.2 0.3%Tesco Express, Horndean Road, Forest Park, Bracknell Bracknell Forest 0.0 0.0 0.0 0.0 0.0 0.0 0.0 0.0 0.0 11.5 0.0 0.0 0.0 0.0 0.0 0.0 0.0 0.0 0.0 0.0 0.0 11.5 0.3%Sub-total, Bracknell district centres in-centre foodstores 0.0 0.0 0.0 0.0 0.7 1.8 0.0 11.7 2.1 76.8 2.6 0.3 0.0 0.0 0.0 0.0 0.0 0.0 0.0 0.0 0.0 95.9 2.6%
Bracknell edge/out-of-centre foodstores (zone 10)Sainsbury's, Bagshot Road, Ringmead, Bracknell Bracknell Forest 0.0 0.0 0.0 0.0 0.0 0.0 0.0 6.2 0.0 30.9 3.0 1.3 0.0 0.0 0.0 0.0 0.0 0.0 0.0 0.0 0.0 41.4 1.1%Waitrose, Bond Way, Bracknell Bracknell Forest 1.6 0.0 0.0 0.0 0.0 0.0 0.0 0.9 0.0 33.4 0.0 0.6 0.0 0.0 0.4 0.0 0.0 0.0 0.0 0.0 0.0 36.8 1.0%Morrisons, The Peel Centre, Skimped Hill Lane, Bracknell Bracknell Forest 0.0 0.0 0.0 0.0 0.0 6.9 0.0 0.8 0.0 15.4 0.0 0.4 0.0 0.0 0.0 0.0 0.0 0.0 0.0 0.2 0.0 23.7 0.6%Sub-total, Bracknell edge/out-of-centre foodstores 1.6 0.0 0.0 0.0 0.0 6.9 0.0 7.9 0.0 79.7 3.0 2.2 0.0 0.0 0.4 0.0 0.0 0.0 0.0 0.2 0.0 101.9 2.7%
Sub-total, Bracknell main stores 1.6 0.0 0.0 0.0 0.7 8.7 0.0 20.3 2.1 161.3 5.6 2.5 0.0 0.0 0.4 0.0 0.0 0.0 0.0 0.2 0.0 203.4 5.4%
Western Berkshire Authorities — Retail & Commercial Leisure Assessment 2016Convenience Capacity Modelling
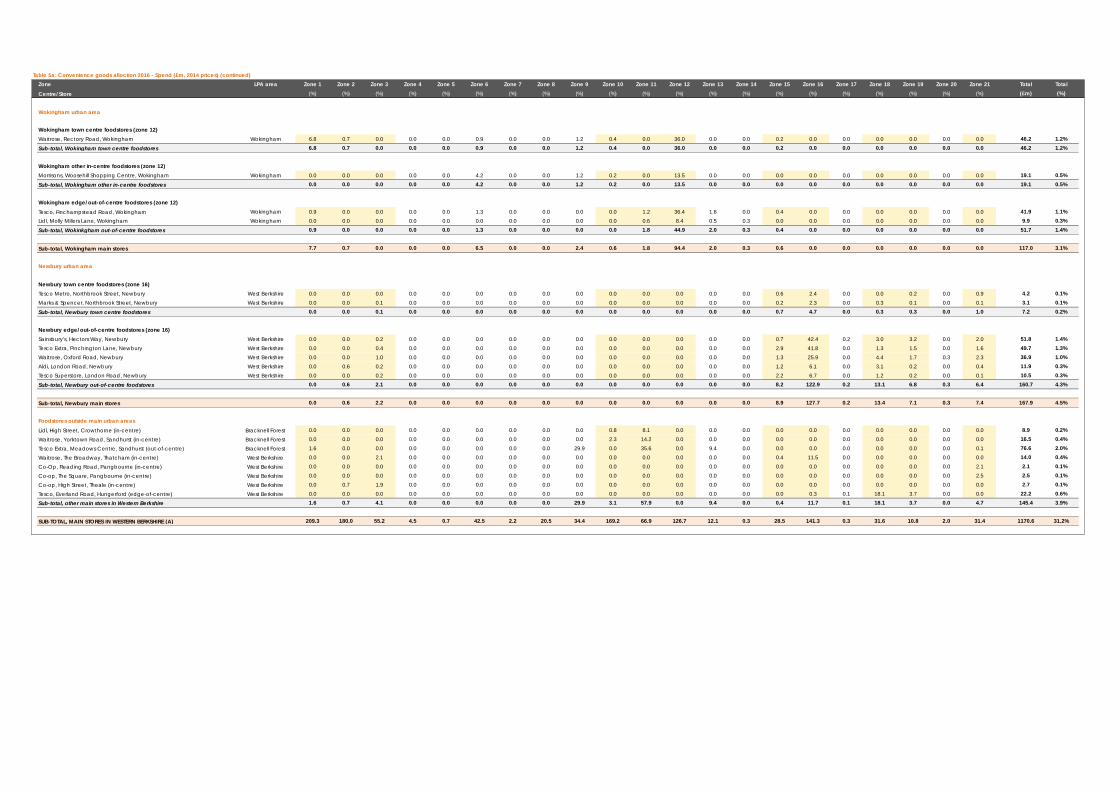
Table 5a: Convenience goods alloction 2016 - Spend (£m, 2014 prices) (continued)Zone LPA area Zone 1 Zone 2 Zone 3 Zone 4 Zone 5 Zone 6 Zone 7 Zone 8 Zone 9 Zone 10 Zone 11 Zone 12 Zone 13 Zone 14 Zone 15 Zone 16 Zone 17 Zone 18 Zone 19 Zone 20 Zone 21 Total Total
Centre/Store (%) (%) (%) (%) (%) (%) (%) (%) (%) (%) (%) (%) (%) (%) (%) (%) (%) (%) (%) (%) (%) (£m) (%)
Wokingham urban area
Wokingham town centre foodstores (zone 12)Waitrose, Rectory Road, Wokingham Wokingham 6.8 0.7 0.0 0.0 0.0 0.9 0.0 0.0 1.2 0.4 0.0 36.0 0.0 0.0 0.2 0.0 0.0 0.0 0.0 0.0 0.0 46.2 1.2%Sub-total, Wokingham town centre foodstores 6.8 0.7 0.0 0.0 0.0 0.9 0.0 0.0 1.2 0.4 0.0 36.0 0.0 0.0 0.2 0.0 0.0 0.0 0.0 0.0 0.0 46.2 1.2%
Wokingham other in-centre foodstores (zone 12)Morrisons, Woosehill Shopping Centre, Wokingham Wokingham 0.0 0.0 0.0 0.0 0.0 4.2 0.0 0.0 1.2 0.2 0.0 13.5 0.0 0.0 0.0 0.0 0.0 0.0 0.0 0.0 0.0 19.1 0.5%Sub-total, Wokingham other in-centre foodstores 0.0 0.0 0.0 0.0 0.0 4.2 0.0 0.0 1.2 0.2 0.0 13.5 0.0 0.0 0.0 0.0 0.0 0.0 0.0 0.0 0.0 19.1 0.5%
Wokingham edge/out-of-centre foodstores (zone 12)Tesco, Finchampstead Road, Wokingham Wokingham 0.9 0.0 0.0 0.0 0.0 1.3 0.0 0.0 0.0 0.0 1.2 36.4 1.6 0.0 0.4 0.0 0.0 0.0 0.0 0.0 0.0 41.9 1.1%Lidl, Molly Millers Lane, Wokingham Wokingham 0.0 0.0 0.0 0.0 0.0 0.0 0.0 0.0 0.0 0.0 0.6 8.4 0.5 0.3 0.0 0.0 0.0 0.0 0.0 0.0 0.0 9.9 0.3%Sub-total, Wokinkgham out-of-centre foodstores 0.9 0.0 0.0 0.0 0.0 1.3 0.0 0.0 0.0 0.0 1.8 44.9 2.0 0.3 0.4 0.0 0.0 0.0 0.0 0.0 0.0 51.7 1.4%
Sub-total, Wokingham main stores 7.7 0.7 0.0 0.0 0.0 6.5 0.0 0.0 2.4 0.6 1.8 94.4 2.0 0.3 0.6 0.0 0.0 0.0 0.0 0.0 0.0 117.0 3.1%
Newbury urban area
Newbury town centre foodstores (zone 16)Tesco Metro, Northbrook Street, Newbury West Berkshire 0.0 0.0 0.0 0.0 0.0 0.0 0.0 0.0 0.0 0.0 0.0 0.0 0.0 0.0 0.6 2.4 0.0 0.0 0.2 0.0 0.9 4.2 0.1%Marks & Spencer, Northbrook Street, Newbury West Berkshire 0.0 0.0 0.1 0.0 0.0 0.0 0.0 0.0 0.0 0.0 0.0 0.0 0.0 0.0 0.2 2.3 0.0 0.3 0.1 0.0 0.1 3.1 0.1%Sub-total, Newbury town centre foodstores 0.0 0.0 0.1 0.0 0.0 0.0 0.0 0.0 0.0 0.0 0.0 0.0 0.0 0.0 0.7 4.7 0.0 0.3 0.3 0.0 1.0 7.2 0.2%
Newbury edge/out-of-centre foodstores (zone 16)Sainsbury's, Hectors Way, Newbury West Berkshire 0.0 0.0 0.2 0.0 0.0 0.0 0.0 0.0 0.0 0.0 0.0 0.0 0.0 0.0 0.7 42.4 0.2 3.0 3.2 0.0 2.0 51.8 1.4%Tesco Extra, Pinchington Lane, Newbury West Berkshire 0.0 0.0 0.4 0.0 0.0 0.0 0.0 0.0 0.0 0.0 0.0 0.0 0.0 0.0 2.9 41.8 0.0 1.3 1.5 0.0 1.6 49.7 1.3%Waitrose, Oxford Road, Newbury West Berkshire 0.0 0.0 1.0 0.0 0.0 0.0 0.0 0.0 0.0 0.0 0.0 0.0 0.0 0.0 1.3 25.9 0.0 4.4 1.7 0.3 2.3 36.9 1.0%Aldi, London Road, Newbury West Berkshire 0.0 0.6 0.2 0.0 0.0 0.0 0.0 0.0 0.0 0.0 0.0 0.0 0.0 0.0 1.2 6.1 0.0 3.1 0.2 0.0 0.4 11.9 0.3%Tesco Superstore, London Road, Newbury West Berkshire 0.0 0.0 0.2 0.0 0.0 0.0 0.0 0.0 0.0 0.0 0.0 0.0 0.0 0.0 2.2 6.7 0.0 1.2 0.2 0.0 0.1 10.5 0.3%Sub-total, Newbury out-of-centre foodstores 0.0 0.6 2.1 0.0 0.0 0.0 0.0 0.0 0.0 0.0 0.0 0.0 0.0 0.0 8.2 122.9 0.2 13.1 6.8 0.3 6.4 160.7 4.3%
Sub-total, Newbury main stores 0.0 0.6 2.2 0.0 0.0 0.0 0.0 0.0 0.0 0.0 0.0 0.0 0.0 0.0 8.9 127.7 0.2 13.4 7.1 0.3 7.4 167.9 4.5%
Foodstores outside main urban areasLidl, High Street, Crowthorne (in-centre) Bracknell Forest 0.0 0.0 0.0 0.0 0.0 0.0 0.0 0.0 0.0 0.8 8.1 0.0 0.0 0.0 0.0 0.0 0.0 0.0 0.0 0.0 0.0 8.9 0.2%Waitrose, Yorktown Road, Sandhurst (in-centre) Bracknell Forest 0.0 0.0 0.0 0.0 0.0 0.0 0.0 0.0 0.0 2.3 14.2 0.0 0.0 0.0 0.0 0.0 0.0 0.0 0.0 0.0 0.0 16.5 0.4%Tesco Extra, Meadows Centre, Sandhurst (out-of-centre) Bracknell Forest 1.6 0.0 0.0 0.0 0.0 0.0 0.0 0.0 29.9 0.0 35.6 0.0 9.4 0.0 0.0 0.0 0.0 0.0 0.0 0.0 0.1 76.6 2.0%Waitrose, The Broadway, Thatcham (in-centre) West Berkshire 0.0 0.0 2.1 0.0 0.0 0.0 0.0 0.0 0.0 0.0 0.0 0.0 0.0 0.0 0.4 11.5 0.0 0.0 0.0 0.0 0.0 14.0 0.4%Co-Op, Reading Road, Pangbourne (in-centre) West Berkshire 0.0 0.0 0.0 0.0 0.0 0.0 0.0 0.0 0.0 0.0 0.0 0.0 0.0 0.0 0.0 0.0 0.0 0.0 0.0 0.0 2.1 2.1 0.1%Co-op, The Square, Pangbourne (in-centre) West Berkshire 0.0 0.0 0.0 0.0 0.0 0.0 0.0 0.0 0.0 0.0 0.0 0.0 0.0 0.0 0.0 0.0 0.0 0.0 0.0 0.0 2.5 2.5 0.1%Co-op, High Street, Theale (in-centre) West Berkshire 0.0 0.7 1.9 0.0 0.0 0.0 0.0 0.0 0.0 0.0 0.0 0.0 0.0 0.0 0.0 0.0 0.0 0.0 0.0 0.0 0.0 2.7 0.1%Tesco, Everland Road, Hungerford (edge-of-centre) West Berkshire 0.0 0.0 0.0 0.0 0.0 0.0 0.0 0.0 0.0 0.0 0.0 0.0 0.0 0.0 0.0 0.3 0.1 18.1 3.7 0.0 0.0 22.2 0.6%Sub-total, other main stores in Western Berkshire 1.6 0.7 4.1 0.0 0.0 0.0 0.0 0.0 29.9 3.1 57.9 0.0 9.4 0.0 0.4 11.7 0.1 18.1 3.7 0.0 4.7 145.4 3.9%
SUB-TOTAL, MAIN STORES IN WESTERN BERKSHIRE (A) 209.3 180.0 55.2 4.5 0.7 42.5 2.2 20.5 34.4 169.2 66.9 126.7 12.1 0.3 28.5 141.3 0.3 31.6 10.8 2.0 31.4 1170.6 31.2%
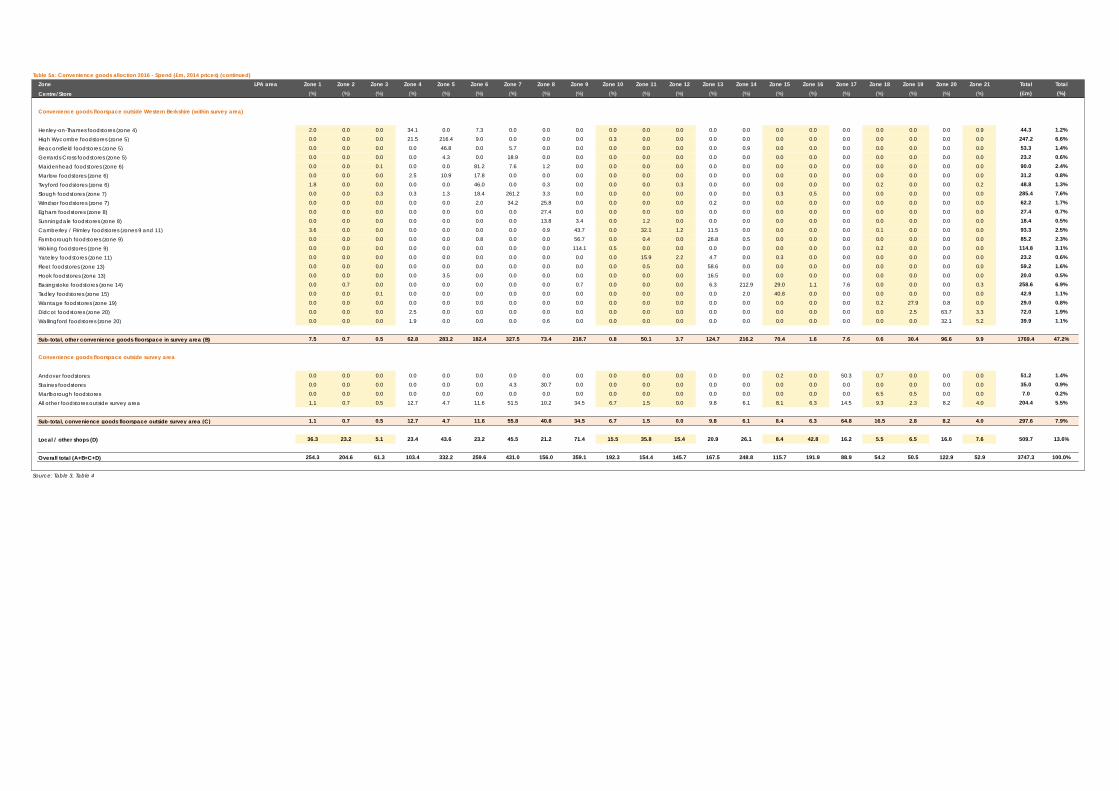
Table 5a: Convenience goods alloction 2016 - Spend (£m, 2014 prices) (continued)Zone LPA area Zone 1 Zone 2 Zone 3 Zone 4 Zone 5 Zone 6 Zone 7 Zone 8 Zone 9 Zone 10 Zone 11 Zone 12 Zone 13 Zone 14 Zone 15 Zone 16 Zone 17 Zone 18 Zone 19 Zone 20 Zone 21 Total Total
Centre/Store (%) (%) (%) (%) (%) (%) (%) (%) (%) (%) (%) (%) (%) (%) (%) (%) (%) (%) (%) (%) (%) (£m) (%)
Convenience goods floorspace outside Western Berkshire (within survey area)
Henley-on-Thames foodstores (zone 4) 2.0 0.0 0.0 34.1 0.0 7.3 0.0 0.0 0.0 0.0 0.0 0.0 0.0 0.0 0.0 0.0 0.0 0.0 0.0 0.0 0.9 44.3 1.2%High Wycombe foodstores (zone 5) 0.0 0.0 0.0 21.5 216.4 9.0 0.0 0.0 0.0 0.3 0.0 0.0 0.0 0.0 0.0 0.0 0.0 0.0 0.0 0.0 0.0 247.2 6.6%Beaconsfield foodstores (zone 5) 0.0 0.0 0.0 0.0 46.8 0.0 5.7 0.0 0.0 0.0 0.0 0.0 0.0 0.9 0.0 0.0 0.0 0.0 0.0 0.0 0.0 53.3 1.4%Gerrards Cross foodstores (zone 5) 0.0 0.0 0.0 0.0 4.3 0.0 18.9 0.0 0.0 0.0 0.0 0.0 0.0 0.0 0.0 0.0 0.0 0.0 0.0 0.0 0.0 23.2 0.6%Maidenhead foodstores (zone 6) 0.0 0.0 0.1 0.0 0.0 81.2 7.6 1.2 0.0 0.0 0.0 0.0 0.0 0.0 0.0 0.0 0.0 0.0 0.0 0.0 0.0 90.0 2.4%Marlow foodstores (zone 6) 0.0 0.0 0.0 2.5 10.9 17.8 0.0 0.0 0.0 0.0 0.0 0.0 0.0 0.0 0.0 0.0 0.0 0.0 0.0 0.0 0.0 31.2 0.8%Twyford foodstores (zone 6) 1.8 0.0 0.0 0.0 0.0 46.0 0.0 0.3 0.0 0.0 0.0 0.3 0.0 0.0 0.0 0.0 0.0 0.2 0.0 0.0 0.2 48.8 1.3%Slough foodstores (zone 7) 0.0 0.0 0.3 0.3 1.3 18.4 261.2 3.3 0.0 0.0 0.0 0.0 0.0 0.0 0.3 0.5 0.0 0.0 0.0 0.0 0.0 285.4 7.6%Windsor foodstores (zone 7) 0.0 0.0 0.0 0.0 0.0 2.0 34.2 25.8 0.0 0.0 0.0 0.0 0.2 0.0 0.0 0.0 0.0 0.0 0.0 0.0 0.0 62.2 1.7%Egham foodstores (zone 8) 0.0 0.0 0.0 0.0 0.0 0.0 0.0 27.4 0.0 0.0 0.0 0.0 0.0 0.0 0.0 0.0 0.0 0.0 0.0 0.0 0.0 27.4 0.7%Sunningdale foodstores (zone 8) 0.0 0.0 0.0 0.0 0.0 0.0 0.0 13.8 3.4 0.0 1.2 0.0 0.0 0.0 0.0 0.0 0.0 0.0 0.0 0.0 0.0 18.4 0.5%Camberley / Frimley foodstores (zones 9 and 11) 3.6 0.0 0.0 0.0 0.0 0.0 0.0 0.9 43.7 0.0 32.1 1.2 11.5 0.0 0.0 0.0 0.0 0.1 0.0 0.0 0.0 93.3 2.5%Farnborough foodstores (zone 9) 0.0 0.0 0.0 0.0 0.0 0.8 0.0 0.0 56.7 0.0 0.4 0.0 26.8 0.5 0.0 0.0 0.0 0.0 0.0 0.0 0.0 85.2 2.3%Woking foodstores (zone 9) 0.0 0.0 0.0 0.0 0.0 0.0 0.0 0.0 114.1 0.5 0.0 0.0 0.0 0.0 0.0 0.0 0.0 0.2 0.0 0.0 0.0 114.8 3.1%Yateley foodstores (zone 11) 0.0 0.0 0.0 0.0 0.0 0.0 0.0 0.0 0.0 0.0 15.9 2.2 4.7 0.0 0.3 0.0 0.0 0.0 0.0 0.0 0.0 23.2 0.6%Fleet foodstores (zone 13) 0.0 0.0 0.0 0.0 0.0 0.0 0.0 0.0 0.0 0.0 0.5 0.0 58.6 0.0 0.0 0.0 0.0 0.0 0.0 0.0 0.0 59.2 1.6%Hook foodstores (zone 13) 0.0 0.0 0.0 0.0 3.5 0.0 0.0 0.0 0.0 0.0 0.0 0.0 16.5 0.0 0.0 0.0 0.0 0.0 0.0 0.0 0.0 20.0 0.5%Basingstoke foodstores (zone 14) 0.0 0.7 0.0 0.0 0.0 0.0 0.0 0.0 0.7 0.0 0.0 0.0 6.3 212.9 29.0 1.1 7.6 0.0 0.0 0.0 0.3 258.6 6.9%Tadley foodstores (zone 15) 0.0 0.0 0.1 0.0 0.0 0.0 0.0 0.0 0.0 0.0 0.0 0.0 0.0 2.0 40.8 0.0 0.0 0.0 0.0 0.0 0.0 42.9 1.1%Wantage foodstores (zone 19) 0.0 0.0 0.0 0.0 0.0 0.0 0.0 0.0 0.0 0.0 0.0 0.0 0.0 0.0 0.0 0.0 0.0 0.2 27.9 0.8 0.0 29.0 0.8%Didcot foodstores (zone 20) 0.0 0.0 0.0 2.5 0.0 0.0 0.0 0.0 0.0 0.0 0.0 0.0 0.0 0.0 0.0 0.0 0.0 0.0 2.5 63.7 3.3 72.0 1.9%Wallingford foodstores (zone 20) 0.0 0.0 0.0 1.9 0.0 0.0 0.0 0.6 0.0 0.0 0.0 0.0 0.0 0.0 0.0 0.0 0.0 0.0 0.0 32.1 5.2 39.9 1.1%
Sub-total, other convenience goods floorspace in survey area (B) 7.5 0.7 0.5 62.8 283.2 182.4 327.5 73.4 218.7 0.8 50.1 3.7 124.7 216.2 70.4 1.6 7.6 0.6 30.4 96.6 9.9 1769.4 47.2%
Convenience goods floorspace outside survey area
Andover foodstores 0.0 0.0 0.0 0.0 0.0 0.0 0.0 0.0 0.0 0.0 0.0 0.0 0.0 0.0 0.2 0.0 50.3 0.7 0.0 0.0 0.0 51.2 1.4%Staines foodstores 0.0 0.0 0.0 0.0 0.0 0.0 4.3 30.7 0.0 0.0 0.0 0.0 0.0 0.0 0.0 0.0 0.0 0.0 0.0 0.0 0.0 35.0 0.9%Marlborough foodstores 0.0 0.0 0.0 0.0 0.0 0.0 0.0 0.0 0.0 0.0 0.0 0.0 0.0 0.0 0.0 0.0 0.0 6.5 0.5 0.0 0.0 7.0 0.2%All other foodstores outside survey area 1.1 0.7 0.5 12.7 4.7 11.6 51.5 10.2 34.5 6.7 1.5 0.0 9.8 6.1 8.1 6.3 14.5 9.3 2.3 8.2 4.0 204.4 5.5%
Sub-total, convenience goods floorspace outside survey area (C) 1.1 0.7 0.5 12.7 4.7 11.6 55.8 40.8 34.5 6.7 1.5 0.0 9.8 6.1 8.4 6.3 64.8 16.5 2.8 8.2 4.0 297.6 7.9%
Local / other shops (D) 36.3 23.2 5.1 23.4 43.6 23.2 45.5 21.2 71.4 15.5 35.8 15.4 20.9 26.1 8.4 42.8 16.2 5.5 6.5 16.0 7.6 509.7 13.6%
Overall total (A+B+C+D) 254.3 204.6 61.3 103.4 332.2 259.6 431.0 156.0 359.1 192.3 154.4 145.7 167.5 248.8 115.7 191.9 88.9 54.2 50.5 122.9 52.9 3747.3 100.0%
Source: Table 3, Table 4
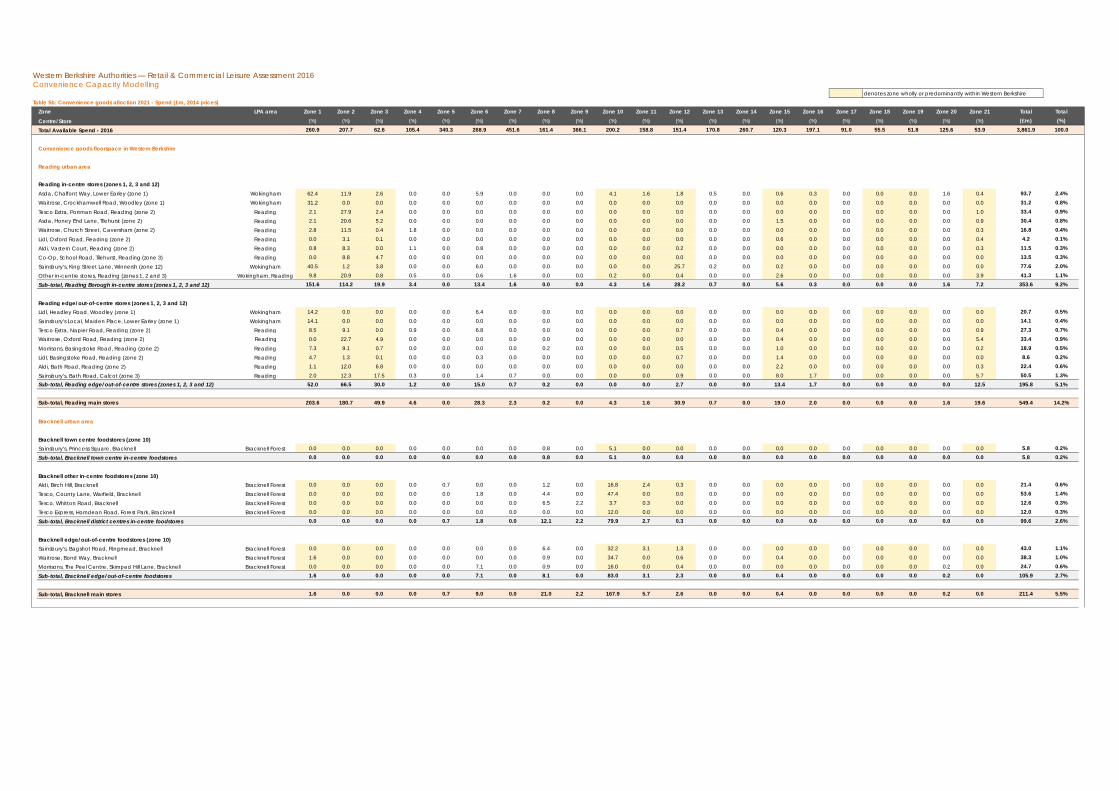
Western Berkshire Authorities — Retail & Commercial Leisure Assessment 2016Convenience Capacity Modelling
denotes zone wholly or predominantly within Western BerkshireTable 5b: Convenience goods alloction 2021 - Spend (£m, 2014 prices)
Zone LPA area Zone 1 Zone 2 Zone 3 Zone 4 Zone 5 Zone 6 Zone 7 Zone 8 Zone 9 Zone 10 Zone 11 Zone 12 Zone 13 Zone 14 Zone 15 Zone 16 Zone 17 Zone 18 Zone 19 Zone 20 Zone 21 Total Total
Centre/Store (%) (%) (%) (%) (%) (%) (%) (%) (%) (%) (%) (%) (%) (%) (%) (%) (%) (%) (%) (%) (%) (£m) (%)
Total Available Spend - 2016 260.9 207.7 62.6 105.4 340.3 268.9 451.6 161.4 366.1 200.2 158.8 151.4 170.8 260.7 120.3 197.1 91.0 55.5 51.8 125.6 53.9 3,861.9 100.0
Convenience goods floorspace in Western Berkshire
Reading urban area
Reading in-centre stores (zones 1, 2, 3 and 12)Asda, Chalfont Way, Lower Earley (zone 1) Wokingham 62.4 11.9 2.6 0.0 0.0 5.9 0.0 0.0 0.0 4.1 1.6 1.8 0.5 0.0 0.6 0.3 0.0 0.0 0.0 1.6 0.4 93.7 2.4%Waitrose, Crockhamwell Road, Woodley (zone 1) Wokingham 31.2 0.0 0.0 0.0 0.0 0.0 0.0 0.0 0.0 0.0 0.0 0.0 0.0 0.0 0.0 0.0 0.0 0.0 0.0 0.0 0.0 31.2 0.8%Tesco Extra, Portman Road, Reading (zone 2) Reading 2.1 27.9 2.4 0.0 0.0 0.0 0.0 0.0 0.0 0.0 0.0 0.0 0.0 0.0 0.0 0.0 0.0 0.0 0.0 0.0 1.0 33.4 0.9%Asda, Honey End Lane, Tilehurst (zone 2) Reading 2.1 20.6 5.2 0.0 0.0 0.0 0.0 0.0 0.0 0.0 0.0 0.0 0.0 0.0 1.5 0.0 0.0 0.0 0.0 0.0 0.9 30.4 0.8%Waitrose, Church Street, Caversham (zone 2) Reading 2.8 11.5 0.4 1.8 0.0 0.0 0.0 0.0 0.0 0.0 0.0 0.0 0.0 0.0 0.0 0.0 0.0 0.0 0.0 0.0 0.3 16.8 0.4%Lidl, Oxford Road, Reading (zone 2) Reading 0.0 3.1 0.1 0.0 0.0 0.0 0.0 0.0 0.0 0.0 0.0 0.0 0.0 0.0 0.6 0.0 0.0 0.0 0.0 0.0 0.4 4.2 0.1%Aldi, Vastern Court, Reading (zone 2) Reading 0.8 8.3 0.0 1.1 0.0 0.8 0.0 0.0 0.0 0.0 0.0 0.2 0.0 0.0 0.0 0.0 0.0 0.0 0.0 0.0 0.3 11.5 0.3%Co-Op, School Road, Tilehurst, Reading (zone 3) Reading 0.0 8.8 4.7 0.0 0.0 0.0 0.0 0.0 0.0 0.0 0.0 0.0 0.0 0.0 0.0 0.0 0.0 0.0 0.0 0.0 0.0 13.5 0.3%Sainsbury's, King Street Lane, Winnersh (zone 12) Wokingham 40.5 1.2 3.8 0.0 0.0 6.0 0.0 0.0 0.0 0.0 0.0 25.7 0.2 0.0 0.2 0.0 0.0 0.0 0.0 0.0 0.0 77.6 2.0%Other in-centre stores, Reading (zones 1, 2 and 3) Wokingham, Reading 9.8 20.9 0.8 0.5 0.0 0.6 1.6 0.0 0.0 0.2 0.0 0.4 0.0 0.0 2.6 0.0 0.0 0.0 0.0 0.0 3.9 41.3 1.1%Sub-total, Reading Borough in-centre stores (zones 1, 2, 3 and 12) 151.6 114.2 19.9 3.4 0.0 13.4 1.6 0.0 0.0 4.3 1.6 28.2 0.7 0.0 5.6 0.3 0.0 0.0 0.0 1.6 7.2 353.6 9.2%
Reading edge/out-of-centre stores (zones 1, 2, 3 and 12)Lidl, Headley Road, Woodley (zone 1) Wokingham 14.2 0.0 0.0 0.0 0.0 6.4 0.0 0.0 0.0 0.0 0.0 0.0 0.0 0.0 0.0 0.0 0.0 0.0 0.0 0.0 0.0 20.7 0.5%Sainsbury's Local, Maiden Place, Lower Earley (zone 1) Wokingham 14.1 0.0 0.0 0.0 0.0 0.0 0.0 0.0 0.0 0.0 0.0 0.0 0.0 0.0 0.0 0.0 0.0 0.0 0.0 0.0 0.0 14.1 0.4%Tesco Extra, Napier Road, Reading (zone 2) Reading 8.5 9.1 0.0 0.9 0.0 6.8 0.0 0.0 0.0 0.0 0.0 0.7 0.0 0.0 0.4 0.0 0.0 0.0 0.0 0.0 0.9 27.3 0.7%Waitrose, Oxford Road, Reading (zone 2) Reading 0.0 22.7 4.9 0.0 0.0 0.0 0.0 0.0 0.0 0.0 0.0 0.0 0.0 0.0 0.4 0.0 0.0 0.0 0.0 0.0 5.4 33.4 0.9%Morrisons, Basingstoke Road, Reading (zone 2) Reading 7.3 9.1 0.7 0.0 0.0 0.0 0.0 0.2 0.0 0.0 0.0 0.5 0.0 0.0 1.0 0.0 0.0 0.0 0.0 0.0 0.2 18.9 0.5%Lidl, Basingstoke Road, Reading (zone 2) Reading 4.7 1.3 0.1 0.0 0.0 0.3 0.0 0.0 0.0 0.0 0.0 0.7 0.0 0.0 1.4 0.0 0.0 0.0 0.0 0.0 0.0 8.6 0.2%Aldi, Bath Road, Reading (zone 2) Reading 1.1 12.0 6.8 0.0 0.0 0.0 0.0 0.0 0.0 0.0 0.0 0.0 0.0 0.0 2.2 0.0 0.0 0.0 0.0 0.0 0.3 22.4 0.6%Sainsbury's, Bath Road, Calcot (zone 3) Reading 2.0 12.3 17.5 0.3 0.0 1.4 0.7 0.0 0.0 0.0 0.0 0.9 0.0 0.0 8.0 1.7 0.0 0.0 0.0 0.0 5.7 50.5 1.3%Sub-total, Reading edge/out-of-centre stores (zones 1, 2, 3 and 12) 52.0 66.5 30.0 1.2 0.0 15.0 0.7 0.2 0.0 0.0 0.0 2.7 0.0 0.0 13.4 1.7 0.0 0.0 0.0 0.0 12.5 195.8 5.1%
Sub-total, Reading main stores 203.6 180.7 49.9 4.6 0.0 28.3 2.3 0.2 0.0 4.3 1.6 30.9 0.7 0.0 19.0 2.0 0.0 0.0 0.0 1.6 19.6 549.4 14.2%
Bracknell urban area
Bracknell town centre foodstores (zone 10)Sainsbury's, Princess Square, Bracknell Bracknell Forest 0.0 0.0 0.0 0.0 0.0 0.0 0.0 0.8 0.0 5.1 0.0 0.0 0.0 0.0 0.0 0.0 0.0 0.0 0.0 0.0 0.0 5.8 0.2%Sub-total, Bracknell town centre in-centre foodstores 0.0 0.0 0.0 0.0 0.0 0.0 0.0 0.8 0.0 5.1 0.0 0.0 0.0 0.0 0.0 0.0 0.0 0.0 0.0 0.0 0.0 5.8 0.2%
Bracknell other in-centre foodstores (zone 10)Aldi, Birch Hill, Bracknell Bracknell Forest 0.0 0.0 0.0 0.0 0.7 0.0 0.0 1.2 0.0 16.8 2.4 0.3 0.0 0.0 0.0 0.0 0.0 0.0 0.0 0.0 0.0 21.4 0.6%Tesco, County Lane, Warfield, Bracknell Bracknell Forest 0.0 0.0 0.0 0.0 0.0 1.8 0.0 4.4 0.0 47.4 0.0 0.0 0.0 0.0 0.0 0.0 0.0 0.0 0.0 0.0 0.0 53.6 1.4%Tesco, Whitton Road, Bracknell Bracknell Forest 0.0 0.0 0.0 0.0 0.0 0.0 0.0 6.5 2.2 3.7 0.3 0.0 0.0 0.0 0.0 0.0 0.0 0.0 0.0 0.0 0.0 12.6 0.3%Tesco Express, Horndean Road, Forest Park, Bracknell Bracknell Forest 0.0 0.0 0.0 0.0 0.0 0.0 0.0 0.0 0.0 12.0 0.0 0.0 0.0 0.0 0.0 0.0 0.0 0.0 0.0 0.0 0.0 12.0 0.3%Sub-total, Bracknell district centres in-centre foodstores 0.0 0.0 0.0 0.0 0.7 1.8 0.0 12.1 2.2 79.9 2.7 0.3 0.0 0.0 0.0 0.0 0.0 0.0 0.0 0.0 0.0 99.6 2.6%
Bracknell edge/out-of-centre foodstores (zone 10)Sainsbury's, Bagshot Road, Ringmead, Bracknell Bracknell Forest 0.0 0.0 0.0 0.0 0.0 0.0 0.0 6.4 0.0 32.2 3.1 1.3 0.0 0.0 0.0 0.0 0.0 0.0 0.0 0.0 0.0 43.0 1.1%Waitrose, Bond Way, Bracknell Bracknell Forest 1.6 0.0 0.0 0.0 0.0 0.0 0.0 0.9 0.0 34.7 0.0 0.6 0.0 0.0 0.4 0.0 0.0 0.0 0.0 0.0 0.0 38.3 1.0%Morrisons, The Peel Centre, Skimped Hill Lane, Bracknell Bracknell Forest 0.0 0.0 0.0 0.0 0.0 7.1 0.0 0.9 0.0 16.0 0.0 0.4 0.0 0.0 0.0 0.0 0.0 0.0 0.0 0.2 0.0 24.7 0.6%Sub-total, Bracknell edge/out-of-centre foodstores 1.6 0.0 0.0 0.0 0.0 7.1 0.0 8.1 0.0 83.0 3.1 2.3 0.0 0.0 0.4 0.0 0.0 0.0 0.0 0.2 0.0 105.9 2.7%
Sub-total, Bracknell main stores 1.6 0.0 0.0 0.0 0.7 9.0 0.0 21.0 2.2 167.9 5.7 2.6 0.0 0.0 0.4 0.0 0.0 0.0 0.0 0.2 0.0 211.4 5.5%
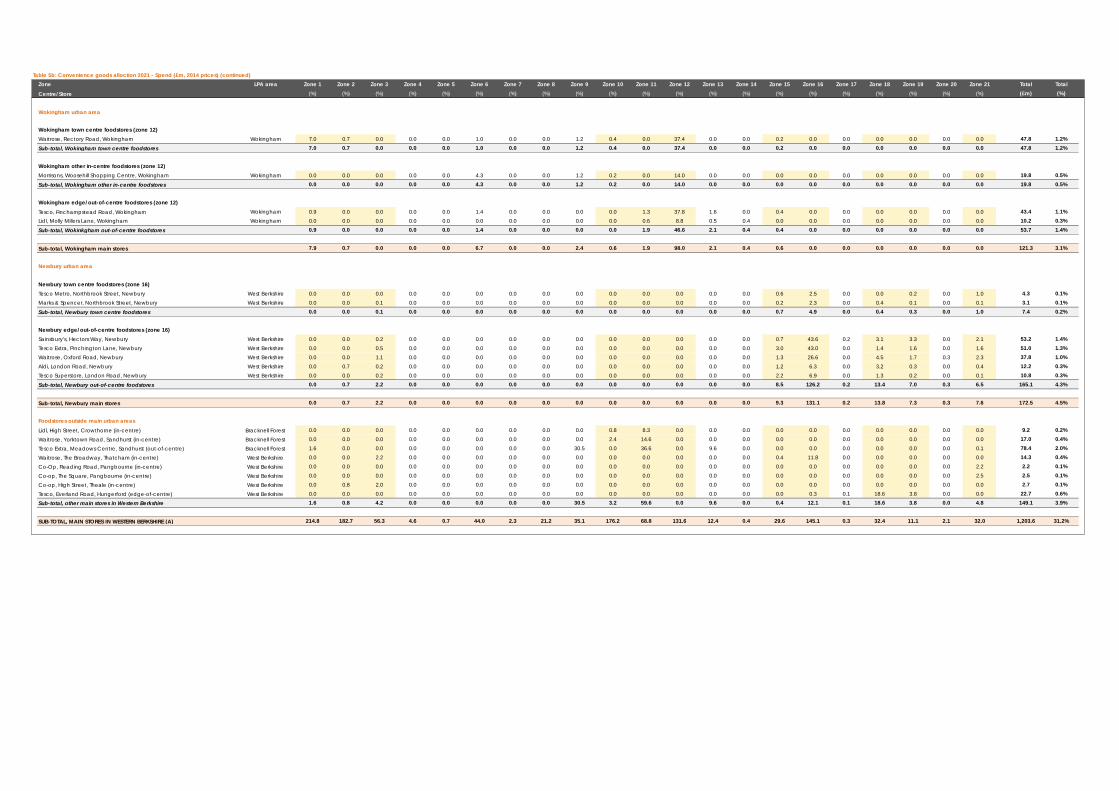
Table 5b: Convenience goods alloction 2021 - Spend (£m, 2014 prices) (continued)Zone LPA area Zone 1 Zone 2 Zone 3 Zone 4 Zone 5 Zone 6 Zone 7 Zone 8 Zone 9 Zone 10 Zone 11 Zone 12 Zone 13 Zone 14 Zone 15 Zone 16 Zone 17 Zone 18 Zone 19 Zone 20 Zone 21 Total Total
Centre/Store (%) (%) (%) (%) (%) (%) (%) (%) (%) (%) (%) (%) (%) (%) (%) (%) (%) (%) (%) (%) (%) (£m) (%)
Wokingham urban area
Wokingham town centre foodstores (zone 12)Waitrose, Rectory Road, Wokingham Wokingham 7.0 0.7 0.0 0.0 0.0 1.0 0.0 0.0 1.2 0.4 0.0 37.4 0.0 0.0 0.2 0.0 0.0 0.0 0.0 0.0 0.0 47.8 1.2%Sub-total, Wokingham town centre foodstores 7.0 0.7 0.0 0.0 0.0 1.0 0.0 0.0 1.2 0.4 0.0 37.4 0.0 0.0 0.2 0.0 0.0 0.0 0.0 0.0 0.0 47.8 1.2%
Wokingham other in-centre foodstores (zone 12)Morrisons, Woosehill Shopping Centre, Wokingham Wokingham 0.0 0.0 0.0 0.0 0.0 4.3 0.0 0.0 1.2 0.2 0.0 14.0 0.0 0.0 0.0 0.0 0.0 0.0 0.0 0.0 0.0 19.8 0.5%Sub-total, Wokingham other in-centre foodstores 0.0 0.0 0.0 0.0 0.0 4.3 0.0 0.0 1.2 0.2 0.0 14.0 0.0 0.0 0.0 0.0 0.0 0.0 0.0 0.0 0.0 19.8 0.5%
Wokingham edge/out-of-centre foodstores (zone 12)Tesco, Finchampstead Road, Wokingham Wokingham 0.9 0.0 0.0 0.0 0.0 1.4 0.0 0.0 0.0 0.0 1.3 37.8 1.6 0.0 0.4 0.0 0.0 0.0 0.0 0.0 0.0 43.4 1.1%Lidl, Molly Millers Lane, Wokingham Wokingham 0.0 0.0 0.0 0.0 0.0 0.0 0.0 0.0 0.0 0.0 0.6 8.8 0.5 0.4 0.0 0.0 0.0 0.0 0.0 0.0 0.0 10.2 0.3%Sub-total, Wokinkgham out-of-centre foodstores 0.9 0.0 0.0 0.0 0.0 1.4 0.0 0.0 0.0 0.0 1.9 46.6 2.1 0.4 0.4 0.0 0.0 0.0 0.0 0.0 0.0 53.7 1.4%
Sub-total, Wokingham main stores 7.9 0.7 0.0 0.0 0.0 6.7 0.0 0.0 2.4 0.6 1.9 98.0 2.1 0.4 0.6 0.0 0.0 0.0 0.0 0.0 0.0 121.3 3.1%
Newbury urban area
Newbury town centre foodstores (zone 16)Tesco Metro, Northbrook Street, Newbury West Berkshire 0.0 0.0 0.0 0.0 0.0 0.0 0.0 0.0 0.0 0.0 0.0 0.0 0.0 0.0 0.6 2.5 0.0 0.0 0.2 0.0 1.0 4.3 0.1%Marks & Spencer, Northbrook Street, Newbury West Berkshire 0.0 0.0 0.1 0.0 0.0 0.0 0.0 0.0 0.0 0.0 0.0 0.0 0.0 0.0 0.2 2.3 0.0 0.4 0.1 0.0 0.1 3.1 0.1%Sub-total, Newbury town centre foodstores 0.0 0.0 0.1 0.0 0.0 0.0 0.0 0.0 0.0 0.0 0.0 0.0 0.0 0.0 0.7 4.9 0.0 0.4 0.3 0.0 1.0 7.4 0.2%
Newbury edge/out-of-centre foodstores (zone 16)Sainsbury's, Hectors Way, Newbury West Berkshire 0.0 0.0 0.2 0.0 0.0 0.0 0.0 0.0 0.0 0.0 0.0 0.0 0.0 0.0 0.7 43.6 0.2 3.1 3.3 0.0 2.1 53.2 1.4%Tesco Extra, Pinchington Lane, Newbury West Berkshire 0.0 0.0 0.5 0.0 0.0 0.0 0.0 0.0 0.0 0.0 0.0 0.0 0.0 0.0 3.0 43.0 0.0 1.4 1.6 0.0 1.6 51.0 1.3%Waitrose, Oxford Road, Newbury West Berkshire 0.0 0.0 1.1 0.0 0.0 0.0 0.0 0.0 0.0 0.0 0.0 0.0 0.0 0.0 1.3 26.6 0.0 4.5 1.7 0.3 2.3 37.8 1.0%Aldi, London Road, Newbury West Berkshire 0.0 0.7 0.2 0.0 0.0 0.0 0.0 0.0 0.0 0.0 0.0 0.0 0.0 0.0 1.2 6.3 0.0 3.2 0.3 0.0 0.4 12.2 0.3%Tesco Superstore, London Road, Newbury West Berkshire 0.0 0.0 0.2 0.0 0.0 0.0 0.0 0.0 0.0 0.0 0.0 0.0 0.0 0.0 2.2 6.9 0.0 1.3 0.2 0.0 0.1 10.8 0.3%Sub-total, Newbury out-of-centre foodstores 0.0 0.7 2.2 0.0 0.0 0.0 0.0 0.0 0.0 0.0 0.0 0.0 0.0 0.0 8.5 126.2 0.2 13.4 7.0 0.3 6.5 165.1 4.3%
Sub-total, Newbury main stores 0.0 0.7 2.2 0.0 0.0 0.0 0.0 0.0 0.0 0.0 0.0 0.0 0.0 0.0 9.3 131.1 0.2 13.8 7.3 0.3 7.6 172.5 4.5%
Foodstores outside main urban areasLidl, High Street, Crowthorne (in-centre) Bracknell Forest 0.0 0.0 0.0 0.0 0.0 0.0 0.0 0.0 0.0 0.8 8.3 0.0 0.0 0.0 0.0 0.0 0.0 0.0 0.0 0.0 0.0 9.2 0.2%Waitrose, Yorktown Road, Sandhurst (in-centre) Bracknell Forest 0.0 0.0 0.0 0.0 0.0 0.0 0.0 0.0 0.0 2.4 14.6 0.0 0.0 0.0 0.0 0.0 0.0 0.0 0.0 0.0 0.0 17.0 0.4%Tesco Extra, Meadows Centre, Sandhurst (out-of-centre) Bracknell Forest 1.6 0.0 0.0 0.0 0.0 0.0 0.0 0.0 30.5 0.0 36.6 0.0 9.6 0.0 0.0 0.0 0.0 0.0 0.0 0.0 0.1 78.4 2.0%Waitrose, The Broadway, Thatcham (in-centre) West Berkshire 0.0 0.0 2.2 0.0 0.0 0.0 0.0 0.0 0.0 0.0 0.0 0.0 0.0 0.0 0.4 11.8 0.0 0.0 0.0 0.0 0.0 14.3 0.4%Co-Op, Reading Road, Pangbourne (in-centre) West Berkshire 0.0 0.0 0.0 0.0 0.0 0.0 0.0 0.0 0.0 0.0 0.0 0.0 0.0 0.0 0.0 0.0 0.0 0.0 0.0 0.0 2.2 2.2 0.1%Co-op, The Square, Pangbourne (in-centre) West Berkshire 0.0 0.0 0.0 0.0 0.0 0.0 0.0 0.0 0.0 0.0 0.0 0.0 0.0 0.0 0.0 0.0 0.0 0.0 0.0 0.0 2.5 2.5 0.1%Co-op, High Street, Theale (in-centre) West Berkshire 0.0 0.8 2.0 0.0 0.0 0.0 0.0 0.0 0.0 0.0 0.0 0.0 0.0 0.0 0.0 0.0 0.0 0.0 0.0 0.0 0.0 2.7 0.1%Tesco, Everland Road, Hungerford (edge-of-centre) West Berkshire 0.0 0.0 0.0 0.0 0.0 0.0 0.0 0.0 0.0 0.0 0.0 0.0 0.0 0.0 0.0 0.3 0.1 18.6 3.8 0.0 0.0 22.7 0.6%Sub-total, other main stores in Western Berkshire 1.6 0.8 4.2 0.0 0.0 0.0 0.0 0.0 30.5 3.2 59.6 0.0 9.6 0.0 0.4 12.1 0.1 18.6 3.8 0.0 4.8 149.1 3.9%
SUB-TOTAL, MAIN STORES IN WESTERN BERKSHIRE (A) 214.8 182.7 56.3 4.6 0.7 44.0 2.3 21.2 35.1 176.2 68.8 131.6 12.4 0.4 29.6 145.1 0.3 32.4 11.1 2.1 32.0 1,203.6 31.2%

Table 5b: Convenience goods alloction 2021 - Spend (£m, 2014 prices) (continued)Zone LPA area Zone 1 Zone 2 Zone 3 Zone 4 Zone 5 Zone 6 Zone 7 Zone 8 Zone 9 Zone 10 Zone 11 Zone 12 Zone 13 Zone 14 Zone 15 Zone 16 Zone 17 Zone 18 Zone 19 Zone 20 Zone 21 Total Total
Centre/Store (%) (%) (%) (%) (%) (%) (%) (%) (%) (%) (%) (%) (%) (%) (%) (%) (%) (%) (%) (%) (%) (£m) (%)
Convenience goods floorspace outside Western Berkshire (within survey area)
Henley-on-Thames foodstores (zone 4) 2.1 0.0 0.0 34.7 0.0 7.6 0.0 0.0 0.0 0.0 0.0 0.0 0.0 0.0 0.0 0.0 0.0 0.0 0.0 0.0 0.9 45.3 1.2%High Wycombe foodstores (zone 5) 0.0 0.0 0.0 21.9 221.7 9.3 0.0 0.0 0.0 0.4 0.0 0.0 0.0 0.0 0.0 0.0 0.0 0.0 0.0 0.0 0.0 253.3 6.6%Beaconsfield foodstores (zone 5) 0.0 0.0 0.0 0.0 47.9 0.0 6.0 0.0 0.0 0.0 0.0 0.0 0.0 0.9 0.0 0.0 0.0 0.0 0.0 0.0 0.0 54.8 1.4%Gerrards Cross foodstores (zone 5) 0.0 0.0 0.0 0.0 4.4 0.0 19.8 0.0 0.0 0.0 0.0 0.0 0.0 0.0 0.0 0.0 0.0 0.0 0.0 0.0 0.0 24.2 0.6%Maidenhead foodstores (zone 6) 0.0 0.0 0.1 0.0 0.0 84.0 7.9 1.2 0.0 0.0 0.0 0.0 0.0 0.0 0.0 0.0 0.0 0.0 0.0 0.0 0.0 93.3 2.4%Marlow foodstores (zone 6) 0.0 0.0 0.0 2.6 11.2 18.4 0.0 0.0 0.0 0.0 0.0 0.0 0.0 0.0 0.0 0.0 0.0 0.0 0.0 0.0 0.0 32.2 0.8%Twyford foodstores (zone 6) 1.8 0.0 0.0 0.0 0.0 47.7 0.0 0.4 0.0 0.0 0.0 0.3 0.0 0.0 0.0 0.0 0.0 0.2 0.0 0.0 0.2 50.5 1.3%Slough foodstores (zone 7) 0.0 0.0 0.3 0.3 1.3 19.0 273.6 3.4 0.0 0.0 0.0 0.0 0.0 0.0 0.3 0.5 0.0 0.0 0.0 0.0 0.0 298.7 7.7%Windsor foodstores (zone 7) 0.0 0.0 0.0 0.0 0.0 2.1 35.8 26.7 0.0 0.0 0.0 0.0 0.2 0.0 0.0 0.0 0.0 0.0 0.0 0.0 0.0 64.8 1.7%Egham foodstores (zone 8) 0.0 0.0 0.0 0.0 0.0 0.0 0.0 28.3 0.0 0.0 0.0 0.0 0.0 0.0 0.0 0.0 0.0 0.0 0.0 0.0 0.0 28.3 0.7%Sunningdale foodstores (zone 8) 0.0 0.0 0.0 0.0 0.0 0.0 0.0 14.3 3.5 0.0 1.2 0.0 0.0 0.0 0.0 0.0 0.0 0.0 0.0 0.0 0.0 19.0 0.5%Camberley / Frimley foodstores (zones 9 and 11) 3.7 0.0 0.0 0.0 0.0 0.0 0.0 1.0 44.6 0.0 33.0 1.3 11.8 0.0 0.0 0.0 0.0 0.1 0.0 0.0 0.0 95.4 2.5%Farnborough foodstores (zone 9) 0.0 0.0 0.0 0.0 0.0 0.8 0.0 0.0 57.8 0.0 0.4 0.0 27.3 0.5 0.0 0.0 0.0 0.0 0.0 0.0 0.0 86.9 2.2%Woking foodstores (zone 9) 0.0 0.0 0.0 0.0 0.0 0.0 0.0 0.0 116.3 0.5 0.0 0.0 0.0 0.0 0.0 0.0 0.0 0.2 0.0 0.0 0.0 117.0 3.0%Yateley foodstores (zone 11) 0.0 0.0 0.0 0.0 0.0 0.0 0.0 0.0 0.0 0.0 16.4 2.2 4.8 0.0 0.3 0.0 0.0 0.0 0.0 0.0 0.0 23.8 0.6%Fleet foodstores (zone 13) 0.0 0.0 0.0 0.0 0.0 0.0 0.0 0.0 0.0 0.0 0.5 0.0 59.8 0.0 0.0 0.0 0.0 0.0 0.0 0.0 0.0 60.3 1.6%Hook foodstores (zone 13) 0.0 0.0 0.0 0.0 3.6 0.0 0.0 0.0 0.0 0.0 0.0 0.0 16.8 0.0 0.0 0.0 0.0 0.0 0.0 0.0 0.0 20.5 0.5%Basingstoke foodstores (zone 14) 0.0 0.8 0.0 0.0 0.0 0.0 0.0 0.0 0.7 0.0 0.0 0.0 6.4 223.1 30.1 1.1 7.8 0.0 0.0 0.0 0.3 270.3 7.0%Tadley foodstores (zone 15) 0.0 0.0 0.1 0.0 0.0 0.0 0.0 0.0 0.0 0.0 0.0 0.0 0.0 2.1 42.4 0.0 0.0 0.0 0.0 0.0 0.0 44.6 1.2%Wantage foodstores (zone 19) 0.0 0.0 0.0 0.0 0.0 0.0 0.0 0.0 0.0 0.0 0.0 0.0 0.0 0.0 0.0 0.0 0.0 0.2 28.6 0.9 0.0 29.7 0.8%Didcot foodstores (zone 20) 0.0 0.0 0.0 2.5 0.0 0.0 0.0 0.0 0.0 0.0 0.0 0.0 0.0 0.0 0.0 0.0 0.0 0.0 2.6 65.0 3.4 73.5 1.9%Wallingford foodstores (zone 20) 0.0 0.0 0.0 2.0 0.0 0.0 0.0 0.7 0.0 0.0 0.0 0.0 0.0 0.0 0.0 0.0 0.0 0.0 0.0 32.8 5.3 40.7 1.1%
Sub-total, other convenience goods floorspace in survey area (B) 7.7 0.8 0.5 64.0 290.1 188.9 343.1 76.0 223.0 0.9 51.5 3.8 127.1 226.5 73.2 1.6 7.8 0.6 31.2 98.7 10.1 1,827.2 47.3%
Convenience goods floorspace outside survey area
Andover foodstores 0.0 0.0 0.0 0.0 0.0 0.0 0.0 0.0 0.0 0.0 0.0 0.0 0.0 0.0 0.2 0.0 51.5 0.7 0.0 0.0 0.0 52.4 1.4%Staines foodstores 0.0 0.0 0.0 0.0 0.0 0.0 4.5 31.7 0.0 0.0 0.0 0.0 0.0 0.0 0.0 0.0 0.0 0.0 0.0 0.0 0.0 36.3 0.9%Marlborough foodstores 0.0 0.0 0.0 0.0 0.0 0.0 0.0 0.0 0.0 0.0 0.0 0.0 0.0 0.0 0.0 0.0 0.0 6.7 0.5 0.0 0.0 7.1 0.2%All other foodstores outside survey area 1.2 0.7 0.5 13.0 4.8 12.0 54.0 10.5 35.2 7.0 1.5 0.0 10.0 6.4 8.5 6.5 14.8 9.6 2.4 8.4 4.1 210.9 5.5%
Sub-total, convenience goods floorspace outside survey area (C) 1.2 0.7 0.5 13.0 4.8 12.0 58.5 42.3 35.2 7.0 1.5 0.0 10.0 6.4 8.7 6.5 66.3 16.9 2.9 8.4 4.1 306.7 7.9%
Local / other shops (D) 37.3 23.6 5.2 23.8 44.7 24.0 47.7 22.0 72.8 16.2 36.9 16.0 21.3 27.4 8.7 43.9 16.6 5.6 6.7 16.3 7.8 524.3 13.6%
Overall total (A+B+C+D) 260.9 207.7 62.6 105.4 340.3 268.9 451.6 161.4 366.1 200.2 158.8 151.4 170.8 260.7 120.3 197.1 91.0 55.5 51.8 125.6 53.9 3,861.9 100.0%
Source: Table 3, Table 4

Western Berkshire Authorities — Retail & Commercial Leisure Assessment 2016Convenience Capacity Modelling
denotes zone wholly or predominantly within Western BerkshireTable 5c: Convenience goods alloction 2026 - Spend (£m, 2014 prices)
Zone LPA area Zone 1 Zone 2 Zone 3 Zone 4 Zone 5 Zone 6 Zone 7 Zone 8 Zone 9 Zone 10 Zone 11 Zone 12 Zone 13 Zone 14 Zone 15 Zone 16 Zone 17 Zone 18 Zone 19 Zone 20 Zone 21 Total Total
Centre/Store (%) (%) (%) (%) (%) (%) (%) (%) (%) (%) (%) (%) (%) (%) (%) (%) (%) (%) (%) (%) (%) (£m) (%)
Total Available Spend - 2016 268.0 211.9 64.0 107.5 349.4 278.3 471.1 167.0 374.5 207.7 163.2 156.6 174.5 271.7 124.8 202.4 93.6 56.8 53.2 128.8 54.9 3,980.1 100.0
Convenience goods floorspace in Western Berkshire
Reading urban area
Reading in-centre stores (zones 1, 2, 3 and 12)Asda, Chalfont Way, Lower Earley (zone 1) Wokingham 64.1 12.1 2.7 0.0 0.0 6.1 0.0 0.0 0.0 4.3 1.7 1.9 0.5 0.0 0.6 0.3 0.0 0.0 0.0 1.6 0.4 96.3 2.4%Waitrose, Crockhamwell Road, Woodley (zone 1) Wokingham 32.1 0.0 0.0 0.0 0.0 0.0 0.0 0.0 0.0 0.0 0.0 0.0 0.0 0.0 0.0 0.0 0.0 0.0 0.0 0.0 0.0 32.1 0.8%Tesco Extra, Portman Road, Reading (zone 2) Reading 2.2 28.4 2.4 0.0 0.0 0.0 0.0 0.0 0.0 0.0 0.0 0.0 0.0 0.0 0.0 0.0 0.0 0.0 0.0 0.0 1.0 34.1 0.9%Asda, Honey End Lane, Tilehurst (zone 2) Reading 2.1 21.1 5.3 0.0 0.0 0.0 0.0 0.0 0.0 0.0 0.0 0.0 0.0 0.0 1.6 0.0 0.0 0.0 0.0 0.0 0.9 31.0 0.8%Waitrose, Church Street, Caversham (zone 2) Reading 2.9 11.7 0.4 1.8 0.0 0.0 0.0 0.0 0.0 0.0 0.0 0.0 0.0 0.0 0.0 0.0 0.0 0.0 0.0 0.0 0.3 17.1 0.4%Lidl, Oxford Road, Reading (zone 2) Reading 0.0 3.1 0.1 0.0 0.0 0.0 0.0 0.0 0.0 0.0 0.0 0.0 0.0 0.0 0.6 0.0 0.0 0.0 0.0 0.0 0.5 4.3 0.1%Aldi, Vastern Court, Reading (zone 2) Reading 0.8 8.4 0.0 1.1 0.0 0.9 0.0 0.0 0.0 0.0 0.0 0.3 0.0 0.0 0.0 0.0 0.0 0.0 0.0 0.0 0.3 11.7 0.3%Co-Op, School Road, Tilehurst, Reading (zone 3) Reading 0.0 9.0 4.8 0.0 0.0 0.0 0.0 0.0 0.0 0.0 0.0 0.0 0.0 0.0 0.0 0.0 0.0 0.0 0.0 0.0 0.0 13.8 0.3%Sainsbury's, King Street Lane, Winnersh (zone 12) Wokingham 41.6 1.2 3.9 0.0 0.0 6.2 0.0 0.0 0.0 0.0 0.0 26.6 0.2 0.0 0.3 0.0 0.0 0.0 0.0 0.0 0.0 79.9 2.0%Other in-centre stores, Reading (zones 1, 2 and 3) Wokingham, Reading 10.0 21.3 0.8 0.5 0.0 0.7 1.6 0.0 0.0 0.2 0.0 0.4 0.0 0.0 2.7 0.0 0.0 0.0 0.0 0.0 3.9 42.3 1.1%Sub-total, Reading Borough in-centre stores (zones 1, 2, 3 and 12) 155.8 116.5 20.4 3.5 0.0 13.8 1.6 0.0 0.0 4.5 1.7 29.2 0.7 0.0 5.8 0.3 0.0 0.0 0.0 1.6 7.3 362.7 9.1%
Reading edge/out-of-centre stores (zones 1, 2, 3 and 12)Lidl, Headley Road, Woodley (zone 1) Wokingham 14.6 0.0 0.0 0.0 0.0 6.7 0.0 0.0 0.0 0.0 0.0 0.0 0.0 0.0 0.0 0.0 0.0 0.0 0.0 0.0 0.0 21.3 0.5%Sainsbury's Local, Maiden Place, Lower Earley (zone 1) Wokingham 14.5 0.0 0.0 0.0 0.0 0.0 0.0 0.0 0.0 0.0 0.0 0.0 0.0 0.0 0.0 0.0 0.0 0.0 0.0 0.0 0.0 14.5 0.4%Tesco Extra, Napier Road, Reading (zone 2) Reading 8.8 9.3 0.0 0.9 0.0 7.0 0.0 0.0 0.0 0.0 0.0 0.7 0.0 0.0 0.4 0.0 0.0 0.0 0.0 0.0 1.0 28.1 0.7%Waitrose, Oxford Road, Reading (zone 2) Reading 0.0 23.1 5.0 0.0 0.0 0.0 0.0 0.0 0.0 0.0 0.0 0.0 0.0 0.0 0.4 0.0 0.0 0.0 0.0 0.0 5.5 34.0 0.9%Morrisons, Basingstoke Road, Reading (zone 2) Reading 7.5 9.2 0.7 0.0 0.0 0.0 0.0 0.2 0.0 0.0 0.0 0.5 0.0 0.0 1.0 0.0 0.0 0.0 0.0 0.0 0.2 19.3 0.5%Lidl, Basingstoke Road, Reading (zone 2) Reading 4.8 1.3 0.1 0.0 0.0 0.4 0.0 0.0 0.0 0.0 0.0 0.7 0.0 0.0 1.5 0.0 0.0 0.0 0.0 0.0 0.0 8.8 0.2%Aldi, Bath Road, Reading (zone 2) Reading 1.1 12.3 6.9 0.0 0.0 0.0 0.0 0.0 0.0 0.0 0.0 0.0 0.0 0.0 2.2 0.0 0.0 0.0 0.0 0.0 0.3 22.9 0.6%Sainsbury's, Bath Road, Calcot (zone 3) Reading 2.1 12.6 17.9 0.3 0.0 1.4 0.8 0.0 0.0 0.0 0.0 0.9 0.0 0.0 8.3 1.7 0.0 0.0 0.0 0.0 5.8 51.8 1.3%Sub-total, Reading edge/out-of-centre stores (zones 1, 2, 3 and 12) 53.4 67.8 30.7 1.2 0.0 15.5 0.8 0.2 0.0 0.0 0.0 2.8 0.0 0.0 13.9 1.7 0.0 0.0 0.0 0.0 12.7 200.7 5.0%
Sub-total, Reading main stores 209.2 184.3 51.1 4.7 0.0 29.3 2.4 0.2 0.0 4.5 1.7 32.0 0.7 0.0 19.7 2.0 0.0 0.0 0.0 1.6 20.0 563.4 14.2%
Bracknell urban area
Bracknell town centre foodstores (zone 10)Sainsbury's, Princess Square, Bracknell Bracknell Forest 0.0 0.0 0.0 0.0 0.0 0.0 0.0 0.8 0.0 5.3 0.0 0.0 0.0 0.0 0.0 0.0 0.0 0.0 0.0 0.0 0.0 6.0 0.2%Sub-total, Bracknell town centre in-centre foodstores 0.0 0.0 0.0 0.0 0.0 0.0 0.0 0.8 0.0 5.3 0.0 0.0 0.0 0.0 0.0 0.0 0.0 0.0 0.0 0.0 0.0 6.0 0.2%
Bracknell other in-centre foodstores (zone 10)Aldi, Birch Hill, Bracknell Bracknell Forest 0.0 0.0 0.0 0.0 0.7 0.0 0.0 1.2 0.0 17.5 2.5 0.3 0.0 0.0 0.0 0.0 0.0 0.0 0.0 0.0 0.0 22.2 0.6%Tesco, County Lane, Warfield, Bracknell Bracknell Forest 0.0 0.0 0.0 0.0 0.0 1.9 0.0 4.6 0.0 49.2 0.0 0.0 0.0 0.0 0.0 0.0 0.0 0.0 0.0 0.0 0.0 55.6 1.4%Tesco, Whitton Road, Bracknell Bracknell Forest 0.0 0.0 0.0 0.0 0.0 0.0 0.0 6.7 2.2 3.9 0.3 0.0 0.0 0.0 0.0 0.0 0.0 0.0 0.0 0.0 0.0 13.0 0.3%Tesco Express, Horndean Road, Forest Park, Bracknell Bracknell Forest 0.0 0.0 0.0 0.0 0.0 0.0 0.0 0.0 0.0 12.4 0.0 0.0 0.0 0.0 0.0 0.0 0.0 0.0 0.0 0.0 0.0 12.4 0.3%Sub-total, Bracknell district centres in-centre foodstores 0.0 0.0 0.0 0.0 0.7 1.9 0.0 12.5 2.2 82.9 2.7 0.3 0.0 0.0 0.0 0.0 0.0 0.0 0.0 0.0 0.0 103.3 2.6%
Bracknell edge/out-of-centre foodstores (zone 10)Sainsbury's, Bagshot Road, Ringmead, Bracknell Bracknell Forest 0.0 0.0 0.0 0.0 0.0 0.0 0.0 6.6 0.0 33.4 3.1 1.4 0.0 0.0 0.0 0.0 0.0 0.0 0.0 0.0 0.0 44.5 1.1%Waitrose, Bond Way, Bracknell Bracknell Forest 1.7 0.0 0.0 0.0 0.0 0.0 0.0 0.9 0.0 36.1 0.0 0.6 0.0 0.0 0.4 0.0 0.0 0.0 0.0 0.0 0.0 39.7 1.0%Morrisons, The Peel Centre, Skimped Hill Lane, Bracknell Bracknell Forest 0.0 0.0 0.0 0.0 0.0 7.4 0.0 0.9 0.0 16.6 0.0 0.4 0.0 0.0 0.0 0.0 0.0 0.0 0.0 0.2 0.0 25.6 0.6%Sub-total, Bracknell edge/out-of-centre foodstores 1.7 0.0 0.0 0.0 0.0 7.4 0.0 8.4 0.0 86.1 3.1 2.4 0.0 0.0 0.4 0.0 0.0 0.0 0.0 0.2 0.0 109.8 2.8%
Sub-total, Bracknell main stores 1.7 0.0 0.0 0.0 0.7 9.3 0.0 21.7 2.2 174.3 5.9 2.7 0.0 0.0 0.4 0.0 0.0 0.0 0.0 0.2 0.0 219.1 5.5%
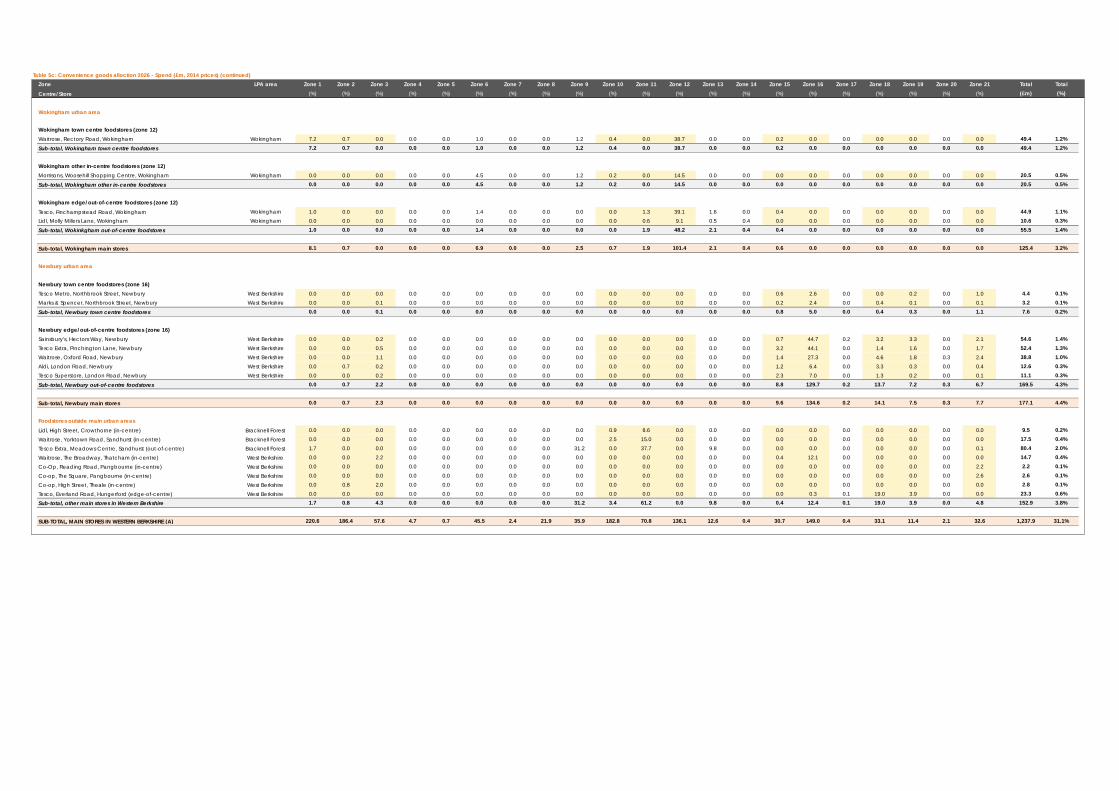
Table 5c: Convenience goods alloction 2026 - Spend (£m, 2014 prices) (continued)Zone LPA area Zone 1 Zone 2 Zone 3 Zone 4 Zone 5 Zone 6 Zone 7 Zone 8 Zone 9 Zone 10 Zone 11 Zone 12 Zone 13 Zone 14 Zone 15 Zone 16 Zone 17 Zone 18 Zone 19 Zone 20 Zone 21 Total Total
Centre/Store (%) (%) (%) (%) (%) (%) (%) (%) (%) (%) (%) (%) (%) (%) (%) (%) (%) (%) (%) (%) (%) (£m) (%)
Wokingham urban area
Wokingham town centre foodstores (zone 12)Waitrose, Rectory Road, Wokingham Wokingham 7.2 0.7 0.0 0.0 0.0 1.0 0.0 0.0 1.2 0.4 0.0 38.7 0.0 0.0 0.2 0.0 0.0 0.0 0.0 0.0 0.0 49.4 1.2%Sub-total, Wokingham town centre foodstores 7.2 0.7 0.0 0.0 0.0 1.0 0.0 0.0 1.2 0.4 0.0 38.7 0.0 0.0 0.2 0.0 0.0 0.0 0.0 0.0 0.0 49.4 1.2%
Wokingham other in-centre foodstores (zone 12)Morrisons, Woosehill Shopping Centre, Wokingham Wokingham 0.0 0.0 0.0 0.0 0.0 4.5 0.0 0.0 1.2 0.2 0.0 14.5 0.0 0.0 0.0 0.0 0.0 0.0 0.0 0.0 0.0 20.5 0.5%Sub-total, Wokingham other in-centre foodstores 0.0 0.0 0.0 0.0 0.0 4.5 0.0 0.0 1.2 0.2 0.0 14.5 0.0 0.0 0.0 0.0 0.0 0.0 0.0 0.0 0.0 20.5 0.5%
Wokingham edge/out-of-centre foodstores (zone 12)Tesco, Finchampstead Road, Wokingham Wokingham 1.0 0.0 0.0 0.0 0.0 1.4 0.0 0.0 0.0 0.0 1.3 39.1 1.6 0.0 0.4 0.0 0.0 0.0 0.0 0.0 0.0 44.9 1.1%Lidl, Molly Millers Lane, Wokingham Wokingham 0.0 0.0 0.0 0.0 0.0 0.0 0.0 0.0 0.0 0.0 0.6 9.1 0.5 0.4 0.0 0.0 0.0 0.0 0.0 0.0 0.0 10.6 0.3%Sub-total, Wokinkgham out-of-centre foodstores 1.0 0.0 0.0 0.0 0.0 1.4 0.0 0.0 0.0 0.0 1.9 48.2 2.1 0.4 0.4 0.0 0.0 0.0 0.0 0.0 0.0 55.5 1.4%
Sub-total, Wokingham main stores 8.1 0.7 0.0 0.0 0.0 6.9 0.0 0.0 2.5 0.7 1.9 101.4 2.1 0.4 0.6 0.0 0.0 0.0 0.0 0.0 0.0 125.4 3.2%
Newbury urban area
Newbury town centre foodstores (zone 16)Tesco Metro, Northbrook Street, Newbury West Berkshire 0.0 0.0 0.0 0.0 0.0 0.0 0.0 0.0 0.0 0.0 0.0 0.0 0.0 0.0 0.6 2.6 0.0 0.0 0.2 0.0 1.0 4.4 0.1%Marks & Spencer, Northbrook Street, Newbury West Berkshire 0.0 0.0 0.1 0.0 0.0 0.0 0.0 0.0 0.0 0.0 0.0 0.0 0.0 0.0 0.2 2.4 0.0 0.4 0.1 0.0 0.1 3.2 0.1%Sub-total, Newbury town centre foodstores 0.0 0.0 0.1 0.0 0.0 0.0 0.0 0.0 0.0 0.0 0.0 0.0 0.0 0.0 0.8 5.0 0.0 0.4 0.3 0.0 1.1 7.6 0.2%
Newbury edge/out-of-centre foodstores (zone 16)Sainsbury's, Hectors Way, Newbury West Berkshire 0.0 0.0 0.2 0.0 0.0 0.0 0.0 0.0 0.0 0.0 0.0 0.0 0.0 0.0 0.7 44.7 0.2 3.2 3.3 0.0 2.1 54.6 1.4%Tesco Extra, Pinchington Lane, Newbury West Berkshire 0.0 0.0 0.5 0.0 0.0 0.0 0.0 0.0 0.0 0.0 0.0 0.0 0.0 0.0 3.2 44.1 0.0 1.4 1.6 0.0 1.7 52.4 1.3%Waitrose, Oxford Road, Newbury West Berkshire 0.0 0.0 1.1 0.0 0.0 0.0 0.0 0.0 0.0 0.0 0.0 0.0 0.0 0.0 1.4 27.3 0.0 4.6 1.8 0.3 2.4 38.8 1.0%Aldi, London Road, Newbury West Berkshire 0.0 0.7 0.2 0.0 0.0 0.0 0.0 0.0 0.0 0.0 0.0 0.0 0.0 0.0 1.2 6.4 0.0 3.3 0.3 0.0 0.4 12.6 0.3%Tesco Superstore, London Road, Newbury West Berkshire 0.0 0.0 0.2 0.0 0.0 0.0 0.0 0.0 0.0 0.0 0.0 0.0 0.0 0.0 2.3 7.0 0.0 1.3 0.2 0.0 0.1 11.1 0.3%Sub-total, Newbury out-of-centre foodstores 0.0 0.7 2.2 0.0 0.0 0.0 0.0 0.0 0.0 0.0 0.0 0.0 0.0 0.0 8.8 129.7 0.2 13.7 7.2 0.3 6.7 169.5 4.3%
Sub-total, Newbury main stores 0.0 0.7 2.3 0.0 0.0 0.0 0.0 0.0 0.0 0.0 0.0 0.0 0.0 0.0 9.6 134.6 0.2 14.1 7.5 0.3 7.7 177.1 4.4%
Foodstores outside main urban areasLidl, High Street, Crowthorne (in-centre) Bracknell Forest 0.0 0.0 0.0 0.0 0.0 0.0 0.0 0.0 0.0 0.9 8.6 0.0 0.0 0.0 0.0 0.0 0.0 0.0 0.0 0.0 0.0 9.5 0.2%Waitrose, Yorktown Road, Sandhurst (in-centre) Bracknell Forest 0.0 0.0 0.0 0.0 0.0 0.0 0.0 0.0 0.0 2.5 15.0 0.0 0.0 0.0 0.0 0.0 0.0 0.0 0.0 0.0 0.0 17.5 0.4%Tesco Extra, Meadows Centre, Sandhurst (out-of-centre) Bracknell Forest 1.7 0.0 0.0 0.0 0.0 0.0 0.0 0.0 31.2 0.0 37.7 0.0 9.8 0.0 0.0 0.0 0.0 0.0 0.0 0.0 0.1 80.4 2.0%Waitrose, The Broadway, Thatcham (in-centre) West Berkshire 0.0 0.0 2.2 0.0 0.0 0.0 0.0 0.0 0.0 0.0 0.0 0.0 0.0 0.0 0.4 12.1 0.0 0.0 0.0 0.0 0.0 14.7 0.4%Co-Op, Reading Road, Pangbourne (in-centre) West Berkshire 0.0 0.0 0.0 0.0 0.0 0.0 0.0 0.0 0.0 0.0 0.0 0.0 0.0 0.0 0.0 0.0 0.0 0.0 0.0 0.0 2.2 2.2 0.1%Co-op, The Square, Pangbourne (in-centre) West Berkshire 0.0 0.0 0.0 0.0 0.0 0.0 0.0 0.0 0.0 0.0 0.0 0.0 0.0 0.0 0.0 0.0 0.0 0.0 0.0 0.0 2.6 2.6 0.1%Co-op, High Street, Theale (in-centre) West Berkshire 0.0 0.8 2.0 0.0 0.0 0.0 0.0 0.0 0.0 0.0 0.0 0.0 0.0 0.0 0.0 0.0 0.0 0.0 0.0 0.0 0.0 2.8 0.1%Tesco, Everland Road, Hungerford (edge-of-centre) West Berkshire 0.0 0.0 0.0 0.0 0.0 0.0 0.0 0.0 0.0 0.0 0.0 0.0 0.0 0.0 0.0 0.3 0.1 19.0 3.9 0.0 0.0 23.3 0.6%Sub-total, other main stores in Western Berkshire 1.7 0.8 4.3 0.0 0.0 0.0 0.0 0.0 31.2 3.4 61.2 0.0 9.8 0.0 0.4 12.4 0.1 19.0 3.9 0.0 4.8 152.9 3.8%
SUB-TOTAL, MAIN STORES IN WESTERN BERKSHIRE (A) 220.6 186.4 57.6 4.7 0.7 45.5 2.4 21.9 35.9 182.8 70.8 136.1 12.6 0.4 30.7 149.0 0.4 33.1 11.4 2.1 32.6 1,237.9 31.1%

Table 5c: Convenience goods alloction 2026 - Spend (£m, 2014 prices) (continued)Zone LPA area Zone 1 Zone 2 Zone 3 Zone 4 Zone 5 Zone 6 Zone 7 Zone 8 Zone 9 Zone 10 Zone 11 Zone 12 Zone 13 Zone 14 Zone 15 Zone 16 Zone 17 Zone 18 Zone 19 Zone 20 Zone 21 Total Total
Centre/Store (%) (%) (%) (%) (%) (%) (%) (%) (%) (%) (%) (%) (%) (%) (%) (%) (%) (%) (%) (%) (%) (£m) (%)
Convenience goods floorspace outside Western Berkshire (within survey area)
Henley-on-Thames foodstores (zone 4) 2.1 0.0 0.0 35.4 0.0 7.8 0.0 0.0 0.0 0.0 0.0 0.0 0.0 0.0 0.0 0.0 0.0 0.0 0.0 0.0 1.0 46.4 1.2%High Wycombe foodstores (zone 5) 0.0 0.0 0.0 22.4 227.6 9.6 0.0 0.0 0.0 0.4 0.0 0.0 0.0 0.0 0.0 0.0 0.0 0.0 0.0 0.0 0.0 260.0 6.5%Beaconsfield foodstores (zone 5) 0.0 0.0 0.0 0.0 49.2 0.0 6.2 0.0 0.0 0.0 0.0 0.0 0.0 0.9 0.0 0.0 0.0 0.0 0.0 0.0 0.0 56.4 1.4%Gerrards Cross foodstores (zone 5) 0.0 0.0 0.0 0.0 4.5 0.0 20.6 0.0 0.0 0.0 0.0 0.0 0.0 0.0 0.0 0.0 0.0 0.0 0.0 0.0 0.0 25.2 0.6%Maidenhead foodstores (zone 6) 0.0 0.0 0.1 0.0 0.0 87.0 8.3 1.2 0.0 0.0 0.0 0.0 0.0 0.0 0.0 0.0 0.0 0.0 0.0 0.0 0.0 96.6 2.4%Marlow foodstores (zone 6) 0.0 0.0 0.0 2.6 11.5 19.1 0.0 0.0 0.0 0.0 0.0 0.0 0.0 0.0 0.0 0.0 0.0 0.0 0.0 0.0 0.0 33.2 0.8%Twyford foodstores (zone 6) 1.9 0.0 0.0 0.0 0.0 49.3 0.0 0.4 0.0 0.0 0.0 0.3 0.0 0.0 0.0 0.0 0.0 0.2 0.0 0.0 0.2 52.2 1.3%Slough foodstores (zone 7) 0.0 0.0 0.3 0.3 1.3 19.7 285.5 3.5 0.0 0.0 0.0 0.0 0.0 0.0 0.3 0.5 0.0 0.0 0.0 0.0 0.0 311.4 7.8%Windsor foodstores (zone 7) 0.0 0.0 0.0 0.0 0.0 2.1 37.3 27.7 0.0 0.0 0.0 0.0 0.2 0.0 0.0 0.0 0.0 0.0 0.0 0.0 0.0 67.4 1.7%Egham foodstores (zone 8) 0.0 0.0 0.0 0.0 0.0 0.0 0.0 29.3 0.0 0.0 0.0 0.0 0.0 0.0 0.0 0.0 0.0 0.0 0.0 0.0 0.0 29.3 0.7%Sunningdale foodstores (zone 8) 0.0 0.0 0.0 0.0 0.0 0.0 0.0 14.8 3.6 0.0 1.2 0.0 0.0 0.0 0.0 0.0 0.0 0.0 0.0 0.0 0.0 19.6 0.5%Camberley / Frimley foodstores (zones 9 and 11) 3.8 0.0 0.0 0.0 0.0 0.0 0.0 1.0 45.6 0.0 33.9 1.3 12.0 0.0 0.0 0.0 0.0 0.1 0.0 0.0 0.0 97.8 2.5%Farnborough foodstores (zone 9) 0.0 0.0 0.0 0.0 0.0 0.9 0.0 0.0 59.2 0.0 0.4 0.0 27.9 0.5 0.0 0.0 0.0 0.0 0.0 0.0 0.0 88.9 2.2%Woking foodstores (zone 9) 0.0 0.0 0.0 0.0 0.0 0.0 0.0 0.0 119.0 0.5 0.0 0.0 0.0 0.0 0.0 0.0 0.0 0.2 0.0 0.0 0.0 119.7 3.0%Yateley foodstores (zone 11) 0.0 0.0 0.0 0.0 0.0 0.0 0.0 0.0 0.0 0.0 16.8 2.3 4.9 0.0 0.4 0.0 0.0 0.0 0.0 0.0 0.0 24.4 0.6%Fleet foodstores (zone 13) 0.0 0.0 0.0 0.0 0.0 0.0 0.0 0.0 0.0 0.0 0.6 0.0 61.1 0.0 0.0 0.0 0.0 0.0 0.0 0.0 0.0 61.6 1.5%Hook foodstores (zone 13) 0.0 0.0 0.0 0.0 3.7 0.0 0.0 0.0 0.0 0.0 0.0 0.0 17.2 0.0 0.0 0.0 0.0 0.0 0.0 0.0 0.0 20.9 0.5%Basingstoke foodstores (zone 14) 0.0 0.8 0.0 0.0 0.0 0.0 0.0 0.0 0.8 0.0 0.0 0.0 6.5 232.5 31.3 1.1 8.0 0.0 0.0 0.0 0.3 281.3 7.1%Tadley foodstores (zone 15) 0.0 0.0 0.1 0.0 0.0 0.0 0.0 0.0 0.0 0.0 0.0 0.0 0.0 2.1 44.0 0.0 0.0 0.0 0.0 0.0 0.0 46.3 1.2%Wantage foodstores (zone 19) 0.0 0.0 0.0 0.0 0.0 0.0 0.0 0.0 0.0 0.0 0.0 0.0 0.0 0.0 0.0 0.0 0.0 0.2 29.4 0.9 0.0 30.5 0.8%Didcot foodstores (zone 20) 0.0 0.0 0.0 2.6 0.0 0.0 0.0 0.0 0.0 0.0 0.0 0.0 0.0 0.0 0.0 0.0 0.0 0.0 2.7 66.7 3.4 75.4 1.9%Wallingford foodstores (zone 20) 0.0 0.0 0.0 2.0 0.0 0.0 0.0 0.7 0.0 0.0 0.0 0.0 0.0 0.0 0.0 0.0 0.0 0.0 0.0 33.7 5.4 41.7 1.0%
Sub-total, other convenience goods floorspace in survey area (B) 7.9 0.8 0.5 65.2 297.9 195.5 357.9 78.6 228.1 0.9 53.0 3.9 129.9 236.1 76.0 1.6 8.0 0.6 32.1 101.3 10.2 1,886.3 47.4%
Convenience goods floorspace outside survey area
Andover foodstores 0.0 0.0 0.0 0.0 0.0 0.0 0.0 0.0 0.0 0.0 0.0 0.0 0.0 0.0 0.3 0.0 52.9 0.7 0.0 0.0 0.0 53.9 1.4%Staines foodstores 0.0 0.0 0.0 0.0 0.0 0.0 4.7 32.8 0.0 0.0 0.0 0.0 0.0 0.0 0.0 0.0 0.0 0.0 0.0 0.0 0.0 37.6 0.9%Marlborough foodstores 0.0 0.0 0.0 0.0 0.0 0.0 0.0 0.0 0.0 0.0 0.0 0.0 0.0 0.0 0.0 0.0 0.0 6.8 0.5 0.0 0.0 7.3 0.2%All other foodstores outside survey area 1.2 0.7 0.5 13.2 5.0 12.4 56.3 10.9 36.0 7.3 1.6 0.0 10.2 6.7 8.8 6.6 15.2 9.8 2.4 8.6 4.2 217.6 5.5%
Sub-total, convenience goods floorspace outside survey area (C) 1.2 0.7 0.5 13.2 5.0 12.4 61.0 43.7 36.0 7.3 1.6 0.0 10.2 6.7 9.1 6.6 68.2 17.3 2.9 8.6 4.2 316.4 7.9%
Local / other shops (D) 38.3 24.0 5.3 24.3 45.8 24.8 49.7 22.7 74.5 16.8 37.9 16.5 21.8 28.5 9.1 45.1 17.0 5.7 6.8 16.7 7.9 539.6 13.6%
Overall total (A+B+C+D) 268.0 211.9 64.0 107.5 349.4 278.3 471.1 167.0 374.5 207.7 163.2 156.6 174.5 271.7 124.8 202.4 93.6 56.8 53.2 128.8 54.9 3,980.1 100.0%
Source: Table 3, Table 4

Western Berkshire Authorities — Retail & Commercial Leisure Assessment 2016Convenience Capacity Modelling
denotes zone wholly or predominantly within Western BerkshireTable 5d: Convenience goods alloction 2031 - Spend (£m, 2014 prices)
Zone LPA area Zone 1 Zone 2 Zone 3 Zone 4 Zone 5 Zone 6 Zone 7 Zone 8 Zone 9 Zone 10 Zone 11 Zone 12 Zone 13 Zone 14 Zone 15 Zone 16 Zone 17 Zone 18 Zone 19 Zone 20 Zone 21 Total Total
Centre/Store (%) (%) (%) (%) (%) (%) (%) (%) (%) (%) (%) (%) (%) (%) (%) (%) (%) (%) (%) (%) (%) (£m) (%)
Total Available Spend - 2016 274.5 215.4 65.0 109.2 357.9 285.8 487.5 172.1 382.0 213.7 166.8 160.4 177.6 280.5 128.4 206.6 95.9 57.7 54.4 131.5 55.7 4,078.6 100.0
Convenience goods floorspace in Western Berkshire
Reading urban area
Reading in-centre stores (zones 1, 2, 3 and 12)Asda, Chalfont Way, Lower Earley (zone 1) Wokingham 65.7 12.3 2.7 0.0 0.0 6.3 0.0 0.0 0.0 4.4 1.7 1.9 0.5 0.0 0.7 0.3 0.0 0.0 0.0 1.6 0.4 98.5 2.4%Waitrose, Crockhamwell Road, Woodley (zone 1) Wokingham 32.8 0.0 0.0 0.0 0.0 0.0 0.0 0.0 0.0 0.0 0.0 0.0 0.0 0.0 0.0 0.0 0.0 0.0 0.0 0.0 0.0 32.8 0.8%Tesco Extra, Portman Road, Reading (zone 2) Reading 2.2 28.9 2.5 0.0 0.0 0.0 0.0 0.0 0.0 0.0 0.0 0.0 0.0 0.0 0.0 0.0 0.0 0.0 0.0 0.0 1.1 34.7 0.9%Asda, Honey End Lane, Tilehurst (zone 2) Reading 2.2 21.4 5.4 0.0 0.0 0.0 0.0 0.0 0.0 0.0 0.0 0.0 0.0 0.0 1.6 0.0 0.0 0.0 0.0 0.0 0.9 31.6 0.8%Waitrose, Church Street, Caversham (zone 2) Reading 2.9 11.9 0.4 1.9 0.0 0.0 0.0 0.0 0.0 0.0 0.0 0.0 0.0 0.0 0.0 0.0 0.0 0.0 0.0 0.0 0.3 17.4 0.4%Lidl, Oxford Road, Reading (zone 2) Reading 0.0 3.2 0.1 0.0 0.0 0.0 0.0 0.0 0.0 0.0 0.0 0.0 0.0 0.0 0.6 0.0 0.0 0.0 0.0 0.0 0.5 4.4 0.1%Aldi, Vastern Court, Reading (zone 2) Reading 0.8 8.6 0.0 1.1 0.0 0.9 0.0 0.0 0.0 0.0 0.0 0.3 0.0 0.0 0.0 0.0 0.0 0.0 0.0 0.0 0.3 11.9 0.3%Co-Op, School Road, Tilehurst, Reading (zone 3) Reading 0.0 9.2 4.8 0.0 0.0 0.0 0.0 0.0 0.0 0.0 0.0 0.0 0.0 0.0 0.0 0.0 0.0 0.0 0.0 0.0 0.0 14.0 0.3%Sainsbury's, King Street Lane, Winnersh (zone 12) Wokingham 42.6 1.3 3.9 0.0 0.0 6.3 0.0 0.0 0.0 0.0 0.0 27.2 0.2 0.0 0.3 0.0 0.0 0.0 0.0 0.0 0.0 81.8 2.0%Other in-centre stores, Reading (zones 1, 2 and 3) Wokingham, Reading 10.3 21.7 0.8 0.5 0.0 0.7 1.7 0.0 0.0 0.2 0.0 0.5 0.0 0.0 2.8 0.0 0.0 0.0 0.0 0.0 4.0 43.2 1.1%Sub-total, Reading Borough in-centre stores (zones 1, 2, 3 and 12) 159.6 118.4 20.7 3.5 0.0 14.2 1.7 0.0 0.0 4.6 1.7 29.9 0.8 0.0 6.0 0.3 0.0 0.0 0.0 1.6 7.4 370.4 9.1%
Reading edge/out-of-centre stores (zones 1, 2, 3 and 12)Lidl, Headley Road, Woodley (zone 1) Wokingham 15.0 0.0 0.0 0.0 0.0 6.9 0.0 0.0 0.0 0.0 0.0 0.0 0.0 0.0 0.0 0.0 0.0 0.0 0.0 0.0 0.0 21.8 0.5%Sainsbury's Local, Maiden Place, Lower Earley (zone 1) Wokingham 14.9 0.0 0.0 0.0 0.0 0.0 0.0 0.0 0.0 0.0 0.0 0.0 0.0 0.0 0.0 0.0 0.0 0.0 0.0 0.0 0.0 14.9 0.4%Tesco Extra, Napier Road, Reading (zone 2) Reading 9.0 9.4 0.0 0.9 0.0 7.2 0.0 0.0 0.0 0.0 0.0 0.7 0.0 0.0 0.4 0.0 0.0 0.0 0.0 0.0 1.0 28.7 0.7%Waitrose, Oxford Road, Reading (zone 2) Reading 0.0 23.5 5.1 0.0 0.0 0.0 0.0 0.0 0.0 0.0 0.0 0.0 0.0 0.0 0.4 0.0 0.0 0.0 0.0 0.0 5.6 34.6 0.8%Morrisons, Basingstoke Road, Reading (zone 2) Reading 7.6 9.4 0.7 0.0 0.0 0.0 0.0 0.2 0.0 0.0 0.0 0.5 0.0 0.0 1.1 0.0 0.0 0.0 0.0 0.0 0.2 19.7 0.5%Lidl, Basingstoke Road, Reading (zone 2) Reading 5.0 1.4 0.1 0.0 0.0 0.4 0.0 0.0 0.0 0.0 0.0 0.7 0.0 0.0 1.5 0.0 0.0 0.0 0.0 0.0 0.0 9.0 0.2%Aldi, Bath Road, Reading (zone 2) Reading 1.2 12.5 7.0 0.0 0.0 0.0 0.0 0.0 0.0 0.0 0.0 0.0 0.0 0.0 2.3 0.0 0.0 0.0 0.0 0.0 0.3 23.3 0.6%Sainsbury's, Bath Road, Calcot (zone 3) Reading 2.1 12.8 18.1 0.3 0.0 1.4 0.8 0.0 0.0 0.0 0.0 1.0 0.0 0.0 8.6 1.8 0.0 0.0 0.0 0.0 5.9 52.8 1.3%Sub-total, Reading edge/out-of-centre stores (zones 1, 2, 3 and 12) 54.7 68.9 31.2 1.2 0.0 15.9 0.8 0.2 0.0 0.0 0.0 2.9 0.0 0.0 14.3 1.8 0.0 0.0 0.0 0.0 12.9 204.7 5.0%
Sub-total, Reading main stores 214.3 187.3 51.9 4.8 0.0 30.1 2.5 0.2 0.0 4.6 1.7 32.8 0.8 0.0 20.2 2.1 0.0 0.0 0.0 1.6 20.3 575.1 14.1%
Bracknell urban area
Bracknell town centre foodstores (zone 10)Sainsbury's, Princess Square, Bracknell Bracknell Forest 0.0 0.0 0.0 0.0 0.0 0.0 0.0 0.8 0.0 5.4 0.0 0.0 0.0 0.0 0.0 0.0 0.0 0.0 0.0 0.0 0.0 6.2 0.2%Sub-total, Bracknell town centre in-centre foodstores 0.0 0.0 0.0 0.0 0.0 0.0 0.0 0.8 0.0 5.4 0.0 0.0 0.0 0.0 0.0 0.0 0.0 0.0 0.0 0.0 0.0 6.2 0.2%
Bracknell other in-centre foodstores (zone 10)Aldi, Birch Hill, Bracknell Bracknell Forest 0.0 0.0 0.0 0.0 0.7 0.0 0.0 1.3 0.0 18.0 2.5 0.3 0.0 0.0 0.0 0.0 0.0 0.0 0.0 0.0 0.0 22.8 0.6%Tesco, County Lane, Warfield, Bracknell Bracknell Forest 0.0 0.0 0.0 0.0 0.0 2.0 0.0 4.7 0.0 50.6 0.0 0.0 0.0 0.0 0.0 0.0 0.0 0.0 0.0 0.0 0.0 57.2 1.4%Tesco, Whitton Road, Bracknell Bracknell Forest 0.0 0.0 0.0 0.0 0.0 0.0 0.0 6.9 2.3 4.0 0.3 0.0 0.0 0.0 0.0 0.0 0.0 0.0 0.0 0.0 0.0 13.4 0.3%Tesco Express, Horndean Road, Forest Park, Bracknell Bracknell Forest 0.0 0.0 0.0 0.0 0.0 0.0 0.0 0.0 0.0 12.8 0.0 0.0 0.0 0.0 0.0 0.0 0.0 0.0 0.0 0.0 0.0 12.8 0.3%Sub-total, Bracknell district centres in-centre foodstores 0.0 0.0 0.0 0.0 0.7 2.0 0.0 12.9 2.3 85.3 2.8 0.3 0.0 0.0 0.0 0.0 0.0 0.0 0.0 0.0 0.0 106.2 2.6%
Bracknell edge/out-of-centre foodstores (zone 10)Sainsbury's, Bagshot Road, Ringmead, Bracknell Bracknell Forest 0.0 0.0 0.0 0.0 0.0 0.0 0.0 6.8 0.0 34.3 3.2 1.4 0.0 0.0 0.0 0.0 0.0 0.0 0.0 0.0 0.0 45.8 1.1%Waitrose, Bond Way, Bracknell Bracknell Forest 1.7 0.0 0.0 0.0 0.0 0.0 0.0 0.9 0.0 37.1 0.0 0.6 0.0 0.0 0.5 0.0 0.0 0.0 0.0 0.0 0.0 40.8 1.0%Morrisons, The Peel Centre, Skimped Hill Lane, Bracknell Bracknell Forest 0.0 0.0 0.0 0.0 0.0 7.6 0.0 0.9 0.0 17.1 0.0 0.4 0.0 0.0 0.0 0.0 0.0 0.0 0.0 0.2 0.0 26.3 0.6%Sub-total, Bracknell edge/out-of-centre foodstores 1.7 0.0 0.0 0.0 0.0 7.6 0.0 8.7 0.0 88.6 3.2 2.5 0.0 0.0 0.5 0.0 0.0 0.0 0.0 0.2 0.0 112.9 2.8%
Sub-total, Bracknell main stores 1.7 0.0 0.0 0.0 0.7 9.6 0.0 22.4 2.3 179.3 6.0 2.8 0.0 0.0 0.5 0.0 0.0 0.0 0.0 0.2 0.0 225.4 5.5%

Table 5d: Convenience goods alloction 2031 - Spend (£m, 2014 prices) (continued)Zone LPA area Zone 1 Zone 2 Zone 3 Zone 4 Zone 5 Zone 6 Zone 7 Zone 8 Zone 9 Zone 10 Zone 11 Zone 12 Zone 13 Zone 14 Zone 15 Zone 16 Zone 17 Zone 18 Zone 19 Zone 20 Zone 21 Total Total
Centre/Store (%) (%) (%) (%) (%) (%) (%) (%) (%) (%) (%) (%) (%) (%) (%) (%) (%) (%) (%) (%) (%) (£m) (%)
Wokingham urban area
Wokingham town centre foodstores (zone 12)Waitrose, Rectory Road, Wokingham Wokingham 7.4 0.7 0.0 0.0 0.0 1.0 0.0 0.0 1.3 0.4 0.0 39.6 0.0 0.0 0.2 0.0 0.0 0.0 0.0 0.0 0.0 50.6 1.2%Sub-total, Wokingham town centre foodstores 7.4 0.7 0.0 0.0 0.0 1.0 0.0 0.0 1.3 0.4 0.0 39.6 0.0 0.0 0.2 0.0 0.0 0.0 0.0 0.0 0.0 50.6 1.2%
Wokingham other in-centre foodstores (zone 12)Morrisons, Woosehill Shopping Centre, Wokingham Wokingham 0.0 0.0 0.0 0.0 0.0 4.6 0.0 0.0 1.3 0.2 0.0 14.9 0.0 0.0 0.0 0.0 0.0 0.0 0.0 0.0 0.0 21.0 0.5%Sub-total, Wokingham other in-centre foodstores 0.0 0.0 0.0 0.0 0.0 4.6 0.0 0.0 1.3 0.2 0.0 14.9 0.0 0.0 0.0 0.0 0.0 0.0 0.0 0.0 0.0 21.0 0.5%
Wokingham edge/out-of-centre foodstores (zone 12)Tesco, Finchampstead Road, Wokingham Wokingham 1.0 0.0 0.0 0.0 0.0 1.5 0.0 0.0 0.0 0.0 1.3 40.1 1.6 0.0 0.5 0.0 0.0 0.0 0.0 0.0 0.0 46.0 1.1%Lidl, Molly Millers Lane, Wokingham Wokingham 0.0 0.0 0.0 0.0 0.0 0.0 0.0 0.0 0.0 0.0 0.7 9.3 0.5 0.4 0.0 0.0 0.0 0.0 0.0 0.0 0.0 10.8 0.3%Sub-total, Wokinkgham out-of-centre foodstores 1.0 0.0 0.0 0.0 0.0 1.5 0.0 0.0 0.0 0.0 2.0 49.4 2.2 0.4 0.5 0.0 0.0 0.0 0.0 0.0 0.0 56.8 1.4%
Sub-total, Wokingham main stores 8.3 0.7 0.0 0.0 0.0 7.1 0.0 0.0 2.5 0.7 2.0 103.9 2.2 0.4 0.6 0.0 0.0 0.0 0.0 0.0 0.0 128.4 3.1%
Newbury urban area
Newbury town centre foodstores (zone 16)Tesco Metro, Northbrook Street, Newbury West Berkshire 0.0 0.0 0.0 0.0 0.0 0.0 0.0 0.0 0.0 0.0 0.0 0.0 0.0 0.0 0.6 2.6 0.0 0.0 0.2 0.0 1.0 4.5 0.1%Marks & Spencer, Northbrook Street, Newbury West Berkshire 0.0 0.0 0.1 0.0 0.0 0.0 0.0 0.0 0.0 0.0 0.0 0.0 0.0 0.0 0.2 2.5 0.0 0.4 0.1 0.0 0.1 3.3 0.1%Sub-total, Newbury town centre foodstores 0.0 0.0 0.1 0.0 0.0 0.0 0.0 0.0 0.0 0.0 0.0 0.0 0.0 0.0 0.8 5.1 0.0 0.4 0.3 0.0 1.1 7.7 0.2%
Newbury edge/out-of-centre foodstores (zone 16)Sainsbury's, Hectors Way, Newbury West Berkshire 0.0 0.0 0.3 0.0 0.0 0.0 0.0 0.0 0.0 0.0 0.0 0.0 0.0 0.0 0.8 45.7 0.2 3.2 3.4 0.0 2.1 55.7 1.4%Tesco Extra, Pinchington Lane, Newbury West Berkshire 0.0 0.0 0.5 0.0 0.0 0.0 0.0 0.0 0.0 0.0 0.0 0.0 0.0 0.0 3.2 45.0 0.0 1.4 1.7 0.0 1.7 53.5 1.3%Waitrose, Oxford Road, Newbury West Berkshire 0.0 0.0 1.1 0.0 0.0 0.0 0.0 0.0 0.0 0.0 0.0 0.0 0.0 0.0 1.4 27.9 0.0 4.7 1.8 0.3 2.4 39.6 1.0%Aldi, London Road, Newbury West Berkshire 0.0 0.7 0.3 0.0 0.0 0.0 0.0 0.0 0.0 0.0 0.0 0.0 0.0 0.0 1.3 6.6 0.0 3.3 0.3 0.0 0.4 12.8 0.3%Tesco Superstore, London Road, Newbury West Berkshire 0.0 0.0 0.2 0.0 0.0 0.0 0.0 0.0 0.0 0.0 0.0 0.0 0.0 0.0 2.4 7.2 0.0 1.3 0.2 0.0 0.1 11.3 0.3%Sub-total, Newbury out-of-centre foodstores 0.0 0.7 2.3 0.0 0.0 0.0 0.0 0.0 0.0 0.0 0.0 0.0 0.0 0.0 9.1 132.3 0.2 14.0 7.3 0.3 6.8 173.0 4.2%
Sub-total, Newbury main stores 0.0 0.7 2.3 0.0 0.0 0.0 0.0 0.0 0.0 0.0 0.0 0.0 0.0 0.0 9.9 137.4 0.2 14.3 7.7 0.3 7.8 180.7 4.4%
Foodstores outside main urban areasLidl, High Street, Crowthorne (in-centre) Bracknell Forest 0.0 0.0 0.0 0.0 0.0 0.0 0.0 0.0 0.0 0.9 8.8 0.0 0.0 0.0 0.0 0.0 0.0 0.0 0.0 0.0 0.0 9.7 0.2%Waitrose, Yorktown Road, Sandhurst (in-centre) Bracknell Forest 0.0 0.0 0.0 0.0 0.0 0.0 0.0 0.0 0.0 2.6 15.3 0.0 0.0 0.0 0.0 0.0 0.0 0.0 0.0 0.0 0.0 17.9 0.4%Tesco Extra, Meadows Centre, Sandhurst (out-of-centre) Bracknell Forest 1.7 0.0 0.0 0.0 0.0 0.0 0.0 0.0 31.8 0.0 38.5 0.0 10.0 0.0 0.0 0.0 0.0 0.0 0.0 0.0 0.1 82.0 2.0%Waitrose, The Broadway, Thatcham (in-centre) West Berkshire 0.0 0.0 2.3 0.0 0.0 0.0 0.0 0.0 0.0 0.0 0.0 0.0 0.0 0.0 0.4 12.4 0.0 0.0 0.0 0.0 0.0 15.0 0.4%Co-Op, Reading Road, Pangbourne (in-centre) West Berkshire 0.0 0.0 0.0 0.0 0.0 0.0 0.0 0.0 0.0 0.0 0.0 0.0 0.0 0.0 0.0 0.0 0.0 0.0 0.0 0.0 2.2 2.2 0.1%Co-op, The Square, Pangbourne (in-centre) West Berkshire 0.0 0.0 0.0 0.0 0.0 0.0 0.0 0.0 0.0 0.0 0.0 0.0 0.0 0.0 0.0 0.0 0.0 0.0 0.0 0.0 2.6 2.6 0.1%Co-op, High Street, Theale (in-centre) West Berkshire 0.0 0.8 2.1 0.0 0.0 0.0 0.0 0.0 0.0 0.0 0.0 0.0 0.0 0.0 0.0 0.0 0.0 0.0 0.0 0.0 0.0 2.8 0.1%Tesco, Everland Road, Hungerford (edge-of-centre) West Berkshire 0.0 0.0 0.0 0.0 0.0 0.0 0.0 0.0 0.0 0.0 0.0 0.0 0.0 0.0 0.0 0.3 0.1 19.3 3.9 0.0 0.0 23.7 0.6%Sub-total, other main stores in Western Berkshire 1.7 0.8 4.3 0.0 0.0 0.0 0.0 0.0 31.8 3.5 62.6 0.0 10.0 0.0 0.4 12.6 0.1 19.3 3.9 0.0 4.9 156.0 3.8%
SUB-TOTAL, MAIN STORES IN WESTERN BERKSHIRE (A) 226.0 189.5 58.5 4.8 0.7 46.8 2.5 22.6 36.6 188.1 72.3 139.4 12.9 0.4 31.6 152.1 0.4 33.7 11.6 2.2 33.0 1,265.6 31.0%

Table 5d: Convenience goods alloction 2031 - Spend (£m, 2014 prices) (continued)Zone LPA area Zone 1 Zone 2 Zone 3 Zone 4 Zone 5 Zone 6 Zone 7 Zone 8 Zone 9 Zone 10 Zone 11 Zone 12 Zone 13 Zone 14 Zone 15 Zone 16 Zone 17 Zone 18 Zone 19 Zone 20 Zone 21 Total Total
Centre/Store (%) (%) (%) (%) (%) (%) (%) (%) (%) (%) (%) (%) (%) (%) (%) (%) (%) (%) (%) (%) (%) (£m) (%)
Convenience goods floorspace outside Western Berkshire (within survey area)
Henley-on-Thames foodstores (zone 4) 2.2 0.0 0.0 36.0 0.0 8.1 0.0 0.0 0.0 0.0 0.0 0.0 0.0 0.0 0.0 0.0 0.0 0.0 0.0 0.0 1.0 47.2 1.2%High Wycombe foodstores (zone 5) 0.0 0.0 0.0 22.7 233.1 9.9 0.0 0.0 0.0 0.4 0.0 0.0 0.0 0.0 0.0 0.0 0.0 0.0 0.0 0.0 0.0 266.1 6.5%Beaconsfield foodstores (zone 5) 0.0 0.0 0.0 0.0 50.4 0.0 6.4 0.0 0.0 0.0 0.0 0.0 0.0 1.0 0.0 0.0 0.0 0.0 0.0 0.0 0.0 57.8 1.4%Gerrards Cross foodstores (zone 5) 0.0 0.0 0.0 0.0 4.6 0.0 21.4 0.0 0.0 0.0 0.0 0.0 0.0 0.0 0.0 0.0 0.0 0.0 0.0 0.0 0.0 26.0 0.6%Maidenhead foodstores (zone 6) 0.0 0.0 0.1 0.0 0.0 89.3 8.6 1.3 0.0 0.0 0.0 0.0 0.0 0.0 0.0 0.0 0.0 0.0 0.0 0.0 0.0 99.3 2.4%Marlow foodstores (zone 6) 0.0 0.0 0.0 2.6 11.8 19.6 0.0 0.0 0.0 0.0 0.0 0.0 0.0 0.0 0.0 0.0 0.0 0.0 0.0 0.0 0.0 34.0 0.8%Twyford foodstores (zone 6) 1.9 0.0 0.0 0.0 0.0 50.6 0.0 0.4 0.0 0.0 0.0 0.3 0.0 0.0 0.0 0.0 0.0 0.2 0.0 0.0 0.2 53.6 1.3%Slough foodstores (zone 7) 0.0 0.0 0.3 0.3 1.4 20.2 295.4 3.6 0.0 0.0 0.0 0.0 0.0 0.0 0.3 0.5 0.0 0.0 0.0 0.0 0.0 322.0 7.9%Windsor foodstores (zone 7) 0.0 0.0 0.0 0.0 0.0 2.2 38.6 28.5 0.0 0.0 0.0 0.0 0.2 0.0 0.0 0.0 0.0 0.0 0.0 0.0 0.0 69.6 1.7%Egham foodstores (zone 8) 0.0 0.0 0.0 0.0 0.0 0.0 0.0 30.2 0.0 0.0 0.0 0.0 0.0 0.0 0.0 0.0 0.0 0.0 0.0 0.0 0.0 30.2 0.7%Sunningdale foodstores (zone 8) 0.0 0.0 0.0 0.0 0.0 0.0 0.0 15.3 3.7 0.0 1.3 0.0 0.0 0.0 0.0 0.0 0.0 0.0 0.0 0.0 0.0 20.2 0.5%Camberley / Frimley foodstores (zones 9 and 11) 3.9 0.0 0.0 0.0 0.0 0.0 0.0 1.0 46.5 0.0 34.7 1.4 12.2 0.0 0.0 0.0 0.0 0.1 0.0 0.0 0.0 99.9 2.4%Farnborough foodstores (zone 9) 0.0 0.0 0.0 0.0 0.0 0.9 0.0 0.0 60.4 0.0 0.4 0.0 28.4 0.5 0.0 0.0 0.0 0.0 0.0 0.0 0.0 90.6 2.2%Woking foodstores (zone 9) 0.0 0.0 0.0 0.0 0.0 0.0 0.0 0.0 121.4 0.5 0.0 0.0 0.0 0.0 0.0 0.0 0.0 0.2 0.0 0.0 0.0 122.1 3.0%Yateley foodstores (zone 11) 0.0 0.0 0.0 0.0 0.0 0.0 0.0 0.0 0.0 0.0 17.2 2.4 5.0 0.0 0.4 0.0 0.0 0.0 0.0 0.0 0.0 25.0 0.6%Fleet foodstores (zone 13) 0.0 0.0 0.0 0.0 0.0 0.0 0.0 0.0 0.0 0.0 0.6 0.0 62.2 0.0 0.0 0.0 0.0 0.0 0.0 0.0 0.0 62.7 1.5%Hook foodstores (zone 13) 0.0 0.0 0.0 0.0 3.8 0.0 0.0 0.0 0.0 0.0 0.0 0.0 17.5 0.0 0.0 0.0 0.0 0.0 0.0 0.0 0.0 21.3 0.5%Basingstoke foodstores (zone 14) 0.0 0.8 0.0 0.0 0.0 0.0 0.0 0.0 0.8 0.0 0.0 0.0 6.7 240.0 32.2 1.1 8.2 0.0 0.0 0.0 0.3 290.1 7.1%Tadley foodstores (zone 15) 0.0 0.0 0.1 0.0 0.0 0.0 0.0 0.0 0.0 0.0 0.0 0.0 0.0 2.2 45.3 0.0 0.0 0.0 0.0 0.0 0.0 47.6 1.2%Wantage foodstores (zone 19) 0.0 0.0 0.0 0.0 0.0 0.0 0.0 0.0 0.0 0.0 0.0 0.0 0.0 0.0 0.0 0.0 0.0 0.2 30.1 0.9 0.0 31.2 0.8%Didcot foodstores (zone 20) 0.0 0.0 0.0 2.6 0.0 0.0 0.0 0.0 0.0 0.0 0.0 0.0 0.0 0.0 0.0 0.0 0.0 0.0 2.7 68.1 3.5 77.0 1.9%Wallingford foodstores (zone 20) 0.0 0.0 0.0 2.0 0.0 0.0 0.0 0.7 0.0 0.0 0.0 0.0 0.0 0.0 0.0 0.0 0.0 0.0 0.0 34.4 5.4 42.6 1.0%
Sub-total, other convenience goods floorspace in survey area (B) 8.1 0.8 0.5 66.3 305.1 200.8 370.4 81.0 232.7 0.9 54.1 4.0 132.2 243.7 78.2 1.7 8.2 0.7 32.8 103.5 10.4 1,936.0 47.5%
Convenience goods floorspace outside survey area
Andover foodstores 0.0 0.0 0.0 0.0 0.0 0.0 0.0 0.0 0.0 0.0 0.0 0.0 0.0 0.0 0.3 0.0 54.3 0.7 0.0 0.0 0.0 55.3 1.4%Staines foodstores 0.0 0.0 0.0 0.0 0.0 0.0 4.9 33.8 0.0 0.0 0.0 0.0 0.0 0.0 0.0 0.0 0.0 0.0 0.0 0.0 0.0 38.7 0.9%Marlborough foodstores 0.0 0.0 0.0 0.0 0.0 0.0 0.0 0.0 0.0 0.0 0.0 0.0 0.0 0.0 0.0 0.0 0.0 6.9 0.5 0.0 0.0 7.4 0.2%All other foodstores outside survey area 1.2 0.7 0.5 13.4 5.1 12.8 58.3 11.2 36.7 7.5 1.6 0.0 10.4 6.9 9.0 6.8 15.6 9.9 2.5 8.8 4.2 223.2 5.5%
Sub-total, convenience goods floorspace outside survey area (C) 1.2 0.7 0.5 13.4 5.1 12.8 63.2 45.1 36.7 7.5 1.6 0.0 10.4 6.9 9.3 6.8 69.9 17.6 3.0 8.8 4.2 324.6 8.0%
Local / other shops (D) 39.2 24.4 5.4 24.7 47.0 25.5 51.5 23.4 76.0 17.3 38.7 16.9 22.2 29.5 9.3 46.1 17.4 5.8 7.0 17.1 8.0 552.4 13.5%
Overall total (A+B+C+D) 274.5 215.4 65.0 109.2 357.9 285.8 487.5 172.1 382.0 213.7 166.8 160.4 177.6 280.5 128.4 206.6 95.9 57.7 54.4 131.5 55.7 4,078.6 100.0%
Source: Table 3, Table 4

Western Berkshire Authorities — Retail & Commercial Leisure Assessment 2016Convenience Capacity Modelling
denotes zone wholly or predominantly within Western BerkshireTable 5e: Convenience goods alloction 2036 - Spend (£m, 2014 prices)
Zone LPA area Zone 1 Zone 2 Zone 3 Zone 4 Zone 5 Zone 6 Zone 7 Zone 8 Zone 9 Zone 10 Zone 11 Zone 12 Zone 13 Zone 14 Zone 15 Zone 16 Zone 17 Zone 18 Zone 19 Zone 20 Zone 21 Total Total
Centre/Store (%) (%) (%) (%) (%) (%) (%) (%) (%) (%) (%) (%) (%) (%) (%) (%) (%) (%) (%) (%) (%) (£m) (%)
Total Available Spend - 2016 280.0 219.0 66.0 110.8 365.6 293.0 503.7 176.7 390.4 219.7 170.5 164.1 180.5 288.7 131.6 210.7 98.2 58.6 55.4 134.1 56.5 4,173.7 100.0
Convenience goods floorspace in Western Berkshire
Reading urban area
Reading in-centre stores (zones 1, 2, 3 and 12)Asda, Chalfont Way, Lower Earley (zone 1) Wokingham 67.0 12.5 2.8 0.0 0.0 6.5 0.0 0.0 0.0 4.5 1.8 2.0 0.5 0.0 0.7 0.3 0.0 0.0 0.0 1.7 0.4 100.5 2.4%Waitrose, Crockhamwell Road, Woodley (zone 1) Wokingham 33.5 0.0 0.0 0.0 0.0 0.0 0.0 0.0 0.0 0.0 0.0 0.0 0.0 0.0 0.0 0.0 0.0 0.0 0.0 0.0 0.0 33.5 0.8%Tesco Extra, Portman Road, Reading (zone 2) Reading 2.3 29.4 2.5 0.0 0.0 0.0 0.0 0.0 0.0 0.0 0.0 0.0 0.0 0.0 0.0 0.0 0.0 0.0 0.0 0.0 1.1 35.3 0.8%Asda, Honey End Lane, Tilehurst (zone 2) Reading 2.2 21.8 5.5 0.0 0.0 0.0 0.0 0.0 0.0 0.0 0.0 0.0 0.0 0.0 1.7 0.0 0.0 0.0 0.0 0.0 1.0 32.1 0.8%Waitrose, Church Street, Caversham (zone 2) Reading 3.0 12.1 0.4 1.9 0.0 0.0 0.0 0.0 0.0 0.0 0.0 0.0 0.0 0.0 0.0 0.0 0.0 0.0 0.0 0.0 0.3 17.7 0.4%Lidl, Oxford Road, Reading (zone 2) Reading 0.0 3.3 0.1 0.0 0.0 0.0 0.0 0.0 0.0 0.0 0.0 0.0 0.0 0.0 0.6 0.0 0.0 0.0 0.0 0.0 0.5 4.5 0.1%Aldi, Vastern Court, Reading (zone 2) Reading 0.9 8.7 0.0 1.2 0.0 0.9 0.0 0.0 0.0 0.0 0.0 0.3 0.0 0.0 0.0 0.0 0.0 0.0 0.0 0.0 0.3 12.1 0.3%Co-Op, School Road, Tilehurst, Reading (zone 3) Reading 0.0 9.3 4.9 0.0 0.0 0.0 0.0 0.0 0.0 0.0 0.0 0.0 0.0 0.0 0.0 0.0 0.0 0.0 0.0 0.0 0.0 14.2 0.3%Sainsbury's, King Street Lane, Winnersh (zone 12) Wokingham 43.4 1.3 4.0 0.0 0.0 6.5 0.0 0.0 0.0 0.0 0.0 27.9 0.3 0.0 0.3 0.0 0.0 0.0 0.0 0.0 0.0 83.5 2.0%Other in-centre stores, Reading (zones 1, 2 and 3) Wokingham, Reading 10.5 22.1 0.8 0.5 0.0 0.7 1.7 0.0 0.0 0.2 0.0 0.5 0.0 0.0 2.9 0.0 0.0 0.0 0.0 0.0 4.1 44.0 1.1%Sub-total, Reading Borough in-centre stores (zones 1, 2, 3 and 12) 162.7 120.4 21.0 3.6 0.0 14.6 1.7 0.0 0.0 4.8 1.8 30.6 0.8 0.0 6.1 0.3 0.0 0.0 0.0 1.7 7.5 377.5 9.0%
Reading edge/out-of-centre stores (zones 1, 2, 3 and 12)Lidl, Headley Road, Woodley (zone 1) Wokingham 15.3 0.0 0.0 0.0 0.0 7.0 0.0 0.0 0.0 0.0 0.0 0.0 0.0 0.0 0.0 0.0 0.0 0.0 0.0 0.0 0.0 22.3 0.5%Sainsbury's Local, Maiden Place, Lower Earley (zone 1) Wokingham 15.2 0.0 0.0 0.0 0.0 0.0 0.0 0.0 0.0 0.0 0.0 0.0 0.0 0.0 0.0 0.0 0.0 0.0 0.0 0.0 0.0 15.2 0.4%Tesco Extra, Napier Road, Reading (zone 2) Reading 9.2 9.6 0.0 1.0 0.0 7.4 0.0 0.0 0.0 0.0 0.0 0.7 0.0 0.0 0.4 0.0 0.0 0.0 0.0 0.0 1.0 29.2 0.7%Waitrose, Oxford Road, Reading (zone 2) Reading 0.0 23.9 5.2 0.0 0.0 0.0 0.0 0.0 0.0 0.0 0.0 0.0 0.0 0.0 0.4 0.0 0.0 0.0 0.0 0.0 5.6 35.2 0.8%Morrisons, Basingstoke Road, Reading (zone 2) Reading 7.8 9.5 0.7 0.0 0.0 0.0 0.0 0.2 0.0 0.0 0.0 0.5 0.0 0.0 1.1 0.0 0.0 0.0 0.0 0.0 0.2 20.1 0.5%Lidl, Basingstoke Road, Reading (zone 2) Reading 5.0 1.4 0.1 0.0 0.0 0.4 0.0 0.0 0.0 0.0 0.0 0.7 0.0 0.0 1.6 0.0 0.0 0.0 0.0 0.0 0.0 9.2 0.2%Aldi, Bath Road, Reading (zone 2) Reading 1.2 12.7 7.2 0.0 0.0 0.0 0.0 0.0 0.0 0.0 0.0 0.0 0.0 0.0 2.4 0.0 0.0 0.0 0.0 0.0 0.3 23.7 0.6%Sainsbury's, Bath Road, Calcot (zone 3) Reading 2.2 13.0 18.4 0.3 0.0 1.5 0.8 0.0 0.0 0.0 0.0 1.0 0.0 0.0 8.8 1.8 0.0 0.0 0.0 0.0 6.0 53.7 1.3%Sub-total, Reading edge/out-of-centre stores (zones 1, 2, 3 and 12) 55.8 70.1 31.6 1.2 0.0 16.3 0.8 0.2 0.0 0.0 0.0 3.0 0.0 0.0 14.6 1.8 0.0 0.0 0.0 0.0 13.1 208.6 5.0%
Sub-total, Reading main stores 218.5 190.5 52.6 4.8 0.0 30.9 2.6 0.2 0.0 4.8 1.8 33.5 0.8 0.0 20.7 2.1 0.0 0.0 0.0 1.7 20.6 586.1 14.0%
Bracknell urban area
Bracknell town centre foodstores (zone 10)Sainsbury's, Princess Square, Bracknell Bracknell Forest 0.0 0.0 0.0 0.0 0.0 0.0 0.0 0.8 0.0 5.6 0.0 0.0 0.0 0.0 0.0 0.0 0.0 0.0 0.0 0.0 0.0 6.4 0.2%Sub-total, Bracknell town centre in-centre foodstores 0.0 0.0 0.0 0.0 0.0 0.0 0.0 0.8 0.0 5.6 0.0 0.0 0.0 0.0 0.0 0.0 0.0 0.0 0.0 0.0 0.0 6.4 0.2%
Bracknell other in-centre foodstores (zone 10)Aldi, Birch Hill, Bracknell Bracknell Forest 0.0 0.0 0.0 0.0 0.7 0.0 0.0 1.3 0.0 18.5 2.6 0.3 0.0 0.0 0.0 0.0 0.0 0.0 0.0 0.0 0.0 23.4 0.6%Tesco, County Lane, Warfield, Bracknell Bracknell Forest 0.0 0.0 0.0 0.0 0.0 2.0 0.0 4.8 0.0 52.0 0.0 0.0 0.0 0.0 0.0 0.0 0.0 0.0 0.0 0.0 0.0 58.8 1.4%Tesco, Whitton Road, Bracknell Bracknell Forest 0.0 0.0 0.0 0.0 0.0 0.0 0.0 7.1 2.3 4.1 0.3 0.0 0.0 0.0 0.0 0.0 0.0 0.0 0.0 0.0 0.0 13.7 0.3%Tesco Express, Horndean Road, Forest Park, Bracknell Bracknell Forest 0.0 0.0 0.0 0.0 0.0 0.0 0.0 0.0 0.0 13.2 0.0 0.0 0.0 0.0 0.0 0.0 0.0 0.0 0.0 0.0 0.0 13.2 0.3%Sub-total, Bracknell district centres in-centre foodstores 0.0 0.0 0.0 0.0 0.7 2.0 0.0 13.2 2.3 87.7 2.9 0.3 0.0 0.0 0.0 0.0 0.0 0.0 0.0 0.0 0.0 109.1 2.6%
Bracknell edge/out-of-centre foodstores (zone 10)Sainsbury's, Bagshot Road, Ringmead, Bracknell Bracknell Forest 0.0 0.0 0.0 0.0 0.0 0.0 0.0 7.0 0.0 35.3 3.3 1.5 0.0 0.0 0.0 0.0 0.0 0.0 0.0 0.0 0.0 47.0 1.1%Waitrose, Bond Way, Bracknell Bracknell Forest 1.7 0.0 0.0 0.0 0.0 0.0 0.0 1.0 0.0 38.1 0.0 0.6 0.0 0.0 0.5 0.0 0.0 0.0 0.0 0.0 0.0 41.9 1.0%Morrisons, The Peel Centre, Skimped Hill Lane, Bracknell Bracknell Forest 0.0 0.0 0.0 0.0 0.0 7.8 0.0 1.0 0.0 17.6 0.0 0.4 0.0 0.0 0.0 0.0 0.0 0.0 0.0 0.2 0.0 27.0 0.6%Sub-total, Bracknell edge/out-of-centre foodstores 1.7 0.0 0.0 0.0 0.0 7.8 0.0 8.9 0.0 91.0 3.3 2.5 0.0 0.0 0.5 0.0 0.0 0.0 0.0 0.2 0.0 116.0 2.8%
Sub-total, Bracknell main stores 1.7 0.0 0.0 0.0 0.7 9.8 0.0 23.0 2.3 184.3 6.2 2.8 0.0 0.0 0.5 0.0 0.0 0.0 0.0 0.2 0.0 231.5 5.5%

Table 5e: Convenience goods alloction 2036 - Spend (£m, 2014 prices) (continued)Zone LPA area Zone 1 Zone 2 Zone 3 Zone 4 Zone 5 Zone 6 Zone 7 Zone 8 Zone 9 Zone 10 Zone 11 Zone 12 Zone 13 Zone 14 Zone 15 Zone 16 Zone 17 Zone 18 Zone 19 Zone 20 Zone 21 Total Total
Centre/Store (%) (%) (%) (%) (%) (%) (%) (%) (%) (%) (%) (%) (%) (%) (%) (%) (%) (%) (%) (%) (%) (£m) (%)
Wokingham urban area
Wokingham town centre foodstores (zone 12)Waitrose, Rectory Road, Wokingham Wokingham 7.5 0.7 0.0 0.0 0.0 1.1 0.0 0.0 1.3 0.5 0.0 40.6 0.0 0.0 0.2 0.0 0.0 0.0 0.0 0.0 0.0 51.8 1.2%Sub-total, Wokingham town centre foodstores 7.5 0.7 0.0 0.0 0.0 1.1 0.0 0.0 1.3 0.5 0.0 40.6 0.0 0.0 0.2 0.0 0.0 0.0 0.0 0.0 0.0 51.8 1.2%
Wokingham other in-centre foodstores (zone 12)Morrisons, Woosehill Shopping Centre, Wokingham Wokingham 0.0 0.0 0.0 0.0 0.0 4.7 0.0 0.0 1.3 0.2 0.0 15.2 0.0 0.0 0.0 0.0 0.0 0.0 0.0 0.0 0.0 21.5 0.5%Sub-total, Wokingham other in-centre foodstores 0.0 0.0 0.0 0.0 0.0 4.7 0.0 0.0 1.3 0.2 0.0 15.2 0.0 0.0 0.0 0.0 0.0 0.0 0.0 0.0 0.0 21.5 0.5%
Wokingham edge/out-of-centre foodstores (zone 12)Tesco, Finchampstead Road, Wokingham Wokingham 1.0 0.0 0.0 0.0 0.0 1.5 0.0 0.0 0.0 0.0 1.4 41.0 1.7 0.0 0.5 0.0 0.0 0.0 0.0 0.0 0.0 47.0 1.1%Lidl, Molly Millers Lane, Wokingham Wokingham 0.0 0.0 0.0 0.0 0.0 0.0 0.0 0.0 0.0 0.0 0.7 9.5 0.5 0.4 0.0 0.0 0.0 0.0 0.0 0.0 0.0 11.1 0.3%Sub-total, Wokinkgham out-of-centre foodstores 1.0 0.0 0.0 0.0 0.0 1.5 0.0 0.0 0.0 0.0 2.0 50.5 2.2 0.4 0.5 0.0 0.0 0.0 0.0 0.0 0.0 58.1 1.4%
Sub-total, Wokingham main stores 8.5 0.7 0.0 0.0 0.0 7.3 0.0 0.0 2.6 0.7 2.0 106.3 2.2 0.4 0.6 0.0 0.0 0.0 0.0 0.0 0.0 131.4 3.1%
Newbury urban area
Newbury town centre foodstores (zone 16)Tesco Metro, Northbrook Street, Newbury West Berkshire 0.0 0.0 0.0 0.0 0.0 0.0 0.0 0.0 0.0 0.0 0.0 0.0 0.0 0.0 0.6 2.7 0.0 0.0 0.2 0.0 1.0 4.6 0.1%Marks & Spencer, Northbrook Street, Newbury West Berkshire 0.0 0.0 0.1 0.0 0.0 0.0 0.0 0.0 0.0 0.0 0.0 0.0 0.0 0.0 0.2 2.5 0.0 0.4 0.1 0.0 0.1 3.3 0.1%Sub-total, Newbury town centre foodstores 0.0 0.0 0.1 0.0 0.0 0.0 0.0 0.0 0.0 0.0 0.0 0.0 0.0 0.0 0.8 5.2 0.0 0.4 0.3 0.0 1.1 7.9 0.2%
Newbury edge/out-of-centre foodstores (zone 16)Sainsbury's, Hectors Way, Newbury West Berkshire 0.0 0.0 0.3 0.0 0.0 0.0 0.0 0.0 0.0 0.0 0.0 0.0 0.0 0.0 0.8 46.6 0.2 3.3 3.5 0.0 2.2 56.8 1.4%Tesco Extra, Pinchington Lane, Newbury West Berkshire 0.0 0.0 0.5 0.0 0.0 0.0 0.0 0.0 0.0 0.0 0.0 0.0 0.0 0.0 3.3 45.9 0.0 1.4 1.7 0.0 1.7 54.6 1.3%Waitrose, Oxford Road, Newbury West Berkshire 0.0 0.0 1.1 0.0 0.0 0.0 0.0 0.0 0.0 0.0 0.0 0.0 0.0 0.0 1.5 28.4 0.0 4.7 1.8 0.3 2.5 40.4 1.0%Aldi, London Road, Newbury West Berkshire 0.0 0.7 0.3 0.0 0.0 0.0 0.0 0.0 0.0 0.0 0.0 0.0 0.0 0.0 1.3 6.7 0.0 3.4 0.3 0.0 0.4 13.0 0.3%Tesco Superstore, London Road, Newbury West Berkshire 0.0 0.0 0.2 0.0 0.0 0.0 0.0 0.0 0.0 0.0 0.0 0.0 0.0 0.0 2.5 7.3 0.0 1.3 0.2 0.0 0.1 11.6 0.3%Sub-total, Newbury out-of-centre foodstores 0.0 0.7 2.3 0.0 0.0 0.0 0.0 0.0 0.0 0.0 0.0 0.0 0.0 0.0 9.3 135.0 0.2 14.2 7.5 0.3 6.9 176.3 4.2%
Sub-total, Newbury main stores 0.0 0.7 2.4 0.0 0.0 0.0 0.0 0.0 0.0 0.0 0.0 0.0 0.0 0.0 10.1 140.2 0.2 14.5 7.8 0.3 8.0 184.2 4.4%
Foodstores outside main urban areasLidl, High Street, Crowthorne (in-centre) Bracknell Forest 0.0 0.0 0.0 0.0 0.0 0.0 0.0 0.0 0.0 0.9 9.0 0.0 0.0 0.0 0.0 0.0 0.0 0.0 0.0 0.0 0.0 9.9 0.2%Waitrose, Yorktown Road, Sandhurst (in-centre) Bracknell Forest 0.0 0.0 0.0 0.0 0.0 0.0 0.0 0.0 0.0 2.6 15.7 0.0 0.0 0.0 0.0 0.0 0.0 0.0 0.0 0.0 0.0 18.3 0.4%Tesco Extra, Meadows Centre, Sandhurst (out-of-centre) Bracknell Forest 1.7 0.0 0.0 0.0 0.0 0.0 0.0 0.0 32.5 0.0 39.3 0.0 10.1 0.0 0.0 0.0 0.0 0.0 0.0 0.0 0.1 83.8 2.0%Waitrose, The Broadway, Thatcham (in-centre) West Berkshire 0.0 0.0 2.3 0.0 0.0 0.0 0.0 0.0 0.0 0.0 0.0 0.0 0.0 0.0 0.4 12.6 0.0 0.0 0.0 0.0 0.0 15.3 0.4%Co-Op, Reading Road, Pangbourne (in-centre) West Berkshire 0.0 0.0 0.0 0.0 0.0 0.0 0.0 0.0 0.0 0.0 0.0 0.0 0.0 0.0 0.0 0.0 0.0 0.0 0.0 0.0 2.3 2.3 0.1%Co-op, The Square, Pangbourne (in-centre) West Berkshire 0.0 0.0 0.0 0.0 0.0 0.0 0.0 0.0 0.0 0.0 0.0 0.0 0.0 0.0 0.0 0.0 0.0 0.0 0.0 0.0 2.6 2.6 0.1%Co-op, High Street, Theale (in-centre) West Berkshire 0.0 0.8 2.1 0.0 0.0 0.0 0.0 0.0 0.0 0.0 0.0 0.0 0.0 0.0 0.0 0.0 0.0 0.0 0.0 0.0 0.0 2.9 0.1%Tesco, Everland Road, Hungerford (edge-of-centre) West Berkshire 0.0 0.0 0.0 0.0 0.0 0.0 0.0 0.0 0.0 0.0 0.0 0.0 0.0 0.0 0.0 0.3 0.1 19.6 4.0 0.0 0.0 24.1 0.6%Sub-total, other main stores in Western Berkshire 1.7 0.8 4.4 0.0 0.0 0.0 0.0 0.0 32.5 3.6 64.0 0.0 10.1 0.0 0.4 12.9 0.1 19.6 4.0 0.0 5.0 159.2 3.8%
SUB-TOTAL, MAIN STORES IN WESTERN BERKSHIRE (A) 230.5 192.6 59.4 4.8 0.7 47.9 2.6 23.2 37.4 193.3 73.9 142.7 13.1 0.4 32.4 155.1 0.4 34.2 11.8 2.2 33.5 1,292.3 31.0%
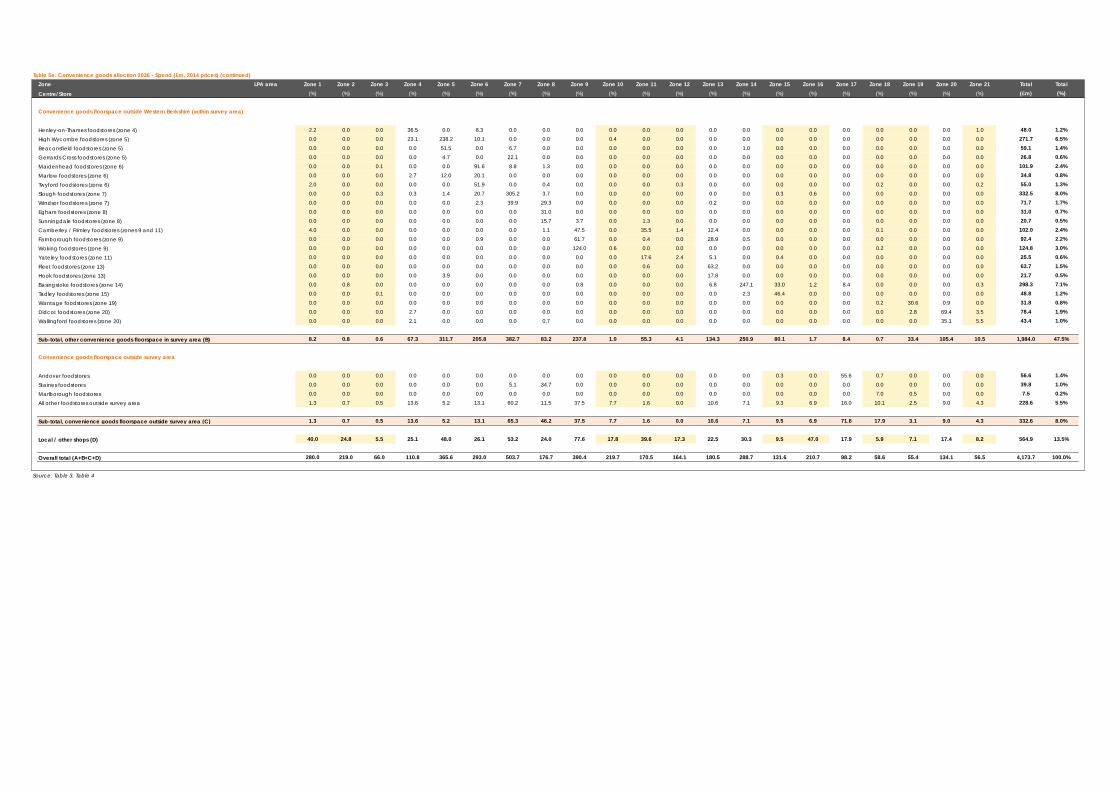
Table 5e: Convenience goods alloction 2036 - Spend (£m, 2014 prices) (continued)Zone LPA area Zone 1 Zone 2 Zone 3 Zone 4 Zone 5 Zone 6 Zone 7 Zone 8 Zone 9 Zone 10 Zone 11 Zone 12 Zone 13 Zone 14 Zone 15 Zone 16 Zone 17 Zone 18 Zone 19 Zone 20 Zone 21 Total Total
Centre/Store (%) (%) (%) (%) (%) (%) (%) (%) (%) (%) (%) (%) (%) (%) (%) (%) (%) (%) (%) (%) (%) (£m) (%)
Convenience goods floorspace outside Western Berkshire (within survey area)
Henley-on-Thames foodstores (zone 4) 2.2 0.0 0.0 36.5 0.0 8.3 0.0 0.0 0.0 0.0 0.0 0.0 0.0 0.0 0.0 0.0 0.0 0.0 0.0 0.0 1.0 48.0 1.2%High Wycombe foodstores (zone 5) 0.0 0.0 0.0 23.1 238.2 10.1 0.0 0.0 0.0 0.4 0.0 0.0 0.0 0.0 0.0 0.0 0.0 0.0 0.0 0.0 0.0 271.7 6.5%Beaconsfield foodstores (zone 5) 0.0 0.0 0.0 0.0 51.5 0.0 6.7 0.0 0.0 0.0 0.0 0.0 0.0 1.0 0.0 0.0 0.0 0.0 0.0 0.0 0.0 59.1 1.4%Gerrards Cross foodstores (zone 5) 0.0 0.0 0.0 0.0 4.7 0.0 22.1 0.0 0.0 0.0 0.0 0.0 0.0 0.0 0.0 0.0 0.0 0.0 0.0 0.0 0.0 26.8 0.6%Maidenhead foodstores (zone 6) 0.0 0.0 0.1 0.0 0.0 91.6 8.8 1.3 0.0 0.0 0.0 0.0 0.0 0.0 0.0 0.0 0.0 0.0 0.0 0.0 0.0 101.9 2.4%Marlow foodstores (zone 6) 0.0 0.0 0.0 2.7 12.0 20.1 0.0 0.0 0.0 0.0 0.0 0.0 0.0 0.0 0.0 0.0 0.0 0.0 0.0 0.0 0.0 34.8 0.8%Twyford foodstores (zone 6) 2.0 0.0 0.0 0.0 0.0 51.9 0.0 0.4 0.0 0.0 0.0 0.3 0.0 0.0 0.0 0.0 0.0 0.2 0.0 0.0 0.2 55.0 1.3%Slough foodstores (zone 7) 0.0 0.0 0.3 0.3 1.4 20.7 305.2 3.7 0.0 0.0 0.0 0.0 0.0 0.0 0.3 0.6 0.0 0.0 0.0 0.0 0.0 332.5 8.0%Windsor foodstores (zone 7) 0.0 0.0 0.0 0.0 0.0 2.3 39.9 29.3 0.0 0.0 0.0 0.0 0.2 0.0 0.0 0.0 0.0 0.0 0.0 0.0 0.0 71.7 1.7%Egham foodstores (zone 8) 0.0 0.0 0.0 0.0 0.0 0.0 0.0 31.0 0.0 0.0 0.0 0.0 0.0 0.0 0.0 0.0 0.0 0.0 0.0 0.0 0.0 31.0 0.7%Sunningdale foodstores (zone 8) 0.0 0.0 0.0 0.0 0.0 0.0 0.0 15.7 3.7 0.0 1.3 0.0 0.0 0.0 0.0 0.0 0.0 0.0 0.0 0.0 0.0 20.7 0.5%Camberley / Frimley foodstores (zones 9 and 11) 4.0 0.0 0.0 0.0 0.0 0.0 0.0 1.1 47.5 0.0 35.5 1.4 12.4 0.0 0.0 0.0 0.0 0.1 0.0 0.0 0.0 102.0 2.4%Farnborough foodstores (zone 9) 0.0 0.0 0.0 0.0 0.0 0.9 0.0 0.0 61.7 0.0 0.4 0.0 28.9 0.5 0.0 0.0 0.0 0.0 0.0 0.0 0.0 92.4 2.2%Woking foodstores (zone 9) 0.0 0.0 0.0 0.0 0.0 0.0 0.0 0.0 124.0 0.6 0.0 0.0 0.0 0.0 0.0 0.0 0.0 0.2 0.0 0.0 0.0 124.8 3.0%Yateley foodstores (zone 11) 0.0 0.0 0.0 0.0 0.0 0.0 0.0 0.0 0.0 0.0 17.6 2.4 5.1 0.0 0.4 0.0 0.0 0.0 0.0 0.0 0.0 25.5 0.6%Fleet foodstores (zone 13) 0.0 0.0 0.0 0.0 0.0 0.0 0.0 0.0 0.0 0.0 0.6 0.0 63.2 0.0 0.0 0.0 0.0 0.0 0.0 0.0 0.0 63.7 1.5%Hook foodstores (zone 13) 0.0 0.0 0.0 0.0 3.9 0.0 0.0 0.0 0.0 0.0 0.0 0.0 17.8 0.0 0.0 0.0 0.0 0.0 0.0 0.0 0.0 21.7 0.5%Basingstoke foodstores (zone 14) 0.0 0.8 0.0 0.0 0.0 0.0 0.0 0.0 0.8 0.0 0.0 0.0 6.8 247.1 33.0 1.2 8.4 0.0 0.0 0.0 0.3 298.3 7.1%Tadley foodstores (zone 15) 0.0 0.0 0.1 0.0 0.0 0.0 0.0 0.0 0.0 0.0 0.0 0.0 0.0 2.3 46.4 0.0 0.0 0.0 0.0 0.0 0.0 48.8 1.2%Wantage foodstores (zone 19) 0.0 0.0 0.0 0.0 0.0 0.0 0.0 0.0 0.0 0.0 0.0 0.0 0.0 0.0 0.0 0.0 0.0 0.2 30.6 0.9 0.0 31.8 0.8%Didcot foodstores (zone 20) 0.0 0.0 0.0 2.7 0.0 0.0 0.0 0.0 0.0 0.0 0.0 0.0 0.0 0.0 0.0 0.0 0.0 0.0 2.8 69.4 3.5 78.4 1.9%Wallingford foodstores (zone 20) 0.0 0.0 0.0 2.1 0.0 0.0 0.0 0.7 0.0 0.0 0.0 0.0 0.0 0.0 0.0 0.0 0.0 0.0 0.0 35.1 5.5 43.4 1.0%
Sub-total, other convenience goods floorspace in survey area (B) 8.2 0.8 0.6 67.3 311.7 205.8 382.7 83.2 237.8 1.0 55.3 4.1 134.3 250.9 80.1 1.7 8.4 0.7 33.4 105.4 10.5 1,984.0 47.5%
Convenience goods floorspace outside survey area
Andover foodstores 0.0 0.0 0.0 0.0 0.0 0.0 0.0 0.0 0.0 0.0 0.0 0.0 0.0 0.0 0.3 0.0 55.6 0.7 0.0 0.0 0.0 56.6 1.4%Staines foodstores 0.0 0.0 0.0 0.0 0.0 0.0 5.1 34.7 0.0 0.0 0.0 0.0 0.0 0.0 0.0 0.0 0.0 0.0 0.0 0.0 0.0 39.8 1.0%Marlborough foodstores 0.0 0.0 0.0 0.0 0.0 0.0 0.0 0.0 0.0 0.0 0.0 0.0 0.0 0.0 0.0 0.0 0.0 7.0 0.5 0.0 0.0 7.5 0.2%All other foodstores outside survey area 1.3 0.7 0.5 13.6 5.2 13.1 60.2 11.5 37.5 7.7 1.6 0.0 10.6 7.1 9.3 6.9 16.0 10.1 2.5 9.0 4.3 228.6 5.5%
Sub-total, convenience goods floorspace outside survey area (C) 1.3 0.7 0.5 13.6 5.2 13.1 65.3 46.2 37.5 7.7 1.6 0.0 10.6 7.1 9.5 6.9 71.6 17.9 3.1 9.0 4.3 332.6 8.0%
Local / other shops (D) 40.0 24.8 5.5 25.1 48.0 26.1 53.2 24.0 77.6 17.8 39.6 17.3 22.5 30.3 9.5 47.0 17.9 5.9 7.1 17.4 8.2 564.9 13.5%
Overall total (A+B+C+D) 280.0 219.0 66.0 110.8 365.6 293.0 503.7 176.7 390.4 219.7 170.5 164.1 180.5 288.7 131.6 210.7 98.2 58.6 55.4 134.1 56.5 4,173.7 100.0%
Source: Table 3, Table 4
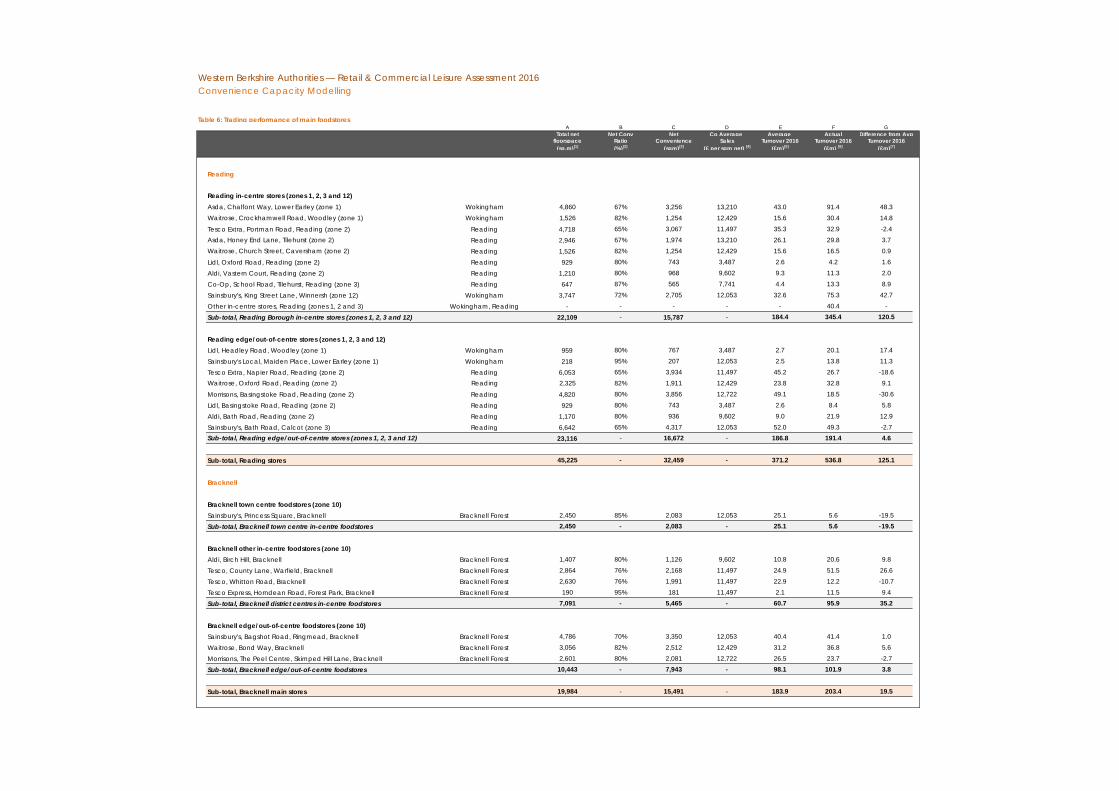
Western Berkshire Authorities — Retail & Commercial Leisure Assessment 2016Convenience Capacity Modelling
Table 6: Trading performance of main foodstoresA B C D E F G
Total net Net Conv Net Co Average Average Actual Difference from Avgfloorspace Ratio Convenience Sales Turnover 2016 Turnover 2016 Turnover 2016
(sq.m)[1] (%)[2] (sqm)[3] (£ per sqm net) [4] (£m)[5] (£m) [6] (£m)[7]
Reading
Reading in-centre stores (zones 1, 2, 3 and 12)Asda, Chalfont Way, Lower Earley (zone 1) Wokingham 4,860 67% 3,256 13,210 43.0 91.4 48.3Waitrose, Crockhamwell Road, Woodley (zone 1) Wokingham 1,526 82% 1,254 12,429 15.6 30.4 14.8
Tesco Extra, Portman Road, Reading (zone 2) Reading 4,718 65% 3,067 11,497 35.3 32.9 -2.4Asda, Honey End Lane, Tilehurst (zone 2) Reading 2,946 67% 1,974 13,210 26.1 29.8 3.7Waitrose, Church Street, Caversham (zone 2) Reading 1,526 82% 1,254 12,429 15.6 16.5 0.9
Lidl, Oxford Road, Reading (zone 2) Reading 929 80% 743 3,487 2.6 4.2 1.6
Aldi, Vastern Court, Reading (zone 2) Reading 1,210 80% 968 9,602 9.3 11.3 2.0
Co-Op, School Road, Tilehurst, Reading (zone 3) Reading 647 87% 565 7,741 4.4 13.3 8.9
Sainsbury's, King Street Lane, Winnersh (zone 12) Wokingham 3,747 72% 2,705 12,053 32.6 75.3 42.7
Other in-centre stores, Reading (zones 1, 2 and 3) Wokingham, Reading - - - - - 40.4 -
Sub-total, Reading Borough in-centre stores (zones 1, 2, 3 and 12) 22,109 - 15,787 - 184.4 345.4 120.5
Reading edge/out-of-centre stores (zones 1, 2, 3 and 12)Lidl, Headley Road, Woodley (zone 1) Wokingham 959 80% 767 3,487 2.7 20.1 17.4
Sainsbury's Local, Maiden Place, Lower Earley (zone 1) Wokingham 218 95% 207 12,053 2.5 13.8 11.3
Tesco Extra, Napier Road, Reading (zone 2) Reading 6,053 65% 3,934 11,497 45.2 26.7 -18.6Waitrose, Oxford Road, Reading (zone 2) Reading 2,325 82% 1,911 12,429 23.8 32.8 9.1
Morrisons, Basingstoke Road, Reading (zone 2) Reading 4,820 80% 3,856 12,722 49.1 18.5 -30.6
Lidl, Basingstoke Road, Reading (zone 2) Reading 929 80% 743 3,487 2.6 8.4 5.8
Aldi, Bath Road, Reading (zone 2) Reading 1,170 80% 936 9,602 9.0 21.9 12.9
Sainsbury's, Bath Road, Calcot (zone 3) Reading 6,642 65% 4,317 12,053 52.0 49.3 -2.7Sub-total, Reading edge/out-of-centre stores (zones 1, 2, 3 and 12) 23,116 - 16,672 - 186.8 191.4 4.6
Sub-total, Reading stores 45,225 - 32,459 - 371.2 536.8 125.1
Bracknell
Bracknell town centre foodstores (zone 10)Sainsbury's, Princess Square, Bracknell Bracknell Forest 2,450 85% 2,083 12,053 25.1 5.6 -19.5
Sub-total, Bracknell town centre in-centre foodstores 2,450 - 2,083 - 25.1 5.6 -19.5
Bracknell other in-centre foodstores (zone 10)Aldi, Birch Hill, Bracknell Bracknell Forest 1,407 80% 1,126 9,602 10.8 20.6 9.8
Tesco, County Lane, Warfield, Bracknell Bracknell Forest 2,864 76% 2,168 11,497 24.9 51.5 26.6
Tesco, Whitton Road, Bracknell Bracknell Forest 2,630 76% 1,991 11,497 22.9 12.2 -10.7
Tesco Express, Horndean Road, Forest Park, Bracknell Bracknell Forest 190 95% 181 11,497 2.1 11.5 9.4
Sub-total, Bracknell district centres in-centre foodstores 7,091 - 5,465 - 60.7 95.9 35.2
Bracknell edge/out-of-centre foodstores (zone 10)Sainsbury's, Bagshot Road, Ringmead, Bracknell Bracknell Forest 4,786 70% 3,350 12,053 40.4 41.4 1.0
Waitrose, Bond Way, Bracknell Bracknell Forest 3,056 82% 2,512 12,429 31.2 36.8 5.6
Morrisons, The Peel Centre, Skimped Hill Lane, Bracknell Bracknell Forest 2,601 80% 2,081 12,722 26.5 23.7 -2.7
Sub-total, Bracknell edge/out-of-centre foodstores 10,443 - 7,943 - 98.1 101.9 3.8
Sub-total, Bracknell main stores 19,984 - 15,491 - 183.9 203.4 19.5
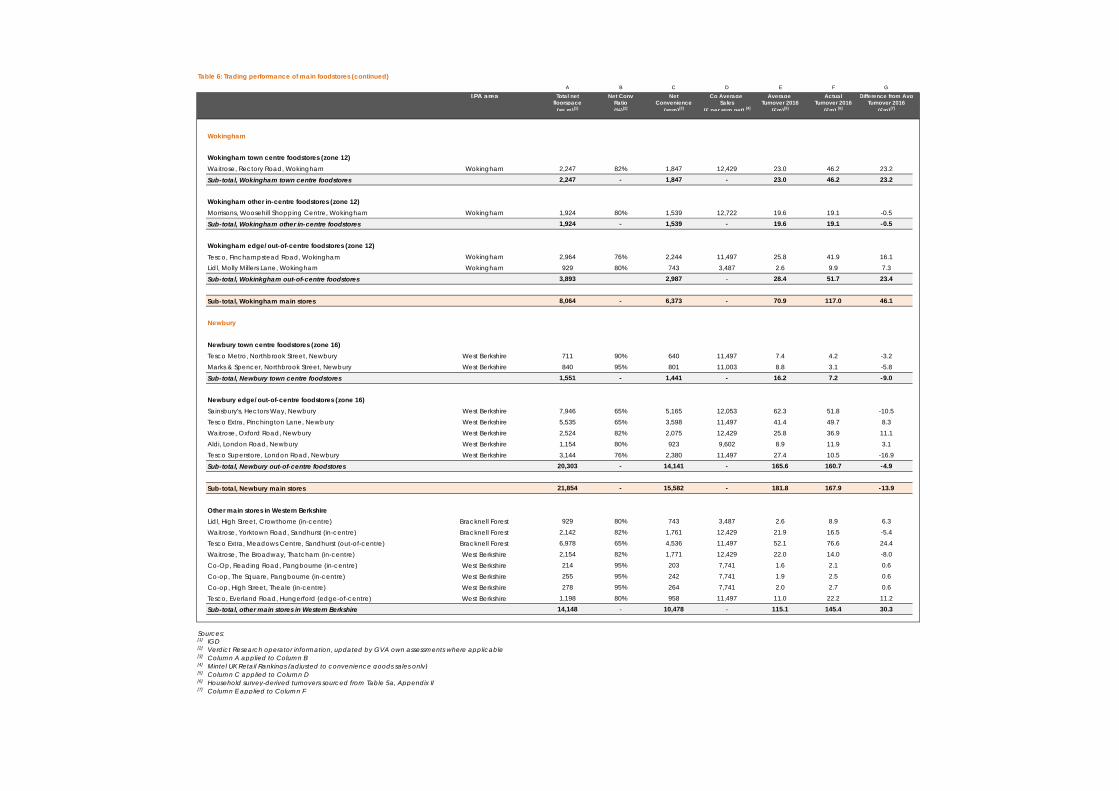
Table 6: Trading performance of main foodstores (continued)A B C D E F G
LPA area Total net Net Conv Net Co Average Average Actual Difference from Avgfloorspace Ratio Convenience Sales Turnover 2016 Turnover 2016 Turnover 2016
(sq.m)[1] (%)[2] (sqm)[3] (£ per sqm net) [4] (£m)[5] (£m) [6] (£m)[7]
Wokingham
Wokingham town centre foodstores (zone 12)Waitrose, Rectory Road, Wokingham Wokingham 2,247 82% 1,847 12,429 23.0 46.2 23.2
Sub-total, Wokingham town centre foodstores 2,247 - 1,847 - 23.0 46.2 23.2
Wokingham other in-centre foodstores (zone 12)Morrisons, Woosehill Shopping Centre, Wokingham Wokingham 1,924 80% 1,539 12,722 19.6 19.1 -0.5
Sub-total, Wokingham other in-centre foodstores 1,924 - 1,539 - 19.6 19.1 -0.5
Wokingham edge/out-of-centre foodstores (zone 12)Tesco, Finchampstead Road, Wokingham Wokingham 2,964 76% 2,244 11,497 25.8 41.9 16.1Lidl, Molly Millers Lane, Wokingham Wokingham 929 80% 743 3,487 2.6 9.9 7.3
Sub-total, Wokinkgham out-of-centre foodstores 3,893 2,987 - 28.4 51.7 23.4
Sub-total, Wokingham main stores 8,064 - 6,373 - 70.9 117.0 46.1
Newbury
Newbury town centre foodstores (zone 16)Tesco Metro, Northbrook Street, Newbury West Berkshire 711 90% 640 11,497 7.4 4.2 -3.2Marks & Spencer, Northbrook Street, Newbury West Berkshire 840 95% 801 11,003 8.8 3.1 -5.8
Sub-total, Newbury town centre foodstores 1,551 - 1,441 - 16.2 7.2 -9.0
Newbury edge/out-of-centre foodstores (zone 16)Sainsbury's, Hectors Way, Newbury West Berkshire 7,946 65% 5,165 12,053 62.3 51.8 -10.5Tesco Extra, Pinchington Lane, Newbury West Berkshire 5,535 65% 3,598 11,497 41.4 49.7 8.3Waitrose, Oxford Road, Newbury West Berkshire 2,524 82% 2,075 12,429 25.8 36.9 11.1Aldi, London Road, Newbury West Berkshire 1,154 80% 923 9,602 8.9 11.9 3.1Tesco Superstore, London Road, Newbury West Berkshire 3,144 76% 2,380 11,497 27.4 10.5 -16.9
Sub-total, Newbury out-of-centre foodstores 20,303 - 14,141 - 165.6 160.7 -4.9
Sub-total, Newbury main stores 21,854 - 15,582 - 181.8 167.9 -13.9
Other main stores in Western BerkshireLidl, High Street, Crowthorne (in-centre) Bracknell Forest 929 80% 743 3,487 2.6 8.9 6.3
Waitrose, Yorktown Road, Sandhurst (in-centre) Bracknell Forest 2,142 82% 1,761 12,429 21.9 16.5 -5.4
Tesco Extra, Meadows Centre, Sandhurst (out-of-centre) Bracknell Forest 6,978 65% 4,536 11,497 52.1 76.6 24.4
Waitrose, The Broadway, Thatcham (in-centre) West Berkshire 2,154 82% 1,771 12,429 22.0 14.0 -8.0
Co-Op, Reading Road, Pangbourne (in-centre) West Berkshire 214 95% 203 7,741 1.6 2.1 0.6
Co-op, The Square, Pangbourne (in-centre) West Berkshire 255 95% 242 7,741 1.9 2.5 0.6
Co-op, High Street, Theale (in-centre) West Berkshire 278 95% 264 7,741 2.0 2.7 0.6
Tesco, Everland Road, Hungerford (edge-of-centre) West Berkshire 1,198 80% 958 11,497 11.0 22.2 11.2
Sub-total, other main stores in Western Berkshire 14,148 - 10,478 - 115.1 145.4 30.3
Sources:[1] IGD[2] Verdict Research operator information, updated by GVA own assessments where applicable[3] Column A applied to Column B[4] Mintel UK Retail Rankings (adjusted to convenience goods sales only)[5] Column C applied to Column D[6] Household survey-derived turnovers sourced from Table 5a, Appendix II[7] Column E applied to Column F
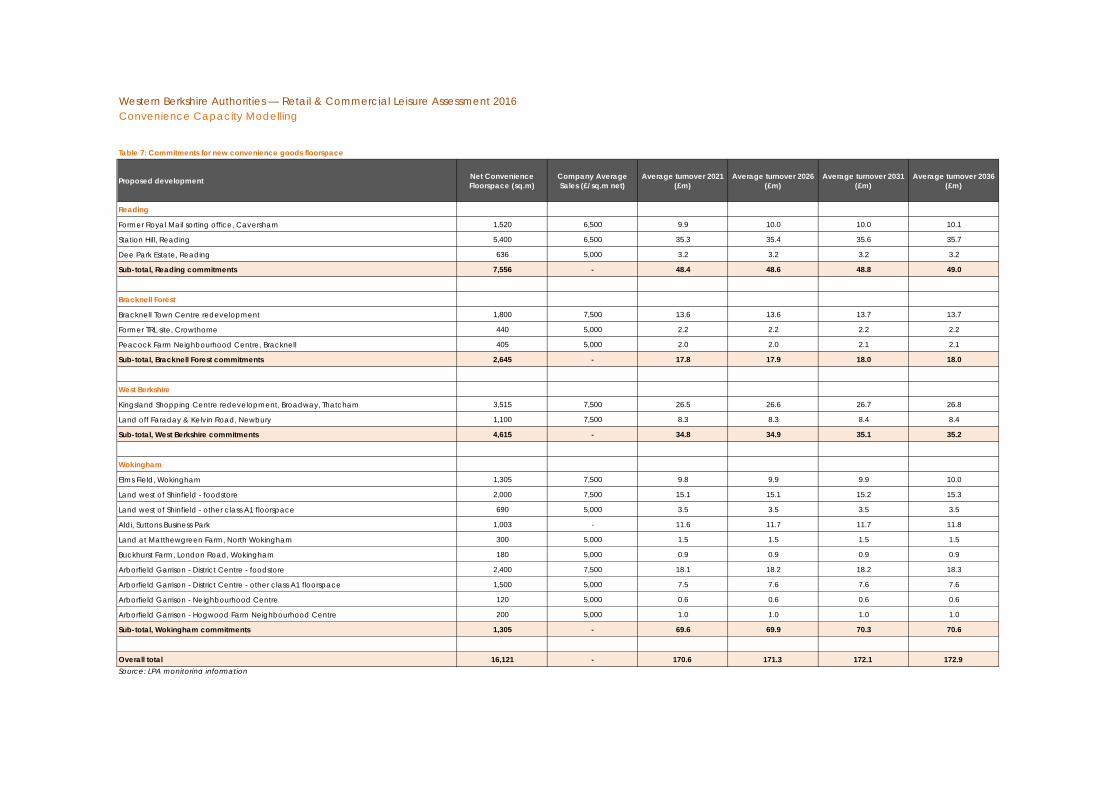
Western Berkshire Authorities — Retail & Commercial Leisure Assessment 2016Convenience Capacity Modelling
Table 7: Commitments for new convenience goods floorspace
Proposed development Net Convenience Floorspace (sq.m)
Company Average Sales (£/sq.m net)
Average turnover 2021 (£m)
Average turnover 2026 (£m)
Average turnover 2031 (£m)
Average turnover 2036 (£m)
Reading
Former Royal Mail sorting office, Caversham 1,520 6,500 9.9 10.0 10.0 10.1
Station Hill, Reading 5,400 6,500 35.3 35.4 35.6 35.7
Dee Park Estate, Reading 636 5,000 3.2 3.2 3.2 3.2
Sub-total, Reading commitments 7,556 - 48.4 48.6 48.8 49.0
Bracknell Forest
Bracknell Town Centre redevelopment 1,800 7,500 13.6 13.6 13.7 13.7
Former TRL site, Crowthorne 440 5,000 2.2 2.2 2.2 2.2
Peacock Farm Neighbourhood Centre, Bracknell 405 5,000 2.0 2.0 2.1 2.1
Sub-total, Bracknell Forest commitments 2,645 - 17.8 17.9 18.0 18.0
West Berkshire
Kingsland Shopping Centre redevelopment, Broadway, Thatcham 3,515 7,500 26.5 26.6 26.7 26.8
Land off Faraday & Kelvin Road, Newbury 1,100 7,500 8.3 8.3 8.4 8.4
Sub-total, West Berkshire commitments 4,615 - 34.8 34.9 35.1 35.2
Wokingham
Elms Field, Wokingham 1,305 7,500 9.8 9.9 9.9 10.0
Land west of Shinfield - foodstore 2,000 7,500 15.1 15.1 15.2 15.3
Land west of Shinfield - other class A1 floorspace 690 5,000 3.5 3.5 3.5 3.5
Aldi, Suttons Business Park 1,003 - 11.6 11.7 11.7 11.8
Land at Matthewgreen Farm, North Wokingham 300 5,000 1.5 1.5 1.5 1.5
Buckhurst Farm, London Road, Wokingham 180 5,000 0.9 0.9 0.9 0.9
Arborfield Garrison - District Centre - foodstore 2,400 7,500 18.1 18.2 18.2 18.3
Arborfield Garrison - District Centre - other class A1 floorspace 1,500 5,000 7.5 7.6 7.6 7.6
Arborfield Garrison - Neighbourhood Centre 120 5,000 0.6 0.6 0.6 0.6
Arborfield Garrison - Hogwood Farm Neighbourhood Centre 200 5,000 1.0 1.0 1.0 1.0
Sub-total, Wokingham commitments 1,305 - 69.6 69.9 70.3 70.6
Overall total 16,121 - 170.6 171.3 172.1 172.9Source: LPA monitoring information
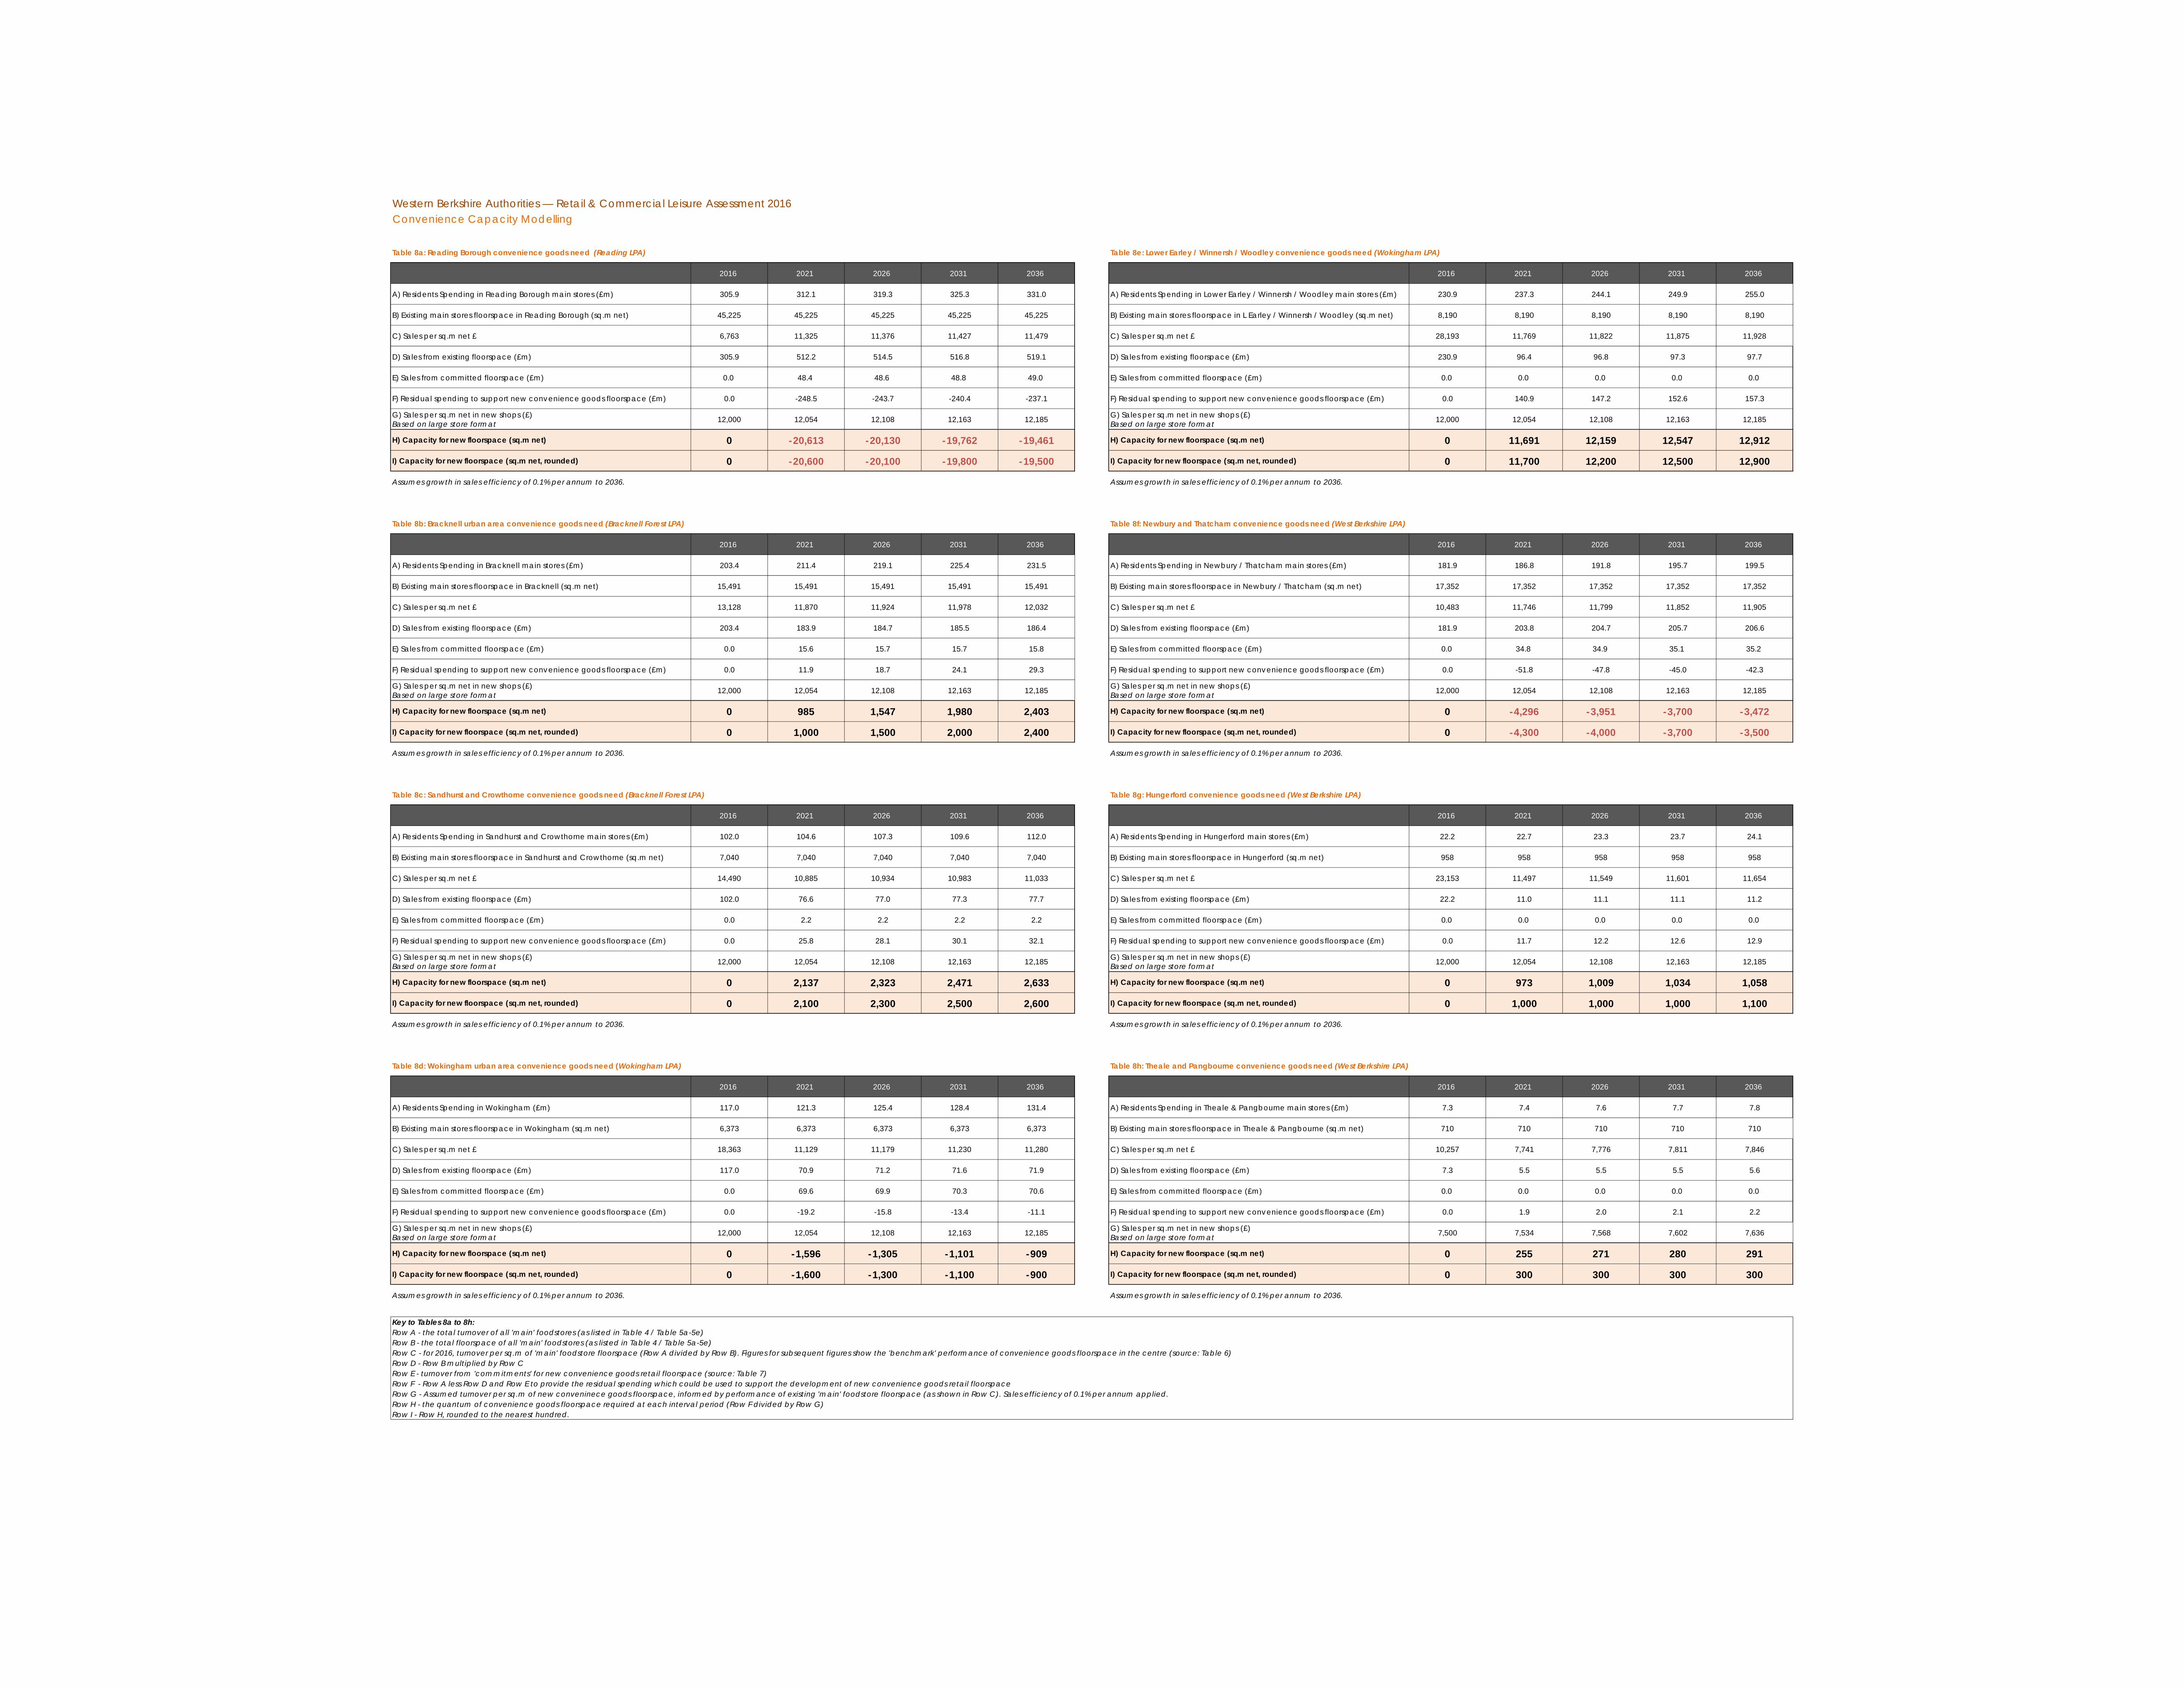
Western Berkshire Authorities — Retail & Commercial Leisure Assessment 2016Convenience Capacity Modelling
Table 8a: Reading Borough convenience goods need (Reading LPA) Table 8e: Lower Earley / Winnersh / Woodley convenience goods need (Wokingham LPA)
2016 2021 2026 2031 2036 2016 2021 2026 2031 2036
A) Residents Spending in Reading Borough main stores (£m) 305.9 312.1 319.3 325.3 331.0 A) Residents Spending in Lower Earley / Winnersh / Woodley main stores (£m) 230.9 237.3 244.1 249.9 255.0
B) Existing main stores floorspace in Reading Borough (sq.m net) 45,225 45,225 45,225 45,225 45,225 B) Existing main stores floorspace in L Earley / Winnersh / Woodley (sq.m net) 8,190 8,190 8,190 8,190 8,190
C) Sales per sq.m net £ 6,763 11,325 11,376 11,427 11,479 C) Sales per sq.m net £ 28,193 11,769 11,822 11,875 11,928
D) Sales from existing floorspace (£m) 305.9 512.2 514.5 516.8 519.1 D) Sales from existing floorspace (£m) 230.9 96.4 96.8 97.3 97.7
E) Sales from committed floorspace (£m) 0.0 48.4 48.6 48.8 49.0 E) Sales from committed floorspace (£m) 0.0 0.0 0.0 0.0 0.0
F) Residual spending to support new convenience goods floorspace (£m) 0.0 -248.5 -243.7 -240.4 -237.1 F) Residual spending to support new convenience goods floorspace (£m) 0.0 140.9 147.2 152.6 157.3
G) Sales per sq.m net in new shops (£) Based on large store format 12,000 12,054 12,108 12,163 12,185 G) Sales per sq.m net in new shops (£)
Based on large store format 12,000 12,054 12,108 12,163 12,185
H) Capacity for new floorspace (sq.m net) 0 -20,613 -20,130 -19,762 -19,461 H) Capacity for new floorspace (sq.m net) 0 11,691 12,159 12,547 12,912
I) Capacity for new floorspace (sq.m net, rounded) 0 -20,600 -20,100 -19,800 -19,500 I) Capacity for new floorspace (sq.m net, rounded) 0 11,700 12,200 12,500 12,900
Assumes growth in sales efficiency of 0.1% per annum to 2036. Assumes growth in sales efficiency of 0.1% per annum to 2036.
Table 8b: Bracknell urban area convenience goods need (Bracknell Forest LPA) Table 8f: Newbury and Thatcham convenience goods need (West Berkshire LPA)
2016 2021 2026 2031 2036 2016 2021 2026 2031 2036
A) Residents Spending in Bracknell main stores (£m) 203.4 211.4 219.1 225.4 231.5 A) Residents Spending in Newbury / Thatcham main stores (£m) 181.9 186.8 191.8 195.7 199.5
B) Existing main stores floorspace in Bracknell (sq.m net) 15,491 15,491 15,491 15,491 15,491 B) Existing main stores floorspace in Newbury / Thatcham (sq.m net) 17,352 17,352 17,352 17,352 17,352
C) Sales per sq.m net £ 13,128 11,870 11,924 11,978 12,032 C) Sales per sq.m net £ 10,483 11,746 11,799 11,852 11,905
D) Sales from existing floorspace (£m) 203.4 183.9 184.7 185.5 186.4 D) Sales from existing floorspace (£m) 181.9 203.8 204.7 205.7 206.6
E) Sales from committed floorspace (£m) 0.0 15.6 15.7 15.7 15.8 E) Sales from committed floorspace (£m) 0.0 34.8 34.9 35.1 35.2
F) Residual spending to support new convenience goods floorspace (£m) 0.0 11.9 18.7 24.1 29.3 F) Residual spending to support new convenience goods floorspace (£m) 0.0 -51.8 -47.8 -45.0 -42.3
G) Sales per sq.m net in new shops (£) Based on large store format 12,000 12,054 12,108 12,163 12,185 G) Sales per sq.m net in new shops (£)
Based on large store format 12,000 12,054 12,108 12,163 12,185
H) Capacity for new floorspace (sq.m net) 0 985 1,547 1,980 2,403 H) Capacity for new floorspace (sq.m net) 0 -4,296 -3,951 -3,700 -3,472
I) Capacity for new floorspace (sq.m net, rounded) 0 1,000 1,500 2,000 2,400 I) Capacity for new floorspace (sq.m net, rounded) 0 -4,300 -4,000 -3,700 -3,500
Assumes growth in sales efficiency of 0.1% per annum to 2036. Assumes growth in sales efficiency of 0.1% per annum to 2036.
Table 8c: Sandhurst and Crowthorne convenience goods need (Bracknell Forest LPA) Table 8g: Hungerford convenience goods need (West Berkshire LPA)
2016 2021 2026 2031 2036 2016 2021 2026 2031 2036
A) Residents Spending in Sandhurst and Crowthorne main stores (£m) 102.0 104.6 107.3 109.6 112.0 A) Residents Spending in Hungerford main stores (£m) 22.2 22.7 23.3 23.7 24.1
B) Existing main stores floorspace in Sandhurst and Crowthorne (sq.m net) 7,040 7,040 7,040 7,040 7,040 B) Existing main stores floorspace in Hungerford (sq.m net) 958 958 958 958 958
C) Sales per sq.m net £ 14,490 10,885 10,934 10,983 11,033 C) Sales per sq.m net £ 23,153 11,497 11,549 11,601 11,654
D) Sales from existing floorspace (£m) 102.0 76.6 77.0 77.3 77.7 D) Sales from existing floorspace (£m) 22.2 11.0 11.1 11.1 11.2
E) Sales from committed floorspace (£m) 0.0 2.2 2.2 2.2 2.2 E) Sales from committed floorspace (£m) 0.0 0.0 0.0 0.0 0.0
F) Residual spending to support new convenience goods floorspace (£m) 0.0 25.8 28.1 30.1 32.1 F) Residual spending to support new convenience goods floorspace (£m) 0.0 11.7 12.2 12.6 12.9
G) Sales per sq.m net in new shops (£) Based on large store format 12,000 12,054 12,108 12,163 12,185 G) Sales per sq.m net in new shops (£)
Based on large store format 12,000 12,054 12,108 12,163 12,185
H) Capacity for new floorspace (sq.m net) 0 2,137 2,323 2,471 2,633 H) Capacity for new floorspace (sq.m net) 0 973 1,009 1,034 1,058
I) Capacity for new floorspace (sq.m net, rounded) 0 2,100 2,300 2,500 2,600 I) Capacity for new floorspace (sq.m net, rounded) 0 1,000 1,000 1,000 1,100
Assumes growth in sales efficiency of 0.1% per annum to 2036. Assumes growth in sales efficiency of 0.1% per annum to 2036.
Table 8d: Wokingham urban area convenience goods need (Wokingham LPA) Table 8h: Theale and Pangbourne convenience goods need (West Berkshire LPA)
2016 2021 2026 2031 2036 2016 2021 2026 2031 2036
A) Residents Spending in Wokingham (£m) 117.0 121.3 125.4 128.4 131.4 A) Residents Spending in Theale & Pangbourne main stores (£m) 7.3 7.4 7.6 7.7 7.8
B) Existing main stores floorspace in Wokingham (sq.m net) 6,373 6,373 6,373 6,373 6,373 B) Existing main stores floorspace in Theale & Pangbourne (sq.m net) 710 710 710 710 710
C) Sales per sq.m net £ 18,363 11,129 11,179 11,230 11,280 C) Sales per sq.m net £ 10,257 7,741 7,776 7,811 7,846
D) Sales from existing floorspace (£m) 117.0 70.9 71.2 71.6 71.9 D) Sales from existing floorspace (£m) 7.3 5.5 5.5 5.5 5.6
E) Sales from committed floorspace (£m) 0.0 69.6 69.9 70.3 70.6 E) Sales from committed floorspace (£m) 0.0 0.0 0.0 0.0 0.0
F) Residual spending to support new convenience goods floorspace (£m) 0.0 -19.2 -15.8 -13.4 -11.1 F) Residual spending to support new convenience goods floorspace (£m) 0.0 1.9 2.0 2.1 2.2
G) Sales per sq.m net in new shops (£) Based on large store format 12,000 12,054 12,108 12,163 12,185 G) Sales per sq.m net in new shops (£)
Based on large store format 7,500 7,534 7,568 7,602 7,636
H) Capacity for new floorspace (sq.m net) 0 -1,596 -1,305 -1,101 -909 H) Capacity for new floorspace (sq.m net) 0 255 271 280 291
I) Capacity for new floorspace (sq.m net, rounded) 0 -1,600 -1,300 -1,100 -900 I) Capacity for new floorspace (sq.m net, rounded) 0 300 300 300 300
Assumes growth in sales efficiency of 0.1% per annum to 2036. Assumes growth in sales efficiency of 0.1% per annum to 2036.
Key to Tables 8a to 8h:Row A - the total turnover of all 'main' foodstores (as listed in Table 4 / Table 5a-5e)Row B - the total floorspace of all 'main' foodstores (as listed in Table 4 / Table 5a-5e)Row C - for 2016, turnover per sq.m of 'main' foodstore floorspace (Row A divided by Row B). Figures for subsequent figures show the 'benchmark' performance of convenience goods floorspace in the centre (source: Table 6)Row D - Row B multiplied by Row CRow E - turnover from 'commitments' for new convenience goods retail floorspace (source: Table 7)Row F - Row A less Row D and Row E to provide the residual spending which could be used to support the development of new convenience goods retail floorspaceRow G - Assumed turnover per sq.m of new conveninece goods floorspace, informed by performance of existing 'main' foodstore floorspace (as shown in Row C). Sales efficiency of 0.1% per annum applied.Row H - the quantum of convenience goods floorspace required at each interval period (Row F divided by Row G)Row I - Row H, rounded to the nearest hundred.

CONSULTATION STATEMENT
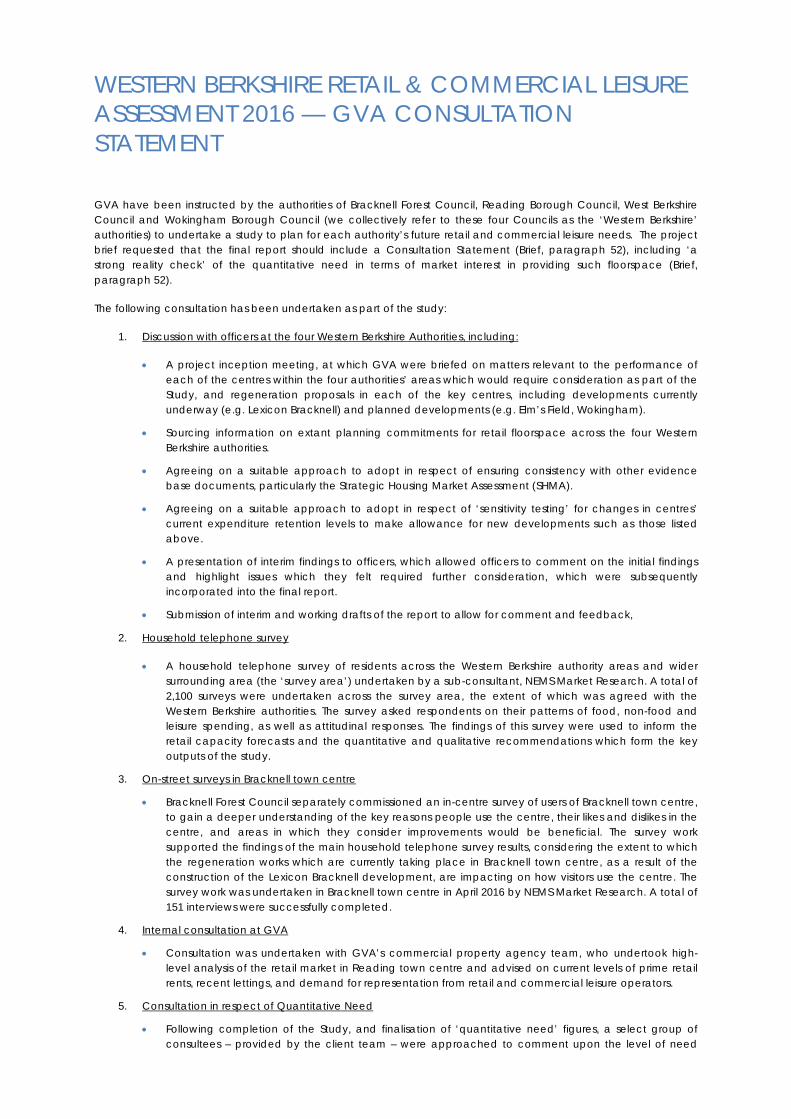
WESTERN BERKSHIRE RETAIL & COMMERCIAL LEISURE ASSESSMENT 2016 — GVA CONSULTATION STATEMENT
GVA have been instructed by the authorities of Bracknell Forest Council, Reading Borough Council, West Berkshire Council and Wokingham Borough Council (we collectively refer to these four Councils as the ‘Western Berkshire’ authorities) to undertake a study to plan for each authority’s future retail and commercial leisure needs. The project brief requested that the final report should include a Consultation Statement (Brief, paragraph 52), including ‘a strong reality check’ of the quantitative need in terms of market interest in providing such floorspace (Brief, paragraph 52).
The following consultation has been undertaken as part of the study:
1. Discussion with officers at the four Western Berkshire Authorities, including:
• A project inception meeting, at which GVA were briefed on matters relevant to the performance of each of the centres within the four authorities’ areas which would require consideration as part of the Study, and regeneration proposals in each of the key centres, including developments currently underway (e.g. Lexicon Bracknell) and planned developments (e.g. Elm’s Field, Wokingham).
• Sourcing information on extant planning commitments for retail floorspace across the four Western Berkshire authorities.
• Agreeing on a suitable approach to adopt in respect of ensuring consistency with other evidence base documents, particularly the Strategic Housing Market Assessment (SHMA).
• Agreeing on a suitable approach to adopt in respect of ‘sensitivity testing’ for changes in centres’ current expenditure retention levels to make allowance for new developments such as those listed above.
• A presentation of interim findings to officers, which allowed officers to comment on the initial findings and highlight issues which they felt required further consideration, which were subsequently incorporated into the final report.
• Submission of interim and working drafts of the report to allow for comment and feedback,
2. Household telephone survey
• A household telephone survey of residents across the Western Berkshire authority areas and wider surrounding area (the ‘survey area’) undertaken by a sub-consultant, NEMS Market Research. A total of 2,100 surveys were undertaken across the survey area, the extent of which was agreed with the Western Berkshire authorities. The survey asked respondents on their patterns of food, non-food and leisure spending, as well as attitudinal responses. The findings of this survey were used to inform the retail capacity forecasts and the quantitative and qualitative recommendations which form the key outputs of the study.
3. On-street surveys in Bracknell town centre
• Bracknell Forest Council separately commissioned an in-centre survey of users of Bracknell town centre, to gain a deeper understanding of the key reasons people use the centre, their likes and dislikes in the centre, and areas in which they consider improvements would be beneficial. The survey work supported the findings of the main household telephone survey results, considering the extent to which the regeneration works which are currently taking place in Bracknell town centre, as a result of the construction of the Lexicon Bracknell development, are impacting on how visitors use the centre. The survey work was undertaken in Bracknell town centre in April 2016 by NEMS Market Research. A total of 151 interviews were successfully completed.
4. Internal consultation at GVA
• Consultation was undertaken with GVA’s commercial property agency team, who undertook high-level analysis of the retail market in Reading town centre and advised on current levels of prime retail rents, recent lettings, and demand for representation from retail and commercial leisure operators.
5. Consultation in respect of Quantitative Need
• Following completion of the Study, and finalisation of ‘quantitative need’ figures, a select group of consultees – provided by the client team – were approached to comment upon the level of need
identified. A copy of the email sent to consultees is shown overleaf as Annex A. Those consulted by email included:
― Grant Thornton, Head of Economic and Cultural Development, Reading Borough Council
― Living BID, Reading
― Sarah Morgan, Regeneration Planning Manager, Wokingham Borough Council
― Beverley Thompson, Service Manager – Sports and Leisure, Wokingham Borough Council
― Melanie Allen, Town Centre Regeneration Team, Wokingham Borough Council
― Simon Russian, Head of Development for Bracknell, Legal and General Investment
Management
― Veryan Lyons, Regeneration Team Manager, Bracknell Forest Borough Council
― Sarah Hall, Senior Planner, Deloitte (on behalf of Bracknell Regeneration Partnership)
― Vincent Paliczka, Director of Environment, Culture & Communities, Bracknell Forest Borough
Council
― Russell Downing, Managing Director, Newbury BID
― David Pickett, Centre Director, Parkway Shopping Centre, Newbury
― Mag Williams, Centre Manager, Kennet Shopping Centre, Newbury
― Hogan Music, Newbury
― Johanna Heuren, Store Manager, Ikea Reading
― Janet Duffield, Economic Development, West Berkshire Council
• Two relevant responses were received. Sarah Morgan from Wokingham Council concluded that ‘the numbers of Wokingham urban area (both comparison and convenience) look appropriate and reflect where we think demand will be in the longer term’. Sarah Hall of Deloitte’s, acting on behalf of the Bracknell Regeneration Partnership raised concern that the figures seemed high, and an associated concern in respect of the impact this may have on the Lexicon, which is due to open in September 2017. In consultation with Bracknell Forest Council, GVA provided clarity and reassurance on this point.
• Consultation was also undertaken with Fiona Brownfoot of Hicks Baker commercial property agents, based in Reading. This enabled a more detailed discussion of the findings of GVA’s commercial property agents to be undertaken, including current levels of operator demand, operator sentiment from those currently trading in the centre, trends in vacancy/availability levels, and potential future influences of operator demand such as changes to business rates. Fiona commented that the comparison goods figure to 2036 seemed high, albeit the study does recommending planning for the scale identified to 2026, which is considerably lower. Fiona noted that many of the operators likely to locate in Reading were already represented, and she felt Reading would be unable to attract a new range of operator beyond that already represented. She also raised concerns around business rates, and difficulties in letting some units – although was unspecific about the location and quality of unit.
For and on behalf of GVA Grimley April 2017 gva.co.uk/planning
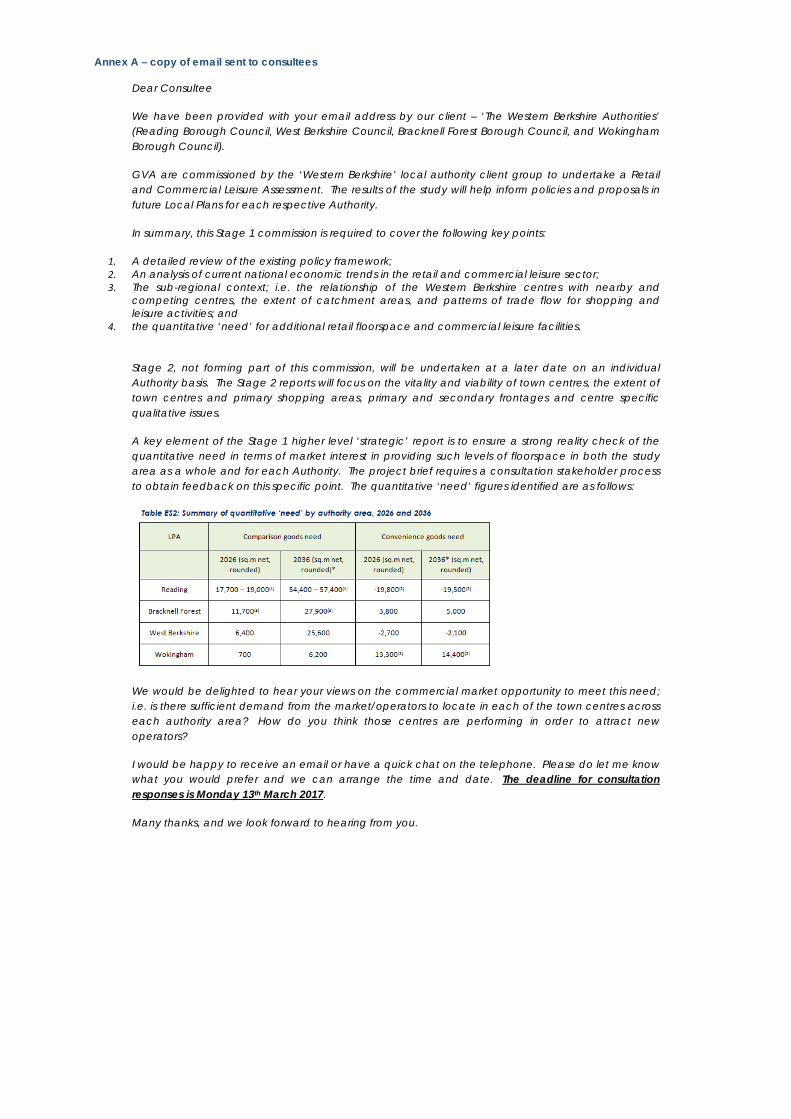
Annex A – copy of email sent to consultees
Dear Consultee
We have been provided with your email address by our client – ‘The Western Berkshire Authorities’ (Reading Borough Council, West Berkshire Council, Bracknell Forest Borough Council, and Wokingham Borough Council).
GVA are commissioned by the ‘Western Berkshire’ local authority client group to undertake a Retail and Commercial Leisure Assessment. The results of the study will help inform policies and proposals in future Local Plans for each respective Authority.
In summary, this Stage 1 commission is required to cover the following key points:
1. A detailed review of the existing policy framework; 2. An analysis of current national economic trends in the retail and commercial leisure sector; 3. The sub-regional context; i.e. the relationship of the Western Berkshire centres with nearby and
competing centres, the extent of catchment areas, and patterns of trade flow for shopping and leisure activities; and
4. the quantitative ‘need’ for additional retail floorspace and commercial leisure facilities.
Stage 2, not forming part of this commission, will be undertaken at a later date on an individual Authority basis. The Stage 2 reports will focus on the vitality and viability of town centres, the extent of town centres and primary shopping areas, primary and secondary frontages and centre specific qualitative issues.
A key element of the Stage 1 higher level ‘strategic’ report is to ensure a strong reality check of the quantitative need in terms of market interest in providing such levels of floorspace in both the study area as a whole and for each Authority. The project brief requires a consultation stakeholder process to obtain feedback on this specific point. The quantitative ‘need’ figures identified are as follows:
We would be delighted to hear your views on the commercial market opportunity to meet this need; i.e. is there sufficient demand from the market/operators to locate in each of the town centres across each authority area? How do you think those centres are performing in order to attract new operators?
I would be happy to receive an email or have a quick chat on the telephone. Please do let me know what you would prefer and we can arrange the time and date. The deadline for consultation responses is Monday 13th March 2017.
Many thanks, and we look forward to hearing from you.

gva.co.uk/planning
WESTERN BERKSHIRE AUTHORITIES | RETAIL & COMMERCIAL LEISURE ASSESSMENT 2016 | FINAL REPORT | APRIL 2017
Western Berkshire Retail & Commercial Leisure Assessment 2016 Volume 3 — Household Survey Results NEMS Market Research April 2017
GVA on behalf of Bracknell Forest Council | Reading Borough Council | West Berkshire Council | Wokingham Borough Council
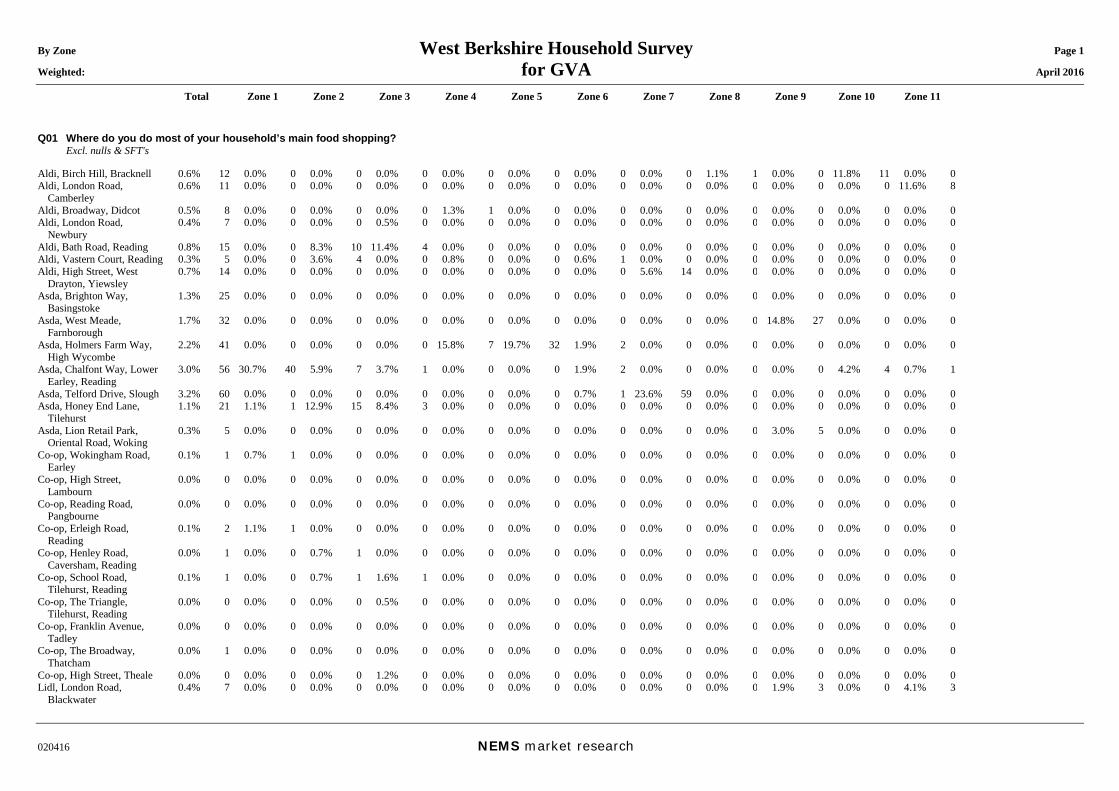
By Zone West Berkshire Household Survey Page 1 Weighted: for GVA April 2016
Total Zone 1 Zone 2 Zone 3 Zone 4 Zone 5 Zone 6 Zone 7 Zone 8 Zone 9 Zone 10 Zone 11
020416 NEMS market research
Q01 Where do you do most of your household’s main food shopping? Excl. nulls & SFT's Aldi, Birch Hill, Bracknell 0.6% 12 0.0% 0 0.0% 0 0.0% 0 0.0% 0 0.0% 0 0.0% 0 0.0% 0 1.1% 1 0.0% 0 11.8% 11 0.0% 0 Aldi, London Road,
Camberley 0.6% 11 0.0% 0 0.0% 0 0.0% 0 0.0% 0 0.0% 0 0.0% 0 0.0% 0 0.0% 0 0.0% 0 0.0% 0 11.6% 8
Aldi, Broadway, Didcot 0.5% 8 0.0% 0 0.0% 0 0.0% 0 1.3% 1 0.0% 0 0.0% 0 0.0% 0 0.0% 0 0.0% 0 0.0% 0 0.0% 0 Aldi, London Road,
Newbury 0.4% 7 0.0% 0 0.0% 0 0.5% 0 0.0% 0 0.0% 0 0.0% 0 0.0% 0 0.0% 0 0.0% 0 0.0% 0 0.0% 0
Aldi, Bath Road, Reading 0.8% 15 0.0% 0 8.3% 10 11.4% 4 0.0% 0 0.0% 0 0.0% 0 0.0% 0 0.0% 0 0.0% 0 0.0% 0 0.0% 0 Aldi, Vastern Court, Reading 0.3% 5 0.0% 0 3.6% 4 0.0% 0 0.8% 0 0.0% 0 0.6% 1 0.0% 0 0.0% 0 0.0% 0 0.0% 0 0.0% 0 Aldi, High Street, West
Drayton, Yiewsley 0.7% 14 0.0% 0 0.0% 0 0.0% 0 0.0% 0 0.0% 0 0.0% 0 5.6% 14 0.0% 0 0.0% 0 0.0% 0 0.0% 0
Asda, Brighton Way, Basingstoke
1.3% 25 0.0% 0 0.0% 0 0.0% 0 0.0% 0 0.0% 0 0.0% 0 0.0% 0 0.0% 0 0.0% 0 0.0% 0 0.0% 0
Asda, West Meade, Farnborough
1.7% 32 0.0% 0 0.0% 0 0.0% 0 0.0% 0 0.0% 0 0.0% 0 0.0% 0 0.0% 0 14.8% 27 0.0% 0 0.0% 0
Asda, Holmers Farm Way, High Wycombe
2.2% 41 0.0% 0 0.0% 0 0.0% 0 15.8% 7 19.7% 32 1.9% 2 0.0% 0 0.0% 0 0.0% 0 0.0% 0 0.0% 0
Asda, Chalfont Way, Lower Earley, Reading
3.0% 56 30.7% 40 5.9% 7 3.7% 1 0.0% 0 0.0% 0 1.9% 2 0.0% 0 0.0% 0 0.0% 0 4.2% 4 0.7% 1
Asda, Telford Drive, Slough 3.2% 60 0.0% 0 0.0% 0 0.0% 0 0.0% 0 0.0% 0 0.7% 1 23.6% 59 0.0% 0 0.0% 0 0.0% 0 0.0% 0 Asda, Honey End Lane,
Tilehurst 1.1% 21 1.1% 1 12.9% 15 8.4% 3 0.0% 0 0.0% 0 0.0% 0 0.0% 0 0.0% 0 0.0% 0 0.0% 0 0.0% 0
Asda, Lion Retail Park, Oriental Road, Woking
0.3% 5 0.0% 0 0.0% 0 0.0% 0 0.0% 0 0.0% 0 0.0% 0 0.0% 0 0.0% 0 3.0% 5 0.0% 0 0.0% 0
Co-op, Wokingham Road, Earley
0.1% 1 0.7% 1 0.0% 0 0.0% 0 0.0% 0 0.0% 0 0.0% 0 0.0% 0 0.0% 0 0.0% 0 0.0% 0 0.0% 0
Co-op, High Street, Lambourn
0.0% 0 0.0% 0 0.0% 0 0.0% 0 0.0% 0 0.0% 0 0.0% 0 0.0% 0 0.0% 0 0.0% 0 0.0% 0 0.0% 0
Co-op, Reading Road, Pangbourne
0.0% 0 0.0% 0 0.0% 0 0.0% 0 0.0% 0 0.0% 0 0.0% 0 0.0% 0 0.0% 0 0.0% 0 0.0% 0 0.0% 0
Co-op, Erleigh Road, Reading
0.1% 2 1.1% 1 0.0% 0 0.0% 0 0.0% 0 0.0% 0 0.0% 0 0.0% 0 0.0% 0 0.0% 0 0.0% 0 0.0% 0
Co-op, Henley Road, Caversham, Reading
0.0% 1 0.0% 0 0.7% 1 0.0% 0 0.0% 0 0.0% 0 0.0% 0 0.0% 0 0.0% 0 0.0% 0 0.0% 0 0.0% 0
Co-op, School Road, Tilehurst, Reading
0.1% 1 0.0% 0 0.7% 1 1.6% 1 0.0% 0 0.0% 0 0.0% 0 0.0% 0 0.0% 0 0.0% 0 0.0% 0 0.0% 0
Co-op, The Triangle, Tilehurst, Reading
0.0% 0 0.0% 0 0.0% 0 0.5% 0 0.0% 0 0.0% 0 0.0% 0 0.0% 0 0.0% 0 0.0% 0 0.0% 0 0.0% 0
Co-op, Franklin Avenue, Tadley
0.0% 0 0.0% 0 0.0% 0 0.0% 0 0.0% 0 0.0% 0 0.0% 0 0.0% 0 0.0% 0 0.0% 0 0.0% 0 0.0% 0
Co-op, The Broadway, Thatcham
0.0% 1 0.0% 0 0.0% 0 0.0% 0 0.0% 0 0.0% 0 0.0% 0 0.0% 0 0.0% 0 0.0% 0 0.0% 0 0.0% 0
Co-op, High Street, Theale 0.0% 0 0.0% 0 0.0% 0 1.2% 0 0.0% 0 0.0% 0 0.0% 0 0.0% 0 0.0% 0 0.0% 0 0.0% 0 0.0% 0 Lidl, London Road,
Blackwater 0.4% 7 0.0% 0 0.0% 0 0.0% 0 0.0% 0 0.0% 0 0.0% 0 0.0% 0 0.0% 0 1.9% 3 0.0% 0 4.1% 3
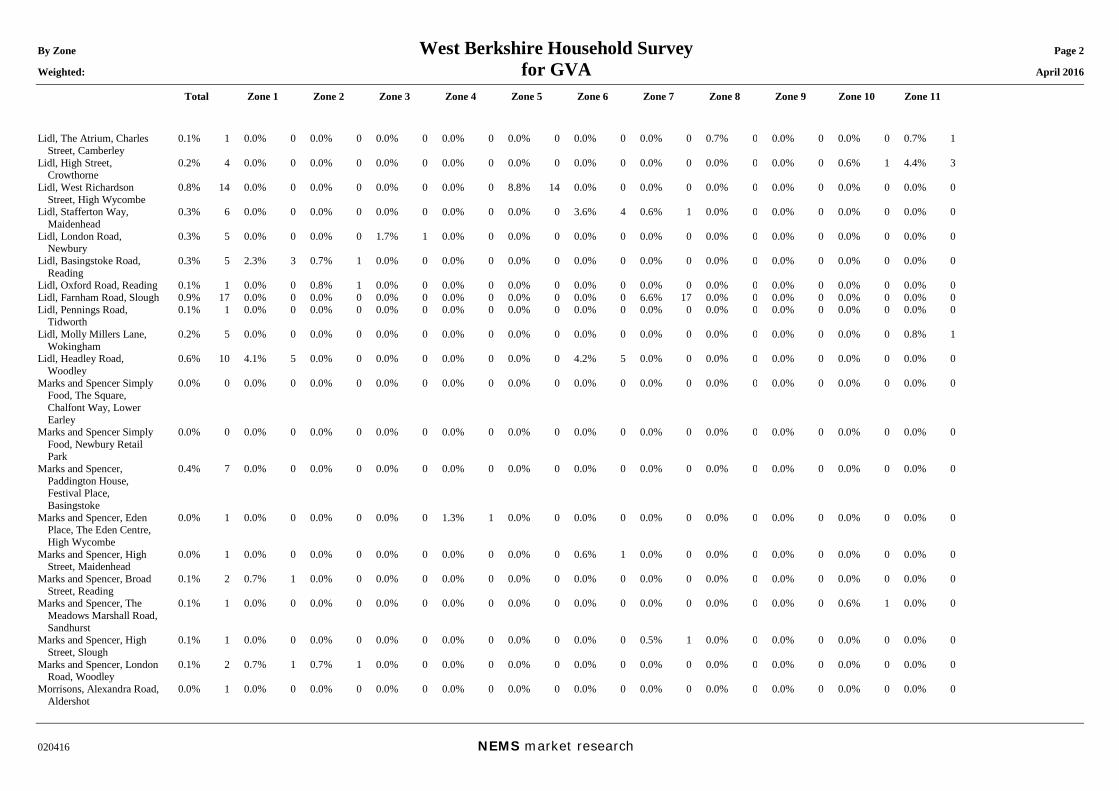
By Zone West Berkshire Household Survey Page 2 Weighted: for GVA April 2016
Total Zone 1 Zone 2 Zone 3 Zone 4 Zone 5 Zone 6 Zone 7 Zone 8 Zone 9 Zone 10 Zone 11
020416 NEMS market research
Lidl, The Atrium, Charles Street, Camberley
0.1% 1 0.0% 0 0.0% 0 0.0% 0 0.0% 0 0.0% 0 0.0% 0 0.0% 0 0.7% 0 0.0% 0 0.0% 0 0.7% 1
Lidl, High Street, Crowthorne
0.2% 4 0.0% 0 0.0% 0 0.0% 0 0.0% 0 0.0% 0 0.0% 0 0.0% 0 0.0% 0 0.0% 0 0.6% 1 4.4% 3
Lidl, West Richardson Street, High Wycombe
0.8% 14 0.0% 0 0.0% 0 0.0% 0 0.0% 0 8.8% 14 0.0% 0 0.0% 0 0.0% 0 0.0% 0 0.0% 0 0.0% 0
Lidl, Stafferton Way, Maidenhead
0.3% 6 0.0% 0 0.0% 0 0.0% 0 0.0% 0 0.0% 0 3.6% 4 0.6% 1 0.0% 0 0.0% 0 0.0% 0 0.0% 0
Lidl, London Road, Newbury
0.3% 5 0.0% 0 0.0% 0 1.7% 1 0.0% 0 0.0% 0 0.0% 0 0.0% 0 0.0% 0 0.0% 0 0.0% 0 0.0% 0
Lidl, Basingstoke Road, Reading
0.3% 5 2.3% 3 0.7% 1 0.0% 0 0.0% 0 0.0% 0 0.0% 0 0.0% 0 0.0% 0 0.0% 0 0.0% 0 0.0% 0
Lidl, Oxford Road, Reading 0.1% 1 0.0% 0 0.8% 1 0.0% 0 0.0% 0 0.0% 0 0.0% 0 0.0% 0 0.0% 0 0.0% 0 0.0% 0 0.0% 0 Lidl, Farnham Road, Slough 0.9% 17 0.0% 0 0.0% 0 0.0% 0 0.0% 0 0.0% 0 0.0% 0 6.6% 17 0.0% 0 0.0% 0 0.0% 0 0.0% 0 Lidl, Pennings Road,
Tidworth 0.1% 1 0.0% 0 0.0% 0 0.0% 0 0.0% 0 0.0% 0 0.0% 0 0.0% 0 0.0% 0 0.0% 0 0.0% 0 0.0% 0
Lidl, Molly Millers Lane, Wokingham
0.2% 5 0.0% 0 0.0% 0 0.0% 0 0.0% 0 0.0% 0 0.0% 0 0.0% 0 0.0% 0 0.0% 0 0.0% 0 0.8% 1
Lidl, Headley Road, Woodley
0.6% 10 4.1% 5 0.0% 0 0.0% 0 0.0% 0 0.0% 0 4.2% 5 0.0% 0 0.0% 0 0.0% 0 0.0% 0 0.0% 0
Marks and Spencer Simply Food, The Square, Chalfont Way, Lower Earley
0.0% 0 0.0% 0 0.0% 0 0.0% 0 0.0% 0 0.0% 0 0.0% 0 0.0% 0 0.0% 0 0.0% 0 0.0% 0 0.0% 0
Marks and Spencer Simply Food, Newbury Retail Park
0.0% 0 0.0% 0 0.0% 0 0.0% 0 0.0% 0 0.0% 0 0.0% 0 0.0% 0 0.0% 0 0.0% 0 0.0% 0 0.0% 0
Marks and Spencer, Paddington House, Festival Place, Basingstoke
0.4% 7 0.0% 0 0.0% 0 0.0% 0 0.0% 0 0.0% 0 0.0% 0 0.0% 0 0.0% 0 0.0% 0 0.0% 0 0.0% 0
Marks and Spencer, Eden Place, The Eden Centre, High Wycombe
0.0% 1 0.0% 0 0.0% 0 0.0% 0 1.3% 1 0.0% 0 0.0% 0 0.0% 0 0.0% 0 0.0% 0 0.0% 0 0.0% 0
Marks and Spencer, High Street, Maidenhead
0.0% 1 0.0% 0 0.0% 0 0.0% 0 0.0% 0 0.0% 0 0.6% 1 0.0% 0 0.0% 0 0.0% 0 0.0% 0 0.0% 0
Marks and Spencer, Broad Street, Reading
0.1% 2 0.7% 1 0.0% 0 0.0% 0 0.0% 0 0.0% 0 0.0% 0 0.0% 0 0.0% 0 0.0% 0 0.0% 0 0.0% 0
Marks and Spencer, The Meadows Marshall Road, Sandhurst
0.1% 1 0.0% 0 0.0% 0 0.0% 0 0.0% 0 0.0% 0 0.0% 0 0.0% 0 0.0% 0 0.0% 0 0.6% 1 0.0% 0
Marks and Spencer, High Street, Slough
0.1% 1 0.0% 0 0.0% 0 0.0% 0 0.0% 0 0.0% 0 0.0% 0 0.5% 1 0.0% 0 0.0% 0 0.0% 0 0.0% 0
Marks and Spencer, London Road, Woodley
0.1% 2 0.7% 1 0.7% 1 0.0% 0 0.0% 0 0.0% 0 0.0% 0 0.0% 0 0.0% 0 0.0% 0 0.0% 0 0.0% 0
Morrisons, Alexandra Road, Aldershot
0.0% 1 0.0% 0 0.0% 0 0.0% 0 0.0% 0 0.0% 0 0.0% 0 0.0% 0 0.0% 0 0.0% 0 0.0% 0 0.0% 0
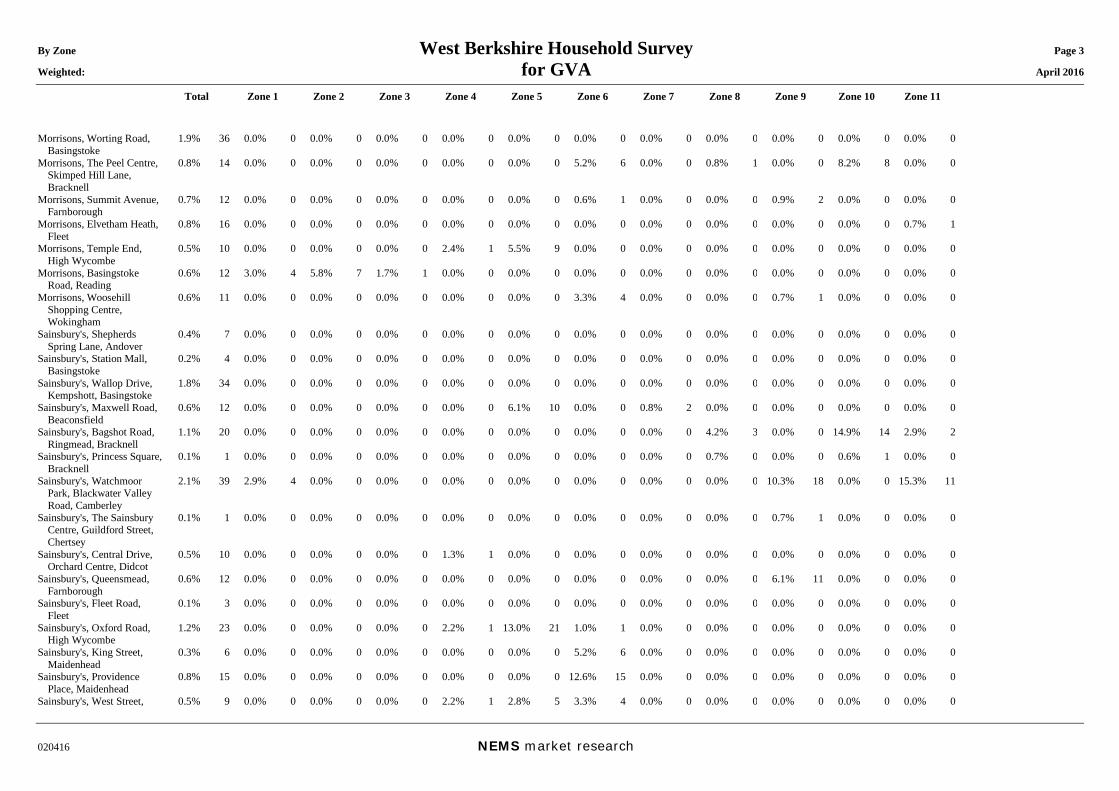
By Zone West Berkshire Household Survey Page 3 Weighted: for GVA April 2016
Total Zone 1 Zone 2 Zone 3 Zone 4 Zone 5 Zone 6 Zone 7 Zone 8 Zone 9 Zone 10 Zone 11
020416 NEMS market research
Morrisons, Worting Road, Basingstoke
1.9% 36 0.0% 0 0.0% 0 0.0% 0 0.0% 0 0.0% 0 0.0% 0 0.0% 0 0.0% 0 0.0% 0 0.0% 0 0.0% 0
Morrisons, The Peel Centre, Skimped Hill Lane, Bracknell
0.8% 14 0.0% 0 0.0% 0 0.0% 0 0.0% 0 0.0% 0 5.2% 6 0.0% 0 0.8% 1 0.0% 0 8.2% 8 0.0% 0
Morrisons, Summit Avenue, Farnborough
0.7% 12 0.0% 0 0.0% 0 0.0% 0 0.0% 0 0.0% 0 0.6% 1 0.0% 0 0.0% 0 0.9% 2 0.0% 0 0.0% 0
Morrisons, Elvetham Heath, Fleet
0.8% 16 0.0% 0 0.0% 0 0.0% 0 0.0% 0 0.0% 0 0.0% 0 0.0% 0 0.0% 0 0.0% 0 0.0% 0 0.7% 1
Morrisons, Temple End, High Wycombe
0.5% 10 0.0% 0 0.0% 0 0.0% 0 2.4% 1 5.5% 9 0.0% 0 0.0% 0 0.0% 0 0.0% 0 0.0% 0 0.0% 0
Morrisons, Basingstoke Road, Reading
0.6% 12 3.0% 4 5.8% 7 1.7% 1 0.0% 0 0.0% 0 0.0% 0 0.0% 0 0.0% 0 0.0% 0 0.0% 0 0.0% 0
Morrisons, Woosehill Shopping Centre, Wokingham
0.6% 11 0.0% 0 0.0% 0 0.0% 0 0.0% 0 0.0% 0 3.3% 4 0.0% 0 0.0% 0 0.7% 1 0.0% 0 0.0% 0
Sainsbury's, Shepherds Spring Lane, Andover
0.4% 7 0.0% 0 0.0% 0 0.0% 0 0.0% 0 0.0% 0 0.0% 0 0.0% 0 0.0% 0 0.0% 0 0.0% 0 0.0% 0
Sainsbury's, Station Mall, Basingstoke
0.2% 4 0.0% 0 0.0% 0 0.0% 0 0.0% 0 0.0% 0 0.0% 0 0.0% 0 0.0% 0 0.0% 0 0.0% 0 0.0% 0
Sainsbury's, Wallop Drive, Kempshott, Basingstoke
1.8% 34 0.0% 0 0.0% 0 0.0% 0 0.0% 0 0.0% 0 0.0% 0 0.0% 0 0.0% 0 0.0% 0 0.0% 0 0.0% 0
Sainsbury's, Maxwell Road, Beaconsfield
0.6% 12 0.0% 0 0.0% 0 0.0% 0 0.0% 0 6.1% 10 0.0% 0 0.8% 2 0.0% 0 0.0% 0 0.0% 0 0.0% 0
Sainsbury's, Bagshot Road, Ringmead, Bracknell
1.1% 20 0.0% 0 0.0% 0 0.0% 0 0.0% 0 0.0% 0 0.0% 0 0.0% 0 4.2% 3 0.0% 0 14.9% 14 2.9% 2
Sainsbury's, Princess Square, Bracknell
0.1% 1 0.0% 0 0.0% 0 0.0% 0 0.0% 0 0.0% 0 0.0% 0 0.0% 0 0.7% 0 0.0% 0 0.6% 1 0.0% 0
Sainsbury's, Watchmoor Park, Blackwater Valley Road, Camberley
2.1% 39 2.9% 4 0.0% 0 0.0% 0 0.0% 0 0.0% 0 0.0% 0 0.0% 0 0.0% 0 10.3% 18 0.0% 0 15.3% 11
Sainsbury's, The Sainsbury Centre, Guildford Street, Chertsey
0.1% 1 0.0% 0 0.0% 0 0.0% 0 0.0% 0 0.0% 0 0.0% 0 0.0% 0 0.0% 0 0.7% 1 0.0% 0 0.0% 0
Sainsbury's, Central Drive, Orchard Centre, Didcot
0.5% 10 0.0% 0 0.0% 0 0.0% 0 1.3% 1 0.0% 0 0.0% 0 0.0% 0 0.0% 0 0.0% 0 0.0% 0 0.0% 0
Sainsbury's, Queensmead, Farnborough
0.6% 12 0.0% 0 0.0% 0 0.0% 0 0.0% 0 0.0% 0 0.0% 0 0.0% 0 0.0% 0 6.1% 11 0.0% 0 0.0% 0
Sainsbury's, Fleet Road, Fleet
0.1% 3 0.0% 0 0.0% 0 0.0% 0 0.0% 0 0.0% 0 0.0% 0 0.0% 0 0.0% 0 0.0% 0 0.0% 0 0.0% 0
Sainsbury's, Oxford Road, High Wycombe
1.2% 23 0.0% 0 0.0% 0 0.0% 0 2.2% 1 13.0% 21 1.0% 1 0.0% 0 0.0% 0 0.0% 0 0.0% 0 0.0% 0
Sainsbury's, King Street, Maidenhead
0.3% 6 0.0% 0 0.0% 0 0.0% 0 0.0% 0 0.0% 0 5.2% 6 0.0% 0 0.0% 0 0.0% 0 0.0% 0 0.0% 0
Sainsbury's, Providence Place, Maidenhead
0.8% 15 0.0% 0 0.0% 0 0.0% 0 0.0% 0 0.0% 0 12.6% 15 0.0% 0 0.0% 0 0.0% 0 0.0% 0 0.0% 0
Sainsbury's, West Street, 0.5% 9 0.0% 0 0.0% 0 0.0% 0 2.2% 1 2.8% 5 3.3% 4 0.0% 0 0.0% 0 0.0% 0 0.0% 0 0.0% 0
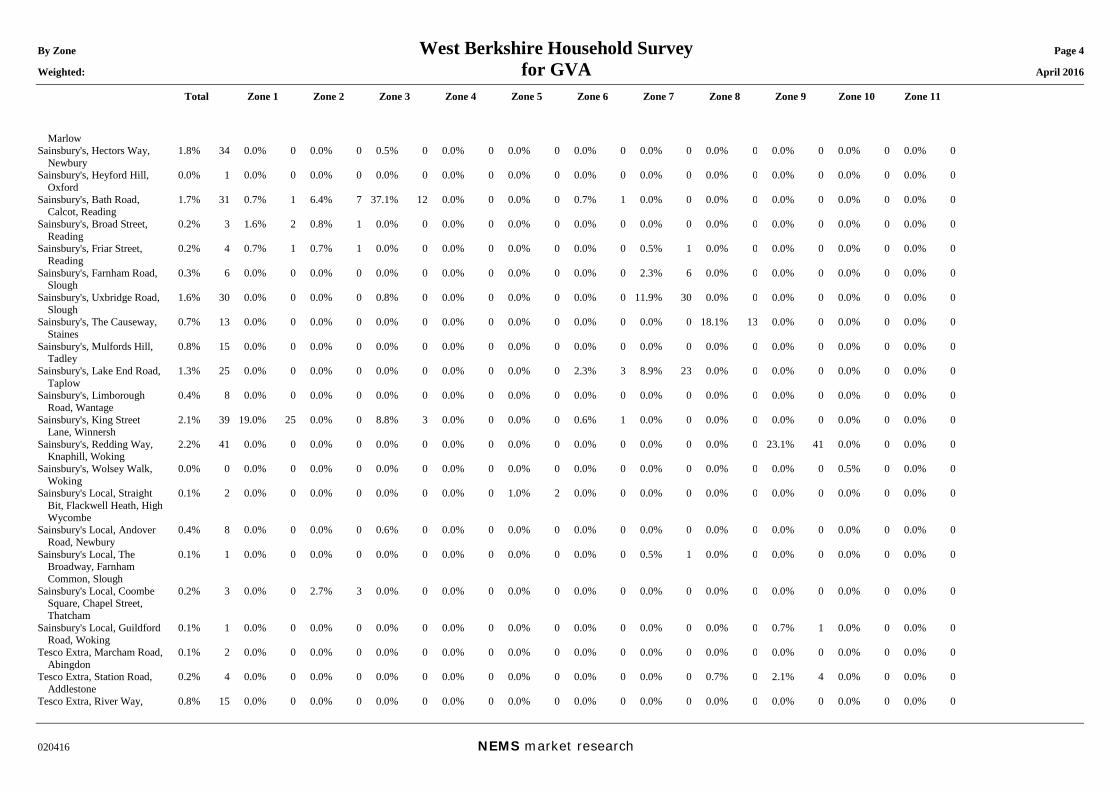
By Zone West Berkshire Household Survey Page 4 Weighted: for GVA April 2016
Total Zone 1 Zone 2 Zone 3 Zone 4 Zone 5 Zone 6 Zone 7 Zone 8 Zone 9 Zone 10 Zone 11
020416 NEMS market research
Marlow Sainsbury's, Hectors Way,
Newbury 1.8% 34 0.0% 0 0.0% 0 0.5% 0 0.0% 0 0.0% 0 0.0% 0 0.0% 0 0.0% 0 0.0% 0 0.0% 0 0.0% 0
Sainsbury's, Heyford Hill, Oxford
0.0% 1 0.0% 0 0.0% 0 0.0% 0 0.0% 0 0.0% 0 0.0% 0 0.0% 0 0.0% 0 0.0% 0 0.0% 0 0.0% 0
Sainsbury's, Bath Road, Calcot, Reading
1.7% 31 0.7% 1 6.4% 7 37.1% 12 0.0% 0 0.0% 0 0.7% 1 0.0% 0 0.0% 0 0.0% 0 0.0% 0 0.0% 0
Sainsbury's, Broad Street, Reading
0.2% 3 1.6% 2 0.8% 1 0.0% 0 0.0% 0 0.0% 0 0.0% 0 0.0% 0 0.0% 0 0.0% 0 0.0% 0 0.0% 0
Sainsbury's, Friar Street, Reading
0.2% 4 0.7% 1 0.7% 1 0.0% 0 0.0% 0 0.0% 0 0.0% 0 0.5% 1 0.0% 0 0.0% 0 0.0% 0 0.0% 0
Sainsbury's, Farnham Road, Slough
0.3% 6 0.0% 0 0.0% 0 0.0% 0 0.0% 0 0.0% 0 0.0% 0 2.3% 6 0.0% 0 0.0% 0 0.0% 0 0.0% 0
Sainsbury's, Uxbridge Road, Slough
1.6% 30 0.0% 0 0.0% 0 0.8% 0 0.0% 0 0.0% 0 0.0% 0 11.9% 30 0.0% 0 0.0% 0 0.0% 0 0.0% 0
Sainsbury's, The Causeway, Staines
0.7% 13 0.0% 0 0.0% 0 0.0% 0 0.0% 0 0.0% 0 0.0% 0 0.0% 0 18.1% 13 0.0% 0 0.0% 0 0.0% 0
Sainsbury's, Mulfords Hill, Tadley
0.8% 15 0.0% 0 0.0% 0 0.0% 0 0.0% 0 0.0% 0 0.0% 0 0.0% 0 0.0% 0 0.0% 0 0.0% 0 0.0% 0
Sainsbury's, Lake End Road, Taplow
1.3% 25 0.0% 0 0.0% 0 0.0% 0 0.0% 0 0.0% 0 2.3% 3 8.9% 23 0.0% 0 0.0% 0 0.0% 0 0.0% 0
Sainsbury's, Limborough Road, Wantage
0.4% 8 0.0% 0 0.0% 0 0.0% 0 0.0% 0 0.0% 0 0.0% 0 0.0% 0 0.0% 0 0.0% 0 0.0% 0 0.0% 0
Sainsbury's, King Street Lane, Winnersh
2.1% 39 19.0% 25 0.0% 0 8.8% 3 0.0% 0 0.0% 0 0.6% 1 0.0% 0 0.0% 0 0.0% 0 0.0% 0 0.0% 0
Sainsbury's, Redding Way, Knaphill, Woking
2.2% 41 0.0% 0 0.0% 0 0.0% 0 0.0% 0 0.0% 0 0.0% 0 0.0% 0 0.0% 0 23.1% 41 0.0% 0 0.0% 0
Sainsbury's, Wolsey Walk, Woking
0.0% 0 0.0% 0 0.0% 0 0.0% 0 0.0% 0 0.0% 0 0.0% 0 0.0% 0 0.0% 0 0.0% 0 0.5% 0 0.0% 0
Sainsbury's Local, Straight Bit, Flackwell Heath, High Wycombe
0.1% 2 0.0% 0 0.0% 0 0.0% 0 0.0% 0 1.0% 2 0.0% 0 0.0% 0 0.0% 0 0.0% 0 0.0% 0 0.0% 0
Sainsbury's Local, Andover Road, Newbury
0.4% 8 0.0% 0 0.0% 0 0.6% 0 0.0% 0 0.0% 0 0.0% 0 0.0% 0 0.0% 0 0.0% 0 0.0% 0 0.0% 0
Sainsbury's Local, The Broadway, Farnham Common, Slough
0.1% 1 0.0% 0 0.0% 0 0.0% 0 0.0% 0 0.0% 0 0.0% 0 0.5% 1 0.0% 0 0.0% 0 0.0% 0 0.0% 0
Sainsbury's Local, Coombe Square, Chapel Street, Thatcham
0.2% 3 0.0% 0 2.7% 3 0.0% 0 0.0% 0 0.0% 0 0.0% 0 0.0% 0 0.0% 0 0.0% 0 0.0% 0 0.0% 0
Sainsbury's Local, Guildford Road, Woking
0.1% 1 0.0% 0 0.0% 0 0.0% 0 0.0% 0 0.0% 0 0.0% 0 0.0% 0 0.0% 0 0.7% 1 0.0% 0 0.0% 0
Tesco Extra, Marcham Road, Abingdon
0.1% 2 0.0% 0 0.0% 0 0.0% 0 0.0% 0 0.0% 0 0.0% 0 0.0% 0 0.0% 0 0.0% 0 0.0% 0 0.0% 0
Tesco Extra, Station Road, Addlestone
0.2% 4 0.0% 0 0.0% 0 0.0% 0 0.0% 0 0.0% 0 0.0% 0 0.0% 0 0.7% 0 2.1% 4 0.0% 0 0.0% 0
Tesco Extra, River Way, 0.8% 15 0.0% 0 0.0% 0 0.0% 0 0.0% 0 0.0% 0 0.0% 0 0.0% 0 0.0% 0 0.0% 0 0.0% 0 0.0% 0
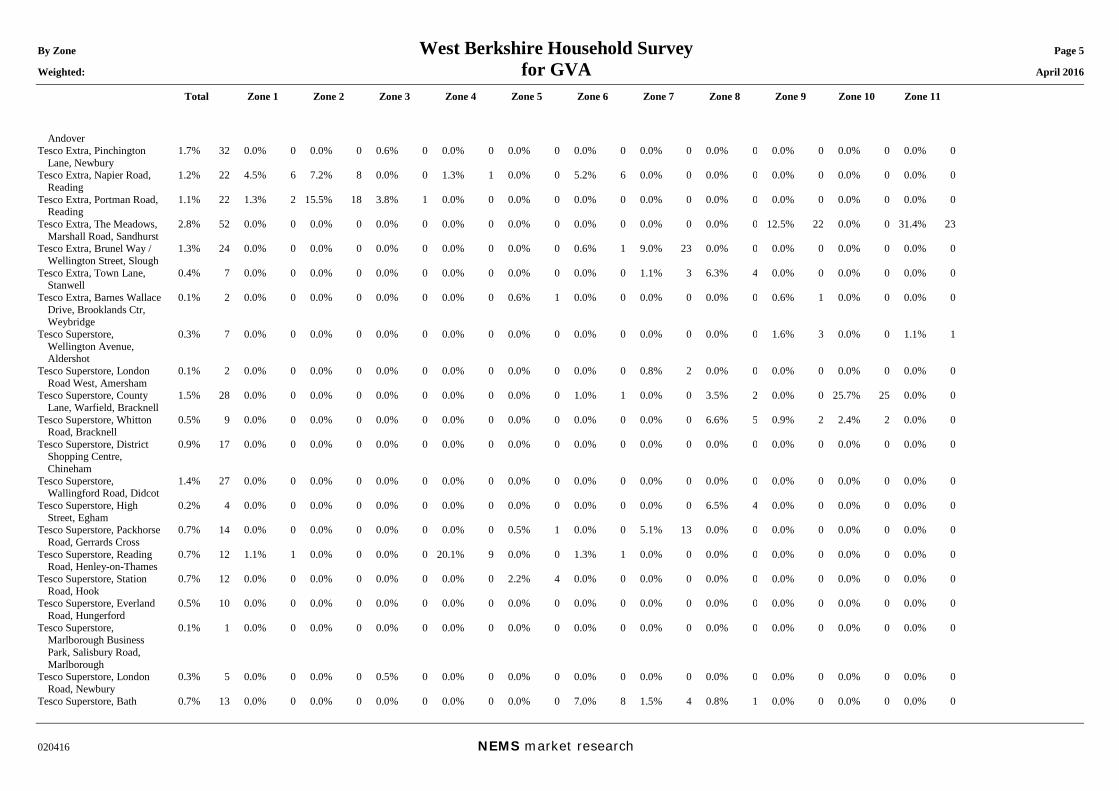
By Zone West Berkshire Household Survey Page 5 Weighted: for GVA April 2016
Total Zone 1 Zone 2 Zone 3 Zone 4 Zone 5 Zone 6 Zone 7 Zone 8 Zone 9 Zone 10 Zone 11
020416 NEMS market research
Andover Tesco Extra, Pinchington
Lane, Newbury 1.7% 32 0.0% 0 0.0% 0 0.6% 0 0.0% 0 0.0% 0 0.0% 0 0.0% 0 0.0% 0 0.0% 0 0.0% 0 0.0% 0
Tesco Extra, Napier Road, Reading
1.2% 22 4.5% 6 7.2% 8 0.0% 0 1.3% 1 0.0% 0 5.2% 6 0.0% 0 0.0% 0 0.0% 0 0.0% 0 0.0% 0
Tesco Extra, Portman Road, Reading
1.1% 22 1.3% 2 15.5% 18 3.8% 1 0.0% 0 0.0% 0 0.0% 0 0.0% 0 0.0% 0 0.0% 0 0.0% 0 0.0% 0
Tesco Extra, The Meadows, Marshall Road, Sandhurst
2.8% 52 0.0% 0 0.0% 0 0.0% 0 0.0% 0 0.0% 0 0.0% 0 0.0% 0 0.0% 0 12.5% 22 0.0% 0 31.4% 23
Tesco Extra, Brunel Way / Wellington Street, Slough
1.3% 24 0.0% 0 0.0% 0 0.0% 0 0.0% 0 0.0% 0 0.6% 1 9.0% 23 0.0% 0 0.0% 0 0.0% 0 0.0% 0
Tesco Extra, Town Lane, Stanwell
0.4% 7 0.0% 0 0.0% 0 0.0% 0 0.0% 0 0.0% 0 0.0% 0 1.1% 3 6.3% 4 0.0% 0 0.0% 0 0.0% 0
Tesco Extra, Barnes Wallace Drive, Brooklands Ctr, Weybridge
0.1% 2 0.0% 0 0.0% 0 0.0% 0 0.0% 0 0.6% 1 0.0% 0 0.0% 0 0.0% 0 0.6% 1 0.0% 0 0.0% 0
Tesco Superstore, Wellington Avenue, Aldershot
0.3% 7 0.0% 0 0.0% 0 0.0% 0 0.0% 0 0.0% 0 0.0% 0 0.0% 0 0.0% 0 1.6% 3 0.0% 0 1.1% 1
Tesco Superstore, London Road West, Amersham
0.1% 2 0.0% 0 0.0% 0 0.0% 0 0.0% 0 0.0% 0 0.0% 0 0.8% 2 0.0% 0 0.0% 0 0.0% 0 0.0% 0
Tesco Superstore, County Lane, Warfield, Bracknell
1.5% 28 0.0% 0 0.0% 0 0.0% 0 0.0% 0 0.0% 0 1.0% 1 0.0% 0 3.5% 2 0.0% 0 25.7% 25 0.0% 0
Tesco Superstore, Whitton Road, Bracknell
0.5% 9 0.0% 0 0.0% 0 0.0% 0 0.0% 0 0.0% 0 0.0% 0 0.0% 0 6.6% 5 0.9% 2 2.4% 2 0.0% 0
Tesco Superstore, District Shopping Centre, Chineham
0.9% 17 0.0% 0 0.0% 0 0.0% 0 0.0% 0 0.0% 0 0.0% 0 0.0% 0 0.0% 0 0.0% 0 0.0% 0 0.0% 0
Tesco Superstore, Wallingford Road, Didcot
1.4% 27 0.0% 0 0.0% 0 0.0% 0 0.0% 0 0.0% 0 0.0% 0 0.0% 0 0.0% 0 0.0% 0 0.0% 0 0.0% 0
Tesco Superstore, High Street, Egham
0.2% 4 0.0% 0 0.0% 0 0.0% 0 0.0% 0 0.0% 0 0.0% 0 0.0% 0 6.5% 4 0.0% 0 0.0% 0 0.0% 0
Tesco Superstore, Packhorse Road, Gerrards Cross
0.7% 14 0.0% 0 0.0% 0 0.0% 0 0.0% 0 0.5% 1 0.0% 0 5.1% 13 0.0% 0 0.0% 0 0.0% 0 0.0% 0
Tesco Superstore, Reading Road, Henley-on-Thames
0.7% 12 1.1% 1 0.0% 0 0.0% 0 20.1% 9 0.0% 0 1.3% 1 0.0% 0 0.0% 0 0.0% 0 0.0% 0 0.0% 0
Tesco Superstore, Station Road, Hook
0.7% 12 0.0% 0 0.0% 0 0.0% 0 0.0% 0 2.2% 4 0.0% 0 0.0% 0 0.0% 0 0.0% 0 0.0% 0 0.0% 0
Tesco Superstore, Everland Road, Hungerford
0.5% 10 0.0% 0 0.0% 0 0.0% 0 0.0% 0 0.0% 0 0.0% 0 0.0% 0 0.0% 0 0.0% 0 0.0% 0 0.0% 0
Tesco Superstore, Marlborough Business Park, Salisbury Road, Marlborough
0.1% 1 0.0% 0 0.0% 0 0.0% 0 0.0% 0 0.0% 0 0.0% 0 0.0% 0 0.0% 0 0.0% 0 0.0% 0 0.0% 0
Tesco Superstore, London Road, Newbury
0.3% 5 0.0% 0 0.0% 0 0.5% 0 0.0% 0 0.0% 0 0.0% 0 0.0% 0 0.0% 0 0.0% 0 0.0% 0 0.0% 0
Tesco Superstore, Bath 0.7% 13 0.0% 0 0.0% 0 0.0% 0 0.0% 0 0.0% 0 7.0% 8 1.5% 4 0.8% 1 0.0% 0 0.0% 0 0.0% 0

By Zone West Berkshire Household Survey Page 6 Weighted: for GVA April 2016
Total Zone 1 Zone 2 Zone 3 Zone 4 Zone 5 Zone 6 Zone 7 Zone 8 Zone 9 Zone 10 Zone 11
020416 NEMS market research
Road, Taplow Tesco Superstore, Station
Road, Tidworth 0.1% 2 0.0% 0 0.0% 0 0.0% 0 0.0% 0 0.0% 0 0.0% 0 0.0% 0 0.0% 0 0.0% 0 0.0% 0 0.0% 0
Tesco Superstore, High Street, West Drayton
0.2% 3 0.0% 0 0.0% 0 0.0% 0 0.0% 0 0.0% 0 0.0% 0 1.3% 3 0.0% 0 0.0% 0 0.0% 0 0.0% 0
Tesco Superstore, Dedworth Road, Windsor
0.6% 12 0.0% 0 0.0% 0 0.0% 0 0.0% 0 0.0% 0 0.6% 1 2.0% 5 8.5% 6 0.0% 0 0.0% 0 0.0% 0
Tesco Superstore, Finchampstead Road, Wokingham
1.0% 20 0.7% 1 0.0% 0 0.0% 0 0.0% 0 0.0% 0 0.0% 0 0.0% 0 0.0% 0 0.0% 0 0.0% 0 0.7% 1
Tesco Metro, Hampstead House, Basingstoke
0.5% 9 0.0% 0 0.0% 0 0.0% 0 0.0% 0 0.0% 0 0.0% 0 0.0% 0 0.0% 0 0.0% 0 0.0% 0 0.0% 0
Tesco Metro, Nicholson Walk, Maidenhead
0.1% 2 0.0% 0 0.0% 0 0.0% 0 0.0% 0 0.0% 0 2.1% 2 0.0% 0 0.0% 0 0.0% 0 0.0% 0 0.0% 0
Tesco Metro, Northbrook Street, Newbury
0.0% 1 0.0% 0 0.0% 0 0.0% 0 0.0% 0 0.0% 0 0.0% 0 0.0% 0 0.0% 0 0.0% 0 0.0% 0 0.0% 0
Tesco Express, High Street, Ascot
0.0% 1 0.0% 0 0.0% 0 0.0% 0 0.0% 0 0.0% 0 0.0% 0 0.0% 0 0.8% 1 0.0% 0 0.0% 0 0.0% 0
Tesco Express, Buckingham Parade, Kempshott, Basingstoke
0.0% 1 0.0% 0 0.0% 0 0.0% 0 0.0% 0 0.0% 0 0.0% 0 0.0% 0 0.0% 0 0.0% 0 0.0% 0 0.0% 0
Tesco Express, Carpenters Down, Popley, Basingstoke
0.1% 1 0.0% 0 0.0% 0 0.0% 0 0.0% 0 0.0% 0 0.0% 0 0.0% 0 0.0% 0 0.0% 0 0.0% 0 0.0% 0
Tesco Express, The Parade, Bourne End
0.1% 2 0.0% 0 0.0% 0 0.0% 0 0.0% 0 1.0% 2 0.0% 0 0.0% 0 0.0% 0 0.0% 0 0.0% 0 0.0% 0
Tesco Express, Horndean Road, Forest Park, Bracknell
0.4% 8 0.0% 0 0.0% 0 0.0% 0 0.0% 0 0.0% 0 0.0% 0 0.0% 0 0.0% 0 0.0% 0 8.5% 8 0.0% 0
Tesco Express, Burnham Lane, Burnham
0.1% 2 0.0% 0 0.0% 0 0.0% 0 0.0% 0 0.0% 0 0.0% 0 0.8% 2 0.0% 0 0.0% 0 0.0% 0 0.0% 0
Tesco Express, Lychpit Local Centre, Chineham
0.0% 1 0.0% 0 0.0% 0 0.0% 0 0.0% 0 0.0% 0 0.0% 0 0.0% 0 0.0% 0 0.0% 0 0.0% 0 0.0% 0
Tesco Express, Cockcroft Road, Didcot
0.0% 1 0.0% 0 0.0% 0 0.0% 0 0.9% 0 0.0% 0 0.0% 0 0.0% 0 0.0% 0 0.0% 0 0.0% 0 0.0% 0
Tesco Express, The Broadway, Farnham Common
0.1% 1 0.0% 0 0.0% 0 0.0% 0 0.0% 0 0.0% 0 0.0% 0 0.5% 1 0.0% 0 0.0% 0 0.0% 0 0.0% 0
Tesco Express, Beaumaris Parade, Balmoral Drive, Frimley
0.1% 1 0.0% 0 0.0% 0 0.0% 0 0.0% 0 0.0% 0 0.0% 0 0.0% 0 0.0% 0 0.7% 1 0.0% 0 0.0% 0
Tesco Express, Chapel Lane, High Wycombe
0.1% 2 0.0% 0 0.0% 0 0.0% 0 3.2% 1 0.6% 1 0.0% 0 0.0% 0 0.0% 0 0.0% 0 0.0% 0 0.0% 0
Tesco Express, New Road, High Wycombe
0.5% 9 0.0% 0 0.0% 0 0.0% 0 0.0% 0 5.7% 9 0.0% 0 0.0% 0 0.0% 0 0.0% 0 0.0% 0 0.0% 0
Tesco Express, Esso PFS, Church Street, Caversham,
0.2% 4 0.0% 0 1.8% 2 0.0% 0 0.0% 0 0.0% 0 0.0% 0 0.0% 0 0.0% 0 0.0% 0 0.0% 0 0.0% 0
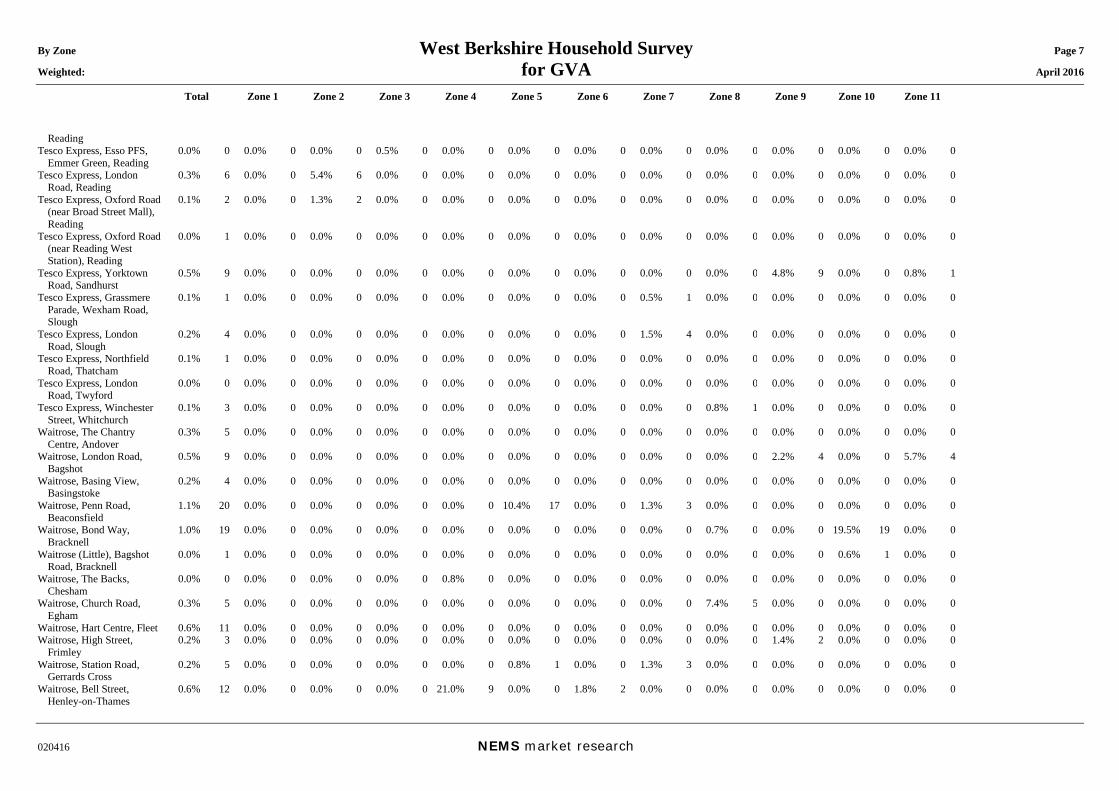
By Zone West Berkshire Household Survey Page 7 Weighted: for GVA April 2016
Total Zone 1 Zone 2 Zone 3 Zone 4 Zone 5 Zone 6 Zone 7 Zone 8 Zone 9 Zone 10 Zone 11
020416 NEMS market research
Reading Tesco Express, Esso PFS,
Emmer Green, Reading 0.0% 0 0.0% 0 0.0% 0 0.5% 0 0.0% 0 0.0% 0 0.0% 0 0.0% 0 0.0% 0 0.0% 0 0.0% 0 0.0% 0
Tesco Express, London Road, Reading
0.3% 6 0.0% 0 5.4% 6 0.0% 0 0.0% 0 0.0% 0 0.0% 0 0.0% 0 0.0% 0 0.0% 0 0.0% 0 0.0% 0
Tesco Express, Oxford Road (near Broad Street Mall), Reading
0.1% 2 0.0% 0 1.3% 2 0.0% 0 0.0% 0 0.0% 0 0.0% 0 0.0% 0 0.0% 0 0.0% 0 0.0% 0 0.0% 0
Tesco Express, Oxford Road (near Reading West Station), Reading
0.0% 1 0.0% 0 0.0% 0 0.0% 0 0.0% 0 0.0% 0 0.0% 0 0.0% 0 0.0% 0 0.0% 0 0.0% 0 0.0% 0
Tesco Express, Yorktown Road, Sandhurst
0.5% 9 0.0% 0 0.0% 0 0.0% 0 0.0% 0 0.0% 0 0.0% 0 0.0% 0 0.0% 0 4.8% 9 0.0% 0 0.8% 1
Tesco Express, Grassmere Parade, Wexham Road, Slough
0.1% 1 0.0% 0 0.0% 0 0.0% 0 0.0% 0 0.0% 0 0.0% 0 0.5% 1 0.0% 0 0.0% 0 0.0% 0 0.0% 0
Tesco Express, London Road, Slough
0.2% 4 0.0% 0 0.0% 0 0.0% 0 0.0% 0 0.0% 0 0.0% 0 1.5% 4 0.0% 0 0.0% 0 0.0% 0 0.0% 0
Tesco Express, Northfield Road, Thatcham
0.1% 1 0.0% 0 0.0% 0 0.0% 0 0.0% 0 0.0% 0 0.0% 0 0.0% 0 0.0% 0 0.0% 0 0.0% 0 0.0% 0
Tesco Express, London Road, Twyford
0.0% 0 0.0% 0 0.0% 0 0.0% 0 0.0% 0 0.0% 0 0.0% 0 0.0% 0 0.0% 0 0.0% 0 0.0% 0 0.0% 0
Tesco Express, Winchester Street, Whitchurch
0.1% 3 0.0% 0 0.0% 0 0.0% 0 0.0% 0 0.0% 0 0.0% 0 0.0% 0 0.8% 1 0.0% 0 0.0% 0 0.0% 0
Waitrose, The Chantry Centre, Andover
0.3% 5 0.0% 0 0.0% 0 0.0% 0 0.0% 0 0.0% 0 0.0% 0 0.0% 0 0.0% 0 0.0% 0 0.0% 0 0.0% 0
Waitrose, London Road, Bagshot
0.5% 9 0.0% 0 0.0% 0 0.0% 0 0.0% 0 0.0% 0 0.0% 0 0.0% 0 0.0% 0 2.2% 4 0.0% 0 5.7% 4
Waitrose, Basing View, Basingstoke
0.2% 4 0.0% 0 0.0% 0 0.0% 0 0.0% 0 0.0% 0 0.0% 0 0.0% 0 0.0% 0 0.0% 0 0.0% 0 0.0% 0
Waitrose, Penn Road, Beaconsfield
1.1% 20 0.0% 0 0.0% 0 0.0% 0 0.0% 0 10.4% 17 0.0% 0 1.3% 3 0.0% 0 0.0% 0 0.0% 0 0.0% 0
Waitrose, Bond Way, Bracknell
1.0% 19 0.0% 0 0.0% 0 0.0% 0 0.0% 0 0.0% 0 0.0% 0 0.0% 0 0.7% 0 0.0% 0 19.5% 19 0.0% 0
Waitrose (Little), Bagshot Road, Bracknell
0.0% 1 0.0% 0 0.0% 0 0.0% 0 0.0% 0 0.0% 0 0.0% 0 0.0% 0 0.0% 0 0.0% 0 0.6% 1 0.0% 0
Waitrose, The Backs, Chesham
0.0% 0 0.0% 0 0.0% 0 0.0% 0 0.8% 0 0.0% 0 0.0% 0 0.0% 0 0.0% 0 0.0% 0 0.0% 0 0.0% 0
Waitrose, Church Road, Egham
0.3% 5 0.0% 0 0.0% 0 0.0% 0 0.0% 0 0.0% 0 0.0% 0 0.0% 0 7.4% 5 0.0% 0 0.0% 0 0.0% 0
Waitrose, Hart Centre, Fleet 0.6% 11 0.0% 0 0.0% 0 0.0% 0 0.0% 0 0.0% 0 0.0% 0 0.0% 0 0.0% 0 0.0% 0 0.0% 0 0.0% 0 Waitrose, High Street,
Frimley 0.2% 3 0.0% 0 0.0% 0 0.0% 0 0.0% 0 0.0% 0 0.0% 0 0.0% 0 0.0% 0 1.4% 2 0.0% 0 0.0% 0
Waitrose, Station Road, Gerrards Cross
0.2% 5 0.0% 0 0.0% 0 0.0% 0 0.0% 0 0.8% 1 0.0% 0 1.3% 3 0.0% 0 0.0% 0 0.0% 0 0.0% 0
Waitrose, Bell Street, Henley-on-Thames
0.6% 12 0.0% 0 0.0% 0 0.0% 0 21.0% 9 0.0% 0 1.8% 2 0.0% 0 0.0% 0 0.0% 0 0.0% 0 0.0% 0
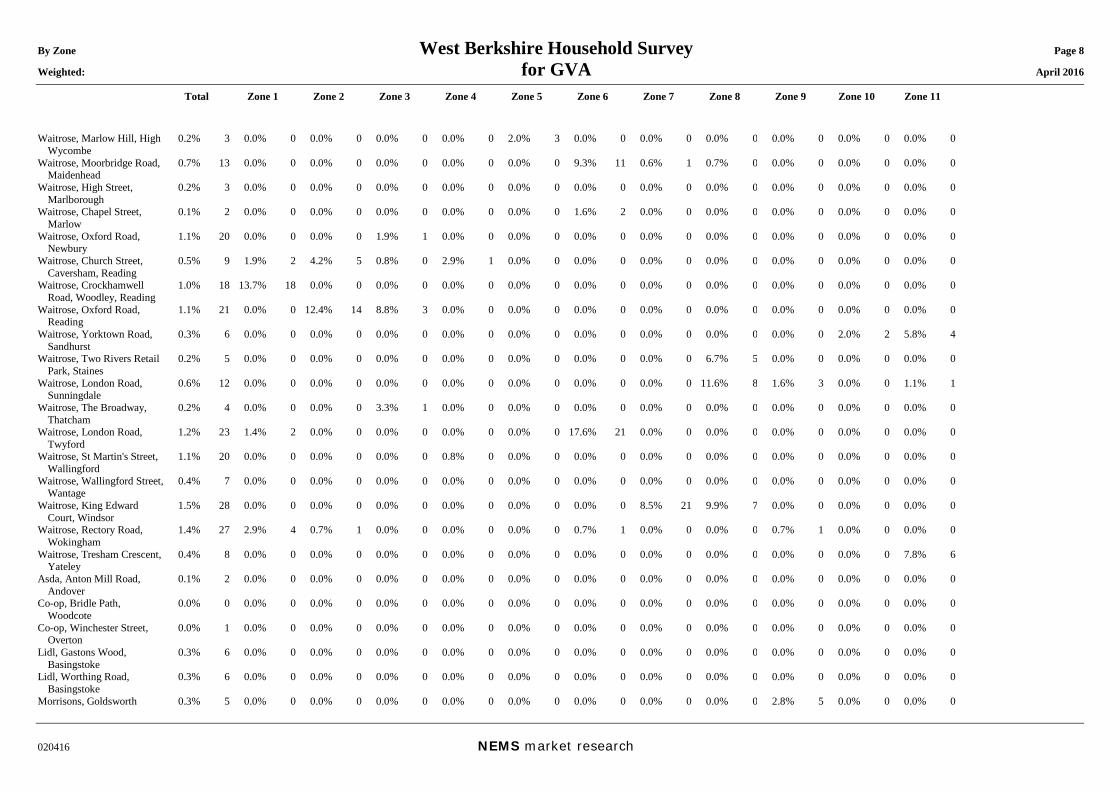
By Zone West Berkshire Household Survey Page 8 Weighted: for GVA April 2016
Total Zone 1 Zone 2 Zone 3 Zone 4 Zone 5 Zone 6 Zone 7 Zone 8 Zone 9 Zone 10 Zone 11
020416 NEMS market research
Waitrose, Marlow Hill, High Wycombe
0.2% 3 0.0% 0 0.0% 0 0.0% 0 0.0% 0 2.0% 3 0.0% 0 0.0% 0 0.0% 0 0.0% 0 0.0% 0 0.0% 0
Waitrose, Moorbridge Road, Maidenhead
0.7% 13 0.0% 0 0.0% 0 0.0% 0 0.0% 0 0.0% 0 9.3% 11 0.6% 1 0.7% 0 0.0% 0 0.0% 0 0.0% 0
Waitrose, High Street, Marlborough
0.2% 3 0.0% 0 0.0% 0 0.0% 0 0.0% 0 0.0% 0 0.0% 0 0.0% 0 0.0% 0 0.0% 0 0.0% 0 0.0% 0
Waitrose, Chapel Street, Marlow
0.1% 2 0.0% 0 0.0% 0 0.0% 0 0.0% 0 0.0% 0 1.6% 2 0.0% 0 0.0% 0 0.0% 0 0.0% 0 0.0% 0
Waitrose, Oxford Road, Newbury
1.1% 20 0.0% 0 0.0% 0 1.9% 1 0.0% 0 0.0% 0 0.0% 0 0.0% 0 0.0% 0 0.0% 0 0.0% 0 0.0% 0
Waitrose, Church Street, Caversham, Reading
0.5% 9 1.9% 2 4.2% 5 0.8% 0 2.9% 1 0.0% 0 0.0% 0 0.0% 0 0.0% 0 0.0% 0 0.0% 0 0.0% 0
Waitrose, Crockhamwell Road, Woodley, Reading
1.0% 18 13.7% 18 0.0% 0 0.0% 0 0.0% 0 0.0% 0 0.0% 0 0.0% 0 0.0% 0 0.0% 0 0.0% 0 0.0% 0
Waitrose, Oxford Road, Reading
1.1% 21 0.0% 0 12.4% 14 8.8% 3 0.0% 0 0.0% 0 0.0% 0 0.0% 0 0.0% 0 0.0% 0 0.0% 0 0.0% 0
Waitrose, Yorktown Road, Sandhurst
0.3% 6 0.0% 0 0.0% 0 0.0% 0 0.0% 0 0.0% 0 0.0% 0 0.0% 0 0.0% 0 0.0% 0 2.0% 2 5.8% 4
Waitrose, Two Rivers Retail Park, Staines
0.2% 5 0.0% 0 0.0% 0 0.0% 0 0.0% 0 0.0% 0 0.0% 0 0.0% 0 6.7% 5 0.0% 0 0.0% 0 0.0% 0
Waitrose, London Road, Sunningdale
0.6% 12 0.0% 0 0.0% 0 0.0% 0 0.0% 0 0.0% 0 0.0% 0 0.0% 0 11.6% 8 1.6% 3 0.0% 0 1.1% 1
Waitrose, The Broadway, Thatcham
0.2% 4 0.0% 0 0.0% 0 3.3% 1 0.0% 0 0.0% 0 0.0% 0 0.0% 0 0.0% 0 0.0% 0 0.0% 0 0.0% 0
Waitrose, London Road, Twyford
1.2% 23 1.4% 2 0.0% 0 0.0% 0 0.0% 0 0.0% 0 17.6% 21 0.0% 0 0.0% 0 0.0% 0 0.0% 0 0.0% 0
Waitrose, St Martin's Street, Wallingford
1.1% 20 0.0% 0 0.0% 0 0.0% 0 0.8% 0 0.0% 0 0.0% 0 0.0% 0 0.0% 0 0.0% 0 0.0% 0 0.0% 0
Waitrose, Wallingford Street, Wantage
0.4% 7 0.0% 0 0.0% 0 0.0% 0 0.0% 0 0.0% 0 0.0% 0 0.0% 0 0.0% 0 0.0% 0 0.0% 0 0.0% 0
Waitrose, King Edward Court, Windsor
1.5% 28 0.0% 0 0.0% 0 0.0% 0 0.0% 0 0.0% 0 0.0% 0 8.5% 21 9.9% 7 0.0% 0 0.0% 0 0.0% 0
Waitrose, Rectory Road, Wokingham
1.4% 27 2.9% 4 0.7% 1 0.0% 0 0.0% 0 0.0% 0 0.7% 1 0.0% 0 0.0% 0 0.7% 1 0.0% 0 0.0% 0
Waitrose, Tresham Crescent, Yateley
0.4% 8 0.0% 0 0.0% 0 0.0% 0 0.0% 0 0.0% 0 0.0% 0 0.0% 0 0.0% 0 0.0% 0 0.0% 0 7.8% 6
Asda, Anton Mill Road, Andover
0.1% 2 0.0% 0 0.0% 0 0.0% 0 0.0% 0 0.0% 0 0.0% 0 0.0% 0 0.0% 0 0.0% 0 0.0% 0 0.0% 0
Co-op, Bridle Path, Woodcote
0.0% 0 0.0% 0 0.0% 0 0.0% 0 0.0% 0 0.0% 0 0.0% 0 0.0% 0 0.0% 0 0.0% 0 0.0% 0 0.0% 0
Co-op, Winchester Street, Overton
0.0% 1 0.0% 0 0.0% 0 0.0% 0 0.0% 0 0.0% 0 0.0% 0 0.0% 0 0.0% 0 0.0% 0 0.0% 0 0.0% 0
Lidl, Gastons Wood, Basingstoke
0.3% 6 0.0% 0 0.0% 0 0.0% 0 0.0% 0 0.0% 0 0.0% 0 0.0% 0 0.0% 0 0.0% 0 0.0% 0 0.0% 0
Lidl, Worthing Road, Basingstoke
0.3% 6 0.0% 0 0.0% 0 0.0% 0 0.0% 0 0.0% 0 0.0% 0 0.0% 0 0.0% 0 0.0% 0 0.0% 0 0.0% 0
Morrisons, Goldsworth 0.3% 5 0.0% 0 0.0% 0 0.0% 0 0.0% 0 0.0% 0 0.0% 0 0.0% 0 0.0% 0 2.8% 5 0.0% 0 0.0% 0
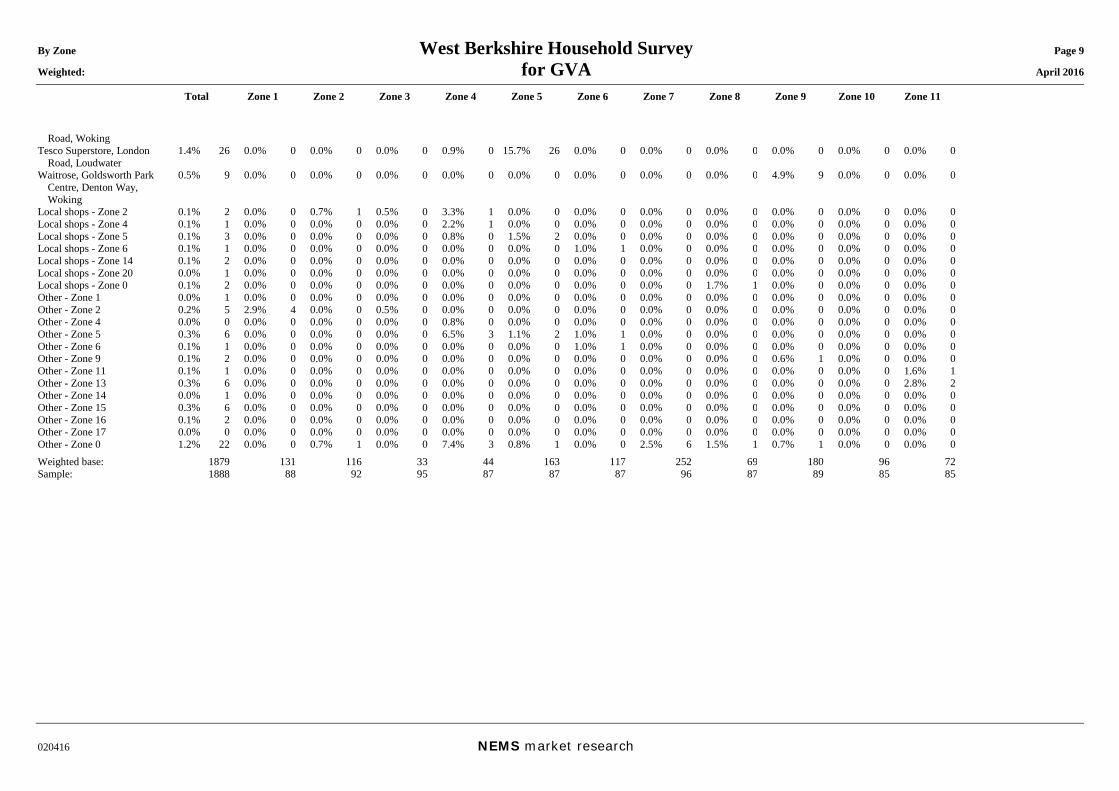
By Zone West Berkshire Household Survey Page 9 Weighted: for GVA April 2016
Total Zone 1 Zone 2 Zone 3 Zone 4 Zone 5 Zone 6 Zone 7 Zone 8 Zone 9 Zone 10 Zone 11
020416 NEMS market research
Road, Woking Tesco Superstore, London
Road, Loudwater 1.4% 26 0.0% 0 0.0% 0 0.0% 0 0.9% 0 15.7% 26 0.0% 0 0.0% 0 0.0% 0 0.0% 0 0.0% 0 0.0% 0
Waitrose, Goldsworth Park Centre, Denton Way, Woking
0.5% 9 0.0% 0 0.0% 0 0.0% 0 0.0% 0 0.0% 0 0.0% 0 0.0% 0 0.0% 0 4.9% 9 0.0% 0 0.0% 0
Local shops - Zone 2 0.1% 2 0.0% 0 0.7% 1 0.5% 0 3.3% 1 0.0% 0 0.0% 0 0.0% 0 0.0% 0 0.0% 0 0.0% 0 0.0% 0 Local shops - Zone 4 0.1% 1 0.0% 0 0.0% 0 0.0% 0 2.2% 1 0.0% 0 0.0% 0 0.0% 0 0.0% 0 0.0% 0 0.0% 0 0.0% 0 Local shops - Zone 5 0.1% 3 0.0% 0 0.0% 0 0.0% 0 0.8% 0 1.5% 2 0.0% 0 0.0% 0 0.0% 0 0.0% 0 0.0% 0 0.0% 0 Local shops - Zone 6 0.1% 1 0.0% 0 0.0% 0 0.0% 0 0.0% 0 0.0% 0 1.0% 1 0.0% 0 0.0% 0 0.0% 0 0.0% 0 0.0% 0 Local shops - Zone 14 0.1% 2 0.0% 0 0.0% 0 0.0% 0 0.0% 0 0.0% 0 0.0% 0 0.0% 0 0.0% 0 0.0% 0 0.0% 0 0.0% 0 Local shops - Zone 20 0.0% 1 0.0% 0 0.0% 0 0.0% 0 0.0% 0 0.0% 0 0.0% 0 0.0% 0 0.0% 0 0.0% 0 0.0% 0 0.0% 0 Local shops - Zone 0 0.1% 2 0.0% 0 0.0% 0 0.0% 0 0.0% 0 0.0% 0 0.0% 0 0.0% 0 1.7% 1 0.0% 0 0.0% 0 0.0% 0 Other - Zone 1 0.0% 1 0.0% 0 0.0% 0 0.0% 0 0.0% 0 0.0% 0 0.0% 0 0.0% 0 0.0% 0 0.0% 0 0.0% 0 0.0% 0 Other - Zone 2 0.2% 5 2.9% 4 0.0% 0 0.5% 0 0.0% 0 0.0% 0 0.0% 0 0.0% 0 0.0% 0 0.0% 0 0.0% 0 0.0% 0 Other - Zone 4 0.0% 0 0.0% 0 0.0% 0 0.0% 0 0.8% 0 0.0% 0 0.0% 0 0.0% 0 0.0% 0 0.0% 0 0.0% 0 0.0% 0 Other - Zone 5 0.3% 6 0.0% 0 0.0% 0 0.0% 0 6.5% 3 1.1% 2 1.0% 1 0.0% 0 0.0% 0 0.0% 0 0.0% 0 0.0% 0 Other - Zone 6 0.1% 1 0.0% 0 0.0% 0 0.0% 0 0.0% 0 0.0% 0 1.0% 1 0.0% 0 0.0% 0 0.0% 0 0.0% 0 0.0% 0 Other - Zone 9 0.1% 2 0.0% 0 0.0% 0 0.0% 0 0.0% 0 0.0% 0 0.0% 0 0.0% 0 0.0% 0 0.6% 1 0.0% 0 0.0% 0 Other - Zone 11 0.1% 1 0.0% 0 0.0% 0 0.0% 0 0.0% 0 0.0% 0 0.0% 0 0.0% 0 0.0% 0 0.0% 0 0.0% 0 1.6% 1 Other - Zone 13 0.3% 6 0.0% 0 0.0% 0 0.0% 0 0.0% 0 0.0% 0 0.0% 0 0.0% 0 0.0% 0 0.0% 0 0.0% 0 2.8% 2 Other - Zone 14 0.0% 1 0.0% 0 0.0% 0 0.0% 0 0.0% 0 0.0% 0 0.0% 0 0.0% 0 0.0% 0 0.0% 0 0.0% 0 0.0% 0 Other - Zone 15 0.3% 6 0.0% 0 0.0% 0 0.0% 0 0.0% 0 0.0% 0 0.0% 0 0.0% 0 0.0% 0 0.0% 0 0.0% 0 0.0% 0 Other - Zone 16 0.1% 2 0.0% 0 0.0% 0 0.0% 0 0.0% 0 0.0% 0 0.0% 0 0.0% 0 0.0% 0 0.0% 0 0.0% 0 0.0% 0 Other - Zone 17 0.0% 0 0.0% 0 0.0% 0 0.0% 0 0.0% 0 0.0% 0 0.0% 0 0.0% 0 0.0% 0 0.0% 0 0.0% 0 0.0% 0 Other - Zone 0 1.2% 22 0.0% 0 0.7% 1 0.0% 0 7.4% 3 0.8% 1 0.0% 0 2.5% 6 1.5% 1 0.7% 1 0.0% 0 0.0% 0 Weighted base: 1879 131 116 33 44 163 117 252 69 180 96 72 Sample: 1888 88 92 95 87 87 87 96 87 89 85 85
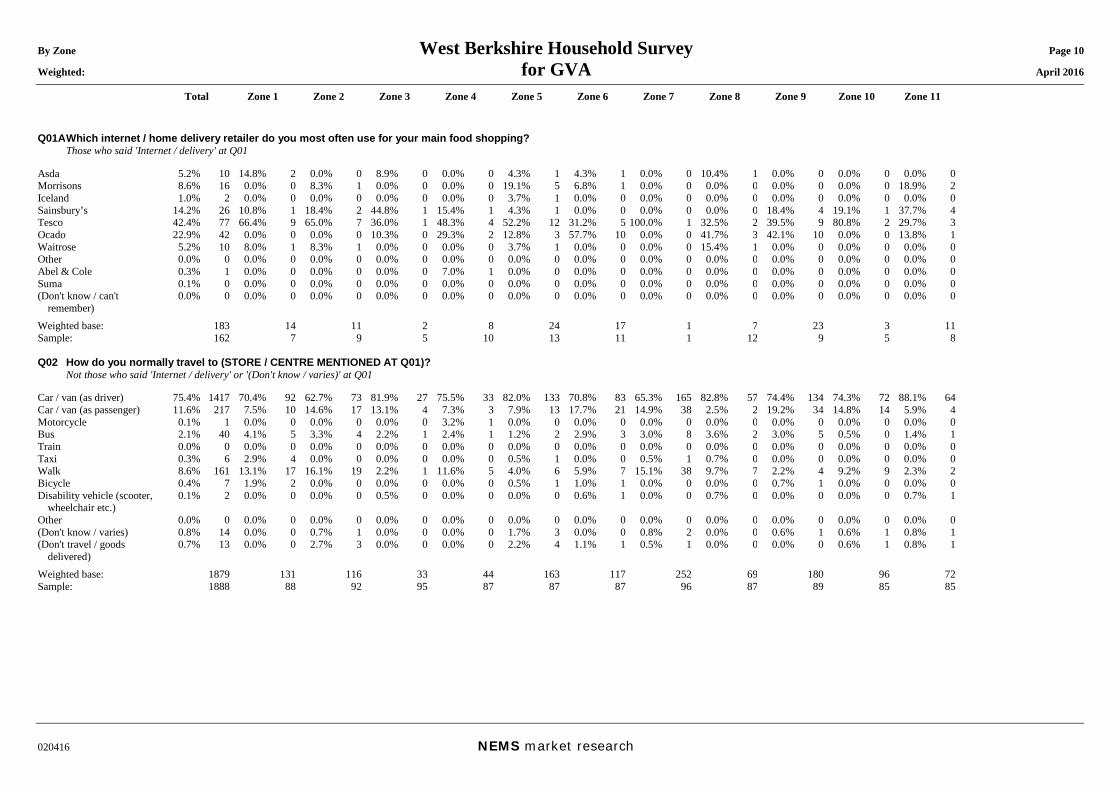
By Zone West Berkshire Household Survey Page 10 Weighted: for GVA April 2016
Total Zone 1 Zone 2 Zone 3 Zone 4 Zone 5 Zone 6 Zone 7 Zone 8 Zone 9 Zone 10 Zone 11
020416 NEMS market research
Q01A Which internet / home delivery retailer do you most often use for your main food shopping? Those who said 'Internet / delivery' at Q01 Asda 5.2% 10 14.8% 2 0.0% 0 8.9% 0 0.0% 0 4.3% 1 4.3% 1 0.0% 0 10.4% 1 0.0% 0 0.0% 0 0.0% 0 Morrisons 8.6% 16 0.0% 0 8.3% 1 0.0% 0 0.0% 0 19.1% 5 6.8% 1 0.0% 0 0.0% 0 0.0% 0 0.0% 0 18.9% 2 Iceland 1.0% 2 0.0% 0 0.0% 0 0.0% 0 0.0% 0 3.7% 1 0.0% 0 0.0% 0 0.0% 0 0.0% 0 0.0% 0 0.0% 0 Sainsbury’s 14.2% 26 10.8% 1 18.4% 2 44.8% 1 15.4% 1 4.3% 1 0.0% 0 0.0% 0 0.0% 0 18.4% 4 19.1% 1 37.7% 4 Tesco 42.4% 77 66.4% 9 65.0% 7 36.0% 1 48.3% 4 52.2% 12 31.2% 5 100.0% 1 32.5% 2 39.5% 9 80.8% 2 29.7% 3 Ocado 22.9% 42 0.0% 0 0.0% 0 10.3% 0 29.3% 2 12.8% 3 57.7% 10 0.0% 0 41.7% 3 42.1% 10 0.0% 0 13.8% 1 Waitrose 5.2% 10 8.0% 1 8.3% 1 0.0% 0 0.0% 0 3.7% 1 0.0% 0 0.0% 0 15.4% 1 0.0% 0 0.0% 0 0.0% 0 Other 0.0% 0 0.0% 0 0.0% 0 0.0% 0 0.0% 0 0.0% 0 0.0% 0 0.0% 0 0.0% 0 0.0% 0 0.0% 0 0.0% 0 Abel & Cole 0.3% 1 0.0% 0 0.0% 0 0.0% 0 7.0% 1 0.0% 0 0.0% 0 0.0% 0 0.0% 0 0.0% 0 0.0% 0 0.0% 0 Suma 0.1% 0 0.0% 0 0.0% 0 0.0% 0 0.0% 0 0.0% 0 0.0% 0 0.0% 0 0.0% 0 0.0% 0 0.0% 0 0.0% 0 (Don't know / can't
remember) 0.0% 0 0.0% 0 0.0% 0 0.0% 0 0.0% 0 0.0% 0 0.0% 0 0.0% 0 0.0% 0 0.0% 0 0.0% 0 0.0% 0
Weighted base: 183 14 11 2 8 24 17 1 7 23 3 11 Sample: 162 7 9 5 10 13 11 1 12 9 5 8 Q02 How do you normally travel to (STORE / CENTRE MENTIONED AT Q01)? Not those who said 'Internet / delivery' or '(Don't know / varies)' at Q01 Car / van (as driver) 75.4% 1417 70.4% 92 62.7% 73 81.9% 27 75.5% 33 82.0% 133 70.8% 83 65.3% 165 82.8% 57 74.4% 134 74.3% 72 88.1% 64 Car / van (as passenger) 11.6% 217 7.5% 10 14.6% 17 13.1% 4 7.3% 3 7.9% 13 17.7% 21 14.9% 38 2.5% 2 19.2% 34 14.8% 14 5.9% 4 Motorcycle 0.1% 1 0.0% 0 0.0% 0 0.0% 0 3.2% 1 0.0% 0 0.0% 0 0.0% 0 0.0% 0 0.0% 0 0.0% 0 0.0% 0 Bus 2.1% 40 4.1% 5 3.3% 4 2.2% 1 2.4% 1 1.2% 2 2.9% 3 3.0% 8 3.6% 2 3.0% 5 0.5% 0 1.4% 1 Train 0.0% 0 0.0% 0 0.0% 0 0.0% 0 0.0% 0 0.0% 0 0.0% 0 0.0% 0 0.0% 0 0.0% 0 0.0% 0 0.0% 0 Taxi 0.3% 6 2.9% 4 0.0% 0 0.0% 0 0.0% 0 0.5% 1 0.0% 0 0.5% 1 0.7% 0 0.0% 0 0.0% 0 0.0% 0 Walk 8.6% 161 13.1% 17 16.1% 19 2.2% 1 11.6% 5 4.0% 6 5.9% 7 15.1% 38 9.7% 7 2.2% 4 9.2% 9 2.3% 2 Bicycle 0.4% 7 1.9% 2 0.0% 0 0.0% 0 0.0% 0 0.5% 1 1.0% 1 0.0% 0 0.0% 0 0.7% 1 0.0% 0 0.0% 0 Disability vehicle (scooter,
wheelchair etc.) 0.1% 2 0.0% 0 0.0% 0 0.5% 0 0.0% 0 0.0% 0 0.6% 1 0.0% 0 0.7% 0 0.0% 0 0.0% 0 0.7% 1
Other 0.0% 0 0.0% 0 0.0% 0 0.0% 0 0.0% 0 0.0% 0 0.0% 0 0.0% 0 0.0% 0 0.0% 0 0.0% 0 0.0% 0 (Don't know / varies) 0.8% 14 0.0% 0 0.7% 1 0.0% 0 0.0% 0 1.7% 3 0.0% 0 0.8% 2 0.0% 0 0.6% 1 0.6% 1 0.8% 1 (Don't travel / goods
delivered) 0.7% 13 0.0% 0 2.7% 3 0.0% 0 0.0% 0 2.2% 4 1.1% 1 0.5% 1 0.0% 0 0.0% 0 0.6% 1 0.8% 1
Weighted base: 1879 131 116 33 44 163 117 252 69 180 96 72 Sample: 1888 88 92 95 87 87 87 96 87 89 85 85
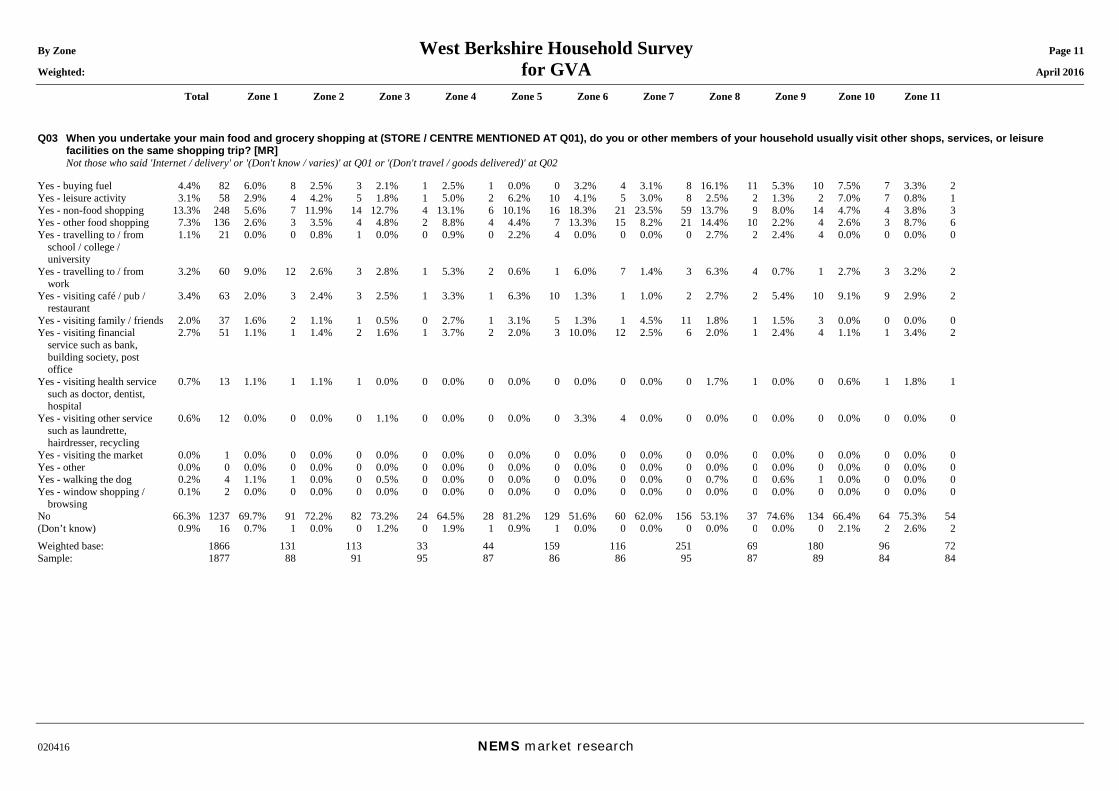
By Zone West Berkshire Household Survey Page 11 Weighted: for GVA April 2016
Total Zone 1 Zone 2 Zone 3 Zone 4 Zone 5 Zone 6 Zone 7 Zone 8 Zone 9 Zone 10 Zone 11
020416 NEMS market research
Q03 When you undertake your main food and grocery shopping at (STORE / CENTRE MENTIONED AT Q01), do you or other members of your household usually visit other shops, services, or leisure facilities on the same shopping trip? [MR]
Not those who said 'Internet / delivery' or '(Don't know / varies)' at Q01 or '(Don't travel / goods delivered)' at Q02 Yes - buying fuel 4.4% 82 6.0% 8 2.5% 3 2.1% 1 2.5% 1 0.0% 0 3.2% 4 3.1% 8 16.1% 11 5.3% 10 7.5% 7 3.3% 2 Yes - leisure activity 3.1% 58 2.9% 4 4.2% 5 1.8% 1 5.0% 2 6.2% 10 4.1% 5 3.0% 8 2.5% 2 1.3% 2 7.0% 7 0.8% 1 Yes - non-food shopping 13.3% 248 5.6% 7 11.9% 14 12.7% 4 13.1% 6 10.1% 16 18.3% 21 23.5% 59 13.7% 9 8.0% 14 4.7% 4 3.8% 3 Yes - other food shopping 7.3% 136 2.6% 3 3.5% 4 4.8% 2 8.8% 4 4.4% 7 13.3% 15 8.2% 21 14.4% 10 2.2% 4 2.6% 3 8.7% 6 Yes - travelling to / from
school / college / university
1.1% 21 0.0% 0 0.8% 1 0.0% 0 0.9% 0 2.2% 4 0.0% 0 0.0% 0 2.7% 2 2.4% 4 0.0% 0 0.0% 0
Yes - travelling to / from work
3.2% 60 9.0% 12 2.6% 3 2.8% 1 5.3% 2 0.6% 1 6.0% 7 1.4% 3 6.3% 4 0.7% 1 2.7% 3 3.2% 2
Yes - visiting café / pub / restaurant
3.4% 63 2.0% 3 2.4% 3 2.5% 1 3.3% 1 6.3% 10 1.3% 1 1.0% 2 2.7% 2 5.4% 10 9.1% 9 2.9% 2
Yes - visiting family / friends 2.0% 37 1.6% 2 1.1% 1 0.5% 0 2.7% 1 3.1% 5 1.3% 1 4.5% 11 1.8% 1 1.5% 3 0.0% 0 0.0% 0 Yes - visiting financial
service such as bank, building society, post office
2.7% 51 1.1% 1 1.4% 2 1.6% 1 3.7% 2 2.0% 3 10.0% 12 2.5% 6 2.0% 1 2.4% 4 1.1% 1 3.4% 2
Yes - visiting health service such as doctor, dentist, hospital
0.7% 13 1.1% 1 1.1% 1 0.0% 0 0.0% 0 0.0% 0 0.0% 0 0.0% 0 1.7% 1 0.0% 0 0.6% 1 1.8% 1
Yes - visiting other service such as laundrette, hairdresser, recycling
0.6% 12 0.0% 0 0.0% 0 1.1% 0 0.0% 0 0.0% 0 3.3% 4 0.0% 0 0.0% 0 0.0% 0 0.0% 0 0.0% 0
Yes - visiting the market 0.0% 1 0.0% 0 0.0% 0 0.0% 0 0.0% 0 0.0% 0 0.0% 0 0.0% 0 0.0% 0 0.0% 0 0.0% 0 0.0% 0 Yes - other 0.0% 0 0.0% 0 0.0% 0 0.0% 0 0.0% 0 0.0% 0 0.0% 0 0.0% 0 0.0% 0 0.0% 0 0.0% 0 0.0% 0 Yes - walking the dog 0.2% 4 1.1% 1 0.0% 0 0.5% 0 0.0% 0 0.0% 0 0.0% 0 0.0% 0 0.7% 0 0.6% 1 0.0% 0 0.0% 0 Yes - window shopping /
browsing 0.1% 2 0.0% 0 0.0% 0 0.0% 0 0.0% 0 0.0% 0 0.0% 0 0.0% 0 0.0% 0 0.0% 0 0.0% 0 0.0% 0
No 66.3% 1237 69.7% 91 72.2% 82 73.2% 24 64.5% 28 81.2% 129 51.6% 60 62.0% 156 53.1% 37 74.6% 134 66.4% 64 75.3% 54 (Don’t know) 0.9% 16 0.7% 1 0.0% 0 1.2% 0 1.9% 1 0.9% 1 0.0% 0 0.0% 0 0.0% 0 0.0% 0 2.1% 2 2.6% 2 Weighted base: 1866 131 113 33 44 159 116 251 69 180 96 72 Sample: 1877 88 91 95 87 86 86 95 87 89 84 84
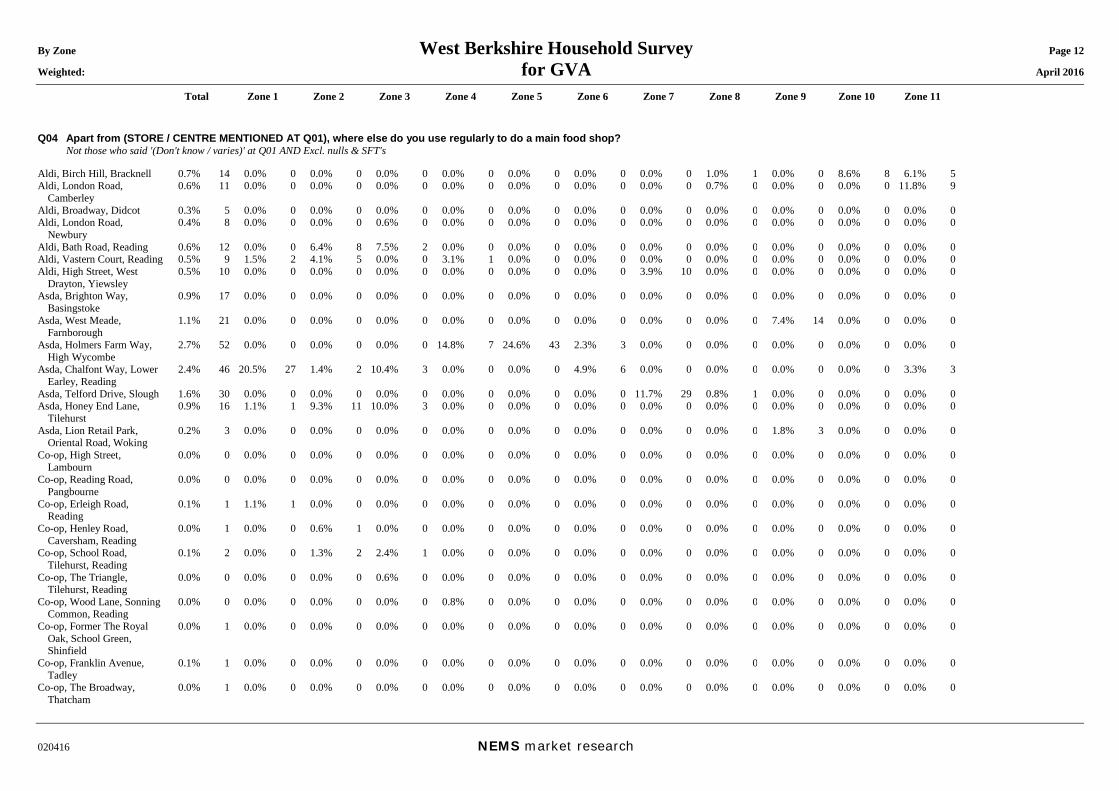
By Zone West Berkshire Household Survey Page 12 Weighted: for GVA April 2016
Total Zone 1 Zone 2 Zone 3 Zone 4 Zone 5 Zone 6 Zone 7 Zone 8 Zone 9 Zone 10 Zone 11
020416 NEMS market research
Q04 Apart from (STORE / CENTRE MENTIONED AT Q01), where else do you use regularly to do a main food shop? Not those who said '(Don't know / varies)' at Q01 AND Excl. nulls & SFT's Aldi, Birch Hill, Bracknell 0.7% 14 0.0% 0 0.0% 0 0.0% 0 0.0% 0 0.0% 0 0.0% 0 0.0% 0 1.0% 1 0.0% 0 8.6% 8 6.1% 5 Aldi, London Road,
Camberley 0.6% 11 0.0% 0 0.0% 0 0.0% 0 0.0% 0 0.0% 0 0.0% 0 0.0% 0 0.7% 0 0.0% 0 0.0% 0 11.8% 9
Aldi, Broadway, Didcot 0.3% 5 0.0% 0 0.0% 0 0.0% 0 0.0% 0 0.0% 0 0.0% 0 0.0% 0 0.0% 0 0.0% 0 0.0% 0 0.0% 0 Aldi, London Road,
Newbury 0.4% 8 0.0% 0 0.0% 0 0.6% 0 0.0% 0 0.0% 0 0.0% 0 0.0% 0 0.0% 0 0.0% 0 0.0% 0 0.0% 0
Aldi, Bath Road, Reading 0.6% 12 0.0% 0 6.4% 8 7.5% 2 0.0% 0 0.0% 0 0.0% 0 0.0% 0 0.0% 0 0.0% 0 0.0% 0 0.0% 0 Aldi, Vastern Court, Reading 0.5% 9 1.5% 2 4.1% 5 0.0% 0 3.1% 1 0.0% 0 0.0% 0 0.0% 0 0.0% 0 0.0% 0 0.0% 0 0.0% 0 Aldi, High Street, West
Drayton, Yiewsley 0.5% 10 0.0% 0 0.0% 0 0.0% 0 0.0% 0 0.0% 0 0.0% 0 3.9% 10 0.0% 0 0.0% 0 0.0% 0 0.0% 0
Asda, Brighton Way, Basingstoke
0.9% 17 0.0% 0 0.0% 0 0.0% 0 0.0% 0 0.0% 0 0.0% 0 0.0% 0 0.0% 0 0.0% 0 0.0% 0 0.0% 0
Asda, West Meade, Farnborough
1.1% 21 0.0% 0 0.0% 0 0.0% 0 0.0% 0 0.0% 0 0.0% 0 0.0% 0 0.0% 0 7.4% 14 0.0% 0 0.0% 0
Asda, Holmers Farm Way, High Wycombe
2.7% 52 0.0% 0 0.0% 0 0.0% 0 14.8% 7 24.6% 43 2.3% 3 0.0% 0 0.0% 0 0.0% 0 0.0% 0 0.0% 0
Asda, Chalfont Way, Lower Earley, Reading
2.4% 46 20.5% 27 1.4% 2 10.4% 3 0.0% 0 0.0% 0 4.9% 6 0.0% 0 0.0% 0 0.0% 0 0.0% 0 3.3% 3
Asda, Telford Drive, Slough 1.6% 30 0.0% 0 0.0% 0 0.0% 0 0.0% 0 0.0% 0 0.0% 0 11.7% 29 0.8% 1 0.0% 0 0.0% 0 0.0% 0 Asda, Honey End Lane,
Tilehurst 0.9% 16 1.1% 1 9.3% 11 10.0% 3 0.0% 0 0.0% 0 0.0% 0 0.0% 0 0.0% 0 0.0% 0 0.0% 0 0.0% 0
Asda, Lion Retail Park, Oriental Road, Woking
0.2% 3 0.0% 0 0.0% 0 0.0% 0 0.0% 0 0.0% 0 0.0% 0 0.0% 0 0.0% 0 1.8% 3 0.0% 0 0.0% 0
Co-op, High Street, Lambourn
0.0% 0 0.0% 0 0.0% 0 0.0% 0 0.0% 0 0.0% 0 0.0% 0 0.0% 0 0.0% 0 0.0% 0 0.0% 0 0.0% 0
Co-op, Reading Road, Pangbourne
0.0% 0 0.0% 0 0.0% 0 0.0% 0 0.0% 0 0.0% 0 0.0% 0 0.0% 0 0.0% 0 0.0% 0 0.0% 0 0.0% 0
Co-op, Erleigh Road, Reading
0.1% 1 1.1% 1 0.0% 0 0.0% 0 0.0% 0 0.0% 0 0.0% 0 0.0% 0 0.0% 0 0.0% 0 0.0% 0 0.0% 0
Co-op, Henley Road, Caversham, Reading
0.0% 1 0.0% 0 0.6% 1 0.0% 0 0.0% 0 0.0% 0 0.0% 0 0.0% 0 0.0% 0 0.0% 0 0.0% 0 0.0% 0
Co-op, School Road, Tilehurst, Reading
0.1% 2 0.0% 0 1.3% 2 2.4% 1 0.0% 0 0.0% 0 0.0% 0 0.0% 0 0.0% 0 0.0% 0 0.0% 0 0.0% 0
Co-op, The Triangle, Tilehurst, Reading
0.0% 0 0.0% 0 0.0% 0 0.6% 0 0.0% 0 0.0% 0 0.0% 0 0.0% 0 0.0% 0 0.0% 0 0.0% 0 0.0% 0
Co-op, Wood Lane, Sonning Common, Reading
0.0% 0 0.0% 0 0.0% 0 0.0% 0 0.8% 0 0.0% 0 0.0% 0 0.0% 0 0.0% 0 0.0% 0 0.0% 0 0.0% 0
Co-op, Former The Royal Oak, School Green, Shinfield
0.0% 1 0.0% 0 0.0% 0 0.0% 0 0.0% 0 0.0% 0 0.0% 0 0.0% 0 0.0% 0 0.0% 0 0.0% 0 0.0% 0
Co-op, Franklin Avenue, Tadley
0.1% 1 0.0% 0 0.0% 0 0.0% 0 0.0% 0 0.0% 0 0.0% 0 0.0% 0 0.0% 0 0.0% 0 0.0% 0 0.0% 0
Co-op, The Broadway, Thatcham
0.0% 1 0.0% 0 0.0% 0 0.0% 0 0.0% 0 0.0% 0 0.0% 0 0.0% 0 0.0% 0 0.0% 0 0.0% 0 0.0% 0
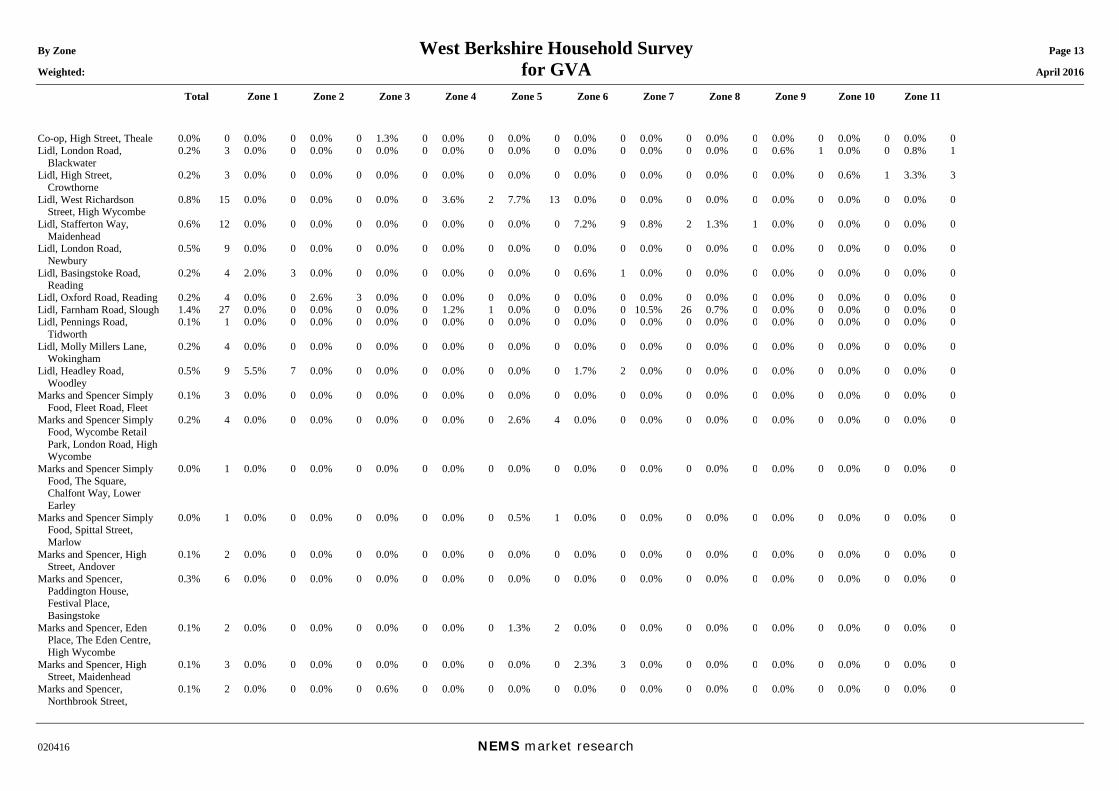
By Zone West Berkshire Household Survey Page 13 Weighted: for GVA April 2016
Total Zone 1 Zone 2 Zone 3 Zone 4 Zone 5 Zone 6 Zone 7 Zone 8 Zone 9 Zone 10 Zone 11
020416 NEMS market research
Co-op, High Street, Theale 0.0% 0 0.0% 0 0.0% 0 1.3% 0 0.0% 0 0.0% 0 0.0% 0 0.0% 0 0.0% 0 0.0% 0 0.0% 0 0.0% 0 Lidl, London Road,
Blackwater 0.2% 3 0.0% 0 0.0% 0 0.0% 0 0.0% 0 0.0% 0 0.0% 0 0.0% 0 0.0% 0 0.6% 1 0.0% 0 0.8% 1
Lidl, High Street, Crowthorne
0.2% 3 0.0% 0 0.0% 0 0.0% 0 0.0% 0 0.0% 0 0.0% 0 0.0% 0 0.0% 0 0.0% 0 0.6% 1 3.3% 3
Lidl, West Richardson Street, High Wycombe
0.8% 15 0.0% 0 0.0% 0 0.0% 0 3.6% 2 7.7% 13 0.0% 0 0.0% 0 0.0% 0 0.0% 0 0.0% 0 0.0% 0
Lidl, Stafferton Way, Maidenhead
0.6% 12 0.0% 0 0.0% 0 0.0% 0 0.0% 0 0.0% 0 7.2% 9 0.8% 2 1.3% 1 0.0% 0 0.0% 0 0.0% 0
Lidl, London Road, Newbury
0.5% 9 0.0% 0 0.0% 0 0.0% 0 0.0% 0 0.0% 0 0.0% 0 0.0% 0 0.0% 0 0.0% 0 0.0% 0 0.0% 0
Lidl, Basingstoke Road, Reading
0.2% 4 2.0% 3 0.0% 0 0.0% 0 0.0% 0 0.0% 0 0.6% 1 0.0% 0 0.0% 0 0.0% 0 0.0% 0 0.0% 0
Lidl, Oxford Road, Reading 0.2% 4 0.0% 0 2.6% 3 0.0% 0 0.0% 0 0.0% 0 0.0% 0 0.0% 0 0.0% 0 0.0% 0 0.0% 0 0.0% 0 Lidl, Farnham Road, Slough 1.4% 27 0.0% 0 0.0% 0 0.0% 0 1.2% 1 0.0% 0 0.0% 0 10.5% 26 0.7% 0 0.0% 0 0.0% 0 0.0% 0 Lidl, Pennings Road,
Tidworth 0.1% 1 0.0% 0 0.0% 0 0.0% 0 0.0% 0 0.0% 0 0.0% 0 0.0% 0 0.0% 0 0.0% 0 0.0% 0 0.0% 0
Lidl, Molly Millers Lane, Wokingham
0.2% 4 0.0% 0 0.0% 0 0.0% 0 0.0% 0 0.0% 0 0.0% 0 0.0% 0 0.0% 0 0.0% 0 0.0% 0 0.0% 0
Lidl, Headley Road, Woodley
0.5% 9 5.5% 7 0.0% 0 0.0% 0 0.0% 0 0.0% 0 1.7% 2 0.0% 0 0.0% 0 0.0% 0 0.0% 0 0.0% 0
Marks and Spencer Simply Food, Fleet Road, Fleet
0.1% 3 0.0% 0 0.0% 0 0.0% 0 0.0% 0 0.0% 0 0.0% 0 0.0% 0 0.0% 0 0.0% 0 0.0% 0 0.0% 0
Marks and Spencer Simply Food, Wycombe Retail Park, London Road, High Wycombe
0.2% 4 0.0% 0 0.0% 0 0.0% 0 0.0% 0 2.6% 4 0.0% 0 0.0% 0 0.0% 0 0.0% 0 0.0% 0 0.0% 0
Marks and Spencer Simply Food, The Square, Chalfont Way, Lower Earley
0.0% 1 0.0% 0 0.0% 0 0.0% 0 0.0% 0 0.0% 0 0.0% 0 0.0% 0 0.0% 0 0.0% 0 0.0% 0 0.0% 0
Marks and Spencer Simply Food, Spittal Street, Marlow
0.0% 1 0.0% 0 0.0% 0 0.0% 0 0.0% 0 0.5% 1 0.0% 0 0.0% 0 0.0% 0 0.0% 0 0.0% 0 0.0% 0
Marks and Spencer, High Street, Andover
0.1% 2 0.0% 0 0.0% 0 0.0% 0 0.0% 0 0.0% 0 0.0% 0 0.0% 0 0.0% 0 0.0% 0 0.0% 0 0.0% 0
Marks and Spencer, Paddington House, Festival Place, Basingstoke
0.3% 6 0.0% 0 0.0% 0 0.0% 0 0.0% 0 0.0% 0 0.0% 0 0.0% 0 0.0% 0 0.0% 0 0.0% 0 0.0% 0
Marks and Spencer, Eden Place, The Eden Centre, High Wycombe
0.1% 2 0.0% 0 0.0% 0 0.0% 0 0.0% 0 1.3% 2 0.0% 0 0.0% 0 0.0% 0 0.0% 0 0.0% 0 0.0% 0
Marks and Spencer, High Street, Maidenhead
0.1% 3 0.0% 0 0.0% 0 0.0% 0 0.0% 0 0.0% 0 2.3% 3 0.0% 0 0.0% 0 0.0% 0 0.0% 0 0.0% 0
Marks and Spencer, Northbrook Street,
0.1% 2 0.0% 0 0.0% 0 0.6% 0 0.0% 0 0.0% 0 0.0% 0 0.0% 0 0.0% 0 0.0% 0 0.0% 0 0.0% 0

By Zone West Berkshire Household Survey Page 14 Weighted: for GVA April 2016
Total Zone 1 Zone 2 Zone 3 Zone 4 Zone 5 Zone 6 Zone 7 Zone 8 Zone 9 Zone 10 Zone 11
020416 NEMS market research
Newbury Marks and Spencer, Broad
Street, Reading 0.3% 6 1.5% 2 2.6% 3 1.2% 0 0.0% 0 0.0% 0 0.0% 0 0.0% 0 0.0% 0 0.0% 0 0.5% 0 0.0% 0
Marks and Spencer, The Meadows Marshall Road, Sandhurst
0.4% 8 0.0% 0 0.0% 0 0.0% 0 0.0% 0 0.0% 0 0.0% 0 0.0% 0 0.0% 0 1.6% 3 0.6% 1 4.2% 3
Marks and Spencer, High Street, Slough
0.1% 2 0.0% 0 0.0% 0 0.0% 0 0.0% 0 0.0% 0 0.0% 0 0.8% 2 0.7% 0 0.0% 0 0.0% 0 0.0% 0
Marks and Spencer, Peach Street, Wokingham
0.2% 3 0.0% 0 0.0% 0 0.0% 0 0.0% 0 0.0% 0 0.0% 0 0.0% 0 0.0% 0 0.0% 0 0.0% 0 0.0% 0
Marks and Spencer, London Road, Woodley
0.1% 2 1.5% 2 0.0% 0 0.0% 0 0.8% 0 0.0% 0 0.0% 0 0.0% 0 0.0% 0 0.0% 0 0.0% 0 0.0% 0
Morrisons, Alexandra Road, Aldershot
0.1% 3 0.0% 0 0.0% 0 0.0% 0 0.0% 0 0.0% 0 0.0% 0 0.0% 0 0.0% 0 1.1% 2 0.0% 0 0.0% 0
Morrisons, Worting Road, Basingstoke
1.9% 35 0.0% 0 0.0% 0 0.0% 0 0.0% 0 0.0% 0 0.0% 0 0.0% 0 0.0% 0 0.0% 0 0.0% 0 0.0% 0
Morrisons, The Peel Centre, Skimped Hill Lane, Bracknell
0.6% 11 0.0% 0 0.0% 0 0.0% 0 0.0% 0 0.0% 0 0.6% 1 0.0% 0 0.8% 1 0.0% 0 9.5% 9 0.0% 0
Morrisons, Summit Avenue, Farnborough
0.7% 14 0.0% 0 0.0% 0 0.0% 0 0.0% 0 0.0% 0 0.0% 0 0.0% 0 0.0% 0 5.0% 9 0.0% 0 0.0% 0
Morrisons, Elvetham Heath, Fleet
1.1% 21 0.0% 0 0.0% 0 0.0% 0 0.0% 0 0.0% 0 0.0% 0 0.0% 0 0.0% 0 0.0% 0 0.0% 0 0.0% 0
Morrisons, Temple End, High Wycombe
1.0% 19 0.0% 0 0.0% 0 0.0% 0 3.5% 2 10.1% 17 0.0% 0 0.0% 0 0.0% 0 0.0% 0 0.0% 0 0.0% 0
Morrisons, Basingstoke Road, Reading
0.6% 12 2.7% 4 4.1% 5 1.2% 0 0.0% 0 0.0% 0 0.0% 0 0.0% 0 0.7% 0 0.0% 0 0.0% 0 0.0% 0
Morrisons, Woosehill Shopping Centre, Wokingham
0.3% 6 0.0% 0 0.0% 0 0.0% 0 0.0% 0 0.0% 0 0.0% 0 0.0% 0 0.0% 0 0.0% 0 0.5% 0 0.0% 0
Sainsbury's, Bridge Street, Andover
0.0% 0 0.0% 0 0.0% 0 0.0% 0 0.0% 0 0.0% 0 0.0% 0 0.0% 0 0.0% 0 0.0% 0 0.0% 0 0.0% 0
Sainsbury's, Shepherds Spring Lane, Andover
0.3% 6 0.0% 0 0.0% 0 0.0% 0 0.0% 0 0.0% 0 0.0% 0 0.0% 0 0.0% 0 0.0% 0 0.0% 0 0.0% 0
Sainsbury's, Station Mall, Basingstoke
0.4% 8 0.0% 0 0.0% 0 0.0% 0 0.0% 0 0.0% 0 0.0% 0 0.0% 0 0.0% 0 0.0% 0 0.0% 0 0.0% 0
Sainsbury's, Wallop Drive, Kempshott, Basingstoke
1.5% 29 0.0% 0 0.0% 0 0.0% 0 0.0% 0 0.0% 0 0.0% 0 0.0% 0 0.0% 0 0.0% 0 0.0% 0 0.0% 0
Sainsbury's, Maxwell Road, Beaconsfield
0.5% 9 0.0% 0 0.0% 0 0.0% 0 0.0% 0 4.0% 7 0.0% 0 0.8% 2 0.0% 0 0.0% 0 0.0% 0 0.0% 0
Sainsbury's, Bagshot Road, Ringmead, Bracknell
1.3% 24 0.0% 0 0.0% 0 0.0% 0 0.0% 0 0.0% 0 0.0% 0 0.0% 0 9.1% 6 0.0% 0 16.7% 16 2.4% 2
Sainsbury's, Princess Square, Bracknell
0.3% 5 0.0% 0 0.0% 0 0.0% 0 0.0% 0 0.0% 0 0.0% 0 0.0% 0 0.7% 0 0.0% 0 5.2% 5 0.0% 0
Sainsbury's, Cambridge Walk, Camberley
0.1% 1 0.0% 0 0.0% 0 0.0% 0 0.0% 0 0.0% 0 0.0% 0 0.0% 0 0.7% 0 0.0% 0 0.0% 0 0.7% 1
Sainsbury's, Watchmoor 1.8% 35 0.0% 0 0.0% 0 0.0% 0 0.0% 0 0.0% 0 0.0% 0 0.0% 0 0.0% 0 11.6% 21 0.0% 0 13.0% 10

By Zone West Berkshire Household Survey Page 15 Weighted: for GVA April 2016
Total Zone 1 Zone 2 Zone 3 Zone 4 Zone 5 Zone 6 Zone 7 Zone 8 Zone 9 Zone 10 Zone 11
020416 NEMS market research
Park, Blackwater Valley Road, Camberley
Sainsbury's, The Sainsbury Centre, Guildford Street, Chertsey
0.1% 1 0.0% 0 0.0% 0 0.0% 0 0.0% 0 0.0% 0 0.0% 0 0.0% 0 0.0% 0 0.7% 1 0.0% 0 0.0% 0
Sainsbury's, Central Drive, Orchard Centre, Didcot
0.8% 16 0.0% 0 0.0% 0 0.0% 0 0.9% 0 0.0% 0 0.0% 0 0.0% 0 0.0% 0 0.0% 0 0.0% 0 0.0% 0
Sainsbury's, Queensmead, Farnborough
0.3% 5 0.0% 0 0.0% 0 0.0% 0 0.0% 0 0.0% 0 0.0% 0 0.0% 0 0.0% 0 1.1% 2 0.0% 0 0.0% 0
Sainsbury's, Water Lane, Farnham
0.1% 1 0.0% 0 0.0% 0 0.0% 0 0.0% 0 0.0% 0 0.0% 0 0.0% 0 0.0% 0 0.0% 0 0.0% 0 0.0% 0
Sainsbury's, Fleet Road, Fleet
0.1% 1 0.0% 0 0.0% 0 0.0% 0 0.0% 0 0.0% 0 0.0% 0 0.0% 0 0.0% 0 0.0% 0 0.0% 0 0.0% 0
Sainsbury's, Oxford Road, High Wycombe
1.5% 30 0.0% 0 0.0% 0 0.0% 0 2.4% 1 15.8% 27 1.0% 1 0.0% 0 0.0% 0 0.0% 0 0.0% 0 0.0% 0
Sainsbury's, Providence Place, Maidenhead
0.5% 9 0.0% 0 0.0% 0 0.0% 0 0.0% 0 0.0% 0 7.7% 9 0.0% 0 0.0% 0 0.0% 0 0.0% 0 0.0% 0
Sainsbury's, West Street, Marlow
0.2% 3 0.0% 0 0.0% 0 0.0% 0 1.7% 1 0.6% 1 1.3% 2 0.0% 0 0.0% 0 0.0% 0 0.0% 0 0.0% 0
Sainsbury's, Hectors Way, Newbury
1.6% 30 0.0% 0 0.0% 0 0.6% 0 0.0% 0 0.0% 0 0.0% 0 0.0% 0 0.0% 0 0.0% 0 0.0% 0 0.0% 0
Sainsbury's, Heyford Hill, Oxford
0.1% 2 0.0% 0 0.0% 0 0.0% 0 0.0% 0 0.0% 0 0.0% 0 0.0% 0 0.0% 0 0.0% 0 0.0% 0 0.0% 0
Sainsbury's, Bath Road, Calcot, Reading
2.0% 38 0.7% 1 11.8% 14 30.4% 9 1.2% 1 0.0% 0 0.7% 1 0.8% 2 0.0% 0 0.0% 0 0.0% 0 0.0% 0
Sainsbury's, Broad Street, Reading
0.1% 2 0.8% 1 0.0% 0 0.7% 0 0.0% 0 0.0% 0 0.0% 0 0.0% 0 0.0% 0 0.0% 0 0.0% 0 0.0% 0
Sainsbury's, Friar Street, Reading
0.1% 2 0.0% 0 0.0% 0 0.0% 0 0.8% 0 0.0% 0 0.0% 0 0.5% 1 0.0% 0 0.0% 0 0.0% 0 0.0% 0
Sainsbury's, Uxbridge Road, Slough
1.5% 28 0.0% 0 0.0% 0 0.0% 0 0.0% 0 0.0% 0 0.0% 0 11.0% 28 0.8% 1 0.0% 0 0.0% 0 0.0% 0
Sainsbury's, The Causeway, Staines
0.3% 5 0.0% 0 0.0% 0 0.0% 0 0.0% 0 0.0% 0 0.0% 0 0.0% 0 7.3% 5 0.0% 0 0.0% 0 0.0% 0
Sainsbury's, Brunel Plaza, Swindon
0.0% 0 0.0% 0 0.0% 0 0.0% 0 0.0% 0 0.0% 0 0.0% 0 0.0% 0 0.0% 0 0.0% 0 0.0% 0 0.0% 0
Sainsbury's, Oxford Road, Stratton, Swindon
0.0% 0 0.0% 0 0.0% 0 0.0% 0 0.0% 0 0.0% 0 0.0% 0 0.0% 0 0.0% 0 0.0% 0 0.0% 0 0.0% 0
Sainsbury's, Mulfords Hill, Tadley
0.8% 16 0.0% 0 0.0% 0 0.0% 0 0.0% 0 0.0% 0 0.0% 0 0.0% 0 0.0% 0 0.0% 0 0.0% 0 0.0% 0
Sainsbury's, Lake End Road, Taplow
0.3% 6 0.0% 0 0.0% 0 0.0% 0 0.0% 0 0.0% 0 1.3% 2 1.6% 4 0.0% 0 0.0% 0 0.0% 0 0.0% 0
Sainsbury's, Limborough Road, Wantage
0.6% 11 0.0% 0 0.0% 0 0.0% 0 0.0% 0 0.0% 0 0.0% 0 0.0% 0 0.0% 0 0.0% 0 0.0% 0 0.0% 0
Sainsbury's, King Street Lane, Winnersh
2.6% 50 17.7% 23 1.3% 2 0.0% 0 0.0% 0 0.0% 0 7.5% 9 0.0% 0 0.0% 0 0.0% 0 0.0% 0 0.0% 0
Sainsbury's, Redding Way, Knaphill, Woking
2.0% 38 0.0% 0 0.0% 0 0.0% 0 0.0% 0 0.0% 0 0.0% 0 0.0% 0 0.0% 0 20.5% 38 0.0% 0 0.0% 0
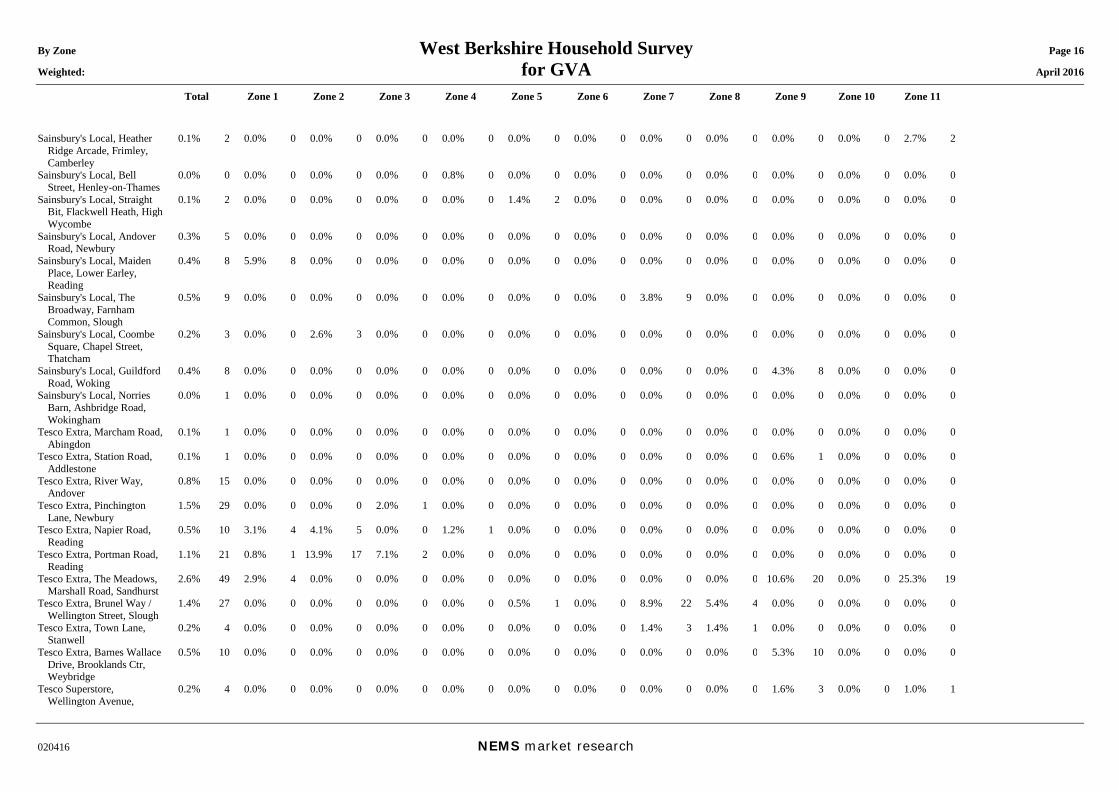
By Zone West Berkshire Household Survey Page 16 Weighted: for GVA April 2016
Total Zone 1 Zone 2 Zone 3 Zone 4 Zone 5 Zone 6 Zone 7 Zone 8 Zone 9 Zone 10 Zone 11
020416 NEMS market research
Sainsbury's Local, Heather Ridge Arcade, Frimley, Camberley
0.1% 2 0.0% 0 0.0% 0 0.0% 0 0.0% 0 0.0% 0 0.0% 0 0.0% 0 0.0% 0 0.0% 0 0.0% 0 2.7% 2
Sainsbury's Local, Bell Street, Henley-on-Thames
0.0% 0 0.0% 0 0.0% 0 0.0% 0 0.8% 0 0.0% 0 0.0% 0 0.0% 0 0.0% 0 0.0% 0 0.0% 0 0.0% 0
Sainsbury's Local, Straight Bit, Flackwell Heath, High Wycombe
0.1% 2 0.0% 0 0.0% 0 0.0% 0 0.0% 0 1.4% 2 0.0% 0 0.0% 0 0.0% 0 0.0% 0 0.0% 0 0.0% 0
Sainsbury's Local, Andover Road, Newbury
0.3% 5 0.0% 0 0.0% 0 0.0% 0 0.0% 0 0.0% 0 0.0% 0 0.0% 0 0.0% 0 0.0% 0 0.0% 0 0.0% 0
Sainsbury's Local, Maiden Place, Lower Earley, Reading
0.4% 8 5.9% 8 0.0% 0 0.0% 0 0.0% 0 0.0% 0 0.0% 0 0.0% 0 0.0% 0 0.0% 0 0.0% 0 0.0% 0
Sainsbury's Local, The Broadway, Farnham Common, Slough
0.5% 9 0.0% 0 0.0% 0 0.0% 0 0.0% 0 0.0% 0 0.0% 0 3.8% 9 0.0% 0 0.0% 0 0.0% 0 0.0% 0
Sainsbury's Local, Coombe Square, Chapel Street, Thatcham
0.2% 3 0.0% 0 2.6% 3 0.0% 0 0.0% 0 0.0% 0 0.0% 0 0.0% 0 0.0% 0 0.0% 0 0.0% 0 0.0% 0
Sainsbury's Local, Guildford Road, Woking
0.4% 8 0.0% 0 0.0% 0 0.0% 0 0.0% 0 0.0% 0 0.0% 0 0.0% 0 0.0% 0 4.3% 8 0.0% 0 0.0% 0
Sainsbury's Local, Norries Barn, Ashbridge Road, Wokingham
0.0% 1 0.0% 0 0.0% 0 0.0% 0 0.0% 0 0.0% 0 0.0% 0 0.0% 0 0.0% 0 0.0% 0 0.0% 0 0.0% 0
Tesco Extra, Marcham Road, Abingdon
0.1% 1 0.0% 0 0.0% 0 0.0% 0 0.0% 0 0.0% 0 0.0% 0 0.0% 0 0.0% 0 0.0% 0 0.0% 0 0.0% 0
Tesco Extra, Station Road, Addlestone
0.1% 1 0.0% 0 0.0% 0 0.0% 0 0.0% 0 0.0% 0 0.0% 0 0.0% 0 0.0% 0 0.6% 1 0.0% 0 0.0% 0
Tesco Extra, River Way, Andover
0.8% 15 0.0% 0 0.0% 0 0.0% 0 0.0% 0 0.0% 0 0.0% 0 0.0% 0 0.0% 0 0.0% 0 0.0% 0 0.0% 0
Tesco Extra, Pinchington Lane, Newbury
1.5% 29 0.0% 0 0.0% 0 2.0% 1 0.0% 0 0.0% 0 0.0% 0 0.0% 0 0.0% 0 0.0% 0 0.0% 0 0.0% 0
Tesco Extra, Napier Road, Reading
0.5% 10 3.1% 4 4.1% 5 0.0% 0 1.2% 1 0.0% 0 0.0% 0 0.0% 0 0.0% 0 0.0% 0 0.0% 0 0.0% 0
Tesco Extra, Portman Road, Reading
1.1% 21 0.8% 1 13.9% 17 7.1% 2 0.0% 0 0.0% 0 0.0% 0 0.0% 0 0.0% 0 0.0% 0 0.0% 0 0.0% 0
Tesco Extra, The Meadows, Marshall Road, Sandhurst
2.6% 49 2.9% 4 0.0% 0 0.0% 0 0.0% 0 0.0% 0 0.0% 0 0.0% 0 0.0% 0 10.6% 20 0.0% 0 25.3% 19
Tesco Extra, Brunel Way / Wellington Street, Slough
1.4% 27 0.0% 0 0.0% 0 0.0% 0 0.0% 0 0.5% 1 0.0% 0 8.9% 22 5.4% 4 0.0% 0 0.0% 0 0.0% 0
Tesco Extra, Town Lane, Stanwell
0.2% 4 0.0% 0 0.0% 0 0.0% 0 0.0% 0 0.0% 0 0.0% 0 1.4% 3 1.4% 1 0.0% 0 0.0% 0 0.0% 0
Tesco Extra, Barnes Wallace Drive, Brooklands Ctr, Weybridge
0.5% 10 0.0% 0 0.0% 0 0.0% 0 0.0% 0 0.0% 0 0.0% 0 0.0% 0 0.0% 0 5.3% 10 0.0% 0 0.0% 0
Tesco Superstore, Wellington Avenue,
0.2% 4 0.0% 0 0.0% 0 0.0% 0 0.0% 0 0.0% 0 0.0% 0 0.0% 0 0.0% 0 1.6% 3 0.0% 0 1.0% 1

By Zone West Berkshire Household Survey Page 17 Weighted: for GVA April 2016
Total Zone 1 Zone 2 Zone 3 Zone 4 Zone 5 Zone 6 Zone 7 Zone 8 Zone 9 Zone 10 Zone 11
020416 NEMS market research
Aldershot Tesco Superstore, London
Road West, Amersham 0.1% 2 0.0% 0 0.0% 0 0.0% 0 0.0% 0 0.0% 0 0.0% 0 0.8% 2 0.0% 0 0.0% 0 0.0% 0 0.0% 0
Tesco Superstore, County Lane, Warfield, Bracknell
1.5% 29 0.0% 0 0.0% 0 0.0% 0 0.0% 0 0.0% 0 1.0% 1 0.0% 0 2.5% 2 0.0% 0 27.6% 26 0.0% 0
Tesco Superstore, Whitton Road, Bracknell
0.3% 5 0.0% 0 0.0% 0 0.0% 0 0.0% 0 0.0% 0 0.0% 0 0.0% 0 2.7% 2 0.7% 1 1.2% 1 0.8% 1
Tesco Superstore, District Shopping Centre, Chineham
1.1% 22 0.0% 0 0.0% 0 0.0% 0 0.0% 0 0.0% 0 0.0% 0 0.0% 0 0.0% 0 0.0% 0 0.0% 0 0.0% 0
Tesco Superstore, Wallingford Road, Didcot
1.0% 19 0.0% 0 0.0% 0 0.0% 0 1.2% 1 0.0% 0 0.0% 0 0.0% 0 0.0% 0 0.0% 0 0.0% 0 0.0% 0
Tesco Superstore, High Street, Egham
0.4% 7 0.0% 0 0.0% 0 0.0% 0 0.0% 0 0.0% 0 0.0% 0 0.0% 0 10.4% 7 0.0% 0 0.0% 0 0.0% 0
Tesco Superstore, Packhorse Road, Gerrards Cross
0.7% 13 0.0% 0 0.0% 0 0.0% 0 0.0% 0 0.8% 1 0.0% 0 4.5% 11 0.0% 0 0.0% 0 0.0% 0 0.0% 0
Tesco Superstore, Reading Road, Henley-on-Thames
0.7% 13 1.1% 1 0.0% 0 0.0% 0 13.8% 6 0.0% 0 4.1% 5 0.0% 0 0.0% 0 0.0% 0 0.0% 0 0.0% 0
Tesco Superstore, Station Road, Hook
0.1% 2 0.0% 0 0.0% 0 0.0% 0 0.0% 0 0.0% 0 0.0% 0 0.0% 0 0.0% 0 0.0% 0 0.0% 0 0.0% 0
Tesco Superstore, Everland Road, Hungerford
0.5% 9 0.0% 0 0.0% 0 0.0% 0 0.0% 0 0.0% 0 0.0% 0 0.0% 0 0.0% 0 0.0% 0 0.0% 0 0.0% 0
Tesco Superstore, Marlborough Business Park, Salisbury Road, Marlborough
0.0% 1 0.0% 0 0.0% 0 0.0% 0 0.0% 0 0.0% 0 0.0% 0 0.0% 0 0.0% 0 0.0% 0 0.0% 0 0.0% 0
Tesco Superstore, London Road, Newbury
0.3% 6 0.0% 0 0.0% 0 0.0% 0 0.0% 0 0.0% 0 0.0% 0 0.0% 0 0.0% 0 0.0% 0 0.0% 0 0.0% 0
Tesco Superstore, Bath Road, Taplow
2.2% 43 0.0% 0 0.0% 0 0.0% 0 0.0% 0 0.0% 0 4.2% 5 15.1% 38 0.0% 0 0.0% 0 0.0% 0 0.0% 0
Tesco Superstore, Station Road, Tidworth
0.1% 1 0.0% 0 0.0% 0 0.0% 0 0.0% 0 0.0% 0 0.0% 0 0.0% 0 0.0% 0 0.0% 0 0.0% 0 0.0% 0
Tesco Superstore, Dedworth Road, Windsor
1.5% 28 0.0% 0 0.0% 0 0.0% 0 0.0% 0 0.0% 0 0.6% 1 9.1% 23 6.4% 5 0.0% 0 0.0% 0 0.0% 0
Tesco Superstore, Finchampstead Road, Wokingham
1.4% 27 0.0% 0 0.0% 0 0.0% 0 0.0% 0 0.0% 0 2.5% 3 0.0% 0 0.0% 0 0.0% 0 0.0% 0 2.2% 2
Tesco Metro, Hampstead House, Basingstoke
0.2% 4 0.0% 0 0.0% 0 0.0% 0 0.0% 0 0.0% 0 0.0% 0 0.0% 0 0.0% 0 0.0% 0 0.0% 0 0.0% 0
Tesco Metro, Nicholson Walk, Maidenhead
0.1% 3 0.0% 0 0.0% 0 0.0% 0 0.0% 0 0.0% 0 2.2% 3 0.0% 0 0.0% 0 0.0% 0 0.0% 0 0.0% 0
Tesco Metro, Northbrook Street, Newbury
0.3% 6 0.0% 0 0.0% 0 0.0% 0 0.0% 0 0.0% 0 0.0% 0 0.0% 0 0.0% 0 0.0% 0 0.0% 0 0.0% 0
Tesco Express, Charlon Road, Charlton, Andover
0.0% 1 0.0% 0 0.0% 0 0.0% 0 0.0% 0 0.0% 0 0.0% 0 0.0% 0 0.0% 0 0.0% 0 0.0% 0 0.0% 0
Tesco Express, High Street, Ascot
0.0% 1 0.0% 0 0.0% 0 0.0% 0 0.0% 0 0.0% 0 0.0% 0 0.0% 0 0.8% 1 0.0% 0 0.0% 0 0.0% 0
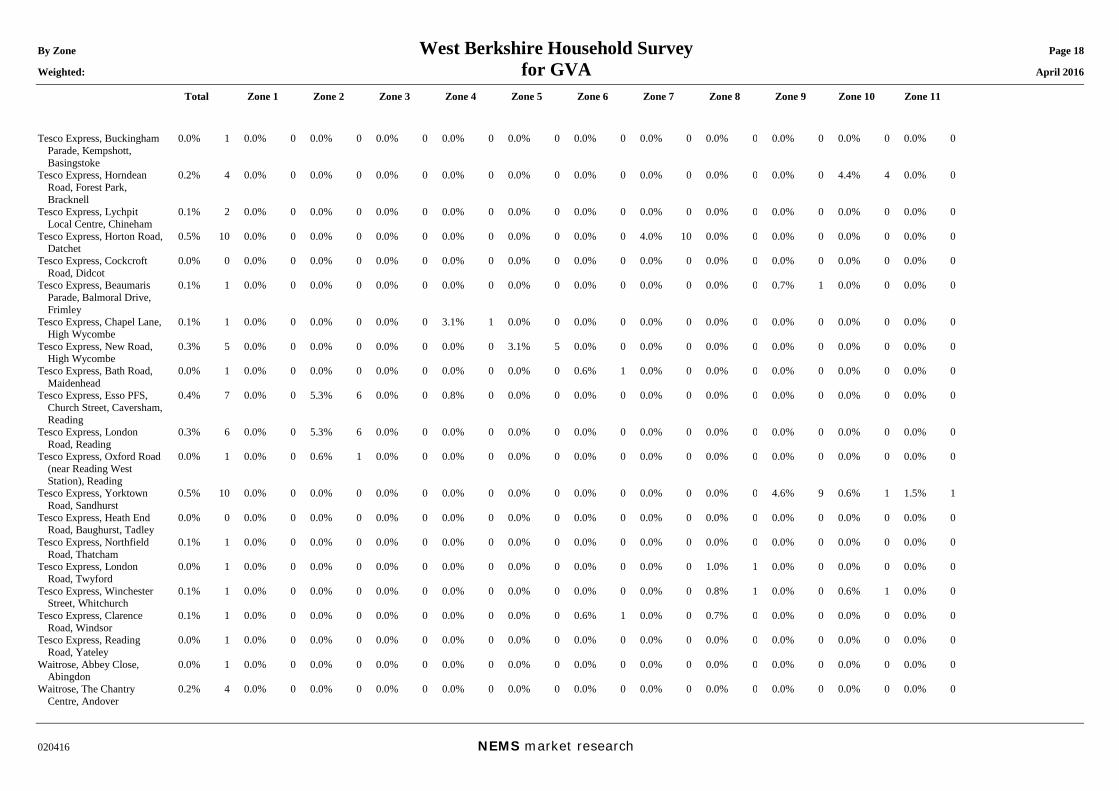
By Zone West Berkshire Household Survey Page 18 Weighted: for GVA April 2016
Total Zone 1 Zone 2 Zone 3 Zone 4 Zone 5 Zone 6 Zone 7 Zone 8 Zone 9 Zone 10 Zone 11
020416 NEMS market research
Tesco Express, Buckingham Parade, Kempshott, Basingstoke
0.0% 1 0.0% 0 0.0% 0 0.0% 0 0.0% 0 0.0% 0 0.0% 0 0.0% 0 0.0% 0 0.0% 0 0.0% 0 0.0% 0
Tesco Express, Horndean Road, Forest Park, Bracknell
0.2% 4 0.0% 0 0.0% 0 0.0% 0 0.0% 0 0.0% 0 0.0% 0 0.0% 0 0.0% 0 0.0% 0 4.4% 4 0.0% 0
Tesco Express, Lychpit Local Centre, Chineham
0.1% 2 0.0% 0 0.0% 0 0.0% 0 0.0% 0 0.0% 0 0.0% 0 0.0% 0 0.0% 0 0.0% 0 0.0% 0 0.0% 0
Tesco Express, Horton Road, Datchet
0.5% 10 0.0% 0 0.0% 0 0.0% 0 0.0% 0 0.0% 0 0.0% 0 4.0% 10 0.0% 0 0.0% 0 0.0% 0 0.0% 0
Tesco Express, Cockcroft Road, Didcot
0.0% 0 0.0% 0 0.0% 0 0.0% 0 0.0% 0 0.0% 0 0.0% 0 0.0% 0 0.0% 0 0.0% 0 0.0% 0 0.0% 0
Tesco Express, Beaumaris Parade, Balmoral Drive, Frimley
0.1% 1 0.0% 0 0.0% 0 0.0% 0 0.0% 0 0.0% 0 0.0% 0 0.0% 0 0.0% 0 0.7% 1 0.0% 0 0.0% 0
Tesco Express, Chapel Lane, High Wycombe
0.1% 1 0.0% 0 0.0% 0 0.0% 0 3.1% 1 0.0% 0 0.0% 0 0.0% 0 0.0% 0 0.0% 0 0.0% 0 0.0% 0
Tesco Express, New Road, High Wycombe
0.3% 5 0.0% 0 0.0% 0 0.0% 0 0.0% 0 3.1% 5 0.0% 0 0.0% 0 0.0% 0 0.0% 0 0.0% 0 0.0% 0
Tesco Express, Bath Road, Maidenhead
0.0% 1 0.0% 0 0.0% 0 0.0% 0 0.0% 0 0.0% 0 0.6% 1 0.0% 0 0.0% 0 0.0% 0 0.0% 0 0.0% 0
Tesco Express, Esso PFS, Church Street, Caversham, Reading
0.4% 7 0.0% 0 5.3% 6 0.0% 0 0.8% 0 0.0% 0 0.0% 0 0.0% 0 0.0% 0 0.0% 0 0.0% 0 0.0% 0
Tesco Express, London Road, Reading
0.3% 6 0.0% 0 5.3% 6 0.0% 0 0.0% 0 0.0% 0 0.0% 0 0.0% 0 0.0% 0 0.0% 0 0.0% 0 0.0% 0
Tesco Express, Oxford Road (near Reading West Station), Reading
0.0% 1 0.0% 0 0.6% 1 0.0% 0 0.0% 0 0.0% 0 0.0% 0 0.0% 0 0.0% 0 0.0% 0 0.0% 0 0.0% 0
Tesco Express, Yorktown Road, Sandhurst
0.5% 10 0.0% 0 0.0% 0 0.0% 0 0.0% 0 0.0% 0 0.0% 0 0.0% 0 0.0% 0 4.6% 9 0.6% 1 1.5% 1
Tesco Express, Heath End Road, Baughurst, Tadley
0.0% 0 0.0% 0 0.0% 0 0.0% 0 0.0% 0 0.0% 0 0.0% 0 0.0% 0 0.0% 0 0.0% 0 0.0% 0 0.0% 0
Tesco Express, Northfield Road, Thatcham
0.1% 1 0.0% 0 0.0% 0 0.0% 0 0.0% 0 0.0% 0 0.0% 0 0.0% 0 0.0% 0 0.0% 0 0.0% 0 0.0% 0
Tesco Express, London Road, Twyford
0.0% 1 0.0% 0 0.0% 0 0.0% 0 0.0% 0 0.0% 0 0.0% 0 0.0% 0 1.0% 1 0.0% 0 0.0% 0 0.0% 0
Tesco Express, Winchester Street, Whitchurch
0.1% 1 0.0% 0 0.0% 0 0.0% 0 0.0% 0 0.0% 0 0.0% 0 0.0% 0 0.8% 1 0.0% 0 0.6% 1 0.0% 0
Tesco Express, Clarence Road, Windsor
0.1% 1 0.0% 0 0.0% 0 0.0% 0 0.0% 0 0.0% 0 0.6% 1 0.0% 0 0.7% 0 0.0% 0 0.0% 0 0.0% 0
Tesco Express, Reading Road, Yateley
0.0% 1 0.0% 0 0.0% 0 0.0% 0 0.0% 0 0.0% 0 0.0% 0 0.0% 0 0.0% 0 0.0% 0 0.0% 0 0.0% 0
Waitrose, Abbey Close, Abingdon
0.0% 1 0.0% 0 0.0% 0 0.0% 0 0.0% 0 0.0% 0 0.0% 0 0.0% 0 0.0% 0 0.0% 0 0.0% 0 0.0% 0
Waitrose, The Chantry Centre, Andover
0.2% 4 0.0% 0 0.0% 0 0.0% 0 0.0% 0 0.0% 0 0.0% 0 0.0% 0 0.0% 0 0.0% 0 0.0% 0 0.0% 0
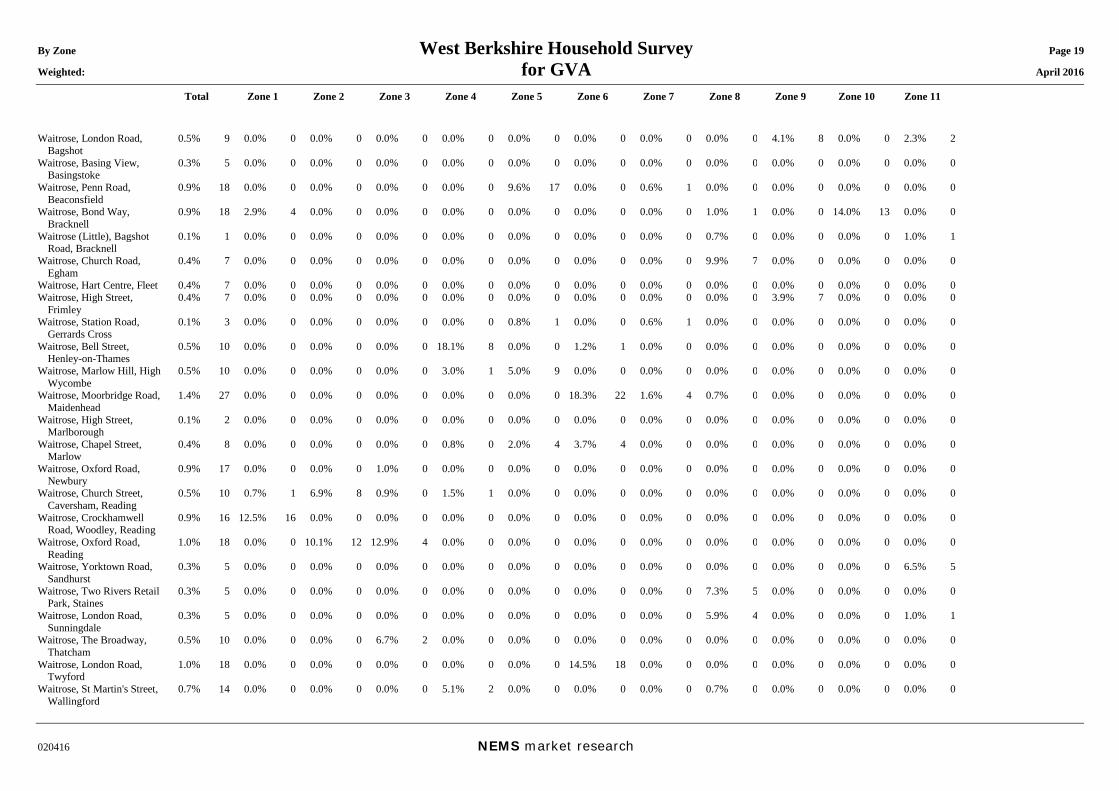
By Zone West Berkshire Household Survey Page 19 Weighted: for GVA April 2016
Total Zone 1 Zone 2 Zone 3 Zone 4 Zone 5 Zone 6 Zone 7 Zone 8 Zone 9 Zone 10 Zone 11
020416 NEMS market research
Waitrose, London Road, Bagshot
0.5% 9 0.0% 0 0.0% 0 0.0% 0 0.0% 0 0.0% 0 0.0% 0 0.0% 0 0.0% 0 4.1% 8 0.0% 0 2.3% 2
Waitrose, Basing View, Basingstoke
0.3% 5 0.0% 0 0.0% 0 0.0% 0 0.0% 0 0.0% 0 0.0% 0 0.0% 0 0.0% 0 0.0% 0 0.0% 0 0.0% 0
Waitrose, Penn Road, Beaconsfield
0.9% 18 0.0% 0 0.0% 0 0.0% 0 0.0% 0 9.6% 17 0.0% 0 0.6% 1 0.0% 0 0.0% 0 0.0% 0 0.0% 0
Waitrose, Bond Way, Bracknell
0.9% 18 2.9% 4 0.0% 0 0.0% 0 0.0% 0 0.0% 0 0.0% 0 0.0% 0 1.0% 1 0.0% 0 14.0% 13 0.0% 0
Waitrose (Little), Bagshot Road, Bracknell
0.1% 1 0.0% 0 0.0% 0 0.0% 0 0.0% 0 0.0% 0 0.0% 0 0.0% 0 0.7% 0 0.0% 0 0.0% 0 1.0% 1
Waitrose, Church Road, Egham
0.4% 7 0.0% 0 0.0% 0 0.0% 0 0.0% 0 0.0% 0 0.0% 0 0.0% 0 9.9% 7 0.0% 0 0.0% 0 0.0% 0
Waitrose, Hart Centre, Fleet 0.4% 7 0.0% 0 0.0% 0 0.0% 0 0.0% 0 0.0% 0 0.0% 0 0.0% 0 0.0% 0 0.0% 0 0.0% 0 0.0% 0 Waitrose, High Street,
Frimley 0.4% 7 0.0% 0 0.0% 0 0.0% 0 0.0% 0 0.0% 0 0.0% 0 0.0% 0 0.0% 0 3.9% 7 0.0% 0 0.0% 0
Waitrose, Station Road, Gerrards Cross
0.1% 3 0.0% 0 0.0% 0 0.0% 0 0.0% 0 0.8% 1 0.0% 0 0.6% 1 0.0% 0 0.0% 0 0.0% 0 0.0% 0
Waitrose, Bell Street, Henley-on-Thames
0.5% 10 0.0% 0 0.0% 0 0.0% 0 18.1% 8 0.0% 0 1.2% 1 0.0% 0 0.0% 0 0.0% 0 0.0% 0 0.0% 0
Waitrose, Marlow Hill, High Wycombe
0.5% 10 0.0% 0 0.0% 0 0.0% 0 3.0% 1 5.0% 9 0.0% 0 0.0% 0 0.0% 0 0.0% 0 0.0% 0 0.0% 0
Waitrose, Moorbridge Road, Maidenhead
1.4% 27 0.0% 0 0.0% 0 0.0% 0 0.0% 0 0.0% 0 18.3% 22 1.6% 4 0.7% 0 0.0% 0 0.0% 0 0.0% 0
Waitrose, High Street, Marlborough
0.1% 2 0.0% 0 0.0% 0 0.0% 0 0.0% 0 0.0% 0 0.0% 0 0.0% 0 0.0% 0 0.0% 0 0.0% 0 0.0% 0
Waitrose, Chapel Street, Marlow
0.4% 8 0.0% 0 0.0% 0 0.0% 0 0.8% 0 2.0% 4 3.7% 4 0.0% 0 0.0% 0 0.0% 0 0.0% 0 0.0% 0
Waitrose, Oxford Road, Newbury
0.9% 17 0.0% 0 0.0% 0 1.0% 0 0.0% 0 0.0% 0 0.0% 0 0.0% 0 0.0% 0 0.0% 0 0.0% 0 0.0% 0
Waitrose, Church Street, Caversham, Reading
0.5% 10 0.7% 1 6.9% 8 0.9% 0 1.5% 1 0.0% 0 0.0% 0 0.0% 0 0.0% 0 0.0% 0 0.0% 0 0.0% 0
Waitrose, Crockhamwell Road, Woodley, Reading
0.9% 16 12.5% 16 0.0% 0 0.0% 0 0.0% 0 0.0% 0 0.0% 0 0.0% 0 0.0% 0 0.0% 0 0.0% 0 0.0% 0
Waitrose, Oxford Road, Reading
1.0% 18 0.0% 0 10.1% 12 12.9% 4 0.0% 0 0.0% 0 0.0% 0 0.0% 0 0.0% 0 0.0% 0 0.0% 0 0.0% 0
Waitrose, Yorktown Road, Sandhurst
0.3% 5 0.0% 0 0.0% 0 0.0% 0 0.0% 0 0.0% 0 0.0% 0 0.0% 0 0.0% 0 0.0% 0 0.0% 0 6.5% 5
Waitrose, Two Rivers Retail Park, Staines
0.3% 5 0.0% 0 0.0% 0 0.0% 0 0.0% 0 0.0% 0 0.0% 0 0.0% 0 7.3% 5 0.0% 0 0.0% 0 0.0% 0
Waitrose, London Road, Sunningdale
0.3% 5 0.0% 0 0.0% 0 0.0% 0 0.0% 0 0.0% 0 0.0% 0 0.0% 0 5.9% 4 0.0% 0 0.0% 0 1.0% 1
Waitrose, The Broadway, Thatcham
0.5% 10 0.0% 0 0.0% 0 6.7% 2 0.0% 0 0.0% 0 0.0% 0 0.0% 0 0.0% 0 0.0% 0 0.0% 0 0.0% 0
Waitrose, London Road, Twyford
1.0% 18 0.0% 0 0.0% 0 0.0% 0 0.0% 0 0.0% 0 14.5% 18 0.0% 0 0.0% 0 0.0% 0 0.0% 0 0.0% 0
Waitrose, St Martin's Street, Wallingford
0.7% 14 0.0% 0 0.0% 0 0.0% 0 5.1% 2 0.0% 0 0.0% 0 0.0% 0 0.7% 0 0.0% 0 0.0% 0 0.0% 0
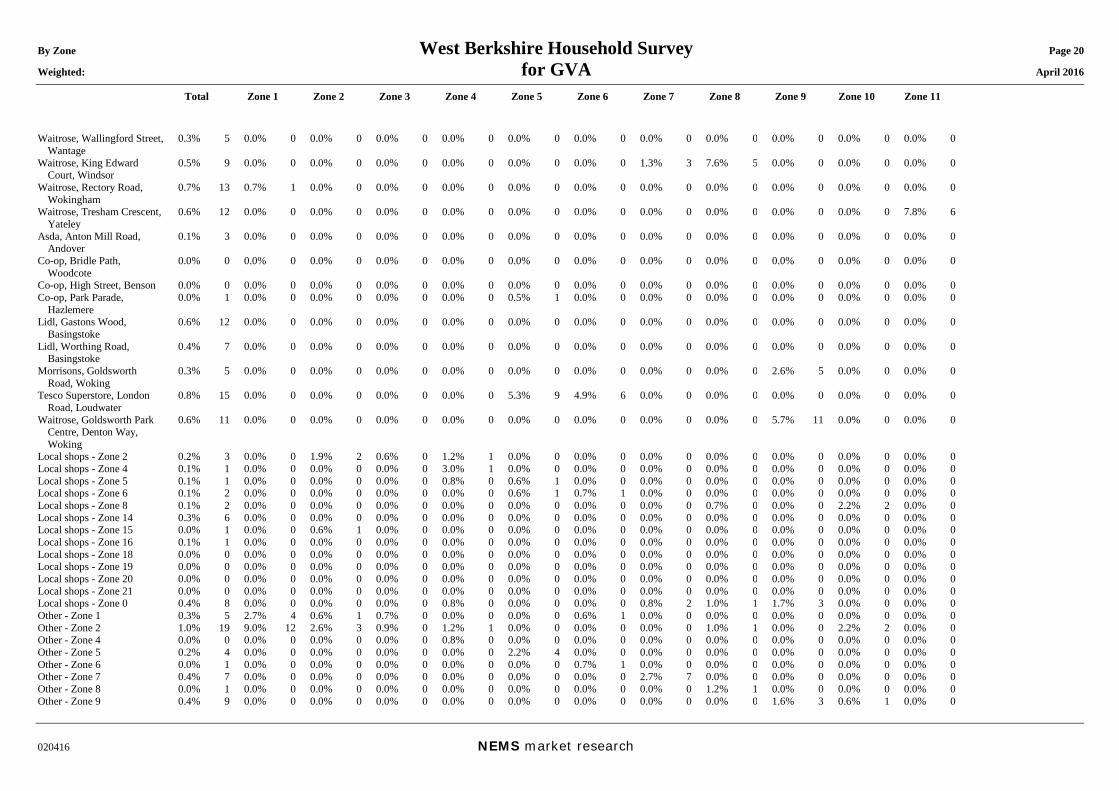
By Zone West Berkshire Household Survey Page 20 Weighted: for GVA April 2016
Total Zone 1 Zone 2 Zone 3 Zone 4 Zone 5 Zone 6 Zone 7 Zone 8 Zone 9 Zone 10 Zone 11
020416 NEMS market research
Waitrose, Wallingford Street, Wantage
0.3% 5 0.0% 0 0.0% 0 0.0% 0 0.0% 0 0.0% 0 0.0% 0 0.0% 0 0.0% 0 0.0% 0 0.0% 0 0.0% 0
Waitrose, King Edward Court, Windsor
0.5% 9 0.0% 0 0.0% 0 0.0% 0 0.0% 0 0.0% 0 0.0% 0 1.3% 3 7.6% 5 0.0% 0 0.0% 0 0.0% 0
Waitrose, Rectory Road, Wokingham
0.7% 13 0.7% 1 0.0% 0 0.0% 0 0.0% 0 0.0% 0 0.0% 0 0.0% 0 0.0% 0 0.0% 0 0.0% 0 0.0% 0
Waitrose, Tresham Crescent, Yateley
0.6% 12 0.0% 0 0.0% 0 0.0% 0 0.0% 0 0.0% 0 0.0% 0 0.0% 0 0.0% 0 0.0% 0 0.0% 0 7.8% 6
Asda, Anton Mill Road, Andover
0.1% 3 0.0% 0 0.0% 0 0.0% 0 0.0% 0 0.0% 0 0.0% 0 0.0% 0 0.0% 0 0.0% 0 0.0% 0 0.0% 0
Co-op, Bridle Path, Woodcote
0.0% 0 0.0% 0 0.0% 0 0.0% 0 0.0% 0 0.0% 0 0.0% 0 0.0% 0 0.0% 0 0.0% 0 0.0% 0 0.0% 0
Co-op, High Street, Benson 0.0% 0 0.0% 0 0.0% 0 0.0% 0 0.0% 0 0.0% 0 0.0% 0 0.0% 0 0.0% 0 0.0% 0 0.0% 0 0.0% 0 Co-op, Park Parade,
Hazlemere 0.0% 1 0.0% 0 0.0% 0 0.0% 0 0.0% 0 0.5% 1 0.0% 0 0.0% 0 0.0% 0 0.0% 0 0.0% 0 0.0% 0
Lidl, Gastons Wood, Basingstoke
0.6% 12 0.0% 0 0.0% 0 0.0% 0 0.0% 0 0.0% 0 0.0% 0 0.0% 0 0.0% 0 0.0% 0 0.0% 0 0.0% 0
Lidl, Worthing Road, Basingstoke
0.4% 7 0.0% 0 0.0% 0 0.0% 0 0.0% 0 0.0% 0 0.0% 0 0.0% 0 0.0% 0 0.0% 0 0.0% 0 0.0% 0
Morrisons, Goldsworth Road, Woking
0.3% 5 0.0% 0 0.0% 0 0.0% 0 0.0% 0 0.0% 0 0.0% 0 0.0% 0 0.0% 0 2.6% 5 0.0% 0 0.0% 0
Tesco Superstore, London Road, Loudwater
0.8% 15 0.0% 0 0.0% 0 0.0% 0 0.0% 0 5.3% 9 4.9% 6 0.0% 0 0.0% 0 0.0% 0 0.0% 0 0.0% 0
Waitrose, Goldsworth Park Centre, Denton Way, Woking
0.6% 11 0.0% 0 0.0% 0 0.0% 0 0.0% 0 0.0% 0 0.0% 0 0.0% 0 0.0% 0 5.7% 11 0.0% 0 0.0% 0
Local shops - Zone 2 0.2% 3 0.0% 0 1.9% 2 0.6% 0 1.2% 1 0.0% 0 0.0% 0 0.0% 0 0.0% 0 0.0% 0 0.0% 0 0.0% 0 Local shops - Zone 4 0.1% 1 0.0% 0 0.0% 0 0.0% 0 3.0% 1 0.0% 0 0.0% 0 0.0% 0 0.0% 0 0.0% 0 0.0% 0 0.0% 0 Local shops - Zone 5 0.1% 1 0.0% 0 0.0% 0 0.0% 0 0.8% 0 0.6% 1 0.0% 0 0.0% 0 0.0% 0 0.0% 0 0.0% 0 0.0% 0 Local shops - Zone 6 0.1% 2 0.0% 0 0.0% 0 0.0% 0 0.0% 0 0.6% 1 0.7% 1 0.0% 0 0.0% 0 0.0% 0 0.0% 0 0.0% 0 Local shops - Zone 8 0.1% 2 0.0% 0 0.0% 0 0.0% 0 0.0% 0 0.0% 0 0.0% 0 0.0% 0 0.7% 0 0.0% 0 2.2% 2 0.0% 0 Local shops - Zone 14 0.3% 6 0.0% 0 0.0% 0 0.0% 0 0.0% 0 0.0% 0 0.0% 0 0.0% 0 0.0% 0 0.0% 0 0.0% 0 0.0% 0 Local shops - Zone 15 0.0% 1 0.0% 0 0.6% 1 0.0% 0 0.0% 0 0.0% 0 0.0% 0 0.0% 0 0.0% 0 0.0% 0 0.0% 0 0.0% 0 Local shops - Zone 16 0.1% 1 0.0% 0 0.0% 0 0.0% 0 0.0% 0 0.0% 0 0.0% 0 0.0% 0 0.0% 0 0.0% 0 0.0% 0 0.0% 0 Local shops - Zone 18 0.0% 0 0.0% 0 0.0% 0 0.0% 0 0.0% 0 0.0% 0 0.0% 0 0.0% 0 0.0% 0 0.0% 0 0.0% 0 0.0% 0 Local shops - Zone 19 0.0% 0 0.0% 0 0.0% 0 0.0% 0 0.0% 0 0.0% 0 0.0% 0 0.0% 0 0.0% 0 0.0% 0 0.0% 0 0.0% 0 Local shops - Zone 20 0.0% 0 0.0% 0 0.0% 0 0.0% 0 0.0% 0 0.0% 0 0.0% 0 0.0% 0 0.0% 0 0.0% 0 0.0% 0 0.0% 0 Local shops - Zone 21 0.0% 0 0.0% 0 0.0% 0 0.0% 0 0.0% 0 0.0% 0 0.0% 0 0.0% 0 0.0% 0 0.0% 0 0.0% 0 0.0% 0 Local shops - Zone 0 0.4% 8 0.0% 0 0.0% 0 0.0% 0 0.8% 0 0.0% 0 0.0% 0 0.8% 2 1.0% 1 1.7% 3 0.0% 0 0.0% 0 Other - Zone 1 0.3% 5 2.7% 4 0.6% 1 0.7% 0 0.0% 0 0.0% 0 0.6% 1 0.0% 0 0.0% 0 0.0% 0 0.0% 0 0.0% 0 Other - Zone 2 1.0% 19 9.0% 12 2.6% 3 0.9% 0 1.2% 1 0.0% 0 0.0% 0 0.0% 0 1.0% 1 0.0% 0 2.2% 2 0.0% 0 Other - Zone 4 0.0% 0 0.0% 0 0.0% 0 0.0% 0 0.8% 0 0.0% 0 0.0% 0 0.0% 0 0.0% 0 0.0% 0 0.0% 0 0.0% 0 Other - Zone 5 0.2% 4 0.0% 0 0.0% 0 0.0% 0 0.0% 0 2.2% 4 0.0% 0 0.0% 0 0.0% 0 0.0% 0 0.0% 0 0.0% 0 Other - Zone 6 0.0% 1 0.0% 0 0.0% 0 0.0% 0 0.0% 0 0.0% 0 0.7% 1 0.0% 0 0.0% 0 0.0% 0 0.0% 0 0.0% 0 Other - Zone 7 0.4% 7 0.0% 0 0.0% 0 0.0% 0 0.0% 0 0.0% 0 0.0% 0 2.7% 7 0.0% 0 0.0% 0 0.0% 0 0.0% 0 Other - Zone 8 0.0% 1 0.0% 0 0.0% 0 0.0% 0 0.0% 0 0.0% 0 0.0% 0 0.0% 0 1.2% 1 0.0% 0 0.0% 0 0.0% 0 Other - Zone 9 0.4% 9 0.0% 0 0.0% 0 0.0% 0 0.0% 0 0.0% 0 0.0% 0 0.0% 0 0.0% 0 1.6% 3 0.6% 1 0.0% 0
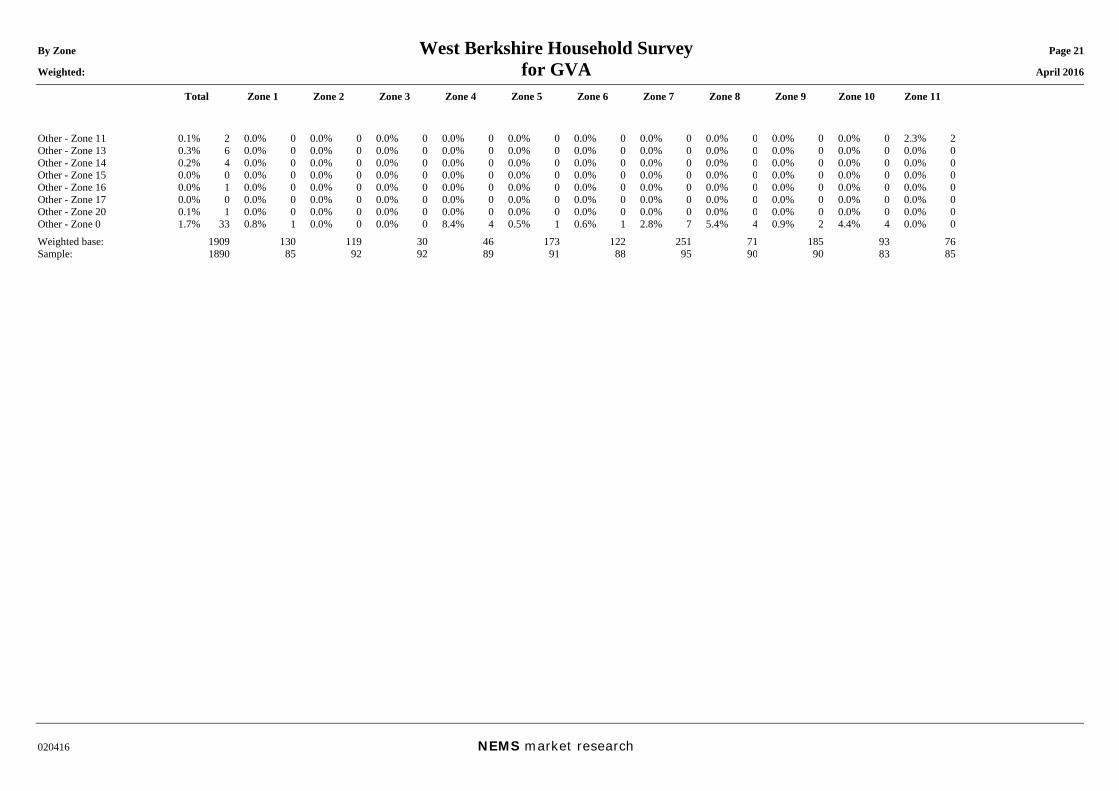
By Zone West Berkshire Household Survey Page 21 Weighted: for GVA April 2016
Total Zone 1 Zone 2 Zone 3 Zone 4 Zone 5 Zone 6 Zone 7 Zone 8 Zone 9 Zone 10 Zone 11
020416 NEMS market research
Other - Zone 11 0.1% 2 0.0% 0 0.0% 0 0.0% 0 0.0% 0 0.0% 0 0.0% 0 0.0% 0 0.0% 0 0.0% 0 0.0% 0 2.3% 2 Other - Zone 13 0.3% 6 0.0% 0 0.0% 0 0.0% 0 0.0% 0 0.0% 0 0.0% 0 0.0% 0 0.0% 0 0.0% 0 0.0% 0 0.0% 0 Other - Zone 14 0.2% 4 0.0% 0 0.0% 0 0.0% 0 0.0% 0 0.0% 0 0.0% 0 0.0% 0 0.0% 0 0.0% 0 0.0% 0 0.0% 0 Other - Zone 15 0.0% 0 0.0% 0 0.0% 0 0.0% 0 0.0% 0 0.0% 0 0.0% 0 0.0% 0 0.0% 0 0.0% 0 0.0% 0 0.0% 0 Other - Zone 16 0.0% 1 0.0% 0 0.0% 0 0.0% 0 0.0% 0 0.0% 0 0.0% 0 0.0% 0 0.0% 0 0.0% 0 0.0% 0 0.0% 0 Other - Zone 17 0.0% 0 0.0% 0 0.0% 0 0.0% 0 0.0% 0 0.0% 0 0.0% 0 0.0% 0 0.0% 0 0.0% 0 0.0% 0 0.0% 0 Other - Zone 20 0.1% 1 0.0% 0 0.0% 0 0.0% 0 0.0% 0 0.0% 0 0.0% 0 0.0% 0 0.0% 0 0.0% 0 0.0% 0 0.0% 0 Other - Zone 0 1.7% 33 0.8% 1 0.0% 0 0.0% 0 8.4% 4 0.5% 1 0.6% 1 2.8% 7 5.4% 4 0.9% 2 4.4% 4 0.0% 0 Weighted base: 1909 130 119 30 46 173 122 251 71 185 93 76 Sample: 1890 85 92 92 89 91 88 95 90 90 83 85
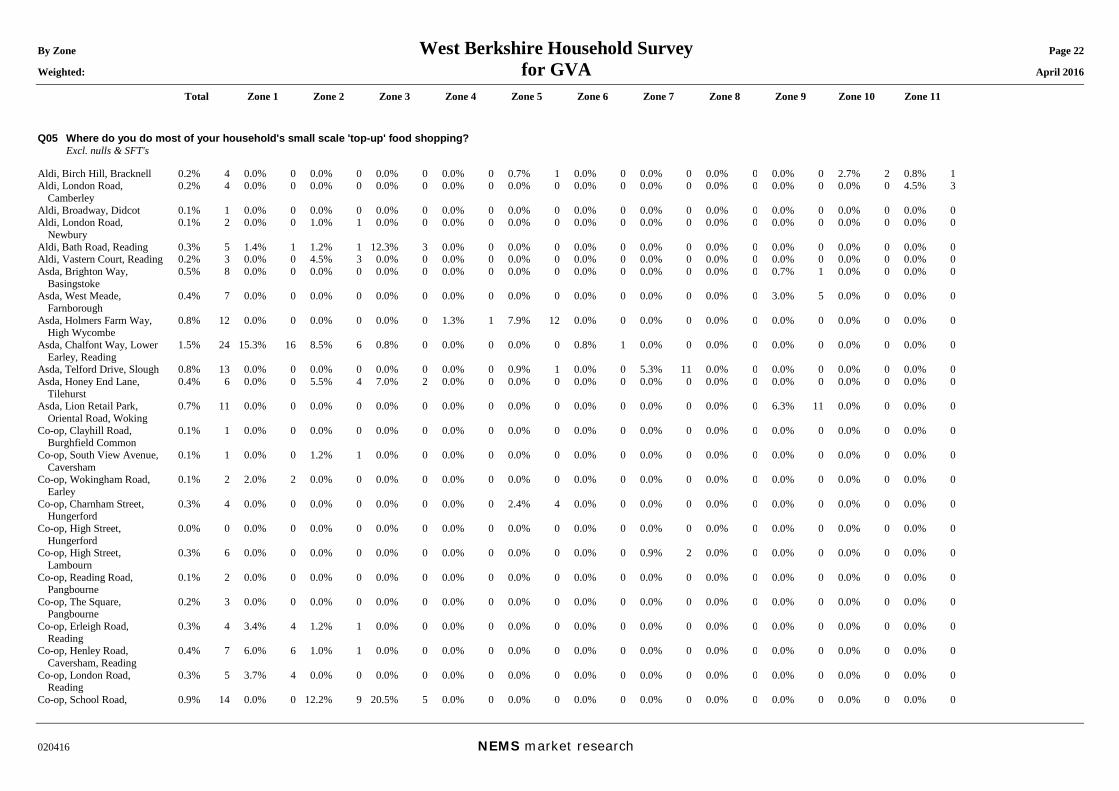
By Zone West Berkshire Household Survey Page 22 Weighted: for GVA April 2016
Total Zone 1 Zone 2 Zone 3 Zone 4 Zone 5 Zone 6 Zone 7 Zone 8 Zone 9 Zone 10 Zone 11
020416 NEMS market research
Q05 Where do you do most of your household's small scale 'top-up' food shopping? Excl. nulls & SFT's Aldi, Birch Hill, Bracknell 0.2% 4 0.0% 0 0.0% 0 0.0% 0 0.0% 0 0.7% 1 0.0% 0 0.0% 0 0.0% 0 0.0% 0 2.7% 2 0.8% 1 Aldi, London Road,
Camberley 0.2% 4 0.0% 0 0.0% 0 0.0% 0 0.0% 0 0.0% 0 0.0% 0 0.0% 0 0.0% 0 0.0% 0 0.0% 0 4.5% 3
Aldi, Broadway, Didcot 0.1% 1 0.0% 0 0.0% 0 0.0% 0 0.0% 0 0.0% 0 0.0% 0 0.0% 0 0.0% 0 0.0% 0 0.0% 0 0.0% 0 Aldi, London Road,
Newbury 0.1% 2 0.0% 0 1.0% 1 0.0% 0 0.0% 0 0.0% 0 0.0% 0 0.0% 0 0.0% 0 0.0% 0 0.0% 0 0.0% 0
Aldi, Bath Road, Reading 0.3% 5 1.4% 1 1.2% 1 12.3% 3 0.0% 0 0.0% 0 0.0% 0 0.0% 0 0.0% 0 0.0% 0 0.0% 0 0.0% 0 Aldi, Vastern Court, Reading 0.2% 3 0.0% 0 4.5% 3 0.0% 0 0.0% 0 0.0% 0 0.0% 0 0.0% 0 0.0% 0 0.0% 0 0.0% 0 0.0% 0 Asda, Brighton Way,
Basingstoke 0.5% 8 0.0% 0 0.0% 0 0.0% 0 0.0% 0 0.0% 0 0.0% 0 0.0% 0 0.0% 0 0.7% 1 0.0% 0 0.0% 0
Asda, West Meade, Farnborough
0.4% 7 0.0% 0 0.0% 0 0.0% 0 0.0% 0 0.0% 0 0.0% 0 0.0% 0 0.0% 0 3.0% 5 0.0% 0 0.0% 0
Asda, Holmers Farm Way, High Wycombe
0.8% 12 0.0% 0 0.0% 0 0.0% 0 1.3% 1 7.9% 12 0.0% 0 0.0% 0 0.0% 0 0.0% 0 0.0% 0 0.0% 0
Asda, Chalfont Way, Lower Earley, Reading
1.5% 24 15.3% 16 8.5% 6 0.8% 0 0.0% 0 0.0% 0 0.8% 1 0.0% 0 0.0% 0 0.0% 0 0.0% 0 0.0% 0
Asda, Telford Drive, Slough 0.8% 13 0.0% 0 0.0% 0 0.0% 0 0.0% 0 0.9% 1 0.0% 0 5.3% 11 0.0% 0 0.0% 0 0.0% 0 0.0% 0 Asda, Honey End Lane,
Tilehurst 0.4% 6 0.0% 0 5.5% 4 7.0% 2 0.0% 0 0.0% 0 0.0% 0 0.0% 0 0.0% 0 0.0% 0 0.0% 0 0.0% 0
Asda, Lion Retail Park, Oriental Road, Woking
0.7% 11 0.0% 0 0.0% 0 0.0% 0 0.0% 0 0.0% 0 0.0% 0 0.0% 0 0.0% 0 6.3% 11 0.0% 0 0.0% 0
Co-op, Clayhill Road, Burghfield Common
0.1% 1 0.0% 0 0.0% 0 0.0% 0 0.0% 0 0.0% 0 0.0% 0 0.0% 0 0.0% 0 0.0% 0 0.0% 0 0.0% 0
Co-op, South View Avenue, Caversham
0.1% 1 0.0% 0 1.2% 1 0.0% 0 0.0% 0 0.0% 0 0.0% 0 0.0% 0 0.0% 0 0.0% 0 0.0% 0 0.0% 0
Co-op, Wokingham Road, Earley
0.1% 2 2.0% 2 0.0% 0 0.0% 0 0.0% 0 0.0% 0 0.0% 0 0.0% 0 0.0% 0 0.0% 0 0.0% 0 0.0% 0
Co-op, Charnham Street, Hungerford
0.3% 4 0.0% 0 0.0% 0 0.0% 0 0.0% 0 2.4% 4 0.0% 0 0.0% 0 0.0% 0 0.0% 0 0.0% 0 0.0% 0
Co-op, High Street, Hungerford
0.0% 0 0.0% 0 0.0% 0 0.0% 0 0.0% 0 0.0% 0 0.0% 0 0.0% 0 0.0% 0 0.0% 0 0.0% 0 0.0% 0
Co-op, High Street, Lambourn
0.3% 6 0.0% 0 0.0% 0 0.0% 0 0.0% 0 0.0% 0 0.0% 0 0.9% 2 0.0% 0 0.0% 0 0.0% 0 0.0% 0
Co-op, Reading Road, Pangbourne
0.1% 2 0.0% 0 0.0% 0 0.0% 0 0.0% 0 0.0% 0 0.0% 0 0.0% 0 0.0% 0 0.0% 0 0.0% 0 0.0% 0
Co-op, The Square, Pangbourne
0.2% 3 0.0% 0 0.0% 0 0.0% 0 0.0% 0 0.0% 0 0.0% 0 0.0% 0 0.0% 0 0.0% 0 0.0% 0 0.0% 0
Co-op, Erleigh Road, Reading
0.3% 4 3.4% 4 1.2% 1 0.0% 0 0.0% 0 0.0% 0 0.0% 0 0.0% 0 0.0% 0 0.0% 0 0.0% 0 0.0% 0
Co-op, Henley Road, Caversham, Reading
0.4% 7 6.0% 6 1.0% 1 0.0% 0 0.0% 0 0.0% 0 0.0% 0 0.0% 0 0.0% 0 0.0% 0 0.0% 0 0.0% 0
Co-op, London Road, Reading
0.3% 5 3.7% 4 0.0% 0 0.0% 0 0.0% 0 0.0% 0 0.0% 0 0.0% 0 0.0% 0 0.0% 0 0.0% 0 0.0% 0
Co-op, School Road, 0.9% 14 0.0% 0 12.2% 9 20.5% 5 0.0% 0 0.0% 0 0.0% 0 0.0% 0 0.0% 0 0.0% 0 0.0% 0 0.0% 0
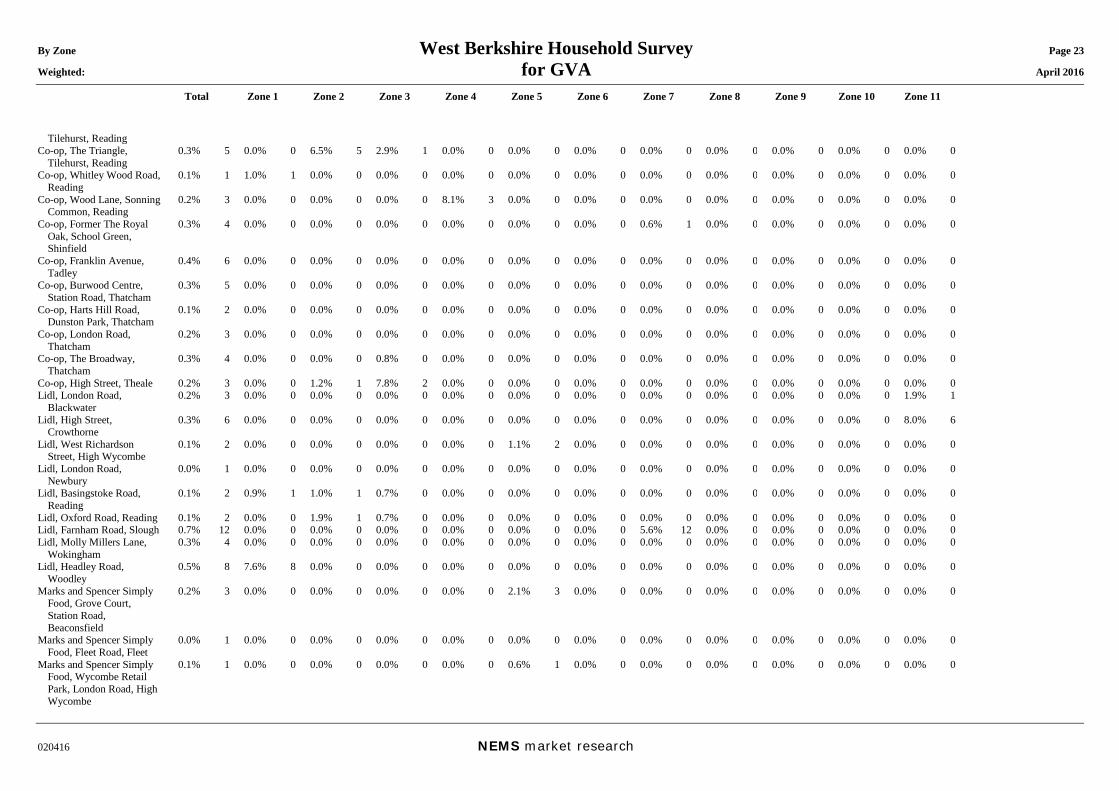
By Zone West Berkshire Household Survey Page 23 Weighted: for GVA April 2016
Total Zone 1 Zone 2 Zone 3 Zone 4 Zone 5 Zone 6 Zone 7 Zone 8 Zone 9 Zone 10 Zone 11
020416 NEMS market research
Tilehurst, Reading Co-op, The Triangle,
Tilehurst, Reading 0.3% 5 0.0% 0 6.5% 5 2.9% 1 0.0% 0 0.0% 0 0.0% 0 0.0% 0 0.0% 0 0.0% 0 0.0% 0 0.0% 0
Co-op, Whitley Wood Road, Reading
0.1% 1 1.0% 1 0.0% 0 0.0% 0 0.0% 0 0.0% 0 0.0% 0 0.0% 0 0.0% 0 0.0% 0 0.0% 0 0.0% 0
Co-op, Wood Lane, Sonning Common, Reading
0.2% 3 0.0% 0 0.0% 0 0.0% 0 8.1% 3 0.0% 0 0.0% 0 0.0% 0 0.0% 0 0.0% 0 0.0% 0 0.0% 0
Co-op, Former The Royal Oak, School Green, Shinfield
0.3% 4 0.0% 0 0.0% 0 0.0% 0 0.0% 0 0.0% 0 0.0% 0 0.6% 1 0.0% 0 0.0% 0 0.0% 0 0.0% 0
Co-op, Franklin Avenue, Tadley
0.4% 6 0.0% 0 0.0% 0 0.0% 0 0.0% 0 0.0% 0 0.0% 0 0.0% 0 0.0% 0 0.0% 0 0.0% 0 0.0% 0
Co-op, Burwood Centre, Station Road, Thatcham
0.3% 5 0.0% 0 0.0% 0 0.0% 0 0.0% 0 0.0% 0 0.0% 0 0.0% 0 0.0% 0 0.0% 0 0.0% 0 0.0% 0
Co-op, Harts Hill Road, Dunston Park, Thatcham
0.1% 2 0.0% 0 0.0% 0 0.0% 0 0.0% 0 0.0% 0 0.0% 0 0.0% 0 0.0% 0 0.0% 0 0.0% 0 0.0% 0
Co-op, London Road, Thatcham
0.2% 3 0.0% 0 0.0% 0 0.0% 0 0.0% 0 0.0% 0 0.0% 0 0.0% 0 0.0% 0 0.0% 0 0.0% 0 0.0% 0
Co-op, The Broadway, Thatcham
0.3% 4 0.0% 0 0.0% 0 0.8% 0 0.0% 0 0.0% 0 0.0% 0 0.0% 0 0.0% 0 0.0% 0 0.0% 0 0.0% 0
Co-op, High Street, Theale 0.2% 3 0.0% 0 1.2% 1 7.8% 2 0.0% 0 0.0% 0 0.0% 0 0.0% 0 0.0% 0 0.0% 0 0.0% 0 0.0% 0 Lidl, London Road,
Blackwater 0.2% 3 0.0% 0 0.0% 0 0.0% 0 0.0% 0 0.0% 0 0.0% 0 0.0% 0 0.0% 0 0.0% 0 0.0% 0 1.9% 1
Lidl, High Street, Crowthorne
0.3% 6 0.0% 0 0.0% 0 0.0% 0 0.0% 0 0.0% 0 0.0% 0 0.0% 0 0.0% 0 0.0% 0 0.0% 0 8.0% 6
Lidl, West Richardson Street, High Wycombe
0.1% 2 0.0% 0 0.0% 0 0.0% 0 0.0% 0 1.1% 2 0.0% 0 0.0% 0 0.0% 0 0.0% 0 0.0% 0 0.0% 0
Lidl, London Road, Newbury
0.0% 1 0.0% 0 0.0% 0 0.0% 0 0.0% 0 0.0% 0 0.0% 0 0.0% 0 0.0% 0 0.0% 0 0.0% 0 0.0% 0
Lidl, Basingstoke Road, Reading
0.1% 2 0.9% 1 1.0% 1 0.7% 0 0.0% 0 0.0% 0 0.0% 0 0.0% 0 0.0% 0 0.0% 0 0.0% 0 0.0% 0
Lidl, Oxford Road, Reading 0.1% 2 0.0% 0 1.9% 1 0.7% 0 0.0% 0 0.0% 0 0.0% 0 0.0% 0 0.0% 0 0.0% 0 0.0% 0 0.0% 0 Lidl, Farnham Road, Slough 0.7% 12 0.0% 0 0.0% 0 0.0% 0 0.0% 0 0.0% 0 0.0% 0 5.6% 12 0.0% 0 0.0% 0 0.0% 0 0.0% 0 Lidl, Molly Millers Lane,
Wokingham 0.3% 4 0.0% 0 0.0% 0 0.0% 0 0.0% 0 0.0% 0 0.0% 0 0.0% 0 0.0% 0 0.0% 0 0.0% 0 0.0% 0
Lidl, Headley Road, Woodley
0.5% 8 7.6% 8 0.0% 0 0.0% 0 0.0% 0 0.0% 0 0.0% 0 0.0% 0 0.0% 0 0.0% 0 0.0% 0 0.0% 0
Marks and Spencer Simply Food, Grove Court, Station Road, Beaconsfield
0.2% 3 0.0% 0 0.0% 0 0.0% 0 0.0% 0 2.1% 3 0.0% 0 0.0% 0 0.0% 0 0.0% 0 0.0% 0 0.0% 0
Marks and Spencer Simply Food, Fleet Road, Fleet
0.0% 1 0.0% 0 0.0% 0 0.0% 0 0.0% 0 0.0% 0 0.0% 0 0.0% 0 0.0% 0 0.0% 0 0.0% 0 0.0% 0
Marks and Spencer Simply Food, Wycombe Retail Park, London Road, High Wycombe
0.1% 1 0.0% 0 0.0% 0 0.0% 0 0.0% 0 0.6% 1 0.0% 0 0.0% 0 0.0% 0 0.0% 0 0.0% 0 0.0% 0
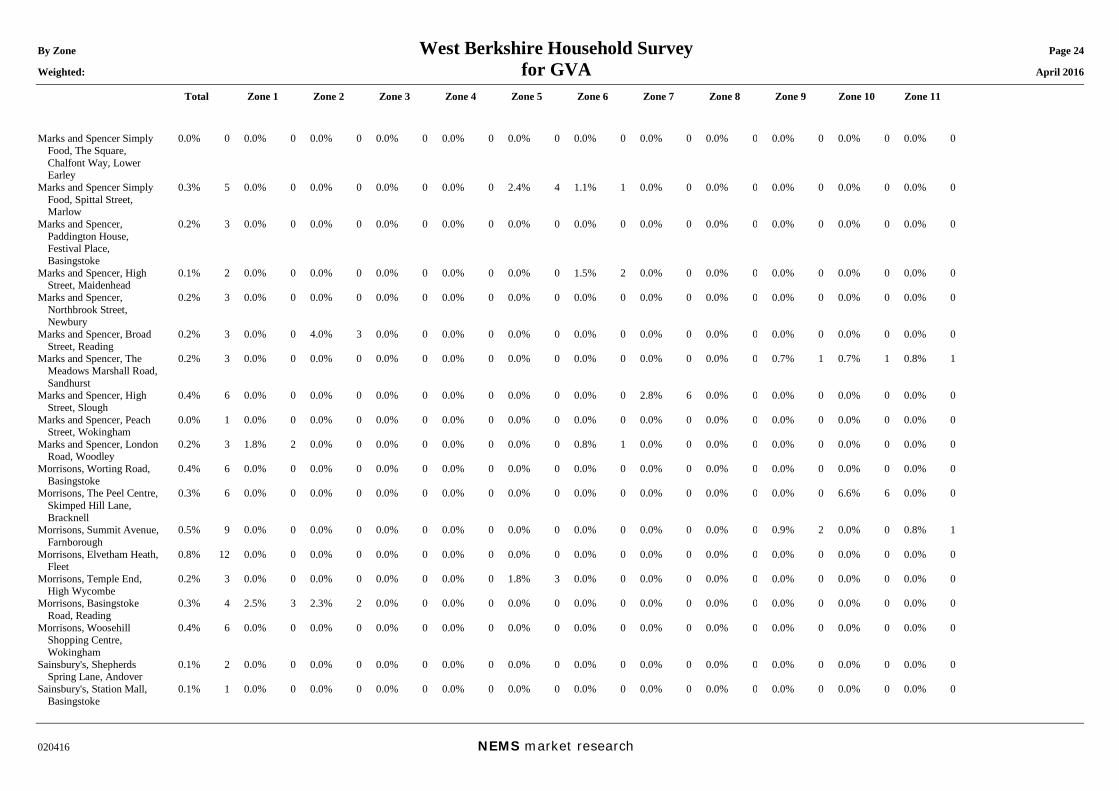
By Zone West Berkshire Household Survey Page 24 Weighted: for GVA April 2016
Total Zone 1 Zone 2 Zone 3 Zone 4 Zone 5 Zone 6 Zone 7 Zone 8 Zone 9 Zone 10 Zone 11
020416 NEMS market research
Marks and Spencer Simply Food, The Square, Chalfont Way, Lower Earley
0.0% 0 0.0% 0 0.0% 0 0.0% 0 0.0% 0 0.0% 0 0.0% 0 0.0% 0 0.0% 0 0.0% 0 0.0% 0 0.0% 0
Marks and Spencer Simply Food, Spittal Street, Marlow
0.3% 5 0.0% 0 0.0% 0 0.0% 0 0.0% 0 2.4% 4 1.1% 1 0.0% 0 0.0% 0 0.0% 0 0.0% 0 0.0% 0
Marks and Spencer, Paddington House, Festival Place, Basingstoke
0.2% 3 0.0% 0 0.0% 0 0.0% 0 0.0% 0 0.0% 0 0.0% 0 0.0% 0 0.0% 0 0.0% 0 0.0% 0 0.0% 0
Marks and Spencer, High Street, Maidenhead
0.1% 2 0.0% 0 0.0% 0 0.0% 0 0.0% 0 0.0% 0 1.5% 2 0.0% 0 0.0% 0 0.0% 0 0.0% 0 0.0% 0
Marks and Spencer, Northbrook Street, Newbury
0.2% 3 0.0% 0 0.0% 0 0.0% 0 0.0% 0 0.0% 0 0.0% 0 0.0% 0 0.0% 0 0.0% 0 0.0% 0 0.0% 0
Marks and Spencer, Broad Street, Reading
0.2% 3 0.0% 0 4.0% 3 0.0% 0 0.0% 0 0.0% 0 0.0% 0 0.0% 0 0.0% 0 0.0% 0 0.0% 0 0.0% 0
Marks and Spencer, The Meadows Marshall Road, Sandhurst
0.2% 3 0.0% 0 0.0% 0 0.0% 0 0.0% 0 0.0% 0 0.0% 0 0.0% 0 0.0% 0 0.7% 1 0.7% 1 0.8% 1
Marks and Spencer, High Street, Slough
0.4% 6 0.0% 0 0.0% 0 0.0% 0 0.0% 0 0.0% 0 0.0% 0 2.8% 6 0.0% 0 0.0% 0 0.0% 0 0.0% 0
Marks and Spencer, Peach Street, Wokingham
0.0% 1 0.0% 0 0.0% 0 0.0% 0 0.0% 0 0.0% 0 0.0% 0 0.0% 0 0.0% 0 0.0% 0 0.0% 0 0.0% 0
Marks and Spencer, London Road, Woodley
0.2% 3 1.8% 2 0.0% 0 0.0% 0 0.0% 0 0.0% 0 0.8% 1 0.0% 0 0.0% 0 0.0% 0 0.0% 0 0.0% 0
Morrisons, Worting Road, Basingstoke
0.4% 6 0.0% 0 0.0% 0 0.0% 0 0.0% 0 0.0% 0 0.0% 0 0.0% 0 0.0% 0 0.0% 0 0.0% 0 0.0% 0
Morrisons, The Peel Centre, Skimped Hill Lane, Bracknell
0.3% 6 0.0% 0 0.0% 0 0.0% 0 0.0% 0 0.0% 0 0.0% 0 0.0% 0 0.0% 0 0.0% 0 6.6% 6 0.0% 0
Morrisons, Summit Avenue, Farnborough
0.5% 9 0.0% 0 0.0% 0 0.0% 0 0.0% 0 0.0% 0 0.0% 0 0.0% 0 0.0% 0 0.9% 2 0.0% 0 0.8% 1
Morrisons, Elvetham Heath, Fleet
0.8% 12 0.0% 0 0.0% 0 0.0% 0 0.0% 0 0.0% 0 0.0% 0 0.0% 0 0.0% 0 0.0% 0 0.0% 0 0.0% 0
Morrisons, Temple End, High Wycombe
0.2% 3 0.0% 0 0.0% 0 0.0% 0 0.0% 0 1.8% 3 0.0% 0 0.0% 0 0.0% 0 0.0% 0 0.0% 0 0.0% 0
Morrisons, Basingstoke Road, Reading
0.3% 4 2.5% 3 2.3% 2 0.0% 0 0.0% 0 0.0% 0 0.0% 0 0.0% 0 0.0% 0 0.0% 0 0.0% 0 0.0% 0
Morrisons, Woosehill Shopping Centre, Wokingham
0.4% 6 0.0% 0 0.0% 0 0.0% 0 0.0% 0 0.0% 0 0.0% 0 0.0% 0 0.0% 0 0.0% 0 0.0% 0 0.0% 0
Sainsbury's, Shepherds Spring Lane, Andover
0.1% 2 0.0% 0 0.0% 0 0.0% 0 0.0% 0 0.0% 0 0.0% 0 0.0% 0 0.0% 0 0.0% 0 0.0% 0 0.0% 0
Sainsbury's, Station Mall, Basingstoke
0.1% 1 0.0% 0 0.0% 0 0.0% 0 0.0% 0 0.0% 0 0.0% 0 0.0% 0 0.0% 0 0.0% 0 0.0% 0 0.0% 0
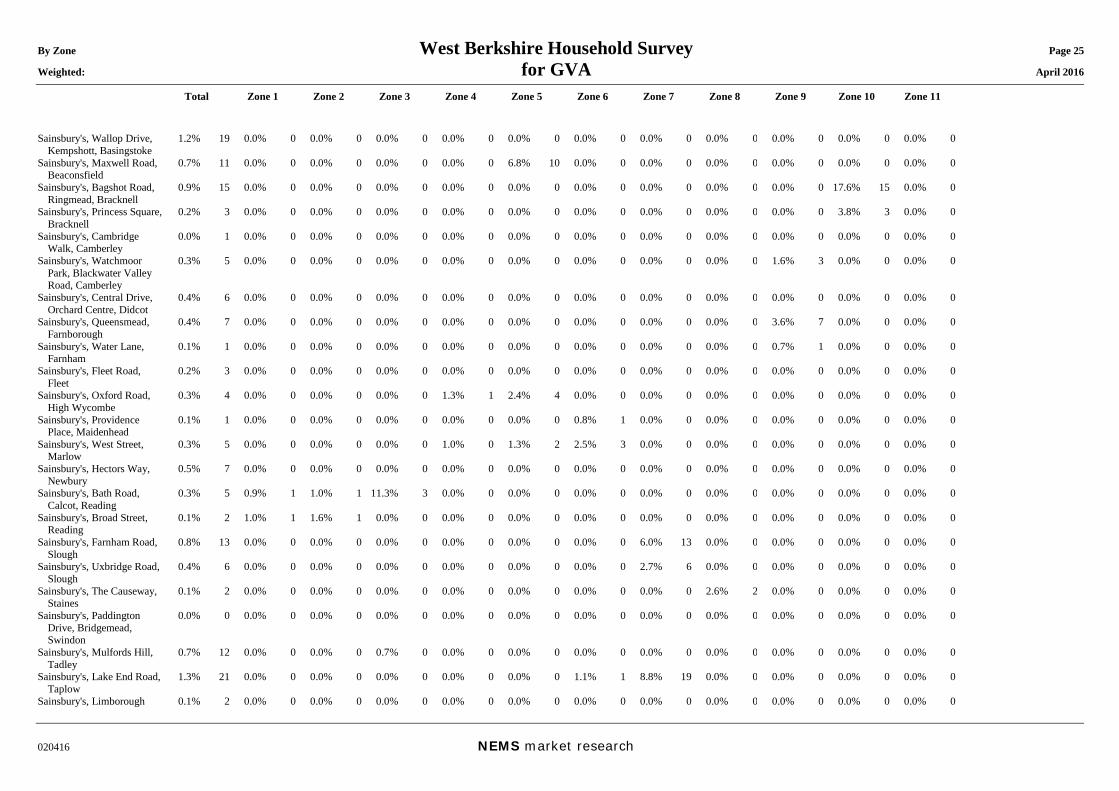
By Zone West Berkshire Household Survey Page 25 Weighted: for GVA April 2016
Total Zone 1 Zone 2 Zone 3 Zone 4 Zone 5 Zone 6 Zone 7 Zone 8 Zone 9 Zone 10 Zone 11
020416 NEMS market research
Sainsbury's, Wallop Drive, Kempshott, Basingstoke
1.2% 19 0.0% 0 0.0% 0 0.0% 0 0.0% 0 0.0% 0 0.0% 0 0.0% 0 0.0% 0 0.0% 0 0.0% 0 0.0% 0
Sainsbury's, Maxwell Road, Beaconsfield
0.7% 11 0.0% 0 0.0% 0 0.0% 0 0.0% 0 6.8% 10 0.0% 0 0.0% 0 0.0% 0 0.0% 0 0.0% 0 0.0% 0
Sainsbury's, Bagshot Road, Ringmead, Bracknell
0.9% 15 0.0% 0 0.0% 0 0.0% 0 0.0% 0 0.0% 0 0.0% 0 0.0% 0 0.0% 0 0.0% 0 17.6% 15 0.0% 0
Sainsbury's, Princess Square, Bracknell
0.2% 3 0.0% 0 0.0% 0 0.0% 0 0.0% 0 0.0% 0 0.0% 0 0.0% 0 0.0% 0 0.0% 0 3.8% 3 0.0% 0
Sainsbury's, Cambridge Walk, Camberley
0.0% 1 0.0% 0 0.0% 0 0.0% 0 0.0% 0 0.0% 0 0.0% 0 0.0% 0 0.0% 0 0.0% 0 0.0% 0 0.0% 0
Sainsbury's, Watchmoor Park, Blackwater Valley Road, Camberley
0.3% 5 0.0% 0 0.0% 0 0.0% 0 0.0% 0 0.0% 0 0.0% 0 0.0% 0 0.0% 0 1.6% 3 0.0% 0 0.0% 0
Sainsbury's, Central Drive, Orchard Centre, Didcot
0.4% 6 0.0% 0 0.0% 0 0.0% 0 0.0% 0 0.0% 0 0.0% 0 0.0% 0 0.0% 0 0.0% 0 0.0% 0 0.0% 0
Sainsbury's, Queensmead, Farnborough
0.4% 7 0.0% 0 0.0% 0 0.0% 0 0.0% 0 0.0% 0 0.0% 0 0.0% 0 0.0% 0 3.6% 7 0.0% 0 0.0% 0
Sainsbury's, Water Lane, Farnham
0.1% 1 0.0% 0 0.0% 0 0.0% 0 0.0% 0 0.0% 0 0.0% 0 0.0% 0 0.0% 0 0.7% 1 0.0% 0 0.0% 0
Sainsbury's, Fleet Road, Fleet
0.2% 3 0.0% 0 0.0% 0 0.0% 0 0.0% 0 0.0% 0 0.0% 0 0.0% 0 0.0% 0 0.0% 0 0.0% 0 0.0% 0
Sainsbury's, Oxford Road, High Wycombe
0.3% 4 0.0% 0 0.0% 0 0.0% 0 1.3% 1 2.4% 4 0.0% 0 0.0% 0 0.0% 0 0.0% 0 0.0% 0 0.0% 0
Sainsbury's, Providence Place, Maidenhead
0.1% 1 0.0% 0 0.0% 0 0.0% 0 0.0% 0 0.0% 0 0.8% 1 0.0% 0 0.0% 0 0.0% 0 0.0% 0 0.0% 0
Sainsbury's, West Street, Marlow
0.3% 5 0.0% 0 0.0% 0 0.0% 0 1.0% 0 1.3% 2 2.5% 3 0.0% 0 0.0% 0 0.0% 0 0.0% 0 0.0% 0
Sainsbury's, Hectors Way, Newbury
0.5% 7 0.0% 0 0.0% 0 0.0% 0 0.0% 0 0.0% 0 0.0% 0 0.0% 0 0.0% 0 0.0% 0 0.0% 0 0.0% 0
Sainsbury's, Bath Road, Calcot, Reading
0.3% 5 0.9% 1 1.0% 1 11.3% 3 0.0% 0 0.0% 0 0.0% 0 0.0% 0 0.0% 0 0.0% 0 0.0% 0 0.0% 0
Sainsbury's, Broad Street, Reading
0.1% 2 1.0% 1 1.6% 1 0.0% 0 0.0% 0 0.0% 0 0.0% 0 0.0% 0 0.0% 0 0.0% 0 0.0% 0 0.0% 0
Sainsbury's, Farnham Road, Slough
0.8% 13 0.0% 0 0.0% 0 0.0% 0 0.0% 0 0.0% 0 0.0% 0 6.0% 13 0.0% 0 0.0% 0 0.0% 0 0.0% 0
Sainsbury's, Uxbridge Road, Slough
0.4% 6 0.0% 0 0.0% 0 0.0% 0 0.0% 0 0.0% 0 0.0% 0 2.7% 6 0.0% 0 0.0% 0 0.0% 0 0.0% 0
Sainsbury's, The Causeway, Staines
0.1% 2 0.0% 0 0.0% 0 0.0% 0 0.0% 0 0.0% 0 0.0% 0 0.0% 0 2.6% 2 0.0% 0 0.0% 0 0.0% 0
Sainsbury's, Paddington Drive, Bridgemead, Swindon
0.0% 0 0.0% 0 0.0% 0 0.0% 0 0.0% 0 0.0% 0 0.0% 0 0.0% 0 0.0% 0 0.0% 0 0.0% 0 0.0% 0
Sainsbury's, Mulfords Hill, Tadley
0.7% 12 0.0% 0 0.0% 0 0.7% 0 0.0% 0 0.0% 0 0.0% 0 0.0% 0 0.0% 0 0.0% 0 0.0% 0 0.0% 0
Sainsbury's, Lake End Road, Taplow
1.3% 21 0.0% 0 0.0% 0 0.0% 0 0.0% 0 0.0% 0 1.1% 1 8.8% 19 0.0% 0 0.0% 0 0.0% 0 0.0% 0
Sainsbury's, Limborough 0.1% 2 0.0% 0 0.0% 0 0.0% 0 0.0% 0 0.0% 0 0.0% 0 0.0% 0 0.0% 0 0.0% 0 0.0% 0 0.0% 0
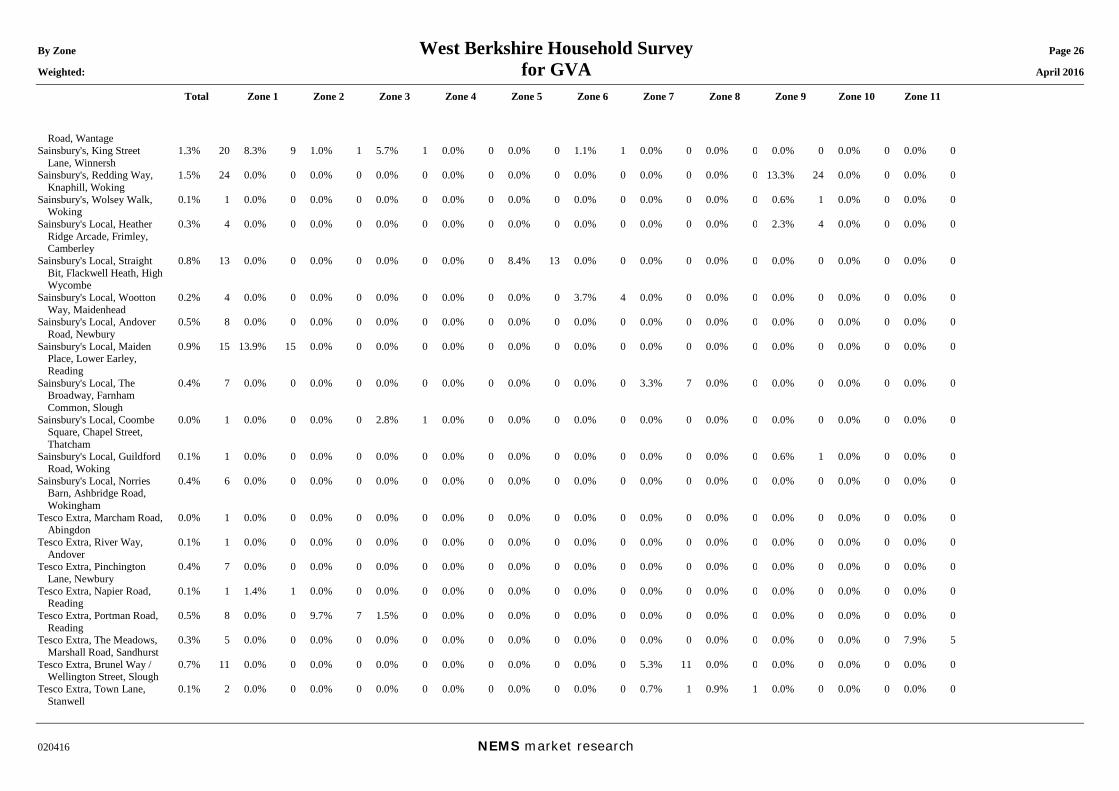
By Zone West Berkshire Household Survey Page 26 Weighted: for GVA April 2016
Total Zone 1 Zone 2 Zone 3 Zone 4 Zone 5 Zone 6 Zone 7 Zone 8 Zone 9 Zone 10 Zone 11
020416 NEMS market research
Road, Wantage Sainsbury's, King Street
Lane, Winnersh 1.3% 20 8.3% 9 1.0% 1 5.7% 1 0.0% 0 0.0% 0 1.1% 1 0.0% 0 0.0% 0 0.0% 0 0.0% 0 0.0% 0
Sainsbury's, Redding Way, Knaphill, Woking
1.5% 24 0.0% 0 0.0% 0 0.0% 0 0.0% 0 0.0% 0 0.0% 0 0.0% 0 0.0% 0 13.3% 24 0.0% 0 0.0% 0
Sainsbury's, Wolsey Walk, Woking
0.1% 1 0.0% 0 0.0% 0 0.0% 0 0.0% 0 0.0% 0 0.0% 0 0.0% 0 0.0% 0 0.6% 1 0.0% 0 0.0% 0
Sainsbury's Local, Heather Ridge Arcade, Frimley, Camberley
0.3% 4 0.0% 0 0.0% 0 0.0% 0 0.0% 0 0.0% 0 0.0% 0 0.0% 0 0.0% 0 2.3% 4 0.0% 0 0.0% 0
Sainsbury's Local, Straight Bit, Flackwell Heath, High Wycombe
0.8% 13 0.0% 0 0.0% 0 0.0% 0 0.0% 0 8.4% 13 0.0% 0 0.0% 0 0.0% 0 0.0% 0 0.0% 0 0.0% 0
Sainsbury's Local, Wootton Way, Maidenhead
0.2% 4 0.0% 0 0.0% 0 0.0% 0 0.0% 0 0.0% 0 3.7% 4 0.0% 0 0.0% 0 0.0% 0 0.0% 0 0.0% 0
Sainsbury's Local, Andover Road, Newbury
0.5% 8 0.0% 0 0.0% 0 0.0% 0 0.0% 0 0.0% 0 0.0% 0 0.0% 0 0.0% 0 0.0% 0 0.0% 0 0.0% 0
Sainsbury's Local, Maiden Place, Lower Earley, Reading
0.9% 15 13.9% 15 0.0% 0 0.0% 0 0.0% 0 0.0% 0 0.0% 0 0.0% 0 0.0% 0 0.0% 0 0.0% 0 0.0% 0
Sainsbury's Local, The Broadway, Farnham Common, Slough
0.4% 7 0.0% 0 0.0% 0 0.0% 0 0.0% 0 0.0% 0 0.0% 0 3.3% 7 0.0% 0 0.0% 0 0.0% 0 0.0% 0
Sainsbury's Local, Coombe Square, Chapel Street, Thatcham
0.0% 1 0.0% 0 0.0% 0 2.8% 1 0.0% 0 0.0% 0 0.0% 0 0.0% 0 0.0% 0 0.0% 0 0.0% 0 0.0% 0
Sainsbury's Local, Guildford Road, Woking
0.1% 1 0.0% 0 0.0% 0 0.0% 0 0.0% 0 0.0% 0 0.0% 0 0.0% 0 0.0% 0 0.6% 1 0.0% 0 0.0% 0
Sainsbury's Local, Norries Barn, Ashbridge Road, Wokingham
0.4% 6 0.0% 0 0.0% 0 0.0% 0 0.0% 0 0.0% 0 0.0% 0 0.0% 0 0.0% 0 0.0% 0 0.0% 0 0.0% 0
Tesco Extra, Marcham Road, Abingdon
0.0% 1 0.0% 0 0.0% 0 0.0% 0 0.0% 0 0.0% 0 0.0% 0 0.0% 0 0.0% 0 0.0% 0 0.0% 0 0.0% 0
Tesco Extra, River Way, Andover
0.1% 1 0.0% 0 0.0% 0 0.0% 0 0.0% 0 0.0% 0 0.0% 0 0.0% 0 0.0% 0 0.0% 0 0.0% 0 0.0% 0
Tesco Extra, Pinchington Lane, Newbury
0.4% 7 0.0% 0 0.0% 0 0.0% 0 0.0% 0 0.0% 0 0.0% 0 0.0% 0 0.0% 0 0.0% 0 0.0% 0 0.0% 0
Tesco Extra, Napier Road, Reading
0.1% 1 1.4% 1 0.0% 0 0.0% 0 0.0% 0 0.0% 0 0.0% 0 0.0% 0 0.0% 0 0.0% 0 0.0% 0 0.0% 0
Tesco Extra, Portman Road, Reading
0.5% 8 0.0% 0 9.7% 7 1.5% 0 0.0% 0 0.0% 0 0.0% 0 0.0% 0 0.0% 0 0.0% 0 0.0% 0 0.0% 0
Tesco Extra, The Meadows, Marshall Road, Sandhurst
0.3% 5 0.0% 0 0.0% 0 0.0% 0 0.0% 0 0.0% 0 0.0% 0 0.0% 0 0.0% 0 0.0% 0 0.0% 0 7.9% 5
Tesco Extra, Brunel Way / Wellington Street, Slough
0.7% 11 0.0% 0 0.0% 0 0.0% 0 0.0% 0 0.0% 0 0.0% 0 5.3% 11 0.0% 0 0.0% 0 0.0% 0 0.0% 0
Tesco Extra, Town Lane, Stanwell
0.1% 2 0.0% 0 0.0% 0 0.0% 0 0.0% 0 0.0% 0 0.0% 0 0.7% 1 0.9% 1 0.0% 0 0.0% 0 0.0% 0
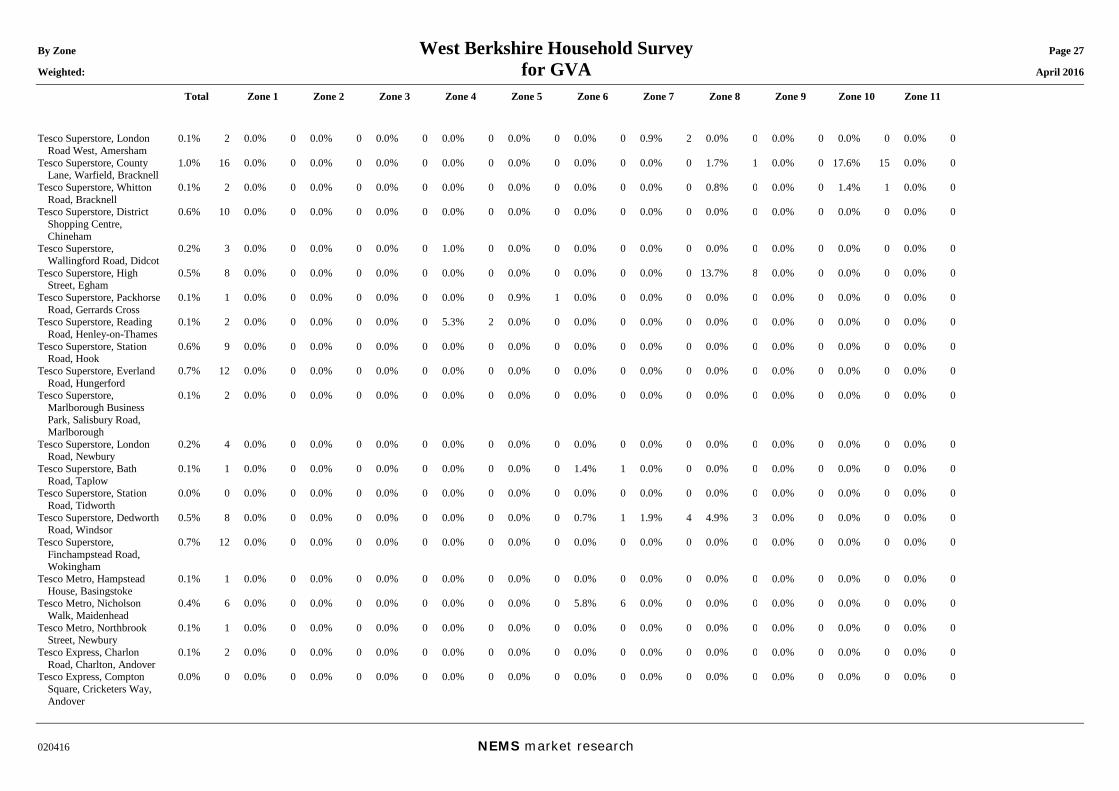
By Zone West Berkshire Household Survey Page 27 Weighted: for GVA April 2016
Total Zone 1 Zone 2 Zone 3 Zone 4 Zone 5 Zone 6 Zone 7 Zone 8 Zone 9 Zone 10 Zone 11
020416 NEMS market research
Tesco Superstore, London Road West, Amersham
0.1% 2 0.0% 0 0.0% 0 0.0% 0 0.0% 0 0.0% 0 0.0% 0 0.9% 2 0.0% 0 0.0% 0 0.0% 0 0.0% 0
Tesco Superstore, County Lane, Warfield, Bracknell
1.0% 16 0.0% 0 0.0% 0 0.0% 0 0.0% 0 0.0% 0 0.0% 0 0.0% 0 1.7% 1 0.0% 0 17.6% 15 0.0% 0
Tesco Superstore, Whitton Road, Bracknell
0.1% 2 0.0% 0 0.0% 0 0.0% 0 0.0% 0 0.0% 0 0.0% 0 0.0% 0 0.8% 0 0.0% 0 1.4% 1 0.0% 0
Tesco Superstore, District Shopping Centre, Chineham
0.6% 10 0.0% 0 0.0% 0 0.0% 0 0.0% 0 0.0% 0 0.0% 0 0.0% 0 0.0% 0 0.0% 0 0.0% 0 0.0% 0
Tesco Superstore, Wallingford Road, Didcot
0.2% 3 0.0% 0 0.0% 0 0.0% 0 1.0% 0 0.0% 0 0.0% 0 0.0% 0 0.0% 0 0.0% 0 0.0% 0 0.0% 0
Tesco Superstore, High Street, Egham
0.5% 8 0.0% 0 0.0% 0 0.0% 0 0.0% 0 0.0% 0 0.0% 0 0.0% 0 13.7% 8 0.0% 0 0.0% 0 0.0% 0
Tesco Superstore, Packhorse Road, Gerrards Cross
0.1% 1 0.0% 0 0.0% 0 0.0% 0 0.0% 0 0.9% 1 0.0% 0 0.0% 0 0.0% 0 0.0% 0 0.0% 0 0.0% 0
Tesco Superstore, Reading Road, Henley-on-Thames
0.1% 2 0.0% 0 0.0% 0 0.0% 0 5.3% 2 0.0% 0 0.0% 0 0.0% 0 0.0% 0 0.0% 0 0.0% 0 0.0% 0
Tesco Superstore, Station Road, Hook
0.6% 9 0.0% 0 0.0% 0 0.0% 0 0.0% 0 0.0% 0 0.0% 0 0.0% 0 0.0% 0 0.0% 0 0.0% 0 0.0% 0
Tesco Superstore, Everland Road, Hungerford
0.7% 12 0.0% 0 0.0% 0 0.0% 0 0.0% 0 0.0% 0 0.0% 0 0.0% 0 0.0% 0 0.0% 0 0.0% 0 0.0% 0
Tesco Superstore, Marlborough Business Park, Salisbury Road, Marlborough
0.1% 2 0.0% 0 0.0% 0 0.0% 0 0.0% 0 0.0% 0 0.0% 0 0.0% 0 0.0% 0 0.0% 0 0.0% 0 0.0% 0
Tesco Superstore, London Road, Newbury
0.2% 4 0.0% 0 0.0% 0 0.0% 0 0.0% 0 0.0% 0 0.0% 0 0.0% 0 0.0% 0 0.0% 0 0.0% 0 0.0% 0
Tesco Superstore, Bath Road, Taplow
0.1% 1 0.0% 0 0.0% 0 0.0% 0 0.0% 0 0.0% 0 1.4% 1 0.0% 0 0.0% 0 0.0% 0 0.0% 0 0.0% 0
Tesco Superstore, Station Road, Tidworth
0.0% 0 0.0% 0 0.0% 0 0.0% 0 0.0% 0 0.0% 0 0.0% 0 0.0% 0 0.0% 0 0.0% 0 0.0% 0 0.0% 0
Tesco Superstore, Dedworth Road, Windsor
0.5% 8 0.0% 0 0.0% 0 0.0% 0 0.0% 0 0.0% 0 0.7% 1 1.9% 4 4.9% 3 0.0% 0 0.0% 0 0.0% 0
Tesco Superstore, Finchampstead Road, Wokingham
0.7% 12 0.0% 0 0.0% 0 0.0% 0 0.0% 0 0.0% 0 0.0% 0 0.0% 0 0.0% 0 0.0% 0 0.0% 0 0.0% 0
Tesco Metro, Hampstead House, Basingstoke
0.1% 1 0.0% 0 0.0% 0 0.0% 0 0.0% 0 0.0% 0 0.0% 0 0.0% 0 0.0% 0 0.0% 0 0.0% 0 0.0% 0
Tesco Metro, Nicholson Walk, Maidenhead
0.4% 6 0.0% 0 0.0% 0 0.0% 0 0.0% 0 0.0% 0 5.8% 6 0.0% 0 0.0% 0 0.0% 0 0.0% 0 0.0% 0
Tesco Metro, Northbrook Street, Newbury
0.1% 1 0.0% 0 0.0% 0 0.0% 0 0.0% 0 0.0% 0 0.0% 0 0.0% 0 0.0% 0 0.0% 0 0.0% 0 0.0% 0
Tesco Express, Charlon Road, Charlton, Andover
0.1% 2 0.0% 0 0.0% 0 0.0% 0 0.0% 0 0.0% 0 0.0% 0 0.0% 0 0.0% 0 0.0% 0 0.0% 0 0.0% 0
Tesco Express, Compton Square, Cricketers Way, Andover
0.0% 0 0.0% 0 0.0% 0 0.0% 0 0.0% 0 0.0% 0 0.0% 0 0.0% 0 0.0% 0 0.0% 0 0.0% 0 0.0% 0
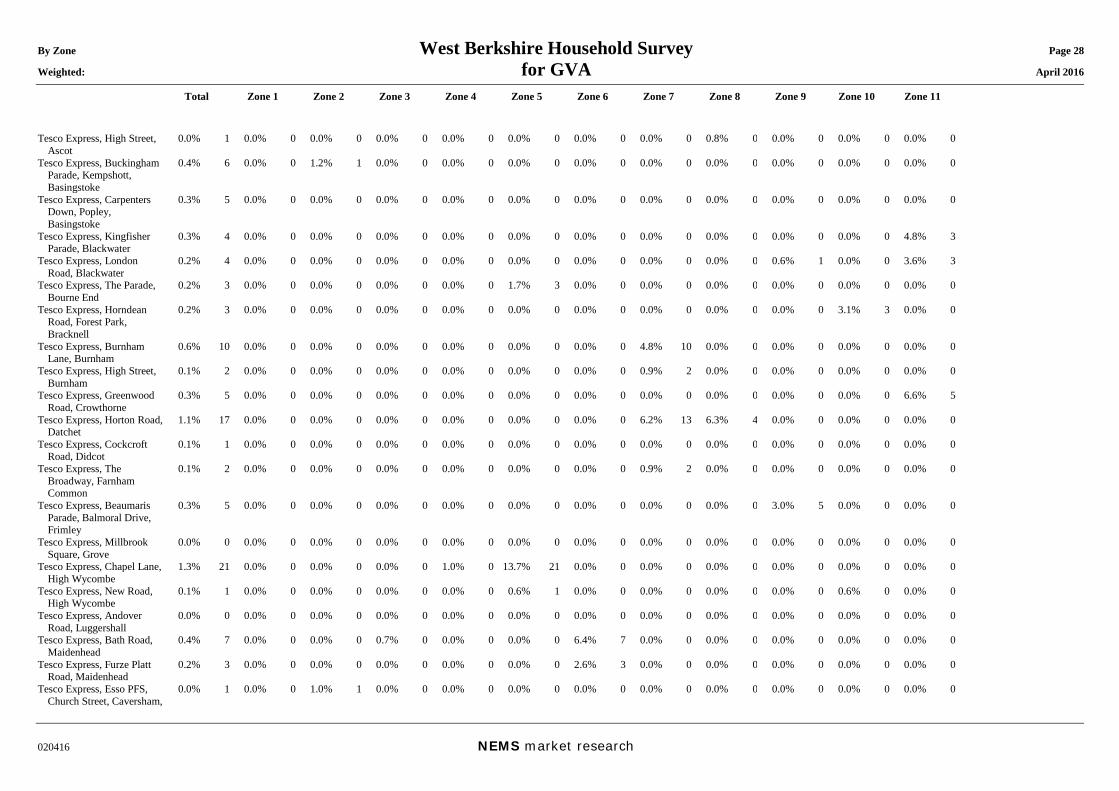
By Zone West Berkshire Household Survey Page 28 Weighted: for GVA April 2016
Total Zone 1 Zone 2 Zone 3 Zone 4 Zone 5 Zone 6 Zone 7 Zone 8 Zone 9 Zone 10 Zone 11
020416 NEMS market research
Tesco Express, High Street, Ascot
0.0% 1 0.0% 0 0.0% 0 0.0% 0 0.0% 0 0.0% 0 0.0% 0 0.0% 0 0.8% 0 0.0% 0 0.0% 0 0.0% 0
Tesco Express, Buckingham Parade, Kempshott, Basingstoke
0.4% 6 0.0% 0 1.2% 1 0.0% 0 0.0% 0 0.0% 0 0.0% 0 0.0% 0 0.0% 0 0.0% 0 0.0% 0 0.0% 0
Tesco Express, Carpenters Down, Popley, Basingstoke
0.3% 5 0.0% 0 0.0% 0 0.0% 0 0.0% 0 0.0% 0 0.0% 0 0.0% 0 0.0% 0 0.0% 0 0.0% 0 0.0% 0
Tesco Express, Kingfisher Parade, Blackwater
0.3% 4 0.0% 0 0.0% 0 0.0% 0 0.0% 0 0.0% 0 0.0% 0 0.0% 0 0.0% 0 0.0% 0 0.0% 0 4.8% 3
Tesco Express, London Road, Blackwater
0.2% 4 0.0% 0 0.0% 0 0.0% 0 0.0% 0 0.0% 0 0.0% 0 0.0% 0 0.0% 0 0.6% 1 0.0% 0 3.6% 3
Tesco Express, The Parade, Bourne End
0.2% 3 0.0% 0 0.0% 0 0.0% 0 0.0% 0 1.7% 3 0.0% 0 0.0% 0 0.0% 0 0.0% 0 0.0% 0 0.0% 0
Tesco Express, Horndean Road, Forest Park, Bracknell
0.2% 3 0.0% 0 0.0% 0 0.0% 0 0.0% 0 0.0% 0 0.0% 0 0.0% 0 0.0% 0 0.0% 0 3.1% 3 0.0% 0
Tesco Express, Burnham Lane, Burnham
0.6% 10 0.0% 0 0.0% 0 0.0% 0 0.0% 0 0.0% 0 0.0% 0 4.8% 10 0.0% 0 0.0% 0 0.0% 0 0.0% 0
Tesco Express, High Street, Burnham
0.1% 2 0.0% 0 0.0% 0 0.0% 0 0.0% 0 0.0% 0 0.0% 0 0.9% 2 0.0% 0 0.0% 0 0.0% 0 0.0% 0
Tesco Express, Greenwood Road, Crowthorne
0.3% 5 0.0% 0 0.0% 0 0.0% 0 0.0% 0 0.0% 0 0.0% 0 0.0% 0 0.0% 0 0.0% 0 0.0% 0 6.6% 5
Tesco Express, Horton Road, Datchet
1.1% 17 0.0% 0 0.0% 0 0.0% 0 0.0% 0 0.0% 0 0.0% 0 6.2% 13 6.3% 4 0.0% 0 0.0% 0 0.0% 0
Tesco Express, Cockcroft Road, Didcot
0.1% 1 0.0% 0 0.0% 0 0.0% 0 0.0% 0 0.0% 0 0.0% 0 0.0% 0 0.0% 0 0.0% 0 0.0% 0 0.0% 0
Tesco Express, The Broadway, Farnham Common
0.1% 2 0.0% 0 0.0% 0 0.0% 0 0.0% 0 0.0% 0 0.0% 0 0.9% 2 0.0% 0 0.0% 0 0.0% 0 0.0% 0
Tesco Express, Beaumaris Parade, Balmoral Drive, Frimley
0.3% 5 0.0% 0 0.0% 0 0.0% 0 0.0% 0 0.0% 0 0.0% 0 0.0% 0 0.0% 0 3.0% 5 0.0% 0 0.0% 0
Tesco Express, Millbrook Square, Grove
0.0% 0 0.0% 0 0.0% 0 0.0% 0 0.0% 0 0.0% 0 0.0% 0 0.0% 0 0.0% 0 0.0% 0 0.0% 0 0.0% 0
Tesco Express, Chapel Lane, High Wycombe
1.3% 21 0.0% 0 0.0% 0 0.0% 0 1.0% 0 13.7% 21 0.0% 0 0.0% 0 0.0% 0 0.0% 0 0.0% 0 0.0% 0
Tesco Express, New Road, High Wycombe
0.1% 1 0.0% 0 0.0% 0 0.0% 0 0.0% 0 0.6% 1 0.0% 0 0.0% 0 0.0% 0 0.0% 0 0.6% 0 0.0% 0
Tesco Express, Andover Road, Luggershall
0.0% 0 0.0% 0 0.0% 0 0.0% 0 0.0% 0 0.0% 0 0.0% 0 0.0% 0 0.0% 0 0.0% 0 0.0% 0 0.0% 0
Tesco Express, Bath Road, Maidenhead
0.4% 7 0.0% 0 0.0% 0 0.7% 0 0.0% 0 0.0% 0 6.4% 7 0.0% 0 0.0% 0 0.0% 0 0.0% 0 0.0% 0
Tesco Express, Furze Platt Road, Maidenhead
0.2% 3 0.0% 0 0.0% 0 0.0% 0 0.0% 0 0.0% 0 2.6% 3 0.0% 0 0.0% 0 0.0% 0 0.0% 0 0.0% 0
Tesco Express, Esso PFS, Church Street, Caversham,
0.0% 1 0.0% 0 1.0% 1 0.0% 0 0.0% 0 0.0% 0 0.0% 0 0.0% 0 0.0% 0 0.0% 0 0.0% 0 0.0% 0
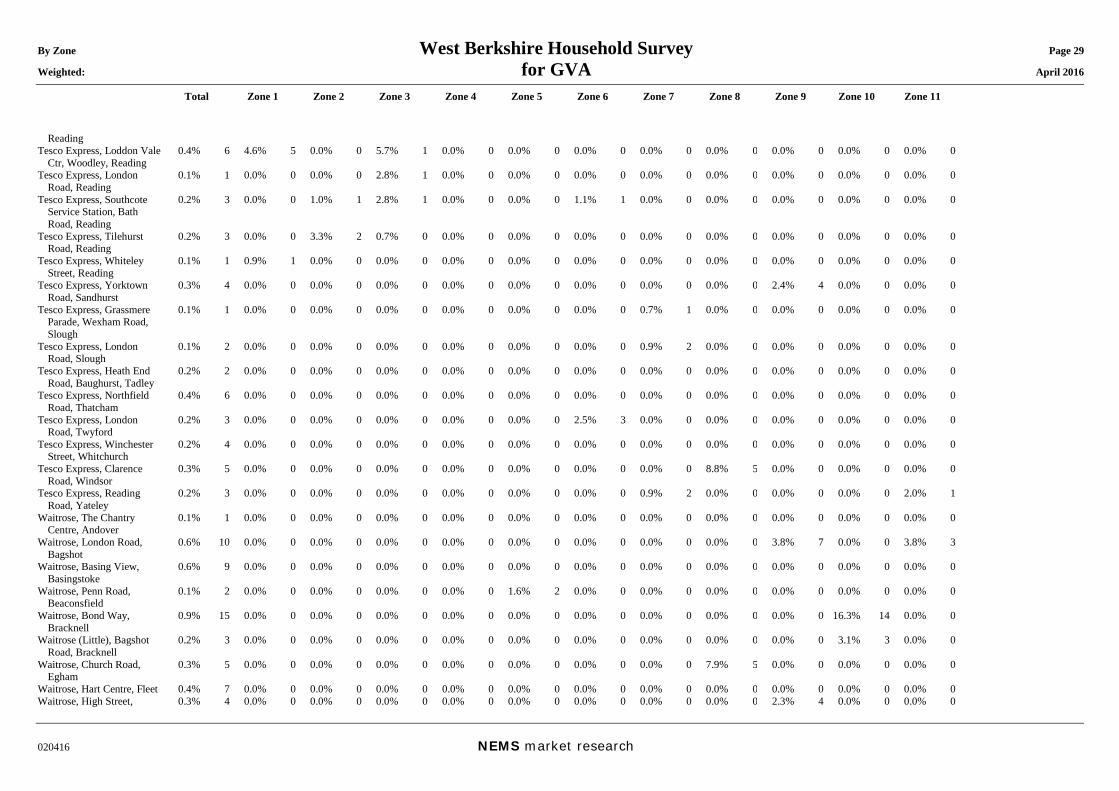
By Zone West Berkshire Household Survey Page 29 Weighted: for GVA April 2016
Total Zone 1 Zone 2 Zone 3 Zone 4 Zone 5 Zone 6 Zone 7 Zone 8 Zone 9 Zone 10 Zone 11
020416 NEMS market research
Reading Tesco Express, Loddon Vale
Ctr, Woodley, Reading 0.4% 6 4.6% 5 0.0% 0 5.7% 1 0.0% 0 0.0% 0 0.0% 0 0.0% 0 0.0% 0 0.0% 0 0.0% 0 0.0% 0
Tesco Express, London Road, Reading
0.1% 1 0.0% 0 0.0% 0 2.8% 1 0.0% 0 0.0% 0 0.0% 0 0.0% 0 0.0% 0 0.0% 0 0.0% 0 0.0% 0
Tesco Express, Southcote Service Station, Bath Road, Reading
0.2% 3 0.0% 0 1.0% 1 2.8% 1 0.0% 0 0.0% 0 1.1% 1 0.0% 0 0.0% 0 0.0% 0 0.0% 0 0.0% 0
Tesco Express, Tilehurst Road, Reading
0.2% 3 0.0% 0 3.3% 2 0.7% 0 0.0% 0 0.0% 0 0.0% 0 0.0% 0 0.0% 0 0.0% 0 0.0% 0 0.0% 0
Tesco Express, Whiteley Street, Reading
0.1% 1 0.9% 1 0.0% 0 0.0% 0 0.0% 0 0.0% 0 0.0% 0 0.0% 0 0.0% 0 0.0% 0 0.0% 0 0.0% 0
Tesco Express, Yorktown Road, Sandhurst
0.3% 4 0.0% 0 0.0% 0 0.0% 0 0.0% 0 0.0% 0 0.0% 0 0.0% 0 0.0% 0 2.4% 4 0.0% 0 0.0% 0
Tesco Express, Grassmere Parade, Wexham Road, Slough
0.1% 1 0.0% 0 0.0% 0 0.0% 0 0.0% 0 0.0% 0 0.0% 0 0.7% 1 0.0% 0 0.0% 0 0.0% 0 0.0% 0
Tesco Express, London Road, Slough
0.1% 2 0.0% 0 0.0% 0 0.0% 0 0.0% 0 0.0% 0 0.0% 0 0.9% 2 0.0% 0 0.0% 0 0.0% 0 0.0% 0
Tesco Express, Heath End Road, Baughurst, Tadley
0.2% 2 0.0% 0 0.0% 0 0.0% 0 0.0% 0 0.0% 0 0.0% 0 0.0% 0 0.0% 0 0.0% 0 0.0% 0 0.0% 0
Tesco Express, Northfield Road, Thatcham
0.4% 6 0.0% 0 0.0% 0 0.0% 0 0.0% 0 0.0% 0 0.0% 0 0.0% 0 0.0% 0 0.0% 0 0.0% 0 0.0% 0
Tesco Express, London Road, Twyford
0.2% 3 0.0% 0 0.0% 0 0.0% 0 0.0% 0 0.0% 0 2.5% 3 0.0% 0 0.0% 0 0.0% 0 0.0% 0 0.0% 0
Tesco Express, Winchester Street, Whitchurch
0.2% 4 0.0% 0 0.0% 0 0.0% 0 0.0% 0 0.0% 0 0.0% 0 0.0% 0 0.0% 0 0.0% 0 0.0% 0 0.0% 0
Tesco Express, Clarence Road, Windsor
0.3% 5 0.0% 0 0.0% 0 0.0% 0 0.0% 0 0.0% 0 0.0% 0 0.0% 0 8.8% 5 0.0% 0 0.0% 0 0.0% 0
Tesco Express, Reading Road, Yateley
0.2% 3 0.0% 0 0.0% 0 0.0% 0 0.0% 0 0.0% 0 0.0% 0 0.9% 2 0.0% 0 0.0% 0 0.0% 0 2.0% 1
Waitrose, The Chantry Centre, Andover
0.1% 1 0.0% 0 0.0% 0 0.0% 0 0.0% 0 0.0% 0 0.0% 0 0.0% 0 0.0% 0 0.0% 0 0.0% 0 0.0% 0
Waitrose, London Road, Bagshot
0.6% 10 0.0% 0 0.0% 0 0.0% 0 0.0% 0 0.0% 0 0.0% 0 0.0% 0 0.0% 0 3.8% 7 0.0% 0 3.8% 3
Waitrose, Basing View, Basingstoke
0.6% 9 0.0% 0 0.0% 0 0.0% 0 0.0% 0 0.0% 0 0.0% 0 0.0% 0 0.0% 0 0.0% 0 0.0% 0 0.0% 0
Waitrose, Penn Road, Beaconsfield
0.1% 2 0.0% 0 0.0% 0 0.0% 0 0.0% 0 1.6% 2 0.0% 0 0.0% 0 0.0% 0 0.0% 0 0.0% 0 0.0% 0
Waitrose, Bond Way, Bracknell
0.9% 15 0.0% 0 0.0% 0 0.0% 0 0.0% 0 0.0% 0 0.0% 0 0.0% 0 0.0% 0 0.0% 0 16.3% 14 0.0% 0
Waitrose (Little), Bagshot Road, Bracknell
0.2% 3 0.0% 0 0.0% 0 0.0% 0 0.0% 0 0.0% 0 0.0% 0 0.0% 0 0.0% 0 0.0% 0 3.1% 3 0.0% 0
Waitrose, Church Road, Egham
0.3% 5 0.0% 0 0.0% 0 0.0% 0 0.0% 0 0.0% 0 0.0% 0 0.0% 0 7.9% 5 0.0% 0 0.0% 0 0.0% 0
Waitrose, Hart Centre, Fleet 0.4% 7 0.0% 0 0.0% 0 0.0% 0 0.0% 0 0.0% 0 0.0% 0 0.0% 0 0.0% 0 0.0% 0 0.0% 0 0.0% 0 Waitrose, High Street, 0.3% 4 0.0% 0 0.0% 0 0.0% 0 0.0% 0 0.0% 0 0.0% 0 0.0% 0 0.0% 0 2.3% 4 0.0% 0 0.0% 0
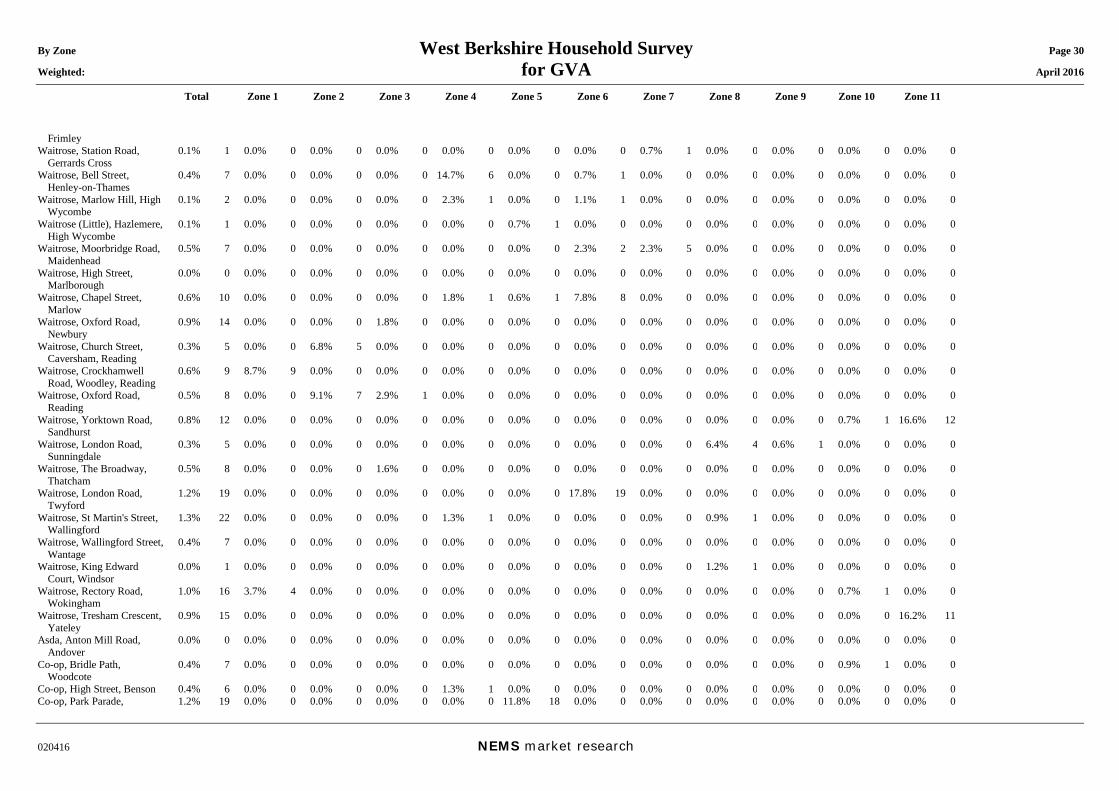
By Zone West Berkshire Household Survey Page 30 Weighted: for GVA April 2016
Total Zone 1 Zone 2 Zone 3 Zone 4 Zone 5 Zone 6 Zone 7 Zone 8 Zone 9 Zone 10 Zone 11
020416 NEMS market research
Frimley Waitrose, Station Road,
Gerrards Cross 0.1% 1 0.0% 0 0.0% 0 0.0% 0 0.0% 0 0.0% 0 0.0% 0 0.7% 1 0.0% 0 0.0% 0 0.0% 0 0.0% 0
Waitrose, Bell Street, Henley-on-Thames
0.4% 7 0.0% 0 0.0% 0 0.0% 0 14.7% 6 0.0% 0 0.7% 1 0.0% 0 0.0% 0 0.0% 0 0.0% 0 0.0% 0
Waitrose, Marlow Hill, High Wycombe
0.1% 2 0.0% 0 0.0% 0 0.0% 0 2.3% 1 0.0% 0 1.1% 1 0.0% 0 0.0% 0 0.0% 0 0.0% 0 0.0% 0
Waitrose (Little), Hazlemere, High Wycombe
0.1% 1 0.0% 0 0.0% 0 0.0% 0 0.0% 0 0.7% 1 0.0% 0 0.0% 0 0.0% 0 0.0% 0 0.0% 0 0.0% 0
Waitrose, Moorbridge Road, Maidenhead
0.5% 7 0.0% 0 0.0% 0 0.0% 0 0.0% 0 0.0% 0 2.3% 2 2.3% 5 0.0% 0 0.0% 0 0.0% 0 0.0% 0
Waitrose, High Street, Marlborough
0.0% 0 0.0% 0 0.0% 0 0.0% 0 0.0% 0 0.0% 0 0.0% 0 0.0% 0 0.0% 0 0.0% 0 0.0% 0 0.0% 0
Waitrose, Chapel Street, Marlow
0.6% 10 0.0% 0 0.0% 0 0.0% 0 1.8% 1 0.6% 1 7.8% 8 0.0% 0 0.0% 0 0.0% 0 0.0% 0 0.0% 0
Waitrose, Oxford Road, Newbury
0.9% 14 0.0% 0 0.0% 0 1.8% 0 0.0% 0 0.0% 0 0.0% 0 0.0% 0 0.0% 0 0.0% 0 0.0% 0 0.0% 0
Waitrose, Church Street, Caversham, Reading
0.3% 5 0.0% 0 6.8% 5 0.0% 0 0.0% 0 0.0% 0 0.0% 0 0.0% 0 0.0% 0 0.0% 0 0.0% 0 0.0% 0
Waitrose, Crockhamwell Road, Woodley, Reading
0.6% 9 8.7% 9 0.0% 0 0.0% 0 0.0% 0 0.0% 0 0.0% 0 0.0% 0 0.0% 0 0.0% 0 0.0% 0 0.0% 0
Waitrose, Oxford Road, Reading
0.5% 8 0.0% 0 9.1% 7 2.9% 1 0.0% 0 0.0% 0 0.0% 0 0.0% 0 0.0% 0 0.0% 0 0.0% 0 0.0% 0
Waitrose, Yorktown Road, Sandhurst
0.8% 12 0.0% 0 0.0% 0 0.0% 0 0.0% 0 0.0% 0 0.0% 0 0.0% 0 0.0% 0 0.0% 0 0.7% 1 16.6% 12
Waitrose, London Road, Sunningdale
0.3% 5 0.0% 0 0.0% 0 0.0% 0 0.0% 0 0.0% 0 0.0% 0 0.0% 0 6.4% 4 0.6% 1 0.0% 0 0.0% 0
Waitrose, The Broadway, Thatcham
0.5% 8 0.0% 0 0.0% 0 1.6% 0 0.0% 0 0.0% 0 0.0% 0 0.0% 0 0.0% 0 0.0% 0 0.0% 0 0.0% 0
Waitrose, London Road, Twyford
1.2% 19 0.0% 0 0.0% 0 0.0% 0 0.0% 0 0.0% 0 17.8% 19 0.0% 0 0.0% 0 0.0% 0 0.0% 0 0.0% 0
Waitrose, St Martin's Street, Wallingford
1.3% 22 0.0% 0 0.0% 0 0.0% 0 1.3% 1 0.0% 0 0.0% 0 0.0% 0 0.9% 1 0.0% 0 0.0% 0 0.0% 0
Waitrose, Wallingford Street, Wantage
0.4% 7 0.0% 0 0.0% 0 0.0% 0 0.0% 0 0.0% 0 0.0% 0 0.0% 0 0.0% 0 0.0% 0 0.0% 0 0.0% 0
Waitrose, King Edward Court, Windsor
0.0% 1 0.0% 0 0.0% 0 0.0% 0 0.0% 0 0.0% 0 0.0% 0 0.0% 0 1.2% 1 0.0% 0 0.0% 0 0.0% 0
Waitrose, Rectory Road, Wokingham
1.0% 16 3.7% 4 0.0% 0 0.0% 0 0.0% 0 0.0% 0 0.0% 0 0.0% 0 0.0% 0 0.0% 0 0.7% 1 0.0% 0
Waitrose, Tresham Crescent, Yateley
0.9% 15 0.0% 0 0.0% 0 0.0% 0 0.0% 0 0.0% 0 0.0% 0 0.0% 0 0.0% 0 0.0% 0 0.0% 0 16.2% 11
Asda, Anton Mill Road, Andover
0.0% 0 0.0% 0 0.0% 0 0.0% 0 0.0% 0 0.0% 0 0.0% 0 0.0% 0 0.0% 0 0.0% 0 0.0% 0 0.0% 0
Co-op, Bridle Path, Woodcote
0.4% 7 0.0% 0 0.0% 0 0.0% 0 0.0% 0 0.0% 0 0.0% 0 0.0% 0 0.0% 0 0.0% 0 0.9% 1 0.0% 0
Co-op, High Street, Benson 0.4% 6 0.0% 0 0.0% 0 0.0% 0 1.3% 1 0.0% 0 0.0% 0 0.0% 0 0.0% 0 0.0% 0 0.0% 0 0.0% 0 Co-op, Park Parade, 1.2% 19 0.0% 0 0.0% 0 0.0% 0 0.0% 0 11.8% 18 0.0% 0 0.0% 0 0.0% 0 0.0% 0 0.0% 0 0.0% 0
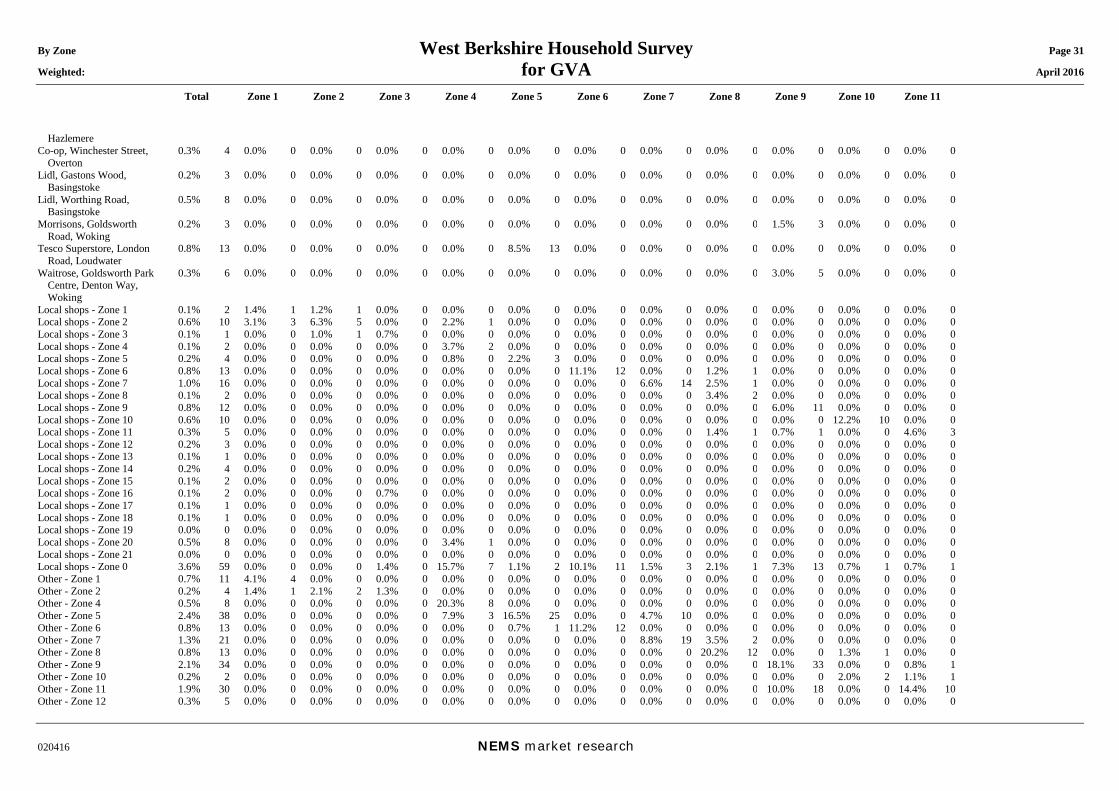
By Zone West Berkshire Household Survey Page 31 Weighted: for GVA April 2016
Total Zone 1 Zone 2 Zone 3 Zone 4 Zone 5 Zone 6 Zone 7 Zone 8 Zone 9 Zone 10 Zone 11
020416 NEMS market research
Hazlemere Co-op, Winchester Street,
Overton 0.3% 4 0.0% 0 0.0% 0 0.0% 0 0.0% 0 0.0% 0 0.0% 0 0.0% 0 0.0% 0 0.0% 0 0.0% 0 0.0% 0
Lidl, Gastons Wood, Basingstoke
0.2% 3 0.0% 0 0.0% 0 0.0% 0 0.0% 0 0.0% 0 0.0% 0 0.0% 0 0.0% 0 0.0% 0 0.0% 0 0.0% 0
Lidl, Worthing Road, Basingstoke
0.5% 8 0.0% 0 0.0% 0 0.0% 0 0.0% 0 0.0% 0 0.0% 0 0.0% 0 0.0% 0 0.0% 0 0.0% 0 0.0% 0
Morrisons, Goldsworth Road, Woking
0.2% 3 0.0% 0 0.0% 0 0.0% 0 0.0% 0 0.0% 0 0.0% 0 0.0% 0 0.0% 0 1.5% 3 0.0% 0 0.0% 0
Tesco Superstore, London Road, Loudwater
0.8% 13 0.0% 0 0.0% 0 0.0% 0 0.0% 0 8.5% 13 0.0% 0 0.0% 0 0.0% 0 0.0% 0 0.0% 0 0.0% 0
Waitrose, Goldsworth Park Centre, Denton Way, Woking
0.3% 6 0.0% 0 0.0% 0 0.0% 0 0.0% 0 0.0% 0 0.0% 0 0.0% 0 0.0% 0 3.0% 5 0.0% 0 0.0% 0
Local shops - Zone 1 0.1% 2 1.4% 1 1.2% 1 0.0% 0 0.0% 0 0.0% 0 0.0% 0 0.0% 0 0.0% 0 0.0% 0 0.0% 0 0.0% 0 Local shops - Zone 2 0.6% 10 3.1% 3 6.3% 5 0.0% 0 2.2% 1 0.0% 0 0.0% 0 0.0% 0 0.0% 0 0.0% 0 0.0% 0 0.0% 0 Local shops - Zone 3 0.1% 1 0.0% 0 1.0% 1 0.7% 0 0.0% 0 0.0% 0 0.0% 0 0.0% 0 0.0% 0 0.0% 0 0.0% 0 0.0% 0 Local shops - Zone 4 0.1% 2 0.0% 0 0.0% 0 0.0% 0 3.7% 2 0.0% 0 0.0% 0 0.0% 0 0.0% 0 0.0% 0 0.0% 0 0.0% 0 Local shops - Zone 5 0.2% 4 0.0% 0 0.0% 0 0.0% 0 0.8% 0 2.2% 3 0.0% 0 0.0% 0 0.0% 0 0.0% 0 0.0% 0 0.0% 0 Local shops - Zone 6 0.8% 13 0.0% 0 0.0% 0 0.0% 0 0.0% 0 0.0% 0 11.1% 12 0.0% 0 1.2% 1 0.0% 0 0.0% 0 0.0% 0 Local shops - Zone 7 1.0% 16 0.0% 0 0.0% 0 0.0% 0 0.0% 0 0.0% 0 0.0% 0 6.6% 14 2.5% 1 0.0% 0 0.0% 0 0.0% 0 Local shops - Zone 8 0.1% 2 0.0% 0 0.0% 0 0.0% 0 0.0% 0 0.0% 0 0.0% 0 0.0% 0 3.4% 2 0.0% 0 0.0% 0 0.0% 0 Local shops - Zone 9 0.8% 12 0.0% 0 0.0% 0 0.0% 0 0.0% 0 0.0% 0 0.0% 0 0.0% 0 0.0% 0 6.0% 11 0.0% 0 0.0% 0 Local shops - Zone 10 0.6% 10 0.0% 0 0.0% 0 0.0% 0 0.0% 0 0.0% 0 0.0% 0 0.0% 0 0.0% 0 0.0% 0 12.2% 10 0.0% 0 Local shops - Zone 11 0.3% 5 0.0% 0 0.0% 0 0.0% 0 0.0% 0 0.0% 0 0.0% 0 0.0% 0 1.4% 1 0.7% 1 0.0% 0 4.6% 3 Local shops - Zone 12 0.2% 3 0.0% 0 0.0% 0 0.0% 0 0.0% 0 0.0% 0 0.0% 0 0.0% 0 0.0% 0 0.0% 0 0.0% 0 0.0% 0 Local shops - Zone 13 0.1% 1 0.0% 0 0.0% 0 0.0% 0 0.0% 0 0.0% 0 0.0% 0 0.0% 0 0.0% 0 0.0% 0 0.0% 0 0.0% 0 Local shops - Zone 14 0.2% 4 0.0% 0 0.0% 0 0.0% 0 0.0% 0 0.0% 0 0.0% 0 0.0% 0 0.0% 0 0.0% 0 0.0% 0 0.0% 0 Local shops - Zone 15 0.1% 2 0.0% 0 0.0% 0 0.0% 0 0.0% 0 0.0% 0 0.0% 0 0.0% 0 0.0% 0 0.0% 0 0.0% 0 0.0% 0 Local shops - Zone 16 0.1% 2 0.0% 0 0.0% 0 0.7% 0 0.0% 0 0.0% 0 0.0% 0 0.0% 0 0.0% 0 0.0% 0 0.0% 0 0.0% 0 Local shops - Zone 17 0.1% 1 0.0% 0 0.0% 0 0.0% 0 0.0% 0 0.0% 0 0.0% 0 0.0% 0 0.0% 0 0.0% 0 0.0% 0 0.0% 0 Local shops - Zone 18 0.1% 1 0.0% 0 0.0% 0 0.0% 0 0.0% 0 0.0% 0 0.0% 0 0.0% 0 0.0% 0 0.0% 0 0.0% 0 0.0% 0 Local shops - Zone 19 0.0% 0 0.0% 0 0.0% 0 0.0% 0 0.0% 0 0.0% 0 0.0% 0 0.0% 0 0.0% 0 0.0% 0 0.0% 0 0.0% 0 Local shops - Zone 20 0.5% 8 0.0% 0 0.0% 0 0.0% 0 3.4% 1 0.0% 0 0.0% 0 0.0% 0 0.0% 0 0.0% 0 0.0% 0 0.0% 0 Local shops - Zone 21 0.0% 0 0.0% 0 0.0% 0 0.0% 0 0.0% 0 0.0% 0 0.0% 0 0.0% 0 0.0% 0 0.0% 0 0.0% 0 0.0% 0 Local shops - Zone 0 3.6% 59 0.0% 0 0.0% 0 1.4% 0 15.7% 7 1.1% 2 10.1% 11 1.5% 3 2.1% 1 7.3% 13 0.7% 1 0.7% 1 Other - Zone 1 0.7% 11 4.1% 4 0.0% 0 0.0% 0 0.0% 0 0.0% 0 0.0% 0 0.0% 0 0.0% 0 0.0% 0 0.0% 0 0.0% 0 Other - Zone 2 0.2% 4 1.4% 1 2.1% 2 1.3% 0 0.0% 0 0.0% 0 0.0% 0 0.0% 0 0.0% 0 0.0% 0 0.0% 0 0.0% 0 Other - Zone 4 0.5% 8 0.0% 0 0.0% 0 0.0% 0 20.3% 8 0.0% 0 0.0% 0 0.0% 0 0.0% 0 0.0% 0 0.0% 0 0.0% 0 Other - Zone 5 2.4% 38 0.0% 0 0.0% 0 0.0% 0 7.9% 3 16.5% 25 0.0% 0 4.7% 10 0.0% 0 0.0% 0 0.0% 0 0.0% 0 Other - Zone 6 0.8% 13 0.0% 0 0.0% 0 0.0% 0 0.0% 0 0.7% 1 11.2% 12 0.0% 0 0.0% 0 0.0% 0 0.0% 0 0.0% 0 Other - Zone 7 1.3% 21 0.0% 0 0.0% 0 0.0% 0 0.0% 0 0.0% 0 0.0% 0 8.8% 19 3.5% 2 0.0% 0 0.0% 0 0.0% 0 Other - Zone 8 0.8% 13 0.0% 0 0.0% 0 0.0% 0 0.0% 0 0.0% 0 0.0% 0 0.0% 0 20.2% 12 0.0% 0 1.3% 1 0.0% 0 Other - Zone 9 2.1% 34 0.0% 0 0.0% 0 0.0% 0 0.0% 0 0.0% 0 0.0% 0 0.0% 0 0.0% 0 18.1% 33 0.0% 0 0.8% 1 Other - Zone 10 0.2% 2 0.0% 0 0.0% 0 0.0% 0 0.0% 0 0.0% 0 0.0% 0 0.0% 0 0.0% 0 0.0% 0 2.0% 2 1.1% 1 Other - Zone 11 1.9% 30 0.0% 0 0.0% 0 0.0% 0 0.0% 0 0.0% 0 0.0% 0 0.0% 0 0.0% 0 10.0% 18 0.0% 0 14.4% 10 Other - Zone 12 0.3% 5 0.0% 0 0.0% 0 0.0% 0 0.0% 0 0.0% 0 0.0% 0 0.0% 0 0.0% 0 0.0% 0 0.0% 0 0.0% 0

By Zone West Berkshire Household Survey Page 32 Weighted: for GVA April 2016
Total Zone 1 Zone 2 Zone 3 Zone 4 Zone 5 Zone 6 Zone 7 Zone 8 Zone 9 Zone 10 Zone 11
020416 NEMS market research
Other - Zone 13 0.4% 6 0.0% 0 0.0% 0 0.0% 0 0.0% 0 0.0% 0 0.0% 0 0.0% 0 0.0% 0 0.0% 0 0.0% 0 0.0% 0 Other - Zone 14 0.7% 11 0.0% 0 0.0% 0 0.0% 0 0.0% 0 0.0% 0 0.0% 0 0.0% 0 0.0% 0 0.0% 0 0.0% 0 0.0% 0 Other - Zone 16 0.3% 5 0.0% 0 0.0% 0 0.0% 0 0.0% 0 0.0% 0 0.0% 0 0.0% 0 0.0% 0 0.0% 0 0.0% 0 0.0% 0 Other - Zone 17 0.2% 3 0.0% 0 0.0% 0 0.0% 0 0.0% 0 0.0% 0 0.0% 0 0.0% 0 0.0% 0 0.0% 0 0.0% 0 0.0% 0 Other - Zone 18 0.2% 3 0.0% 0 0.0% 0 0.0% 0 0.0% 0 0.0% 0 0.0% 0 0.0% 0 0.0% 0 0.0% 0 0.0% 0 0.0% 0 Other - Zone 20 0.7% 11 0.0% 0 0.0% 0 0.0% 0 0.0% 0 0.0% 0 0.0% 0 0.0% 0 0.0% 0 0.0% 0 0.0% 0 0.0% 0 Other - Zone 21 0.0% 0 0.0% 0 0.0% 0 0.0% 0 0.0% 0 0.0% 0 0.0% 0 0.0% 0 0.0% 0 0.0% 0 0.0% 0 0.0% 0 Other - Zone 0 6.0% 97 0.9% 1 0.0% 0 1.3% 0 5.5% 2 0.9% 1 4.4% 5 15.1% 32 8.8% 5 6.6% 12 7.9% 7 0.0% 0 Weighted base: 1612 105 73 25 42 150 108 214 60 181 83 69 Sample: 1557 66 64 70 72 80 77 74 75 81 78 77
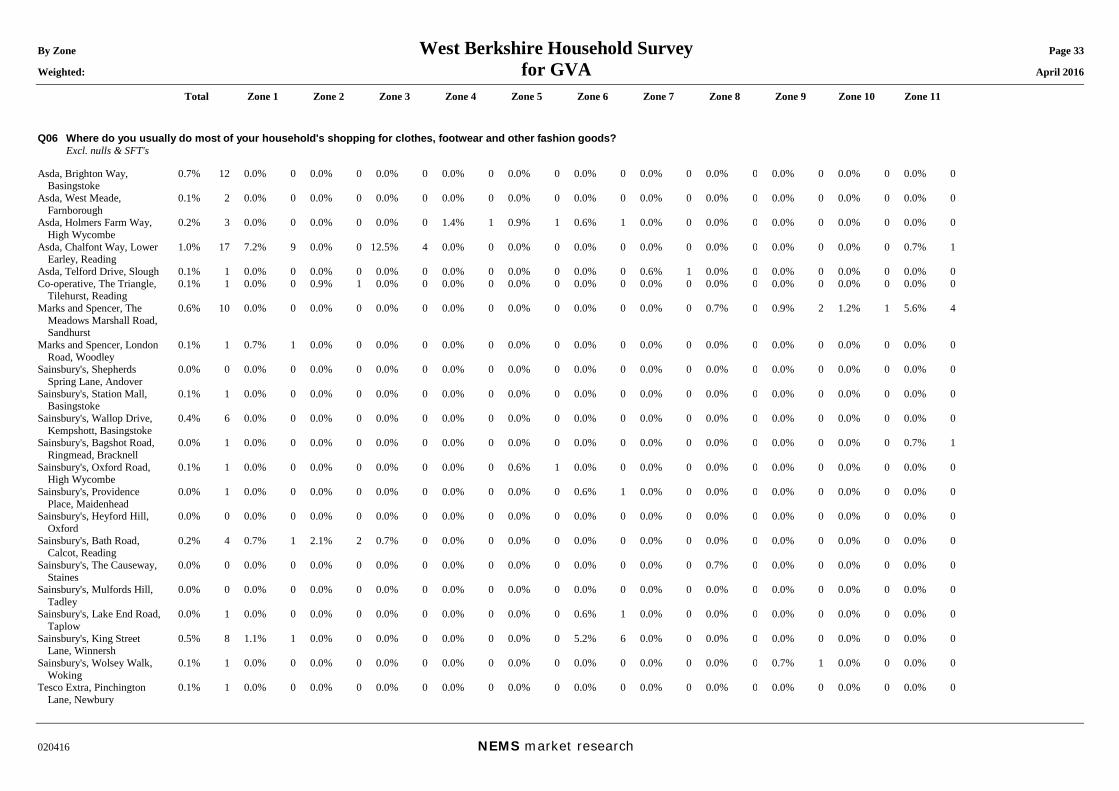
By Zone West Berkshire Household Survey Page 33 Weighted: for GVA April 2016
Total Zone 1 Zone 2 Zone 3 Zone 4 Zone 5 Zone 6 Zone 7 Zone 8 Zone 9 Zone 10 Zone 11
020416 NEMS market research
Q06 Where do you usually do most of your household's shopping for clothes, footwear and other fashion goods? Excl. nulls & SFT's Asda, Brighton Way,
Basingstoke 0.7% 12 0.0% 0 0.0% 0 0.0% 0 0.0% 0 0.0% 0 0.0% 0 0.0% 0 0.0% 0 0.0% 0 0.0% 0 0.0% 0
Asda, West Meade, Farnborough
0.1% 2 0.0% 0 0.0% 0 0.0% 0 0.0% 0 0.0% 0 0.0% 0 0.0% 0 0.0% 0 0.0% 0 0.0% 0 0.0% 0
Asda, Holmers Farm Way, High Wycombe
0.2% 3 0.0% 0 0.0% 0 0.0% 0 1.4% 1 0.9% 1 0.6% 1 0.0% 0 0.0% 0 0.0% 0 0.0% 0 0.0% 0
Asda, Chalfont Way, Lower Earley, Reading
1.0% 17 7.2% 9 0.0% 0 12.5% 4 0.0% 0 0.0% 0 0.0% 0 0.0% 0 0.0% 0 0.0% 0 0.0% 0 0.7% 1
Asda, Telford Drive, Slough 0.1% 1 0.0% 0 0.0% 0 0.0% 0 0.0% 0 0.0% 0 0.0% 0 0.6% 1 0.0% 0 0.0% 0 0.0% 0 0.0% 0 Co-operative, The Triangle,
Tilehurst, Reading 0.1% 1 0.0% 0 0.9% 1 0.0% 0 0.0% 0 0.0% 0 0.0% 0 0.0% 0 0.0% 0 0.0% 0 0.0% 0 0.0% 0
Marks and Spencer, The Meadows Marshall Road, Sandhurst
0.6% 10 0.0% 0 0.0% 0 0.0% 0 0.0% 0 0.0% 0 0.0% 0 0.0% 0 0.7% 0 0.9% 2 1.2% 1 5.6% 4
Marks and Spencer, London Road, Woodley
0.1% 1 0.7% 1 0.0% 0 0.0% 0 0.0% 0 0.0% 0 0.0% 0 0.0% 0 0.0% 0 0.0% 0 0.0% 0 0.0% 0
Sainsbury's, Shepherds Spring Lane, Andover
0.0% 0 0.0% 0 0.0% 0 0.0% 0 0.0% 0 0.0% 0 0.0% 0 0.0% 0 0.0% 0 0.0% 0 0.0% 0 0.0% 0
Sainsbury's, Station Mall, Basingstoke
0.1% 1 0.0% 0 0.0% 0 0.0% 0 0.0% 0 0.0% 0 0.0% 0 0.0% 0 0.0% 0 0.0% 0 0.0% 0 0.0% 0
Sainsbury's, Wallop Drive, Kempshott, Basingstoke
0.4% 6 0.0% 0 0.0% 0 0.0% 0 0.0% 0 0.0% 0 0.0% 0 0.0% 0 0.0% 0 0.0% 0 0.0% 0 0.0% 0
Sainsbury's, Bagshot Road, Ringmead, Bracknell
0.0% 1 0.0% 0 0.0% 0 0.0% 0 0.0% 0 0.0% 0 0.0% 0 0.0% 0 0.0% 0 0.0% 0 0.0% 0 0.7% 1
Sainsbury's, Oxford Road, High Wycombe
0.1% 1 0.0% 0 0.0% 0 0.0% 0 0.0% 0 0.6% 1 0.0% 0 0.0% 0 0.0% 0 0.0% 0 0.0% 0 0.0% 0
Sainsbury's, Providence Place, Maidenhead
0.0% 1 0.0% 0 0.0% 0 0.0% 0 0.0% 0 0.0% 0 0.6% 1 0.0% 0 0.0% 0 0.0% 0 0.0% 0 0.0% 0
Sainsbury's, Heyford Hill, Oxford
0.0% 0 0.0% 0 0.0% 0 0.0% 0 0.0% 0 0.0% 0 0.0% 0 0.0% 0 0.0% 0 0.0% 0 0.0% 0 0.0% 0
Sainsbury's, Bath Road, Calcot, Reading
0.2% 4 0.7% 1 2.1% 2 0.7% 0 0.0% 0 0.0% 0 0.0% 0 0.0% 0 0.0% 0 0.0% 0 0.0% 0 0.0% 0
Sainsbury's, The Causeway, Staines
0.0% 0 0.0% 0 0.0% 0 0.0% 0 0.0% 0 0.0% 0 0.0% 0 0.0% 0 0.7% 0 0.0% 0 0.0% 0 0.0% 0
Sainsbury's, Mulfords Hill, Tadley
0.0% 0 0.0% 0 0.0% 0 0.0% 0 0.0% 0 0.0% 0 0.0% 0 0.0% 0 0.0% 0 0.0% 0 0.0% 0 0.0% 0
Sainsbury's, Lake End Road, Taplow
0.0% 1 0.0% 0 0.0% 0 0.0% 0 0.0% 0 0.0% 0 0.6% 1 0.0% 0 0.0% 0 0.0% 0 0.0% 0 0.0% 0
Sainsbury's, King Street Lane, Winnersh
0.5% 8 1.1% 1 0.0% 0 0.0% 0 0.0% 0 0.0% 0 5.2% 6 0.0% 0 0.0% 0 0.0% 0 0.0% 0 0.0% 0
Sainsbury's, Wolsey Walk, Woking
0.1% 1 0.0% 0 0.0% 0 0.0% 0 0.0% 0 0.0% 0 0.0% 0 0.0% 0 0.0% 0 0.7% 1 0.0% 0 0.0% 0
Tesco Extra, Pinchington Lane, Newbury
0.1% 1 0.0% 0 0.0% 0 0.0% 0 0.0% 0 0.0% 0 0.0% 0 0.0% 0 0.0% 0 0.0% 0 0.0% 0 0.0% 0
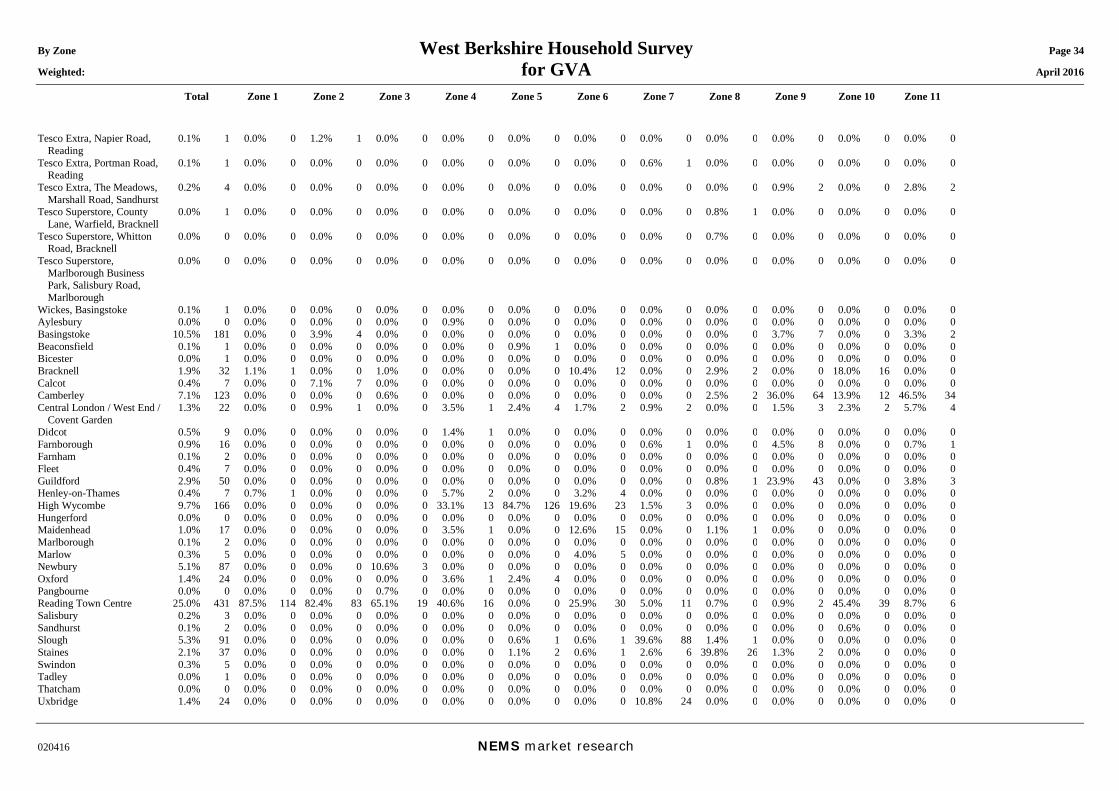
By Zone West Berkshire Household Survey Page 34 Weighted: for GVA April 2016
Total Zone 1 Zone 2 Zone 3 Zone 4 Zone 5 Zone 6 Zone 7 Zone 8 Zone 9 Zone 10 Zone 11
020416 NEMS market research
Tesco Extra, Napier Road, Reading
0.1% 1 0.0% 0 1.2% 1 0.0% 0 0.0% 0 0.0% 0 0.0% 0 0.0% 0 0.0% 0 0.0% 0 0.0% 0 0.0% 0
Tesco Extra, Portman Road, Reading
0.1% 1 0.0% 0 0.0% 0 0.0% 0 0.0% 0 0.0% 0 0.0% 0 0.6% 1 0.0% 0 0.0% 0 0.0% 0 0.0% 0
Tesco Extra, The Meadows, Marshall Road, Sandhurst
0.2% 4 0.0% 0 0.0% 0 0.0% 0 0.0% 0 0.0% 0 0.0% 0 0.0% 0 0.0% 0 0.9% 2 0.0% 0 2.8% 2
Tesco Superstore, County Lane, Warfield, Bracknell
0.0% 1 0.0% 0 0.0% 0 0.0% 0 0.0% 0 0.0% 0 0.0% 0 0.0% 0 0.8% 1 0.0% 0 0.0% 0 0.0% 0
Tesco Superstore, Whitton Road, Bracknell
0.0% 0 0.0% 0 0.0% 0 0.0% 0 0.0% 0 0.0% 0 0.0% 0 0.0% 0 0.7% 0 0.0% 0 0.0% 0 0.0% 0
Tesco Superstore, Marlborough Business Park, Salisbury Road, Marlborough
0.0% 0 0.0% 0 0.0% 0 0.0% 0 0.0% 0 0.0% 0 0.0% 0 0.0% 0 0.0% 0 0.0% 0 0.0% 0 0.0% 0
Wickes, Basingstoke 0.1% 1 0.0% 0 0.0% 0 0.0% 0 0.0% 0 0.0% 0 0.0% 0 0.0% 0 0.0% 0 0.0% 0 0.0% 0 0.0% 0 Aylesbury 0.0% 0 0.0% 0 0.0% 0 0.0% 0 0.9% 0 0.0% 0 0.0% 0 0.0% 0 0.0% 0 0.0% 0 0.0% 0 0.0% 0 Basingstoke 10.5% 181 0.0% 0 3.9% 4 0.0% 0 0.0% 0 0.0% 0 0.0% 0 0.0% 0 0.0% 0 3.7% 7 0.0% 0 3.3% 2 Beaconsfield 0.1% 1 0.0% 0 0.0% 0 0.0% 0 0.0% 0 0.9% 1 0.0% 0 0.0% 0 0.0% 0 0.0% 0 0.0% 0 0.0% 0 Bicester 0.0% 1 0.0% 0 0.0% 0 0.0% 0 0.0% 0 0.0% 0 0.0% 0 0.0% 0 0.0% 0 0.0% 0 0.0% 0 0.0% 0 Bracknell 1.9% 32 1.1% 1 0.0% 0 1.0% 0 0.0% 0 0.0% 0 10.4% 12 0.0% 0 2.9% 2 0.0% 0 18.0% 16 0.0% 0 Calcot 0.4% 7 0.0% 0 7.1% 7 0.0% 0 0.0% 0 0.0% 0 0.0% 0 0.0% 0 0.0% 0 0.0% 0 0.0% 0 0.0% 0 Camberley 7.1% 123 0.0% 0 0.0% 0 0.6% 0 0.0% 0 0.0% 0 0.0% 0 0.0% 0 2.5% 2 36.0% 64 13.9% 12 46.5% 34 Central London / West End /
Covent Garden 1.3% 22 0.0% 0 0.9% 1 0.0% 0 3.5% 1 2.4% 4 1.7% 2 0.9% 2 0.0% 0 1.5% 3 2.3% 2 5.7% 4
Didcot 0.5% 9 0.0% 0 0.0% 0 0.0% 0 1.4% 1 0.0% 0 0.0% 0 0.0% 0 0.0% 0 0.0% 0 0.0% 0 0.0% 0 Farnborough 0.9% 16 0.0% 0 0.0% 0 0.0% 0 0.0% 0 0.0% 0 0.0% 0 0.6% 1 0.0% 0 4.5% 8 0.0% 0 0.7% 1 Farnham 0.1% 2 0.0% 0 0.0% 0 0.0% 0 0.0% 0 0.0% 0 0.0% 0 0.0% 0 0.0% 0 0.0% 0 0.0% 0 0.0% 0 Fleet 0.4% 7 0.0% 0 0.0% 0 0.0% 0 0.0% 0 0.0% 0 0.0% 0 0.0% 0 0.0% 0 0.0% 0 0.0% 0 0.0% 0 Guildford 2.9% 50 0.0% 0 0.0% 0 0.0% 0 0.0% 0 0.0% 0 0.0% 0 0.0% 0 0.8% 1 23.9% 43 0.0% 0 3.8% 3 Henley-on-Thames 0.4% 7 0.7% 1 0.0% 0 0.0% 0 5.7% 2 0.0% 0 3.2% 4 0.0% 0 0.0% 0 0.0% 0 0.0% 0 0.0% 0 High Wycombe 9.7% 166 0.0% 0 0.0% 0 0.0% 0 33.1% 13 84.7% 126 19.6% 23 1.5% 3 0.0% 0 0.0% 0 0.0% 0 0.0% 0 Hungerford 0.0% 0 0.0% 0 0.0% 0 0.0% 0 0.0% 0 0.0% 0 0.0% 0 0.0% 0 0.0% 0 0.0% 0 0.0% 0 0.0% 0 Maidenhead 1.0% 17 0.0% 0 0.0% 0 0.0% 0 3.5% 1 0.0% 0 12.6% 15 0.0% 0 1.1% 1 0.0% 0 0.0% 0 0.0% 0 Marlborough 0.1% 2 0.0% 0 0.0% 0 0.0% 0 0.0% 0 0.0% 0 0.0% 0 0.0% 0 0.0% 0 0.0% 0 0.0% 0 0.0% 0 Marlow 0.3% 5 0.0% 0 0.0% 0 0.0% 0 0.0% 0 0.0% 0 4.0% 5 0.0% 0 0.0% 0 0.0% 0 0.0% 0 0.0% 0 Newbury 5.1% 87 0.0% 0 0.0% 0 10.6% 3 0.0% 0 0.0% 0 0.0% 0 0.0% 0 0.0% 0 0.0% 0 0.0% 0 0.0% 0 Oxford 1.4% 24 0.0% 0 0.0% 0 0.0% 0 3.6% 1 2.4% 4 0.0% 0 0.0% 0 0.0% 0 0.0% 0 0.0% 0 0.0% 0 Pangbourne 0.0% 0 0.0% 0 0.0% 0 0.7% 0 0.0% 0 0.0% 0 0.0% 0 0.0% 0 0.0% 0 0.0% 0 0.0% 0 0.0% 0 Reading Town Centre 25.0% 431 87.5% 114 82.4% 83 65.1% 19 40.6% 16 0.0% 0 25.9% 30 5.0% 11 0.7% 0 0.9% 2 45.4% 39 8.7% 6 Salisbury 0.2% 3 0.0% 0 0.0% 0 0.0% 0 0.0% 0 0.0% 0 0.0% 0 0.0% 0 0.0% 0 0.0% 0 0.0% 0 0.0% 0 Sandhurst 0.1% 2 0.0% 0 0.0% 0 0.0% 0 0.0% 0 0.0% 0 0.0% 0 0.0% 0 0.0% 0 0.0% 0 0.6% 0 0.0% 0 Slough 5.3% 91 0.0% 0 0.0% 0 0.0% 0 0.0% 0 0.6% 1 0.6% 1 39.6% 88 1.4% 1 0.0% 0 0.0% 0 0.0% 0 Staines 2.1% 37 0.0% 0 0.0% 0 0.0% 0 0.0% 0 1.1% 2 0.6% 1 2.6% 6 39.8% 26 1.3% 2 0.0% 0 0.0% 0 Swindon 0.3% 5 0.0% 0 0.0% 0 0.0% 0 0.0% 0 0.0% 0 0.0% 0 0.0% 0 0.0% 0 0.0% 0 0.0% 0 0.0% 0 Tadley 0.0% 1 0.0% 0 0.0% 0 0.0% 0 0.0% 0 0.0% 0 0.0% 0 0.0% 0 0.0% 0 0.0% 0 0.0% 0 0.0% 0 Thatcham 0.0% 0 0.0% 0 0.0% 0 0.0% 0 0.0% 0 0.0% 0 0.0% 0 0.0% 0 0.0% 0 0.0% 0 0.0% 0 0.0% 0 Uxbridge 1.4% 24 0.0% 0 0.0% 0 0.0% 0 0.0% 0 0.0% 0 0.0% 0 10.8% 24 0.0% 0 0.0% 0 0.0% 0 0.0% 0
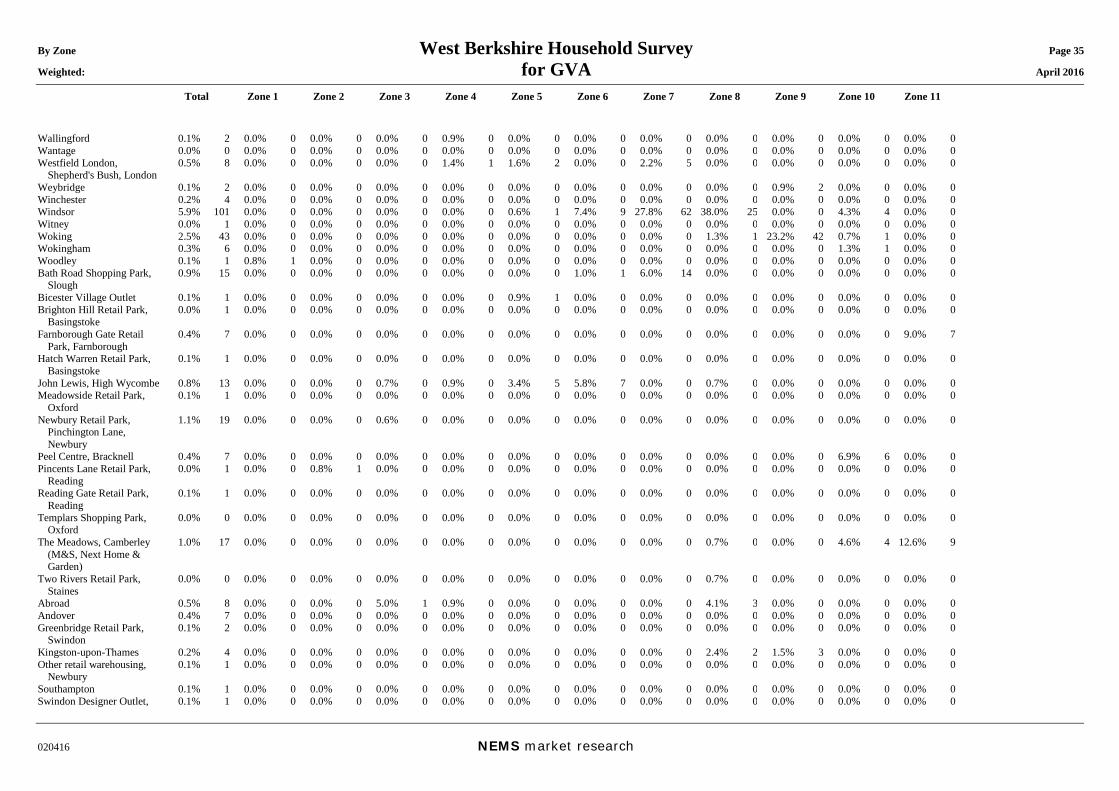
By Zone West Berkshire Household Survey Page 35 Weighted: for GVA April 2016
Total Zone 1 Zone 2 Zone 3 Zone 4 Zone 5 Zone 6 Zone 7 Zone 8 Zone 9 Zone 10 Zone 11
020416 NEMS market research
Wallingford 0.1% 2 0.0% 0 0.0% 0 0.0% 0 0.9% 0 0.0% 0 0.0% 0 0.0% 0 0.0% 0 0.0% 0 0.0% 0 0.0% 0 Wantage 0.0% 0 0.0% 0 0.0% 0 0.0% 0 0.0% 0 0.0% 0 0.0% 0 0.0% 0 0.0% 0 0.0% 0 0.0% 0 0.0% 0 Westfield London,
Shepherd's Bush, London 0.5% 8 0.0% 0 0.0% 0 0.0% 0 1.4% 1 1.6% 2 0.0% 0 2.2% 5 0.0% 0 0.0% 0 0.0% 0 0.0% 0
Weybridge 0.1% 2 0.0% 0 0.0% 0 0.0% 0 0.0% 0 0.0% 0 0.0% 0 0.0% 0 0.0% 0 0.9% 2 0.0% 0 0.0% 0 Winchester 0.2% 4 0.0% 0 0.0% 0 0.0% 0 0.0% 0 0.0% 0 0.0% 0 0.0% 0 0.0% 0 0.0% 0 0.0% 0 0.0% 0 Windsor 5.9% 101 0.0% 0 0.0% 0 0.0% 0 0.0% 0 0.6% 1 7.4% 9 27.8% 62 38.0% 25 0.0% 0 4.3% 4 0.0% 0 Witney 0.0% 1 0.0% 0 0.0% 0 0.0% 0 0.0% 0 0.0% 0 0.0% 0 0.0% 0 0.0% 0 0.0% 0 0.0% 0 0.0% 0 Woking 2.5% 43 0.0% 0 0.0% 0 0.0% 0 0.0% 0 0.0% 0 0.0% 0 0.0% 0 1.3% 1 23.2% 42 0.7% 1 0.0% 0 Wokingham 0.3% 6 0.0% 0 0.0% 0 0.0% 0 0.0% 0 0.0% 0 0.0% 0 0.0% 0 0.0% 0 0.0% 0 1.3% 1 0.0% 0 Woodley 0.1% 1 0.8% 1 0.0% 0 0.0% 0 0.0% 0 0.0% 0 0.0% 0 0.0% 0 0.0% 0 0.0% 0 0.0% 0 0.0% 0 Bath Road Shopping Park,
Slough 0.9% 15 0.0% 0 0.0% 0 0.0% 0 0.0% 0 0.0% 0 1.0% 1 6.0% 14 0.0% 0 0.0% 0 0.0% 0 0.0% 0
Bicester Village Outlet 0.1% 1 0.0% 0 0.0% 0 0.0% 0 0.0% 0 0.9% 1 0.0% 0 0.0% 0 0.0% 0 0.0% 0 0.0% 0 0.0% 0 Brighton Hill Retail Park,
Basingstoke 0.0% 1 0.0% 0 0.0% 0 0.0% 0 0.0% 0 0.0% 0 0.0% 0 0.0% 0 0.0% 0 0.0% 0 0.0% 0 0.0% 0
Farnborough Gate Retail Park, Farnborough
0.4% 7 0.0% 0 0.0% 0 0.0% 0 0.0% 0 0.0% 0 0.0% 0 0.0% 0 0.0% 0 0.0% 0 0.0% 0 9.0% 7
Hatch Warren Retail Park, Basingstoke
0.1% 1 0.0% 0 0.0% 0 0.0% 0 0.0% 0 0.0% 0 0.0% 0 0.0% 0 0.0% 0 0.0% 0 0.0% 0 0.0% 0
John Lewis, High Wycombe 0.8% 13 0.0% 0 0.0% 0 0.7% 0 0.9% 0 3.4% 5 5.8% 7 0.0% 0 0.7% 0 0.0% 0 0.0% 0 0.0% 0 Meadowside Retail Park,
Oxford 0.1% 1 0.0% 0 0.0% 0 0.0% 0 0.0% 0 0.0% 0 0.0% 0 0.0% 0 0.0% 0 0.0% 0 0.0% 0 0.0% 0
Newbury Retail Park, Pinchington Lane, Newbury
1.1% 19 0.0% 0 0.0% 0 0.6% 0 0.0% 0 0.0% 0 0.0% 0 0.0% 0 0.0% 0 0.0% 0 0.0% 0 0.0% 0
Peel Centre, Bracknell 0.4% 7 0.0% 0 0.0% 0 0.0% 0 0.0% 0 0.0% 0 0.0% 0 0.0% 0 0.0% 0 0.0% 0 6.9% 6 0.0% 0 Pincents Lane Retail Park,
Reading 0.0% 1 0.0% 0 0.8% 1 0.0% 0 0.0% 0 0.0% 0 0.0% 0 0.0% 0 0.0% 0 0.0% 0 0.0% 0 0.0% 0
Reading Gate Retail Park, Reading
0.1% 1 0.0% 0 0.0% 0 0.0% 0 0.0% 0 0.0% 0 0.0% 0 0.0% 0 0.0% 0 0.0% 0 0.0% 0 0.0% 0
Templars Shopping Park, Oxford
0.0% 0 0.0% 0 0.0% 0 0.0% 0 0.0% 0 0.0% 0 0.0% 0 0.0% 0 0.0% 0 0.0% 0 0.0% 0 0.0% 0
The Meadows, Camberley (M&S, Next Home & Garden)
1.0% 17 0.0% 0 0.0% 0 0.0% 0 0.0% 0 0.0% 0 0.0% 0 0.0% 0 0.7% 0 0.0% 0 4.6% 4 12.6% 9
Two Rivers Retail Park, Staines
0.0% 0 0.0% 0 0.0% 0 0.0% 0 0.0% 0 0.0% 0 0.0% 0 0.0% 0 0.7% 0 0.0% 0 0.0% 0 0.0% 0
Abroad 0.5% 8 0.0% 0 0.0% 0 5.0% 1 0.9% 0 0.0% 0 0.0% 0 0.0% 0 4.1% 3 0.0% 0 0.0% 0 0.0% 0 Andover 0.4% 7 0.0% 0 0.0% 0 0.0% 0 0.0% 0 0.0% 0 0.0% 0 0.0% 0 0.0% 0 0.0% 0 0.0% 0 0.0% 0 Greenbridge Retail Park,
Swindon 0.1% 2 0.0% 0 0.0% 0 0.0% 0 0.0% 0 0.0% 0 0.0% 0 0.0% 0 0.0% 0 0.0% 0 0.0% 0 0.0% 0
Kingston-upon-Thames 0.2% 4 0.0% 0 0.0% 0 0.0% 0 0.0% 0 0.0% 0 0.0% 0 0.0% 0 2.4% 2 1.5% 3 0.0% 0 0.0% 0 Other retail warehousing,
Newbury 0.1% 1 0.0% 0 0.0% 0 0.0% 0 0.0% 0 0.0% 0 0.0% 0 0.0% 0 0.0% 0 0.0% 0 0.0% 0 0.0% 0
Southampton 0.1% 1 0.0% 0 0.0% 0 0.0% 0 0.0% 0 0.0% 0 0.0% 0 0.0% 0 0.0% 0 0.0% 0 0.0% 0 0.0% 0 Swindon Designer Outlet, 0.1% 1 0.0% 0 0.0% 0 0.0% 0 0.0% 0 0.0% 0 0.0% 0 0.0% 0 0.0% 0 0.0% 0 0.0% 0 0.0% 0
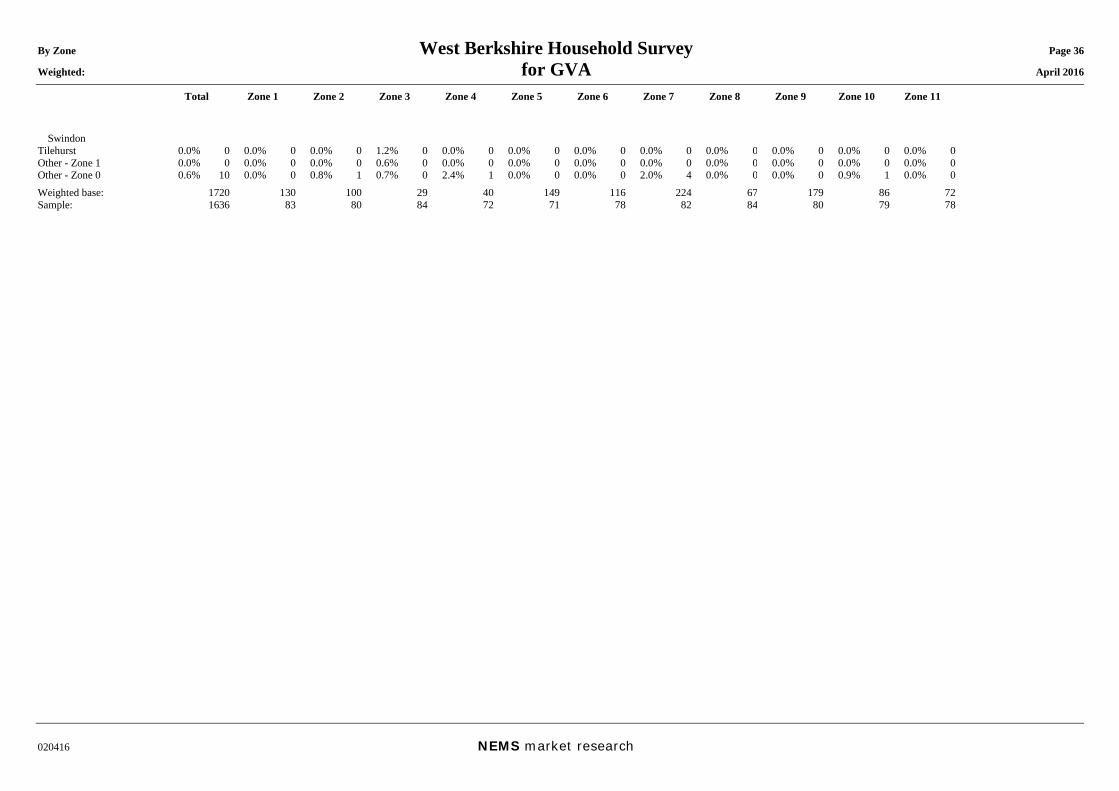
By Zone West Berkshire Household Survey Page 36 Weighted: for GVA April 2016
Total Zone 1 Zone 2 Zone 3 Zone 4 Zone 5 Zone 6 Zone 7 Zone 8 Zone 9 Zone 10 Zone 11
020416 NEMS market research
Swindon Tilehurst 0.0% 0 0.0% 0 0.0% 0 1.2% 0 0.0% 0 0.0% 0 0.0% 0 0.0% 0 0.0% 0 0.0% 0 0.0% 0 0.0% 0 Other - Zone 1 0.0% 0 0.0% 0 0.0% 0 0.6% 0 0.0% 0 0.0% 0 0.0% 0 0.0% 0 0.0% 0 0.0% 0 0.0% 0 0.0% 0 Other - Zone 0 0.6% 10 0.0% 0 0.8% 1 0.7% 0 2.4% 1 0.0% 0 0.0% 0 2.0% 4 0.0% 0 0.0% 0 0.9% 1 0.0% 0 Weighted base: 1720 130 100 29 40 149 116 224 67 179 86 72 Sample: 1636 83 80 84 72 71 78 82 84 80 79 78
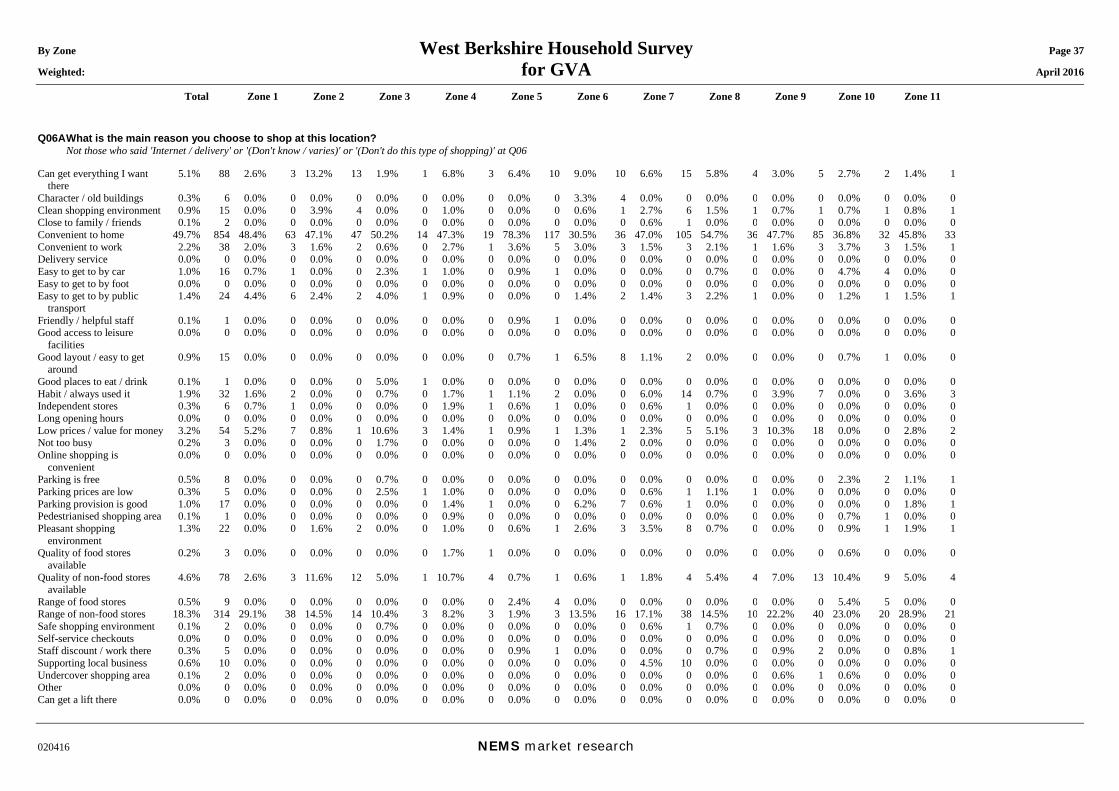
By Zone West Berkshire Household Survey Page 37 Weighted: for GVA April 2016
Total Zone 1 Zone 2 Zone 3 Zone 4 Zone 5 Zone 6 Zone 7 Zone 8 Zone 9 Zone 10 Zone 11
020416 NEMS market research
Q06A What is the main reason you choose to shop at this location? Not those who said 'Internet / delivery' or '(Don't know / varies)' or '(Don't do this type of shopping)' at Q06 Can get everything I want
there 5.1% 88 2.6% 3 13.2% 13 1.9% 1 6.8% 3 6.4% 10 9.0% 10 6.6% 15 5.8% 4 3.0% 5 2.7% 2 1.4% 1
Character / old buildings 0.3% 6 0.0% 0 0.0% 0 0.0% 0 0.0% 0 0.0% 0 3.3% 4 0.0% 0 0.0% 0 0.0% 0 0.0% 0 0.0% 0 Clean shopping environment 0.9% 15 0.0% 0 3.9% 4 0.0% 0 1.0% 0 0.0% 0 0.6% 1 2.7% 6 1.5% 1 0.7% 1 0.7% 1 0.8% 1 Close to family / friends 0.1% 2 0.0% 0 0.0% 0 0.0% 0 0.0% 0 0.0% 0 0.0% 0 0.6% 1 0.0% 0 0.0% 0 0.0% 0 0.0% 0 Convenient to home 49.7% 854 48.4% 63 47.1% 47 50.2% 14 47.3% 19 78.3% 117 30.5% 36 47.0% 105 54.7% 36 47.7% 85 36.8% 32 45.8% 33 Convenient to work 2.2% 38 2.0% 3 1.6% 2 0.6% 0 2.7% 1 3.6% 5 3.0% 3 1.5% 3 2.1% 1 1.6% 3 3.7% 3 1.5% 1 Delivery service 0.0% 0 0.0% 0 0.0% 0 0.0% 0 0.0% 0 0.0% 0 0.0% 0 0.0% 0 0.0% 0 0.0% 0 0.0% 0 0.0% 0 Easy to get to by car 1.0% 16 0.7% 1 0.0% 0 2.3% 1 1.0% 0 0.9% 1 0.0% 0 0.0% 0 0.7% 0 0.0% 0 4.7% 4 0.0% 0 Easy to get to by foot 0.0% 0 0.0% 0 0.0% 0 0.0% 0 0.0% 0 0.0% 0 0.0% 0 0.0% 0 0.0% 0 0.0% 0 0.0% 0 0.0% 0 Easy to get to by public
transport 1.4% 24 4.4% 6 2.4% 2 4.0% 1 0.9% 0 0.0% 0 1.4% 2 1.4% 3 2.2% 1 0.0% 0 1.2% 1 1.5% 1
Friendly / helpful staff 0.1% 1 0.0% 0 0.0% 0 0.0% 0 0.0% 0 0.9% 1 0.0% 0 0.0% 0 0.0% 0 0.0% 0 0.0% 0 0.0% 0 Good access to leisure
facilities 0.0% 0 0.0% 0 0.0% 0 0.0% 0 0.0% 0 0.0% 0 0.0% 0 0.0% 0 0.0% 0 0.0% 0 0.0% 0 0.0% 0
Good layout / easy to get around
0.9% 15 0.0% 0 0.0% 0 0.0% 0 0.0% 0 0.7% 1 6.5% 8 1.1% 2 0.0% 0 0.0% 0 0.7% 1 0.0% 0
Good places to eat / drink 0.1% 1 0.0% 0 0.0% 0 5.0% 1 0.0% 0 0.0% 0 0.0% 0 0.0% 0 0.0% 0 0.0% 0 0.0% 0 0.0% 0 Habit / always used it 1.9% 32 1.6% 2 0.0% 0 0.7% 0 1.7% 1 1.1% 2 0.0% 0 6.0% 14 0.7% 0 3.9% 7 0.0% 0 3.6% 3 Independent stores 0.3% 6 0.7% 1 0.0% 0 0.0% 0 1.9% 1 0.6% 1 0.0% 0 0.6% 1 0.0% 0 0.0% 0 0.0% 0 0.0% 0 Long opening hours 0.0% 0 0.0% 0 0.0% 0 0.0% 0 0.0% 0 0.0% 0 0.0% 0 0.0% 0 0.0% 0 0.0% 0 0.0% 0 0.0% 0 Low prices / value for money 3.2% 54 5.2% 7 0.8% 1 10.6% 3 1.4% 1 0.9% 1 1.3% 1 2.3% 5 5.1% 3 10.3% 18 0.0% 0 2.8% 2 Not too busy 0.2% 3 0.0% 0 0.0% 0 1.7% 0 0.0% 0 0.0% 0 1.4% 2 0.0% 0 0.0% 0 0.0% 0 0.0% 0 0.0% 0 Online shopping is
convenient 0.0% 0 0.0% 0 0.0% 0 0.0% 0 0.0% 0 0.0% 0 0.0% 0 0.0% 0 0.0% 0 0.0% 0 0.0% 0 0.0% 0
Parking is free 0.5% 8 0.0% 0 0.0% 0 0.7% 0 0.0% 0 0.0% 0 0.0% 0 0.0% 0 0.0% 0 0.0% 0 2.3% 2 1.1% 1 Parking prices are low 0.3% 5 0.0% 0 0.0% 0 2.5% 1 1.0% 0 0.0% 0 0.0% 0 0.6% 1 1.1% 1 0.0% 0 0.0% 0 0.0% 0 Parking provision is good 1.0% 17 0.0% 0 0.0% 0 0.0% 0 1.4% 1 0.0% 0 6.2% 7 0.6% 1 0.0% 0 0.0% 0 0.0% 0 1.8% 1 Pedestrianised shopping area 0.1% 1 0.0% 0 0.0% 0 0.0% 0 0.9% 0 0.0% 0 0.0% 0 0.0% 0 0.0% 0 0.0% 0 0.7% 1 0.0% 0 Pleasant shopping
environment 1.3% 22 0.0% 0 1.6% 2 0.0% 0 1.0% 0 0.6% 1 2.6% 3 3.5% 8 0.7% 0 0.0% 0 0.9% 1 1.9% 1
Quality of food stores available
0.2% 3 0.0% 0 0.0% 0 0.0% 0 1.7% 1 0.0% 0 0.0% 0 0.0% 0 0.0% 0 0.0% 0 0.6% 0 0.0% 0
Quality of non-food stores available
4.6% 78 2.6% 3 11.6% 12 5.0% 1 10.7% 4 0.7% 1 0.6% 1 1.8% 4 5.4% 4 7.0% 13 10.4% 9 5.0% 4
Range of food stores 0.5% 9 0.0% 0 0.0% 0 0.0% 0 0.0% 0 2.4% 4 0.0% 0 0.0% 0 0.0% 0 0.0% 0 5.4% 5 0.0% 0 Range of non-food stores 18.3% 314 29.1% 38 14.5% 14 10.4% 3 8.2% 3 1.9% 3 13.5% 16 17.1% 38 14.5% 10 22.2% 40 23.0% 20 28.9% 21 Safe shopping environment 0.1% 2 0.0% 0 0.0% 0 0.7% 0 0.0% 0 0.0% 0 0.0% 0 0.6% 1 0.7% 0 0.0% 0 0.0% 0 0.0% 0 Self-service checkouts 0.0% 0 0.0% 0 0.0% 0 0.0% 0 0.0% 0 0.0% 0 0.0% 0 0.0% 0 0.0% 0 0.0% 0 0.0% 0 0.0% 0 Staff discount / work there 0.3% 5 0.0% 0 0.0% 0 0.0% 0 0.0% 0 0.9% 1 0.0% 0 0.0% 0 0.7% 0 0.9% 2 0.0% 0 0.8% 1 Supporting local business 0.6% 10 0.0% 0 0.0% 0 0.0% 0 0.0% 0 0.0% 0 0.0% 0 4.5% 10 0.0% 0 0.0% 0 0.0% 0 0.0% 0 Undercover shopping area 0.1% 2 0.0% 0 0.0% 0 0.0% 0 0.0% 0 0.0% 0 0.0% 0 0.0% 0 0.0% 0 0.6% 1 0.6% 0 0.0% 0 Other 0.0% 0 0.0% 0 0.0% 0 0.0% 0 0.0% 0 0.0% 0 0.0% 0 0.0% 0 0.0% 0 0.0% 0 0.0% 0 0.0% 0 Can get a lift there 0.0% 0 0.0% 0 0.0% 0 0.0% 0 0.0% 0 0.0% 0 0.0% 0 0.0% 0 0.0% 0 0.0% 0 0.0% 0 0.0% 0
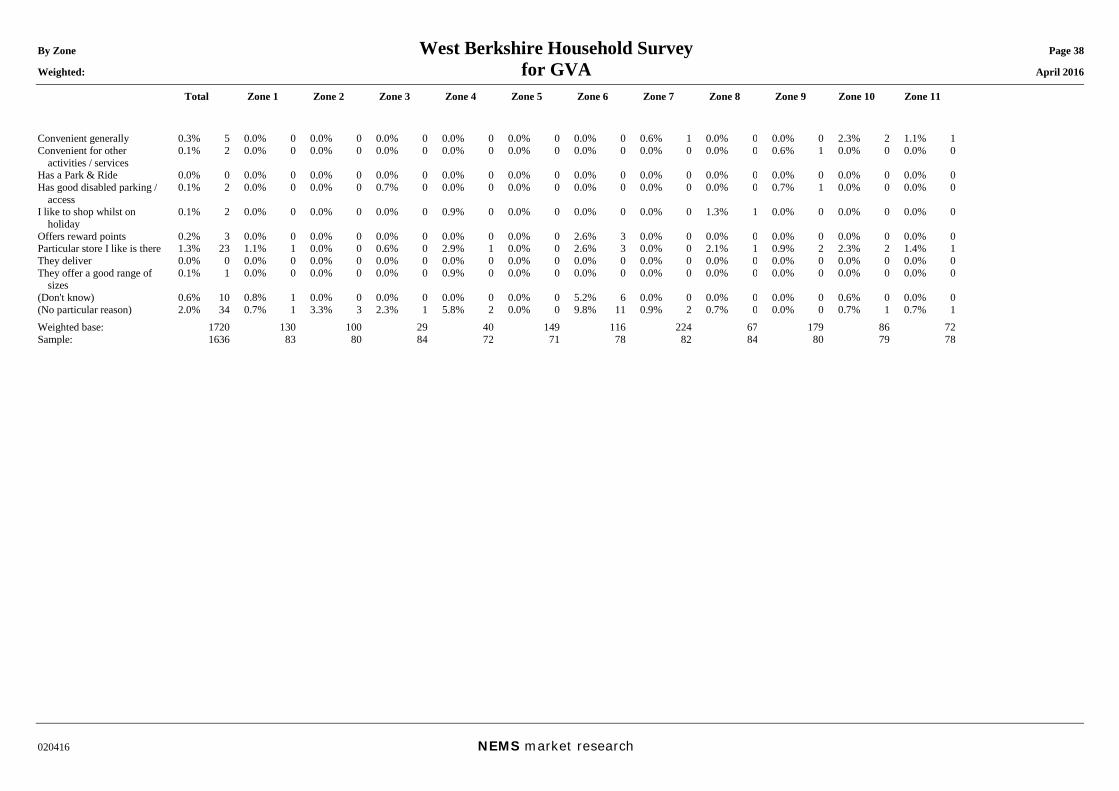
By Zone West Berkshire Household Survey Page 38 Weighted: for GVA April 2016
Total Zone 1 Zone 2 Zone 3 Zone 4 Zone 5 Zone 6 Zone 7 Zone 8 Zone 9 Zone 10 Zone 11
020416 NEMS market research
Convenient generally 0.3% 5 0.0% 0 0.0% 0 0.0% 0 0.0% 0 0.0% 0 0.0% 0 0.6% 1 0.0% 0 0.0% 0 2.3% 2 1.1% 1 Convenient for other
activities / services 0.1% 2 0.0% 0 0.0% 0 0.0% 0 0.0% 0 0.0% 0 0.0% 0 0.0% 0 0.0% 0 0.6% 1 0.0% 0 0.0% 0
Has a Park & Ride 0.0% 0 0.0% 0 0.0% 0 0.0% 0 0.0% 0 0.0% 0 0.0% 0 0.0% 0 0.0% 0 0.0% 0 0.0% 0 0.0% 0 Has good disabled parking /
access 0.1% 2 0.0% 0 0.0% 0 0.7% 0 0.0% 0 0.0% 0 0.0% 0 0.0% 0 0.0% 0 0.7% 1 0.0% 0 0.0% 0
I like to shop whilst on holiday
0.1% 2 0.0% 0 0.0% 0 0.0% 0 0.9% 0 0.0% 0 0.0% 0 0.0% 0 1.3% 1 0.0% 0 0.0% 0 0.0% 0
Offers reward points 0.2% 3 0.0% 0 0.0% 0 0.0% 0 0.0% 0 0.0% 0 2.6% 3 0.0% 0 0.0% 0 0.0% 0 0.0% 0 0.0% 0 Particular store I like is there 1.3% 23 1.1% 1 0.0% 0 0.6% 0 2.9% 1 0.0% 0 2.6% 3 0.0% 0 2.1% 1 0.9% 2 2.3% 2 1.4% 1 They deliver 0.0% 0 0.0% 0 0.0% 0 0.0% 0 0.0% 0 0.0% 0 0.0% 0 0.0% 0 0.0% 0 0.0% 0 0.0% 0 0.0% 0 They offer a good range of
sizes 0.1% 1 0.0% 0 0.0% 0 0.0% 0 0.9% 0 0.0% 0 0.0% 0 0.0% 0 0.0% 0 0.0% 0 0.0% 0 0.0% 0
(Don't know) 0.6% 10 0.8% 1 0.0% 0 0.0% 0 0.0% 0 0.0% 0 5.2% 6 0.0% 0 0.0% 0 0.0% 0 0.6% 0 0.0% 0 (No particular reason) 2.0% 34 0.7% 1 3.3% 3 2.3% 1 5.8% 2 0.0% 0 9.8% 11 0.9% 2 0.7% 0 0.0% 0 0.7% 1 0.7% 1 Weighted base: 1720 130 100 29 40 149 116 224 67 179 86 72 Sample: 1636 83 80 84 72 71 78 82 84 80 79 78
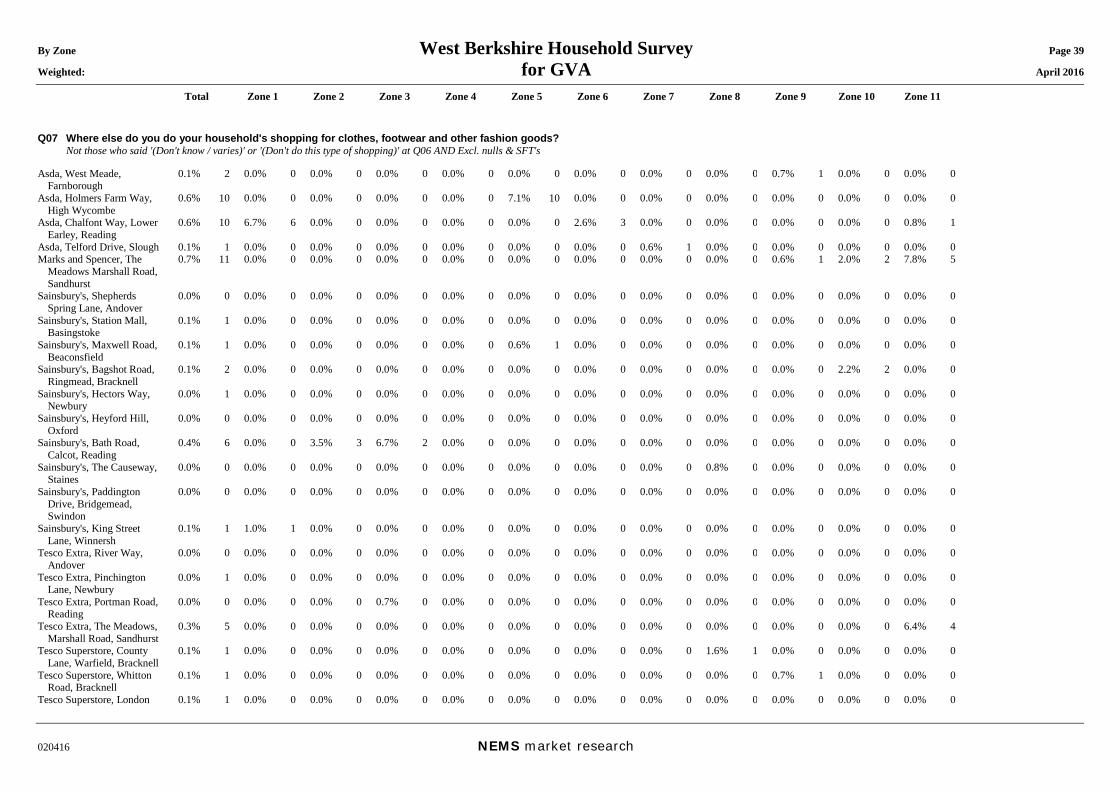
By Zone West Berkshire Household Survey Page 39 Weighted: for GVA April 2016
Total Zone 1 Zone 2 Zone 3 Zone 4 Zone 5 Zone 6 Zone 7 Zone 8 Zone 9 Zone 10 Zone 11
020416 NEMS market research
Q07 Where else do you do your household's shopping for clothes, footwear and other fashion goods? Not those who said '(Don't know / varies)' or '(Don't do this type of shopping)' at Q06 AND Excl. nulls & SFT's Asda, West Meade,
Farnborough 0.1% 2 0.0% 0 0.0% 0 0.0% 0 0.0% 0 0.0% 0 0.0% 0 0.0% 0 0.0% 0 0.7% 1 0.0% 0 0.0% 0
Asda, Holmers Farm Way, High Wycombe
0.6% 10 0.0% 0 0.0% 0 0.0% 0 0.0% 0 7.1% 10 0.0% 0 0.0% 0 0.0% 0 0.0% 0 0.0% 0 0.0% 0
Asda, Chalfont Way, Lower Earley, Reading
0.6% 10 6.7% 6 0.0% 0 0.0% 0 0.0% 0 0.0% 0 2.6% 3 0.0% 0 0.0% 0 0.0% 0 0.0% 0 0.8% 1
Asda, Telford Drive, Slough 0.1% 1 0.0% 0 0.0% 0 0.0% 0 0.0% 0 0.0% 0 0.0% 0 0.6% 1 0.0% 0 0.0% 0 0.0% 0 0.0% 0 Marks and Spencer, The
Meadows Marshall Road, Sandhurst
0.7% 11 0.0% 0 0.0% 0 0.0% 0 0.0% 0 0.0% 0 0.0% 0 0.0% 0 0.0% 0 0.6% 1 2.0% 2 7.8% 5
Sainsbury's, Shepherds Spring Lane, Andover
0.0% 0 0.0% 0 0.0% 0 0.0% 0 0.0% 0 0.0% 0 0.0% 0 0.0% 0 0.0% 0 0.0% 0 0.0% 0 0.0% 0
Sainsbury's, Station Mall, Basingstoke
0.1% 1 0.0% 0 0.0% 0 0.0% 0 0.0% 0 0.0% 0 0.0% 0 0.0% 0 0.0% 0 0.0% 0 0.0% 0 0.0% 0
Sainsbury's, Maxwell Road, Beaconsfield
0.1% 1 0.0% 0 0.0% 0 0.0% 0 0.0% 0 0.6% 1 0.0% 0 0.0% 0 0.0% 0 0.0% 0 0.0% 0 0.0% 0
Sainsbury's, Bagshot Road, Ringmead, Bracknell
0.1% 2 0.0% 0 0.0% 0 0.0% 0 0.0% 0 0.0% 0 0.0% 0 0.0% 0 0.0% 0 0.0% 0 2.2% 2 0.0% 0
Sainsbury's, Hectors Way, Newbury
0.0% 1 0.0% 0 0.0% 0 0.0% 0 0.0% 0 0.0% 0 0.0% 0 0.0% 0 0.0% 0 0.0% 0 0.0% 0 0.0% 0
Sainsbury's, Heyford Hill, Oxford
0.0% 0 0.0% 0 0.0% 0 0.0% 0 0.0% 0 0.0% 0 0.0% 0 0.0% 0 0.0% 0 0.0% 0 0.0% 0 0.0% 0
Sainsbury's, Bath Road, Calcot, Reading
0.4% 6 0.0% 0 3.5% 3 6.7% 2 0.0% 0 0.0% 0 0.0% 0 0.0% 0 0.0% 0 0.0% 0 0.0% 0 0.0% 0
Sainsbury's, The Causeway, Staines
0.0% 0 0.0% 0 0.0% 0 0.0% 0 0.0% 0 0.0% 0 0.0% 0 0.0% 0 0.8% 0 0.0% 0 0.0% 0 0.0% 0
Sainsbury's, Paddington Drive, Bridgemead, Swindon
0.0% 0 0.0% 0 0.0% 0 0.0% 0 0.0% 0 0.0% 0 0.0% 0 0.0% 0 0.0% 0 0.0% 0 0.0% 0 0.0% 0
Sainsbury's, King Street Lane, Winnersh
0.1% 1 1.0% 1 0.0% 0 0.0% 0 0.0% 0 0.0% 0 0.0% 0 0.0% 0 0.0% 0 0.0% 0 0.0% 0 0.0% 0
Tesco Extra, River Way, Andover
0.0% 0 0.0% 0 0.0% 0 0.0% 0 0.0% 0 0.0% 0 0.0% 0 0.0% 0 0.0% 0 0.0% 0 0.0% 0 0.0% 0
Tesco Extra, Pinchington Lane, Newbury
0.0% 1 0.0% 0 0.0% 0 0.0% 0 0.0% 0 0.0% 0 0.0% 0 0.0% 0 0.0% 0 0.0% 0 0.0% 0 0.0% 0
Tesco Extra, Portman Road, Reading
0.0% 0 0.0% 0 0.0% 0 0.7% 0 0.0% 0 0.0% 0 0.0% 0 0.0% 0 0.0% 0 0.0% 0 0.0% 0 0.0% 0
Tesco Extra, The Meadows, Marshall Road, Sandhurst
0.3% 5 0.0% 0 0.0% 0 0.0% 0 0.0% 0 0.0% 0 0.0% 0 0.0% 0 0.0% 0 0.0% 0 0.0% 0 6.4% 4
Tesco Superstore, County Lane, Warfield, Bracknell
0.1% 1 0.0% 0 0.0% 0 0.0% 0 0.0% 0 0.0% 0 0.0% 0 0.0% 0 1.6% 1 0.0% 0 0.0% 0 0.0% 0
Tesco Superstore, Whitton Road, Bracknell
0.1% 1 0.0% 0 0.0% 0 0.0% 0 0.0% 0 0.0% 0 0.0% 0 0.0% 0 0.0% 0 0.7% 1 0.0% 0 0.0% 0
Tesco Superstore, London 0.1% 1 0.0% 0 0.0% 0 0.0% 0 0.0% 0 0.0% 0 0.0% 0 0.0% 0 0.0% 0 0.0% 0 0.0% 0 0.0% 0
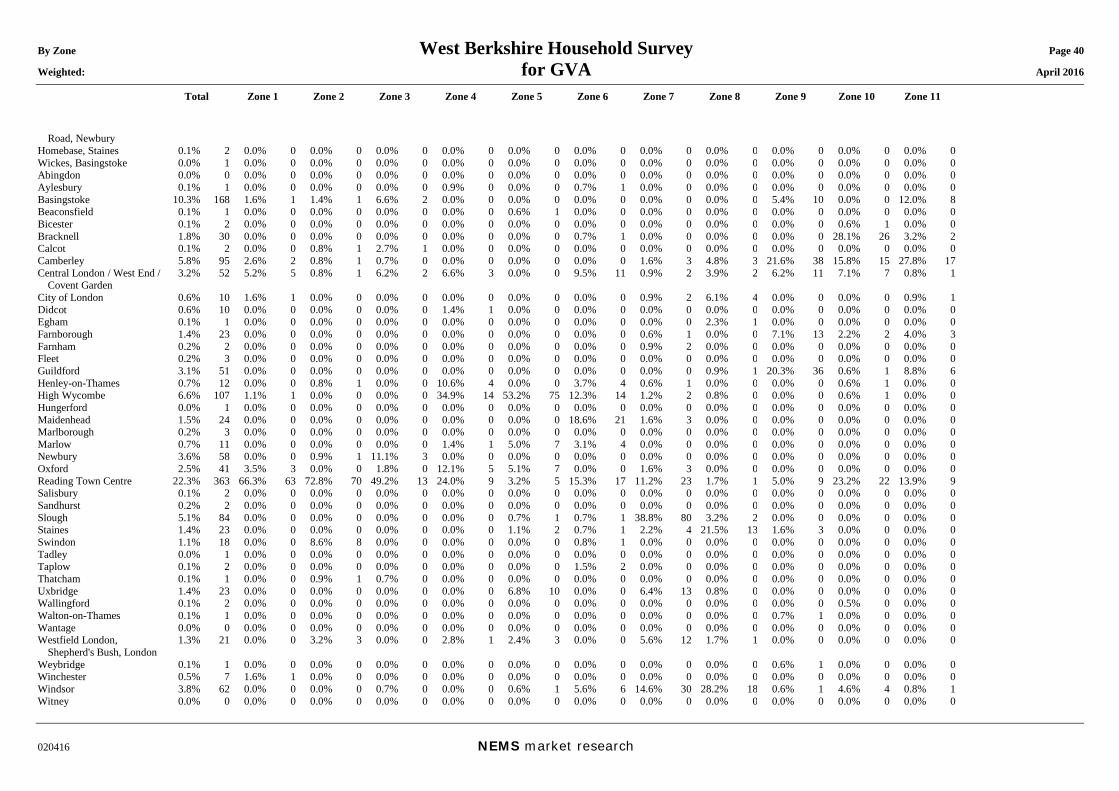
By Zone West Berkshire Household Survey Page 40 Weighted: for GVA April 2016
Total Zone 1 Zone 2 Zone 3 Zone 4 Zone 5 Zone 6 Zone 7 Zone 8 Zone 9 Zone 10 Zone 11
020416 NEMS market research
Road, Newbury Homebase, Staines 0.1% 2 0.0% 0 0.0% 0 0.0% 0 0.0% 0 0.0% 0 0.0% 0 0.0% 0 0.0% 0 0.0% 0 0.0% 0 0.0% 0 Wickes, Basingstoke 0.0% 1 0.0% 0 0.0% 0 0.0% 0 0.0% 0 0.0% 0 0.0% 0 0.0% 0 0.0% 0 0.0% 0 0.0% 0 0.0% 0 Abingdon 0.0% 0 0.0% 0 0.0% 0 0.0% 0 0.0% 0 0.0% 0 0.0% 0 0.0% 0 0.0% 0 0.0% 0 0.0% 0 0.0% 0 Aylesbury 0.1% 1 0.0% 0 0.0% 0 0.0% 0 0.9% 0 0.0% 0 0.7% 1 0.0% 0 0.0% 0 0.0% 0 0.0% 0 0.0% 0 Basingstoke 10.3% 168 1.6% 1 1.4% 1 6.6% 2 0.0% 0 0.0% 0 0.0% 0 0.0% 0 0.0% 0 5.4% 10 0.0% 0 12.0% 8 Beaconsfield 0.1% 1 0.0% 0 0.0% 0 0.0% 0 0.0% 0 0.6% 1 0.0% 0 0.0% 0 0.0% 0 0.0% 0 0.0% 0 0.0% 0 Bicester 0.1% 2 0.0% 0 0.0% 0 0.0% 0 0.0% 0 0.0% 0 0.0% 0 0.0% 0 0.0% 0 0.0% 0 0.6% 1 0.0% 0 Bracknell 1.8% 30 0.0% 0 0.0% 0 0.0% 0 0.0% 0 0.0% 0 0.7% 1 0.0% 0 0.0% 0 0.0% 0 28.1% 26 3.2% 2 Calcot 0.1% 2 0.0% 0 0.8% 1 2.7% 1 0.0% 0 0.0% 0 0.0% 0 0.0% 0 0.0% 0 0.0% 0 0.0% 0 0.0% 0 Camberley 5.8% 95 2.6% 2 0.8% 1 0.7% 0 0.0% 0 0.0% 0 0.0% 0 1.6% 3 4.8% 3 21.6% 38 15.8% 15 27.8% 17 Central London / West End /
Covent Garden 3.2% 52 5.2% 5 0.8% 1 6.2% 2 6.6% 3 0.0% 0 9.5% 11 0.9% 2 3.9% 2 6.2% 11 7.1% 7 0.8% 1
City of London 0.6% 10 1.6% 1 0.0% 0 0.0% 0 0.0% 0 0.0% 0 0.0% 0 0.9% 2 6.1% 4 0.0% 0 0.0% 0 0.9% 1 Didcot 0.6% 10 0.0% 0 0.0% 0 0.0% 0 1.4% 1 0.0% 0 0.0% 0 0.0% 0 0.0% 0 0.0% 0 0.0% 0 0.0% 0 Egham 0.1% 1 0.0% 0 0.0% 0 0.0% 0 0.0% 0 0.0% 0 0.0% 0 0.0% 0 2.3% 1 0.0% 0 0.0% 0 0.0% 0 Farnborough 1.4% 23 0.0% 0 0.0% 0 0.0% 0 0.0% 0 0.0% 0 0.0% 0 0.6% 1 0.0% 0 7.1% 13 2.2% 2 4.0% 3 Farnham 0.2% 2 0.0% 0 0.0% 0 0.0% 0 0.0% 0 0.0% 0 0.0% 0 0.9% 2 0.0% 0 0.0% 0 0.0% 0 0.0% 0 Fleet 0.2% 3 0.0% 0 0.0% 0 0.0% 0 0.0% 0 0.0% 0 0.0% 0 0.0% 0 0.0% 0 0.0% 0 0.0% 0 0.0% 0 Guildford 3.1% 51 0.0% 0 0.0% 0 0.0% 0 0.0% 0 0.0% 0 0.0% 0 0.0% 0 0.9% 1 20.3% 36 0.6% 1 8.8% 6 Henley-on-Thames 0.7% 12 0.0% 0 0.8% 1 0.0% 0 10.6% 4 0.0% 0 3.7% 4 0.6% 1 0.0% 0 0.0% 0 0.6% 1 0.0% 0 High Wycombe 6.6% 107 1.1% 1 0.0% 0 0.0% 0 34.9% 14 53.2% 75 12.3% 14 1.2% 2 0.8% 0 0.0% 0 0.6% 1 0.0% 0 Hungerford 0.0% 1 0.0% 0 0.0% 0 0.0% 0 0.0% 0 0.0% 0 0.0% 0 0.0% 0 0.0% 0 0.0% 0 0.0% 0 0.0% 0 Maidenhead 1.5% 24 0.0% 0 0.0% 0 0.0% 0 0.0% 0 0.0% 0 18.6% 21 1.6% 3 0.0% 0 0.0% 0 0.0% 0 0.0% 0 Marlborough 0.2% 3 0.0% 0 0.0% 0 0.0% 0 0.0% 0 0.0% 0 0.0% 0 0.0% 0 0.0% 0 0.0% 0 0.0% 0 0.0% 0 Marlow 0.7% 11 0.0% 0 0.0% 0 0.0% 0 1.4% 1 5.0% 7 3.1% 4 0.0% 0 0.0% 0 0.0% 0 0.0% 0 0.0% 0 Newbury 3.6% 58 0.0% 0 0.9% 1 11.1% 3 0.0% 0 0.0% 0 0.0% 0 0.0% 0 0.0% 0 0.0% 0 0.0% 0 0.0% 0 Oxford 2.5% 41 3.5% 3 0.0% 0 1.8% 0 12.1% 5 5.1% 7 0.0% 0 1.6% 3 0.0% 0 0.0% 0 0.0% 0 0.0% 0 Reading Town Centre 22.3% 363 66.3% 63 72.8% 70 49.2% 13 24.0% 9 3.2% 5 15.3% 17 11.2% 23 1.7% 1 5.0% 9 23.2% 22 13.9% 9 Salisbury 0.1% 2 0.0% 0 0.0% 0 0.0% 0 0.0% 0 0.0% 0 0.0% 0 0.0% 0 0.0% 0 0.0% 0 0.0% 0 0.0% 0 Sandhurst 0.2% 2 0.0% 0 0.0% 0 0.0% 0 0.0% 0 0.0% 0 0.0% 0 0.0% 0 0.0% 0 0.0% 0 0.0% 0 0.0% 0 Slough 5.1% 84 0.0% 0 0.0% 0 0.0% 0 0.0% 0 0.7% 1 0.7% 1 38.8% 80 3.2% 2 0.0% 0 0.0% 0 0.0% 0 Staines 1.4% 23 0.0% 0 0.0% 0 0.0% 0 0.0% 0 1.1% 2 0.7% 1 2.2% 4 21.5% 13 1.6% 3 0.0% 0 0.0% 0 Swindon 1.1% 18 0.0% 0 8.6% 8 0.0% 0 0.0% 0 0.0% 0 0.8% 1 0.0% 0 0.0% 0 0.0% 0 0.0% 0 0.0% 0 Tadley 0.0% 1 0.0% 0 0.0% 0 0.0% 0 0.0% 0 0.0% 0 0.0% 0 0.0% 0 0.0% 0 0.0% 0 0.0% 0 0.0% 0 Taplow 0.1% 2 0.0% 0 0.0% 0 0.0% 0 0.0% 0 0.0% 0 1.5% 2 0.0% 0 0.0% 0 0.0% 0 0.0% 0 0.0% 0 Thatcham 0.1% 1 0.0% 0 0.9% 1 0.7% 0 0.0% 0 0.0% 0 0.0% 0 0.0% 0 0.0% 0 0.0% 0 0.0% 0 0.0% 0 Uxbridge 1.4% 23 0.0% 0 0.0% 0 0.0% 0 0.0% 0 6.8% 10 0.0% 0 6.4% 13 0.8% 0 0.0% 0 0.0% 0 0.0% 0 Wallingford 0.1% 2 0.0% 0 0.0% 0 0.0% 0 0.0% 0 0.0% 0 0.0% 0 0.0% 0 0.0% 0 0.0% 0 0.5% 0 0.0% 0 Walton-on-Thames 0.1% 1 0.0% 0 0.0% 0 0.0% 0 0.0% 0 0.0% 0 0.0% 0 0.0% 0 0.0% 0 0.7% 1 0.0% 0 0.0% 0 Wantage 0.0% 0 0.0% 0 0.0% 0 0.0% 0 0.0% 0 0.0% 0 0.0% 0 0.0% 0 0.0% 0 0.0% 0 0.0% 0 0.0% 0 Westfield London,
Shepherd's Bush, London 1.3% 21 0.0% 0 3.2% 3 0.0% 0 2.8% 1 2.4% 3 0.0% 0 5.6% 12 1.7% 1 0.0% 0 0.0% 0 0.0% 0
Weybridge 0.1% 1 0.0% 0 0.0% 0 0.0% 0 0.0% 0 0.0% 0 0.0% 0 0.0% 0 0.0% 0 0.6% 1 0.0% 0 0.0% 0 Winchester 0.5% 7 1.6% 1 0.0% 0 0.0% 0 0.0% 0 0.0% 0 0.0% 0 0.0% 0 0.0% 0 0.0% 0 0.0% 0 0.0% 0 Windsor 3.8% 62 0.0% 0 0.0% 0 0.7% 0 0.0% 0 0.6% 1 5.6% 6 14.6% 30 28.2% 18 0.6% 1 4.6% 4 0.8% 1 Witney 0.0% 0 0.0% 0 0.0% 0 0.0% 0 0.0% 0 0.0% 0 0.0% 0 0.0% 0 0.0% 0 0.0% 0 0.0% 0 0.0% 0
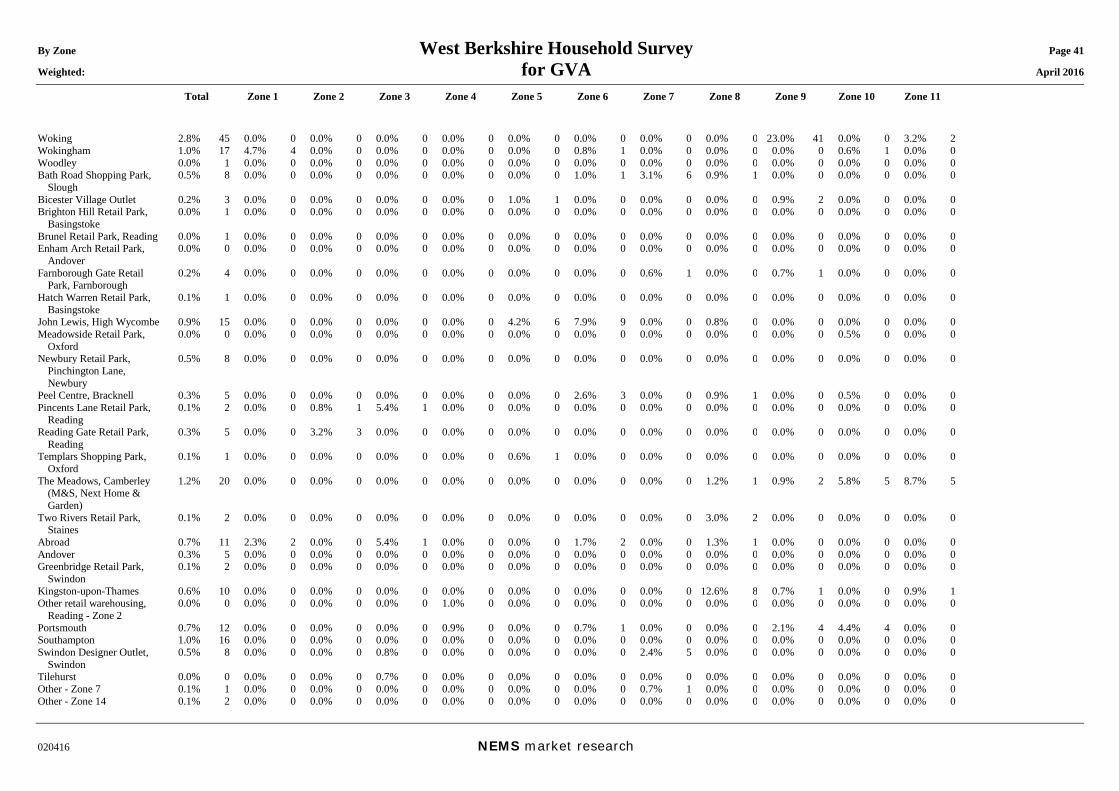
By Zone West Berkshire Household Survey Page 41 Weighted: for GVA April 2016
Total Zone 1 Zone 2 Zone 3 Zone 4 Zone 5 Zone 6 Zone 7 Zone 8 Zone 9 Zone 10 Zone 11
020416 NEMS market research
Woking 2.8% 45 0.0% 0 0.0% 0 0.0% 0 0.0% 0 0.0% 0 0.0% 0 0.0% 0 0.0% 0 23.0% 41 0.0% 0 3.2% 2 Wokingham 1.0% 17 4.7% 4 0.0% 0 0.0% 0 0.0% 0 0.0% 0 0.8% 1 0.0% 0 0.0% 0 0.0% 0 0.6% 1 0.0% 0 Woodley 0.0% 1 0.0% 0 0.0% 0 0.0% 0 0.0% 0 0.0% 0 0.0% 0 0.0% 0 0.0% 0 0.0% 0 0.0% 0 0.0% 0 Bath Road Shopping Park,
Slough 0.5% 8 0.0% 0 0.0% 0 0.0% 0 0.0% 0 0.0% 0 1.0% 1 3.1% 6 0.9% 1 0.0% 0 0.0% 0 0.0% 0
Bicester Village Outlet 0.2% 3 0.0% 0 0.0% 0 0.0% 0 0.0% 0 1.0% 1 0.0% 0 0.0% 0 0.0% 0 0.9% 2 0.0% 0 0.0% 0 Brighton Hill Retail Park,
Basingstoke 0.0% 1 0.0% 0 0.0% 0 0.0% 0 0.0% 0 0.0% 0 0.0% 0 0.0% 0 0.0% 0 0.0% 0 0.0% 0 0.0% 0
Brunel Retail Park, Reading 0.0% 1 0.0% 0 0.0% 0 0.0% 0 0.0% 0 0.0% 0 0.0% 0 0.0% 0 0.0% 0 0.0% 0 0.0% 0 0.0% 0 Enham Arch Retail Park,
Andover 0.0% 0 0.0% 0 0.0% 0 0.0% 0 0.0% 0 0.0% 0 0.0% 0 0.0% 0 0.0% 0 0.0% 0 0.0% 0 0.0% 0
Farnborough Gate Retail Park, Farnborough
0.2% 4 0.0% 0 0.0% 0 0.0% 0 0.0% 0 0.0% 0 0.0% 0 0.6% 1 0.0% 0 0.7% 1 0.0% 0 0.0% 0
Hatch Warren Retail Park, Basingstoke
0.1% 1 0.0% 0 0.0% 0 0.0% 0 0.0% 0 0.0% 0 0.0% 0 0.0% 0 0.0% 0 0.0% 0 0.0% 0 0.0% 0
John Lewis, High Wycombe 0.9% 15 0.0% 0 0.0% 0 0.0% 0 0.0% 0 4.2% 6 7.9% 9 0.0% 0 0.8% 0 0.0% 0 0.0% 0 0.0% 0 Meadowside Retail Park,
Oxford 0.0% 0 0.0% 0 0.0% 0 0.0% 0 0.0% 0 0.0% 0 0.0% 0 0.0% 0 0.0% 0 0.0% 0 0.5% 0 0.0% 0
Newbury Retail Park, Pinchington Lane, Newbury
0.5% 8 0.0% 0 0.0% 0 0.0% 0 0.0% 0 0.0% 0 0.0% 0 0.0% 0 0.0% 0 0.0% 0 0.0% 0 0.0% 0
Peel Centre, Bracknell 0.3% 5 0.0% 0 0.0% 0 0.0% 0 0.0% 0 0.0% 0 2.6% 3 0.0% 0 0.9% 1 0.0% 0 0.5% 0 0.0% 0 Pincents Lane Retail Park,
Reading 0.1% 2 0.0% 0 0.8% 1 5.4% 1 0.0% 0 0.0% 0 0.0% 0 0.0% 0 0.0% 0 0.0% 0 0.0% 0 0.0% 0
Reading Gate Retail Park, Reading
0.3% 5 0.0% 0 3.2% 3 0.0% 0 0.0% 0 0.0% 0 0.0% 0 0.0% 0 0.0% 0 0.0% 0 0.0% 0 0.0% 0
Templars Shopping Park, Oxford
0.1% 1 0.0% 0 0.0% 0 0.0% 0 0.0% 0 0.6% 1 0.0% 0 0.0% 0 0.0% 0 0.0% 0 0.0% 0 0.0% 0
The Meadows, Camberley (M&S, Next Home & Garden)
1.2% 20 0.0% 0 0.0% 0 0.0% 0 0.0% 0 0.0% 0 0.0% 0 0.0% 0 1.2% 1 0.9% 2 5.8% 5 8.7% 5
Two Rivers Retail Park, Staines
0.1% 2 0.0% 0 0.0% 0 0.0% 0 0.0% 0 0.0% 0 0.0% 0 0.0% 0 3.0% 2 0.0% 0 0.0% 0 0.0% 0
Abroad 0.7% 11 2.3% 2 0.0% 0 5.4% 1 0.0% 0 0.0% 0 1.7% 2 0.0% 0 1.3% 1 0.0% 0 0.0% 0 0.0% 0 Andover 0.3% 5 0.0% 0 0.0% 0 0.0% 0 0.0% 0 0.0% 0 0.0% 0 0.0% 0 0.0% 0 0.0% 0 0.0% 0 0.0% 0 Greenbridge Retail Park,
Swindon 0.1% 2 0.0% 0 0.0% 0 0.0% 0 0.0% 0 0.0% 0 0.0% 0 0.0% 0 0.0% 0 0.0% 0 0.0% 0 0.0% 0
Kingston-upon-Thames 0.6% 10 0.0% 0 0.0% 0 0.0% 0 0.0% 0 0.0% 0 0.0% 0 0.0% 0 12.6% 8 0.7% 1 0.0% 0 0.9% 1 Other retail warehousing,
Reading - Zone 2 0.0% 0 0.0% 0 0.0% 0 0.0% 0 1.0% 0 0.0% 0 0.0% 0 0.0% 0 0.0% 0 0.0% 0 0.0% 0 0.0% 0
Portsmouth 0.7% 12 0.0% 0 0.0% 0 0.0% 0 0.9% 0 0.0% 0 0.7% 1 0.0% 0 0.0% 0 2.1% 4 4.4% 4 0.0% 0 Southampton 1.0% 16 0.0% 0 0.0% 0 0.0% 0 0.0% 0 0.0% 0 0.0% 0 0.0% 0 0.0% 0 0.0% 0 0.0% 0 0.0% 0 Swindon Designer Outlet,
Swindon 0.5% 8 0.0% 0 0.0% 0 0.8% 0 0.0% 0 0.0% 0 0.0% 0 2.4% 5 0.0% 0 0.0% 0 0.0% 0 0.0% 0
Tilehurst 0.0% 0 0.0% 0 0.0% 0 0.7% 0 0.0% 0 0.0% 0 0.0% 0 0.0% 0 0.0% 0 0.0% 0 0.0% 0 0.0% 0 Other - Zone 7 0.1% 1 0.0% 0 0.0% 0 0.0% 0 0.0% 0 0.0% 0 0.0% 0 0.7% 1 0.0% 0 0.0% 0 0.0% 0 0.0% 0 Other - Zone 14 0.1% 2 0.0% 0 0.0% 0 0.0% 0 0.0% 0 0.0% 0 0.0% 0 0.0% 0 0.0% 0 0.0% 0 0.0% 0 0.0% 0
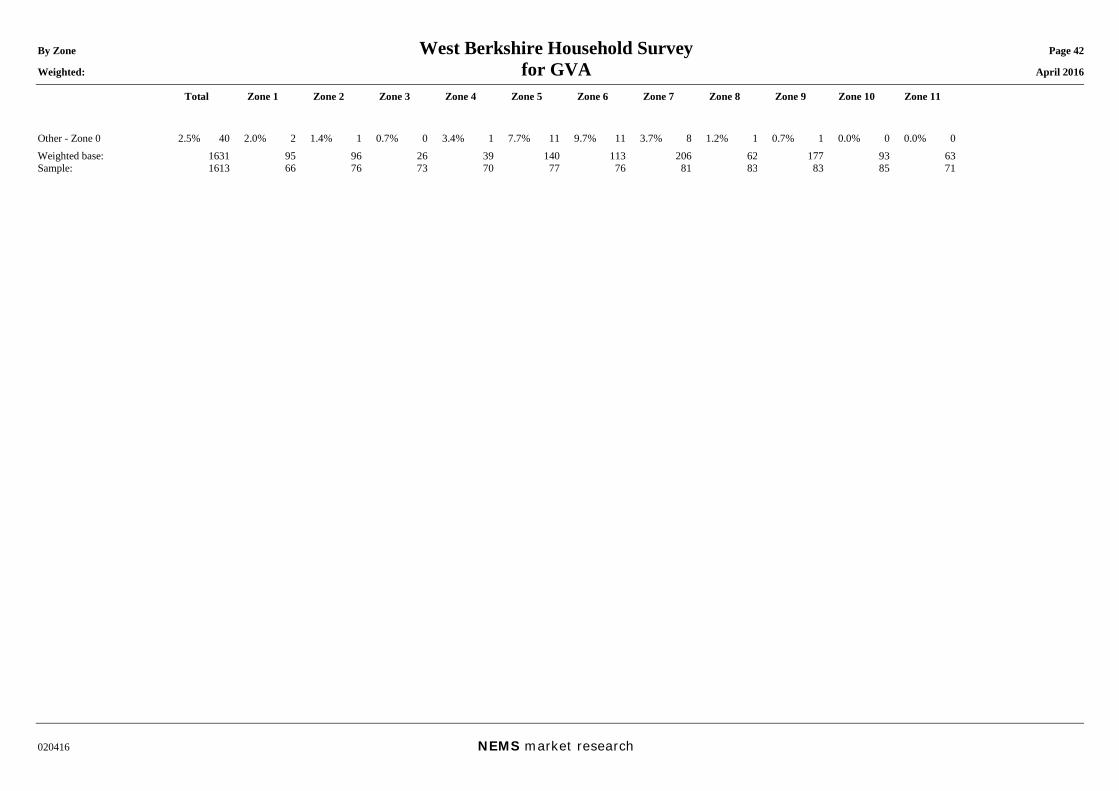
By Zone West Berkshire Household Survey Page 42 Weighted: for GVA April 2016
Total Zone 1 Zone 2 Zone 3 Zone 4 Zone 5 Zone 6 Zone 7 Zone 8 Zone 9 Zone 10 Zone 11
020416 NEMS market research
Other - Zone 0 2.5% 40 2.0% 2 1.4% 1 0.7% 0 3.4% 1 7.7% 11 9.7% 11 3.7% 8 1.2% 1 0.7% 1 0.0% 0 0.0% 0 Weighted base: 1631 95 96 26 39 140 113 206 62 177 93 63 Sample: 1613 66 76 73 70 77 76 81 83 83 85 71
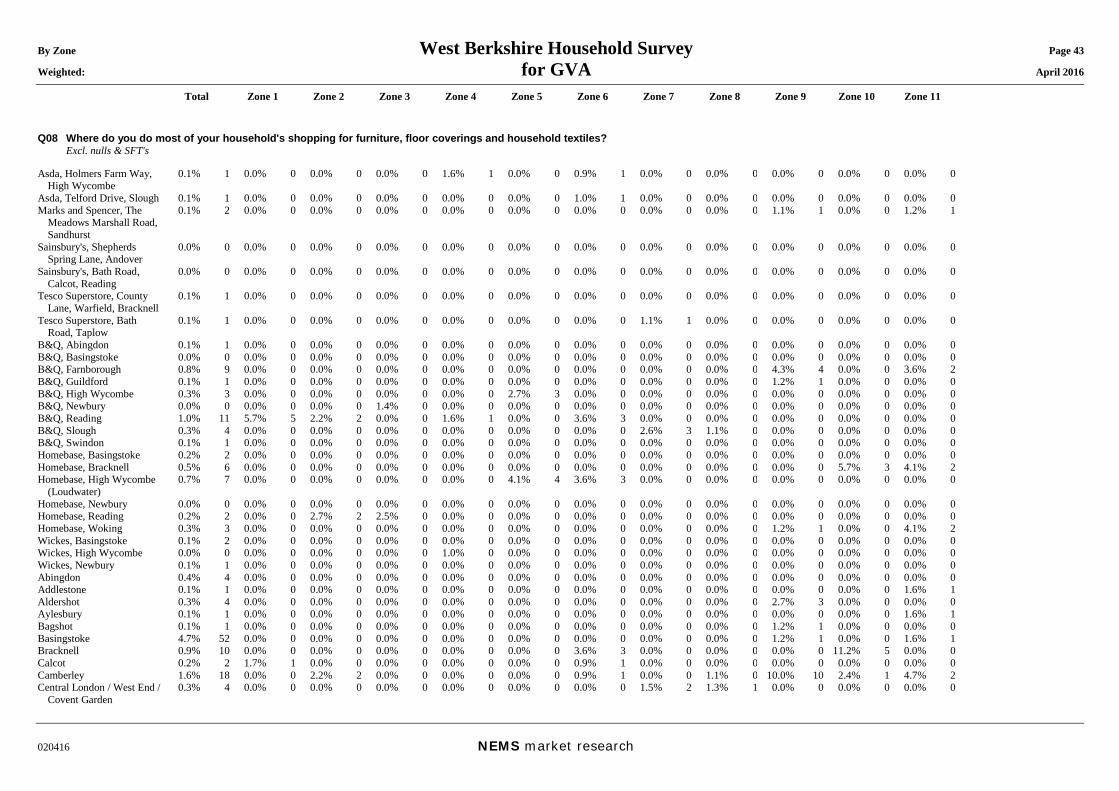
By Zone West Berkshire Household Survey Page 43 Weighted: for GVA April 2016
Total Zone 1 Zone 2 Zone 3 Zone 4 Zone 5 Zone 6 Zone 7 Zone 8 Zone 9 Zone 10 Zone 11
020416 NEMS market research
Q08 Where do you do most of your household's shopping for furniture, floor coverings and household textiles? Excl. nulls & SFT's Asda, Holmers Farm Way,
High Wycombe 0.1% 1 0.0% 0 0.0% 0 0.0% 0 1.6% 1 0.0% 0 0.9% 1 0.0% 0 0.0% 0 0.0% 0 0.0% 0 0.0% 0
Asda, Telford Drive, Slough 0.1% 1 0.0% 0 0.0% 0 0.0% 0 0.0% 0 0.0% 0 1.0% 1 0.0% 0 0.0% 0 0.0% 0 0.0% 0 0.0% 0 Marks and Spencer, The
Meadows Marshall Road, Sandhurst
0.1% 2 0.0% 0 0.0% 0 0.0% 0 0.0% 0 0.0% 0 0.0% 0 0.0% 0 0.0% 0 1.1% 1 0.0% 0 1.2% 1
Sainsbury's, Shepherds Spring Lane, Andover
0.0% 0 0.0% 0 0.0% 0 0.0% 0 0.0% 0 0.0% 0 0.0% 0 0.0% 0 0.0% 0 0.0% 0 0.0% 0 0.0% 0
Sainsbury's, Bath Road, Calcot, Reading
0.0% 0 0.0% 0 0.0% 0 0.0% 0 0.0% 0 0.0% 0 0.0% 0 0.0% 0 0.0% 0 0.0% 0 0.0% 0 0.0% 0
Tesco Superstore, County Lane, Warfield, Bracknell
0.1% 1 0.0% 0 0.0% 0 0.0% 0 0.0% 0 0.0% 0 0.0% 0 0.0% 0 0.0% 0 0.0% 0 0.0% 0 0.0% 0
Tesco Superstore, Bath Road, Taplow
0.1% 1 0.0% 0 0.0% 0 0.0% 0 0.0% 0 0.0% 0 0.0% 0 1.1% 1 0.0% 0 0.0% 0 0.0% 0 0.0% 0
B&Q, Abingdon 0.1% 1 0.0% 0 0.0% 0 0.0% 0 0.0% 0 0.0% 0 0.0% 0 0.0% 0 0.0% 0 0.0% 0 0.0% 0 0.0% 0 B&Q, Basingstoke 0.0% 0 0.0% 0 0.0% 0 0.0% 0 0.0% 0 0.0% 0 0.0% 0 0.0% 0 0.0% 0 0.0% 0 0.0% 0 0.0% 0 B&Q, Farnborough 0.8% 9 0.0% 0 0.0% 0 0.0% 0 0.0% 0 0.0% 0 0.0% 0 0.0% 0 0.0% 0 4.3% 4 0.0% 0 3.6% 2 B&Q, Guildford 0.1% 1 0.0% 0 0.0% 0 0.0% 0 0.0% 0 0.0% 0 0.0% 0 0.0% 0 0.0% 0 1.2% 1 0.0% 0 0.0% 0 B&Q, High Wycombe 0.3% 3 0.0% 0 0.0% 0 0.0% 0 0.0% 0 2.7% 3 0.0% 0 0.0% 0 0.0% 0 0.0% 0 0.0% 0 0.0% 0 B&Q, Newbury 0.0% 0 0.0% 0 0.0% 0 1.4% 0 0.0% 0 0.0% 0 0.0% 0 0.0% 0 0.0% 0 0.0% 0 0.0% 0 0.0% 0 B&Q, Reading 1.0% 11 5.7% 5 2.2% 2 0.0% 0 1.6% 1 0.0% 0 3.6% 3 0.0% 0 0.0% 0 0.0% 0 0.0% 0 0.0% 0 B&Q, Slough 0.3% 4 0.0% 0 0.0% 0 0.0% 0 0.0% 0 0.0% 0 0.0% 0 2.6% 3 1.1% 0 0.0% 0 0.0% 0 0.0% 0 B&Q, Swindon 0.1% 1 0.0% 0 0.0% 0 0.0% 0 0.0% 0 0.0% 0 0.0% 0 0.0% 0 0.0% 0 0.0% 0 0.0% 0 0.0% 0 Homebase, Basingstoke 0.2% 2 0.0% 0 0.0% 0 0.0% 0 0.0% 0 0.0% 0 0.0% 0 0.0% 0 0.0% 0 0.0% 0 0.0% 0 0.0% 0 Homebase, Bracknell 0.5% 6 0.0% 0 0.0% 0 0.0% 0 0.0% 0 0.0% 0 0.0% 0 0.0% 0 0.0% 0 0.0% 0 5.7% 3 4.1% 2 Homebase, High Wycombe
(Loudwater) 0.7% 7 0.0% 0 0.0% 0 0.0% 0 0.0% 0 4.1% 4 3.6% 3 0.0% 0 0.0% 0 0.0% 0 0.0% 0 0.0% 0
Homebase, Newbury 0.0% 0 0.0% 0 0.0% 0 0.0% 0 0.0% 0 0.0% 0 0.0% 0 0.0% 0 0.0% 0 0.0% 0 0.0% 0 0.0% 0 Homebase, Reading 0.2% 2 0.0% 0 2.7% 2 2.5% 0 0.0% 0 0.0% 0 0.0% 0 0.0% 0 0.0% 0 0.0% 0 0.0% 0 0.0% 0 Homebase, Woking 0.3% 3 0.0% 0 0.0% 0 0.0% 0 0.0% 0 0.0% 0 0.0% 0 0.0% 0 0.0% 0 1.2% 1 0.0% 0 4.1% 2 Wickes, Basingstoke 0.1% 2 0.0% 0 0.0% 0 0.0% 0 0.0% 0 0.0% 0 0.0% 0 0.0% 0 0.0% 0 0.0% 0 0.0% 0 0.0% 0 Wickes, High Wycombe 0.0% 0 0.0% 0 0.0% 0 0.0% 0 1.0% 0 0.0% 0 0.0% 0 0.0% 0 0.0% 0 0.0% 0 0.0% 0 0.0% 0 Wickes, Newbury 0.1% 1 0.0% 0 0.0% 0 0.0% 0 0.0% 0 0.0% 0 0.0% 0 0.0% 0 0.0% 0 0.0% 0 0.0% 0 0.0% 0 Abingdon 0.4% 4 0.0% 0 0.0% 0 0.0% 0 0.0% 0 0.0% 0 0.0% 0 0.0% 0 0.0% 0 0.0% 0 0.0% 0 0.0% 0 Addlestone 0.1% 1 0.0% 0 0.0% 0 0.0% 0 0.0% 0 0.0% 0 0.0% 0 0.0% 0 0.0% 0 0.0% 0 0.0% 0 1.6% 1 Aldershot 0.3% 4 0.0% 0 0.0% 0 0.0% 0 0.0% 0 0.0% 0 0.0% 0 0.0% 0 0.0% 0 2.7% 3 0.0% 0 0.0% 0 Aylesbury 0.1% 1 0.0% 0 0.0% 0 0.0% 0 0.0% 0 0.0% 0 0.0% 0 0.0% 0 0.0% 0 0.0% 0 0.0% 0 1.6% 1 Bagshot 0.1% 1 0.0% 0 0.0% 0 0.0% 0 0.0% 0 0.0% 0 0.0% 0 0.0% 0 0.0% 0 1.2% 1 0.0% 0 0.0% 0 Basingstoke 4.7% 52 0.0% 0 0.0% 0 0.0% 0 0.0% 0 0.0% 0 0.0% 0 0.0% 0 0.0% 0 1.2% 1 0.0% 0 1.6% 1 Bracknell 0.9% 10 0.0% 0 0.0% 0 0.0% 0 0.0% 0 0.0% 0 3.6% 3 0.0% 0 0.0% 0 0.0% 0 11.2% 5 0.0% 0 Calcot 0.2% 2 1.7% 1 0.0% 0 0.0% 0 0.0% 0 0.0% 0 0.9% 1 0.0% 0 0.0% 0 0.0% 0 0.0% 0 0.0% 0 Camberley 1.6% 18 0.0% 0 2.2% 2 0.0% 0 0.0% 0 0.0% 0 0.9% 1 0.0% 0 1.1% 0 10.0% 10 2.4% 1 4.7% 2 Central London / West End /
Covent Garden 0.3% 4 0.0% 0 0.0% 0 0.0% 0 0.0% 0 0.0% 0 0.0% 0 1.5% 2 1.3% 1 0.0% 0 0.0% 0 0.0% 0
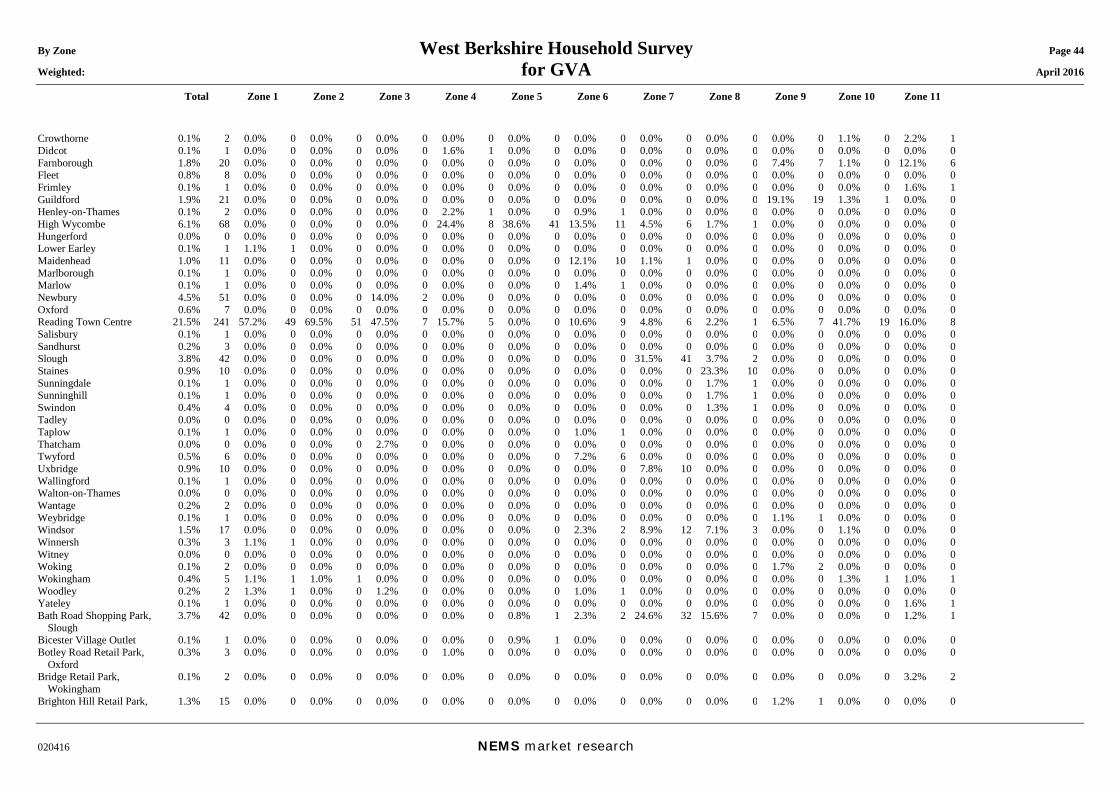
By Zone West Berkshire Household Survey Page 44 Weighted: for GVA April 2016
Total Zone 1 Zone 2 Zone 3 Zone 4 Zone 5 Zone 6 Zone 7 Zone 8 Zone 9 Zone 10 Zone 11
020416 NEMS market research
Crowthorne 0.1% 2 0.0% 0 0.0% 0 0.0% 0 0.0% 0 0.0% 0 0.0% 0 0.0% 0 0.0% 0 0.0% 0 1.1% 0 2.2% 1 Didcot 0.1% 1 0.0% 0 0.0% 0 0.0% 0 1.6% 1 0.0% 0 0.0% 0 0.0% 0 0.0% 0 0.0% 0 0.0% 0 0.0% 0 Farnborough 1.8% 20 0.0% 0 0.0% 0 0.0% 0 0.0% 0 0.0% 0 0.0% 0 0.0% 0 0.0% 0 7.4% 7 1.1% 0 12.1% 6 Fleet 0.8% 8 0.0% 0 0.0% 0 0.0% 0 0.0% 0 0.0% 0 0.0% 0 0.0% 0 0.0% 0 0.0% 0 0.0% 0 0.0% 0 Frimley 0.1% 1 0.0% 0 0.0% 0 0.0% 0 0.0% 0 0.0% 0 0.0% 0 0.0% 0 0.0% 0 0.0% 0 0.0% 0 1.6% 1 Guildford 1.9% 21 0.0% 0 0.0% 0 0.0% 0 0.0% 0 0.0% 0 0.0% 0 0.0% 0 0.0% 0 19.1% 19 1.3% 1 0.0% 0 Henley-on-Thames 0.1% 2 0.0% 0 0.0% 0 0.0% 0 2.2% 1 0.0% 0 0.9% 1 0.0% 0 0.0% 0 0.0% 0 0.0% 0 0.0% 0 High Wycombe 6.1% 68 0.0% 0 0.0% 0 0.0% 0 24.4% 8 38.6% 41 13.5% 11 4.5% 6 1.7% 1 0.0% 0 0.0% 0 0.0% 0 Hungerford 0.0% 0 0.0% 0 0.0% 0 0.0% 0 0.0% 0 0.0% 0 0.0% 0 0.0% 0 0.0% 0 0.0% 0 0.0% 0 0.0% 0 Lower Earley 0.1% 1 1.1% 1 0.0% 0 0.0% 0 0.0% 0 0.0% 0 0.0% 0 0.0% 0 0.0% 0 0.0% 0 0.0% 0 0.0% 0 Maidenhead 1.0% 11 0.0% 0 0.0% 0 0.0% 0 0.0% 0 0.0% 0 12.1% 10 1.1% 1 0.0% 0 0.0% 0 0.0% 0 0.0% 0 Marlborough 0.1% 1 0.0% 0 0.0% 0 0.0% 0 0.0% 0 0.0% 0 0.0% 0 0.0% 0 0.0% 0 0.0% 0 0.0% 0 0.0% 0 Marlow 0.1% 1 0.0% 0 0.0% 0 0.0% 0 0.0% 0 0.0% 0 1.4% 1 0.0% 0 0.0% 0 0.0% 0 0.0% 0 0.0% 0 Newbury 4.5% 51 0.0% 0 0.0% 0 14.0% 2 0.0% 0 0.0% 0 0.0% 0 0.0% 0 0.0% 0 0.0% 0 0.0% 0 0.0% 0 Oxford 0.6% 7 0.0% 0 0.0% 0 0.0% 0 0.0% 0 0.0% 0 0.0% 0 0.0% 0 0.0% 0 0.0% 0 0.0% 0 0.0% 0 Reading Town Centre 21.5% 241 57.2% 49 69.5% 51 47.5% 7 15.7% 5 0.0% 0 10.6% 9 4.8% 6 2.2% 1 6.5% 7 41.7% 19 16.0% 8 Salisbury 0.1% 1 0.0% 0 0.0% 0 0.0% 0 0.0% 0 0.0% 0 0.0% 0 0.0% 0 0.0% 0 0.0% 0 0.0% 0 0.0% 0 Sandhurst 0.2% 3 0.0% 0 0.0% 0 0.0% 0 0.0% 0 0.0% 0 0.0% 0 0.0% 0 0.0% 0 0.0% 0 0.0% 0 0.0% 0 Slough 3.8% 42 0.0% 0 0.0% 0 0.0% 0 0.0% 0 0.0% 0 0.0% 0 31.5% 41 3.7% 2 0.0% 0 0.0% 0 0.0% 0 Staines 0.9% 10 0.0% 0 0.0% 0 0.0% 0 0.0% 0 0.0% 0 0.0% 0 0.0% 0 23.3% 10 0.0% 0 0.0% 0 0.0% 0 Sunningdale 0.1% 1 0.0% 0 0.0% 0 0.0% 0 0.0% 0 0.0% 0 0.0% 0 0.0% 0 1.7% 1 0.0% 0 0.0% 0 0.0% 0 Sunninghill 0.1% 1 0.0% 0 0.0% 0 0.0% 0 0.0% 0 0.0% 0 0.0% 0 0.0% 0 1.7% 1 0.0% 0 0.0% 0 0.0% 0 Swindon 0.4% 4 0.0% 0 0.0% 0 0.0% 0 0.0% 0 0.0% 0 0.0% 0 0.0% 0 1.3% 1 0.0% 0 0.0% 0 0.0% 0 Tadley 0.0% 0 0.0% 0 0.0% 0 0.0% 0 0.0% 0 0.0% 0 0.0% 0 0.0% 0 0.0% 0 0.0% 0 0.0% 0 0.0% 0 Taplow 0.1% 1 0.0% 0 0.0% 0 0.0% 0 0.0% 0 0.0% 0 1.0% 1 0.0% 0 0.0% 0 0.0% 0 0.0% 0 0.0% 0 Thatcham 0.0% 0 0.0% 0 0.0% 0 2.7% 0 0.0% 0 0.0% 0 0.0% 0 0.0% 0 0.0% 0 0.0% 0 0.0% 0 0.0% 0 Twyford 0.5% 6 0.0% 0 0.0% 0 0.0% 0 0.0% 0 0.0% 0 7.2% 6 0.0% 0 0.0% 0 0.0% 0 0.0% 0 0.0% 0 Uxbridge 0.9% 10 0.0% 0 0.0% 0 0.0% 0 0.0% 0 0.0% 0 0.0% 0 7.8% 10 0.0% 0 0.0% 0 0.0% 0 0.0% 0 Wallingford 0.1% 1 0.0% 0 0.0% 0 0.0% 0 0.0% 0 0.0% 0 0.0% 0 0.0% 0 0.0% 0 0.0% 0 0.0% 0 0.0% 0 Walton-on-Thames 0.0% 0 0.0% 0 0.0% 0 0.0% 0 0.0% 0 0.0% 0 0.0% 0 0.0% 0 0.0% 0 0.0% 0 0.0% 0 0.0% 0 Wantage 0.2% 2 0.0% 0 0.0% 0 0.0% 0 0.0% 0 0.0% 0 0.0% 0 0.0% 0 0.0% 0 0.0% 0 0.0% 0 0.0% 0 Weybridge 0.1% 1 0.0% 0 0.0% 0 0.0% 0 0.0% 0 0.0% 0 0.0% 0 0.0% 0 0.0% 0 1.1% 1 0.0% 0 0.0% 0 Windsor 1.5% 17 0.0% 0 0.0% 0 0.0% 0 0.0% 0 0.0% 0 2.3% 2 8.9% 12 7.1% 3 0.0% 0 1.1% 0 0.0% 0 Winnersh 0.3% 3 1.1% 1 0.0% 0 0.0% 0 0.0% 0 0.0% 0 0.0% 0 0.0% 0 0.0% 0 0.0% 0 0.0% 0 0.0% 0 Witney 0.0% 0 0.0% 0 0.0% 0 0.0% 0 0.0% 0 0.0% 0 0.0% 0 0.0% 0 0.0% 0 0.0% 0 0.0% 0 0.0% 0 Woking 0.1% 2 0.0% 0 0.0% 0 0.0% 0 0.0% 0 0.0% 0 0.0% 0 0.0% 0 0.0% 0 1.7% 2 0.0% 0 0.0% 0 Wokingham 0.4% 5 1.1% 1 1.0% 1 0.0% 0 0.0% 0 0.0% 0 0.0% 0 0.0% 0 0.0% 0 0.0% 0 1.3% 1 1.0% 1 Woodley 0.2% 2 1.3% 1 0.0% 0 1.2% 0 0.0% 0 0.0% 0 1.0% 1 0.0% 0 0.0% 0 0.0% 0 0.0% 0 0.0% 0 Yateley 0.1% 1 0.0% 0 0.0% 0 0.0% 0 0.0% 0 0.0% 0 0.0% 0 0.0% 0 0.0% 0 0.0% 0 0.0% 0 1.6% 1 Bath Road Shopping Park,
Slough 3.7% 42 0.0% 0 0.0% 0 0.0% 0 0.0% 0 0.8% 1 2.3% 2 24.6% 32 15.6% 7 0.0% 0 0.0% 0 1.2% 1
Bicester Village Outlet 0.1% 1 0.0% 0 0.0% 0 0.0% 0 0.0% 0 0.9% 1 0.0% 0 0.0% 0 0.0% 0 0.0% 0 0.0% 0 0.0% 0 Botley Road Retail Park,
Oxford 0.3% 3 0.0% 0 0.0% 0 0.0% 0 1.0% 0 0.0% 0 0.0% 0 0.0% 0 0.0% 0 0.0% 0 0.0% 0 0.0% 0
Bridge Retail Park, Wokingham
0.1% 2 0.0% 0 0.0% 0 0.0% 0 0.0% 0 0.0% 0 0.0% 0 0.0% 0 0.0% 0 0.0% 0 0.0% 0 3.2% 2
Brighton Hill Retail Park, 1.3% 15 0.0% 0 0.0% 0 0.0% 0 0.0% 0 0.0% 0 0.0% 0 0.0% 0 0.0% 0 1.2% 1 0.0% 0 0.0% 0
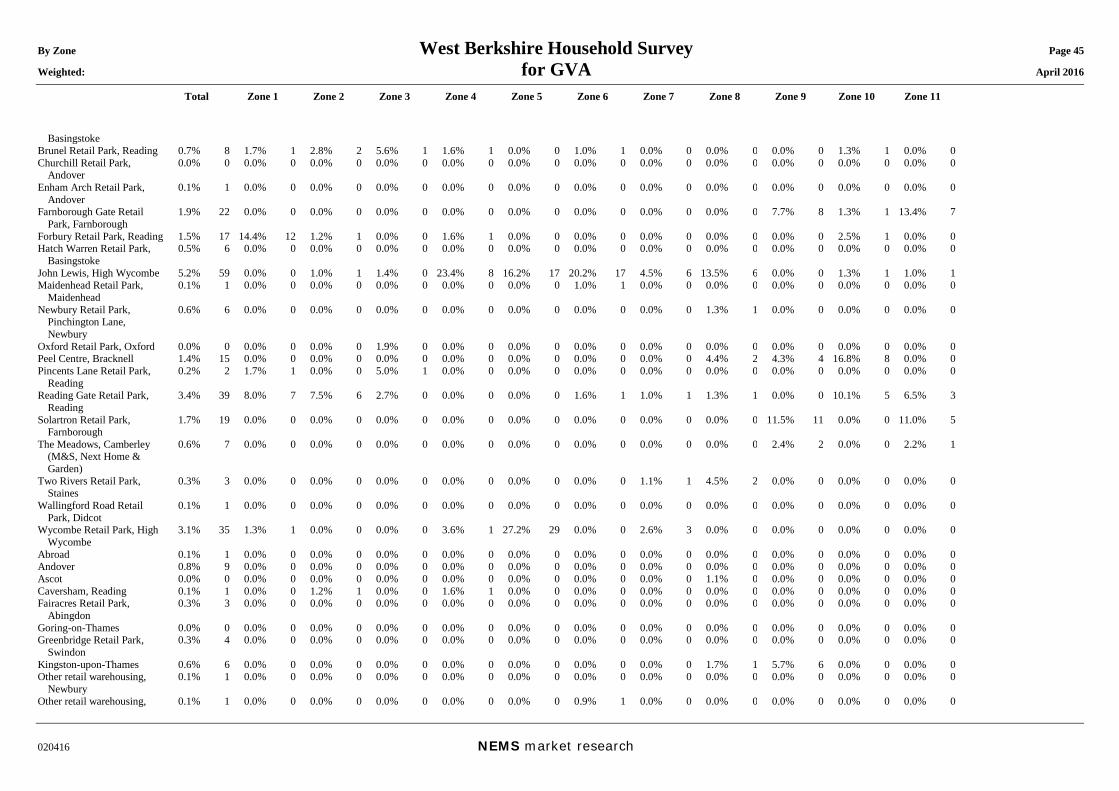
By Zone West Berkshire Household Survey Page 45 Weighted: for GVA April 2016
Total Zone 1 Zone 2 Zone 3 Zone 4 Zone 5 Zone 6 Zone 7 Zone 8 Zone 9 Zone 10 Zone 11
020416 NEMS market research
Basingstoke Brunel Retail Park, Reading 0.7% 8 1.7% 1 2.8% 2 5.6% 1 1.6% 1 0.0% 0 1.0% 1 0.0% 0 0.0% 0 0.0% 0 1.3% 1 0.0% 0 Churchill Retail Park,
Andover 0.0% 0 0.0% 0 0.0% 0 0.0% 0 0.0% 0 0.0% 0 0.0% 0 0.0% 0 0.0% 0 0.0% 0 0.0% 0 0.0% 0
Enham Arch Retail Park, Andover
0.1% 1 0.0% 0 0.0% 0 0.0% 0 0.0% 0 0.0% 0 0.0% 0 0.0% 0 0.0% 0 0.0% 0 0.0% 0 0.0% 0
Farnborough Gate Retail Park, Farnborough
1.9% 22 0.0% 0 0.0% 0 0.0% 0 0.0% 0 0.0% 0 0.0% 0 0.0% 0 0.0% 0 7.7% 8 1.3% 1 13.4% 7
Forbury Retail Park, Reading 1.5% 17 14.4% 12 1.2% 1 0.0% 0 1.6% 1 0.0% 0 0.0% 0 0.0% 0 0.0% 0 0.0% 0 2.5% 1 0.0% 0 Hatch Warren Retail Park,
Basingstoke 0.5% 6 0.0% 0 0.0% 0 0.0% 0 0.0% 0 0.0% 0 0.0% 0 0.0% 0 0.0% 0 0.0% 0 0.0% 0 0.0% 0
John Lewis, High Wycombe 5.2% 59 0.0% 0 1.0% 1 1.4% 0 23.4% 8 16.2% 17 20.2% 17 4.5% 6 13.5% 6 0.0% 0 1.3% 1 1.0% 1 Maidenhead Retail Park,
Maidenhead 0.1% 1 0.0% 0 0.0% 0 0.0% 0 0.0% 0 0.0% 0 1.0% 1 0.0% 0 0.0% 0 0.0% 0 0.0% 0 0.0% 0
Newbury Retail Park, Pinchington Lane, Newbury
0.6% 6 0.0% 0 0.0% 0 0.0% 0 0.0% 0 0.0% 0 0.0% 0 0.0% 0 1.3% 1 0.0% 0 0.0% 0 0.0% 0
Oxford Retail Park, Oxford 0.0% 0 0.0% 0 0.0% 0 1.9% 0 0.0% 0 0.0% 0 0.0% 0 0.0% 0 0.0% 0 0.0% 0 0.0% 0 0.0% 0 Peel Centre, Bracknell 1.4% 15 0.0% 0 0.0% 0 0.0% 0 0.0% 0 0.0% 0 0.0% 0 0.0% 0 4.4% 2 4.3% 4 16.8% 8 0.0% 0 Pincents Lane Retail Park,
Reading 0.2% 2 1.7% 1 0.0% 0 5.0% 1 0.0% 0 0.0% 0 0.0% 0 0.0% 0 0.0% 0 0.0% 0 0.0% 0 0.0% 0
Reading Gate Retail Park, Reading
3.4% 39 8.0% 7 7.5% 6 2.7% 0 0.0% 0 0.0% 0 1.6% 1 1.0% 1 1.3% 1 0.0% 0 10.1% 5 6.5% 3
Solartron Retail Park, Farnborough
1.7% 19 0.0% 0 0.0% 0 0.0% 0 0.0% 0 0.0% 0 0.0% 0 0.0% 0 0.0% 0 11.5% 11 0.0% 0 11.0% 5
The Meadows, Camberley (M&S, Next Home & Garden)
0.6% 7 0.0% 0 0.0% 0 0.0% 0 0.0% 0 0.0% 0 0.0% 0 0.0% 0 0.0% 0 2.4% 2 0.0% 0 2.2% 1
Two Rivers Retail Park, Staines
0.3% 3 0.0% 0 0.0% 0 0.0% 0 0.0% 0 0.0% 0 0.0% 0 1.1% 1 4.5% 2 0.0% 0 0.0% 0 0.0% 0
Wallingford Road Retail Park, Didcot
0.1% 1 0.0% 0 0.0% 0 0.0% 0 0.0% 0 0.0% 0 0.0% 0 0.0% 0 0.0% 0 0.0% 0 0.0% 0 0.0% 0
Wycombe Retail Park, High Wycombe
3.1% 35 1.3% 1 0.0% 0 0.0% 0 3.6% 1 27.2% 29 0.0% 0 2.6% 3 0.0% 0 0.0% 0 0.0% 0 0.0% 0
Abroad 0.1% 1 0.0% 0 0.0% 0 0.0% 0 0.0% 0 0.0% 0 0.0% 0 0.0% 0 0.0% 0 0.0% 0 0.0% 0 0.0% 0 Andover 0.8% 9 0.0% 0 0.0% 0 0.0% 0 0.0% 0 0.0% 0 0.0% 0 0.0% 0 0.0% 0 0.0% 0 0.0% 0 0.0% 0 Ascot 0.0% 0 0.0% 0 0.0% 0 0.0% 0 0.0% 0 0.0% 0 0.0% 0 0.0% 0 1.1% 0 0.0% 0 0.0% 0 0.0% 0 Caversham, Reading 0.1% 1 0.0% 0 1.2% 1 0.0% 0 1.6% 1 0.0% 0 0.0% 0 0.0% 0 0.0% 0 0.0% 0 0.0% 0 0.0% 0 Fairacres Retail Park,
Abingdon 0.3% 3 0.0% 0 0.0% 0 0.0% 0 0.0% 0 0.0% 0 0.0% 0 0.0% 0 0.0% 0 0.0% 0 0.0% 0 0.0% 0
Goring-on-Thames 0.0% 0 0.0% 0 0.0% 0 0.0% 0 0.0% 0 0.0% 0 0.0% 0 0.0% 0 0.0% 0 0.0% 0 0.0% 0 0.0% 0 Greenbridge Retail Park,
Swindon 0.3% 4 0.0% 0 0.0% 0 0.0% 0 0.0% 0 0.0% 0 0.0% 0 0.0% 0 0.0% 0 0.0% 0 0.0% 0 0.0% 0
Kingston-upon-Thames 0.6% 6 0.0% 0 0.0% 0 0.0% 0 0.0% 0 0.0% 0 0.0% 0 0.0% 0 1.7% 1 5.7% 6 0.0% 0 0.0% 0 Other retail warehousing,
Newbury 0.1% 1 0.0% 0 0.0% 0 0.0% 0 0.0% 0 0.0% 0 0.0% 0 0.0% 0 0.0% 0 0.0% 0 0.0% 0 0.0% 0
Other retail warehousing, 0.1% 1 0.0% 0 0.0% 0 0.0% 0 0.0% 0 0.0% 0 0.9% 1 0.0% 0 0.0% 0 0.0% 0 0.0% 0 0.0% 0
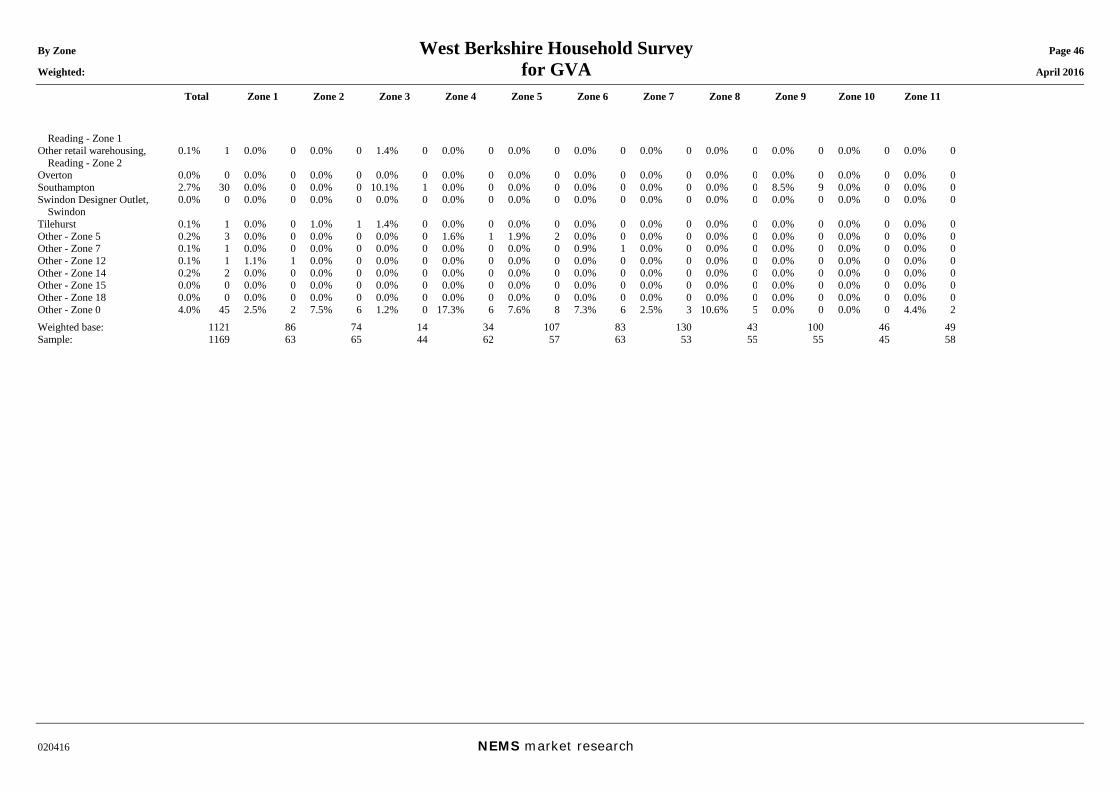
By Zone West Berkshire Household Survey Page 46 Weighted: for GVA April 2016
Total Zone 1 Zone 2 Zone 3 Zone 4 Zone 5 Zone 6 Zone 7 Zone 8 Zone 9 Zone 10 Zone 11
020416 NEMS market research
Reading - Zone 1 Other retail warehousing,
Reading - Zone 2 0.1% 1 0.0% 0 0.0% 0 1.4% 0 0.0% 0 0.0% 0 0.0% 0 0.0% 0 0.0% 0 0.0% 0 0.0% 0 0.0% 0
Overton 0.0% 0 0.0% 0 0.0% 0 0.0% 0 0.0% 0 0.0% 0 0.0% 0 0.0% 0 0.0% 0 0.0% 0 0.0% 0 0.0% 0 Southampton 2.7% 30 0.0% 0 0.0% 0 10.1% 1 0.0% 0 0.0% 0 0.0% 0 0.0% 0 0.0% 0 8.5% 9 0.0% 0 0.0% 0 Swindon Designer Outlet,
Swindon 0.0% 0 0.0% 0 0.0% 0 0.0% 0 0.0% 0 0.0% 0 0.0% 0 0.0% 0 0.0% 0 0.0% 0 0.0% 0 0.0% 0
Tilehurst 0.1% 1 0.0% 0 1.0% 1 1.4% 0 0.0% 0 0.0% 0 0.0% 0 0.0% 0 0.0% 0 0.0% 0 0.0% 0 0.0% 0 Other - Zone 5 0.2% 3 0.0% 0 0.0% 0 0.0% 0 1.6% 1 1.9% 2 0.0% 0 0.0% 0 0.0% 0 0.0% 0 0.0% 0 0.0% 0 Other - Zone 7 0.1% 1 0.0% 0 0.0% 0 0.0% 0 0.0% 0 0.0% 0 0.9% 1 0.0% 0 0.0% 0 0.0% 0 0.0% 0 0.0% 0 Other - Zone 12 0.1% 1 1.1% 1 0.0% 0 0.0% 0 0.0% 0 0.0% 0 0.0% 0 0.0% 0 0.0% 0 0.0% 0 0.0% 0 0.0% 0 Other - Zone 14 0.2% 2 0.0% 0 0.0% 0 0.0% 0 0.0% 0 0.0% 0 0.0% 0 0.0% 0 0.0% 0 0.0% 0 0.0% 0 0.0% 0 Other - Zone 15 0.0% 0 0.0% 0 0.0% 0 0.0% 0 0.0% 0 0.0% 0 0.0% 0 0.0% 0 0.0% 0 0.0% 0 0.0% 0 0.0% 0 Other - Zone 18 0.0% 0 0.0% 0 0.0% 0 0.0% 0 0.0% 0 0.0% 0 0.0% 0 0.0% 0 0.0% 0 0.0% 0 0.0% 0 0.0% 0 Other - Zone 0 4.0% 45 2.5% 2 7.5% 6 1.2% 0 17.3% 6 7.6% 8 7.3% 6 2.5% 3 10.6% 5 0.0% 0 0.0% 0 4.4% 2 Weighted base: 1121 86 74 14 34 107 83 130 43 100 46 49 Sample: 1169 63 65 44 62 57 63 53 55 55 45 58
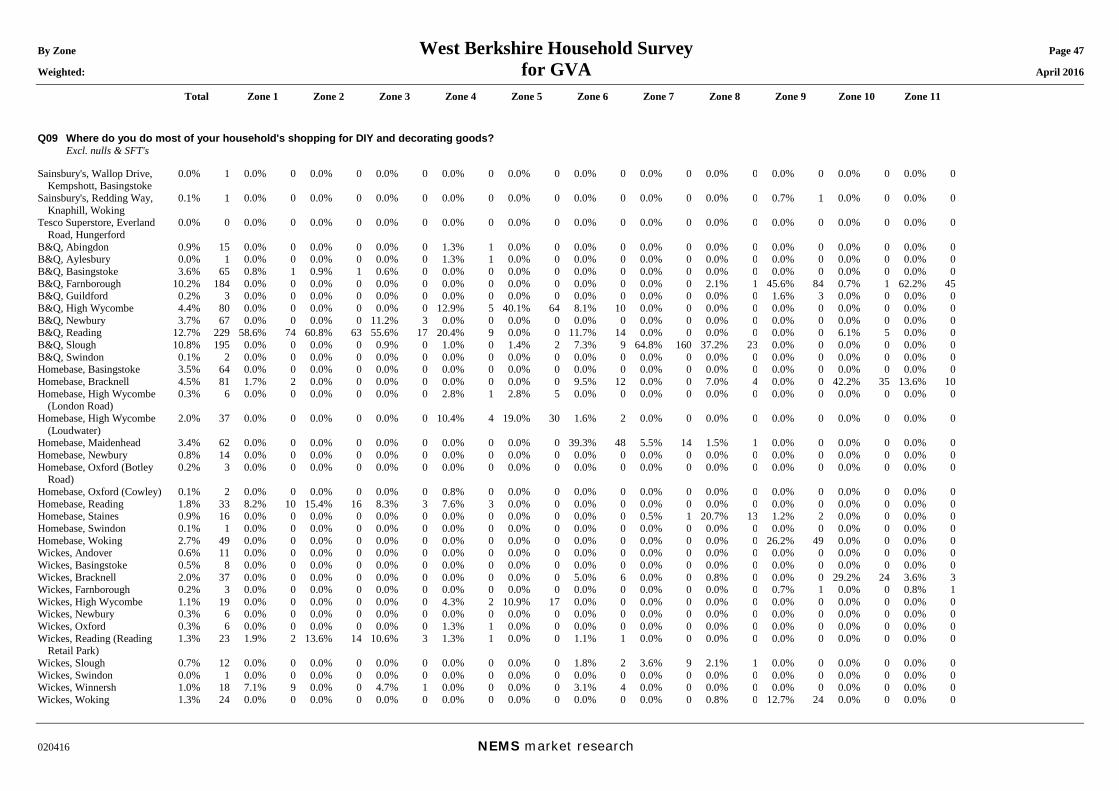
By Zone West Berkshire Household Survey Page 47 Weighted: for GVA April 2016
Total Zone 1 Zone 2 Zone 3 Zone 4 Zone 5 Zone 6 Zone 7 Zone 8 Zone 9 Zone 10 Zone 11
020416 NEMS market research
Q09 Where do you do most of your household's shopping for DIY and decorating goods? Excl. nulls & SFT's Sainsbury's, Wallop Drive,
Kempshott, Basingstoke 0.0% 1 0.0% 0 0.0% 0 0.0% 0 0.0% 0 0.0% 0 0.0% 0 0.0% 0 0.0% 0 0.0% 0 0.0% 0 0.0% 0
Sainsbury's, Redding Way, Knaphill, Woking
0.1% 1 0.0% 0 0.0% 0 0.0% 0 0.0% 0 0.0% 0 0.0% 0 0.0% 0 0.0% 0 0.7% 1 0.0% 0 0.0% 0
Tesco Superstore, Everland Road, Hungerford
0.0% 0 0.0% 0 0.0% 0 0.0% 0 0.0% 0 0.0% 0 0.0% 0 0.0% 0 0.0% 0 0.0% 0 0.0% 0 0.0% 0
B&Q, Abingdon 0.9% 15 0.0% 0 0.0% 0 0.0% 0 1.3% 1 0.0% 0 0.0% 0 0.0% 0 0.0% 0 0.0% 0 0.0% 0 0.0% 0 B&Q, Aylesbury 0.0% 1 0.0% 0 0.0% 0 0.0% 0 1.3% 1 0.0% 0 0.0% 0 0.0% 0 0.0% 0 0.0% 0 0.0% 0 0.0% 0 B&Q, Basingstoke 3.6% 65 0.8% 1 0.9% 1 0.6% 0 0.0% 0 0.0% 0 0.0% 0 0.0% 0 0.0% 0 0.0% 0 0.0% 0 0.0% 0 B&Q, Farnborough 10.2% 184 0.0% 0 0.0% 0 0.0% 0 0.0% 0 0.0% 0 0.0% 0 0.0% 0 2.1% 1 45.6% 84 0.7% 1 62.2% 45 B&Q, Guildford 0.2% 3 0.0% 0 0.0% 0 0.0% 0 0.0% 0 0.0% 0 0.0% 0 0.0% 0 0.0% 0 1.6% 3 0.0% 0 0.0% 0 B&Q, High Wycombe 4.4% 80 0.0% 0 0.0% 0 0.0% 0 12.9% 5 40.1% 64 8.1% 10 0.0% 0 0.0% 0 0.0% 0 0.0% 0 0.0% 0 B&Q, Newbury 3.7% 67 0.0% 0 0.0% 0 11.2% 3 0.0% 0 0.0% 0 0.0% 0 0.0% 0 0.0% 0 0.0% 0 0.0% 0 0.0% 0 B&Q, Reading 12.7% 229 58.6% 74 60.8% 63 55.6% 17 20.4% 9 0.0% 0 11.7% 14 0.0% 0 0.0% 0 0.0% 0 6.1% 5 0.0% 0 B&Q, Slough 10.8% 195 0.0% 0 0.0% 0 0.9% 0 1.0% 0 1.4% 2 7.3% 9 64.8% 160 37.2% 23 0.0% 0 0.0% 0 0.0% 0 B&Q, Swindon 0.1% 2 0.0% 0 0.0% 0 0.0% 0 0.0% 0 0.0% 0 0.0% 0 0.0% 0 0.0% 0 0.0% 0 0.0% 0 0.0% 0 Homebase, Basingstoke 3.5% 64 0.0% 0 0.0% 0 0.0% 0 0.0% 0 0.0% 0 0.0% 0 0.0% 0 0.0% 0 0.0% 0 0.0% 0 0.0% 0 Homebase, Bracknell 4.5% 81 1.7% 2 0.0% 0 0.0% 0 0.0% 0 0.0% 0 9.5% 12 0.0% 0 7.0% 4 0.0% 0 42.2% 35 13.6% 10 Homebase, High Wycombe
(London Road) 0.3% 6 0.0% 0 0.0% 0 0.0% 0 2.8% 1 2.8% 5 0.0% 0 0.0% 0 0.0% 0 0.0% 0 0.0% 0 0.0% 0
Homebase, High Wycombe (Loudwater)
2.0% 37 0.0% 0 0.0% 0 0.0% 0 10.4% 4 19.0% 30 1.6% 2 0.0% 0 0.0% 0 0.0% 0 0.0% 0 0.0% 0
Homebase, Maidenhead 3.4% 62 0.0% 0 0.0% 0 0.0% 0 0.0% 0 0.0% 0 39.3% 48 5.5% 14 1.5% 1 0.0% 0 0.0% 0 0.0% 0 Homebase, Newbury 0.8% 14 0.0% 0 0.0% 0 0.0% 0 0.0% 0 0.0% 0 0.0% 0 0.0% 0 0.0% 0 0.0% 0 0.0% 0 0.0% 0 Homebase, Oxford (Botley
Road) 0.2% 3 0.0% 0 0.0% 0 0.0% 0 0.0% 0 0.0% 0 0.0% 0 0.0% 0 0.0% 0 0.0% 0 0.0% 0 0.0% 0
Homebase, Oxford (Cowley) 0.1% 2 0.0% 0 0.0% 0 0.0% 0 0.8% 0 0.0% 0 0.0% 0 0.0% 0 0.0% 0 0.0% 0 0.0% 0 0.0% 0 Homebase, Reading 1.8% 33 8.2% 10 15.4% 16 8.3% 3 7.6% 3 0.0% 0 0.0% 0 0.0% 0 0.0% 0 0.0% 0 0.0% 0 0.0% 0 Homebase, Staines 0.9% 16 0.0% 0 0.0% 0 0.0% 0 0.0% 0 0.0% 0 0.0% 0 0.5% 1 20.7% 13 1.2% 2 0.0% 0 0.0% 0 Homebase, Swindon 0.1% 1 0.0% 0 0.0% 0 0.0% 0 0.0% 0 0.0% 0 0.0% 0 0.0% 0 0.0% 0 0.0% 0 0.0% 0 0.0% 0 Homebase, Woking 2.7% 49 0.0% 0 0.0% 0 0.0% 0 0.0% 0 0.0% 0 0.0% 0 0.0% 0 0.0% 0 26.2% 49 0.0% 0 0.0% 0 Wickes, Andover 0.6% 11 0.0% 0 0.0% 0 0.0% 0 0.0% 0 0.0% 0 0.0% 0 0.0% 0 0.0% 0 0.0% 0 0.0% 0 0.0% 0 Wickes, Basingstoke 0.5% 8 0.0% 0 0.0% 0 0.0% 0 0.0% 0 0.0% 0 0.0% 0 0.0% 0 0.0% 0 0.0% 0 0.0% 0 0.0% 0 Wickes, Bracknell 2.0% 37 0.0% 0 0.0% 0 0.0% 0 0.0% 0 0.0% 0 5.0% 6 0.0% 0 0.8% 0 0.0% 0 29.2% 24 3.6% 3 Wickes, Farnborough 0.2% 3 0.0% 0 0.0% 0 0.0% 0 0.0% 0 0.0% 0 0.0% 0 0.0% 0 0.0% 0 0.7% 1 0.0% 0 0.8% 1 Wickes, High Wycombe 1.1% 19 0.0% 0 0.0% 0 0.0% 0 4.3% 2 10.9% 17 0.0% 0 0.0% 0 0.0% 0 0.0% 0 0.0% 0 0.0% 0 Wickes, Newbury 0.3% 6 0.0% 0 0.0% 0 0.0% 0 0.0% 0 0.0% 0 0.0% 0 0.0% 0 0.0% 0 0.0% 0 0.0% 0 0.0% 0 Wickes, Oxford 0.3% 6 0.0% 0 0.0% 0 0.0% 0 1.3% 1 0.0% 0 0.0% 0 0.0% 0 0.0% 0 0.0% 0 0.0% 0 0.0% 0 Wickes, Reading (Reading
Retail Park) 1.3% 23 1.9% 2 13.6% 14 10.6% 3 1.3% 1 0.0% 0 1.1% 1 0.0% 0 0.0% 0 0.0% 0 0.0% 0 0.0% 0
Wickes, Slough 0.7% 12 0.0% 0 0.0% 0 0.0% 0 0.0% 0 0.0% 0 1.8% 2 3.6% 9 2.1% 1 0.0% 0 0.0% 0 0.0% 0 Wickes, Swindon 0.0% 1 0.0% 0 0.0% 0 0.0% 0 0.0% 0 0.0% 0 0.0% 0 0.0% 0 0.0% 0 0.0% 0 0.0% 0 0.0% 0 Wickes, Winnersh 1.0% 18 7.1% 9 0.0% 0 4.7% 1 0.0% 0 0.0% 0 3.1% 4 0.0% 0 0.0% 0 0.0% 0 0.0% 0 0.0% 0 Wickes, Woking 1.3% 24 0.0% 0 0.0% 0 0.0% 0 0.0% 0 0.0% 0 0.0% 0 0.0% 0 0.8% 0 12.7% 24 0.0% 0 0.0% 0
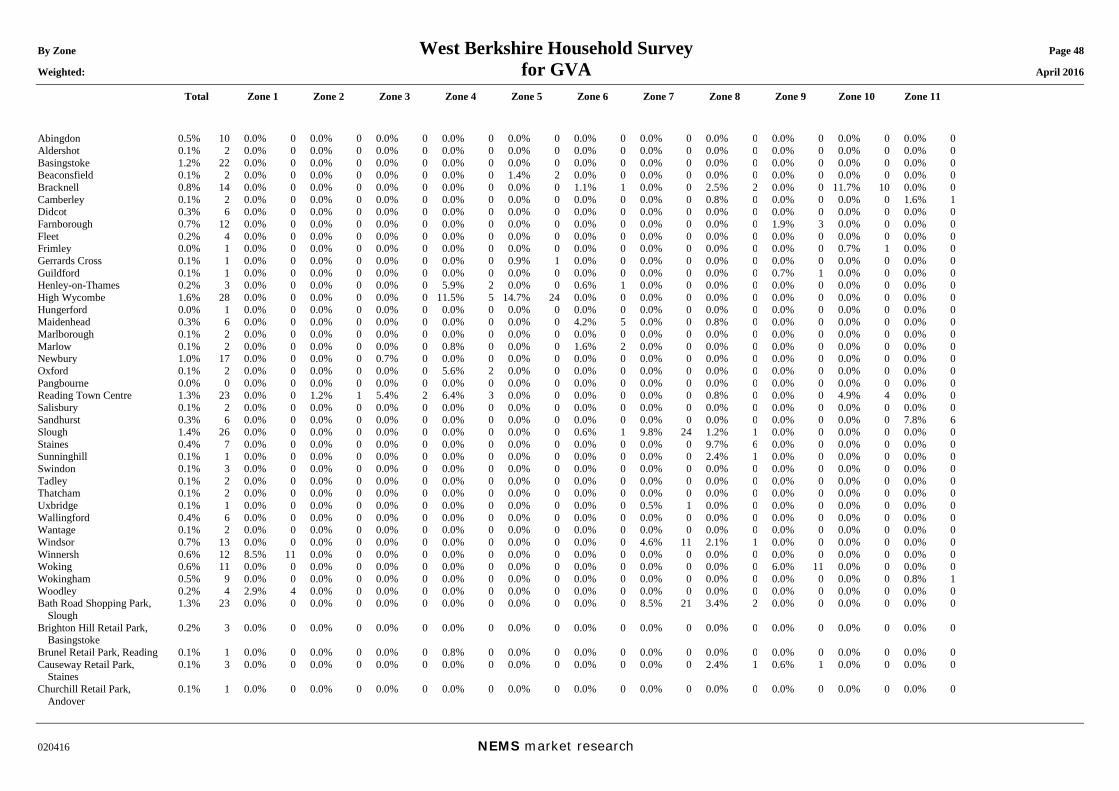
By Zone West Berkshire Household Survey Page 48 Weighted: for GVA April 2016
Total Zone 1 Zone 2 Zone 3 Zone 4 Zone 5 Zone 6 Zone 7 Zone 8 Zone 9 Zone 10 Zone 11
020416 NEMS market research
Abingdon 0.5% 10 0.0% 0 0.0% 0 0.0% 0 0.0% 0 0.0% 0 0.0% 0 0.0% 0 0.0% 0 0.0% 0 0.0% 0 0.0% 0 Aldershot 0.1% 2 0.0% 0 0.0% 0 0.0% 0 0.0% 0 0.0% 0 0.0% 0 0.0% 0 0.0% 0 0.0% 0 0.0% 0 0.0% 0 Basingstoke 1.2% 22 0.0% 0 0.0% 0 0.0% 0 0.0% 0 0.0% 0 0.0% 0 0.0% 0 0.0% 0 0.0% 0 0.0% 0 0.0% 0 Beaconsfield 0.1% 2 0.0% 0 0.0% 0 0.0% 0 0.0% 0 1.4% 2 0.0% 0 0.0% 0 0.0% 0 0.0% 0 0.0% 0 0.0% 0 Bracknell 0.8% 14 0.0% 0 0.0% 0 0.0% 0 0.0% 0 0.0% 0 1.1% 1 0.0% 0 2.5% 2 0.0% 0 11.7% 10 0.0% 0 Camberley 0.1% 2 0.0% 0 0.0% 0 0.0% 0 0.0% 0 0.0% 0 0.0% 0 0.0% 0 0.8% 0 0.0% 0 0.0% 0 1.6% 1 Didcot 0.3% 6 0.0% 0 0.0% 0 0.0% 0 0.0% 0 0.0% 0 0.0% 0 0.0% 0 0.0% 0 0.0% 0 0.0% 0 0.0% 0 Farnborough 0.7% 12 0.0% 0 0.0% 0 0.0% 0 0.0% 0 0.0% 0 0.0% 0 0.0% 0 0.0% 0 1.9% 3 0.0% 0 0.0% 0 Fleet 0.2% 4 0.0% 0 0.0% 0 0.0% 0 0.0% 0 0.0% 0 0.0% 0 0.0% 0 0.0% 0 0.0% 0 0.0% 0 0.0% 0 Frimley 0.0% 1 0.0% 0 0.0% 0 0.0% 0 0.0% 0 0.0% 0 0.0% 0 0.0% 0 0.0% 0 0.0% 0 0.7% 1 0.0% 0 Gerrards Cross 0.1% 1 0.0% 0 0.0% 0 0.0% 0 0.0% 0 0.9% 1 0.0% 0 0.0% 0 0.0% 0 0.0% 0 0.0% 0 0.0% 0 Guildford 0.1% 1 0.0% 0 0.0% 0 0.0% 0 0.0% 0 0.0% 0 0.0% 0 0.0% 0 0.0% 0 0.7% 1 0.0% 0 0.0% 0 Henley-on-Thames 0.2% 3 0.0% 0 0.0% 0 0.0% 0 5.9% 2 0.0% 0 0.6% 1 0.0% 0 0.0% 0 0.0% 0 0.0% 0 0.0% 0 High Wycombe 1.6% 28 0.0% 0 0.0% 0 0.0% 0 11.5% 5 14.7% 24 0.0% 0 0.0% 0 0.0% 0 0.0% 0 0.0% 0 0.0% 0 Hungerford 0.0% 1 0.0% 0 0.0% 0 0.0% 0 0.0% 0 0.0% 0 0.0% 0 0.0% 0 0.0% 0 0.0% 0 0.0% 0 0.0% 0 Maidenhead 0.3% 6 0.0% 0 0.0% 0 0.0% 0 0.0% 0 0.0% 0 4.2% 5 0.0% 0 0.8% 0 0.0% 0 0.0% 0 0.0% 0 Marlborough 0.1% 2 0.0% 0 0.0% 0 0.0% 0 0.0% 0 0.0% 0 0.0% 0 0.0% 0 0.0% 0 0.0% 0 0.0% 0 0.0% 0 Marlow 0.1% 2 0.0% 0 0.0% 0 0.0% 0 0.8% 0 0.0% 0 1.6% 2 0.0% 0 0.0% 0 0.0% 0 0.0% 0 0.0% 0 Newbury 1.0% 17 0.0% 0 0.0% 0 0.7% 0 0.0% 0 0.0% 0 0.0% 0 0.0% 0 0.0% 0 0.0% 0 0.0% 0 0.0% 0 Oxford 0.1% 2 0.0% 0 0.0% 0 0.0% 0 5.6% 2 0.0% 0 0.0% 0 0.0% 0 0.0% 0 0.0% 0 0.0% 0 0.0% 0 Pangbourne 0.0% 0 0.0% 0 0.0% 0 0.0% 0 0.0% 0 0.0% 0 0.0% 0 0.0% 0 0.0% 0 0.0% 0 0.0% 0 0.0% 0 Reading Town Centre 1.3% 23 0.0% 0 1.2% 1 5.4% 2 6.4% 3 0.0% 0 0.0% 0 0.0% 0 0.8% 0 0.0% 0 4.9% 4 0.0% 0 Salisbury 0.1% 2 0.0% 0 0.0% 0 0.0% 0 0.0% 0 0.0% 0 0.0% 0 0.0% 0 0.0% 0 0.0% 0 0.0% 0 0.0% 0 Sandhurst 0.3% 6 0.0% 0 0.0% 0 0.0% 0 0.0% 0 0.0% 0 0.0% 0 0.0% 0 0.0% 0 0.0% 0 0.0% 0 7.8% 6 Slough 1.4% 26 0.0% 0 0.0% 0 0.0% 0 0.0% 0 0.0% 0 0.6% 1 9.8% 24 1.2% 1 0.0% 0 0.0% 0 0.0% 0 Staines 0.4% 7 0.0% 0 0.0% 0 0.0% 0 0.0% 0 0.0% 0 0.0% 0 0.0% 0 9.7% 6 0.0% 0 0.0% 0 0.0% 0 Sunninghill 0.1% 1 0.0% 0 0.0% 0 0.0% 0 0.0% 0 0.0% 0 0.0% 0 0.0% 0 2.4% 1 0.0% 0 0.0% 0 0.0% 0 Swindon 0.1% 3 0.0% 0 0.0% 0 0.0% 0 0.0% 0 0.0% 0 0.0% 0 0.0% 0 0.0% 0 0.0% 0 0.0% 0 0.0% 0 Tadley 0.1% 2 0.0% 0 0.0% 0 0.0% 0 0.0% 0 0.0% 0 0.0% 0 0.0% 0 0.0% 0 0.0% 0 0.0% 0 0.0% 0 Thatcham 0.1% 2 0.0% 0 0.0% 0 0.0% 0 0.0% 0 0.0% 0 0.0% 0 0.0% 0 0.0% 0 0.0% 0 0.0% 0 0.0% 0 Uxbridge 0.1% 1 0.0% 0 0.0% 0 0.0% 0 0.0% 0 0.0% 0 0.0% 0 0.5% 1 0.0% 0 0.0% 0 0.0% 0 0.0% 0 Wallingford 0.4% 6 0.0% 0 0.0% 0 0.0% 0 0.0% 0 0.0% 0 0.0% 0 0.0% 0 0.0% 0 0.0% 0 0.0% 0 0.0% 0 Wantage 0.1% 2 0.0% 0 0.0% 0 0.0% 0 0.0% 0 0.0% 0 0.0% 0 0.0% 0 0.0% 0 0.0% 0 0.0% 0 0.0% 0 Windsor 0.7% 13 0.0% 0 0.0% 0 0.0% 0 0.0% 0 0.0% 0 0.0% 0 4.6% 11 2.1% 1 0.0% 0 0.0% 0 0.0% 0 Winnersh 0.6% 12 8.5% 11 0.0% 0 0.0% 0 0.0% 0 0.0% 0 0.0% 0 0.0% 0 0.0% 0 0.0% 0 0.0% 0 0.0% 0 Woking 0.6% 11 0.0% 0 0.0% 0 0.0% 0 0.0% 0 0.0% 0 0.0% 0 0.0% 0 0.0% 0 6.0% 11 0.0% 0 0.0% 0 Wokingham 0.5% 9 0.0% 0 0.0% 0 0.0% 0 0.0% 0 0.0% 0 0.0% 0 0.0% 0 0.0% 0 0.0% 0 0.0% 0 0.8% 1 Woodley 0.2% 4 2.9% 4 0.0% 0 0.0% 0 0.0% 0 0.0% 0 0.0% 0 0.0% 0 0.0% 0 0.0% 0 0.0% 0 0.0% 0 Bath Road Shopping Park,
Slough 1.3% 23 0.0% 0 0.0% 0 0.0% 0 0.0% 0 0.0% 0 0.0% 0 8.5% 21 3.4% 2 0.0% 0 0.0% 0 0.0% 0
Brighton Hill Retail Park, Basingstoke
0.2% 3 0.0% 0 0.0% 0 0.0% 0 0.0% 0 0.0% 0 0.0% 0 0.0% 0 0.0% 0 0.0% 0 0.0% 0 0.0% 0
Brunel Retail Park, Reading 0.1% 1 0.0% 0 0.0% 0 0.0% 0 0.8% 0 0.0% 0 0.0% 0 0.0% 0 0.0% 0 0.0% 0 0.0% 0 0.0% 0 Causeway Retail Park,
Staines 0.1% 3 0.0% 0 0.0% 0 0.0% 0 0.0% 0 0.0% 0 0.0% 0 0.0% 0 2.4% 1 0.6% 1 0.0% 0 0.0% 0
Churchill Retail Park, Andover
0.1% 1 0.0% 0 0.0% 0 0.0% 0 0.0% 0 0.0% 0 0.0% 0 0.0% 0 0.0% 0 0.0% 0 0.0% 0 0.0% 0
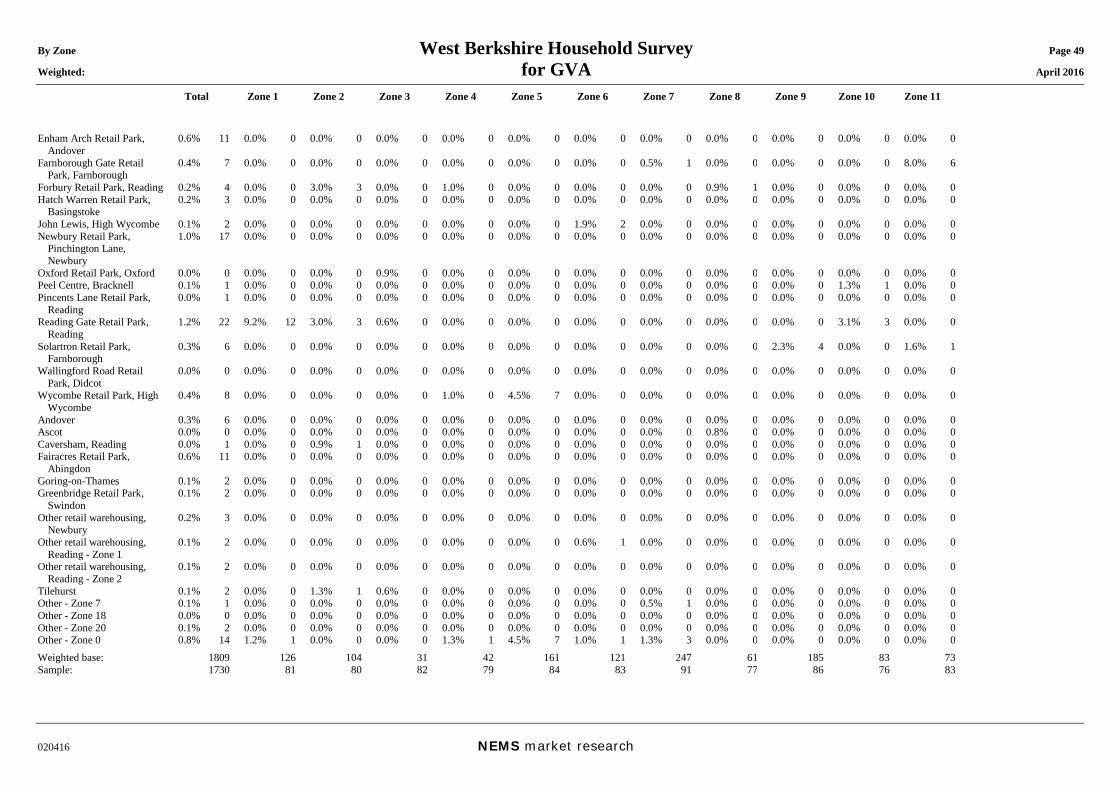
By Zone West Berkshire Household Survey Page 49 Weighted: for GVA April 2016
Total Zone 1 Zone 2 Zone 3 Zone 4 Zone 5 Zone 6 Zone 7 Zone 8 Zone 9 Zone 10 Zone 11
020416 NEMS market research
Enham Arch Retail Park, Andover
0.6% 11 0.0% 0 0.0% 0 0.0% 0 0.0% 0 0.0% 0 0.0% 0 0.0% 0 0.0% 0 0.0% 0 0.0% 0 0.0% 0
Farnborough Gate Retail Park, Farnborough
0.4% 7 0.0% 0 0.0% 0 0.0% 0 0.0% 0 0.0% 0 0.0% 0 0.5% 1 0.0% 0 0.0% 0 0.0% 0 8.0% 6
Forbury Retail Park, Reading 0.2% 4 0.0% 0 3.0% 3 0.0% 0 1.0% 0 0.0% 0 0.0% 0 0.0% 0 0.9% 1 0.0% 0 0.0% 0 0.0% 0 Hatch Warren Retail Park,
Basingstoke 0.2% 3 0.0% 0 0.0% 0 0.0% 0 0.0% 0 0.0% 0 0.0% 0 0.0% 0 0.0% 0 0.0% 0 0.0% 0 0.0% 0
John Lewis, High Wycombe 0.1% 2 0.0% 0 0.0% 0 0.0% 0 0.0% 0 0.0% 0 1.9% 2 0.0% 0 0.0% 0 0.0% 0 0.0% 0 0.0% 0 Newbury Retail Park,
Pinchington Lane, Newbury
1.0% 17 0.0% 0 0.0% 0 0.0% 0 0.0% 0 0.0% 0 0.0% 0 0.0% 0 0.0% 0 0.0% 0 0.0% 0 0.0% 0
Oxford Retail Park, Oxford 0.0% 0 0.0% 0 0.0% 0 0.9% 0 0.0% 0 0.0% 0 0.0% 0 0.0% 0 0.0% 0 0.0% 0 0.0% 0 0.0% 0 Peel Centre, Bracknell 0.1% 1 0.0% 0 0.0% 0 0.0% 0 0.0% 0 0.0% 0 0.0% 0 0.0% 0 0.0% 0 0.0% 0 1.3% 1 0.0% 0 Pincents Lane Retail Park,
Reading 0.0% 1 0.0% 0 0.0% 0 0.0% 0 0.0% 0 0.0% 0 0.0% 0 0.0% 0 0.0% 0 0.0% 0 0.0% 0 0.0% 0
Reading Gate Retail Park, Reading
1.2% 22 9.2% 12 3.0% 3 0.6% 0 0.0% 0 0.0% 0 0.0% 0 0.0% 0 0.0% 0 0.0% 0 3.1% 3 0.0% 0
Solartron Retail Park, Farnborough
0.3% 6 0.0% 0 0.0% 0 0.0% 0 0.0% 0 0.0% 0 0.0% 0 0.0% 0 0.0% 0 2.3% 4 0.0% 0 1.6% 1
Wallingford Road Retail Park, Didcot
0.0% 0 0.0% 0 0.0% 0 0.0% 0 0.0% 0 0.0% 0 0.0% 0 0.0% 0 0.0% 0 0.0% 0 0.0% 0 0.0% 0
Wycombe Retail Park, High Wycombe
0.4% 8 0.0% 0 0.0% 0 0.0% 0 1.0% 0 4.5% 7 0.0% 0 0.0% 0 0.0% 0 0.0% 0 0.0% 0 0.0% 0
Andover 0.3% 6 0.0% 0 0.0% 0 0.0% 0 0.0% 0 0.0% 0 0.0% 0 0.0% 0 0.0% 0 0.0% 0 0.0% 0 0.0% 0 Ascot 0.0% 0 0.0% 0 0.0% 0 0.0% 0 0.0% 0 0.0% 0 0.0% 0 0.0% 0 0.8% 0 0.0% 0 0.0% 0 0.0% 0 Caversham, Reading 0.0% 1 0.0% 0 0.9% 1 0.0% 0 0.0% 0 0.0% 0 0.0% 0 0.0% 0 0.0% 0 0.0% 0 0.0% 0 0.0% 0 Fairacres Retail Park,
Abingdon 0.6% 11 0.0% 0 0.0% 0 0.0% 0 0.0% 0 0.0% 0 0.0% 0 0.0% 0 0.0% 0 0.0% 0 0.0% 0 0.0% 0
Goring-on-Thames 0.1% 2 0.0% 0 0.0% 0 0.0% 0 0.0% 0 0.0% 0 0.0% 0 0.0% 0 0.0% 0 0.0% 0 0.0% 0 0.0% 0 Greenbridge Retail Park,
Swindon 0.1% 2 0.0% 0 0.0% 0 0.0% 0 0.0% 0 0.0% 0 0.0% 0 0.0% 0 0.0% 0 0.0% 0 0.0% 0 0.0% 0
Other retail warehousing, Newbury
0.2% 3 0.0% 0 0.0% 0 0.0% 0 0.0% 0 0.0% 0 0.0% 0 0.0% 0 0.0% 0 0.0% 0 0.0% 0 0.0% 0
Other retail warehousing, Reading - Zone 1
0.1% 2 0.0% 0 0.0% 0 0.0% 0 0.0% 0 0.0% 0 0.6% 1 0.0% 0 0.0% 0 0.0% 0 0.0% 0 0.0% 0
Other retail warehousing, Reading - Zone 2
0.1% 2 0.0% 0 0.0% 0 0.0% 0 0.0% 0 0.0% 0 0.0% 0 0.0% 0 0.0% 0 0.0% 0 0.0% 0 0.0% 0
Tilehurst 0.1% 2 0.0% 0 1.3% 1 0.6% 0 0.0% 0 0.0% 0 0.0% 0 0.0% 0 0.0% 0 0.0% 0 0.0% 0 0.0% 0 Other - Zone 7 0.1% 1 0.0% 0 0.0% 0 0.0% 0 0.0% 0 0.0% 0 0.0% 0 0.5% 1 0.0% 0 0.0% 0 0.0% 0 0.0% 0 Other - Zone 18 0.0% 0 0.0% 0 0.0% 0 0.0% 0 0.0% 0 0.0% 0 0.0% 0 0.0% 0 0.0% 0 0.0% 0 0.0% 0 0.0% 0 Other - Zone 20 0.1% 2 0.0% 0 0.0% 0 0.0% 0 0.0% 0 0.0% 0 0.0% 0 0.0% 0 0.0% 0 0.0% 0 0.0% 0 0.0% 0 Other - Zone 0 0.8% 14 1.2% 1 0.0% 0 0.0% 0 1.3% 1 4.5% 7 1.0% 1 1.3% 3 0.0% 0 0.0% 0 0.0% 0 0.0% 0 Weighted base: 1809 126 104 31 42 161 121 247 61 185 83 73 Sample: 1730 81 80 82 79 84 83 91 77 86 76 83
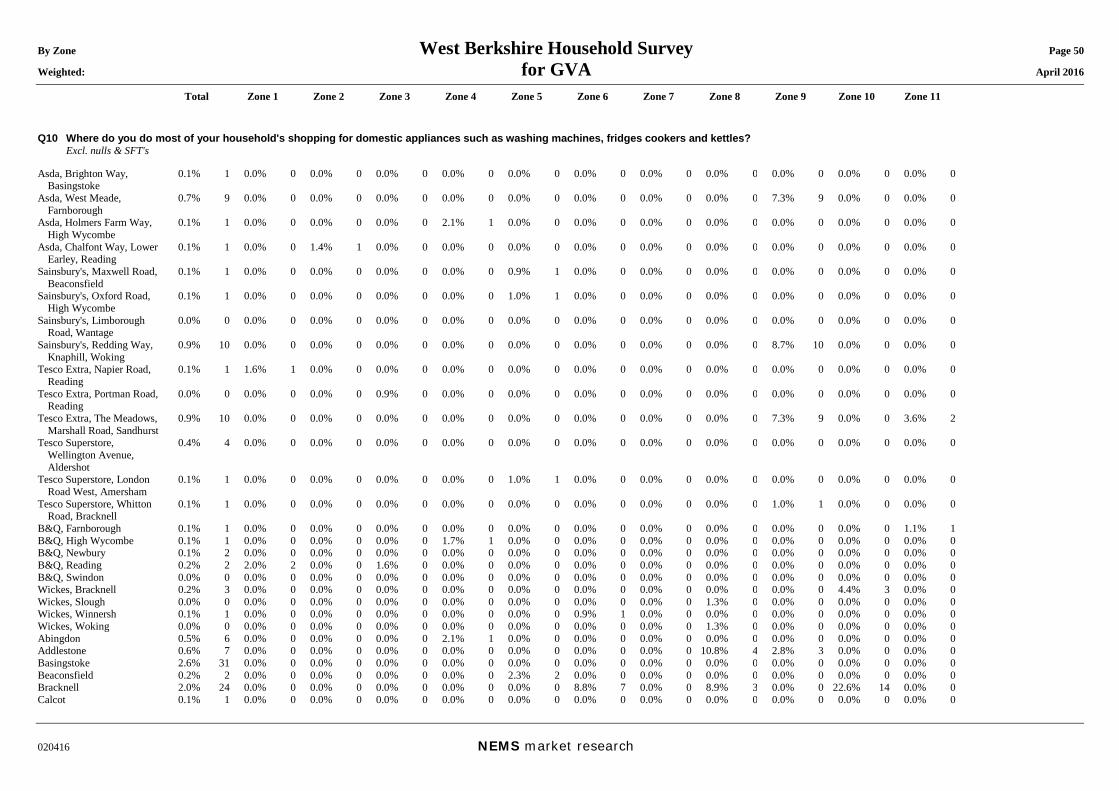
By Zone West Berkshire Household Survey Page 50 Weighted: for GVA April 2016
Total Zone 1 Zone 2 Zone 3 Zone 4 Zone 5 Zone 6 Zone 7 Zone 8 Zone 9 Zone 10 Zone 11
020416 NEMS market research
Q10 Where do you do most of your household's shopping for domestic appliances such as washing machines, fridges cookers and kettles? Excl. nulls & SFT's Asda, Brighton Way,
Basingstoke 0.1% 1 0.0% 0 0.0% 0 0.0% 0 0.0% 0 0.0% 0 0.0% 0 0.0% 0 0.0% 0 0.0% 0 0.0% 0 0.0% 0
Asda, West Meade, Farnborough
0.7% 9 0.0% 0 0.0% 0 0.0% 0 0.0% 0 0.0% 0 0.0% 0 0.0% 0 0.0% 0 7.3% 9 0.0% 0 0.0% 0
Asda, Holmers Farm Way, High Wycombe
0.1% 1 0.0% 0 0.0% 0 0.0% 0 2.1% 1 0.0% 0 0.0% 0 0.0% 0 0.0% 0 0.0% 0 0.0% 0 0.0% 0
Asda, Chalfont Way, Lower Earley, Reading
0.1% 1 0.0% 0 1.4% 1 0.0% 0 0.0% 0 0.0% 0 0.0% 0 0.0% 0 0.0% 0 0.0% 0 0.0% 0 0.0% 0
Sainsbury's, Maxwell Road, Beaconsfield
0.1% 1 0.0% 0 0.0% 0 0.0% 0 0.0% 0 0.9% 1 0.0% 0 0.0% 0 0.0% 0 0.0% 0 0.0% 0 0.0% 0
Sainsbury's, Oxford Road, High Wycombe
0.1% 1 0.0% 0 0.0% 0 0.0% 0 0.0% 0 1.0% 1 0.0% 0 0.0% 0 0.0% 0 0.0% 0 0.0% 0 0.0% 0
Sainsbury's, Limborough Road, Wantage
0.0% 0 0.0% 0 0.0% 0 0.0% 0 0.0% 0 0.0% 0 0.0% 0 0.0% 0 0.0% 0 0.0% 0 0.0% 0 0.0% 0
Sainsbury's, Redding Way, Knaphill, Woking
0.9% 10 0.0% 0 0.0% 0 0.0% 0 0.0% 0 0.0% 0 0.0% 0 0.0% 0 0.0% 0 8.7% 10 0.0% 0 0.0% 0
Tesco Extra, Napier Road, Reading
0.1% 1 1.6% 1 0.0% 0 0.0% 0 0.0% 0 0.0% 0 0.0% 0 0.0% 0 0.0% 0 0.0% 0 0.0% 0 0.0% 0
Tesco Extra, Portman Road, Reading
0.0% 0 0.0% 0 0.0% 0 0.9% 0 0.0% 0 0.0% 0 0.0% 0 0.0% 0 0.0% 0 0.0% 0 0.0% 0 0.0% 0
Tesco Extra, The Meadows, Marshall Road, Sandhurst
0.9% 10 0.0% 0 0.0% 0 0.0% 0 0.0% 0 0.0% 0 0.0% 0 0.0% 0 0.0% 0 7.3% 9 0.0% 0 3.6% 2
Tesco Superstore, Wellington Avenue, Aldershot
0.4% 4 0.0% 0 0.0% 0 0.0% 0 0.0% 0 0.0% 0 0.0% 0 0.0% 0 0.0% 0 0.0% 0 0.0% 0 0.0% 0
Tesco Superstore, London Road West, Amersham
0.1% 1 0.0% 0 0.0% 0 0.0% 0 0.0% 0 1.0% 1 0.0% 0 0.0% 0 0.0% 0 0.0% 0 0.0% 0 0.0% 0
Tesco Superstore, Whitton Road, Bracknell
0.1% 1 0.0% 0 0.0% 0 0.0% 0 0.0% 0 0.0% 0 0.0% 0 0.0% 0 0.0% 0 1.0% 1 0.0% 0 0.0% 0
B&Q, Farnborough 0.1% 1 0.0% 0 0.0% 0 0.0% 0 0.0% 0 0.0% 0 0.0% 0 0.0% 0 0.0% 0 0.0% 0 0.0% 0 1.1% 1 B&Q, High Wycombe 0.1% 1 0.0% 0 0.0% 0 0.0% 0 1.7% 1 0.0% 0 0.0% 0 0.0% 0 0.0% 0 0.0% 0 0.0% 0 0.0% 0 B&Q, Newbury 0.1% 2 0.0% 0 0.0% 0 0.0% 0 0.0% 0 0.0% 0 0.0% 0 0.0% 0 0.0% 0 0.0% 0 0.0% 0 0.0% 0 B&Q, Reading 0.2% 2 2.0% 2 0.0% 0 1.6% 0 0.0% 0 0.0% 0 0.0% 0 0.0% 0 0.0% 0 0.0% 0 0.0% 0 0.0% 0 B&Q, Swindon 0.0% 0 0.0% 0 0.0% 0 0.0% 0 0.0% 0 0.0% 0 0.0% 0 0.0% 0 0.0% 0 0.0% 0 0.0% 0 0.0% 0 Wickes, Bracknell 0.2% 3 0.0% 0 0.0% 0 0.0% 0 0.0% 0 0.0% 0 0.0% 0 0.0% 0 0.0% 0 0.0% 0 4.4% 3 0.0% 0 Wickes, Slough 0.0% 0 0.0% 0 0.0% 0 0.0% 0 0.0% 0 0.0% 0 0.0% 0 0.0% 0 1.3% 0 0.0% 0 0.0% 0 0.0% 0 Wickes, Winnersh 0.1% 1 0.0% 0 0.0% 0 0.0% 0 0.0% 0 0.0% 0 0.9% 1 0.0% 0 0.0% 0 0.0% 0 0.0% 0 0.0% 0 Wickes, Woking 0.0% 0 0.0% 0 0.0% 0 0.0% 0 0.0% 0 0.0% 0 0.0% 0 0.0% 0 1.3% 0 0.0% 0 0.0% 0 0.0% 0 Abingdon 0.5% 6 0.0% 0 0.0% 0 0.0% 0 2.1% 1 0.0% 0 0.0% 0 0.0% 0 0.0% 0 0.0% 0 0.0% 0 0.0% 0 Addlestone 0.6% 7 0.0% 0 0.0% 0 0.0% 0 0.0% 0 0.0% 0 0.0% 0 0.0% 0 10.8% 4 2.8% 3 0.0% 0 0.0% 0 Basingstoke 2.6% 31 0.0% 0 0.0% 0 0.0% 0 0.0% 0 0.0% 0 0.0% 0 0.0% 0 0.0% 0 0.0% 0 0.0% 0 0.0% 0 Beaconsfield 0.2% 2 0.0% 0 0.0% 0 0.0% 0 0.0% 0 2.3% 2 0.0% 0 0.0% 0 0.0% 0 0.0% 0 0.0% 0 0.0% 0 Bracknell 2.0% 24 0.0% 0 0.0% 0 0.0% 0 0.0% 0 0.0% 0 8.8% 7 0.0% 0 8.9% 3 0.0% 0 22.6% 14 0.0% 0 Calcot 0.1% 1 0.0% 0 0.0% 0 0.0% 0 0.0% 0 0.0% 0 0.0% 0 0.0% 0 0.0% 0 0.0% 0 0.0% 0 0.0% 0
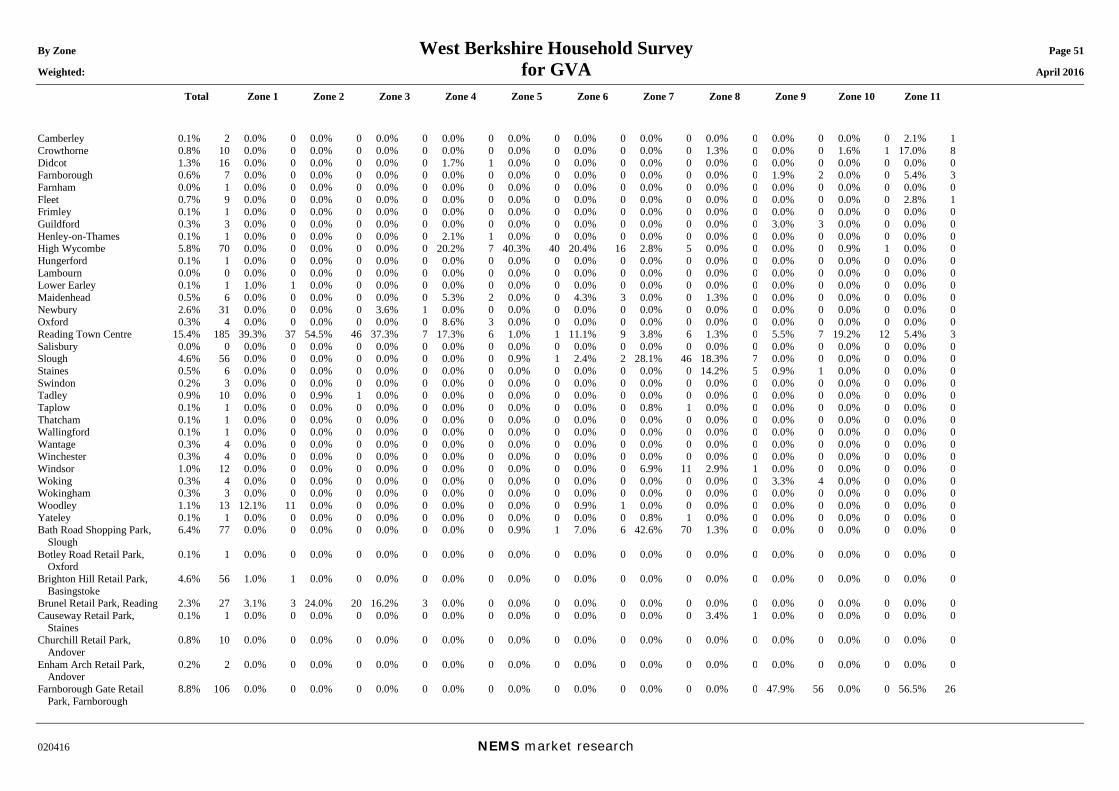
By Zone West Berkshire Household Survey Page 51 Weighted: for GVA April 2016
Total Zone 1 Zone 2 Zone 3 Zone 4 Zone 5 Zone 6 Zone 7 Zone 8 Zone 9 Zone 10 Zone 11
020416 NEMS market research
Camberley 0.1% 2 0.0% 0 0.0% 0 0.0% 0 0.0% 0 0.0% 0 0.0% 0 0.0% 0 0.0% 0 0.0% 0 0.0% 0 2.1% 1 Crowthorne 0.8% 10 0.0% 0 0.0% 0 0.0% 0 0.0% 0 0.0% 0 0.0% 0 0.0% 0 1.3% 0 0.0% 0 1.6% 1 17.0% 8 Didcot 1.3% 16 0.0% 0 0.0% 0 0.0% 0 1.7% 1 0.0% 0 0.0% 0 0.0% 0 0.0% 0 0.0% 0 0.0% 0 0.0% 0 Farnborough 0.6% 7 0.0% 0 0.0% 0 0.0% 0 0.0% 0 0.0% 0 0.0% 0 0.0% 0 0.0% 0 1.9% 2 0.0% 0 5.4% 3 Farnham 0.0% 1 0.0% 0 0.0% 0 0.0% 0 0.0% 0 0.0% 0 0.0% 0 0.0% 0 0.0% 0 0.0% 0 0.0% 0 0.0% 0 Fleet 0.7% 9 0.0% 0 0.0% 0 0.0% 0 0.0% 0 0.0% 0 0.0% 0 0.0% 0 0.0% 0 0.0% 0 0.0% 0 2.8% 1 Frimley 0.1% 1 0.0% 0 0.0% 0 0.0% 0 0.0% 0 0.0% 0 0.0% 0 0.0% 0 0.0% 0 0.0% 0 0.0% 0 0.0% 0 Guildford 0.3% 3 0.0% 0 0.0% 0 0.0% 0 0.0% 0 0.0% 0 0.0% 0 0.0% 0 0.0% 0 3.0% 3 0.0% 0 0.0% 0 Henley-on-Thames 0.1% 1 0.0% 0 0.0% 0 0.0% 0 2.1% 1 0.0% 0 0.0% 0 0.0% 0 0.0% 0 0.0% 0 0.0% 0 0.0% 0 High Wycombe 5.8% 70 0.0% 0 0.0% 0 0.0% 0 20.2% 7 40.3% 40 20.4% 16 2.8% 5 0.0% 0 0.0% 0 0.9% 1 0.0% 0 Hungerford 0.1% 1 0.0% 0 0.0% 0 0.0% 0 0.0% 0 0.0% 0 0.0% 0 0.0% 0 0.0% 0 0.0% 0 0.0% 0 0.0% 0 Lambourn 0.0% 0 0.0% 0 0.0% 0 0.0% 0 0.0% 0 0.0% 0 0.0% 0 0.0% 0 0.0% 0 0.0% 0 0.0% 0 0.0% 0 Lower Earley 0.1% 1 1.0% 1 0.0% 0 0.0% 0 0.0% 0 0.0% 0 0.0% 0 0.0% 0 0.0% 0 0.0% 0 0.0% 0 0.0% 0 Maidenhead 0.5% 6 0.0% 0 0.0% 0 0.0% 0 5.3% 2 0.0% 0 4.3% 3 0.0% 0 1.3% 0 0.0% 0 0.0% 0 0.0% 0 Newbury 2.6% 31 0.0% 0 0.0% 0 3.6% 1 0.0% 0 0.0% 0 0.0% 0 0.0% 0 0.0% 0 0.0% 0 0.0% 0 0.0% 0 Oxford 0.3% 4 0.0% 0 0.0% 0 0.0% 0 8.6% 3 0.0% 0 0.0% 0 0.0% 0 0.0% 0 0.0% 0 0.0% 0 0.0% 0 Reading Town Centre 15.4% 185 39.3% 37 54.5% 46 37.3% 7 17.3% 6 1.0% 1 11.1% 9 3.8% 6 1.3% 0 5.5% 7 19.2% 12 5.4% 3 Salisbury 0.0% 0 0.0% 0 0.0% 0 0.0% 0 0.0% 0 0.0% 0 0.0% 0 0.0% 0 0.0% 0 0.0% 0 0.0% 0 0.0% 0 Slough 4.6% 56 0.0% 0 0.0% 0 0.0% 0 0.0% 0 0.9% 1 2.4% 2 28.1% 46 18.3% 7 0.0% 0 0.0% 0 0.0% 0 Staines 0.5% 6 0.0% 0 0.0% 0 0.0% 0 0.0% 0 0.0% 0 0.0% 0 0.0% 0 14.2% 5 0.9% 1 0.0% 0 0.0% 0 Swindon 0.2% 3 0.0% 0 0.0% 0 0.0% 0 0.0% 0 0.0% 0 0.0% 0 0.0% 0 0.0% 0 0.0% 0 0.0% 0 0.0% 0 Tadley 0.9% 10 0.0% 0 0.9% 1 0.0% 0 0.0% 0 0.0% 0 0.0% 0 0.0% 0 0.0% 0 0.0% 0 0.0% 0 0.0% 0 Taplow 0.1% 1 0.0% 0 0.0% 0 0.0% 0 0.0% 0 0.0% 0 0.0% 0 0.8% 1 0.0% 0 0.0% 0 0.0% 0 0.0% 0 Thatcham 0.1% 1 0.0% 0 0.0% 0 0.0% 0 0.0% 0 0.0% 0 0.0% 0 0.0% 0 0.0% 0 0.0% 0 0.0% 0 0.0% 0 Wallingford 0.1% 1 0.0% 0 0.0% 0 0.0% 0 0.0% 0 0.0% 0 0.0% 0 0.0% 0 0.0% 0 0.0% 0 0.0% 0 0.0% 0 Wantage 0.3% 4 0.0% 0 0.0% 0 0.0% 0 0.0% 0 0.0% 0 0.0% 0 0.0% 0 0.0% 0 0.0% 0 0.0% 0 0.0% 0 Winchester 0.3% 4 0.0% 0 0.0% 0 0.0% 0 0.0% 0 0.0% 0 0.0% 0 0.0% 0 0.0% 0 0.0% 0 0.0% 0 0.0% 0 Windsor 1.0% 12 0.0% 0 0.0% 0 0.0% 0 0.0% 0 0.0% 0 0.0% 0 6.9% 11 2.9% 1 0.0% 0 0.0% 0 0.0% 0 Woking 0.3% 4 0.0% 0 0.0% 0 0.0% 0 0.0% 0 0.0% 0 0.0% 0 0.0% 0 0.0% 0 3.3% 4 0.0% 0 0.0% 0 Wokingham 0.3% 3 0.0% 0 0.0% 0 0.0% 0 0.0% 0 0.0% 0 0.0% 0 0.0% 0 0.0% 0 0.0% 0 0.0% 0 0.0% 0 Woodley 1.1% 13 12.1% 11 0.0% 0 0.0% 0 0.0% 0 0.0% 0 0.9% 1 0.0% 0 0.0% 0 0.0% 0 0.0% 0 0.0% 0 Yateley 0.1% 1 0.0% 0 0.0% 0 0.0% 0 0.0% 0 0.0% 0 0.0% 0 0.8% 1 0.0% 0 0.0% 0 0.0% 0 0.0% 0 Bath Road Shopping Park,
Slough 6.4% 77 0.0% 0 0.0% 0 0.0% 0 0.0% 0 0.9% 1 7.0% 6 42.6% 70 1.3% 0 0.0% 0 0.0% 0 0.0% 0
Botley Road Retail Park, Oxford
0.1% 1 0.0% 0 0.0% 0 0.0% 0 0.0% 0 0.0% 0 0.0% 0 0.0% 0 0.0% 0 0.0% 0 0.0% 0 0.0% 0
Brighton Hill Retail Park, Basingstoke
4.6% 56 1.0% 1 0.0% 0 0.0% 0 0.0% 0 0.0% 0 0.0% 0 0.0% 0 0.0% 0 0.0% 0 0.0% 0 0.0% 0
Brunel Retail Park, Reading 2.3% 27 3.1% 3 24.0% 20 16.2% 3 0.0% 0 0.0% 0 0.0% 0 0.0% 0 0.0% 0 0.0% 0 0.0% 0 0.0% 0 Causeway Retail Park,
Staines 0.1% 1 0.0% 0 0.0% 0 0.0% 0 0.0% 0 0.0% 0 0.0% 0 0.0% 0 3.4% 1 0.0% 0 0.0% 0 0.0% 0
Churchill Retail Park, Andover
0.8% 10 0.0% 0 0.0% 0 0.0% 0 0.0% 0 0.0% 0 0.0% 0 0.0% 0 0.0% 0 0.0% 0 0.0% 0 0.0% 0
Enham Arch Retail Park, Andover
0.2% 2 0.0% 0 0.0% 0 0.0% 0 0.0% 0 0.0% 0 0.0% 0 0.0% 0 0.0% 0 0.0% 0 0.0% 0 0.0% 0
Farnborough Gate Retail Park, Farnborough
8.8% 106 0.0% 0 0.0% 0 0.0% 0 0.0% 0 0.0% 0 0.0% 0 0.0% 0 0.0% 0 47.9% 56 0.0% 0 56.5% 26
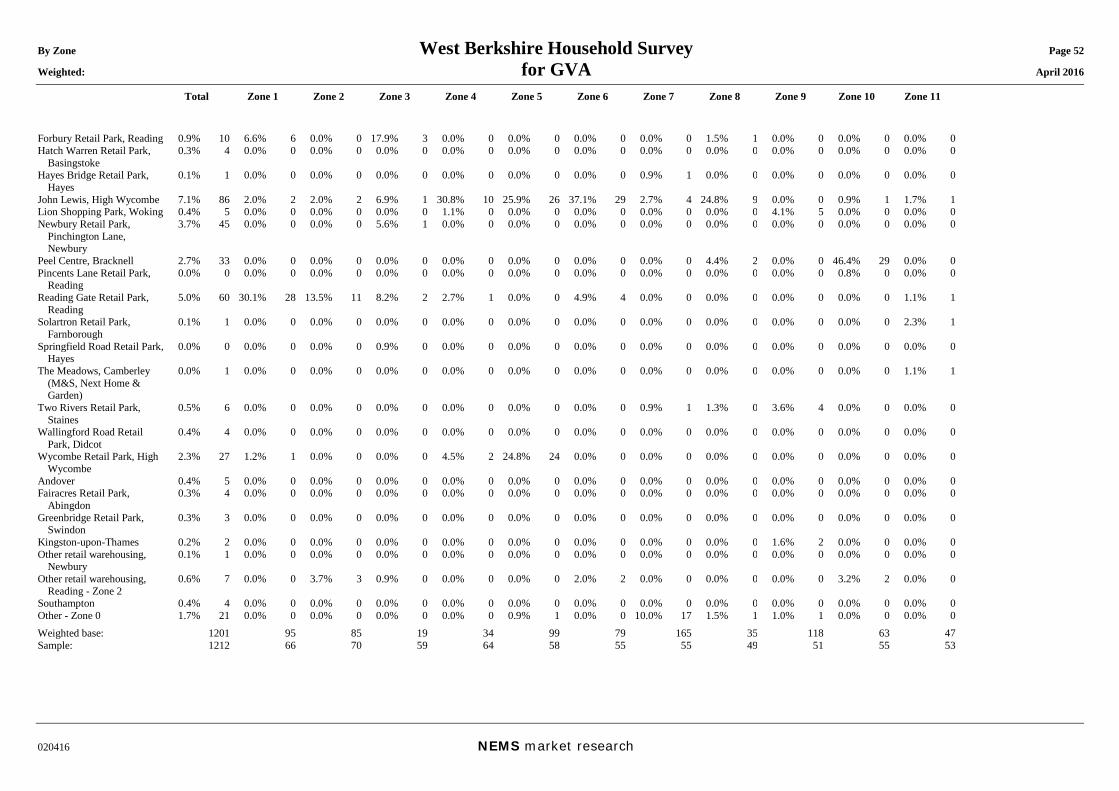
By Zone West Berkshire Household Survey Page 52 Weighted: for GVA April 2016
Total Zone 1 Zone 2 Zone 3 Zone 4 Zone 5 Zone 6 Zone 7 Zone 8 Zone 9 Zone 10 Zone 11
020416 NEMS market research
Forbury Retail Park, Reading 0.9% 10 6.6% 6 0.0% 0 17.9% 3 0.0% 0 0.0% 0 0.0% 0 0.0% 0 1.5% 1 0.0% 0 0.0% 0 0.0% 0 Hatch Warren Retail Park,
Basingstoke 0.3% 4 0.0% 0 0.0% 0 0.0% 0 0.0% 0 0.0% 0 0.0% 0 0.0% 0 0.0% 0 0.0% 0 0.0% 0 0.0% 0
Hayes Bridge Retail Park, Hayes
0.1% 1 0.0% 0 0.0% 0 0.0% 0 0.0% 0 0.0% 0 0.0% 0 0.9% 1 0.0% 0 0.0% 0 0.0% 0 0.0% 0
John Lewis, High Wycombe 7.1% 86 2.0% 2 2.0% 2 6.9% 1 30.8% 10 25.9% 26 37.1% 29 2.7% 4 24.8% 9 0.0% 0 0.9% 1 1.7% 1 Lion Shopping Park, Woking 0.4% 5 0.0% 0 0.0% 0 0.0% 0 1.1% 0 0.0% 0 0.0% 0 0.0% 0 0.0% 0 4.1% 5 0.0% 0 0.0% 0 Newbury Retail Park,
Pinchington Lane, Newbury
3.7% 45 0.0% 0 0.0% 0 5.6% 1 0.0% 0 0.0% 0 0.0% 0 0.0% 0 0.0% 0 0.0% 0 0.0% 0 0.0% 0
Peel Centre, Bracknell 2.7% 33 0.0% 0 0.0% 0 0.0% 0 0.0% 0 0.0% 0 0.0% 0 0.0% 0 4.4% 2 0.0% 0 46.4% 29 0.0% 0 Pincents Lane Retail Park,
Reading 0.0% 0 0.0% 0 0.0% 0 0.0% 0 0.0% 0 0.0% 0 0.0% 0 0.0% 0 0.0% 0 0.0% 0 0.8% 0 0.0% 0
Reading Gate Retail Park, Reading
5.0% 60 30.1% 28 13.5% 11 8.2% 2 2.7% 1 0.0% 0 4.9% 4 0.0% 0 0.0% 0 0.0% 0 0.0% 0 1.1% 1
Solartron Retail Park, Farnborough
0.1% 1 0.0% 0 0.0% 0 0.0% 0 0.0% 0 0.0% 0 0.0% 0 0.0% 0 0.0% 0 0.0% 0 0.0% 0 2.3% 1
Springfield Road Retail Park, Hayes
0.0% 0 0.0% 0 0.0% 0 0.9% 0 0.0% 0 0.0% 0 0.0% 0 0.0% 0 0.0% 0 0.0% 0 0.0% 0 0.0% 0
The Meadows, Camberley (M&S, Next Home & Garden)
0.0% 1 0.0% 0 0.0% 0 0.0% 0 0.0% 0 0.0% 0 0.0% 0 0.0% 0 0.0% 0 0.0% 0 0.0% 0 1.1% 1
Two Rivers Retail Park, Staines
0.5% 6 0.0% 0 0.0% 0 0.0% 0 0.0% 0 0.0% 0 0.0% 0 0.9% 1 1.3% 0 3.6% 4 0.0% 0 0.0% 0
Wallingford Road Retail Park, Didcot
0.4% 4 0.0% 0 0.0% 0 0.0% 0 0.0% 0 0.0% 0 0.0% 0 0.0% 0 0.0% 0 0.0% 0 0.0% 0 0.0% 0
Wycombe Retail Park, High Wycombe
2.3% 27 1.2% 1 0.0% 0 0.0% 0 4.5% 2 24.8% 24 0.0% 0 0.0% 0 0.0% 0 0.0% 0 0.0% 0 0.0% 0
Andover 0.4% 5 0.0% 0 0.0% 0 0.0% 0 0.0% 0 0.0% 0 0.0% 0 0.0% 0 0.0% 0 0.0% 0 0.0% 0 0.0% 0 Fairacres Retail Park,
Abingdon 0.3% 4 0.0% 0 0.0% 0 0.0% 0 0.0% 0 0.0% 0 0.0% 0 0.0% 0 0.0% 0 0.0% 0 0.0% 0 0.0% 0
Greenbridge Retail Park, Swindon
0.3% 3 0.0% 0 0.0% 0 0.0% 0 0.0% 0 0.0% 0 0.0% 0 0.0% 0 0.0% 0 0.0% 0 0.0% 0 0.0% 0
Kingston-upon-Thames 0.2% 2 0.0% 0 0.0% 0 0.0% 0 0.0% 0 0.0% 0 0.0% 0 0.0% 0 0.0% 0 1.6% 2 0.0% 0 0.0% 0 Other retail warehousing,
Newbury 0.1% 1 0.0% 0 0.0% 0 0.0% 0 0.0% 0 0.0% 0 0.0% 0 0.0% 0 0.0% 0 0.0% 0 0.0% 0 0.0% 0
Other retail warehousing, Reading - Zone 2
0.6% 7 0.0% 0 3.7% 3 0.9% 0 0.0% 0 0.0% 0 2.0% 2 0.0% 0 0.0% 0 0.0% 0 3.2% 2 0.0% 0
Southampton 0.4% 4 0.0% 0 0.0% 0 0.0% 0 0.0% 0 0.0% 0 0.0% 0 0.0% 0 0.0% 0 0.0% 0 0.0% 0 0.0% 0 Other - Zone 0 1.7% 21 0.0% 0 0.0% 0 0.0% 0 0.0% 0 0.9% 1 0.0% 0 10.0% 17 1.5% 1 1.0% 1 0.0% 0 0.0% 0 Weighted base: 1201 95 85 19 34 99 79 165 35 118 63 47 Sample: 1212 66 70 59 64 58 55 55 49 51 55 53
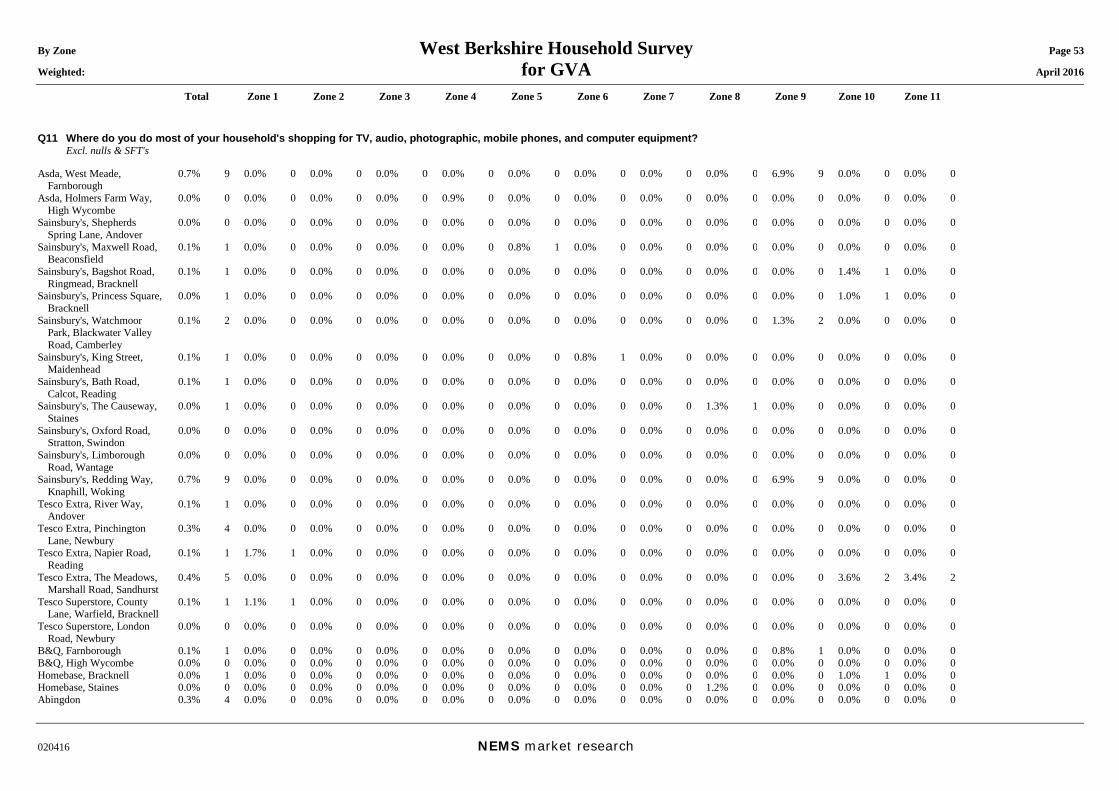
By Zone West Berkshire Household Survey Page 53 Weighted: for GVA April 2016
Total Zone 1 Zone 2 Zone 3 Zone 4 Zone 5 Zone 6 Zone 7 Zone 8 Zone 9 Zone 10 Zone 11
020416 NEMS market research
Q11 Where do you do most of your household's shopping for TV, audio, photographic, mobile phones, and computer equipment? Excl. nulls & SFT's Asda, West Meade,
Farnborough 0.7% 9 0.0% 0 0.0% 0 0.0% 0 0.0% 0 0.0% 0 0.0% 0 0.0% 0 0.0% 0 6.9% 9 0.0% 0 0.0% 0
Asda, Holmers Farm Way, High Wycombe
0.0% 0 0.0% 0 0.0% 0 0.0% 0 0.9% 0 0.0% 0 0.0% 0 0.0% 0 0.0% 0 0.0% 0 0.0% 0 0.0% 0
Sainsbury's, Shepherds Spring Lane, Andover
0.0% 0 0.0% 0 0.0% 0 0.0% 0 0.0% 0 0.0% 0 0.0% 0 0.0% 0 0.0% 0 0.0% 0 0.0% 0 0.0% 0
Sainsbury's, Maxwell Road, Beaconsfield
0.1% 1 0.0% 0 0.0% 0 0.0% 0 0.0% 0 0.8% 1 0.0% 0 0.0% 0 0.0% 0 0.0% 0 0.0% 0 0.0% 0
Sainsbury's, Bagshot Road, Ringmead, Bracknell
0.1% 1 0.0% 0 0.0% 0 0.0% 0 0.0% 0 0.0% 0 0.0% 0 0.0% 0 0.0% 0 0.0% 0 1.4% 1 0.0% 0
Sainsbury's, Princess Square, Bracknell
0.0% 1 0.0% 0 0.0% 0 0.0% 0 0.0% 0 0.0% 0 0.0% 0 0.0% 0 0.0% 0 0.0% 0 1.0% 1 0.0% 0
Sainsbury's, Watchmoor Park, Blackwater Valley Road, Camberley
0.1% 2 0.0% 0 0.0% 0 0.0% 0 0.0% 0 0.0% 0 0.0% 0 0.0% 0 0.0% 0 1.3% 2 0.0% 0 0.0% 0
Sainsbury's, King Street, Maidenhead
0.1% 1 0.0% 0 0.0% 0 0.0% 0 0.0% 0 0.0% 0 0.8% 1 0.0% 0 0.0% 0 0.0% 0 0.0% 0 0.0% 0
Sainsbury's, Bath Road, Calcot, Reading
0.1% 1 0.0% 0 0.0% 0 0.0% 0 0.0% 0 0.0% 0 0.0% 0 0.0% 0 0.0% 0 0.0% 0 0.0% 0 0.0% 0
Sainsbury's, The Causeway, Staines
0.0% 1 0.0% 0 0.0% 0 0.0% 0 0.0% 0 0.0% 0 0.0% 0 0.0% 0 1.3% 1 0.0% 0 0.0% 0 0.0% 0
Sainsbury's, Oxford Road, Stratton, Swindon
0.0% 0 0.0% 0 0.0% 0 0.0% 0 0.0% 0 0.0% 0 0.0% 0 0.0% 0 0.0% 0 0.0% 0 0.0% 0 0.0% 0
Sainsbury's, Limborough Road, Wantage
0.0% 0 0.0% 0 0.0% 0 0.0% 0 0.0% 0 0.0% 0 0.0% 0 0.0% 0 0.0% 0 0.0% 0 0.0% 0 0.0% 0
Sainsbury's, Redding Way, Knaphill, Woking
0.7% 9 0.0% 0 0.0% 0 0.0% 0 0.0% 0 0.0% 0 0.0% 0 0.0% 0 0.0% 0 6.9% 9 0.0% 0 0.0% 0
Tesco Extra, River Way, Andover
0.1% 1 0.0% 0 0.0% 0 0.0% 0 0.0% 0 0.0% 0 0.0% 0 0.0% 0 0.0% 0 0.0% 0 0.0% 0 0.0% 0
Tesco Extra, Pinchington Lane, Newbury
0.3% 4 0.0% 0 0.0% 0 0.0% 0 0.0% 0 0.0% 0 0.0% 0 0.0% 0 0.0% 0 0.0% 0 0.0% 0 0.0% 0
Tesco Extra, Napier Road, Reading
0.1% 1 1.7% 1 0.0% 0 0.0% 0 0.0% 0 0.0% 0 0.0% 0 0.0% 0 0.0% 0 0.0% 0 0.0% 0 0.0% 0
Tesco Extra, The Meadows, Marshall Road, Sandhurst
0.4% 5 0.0% 0 0.0% 0 0.0% 0 0.0% 0 0.0% 0 0.0% 0 0.0% 0 0.0% 0 0.0% 0 3.6% 2 3.4% 2
Tesco Superstore, County Lane, Warfield, Bracknell
0.1% 1 1.1% 1 0.0% 0 0.0% 0 0.0% 0 0.0% 0 0.0% 0 0.0% 0 0.0% 0 0.0% 0 0.0% 0 0.0% 0
Tesco Superstore, London Road, Newbury
0.0% 0 0.0% 0 0.0% 0 0.0% 0 0.0% 0 0.0% 0 0.0% 0 0.0% 0 0.0% 0 0.0% 0 0.0% 0 0.0% 0
B&Q, Farnborough 0.1% 1 0.0% 0 0.0% 0 0.0% 0 0.0% 0 0.0% 0 0.0% 0 0.0% 0 0.0% 0 0.8% 1 0.0% 0 0.0% 0 B&Q, High Wycombe 0.0% 0 0.0% 0 0.0% 0 0.0% 0 0.0% 0 0.0% 0 0.0% 0 0.0% 0 0.0% 0 0.0% 0 0.0% 0 0.0% 0 Homebase, Bracknell 0.0% 1 0.0% 0 0.0% 0 0.0% 0 0.0% 0 0.0% 0 0.0% 0 0.0% 0 0.0% 0 0.0% 0 1.0% 1 0.0% 0 Homebase, Staines 0.0% 0 0.0% 0 0.0% 0 0.0% 0 0.0% 0 0.0% 0 0.0% 0 0.0% 0 1.2% 0 0.0% 0 0.0% 0 0.0% 0 Abingdon 0.3% 4 0.0% 0 0.0% 0 0.0% 0 0.0% 0 0.0% 0 0.0% 0 0.0% 0 0.0% 0 0.0% 0 0.0% 0 0.0% 0
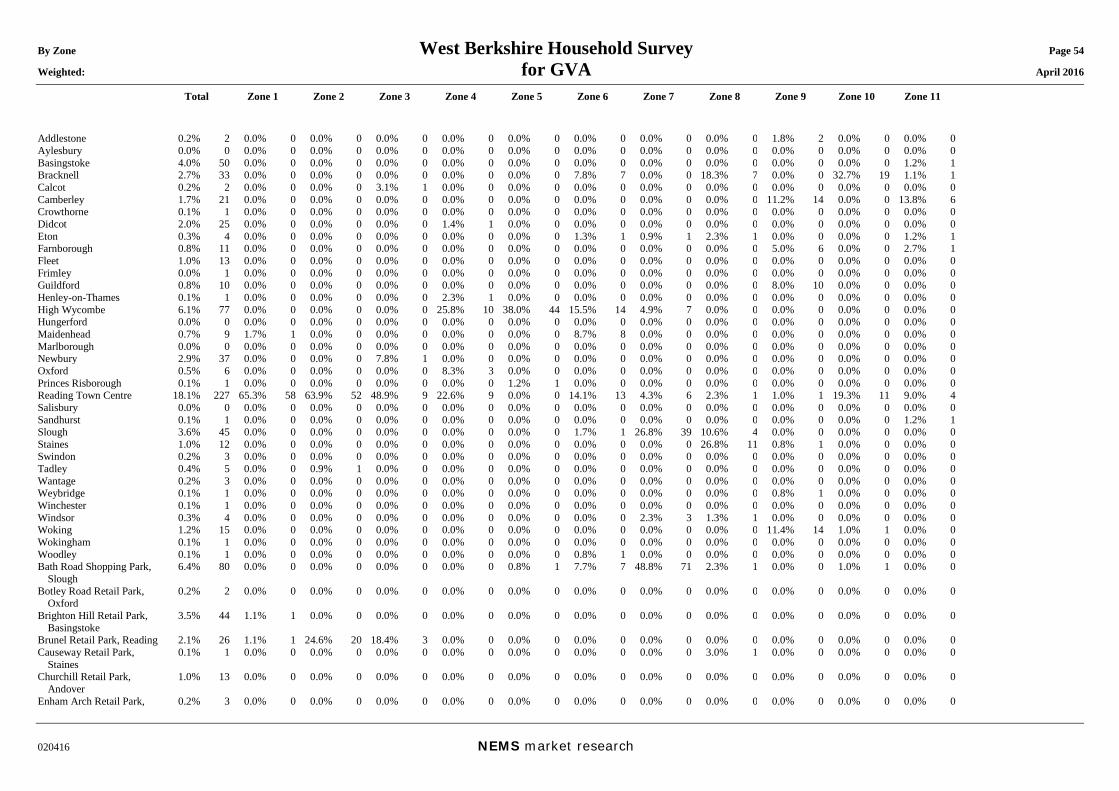
By Zone West Berkshire Household Survey Page 54 Weighted: for GVA April 2016
Total Zone 1 Zone 2 Zone 3 Zone 4 Zone 5 Zone 6 Zone 7 Zone 8 Zone 9 Zone 10 Zone 11
020416 NEMS market research
Addlestone 0.2% 2 0.0% 0 0.0% 0 0.0% 0 0.0% 0 0.0% 0 0.0% 0 0.0% 0 0.0% 0 1.8% 2 0.0% 0 0.0% 0 Aylesbury 0.0% 0 0.0% 0 0.0% 0 0.0% 0 0.0% 0 0.0% 0 0.0% 0 0.0% 0 0.0% 0 0.0% 0 0.0% 0 0.0% 0 Basingstoke 4.0% 50 0.0% 0 0.0% 0 0.0% 0 0.0% 0 0.0% 0 0.0% 0 0.0% 0 0.0% 0 0.0% 0 0.0% 0 1.2% 1 Bracknell 2.7% 33 0.0% 0 0.0% 0 0.0% 0 0.0% 0 0.0% 0 7.8% 7 0.0% 0 18.3% 7 0.0% 0 32.7% 19 1.1% 1 Calcot 0.2% 2 0.0% 0 0.0% 0 3.1% 1 0.0% 0 0.0% 0 0.0% 0 0.0% 0 0.0% 0 0.0% 0 0.0% 0 0.0% 0 Camberley 1.7% 21 0.0% 0 0.0% 0 0.0% 0 0.0% 0 0.0% 0 0.0% 0 0.0% 0 0.0% 0 11.2% 14 0.0% 0 13.8% 6 Crowthorne 0.1% 1 0.0% 0 0.0% 0 0.0% 0 0.0% 0 0.0% 0 0.0% 0 0.0% 0 0.0% 0 0.0% 0 0.0% 0 0.0% 0 Didcot 2.0% 25 0.0% 0 0.0% 0 0.0% 0 1.4% 1 0.0% 0 0.0% 0 0.0% 0 0.0% 0 0.0% 0 0.0% 0 0.0% 0 Eton 0.3% 4 0.0% 0 0.0% 0 0.0% 0 0.0% 0 0.0% 0 1.3% 1 0.9% 1 2.3% 1 0.0% 0 0.0% 0 1.2% 1 Farnborough 0.8% 11 0.0% 0 0.0% 0 0.0% 0 0.0% 0 0.0% 0 0.0% 0 0.0% 0 0.0% 0 5.0% 6 0.0% 0 2.7% 1 Fleet 1.0% 13 0.0% 0 0.0% 0 0.0% 0 0.0% 0 0.0% 0 0.0% 0 0.0% 0 0.0% 0 0.0% 0 0.0% 0 0.0% 0 Frimley 0.0% 1 0.0% 0 0.0% 0 0.0% 0 0.0% 0 0.0% 0 0.0% 0 0.0% 0 0.0% 0 0.0% 0 0.0% 0 0.0% 0 Guildford 0.8% 10 0.0% 0 0.0% 0 0.0% 0 0.0% 0 0.0% 0 0.0% 0 0.0% 0 0.0% 0 8.0% 10 0.0% 0 0.0% 0 Henley-on-Thames 0.1% 1 0.0% 0 0.0% 0 0.0% 0 2.3% 1 0.0% 0 0.0% 0 0.0% 0 0.0% 0 0.0% 0 0.0% 0 0.0% 0 High Wycombe 6.1% 77 0.0% 0 0.0% 0 0.0% 0 25.8% 10 38.0% 44 15.5% 14 4.9% 7 0.0% 0 0.0% 0 0.0% 0 0.0% 0 Hungerford 0.0% 0 0.0% 0 0.0% 0 0.0% 0 0.0% 0 0.0% 0 0.0% 0 0.0% 0 0.0% 0 0.0% 0 0.0% 0 0.0% 0 Maidenhead 0.7% 9 1.7% 1 0.0% 0 0.0% 0 0.0% 0 0.0% 0 8.7% 8 0.0% 0 0.0% 0 0.0% 0 0.0% 0 0.0% 0 Marlborough 0.0% 0 0.0% 0 0.0% 0 0.0% 0 0.0% 0 0.0% 0 0.0% 0 0.0% 0 0.0% 0 0.0% 0 0.0% 0 0.0% 0 Newbury 2.9% 37 0.0% 0 0.0% 0 7.8% 1 0.0% 0 0.0% 0 0.0% 0 0.0% 0 0.0% 0 0.0% 0 0.0% 0 0.0% 0 Oxford 0.5% 6 0.0% 0 0.0% 0 0.0% 0 8.3% 3 0.0% 0 0.0% 0 0.0% 0 0.0% 0 0.0% 0 0.0% 0 0.0% 0 Princes Risborough 0.1% 1 0.0% 0 0.0% 0 0.0% 0 0.0% 0 1.2% 1 0.0% 0 0.0% 0 0.0% 0 0.0% 0 0.0% 0 0.0% 0 Reading Town Centre 18.1% 227 65.3% 58 63.9% 52 48.9% 9 22.6% 9 0.0% 0 14.1% 13 4.3% 6 2.3% 1 1.0% 1 19.3% 11 9.0% 4 Salisbury 0.0% 0 0.0% 0 0.0% 0 0.0% 0 0.0% 0 0.0% 0 0.0% 0 0.0% 0 0.0% 0 0.0% 0 0.0% 0 0.0% 0 Sandhurst 0.1% 1 0.0% 0 0.0% 0 0.0% 0 0.0% 0 0.0% 0 0.0% 0 0.0% 0 0.0% 0 0.0% 0 0.0% 0 1.2% 1 Slough 3.6% 45 0.0% 0 0.0% 0 0.0% 0 0.0% 0 0.0% 0 1.7% 1 26.8% 39 10.6% 4 0.0% 0 0.0% 0 0.0% 0 Staines 1.0% 12 0.0% 0 0.0% 0 0.0% 0 0.0% 0 0.0% 0 0.0% 0 0.0% 0 26.8% 11 0.8% 1 0.0% 0 0.0% 0 Swindon 0.2% 3 0.0% 0 0.0% 0 0.0% 0 0.0% 0 0.0% 0 0.0% 0 0.0% 0 0.0% 0 0.0% 0 0.0% 0 0.0% 0 Tadley 0.4% 5 0.0% 0 0.9% 1 0.0% 0 0.0% 0 0.0% 0 0.0% 0 0.0% 0 0.0% 0 0.0% 0 0.0% 0 0.0% 0 Wantage 0.2% 3 0.0% 0 0.0% 0 0.0% 0 0.0% 0 0.0% 0 0.0% 0 0.0% 0 0.0% 0 0.0% 0 0.0% 0 0.0% 0 Weybridge 0.1% 1 0.0% 0 0.0% 0 0.0% 0 0.0% 0 0.0% 0 0.0% 0 0.0% 0 0.0% 0 0.8% 1 0.0% 0 0.0% 0 Winchester 0.1% 1 0.0% 0 0.0% 0 0.0% 0 0.0% 0 0.0% 0 0.0% 0 0.0% 0 0.0% 0 0.0% 0 0.0% 0 0.0% 0 Windsor 0.3% 4 0.0% 0 0.0% 0 0.0% 0 0.0% 0 0.0% 0 0.0% 0 2.3% 3 1.3% 1 0.0% 0 0.0% 0 0.0% 0 Woking 1.2% 15 0.0% 0 0.0% 0 0.0% 0 0.0% 0 0.0% 0 0.0% 0 0.0% 0 0.0% 0 11.4% 14 1.0% 1 0.0% 0 Wokingham 0.1% 1 0.0% 0 0.0% 0 0.0% 0 0.0% 0 0.0% 0 0.0% 0 0.0% 0 0.0% 0 0.0% 0 0.0% 0 0.0% 0 Woodley 0.1% 1 0.0% 0 0.0% 0 0.0% 0 0.0% 0 0.0% 0 0.8% 1 0.0% 0 0.0% 0 0.0% 0 0.0% 0 0.0% 0 Bath Road Shopping Park,
Slough 6.4% 80 0.0% 0 0.0% 0 0.0% 0 0.0% 0 0.8% 1 7.7% 7 48.8% 71 2.3% 1 0.0% 0 1.0% 1 0.0% 0
Botley Road Retail Park, Oxford
0.2% 2 0.0% 0 0.0% 0 0.0% 0 0.0% 0 0.0% 0 0.0% 0 0.0% 0 0.0% 0 0.0% 0 0.0% 0 0.0% 0
Brighton Hill Retail Park, Basingstoke
3.5% 44 1.1% 1 0.0% 0 0.0% 0 0.0% 0 0.0% 0 0.0% 0 0.0% 0 0.0% 0 0.0% 0 0.0% 0 0.0% 0
Brunel Retail Park, Reading 2.1% 26 1.1% 1 24.6% 20 18.4% 3 0.0% 0 0.0% 0 0.0% 0 0.0% 0 0.0% 0 0.0% 0 0.0% 0 0.0% 0 Causeway Retail Park,
Staines 0.1% 1 0.0% 0 0.0% 0 0.0% 0 0.0% 0 0.0% 0 0.0% 0 0.0% 0 3.0% 1 0.0% 0 0.0% 0 0.0% 0
Churchill Retail Park, Andover
1.0% 13 0.0% 0 0.0% 0 0.0% 0 0.0% 0 0.0% 0 0.0% 0 0.0% 0 0.0% 0 0.0% 0 0.0% 0 0.0% 0
Enham Arch Retail Park, 0.2% 3 0.0% 0 0.0% 0 0.0% 0 0.0% 0 0.0% 0 0.0% 0 0.0% 0 0.0% 0 0.0% 0 0.0% 0 0.0% 0
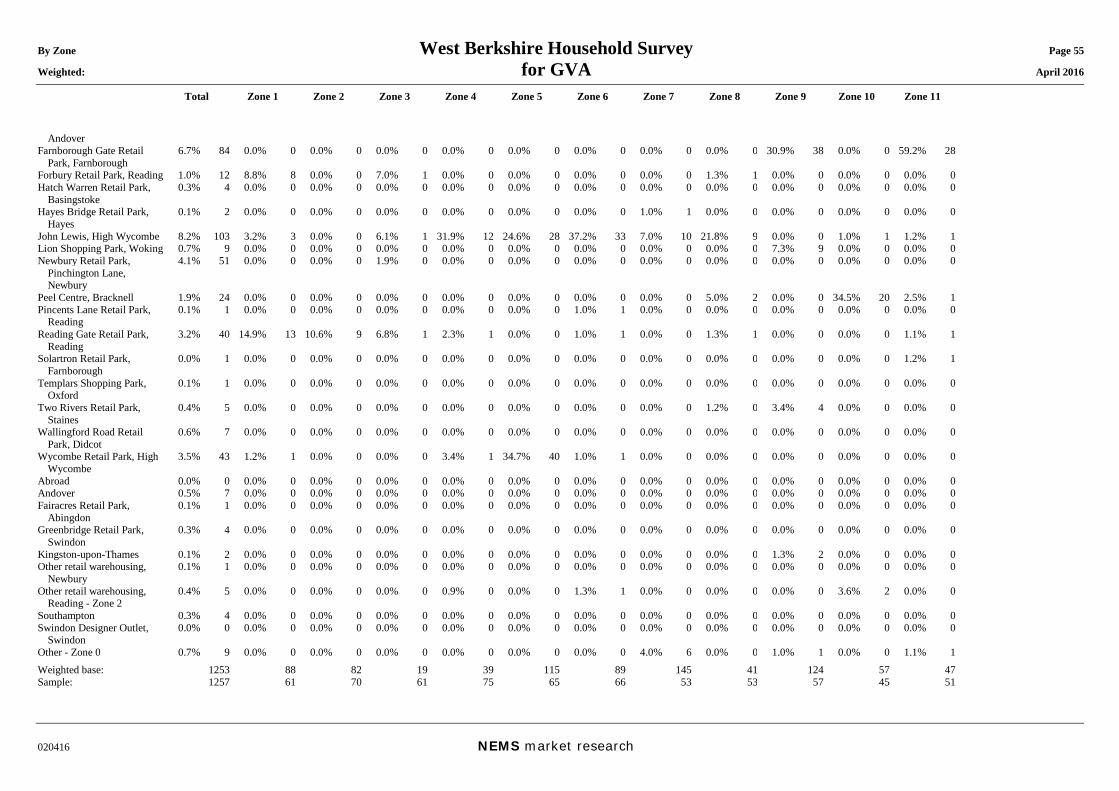
By Zone West Berkshire Household Survey Page 55 Weighted: for GVA April 2016
Total Zone 1 Zone 2 Zone 3 Zone 4 Zone 5 Zone 6 Zone 7 Zone 8 Zone 9 Zone 10 Zone 11
020416 NEMS market research
Andover Farnborough Gate Retail
Park, Farnborough 6.7% 84 0.0% 0 0.0% 0 0.0% 0 0.0% 0 0.0% 0 0.0% 0 0.0% 0 0.0% 0 30.9% 38 0.0% 0 59.2% 28
Forbury Retail Park, Reading 1.0% 12 8.8% 8 0.0% 0 7.0% 1 0.0% 0 0.0% 0 0.0% 0 0.0% 0 1.3% 1 0.0% 0 0.0% 0 0.0% 0 Hatch Warren Retail Park,
Basingstoke 0.3% 4 0.0% 0 0.0% 0 0.0% 0 0.0% 0 0.0% 0 0.0% 0 0.0% 0 0.0% 0 0.0% 0 0.0% 0 0.0% 0
Hayes Bridge Retail Park, Hayes
0.1% 2 0.0% 0 0.0% 0 0.0% 0 0.0% 0 0.0% 0 0.0% 0 1.0% 1 0.0% 0 0.0% 0 0.0% 0 0.0% 0
John Lewis, High Wycombe 8.2% 103 3.2% 3 0.0% 0 6.1% 1 31.9% 12 24.6% 28 37.2% 33 7.0% 10 21.8% 9 0.0% 0 1.0% 1 1.2% 1 Lion Shopping Park, Woking 0.7% 9 0.0% 0 0.0% 0 0.0% 0 0.0% 0 0.0% 0 0.0% 0 0.0% 0 0.0% 0 7.3% 9 0.0% 0 0.0% 0 Newbury Retail Park,
Pinchington Lane, Newbury
4.1% 51 0.0% 0 0.0% 0 1.9% 0 0.0% 0 0.0% 0 0.0% 0 0.0% 0 0.0% 0 0.0% 0 0.0% 0 0.0% 0
Peel Centre, Bracknell 1.9% 24 0.0% 0 0.0% 0 0.0% 0 0.0% 0 0.0% 0 0.0% 0 0.0% 0 5.0% 2 0.0% 0 34.5% 20 2.5% 1 Pincents Lane Retail Park,
Reading 0.1% 1 0.0% 0 0.0% 0 0.0% 0 0.0% 0 0.0% 0 1.0% 1 0.0% 0 0.0% 0 0.0% 0 0.0% 0 0.0% 0
Reading Gate Retail Park, Reading
3.2% 40 14.9% 13 10.6% 9 6.8% 1 2.3% 1 0.0% 0 1.0% 1 0.0% 0 1.3% 1 0.0% 0 0.0% 0 1.1% 1
Solartron Retail Park, Farnborough
0.0% 1 0.0% 0 0.0% 0 0.0% 0 0.0% 0 0.0% 0 0.0% 0 0.0% 0 0.0% 0 0.0% 0 0.0% 0 1.2% 1
Templars Shopping Park, Oxford
0.1% 1 0.0% 0 0.0% 0 0.0% 0 0.0% 0 0.0% 0 0.0% 0 0.0% 0 0.0% 0 0.0% 0 0.0% 0 0.0% 0
Two Rivers Retail Park, Staines
0.4% 5 0.0% 0 0.0% 0 0.0% 0 0.0% 0 0.0% 0 0.0% 0 0.0% 0 1.2% 0 3.4% 4 0.0% 0 0.0% 0
Wallingford Road Retail Park, Didcot
0.6% 7 0.0% 0 0.0% 0 0.0% 0 0.0% 0 0.0% 0 0.0% 0 0.0% 0 0.0% 0 0.0% 0 0.0% 0 0.0% 0
Wycombe Retail Park, High Wycombe
3.5% 43 1.2% 1 0.0% 0 0.0% 0 3.4% 1 34.7% 40 1.0% 1 0.0% 0 0.0% 0 0.0% 0 0.0% 0 0.0% 0
Abroad 0.0% 0 0.0% 0 0.0% 0 0.0% 0 0.0% 0 0.0% 0 0.0% 0 0.0% 0 0.0% 0 0.0% 0 0.0% 0 0.0% 0 Andover 0.5% 7 0.0% 0 0.0% 0 0.0% 0 0.0% 0 0.0% 0 0.0% 0 0.0% 0 0.0% 0 0.0% 0 0.0% 0 0.0% 0 Fairacres Retail Park,
Abingdon 0.1% 1 0.0% 0 0.0% 0 0.0% 0 0.0% 0 0.0% 0 0.0% 0 0.0% 0 0.0% 0 0.0% 0 0.0% 0 0.0% 0
Greenbridge Retail Park, Swindon
0.3% 4 0.0% 0 0.0% 0 0.0% 0 0.0% 0 0.0% 0 0.0% 0 0.0% 0 0.0% 0 0.0% 0 0.0% 0 0.0% 0
Kingston-upon-Thames 0.1% 2 0.0% 0 0.0% 0 0.0% 0 0.0% 0 0.0% 0 0.0% 0 0.0% 0 0.0% 0 1.3% 2 0.0% 0 0.0% 0 Other retail warehousing,
Newbury 0.1% 1 0.0% 0 0.0% 0 0.0% 0 0.0% 0 0.0% 0 0.0% 0 0.0% 0 0.0% 0 0.0% 0 0.0% 0 0.0% 0
Other retail warehousing, Reading - Zone 2
0.4% 5 0.0% 0 0.0% 0 0.0% 0 0.9% 0 0.0% 0 1.3% 1 0.0% 0 0.0% 0 0.0% 0 3.6% 2 0.0% 0
Southampton 0.3% 4 0.0% 0 0.0% 0 0.0% 0 0.0% 0 0.0% 0 0.0% 0 0.0% 0 0.0% 0 0.0% 0 0.0% 0 0.0% 0 Swindon Designer Outlet,
Swindon 0.0% 0 0.0% 0 0.0% 0 0.0% 0 0.0% 0 0.0% 0 0.0% 0 0.0% 0 0.0% 0 0.0% 0 0.0% 0 0.0% 0
Other - Zone 0 0.7% 9 0.0% 0 0.0% 0 0.0% 0 0.0% 0 0.0% 0 0.0% 0 4.0% 6 0.0% 0 1.0% 1 0.0% 0 1.1% 1 Weighted base: 1253 88 82 19 39 115 89 145 41 124 57 47 Sample: 1257 61 70 61 75 65 66 53 53 57 45 51
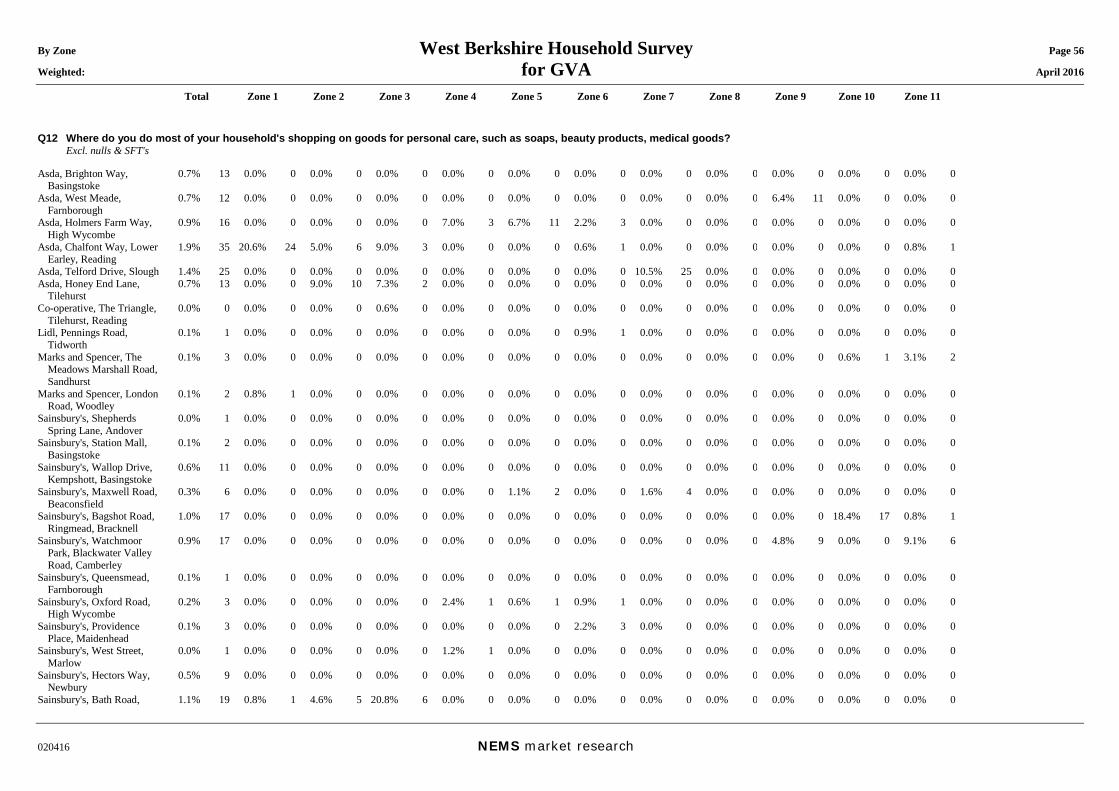
By Zone West Berkshire Household Survey Page 56 Weighted: for GVA April 2016
Total Zone 1 Zone 2 Zone 3 Zone 4 Zone 5 Zone 6 Zone 7 Zone 8 Zone 9 Zone 10 Zone 11
020416 NEMS market research
Q12 Where do you do most of your household's shopping on goods for personal care, such as soaps, beauty products, medical goods? Excl. nulls & SFT's Asda, Brighton Way,
Basingstoke 0.7% 13 0.0% 0 0.0% 0 0.0% 0 0.0% 0 0.0% 0 0.0% 0 0.0% 0 0.0% 0 0.0% 0 0.0% 0 0.0% 0
Asda, West Meade, Farnborough
0.7% 12 0.0% 0 0.0% 0 0.0% 0 0.0% 0 0.0% 0 0.0% 0 0.0% 0 0.0% 0 6.4% 11 0.0% 0 0.0% 0
Asda, Holmers Farm Way, High Wycombe
0.9% 16 0.0% 0 0.0% 0 0.0% 0 7.0% 3 6.7% 11 2.2% 3 0.0% 0 0.0% 0 0.0% 0 0.0% 0 0.0% 0
Asda, Chalfont Way, Lower Earley, Reading
1.9% 35 20.6% 24 5.0% 6 9.0% 3 0.0% 0 0.0% 0 0.6% 1 0.0% 0 0.0% 0 0.0% 0 0.0% 0 0.8% 1
Asda, Telford Drive, Slough 1.4% 25 0.0% 0 0.0% 0 0.0% 0 0.0% 0 0.0% 0 0.0% 0 10.5% 25 0.0% 0 0.0% 0 0.0% 0 0.0% 0 Asda, Honey End Lane,
Tilehurst 0.7% 13 0.0% 0 9.0% 10 7.3% 2 0.0% 0 0.0% 0 0.0% 0 0.0% 0 0.0% 0 0.0% 0 0.0% 0 0.0% 0
Co-operative, The Triangle, Tilehurst, Reading
0.0% 0 0.0% 0 0.0% 0 0.6% 0 0.0% 0 0.0% 0 0.0% 0 0.0% 0 0.0% 0 0.0% 0 0.0% 0 0.0% 0
Lidl, Pennings Road, Tidworth
0.1% 1 0.0% 0 0.0% 0 0.0% 0 0.0% 0 0.0% 0 0.9% 1 0.0% 0 0.0% 0 0.0% 0 0.0% 0 0.0% 0
Marks and Spencer, The Meadows Marshall Road, Sandhurst
0.1% 3 0.0% 0 0.0% 0 0.0% 0 0.0% 0 0.0% 0 0.0% 0 0.0% 0 0.0% 0 0.0% 0 0.6% 1 3.1% 2
Marks and Spencer, London Road, Woodley
0.1% 2 0.8% 1 0.0% 0 0.0% 0 0.0% 0 0.0% 0 0.0% 0 0.0% 0 0.0% 0 0.0% 0 0.0% 0 0.0% 0
Sainsbury's, Shepherds Spring Lane, Andover
0.0% 1 0.0% 0 0.0% 0 0.0% 0 0.0% 0 0.0% 0 0.0% 0 0.0% 0 0.0% 0 0.0% 0 0.0% 0 0.0% 0
Sainsbury's, Station Mall, Basingstoke
0.1% 2 0.0% 0 0.0% 0 0.0% 0 0.0% 0 0.0% 0 0.0% 0 0.0% 0 0.0% 0 0.0% 0 0.0% 0 0.0% 0
Sainsbury's, Wallop Drive, Kempshott, Basingstoke
0.6% 11 0.0% 0 0.0% 0 0.0% 0 0.0% 0 0.0% 0 0.0% 0 0.0% 0 0.0% 0 0.0% 0 0.0% 0 0.0% 0
Sainsbury's, Maxwell Road, Beaconsfield
0.3% 6 0.0% 0 0.0% 0 0.0% 0 0.0% 0 1.1% 2 0.0% 0 1.6% 4 0.0% 0 0.0% 0 0.0% 0 0.0% 0
Sainsbury's, Bagshot Road, Ringmead, Bracknell
1.0% 17 0.0% 0 0.0% 0 0.0% 0 0.0% 0 0.0% 0 0.0% 0 0.0% 0 0.0% 0 0.0% 0 18.4% 17 0.8% 1
Sainsbury's, Watchmoor Park, Blackwater Valley Road, Camberley
0.9% 17 0.0% 0 0.0% 0 0.0% 0 0.0% 0 0.0% 0 0.0% 0 0.0% 0 0.0% 0 4.8% 9 0.0% 0 9.1% 6
Sainsbury's, Queensmead, Farnborough
0.1% 1 0.0% 0 0.0% 0 0.0% 0 0.0% 0 0.0% 0 0.0% 0 0.0% 0 0.0% 0 0.0% 0 0.0% 0 0.0% 0
Sainsbury's, Oxford Road, High Wycombe
0.2% 3 0.0% 0 0.0% 0 0.0% 0 2.4% 1 0.6% 1 0.9% 1 0.0% 0 0.0% 0 0.0% 0 0.0% 0 0.0% 0
Sainsbury's, Providence Place, Maidenhead
0.1% 3 0.0% 0 0.0% 0 0.0% 0 0.0% 0 0.0% 0 2.2% 3 0.0% 0 0.0% 0 0.0% 0 0.0% 0 0.0% 0
Sainsbury's, West Street, Marlow
0.0% 1 0.0% 0 0.0% 0 0.0% 0 1.2% 1 0.0% 0 0.0% 0 0.0% 0 0.0% 0 0.0% 0 0.0% 0 0.0% 0
Sainsbury's, Hectors Way, Newbury
0.5% 9 0.0% 0 0.0% 0 0.0% 0 0.0% 0 0.0% 0 0.0% 0 0.0% 0 0.0% 0 0.0% 0 0.0% 0 0.0% 0
Sainsbury's, Bath Road, 1.1% 19 0.8% 1 4.6% 5 20.8% 6 0.0% 0 0.0% 0 0.0% 0 0.0% 0 0.0% 0 0.0% 0 0.0% 0 0.0% 0
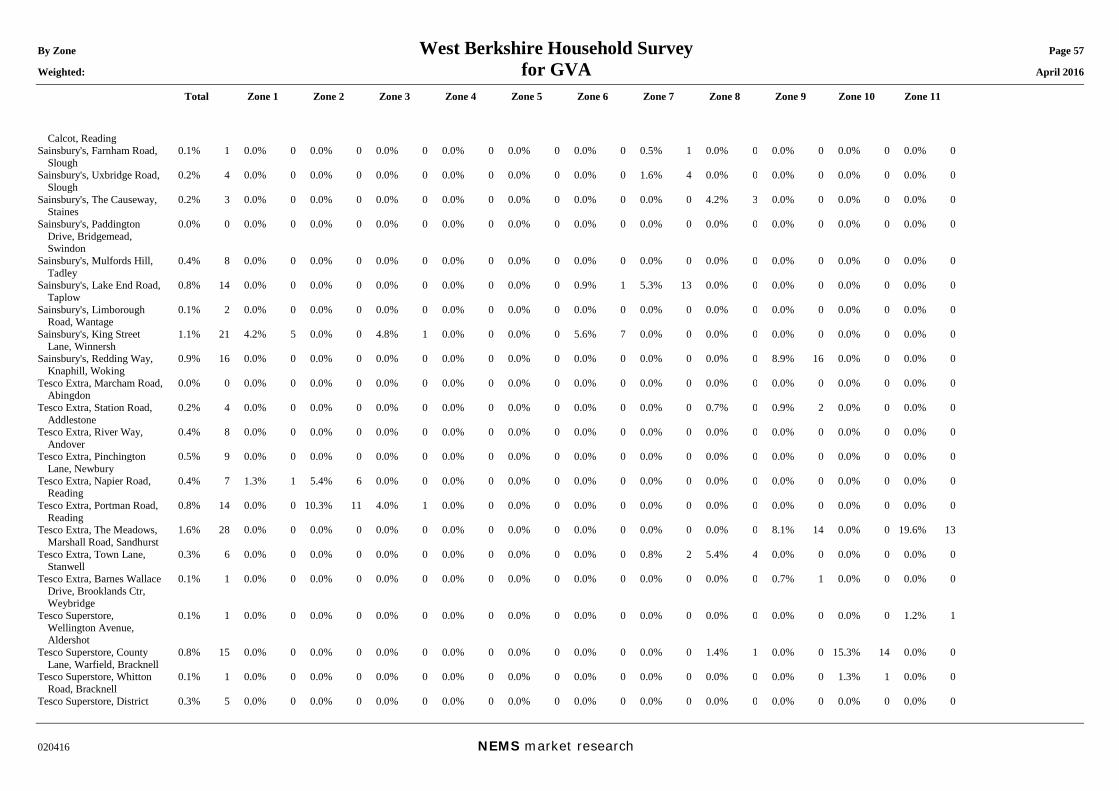
By Zone West Berkshire Household Survey Page 57 Weighted: for GVA April 2016
Total Zone 1 Zone 2 Zone 3 Zone 4 Zone 5 Zone 6 Zone 7 Zone 8 Zone 9 Zone 10 Zone 11
020416 NEMS market research
Calcot, Reading Sainsbury's, Farnham Road,
Slough 0.1% 1 0.0% 0 0.0% 0 0.0% 0 0.0% 0 0.0% 0 0.0% 0 0.5% 1 0.0% 0 0.0% 0 0.0% 0 0.0% 0
Sainsbury's, Uxbridge Road, Slough
0.2% 4 0.0% 0 0.0% 0 0.0% 0 0.0% 0 0.0% 0 0.0% 0 1.6% 4 0.0% 0 0.0% 0 0.0% 0 0.0% 0
Sainsbury's, The Causeway, Staines
0.2% 3 0.0% 0 0.0% 0 0.0% 0 0.0% 0 0.0% 0 0.0% 0 0.0% 0 4.2% 3 0.0% 0 0.0% 0 0.0% 0
Sainsbury's, Paddington Drive, Bridgemead, Swindon
0.0% 0 0.0% 0 0.0% 0 0.0% 0 0.0% 0 0.0% 0 0.0% 0 0.0% 0 0.0% 0 0.0% 0 0.0% 0 0.0% 0
Sainsbury's, Mulfords Hill, Tadley
0.4% 8 0.0% 0 0.0% 0 0.0% 0 0.0% 0 0.0% 0 0.0% 0 0.0% 0 0.0% 0 0.0% 0 0.0% 0 0.0% 0
Sainsbury's, Lake End Road, Taplow
0.8% 14 0.0% 0 0.0% 0 0.0% 0 0.0% 0 0.0% 0 0.9% 1 5.3% 13 0.0% 0 0.0% 0 0.0% 0 0.0% 0
Sainsbury's, Limborough Road, Wantage
0.1% 2 0.0% 0 0.0% 0 0.0% 0 0.0% 0 0.0% 0 0.0% 0 0.0% 0 0.0% 0 0.0% 0 0.0% 0 0.0% 0
Sainsbury's, King Street Lane, Winnersh
1.1% 21 4.2% 5 0.0% 0 4.8% 1 0.0% 0 0.0% 0 5.6% 7 0.0% 0 0.0% 0 0.0% 0 0.0% 0 0.0% 0
Sainsbury's, Redding Way, Knaphill, Woking
0.9% 16 0.0% 0 0.0% 0 0.0% 0 0.0% 0 0.0% 0 0.0% 0 0.0% 0 0.0% 0 8.9% 16 0.0% 0 0.0% 0
Tesco Extra, Marcham Road, Abingdon
0.0% 0 0.0% 0 0.0% 0 0.0% 0 0.0% 0 0.0% 0 0.0% 0 0.0% 0 0.0% 0 0.0% 0 0.0% 0 0.0% 0
Tesco Extra, Station Road, Addlestone
0.2% 4 0.0% 0 0.0% 0 0.0% 0 0.0% 0 0.0% 0 0.0% 0 0.0% 0 0.7% 0 0.9% 2 0.0% 0 0.0% 0
Tesco Extra, River Way, Andover
0.4% 8 0.0% 0 0.0% 0 0.0% 0 0.0% 0 0.0% 0 0.0% 0 0.0% 0 0.0% 0 0.0% 0 0.0% 0 0.0% 0
Tesco Extra, Pinchington Lane, Newbury
0.5% 9 0.0% 0 0.0% 0 0.0% 0 0.0% 0 0.0% 0 0.0% 0 0.0% 0 0.0% 0 0.0% 0 0.0% 0 0.0% 0
Tesco Extra, Napier Road, Reading
0.4% 7 1.3% 1 5.4% 6 0.0% 0 0.0% 0 0.0% 0 0.0% 0 0.0% 0 0.0% 0 0.0% 0 0.0% 0 0.0% 0
Tesco Extra, Portman Road, Reading
0.8% 14 0.0% 0 10.3% 11 4.0% 1 0.0% 0 0.0% 0 0.0% 0 0.0% 0 0.0% 0 0.0% 0 0.0% 0 0.0% 0
Tesco Extra, The Meadows, Marshall Road, Sandhurst
1.6% 28 0.0% 0 0.0% 0 0.0% 0 0.0% 0 0.0% 0 0.0% 0 0.0% 0 0.0% 0 8.1% 14 0.0% 0 19.6% 13
Tesco Extra, Town Lane, Stanwell
0.3% 6 0.0% 0 0.0% 0 0.0% 0 0.0% 0 0.0% 0 0.0% 0 0.8% 2 5.4% 4 0.0% 0 0.0% 0 0.0% 0
Tesco Extra, Barnes Wallace Drive, Brooklands Ctr, Weybridge
0.1% 1 0.0% 0 0.0% 0 0.0% 0 0.0% 0 0.0% 0 0.0% 0 0.0% 0 0.0% 0 0.7% 1 0.0% 0 0.0% 0
Tesco Superstore, Wellington Avenue, Aldershot
0.1% 1 0.0% 0 0.0% 0 0.0% 0 0.0% 0 0.0% 0 0.0% 0 0.0% 0 0.0% 0 0.0% 0 0.0% 0 1.2% 1
Tesco Superstore, County Lane, Warfield, Bracknell
0.8% 15 0.0% 0 0.0% 0 0.0% 0 0.0% 0 0.0% 0 0.0% 0 0.0% 0 1.4% 1 0.0% 0 15.3% 14 0.0% 0
Tesco Superstore, Whitton Road, Bracknell
0.1% 1 0.0% 0 0.0% 0 0.0% 0 0.0% 0 0.0% 0 0.0% 0 0.0% 0 0.0% 0 0.0% 0 1.3% 1 0.0% 0
Tesco Superstore, District 0.3% 5 0.0% 0 0.0% 0 0.0% 0 0.0% 0 0.0% 0 0.0% 0 0.0% 0 0.0% 0 0.0% 0 0.0% 0 0.0% 0
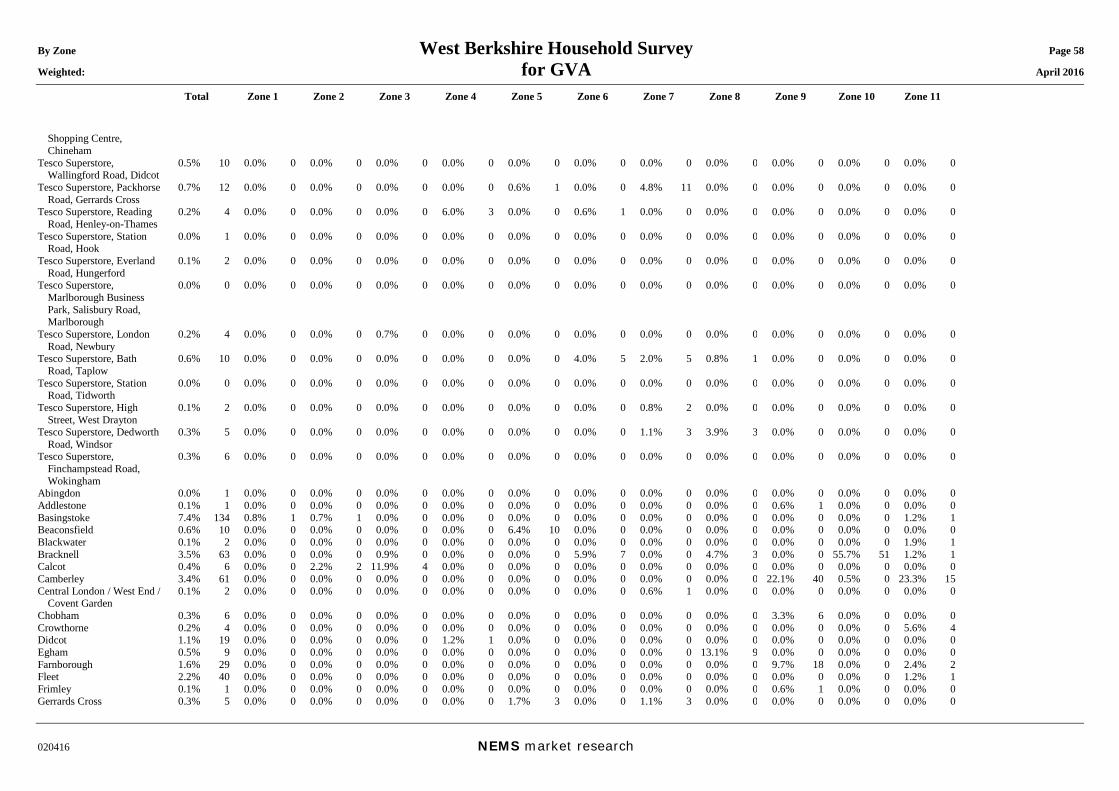
By Zone West Berkshire Household Survey Page 58 Weighted: for GVA April 2016
Total Zone 1 Zone 2 Zone 3 Zone 4 Zone 5 Zone 6 Zone 7 Zone 8 Zone 9 Zone 10 Zone 11
020416 NEMS market research
Shopping Centre, Chineham
Tesco Superstore, Wallingford Road, Didcot
0.5% 10 0.0% 0 0.0% 0 0.0% 0 0.0% 0 0.0% 0 0.0% 0 0.0% 0 0.0% 0 0.0% 0 0.0% 0 0.0% 0
Tesco Superstore, Packhorse Road, Gerrards Cross
0.7% 12 0.0% 0 0.0% 0 0.0% 0 0.0% 0 0.6% 1 0.0% 0 4.8% 11 0.0% 0 0.0% 0 0.0% 0 0.0% 0
Tesco Superstore, Reading Road, Henley-on-Thames
0.2% 4 0.0% 0 0.0% 0 0.0% 0 6.0% 3 0.0% 0 0.6% 1 0.0% 0 0.0% 0 0.0% 0 0.0% 0 0.0% 0
Tesco Superstore, Station Road, Hook
0.0% 1 0.0% 0 0.0% 0 0.0% 0 0.0% 0 0.0% 0 0.0% 0 0.0% 0 0.0% 0 0.0% 0 0.0% 0 0.0% 0
Tesco Superstore, Everland Road, Hungerford
0.1% 2 0.0% 0 0.0% 0 0.0% 0 0.0% 0 0.0% 0 0.0% 0 0.0% 0 0.0% 0 0.0% 0 0.0% 0 0.0% 0
Tesco Superstore, Marlborough Business Park, Salisbury Road, Marlborough
0.0% 0 0.0% 0 0.0% 0 0.0% 0 0.0% 0 0.0% 0 0.0% 0 0.0% 0 0.0% 0 0.0% 0 0.0% 0 0.0% 0
Tesco Superstore, London Road, Newbury
0.2% 4 0.0% 0 0.0% 0 0.7% 0 0.0% 0 0.0% 0 0.0% 0 0.0% 0 0.0% 0 0.0% 0 0.0% 0 0.0% 0
Tesco Superstore, Bath Road, Taplow
0.6% 10 0.0% 0 0.0% 0 0.0% 0 0.0% 0 0.0% 0 4.0% 5 2.0% 5 0.8% 1 0.0% 0 0.0% 0 0.0% 0
Tesco Superstore, Station Road, Tidworth
0.0% 0 0.0% 0 0.0% 0 0.0% 0 0.0% 0 0.0% 0 0.0% 0 0.0% 0 0.0% 0 0.0% 0 0.0% 0 0.0% 0
Tesco Superstore, High Street, West Drayton
0.1% 2 0.0% 0 0.0% 0 0.0% 0 0.0% 0 0.0% 0 0.0% 0 0.8% 2 0.0% 0 0.0% 0 0.0% 0 0.0% 0
Tesco Superstore, Dedworth Road, Windsor
0.3% 5 0.0% 0 0.0% 0 0.0% 0 0.0% 0 0.0% 0 0.0% 0 1.1% 3 3.9% 3 0.0% 0 0.0% 0 0.0% 0
Tesco Superstore, Finchampstead Road, Wokingham
0.3% 6 0.0% 0 0.0% 0 0.0% 0 0.0% 0 0.0% 0 0.0% 0 0.0% 0 0.0% 0 0.0% 0 0.0% 0 0.0% 0
Abingdon 0.0% 1 0.0% 0 0.0% 0 0.0% 0 0.0% 0 0.0% 0 0.0% 0 0.0% 0 0.0% 0 0.0% 0 0.0% 0 0.0% 0 Addlestone 0.1% 1 0.0% 0 0.0% 0 0.0% 0 0.0% 0 0.0% 0 0.0% 0 0.0% 0 0.0% 0 0.6% 1 0.0% 0 0.0% 0 Basingstoke 7.4% 134 0.8% 1 0.7% 1 0.0% 0 0.0% 0 0.0% 0 0.0% 0 0.0% 0 0.0% 0 0.0% 0 0.0% 0 1.2% 1 Beaconsfield 0.6% 10 0.0% 0 0.0% 0 0.0% 0 0.0% 0 6.4% 10 0.0% 0 0.0% 0 0.0% 0 0.0% 0 0.0% 0 0.0% 0 Blackwater 0.1% 2 0.0% 0 0.0% 0 0.0% 0 0.0% 0 0.0% 0 0.0% 0 0.0% 0 0.0% 0 0.0% 0 0.0% 0 1.9% 1 Bracknell 3.5% 63 0.0% 0 0.0% 0 0.9% 0 0.0% 0 0.0% 0 5.9% 7 0.0% 0 4.7% 3 0.0% 0 55.7% 51 1.2% 1 Calcot 0.4% 6 0.0% 0 2.2% 2 11.9% 4 0.0% 0 0.0% 0 0.0% 0 0.0% 0 0.0% 0 0.0% 0 0.0% 0 0.0% 0 Camberley 3.4% 61 0.0% 0 0.0% 0 0.0% 0 0.0% 0 0.0% 0 0.0% 0 0.0% 0 0.0% 0 22.1% 40 0.5% 0 23.3% 15 Central London / West End /
Covent Garden 0.1% 2 0.0% 0 0.0% 0 0.0% 0 0.0% 0 0.0% 0 0.0% 0 0.6% 1 0.0% 0 0.0% 0 0.0% 0 0.0% 0
Chobham 0.3% 6 0.0% 0 0.0% 0 0.0% 0 0.0% 0 0.0% 0 0.0% 0 0.0% 0 0.0% 0 3.3% 6 0.0% 0 0.0% 0 Crowthorne 0.2% 4 0.0% 0 0.0% 0 0.0% 0 0.0% 0 0.0% 0 0.0% 0 0.0% 0 0.0% 0 0.0% 0 0.0% 0 5.6% 4 Didcot 1.1% 19 0.0% 0 0.0% 0 0.0% 0 1.2% 1 0.0% 0 0.0% 0 0.0% 0 0.0% 0 0.0% 0 0.0% 0 0.0% 0 Egham 0.5% 9 0.0% 0 0.0% 0 0.0% 0 0.0% 0 0.0% 0 0.0% 0 0.0% 0 13.1% 9 0.0% 0 0.0% 0 0.0% 0 Farnborough 1.6% 29 0.0% 0 0.0% 0 0.0% 0 0.0% 0 0.0% 0 0.0% 0 0.0% 0 0.0% 0 9.7% 18 0.0% 0 2.4% 2 Fleet 2.2% 40 0.0% 0 0.0% 0 0.0% 0 0.0% 0 0.0% 0 0.0% 0 0.0% 0 0.0% 0 0.0% 0 0.0% 0 1.2% 1 Frimley 0.1% 1 0.0% 0 0.0% 0 0.0% 0 0.0% 0 0.0% 0 0.0% 0 0.0% 0 0.0% 0 0.6% 1 0.0% 0 0.0% 0 Gerrards Cross 0.3% 5 0.0% 0 0.0% 0 0.0% 0 0.0% 0 1.7% 3 0.0% 0 1.1% 3 0.0% 0 0.0% 0 0.0% 0 0.0% 0
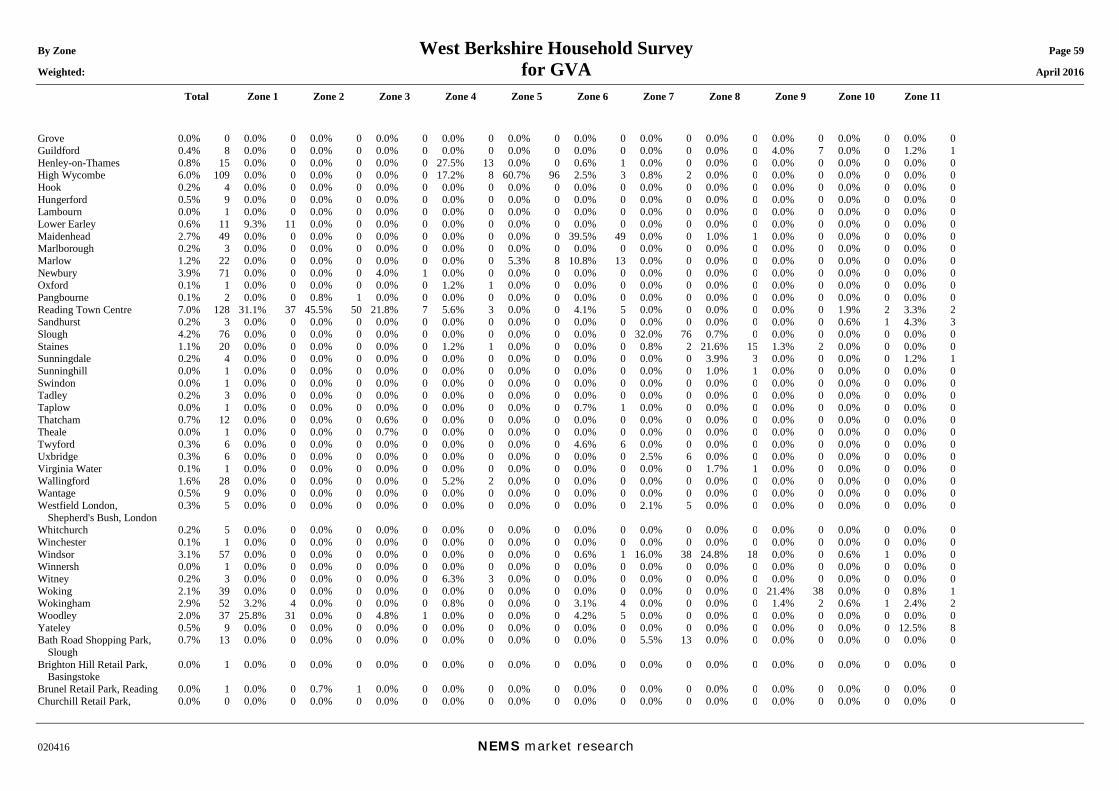
By Zone West Berkshire Household Survey Page 59 Weighted: for GVA April 2016
Total Zone 1 Zone 2 Zone 3 Zone 4 Zone 5 Zone 6 Zone 7 Zone 8 Zone 9 Zone 10 Zone 11
020416 NEMS market research
Grove 0.0% 0 0.0% 0 0.0% 0 0.0% 0 0.0% 0 0.0% 0 0.0% 0 0.0% 0 0.0% 0 0.0% 0 0.0% 0 0.0% 0 Guildford 0.4% 8 0.0% 0 0.0% 0 0.0% 0 0.0% 0 0.0% 0 0.0% 0 0.0% 0 0.0% 0 4.0% 7 0.0% 0 1.2% 1 Henley-on-Thames 0.8% 15 0.0% 0 0.0% 0 0.0% 0 27.5% 13 0.0% 0 0.6% 1 0.0% 0 0.0% 0 0.0% 0 0.0% 0 0.0% 0 High Wycombe 6.0% 109 0.0% 0 0.0% 0 0.0% 0 17.2% 8 60.7% 96 2.5% 3 0.8% 2 0.0% 0 0.0% 0 0.0% 0 0.0% 0 Hook 0.2% 4 0.0% 0 0.0% 0 0.0% 0 0.0% 0 0.0% 0 0.0% 0 0.0% 0 0.0% 0 0.0% 0 0.0% 0 0.0% 0 Hungerford 0.5% 9 0.0% 0 0.0% 0 0.0% 0 0.0% 0 0.0% 0 0.0% 0 0.0% 0 0.0% 0 0.0% 0 0.0% 0 0.0% 0 Lambourn 0.0% 1 0.0% 0 0.0% 0 0.0% 0 0.0% 0 0.0% 0 0.0% 0 0.0% 0 0.0% 0 0.0% 0 0.0% 0 0.0% 0 Lower Earley 0.6% 11 9.3% 11 0.0% 0 0.0% 0 0.0% 0 0.0% 0 0.0% 0 0.0% 0 0.0% 0 0.0% 0 0.0% 0 0.0% 0 Maidenhead 2.7% 49 0.0% 0 0.0% 0 0.0% 0 0.0% 0 0.0% 0 39.5% 49 0.0% 0 1.0% 1 0.0% 0 0.0% 0 0.0% 0 Marlborough 0.2% 3 0.0% 0 0.0% 0 0.0% 0 0.0% 0 0.0% 0 0.0% 0 0.0% 0 0.0% 0 0.0% 0 0.0% 0 0.0% 0 Marlow 1.2% 22 0.0% 0 0.0% 0 0.0% 0 0.0% 0 5.3% 8 10.8% 13 0.0% 0 0.0% 0 0.0% 0 0.0% 0 0.0% 0 Newbury 3.9% 71 0.0% 0 0.0% 0 4.0% 1 0.0% 0 0.0% 0 0.0% 0 0.0% 0 0.0% 0 0.0% 0 0.0% 0 0.0% 0 Oxford 0.1% 1 0.0% 0 0.0% 0 0.0% 0 1.2% 1 0.0% 0 0.0% 0 0.0% 0 0.0% 0 0.0% 0 0.0% 0 0.0% 0 Pangbourne 0.1% 2 0.0% 0 0.8% 1 0.0% 0 0.0% 0 0.0% 0 0.0% 0 0.0% 0 0.0% 0 0.0% 0 0.0% 0 0.0% 0 Reading Town Centre 7.0% 128 31.1% 37 45.5% 50 21.8% 7 5.6% 3 0.0% 0 4.1% 5 0.0% 0 0.0% 0 0.0% 0 1.9% 2 3.3% 2 Sandhurst 0.2% 3 0.0% 0 0.0% 0 0.0% 0 0.0% 0 0.0% 0 0.0% 0 0.0% 0 0.0% 0 0.0% 0 0.6% 1 4.3% 3 Slough 4.2% 76 0.0% 0 0.0% 0 0.0% 0 0.0% 0 0.0% 0 0.0% 0 32.0% 76 0.7% 0 0.0% 0 0.0% 0 0.0% 0 Staines 1.1% 20 0.0% 0 0.0% 0 0.0% 0 1.2% 1 0.0% 0 0.0% 0 0.8% 2 21.6% 15 1.3% 2 0.0% 0 0.0% 0 Sunningdale 0.2% 4 0.0% 0 0.0% 0 0.0% 0 0.0% 0 0.0% 0 0.0% 0 0.0% 0 3.9% 3 0.0% 0 0.0% 0 1.2% 1 Sunninghill 0.0% 1 0.0% 0 0.0% 0 0.0% 0 0.0% 0 0.0% 0 0.0% 0 0.0% 0 1.0% 1 0.0% 0 0.0% 0 0.0% 0 Swindon 0.0% 1 0.0% 0 0.0% 0 0.0% 0 0.0% 0 0.0% 0 0.0% 0 0.0% 0 0.0% 0 0.0% 0 0.0% 0 0.0% 0 Tadley 0.2% 3 0.0% 0 0.0% 0 0.0% 0 0.0% 0 0.0% 0 0.0% 0 0.0% 0 0.0% 0 0.0% 0 0.0% 0 0.0% 0 Taplow 0.0% 1 0.0% 0 0.0% 0 0.0% 0 0.0% 0 0.0% 0 0.7% 1 0.0% 0 0.0% 0 0.0% 0 0.0% 0 0.0% 0 Thatcham 0.7% 12 0.0% 0 0.0% 0 0.6% 0 0.0% 0 0.0% 0 0.0% 0 0.0% 0 0.0% 0 0.0% 0 0.0% 0 0.0% 0 Theale 0.0% 1 0.0% 0 0.0% 0 0.7% 0 0.0% 0 0.0% 0 0.0% 0 0.0% 0 0.0% 0 0.0% 0 0.0% 0 0.0% 0 Twyford 0.3% 6 0.0% 0 0.0% 0 0.0% 0 0.0% 0 0.0% 0 4.6% 6 0.0% 0 0.0% 0 0.0% 0 0.0% 0 0.0% 0 Uxbridge 0.3% 6 0.0% 0 0.0% 0 0.0% 0 0.0% 0 0.0% 0 0.0% 0 2.5% 6 0.0% 0 0.0% 0 0.0% 0 0.0% 0 Virginia Water 0.1% 1 0.0% 0 0.0% 0 0.0% 0 0.0% 0 0.0% 0 0.0% 0 0.0% 0 1.7% 1 0.0% 0 0.0% 0 0.0% 0 Wallingford 1.6% 28 0.0% 0 0.0% 0 0.0% 0 5.2% 2 0.0% 0 0.0% 0 0.0% 0 0.0% 0 0.0% 0 0.0% 0 0.0% 0 Wantage 0.5% 9 0.0% 0 0.0% 0 0.0% 0 0.0% 0 0.0% 0 0.0% 0 0.0% 0 0.0% 0 0.0% 0 0.0% 0 0.0% 0 Westfield London,
Shepherd's Bush, London 0.3% 5 0.0% 0 0.0% 0 0.0% 0 0.0% 0 0.0% 0 0.0% 0 2.1% 5 0.0% 0 0.0% 0 0.0% 0 0.0% 0
Whitchurch 0.2% 5 0.0% 0 0.0% 0 0.0% 0 0.0% 0 0.0% 0 0.0% 0 0.0% 0 0.0% 0 0.0% 0 0.0% 0 0.0% 0 Winchester 0.1% 1 0.0% 0 0.0% 0 0.0% 0 0.0% 0 0.0% 0 0.0% 0 0.0% 0 0.0% 0 0.0% 0 0.0% 0 0.0% 0 Windsor 3.1% 57 0.0% 0 0.0% 0 0.0% 0 0.0% 0 0.0% 0 0.6% 1 16.0% 38 24.8% 18 0.0% 0 0.6% 1 0.0% 0 Winnersh 0.0% 1 0.0% 0 0.0% 0 0.0% 0 0.0% 0 0.0% 0 0.0% 0 0.0% 0 0.0% 0 0.0% 0 0.0% 0 0.0% 0 Witney 0.2% 3 0.0% 0 0.0% 0 0.0% 0 6.3% 3 0.0% 0 0.0% 0 0.0% 0 0.0% 0 0.0% 0 0.0% 0 0.0% 0 Woking 2.1% 39 0.0% 0 0.0% 0 0.0% 0 0.0% 0 0.0% 0 0.0% 0 0.0% 0 0.0% 0 21.4% 38 0.0% 0 0.8% 1 Wokingham 2.9% 52 3.2% 4 0.0% 0 0.0% 0 0.8% 0 0.0% 0 3.1% 4 0.0% 0 0.0% 0 1.4% 2 0.6% 1 2.4% 2 Woodley 2.0% 37 25.8% 31 0.0% 0 4.8% 1 0.0% 0 0.0% 0 4.2% 5 0.0% 0 0.0% 0 0.0% 0 0.0% 0 0.0% 0 Yateley 0.5% 9 0.0% 0 0.0% 0 0.0% 0 0.0% 0 0.0% 0 0.0% 0 0.0% 0 0.0% 0 0.0% 0 0.0% 0 12.5% 8 Bath Road Shopping Park,
Slough 0.7% 13 0.0% 0 0.0% 0 0.0% 0 0.0% 0 0.0% 0 0.0% 0 5.5% 13 0.0% 0 0.0% 0 0.0% 0 0.0% 0
Brighton Hill Retail Park, Basingstoke
0.0% 1 0.0% 0 0.0% 0 0.0% 0 0.0% 0 0.0% 0 0.0% 0 0.0% 0 0.0% 0 0.0% 0 0.0% 0 0.0% 0
Brunel Retail Park, Reading 0.0% 1 0.0% 0 0.7% 1 0.0% 0 0.0% 0 0.0% 0 0.0% 0 0.0% 0 0.0% 0 0.0% 0 0.0% 0 0.0% 0 Churchill Retail Park, 0.0% 0 0.0% 0 0.0% 0 0.0% 0 0.0% 0 0.0% 0 0.0% 0 0.0% 0 0.0% 0 0.0% 0 0.0% 0 0.0% 0
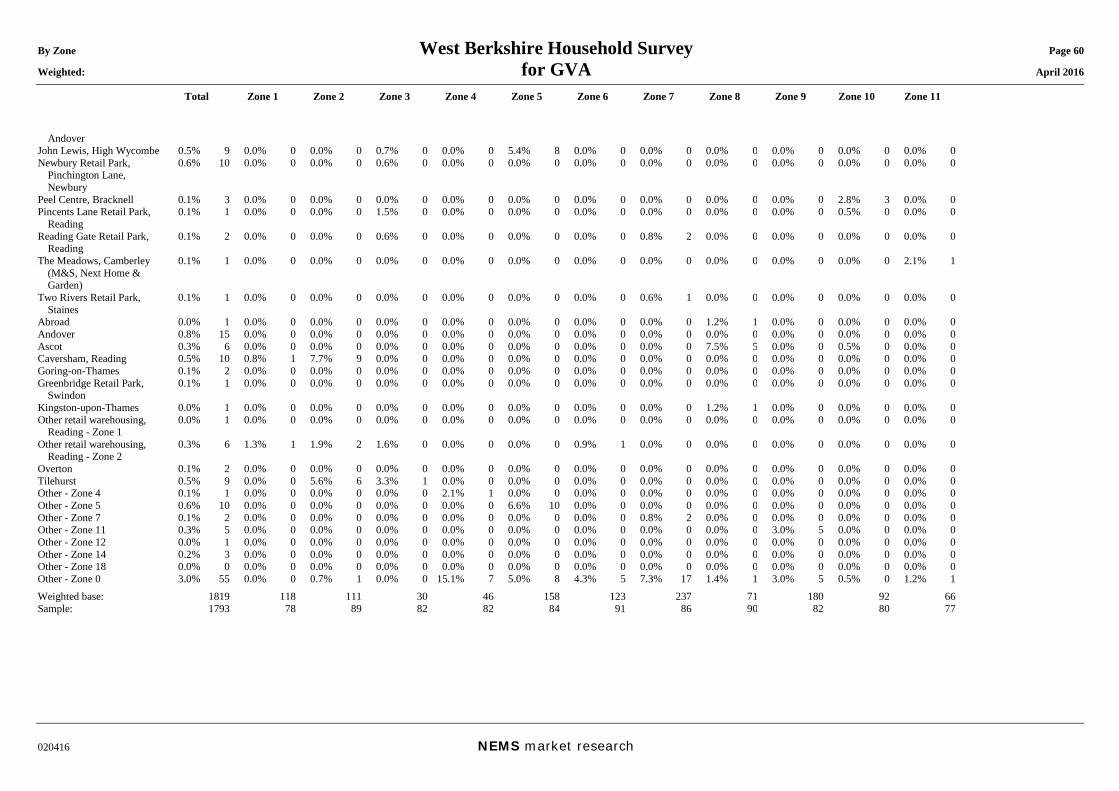
By Zone West Berkshire Household Survey Page 60 Weighted: for GVA April 2016
Total Zone 1 Zone 2 Zone 3 Zone 4 Zone 5 Zone 6 Zone 7 Zone 8 Zone 9 Zone 10 Zone 11
020416 NEMS market research
Andover John Lewis, High Wycombe 0.5% 9 0.0% 0 0.0% 0 0.7% 0 0.0% 0 5.4% 8 0.0% 0 0.0% 0 0.0% 0 0.0% 0 0.0% 0 0.0% 0 Newbury Retail Park,
Pinchington Lane, Newbury
0.6% 10 0.0% 0 0.0% 0 0.6% 0 0.0% 0 0.0% 0 0.0% 0 0.0% 0 0.0% 0 0.0% 0 0.0% 0 0.0% 0
Peel Centre, Bracknell 0.1% 3 0.0% 0 0.0% 0 0.0% 0 0.0% 0 0.0% 0 0.0% 0 0.0% 0 0.0% 0 0.0% 0 2.8% 3 0.0% 0 Pincents Lane Retail Park,
Reading 0.1% 1 0.0% 0 0.0% 0 1.5% 0 0.0% 0 0.0% 0 0.0% 0 0.0% 0 0.0% 0 0.0% 0 0.5% 0 0.0% 0
Reading Gate Retail Park, Reading
0.1% 2 0.0% 0 0.0% 0 0.6% 0 0.0% 0 0.0% 0 0.0% 0 0.8% 2 0.0% 0 0.0% 0 0.0% 0 0.0% 0
The Meadows, Camberley (M&S, Next Home & Garden)
0.1% 1 0.0% 0 0.0% 0 0.0% 0 0.0% 0 0.0% 0 0.0% 0 0.0% 0 0.0% 0 0.0% 0 0.0% 0 2.1% 1
Two Rivers Retail Park, Staines
0.1% 1 0.0% 0 0.0% 0 0.0% 0 0.0% 0 0.0% 0 0.0% 0 0.6% 1 0.0% 0 0.0% 0 0.0% 0 0.0% 0
Abroad 0.0% 1 0.0% 0 0.0% 0 0.0% 0 0.0% 0 0.0% 0 0.0% 0 0.0% 0 1.2% 1 0.0% 0 0.0% 0 0.0% 0 Andover 0.8% 15 0.0% 0 0.0% 0 0.0% 0 0.0% 0 0.0% 0 0.0% 0 0.0% 0 0.0% 0 0.0% 0 0.0% 0 0.0% 0 Ascot 0.3% 6 0.0% 0 0.0% 0 0.0% 0 0.0% 0 0.0% 0 0.0% 0 0.0% 0 7.5% 5 0.0% 0 0.5% 0 0.0% 0 Caversham, Reading 0.5% 10 0.8% 1 7.7% 9 0.0% 0 0.0% 0 0.0% 0 0.0% 0 0.0% 0 0.0% 0 0.0% 0 0.0% 0 0.0% 0 Goring-on-Thames 0.1% 2 0.0% 0 0.0% 0 0.0% 0 0.0% 0 0.0% 0 0.0% 0 0.0% 0 0.0% 0 0.0% 0 0.0% 0 0.0% 0 Greenbridge Retail Park,
Swindon 0.1% 1 0.0% 0 0.0% 0 0.0% 0 0.0% 0 0.0% 0 0.0% 0 0.0% 0 0.0% 0 0.0% 0 0.0% 0 0.0% 0
Kingston-upon-Thames 0.0% 1 0.0% 0 0.0% 0 0.0% 0 0.0% 0 0.0% 0 0.0% 0 0.0% 0 1.2% 1 0.0% 0 0.0% 0 0.0% 0 Other retail warehousing,
Reading - Zone 1 0.0% 1 0.0% 0 0.0% 0 0.0% 0 0.0% 0 0.0% 0 0.0% 0 0.0% 0 0.0% 0 0.0% 0 0.0% 0 0.0% 0
Other retail warehousing, Reading - Zone 2
0.3% 6 1.3% 1 1.9% 2 1.6% 0 0.0% 0 0.0% 0 0.9% 1 0.0% 0 0.0% 0 0.0% 0 0.0% 0 0.0% 0
Overton 0.1% 2 0.0% 0 0.0% 0 0.0% 0 0.0% 0 0.0% 0 0.0% 0 0.0% 0 0.0% 0 0.0% 0 0.0% 0 0.0% 0 Tilehurst 0.5% 9 0.0% 0 5.6% 6 3.3% 1 0.0% 0 0.0% 0 0.0% 0 0.0% 0 0.0% 0 0.0% 0 0.0% 0 0.0% 0 Other - Zone 4 0.1% 1 0.0% 0 0.0% 0 0.0% 0 2.1% 1 0.0% 0 0.0% 0 0.0% 0 0.0% 0 0.0% 0 0.0% 0 0.0% 0 Other - Zone 5 0.6% 10 0.0% 0 0.0% 0 0.0% 0 0.0% 0 6.6% 10 0.0% 0 0.0% 0 0.0% 0 0.0% 0 0.0% 0 0.0% 0 Other - Zone 7 0.1% 2 0.0% 0 0.0% 0 0.0% 0 0.0% 0 0.0% 0 0.0% 0 0.8% 2 0.0% 0 0.0% 0 0.0% 0 0.0% 0 Other - Zone 11 0.3% 5 0.0% 0 0.0% 0 0.0% 0 0.0% 0 0.0% 0 0.0% 0 0.0% 0 0.0% 0 3.0% 5 0.0% 0 0.0% 0 Other - Zone 12 0.0% 1 0.0% 0 0.0% 0 0.0% 0 0.0% 0 0.0% 0 0.0% 0 0.0% 0 0.0% 0 0.0% 0 0.0% 0 0.0% 0 Other - Zone 14 0.2% 3 0.0% 0 0.0% 0 0.0% 0 0.0% 0 0.0% 0 0.0% 0 0.0% 0 0.0% 0 0.0% 0 0.0% 0 0.0% 0 Other - Zone 18 0.0% 0 0.0% 0 0.0% 0 0.0% 0 0.0% 0 0.0% 0 0.0% 0 0.0% 0 0.0% 0 0.0% 0 0.0% 0 0.0% 0 Other - Zone 0 3.0% 55 0.0% 0 0.7% 1 0.0% 0 15.1% 7 5.0% 8 4.3% 5 7.3% 17 1.4% 1 3.0% 5 0.5% 0 1.2% 1 Weighted base: 1819 118 111 30 46 158 123 237 71 180 92 66 Sample: 1793 78 89 82 82 84 91 86 90 82 80 77

By Zone West Berkshire Household Survey Page 61 Weighted: for GVA April 2016
Total Zone 1 Zone 2 Zone 3 Zone 4 Zone 5 Zone 6 Zone 7 Zone 8 Zone 9 Zone 10 Zone 11
020416 NEMS market research
Q13 Where do you do most of your household's shopping on goods for recreational goods including books, games, sports goods and bicycles? Excl. nulls & SFT's Asda, Brighton Way,
Basingstoke 0.9% 8 0.0% 0 0.0% 0 0.0% 0 0.0% 0 0.0% 0 0.0% 0 0.0% 0 0.0% 0 0.0% 0 0.0% 0 0.0% 0
Asda, Holmers Farm Way, High Wycombe
0.5% 5 0.0% 0 0.0% 0 0.0% 0 1.5% 0 4.2% 4 1.5% 1 0.0% 0 0.0% 0 0.0% 0 0.0% 0 0.0% 0
Asda, Chalfont Way, Lower Earley, Reading
0.6% 6 7.8% 5 0.0% 0 2.1% 0 0.0% 0 0.0% 0 0.0% 0 0.0% 0 0.0% 0 0.0% 0 0.0% 0 0.0% 0
Asda, Telford Drive, Slough 0.1% 1 0.0% 0 0.0% 0 0.0% 0 0.0% 0 0.0% 0 0.0% 0 0.9% 1 0.0% 0 0.0% 0 0.0% 0 0.0% 0 Asda, Honey End Lane,
Tilehurst 0.4% 3 0.0% 0 6.4% 3 1.4% 0 0.0% 0 0.0% 0 0.0% 0 0.0% 0 0.0% 0 0.0% 0 0.0% 0 0.0% 0
Sainsbury's, Wallop Drive, Kempshott, Basingstoke
0.1% 1 0.0% 0 0.0% 0 0.0% 0 0.0% 0 0.0% 0 0.0% 0 0.0% 0 0.0% 0 0.0% 0 0.0% 0 0.0% 0
Sainsbury's, Bagshot Road, Ringmead, Bracknell
0.3% 3 0.0% 0 0.0% 0 0.0% 0 0.0% 0 0.0% 0 0.0% 0 0.0% 0 0.0% 0 0.0% 0 6.8% 3 0.0% 0
Sainsbury's, Hectors Way, Newbury
0.4% 3 0.0% 0 0.0% 0 0.0% 0 0.0% 0 0.0% 0 0.0% 0 0.0% 0 0.0% 0 0.0% 0 0.0% 0 0.0% 0
Sainsbury's, Bath Road, Calcot, Reading
0.2% 2 0.0% 0 0.0% 0 0.0% 0 0.0% 0 0.0% 0 0.0% 0 0.0% 0 0.0% 0 0.0% 0 0.0% 0 0.0% 0
Sainsbury's, The Causeway, Staines
0.1% 0 0.0% 0 0.0% 0 0.0% 0 0.0% 0 0.0% 0 0.0% 0 0.0% 0 1.3% 0 0.0% 0 0.0% 0 0.0% 0
Sainsbury's, King Street Lane, Winnersh
0.1% 1 0.0% 0 0.0% 0 0.0% 0 0.0% 0 0.0% 0 0.0% 0 0.0% 0 0.0% 0 0.0% 0 0.0% 0 0.0% 0
Tesco Extra, River Way, Andover
0.3% 3 0.0% 0 0.0% 0 0.0% 0 0.0% 0 0.0% 0 0.0% 0 0.0% 0 0.0% 0 0.0% 0 0.0% 0 0.0% 0
Tesco Extra, Pinchington Lane, Newbury
0.3% 3 0.0% 0 0.0% 0 0.0% 0 0.0% 0 0.0% 0 0.0% 0 0.0% 0 0.0% 0 0.0% 0 0.0% 0 0.0% 0
Tesco Extra, Napier Road, Reading
0.2% 2 1.4% 1 1.6% 1 0.0% 0 0.0% 0 0.0% 0 0.0% 0 0.0% 0 0.0% 0 0.0% 0 0.0% 0 0.0% 0
Tesco Extra, Portman Road, Reading
0.1% 1 0.0% 0 1.8% 1 1.4% 0 0.0% 0 0.0% 0 0.0% 0 0.0% 0 0.0% 0 0.0% 0 0.0% 0 0.0% 0
Tesco Extra, The Meadows, Marshall Road, Sandhurst
1.1% 10 0.0% 0 0.0% 0 0.0% 0 0.0% 0 0.0% 0 0.0% 0 0.0% 0 0.0% 0 6.9% 9 0.0% 0 3.2% 1
Tesco Extra, Town Lane, Stanwell
0.2% 1 0.0% 0 0.0% 0 0.0% 0 0.0% 0 0.0% 0 0.0% 0 1.1% 1 0.0% 0 0.0% 0 0.0% 0 0.0% 0
Tesco Superstore, Wellington Avenue, Aldershot
0.2% 2 0.0% 0 0.0% 0 0.0% 0 0.0% 0 0.0% 0 0.0% 0 0.0% 0 0.0% 0 1.0% 1 0.0% 0 0.0% 0
Tesco Superstore, Wallingford Road, Didcot
0.2% 2 0.0% 0 0.0% 0 0.0% 0 0.0% 0 0.0% 0 0.0% 0 0.0% 0 0.0% 0 0.0% 0 0.0% 0 0.0% 0
Tesco Superstore, Reading Road, Henley-on-Thames
0.0% 0 0.0% 0 0.0% 0 0.0% 0 1.5% 0 0.0% 0 0.0% 0 0.0% 0 0.0% 0 0.0% 0 0.0% 0 0.0% 0
Tesco Superstore, Everland Road, Hungerford
0.0% 0 0.0% 0 0.0% 0 0.0% 0 0.0% 0 0.0% 0 0.0% 0 0.0% 0 0.0% 0 0.0% 0 0.0% 0 0.0% 0
Tesco Superstore, London Road, Newbury
0.0% 0 0.0% 0 0.0% 0 1.6% 0 0.0% 0 0.0% 0 0.0% 0 0.0% 0 0.0% 0 0.0% 0 0.0% 0 0.0% 0
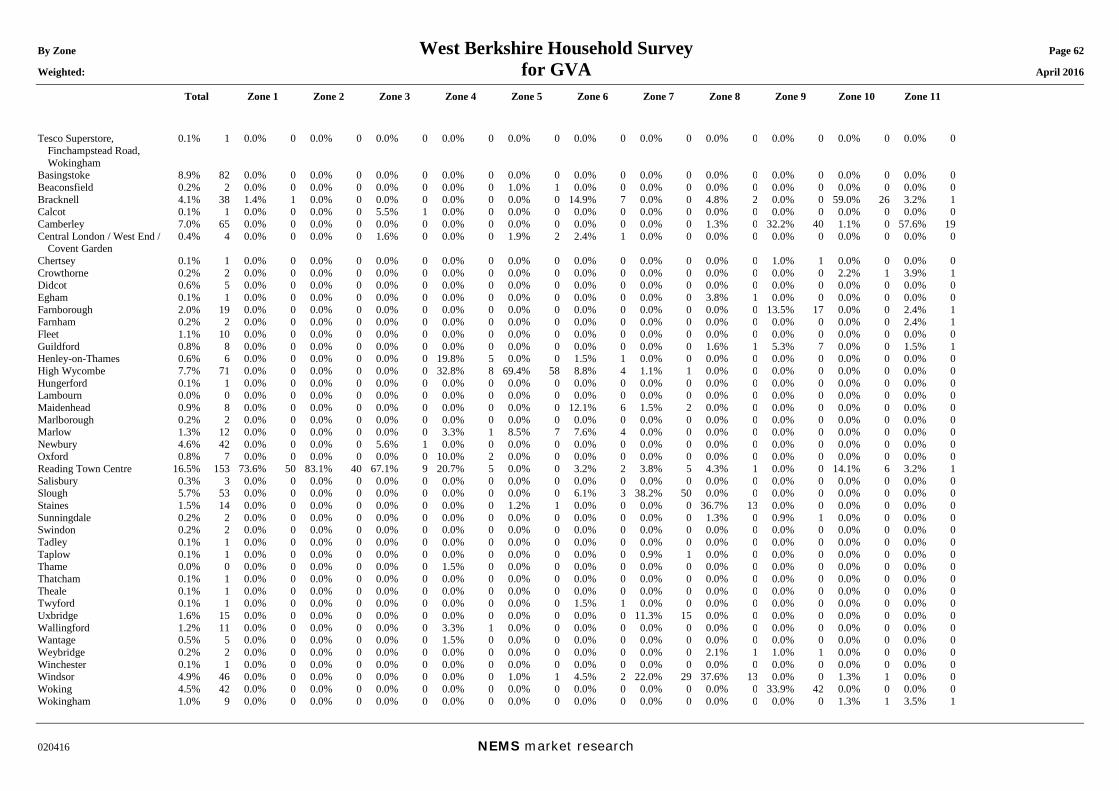
By Zone West Berkshire Household Survey Page 62 Weighted: for GVA April 2016
Total Zone 1 Zone 2 Zone 3 Zone 4 Zone 5 Zone 6 Zone 7 Zone 8 Zone 9 Zone 10 Zone 11
020416 NEMS market research
Tesco Superstore, Finchampstead Road, Wokingham
0.1% 1 0.0% 0 0.0% 0 0.0% 0 0.0% 0 0.0% 0 0.0% 0 0.0% 0 0.0% 0 0.0% 0 0.0% 0 0.0% 0
Basingstoke 8.9% 82 0.0% 0 0.0% 0 0.0% 0 0.0% 0 0.0% 0 0.0% 0 0.0% 0 0.0% 0 0.0% 0 0.0% 0 0.0% 0 Beaconsfield 0.2% 2 0.0% 0 0.0% 0 0.0% 0 0.0% 0 1.0% 1 0.0% 0 0.0% 0 0.0% 0 0.0% 0 0.0% 0 0.0% 0 Bracknell 4.1% 38 1.4% 1 0.0% 0 0.0% 0 0.0% 0 0.0% 0 14.9% 7 0.0% 0 4.8% 2 0.0% 0 59.0% 26 3.2% 1 Calcot 0.1% 1 0.0% 0 0.0% 0 5.5% 1 0.0% 0 0.0% 0 0.0% 0 0.0% 0 0.0% 0 0.0% 0 0.0% 0 0.0% 0 Camberley 7.0% 65 0.0% 0 0.0% 0 0.0% 0 0.0% 0 0.0% 0 0.0% 0 0.0% 0 1.3% 0 32.2% 40 1.1% 0 57.6% 19 Central London / West End /
Covent Garden 0.4% 4 0.0% 0 0.0% 0 1.6% 0 0.0% 0 1.9% 2 2.4% 1 0.0% 0 0.0% 0 0.0% 0 0.0% 0 0.0% 0
Chertsey 0.1% 1 0.0% 0 0.0% 0 0.0% 0 0.0% 0 0.0% 0 0.0% 0 0.0% 0 0.0% 0 1.0% 1 0.0% 0 0.0% 0 Crowthorne 0.2% 2 0.0% 0 0.0% 0 0.0% 0 0.0% 0 0.0% 0 0.0% 0 0.0% 0 0.0% 0 0.0% 0 2.2% 1 3.9% 1 Didcot 0.6% 5 0.0% 0 0.0% 0 0.0% 0 0.0% 0 0.0% 0 0.0% 0 0.0% 0 0.0% 0 0.0% 0 0.0% 0 0.0% 0 Egham 0.1% 1 0.0% 0 0.0% 0 0.0% 0 0.0% 0 0.0% 0 0.0% 0 0.0% 0 3.8% 1 0.0% 0 0.0% 0 0.0% 0 Farnborough 2.0% 19 0.0% 0 0.0% 0 0.0% 0 0.0% 0 0.0% 0 0.0% 0 0.0% 0 0.0% 0 13.5% 17 0.0% 0 2.4% 1 Farnham 0.2% 2 0.0% 0 0.0% 0 0.0% 0 0.0% 0 0.0% 0 0.0% 0 0.0% 0 0.0% 0 0.0% 0 0.0% 0 2.4% 1 Fleet 1.1% 10 0.0% 0 0.0% 0 0.0% 0 0.0% 0 0.0% 0 0.0% 0 0.0% 0 0.0% 0 0.0% 0 0.0% 0 0.0% 0 Guildford 0.8% 8 0.0% 0 0.0% 0 0.0% 0 0.0% 0 0.0% 0 0.0% 0 0.0% 0 1.6% 1 5.3% 7 0.0% 0 1.5% 1 Henley-on-Thames 0.6% 6 0.0% 0 0.0% 0 0.0% 0 19.8% 5 0.0% 0 1.5% 1 0.0% 0 0.0% 0 0.0% 0 0.0% 0 0.0% 0 High Wycombe 7.7% 71 0.0% 0 0.0% 0 0.0% 0 32.8% 8 69.4% 58 8.8% 4 1.1% 1 0.0% 0 0.0% 0 0.0% 0 0.0% 0 Hungerford 0.1% 1 0.0% 0 0.0% 0 0.0% 0 0.0% 0 0.0% 0 0.0% 0 0.0% 0 0.0% 0 0.0% 0 0.0% 0 0.0% 0 Lambourn 0.0% 0 0.0% 0 0.0% 0 0.0% 0 0.0% 0 0.0% 0 0.0% 0 0.0% 0 0.0% 0 0.0% 0 0.0% 0 0.0% 0 Maidenhead 0.9% 8 0.0% 0 0.0% 0 0.0% 0 0.0% 0 0.0% 0 12.1% 6 1.5% 2 0.0% 0 0.0% 0 0.0% 0 0.0% 0 Marlborough 0.2% 2 0.0% 0 0.0% 0 0.0% 0 0.0% 0 0.0% 0 0.0% 0 0.0% 0 0.0% 0 0.0% 0 0.0% 0 0.0% 0 Marlow 1.3% 12 0.0% 0 0.0% 0 0.0% 0 3.3% 1 8.5% 7 7.6% 4 0.0% 0 0.0% 0 0.0% 0 0.0% 0 0.0% 0 Newbury 4.6% 42 0.0% 0 0.0% 0 5.6% 1 0.0% 0 0.0% 0 0.0% 0 0.0% 0 0.0% 0 0.0% 0 0.0% 0 0.0% 0 Oxford 0.8% 7 0.0% 0 0.0% 0 0.0% 0 10.0% 2 0.0% 0 0.0% 0 0.0% 0 0.0% 0 0.0% 0 0.0% 0 0.0% 0 Reading Town Centre 16.5% 153 73.6% 50 83.1% 40 67.1% 9 20.7% 5 0.0% 0 3.2% 2 3.8% 5 4.3% 1 0.0% 0 14.1% 6 3.2% 1 Salisbury 0.3% 3 0.0% 0 0.0% 0 0.0% 0 0.0% 0 0.0% 0 0.0% 0 0.0% 0 0.0% 0 0.0% 0 0.0% 0 0.0% 0 Slough 5.7% 53 0.0% 0 0.0% 0 0.0% 0 0.0% 0 0.0% 0 6.1% 3 38.2% 50 0.0% 0 0.0% 0 0.0% 0 0.0% 0 Staines 1.5% 14 0.0% 0 0.0% 0 0.0% 0 0.0% 0 1.2% 1 0.0% 0 0.0% 0 36.7% 13 0.0% 0 0.0% 0 0.0% 0 Sunningdale 0.2% 2 0.0% 0 0.0% 0 0.0% 0 0.0% 0 0.0% 0 0.0% 0 0.0% 0 1.3% 0 0.9% 1 0.0% 0 0.0% 0 Swindon 0.2% 2 0.0% 0 0.0% 0 0.0% 0 0.0% 0 0.0% 0 0.0% 0 0.0% 0 0.0% 0 0.0% 0 0.0% 0 0.0% 0 Tadley 0.1% 1 0.0% 0 0.0% 0 0.0% 0 0.0% 0 0.0% 0 0.0% 0 0.0% 0 0.0% 0 0.0% 0 0.0% 0 0.0% 0 Taplow 0.1% 1 0.0% 0 0.0% 0 0.0% 0 0.0% 0 0.0% 0 0.0% 0 0.9% 1 0.0% 0 0.0% 0 0.0% 0 0.0% 0 Thame 0.0% 0 0.0% 0 0.0% 0 0.0% 0 1.5% 0 0.0% 0 0.0% 0 0.0% 0 0.0% 0 0.0% 0 0.0% 0 0.0% 0 Thatcham 0.1% 1 0.0% 0 0.0% 0 0.0% 0 0.0% 0 0.0% 0 0.0% 0 0.0% 0 0.0% 0 0.0% 0 0.0% 0 0.0% 0 Theale 0.1% 1 0.0% 0 0.0% 0 0.0% 0 0.0% 0 0.0% 0 0.0% 0 0.0% 0 0.0% 0 0.0% 0 0.0% 0 0.0% 0 Twyford 0.1% 1 0.0% 0 0.0% 0 0.0% 0 0.0% 0 0.0% 0 1.5% 1 0.0% 0 0.0% 0 0.0% 0 0.0% 0 0.0% 0 Uxbridge 1.6% 15 0.0% 0 0.0% 0 0.0% 0 0.0% 0 0.0% 0 0.0% 0 11.3% 15 0.0% 0 0.0% 0 0.0% 0 0.0% 0 Wallingford 1.2% 11 0.0% 0 0.0% 0 0.0% 0 3.3% 1 0.0% 0 0.0% 0 0.0% 0 0.0% 0 0.0% 0 0.0% 0 0.0% 0 Wantage 0.5% 5 0.0% 0 0.0% 0 0.0% 0 1.5% 0 0.0% 0 0.0% 0 0.0% 0 0.0% 0 0.0% 0 0.0% 0 0.0% 0 Weybridge 0.2% 2 0.0% 0 0.0% 0 0.0% 0 0.0% 0 0.0% 0 0.0% 0 0.0% 0 2.1% 1 1.0% 1 0.0% 0 0.0% 0 Winchester 0.1% 1 0.0% 0 0.0% 0 0.0% 0 0.0% 0 0.0% 0 0.0% 0 0.0% 0 0.0% 0 0.0% 0 0.0% 0 0.0% 0 Windsor 4.9% 46 0.0% 0 0.0% 0 0.0% 0 0.0% 0 1.0% 1 4.5% 2 22.0% 29 37.6% 13 0.0% 0 1.3% 1 0.0% 0 Woking 4.5% 42 0.0% 0 0.0% 0 0.0% 0 0.0% 0 0.0% 0 0.0% 0 0.0% 0 0.0% 0 33.9% 42 0.0% 0 0.0% 0 Wokingham 1.0% 9 0.0% 0 0.0% 0 0.0% 0 0.0% 0 0.0% 0 0.0% 0 0.0% 0 0.0% 0 0.0% 0 1.3% 1 3.5% 1
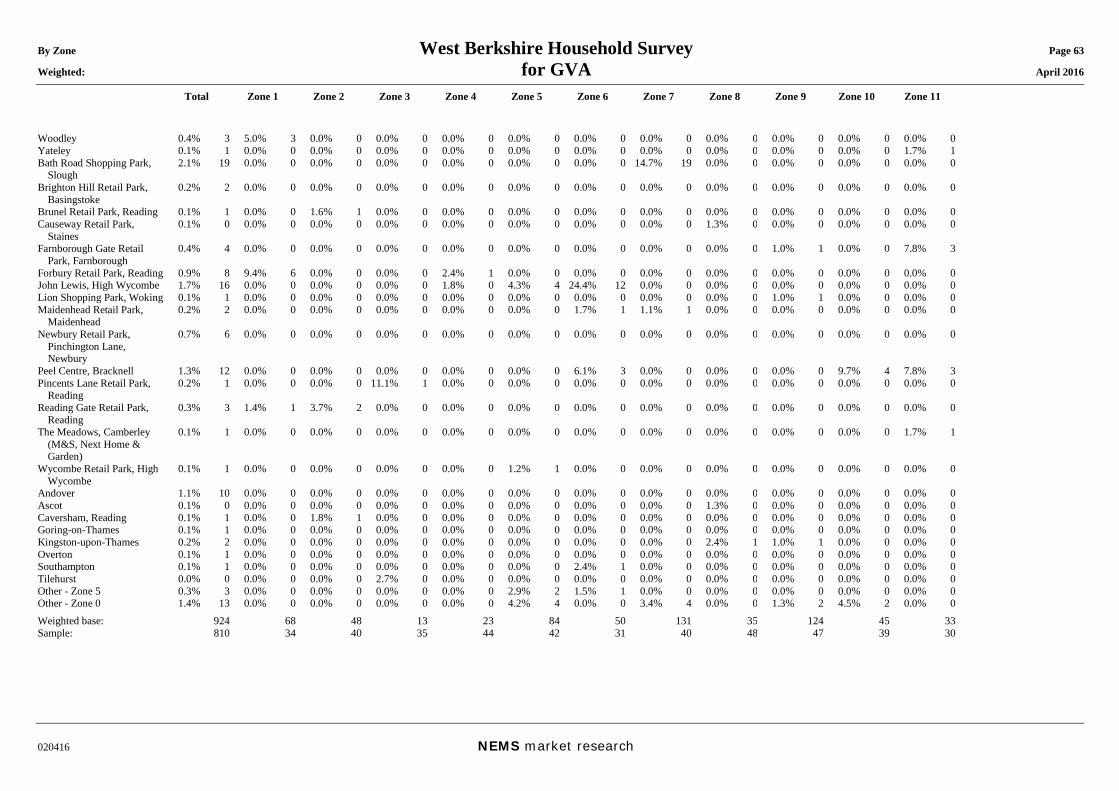
By Zone West Berkshire Household Survey Page 63 Weighted: for GVA April 2016
Total Zone 1 Zone 2 Zone 3 Zone 4 Zone 5 Zone 6 Zone 7 Zone 8 Zone 9 Zone 10 Zone 11
020416 NEMS market research
Woodley 0.4% 3 5.0% 3 0.0% 0 0.0% 0 0.0% 0 0.0% 0 0.0% 0 0.0% 0 0.0% 0 0.0% 0 0.0% 0 0.0% 0 Yateley 0.1% 1 0.0% 0 0.0% 0 0.0% 0 0.0% 0 0.0% 0 0.0% 0 0.0% 0 0.0% 0 0.0% 0 0.0% 0 1.7% 1 Bath Road Shopping Park,
Slough 2.1% 19 0.0% 0 0.0% 0 0.0% 0 0.0% 0 0.0% 0 0.0% 0 14.7% 19 0.0% 0 0.0% 0 0.0% 0 0.0% 0
Brighton Hill Retail Park, Basingstoke
0.2% 2 0.0% 0 0.0% 0 0.0% 0 0.0% 0 0.0% 0 0.0% 0 0.0% 0 0.0% 0 0.0% 0 0.0% 0 0.0% 0
Brunel Retail Park, Reading 0.1% 1 0.0% 0 1.6% 1 0.0% 0 0.0% 0 0.0% 0 0.0% 0 0.0% 0 0.0% 0 0.0% 0 0.0% 0 0.0% 0 Causeway Retail Park,
Staines 0.1% 0 0.0% 0 0.0% 0 0.0% 0 0.0% 0 0.0% 0 0.0% 0 0.0% 0 1.3% 0 0.0% 0 0.0% 0 0.0% 0
Farnborough Gate Retail Park, Farnborough
0.4% 4 0.0% 0 0.0% 0 0.0% 0 0.0% 0 0.0% 0 0.0% 0 0.0% 0 0.0% 0 1.0% 1 0.0% 0 7.8% 3
Forbury Retail Park, Reading 0.9% 8 9.4% 6 0.0% 0 0.0% 0 2.4% 1 0.0% 0 0.0% 0 0.0% 0 0.0% 0 0.0% 0 0.0% 0 0.0% 0 John Lewis, High Wycombe 1.7% 16 0.0% 0 0.0% 0 0.0% 0 1.8% 0 4.3% 4 24.4% 12 0.0% 0 0.0% 0 0.0% 0 0.0% 0 0.0% 0 Lion Shopping Park, Woking 0.1% 1 0.0% 0 0.0% 0 0.0% 0 0.0% 0 0.0% 0 0.0% 0 0.0% 0 0.0% 0 1.0% 1 0.0% 0 0.0% 0 Maidenhead Retail Park,
Maidenhead 0.2% 2 0.0% 0 0.0% 0 0.0% 0 0.0% 0 0.0% 0 1.7% 1 1.1% 1 0.0% 0 0.0% 0 0.0% 0 0.0% 0
Newbury Retail Park, Pinchington Lane, Newbury
0.7% 6 0.0% 0 0.0% 0 0.0% 0 0.0% 0 0.0% 0 0.0% 0 0.0% 0 0.0% 0 0.0% 0 0.0% 0 0.0% 0
Peel Centre, Bracknell 1.3% 12 0.0% 0 0.0% 0 0.0% 0 0.0% 0 0.0% 0 6.1% 3 0.0% 0 0.0% 0 0.0% 0 9.7% 4 7.8% 3 Pincents Lane Retail Park,
Reading 0.2% 1 0.0% 0 0.0% 0 11.1% 1 0.0% 0 0.0% 0 0.0% 0 0.0% 0 0.0% 0 0.0% 0 0.0% 0 0.0% 0
Reading Gate Retail Park, Reading
0.3% 3 1.4% 1 3.7% 2 0.0% 0 0.0% 0 0.0% 0 0.0% 0 0.0% 0 0.0% 0 0.0% 0 0.0% 0 0.0% 0
The Meadows, Camberley (M&S, Next Home & Garden)
0.1% 1 0.0% 0 0.0% 0 0.0% 0 0.0% 0 0.0% 0 0.0% 0 0.0% 0 0.0% 0 0.0% 0 0.0% 0 1.7% 1
Wycombe Retail Park, High Wycombe
0.1% 1 0.0% 0 0.0% 0 0.0% 0 0.0% 0 1.2% 1 0.0% 0 0.0% 0 0.0% 0 0.0% 0 0.0% 0 0.0% 0
Andover 1.1% 10 0.0% 0 0.0% 0 0.0% 0 0.0% 0 0.0% 0 0.0% 0 0.0% 0 0.0% 0 0.0% 0 0.0% 0 0.0% 0 Ascot 0.1% 0 0.0% 0 0.0% 0 0.0% 0 0.0% 0 0.0% 0 0.0% 0 0.0% 0 1.3% 0 0.0% 0 0.0% 0 0.0% 0 Caversham, Reading 0.1% 1 0.0% 0 1.8% 1 0.0% 0 0.0% 0 0.0% 0 0.0% 0 0.0% 0 0.0% 0 0.0% 0 0.0% 0 0.0% 0 Goring-on-Thames 0.1% 1 0.0% 0 0.0% 0 0.0% 0 0.0% 0 0.0% 0 0.0% 0 0.0% 0 0.0% 0 0.0% 0 0.0% 0 0.0% 0 Kingston-upon-Thames 0.2% 2 0.0% 0 0.0% 0 0.0% 0 0.0% 0 0.0% 0 0.0% 0 0.0% 0 2.4% 1 1.0% 1 0.0% 0 0.0% 0 Overton 0.1% 1 0.0% 0 0.0% 0 0.0% 0 0.0% 0 0.0% 0 0.0% 0 0.0% 0 0.0% 0 0.0% 0 0.0% 0 0.0% 0 Southampton 0.1% 1 0.0% 0 0.0% 0 0.0% 0 0.0% 0 0.0% 0 2.4% 1 0.0% 0 0.0% 0 0.0% 0 0.0% 0 0.0% 0 Tilehurst 0.0% 0 0.0% 0 0.0% 0 2.7% 0 0.0% 0 0.0% 0 0.0% 0 0.0% 0 0.0% 0 0.0% 0 0.0% 0 0.0% 0 Other - Zone 5 0.3% 3 0.0% 0 0.0% 0 0.0% 0 0.0% 0 2.9% 2 1.5% 1 0.0% 0 0.0% 0 0.0% 0 0.0% 0 0.0% 0 Other - Zone 0 1.4% 13 0.0% 0 0.0% 0 0.0% 0 0.0% 0 4.2% 4 0.0% 0 3.4% 4 0.0% 0 1.3% 2 4.5% 2 0.0% 0 Weighted base: 924 68 48 13 23 84 50 131 35 124 45 33 Sample: 810 34 40 35 44 42 31 40 48 47 39 30
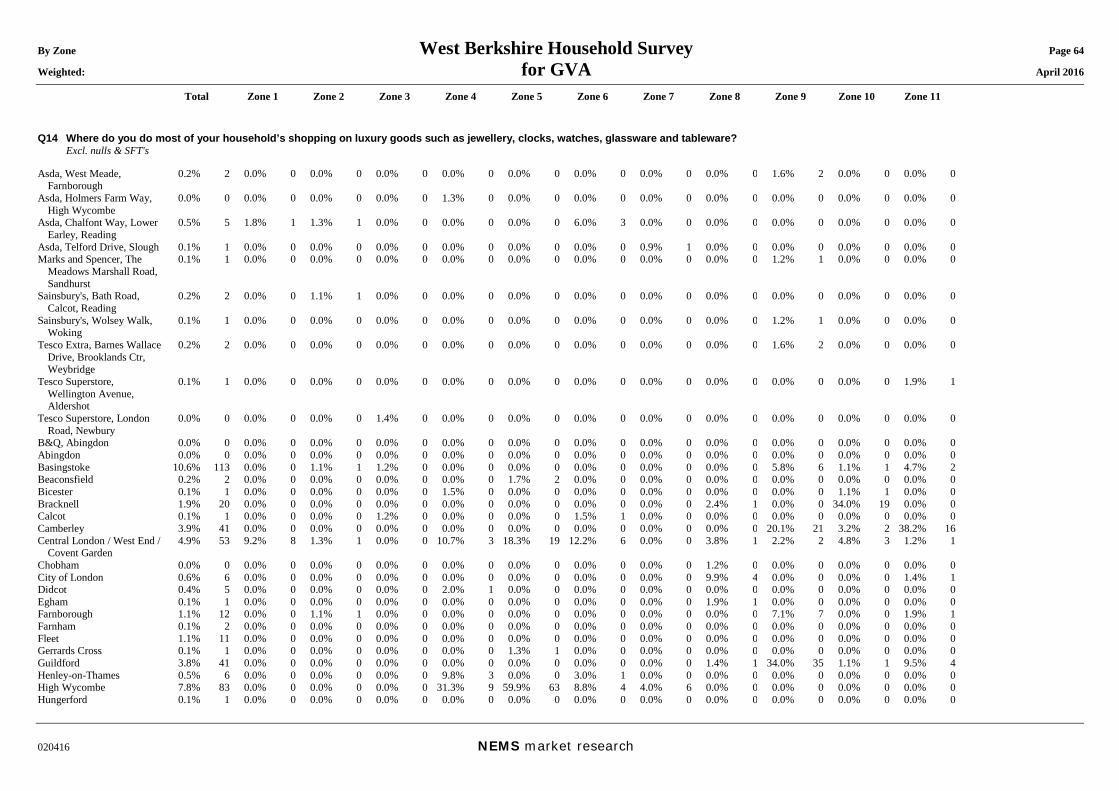
By Zone West Berkshire Household Survey Page 64 Weighted: for GVA April 2016
Total Zone 1 Zone 2 Zone 3 Zone 4 Zone 5 Zone 6 Zone 7 Zone 8 Zone 9 Zone 10 Zone 11
020416 NEMS market research
Q14 Where do you do most of your household’s shopping on luxury goods such as jewellery, clocks, watches, glassware and tableware? Excl. nulls & SFT's Asda, West Meade,
Farnborough 0.2% 2 0.0% 0 0.0% 0 0.0% 0 0.0% 0 0.0% 0 0.0% 0 0.0% 0 0.0% 0 1.6% 2 0.0% 0 0.0% 0
Asda, Holmers Farm Way, High Wycombe
0.0% 0 0.0% 0 0.0% 0 0.0% 0 1.3% 0 0.0% 0 0.0% 0 0.0% 0 0.0% 0 0.0% 0 0.0% 0 0.0% 0
Asda, Chalfont Way, Lower Earley, Reading
0.5% 5 1.8% 1 1.3% 1 0.0% 0 0.0% 0 0.0% 0 6.0% 3 0.0% 0 0.0% 0 0.0% 0 0.0% 0 0.0% 0
Asda, Telford Drive, Slough 0.1% 1 0.0% 0 0.0% 0 0.0% 0 0.0% 0 0.0% 0 0.0% 0 0.9% 1 0.0% 0 0.0% 0 0.0% 0 0.0% 0 Marks and Spencer, The
Meadows Marshall Road, Sandhurst
0.1% 1 0.0% 0 0.0% 0 0.0% 0 0.0% 0 0.0% 0 0.0% 0 0.0% 0 0.0% 0 1.2% 1 0.0% 0 0.0% 0
Sainsbury's, Bath Road, Calcot, Reading
0.2% 2 0.0% 0 1.1% 1 0.0% 0 0.0% 0 0.0% 0 0.0% 0 0.0% 0 0.0% 0 0.0% 0 0.0% 0 0.0% 0
Sainsbury's, Wolsey Walk, Woking
0.1% 1 0.0% 0 0.0% 0 0.0% 0 0.0% 0 0.0% 0 0.0% 0 0.0% 0 0.0% 0 1.2% 1 0.0% 0 0.0% 0
Tesco Extra, Barnes Wallace Drive, Brooklands Ctr, Weybridge
0.2% 2 0.0% 0 0.0% 0 0.0% 0 0.0% 0 0.0% 0 0.0% 0 0.0% 0 0.0% 0 1.6% 2 0.0% 0 0.0% 0
Tesco Superstore, Wellington Avenue, Aldershot
0.1% 1 0.0% 0 0.0% 0 0.0% 0 0.0% 0 0.0% 0 0.0% 0 0.0% 0 0.0% 0 0.0% 0 0.0% 0 1.9% 1
Tesco Superstore, London Road, Newbury
0.0% 0 0.0% 0 0.0% 0 1.4% 0 0.0% 0 0.0% 0 0.0% 0 0.0% 0 0.0% 0 0.0% 0 0.0% 0 0.0% 0
B&Q, Abingdon 0.0% 0 0.0% 0 0.0% 0 0.0% 0 0.0% 0 0.0% 0 0.0% 0 0.0% 0 0.0% 0 0.0% 0 0.0% 0 0.0% 0 Abingdon 0.0% 0 0.0% 0 0.0% 0 0.0% 0 0.0% 0 0.0% 0 0.0% 0 0.0% 0 0.0% 0 0.0% 0 0.0% 0 0.0% 0 Basingstoke 10.6% 113 0.0% 0 1.1% 1 1.2% 0 0.0% 0 0.0% 0 0.0% 0 0.0% 0 0.0% 0 5.8% 6 1.1% 1 4.7% 2 Beaconsfield 0.2% 2 0.0% 0 0.0% 0 0.0% 0 0.0% 0 1.7% 2 0.0% 0 0.0% 0 0.0% 0 0.0% 0 0.0% 0 0.0% 0 Bicester 0.1% 1 0.0% 0 0.0% 0 0.0% 0 1.5% 0 0.0% 0 0.0% 0 0.0% 0 0.0% 0 0.0% 0 1.1% 1 0.0% 0 Bracknell 1.9% 20 0.0% 0 0.0% 0 0.0% 0 0.0% 0 0.0% 0 0.0% 0 0.0% 0 2.4% 1 0.0% 0 34.0% 19 0.0% 0 Calcot 0.1% 1 0.0% 0 0.0% 0 1.2% 0 0.0% 0 0.0% 0 1.5% 1 0.0% 0 0.0% 0 0.0% 0 0.0% 0 0.0% 0 Camberley 3.9% 41 0.0% 0 0.0% 0 0.0% 0 0.0% 0 0.0% 0 0.0% 0 0.0% 0 0.0% 0 20.1% 21 3.2% 2 38.2% 16 Central London / West End /
Covent Garden 4.9% 53 9.2% 8 1.3% 1 0.0% 0 10.7% 3 18.3% 19 12.2% 6 0.0% 0 3.8% 1 2.2% 2 4.8% 3 1.2% 1
Chobham 0.0% 0 0.0% 0 0.0% 0 0.0% 0 0.0% 0 0.0% 0 0.0% 0 0.0% 0 1.2% 0 0.0% 0 0.0% 0 0.0% 0 City of London 0.6% 6 0.0% 0 0.0% 0 0.0% 0 0.0% 0 0.0% 0 0.0% 0 0.0% 0 9.9% 4 0.0% 0 0.0% 0 1.4% 1 Didcot 0.4% 5 0.0% 0 0.0% 0 0.0% 0 2.0% 1 0.0% 0 0.0% 0 0.0% 0 0.0% 0 0.0% 0 0.0% 0 0.0% 0 Egham 0.1% 1 0.0% 0 0.0% 0 0.0% 0 0.0% 0 0.0% 0 0.0% 0 0.0% 0 1.9% 1 0.0% 0 0.0% 0 0.0% 0 Farnborough 1.1% 12 0.0% 0 1.1% 1 0.0% 0 0.0% 0 0.0% 0 0.0% 0 0.0% 0 0.0% 0 7.1% 7 0.0% 0 1.9% 1 Farnham 0.1% 2 0.0% 0 0.0% 0 0.0% 0 0.0% 0 0.0% 0 0.0% 0 0.0% 0 0.0% 0 0.0% 0 0.0% 0 0.0% 0 Fleet 1.1% 11 0.0% 0 0.0% 0 0.0% 0 0.0% 0 0.0% 0 0.0% 0 0.0% 0 0.0% 0 0.0% 0 0.0% 0 0.0% 0 Gerrards Cross 0.1% 1 0.0% 0 0.0% 0 0.0% 0 0.0% 0 1.3% 1 0.0% 0 0.0% 0 0.0% 0 0.0% 0 0.0% 0 0.0% 0 Guildford 3.8% 41 0.0% 0 0.0% 0 0.0% 0 0.0% 0 0.0% 0 0.0% 0 0.0% 0 1.4% 1 34.0% 35 1.1% 1 9.5% 4 Henley-on-Thames 0.5% 6 0.0% 0 0.0% 0 0.0% 0 9.8% 3 0.0% 0 3.0% 1 0.0% 0 0.0% 0 0.0% 0 0.0% 0 0.0% 0 High Wycombe 7.8% 83 0.0% 0 0.0% 0 0.0% 0 31.3% 9 59.9% 63 8.8% 4 4.0% 6 0.0% 0 0.0% 0 0.0% 0 0.0% 0 Hungerford 0.1% 1 0.0% 0 0.0% 0 0.0% 0 0.0% 0 0.0% 0 0.0% 0 0.0% 0 0.0% 0 0.0% 0 0.0% 0 0.0% 0
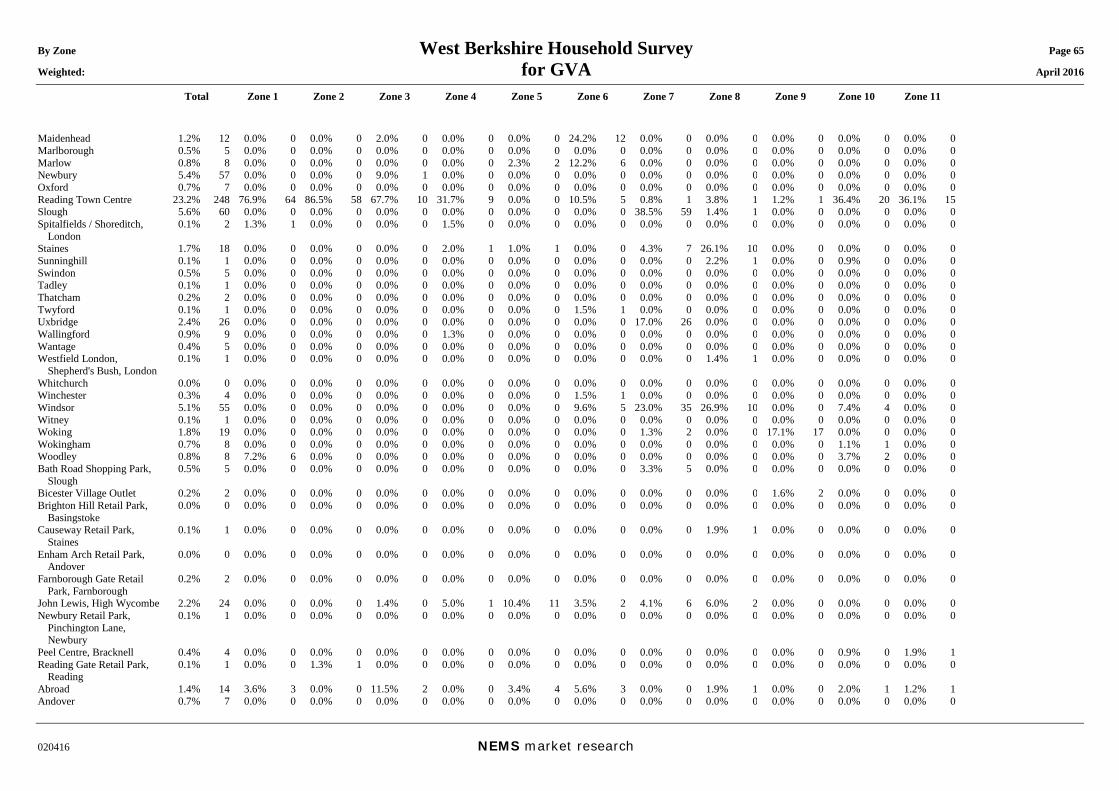
By Zone West Berkshire Household Survey Page 65 Weighted: for GVA April 2016
Total Zone 1 Zone 2 Zone 3 Zone 4 Zone 5 Zone 6 Zone 7 Zone 8 Zone 9 Zone 10 Zone 11
020416 NEMS market research
Maidenhead 1.2% 12 0.0% 0 0.0% 0 2.0% 0 0.0% 0 0.0% 0 24.2% 12 0.0% 0 0.0% 0 0.0% 0 0.0% 0 0.0% 0 Marlborough 0.5% 5 0.0% 0 0.0% 0 0.0% 0 0.0% 0 0.0% 0 0.0% 0 0.0% 0 0.0% 0 0.0% 0 0.0% 0 0.0% 0 Marlow 0.8% 8 0.0% 0 0.0% 0 0.0% 0 0.0% 0 2.3% 2 12.2% 6 0.0% 0 0.0% 0 0.0% 0 0.0% 0 0.0% 0 Newbury 5.4% 57 0.0% 0 0.0% 0 9.0% 1 0.0% 0 0.0% 0 0.0% 0 0.0% 0 0.0% 0 0.0% 0 0.0% 0 0.0% 0 Oxford 0.7% 7 0.0% 0 0.0% 0 0.0% 0 0.0% 0 0.0% 0 0.0% 0 0.0% 0 0.0% 0 0.0% 0 0.0% 0 0.0% 0 Reading Town Centre 23.2% 248 76.9% 64 86.5% 58 67.7% 10 31.7% 9 0.0% 0 10.5% 5 0.8% 1 3.8% 1 1.2% 1 36.4% 20 36.1% 15 Slough 5.6% 60 0.0% 0 0.0% 0 0.0% 0 0.0% 0 0.0% 0 0.0% 0 38.5% 59 1.4% 1 0.0% 0 0.0% 0 0.0% 0 Spitalfields / Shoreditch,
London 0.1% 2 1.3% 1 0.0% 0 0.0% 0 1.5% 0 0.0% 0 0.0% 0 0.0% 0 0.0% 0 0.0% 0 0.0% 0 0.0% 0
Staines 1.7% 18 0.0% 0 0.0% 0 0.0% 0 2.0% 1 1.0% 1 0.0% 0 4.3% 7 26.1% 10 0.0% 0 0.0% 0 0.0% 0 Sunninghill 0.1% 1 0.0% 0 0.0% 0 0.0% 0 0.0% 0 0.0% 0 0.0% 0 0.0% 0 2.2% 1 0.0% 0 0.9% 0 0.0% 0 Swindon 0.5% 5 0.0% 0 0.0% 0 0.0% 0 0.0% 0 0.0% 0 0.0% 0 0.0% 0 0.0% 0 0.0% 0 0.0% 0 0.0% 0 Tadley 0.1% 1 0.0% 0 0.0% 0 0.0% 0 0.0% 0 0.0% 0 0.0% 0 0.0% 0 0.0% 0 0.0% 0 0.0% 0 0.0% 0 Thatcham 0.2% 2 0.0% 0 0.0% 0 0.0% 0 0.0% 0 0.0% 0 0.0% 0 0.0% 0 0.0% 0 0.0% 0 0.0% 0 0.0% 0 Twyford 0.1% 1 0.0% 0 0.0% 0 0.0% 0 0.0% 0 0.0% 0 1.5% 1 0.0% 0 0.0% 0 0.0% 0 0.0% 0 0.0% 0 Uxbridge 2.4% 26 0.0% 0 0.0% 0 0.0% 0 0.0% 0 0.0% 0 0.0% 0 17.0% 26 0.0% 0 0.0% 0 0.0% 0 0.0% 0 Wallingford 0.9% 9 0.0% 0 0.0% 0 0.0% 0 1.3% 0 0.0% 0 0.0% 0 0.0% 0 0.0% 0 0.0% 0 0.0% 0 0.0% 0 Wantage 0.4% 5 0.0% 0 0.0% 0 0.0% 0 0.0% 0 0.0% 0 0.0% 0 0.0% 0 0.0% 0 0.0% 0 0.0% 0 0.0% 0 Westfield London,
Shepherd's Bush, London 0.1% 1 0.0% 0 0.0% 0 0.0% 0 0.0% 0 0.0% 0 0.0% 0 0.0% 0 1.4% 1 0.0% 0 0.0% 0 0.0% 0
Whitchurch 0.0% 0 0.0% 0 0.0% 0 0.0% 0 0.0% 0 0.0% 0 0.0% 0 0.0% 0 0.0% 0 0.0% 0 0.0% 0 0.0% 0 Winchester 0.3% 4 0.0% 0 0.0% 0 0.0% 0 0.0% 0 0.0% 0 1.5% 1 0.0% 0 0.0% 0 0.0% 0 0.0% 0 0.0% 0 Windsor 5.1% 55 0.0% 0 0.0% 0 0.0% 0 0.0% 0 0.0% 0 9.6% 5 23.0% 35 26.9% 10 0.0% 0 7.4% 4 0.0% 0 Witney 0.1% 1 0.0% 0 0.0% 0 0.0% 0 0.0% 0 0.0% 0 0.0% 0 0.0% 0 0.0% 0 0.0% 0 0.0% 0 0.0% 0 Woking 1.8% 19 0.0% 0 0.0% 0 0.0% 0 0.0% 0 0.0% 0 0.0% 0 1.3% 2 0.0% 0 17.1% 17 0.0% 0 0.0% 0 Wokingham 0.7% 8 0.0% 0 0.0% 0 0.0% 0 0.0% 0 0.0% 0 0.0% 0 0.0% 0 0.0% 0 0.0% 0 1.1% 1 0.0% 0 Woodley 0.8% 8 7.2% 6 0.0% 0 0.0% 0 0.0% 0 0.0% 0 0.0% 0 0.0% 0 0.0% 0 0.0% 0 3.7% 2 0.0% 0 Bath Road Shopping Park,
Slough 0.5% 5 0.0% 0 0.0% 0 0.0% 0 0.0% 0 0.0% 0 0.0% 0 3.3% 5 0.0% 0 0.0% 0 0.0% 0 0.0% 0
Bicester Village Outlet 0.2% 2 0.0% 0 0.0% 0 0.0% 0 0.0% 0 0.0% 0 0.0% 0 0.0% 0 0.0% 0 1.6% 2 0.0% 0 0.0% 0 Brighton Hill Retail Park,
Basingstoke 0.0% 0 0.0% 0 0.0% 0 0.0% 0 0.0% 0 0.0% 0 0.0% 0 0.0% 0 0.0% 0 0.0% 0 0.0% 0 0.0% 0
Causeway Retail Park, Staines
0.1% 1 0.0% 0 0.0% 0 0.0% 0 0.0% 0 0.0% 0 0.0% 0 0.0% 0 1.9% 1 0.0% 0 0.0% 0 0.0% 0
Enham Arch Retail Park, Andover
0.0% 0 0.0% 0 0.0% 0 0.0% 0 0.0% 0 0.0% 0 0.0% 0 0.0% 0 0.0% 0 0.0% 0 0.0% 0 0.0% 0
Farnborough Gate Retail Park, Farnborough
0.2% 2 0.0% 0 0.0% 0 0.0% 0 0.0% 0 0.0% 0 0.0% 0 0.0% 0 0.0% 0 0.0% 0 0.0% 0 0.0% 0
John Lewis, High Wycombe 2.2% 24 0.0% 0 0.0% 0 1.4% 0 5.0% 1 10.4% 11 3.5% 2 4.1% 6 6.0% 2 0.0% 0 0.0% 0 0.0% 0 Newbury Retail Park,
Pinchington Lane, Newbury
0.1% 1 0.0% 0 0.0% 0 0.0% 0 0.0% 0 0.0% 0 0.0% 0 0.0% 0 0.0% 0 0.0% 0 0.0% 0 0.0% 0
Peel Centre, Bracknell 0.4% 4 0.0% 0 0.0% 0 0.0% 0 0.0% 0 0.0% 0 0.0% 0 0.0% 0 0.0% 0 0.0% 0 0.9% 0 1.9% 1 Reading Gate Retail Park,
Reading 0.1% 1 0.0% 0 1.3% 1 0.0% 0 0.0% 0 0.0% 0 0.0% 0 0.0% 0 0.0% 0 0.0% 0 0.0% 0 0.0% 0
Abroad 1.4% 14 3.6% 3 0.0% 0 11.5% 2 0.0% 0 3.4% 4 5.6% 3 0.0% 0 1.9% 1 0.0% 0 2.0% 1 1.2% 1 Andover 0.7% 7 0.0% 0 0.0% 0 0.0% 0 0.0% 0 0.0% 0 0.0% 0 0.0% 0 0.0% 0 0.0% 0 0.0% 0 0.0% 0
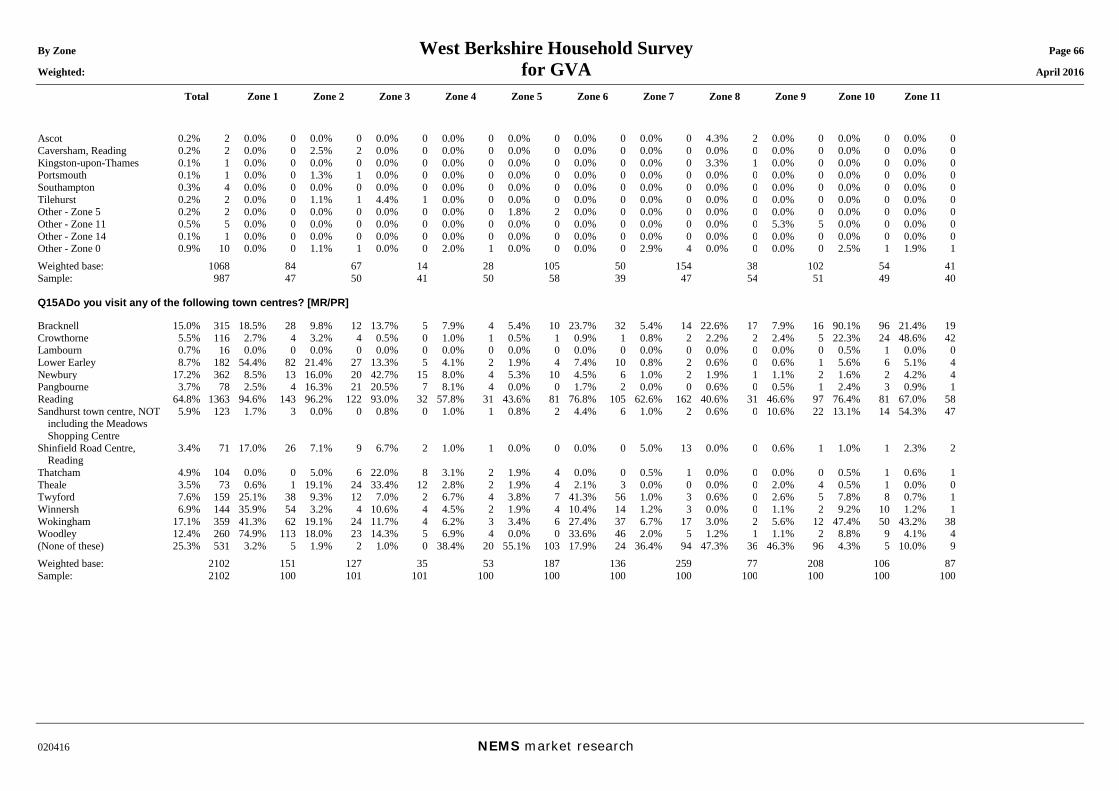
By Zone West Berkshire Household Survey Page 66 Weighted: for GVA April 2016
Total Zone 1 Zone 2 Zone 3 Zone 4 Zone 5 Zone 6 Zone 7 Zone 8 Zone 9 Zone 10 Zone 11
020416 NEMS market research
Ascot 0.2% 2 0.0% 0 0.0% 0 0.0% 0 0.0% 0 0.0% 0 0.0% 0 0.0% 0 4.3% 2 0.0% 0 0.0% 0 0.0% 0 Caversham, Reading 0.2% 2 0.0% 0 2.5% 2 0.0% 0 0.0% 0 0.0% 0 0.0% 0 0.0% 0 0.0% 0 0.0% 0 0.0% 0 0.0% 0 Kingston-upon-Thames 0.1% 1 0.0% 0 0.0% 0 0.0% 0 0.0% 0 0.0% 0 0.0% 0 0.0% 0 3.3% 1 0.0% 0 0.0% 0 0.0% 0 Portsmouth 0.1% 1 0.0% 0 1.3% 1 0.0% 0 0.0% 0 0.0% 0 0.0% 0 0.0% 0 0.0% 0 0.0% 0 0.0% 0 0.0% 0 Southampton 0.3% 4 0.0% 0 0.0% 0 0.0% 0 0.0% 0 0.0% 0 0.0% 0 0.0% 0 0.0% 0 0.0% 0 0.0% 0 0.0% 0 Tilehurst 0.2% 2 0.0% 0 1.1% 1 4.4% 1 0.0% 0 0.0% 0 0.0% 0 0.0% 0 0.0% 0 0.0% 0 0.0% 0 0.0% 0 Other - Zone 5 0.2% 2 0.0% 0 0.0% 0 0.0% 0 0.0% 0 1.8% 2 0.0% 0 0.0% 0 0.0% 0 0.0% 0 0.0% 0 0.0% 0 Other - Zone 11 0.5% 5 0.0% 0 0.0% 0 0.0% 0 0.0% 0 0.0% 0 0.0% 0 0.0% 0 0.0% 0 5.3% 5 0.0% 0 0.0% 0 Other - Zone 14 0.1% 1 0.0% 0 0.0% 0 0.0% 0 0.0% 0 0.0% 0 0.0% 0 0.0% 0 0.0% 0 0.0% 0 0.0% 0 0.0% 0 Other - Zone 0 0.9% 10 0.0% 0 1.1% 1 0.0% 0 2.0% 1 0.0% 0 0.0% 0 2.9% 4 0.0% 0 0.0% 0 2.5% 1 1.9% 1 Weighted base: 1068 84 67 14 28 105 50 154 38 102 54 41 Sample: 987 47 50 41 50 58 39 47 54 51 49 40 Q15A Do you visit any of the following town centres? [MR/PR] Bracknell 15.0% 315 18.5% 28 9.8% 12 13.7% 5 7.9% 4 5.4% 10 23.7% 32 5.4% 14 22.6% 17 7.9% 16 90.1% 96 21.4% 19 Crowthorne 5.5% 116 2.7% 4 3.2% 4 0.5% 0 1.0% 1 0.5% 1 0.9% 1 0.8% 2 2.2% 2 2.4% 5 22.3% 24 48.6% 42 Lambourn 0.7% 16 0.0% 0 0.0% 0 0.0% 0 0.0% 0 0.0% 0 0.0% 0 0.0% 0 0.0% 0 0.0% 0 0.5% 1 0.0% 0 Lower Earley 8.7% 182 54.4% 82 21.4% 27 13.3% 5 4.1% 2 1.9% 4 7.4% 10 0.8% 2 0.6% 0 0.6% 1 5.6% 6 5.1% 4 Newbury 17.2% 362 8.5% 13 16.0% 20 42.7% 15 8.0% 4 5.3% 10 4.5% 6 1.0% 2 1.9% 1 1.1% 2 1.6% 2 4.2% 4 Pangbourne 3.7% 78 2.5% 4 16.3% 21 20.5% 7 8.1% 4 0.0% 0 1.7% 2 0.0% 0 0.6% 0 0.5% 1 2.4% 3 0.9% 1 Reading 64.8% 1363 94.6% 143 96.2% 122 93.0% 32 57.8% 31 43.6% 81 76.8% 105 62.6% 162 40.6% 31 46.6% 97 76.4% 81 67.0% 58 Sandhurst town centre, NOT
including the Meadows Shopping Centre
5.9% 123 1.7% 3 0.0% 0 0.8% 0 1.0% 1 0.8% 2 4.4% 6 1.0% 2 0.6% 0 10.6% 22 13.1% 14 54.3% 47
Shinfield Road Centre, Reading
3.4% 71 17.0% 26 7.1% 9 6.7% 2 1.0% 1 0.0% 0 0.0% 0 5.0% 13 0.0% 0 0.6% 1 1.0% 1 2.3% 2
Thatcham 4.9% 104 0.0% 0 5.0% 6 22.0% 8 3.1% 2 1.9% 4 0.0% 0 0.5% 1 0.0% 0 0.0% 0 0.5% 1 0.6% 1 Theale 3.5% 73 0.6% 1 19.1% 24 33.4% 12 2.8% 2 1.9% 4 2.1% 3 0.0% 0 0.0% 0 2.0% 4 0.5% 1 0.0% 0 Twyford 7.6% 159 25.1% 38 9.3% 12 7.0% 2 6.7% 4 3.8% 7 41.3% 56 1.0% 3 0.6% 0 2.6% 5 7.8% 8 0.7% 1 Winnersh 6.9% 144 35.9% 54 3.2% 4 10.6% 4 4.5% 2 1.9% 4 10.4% 14 1.2% 3 0.0% 0 1.1% 2 9.2% 10 1.2% 1 Wokingham 17.1% 359 41.3% 62 19.1% 24 11.7% 4 6.2% 3 3.4% 6 27.4% 37 6.7% 17 3.0% 2 5.6% 12 47.4% 50 43.2% 38 Woodley 12.4% 260 74.9% 113 18.0% 23 14.3% 5 6.9% 4 0.0% 0 33.6% 46 2.0% 5 1.2% 1 1.1% 2 8.8% 9 4.1% 4 (None of these) 25.3% 531 3.2% 5 1.9% 2 1.0% 0 38.4% 20 55.1% 103 17.9% 24 36.4% 94 47.3% 36 46.3% 96 4.3% 5 10.0% 9 Weighted base: 2102 151 127 35 53 187 136 259 77 208 106 87 Sample: 2102 100 101 101 100 100 100 100 100 100 100 100
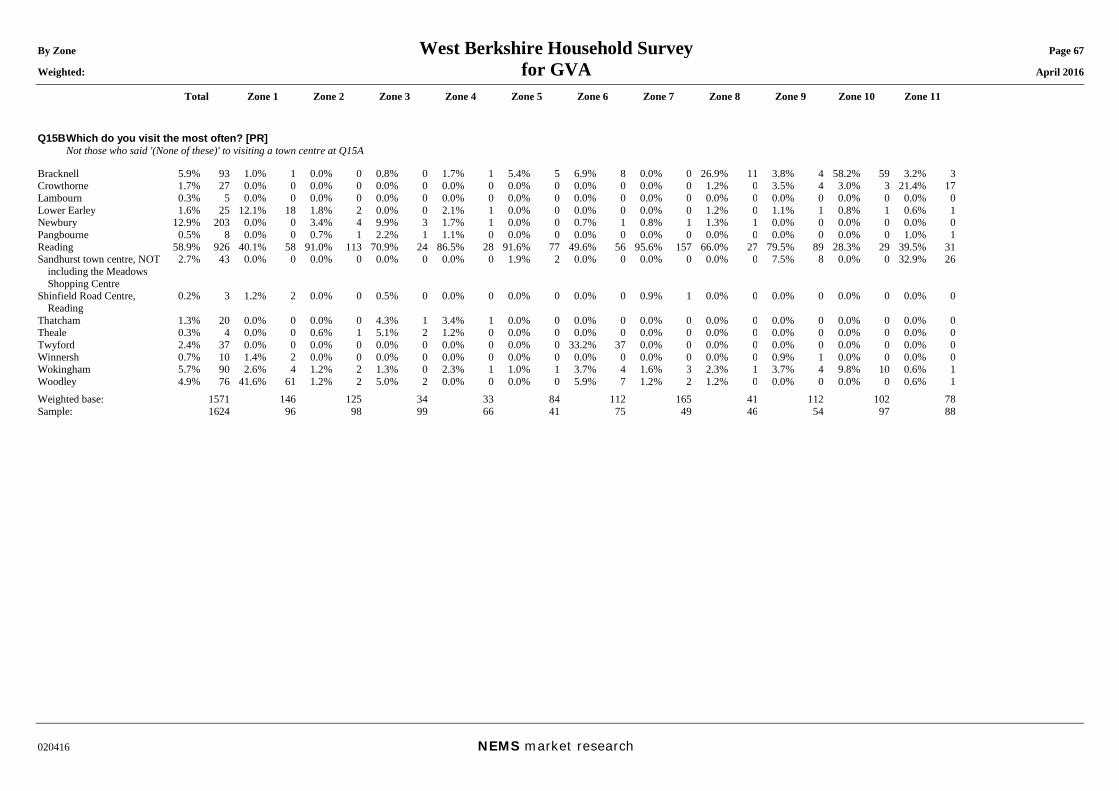
By Zone West Berkshire Household Survey Page 67 Weighted: for GVA April 2016
Total Zone 1 Zone 2 Zone 3 Zone 4 Zone 5 Zone 6 Zone 7 Zone 8 Zone 9 Zone 10 Zone 11
020416 NEMS market research
Q15B Which do you visit the most often? [PR] Not those who said '(None of these)' to visiting a town centre at Q15A Bracknell 5.9% 93 1.0% 1 0.0% 0 0.8% 0 1.7% 1 5.4% 5 6.9% 8 0.0% 0 26.9% 11 3.8% 4 58.2% 59 3.2% 3 Crowthorne 1.7% 27 0.0% 0 0.0% 0 0.0% 0 0.0% 0 0.0% 0 0.0% 0 0.0% 0 1.2% 0 3.5% 4 3.0% 3 21.4% 17 Lambourn 0.3% 5 0.0% 0 0.0% 0 0.0% 0 0.0% 0 0.0% 0 0.0% 0 0.0% 0 0.0% 0 0.0% 0 0.0% 0 0.0% 0 Lower Earley 1.6% 25 12.1% 18 1.8% 2 0.0% 0 2.1% 1 0.0% 0 0.0% 0 0.0% 0 1.2% 0 1.1% 1 0.8% 1 0.6% 1 Newbury 12.9% 203 0.0% 0 3.4% 4 9.9% 3 1.7% 1 0.0% 0 0.7% 1 0.8% 1 1.3% 1 0.0% 0 0.0% 0 0.0% 0 Pangbourne 0.5% 8 0.0% 0 0.7% 1 2.2% 1 1.1% 0 0.0% 0 0.0% 0 0.0% 0 0.0% 0 0.0% 0 0.0% 0 1.0% 1 Reading 58.9% 926 40.1% 58 91.0% 113 70.9% 24 86.5% 28 91.6% 77 49.6% 56 95.6% 157 66.0% 27 79.5% 89 28.3% 29 39.5% 31 Sandhurst town centre, NOT
including the Meadows Shopping Centre
2.7% 43 0.0% 0 0.0% 0 0.0% 0 0.0% 0 1.9% 2 0.0% 0 0.0% 0 0.0% 0 7.5% 8 0.0% 0 32.9% 26
Shinfield Road Centre, Reading
0.2% 3 1.2% 2 0.0% 0 0.5% 0 0.0% 0 0.0% 0 0.0% 0 0.9% 1 0.0% 0 0.0% 0 0.0% 0 0.0% 0
Thatcham 1.3% 20 0.0% 0 0.0% 0 4.3% 1 3.4% 1 0.0% 0 0.0% 0 0.0% 0 0.0% 0 0.0% 0 0.0% 0 0.0% 0 Theale 0.3% 4 0.0% 0 0.6% 1 5.1% 2 1.2% 0 0.0% 0 0.0% 0 0.0% 0 0.0% 0 0.0% 0 0.0% 0 0.0% 0 Twyford 2.4% 37 0.0% 0 0.0% 0 0.0% 0 0.0% 0 0.0% 0 33.2% 37 0.0% 0 0.0% 0 0.0% 0 0.0% 0 0.0% 0 Winnersh 0.7% 10 1.4% 2 0.0% 0 0.0% 0 0.0% 0 0.0% 0 0.0% 0 0.0% 0 0.0% 0 0.9% 1 0.0% 0 0.0% 0 Wokingham 5.7% 90 2.6% 4 1.2% 2 1.3% 0 2.3% 1 1.0% 1 3.7% 4 1.6% 3 2.3% 1 3.7% 4 9.8% 10 0.6% 1 Woodley 4.9% 76 41.6% 61 1.2% 2 5.0% 2 0.0% 0 0.0% 0 5.9% 7 1.2% 2 1.2% 0 0.0% 0 0.0% 0 0.6% 1 Weighted base: 1571 146 125 34 33 84 112 165 41 112 102 78 Sample: 1624 96 98 99 66 41 75 49 46 54 97 88
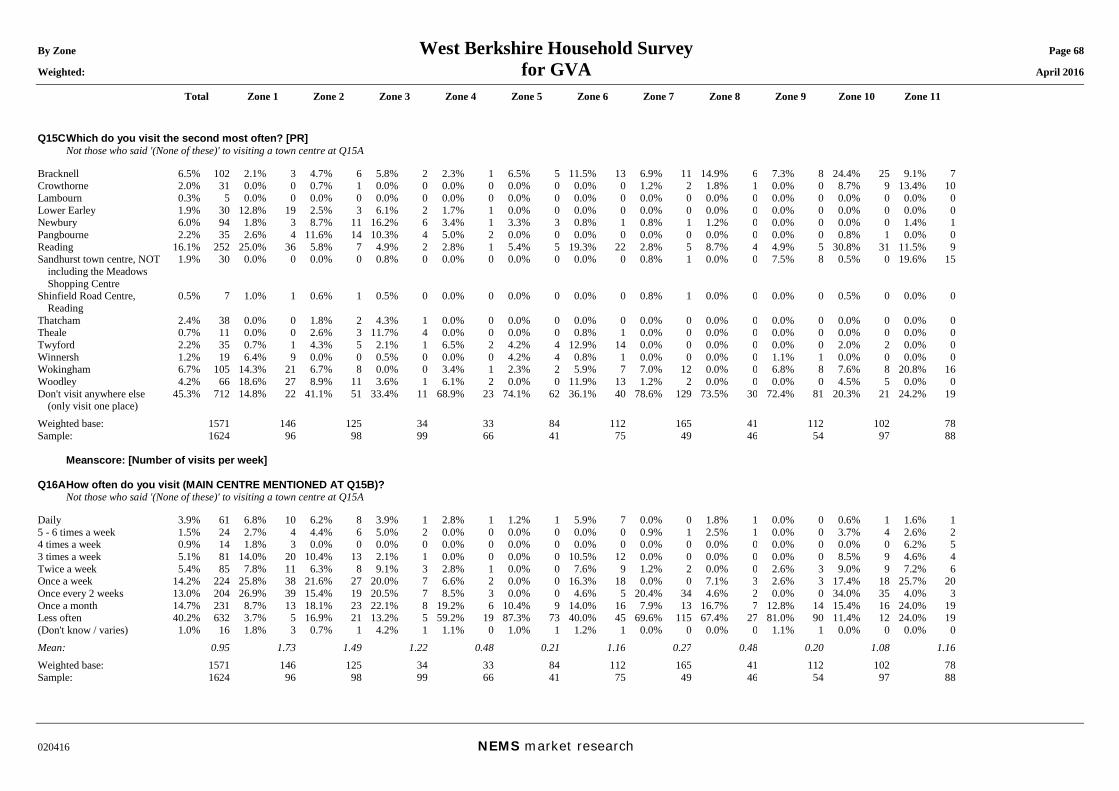
By Zone West Berkshire Household Survey Page 68 Weighted: for GVA April 2016
Total Zone 1 Zone 2 Zone 3 Zone 4 Zone 5 Zone 6 Zone 7 Zone 8 Zone 9 Zone 10 Zone 11
020416 NEMS market research
Q15C Which do you visit the second most often? [PR] Not those who said '(None of these)' to visiting a town centre at Q15A Bracknell 6.5% 102 2.1% 3 4.7% 6 5.8% 2 2.3% 1 6.5% 5 11.5% 13 6.9% 11 14.9% 6 7.3% 8 24.4% 25 9.1% 7 Crowthorne 2.0% 31 0.0% 0 0.7% 1 0.0% 0 0.0% 0 0.0% 0 0.0% 0 1.2% 2 1.8% 1 0.0% 0 8.7% 9 13.4% 10 Lambourn 0.3% 5 0.0% 0 0.0% 0 0.0% 0 0.0% 0 0.0% 0 0.0% 0 0.0% 0 0.0% 0 0.0% 0 0.0% 0 0.0% 0 Lower Earley 1.9% 30 12.8% 19 2.5% 3 6.1% 2 1.7% 1 0.0% 0 0.0% 0 0.0% 0 0.0% 0 0.0% 0 0.0% 0 0.0% 0 Newbury 6.0% 94 1.8% 3 8.7% 11 16.2% 6 3.4% 1 3.3% 3 0.8% 1 0.8% 1 1.2% 0 0.0% 0 0.0% 0 1.4% 1 Pangbourne 2.2% 35 2.6% 4 11.6% 14 10.3% 4 5.0% 2 0.0% 0 0.0% 0 0.0% 0 0.0% 0 0.0% 0 0.8% 1 0.0% 0 Reading 16.1% 252 25.0% 36 5.8% 7 4.9% 2 2.8% 1 5.4% 5 19.3% 22 2.8% 5 8.7% 4 4.9% 5 30.8% 31 11.5% 9 Sandhurst town centre, NOT
including the Meadows Shopping Centre
1.9% 30 0.0% 0 0.0% 0 0.8% 0 0.0% 0 0.0% 0 0.0% 0 0.8% 1 0.0% 0 7.5% 8 0.5% 0 19.6% 15
Shinfield Road Centre, Reading
0.5% 7 1.0% 1 0.6% 1 0.5% 0 0.0% 0 0.0% 0 0.0% 0 0.8% 1 0.0% 0 0.0% 0 0.5% 0 0.0% 0
Thatcham 2.4% 38 0.0% 0 1.8% 2 4.3% 1 0.0% 0 0.0% 0 0.0% 0 0.0% 0 0.0% 0 0.0% 0 0.0% 0 0.0% 0 Theale 0.7% 11 0.0% 0 2.6% 3 11.7% 4 0.0% 0 0.0% 0 0.8% 1 0.0% 0 0.0% 0 0.0% 0 0.0% 0 0.0% 0 Twyford 2.2% 35 0.7% 1 4.3% 5 2.1% 1 6.5% 2 4.2% 4 12.9% 14 0.0% 0 0.0% 0 0.0% 0 2.0% 2 0.0% 0 Winnersh 1.2% 19 6.4% 9 0.0% 0 0.5% 0 0.0% 0 4.2% 4 0.8% 1 0.0% 0 0.0% 0 1.1% 1 0.0% 0 0.0% 0 Wokingham 6.7% 105 14.3% 21 6.7% 8 0.0% 0 3.4% 1 2.3% 2 5.9% 7 7.0% 12 0.0% 0 6.8% 8 7.6% 8 20.8% 16 Woodley 4.2% 66 18.6% 27 8.9% 11 3.6% 1 6.1% 2 0.0% 0 11.9% 13 1.2% 2 0.0% 0 0.0% 0 4.5% 5 0.0% 0 Don't visit anywhere else
(only visit one place) 45.3% 712 14.8% 22 41.1% 51 33.4% 11 68.9% 23 74.1% 62 36.1% 40 78.6% 129 73.5% 30 72.4% 81 20.3% 21 24.2% 19
Weighted base: 1571 146 125 34 33 84 112 165 41 112 102 78 Sample: 1624 96 98 99 66 41 75 49 46 54 97 88 Meanscore: [Number of visits per week] Q16A How often do you visit (MAIN CENTRE MENTIONED AT Q15B)? Not those who said '(None of these)' to visiting a town centre at Q15A Daily 3.9% 61 6.8% 10 6.2% 8 3.9% 1 2.8% 1 1.2% 1 5.9% 7 0.0% 0 1.8% 1 0.0% 0 0.6% 1 1.6% 1 5 - 6 times a week 1.5% 24 2.7% 4 4.4% 6 5.0% 2 0.0% 0 0.0% 0 0.0% 0 0.9% 1 2.5% 1 0.0% 0 3.7% 4 2.6% 2 4 times a week 0.9% 14 1.8% 3 0.0% 0 0.0% 0 0.0% 0 0.0% 0 0.0% 0 0.0% 0 0.0% 0 0.0% 0 0.0% 0 6.2% 5 3 times a week 5.1% 81 14.0% 20 10.4% 13 2.1% 1 0.0% 0 0.0% 0 10.5% 12 0.0% 0 0.0% 0 0.0% 0 8.5% 9 4.6% 4 Twice a week 5.4% 85 7.8% 11 6.3% 8 9.1% 3 2.8% 1 0.0% 0 7.6% 9 1.2% 2 0.0% 0 2.6% 3 9.0% 9 7.2% 6 Once a week 14.2% 224 25.8% 38 21.6% 27 20.0% 7 6.6% 2 0.0% 0 16.3% 18 0.0% 0 7.1% 3 2.6% 3 17.4% 18 25.7% 20 Once every 2 weeks 13.0% 204 26.9% 39 15.4% 19 20.5% 7 8.5% 3 0.0% 0 4.6% 5 20.4% 34 4.6% 2 0.0% 0 34.0% 35 4.0% 3 Once a month 14.7% 231 8.7% 13 18.1% 23 22.1% 8 19.2% 6 10.4% 9 14.0% 16 7.9% 13 16.7% 7 12.8% 14 15.4% 16 24.0% 19 Less often 40.2% 632 3.7% 5 16.9% 21 13.2% 5 59.2% 19 87.3% 73 40.0% 45 69.6% 115 67.4% 27 81.0% 90 11.4% 12 24.0% 19 (Don't know / varies) 1.0% 16 1.8% 3 0.7% 1 4.2% 1 1.1% 0 1.0% 1 1.2% 1 0.0% 0 0.0% 0 1.1% 1 0.0% 0 0.0% 0 Mean: 0.95 1.73 1.49 1.22 0.48 0.21 1.16 0.27 0.48 0.20 1.08 1.16 Weighted base: 1571 146 125 34 33 84 112 165 41 112 102 78 Sample: 1624 96 98 99 66 41 75 49 46 54 97 88
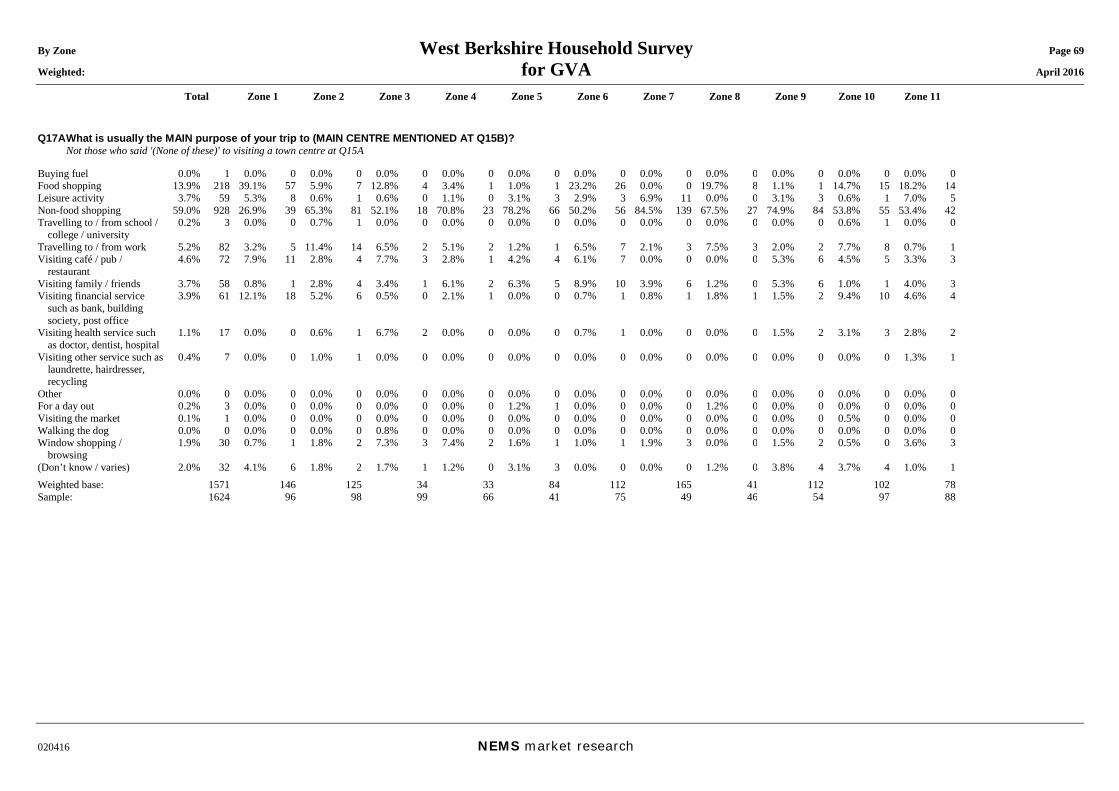
By Zone West Berkshire Household Survey Page 69 Weighted: for GVA April 2016
Total Zone 1 Zone 2 Zone 3 Zone 4 Zone 5 Zone 6 Zone 7 Zone 8 Zone 9 Zone 10 Zone 11
020416 NEMS market research
Q17A What is usually the MAIN purpose of your trip to (MAIN CENTRE MENTIONED AT Q15B)? Not those who said '(None of these)' to visiting a town centre at Q15A Buying fuel 0.0% 1 0.0% 0 0.0% 0 0.0% 0 0.0% 0 0.0% 0 0.0% 0 0.0% 0 0.0% 0 0.0% 0 0.0% 0 0.0% 0 Food shopping 13.9% 218 39.1% 57 5.9% 7 12.8% 4 3.4% 1 1.0% 1 23.2% 26 0.0% 0 19.7% 8 1.1% 1 14.7% 15 18.2% 14 Leisure activity 3.7% 59 5.3% 8 0.6% 1 0.6% 0 1.1% 0 3.1% 3 2.9% 3 6.9% 11 0.0% 0 3.1% 3 0.6% 1 7.0% 5 Non-food shopping 59.0% 928 26.9% 39 65.3% 81 52.1% 18 70.8% 23 78.2% 66 50.2% 56 84.5% 139 67.5% 27 74.9% 84 53.8% 55 53.4% 42 Travelling to / from school /
college / university 0.2% 3 0.0% 0 0.7% 1 0.0% 0 0.0% 0 0.0% 0 0.0% 0 0.0% 0 0.0% 0 0.0% 0 0.6% 1 0.0% 0
Travelling to / from work 5.2% 82 3.2% 5 11.4% 14 6.5% 2 5.1% 2 1.2% 1 6.5% 7 2.1% 3 7.5% 3 2.0% 2 7.7% 8 0.7% 1 Visiting café / pub /
restaurant 4.6% 72 7.9% 11 2.8% 4 7.7% 3 2.8% 1 4.2% 4 6.1% 7 0.0% 0 0.0% 0 5.3% 6 4.5% 5 3.3% 3
Visiting family / friends 3.7% 58 0.8% 1 2.8% 4 3.4% 1 6.1% 2 6.3% 5 8.9% 10 3.9% 6 1.2% 0 5.3% 6 1.0% 1 4.0% 3 Visiting financial service
such as bank, building society, post office
3.9% 61 12.1% 18 5.2% 6 0.5% 0 2.1% 1 0.0% 0 0.7% 1 0.8% 1 1.8% 1 1.5% 2 9.4% 10 4.6% 4
Visiting health service such as doctor, dentist, hospital
1.1% 17 0.0% 0 0.6% 1 6.7% 2 0.0% 0 0.0% 0 0.7% 1 0.0% 0 0.0% 0 1.5% 2 3.1% 3 2.8% 2
Visiting other service such as laundrette, hairdresser, recycling
0.4% 7 0.0% 0 1.0% 1 0.0% 0 0.0% 0 0.0% 0 0.0% 0 0.0% 0 0.0% 0 0.0% 0 0.0% 0 1.3% 1
Other 0.0% 0 0.0% 0 0.0% 0 0.0% 0 0.0% 0 0.0% 0 0.0% 0 0.0% 0 0.0% 0 0.0% 0 0.0% 0 0.0% 0 For a day out 0.2% 3 0.0% 0 0.0% 0 0.0% 0 0.0% 0 1.2% 1 0.0% 0 0.0% 0 1.2% 0 0.0% 0 0.0% 0 0.0% 0 Visiting the market 0.1% 1 0.0% 0 0.0% 0 0.0% 0 0.0% 0 0.0% 0 0.0% 0 0.0% 0 0.0% 0 0.0% 0 0.5% 0 0.0% 0 Walking the dog 0.0% 0 0.0% 0 0.0% 0 0.8% 0 0.0% 0 0.0% 0 0.0% 0 0.0% 0 0.0% 0 0.0% 0 0.0% 0 0.0% 0 Window shopping /
browsing 1.9% 30 0.7% 1 1.8% 2 7.3% 3 7.4% 2 1.6% 1 1.0% 1 1.9% 3 0.0% 0 1.5% 2 0.5% 0 3.6% 3
(Don’t know / varies) 2.0% 32 4.1% 6 1.8% 2 1.7% 1 1.2% 0 3.1% 3 0.0% 0 0.0% 0 1.2% 0 3.8% 4 3.7% 4 1.0% 1 Weighted base: 1571 146 125 34 33 84 112 165 41 112 102 78 Sample: 1624 96 98 99 66 41 75 49 46 54 97 88
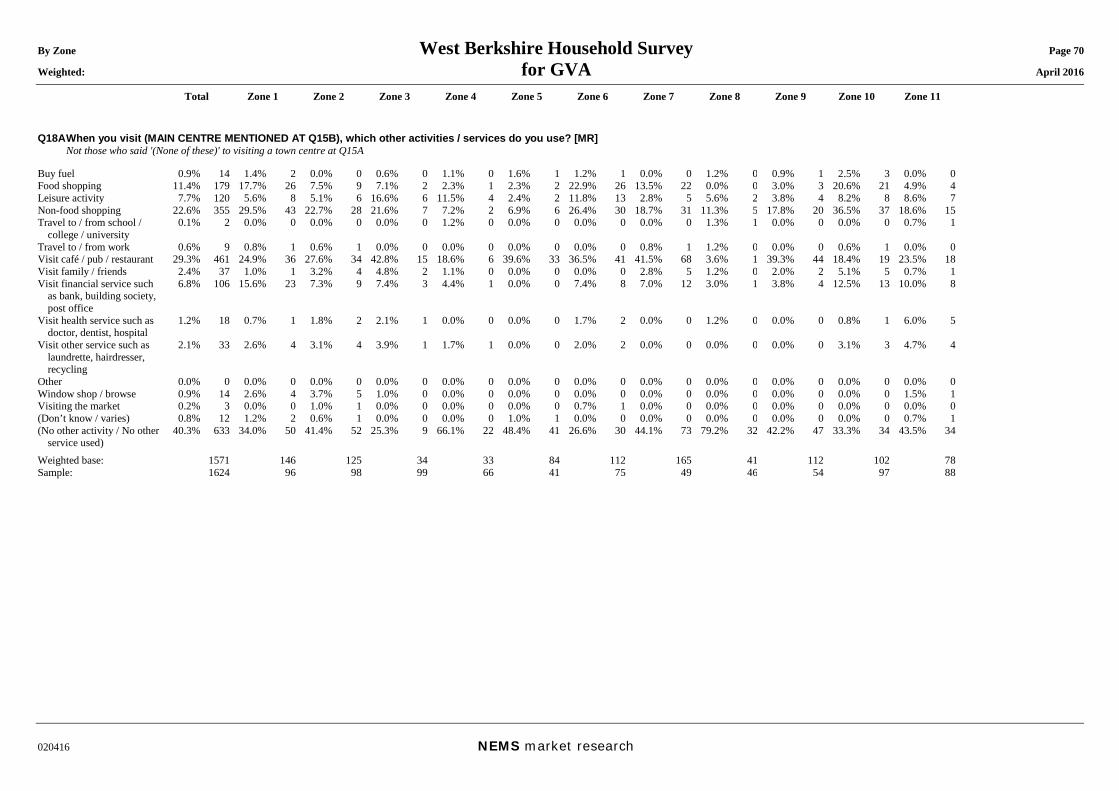
By Zone West Berkshire Household Survey Page 70 Weighted: for GVA April 2016
Total Zone 1 Zone 2 Zone 3 Zone 4 Zone 5 Zone 6 Zone 7 Zone 8 Zone 9 Zone 10 Zone 11
020416 NEMS market research
Q18A When you visit (MAIN CENTRE MENTIONED AT Q15B), which other activities / services do you use? [MR] Not those who said '(None of these)' to visiting a town centre at Q15A Buy fuel 0.9% 14 1.4% 2 0.0% 0 0.6% 0 1.1% 0 1.6% 1 1.2% 1 0.0% 0 1.2% 0 0.9% 1 2.5% 3 0.0% 0 Food shopping 11.4% 179 17.7% 26 7.5% 9 7.1% 2 2.3% 1 2.3% 2 22.9% 26 13.5% 22 0.0% 0 3.0% 3 20.6% 21 4.9% 4 Leisure activity 7.7% 120 5.6% 8 5.1% 6 16.6% 6 11.5% 4 2.4% 2 11.8% 13 2.8% 5 5.6% 2 3.8% 4 8.2% 8 8.6% 7 Non-food shopping 22.6% 355 29.5% 43 22.7% 28 21.6% 7 7.2% 2 6.9% 6 26.4% 30 18.7% 31 11.3% 5 17.8% 20 36.5% 37 18.6% 15 Travel to / from school /
college / university 0.1% 2 0.0% 0 0.0% 0 0.0% 0 1.2% 0 0.0% 0 0.0% 0 0.0% 0 1.3% 1 0.0% 0 0.0% 0 0.7% 1
Travel to / from work 0.6% 9 0.8% 1 0.6% 1 0.0% 0 0.0% 0 0.0% 0 0.0% 0 0.8% 1 1.2% 0 0.0% 0 0.6% 1 0.0% 0 Visit café / pub / restaurant 29.3% 461 24.9% 36 27.6% 34 42.8% 15 18.6% 6 39.6% 33 36.5% 41 41.5% 68 3.6% 1 39.3% 44 18.4% 19 23.5% 18 Visit family / friends 2.4% 37 1.0% 1 3.2% 4 4.8% 2 1.1% 0 0.0% 0 0.0% 0 2.8% 5 1.2% 0 2.0% 2 5.1% 5 0.7% 1 Visit financial service such
as bank, building society, post office
6.8% 106 15.6% 23 7.3% 9 7.4% 3 4.4% 1 0.0% 0 7.4% 8 7.0% 12 3.0% 1 3.8% 4 12.5% 13 10.0% 8
Visit health service such as doctor, dentist, hospital
1.2% 18 0.7% 1 1.8% 2 2.1% 1 0.0% 0 0.0% 0 1.7% 2 0.0% 0 1.2% 0 0.0% 0 0.8% 1 6.0% 5
Visit other service such as laundrette, hairdresser, recycling
2.1% 33 2.6% 4 3.1% 4 3.9% 1 1.7% 1 0.0% 0 2.0% 2 0.0% 0 0.0% 0 0.0% 0 3.1% 3 4.7% 4
Other 0.0% 0 0.0% 0 0.0% 0 0.0% 0 0.0% 0 0.0% 0 0.0% 0 0.0% 0 0.0% 0 0.0% 0 0.0% 0 0.0% 0 Window shop / browse 0.9% 14 2.6% 4 3.7% 5 1.0% 0 0.0% 0 0.0% 0 0.0% 0 0.0% 0 0.0% 0 0.0% 0 0.0% 0 1.5% 1 Visiting the market 0.2% 3 0.0% 0 1.0% 1 0.0% 0 0.0% 0 0.0% 0 0.7% 1 0.0% 0 0.0% 0 0.0% 0 0.0% 0 0.0% 0 (Don’t know / varies) 0.8% 12 1.2% 2 0.6% 1 0.0% 0 0.0% 0 1.0% 1 0.0% 0 0.0% 0 0.0% 0 0.0% 0 0.0% 0 0.7% 1 (No other activity / No other
service used) 40.3% 633 34.0% 50 41.4% 52 25.3% 9 66.1% 22 48.4% 41 26.6% 30 44.1% 73 79.2% 32 42.2% 47 33.3% 34 43.5% 34
Weighted base: 1571 146 125 34 33 84 112 165 41 112 102 78 Sample: 1624 96 98 99 66 41 75 49 46 54 97 88
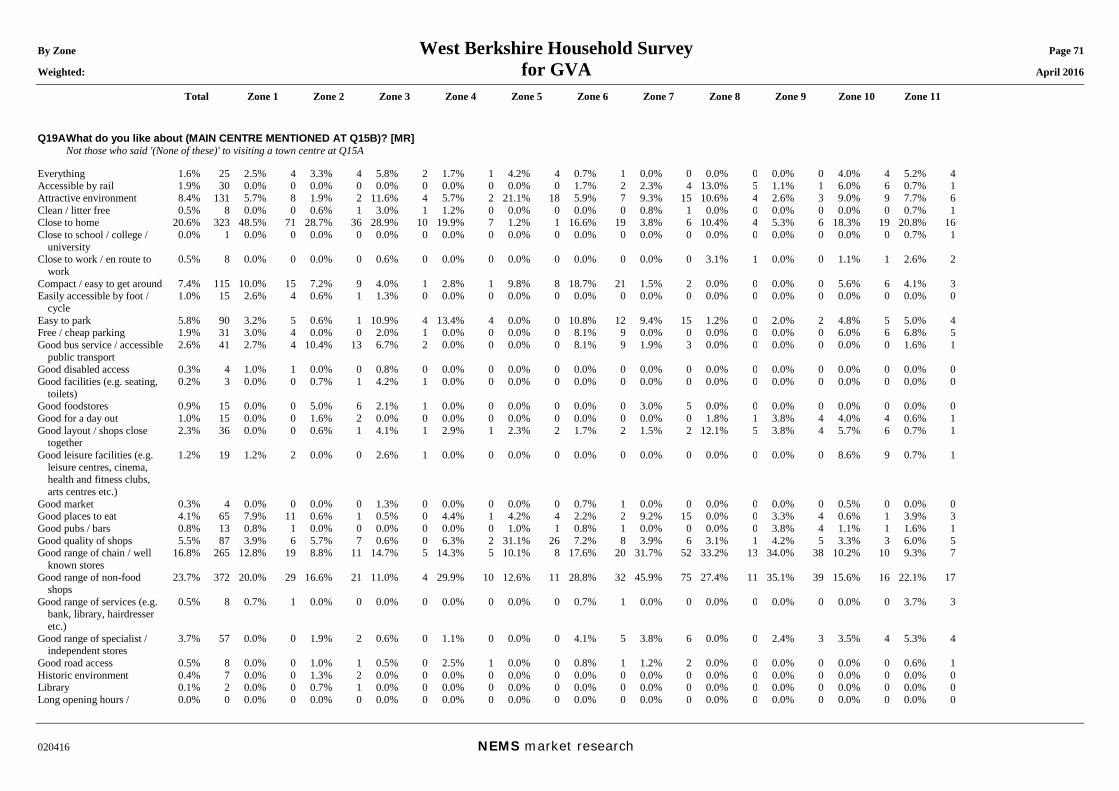
By Zone West Berkshire Household Survey Page 71 Weighted: for GVA April 2016
Total Zone 1 Zone 2 Zone 3 Zone 4 Zone 5 Zone 6 Zone 7 Zone 8 Zone 9 Zone 10 Zone 11
020416 NEMS market research
Q19A What do you like about (MAIN CENTRE MENTIONED AT Q15B)? [MR] Not those who said '(None of these)' to visiting a town centre at Q15A Everything 1.6% 25 2.5% 4 3.3% 4 5.8% 2 1.7% 1 4.2% 4 0.7% 1 0.0% 0 0.0% 0 0.0% 0 4.0% 4 5.2% 4 Accessible by rail 1.9% 30 0.0% 0 0.0% 0 0.0% 0 0.0% 0 0.0% 0 1.7% 2 2.3% 4 13.0% 5 1.1% 1 6.0% 6 0.7% 1 Attractive environment 8.4% 131 5.7% 8 1.9% 2 11.6% 4 5.7% 2 21.1% 18 5.9% 7 9.3% 15 10.6% 4 2.6% 3 9.0% 9 7.7% 6 Clean / litter free 0.5% 8 0.0% 0 0.6% 1 3.0% 1 1.2% 0 0.0% 0 0.0% 0 0.8% 1 0.0% 0 0.0% 0 0.0% 0 0.7% 1 Close to home 20.6% 323 48.5% 71 28.7% 36 28.9% 10 19.9% 7 1.2% 1 16.6% 19 3.8% 6 10.4% 4 5.3% 6 18.3% 19 20.8% 16 Close to school / college /
university 0.0% 1 0.0% 0 0.0% 0 0.0% 0 0.0% 0 0.0% 0 0.0% 0 0.0% 0 0.0% 0 0.0% 0 0.0% 0 0.7% 1
Close to work / en route to work
0.5% 8 0.0% 0 0.0% 0 0.6% 0 0.0% 0 0.0% 0 0.0% 0 0.0% 0 3.1% 1 0.0% 0 1.1% 1 2.6% 2
Compact / easy to get around 7.4% 115 10.0% 15 7.2% 9 4.0% 1 2.8% 1 9.8% 8 18.7% 21 1.5% 2 0.0% 0 0.0% 0 5.6% 6 4.1% 3 Easily accessible by foot /
cycle 1.0% 15 2.6% 4 0.6% 1 1.3% 0 0.0% 0 0.0% 0 0.0% 0 0.0% 0 0.0% 0 0.0% 0 0.0% 0 0.0% 0
Easy to park 5.8% 90 3.2% 5 0.6% 1 10.9% 4 13.4% 4 0.0% 0 10.8% 12 9.4% 15 1.2% 0 2.0% 2 4.8% 5 5.0% 4 Free / cheap parking 1.9% 31 3.0% 4 0.0% 0 2.0% 1 0.0% 0 0.0% 0 8.1% 9 0.0% 0 0.0% 0 0.0% 0 6.0% 6 6.8% 5 Good bus service / accessible
public transport 2.6% 41 2.7% 4 10.4% 13 6.7% 2 0.0% 0 0.0% 0 8.1% 9 1.9% 3 0.0% 0 0.0% 0 0.0% 0 1.6% 1
Good disabled access 0.3% 4 1.0% 1 0.0% 0 0.8% 0 0.0% 0 0.0% 0 0.0% 0 0.0% 0 0.0% 0 0.0% 0 0.0% 0 0.0% 0 Good facilities (e.g. seating,
toilets) 0.2% 3 0.0% 0 0.7% 1 4.2% 1 0.0% 0 0.0% 0 0.0% 0 0.0% 0 0.0% 0 0.0% 0 0.0% 0 0.0% 0
Good foodstores 0.9% 15 0.0% 0 5.0% 6 2.1% 1 0.0% 0 0.0% 0 0.0% 0 3.0% 5 0.0% 0 0.0% 0 0.0% 0 0.0% 0 Good for a day out 1.0% 15 0.0% 0 1.6% 2 0.0% 0 0.0% 0 0.0% 0 0.0% 0 0.0% 0 1.8% 1 3.8% 4 4.0% 4 0.6% 1 Good layout / shops close
together 2.3% 36 0.0% 0 0.6% 1 4.1% 1 2.9% 1 2.3% 2 1.7% 2 1.5% 2 12.1% 5 3.8% 4 5.7% 6 0.7% 1
Good leisure facilities (e.g. leisure centres, cinema, health and fitness clubs, arts centres etc.)
1.2% 19 1.2% 2 0.0% 0 2.6% 1 0.0% 0 0.0% 0 0.0% 0 0.0% 0 0.0% 0 0.0% 0 8.6% 9 0.7% 1
Good market 0.3% 4 0.0% 0 0.0% 0 1.3% 0 0.0% 0 0.0% 0 0.7% 1 0.0% 0 0.0% 0 0.0% 0 0.5% 0 0.0% 0 Good places to eat 4.1% 65 7.9% 11 0.6% 1 0.5% 0 4.4% 1 4.2% 4 2.2% 2 9.2% 15 0.0% 0 3.3% 4 0.6% 1 3.9% 3 Good pubs / bars 0.8% 13 0.8% 1 0.0% 0 0.0% 0 0.0% 0 1.0% 1 0.8% 1 0.0% 0 0.0% 0 3.8% 4 1.1% 1 1.6% 1 Good quality of shops 5.5% 87 3.9% 6 5.7% 7 0.6% 0 6.3% 2 31.1% 26 7.2% 8 3.9% 6 3.1% 1 4.2% 5 3.3% 3 6.0% 5 Good range of chain / well
known stores 16.8% 265 12.8% 19 8.8% 11 14.7% 5 14.3% 5 10.1% 8 17.6% 20 31.7% 52 33.2% 13 34.0% 38 10.2% 10 9.3% 7
Good range of non-food shops
23.7% 372 20.0% 29 16.6% 21 11.0% 4 29.9% 10 12.6% 11 28.8% 32 45.9% 75 27.4% 11 35.1% 39 15.6% 16 22.1% 17
Good range of services (e.g. bank, library, hairdresser etc.)
0.5% 8 0.7% 1 0.0% 0 0.0% 0 0.0% 0 0.0% 0 0.7% 1 0.0% 0 0.0% 0 0.0% 0 0.0% 0 3.7% 3
Good range of specialist / independent stores
3.7% 57 0.0% 0 1.9% 2 0.6% 0 1.1% 0 0.0% 0 4.1% 5 3.8% 6 0.0% 0 2.4% 3 3.5% 4 5.3% 4
Good road access 0.5% 8 0.0% 0 1.0% 1 0.5% 0 2.5% 1 0.0% 0 0.8% 1 1.2% 2 0.0% 0 0.0% 0 0.0% 0 0.6% 1 Historic environment 0.4% 7 0.0% 0 1.3% 2 0.0% 0 0.0% 0 0.0% 0 0.0% 0 0.0% 0 0.0% 0 0.0% 0 0.0% 0 0.0% 0 Library 0.1% 2 0.0% 0 0.7% 1 0.0% 0 0.0% 0 0.0% 0 0.0% 0 0.0% 0 0.0% 0 0.0% 0 0.0% 0 0.0% 0 Long opening hours / 0.0% 0 0.0% 0 0.0% 0 0.0% 0 0.0% 0 0.0% 0 0.0% 0 0.0% 0 0.0% 0 0.0% 0 0.0% 0 0.0% 0
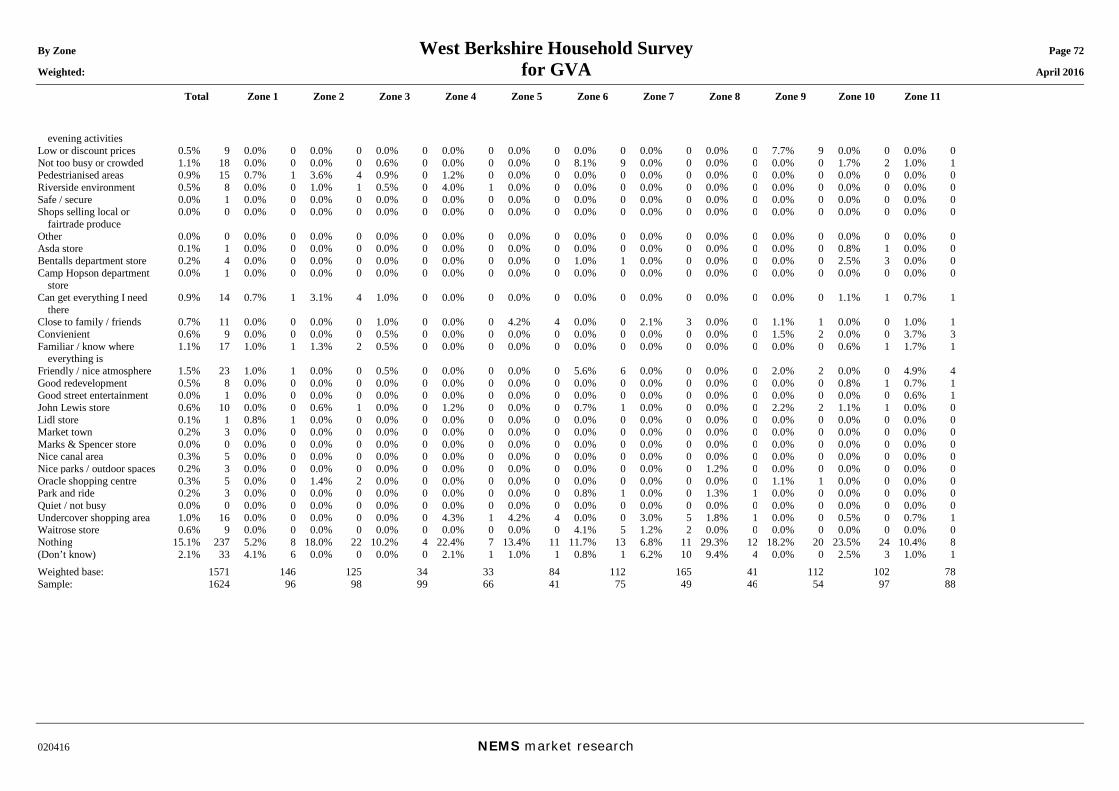
By Zone West Berkshire Household Survey Page 72 Weighted: for GVA April 2016
Total Zone 1 Zone 2 Zone 3 Zone 4 Zone 5 Zone 6 Zone 7 Zone 8 Zone 9 Zone 10 Zone 11
020416 NEMS market research
evening activities Low or discount prices 0.5% 9 0.0% 0 0.0% 0 0.0% 0 0.0% 0 0.0% 0 0.0% 0 0.0% 0 0.0% 0 7.7% 9 0.0% 0 0.0% 0 Not too busy or crowded 1.1% 18 0.0% 0 0.0% 0 0.6% 0 0.0% 0 0.0% 0 8.1% 9 0.0% 0 0.0% 0 0.0% 0 1.7% 2 1.0% 1 Pedestrianised areas 0.9% 15 0.7% 1 3.6% 4 0.9% 0 1.2% 0 0.0% 0 0.0% 0 0.0% 0 0.0% 0 0.0% 0 0.0% 0 0.0% 0 Riverside environment 0.5% 8 0.0% 0 1.0% 1 0.5% 0 4.0% 1 0.0% 0 0.0% 0 0.0% 0 0.0% 0 0.0% 0 0.0% 0 0.0% 0 Safe / secure 0.0% 1 0.0% 0 0.0% 0 0.0% 0 0.0% 0 0.0% 0 0.0% 0 0.0% 0 0.0% 0 0.0% 0 0.0% 0 0.0% 0 Shops selling local or
fairtrade produce 0.0% 0 0.0% 0 0.0% 0 0.0% 0 0.0% 0 0.0% 0 0.0% 0 0.0% 0 0.0% 0 0.0% 0 0.0% 0 0.0% 0
Other 0.0% 0 0.0% 0 0.0% 0 0.0% 0 0.0% 0 0.0% 0 0.0% 0 0.0% 0 0.0% 0 0.0% 0 0.0% 0 0.0% 0 Asda store 0.1% 1 0.0% 0 0.0% 0 0.0% 0 0.0% 0 0.0% 0 0.0% 0 0.0% 0 0.0% 0 0.0% 0 0.8% 1 0.0% 0 Bentalls department store 0.2% 4 0.0% 0 0.0% 0 0.0% 0 0.0% 0 0.0% 0 1.0% 1 0.0% 0 0.0% 0 0.0% 0 2.5% 3 0.0% 0 Camp Hopson department
store 0.0% 1 0.0% 0 0.0% 0 0.0% 0 0.0% 0 0.0% 0 0.0% 0 0.0% 0 0.0% 0 0.0% 0 0.0% 0 0.0% 0
Can get everything I need there
0.9% 14 0.7% 1 3.1% 4 1.0% 0 0.0% 0 0.0% 0 0.0% 0 0.0% 0 0.0% 0 0.0% 0 1.1% 1 0.7% 1
Close to family / friends 0.7% 11 0.0% 0 0.0% 0 1.0% 0 0.0% 0 4.2% 4 0.0% 0 2.1% 3 0.0% 0 1.1% 1 0.0% 0 1.0% 1 Convienient 0.6% 9 0.0% 0 0.0% 0 0.5% 0 0.0% 0 0.0% 0 0.0% 0 0.0% 0 0.0% 0 1.5% 2 0.0% 0 3.7% 3 Familiar / know where
everything is 1.1% 17 1.0% 1 1.3% 2 0.5% 0 0.0% 0 0.0% 0 0.0% 0 0.0% 0 0.0% 0 0.0% 0 0.6% 1 1.7% 1
Friendly / nice atmosphere 1.5% 23 1.0% 1 0.0% 0 0.5% 0 0.0% 0 0.0% 0 5.6% 6 0.0% 0 0.0% 0 2.0% 2 0.0% 0 4.9% 4 Good redevelopment 0.5% 8 0.0% 0 0.0% 0 0.0% 0 0.0% 0 0.0% 0 0.0% 0 0.0% 0 0.0% 0 0.0% 0 0.8% 1 0.7% 1 Good street entertainment 0.0% 1 0.0% 0 0.0% 0 0.0% 0 0.0% 0 0.0% 0 0.0% 0 0.0% 0 0.0% 0 0.0% 0 0.0% 0 0.6% 1 John Lewis store 0.6% 10 0.0% 0 0.6% 1 0.0% 0 1.2% 0 0.0% 0 0.7% 1 0.0% 0 0.0% 0 2.2% 2 1.1% 1 0.0% 0 Lidl store 0.1% 1 0.8% 1 0.0% 0 0.0% 0 0.0% 0 0.0% 0 0.0% 0 0.0% 0 0.0% 0 0.0% 0 0.0% 0 0.0% 0 Market town 0.2% 3 0.0% 0 0.0% 0 0.0% 0 0.0% 0 0.0% 0 0.0% 0 0.0% 0 0.0% 0 0.0% 0 0.0% 0 0.0% 0 Marks & Spencer store 0.0% 0 0.0% 0 0.0% 0 0.0% 0 0.0% 0 0.0% 0 0.0% 0 0.0% 0 0.0% 0 0.0% 0 0.0% 0 0.0% 0 Nice canal area 0.3% 5 0.0% 0 0.0% 0 0.0% 0 0.0% 0 0.0% 0 0.0% 0 0.0% 0 0.0% 0 0.0% 0 0.0% 0 0.0% 0 Nice parks / outdoor spaces 0.2% 3 0.0% 0 0.0% 0 0.0% 0 0.0% 0 0.0% 0 0.0% 0 0.0% 0 1.2% 0 0.0% 0 0.0% 0 0.0% 0 Oracle shopping centre 0.3% 5 0.0% 0 1.4% 2 0.0% 0 0.0% 0 0.0% 0 0.0% 0 0.0% 0 0.0% 0 1.1% 1 0.0% 0 0.0% 0 Park and ride 0.2% 3 0.0% 0 0.0% 0 0.0% 0 0.0% 0 0.0% 0 0.8% 1 0.0% 0 1.3% 1 0.0% 0 0.0% 0 0.0% 0 Quiet / not busy 0.0% 0 0.0% 0 0.0% 0 0.0% 0 0.0% 0 0.0% 0 0.0% 0 0.0% 0 0.0% 0 0.0% 0 0.0% 0 0.0% 0 Undercover shopping area 1.0% 16 0.0% 0 0.0% 0 0.0% 0 4.3% 1 4.2% 4 0.0% 0 3.0% 5 1.8% 1 0.0% 0 0.5% 0 0.7% 1 Waitrose store 0.6% 9 0.0% 0 0.0% 0 0.0% 0 0.0% 0 0.0% 0 4.1% 5 1.2% 2 0.0% 0 0.0% 0 0.0% 0 0.0% 0 Nothing 15.1% 237 5.2% 8 18.0% 22 10.2% 4 22.4% 7 13.4% 11 11.7% 13 6.8% 11 29.3% 12 18.2% 20 23.5% 24 10.4% 8 (Don’t know) 2.1% 33 4.1% 6 0.0% 0 0.0% 0 2.1% 1 1.0% 1 0.8% 1 6.2% 10 9.4% 4 0.0% 0 2.5% 3 1.0% 1 Weighted base: 1571 146 125 34 33 84 112 165 41 112 102 78 Sample: 1624 96 98 99 66 41 75 49 46 54 97 88
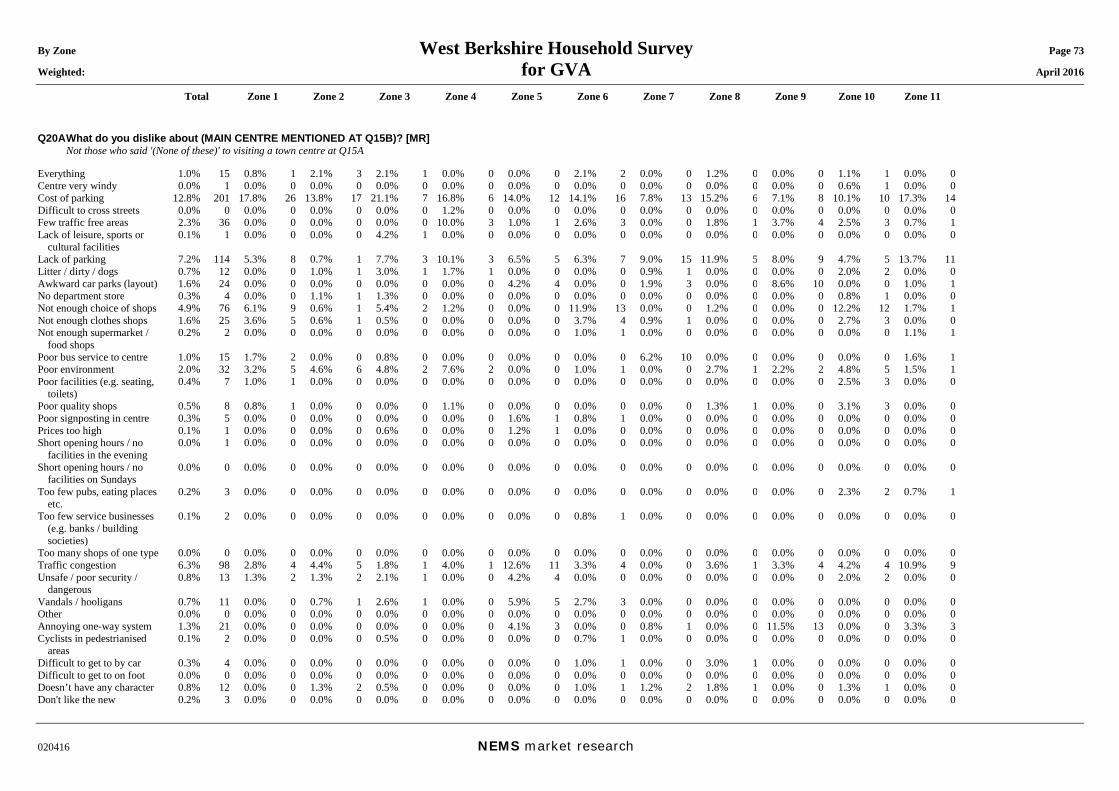
By Zone West Berkshire Household Survey Page 73 Weighted: for GVA April 2016
Total Zone 1 Zone 2 Zone 3 Zone 4 Zone 5 Zone 6 Zone 7 Zone 8 Zone 9 Zone 10 Zone 11
020416 NEMS market research
Q20A What do you dislike about (MAIN CENTRE MENTIONED AT Q15B)? [MR] Not those who said '(None of these)' to visiting a town centre at Q15A Everything 1.0% 15 0.8% 1 2.1% 3 2.1% 1 0.0% 0 0.0% 0 2.1% 2 0.0% 0 1.2% 0 0.0% 0 1.1% 1 0.0% 0 Centre very windy 0.0% 1 0.0% 0 0.0% 0 0.0% 0 0.0% 0 0.0% 0 0.0% 0 0.0% 0 0.0% 0 0.0% 0 0.6% 1 0.0% 0 Cost of parking 12.8% 201 17.8% 26 13.8% 17 21.1% 7 16.8% 6 14.0% 12 14.1% 16 7.8% 13 15.2% 6 7.1% 8 10.1% 10 17.3% 14 Difficult to cross streets 0.0% 0 0.0% 0 0.0% 0 0.0% 0 1.2% 0 0.0% 0 0.0% 0 0.0% 0 0.0% 0 0.0% 0 0.0% 0 0.0% 0 Few traffic free areas 2.3% 36 0.0% 0 0.0% 0 0.0% 0 10.0% 3 1.0% 1 2.6% 3 0.0% 0 1.8% 1 3.7% 4 2.5% 3 0.7% 1 Lack of leisure, sports or
cultural facilities 0.1% 1 0.0% 0 0.0% 0 4.2% 1 0.0% 0 0.0% 0 0.0% 0 0.0% 0 0.0% 0 0.0% 0 0.0% 0 0.0% 0
Lack of parking 7.2% 114 5.3% 8 0.7% 1 7.7% 3 10.1% 3 6.5% 5 6.3% 7 9.0% 15 11.9% 5 8.0% 9 4.7% 5 13.7% 11 Litter / dirty / dogs 0.7% 12 0.0% 0 1.0% 1 3.0% 1 1.7% 1 0.0% 0 0.0% 0 0.9% 1 0.0% 0 0.0% 0 2.0% 2 0.0% 0 Awkward car parks (layout) 1.6% 24 0.0% 0 0.0% 0 0.0% 0 0.0% 0 4.2% 4 0.0% 0 1.9% 3 0.0% 0 8.6% 10 0.0% 0 1.0% 1 No department store 0.3% 4 0.0% 0 1.1% 1 1.3% 0 0.0% 0 0.0% 0 0.0% 0 0.0% 0 0.0% 0 0.0% 0 0.8% 1 0.0% 0 Not enough choice of shops 4.9% 76 6.1% 9 0.6% 1 5.4% 2 1.2% 0 0.0% 0 11.9% 13 0.0% 0 1.2% 0 0.0% 0 12.2% 12 1.7% 1 Not enough clothes shops 1.6% 25 3.6% 5 0.6% 1 0.5% 0 0.0% 0 0.0% 0 3.7% 4 0.9% 1 0.0% 0 0.0% 0 2.7% 3 0.0% 0 Not enough supermarket /
food shops 0.2% 2 0.0% 0 0.0% 0 0.0% 0 0.0% 0 0.0% 0 1.0% 1 0.0% 0 0.0% 0 0.0% 0 0.0% 0 1.1% 1
Poor bus service to centre 1.0% 15 1.7% 2 0.0% 0 0.8% 0 0.0% 0 0.0% 0 0.0% 0 6.2% 10 0.0% 0 0.0% 0 0.0% 0 1.6% 1 Poor environment 2.0% 32 3.2% 5 4.6% 6 4.8% 2 7.6% 2 0.0% 0 1.0% 1 0.0% 0 2.7% 1 2.2% 2 4.8% 5 1.5% 1 Poor facilities (e.g. seating,
toilets) 0.4% 7 1.0% 1 0.0% 0 0.0% 0 0.0% 0 0.0% 0 0.0% 0 0.0% 0 0.0% 0 0.0% 0 2.5% 3 0.0% 0
Poor quality shops 0.5% 8 0.8% 1 0.0% 0 0.0% 0 1.1% 0 0.0% 0 0.0% 0 0.0% 0 1.3% 1 0.0% 0 3.1% 3 0.0% 0 Poor signposting in centre 0.3% 5 0.0% 0 0.0% 0 0.0% 0 0.0% 0 1.6% 1 0.8% 1 0.0% 0 0.0% 0 0.0% 0 0.0% 0 0.0% 0 Prices too high 0.1% 1 0.0% 0 0.0% 0 0.6% 0 0.0% 0 1.2% 1 0.0% 0 0.0% 0 0.0% 0 0.0% 0 0.0% 0 0.0% 0 Short opening hours / no
facilities in the evening 0.0% 1 0.0% 0 0.0% 0 0.0% 0 0.0% 0 0.0% 0 0.0% 0 0.0% 0 0.0% 0 0.0% 0 0.0% 0 0.0% 0
Short opening hours / no facilities on Sundays
0.0% 0 0.0% 0 0.0% 0 0.0% 0 0.0% 0 0.0% 0 0.0% 0 0.0% 0 0.0% 0 0.0% 0 0.0% 0 0.0% 0
Too few pubs, eating places etc.
0.2% 3 0.0% 0 0.0% 0 0.0% 0 0.0% 0 0.0% 0 0.0% 0 0.0% 0 0.0% 0 0.0% 0 2.3% 2 0.7% 1
Too few service businesses (e.g. banks / building societies)
0.1% 2 0.0% 0 0.0% 0 0.0% 0 0.0% 0 0.0% 0 0.8% 1 0.0% 0 0.0% 0 0.0% 0 0.0% 0 0.0% 0
Too many shops of one type 0.0% 0 0.0% 0 0.0% 0 0.0% 0 0.0% 0 0.0% 0 0.0% 0 0.0% 0 0.0% 0 0.0% 0 0.0% 0 0.0% 0 Traffic congestion 6.3% 98 2.8% 4 4.4% 5 1.8% 1 4.0% 1 12.6% 11 3.3% 4 0.0% 0 3.6% 1 3.3% 4 4.2% 4 10.9% 9 Unsafe / poor security /
dangerous 0.8% 13 1.3% 2 1.3% 2 2.1% 1 0.0% 0 4.2% 4 0.0% 0 0.0% 0 0.0% 0 0.0% 0 2.0% 2 0.0% 0
Vandals / hooligans 0.7% 11 0.0% 0 0.7% 1 2.6% 1 0.0% 0 5.9% 5 2.7% 3 0.0% 0 0.0% 0 0.0% 0 0.0% 0 0.0% 0 Other 0.0% 0 0.0% 0 0.0% 0 0.0% 0 0.0% 0 0.0% 0 0.0% 0 0.0% 0 0.0% 0 0.0% 0 0.0% 0 0.0% 0 Annoying one-way system 1.3% 21 0.0% 0 0.0% 0 0.0% 0 0.0% 0 4.1% 3 0.0% 0 0.8% 1 0.0% 0 11.5% 13 0.0% 0 3.3% 3 Cyclists in pedestrianised
areas 0.1% 2 0.0% 0 0.0% 0 0.5% 0 0.0% 0 0.0% 0 0.7% 1 0.0% 0 0.0% 0 0.0% 0 0.0% 0 0.0% 0
Difficult to get to by car 0.3% 4 0.0% 0 0.0% 0 0.0% 0 0.0% 0 0.0% 0 1.0% 1 0.0% 0 3.0% 1 0.0% 0 0.0% 0 0.0% 0 Difficult to get to on foot 0.0% 0 0.0% 0 0.0% 0 0.0% 0 0.0% 0 0.0% 0 0.0% 0 0.0% 0 0.0% 0 0.0% 0 0.0% 0 0.0% 0 Doesn’t have any character 0.8% 12 0.0% 0 1.3% 2 0.5% 0 0.0% 0 0.0% 0 1.0% 1 1.2% 2 1.8% 1 0.0% 0 1.3% 1 0.0% 0 Don't like the new 0.2% 3 0.0% 0 0.0% 0 0.0% 0 0.0% 0 0.0% 0 0.0% 0 0.0% 0 0.0% 0 0.0% 0 0.0% 0 0.0% 0
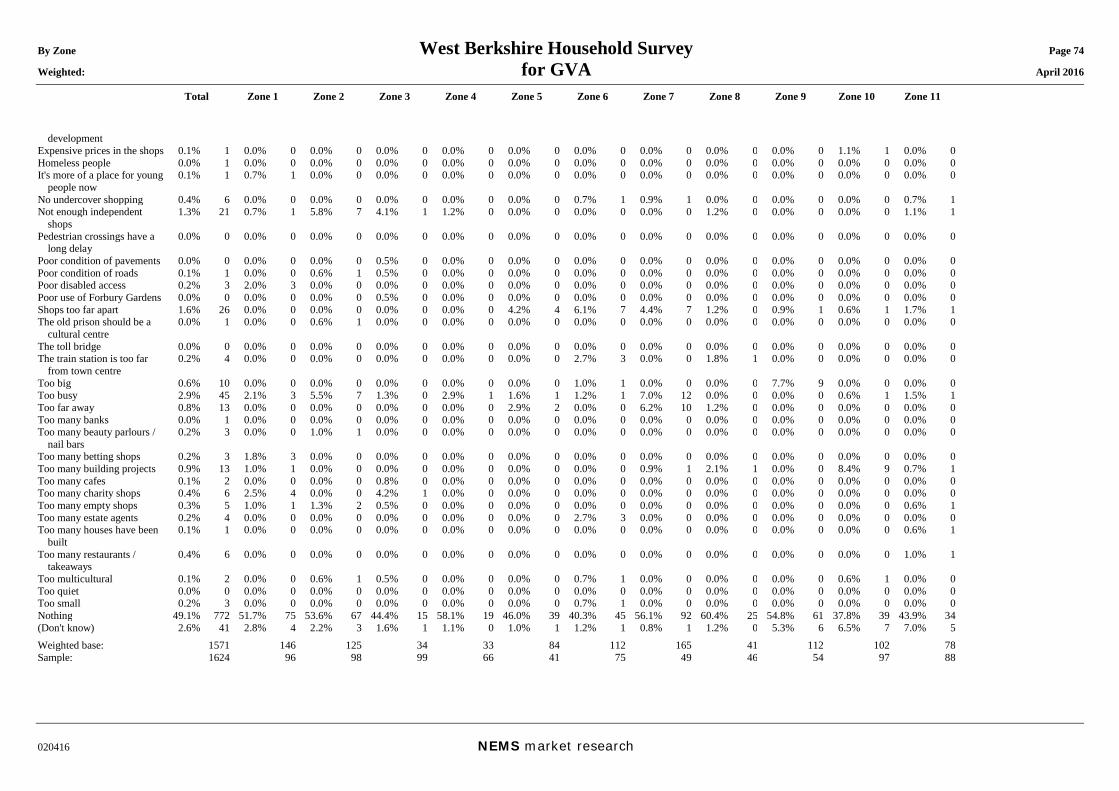
By Zone West Berkshire Household Survey Page 74 Weighted: for GVA April 2016
Total Zone 1 Zone 2 Zone 3 Zone 4 Zone 5 Zone 6 Zone 7 Zone 8 Zone 9 Zone 10 Zone 11
020416 NEMS market research
development Expensive prices in the shops 0.1% 1 0.0% 0 0.0% 0 0.0% 0 0.0% 0 0.0% 0 0.0% 0 0.0% 0 0.0% 0 0.0% 0 1.1% 1 0.0% 0 Homeless people 0.0% 1 0.0% 0 0.0% 0 0.0% 0 0.0% 0 0.0% 0 0.0% 0 0.0% 0 0.0% 0 0.0% 0 0.0% 0 0.0% 0 It's more of a place for young
people now 0.1% 1 0.7% 1 0.0% 0 0.0% 0 0.0% 0 0.0% 0 0.0% 0 0.0% 0 0.0% 0 0.0% 0 0.0% 0 0.0% 0
No undercover shopping 0.4% 6 0.0% 0 0.0% 0 0.0% 0 0.0% 0 0.0% 0 0.7% 1 0.9% 1 0.0% 0 0.0% 0 0.0% 0 0.7% 1 Not enough independent
shops 1.3% 21 0.7% 1 5.8% 7 4.1% 1 1.2% 0 0.0% 0 0.0% 0 0.0% 0 1.2% 0 0.0% 0 0.0% 0 1.1% 1
Pedestrian crossings have a long delay
0.0% 0 0.0% 0 0.0% 0 0.0% 0 0.0% 0 0.0% 0 0.0% 0 0.0% 0 0.0% 0 0.0% 0 0.0% 0 0.0% 0
Poor condition of pavements 0.0% 0 0.0% 0 0.0% 0 0.5% 0 0.0% 0 0.0% 0 0.0% 0 0.0% 0 0.0% 0 0.0% 0 0.0% 0 0.0% 0 Poor condition of roads 0.1% 1 0.0% 0 0.6% 1 0.5% 0 0.0% 0 0.0% 0 0.0% 0 0.0% 0 0.0% 0 0.0% 0 0.0% 0 0.0% 0 Poor disabled access 0.2% 3 2.0% 3 0.0% 0 0.0% 0 0.0% 0 0.0% 0 0.0% 0 0.0% 0 0.0% 0 0.0% 0 0.0% 0 0.0% 0 Poor use of Forbury Gardens 0.0% 0 0.0% 0 0.0% 0 0.5% 0 0.0% 0 0.0% 0 0.0% 0 0.0% 0 0.0% 0 0.0% 0 0.0% 0 0.0% 0 Shops too far apart 1.6% 26 0.0% 0 0.0% 0 0.0% 0 0.0% 0 4.2% 4 6.1% 7 4.4% 7 1.2% 0 0.9% 1 0.6% 1 1.7% 1 The old prison should be a
cultural centre 0.0% 1 0.0% 0 0.6% 1 0.0% 0 0.0% 0 0.0% 0 0.0% 0 0.0% 0 0.0% 0 0.0% 0 0.0% 0 0.0% 0
The toll bridge 0.0% 0 0.0% 0 0.0% 0 0.0% 0 0.0% 0 0.0% 0 0.0% 0 0.0% 0 0.0% 0 0.0% 0 0.0% 0 0.0% 0 The train station is too far
from town centre 0.2% 4 0.0% 0 0.0% 0 0.0% 0 0.0% 0 0.0% 0 2.7% 3 0.0% 0 1.8% 1 0.0% 0 0.0% 0 0.0% 0
Too big 0.6% 10 0.0% 0 0.0% 0 0.0% 0 0.0% 0 0.0% 0 1.0% 1 0.0% 0 0.0% 0 7.7% 9 0.0% 0 0.0% 0 Too busy 2.9% 45 2.1% 3 5.5% 7 1.3% 0 2.9% 1 1.6% 1 1.2% 1 7.0% 12 0.0% 0 0.0% 0 0.6% 1 1.5% 1 Too far away 0.8% 13 0.0% 0 0.0% 0 0.0% 0 0.0% 0 2.9% 2 0.0% 0 6.2% 10 1.2% 0 0.0% 0 0.0% 0 0.0% 0 Too many banks 0.0% 1 0.0% 0 0.0% 0 0.0% 0 0.0% 0 0.0% 0 0.0% 0 0.0% 0 0.0% 0 0.0% 0 0.0% 0 0.0% 0 Too many beauty parlours /
nail bars 0.2% 3 0.0% 0 1.0% 1 0.0% 0 0.0% 0 0.0% 0 0.0% 0 0.0% 0 0.0% 0 0.0% 0 0.0% 0 0.0% 0
Too many betting shops 0.2% 3 1.8% 3 0.0% 0 0.0% 0 0.0% 0 0.0% 0 0.0% 0 0.0% 0 0.0% 0 0.0% 0 0.0% 0 0.0% 0 Too many building projects 0.9% 13 1.0% 1 0.0% 0 0.0% 0 0.0% 0 0.0% 0 0.0% 0 0.9% 1 2.1% 1 0.0% 0 8.4% 9 0.7% 1 Too many cafes 0.1% 2 0.0% 0 0.0% 0 0.8% 0 0.0% 0 0.0% 0 0.0% 0 0.0% 0 0.0% 0 0.0% 0 0.0% 0 0.0% 0 Too many charity shops 0.4% 6 2.5% 4 0.0% 0 4.2% 1 0.0% 0 0.0% 0 0.0% 0 0.0% 0 0.0% 0 0.0% 0 0.0% 0 0.0% 0 Too many empty shops 0.3% 5 1.0% 1 1.3% 2 0.5% 0 0.0% 0 0.0% 0 0.0% 0 0.0% 0 0.0% 0 0.0% 0 0.0% 0 0.6% 1 Too many estate agents 0.2% 4 0.0% 0 0.0% 0 0.0% 0 0.0% 0 0.0% 0 2.7% 3 0.0% 0 0.0% 0 0.0% 0 0.0% 0 0.0% 0 Too many houses have been
built 0.1% 1 0.0% 0 0.0% 0 0.0% 0 0.0% 0 0.0% 0 0.0% 0 0.0% 0 0.0% 0 0.0% 0 0.0% 0 0.6% 1
Too many restaurants / takeaways
0.4% 6 0.0% 0 0.0% 0 0.0% 0 0.0% 0 0.0% 0 0.0% 0 0.0% 0 0.0% 0 0.0% 0 0.0% 0 1.0% 1
Too multicultural 0.1% 2 0.0% 0 0.6% 1 0.5% 0 0.0% 0 0.0% 0 0.7% 1 0.0% 0 0.0% 0 0.0% 0 0.6% 1 0.0% 0 Too quiet 0.0% 0 0.0% 0 0.0% 0 0.0% 0 0.0% 0 0.0% 0 0.0% 0 0.0% 0 0.0% 0 0.0% 0 0.0% 0 0.0% 0 Too small 0.2% 3 0.0% 0 0.0% 0 0.0% 0 0.0% 0 0.0% 0 0.7% 1 0.0% 0 0.0% 0 0.0% 0 0.0% 0 0.0% 0 Nothing 49.1% 772 51.7% 75 53.6% 67 44.4% 15 58.1% 19 46.0% 39 40.3% 45 56.1% 92 60.4% 25 54.8% 61 37.8% 39 43.9% 34 (Don't know) 2.6% 41 2.8% 4 2.2% 3 1.6% 1 1.1% 0 1.0% 1 1.2% 1 0.8% 1 1.2% 0 5.3% 6 6.5% 7 7.0% 5 Weighted base: 1571 146 125 34 33 84 112 165 41 112 102 78 Sample: 1624 96 98 99 66 41 75 49 46 54 97 88
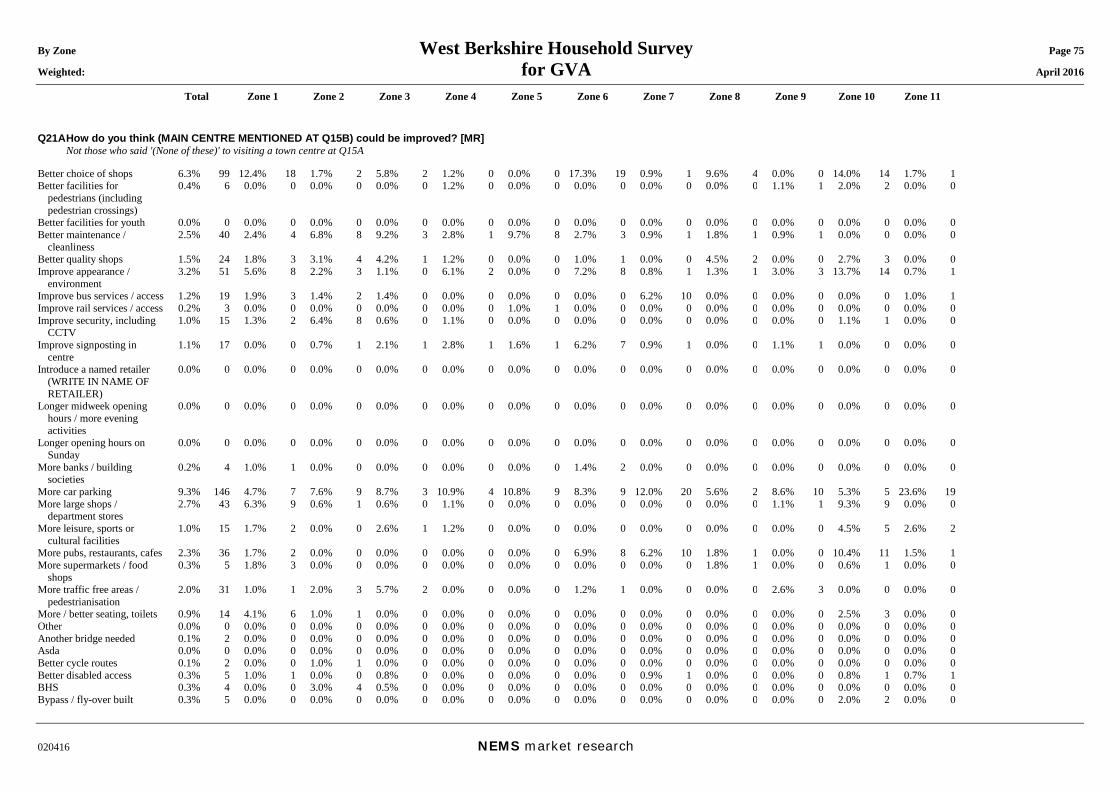
By Zone West Berkshire Household Survey Page 75 Weighted: for GVA April 2016
Total Zone 1 Zone 2 Zone 3 Zone 4 Zone 5 Zone 6 Zone 7 Zone 8 Zone 9 Zone 10 Zone 11
020416 NEMS market research
Q21A How do you think (MAIN CENTRE MENTIONED AT Q15B) could be improved? [MR] Not those who said '(None of these)' to visiting a town centre at Q15A Better choice of shops 6.3% 99 12.4% 18 1.7% 2 5.8% 2 1.2% 0 0.0% 0 17.3% 19 0.9% 1 9.6% 4 0.0% 0 14.0% 14 1.7% 1 Better facilities for
pedestrians (including pedestrian crossings)
0.4% 6 0.0% 0 0.0% 0 0.0% 0 1.2% 0 0.0% 0 0.0% 0 0.0% 0 0.0% 0 1.1% 1 2.0% 2 0.0% 0
Better facilities for youth 0.0% 0 0.0% 0 0.0% 0 0.0% 0 0.0% 0 0.0% 0 0.0% 0 0.0% 0 0.0% 0 0.0% 0 0.0% 0 0.0% 0 Better maintenance /
cleanliness 2.5% 40 2.4% 4 6.8% 8 9.2% 3 2.8% 1 9.7% 8 2.7% 3 0.9% 1 1.8% 1 0.9% 1 0.0% 0 0.0% 0
Better quality shops 1.5% 24 1.8% 3 3.1% 4 4.2% 1 1.2% 0 0.0% 0 1.0% 1 0.0% 0 4.5% 2 0.0% 0 2.7% 3 0.0% 0 Improve appearance /
environment 3.2% 51 5.6% 8 2.2% 3 1.1% 0 6.1% 2 0.0% 0 7.2% 8 0.8% 1 1.3% 1 3.0% 3 13.7% 14 0.7% 1
Improve bus services / access 1.2% 19 1.9% 3 1.4% 2 1.4% 0 0.0% 0 0.0% 0 0.0% 0 6.2% 10 0.0% 0 0.0% 0 0.0% 0 1.0% 1 Improve rail services / access 0.2% 3 0.0% 0 0.0% 0 0.0% 0 0.0% 0 1.0% 1 0.0% 0 0.0% 0 0.0% 0 0.0% 0 0.0% 0 0.0% 0 Improve security, including
CCTV 1.0% 15 1.3% 2 6.4% 8 0.6% 0 1.1% 0 0.0% 0 0.0% 0 0.0% 0 0.0% 0 0.0% 0 1.1% 1 0.0% 0
Improve signposting in centre
1.1% 17 0.0% 0 0.7% 1 2.1% 1 2.8% 1 1.6% 1 6.2% 7 0.9% 1 0.0% 0 1.1% 1 0.0% 0 0.0% 0
Introduce a named retailer (WRITE IN NAME OF RETAILER)
0.0% 0 0.0% 0 0.0% 0 0.0% 0 0.0% 0 0.0% 0 0.0% 0 0.0% 0 0.0% 0 0.0% 0 0.0% 0 0.0% 0
Longer midweek opening hours / more evening activities
0.0% 0 0.0% 0 0.0% 0 0.0% 0 0.0% 0 0.0% 0 0.0% 0 0.0% 0 0.0% 0 0.0% 0 0.0% 0 0.0% 0
Longer opening hours on Sunday
0.0% 0 0.0% 0 0.0% 0 0.0% 0 0.0% 0 0.0% 0 0.0% 0 0.0% 0 0.0% 0 0.0% 0 0.0% 0 0.0% 0
More banks / building societies
0.2% 4 1.0% 1 0.0% 0 0.0% 0 0.0% 0 0.0% 0 1.4% 2 0.0% 0 0.0% 0 0.0% 0 0.0% 0 0.0% 0
More car parking 9.3% 146 4.7% 7 7.6% 9 8.7% 3 10.9% 4 10.8% 9 8.3% 9 12.0% 20 5.6% 2 8.6% 10 5.3% 5 23.6% 19 More large shops /
department stores 2.7% 43 6.3% 9 0.6% 1 0.6% 0 1.1% 0 0.0% 0 0.0% 0 0.0% 0 0.0% 0 1.1% 1 9.3% 9 0.0% 0
More leisure, sports or cultural facilities
1.0% 15 1.7% 2 0.0% 0 2.6% 1 1.2% 0 0.0% 0 0.0% 0 0.0% 0 0.0% 0 0.0% 0 4.5% 5 2.6% 2
More pubs, restaurants, cafes 2.3% 36 1.7% 2 0.0% 0 0.0% 0 0.0% 0 0.0% 0 6.9% 8 6.2% 10 1.8% 1 0.0% 0 10.4% 11 1.5% 1 More supermarkets / food
shops 0.3% 5 1.8% 3 0.0% 0 0.0% 0 0.0% 0 0.0% 0 0.0% 0 0.0% 0 1.8% 1 0.0% 0 0.6% 1 0.0% 0
More traffic free areas / pedestrianisation
2.0% 31 1.0% 1 2.0% 3 5.7% 2 0.0% 0 0.0% 0 1.2% 1 0.0% 0 0.0% 0 2.6% 3 0.0% 0 0.0% 0
More / better seating, toilets 0.9% 14 4.1% 6 1.0% 1 0.0% 0 0.0% 0 0.0% 0 0.0% 0 0.0% 0 0.0% 0 0.0% 0 2.5% 3 0.0% 0 Other 0.0% 0 0.0% 0 0.0% 0 0.0% 0 0.0% 0 0.0% 0 0.0% 0 0.0% 0 0.0% 0 0.0% 0 0.0% 0 0.0% 0 Another bridge needed 0.1% 2 0.0% 0 0.0% 0 0.0% 0 0.0% 0 0.0% 0 0.0% 0 0.0% 0 0.0% 0 0.0% 0 0.0% 0 0.0% 0 Asda 0.0% 0 0.0% 0 0.0% 0 0.0% 0 0.0% 0 0.0% 0 0.0% 0 0.0% 0 0.0% 0 0.0% 0 0.0% 0 0.0% 0 Better cycle routes 0.1% 2 0.0% 0 1.0% 1 0.0% 0 0.0% 0 0.0% 0 0.0% 0 0.0% 0 0.0% 0 0.0% 0 0.0% 0 0.0% 0 Better disabled access 0.3% 5 1.0% 1 0.0% 0 0.8% 0 0.0% 0 0.0% 0 0.0% 0 0.9% 1 0.0% 0 0.0% 0 0.8% 1 0.7% 1 BHS 0.3% 4 0.0% 0 3.0% 4 0.5% 0 0.0% 0 0.0% 0 0.0% 0 0.0% 0 0.0% 0 0.0% 0 0.0% 0 0.0% 0 Bypass / fly-over built 0.3% 5 0.0% 0 0.0% 0 0.0% 0 0.0% 0 0.0% 0 0.0% 0 0.0% 0 0.0% 0 0.0% 0 2.0% 2 0.0% 0
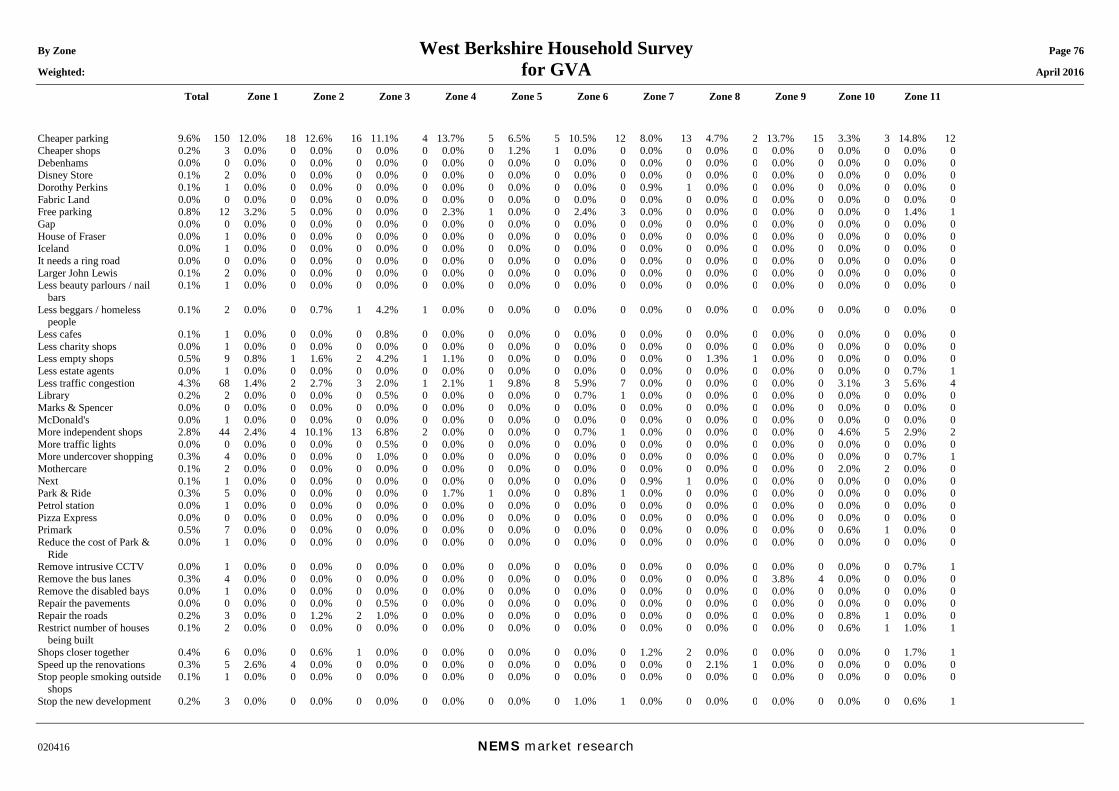
By Zone West Berkshire Household Survey Page 76 Weighted: for GVA April 2016
Total Zone 1 Zone 2 Zone 3 Zone 4 Zone 5 Zone 6 Zone 7 Zone 8 Zone 9 Zone 10 Zone 11
020416 NEMS market research
Cheaper parking 9.6% 150 12.0% 18 12.6% 16 11.1% 4 13.7% 5 6.5% 5 10.5% 12 8.0% 13 4.7% 2 13.7% 15 3.3% 3 14.8% 12 Cheaper shops 0.2% 3 0.0% 0 0.0% 0 0.0% 0 0.0% 0 1.2% 1 0.0% 0 0.0% 0 0.0% 0 0.0% 0 0.0% 0 0.0% 0 Debenhams 0.0% 0 0.0% 0 0.0% 0 0.0% 0 0.0% 0 0.0% 0 0.0% 0 0.0% 0 0.0% 0 0.0% 0 0.0% 0 0.0% 0 Disney Store 0.1% 2 0.0% 0 0.0% 0 0.0% 0 0.0% 0 0.0% 0 0.0% 0 0.0% 0 0.0% 0 0.0% 0 0.0% 0 0.0% 0 Dorothy Perkins 0.1% 1 0.0% 0 0.0% 0 0.0% 0 0.0% 0 0.0% 0 0.0% 0 0.9% 1 0.0% 0 0.0% 0 0.0% 0 0.0% 0 Fabric Land 0.0% 0 0.0% 0 0.0% 0 0.0% 0 0.0% 0 0.0% 0 0.0% 0 0.0% 0 0.0% 0 0.0% 0 0.0% 0 0.0% 0 Free parking 0.8% 12 3.2% 5 0.0% 0 0.0% 0 2.3% 1 0.0% 0 2.4% 3 0.0% 0 0.0% 0 0.0% 0 0.0% 0 1.4% 1 Gap 0.0% 0 0.0% 0 0.0% 0 0.0% 0 0.0% 0 0.0% 0 0.0% 0 0.0% 0 0.0% 0 0.0% 0 0.0% 0 0.0% 0 House of Fraser 0.0% 1 0.0% 0 0.0% 0 0.0% 0 0.0% 0 0.0% 0 0.0% 0 0.0% 0 0.0% 0 0.0% 0 0.0% 0 0.0% 0 Iceland 0.0% 1 0.0% 0 0.0% 0 0.0% 0 0.0% 0 0.0% 0 0.0% 0 0.0% 0 0.0% 0 0.0% 0 0.0% 0 0.0% 0 It needs a ring road 0.0% 0 0.0% 0 0.0% 0 0.0% 0 0.0% 0 0.0% 0 0.0% 0 0.0% 0 0.0% 0 0.0% 0 0.0% 0 0.0% 0 Larger John Lewis 0.1% 2 0.0% 0 0.0% 0 0.0% 0 0.0% 0 0.0% 0 0.0% 0 0.0% 0 0.0% 0 0.0% 0 0.0% 0 0.0% 0 Less beauty parlours / nail
bars 0.1% 1 0.0% 0 0.0% 0 0.0% 0 0.0% 0 0.0% 0 0.0% 0 0.0% 0 0.0% 0 0.0% 0 0.0% 0 0.0% 0
Less beggars / homeless people
0.1% 2 0.0% 0 0.7% 1 4.2% 1 0.0% 0 0.0% 0 0.0% 0 0.0% 0 0.0% 0 0.0% 0 0.0% 0 0.0% 0
Less cafes 0.1% 1 0.0% 0 0.0% 0 0.8% 0 0.0% 0 0.0% 0 0.0% 0 0.0% 0 0.0% 0 0.0% 0 0.0% 0 0.0% 0 Less charity shops 0.0% 1 0.0% 0 0.0% 0 0.0% 0 0.0% 0 0.0% 0 0.0% 0 0.0% 0 0.0% 0 0.0% 0 0.0% 0 0.0% 0 Less empty shops 0.5% 9 0.8% 1 1.6% 2 4.2% 1 1.1% 0 0.0% 0 0.0% 0 0.0% 0 1.3% 1 0.0% 0 0.0% 0 0.0% 0 Less estate agents 0.0% 1 0.0% 0 0.0% 0 0.0% 0 0.0% 0 0.0% 0 0.0% 0 0.0% 0 0.0% 0 0.0% 0 0.0% 0 0.7% 1 Less traffic congestion 4.3% 68 1.4% 2 2.7% 3 2.0% 1 2.1% 1 9.8% 8 5.9% 7 0.0% 0 0.0% 0 0.0% 0 3.1% 3 5.6% 4 Library 0.2% 2 0.0% 0 0.0% 0 0.5% 0 0.0% 0 0.0% 0 0.7% 1 0.0% 0 0.0% 0 0.0% 0 0.0% 0 0.0% 0 Marks & Spencer 0.0% 0 0.0% 0 0.0% 0 0.0% 0 0.0% 0 0.0% 0 0.0% 0 0.0% 0 0.0% 0 0.0% 0 0.0% 0 0.0% 0 McDonald's 0.0% 1 0.0% 0 0.0% 0 0.0% 0 0.0% 0 0.0% 0 0.0% 0 0.0% 0 0.0% 0 0.0% 0 0.0% 0 0.0% 0 More independent shops 2.8% 44 2.4% 4 10.1% 13 6.8% 2 0.0% 0 0.0% 0 0.7% 1 0.0% 0 0.0% 0 0.0% 0 4.6% 5 2.9% 2 More traffic lights 0.0% 0 0.0% 0 0.0% 0 0.5% 0 0.0% 0 0.0% 0 0.0% 0 0.0% 0 0.0% 0 0.0% 0 0.0% 0 0.0% 0 More undercover shopping 0.3% 4 0.0% 0 0.0% 0 1.0% 0 0.0% 0 0.0% 0 0.0% 0 0.0% 0 0.0% 0 0.0% 0 0.0% 0 0.7% 1 Mothercare 0.1% 2 0.0% 0 0.0% 0 0.0% 0 0.0% 0 0.0% 0 0.0% 0 0.0% 0 0.0% 0 0.0% 0 2.0% 2 0.0% 0 Next 0.1% 1 0.0% 0 0.0% 0 0.0% 0 0.0% 0 0.0% 0 0.0% 0 0.9% 1 0.0% 0 0.0% 0 0.0% 0 0.0% 0 Park & Ride 0.3% 5 0.0% 0 0.0% 0 0.0% 0 1.7% 1 0.0% 0 0.8% 1 0.0% 0 0.0% 0 0.0% 0 0.0% 0 0.0% 0 Petrol station 0.0% 1 0.0% 0 0.0% 0 0.0% 0 0.0% 0 0.0% 0 0.0% 0 0.0% 0 0.0% 0 0.0% 0 0.0% 0 0.0% 0 Pizza Express 0.0% 0 0.0% 0 0.0% 0 0.0% 0 0.0% 0 0.0% 0 0.0% 0 0.0% 0 0.0% 0 0.0% 0 0.0% 0 0.0% 0 Primark 0.5% 7 0.0% 0 0.0% 0 0.0% 0 0.0% 0 0.0% 0 0.0% 0 0.0% 0 0.0% 0 0.0% 0 0.6% 1 0.0% 0 Reduce the cost of Park &
Ride 0.0% 1 0.0% 0 0.0% 0 0.0% 0 0.0% 0 0.0% 0 0.0% 0 0.0% 0 0.0% 0 0.0% 0 0.0% 0 0.0% 0
Remove intrusive CCTV 0.0% 1 0.0% 0 0.0% 0 0.0% 0 0.0% 0 0.0% 0 0.0% 0 0.0% 0 0.0% 0 0.0% 0 0.0% 0 0.7% 1 Remove the bus lanes 0.3% 4 0.0% 0 0.0% 0 0.0% 0 0.0% 0 0.0% 0 0.0% 0 0.0% 0 0.0% 0 3.8% 4 0.0% 0 0.0% 0 Remove the disabled bays 0.0% 1 0.0% 0 0.0% 0 0.0% 0 0.0% 0 0.0% 0 0.0% 0 0.0% 0 0.0% 0 0.0% 0 0.0% 0 0.0% 0 Repair the pavements 0.0% 0 0.0% 0 0.0% 0 0.5% 0 0.0% 0 0.0% 0 0.0% 0 0.0% 0 0.0% 0 0.0% 0 0.0% 0 0.0% 0 Repair the roads 0.2% 3 0.0% 0 1.2% 2 1.0% 0 0.0% 0 0.0% 0 0.0% 0 0.0% 0 0.0% 0 0.0% 0 0.8% 1 0.0% 0 Restrict number of houses
being built 0.1% 2 0.0% 0 0.0% 0 0.0% 0 0.0% 0 0.0% 0 0.0% 0 0.0% 0 0.0% 0 0.0% 0 0.6% 1 1.0% 1
Shops closer together 0.4% 6 0.0% 0 0.6% 1 0.0% 0 0.0% 0 0.0% 0 0.0% 0 1.2% 2 0.0% 0 0.0% 0 0.0% 0 1.7% 1 Speed up the renovations 0.3% 5 2.6% 4 0.0% 0 0.0% 0 0.0% 0 0.0% 0 0.0% 0 0.0% 0 2.1% 1 0.0% 0 0.0% 0 0.0% 0 Stop people smoking outside
shops 0.1% 1 0.0% 0 0.0% 0 0.0% 0 0.0% 0 0.0% 0 0.0% 0 0.0% 0 0.0% 0 0.0% 0 0.0% 0 0.0% 0
Stop the new development 0.2% 3 0.0% 0 0.0% 0 0.0% 0 0.0% 0 0.0% 0 1.0% 1 0.0% 0 0.0% 0 0.0% 0 0.0% 0 0.6% 1
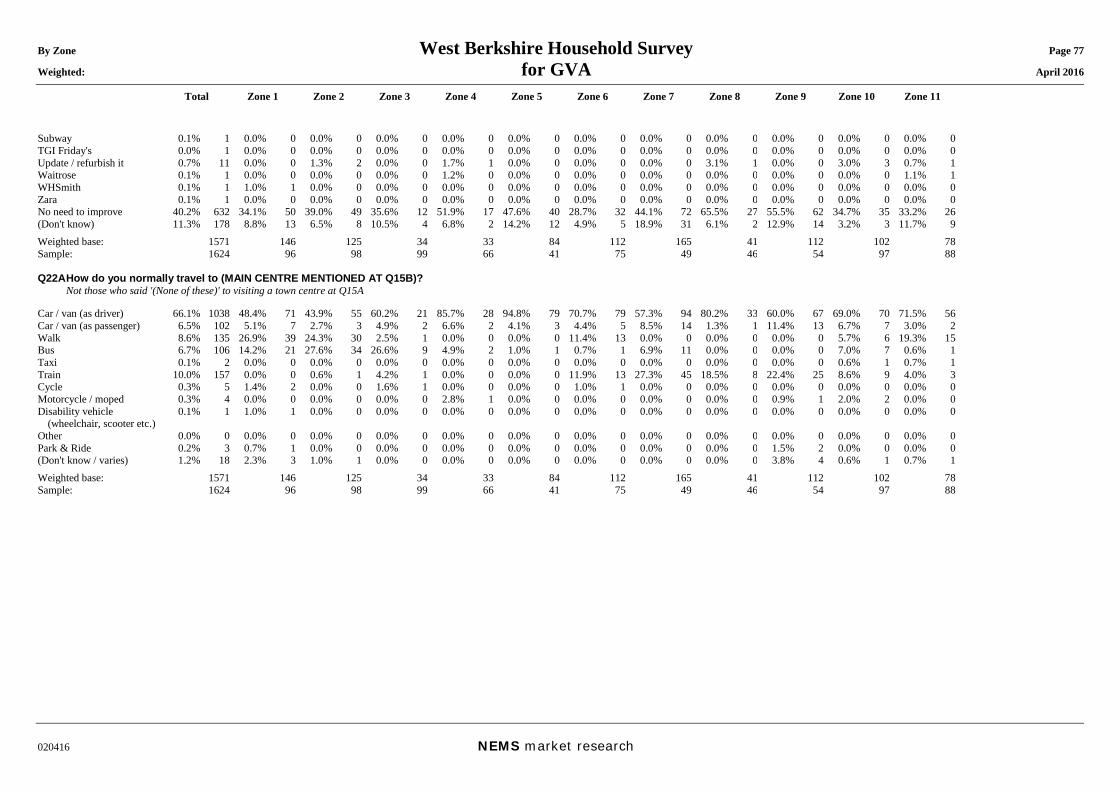
By Zone West Berkshire Household Survey Page 77 Weighted: for GVA April 2016
Total Zone 1 Zone 2 Zone 3 Zone 4 Zone 5 Zone 6 Zone 7 Zone 8 Zone 9 Zone 10 Zone 11
020416 NEMS market research
Subway 0.1% 1 0.0% 0 0.0% 0 0.0% 0 0.0% 0 0.0% 0 0.0% 0 0.0% 0 0.0% 0 0.0% 0 0.0% 0 0.0% 0 TGI Friday's 0.0% 1 0.0% 0 0.0% 0 0.0% 0 0.0% 0 0.0% 0 0.0% 0 0.0% 0 0.0% 0 0.0% 0 0.0% 0 0.0% 0 Update / refurbish it 0.7% 11 0.0% 0 1.3% 2 0.0% 0 1.7% 1 0.0% 0 0.0% 0 0.0% 0 3.1% 1 0.0% 0 3.0% 3 0.7% 1 Waitrose 0.1% 1 0.0% 0 0.0% 0 0.0% 0 1.2% 0 0.0% 0 0.0% 0 0.0% 0 0.0% 0 0.0% 0 0.0% 0 1.1% 1 WHSmith 0.1% 1 1.0% 1 0.0% 0 0.0% 0 0.0% 0 0.0% 0 0.0% 0 0.0% 0 0.0% 0 0.0% 0 0.0% 0 0.0% 0 Zara 0.1% 1 0.0% 0 0.0% 0 0.0% 0 0.0% 0 0.0% 0 0.0% 0 0.0% 0 0.0% 0 0.0% 0 0.0% 0 0.0% 0 No need to improve 40.2% 632 34.1% 50 39.0% 49 35.6% 12 51.9% 17 47.6% 40 28.7% 32 44.1% 72 65.5% 27 55.5% 62 34.7% 35 33.2% 26 (Don't know) 11.3% 178 8.8% 13 6.5% 8 10.5% 4 6.8% 2 14.2% 12 4.9% 5 18.9% 31 6.1% 2 12.9% 14 3.2% 3 11.7% 9 Weighted base: 1571 146 125 34 33 84 112 165 41 112 102 78 Sample: 1624 96 98 99 66 41 75 49 46 54 97 88 Q22A How do you normally travel to (MAIN CENTRE MENTIONED AT Q15B)? Not those who said '(None of these)' to visiting a town centre at Q15A Car / van (as driver) 66.1% 1038 48.4% 71 43.9% 55 60.2% 21 85.7% 28 94.8% 79 70.7% 79 57.3% 94 80.2% 33 60.0% 67 69.0% 70 71.5% 56 Car / van (as passenger) 6.5% 102 5.1% 7 2.7% 3 4.9% 2 6.6% 2 4.1% 3 4.4% 5 8.5% 14 1.3% 1 11.4% 13 6.7% 7 3.0% 2 Walk 8.6% 135 26.9% 39 24.3% 30 2.5% 1 0.0% 0 0.0% 0 11.4% 13 0.0% 0 0.0% 0 0.0% 0 5.7% 6 19.3% 15 Bus 6.7% 106 14.2% 21 27.6% 34 26.6% 9 4.9% 2 1.0% 1 0.7% 1 6.9% 11 0.0% 0 0.0% 0 7.0% 7 0.6% 1 Taxi 0.1% 2 0.0% 0 0.0% 0 0.0% 0 0.0% 0 0.0% 0 0.0% 0 0.0% 0 0.0% 0 0.0% 0 0.6% 1 0.7% 1 Train 10.0% 157 0.0% 0 0.6% 1 4.2% 1 0.0% 0 0.0% 0 11.9% 13 27.3% 45 18.5% 8 22.4% 25 8.6% 9 4.0% 3 Cycle 0.3% 5 1.4% 2 0.0% 0 1.6% 1 0.0% 0 0.0% 0 1.0% 1 0.0% 0 0.0% 0 0.0% 0 0.0% 0 0.0% 0 Motorcycle / moped 0.3% 4 0.0% 0 0.0% 0 0.0% 0 2.8% 1 0.0% 0 0.0% 0 0.0% 0 0.0% 0 0.9% 1 2.0% 2 0.0% 0 Disability vehicle
(wheelchair, scooter etc.) 0.1% 1 1.0% 1 0.0% 0 0.0% 0 0.0% 0 0.0% 0 0.0% 0 0.0% 0 0.0% 0 0.0% 0 0.0% 0 0.0% 0
Other 0.0% 0 0.0% 0 0.0% 0 0.0% 0 0.0% 0 0.0% 0 0.0% 0 0.0% 0 0.0% 0 0.0% 0 0.0% 0 0.0% 0 Park & Ride 0.2% 3 0.7% 1 0.0% 0 0.0% 0 0.0% 0 0.0% 0 0.0% 0 0.0% 0 0.0% 0 1.5% 2 0.0% 0 0.0% 0 (Don't know / varies) 1.2% 18 2.3% 3 1.0% 1 0.0% 0 0.0% 0 0.0% 0 0.0% 0 0.0% 0 0.0% 0 3.8% 4 0.6% 1 0.7% 1 Weighted base: 1571 146 125 34 33 84 112 165 41 112 102 78 Sample: 1624 96 98 99 66 41 75 49 46 54 97 88
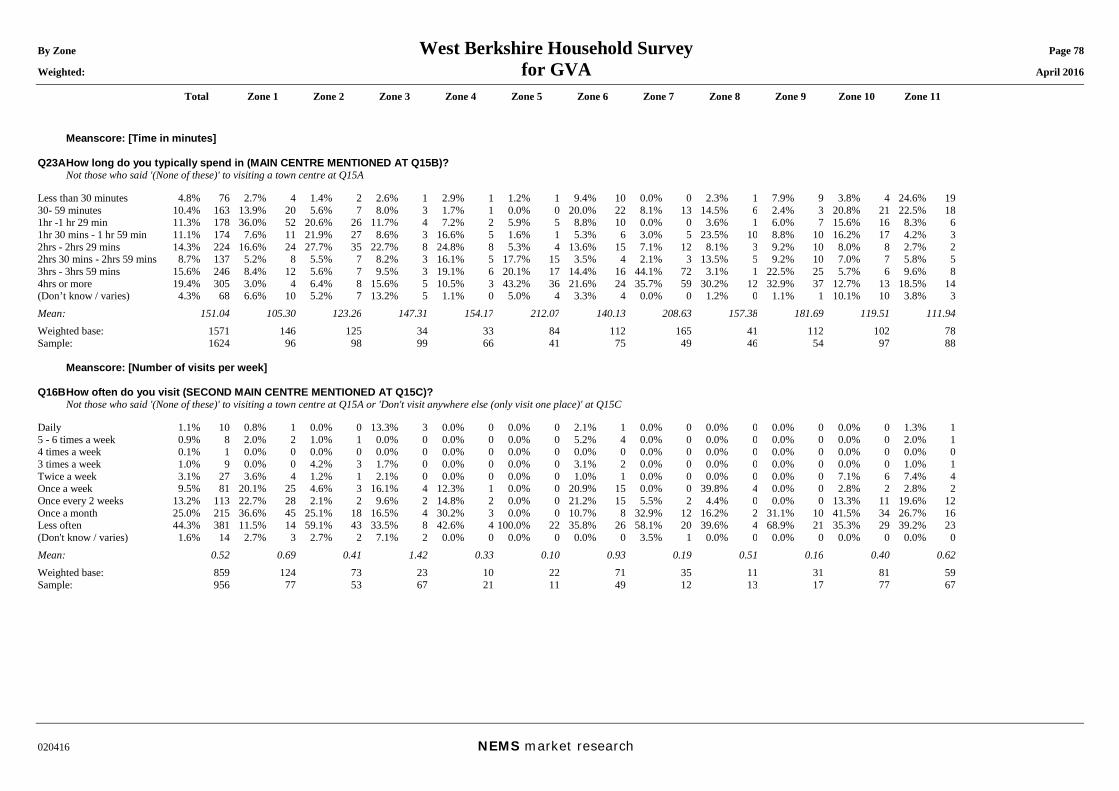
By Zone West Berkshire Household Survey Page 78 Weighted: for GVA April 2016
Total Zone 1 Zone 2 Zone 3 Zone 4 Zone 5 Zone 6 Zone 7 Zone 8 Zone 9 Zone 10 Zone 11
020416 NEMS market research
Meanscore: [Time in minutes] Q23A How long do you typically spend in (MAIN CENTRE MENTIONED AT Q15B)? Not those who said '(None of these)' to visiting a town centre at Q15A Less than 30 minutes 4.8% 76 2.7% 4 1.4% 2 2.6% 1 2.9% 1 1.2% 1 9.4% 10 0.0% 0 2.3% 1 7.9% 9 3.8% 4 24.6% 19 30- 59 minutes 10.4% 163 13.9% 20 5.6% 7 8.0% 3 1.7% 1 0.0% 0 20.0% 22 8.1% 13 14.5% 6 2.4% 3 20.8% 21 22.5% 18 1hr -1 hr 29 min 11.3% 178 36.0% 52 20.6% 26 11.7% 4 7.2% 2 5.9% 5 8.8% 10 0.0% 0 3.6% 1 6.0% 7 15.6% 16 8.3% 6 1hr 30 mins - 1 hr 59 min 11.1% 174 7.6% 11 21.9% 27 8.6% 3 16.6% 5 1.6% 1 5.3% 6 3.0% 5 23.5% 10 8.8% 10 16.2% 17 4.2% 3 2hrs - 2hrs 29 mins 14.3% 224 16.6% 24 27.7% 35 22.7% 8 24.8% 8 5.3% 4 13.6% 15 7.1% 12 8.1% 3 9.2% 10 8.0% 8 2.7% 2 2hrs 30 mins - 2hrs 59 mins 8.7% 137 5.2% 8 5.5% 7 8.2% 3 16.1% 5 17.7% 15 3.5% 4 2.1% 3 13.5% 5 9.2% 10 7.0% 7 5.8% 5 3hrs - 3hrs 59 mins 15.6% 246 8.4% 12 5.6% 7 9.5% 3 19.1% 6 20.1% 17 14.4% 16 44.1% 72 3.1% 1 22.5% 25 5.7% 6 9.6% 8 4hrs or more 19.4% 305 3.0% 4 6.4% 8 15.6% 5 10.5% 3 43.2% 36 21.6% 24 35.7% 59 30.2% 12 32.9% 37 12.7% 13 18.5% 14 (Don’t know / varies) 4.3% 68 6.6% 10 5.2% 7 13.2% 5 1.1% 0 5.0% 4 3.3% 4 0.0% 0 1.2% 0 1.1% 1 10.1% 10 3.8% 3 Mean: 151.04 105.30 123.26 147.31 154.17 212.07 140.13 208.63 157.38 181.69 119.51 111.94 Weighted base: 1571 146 125 34 33 84 112 165 41 112 102 78 Sample: 1624 96 98 99 66 41 75 49 46 54 97 88 Meanscore: [Number of visits per week] Q16B How often do you visit (SECOND MAIN CENTRE MENTIONED AT Q15C)? Not those who said '(None of these)' to visiting a town centre at Q15A or 'Don't visit anywhere else (only visit one place)' at Q15C Daily 1.1% 10 0.8% 1 0.0% 0 13.3% 3 0.0% 0 0.0% 0 2.1% 1 0.0% 0 0.0% 0 0.0% 0 0.0% 0 1.3% 1 5 - 6 times a week 0.9% 8 2.0% 2 1.0% 1 0.0% 0 0.0% 0 0.0% 0 5.2% 4 0.0% 0 0.0% 0 0.0% 0 0.0% 0 2.0% 1 4 times a week 0.1% 1 0.0% 0 0.0% 0 0.0% 0 0.0% 0 0.0% 0 0.0% 0 0.0% 0 0.0% 0 0.0% 0 0.0% 0 0.0% 0 3 times a week 1.0% 9 0.0% 0 4.2% 3 1.7% 0 0.0% 0 0.0% 0 3.1% 2 0.0% 0 0.0% 0 0.0% 0 0.0% 0 1.0% 1 Twice a week 3.1% 27 3.6% 4 1.2% 1 2.1% 0 0.0% 0 0.0% 0 1.0% 1 0.0% 0 0.0% 0 0.0% 0 7.1% 6 7.4% 4 Once a week 9.5% 81 20.1% 25 4.6% 3 16.1% 4 12.3% 1 0.0% 0 20.9% 15 0.0% 0 39.8% 4 0.0% 0 2.8% 2 2.8% 2 Once every 2 weeks 13.2% 113 22.7% 28 2.1% 2 9.6% 2 14.8% 2 0.0% 0 21.2% 15 5.5% 2 4.4% 0 0.0% 0 13.3% 11 19.6% 12 Once a month 25.0% 215 36.6% 45 25.1% 18 16.5% 4 30.2% 3 0.0% 0 10.7% 8 32.9% 12 16.2% 2 31.1% 10 41.5% 34 26.7% 16 Less often 44.3% 381 11.5% 14 59.1% 43 33.5% 8 42.6% 4 100.0% 22 35.8% 26 58.1% 20 39.6% 4 68.9% 21 35.3% 29 39.2% 23 (Don't know / varies) 1.6% 14 2.7% 3 2.7% 2 7.1% 2 0.0% 0 0.0% 0 0.0% 0 3.5% 1 0.0% 0 0.0% 0 0.0% 0 0.0% 0 Mean: 0.52 0.69 0.41 1.42 0.33 0.10 0.93 0.19 0.51 0.16 0.40 0.62 Weighted base: 859 124 73 23 10 22 71 35 11 31 81 59 Sample: 956 77 53 67 21 11 49 12 13 17 77 67
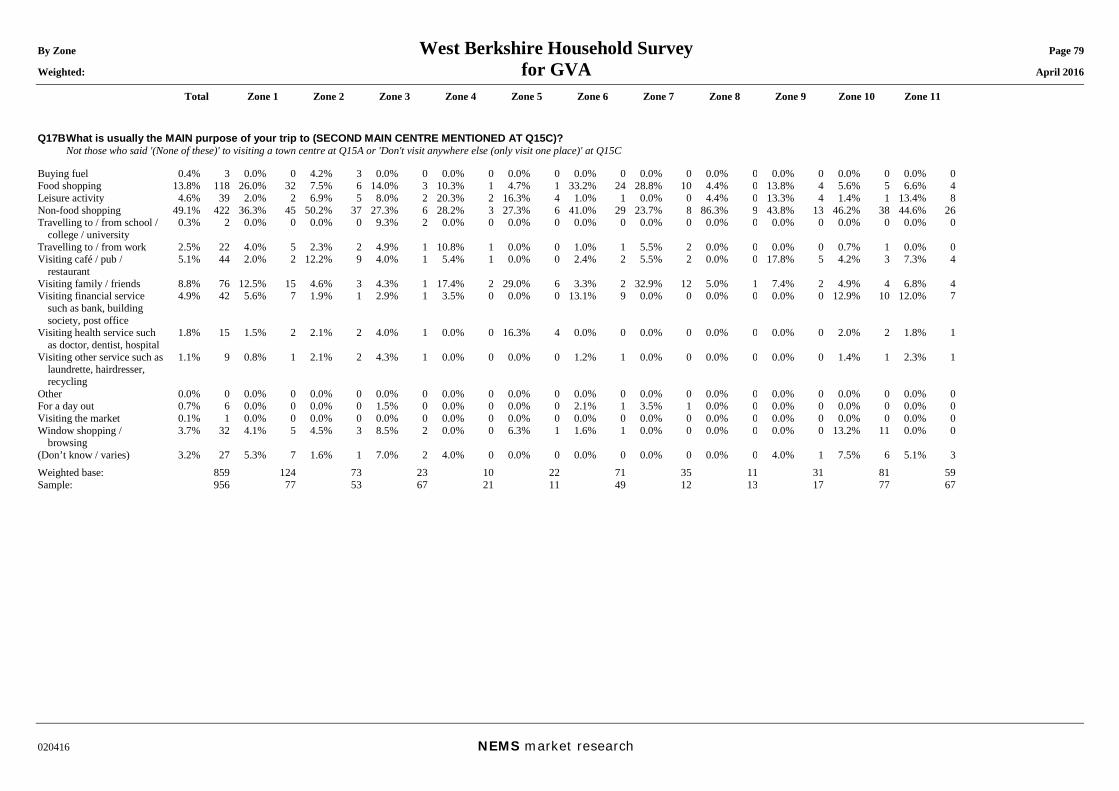
By Zone West Berkshire Household Survey Page 79 Weighted: for GVA April 2016
Total Zone 1 Zone 2 Zone 3 Zone 4 Zone 5 Zone 6 Zone 7 Zone 8 Zone 9 Zone 10 Zone 11
020416 NEMS market research
Q17B What is usually the MAIN purpose of your trip to (SECOND MAIN CENTRE MENTIONED AT Q15C)? Not those who said '(None of these)' to visiting a town centre at Q15A or 'Don't visit anywhere else (only visit one place)' at Q15C Buying fuel 0.4% 3 0.0% 0 4.2% 3 0.0% 0 0.0% 0 0.0% 0 0.0% 0 0.0% 0 0.0% 0 0.0% 0 0.0% 0 0.0% 0 Food shopping 13.8% 118 26.0% 32 7.5% 6 14.0% 3 10.3% 1 4.7% 1 33.2% 24 28.8% 10 4.4% 0 13.8% 4 5.6% 5 6.6% 4 Leisure activity 4.6% 39 2.0% 2 6.9% 5 8.0% 2 20.3% 2 16.3% 4 1.0% 1 0.0% 0 4.4% 0 13.3% 4 1.4% 1 13.4% 8 Non-food shopping 49.1% 422 36.3% 45 50.2% 37 27.3% 6 28.2% 3 27.3% 6 41.0% 29 23.7% 8 86.3% 9 43.8% 13 46.2% 38 44.6% 26 Travelling to / from school /
college / university 0.3% 2 0.0% 0 0.0% 0 9.3% 2 0.0% 0 0.0% 0 0.0% 0 0.0% 0 0.0% 0 0.0% 0 0.0% 0 0.0% 0
Travelling to / from work 2.5% 22 4.0% 5 2.3% 2 4.9% 1 10.8% 1 0.0% 0 1.0% 1 5.5% 2 0.0% 0 0.0% 0 0.7% 1 0.0% 0 Visiting café / pub /
restaurant 5.1% 44 2.0% 2 12.2% 9 4.0% 1 5.4% 1 0.0% 0 2.4% 2 5.5% 2 0.0% 0 17.8% 5 4.2% 3 7.3% 4
Visiting family / friends 8.8% 76 12.5% 15 4.6% 3 4.3% 1 17.4% 2 29.0% 6 3.3% 2 32.9% 12 5.0% 1 7.4% 2 4.9% 4 6.8% 4 Visiting financial service
such as bank, building society, post office
4.9% 42 5.6% 7 1.9% 1 2.9% 1 3.5% 0 0.0% 0 13.1% 9 0.0% 0 0.0% 0 0.0% 0 12.9% 10 12.0% 7
Visiting health service such as doctor, dentist, hospital
1.8% 15 1.5% 2 2.1% 2 4.0% 1 0.0% 0 16.3% 4 0.0% 0 0.0% 0 0.0% 0 0.0% 0 2.0% 2 1.8% 1
Visiting other service such as laundrette, hairdresser, recycling
1.1% 9 0.8% 1 2.1% 2 4.3% 1 0.0% 0 0.0% 0 1.2% 1 0.0% 0 0.0% 0 0.0% 0 1.4% 1 2.3% 1
Other 0.0% 0 0.0% 0 0.0% 0 0.0% 0 0.0% 0 0.0% 0 0.0% 0 0.0% 0 0.0% 0 0.0% 0 0.0% 0 0.0% 0 For a day out 0.7% 6 0.0% 0 0.0% 0 1.5% 0 0.0% 0 0.0% 0 2.1% 1 3.5% 1 0.0% 0 0.0% 0 0.0% 0 0.0% 0 Visiting the market 0.1% 1 0.0% 0 0.0% 0 0.0% 0 0.0% 0 0.0% 0 0.0% 0 0.0% 0 0.0% 0 0.0% 0 0.0% 0 0.0% 0 Window shopping /
browsing 3.7% 32 4.1% 5 4.5% 3 8.5% 2 0.0% 0 6.3% 1 1.6% 1 0.0% 0 0.0% 0 0.0% 0 13.2% 11 0.0% 0
(Don’t know / varies) 3.2% 27 5.3% 7 1.6% 1 7.0% 2 4.0% 0 0.0% 0 0.0% 0 0.0% 0 0.0% 0 4.0% 1 7.5% 6 5.1% 3 Weighted base: 859 124 73 23 10 22 71 35 11 31 81 59 Sample: 956 77 53 67 21 11 49 12 13 17 77 67
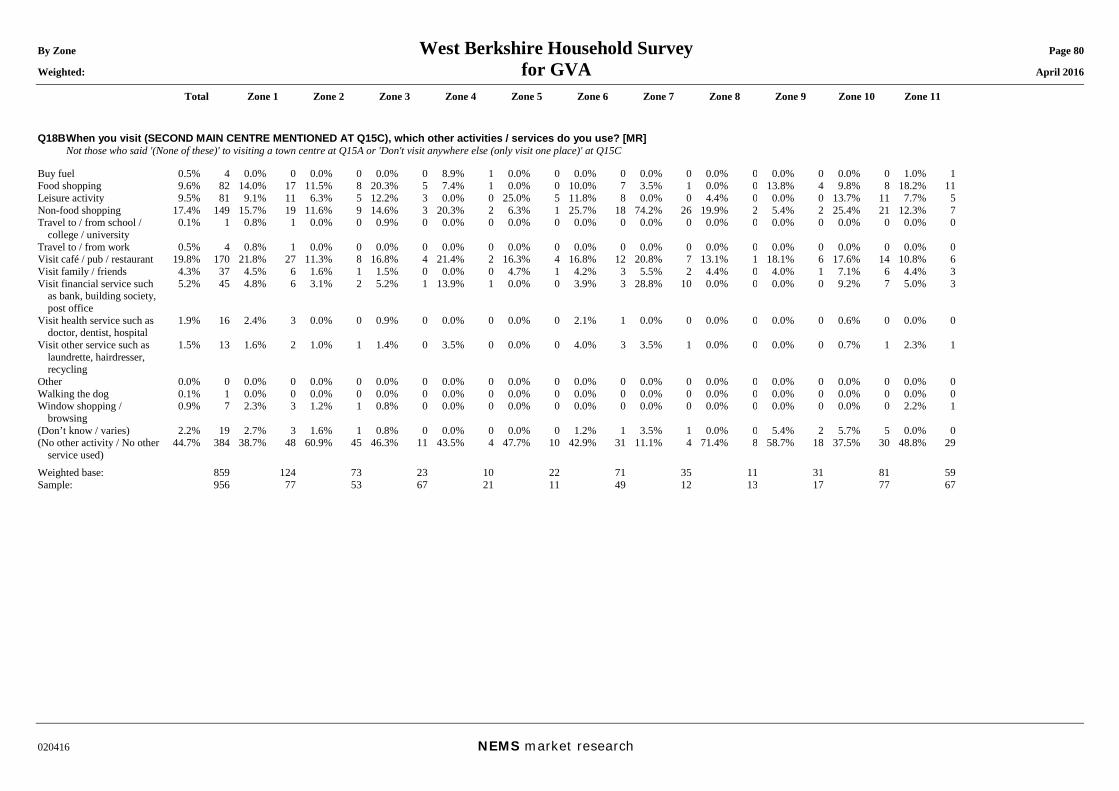
By Zone West Berkshire Household Survey Page 80 Weighted: for GVA April 2016
Total Zone 1 Zone 2 Zone 3 Zone 4 Zone 5 Zone 6 Zone 7 Zone 8 Zone 9 Zone 10 Zone 11
020416 NEMS market research
Q18B When you visit (SECOND MAIN CENTRE MENTIONED AT Q15C), which other activities / services do you use? [MR] Not those who said '(None of these)' to visiting a town centre at Q15A or 'Don't visit anywhere else (only visit one place)' at Q15C Buy fuel 0.5% 4 0.0% 0 0.0% 0 0.0% 0 8.9% 1 0.0% 0 0.0% 0 0.0% 0 0.0% 0 0.0% 0 0.0% 0 1.0% 1 Food shopping 9.6% 82 14.0% 17 11.5% 8 20.3% 5 7.4% 1 0.0% 0 10.0% 7 3.5% 1 0.0% 0 13.8% 4 9.8% 8 18.2% 11 Leisure activity 9.5% 81 9.1% 11 6.3% 5 12.2% 3 0.0% 0 25.0% 5 11.8% 8 0.0% 0 4.4% 0 0.0% 0 13.7% 11 7.7% 5 Non-food shopping 17.4% 149 15.7% 19 11.6% 9 14.6% 3 20.3% 2 6.3% 1 25.7% 18 74.2% 26 19.9% 2 5.4% 2 25.4% 21 12.3% 7 Travel to / from school /
college / university 0.1% 1 0.8% 1 0.0% 0 0.9% 0 0.0% 0 0.0% 0 0.0% 0 0.0% 0 0.0% 0 0.0% 0 0.0% 0 0.0% 0
Travel to / from work 0.5% 4 0.8% 1 0.0% 0 0.0% 0 0.0% 0 0.0% 0 0.0% 0 0.0% 0 0.0% 0 0.0% 0 0.0% 0 0.0% 0 Visit café / pub / restaurant 19.8% 170 21.8% 27 11.3% 8 16.8% 4 21.4% 2 16.3% 4 16.8% 12 20.8% 7 13.1% 1 18.1% 6 17.6% 14 10.8% 6 Visit family / friends 4.3% 37 4.5% 6 1.6% 1 1.5% 0 0.0% 0 4.7% 1 4.2% 3 5.5% 2 4.4% 0 4.0% 1 7.1% 6 4.4% 3 Visit financial service such
as bank, building society, post office
5.2% 45 4.8% 6 3.1% 2 5.2% 1 13.9% 1 0.0% 0 3.9% 3 28.8% 10 0.0% 0 0.0% 0 9.2% 7 5.0% 3
Visit health service such as doctor, dentist, hospital
1.9% 16 2.4% 3 0.0% 0 0.9% 0 0.0% 0 0.0% 0 2.1% 1 0.0% 0 0.0% 0 0.0% 0 0.6% 0 0.0% 0
Visit other service such as laundrette, hairdresser, recycling
1.5% 13 1.6% 2 1.0% 1 1.4% 0 3.5% 0 0.0% 0 4.0% 3 3.5% 1 0.0% 0 0.0% 0 0.7% 1 2.3% 1
Other 0.0% 0 0.0% 0 0.0% 0 0.0% 0 0.0% 0 0.0% 0 0.0% 0 0.0% 0 0.0% 0 0.0% 0 0.0% 0 0.0% 0 Walking the dog 0.1% 1 0.0% 0 0.0% 0 0.0% 0 0.0% 0 0.0% 0 0.0% 0 0.0% 0 0.0% 0 0.0% 0 0.0% 0 0.0% 0 Window shopping /
browsing 0.9% 7 2.3% 3 1.2% 1 0.8% 0 0.0% 0 0.0% 0 0.0% 0 0.0% 0 0.0% 0 0.0% 0 0.0% 0 2.2% 1
(Don’t know / varies) 2.2% 19 2.7% 3 1.6% 1 0.8% 0 0.0% 0 0.0% 0 1.2% 1 3.5% 1 0.0% 0 5.4% 2 5.7% 5 0.0% 0 (No other activity / No other
service used) 44.7% 384 38.7% 48 60.9% 45 46.3% 11 43.5% 4 47.7% 10 42.9% 31 11.1% 4 71.4% 8 58.7% 18 37.5% 30 48.8% 29
Weighted base: 859 124 73 23 10 22 71 35 11 31 81 59 Sample: 956 77 53 67 21 11 49 12 13 17 77 67
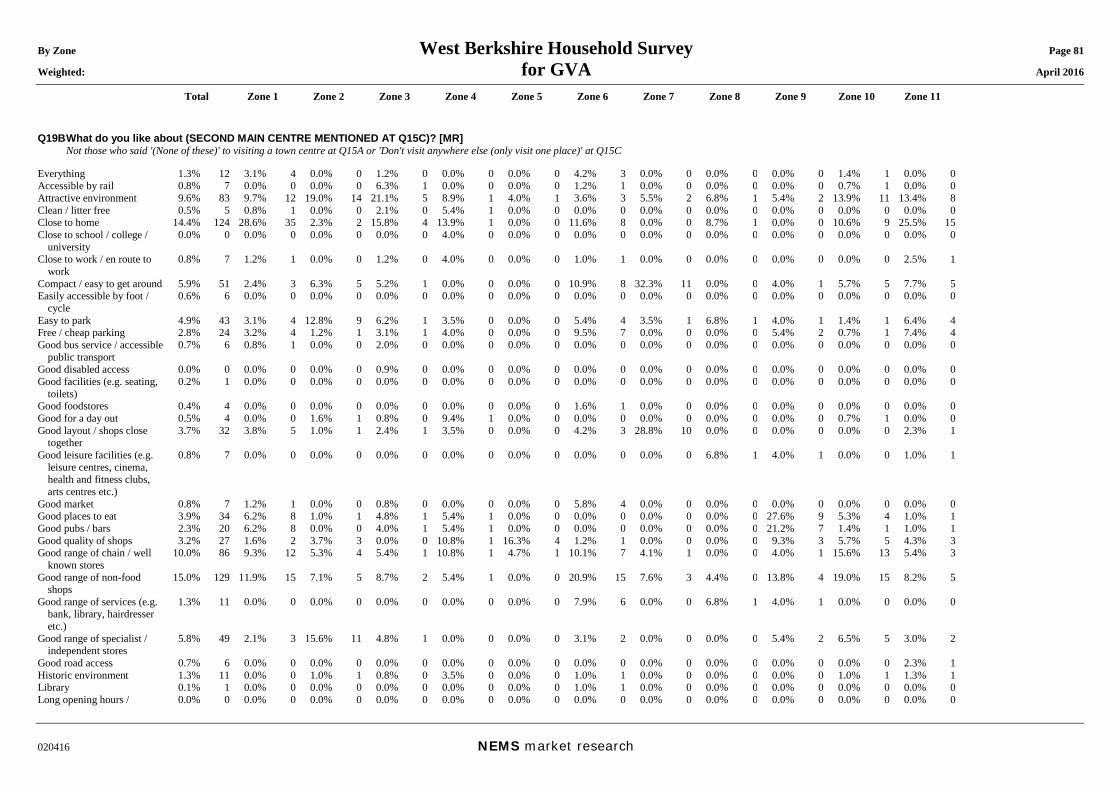
By Zone West Berkshire Household Survey Page 81 Weighted: for GVA April 2016
Total Zone 1 Zone 2 Zone 3 Zone 4 Zone 5 Zone 6 Zone 7 Zone 8 Zone 9 Zone 10 Zone 11
020416 NEMS market research
Q19B What do you like about (SECOND MAIN CENTRE MENTIONED AT Q15C)? [MR] Not those who said '(None of these)' to visiting a town centre at Q15A or 'Don't visit anywhere else (only visit one place)' at Q15C Everything 1.3% 12 3.1% 4 0.0% 0 1.2% 0 0.0% 0 0.0% 0 4.2% 3 0.0% 0 0.0% 0 0.0% 0 1.4% 1 0.0% 0 Accessible by rail 0.8% 7 0.0% 0 0.0% 0 6.3% 1 0.0% 0 0.0% 0 1.2% 1 0.0% 0 0.0% 0 0.0% 0 0.7% 1 0.0% 0 Attractive environment 9.6% 83 9.7% 12 19.0% 14 21.1% 5 8.9% 1 4.0% 1 3.6% 3 5.5% 2 6.8% 1 5.4% 2 13.9% 11 13.4% 8 Clean / litter free 0.5% 5 0.8% 1 0.0% 0 2.1% 0 5.4% 1 0.0% 0 0.0% 0 0.0% 0 0.0% 0 0.0% 0 0.0% 0 0.0% 0 Close to home 14.4% 124 28.6% 35 2.3% 2 15.8% 4 13.9% 1 0.0% 0 11.6% 8 0.0% 0 8.7% 1 0.0% 0 10.6% 9 25.5% 15 Close to school / college /
university 0.0% 0 0.0% 0 0.0% 0 0.0% 0 4.0% 0 0.0% 0 0.0% 0 0.0% 0 0.0% 0 0.0% 0 0.0% 0 0.0% 0
Close to work / en route to work
0.8% 7 1.2% 1 0.0% 0 1.2% 0 4.0% 0 0.0% 0 1.0% 1 0.0% 0 0.0% 0 0.0% 0 0.0% 0 2.5% 1
Compact / easy to get around 5.9% 51 2.4% 3 6.3% 5 5.2% 1 0.0% 0 0.0% 0 10.9% 8 32.3% 11 0.0% 0 4.0% 1 5.7% 5 7.7% 5 Easily accessible by foot /
cycle 0.6% 6 0.0% 0 0.0% 0 0.0% 0 0.0% 0 0.0% 0 0.0% 0 0.0% 0 0.0% 0 0.0% 0 0.0% 0 0.0% 0
Easy to park 4.9% 43 3.1% 4 12.8% 9 6.2% 1 3.5% 0 0.0% 0 5.4% 4 3.5% 1 6.8% 1 4.0% 1 1.4% 1 6.4% 4 Free / cheap parking 2.8% 24 3.2% 4 1.2% 1 3.1% 1 4.0% 0 0.0% 0 9.5% 7 0.0% 0 0.0% 0 5.4% 2 0.7% 1 7.4% 4 Good bus service / accessible
public transport 0.7% 6 0.8% 1 0.0% 0 2.0% 0 0.0% 0 0.0% 0 0.0% 0 0.0% 0 0.0% 0 0.0% 0 0.0% 0 0.0% 0
Good disabled access 0.0% 0 0.0% 0 0.0% 0 0.9% 0 0.0% 0 0.0% 0 0.0% 0 0.0% 0 0.0% 0 0.0% 0 0.0% 0 0.0% 0 Good facilities (e.g. seating,
toilets) 0.2% 1 0.0% 0 0.0% 0 0.0% 0 0.0% 0 0.0% 0 0.0% 0 0.0% 0 0.0% 0 0.0% 0 0.0% 0 0.0% 0
Good foodstores 0.4% 4 0.0% 0 0.0% 0 0.0% 0 0.0% 0 0.0% 0 1.6% 1 0.0% 0 0.0% 0 0.0% 0 0.0% 0 0.0% 0 Good for a day out 0.5% 4 0.0% 0 1.6% 1 0.8% 0 9.4% 1 0.0% 0 0.0% 0 0.0% 0 0.0% 0 0.0% 0 0.7% 1 0.0% 0 Good layout / shops close
together 3.7% 32 3.8% 5 1.0% 1 2.4% 1 3.5% 0 0.0% 0 4.2% 3 28.8% 10 0.0% 0 0.0% 0 0.0% 0 2.3% 1
Good leisure facilities (e.g. leisure centres, cinema, health and fitness clubs, arts centres etc.)
0.8% 7 0.0% 0 0.0% 0 0.0% 0 0.0% 0 0.0% 0 0.0% 0 0.0% 0 6.8% 1 4.0% 1 0.0% 0 1.0% 1
Good market 0.8% 7 1.2% 1 0.0% 0 0.8% 0 0.0% 0 0.0% 0 5.8% 4 0.0% 0 0.0% 0 0.0% 0 0.0% 0 0.0% 0 Good places to eat 3.9% 34 6.2% 8 1.0% 1 4.8% 1 5.4% 1 0.0% 0 0.0% 0 0.0% 0 0.0% 0 27.6% 9 5.3% 4 1.0% 1 Good pubs / bars 2.3% 20 6.2% 8 0.0% 0 4.0% 1 5.4% 1 0.0% 0 0.0% 0 0.0% 0 0.0% 0 21.2% 7 1.4% 1 1.0% 1 Good quality of shops 3.2% 27 1.6% 2 3.7% 3 0.0% 0 10.8% 1 16.3% 4 1.2% 1 0.0% 0 0.0% 0 9.3% 3 5.7% 5 4.3% 3 Good range of chain / well
known stores 10.0% 86 9.3% 12 5.3% 4 5.4% 1 10.8% 1 4.7% 1 10.1% 7 4.1% 1 0.0% 0 4.0% 1 15.6% 13 5.4% 3
Good range of non-food shops
15.0% 129 11.9% 15 7.1% 5 8.7% 2 5.4% 1 0.0% 0 20.9% 15 7.6% 3 4.4% 0 13.8% 4 19.0% 15 8.2% 5
Good range of services (e.g. bank, library, hairdresser etc.)
1.3% 11 0.0% 0 0.0% 0 0.0% 0 0.0% 0 0.0% 0 7.9% 6 0.0% 0 6.8% 1 4.0% 1 0.0% 0 0.0% 0
Good range of specialist / independent stores
5.8% 49 2.1% 3 15.6% 11 4.8% 1 0.0% 0 0.0% 0 3.1% 2 0.0% 0 0.0% 0 5.4% 2 6.5% 5 3.0% 2
Good road access 0.7% 6 0.0% 0 0.0% 0 0.0% 0 0.0% 0 0.0% 0 0.0% 0 0.0% 0 0.0% 0 0.0% 0 0.0% 0 2.3% 1 Historic environment 1.3% 11 0.0% 0 1.0% 1 0.8% 0 3.5% 0 0.0% 0 1.0% 1 0.0% 0 0.0% 0 0.0% 0 1.0% 1 1.3% 1 Library 0.1% 1 0.0% 0 0.0% 0 0.0% 0 0.0% 0 0.0% 0 1.0% 1 0.0% 0 0.0% 0 0.0% 0 0.0% 0 0.0% 0 Long opening hours / 0.0% 0 0.0% 0 0.0% 0 0.0% 0 0.0% 0 0.0% 0 0.0% 0 0.0% 0 0.0% 0 0.0% 0 0.0% 0 0.0% 0
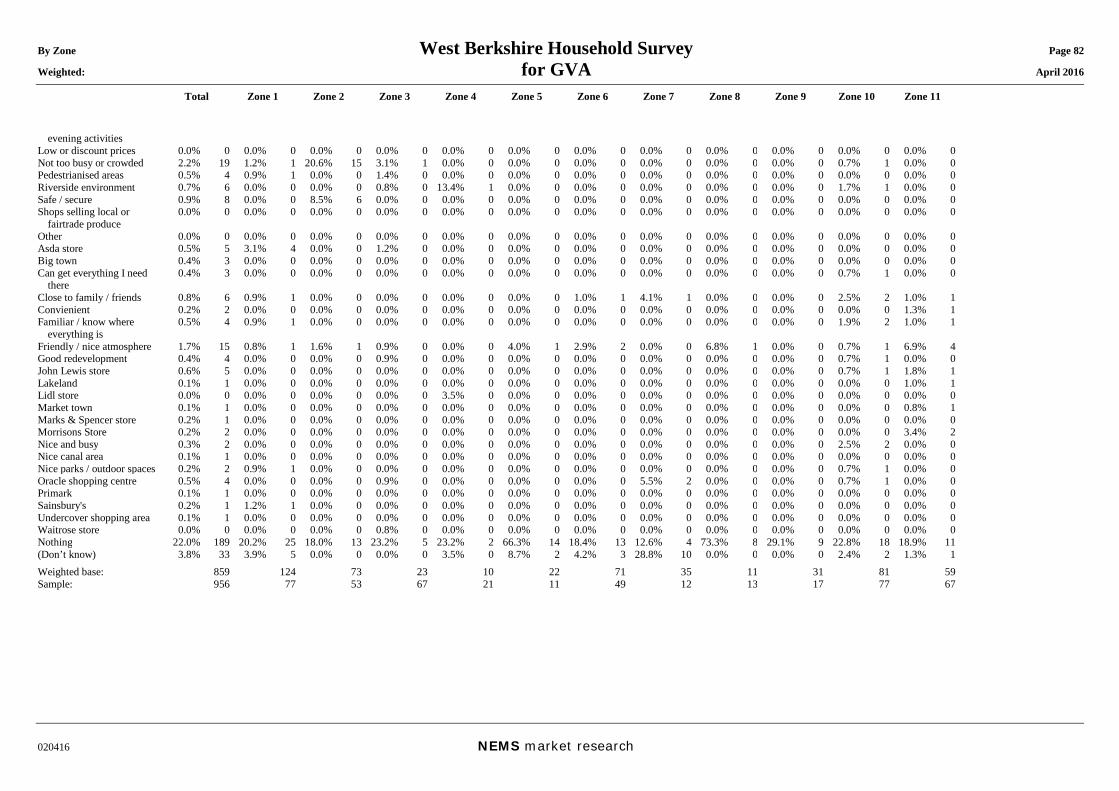
By Zone West Berkshire Household Survey Page 82 Weighted: for GVA April 2016
Total Zone 1 Zone 2 Zone 3 Zone 4 Zone 5 Zone 6 Zone 7 Zone 8 Zone 9 Zone 10 Zone 11
020416 NEMS market research
evening activities Low or discount prices 0.0% 0 0.0% 0 0.0% 0 0.0% 0 0.0% 0 0.0% 0 0.0% 0 0.0% 0 0.0% 0 0.0% 0 0.0% 0 0.0% 0 Not too busy or crowded 2.2% 19 1.2% 1 20.6% 15 3.1% 1 0.0% 0 0.0% 0 0.0% 0 0.0% 0 0.0% 0 0.0% 0 0.7% 1 0.0% 0 Pedestrianised areas 0.5% 4 0.9% 1 0.0% 0 1.4% 0 0.0% 0 0.0% 0 0.0% 0 0.0% 0 0.0% 0 0.0% 0 0.0% 0 0.0% 0 Riverside environment 0.7% 6 0.0% 0 0.0% 0 0.8% 0 13.4% 1 0.0% 0 0.0% 0 0.0% 0 0.0% 0 0.0% 0 1.7% 1 0.0% 0 Safe / secure 0.9% 8 0.0% 0 8.5% 6 0.0% 0 0.0% 0 0.0% 0 0.0% 0 0.0% 0 0.0% 0 0.0% 0 0.0% 0 0.0% 0 Shops selling local or
fairtrade produce 0.0% 0 0.0% 0 0.0% 0 0.0% 0 0.0% 0 0.0% 0 0.0% 0 0.0% 0 0.0% 0 0.0% 0 0.0% 0 0.0% 0
Other 0.0% 0 0.0% 0 0.0% 0 0.0% 0 0.0% 0 0.0% 0 0.0% 0 0.0% 0 0.0% 0 0.0% 0 0.0% 0 0.0% 0 Asda store 0.5% 5 3.1% 4 0.0% 0 1.2% 0 0.0% 0 0.0% 0 0.0% 0 0.0% 0 0.0% 0 0.0% 0 0.0% 0 0.0% 0 Big town 0.4% 3 0.0% 0 0.0% 0 0.0% 0 0.0% 0 0.0% 0 0.0% 0 0.0% 0 0.0% 0 0.0% 0 0.0% 0 0.0% 0 Can get everything I need
there 0.4% 3 0.0% 0 0.0% 0 0.0% 0 0.0% 0 0.0% 0 0.0% 0 0.0% 0 0.0% 0 0.0% 0 0.7% 1 0.0% 0
Close to family / friends 0.8% 6 0.9% 1 0.0% 0 0.0% 0 0.0% 0 0.0% 0 1.0% 1 4.1% 1 0.0% 0 0.0% 0 2.5% 2 1.0% 1 Convienient 0.2% 2 0.0% 0 0.0% 0 0.0% 0 0.0% 0 0.0% 0 0.0% 0 0.0% 0 0.0% 0 0.0% 0 0.0% 0 1.3% 1 Familiar / know where
everything is 0.5% 4 0.9% 1 0.0% 0 0.0% 0 0.0% 0 0.0% 0 0.0% 0 0.0% 0 0.0% 0 0.0% 0 1.9% 2 1.0% 1
Friendly / nice atmosphere 1.7% 15 0.8% 1 1.6% 1 0.9% 0 0.0% 0 4.0% 1 2.9% 2 0.0% 0 6.8% 1 0.0% 0 0.7% 1 6.9% 4 Good redevelopment 0.4% 4 0.0% 0 0.0% 0 0.9% 0 0.0% 0 0.0% 0 0.0% 0 0.0% 0 0.0% 0 0.0% 0 0.7% 1 0.0% 0 John Lewis store 0.6% 5 0.0% 0 0.0% 0 0.0% 0 0.0% 0 0.0% 0 0.0% 0 0.0% 0 0.0% 0 0.0% 0 0.7% 1 1.8% 1 Lakeland 0.1% 1 0.0% 0 0.0% 0 0.0% 0 0.0% 0 0.0% 0 0.0% 0 0.0% 0 0.0% 0 0.0% 0 0.0% 0 1.0% 1 Lidl store 0.0% 0 0.0% 0 0.0% 0 0.0% 0 3.5% 0 0.0% 0 0.0% 0 0.0% 0 0.0% 0 0.0% 0 0.0% 0 0.0% 0 Market town 0.1% 1 0.0% 0 0.0% 0 0.0% 0 0.0% 0 0.0% 0 0.0% 0 0.0% 0 0.0% 0 0.0% 0 0.0% 0 0.8% 1 Marks & Spencer store 0.2% 1 0.0% 0 0.0% 0 0.0% 0 0.0% 0 0.0% 0 0.0% 0 0.0% 0 0.0% 0 0.0% 0 0.0% 0 0.0% 0 Morrisons Store 0.2% 2 0.0% 0 0.0% 0 0.0% 0 0.0% 0 0.0% 0 0.0% 0 0.0% 0 0.0% 0 0.0% 0 0.0% 0 3.4% 2 Nice and busy 0.3% 2 0.0% 0 0.0% 0 0.0% 0 0.0% 0 0.0% 0 0.0% 0 0.0% 0 0.0% 0 0.0% 0 2.5% 2 0.0% 0 Nice canal area 0.1% 1 0.0% 0 0.0% 0 0.0% 0 0.0% 0 0.0% 0 0.0% 0 0.0% 0 0.0% 0 0.0% 0 0.0% 0 0.0% 0 Nice parks / outdoor spaces 0.2% 2 0.9% 1 0.0% 0 0.0% 0 0.0% 0 0.0% 0 0.0% 0 0.0% 0 0.0% 0 0.0% 0 0.7% 1 0.0% 0 Oracle shopping centre 0.5% 4 0.0% 0 0.0% 0 0.9% 0 0.0% 0 0.0% 0 0.0% 0 5.5% 2 0.0% 0 0.0% 0 0.7% 1 0.0% 0 Primark 0.1% 1 0.0% 0 0.0% 0 0.0% 0 0.0% 0 0.0% 0 0.0% 0 0.0% 0 0.0% 0 0.0% 0 0.0% 0 0.0% 0 Sainsbury's 0.2% 1 1.2% 1 0.0% 0 0.0% 0 0.0% 0 0.0% 0 0.0% 0 0.0% 0 0.0% 0 0.0% 0 0.0% 0 0.0% 0 Undercover shopping area 0.1% 1 0.0% 0 0.0% 0 0.0% 0 0.0% 0 0.0% 0 0.0% 0 0.0% 0 0.0% 0 0.0% 0 0.0% 0 0.0% 0 Waitrose store 0.0% 0 0.0% 0 0.0% 0 0.8% 0 0.0% 0 0.0% 0 0.0% 0 0.0% 0 0.0% 0 0.0% 0 0.0% 0 0.0% 0 Nothing 22.0% 189 20.2% 25 18.0% 13 23.2% 5 23.2% 2 66.3% 14 18.4% 13 12.6% 4 73.3% 8 29.1% 9 22.8% 18 18.9% 11 (Don’t know) 3.8% 33 3.9% 5 0.0% 0 0.0% 0 3.5% 0 8.7% 2 4.2% 3 28.8% 10 0.0% 0 0.0% 0 2.4% 2 1.3% 1 Weighted base: 859 124 73 23 10 22 71 35 11 31 81 59 Sample: 956 77 53 67 21 11 49 12 13 17 77 67
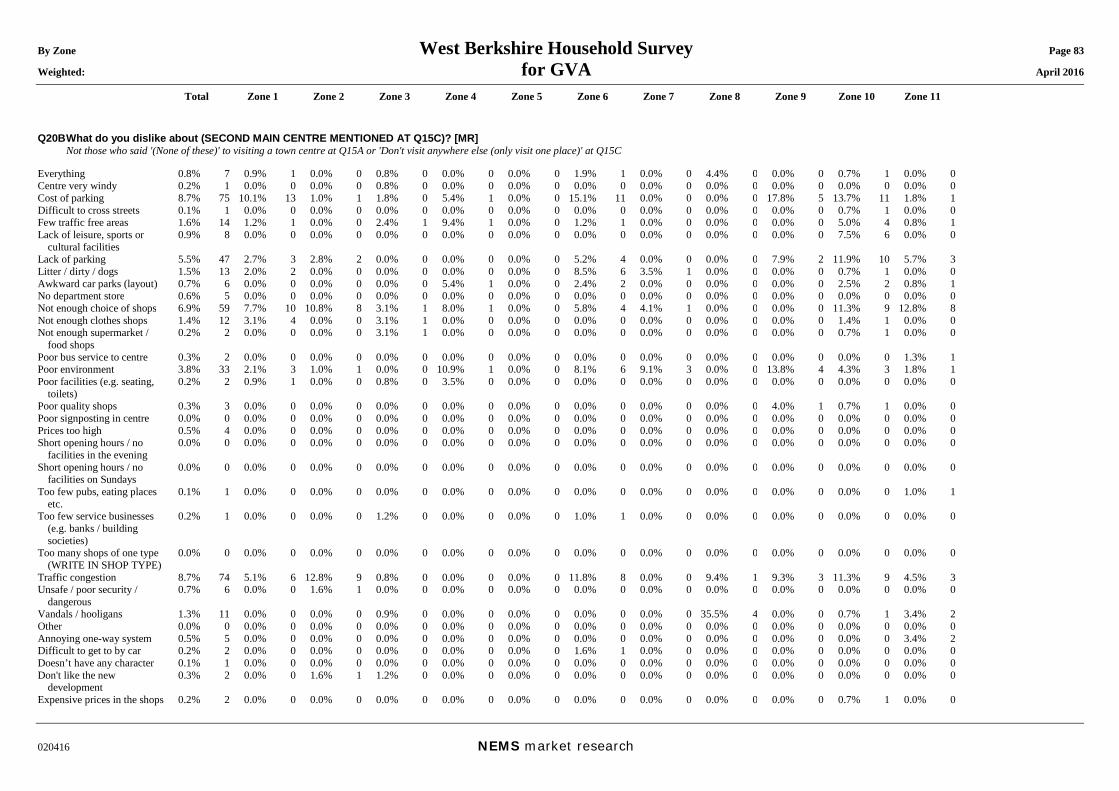
By Zone West Berkshire Household Survey Page 83 Weighted: for GVA April 2016
Total Zone 1 Zone 2 Zone 3 Zone 4 Zone 5 Zone 6 Zone 7 Zone 8 Zone 9 Zone 10 Zone 11
020416 NEMS market research
Q20B What do you dislike about (SECOND MAIN CENTRE MENTIONED AT Q15C)? [MR] Not those who said '(None of these)' to visiting a town centre at Q15A or 'Don't visit anywhere else (only visit one place)' at Q15C Everything 0.8% 7 0.9% 1 0.0% 0 0.8% 0 0.0% 0 0.0% 0 1.9% 1 0.0% 0 4.4% 0 0.0% 0 0.7% 1 0.0% 0 Centre very windy 0.2% 1 0.0% 0 0.0% 0 0.8% 0 0.0% 0 0.0% 0 0.0% 0 0.0% 0 0.0% 0 0.0% 0 0.0% 0 0.0% 0 Cost of parking 8.7% 75 10.1% 13 1.0% 1 1.8% 0 5.4% 1 0.0% 0 15.1% 11 0.0% 0 0.0% 0 17.8% 5 13.7% 11 1.8% 1 Difficult to cross streets 0.1% 1 0.0% 0 0.0% 0 0.0% 0 0.0% 0 0.0% 0 0.0% 0 0.0% 0 0.0% 0 0.0% 0 0.7% 1 0.0% 0 Few traffic free areas 1.6% 14 1.2% 1 0.0% 0 2.4% 1 9.4% 1 0.0% 0 1.2% 1 0.0% 0 0.0% 0 0.0% 0 5.0% 4 0.8% 1 Lack of leisure, sports or
cultural facilities 0.9% 8 0.0% 0 0.0% 0 0.0% 0 0.0% 0 0.0% 0 0.0% 0 0.0% 0 0.0% 0 0.0% 0 7.5% 6 0.0% 0
Lack of parking 5.5% 47 2.7% 3 2.8% 2 0.0% 0 0.0% 0 0.0% 0 5.2% 4 0.0% 0 0.0% 0 7.9% 2 11.9% 10 5.7% 3 Litter / dirty / dogs 1.5% 13 2.0% 2 0.0% 0 0.0% 0 0.0% 0 0.0% 0 8.5% 6 3.5% 1 0.0% 0 0.0% 0 0.7% 1 0.0% 0 Awkward car parks (layout) 0.7% 6 0.0% 0 0.0% 0 0.0% 0 5.4% 1 0.0% 0 2.4% 2 0.0% 0 0.0% 0 0.0% 0 2.5% 2 0.8% 1 No department store 0.6% 5 0.0% 0 0.0% 0 0.0% 0 0.0% 0 0.0% 0 0.0% 0 0.0% 0 0.0% 0 0.0% 0 0.0% 0 0.0% 0 Not enough choice of shops 6.9% 59 7.7% 10 10.8% 8 3.1% 1 8.0% 1 0.0% 0 5.8% 4 4.1% 1 0.0% 0 0.0% 0 11.3% 9 12.8% 8 Not enough clothes shops 1.4% 12 3.1% 4 0.0% 0 3.1% 1 0.0% 0 0.0% 0 0.0% 0 0.0% 0 0.0% 0 0.0% 0 1.4% 1 0.0% 0 Not enough supermarket /
food shops 0.2% 2 0.0% 0 0.0% 0 3.1% 1 0.0% 0 0.0% 0 0.0% 0 0.0% 0 0.0% 0 0.0% 0 0.7% 1 0.0% 0
Poor bus service to centre 0.3% 2 0.0% 0 0.0% 0 0.0% 0 0.0% 0 0.0% 0 0.0% 0 0.0% 0 0.0% 0 0.0% 0 0.0% 0 1.3% 1 Poor environment 3.8% 33 2.1% 3 1.0% 1 0.0% 0 10.9% 1 0.0% 0 8.1% 6 9.1% 3 0.0% 0 13.8% 4 4.3% 3 1.8% 1 Poor facilities (e.g. seating,
toilets) 0.2% 2 0.9% 1 0.0% 0 0.8% 0 3.5% 0 0.0% 0 0.0% 0 0.0% 0 0.0% 0 0.0% 0 0.0% 0 0.0% 0
Poor quality shops 0.3% 3 0.0% 0 0.0% 0 0.0% 0 0.0% 0 0.0% 0 0.0% 0 0.0% 0 0.0% 0 4.0% 1 0.7% 1 0.0% 0 Poor signposting in centre 0.0% 0 0.0% 0 0.0% 0 0.0% 0 0.0% 0 0.0% 0 0.0% 0 0.0% 0 0.0% 0 0.0% 0 0.0% 0 0.0% 0 Prices too high 0.5% 4 0.0% 0 0.0% 0 0.0% 0 0.0% 0 0.0% 0 0.0% 0 0.0% 0 0.0% 0 0.0% 0 0.0% 0 0.0% 0 Short opening hours / no
facilities in the evening 0.0% 0 0.0% 0 0.0% 0 0.0% 0 0.0% 0 0.0% 0 0.0% 0 0.0% 0 0.0% 0 0.0% 0 0.0% 0 0.0% 0
Short opening hours / no facilities on Sundays
0.0% 0 0.0% 0 0.0% 0 0.0% 0 0.0% 0 0.0% 0 0.0% 0 0.0% 0 0.0% 0 0.0% 0 0.0% 0 0.0% 0
Too few pubs, eating places etc.
0.1% 1 0.0% 0 0.0% 0 0.0% 0 0.0% 0 0.0% 0 0.0% 0 0.0% 0 0.0% 0 0.0% 0 0.0% 0 1.0% 1
Too few service businesses (e.g. banks / building societies)
0.2% 1 0.0% 0 0.0% 0 1.2% 0 0.0% 0 0.0% 0 1.0% 1 0.0% 0 0.0% 0 0.0% 0 0.0% 0 0.0% 0
Too many shops of one type (WRITE IN SHOP TYPE)
0.0% 0 0.0% 0 0.0% 0 0.0% 0 0.0% 0 0.0% 0 0.0% 0 0.0% 0 0.0% 0 0.0% 0 0.0% 0 0.0% 0
Traffic congestion 8.7% 74 5.1% 6 12.8% 9 0.8% 0 0.0% 0 0.0% 0 11.8% 8 0.0% 0 9.4% 1 9.3% 3 11.3% 9 4.5% 3 Unsafe / poor security /
dangerous 0.7% 6 0.0% 0 1.6% 1 0.0% 0 0.0% 0 0.0% 0 0.0% 0 0.0% 0 0.0% 0 0.0% 0 0.0% 0 0.0% 0
Vandals / hooligans 1.3% 11 0.0% 0 0.0% 0 0.9% 0 0.0% 0 0.0% 0 0.0% 0 0.0% 0 35.5% 4 0.0% 0 0.7% 1 3.4% 2 Other 0.0% 0 0.0% 0 0.0% 0 0.0% 0 0.0% 0 0.0% 0 0.0% 0 0.0% 0 0.0% 0 0.0% 0 0.0% 0 0.0% 0 Annoying one-way system 0.5% 5 0.0% 0 0.0% 0 0.0% 0 0.0% 0 0.0% 0 0.0% 0 0.0% 0 0.0% 0 0.0% 0 0.0% 0 3.4% 2 Difficult to get to by car 0.2% 2 0.0% 0 0.0% 0 0.0% 0 0.0% 0 0.0% 0 1.6% 1 0.0% 0 0.0% 0 0.0% 0 0.0% 0 0.0% 0 Doesn’t have any character 0.1% 1 0.0% 0 0.0% 0 0.0% 0 0.0% 0 0.0% 0 0.0% 0 0.0% 0 0.0% 0 0.0% 0 0.0% 0 0.0% 0 Don't like the new
development 0.3% 2 0.0% 0 1.6% 1 1.2% 0 0.0% 0 0.0% 0 0.0% 0 0.0% 0 0.0% 0 0.0% 0 0.0% 0 0.0% 0
Expensive prices in the shops 0.2% 2 0.0% 0 0.0% 0 0.0% 0 0.0% 0 0.0% 0 0.0% 0 0.0% 0 0.0% 0 0.0% 0 0.7% 1 0.0% 0
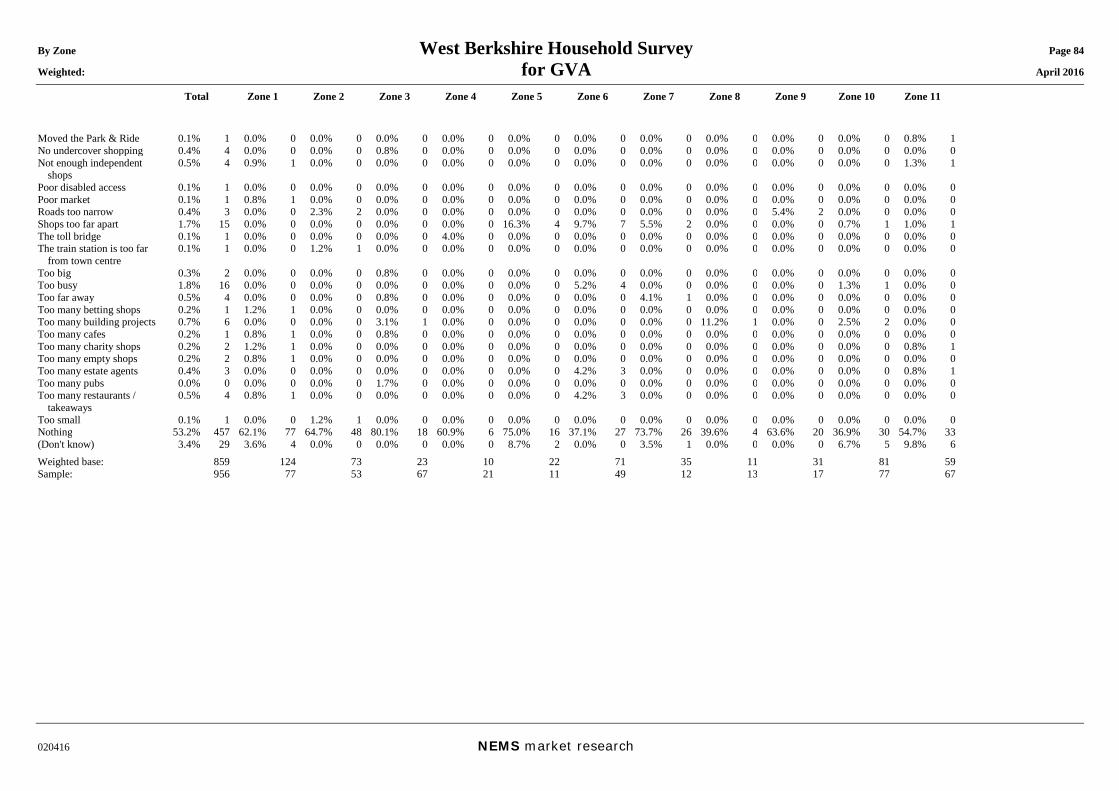
By Zone West Berkshire Household Survey Page 84 Weighted: for GVA April 2016
Total Zone 1 Zone 2 Zone 3 Zone 4 Zone 5 Zone 6 Zone 7 Zone 8 Zone 9 Zone 10 Zone 11
020416 NEMS market research
Moved the Park & Ride 0.1% 1 0.0% 0 0.0% 0 0.0% 0 0.0% 0 0.0% 0 0.0% 0 0.0% 0 0.0% 0 0.0% 0 0.0% 0 0.8% 1 No undercover shopping 0.4% 4 0.0% 0 0.0% 0 0.8% 0 0.0% 0 0.0% 0 0.0% 0 0.0% 0 0.0% 0 0.0% 0 0.0% 0 0.0% 0 Not enough independent
shops 0.5% 4 0.9% 1 0.0% 0 0.0% 0 0.0% 0 0.0% 0 0.0% 0 0.0% 0 0.0% 0 0.0% 0 0.0% 0 1.3% 1
Poor disabled access 0.1% 1 0.0% 0 0.0% 0 0.0% 0 0.0% 0 0.0% 0 0.0% 0 0.0% 0 0.0% 0 0.0% 0 0.0% 0 0.0% 0 Poor market 0.1% 1 0.8% 1 0.0% 0 0.0% 0 0.0% 0 0.0% 0 0.0% 0 0.0% 0 0.0% 0 0.0% 0 0.0% 0 0.0% 0 Roads too narrow 0.4% 3 0.0% 0 2.3% 2 0.0% 0 0.0% 0 0.0% 0 0.0% 0 0.0% 0 0.0% 0 5.4% 2 0.0% 0 0.0% 0 Shops too far apart 1.7% 15 0.0% 0 0.0% 0 0.0% 0 0.0% 0 16.3% 4 9.7% 7 5.5% 2 0.0% 0 0.0% 0 0.7% 1 1.0% 1 The toll bridge 0.1% 1 0.0% 0 0.0% 0 0.0% 0 4.0% 0 0.0% 0 0.0% 0 0.0% 0 0.0% 0 0.0% 0 0.0% 0 0.0% 0 The train station is too far
from town centre 0.1% 1 0.0% 0 1.2% 1 0.0% 0 0.0% 0 0.0% 0 0.0% 0 0.0% 0 0.0% 0 0.0% 0 0.0% 0 0.0% 0
Too big 0.3% 2 0.0% 0 0.0% 0 0.8% 0 0.0% 0 0.0% 0 0.0% 0 0.0% 0 0.0% 0 0.0% 0 0.0% 0 0.0% 0 Too busy 1.8% 16 0.0% 0 0.0% 0 0.0% 0 0.0% 0 0.0% 0 5.2% 4 0.0% 0 0.0% 0 0.0% 0 1.3% 1 0.0% 0 Too far away 0.5% 4 0.0% 0 0.0% 0 0.8% 0 0.0% 0 0.0% 0 0.0% 0 4.1% 1 0.0% 0 0.0% 0 0.0% 0 0.0% 0 Too many betting shops 0.2% 1 1.2% 1 0.0% 0 0.0% 0 0.0% 0 0.0% 0 0.0% 0 0.0% 0 0.0% 0 0.0% 0 0.0% 0 0.0% 0 Too many building projects 0.7% 6 0.0% 0 0.0% 0 3.1% 1 0.0% 0 0.0% 0 0.0% 0 0.0% 0 11.2% 1 0.0% 0 2.5% 2 0.0% 0 Too many cafes 0.2% 1 0.8% 1 0.0% 0 0.8% 0 0.0% 0 0.0% 0 0.0% 0 0.0% 0 0.0% 0 0.0% 0 0.0% 0 0.0% 0 Too many charity shops 0.2% 2 1.2% 1 0.0% 0 0.0% 0 0.0% 0 0.0% 0 0.0% 0 0.0% 0 0.0% 0 0.0% 0 0.0% 0 0.8% 1 Too many empty shops 0.2% 2 0.8% 1 0.0% 0 0.0% 0 0.0% 0 0.0% 0 0.0% 0 0.0% 0 0.0% 0 0.0% 0 0.0% 0 0.0% 0 Too many estate agents 0.4% 3 0.0% 0 0.0% 0 0.0% 0 0.0% 0 0.0% 0 4.2% 3 0.0% 0 0.0% 0 0.0% 0 0.0% 0 0.8% 1 Too many pubs 0.0% 0 0.0% 0 0.0% 0 1.7% 0 0.0% 0 0.0% 0 0.0% 0 0.0% 0 0.0% 0 0.0% 0 0.0% 0 0.0% 0 Too many restaurants /
takeaways 0.5% 4 0.8% 1 0.0% 0 0.0% 0 0.0% 0 0.0% 0 4.2% 3 0.0% 0 0.0% 0 0.0% 0 0.0% 0 0.0% 0
Too small 0.1% 1 0.0% 0 1.2% 1 0.0% 0 0.0% 0 0.0% 0 0.0% 0 0.0% 0 0.0% 0 0.0% 0 0.0% 0 0.0% 0 Nothing 53.2% 457 62.1% 77 64.7% 48 80.1% 18 60.9% 6 75.0% 16 37.1% 27 73.7% 26 39.6% 4 63.6% 20 36.9% 30 54.7% 33 (Don't know) 3.4% 29 3.6% 4 0.0% 0 0.0% 0 0.0% 0 8.7% 2 0.0% 0 3.5% 1 0.0% 0 0.0% 0 6.7% 5 9.8% 6 Weighted base: 859 124 73 23 10 22 71 35 11 31 81 59 Sample: 956 77 53 67 21 11 49 12 13 17 77 67
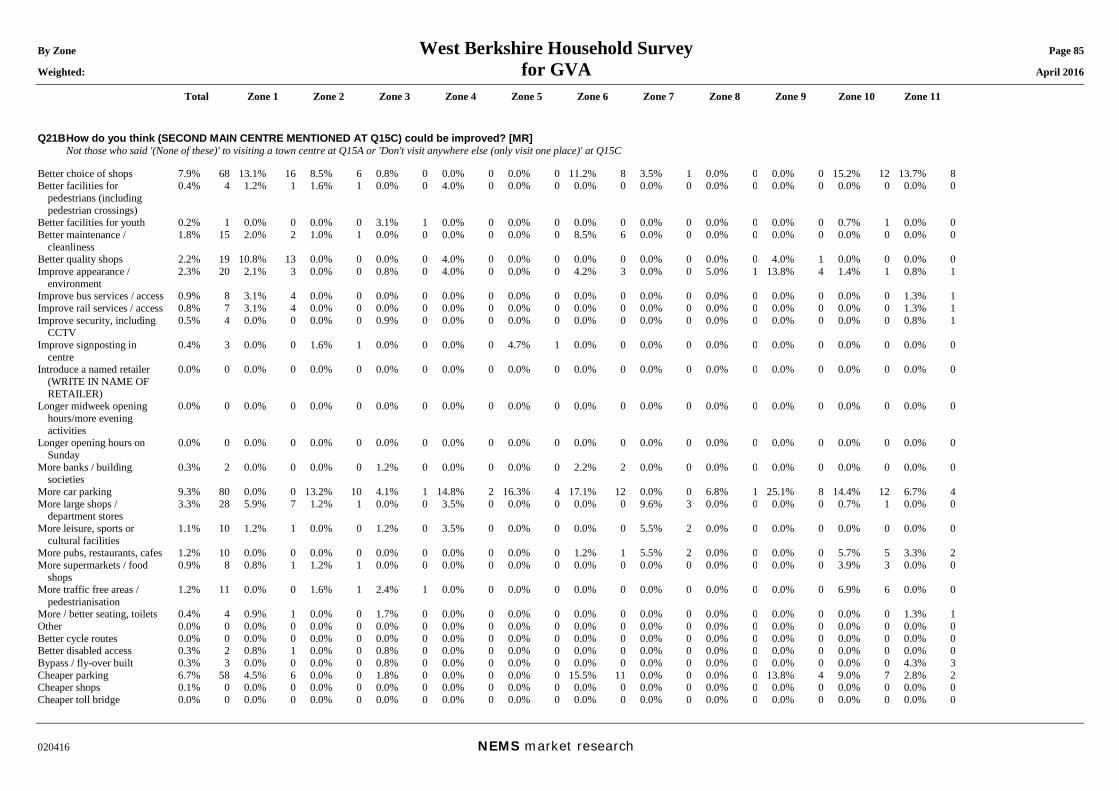
By Zone West Berkshire Household Survey Page 85 Weighted: for GVA April 2016
Total Zone 1 Zone 2 Zone 3 Zone 4 Zone 5 Zone 6 Zone 7 Zone 8 Zone 9 Zone 10 Zone 11
020416 NEMS market research
Q21B How do you think (SECOND MAIN CENTRE MENTIONED AT Q15C) could be improved? [MR] Not those who said '(None of these)' to visiting a town centre at Q15A or 'Don't visit anywhere else (only visit one place)' at Q15C Better choice of shops 7.9% 68 13.1% 16 8.5% 6 0.8% 0 0.0% 0 0.0% 0 11.2% 8 3.5% 1 0.0% 0 0.0% 0 15.2% 12 13.7% 8 Better facilities for
pedestrians (including pedestrian crossings)
0.4% 4 1.2% 1 1.6% 1 0.0% 0 4.0% 0 0.0% 0 0.0% 0 0.0% 0 0.0% 0 0.0% 0 0.0% 0 0.0% 0
Better facilities for youth 0.2% 1 0.0% 0 0.0% 0 3.1% 1 0.0% 0 0.0% 0 0.0% 0 0.0% 0 0.0% 0 0.0% 0 0.7% 1 0.0% 0 Better maintenance /
cleanliness 1.8% 15 2.0% 2 1.0% 1 0.0% 0 0.0% 0 0.0% 0 8.5% 6 0.0% 0 0.0% 0 0.0% 0 0.0% 0 0.0% 0
Better quality shops 2.2% 19 10.8% 13 0.0% 0 0.0% 0 4.0% 0 0.0% 0 0.0% 0 0.0% 0 0.0% 0 4.0% 1 0.0% 0 0.0% 0 Improve appearance /
environment 2.3% 20 2.1% 3 0.0% 0 0.8% 0 4.0% 0 0.0% 0 4.2% 3 0.0% 0 5.0% 1 13.8% 4 1.4% 1 0.8% 1
Improve bus services / access 0.9% 8 3.1% 4 0.0% 0 0.0% 0 0.0% 0 0.0% 0 0.0% 0 0.0% 0 0.0% 0 0.0% 0 0.0% 0 1.3% 1 Improve rail services / access 0.8% 7 3.1% 4 0.0% 0 0.0% 0 0.0% 0 0.0% 0 0.0% 0 0.0% 0 0.0% 0 0.0% 0 0.0% 0 1.3% 1 Improve security, including
CCTV 0.5% 4 0.0% 0 0.0% 0 0.9% 0 0.0% 0 0.0% 0 0.0% 0 0.0% 0 0.0% 0 0.0% 0 0.0% 0 0.8% 1
Improve signposting in centre
0.4% 3 0.0% 0 1.6% 1 0.0% 0 0.0% 0 4.7% 1 0.0% 0 0.0% 0 0.0% 0 0.0% 0 0.0% 0 0.0% 0
Introduce a named retailer (WRITE IN NAME OF RETAILER)
0.0% 0 0.0% 0 0.0% 0 0.0% 0 0.0% 0 0.0% 0 0.0% 0 0.0% 0 0.0% 0 0.0% 0 0.0% 0 0.0% 0
Longer midweek opening hours/more evening activities
0.0% 0 0.0% 0 0.0% 0 0.0% 0 0.0% 0 0.0% 0 0.0% 0 0.0% 0 0.0% 0 0.0% 0 0.0% 0 0.0% 0
Longer opening hours on Sunday
0.0% 0 0.0% 0 0.0% 0 0.0% 0 0.0% 0 0.0% 0 0.0% 0 0.0% 0 0.0% 0 0.0% 0 0.0% 0 0.0% 0
More banks / building societies
0.3% 2 0.0% 0 0.0% 0 1.2% 0 0.0% 0 0.0% 0 2.2% 2 0.0% 0 0.0% 0 0.0% 0 0.0% 0 0.0% 0
More car parking 9.3% 80 0.0% 0 13.2% 10 4.1% 1 14.8% 2 16.3% 4 17.1% 12 0.0% 0 6.8% 1 25.1% 8 14.4% 12 6.7% 4 More large shops /
department stores 3.3% 28 5.9% 7 1.2% 1 0.0% 0 3.5% 0 0.0% 0 0.0% 0 9.6% 3 0.0% 0 0.0% 0 0.7% 1 0.0% 0
More leisure, sports or cultural facilities
1.1% 10 1.2% 1 0.0% 0 1.2% 0 3.5% 0 0.0% 0 0.0% 0 5.5% 2 0.0% 0 0.0% 0 0.0% 0 0.0% 0
More pubs, restaurants, cafes 1.2% 10 0.0% 0 0.0% 0 0.0% 0 0.0% 0 0.0% 0 1.2% 1 5.5% 2 0.0% 0 0.0% 0 5.7% 5 3.3% 2 More supermarkets / food
shops 0.9% 8 0.8% 1 1.2% 1 0.0% 0 0.0% 0 0.0% 0 0.0% 0 0.0% 0 0.0% 0 0.0% 0 3.9% 3 0.0% 0
More traffic free areas / pedestrianisation
1.2% 11 0.0% 0 1.6% 1 2.4% 1 0.0% 0 0.0% 0 0.0% 0 0.0% 0 0.0% 0 0.0% 0 6.9% 6 0.0% 0
More / better seating, toilets 0.4% 4 0.9% 1 0.0% 0 1.7% 0 0.0% 0 0.0% 0 0.0% 0 0.0% 0 0.0% 0 0.0% 0 0.0% 0 1.3% 1 Other 0.0% 0 0.0% 0 0.0% 0 0.0% 0 0.0% 0 0.0% 0 0.0% 0 0.0% 0 0.0% 0 0.0% 0 0.0% 0 0.0% 0 Better cycle routes 0.0% 0 0.0% 0 0.0% 0 0.0% 0 0.0% 0 0.0% 0 0.0% 0 0.0% 0 0.0% 0 0.0% 0 0.0% 0 0.0% 0 Better disabled access 0.3% 2 0.8% 1 0.0% 0 0.8% 0 0.0% 0 0.0% 0 0.0% 0 0.0% 0 0.0% 0 0.0% 0 0.0% 0 0.0% 0 Bypass / fly-over built 0.3% 3 0.0% 0 0.0% 0 0.8% 0 0.0% 0 0.0% 0 0.0% 0 0.0% 0 0.0% 0 0.0% 0 0.0% 0 4.3% 3 Cheaper parking 6.7% 58 4.5% 6 0.0% 0 1.8% 0 0.0% 0 0.0% 0 15.5% 11 0.0% 0 0.0% 0 13.8% 4 9.0% 7 2.8% 2 Cheaper shops 0.1% 0 0.0% 0 0.0% 0 0.0% 0 0.0% 0 0.0% 0 0.0% 0 0.0% 0 0.0% 0 0.0% 0 0.0% 0 0.0% 0 Cheaper toll bridge 0.0% 0 0.0% 0 0.0% 0 0.0% 0 0.0% 0 0.0% 0 0.0% 0 0.0% 0 0.0% 0 0.0% 0 0.0% 0 0.0% 0
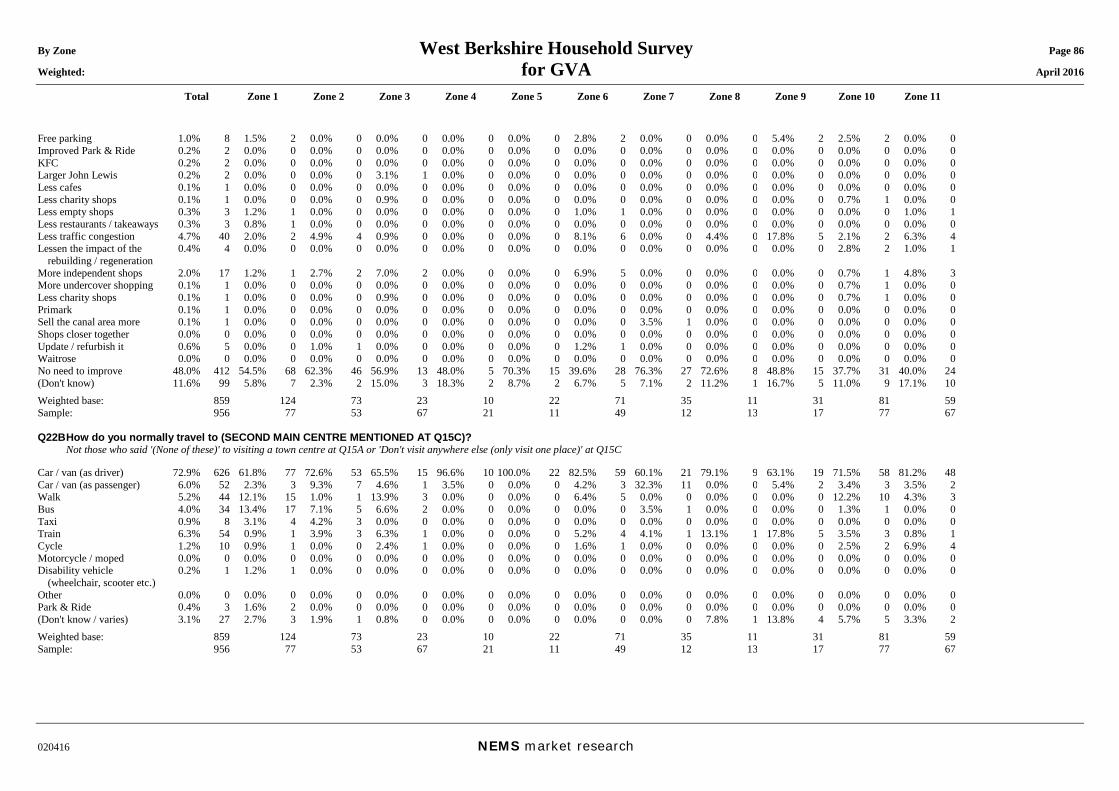
By Zone West Berkshire Household Survey Page 86 Weighted: for GVA April 2016
Total Zone 1 Zone 2 Zone 3 Zone 4 Zone 5 Zone 6 Zone 7 Zone 8 Zone 9 Zone 10 Zone 11
020416 NEMS market research
Free parking 1.0% 8 1.5% 2 0.0% 0 0.0% 0 0.0% 0 0.0% 0 2.8% 2 0.0% 0 0.0% 0 5.4% 2 2.5% 2 0.0% 0 Improved Park & Ride 0.2% 2 0.0% 0 0.0% 0 0.0% 0 0.0% 0 0.0% 0 0.0% 0 0.0% 0 0.0% 0 0.0% 0 0.0% 0 0.0% 0 KFC 0.2% 2 0.0% 0 0.0% 0 0.0% 0 0.0% 0 0.0% 0 0.0% 0 0.0% 0 0.0% 0 0.0% 0 0.0% 0 0.0% 0 Larger John Lewis 0.2% 2 0.0% 0 0.0% 0 3.1% 1 0.0% 0 0.0% 0 0.0% 0 0.0% 0 0.0% 0 0.0% 0 0.0% 0 0.0% 0 Less cafes 0.1% 1 0.0% 0 0.0% 0 0.0% 0 0.0% 0 0.0% 0 0.0% 0 0.0% 0 0.0% 0 0.0% 0 0.0% 0 0.0% 0 Less charity shops 0.1% 1 0.0% 0 0.0% 0 0.9% 0 0.0% 0 0.0% 0 0.0% 0 0.0% 0 0.0% 0 0.0% 0 0.7% 1 0.0% 0 Less empty shops 0.3% 3 1.2% 1 0.0% 0 0.0% 0 0.0% 0 0.0% 0 1.0% 1 0.0% 0 0.0% 0 0.0% 0 0.0% 0 1.0% 1 Less restaurants / takeaways 0.3% 3 0.8% 1 0.0% 0 0.0% 0 0.0% 0 0.0% 0 0.0% 0 0.0% 0 0.0% 0 0.0% 0 0.0% 0 0.0% 0 Less traffic congestion 4.7% 40 2.0% 2 4.9% 4 0.9% 0 0.0% 0 0.0% 0 8.1% 6 0.0% 0 4.4% 0 17.8% 5 2.1% 2 6.3% 4 Lessen the impact of the
rebuilding / regeneration 0.4% 4 0.0% 0 0.0% 0 0.0% 0 0.0% 0 0.0% 0 0.0% 0 0.0% 0 0.0% 0 0.0% 0 2.8% 2 1.0% 1
More independent shops 2.0% 17 1.2% 1 2.7% 2 7.0% 2 0.0% 0 0.0% 0 6.9% 5 0.0% 0 0.0% 0 0.0% 0 0.7% 1 4.8% 3 More undercover shopping 0.1% 1 0.0% 0 0.0% 0 0.0% 0 0.0% 0 0.0% 0 0.0% 0 0.0% 0 0.0% 0 0.0% 0 0.7% 1 0.0% 0 Less charity shops 0.1% 1 0.0% 0 0.0% 0 0.9% 0 0.0% 0 0.0% 0 0.0% 0 0.0% 0 0.0% 0 0.0% 0 0.7% 1 0.0% 0 Primark 0.1% 1 0.0% 0 0.0% 0 0.0% 0 0.0% 0 0.0% 0 0.0% 0 0.0% 0 0.0% 0 0.0% 0 0.0% 0 0.0% 0 Sell the canal area more 0.1% 1 0.0% 0 0.0% 0 0.0% 0 0.0% 0 0.0% 0 0.0% 0 3.5% 1 0.0% 0 0.0% 0 0.0% 0 0.0% 0 Shops closer together 0.0% 0 0.0% 0 0.0% 0 0.0% 0 0.0% 0 0.0% 0 0.0% 0 0.0% 0 0.0% 0 0.0% 0 0.0% 0 0.0% 0 Update / refurbish it 0.6% 5 0.0% 0 1.0% 1 0.0% 0 0.0% 0 0.0% 0 1.2% 1 0.0% 0 0.0% 0 0.0% 0 0.0% 0 0.0% 0 Waitrose 0.0% 0 0.0% 0 0.0% 0 0.0% 0 0.0% 0 0.0% 0 0.0% 0 0.0% 0 0.0% 0 0.0% 0 0.0% 0 0.0% 0 No need to improve 48.0% 412 54.5% 68 62.3% 46 56.9% 13 48.0% 5 70.3% 15 39.6% 28 76.3% 27 72.6% 8 48.8% 15 37.7% 31 40.0% 24 (Don't know) 11.6% 99 5.8% 7 2.3% 2 15.0% 3 18.3% 2 8.7% 2 6.7% 5 7.1% 2 11.2% 1 16.7% 5 11.0% 9 17.1% 10 Weighted base: 859 124 73 23 10 22 71 35 11 31 81 59 Sample: 956 77 53 67 21 11 49 12 13 17 77 67 Q22B How do you normally travel to (SECOND MAIN CENTRE MENTIONED AT Q15C)? Not those who said '(None of these)' to visiting a town centre at Q15A or 'Don't visit anywhere else (only visit one place)' at Q15C Car / van (as driver) 72.9% 626 61.8% 77 72.6% 53 65.5% 15 96.6% 10 100.0% 22 82.5% 59 60.1% 21 79.1% 9 63.1% 19 71.5% 58 81.2% 48 Car / van (as passenger) 6.0% 52 2.3% 3 9.3% 7 4.6% 1 3.5% 0 0.0% 0 4.2% 3 32.3% 11 0.0% 0 5.4% 2 3.4% 3 3.5% 2 Walk 5.2% 44 12.1% 15 1.0% 1 13.9% 3 0.0% 0 0.0% 0 6.4% 5 0.0% 0 0.0% 0 0.0% 0 12.2% 10 4.3% 3 Bus 4.0% 34 13.4% 17 7.1% 5 6.6% 2 0.0% 0 0.0% 0 0.0% 0 3.5% 1 0.0% 0 0.0% 0 1.3% 1 0.0% 0 Taxi 0.9% 8 3.1% 4 4.2% 3 0.0% 0 0.0% 0 0.0% 0 0.0% 0 0.0% 0 0.0% 0 0.0% 0 0.0% 0 0.0% 0 Train 6.3% 54 0.9% 1 3.9% 3 6.3% 1 0.0% 0 0.0% 0 5.2% 4 4.1% 1 13.1% 1 17.8% 5 3.5% 3 0.8% 1 Cycle 1.2% 10 0.9% 1 0.0% 0 2.4% 1 0.0% 0 0.0% 0 1.6% 1 0.0% 0 0.0% 0 0.0% 0 2.5% 2 6.9% 4 Motorcycle / moped 0.0% 0 0.0% 0 0.0% 0 0.0% 0 0.0% 0 0.0% 0 0.0% 0 0.0% 0 0.0% 0 0.0% 0 0.0% 0 0.0% 0 Disability vehicle
(wheelchair, scooter etc.) 0.2% 1 1.2% 1 0.0% 0 0.0% 0 0.0% 0 0.0% 0 0.0% 0 0.0% 0 0.0% 0 0.0% 0 0.0% 0 0.0% 0
Other 0.0% 0 0.0% 0 0.0% 0 0.0% 0 0.0% 0 0.0% 0 0.0% 0 0.0% 0 0.0% 0 0.0% 0 0.0% 0 0.0% 0 Park & Ride 0.4% 3 1.6% 2 0.0% 0 0.0% 0 0.0% 0 0.0% 0 0.0% 0 0.0% 0 0.0% 0 0.0% 0 0.0% 0 0.0% 0 (Don't know / varies) 3.1% 27 2.7% 3 1.9% 1 0.8% 0 0.0% 0 0.0% 0 0.0% 0 0.0% 0 7.8% 1 13.8% 4 5.7% 5 3.3% 2 Weighted base: 859 124 73 23 10 22 71 35 11 31 81 59 Sample: 956 77 53 67 21 11 49 12 13 17 77 67
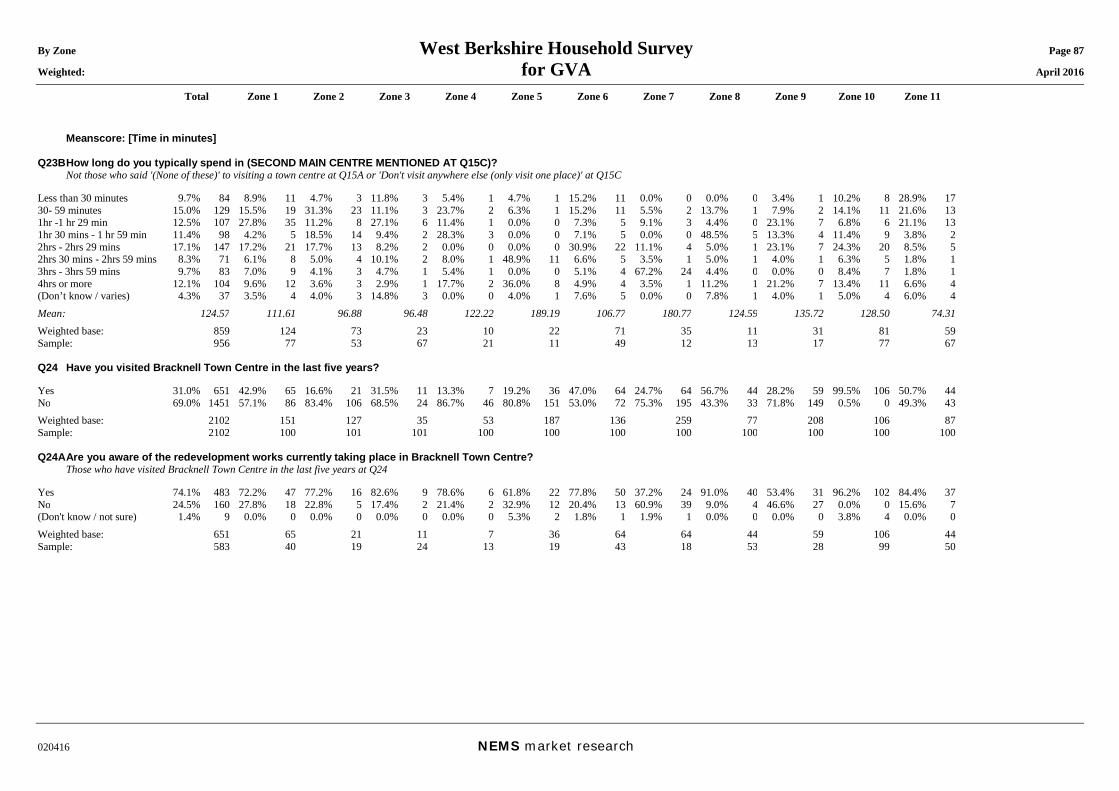
By Zone West Berkshire Household Survey Page 87 Weighted: for GVA April 2016
Total Zone 1 Zone 2 Zone 3 Zone 4 Zone 5 Zone 6 Zone 7 Zone 8 Zone 9 Zone 10 Zone 11
020416 NEMS market research
Meanscore: [Time in minutes] Q23B How long do you typically spend in (SECOND MAIN CENTRE MENTIONED AT Q15C)? Not those who said '(None of these)' to visiting a town centre at Q15A or 'Don't visit anywhere else (only visit one place)' at Q15C Less than 30 minutes 9.7% 84 8.9% 11 4.7% 3 11.8% 3 5.4% 1 4.7% 1 15.2% 11 0.0% 0 0.0% 0 3.4% 1 10.2% 8 28.9% 17 30- 59 minutes 15.0% 129 15.5% 19 31.3% 23 11.1% 3 23.7% 2 6.3% 1 15.2% 11 5.5% 2 13.7% 1 7.9% 2 14.1% 11 21.6% 13 1hr -1 hr 29 min 12.5% 107 27.8% 35 11.2% 8 27.1% 6 11.4% 1 0.0% 0 7.3% 5 9.1% 3 4.4% 0 23.1% 7 6.8% 6 21.1% 13 1hr 30 mins - 1 hr 59 min 11.4% 98 4.2% 5 18.5% 14 9.4% 2 28.3% 3 0.0% 0 7.1% 5 0.0% 0 48.5% 5 13.3% 4 11.4% 9 3.8% 2 2hrs - 2hrs 29 mins 17.1% 147 17.2% 21 17.7% 13 8.2% 2 0.0% 0 0.0% 0 30.9% 22 11.1% 4 5.0% 1 23.1% 7 24.3% 20 8.5% 5 2hrs 30 mins - 2hrs 59 mins 8.3% 71 6.1% 8 5.0% 4 10.1% 2 8.0% 1 48.9% 11 6.6% 5 3.5% 1 5.0% 1 4.0% 1 6.3% 5 1.8% 1 3hrs - 3hrs 59 mins 9.7% 83 7.0% 9 4.1% 3 4.7% 1 5.4% 1 0.0% 0 5.1% 4 67.2% 24 4.4% 0 0.0% 0 8.4% 7 1.8% 1 4hrs or more 12.1% 104 9.6% 12 3.6% 3 2.9% 1 17.7% 2 36.0% 8 4.9% 4 3.5% 1 11.2% 1 21.2% 7 13.4% 11 6.6% 4 (Don’t know / varies) 4.3% 37 3.5% 4 4.0% 3 14.8% 3 0.0% 0 4.0% 1 7.6% 5 0.0% 0 7.8% 1 4.0% 1 5.0% 4 6.0% 4 Mean: 124.57 111.61 96.88 96.48 122.22 189.19 106.77 180.77 124.59 135.72 128.50 74.31 Weighted base: 859 124 73 23 10 22 71 35 11 31 81 59 Sample: 956 77 53 67 21 11 49 12 13 17 77 67 Q24 Have you visited Bracknell Town Centre in the last five years? Yes 31.0% 651 42.9% 65 16.6% 21 31.5% 11 13.3% 7 19.2% 36 47.0% 64 24.7% 64 56.7% 44 28.2% 59 99.5% 106 50.7% 44 No 69.0% 1451 57.1% 86 83.4% 106 68.5% 24 86.7% 46 80.8% 151 53.0% 72 75.3% 195 43.3% 33 71.8% 149 0.5% 0 49.3% 43 Weighted base: 2102 151 127 35 53 187 136 259 77 208 106 87 Sample: 2102 100 101 101 100 100 100 100 100 100 100 100 Q24A Are you aware of the redevelopment works currently taking place in Bracknell Town Centre? Those who have visited Bracknell Town Centre in the last five years at Q24 Yes 74.1% 483 72.2% 47 77.2% 16 82.6% 9 78.6% 6 61.8% 22 77.8% 50 37.2% 24 91.0% 40 53.4% 31 96.2% 102 84.4% 37 No 24.5% 160 27.8% 18 22.8% 5 17.4% 2 21.4% 2 32.9% 12 20.4% 13 60.9% 39 9.0% 4 46.6% 27 0.0% 0 15.6% 7 (Don't know / not sure) 1.4% 9 0.0% 0 0.0% 0 0.0% 0 0.0% 0 5.3% 2 1.8% 1 1.9% 1 0.0% 0 0.0% 0 3.8% 4 0.0% 0 Weighted base: 651 65 21 11 7 36 64 64 44 59 106 44 Sample: 583 40 19 24 13 19 43 18 53 28 99 50
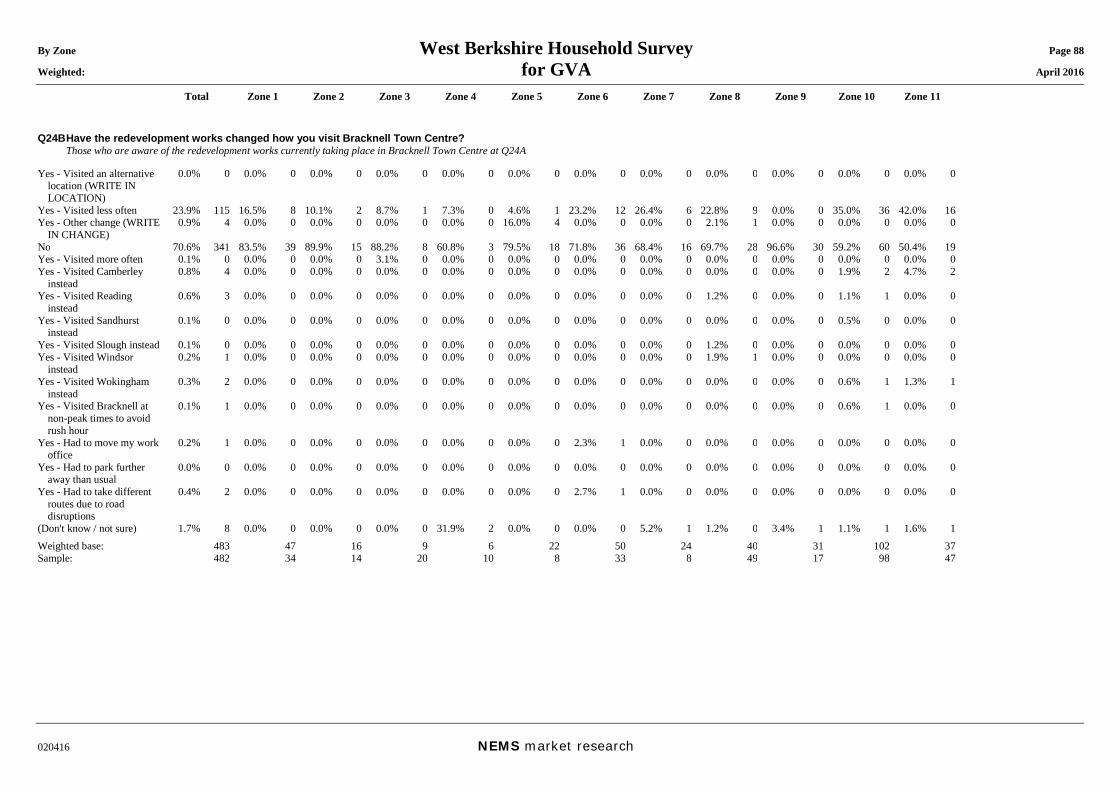
By Zone West Berkshire Household Survey Page 88 Weighted: for GVA April 2016
Total Zone 1 Zone 2 Zone 3 Zone 4 Zone 5 Zone 6 Zone 7 Zone 8 Zone 9 Zone 10 Zone 11
020416 NEMS market research
Q24B Have the redevelopment works changed how you visit Bracknell Town Centre? Those who are aware of the redevelopment works currently taking place in Bracknell Town Centre at Q24A Yes - Visited an alternative
location (WRITE IN LOCATION)
0.0% 0 0.0% 0 0.0% 0 0.0% 0 0.0% 0 0.0% 0 0.0% 0 0.0% 0 0.0% 0 0.0% 0 0.0% 0 0.0% 0
Yes - Visited less often 23.9% 115 16.5% 8 10.1% 2 8.7% 1 7.3% 0 4.6% 1 23.2% 12 26.4% 6 22.8% 9 0.0% 0 35.0% 36 42.0% 16 Yes - Other change (WRITE
IN CHANGE) 0.9% 4 0.0% 0 0.0% 0 0.0% 0 0.0% 0 16.0% 4 0.0% 0 0.0% 0 2.1% 1 0.0% 0 0.0% 0 0.0% 0
No 70.6% 341 83.5% 39 89.9% 15 88.2% 8 60.8% 3 79.5% 18 71.8% 36 68.4% 16 69.7% 28 96.6% 30 59.2% 60 50.4% 19 Yes - Visited more often 0.1% 0 0.0% 0 0.0% 0 3.1% 0 0.0% 0 0.0% 0 0.0% 0 0.0% 0 0.0% 0 0.0% 0 0.0% 0 0.0% 0 Yes - Visited Camberley
instead 0.8% 4 0.0% 0 0.0% 0 0.0% 0 0.0% 0 0.0% 0 0.0% 0 0.0% 0 0.0% 0 0.0% 0 1.9% 2 4.7% 2
Yes - Visited Reading instead
0.6% 3 0.0% 0 0.0% 0 0.0% 0 0.0% 0 0.0% 0 0.0% 0 0.0% 0 1.2% 0 0.0% 0 1.1% 1 0.0% 0
Yes - Visited Sandhurst instead
0.1% 0 0.0% 0 0.0% 0 0.0% 0 0.0% 0 0.0% 0 0.0% 0 0.0% 0 0.0% 0 0.0% 0 0.5% 0 0.0% 0
Yes - Visited Slough instead 0.1% 0 0.0% 0 0.0% 0 0.0% 0 0.0% 0 0.0% 0 0.0% 0 0.0% 0 1.2% 0 0.0% 0 0.0% 0 0.0% 0 Yes - Visited Windsor
instead 0.2% 1 0.0% 0 0.0% 0 0.0% 0 0.0% 0 0.0% 0 0.0% 0 0.0% 0 1.9% 1 0.0% 0 0.0% 0 0.0% 0
Yes - Visited Wokingham instead
0.3% 2 0.0% 0 0.0% 0 0.0% 0 0.0% 0 0.0% 0 0.0% 0 0.0% 0 0.0% 0 0.0% 0 0.6% 1 1.3% 1
Yes - Visited Bracknell at non-peak times to avoid rush hour
0.1% 1 0.0% 0 0.0% 0 0.0% 0 0.0% 0 0.0% 0 0.0% 0 0.0% 0 0.0% 0 0.0% 0 0.6% 1 0.0% 0
Yes - Had to move my work office
0.2% 1 0.0% 0 0.0% 0 0.0% 0 0.0% 0 0.0% 0 2.3% 1 0.0% 0 0.0% 0 0.0% 0 0.0% 0 0.0% 0
Yes - Had to park further away than usual
0.0% 0 0.0% 0 0.0% 0 0.0% 0 0.0% 0 0.0% 0 0.0% 0 0.0% 0 0.0% 0 0.0% 0 0.0% 0 0.0% 0
Yes - Had to take different routes due to road disruptions
0.4% 2 0.0% 0 0.0% 0 0.0% 0 0.0% 0 0.0% 0 2.7% 1 0.0% 0 0.0% 0 0.0% 0 0.0% 0 0.0% 0
(Don't know / not sure) 1.7% 8 0.0% 0 0.0% 0 0.0% 0 31.9% 2 0.0% 0 0.0% 0 5.2% 1 1.2% 0 3.4% 1 1.1% 1 1.6% 1 Weighted base: 483 47 16 9 6 22 50 24 40 31 102 37 Sample: 482 34 14 20 10 8 33 8 49 17 98 47
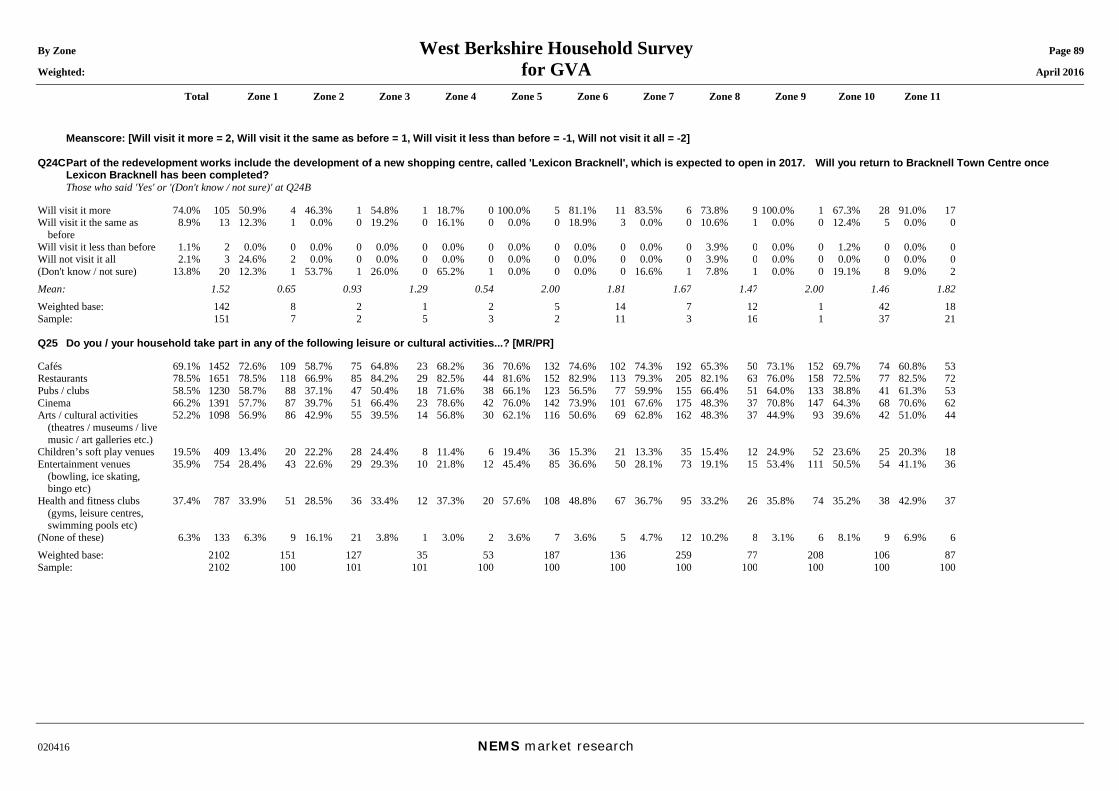
By Zone West Berkshire Household Survey Page 89 Weighted: for GVA April 2016
Total Zone 1 Zone 2 Zone 3 Zone 4 Zone 5 Zone 6 Zone 7 Zone 8 Zone 9 Zone 10 Zone 11
020416 NEMS market research
Meanscore: [Will visit it more = 2, Will visit it the same as before = 1, Will visit it less than before = -1, Will not visit it all = -2] Q24C Part of the redevelopment works include the development of a new shopping centre, called 'Lexicon Bracknell', which is expected to open in 2017. Will you return to Bracknell Town Centre once
Lexicon Bracknell has been completed? Those who said 'Yes' or '(Don't know / not sure)' at Q24B Will visit it more 74.0% 105 50.9% 4 46.3% 1 54.8% 1 18.7% 0 100.0% 5 81.1% 11 83.5% 6 73.8% 9 100.0% 1 67.3% 28 91.0% 17 Will visit it the same as
before 8.9% 13 12.3% 1 0.0% 0 19.2% 0 16.1% 0 0.0% 0 18.9% 3 0.0% 0 10.6% 1 0.0% 0 12.4% 5 0.0% 0
Will visit it less than before 1.1% 2 0.0% 0 0.0% 0 0.0% 0 0.0% 0 0.0% 0 0.0% 0 0.0% 0 3.9% 0 0.0% 0 1.2% 0 0.0% 0 Will not visit it all 2.1% 3 24.6% 2 0.0% 0 0.0% 0 0.0% 0 0.0% 0 0.0% 0 0.0% 0 3.9% 0 0.0% 0 0.0% 0 0.0% 0 (Don't know / not sure) 13.8% 20 12.3% 1 53.7% 1 26.0% 0 65.2% 1 0.0% 0 0.0% 0 16.6% 1 7.8% 1 0.0% 0 19.1% 8 9.0% 2 Mean: 1.52 0.65 0.93 1.29 0.54 2.00 1.81 1.67 1.47 2.00 1.46 1.82 Weighted base: 142 8 2 1 2 5 14 7 12 1 42 18 Sample: 151 7 2 5 3 2 11 3 16 1 37 21 Q25 Do you / your household take part in any of the following leisure or cultural activities...? [MR/PR] Cafés 69.1% 1452 72.6% 109 58.7% 75 64.8% 23 68.2% 36 70.6% 132 74.6% 102 74.3% 192 65.3% 50 73.1% 152 69.7% 74 60.8% 53 Restaurants 78.5% 1651 78.5% 118 66.9% 85 84.2% 29 82.5% 44 81.6% 152 82.9% 113 79.3% 205 82.1% 63 76.0% 158 72.5% 77 82.5% 72 Pubs / clubs 58.5% 1230 58.7% 88 37.1% 47 50.4% 18 71.6% 38 66.1% 123 56.5% 77 59.9% 155 66.4% 51 64.0% 133 38.8% 41 61.3% 53 Cinema 66.2% 1391 57.7% 87 39.7% 51 66.4% 23 78.6% 42 76.0% 142 73.9% 101 67.6% 175 48.3% 37 70.8% 147 64.3% 68 70.6% 62 Arts / cultural activities
(theatres / museums / live music / art galleries etc.)
52.2% 1098 56.9% 86 42.9% 55 39.5% 14 56.8% 30 62.1% 116 50.6% 69 62.8% 162 48.3% 37 44.9% 93 39.6% 42 51.0% 44
Children’s soft play venues 19.5% 409 13.4% 20 22.2% 28 24.4% 8 11.4% 6 19.4% 36 15.3% 21 13.3% 35 15.4% 12 24.9% 52 23.6% 25 20.3% 18 Entertainment venues
(bowling, ice skating, bingo etc)
35.9% 754 28.4% 43 22.6% 29 29.3% 10 21.8% 12 45.4% 85 36.6% 50 28.1% 73 19.1% 15 53.4% 111 50.5% 54 41.1% 36
Health and fitness clubs (gyms, leisure centres, swimming pools etc)
37.4% 787 33.9% 51 28.5% 36 33.4% 12 37.3% 20 57.6% 108 48.8% 67 36.7% 95 33.2% 26 35.8% 74 35.2% 38 42.9% 37
(None of these) 6.3% 133 6.3% 9 16.1% 21 3.8% 1 3.0% 2 3.6% 7 3.6% 5 4.7% 12 10.2% 8 3.1% 6 8.1% 9 6.9% 6 Weighted base: 2102 151 127 35 53 187 136 259 77 208 106 87 Sample: 2102 100 101 101 100 100 100 100 100 100 100 100
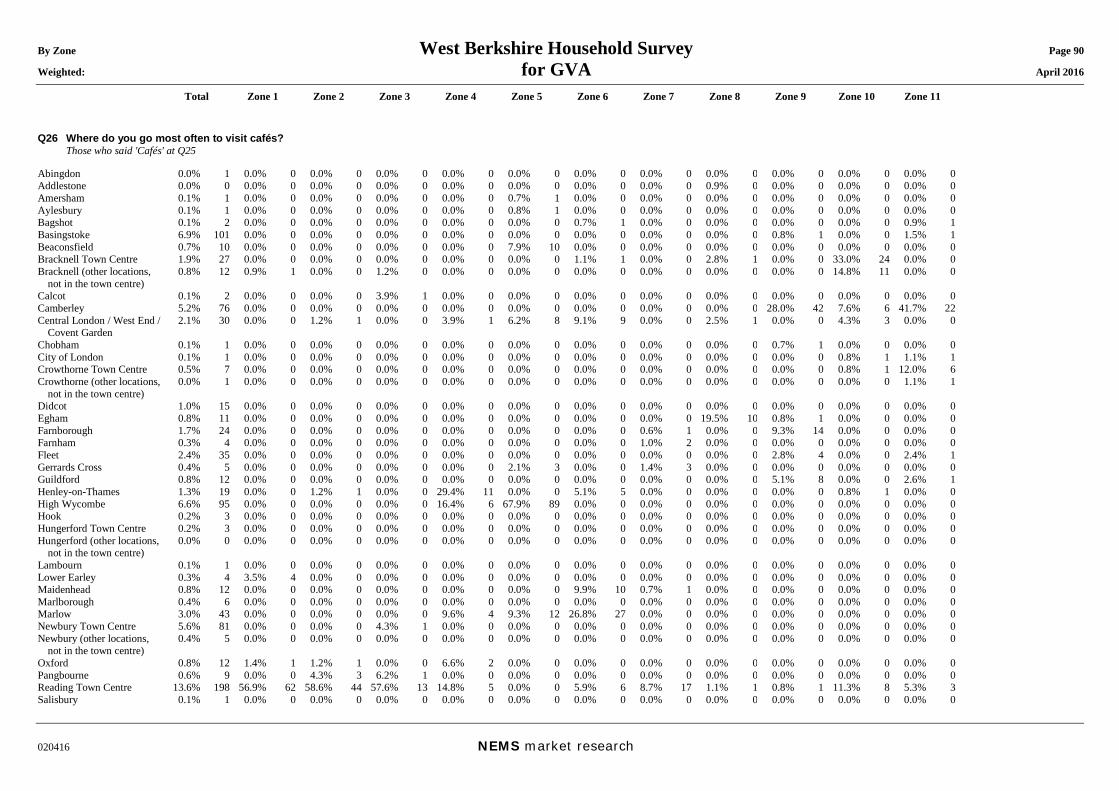
By Zone West Berkshire Household Survey Page 90 Weighted: for GVA April 2016
Total Zone 1 Zone 2 Zone 3 Zone 4 Zone 5 Zone 6 Zone 7 Zone 8 Zone 9 Zone 10 Zone 11
020416 NEMS market research
Q26 Where do you go most often to visit cafés? Those who said 'Cafés' at Q25 Abingdon 0.0% 1 0.0% 0 0.0% 0 0.0% 0 0.0% 0 0.0% 0 0.0% 0 0.0% 0 0.0% 0 0.0% 0 0.0% 0 0.0% 0 Addlestone 0.0% 0 0.0% 0 0.0% 0 0.0% 0 0.0% 0 0.0% 0 0.0% 0 0.0% 0 0.9% 0 0.0% 0 0.0% 0 0.0% 0 Amersham 0.1% 1 0.0% 0 0.0% 0 0.0% 0 0.0% 0 0.7% 1 0.0% 0 0.0% 0 0.0% 0 0.0% 0 0.0% 0 0.0% 0 Aylesbury 0.1% 1 0.0% 0 0.0% 0 0.0% 0 0.0% 0 0.8% 1 0.0% 0 0.0% 0 0.0% 0 0.0% 0 0.0% 0 0.0% 0 Bagshot 0.1% 2 0.0% 0 0.0% 0 0.0% 0 0.0% 0 0.0% 0 0.7% 1 0.0% 0 0.0% 0 0.0% 0 0.0% 0 0.9% 1 Basingstoke 6.9% 101 0.0% 0 0.0% 0 0.0% 0 0.0% 0 0.0% 0 0.0% 0 0.0% 0 0.0% 0 0.8% 1 0.0% 0 1.5% 1 Beaconsfield 0.7% 10 0.0% 0 0.0% 0 0.0% 0 0.0% 0 7.9% 10 0.0% 0 0.0% 0 0.0% 0 0.0% 0 0.0% 0 0.0% 0 Bracknell Town Centre 1.9% 27 0.0% 0 0.0% 0 0.0% 0 0.0% 0 0.0% 0 1.1% 1 0.0% 0 2.8% 1 0.0% 0 33.0% 24 0.0% 0 Bracknell (other locations,
not in the town centre) 0.8% 12 0.9% 1 0.0% 0 1.2% 0 0.0% 0 0.0% 0 0.0% 0 0.0% 0 0.0% 0 0.0% 0 14.8% 11 0.0% 0
Calcot 0.1% 2 0.0% 0 0.0% 0 3.9% 1 0.0% 0 0.0% 0 0.0% 0 0.0% 0 0.0% 0 0.0% 0 0.0% 0 0.0% 0 Camberley 5.2% 76 0.0% 0 0.0% 0 0.0% 0 0.0% 0 0.0% 0 0.0% 0 0.0% 0 0.0% 0 28.0% 42 7.6% 6 41.7% 22 Central London / West End /
Covent Garden 2.1% 30 0.0% 0 1.2% 1 0.0% 0 3.9% 1 6.2% 8 9.1% 9 0.0% 0 2.5% 1 0.0% 0 4.3% 3 0.0% 0
Chobham 0.1% 1 0.0% 0 0.0% 0 0.0% 0 0.0% 0 0.0% 0 0.0% 0 0.0% 0 0.0% 0 0.7% 1 0.0% 0 0.0% 0 City of London 0.1% 1 0.0% 0 0.0% 0 0.0% 0 0.0% 0 0.0% 0 0.0% 0 0.0% 0 0.0% 0 0.0% 0 0.8% 1 1.1% 1 Crowthorne Town Centre 0.5% 7 0.0% 0 0.0% 0 0.0% 0 0.0% 0 0.0% 0 0.0% 0 0.0% 0 0.0% 0 0.0% 0 0.8% 1 12.0% 6 Crowthorne (other locations,
not in the town centre) 0.0% 1 0.0% 0 0.0% 0 0.0% 0 0.0% 0 0.0% 0 0.0% 0 0.0% 0 0.0% 0 0.0% 0 0.0% 0 1.1% 1
Didcot 1.0% 15 0.0% 0 0.0% 0 0.0% 0 0.0% 0 0.0% 0 0.0% 0 0.0% 0 0.0% 0 0.0% 0 0.0% 0 0.0% 0 Egham 0.8% 11 0.0% 0 0.0% 0 0.0% 0 0.0% 0 0.0% 0 0.0% 0 0.0% 0 19.5% 10 0.8% 1 0.0% 0 0.0% 0 Farnborough 1.7% 24 0.0% 0 0.0% 0 0.0% 0 0.0% 0 0.0% 0 0.0% 0 0.6% 1 0.0% 0 9.3% 14 0.0% 0 0.0% 0 Farnham 0.3% 4 0.0% 0 0.0% 0 0.0% 0 0.0% 0 0.0% 0 0.0% 0 1.0% 2 0.0% 0 0.0% 0 0.0% 0 0.0% 0 Fleet 2.4% 35 0.0% 0 0.0% 0 0.0% 0 0.0% 0 0.0% 0 0.0% 0 0.0% 0 0.0% 0 2.8% 4 0.0% 0 2.4% 1 Gerrards Cross 0.4% 5 0.0% 0 0.0% 0 0.0% 0 0.0% 0 2.1% 3 0.0% 0 1.4% 3 0.0% 0 0.0% 0 0.0% 0 0.0% 0 Guildford 0.8% 12 0.0% 0 0.0% 0 0.0% 0 0.0% 0 0.0% 0 0.0% 0 0.0% 0 0.0% 0 5.1% 8 0.0% 0 2.6% 1 Henley-on-Thames 1.3% 19 0.0% 0 1.2% 1 0.0% 0 29.4% 11 0.0% 0 5.1% 5 0.0% 0 0.0% 0 0.0% 0 0.8% 1 0.0% 0 High Wycombe 6.6% 95 0.0% 0 0.0% 0 0.0% 0 16.4% 6 67.9% 89 0.0% 0 0.0% 0 0.0% 0 0.0% 0 0.0% 0 0.0% 0 Hook 0.2% 3 0.0% 0 0.0% 0 0.0% 0 0.0% 0 0.0% 0 0.0% 0 0.0% 0 0.0% 0 0.0% 0 0.0% 0 0.0% 0 Hungerford Town Centre 0.2% 3 0.0% 0 0.0% 0 0.0% 0 0.0% 0 0.0% 0 0.0% 0 0.0% 0 0.0% 0 0.0% 0 0.0% 0 0.0% 0 Hungerford (other locations,
not in the town centre) 0.0% 0 0.0% 0 0.0% 0 0.0% 0 0.0% 0 0.0% 0 0.0% 0 0.0% 0 0.0% 0 0.0% 0 0.0% 0 0.0% 0
Lambourn 0.1% 1 0.0% 0 0.0% 0 0.0% 0 0.0% 0 0.0% 0 0.0% 0 0.0% 0 0.0% 0 0.0% 0 0.0% 0 0.0% 0 Lower Earley 0.3% 4 3.5% 4 0.0% 0 0.0% 0 0.0% 0 0.0% 0 0.0% 0 0.0% 0 0.0% 0 0.0% 0 0.0% 0 0.0% 0 Maidenhead 0.8% 12 0.0% 0 0.0% 0 0.0% 0 0.0% 0 0.0% 0 9.9% 10 0.7% 1 0.0% 0 0.0% 0 0.0% 0 0.0% 0 Marlborough 0.4% 6 0.0% 0 0.0% 0 0.0% 0 0.0% 0 0.0% 0 0.0% 0 0.0% 0 0.0% 0 0.0% 0 0.0% 0 0.0% 0 Marlow 3.0% 43 0.0% 0 0.0% 0 0.0% 0 9.6% 4 9.3% 12 26.8% 27 0.0% 0 0.0% 0 0.0% 0 0.0% 0 0.0% 0 Newbury Town Centre 5.6% 81 0.0% 0 0.0% 0 4.3% 1 0.0% 0 0.0% 0 0.0% 0 0.0% 0 0.0% 0 0.0% 0 0.0% 0 0.0% 0 Newbury (other locations,
not in the town centre) 0.4% 5 0.0% 0 0.0% 0 0.0% 0 0.0% 0 0.0% 0 0.0% 0 0.0% 0 0.0% 0 0.0% 0 0.0% 0 0.0% 0
Oxford 0.8% 12 1.4% 1 1.2% 1 0.0% 0 6.6% 2 0.0% 0 0.0% 0 0.0% 0 0.0% 0 0.0% 0 0.0% 0 0.0% 0 Pangbourne 0.6% 9 0.0% 0 4.3% 3 6.2% 1 0.0% 0 0.0% 0 0.0% 0 0.0% 0 0.0% 0 0.0% 0 0.0% 0 0.0% 0 Reading Town Centre 13.6% 198 56.9% 62 58.6% 44 57.6% 13 14.8% 5 0.0% 0 5.9% 6 8.7% 17 1.1% 1 0.8% 1 11.3% 8 5.3% 3 Salisbury 0.1% 1 0.0% 0 0.0% 0 0.0% 0 0.0% 0 0.0% 0 0.0% 0 0.0% 0 0.0% 0 0.0% 0 0.0% 0 0.0% 0
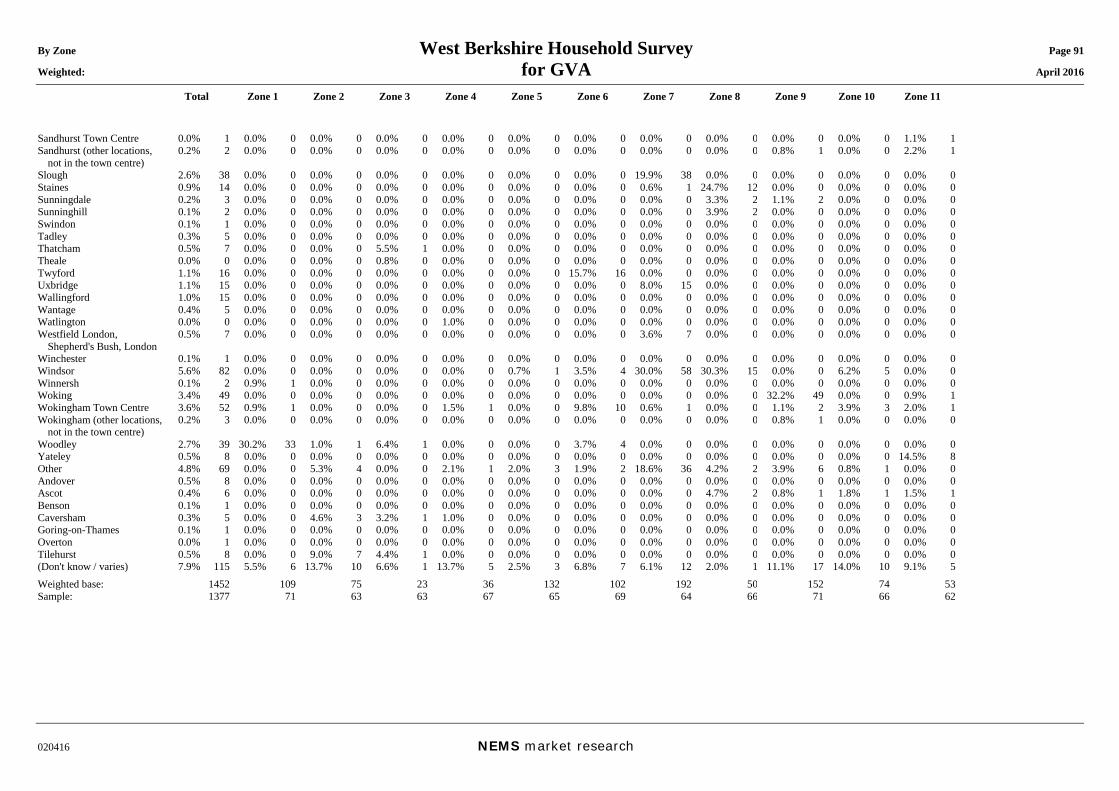
By Zone West Berkshire Household Survey Page 91 Weighted: for GVA April 2016
Total Zone 1 Zone 2 Zone 3 Zone 4 Zone 5 Zone 6 Zone 7 Zone 8 Zone 9 Zone 10 Zone 11
020416 NEMS market research
Sandhurst Town Centre 0.0% 1 0.0% 0 0.0% 0 0.0% 0 0.0% 0 0.0% 0 0.0% 0 0.0% 0 0.0% 0 0.0% 0 0.0% 0 1.1% 1 Sandhurst (other locations,
not in the town centre) 0.2% 2 0.0% 0 0.0% 0 0.0% 0 0.0% 0 0.0% 0 0.0% 0 0.0% 0 0.0% 0 0.8% 1 0.0% 0 2.2% 1
Slough 2.6% 38 0.0% 0 0.0% 0 0.0% 0 0.0% 0 0.0% 0 0.0% 0 19.9% 38 0.0% 0 0.0% 0 0.0% 0 0.0% 0 Staines 0.9% 14 0.0% 0 0.0% 0 0.0% 0 0.0% 0 0.0% 0 0.0% 0 0.6% 1 24.7% 12 0.0% 0 0.0% 0 0.0% 0 Sunningdale 0.2% 3 0.0% 0 0.0% 0 0.0% 0 0.0% 0 0.0% 0 0.0% 0 0.0% 0 3.3% 2 1.1% 2 0.0% 0 0.0% 0 Sunninghill 0.1% 2 0.0% 0 0.0% 0 0.0% 0 0.0% 0 0.0% 0 0.0% 0 0.0% 0 3.9% 2 0.0% 0 0.0% 0 0.0% 0 Swindon 0.1% 1 0.0% 0 0.0% 0 0.0% 0 0.0% 0 0.0% 0 0.0% 0 0.0% 0 0.0% 0 0.0% 0 0.0% 0 0.0% 0 Tadley 0.3% 5 0.0% 0 0.0% 0 0.0% 0 0.0% 0 0.0% 0 0.0% 0 0.0% 0 0.0% 0 0.0% 0 0.0% 0 0.0% 0 Thatcham 0.5% 7 0.0% 0 0.0% 0 5.5% 1 0.0% 0 0.0% 0 0.0% 0 0.0% 0 0.0% 0 0.0% 0 0.0% 0 0.0% 0 Theale 0.0% 0 0.0% 0 0.0% 0 0.8% 0 0.0% 0 0.0% 0 0.0% 0 0.0% 0 0.0% 0 0.0% 0 0.0% 0 0.0% 0 Twyford 1.1% 16 0.0% 0 0.0% 0 0.0% 0 0.0% 0 0.0% 0 15.7% 16 0.0% 0 0.0% 0 0.0% 0 0.0% 0 0.0% 0 Uxbridge 1.1% 15 0.0% 0 0.0% 0 0.0% 0 0.0% 0 0.0% 0 0.0% 0 8.0% 15 0.0% 0 0.0% 0 0.0% 0 0.0% 0 Wallingford 1.0% 15 0.0% 0 0.0% 0 0.0% 0 0.0% 0 0.0% 0 0.0% 0 0.0% 0 0.0% 0 0.0% 0 0.0% 0 0.0% 0 Wantage 0.4% 5 0.0% 0 0.0% 0 0.0% 0 0.0% 0 0.0% 0 0.0% 0 0.0% 0 0.0% 0 0.0% 0 0.0% 0 0.0% 0 Watlington 0.0% 0 0.0% 0 0.0% 0 0.0% 0 1.0% 0 0.0% 0 0.0% 0 0.0% 0 0.0% 0 0.0% 0 0.0% 0 0.0% 0 Westfield London,
Shepherd's Bush, London 0.5% 7 0.0% 0 0.0% 0 0.0% 0 0.0% 0 0.0% 0 0.0% 0 3.6% 7 0.0% 0 0.0% 0 0.0% 0 0.0% 0
Winchester 0.1% 1 0.0% 0 0.0% 0 0.0% 0 0.0% 0 0.0% 0 0.0% 0 0.0% 0 0.0% 0 0.0% 0 0.0% 0 0.0% 0 Windsor 5.6% 82 0.0% 0 0.0% 0 0.0% 0 0.0% 0 0.7% 1 3.5% 4 30.0% 58 30.3% 15 0.0% 0 6.2% 5 0.0% 0 Winnersh 0.1% 2 0.9% 1 0.0% 0 0.0% 0 0.0% 0 0.0% 0 0.0% 0 0.0% 0 0.0% 0 0.0% 0 0.0% 0 0.0% 0 Woking 3.4% 49 0.0% 0 0.0% 0 0.0% 0 0.0% 0 0.0% 0 0.0% 0 0.0% 0 0.0% 0 32.2% 49 0.0% 0 0.9% 1 Wokingham Town Centre 3.6% 52 0.9% 1 0.0% 0 0.0% 0 1.5% 1 0.0% 0 9.8% 10 0.6% 1 0.0% 0 1.1% 2 3.9% 3 2.0% 1 Wokingham (other locations,
not in the town centre) 0.2% 3 0.0% 0 0.0% 0 0.0% 0 0.0% 0 0.0% 0 0.0% 0 0.0% 0 0.0% 0 0.8% 1 0.0% 0 0.0% 0
Woodley 2.7% 39 30.2% 33 1.0% 1 6.4% 1 0.0% 0 0.0% 0 3.7% 4 0.0% 0 0.0% 0 0.0% 0 0.0% 0 0.0% 0 Yateley 0.5% 8 0.0% 0 0.0% 0 0.0% 0 0.0% 0 0.0% 0 0.0% 0 0.0% 0 0.0% 0 0.0% 0 0.0% 0 14.5% 8 Other 4.8% 69 0.0% 0 5.3% 4 0.0% 0 2.1% 1 2.0% 3 1.9% 2 18.6% 36 4.2% 2 3.9% 6 0.8% 1 0.0% 0 Andover 0.5% 8 0.0% 0 0.0% 0 0.0% 0 0.0% 0 0.0% 0 0.0% 0 0.0% 0 0.0% 0 0.0% 0 0.0% 0 0.0% 0 Ascot 0.4% 6 0.0% 0 0.0% 0 0.0% 0 0.0% 0 0.0% 0 0.0% 0 0.0% 0 4.7% 2 0.8% 1 1.8% 1 1.5% 1 Benson 0.1% 1 0.0% 0 0.0% 0 0.0% 0 0.0% 0 0.0% 0 0.0% 0 0.0% 0 0.0% 0 0.0% 0 0.0% 0 0.0% 0 Caversham 0.3% 5 0.0% 0 4.6% 3 3.2% 1 1.0% 0 0.0% 0 0.0% 0 0.0% 0 0.0% 0 0.0% 0 0.0% 0 0.0% 0 Goring-on-Thames 0.1% 1 0.0% 0 0.0% 0 0.0% 0 0.0% 0 0.0% 0 0.0% 0 0.0% 0 0.0% 0 0.0% 0 0.0% 0 0.0% 0 Overton 0.0% 1 0.0% 0 0.0% 0 0.0% 0 0.0% 0 0.0% 0 0.0% 0 0.0% 0 0.0% 0 0.0% 0 0.0% 0 0.0% 0 Tilehurst 0.5% 8 0.0% 0 9.0% 7 4.4% 1 0.0% 0 0.0% 0 0.0% 0 0.0% 0 0.0% 0 0.0% 0 0.0% 0 0.0% 0 (Don't know / varies) 7.9% 115 5.5% 6 13.7% 10 6.6% 1 13.7% 5 2.5% 3 6.8% 7 6.1% 12 2.0% 1 11.1% 17 14.0% 10 9.1% 5 Weighted base: 1452 109 75 23 36 132 102 192 50 152 74 53 Sample: 1377 71 63 63 67 65 69 64 66 71 66 62
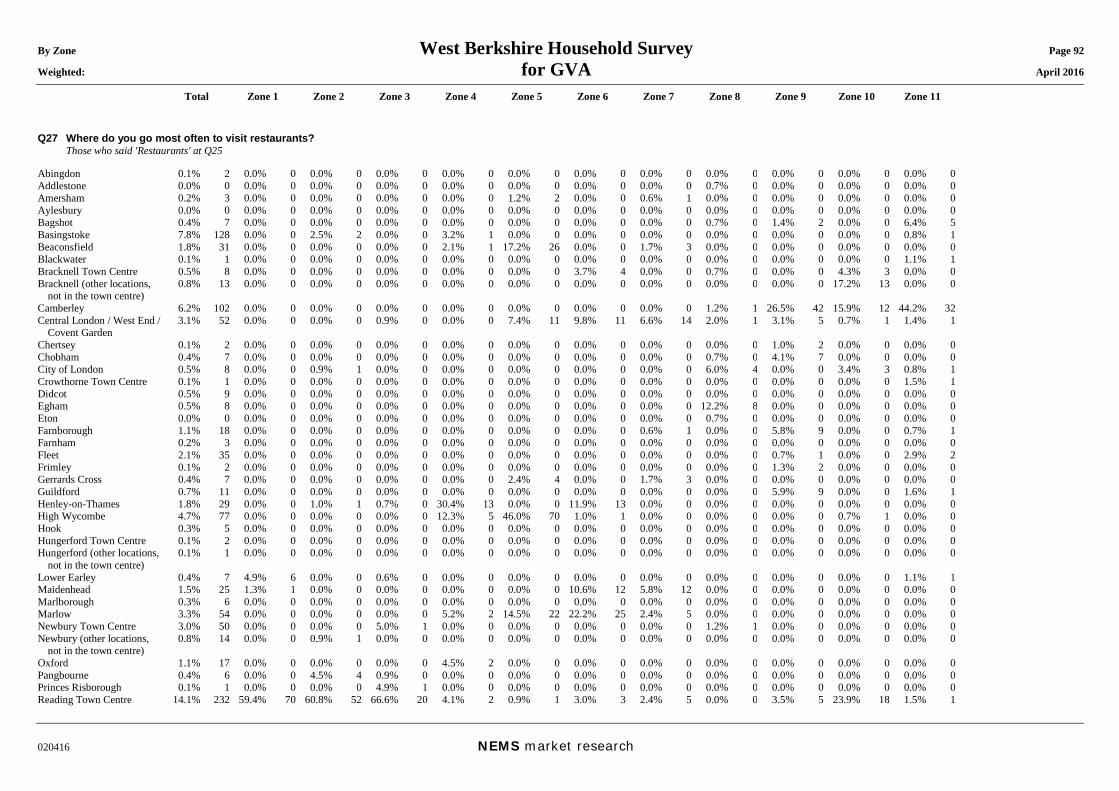
By Zone West Berkshire Household Survey Page 92 Weighted: for GVA April 2016
Total Zone 1 Zone 2 Zone 3 Zone 4 Zone 5 Zone 6 Zone 7 Zone 8 Zone 9 Zone 10 Zone 11
020416 NEMS market research
Q27 Where do you go most often to visit restaurants? Those who said 'Restaurants' at Q25 Abingdon 0.1% 2 0.0% 0 0.0% 0 0.0% 0 0.0% 0 0.0% 0 0.0% 0 0.0% 0 0.0% 0 0.0% 0 0.0% 0 0.0% 0 Addlestone 0.0% 0 0.0% 0 0.0% 0 0.0% 0 0.0% 0 0.0% 0 0.0% 0 0.0% 0 0.7% 0 0.0% 0 0.0% 0 0.0% 0 Amersham 0.2% 3 0.0% 0 0.0% 0 0.0% 0 0.0% 0 1.2% 2 0.0% 0 0.6% 1 0.0% 0 0.0% 0 0.0% 0 0.0% 0 Aylesbury 0.0% 0 0.0% 0 0.0% 0 0.0% 0 0.0% 0 0.0% 0 0.0% 0 0.0% 0 0.0% 0 0.0% 0 0.0% 0 0.0% 0 Bagshot 0.4% 7 0.0% 0 0.0% 0 0.0% 0 0.0% 0 0.0% 0 0.0% 0 0.0% 0 0.7% 0 1.4% 2 0.0% 0 6.4% 5 Basingstoke 7.8% 128 0.0% 0 2.5% 2 0.0% 0 3.2% 1 0.0% 0 0.0% 0 0.0% 0 0.0% 0 0.0% 0 0.0% 0 0.8% 1 Beaconsfield 1.8% 31 0.0% 0 0.0% 0 0.0% 0 2.1% 1 17.2% 26 0.0% 0 1.7% 3 0.0% 0 0.0% 0 0.0% 0 0.0% 0 Blackwater 0.1% 1 0.0% 0 0.0% 0 0.0% 0 0.0% 0 0.0% 0 0.0% 0 0.0% 0 0.0% 0 0.0% 0 0.0% 0 1.1% 1 Bracknell Town Centre 0.5% 8 0.0% 0 0.0% 0 0.0% 0 0.0% 0 0.0% 0 3.7% 4 0.0% 0 0.7% 0 0.0% 0 4.3% 3 0.0% 0 Bracknell (other locations,
not in the town centre) 0.8% 13 0.0% 0 0.0% 0 0.0% 0 0.0% 0 0.0% 0 0.0% 0 0.0% 0 0.0% 0 0.0% 0 17.2% 13 0.0% 0
Camberley 6.2% 102 0.0% 0 0.0% 0 0.0% 0 0.0% 0 0.0% 0 0.0% 0 0.0% 0 1.2% 1 26.5% 42 15.9% 12 44.2% 32 Central London / West End /
Covent Garden 3.1% 52 0.0% 0 0.0% 0 0.9% 0 0.0% 0 7.4% 11 9.8% 11 6.6% 14 2.0% 1 3.1% 5 0.7% 1 1.4% 1
Chertsey 0.1% 2 0.0% 0 0.0% 0 0.0% 0 0.0% 0 0.0% 0 0.0% 0 0.0% 0 0.0% 0 1.0% 2 0.0% 0 0.0% 0 Chobham 0.4% 7 0.0% 0 0.0% 0 0.0% 0 0.0% 0 0.0% 0 0.0% 0 0.0% 0 0.7% 0 4.1% 7 0.0% 0 0.0% 0 City of London 0.5% 8 0.0% 0 0.9% 1 0.0% 0 0.0% 0 0.0% 0 0.0% 0 0.0% 0 6.0% 4 0.0% 0 3.4% 3 0.8% 1 Crowthorne Town Centre 0.1% 1 0.0% 0 0.0% 0 0.0% 0 0.0% 0 0.0% 0 0.0% 0 0.0% 0 0.0% 0 0.0% 0 0.0% 0 1.5% 1 Didcot 0.5% 9 0.0% 0 0.0% 0 0.0% 0 0.0% 0 0.0% 0 0.0% 0 0.0% 0 0.0% 0 0.0% 0 0.0% 0 0.0% 0 Egham 0.5% 8 0.0% 0 0.0% 0 0.0% 0 0.0% 0 0.0% 0 0.0% 0 0.0% 0 12.2% 8 0.0% 0 0.0% 0 0.0% 0 Eton 0.0% 0 0.0% 0 0.0% 0 0.0% 0 0.0% 0 0.0% 0 0.0% 0 0.0% 0 0.7% 0 0.0% 0 0.0% 0 0.0% 0 Farnborough 1.1% 18 0.0% 0 0.0% 0 0.0% 0 0.0% 0 0.0% 0 0.0% 0 0.6% 1 0.0% 0 5.8% 9 0.0% 0 0.7% 1 Farnham 0.2% 3 0.0% 0 0.0% 0 0.0% 0 0.0% 0 0.0% 0 0.0% 0 0.0% 0 0.0% 0 0.0% 0 0.0% 0 0.0% 0 Fleet 2.1% 35 0.0% 0 0.0% 0 0.0% 0 0.0% 0 0.0% 0 0.0% 0 0.0% 0 0.0% 0 0.7% 1 0.0% 0 2.9% 2 Frimley 0.1% 2 0.0% 0 0.0% 0 0.0% 0 0.0% 0 0.0% 0 0.0% 0 0.0% 0 0.0% 0 1.3% 2 0.0% 0 0.0% 0 Gerrards Cross 0.4% 7 0.0% 0 0.0% 0 0.0% 0 0.0% 0 2.4% 4 0.0% 0 1.7% 3 0.0% 0 0.0% 0 0.0% 0 0.0% 0 Guildford 0.7% 11 0.0% 0 0.0% 0 0.0% 0 0.0% 0 0.0% 0 0.0% 0 0.0% 0 0.0% 0 5.9% 9 0.0% 0 1.6% 1 Henley-on-Thames 1.8% 29 0.0% 0 1.0% 1 0.7% 0 30.4% 13 0.0% 0 11.9% 13 0.0% 0 0.0% 0 0.0% 0 0.0% 0 0.0% 0 High Wycombe 4.7% 77 0.0% 0 0.0% 0 0.0% 0 12.3% 5 46.0% 70 1.0% 1 0.0% 0 0.0% 0 0.0% 0 0.7% 1 0.0% 0 Hook 0.3% 5 0.0% 0 0.0% 0 0.0% 0 0.0% 0 0.0% 0 0.0% 0 0.0% 0 0.0% 0 0.0% 0 0.0% 0 0.0% 0 Hungerford Town Centre 0.1% 2 0.0% 0 0.0% 0 0.0% 0 0.0% 0 0.0% 0 0.0% 0 0.0% 0 0.0% 0 0.0% 0 0.0% 0 0.0% 0 Hungerford (other locations,
not in the town centre) 0.1% 1 0.0% 0 0.0% 0 0.0% 0 0.0% 0 0.0% 0 0.0% 0 0.0% 0 0.0% 0 0.0% 0 0.0% 0 0.0% 0
Lower Earley 0.4% 7 4.9% 6 0.0% 0 0.6% 0 0.0% 0 0.0% 0 0.0% 0 0.0% 0 0.0% 0 0.0% 0 0.0% 0 1.1% 1 Maidenhead 1.5% 25 1.3% 1 0.0% 0 0.0% 0 0.0% 0 0.0% 0 10.6% 12 5.8% 12 0.0% 0 0.0% 0 0.0% 0 0.0% 0 Marlborough 0.3% 6 0.0% 0 0.0% 0 0.0% 0 0.0% 0 0.0% 0 0.0% 0 0.0% 0 0.0% 0 0.0% 0 0.0% 0 0.0% 0 Marlow 3.3% 54 0.0% 0 0.0% 0 0.0% 0 5.2% 2 14.5% 22 22.2% 25 2.4% 5 0.0% 0 0.0% 0 0.0% 0 0.0% 0 Newbury Town Centre 3.0% 50 0.0% 0 0.0% 0 5.0% 1 0.0% 0 0.0% 0 0.0% 0 0.0% 0 1.2% 1 0.0% 0 0.0% 0 0.0% 0 Newbury (other locations,
not in the town centre) 0.8% 14 0.0% 0 0.9% 1 0.0% 0 0.0% 0 0.0% 0 0.0% 0 0.0% 0 0.0% 0 0.0% 0 0.0% 0 0.0% 0
Oxford 1.1% 17 0.0% 0 0.0% 0 0.0% 0 4.5% 2 0.0% 0 0.0% 0 0.0% 0 0.0% 0 0.0% 0 0.0% 0 0.0% 0 Pangbourne 0.4% 6 0.0% 0 4.5% 4 0.9% 0 0.0% 0 0.0% 0 0.0% 0 0.0% 0 0.0% 0 0.0% 0 0.0% 0 0.0% 0 Princes Risborough 0.1% 1 0.0% 0 0.0% 0 4.9% 1 0.0% 0 0.0% 0 0.0% 0 0.0% 0 0.0% 0 0.0% 0 0.0% 0 0.0% 0 Reading Town Centre 14.1% 232 59.4% 70 60.8% 52 66.6% 20 4.1% 2 0.9% 1 3.0% 3 2.4% 5 0.0% 0 3.5% 5 23.9% 18 1.5% 1
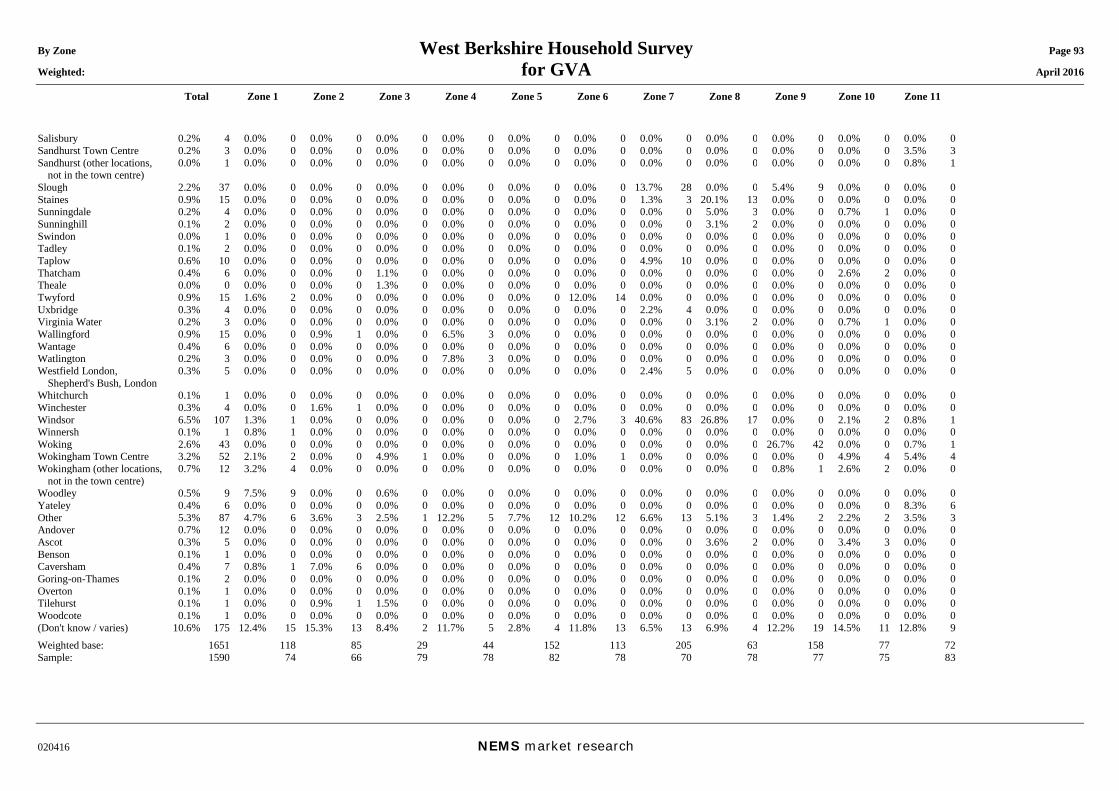
By Zone West Berkshire Household Survey Page 93 Weighted: for GVA April 2016
Total Zone 1 Zone 2 Zone 3 Zone 4 Zone 5 Zone 6 Zone 7 Zone 8 Zone 9 Zone 10 Zone 11
020416 NEMS market research
Salisbury 0.2% 4 0.0% 0 0.0% 0 0.0% 0 0.0% 0 0.0% 0 0.0% 0 0.0% 0 0.0% 0 0.0% 0 0.0% 0 0.0% 0 Sandhurst Town Centre 0.2% 3 0.0% 0 0.0% 0 0.0% 0 0.0% 0 0.0% 0 0.0% 0 0.0% 0 0.0% 0 0.0% 0 0.0% 0 3.5% 3 Sandhurst (other locations,
not in the town centre) 0.0% 1 0.0% 0 0.0% 0 0.0% 0 0.0% 0 0.0% 0 0.0% 0 0.0% 0 0.0% 0 0.0% 0 0.0% 0 0.8% 1
Slough 2.2% 37 0.0% 0 0.0% 0 0.0% 0 0.0% 0 0.0% 0 0.0% 0 13.7% 28 0.0% 0 5.4% 9 0.0% 0 0.0% 0 Staines 0.9% 15 0.0% 0 0.0% 0 0.0% 0 0.0% 0 0.0% 0 0.0% 0 1.3% 3 20.1% 13 0.0% 0 0.0% 0 0.0% 0 Sunningdale 0.2% 4 0.0% 0 0.0% 0 0.0% 0 0.0% 0 0.0% 0 0.0% 0 0.0% 0 5.0% 3 0.0% 0 0.7% 1 0.0% 0 Sunninghill 0.1% 2 0.0% 0 0.0% 0 0.0% 0 0.0% 0 0.0% 0 0.0% 0 0.0% 0 3.1% 2 0.0% 0 0.0% 0 0.0% 0 Swindon 0.0% 1 0.0% 0 0.0% 0 0.0% 0 0.0% 0 0.0% 0 0.0% 0 0.0% 0 0.0% 0 0.0% 0 0.0% 0 0.0% 0 Tadley 0.1% 2 0.0% 0 0.0% 0 0.0% 0 0.0% 0 0.0% 0 0.0% 0 0.0% 0 0.0% 0 0.0% 0 0.0% 0 0.0% 0 Taplow 0.6% 10 0.0% 0 0.0% 0 0.0% 0 0.0% 0 0.0% 0 0.0% 0 4.9% 10 0.0% 0 0.0% 0 0.0% 0 0.0% 0 Thatcham 0.4% 6 0.0% 0 0.0% 0 1.1% 0 0.0% 0 0.0% 0 0.0% 0 0.0% 0 0.0% 0 0.0% 0 2.6% 2 0.0% 0 Theale 0.0% 0 0.0% 0 0.0% 0 1.3% 0 0.0% 0 0.0% 0 0.0% 0 0.0% 0 0.0% 0 0.0% 0 0.0% 0 0.0% 0 Twyford 0.9% 15 1.6% 2 0.0% 0 0.0% 0 0.0% 0 0.0% 0 12.0% 14 0.0% 0 0.0% 0 0.0% 0 0.0% 0 0.0% 0 Uxbridge 0.3% 4 0.0% 0 0.0% 0 0.0% 0 0.0% 0 0.0% 0 0.0% 0 2.2% 4 0.0% 0 0.0% 0 0.0% 0 0.0% 0 Virginia Water 0.2% 3 0.0% 0 0.0% 0 0.0% 0 0.0% 0 0.0% 0 0.0% 0 0.0% 0 3.1% 2 0.0% 0 0.7% 1 0.0% 0 Wallingford 0.9% 15 0.0% 0 0.9% 1 0.0% 0 6.5% 3 0.0% 0 0.0% 0 0.0% 0 0.0% 0 0.0% 0 0.0% 0 0.0% 0 Wantage 0.4% 6 0.0% 0 0.0% 0 0.0% 0 0.0% 0 0.0% 0 0.0% 0 0.0% 0 0.0% 0 0.0% 0 0.0% 0 0.0% 0 Watlington 0.2% 3 0.0% 0 0.0% 0 0.0% 0 7.8% 3 0.0% 0 0.0% 0 0.0% 0 0.0% 0 0.0% 0 0.0% 0 0.0% 0 Westfield London,
Shepherd's Bush, London 0.3% 5 0.0% 0 0.0% 0 0.0% 0 0.0% 0 0.0% 0 0.0% 0 2.4% 5 0.0% 0 0.0% 0 0.0% 0 0.0% 0
Whitchurch 0.1% 1 0.0% 0 0.0% 0 0.0% 0 0.0% 0 0.0% 0 0.0% 0 0.0% 0 0.0% 0 0.0% 0 0.0% 0 0.0% 0 Winchester 0.3% 4 0.0% 0 1.6% 1 0.0% 0 0.0% 0 0.0% 0 0.0% 0 0.0% 0 0.0% 0 0.0% 0 0.0% 0 0.0% 0 Windsor 6.5% 107 1.3% 1 0.0% 0 0.0% 0 0.0% 0 0.0% 0 2.7% 3 40.6% 83 26.8% 17 0.0% 0 2.1% 2 0.8% 1 Winnersh 0.1% 1 0.8% 1 0.0% 0 0.0% 0 0.0% 0 0.0% 0 0.0% 0 0.0% 0 0.0% 0 0.0% 0 0.0% 0 0.0% 0 Woking 2.6% 43 0.0% 0 0.0% 0 0.0% 0 0.0% 0 0.0% 0 0.0% 0 0.0% 0 0.0% 0 26.7% 42 0.0% 0 0.7% 1 Wokingham Town Centre 3.2% 52 2.1% 2 0.0% 0 4.9% 1 0.0% 0 0.0% 0 1.0% 1 0.0% 0 0.0% 0 0.0% 0 4.9% 4 5.4% 4 Wokingham (other locations,
not in the town centre) 0.7% 12 3.2% 4 0.0% 0 0.0% 0 0.0% 0 0.0% 0 0.0% 0 0.0% 0 0.0% 0 0.8% 1 2.6% 2 0.0% 0
Woodley 0.5% 9 7.5% 9 0.0% 0 0.6% 0 0.0% 0 0.0% 0 0.0% 0 0.0% 0 0.0% 0 0.0% 0 0.0% 0 0.0% 0 Yateley 0.4% 6 0.0% 0 0.0% 0 0.0% 0 0.0% 0 0.0% 0 0.0% 0 0.0% 0 0.0% 0 0.0% 0 0.0% 0 8.3% 6 Other 5.3% 87 4.7% 6 3.6% 3 2.5% 1 12.2% 5 7.7% 12 10.2% 12 6.6% 13 5.1% 3 1.4% 2 2.2% 2 3.5% 3 Andover 0.7% 12 0.0% 0 0.0% 0 0.0% 0 0.0% 0 0.0% 0 0.0% 0 0.0% 0 0.0% 0 0.0% 0 0.0% 0 0.0% 0 Ascot 0.3% 5 0.0% 0 0.0% 0 0.0% 0 0.0% 0 0.0% 0 0.0% 0 0.0% 0 3.6% 2 0.0% 0 3.4% 3 0.0% 0 Benson 0.1% 1 0.0% 0 0.0% 0 0.0% 0 0.0% 0 0.0% 0 0.0% 0 0.0% 0 0.0% 0 0.0% 0 0.0% 0 0.0% 0 Caversham 0.4% 7 0.8% 1 7.0% 6 0.0% 0 0.0% 0 0.0% 0 0.0% 0 0.0% 0 0.0% 0 0.0% 0 0.0% 0 0.0% 0 Goring-on-Thames 0.1% 2 0.0% 0 0.0% 0 0.0% 0 0.0% 0 0.0% 0 0.0% 0 0.0% 0 0.0% 0 0.0% 0 0.0% 0 0.0% 0 Overton 0.1% 1 0.0% 0 0.0% 0 0.0% 0 0.0% 0 0.0% 0 0.0% 0 0.0% 0 0.0% 0 0.0% 0 0.0% 0 0.0% 0 Tilehurst 0.1% 1 0.0% 0 0.9% 1 1.5% 0 0.0% 0 0.0% 0 0.0% 0 0.0% 0 0.0% 0 0.0% 0 0.0% 0 0.0% 0 Woodcote 0.1% 1 0.0% 0 0.0% 0 0.0% 0 0.0% 0 0.0% 0 0.0% 0 0.0% 0 0.0% 0 0.0% 0 0.0% 0 0.0% 0 (Don't know / varies) 10.6% 175 12.4% 15 15.3% 13 8.4% 2 11.7% 5 2.8% 4 11.8% 13 6.5% 13 6.9% 4 12.2% 19 14.5% 11 12.8% 9 Weighted base: 1651 118 85 29 44 152 113 205 63 158 77 72 Sample: 1590 74 66 79 78 82 78 70 78 77 75 83
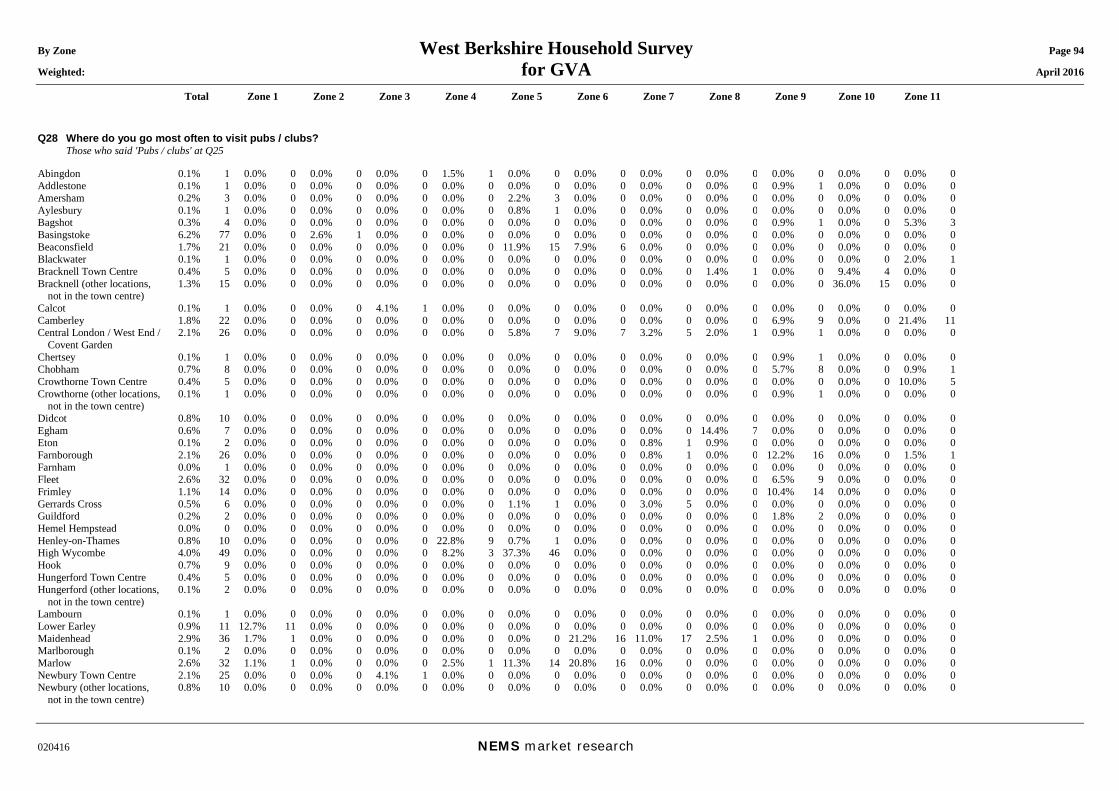
By Zone West Berkshire Household Survey Page 94 Weighted: for GVA April 2016
Total Zone 1 Zone 2 Zone 3 Zone 4 Zone 5 Zone 6 Zone 7 Zone 8 Zone 9 Zone 10 Zone 11
020416 NEMS market research
Q28 Where do you go most often to visit pubs / clubs? Those who said 'Pubs / clubs' at Q25 Abingdon 0.1% 1 0.0% 0 0.0% 0 0.0% 0 1.5% 1 0.0% 0 0.0% 0 0.0% 0 0.0% 0 0.0% 0 0.0% 0 0.0% 0 Addlestone 0.1% 1 0.0% 0 0.0% 0 0.0% 0 0.0% 0 0.0% 0 0.0% 0 0.0% 0 0.0% 0 0.9% 1 0.0% 0 0.0% 0 Amersham 0.2% 3 0.0% 0 0.0% 0 0.0% 0 0.0% 0 2.2% 3 0.0% 0 0.0% 0 0.0% 0 0.0% 0 0.0% 0 0.0% 0 Aylesbury 0.1% 1 0.0% 0 0.0% 0 0.0% 0 0.0% 0 0.8% 1 0.0% 0 0.0% 0 0.0% 0 0.0% 0 0.0% 0 0.0% 0 Bagshot 0.3% 4 0.0% 0 0.0% 0 0.0% 0 0.0% 0 0.0% 0 0.0% 0 0.0% 0 0.0% 0 0.9% 1 0.0% 0 5.3% 3 Basingstoke 6.2% 77 0.0% 0 2.6% 1 0.0% 0 0.0% 0 0.0% 0 0.0% 0 0.0% 0 0.0% 0 0.0% 0 0.0% 0 0.0% 0 Beaconsfield 1.7% 21 0.0% 0 0.0% 0 0.0% 0 0.0% 0 11.9% 15 7.9% 6 0.0% 0 0.0% 0 0.0% 0 0.0% 0 0.0% 0 Blackwater 0.1% 1 0.0% 0 0.0% 0 0.0% 0 0.0% 0 0.0% 0 0.0% 0 0.0% 0 0.0% 0 0.0% 0 0.0% 0 2.0% 1 Bracknell Town Centre 0.4% 5 0.0% 0 0.0% 0 0.0% 0 0.0% 0 0.0% 0 0.0% 0 0.0% 0 1.4% 1 0.0% 0 9.4% 4 0.0% 0 Bracknell (other locations,
not in the town centre) 1.3% 15 0.0% 0 0.0% 0 0.0% 0 0.0% 0 0.0% 0 0.0% 0 0.0% 0 0.0% 0 0.0% 0 36.0% 15 0.0% 0
Calcot 0.1% 1 0.0% 0 0.0% 0 4.1% 1 0.0% 0 0.0% 0 0.0% 0 0.0% 0 0.0% 0 0.0% 0 0.0% 0 0.0% 0 Camberley 1.8% 22 0.0% 0 0.0% 0 0.0% 0 0.0% 0 0.0% 0 0.0% 0 0.0% 0 0.0% 0 6.9% 9 0.0% 0 21.4% 11 Central London / West End /
Covent Garden 2.1% 26 0.0% 0 0.0% 0 0.0% 0 0.0% 0 5.8% 7 9.0% 7 3.2% 5 2.0% 1 0.9% 1 0.0% 0 0.0% 0
Chertsey 0.1% 1 0.0% 0 0.0% 0 0.0% 0 0.0% 0 0.0% 0 0.0% 0 0.0% 0 0.0% 0 0.9% 1 0.0% 0 0.0% 0 Chobham 0.7% 8 0.0% 0 0.0% 0 0.0% 0 0.0% 0 0.0% 0 0.0% 0 0.0% 0 0.0% 0 5.7% 8 0.0% 0 0.9% 1 Crowthorne Town Centre 0.4% 5 0.0% 0 0.0% 0 0.0% 0 0.0% 0 0.0% 0 0.0% 0 0.0% 0 0.0% 0 0.0% 0 0.0% 0 10.0% 5 Crowthorne (other locations,
not in the town centre) 0.1% 1 0.0% 0 0.0% 0 0.0% 0 0.0% 0 0.0% 0 0.0% 0 0.0% 0 0.0% 0 0.9% 1 0.0% 0 0.0% 0
Didcot 0.8% 10 0.0% 0 0.0% 0 0.0% 0 0.0% 0 0.0% 0 0.0% 0 0.0% 0 0.0% 0 0.0% 0 0.0% 0 0.0% 0 Egham 0.6% 7 0.0% 0 0.0% 0 0.0% 0 0.0% 0 0.0% 0 0.0% 0 0.0% 0 14.4% 7 0.0% 0 0.0% 0 0.0% 0 Eton 0.1% 2 0.0% 0 0.0% 0 0.0% 0 0.0% 0 0.0% 0 0.0% 0 0.8% 1 0.9% 0 0.0% 0 0.0% 0 0.0% 0 Farnborough 2.1% 26 0.0% 0 0.0% 0 0.0% 0 0.0% 0 0.0% 0 0.0% 0 0.8% 1 0.0% 0 12.2% 16 0.0% 0 1.5% 1 Farnham 0.0% 1 0.0% 0 0.0% 0 0.0% 0 0.0% 0 0.0% 0 0.0% 0 0.0% 0 0.0% 0 0.0% 0 0.0% 0 0.0% 0 Fleet 2.6% 32 0.0% 0 0.0% 0 0.0% 0 0.0% 0 0.0% 0 0.0% 0 0.0% 0 0.0% 0 6.5% 9 0.0% 0 0.0% 0 Frimley 1.1% 14 0.0% 0 0.0% 0 0.0% 0 0.0% 0 0.0% 0 0.0% 0 0.0% 0 0.0% 0 10.4% 14 0.0% 0 0.0% 0 Gerrards Cross 0.5% 6 0.0% 0 0.0% 0 0.0% 0 0.0% 0 1.1% 1 0.0% 0 3.0% 5 0.0% 0 0.0% 0 0.0% 0 0.0% 0 Guildford 0.2% 2 0.0% 0 0.0% 0 0.0% 0 0.0% 0 0.0% 0 0.0% 0 0.0% 0 0.0% 0 1.8% 2 0.0% 0 0.0% 0 Hemel Hempstead 0.0% 0 0.0% 0 0.0% 0 0.0% 0 0.0% 0 0.0% 0 0.0% 0 0.0% 0 0.0% 0 0.0% 0 0.0% 0 0.0% 0 Henley-on-Thames 0.8% 10 0.0% 0 0.0% 0 0.0% 0 22.8% 9 0.7% 1 0.0% 0 0.0% 0 0.0% 0 0.0% 0 0.0% 0 0.0% 0 High Wycombe 4.0% 49 0.0% 0 0.0% 0 0.0% 0 8.2% 3 37.3% 46 0.0% 0 0.0% 0 0.0% 0 0.0% 0 0.0% 0 0.0% 0 Hook 0.7% 9 0.0% 0 0.0% 0 0.0% 0 0.0% 0 0.0% 0 0.0% 0 0.0% 0 0.0% 0 0.0% 0 0.0% 0 0.0% 0 Hungerford Town Centre 0.4% 5 0.0% 0 0.0% 0 0.0% 0 0.0% 0 0.0% 0 0.0% 0 0.0% 0 0.0% 0 0.0% 0 0.0% 0 0.0% 0 Hungerford (other locations,
not in the town centre) 0.1% 2 0.0% 0 0.0% 0 0.0% 0 0.0% 0 0.0% 0 0.0% 0 0.0% 0 0.0% 0 0.0% 0 0.0% 0 0.0% 0
Lambourn 0.1% 1 0.0% 0 0.0% 0 0.0% 0 0.0% 0 0.0% 0 0.0% 0 0.0% 0 0.0% 0 0.0% 0 0.0% 0 0.0% 0 Lower Earley 0.9% 11 12.7% 11 0.0% 0 0.0% 0 0.0% 0 0.0% 0 0.0% 0 0.0% 0 0.0% 0 0.0% 0 0.0% 0 0.0% 0 Maidenhead 2.9% 36 1.7% 1 0.0% 0 0.0% 0 0.0% 0 0.0% 0 21.2% 16 11.0% 17 2.5% 1 0.0% 0 0.0% 0 0.0% 0 Marlborough 0.1% 2 0.0% 0 0.0% 0 0.0% 0 0.0% 0 0.0% 0 0.0% 0 0.0% 0 0.0% 0 0.0% 0 0.0% 0 0.0% 0 Marlow 2.6% 32 1.1% 1 0.0% 0 0.0% 0 2.5% 1 11.3% 14 20.8% 16 0.0% 0 0.0% 0 0.0% 0 0.0% 0 0.0% 0 Newbury Town Centre 2.1% 25 0.0% 0 0.0% 0 4.1% 1 0.0% 0 0.0% 0 0.0% 0 0.0% 0 0.0% 0 0.0% 0 0.0% 0 0.0% 0 Newbury (other locations,
not in the town centre) 0.8% 10 0.0% 0 0.0% 0 0.0% 0 0.0% 0 0.0% 0 0.0% 0 0.0% 0 0.0% 0 0.0% 0 0.0% 0 0.0% 0
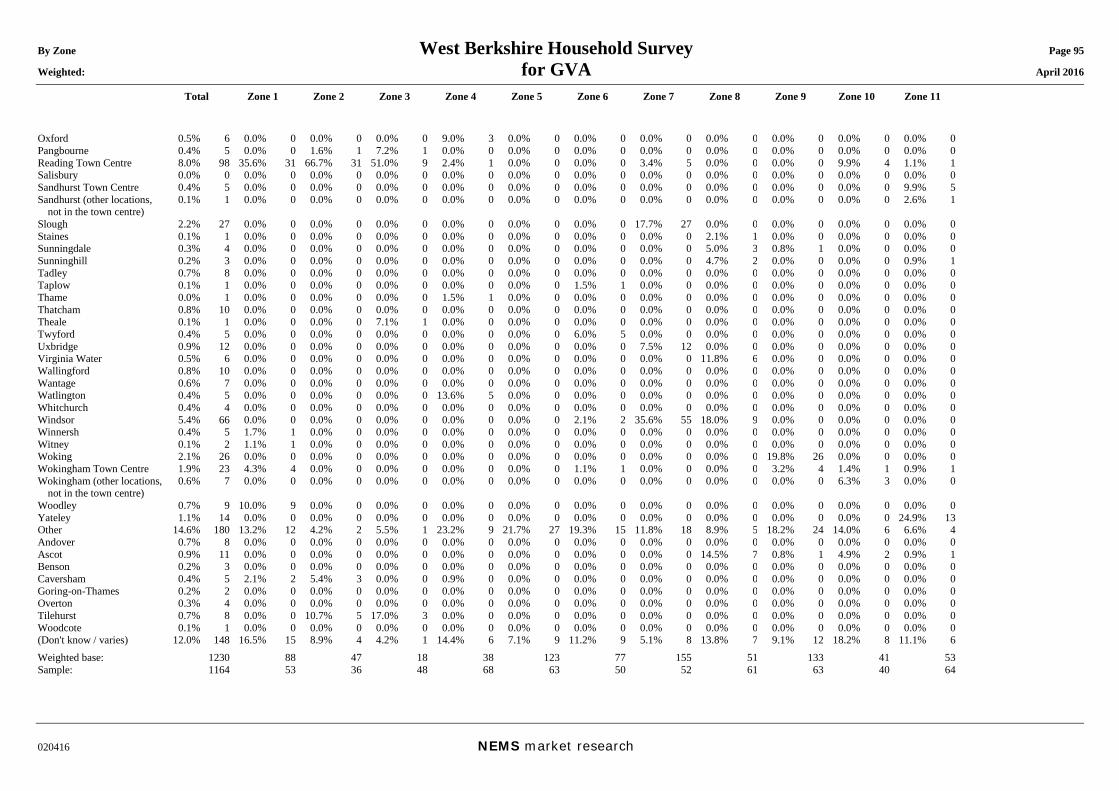
By Zone West Berkshire Household Survey Page 95 Weighted: for GVA April 2016
Total Zone 1 Zone 2 Zone 3 Zone 4 Zone 5 Zone 6 Zone 7 Zone 8 Zone 9 Zone 10 Zone 11
020416 NEMS market research
Oxford 0.5% 6 0.0% 0 0.0% 0 0.0% 0 9.0% 3 0.0% 0 0.0% 0 0.0% 0 0.0% 0 0.0% 0 0.0% 0 0.0% 0 Pangbourne 0.4% 5 0.0% 0 1.6% 1 7.2% 1 0.0% 0 0.0% 0 0.0% 0 0.0% 0 0.0% 0 0.0% 0 0.0% 0 0.0% 0 Reading Town Centre 8.0% 98 35.6% 31 66.7% 31 51.0% 9 2.4% 1 0.0% 0 0.0% 0 3.4% 5 0.0% 0 0.0% 0 9.9% 4 1.1% 1 Salisbury 0.0% 0 0.0% 0 0.0% 0 0.0% 0 0.0% 0 0.0% 0 0.0% 0 0.0% 0 0.0% 0 0.0% 0 0.0% 0 0.0% 0 Sandhurst Town Centre 0.4% 5 0.0% 0 0.0% 0 0.0% 0 0.0% 0 0.0% 0 0.0% 0 0.0% 0 0.0% 0 0.0% 0 0.0% 0 9.9% 5 Sandhurst (other locations,
not in the town centre) 0.1% 1 0.0% 0 0.0% 0 0.0% 0 0.0% 0 0.0% 0 0.0% 0 0.0% 0 0.0% 0 0.0% 0 0.0% 0 2.6% 1
Slough 2.2% 27 0.0% 0 0.0% 0 0.0% 0 0.0% 0 0.0% 0 0.0% 0 17.7% 27 0.0% 0 0.0% 0 0.0% 0 0.0% 0 Staines 0.1% 1 0.0% 0 0.0% 0 0.0% 0 0.0% 0 0.0% 0 0.0% 0 0.0% 0 2.1% 1 0.0% 0 0.0% 0 0.0% 0 Sunningdale 0.3% 4 0.0% 0 0.0% 0 0.0% 0 0.0% 0 0.0% 0 0.0% 0 0.0% 0 5.0% 3 0.8% 1 0.0% 0 0.0% 0 Sunninghill 0.2% 3 0.0% 0 0.0% 0 0.0% 0 0.0% 0 0.0% 0 0.0% 0 0.0% 0 4.7% 2 0.0% 0 0.0% 0 0.9% 1 Tadley 0.7% 8 0.0% 0 0.0% 0 0.0% 0 0.0% 0 0.0% 0 0.0% 0 0.0% 0 0.0% 0 0.0% 0 0.0% 0 0.0% 0 Taplow 0.1% 1 0.0% 0 0.0% 0 0.0% 0 0.0% 0 0.0% 0 1.5% 1 0.0% 0 0.0% 0 0.0% 0 0.0% 0 0.0% 0 Thame 0.0% 1 0.0% 0 0.0% 0 0.0% 0 1.5% 1 0.0% 0 0.0% 0 0.0% 0 0.0% 0 0.0% 0 0.0% 0 0.0% 0 Thatcham 0.8% 10 0.0% 0 0.0% 0 0.0% 0 0.0% 0 0.0% 0 0.0% 0 0.0% 0 0.0% 0 0.0% 0 0.0% 0 0.0% 0 Theale 0.1% 1 0.0% 0 0.0% 0 7.1% 1 0.0% 0 0.0% 0 0.0% 0 0.0% 0 0.0% 0 0.0% 0 0.0% 0 0.0% 0 Twyford 0.4% 5 0.0% 0 0.0% 0 0.0% 0 0.0% 0 0.0% 0 6.0% 5 0.0% 0 0.0% 0 0.0% 0 0.0% 0 0.0% 0 Uxbridge 0.9% 12 0.0% 0 0.0% 0 0.0% 0 0.0% 0 0.0% 0 0.0% 0 7.5% 12 0.0% 0 0.0% 0 0.0% 0 0.0% 0 Virginia Water 0.5% 6 0.0% 0 0.0% 0 0.0% 0 0.0% 0 0.0% 0 0.0% 0 0.0% 0 11.8% 6 0.0% 0 0.0% 0 0.0% 0 Wallingford 0.8% 10 0.0% 0 0.0% 0 0.0% 0 0.0% 0 0.0% 0 0.0% 0 0.0% 0 0.0% 0 0.0% 0 0.0% 0 0.0% 0 Wantage 0.6% 7 0.0% 0 0.0% 0 0.0% 0 0.0% 0 0.0% 0 0.0% 0 0.0% 0 0.0% 0 0.0% 0 0.0% 0 0.0% 0 Watlington 0.4% 5 0.0% 0 0.0% 0 0.0% 0 13.6% 5 0.0% 0 0.0% 0 0.0% 0 0.0% 0 0.0% 0 0.0% 0 0.0% 0 Whitchurch 0.4% 4 0.0% 0 0.0% 0 0.0% 0 0.0% 0 0.0% 0 0.0% 0 0.0% 0 0.0% 0 0.0% 0 0.0% 0 0.0% 0 Windsor 5.4% 66 0.0% 0 0.0% 0 0.0% 0 0.0% 0 0.0% 0 2.1% 2 35.6% 55 18.0% 9 0.0% 0 0.0% 0 0.0% 0 Winnersh 0.4% 5 1.7% 1 0.0% 0 0.0% 0 0.0% 0 0.0% 0 0.0% 0 0.0% 0 0.0% 0 0.0% 0 0.0% 0 0.0% 0 Witney 0.1% 2 1.1% 1 0.0% 0 0.0% 0 0.0% 0 0.0% 0 0.0% 0 0.0% 0 0.0% 0 0.0% 0 0.0% 0 0.0% 0 Woking 2.1% 26 0.0% 0 0.0% 0 0.0% 0 0.0% 0 0.0% 0 0.0% 0 0.0% 0 0.0% 0 19.8% 26 0.0% 0 0.0% 0 Wokingham Town Centre 1.9% 23 4.3% 4 0.0% 0 0.0% 0 0.0% 0 0.0% 0 1.1% 1 0.0% 0 0.0% 0 3.2% 4 1.4% 1 0.9% 1 Wokingham (other locations,
not in the town centre) 0.6% 7 0.0% 0 0.0% 0 0.0% 0 0.0% 0 0.0% 0 0.0% 0 0.0% 0 0.0% 0 0.0% 0 6.3% 3 0.0% 0
Woodley 0.7% 9 10.0% 9 0.0% 0 0.0% 0 0.0% 0 0.0% 0 0.0% 0 0.0% 0 0.0% 0 0.0% 0 0.0% 0 0.0% 0 Yateley 1.1% 14 0.0% 0 0.0% 0 0.0% 0 0.0% 0 0.0% 0 0.0% 0 0.0% 0 0.0% 0 0.0% 0 0.0% 0 24.9% 13 Other 14.6% 180 13.2% 12 4.2% 2 5.5% 1 23.2% 9 21.7% 27 19.3% 15 11.8% 18 8.9% 5 18.2% 24 14.0% 6 6.6% 4 Andover 0.7% 8 0.0% 0 0.0% 0 0.0% 0 0.0% 0 0.0% 0 0.0% 0 0.0% 0 0.0% 0 0.0% 0 0.0% 0 0.0% 0 Ascot 0.9% 11 0.0% 0 0.0% 0 0.0% 0 0.0% 0 0.0% 0 0.0% 0 0.0% 0 14.5% 7 0.8% 1 4.9% 2 0.9% 1 Benson 0.2% 3 0.0% 0 0.0% 0 0.0% 0 0.0% 0 0.0% 0 0.0% 0 0.0% 0 0.0% 0 0.0% 0 0.0% 0 0.0% 0 Caversham 0.4% 5 2.1% 2 5.4% 3 0.0% 0 0.9% 0 0.0% 0 0.0% 0 0.0% 0 0.0% 0 0.0% 0 0.0% 0 0.0% 0 Goring-on-Thames 0.2% 2 0.0% 0 0.0% 0 0.0% 0 0.0% 0 0.0% 0 0.0% 0 0.0% 0 0.0% 0 0.0% 0 0.0% 0 0.0% 0 Overton 0.3% 4 0.0% 0 0.0% 0 0.0% 0 0.0% 0 0.0% 0 0.0% 0 0.0% 0 0.0% 0 0.0% 0 0.0% 0 0.0% 0 Tilehurst 0.7% 8 0.0% 0 10.7% 5 17.0% 3 0.0% 0 0.0% 0 0.0% 0 0.0% 0 0.0% 0 0.0% 0 0.0% 0 0.0% 0 Woodcote 0.1% 1 0.0% 0 0.0% 0 0.0% 0 0.0% 0 0.0% 0 0.0% 0 0.0% 0 0.0% 0 0.0% 0 0.0% 0 0.0% 0 (Don't know / varies) 12.0% 148 16.5% 15 8.9% 4 4.2% 1 14.4% 6 7.1% 9 11.2% 9 5.1% 8 13.8% 7 9.1% 12 18.2% 8 11.1% 6 Weighted base: 1230 88 47 18 38 123 77 155 51 133 41 53 Sample: 1164 53 36 48 68 63 50 52 61 63 40 64
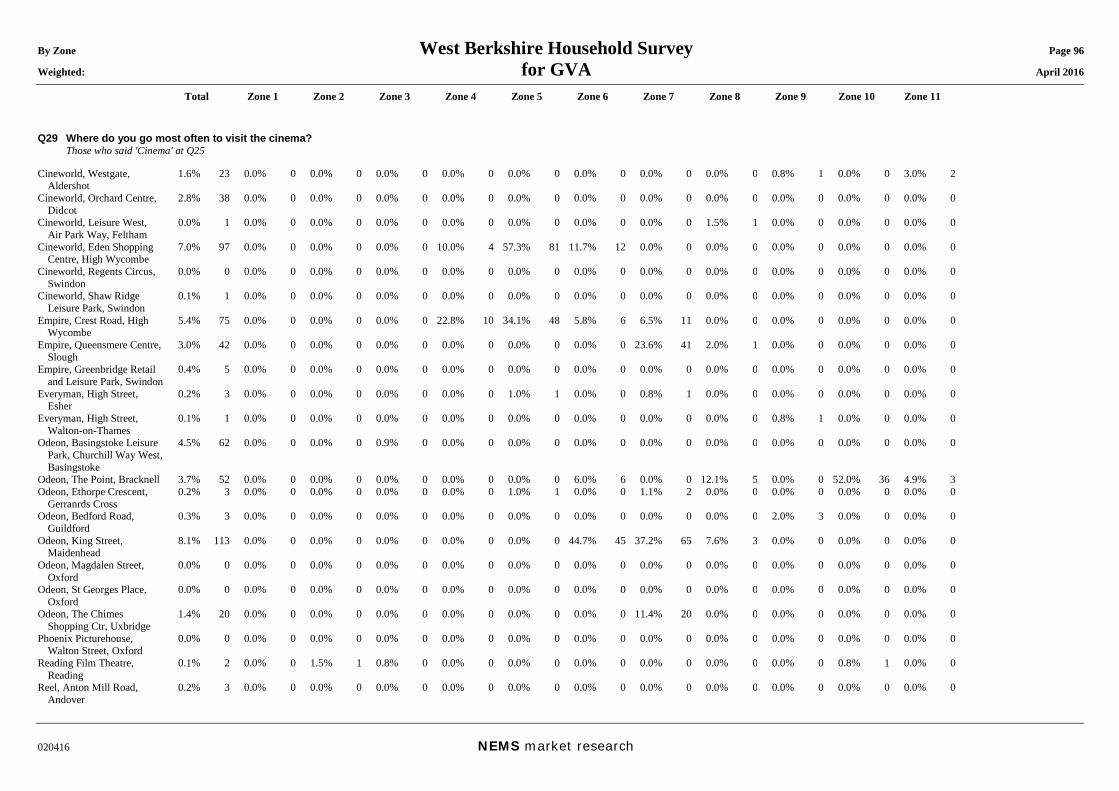
By Zone West Berkshire Household Survey Page 96 Weighted: for GVA April 2016
Total Zone 1 Zone 2 Zone 3 Zone 4 Zone 5 Zone 6 Zone 7 Zone 8 Zone 9 Zone 10 Zone 11
020416 NEMS market research
Q29 Where do you go most often to visit the cinema? Those who said 'Cinema' at Q25 Cineworld, Westgate,
Aldershot 1.6% 23 0.0% 0 0.0% 0 0.0% 0 0.0% 0 0.0% 0 0.0% 0 0.0% 0 0.0% 0 0.8% 1 0.0% 0 3.0% 2
Cineworld, Orchard Centre, Didcot
2.8% 38 0.0% 0 0.0% 0 0.0% 0 0.0% 0 0.0% 0 0.0% 0 0.0% 0 0.0% 0 0.0% 0 0.0% 0 0.0% 0
Cineworld, Leisure West, Air Park Way, Feltham
0.0% 1 0.0% 0 0.0% 0 0.0% 0 0.0% 0 0.0% 0 0.0% 0 0.0% 0 1.5% 1 0.0% 0 0.0% 0 0.0% 0
Cineworld, Eden Shopping Centre, High Wycombe
7.0% 97 0.0% 0 0.0% 0 0.0% 0 10.0% 4 57.3% 81 11.7% 12 0.0% 0 0.0% 0 0.0% 0 0.0% 0 0.0% 0
Cineworld, Regents Circus, Swindon
0.0% 0 0.0% 0 0.0% 0 0.0% 0 0.0% 0 0.0% 0 0.0% 0 0.0% 0 0.0% 0 0.0% 0 0.0% 0 0.0% 0
Cineworld, Shaw Ridge Leisure Park, Swindon
0.1% 1 0.0% 0 0.0% 0 0.0% 0 0.0% 0 0.0% 0 0.0% 0 0.0% 0 0.0% 0 0.0% 0 0.0% 0 0.0% 0
Empire, Crest Road, High Wycombe
5.4% 75 0.0% 0 0.0% 0 0.0% 0 22.8% 10 34.1% 48 5.8% 6 6.5% 11 0.0% 0 0.0% 0 0.0% 0 0.0% 0
Empire, Queensmere Centre, Slough
3.0% 42 0.0% 0 0.0% 0 0.0% 0 0.0% 0 0.0% 0 0.0% 0 23.6% 41 2.0% 1 0.0% 0 0.0% 0 0.0% 0
Empire, Greenbridge Retail and Leisure Park, Swindon
0.4% 5 0.0% 0 0.0% 0 0.0% 0 0.0% 0 0.0% 0 0.0% 0 0.0% 0 0.0% 0 0.0% 0 0.0% 0 0.0% 0
Everyman, High Street, Esher
0.2% 3 0.0% 0 0.0% 0 0.0% 0 0.0% 0 1.0% 1 0.0% 0 0.8% 1 0.0% 0 0.0% 0 0.0% 0 0.0% 0
Everyman, High Street, Walton-on-Thames
0.1% 1 0.0% 0 0.0% 0 0.0% 0 0.0% 0 0.0% 0 0.0% 0 0.0% 0 0.0% 0 0.8% 1 0.0% 0 0.0% 0
Odeon, Basingstoke Leisure Park, Churchill Way West, Basingstoke
4.5% 62 0.0% 0 0.0% 0 0.9% 0 0.0% 0 0.0% 0 0.0% 0 0.0% 0 0.0% 0 0.0% 0 0.0% 0 0.0% 0
Odeon, The Point, Bracknell 3.7% 52 0.0% 0 0.0% 0 0.0% 0 0.0% 0 0.0% 0 6.0% 6 0.0% 0 12.1% 5 0.0% 0 52.0% 36 4.9% 3 Odeon, Ethorpe Crescent,
Gerranrds Cross 0.2% 3 0.0% 0 0.0% 0 0.0% 0 0.0% 0 1.0% 1 0.0% 0 1.1% 2 0.0% 0 0.0% 0 0.0% 0 0.0% 0
Odeon, Bedford Road, Guildford
0.3% 3 0.0% 0 0.0% 0 0.0% 0 0.0% 0 0.0% 0 0.0% 0 0.0% 0 0.0% 0 2.0% 3 0.0% 0 0.0% 0
Odeon, King Street, Maidenhead
8.1% 113 0.0% 0 0.0% 0 0.0% 0 0.0% 0 0.0% 0 44.7% 45 37.2% 65 7.6% 3 0.0% 0 0.0% 0 0.0% 0
Odeon, Magdalen Street, Oxford
0.0% 0 0.0% 0 0.0% 0 0.0% 0 0.0% 0 0.0% 0 0.0% 0 0.0% 0 0.0% 0 0.0% 0 0.0% 0 0.0% 0
Odeon, St Georges Place, Oxford
0.0% 0 0.0% 0 0.0% 0 0.0% 0 0.0% 0 0.0% 0 0.0% 0 0.0% 0 0.0% 0 0.0% 0 0.0% 0 0.0% 0
Odeon, The Chimes Shopping Ctr, Uxbridge
1.4% 20 0.0% 0 0.0% 0 0.0% 0 0.0% 0 0.0% 0 0.0% 0 11.4% 20 0.0% 0 0.0% 0 0.0% 0 0.0% 0
Phoenix Picturehouse, Walton Street, Oxford
0.0% 0 0.0% 0 0.0% 0 0.0% 0 0.0% 0 0.0% 0 0.0% 0 0.0% 0 0.0% 0 0.0% 0 0.0% 0 0.0% 0
Reading Film Theatre, Reading
0.1% 2 0.0% 0 1.5% 1 0.8% 0 0.0% 0 0.0% 0 0.0% 0 0.0% 0 0.0% 0 0.0% 0 0.8% 1 0.0% 0
Reel, Anton Mill Road, Andover
0.2% 3 0.0% 0 0.0% 0 0.0% 0 0.0% 0 0.0% 0 0.0% 0 0.0% 0 0.0% 0 0.0% 0 0.0% 0 0.0% 0
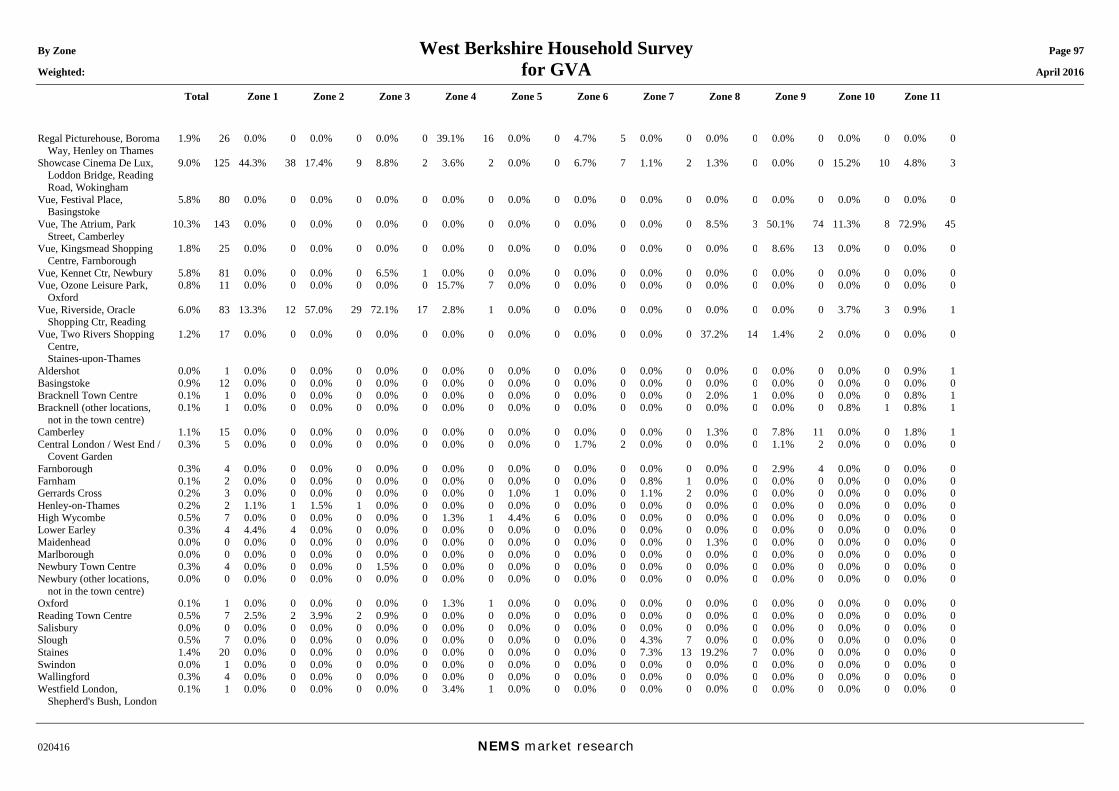
By Zone West Berkshire Household Survey Page 97 Weighted: for GVA April 2016
Total Zone 1 Zone 2 Zone 3 Zone 4 Zone 5 Zone 6 Zone 7 Zone 8 Zone 9 Zone 10 Zone 11
020416 NEMS market research
Regal Picturehouse, Boroma Way, Henley on Thames
1.9% 26 0.0% 0 0.0% 0 0.0% 0 39.1% 16 0.0% 0 4.7% 5 0.0% 0 0.0% 0 0.0% 0 0.0% 0 0.0% 0
Showcase Cinema De Lux, Loddon Bridge, Reading Road, Wokingham
9.0% 125 44.3% 38 17.4% 9 8.8% 2 3.6% 2 0.0% 0 6.7% 7 1.1% 2 1.3% 0 0.0% 0 15.2% 10 4.8% 3
Vue, Festival Place, Basingstoke
5.8% 80 0.0% 0 0.0% 0 0.0% 0 0.0% 0 0.0% 0 0.0% 0 0.0% 0 0.0% 0 0.0% 0 0.0% 0 0.0% 0
Vue, The Atrium, Park Street, Camberley
10.3% 143 0.0% 0 0.0% 0 0.0% 0 0.0% 0 0.0% 0 0.0% 0 0.0% 0 8.5% 3 50.1% 74 11.3% 8 72.9% 45
Vue, Kingsmead Shopping Centre, Farnborough
1.8% 25 0.0% 0 0.0% 0 0.0% 0 0.0% 0 0.0% 0 0.0% 0 0.0% 0 0.0% 0 8.6% 13 0.0% 0 0.0% 0
Vue, Kennet Ctr, Newbury 5.8% 81 0.0% 0 0.0% 0 6.5% 1 0.0% 0 0.0% 0 0.0% 0 0.0% 0 0.0% 0 0.0% 0 0.0% 0 0.0% 0 Vue, Ozone Leisure Park,
Oxford 0.8% 11 0.0% 0 0.0% 0 0.0% 0 15.7% 7 0.0% 0 0.0% 0 0.0% 0 0.0% 0 0.0% 0 0.0% 0 0.0% 0
Vue, Riverside, Oracle Shopping Ctr, Reading
6.0% 83 13.3% 12 57.0% 29 72.1% 17 2.8% 1 0.0% 0 0.0% 0 0.0% 0 0.0% 0 0.0% 0 3.7% 3 0.9% 1
Vue, Two Rivers Shopping Centre, Staines-upon-Thames
1.2% 17 0.0% 0 0.0% 0 0.0% 0 0.0% 0 0.0% 0 0.0% 0 0.0% 0 37.2% 14 1.4% 2 0.0% 0 0.0% 0
Aldershot 0.0% 1 0.0% 0 0.0% 0 0.0% 0 0.0% 0 0.0% 0 0.0% 0 0.0% 0 0.0% 0 0.0% 0 0.0% 0 0.9% 1 Basingstoke 0.9% 12 0.0% 0 0.0% 0 0.0% 0 0.0% 0 0.0% 0 0.0% 0 0.0% 0 0.0% 0 0.0% 0 0.0% 0 0.0% 0 Bracknell Town Centre 0.1% 1 0.0% 0 0.0% 0 0.0% 0 0.0% 0 0.0% 0 0.0% 0 0.0% 0 2.0% 1 0.0% 0 0.0% 0 0.8% 1 Bracknell (other locations,
not in the town centre) 0.1% 1 0.0% 0 0.0% 0 0.0% 0 0.0% 0 0.0% 0 0.0% 0 0.0% 0 0.0% 0 0.0% 0 0.8% 1 0.8% 1
Camberley 1.1% 15 0.0% 0 0.0% 0 0.0% 0 0.0% 0 0.0% 0 0.0% 0 0.0% 0 1.3% 0 7.8% 11 0.0% 0 1.8% 1 Central London / West End /
Covent Garden 0.3% 5 0.0% 0 0.0% 0 0.0% 0 0.0% 0 0.0% 0 1.7% 2 0.0% 0 0.0% 0 1.1% 2 0.0% 0 0.0% 0
Farnborough 0.3% 4 0.0% 0 0.0% 0 0.0% 0 0.0% 0 0.0% 0 0.0% 0 0.0% 0 0.0% 0 2.9% 4 0.0% 0 0.0% 0 Farnham 0.1% 2 0.0% 0 0.0% 0 0.0% 0 0.0% 0 0.0% 0 0.0% 0 0.8% 1 0.0% 0 0.0% 0 0.0% 0 0.0% 0 Gerrards Cross 0.2% 3 0.0% 0 0.0% 0 0.0% 0 0.0% 0 1.0% 1 0.0% 0 1.1% 2 0.0% 0 0.0% 0 0.0% 0 0.0% 0 Henley-on-Thames 0.2% 2 1.1% 1 1.5% 1 0.0% 0 0.0% 0 0.0% 0 0.0% 0 0.0% 0 0.0% 0 0.0% 0 0.0% 0 0.0% 0 High Wycombe 0.5% 7 0.0% 0 0.0% 0 0.0% 0 1.3% 1 4.4% 6 0.0% 0 0.0% 0 0.0% 0 0.0% 0 0.0% 0 0.0% 0 Lower Earley 0.3% 4 4.4% 4 0.0% 0 0.0% 0 0.0% 0 0.0% 0 0.0% 0 0.0% 0 0.0% 0 0.0% 0 0.0% 0 0.0% 0 Maidenhead 0.0% 0 0.0% 0 0.0% 0 0.0% 0 0.0% 0 0.0% 0 0.0% 0 0.0% 0 1.3% 0 0.0% 0 0.0% 0 0.0% 0 Marlborough 0.0% 0 0.0% 0 0.0% 0 0.0% 0 0.0% 0 0.0% 0 0.0% 0 0.0% 0 0.0% 0 0.0% 0 0.0% 0 0.0% 0 Newbury Town Centre 0.3% 4 0.0% 0 0.0% 0 1.5% 0 0.0% 0 0.0% 0 0.0% 0 0.0% 0 0.0% 0 0.0% 0 0.0% 0 0.0% 0 Newbury (other locations,
not in the town centre) 0.0% 0 0.0% 0 0.0% 0 0.0% 0 0.0% 0 0.0% 0 0.0% 0 0.0% 0 0.0% 0 0.0% 0 0.0% 0 0.0% 0
Oxford 0.1% 1 0.0% 0 0.0% 0 0.0% 0 1.3% 1 0.0% 0 0.0% 0 0.0% 0 0.0% 0 0.0% 0 0.0% 0 0.0% 0 Reading Town Centre 0.5% 7 2.5% 2 3.9% 2 0.9% 0 0.0% 0 0.0% 0 0.0% 0 0.0% 0 0.0% 0 0.0% 0 0.0% 0 0.0% 0 Salisbury 0.0% 0 0.0% 0 0.0% 0 0.0% 0 0.0% 0 0.0% 0 0.0% 0 0.0% 0 0.0% 0 0.0% 0 0.0% 0 0.0% 0 Slough 0.5% 7 0.0% 0 0.0% 0 0.0% 0 0.0% 0 0.0% 0 0.0% 0 4.3% 7 0.0% 0 0.0% 0 0.0% 0 0.0% 0 Staines 1.4% 20 0.0% 0 0.0% 0 0.0% 0 0.0% 0 0.0% 0 0.0% 0 7.3% 13 19.2% 7 0.0% 0 0.0% 0 0.0% 0 Swindon 0.0% 1 0.0% 0 0.0% 0 0.0% 0 0.0% 0 0.0% 0 0.0% 0 0.0% 0 0.0% 0 0.0% 0 0.0% 0 0.0% 0 Wallingford 0.3% 4 0.0% 0 0.0% 0 0.0% 0 0.0% 0 0.0% 0 0.0% 0 0.0% 0 0.0% 0 0.0% 0 0.0% 0 0.0% 0 Westfield London,
Shepherd's Bush, London 0.1% 1 0.0% 0 0.0% 0 0.0% 0 3.4% 1 0.0% 0 0.0% 0 0.0% 0 0.0% 0 0.0% 0 0.0% 0 0.0% 0
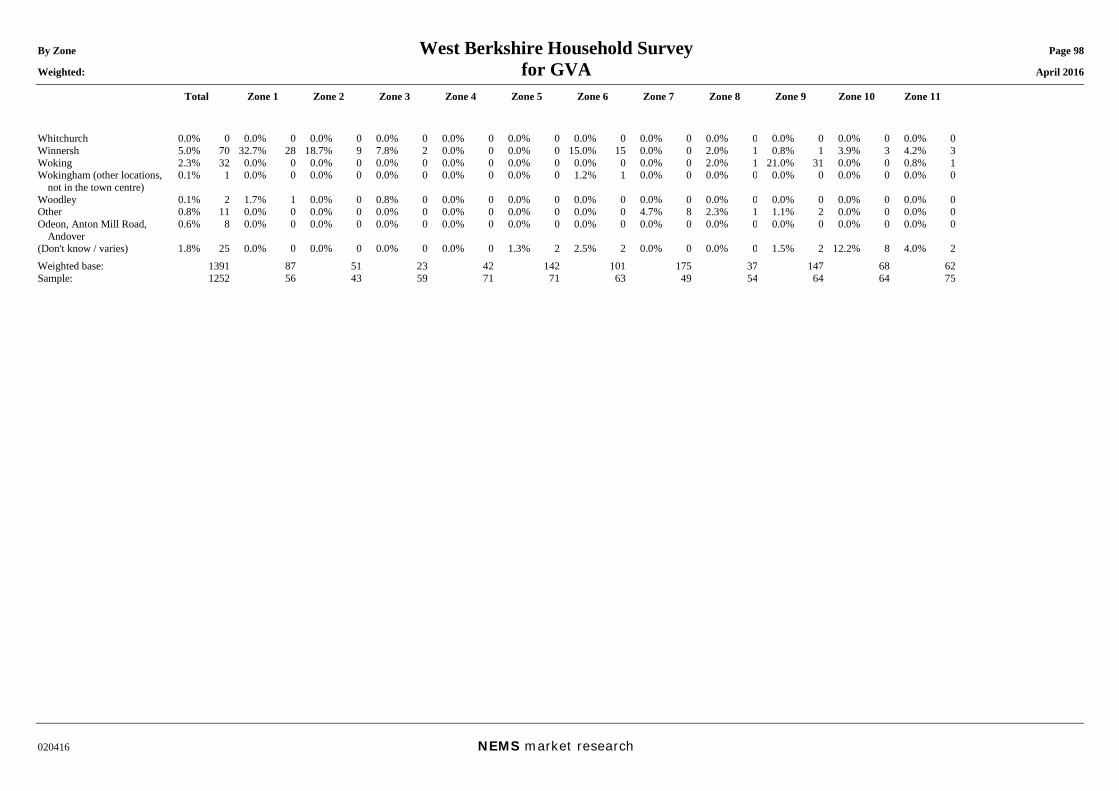
By Zone West Berkshire Household Survey Page 98 Weighted: for GVA April 2016
Total Zone 1 Zone 2 Zone 3 Zone 4 Zone 5 Zone 6 Zone 7 Zone 8 Zone 9 Zone 10 Zone 11
020416 NEMS market research
Whitchurch 0.0% 0 0.0% 0 0.0% 0 0.0% 0 0.0% 0 0.0% 0 0.0% 0 0.0% 0 0.0% 0 0.0% 0 0.0% 0 0.0% 0 Winnersh 5.0% 70 32.7% 28 18.7% 9 7.8% 2 0.0% 0 0.0% 0 15.0% 15 0.0% 0 2.0% 1 0.8% 1 3.9% 3 4.2% 3 Woking 2.3% 32 0.0% 0 0.0% 0 0.0% 0 0.0% 0 0.0% 0 0.0% 0 0.0% 0 2.0% 1 21.0% 31 0.0% 0 0.8% 1 Wokingham (other locations,
not in the town centre) 0.1% 1 0.0% 0 0.0% 0 0.0% 0 0.0% 0 0.0% 0 1.2% 1 0.0% 0 0.0% 0 0.0% 0 0.0% 0 0.0% 0
Woodley 0.1% 2 1.7% 1 0.0% 0 0.8% 0 0.0% 0 0.0% 0 0.0% 0 0.0% 0 0.0% 0 0.0% 0 0.0% 0 0.0% 0 Other 0.8% 11 0.0% 0 0.0% 0 0.0% 0 0.0% 0 0.0% 0 0.0% 0 4.7% 8 2.3% 1 1.1% 2 0.0% 0 0.0% 0 Odeon, Anton Mill Road,
Andover 0.6% 8 0.0% 0 0.0% 0 0.0% 0 0.0% 0 0.0% 0 0.0% 0 0.0% 0 0.0% 0 0.0% 0 0.0% 0 0.0% 0
(Don't know / varies) 1.8% 25 0.0% 0 0.0% 0 0.0% 0 0.0% 0 1.3% 2 2.5% 2 0.0% 0 0.0% 0 1.5% 2 12.2% 8 4.0% 2 Weighted base: 1391 87 51 23 42 142 101 175 37 147 68 62 Sample: 1252 56 43 59 71 71 63 49 54 64 64 75
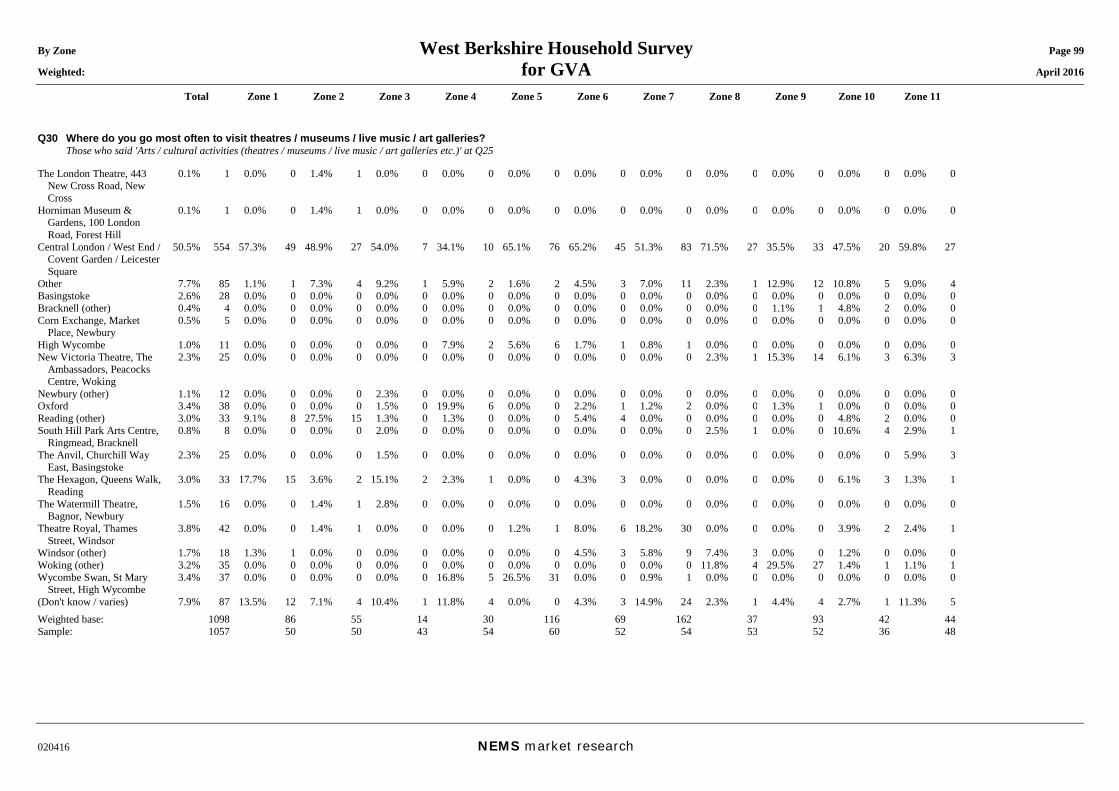
By Zone West Berkshire Household Survey Page 99 Weighted: for GVA April 2016
Total Zone 1 Zone 2 Zone 3 Zone 4 Zone 5 Zone 6 Zone 7 Zone 8 Zone 9 Zone 10 Zone 11
020416 NEMS market research
Q30 Where do you go most often to visit theatres / museums / live music / art galleries? Those who said 'Arts / cultural activities (theatres / museums / live music / art galleries etc.)' at Q25 The London Theatre, 443
New Cross Road, New Cross
0.1% 1 0.0% 0 1.4% 1 0.0% 0 0.0% 0 0.0% 0 0.0% 0 0.0% 0 0.0% 0 0.0% 0 0.0% 0 0.0% 0
Horniman Museum & Gardens, 100 London Road, Forest Hill
0.1% 1 0.0% 0 1.4% 1 0.0% 0 0.0% 0 0.0% 0 0.0% 0 0.0% 0 0.0% 0 0.0% 0 0.0% 0 0.0% 0
Central London / West End / Covent Garden / Leicester Square
50.5% 554 57.3% 49 48.9% 27 54.0% 7 34.1% 10 65.1% 76 65.2% 45 51.3% 83 71.5% 27 35.5% 33 47.5% 20 59.8% 27
Other 7.7% 85 1.1% 1 7.3% 4 9.2% 1 5.9% 2 1.6% 2 4.5% 3 7.0% 11 2.3% 1 12.9% 12 10.8% 5 9.0% 4 Basingstoke 2.6% 28 0.0% 0 0.0% 0 0.0% 0 0.0% 0 0.0% 0 0.0% 0 0.0% 0 0.0% 0 0.0% 0 0.0% 0 0.0% 0 Bracknell (other) 0.4% 4 0.0% 0 0.0% 0 0.0% 0 0.0% 0 0.0% 0 0.0% 0 0.0% 0 0.0% 0 1.1% 1 4.8% 2 0.0% 0 Corn Exchange, Market
Place, Newbury 0.5% 5 0.0% 0 0.0% 0 0.0% 0 0.0% 0 0.0% 0 0.0% 0 0.0% 0 0.0% 0 0.0% 0 0.0% 0 0.0% 0
High Wycombe 1.0% 11 0.0% 0 0.0% 0 0.0% 0 7.9% 2 5.6% 6 1.7% 1 0.8% 1 0.0% 0 0.0% 0 0.0% 0 0.0% 0 New Victoria Theatre, The
Ambassadors, Peacocks Centre, Woking
2.3% 25 0.0% 0 0.0% 0 0.0% 0 0.0% 0 0.0% 0 0.0% 0 0.0% 0 2.3% 1 15.3% 14 6.1% 3 6.3% 3
Newbury (other) 1.1% 12 0.0% 0 0.0% 0 2.3% 0 0.0% 0 0.0% 0 0.0% 0 0.0% 0 0.0% 0 0.0% 0 0.0% 0 0.0% 0 Oxford 3.4% 38 0.0% 0 0.0% 0 1.5% 0 19.9% 6 0.0% 0 2.2% 1 1.2% 2 0.0% 0 1.3% 1 0.0% 0 0.0% 0 Reading (other) 3.0% 33 9.1% 8 27.5% 15 1.3% 0 1.3% 0 0.0% 0 5.4% 4 0.0% 0 0.0% 0 0.0% 0 4.8% 2 0.0% 0 South Hill Park Arts Centre,
Ringmead, Bracknell 0.8% 8 0.0% 0 0.0% 0 2.0% 0 0.0% 0 0.0% 0 0.0% 0 0.0% 0 2.5% 1 0.0% 0 10.6% 4 2.9% 1
The Anvil, Churchill Way East, Basingstoke
2.3% 25 0.0% 0 0.0% 0 1.5% 0 0.0% 0 0.0% 0 0.0% 0 0.0% 0 0.0% 0 0.0% 0 0.0% 0 5.9% 3
The Hexagon, Queens Walk, Reading
3.0% 33 17.7% 15 3.6% 2 15.1% 2 2.3% 1 0.0% 0 4.3% 3 0.0% 0 0.0% 0 0.0% 0 6.1% 3 1.3% 1
The Watermill Theatre, Bagnor, Newbury
1.5% 16 0.0% 0 1.4% 1 2.8% 0 0.0% 0 0.0% 0 0.0% 0 0.0% 0 0.0% 0 0.0% 0 0.0% 0 0.0% 0
Theatre Royal, Thames Street, Windsor
3.8% 42 0.0% 0 1.4% 1 0.0% 0 0.0% 0 1.2% 1 8.0% 6 18.2% 30 0.0% 0 0.0% 0 3.9% 2 2.4% 1
Windsor (other) 1.7% 18 1.3% 1 0.0% 0 0.0% 0 0.0% 0 0.0% 0 4.5% 3 5.8% 9 7.4% 3 0.0% 0 1.2% 0 0.0% 0 Woking (other) 3.2% 35 0.0% 0 0.0% 0 0.0% 0 0.0% 0 0.0% 0 0.0% 0 0.0% 0 11.8% 4 29.5% 27 1.4% 1 1.1% 1 Wycombe Swan, St Mary
Street, High Wycombe 3.4% 37 0.0% 0 0.0% 0 0.0% 0 16.8% 5 26.5% 31 0.0% 0 0.9% 1 0.0% 0 0.0% 0 0.0% 0 0.0% 0
(Don't know / varies) 7.9% 87 13.5% 12 7.1% 4 10.4% 1 11.8% 4 0.0% 0 4.3% 3 14.9% 24 2.3% 1 4.4% 4 2.7% 1 11.3% 5 Weighted base: 1098 86 55 14 30 116 69 162 37 93 42 44 Sample: 1057 50 50 43 54 60 52 54 53 52 36 48
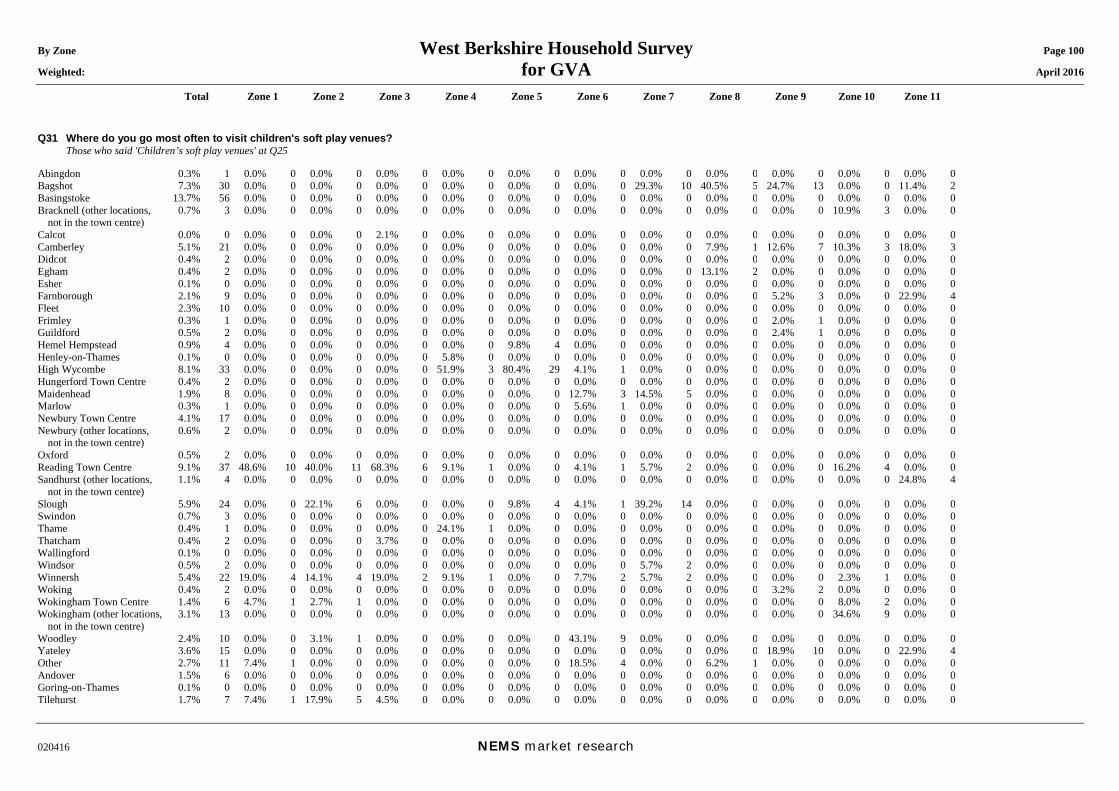
By Zone West Berkshire Household Survey Page 100 Weighted: for GVA April 2016
Total Zone 1 Zone 2 Zone 3 Zone 4 Zone 5 Zone 6 Zone 7 Zone 8 Zone 9 Zone 10 Zone 11
020416 NEMS market research
Q31 Where do you go most often to visit children's soft play venues? Those who said 'Children’s soft play venues' at Q25 Abingdon 0.3% 1 0.0% 0 0.0% 0 0.0% 0 0.0% 0 0.0% 0 0.0% 0 0.0% 0 0.0% 0 0.0% 0 0.0% 0 0.0% 0 Bagshot 7.3% 30 0.0% 0 0.0% 0 0.0% 0 0.0% 0 0.0% 0 0.0% 0 29.3% 10 40.5% 5 24.7% 13 0.0% 0 11.4% 2 Basingstoke 13.7% 56 0.0% 0 0.0% 0 0.0% 0 0.0% 0 0.0% 0 0.0% 0 0.0% 0 0.0% 0 0.0% 0 0.0% 0 0.0% 0 Bracknell (other locations,
not in the town centre) 0.7% 3 0.0% 0 0.0% 0 0.0% 0 0.0% 0 0.0% 0 0.0% 0 0.0% 0 0.0% 0 0.0% 0 10.9% 3 0.0% 0
Calcot 0.0% 0 0.0% 0 0.0% 0 2.1% 0 0.0% 0 0.0% 0 0.0% 0 0.0% 0 0.0% 0 0.0% 0 0.0% 0 0.0% 0 Camberley 5.1% 21 0.0% 0 0.0% 0 0.0% 0 0.0% 0 0.0% 0 0.0% 0 0.0% 0 7.9% 1 12.6% 7 10.3% 3 18.0% 3 Didcot 0.4% 2 0.0% 0 0.0% 0 0.0% 0 0.0% 0 0.0% 0 0.0% 0 0.0% 0 0.0% 0 0.0% 0 0.0% 0 0.0% 0 Egham 0.4% 2 0.0% 0 0.0% 0 0.0% 0 0.0% 0 0.0% 0 0.0% 0 0.0% 0 13.1% 2 0.0% 0 0.0% 0 0.0% 0 Esher 0.1% 0 0.0% 0 0.0% 0 0.0% 0 0.0% 0 0.0% 0 0.0% 0 0.0% 0 0.0% 0 0.0% 0 0.0% 0 0.0% 0 Farnborough 2.1% 9 0.0% 0 0.0% 0 0.0% 0 0.0% 0 0.0% 0 0.0% 0 0.0% 0 0.0% 0 5.2% 3 0.0% 0 22.9% 4 Fleet 2.3% 10 0.0% 0 0.0% 0 0.0% 0 0.0% 0 0.0% 0 0.0% 0 0.0% 0 0.0% 0 0.0% 0 0.0% 0 0.0% 0 Frimley 0.3% 1 0.0% 0 0.0% 0 0.0% 0 0.0% 0 0.0% 0 0.0% 0 0.0% 0 0.0% 0 2.0% 1 0.0% 0 0.0% 0 Guildford 0.5% 2 0.0% 0 0.0% 0 0.0% 0 0.0% 0 0.0% 0 0.0% 0 0.0% 0 0.0% 0 2.4% 1 0.0% 0 0.0% 0 Hemel Hempstead 0.9% 4 0.0% 0 0.0% 0 0.0% 0 0.0% 0 9.8% 4 0.0% 0 0.0% 0 0.0% 0 0.0% 0 0.0% 0 0.0% 0 Henley-on-Thames 0.1% 0 0.0% 0 0.0% 0 0.0% 0 5.8% 0 0.0% 0 0.0% 0 0.0% 0 0.0% 0 0.0% 0 0.0% 0 0.0% 0 High Wycombe 8.1% 33 0.0% 0 0.0% 0 0.0% 0 51.9% 3 80.4% 29 4.1% 1 0.0% 0 0.0% 0 0.0% 0 0.0% 0 0.0% 0 Hungerford Town Centre 0.4% 2 0.0% 0 0.0% 0 0.0% 0 0.0% 0 0.0% 0 0.0% 0 0.0% 0 0.0% 0 0.0% 0 0.0% 0 0.0% 0 Maidenhead 1.9% 8 0.0% 0 0.0% 0 0.0% 0 0.0% 0 0.0% 0 12.7% 3 14.5% 5 0.0% 0 0.0% 0 0.0% 0 0.0% 0 Marlow 0.3% 1 0.0% 0 0.0% 0 0.0% 0 0.0% 0 0.0% 0 5.6% 1 0.0% 0 0.0% 0 0.0% 0 0.0% 0 0.0% 0 Newbury Town Centre 4.1% 17 0.0% 0 0.0% 0 0.0% 0 0.0% 0 0.0% 0 0.0% 0 0.0% 0 0.0% 0 0.0% 0 0.0% 0 0.0% 0 Newbury (other locations,
not in the town centre) 0.6% 2 0.0% 0 0.0% 0 0.0% 0 0.0% 0 0.0% 0 0.0% 0 0.0% 0 0.0% 0 0.0% 0 0.0% 0 0.0% 0
Oxford 0.5% 2 0.0% 0 0.0% 0 0.0% 0 0.0% 0 0.0% 0 0.0% 0 0.0% 0 0.0% 0 0.0% 0 0.0% 0 0.0% 0 Reading Town Centre 9.1% 37 48.6% 10 40.0% 11 68.3% 6 9.1% 1 0.0% 0 4.1% 1 5.7% 2 0.0% 0 0.0% 0 16.2% 4 0.0% 0 Sandhurst (other locations,
not in the town centre) 1.1% 4 0.0% 0 0.0% 0 0.0% 0 0.0% 0 0.0% 0 0.0% 0 0.0% 0 0.0% 0 0.0% 0 0.0% 0 24.8% 4
Slough 5.9% 24 0.0% 0 22.1% 6 0.0% 0 0.0% 0 9.8% 4 4.1% 1 39.2% 14 0.0% 0 0.0% 0 0.0% 0 0.0% 0 Swindon 0.7% 3 0.0% 0 0.0% 0 0.0% 0 0.0% 0 0.0% 0 0.0% 0 0.0% 0 0.0% 0 0.0% 0 0.0% 0 0.0% 0 Thame 0.4% 1 0.0% 0 0.0% 0 0.0% 0 24.1% 1 0.0% 0 0.0% 0 0.0% 0 0.0% 0 0.0% 0 0.0% 0 0.0% 0 Thatcham 0.4% 2 0.0% 0 0.0% 0 3.7% 0 0.0% 0 0.0% 0 0.0% 0 0.0% 0 0.0% 0 0.0% 0 0.0% 0 0.0% 0 Wallingford 0.1% 0 0.0% 0 0.0% 0 0.0% 0 0.0% 0 0.0% 0 0.0% 0 0.0% 0 0.0% 0 0.0% 0 0.0% 0 0.0% 0 Windsor 0.5% 2 0.0% 0 0.0% 0 0.0% 0 0.0% 0 0.0% 0 0.0% 0 5.7% 2 0.0% 0 0.0% 0 0.0% 0 0.0% 0 Winnersh 5.4% 22 19.0% 4 14.1% 4 19.0% 2 9.1% 1 0.0% 0 7.7% 2 5.7% 2 0.0% 0 0.0% 0 2.3% 1 0.0% 0 Woking 0.4% 2 0.0% 0 0.0% 0 0.0% 0 0.0% 0 0.0% 0 0.0% 0 0.0% 0 0.0% 0 3.2% 2 0.0% 0 0.0% 0 Wokingham Town Centre 1.4% 6 4.7% 1 2.7% 1 0.0% 0 0.0% 0 0.0% 0 0.0% 0 0.0% 0 0.0% 0 0.0% 0 8.0% 2 0.0% 0 Wokingham (other locations,
not in the town centre) 3.1% 13 0.0% 0 0.0% 0 0.0% 0 0.0% 0 0.0% 0 0.0% 0 0.0% 0 0.0% 0 0.0% 0 34.6% 9 0.0% 0
Woodley 2.4% 10 0.0% 0 3.1% 1 0.0% 0 0.0% 0 0.0% 0 43.1% 9 0.0% 0 0.0% 0 0.0% 0 0.0% 0 0.0% 0 Yateley 3.6% 15 0.0% 0 0.0% 0 0.0% 0 0.0% 0 0.0% 0 0.0% 0 0.0% 0 0.0% 0 18.9% 10 0.0% 0 22.9% 4 Other 2.7% 11 7.4% 1 0.0% 0 0.0% 0 0.0% 0 0.0% 0 18.5% 4 0.0% 0 6.2% 1 0.0% 0 0.0% 0 0.0% 0 Andover 1.5% 6 0.0% 0 0.0% 0 0.0% 0 0.0% 0 0.0% 0 0.0% 0 0.0% 0 0.0% 0 0.0% 0 0.0% 0 0.0% 0 Goring-on-Thames 0.1% 0 0.0% 0 0.0% 0 0.0% 0 0.0% 0 0.0% 0 0.0% 0 0.0% 0 0.0% 0 0.0% 0 0.0% 0 0.0% 0 Tilehurst 1.7% 7 7.4% 1 17.9% 5 4.5% 0 0.0% 0 0.0% 0 0.0% 0 0.0% 0 0.0% 0 0.0% 0 0.0% 0 0.0% 0
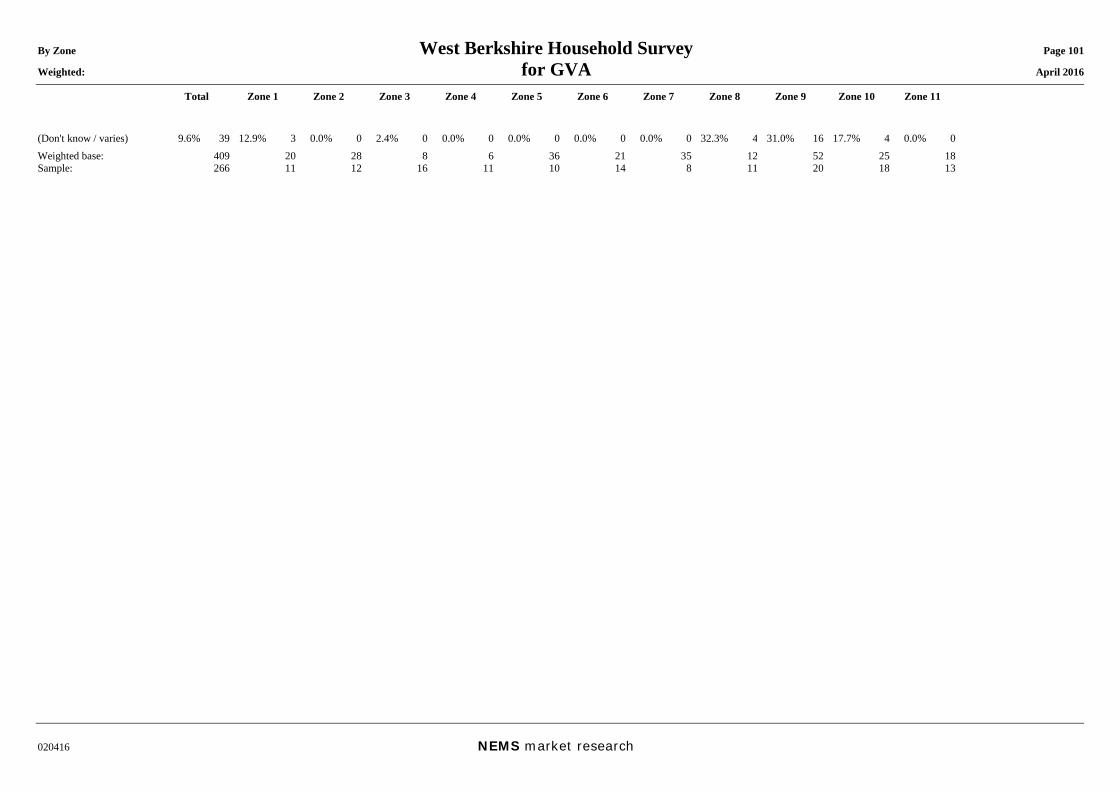
By Zone West Berkshire Household Survey Page 101 Weighted: for GVA April 2016
Total Zone 1 Zone 2 Zone 3 Zone 4 Zone 5 Zone 6 Zone 7 Zone 8 Zone 9 Zone 10 Zone 11
020416 NEMS market research
(Don't know / varies) 9.6% 39 12.9% 3 0.0% 0 2.4% 0 0.0% 0 0.0% 0 0.0% 0 0.0% 0 32.3% 4 31.0% 16 17.7% 4 0.0% 0 Weighted base: 409 20 28 8 6 36 21 35 12 52 25 18 Sample: 266 11 12 16 11 10 14 8 11 20 18 13
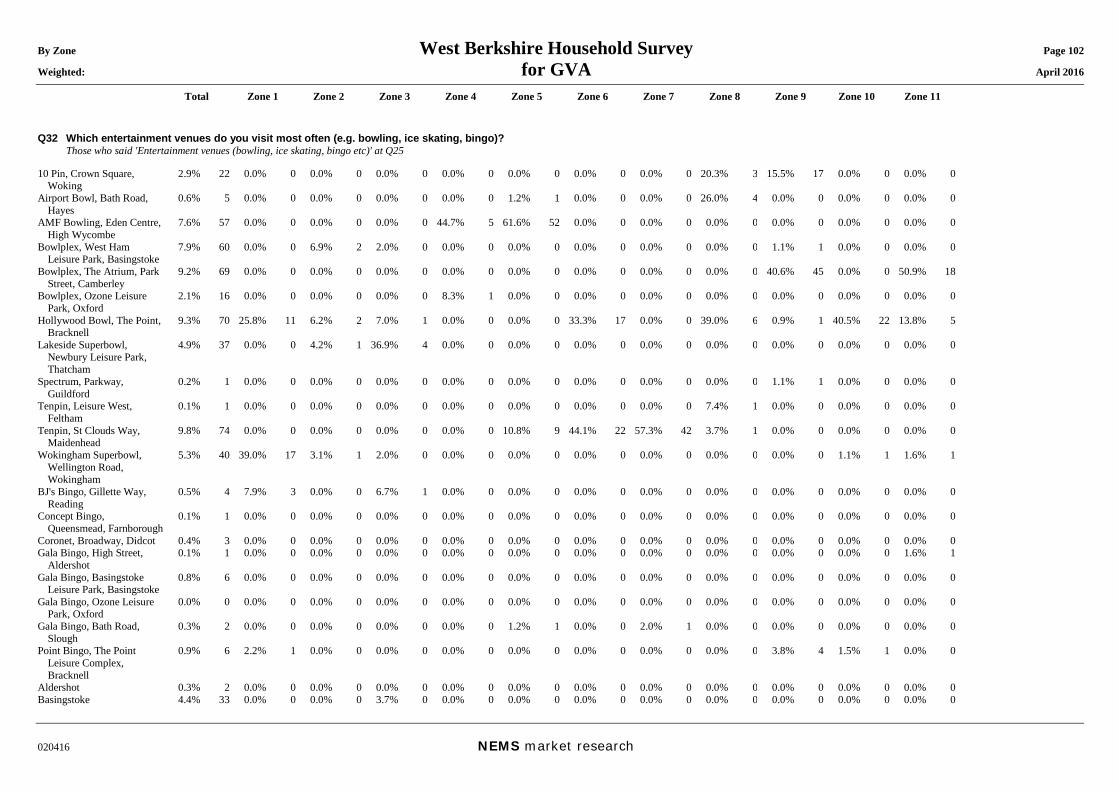
By Zone West Berkshire Household Survey Page 102 Weighted: for GVA April 2016
Total Zone 1 Zone 2 Zone 3 Zone 4 Zone 5 Zone 6 Zone 7 Zone 8 Zone 9 Zone 10 Zone 11
020416 NEMS market research
Q32 Which entertainment venues do you visit most often (e.g. bowling, ice skating, bingo)? Those who said 'Entertainment venues (bowling, ice skating, bingo etc)' at Q25 10 Pin, Crown Square,
Woking 2.9% 22 0.0% 0 0.0% 0 0.0% 0 0.0% 0 0.0% 0 0.0% 0 0.0% 0 20.3% 3 15.5% 17 0.0% 0 0.0% 0
Airport Bowl, Bath Road, Hayes
0.6% 5 0.0% 0 0.0% 0 0.0% 0 0.0% 0 1.2% 1 0.0% 0 0.0% 0 26.0% 4 0.0% 0 0.0% 0 0.0% 0
AMF Bowling, Eden Centre, High Wycombe
7.6% 57 0.0% 0 0.0% 0 0.0% 0 44.7% 5 61.6% 52 0.0% 0 0.0% 0 0.0% 0 0.0% 0 0.0% 0 0.0% 0
Bowlplex, West Ham Leisure Park, Basingstoke
7.9% 60 0.0% 0 6.9% 2 2.0% 0 0.0% 0 0.0% 0 0.0% 0 0.0% 0 0.0% 0 1.1% 1 0.0% 0 0.0% 0
Bowlplex, The Atrium, Park Street, Camberley
9.2% 69 0.0% 0 0.0% 0 0.0% 0 0.0% 0 0.0% 0 0.0% 0 0.0% 0 0.0% 0 40.6% 45 0.0% 0 50.9% 18
Bowlplex, Ozone Leisure Park, Oxford
2.1% 16 0.0% 0 0.0% 0 0.0% 0 8.3% 1 0.0% 0 0.0% 0 0.0% 0 0.0% 0 0.0% 0 0.0% 0 0.0% 0
Hollywood Bowl, The Point, Bracknell
9.3% 70 25.8% 11 6.2% 2 7.0% 1 0.0% 0 0.0% 0 33.3% 17 0.0% 0 39.0% 6 0.9% 1 40.5% 22 13.8% 5
Lakeside Superbowl, Newbury Leisure Park, Thatcham
4.9% 37 0.0% 0 4.2% 1 36.9% 4 0.0% 0 0.0% 0 0.0% 0 0.0% 0 0.0% 0 0.0% 0 0.0% 0 0.0% 0
Spectrum, Parkway, Guildford
0.2% 1 0.0% 0 0.0% 0 0.0% 0 0.0% 0 0.0% 0 0.0% 0 0.0% 0 0.0% 0 1.1% 1 0.0% 0 0.0% 0
Tenpin, Leisure West, Feltham
0.1% 1 0.0% 0 0.0% 0 0.0% 0 0.0% 0 0.0% 0 0.0% 0 0.0% 0 7.4% 1 0.0% 0 0.0% 0 0.0% 0
Tenpin, St Clouds Way, Maidenhead
9.8% 74 0.0% 0 0.0% 0 0.0% 0 0.0% 0 10.8% 9 44.1% 22 57.3% 42 3.7% 1 0.0% 0 0.0% 0 0.0% 0
Wokingham Superbowl, Wellington Road, Wokingham
5.3% 40 39.0% 17 3.1% 1 2.0% 0 0.0% 0 0.0% 0 0.0% 0 0.0% 0 0.0% 0 0.0% 0 1.1% 1 1.6% 1
BJ's Bingo, Gillette Way, Reading
0.5% 4 7.9% 3 0.0% 0 6.7% 1 0.0% 0 0.0% 0 0.0% 0 0.0% 0 0.0% 0 0.0% 0 0.0% 0 0.0% 0
Concept Bingo, Queensmead, Farnborough
0.1% 1 0.0% 0 0.0% 0 0.0% 0 0.0% 0 0.0% 0 0.0% 0 0.0% 0 0.0% 0 0.0% 0 0.0% 0 0.0% 0
Coronet, Broadway, Didcot 0.4% 3 0.0% 0 0.0% 0 0.0% 0 0.0% 0 0.0% 0 0.0% 0 0.0% 0 0.0% 0 0.0% 0 0.0% 0 0.0% 0 Gala Bingo, High Street,
Aldershot 0.1% 1 0.0% 0 0.0% 0 0.0% 0 0.0% 0 0.0% 0 0.0% 0 0.0% 0 0.0% 0 0.0% 0 0.0% 0 1.6% 1
Gala Bingo, Basingstoke Leisure Park, Basingstoke
0.8% 6 0.0% 0 0.0% 0 0.0% 0 0.0% 0 0.0% 0 0.0% 0 0.0% 0 0.0% 0 0.0% 0 0.0% 0 0.0% 0
Gala Bingo, Ozone Leisure Park, Oxford
0.0% 0 0.0% 0 0.0% 0 0.0% 0 0.0% 0 0.0% 0 0.0% 0 0.0% 0 0.0% 0 0.0% 0 0.0% 0 0.0% 0
Gala Bingo, Bath Road, Slough
0.3% 2 0.0% 0 0.0% 0 0.0% 0 0.0% 0 1.2% 1 0.0% 0 2.0% 1 0.0% 0 0.0% 0 0.0% 0 0.0% 0
Point Bingo, The Point Leisure Complex, Bracknell
0.9% 6 2.2% 1 0.0% 0 0.0% 0 0.0% 0 0.0% 0 0.0% 0 0.0% 0 0.0% 0 3.8% 4 1.5% 1 0.0% 0
Aldershot 0.3% 2 0.0% 0 0.0% 0 0.0% 0 0.0% 0 0.0% 0 0.0% 0 0.0% 0 0.0% 0 0.0% 0 0.0% 0 0.0% 0 Basingstoke 4.4% 33 0.0% 0 0.0% 0 3.7% 0 0.0% 0 0.0% 0 0.0% 0 0.0% 0 0.0% 0 0.0% 0 0.0% 0 0.0% 0
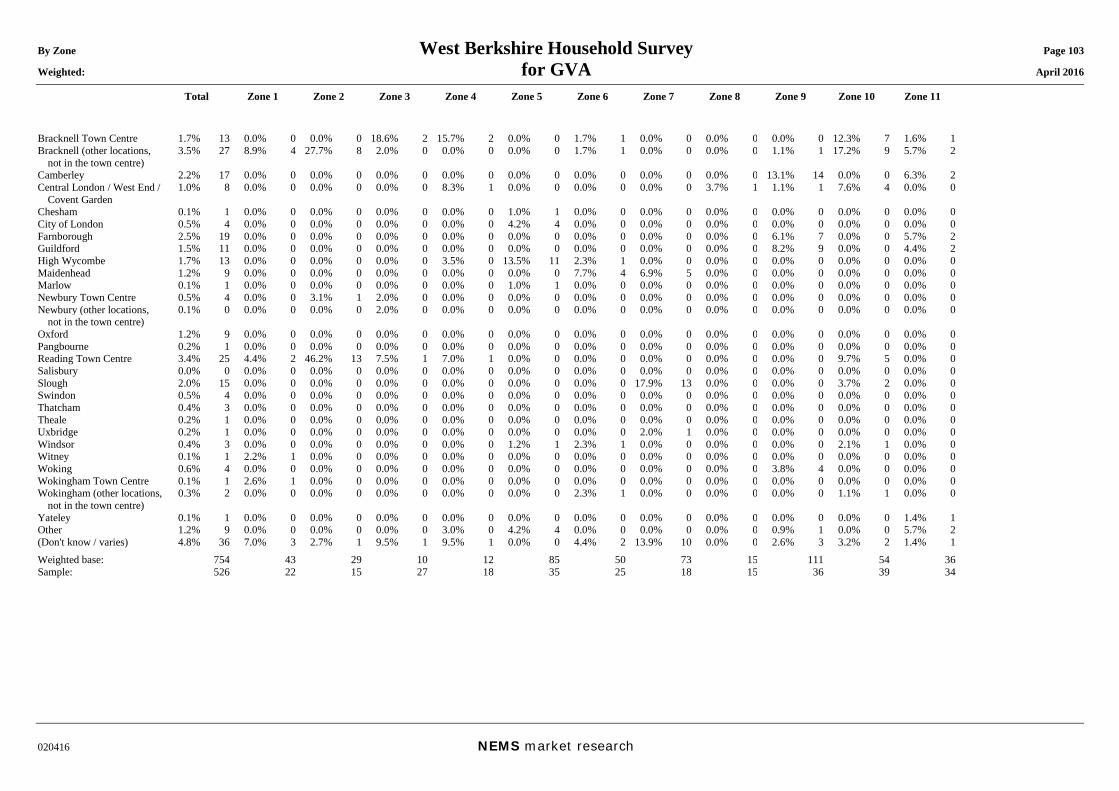
By Zone West Berkshire Household Survey Page 103 Weighted: for GVA April 2016
Total Zone 1 Zone 2 Zone 3 Zone 4 Zone 5 Zone 6 Zone 7 Zone 8 Zone 9 Zone 10 Zone 11
020416 NEMS market research
Bracknell Town Centre 1.7% 13 0.0% 0 0.0% 0 18.6% 2 15.7% 2 0.0% 0 1.7% 1 0.0% 0 0.0% 0 0.0% 0 12.3% 7 1.6% 1 Bracknell (other locations,
not in the town centre) 3.5% 27 8.9% 4 27.7% 8 2.0% 0 0.0% 0 0.0% 0 1.7% 1 0.0% 0 0.0% 0 1.1% 1 17.2% 9 5.7% 2
Camberley 2.2% 17 0.0% 0 0.0% 0 0.0% 0 0.0% 0 0.0% 0 0.0% 0 0.0% 0 0.0% 0 13.1% 14 0.0% 0 6.3% 2 Central London / West End /
Covent Garden 1.0% 8 0.0% 0 0.0% 0 0.0% 0 8.3% 1 0.0% 0 0.0% 0 0.0% 0 3.7% 1 1.1% 1 7.6% 4 0.0% 0
Chesham 0.1% 1 0.0% 0 0.0% 0 0.0% 0 0.0% 0 1.0% 1 0.0% 0 0.0% 0 0.0% 0 0.0% 0 0.0% 0 0.0% 0 City of London 0.5% 4 0.0% 0 0.0% 0 0.0% 0 0.0% 0 4.2% 4 0.0% 0 0.0% 0 0.0% 0 0.0% 0 0.0% 0 0.0% 0 Farnborough 2.5% 19 0.0% 0 0.0% 0 0.0% 0 0.0% 0 0.0% 0 0.0% 0 0.0% 0 0.0% 0 6.1% 7 0.0% 0 5.7% 2 Guildford 1.5% 11 0.0% 0 0.0% 0 0.0% 0 0.0% 0 0.0% 0 0.0% 0 0.0% 0 0.0% 0 8.2% 9 0.0% 0 4.4% 2 High Wycombe 1.7% 13 0.0% 0 0.0% 0 0.0% 0 3.5% 0 13.5% 11 2.3% 1 0.0% 0 0.0% 0 0.0% 0 0.0% 0 0.0% 0 Maidenhead 1.2% 9 0.0% 0 0.0% 0 0.0% 0 0.0% 0 0.0% 0 7.7% 4 6.9% 5 0.0% 0 0.0% 0 0.0% 0 0.0% 0 Marlow 0.1% 1 0.0% 0 0.0% 0 0.0% 0 0.0% 0 1.0% 1 0.0% 0 0.0% 0 0.0% 0 0.0% 0 0.0% 0 0.0% 0 Newbury Town Centre 0.5% 4 0.0% 0 3.1% 1 2.0% 0 0.0% 0 0.0% 0 0.0% 0 0.0% 0 0.0% 0 0.0% 0 0.0% 0 0.0% 0 Newbury (other locations,
not in the town centre) 0.1% 0 0.0% 0 0.0% 0 2.0% 0 0.0% 0 0.0% 0 0.0% 0 0.0% 0 0.0% 0 0.0% 0 0.0% 0 0.0% 0
Oxford 1.2% 9 0.0% 0 0.0% 0 0.0% 0 0.0% 0 0.0% 0 0.0% 0 0.0% 0 0.0% 0 0.0% 0 0.0% 0 0.0% 0 Pangbourne 0.2% 1 0.0% 0 0.0% 0 0.0% 0 0.0% 0 0.0% 0 0.0% 0 0.0% 0 0.0% 0 0.0% 0 0.0% 0 0.0% 0 Reading Town Centre 3.4% 25 4.4% 2 46.2% 13 7.5% 1 7.0% 1 0.0% 0 0.0% 0 0.0% 0 0.0% 0 0.0% 0 9.7% 5 0.0% 0 Salisbury 0.0% 0 0.0% 0 0.0% 0 0.0% 0 0.0% 0 0.0% 0 0.0% 0 0.0% 0 0.0% 0 0.0% 0 0.0% 0 0.0% 0 Slough 2.0% 15 0.0% 0 0.0% 0 0.0% 0 0.0% 0 0.0% 0 0.0% 0 17.9% 13 0.0% 0 0.0% 0 3.7% 2 0.0% 0 Swindon 0.5% 4 0.0% 0 0.0% 0 0.0% 0 0.0% 0 0.0% 0 0.0% 0 0.0% 0 0.0% 0 0.0% 0 0.0% 0 0.0% 0 Thatcham 0.4% 3 0.0% 0 0.0% 0 0.0% 0 0.0% 0 0.0% 0 0.0% 0 0.0% 0 0.0% 0 0.0% 0 0.0% 0 0.0% 0 Theale 0.2% 1 0.0% 0 0.0% 0 0.0% 0 0.0% 0 0.0% 0 0.0% 0 0.0% 0 0.0% 0 0.0% 0 0.0% 0 0.0% 0 Uxbridge 0.2% 1 0.0% 0 0.0% 0 0.0% 0 0.0% 0 0.0% 0 0.0% 0 2.0% 1 0.0% 0 0.0% 0 0.0% 0 0.0% 0 Windsor 0.4% 3 0.0% 0 0.0% 0 0.0% 0 0.0% 0 1.2% 1 2.3% 1 0.0% 0 0.0% 0 0.0% 0 2.1% 1 0.0% 0 Witney 0.1% 1 2.2% 1 0.0% 0 0.0% 0 0.0% 0 0.0% 0 0.0% 0 0.0% 0 0.0% 0 0.0% 0 0.0% 0 0.0% 0 Woking 0.6% 4 0.0% 0 0.0% 0 0.0% 0 0.0% 0 0.0% 0 0.0% 0 0.0% 0 0.0% 0 3.8% 4 0.0% 0 0.0% 0 Wokingham Town Centre 0.1% 1 2.6% 1 0.0% 0 0.0% 0 0.0% 0 0.0% 0 0.0% 0 0.0% 0 0.0% 0 0.0% 0 0.0% 0 0.0% 0 Wokingham (other locations,
not in the town centre) 0.3% 2 0.0% 0 0.0% 0 0.0% 0 0.0% 0 0.0% 0 2.3% 1 0.0% 0 0.0% 0 0.0% 0 1.1% 1 0.0% 0
Yateley 0.1% 1 0.0% 0 0.0% 0 0.0% 0 0.0% 0 0.0% 0 0.0% 0 0.0% 0 0.0% 0 0.0% 0 0.0% 0 1.4% 1 Other 1.2% 9 0.0% 0 0.0% 0 0.0% 0 3.0% 0 4.2% 4 0.0% 0 0.0% 0 0.0% 0 0.9% 1 0.0% 0 5.7% 2 (Don't know / varies) 4.8% 36 7.0% 3 2.7% 1 9.5% 1 9.5% 1 0.0% 0 4.4% 2 13.9% 10 0.0% 0 2.6% 3 3.2% 2 1.4% 1 Weighted base: 754 43 29 10 12 85 50 73 15 111 54 36 Sample: 526 22 15 27 18 35 25 18 15 36 39 34
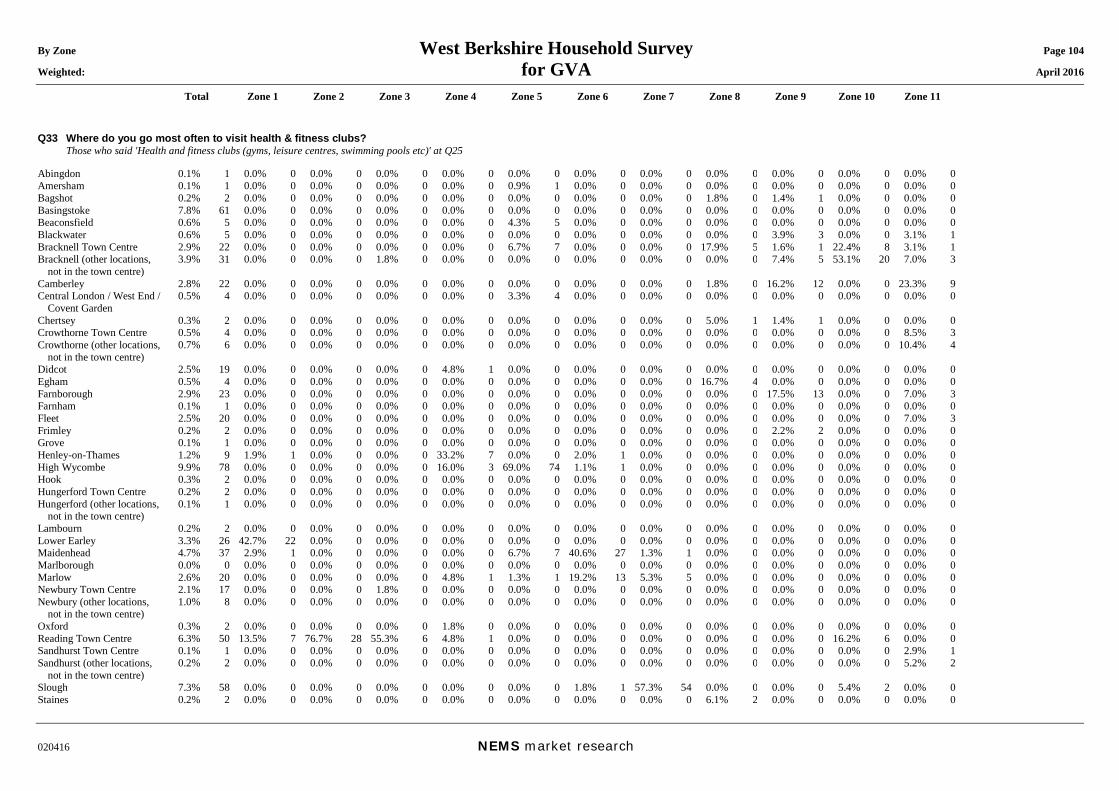
By Zone West Berkshire Household Survey Page 104 Weighted: for GVA April 2016
Total Zone 1 Zone 2 Zone 3 Zone 4 Zone 5 Zone 6 Zone 7 Zone 8 Zone 9 Zone 10 Zone 11
020416 NEMS market research
Q33 Where do you go most often to visit health & fitness clubs? Those who said 'Health and fitness clubs (gyms, leisure centres, swimming pools etc)' at Q25 Abingdon 0.1% 1 0.0% 0 0.0% 0 0.0% 0 0.0% 0 0.0% 0 0.0% 0 0.0% 0 0.0% 0 0.0% 0 0.0% 0 0.0% 0 Amersham 0.1% 1 0.0% 0 0.0% 0 0.0% 0 0.0% 0 0.9% 1 0.0% 0 0.0% 0 0.0% 0 0.0% 0 0.0% 0 0.0% 0 Bagshot 0.2% 2 0.0% 0 0.0% 0 0.0% 0 0.0% 0 0.0% 0 0.0% 0 0.0% 0 1.8% 0 1.4% 1 0.0% 0 0.0% 0 Basingstoke 7.8% 61 0.0% 0 0.0% 0 0.0% 0 0.0% 0 0.0% 0 0.0% 0 0.0% 0 0.0% 0 0.0% 0 0.0% 0 0.0% 0 Beaconsfield 0.6% 5 0.0% 0 0.0% 0 0.0% 0 0.0% 0 4.3% 5 0.0% 0 0.0% 0 0.0% 0 0.0% 0 0.0% 0 0.0% 0 Blackwater 0.6% 5 0.0% 0 0.0% 0 0.0% 0 0.0% 0 0.0% 0 0.0% 0 0.0% 0 0.0% 0 3.9% 3 0.0% 0 3.1% 1 Bracknell Town Centre 2.9% 22 0.0% 0 0.0% 0 0.0% 0 0.0% 0 6.7% 7 0.0% 0 0.0% 0 17.9% 5 1.6% 1 22.4% 8 3.1% 1 Bracknell (other locations,
not in the town centre) 3.9% 31 0.0% 0 0.0% 0 1.8% 0 0.0% 0 0.0% 0 0.0% 0 0.0% 0 0.0% 0 7.4% 5 53.1% 20 7.0% 3
Camberley 2.8% 22 0.0% 0 0.0% 0 0.0% 0 0.0% 0 0.0% 0 0.0% 0 0.0% 0 1.8% 0 16.2% 12 0.0% 0 23.3% 9 Central London / West End /
Covent Garden 0.5% 4 0.0% 0 0.0% 0 0.0% 0 0.0% 0 3.3% 4 0.0% 0 0.0% 0 0.0% 0 0.0% 0 0.0% 0 0.0% 0
Chertsey 0.3% 2 0.0% 0 0.0% 0 0.0% 0 0.0% 0 0.0% 0 0.0% 0 0.0% 0 5.0% 1 1.4% 1 0.0% 0 0.0% 0 Crowthorne Town Centre 0.5% 4 0.0% 0 0.0% 0 0.0% 0 0.0% 0 0.0% 0 0.0% 0 0.0% 0 0.0% 0 0.0% 0 0.0% 0 8.5% 3 Crowthorne (other locations,
not in the town centre) 0.7% 6 0.0% 0 0.0% 0 0.0% 0 0.0% 0 0.0% 0 0.0% 0 0.0% 0 0.0% 0 0.0% 0 0.0% 0 10.4% 4
Didcot 2.5% 19 0.0% 0 0.0% 0 0.0% 0 4.8% 1 0.0% 0 0.0% 0 0.0% 0 0.0% 0 0.0% 0 0.0% 0 0.0% 0 Egham 0.5% 4 0.0% 0 0.0% 0 0.0% 0 0.0% 0 0.0% 0 0.0% 0 0.0% 0 16.7% 4 0.0% 0 0.0% 0 0.0% 0 Farnborough 2.9% 23 0.0% 0 0.0% 0 0.0% 0 0.0% 0 0.0% 0 0.0% 0 0.0% 0 0.0% 0 17.5% 13 0.0% 0 7.0% 3 Farnham 0.1% 1 0.0% 0 0.0% 0 0.0% 0 0.0% 0 0.0% 0 0.0% 0 0.0% 0 0.0% 0 0.0% 0 0.0% 0 0.0% 0 Fleet 2.5% 20 0.0% 0 0.0% 0 0.0% 0 0.0% 0 0.0% 0 0.0% 0 0.0% 0 0.0% 0 0.0% 0 0.0% 0 7.0% 3 Frimley 0.2% 2 0.0% 0 0.0% 0 0.0% 0 0.0% 0 0.0% 0 0.0% 0 0.0% 0 0.0% 0 2.2% 2 0.0% 0 0.0% 0 Grove 0.1% 1 0.0% 0 0.0% 0 0.0% 0 0.0% 0 0.0% 0 0.0% 0 0.0% 0 0.0% 0 0.0% 0 0.0% 0 0.0% 0 Henley-on-Thames 1.2% 9 1.9% 1 0.0% 0 0.0% 0 33.2% 7 0.0% 0 2.0% 1 0.0% 0 0.0% 0 0.0% 0 0.0% 0 0.0% 0 High Wycombe 9.9% 78 0.0% 0 0.0% 0 0.0% 0 16.0% 3 69.0% 74 1.1% 1 0.0% 0 0.0% 0 0.0% 0 0.0% 0 0.0% 0 Hook 0.3% 2 0.0% 0 0.0% 0 0.0% 0 0.0% 0 0.0% 0 0.0% 0 0.0% 0 0.0% 0 0.0% 0 0.0% 0 0.0% 0 Hungerford Town Centre 0.2% 2 0.0% 0 0.0% 0 0.0% 0 0.0% 0 0.0% 0 0.0% 0 0.0% 0 0.0% 0 0.0% 0 0.0% 0 0.0% 0 Hungerford (other locations,
not in the town centre) 0.1% 1 0.0% 0 0.0% 0 0.0% 0 0.0% 0 0.0% 0 0.0% 0 0.0% 0 0.0% 0 0.0% 0 0.0% 0 0.0% 0
Lambourn 0.2% 2 0.0% 0 0.0% 0 0.0% 0 0.0% 0 0.0% 0 0.0% 0 0.0% 0 0.0% 0 0.0% 0 0.0% 0 0.0% 0 Lower Earley 3.3% 26 42.7% 22 0.0% 0 0.0% 0 0.0% 0 0.0% 0 0.0% 0 0.0% 0 0.0% 0 0.0% 0 0.0% 0 0.0% 0 Maidenhead 4.7% 37 2.9% 1 0.0% 0 0.0% 0 0.0% 0 6.7% 7 40.6% 27 1.3% 1 0.0% 0 0.0% 0 0.0% 0 0.0% 0 Marlborough 0.0% 0 0.0% 0 0.0% 0 0.0% 0 0.0% 0 0.0% 0 0.0% 0 0.0% 0 0.0% 0 0.0% 0 0.0% 0 0.0% 0 Marlow 2.6% 20 0.0% 0 0.0% 0 0.0% 0 4.8% 1 1.3% 1 19.2% 13 5.3% 5 0.0% 0 0.0% 0 0.0% 0 0.0% 0 Newbury Town Centre 2.1% 17 0.0% 0 0.0% 0 1.8% 0 0.0% 0 0.0% 0 0.0% 0 0.0% 0 0.0% 0 0.0% 0 0.0% 0 0.0% 0 Newbury (other locations,
not in the town centre) 1.0% 8 0.0% 0 0.0% 0 0.0% 0 0.0% 0 0.0% 0 0.0% 0 0.0% 0 0.0% 0 0.0% 0 0.0% 0 0.0% 0
Oxford 0.3% 2 0.0% 0 0.0% 0 0.0% 0 1.8% 0 0.0% 0 0.0% 0 0.0% 0 0.0% 0 0.0% 0 0.0% 0 0.0% 0 Reading Town Centre 6.3% 50 13.5% 7 76.7% 28 55.3% 6 4.8% 1 0.0% 0 0.0% 0 0.0% 0 0.0% 0 0.0% 0 16.2% 6 0.0% 0 Sandhurst Town Centre 0.1% 1 0.0% 0 0.0% 0 0.0% 0 0.0% 0 0.0% 0 0.0% 0 0.0% 0 0.0% 0 0.0% 0 0.0% 0 2.9% 1 Sandhurst (other locations,
not in the town centre) 0.2% 2 0.0% 0 0.0% 0 0.0% 0 0.0% 0 0.0% 0 0.0% 0 0.0% 0 0.0% 0 0.0% 0 0.0% 0 5.2% 2
Slough 7.3% 58 0.0% 0 0.0% 0 0.0% 0 0.0% 0 0.0% 0 1.8% 1 57.3% 54 0.0% 0 0.0% 0 5.4% 2 0.0% 0 Staines 0.2% 2 0.0% 0 0.0% 0 0.0% 0 0.0% 0 0.0% 0 0.0% 0 0.0% 0 6.1% 2 0.0% 0 0.0% 0 0.0% 0
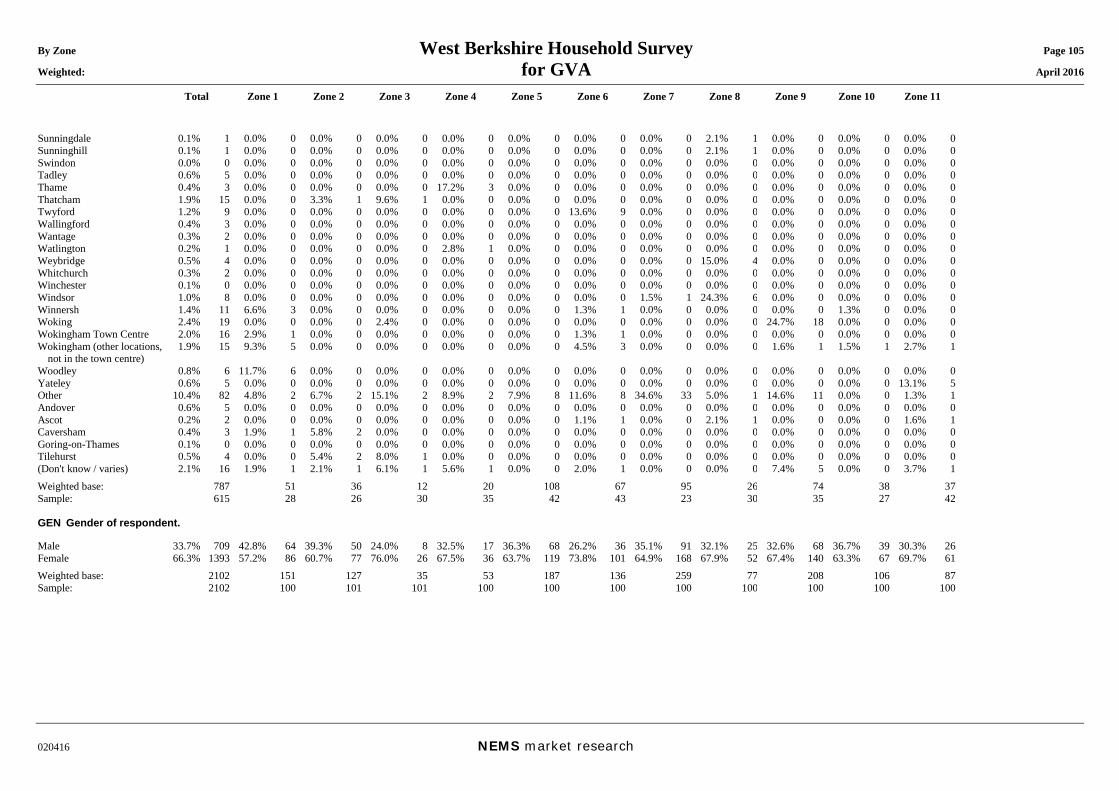
By Zone West Berkshire Household Survey Page 105 Weighted: for GVA April 2016
Total Zone 1 Zone 2 Zone 3 Zone 4 Zone 5 Zone 6 Zone 7 Zone 8 Zone 9 Zone 10 Zone 11
020416 NEMS market research
Sunningdale 0.1% 1 0.0% 0 0.0% 0 0.0% 0 0.0% 0 0.0% 0 0.0% 0 0.0% 0 2.1% 1 0.0% 0 0.0% 0 0.0% 0 Sunninghill 0.1% 1 0.0% 0 0.0% 0 0.0% 0 0.0% 0 0.0% 0 0.0% 0 0.0% 0 2.1% 1 0.0% 0 0.0% 0 0.0% 0 Swindon 0.0% 0 0.0% 0 0.0% 0 0.0% 0 0.0% 0 0.0% 0 0.0% 0 0.0% 0 0.0% 0 0.0% 0 0.0% 0 0.0% 0 Tadley 0.6% 5 0.0% 0 0.0% 0 0.0% 0 0.0% 0 0.0% 0 0.0% 0 0.0% 0 0.0% 0 0.0% 0 0.0% 0 0.0% 0 Thame 0.4% 3 0.0% 0 0.0% 0 0.0% 0 17.2% 3 0.0% 0 0.0% 0 0.0% 0 0.0% 0 0.0% 0 0.0% 0 0.0% 0 Thatcham 1.9% 15 0.0% 0 3.3% 1 9.6% 1 0.0% 0 0.0% 0 0.0% 0 0.0% 0 0.0% 0 0.0% 0 0.0% 0 0.0% 0 Twyford 1.2% 9 0.0% 0 0.0% 0 0.0% 0 0.0% 0 0.0% 0 13.6% 9 0.0% 0 0.0% 0 0.0% 0 0.0% 0 0.0% 0 Wallingford 0.4% 3 0.0% 0 0.0% 0 0.0% 0 0.0% 0 0.0% 0 0.0% 0 0.0% 0 0.0% 0 0.0% 0 0.0% 0 0.0% 0 Wantage 0.3% 2 0.0% 0 0.0% 0 0.0% 0 0.0% 0 0.0% 0 0.0% 0 0.0% 0 0.0% 0 0.0% 0 0.0% 0 0.0% 0 Watlington 0.2% 1 0.0% 0 0.0% 0 0.0% 0 2.8% 1 0.0% 0 0.0% 0 0.0% 0 0.0% 0 0.0% 0 0.0% 0 0.0% 0 Weybridge 0.5% 4 0.0% 0 0.0% 0 0.0% 0 0.0% 0 0.0% 0 0.0% 0 0.0% 0 15.0% 4 0.0% 0 0.0% 0 0.0% 0 Whitchurch 0.3% 2 0.0% 0 0.0% 0 0.0% 0 0.0% 0 0.0% 0 0.0% 0 0.0% 0 0.0% 0 0.0% 0 0.0% 0 0.0% 0 Winchester 0.1% 0 0.0% 0 0.0% 0 0.0% 0 0.0% 0 0.0% 0 0.0% 0 0.0% 0 0.0% 0 0.0% 0 0.0% 0 0.0% 0 Windsor 1.0% 8 0.0% 0 0.0% 0 0.0% 0 0.0% 0 0.0% 0 0.0% 0 1.5% 1 24.3% 6 0.0% 0 0.0% 0 0.0% 0 Winnersh 1.4% 11 6.6% 3 0.0% 0 0.0% 0 0.0% 0 0.0% 0 1.3% 1 0.0% 0 0.0% 0 0.0% 0 1.3% 0 0.0% 0 Woking 2.4% 19 0.0% 0 0.0% 0 2.4% 0 0.0% 0 0.0% 0 0.0% 0 0.0% 0 0.0% 0 24.7% 18 0.0% 0 0.0% 0 Wokingham Town Centre 2.0% 16 2.9% 1 0.0% 0 0.0% 0 0.0% 0 0.0% 0 1.3% 1 0.0% 0 0.0% 0 0.0% 0 0.0% 0 0.0% 0 Wokingham (other locations,
not in the town centre) 1.9% 15 9.3% 5 0.0% 0 0.0% 0 0.0% 0 0.0% 0 4.5% 3 0.0% 0 0.0% 0 1.6% 1 1.5% 1 2.7% 1
Woodley 0.8% 6 11.7% 6 0.0% 0 0.0% 0 0.0% 0 0.0% 0 0.0% 0 0.0% 0 0.0% 0 0.0% 0 0.0% 0 0.0% 0 Yateley 0.6% 5 0.0% 0 0.0% 0 0.0% 0 0.0% 0 0.0% 0 0.0% 0 0.0% 0 0.0% 0 0.0% 0 0.0% 0 13.1% 5 Other 10.4% 82 4.8% 2 6.7% 2 15.1% 2 8.9% 2 7.9% 8 11.6% 8 34.6% 33 5.0% 1 14.6% 11 0.0% 0 1.3% 1 Andover 0.6% 5 0.0% 0 0.0% 0 0.0% 0 0.0% 0 0.0% 0 0.0% 0 0.0% 0 0.0% 0 0.0% 0 0.0% 0 0.0% 0 Ascot 0.2% 2 0.0% 0 0.0% 0 0.0% 0 0.0% 0 0.0% 0 1.1% 1 0.0% 0 2.1% 1 0.0% 0 0.0% 0 1.6% 1 Caversham 0.4% 3 1.9% 1 5.8% 2 0.0% 0 0.0% 0 0.0% 0 0.0% 0 0.0% 0 0.0% 0 0.0% 0 0.0% 0 0.0% 0 Goring-on-Thames 0.1% 0 0.0% 0 0.0% 0 0.0% 0 0.0% 0 0.0% 0 0.0% 0 0.0% 0 0.0% 0 0.0% 0 0.0% 0 0.0% 0 Tilehurst 0.5% 4 0.0% 0 5.4% 2 8.0% 1 0.0% 0 0.0% 0 0.0% 0 0.0% 0 0.0% 0 0.0% 0 0.0% 0 0.0% 0 (Don't know / varies) 2.1% 16 1.9% 1 2.1% 1 6.1% 1 5.6% 1 0.0% 0 2.0% 1 0.0% 0 0.0% 0 7.4% 5 0.0% 0 3.7% 1 Weighted base: 787 51 36 12 20 108 67 95 26 74 38 37 Sample: 615 28 26 30 35 42 43 23 30 35 27 42 GEN Gender of respondent. Male 33.7% 709 42.8% 64 39.3% 50 24.0% 8 32.5% 17 36.3% 68 26.2% 36 35.1% 91 32.1% 25 32.6% 68 36.7% 39 30.3% 26 Female 66.3% 1393 57.2% 86 60.7% 77 76.0% 26 67.5% 36 63.7% 119 73.8% 101 64.9% 168 67.9% 52 67.4% 140 63.3% 67 69.7% 61 Weighted base: 2102 151 127 35 53 187 136 259 77 208 106 87 Sample: 2102 100 101 101 100 100 100 100 100 100 100 100
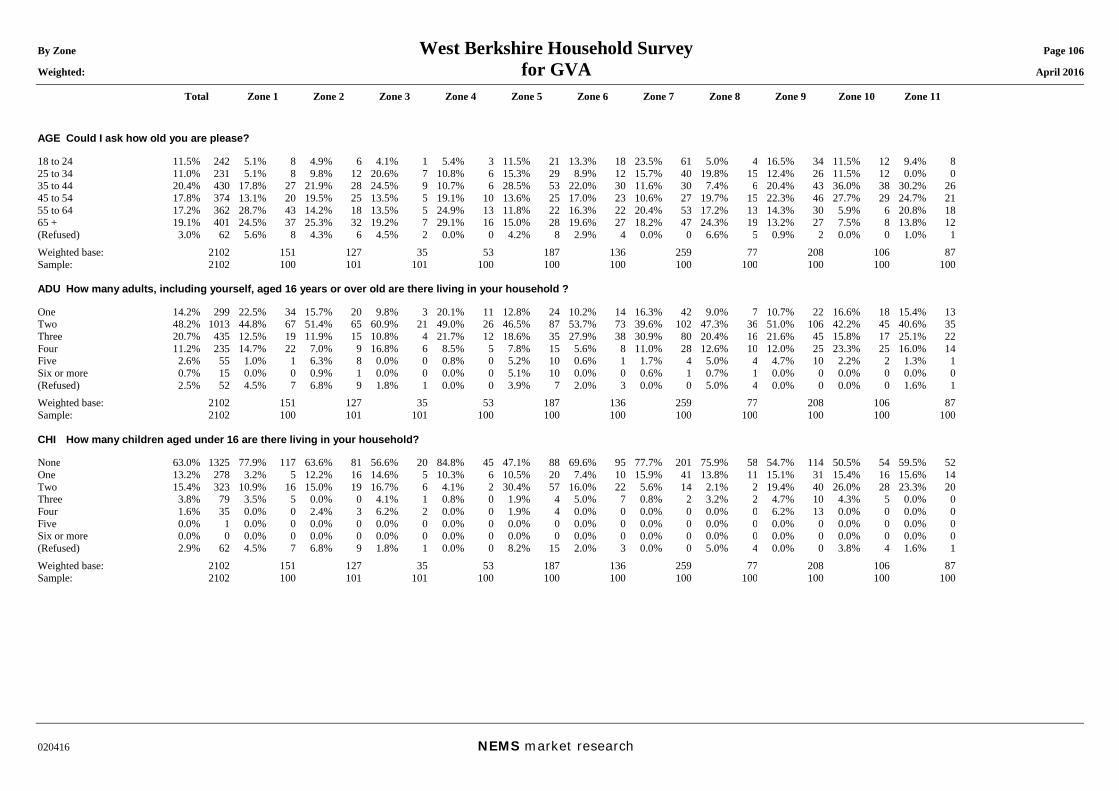
By Zone West Berkshire Household Survey Page 106 Weighted: for GVA April 2016
Total Zone 1 Zone 2 Zone 3 Zone 4 Zone 5 Zone 6 Zone 7 Zone 8 Zone 9 Zone 10 Zone 11
020416 NEMS market research
AGE Could I ask how old you are please? 18 to 24 11.5% 242 5.1% 8 4.9% 6 4.1% 1 5.4% 3 11.5% 21 13.3% 18 23.5% 61 5.0% 4 16.5% 34 11.5% 12 9.4% 8 25 to 34 11.0% 231 5.1% 8 9.8% 12 20.6% 7 10.8% 6 15.3% 29 8.9% 12 15.7% 40 19.8% 15 12.4% 26 11.5% 12 0.0% 0 35 to 44 20.4% 430 17.8% 27 21.9% 28 24.5% 9 10.7% 6 28.5% 53 22.0% 30 11.6% 30 7.4% 6 20.4% 43 36.0% 38 30.2% 26 45 to 54 17.8% 374 13.1% 20 19.5% 25 13.5% 5 19.1% 10 13.6% 25 17.0% 23 10.6% 27 19.7% 15 22.3% 46 27.7% 29 24.7% 21 55 to 64 17.2% 362 28.7% 43 14.2% 18 13.5% 5 24.9% 13 11.8% 22 16.3% 22 20.4% 53 17.2% 13 14.3% 30 5.9% 6 20.8% 18 65 + 19.1% 401 24.5% 37 25.3% 32 19.2% 7 29.1% 16 15.0% 28 19.6% 27 18.2% 47 24.3% 19 13.2% 27 7.5% 8 13.8% 12 (Refused) 3.0% 62 5.6% 8 4.3% 6 4.5% 2 0.0% 0 4.2% 8 2.9% 4 0.0% 0 6.6% 5 0.9% 2 0.0% 0 1.0% 1 Weighted base: 2102 151 127 35 53 187 136 259 77 208 106 87 Sample: 2102 100 101 101 100 100 100 100 100 100 100 100 ADU How many adults, including yourself, aged 16 years or over old are there living in your household ? One 14.2% 299 22.5% 34 15.7% 20 9.8% 3 20.1% 11 12.8% 24 10.2% 14 16.3% 42 9.0% 7 10.7% 22 16.6% 18 15.4% 13 Two 48.2% 1013 44.8% 67 51.4% 65 60.9% 21 49.0% 26 46.5% 87 53.7% 73 39.6% 102 47.3% 36 51.0% 106 42.2% 45 40.6% 35 Three 20.7% 435 12.5% 19 11.9% 15 10.8% 4 21.7% 12 18.6% 35 27.9% 38 30.9% 80 20.4% 16 21.6% 45 15.8% 17 25.1% 22 Four 11.2% 235 14.7% 22 7.0% 9 16.8% 6 8.5% 5 7.8% 15 5.6% 8 11.0% 28 12.6% 10 12.0% 25 23.3% 25 16.0% 14 Five 2.6% 55 1.0% 1 6.3% 8 0.0% 0 0.8% 0 5.2% 10 0.6% 1 1.7% 4 5.0% 4 4.7% 10 2.2% 2 1.3% 1 Six or more 0.7% 15 0.0% 0 0.9% 1 0.0% 0 0.0% 0 5.1% 10 0.0% 0 0.6% 1 0.7% 1 0.0% 0 0.0% 0 0.0% 0 (Refused) 2.5% 52 4.5% 7 6.8% 9 1.8% 1 0.0% 0 3.9% 7 2.0% 3 0.0% 0 5.0% 4 0.0% 0 0.0% 0 1.6% 1 Weighted base: 2102 151 127 35 53 187 136 259 77 208 106 87 Sample: 2102 100 101 101 100 100 100 100 100 100 100 100 CHI How many children aged under 16 are there living in your household? None 63.0% 1325 77.9% 117 63.6% 81 56.6% 20 84.8% 45 47.1% 88 69.6% 95 77.7% 201 75.9% 58 54.7% 114 50.5% 54 59.5% 52 One 13.2% 278 3.2% 5 12.2% 16 14.6% 5 10.3% 6 10.5% 20 7.4% 10 15.9% 41 13.8% 11 15.1% 31 15.4% 16 15.6% 14 Two 15.4% 323 10.9% 16 15.0% 19 16.7% 6 4.1% 2 30.4% 57 16.0% 22 5.6% 14 2.1% 2 19.4% 40 26.0% 28 23.3% 20 Three 3.8% 79 3.5% 5 0.0% 0 4.1% 1 0.8% 0 1.9% 4 5.0% 7 0.8% 2 3.2% 2 4.7% 10 4.3% 5 0.0% 0 Four 1.6% 35 0.0% 0 2.4% 3 6.2% 2 0.0% 0 1.9% 4 0.0% 0 0.0% 0 0.0% 0 6.2% 13 0.0% 0 0.0% 0 Five 0.0% 1 0.0% 0 0.0% 0 0.0% 0 0.0% 0 0.0% 0 0.0% 0 0.0% 0 0.0% 0 0.0% 0 0.0% 0 0.0% 0 Six or more 0.0% 0 0.0% 0 0.0% 0 0.0% 0 0.0% 0 0.0% 0 0.0% 0 0.0% 0 0.0% 0 0.0% 0 0.0% 0 0.0% 0 (Refused) 2.9% 62 4.5% 7 6.8% 9 1.8% 1 0.0% 0 8.2% 15 2.0% 3 0.0% 0 5.0% 4 0.0% 0 3.8% 4 1.6% 1 Weighted base: 2102 151 127 35 53 187 136 259 77 208 106 87 Sample: 2102 100 101 101 100 100 100 100 100 100 100 100
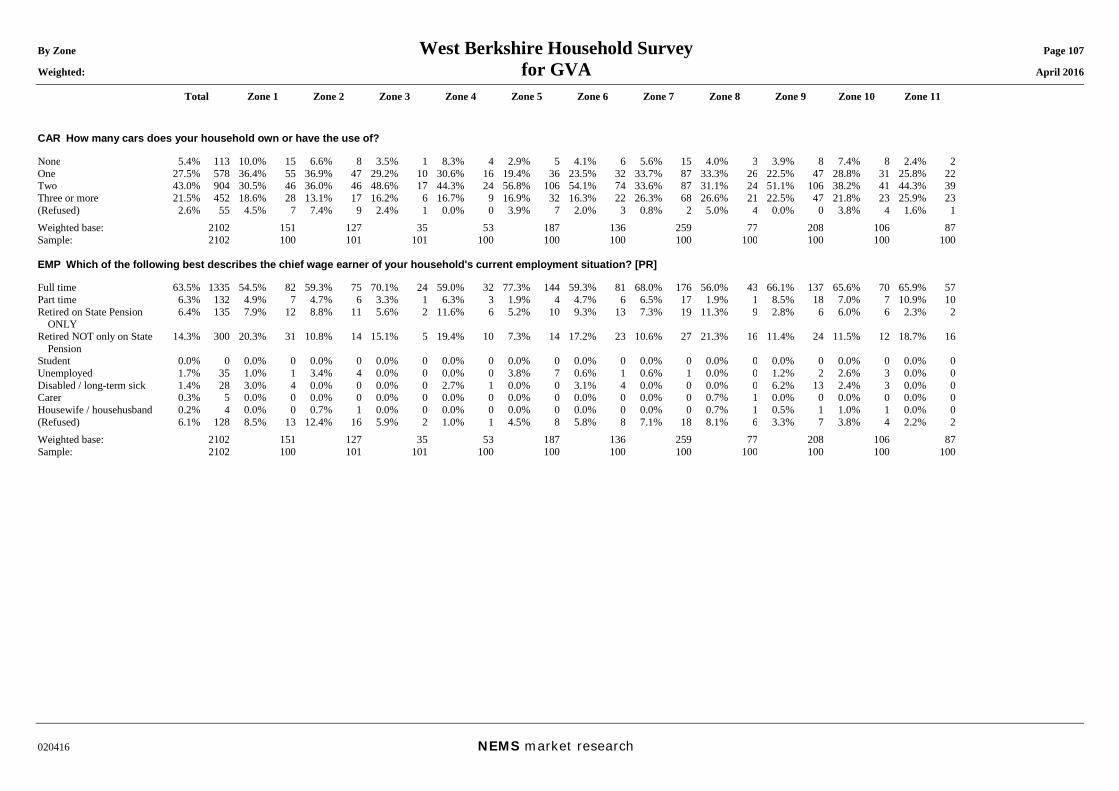
By Zone West Berkshire Household Survey Page 107 Weighted: for GVA April 2016
Total Zone 1 Zone 2 Zone 3 Zone 4 Zone 5 Zone 6 Zone 7 Zone 8 Zone 9 Zone 10 Zone 11
020416 NEMS market research
CAR How many cars does your household own or have the use of? None 5.4% 113 10.0% 15 6.6% 8 3.5% 1 8.3% 4 2.9% 5 4.1% 6 5.6% 15 4.0% 3 3.9% 8 7.4% 8 2.4% 2 One 27.5% 578 36.4% 55 36.9% 47 29.2% 10 30.6% 16 19.4% 36 23.5% 32 33.7% 87 33.3% 26 22.5% 47 28.8% 31 25.8% 22 Two 43.0% 904 30.5% 46 36.0% 46 48.6% 17 44.3% 24 56.8% 106 54.1% 74 33.6% 87 31.1% 24 51.1% 106 38.2% 41 44.3% 39 Three or more 21.5% 452 18.6% 28 13.1% 17 16.2% 6 16.7% 9 16.9% 32 16.3% 22 26.3% 68 26.6% 21 22.5% 47 21.8% 23 25.9% 23 (Refused) 2.6% 55 4.5% 7 7.4% 9 2.4% 1 0.0% 0 3.9% 7 2.0% 3 0.8% 2 5.0% 4 0.0% 0 3.8% 4 1.6% 1 Weighted base: 2102 151 127 35 53 187 136 259 77 208 106 87 Sample: 2102 100 101 101 100 100 100 100 100 100 100 100 EMP Which of the following best describes the chief wage earner of your household's current employment situation? [PR] Full time 63.5% 1335 54.5% 82 59.3% 75 70.1% 24 59.0% 32 77.3% 144 59.3% 81 68.0% 176 56.0% 43 66.1% 137 65.6% 70 65.9% 57 Part time 6.3% 132 4.9% 7 4.7% 6 3.3% 1 6.3% 3 1.9% 4 4.7% 6 6.5% 17 1.9% 1 8.5% 18 7.0% 7 10.9% 10 Retired on State Pension
ONLY 6.4% 135 7.9% 12 8.8% 11 5.6% 2 11.6% 6 5.2% 10 9.3% 13 7.3% 19 11.3% 9 2.8% 6 6.0% 6 2.3% 2
Retired NOT only on State Pension
14.3% 300 20.3% 31 10.8% 14 15.1% 5 19.4% 10 7.3% 14 17.2% 23 10.6% 27 21.3% 16 11.4% 24 11.5% 12 18.7% 16
Student 0.0% 0 0.0% 0 0.0% 0 0.0% 0 0.0% 0 0.0% 0 0.0% 0 0.0% 0 0.0% 0 0.0% 0 0.0% 0 0.0% 0 Unemployed 1.7% 35 1.0% 1 3.4% 4 0.0% 0 0.0% 0 3.8% 7 0.6% 1 0.6% 1 0.0% 0 1.2% 2 2.6% 3 0.0% 0 Disabled / long-term sick 1.4% 28 3.0% 4 0.0% 0 0.0% 0 2.7% 1 0.0% 0 3.1% 4 0.0% 0 0.0% 0 6.2% 13 2.4% 3 0.0% 0 Carer 0.3% 5 0.0% 0 0.0% 0 0.0% 0 0.0% 0 0.0% 0 0.0% 0 0.0% 0 0.7% 1 0.0% 0 0.0% 0 0.0% 0 Housewife / househusband 0.2% 4 0.0% 0 0.7% 1 0.0% 0 0.0% 0 0.0% 0 0.0% 0 0.0% 0 0.7% 1 0.5% 1 1.0% 1 0.0% 0 (Refused) 6.1% 128 8.5% 13 12.4% 16 5.9% 2 1.0% 1 4.5% 8 5.8% 8 7.1% 18 8.1% 6 3.3% 7 3.8% 4 2.2% 2 Weighted base: 2102 151 127 35 53 187 136 259 77 208 106 87 Sample: 2102 100 101 101 100 100 100 100 100 100 100 100
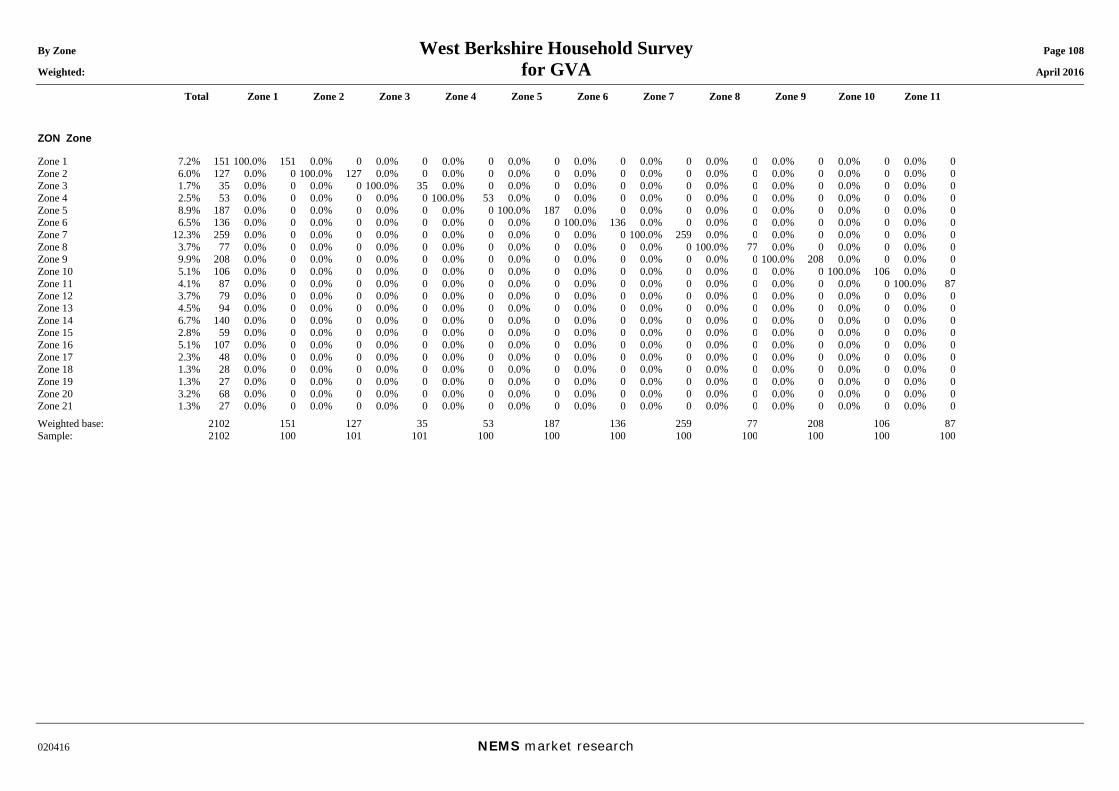
By Zone West Berkshire Household Survey Page 108 Weighted: for GVA April 2016
Total Zone 1 Zone 2 Zone 3 Zone 4 Zone 5 Zone 6 Zone 7 Zone 8 Zone 9 Zone 10 Zone 11
020416 NEMS market research
ZON Zone Zone 1 7.2% 151 100.0% 151 0.0% 0 0.0% 0 0.0% 0 0.0% 0 0.0% 0 0.0% 0 0.0% 0 0.0% 0 0.0% 0 0.0% 0 Zone 2 6.0% 127 0.0% 0 100.0% 127 0.0% 0 0.0% 0 0.0% 0 0.0% 0 0.0% 0 0.0% 0 0.0% 0 0.0% 0 0.0% 0 Zone 3 1.7% 35 0.0% 0 0.0% 0 100.0% 35 0.0% 0 0.0% 0 0.0% 0 0.0% 0 0.0% 0 0.0% 0 0.0% 0 0.0% 0 Zone 4 2.5% 53 0.0% 0 0.0% 0 0.0% 0 100.0% 53 0.0% 0 0.0% 0 0.0% 0 0.0% 0 0.0% 0 0.0% 0 0.0% 0 Zone 5 8.9% 187 0.0% 0 0.0% 0 0.0% 0 0.0% 0 100.0% 187 0.0% 0 0.0% 0 0.0% 0 0.0% 0 0.0% 0 0.0% 0 Zone 6 6.5% 136 0.0% 0 0.0% 0 0.0% 0 0.0% 0 0.0% 0 100.0% 136 0.0% 0 0.0% 0 0.0% 0 0.0% 0 0.0% 0 Zone 7 12.3% 259 0.0% 0 0.0% 0 0.0% 0 0.0% 0 0.0% 0 0.0% 0 100.0% 259 0.0% 0 0.0% 0 0.0% 0 0.0% 0 Zone 8 3.7% 77 0.0% 0 0.0% 0 0.0% 0 0.0% 0 0.0% 0 0.0% 0 0.0% 0 100.0% 77 0.0% 0 0.0% 0 0.0% 0 Zone 9 9.9% 208 0.0% 0 0.0% 0 0.0% 0 0.0% 0 0.0% 0 0.0% 0 0.0% 0 0.0% 0 100.0% 208 0.0% 0 0.0% 0 Zone 10 5.1% 106 0.0% 0 0.0% 0 0.0% 0 0.0% 0 0.0% 0 0.0% 0 0.0% 0 0.0% 0 0.0% 0 100.0% 106 0.0% 0 Zone 11 4.1% 87 0.0% 0 0.0% 0 0.0% 0 0.0% 0 0.0% 0 0.0% 0 0.0% 0 0.0% 0 0.0% 0 0.0% 0 100.0% 87 Zone 12 3.7% 79 0.0% 0 0.0% 0 0.0% 0 0.0% 0 0.0% 0 0.0% 0 0.0% 0 0.0% 0 0.0% 0 0.0% 0 0.0% 0 Zone 13 4.5% 94 0.0% 0 0.0% 0 0.0% 0 0.0% 0 0.0% 0 0.0% 0 0.0% 0 0.0% 0 0.0% 0 0.0% 0 0.0% 0 Zone 14 6.7% 140 0.0% 0 0.0% 0 0.0% 0 0.0% 0 0.0% 0 0.0% 0 0.0% 0 0.0% 0 0.0% 0 0.0% 0 0.0% 0 Zone 15 2.8% 59 0.0% 0 0.0% 0 0.0% 0 0.0% 0 0.0% 0 0.0% 0 0.0% 0 0.0% 0 0.0% 0 0.0% 0 0.0% 0 Zone 16 5.1% 107 0.0% 0 0.0% 0 0.0% 0 0.0% 0 0.0% 0 0.0% 0 0.0% 0 0.0% 0 0.0% 0 0.0% 0 0.0% 0 Zone 17 2.3% 48 0.0% 0 0.0% 0 0.0% 0 0.0% 0 0.0% 0 0.0% 0 0.0% 0 0.0% 0 0.0% 0 0.0% 0 0.0% 0 Zone 18 1.3% 28 0.0% 0 0.0% 0 0.0% 0 0.0% 0 0.0% 0 0.0% 0 0.0% 0 0.0% 0 0.0% 0 0.0% 0 0.0% 0 Zone 19 1.3% 27 0.0% 0 0.0% 0 0.0% 0 0.0% 0 0.0% 0 0.0% 0 0.0% 0 0.0% 0 0.0% 0 0.0% 0 0.0% 0 Zone 20 3.2% 68 0.0% 0 0.0% 0 0.0% 0 0.0% 0 0.0% 0 0.0% 0 0.0% 0 0.0% 0 0.0% 0 0.0% 0 0.0% 0 Zone 21 1.3% 27 0.0% 0 0.0% 0 0.0% 0 0.0% 0 0.0% 0 0.0% 0 0.0% 0 0.0% 0 0.0% 0 0.0% 0 0.0% 0 Weighted base: 2102 151 127 35 53 187 136 259 77 208 106 87 Sample: 2102 100 101 101 100 100 100 100 100 100 100 100
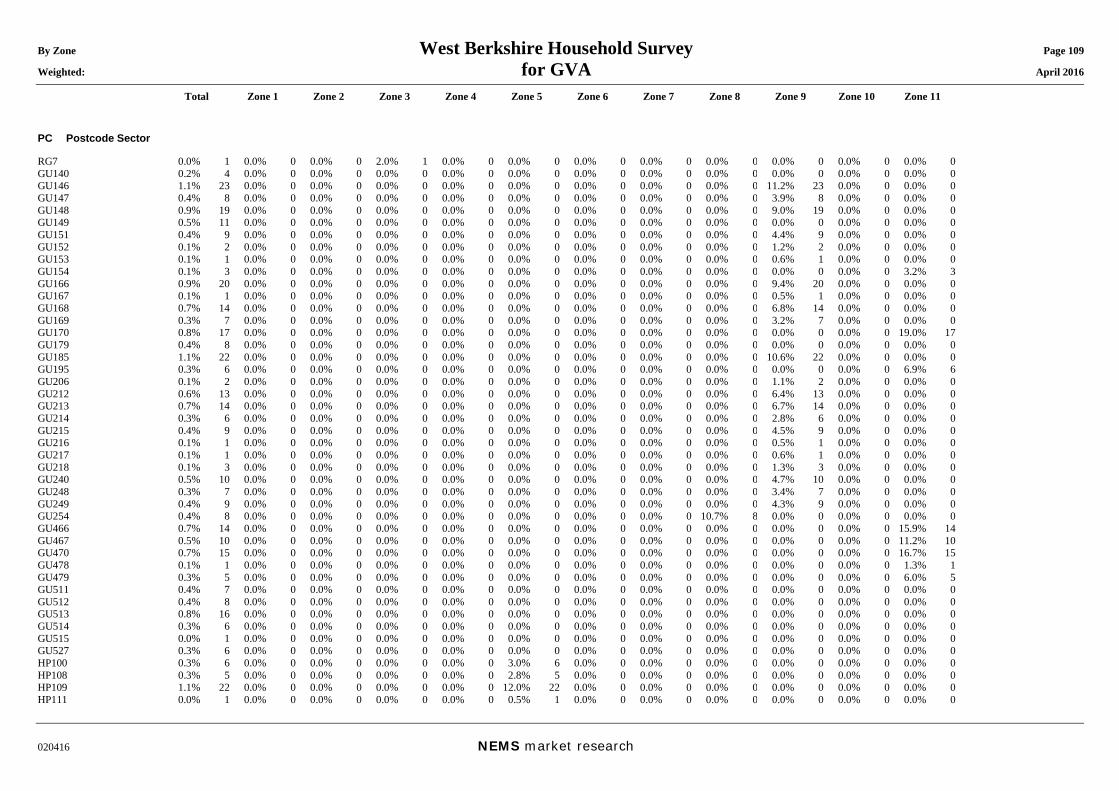
By Zone West Berkshire Household Survey Page 109 Weighted: for GVA April 2016
Total Zone 1 Zone 2 Zone 3 Zone 4 Zone 5 Zone 6 Zone 7 Zone 8 Zone 9 Zone 10 Zone 11
020416 NEMS market research
PC Postcode Sector RG7 0.0% 1 0.0% 0 0.0% 0 2.0% 1 0.0% 0 0.0% 0 0.0% 0 0.0% 0 0.0% 0 0.0% 0 0.0% 0 0.0% 0 GU140 0.2% 4 0.0% 0 0.0% 0 0.0% 0 0.0% 0 0.0% 0 0.0% 0 0.0% 0 0.0% 0 0.0% 0 0.0% 0 0.0% 0 GU146 1.1% 23 0.0% 0 0.0% 0 0.0% 0 0.0% 0 0.0% 0 0.0% 0 0.0% 0 0.0% 0 11.2% 23 0.0% 0 0.0% 0 GU147 0.4% 8 0.0% 0 0.0% 0 0.0% 0 0.0% 0 0.0% 0 0.0% 0 0.0% 0 0.0% 0 3.9% 8 0.0% 0 0.0% 0 GU148 0.9% 19 0.0% 0 0.0% 0 0.0% 0 0.0% 0 0.0% 0 0.0% 0 0.0% 0 0.0% 0 9.0% 19 0.0% 0 0.0% 0 GU149 0.5% 11 0.0% 0 0.0% 0 0.0% 0 0.0% 0 0.0% 0 0.0% 0 0.0% 0 0.0% 0 0.0% 0 0.0% 0 0.0% 0 GU151 0.4% 9 0.0% 0 0.0% 0 0.0% 0 0.0% 0 0.0% 0 0.0% 0 0.0% 0 0.0% 0 4.4% 9 0.0% 0 0.0% 0 GU152 0.1% 2 0.0% 0 0.0% 0 0.0% 0 0.0% 0 0.0% 0 0.0% 0 0.0% 0 0.0% 0 1.2% 2 0.0% 0 0.0% 0 GU153 0.1% 1 0.0% 0 0.0% 0 0.0% 0 0.0% 0 0.0% 0 0.0% 0 0.0% 0 0.0% 0 0.6% 1 0.0% 0 0.0% 0 GU154 0.1% 3 0.0% 0 0.0% 0 0.0% 0 0.0% 0 0.0% 0 0.0% 0 0.0% 0 0.0% 0 0.0% 0 0.0% 0 3.2% 3 GU166 0.9% 20 0.0% 0 0.0% 0 0.0% 0 0.0% 0 0.0% 0 0.0% 0 0.0% 0 0.0% 0 9.4% 20 0.0% 0 0.0% 0 GU167 0.1% 1 0.0% 0 0.0% 0 0.0% 0 0.0% 0 0.0% 0 0.0% 0 0.0% 0 0.0% 0 0.5% 1 0.0% 0 0.0% 0 GU168 0.7% 14 0.0% 0 0.0% 0 0.0% 0 0.0% 0 0.0% 0 0.0% 0 0.0% 0 0.0% 0 6.8% 14 0.0% 0 0.0% 0 GU169 0.3% 7 0.0% 0 0.0% 0 0.0% 0 0.0% 0 0.0% 0 0.0% 0 0.0% 0 0.0% 0 3.2% 7 0.0% 0 0.0% 0 GU170 0.8% 17 0.0% 0 0.0% 0 0.0% 0 0.0% 0 0.0% 0 0.0% 0 0.0% 0 0.0% 0 0.0% 0 0.0% 0 19.0% 17 GU179 0.4% 8 0.0% 0 0.0% 0 0.0% 0 0.0% 0 0.0% 0 0.0% 0 0.0% 0 0.0% 0 0.0% 0 0.0% 0 0.0% 0 GU185 1.1% 22 0.0% 0 0.0% 0 0.0% 0 0.0% 0 0.0% 0 0.0% 0 0.0% 0 0.0% 0 10.6% 22 0.0% 0 0.0% 0 GU195 0.3% 6 0.0% 0 0.0% 0 0.0% 0 0.0% 0 0.0% 0 0.0% 0 0.0% 0 0.0% 0 0.0% 0 0.0% 0 6.9% 6 GU206 0.1% 2 0.0% 0 0.0% 0 0.0% 0 0.0% 0 0.0% 0 0.0% 0 0.0% 0 0.0% 0 1.1% 2 0.0% 0 0.0% 0 GU212 0.6% 13 0.0% 0 0.0% 0 0.0% 0 0.0% 0 0.0% 0 0.0% 0 0.0% 0 0.0% 0 6.4% 13 0.0% 0 0.0% 0 GU213 0.7% 14 0.0% 0 0.0% 0 0.0% 0 0.0% 0 0.0% 0 0.0% 0 0.0% 0 0.0% 0 6.7% 14 0.0% 0 0.0% 0 GU214 0.3% 6 0.0% 0 0.0% 0 0.0% 0 0.0% 0 0.0% 0 0.0% 0 0.0% 0 0.0% 0 2.8% 6 0.0% 0 0.0% 0 GU215 0.4% 9 0.0% 0 0.0% 0 0.0% 0 0.0% 0 0.0% 0 0.0% 0 0.0% 0 0.0% 0 4.5% 9 0.0% 0 0.0% 0 GU216 0.1% 1 0.0% 0 0.0% 0 0.0% 0 0.0% 0 0.0% 0 0.0% 0 0.0% 0 0.0% 0 0.5% 1 0.0% 0 0.0% 0 GU217 0.1% 1 0.0% 0 0.0% 0 0.0% 0 0.0% 0 0.0% 0 0.0% 0 0.0% 0 0.0% 0 0.6% 1 0.0% 0 0.0% 0 GU218 0.1% 3 0.0% 0 0.0% 0 0.0% 0 0.0% 0 0.0% 0 0.0% 0 0.0% 0 0.0% 0 1.3% 3 0.0% 0 0.0% 0 GU240 0.5% 10 0.0% 0 0.0% 0 0.0% 0 0.0% 0 0.0% 0 0.0% 0 0.0% 0 0.0% 0 4.7% 10 0.0% 0 0.0% 0 GU248 0.3% 7 0.0% 0 0.0% 0 0.0% 0 0.0% 0 0.0% 0 0.0% 0 0.0% 0 0.0% 0 3.4% 7 0.0% 0 0.0% 0 GU249 0.4% 9 0.0% 0 0.0% 0 0.0% 0 0.0% 0 0.0% 0 0.0% 0 0.0% 0 0.0% 0 4.3% 9 0.0% 0 0.0% 0 GU254 0.4% 8 0.0% 0 0.0% 0 0.0% 0 0.0% 0 0.0% 0 0.0% 0 0.0% 0 10.7% 8 0.0% 0 0.0% 0 0.0% 0 GU466 0.7% 14 0.0% 0 0.0% 0 0.0% 0 0.0% 0 0.0% 0 0.0% 0 0.0% 0 0.0% 0 0.0% 0 0.0% 0 15.9% 14 GU467 0.5% 10 0.0% 0 0.0% 0 0.0% 0 0.0% 0 0.0% 0 0.0% 0 0.0% 0 0.0% 0 0.0% 0 0.0% 0 11.2% 10 GU470 0.7% 15 0.0% 0 0.0% 0 0.0% 0 0.0% 0 0.0% 0 0.0% 0 0.0% 0 0.0% 0 0.0% 0 0.0% 0 16.7% 15 GU478 0.1% 1 0.0% 0 0.0% 0 0.0% 0 0.0% 0 0.0% 0 0.0% 0 0.0% 0 0.0% 0 0.0% 0 0.0% 0 1.3% 1 GU479 0.3% 5 0.0% 0 0.0% 0 0.0% 0 0.0% 0 0.0% 0 0.0% 0 0.0% 0 0.0% 0 0.0% 0 0.0% 0 6.0% 5 GU511 0.4% 7 0.0% 0 0.0% 0 0.0% 0 0.0% 0 0.0% 0 0.0% 0 0.0% 0 0.0% 0 0.0% 0 0.0% 0 0.0% 0 GU512 0.4% 8 0.0% 0 0.0% 0 0.0% 0 0.0% 0 0.0% 0 0.0% 0 0.0% 0 0.0% 0 0.0% 0 0.0% 0 0.0% 0 GU513 0.8% 16 0.0% 0 0.0% 0 0.0% 0 0.0% 0 0.0% 0 0.0% 0 0.0% 0 0.0% 0 0.0% 0 0.0% 0 0.0% 0 GU514 0.3% 6 0.0% 0 0.0% 0 0.0% 0 0.0% 0 0.0% 0 0.0% 0 0.0% 0 0.0% 0 0.0% 0 0.0% 0 0.0% 0 GU515 0.0% 1 0.0% 0 0.0% 0 0.0% 0 0.0% 0 0.0% 0 0.0% 0 0.0% 0 0.0% 0 0.0% 0 0.0% 0 0.0% 0 GU527 0.3% 6 0.0% 0 0.0% 0 0.0% 0 0.0% 0 0.0% 0 0.0% 0 0.0% 0 0.0% 0 0.0% 0 0.0% 0 0.0% 0 HP100 0.3% 6 0.0% 0 0.0% 0 0.0% 0 0.0% 0 3.0% 6 0.0% 0 0.0% 0 0.0% 0 0.0% 0 0.0% 0 0.0% 0 HP108 0.3% 5 0.0% 0 0.0% 0 0.0% 0 0.0% 0 2.8% 5 0.0% 0 0.0% 0 0.0% 0 0.0% 0 0.0% 0 0.0% 0 HP109 1.1% 22 0.0% 0 0.0% 0 0.0% 0 0.0% 0 12.0% 22 0.0% 0 0.0% 0 0.0% 0 0.0% 0 0.0% 0 0.0% 0 HP111 0.0% 1 0.0% 0 0.0% 0 0.0% 0 0.0% 0 0.5% 1 0.0% 0 0.0% 0 0.0% 0 0.0% 0 0.0% 0 0.0% 0
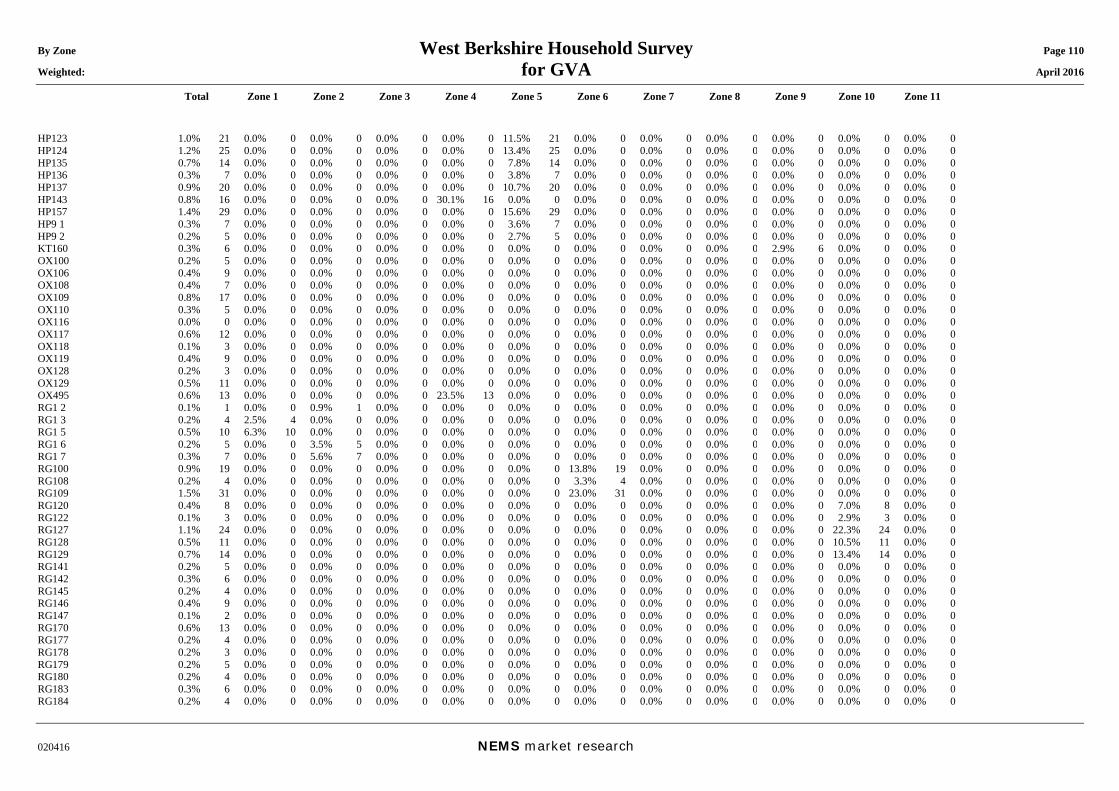
By Zone West Berkshire Household Survey Page 110 Weighted: for GVA April 2016
Total Zone 1 Zone 2 Zone 3 Zone 4 Zone 5 Zone 6 Zone 7 Zone 8 Zone 9 Zone 10 Zone 11
020416 NEMS market research
HP123 1.0% 21 0.0% 0 0.0% 0 0.0% 0 0.0% 0 11.5% 21 0.0% 0 0.0% 0 0.0% 0 0.0% 0 0.0% 0 0.0% 0 HP124 1.2% 25 0.0% 0 0.0% 0 0.0% 0 0.0% 0 13.4% 25 0.0% 0 0.0% 0 0.0% 0 0.0% 0 0.0% 0 0.0% 0 HP135 0.7% 14 0.0% 0 0.0% 0 0.0% 0 0.0% 0 7.8% 14 0.0% 0 0.0% 0 0.0% 0 0.0% 0 0.0% 0 0.0% 0 HP136 0.3% 7 0.0% 0 0.0% 0 0.0% 0 0.0% 0 3.8% 7 0.0% 0 0.0% 0 0.0% 0 0.0% 0 0.0% 0 0.0% 0 HP137 0.9% 20 0.0% 0 0.0% 0 0.0% 0 0.0% 0 10.7% 20 0.0% 0 0.0% 0 0.0% 0 0.0% 0 0.0% 0 0.0% 0 HP143 0.8% 16 0.0% 0 0.0% 0 0.0% 0 30.1% 16 0.0% 0 0.0% 0 0.0% 0 0.0% 0 0.0% 0 0.0% 0 0.0% 0 HP157 1.4% 29 0.0% 0 0.0% 0 0.0% 0 0.0% 0 15.6% 29 0.0% 0 0.0% 0 0.0% 0 0.0% 0 0.0% 0 0.0% 0 HP9 1 0.3% 7 0.0% 0 0.0% 0 0.0% 0 0.0% 0 3.6% 7 0.0% 0 0.0% 0 0.0% 0 0.0% 0 0.0% 0 0.0% 0 HP9 2 0.2% 5 0.0% 0 0.0% 0 0.0% 0 0.0% 0 2.7% 5 0.0% 0 0.0% 0 0.0% 0 0.0% 0 0.0% 0 0.0% 0 KT160 0.3% 6 0.0% 0 0.0% 0 0.0% 0 0.0% 0 0.0% 0 0.0% 0 0.0% 0 0.0% 0 2.9% 6 0.0% 0 0.0% 0 OX100 0.2% 5 0.0% 0 0.0% 0 0.0% 0 0.0% 0 0.0% 0 0.0% 0 0.0% 0 0.0% 0 0.0% 0 0.0% 0 0.0% 0 OX106 0.4% 9 0.0% 0 0.0% 0 0.0% 0 0.0% 0 0.0% 0 0.0% 0 0.0% 0 0.0% 0 0.0% 0 0.0% 0 0.0% 0 OX108 0.4% 7 0.0% 0 0.0% 0 0.0% 0 0.0% 0 0.0% 0 0.0% 0 0.0% 0 0.0% 0 0.0% 0 0.0% 0 0.0% 0 OX109 0.8% 17 0.0% 0 0.0% 0 0.0% 0 0.0% 0 0.0% 0 0.0% 0 0.0% 0 0.0% 0 0.0% 0 0.0% 0 0.0% 0 OX110 0.3% 5 0.0% 0 0.0% 0 0.0% 0 0.0% 0 0.0% 0 0.0% 0 0.0% 0 0.0% 0 0.0% 0 0.0% 0 0.0% 0 OX116 0.0% 0 0.0% 0 0.0% 0 0.0% 0 0.0% 0 0.0% 0 0.0% 0 0.0% 0 0.0% 0 0.0% 0 0.0% 0 0.0% 0 OX117 0.6% 12 0.0% 0 0.0% 0 0.0% 0 0.0% 0 0.0% 0 0.0% 0 0.0% 0 0.0% 0 0.0% 0 0.0% 0 0.0% 0 OX118 0.1% 3 0.0% 0 0.0% 0 0.0% 0 0.0% 0 0.0% 0 0.0% 0 0.0% 0 0.0% 0 0.0% 0 0.0% 0 0.0% 0 OX119 0.4% 9 0.0% 0 0.0% 0 0.0% 0 0.0% 0 0.0% 0 0.0% 0 0.0% 0 0.0% 0 0.0% 0 0.0% 0 0.0% 0 OX128 0.2% 3 0.0% 0 0.0% 0 0.0% 0 0.0% 0 0.0% 0 0.0% 0 0.0% 0 0.0% 0 0.0% 0 0.0% 0 0.0% 0 OX129 0.5% 11 0.0% 0 0.0% 0 0.0% 0 0.0% 0 0.0% 0 0.0% 0 0.0% 0 0.0% 0 0.0% 0 0.0% 0 0.0% 0 OX495 0.6% 13 0.0% 0 0.0% 0 0.0% 0 23.5% 13 0.0% 0 0.0% 0 0.0% 0 0.0% 0 0.0% 0 0.0% 0 0.0% 0 RG1 2 0.1% 1 0.0% 0 0.9% 1 0.0% 0 0.0% 0 0.0% 0 0.0% 0 0.0% 0 0.0% 0 0.0% 0 0.0% 0 0.0% 0 RG1 3 0.2% 4 2.5% 4 0.0% 0 0.0% 0 0.0% 0 0.0% 0 0.0% 0 0.0% 0 0.0% 0 0.0% 0 0.0% 0 0.0% 0 RG1 5 0.5% 10 6.3% 10 0.0% 0 0.0% 0 0.0% 0 0.0% 0 0.0% 0 0.0% 0 0.0% 0 0.0% 0 0.0% 0 0.0% 0 RG1 6 0.2% 5 0.0% 0 3.5% 5 0.0% 0 0.0% 0 0.0% 0 0.0% 0 0.0% 0 0.0% 0 0.0% 0 0.0% 0 0.0% 0 RG1 7 0.3% 7 0.0% 0 5.6% 7 0.0% 0 0.0% 0 0.0% 0 0.0% 0 0.0% 0 0.0% 0 0.0% 0 0.0% 0 0.0% 0 RG100 0.9% 19 0.0% 0 0.0% 0 0.0% 0 0.0% 0 0.0% 0 13.8% 19 0.0% 0 0.0% 0 0.0% 0 0.0% 0 0.0% 0 RG108 0.2% 4 0.0% 0 0.0% 0 0.0% 0 0.0% 0 0.0% 0 3.3% 4 0.0% 0 0.0% 0 0.0% 0 0.0% 0 0.0% 0 RG109 1.5% 31 0.0% 0 0.0% 0 0.0% 0 0.0% 0 0.0% 0 23.0% 31 0.0% 0 0.0% 0 0.0% 0 0.0% 0 0.0% 0 RG120 0.4% 8 0.0% 0 0.0% 0 0.0% 0 0.0% 0 0.0% 0 0.0% 0 0.0% 0 0.0% 0 0.0% 0 7.0% 8 0.0% 0 RG122 0.1% 3 0.0% 0 0.0% 0 0.0% 0 0.0% 0 0.0% 0 0.0% 0 0.0% 0 0.0% 0 0.0% 0 2.9% 3 0.0% 0 RG127 1.1% 24 0.0% 0 0.0% 0 0.0% 0 0.0% 0 0.0% 0 0.0% 0 0.0% 0 0.0% 0 0.0% 0 22.3% 24 0.0% 0 RG128 0.5% 11 0.0% 0 0.0% 0 0.0% 0 0.0% 0 0.0% 0 0.0% 0 0.0% 0 0.0% 0 0.0% 0 10.5% 11 0.0% 0 RG129 0.7% 14 0.0% 0 0.0% 0 0.0% 0 0.0% 0 0.0% 0 0.0% 0 0.0% 0 0.0% 0 0.0% 0 13.4% 14 0.0% 0 RG141 0.2% 5 0.0% 0 0.0% 0 0.0% 0 0.0% 0 0.0% 0 0.0% 0 0.0% 0 0.0% 0 0.0% 0 0.0% 0 0.0% 0 RG142 0.3% 6 0.0% 0 0.0% 0 0.0% 0 0.0% 0 0.0% 0 0.0% 0 0.0% 0 0.0% 0 0.0% 0 0.0% 0 0.0% 0 RG145 0.2% 4 0.0% 0 0.0% 0 0.0% 0 0.0% 0 0.0% 0 0.0% 0 0.0% 0 0.0% 0 0.0% 0 0.0% 0 0.0% 0 RG146 0.4% 9 0.0% 0 0.0% 0 0.0% 0 0.0% 0 0.0% 0 0.0% 0 0.0% 0 0.0% 0 0.0% 0 0.0% 0 0.0% 0 RG147 0.1% 2 0.0% 0 0.0% 0 0.0% 0 0.0% 0 0.0% 0 0.0% 0 0.0% 0 0.0% 0 0.0% 0 0.0% 0 0.0% 0 RG170 0.6% 13 0.0% 0 0.0% 0 0.0% 0 0.0% 0 0.0% 0 0.0% 0 0.0% 0 0.0% 0 0.0% 0 0.0% 0 0.0% 0 RG177 0.2% 4 0.0% 0 0.0% 0 0.0% 0 0.0% 0 0.0% 0 0.0% 0 0.0% 0 0.0% 0 0.0% 0 0.0% 0 0.0% 0 RG178 0.2% 3 0.0% 0 0.0% 0 0.0% 0 0.0% 0 0.0% 0 0.0% 0 0.0% 0 0.0% 0 0.0% 0 0.0% 0 0.0% 0 RG179 0.2% 5 0.0% 0 0.0% 0 0.0% 0 0.0% 0 0.0% 0 0.0% 0 0.0% 0 0.0% 0 0.0% 0 0.0% 0 0.0% 0 RG180 0.2% 4 0.0% 0 0.0% 0 0.0% 0 0.0% 0 0.0% 0 0.0% 0 0.0% 0 0.0% 0 0.0% 0 0.0% 0 0.0% 0 RG183 0.3% 6 0.0% 0 0.0% 0 0.0% 0 0.0% 0 0.0% 0 0.0% 0 0.0% 0 0.0% 0 0.0% 0 0.0% 0 0.0% 0 RG184 0.2% 4 0.0% 0 0.0% 0 0.0% 0 0.0% 0 0.0% 0 0.0% 0 0.0% 0 0.0% 0 0.0% 0 0.0% 0 0.0% 0
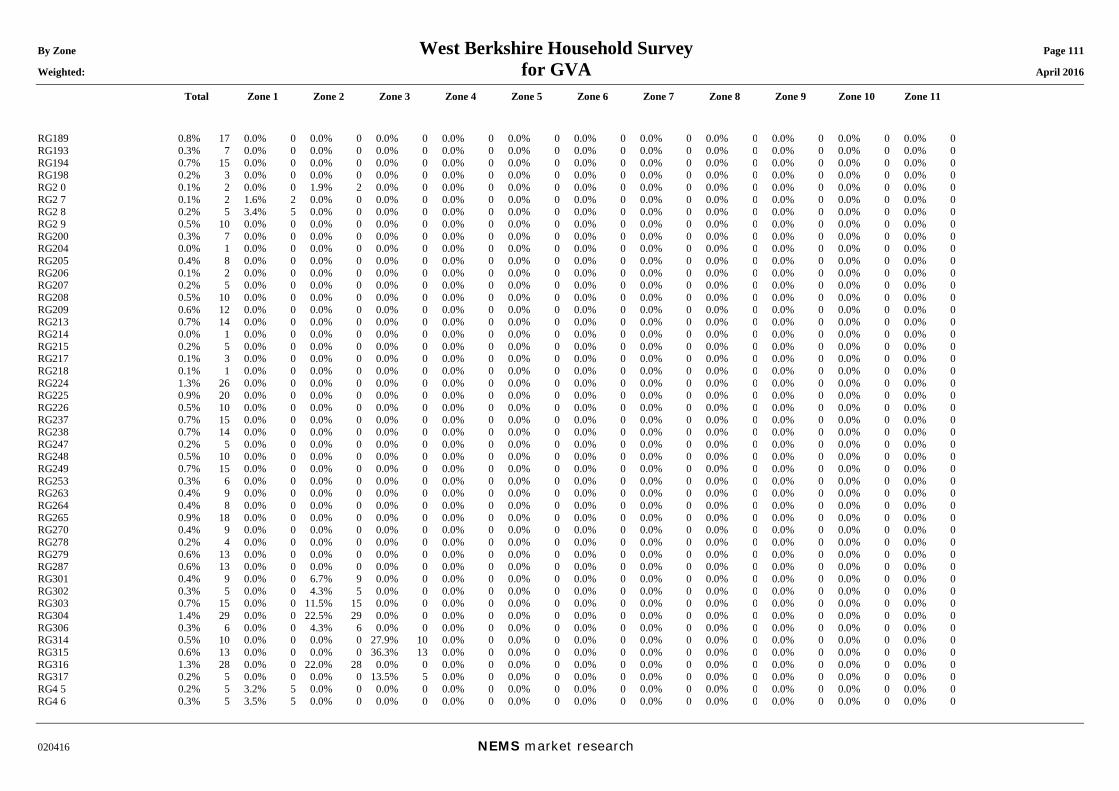
By Zone West Berkshire Household Survey Page 111 Weighted: for GVA April 2016
Total Zone 1 Zone 2 Zone 3 Zone 4 Zone 5 Zone 6 Zone 7 Zone 8 Zone 9 Zone 10 Zone 11
020416 NEMS market research
RG189 0.8% 17 0.0% 0 0.0% 0 0.0% 0 0.0% 0 0.0% 0 0.0% 0 0.0% 0 0.0% 0 0.0% 0 0.0% 0 0.0% 0 RG193 0.3% 7 0.0% 0 0.0% 0 0.0% 0 0.0% 0 0.0% 0 0.0% 0 0.0% 0 0.0% 0 0.0% 0 0.0% 0 0.0% 0 RG194 0.7% 15 0.0% 0 0.0% 0 0.0% 0 0.0% 0 0.0% 0 0.0% 0 0.0% 0 0.0% 0 0.0% 0 0.0% 0 0.0% 0 RG198 0.2% 3 0.0% 0 0.0% 0 0.0% 0 0.0% 0 0.0% 0 0.0% 0 0.0% 0 0.0% 0 0.0% 0 0.0% 0 0.0% 0 RG2 0 0.1% 2 0.0% 0 1.9% 2 0.0% 0 0.0% 0 0.0% 0 0.0% 0 0.0% 0 0.0% 0 0.0% 0 0.0% 0 0.0% 0 RG2 7 0.1% 2 1.6% 2 0.0% 0 0.0% 0 0.0% 0 0.0% 0 0.0% 0 0.0% 0 0.0% 0 0.0% 0 0.0% 0 0.0% 0 RG2 8 0.2% 5 3.4% 5 0.0% 0 0.0% 0 0.0% 0 0.0% 0 0.0% 0 0.0% 0 0.0% 0 0.0% 0 0.0% 0 0.0% 0 RG2 9 0.5% 10 0.0% 0 0.0% 0 0.0% 0 0.0% 0 0.0% 0 0.0% 0 0.0% 0 0.0% 0 0.0% 0 0.0% 0 0.0% 0 RG200 0.3% 7 0.0% 0 0.0% 0 0.0% 0 0.0% 0 0.0% 0 0.0% 0 0.0% 0 0.0% 0 0.0% 0 0.0% 0 0.0% 0 RG204 0.0% 1 0.0% 0 0.0% 0 0.0% 0 0.0% 0 0.0% 0 0.0% 0 0.0% 0 0.0% 0 0.0% 0 0.0% 0 0.0% 0 RG205 0.4% 8 0.0% 0 0.0% 0 0.0% 0 0.0% 0 0.0% 0 0.0% 0 0.0% 0 0.0% 0 0.0% 0 0.0% 0 0.0% 0 RG206 0.1% 2 0.0% 0 0.0% 0 0.0% 0 0.0% 0 0.0% 0 0.0% 0 0.0% 0 0.0% 0 0.0% 0 0.0% 0 0.0% 0 RG207 0.2% 5 0.0% 0 0.0% 0 0.0% 0 0.0% 0 0.0% 0 0.0% 0 0.0% 0 0.0% 0 0.0% 0 0.0% 0 0.0% 0 RG208 0.5% 10 0.0% 0 0.0% 0 0.0% 0 0.0% 0 0.0% 0 0.0% 0 0.0% 0 0.0% 0 0.0% 0 0.0% 0 0.0% 0 RG209 0.6% 12 0.0% 0 0.0% 0 0.0% 0 0.0% 0 0.0% 0 0.0% 0 0.0% 0 0.0% 0 0.0% 0 0.0% 0 0.0% 0 RG213 0.7% 14 0.0% 0 0.0% 0 0.0% 0 0.0% 0 0.0% 0 0.0% 0 0.0% 0 0.0% 0 0.0% 0 0.0% 0 0.0% 0 RG214 0.0% 1 0.0% 0 0.0% 0 0.0% 0 0.0% 0 0.0% 0 0.0% 0 0.0% 0 0.0% 0 0.0% 0 0.0% 0 0.0% 0 RG215 0.2% 5 0.0% 0 0.0% 0 0.0% 0 0.0% 0 0.0% 0 0.0% 0 0.0% 0 0.0% 0 0.0% 0 0.0% 0 0.0% 0 RG217 0.1% 3 0.0% 0 0.0% 0 0.0% 0 0.0% 0 0.0% 0 0.0% 0 0.0% 0 0.0% 0 0.0% 0 0.0% 0 0.0% 0 RG218 0.1% 1 0.0% 0 0.0% 0 0.0% 0 0.0% 0 0.0% 0 0.0% 0 0.0% 0 0.0% 0 0.0% 0 0.0% 0 0.0% 0 RG224 1.3% 26 0.0% 0 0.0% 0 0.0% 0 0.0% 0 0.0% 0 0.0% 0 0.0% 0 0.0% 0 0.0% 0 0.0% 0 0.0% 0 RG225 0.9% 20 0.0% 0 0.0% 0 0.0% 0 0.0% 0 0.0% 0 0.0% 0 0.0% 0 0.0% 0 0.0% 0 0.0% 0 0.0% 0 RG226 0.5% 10 0.0% 0 0.0% 0 0.0% 0 0.0% 0 0.0% 0 0.0% 0 0.0% 0 0.0% 0 0.0% 0 0.0% 0 0.0% 0 RG237 0.7% 15 0.0% 0 0.0% 0 0.0% 0 0.0% 0 0.0% 0 0.0% 0 0.0% 0 0.0% 0 0.0% 0 0.0% 0 0.0% 0 RG238 0.7% 14 0.0% 0 0.0% 0 0.0% 0 0.0% 0 0.0% 0 0.0% 0 0.0% 0 0.0% 0 0.0% 0 0.0% 0 0.0% 0 RG247 0.2% 5 0.0% 0 0.0% 0 0.0% 0 0.0% 0 0.0% 0 0.0% 0 0.0% 0 0.0% 0 0.0% 0 0.0% 0 0.0% 0 RG248 0.5% 10 0.0% 0 0.0% 0 0.0% 0 0.0% 0 0.0% 0 0.0% 0 0.0% 0 0.0% 0 0.0% 0 0.0% 0 0.0% 0 RG249 0.7% 15 0.0% 0 0.0% 0 0.0% 0 0.0% 0 0.0% 0 0.0% 0 0.0% 0 0.0% 0 0.0% 0 0.0% 0 0.0% 0 RG253 0.3% 6 0.0% 0 0.0% 0 0.0% 0 0.0% 0 0.0% 0 0.0% 0 0.0% 0 0.0% 0 0.0% 0 0.0% 0 0.0% 0 RG263 0.4% 9 0.0% 0 0.0% 0 0.0% 0 0.0% 0 0.0% 0 0.0% 0 0.0% 0 0.0% 0 0.0% 0 0.0% 0 0.0% 0 RG264 0.4% 8 0.0% 0 0.0% 0 0.0% 0 0.0% 0 0.0% 0 0.0% 0 0.0% 0 0.0% 0 0.0% 0 0.0% 0 0.0% 0 RG265 0.9% 18 0.0% 0 0.0% 0 0.0% 0 0.0% 0 0.0% 0 0.0% 0 0.0% 0 0.0% 0 0.0% 0 0.0% 0 0.0% 0 RG270 0.4% 9 0.0% 0 0.0% 0 0.0% 0 0.0% 0 0.0% 0 0.0% 0 0.0% 0 0.0% 0 0.0% 0 0.0% 0 0.0% 0 RG278 0.2% 4 0.0% 0 0.0% 0 0.0% 0 0.0% 0 0.0% 0 0.0% 0 0.0% 0 0.0% 0 0.0% 0 0.0% 0 0.0% 0 RG279 0.6% 13 0.0% 0 0.0% 0 0.0% 0 0.0% 0 0.0% 0 0.0% 0 0.0% 0 0.0% 0 0.0% 0 0.0% 0 0.0% 0 RG287 0.6% 13 0.0% 0 0.0% 0 0.0% 0 0.0% 0 0.0% 0 0.0% 0 0.0% 0 0.0% 0 0.0% 0 0.0% 0 0.0% 0 RG301 0.4% 9 0.0% 0 6.7% 9 0.0% 0 0.0% 0 0.0% 0 0.0% 0 0.0% 0 0.0% 0 0.0% 0 0.0% 0 0.0% 0 RG302 0.3% 5 0.0% 0 4.3% 5 0.0% 0 0.0% 0 0.0% 0 0.0% 0 0.0% 0 0.0% 0 0.0% 0 0.0% 0 0.0% 0 RG303 0.7% 15 0.0% 0 11.5% 15 0.0% 0 0.0% 0 0.0% 0 0.0% 0 0.0% 0 0.0% 0 0.0% 0 0.0% 0 0.0% 0 RG304 1.4% 29 0.0% 0 22.5% 29 0.0% 0 0.0% 0 0.0% 0 0.0% 0 0.0% 0 0.0% 0 0.0% 0 0.0% 0 0.0% 0 RG306 0.3% 6 0.0% 0 4.3% 6 0.0% 0 0.0% 0 0.0% 0 0.0% 0 0.0% 0 0.0% 0 0.0% 0 0.0% 0 0.0% 0 RG314 0.5% 10 0.0% 0 0.0% 0 27.9% 10 0.0% 0 0.0% 0 0.0% 0 0.0% 0 0.0% 0 0.0% 0 0.0% 0 0.0% 0 RG315 0.6% 13 0.0% 0 0.0% 0 36.3% 13 0.0% 0 0.0% 0 0.0% 0 0.0% 0 0.0% 0 0.0% 0 0.0% 0 0.0% 0 RG316 1.3% 28 0.0% 0 22.0% 28 0.0% 0 0.0% 0 0.0% 0 0.0% 0 0.0% 0 0.0% 0 0.0% 0 0.0% 0 0.0% 0 RG317 0.2% 5 0.0% 0 0.0% 0 13.5% 5 0.0% 0 0.0% 0 0.0% 0 0.0% 0 0.0% 0 0.0% 0 0.0% 0 0.0% 0 RG4 5 0.2% 5 3.2% 5 0.0% 0 0.0% 0 0.0% 0 0.0% 0 0.0% 0 0.0% 0 0.0% 0 0.0% 0 0.0% 0 0.0% 0 RG4 6 0.3% 5 3.5% 5 0.0% 0 0.0% 0 0.0% 0 0.0% 0 0.0% 0 0.0% 0 0.0% 0 0.0% 0 0.0% 0 0.0% 0
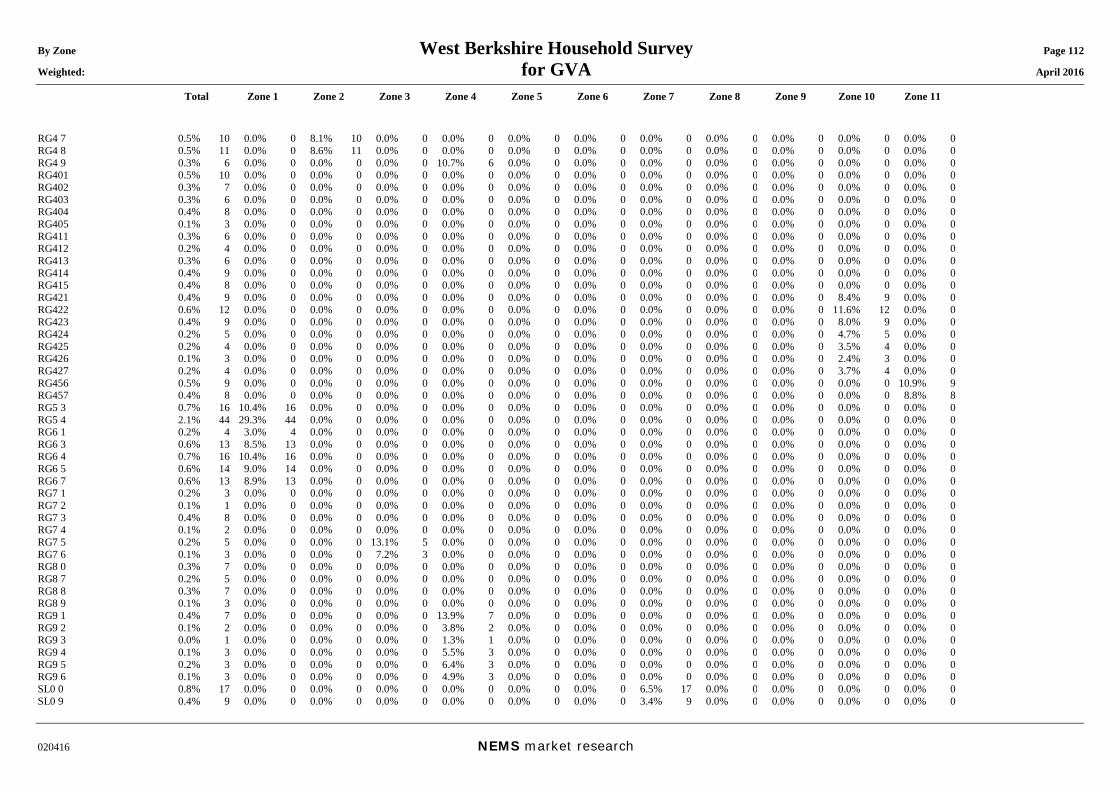
By Zone West Berkshire Household Survey Page 112 Weighted: for GVA April 2016
Total Zone 1 Zone 2 Zone 3 Zone 4 Zone 5 Zone 6 Zone 7 Zone 8 Zone 9 Zone 10 Zone 11
020416 NEMS market research
RG4 7 0.5% 10 0.0% 0 8.1% 10 0.0% 0 0.0% 0 0.0% 0 0.0% 0 0.0% 0 0.0% 0 0.0% 0 0.0% 0 0.0% 0 RG4 8 0.5% 11 0.0% 0 8.6% 11 0.0% 0 0.0% 0 0.0% 0 0.0% 0 0.0% 0 0.0% 0 0.0% 0 0.0% 0 0.0% 0 RG4 9 0.3% 6 0.0% 0 0.0% 0 0.0% 0 10.7% 6 0.0% 0 0.0% 0 0.0% 0 0.0% 0 0.0% 0 0.0% 0 0.0% 0 RG401 0.5% 10 0.0% 0 0.0% 0 0.0% 0 0.0% 0 0.0% 0 0.0% 0 0.0% 0 0.0% 0 0.0% 0 0.0% 0 0.0% 0 RG402 0.3% 7 0.0% 0 0.0% 0 0.0% 0 0.0% 0 0.0% 0 0.0% 0 0.0% 0 0.0% 0 0.0% 0 0.0% 0 0.0% 0 RG403 0.3% 6 0.0% 0 0.0% 0 0.0% 0 0.0% 0 0.0% 0 0.0% 0 0.0% 0 0.0% 0 0.0% 0 0.0% 0 0.0% 0 RG404 0.4% 8 0.0% 0 0.0% 0 0.0% 0 0.0% 0 0.0% 0 0.0% 0 0.0% 0 0.0% 0 0.0% 0 0.0% 0 0.0% 0 RG405 0.1% 3 0.0% 0 0.0% 0 0.0% 0 0.0% 0 0.0% 0 0.0% 0 0.0% 0 0.0% 0 0.0% 0 0.0% 0 0.0% 0 RG411 0.3% 6 0.0% 0 0.0% 0 0.0% 0 0.0% 0 0.0% 0 0.0% 0 0.0% 0 0.0% 0 0.0% 0 0.0% 0 0.0% 0 RG412 0.2% 4 0.0% 0 0.0% 0 0.0% 0 0.0% 0 0.0% 0 0.0% 0 0.0% 0 0.0% 0 0.0% 0 0.0% 0 0.0% 0 RG413 0.3% 6 0.0% 0 0.0% 0 0.0% 0 0.0% 0 0.0% 0 0.0% 0 0.0% 0 0.0% 0 0.0% 0 0.0% 0 0.0% 0 RG414 0.4% 9 0.0% 0 0.0% 0 0.0% 0 0.0% 0 0.0% 0 0.0% 0 0.0% 0 0.0% 0 0.0% 0 0.0% 0 0.0% 0 RG415 0.4% 8 0.0% 0 0.0% 0 0.0% 0 0.0% 0 0.0% 0 0.0% 0 0.0% 0 0.0% 0 0.0% 0 0.0% 0 0.0% 0 RG421 0.4% 9 0.0% 0 0.0% 0 0.0% 0 0.0% 0 0.0% 0 0.0% 0 0.0% 0 0.0% 0 0.0% 0 8.4% 9 0.0% 0 RG422 0.6% 12 0.0% 0 0.0% 0 0.0% 0 0.0% 0 0.0% 0 0.0% 0 0.0% 0 0.0% 0 0.0% 0 11.6% 12 0.0% 0 RG423 0.4% 9 0.0% 0 0.0% 0 0.0% 0 0.0% 0 0.0% 0 0.0% 0 0.0% 0 0.0% 0 0.0% 0 8.0% 9 0.0% 0 RG424 0.2% 5 0.0% 0 0.0% 0 0.0% 0 0.0% 0 0.0% 0 0.0% 0 0.0% 0 0.0% 0 0.0% 0 4.7% 5 0.0% 0 RG425 0.2% 4 0.0% 0 0.0% 0 0.0% 0 0.0% 0 0.0% 0 0.0% 0 0.0% 0 0.0% 0 0.0% 0 3.5% 4 0.0% 0 RG426 0.1% 3 0.0% 0 0.0% 0 0.0% 0 0.0% 0 0.0% 0 0.0% 0 0.0% 0 0.0% 0 0.0% 0 2.4% 3 0.0% 0 RG427 0.2% 4 0.0% 0 0.0% 0 0.0% 0 0.0% 0 0.0% 0 0.0% 0 0.0% 0 0.0% 0 0.0% 0 3.7% 4 0.0% 0 RG456 0.5% 9 0.0% 0 0.0% 0 0.0% 0 0.0% 0 0.0% 0 0.0% 0 0.0% 0 0.0% 0 0.0% 0 0.0% 0 10.9% 9 RG457 0.4% 8 0.0% 0 0.0% 0 0.0% 0 0.0% 0 0.0% 0 0.0% 0 0.0% 0 0.0% 0 0.0% 0 0.0% 0 8.8% 8 RG5 3 0.7% 16 10.4% 16 0.0% 0 0.0% 0 0.0% 0 0.0% 0 0.0% 0 0.0% 0 0.0% 0 0.0% 0 0.0% 0 0.0% 0 RG5 4 2.1% 44 29.3% 44 0.0% 0 0.0% 0 0.0% 0 0.0% 0 0.0% 0 0.0% 0 0.0% 0 0.0% 0 0.0% 0 0.0% 0 RG6 1 0.2% 4 3.0% 4 0.0% 0 0.0% 0 0.0% 0 0.0% 0 0.0% 0 0.0% 0 0.0% 0 0.0% 0 0.0% 0 0.0% 0 RG6 3 0.6% 13 8.5% 13 0.0% 0 0.0% 0 0.0% 0 0.0% 0 0.0% 0 0.0% 0 0.0% 0 0.0% 0 0.0% 0 0.0% 0 RG6 4 0.7% 16 10.4% 16 0.0% 0 0.0% 0 0.0% 0 0.0% 0 0.0% 0 0.0% 0 0.0% 0 0.0% 0 0.0% 0 0.0% 0 RG6 5 0.6% 14 9.0% 14 0.0% 0 0.0% 0 0.0% 0 0.0% 0 0.0% 0 0.0% 0 0.0% 0 0.0% 0 0.0% 0 0.0% 0 RG6 7 0.6% 13 8.9% 13 0.0% 0 0.0% 0 0.0% 0 0.0% 0 0.0% 0 0.0% 0 0.0% 0 0.0% 0 0.0% 0 0.0% 0 RG7 1 0.2% 3 0.0% 0 0.0% 0 0.0% 0 0.0% 0 0.0% 0 0.0% 0 0.0% 0 0.0% 0 0.0% 0 0.0% 0 0.0% 0 RG7 2 0.1% 1 0.0% 0 0.0% 0 0.0% 0 0.0% 0 0.0% 0 0.0% 0 0.0% 0 0.0% 0 0.0% 0 0.0% 0 0.0% 0 RG7 3 0.4% 8 0.0% 0 0.0% 0 0.0% 0 0.0% 0 0.0% 0 0.0% 0 0.0% 0 0.0% 0 0.0% 0 0.0% 0 0.0% 0 RG7 4 0.1% 2 0.0% 0 0.0% 0 0.0% 0 0.0% 0 0.0% 0 0.0% 0 0.0% 0 0.0% 0 0.0% 0 0.0% 0 0.0% 0 RG7 5 0.2% 5 0.0% 0 0.0% 0 13.1% 5 0.0% 0 0.0% 0 0.0% 0 0.0% 0 0.0% 0 0.0% 0 0.0% 0 0.0% 0 RG7 6 0.1% 3 0.0% 0 0.0% 0 7.2% 3 0.0% 0 0.0% 0 0.0% 0 0.0% 0 0.0% 0 0.0% 0 0.0% 0 0.0% 0 RG8 0 0.3% 7 0.0% 0 0.0% 0 0.0% 0 0.0% 0 0.0% 0 0.0% 0 0.0% 0 0.0% 0 0.0% 0 0.0% 0 0.0% 0 RG8 7 0.2% 5 0.0% 0 0.0% 0 0.0% 0 0.0% 0 0.0% 0 0.0% 0 0.0% 0 0.0% 0 0.0% 0 0.0% 0 0.0% 0 RG8 8 0.3% 7 0.0% 0 0.0% 0 0.0% 0 0.0% 0 0.0% 0 0.0% 0 0.0% 0 0.0% 0 0.0% 0 0.0% 0 0.0% 0 RG8 9 0.1% 3 0.0% 0 0.0% 0 0.0% 0 0.0% 0 0.0% 0 0.0% 0 0.0% 0 0.0% 0 0.0% 0 0.0% 0 0.0% 0 RG9 1 0.4% 7 0.0% 0 0.0% 0 0.0% 0 13.9% 7 0.0% 0 0.0% 0 0.0% 0 0.0% 0 0.0% 0 0.0% 0 0.0% 0 RG9 2 0.1% 2 0.0% 0 0.0% 0 0.0% 0 3.8% 2 0.0% 0 0.0% 0 0.0% 0 0.0% 0 0.0% 0 0.0% 0 0.0% 0 RG9 3 0.0% 1 0.0% 0 0.0% 0 0.0% 0 1.3% 1 0.0% 0 0.0% 0 0.0% 0 0.0% 0 0.0% 0 0.0% 0 0.0% 0 RG9 4 0.1% 3 0.0% 0 0.0% 0 0.0% 0 5.5% 3 0.0% 0 0.0% 0 0.0% 0 0.0% 0 0.0% 0 0.0% 0 0.0% 0 RG9 5 0.2% 3 0.0% 0 0.0% 0 0.0% 0 6.4% 3 0.0% 0 0.0% 0 0.0% 0 0.0% 0 0.0% 0 0.0% 0 0.0% 0 RG9 6 0.1% 3 0.0% 0 0.0% 0 0.0% 0 4.9% 3 0.0% 0 0.0% 0 0.0% 0 0.0% 0 0.0% 0 0.0% 0 0.0% 0 SL0 0 0.8% 17 0.0% 0 0.0% 0 0.0% 0 0.0% 0 0.0% 0 0.0% 0 6.5% 17 0.0% 0 0.0% 0 0.0% 0 0.0% 0 SL0 9 0.4% 9 0.0% 0 0.0% 0 0.0% 0 0.0% 0 0.0% 0 0.0% 0 3.4% 9 0.0% 0 0.0% 0 0.0% 0 0.0% 0
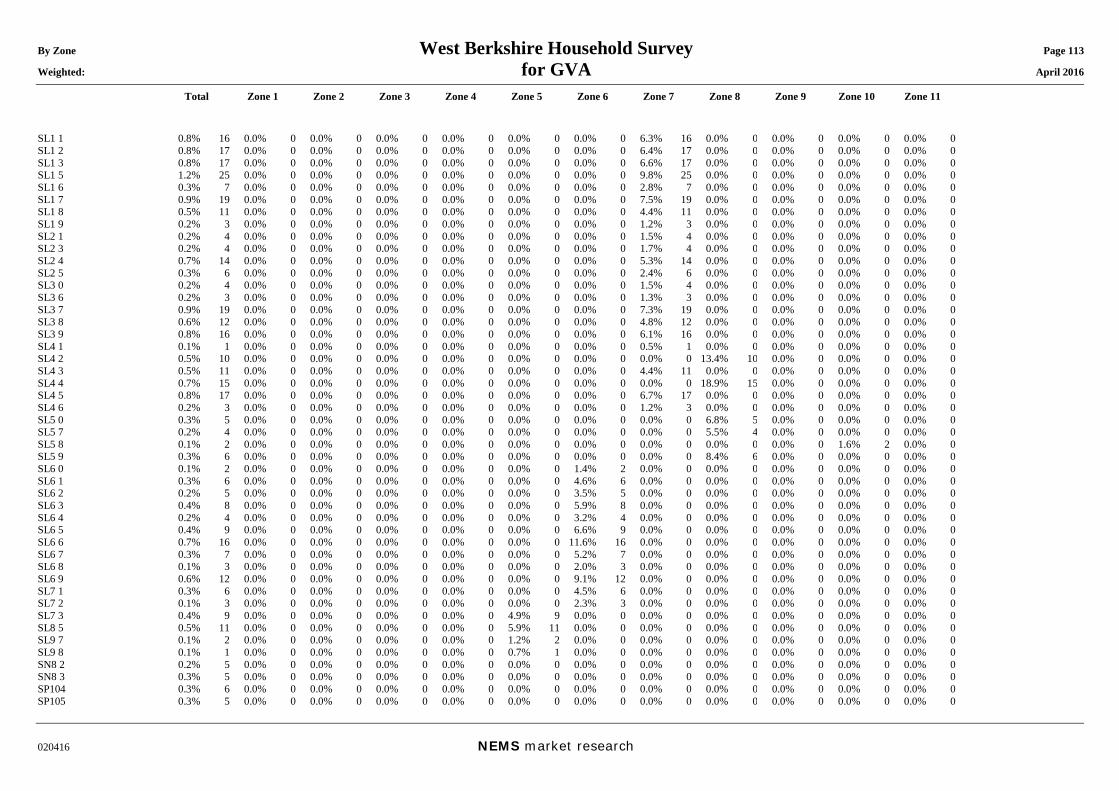
By Zone West Berkshire Household Survey Page 113 Weighted: for GVA April 2016
Total Zone 1 Zone 2 Zone 3 Zone 4 Zone 5 Zone 6 Zone 7 Zone 8 Zone 9 Zone 10 Zone 11
020416 NEMS market research
SL1 1 0.8% 16 0.0% 0 0.0% 0 0.0% 0 0.0% 0 0.0% 0 0.0% 0 6.3% 16 0.0% 0 0.0% 0 0.0% 0 0.0% 0 SL1 2 0.8% 17 0.0% 0 0.0% 0 0.0% 0 0.0% 0 0.0% 0 0.0% 0 6.4% 17 0.0% 0 0.0% 0 0.0% 0 0.0% 0 SL1 3 0.8% 17 0.0% 0 0.0% 0 0.0% 0 0.0% 0 0.0% 0 0.0% 0 6.6% 17 0.0% 0 0.0% 0 0.0% 0 0.0% 0 SL1 5 1.2% 25 0.0% 0 0.0% 0 0.0% 0 0.0% 0 0.0% 0 0.0% 0 9.8% 25 0.0% 0 0.0% 0 0.0% 0 0.0% 0 SL1 6 0.3% 7 0.0% 0 0.0% 0 0.0% 0 0.0% 0 0.0% 0 0.0% 0 2.8% 7 0.0% 0 0.0% 0 0.0% 0 0.0% 0 SL1 7 0.9% 19 0.0% 0 0.0% 0 0.0% 0 0.0% 0 0.0% 0 0.0% 0 7.5% 19 0.0% 0 0.0% 0 0.0% 0 0.0% 0 SL1 8 0.5% 11 0.0% 0 0.0% 0 0.0% 0 0.0% 0 0.0% 0 0.0% 0 4.4% 11 0.0% 0 0.0% 0 0.0% 0 0.0% 0 SL1 9 0.2% 3 0.0% 0 0.0% 0 0.0% 0 0.0% 0 0.0% 0 0.0% 0 1.2% 3 0.0% 0 0.0% 0 0.0% 0 0.0% 0 SL2 1 0.2% 4 0.0% 0 0.0% 0 0.0% 0 0.0% 0 0.0% 0 0.0% 0 1.5% 4 0.0% 0 0.0% 0 0.0% 0 0.0% 0 SL2 3 0.2% 4 0.0% 0 0.0% 0 0.0% 0 0.0% 0 0.0% 0 0.0% 0 1.7% 4 0.0% 0 0.0% 0 0.0% 0 0.0% 0 SL2 4 0.7% 14 0.0% 0 0.0% 0 0.0% 0 0.0% 0 0.0% 0 0.0% 0 5.3% 14 0.0% 0 0.0% 0 0.0% 0 0.0% 0 SL2 5 0.3% 6 0.0% 0 0.0% 0 0.0% 0 0.0% 0 0.0% 0 0.0% 0 2.4% 6 0.0% 0 0.0% 0 0.0% 0 0.0% 0 SL3 0 0.2% 4 0.0% 0 0.0% 0 0.0% 0 0.0% 0 0.0% 0 0.0% 0 1.5% 4 0.0% 0 0.0% 0 0.0% 0 0.0% 0 SL3 6 0.2% 3 0.0% 0 0.0% 0 0.0% 0 0.0% 0 0.0% 0 0.0% 0 1.3% 3 0.0% 0 0.0% 0 0.0% 0 0.0% 0 SL3 7 0.9% 19 0.0% 0 0.0% 0 0.0% 0 0.0% 0 0.0% 0 0.0% 0 7.3% 19 0.0% 0 0.0% 0 0.0% 0 0.0% 0 SL3 8 0.6% 12 0.0% 0 0.0% 0 0.0% 0 0.0% 0 0.0% 0 0.0% 0 4.8% 12 0.0% 0 0.0% 0 0.0% 0 0.0% 0 SL3 9 0.8% 16 0.0% 0 0.0% 0 0.0% 0 0.0% 0 0.0% 0 0.0% 0 6.1% 16 0.0% 0 0.0% 0 0.0% 0 0.0% 0 SL4 1 0.1% 1 0.0% 0 0.0% 0 0.0% 0 0.0% 0 0.0% 0 0.0% 0 0.5% 1 0.0% 0 0.0% 0 0.0% 0 0.0% 0 SL4 2 0.5% 10 0.0% 0 0.0% 0 0.0% 0 0.0% 0 0.0% 0 0.0% 0 0.0% 0 13.4% 10 0.0% 0 0.0% 0 0.0% 0 SL4 3 0.5% 11 0.0% 0 0.0% 0 0.0% 0 0.0% 0 0.0% 0 0.0% 0 4.4% 11 0.0% 0 0.0% 0 0.0% 0 0.0% 0 SL4 4 0.7% 15 0.0% 0 0.0% 0 0.0% 0 0.0% 0 0.0% 0 0.0% 0 0.0% 0 18.9% 15 0.0% 0 0.0% 0 0.0% 0 SL4 5 0.8% 17 0.0% 0 0.0% 0 0.0% 0 0.0% 0 0.0% 0 0.0% 0 6.7% 17 0.0% 0 0.0% 0 0.0% 0 0.0% 0 SL4 6 0.2% 3 0.0% 0 0.0% 0 0.0% 0 0.0% 0 0.0% 0 0.0% 0 1.2% 3 0.0% 0 0.0% 0 0.0% 0 0.0% 0 SL5 0 0.3% 5 0.0% 0 0.0% 0 0.0% 0 0.0% 0 0.0% 0 0.0% 0 0.0% 0 6.8% 5 0.0% 0 0.0% 0 0.0% 0 SL5 7 0.2% 4 0.0% 0 0.0% 0 0.0% 0 0.0% 0 0.0% 0 0.0% 0 0.0% 0 5.5% 4 0.0% 0 0.0% 0 0.0% 0 SL5 8 0.1% 2 0.0% 0 0.0% 0 0.0% 0 0.0% 0 0.0% 0 0.0% 0 0.0% 0 0.0% 0 0.0% 0 1.6% 2 0.0% 0 SL5 9 0.3% 6 0.0% 0 0.0% 0 0.0% 0 0.0% 0 0.0% 0 0.0% 0 0.0% 0 8.4% 6 0.0% 0 0.0% 0 0.0% 0 SL6 0 0.1% 2 0.0% 0 0.0% 0 0.0% 0 0.0% 0 0.0% 0 1.4% 2 0.0% 0 0.0% 0 0.0% 0 0.0% 0 0.0% 0 SL6 1 0.3% 6 0.0% 0 0.0% 0 0.0% 0 0.0% 0 0.0% 0 4.6% 6 0.0% 0 0.0% 0 0.0% 0 0.0% 0 0.0% 0 SL6 2 0.2% 5 0.0% 0 0.0% 0 0.0% 0 0.0% 0 0.0% 0 3.5% 5 0.0% 0 0.0% 0 0.0% 0 0.0% 0 0.0% 0 SL6 3 0.4% 8 0.0% 0 0.0% 0 0.0% 0 0.0% 0 0.0% 0 5.9% 8 0.0% 0 0.0% 0 0.0% 0 0.0% 0 0.0% 0 SL6 4 0.2% 4 0.0% 0 0.0% 0 0.0% 0 0.0% 0 0.0% 0 3.2% 4 0.0% 0 0.0% 0 0.0% 0 0.0% 0 0.0% 0 SL6 5 0.4% 9 0.0% 0 0.0% 0 0.0% 0 0.0% 0 0.0% 0 6.6% 9 0.0% 0 0.0% 0 0.0% 0 0.0% 0 0.0% 0 SL6 6 0.7% 16 0.0% 0 0.0% 0 0.0% 0 0.0% 0 0.0% 0 11.6% 16 0.0% 0 0.0% 0 0.0% 0 0.0% 0 0.0% 0 SL6 7 0.3% 7 0.0% 0 0.0% 0 0.0% 0 0.0% 0 0.0% 0 5.2% 7 0.0% 0 0.0% 0 0.0% 0 0.0% 0 0.0% 0 SL6 8 0.1% 3 0.0% 0 0.0% 0 0.0% 0 0.0% 0 0.0% 0 2.0% 3 0.0% 0 0.0% 0 0.0% 0 0.0% 0 0.0% 0 SL6 9 0.6% 12 0.0% 0 0.0% 0 0.0% 0 0.0% 0 0.0% 0 9.1% 12 0.0% 0 0.0% 0 0.0% 0 0.0% 0 0.0% 0 SL7 1 0.3% 6 0.0% 0 0.0% 0 0.0% 0 0.0% 0 0.0% 0 4.5% 6 0.0% 0 0.0% 0 0.0% 0 0.0% 0 0.0% 0 SL7 2 0.1% 3 0.0% 0 0.0% 0 0.0% 0 0.0% 0 0.0% 0 2.3% 3 0.0% 0 0.0% 0 0.0% 0 0.0% 0 0.0% 0 SL7 3 0.4% 9 0.0% 0 0.0% 0 0.0% 0 0.0% 0 4.9% 9 0.0% 0 0.0% 0 0.0% 0 0.0% 0 0.0% 0 0.0% 0 SL8 5 0.5% 11 0.0% 0 0.0% 0 0.0% 0 0.0% 0 5.9% 11 0.0% 0 0.0% 0 0.0% 0 0.0% 0 0.0% 0 0.0% 0 SL9 7 0.1% 2 0.0% 0 0.0% 0 0.0% 0 0.0% 0 1.2% 2 0.0% 0 0.0% 0 0.0% 0 0.0% 0 0.0% 0 0.0% 0 SL9 8 0.1% 1 0.0% 0 0.0% 0 0.0% 0 0.0% 0 0.7% 1 0.0% 0 0.0% 0 0.0% 0 0.0% 0 0.0% 0 0.0% 0 SN8 2 0.2% 5 0.0% 0 0.0% 0 0.0% 0 0.0% 0 0.0% 0 0.0% 0 0.0% 0 0.0% 0 0.0% 0 0.0% 0 0.0% 0 SN8 3 0.3% 5 0.0% 0 0.0% 0 0.0% 0 0.0% 0 0.0% 0 0.0% 0 0.0% 0 0.0% 0 0.0% 0 0.0% 0 0.0% 0 SP104 0.3% 6 0.0% 0 0.0% 0 0.0% 0 0.0% 0 0.0% 0 0.0% 0 0.0% 0 0.0% 0 0.0% 0 0.0% 0 0.0% 0 SP105 0.3% 5 0.0% 0 0.0% 0 0.0% 0 0.0% 0 0.0% 0 0.0% 0 0.0% 0 0.0% 0 0.0% 0 0.0% 0 0.0% 0
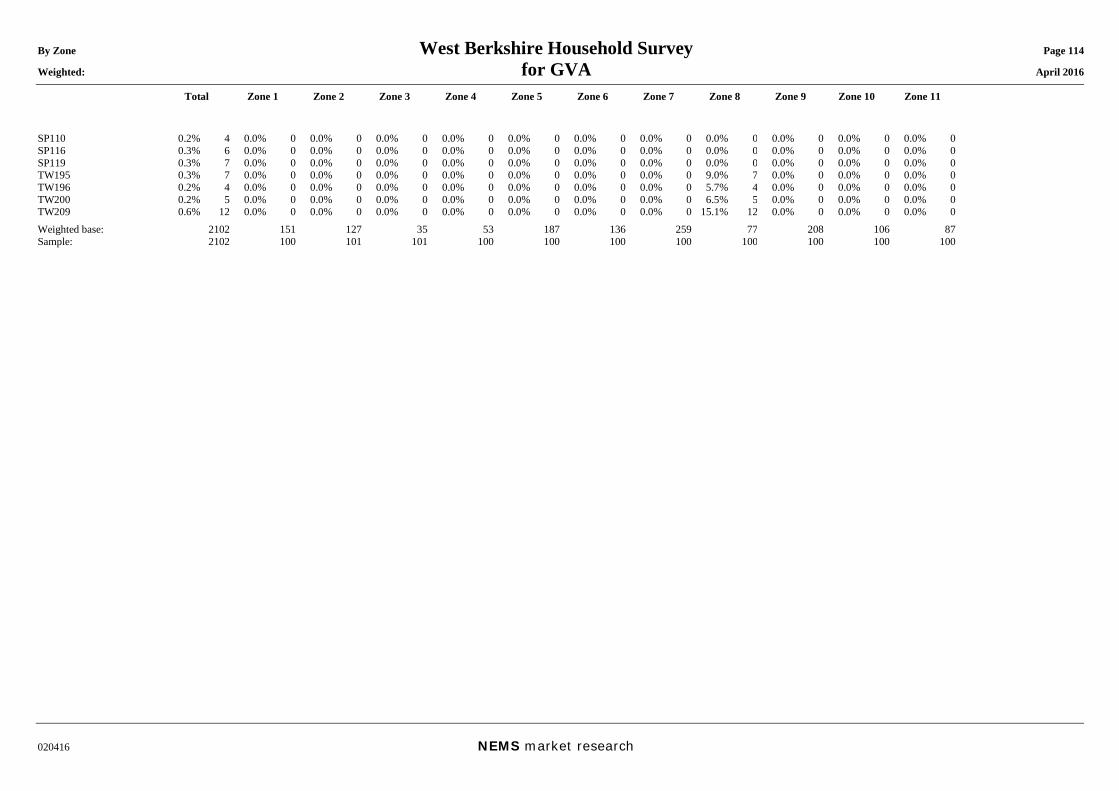
By Zone West Berkshire Household Survey Page 114 Weighted: for GVA April 2016
Total Zone 1 Zone 2 Zone 3 Zone 4 Zone 5 Zone 6 Zone 7 Zone 8 Zone 9 Zone 10 Zone 11
020416 NEMS market research
SP110 0.2% 4 0.0% 0 0.0% 0 0.0% 0 0.0% 0 0.0% 0 0.0% 0 0.0% 0 0.0% 0 0.0% 0 0.0% 0 0.0% 0 SP116 0.3% 6 0.0% 0 0.0% 0 0.0% 0 0.0% 0 0.0% 0 0.0% 0 0.0% 0 0.0% 0 0.0% 0 0.0% 0 0.0% 0 SP119 0.3% 7 0.0% 0 0.0% 0 0.0% 0 0.0% 0 0.0% 0 0.0% 0 0.0% 0 0.0% 0 0.0% 0 0.0% 0 0.0% 0 TW195 0.3% 7 0.0% 0 0.0% 0 0.0% 0 0.0% 0 0.0% 0 0.0% 0 0.0% 0 9.0% 7 0.0% 0 0.0% 0 0.0% 0 TW196 0.2% 4 0.0% 0 0.0% 0 0.0% 0 0.0% 0 0.0% 0 0.0% 0 0.0% 0 5.7% 4 0.0% 0 0.0% 0 0.0% 0 TW200 0.2% 5 0.0% 0 0.0% 0 0.0% 0 0.0% 0 0.0% 0 0.0% 0 0.0% 0 6.5% 5 0.0% 0 0.0% 0 0.0% 0 TW209 0.6% 12 0.0% 0 0.0% 0 0.0% 0 0.0% 0 0.0% 0 0.0% 0 0.0% 0 15.1% 12 0.0% 0 0.0% 0 0.0% 0 Weighted base: 2102 151 127 35 53 187 136 259 77 208 106 87 Sample: 2102 100 101 101 100 100 100 100 100 100 100 100
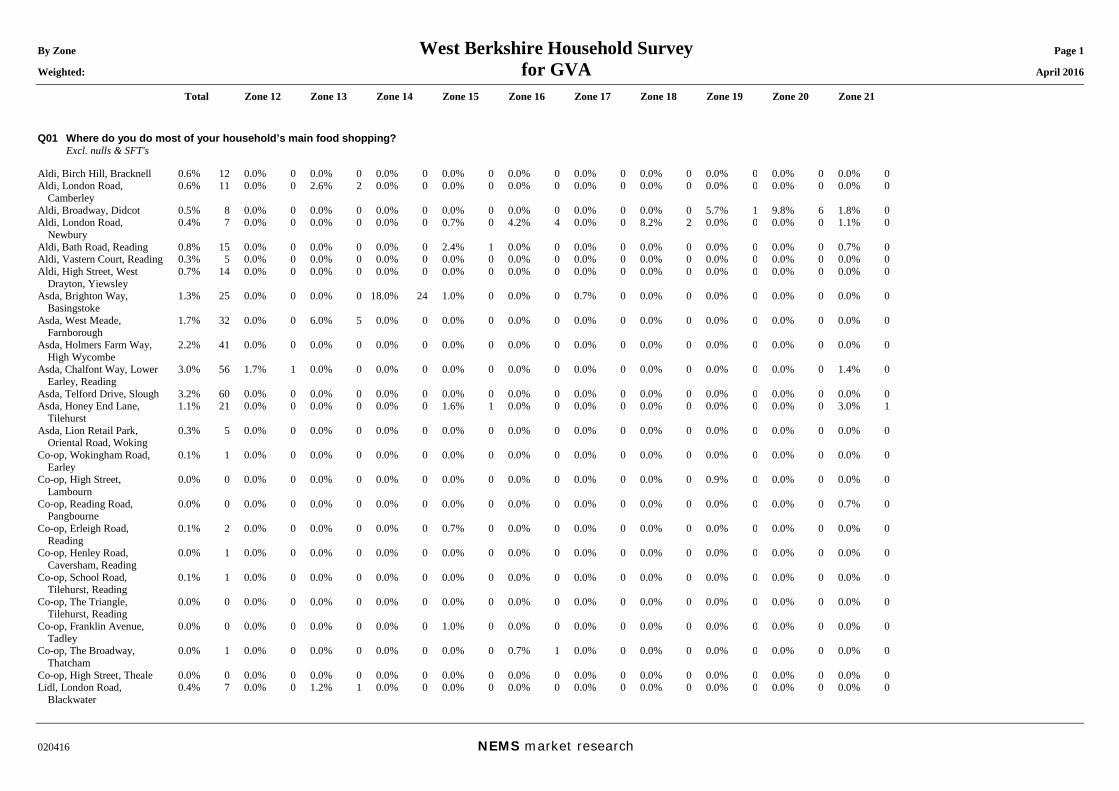
By Zone West Berkshire Household Survey Page 1 Weighted: for GVA April 2016
Total Zone 12 Zone 13 Zone 14 Zone 15 Zone 16 Zone 17 Zone 18 Zone 19 Zone 20 Zone 21
020416 NEMS market research
Q01 Where do you do most of your household’s main food shopping? Excl. nulls & SFT's Aldi, Birch Hill, Bracknell 0.6% 12 0.0% 0 0.0% 0 0.0% 0 0.0% 0 0.0% 0 0.0% 0 0.0% 0 0.0% 0 0.0% 0 0.0% 0Aldi, London Road,
Camberley 0.6% 11 0.0% 0 2.6% 2 0.0% 0 0.0% 0 0.0% 0 0.0% 0 0.0% 0 0.0% 0 0.0% 0 0.0% 0
Aldi, Broadway, Didcot 0.5% 8 0.0% 0 0.0% 0 0.0% 0 0.0% 0 0.0% 0 0.0% 0 0.0% 0 5.7% 1 9.8% 6 1.8% 0Aldi, London Road,
Newbury 0.4% 7 0.0% 0 0.0% 0 0.0% 0 0.7% 0 4.2% 4 0.0% 0 8.2% 2 0.0% 0 0.0% 0 1.1% 0
Aldi, Bath Road, Reading 0.8% 15 0.0% 0 0.0% 0 0.0% 0 2.4% 1 0.0% 0 0.0% 0 0.0% 0 0.0% 0 0.0% 0 0.7% 0Aldi, Vastern Court, Reading 0.3% 5 0.0% 0 0.0% 0 0.0% 0 0.0% 0 0.0% 0 0.0% 0 0.0% 0 0.0% 0 0.0% 0 0.0% 0Aldi, High Street, West
Drayton, Yiewsley 0.7% 14 0.0% 0 0.0% 0 0.0% 0 0.0% 0 0.0% 0 0.0% 0 0.0% 0 0.0% 0 0.0% 0 0.0% 0
Asda, Brighton Way, Basingstoke
1.3% 25 0.0% 0 0.0% 0 18.0% 24 1.0% 0 0.0% 0 0.7% 0 0.0% 0 0.0% 0 0.0% 0 0.0% 0
Asda, West Meade, Farnborough
1.7% 32 0.0% 0 6.0% 5 0.0% 0 0.0% 0 0.0% 0 0.0% 0 0.0% 0 0.0% 0 0.0% 0 0.0% 0
Asda, Holmers Farm Way, High Wycombe
2.2% 41 0.0% 0 0.0% 0 0.0% 0 0.0% 0 0.0% 0 0.0% 0 0.0% 0 0.0% 0 0.0% 0 0.0% 0
Asda, Chalfont Way, Lower Earley, Reading
3.0% 56 1.7% 1 0.0% 0 0.0% 0 0.0% 0 0.0% 0 0.0% 0 0.0% 0 0.0% 0 0.0% 0 1.4% 0
Asda, Telford Drive, Slough 3.2% 60 0.0% 0 0.0% 0 0.0% 0 0.0% 0 0.0% 0 0.0% 0 0.0% 0 0.0% 0 0.0% 0 0.0% 0Asda, Honey End Lane,
Tilehurst 1.1% 21 0.0% 0 0.0% 0 0.0% 0 1.6% 1 0.0% 0 0.0% 0 0.0% 0 0.0% 0 0.0% 0 3.0% 1
Asda, Lion Retail Park, Oriental Road, Woking
0.3% 5 0.0% 0 0.0% 0 0.0% 0 0.0% 0 0.0% 0 0.0% 0 0.0% 0 0.0% 0 0.0% 0 0.0% 0
Co-op, Wokingham Road, Earley
0.1% 1 0.0% 0 0.0% 0 0.0% 0 0.0% 0 0.0% 0 0.0% 0 0.0% 0 0.0% 0 0.0% 0 0.0% 0
Co-op, High Street, Lambourn
0.0% 0 0.0% 0 0.0% 0 0.0% 0 0.0% 0 0.0% 0 0.0% 0 0.0% 0 0.9% 0 0.0% 0 0.0% 0
Co-op, Reading Road, Pangbourne
0.0% 0 0.0% 0 0.0% 0 0.0% 0 0.0% 0 0.0% 0 0.0% 0 0.0% 0 0.0% 0 0.0% 0 0.7% 0
Co-op, Erleigh Road, Reading
0.1% 2 0.0% 0 0.0% 0 0.0% 0 0.7% 0 0.0% 0 0.0% 0 0.0% 0 0.0% 0 0.0% 0 0.0% 0
Co-op, Henley Road, Caversham, Reading
0.0% 1 0.0% 0 0.0% 0 0.0% 0 0.0% 0 0.0% 0 0.0% 0 0.0% 0 0.0% 0 0.0% 0 0.0% 0
Co-op, School Road, Tilehurst, Reading
0.1% 1 0.0% 0 0.0% 0 0.0% 0 0.0% 0 0.0% 0 0.0% 0 0.0% 0 0.0% 0 0.0% 0 0.0% 0
Co-op, The Triangle, Tilehurst, Reading
0.0% 0 0.0% 0 0.0% 0 0.0% 0 0.0% 0 0.0% 0 0.0% 0 0.0% 0 0.0% 0 0.0% 0 0.0% 0
Co-op, Franklin Avenue, Tadley
0.0% 0 0.0% 0 0.0% 0 0.0% 0 1.0% 0 0.0% 0 0.0% 0 0.0% 0 0.0% 0 0.0% 0 0.0% 0
Co-op, The Broadway, Thatcham
0.0% 1 0.0% 0 0.0% 0 0.0% 0 0.0% 0 0.7% 1 0.0% 0 0.0% 0 0.0% 0 0.0% 0 0.0% 0
Co-op, High Street, Theale 0.0% 0 0.0% 0 0.0% 0 0.0% 0 0.0% 0 0.0% 0 0.0% 0 0.0% 0 0.0% 0 0.0% 0 0.0% 0Lidl, London Road,
Blackwater 0.4% 7 0.0% 0 1.2% 1 0.0% 0 0.0% 0 0.0% 0 0.0% 0 0.0% 0 0.0% 0 0.0% 0 0.0% 0
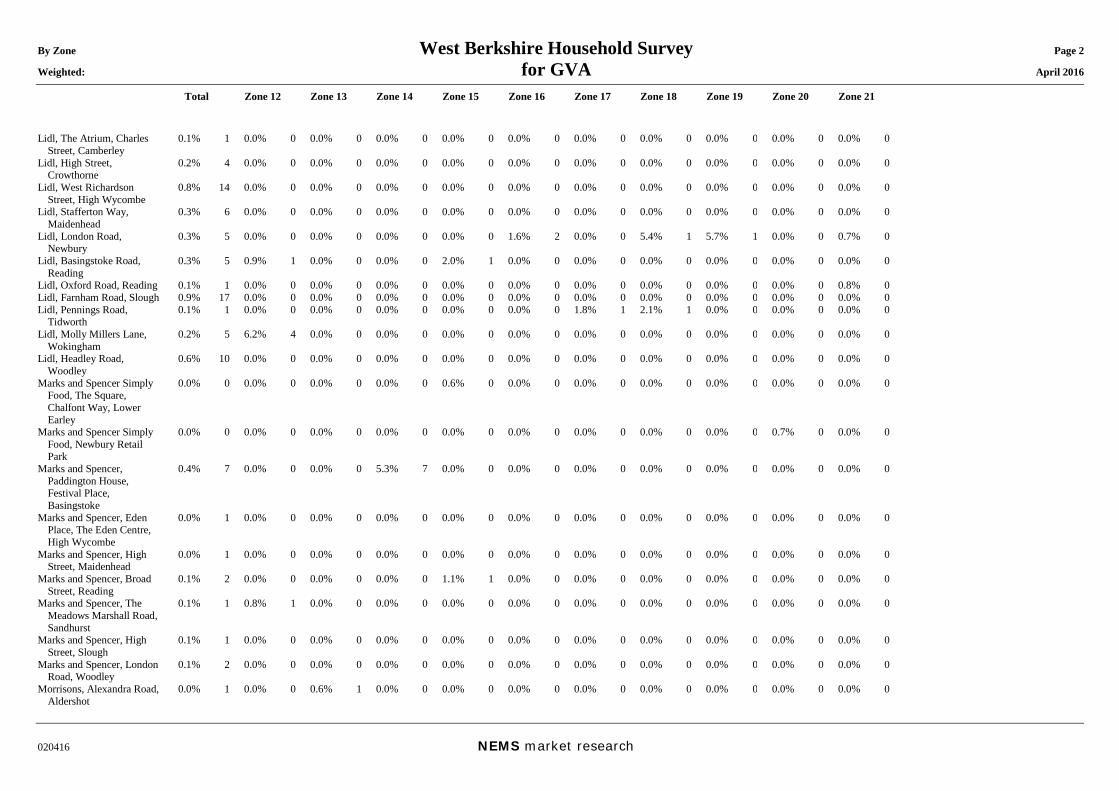
By Zone West Berkshire Household Survey Page 2 Weighted: for GVA April 2016
Total Zone 12 Zone 13 Zone 14 Zone 15 Zone 16 Zone 17 Zone 18 Zone 19 Zone 20 Zone 21
020416 NEMS market research
Lidl, The Atrium, Charles Street, Camberley
0.1% 1 0.0% 0 0.0% 0 0.0% 0 0.0% 0 0.0% 0 0.0% 0 0.0% 0 0.0% 0 0.0% 0 0.0% 0
Lidl, High Street, Crowthorne
0.2% 4 0.0% 0 0.0% 0 0.0% 0 0.0% 0 0.0% 0 0.0% 0 0.0% 0 0.0% 0 0.0% 0 0.0% 0
Lidl, West Richardson Street, High Wycombe
0.8% 14 0.0% 0 0.0% 0 0.0% 0 0.0% 0 0.0% 0 0.0% 0 0.0% 0 0.0% 0 0.0% 0 0.0% 0
Lidl, Stafferton Way, Maidenhead
0.3% 6 0.0% 0 0.0% 0 0.0% 0 0.0% 0 0.0% 0 0.0% 0 0.0% 0 0.0% 0 0.0% 0 0.0% 0
Lidl, London Road, Newbury
0.3% 5 0.0% 0 0.0% 0 0.0% 0 0.0% 0 1.6% 2 0.0% 0 5.4% 1 5.7% 1 0.0% 0 0.7% 0
Lidl, Basingstoke Road, Reading
0.3% 5 0.9% 1 0.0% 0 0.0% 0 2.0% 1 0.0% 0 0.0% 0 0.0% 0 0.0% 0 0.0% 0 0.0% 0
Lidl, Oxford Road, Reading 0.1% 1 0.0% 0 0.0% 0 0.0% 0 0.0% 0 0.0% 0 0.0% 0 0.0% 0 0.0% 0 0.0% 0 0.8% 0Lidl, Farnham Road, Slough 0.9% 17 0.0% 0 0.0% 0 0.0% 0 0.0% 0 0.0% 0 0.0% 0 0.0% 0 0.0% 0 0.0% 0 0.0% 0Lidl, Pennings Road,
Tidworth 0.1% 1 0.0% 0 0.0% 0 0.0% 0 0.0% 0 0.0% 0 1.8% 1 2.1% 1 0.0% 0 0.0% 0 0.0% 0
Lidl, Molly Millers Lane, Wokingham
0.2% 5 6.2% 4 0.0% 0 0.0% 0 0.0% 0 0.0% 0 0.0% 0 0.0% 0 0.0% 0 0.0% 0 0.0% 0
Lidl, Headley Road, Woodley
0.6% 10 0.0% 0 0.0% 0 0.0% 0 0.0% 0 0.0% 0 0.0% 0 0.0% 0 0.0% 0 0.0% 0 0.0% 0
Marks and Spencer Simply Food, The Square, Chalfont Way, Lower Earley
0.0% 0 0.0% 0 0.0% 0 0.0% 0 0.6% 0 0.0% 0 0.0% 0 0.0% 0 0.0% 0 0.0% 0 0.0% 0
Marks and Spencer Simply Food, Newbury Retail Park
0.0% 0 0.0% 0 0.0% 0 0.0% 0 0.0% 0 0.0% 0 0.0% 0 0.0% 0 0.0% 0 0.7% 0 0.0% 0
Marks and Spencer, Paddington House, Festival Place, Basingstoke
0.4% 7 0.0% 0 0.0% 0 5.3% 7 0.0% 0 0.0% 0 0.0% 0 0.0% 0 0.0% 0 0.0% 0 0.0% 0
Marks and Spencer, Eden Place, The Eden Centre, High Wycombe
0.0% 1 0.0% 0 0.0% 0 0.0% 0 0.0% 0 0.0% 0 0.0% 0 0.0% 0 0.0% 0 0.0% 0 0.0% 0
Marks and Spencer, High Street, Maidenhead
0.0% 1 0.0% 0 0.0% 0 0.0% 0 0.0% 0 0.0% 0 0.0% 0 0.0% 0 0.0% 0 0.0% 0 0.0% 0
Marks and Spencer, Broad Street, Reading
0.1% 2 0.0% 0 0.0% 0 0.0% 0 1.1% 1 0.0% 0 0.0% 0 0.0% 0 0.0% 0 0.0% 0 0.0% 0
Marks and Spencer, The Meadows Marshall Road, Sandhurst
0.1% 1 0.8% 1 0.0% 0 0.0% 0 0.0% 0 0.0% 0 0.0% 0 0.0% 0 0.0% 0 0.0% 0 0.0% 0
Marks and Spencer, High Street, Slough
0.1% 1 0.0% 0 0.0% 0 0.0% 0 0.0% 0 0.0% 0 0.0% 0 0.0% 0 0.0% 0 0.0% 0 0.0% 0
Marks and Spencer, London Road, Woodley
0.1% 2 0.0% 0 0.0% 0 0.0% 0 0.0% 0 0.0% 0 0.0% 0 0.0% 0 0.0% 0 0.0% 0 0.0% 0
Morrisons, Alexandra Road, Aldershot
0.0% 1 0.0% 0 0.6% 1 0.0% 0 0.0% 0 0.0% 0 0.0% 0 0.0% 0 0.0% 0 0.0% 0 0.0% 0
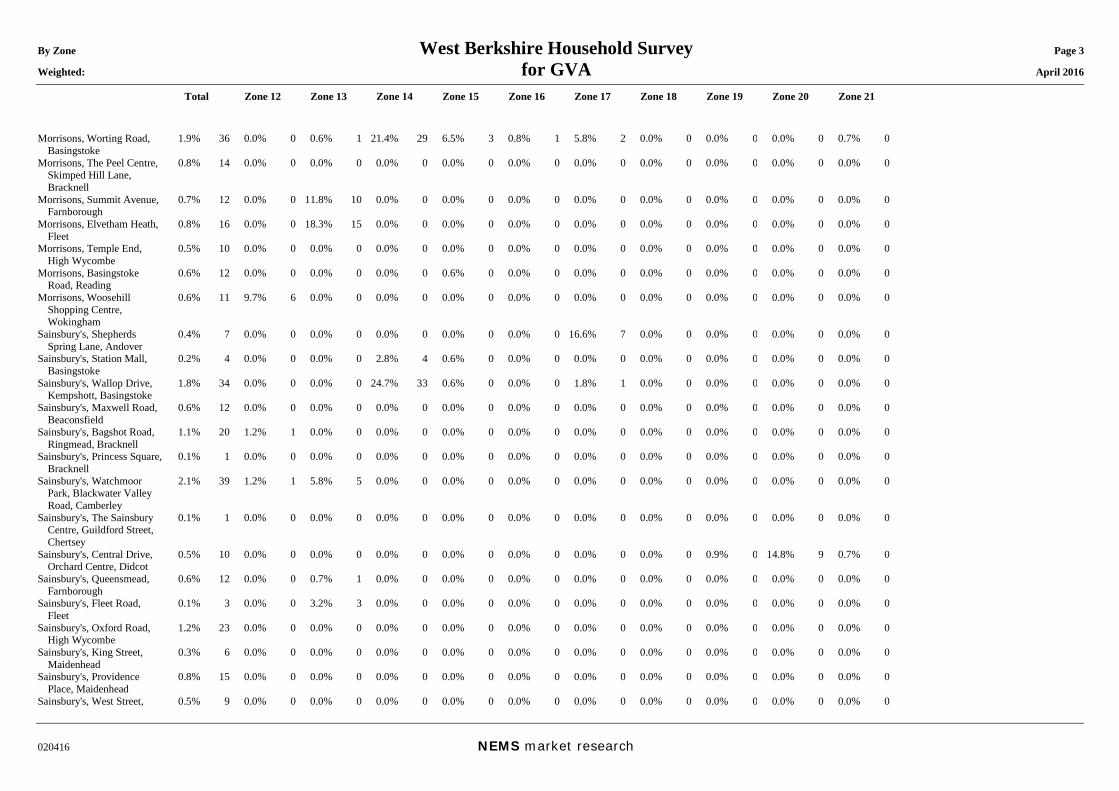
By Zone West Berkshire Household Survey Page 3 Weighted: for GVA April 2016
Total Zone 12 Zone 13 Zone 14 Zone 15 Zone 16 Zone 17 Zone 18 Zone 19 Zone 20 Zone 21
020416 NEMS market research
Morrisons, Worting Road, Basingstoke
1.9% 36 0.0% 0 0.6% 1 21.4% 29 6.5% 3 0.8% 1 5.8% 2 0.0% 0 0.0% 0 0.0% 0 0.7% 0
Morrisons, The Peel Centre, Skimped Hill Lane, Bracknell
0.8% 14 0.0% 0 0.0% 0 0.0% 0 0.0% 0 0.0% 0 0.0% 0 0.0% 0 0.0% 0 0.0% 0 0.0% 0
Morrisons, Summit Avenue, Farnborough
0.7% 12 0.0% 0 11.8% 10 0.0% 0 0.0% 0 0.0% 0 0.0% 0 0.0% 0 0.0% 0 0.0% 0 0.0% 0
Morrisons, Elvetham Heath, Fleet
0.8% 16 0.0% 0 18.3% 15 0.0% 0 0.0% 0 0.0% 0 0.0% 0 0.0% 0 0.0% 0 0.0% 0 0.0% 0
Morrisons, Temple End, High Wycombe
0.5% 10 0.0% 0 0.0% 0 0.0% 0 0.0% 0 0.0% 0 0.0% 0 0.0% 0 0.0% 0 0.0% 0 0.0% 0
Morrisons, Basingstoke Road, Reading
0.6% 12 0.0% 0 0.0% 0 0.0% 0 0.6% 0 0.0% 0 0.0% 0 0.0% 0 0.0% 0 0.0% 0 0.0% 0
Morrisons, Woosehill Shopping Centre, Wokingham
0.6% 11 9.7% 6 0.0% 0 0.0% 0 0.0% 0 0.0% 0 0.0% 0 0.0% 0 0.0% 0 0.0% 0 0.0% 0
Sainsbury's, Shepherds Spring Lane, Andover
0.4% 7 0.0% 0 0.0% 0 0.0% 0 0.0% 0 0.0% 0 16.6% 7 0.0% 0 0.0% 0 0.0% 0 0.0% 0
Sainsbury's, Station Mall, Basingstoke
0.2% 4 0.0% 0 0.0% 0 2.8% 4 0.6% 0 0.0% 0 0.0% 0 0.0% 0 0.0% 0 0.0% 0 0.0% 0
Sainsbury's, Wallop Drive, Kempshott, Basingstoke
1.8% 34 0.0% 0 0.0% 0 24.7% 33 0.6% 0 0.0% 0 1.8% 1 0.0% 0 0.0% 0 0.0% 0 0.0% 0
Sainsbury's, Maxwell Road, Beaconsfield
0.6% 12 0.0% 0 0.0% 0 0.0% 0 0.0% 0 0.0% 0 0.0% 0 0.0% 0 0.0% 0 0.0% 0 0.0% 0
Sainsbury's, Bagshot Road, Ringmead, Bracknell
1.1% 20 1.2% 1 0.0% 0 0.0% 0 0.0% 0 0.0% 0 0.0% 0 0.0% 0 0.0% 0 0.0% 0 0.0% 0
Sainsbury's, Princess Square, Bracknell
0.1% 1 0.0% 0 0.0% 0 0.0% 0 0.0% 0 0.0% 0 0.0% 0 0.0% 0 0.0% 0 0.0% 0 0.0% 0
Sainsbury's, Watchmoor Park, Blackwater Valley Road, Camberley
2.1% 39 1.2% 1 5.8% 5 0.0% 0 0.0% 0 0.0% 0 0.0% 0 0.0% 0 0.0% 0 0.0% 0 0.0% 0
Sainsbury's, The Sainsbury Centre, Guildford Street, Chertsey
0.1% 1 0.0% 0 0.0% 0 0.0% 0 0.0% 0 0.0% 0 0.0% 0 0.0% 0 0.0% 0 0.0% 0 0.0% 0
Sainsbury's, Central Drive, Orchard Centre, Didcot
0.5% 10 0.0% 0 0.0% 0 0.0% 0 0.0% 0 0.0% 0 0.0% 0 0.0% 0 0.9% 0 14.8% 9 0.7% 0
Sainsbury's, Queensmead, Farnborough
0.6% 12 0.0% 0 0.7% 1 0.0% 0 0.0% 0 0.0% 0 0.0% 0 0.0% 0 0.0% 0 0.0% 0 0.0% 0
Sainsbury's, Fleet Road, Fleet
0.1% 3 0.0% 0 3.2% 3 0.0% 0 0.0% 0 0.0% 0 0.0% 0 0.0% 0 0.0% 0 0.0% 0 0.0% 0
Sainsbury's, Oxford Road, High Wycombe
1.2% 23 0.0% 0 0.0% 0 0.0% 0 0.0% 0 0.0% 0 0.0% 0 0.0% 0 0.0% 0 0.0% 0 0.0% 0
Sainsbury's, King Street, Maidenhead
0.3% 6 0.0% 0 0.0% 0 0.0% 0 0.0% 0 0.0% 0 0.0% 0 0.0% 0 0.0% 0 0.0% 0 0.0% 0
Sainsbury's, Providence Place, Maidenhead
0.8% 15 0.0% 0 0.0% 0 0.0% 0 0.0% 0 0.0% 0 0.0% 0 0.0% 0 0.0% 0 0.0% 0 0.0% 0
Sainsbury's, West Street, 0.5% 9 0.0% 0 0.0% 0 0.0% 0 0.0% 0 0.0% 0 0.0% 0 0.0% 0 0.0% 0 0.0% 0 0.0% 0
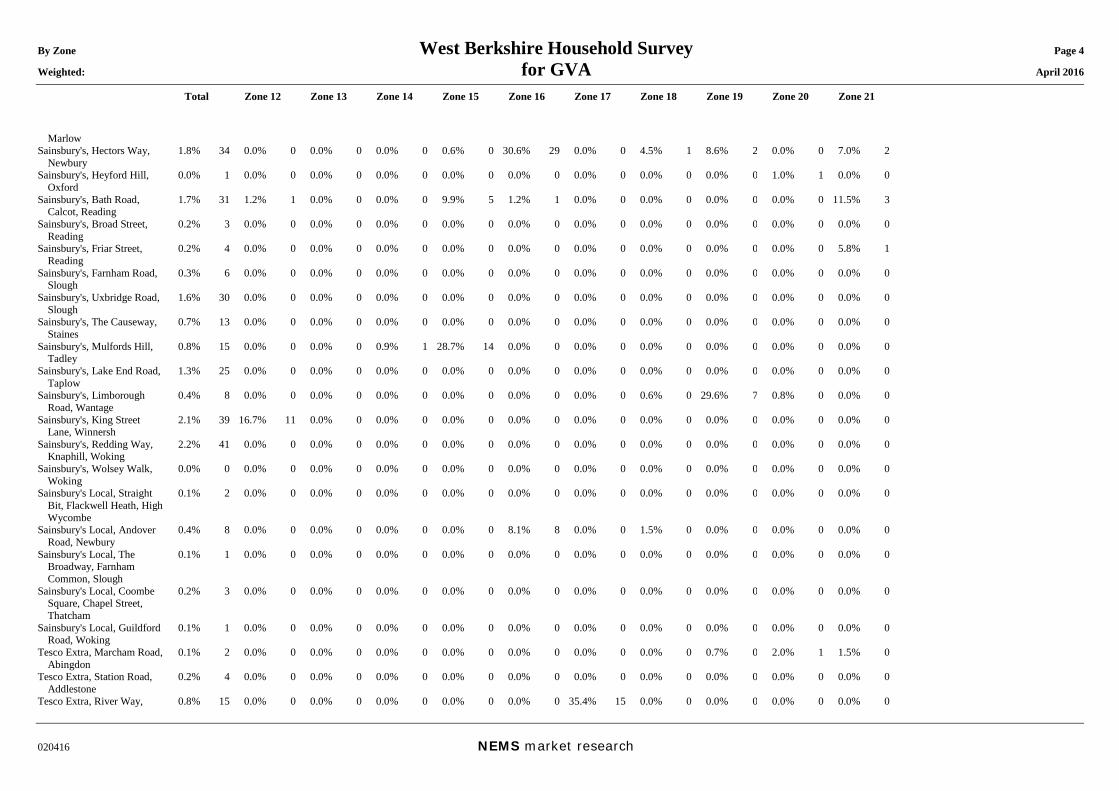
By Zone West Berkshire Household Survey Page 4 Weighted: for GVA April 2016
Total Zone 12 Zone 13 Zone 14 Zone 15 Zone 16 Zone 17 Zone 18 Zone 19 Zone 20 Zone 21
020416 NEMS market research
Marlow Sainsbury's, Hectors Way,
Newbury 1.8% 34 0.0% 0 0.0% 0 0.0% 0 0.6% 0 30.6% 29 0.0% 0 4.5% 1 8.6% 2 0.0% 0 7.0% 2
Sainsbury's, Heyford Hill, Oxford
0.0% 1 0.0% 0 0.0% 0 0.0% 0 0.0% 0 0.0% 0 0.0% 0 0.0% 0 0.0% 0 1.0% 1 0.0% 0
Sainsbury's, Bath Road, Calcot, Reading
1.7% 31 1.2% 1 0.0% 0 0.0% 0 9.9% 5 1.2% 1 0.0% 0 0.0% 0 0.0% 0 0.0% 0 11.5% 3
Sainsbury's, Broad Street, Reading
0.2% 3 0.0% 0 0.0% 0 0.0% 0 0.0% 0 0.0% 0 0.0% 0 0.0% 0 0.0% 0 0.0% 0 0.0% 0
Sainsbury's, Friar Street, Reading
0.2% 4 0.0% 0 0.0% 0 0.0% 0 0.0% 0 0.0% 0 0.0% 0 0.0% 0 0.0% 0 0.0% 0 5.8% 1
Sainsbury's, Farnham Road, Slough
0.3% 6 0.0% 0 0.0% 0 0.0% 0 0.0% 0 0.0% 0 0.0% 0 0.0% 0 0.0% 0 0.0% 0 0.0% 0
Sainsbury's, Uxbridge Road, Slough
1.6% 30 0.0% 0 0.0% 0 0.0% 0 0.0% 0 0.0% 0 0.0% 0 0.0% 0 0.0% 0 0.0% 0 0.0% 0
Sainsbury's, The Causeway, Staines
0.7% 13 0.0% 0 0.0% 0 0.0% 0 0.0% 0 0.0% 0 0.0% 0 0.0% 0 0.0% 0 0.0% 0 0.0% 0
Sainsbury's, Mulfords Hill, Tadley
0.8% 15 0.0% 0 0.0% 0 0.9% 1 28.7% 14 0.0% 0 0.0% 0 0.0% 0 0.0% 0 0.0% 0 0.0% 0
Sainsbury's, Lake End Road, Taplow
1.3% 25 0.0% 0 0.0% 0 0.0% 0 0.0% 0 0.0% 0 0.0% 0 0.0% 0 0.0% 0 0.0% 0 0.0% 0
Sainsbury's, Limborough Road, Wantage
0.4% 8 0.0% 0 0.0% 0 0.0% 0 0.0% 0 0.0% 0 0.0% 0 0.6% 0 29.6% 7 0.8% 0 0.0% 0
Sainsbury's, King Street Lane, Winnersh
2.1% 39 16.7% 11 0.0% 0 0.0% 0 0.0% 0 0.0% 0 0.0% 0 0.0% 0 0.0% 0 0.0% 0 0.0% 0
Sainsbury's, Redding Way, Knaphill, Woking
2.2% 41 0.0% 0 0.0% 0 0.0% 0 0.0% 0 0.0% 0 0.0% 0 0.0% 0 0.0% 0 0.0% 0 0.0% 0
Sainsbury's, Wolsey Walk, Woking
0.0% 0 0.0% 0 0.0% 0 0.0% 0 0.0% 0 0.0% 0 0.0% 0 0.0% 0 0.0% 0 0.0% 0 0.0% 0
Sainsbury's Local, Straight Bit, Flackwell Heath, High Wycombe
0.1% 2 0.0% 0 0.0% 0 0.0% 0 0.0% 0 0.0% 0 0.0% 0 0.0% 0 0.0% 0 0.0% 0 0.0% 0
Sainsbury's Local, Andover Road, Newbury
0.4% 8 0.0% 0 0.0% 0 0.0% 0 0.0% 0 8.1% 8 0.0% 0 1.5% 0 0.0% 0 0.0% 0 0.0% 0
Sainsbury's Local, The Broadway, Farnham Common, Slough
0.1% 1 0.0% 0 0.0% 0 0.0% 0 0.0% 0 0.0% 0 0.0% 0 0.0% 0 0.0% 0 0.0% 0 0.0% 0
Sainsbury's Local, Coombe Square, Chapel Street, Thatcham
0.2% 3 0.0% 0 0.0% 0 0.0% 0 0.0% 0 0.0% 0 0.0% 0 0.0% 0 0.0% 0 0.0% 0 0.0% 0
Sainsbury's Local, Guildford Road, Woking
0.1% 1 0.0% 0 0.0% 0 0.0% 0 0.0% 0 0.0% 0 0.0% 0 0.0% 0 0.0% 0 0.0% 0 0.0% 0
Tesco Extra, Marcham Road, Abingdon
0.1% 2 0.0% 0 0.0% 0 0.0% 0 0.0% 0 0.0% 0 0.0% 0 0.0% 0 0.7% 0 2.0% 1 1.5% 0
Tesco Extra, Station Road, Addlestone
0.2% 4 0.0% 0 0.0% 0 0.0% 0 0.0% 0 0.0% 0 0.0% 0 0.0% 0 0.0% 0 0.0% 0 0.0% 0
Tesco Extra, River Way, 0.8% 15 0.0% 0 0.0% 0 0.0% 0 0.0% 0 0.0% 0 35.4% 15 0.0% 0 0.0% 0 0.0% 0 0.0% 0
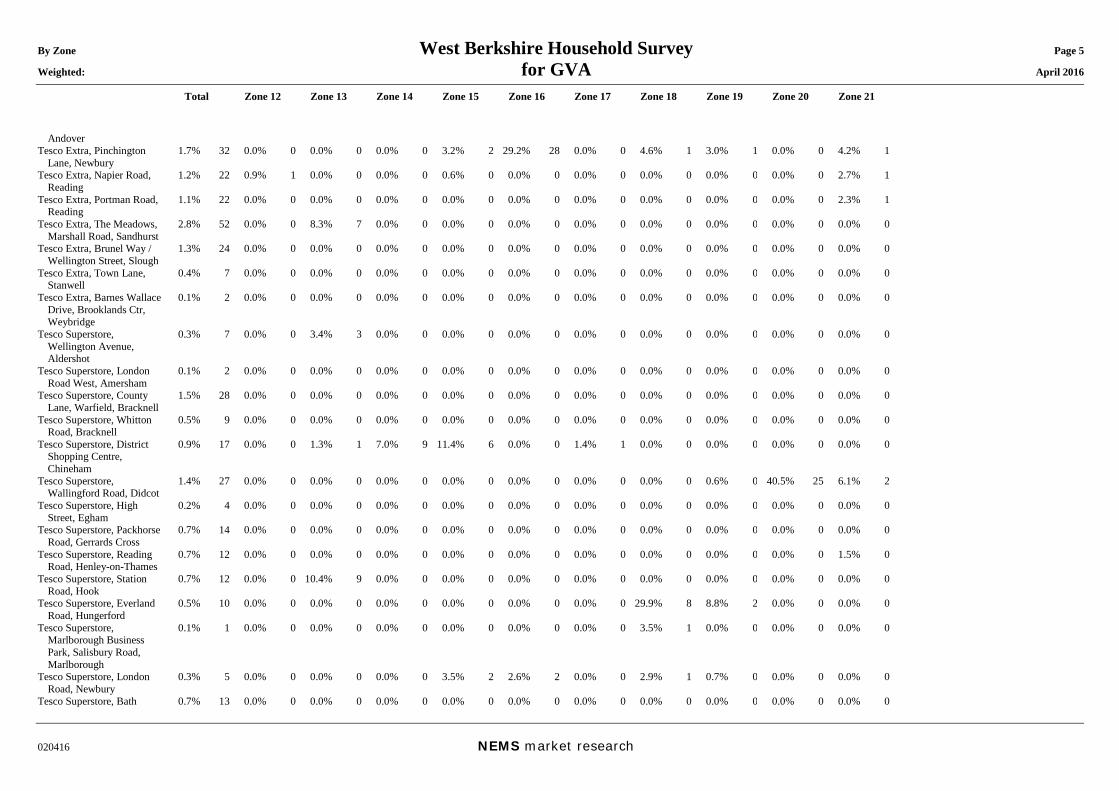
By Zone West Berkshire Household Survey Page 5 Weighted: for GVA April 2016
Total Zone 12 Zone 13 Zone 14 Zone 15 Zone 16 Zone 17 Zone 18 Zone 19 Zone 20 Zone 21
020416 NEMS market research
Andover Tesco Extra, Pinchington
Lane, Newbury 1.7% 32 0.0% 0 0.0% 0 0.0% 0 3.2% 2 29.2% 28 0.0% 0 4.6% 1 3.0% 1 0.0% 0 4.2% 1
Tesco Extra, Napier Road, Reading
1.2% 22 0.9% 1 0.0% 0 0.0% 0 0.6% 0 0.0% 0 0.0% 0 0.0% 0 0.0% 0 0.0% 0 2.7% 1
Tesco Extra, Portman Road, Reading
1.1% 22 0.0% 0 0.0% 0 0.0% 0 0.0% 0 0.0% 0 0.0% 0 0.0% 0 0.0% 0 0.0% 0 2.3% 1
Tesco Extra, The Meadows, Marshall Road, Sandhurst
2.8% 52 0.0% 0 8.3% 7 0.0% 0 0.0% 0 0.0% 0 0.0% 0 0.0% 0 0.0% 0 0.0% 0 0.0% 0
Tesco Extra, Brunel Way / Wellington Street, Slough
1.3% 24 0.0% 0 0.0% 0 0.0% 0 0.0% 0 0.0% 0 0.0% 0 0.0% 0 0.0% 0 0.0% 0 0.0% 0
Tesco Extra, Town Lane, Stanwell
0.4% 7 0.0% 0 0.0% 0 0.0% 0 0.0% 0 0.0% 0 0.0% 0 0.0% 0 0.0% 0 0.0% 0 0.0% 0
Tesco Extra, Barnes Wallace Drive, Brooklands Ctr, Weybridge
0.1% 2 0.0% 0 0.0% 0 0.0% 0 0.0% 0 0.0% 0 0.0% 0 0.0% 0 0.0% 0 0.0% 0 0.0% 0
Tesco Superstore, Wellington Avenue, Aldershot
0.3% 7 0.0% 0 3.4% 3 0.0% 0 0.0% 0 0.0% 0 0.0% 0 0.0% 0 0.0% 0 0.0% 0 0.0% 0
Tesco Superstore, London Road West, Amersham
0.1% 2 0.0% 0 0.0% 0 0.0% 0 0.0% 0 0.0% 0 0.0% 0 0.0% 0 0.0% 0 0.0% 0 0.0% 0
Tesco Superstore, County Lane, Warfield, Bracknell
1.5% 28 0.0% 0 0.0% 0 0.0% 0 0.0% 0 0.0% 0 0.0% 0 0.0% 0 0.0% 0 0.0% 0 0.0% 0
Tesco Superstore, Whitton Road, Bracknell
0.5% 9 0.0% 0 0.0% 0 0.0% 0 0.0% 0 0.0% 0 0.0% 0 0.0% 0 0.0% 0 0.0% 0 0.0% 0
Tesco Superstore, District Shopping Centre, Chineham
0.9% 17 0.0% 0 1.3% 1 7.0% 9 11.4% 6 0.0% 0 1.4% 1 0.0% 0 0.0% 0 0.0% 0 0.0% 0
Tesco Superstore, Wallingford Road, Didcot
1.4% 27 0.0% 0 0.0% 0 0.0% 0 0.0% 0 0.0% 0 0.0% 0 0.0% 0 0.6% 0 40.5% 25 6.1% 2
Tesco Superstore, High Street, Egham
0.2% 4 0.0% 0 0.0% 0 0.0% 0 0.0% 0 0.0% 0 0.0% 0 0.0% 0 0.0% 0 0.0% 0 0.0% 0
Tesco Superstore, Packhorse Road, Gerrards Cross
0.7% 14 0.0% 0 0.0% 0 0.0% 0 0.0% 0 0.0% 0 0.0% 0 0.0% 0 0.0% 0 0.0% 0 0.0% 0
Tesco Superstore, Reading Road, Henley-on-Thames
0.7% 12 0.0% 0 0.0% 0 0.0% 0 0.0% 0 0.0% 0 0.0% 0 0.0% 0 0.0% 0 0.0% 0 1.5% 0
Tesco Superstore, Station Road, Hook
0.7% 12 0.0% 0 10.4% 9 0.0% 0 0.0% 0 0.0% 0 0.0% 0 0.0% 0 0.0% 0 0.0% 0 0.0% 0
Tesco Superstore, Everland Road, Hungerford
0.5% 10 0.0% 0 0.0% 0 0.0% 0 0.0% 0 0.0% 0 0.0% 0 29.9% 8 8.8% 2 0.0% 0 0.0% 0
Tesco Superstore, Marlborough Business Park, Salisbury Road, Marlborough
0.1% 1 0.0% 0 0.0% 0 0.0% 0 0.0% 0 0.0% 0 0.0% 0 3.5% 1 0.0% 0 0.0% 0 0.0% 0
Tesco Superstore, London Road, Newbury
0.3% 5 0.0% 0 0.0% 0 0.0% 0 3.5% 2 2.6% 2 0.0% 0 2.9% 1 0.7% 0 0.0% 0 0.0% 0
Tesco Superstore, Bath 0.7% 13 0.0% 0 0.0% 0 0.0% 0 0.0% 0 0.0% 0 0.0% 0 0.0% 0 0.0% 0 0.0% 0 0.0% 0
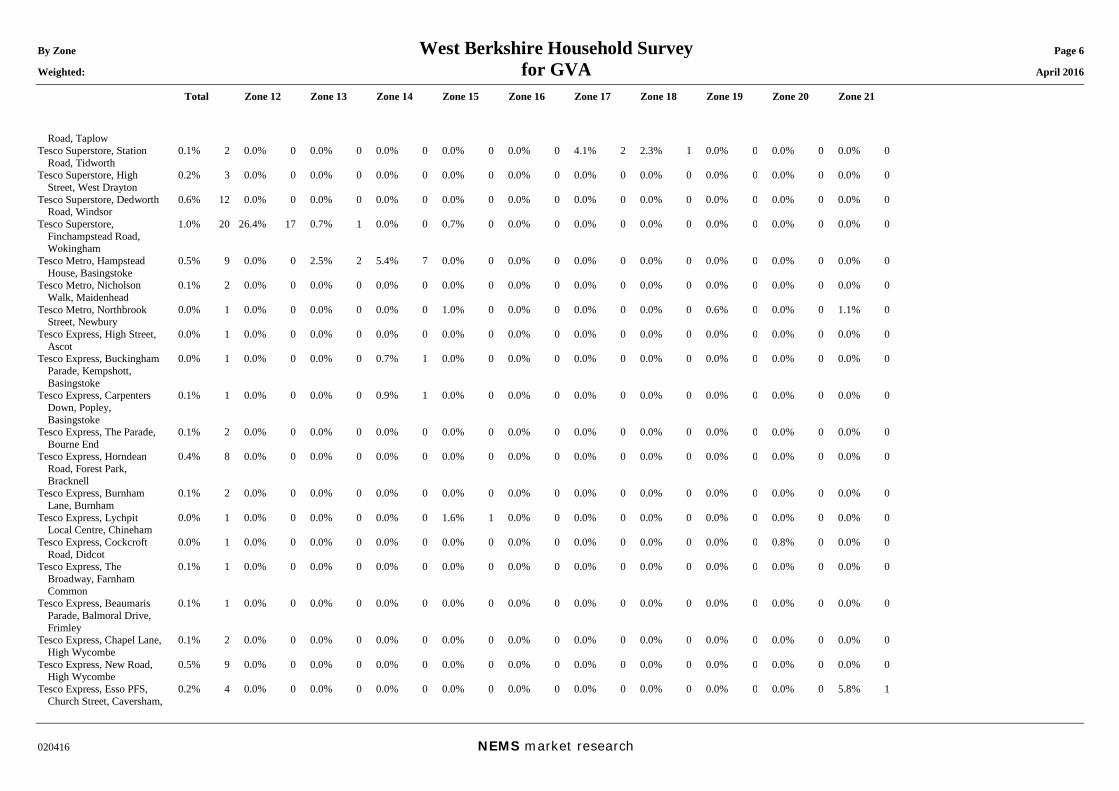
By Zone West Berkshire Household Survey Page 6 Weighted: for GVA April 2016
Total Zone 12 Zone 13 Zone 14 Zone 15 Zone 16 Zone 17 Zone 18 Zone 19 Zone 20 Zone 21
020416 NEMS market research
Road, Taplow Tesco Superstore, Station
Road, Tidworth 0.1% 2 0.0% 0 0.0% 0 0.0% 0 0.0% 0 0.0% 0 4.1% 2 2.3% 1 0.0% 0 0.0% 0 0.0% 0
Tesco Superstore, High Street, West Drayton
0.2% 3 0.0% 0 0.0% 0 0.0% 0 0.0% 0 0.0% 0 0.0% 0 0.0% 0 0.0% 0 0.0% 0 0.0% 0
Tesco Superstore, Dedworth Road, Windsor
0.6% 12 0.0% 0 0.0% 0 0.0% 0 0.0% 0 0.0% 0 0.0% 0 0.0% 0 0.0% 0 0.0% 0 0.0% 0
Tesco Superstore, Finchampstead Road, Wokingham
1.0% 20 26.4% 17 0.7% 1 0.0% 0 0.7% 0 0.0% 0 0.0% 0 0.0% 0 0.0% 0 0.0% 0 0.0% 0
Tesco Metro, Hampstead House, Basingstoke
0.5% 9 0.0% 0 2.5% 2 5.4% 7 0.0% 0 0.0% 0 0.0% 0 0.0% 0 0.0% 0 0.0% 0 0.0% 0
Tesco Metro, Nicholson Walk, Maidenhead
0.1% 2 0.0% 0 0.0% 0 0.0% 0 0.0% 0 0.0% 0 0.0% 0 0.0% 0 0.0% 0 0.0% 0 0.0% 0
Tesco Metro, Northbrook Street, Newbury
0.0% 1 0.0% 0 0.0% 0 0.0% 0 1.0% 0 0.0% 0 0.0% 0 0.0% 0 0.6% 0 0.0% 0 1.1% 0
Tesco Express, High Street, Ascot
0.0% 1 0.0% 0 0.0% 0 0.0% 0 0.0% 0 0.0% 0 0.0% 0 0.0% 0 0.0% 0 0.0% 0 0.0% 0
Tesco Express, Buckingham Parade, Kempshott, Basingstoke
0.0% 1 0.0% 0 0.0% 0 0.7% 1 0.0% 0 0.0% 0 0.0% 0 0.0% 0 0.0% 0 0.0% 0 0.0% 0
Tesco Express, Carpenters Down, Popley, Basingstoke
0.1% 1 0.0% 0 0.0% 0 0.9% 1 0.0% 0 0.0% 0 0.0% 0 0.0% 0 0.0% 0 0.0% 0 0.0% 0
Tesco Express, The Parade, Bourne End
0.1% 2 0.0% 0 0.0% 0 0.0% 0 0.0% 0 0.0% 0 0.0% 0 0.0% 0 0.0% 0 0.0% 0 0.0% 0
Tesco Express, Horndean Road, Forest Park, Bracknell
0.4% 8 0.0% 0 0.0% 0 0.0% 0 0.0% 0 0.0% 0 0.0% 0 0.0% 0 0.0% 0 0.0% 0 0.0% 0
Tesco Express, Burnham Lane, Burnham
0.1% 2 0.0% 0 0.0% 0 0.0% 0 0.0% 0 0.0% 0 0.0% 0 0.0% 0 0.0% 0 0.0% 0 0.0% 0
Tesco Express, Lychpit Local Centre, Chineham
0.0% 1 0.0% 0 0.0% 0 0.0% 0 1.6% 1 0.0% 0 0.0% 0 0.0% 0 0.0% 0 0.0% 0 0.0% 0
Tesco Express, Cockcroft Road, Didcot
0.0% 1 0.0% 0 0.0% 0 0.0% 0 0.0% 0 0.0% 0 0.0% 0 0.0% 0 0.0% 0 0.8% 0 0.0% 0
Tesco Express, The Broadway, Farnham Common
0.1% 1 0.0% 0 0.0% 0 0.0% 0 0.0% 0 0.0% 0 0.0% 0 0.0% 0 0.0% 0 0.0% 0 0.0% 0
Tesco Express, Beaumaris Parade, Balmoral Drive, Frimley
0.1% 1 0.0% 0 0.0% 0 0.0% 0 0.0% 0 0.0% 0 0.0% 0 0.0% 0 0.0% 0 0.0% 0 0.0% 0
Tesco Express, Chapel Lane, High Wycombe
0.1% 2 0.0% 0 0.0% 0 0.0% 0 0.0% 0 0.0% 0 0.0% 0 0.0% 0 0.0% 0 0.0% 0 0.0% 0
Tesco Express, New Road, High Wycombe
0.5% 9 0.0% 0 0.0% 0 0.0% 0 0.0% 0 0.0% 0 0.0% 0 0.0% 0 0.0% 0 0.0% 0 0.0% 0
Tesco Express, Esso PFS, Church Street, Caversham,
0.2% 4 0.0% 0 0.0% 0 0.0% 0 0.0% 0 0.0% 0 0.0% 0 0.0% 0 0.0% 0 0.0% 0 5.8% 1
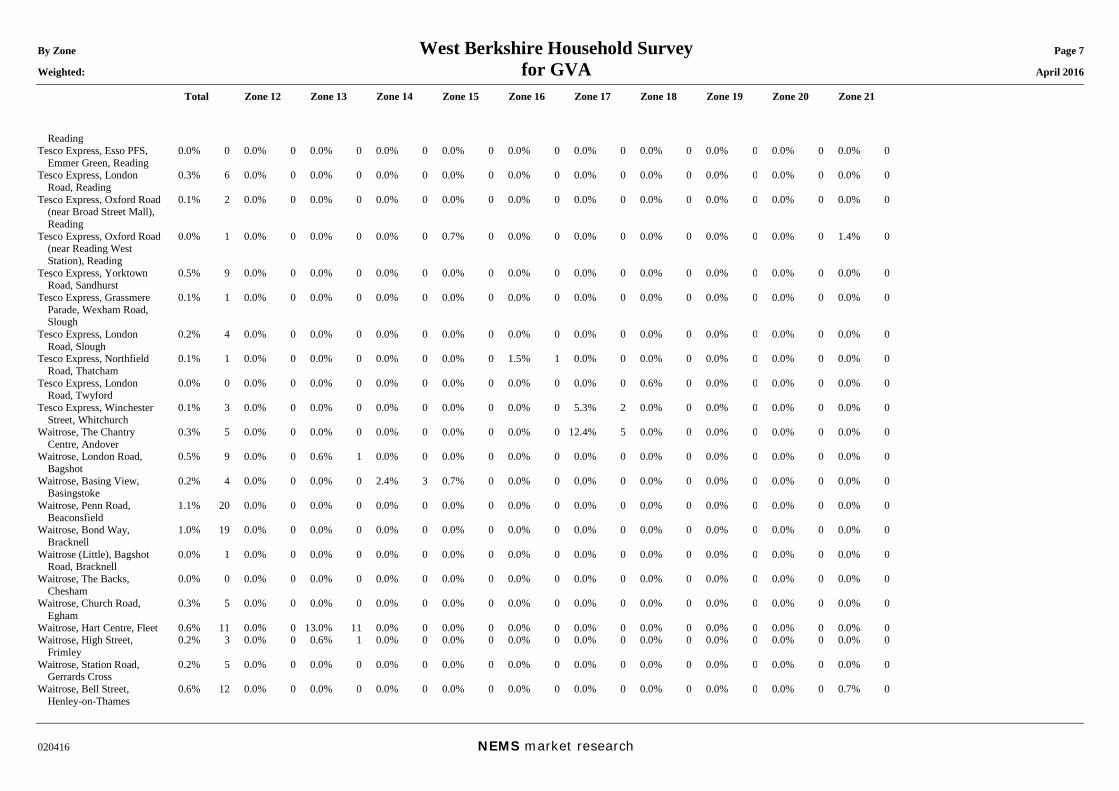
By Zone West Berkshire Household Survey Page 7 Weighted: for GVA April 2016
Total Zone 12 Zone 13 Zone 14 Zone 15 Zone 16 Zone 17 Zone 18 Zone 19 Zone 20 Zone 21
020416 NEMS market research
Reading Tesco Express, Esso PFS,
Emmer Green, Reading 0.0% 0 0.0% 0 0.0% 0 0.0% 0 0.0% 0 0.0% 0 0.0% 0 0.0% 0 0.0% 0 0.0% 0 0.0% 0
Tesco Express, London Road, Reading
0.3% 6 0.0% 0 0.0% 0 0.0% 0 0.0% 0 0.0% 0 0.0% 0 0.0% 0 0.0% 0 0.0% 0 0.0% 0
Tesco Express, Oxford Road (near Broad Street Mall), Reading
0.1% 2 0.0% 0 0.0% 0 0.0% 0 0.0% 0 0.0% 0 0.0% 0 0.0% 0 0.0% 0 0.0% 0 0.0% 0
Tesco Express, Oxford Road (near Reading West Station), Reading
0.0% 1 0.0% 0 0.0% 0 0.0% 0 0.7% 0 0.0% 0 0.0% 0 0.0% 0 0.0% 0 0.0% 0 1.4% 0
Tesco Express, Yorktown Road, Sandhurst
0.5% 9 0.0% 0 0.0% 0 0.0% 0 0.0% 0 0.0% 0 0.0% 0 0.0% 0 0.0% 0 0.0% 0 0.0% 0
Tesco Express, Grassmere Parade, Wexham Road, Slough
0.1% 1 0.0% 0 0.0% 0 0.0% 0 0.0% 0 0.0% 0 0.0% 0 0.0% 0 0.0% 0 0.0% 0 0.0% 0
Tesco Express, London Road, Slough
0.2% 4 0.0% 0 0.0% 0 0.0% 0 0.0% 0 0.0% 0 0.0% 0 0.0% 0 0.0% 0 0.0% 0 0.0% 0
Tesco Express, Northfield Road, Thatcham
0.1% 1 0.0% 0 0.0% 0 0.0% 0 0.0% 0 1.5% 1 0.0% 0 0.0% 0 0.0% 0 0.0% 0 0.0% 0
Tesco Express, London Road, Twyford
0.0% 0 0.0% 0 0.0% 0 0.0% 0 0.0% 0 0.0% 0 0.0% 0 0.6% 0 0.0% 0 0.0% 0 0.0% 0
Tesco Express, Winchester Street, Whitchurch
0.1% 3 0.0% 0 0.0% 0 0.0% 0 0.0% 0 0.0% 0 5.3% 2 0.0% 0 0.0% 0 0.0% 0 0.0% 0
Waitrose, The Chantry Centre, Andover
0.3% 5 0.0% 0 0.0% 0 0.0% 0 0.0% 0 0.0% 0 12.4% 5 0.0% 0 0.0% 0 0.0% 0 0.0% 0
Waitrose, London Road, Bagshot
0.5% 9 0.0% 0 0.6% 1 0.0% 0 0.0% 0 0.0% 0 0.0% 0 0.0% 0 0.0% 0 0.0% 0 0.0% 0
Waitrose, Basing View, Basingstoke
0.2% 4 0.0% 0 0.0% 0 2.4% 3 0.7% 0 0.0% 0 0.0% 0 0.0% 0 0.0% 0 0.0% 0 0.0% 0
Waitrose, Penn Road, Beaconsfield
1.1% 20 0.0% 0 0.0% 0 0.0% 0 0.0% 0 0.0% 0 0.0% 0 0.0% 0 0.0% 0 0.0% 0 0.0% 0
Waitrose, Bond Way, Bracknell
1.0% 19 0.0% 0 0.0% 0 0.0% 0 0.0% 0 0.0% 0 0.0% 0 0.0% 0 0.0% 0 0.0% 0 0.0% 0
Waitrose (Little), Bagshot Road, Bracknell
0.0% 1 0.0% 0 0.0% 0 0.0% 0 0.0% 0 0.0% 0 0.0% 0 0.0% 0 0.0% 0 0.0% 0 0.0% 0
Waitrose, The Backs, Chesham
0.0% 0 0.0% 0 0.0% 0 0.0% 0 0.0% 0 0.0% 0 0.0% 0 0.0% 0 0.0% 0 0.0% 0 0.0% 0
Waitrose, Church Road, Egham
0.3% 5 0.0% 0 0.0% 0 0.0% 0 0.0% 0 0.0% 0 0.0% 0 0.0% 0 0.0% 0 0.0% 0 0.0% 0
Waitrose, Hart Centre, Fleet 0.6% 11 0.0% 0 13.0% 11 0.0% 0 0.0% 0 0.0% 0 0.0% 0 0.0% 0 0.0% 0 0.0% 0 0.0% 0Waitrose, High Street,
Frimley 0.2% 3 0.0% 0 0.6% 1 0.0% 0 0.0% 0 0.0% 0 0.0% 0 0.0% 0 0.0% 0 0.0% 0 0.0% 0
Waitrose, Station Road, Gerrards Cross
0.2% 5 0.0% 0 0.0% 0 0.0% 0 0.0% 0 0.0% 0 0.0% 0 0.0% 0 0.0% 0 0.0% 0 0.0% 0
Waitrose, Bell Street, Henley-on-Thames
0.6% 12 0.0% 0 0.0% 0 0.0% 0 0.0% 0 0.0% 0 0.0% 0 0.0% 0 0.0% 0 0.0% 0 0.7% 0
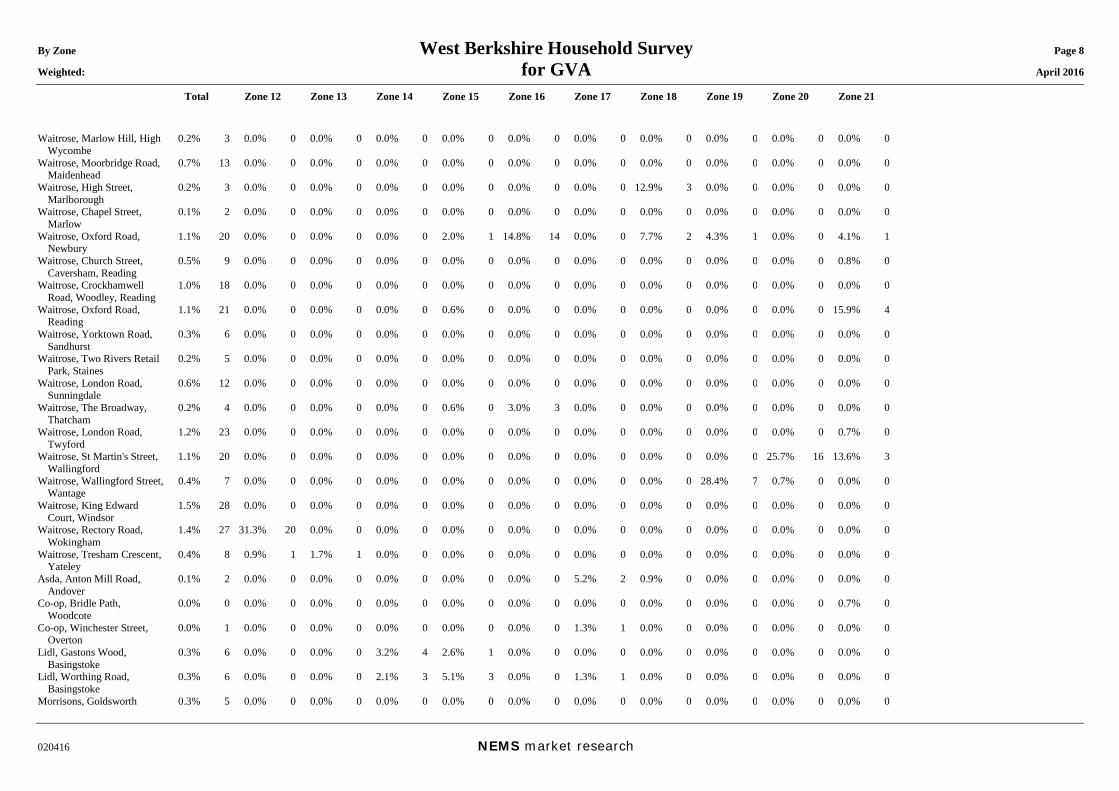
By Zone West Berkshire Household Survey Page 8 Weighted: for GVA April 2016
Total Zone 12 Zone 13 Zone 14 Zone 15 Zone 16 Zone 17 Zone 18 Zone 19 Zone 20 Zone 21
020416 NEMS market research
Waitrose, Marlow Hill, High Wycombe
0.2% 3 0.0% 0 0.0% 0 0.0% 0 0.0% 0 0.0% 0 0.0% 0 0.0% 0 0.0% 0 0.0% 0 0.0% 0
Waitrose, Moorbridge Road, Maidenhead
0.7% 13 0.0% 0 0.0% 0 0.0% 0 0.0% 0 0.0% 0 0.0% 0 0.0% 0 0.0% 0 0.0% 0 0.0% 0
Waitrose, High Street, Marlborough
0.2% 3 0.0% 0 0.0% 0 0.0% 0 0.0% 0 0.0% 0 0.0% 0 12.9% 3 0.0% 0 0.0% 0 0.0% 0
Waitrose, Chapel Street, Marlow
0.1% 2 0.0% 0 0.0% 0 0.0% 0 0.0% 0 0.0% 0 0.0% 0 0.0% 0 0.0% 0 0.0% 0 0.0% 0
Waitrose, Oxford Road, Newbury
1.1% 20 0.0% 0 0.0% 0 0.0% 0 2.0% 1 14.8% 14 0.0% 0 7.7% 2 4.3% 1 0.0% 0 4.1% 1
Waitrose, Church Street, Caversham, Reading
0.5% 9 0.0% 0 0.0% 0 0.0% 0 0.0% 0 0.0% 0 0.0% 0 0.0% 0 0.0% 0 0.0% 0 0.8% 0
Waitrose, Crockhamwell Road, Woodley, Reading
1.0% 18 0.0% 0 0.0% 0 0.0% 0 0.0% 0 0.0% 0 0.0% 0 0.0% 0 0.0% 0 0.0% 0 0.0% 0
Waitrose, Oxford Road, Reading
1.1% 21 0.0% 0 0.0% 0 0.0% 0 0.6% 0 0.0% 0 0.0% 0 0.0% 0 0.0% 0 0.0% 0 15.9% 4
Waitrose, Yorktown Road, Sandhurst
0.3% 6 0.0% 0 0.0% 0 0.0% 0 0.0% 0 0.0% 0 0.0% 0 0.0% 0 0.0% 0 0.0% 0 0.0% 0
Waitrose, Two Rivers Retail Park, Staines
0.2% 5 0.0% 0 0.0% 0 0.0% 0 0.0% 0 0.0% 0 0.0% 0 0.0% 0 0.0% 0 0.0% 0 0.0% 0
Waitrose, London Road, Sunningdale
0.6% 12 0.0% 0 0.0% 0 0.0% 0 0.0% 0 0.0% 0 0.0% 0 0.0% 0 0.0% 0 0.0% 0 0.0% 0
Waitrose, The Broadway, Thatcham
0.2% 4 0.0% 0 0.0% 0 0.0% 0 0.6% 0 3.0% 3 0.0% 0 0.0% 0 0.0% 0 0.0% 0 0.0% 0
Waitrose, London Road, Twyford
1.2% 23 0.0% 0 0.0% 0 0.0% 0 0.0% 0 0.0% 0 0.0% 0 0.0% 0 0.0% 0 0.0% 0 0.7% 0
Waitrose, St Martin's Street, Wallingford
1.1% 20 0.0% 0 0.0% 0 0.0% 0 0.0% 0 0.0% 0 0.0% 0 0.0% 0 0.0% 0 25.7% 16 13.6% 3
Waitrose, Wallingford Street, Wantage
0.4% 7 0.0% 0 0.0% 0 0.0% 0 0.0% 0 0.0% 0 0.0% 0 0.0% 0 28.4% 7 0.7% 0 0.0% 0
Waitrose, King Edward Court, Windsor
1.5% 28 0.0% 0 0.0% 0 0.0% 0 0.0% 0 0.0% 0 0.0% 0 0.0% 0 0.0% 0 0.0% 0 0.0% 0
Waitrose, Rectory Road, Wokingham
1.4% 27 31.3% 20 0.0% 0 0.0% 0 0.0% 0 0.0% 0 0.0% 0 0.0% 0 0.0% 0 0.0% 0 0.0% 0
Waitrose, Tresham Crescent, Yateley
0.4% 8 0.9% 1 1.7% 1 0.0% 0 0.0% 0 0.0% 0 0.0% 0 0.0% 0 0.0% 0 0.0% 0 0.0% 0
Asda, Anton Mill Road, Andover
0.1% 2 0.0% 0 0.0% 0 0.0% 0 0.0% 0 0.0% 0 5.2% 2 0.9% 0 0.0% 0 0.0% 0 0.0% 0
Co-op, Bridle Path, Woodcote
0.0% 0 0.0% 0 0.0% 0 0.0% 0 0.0% 0 0.0% 0 0.0% 0 0.0% 0 0.0% 0 0.0% 0 0.7% 0
Co-op, Winchester Street, Overton
0.0% 1 0.0% 0 0.0% 0 0.0% 0 0.0% 0 0.0% 0 1.3% 1 0.0% 0 0.0% 0 0.0% 0 0.0% 0
Lidl, Gastons Wood, Basingstoke
0.3% 6 0.0% 0 0.0% 0 3.2% 4 2.6% 1 0.0% 0 0.0% 0 0.0% 0 0.0% 0 0.0% 0 0.0% 0
Lidl, Worthing Road, Basingstoke
0.3% 6 0.0% 0 0.0% 0 2.1% 3 5.1% 3 0.0% 0 1.3% 1 0.0% 0 0.0% 0 0.0% 0 0.0% 0
Morrisons, Goldsworth 0.3% 5 0.0% 0 0.0% 0 0.0% 0 0.0% 0 0.0% 0 0.0% 0 0.0% 0 0.0% 0 0.0% 0 0.0% 0
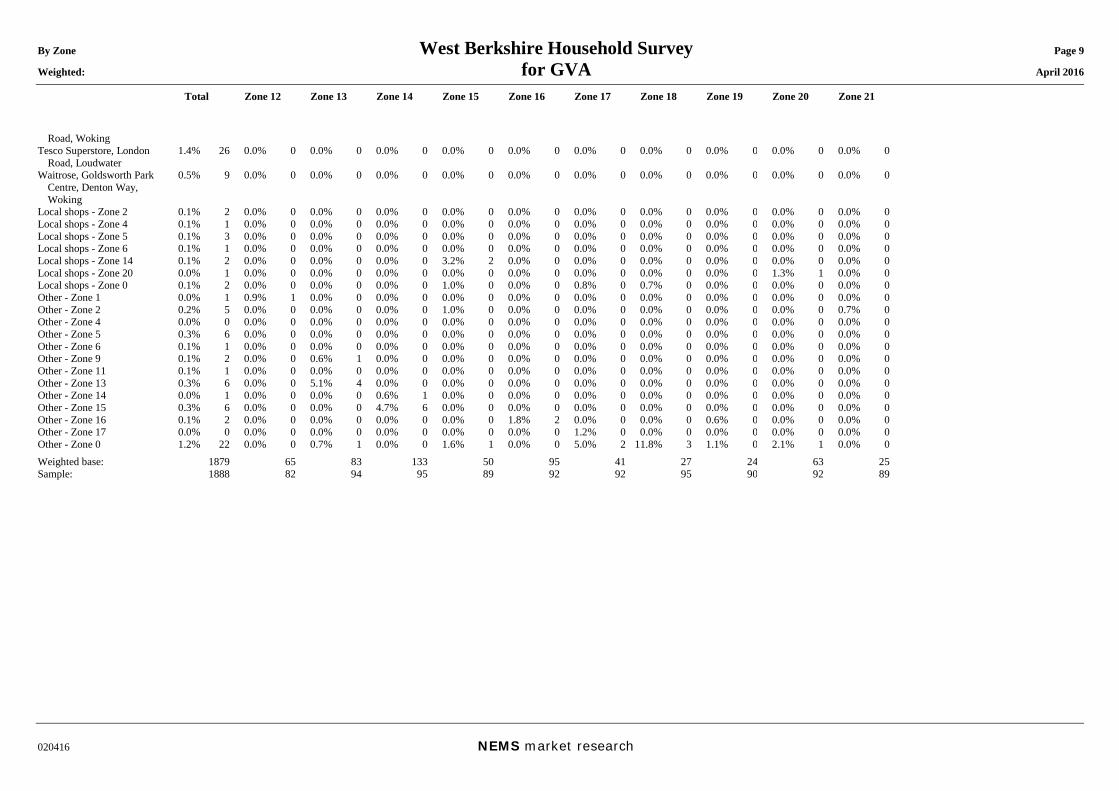
By Zone West Berkshire Household Survey Page 9 Weighted: for GVA April 2016
Total Zone 12 Zone 13 Zone 14 Zone 15 Zone 16 Zone 17 Zone 18 Zone 19 Zone 20 Zone 21
020416 NEMS market research
Road, Woking Tesco Superstore, London
Road, Loudwater 1.4% 26 0.0% 0 0.0% 0 0.0% 0 0.0% 0 0.0% 0 0.0% 0 0.0% 0 0.0% 0 0.0% 0 0.0% 0
Waitrose, Goldsworth Park Centre, Denton Way, Woking
0.5% 9 0.0% 0 0.0% 0 0.0% 0 0.0% 0 0.0% 0 0.0% 0 0.0% 0 0.0% 0 0.0% 0 0.0% 0
Local shops - Zone 2 0.1% 2 0.0% 0 0.0% 0 0.0% 0 0.0% 0 0.0% 0 0.0% 0 0.0% 0 0.0% 0 0.0% 0 0.0% 0Local shops - Zone 4 0.1% 1 0.0% 0 0.0% 0 0.0% 0 0.0% 0 0.0% 0 0.0% 0 0.0% 0 0.0% 0 0.0% 0 0.0% 0Local shops - Zone 5 0.1% 3 0.0% 0 0.0% 0 0.0% 0 0.0% 0 0.0% 0 0.0% 0 0.0% 0 0.0% 0 0.0% 0 0.0% 0Local shops - Zone 6 0.1% 1 0.0% 0 0.0% 0 0.0% 0 0.0% 0 0.0% 0 0.0% 0 0.0% 0 0.0% 0 0.0% 0 0.0% 0Local shops - Zone 14 0.1% 2 0.0% 0 0.0% 0 0.0% 0 3.2% 2 0.0% 0 0.0% 0 0.0% 0 0.0% 0 0.0% 0 0.0% 0Local shops - Zone 20 0.0% 1 0.0% 0 0.0% 0 0.0% 0 0.0% 0 0.0% 0 0.0% 0 0.0% 0 0.0% 0 1.3% 1 0.0% 0Local shops - Zone 0 0.1% 2 0.0% 0 0.0% 0 0.0% 0 1.0% 0 0.0% 0 0.8% 0 0.7% 0 0.0% 0 0.0% 0 0.0% 0Other - Zone 1 0.0% 1 0.9% 1 0.0% 0 0.0% 0 0.0% 0 0.0% 0 0.0% 0 0.0% 0 0.0% 0 0.0% 0 0.0% 0Other - Zone 2 0.2% 5 0.0% 0 0.0% 0 0.0% 0 1.0% 0 0.0% 0 0.0% 0 0.0% 0 0.0% 0 0.0% 0 0.7% 0Other - Zone 4 0.0% 0 0.0% 0 0.0% 0 0.0% 0 0.0% 0 0.0% 0 0.0% 0 0.0% 0 0.0% 0 0.0% 0 0.0% 0Other - Zone 5 0.3% 6 0.0% 0 0.0% 0 0.0% 0 0.0% 0 0.0% 0 0.0% 0 0.0% 0 0.0% 0 0.0% 0 0.0% 0Other - Zone 6 0.1% 1 0.0% 0 0.0% 0 0.0% 0 0.0% 0 0.0% 0 0.0% 0 0.0% 0 0.0% 0 0.0% 0 0.0% 0Other - Zone 9 0.1% 2 0.0% 0 0.6% 1 0.0% 0 0.0% 0 0.0% 0 0.0% 0 0.0% 0 0.0% 0 0.0% 0 0.0% 0Other - Zone 11 0.1% 1 0.0% 0 0.0% 0 0.0% 0 0.0% 0 0.0% 0 0.0% 0 0.0% 0 0.0% 0 0.0% 0 0.0% 0Other - Zone 13 0.3% 6 0.0% 0 5.1% 4 0.0% 0 0.0% 0 0.0% 0 0.0% 0 0.0% 0 0.0% 0 0.0% 0 0.0% 0Other - Zone 14 0.0% 1 0.0% 0 0.0% 0 0.6% 1 0.0% 0 0.0% 0 0.0% 0 0.0% 0 0.0% 0 0.0% 0 0.0% 0Other - Zone 15 0.3% 6 0.0% 0 0.0% 0 4.7% 6 0.0% 0 0.0% 0 0.0% 0 0.0% 0 0.0% 0 0.0% 0 0.0% 0Other - Zone 16 0.1% 2 0.0% 0 0.0% 0 0.0% 0 0.0% 0 1.8% 2 0.0% 0 0.0% 0 0.6% 0 0.0% 0 0.0% 0Other - Zone 17 0.0% 0 0.0% 0 0.0% 0 0.0% 0 0.0% 0 0.0% 0 1.2% 0 0.0% 0 0.0% 0 0.0% 0 0.0% 0Other - Zone 0 1.2% 22 0.0% 0 0.7% 1 0.0% 0 1.6% 1 0.0% 0 5.0% 2 11.8% 3 1.1% 0 2.1% 1 0.0% 0Weighted base: 1879 65 83 133 50 95 41 27 24 63 25Sample: 1888 82 94 95 89 92 92 95 90 92 89
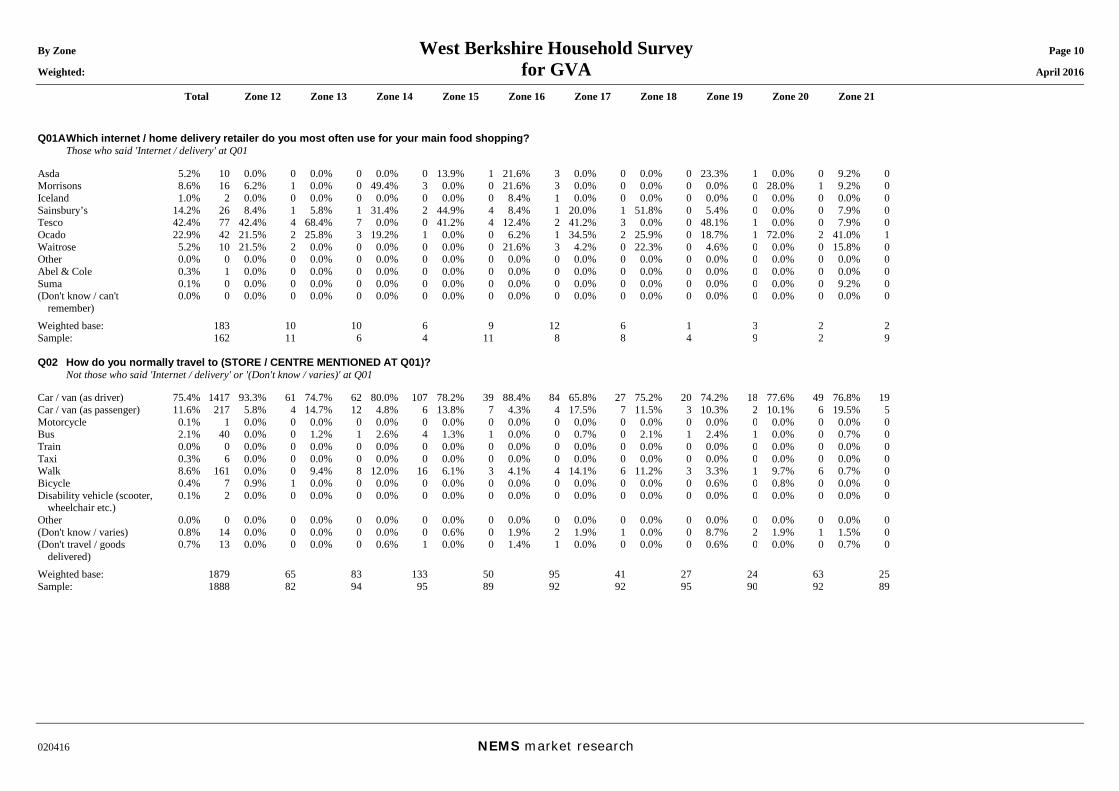
By Zone West Berkshire Household Survey Page 10 Weighted: for GVA April 2016
Total Zone 12 Zone 13 Zone 14 Zone 15 Zone 16 Zone 17 Zone 18 Zone 19 Zone 20 Zone 21
020416 NEMS market research
Q01A Which internet / home delivery retailer do you most often use for your main food shopping? Those who said 'Internet / delivery' at Q01 Asda 5.2% 10 0.0% 0 0.0% 0 0.0% 0 13.9% 1 21.6% 3 0.0% 0 0.0% 0 23.3% 1 0.0% 0 9.2% 0Morrisons 8.6% 16 6.2% 1 0.0% 0 49.4% 3 0.0% 0 21.6% 3 0.0% 0 0.0% 0 0.0% 0 28.0% 1 9.2% 0Iceland 1.0% 2 0.0% 0 0.0% 0 0.0% 0 0.0% 0 8.4% 1 0.0% 0 0.0% 0 0.0% 0 0.0% 0 0.0% 0Sainsbury’s 14.2% 26 8.4% 1 5.8% 1 31.4% 2 44.9% 4 8.4% 1 20.0% 1 51.8% 0 5.4% 0 0.0% 0 7.9% 0Tesco 42.4% 77 42.4% 4 68.4% 7 0.0% 0 41.2% 4 12.4% 2 41.2% 3 0.0% 0 48.1% 1 0.0% 0 7.9% 0Ocado 22.9% 42 21.5% 2 25.8% 3 19.2% 1 0.0% 0 6.2% 1 34.5% 2 25.9% 0 18.7% 1 72.0% 2 41.0% 1Waitrose 5.2% 10 21.5% 2 0.0% 0 0.0% 0 0.0% 0 21.6% 3 4.2% 0 22.3% 0 4.6% 0 0.0% 0 15.8% 0Other 0.0% 0 0.0% 0 0.0% 0 0.0% 0 0.0% 0 0.0% 0 0.0% 0 0.0% 0 0.0% 0 0.0% 0 0.0% 0Abel & Cole 0.3% 1 0.0% 0 0.0% 0 0.0% 0 0.0% 0 0.0% 0 0.0% 0 0.0% 0 0.0% 0 0.0% 0 0.0% 0Suma 0.1% 0 0.0% 0 0.0% 0 0.0% 0 0.0% 0 0.0% 0 0.0% 0 0.0% 0 0.0% 0 0.0% 0 9.2% 0(Don't know / can't
remember) 0.0% 0 0.0% 0 0.0% 0 0.0% 0 0.0% 0 0.0% 0 0.0% 0 0.0% 0 0.0% 0 0.0% 0 0.0% 0
Weighted base: 183 10 10 6 9 12 6 1 3 2 2Sample: 162 11 6 4 11 8 8 4 9 2 9 Q02 How do you normally travel to (STORE / CENTRE MENTIONED AT Q01)? Not those who said 'Internet / delivery' or '(Don't know / varies)' at Q01 Car / van (as driver) 75.4% 1417 93.3% 61 74.7% 62 80.0% 107 78.2% 39 88.4% 84 65.8% 27 75.2% 20 74.2% 18 77.6% 49 76.8% 19Car / van (as passenger) 11.6% 217 5.8% 4 14.7% 12 4.8% 6 13.8% 7 4.3% 4 17.5% 7 11.5% 3 10.3% 2 10.1% 6 19.5% 5Motorcycle 0.1% 1 0.0% 0 0.0% 0 0.0% 0 0.0% 0 0.0% 0 0.0% 0 0.0% 0 0.0% 0 0.0% 0 0.0% 0Bus 2.1% 40 0.0% 0 1.2% 1 2.6% 4 1.3% 1 0.0% 0 0.7% 0 2.1% 1 2.4% 1 0.0% 0 0.7% 0Train 0.0% 0 0.0% 0 0.0% 0 0.0% 0 0.0% 0 0.0% 0 0.0% 0 0.0% 0 0.0% 0 0.0% 0 0.0% 0Taxi 0.3% 6 0.0% 0 0.0% 0 0.0% 0 0.0% 0 0.0% 0 0.0% 0 0.0% 0 0.0% 0 0.0% 0 0.0% 0Walk 8.6% 161 0.0% 0 9.4% 8 12.0% 16 6.1% 3 4.1% 4 14.1% 6 11.2% 3 3.3% 1 9.7% 6 0.7% 0Bicycle 0.4% 7 0.9% 1 0.0% 0 0.0% 0 0.0% 0 0.0% 0 0.0% 0 0.0% 0 0.6% 0 0.8% 0 0.0% 0Disability vehicle (scooter,
wheelchair etc.) 0.1% 2 0.0% 0 0.0% 0 0.0% 0 0.0% 0 0.0% 0 0.0% 0 0.0% 0 0.0% 0 0.0% 0 0.0% 0
Other 0.0% 0 0.0% 0 0.0% 0 0.0% 0 0.0% 0 0.0% 0 0.0% 0 0.0% 0 0.0% 0 0.0% 0 0.0% 0(Don't know / varies) 0.8% 14 0.0% 0 0.0% 0 0.0% 0 0.6% 0 1.9% 2 1.9% 1 0.0% 0 8.7% 2 1.9% 1 1.5% 0(Don't travel / goods
delivered) 0.7% 13 0.0% 0 0.0% 0 0.6% 1 0.0% 0 1.4% 1 0.0% 0 0.0% 0 0.6% 0 0.0% 0 0.7% 0
Weighted base: 1879 65 83 133 50 95 41 27 24 63 25Sample: 1888 82 94 95 89 92 92 95 90 92 89
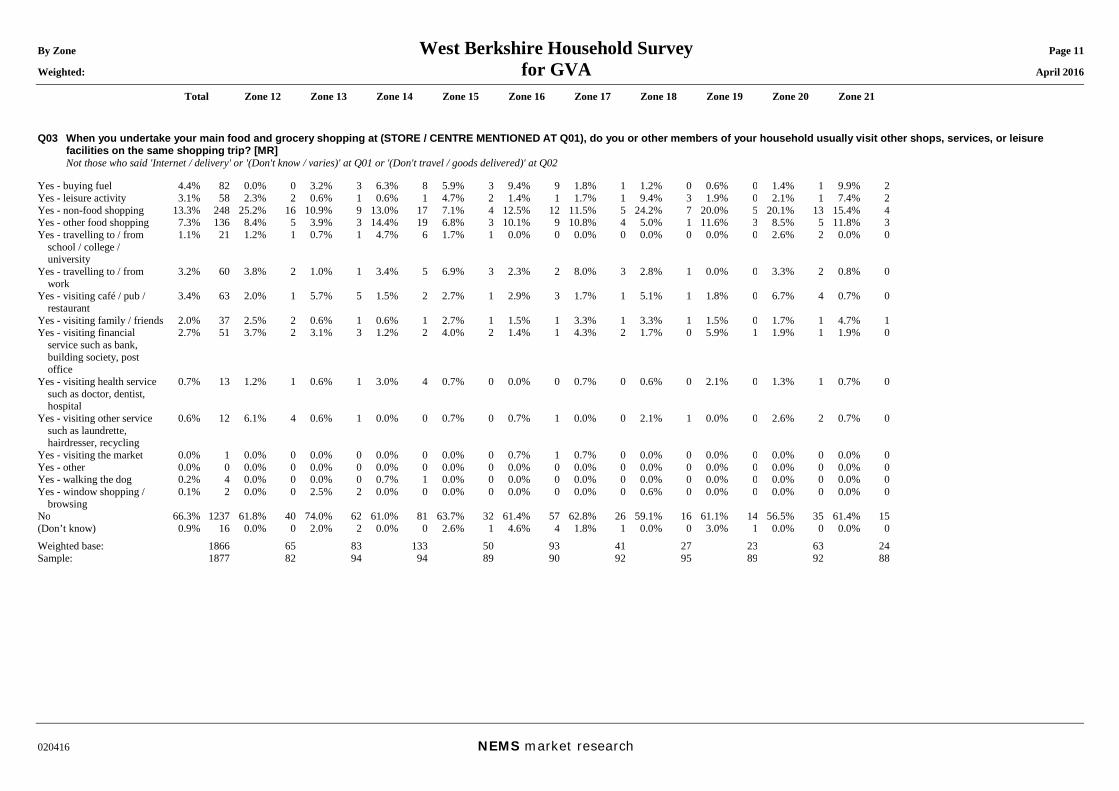
By Zone West Berkshire Household Survey Page 11 Weighted: for GVA April 2016
Total Zone 12 Zone 13 Zone 14 Zone 15 Zone 16 Zone 17 Zone 18 Zone 19 Zone 20 Zone 21
020416 NEMS market research
Q03 When you undertake your main food and grocery shopping at (STORE / CENTRE MENTIONED AT Q01), do you or other members of your household usually visit other shops, services, or leisure facilities on the same shopping trip? [MR]
Not those who said 'Internet / delivery' or '(Don't know / varies)' at Q01 or '(Don't travel / goods delivered)' at Q02 Yes - buying fuel 4.4% 82 0.0% 0 3.2% 3 6.3% 8 5.9% 3 9.4% 9 1.8% 1 1.2% 0 0.6% 0 1.4% 1 9.9% 2Yes - leisure activity 3.1% 58 2.3% 2 0.6% 1 0.6% 1 4.7% 2 1.4% 1 1.7% 1 9.4% 3 1.9% 0 2.1% 1 7.4% 2Yes - non-food shopping 13.3% 248 25.2% 16 10.9% 9 13.0% 17 7.1% 4 12.5% 12 11.5% 5 24.2% 7 20.0% 5 20.1% 13 15.4% 4Yes - other food shopping 7.3% 136 8.4% 5 3.9% 3 14.4% 19 6.8% 3 10.1% 9 10.8% 4 5.0% 1 11.6% 3 8.5% 5 11.8% 3Yes - travelling to / from
school / college / university
1.1% 21 1.2% 1 0.7% 1 4.7% 6 1.7% 1 0.0% 0 0.0% 0 0.0% 0 0.0% 0 2.6% 2 0.0% 0
Yes - travelling to / from work
3.2% 60 3.8% 2 1.0% 1 3.4% 5 6.9% 3 2.3% 2 8.0% 3 2.8% 1 0.0% 0 3.3% 2 0.8% 0
Yes - visiting café / pub / restaurant
3.4% 63 2.0% 1 5.7% 5 1.5% 2 2.7% 1 2.9% 3 1.7% 1 5.1% 1 1.8% 0 6.7% 4 0.7% 0
Yes - visiting family / friends 2.0% 37 2.5% 2 0.6% 1 0.6% 1 2.7% 1 1.5% 1 3.3% 1 3.3% 1 1.5% 0 1.7% 1 4.7% 1Yes - visiting financial
service such as bank, building society, post office
2.7% 51 3.7% 2 3.1% 3 1.2% 2 4.0% 2 1.4% 1 4.3% 2 1.7% 0 5.9% 1 1.9% 1 1.9% 0
Yes - visiting health service such as doctor, dentist, hospital
0.7% 13 1.2% 1 0.6% 1 3.0% 4 0.7% 0 0.0% 0 0.7% 0 0.6% 0 2.1% 0 1.3% 1 0.7% 0
Yes - visiting other service such as laundrette, hairdresser, recycling
0.6% 12 6.1% 4 0.6% 1 0.0% 0 0.7% 0 0.7% 1 0.0% 0 2.1% 1 0.0% 0 2.6% 2 0.7% 0
Yes - visiting the market 0.0% 1 0.0% 0 0.0% 0 0.0% 0 0.0% 0 0.7% 1 0.7% 0 0.0% 0 0.0% 0 0.0% 0 0.0% 0Yes - other 0.0% 0 0.0% 0 0.0% 0 0.0% 0 0.0% 0 0.0% 0 0.0% 0 0.0% 0 0.0% 0 0.0% 0 0.0% 0Yes - walking the dog 0.2% 4 0.0% 0 0.0% 0 0.7% 1 0.0% 0 0.0% 0 0.0% 0 0.0% 0 0.0% 0 0.0% 0 0.0% 0Yes - window shopping /
browsing 0.1% 2 0.0% 0 2.5% 2 0.0% 0 0.0% 0 0.0% 0 0.0% 0 0.6% 0 0.0% 0 0.0% 0 0.0% 0
No 66.3% 1237 61.8% 40 74.0% 62 61.0% 81 63.7% 32 61.4% 57 62.8% 26 59.1% 16 61.1% 14 56.5% 35 61.4% 15(Don’t know) 0.9% 16 0.0% 0 2.0% 2 0.0% 0 2.6% 1 4.6% 4 1.8% 1 0.0% 0 3.0% 1 0.0% 0 0.0% 0Weighted base: 1866 65 83 133 50 93 41 27 23 63 24Sample: 1877 82 94 94 89 90 92 95 89 92 88
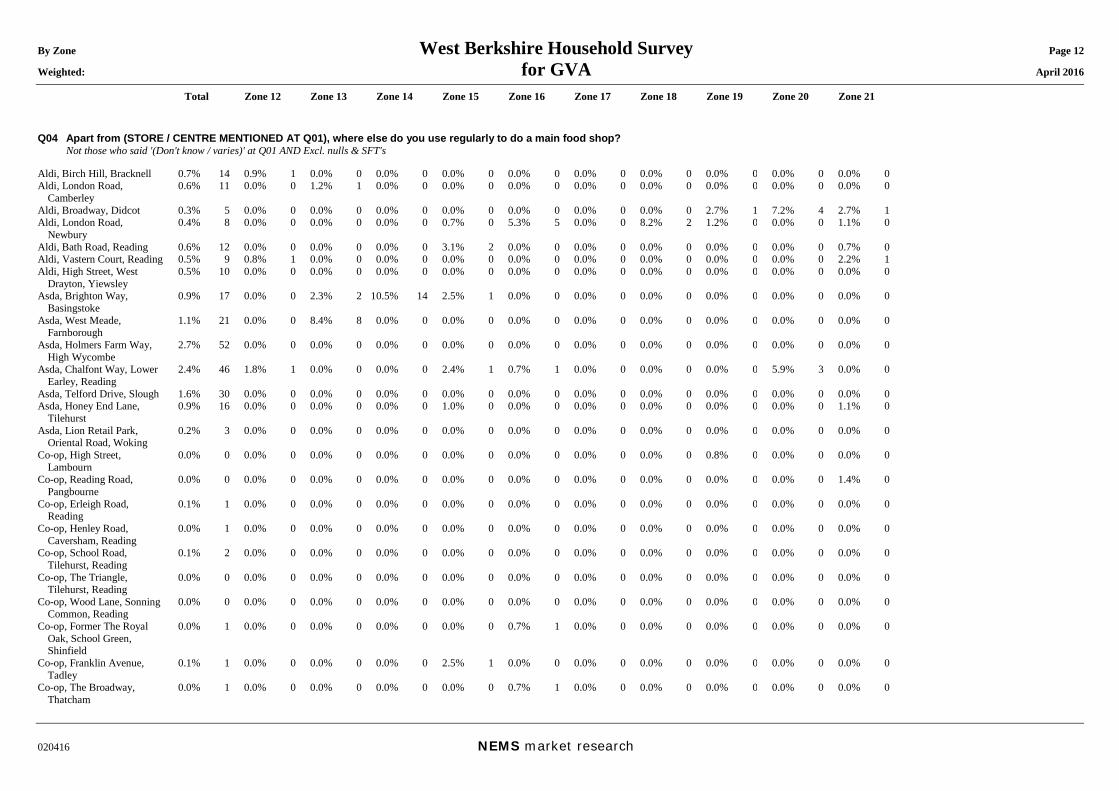
By Zone West Berkshire Household Survey Page 12 Weighted: for GVA April 2016
Total Zone 12 Zone 13 Zone 14 Zone 15 Zone 16 Zone 17 Zone 18 Zone 19 Zone 20 Zone 21
020416 NEMS market research
Q04 Apart from (STORE / CENTRE MENTIONED AT Q01), where else do you use regularly to do a main food shop? Not those who said '(Don't know / varies)' at Q01 AND Excl. nulls & SFT's Aldi, Birch Hill, Bracknell 0.7% 14 0.9% 1 0.0% 0 0.0% 0 0.0% 0 0.0% 0 0.0% 0 0.0% 0 0.0% 0 0.0% 0 0.0% 0Aldi, London Road,
Camberley 0.6% 11 0.0% 0 1.2% 1 0.0% 0 0.0% 0 0.0% 0 0.0% 0 0.0% 0 0.0% 0 0.0% 0 0.0% 0
Aldi, Broadway, Didcot 0.3% 5 0.0% 0 0.0% 0 0.0% 0 0.0% 0 0.0% 0 0.0% 0 0.0% 0 2.7% 1 7.2% 4 2.7% 1Aldi, London Road,
Newbury 0.4% 8 0.0% 0 0.0% 0 0.0% 0 0.7% 0 5.3% 5 0.0% 0 8.2% 2 1.2% 0 0.0% 0 1.1% 0
Aldi, Bath Road, Reading 0.6% 12 0.0% 0 0.0% 0 0.0% 0 3.1% 2 0.0% 0 0.0% 0 0.0% 0 0.0% 0 0.0% 0 0.7% 0Aldi, Vastern Court, Reading 0.5% 9 0.8% 1 0.0% 0 0.0% 0 0.0% 0 0.0% 0 0.0% 0 0.0% 0 0.0% 0 0.0% 0 2.2% 1Aldi, High Street, West
Drayton, Yiewsley 0.5% 10 0.0% 0 0.0% 0 0.0% 0 0.0% 0 0.0% 0 0.0% 0 0.0% 0 0.0% 0 0.0% 0 0.0% 0
Asda, Brighton Way, Basingstoke
0.9% 17 0.0% 0 2.3% 2 10.5% 14 2.5% 1 0.0% 0 0.0% 0 0.0% 0 0.0% 0 0.0% 0 0.0% 0
Asda, West Meade, Farnborough
1.1% 21 0.0% 0 8.4% 8 0.0% 0 0.0% 0 0.0% 0 0.0% 0 0.0% 0 0.0% 0 0.0% 0 0.0% 0
Asda, Holmers Farm Way, High Wycombe
2.7% 52 0.0% 0 0.0% 0 0.0% 0 0.0% 0 0.0% 0 0.0% 0 0.0% 0 0.0% 0 0.0% 0 0.0% 0
Asda, Chalfont Way, Lower Earley, Reading
2.4% 46 1.8% 1 0.0% 0 0.0% 0 2.4% 1 0.7% 1 0.0% 0 0.0% 0 0.0% 0 5.9% 3 0.0% 0
Asda, Telford Drive, Slough 1.6% 30 0.0% 0 0.0% 0 0.0% 0 0.0% 0 0.0% 0 0.0% 0 0.0% 0 0.0% 0 0.0% 0 0.0% 0Asda, Honey End Lane,
Tilehurst 0.9% 16 0.0% 0 0.0% 0 0.0% 0 1.0% 0 0.0% 0 0.0% 0 0.0% 0 0.0% 0 0.0% 0 1.1% 0
Asda, Lion Retail Park, Oriental Road, Woking
0.2% 3 0.0% 0 0.0% 0 0.0% 0 0.0% 0 0.0% 0 0.0% 0 0.0% 0 0.0% 0 0.0% 0 0.0% 0
Co-op, High Street, Lambourn
0.0% 0 0.0% 0 0.0% 0 0.0% 0 0.0% 0 0.0% 0 0.0% 0 0.0% 0 0.8% 0 0.0% 0 0.0% 0
Co-op, Reading Road, Pangbourne
0.0% 0 0.0% 0 0.0% 0 0.0% 0 0.0% 0 0.0% 0 0.0% 0 0.0% 0 0.0% 0 0.0% 0 1.4% 0
Co-op, Erleigh Road, Reading
0.1% 1 0.0% 0 0.0% 0 0.0% 0 0.0% 0 0.0% 0 0.0% 0 0.0% 0 0.0% 0 0.0% 0 0.0% 0
Co-op, Henley Road, Caversham, Reading
0.0% 1 0.0% 0 0.0% 0 0.0% 0 0.0% 0 0.0% 0 0.0% 0 0.0% 0 0.0% 0 0.0% 0 0.0% 0
Co-op, School Road, Tilehurst, Reading
0.1% 2 0.0% 0 0.0% 0 0.0% 0 0.0% 0 0.0% 0 0.0% 0 0.0% 0 0.0% 0 0.0% 0 0.0% 0
Co-op, The Triangle, Tilehurst, Reading
0.0% 0 0.0% 0 0.0% 0 0.0% 0 0.0% 0 0.0% 0 0.0% 0 0.0% 0 0.0% 0 0.0% 0 0.0% 0
Co-op, Wood Lane, Sonning Common, Reading
0.0% 0 0.0% 0 0.0% 0 0.0% 0 0.0% 0 0.0% 0 0.0% 0 0.0% 0 0.0% 0 0.0% 0 0.0% 0
Co-op, Former The Royal Oak, School Green, Shinfield
0.0% 1 0.0% 0 0.0% 0 0.0% 0 0.0% 0 0.7% 1 0.0% 0 0.0% 0 0.0% 0 0.0% 0 0.0% 0
Co-op, Franklin Avenue, Tadley
0.1% 1 0.0% 0 0.0% 0 0.0% 0 2.5% 1 0.0% 0 0.0% 0 0.0% 0 0.0% 0 0.0% 0 0.0% 0
Co-op, The Broadway, Thatcham
0.0% 1 0.0% 0 0.0% 0 0.0% 0 0.0% 0 0.7% 1 0.0% 0 0.0% 0 0.0% 0 0.0% 0 0.0% 0
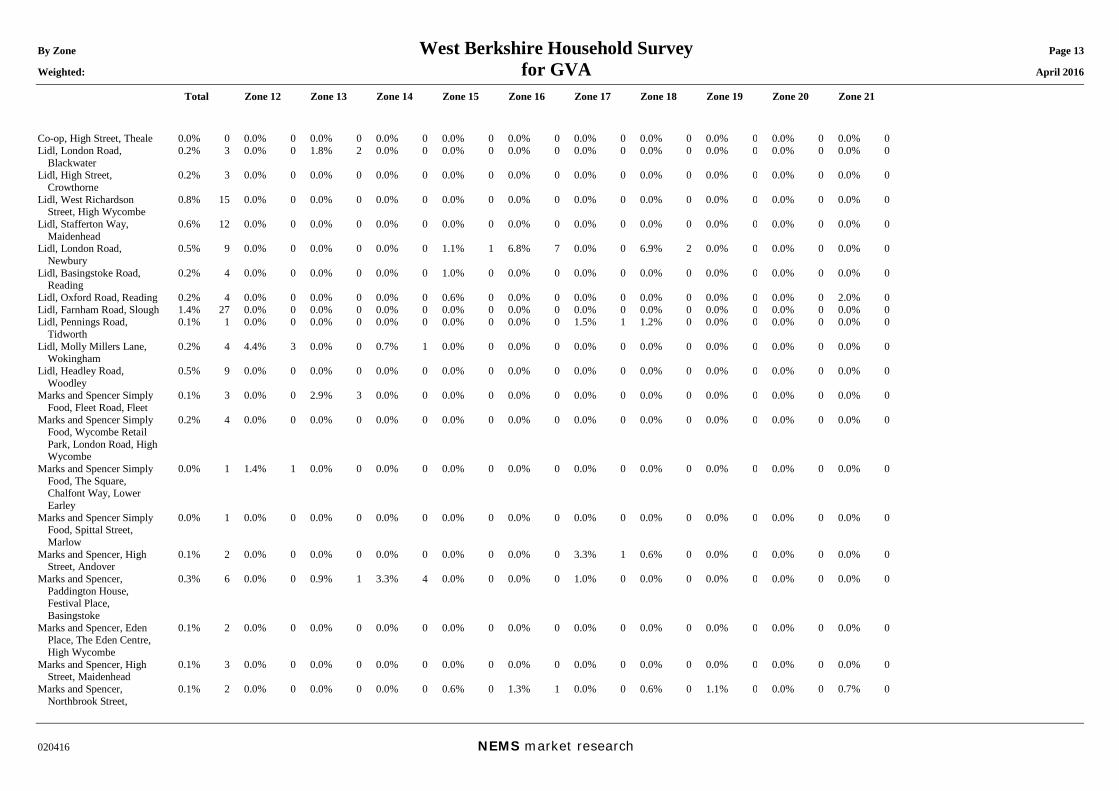
By Zone West Berkshire Household Survey Page 13 Weighted: for GVA April 2016
Total Zone 12 Zone 13 Zone 14 Zone 15 Zone 16 Zone 17 Zone 18 Zone 19 Zone 20 Zone 21
020416 NEMS market research
Co-op, High Street, Theale 0.0% 0 0.0% 0 0.0% 0 0.0% 0 0.0% 0 0.0% 0 0.0% 0 0.0% 0 0.0% 0 0.0% 0 0.0% 0Lidl, London Road,
Blackwater 0.2% 3 0.0% 0 1.8% 2 0.0% 0 0.0% 0 0.0% 0 0.0% 0 0.0% 0 0.0% 0 0.0% 0 0.0% 0
Lidl, High Street, Crowthorne
0.2% 3 0.0% 0 0.0% 0 0.0% 0 0.0% 0 0.0% 0 0.0% 0 0.0% 0 0.0% 0 0.0% 0 0.0% 0
Lidl, West Richardson Street, High Wycombe
0.8% 15 0.0% 0 0.0% 0 0.0% 0 0.0% 0 0.0% 0 0.0% 0 0.0% 0 0.0% 0 0.0% 0 0.0% 0
Lidl, Stafferton Way, Maidenhead
0.6% 12 0.0% 0 0.0% 0 0.0% 0 0.0% 0 0.0% 0 0.0% 0 0.0% 0 0.0% 0 0.0% 0 0.0% 0
Lidl, London Road, Newbury
0.5% 9 0.0% 0 0.0% 0 0.0% 0 1.1% 1 6.8% 7 0.0% 0 6.9% 2 0.0% 0 0.0% 0 0.0% 0
Lidl, Basingstoke Road, Reading
0.2% 4 0.0% 0 0.0% 0 0.0% 0 1.0% 0 0.0% 0 0.0% 0 0.0% 0 0.0% 0 0.0% 0 0.0% 0
Lidl, Oxford Road, Reading 0.2% 4 0.0% 0 0.0% 0 0.0% 0 0.6% 0 0.0% 0 0.0% 0 0.0% 0 0.0% 0 0.0% 0 2.0% 0Lidl, Farnham Road, Slough 1.4% 27 0.0% 0 0.0% 0 0.0% 0 0.0% 0 0.0% 0 0.0% 0 0.0% 0 0.0% 0 0.0% 0 0.0% 0Lidl, Pennings Road,
Tidworth 0.1% 1 0.0% 0 0.0% 0 0.0% 0 0.0% 0 0.0% 0 1.5% 1 1.2% 0 0.0% 0 0.0% 0 0.0% 0
Lidl, Molly Millers Lane, Wokingham
0.2% 4 4.4% 3 0.0% 0 0.7% 1 0.0% 0 0.0% 0 0.0% 0 0.0% 0 0.0% 0 0.0% 0 0.0% 0
Lidl, Headley Road, Woodley
0.5% 9 0.0% 0 0.0% 0 0.0% 0 0.0% 0 0.0% 0 0.0% 0 0.0% 0 0.0% 0 0.0% 0 0.0% 0
Marks and Spencer Simply Food, Fleet Road, Fleet
0.1% 3 0.0% 0 2.9% 3 0.0% 0 0.0% 0 0.0% 0 0.0% 0 0.0% 0 0.0% 0 0.0% 0 0.0% 0
Marks and Spencer Simply Food, Wycombe Retail Park, London Road, High Wycombe
0.2% 4 0.0% 0 0.0% 0 0.0% 0 0.0% 0 0.0% 0 0.0% 0 0.0% 0 0.0% 0 0.0% 0 0.0% 0
Marks and Spencer Simply Food, The Square, Chalfont Way, Lower Earley
0.0% 1 1.4% 1 0.0% 0 0.0% 0 0.0% 0 0.0% 0 0.0% 0 0.0% 0 0.0% 0 0.0% 0 0.0% 0
Marks and Spencer Simply Food, Spittal Street, Marlow
0.0% 1 0.0% 0 0.0% 0 0.0% 0 0.0% 0 0.0% 0 0.0% 0 0.0% 0 0.0% 0 0.0% 0 0.0% 0
Marks and Spencer, High Street, Andover
0.1% 2 0.0% 0 0.0% 0 0.0% 0 0.0% 0 0.0% 0 3.3% 1 0.6% 0 0.0% 0 0.0% 0 0.0% 0
Marks and Spencer, Paddington House, Festival Place, Basingstoke
0.3% 6 0.0% 0 0.9% 1 3.3% 4 0.0% 0 0.0% 0 1.0% 0 0.0% 0 0.0% 0 0.0% 0 0.0% 0
Marks and Spencer, Eden Place, The Eden Centre, High Wycombe
0.1% 2 0.0% 0 0.0% 0 0.0% 0 0.0% 0 0.0% 0 0.0% 0 0.0% 0 0.0% 0 0.0% 0 0.0% 0
Marks and Spencer, High Street, Maidenhead
0.1% 3 0.0% 0 0.0% 0 0.0% 0 0.0% 0 0.0% 0 0.0% 0 0.0% 0 0.0% 0 0.0% 0 0.0% 0
Marks and Spencer, Northbrook Street,
0.1% 2 0.0% 0 0.0% 0 0.0% 0 0.6% 0 1.3% 1 0.0% 0 0.6% 0 1.1% 0 0.0% 0 0.7% 0
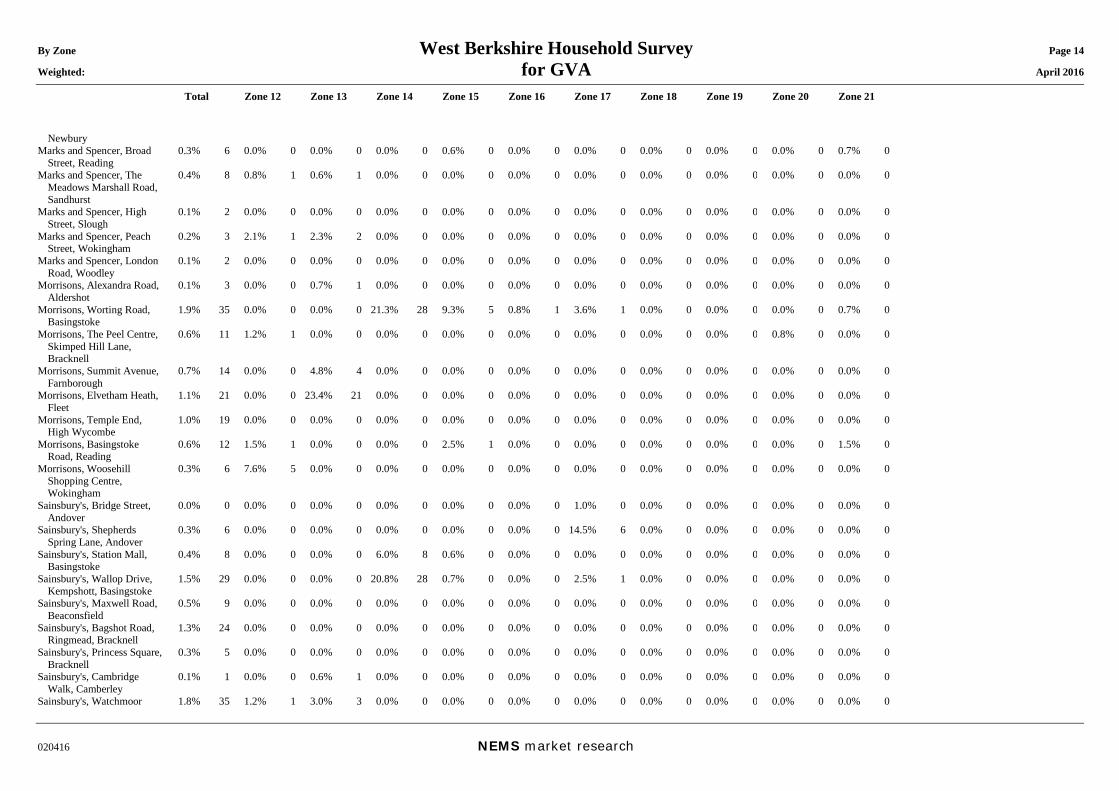
By Zone West Berkshire Household Survey Page 14 Weighted: for GVA April 2016
Total Zone 12 Zone 13 Zone 14 Zone 15 Zone 16 Zone 17 Zone 18 Zone 19 Zone 20 Zone 21
020416 NEMS market research
Newbury Marks and Spencer, Broad
Street, Reading 0.3% 6 0.0% 0 0.0% 0 0.0% 0 0.6% 0 0.0% 0 0.0% 0 0.0% 0 0.0% 0 0.0% 0 0.7% 0
Marks and Spencer, The Meadows Marshall Road, Sandhurst
0.4% 8 0.8% 1 0.6% 1 0.0% 0 0.0% 0 0.0% 0 0.0% 0 0.0% 0 0.0% 0 0.0% 0 0.0% 0
Marks and Spencer, High Street, Slough
0.1% 2 0.0% 0 0.0% 0 0.0% 0 0.0% 0 0.0% 0 0.0% 0 0.0% 0 0.0% 0 0.0% 0 0.0% 0
Marks and Spencer, Peach Street, Wokingham
0.2% 3 2.1% 1 2.3% 2 0.0% 0 0.0% 0 0.0% 0 0.0% 0 0.0% 0 0.0% 0 0.0% 0 0.0% 0
Marks and Spencer, London Road, Woodley
0.1% 2 0.0% 0 0.0% 0 0.0% 0 0.0% 0 0.0% 0 0.0% 0 0.0% 0 0.0% 0 0.0% 0 0.0% 0
Morrisons, Alexandra Road, Aldershot
0.1% 3 0.0% 0 0.7% 1 0.0% 0 0.0% 0 0.0% 0 0.0% 0 0.0% 0 0.0% 0 0.0% 0 0.0% 0
Morrisons, Worting Road, Basingstoke
1.9% 35 0.0% 0 0.0% 0 21.3% 28 9.3% 5 0.8% 1 3.6% 1 0.0% 0 0.0% 0 0.0% 0 0.7% 0
Morrisons, The Peel Centre, Skimped Hill Lane, Bracknell
0.6% 11 1.2% 1 0.0% 0 0.0% 0 0.0% 0 0.0% 0 0.0% 0 0.0% 0 0.0% 0 0.8% 0 0.0% 0
Morrisons, Summit Avenue, Farnborough
0.7% 14 0.0% 0 4.8% 4 0.0% 0 0.0% 0 0.0% 0 0.0% 0 0.0% 0 0.0% 0 0.0% 0 0.0% 0
Morrisons, Elvetham Heath, Fleet
1.1% 21 0.0% 0 23.4% 21 0.0% 0 0.0% 0 0.0% 0 0.0% 0 0.0% 0 0.0% 0 0.0% 0 0.0% 0
Morrisons, Temple End, High Wycombe
1.0% 19 0.0% 0 0.0% 0 0.0% 0 0.0% 0 0.0% 0 0.0% 0 0.0% 0 0.0% 0 0.0% 0 0.0% 0
Morrisons, Basingstoke Road, Reading
0.6% 12 1.5% 1 0.0% 0 0.0% 0 2.5% 1 0.0% 0 0.0% 0 0.0% 0 0.0% 0 0.0% 0 1.5% 0
Morrisons, Woosehill Shopping Centre, Wokingham
0.3% 6 7.6% 5 0.0% 0 0.0% 0 0.0% 0 0.0% 0 0.0% 0 0.0% 0 0.0% 0 0.0% 0 0.0% 0
Sainsbury's, Bridge Street, Andover
0.0% 0 0.0% 0 0.0% 0 0.0% 0 0.0% 0 0.0% 0 1.0% 0 0.0% 0 0.0% 0 0.0% 0 0.0% 0
Sainsbury's, Shepherds Spring Lane, Andover
0.3% 6 0.0% 0 0.0% 0 0.0% 0 0.0% 0 0.0% 0 14.5% 6 0.0% 0 0.0% 0 0.0% 0 0.0% 0
Sainsbury's, Station Mall, Basingstoke
0.4% 8 0.0% 0 0.0% 0 6.0% 8 0.6% 0 0.0% 0 0.0% 0 0.0% 0 0.0% 0 0.0% 0 0.0% 0
Sainsbury's, Wallop Drive, Kempshott, Basingstoke
1.5% 29 0.0% 0 0.0% 0 20.8% 28 0.7% 0 0.0% 0 2.5% 1 0.0% 0 0.0% 0 0.0% 0 0.0% 0
Sainsbury's, Maxwell Road, Beaconsfield
0.5% 9 0.0% 0 0.0% 0 0.0% 0 0.0% 0 0.0% 0 0.0% 0 0.0% 0 0.0% 0 0.0% 0 0.0% 0
Sainsbury's, Bagshot Road, Ringmead, Bracknell
1.3% 24 0.0% 0 0.0% 0 0.0% 0 0.0% 0 0.0% 0 0.0% 0 0.0% 0 0.0% 0 0.0% 0 0.0% 0
Sainsbury's, Princess Square, Bracknell
0.3% 5 0.0% 0 0.0% 0 0.0% 0 0.0% 0 0.0% 0 0.0% 0 0.0% 0 0.0% 0 0.0% 0 0.0% 0
Sainsbury's, Cambridge Walk, Camberley
0.1% 1 0.0% 0 0.6% 1 0.0% 0 0.0% 0 0.0% 0 0.0% 0 0.0% 0 0.0% 0 0.0% 0 0.0% 0
Sainsbury's, Watchmoor 1.8% 35 1.2% 1 3.0% 3 0.0% 0 0.0% 0 0.0% 0 0.0% 0 0.0% 0 0.0% 0 0.0% 0 0.0% 0
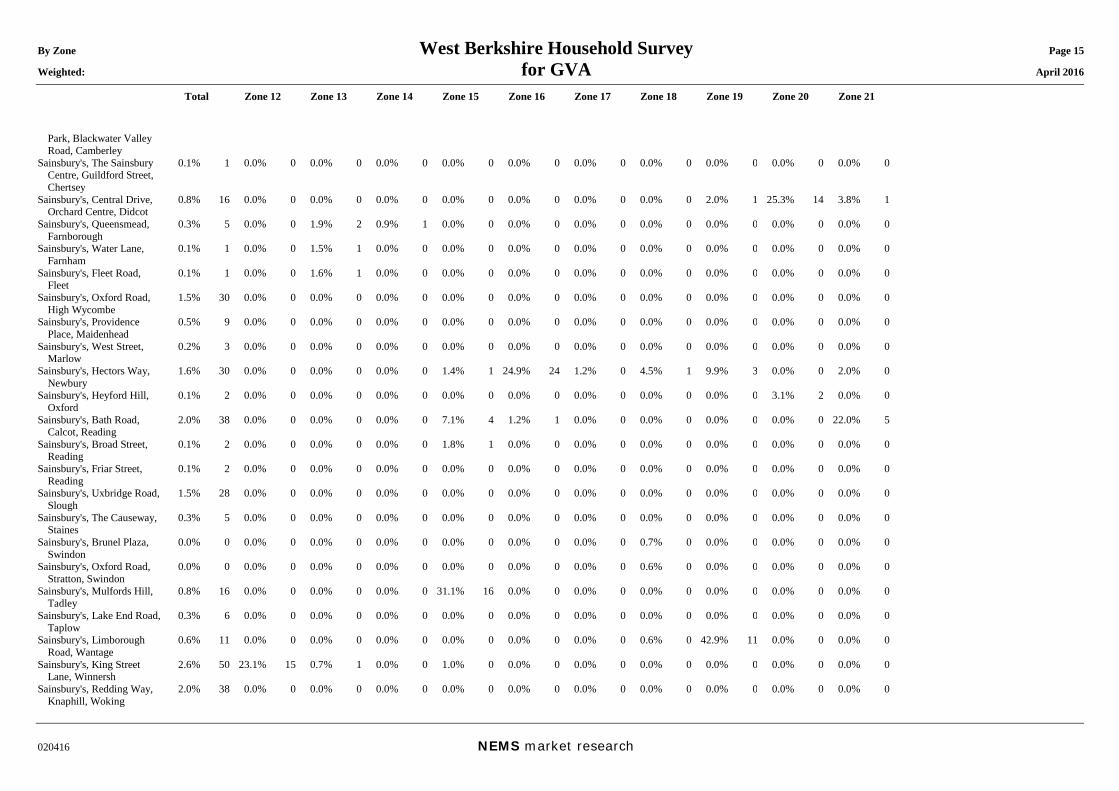
By Zone West Berkshire Household Survey Page 15 Weighted: for GVA April 2016
Total Zone 12 Zone 13 Zone 14 Zone 15 Zone 16 Zone 17 Zone 18 Zone 19 Zone 20 Zone 21
020416 NEMS market research
Park, Blackwater Valley Road, Camberley
Sainsbury's, The Sainsbury Centre, Guildford Street, Chertsey
0.1% 1 0.0% 0 0.0% 0 0.0% 0 0.0% 0 0.0% 0 0.0% 0 0.0% 0 0.0% 0 0.0% 0 0.0% 0
Sainsbury's, Central Drive, Orchard Centre, Didcot
0.8% 16 0.0% 0 0.0% 0 0.0% 0 0.0% 0 0.0% 0 0.0% 0 0.0% 0 2.0% 1 25.3% 14 3.8% 1
Sainsbury's, Queensmead, Farnborough
0.3% 5 0.0% 0 1.9% 2 0.9% 1 0.0% 0 0.0% 0 0.0% 0 0.0% 0 0.0% 0 0.0% 0 0.0% 0
Sainsbury's, Water Lane, Farnham
0.1% 1 0.0% 0 1.5% 1 0.0% 0 0.0% 0 0.0% 0 0.0% 0 0.0% 0 0.0% 0 0.0% 0 0.0% 0
Sainsbury's, Fleet Road, Fleet
0.1% 1 0.0% 0 1.6% 1 0.0% 0 0.0% 0 0.0% 0 0.0% 0 0.0% 0 0.0% 0 0.0% 0 0.0% 0
Sainsbury's, Oxford Road, High Wycombe
1.5% 30 0.0% 0 0.0% 0 0.0% 0 0.0% 0 0.0% 0 0.0% 0 0.0% 0 0.0% 0 0.0% 0 0.0% 0
Sainsbury's, Providence Place, Maidenhead
0.5% 9 0.0% 0 0.0% 0 0.0% 0 0.0% 0 0.0% 0 0.0% 0 0.0% 0 0.0% 0 0.0% 0 0.0% 0
Sainsbury's, West Street, Marlow
0.2% 3 0.0% 0 0.0% 0 0.0% 0 0.0% 0 0.0% 0 0.0% 0 0.0% 0 0.0% 0 0.0% 0 0.0% 0
Sainsbury's, Hectors Way, Newbury
1.6% 30 0.0% 0 0.0% 0 0.0% 0 1.4% 1 24.9% 24 1.2% 0 4.5% 1 9.9% 3 0.0% 0 2.0% 0
Sainsbury's, Heyford Hill, Oxford
0.1% 2 0.0% 0 0.0% 0 0.0% 0 0.0% 0 0.0% 0 0.0% 0 0.0% 0 0.0% 0 3.1% 2 0.0% 0
Sainsbury's, Bath Road, Calcot, Reading
2.0% 38 0.0% 0 0.0% 0 0.0% 0 7.1% 4 1.2% 1 0.0% 0 0.0% 0 0.0% 0 0.0% 0 22.0% 5
Sainsbury's, Broad Street, Reading
0.1% 2 0.0% 0 0.0% 0 0.0% 0 1.8% 1 0.0% 0 0.0% 0 0.0% 0 0.0% 0 0.0% 0 0.0% 0
Sainsbury's, Friar Street, Reading
0.1% 2 0.0% 0 0.0% 0 0.0% 0 0.0% 0 0.0% 0 0.0% 0 0.0% 0 0.0% 0 0.0% 0 0.0% 0
Sainsbury's, Uxbridge Road, Slough
1.5% 28 0.0% 0 0.0% 0 0.0% 0 0.0% 0 0.0% 0 0.0% 0 0.0% 0 0.0% 0 0.0% 0 0.0% 0
Sainsbury's, The Causeway, Staines
0.3% 5 0.0% 0 0.0% 0 0.0% 0 0.0% 0 0.0% 0 0.0% 0 0.0% 0 0.0% 0 0.0% 0 0.0% 0
Sainsbury's, Brunel Plaza, Swindon
0.0% 0 0.0% 0 0.0% 0 0.0% 0 0.0% 0 0.0% 0 0.0% 0 0.7% 0 0.0% 0 0.0% 0 0.0% 0
Sainsbury's, Oxford Road, Stratton, Swindon
0.0% 0 0.0% 0 0.0% 0 0.0% 0 0.0% 0 0.0% 0 0.0% 0 0.6% 0 0.0% 0 0.0% 0 0.0% 0
Sainsbury's, Mulfords Hill, Tadley
0.8% 16 0.0% 0 0.0% 0 0.0% 0 31.1% 16 0.0% 0 0.0% 0 0.0% 0 0.0% 0 0.0% 0 0.0% 0
Sainsbury's, Lake End Road, Taplow
0.3% 6 0.0% 0 0.0% 0 0.0% 0 0.0% 0 0.0% 0 0.0% 0 0.0% 0 0.0% 0 0.0% 0 0.0% 0
Sainsbury's, Limborough Road, Wantage
0.6% 11 0.0% 0 0.0% 0 0.0% 0 0.0% 0 0.0% 0 0.0% 0 0.6% 0 42.9% 11 0.0% 0 0.0% 0
Sainsbury's, King Street Lane, Winnersh
2.6% 50 23.1% 15 0.7% 1 0.0% 0 1.0% 0 0.0% 0 0.0% 0 0.0% 0 0.0% 0 0.0% 0 0.0% 0
Sainsbury's, Redding Way, Knaphill, Woking
2.0% 38 0.0% 0 0.0% 0 0.0% 0 0.0% 0 0.0% 0 0.0% 0 0.0% 0 0.0% 0 0.0% 0 0.0% 0
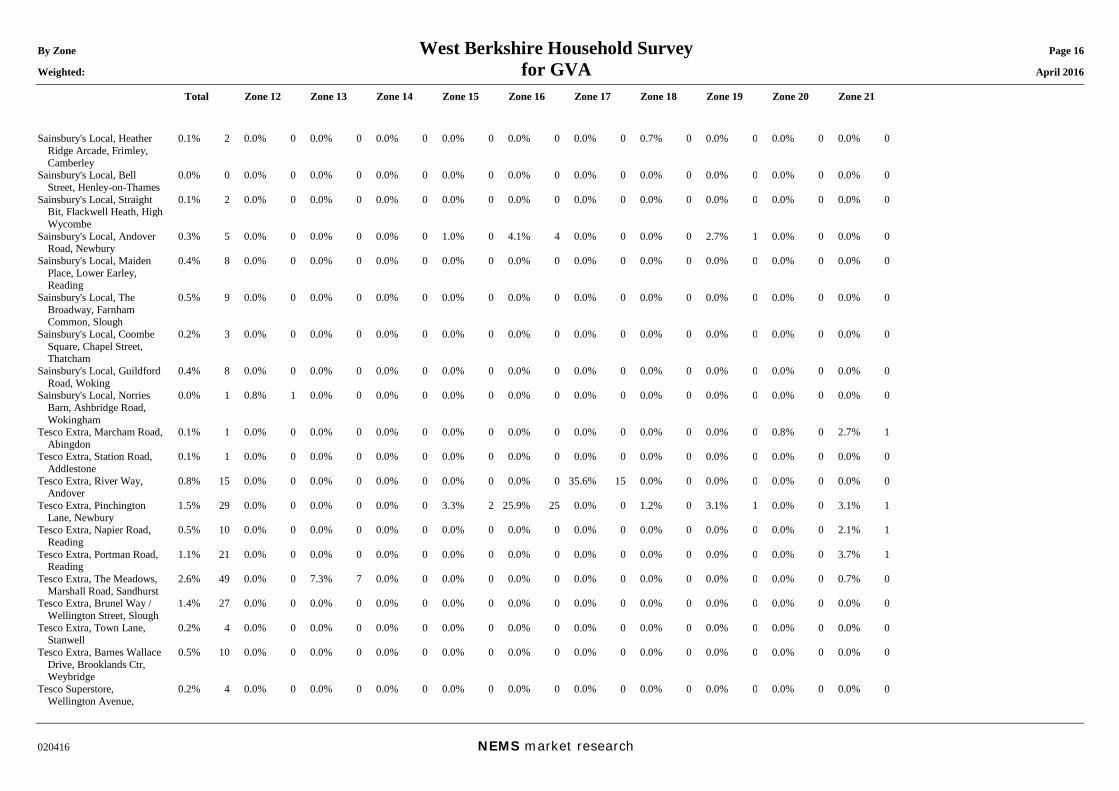
By Zone West Berkshire Household Survey Page 16 Weighted: for GVA April 2016
Total Zone 12 Zone 13 Zone 14 Zone 15 Zone 16 Zone 17 Zone 18 Zone 19 Zone 20 Zone 21
020416 NEMS market research
Sainsbury's Local, Heather Ridge Arcade, Frimley, Camberley
0.1% 2 0.0% 0 0.0% 0 0.0% 0 0.0% 0 0.0% 0 0.0% 0 0.7% 0 0.0% 0 0.0% 0 0.0% 0
Sainsbury's Local, Bell Street, Henley-on-Thames
0.0% 0 0.0% 0 0.0% 0 0.0% 0 0.0% 0 0.0% 0 0.0% 0 0.0% 0 0.0% 0 0.0% 0 0.0% 0
Sainsbury's Local, Straight Bit, Flackwell Heath, High Wycombe
0.1% 2 0.0% 0 0.0% 0 0.0% 0 0.0% 0 0.0% 0 0.0% 0 0.0% 0 0.0% 0 0.0% 0 0.0% 0
Sainsbury's Local, Andover Road, Newbury
0.3% 5 0.0% 0 0.0% 0 0.0% 0 1.0% 0 4.1% 4 0.0% 0 0.0% 0 2.7% 1 0.0% 0 0.0% 0
Sainsbury's Local, Maiden Place, Lower Earley, Reading
0.4% 8 0.0% 0 0.0% 0 0.0% 0 0.0% 0 0.0% 0 0.0% 0 0.0% 0 0.0% 0 0.0% 0 0.0% 0
Sainsbury's Local, The Broadway, Farnham Common, Slough
0.5% 9 0.0% 0 0.0% 0 0.0% 0 0.0% 0 0.0% 0 0.0% 0 0.0% 0 0.0% 0 0.0% 0 0.0% 0
Sainsbury's Local, Coombe Square, Chapel Street, Thatcham
0.2% 3 0.0% 0 0.0% 0 0.0% 0 0.0% 0 0.0% 0 0.0% 0 0.0% 0 0.0% 0 0.0% 0 0.0% 0
Sainsbury's Local, Guildford Road, Woking
0.4% 8 0.0% 0 0.0% 0 0.0% 0 0.0% 0 0.0% 0 0.0% 0 0.0% 0 0.0% 0 0.0% 0 0.0% 0
Sainsbury's Local, Norries Barn, Ashbridge Road, Wokingham
0.0% 1 0.8% 1 0.0% 0 0.0% 0 0.0% 0 0.0% 0 0.0% 0 0.0% 0 0.0% 0 0.0% 0 0.0% 0
Tesco Extra, Marcham Road, Abingdon
0.1% 1 0.0% 0 0.0% 0 0.0% 0 0.0% 0 0.0% 0 0.0% 0 0.0% 0 0.0% 0 0.8% 0 2.7% 1
Tesco Extra, Station Road, Addlestone
0.1% 1 0.0% 0 0.0% 0 0.0% 0 0.0% 0 0.0% 0 0.0% 0 0.0% 0 0.0% 0 0.0% 0 0.0% 0
Tesco Extra, River Way, Andover
0.8% 15 0.0% 0 0.0% 0 0.0% 0 0.0% 0 0.0% 0 35.6% 15 0.0% 0 0.0% 0 0.0% 0 0.0% 0
Tesco Extra, Pinchington Lane, Newbury
1.5% 29 0.0% 0 0.0% 0 0.0% 0 3.3% 2 25.9% 25 0.0% 0 1.2% 0 3.1% 1 0.0% 0 3.1% 1
Tesco Extra, Napier Road, Reading
0.5% 10 0.0% 0 0.0% 0 0.0% 0 0.0% 0 0.0% 0 0.0% 0 0.0% 0 0.0% 0 0.0% 0 2.1% 1
Tesco Extra, Portman Road, Reading
1.1% 21 0.0% 0 0.0% 0 0.0% 0 0.0% 0 0.0% 0 0.0% 0 0.0% 0 0.0% 0 0.0% 0 3.7% 1
Tesco Extra, The Meadows, Marshall Road, Sandhurst
2.6% 49 0.0% 0 7.3% 7 0.0% 0 0.0% 0 0.0% 0 0.0% 0 0.0% 0 0.0% 0 0.0% 0 0.7% 0
Tesco Extra, Brunel Way / Wellington Street, Slough
1.4% 27 0.0% 0 0.0% 0 0.0% 0 0.0% 0 0.0% 0 0.0% 0 0.0% 0 0.0% 0 0.0% 0 0.0% 0
Tesco Extra, Town Lane, Stanwell
0.2% 4 0.0% 0 0.0% 0 0.0% 0 0.0% 0 0.0% 0 0.0% 0 0.0% 0 0.0% 0 0.0% 0 0.0% 0
Tesco Extra, Barnes Wallace Drive, Brooklands Ctr, Weybridge
0.5% 10 0.0% 0 0.0% 0 0.0% 0 0.0% 0 0.0% 0 0.0% 0 0.0% 0 0.0% 0 0.0% 0 0.0% 0
Tesco Superstore, Wellington Avenue,
0.2% 4 0.0% 0 0.0% 0 0.0% 0 0.0% 0 0.0% 0 0.0% 0 0.0% 0 0.0% 0 0.0% 0 0.0% 0
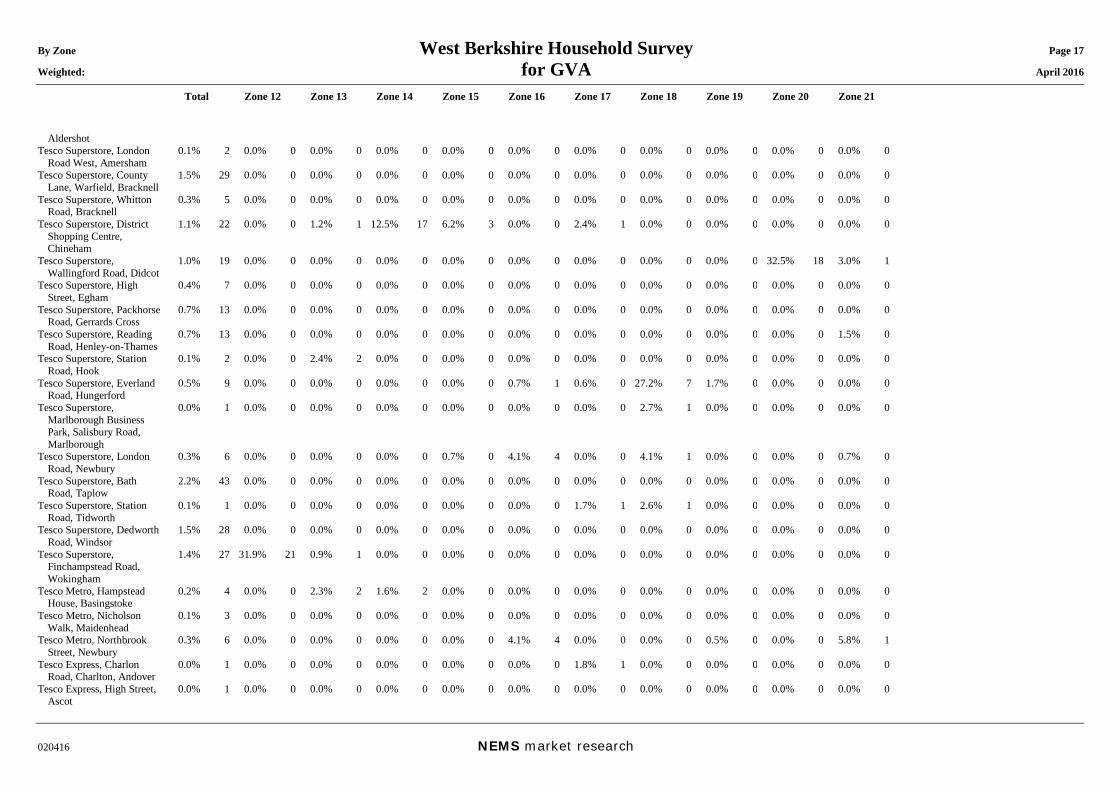
By Zone West Berkshire Household Survey Page 17 Weighted: for GVA April 2016
Total Zone 12 Zone 13 Zone 14 Zone 15 Zone 16 Zone 17 Zone 18 Zone 19 Zone 20 Zone 21
020416 NEMS market research
Aldershot Tesco Superstore, London
Road West, Amersham 0.1% 2 0.0% 0 0.0% 0 0.0% 0 0.0% 0 0.0% 0 0.0% 0 0.0% 0 0.0% 0 0.0% 0 0.0% 0
Tesco Superstore, County Lane, Warfield, Bracknell
1.5% 29 0.0% 0 0.0% 0 0.0% 0 0.0% 0 0.0% 0 0.0% 0 0.0% 0 0.0% 0 0.0% 0 0.0% 0
Tesco Superstore, Whitton Road, Bracknell
0.3% 5 0.0% 0 0.0% 0 0.0% 0 0.0% 0 0.0% 0 0.0% 0 0.0% 0 0.0% 0 0.0% 0 0.0% 0
Tesco Superstore, District Shopping Centre, Chineham
1.1% 22 0.0% 0 1.2% 1 12.5% 17 6.2% 3 0.0% 0 2.4% 1 0.0% 0 0.0% 0 0.0% 0 0.0% 0
Tesco Superstore, Wallingford Road, Didcot
1.0% 19 0.0% 0 0.0% 0 0.0% 0 0.0% 0 0.0% 0 0.0% 0 0.0% 0 0.0% 0 32.5% 18 3.0% 1
Tesco Superstore, High Street, Egham
0.4% 7 0.0% 0 0.0% 0 0.0% 0 0.0% 0 0.0% 0 0.0% 0 0.0% 0 0.0% 0 0.0% 0 0.0% 0
Tesco Superstore, Packhorse Road, Gerrards Cross
0.7% 13 0.0% 0 0.0% 0 0.0% 0 0.0% 0 0.0% 0 0.0% 0 0.0% 0 0.0% 0 0.0% 0 0.0% 0
Tesco Superstore, Reading Road, Henley-on-Thames
0.7% 13 0.0% 0 0.0% 0 0.0% 0 0.0% 0 0.0% 0 0.0% 0 0.0% 0 0.0% 0 0.0% 0 1.5% 0
Tesco Superstore, Station Road, Hook
0.1% 2 0.0% 0 2.4% 2 0.0% 0 0.0% 0 0.0% 0 0.0% 0 0.0% 0 0.0% 0 0.0% 0 0.0% 0
Tesco Superstore, Everland Road, Hungerford
0.5% 9 0.0% 0 0.0% 0 0.0% 0 0.0% 0 0.7% 1 0.6% 0 27.2% 7 1.7% 0 0.0% 0 0.0% 0
Tesco Superstore, Marlborough Business Park, Salisbury Road, Marlborough
0.0% 1 0.0% 0 0.0% 0 0.0% 0 0.0% 0 0.0% 0 0.0% 0 2.7% 1 0.0% 0 0.0% 0 0.0% 0
Tesco Superstore, London Road, Newbury
0.3% 6 0.0% 0 0.0% 0 0.0% 0 0.7% 0 4.1% 4 0.0% 0 4.1% 1 0.0% 0 0.0% 0 0.7% 0
Tesco Superstore, Bath Road, Taplow
2.2% 43 0.0% 0 0.0% 0 0.0% 0 0.0% 0 0.0% 0 0.0% 0 0.0% 0 0.0% 0 0.0% 0 0.0% 0
Tesco Superstore, Station Road, Tidworth
0.1% 1 0.0% 0 0.0% 0 0.0% 0 0.0% 0 0.0% 0 1.7% 1 2.6% 1 0.0% 0 0.0% 0 0.0% 0
Tesco Superstore, Dedworth Road, Windsor
1.5% 28 0.0% 0 0.0% 0 0.0% 0 0.0% 0 0.0% 0 0.0% 0 0.0% 0 0.0% 0 0.0% 0 0.0% 0
Tesco Superstore, Finchampstead Road, Wokingham
1.4% 27 31.9% 21 0.9% 1 0.0% 0 0.0% 0 0.0% 0 0.0% 0 0.0% 0 0.0% 0 0.0% 0 0.0% 0
Tesco Metro, Hampstead House, Basingstoke
0.2% 4 0.0% 0 2.3% 2 1.6% 2 0.0% 0 0.0% 0 0.0% 0 0.0% 0 0.0% 0 0.0% 0 0.0% 0
Tesco Metro, Nicholson Walk, Maidenhead
0.1% 3 0.0% 0 0.0% 0 0.0% 0 0.0% 0 0.0% 0 0.0% 0 0.0% 0 0.0% 0 0.0% 0 0.0% 0
Tesco Metro, Northbrook Street, Newbury
0.3% 6 0.0% 0 0.0% 0 0.0% 0 0.0% 0 4.1% 4 0.0% 0 0.0% 0 0.5% 0 0.0% 0 5.8% 1
Tesco Express, Charlon Road, Charlton, Andover
0.0% 1 0.0% 0 0.0% 0 0.0% 0 0.0% 0 0.0% 0 1.8% 1 0.0% 0 0.0% 0 0.0% 0 0.0% 0
Tesco Express, High Street, Ascot
0.0% 1 0.0% 0 0.0% 0 0.0% 0 0.0% 0 0.0% 0 0.0% 0 0.0% 0 0.0% 0 0.0% 0 0.0% 0
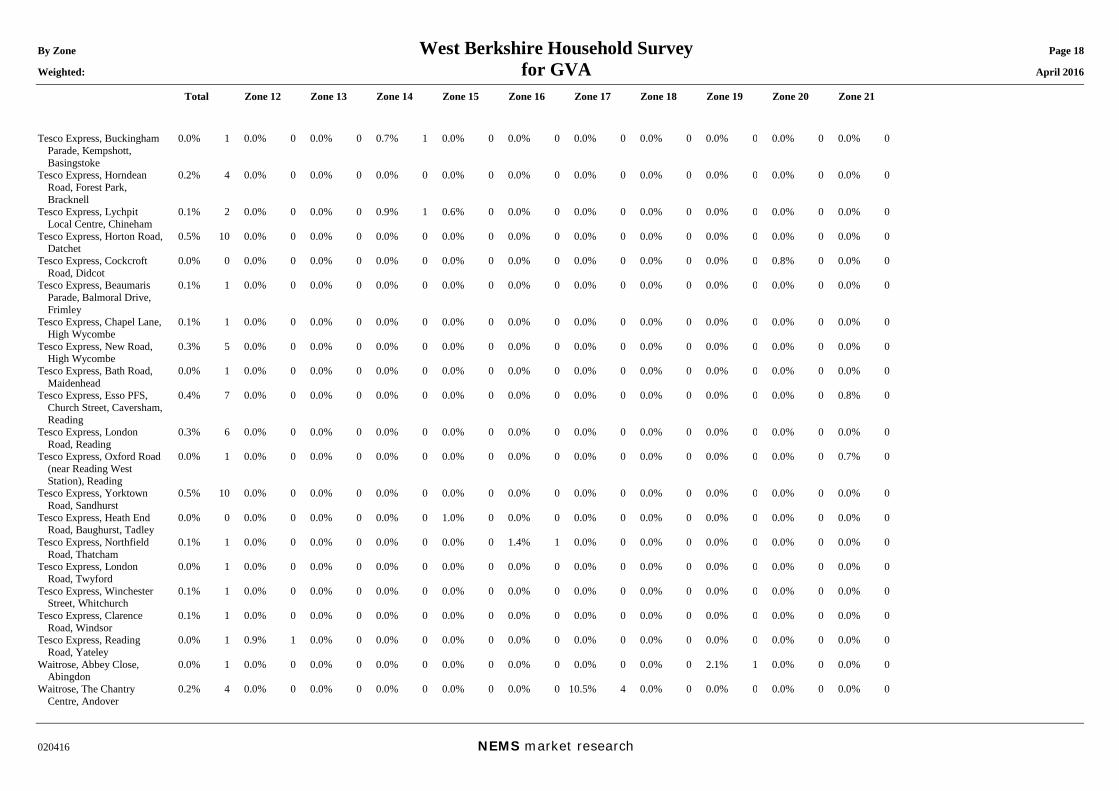
By Zone West Berkshire Household Survey Page 18 Weighted: for GVA April 2016
Total Zone 12 Zone 13 Zone 14 Zone 15 Zone 16 Zone 17 Zone 18 Zone 19 Zone 20 Zone 21
020416 NEMS market research
Tesco Express, Buckingham Parade, Kempshott, Basingstoke
0.0% 1 0.0% 0 0.0% 0 0.7% 1 0.0% 0 0.0% 0 0.0% 0 0.0% 0 0.0% 0 0.0% 0 0.0% 0
Tesco Express, Horndean Road, Forest Park, Bracknell
0.2% 4 0.0% 0 0.0% 0 0.0% 0 0.0% 0 0.0% 0 0.0% 0 0.0% 0 0.0% 0 0.0% 0 0.0% 0
Tesco Express, Lychpit Local Centre, Chineham
0.1% 2 0.0% 0 0.0% 0 0.9% 1 0.6% 0 0.0% 0 0.0% 0 0.0% 0 0.0% 0 0.0% 0 0.0% 0
Tesco Express, Horton Road, Datchet
0.5% 10 0.0% 0 0.0% 0 0.0% 0 0.0% 0 0.0% 0 0.0% 0 0.0% 0 0.0% 0 0.0% 0 0.0% 0
Tesco Express, Cockcroft Road, Didcot
0.0% 0 0.0% 0 0.0% 0 0.0% 0 0.0% 0 0.0% 0 0.0% 0 0.0% 0 0.0% 0 0.8% 0 0.0% 0
Tesco Express, Beaumaris Parade, Balmoral Drive, Frimley
0.1% 1 0.0% 0 0.0% 0 0.0% 0 0.0% 0 0.0% 0 0.0% 0 0.0% 0 0.0% 0 0.0% 0 0.0% 0
Tesco Express, Chapel Lane, High Wycombe
0.1% 1 0.0% 0 0.0% 0 0.0% 0 0.0% 0 0.0% 0 0.0% 0 0.0% 0 0.0% 0 0.0% 0 0.0% 0
Tesco Express, New Road, High Wycombe
0.3% 5 0.0% 0 0.0% 0 0.0% 0 0.0% 0 0.0% 0 0.0% 0 0.0% 0 0.0% 0 0.0% 0 0.0% 0
Tesco Express, Bath Road, Maidenhead
0.0% 1 0.0% 0 0.0% 0 0.0% 0 0.0% 0 0.0% 0 0.0% 0 0.0% 0 0.0% 0 0.0% 0 0.0% 0
Tesco Express, Esso PFS, Church Street, Caversham, Reading
0.4% 7 0.0% 0 0.0% 0 0.0% 0 0.0% 0 0.0% 0 0.0% 0 0.0% 0 0.0% 0 0.0% 0 0.8% 0
Tesco Express, London Road, Reading
0.3% 6 0.0% 0 0.0% 0 0.0% 0 0.0% 0 0.0% 0 0.0% 0 0.0% 0 0.0% 0 0.0% 0 0.0% 0
Tesco Express, Oxford Road (near Reading West Station), Reading
0.0% 1 0.0% 0 0.0% 0 0.0% 0 0.0% 0 0.0% 0 0.0% 0 0.0% 0 0.0% 0 0.0% 0 0.7% 0
Tesco Express, Yorktown Road, Sandhurst
0.5% 10 0.0% 0 0.0% 0 0.0% 0 0.0% 0 0.0% 0 0.0% 0 0.0% 0 0.0% 0 0.0% 0 0.0% 0
Tesco Express, Heath End Road, Baughurst, Tadley
0.0% 0 0.0% 0 0.0% 0 0.0% 0 1.0% 0 0.0% 0 0.0% 0 0.0% 0 0.0% 0 0.0% 0 0.0% 0
Tesco Express, Northfield Road, Thatcham
0.1% 1 0.0% 0 0.0% 0 0.0% 0 0.0% 0 1.4% 1 0.0% 0 0.0% 0 0.0% 0 0.0% 0 0.0% 0
Tesco Express, London Road, Twyford
0.0% 1 0.0% 0 0.0% 0 0.0% 0 0.0% 0 0.0% 0 0.0% 0 0.0% 0 0.0% 0 0.0% 0 0.0% 0
Tesco Express, Winchester Street, Whitchurch
0.1% 1 0.0% 0 0.0% 0 0.0% 0 0.0% 0 0.0% 0 0.0% 0 0.0% 0 0.0% 0 0.0% 0 0.0% 0
Tesco Express, Clarence Road, Windsor
0.1% 1 0.0% 0 0.0% 0 0.0% 0 0.0% 0 0.0% 0 0.0% 0 0.0% 0 0.0% 0 0.0% 0 0.0% 0
Tesco Express, Reading Road, Yateley
0.0% 1 0.9% 1 0.0% 0 0.0% 0 0.0% 0 0.0% 0 0.0% 0 0.0% 0 0.0% 0 0.0% 0 0.0% 0
Waitrose, Abbey Close, Abingdon
0.0% 1 0.0% 0 0.0% 0 0.0% 0 0.0% 0 0.0% 0 0.0% 0 0.0% 0 2.1% 1 0.0% 0 0.0% 0
Waitrose, The Chantry Centre, Andover
0.2% 4 0.0% 0 0.0% 0 0.0% 0 0.0% 0 0.0% 0 10.5% 4 0.0% 0 0.0% 0 0.0% 0 0.0% 0
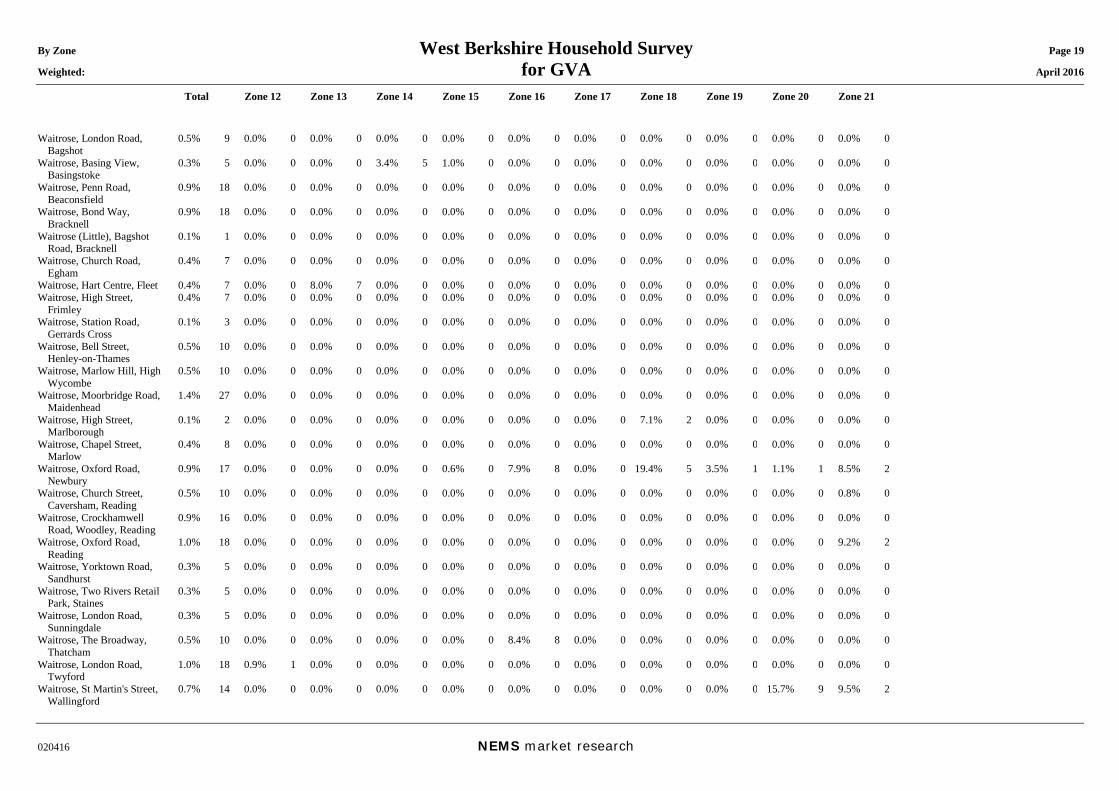
By Zone West Berkshire Household Survey Page 19 Weighted: for GVA April 2016
Total Zone 12 Zone 13 Zone 14 Zone 15 Zone 16 Zone 17 Zone 18 Zone 19 Zone 20 Zone 21
020416 NEMS market research
Waitrose, London Road, Bagshot
0.5% 9 0.0% 0 0.0% 0 0.0% 0 0.0% 0 0.0% 0 0.0% 0 0.0% 0 0.0% 0 0.0% 0 0.0% 0
Waitrose, Basing View, Basingstoke
0.3% 5 0.0% 0 0.0% 0 3.4% 5 1.0% 0 0.0% 0 0.0% 0 0.0% 0 0.0% 0 0.0% 0 0.0% 0
Waitrose, Penn Road, Beaconsfield
0.9% 18 0.0% 0 0.0% 0 0.0% 0 0.0% 0 0.0% 0 0.0% 0 0.0% 0 0.0% 0 0.0% 0 0.0% 0
Waitrose, Bond Way, Bracknell
0.9% 18 0.0% 0 0.0% 0 0.0% 0 0.0% 0 0.0% 0 0.0% 0 0.0% 0 0.0% 0 0.0% 0 0.0% 0
Waitrose (Little), Bagshot Road, Bracknell
0.1% 1 0.0% 0 0.0% 0 0.0% 0 0.0% 0 0.0% 0 0.0% 0 0.0% 0 0.0% 0 0.0% 0 0.0% 0
Waitrose, Church Road, Egham
0.4% 7 0.0% 0 0.0% 0 0.0% 0 0.0% 0 0.0% 0 0.0% 0 0.0% 0 0.0% 0 0.0% 0 0.0% 0
Waitrose, Hart Centre, Fleet 0.4% 7 0.0% 0 8.0% 7 0.0% 0 0.0% 0 0.0% 0 0.0% 0 0.0% 0 0.0% 0 0.0% 0 0.0% 0Waitrose, High Street,
Frimley 0.4% 7 0.0% 0 0.0% 0 0.0% 0 0.0% 0 0.0% 0 0.0% 0 0.0% 0 0.0% 0 0.0% 0 0.0% 0
Waitrose, Station Road, Gerrards Cross
0.1% 3 0.0% 0 0.0% 0 0.0% 0 0.0% 0 0.0% 0 0.0% 0 0.0% 0 0.0% 0 0.0% 0 0.0% 0
Waitrose, Bell Street, Henley-on-Thames
0.5% 10 0.0% 0 0.0% 0 0.0% 0 0.0% 0 0.0% 0 0.0% 0 0.0% 0 0.0% 0 0.0% 0 0.0% 0
Waitrose, Marlow Hill, High Wycombe
0.5% 10 0.0% 0 0.0% 0 0.0% 0 0.0% 0 0.0% 0 0.0% 0 0.0% 0 0.0% 0 0.0% 0 0.0% 0
Waitrose, Moorbridge Road, Maidenhead
1.4% 27 0.0% 0 0.0% 0 0.0% 0 0.0% 0 0.0% 0 0.0% 0 0.0% 0 0.0% 0 0.0% 0 0.0% 0
Waitrose, High Street, Marlborough
0.1% 2 0.0% 0 0.0% 0 0.0% 0 0.0% 0 0.0% 0 0.0% 0 7.1% 2 0.0% 0 0.0% 0 0.0% 0
Waitrose, Chapel Street, Marlow
0.4% 8 0.0% 0 0.0% 0 0.0% 0 0.0% 0 0.0% 0 0.0% 0 0.0% 0 0.0% 0 0.0% 0 0.0% 0
Waitrose, Oxford Road, Newbury
0.9% 17 0.0% 0 0.0% 0 0.0% 0 0.6% 0 7.9% 8 0.0% 0 19.4% 5 3.5% 1 1.1% 1 8.5% 2
Waitrose, Church Street, Caversham, Reading
0.5% 10 0.0% 0 0.0% 0 0.0% 0 0.0% 0 0.0% 0 0.0% 0 0.0% 0 0.0% 0 0.0% 0 0.8% 0
Waitrose, Crockhamwell Road, Woodley, Reading
0.9% 16 0.0% 0 0.0% 0 0.0% 0 0.0% 0 0.0% 0 0.0% 0 0.0% 0 0.0% 0 0.0% 0 0.0% 0
Waitrose, Oxford Road, Reading
1.0% 18 0.0% 0 0.0% 0 0.0% 0 0.0% 0 0.0% 0 0.0% 0 0.0% 0 0.0% 0 0.0% 0 9.2% 2
Waitrose, Yorktown Road, Sandhurst
0.3% 5 0.0% 0 0.0% 0 0.0% 0 0.0% 0 0.0% 0 0.0% 0 0.0% 0 0.0% 0 0.0% 0 0.0% 0
Waitrose, Two Rivers Retail Park, Staines
0.3% 5 0.0% 0 0.0% 0 0.0% 0 0.0% 0 0.0% 0 0.0% 0 0.0% 0 0.0% 0 0.0% 0 0.0% 0
Waitrose, London Road, Sunningdale
0.3% 5 0.0% 0 0.0% 0 0.0% 0 0.0% 0 0.0% 0 0.0% 0 0.0% 0 0.0% 0 0.0% 0 0.0% 0
Waitrose, The Broadway, Thatcham
0.5% 10 0.0% 0 0.0% 0 0.0% 0 0.0% 0 8.4% 8 0.0% 0 0.0% 0 0.0% 0 0.0% 0 0.0% 0
Waitrose, London Road, Twyford
1.0% 18 0.9% 1 0.0% 0 0.0% 0 0.0% 0 0.0% 0 0.0% 0 0.0% 0 0.0% 0 0.0% 0 0.0% 0
Waitrose, St Martin's Street, Wallingford
0.7% 14 0.0% 0 0.0% 0 0.0% 0 0.0% 0 0.0% 0 0.0% 0 0.0% 0 0.0% 0 15.7% 9 9.5% 2
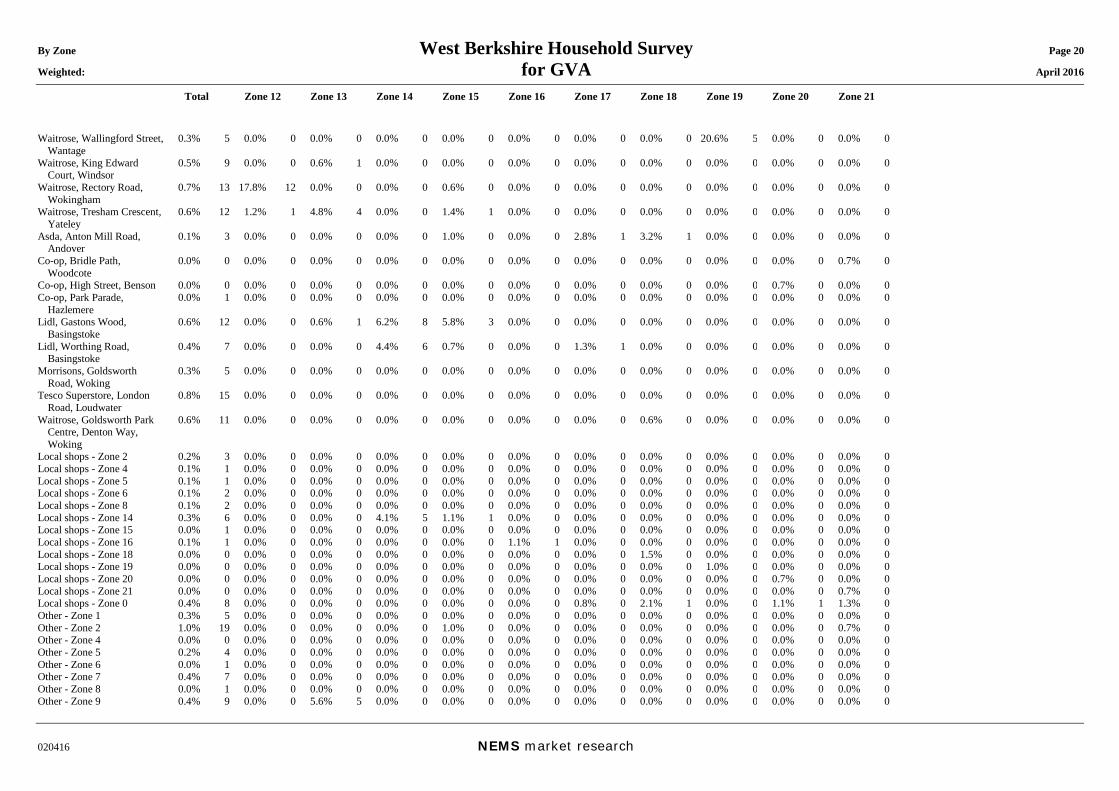
By Zone West Berkshire Household Survey Page 20 Weighted: for GVA April 2016
Total Zone 12 Zone 13 Zone 14 Zone 15 Zone 16 Zone 17 Zone 18 Zone 19 Zone 20 Zone 21
020416 NEMS market research
Waitrose, Wallingford Street, Wantage
0.3% 5 0.0% 0 0.0% 0 0.0% 0 0.0% 0 0.0% 0 0.0% 0 0.0% 0 20.6% 5 0.0% 0 0.0% 0
Waitrose, King Edward Court, Windsor
0.5% 9 0.0% 0 0.6% 1 0.0% 0 0.0% 0 0.0% 0 0.0% 0 0.0% 0 0.0% 0 0.0% 0 0.0% 0
Waitrose, Rectory Road, Wokingham
0.7% 13 17.8% 12 0.0% 0 0.0% 0 0.6% 0 0.0% 0 0.0% 0 0.0% 0 0.0% 0 0.0% 0 0.0% 0
Waitrose, Tresham Crescent, Yateley
0.6% 12 1.2% 1 4.8% 4 0.0% 0 1.4% 1 0.0% 0 0.0% 0 0.0% 0 0.0% 0 0.0% 0 0.0% 0
Asda, Anton Mill Road, Andover
0.1% 3 0.0% 0 0.0% 0 0.0% 0 1.0% 0 0.0% 0 2.8% 1 3.2% 1 0.0% 0 0.0% 0 0.0% 0
Co-op, Bridle Path, Woodcote
0.0% 0 0.0% 0 0.0% 0 0.0% 0 0.0% 0 0.0% 0 0.0% 0 0.0% 0 0.0% 0 0.0% 0 0.7% 0
Co-op, High Street, Benson 0.0% 0 0.0% 0 0.0% 0 0.0% 0 0.0% 0 0.0% 0 0.0% 0 0.0% 0 0.0% 0 0.7% 0 0.0% 0Co-op, Park Parade,
Hazlemere 0.0% 1 0.0% 0 0.0% 0 0.0% 0 0.0% 0 0.0% 0 0.0% 0 0.0% 0 0.0% 0 0.0% 0 0.0% 0
Lidl, Gastons Wood, Basingstoke
0.6% 12 0.0% 0 0.6% 1 6.2% 8 5.8% 3 0.0% 0 0.0% 0 0.0% 0 0.0% 0 0.0% 0 0.0% 0
Lidl, Worthing Road, Basingstoke
0.4% 7 0.0% 0 0.0% 0 4.4% 6 0.7% 0 0.0% 0 1.3% 1 0.0% 0 0.0% 0 0.0% 0 0.0% 0
Morrisons, Goldsworth Road, Woking
0.3% 5 0.0% 0 0.0% 0 0.0% 0 0.0% 0 0.0% 0 0.0% 0 0.0% 0 0.0% 0 0.0% 0 0.0% 0
Tesco Superstore, London Road, Loudwater
0.8% 15 0.0% 0 0.0% 0 0.0% 0 0.0% 0 0.0% 0 0.0% 0 0.0% 0 0.0% 0 0.0% 0 0.0% 0
Waitrose, Goldsworth Park Centre, Denton Way, Woking
0.6% 11 0.0% 0 0.0% 0 0.0% 0 0.0% 0 0.0% 0 0.0% 0 0.6% 0 0.0% 0 0.0% 0 0.0% 0
Local shops - Zone 2 0.2% 3 0.0% 0 0.0% 0 0.0% 0 0.0% 0 0.0% 0 0.0% 0 0.0% 0 0.0% 0 0.0% 0 0.0% 0Local shops - Zone 4 0.1% 1 0.0% 0 0.0% 0 0.0% 0 0.0% 0 0.0% 0 0.0% 0 0.0% 0 0.0% 0 0.0% 0 0.0% 0Local shops - Zone 5 0.1% 1 0.0% 0 0.0% 0 0.0% 0 0.0% 0 0.0% 0 0.0% 0 0.0% 0 0.0% 0 0.0% 0 0.0% 0Local shops - Zone 6 0.1% 2 0.0% 0 0.0% 0 0.0% 0 0.0% 0 0.0% 0 0.0% 0 0.0% 0 0.0% 0 0.0% 0 0.0% 0Local shops - Zone 8 0.1% 2 0.0% 0 0.0% 0 0.0% 0 0.0% 0 0.0% 0 0.0% 0 0.0% 0 0.0% 0 0.0% 0 0.0% 0Local shops - Zone 14 0.3% 6 0.0% 0 0.0% 0 4.1% 5 1.1% 1 0.0% 0 0.0% 0 0.0% 0 0.0% 0 0.0% 0 0.0% 0Local shops - Zone 15 0.0% 1 0.0% 0 0.0% 0 0.0% 0 0.0% 0 0.0% 0 0.0% 0 0.0% 0 0.0% 0 0.0% 0 0.0% 0Local shops - Zone 16 0.1% 1 0.0% 0 0.0% 0 0.0% 0 0.0% 0 1.1% 1 0.0% 0 0.0% 0 0.0% 0 0.0% 0 0.0% 0Local shops - Zone 18 0.0% 0 0.0% 0 0.0% 0 0.0% 0 0.0% 0 0.0% 0 0.0% 0 1.5% 0 0.0% 0 0.0% 0 0.0% 0Local shops - Zone 19 0.0% 0 0.0% 0 0.0% 0 0.0% 0 0.0% 0 0.0% 0 0.0% 0 0.0% 0 1.0% 0 0.0% 0 0.0% 0Local shops - Zone 20 0.0% 0 0.0% 0 0.0% 0 0.0% 0 0.0% 0 0.0% 0 0.0% 0 0.0% 0 0.0% 0 0.7% 0 0.0% 0Local shops - Zone 21 0.0% 0 0.0% 0 0.0% 0 0.0% 0 0.0% 0 0.0% 0 0.0% 0 0.0% 0 0.0% 0 0.0% 0 0.7% 0Local shops - Zone 0 0.4% 8 0.0% 0 0.0% 0 0.0% 0 0.0% 0 0.0% 0 0.8% 0 2.1% 1 0.0% 0 1.1% 1 1.3% 0Other - Zone 1 0.3% 5 0.0% 0 0.0% 0 0.0% 0 0.0% 0 0.0% 0 0.0% 0 0.0% 0 0.0% 0 0.0% 0 0.0% 0Other - Zone 2 1.0% 19 0.0% 0 0.0% 0 0.0% 0 1.0% 0 0.0% 0 0.0% 0 0.0% 0 0.0% 0 0.0% 0 0.7% 0Other - Zone 4 0.0% 0 0.0% 0 0.0% 0 0.0% 0 0.0% 0 0.0% 0 0.0% 0 0.0% 0 0.0% 0 0.0% 0 0.0% 0Other - Zone 5 0.2% 4 0.0% 0 0.0% 0 0.0% 0 0.0% 0 0.0% 0 0.0% 0 0.0% 0 0.0% 0 0.0% 0 0.0% 0Other - Zone 6 0.0% 1 0.0% 0 0.0% 0 0.0% 0 0.0% 0 0.0% 0 0.0% 0 0.0% 0 0.0% 0 0.0% 0 0.0% 0Other - Zone 7 0.4% 7 0.0% 0 0.0% 0 0.0% 0 0.0% 0 0.0% 0 0.0% 0 0.0% 0 0.0% 0 0.0% 0 0.0% 0Other - Zone 8 0.0% 1 0.0% 0 0.0% 0 0.0% 0 0.0% 0 0.0% 0 0.0% 0 0.0% 0 0.0% 0 0.0% 0 0.0% 0Other - Zone 9 0.4% 9 0.0% 0 5.6% 5 0.0% 0 0.0% 0 0.0% 0 0.0% 0 0.0% 0 0.0% 0 0.0% 0 0.0% 0
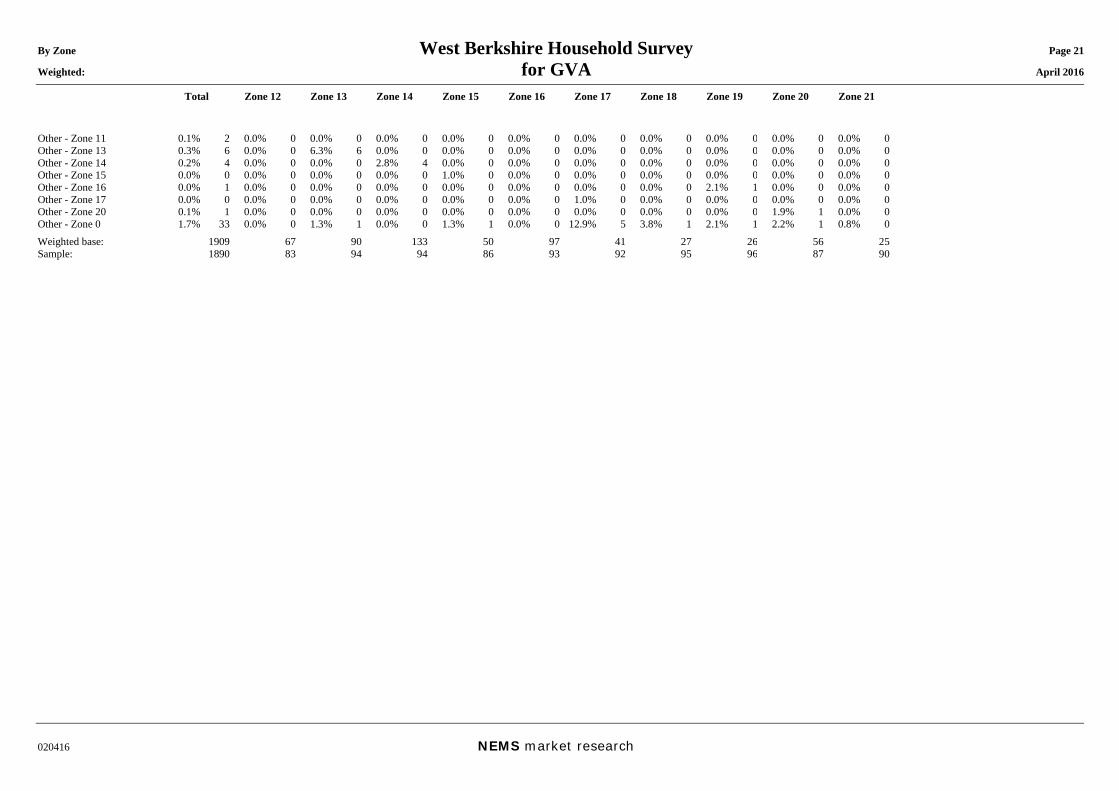
By Zone West Berkshire Household Survey Page 21 Weighted: for GVA April 2016
Total Zone 12 Zone 13 Zone 14 Zone 15 Zone 16 Zone 17 Zone 18 Zone 19 Zone 20 Zone 21
020416 NEMS market research
Other - Zone 11 0.1% 2 0.0% 0 0.0% 0 0.0% 0 0.0% 0 0.0% 0 0.0% 0 0.0% 0 0.0% 0 0.0% 0 0.0% 0Other - Zone 13 0.3% 6 0.0% 0 6.3% 6 0.0% 0 0.0% 0 0.0% 0 0.0% 0 0.0% 0 0.0% 0 0.0% 0 0.0% 0Other - Zone 14 0.2% 4 0.0% 0 0.0% 0 2.8% 4 0.0% 0 0.0% 0 0.0% 0 0.0% 0 0.0% 0 0.0% 0 0.0% 0Other - Zone 15 0.0% 0 0.0% 0 0.0% 0 0.0% 0 1.0% 0 0.0% 0 0.0% 0 0.0% 0 0.0% 0 0.0% 0 0.0% 0Other - Zone 16 0.0% 1 0.0% 0 0.0% 0 0.0% 0 0.0% 0 0.0% 0 0.0% 0 0.0% 0 2.1% 1 0.0% 0 0.0% 0Other - Zone 17 0.0% 0 0.0% 0 0.0% 0 0.0% 0 0.0% 0 0.0% 0 1.0% 0 0.0% 0 0.0% 0 0.0% 0 0.0% 0Other - Zone 20 0.1% 1 0.0% 0 0.0% 0 0.0% 0 0.0% 0 0.0% 0 0.0% 0 0.0% 0 0.0% 0 1.9% 1 0.0% 0Other - Zone 0 1.7% 33 0.0% 0 1.3% 1 0.0% 0 1.3% 1 0.0% 0 12.9% 5 3.8% 1 2.1% 1 2.2% 1 0.8% 0Weighted base: 1909 67 90 133 50 97 41 27 26 56 25Sample: 1890 83 94 94 86 93 92 95 96 87 90
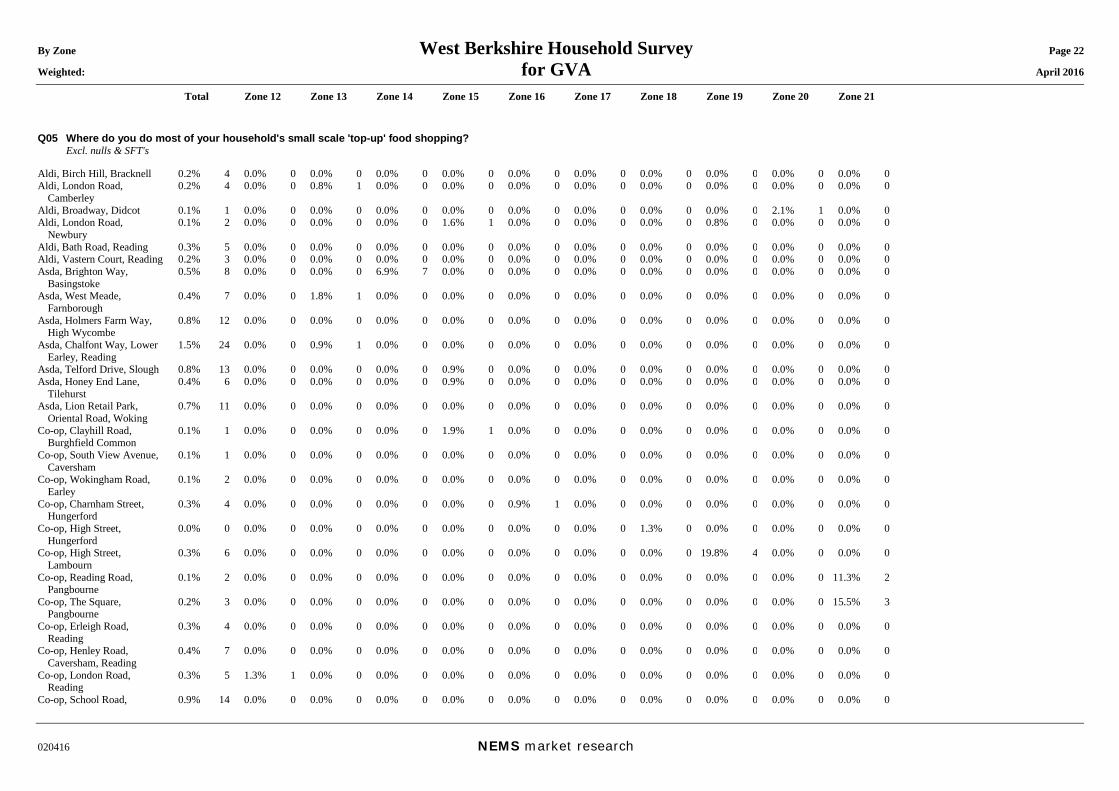
By Zone West Berkshire Household Survey Page 22 Weighted: for GVA April 2016
Total Zone 12 Zone 13 Zone 14 Zone 15 Zone 16 Zone 17 Zone 18 Zone 19 Zone 20 Zone 21
020416 NEMS market research
Q05 Where do you do most of your household's small scale 'top-up' food shopping? Excl. nulls & SFT's Aldi, Birch Hill, Bracknell 0.2% 4 0.0% 0 0.0% 0 0.0% 0 0.0% 0 0.0% 0 0.0% 0 0.0% 0 0.0% 0 0.0% 0 0.0% 0Aldi, London Road,
Camberley 0.2% 4 0.0% 0 0.8% 1 0.0% 0 0.0% 0 0.0% 0 0.0% 0 0.0% 0 0.0% 0 0.0% 0 0.0% 0
Aldi, Broadway, Didcot 0.1% 1 0.0% 0 0.0% 0 0.0% 0 0.0% 0 0.0% 0 0.0% 0 0.0% 0 0.0% 0 2.1% 1 0.0% 0Aldi, London Road,
Newbury 0.1% 2 0.0% 0 0.0% 0 0.0% 0 1.6% 1 0.0% 0 0.0% 0 0.0% 0 0.8% 0 0.0% 0 0.0% 0
Aldi, Bath Road, Reading 0.3% 5 0.0% 0 0.0% 0 0.0% 0 0.0% 0 0.0% 0 0.0% 0 0.0% 0 0.0% 0 0.0% 0 0.0% 0Aldi, Vastern Court, Reading 0.2% 3 0.0% 0 0.0% 0 0.0% 0 0.0% 0 0.0% 0 0.0% 0 0.0% 0 0.0% 0 0.0% 0 0.0% 0Asda, Brighton Way,
Basingstoke 0.5% 8 0.0% 0 0.0% 0 6.9% 7 0.0% 0 0.0% 0 0.0% 0 0.0% 0 0.0% 0 0.0% 0 0.0% 0
Asda, West Meade, Farnborough
0.4% 7 0.0% 0 1.8% 1 0.0% 0 0.0% 0 0.0% 0 0.0% 0 0.0% 0 0.0% 0 0.0% 0 0.0% 0
Asda, Holmers Farm Way, High Wycombe
0.8% 12 0.0% 0 0.0% 0 0.0% 0 0.0% 0 0.0% 0 0.0% 0 0.0% 0 0.0% 0 0.0% 0 0.0% 0
Asda, Chalfont Way, Lower Earley, Reading
1.5% 24 0.0% 0 0.9% 1 0.0% 0 0.0% 0 0.0% 0 0.0% 0 0.0% 0 0.0% 0 0.0% 0 0.0% 0
Asda, Telford Drive, Slough 0.8% 13 0.0% 0 0.0% 0 0.0% 0 0.9% 0 0.0% 0 0.0% 0 0.0% 0 0.0% 0 0.0% 0 0.0% 0Asda, Honey End Lane,
Tilehurst 0.4% 6 0.0% 0 0.0% 0 0.0% 0 0.9% 0 0.0% 0 0.0% 0 0.0% 0 0.0% 0 0.0% 0 0.0% 0
Asda, Lion Retail Park, Oriental Road, Woking
0.7% 11 0.0% 0 0.0% 0 0.0% 0 0.0% 0 0.0% 0 0.0% 0 0.0% 0 0.0% 0 0.0% 0 0.0% 0
Co-op, Clayhill Road, Burghfield Common
0.1% 1 0.0% 0 0.0% 0 0.0% 0 1.9% 1 0.0% 0 0.0% 0 0.0% 0 0.0% 0 0.0% 0 0.0% 0
Co-op, South View Avenue, Caversham
0.1% 1 0.0% 0 0.0% 0 0.0% 0 0.0% 0 0.0% 0 0.0% 0 0.0% 0 0.0% 0 0.0% 0 0.0% 0
Co-op, Wokingham Road, Earley
0.1% 2 0.0% 0 0.0% 0 0.0% 0 0.0% 0 0.0% 0 0.0% 0 0.0% 0 0.0% 0 0.0% 0 0.0% 0
Co-op, Charnham Street, Hungerford
0.3% 4 0.0% 0 0.0% 0 0.0% 0 0.0% 0 0.9% 1 0.0% 0 0.0% 0 0.0% 0 0.0% 0 0.0% 0
Co-op, High Street, Hungerford
0.0% 0 0.0% 0 0.0% 0 0.0% 0 0.0% 0 0.0% 0 0.0% 0 1.3% 0 0.0% 0 0.0% 0 0.0% 0
Co-op, High Street, Lambourn
0.3% 6 0.0% 0 0.0% 0 0.0% 0 0.0% 0 0.0% 0 0.0% 0 0.0% 0 19.8% 4 0.0% 0 0.0% 0
Co-op, Reading Road, Pangbourne
0.1% 2 0.0% 0 0.0% 0 0.0% 0 0.0% 0 0.0% 0 0.0% 0 0.0% 0 0.0% 0 0.0% 0 11.3% 2
Co-op, The Square, Pangbourne
0.2% 3 0.0% 0 0.0% 0 0.0% 0 0.0% 0 0.0% 0 0.0% 0 0.0% 0 0.0% 0 0.0% 0 15.5% 3
Co-op, Erleigh Road, Reading
0.3% 4 0.0% 0 0.0% 0 0.0% 0 0.0% 0 0.0% 0 0.0% 0 0.0% 0 0.0% 0 0.0% 0 0.0% 0
Co-op, Henley Road, Caversham, Reading
0.4% 7 0.0% 0 0.0% 0 0.0% 0 0.0% 0 0.0% 0 0.0% 0 0.0% 0 0.0% 0 0.0% 0 0.0% 0
Co-op, London Road, Reading
0.3% 5 1.3% 1 0.0% 0 0.0% 0 0.0% 0 0.0% 0 0.0% 0 0.0% 0 0.0% 0 0.0% 0 0.0% 0
Co-op, School Road, 0.9% 14 0.0% 0 0.0% 0 0.0% 0 0.0% 0 0.0% 0 0.0% 0 0.0% 0 0.0% 0 0.0% 0 0.0% 0
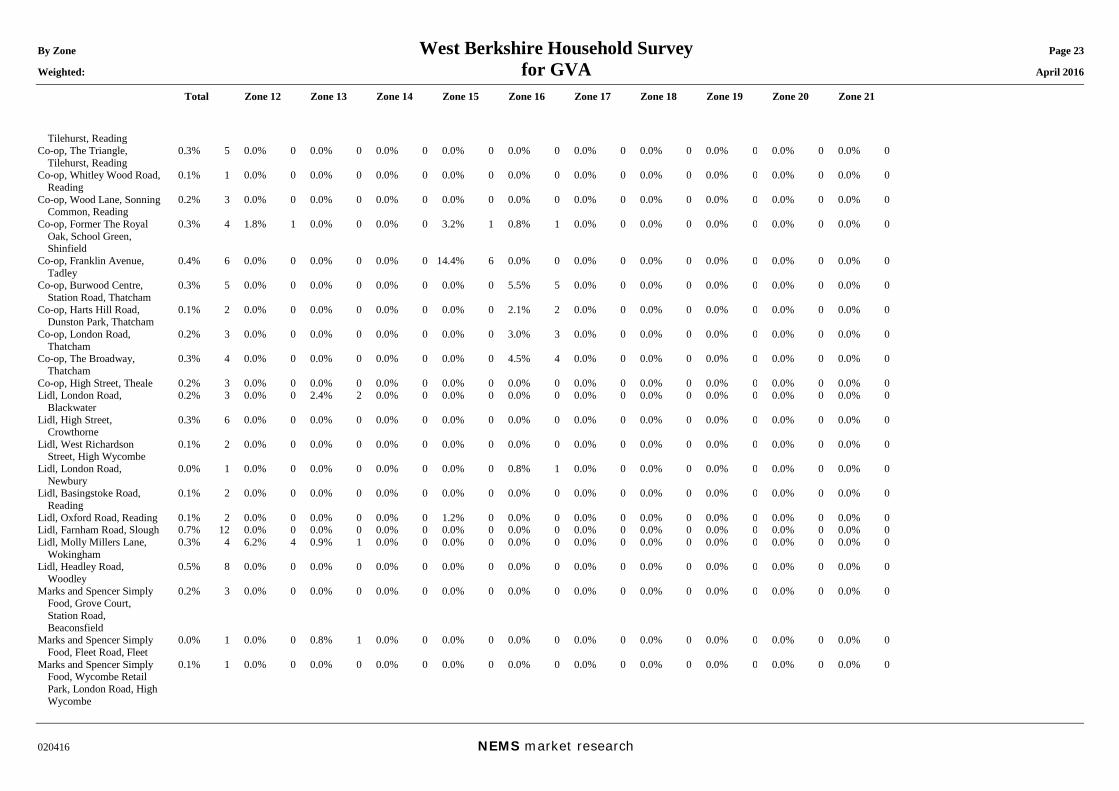
By Zone West Berkshire Household Survey Page 23 Weighted: for GVA April 2016
Total Zone 12 Zone 13 Zone 14 Zone 15 Zone 16 Zone 17 Zone 18 Zone 19 Zone 20 Zone 21
020416 NEMS market research
Tilehurst, Reading Co-op, The Triangle,
Tilehurst, Reading 0.3% 5 0.0% 0 0.0% 0 0.0% 0 0.0% 0 0.0% 0 0.0% 0 0.0% 0 0.0% 0 0.0% 0 0.0% 0
Co-op, Whitley Wood Road, Reading
0.1% 1 0.0% 0 0.0% 0 0.0% 0 0.0% 0 0.0% 0 0.0% 0 0.0% 0 0.0% 0 0.0% 0 0.0% 0
Co-op, Wood Lane, Sonning Common, Reading
0.2% 3 0.0% 0 0.0% 0 0.0% 0 0.0% 0 0.0% 0 0.0% 0 0.0% 0 0.0% 0 0.0% 0 0.0% 0
Co-op, Former The Royal Oak, School Green, Shinfield
0.3% 4 1.8% 1 0.0% 0 0.0% 0 3.2% 1 0.8% 1 0.0% 0 0.0% 0 0.0% 0 0.0% 0 0.0% 0
Co-op, Franklin Avenue, Tadley
0.4% 6 0.0% 0 0.0% 0 0.0% 0 14.4% 6 0.0% 0 0.0% 0 0.0% 0 0.0% 0 0.0% 0 0.0% 0
Co-op, Burwood Centre, Station Road, Thatcham
0.3% 5 0.0% 0 0.0% 0 0.0% 0 0.0% 0 5.5% 5 0.0% 0 0.0% 0 0.0% 0 0.0% 0 0.0% 0
Co-op, Harts Hill Road, Dunston Park, Thatcham
0.1% 2 0.0% 0 0.0% 0 0.0% 0 0.0% 0 2.1% 2 0.0% 0 0.0% 0 0.0% 0 0.0% 0 0.0% 0
Co-op, London Road, Thatcham
0.2% 3 0.0% 0 0.0% 0 0.0% 0 0.0% 0 3.0% 3 0.0% 0 0.0% 0 0.0% 0 0.0% 0 0.0% 0
Co-op, The Broadway, Thatcham
0.3% 4 0.0% 0 0.0% 0 0.0% 0 0.0% 0 4.5% 4 0.0% 0 0.0% 0 0.0% 0 0.0% 0 0.0% 0
Co-op, High Street, Theale 0.2% 3 0.0% 0 0.0% 0 0.0% 0 0.0% 0 0.0% 0 0.0% 0 0.0% 0 0.0% 0 0.0% 0 0.0% 0Lidl, London Road,
Blackwater 0.2% 3 0.0% 0 2.4% 2 0.0% 0 0.0% 0 0.0% 0 0.0% 0 0.0% 0 0.0% 0 0.0% 0 0.0% 0
Lidl, High Street, Crowthorne
0.3% 6 0.0% 0 0.0% 0 0.0% 0 0.0% 0 0.0% 0 0.0% 0 0.0% 0 0.0% 0 0.0% 0 0.0% 0
Lidl, West Richardson Street, High Wycombe
0.1% 2 0.0% 0 0.0% 0 0.0% 0 0.0% 0 0.0% 0 0.0% 0 0.0% 0 0.0% 0 0.0% 0 0.0% 0
Lidl, London Road, Newbury
0.0% 1 0.0% 0 0.0% 0 0.0% 0 0.0% 0 0.8% 1 0.0% 0 0.0% 0 0.0% 0 0.0% 0 0.0% 0
Lidl, Basingstoke Road, Reading
0.1% 2 0.0% 0 0.0% 0 0.0% 0 0.0% 0 0.0% 0 0.0% 0 0.0% 0 0.0% 0 0.0% 0 0.0% 0
Lidl, Oxford Road, Reading 0.1% 2 0.0% 0 0.0% 0 0.0% 0 1.2% 0 0.0% 0 0.0% 0 0.0% 0 0.0% 0 0.0% 0 0.0% 0Lidl, Farnham Road, Slough 0.7% 12 0.0% 0 0.0% 0 0.0% 0 0.0% 0 0.0% 0 0.0% 0 0.0% 0 0.0% 0 0.0% 0 0.0% 0Lidl, Molly Millers Lane,
Wokingham 0.3% 4 6.2% 4 0.9% 1 0.0% 0 0.0% 0 0.0% 0 0.0% 0 0.0% 0 0.0% 0 0.0% 0 0.0% 0
Lidl, Headley Road, Woodley
0.5% 8 0.0% 0 0.0% 0 0.0% 0 0.0% 0 0.0% 0 0.0% 0 0.0% 0 0.0% 0 0.0% 0 0.0% 0
Marks and Spencer Simply Food, Grove Court, Station Road, Beaconsfield
0.2% 3 0.0% 0 0.0% 0 0.0% 0 0.0% 0 0.0% 0 0.0% 0 0.0% 0 0.0% 0 0.0% 0 0.0% 0
Marks and Spencer Simply Food, Fleet Road, Fleet
0.0% 1 0.0% 0 0.8% 1 0.0% 0 0.0% 0 0.0% 0 0.0% 0 0.0% 0 0.0% 0 0.0% 0 0.0% 0
Marks and Spencer Simply Food, Wycombe Retail Park, London Road, High Wycombe
0.1% 1 0.0% 0 0.0% 0 0.0% 0 0.0% 0 0.0% 0 0.0% 0 0.0% 0 0.0% 0 0.0% 0 0.0% 0
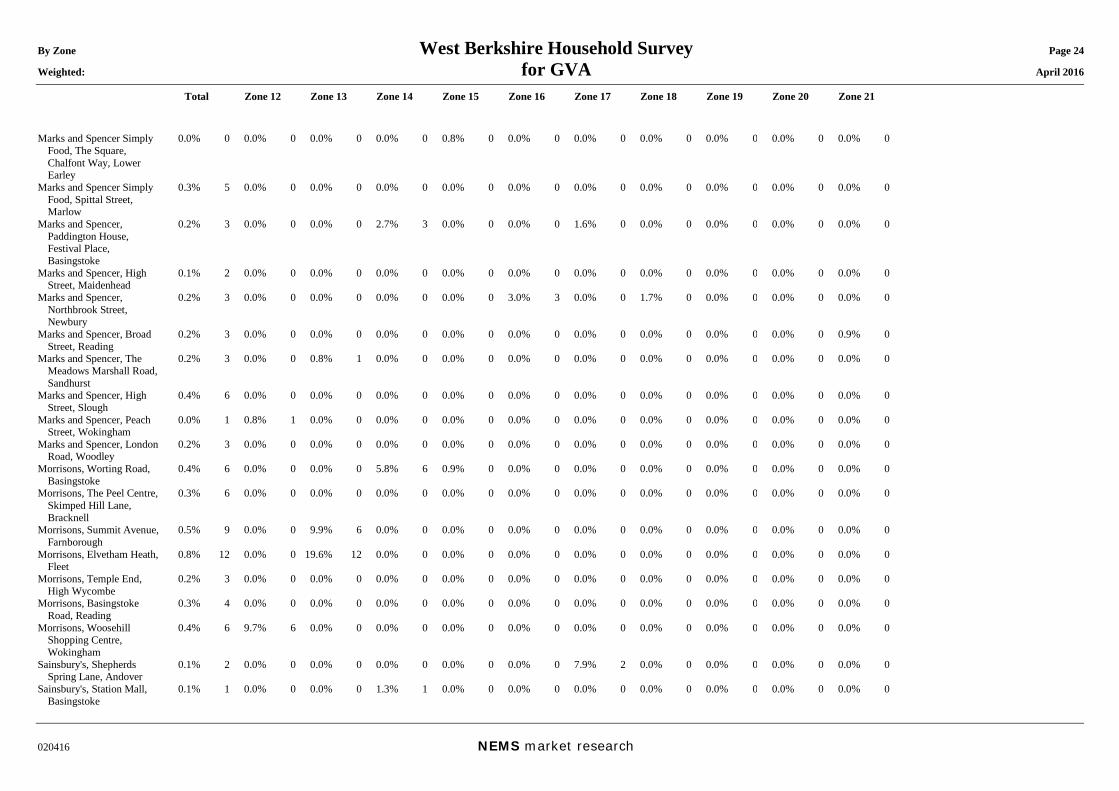
By Zone West Berkshire Household Survey Page 24 Weighted: for GVA April 2016
Total Zone 12 Zone 13 Zone 14 Zone 15 Zone 16 Zone 17 Zone 18 Zone 19 Zone 20 Zone 21
020416 NEMS market research
Marks and Spencer Simply Food, The Square, Chalfont Way, Lower Earley
0.0% 0 0.0% 0 0.0% 0 0.0% 0 0.8% 0 0.0% 0 0.0% 0 0.0% 0 0.0% 0 0.0% 0 0.0% 0
Marks and Spencer Simply Food, Spittal Street, Marlow
0.3% 5 0.0% 0 0.0% 0 0.0% 0 0.0% 0 0.0% 0 0.0% 0 0.0% 0 0.0% 0 0.0% 0 0.0% 0
Marks and Spencer, Paddington House, Festival Place, Basingstoke
0.2% 3 0.0% 0 0.0% 0 2.7% 3 0.0% 0 0.0% 0 1.6% 0 0.0% 0 0.0% 0 0.0% 0 0.0% 0
Marks and Spencer, High Street, Maidenhead
0.1% 2 0.0% 0 0.0% 0 0.0% 0 0.0% 0 0.0% 0 0.0% 0 0.0% 0 0.0% 0 0.0% 0 0.0% 0
Marks and Spencer, Northbrook Street, Newbury
0.2% 3 0.0% 0 0.0% 0 0.0% 0 0.0% 0 3.0% 3 0.0% 0 1.7% 0 0.0% 0 0.0% 0 0.0% 0
Marks and Spencer, Broad Street, Reading
0.2% 3 0.0% 0 0.0% 0 0.0% 0 0.0% 0 0.0% 0 0.0% 0 0.0% 0 0.0% 0 0.0% 0 0.9% 0
Marks and Spencer, The Meadows Marshall Road, Sandhurst
0.2% 3 0.0% 0 0.8% 1 0.0% 0 0.0% 0 0.0% 0 0.0% 0 0.0% 0 0.0% 0 0.0% 0 0.0% 0
Marks and Spencer, High Street, Slough
0.4% 6 0.0% 0 0.0% 0 0.0% 0 0.0% 0 0.0% 0 0.0% 0 0.0% 0 0.0% 0 0.0% 0 0.0% 0
Marks and Spencer, Peach Street, Wokingham
0.0% 1 0.8% 1 0.0% 0 0.0% 0 0.0% 0 0.0% 0 0.0% 0 0.0% 0 0.0% 0 0.0% 0 0.0% 0
Marks and Spencer, London Road, Woodley
0.2% 3 0.0% 0 0.0% 0 0.0% 0 0.0% 0 0.0% 0 0.0% 0 0.0% 0 0.0% 0 0.0% 0 0.0% 0
Morrisons, Worting Road, Basingstoke
0.4% 6 0.0% 0 0.0% 0 5.8% 6 0.9% 0 0.0% 0 0.0% 0 0.0% 0 0.0% 0 0.0% 0 0.0% 0
Morrisons, The Peel Centre, Skimped Hill Lane, Bracknell
0.3% 6 0.0% 0 0.0% 0 0.0% 0 0.0% 0 0.0% 0 0.0% 0 0.0% 0 0.0% 0 0.0% 0 0.0% 0
Morrisons, Summit Avenue, Farnborough
0.5% 9 0.0% 0 9.9% 6 0.0% 0 0.0% 0 0.0% 0 0.0% 0 0.0% 0 0.0% 0 0.0% 0 0.0% 0
Morrisons, Elvetham Heath, Fleet
0.8% 12 0.0% 0 19.6% 12 0.0% 0 0.0% 0 0.0% 0 0.0% 0 0.0% 0 0.0% 0 0.0% 0 0.0% 0
Morrisons, Temple End, High Wycombe
0.2% 3 0.0% 0 0.0% 0 0.0% 0 0.0% 0 0.0% 0 0.0% 0 0.0% 0 0.0% 0 0.0% 0 0.0% 0
Morrisons, Basingstoke Road, Reading
0.3% 4 0.0% 0 0.0% 0 0.0% 0 0.0% 0 0.0% 0 0.0% 0 0.0% 0 0.0% 0 0.0% 0 0.0% 0
Morrisons, Woosehill Shopping Centre, Wokingham
0.4% 6 9.7% 6 0.0% 0 0.0% 0 0.0% 0 0.0% 0 0.0% 0 0.0% 0 0.0% 0 0.0% 0 0.0% 0
Sainsbury's, Shepherds Spring Lane, Andover
0.1% 2 0.0% 0 0.0% 0 0.0% 0 0.0% 0 0.0% 0 7.9% 2 0.0% 0 0.0% 0 0.0% 0 0.0% 0
Sainsbury's, Station Mall, Basingstoke
0.1% 1 0.0% 0 0.0% 0 1.3% 1 0.0% 0 0.0% 0 0.0% 0 0.0% 0 0.0% 0 0.0% 0 0.0% 0
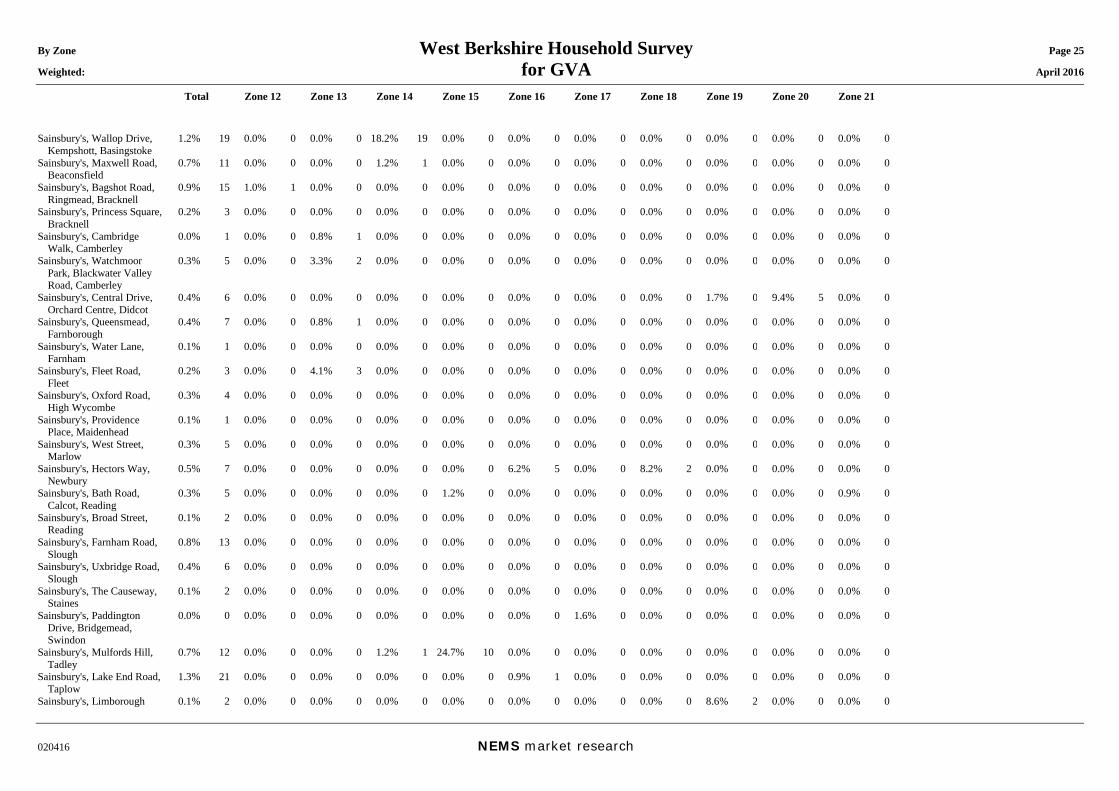
By Zone West Berkshire Household Survey Page 25 Weighted: for GVA April 2016
Total Zone 12 Zone 13 Zone 14 Zone 15 Zone 16 Zone 17 Zone 18 Zone 19 Zone 20 Zone 21
020416 NEMS market research
Sainsbury's, Wallop Drive, Kempshott, Basingstoke
1.2% 19 0.0% 0 0.0% 0 18.2% 19 0.0% 0 0.0% 0 0.0% 0 0.0% 0 0.0% 0 0.0% 0 0.0% 0
Sainsbury's, Maxwell Road, Beaconsfield
0.7% 11 0.0% 0 0.0% 0 1.2% 1 0.0% 0 0.0% 0 0.0% 0 0.0% 0 0.0% 0 0.0% 0 0.0% 0
Sainsbury's, Bagshot Road, Ringmead, Bracknell
0.9% 15 1.0% 1 0.0% 0 0.0% 0 0.0% 0 0.0% 0 0.0% 0 0.0% 0 0.0% 0 0.0% 0 0.0% 0
Sainsbury's, Princess Square, Bracknell
0.2% 3 0.0% 0 0.0% 0 0.0% 0 0.0% 0 0.0% 0 0.0% 0 0.0% 0 0.0% 0 0.0% 0 0.0% 0
Sainsbury's, Cambridge Walk, Camberley
0.0% 1 0.0% 0 0.8% 1 0.0% 0 0.0% 0 0.0% 0 0.0% 0 0.0% 0 0.0% 0 0.0% 0 0.0% 0
Sainsbury's, Watchmoor Park, Blackwater Valley Road, Camberley
0.3% 5 0.0% 0 3.3% 2 0.0% 0 0.0% 0 0.0% 0 0.0% 0 0.0% 0 0.0% 0 0.0% 0 0.0% 0
Sainsbury's, Central Drive, Orchard Centre, Didcot
0.4% 6 0.0% 0 0.0% 0 0.0% 0 0.0% 0 0.0% 0 0.0% 0 0.0% 0 1.7% 0 9.4% 5 0.0% 0
Sainsbury's, Queensmead, Farnborough
0.4% 7 0.0% 0 0.8% 1 0.0% 0 0.0% 0 0.0% 0 0.0% 0 0.0% 0 0.0% 0 0.0% 0 0.0% 0
Sainsbury's, Water Lane, Farnham
0.1% 1 0.0% 0 0.0% 0 0.0% 0 0.0% 0 0.0% 0 0.0% 0 0.0% 0 0.0% 0 0.0% 0 0.0% 0
Sainsbury's, Fleet Road, Fleet
0.2% 3 0.0% 0 4.1% 3 0.0% 0 0.0% 0 0.0% 0 0.0% 0 0.0% 0 0.0% 0 0.0% 0 0.0% 0
Sainsbury's, Oxford Road, High Wycombe
0.3% 4 0.0% 0 0.0% 0 0.0% 0 0.0% 0 0.0% 0 0.0% 0 0.0% 0 0.0% 0 0.0% 0 0.0% 0
Sainsbury's, Providence Place, Maidenhead
0.1% 1 0.0% 0 0.0% 0 0.0% 0 0.0% 0 0.0% 0 0.0% 0 0.0% 0 0.0% 0 0.0% 0 0.0% 0
Sainsbury's, West Street, Marlow
0.3% 5 0.0% 0 0.0% 0 0.0% 0 0.0% 0 0.0% 0 0.0% 0 0.0% 0 0.0% 0 0.0% 0 0.0% 0
Sainsbury's, Hectors Way, Newbury
0.5% 7 0.0% 0 0.0% 0 0.0% 0 0.0% 0 6.2% 5 0.0% 0 8.2% 2 0.0% 0 0.0% 0 0.0% 0
Sainsbury's, Bath Road, Calcot, Reading
0.3% 5 0.0% 0 0.0% 0 0.0% 0 1.2% 0 0.0% 0 0.0% 0 0.0% 0 0.0% 0 0.0% 0 0.9% 0
Sainsbury's, Broad Street, Reading
0.1% 2 0.0% 0 0.0% 0 0.0% 0 0.0% 0 0.0% 0 0.0% 0 0.0% 0 0.0% 0 0.0% 0 0.0% 0
Sainsbury's, Farnham Road, Slough
0.8% 13 0.0% 0 0.0% 0 0.0% 0 0.0% 0 0.0% 0 0.0% 0 0.0% 0 0.0% 0 0.0% 0 0.0% 0
Sainsbury's, Uxbridge Road, Slough
0.4% 6 0.0% 0 0.0% 0 0.0% 0 0.0% 0 0.0% 0 0.0% 0 0.0% 0 0.0% 0 0.0% 0 0.0% 0
Sainsbury's, The Causeway, Staines
0.1% 2 0.0% 0 0.0% 0 0.0% 0 0.0% 0 0.0% 0 0.0% 0 0.0% 0 0.0% 0 0.0% 0 0.0% 0
Sainsbury's, Paddington Drive, Bridgemead, Swindon
0.0% 0 0.0% 0 0.0% 0 0.0% 0 0.0% 0 0.0% 0 1.6% 0 0.0% 0 0.0% 0 0.0% 0 0.0% 0
Sainsbury's, Mulfords Hill, Tadley
0.7% 12 0.0% 0 0.0% 0 1.2% 1 24.7% 10 0.0% 0 0.0% 0 0.0% 0 0.0% 0 0.0% 0 0.0% 0
Sainsbury's, Lake End Road, Taplow
1.3% 21 0.0% 0 0.0% 0 0.0% 0 0.0% 0 0.9% 1 0.0% 0 0.0% 0 0.0% 0 0.0% 0 0.0% 0
Sainsbury's, Limborough 0.1% 2 0.0% 0 0.0% 0 0.0% 0 0.0% 0 0.0% 0 0.0% 0 0.0% 0 8.6% 2 0.0% 0 0.0% 0
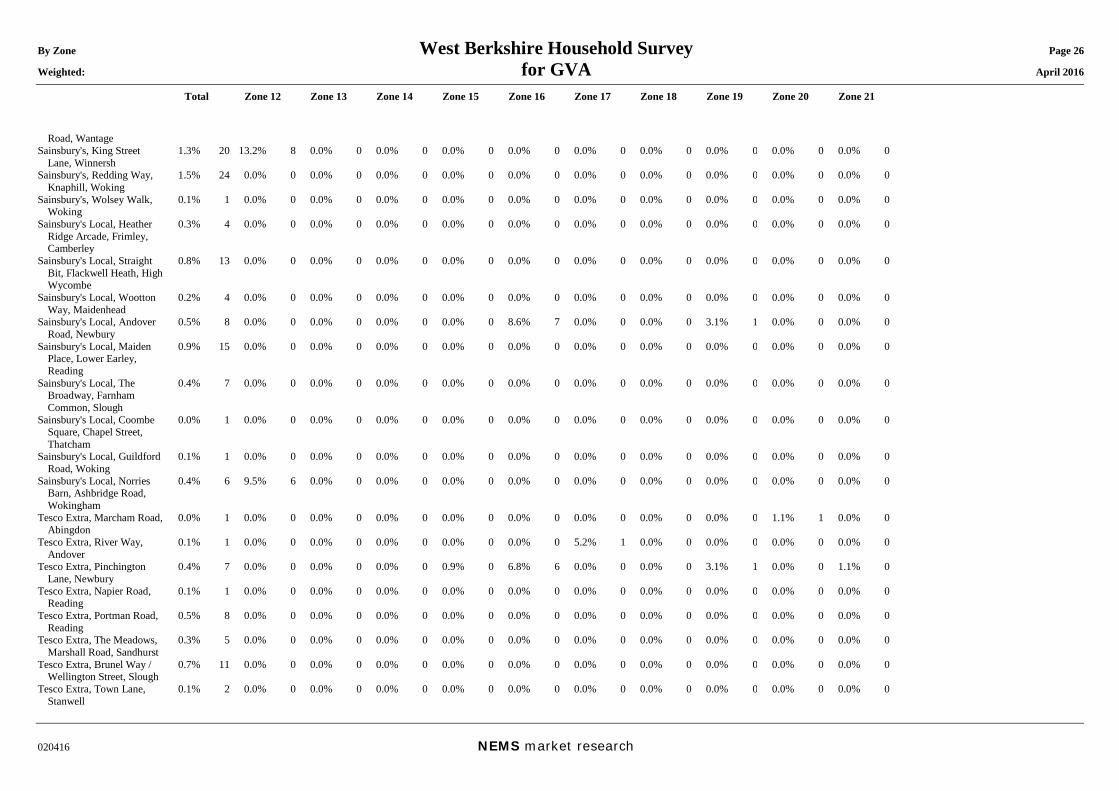
By Zone West Berkshire Household Survey Page 26 Weighted: for GVA April 2016
Total Zone 12 Zone 13 Zone 14 Zone 15 Zone 16 Zone 17 Zone 18 Zone 19 Zone 20 Zone 21
020416 NEMS market research
Road, Wantage Sainsbury's, King Street
Lane, Winnersh 1.3% 20 13.2% 8 0.0% 0 0.0% 0 0.0% 0 0.0% 0 0.0% 0 0.0% 0 0.0% 0 0.0% 0 0.0% 0
Sainsbury's, Redding Way, Knaphill, Woking
1.5% 24 0.0% 0 0.0% 0 0.0% 0 0.0% 0 0.0% 0 0.0% 0 0.0% 0 0.0% 0 0.0% 0 0.0% 0
Sainsbury's, Wolsey Walk, Woking
0.1% 1 0.0% 0 0.0% 0 0.0% 0 0.0% 0 0.0% 0 0.0% 0 0.0% 0 0.0% 0 0.0% 0 0.0% 0
Sainsbury's Local, Heather Ridge Arcade, Frimley, Camberley
0.3% 4 0.0% 0 0.0% 0 0.0% 0 0.0% 0 0.0% 0 0.0% 0 0.0% 0 0.0% 0 0.0% 0 0.0% 0
Sainsbury's Local, Straight Bit, Flackwell Heath, High Wycombe
0.8% 13 0.0% 0 0.0% 0 0.0% 0 0.0% 0 0.0% 0 0.0% 0 0.0% 0 0.0% 0 0.0% 0 0.0% 0
Sainsbury's Local, Wootton Way, Maidenhead
0.2% 4 0.0% 0 0.0% 0 0.0% 0 0.0% 0 0.0% 0 0.0% 0 0.0% 0 0.0% 0 0.0% 0 0.0% 0
Sainsbury's Local, Andover Road, Newbury
0.5% 8 0.0% 0 0.0% 0 0.0% 0 0.0% 0 8.6% 7 0.0% 0 0.0% 0 3.1% 1 0.0% 0 0.0% 0
Sainsbury's Local, Maiden Place, Lower Earley, Reading
0.9% 15 0.0% 0 0.0% 0 0.0% 0 0.0% 0 0.0% 0 0.0% 0 0.0% 0 0.0% 0 0.0% 0 0.0% 0
Sainsbury's Local, The Broadway, Farnham Common, Slough
0.4% 7 0.0% 0 0.0% 0 0.0% 0 0.0% 0 0.0% 0 0.0% 0 0.0% 0 0.0% 0 0.0% 0 0.0% 0
Sainsbury's Local, Coombe Square, Chapel Street, Thatcham
0.0% 1 0.0% 0 0.0% 0 0.0% 0 0.0% 0 0.0% 0 0.0% 0 0.0% 0 0.0% 0 0.0% 0 0.0% 0
Sainsbury's Local, Guildford Road, Woking
0.1% 1 0.0% 0 0.0% 0 0.0% 0 0.0% 0 0.0% 0 0.0% 0 0.0% 0 0.0% 0 0.0% 0 0.0% 0
Sainsbury's Local, Norries Barn, Ashbridge Road, Wokingham
0.4% 6 9.5% 6 0.0% 0 0.0% 0 0.0% 0 0.0% 0 0.0% 0 0.0% 0 0.0% 0 0.0% 0 0.0% 0
Tesco Extra, Marcham Road, Abingdon
0.0% 1 0.0% 0 0.0% 0 0.0% 0 0.0% 0 0.0% 0 0.0% 0 0.0% 0 0.0% 0 1.1% 1 0.0% 0
Tesco Extra, River Way, Andover
0.1% 1 0.0% 0 0.0% 0 0.0% 0 0.0% 0 0.0% 0 5.2% 1 0.0% 0 0.0% 0 0.0% 0 0.0% 0
Tesco Extra, Pinchington Lane, Newbury
0.4% 7 0.0% 0 0.0% 0 0.0% 0 0.9% 0 6.8% 6 0.0% 0 0.0% 0 3.1% 1 0.0% 0 1.1% 0
Tesco Extra, Napier Road, Reading
0.1% 1 0.0% 0 0.0% 0 0.0% 0 0.0% 0 0.0% 0 0.0% 0 0.0% 0 0.0% 0 0.0% 0 0.0% 0
Tesco Extra, Portman Road, Reading
0.5% 8 0.0% 0 0.0% 0 0.0% 0 0.0% 0 0.0% 0 0.0% 0 0.0% 0 0.0% 0 0.0% 0 0.0% 0
Tesco Extra, The Meadows, Marshall Road, Sandhurst
0.3% 5 0.0% 0 0.0% 0 0.0% 0 0.0% 0 0.0% 0 0.0% 0 0.0% 0 0.0% 0 0.0% 0 0.0% 0
Tesco Extra, Brunel Way / Wellington Street, Slough
0.7% 11 0.0% 0 0.0% 0 0.0% 0 0.0% 0 0.0% 0 0.0% 0 0.0% 0 0.0% 0 0.0% 0 0.0% 0
Tesco Extra, Town Lane, Stanwell
0.1% 2 0.0% 0 0.0% 0 0.0% 0 0.0% 0 0.0% 0 0.0% 0 0.0% 0 0.0% 0 0.0% 0 0.0% 0
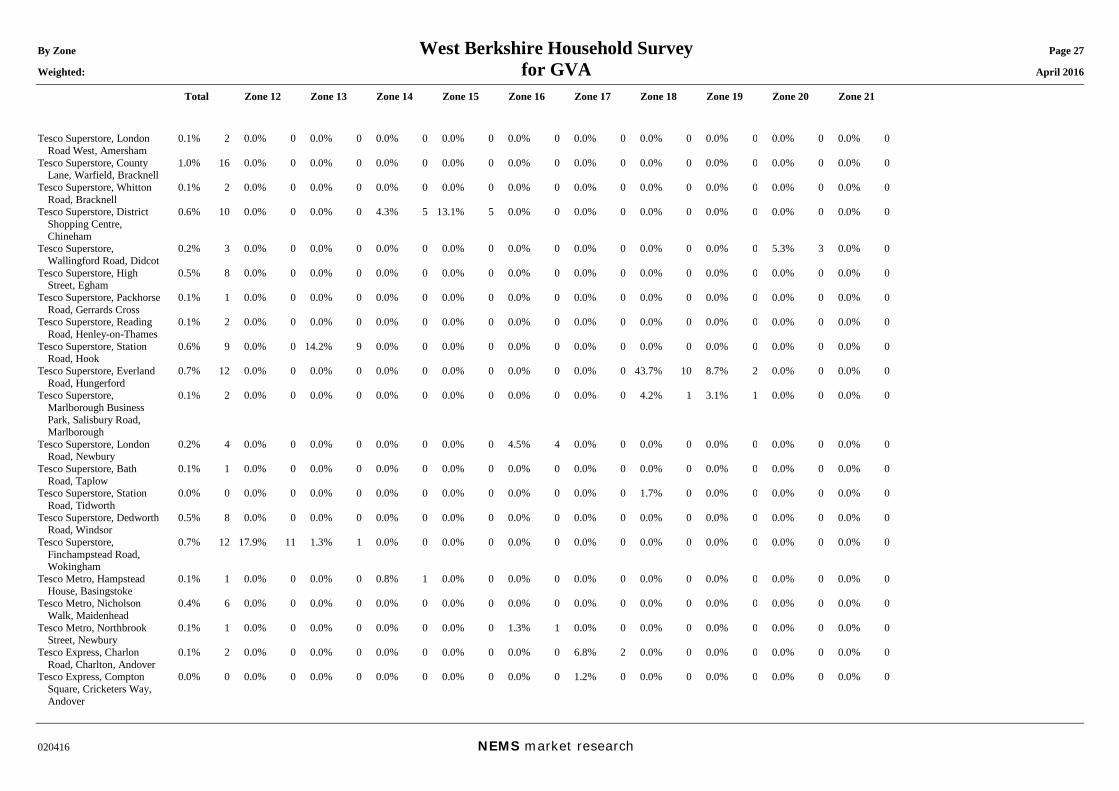
By Zone West Berkshire Household Survey Page 27 Weighted: for GVA April 2016
Total Zone 12 Zone 13 Zone 14 Zone 15 Zone 16 Zone 17 Zone 18 Zone 19 Zone 20 Zone 21
020416 NEMS market research
Tesco Superstore, London Road West, Amersham
0.1% 2 0.0% 0 0.0% 0 0.0% 0 0.0% 0 0.0% 0 0.0% 0 0.0% 0 0.0% 0 0.0% 0 0.0% 0
Tesco Superstore, County Lane, Warfield, Bracknell
1.0% 16 0.0% 0 0.0% 0 0.0% 0 0.0% 0 0.0% 0 0.0% 0 0.0% 0 0.0% 0 0.0% 0 0.0% 0
Tesco Superstore, Whitton Road, Bracknell
0.1% 2 0.0% 0 0.0% 0 0.0% 0 0.0% 0 0.0% 0 0.0% 0 0.0% 0 0.0% 0 0.0% 0 0.0% 0
Tesco Superstore, District Shopping Centre, Chineham
0.6% 10 0.0% 0 0.0% 0 4.3% 5 13.1% 5 0.0% 0 0.0% 0 0.0% 0 0.0% 0 0.0% 0 0.0% 0
Tesco Superstore, Wallingford Road, Didcot
0.2% 3 0.0% 0 0.0% 0 0.0% 0 0.0% 0 0.0% 0 0.0% 0 0.0% 0 0.0% 0 5.3% 3 0.0% 0
Tesco Superstore, High Street, Egham
0.5% 8 0.0% 0 0.0% 0 0.0% 0 0.0% 0 0.0% 0 0.0% 0 0.0% 0 0.0% 0 0.0% 0 0.0% 0
Tesco Superstore, Packhorse Road, Gerrards Cross
0.1% 1 0.0% 0 0.0% 0 0.0% 0 0.0% 0 0.0% 0 0.0% 0 0.0% 0 0.0% 0 0.0% 0 0.0% 0
Tesco Superstore, Reading Road, Henley-on-Thames
0.1% 2 0.0% 0 0.0% 0 0.0% 0 0.0% 0 0.0% 0 0.0% 0 0.0% 0 0.0% 0 0.0% 0 0.0% 0
Tesco Superstore, Station Road, Hook
0.6% 9 0.0% 0 14.2% 9 0.0% 0 0.0% 0 0.0% 0 0.0% 0 0.0% 0 0.0% 0 0.0% 0 0.0% 0
Tesco Superstore, Everland Road, Hungerford
0.7% 12 0.0% 0 0.0% 0 0.0% 0 0.0% 0 0.0% 0 0.0% 0 43.7% 10 8.7% 2 0.0% 0 0.0% 0
Tesco Superstore, Marlborough Business Park, Salisbury Road, Marlborough
0.1% 2 0.0% 0 0.0% 0 0.0% 0 0.0% 0 0.0% 0 0.0% 0 4.2% 1 3.1% 1 0.0% 0 0.0% 0
Tesco Superstore, London Road, Newbury
0.2% 4 0.0% 0 0.0% 0 0.0% 0 0.0% 0 4.5% 4 0.0% 0 0.0% 0 0.0% 0 0.0% 0 0.0% 0
Tesco Superstore, Bath Road, Taplow
0.1% 1 0.0% 0 0.0% 0 0.0% 0 0.0% 0 0.0% 0 0.0% 0 0.0% 0 0.0% 0 0.0% 0 0.0% 0
Tesco Superstore, Station Road, Tidworth
0.0% 0 0.0% 0 0.0% 0 0.0% 0 0.0% 0 0.0% 0 0.0% 0 1.7% 0 0.0% 0 0.0% 0 0.0% 0
Tesco Superstore, Dedworth Road, Windsor
0.5% 8 0.0% 0 0.0% 0 0.0% 0 0.0% 0 0.0% 0 0.0% 0 0.0% 0 0.0% 0 0.0% 0 0.0% 0
Tesco Superstore, Finchampstead Road, Wokingham
0.7% 12 17.9% 11 1.3% 1 0.0% 0 0.0% 0 0.0% 0 0.0% 0 0.0% 0 0.0% 0 0.0% 0 0.0% 0
Tesco Metro, Hampstead House, Basingstoke
0.1% 1 0.0% 0 0.0% 0 0.8% 1 0.0% 0 0.0% 0 0.0% 0 0.0% 0 0.0% 0 0.0% 0 0.0% 0
Tesco Metro, Nicholson Walk, Maidenhead
0.4% 6 0.0% 0 0.0% 0 0.0% 0 0.0% 0 0.0% 0 0.0% 0 0.0% 0 0.0% 0 0.0% 0 0.0% 0
Tesco Metro, Northbrook Street, Newbury
0.1% 1 0.0% 0 0.0% 0 0.0% 0 0.0% 0 1.3% 1 0.0% 0 0.0% 0 0.0% 0 0.0% 0 0.0% 0
Tesco Express, Charlon Road, Charlton, Andover
0.1% 2 0.0% 0 0.0% 0 0.0% 0 0.0% 0 0.0% 0 6.8% 2 0.0% 0 0.0% 0 0.0% 0 0.0% 0
Tesco Express, Compton Square, Cricketers Way, Andover
0.0% 0 0.0% 0 0.0% 0 0.0% 0 0.0% 0 0.0% 0 1.2% 0 0.0% 0 0.0% 0 0.0% 0 0.0% 0
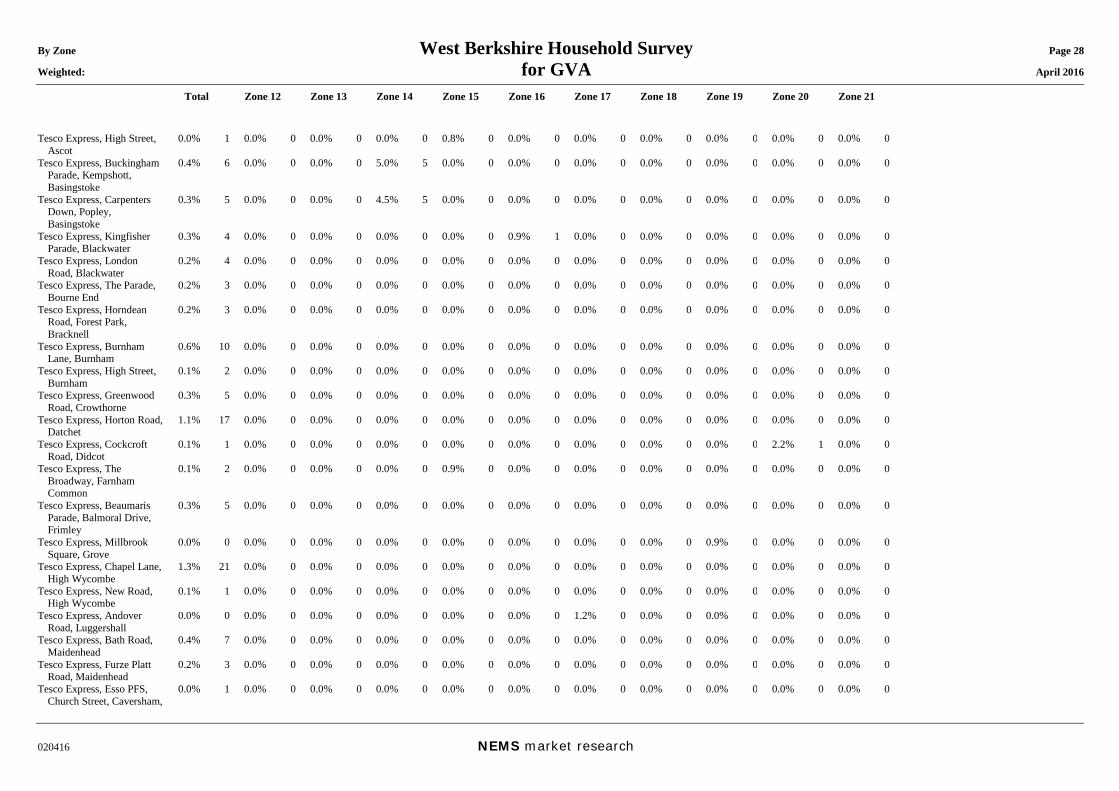
By Zone West Berkshire Household Survey Page 28 Weighted: for GVA April 2016
Total Zone 12 Zone 13 Zone 14 Zone 15 Zone 16 Zone 17 Zone 18 Zone 19 Zone 20 Zone 21
020416 NEMS market research
Tesco Express, High Street, Ascot
0.0% 1 0.0% 0 0.0% 0 0.0% 0 0.8% 0 0.0% 0 0.0% 0 0.0% 0 0.0% 0 0.0% 0 0.0% 0
Tesco Express, Buckingham Parade, Kempshott, Basingstoke
0.4% 6 0.0% 0 0.0% 0 5.0% 5 0.0% 0 0.0% 0 0.0% 0 0.0% 0 0.0% 0 0.0% 0 0.0% 0
Tesco Express, Carpenters Down, Popley, Basingstoke
0.3% 5 0.0% 0 0.0% 0 4.5% 5 0.0% 0 0.0% 0 0.0% 0 0.0% 0 0.0% 0 0.0% 0 0.0% 0
Tesco Express, Kingfisher Parade, Blackwater
0.3% 4 0.0% 0 0.0% 0 0.0% 0 0.0% 0 0.9% 1 0.0% 0 0.0% 0 0.0% 0 0.0% 0 0.0% 0
Tesco Express, London Road, Blackwater
0.2% 4 0.0% 0 0.0% 0 0.0% 0 0.0% 0 0.0% 0 0.0% 0 0.0% 0 0.0% 0 0.0% 0 0.0% 0
Tesco Express, The Parade, Bourne End
0.2% 3 0.0% 0 0.0% 0 0.0% 0 0.0% 0 0.0% 0 0.0% 0 0.0% 0 0.0% 0 0.0% 0 0.0% 0
Tesco Express, Horndean Road, Forest Park, Bracknell
0.2% 3 0.0% 0 0.0% 0 0.0% 0 0.0% 0 0.0% 0 0.0% 0 0.0% 0 0.0% 0 0.0% 0 0.0% 0
Tesco Express, Burnham Lane, Burnham
0.6% 10 0.0% 0 0.0% 0 0.0% 0 0.0% 0 0.0% 0 0.0% 0 0.0% 0 0.0% 0 0.0% 0 0.0% 0
Tesco Express, High Street, Burnham
0.1% 2 0.0% 0 0.0% 0 0.0% 0 0.0% 0 0.0% 0 0.0% 0 0.0% 0 0.0% 0 0.0% 0 0.0% 0
Tesco Express, Greenwood Road, Crowthorne
0.3% 5 0.0% 0 0.0% 0 0.0% 0 0.0% 0 0.0% 0 0.0% 0 0.0% 0 0.0% 0 0.0% 0 0.0% 0
Tesco Express, Horton Road, Datchet
1.1% 17 0.0% 0 0.0% 0 0.0% 0 0.0% 0 0.0% 0 0.0% 0 0.0% 0 0.0% 0 0.0% 0 0.0% 0
Tesco Express, Cockcroft Road, Didcot
0.1% 1 0.0% 0 0.0% 0 0.0% 0 0.0% 0 0.0% 0 0.0% 0 0.0% 0 0.0% 0 2.2% 1 0.0% 0
Tesco Express, The Broadway, Farnham Common
0.1% 2 0.0% 0 0.0% 0 0.0% 0 0.9% 0 0.0% 0 0.0% 0 0.0% 0 0.0% 0 0.0% 0 0.0% 0
Tesco Express, Beaumaris Parade, Balmoral Drive, Frimley
0.3% 5 0.0% 0 0.0% 0 0.0% 0 0.0% 0 0.0% 0 0.0% 0 0.0% 0 0.0% 0 0.0% 0 0.0% 0
Tesco Express, Millbrook Square, Grove
0.0% 0 0.0% 0 0.0% 0 0.0% 0 0.0% 0 0.0% 0 0.0% 0 0.0% 0 0.9% 0 0.0% 0 0.0% 0
Tesco Express, Chapel Lane, High Wycombe
1.3% 21 0.0% 0 0.0% 0 0.0% 0 0.0% 0 0.0% 0 0.0% 0 0.0% 0 0.0% 0 0.0% 0 0.0% 0
Tesco Express, New Road, High Wycombe
0.1% 1 0.0% 0 0.0% 0 0.0% 0 0.0% 0 0.0% 0 0.0% 0 0.0% 0 0.0% 0 0.0% 0 0.0% 0
Tesco Express, Andover Road, Luggershall
0.0% 0 0.0% 0 0.0% 0 0.0% 0 0.0% 0 0.0% 0 1.2% 0 0.0% 0 0.0% 0 0.0% 0 0.0% 0
Tesco Express, Bath Road, Maidenhead
0.4% 7 0.0% 0 0.0% 0 0.0% 0 0.0% 0 0.0% 0 0.0% 0 0.0% 0 0.0% 0 0.0% 0 0.0% 0
Tesco Express, Furze Platt Road, Maidenhead
0.2% 3 0.0% 0 0.0% 0 0.0% 0 0.0% 0 0.0% 0 0.0% 0 0.0% 0 0.0% 0 0.0% 0 0.0% 0
Tesco Express, Esso PFS, Church Street, Caversham,
0.0% 1 0.0% 0 0.0% 0 0.0% 0 0.0% 0 0.0% 0 0.0% 0 0.0% 0 0.0% 0 0.0% 0 0.0% 0

By Zone West Berkshire Household Survey Page 29 Weighted: for GVA April 2016
Total Zone 12 Zone 13 Zone 14 Zone 15 Zone 16 Zone 17 Zone 18 Zone 19 Zone 20 Zone 21
020416 NEMS market research
Reading Tesco Express, Loddon Vale
Ctr, Woodley, Reading 0.4% 6 0.0% 0 0.0% 0 0.0% 0 0.0% 0 0.0% 0 0.0% 0 0.0% 0 0.0% 0 0.0% 0 0.0% 0
Tesco Express, London Road, Reading
0.1% 1 0.0% 0 0.0% 0 0.0% 0 0.8% 0 0.0% 0 0.0% 0 0.0% 0 0.0% 0 0.0% 0 0.0% 0
Tesco Express, Southcote Service Station, Bath Road, Reading
0.2% 3 0.0% 0 0.0% 0 0.0% 0 0.0% 0 0.0% 0 0.0% 0 0.0% 0 0.0% 0 0.0% 0 0.0% 0
Tesco Express, Tilehurst Road, Reading
0.2% 3 0.0% 0 0.0% 0 0.0% 0 0.0% 0 0.0% 0 0.0% 0 0.0% 0 0.0% 0 0.0% 0 0.0% 0
Tesco Express, Whiteley Street, Reading
0.1% 1 0.0% 0 0.0% 0 0.0% 0 0.0% 0 0.0% 0 0.0% 0 0.0% 0 0.0% 0 0.0% 0 0.0% 0
Tesco Express, Yorktown Road, Sandhurst
0.3% 4 0.0% 0 0.0% 0 0.0% 0 0.0% 0 0.0% 0 0.0% 0 0.0% 0 0.0% 0 0.0% 0 0.0% 0
Tesco Express, Grassmere Parade, Wexham Road, Slough
0.1% 1 0.0% 0 0.0% 0 0.0% 0 0.0% 0 0.0% 0 0.0% 0 0.0% 0 0.0% 0 0.0% 0 0.0% 0
Tesco Express, London Road, Slough
0.1% 2 0.0% 0 0.0% 0 0.0% 0 0.0% 0 0.0% 0 0.0% 0 0.0% 0 0.0% 0 0.0% 0 0.0% 0
Tesco Express, Heath End Road, Baughurst, Tadley
0.2% 2 0.0% 0 0.0% 0 0.0% 0 5.9% 2 0.0% 0 0.0% 0 0.0% 0 0.0% 0 0.0% 0 0.0% 0
Tesco Express, Northfield Road, Thatcham
0.4% 6 0.0% 0 0.8% 1 0.0% 0 0.0% 0 6.7% 6 0.0% 0 0.0% 0 0.0% 0 0.0% 0 0.0% 0
Tesco Express, London Road, Twyford
0.2% 3 0.0% 0 0.0% 0 0.0% 0 0.0% 0 0.0% 0 0.0% 0 0.0% 0 0.0% 0 0.0% 0 0.0% 0
Tesco Express, Winchester Street, Whitchurch
0.2% 4 0.0% 0 0.0% 0 0.0% 0 0.0% 0 0.0% 0 13.8% 4 0.0% 0 0.0% 0 0.0% 0 0.0% 0
Tesco Express, Clarence Road, Windsor
0.3% 5 0.0% 0 0.0% 0 0.0% 0 0.0% 0 0.0% 0 0.0% 0 0.0% 0 0.0% 0 0.0% 0 0.0% 0
Tesco Express, Reading Road, Yateley
0.2% 3 0.0% 0 0.0% 0 0.0% 0 0.0% 0 0.0% 0 0.0% 0 0.0% 0 0.0% 0 0.0% 0 0.0% 0
Waitrose, The Chantry Centre, Andover
0.1% 1 0.0% 0 0.0% 0 0.0% 0 0.0% 0 0.0% 0 3.9% 1 0.0% 0 0.0% 0 0.0% 0 0.0% 0
Waitrose, London Road, Bagshot
0.6% 10 0.0% 0 0.0% 0 0.0% 0 0.0% 0 0.0% 0 0.0% 0 0.0% 0 0.0% 0 0.0% 0 0.0% 0
Waitrose, Basing View, Basingstoke
0.6% 9 0.0% 0 0.0% 0 8.6% 9 0.0% 0 0.0% 0 0.0% 0 0.0% 0 0.0% 0 0.0% 0 0.0% 0
Waitrose, Penn Road, Beaconsfield
0.1% 2 0.0% 0 0.0% 0 0.0% 0 0.0% 0 0.0% 0 0.0% 0 0.0% 0 0.0% 0 0.0% 0 0.0% 0
Waitrose, Bond Way, Bracknell
0.9% 15 1.3% 1 0.0% 0 0.0% 0 1.2% 0 0.0% 0 0.0% 0 0.0% 0 0.0% 0 0.0% 0 0.0% 0
Waitrose (Little), Bagshot Road, Bracknell
0.2% 3 0.0% 0 0.0% 0 0.0% 0 0.0% 0 0.0% 0 0.0% 0 0.0% 0 0.0% 0 0.0% 0 0.0% 0
Waitrose, Church Road, Egham
0.3% 5 0.0% 0 0.0% 0 0.0% 0 0.0% 0 0.0% 0 0.0% 0 0.0% 0 0.0% 0 0.0% 0 0.0% 0
Waitrose, Hart Centre, Fleet 0.4% 7 0.0% 0 10.7% 7 0.0% 0 0.0% 0 0.0% 0 0.0% 0 0.0% 0 0.0% 0 0.0% 0 0.0% 0Waitrose, High Street, 0.3% 4 0.0% 0 0.0% 0 0.0% 0 0.0% 0 0.0% 0 0.0% 0 0.0% 0 0.0% 0 0.0% 0 0.0% 0
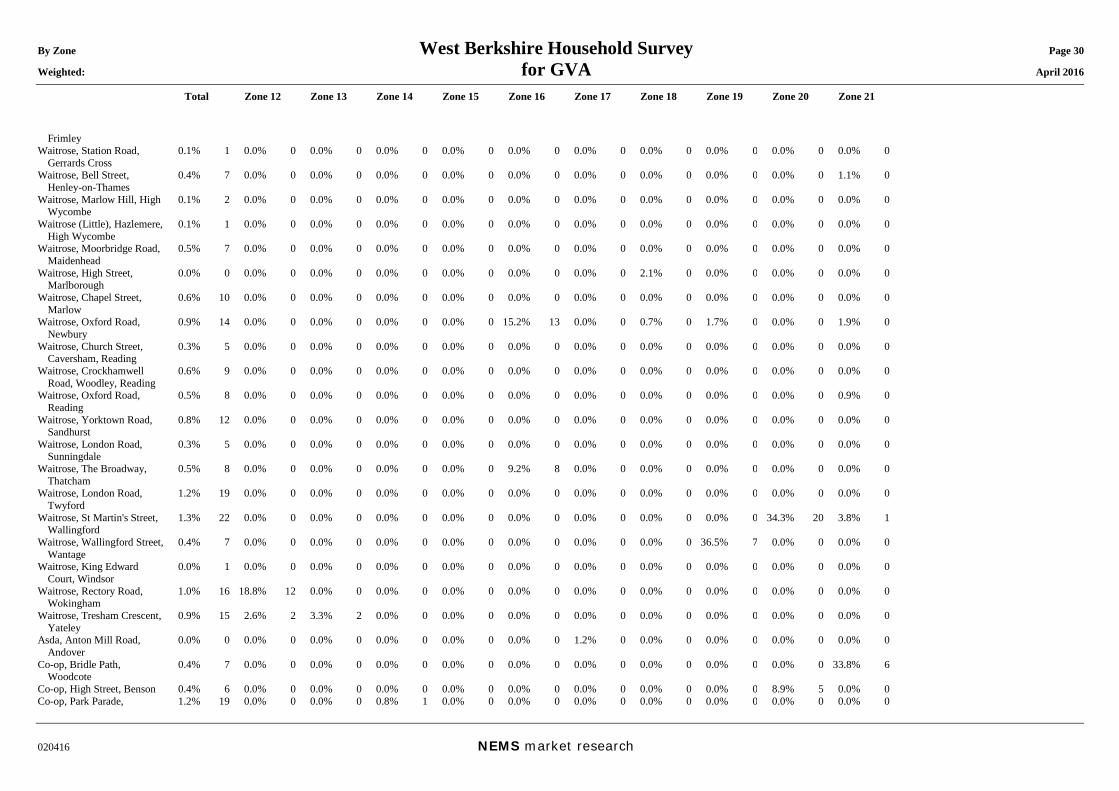
By Zone West Berkshire Household Survey Page 30 Weighted: for GVA April 2016
Total Zone 12 Zone 13 Zone 14 Zone 15 Zone 16 Zone 17 Zone 18 Zone 19 Zone 20 Zone 21
020416 NEMS market research
Frimley Waitrose, Station Road,
Gerrards Cross 0.1% 1 0.0% 0 0.0% 0 0.0% 0 0.0% 0 0.0% 0 0.0% 0 0.0% 0 0.0% 0 0.0% 0 0.0% 0
Waitrose, Bell Street, Henley-on-Thames
0.4% 7 0.0% 0 0.0% 0 0.0% 0 0.0% 0 0.0% 0 0.0% 0 0.0% 0 0.0% 0 0.0% 0 1.1% 0
Waitrose, Marlow Hill, High Wycombe
0.1% 2 0.0% 0 0.0% 0 0.0% 0 0.0% 0 0.0% 0 0.0% 0 0.0% 0 0.0% 0 0.0% 0 0.0% 0
Waitrose (Little), Hazlemere, High Wycombe
0.1% 1 0.0% 0 0.0% 0 0.0% 0 0.0% 0 0.0% 0 0.0% 0 0.0% 0 0.0% 0 0.0% 0 0.0% 0
Waitrose, Moorbridge Road, Maidenhead
0.5% 7 0.0% 0 0.0% 0 0.0% 0 0.0% 0 0.0% 0 0.0% 0 0.0% 0 0.0% 0 0.0% 0 0.0% 0
Waitrose, High Street, Marlborough
0.0% 0 0.0% 0 0.0% 0 0.0% 0 0.0% 0 0.0% 0 0.0% 0 2.1% 0 0.0% 0 0.0% 0 0.0% 0
Waitrose, Chapel Street, Marlow
0.6% 10 0.0% 0 0.0% 0 0.0% 0 0.0% 0 0.0% 0 0.0% 0 0.0% 0 0.0% 0 0.0% 0 0.0% 0
Waitrose, Oxford Road, Newbury
0.9% 14 0.0% 0 0.0% 0 0.0% 0 0.0% 0 15.2% 13 0.0% 0 0.7% 0 1.7% 0 0.0% 0 1.9% 0
Waitrose, Church Street, Caversham, Reading
0.3% 5 0.0% 0 0.0% 0 0.0% 0 0.0% 0 0.0% 0 0.0% 0 0.0% 0 0.0% 0 0.0% 0 0.0% 0
Waitrose, Crockhamwell Road, Woodley, Reading
0.6% 9 0.0% 0 0.0% 0 0.0% 0 0.0% 0 0.0% 0 0.0% 0 0.0% 0 0.0% 0 0.0% 0 0.0% 0
Waitrose, Oxford Road, Reading
0.5% 8 0.0% 0 0.0% 0 0.0% 0 0.0% 0 0.0% 0 0.0% 0 0.0% 0 0.0% 0 0.0% 0 0.9% 0
Waitrose, Yorktown Road, Sandhurst
0.8% 12 0.0% 0 0.0% 0 0.0% 0 0.0% 0 0.0% 0 0.0% 0 0.0% 0 0.0% 0 0.0% 0 0.0% 0
Waitrose, London Road, Sunningdale
0.3% 5 0.0% 0 0.0% 0 0.0% 0 0.0% 0 0.0% 0 0.0% 0 0.0% 0 0.0% 0 0.0% 0 0.0% 0
Waitrose, The Broadway, Thatcham
0.5% 8 0.0% 0 0.0% 0 0.0% 0 0.0% 0 9.2% 8 0.0% 0 0.0% 0 0.0% 0 0.0% 0 0.0% 0
Waitrose, London Road, Twyford
1.2% 19 0.0% 0 0.0% 0 0.0% 0 0.0% 0 0.0% 0 0.0% 0 0.0% 0 0.0% 0 0.0% 0 0.0% 0
Waitrose, St Martin's Street, Wallingford
1.3% 22 0.0% 0 0.0% 0 0.0% 0 0.0% 0 0.0% 0 0.0% 0 0.0% 0 0.0% 0 34.3% 20 3.8% 1
Waitrose, Wallingford Street, Wantage
0.4% 7 0.0% 0 0.0% 0 0.0% 0 0.0% 0 0.0% 0 0.0% 0 0.0% 0 36.5% 7 0.0% 0 0.0% 0
Waitrose, King Edward Court, Windsor
0.0% 1 0.0% 0 0.0% 0 0.0% 0 0.0% 0 0.0% 0 0.0% 0 0.0% 0 0.0% 0 0.0% 0 0.0% 0
Waitrose, Rectory Road, Wokingham
1.0% 16 18.8% 12 0.0% 0 0.0% 0 0.0% 0 0.0% 0 0.0% 0 0.0% 0 0.0% 0 0.0% 0 0.0% 0
Waitrose, Tresham Crescent, Yateley
0.9% 15 2.6% 2 3.3% 2 0.0% 0 0.0% 0 0.0% 0 0.0% 0 0.0% 0 0.0% 0 0.0% 0 0.0% 0
Asda, Anton Mill Road, Andover
0.0% 0 0.0% 0 0.0% 0 0.0% 0 0.0% 0 0.0% 0 1.2% 0 0.0% 0 0.0% 0 0.0% 0 0.0% 0
Co-op, Bridle Path, Woodcote
0.4% 7 0.0% 0 0.0% 0 0.0% 0 0.0% 0 0.0% 0 0.0% 0 0.0% 0 0.0% 0 0.0% 0 33.8% 6
Co-op, High Street, Benson 0.4% 6 0.0% 0 0.0% 0 0.0% 0 0.0% 0 0.0% 0 0.0% 0 0.0% 0 0.0% 0 8.9% 5 0.0% 0Co-op, Park Parade, 1.2% 19 0.0% 0 0.0% 0 0.8% 1 0.0% 0 0.0% 0 0.0% 0 0.0% 0 0.0% 0 0.0% 0 0.0% 0
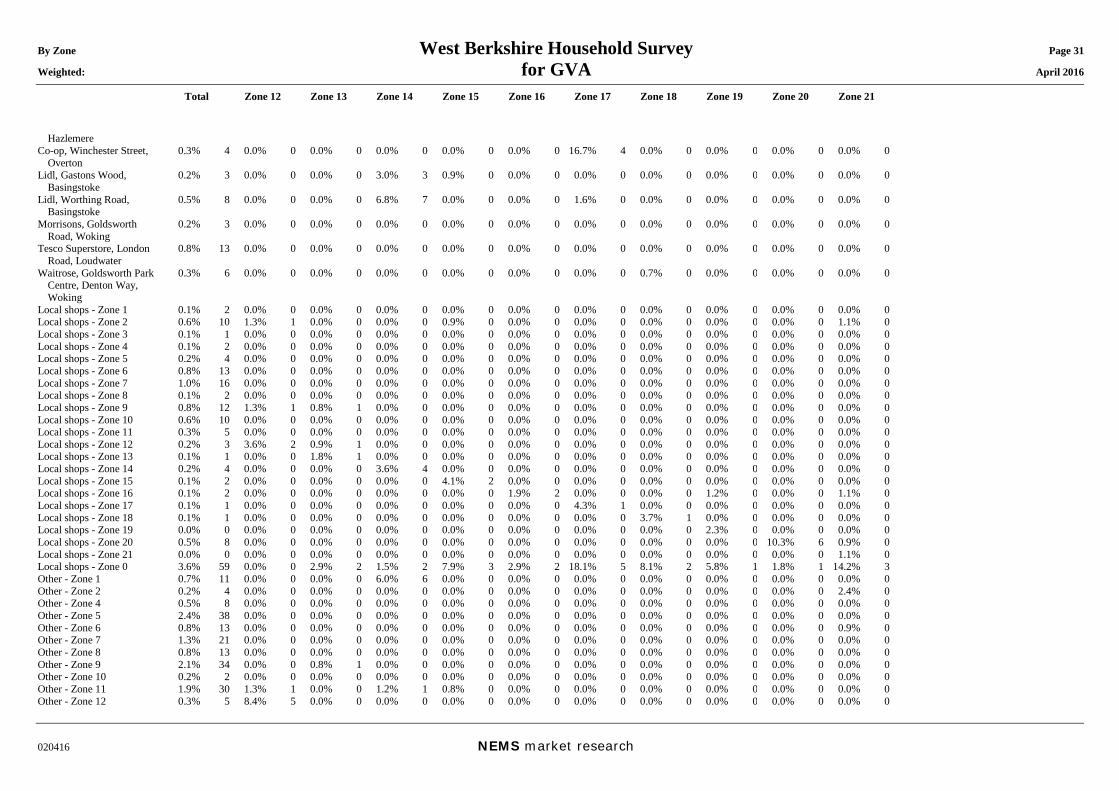
By Zone West Berkshire Household Survey Page 31 Weighted: for GVA April 2016
Total Zone 12 Zone 13 Zone 14 Zone 15 Zone 16 Zone 17 Zone 18 Zone 19 Zone 20 Zone 21
020416 NEMS market research
Hazlemere Co-op, Winchester Street,
Overton 0.3% 4 0.0% 0 0.0% 0 0.0% 0 0.0% 0 0.0% 0 16.7% 4 0.0% 0 0.0% 0 0.0% 0 0.0% 0
Lidl, Gastons Wood, Basingstoke
0.2% 3 0.0% 0 0.0% 0 3.0% 3 0.9% 0 0.0% 0 0.0% 0 0.0% 0 0.0% 0 0.0% 0 0.0% 0
Lidl, Worthing Road, Basingstoke
0.5% 8 0.0% 0 0.0% 0 6.8% 7 0.0% 0 0.0% 0 1.6% 0 0.0% 0 0.0% 0 0.0% 0 0.0% 0
Morrisons, Goldsworth Road, Woking
0.2% 3 0.0% 0 0.0% 0 0.0% 0 0.0% 0 0.0% 0 0.0% 0 0.0% 0 0.0% 0 0.0% 0 0.0% 0
Tesco Superstore, London Road, Loudwater
0.8% 13 0.0% 0 0.0% 0 0.0% 0 0.0% 0 0.0% 0 0.0% 0 0.0% 0 0.0% 0 0.0% 0 0.0% 0
Waitrose, Goldsworth Park Centre, Denton Way, Woking
0.3% 6 0.0% 0 0.0% 0 0.0% 0 0.0% 0 0.0% 0 0.0% 0 0.7% 0 0.0% 0 0.0% 0 0.0% 0
Local shops - Zone 1 0.1% 2 0.0% 0 0.0% 0 0.0% 0 0.0% 0 0.0% 0 0.0% 0 0.0% 0 0.0% 0 0.0% 0 0.0% 0Local shops - Zone 2 0.6% 10 1.3% 1 0.0% 0 0.0% 0 0.9% 0 0.0% 0 0.0% 0 0.0% 0 0.0% 0 0.0% 0 1.1% 0Local shops - Zone 3 0.1% 1 0.0% 0 0.0% 0 0.0% 0 0.0% 0 0.0% 0 0.0% 0 0.0% 0 0.0% 0 0.0% 0 0.0% 0Local shops - Zone 4 0.1% 2 0.0% 0 0.0% 0 0.0% 0 0.0% 0 0.0% 0 0.0% 0 0.0% 0 0.0% 0 0.0% 0 0.0% 0Local shops - Zone 5 0.2% 4 0.0% 0 0.0% 0 0.0% 0 0.0% 0 0.0% 0 0.0% 0 0.0% 0 0.0% 0 0.0% 0 0.0% 0Local shops - Zone 6 0.8% 13 0.0% 0 0.0% 0 0.0% 0 0.0% 0 0.0% 0 0.0% 0 0.0% 0 0.0% 0 0.0% 0 0.0% 0Local shops - Zone 7 1.0% 16 0.0% 0 0.0% 0 0.0% 0 0.0% 0 0.0% 0 0.0% 0 0.0% 0 0.0% 0 0.0% 0 0.0% 0Local shops - Zone 8 0.1% 2 0.0% 0 0.0% 0 0.0% 0 0.0% 0 0.0% 0 0.0% 0 0.0% 0 0.0% 0 0.0% 0 0.0% 0Local shops - Zone 9 0.8% 12 1.3% 1 0.8% 1 0.0% 0 0.0% 0 0.0% 0 0.0% 0 0.0% 0 0.0% 0 0.0% 0 0.0% 0Local shops - Zone 10 0.6% 10 0.0% 0 0.0% 0 0.0% 0 0.0% 0 0.0% 0 0.0% 0 0.0% 0 0.0% 0 0.0% 0 0.0% 0Local shops - Zone 11 0.3% 5 0.0% 0 0.0% 0 0.0% 0 0.0% 0 0.0% 0 0.0% 0 0.0% 0 0.0% 0 0.0% 0 0.0% 0Local shops - Zone 12 0.2% 3 3.6% 2 0.9% 1 0.0% 0 0.0% 0 0.0% 0 0.0% 0 0.0% 0 0.0% 0 0.0% 0 0.0% 0Local shops - Zone 13 0.1% 1 0.0% 0 1.8% 1 0.0% 0 0.0% 0 0.0% 0 0.0% 0 0.0% 0 0.0% 0 0.0% 0 0.0% 0Local shops - Zone 14 0.2% 4 0.0% 0 0.0% 0 3.6% 4 0.0% 0 0.0% 0 0.0% 0 0.0% 0 0.0% 0 0.0% 0 0.0% 0Local shops - Zone 15 0.1% 2 0.0% 0 0.0% 0 0.0% 0 4.1% 2 0.0% 0 0.0% 0 0.0% 0 0.0% 0 0.0% 0 0.0% 0Local shops - Zone 16 0.1% 2 0.0% 0 0.0% 0 0.0% 0 0.0% 0 1.9% 2 0.0% 0 0.0% 0 1.2% 0 0.0% 0 1.1% 0Local shops - Zone 17 0.1% 1 0.0% 0 0.0% 0 0.0% 0 0.0% 0 0.0% 0 4.3% 1 0.0% 0 0.0% 0 0.0% 0 0.0% 0Local shops - Zone 18 0.1% 1 0.0% 0 0.0% 0 0.0% 0 0.0% 0 0.0% 0 0.0% 0 3.7% 1 0.0% 0 0.0% 0 0.0% 0Local shops - Zone 19 0.0% 0 0.0% 0 0.0% 0 0.0% 0 0.0% 0 0.0% 0 0.0% 0 0.0% 0 2.3% 0 0.0% 0 0.0% 0Local shops - Zone 20 0.5% 8 0.0% 0 0.0% 0 0.0% 0 0.0% 0 0.0% 0 0.0% 0 0.0% 0 0.0% 0 10.3% 6 0.9% 0Local shops - Zone 21 0.0% 0 0.0% 0 0.0% 0 0.0% 0 0.0% 0 0.0% 0 0.0% 0 0.0% 0 0.0% 0 0.0% 0 1.1% 0Local shops - Zone 0 3.6% 59 0.0% 0 2.9% 2 1.5% 2 7.9% 3 2.9% 2 18.1% 5 8.1% 2 5.8% 1 1.8% 1 14.2% 3Other - Zone 1 0.7% 11 0.0% 0 0.0% 0 6.0% 6 0.0% 0 0.0% 0 0.0% 0 0.0% 0 0.0% 0 0.0% 0 0.0% 0Other - Zone 2 0.2% 4 0.0% 0 0.0% 0 0.0% 0 0.0% 0 0.0% 0 0.0% 0 0.0% 0 0.0% 0 0.0% 0 2.4% 0Other - Zone 4 0.5% 8 0.0% 0 0.0% 0 0.0% 0 0.0% 0 0.0% 0 0.0% 0 0.0% 0 0.0% 0 0.0% 0 0.0% 0Other - Zone 5 2.4% 38 0.0% 0 0.0% 0 0.0% 0 0.0% 0 0.0% 0 0.0% 0 0.0% 0 0.0% 0 0.0% 0 0.0% 0Other - Zone 6 0.8% 13 0.0% 0 0.0% 0 0.0% 0 0.0% 0 0.0% 0 0.0% 0 0.0% 0 0.0% 0 0.0% 0 0.9% 0Other - Zone 7 1.3% 21 0.0% 0 0.0% 0 0.0% 0 0.0% 0 0.0% 0 0.0% 0 0.0% 0 0.0% 0 0.0% 0 0.0% 0Other - Zone 8 0.8% 13 0.0% 0 0.0% 0 0.0% 0 0.0% 0 0.0% 0 0.0% 0 0.0% 0 0.0% 0 0.0% 0 0.0% 0Other - Zone 9 2.1% 34 0.0% 0 0.8% 1 0.0% 0 0.0% 0 0.0% 0 0.0% 0 0.0% 0 0.0% 0 0.0% 0 0.0% 0Other - Zone 10 0.2% 2 0.0% 0 0.0% 0 0.0% 0 0.0% 0 0.0% 0 0.0% 0 0.0% 0 0.0% 0 0.0% 0 0.0% 0Other - Zone 11 1.9% 30 1.3% 1 0.0% 0 1.2% 1 0.8% 0 0.0% 0 0.0% 0 0.0% 0 0.0% 0 0.0% 0 0.0% 0Other - Zone 12 0.3% 5 8.4% 5 0.0% 0 0.0% 0 0.0% 0 0.0% 0 0.0% 0 0.0% 0 0.0% 0 0.0% 0 0.0% 0
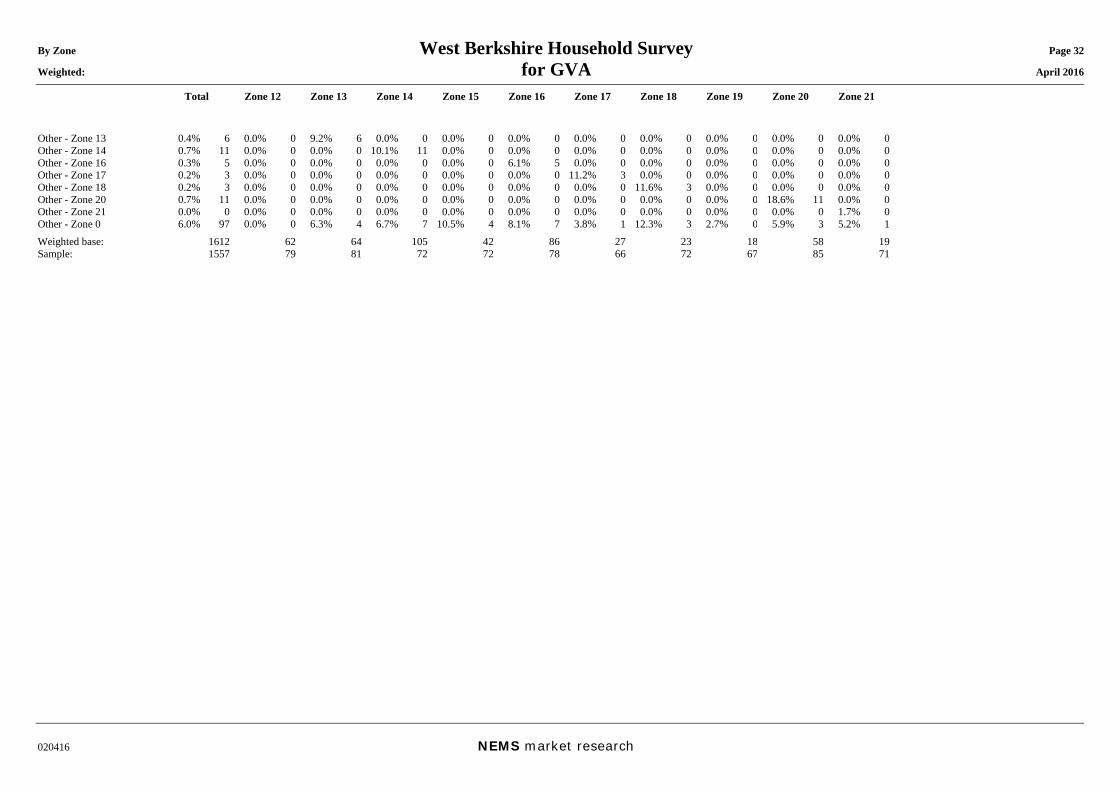
By Zone West Berkshire Household Survey Page 32 Weighted: for GVA April 2016
Total Zone 12 Zone 13 Zone 14 Zone 15 Zone 16 Zone 17 Zone 18 Zone 19 Zone 20 Zone 21
020416 NEMS market research
Other - Zone 13 0.4% 6 0.0% 0 9.2% 6 0.0% 0 0.0% 0 0.0% 0 0.0% 0 0.0% 0 0.0% 0 0.0% 0 0.0% 0Other - Zone 14 0.7% 11 0.0% 0 0.0% 0 10.1% 11 0.0% 0 0.0% 0 0.0% 0 0.0% 0 0.0% 0 0.0% 0 0.0% 0Other - Zone 16 0.3% 5 0.0% 0 0.0% 0 0.0% 0 0.0% 0 6.1% 5 0.0% 0 0.0% 0 0.0% 0 0.0% 0 0.0% 0Other - Zone 17 0.2% 3 0.0% 0 0.0% 0 0.0% 0 0.0% 0 0.0% 0 11.2% 3 0.0% 0 0.0% 0 0.0% 0 0.0% 0Other - Zone 18 0.2% 3 0.0% 0 0.0% 0 0.0% 0 0.0% 0 0.0% 0 0.0% 0 11.6% 3 0.0% 0 0.0% 0 0.0% 0Other - Zone 20 0.7% 11 0.0% 0 0.0% 0 0.0% 0 0.0% 0 0.0% 0 0.0% 0 0.0% 0 0.0% 0 18.6% 11 0.0% 0Other - Zone 21 0.0% 0 0.0% 0 0.0% 0 0.0% 0 0.0% 0 0.0% 0 0.0% 0 0.0% 0 0.0% 0 0.0% 0 1.7% 0Other - Zone 0 6.0% 97 0.0% 0 6.3% 4 6.7% 7 10.5% 4 8.1% 7 3.8% 1 12.3% 3 2.7% 0 5.9% 3 5.2% 1Weighted base: 1612 62 64 105 42 86 27 23 18 58 19Sample: 1557 79 81 72 72 78 66 72 67 85 71
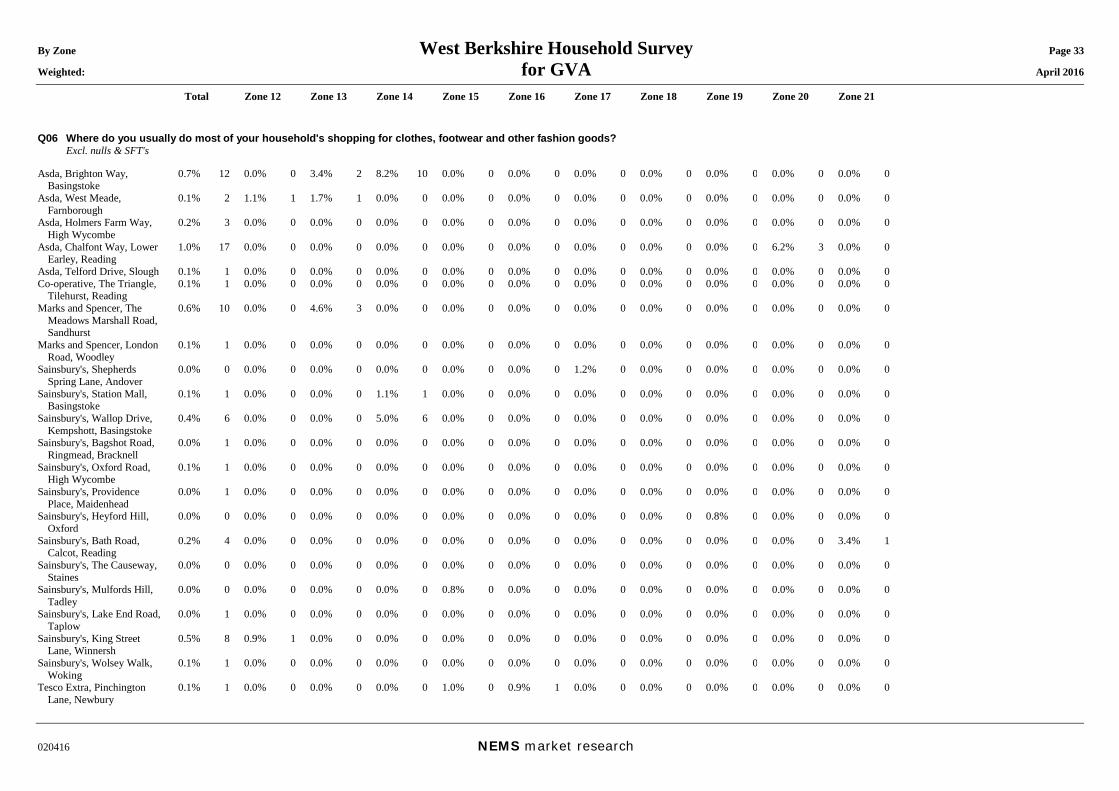
By Zone West Berkshire Household Survey Page 33 Weighted: for GVA April 2016
Total Zone 12 Zone 13 Zone 14 Zone 15 Zone 16 Zone 17 Zone 18 Zone 19 Zone 20 Zone 21
020416 NEMS market research
Q06 Where do you usually do most of your household's shopping for clothes, footwear and other fashion goods? Excl. nulls & SFT's Asda, Brighton Way,
Basingstoke 0.7% 12 0.0% 0 3.4% 2 8.2% 10 0.0% 0 0.0% 0 0.0% 0 0.0% 0 0.0% 0 0.0% 0 0.0% 0
Asda, West Meade, Farnborough
0.1% 2 1.1% 1 1.7% 1 0.0% 0 0.0% 0 0.0% 0 0.0% 0 0.0% 0 0.0% 0 0.0% 0 0.0% 0
Asda, Holmers Farm Way, High Wycombe
0.2% 3 0.0% 0 0.0% 0 0.0% 0 0.0% 0 0.0% 0 0.0% 0 0.0% 0 0.0% 0 0.0% 0 0.0% 0
Asda, Chalfont Way, Lower Earley, Reading
1.0% 17 0.0% 0 0.0% 0 0.0% 0 0.0% 0 0.0% 0 0.0% 0 0.0% 0 0.0% 0 6.2% 3 0.0% 0
Asda, Telford Drive, Slough 0.1% 1 0.0% 0 0.0% 0 0.0% 0 0.0% 0 0.0% 0 0.0% 0 0.0% 0 0.0% 0 0.0% 0 0.0% 0Co-operative, The Triangle,
Tilehurst, Reading 0.1% 1 0.0% 0 0.0% 0 0.0% 0 0.0% 0 0.0% 0 0.0% 0 0.0% 0 0.0% 0 0.0% 0 0.0% 0
Marks and Spencer, The Meadows Marshall Road, Sandhurst
0.6% 10 0.0% 0 4.6% 3 0.0% 0 0.0% 0 0.0% 0 0.0% 0 0.0% 0 0.0% 0 0.0% 0 0.0% 0
Marks and Spencer, London Road, Woodley
0.1% 1 0.0% 0 0.0% 0 0.0% 0 0.0% 0 0.0% 0 0.0% 0 0.0% 0 0.0% 0 0.0% 0 0.0% 0
Sainsbury's, Shepherds Spring Lane, Andover
0.0% 0 0.0% 0 0.0% 0 0.0% 0 0.0% 0 0.0% 0 1.2% 0 0.0% 0 0.0% 0 0.0% 0 0.0% 0
Sainsbury's, Station Mall, Basingstoke
0.1% 1 0.0% 0 0.0% 0 1.1% 1 0.0% 0 0.0% 0 0.0% 0 0.0% 0 0.0% 0 0.0% 0 0.0% 0
Sainsbury's, Wallop Drive, Kempshott, Basingstoke
0.4% 6 0.0% 0 0.0% 0 5.0% 6 0.0% 0 0.0% 0 0.0% 0 0.0% 0 0.0% 0 0.0% 0 0.0% 0
Sainsbury's, Bagshot Road, Ringmead, Bracknell
0.0% 1 0.0% 0 0.0% 0 0.0% 0 0.0% 0 0.0% 0 0.0% 0 0.0% 0 0.0% 0 0.0% 0 0.0% 0
Sainsbury's, Oxford Road, High Wycombe
0.1% 1 0.0% 0 0.0% 0 0.0% 0 0.0% 0 0.0% 0 0.0% 0 0.0% 0 0.0% 0 0.0% 0 0.0% 0
Sainsbury's, Providence Place, Maidenhead
0.0% 1 0.0% 0 0.0% 0 0.0% 0 0.0% 0 0.0% 0 0.0% 0 0.0% 0 0.0% 0 0.0% 0 0.0% 0
Sainsbury's, Heyford Hill, Oxford
0.0% 0 0.0% 0 0.0% 0 0.0% 0 0.0% 0 0.0% 0 0.0% 0 0.0% 0 0.8% 0 0.0% 0 0.0% 0
Sainsbury's, Bath Road, Calcot, Reading
0.2% 4 0.0% 0 0.0% 0 0.0% 0 0.0% 0 0.0% 0 0.0% 0 0.0% 0 0.0% 0 0.0% 0 3.4% 1
Sainsbury's, The Causeway, Staines
0.0% 0 0.0% 0 0.0% 0 0.0% 0 0.0% 0 0.0% 0 0.0% 0 0.0% 0 0.0% 0 0.0% 0 0.0% 0
Sainsbury's, Mulfords Hill, Tadley
0.0% 0 0.0% 0 0.0% 0 0.0% 0 0.8% 0 0.0% 0 0.0% 0 0.0% 0 0.0% 0 0.0% 0 0.0% 0
Sainsbury's, Lake End Road, Taplow
0.0% 1 0.0% 0 0.0% 0 0.0% 0 0.0% 0 0.0% 0 0.0% 0 0.0% 0 0.0% 0 0.0% 0 0.0% 0
Sainsbury's, King Street Lane, Winnersh
0.5% 8 0.9% 1 0.0% 0 0.0% 0 0.0% 0 0.0% 0 0.0% 0 0.0% 0 0.0% 0 0.0% 0 0.0% 0
Sainsbury's, Wolsey Walk, Woking
0.1% 1 0.0% 0 0.0% 0 0.0% 0 0.0% 0 0.0% 0 0.0% 0 0.0% 0 0.0% 0 0.0% 0 0.0% 0
Tesco Extra, Pinchington Lane, Newbury
0.1% 1 0.0% 0 0.0% 0 0.0% 0 1.0% 0 0.9% 1 0.0% 0 0.0% 0 0.0% 0 0.0% 0 0.0% 0
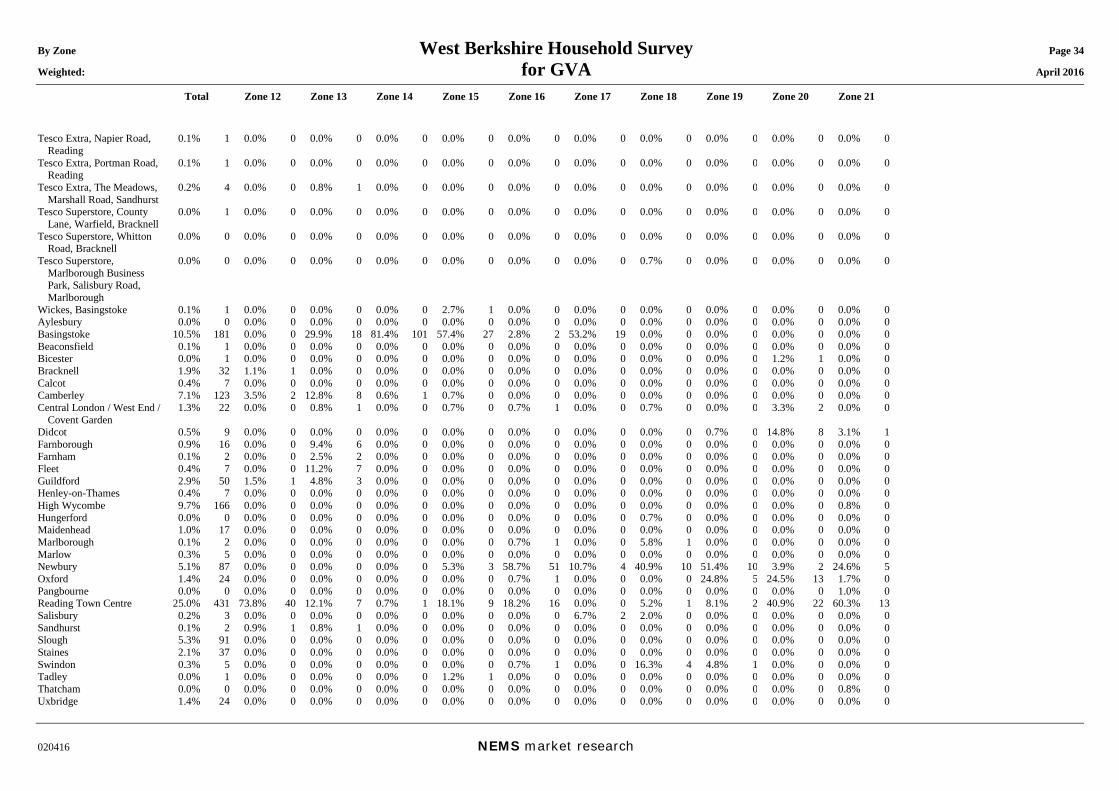
By Zone West Berkshire Household Survey Page 34 Weighted: for GVA April 2016
Total Zone 12 Zone 13 Zone 14 Zone 15 Zone 16 Zone 17 Zone 18 Zone 19 Zone 20 Zone 21
020416 NEMS market research
Tesco Extra, Napier Road, Reading
0.1% 1 0.0% 0 0.0% 0 0.0% 0 0.0% 0 0.0% 0 0.0% 0 0.0% 0 0.0% 0 0.0% 0 0.0% 0
Tesco Extra, Portman Road, Reading
0.1% 1 0.0% 0 0.0% 0 0.0% 0 0.0% 0 0.0% 0 0.0% 0 0.0% 0 0.0% 0 0.0% 0 0.0% 0
Tesco Extra, The Meadows, Marshall Road, Sandhurst
0.2% 4 0.0% 0 0.8% 1 0.0% 0 0.0% 0 0.0% 0 0.0% 0 0.0% 0 0.0% 0 0.0% 0 0.0% 0
Tesco Superstore, County Lane, Warfield, Bracknell
0.0% 1 0.0% 0 0.0% 0 0.0% 0 0.0% 0 0.0% 0 0.0% 0 0.0% 0 0.0% 0 0.0% 0 0.0% 0
Tesco Superstore, Whitton Road, Bracknell
0.0% 0 0.0% 0 0.0% 0 0.0% 0 0.0% 0 0.0% 0 0.0% 0 0.0% 0 0.0% 0 0.0% 0 0.0% 0
Tesco Superstore, Marlborough Business Park, Salisbury Road, Marlborough
0.0% 0 0.0% 0 0.0% 0 0.0% 0 0.0% 0 0.0% 0 0.0% 0 0.7% 0 0.0% 0 0.0% 0 0.0% 0
Wickes, Basingstoke 0.1% 1 0.0% 0 0.0% 0 0.0% 0 2.7% 1 0.0% 0 0.0% 0 0.0% 0 0.0% 0 0.0% 0 0.0% 0Aylesbury 0.0% 0 0.0% 0 0.0% 0 0.0% 0 0.0% 0 0.0% 0 0.0% 0 0.0% 0 0.0% 0 0.0% 0 0.0% 0Basingstoke 10.5% 181 0.0% 0 29.9% 18 81.4% 101 57.4% 27 2.8% 2 53.2% 19 0.0% 0 0.0% 0 0.0% 0 0.0% 0Beaconsfield 0.1% 1 0.0% 0 0.0% 0 0.0% 0 0.0% 0 0.0% 0 0.0% 0 0.0% 0 0.0% 0 0.0% 0 0.0% 0Bicester 0.0% 1 0.0% 0 0.0% 0 0.0% 0 0.0% 0 0.0% 0 0.0% 0 0.0% 0 0.0% 0 1.2% 1 0.0% 0Bracknell 1.9% 32 1.1% 1 0.0% 0 0.0% 0 0.0% 0 0.0% 0 0.0% 0 0.0% 0 0.0% 0 0.0% 0 0.0% 0Calcot 0.4% 7 0.0% 0 0.0% 0 0.0% 0 0.0% 0 0.0% 0 0.0% 0 0.0% 0 0.0% 0 0.0% 0 0.0% 0Camberley 7.1% 123 3.5% 2 12.8% 8 0.6% 1 0.7% 0 0.0% 0 0.0% 0 0.0% 0 0.0% 0 0.0% 0 0.0% 0Central London / West End /
Covent Garden 1.3% 22 0.0% 0 0.8% 1 0.0% 0 0.7% 0 0.7% 1 0.0% 0 0.7% 0 0.0% 0 3.3% 2 0.0% 0
Didcot 0.5% 9 0.0% 0 0.0% 0 0.0% 0 0.0% 0 0.0% 0 0.0% 0 0.0% 0 0.7% 0 14.8% 8 3.1% 1Farnborough 0.9% 16 0.0% 0 9.4% 6 0.0% 0 0.0% 0 0.0% 0 0.0% 0 0.0% 0 0.0% 0 0.0% 0 0.0% 0Farnham 0.1% 2 0.0% 0 2.5% 2 0.0% 0 0.0% 0 0.0% 0 0.0% 0 0.0% 0 0.0% 0 0.0% 0 0.0% 0Fleet 0.4% 7 0.0% 0 11.2% 7 0.0% 0 0.0% 0 0.0% 0 0.0% 0 0.0% 0 0.0% 0 0.0% 0 0.0% 0Guildford 2.9% 50 1.5% 1 4.8% 3 0.0% 0 0.0% 0 0.0% 0 0.0% 0 0.0% 0 0.0% 0 0.0% 0 0.0% 0Henley-on-Thames 0.4% 7 0.0% 0 0.0% 0 0.0% 0 0.0% 0 0.0% 0 0.0% 0 0.0% 0 0.0% 0 0.0% 0 0.0% 0High Wycombe 9.7% 166 0.0% 0 0.0% 0 0.0% 0 0.0% 0 0.0% 0 0.0% 0 0.0% 0 0.0% 0 0.0% 0 0.8% 0Hungerford 0.0% 0 0.0% 0 0.0% 0 0.0% 0 0.0% 0 0.0% 0 0.0% 0 0.7% 0 0.0% 0 0.0% 0 0.0% 0Maidenhead 1.0% 17 0.0% 0 0.0% 0 0.0% 0 0.0% 0 0.0% 0 0.0% 0 0.0% 0 0.0% 0 0.0% 0 0.0% 0Marlborough 0.1% 2 0.0% 0 0.0% 0 0.0% 0 0.0% 0 0.7% 1 0.0% 0 5.8% 1 0.0% 0 0.0% 0 0.0% 0Marlow 0.3% 5 0.0% 0 0.0% 0 0.0% 0 0.0% 0 0.0% 0 0.0% 0 0.0% 0 0.0% 0 0.0% 0 0.0% 0Newbury 5.1% 87 0.0% 0 0.0% 0 0.0% 0 5.3% 3 58.7% 51 10.7% 4 40.9% 10 51.4% 10 3.9% 2 24.6% 5Oxford 1.4% 24 0.0% 0 0.0% 0 0.0% 0 0.0% 0 0.7% 1 0.0% 0 0.0% 0 24.8% 5 24.5% 13 1.7% 0Pangbourne 0.0% 0 0.0% 0 0.0% 0 0.0% 0 0.0% 0 0.0% 0 0.0% 0 0.0% 0 0.0% 0 0.0% 0 1.0% 0Reading Town Centre 25.0% 431 73.8% 40 12.1% 7 0.7% 1 18.1% 9 18.2% 16 0.0% 0 5.2% 1 8.1% 2 40.9% 22 60.3% 13Salisbury 0.2% 3 0.0% 0 0.0% 0 0.0% 0 0.0% 0 0.0% 0 6.7% 2 2.0% 0 0.0% 0 0.0% 0 0.0% 0Sandhurst 0.1% 2 0.9% 1 0.8% 1 0.0% 0 0.0% 0 0.0% 0 0.0% 0 0.0% 0 0.0% 0 0.0% 0 0.0% 0Slough 5.3% 91 0.0% 0 0.0% 0 0.0% 0 0.0% 0 0.0% 0 0.0% 0 0.0% 0 0.0% 0 0.0% 0 0.0% 0Staines 2.1% 37 0.0% 0 0.0% 0 0.0% 0 0.0% 0 0.0% 0 0.0% 0 0.0% 0 0.0% 0 0.0% 0 0.0% 0Swindon 0.3% 5 0.0% 0 0.0% 0 0.0% 0 0.0% 0 0.7% 1 0.0% 0 16.3% 4 4.8% 1 0.0% 0 0.0% 0Tadley 0.0% 1 0.0% 0 0.0% 0 0.0% 0 1.2% 1 0.0% 0 0.0% 0 0.0% 0 0.0% 0 0.0% 0 0.0% 0Thatcham 0.0% 0 0.0% 0 0.0% 0 0.0% 0 0.0% 0 0.0% 0 0.0% 0 0.0% 0 0.0% 0 0.0% 0 0.8% 0Uxbridge 1.4% 24 0.0% 0 0.0% 0 0.0% 0 0.0% 0 0.0% 0 0.0% 0 0.0% 0 0.0% 0 0.0% 0 0.0% 0
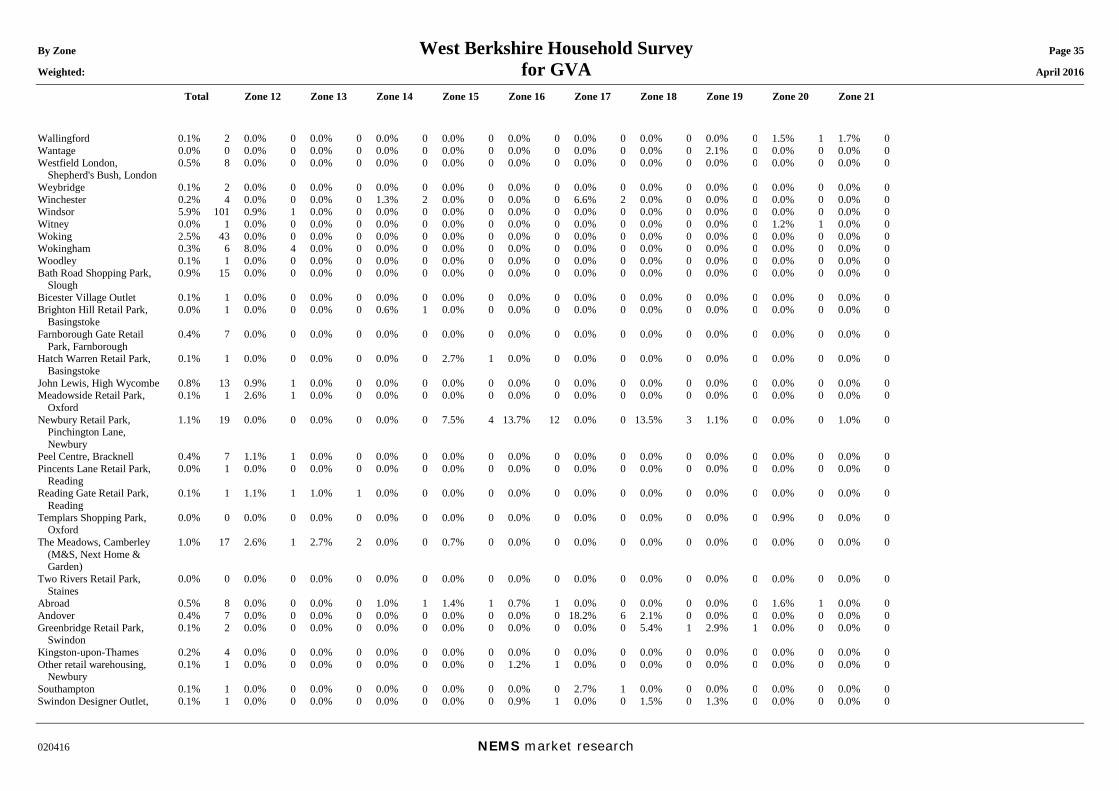
By Zone West Berkshire Household Survey Page 35 Weighted: for GVA April 2016
Total Zone 12 Zone 13 Zone 14 Zone 15 Zone 16 Zone 17 Zone 18 Zone 19 Zone 20 Zone 21
020416 NEMS market research
Wallingford 0.1% 2 0.0% 0 0.0% 0 0.0% 0 0.0% 0 0.0% 0 0.0% 0 0.0% 0 0.0% 0 1.5% 1 1.7% 0Wantage 0.0% 0 0.0% 0 0.0% 0 0.0% 0 0.0% 0 0.0% 0 0.0% 0 0.0% 0 2.1% 0 0.0% 0 0.0% 0Westfield London,
Shepherd's Bush, London 0.5% 8 0.0% 0 0.0% 0 0.0% 0 0.0% 0 0.0% 0 0.0% 0 0.0% 0 0.0% 0 0.0% 0 0.0% 0
Weybridge 0.1% 2 0.0% 0 0.0% 0 0.0% 0 0.0% 0 0.0% 0 0.0% 0 0.0% 0 0.0% 0 0.0% 0 0.0% 0Winchester 0.2% 4 0.0% 0 0.0% 0 1.3% 2 0.0% 0 0.0% 0 6.6% 2 0.0% 0 0.0% 0 0.0% 0 0.0% 0Windsor 5.9% 101 0.9% 1 0.0% 0 0.0% 0 0.0% 0 0.0% 0 0.0% 0 0.0% 0 0.0% 0 0.0% 0 0.0% 0Witney 0.0% 1 0.0% 0 0.0% 0 0.0% 0 0.0% 0 0.0% 0 0.0% 0 0.0% 0 0.0% 0 1.2% 1 0.0% 0Woking 2.5% 43 0.0% 0 0.0% 0 0.0% 0 0.0% 0 0.0% 0 0.0% 0 0.0% 0 0.0% 0 0.0% 0 0.0% 0Wokingham 0.3% 6 8.0% 4 0.0% 0 0.0% 0 0.0% 0 0.0% 0 0.0% 0 0.0% 0 0.0% 0 0.0% 0 0.0% 0Woodley 0.1% 1 0.0% 0 0.0% 0 0.0% 0 0.0% 0 0.0% 0 0.0% 0 0.0% 0 0.0% 0 0.0% 0 0.0% 0Bath Road Shopping Park,
Slough 0.9% 15 0.0% 0 0.0% 0 0.0% 0 0.0% 0 0.0% 0 0.0% 0 0.0% 0 0.0% 0 0.0% 0 0.0% 0
Bicester Village Outlet 0.1% 1 0.0% 0 0.0% 0 0.0% 0 0.0% 0 0.0% 0 0.0% 0 0.0% 0 0.0% 0 0.0% 0 0.0% 0Brighton Hill Retail Park,
Basingstoke 0.0% 1 0.0% 0 0.0% 0 0.6% 1 0.0% 0 0.0% 0 0.0% 0 0.0% 0 0.0% 0 0.0% 0 0.0% 0
Farnborough Gate Retail Park, Farnborough
0.4% 7 0.0% 0 0.0% 0 0.0% 0 0.0% 0 0.0% 0 0.0% 0 0.0% 0 0.0% 0 0.0% 0 0.0% 0
Hatch Warren Retail Park, Basingstoke
0.1% 1 0.0% 0 0.0% 0 0.0% 0 2.7% 1 0.0% 0 0.0% 0 0.0% 0 0.0% 0 0.0% 0 0.0% 0
John Lewis, High Wycombe 0.8% 13 0.9% 1 0.0% 0 0.0% 0 0.0% 0 0.0% 0 0.0% 0 0.0% 0 0.0% 0 0.0% 0 0.0% 0Meadowside Retail Park,
Oxford 0.1% 1 2.6% 1 0.0% 0 0.0% 0 0.0% 0 0.0% 0 0.0% 0 0.0% 0 0.0% 0 0.0% 0 0.0% 0
Newbury Retail Park, Pinchington Lane, Newbury
1.1% 19 0.0% 0 0.0% 0 0.0% 0 7.5% 4 13.7% 12 0.0% 0 13.5% 3 1.1% 0 0.0% 0 1.0% 0
Peel Centre, Bracknell 0.4% 7 1.1% 1 0.0% 0 0.0% 0 0.0% 0 0.0% 0 0.0% 0 0.0% 0 0.0% 0 0.0% 0 0.0% 0Pincents Lane Retail Park,
Reading 0.0% 1 0.0% 0 0.0% 0 0.0% 0 0.0% 0 0.0% 0 0.0% 0 0.0% 0 0.0% 0 0.0% 0 0.0% 0
Reading Gate Retail Park, Reading
0.1% 1 1.1% 1 1.0% 1 0.0% 0 0.0% 0 0.0% 0 0.0% 0 0.0% 0 0.0% 0 0.0% 0 0.0% 0
Templars Shopping Park, Oxford
0.0% 0 0.0% 0 0.0% 0 0.0% 0 0.0% 0 0.0% 0 0.0% 0 0.0% 0 0.0% 0 0.9% 0 0.0% 0
The Meadows, Camberley (M&S, Next Home & Garden)
1.0% 17 2.6% 1 2.7% 2 0.0% 0 0.7% 0 0.0% 0 0.0% 0 0.0% 0 0.0% 0 0.0% 0 0.0% 0
Two Rivers Retail Park, Staines
0.0% 0 0.0% 0 0.0% 0 0.0% 0 0.0% 0 0.0% 0 0.0% 0 0.0% 0 0.0% 0 0.0% 0 0.0% 0
Abroad 0.5% 8 0.0% 0 0.0% 0 1.0% 1 1.4% 1 0.7% 1 0.0% 0 0.0% 0 0.0% 0 1.6% 1 0.0% 0Andover 0.4% 7 0.0% 0 0.0% 0 0.0% 0 0.0% 0 0.0% 0 18.2% 6 2.1% 0 0.0% 0 0.0% 0 0.0% 0Greenbridge Retail Park,
Swindon 0.1% 2 0.0% 0 0.0% 0 0.0% 0 0.0% 0 0.0% 0 0.0% 0 5.4% 1 2.9% 1 0.0% 0 0.0% 0
Kingston-upon-Thames 0.2% 4 0.0% 0 0.0% 0 0.0% 0 0.0% 0 0.0% 0 0.0% 0 0.0% 0 0.0% 0 0.0% 0 0.0% 0Other retail warehousing,
Newbury 0.1% 1 0.0% 0 0.0% 0 0.0% 0 0.0% 0 1.2% 1 0.0% 0 0.0% 0 0.0% 0 0.0% 0 0.0% 0
Southampton 0.1% 1 0.0% 0 0.0% 0 0.0% 0 0.0% 0 0.0% 0 2.7% 1 0.0% 0 0.0% 0 0.0% 0 0.0% 0Swindon Designer Outlet, 0.1% 1 0.0% 0 0.0% 0 0.0% 0 0.0% 0 0.9% 1 0.0% 0 1.5% 0 1.3% 0 0.0% 0 0.0% 0
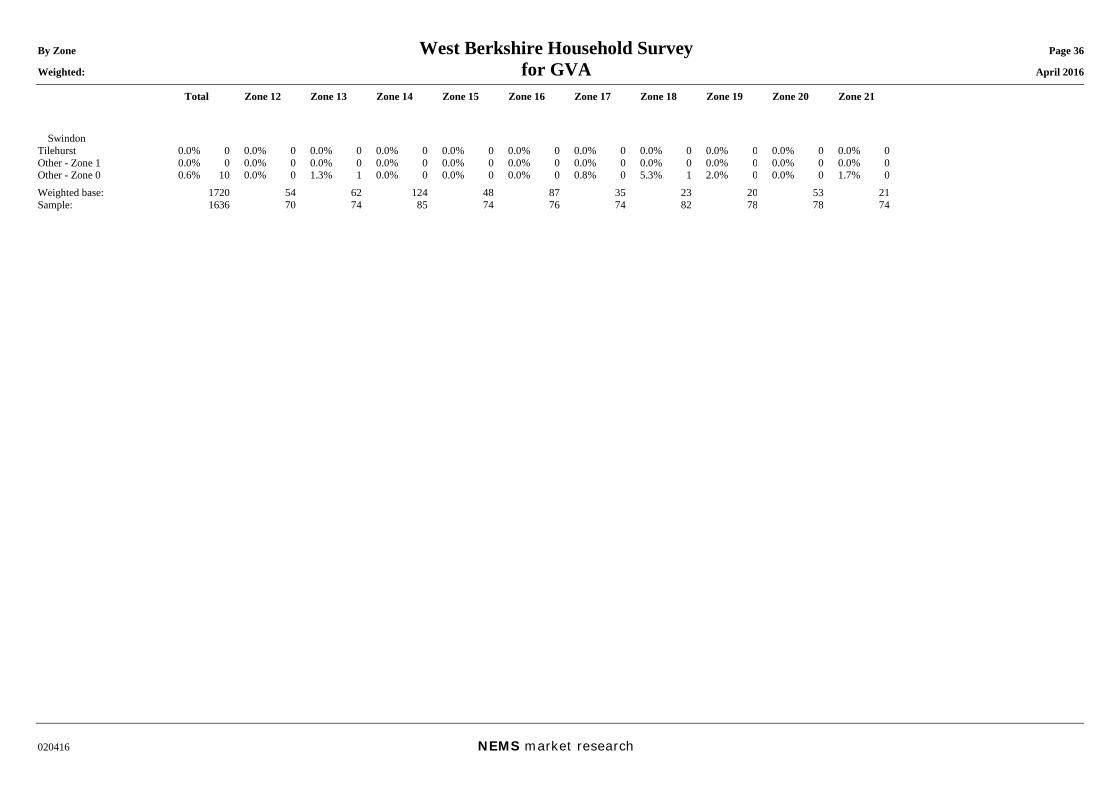
By Zone West Berkshire Household Survey Page 36 Weighted: for GVA April 2016
Total Zone 12 Zone 13 Zone 14 Zone 15 Zone 16 Zone 17 Zone 18 Zone 19 Zone 20 Zone 21
020416 NEMS market research
Swindon Tilehurst 0.0% 0 0.0% 0 0.0% 0 0.0% 0 0.0% 0 0.0% 0 0.0% 0 0.0% 0 0.0% 0 0.0% 0 0.0% 0Other - Zone 1 0.0% 0 0.0% 0 0.0% 0 0.0% 0 0.0% 0 0.0% 0 0.0% 0 0.0% 0 0.0% 0 0.0% 0 0.0% 0Other - Zone 0 0.6% 10 0.0% 0 1.3% 1 0.0% 0 0.0% 0 0.0% 0 0.8% 0 5.3% 1 2.0% 0 0.0% 0 1.7% 0Weighted base: 1720 54 62 124 48 87 35 23 20 53 21Sample: 1636 70 74 85 74 76 74 82 78 78 74
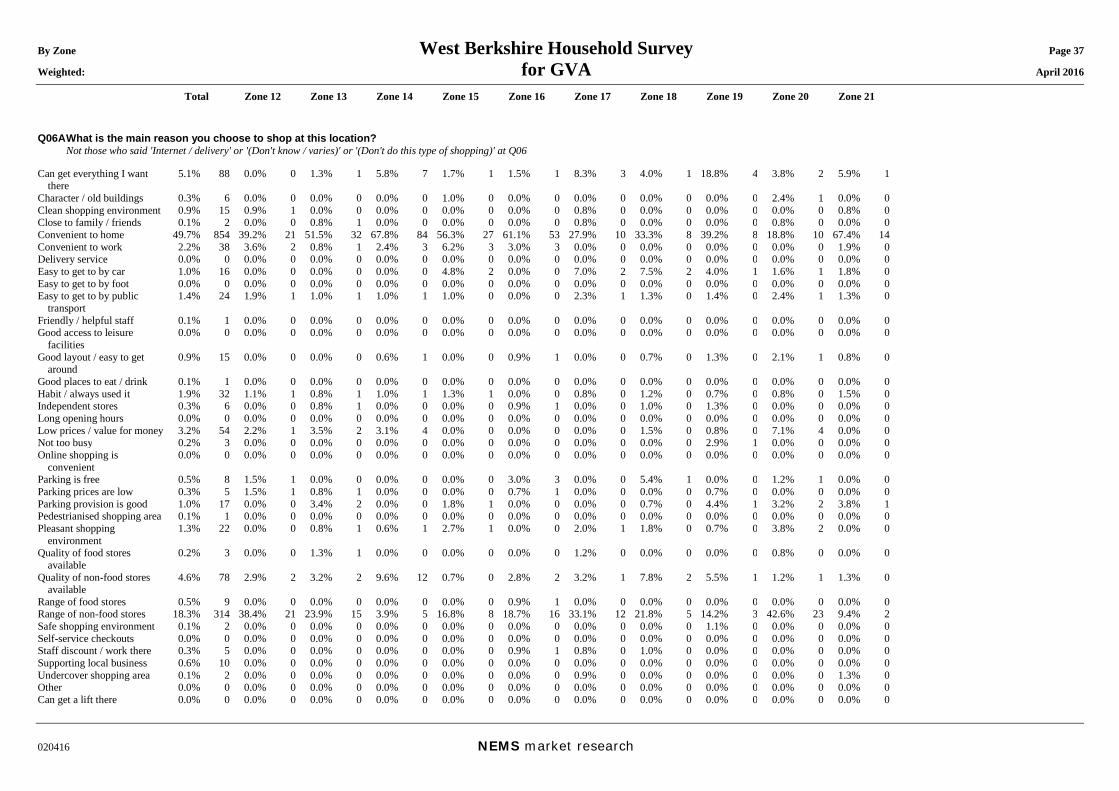
By Zone West Berkshire Household Survey Page 37 Weighted: for GVA April 2016
Total Zone 12 Zone 13 Zone 14 Zone 15 Zone 16 Zone 17 Zone 18 Zone 19 Zone 20 Zone 21
020416 NEMS market research
Q06A What is the main reason you choose to shop at this location? Not those who said 'Internet / delivery' or '(Don't know / varies)' or '(Don't do this type of shopping)' at Q06 Can get everything I want
there 5.1% 88 0.0% 0 1.3% 1 5.8% 7 1.7% 1 1.5% 1 8.3% 3 4.0% 1 18.8% 4 3.8% 2 5.9% 1
Character / old buildings 0.3% 6 0.0% 0 0.0% 0 0.0% 0 1.0% 0 0.0% 0 0.0% 0 0.0% 0 0.0% 0 2.4% 1 0.0% 0Clean shopping environment 0.9% 15 0.9% 1 0.0% 0 0.0% 0 0.0% 0 0.0% 0 0.8% 0 0.0% 0 0.0% 0 0.0% 0 0.8% 0Close to family / friends 0.1% 2 0.0% 0 0.8% 1 0.0% 0 0.0% 0 0.0% 0 0.8% 0 0.0% 0 0.0% 0 0.8% 0 0.0% 0Convenient to home 49.7% 854 39.2% 21 51.5% 32 67.8% 84 56.3% 27 61.1% 53 27.9% 10 33.3% 8 39.2% 8 18.8% 10 67.4% 14Convenient to work 2.2% 38 3.6% 2 0.8% 1 2.4% 3 6.2% 3 3.0% 3 0.0% 0 0.0% 0 0.0% 0 0.0% 0 1.9% 0Delivery service 0.0% 0 0.0% 0 0.0% 0 0.0% 0 0.0% 0 0.0% 0 0.0% 0 0.0% 0 0.0% 0 0.0% 0 0.0% 0Easy to get to by car 1.0% 16 0.0% 0 0.0% 0 0.0% 0 4.8% 2 0.0% 0 7.0% 2 7.5% 2 4.0% 1 1.6% 1 1.8% 0Easy to get to by foot 0.0% 0 0.0% 0 0.0% 0 0.0% 0 0.0% 0 0.0% 0 0.0% 0 0.0% 0 0.0% 0 0.0% 0 0.0% 0Easy to get to by public
transport 1.4% 24 1.9% 1 1.0% 1 1.0% 1 1.0% 0 0.0% 0 2.3% 1 1.3% 0 1.4% 0 2.4% 1 1.3% 0
Friendly / helpful staff 0.1% 1 0.0% 0 0.0% 0 0.0% 0 0.0% 0 0.0% 0 0.0% 0 0.0% 0 0.0% 0 0.0% 0 0.0% 0Good access to leisure
facilities 0.0% 0 0.0% 0 0.0% 0 0.0% 0 0.0% 0 0.0% 0 0.0% 0 0.0% 0 0.0% 0 0.0% 0 0.0% 0
Good layout / easy to get around
0.9% 15 0.0% 0 0.0% 0 0.6% 1 0.0% 0 0.9% 1 0.0% 0 0.7% 0 1.3% 0 2.1% 1 0.8% 0
Good places to eat / drink 0.1% 1 0.0% 0 0.0% 0 0.0% 0 0.0% 0 0.0% 0 0.0% 0 0.0% 0 0.0% 0 0.0% 0 0.0% 0Habit / always used it 1.9% 32 1.1% 1 0.8% 1 1.0% 1 1.3% 1 0.0% 0 0.8% 0 1.2% 0 0.7% 0 0.8% 0 1.5% 0Independent stores 0.3% 6 0.0% 0 0.8% 1 0.0% 0 0.0% 0 0.9% 1 0.0% 0 1.0% 0 1.3% 0 0.0% 0 0.0% 0Long opening hours 0.0% 0 0.0% 0 0.0% 0 0.0% 0 0.0% 0 0.0% 0 0.0% 0 0.0% 0 0.0% 0 0.0% 0 0.0% 0Low prices / value for money 3.2% 54 2.2% 1 3.5% 2 3.1% 4 0.0% 0 0.0% 0 0.0% 0 1.5% 0 0.8% 0 7.1% 4 0.0% 0Not too busy 0.2% 3 0.0% 0 0.0% 0 0.0% 0 0.0% 0 0.0% 0 0.0% 0 0.0% 0 2.9% 1 0.0% 0 0.0% 0Online shopping is
convenient 0.0% 0 0.0% 0 0.0% 0 0.0% 0 0.0% 0 0.0% 0 0.0% 0 0.0% 0 0.0% 0 0.0% 0 0.0% 0
Parking is free 0.5% 8 1.5% 1 0.0% 0 0.0% 0 0.0% 0 3.0% 3 0.0% 0 5.4% 1 0.0% 0 1.2% 1 0.0% 0Parking prices are low 0.3% 5 1.5% 1 0.8% 1 0.0% 0 0.0% 0 0.7% 1 0.0% 0 0.0% 0 0.7% 0 0.0% 0 0.0% 0Parking provision is good 1.0% 17 0.0% 0 3.4% 2 0.0% 0 1.8% 1 0.0% 0 0.0% 0 0.7% 0 4.4% 1 3.2% 2 3.8% 1Pedestrianised shopping area 0.1% 1 0.0% 0 0.0% 0 0.0% 0 0.0% 0 0.0% 0 0.0% 0 0.0% 0 0.0% 0 0.0% 0 0.0% 0Pleasant shopping
environment 1.3% 22 0.0% 0 0.8% 1 0.6% 1 2.7% 1 0.0% 0 2.0% 1 1.8% 0 0.7% 0 3.8% 2 0.0% 0
Quality of food stores available
0.2% 3 0.0% 0 1.3% 1 0.0% 0 0.0% 0 0.0% 0 1.2% 0 0.0% 0 0.0% 0 0.8% 0 0.0% 0
Quality of non-food stores available
4.6% 78 2.9% 2 3.2% 2 9.6% 12 0.7% 0 2.8% 2 3.2% 1 7.8% 2 5.5% 1 1.2% 1 1.3% 0
Range of food stores 0.5% 9 0.0% 0 0.0% 0 0.0% 0 0.0% 0 0.9% 1 0.0% 0 0.0% 0 0.0% 0 0.0% 0 0.0% 0Range of non-food stores 18.3% 314 38.4% 21 23.9% 15 3.9% 5 16.8% 8 18.7% 16 33.1% 12 21.8% 5 14.2% 3 42.6% 23 9.4% 2Safe shopping environment 0.1% 2 0.0% 0 0.0% 0 0.0% 0 0.0% 0 0.0% 0 0.0% 0 0.0% 0 1.1% 0 0.0% 0 0.0% 0Self-service checkouts 0.0% 0 0.0% 0 0.0% 0 0.0% 0 0.0% 0 0.0% 0 0.0% 0 0.0% 0 0.0% 0 0.0% 0 0.0% 0Staff discount / work there 0.3% 5 0.0% 0 0.0% 0 0.0% 0 0.0% 0 0.9% 1 0.8% 0 1.0% 0 0.0% 0 0.0% 0 0.0% 0Supporting local business 0.6% 10 0.0% 0 0.0% 0 0.0% 0 0.0% 0 0.0% 0 0.0% 0 0.0% 0 0.0% 0 0.0% 0 0.0% 0Undercover shopping area 0.1% 2 0.0% 0 0.0% 0 0.0% 0 0.0% 0 0.0% 0 0.9% 0 0.0% 0 0.0% 0 0.0% 0 1.3% 0Other 0.0% 0 0.0% 0 0.0% 0 0.0% 0 0.0% 0 0.0% 0 0.0% 0 0.0% 0 0.0% 0 0.0% 0 0.0% 0Can get a lift there 0.0% 0 0.0% 0 0.0% 0 0.0% 0 0.0% 0 0.0% 0 0.0% 0 0.0% 0 0.0% 0 0.0% 0 0.0% 0
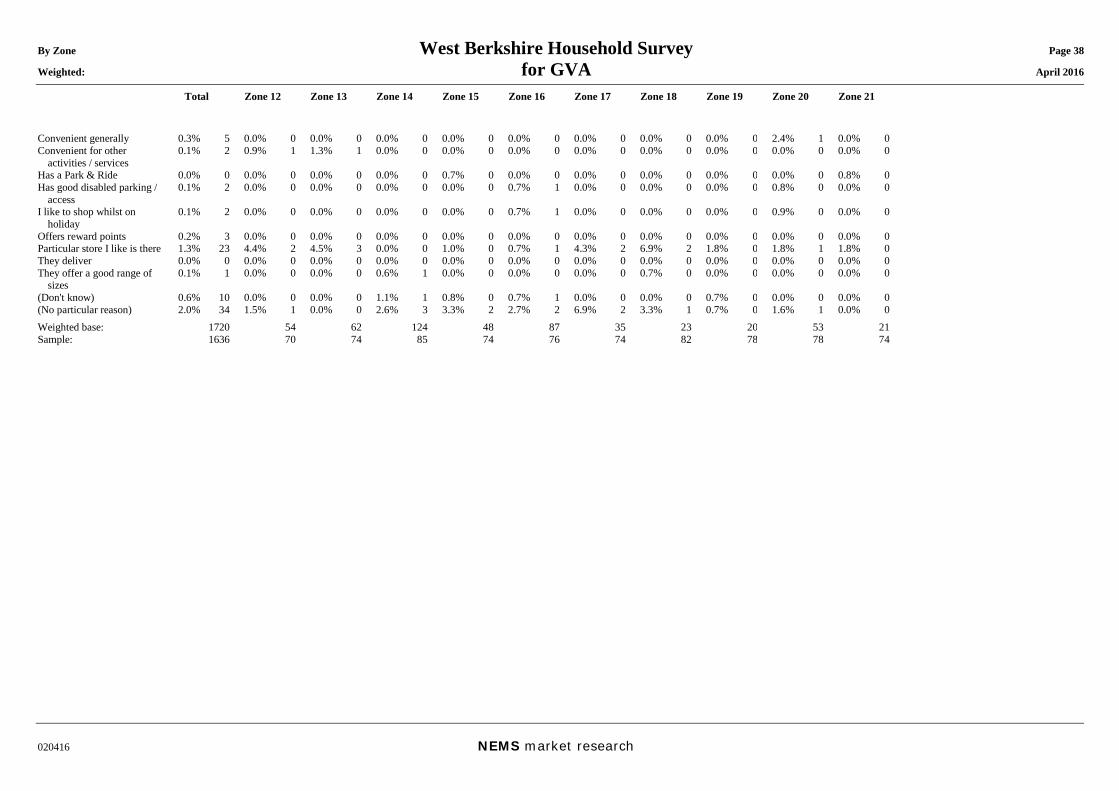
By Zone West Berkshire Household Survey Page 38 Weighted: for GVA April 2016
Total Zone 12 Zone 13 Zone 14 Zone 15 Zone 16 Zone 17 Zone 18 Zone 19 Zone 20 Zone 21
020416 NEMS market research
Convenient generally 0.3% 5 0.0% 0 0.0% 0 0.0% 0 0.0% 0 0.0% 0 0.0% 0 0.0% 0 0.0% 0 2.4% 1 0.0% 0Convenient for other
activities / services 0.1% 2 0.9% 1 1.3% 1 0.0% 0 0.0% 0 0.0% 0 0.0% 0 0.0% 0 0.0% 0 0.0% 0 0.0% 0
Has a Park & Ride 0.0% 0 0.0% 0 0.0% 0 0.0% 0 0.7% 0 0.0% 0 0.0% 0 0.0% 0 0.0% 0 0.0% 0 0.8% 0Has good disabled parking /
access 0.1% 2 0.0% 0 0.0% 0 0.0% 0 0.0% 0 0.7% 1 0.0% 0 0.0% 0 0.0% 0 0.8% 0 0.0% 0
I like to shop whilst on holiday
0.1% 2 0.0% 0 0.0% 0 0.0% 0 0.0% 0 0.7% 1 0.0% 0 0.0% 0 0.0% 0 0.9% 0 0.0% 0
Offers reward points 0.2% 3 0.0% 0 0.0% 0 0.0% 0 0.0% 0 0.0% 0 0.0% 0 0.0% 0 0.0% 0 0.0% 0 0.0% 0Particular store I like is there 1.3% 23 4.4% 2 4.5% 3 0.0% 0 1.0% 0 0.7% 1 4.3% 2 6.9% 2 1.8% 0 1.8% 1 1.8% 0They deliver 0.0% 0 0.0% 0 0.0% 0 0.0% 0 0.0% 0 0.0% 0 0.0% 0 0.0% 0 0.0% 0 0.0% 0 0.0% 0They offer a good range of
sizes 0.1% 1 0.0% 0 0.0% 0 0.6% 1 0.0% 0 0.0% 0 0.0% 0 0.7% 0 0.0% 0 0.0% 0 0.0% 0
(Don't know) 0.6% 10 0.0% 0 0.0% 0 1.1% 1 0.8% 0 0.7% 1 0.0% 0 0.0% 0 0.7% 0 0.0% 0 0.0% 0(No particular reason) 2.0% 34 1.5% 1 0.0% 0 2.6% 3 3.3% 2 2.7% 2 6.9% 2 3.3% 1 0.7% 0 1.6% 1 0.0% 0Weighted base: 1720 54 62 124 48 87 35 23 20 53 21Sample: 1636 70 74 85 74 76 74 82 78 78 74
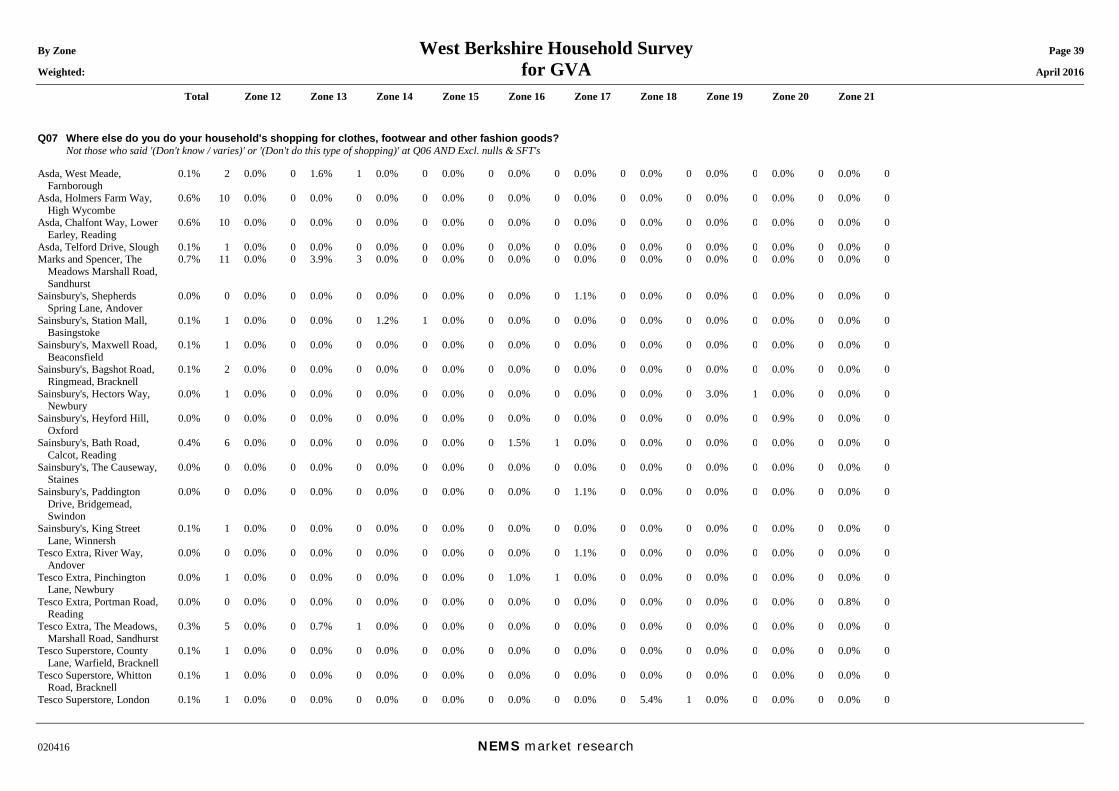
By Zone West Berkshire Household Survey Page 39 Weighted: for GVA April 2016
Total Zone 12 Zone 13 Zone 14 Zone 15 Zone 16 Zone 17 Zone 18 Zone 19 Zone 20 Zone 21
020416 NEMS market research
Q07 Where else do you do your household's shopping for clothes, footwear and other fashion goods? Not those who said '(Don't know / varies)' or '(Don't do this type of shopping)' at Q06 AND Excl. nulls & SFT's Asda, West Meade,
Farnborough 0.1% 2 0.0% 0 1.6% 1 0.0% 0 0.0% 0 0.0% 0 0.0% 0 0.0% 0 0.0% 0 0.0% 0 0.0% 0
Asda, Holmers Farm Way, High Wycombe
0.6% 10 0.0% 0 0.0% 0 0.0% 0 0.0% 0 0.0% 0 0.0% 0 0.0% 0 0.0% 0 0.0% 0 0.0% 0
Asda, Chalfont Way, Lower Earley, Reading
0.6% 10 0.0% 0 0.0% 0 0.0% 0 0.0% 0 0.0% 0 0.0% 0 0.0% 0 0.0% 0 0.0% 0 0.0% 0
Asda, Telford Drive, Slough 0.1% 1 0.0% 0 0.0% 0 0.0% 0 0.0% 0 0.0% 0 0.0% 0 0.0% 0 0.0% 0 0.0% 0 0.0% 0Marks and Spencer, The
Meadows Marshall Road, Sandhurst
0.7% 11 0.0% 0 3.9% 3 0.0% 0 0.0% 0 0.0% 0 0.0% 0 0.0% 0 0.0% 0 0.0% 0 0.0% 0
Sainsbury's, Shepherds Spring Lane, Andover
0.0% 0 0.0% 0 0.0% 0 0.0% 0 0.0% 0 0.0% 0 1.1% 0 0.0% 0 0.0% 0 0.0% 0 0.0% 0
Sainsbury's, Station Mall, Basingstoke
0.1% 1 0.0% 0 0.0% 0 1.2% 1 0.0% 0 0.0% 0 0.0% 0 0.0% 0 0.0% 0 0.0% 0 0.0% 0
Sainsbury's, Maxwell Road, Beaconsfield
0.1% 1 0.0% 0 0.0% 0 0.0% 0 0.0% 0 0.0% 0 0.0% 0 0.0% 0 0.0% 0 0.0% 0 0.0% 0
Sainsbury's, Bagshot Road, Ringmead, Bracknell
0.1% 2 0.0% 0 0.0% 0 0.0% 0 0.0% 0 0.0% 0 0.0% 0 0.0% 0 0.0% 0 0.0% 0 0.0% 0
Sainsbury's, Hectors Way, Newbury
0.0% 1 0.0% 0 0.0% 0 0.0% 0 0.0% 0 0.0% 0 0.0% 0 0.0% 0 3.0% 1 0.0% 0 0.0% 0
Sainsbury's, Heyford Hill, Oxford
0.0% 0 0.0% 0 0.0% 0 0.0% 0 0.0% 0 0.0% 0 0.0% 0 0.0% 0 0.0% 0 0.9% 0 0.0% 0
Sainsbury's, Bath Road, Calcot, Reading
0.4% 6 0.0% 0 0.0% 0 0.0% 0 0.0% 0 1.5% 1 0.0% 0 0.0% 0 0.0% 0 0.0% 0 0.0% 0
Sainsbury's, The Causeway, Staines
0.0% 0 0.0% 0 0.0% 0 0.0% 0 0.0% 0 0.0% 0 0.0% 0 0.0% 0 0.0% 0 0.0% 0 0.0% 0
Sainsbury's, Paddington Drive, Bridgemead, Swindon
0.0% 0 0.0% 0 0.0% 0 0.0% 0 0.0% 0 0.0% 0 1.1% 0 0.0% 0 0.0% 0 0.0% 0 0.0% 0
Sainsbury's, King Street Lane, Winnersh
0.1% 1 0.0% 0 0.0% 0 0.0% 0 0.0% 0 0.0% 0 0.0% 0 0.0% 0 0.0% 0 0.0% 0 0.0% 0
Tesco Extra, River Way, Andover
0.0% 0 0.0% 0 0.0% 0 0.0% 0 0.0% 0 0.0% 0 1.1% 0 0.0% 0 0.0% 0 0.0% 0 0.0% 0
Tesco Extra, Pinchington Lane, Newbury
0.0% 1 0.0% 0 0.0% 0 0.0% 0 0.0% 0 1.0% 1 0.0% 0 0.0% 0 0.0% 0 0.0% 0 0.0% 0
Tesco Extra, Portman Road, Reading
0.0% 0 0.0% 0 0.0% 0 0.0% 0 0.0% 0 0.0% 0 0.0% 0 0.0% 0 0.0% 0 0.0% 0 0.8% 0
Tesco Extra, The Meadows, Marshall Road, Sandhurst
0.3% 5 0.0% 0 0.7% 1 0.0% 0 0.0% 0 0.0% 0 0.0% 0 0.0% 0 0.0% 0 0.0% 0 0.0% 0
Tesco Superstore, County Lane, Warfield, Bracknell
0.1% 1 0.0% 0 0.0% 0 0.0% 0 0.0% 0 0.0% 0 0.0% 0 0.0% 0 0.0% 0 0.0% 0 0.0% 0
Tesco Superstore, Whitton Road, Bracknell
0.1% 1 0.0% 0 0.0% 0 0.0% 0 0.0% 0 0.0% 0 0.0% 0 0.0% 0 0.0% 0 0.0% 0 0.0% 0
Tesco Superstore, London 0.1% 1 0.0% 0 0.0% 0 0.0% 0 0.0% 0 0.0% 0 0.0% 0 5.4% 1 0.0% 0 0.0% 0 0.0% 0
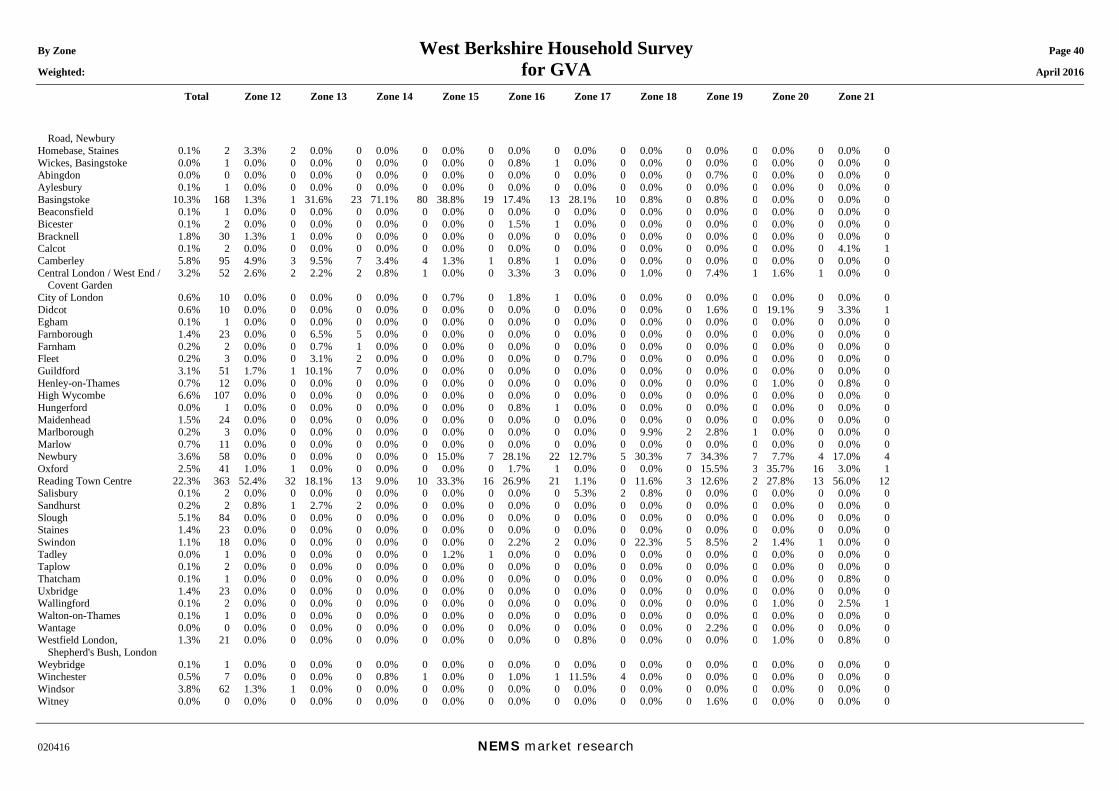
By Zone West Berkshire Household Survey Page 40 Weighted: for GVA April 2016
Total Zone 12 Zone 13 Zone 14 Zone 15 Zone 16 Zone 17 Zone 18 Zone 19 Zone 20 Zone 21
020416 NEMS market research
Road, Newbury Homebase, Staines 0.1% 2 3.3% 2 0.0% 0 0.0% 0 0.0% 0 0.0% 0 0.0% 0 0.0% 0 0.0% 0 0.0% 0 0.0% 0Wickes, Basingstoke 0.0% 1 0.0% 0 0.0% 0 0.0% 0 0.0% 0 0.8% 1 0.0% 0 0.0% 0 0.0% 0 0.0% 0 0.0% 0Abingdon 0.0% 0 0.0% 0 0.0% 0 0.0% 0 0.0% 0 0.0% 0 0.0% 0 0.0% 0 0.7% 0 0.0% 0 0.0% 0Aylesbury 0.1% 1 0.0% 0 0.0% 0 0.0% 0 0.0% 0 0.0% 0 0.0% 0 0.0% 0 0.0% 0 0.0% 0 0.0% 0Basingstoke 10.3% 168 1.3% 1 31.6% 23 71.1% 80 38.8% 19 17.4% 13 28.1% 10 0.8% 0 0.8% 0 0.0% 0 0.0% 0Beaconsfield 0.1% 1 0.0% 0 0.0% 0 0.0% 0 0.0% 0 0.0% 0 0.0% 0 0.0% 0 0.0% 0 0.0% 0 0.0% 0Bicester 0.1% 2 0.0% 0 0.0% 0 0.0% 0 0.0% 0 1.5% 1 0.0% 0 0.0% 0 0.0% 0 0.0% 0 0.0% 0Bracknell 1.8% 30 1.3% 1 0.0% 0 0.0% 0 0.0% 0 0.0% 0 0.0% 0 0.0% 0 0.0% 0 0.0% 0 0.0% 0Calcot 0.1% 2 0.0% 0 0.0% 0 0.0% 0 0.0% 0 0.0% 0 0.0% 0 0.0% 0 0.0% 0 0.0% 0 4.1% 1Camberley 5.8% 95 4.9% 3 9.5% 7 3.4% 4 1.3% 1 0.8% 1 0.0% 0 0.0% 0 0.0% 0 0.0% 0 0.0% 0Central London / West End /
Covent Garden 3.2% 52 2.6% 2 2.2% 2 0.8% 1 0.0% 0 3.3% 3 0.0% 0 1.0% 0 7.4% 1 1.6% 1 0.0% 0
City of London 0.6% 10 0.0% 0 0.0% 0 0.0% 0 0.7% 0 1.8% 1 0.0% 0 0.0% 0 0.0% 0 0.0% 0 0.0% 0Didcot 0.6% 10 0.0% 0 0.0% 0 0.0% 0 0.0% 0 0.0% 0 0.0% 0 0.0% 0 1.6% 0 19.1% 9 3.3% 1Egham 0.1% 1 0.0% 0 0.0% 0 0.0% 0 0.0% 0 0.0% 0 0.0% 0 0.0% 0 0.0% 0 0.0% 0 0.0% 0Farnborough 1.4% 23 0.0% 0 6.5% 5 0.0% 0 0.0% 0 0.0% 0 0.0% 0 0.0% 0 0.0% 0 0.0% 0 0.0% 0Farnham 0.2% 2 0.0% 0 0.7% 1 0.0% 0 0.0% 0 0.0% 0 0.0% 0 0.0% 0 0.0% 0 0.0% 0 0.0% 0Fleet 0.2% 3 0.0% 0 3.1% 2 0.0% 0 0.0% 0 0.0% 0 0.7% 0 0.0% 0 0.0% 0 0.0% 0 0.0% 0Guildford 3.1% 51 1.7% 1 10.1% 7 0.0% 0 0.0% 0 0.0% 0 0.0% 0 0.0% 0 0.0% 0 0.0% 0 0.0% 0Henley-on-Thames 0.7% 12 0.0% 0 0.0% 0 0.0% 0 0.0% 0 0.0% 0 0.0% 0 0.0% 0 0.0% 0 1.0% 0 0.8% 0High Wycombe 6.6% 107 0.0% 0 0.0% 0 0.0% 0 0.0% 0 0.0% 0 0.0% 0 0.0% 0 0.0% 0 0.0% 0 0.0% 0Hungerford 0.0% 1 0.0% 0 0.0% 0 0.0% 0 0.0% 0 0.8% 1 0.0% 0 0.0% 0 0.0% 0 0.0% 0 0.0% 0Maidenhead 1.5% 24 0.0% 0 0.0% 0 0.0% 0 0.0% 0 0.0% 0 0.0% 0 0.0% 0 0.0% 0 0.0% 0 0.0% 0Marlborough 0.2% 3 0.0% 0 0.0% 0 0.0% 0 0.0% 0 0.0% 0 0.0% 0 9.9% 2 2.8% 1 0.0% 0 0.0% 0Marlow 0.7% 11 0.0% 0 0.0% 0 0.0% 0 0.0% 0 0.0% 0 0.0% 0 0.0% 0 0.0% 0 0.0% 0 0.0% 0Newbury 3.6% 58 0.0% 0 0.0% 0 0.0% 0 15.0% 7 28.1% 22 12.7% 5 30.3% 7 34.3% 7 7.7% 4 17.0% 4Oxford 2.5% 41 1.0% 1 0.0% 0 0.0% 0 0.0% 0 1.7% 1 0.0% 0 0.0% 0 15.5% 3 35.7% 16 3.0% 1Reading Town Centre 22.3% 363 52.4% 32 18.1% 13 9.0% 10 33.3% 16 26.9% 21 1.1% 0 11.6% 3 12.6% 2 27.8% 13 56.0% 12Salisbury 0.1% 2 0.0% 0 0.0% 0 0.0% 0 0.0% 0 0.0% 0 5.3% 2 0.8% 0 0.0% 0 0.0% 0 0.0% 0Sandhurst 0.2% 2 0.8% 1 2.7% 2 0.0% 0 0.0% 0 0.0% 0 0.0% 0 0.0% 0 0.0% 0 0.0% 0 0.0% 0Slough 5.1% 84 0.0% 0 0.0% 0 0.0% 0 0.0% 0 0.0% 0 0.0% 0 0.0% 0 0.0% 0 0.0% 0 0.0% 0Staines 1.4% 23 0.0% 0 0.0% 0 0.0% 0 0.0% 0 0.0% 0 0.0% 0 0.0% 0 0.0% 0 0.0% 0 0.0% 0Swindon 1.1% 18 0.0% 0 0.0% 0 0.0% 0 0.0% 0 2.2% 2 0.0% 0 22.3% 5 8.5% 2 1.4% 1 0.0% 0Tadley 0.0% 1 0.0% 0 0.0% 0 0.0% 0 1.2% 1 0.0% 0 0.0% 0 0.0% 0 0.0% 0 0.0% 0 0.0% 0Taplow 0.1% 2 0.0% 0 0.0% 0 0.0% 0 0.0% 0 0.0% 0 0.0% 0 0.0% 0 0.0% 0 0.0% 0 0.0% 0Thatcham 0.1% 1 0.0% 0 0.0% 0 0.0% 0 0.0% 0 0.0% 0 0.0% 0 0.0% 0 0.0% 0 0.0% 0 0.8% 0Uxbridge 1.4% 23 0.0% 0 0.0% 0 0.0% 0 0.0% 0 0.0% 0 0.0% 0 0.0% 0 0.0% 0 0.0% 0 0.0% 0Wallingford 0.1% 2 0.0% 0 0.0% 0 0.0% 0 0.0% 0 0.0% 0 0.0% 0 0.0% 0 0.0% 0 1.0% 0 2.5% 1Walton-on-Thames 0.1% 1 0.0% 0 0.0% 0 0.0% 0 0.0% 0 0.0% 0 0.0% 0 0.0% 0 0.0% 0 0.0% 0 0.0% 0Wantage 0.0% 0 0.0% 0 0.0% 0 0.0% 0 0.0% 0 0.0% 0 0.0% 0 0.0% 0 2.2% 0 0.0% 0 0.0% 0Westfield London,
Shepherd's Bush, London 1.3% 21 0.0% 0 0.0% 0 0.0% 0 0.0% 0 0.0% 0 0.8% 0 0.0% 0 0.0% 0 1.0% 0 0.8% 0
Weybridge 0.1% 1 0.0% 0 0.0% 0 0.0% 0 0.0% 0 0.0% 0 0.0% 0 0.0% 0 0.0% 0 0.0% 0 0.0% 0Winchester 0.5% 7 0.0% 0 0.0% 0 0.8% 1 0.0% 0 1.0% 1 11.5% 4 0.0% 0 0.0% 0 0.0% 0 0.0% 0Windsor 3.8% 62 1.3% 1 0.0% 0 0.0% 0 0.0% 0 0.0% 0 0.0% 0 0.0% 0 0.0% 0 0.0% 0 0.0% 0Witney 0.0% 0 0.0% 0 0.0% 0 0.0% 0 0.0% 0 0.0% 0 0.0% 0 0.0% 0 1.6% 0 0.0% 0 0.0% 0
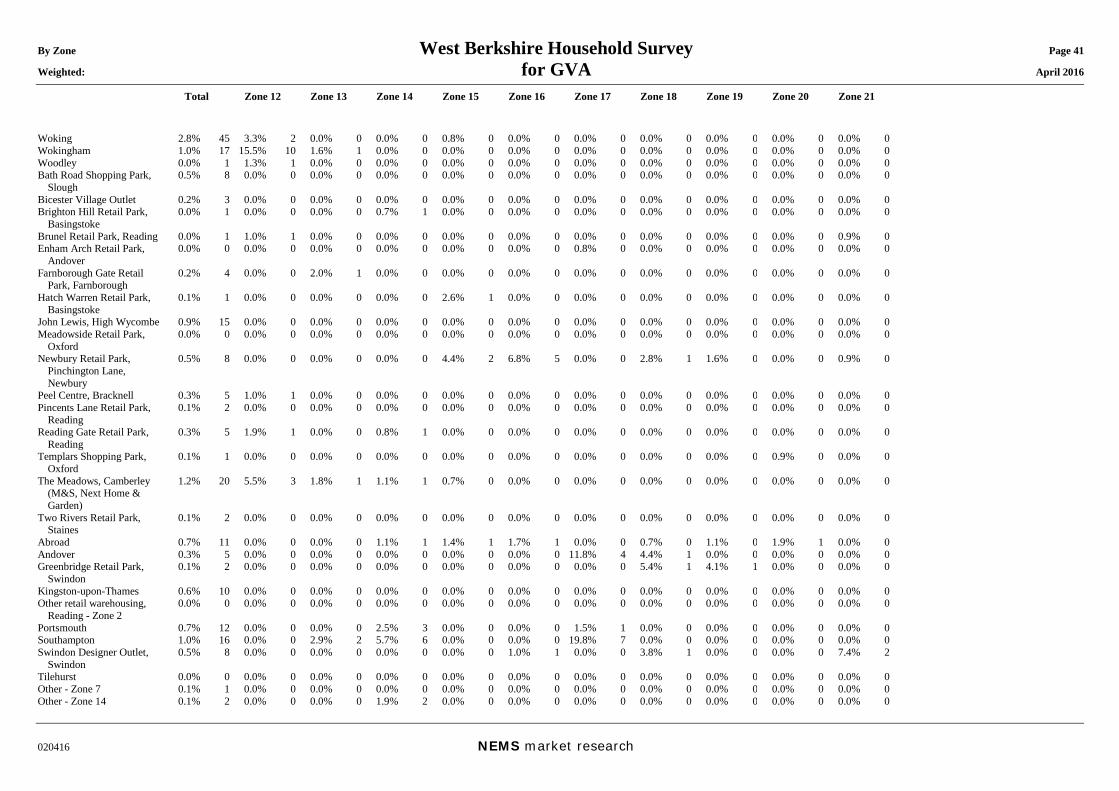
By Zone West Berkshire Household Survey Page 41 Weighted: for GVA April 2016
Total Zone 12 Zone 13 Zone 14 Zone 15 Zone 16 Zone 17 Zone 18 Zone 19 Zone 20 Zone 21
020416 NEMS market research
Woking 2.8% 45 3.3% 2 0.0% 0 0.0% 0 0.8% 0 0.0% 0 0.0% 0 0.0% 0 0.0% 0 0.0% 0 0.0% 0Wokingham 1.0% 17 15.5% 10 1.6% 1 0.0% 0 0.0% 0 0.0% 0 0.0% 0 0.0% 0 0.0% 0 0.0% 0 0.0% 0Woodley 0.0% 1 1.3% 1 0.0% 0 0.0% 0 0.0% 0 0.0% 0 0.0% 0 0.0% 0 0.0% 0 0.0% 0 0.0% 0Bath Road Shopping Park,
Slough 0.5% 8 0.0% 0 0.0% 0 0.0% 0 0.0% 0 0.0% 0 0.0% 0 0.0% 0 0.0% 0 0.0% 0 0.0% 0
Bicester Village Outlet 0.2% 3 0.0% 0 0.0% 0 0.0% 0 0.0% 0 0.0% 0 0.0% 0 0.0% 0 0.0% 0 0.0% 0 0.0% 0Brighton Hill Retail Park,
Basingstoke 0.0% 1 0.0% 0 0.0% 0 0.7% 1 0.0% 0 0.0% 0 0.0% 0 0.0% 0 0.0% 0 0.0% 0 0.0% 0
Brunel Retail Park, Reading 0.0% 1 1.0% 1 0.0% 0 0.0% 0 0.0% 0 0.0% 0 0.0% 0 0.0% 0 0.0% 0 0.0% 0 0.9% 0Enham Arch Retail Park,
Andover 0.0% 0 0.0% 0 0.0% 0 0.0% 0 0.0% 0 0.0% 0 0.8% 0 0.0% 0 0.0% 0 0.0% 0 0.0% 0
Farnborough Gate Retail Park, Farnborough
0.2% 4 0.0% 0 2.0% 1 0.0% 0 0.0% 0 0.0% 0 0.0% 0 0.0% 0 0.0% 0 0.0% 0 0.0% 0
Hatch Warren Retail Park, Basingstoke
0.1% 1 0.0% 0 0.0% 0 0.0% 0 2.6% 1 0.0% 0 0.0% 0 0.0% 0 0.0% 0 0.0% 0 0.0% 0
John Lewis, High Wycombe 0.9% 15 0.0% 0 0.0% 0 0.0% 0 0.0% 0 0.0% 0 0.0% 0 0.0% 0 0.0% 0 0.0% 0 0.0% 0Meadowside Retail Park,
Oxford 0.0% 0 0.0% 0 0.0% 0 0.0% 0 0.0% 0 0.0% 0 0.0% 0 0.0% 0 0.0% 0 0.0% 0 0.0% 0
Newbury Retail Park, Pinchington Lane, Newbury
0.5% 8 0.0% 0 0.0% 0 0.0% 0 4.4% 2 6.8% 5 0.0% 0 2.8% 1 1.6% 0 0.0% 0 0.9% 0
Peel Centre, Bracknell 0.3% 5 1.0% 1 0.0% 0 0.0% 0 0.0% 0 0.0% 0 0.0% 0 0.0% 0 0.0% 0 0.0% 0 0.0% 0Pincents Lane Retail Park,
Reading 0.1% 2 0.0% 0 0.0% 0 0.0% 0 0.0% 0 0.0% 0 0.0% 0 0.0% 0 0.0% 0 0.0% 0 0.0% 0
Reading Gate Retail Park, Reading
0.3% 5 1.9% 1 0.0% 0 0.8% 1 0.0% 0 0.0% 0 0.0% 0 0.0% 0 0.0% 0 0.0% 0 0.0% 0
Templars Shopping Park, Oxford
0.1% 1 0.0% 0 0.0% 0 0.0% 0 0.0% 0 0.0% 0 0.0% 0 0.0% 0 0.0% 0 0.9% 0 0.0% 0
The Meadows, Camberley (M&S, Next Home & Garden)
1.2% 20 5.5% 3 1.8% 1 1.1% 1 0.7% 0 0.0% 0 0.0% 0 0.0% 0 0.0% 0 0.0% 0 0.0% 0
Two Rivers Retail Park, Staines
0.1% 2 0.0% 0 0.0% 0 0.0% 0 0.0% 0 0.0% 0 0.0% 0 0.0% 0 0.0% 0 0.0% 0 0.0% 0
Abroad 0.7% 11 0.0% 0 0.0% 0 1.1% 1 1.4% 1 1.7% 1 0.0% 0 0.7% 0 1.1% 0 1.9% 1 0.0% 0Andover 0.3% 5 0.0% 0 0.0% 0 0.0% 0 0.0% 0 0.0% 0 11.8% 4 4.4% 1 0.0% 0 0.0% 0 0.0% 0Greenbridge Retail Park,
Swindon 0.1% 2 0.0% 0 0.0% 0 0.0% 0 0.0% 0 0.0% 0 0.0% 0 5.4% 1 4.1% 1 0.0% 0 0.0% 0
Kingston-upon-Thames 0.6% 10 0.0% 0 0.0% 0 0.0% 0 0.0% 0 0.0% 0 0.0% 0 0.0% 0 0.0% 0 0.0% 0 0.0% 0Other retail warehousing,
Reading - Zone 2 0.0% 0 0.0% 0 0.0% 0 0.0% 0 0.0% 0 0.0% 0 0.0% 0 0.0% 0 0.0% 0 0.0% 0 0.0% 0
Portsmouth 0.7% 12 0.0% 0 0.0% 0 2.5% 3 0.0% 0 0.0% 0 1.5% 1 0.0% 0 0.0% 0 0.0% 0 0.0% 0Southampton 1.0% 16 0.0% 0 2.9% 2 5.7% 6 0.0% 0 0.0% 0 19.8% 7 0.0% 0 0.0% 0 0.0% 0 0.0% 0Swindon Designer Outlet,
Swindon 0.5% 8 0.0% 0 0.0% 0 0.0% 0 0.0% 0 1.0% 1 0.0% 0 3.8% 1 0.0% 0 0.0% 0 7.4% 2
Tilehurst 0.0% 0 0.0% 0 0.0% 0 0.0% 0 0.0% 0 0.0% 0 0.0% 0 0.0% 0 0.0% 0 0.0% 0 0.0% 0Other - Zone 7 0.1% 1 0.0% 0 0.0% 0 0.0% 0 0.0% 0 0.0% 0 0.0% 0 0.0% 0 0.0% 0 0.0% 0 0.0% 0Other - Zone 14 0.1% 2 0.0% 0 0.0% 0 1.9% 2 0.0% 0 0.0% 0 0.0% 0 0.0% 0 0.0% 0 0.0% 0 0.0% 0
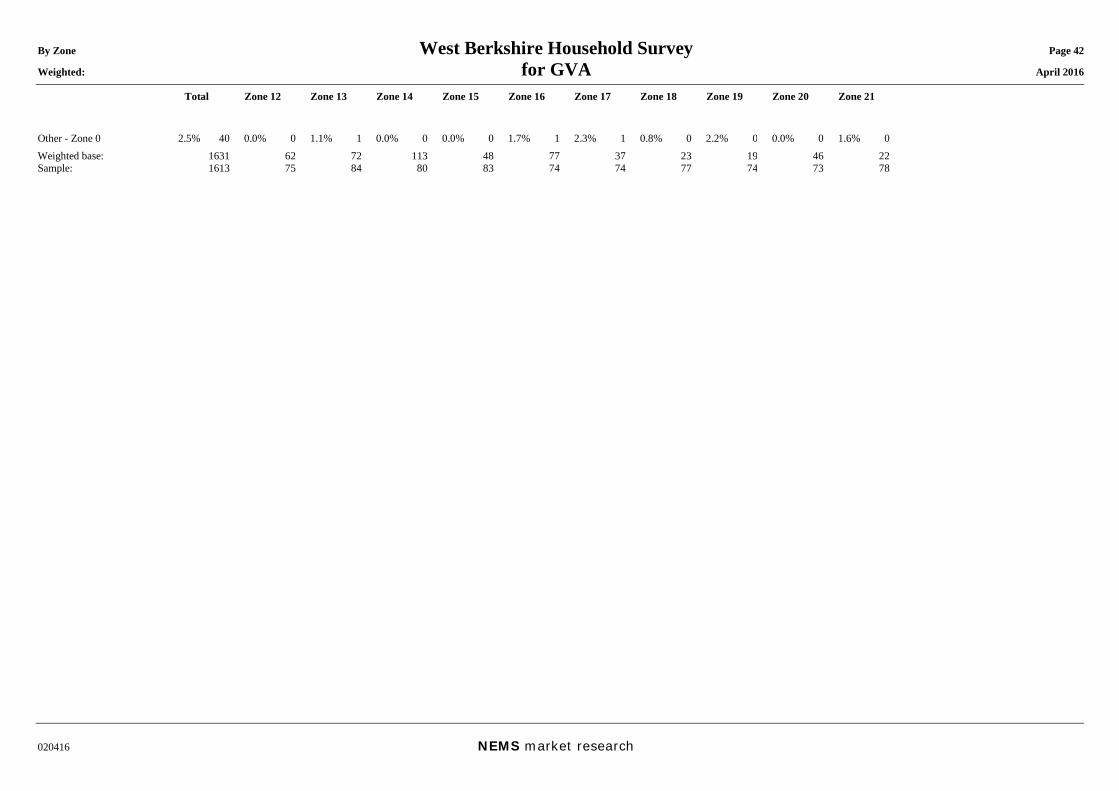
By Zone West Berkshire Household Survey Page 42 Weighted: for GVA April 2016
Total Zone 12 Zone 13 Zone 14 Zone 15 Zone 16 Zone 17 Zone 18 Zone 19 Zone 20 Zone 21
020416 NEMS market research
Other - Zone 0 2.5% 40 0.0% 0 1.1% 1 0.0% 0 0.0% 0 1.7% 1 2.3% 1 0.8% 0 2.2% 0 0.0% 0 1.6% 0Weighted base: 1631 62 72 113 48 77 37 23 19 46 22Sample: 1613 75 84 80 83 74 74 77 74 73 78
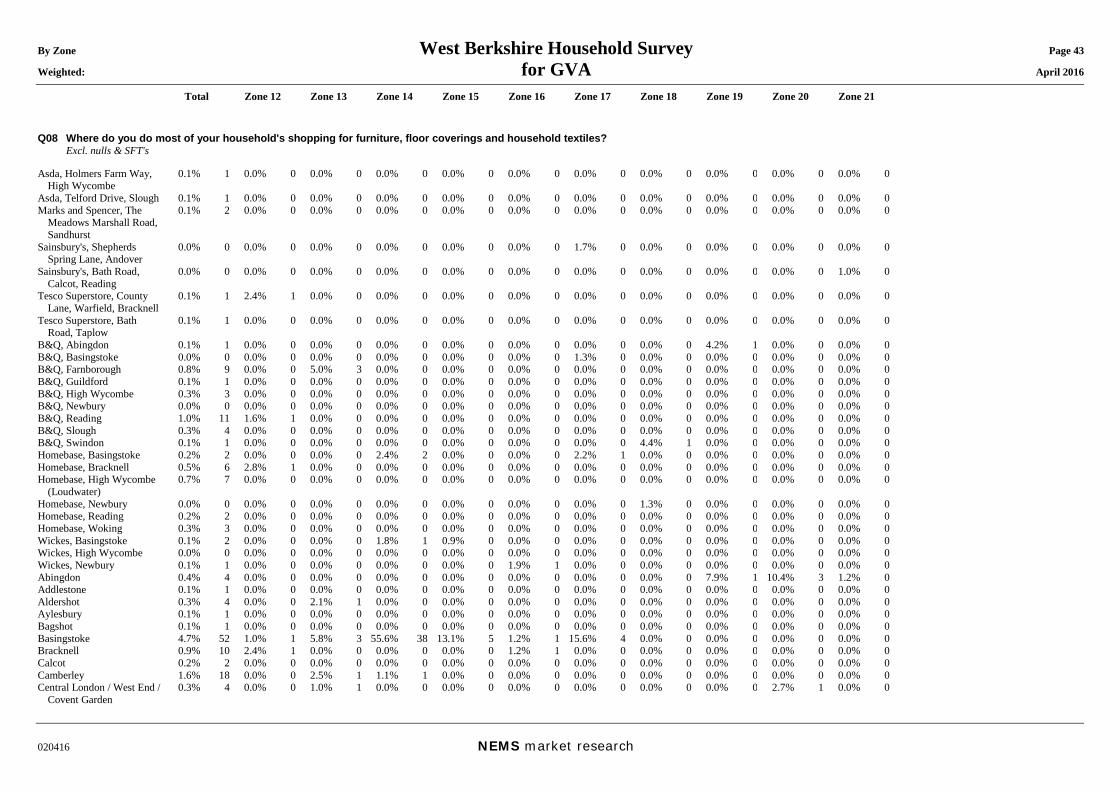
By Zone West Berkshire Household Survey Page 43 Weighted: for GVA April 2016
Total Zone 12 Zone 13 Zone 14 Zone 15 Zone 16 Zone 17 Zone 18 Zone 19 Zone 20 Zone 21
020416 NEMS market research
Q08 Where do you do most of your household's shopping for furniture, floor coverings and household textiles? Excl. nulls & SFT's Asda, Holmers Farm Way,
High Wycombe 0.1% 1 0.0% 0 0.0% 0 0.0% 0 0.0% 0 0.0% 0 0.0% 0 0.0% 0 0.0% 0 0.0% 0 0.0% 0
Asda, Telford Drive, Slough 0.1% 1 0.0% 0 0.0% 0 0.0% 0 0.0% 0 0.0% 0 0.0% 0 0.0% 0 0.0% 0 0.0% 0 0.0% 0Marks and Spencer, The
Meadows Marshall Road, Sandhurst
0.1% 2 0.0% 0 0.0% 0 0.0% 0 0.0% 0 0.0% 0 0.0% 0 0.0% 0 0.0% 0 0.0% 0 0.0% 0
Sainsbury's, Shepherds Spring Lane, Andover
0.0% 0 0.0% 0 0.0% 0 0.0% 0 0.0% 0 0.0% 0 1.7% 0 0.0% 0 0.0% 0 0.0% 0 0.0% 0
Sainsbury's, Bath Road, Calcot, Reading
0.0% 0 0.0% 0 0.0% 0 0.0% 0 0.0% 0 0.0% 0 0.0% 0 0.0% 0 0.0% 0 0.0% 0 1.0% 0
Tesco Superstore, County Lane, Warfield, Bracknell
0.1% 1 2.4% 1 0.0% 0 0.0% 0 0.0% 0 0.0% 0 0.0% 0 0.0% 0 0.0% 0 0.0% 0 0.0% 0
Tesco Superstore, Bath Road, Taplow
0.1% 1 0.0% 0 0.0% 0 0.0% 0 0.0% 0 0.0% 0 0.0% 0 0.0% 0 0.0% 0 0.0% 0 0.0% 0
B&Q, Abingdon 0.1% 1 0.0% 0 0.0% 0 0.0% 0 0.0% 0 0.0% 0 0.0% 0 0.0% 0 4.2% 1 0.0% 0 0.0% 0B&Q, Basingstoke 0.0% 0 0.0% 0 0.0% 0 0.0% 0 0.0% 0 0.0% 0 1.3% 0 0.0% 0 0.0% 0 0.0% 0 0.0% 0B&Q, Farnborough 0.8% 9 0.0% 0 5.0% 3 0.0% 0 0.0% 0 0.0% 0 0.0% 0 0.0% 0 0.0% 0 0.0% 0 0.0% 0B&Q, Guildford 0.1% 1 0.0% 0 0.0% 0 0.0% 0 0.0% 0 0.0% 0 0.0% 0 0.0% 0 0.0% 0 0.0% 0 0.0% 0B&Q, High Wycombe 0.3% 3 0.0% 0 0.0% 0 0.0% 0 0.0% 0 0.0% 0 0.0% 0 0.0% 0 0.0% 0 0.0% 0 0.0% 0B&Q, Newbury 0.0% 0 0.0% 0 0.0% 0 0.0% 0 0.0% 0 0.0% 0 0.0% 0 0.0% 0 0.0% 0 0.0% 0 0.0% 0B&Q, Reading 1.0% 11 1.6% 1 0.0% 0 0.0% 0 0.0% 0 0.0% 0 0.0% 0 0.0% 0 0.0% 0 0.0% 0 0.0% 0B&Q, Slough 0.3% 4 0.0% 0 0.0% 0 0.0% 0 0.0% 0 0.0% 0 0.0% 0 0.0% 0 0.0% 0 0.0% 0 0.0% 0B&Q, Swindon 0.1% 1 0.0% 0 0.0% 0 0.0% 0 0.0% 0 0.0% 0 0.0% 0 4.4% 1 0.0% 0 0.0% 0 0.0% 0Homebase, Basingstoke 0.2% 2 0.0% 0 0.0% 0 2.4% 2 0.0% 0 0.0% 0 2.2% 1 0.0% 0 0.0% 0 0.0% 0 0.0% 0Homebase, Bracknell 0.5% 6 2.8% 1 0.0% 0 0.0% 0 0.0% 0 0.0% 0 0.0% 0 0.0% 0 0.0% 0 0.0% 0 0.0% 0Homebase, High Wycombe
(Loudwater) 0.7% 7 0.0% 0 0.0% 0 0.0% 0 0.0% 0 0.0% 0 0.0% 0 0.0% 0 0.0% 0 0.0% 0 0.0% 0
Homebase, Newbury 0.0% 0 0.0% 0 0.0% 0 0.0% 0 0.0% 0 0.0% 0 0.0% 0 1.3% 0 0.0% 0 0.0% 0 0.0% 0Homebase, Reading 0.2% 2 0.0% 0 0.0% 0 0.0% 0 0.0% 0 0.0% 0 0.0% 0 0.0% 0 0.0% 0 0.0% 0 0.0% 0Homebase, Woking 0.3% 3 0.0% 0 0.0% 0 0.0% 0 0.0% 0 0.0% 0 0.0% 0 0.0% 0 0.0% 0 0.0% 0 0.0% 0Wickes, Basingstoke 0.1% 2 0.0% 0 0.0% 0 1.8% 1 0.9% 0 0.0% 0 0.0% 0 0.0% 0 0.0% 0 0.0% 0 0.0% 0Wickes, High Wycombe 0.0% 0 0.0% 0 0.0% 0 0.0% 0 0.0% 0 0.0% 0 0.0% 0 0.0% 0 0.0% 0 0.0% 0 0.0% 0Wickes, Newbury 0.1% 1 0.0% 0 0.0% 0 0.0% 0 0.0% 0 1.9% 1 0.0% 0 0.0% 0 0.0% 0 0.0% 0 0.0% 0Abingdon 0.4% 4 0.0% 0 0.0% 0 0.0% 0 0.0% 0 0.0% 0 0.0% 0 0.0% 0 7.9% 1 10.4% 3 1.2% 0Addlestone 0.1% 1 0.0% 0 0.0% 0 0.0% 0 0.0% 0 0.0% 0 0.0% 0 0.0% 0 0.0% 0 0.0% 0 0.0% 0Aldershot 0.3% 4 0.0% 0 2.1% 1 0.0% 0 0.0% 0 0.0% 0 0.0% 0 0.0% 0 0.0% 0 0.0% 0 0.0% 0Aylesbury 0.1% 1 0.0% 0 0.0% 0 0.0% 0 0.0% 0 0.0% 0 0.0% 0 0.0% 0 0.0% 0 0.0% 0 0.0% 0Bagshot 0.1% 1 0.0% 0 0.0% 0 0.0% 0 0.0% 0 0.0% 0 0.0% 0 0.0% 0 0.0% 0 0.0% 0 0.0% 0Basingstoke 4.7% 52 1.0% 1 5.8% 3 55.6% 38 13.1% 5 1.2% 1 15.6% 4 0.0% 0 0.0% 0 0.0% 0 0.0% 0Bracknell 0.9% 10 2.4% 1 0.0% 0 0.0% 0 0.0% 0 1.2% 1 0.0% 0 0.0% 0 0.0% 0 0.0% 0 0.0% 0Calcot 0.2% 2 0.0% 0 0.0% 0 0.0% 0 0.0% 0 0.0% 0 0.0% 0 0.0% 0 0.0% 0 0.0% 0 0.0% 0Camberley 1.6% 18 0.0% 0 2.5% 1 1.1% 1 0.0% 0 0.0% 0 0.0% 0 0.0% 0 0.0% 0 0.0% 0 0.0% 0Central London / West End /
Covent Garden 0.3% 4 0.0% 0 1.0% 1 0.0% 0 0.0% 0 0.0% 0 0.0% 0 0.0% 0 0.0% 0 2.7% 1 0.0% 0
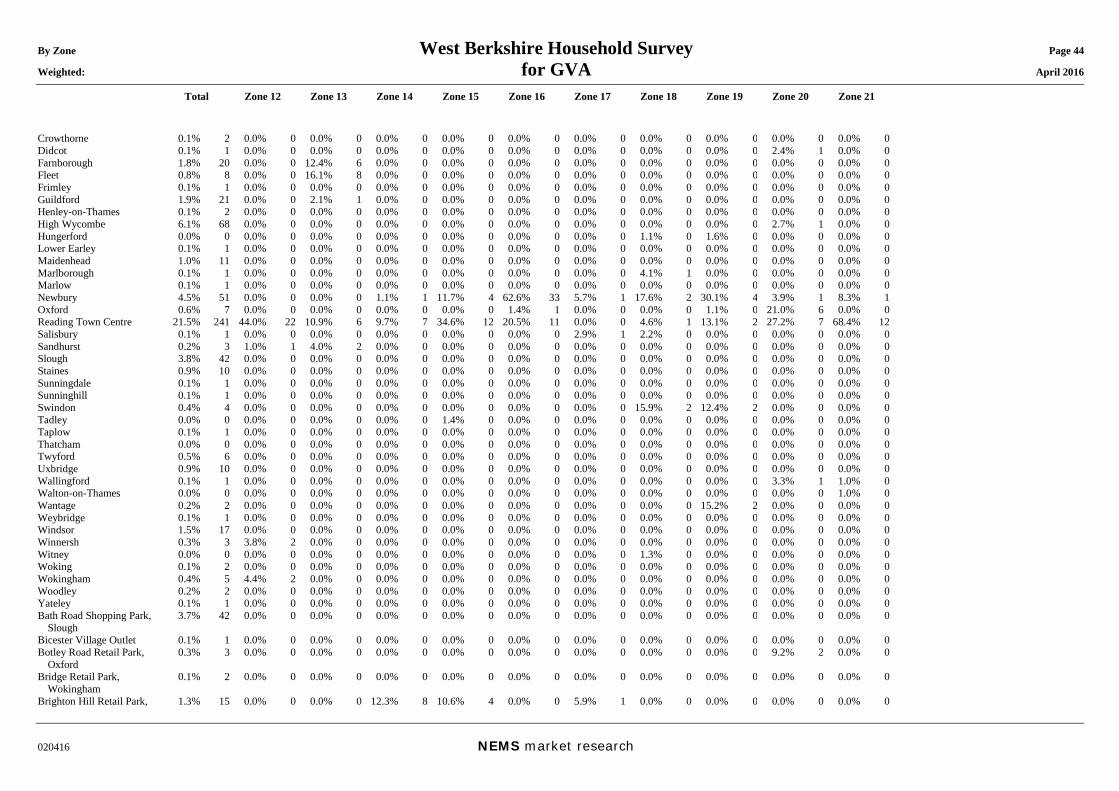
By Zone West Berkshire Household Survey Page 44 Weighted: for GVA April 2016
Total Zone 12 Zone 13 Zone 14 Zone 15 Zone 16 Zone 17 Zone 18 Zone 19 Zone 20 Zone 21
020416 NEMS market research
Crowthorne 0.1% 2 0.0% 0 0.0% 0 0.0% 0 0.0% 0 0.0% 0 0.0% 0 0.0% 0 0.0% 0 0.0% 0 0.0% 0Didcot 0.1% 1 0.0% 0 0.0% 0 0.0% 0 0.0% 0 0.0% 0 0.0% 0 0.0% 0 0.0% 0 2.4% 1 0.0% 0Farnborough 1.8% 20 0.0% 0 12.4% 6 0.0% 0 0.0% 0 0.0% 0 0.0% 0 0.0% 0 0.0% 0 0.0% 0 0.0% 0Fleet 0.8% 8 0.0% 0 16.1% 8 0.0% 0 0.0% 0 0.0% 0 0.0% 0 0.0% 0 0.0% 0 0.0% 0 0.0% 0Frimley 0.1% 1 0.0% 0 0.0% 0 0.0% 0 0.0% 0 0.0% 0 0.0% 0 0.0% 0 0.0% 0 0.0% 0 0.0% 0Guildford 1.9% 21 0.0% 0 2.1% 1 0.0% 0 0.0% 0 0.0% 0 0.0% 0 0.0% 0 0.0% 0 0.0% 0 0.0% 0Henley-on-Thames 0.1% 2 0.0% 0 0.0% 0 0.0% 0 0.0% 0 0.0% 0 0.0% 0 0.0% 0 0.0% 0 0.0% 0 0.0% 0High Wycombe 6.1% 68 0.0% 0 0.0% 0 0.0% 0 0.0% 0 0.0% 0 0.0% 0 0.0% 0 0.0% 0 2.7% 1 0.0% 0Hungerford 0.0% 0 0.0% 0 0.0% 0 0.0% 0 0.0% 0 0.0% 0 0.0% 0 1.1% 0 1.6% 0 0.0% 0 0.0% 0Lower Earley 0.1% 1 0.0% 0 0.0% 0 0.0% 0 0.0% 0 0.0% 0 0.0% 0 0.0% 0 0.0% 0 0.0% 0 0.0% 0Maidenhead 1.0% 11 0.0% 0 0.0% 0 0.0% 0 0.0% 0 0.0% 0 0.0% 0 0.0% 0 0.0% 0 0.0% 0 0.0% 0Marlborough 0.1% 1 0.0% 0 0.0% 0 0.0% 0 0.0% 0 0.0% 0 0.0% 0 4.1% 1 0.0% 0 0.0% 0 0.0% 0Marlow 0.1% 1 0.0% 0 0.0% 0 0.0% 0 0.0% 0 0.0% 0 0.0% 0 0.0% 0 0.0% 0 0.0% 0 0.0% 0Newbury 4.5% 51 0.0% 0 0.0% 0 1.1% 1 11.7% 4 62.6% 33 5.7% 1 17.6% 2 30.1% 4 3.9% 1 8.3% 1Oxford 0.6% 7 0.0% 0 0.0% 0 0.0% 0 0.0% 0 1.4% 1 0.0% 0 0.0% 0 1.1% 0 21.0% 6 0.0% 0Reading Town Centre 21.5% 241 44.0% 22 10.9% 6 9.7% 7 34.6% 12 20.5% 11 0.0% 0 4.6% 1 13.1% 2 27.2% 7 68.4% 12Salisbury 0.1% 1 0.0% 0 0.0% 0 0.0% 0 0.0% 0 0.0% 0 2.9% 1 2.2% 0 0.0% 0 0.0% 0 0.0% 0Sandhurst 0.2% 3 1.0% 1 4.0% 2 0.0% 0 0.0% 0 0.0% 0 0.0% 0 0.0% 0 0.0% 0 0.0% 0 0.0% 0Slough 3.8% 42 0.0% 0 0.0% 0 0.0% 0 0.0% 0 0.0% 0 0.0% 0 0.0% 0 0.0% 0 0.0% 0 0.0% 0Staines 0.9% 10 0.0% 0 0.0% 0 0.0% 0 0.0% 0 0.0% 0 0.0% 0 0.0% 0 0.0% 0 0.0% 0 0.0% 0Sunningdale 0.1% 1 0.0% 0 0.0% 0 0.0% 0 0.0% 0 0.0% 0 0.0% 0 0.0% 0 0.0% 0 0.0% 0 0.0% 0Sunninghill 0.1% 1 0.0% 0 0.0% 0 0.0% 0 0.0% 0 0.0% 0 0.0% 0 0.0% 0 0.0% 0 0.0% 0 0.0% 0Swindon 0.4% 4 0.0% 0 0.0% 0 0.0% 0 0.0% 0 0.0% 0 0.0% 0 15.9% 2 12.4% 2 0.0% 0 0.0% 0Tadley 0.0% 0 0.0% 0 0.0% 0 0.0% 0 1.4% 0 0.0% 0 0.0% 0 0.0% 0 0.0% 0 0.0% 0 0.0% 0Taplow 0.1% 1 0.0% 0 0.0% 0 0.0% 0 0.0% 0 0.0% 0 0.0% 0 0.0% 0 0.0% 0 0.0% 0 0.0% 0Thatcham 0.0% 0 0.0% 0 0.0% 0 0.0% 0 0.0% 0 0.0% 0 0.0% 0 0.0% 0 0.0% 0 0.0% 0 0.0% 0Twyford 0.5% 6 0.0% 0 0.0% 0 0.0% 0 0.0% 0 0.0% 0 0.0% 0 0.0% 0 0.0% 0 0.0% 0 0.0% 0Uxbridge 0.9% 10 0.0% 0 0.0% 0 0.0% 0 0.0% 0 0.0% 0 0.0% 0 0.0% 0 0.0% 0 0.0% 0 0.0% 0Wallingford 0.1% 1 0.0% 0 0.0% 0 0.0% 0 0.0% 0 0.0% 0 0.0% 0 0.0% 0 0.0% 0 3.3% 1 1.0% 0Walton-on-Thames 0.0% 0 0.0% 0 0.0% 0 0.0% 0 0.0% 0 0.0% 0 0.0% 0 0.0% 0 0.0% 0 0.0% 0 1.0% 0Wantage 0.2% 2 0.0% 0 0.0% 0 0.0% 0 0.0% 0 0.0% 0 0.0% 0 0.0% 0 15.2% 2 0.0% 0 0.0% 0Weybridge 0.1% 1 0.0% 0 0.0% 0 0.0% 0 0.0% 0 0.0% 0 0.0% 0 0.0% 0 0.0% 0 0.0% 0 0.0% 0Windsor 1.5% 17 0.0% 0 0.0% 0 0.0% 0 0.0% 0 0.0% 0 0.0% 0 0.0% 0 0.0% 0 0.0% 0 0.0% 0Winnersh 0.3% 3 3.8% 2 0.0% 0 0.0% 0 0.0% 0 0.0% 0 0.0% 0 0.0% 0 0.0% 0 0.0% 0 0.0% 0Witney 0.0% 0 0.0% 0 0.0% 0 0.0% 0 0.0% 0 0.0% 0 0.0% 0 1.3% 0 0.0% 0 0.0% 0 0.0% 0Woking 0.1% 2 0.0% 0 0.0% 0 0.0% 0 0.0% 0 0.0% 0 0.0% 0 0.0% 0 0.0% 0 0.0% 0 0.0% 0Wokingham 0.4% 5 4.4% 2 0.0% 0 0.0% 0 0.0% 0 0.0% 0 0.0% 0 0.0% 0 0.0% 0 0.0% 0 0.0% 0Woodley 0.2% 2 0.0% 0 0.0% 0 0.0% 0 0.0% 0 0.0% 0 0.0% 0 0.0% 0 0.0% 0 0.0% 0 0.0% 0Yateley 0.1% 1 0.0% 0 0.0% 0 0.0% 0 0.0% 0 0.0% 0 0.0% 0 0.0% 0 0.0% 0 0.0% 0 0.0% 0Bath Road Shopping Park,
Slough 3.7% 42 0.0% 0 0.0% 0 0.0% 0 0.0% 0 0.0% 0 0.0% 0 0.0% 0 0.0% 0 0.0% 0 0.0% 0
Bicester Village Outlet 0.1% 1 0.0% 0 0.0% 0 0.0% 0 0.0% 0 0.0% 0 0.0% 0 0.0% 0 0.0% 0 0.0% 0 0.0% 0Botley Road Retail Park,
Oxford 0.3% 3 0.0% 0 0.0% 0 0.0% 0 0.0% 0 0.0% 0 0.0% 0 0.0% 0 0.0% 0 9.2% 2 0.0% 0
Bridge Retail Park, Wokingham
0.1% 2 0.0% 0 0.0% 0 0.0% 0 0.0% 0 0.0% 0 0.0% 0 0.0% 0 0.0% 0 0.0% 0 0.0% 0
Brighton Hill Retail Park, 1.3% 15 0.0% 0 0.0% 0 12.3% 8 10.6% 4 0.0% 0 5.9% 1 0.0% 0 0.0% 0 0.0% 0 0.0% 0
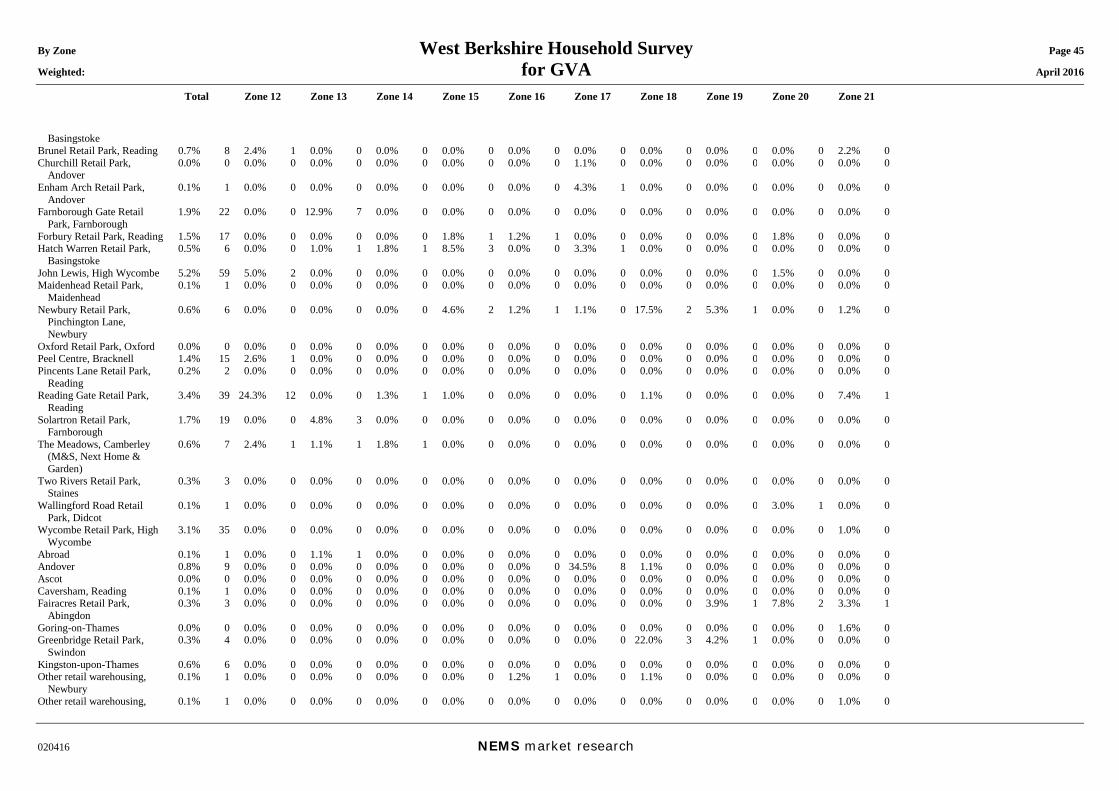
By Zone West Berkshire Household Survey Page 45 Weighted: for GVA April 2016
Total Zone 12 Zone 13 Zone 14 Zone 15 Zone 16 Zone 17 Zone 18 Zone 19 Zone 20 Zone 21
020416 NEMS market research
Basingstoke Brunel Retail Park, Reading 0.7% 8 2.4% 1 0.0% 0 0.0% 0 0.0% 0 0.0% 0 0.0% 0 0.0% 0 0.0% 0 0.0% 0 2.2% 0Churchill Retail Park,
Andover 0.0% 0 0.0% 0 0.0% 0 0.0% 0 0.0% 0 0.0% 0 1.1% 0 0.0% 0 0.0% 0 0.0% 0 0.0% 0
Enham Arch Retail Park, Andover
0.1% 1 0.0% 0 0.0% 0 0.0% 0 0.0% 0 0.0% 0 4.3% 1 0.0% 0 0.0% 0 0.0% 0 0.0% 0
Farnborough Gate Retail Park, Farnborough
1.9% 22 0.0% 0 12.9% 7 0.0% 0 0.0% 0 0.0% 0 0.0% 0 0.0% 0 0.0% 0 0.0% 0 0.0% 0
Forbury Retail Park, Reading 1.5% 17 0.0% 0 0.0% 0 0.0% 0 1.8% 1 1.2% 1 0.0% 0 0.0% 0 0.0% 0 1.8% 0 0.0% 0Hatch Warren Retail Park,
Basingstoke 0.5% 6 0.0% 0 1.0% 1 1.8% 1 8.5% 3 0.0% 0 3.3% 1 0.0% 0 0.0% 0 0.0% 0 0.0% 0
John Lewis, High Wycombe 5.2% 59 5.0% 2 0.0% 0 0.0% 0 0.0% 0 0.0% 0 0.0% 0 0.0% 0 0.0% 0 1.5% 0 0.0% 0Maidenhead Retail Park,
Maidenhead 0.1% 1 0.0% 0 0.0% 0 0.0% 0 0.0% 0 0.0% 0 0.0% 0 0.0% 0 0.0% 0 0.0% 0 0.0% 0
Newbury Retail Park, Pinchington Lane, Newbury
0.6% 6 0.0% 0 0.0% 0 0.0% 0 4.6% 2 1.2% 1 1.1% 0 17.5% 2 5.3% 1 0.0% 0 1.2% 0
Oxford Retail Park, Oxford 0.0% 0 0.0% 0 0.0% 0 0.0% 0 0.0% 0 0.0% 0 0.0% 0 0.0% 0 0.0% 0 0.0% 0 0.0% 0Peel Centre, Bracknell 1.4% 15 2.6% 1 0.0% 0 0.0% 0 0.0% 0 0.0% 0 0.0% 0 0.0% 0 0.0% 0 0.0% 0 0.0% 0Pincents Lane Retail Park,
Reading 0.2% 2 0.0% 0 0.0% 0 0.0% 0 0.0% 0 0.0% 0 0.0% 0 0.0% 0 0.0% 0 0.0% 0 0.0% 0
Reading Gate Retail Park, Reading
3.4% 39 24.3% 12 0.0% 0 1.3% 1 1.0% 0 0.0% 0 0.0% 0 1.1% 0 0.0% 0 0.0% 0 7.4% 1
Solartron Retail Park, Farnborough
1.7% 19 0.0% 0 4.8% 3 0.0% 0 0.0% 0 0.0% 0 0.0% 0 0.0% 0 0.0% 0 0.0% 0 0.0% 0
The Meadows, Camberley (M&S, Next Home & Garden)
0.6% 7 2.4% 1 1.1% 1 1.8% 1 0.0% 0 0.0% 0 0.0% 0 0.0% 0 0.0% 0 0.0% 0 0.0% 0
Two Rivers Retail Park, Staines
0.3% 3 0.0% 0 0.0% 0 0.0% 0 0.0% 0 0.0% 0 0.0% 0 0.0% 0 0.0% 0 0.0% 0 0.0% 0
Wallingford Road Retail Park, Didcot
0.1% 1 0.0% 0 0.0% 0 0.0% 0 0.0% 0 0.0% 0 0.0% 0 0.0% 0 0.0% 0 3.0% 1 0.0% 0
Wycombe Retail Park, High Wycombe
3.1% 35 0.0% 0 0.0% 0 0.0% 0 0.0% 0 0.0% 0 0.0% 0 0.0% 0 0.0% 0 0.0% 0 1.0% 0
Abroad 0.1% 1 0.0% 0 1.1% 1 0.0% 0 0.0% 0 0.0% 0 0.0% 0 0.0% 0 0.0% 0 0.0% 0 0.0% 0Andover 0.8% 9 0.0% 0 0.0% 0 0.0% 0 0.0% 0 0.0% 0 34.5% 8 1.1% 0 0.0% 0 0.0% 0 0.0% 0Ascot 0.0% 0 0.0% 0 0.0% 0 0.0% 0 0.0% 0 0.0% 0 0.0% 0 0.0% 0 0.0% 0 0.0% 0 0.0% 0Caversham, Reading 0.1% 1 0.0% 0 0.0% 0 0.0% 0 0.0% 0 0.0% 0 0.0% 0 0.0% 0 0.0% 0 0.0% 0 0.0% 0Fairacres Retail Park,
Abingdon 0.3% 3 0.0% 0 0.0% 0 0.0% 0 0.0% 0 0.0% 0 0.0% 0 0.0% 0 3.9% 1 7.8% 2 3.3% 1
Goring-on-Thames 0.0% 0 0.0% 0 0.0% 0 0.0% 0 0.0% 0 0.0% 0 0.0% 0 0.0% 0 0.0% 0 0.0% 0 1.6% 0Greenbridge Retail Park,
Swindon 0.3% 4 0.0% 0 0.0% 0 0.0% 0 0.0% 0 0.0% 0 0.0% 0 22.0% 3 4.2% 1 0.0% 0 0.0% 0
Kingston-upon-Thames 0.6% 6 0.0% 0 0.0% 0 0.0% 0 0.0% 0 0.0% 0 0.0% 0 0.0% 0 0.0% 0 0.0% 0 0.0% 0Other retail warehousing,
Newbury 0.1% 1 0.0% 0 0.0% 0 0.0% 0 0.0% 0 1.2% 1 0.0% 0 1.1% 0 0.0% 0 0.0% 0 0.0% 0
Other retail warehousing, 0.1% 1 0.0% 0 0.0% 0 0.0% 0 0.0% 0 0.0% 0 0.0% 0 0.0% 0 0.0% 0 0.0% 0 1.0% 0
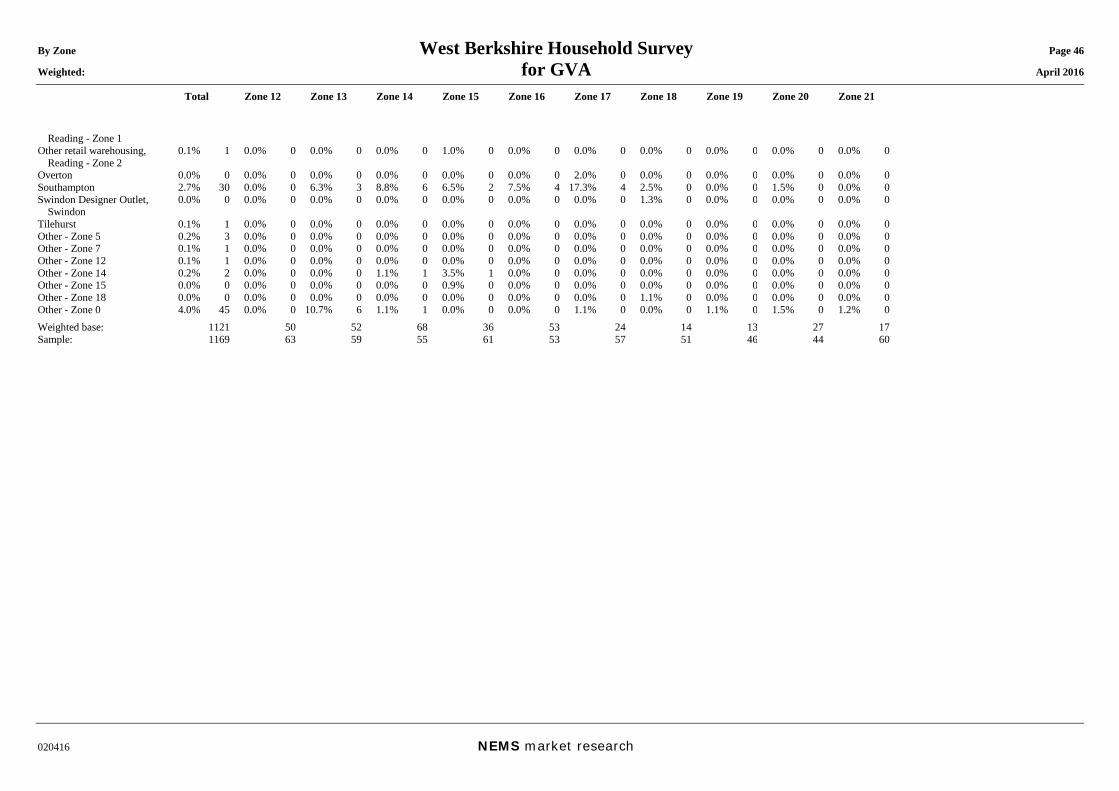
By Zone West Berkshire Household Survey Page 46 Weighted: for GVA April 2016
Total Zone 12 Zone 13 Zone 14 Zone 15 Zone 16 Zone 17 Zone 18 Zone 19 Zone 20 Zone 21
020416 NEMS market research
Reading - Zone 1 Other retail warehousing,
Reading - Zone 2 0.1% 1 0.0% 0 0.0% 0 0.0% 0 1.0% 0 0.0% 0 0.0% 0 0.0% 0 0.0% 0 0.0% 0 0.0% 0
Overton 0.0% 0 0.0% 0 0.0% 0 0.0% 0 0.0% 0 0.0% 0 2.0% 0 0.0% 0 0.0% 0 0.0% 0 0.0% 0Southampton 2.7% 30 0.0% 0 6.3% 3 8.8% 6 6.5% 2 7.5% 4 17.3% 4 2.5% 0 0.0% 0 1.5% 0 0.0% 0Swindon Designer Outlet,
Swindon 0.0% 0 0.0% 0 0.0% 0 0.0% 0 0.0% 0 0.0% 0 0.0% 0 1.3% 0 0.0% 0 0.0% 0 0.0% 0
Tilehurst 0.1% 1 0.0% 0 0.0% 0 0.0% 0 0.0% 0 0.0% 0 0.0% 0 0.0% 0 0.0% 0 0.0% 0 0.0% 0Other - Zone 5 0.2% 3 0.0% 0 0.0% 0 0.0% 0 0.0% 0 0.0% 0 0.0% 0 0.0% 0 0.0% 0 0.0% 0 0.0% 0Other - Zone 7 0.1% 1 0.0% 0 0.0% 0 0.0% 0 0.0% 0 0.0% 0 0.0% 0 0.0% 0 0.0% 0 0.0% 0 0.0% 0Other - Zone 12 0.1% 1 0.0% 0 0.0% 0 0.0% 0 0.0% 0 0.0% 0 0.0% 0 0.0% 0 0.0% 0 0.0% 0 0.0% 0Other - Zone 14 0.2% 2 0.0% 0 0.0% 0 1.1% 1 3.5% 1 0.0% 0 0.0% 0 0.0% 0 0.0% 0 0.0% 0 0.0% 0Other - Zone 15 0.0% 0 0.0% 0 0.0% 0 0.0% 0 0.9% 0 0.0% 0 0.0% 0 0.0% 0 0.0% 0 0.0% 0 0.0% 0Other - Zone 18 0.0% 0 0.0% 0 0.0% 0 0.0% 0 0.0% 0 0.0% 0 0.0% 0 1.1% 0 0.0% 0 0.0% 0 0.0% 0Other - Zone 0 4.0% 45 0.0% 0 10.7% 6 1.1% 1 0.0% 0 0.0% 0 1.1% 0 0.0% 0 1.1% 0 1.5% 0 1.2% 0Weighted base: 1121 50 52 68 36 53 24 14 13 27 17Sample: 1169 63 59 55 61 53 57 51 46 44 60
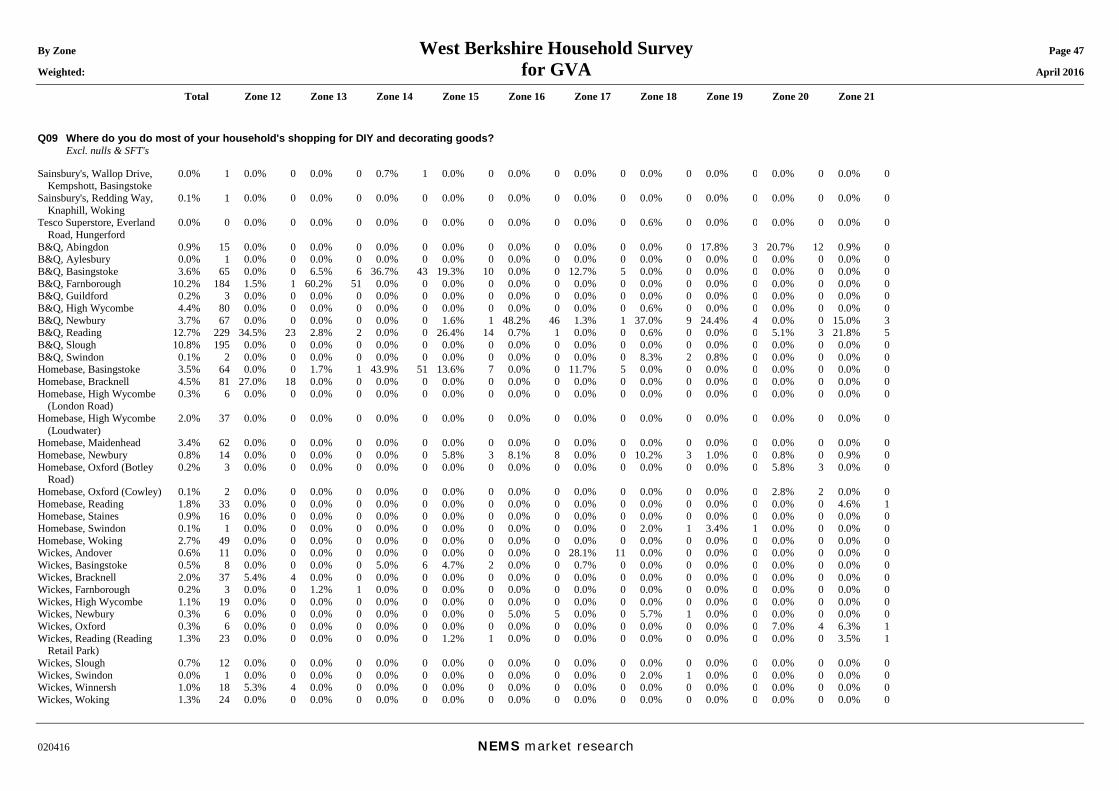
By Zone West Berkshire Household Survey Page 47 Weighted: for GVA April 2016
Total Zone 12 Zone 13 Zone 14 Zone 15 Zone 16 Zone 17 Zone 18 Zone 19 Zone 20 Zone 21
020416 NEMS market research
Q09 Where do you do most of your household's shopping for DIY and decorating goods? Excl. nulls & SFT's Sainsbury's, Wallop Drive,
Kempshott, Basingstoke 0.0% 1 0.0% 0 0.0% 0 0.7% 1 0.0% 0 0.0% 0 0.0% 0 0.0% 0 0.0% 0 0.0% 0 0.0% 0
Sainsbury's, Redding Way, Knaphill, Woking
0.1% 1 0.0% 0 0.0% 0 0.0% 0 0.0% 0 0.0% 0 0.0% 0 0.0% 0 0.0% 0 0.0% 0 0.0% 0
Tesco Superstore, Everland Road, Hungerford
0.0% 0 0.0% 0 0.0% 0 0.0% 0 0.0% 0 0.0% 0 0.0% 0 0.6% 0 0.0% 0 0.0% 0 0.0% 0
B&Q, Abingdon 0.9% 15 0.0% 0 0.0% 0 0.0% 0 0.0% 0 0.0% 0 0.0% 0 0.0% 0 17.8% 3 20.7% 12 0.9% 0B&Q, Aylesbury 0.0% 1 0.0% 0 0.0% 0 0.0% 0 0.0% 0 0.0% 0 0.0% 0 0.0% 0 0.0% 0 0.0% 0 0.0% 0B&Q, Basingstoke 3.6% 65 0.0% 0 6.5% 6 36.7% 43 19.3% 10 0.0% 0 12.7% 5 0.0% 0 0.0% 0 0.0% 0 0.0% 0B&Q, Farnborough 10.2% 184 1.5% 1 60.2% 51 0.0% 0 0.0% 0 0.0% 0 0.0% 0 0.0% 0 0.0% 0 0.0% 0 0.0% 0B&Q, Guildford 0.2% 3 0.0% 0 0.0% 0 0.0% 0 0.0% 0 0.0% 0 0.0% 0 0.0% 0 0.0% 0 0.0% 0 0.0% 0B&Q, High Wycombe 4.4% 80 0.0% 0 0.0% 0 0.0% 0 0.0% 0 0.0% 0 0.0% 0 0.6% 0 0.0% 0 0.0% 0 0.0% 0B&Q, Newbury 3.7% 67 0.0% 0 0.0% 0 0.0% 0 1.6% 1 48.2% 46 1.3% 1 37.0% 9 24.4% 4 0.0% 0 15.0% 3B&Q, Reading 12.7% 229 34.5% 23 2.8% 2 0.0% 0 26.4% 14 0.7% 1 0.0% 0 0.6% 0 0.0% 0 5.1% 3 21.8% 5B&Q, Slough 10.8% 195 0.0% 0 0.0% 0 0.0% 0 0.0% 0 0.0% 0 0.0% 0 0.0% 0 0.0% 0 0.0% 0 0.0% 0B&Q, Swindon 0.1% 2 0.0% 0 0.0% 0 0.0% 0 0.0% 0 0.0% 0 0.0% 0 8.3% 2 0.8% 0 0.0% 0 0.0% 0Homebase, Basingstoke 3.5% 64 0.0% 0 1.7% 1 43.9% 51 13.6% 7 0.0% 0 11.7% 5 0.0% 0 0.0% 0 0.0% 0 0.0% 0Homebase, Bracknell 4.5% 81 27.0% 18 0.0% 0 0.0% 0 0.0% 0 0.0% 0 0.0% 0 0.0% 0 0.0% 0 0.0% 0 0.0% 0Homebase, High Wycombe
(London Road) 0.3% 6 0.0% 0 0.0% 0 0.0% 0 0.0% 0 0.0% 0 0.0% 0 0.0% 0 0.0% 0 0.0% 0 0.0% 0
Homebase, High Wycombe (Loudwater)
2.0% 37 0.0% 0 0.0% 0 0.0% 0 0.0% 0 0.0% 0 0.0% 0 0.0% 0 0.0% 0 0.0% 0 0.0% 0
Homebase, Maidenhead 3.4% 62 0.0% 0 0.0% 0 0.0% 0 0.0% 0 0.0% 0 0.0% 0 0.0% 0 0.0% 0 0.0% 0 0.0% 0Homebase, Newbury 0.8% 14 0.0% 0 0.0% 0 0.0% 0 5.8% 3 8.1% 8 0.0% 0 10.2% 3 1.0% 0 0.8% 0 0.9% 0Homebase, Oxford (Botley
Road) 0.2% 3 0.0% 0 0.0% 0 0.0% 0 0.0% 0 0.0% 0 0.0% 0 0.0% 0 0.0% 0 5.8% 3 0.0% 0
Homebase, Oxford (Cowley) 0.1% 2 0.0% 0 0.0% 0 0.0% 0 0.0% 0 0.0% 0 0.0% 0 0.0% 0 0.0% 0 2.8% 2 0.0% 0Homebase, Reading 1.8% 33 0.0% 0 0.0% 0 0.0% 0 0.0% 0 0.0% 0 0.0% 0 0.0% 0 0.0% 0 0.0% 0 4.6% 1Homebase, Staines 0.9% 16 0.0% 0 0.0% 0 0.0% 0 0.0% 0 0.0% 0 0.0% 0 0.0% 0 0.0% 0 0.0% 0 0.0% 0Homebase, Swindon 0.1% 1 0.0% 0 0.0% 0 0.0% 0 0.0% 0 0.0% 0 0.0% 0 2.0% 1 3.4% 1 0.0% 0 0.0% 0Homebase, Woking 2.7% 49 0.0% 0 0.0% 0 0.0% 0 0.0% 0 0.0% 0 0.0% 0 0.0% 0 0.0% 0 0.0% 0 0.0% 0Wickes, Andover 0.6% 11 0.0% 0 0.0% 0 0.0% 0 0.0% 0 0.0% 0 28.1% 11 0.0% 0 0.0% 0 0.0% 0 0.0% 0Wickes, Basingstoke 0.5% 8 0.0% 0 0.0% 0 5.0% 6 4.7% 2 0.0% 0 0.7% 0 0.0% 0 0.0% 0 0.0% 0 0.0% 0Wickes, Bracknell 2.0% 37 5.4% 4 0.0% 0 0.0% 0 0.0% 0 0.0% 0 0.0% 0 0.0% 0 0.0% 0 0.0% 0 0.0% 0Wickes, Farnborough 0.2% 3 0.0% 0 1.2% 1 0.0% 0 0.0% 0 0.0% 0 0.0% 0 0.0% 0 0.0% 0 0.0% 0 0.0% 0Wickes, High Wycombe 1.1% 19 0.0% 0 0.0% 0 0.0% 0 0.0% 0 0.0% 0 0.0% 0 0.0% 0 0.0% 0 0.0% 0 0.0% 0Wickes, Newbury 0.3% 6 0.0% 0 0.0% 0 0.0% 0 0.0% 0 5.0% 5 0.0% 0 5.7% 1 0.0% 0 0.0% 0 0.0% 0Wickes, Oxford 0.3% 6 0.0% 0 0.0% 0 0.0% 0 0.0% 0 0.0% 0 0.0% 0 0.0% 0 0.0% 0 7.0% 4 6.3% 1Wickes, Reading (Reading
Retail Park) 1.3% 23 0.0% 0 0.0% 0 0.0% 0 1.2% 1 0.0% 0 0.0% 0 0.0% 0 0.0% 0 0.0% 0 3.5% 1
Wickes, Slough 0.7% 12 0.0% 0 0.0% 0 0.0% 0 0.0% 0 0.0% 0 0.0% 0 0.0% 0 0.0% 0 0.0% 0 0.0% 0Wickes, Swindon 0.0% 1 0.0% 0 0.0% 0 0.0% 0 0.0% 0 0.0% 0 0.0% 0 2.0% 1 0.0% 0 0.0% 0 0.0% 0Wickes, Winnersh 1.0% 18 5.3% 4 0.0% 0 0.0% 0 0.0% 0 0.0% 0 0.0% 0 0.0% 0 0.0% 0 0.0% 0 0.0% 0Wickes, Woking 1.3% 24 0.0% 0 0.0% 0 0.0% 0 0.0% 0 0.0% 0 0.0% 0 0.0% 0 0.0% 0 0.0% 0 0.0% 0
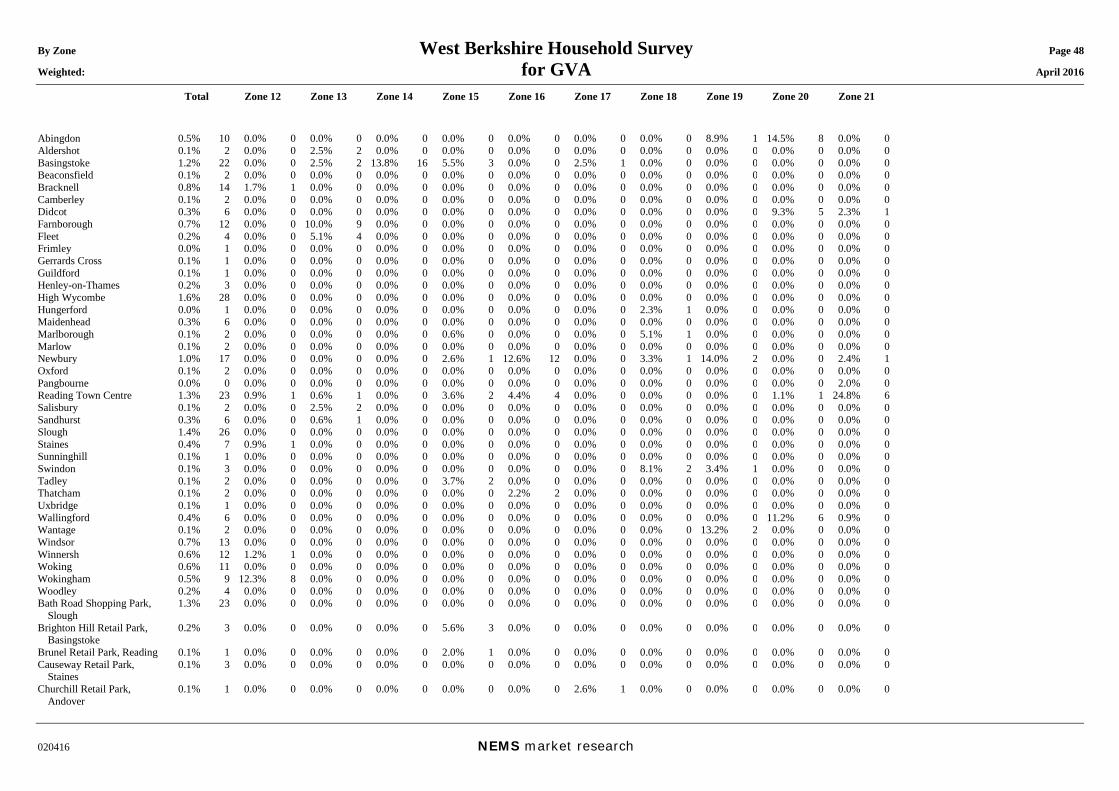
By Zone West Berkshire Household Survey Page 48 Weighted: for GVA April 2016
Total Zone 12 Zone 13 Zone 14 Zone 15 Zone 16 Zone 17 Zone 18 Zone 19 Zone 20 Zone 21
020416 NEMS market research
Abingdon 0.5% 10 0.0% 0 0.0% 0 0.0% 0 0.0% 0 0.0% 0 0.0% 0 0.0% 0 8.9% 1 14.5% 8 0.0% 0Aldershot 0.1% 2 0.0% 0 2.5% 2 0.0% 0 0.0% 0 0.0% 0 0.0% 0 0.0% 0 0.0% 0 0.0% 0 0.0% 0Basingstoke 1.2% 22 0.0% 0 2.5% 2 13.8% 16 5.5% 3 0.0% 0 2.5% 1 0.0% 0 0.0% 0 0.0% 0 0.0% 0Beaconsfield 0.1% 2 0.0% 0 0.0% 0 0.0% 0 0.0% 0 0.0% 0 0.0% 0 0.0% 0 0.0% 0 0.0% 0 0.0% 0Bracknell 0.8% 14 1.7% 1 0.0% 0 0.0% 0 0.0% 0 0.0% 0 0.0% 0 0.0% 0 0.0% 0 0.0% 0 0.0% 0Camberley 0.1% 2 0.0% 0 0.0% 0 0.0% 0 0.0% 0 0.0% 0 0.0% 0 0.0% 0 0.0% 0 0.0% 0 0.0% 0Didcot 0.3% 6 0.0% 0 0.0% 0 0.0% 0 0.0% 0 0.0% 0 0.0% 0 0.0% 0 0.0% 0 9.3% 5 2.3% 1Farnborough 0.7% 12 0.0% 0 10.0% 9 0.0% 0 0.0% 0 0.0% 0 0.0% 0 0.0% 0 0.0% 0 0.0% 0 0.0% 0Fleet 0.2% 4 0.0% 0 5.1% 4 0.0% 0 0.0% 0 0.0% 0 0.0% 0 0.0% 0 0.0% 0 0.0% 0 0.0% 0Frimley 0.0% 1 0.0% 0 0.0% 0 0.0% 0 0.0% 0 0.0% 0 0.0% 0 0.0% 0 0.0% 0 0.0% 0 0.0% 0Gerrards Cross 0.1% 1 0.0% 0 0.0% 0 0.0% 0 0.0% 0 0.0% 0 0.0% 0 0.0% 0 0.0% 0 0.0% 0 0.0% 0Guildford 0.1% 1 0.0% 0 0.0% 0 0.0% 0 0.0% 0 0.0% 0 0.0% 0 0.0% 0 0.0% 0 0.0% 0 0.0% 0Henley-on-Thames 0.2% 3 0.0% 0 0.0% 0 0.0% 0 0.0% 0 0.0% 0 0.0% 0 0.0% 0 0.0% 0 0.0% 0 0.0% 0High Wycombe 1.6% 28 0.0% 0 0.0% 0 0.0% 0 0.0% 0 0.0% 0 0.0% 0 0.0% 0 0.0% 0 0.0% 0 0.0% 0Hungerford 0.0% 1 0.0% 0 0.0% 0 0.0% 0 0.0% 0 0.0% 0 0.0% 0 2.3% 1 0.0% 0 0.0% 0 0.0% 0Maidenhead 0.3% 6 0.0% 0 0.0% 0 0.0% 0 0.0% 0 0.0% 0 0.0% 0 0.0% 0 0.0% 0 0.0% 0 0.0% 0Marlborough 0.1% 2 0.0% 0 0.0% 0 0.0% 0 0.6% 0 0.0% 0 0.0% 0 5.1% 1 0.0% 0 0.0% 0 0.0% 0Marlow 0.1% 2 0.0% 0 0.0% 0 0.0% 0 0.0% 0 0.0% 0 0.0% 0 0.0% 0 0.0% 0 0.0% 0 0.0% 0Newbury 1.0% 17 0.0% 0 0.0% 0 0.0% 0 2.6% 1 12.6% 12 0.0% 0 3.3% 1 14.0% 2 0.0% 0 2.4% 1Oxford 0.1% 2 0.0% 0 0.0% 0 0.0% 0 0.0% 0 0.0% 0 0.0% 0 0.0% 0 0.0% 0 0.0% 0 0.0% 0Pangbourne 0.0% 0 0.0% 0 0.0% 0 0.0% 0 0.0% 0 0.0% 0 0.0% 0 0.0% 0 0.0% 0 0.0% 0 2.0% 0Reading Town Centre 1.3% 23 0.9% 1 0.6% 1 0.0% 0 3.6% 2 4.4% 4 0.0% 0 0.0% 0 0.0% 0 1.1% 1 24.8% 6Salisbury 0.1% 2 0.0% 0 2.5% 2 0.0% 0 0.0% 0 0.0% 0 0.0% 0 0.0% 0 0.0% 0 0.0% 0 0.0% 0Sandhurst 0.3% 6 0.0% 0 0.6% 1 0.0% 0 0.0% 0 0.0% 0 0.0% 0 0.0% 0 0.0% 0 0.0% 0 0.0% 0Slough 1.4% 26 0.0% 0 0.0% 0 0.0% 0 0.0% 0 0.0% 0 0.0% 0 0.0% 0 0.0% 0 0.0% 0 0.0% 0Staines 0.4% 7 0.9% 1 0.0% 0 0.0% 0 0.0% 0 0.0% 0 0.0% 0 0.0% 0 0.0% 0 0.0% 0 0.0% 0Sunninghill 0.1% 1 0.0% 0 0.0% 0 0.0% 0 0.0% 0 0.0% 0 0.0% 0 0.0% 0 0.0% 0 0.0% 0 0.0% 0Swindon 0.1% 3 0.0% 0 0.0% 0 0.0% 0 0.0% 0 0.0% 0 0.0% 0 8.1% 2 3.4% 1 0.0% 0 0.0% 0Tadley 0.1% 2 0.0% 0 0.0% 0 0.0% 0 3.7% 2 0.0% 0 0.0% 0 0.0% 0 0.0% 0 0.0% 0 0.0% 0Thatcham 0.1% 2 0.0% 0 0.0% 0 0.0% 0 0.0% 0 2.2% 2 0.0% 0 0.0% 0 0.0% 0 0.0% 0 0.0% 0Uxbridge 0.1% 1 0.0% 0 0.0% 0 0.0% 0 0.0% 0 0.0% 0 0.0% 0 0.0% 0 0.0% 0 0.0% 0 0.0% 0Wallingford 0.4% 6 0.0% 0 0.0% 0 0.0% 0 0.0% 0 0.0% 0 0.0% 0 0.0% 0 0.0% 0 11.2% 6 0.9% 0Wantage 0.1% 2 0.0% 0 0.0% 0 0.0% 0 0.0% 0 0.0% 0 0.0% 0 0.0% 0 13.2% 2 0.0% 0 0.0% 0Windsor 0.7% 13 0.0% 0 0.0% 0 0.0% 0 0.0% 0 0.0% 0 0.0% 0 0.0% 0 0.0% 0 0.0% 0 0.0% 0Winnersh 0.6% 12 1.2% 1 0.0% 0 0.0% 0 0.0% 0 0.0% 0 0.0% 0 0.0% 0 0.0% 0 0.0% 0 0.0% 0Woking 0.6% 11 0.0% 0 0.0% 0 0.0% 0 0.0% 0 0.0% 0 0.0% 0 0.0% 0 0.0% 0 0.0% 0 0.0% 0Wokingham 0.5% 9 12.3% 8 0.0% 0 0.0% 0 0.0% 0 0.0% 0 0.0% 0 0.0% 0 0.0% 0 0.0% 0 0.0% 0Woodley 0.2% 4 0.0% 0 0.0% 0 0.0% 0 0.0% 0 0.0% 0 0.0% 0 0.0% 0 0.0% 0 0.0% 0 0.0% 0Bath Road Shopping Park,
Slough 1.3% 23 0.0% 0 0.0% 0 0.0% 0 0.0% 0 0.0% 0 0.0% 0 0.0% 0 0.0% 0 0.0% 0 0.0% 0
Brighton Hill Retail Park, Basingstoke
0.2% 3 0.0% 0 0.0% 0 0.0% 0 5.6% 3 0.0% 0 0.0% 0 0.0% 0 0.0% 0 0.0% 0 0.0% 0
Brunel Retail Park, Reading 0.1% 1 0.0% 0 0.0% 0 0.0% 0 2.0% 1 0.0% 0 0.0% 0 0.0% 0 0.0% 0 0.0% 0 0.0% 0Causeway Retail Park,
Staines 0.1% 3 0.0% 0 0.0% 0 0.0% 0 0.0% 0 0.0% 0 0.0% 0 0.0% 0 0.0% 0 0.0% 0 0.0% 0
Churchill Retail Park, Andover
0.1% 1 0.0% 0 0.0% 0 0.0% 0 0.0% 0 0.0% 0 2.6% 1 0.0% 0 0.0% 0 0.0% 0 0.0% 0
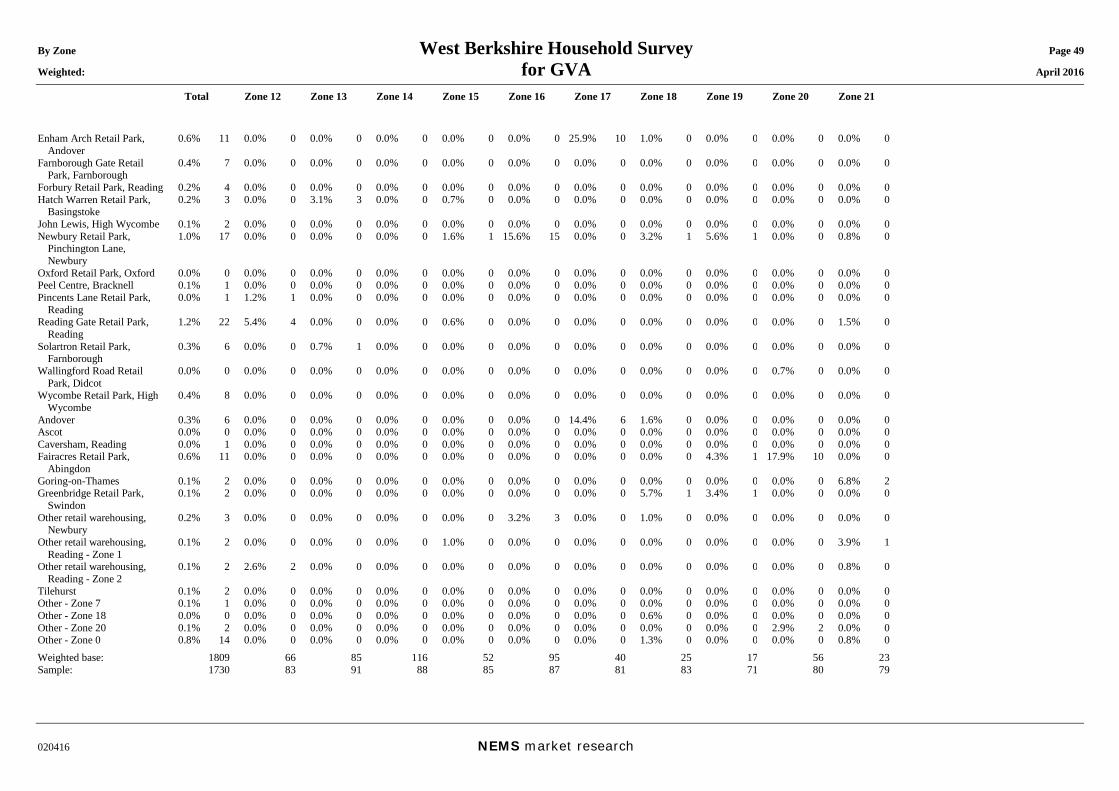
By Zone West Berkshire Household Survey Page 49 Weighted: for GVA April 2016
Total Zone 12 Zone 13 Zone 14 Zone 15 Zone 16 Zone 17 Zone 18 Zone 19 Zone 20 Zone 21
020416 NEMS market research
Enham Arch Retail Park, Andover
0.6% 11 0.0% 0 0.0% 0 0.0% 0 0.0% 0 0.0% 0 25.9% 10 1.0% 0 0.0% 0 0.0% 0 0.0% 0
Farnborough Gate Retail Park, Farnborough
0.4% 7 0.0% 0 0.0% 0 0.0% 0 0.0% 0 0.0% 0 0.0% 0 0.0% 0 0.0% 0 0.0% 0 0.0% 0
Forbury Retail Park, Reading 0.2% 4 0.0% 0 0.0% 0 0.0% 0 0.0% 0 0.0% 0 0.0% 0 0.0% 0 0.0% 0 0.0% 0 0.0% 0Hatch Warren Retail Park,
Basingstoke 0.2% 3 0.0% 0 3.1% 3 0.0% 0 0.7% 0 0.0% 0 0.0% 0 0.0% 0 0.0% 0 0.0% 0 0.0% 0
John Lewis, High Wycombe 0.1% 2 0.0% 0 0.0% 0 0.0% 0 0.0% 0 0.0% 0 0.0% 0 0.0% 0 0.0% 0 0.0% 0 0.0% 0Newbury Retail Park,
Pinchington Lane, Newbury
1.0% 17 0.0% 0 0.0% 0 0.0% 0 1.6% 1 15.6% 15 0.0% 0 3.2% 1 5.6% 1 0.0% 0 0.8% 0
Oxford Retail Park, Oxford 0.0% 0 0.0% 0 0.0% 0 0.0% 0 0.0% 0 0.0% 0 0.0% 0 0.0% 0 0.0% 0 0.0% 0 0.0% 0Peel Centre, Bracknell 0.1% 1 0.0% 0 0.0% 0 0.0% 0 0.0% 0 0.0% 0 0.0% 0 0.0% 0 0.0% 0 0.0% 0 0.0% 0Pincents Lane Retail Park,
Reading 0.0% 1 1.2% 1 0.0% 0 0.0% 0 0.0% 0 0.0% 0 0.0% 0 0.0% 0 0.0% 0 0.0% 0 0.0% 0
Reading Gate Retail Park, Reading
1.2% 22 5.4% 4 0.0% 0 0.0% 0 0.6% 0 0.0% 0 0.0% 0 0.0% 0 0.0% 0 0.0% 0 1.5% 0
Solartron Retail Park, Farnborough
0.3% 6 0.0% 0 0.7% 1 0.0% 0 0.0% 0 0.0% 0 0.0% 0 0.0% 0 0.0% 0 0.0% 0 0.0% 0
Wallingford Road Retail Park, Didcot
0.0% 0 0.0% 0 0.0% 0 0.0% 0 0.0% 0 0.0% 0 0.0% 0 0.0% 0 0.0% 0 0.7% 0 0.0% 0
Wycombe Retail Park, High Wycombe
0.4% 8 0.0% 0 0.0% 0 0.0% 0 0.0% 0 0.0% 0 0.0% 0 0.0% 0 0.0% 0 0.0% 0 0.0% 0
Andover 0.3% 6 0.0% 0 0.0% 0 0.0% 0 0.0% 0 0.0% 0 14.4% 6 1.6% 0 0.0% 0 0.0% 0 0.0% 0Ascot 0.0% 0 0.0% 0 0.0% 0 0.0% 0 0.0% 0 0.0% 0 0.0% 0 0.0% 0 0.0% 0 0.0% 0 0.0% 0Caversham, Reading 0.0% 1 0.0% 0 0.0% 0 0.0% 0 0.0% 0 0.0% 0 0.0% 0 0.0% 0 0.0% 0 0.0% 0 0.0% 0Fairacres Retail Park,
Abingdon 0.6% 11 0.0% 0 0.0% 0 0.0% 0 0.0% 0 0.0% 0 0.0% 0 0.0% 0 4.3% 1 17.9% 10 0.0% 0
Goring-on-Thames 0.1% 2 0.0% 0 0.0% 0 0.0% 0 0.0% 0 0.0% 0 0.0% 0 0.0% 0 0.0% 0 0.0% 0 6.8% 2Greenbridge Retail Park,
Swindon 0.1% 2 0.0% 0 0.0% 0 0.0% 0 0.0% 0 0.0% 0 0.0% 0 5.7% 1 3.4% 1 0.0% 0 0.0% 0
Other retail warehousing, Newbury
0.2% 3 0.0% 0 0.0% 0 0.0% 0 0.0% 0 3.2% 3 0.0% 0 1.0% 0 0.0% 0 0.0% 0 0.0% 0
Other retail warehousing, Reading - Zone 1
0.1% 2 0.0% 0 0.0% 0 0.0% 0 1.0% 0 0.0% 0 0.0% 0 0.0% 0 0.0% 0 0.0% 0 3.9% 1
Other retail warehousing, Reading - Zone 2
0.1% 2 2.6% 2 0.0% 0 0.0% 0 0.0% 0 0.0% 0 0.0% 0 0.0% 0 0.0% 0 0.0% 0 0.8% 0
Tilehurst 0.1% 2 0.0% 0 0.0% 0 0.0% 0 0.0% 0 0.0% 0 0.0% 0 0.0% 0 0.0% 0 0.0% 0 0.0% 0Other - Zone 7 0.1% 1 0.0% 0 0.0% 0 0.0% 0 0.0% 0 0.0% 0 0.0% 0 0.0% 0 0.0% 0 0.0% 0 0.0% 0Other - Zone 18 0.0% 0 0.0% 0 0.0% 0 0.0% 0 0.0% 0 0.0% 0 0.0% 0 0.6% 0 0.0% 0 0.0% 0 0.0% 0Other - Zone 20 0.1% 2 0.0% 0 0.0% 0 0.0% 0 0.0% 0 0.0% 0 0.0% 0 0.0% 0 0.0% 0 2.9% 2 0.0% 0Other - Zone 0 0.8% 14 0.0% 0 0.0% 0 0.0% 0 0.0% 0 0.0% 0 0.0% 0 1.3% 0 0.0% 0 0.0% 0 0.8% 0Weighted base: 1809 66 85 116 52 95 40 25 17 56 23Sample: 1730 83 91 88 85 87 81 83 71 80 79
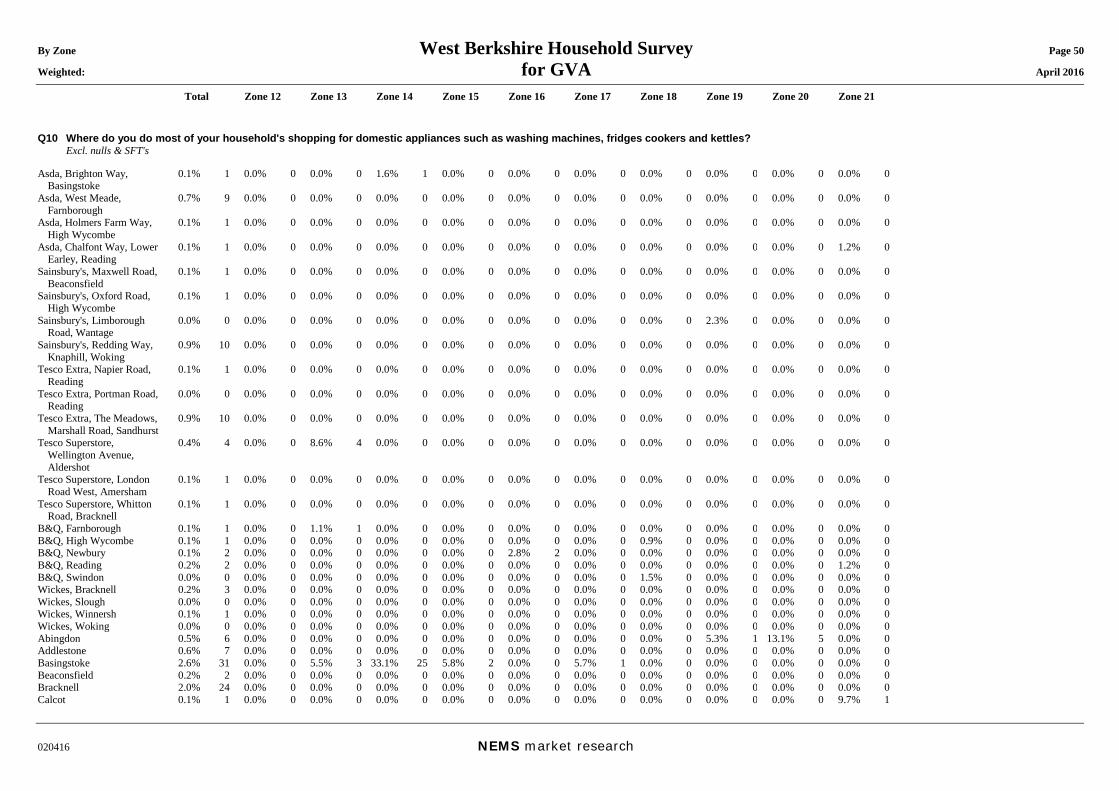
By Zone West Berkshire Household Survey Page 50 Weighted: for GVA April 2016
Total Zone 12 Zone 13 Zone 14 Zone 15 Zone 16 Zone 17 Zone 18 Zone 19 Zone 20 Zone 21
020416 NEMS market research
Q10 Where do you do most of your household's shopping for domestic appliances such as washing machines, fridges cookers and kettles? Excl. nulls & SFT's Asda, Brighton Way,
Basingstoke 0.1% 1 0.0% 0 0.0% 0 1.6% 1 0.0% 0 0.0% 0 0.0% 0 0.0% 0 0.0% 0 0.0% 0 0.0% 0
Asda, West Meade, Farnborough
0.7% 9 0.0% 0 0.0% 0 0.0% 0 0.0% 0 0.0% 0 0.0% 0 0.0% 0 0.0% 0 0.0% 0 0.0% 0
Asda, Holmers Farm Way, High Wycombe
0.1% 1 0.0% 0 0.0% 0 0.0% 0 0.0% 0 0.0% 0 0.0% 0 0.0% 0 0.0% 0 0.0% 0 0.0% 0
Asda, Chalfont Way, Lower Earley, Reading
0.1% 1 0.0% 0 0.0% 0 0.0% 0 0.0% 0 0.0% 0 0.0% 0 0.0% 0 0.0% 0 0.0% 0 1.2% 0
Sainsbury's, Maxwell Road, Beaconsfield
0.1% 1 0.0% 0 0.0% 0 0.0% 0 0.0% 0 0.0% 0 0.0% 0 0.0% 0 0.0% 0 0.0% 0 0.0% 0
Sainsbury's, Oxford Road, High Wycombe
0.1% 1 0.0% 0 0.0% 0 0.0% 0 0.0% 0 0.0% 0 0.0% 0 0.0% 0 0.0% 0 0.0% 0 0.0% 0
Sainsbury's, Limborough Road, Wantage
0.0% 0 0.0% 0 0.0% 0 0.0% 0 0.0% 0 0.0% 0 0.0% 0 0.0% 0 2.3% 0 0.0% 0 0.0% 0
Sainsbury's, Redding Way, Knaphill, Woking
0.9% 10 0.0% 0 0.0% 0 0.0% 0 0.0% 0 0.0% 0 0.0% 0 0.0% 0 0.0% 0 0.0% 0 0.0% 0
Tesco Extra, Napier Road, Reading
0.1% 1 0.0% 0 0.0% 0 0.0% 0 0.0% 0 0.0% 0 0.0% 0 0.0% 0 0.0% 0 0.0% 0 0.0% 0
Tesco Extra, Portman Road, Reading
0.0% 0 0.0% 0 0.0% 0 0.0% 0 0.0% 0 0.0% 0 0.0% 0 0.0% 0 0.0% 0 0.0% 0 0.0% 0
Tesco Extra, The Meadows, Marshall Road, Sandhurst
0.9% 10 0.0% 0 0.0% 0 0.0% 0 0.0% 0 0.0% 0 0.0% 0 0.0% 0 0.0% 0 0.0% 0 0.0% 0
Tesco Superstore, Wellington Avenue, Aldershot
0.4% 4 0.0% 0 8.6% 4 0.0% 0 0.0% 0 0.0% 0 0.0% 0 0.0% 0 0.0% 0 0.0% 0 0.0% 0
Tesco Superstore, London Road West, Amersham
0.1% 1 0.0% 0 0.0% 0 0.0% 0 0.0% 0 0.0% 0 0.0% 0 0.0% 0 0.0% 0 0.0% 0 0.0% 0
Tesco Superstore, Whitton Road, Bracknell
0.1% 1 0.0% 0 0.0% 0 0.0% 0 0.0% 0 0.0% 0 0.0% 0 0.0% 0 0.0% 0 0.0% 0 0.0% 0
B&Q, Farnborough 0.1% 1 0.0% 0 1.1% 1 0.0% 0 0.0% 0 0.0% 0 0.0% 0 0.0% 0 0.0% 0 0.0% 0 0.0% 0B&Q, High Wycombe 0.1% 1 0.0% 0 0.0% 0 0.0% 0 0.0% 0 0.0% 0 0.0% 0 0.9% 0 0.0% 0 0.0% 0 0.0% 0B&Q, Newbury 0.1% 2 0.0% 0 0.0% 0 0.0% 0 0.0% 0 2.8% 2 0.0% 0 0.0% 0 0.0% 0 0.0% 0 0.0% 0B&Q, Reading 0.2% 2 0.0% 0 0.0% 0 0.0% 0 0.0% 0 0.0% 0 0.0% 0 0.0% 0 0.0% 0 0.0% 0 1.2% 0B&Q, Swindon 0.0% 0 0.0% 0 0.0% 0 0.0% 0 0.0% 0 0.0% 0 0.0% 0 1.5% 0 0.0% 0 0.0% 0 0.0% 0Wickes, Bracknell 0.2% 3 0.0% 0 0.0% 0 0.0% 0 0.0% 0 0.0% 0 0.0% 0 0.0% 0 0.0% 0 0.0% 0 0.0% 0Wickes, Slough 0.0% 0 0.0% 0 0.0% 0 0.0% 0 0.0% 0 0.0% 0 0.0% 0 0.0% 0 0.0% 0 0.0% 0 0.0% 0Wickes, Winnersh 0.1% 1 0.0% 0 0.0% 0 0.0% 0 0.0% 0 0.0% 0 0.0% 0 0.0% 0 0.0% 0 0.0% 0 0.0% 0Wickes, Woking 0.0% 0 0.0% 0 0.0% 0 0.0% 0 0.0% 0 0.0% 0 0.0% 0 0.0% 0 0.0% 0 0.0% 0 0.0% 0Abingdon 0.5% 6 0.0% 0 0.0% 0 0.0% 0 0.0% 0 0.0% 0 0.0% 0 0.0% 0 5.3% 1 13.1% 5 0.0% 0Addlestone 0.6% 7 0.0% 0 0.0% 0 0.0% 0 0.0% 0 0.0% 0 0.0% 0 0.0% 0 0.0% 0 0.0% 0 0.0% 0Basingstoke 2.6% 31 0.0% 0 5.5% 3 33.1% 25 5.8% 2 0.0% 0 5.7% 1 0.0% 0 0.0% 0 0.0% 0 0.0% 0Beaconsfield 0.2% 2 0.0% 0 0.0% 0 0.0% 0 0.0% 0 0.0% 0 0.0% 0 0.0% 0 0.0% 0 0.0% 0 0.0% 0Bracknell 2.0% 24 0.0% 0 0.0% 0 0.0% 0 0.0% 0 0.0% 0 0.0% 0 0.0% 0 0.0% 0 0.0% 0 0.0% 0Calcot 0.1% 1 0.0% 0 0.0% 0 0.0% 0 0.0% 0 0.0% 0 0.0% 0 0.0% 0 0.0% 0 0.0% 0 9.7% 1
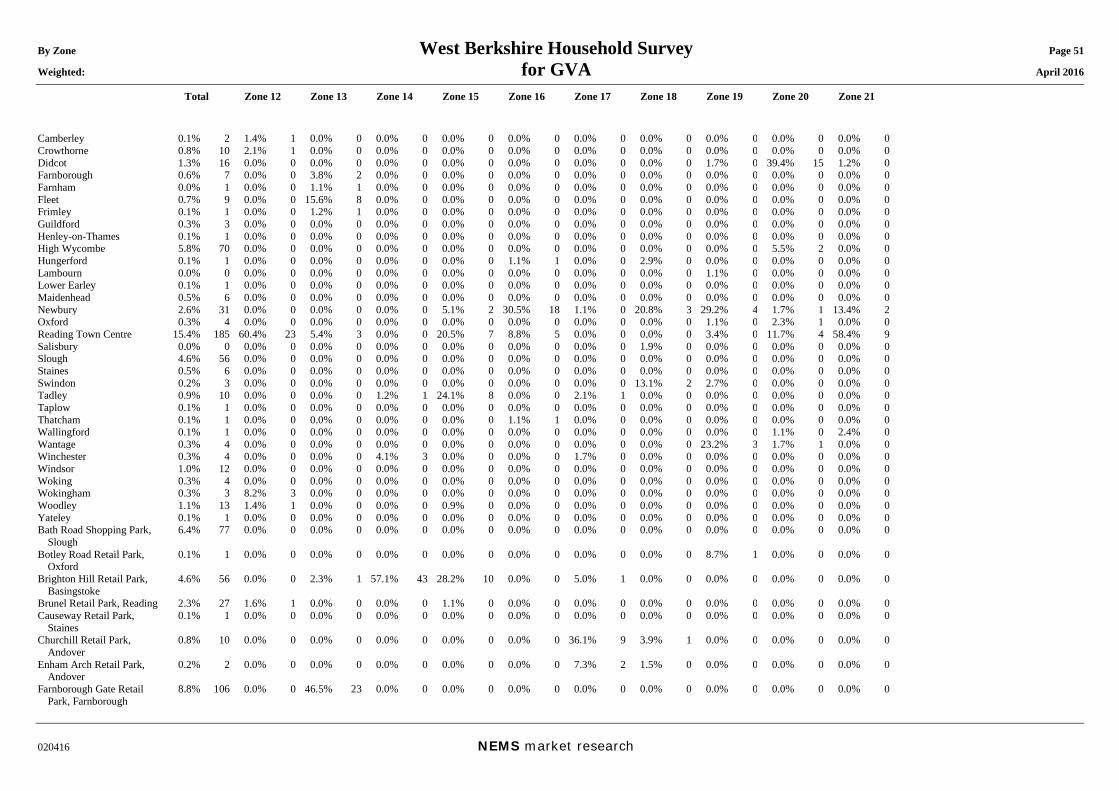
By Zone West Berkshire Household Survey Page 51 Weighted: for GVA April 2016
Total Zone 12 Zone 13 Zone 14 Zone 15 Zone 16 Zone 17 Zone 18 Zone 19 Zone 20 Zone 21
020416 NEMS market research
Camberley 0.1% 2 1.4% 1 0.0% 0 0.0% 0 0.0% 0 0.0% 0 0.0% 0 0.0% 0 0.0% 0 0.0% 0 0.0% 0Crowthorne 0.8% 10 2.1% 1 0.0% 0 0.0% 0 0.0% 0 0.0% 0 0.0% 0 0.0% 0 0.0% 0 0.0% 0 0.0% 0Didcot 1.3% 16 0.0% 0 0.0% 0 0.0% 0 0.0% 0 0.0% 0 0.0% 0 0.0% 0 1.7% 0 39.4% 15 1.2% 0Farnborough 0.6% 7 0.0% 0 3.8% 2 0.0% 0 0.0% 0 0.0% 0 0.0% 0 0.0% 0 0.0% 0 0.0% 0 0.0% 0Farnham 0.0% 1 0.0% 0 1.1% 1 0.0% 0 0.0% 0 0.0% 0 0.0% 0 0.0% 0 0.0% 0 0.0% 0 0.0% 0Fleet 0.7% 9 0.0% 0 15.6% 8 0.0% 0 0.0% 0 0.0% 0 0.0% 0 0.0% 0 0.0% 0 0.0% 0 0.0% 0Frimley 0.1% 1 0.0% 0 1.2% 1 0.0% 0 0.0% 0 0.0% 0 0.0% 0 0.0% 0 0.0% 0 0.0% 0 0.0% 0Guildford 0.3% 3 0.0% 0 0.0% 0 0.0% 0 0.0% 0 0.0% 0 0.0% 0 0.0% 0 0.0% 0 0.0% 0 0.0% 0Henley-on-Thames 0.1% 1 0.0% 0 0.0% 0 0.0% 0 0.0% 0 0.0% 0 0.0% 0 0.0% 0 0.0% 0 0.0% 0 0.0% 0High Wycombe 5.8% 70 0.0% 0 0.0% 0 0.0% 0 0.0% 0 0.0% 0 0.0% 0 0.0% 0 0.0% 0 5.5% 2 0.0% 0Hungerford 0.1% 1 0.0% 0 0.0% 0 0.0% 0 0.0% 0 1.1% 1 0.0% 0 2.9% 0 0.0% 0 0.0% 0 0.0% 0Lambourn 0.0% 0 0.0% 0 0.0% 0 0.0% 0 0.0% 0 0.0% 0 0.0% 0 0.0% 0 1.1% 0 0.0% 0 0.0% 0Lower Earley 0.1% 1 0.0% 0 0.0% 0 0.0% 0 0.0% 0 0.0% 0 0.0% 0 0.0% 0 0.0% 0 0.0% 0 0.0% 0Maidenhead 0.5% 6 0.0% 0 0.0% 0 0.0% 0 0.0% 0 0.0% 0 0.0% 0 0.0% 0 0.0% 0 0.0% 0 0.0% 0Newbury 2.6% 31 0.0% 0 0.0% 0 0.0% 0 5.1% 2 30.5% 18 1.1% 0 20.8% 3 29.2% 4 1.7% 1 13.4% 2Oxford 0.3% 4 0.0% 0 0.0% 0 0.0% 0 0.0% 0 0.0% 0 0.0% 0 0.0% 0 1.1% 0 2.3% 1 0.0% 0Reading Town Centre 15.4% 185 60.4% 23 5.4% 3 0.0% 0 20.5% 7 8.8% 5 0.0% 0 0.0% 0 3.4% 0 11.7% 4 58.4% 9Salisbury 0.0% 0 0.0% 0 0.0% 0 0.0% 0 0.0% 0 0.0% 0 0.0% 0 1.9% 0 0.0% 0 0.0% 0 0.0% 0Slough 4.6% 56 0.0% 0 0.0% 0 0.0% 0 0.0% 0 0.0% 0 0.0% 0 0.0% 0 0.0% 0 0.0% 0 0.0% 0Staines 0.5% 6 0.0% 0 0.0% 0 0.0% 0 0.0% 0 0.0% 0 0.0% 0 0.0% 0 0.0% 0 0.0% 0 0.0% 0Swindon 0.2% 3 0.0% 0 0.0% 0 0.0% 0 0.0% 0 0.0% 0 0.0% 0 13.1% 2 2.7% 0 0.0% 0 0.0% 0Tadley 0.9% 10 0.0% 0 0.0% 0 1.2% 1 24.1% 8 0.0% 0 2.1% 1 0.0% 0 0.0% 0 0.0% 0 0.0% 0Taplow 0.1% 1 0.0% 0 0.0% 0 0.0% 0 0.0% 0 0.0% 0 0.0% 0 0.0% 0 0.0% 0 0.0% 0 0.0% 0Thatcham 0.1% 1 0.0% 0 0.0% 0 0.0% 0 0.0% 0 1.1% 1 0.0% 0 0.0% 0 0.0% 0 0.0% 0 0.0% 0Wallingford 0.1% 1 0.0% 0 0.0% 0 0.0% 0 0.0% 0 0.0% 0 0.0% 0 0.0% 0 0.0% 0 1.1% 0 2.4% 0Wantage 0.3% 4 0.0% 0 0.0% 0 0.0% 0 0.0% 0 0.0% 0 0.0% 0 0.0% 0 23.2% 3 1.7% 1 0.0% 0Winchester 0.3% 4 0.0% 0 0.0% 0 4.1% 3 0.0% 0 0.0% 0 1.7% 0 0.0% 0 0.0% 0 0.0% 0 0.0% 0Windsor 1.0% 12 0.0% 0 0.0% 0 0.0% 0 0.0% 0 0.0% 0 0.0% 0 0.0% 0 0.0% 0 0.0% 0 0.0% 0Woking 0.3% 4 0.0% 0 0.0% 0 0.0% 0 0.0% 0 0.0% 0 0.0% 0 0.0% 0 0.0% 0 0.0% 0 0.0% 0Wokingham 0.3% 3 8.2% 3 0.0% 0 0.0% 0 0.0% 0 0.0% 0 0.0% 0 0.0% 0 0.0% 0 0.0% 0 0.0% 0Woodley 1.1% 13 1.4% 1 0.0% 0 0.0% 0 0.9% 0 0.0% 0 0.0% 0 0.0% 0 0.0% 0 0.0% 0 0.0% 0Yateley 0.1% 1 0.0% 0 0.0% 0 0.0% 0 0.0% 0 0.0% 0 0.0% 0 0.0% 0 0.0% 0 0.0% 0 0.0% 0Bath Road Shopping Park,
Slough 6.4% 77 0.0% 0 0.0% 0 0.0% 0 0.0% 0 0.0% 0 0.0% 0 0.0% 0 0.0% 0 0.0% 0 0.0% 0
Botley Road Retail Park, Oxford
0.1% 1 0.0% 0 0.0% 0 0.0% 0 0.0% 0 0.0% 0 0.0% 0 0.0% 0 8.7% 1 0.0% 0 0.0% 0
Brighton Hill Retail Park, Basingstoke
4.6% 56 0.0% 0 2.3% 1 57.1% 43 28.2% 10 0.0% 0 5.0% 1 0.0% 0 0.0% 0 0.0% 0 0.0% 0
Brunel Retail Park, Reading 2.3% 27 1.6% 1 0.0% 0 0.0% 0 1.1% 0 0.0% 0 0.0% 0 0.0% 0 0.0% 0 0.0% 0 0.0% 0Causeway Retail Park,
Staines 0.1% 1 0.0% 0 0.0% 0 0.0% 0 0.0% 0 0.0% 0 0.0% 0 0.0% 0 0.0% 0 0.0% 0 0.0% 0
Churchill Retail Park, Andover
0.8% 10 0.0% 0 0.0% 0 0.0% 0 0.0% 0 0.0% 0 36.1% 9 3.9% 1 0.0% 0 0.0% 0 0.0% 0
Enham Arch Retail Park, Andover
0.2% 2 0.0% 0 0.0% 0 0.0% 0 0.0% 0 0.0% 0 7.3% 2 1.5% 0 0.0% 0 0.0% 0 0.0% 0
Farnborough Gate Retail Park, Farnborough
8.8% 106 0.0% 0 46.5% 23 0.0% 0 0.0% 0 0.0% 0 0.0% 0 0.0% 0 0.0% 0 0.0% 0 0.0% 0
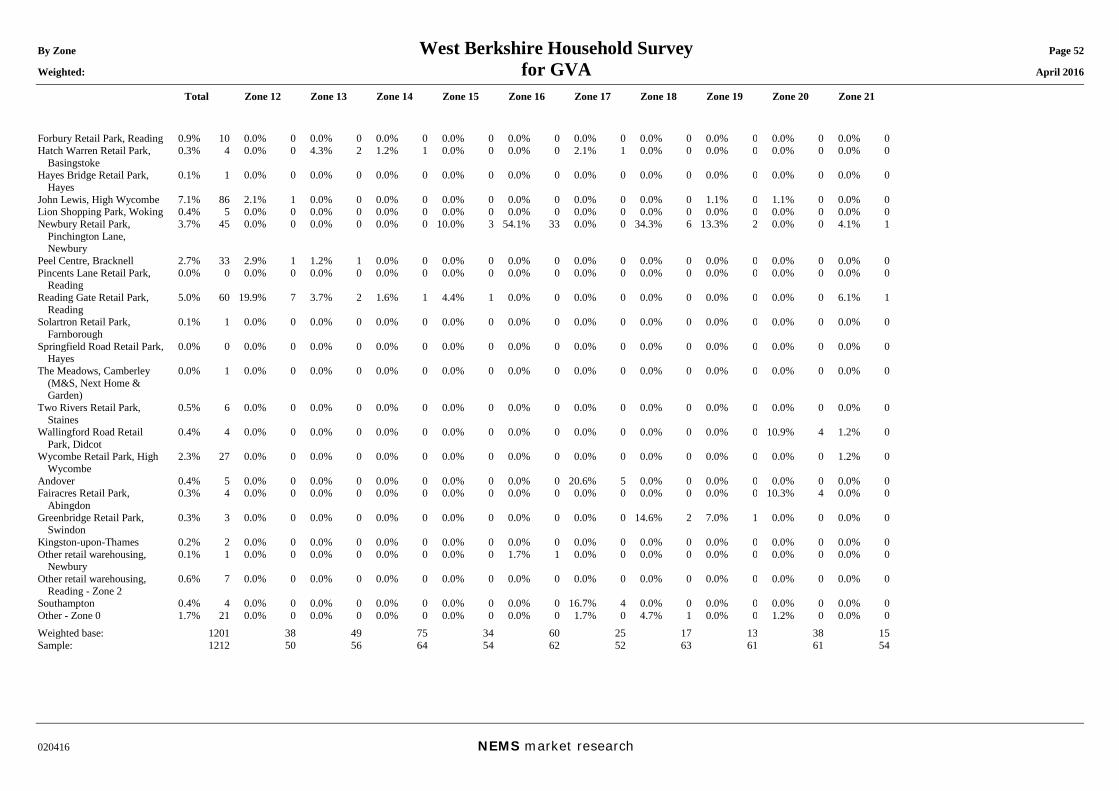
By Zone West Berkshire Household Survey Page 52 Weighted: for GVA April 2016
Total Zone 12 Zone 13 Zone 14 Zone 15 Zone 16 Zone 17 Zone 18 Zone 19 Zone 20 Zone 21
020416 NEMS market research
Forbury Retail Park, Reading 0.9% 10 0.0% 0 0.0% 0 0.0% 0 0.0% 0 0.0% 0 0.0% 0 0.0% 0 0.0% 0 0.0% 0 0.0% 0Hatch Warren Retail Park,
Basingstoke 0.3% 4 0.0% 0 4.3% 2 1.2% 1 0.0% 0 0.0% 0 2.1% 1 0.0% 0 0.0% 0 0.0% 0 0.0% 0
Hayes Bridge Retail Park, Hayes
0.1% 1 0.0% 0 0.0% 0 0.0% 0 0.0% 0 0.0% 0 0.0% 0 0.0% 0 0.0% 0 0.0% 0 0.0% 0
John Lewis, High Wycombe 7.1% 86 2.1% 1 0.0% 0 0.0% 0 0.0% 0 0.0% 0 0.0% 0 0.0% 0 1.1% 0 1.1% 0 0.0% 0Lion Shopping Park, Woking 0.4% 5 0.0% 0 0.0% 0 0.0% 0 0.0% 0 0.0% 0 0.0% 0 0.0% 0 0.0% 0 0.0% 0 0.0% 0Newbury Retail Park,
Pinchington Lane, Newbury
3.7% 45 0.0% 0 0.0% 0 0.0% 0 10.0% 3 54.1% 33 0.0% 0 34.3% 6 13.3% 2 0.0% 0 4.1% 1
Peel Centre, Bracknell 2.7% 33 2.9% 1 1.2% 1 0.0% 0 0.0% 0 0.0% 0 0.0% 0 0.0% 0 0.0% 0 0.0% 0 0.0% 0Pincents Lane Retail Park,
Reading 0.0% 0 0.0% 0 0.0% 0 0.0% 0 0.0% 0 0.0% 0 0.0% 0 0.0% 0 0.0% 0 0.0% 0 0.0% 0
Reading Gate Retail Park, Reading
5.0% 60 19.9% 7 3.7% 2 1.6% 1 4.4% 1 0.0% 0 0.0% 0 0.0% 0 0.0% 0 0.0% 0 6.1% 1
Solartron Retail Park, Farnborough
0.1% 1 0.0% 0 0.0% 0 0.0% 0 0.0% 0 0.0% 0 0.0% 0 0.0% 0 0.0% 0 0.0% 0 0.0% 0
Springfield Road Retail Park, Hayes
0.0% 0 0.0% 0 0.0% 0 0.0% 0 0.0% 0 0.0% 0 0.0% 0 0.0% 0 0.0% 0 0.0% 0 0.0% 0
The Meadows, Camberley (M&S, Next Home & Garden)
0.0% 1 0.0% 0 0.0% 0 0.0% 0 0.0% 0 0.0% 0 0.0% 0 0.0% 0 0.0% 0 0.0% 0 0.0% 0
Two Rivers Retail Park, Staines
0.5% 6 0.0% 0 0.0% 0 0.0% 0 0.0% 0 0.0% 0 0.0% 0 0.0% 0 0.0% 0 0.0% 0 0.0% 0
Wallingford Road Retail Park, Didcot
0.4% 4 0.0% 0 0.0% 0 0.0% 0 0.0% 0 0.0% 0 0.0% 0 0.0% 0 0.0% 0 10.9% 4 1.2% 0
Wycombe Retail Park, High Wycombe
2.3% 27 0.0% 0 0.0% 0 0.0% 0 0.0% 0 0.0% 0 0.0% 0 0.0% 0 0.0% 0 0.0% 0 1.2% 0
Andover 0.4% 5 0.0% 0 0.0% 0 0.0% 0 0.0% 0 0.0% 0 20.6% 5 0.0% 0 0.0% 0 0.0% 0 0.0% 0Fairacres Retail Park,
Abingdon 0.3% 4 0.0% 0 0.0% 0 0.0% 0 0.0% 0 0.0% 0 0.0% 0 0.0% 0 0.0% 0 10.3% 4 0.0% 0
Greenbridge Retail Park, Swindon
0.3% 3 0.0% 0 0.0% 0 0.0% 0 0.0% 0 0.0% 0 0.0% 0 14.6% 2 7.0% 1 0.0% 0 0.0% 0
Kingston-upon-Thames 0.2% 2 0.0% 0 0.0% 0 0.0% 0 0.0% 0 0.0% 0 0.0% 0 0.0% 0 0.0% 0 0.0% 0 0.0% 0Other retail warehousing,
Newbury 0.1% 1 0.0% 0 0.0% 0 0.0% 0 0.0% 0 1.7% 1 0.0% 0 0.0% 0 0.0% 0 0.0% 0 0.0% 0
Other retail warehousing, Reading - Zone 2
0.6% 7 0.0% 0 0.0% 0 0.0% 0 0.0% 0 0.0% 0 0.0% 0 0.0% 0 0.0% 0 0.0% 0 0.0% 0
Southampton 0.4% 4 0.0% 0 0.0% 0 0.0% 0 0.0% 0 0.0% 0 16.7% 4 0.0% 0 0.0% 0 0.0% 0 0.0% 0Other - Zone 0 1.7% 21 0.0% 0 0.0% 0 0.0% 0 0.0% 0 0.0% 0 1.7% 0 4.7% 1 0.0% 0 1.2% 0 0.0% 0Weighted base: 1201 38 49 75 34 60 25 17 13 38 15Sample: 1212 50 56 64 54 62 52 63 61 61 54
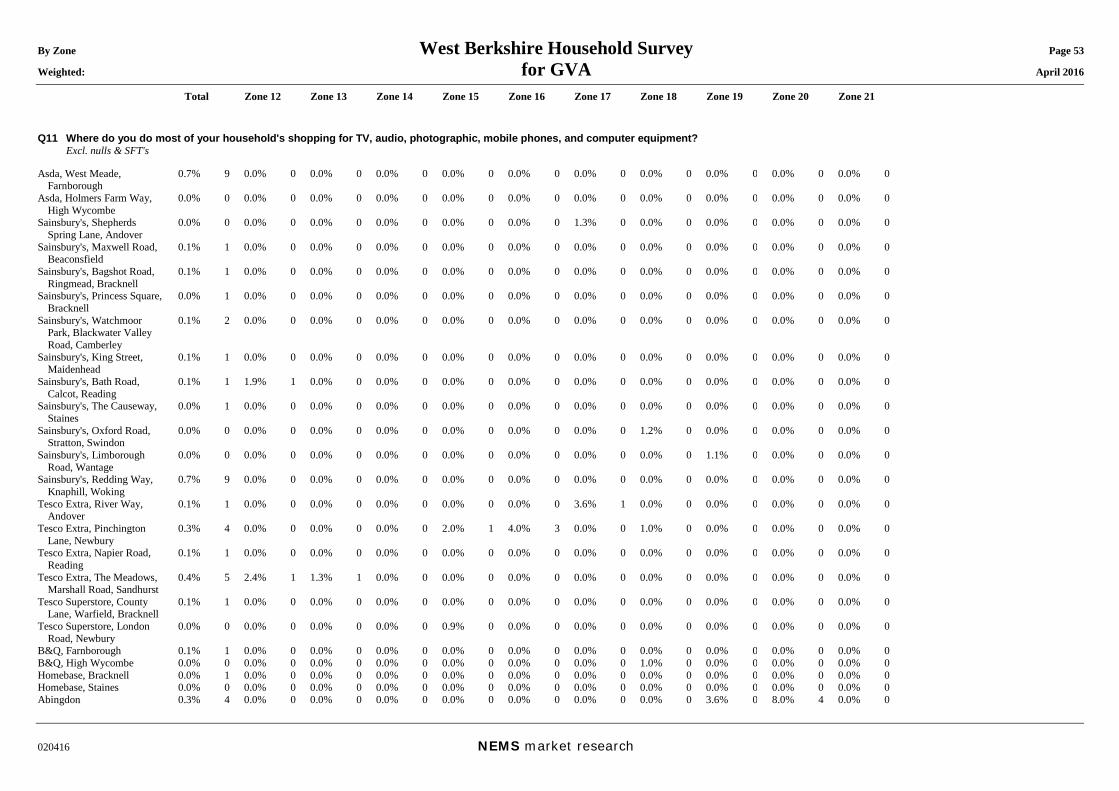
By Zone West Berkshire Household Survey Page 53 Weighted: for GVA April 2016
Total Zone 12 Zone 13 Zone 14 Zone 15 Zone 16 Zone 17 Zone 18 Zone 19 Zone 20 Zone 21
020416 NEMS market research
Q11 Where do you do most of your household's shopping for TV, audio, photographic, mobile phones, and computer equipment? Excl. nulls & SFT's Asda, West Meade,
Farnborough 0.7% 9 0.0% 0 0.0% 0 0.0% 0 0.0% 0 0.0% 0 0.0% 0 0.0% 0 0.0% 0 0.0% 0 0.0% 0
Asda, Holmers Farm Way, High Wycombe
0.0% 0 0.0% 0 0.0% 0 0.0% 0 0.0% 0 0.0% 0 0.0% 0 0.0% 0 0.0% 0 0.0% 0 0.0% 0
Sainsbury's, Shepherds Spring Lane, Andover
0.0% 0 0.0% 0 0.0% 0 0.0% 0 0.0% 0 0.0% 0 1.3% 0 0.0% 0 0.0% 0 0.0% 0 0.0% 0
Sainsbury's, Maxwell Road, Beaconsfield
0.1% 1 0.0% 0 0.0% 0 0.0% 0 0.0% 0 0.0% 0 0.0% 0 0.0% 0 0.0% 0 0.0% 0 0.0% 0
Sainsbury's, Bagshot Road, Ringmead, Bracknell
0.1% 1 0.0% 0 0.0% 0 0.0% 0 0.0% 0 0.0% 0 0.0% 0 0.0% 0 0.0% 0 0.0% 0 0.0% 0
Sainsbury's, Princess Square, Bracknell
0.0% 1 0.0% 0 0.0% 0 0.0% 0 0.0% 0 0.0% 0 0.0% 0 0.0% 0 0.0% 0 0.0% 0 0.0% 0
Sainsbury's, Watchmoor Park, Blackwater Valley Road, Camberley
0.1% 2 0.0% 0 0.0% 0 0.0% 0 0.0% 0 0.0% 0 0.0% 0 0.0% 0 0.0% 0 0.0% 0 0.0% 0
Sainsbury's, King Street, Maidenhead
0.1% 1 0.0% 0 0.0% 0 0.0% 0 0.0% 0 0.0% 0 0.0% 0 0.0% 0 0.0% 0 0.0% 0 0.0% 0
Sainsbury's, Bath Road, Calcot, Reading
0.1% 1 1.9% 1 0.0% 0 0.0% 0 0.0% 0 0.0% 0 0.0% 0 0.0% 0 0.0% 0 0.0% 0 0.0% 0
Sainsbury's, The Causeway, Staines
0.0% 1 0.0% 0 0.0% 0 0.0% 0 0.0% 0 0.0% 0 0.0% 0 0.0% 0 0.0% 0 0.0% 0 0.0% 0
Sainsbury's, Oxford Road, Stratton, Swindon
0.0% 0 0.0% 0 0.0% 0 0.0% 0 0.0% 0 0.0% 0 0.0% 0 1.2% 0 0.0% 0 0.0% 0 0.0% 0
Sainsbury's, Limborough Road, Wantage
0.0% 0 0.0% 0 0.0% 0 0.0% 0 0.0% 0 0.0% 0 0.0% 0 0.0% 0 1.1% 0 0.0% 0 0.0% 0
Sainsbury's, Redding Way, Knaphill, Woking
0.7% 9 0.0% 0 0.0% 0 0.0% 0 0.0% 0 0.0% 0 0.0% 0 0.0% 0 0.0% 0 0.0% 0 0.0% 0
Tesco Extra, River Way, Andover
0.1% 1 0.0% 0 0.0% 0 0.0% 0 0.0% 0 0.0% 0 3.6% 1 0.0% 0 0.0% 0 0.0% 0 0.0% 0
Tesco Extra, Pinchington Lane, Newbury
0.3% 4 0.0% 0 0.0% 0 0.0% 0 2.0% 1 4.0% 3 0.0% 0 1.0% 0 0.0% 0 0.0% 0 0.0% 0
Tesco Extra, Napier Road, Reading
0.1% 1 0.0% 0 0.0% 0 0.0% 0 0.0% 0 0.0% 0 0.0% 0 0.0% 0 0.0% 0 0.0% 0 0.0% 0
Tesco Extra, The Meadows, Marshall Road, Sandhurst
0.4% 5 2.4% 1 1.3% 1 0.0% 0 0.0% 0 0.0% 0 0.0% 0 0.0% 0 0.0% 0 0.0% 0 0.0% 0
Tesco Superstore, County Lane, Warfield, Bracknell
0.1% 1 0.0% 0 0.0% 0 0.0% 0 0.0% 0 0.0% 0 0.0% 0 0.0% 0 0.0% 0 0.0% 0 0.0% 0
Tesco Superstore, London Road, Newbury
0.0% 0 0.0% 0 0.0% 0 0.0% 0 0.9% 0 0.0% 0 0.0% 0 0.0% 0 0.0% 0 0.0% 0 0.0% 0
B&Q, Farnborough 0.1% 1 0.0% 0 0.0% 0 0.0% 0 0.0% 0 0.0% 0 0.0% 0 0.0% 0 0.0% 0 0.0% 0 0.0% 0B&Q, High Wycombe 0.0% 0 0.0% 0 0.0% 0 0.0% 0 0.0% 0 0.0% 0 0.0% 0 1.0% 0 0.0% 0 0.0% 0 0.0% 0Homebase, Bracknell 0.0% 1 0.0% 0 0.0% 0 0.0% 0 0.0% 0 0.0% 0 0.0% 0 0.0% 0 0.0% 0 0.0% 0 0.0% 0Homebase, Staines 0.0% 0 0.0% 0 0.0% 0 0.0% 0 0.0% 0 0.0% 0 0.0% 0 0.0% 0 0.0% 0 0.0% 0 0.0% 0Abingdon 0.3% 4 0.0% 0 0.0% 0 0.0% 0 0.0% 0 0.0% 0 0.0% 0 0.0% 0 3.6% 0 8.0% 4 0.0% 0
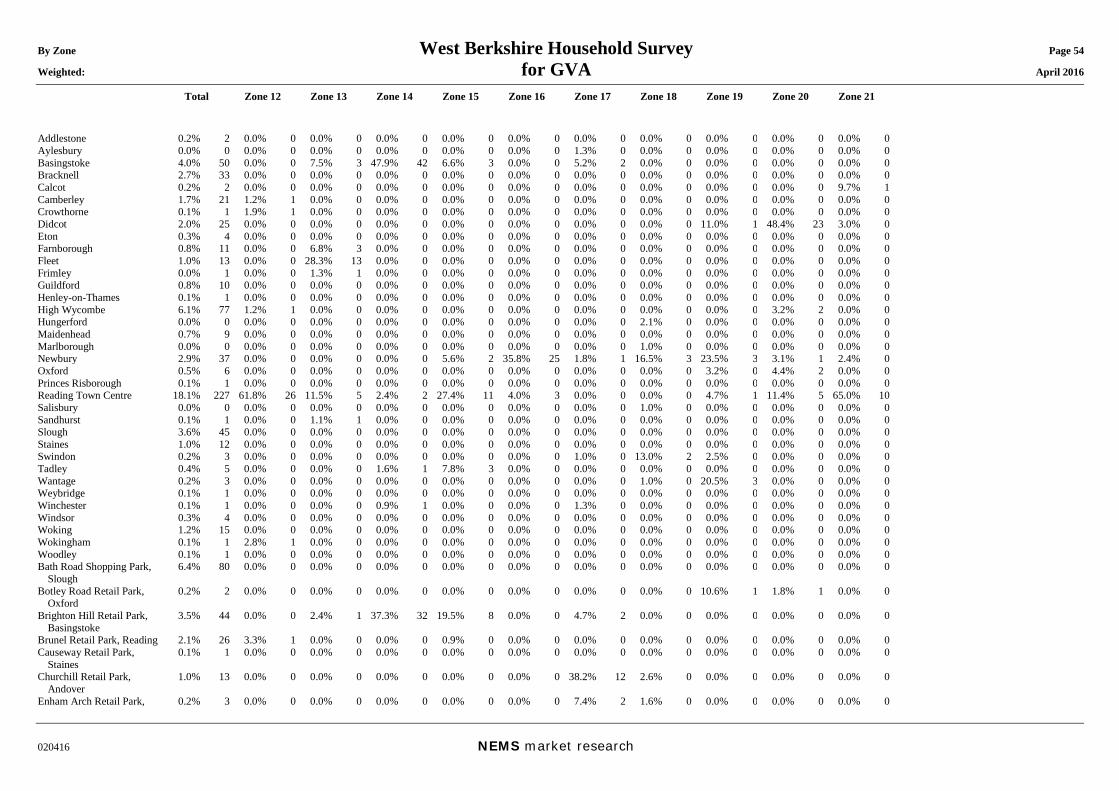
By Zone West Berkshire Household Survey Page 54 Weighted: for GVA April 2016
Total Zone 12 Zone 13 Zone 14 Zone 15 Zone 16 Zone 17 Zone 18 Zone 19 Zone 20 Zone 21
020416 NEMS market research
Addlestone 0.2% 2 0.0% 0 0.0% 0 0.0% 0 0.0% 0 0.0% 0 0.0% 0 0.0% 0 0.0% 0 0.0% 0 0.0% 0Aylesbury 0.0% 0 0.0% 0 0.0% 0 0.0% 0 0.0% 0 0.0% 0 1.3% 0 0.0% 0 0.0% 0 0.0% 0 0.0% 0Basingstoke 4.0% 50 0.0% 0 7.5% 3 47.9% 42 6.6% 3 0.0% 0 5.2% 2 0.0% 0 0.0% 0 0.0% 0 0.0% 0Bracknell 2.7% 33 0.0% 0 0.0% 0 0.0% 0 0.0% 0 0.0% 0 0.0% 0 0.0% 0 0.0% 0 0.0% 0 0.0% 0Calcot 0.2% 2 0.0% 0 0.0% 0 0.0% 0 0.0% 0 0.0% 0 0.0% 0 0.0% 0 0.0% 0 0.0% 0 9.7% 1Camberley 1.7% 21 1.2% 1 0.0% 0 0.0% 0 0.0% 0 0.0% 0 0.0% 0 0.0% 0 0.0% 0 0.0% 0 0.0% 0Crowthorne 0.1% 1 1.9% 1 0.0% 0 0.0% 0 0.0% 0 0.0% 0 0.0% 0 0.0% 0 0.0% 0 0.0% 0 0.0% 0Didcot 2.0% 25 0.0% 0 0.0% 0 0.0% 0 0.0% 0 0.0% 0 0.0% 0 0.0% 0 11.0% 1 48.4% 23 3.0% 0Eton 0.3% 4 0.0% 0 0.0% 0 0.0% 0 0.0% 0 0.0% 0 0.0% 0 0.0% 0 0.0% 0 0.0% 0 0.0% 0Farnborough 0.8% 11 0.0% 0 6.8% 3 0.0% 0 0.0% 0 0.0% 0 0.0% 0 0.0% 0 0.0% 0 0.0% 0 0.0% 0Fleet 1.0% 13 0.0% 0 28.3% 13 0.0% 0 0.0% 0 0.0% 0 0.0% 0 0.0% 0 0.0% 0 0.0% 0 0.0% 0Frimley 0.0% 1 0.0% 0 1.3% 1 0.0% 0 0.0% 0 0.0% 0 0.0% 0 0.0% 0 0.0% 0 0.0% 0 0.0% 0Guildford 0.8% 10 0.0% 0 0.0% 0 0.0% 0 0.0% 0 0.0% 0 0.0% 0 0.0% 0 0.0% 0 0.0% 0 0.0% 0Henley-on-Thames 0.1% 1 0.0% 0 0.0% 0 0.0% 0 0.0% 0 0.0% 0 0.0% 0 0.0% 0 0.0% 0 0.0% 0 0.0% 0High Wycombe 6.1% 77 1.2% 1 0.0% 0 0.0% 0 0.0% 0 0.0% 0 0.0% 0 0.0% 0 0.0% 0 3.2% 2 0.0% 0Hungerford 0.0% 0 0.0% 0 0.0% 0 0.0% 0 0.0% 0 0.0% 0 0.0% 0 2.1% 0 0.0% 0 0.0% 0 0.0% 0Maidenhead 0.7% 9 0.0% 0 0.0% 0 0.0% 0 0.0% 0 0.0% 0 0.0% 0 0.0% 0 0.0% 0 0.0% 0 0.0% 0Marlborough 0.0% 0 0.0% 0 0.0% 0 0.0% 0 0.0% 0 0.0% 0 0.0% 0 1.0% 0 0.0% 0 0.0% 0 0.0% 0Newbury 2.9% 37 0.0% 0 0.0% 0 0.0% 0 5.6% 2 35.8% 25 1.8% 1 16.5% 3 23.5% 3 3.1% 1 2.4% 0Oxford 0.5% 6 0.0% 0 0.0% 0 0.0% 0 0.0% 0 0.0% 0 0.0% 0 0.0% 0 3.2% 0 4.4% 2 0.0% 0Princes Risborough 0.1% 1 0.0% 0 0.0% 0 0.0% 0 0.0% 0 0.0% 0 0.0% 0 0.0% 0 0.0% 0 0.0% 0 0.0% 0Reading Town Centre 18.1% 227 61.8% 26 11.5% 5 2.4% 2 27.4% 11 4.0% 3 0.0% 0 0.0% 0 4.7% 1 11.4% 5 65.0% 10Salisbury 0.0% 0 0.0% 0 0.0% 0 0.0% 0 0.0% 0 0.0% 0 0.0% 0 1.0% 0 0.0% 0 0.0% 0 0.0% 0Sandhurst 0.1% 1 0.0% 0 1.1% 1 0.0% 0 0.0% 0 0.0% 0 0.0% 0 0.0% 0 0.0% 0 0.0% 0 0.0% 0Slough 3.6% 45 0.0% 0 0.0% 0 0.0% 0 0.0% 0 0.0% 0 0.0% 0 0.0% 0 0.0% 0 0.0% 0 0.0% 0Staines 1.0% 12 0.0% 0 0.0% 0 0.0% 0 0.0% 0 0.0% 0 0.0% 0 0.0% 0 0.0% 0 0.0% 0 0.0% 0Swindon 0.2% 3 0.0% 0 0.0% 0 0.0% 0 0.0% 0 0.0% 0 1.0% 0 13.0% 2 2.5% 0 0.0% 0 0.0% 0Tadley 0.4% 5 0.0% 0 0.0% 0 1.6% 1 7.8% 3 0.0% 0 0.0% 0 0.0% 0 0.0% 0 0.0% 0 0.0% 0Wantage 0.2% 3 0.0% 0 0.0% 0 0.0% 0 0.0% 0 0.0% 0 0.0% 0 1.0% 0 20.5% 3 0.0% 0 0.0% 0Weybridge 0.1% 1 0.0% 0 0.0% 0 0.0% 0 0.0% 0 0.0% 0 0.0% 0 0.0% 0 0.0% 0 0.0% 0 0.0% 0Winchester 0.1% 1 0.0% 0 0.0% 0 0.9% 1 0.0% 0 0.0% 0 1.3% 0 0.0% 0 0.0% 0 0.0% 0 0.0% 0Windsor 0.3% 4 0.0% 0 0.0% 0 0.0% 0 0.0% 0 0.0% 0 0.0% 0 0.0% 0 0.0% 0 0.0% 0 0.0% 0Woking 1.2% 15 0.0% 0 0.0% 0 0.0% 0 0.0% 0 0.0% 0 0.0% 0 0.0% 0 0.0% 0 0.0% 0 0.0% 0Wokingham 0.1% 1 2.8% 1 0.0% 0 0.0% 0 0.0% 0 0.0% 0 0.0% 0 0.0% 0 0.0% 0 0.0% 0 0.0% 0Woodley 0.1% 1 0.0% 0 0.0% 0 0.0% 0 0.0% 0 0.0% 0 0.0% 0 0.0% 0 0.0% 0 0.0% 0 0.0% 0Bath Road Shopping Park,
Slough 6.4% 80 0.0% 0 0.0% 0 0.0% 0 0.0% 0 0.0% 0 0.0% 0 0.0% 0 0.0% 0 0.0% 0 0.0% 0
Botley Road Retail Park, Oxford
0.2% 2 0.0% 0 0.0% 0 0.0% 0 0.0% 0 0.0% 0 0.0% 0 0.0% 0 10.6% 1 1.8% 1 0.0% 0
Brighton Hill Retail Park, Basingstoke
3.5% 44 0.0% 0 2.4% 1 37.3% 32 19.5% 8 0.0% 0 4.7% 2 0.0% 0 0.0% 0 0.0% 0 0.0% 0
Brunel Retail Park, Reading 2.1% 26 3.3% 1 0.0% 0 0.0% 0 0.9% 0 0.0% 0 0.0% 0 0.0% 0 0.0% 0 0.0% 0 0.0% 0Causeway Retail Park,
Staines 0.1% 1 0.0% 0 0.0% 0 0.0% 0 0.0% 0 0.0% 0 0.0% 0 0.0% 0 0.0% 0 0.0% 0 0.0% 0
Churchill Retail Park, Andover
1.0% 13 0.0% 0 0.0% 0 0.0% 0 0.0% 0 0.0% 0 38.2% 12 2.6% 0 0.0% 0 0.0% 0 0.0% 0
Enham Arch Retail Park, 0.2% 3 0.0% 0 0.0% 0 0.0% 0 0.0% 0 0.0% 0 7.4% 2 1.6% 0 0.0% 0 0.0% 0 0.0% 0
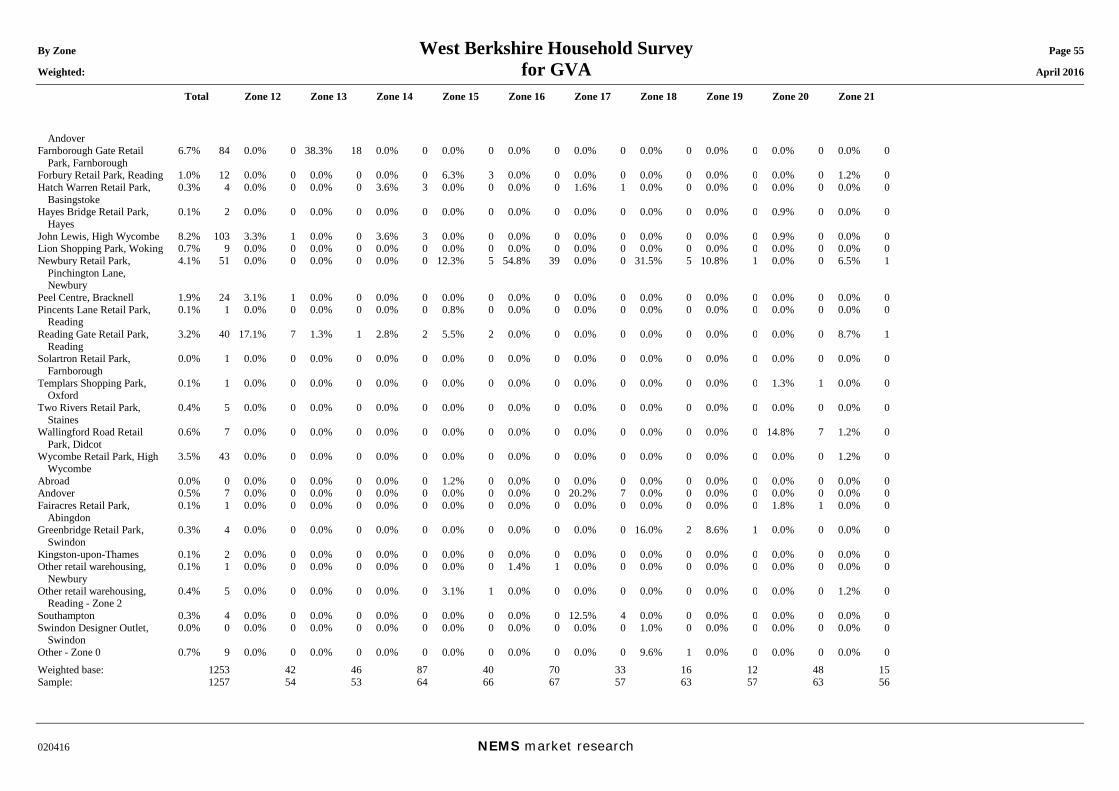
By Zone West Berkshire Household Survey Page 55 Weighted: for GVA April 2016
Total Zone 12 Zone 13 Zone 14 Zone 15 Zone 16 Zone 17 Zone 18 Zone 19 Zone 20 Zone 21
020416 NEMS market research
Andover Farnborough Gate Retail
Park, Farnborough 6.7% 84 0.0% 0 38.3% 18 0.0% 0 0.0% 0 0.0% 0 0.0% 0 0.0% 0 0.0% 0 0.0% 0 0.0% 0
Forbury Retail Park, Reading 1.0% 12 0.0% 0 0.0% 0 0.0% 0 6.3% 3 0.0% 0 0.0% 0 0.0% 0 0.0% 0 0.0% 0 1.2% 0Hatch Warren Retail Park,
Basingstoke 0.3% 4 0.0% 0 0.0% 0 3.6% 3 0.0% 0 0.0% 0 1.6% 1 0.0% 0 0.0% 0 0.0% 0 0.0% 0
Hayes Bridge Retail Park, Hayes
0.1% 2 0.0% 0 0.0% 0 0.0% 0 0.0% 0 0.0% 0 0.0% 0 0.0% 0 0.0% 0 0.9% 0 0.0% 0
John Lewis, High Wycombe 8.2% 103 3.3% 1 0.0% 0 3.6% 3 0.0% 0 0.0% 0 0.0% 0 0.0% 0 0.0% 0 0.9% 0 0.0% 0Lion Shopping Park, Woking 0.7% 9 0.0% 0 0.0% 0 0.0% 0 0.0% 0 0.0% 0 0.0% 0 0.0% 0 0.0% 0 0.0% 0 0.0% 0Newbury Retail Park,
Pinchington Lane, Newbury
4.1% 51 0.0% 0 0.0% 0 0.0% 0 12.3% 5 54.8% 39 0.0% 0 31.5% 5 10.8% 1 0.0% 0 6.5% 1
Peel Centre, Bracknell 1.9% 24 3.1% 1 0.0% 0 0.0% 0 0.0% 0 0.0% 0 0.0% 0 0.0% 0 0.0% 0 0.0% 0 0.0% 0Pincents Lane Retail Park,
Reading 0.1% 1 0.0% 0 0.0% 0 0.0% 0 0.8% 0 0.0% 0 0.0% 0 0.0% 0 0.0% 0 0.0% 0 0.0% 0
Reading Gate Retail Park, Reading
3.2% 40 17.1% 7 1.3% 1 2.8% 2 5.5% 2 0.0% 0 0.0% 0 0.0% 0 0.0% 0 0.0% 0 8.7% 1
Solartron Retail Park, Farnborough
0.0% 1 0.0% 0 0.0% 0 0.0% 0 0.0% 0 0.0% 0 0.0% 0 0.0% 0 0.0% 0 0.0% 0 0.0% 0
Templars Shopping Park, Oxford
0.1% 1 0.0% 0 0.0% 0 0.0% 0 0.0% 0 0.0% 0 0.0% 0 0.0% 0 0.0% 0 1.3% 1 0.0% 0
Two Rivers Retail Park, Staines
0.4% 5 0.0% 0 0.0% 0 0.0% 0 0.0% 0 0.0% 0 0.0% 0 0.0% 0 0.0% 0 0.0% 0 0.0% 0
Wallingford Road Retail Park, Didcot
0.6% 7 0.0% 0 0.0% 0 0.0% 0 0.0% 0 0.0% 0 0.0% 0 0.0% 0 0.0% 0 14.8% 7 1.2% 0
Wycombe Retail Park, High Wycombe
3.5% 43 0.0% 0 0.0% 0 0.0% 0 0.0% 0 0.0% 0 0.0% 0 0.0% 0 0.0% 0 0.0% 0 1.2% 0
Abroad 0.0% 0 0.0% 0 0.0% 0 0.0% 0 1.2% 0 0.0% 0 0.0% 0 0.0% 0 0.0% 0 0.0% 0 0.0% 0Andover 0.5% 7 0.0% 0 0.0% 0 0.0% 0 0.0% 0 0.0% 0 20.2% 7 0.0% 0 0.0% 0 0.0% 0 0.0% 0Fairacres Retail Park,
Abingdon 0.1% 1 0.0% 0 0.0% 0 0.0% 0 0.0% 0 0.0% 0 0.0% 0 0.0% 0 0.0% 0 1.8% 1 0.0% 0
Greenbridge Retail Park, Swindon
0.3% 4 0.0% 0 0.0% 0 0.0% 0 0.0% 0 0.0% 0 0.0% 0 16.0% 2 8.6% 1 0.0% 0 0.0% 0
Kingston-upon-Thames 0.1% 2 0.0% 0 0.0% 0 0.0% 0 0.0% 0 0.0% 0 0.0% 0 0.0% 0 0.0% 0 0.0% 0 0.0% 0Other retail warehousing,
Newbury 0.1% 1 0.0% 0 0.0% 0 0.0% 0 0.0% 0 1.4% 1 0.0% 0 0.0% 0 0.0% 0 0.0% 0 0.0% 0
Other retail warehousing, Reading - Zone 2
0.4% 5 0.0% 0 0.0% 0 0.0% 0 3.1% 1 0.0% 0 0.0% 0 0.0% 0 0.0% 0 0.0% 0 1.2% 0
Southampton 0.3% 4 0.0% 0 0.0% 0 0.0% 0 0.0% 0 0.0% 0 12.5% 4 0.0% 0 0.0% 0 0.0% 0 0.0% 0Swindon Designer Outlet,
Swindon 0.0% 0 0.0% 0 0.0% 0 0.0% 0 0.0% 0 0.0% 0 0.0% 0 1.0% 0 0.0% 0 0.0% 0 0.0% 0
Other - Zone 0 0.7% 9 0.0% 0 0.0% 0 0.0% 0 0.0% 0 0.0% 0 0.0% 0 9.6% 1 0.0% 0 0.0% 0 0.0% 0Weighted base: 1253 42 46 87 40 70 33 16 12 48 15Sample: 1257 54 53 64 66 67 57 63 57 63 56
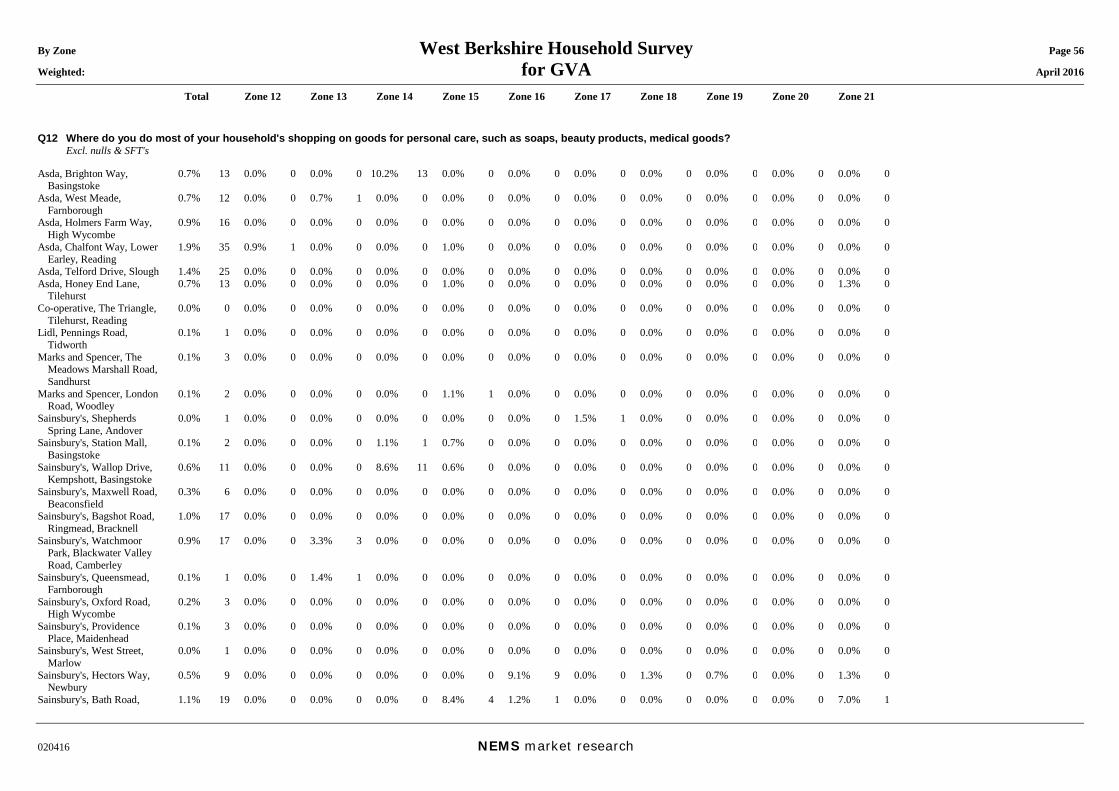
By Zone West Berkshire Household Survey Page 56 Weighted: for GVA April 2016
Total Zone 12 Zone 13 Zone 14 Zone 15 Zone 16 Zone 17 Zone 18 Zone 19 Zone 20 Zone 21
020416 NEMS market research
Q12 Where do you do most of your household's shopping on goods for personal care, such as soaps, beauty products, medical goods? Excl. nulls & SFT's Asda, Brighton Way,
Basingstoke 0.7% 13 0.0% 0 0.0% 0 10.2% 13 0.0% 0 0.0% 0 0.0% 0 0.0% 0 0.0% 0 0.0% 0 0.0% 0
Asda, West Meade, Farnborough
0.7% 12 0.0% 0 0.7% 1 0.0% 0 0.0% 0 0.0% 0 0.0% 0 0.0% 0 0.0% 0 0.0% 0 0.0% 0
Asda, Holmers Farm Way, High Wycombe
0.9% 16 0.0% 0 0.0% 0 0.0% 0 0.0% 0 0.0% 0 0.0% 0 0.0% 0 0.0% 0 0.0% 0 0.0% 0
Asda, Chalfont Way, Lower Earley, Reading
1.9% 35 0.9% 1 0.0% 0 0.0% 0 1.0% 0 0.0% 0 0.0% 0 0.0% 0 0.0% 0 0.0% 0 0.0% 0
Asda, Telford Drive, Slough 1.4% 25 0.0% 0 0.0% 0 0.0% 0 0.0% 0 0.0% 0 0.0% 0 0.0% 0 0.0% 0 0.0% 0 0.0% 0Asda, Honey End Lane,
Tilehurst 0.7% 13 0.0% 0 0.0% 0 0.0% 0 1.0% 0 0.0% 0 0.0% 0 0.0% 0 0.0% 0 0.0% 0 1.3% 0
Co-operative, The Triangle, Tilehurst, Reading
0.0% 0 0.0% 0 0.0% 0 0.0% 0 0.0% 0 0.0% 0 0.0% 0 0.0% 0 0.0% 0 0.0% 0 0.0% 0
Lidl, Pennings Road, Tidworth
0.1% 1 0.0% 0 0.0% 0 0.0% 0 0.0% 0 0.0% 0 0.0% 0 0.0% 0 0.0% 0 0.0% 0 0.0% 0
Marks and Spencer, The Meadows Marshall Road, Sandhurst
0.1% 3 0.0% 0 0.0% 0 0.0% 0 0.0% 0 0.0% 0 0.0% 0 0.0% 0 0.0% 0 0.0% 0 0.0% 0
Marks and Spencer, London Road, Woodley
0.1% 2 0.0% 0 0.0% 0 0.0% 0 1.1% 1 0.0% 0 0.0% 0 0.0% 0 0.0% 0 0.0% 0 0.0% 0
Sainsbury's, Shepherds Spring Lane, Andover
0.0% 1 0.0% 0 0.0% 0 0.0% 0 0.0% 0 0.0% 0 1.5% 1 0.0% 0 0.0% 0 0.0% 0 0.0% 0
Sainsbury's, Station Mall, Basingstoke
0.1% 2 0.0% 0 0.0% 0 1.1% 1 0.7% 0 0.0% 0 0.0% 0 0.0% 0 0.0% 0 0.0% 0 0.0% 0
Sainsbury's, Wallop Drive, Kempshott, Basingstoke
0.6% 11 0.0% 0 0.0% 0 8.6% 11 0.6% 0 0.0% 0 0.0% 0 0.0% 0 0.0% 0 0.0% 0 0.0% 0
Sainsbury's, Maxwell Road, Beaconsfield
0.3% 6 0.0% 0 0.0% 0 0.0% 0 0.0% 0 0.0% 0 0.0% 0 0.0% 0 0.0% 0 0.0% 0 0.0% 0
Sainsbury's, Bagshot Road, Ringmead, Bracknell
1.0% 17 0.0% 0 0.0% 0 0.0% 0 0.0% 0 0.0% 0 0.0% 0 0.0% 0 0.0% 0 0.0% 0 0.0% 0
Sainsbury's, Watchmoor Park, Blackwater Valley Road, Camberley
0.9% 17 0.0% 0 3.3% 3 0.0% 0 0.0% 0 0.0% 0 0.0% 0 0.0% 0 0.0% 0 0.0% 0 0.0% 0
Sainsbury's, Queensmead, Farnborough
0.1% 1 0.0% 0 1.4% 1 0.0% 0 0.0% 0 0.0% 0 0.0% 0 0.0% 0 0.0% 0 0.0% 0 0.0% 0
Sainsbury's, Oxford Road, High Wycombe
0.2% 3 0.0% 0 0.0% 0 0.0% 0 0.0% 0 0.0% 0 0.0% 0 0.0% 0 0.0% 0 0.0% 0 0.0% 0
Sainsbury's, Providence Place, Maidenhead
0.1% 3 0.0% 0 0.0% 0 0.0% 0 0.0% 0 0.0% 0 0.0% 0 0.0% 0 0.0% 0 0.0% 0 0.0% 0
Sainsbury's, West Street, Marlow
0.0% 1 0.0% 0 0.0% 0 0.0% 0 0.0% 0 0.0% 0 0.0% 0 0.0% 0 0.0% 0 0.0% 0 0.0% 0
Sainsbury's, Hectors Way, Newbury
0.5% 9 0.0% 0 0.0% 0 0.0% 0 0.0% 0 9.1% 9 0.0% 0 1.3% 0 0.7% 0 0.0% 0 1.3% 0
Sainsbury's, Bath Road, 1.1% 19 0.0% 0 0.0% 0 0.0% 0 8.4% 4 1.2% 1 0.0% 0 0.0% 0 0.0% 0 0.0% 0 7.0% 1
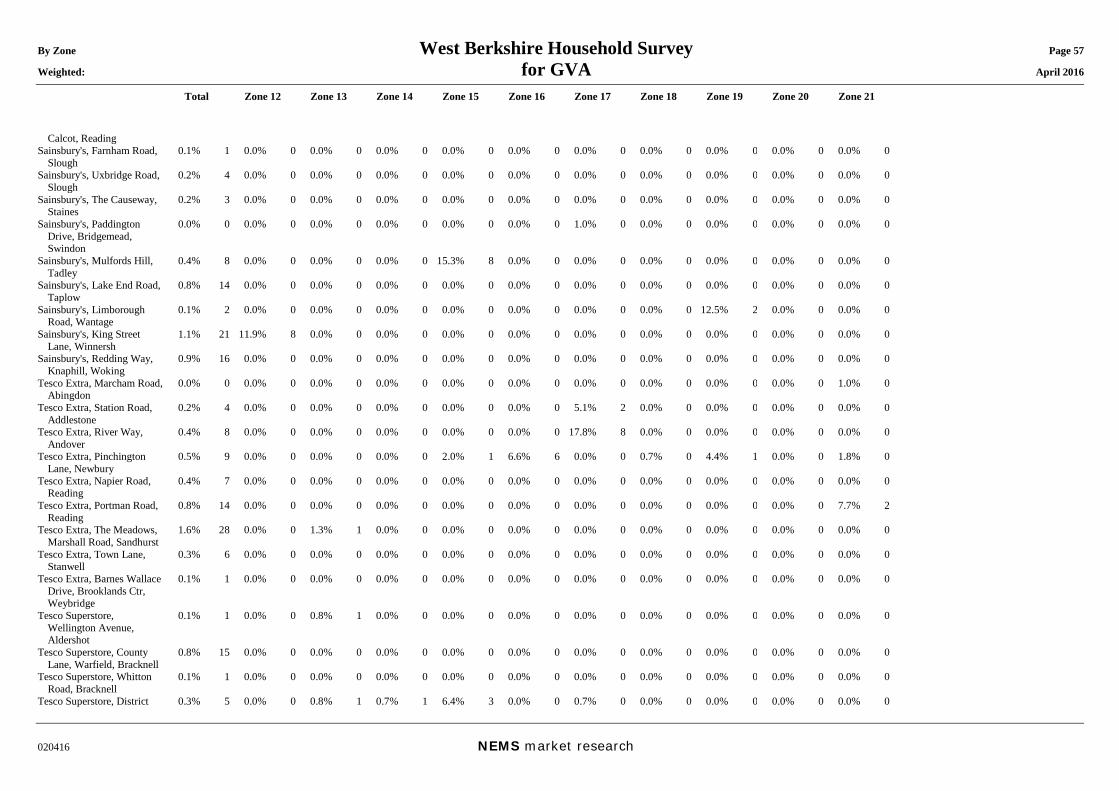
By Zone West Berkshire Household Survey Page 57 Weighted: for GVA April 2016
Total Zone 12 Zone 13 Zone 14 Zone 15 Zone 16 Zone 17 Zone 18 Zone 19 Zone 20 Zone 21
020416 NEMS market research
Calcot, Reading Sainsbury's, Farnham Road,
Slough 0.1% 1 0.0% 0 0.0% 0 0.0% 0 0.0% 0 0.0% 0 0.0% 0 0.0% 0 0.0% 0 0.0% 0 0.0% 0
Sainsbury's, Uxbridge Road, Slough
0.2% 4 0.0% 0 0.0% 0 0.0% 0 0.0% 0 0.0% 0 0.0% 0 0.0% 0 0.0% 0 0.0% 0 0.0% 0
Sainsbury's, The Causeway, Staines
0.2% 3 0.0% 0 0.0% 0 0.0% 0 0.0% 0 0.0% 0 0.0% 0 0.0% 0 0.0% 0 0.0% 0 0.0% 0
Sainsbury's, Paddington Drive, Bridgemead, Swindon
0.0% 0 0.0% 0 0.0% 0 0.0% 0 0.0% 0 0.0% 0 1.0% 0 0.0% 0 0.0% 0 0.0% 0 0.0% 0
Sainsbury's, Mulfords Hill, Tadley
0.4% 8 0.0% 0 0.0% 0 0.0% 0 15.3% 8 0.0% 0 0.0% 0 0.0% 0 0.0% 0 0.0% 0 0.0% 0
Sainsbury's, Lake End Road, Taplow
0.8% 14 0.0% 0 0.0% 0 0.0% 0 0.0% 0 0.0% 0 0.0% 0 0.0% 0 0.0% 0 0.0% 0 0.0% 0
Sainsbury's, Limborough Road, Wantage
0.1% 2 0.0% 0 0.0% 0 0.0% 0 0.0% 0 0.0% 0 0.0% 0 0.0% 0 12.5% 2 0.0% 0 0.0% 0
Sainsbury's, King Street Lane, Winnersh
1.1% 21 11.9% 8 0.0% 0 0.0% 0 0.0% 0 0.0% 0 0.0% 0 0.0% 0 0.0% 0 0.0% 0 0.0% 0
Sainsbury's, Redding Way, Knaphill, Woking
0.9% 16 0.0% 0 0.0% 0 0.0% 0 0.0% 0 0.0% 0 0.0% 0 0.0% 0 0.0% 0 0.0% 0 0.0% 0
Tesco Extra, Marcham Road, Abingdon
0.0% 0 0.0% 0 0.0% 0 0.0% 0 0.0% 0 0.0% 0 0.0% 0 0.0% 0 0.0% 0 0.0% 0 1.0% 0
Tesco Extra, Station Road, Addlestone
0.2% 4 0.0% 0 0.0% 0 0.0% 0 0.0% 0 0.0% 0 5.1% 2 0.0% 0 0.0% 0 0.0% 0 0.0% 0
Tesco Extra, River Way, Andover
0.4% 8 0.0% 0 0.0% 0 0.0% 0 0.0% 0 0.0% 0 17.8% 8 0.0% 0 0.0% 0 0.0% 0 0.0% 0
Tesco Extra, Pinchington Lane, Newbury
0.5% 9 0.0% 0 0.0% 0 0.0% 0 2.0% 1 6.6% 6 0.0% 0 0.7% 0 4.4% 1 0.0% 0 1.8% 0
Tesco Extra, Napier Road, Reading
0.4% 7 0.0% 0 0.0% 0 0.0% 0 0.0% 0 0.0% 0 0.0% 0 0.0% 0 0.0% 0 0.0% 0 0.0% 0
Tesco Extra, Portman Road, Reading
0.8% 14 0.0% 0 0.0% 0 0.0% 0 0.0% 0 0.0% 0 0.0% 0 0.0% 0 0.0% 0 0.0% 0 7.7% 2
Tesco Extra, The Meadows, Marshall Road, Sandhurst
1.6% 28 0.0% 0 1.3% 1 0.0% 0 0.0% 0 0.0% 0 0.0% 0 0.0% 0 0.0% 0 0.0% 0 0.0% 0
Tesco Extra, Town Lane, Stanwell
0.3% 6 0.0% 0 0.0% 0 0.0% 0 0.0% 0 0.0% 0 0.0% 0 0.0% 0 0.0% 0 0.0% 0 0.0% 0
Tesco Extra, Barnes Wallace Drive, Brooklands Ctr, Weybridge
0.1% 1 0.0% 0 0.0% 0 0.0% 0 0.0% 0 0.0% 0 0.0% 0 0.0% 0 0.0% 0 0.0% 0 0.0% 0
Tesco Superstore, Wellington Avenue, Aldershot
0.1% 1 0.0% 0 0.8% 1 0.0% 0 0.0% 0 0.0% 0 0.0% 0 0.0% 0 0.0% 0 0.0% 0 0.0% 0
Tesco Superstore, County Lane, Warfield, Bracknell
0.8% 15 0.0% 0 0.0% 0 0.0% 0 0.0% 0 0.0% 0 0.0% 0 0.0% 0 0.0% 0 0.0% 0 0.0% 0
Tesco Superstore, Whitton Road, Bracknell
0.1% 1 0.0% 0 0.0% 0 0.0% 0 0.0% 0 0.0% 0 0.0% 0 0.0% 0 0.0% 0 0.0% 0 0.0% 0
Tesco Superstore, District 0.3% 5 0.0% 0 0.8% 1 0.7% 1 6.4% 3 0.0% 0 0.7% 0 0.0% 0 0.0% 0 0.0% 0 0.0% 0
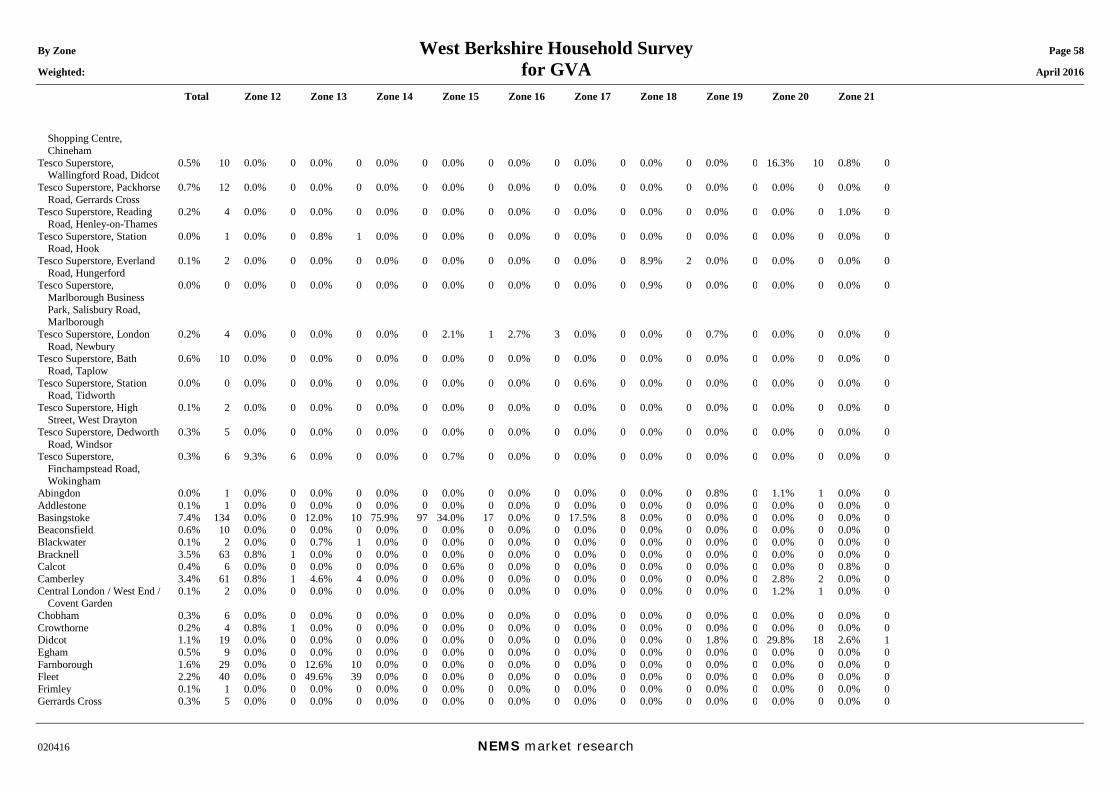
By Zone West Berkshire Household Survey Page 58 Weighted: for GVA April 2016
Total Zone 12 Zone 13 Zone 14 Zone 15 Zone 16 Zone 17 Zone 18 Zone 19 Zone 20 Zone 21
020416 NEMS market research
Shopping Centre, Chineham
Tesco Superstore, Wallingford Road, Didcot
0.5% 10 0.0% 0 0.0% 0 0.0% 0 0.0% 0 0.0% 0 0.0% 0 0.0% 0 0.0% 0 16.3% 10 0.8% 0
Tesco Superstore, Packhorse Road, Gerrards Cross
0.7% 12 0.0% 0 0.0% 0 0.0% 0 0.0% 0 0.0% 0 0.0% 0 0.0% 0 0.0% 0 0.0% 0 0.0% 0
Tesco Superstore, Reading Road, Henley-on-Thames
0.2% 4 0.0% 0 0.0% 0 0.0% 0 0.0% 0 0.0% 0 0.0% 0 0.0% 0 0.0% 0 0.0% 0 1.0% 0
Tesco Superstore, Station Road, Hook
0.0% 1 0.0% 0 0.8% 1 0.0% 0 0.0% 0 0.0% 0 0.0% 0 0.0% 0 0.0% 0 0.0% 0 0.0% 0
Tesco Superstore, Everland Road, Hungerford
0.1% 2 0.0% 0 0.0% 0 0.0% 0 0.0% 0 0.0% 0 0.0% 0 8.9% 2 0.0% 0 0.0% 0 0.0% 0
Tesco Superstore, Marlborough Business Park, Salisbury Road, Marlborough
0.0% 0 0.0% 0 0.0% 0 0.0% 0 0.0% 0 0.0% 0 0.0% 0 0.9% 0 0.0% 0 0.0% 0 0.0% 0
Tesco Superstore, London Road, Newbury
0.2% 4 0.0% 0 0.0% 0 0.0% 0 2.1% 1 2.7% 3 0.0% 0 0.0% 0 0.7% 0 0.0% 0 0.0% 0
Tesco Superstore, Bath Road, Taplow
0.6% 10 0.0% 0 0.0% 0 0.0% 0 0.0% 0 0.0% 0 0.0% 0 0.0% 0 0.0% 0 0.0% 0 0.0% 0
Tesco Superstore, Station Road, Tidworth
0.0% 0 0.0% 0 0.0% 0 0.0% 0 0.0% 0 0.0% 0 0.6% 0 0.0% 0 0.0% 0 0.0% 0 0.0% 0
Tesco Superstore, High Street, West Drayton
0.1% 2 0.0% 0 0.0% 0 0.0% 0 0.0% 0 0.0% 0 0.0% 0 0.0% 0 0.0% 0 0.0% 0 0.0% 0
Tesco Superstore, Dedworth Road, Windsor
0.3% 5 0.0% 0 0.0% 0 0.0% 0 0.0% 0 0.0% 0 0.0% 0 0.0% 0 0.0% 0 0.0% 0 0.0% 0
Tesco Superstore, Finchampstead Road, Wokingham
0.3% 6 9.3% 6 0.0% 0 0.0% 0 0.7% 0 0.0% 0 0.0% 0 0.0% 0 0.0% 0 0.0% 0 0.0% 0
Abingdon 0.0% 1 0.0% 0 0.0% 0 0.0% 0 0.0% 0 0.0% 0 0.0% 0 0.0% 0 0.8% 0 1.1% 1 0.0% 0Addlestone 0.1% 1 0.0% 0 0.0% 0 0.0% 0 0.0% 0 0.0% 0 0.0% 0 0.0% 0 0.0% 0 0.0% 0 0.0% 0Basingstoke 7.4% 134 0.0% 0 12.0% 10 75.9% 97 34.0% 17 0.0% 0 17.5% 8 0.0% 0 0.0% 0 0.0% 0 0.0% 0Beaconsfield 0.6% 10 0.0% 0 0.0% 0 0.0% 0 0.0% 0 0.0% 0 0.0% 0 0.0% 0 0.0% 0 0.0% 0 0.0% 0Blackwater 0.1% 2 0.0% 0 0.7% 1 0.0% 0 0.0% 0 0.0% 0 0.0% 0 0.0% 0 0.0% 0 0.0% 0 0.0% 0Bracknell 3.5% 63 0.8% 1 0.0% 0 0.0% 0 0.0% 0 0.0% 0 0.0% 0 0.0% 0 0.0% 0 0.0% 0 0.0% 0Calcot 0.4% 6 0.0% 0 0.0% 0 0.0% 0 0.6% 0 0.0% 0 0.0% 0 0.0% 0 0.0% 0 0.0% 0 0.8% 0Camberley 3.4% 61 0.8% 1 4.6% 4 0.0% 0 0.0% 0 0.0% 0 0.0% 0 0.0% 0 0.0% 0 2.8% 2 0.0% 0Central London / West End /
Covent Garden 0.1% 2 0.0% 0 0.0% 0 0.0% 0 0.0% 0 0.0% 0 0.0% 0 0.0% 0 0.0% 0 1.2% 1 0.0% 0
Chobham 0.3% 6 0.0% 0 0.0% 0 0.0% 0 0.0% 0 0.0% 0 0.0% 0 0.0% 0 0.0% 0 0.0% 0 0.0% 0Crowthorne 0.2% 4 0.8% 1 0.0% 0 0.0% 0 0.0% 0 0.0% 0 0.0% 0 0.0% 0 0.0% 0 0.0% 0 0.0% 0Didcot 1.1% 19 0.0% 0 0.0% 0 0.0% 0 0.0% 0 0.0% 0 0.0% 0 0.0% 0 1.8% 0 29.8% 18 2.6% 1Egham 0.5% 9 0.0% 0 0.0% 0 0.0% 0 0.0% 0 0.0% 0 0.0% 0 0.0% 0 0.0% 0 0.0% 0 0.0% 0Farnborough 1.6% 29 0.0% 0 12.6% 10 0.0% 0 0.0% 0 0.0% 0 0.0% 0 0.0% 0 0.0% 0 0.0% 0 0.0% 0Fleet 2.2% 40 0.0% 0 49.6% 39 0.0% 0 0.0% 0 0.0% 0 0.0% 0 0.0% 0 0.0% 0 0.0% 0 0.0% 0Frimley 0.1% 1 0.0% 0 0.0% 0 0.0% 0 0.0% 0 0.0% 0 0.0% 0 0.0% 0 0.0% 0 0.0% 0 0.0% 0Gerrards Cross 0.3% 5 0.0% 0 0.0% 0 0.0% 0 0.0% 0 0.0% 0 0.0% 0 0.0% 0 0.0% 0 0.0% 0 0.0% 0
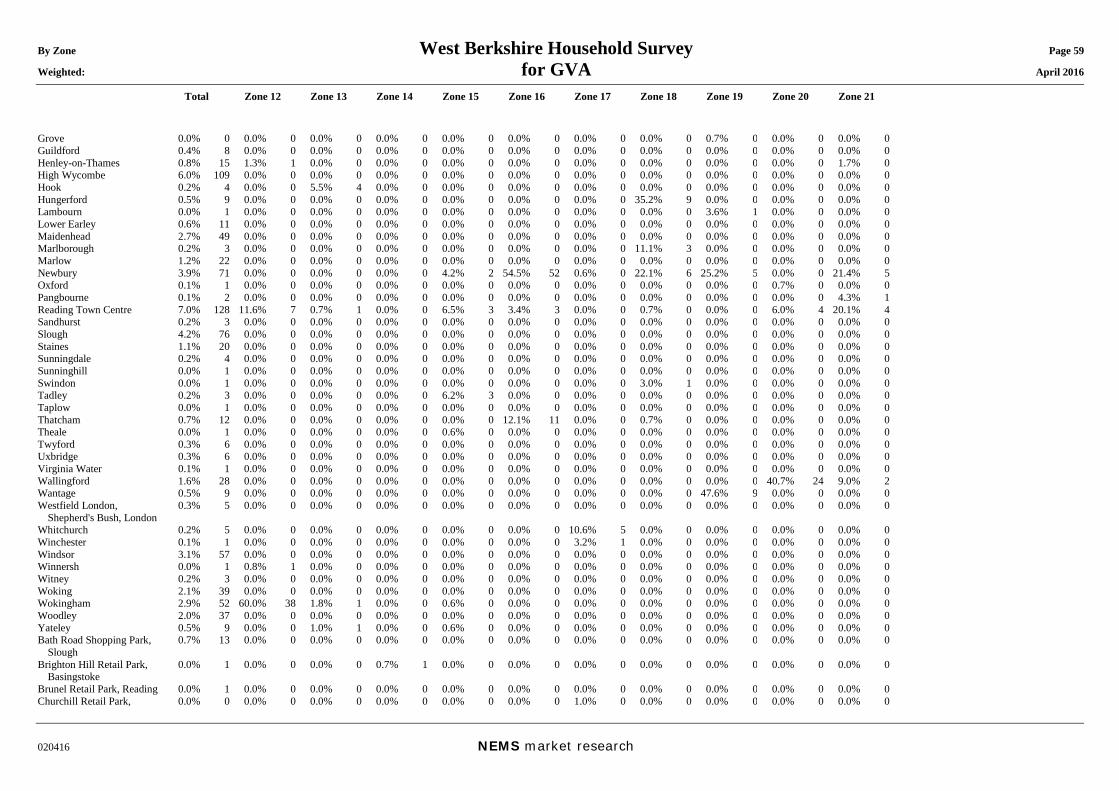
By Zone West Berkshire Household Survey Page 59 Weighted: for GVA April 2016
Total Zone 12 Zone 13 Zone 14 Zone 15 Zone 16 Zone 17 Zone 18 Zone 19 Zone 20 Zone 21
020416 NEMS market research
Grove 0.0% 0 0.0% 0 0.0% 0 0.0% 0 0.0% 0 0.0% 0 0.0% 0 0.0% 0 0.7% 0 0.0% 0 0.0% 0Guildford 0.4% 8 0.0% 0 0.0% 0 0.0% 0 0.0% 0 0.0% 0 0.0% 0 0.0% 0 0.0% 0 0.0% 0 0.0% 0Henley-on-Thames 0.8% 15 1.3% 1 0.0% 0 0.0% 0 0.0% 0 0.0% 0 0.0% 0 0.0% 0 0.0% 0 0.0% 0 1.7% 0High Wycombe 6.0% 109 0.0% 0 0.0% 0 0.0% 0 0.0% 0 0.0% 0 0.0% 0 0.0% 0 0.0% 0 0.0% 0 0.0% 0Hook 0.2% 4 0.0% 0 5.5% 4 0.0% 0 0.0% 0 0.0% 0 0.0% 0 0.0% 0 0.0% 0 0.0% 0 0.0% 0Hungerford 0.5% 9 0.0% 0 0.0% 0 0.0% 0 0.0% 0 0.0% 0 0.0% 0 35.2% 9 0.0% 0 0.0% 0 0.0% 0Lambourn 0.0% 1 0.0% 0 0.0% 0 0.0% 0 0.0% 0 0.0% 0 0.0% 0 0.0% 0 3.6% 1 0.0% 0 0.0% 0Lower Earley 0.6% 11 0.0% 0 0.0% 0 0.0% 0 0.0% 0 0.0% 0 0.0% 0 0.0% 0 0.0% 0 0.0% 0 0.0% 0Maidenhead 2.7% 49 0.0% 0 0.0% 0 0.0% 0 0.0% 0 0.0% 0 0.0% 0 0.0% 0 0.0% 0 0.0% 0 0.0% 0Marlborough 0.2% 3 0.0% 0 0.0% 0 0.0% 0 0.0% 0 0.0% 0 0.0% 0 11.1% 3 0.0% 0 0.0% 0 0.0% 0Marlow 1.2% 22 0.0% 0 0.0% 0 0.0% 0 0.0% 0 0.0% 0 0.0% 0 0.0% 0 0.0% 0 0.0% 0 0.0% 0Newbury 3.9% 71 0.0% 0 0.0% 0 0.0% 0 4.2% 2 54.5% 52 0.6% 0 22.1% 6 25.2% 5 0.0% 0 21.4% 5Oxford 0.1% 1 0.0% 0 0.0% 0 0.0% 0 0.0% 0 0.0% 0 0.0% 0 0.0% 0 0.0% 0 0.7% 0 0.0% 0Pangbourne 0.1% 2 0.0% 0 0.0% 0 0.0% 0 0.0% 0 0.0% 0 0.0% 0 0.0% 0 0.0% 0 0.0% 0 4.3% 1Reading Town Centre 7.0% 128 11.6% 7 0.7% 1 0.0% 0 6.5% 3 3.4% 3 0.0% 0 0.7% 0 0.0% 0 6.0% 4 20.1% 4Sandhurst 0.2% 3 0.0% 0 0.0% 0 0.0% 0 0.0% 0 0.0% 0 0.0% 0 0.0% 0 0.0% 0 0.0% 0 0.0% 0Slough 4.2% 76 0.0% 0 0.0% 0 0.0% 0 0.0% 0 0.0% 0 0.0% 0 0.0% 0 0.0% 0 0.0% 0 0.0% 0Staines 1.1% 20 0.0% 0 0.0% 0 0.0% 0 0.0% 0 0.0% 0 0.0% 0 0.0% 0 0.0% 0 0.0% 0 0.0% 0Sunningdale 0.2% 4 0.0% 0 0.0% 0 0.0% 0 0.0% 0 0.0% 0 0.0% 0 0.0% 0 0.0% 0 0.0% 0 0.0% 0Sunninghill 0.0% 1 0.0% 0 0.0% 0 0.0% 0 0.0% 0 0.0% 0 0.0% 0 0.0% 0 0.0% 0 0.0% 0 0.0% 0Swindon 0.0% 1 0.0% 0 0.0% 0 0.0% 0 0.0% 0 0.0% 0 0.0% 0 3.0% 1 0.0% 0 0.0% 0 0.0% 0Tadley 0.2% 3 0.0% 0 0.0% 0 0.0% 0 6.2% 3 0.0% 0 0.0% 0 0.0% 0 0.0% 0 0.0% 0 0.0% 0Taplow 0.0% 1 0.0% 0 0.0% 0 0.0% 0 0.0% 0 0.0% 0 0.0% 0 0.0% 0 0.0% 0 0.0% 0 0.0% 0Thatcham 0.7% 12 0.0% 0 0.0% 0 0.0% 0 0.0% 0 12.1% 11 0.0% 0 0.7% 0 0.0% 0 0.0% 0 0.0% 0Theale 0.0% 1 0.0% 0 0.0% 0 0.0% 0 0.6% 0 0.0% 0 0.0% 0 0.0% 0 0.0% 0 0.0% 0 0.0% 0Twyford 0.3% 6 0.0% 0 0.0% 0 0.0% 0 0.0% 0 0.0% 0 0.0% 0 0.0% 0 0.0% 0 0.0% 0 0.0% 0Uxbridge 0.3% 6 0.0% 0 0.0% 0 0.0% 0 0.0% 0 0.0% 0 0.0% 0 0.0% 0 0.0% 0 0.0% 0 0.0% 0Virginia Water 0.1% 1 0.0% 0 0.0% 0 0.0% 0 0.0% 0 0.0% 0 0.0% 0 0.0% 0 0.0% 0 0.0% 0 0.0% 0Wallingford 1.6% 28 0.0% 0 0.0% 0 0.0% 0 0.0% 0 0.0% 0 0.0% 0 0.0% 0 0.0% 0 40.7% 24 9.0% 2Wantage 0.5% 9 0.0% 0 0.0% 0 0.0% 0 0.0% 0 0.0% 0 0.0% 0 0.0% 0 47.6% 9 0.0% 0 0.0% 0Westfield London,
Shepherd's Bush, London 0.3% 5 0.0% 0 0.0% 0 0.0% 0 0.0% 0 0.0% 0 0.0% 0 0.0% 0 0.0% 0 0.0% 0 0.0% 0
Whitchurch 0.2% 5 0.0% 0 0.0% 0 0.0% 0 0.0% 0 0.0% 0 10.6% 5 0.0% 0 0.0% 0 0.0% 0 0.0% 0Winchester 0.1% 1 0.0% 0 0.0% 0 0.0% 0 0.0% 0 0.0% 0 3.2% 1 0.0% 0 0.0% 0 0.0% 0 0.0% 0Windsor 3.1% 57 0.0% 0 0.0% 0 0.0% 0 0.0% 0 0.0% 0 0.0% 0 0.0% 0 0.0% 0 0.0% 0 0.0% 0Winnersh 0.0% 1 0.8% 1 0.0% 0 0.0% 0 0.0% 0 0.0% 0 0.0% 0 0.0% 0 0.0% 0 0.0% 0 0.0% 0Witney 0.2% 3 0.0% 0 0.0% 0 0.0% 0 0.0% 0 0.0% 0 0.0% 0 0.0% 0 0.0% 0 0.0% 0 0.0% 0Woking 2.1% 39 0.0% 0 0.0% 0 0.0% 0 0.0% 0 0.0% 0 0.0% 0 0.0% 0 0.0% 0 0.0% 0 0.0% 0Wokingham 2.9% 52 60.0% 38 1.8% 1 0.0% 0 0.6% 0 0.0% 0 0.0% 0 0.0% 0 0.0% 0 0.0% 0 0.0% 0Woodley 2.0% 37 0.0% 0 0.0% 0 0.0% 0 0.0% 0 0.0% 0 0.0% 0 0.0% 0 0.0% 0 0.0% 0 0.0% 0Yateley 0.5% 9 0.0% 0 1.0% 1 0.0% 0 0.6% 0 0.0% 0 0.0% 0 0.0% 0 0.0% 0 0.0% 0 0.0% 0Bath Road Shopping Park,
Slough 0.7% 13 0.0% 0 0.0% 0 0.0% 0 0.0% 0 0.0% 0 0.0% 0 0.0% 0 0.0% 0 0.0% 0 0.0% 0
Brighton Hill Retail Park, Basingstoke
0.0% 1 0.0% 0 0.0% 0 0.7% 1 0.0% 0 0.0% 0 0.0% 0 0.0% 0 0.0% 0 0.0% 0 0.0% 0
Brunel Retail Park, Reading 0.0% 1 0.0% 0 0.0% 0 0.0% 0 0.0% 0 0.0% 0 0.0% 0 0.0% 0 0.0% 0 0.0% 0 0.0% 0Churchill Retail Park, 0.0% 0 0.0% 0 0.0% 0 0.0% 0 0.0% 0 0.0% 0 1.0% 0 0.0% 0 0.0% 0 0.0% 0 0.0% 0
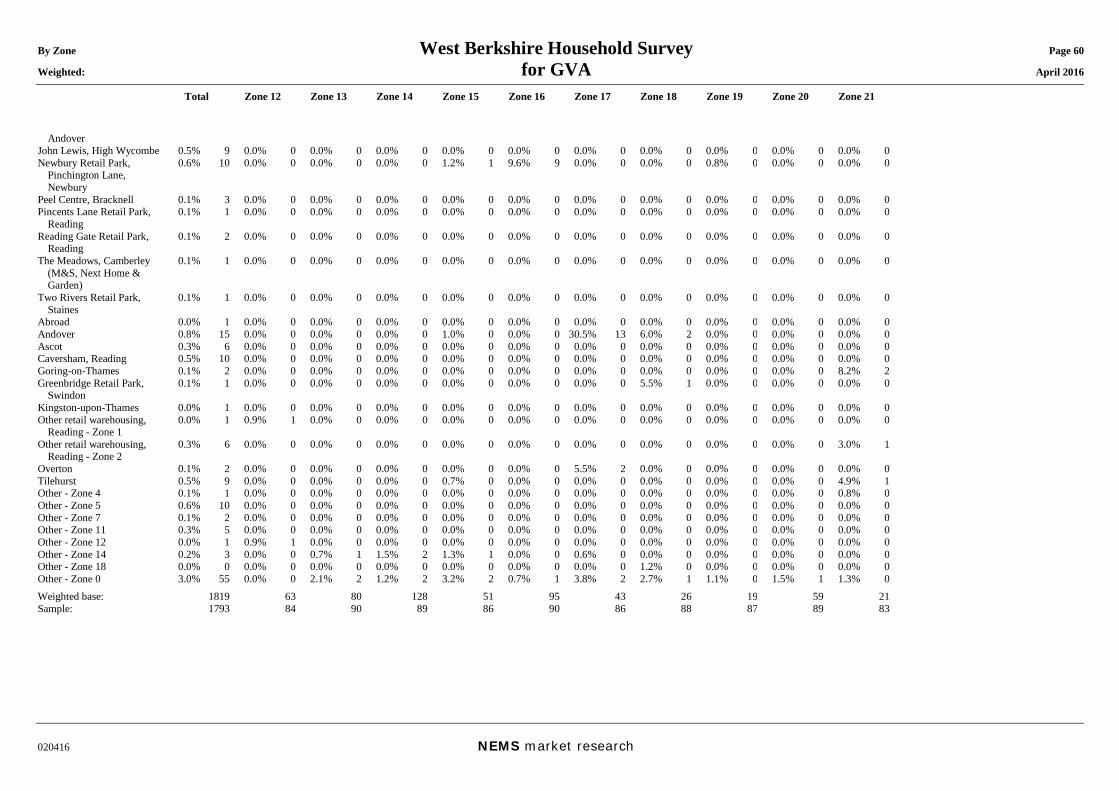
By Zone West Berkshire Household Survey Page 60 Weighted: for GVA April 2016
Total Zone 12 Zone 13 Zone 14 Zone 15 Zone 16 Zone 17 Zone 18 Zone 19 Zone 20 Zone 21
020416 NEMS market research
Andover John Lewis, High Wycombe 0.5% 9 0.0% 0 0.0% 0 0.0% 0 0.0% 0 0.0% 0 0.0% 0 0.0% 0 0.0% 0 0.0% 0 0.0% 0Newbury Retail Park,
Pinchington Lane, Newbury
0.6% 10 0.0% 0 0.0% 0 0.0% 0 1.2% 1 9.6% 9 0.0% 0 0.0% 0 0.8% 0 0.0% 0 0.0% 0
Peel Centre, Bracknell 0.1% 3 0.0% 0 0.0% 0 0.0% 0 0.0% 0 0.0% 0 0.0% 0 0.0% 0 0.0% 0 0.0% 0 0.0% 0Pincents Lane Retail Park,
Reading 0.1% 1 0.0% 0 0.0% 0 0.0% 0 0.0% 0 0.0% 0 0.0% 0 0.0% 0 0.0% 0 0.0% 0 0.0% 0
Reading Gate Retail Park, Reading
0.1% 2 0.0% 0 0.0% 0 0.0% 0 0.0% 0 0.0% 0 0.0% 0 0.0% 0 0.0% 0 0.0% 0 0.0% 0
The Meadows, Camberley (M&S, Next Home & Garden)
0.1% 1 0.0% 0 0.0% 0 0.0% 0 0.0% 0 0.0% 0 0.0% 0 0.0% 0 0.0% 0 0.0% 0 0.0% 0
Two Rivers Retail Park, Staines
0.1% 1 0.0% 0 0.0% 0 0.0% 0 0.0% 0 0.0% 0 0.0% 0 0.0% 0 0.0% 0 0.0% 0 0.0% 0
Abroad 0.0% 1 0.0% 0 0.0% 0 0.0% 0 0.0% 0 0.0% 0 0.0% 0 0.0% 0 0.0% 0 0.0% 0 0.0% 0Andover 0.8% 15 0.0% 0 0.0% 0 0.0% 0 1.0% 0 0.0% 0 30.5% 13 6.0% 2 0.0% 0 0.0% 0 0.0% 0Ascot 0.3% 6 0.0% 0 0.0% 0 0.0% 0 0.0% 0 0.0% 0 0.0% 0 0.0% 0 0.0% 0 0.0% 0 0.0% 0Caversham, Reading 0.5% 10 0.0% 0 0.0% 0 0.0% 0 0.0% 0 0.0% 0 0.0% 0 0.0% 0 0.0% 0 0.0% 0 0.0% 0Goring-on-Thames 0.1% 2 0.0% 0 0.0% 0 0.0% 0 0.0% 0 0.0% 0 0.0% 0 0.0% 0 0.0% 0 0.0% 0 8.2% 2Greenbridge Retail Park,
Swindon 0.1% 1 0.0% 0 0.0% 0 0.0% 0 0.0% 0 0.0% 0 0.0% 0 5.5% 1 0.0% 0 0.0% 0 0.0% 0
Kingston-upon-Thames 0.0% 1 0.0% 0 0.0% 0 0.0% 0 0.0% 0 0.0% 0 0.0% 0 0.0% 0 0.0% 0 0.0% 0 0.0% 0Other retail warehousing,
Reading - Zone 1 0.0% 1 0.9% 1 0.0% 0 0.0% 0 0.0% 0 0.0% 0 0.0% 0 0.0% 0 0.0% 0 0.0% 0 0.0% 0
Other retail warehousing, Reading - Zone 2
0.3% 6 0.0% 0 0.0% 0 0.0% 0 0.0% 0 0.0% 0 0.0% 0 0.0% 0 0.0% 0 0.0% 0 3.0% 1
Overton 0.1% 2 0.0% 0 0.0% 0 0.0% 0 0.0% 0 0.0% 0 5.5% 2 0.0% 0 0.0% 0 0.0% 0 0.0% 0Tilehurst 0.5% 9 0.0% 0 0.0% 0 0.0% 0 0.7% 0 0.0% 0 0.0% 0 0.0% 0 0.0% 0 0.0% 0 4.9% 1Other - Zone 4 0.1% 1 0.0% 0 0.0% 0 0.0% 0 0.0% 0 0.0% 0 0.0% 0 0.0% 0 0.0% 0 0.0% 0 0.8% 0Other - Zone 5 0.6% 10 0.0% 0 0.0% 0 0.0% 0 0.0% 0 0.0% 0 0.0% 0 0.0% 0 0.0% 0 0.0% 0 0.0% 0Other - Zone 7 0.1% 2 0.0% 0 0.0% 0 0.0% 0 0.0% 0 0.0% 0 0.0% 0 0.0% 0 0.0% 0 0.0% 0 0.0% 0Other - Zone 11 0.3% 5 0.0% 0 0.0% 0 0.0% 0 0.0% 0 0.0% 0 0.0% 0 0.0% 0 0.0% 0 0.0% 0 0.0% 0Other - Zone 12 0.0% 1 0.9% 1 0.0% 0 0.0% 0 0.0% 0 0.0% 0 0.0% 0 0.0% 0 0.0% 0 0.0% 0 0.0% 0Other - Zone 14 0.2% 3 0.0% 0 0.7% 1 1.5% 2 1.3% 1 0.0% 0 0.6% 0 0.0% 0 0.0% 0 0.0% 0 0.0% 0Other - Zone 18 0.0% 0 0.0% 0 0.0% 0 0.0% 0 0.0% 0 0.0% 0 0.0% 0 1.2% 0 0.0% 0 0.0% 0 0.0% 0Other - Zone 0 3.0% 55 0.0% 0 2.1% 2 1.2% 2 3.2% 2 0.7% 1 3.8% 2 2.7% 1 1.1% 0 1.5% 1 1.3% 0Weighted base: 1819 63 80 128 51 95 43 26 19 59 21Sample: 1793 84 90 89 86 90 86 88 87 89 83
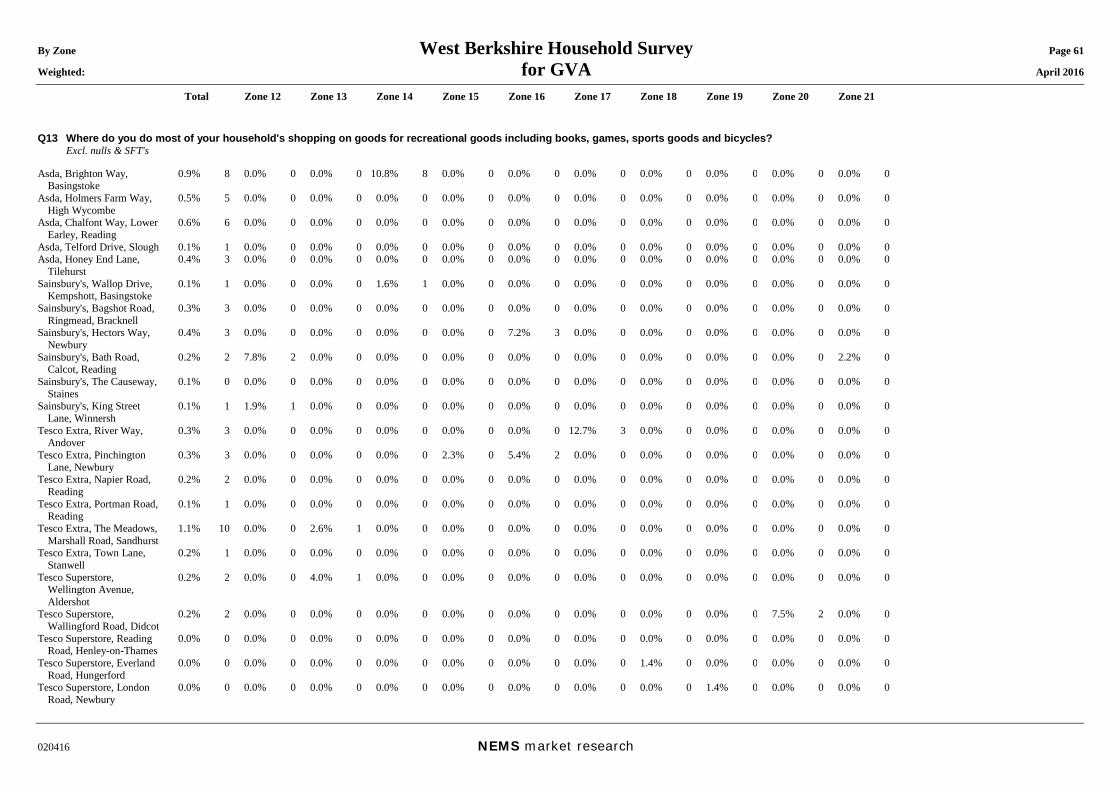
By Zone West Berkshire Household Survey Page 61 Weighted: for GVA April 2016
Total Zone 12 Zone 13 Zone 14 Zone 15 Zone 16 Zone 17 Zone 18 Zone 19 Zone 20 Zone 21
020416 NEMS market research
Q13 Where do you do most of your household's shopping on goods for recreational goods including books, games, sports goods and bicycles? Excl. nulls & SFT's Asda, Brighton Way,
Basingstoke 0.9% 8 0.0% 0 0.0% 0 10.8% 8 0.0% 0 0.0% 0 0.0% 0 0.0% 0 0.0% 0 0.0% 0 0.0% 0
Asda, Holmers Farm Way, High Wycombe
0.5% 5 0.0% 0 0.0% 0 0.0% 0 0.0% 0 0.0% 0 0.0% 0 0.0% 0 0.0% 0 0.0% 0 0.0% 0
Asda, Chalfont Way, Lower Earley, Reading
0.6% 6 0.0% 0 0.0% 0 0.0% 0 0.0% 0 0.0% 0 0.0% 0 0.0% 0 0.0% 0 0.0% 0 0.0% 0
Asda, Telford Drive, Slough 0.1% 1 0.0% 0 0.0% 0 0.0% 0 0.0% 0 0.0% 0 0.0% 0 0.0% 0 0.0% 0 0.0% 0 0.0% 0Asda, Honey End Lane,
Tilehurst 0.4% 3 0.0% 0 0.0% 0 0.0% 0 0.0% 0 0.0% 0 0.0% 0 0.0% 0 0.0% 0 0.0% 0 0.0% 0
Sainsbury's, Wallop Drive, Kempshott, Basingstoke
0.1% 1 0.0% 0 0.0% 0 1.6% 1 0.0% 0 0.0% 0 0.0% 0 0.0% 0 0.0% 0 0.0% 0 0.0% 0
Sainsbury's, Bagshot Road, Ringmead, Bracknell
0.3% 3 0.0% 0 0.0% 0 0.0% 0 0.0% 0 0.0% 0 0.0% 0 0.0% 0 0.0% 0 0.0% 0 0.0% 0
Sainsbury's, Hectors Way, Newbury
0.4% 3 0.0% 0 0.0% 0 0.0% 0 0.0% 0 7.2% 3 0.0% 0 0.0% 0 0.0% 0 0.0% 0 0.0% 0
Sainsbury's, Bath Road, Calcot, Reading
0.2% 2 7.8% 2 0.0% 0 0.0% 0 0.0% 0 0.0% 0 0.0% 0 0.0% 0 0.0% 0 0.0% 0 2.2% 0
Sainsbury's, The Causeway, Staines
0.1% 0 0.0% 0 0.0% 0 0.0% 0 0.0% 0 0.0% 0 0.0% 0 0.0% 0 0.0% 0 0.0% 0 0.0% 0
Sainsbury's, King Street Lane, Winnersh
0.1% 1 1.9% 1 0.0% 0 0.0% 0 0.0% 0 0.0% 0 0.0% 0 0.0% 0 0.0% 0 0.0% 0 0.0% 0
Tesco Extra, River Way, Andover
0.3% 3 0.0% 0 0.0% 0 0.0% 0 0.0% 0 0.0% 0 12.7% 3 0.0% 0 0.0% 0 0.0% 0 0.0% 0
Tesco Extra, Pinchington Lane, Newbury
0.3% 3 0.0% 0 0.0% 0 0.0% 0 2.3% 0 5.4% 2 0.0% 0 0.0% 0 0.0% 0 0.0% 0 0.0% 0
Tesco Extra, Napier Road, Reading
0.2% 2 0.0% 0 0.0% 0 0.0% 0 0.0% 0 0.0% 0 0.0% 0 0.0% 0 0.0% 0 0.0% 0 0.0% 0
Tesco Extra, Portman Road, Reading
0.1% 1 0.0% 0 0.0% 0 0.0% 0 0.0% 0 0.0% 0 0.0% 0 0.0% 0 0.0% 0 0.0% 0 0.0% 0
Tesco Extra, The Meadows, Marshall Road, Sandhurst
1.1% 10 0.0% 0 2.6% 1 0.0% 0 0.0% 0 0.0% 0 0.0% 0 0.0% 0 0.0% 0 0.0% 0 0.0% 0
Tesco Extra, Town Lane, Stanwell
0.2% 1 0.0% 0 0.0% 0 0.0% 0 0.0% 0 0.0% 0 0.0% 0 0.0% 0 0.0% 0 0.0% 0 0.0% 0
Tesco Superstore, Wellington Avenue, Aldershot
0.2% 2 0.0% 0 4.0% 1 0.0% 0 0.0% 0 0.0% 0 0.0% 0 0.0% 0 0.0% 0 0.0% 0 0.0% 0
Tesco Superstore, Wallingford Road, Didcot
0.2% 2 0.0% 0 0.0% 0 0.0% 0 0.0% 0 0.0% 0 0.0% 0 0.0% 0 0.0% 0 7.5% 2 0.0% 0
Tesco Superstore, Reading Road, Henley-on-Thames
0.0% 0 0.0% 0 0.0% 0 0.0% 0 0.0% 0 0.0% 0 0.0% 0 0.0% 0 0.0% 0 0.0% 0 0.0% 0
Tesco Superstore, Everland Road, Hungerford
0.0% 0 0.0% 0 0.0% 0 0.0% 0 0.0% 0 0.0% 0 0.0% 0 1.4% 0 0.0% 0 0.0% 0 0.0% 0
Tesco Superstore, London Road, Newbury
0.0% 0 0.0% 0 0.0% 0 0.0% 0 0.0% 0 0.0% 0 0.0% 0 0.0% 0 1.4% 0 0.0% 0 0.0% 0
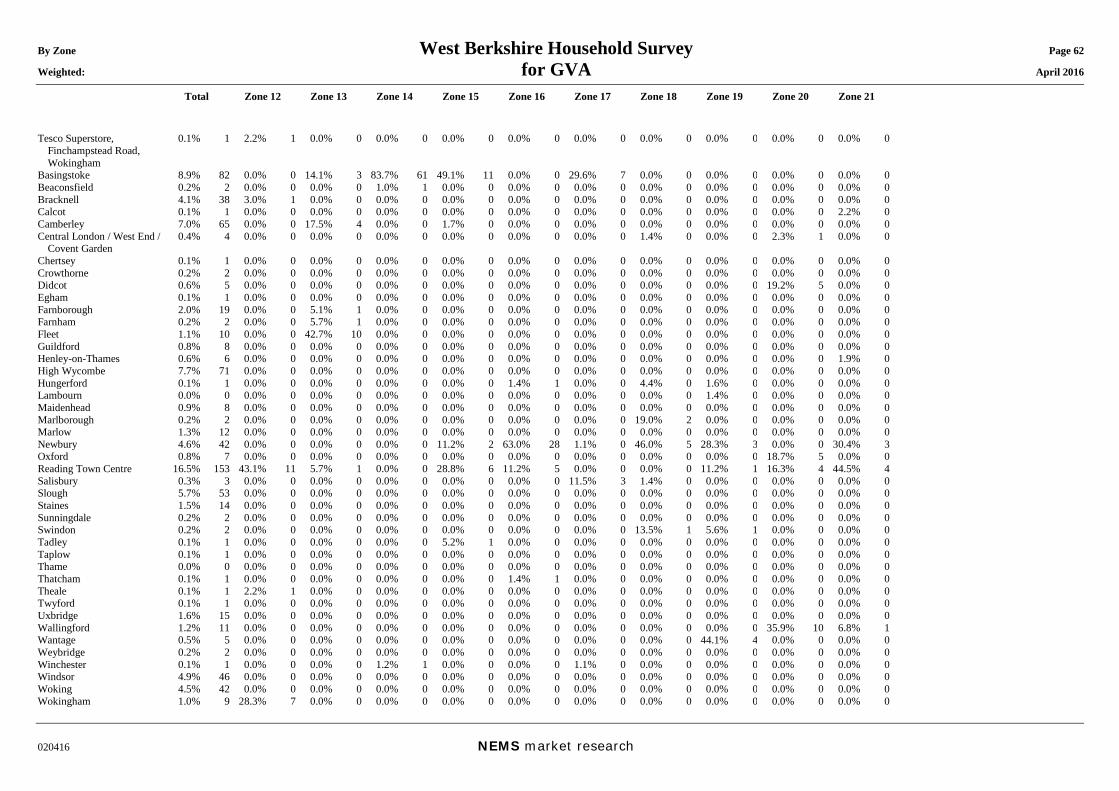
By Zone West Berkshire Household Survey Page 62 Weighted: for GVA April 2016
Total Zone 12 Zone 13 Zone 14 Zone 15 Zone 16 Zone 17 Zone 18 Zone 19 Zone 20 Zone 21
020416 NEMS market research
Tesco Superstore, Finchampstead Road, Wokingham
0.1% 1 2.2% 1 0.0% 0 0.0% 0 0.0% 0 0.0% 0 0.0% 0 0.0% 0 0.0% 0 0.0% 0 0.0% 0
Basingstoke 8.9% 82 0.0% 0 14.1% 3 83.7% 61 49.1% 11 0.0% 0 29.6% 7 0.0% 0 0.0% 0 0.0% 0 0.0% 0Beaconsfield 0.2% 2 0.0% 0 0.0% 0 1.0% 1 0.0% 0 0.0% 0 0.0% 0 0.0% 0 0.0% 0 0.0% 0 0.0% 0Bracknell 4.1% 38 3.0% 1 0.0% 0 0.0% 0 0.0% 0 0.0% 0 0.0% 0 0.0% 0 0.0% 0 0.0% 0 0.0% 0Calcot 0.1% 1 0.0% 0 0.0% 0 0.0% 0 0.0% 0 0.0% 0 0.0% 0 0.0% 0 0.0% 0 0.0% 0 2.2% 0Camberley 7.0% 65 0.0% 0 17.5% 4 0.0% 0 1.7% 0 0.0% 0 0.0% 0 0.0% 0 0.0% 0 0.0% 0 0.0% 0Central London / West End /
Covent Garden 0.4% 4 0.0% 0 0.0% 0 0.0% 0 0.0% 0 0.0% 0 0.0% 0 1.4% 0 0.0% 0 2.3% 1 0.0% 0
Chertsey 0.1% 1 0.0% 0 0.0% 0 0.0% 0 0.0% 0 0.0% 0 0.0% 0 0.0% 0 0.0% 0 0.0% 0 0.0% 0Crowthorne 0.2% 2 0.0% 0 0.0% 0 0.0% 0 0.0% 0 0.0% 0 0.0% 0 0.0% 0 0.0% 0 0.0% 0 0.0% 0Didcot 0.6% 5 0.0% 0 0.0% 0 0.0% 0 0.0% 0 0.0% 0 0.0% 0 0.0% 0 0.0% 0 19.2% 5 0.0% 0Egham 0.1% 1 0.0% 0 0.0% 0 0.0% 0 0.0% 0 0.0% 0 0.0% 0 0.0% 0 0.0% 0 0.0% 0 0.0% 0Farnborough 2.0% 19 0.0% 0 5.1% 1 0.0% 0 0.0% 0 0.0% 0 0.0% 0 0.0% 0 0.0% 0 0.0% 0 0.0% 0Farnham 0.2% 2 0.0% 0 5.7% 1 0.0% 0 0.0% 0 0.0% 0 0.0% 0 0.0% 0 0.0% 0 0.0% 0 0.0% 0Fleet 1.1% 10 0.0% 0 42.7% 10 0.0% 0 0.0% 0 0.0% 0 0.0% 0 0.0% 0 0.0% 0 0.0% 0 0.0% 0Guildford 0.8% 8 0.0% 0 0.0% 0 0.0% 0 0.0% 0 0.0% 0 0.0% 0 0.0% 0 0.0% 0 0.0% 0 0.0% 0Henley-on-Thames 0.6% 6 0.0% 0 0.0% 0 0.0% 0 0.0% 0 0.0% 0 0.0% 0 0.0% 0 0.0% 0 0.0% 0 1.9% 0High Wycombe 7.7% 71 0.0% 0 0.0% 0 0.0% 0 0.0% 0 0.0% 0 0.0% 0 0.0% 0 0.0% 0 0.0% 0 0.0% 0Hungerford 0.1% 1 0.0% 0 0.0% 0 0.0% 0 0.0% 0 1.4% 1 0.0% 0 4.4% 0 1.6% 0 0.0% 0 0.0% 0Lambourn 0.0% 0 0.0% 0 0.0% 0 0.0% 0 0.0% 0 0.0% 0 0.0% 0 0.0% 0 1.4% 0 0.0% 0 0.0% 0Maidenhead 0.9% 8 0.0% 0 0.0% 0 0.0% 0 0.0% 0 0.0% 0 0.0% 0 0.0% 0 0.0% 0 0.0% 0 0.0% 0Marlborough 0.2% 2 0.0% 0 0.0% 0 0.0% 0 0.0% 0 0.0% 0 0.0% 0 19.0% 2 0.0% 0 0.0% 0 0.0% 0Marlow 1.3% 12 0.0% 0 0.0% 0 0.0% 0 0.0% 0 0.0% 0 0.0% 0 0.0% 0 0.0% 0 0.0% 0 0.0% 0Newbury 4.6% 42 0.0% 0 0.0% 0 0.0% 0 11.2% 2 63.0% 28 1.1% 0 46.0% 5 28.3% 3 0.0% 0 30.4% 3Oxford 0.8% 7 0.0% 0 0.0% 0 0.0% 0 0.0% 0 0.0% 0 0.0% 0 0.0% 0 0.0% 0 18.7% 5 0.0% 0Reading Town Centre 16.5% 153 43.1% 11 5.7% 1 0.0% 0 28.8% 6 11.2% 5 0.0% 0 0.0% 0 11.2% 1 16.3% 4 44.5% 4Salisbury 0.3% 3 0.0% 0 0.0% 0 0.0% 0 0.0% 0 0.0% 0 11.5% 3 1.4% 0 0.0% 0 0.0% 0 0.0% 0Slough 5.7% 53 0.0% 0 0.0% 0 0.0% 0 0.0% 0 0.0% 0 0.0% 0 0.0% 0 0.0% 0 0.0% 0 0.0% 0Staines 1.5% 14 0.0% 0 0.0% 0 0.0% 0 0.0% 0 0.0% 0 0.0% 0 0.0% 0 0.0% 0 0.0% 0 0.0% 0Sunningdale 0.2% 2 0.0% 0 0.0% 0 0.0% 0 0.0% 0 0.0% 0 0.0% 0 0.0% 0 0.0% 0 0.0% 0 0.0% 0Swindon 0.2% 2 0.0% 0 0.0% 0 0.0% 0 0.0% 0 0.0% 0 0.0% 0 13.5% 1 5.6% 1 0.0% 0 0.0% 0Tadley 0.1% 1 0.0% 0 0.0% 0 0.0% 0 5.2% 1 0.0% 0 0.0% 0 0.0% 0 0.0% 0 0.0% 0 0.0% 0Taplow 0.1% 1 0.0% 0 0.0% 0 0.0% 0 0.0% 0 0.0% 0 0.0% 0 0.0% 0 0.0% 0 0.0% 0 0.0% 0Thame 0.0% 0 0.0% 0 0.0% 0 0.0% 0 0.0% 0 0.0% 0 0.0% 0 0.0% 0 0.0% 0 0.0% 0 0.0% 0Thatcham 0.1% 1 0.0% 0 0.0% 0 0.0% 0 0.0% 0 1.4% 1 0.0% 0 0.0% 0 0.0% 0 0.0% 0 0.0% 0Theale 0.1% 1 2.2% 1 0.0% 0 0.0% 0 0.0% 0 0.0% 0 0.0% 0 0.0% 0 0.0% 0 0.0% 0 0.0% 0Twyford 0.1% 1 0.0% 0 0.0% 0 0.0% 0 0.0% 0 0.0% 0 0.0% 0 0.0% 0 0.0% 0 0.0% 0 0.0% 0Uxbridge 1.6% 15 0.0% 0 0.0% 0 0.0% 0 0.0% 0 0.0% 0 0.0% 0 0.0% 0 0.0% 0 0.0% 0 0.0% 0Wallingford 1.2% 11 0.0% 0 0.0% 0 0.0% 0 0.0% 0 0.0% 0 0.0% 0 0.0% 0 0.0% 0 35.9% 10 6.8% 1Wantage 0.5% 5 0.0% 0 0.0% 0 0.0% 0 0.0% 0 0.0% 0 0.0% 0 0.0% 0 44.1% 4 0.0% 0 0.0% 0Weybridge 0.2% 2 0.0% 0 0.0% 0 0.0% 0 0.0% 0 0.0% 0 0.0% 0 0.0% 0 0.0% 0 0.0% 0 0.0% 0Winchester 0.1% 1 0.0% 0 0.0% 0 1.2% 1 0.0% 0 0.0% 0 1.1% 0 0.0% 0 0.0% 0 0.0% 0 0.0% 0Windsor 4.9% 46 0.0% 0 0.0% 0 0.0% 0 0.0% 0 0.0% 0 0.0% 0 0.0% 0 0.0% 0 0.0% 0 0.0% 0Woking 4.5% 42 0.0% 0 0.0% 0 0.0% 0 0.0% 0 0.0% 0 0.0% 0 0.0% 0 0.0% 0 0.0% 0 0.0% 0Wokingham 1.0% 9 28.3% 7 0.0% 0 0.0% 0 0.0% 0 0.0% 0 0.0% 0 0.0% 0 0.0% 0 0.0% 0 0.0% 0
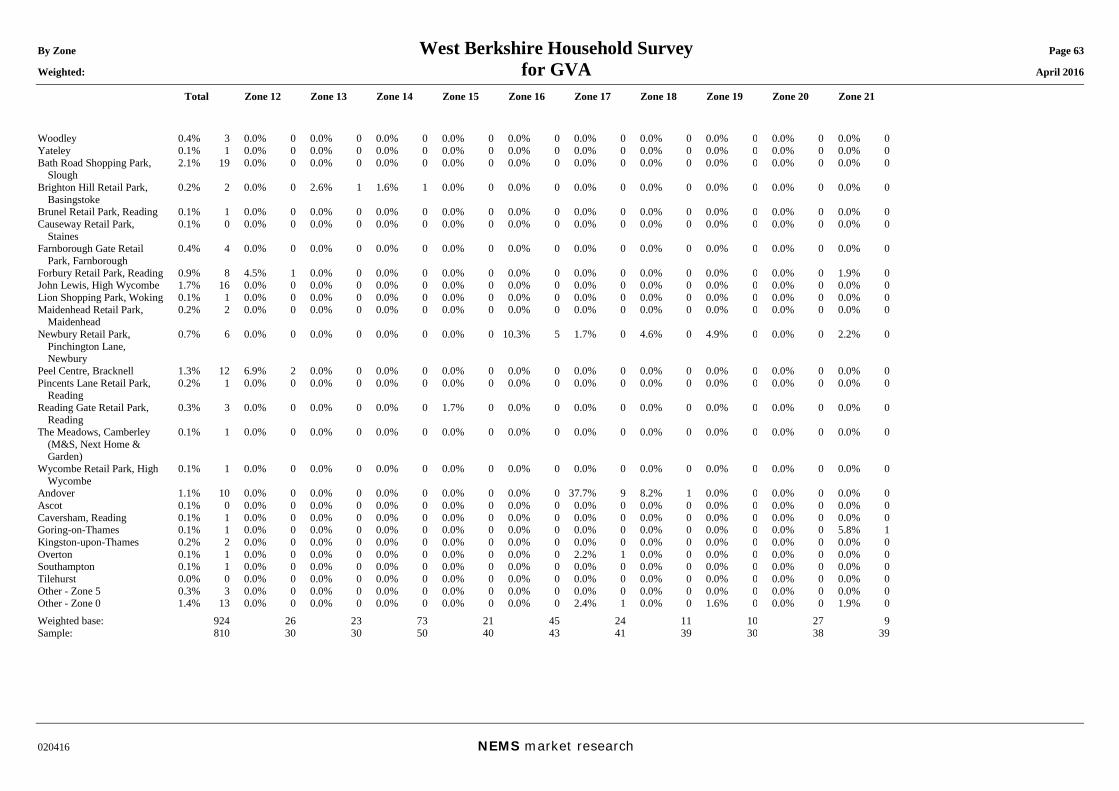
By Zone West Berkshire Household Survey Page 63 Weighted: for GVA April 2016
Total Zone 12 Zone 13 Zone 14 Zone 15 Zone 16 Zone 17 Zone 18 Zone 19 Zone 20 Zone 21
020416 NEMS market research
Woodley 0.4% 3 0.0% 0 0.0% 0 0.0% 0 0.0% 0 0.0% 0 0.0% 0 0.0% 0 0.0% 0 0.0% 0 0.0% 0Yateley 0.1% 1 0.0% 0 0.0% 0 0.0% 0 0.0% 0 0.0% 0 0.0% 0 0.0% 0 0.0% 0 0.0% 0 0.0% 0Bath Road Shopping Park,
Slough 2.1% 19 0.0% 0 0.0% 0 0.0% 0 0.0% 0 0.0% 0 0.0% 0 0.0% 0 0.0% 0 0.0% 0 0.0% 0
Brighton Hill Retail Park, Basingstoke
0.2% 2 0.0% 0 2.6% 1 1.6% 1 0.0% 0 0.0% 0 0.0% 0 0.0% 0 0.0% 0 0.0% 0 0.0% 0
Brunel Retail Park, Reading 0.1% 1 0.0% 0 0.0% 0 0.0% 0 0.0% 0 0.0% 0 0.0% 0 0.0% 0 0.0% 0 0.0% 0 0.0% 0Causeway Retail Park,
Staines 0.1% 0 0.0% 0 0.0% 0 0.0% 0 0.0% 0 0.0% 0 0.0% 0 0.0% 0 0.0% 0 0.0% 0 0.0% 0
Farnborough Gate Retail Park, Farnborough
0.4% 4 0.0% 0 0.0% 0 0.0% 0 0.0% 0 0.0% 0 0.0% 0 0.0% 0 0.0% 0 0.0% 0 0.0% 0
Forbury Retail Park, Reading 0.9% 8 4.5% 1 0.0% 0 0.0% 0 0.0% 0 0.0% 0 0.0% 0 0.0% 0 0.0% 0 0.0% 0 1.9% 0John Lewis, High Wycombe 1.7% 16 0.0% 0 0.0% 0 0.0% 0 0.0% 0 0.0% 0 0.0% 0 0.0% 0 0.0% 0 0.0% 0 0.0% 0Lion Shopping Park, Woking 0.1% 1 0.0% 0 0.0% 0 0.0% 0 0.0% 0 0.0% 0 0.0% 0 0.0% 0 0.0% 0 0.0% 0 0.0% 0Maidenhead Retail Park,
Maidenhead 0.2% 2 0.0% 0 0.0% 0 0.0% 0 0.0% 0 0.0% 0 0.0% 0 0.0% 0 0.0% 0 0.0% 0 0.0% 0
Newbury Retail Park, Pinchington Lane, Newbury
0.7% 6 0.0% 0 0.0% 0 0.0% 0 0.0% 0 10.3% 5 1.7% 0 4.6% 0 4.9% 0 0.0% 0 2.2% 0
Peel Centre, Bracknell 1.3% 12 6.9% 2 0.0% 0 0.0% 0 0.0% 0 0.0% 0 0.0% 0 0.0% 0 0.0% 0 0.0% 0 0.0% 0Pincents Lane Retail Park,
Reading 0.2% 1 0.0% 0 0.0% 0 0.0% 0 0.0% 0 0.0% 0 0.0% 0 0.0% 0 0.0% 0 0.0% 0 0.0% 0
Reading Gate Retail Park, Reading
0.3% 3 0.0% 0 0.0% 0 0.0% 0 1.7% 0 0.0% 0 0.0% 0 0.0% 0 0.0% 0 0.0% 0 0.0% 0
The Meadows, Camberley (M&S, Next Home & Garden)
0.1% 1 0.0% 0 0.0% 0 0.0% 0 0.0% 0 0.0% 0 0.0% 0 0.0% 0 0.0% 0 0.0% 0 0.0% 0
Wycombe Retail Park, High Wycombe
0.1% 1 0.0% 0 0.0% 0 0.0% 0 0.0% 0 0.0% 0 0.0% 0 0.0% 0 0.0% 0 0.0% 0 0.0% 0
Andover 1.1% 10 0.0% 0 0.0% 0 0.0% 0 0.0% 0 0.0% 0 37.7% 9 8.2% 1 0.0% 0 0.0% 0 0.0% 0Ascot 0.1% 0 0.0% 0 0.0% 0 0.0% 0 0.0% 0 0.0% 0 0.0% 0 0.0% 0 0.0% 0 0.0% 0 0.0% 0Caversham, Reading 0.1% 1 0.0% 0 0.0% 0 0.0% 0 0.0% 0 0.0% 0 0.0% 0 0.0% 0 0.0% 0 0.0% 0 0.0% 0Goring-on-Thames 0.1% 1 0.0% 0 0.0% 0 0.0% 0 0.0% 0 0.0% 0 0.0% 0 0.0% 0 0.0% 0 0.0% 0 5.8% 1Kingston-upon-Thames 0.2% 2 0.0% 0 0.0% 0 0.0% 0 0.0% 0 0.0% 0 0.0% 0 0.0% 0 0.0% 0 0.0% 0 0.0% 0Overton 0.1% 1 0.0% 0 0.0% 0 0.0% 0 0.0% 0 0.0% 0 2.2% 1 0.0% 0 0.0% 0 0.0% 0 0.0% 0Southampton 0.1% 1 0.0% 0 0.0% 0 0.0% 0 0.0% 0 0.0% 0 0.0% 0 0.0% 0 0.0% 0 0.0% 0 0.0% 0Tilehurst 0.0% 0 0.0% 0 0.0% 0 0.0% 0 0.0% 0 0.0% 0 0.0% 0 0.0% 0 0.0% 0 0.0% 0 0.0% 0Other - Zone 5 0.3% 3 0.0% 0 0.0% 0 0.0% 0 0.0% 0 0.0% 0 0.0% 0 0.0% 0 0.0% 0 0.0% 0 0.0% 0Other - Zone 0 1.4% 13 0.0% 0 0.0% 0 0.0% 0 0.0% 0 0.0% 0 2.4% 1 0.0% 0 1.6% 0 0.0% 0 1.9% 0Weighted base: 924 26 23 73 21 45 24 11 10 27 9Sample: 810 30 30 50 40 43 41 39 30 38 39
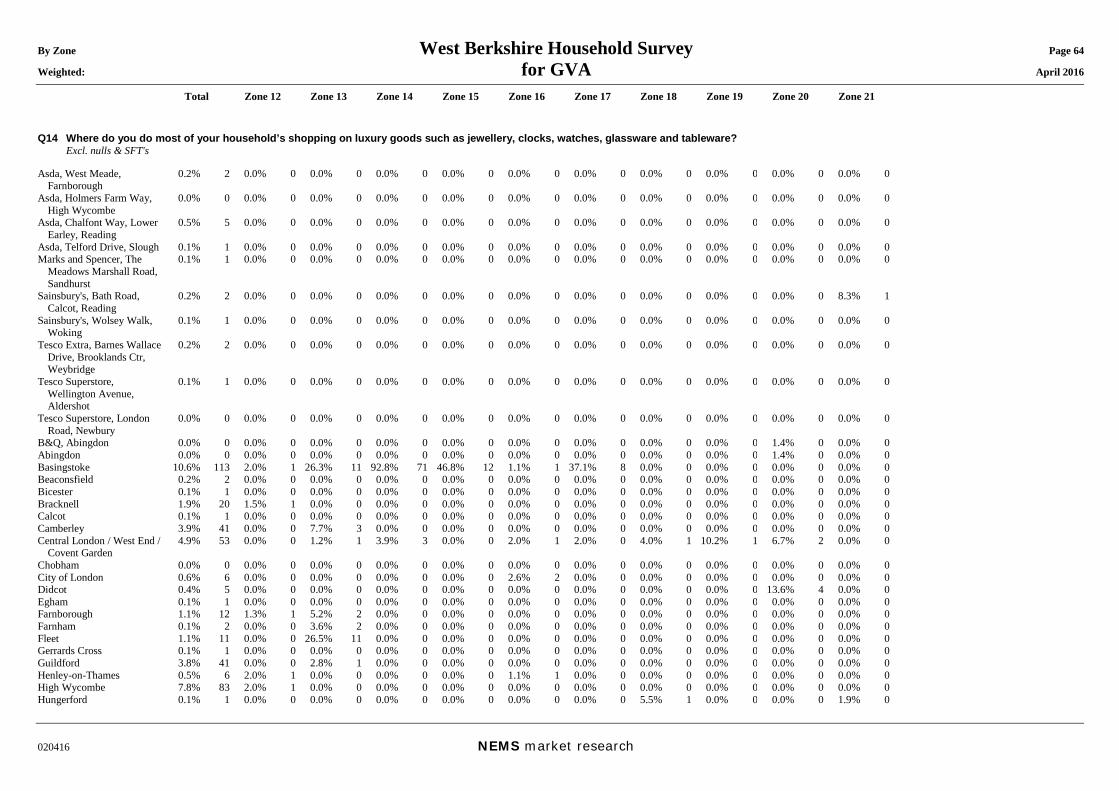
By Zone West Berkshire Household Survey Page 64 Weighted: for GVA April 2016
Total Zone 12 Zone 13 Zone 14 Zone 15 Zone 16 Zone 17 Zone 18 Zone 19 Zone 20 Zone 21
020416 NEMS market research
Q14 Where do you do most of your household’s shopping on luxury goods such as jewellery, clocks, watches, glassware and tableware? Excl. nulls & SFT's Asda, West Meade,
Farnborough 0.2% 2 0.0% 0 0.0% 0 0.0% 0 0.0% 0 0.0% 0 0.0% 0 0.0% 0 0.0% 0 0.0% 0 0.0% 0
Asda, Holmers Farm Way, High Wycombe
0.0% 0 0.0% 0 0.0% 0 0.0% 0 0.0% 0 0.0% 0 0.0% 0 0.0% 0 0.0% 0 0.0% 0 0.0% 0
Asda, Chalfont Way, Lower Earley, Reading
0.5% 5 0.0% 0 0.0% 0 0.0% 0 0.0% 0 0.0% 0 0.0% 0 0.0% 0 0.0% 0 0.0% 0 0.0% 0
Asda, Telford Drive, Slough 0.1% 1 0.0% 0 0.0% 0 0.0% 0 0.0% 0 0.0% 0 0.0% 0 0.0% 0 0.0% 0 0.0% 0 0.0% 0Marks and Spencer, The
Meadows Marshall Road, Sandhurst
0.1% 1 0.0% 0 0.0% 0 0.0% 0 0.0% 0 0.0% 0 0.0% 0 0.0% 0 0.0% 0 0.0% 0 0.0% 0
Sainsbury's, Bath Road, Calcot, Reading
0.2% 2 0.0% 0 0.0% 0 0.0% 0 0.0% 0 0.0% 0 0.0% 0 0.0% 0 0.0% 0 0.0% 0 8.3% 1
Sainsbury's, Wolsey Walk, Woking
0.1% 1 0.0% 0 0.0% 0 0.0% 0 0.0% 0 0.0% 0 0.0% 0 0.0% 0 0.0% 0 0.0% 0 0.0% 0
Tesco Extra, Barnes Wallace Drive, Brooklands Ctr, Weybridge
0.2% 2 0.0% 0 0.0% 0 0.0% 0 0.0% 0 0.0% 0 0.0% 0 0.0% 0 0.0% 0 0.0% 0 0.0% 0
Tesco Superstore, Wellington Avenue, Aldershot
0.1% 1 0.0% 0 0.0% 0 0.0% 0 0.0% 0 0.0% 0 0.0% 0 0.0% 0 0.0% 0 0.0% 0 0.0% 0
Tesco Superstore, London Road, Newbury
0.0% 0 0.0% 0 0.0% 0 0.0% 0 0.0% 0 0.0% 0 0.0% 0 0.0% 0 0.0% 0 0.0% 0 0.0% 0
B&Q, Abingdon 0.0% 0 0.0% 0 0.0% 0 0.0% 0 0.0% 0 0.0% 0 0.0% 0 0.0% 0 0.0% 0 1.4% 0 0.0% 0Abingdon 0.0% 0 0.0% 0 0.0% 0 0.0% 0 0.0% 0 0.0% 0 0.0% 0 0.0% 0 0.0% 0 1.4% 0 0.0% 0Basingstoke 10.6% 113 2.0% 1 26.3% 11 92.8% 71 46.8% 12 1.1% 1 37.1% 8 0.0% 0 0.0% 0 0.0% 0 0.0% 0Beaconsfield 0.2% 2 0.0% 0 0.0% 0 0.0% 0 0.0% 0 0.0% 0 0.0% 0 0.0% 0 0.0% 0 0.0% 0 0.0% 0Bicester 0.1% 1 0.0% 0 0.0% 0 0.0% 0 0.0% 0 0.0% 0 0.0% 0 0.0% 0 0.0% 0 0.0% 0 0.0% 0Bracknell 1.9% 20 1.5% 1 0.0% 0 0.0% 0 0.0% 0 0.0% 0 0.0% 0 0.0% 0 0.0% 0 0.0% 0 0.0% 0Calcot 0.1% 1 0.0% 0 0.0% 0 0.0% 0 0.0% 0 0.0% 0 0.0% 0 0.0% 0 0.0% 0 0.0% 0 0.0% 0Camberley 3.9% 41 0.0% 0 7.7% 3 0.0% 0 0.0% 0 0.0% 0 0.0% 0 0.0% 0 0.0% 0 0.0% 0 0.0% 0Central London / West End /
Covent Garden 4.9% 53 0.0% 0 1.2% 1 3.9% 3 0.0% 0 2.0% 1 2.0% 0 4.0% 1 10.2% 1 6.7% 2 0.0% 0
Chobham 0.0% 0 0.0% 0 0.0% 0 0.0% 0 0.0% 0 0.0% 0 0.0% 0 0.0% 0 0.0% 0 0.0% 0 0.0% 0City of London 0.6% 6 0.0% 0 0.0% 0 0.0% 0 0.0% 0 2.6% 2 0.0% 0 0.0% 0 0.0% 0 0.0% 0 0.0% 0Didcot 0.4% 5 0.0% 0 0.0% 0 0.0% 0 0.0% 0 0.0% 0 0.0% 0 0.0% 0 0.0% 0 13.6% 4 0.0% 0Egham 0.1% 1 0.0% 0 0.0% 0 0.0% 0 0.0% 0 0.0% 0 0.0% 0 0.0% 0 0.0% 0 0.0% 0 0.0% 0Farnborough 1.1% 12 1.3% 1 5.2% 2 0.0% 0 0.0% 0 0.0% 0 0.0% 0 0.0% 0 0.0% 0 0.0% 0 0.0% 0Farnham 0.1% 2 0.0% 0 3.6% 2 0.0% 0 0.0% 0 0.0% 0 0.0% 0 0.0% 0 0.0% 0 0.0% 0 0.0% 0Fleet 1.1% 11 0.0% 0 26.5% 11 0.0% 0 0.0% 0 0.0% 0 0.0% 0 0.0% 0 0.0% 0 0.0% 0 0.0% 0Gerrards Cross 0.1% 1 0.0% 0 0.0% 0 0.0% 0 0.0% 0 0.0% 0 0.0% 0 0.0% 0 0.0% 0 0.0% 0 0.0% 0Guildford 3.8% 41 0.0% 0 2.8% 1 0.0% 0 0.0% 0 0.0% 0 0.0% 0 0.0% 0 0.0% 0 0.0% 0 0.0% 0Henley-on-Thames 0.5% 6 2.0% 1 0.0% 0 0.0% 0 0.0% 0 1.1% 1 0.0% 0 0.0% 0 0.0% 0 0.0% 0 0.0% 0High Wycombe 7.8% 83 2.0% 1 0.0% 0 0.0% 0 0.0% 0 0.0% 0 0.0% 0 0.0% 0 0.0% 0 0.0% 0 0.0% 0Hungerford 0.1% 1 0.0% 0 0.0% 0 0.0% 0 0.0% 0 0.0% 0 0.0% 0 5.5% 1 0.0% 0 0.0% 0 1.9% 0
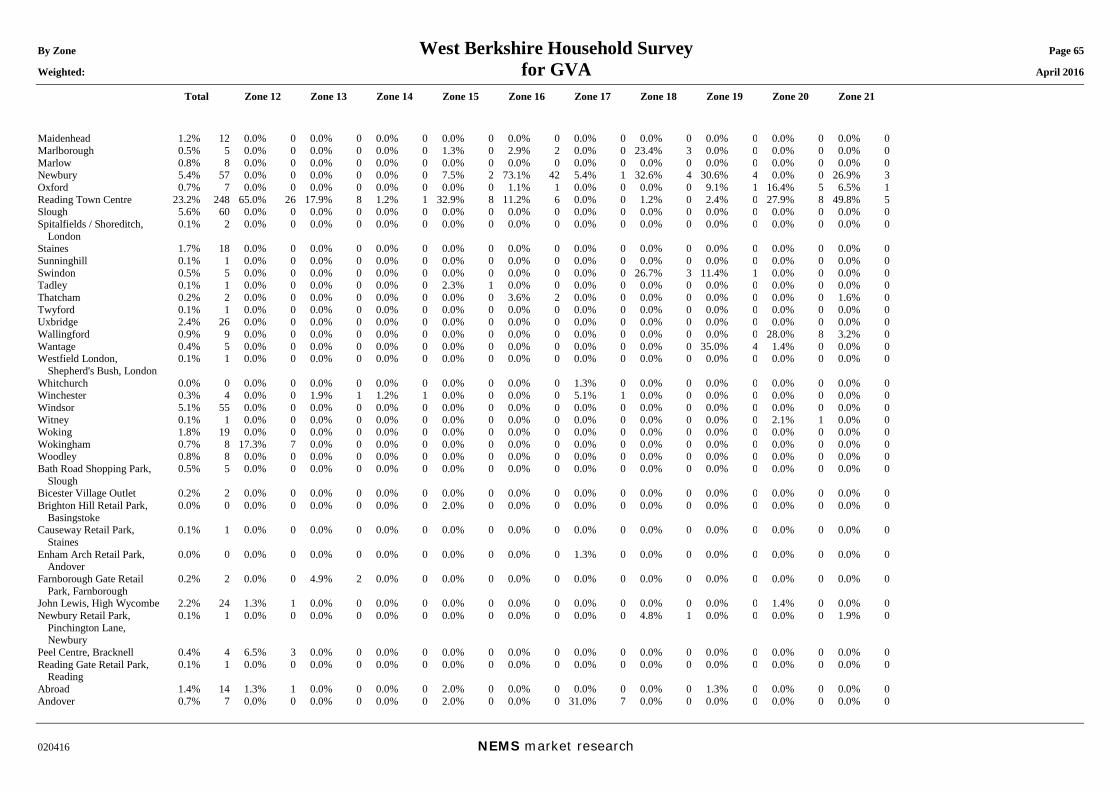
By Zone West Berkshire Household Survey Page 65 Weighted: for GVA April 2016
Total Zone 12 Zone 13 Zone 14 Zone 15 Zone 16 Zone 17 Zone 18 Zone 19 Zone 20 Zone 21
020416 NEMS market research
Maidenhead 1.2% 12 0.0% 0 0.0% 0 0.0% 0 0.0% 0 0.0% 0 0.0% 0 0.0% 0 0.0% 0 0.0% 0 0.0% 0Marlborough 0.5% 5 0.0% 0 0.0% 0 0.0% 0 1.3% 0 2.9% 2 0.0% 0 23.4% 3 0.0% 0 0.0% 0 0.0% 0Marlow 0.8% 8 0.0% 0 0.0% 0 0.0% 0 0.0% 0 0.0% 0 0.0% 0 0.0% 0 0.0% 0 0.0% 0 0.0% 0Newbury 5.4% 57 0.0% 0 0.0% 0 0.0% 0 7.5% 2 73.1% 42 5.4% 1 32.6% 4 30.6% 4 0.0% 0 26.9% 3Oxford 0.7% 7 0.0% 0 0.0% 0 0.0% 0 0.0% 0 1.1% 1 0.0% 0 0.0% 0 9.1% 1 16.4% 5 6.5% 1Reading Town Centre 23.2% 248 65.0% 26 17.9% 8 1.2% 1 32.9% 8 11.2% 6 0.0% 0 1.2% 0 2.4% 0 27.9% 8 49.8% 5Slough 5.6% 60 0.0% 0 0.0% 0 0.0% 0 0.0% 0 0.0% 0 0.0% 0 0.0% 0 0.0% 0 0.0% 0 0.0% 0Spitalfields / Shoreditch,
London 0.1% 2 0.0% 0 0.0% 0 0.0% 0 0.0% 0 0.0% 0 0.0% 0 0.0% 0 0.0% 0 0.0% 0 0.0% 0
Staines 1.7% 18 0.0% 0 0.0% 0 0.0% 0 0.0% 0 0.0% 0 0.0% 0 0.0% 0 0.0% 0 0.0% 0 0.0% 0Sunninghill 0.1% 1 0.0% 0 0.0% 0 0.0% 0 0.0% 0 0.0% 0 0.0% 0 0.0% 0 0.0% 0 0.0% 0 0.0% 0Swindon 0.5% 5 0.0% 0 0.0% 0 0.0% 0 0.0% 0 0.0% 0 0.0% 0 26.7% 3 11.4% 1 0.0% 0 0.0% 0Tadley 0.1% 1 0.0% 0 0.0% 0 0.0% 0 2.3% 1 0.0% 0 0.0% 0 0.0% 0 0.0% 0 0.0% 0 0.0% 0Thatcham 0.2% 2 0.0% 0 0.0% 0 0.0% 0 0.0% 0 3.6% 2 0.0% 0 0.0% 0 0.0% 0 0.0% 0 1.6% 0Twyford 0.1% 1 0.0% 0 0.0% 0 0.0% 0 0.0% 0 0.0% 0 0.0% 0 0.0% 0 0.0% 0 0.0% 0 0.0% 0Uxbridge 2.4% 26 0.0% 0 0.0% 0 0.0% 0 0.0% 0 0.0% 0 0.0% 0 0.0% 0 0.0% 0 0.0% 0 0.0% 0Wallingford 0.9% 9 0.0% 0 0.0% 0 0.0% 0 0.0% 0 0.0% 0 0.0% 0 0.0% 0 0.0% 0 28.0% 8 3.2% 0Wantage 0.4% 5 0.0% 0 0.0% 0 0.0% 0 0.0% 0 0.0% 0 0.0% 0 0.0% 0 35.0% 4 1.4% 0 0.0% 0Westfield London,
Shepherd's Bush, London 0.1% 1 0.0% 0 0.0% 0 0.0% 0 0.0% 0 0.0% 0 0.0% 0 0.0% 0 0.0% 0 0.0% 0 0.0% 0
Whitchurch 0.0% 0 0.0% 0 0.0% 0 0.0% 0 0.0% 0 0.0% 0 1.3% 0 0.0% 0 0.0% 0 0.0% 0 0.0% 0Winchester 0.3% 4 0.0% 0 1.9% 1 1.2% 1 0.0% 0 0.0% 0 5.1% 1 0.0% 0 0.0% 0 0.0% 0 0.0% 0Windsor 5.1% 55 0.0% 0 0.0% 0 0.0% 0 0.0% 0 0.0% 0 0.0% 0 0.0% 0 0.0% 0 0.0% 0 0.0% 0Witney 0.1% 1 0.0% 0 0.0% 0 0.0% 0 0.0% 0 0.0% 0 0.0% 0 0.0% 0 0.0% 0 2.1% 1 0.0% 0Woking 1.8% 19 0.0% 0 0.0% 0 0.0% 0 0.0% 0 0.0% 0 0.0% 0 0.0% 0 0.0% 0 0.0% 0 0.0% 0Wokingham 0.7% 8 17.3% 7 0.0% 0 0.0% 0 0.0% 0 0.0% 0 0.0% 0 0.0% 0 0.0% 0 0.0% 0 0.0% 0Woodley 0.8% 8 0.0% 0 0.0% 0 0.0% 0 0.0% 0 0.0% 0 0.0% 0 0.0% 0 0.0% 0 0.0% 0 0.0% 0Bath Road Shopping Park,
Slough 0.5% 5 0.0% 0 0.0% 0 0.0% 0 0.0% 0 0.0% 0 0.0% 0 0.0% 0 0.0% 0 0.0% 0 0.0% 0
Bicester Village Outlet 0.2% 2 0.0% 0 0.0% 0 0.0% 0 0.0% 0 0.0% 0 0.0% 0 0.0% 0 0.0% 0 0.0% 0 0.0% 0Brighton Hill Retail Park,
Basingstoke 0.0% 0 0.0% 0 0.0% 0 0.0% 0 2.0% 0 0.0% 0 0.0% 0 0.0% 0 0.0% 0 0.0% 0 0.0% 0
Causeway Retail Park, Staines
0.1% 1 0.0% 0 0.0% 0 0.0% 0 0.0% 0 0.0% 0 0.0% 0 0.0% 0 0.0% 0 0.0% 0 0.0% 0
Enham Arch Retail Park, Andover
0.0% 0 0.0% 0 0.0% 0 0.0% 0 0.0% 0 0.0% 0 1.3% 0 0.0% 0 0.0% 0 0.0% 0 0.0% 0
Farnborough Gate Retail Park, Farnborough
0.2% 2 0.0% 0 4.9% 2 0.0% 0 0.0% 0 0.0% 0 0.0% 0 0.0% 0 0.0% 0 0.0% 0 0.0% 0
John Lewis, High Wycombe 2.2% 24 1.3% 1 0.0% 0 0.0% 0 0.0% 0 0.0% 0 0.0% 0 0.0% 0 0.0% 0 1.4% 0 0.0% 0Newbury Retail Park,
Pinchington Lane, Newbury
0.1% 1 0.0% 0 0.0% 0 0.0% 0 0.0% 0 0.0% 0 0.0% 0 4.8% 1 0.0% 0 0.0% 0 1.9% 0
Peel Centre, Bracknell 0.4% 4 6.5% 3 0.0% 0 0.0% 0 0.0% 0 0.0% 0 0.0% 0 0.0% 0 0.0% 0 0.0% 0 0.0% 0Reading Gate Retail Park,
Reading 0.1% 1 0.0% 0 0.0% 0 0.0% 0 0.0% 0 0.0% 0 0.0% 0 0.0% 0 0.0% 0 0.0% 0 0.0% 0
Abroad 1.4% 14 1.3% 1 0.0% 0 0.0% 0 2.0% 0 0.0% 0 0.0% 0 0.0% 0 1.3% 0 0.0% 0 0.0% 0Andover 0.7% 7 0.0% 0 0.0% 0 0.0% 0 2.0% 0 0.0% 0 31.0% 7 0.0% 0 0.0% 0 0.0% 0 0.0% 0
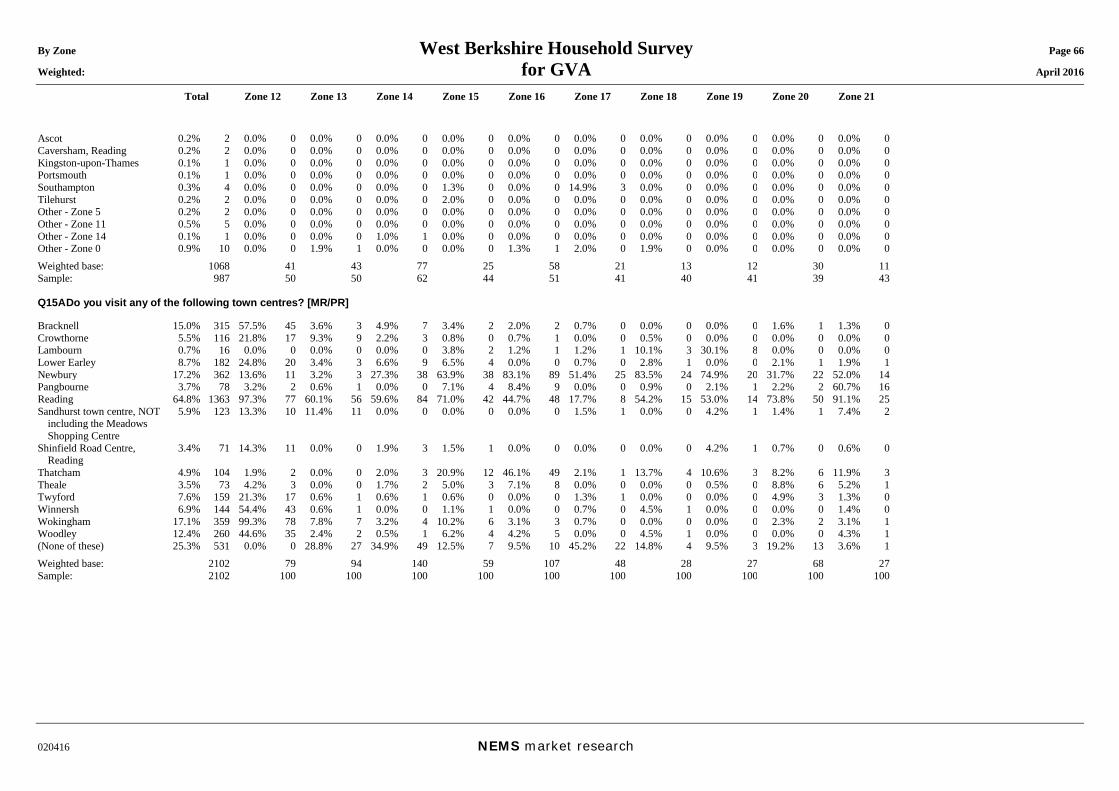
By Zone West Berkshire Household Survey Page 66 Weighted: for GVA April 2016
Total Zone 12 Zone 13 Zone 14 Zone 15 Zone 16 Zone 17 Zone 18 Zone 19 Zone 20 Zone 21
020416 NEMS market research
Ascot 0.2% 2 0.0% 0 0.0% 0 0.0% 0 0.0% 0 0.0% 0 0.0% 0 0.0% 0 0.0% 0 0.0% 0 0.0% 0Caversham, Reading 0.2% 2 0.0% 0 0.0% 0 0.0% 0 0.0% 0 0.0% 0 0.0% 0 0.0% 0 0.0% 0 0.0% 0 0.0% 0Kingston-upon-Thames 0.1% 1 0.0% 0 0.0% 0 0.0% 0 0.0% 0 0.0% 0 0.0% 0 0.0% 0 0.0% 0 0.0% 0 0.0% 0Portsmouth 0.1% 1 0.0% 0 0.0% 0 0.0% 0 0.0% 0 0.0% 0 0.0% 0 0.0% 0 0.0% 0 0.0% 0 0.0% 0Southampton 0.3% 4 0.0% 0 0.0% 0 0.0% 0 1.3% 0 0.0% 0 14.9% 3 0.0% 0 0.0% 0 0.0% 0 0.0% 0Tilehurst 0.2% 2 0.0% 0 0.0% 0 0.0% 0 2.0% 0 0.0% 0 0.0% 0 0.0% 0 0.0% 0 0.0% 0 0.0% 0Other - Zone 5 0.2% 2 0.0% 0 0.0% 0 0.0% 0 0.0% 0 0.0% 0 0.0% 0 0.0% 0 0.0% 0 0.0% 0 0.0% 0Other - Zone 11 0.5% 5 0.0% 0 0.0% 0 0.0% 0 0.0% 0 0.0% 0 0.0% 0 0.0% 0 0.0% 0 0.0% 0 0.0% 0Other - Zone 14 0.1% 1 0.0% 0 0.0% 0 1.0% 1 0.0% 0 0.0% 0 0.0% 0 0.0% 0 0.0% 0 0.0% 0 0.0% 0Other - Zone 0 0.9% 10 0.0% 0 1.9% 1 0.0% 0 0.0% 0 1.3% 1 2.0% 0 1.9% 0 0.0% 0 0.0% 0 0.0% 0Weighted base: 1068 41 43 77 25 58 21 13 12 30 11Sample: 987 50 50 62 44 51 41 40 41 39 43 Q15A Do you visit any of the following town centres? [MR/PR] Bracknell 15.0% 315 57.5% 45 3.6% 3 4.9% 7 3.4% 2 2.0% 2 0.7% 0 0.0% 0 0.0% 0 1.6% 1 1.3% 0Crowthorne 5.5% 116 21.8% 17 9.3% 9 2.2% 3 0.8% 0 0.7% 1 0.0% 0 0.5% 0 0.0% 0 0.0% 0 0.0% 0Lambourn 0.7% 16 0.0% 0 0.0% 0 0.0% 0 3.8% 2 1.2% 1 1.2% 1 10.1% 3 30.1% 8 0.0% 0 0.0% 0Lower Earley 8.7% 182 24.8% 20 3.4% 3 6.6% 9 6.5% 4 0.0% 0 0.7% 0 2.8% 1 0.0% 0 2.1% 1 1.9% 1Newbury 17.2% 362 13.6% 11 3.2% 3 27.3% 38 63.9% 38 83.1% 89 51.4% 25 83.5% 24 74.9% 20 31.7% 22 52.0% 14Pangbourne 3.7% 78 3.2% 2 0.6% 1 0.0% 0 7.1% 4 8.4% 9 0.0% 0 0.9% 0 2.1% 1 2.2% 2 60.7% 16Reading 64.8% 1363 97.3% 77 60.1% 56 59.6% 84 71.0% 42 44.7% 48 17.7% 8 54.2% 15 53.0% 14 73.8% 50 91.1% 25Sandhurst town centre, NOT
including the Meadows Shopping Centre
5.9% 123 13.3% 10 11.4% 11 0.0% 0 0.0% 0 0.0% 0 1.5% 1 0.0% 0 4.2% 1 1.4% 1 7.4% 2
Shinfield Road Centre, Reading
3.4% 71 14.3% 11 0.0% 0 1.9% 3 1.5% 1 0.0% 0 0.0% 0 0.0% 0 4.2% 1 0.7% 0 0.6% 0
Thatcham 4.9% 104 1.9% 2 0.0% 0 2.0% 3 20.9% 12 46.1% 49 2.1% 1 13.7% 4 10.6% 3 8.2% 6 11.9% 3Theale 3.5% 73 4.2% 3 0.0% 0 1.7% 2 5.0% 3 7.1% 8 0.0% 0 0.0% 0 0.5% 0 8.8% 6 5.2% 1Twyford 7.6% 159 21.3% 17 0.6% 1 0.6% 1 0.6% 0 0.0% 0 1.3% 1 0.0% 0 0.0% 0 4.9% 3 1.3% 0Winnersh 6.9% 144 54.4% 43 0.6% 1 0.0% 0 1.1% 1 0.0% 0 0.7% 0 4.5% 1 0.0% 0 0.0% 0 1.4% 0Wokingham 17.1% 359 99.3% 78 7.8% 7 3.2% 4 10.2% 6 3.1% 3 0.7% 0 0.0% 0 0.0% 0 2.3% 2 3.1% 1Woodley 12.4% 260 44.6% 35 2.4% 2 0.5% 1 6.2% 4 4.2% 5 0.0% 0 4.5% 1 0.0% 0 0.0% 0 4.3% 1(None of these) 25.3% 531 0.0% 0 28.8% 27 34.9% 49 12.5% 7 9.5% 10 45.2% 22 14.8% 4 9.5% 3 19.2% 13 3.6% 1Weighted base: 2102 79 94 140 59 107 48 28 27 68 27Sample: 2102 100 100 100 100 100 100 100 100 100 100
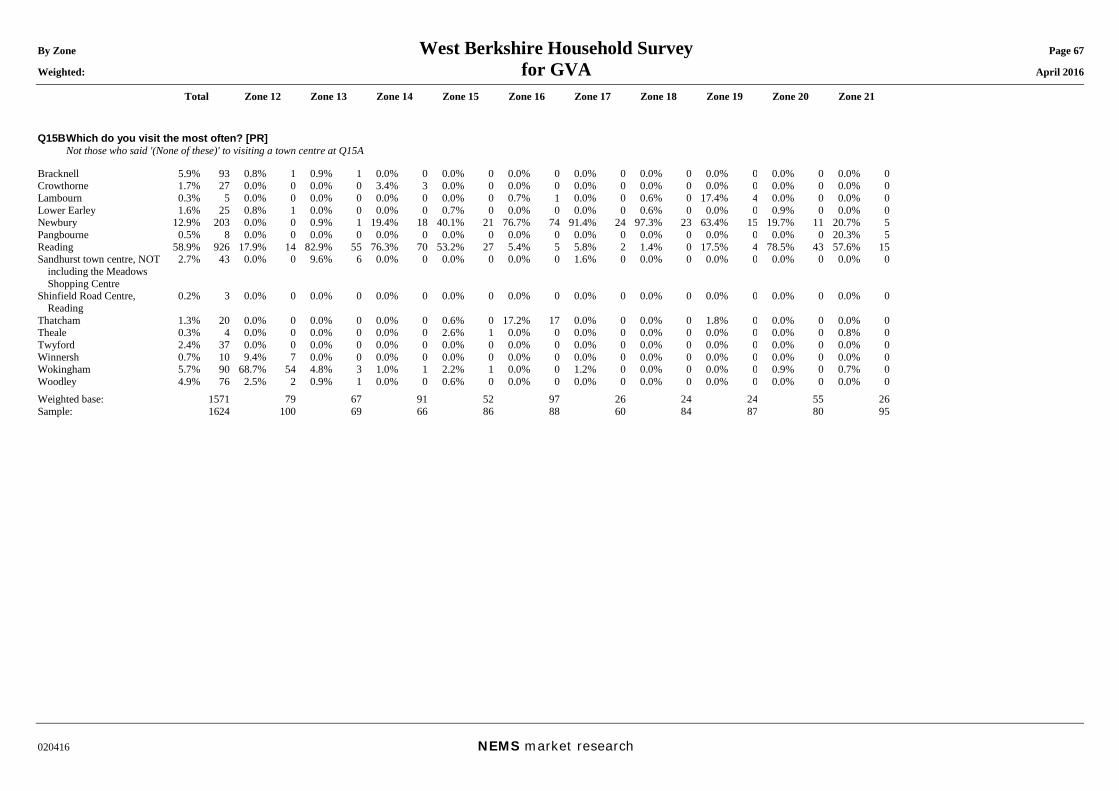
By Zone West Berkshire Household Survey Page 67 Weighted: for GVA April 2016
Total Zone 12 Zone 13 Zone 14 Zone 15 Zone 16 Zone 17 Zone 18 Zone 19 Zone 20 Zone 21
020416 NEMS market research
Q15B Which do you visit the most often? [PR] Not those who said '(None of these)' to visiting a town centre at Q15A Bracknell 5.9% 93 0.8% 1 0.9% 1 0.0% 0 0.0% 0 0.0% 0 0.0% 0 0.0% 0 0.0% 0 0.0% 0 0.0% 0Crowthorne 1.7% 27 0.0% 0 0.0% 0 3.4% 3 0.0% 0 0.0% 0 0.0% 0 0.0% 0 0.0% 0 0.0% 0 0.0% 0Lambourn 0.3% 5 0.0% 0 0.0% 0 0.0% 0 0.0% 0 0.7% 1 0.0% 0 0.6% 0 17.4% 4 0.0% 0 0.0% 0Lower Earley 1.6% 25 0.8% 1 0.0% 0 0.0% 0 0.7% 0 0.0% 0 0.0% 0 0.6% 0 0.0% 0 0.9% 0 0.0% 0Newbury 12.9% 203 0.0% 0 0.9% 1 19.4% 18 40.1% 21 76.7% 74 91.4% 24 97.3% 23 63.4% 15 19.7% 11 20.7% 5Pangbourne 0.5% 8 0.0% 0 0.0% 0 0.0% 0 0.0% 0 0.0% 0 0.0% 0 0.0% 0 0.0% 0 0.0% 0 20.3% 5Reading 58.9% 926 17.9% 14 82.9% 55 76.3% 70 53.2% 27 5.4% 5 5.8% 2 1.4% 0 17.5% 4 78.5% 43 57.6% 15Sandhurst town centre, NOT
including the Meadows Shopping Centre
2.7% 43 0.0% 0 9.6% 6 0.0% 0 0.0% 0 0.0% 0 1.6% 0 0.0% 0 0.0% 0 0.0% 0 0.0% 0
Shinfield Road Centre, Reading
0.2% 3 0.0% 0 0.0% 0 0.0% 0 0.0% 0 0.0% 0 0.0% 0 0.0% 0 0.0% 0 0.0% 0 0.0% 0
Thatcham 1.3% 20 0.0% 0 0.0% 0 0.0% 0 0.6% 0 17.2% 17 0.0% 0 0.0% 0 1.8% 0 0.0% 0 0.0% 0Theale 0.3% 4 0.0% 0 0.0% 0 0.0% 0 2.6% 1 0.0% 0 0.0% 0 0.0% 0 0.0% 0 0.0% 0 0.8% 0Twyford 2.4% 37 0.0% 0 0.0% 0 0.0% 0 0.0% 0 0.0% 0 0.0% 0 0.0% 0 0.0% 0 0.0% 0 0.0% 0Winnersh 0.7% 10 9.4% 7 0.0% 0 0.0% 0 0.0% 0 0.0% 0 0.0% 0 0.0% 0 0.0% 0 0.0% 0 0.0% 0Wokingham 5.7% 90 68.7% 54 4.8% 3 1.0% 1 2.2% 1 0.0% 0 1.2% 0 0.0% 0 0.0% 0 0.9% 0 0.7% 0Woodley 4.9% 76 2.5% 2 0.9% 1 0.0% 0 0.6% 0 0.0% 0 0.0% 0 0.0% 0 0.0% 0 0.0% 0 0.0% 0Weighted base: 1571 79 67 91 52 97 26 24 24 55 26Sample: 1624 100 69 66 86 88 60 84 87 80 95
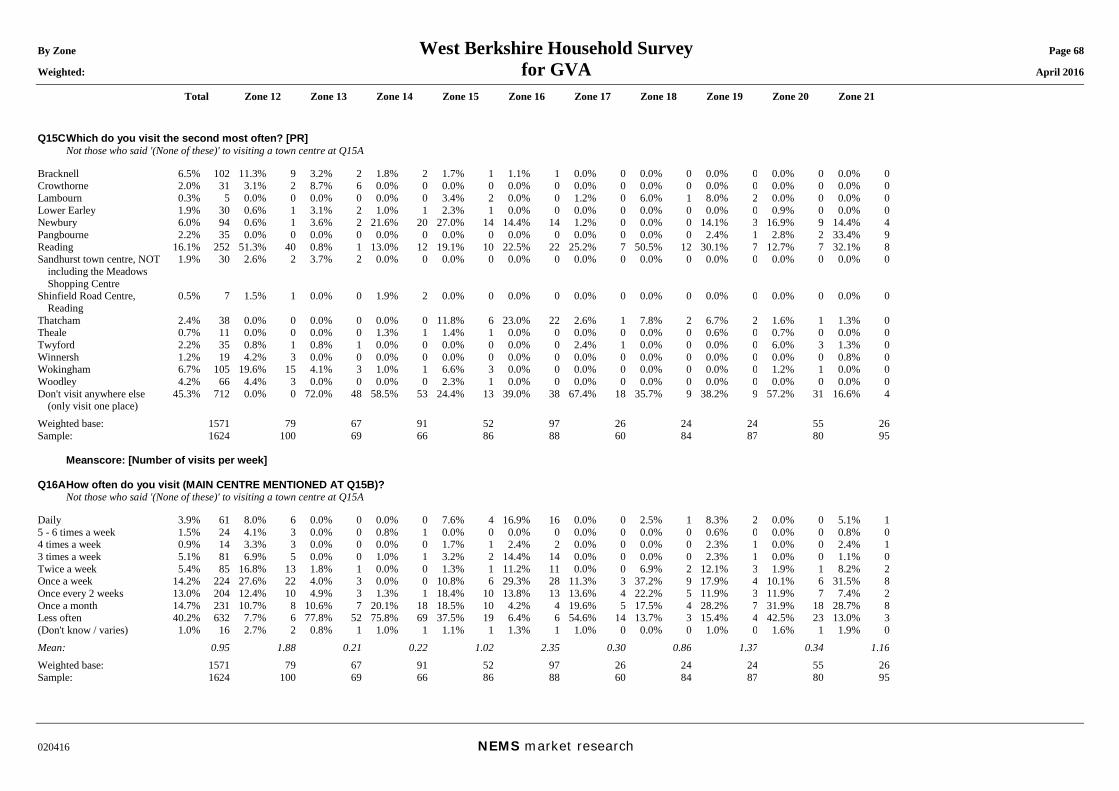
By Zone West Berkshire Household Survey Page 68 Weighted: for GVA April 2016
Total Zone 12 Zone 13 Zone 14 Zone 15 Zone 16 Zone 17 Zone 18 Zone 19 Zone 20 Zone 21
020416 NEMS market research
Q15C Which do you visit the second most often? [PR] Not those who said '(None of these)' to visiting a town centre at Q15A Bracknell 6.5% 102 11.3% 9 3.2% 2 1.8% 2 1.7% 1 1.1% 1 0.0% 0 0.0% 0 0.0% 0 0.0% 0 0.0% 0Crowthorne 2.0% 31 3.1% 2 8.7% 6 0.0% 0 0.0% 0 0.0% 0 0.0% 0 0.0% 0 0.0% 0 0.0% 0 0.0% 0Lambourn 0.3% 5 0.0% 0 0.0% 0 0.0% 0 3.4% 2 0.0% 0 1.2% 0 6.0% 1 8.0% 2 0.0% 0 0.0% 0Lower Earley 1.9% 30 0.6% 1 3.1% 2 1.0% 1 2.3% 1 0.0% 0 0.0% 0 0.0% 0 0.0% 0 0.9% 0 0.0% 0Newbury 6.0% 94 0.6% 1 3.6% 2 21.6% 20 27.0% 14 14.4% 14 1.2% 0 0.0% 0 14.1% 3 16.9% 9 14.4% 4Pangbourne 2.2% 35 0.0% 0 0.0% 0 0.0% 0 0.0% 0 0.0% 0 0.0% 0 0.0% 0 2.4% 1 2.8% 2 33.4% 9Reading 16.1% 252 51.3% 40 0.8% 1 13.0% 12 19.1% 10 22.5% 22 25.2% 7 50.5% 12 30.1% 7 12.7% 7 32.1% 8Sandhurst town centre, NOT
including the Meadows Shopping Centre
1.9% 30 2.6% 2 3.7% 2 0.0% 0 0.0% 0 0.0% 0 0.0% 0 0.0% 0 0.0% 0 0.0% 0 0.0% 0
Shinfield Road Centre, Reading
0.5% 7 1.5% 1 0.0% 0 1.9% 2 0.0% 0 0.0% 0 0.0% 0 0.0% 0 0.0% 0 0.0% 0 0.0% 0
Thatcham 2.4% 38 0.0% 0 0.0% 0 0.0% 0 11.8% 6 23.0% 22 2.6% 1 7.8% 2 6.7% 2 1.6% 1 1.3% 0Theale 0.7% 11 0.0% 0 0.0% 0 1.3% 1 1.4% 1 0.0% 0 0.0% 0 0.0% 0 0.6% 0 0.7% 0 0.0% 0Twyford 2.2% 35 0.8% 1 0.8% 1 0.0% 0 0.0% 0 0.0% 0 2.4% 1 0.0% 0 0.0% 0 6.0% 3 1.3% 0Winnersh 1.2% 19 4.2% 3 0.0% 0 0.0% 0 0.0% 0 0.0% 0 0.0% 0 0.0% 0 0.0% 0 0.0% 0 0.8% 0Wokingham 6.7% 105 19.6% 15 4.1% 3 1.0% 1 6.6% 3 0.0% 0 0.0% 0 0.0% 0 0.0% 0 1.2% 1 0.0% 0Woodley 4.2% 66 4.4% 3 0.0% 0 0.0% 0 2.3% 1 0.0% 0 0.0% 0 0.0% 0 0.0% 0 0.0% 0 0.0% 0Don't visit anywhere else
(only visit one place) 45.3% 712 0.0% 0 72.0% 48 58.5% 53 24.4% 13 39.0% 38 67.4% 18 35.7% 9 38.2% 9 57.2% 31 16.6% 4
Weighted base: 1571 79 67 91 52 97 26 24 24 55 26Sample: 1624 100 69 66 86 88 60 84 87 80 95 Meanscore: [Number of visits per week] Q16A How often do you visit (MAIN CENTRE MENTIONED AT Q15B)? Not those who said '(None of these)' to visiting a town centre at Q15A Daily 3.9% 61 8.0% 6 0.0% 0 0.0% 0 7.6% 4 16.9% 16 0.0% 0 2.5% 1 8.3% 2 0.0% 0 5.1% 15 - 6 times a week 1.5% 24 4.1% 3 0.0% 0 0.8% 1 0.0% 0 0.0% 0 0.0% 0 0.0% 0 0.6% 0 0.0% 0 0.8% 04 times a week 0.9% 14 3.3% 3 0.0% 0 0.0% 0 1.7% 1 2.4% 2 0.0% 0 0.0% 0 2.3% 1 0.0% 0 2.4% 13 times a week 5.1% 81 6.9% 5 0.0% 0 1.0% 1 3.2% 2 14.4% 14 0.0% 0 0.0% 0 2.3% 1 0.0% 0 1.1% 0Twice a week 5.4% 85 16.8% 13 1.8% 1 0.0% 0 1.3% 1 11.2% 11 0.0% 0 6.9% 2 12.1% 3 1.9% 1 8.2% 2Once a week 14.2% 224 27.6% 22 4.0% 3 0.0% 0 10.8% 6 29.3% 28 11.3% 3 37.2% 9 17.9% 4 10.1% 6 31.5% 8Once every 2 weeks 13.0% 204 12.4% 10 4.9% 3 1.3% 1 18.4% 10 13.8% 13 13.6% 4 22.2% 5 11.9% 3 11.9% 7 7.4% 2Once a month 14.7% 231 10.7% 8 10.6% 7 20.1% 18 18.5% 10 4.2% 4 19.6% 5 17.5% 4 28.2% 7 31.9% 18 28.7% 8Less often 40.2% 632 7.7% 6 77.8% 52 75.8% 69 37.5% 19 6.4% 6 54.6% 14 13.7% 3 15.4% 4 42.5% 23 13.0% 3(Don't know / varies) 1.0% 16 2.7% 2 0.8% 1 1.0% 1 1.1% 1 1.3% 1 1.0% 0 0.0% 0 1.0% 0 1.6% 1 1.9% 0Mean: 0.95 1.88 0.21 0.22 1.02 2.35 0.30 0.86 1.37 0.34 1.16Weighted base: 1571 79 67 91 52 97 26 24 24 55 26Sample: 1624 100 69 66 86 88 60 84 87 80 95
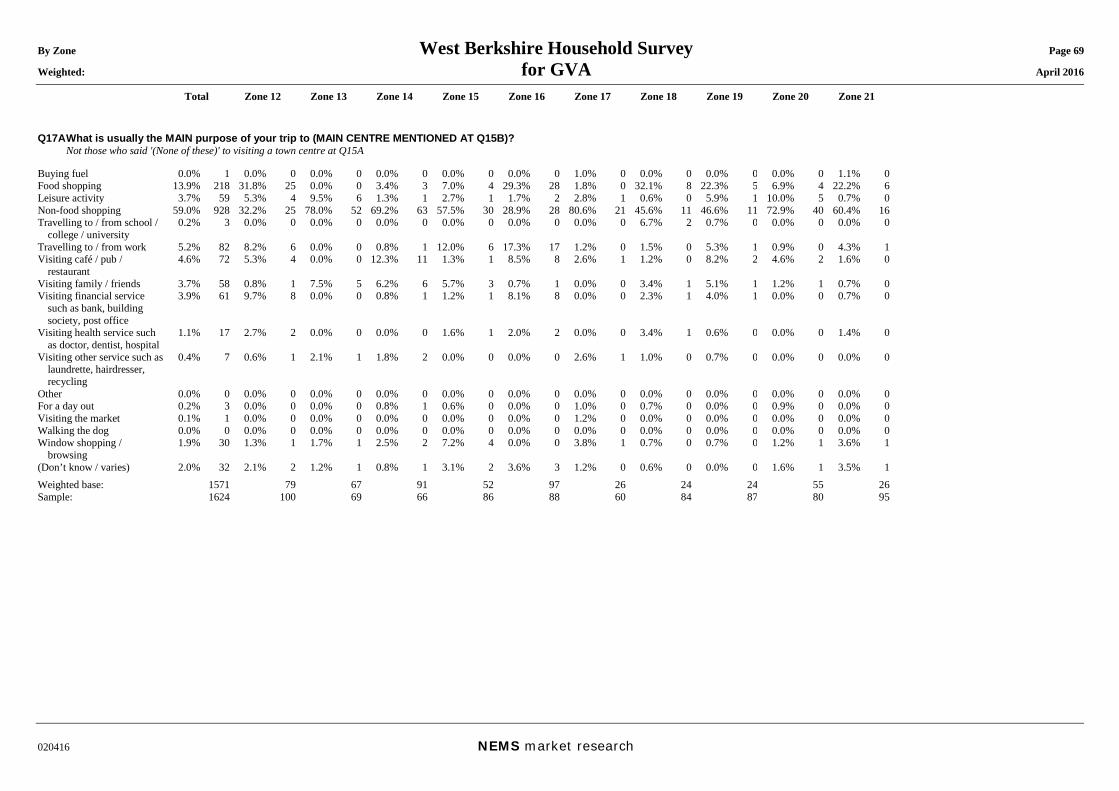
By Zone West Berkshire Household Survey Page 69 Weighted: for GVA April 2016
Total Zone 12 Zone 13 Zone 14 Zone 15 Zone 16 Zone 17 Zone 18 Zone 19 Zone 20 Zone 21
020416 NEMS market research
Q17A What is usually the MAIN purpose of your trip to (MAIN CENTRE MENTIONED AT Q15B)? Not those who said '(None of these)' to visiting a town centre at Q15A Buying fuel 0.0% 1 0.0% 0 0.0% 0 0.0% 0 0.0% 0 0.0% 0 1.0% 0 0.0% 0 0.0% 0 0.0% 0 1.1% 0Food shopping 13.9% 218 31.8% 25 0.0% 0 3.4% 3 7.0% 4 29.3% 28 1.8% 0 32.1% 8 22.3% 5 6.9% 4 22.2% 6Leisure activity 3.7% 59 5.3% 4 9.5% 6 1.3% 1 2.7% 1 1.7% 2 2.8% 1 0.6% 0 5.9% 1 10.0% 5 0.7% 0Non-food shopping 59.0% 928 32.2% 25 78.0% 52 69.2% 63 57.5% 30 28.9% 28 80.6% 21 45.6% 11 46.6% 11 72.9% 40 60.4% 16Travelling to / from school /
college / university 0.2% 3 0.0% 0 0.0% 0 0.0% 0 0.0% 0 0.0% 0 0.0% 0 6.7% 2 0.7% 0 0.0% 0 0.0% 0
Travelling to / from work 5.2% 82 8.2% 6 0.0% 0 0.8% 1 12.0% 6 17.3% 17 1.2% 0 1.5% 0 5.3% 1 0.9% 0 4.3% 1Visiting café / pub /
restaurant 4.6% 72 5.3% 4 0.0% 0 12.3% 11 1.3% 1 8.5% 8 2.6% 1 1.2% 0 8.2% 2 4.6% 2 1.6% 0
Visiting family / friends 3.7% 58 0.8% 1 7.5% 5 6.2% 6 5.7% 3 0.7% 1 0.0% 0 3.4% 1 5.1% 1 1.2% 1 0.7% 0Visiting financial service
such as bank, building society, post office
3.9% 61 9.7% 8 0.0% 0 0.8% 1 1.2% 1 8.1% 8 0.0% 0 2.3% 1 4.0% 1 0.0% 0 0.7% 0
Visiting health service such as doctor, dentist, hospital
1.1% 17 2.7% 2 0.0% 0 0.0% 0 1.6% 1 2.0% 2 0.0% 0 3.4% 1 0.6% 0 0.0% 0 1.4% 0
Visiting other service such as laundrette, hairdresser, recycling
0.4% 7 0.6% 1 2.1% 1 1.8% 2 0.0% 0 0.0% 0 2.6% 1 1.0% 0 0.7% 0 0.0% 0 0.0% 0
Other 0.0% 0 0.0% 0 0.0% 0 0.0% 0 0.0% 0 0.0% 0 0.0% 0 0.0% 0 0.0% 0 0.0% 0 0.0% 0For a day out 0.2% 3 0.0% 0 0.0% 0 0.8% 1 0.6% 0 0.0% 0 1.0% 0 0.7% 0 0.0% 0 0.9% 0 0.0% 0Visiting the market 0.1% 1 0.0% 0 0.0% 0 0.0% 0 0.0% 0 0.0% 0 1.2% 0 0.0% 0 0.0% 0 0.0% 0 0.0% 0Walking the dog 0.0% 0 0.0% 0 0.0% 0 0.0% 0 0.0% 0 0.0% 0 0.0% 0 0.0% 0 0.0% 0 0.0% 0 0.0% 0Window shopping /
browsing 1.9% 30 1.3% 1 1.7% 1 2.5% 2 7.2% 4 0.0% 0 3.8% 1 0.7% 0 0.7% 0 1.2% 1 3.6% 1
(Don’t know / varies) 2.0% 32 2.1% 2 1.2% 1 0.8% 1 3.1% 2 3.6% 3 1.2% 0 0.6% 0 0.0% 0 1.6% 1 3.5% 1Weighted base: 1571 79 67 91 52 97 26 24 24 55 26Sample: 1624 100 69 66 86 88 60 84 87 80 95
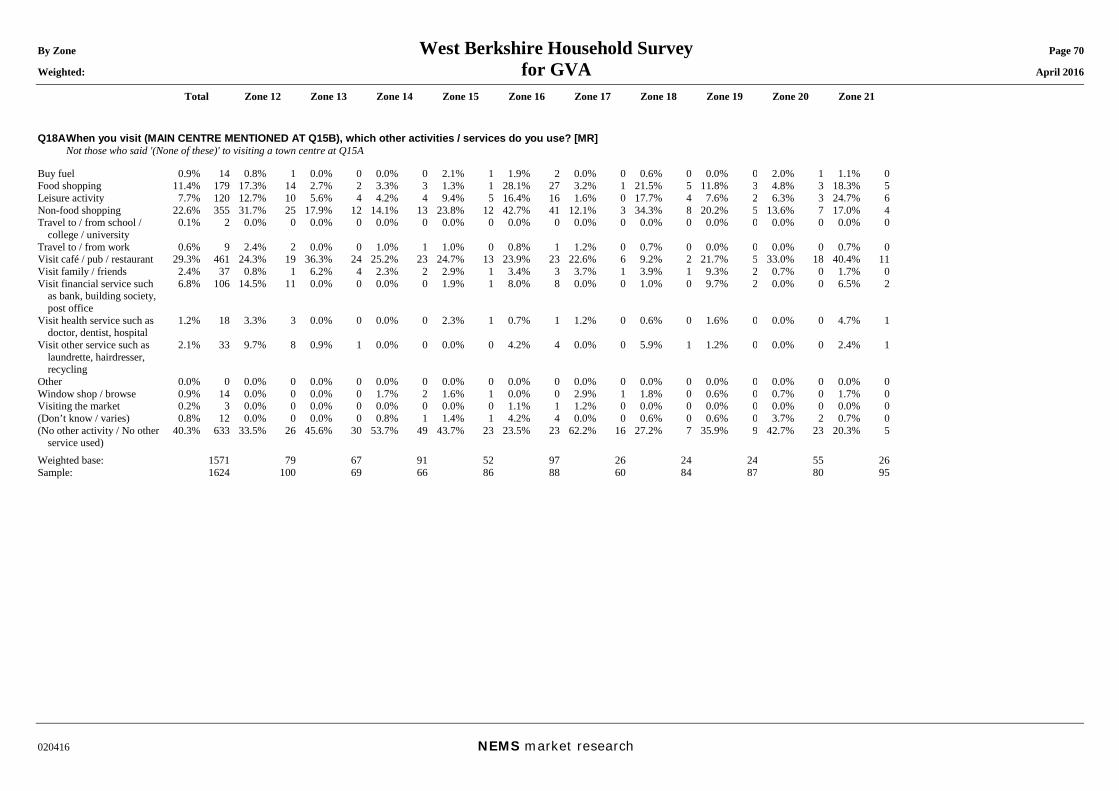
By Zone West Berkshire Household Survey Page 70 Weighted: for GVA April 2016
Total Zone 12 Zone 13 Zone 14 Zone 15 Zone 16 Zone 17 Zone 18 Zone 19 Zone 20 Zone 21
020416 NEMS market research
Q18A When you visit (MAIN CENTRE MENTIONED AT Q15B), which other activities / services do you use? [MR] Not those who said '(None of these)' to visiting a town centre at Q15A Buy fuel 0.9% 14 0.8% 1 0.0% 0 0.0% 0 2.1% 1 1.9% 2 0.0% 0 0.6% 0 0.0% 0 2.0% 1 1.1% 0Food shopping 11.4% 179 17.3% 14 2.7% 2 3.3% 3 1.3% 1 28.1% 27 3.2% 1 21.5% 5 11.8% 3 4.8% 3 18.3% 5Leisure activity 7.7% 120 12.7% 10 5.6% 4 4.2% 4 9.4% 5 16.4% 16 1.6% 0 17.7% 4 7.6% 2 6.3% 3 24.7% 6Non-food shopping 22.6% 355 31.7% 25 17.9% 12 14.1% 13 23.8% 12 42.7% 41 12.1% 3 34.3% 8 20.2% 5 13.6% 7 17.0% 4Travel to / from school /
college / university 0.1% 2 0.0% 0 0.0% 0 0.0% 0 0.0% 0 0.0% 0 0.0% 0 0.0% 0 0.0% 0 0.0% 0 0.0% 0
Travel to / from work 0.6% 9 2.4% 2 0.0% 0 1.0% 1 1.0% 0 0.8% 1 1.2% 0 0.7% 0 0.0% 0 0.0% 0 0.7% 0Visit café / pub / restaurant 29.3% 461 24.3% 19 36.3% 24 25.2% 23 24.7% 13 23.9% 23 22.6% 6 9.2% 2 21.7% 5 33.0% 18 40.4% 11Visit family / friends 2.4% 37 0.8% 1 6.2% 4 2.3% 2 2.9% 1 3.4% 3 3.7% 1 3.9% 1 9.3% 2 0.7% 0 1.7% 0Visit financial service such
as bank, building society, post office
6.8% 106 14.5% 11 0.0% 0 0.0% 0 1.9% 1 8.0% 8 0.0% 0 1.0% 0 9.7% 2 0.0% 0 6.5% 2
Visit health service such as doctor, dentist, hospital
1.2% 18 3.3% 3 0.0% 0 0.0% 0 2.3% 1 0.7% 1 1.2% 0 0.6% 0 1.6% 0 0.0% 0 4.7% 1
Visit other service such as laundrette, hairdresser, recycling
2.1% 33 9.7% 8 0.9% 1 0.0% 0 0.0% 0 4.2% 4 0.0% 0 5.9% 1 1.2% 0 0.0% 0 2.4% 1
Other 0.0% 0 0.0% 0 0.0% 0 0.0% 0 0.0% 0 0.0% 0 0.0% 0 0.0% 0 0.0% 0 0.0% 0 0.0% 0Window shop / browse 0.9% 14 0.0% 0 0.0% 0 1.7% 2 1.6% 1 0.0% 0 2.9% 1 1.8% 0 0.6% 0 0.7% 0 1.7% 0Visiting the market 0.2% 3 0.0% 0 0.0% 0 0.0% 0 0.0% 0 1.1% 1 1.2% 0 0.0% 0 0.0% 0 0.0% 0 0.0% 0(Don’t know / varies) 0.8% 12 0.0% 0 0.0% 0 0.8% 1 1.4% 1 4.2% 4 0.0% 0 0.6% 0 0.6% 0 3.7% 2 0.7% 0(No other activity / No other
service used) 40.3% 633 33.5% 26 45.6% 30 53.7% 49 43.7% 23 23.5% 23 62.2% 16 27.2% 7 35.9% 9 42.7% 23 20.3% 5
Weighted base: 1571 79 67 91 52 97 26 24 24 55 26Sample: 1624 100 69 66 86 88 60 84 87 80 95
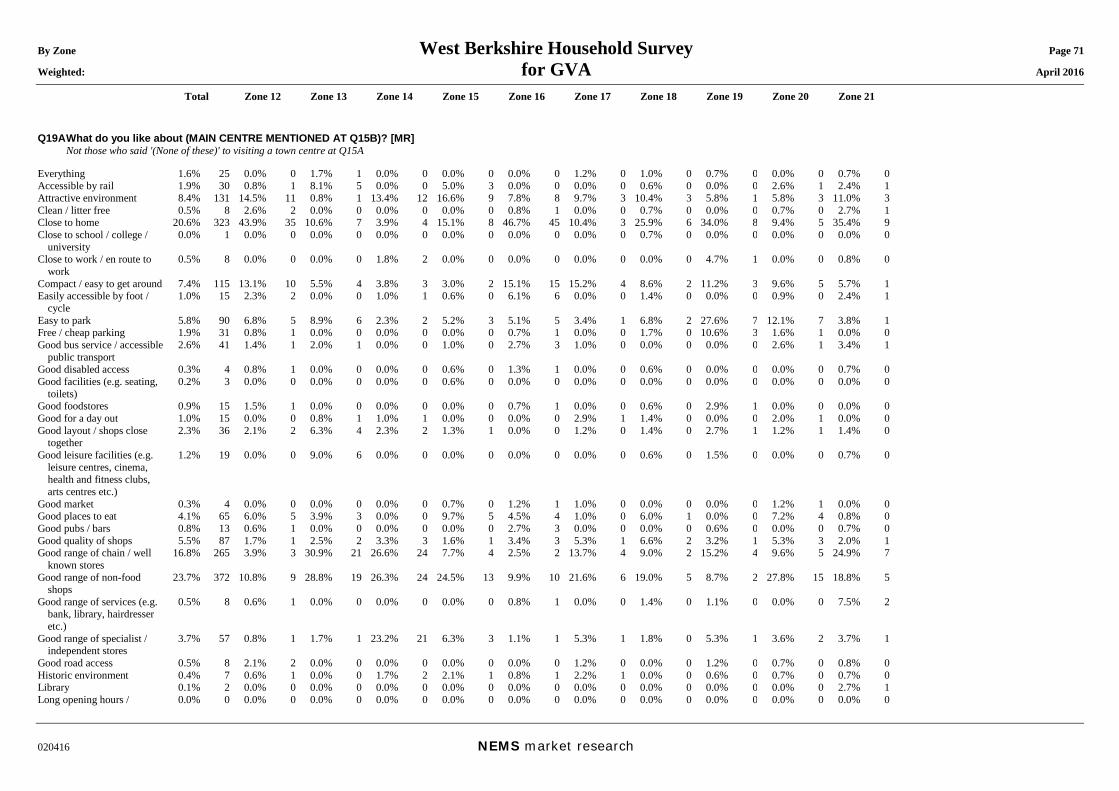
By Zone West Berkshire Household Survey Page 71 Weighted: for GVA April 2016
Total Zone 12 Zone 13 Zone 14 Zone 15 Zone 16 Zone 17 Zone 18 Zone 19 Zone 20 Zone 21
020416 NEMS market research
Q19A What do you like about (MAIN CENTRE MENTIONED AT Q15B)? [MR] Not those who said '(None of these)' to visiting a town centre at Q15A Everything 1.6% 25 0.0% 0 1.7% 1 0.0% 0 0.0% 0 0.0% 0 1.2% 0 1.0% 0 0.7% 0 0.0% 0 0.7% 0Accessible by rail 1.9% 30 0.8% 1 8.1% 5 0.0% 0 5.0% 3 0.0% 0 0.0% 0 0.6% 0 0.0% 0 2.6% 1 2.4% 1Attractive environment 8.4% 131 14.5% 11 0.8% 1 13.4% 12 16.6% 9 7.8% 8 9.7% 3 10.4% 3 5.8% 1 5.8% 3 11.0% 3Clean / litter free 0.5% 8 2.6% 2 0.0% 0 0.0% 0 0.0% 0 0.8% 1 0.0% 0 0.7% 0 0.0% 0 0.7% 0 2.7% 1Close to home 20.6% 323 43.9% 35 10.6% 7 3.9% 4 15.1% 8 46.7% 45 10.4% 3 25.9% 6 34.0% 8 9.4% 5 35.4% 9Close to school / college /
university 0.0% 1 0.0% 0 0.0% 0 0.0% 0 0.0% 0 0.0% 0 0.0% 0 0.7% 0 0.0% 0 0.0% 0 0.0% 0
Close to work / en route to work
0.5% 8 0.0% 0 0.0% 0 1.8% 2 0.0% 0 0.0% 0 0.0% 0 0.0% 0 4.7% 1 0.0% 0 0.8% 0
Compact / easy to get around 7.4% 115 13.1% 10 5.5% 4 3.8% 3 3.0% 2 15.1% 15 15.2% 4 8.6% 2 11.2% 3 9.6% 5 5.7% 1Easily accessible by foot /
cycle 1.0% 15 2.3% 2 0.0% 0 1.0% 1 0.6% 0 6.1% 6 0.0% 0 1.4% 0 0.0% 0 0.9% 0 2.4% 1
Easy to park 5.8% 90 6.8% 5 8.9% 6 2.3% 2 5.2% 3 5.1% 5 3.4% 1 6.8% 2 27.6% 7 12.1% 7 3.8% 1Free / cheap parking 1.9% 31 0.8% 1 0.0% 0 0.0% 0 0.0% 0 0.7% 1 0.0% 0 1.7% 0 10.6% 3 1.6% 1 0.0% 0Good bus service / accessible
public transport 2.6% 41 1.4% 1 2.0% 1 0.0% 0 1.0% 0 2.7% 3 1.0% 0 0.0% 0 0.0% 0 2.6% 1 3.4% 1
Good disabled access 0.3% 4 0.8% 1 0.0% 0 0.0% 0 0.6% 0 1.3% 1 0.0% 0 0.6% 0 0.0% 0 0.0% 0 0.7% 0Good facilities (e.g. seating,
toilets) 0.2% 3 0.0% 0 0.0% 0 0.0% 0 0.6% 0 0.0% 0 0.0% 0 0.0% 0 0.0% 0 0.0% 0 0.0% 0
Good foodstores 0.9% 15 1.5% 1 0.0% 0 0.0% 0 0.0% 0 0.7% 1 0.0% 0 0.6% 0 2.9% 1 0.0% 0 0.0% 0Good for a day out 1.0% 15 0.0% 0 0.8% 1 1.0% 1 0.0% 0 0.0% 0 2.9% 1 1.4% 0 0.0% 0 2.0% 1 0.0% 0Good layout / shops close
together 2.3% 36 2.1% 2 6.3% 4 2.3% 2 1.3% 1 0.0% 0 1.2% 0 1.4% 0 2.7% 1 1.2% 1 1.4% 0
Good leisure facilities (e.g. leisure centres, cinema, health and fitness clubs, arts centres etc.)
1.2% 19 0.0% 0 9.0% 6 0.0% 0 0.0% 0 0.0% 0 0.0% 0 0.6% 0 1.5% 0 0.0% 0 0.7% 0
Good market 0.3% 4 0.0% 0 0.0% 0 0.0% 0 0.7% 0 1.2% 1 1.0% 0 0.0% 0 0.0% 0 1.2% 1 0.0% 0Good places to eat 4.1% 65 6.0% 5 3.9% 3 0.0% 0 9.7% 5 4.5% 4 1.0% 0 6.0% 1 0.0% 0 7.2% 4 0.8% 0Good pubs / bars 0.8% 13 0.6% 1 0.0% 0 0.0% 0 0.0% 0 2.7% 3 0.0% 0 0.0% 0 0.6% 0 0.0% 0 0.7% 0Good quality of shops 5.5% 87 1.7% 1 2.5% 2 3.3% 3 1.6% 1 3.4% 3 5.3% 1 6.6% 2 3.2% 1 5.3% 3 2.0% 1Good range of chain / well
known stores 16.8% 265 3.9% 3 30.9% 21 26.6% 24 7.7% 4 2.5% 2 13.7% 4 9.0% 2 15.2% 4 9.6% 5 24.9% 7
Good range of non-food shops
23.7% 372 10.8% 9 28.8% 19 26.3% 24 24.5% 13 9.9% 10 21.6% 6 19.0% 5 8.7% 2 27.8% 15 18.8% 5
Good range of services (e.g. bank, library, hairdresser etc.)
0.5% 8 0.6% 1 0.0% 0 0.0% 0 0.0% 0 0.8% 1 0.0% 0 1.4% 0 1.1% 0 0.0% 0 7.5% 2
Good range of specialist / independent stores
3.7% 57 0.8% 1 1.7% 1 23.2% 21 6.3% 3 1.1% 1 5.3% 1 1.8% 0 5.3% 1 3.6% 2 3.7% 1
Good road access 0.5% 8 2.1% 2 0.0% 0 0.0% 0 0.0% 0 0.0% 0 1.2% 0 0.0% 0 1.2% 0 0.7% 0 0.8% 0Historic environment 0.4% 7 0.6% 1 0.0% 0 1.7% 2 2.1% 1 0.8% 1 2.2% 1 0.0% 0 0.6% 0 0.7% 0 0.7% 0Library 0.1% 2 0.0% 0 0.0% 0 0.0% 0 0.0% 0 0.0% 0 0.0% 0 0.0% 0 0.0% 0 0.0% 0 2.7% 1Long opening hours / 0.0% 0 0.0% 0 0.0% 0 0.0% 0 0.0% 0 0.0% 0 0.0% 0 0.0% 0 0.0% 0 0.0% 0 0.0% 0
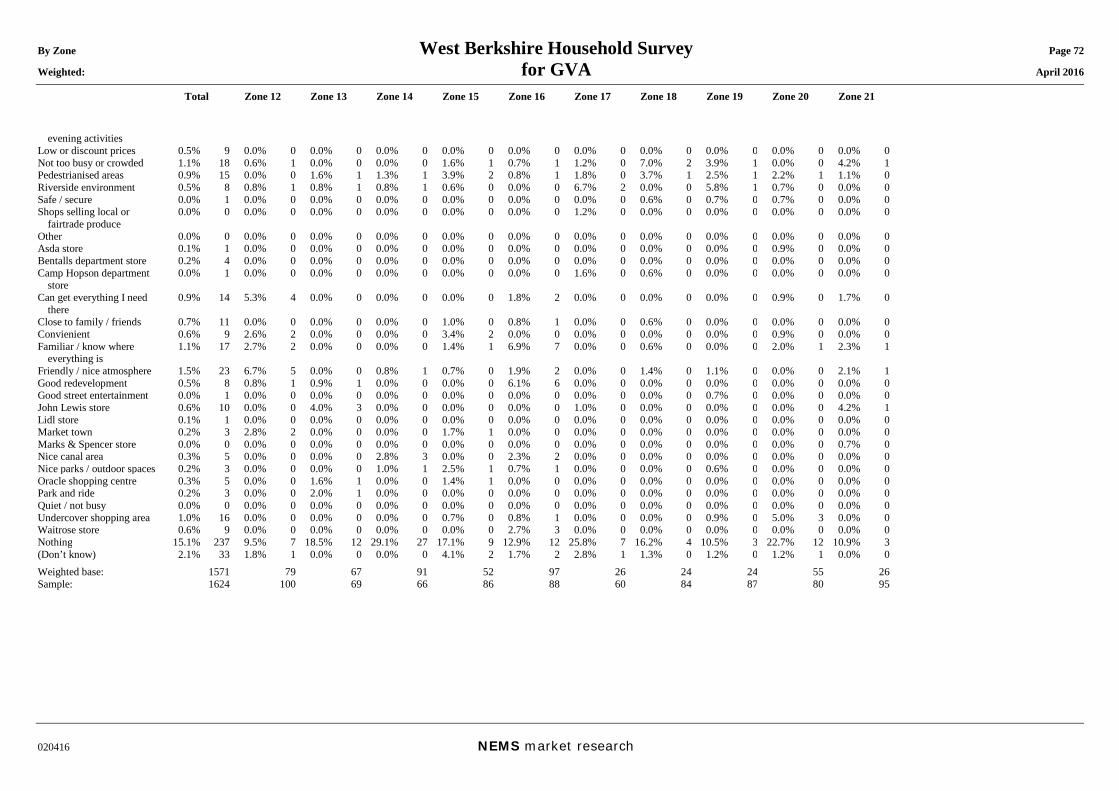
By Zone West Berkshire Household Survey Page 72 Weighted: for GVA April 2016
Total Zone 12 Zone 13 Zone 14 Zone 15 Zone 16 Zone 17 Zone 18 Zone 19 Zone 20 Zone 21
020416 NEMS market research
evening activities Low or discount prices 0.5% 9 0.0% 0 0.0% 0 0.0% 0 0.0% 0 0.0% 0 0.0% 0 0.0% 0 0.0% 0 0.0% 0 0.0% 0Not too busy or crowded 1.1% 18 0.6% 1 0.0% 0 0.0% 0 1.6% 1 0.7% 1 1.2% 0 7.0% 2 3.9% 1 0.0% 0 4.2% 1Pedestrianised areas 0.9% 15 0.0% 0 1.6% 1 1.3% 1 3.9% 2 0.8% 1 1.8% 0 3.7% 1 2.5% 1 2.2% 1 1.1% 0Riverside environment 0.5% 8 0.8% 1 0.8% 1 0.8% 1 0.6% 0 0.0% 0 6.7% 2 0.0% 0 5.8% 1 0.7% 0 0.0% 0Safe / secure 0.0% 1 0.0% 0 0.0% 0 0.0% 0 0.0% 0 0.0% 0 0.0% 0 0.6% 0 0.7% 0 0.7% 0 0.0% 0Shops selling local or
fairtrade produce 0.0% 0 0.0% 0 0.0% 0 0.0% 0 0.0% 0 0.0% 0 1.2% 0 0.0% 0 0.0% 0 0.0% 0 0.0% 0
Other 0.0% 0 0.0% 0 0.0% 0 0.0% 0 0.0% 0 0.0% 0 0.0% 0 0.0% 0 0.0% 0 0.0% 0 0.0% 0Asda store 0.1% 1 0.0% 0 0.0% 0 0.0% 0 0.0% 0 0.0% 0 0.0% 0 0.0% 0 0.0% 0 0.9% 0 0.0% 0Bentalls department store 0.2% 4 0.0% 0 0.0% 0 0.0% 0 0.0% 0 0.0% 0 0.0% 0 0.0% 0 0.0% 0 0.0% 0 0.0% 0Camp Hopson department
store 0.0% 1 0.0% 0 0.0% 0 0.0% 0 0.0% 0 0.0% 0 1.6% 0 0.6% 0 0.0% 0 0.0% 0 0.0% 0
Can get everything I need there
0.9% 14 5.3% 4 0.0% 0 0.0% 0 0.0% 0 1.8% 2 0.0% 0 0.0% 0 0.0% 0 0.9% 0 1.7% 0
Close to family / friends 0.7% 11 0.0% 0 0.0% 0 0.0% 0 1.0% 0 0.8% 1 0.0% 0 0.6% 0 0.0% 0 0.0% 0 0.0% 0Convienient 0.6% 9 2.6% 2 0.0% 0 0.0% 0 3.4% 2 0.0% 0 0.0% 0 0.0% 0 0.0% 0 0.9% 0 0.0% 0Familiar / know where
everything is 1.1% 17 2.7% 2 0.0% 0 0.0% 0 1.4% 1 6.9% 7 0.0% 0 0.6% 0 0.0% 0 2.0% 1 2.3% 1
Friendly / nice atmosphere 1.5% 23 6.7% 5 0.0% 0 0.8% 1 0.7% 0 1.9% 2 0.0% 0 1.4% 0 1.1% 0 0.0% 0 2.1% 1Good redevelopment 0.5% 8 0.8% 1 0.9% 1 0.0% 0 0.0% 0 6.1% 6 0.0% 0 0.0% 0 0.0% 0 0.0% 0 0.0% 0Good street entertainment 0.0% 1 0.0% 0 0.0% 0 0.0% 0 0.0% 0 0.0% 0 0.0% 0 0.0% 0 0.7% 0 0.0% 0 0.0% 0John Lewis store 0.6% 10 0.0% 0 4.0% 3 0.0% 0 0.0% 0 0.0% 0 1.0% 0 0.0% 0 0.0% 0 0.0% 0 4.2% 1Lidl store 0.1% 1 0.0% 0 0.0% 0 0.0% 0 0.0% 0 0.0% 0 0.0% 0 0.0% 0 0.0% 0 0.0% 0 0.0% 0Market town 0.2% 3 2.8% 2 0.0% 0 0.0% 0 1.7% 1 0.0% 0 0.0% 0 0.0% 0 0.0% 0 0.0% 0 0.0% 0Marks & Spencer store 0.0% 0 0.0% 0 0.0% 0 0.0% 0 0.0% 0 0.0% 0 0.0% 0 0.0% 0 0.0% 0 0.0% 0 0.7% 0Nice canal area 0.3% 5 0.0% 0 0.0% 0 2.8% 3 0.0% 0 2.3% 2 0.0% 0 0.0% 0 0.0% 0 0.0% 0 0.0% 0Nice parks / outdoor spaces 0.2% 3 0.0% 0 0.0% 0 1.0% 1 2.5% 1 0.7% 1 0.0% 0 0.0% 0 0.6% 0 0.0% 0 0.0% 0Oracle shopping centre 0.3% 5 0.0% 0 1.6% 1 0.0% 0 1.4% 1 0.0% 0 0.0% 0 0.0% 0 0.0% 0 0.0% 0 0.0% 0Park and ride 0.2% 3 0.0% 0 2.0% 1 0.0% 0 0.0% 0 0.0% 0 0.0% 0 0.0% 0 0.0% 0 0.0% 0 0.0% 0Quiet / not busy 0.0% 0 0.0% 0 0.0% 0 0.0% 0 0.0% 0 0.0% 0 0.0% 0 0.0% 0 0.0% 0 0.0% 0 0.0% 0Undercover shopping area 1.0% 16 0.0% 0 0.0% 0 0.0% 0 0.7% 0 0.8% 1 0.0% 0 0.0% 0 0.9% 0 5.0% 3 0.0% 0Waitrose store 0.6% 9 0.0% 0 0.0% 0 0.0% 0 0.0% 0 2.7% 3 0.0% 0 0.0% 0 0.0% 0 0.0% 0 0.0% 0Nothing 15.1% 237 9.5% 7 18.5% 12 29.1% 27 17.1% 9 12.9% 12 25.8% 7 16.2% 4 10.5% 3 22.7% 12 10.9% 3(Don’t know) 2.1% 33 1.8% 1 0.0% 0 0.0% 0 4.1% 2 1.7% 2 2.8% 1 1.3% 0 1.2% 0 1.2% 1 0.0% 0Weighted base: 1571 79 67 91 52 97 26 24 24 55 26Sample: 1624 100 69 66 86 88 60 84 87 80 95
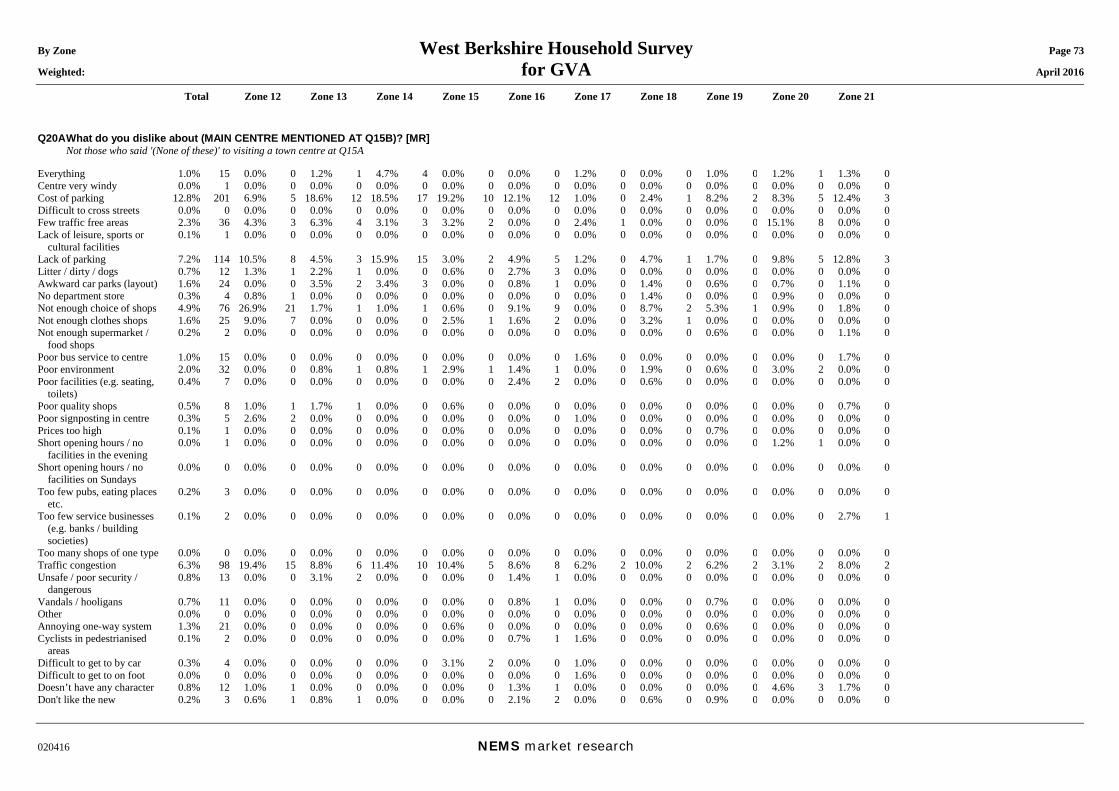
By Zone West Berkshire Household Survey Page 73 Weighted: for GVA April 2016
Total Zone 12 Zone 13 Zone 14 Zone 15 Zone 16 Zone 17 Zone 18 Zone 19 Zone 20 Zone 21
020416 NEMS market research
Q20A What do you dislike about (MAIN CENTRE MENTIONED AT Q15B)? [MR] Not those who said '(None of these)' to visiting a town centre at Q15A Everything 1.0% 15 0.0% 0 1.2% 1 4.7% 4 0.0% 0 0.0% 0 1.2% 0 0.0% 0 1.0% 0 1.2% 1 1.3% 0Centre very windy 0.0% 1 0.0% 0 0.0% 0 0.0% 0 0.0% 0 0.0% 0 0.0% 0 0.0% 0 0.0% 0 0.0% 0 0.0% 0Cost of parking 12.8% 201 6.9% 5 18.6% 12 18.5% 17 19.2% 10 12.1% 12 1.0% 0 2.4% 1 8.2% 2 8.3% 5 12.4% 3Difficult to cross streets 0.0% 0 0.0% 0 0.0% 0 0.0% 0 0.0% 0 0.0% 0 0.0% 0 0.0% 0 0.0% 0 0.0% 0 0.0% 0Few traffic free areas 2.3% 36 4.3% 3 6.3% 4 3.1% 3 3.2% 2 0.0% 0 2.4% 1 0.0% 0 0.0% 0 15.1% 8 0.0% 0Lack of leisure, sports or
cultural facilities 0.1% 1 0.0% 0 0.0% 0 0.0% 0 0.0% 0 0.0% 0 0.0% 0 0.0% 0 0.0% 0 0.0% 0 0.0% 0
Lack of parking 7.2% 114 10.5% 8 4.5% 3 15.9% 15 3.0% 2 4.9% 5 1.2% 0 4.7% 1 1.7% 0 9.8% 5 12.8% 3Litter / dirty / dogs 0.7% 12 1.3% 1 2.2% 1 0.0% 0 0.6% 0 2.7% 3 0.0% 0 0.0% 0 0.0% 0 0.0% 0 0.0% 0Awkward car parks (layout) 1.6% 24 0.0% 0 3.5% 2 3.4% 3 0.0% 0 0.8% 1 0.0% 0 1.4% 0 0.6% 0 0.7% 0 1.1% 0No department store 0.3% 4 0.8% 1 0.0% 0 0.0% 0 0.0% 0 0.0% 0 0.0% 0 1.4% 0 0.0% 0 0.9% 0 0.0% 0Not enough choice of shops 4.9% 76 26.9% 21 1.7% 1 1.0% 1 0.6% 0 9.1% 9 0.0% 0 8.7% 2 5.3% 1 0.9% 0 1.8% 0Not enough clothes shops 1.6% 25 9.0% 7 0.0% 0 0.0% 0 2.5% 1 1.6% 2 0.0% 0 3.2% 1 0.0% 0 0.0% 0 0.0% 0Not enough supermarket /
food shops 0.2% 2 0.0% 0 0.0% 0 0.0% 0 0.0% 0 0.0% 0 0.0% 0 0.0% 0 0.6% 0 0.0% 0 1.1% 0
Poor bus service to centre 1.0% 15 0.0% 0 0.0% 0 0.0% 0 0.0% 0 0.0% 0 1.6% 0 0.0% 0 0.0% 0 0.0% 0 1.7% 0Poor environment 2.0% 32 0.0% 0 0.8% 1 0.8% 1 2.9% 1 1.4% 1 0.0% 0 1.9% 0 0.6% 0 3.0% 2 0.0% 0Poor facilities (e.g. seating,
toilets) 0.4% 7 0.0% 0 0.0% 0 0.0% 0 0.0% 0 2.4% 2 0.0% 0 0.6% 0 0.0% 0 0.0% 0 0.0% 0
Poor quality shops 0.5% 8 1.0% 1 1.7% 1 0.0% 0 0.6% 0 0.0% 0 0.0% 0 0.0% 0 0.0% 0 0.0% 0 0.7% 0Poor signposting in centre 0.3% 5 2.6% 2 0.0% 0 0.0% 0 0.0% 0 0.0% 0 1.0% 0 0.0% 0 0.0% 0 0.0% 0 0.0% 0Prices too high 0.1% 1 0.0% 0 0.0% 0 0.0% 0 0.0% 0 0.0% 0 0.0% 0 0.0% 0 0.7% 0 0.0% 0 0.0% 0Short opening hours / no
facilities in the evening 0.0% 1 0.0% 0 0.0% 0 0.0% 0 0.0% 0 0.0% 0 0.0% 0 0.0% 0 0.0% 0 1.2% 1 0.0% 0
Short opening hours / no facilities on Sundays
0.0% 0 0.0% 0 0.0% 0 0.0% 0 0.0% 0 0.0% 0 0.0% 0 0.0% 0 0.0% 0 0.0% 0 0.0% 0
Too few pubs, eating places etc.
0.2% 3 0.0% 0 0.0% 0 0.0% 0 0.0% 0 0.0% 0 0.0% 0 0.0% 0 0.0% 0 0.0% 0 0.0% 0
Too few service businesses (e.g. banks / building societies)
0.1% 2 0.0% 0 0.0% 0 0.0% 0 0.0% 0 0.0% 0 0.0% 0 0.0% 0 0.0% 0 0.0% 0 2.7% 1
Too many shops of one type 0.0% 0 0.0% 0 0.0% 0 0.0% 0 0.0% 0 0.0% 0 0.0% 0 0.0% 0 0.0% 0 0.0% 0 0.0% 0Traffic congestion 6.3% 98 19.4% 15 8.8% 6 11.4% 10 10.4% 5 8.6% 8 6.2% 2 10.0% 2 6.2% 2 3.1% 2 8.0% 2Unsafe / poor security /
dangerous 0.8% 13 0.0% 0 3.1% 2 0.0% 0 0.0% 0 1.4% 1 0.0% 0 0.0% 0 0.0% 0 0.0% 0 0.0% 0
Vandals / hooligans 0.7% 11 0.0% 0 0.0% 0 0.0% 0 0.0% 0 0.8% 1 0.0% 0 0.0% 0 0.7% 0 0.0% 0 0.0% 0Other 0.0% 0 0.0% 0 0.0% 0 0.0% 0 0.0% 0 0.0% 0 0.0% 0 0.0% 0 0.0% 0 0.0% 0 0.0% 0Annoying one-way system 1.3% 21 0.0% 0 0.0% 0 0.0% 0 0.6% 0 0.0% 0 0.0% 0 0.0% 0 0.6% 0 0.0% 0 0.0% 0Cyclists in pedestrianised
areas 0.1% 2 0.0% 0 0.0% 0 0.0% 0 0.0% 0 0.7% 1 1.6% 0 0.0% 0 0.0% 0 0.0% 0 0.0% 0
Difficult to get to by car 0.3% 4 0.0% 0 0.0% 0 0.0% 0 3.1% 2 0.0% 0 1.0% 0 0.0% 0 0.0% 0 0.0% 0 0.0% 0Difficult to get to on foot 0.0% 0 0.0% 0 0.0% 0 0.0% 0 0.0% 0 0.0% 0 1.6% 0 0.0% 0 0.0% 0 0.0% 0 0.0% 0Doesn’t have any character 0.8% 12 1.0% 1 0.0% 0 0.0% 0 0.0% 0 1.3% 1 0.0% 0 0.0% 0 0.0% 0 4.6% 3 1.7% 0Don't like the new 0.2% 3 0.6% 1 0.8% 1 0.0% 0 0.0% 0 2.1% 2 0.0% 0 0.6% 0 0.9% 0 0.0% 0 0.0% 0
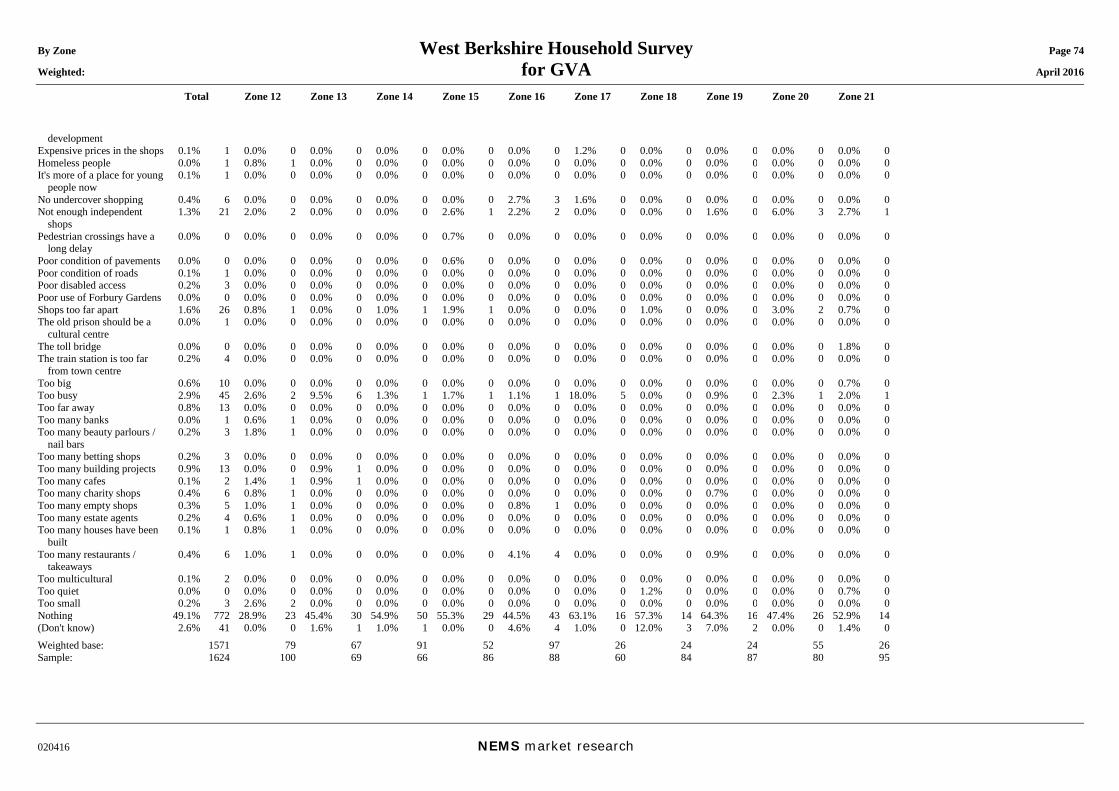
By Zone West Berkshire Household Survey Page 74 Weighted: for GVA April 2016
Total Zone 12 Zone 13 Zone 14 Zone 15 Zone 16 Zone 17 Zone 18 Zone 19 Zone 20 Zone 21
020416 NEMS market research
development Expensive prices in the shops 0.1% 1 0.0% 0 0.0% 0 0.0% 0 0.0% 0 0.0% 0 1.2% 0 0.0% 0 0.0% 0 0.0% 0 0.0% 0Homeless people 0.0% 1 0.8% 1 0.0% 0 0.0% 0 0.0% 0 0.0% 0 0.0% 0 0.0% 0 0.0% 0 0.0% 0 0.0% 0It's more of a place for young
people now 0.1% 1 0.0% 0 0.0% 0 0.0% 0 0.0% 0 0.0% 0 0.0% 0 0.0% 0 0.0% 0 0.0% 0 0.0% 0
No undercover shopping 0.4% 6 0.0% 0 0.0% 0 0.0% 0 0.0% 0 2.7% 3 1.6% 0 0.0% 0 0.0% 0 0.0% 0 0.0% 0Not enough independent
shops 1.3% 21 2.0% 2 0.0% 0 0.0% 0 2.6% 1 2.2% 2 0.0% 0 0.0% 0 1.6% 0 6.0% 3 2.7% 1
Pedestrian crossings have a long delay
0.0% 0 0.0% 0 0.0% 0 0.0% 0 0.7% 0 0.0% 0 0.0% 0 0.0% 0 0.0% 0 0.0% 0 0.0% 0
Poor condition of pavements 0.0% 0 0.0% 0 0.0% 0 0.0% 0 0.6% 0 0.0% 0 0.0% 0 0.0% 0 0.0% 0 0.0% 0 0.0% 0Poor condition of roads 0.1% 1 0.0% 0 0.0% 0 0.0% 0 0.0% 0 0.0% 0 0.0% 0 0.0% 0 0.0% 0 0.0% 0 0.0% 0Poor disabled access 0.2% 3 0.0% 0 0.0% 0 0.0% 0 0.0% 0 0.0% 0 0.0% 0 0.0% 0 0.0% 0 0.0% 0 0.0% 0Poor use of Forbury Gardens 0.0% 0 0.0% 0 0.0% 0 0.0% 0 0.0% 0 0.0% 0 0.0% 0 0.0% 0 0.0% 0 0.0% 0 0.0% 0Shops too far apart 1.6% 26 0.8% 1 0.0% 0 1.0% 1 1.9% 1 0.0% 0 0.0% 0 1.0% 0 0.0% 0 3.0% 2 0.7% 0The old prison should be a
cultural centre 0.0% 1 0.0% 0 0.0% 0 0.0% 0 0.0% 0 0.0% 0 0.0% 0 0.0% 0 0.0% 0 0.0% 0 0.0% 0
The toll bridge 0.0% 0 0.0% 0 0.0% 0 0.0% 0 0.0% 0 0.0% 0 0.0% 0 0.0% 0 0.0% 0 0.0% 0 1.8% 0The train station is too far
from town centre 0.2% 4 0.0% 0 0.0% 0 0.0% 0 0.0% 0 0.0% 0 0.0% 0 0.0% 0 0.0% 0 0.0% 0 0.0% 0
Too big 0.6% 10 0.0% 0 0.0% 0 0.0% 0 0.0% 0 0.0% 0 0.0% 0 0.0% 0 0.0% 0 0.0% 0 0.7% 0Too busy 2.9% 45 2.6% 2 9.5% 6 1.3% 1 1.7% 1 1.1% 1 18.0% 5 0.0% 0 0.9% 0 2.3% 1 2.0% 1Too far away 0.8% 13 0.0% 0 0.0% 0 0.0% 0 0.0% 0 0.0% 0 0.0% 0 0.0% 0 0.0% 0 0.0% 0 0.0% 0Too many banks 0.0% 1 0.6% 1 0.0% 0 0.0% 0 0.0% 0 0.0% 0 0.0% 0 0.0% 0 0.0% 0 0.0% 0 0.0% 0Too many beauty parlours /
nail bars 0.2% 3 1.8% 1 0.0% 0 0.0% 0 0.0% 0 0.0% 0 0.0% 0 0.0% 0 0.0% 0 0.0% 0 0.0% 0
Too many betting shops 0.2% 3 0.0% 0 0.0% 0 0.0% 0 0.0% 0 0.0% 0 0.0% 0 0.0% 0 0.0% 0 0.0% 0 0.0% 0Too many building projects 0.9% 13 0.0% 0 0.9% 1 0.0% 0 0.0% 0 0.0% 0 0.0% 0 0.0% 0 0.0% 0 0.0% 0 0.0% 0Too many cafes 0.1% 2 1.4% 1 0.9% 1 0.0% 0 0.0% 0 0.0% 0 0.0% 0 0.0% 0 0.0% 0 0.0% 0 0.0% 0Too many charity shops 0.4% 6 0.8% 1 0.0% 0 0.0% 0 0.0% 0 0.0% 0 0.0% 0 0.0% 0 0.7% 0 0.0% 0 0.0% 0Too many empty shops 0.3% 5 1.0% 1 0.0% 0 0.0% 0 0.0% 0 0.8% 1 0.0% 0 0.0% 0 0.0% 0 0.0% 0 0.0% 0Too many estate agents 0.2% 4 0.6% 1 0.0% 0 0.0% 0 0.0% 0 0.0% 0 0.0% 0 0.0% 0 0.0% 0 0.0% 0 0.0% 0Too many houses have been
built 0.1% 1 0.8% 1 0.0% 0 0.0% 0 0.0% 0 0.0% 0 0.0% 0 0.0% 0 0.0% 0 0.0% 0 0.0% 0
Too many restaurants / takeaways
0.4% 6 1.0% 1 0.0% 0 0.0% 0 0.0% 0 4.1% 4 0.0% 0 0.0% 0 0.9% 0 0.0% 0 0.0% 0
Too multicultural 0.1% 2 0.0% 0 0.0% 0 0.0% 0 0.0% 0 0.0% 0 0.0% 0 0.0% 0 0.0% 0 0.0% 0 0.0% 0Too quiet 0.0% 0 0.0% 0 0.0% 0 0.0% 0 0.0% 0 0.0% 0 0.0% 0 1.2% 0 0.0% 0 0.0% 0 0.7% 0Too small 0.2% 3 2.6% 2 0.0% 0 0.0% 0 0.0% 0 0.0% 0 0.0% 0 0.0% 0 0.0% 0 0.0% 0 0.0% 0Nothing 49.1% 772 28.9% 23 45.4% 30 54.9% 50 55.3% 29 44.5% 43 63.1% 16 57.3% 14 64.3% 16 47.4% 26 52.9% 14(Don't know) 2.6% 41 0.0% 0 1.6% 1 1.0% 1 0.0% 0 4.6% 4 1.0% 0 12.0% 3 7.0% 2 0.0% 0 1.4% 0Weighted base: 1571 79 67 91 52 97 26 24 24 55 26Sample: 1624 100 69 66 86 88 60 84 87 80 95
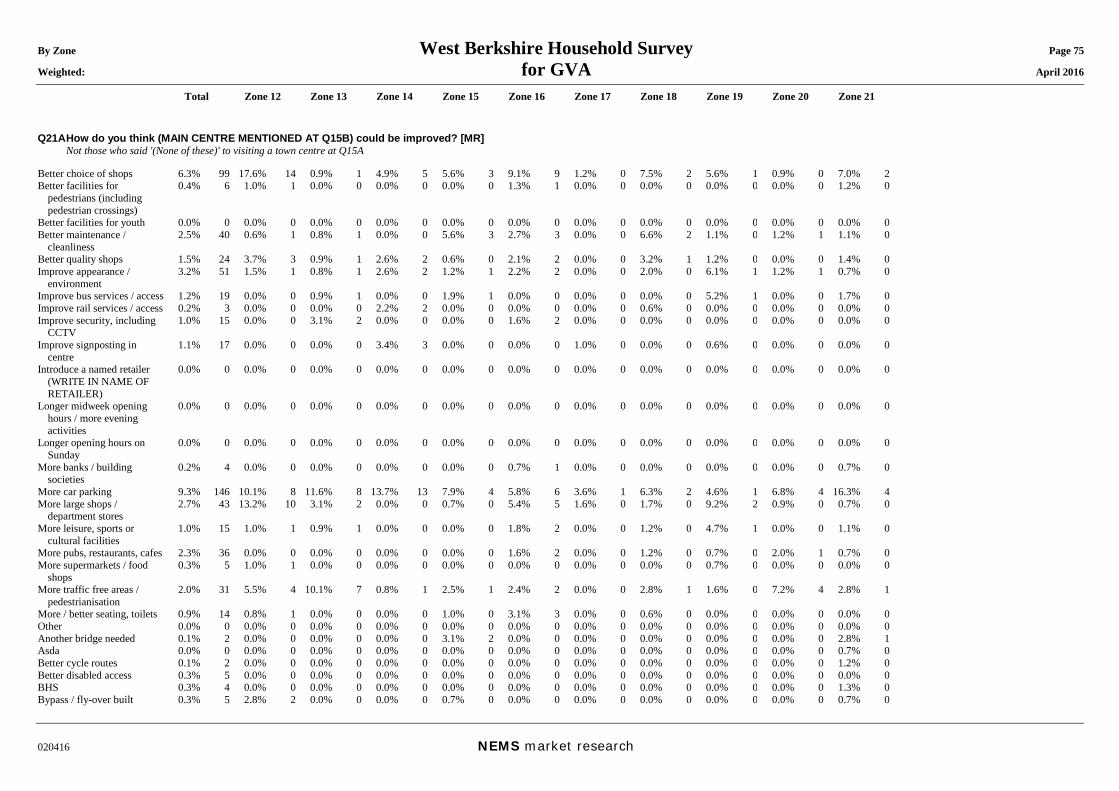
By Zone West Berkshire Household Survey Page 75 Weighted: for GVA April 2016
Total Zone 12 Zone 13 Zone 14 Zone 15 Zone 16 Zone 17 Zone 18 Zone 19 Zone 20 Zone 21
020416 NEMS market research
Q21A How do you think (MAIN CENTRE MENTIONED AT Q15B) could be improved? [MR] Not those who said '(None of these)' to visiting a town centre at Q15A Better choice of shops 6.3% 99 17.6% 14 0.9% 1 4.9% 5 5.6% 3 9.1% 9 1.2% 0 7.5% 2 5.6% 1 0.9% 0 7.0% 2Better facilities for
pedestrians (including pedestrian crossings)
0.4% 6 1.0% 1 0.0% 0 0.0% 0 0.0% 0 1.3% 1 0.0% 0 0.0% 0 0.0% 0 0.0% 0 1.2% 0
Better facilities for youth 0.0% 0 0.0% 0 0.0% 0 0.0% 0 0.0% 0 0.0% 0 0.0% 0 0.0% 0 0.0% 0 0.0% 0 0.0% 0Better maintenance /
cleanliness 2.5% 40 0.6% 1 0.8% 1 0.0% 0 5.6% 3 2.7% 3 0.0% 0 6.6% 2 1.1% 0 1.2% 1 1.1% 0
Better quality shops 1.5% 24 3.7% 3 0.9% 1 2.6% 2 0.6% 0 2.1% 2 0.0% 0 3.2% 1 1.2% 0 0.0% 0 1.4% 0Improve appearance /
environment 3.2% 51 1.5% 1 0.8% 1 2.6% 2 1.2% 1 2.2% 2 0.0% 0 2.0% 0 6.1% 1 1.2% 1 0.7% 0
Improve bus services / access 1.2% 19 0.0% 0 0.9% 1 0.0% 0 1.9% 1 0.0% 0 0.0% 0 0.0% 0 5.2% 1 0.0% 0 1.7% 0Improve rail services / access 0.2% 3 0.0% 0 0.0% 0 2.2% 2 0.0% 0 0.0% 0 0.0% 0 0.6% 0 0.0% 0 0.0% 0 0.0% 0Improve security, including
CCTV 1.0% 15 0.0% 0 3.1% 2 0.0% 0 0.0% 0 1.6% 2 0.0% 0 0.0% 0 0.0% 0 0.0% 0 0.0% 0
Improve signposting in centre
1.1% 17 0.0% 0 0.0% 0 3.4% 3 0.0% 0 0.0% 0 1.0% 0 0.0% 0 0.6% 0 0.0% 0 0.0% 0
Introduce a named retailer (WRITE IN NAME OF RETAILER)
0.0% 0 0.0% 0 0.0% 0 0.0% 0 0.0% 0 0.0% 0 0.0% 0 0.0% 0 0.0% 0 0.0% 0 0.0% 0
Longer midweek opening hours / more evening activities
0.0% 0 0.0% 0 0.0% 0 0.0% 0 0.0% 0 0.0% 0 0.0% 0 0.0% 0 0.0% 0 0.0% 0 0.0% 0
Longer opening hours on Sunday
0.0% 0 0.0% 0 0.0% 0 0.0% 0 0.0% 0 0.0% 0 0.0% 0 0.0% 0 0.0% 0 0.0% 0 0.0% 0
More banks / building societies
0.2% 4 0.0% 0 0.0% 0 0.0% 0 0.0% 0 0.7% 1 0.0% 0 0.0% 0 0.0% 0 0.0% 0 0.7% 0
More car parking 9.3% 146 10.1% 8 11.6% 8 13.7% 13 7.9% 4 5.8% 6 3.6% 1 6.3% 2 4.6% 1 6.8% 4 16.3% 4More large shops /
department stores 2.7% 43 13.2% 10 3.1% 2 0.0% 0 0.7% 0 5.4% 5 1.6% 0 1.7% 0 9.2% 2 0.9% 0 0.7% 0
More leisure, sports or cultural facilities
1.0% 15 1.0% 1 0.9% 1 0.0% 0 0.0% 0 1.8% 2 0.0% 0 1.2% 0 4.7% 1 0.0% 0 1.1% 0
More pubs, restaurants, cafes 2.3% 36 0.0% 0 0.0% 0 0.0% 0 0.0% 0 1.6% 2 0.0% 0 1.2% 0 0.7% 0 2.0% 1 0.7% 0More supermarkets / food
shops 0.3% 5 1.0% 1 0.0% 0 0.0% 0 0.0% 0 0.0% 0 0.0% 0 0.0% 0 0.7% 0 0.0% 0 0.0% 0
More traffic free areas / pedestrianisation
2.0% 31 5.5% 4 10.1% 7 0.8% 1 2.5% 1 2.4% 2 0.0% 0 2.8% 1 1.6% 0 7.2% 4 2.8% 1
More / better seating, toilets 0.9% 14 0.8% 1 0.0% 0 0.0% 0 1.0% 0 3.1% 3 0.0% 0 0.6% 0 0.0% 0 0.0% 0 0.0% 0Other 0.0% 0 0.0% 0 0.0% 0 0.0% 0 0.0% 0 0.0% 0 0.0% 0 0.0% 0 0.0% 0 0.0% 0 0.0% 0Another bridge needed 0.1% 2 0.0% 0 0.0% 0 0.0% 0 3.1% 2 0.0% 0 0.0% 0 0.0% 0 0.0% 0 0.0% 0 2.8% 1Asda 0.0% 0 0.0% 0 0.0% 0 0.0% 0 0.0% 0 0.0% 0 0.0% 0 0.0% 0 0.0% 0 0.0% 0 0.7% 0Better cycle routes 0.1% 2 0.0% 0 0.0% 0 0.0% 0 0.0% 0 0.0% 0 0.0% 0 0.0% 0 0.0% 0 0.0% 0 1.2% 0Better disabled access 0.3% 5 0.0% 0 0.0% 0 0.0% 0 0.0% 0 0.0% 0 0.0% 0 0.0% 0 0.0% 0 0.0% 0 0.0% 0BHS 0.3% 4 0.0% 0 0.0% 0 0.0% 0 0.0% 0 0.0% 0 0.0% 0 0.0% 0 0.0% 0 0.0% 0 1.3% 0Bypass / fly-over built 0.3% 5 2.8% 2 0.0% 0 0.0% 0 0.7% 0 0.0% 0 0.0% 0 0.0% 0 0.0% 0 0.0% 0 0.7% 0
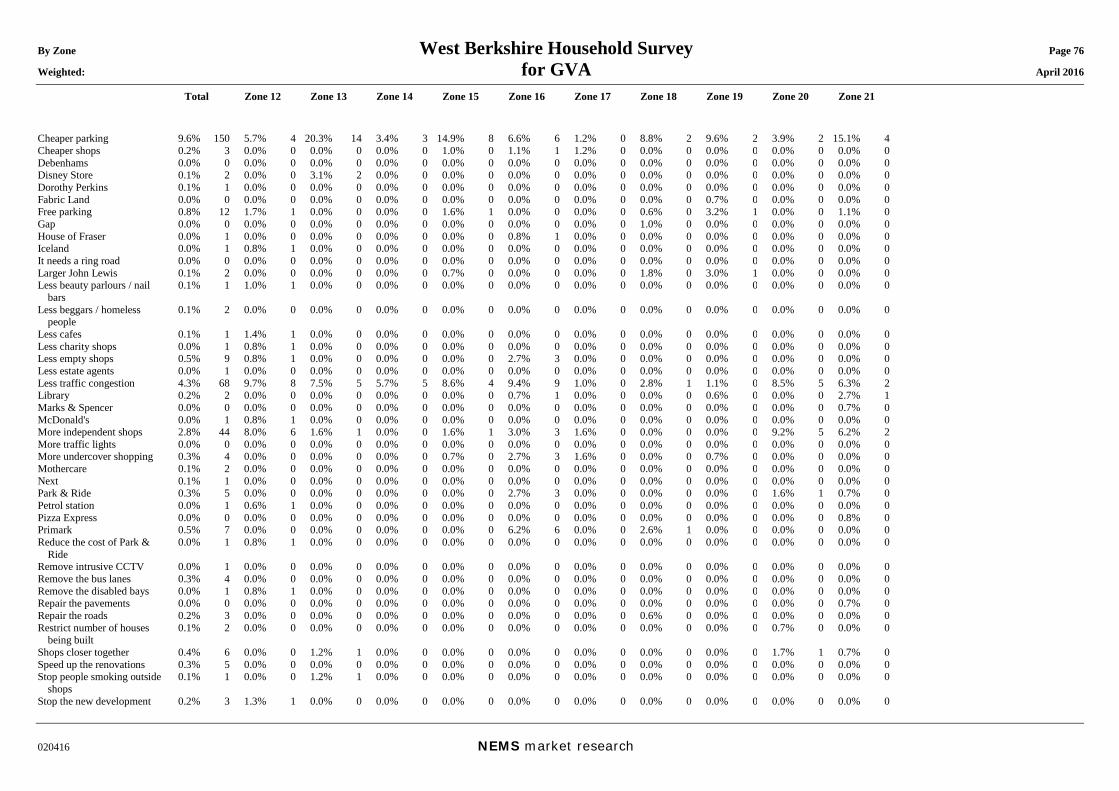
By Zone West Berkshire Household Survey Page 76 Weighted: for GVA April 2016
Total Zone 12 Zone 13 Zone 14 Zone 15 Zone 16 Zone 17 Zone 18 Zone 19 Zone 20 Zone 21
020416 NEMS market research
Cheaper parking 9.6% 150 5.7% 4 20.3% 14 3.4% 3 14.9% 8 6.6% 6 1.2% 0 8.8% 2 9.6% 2 3.9% 2 15.1% 4Cheaper shops 0.2% 3 0.0% 0 0.0% 0 0.0% 0 1.0% 0 1.1% 1 1.2% 0 0.0% 0 0.0% 0 0.0% 0 0.0% 0Debenhams 0.0% 0 0.0% 0 0.0% 0 0.0% 0 0.0% 0 0.0% 0 0.0% 0 0.0% 0 0.0% 0 0.0% 0 0.0% 0Disney Store 0.1% 2 0.0% 0 3.1% 2 0.0% 0 0.0% 0 0.0% 0 0.0% 0 0.0% 0 0.0% 0 0.0% 0 0.0% 0Dorothy Perkins 0.1% 1 0.0% 0 0.0% 0 0.0% 0 0.0% 0 0.0% 0 0.0% 0 0.0% 0 0.0% 0 0.0% 0 0.0% 0Fabric Land 0.0% 0 0.0% 0 0.0% 0 0.0% 0 0.0% 0 0.0% 0 0.0% 0 0.0% 0 0.7% 0 0.0% 0 0.0% 0Free parking 0.8% 12 1.7% 1 0.0% 0 0.0% 0 1.6% 1 0.0% 0 0.0% 0 0.6% 0 3.2% 1 0.0% 0 1.1% 0Gap 0.0% 0 0.0% 0 0.0% 0 0.0% 0 0.0% 0 0.0% 0 0.0% 0 1.0% 0 0.0% 0 0.0% 0 0.0% 0House of Fraser 0.0% 1 0.0% 0 0.0% 0 0.0% 0 0.0% 0 0.8% 1 0.0% 0 0.0% 0 0.0% 0 0.0% 0 0.0% 0Iceland 0.0% 1 0.8% 1 0.0% 0 0.0% 0 0.0% 0 0.0% 0 0.0% 0 0.0% 0 0.0% 0 0.0% 0 0.0% 0It needs a ring road 0.0% 0 0.0% 0 0.0% 0 0.0% 0 0.0% 0 0.0% 0 0.0% 0 0.0% 0 0.0% 0 0.0% 0 0.0% 0Larger John Lewis 0.1% 2 0.0% 0 0.0% 0 0.0% 0 0.7% 0 0.0% 0 0.0% 0 1.8% 0 3.0% 1 0.0% 0 0.0% 0Less beauty parlours / nail
bars 0.1% 1 1.0% 1 0.0% 0 0.0% 0 0.0% 0 0.0% 0 0.0% 0 0.0% 0 0.0% 0 0.0% 0 0.0% 0
Less beggars / homeless people
0.1% 2 0.0% 0 0.0% 0 0.0% 0 0.0% 0 0.0% 0 0.0% 0 0.0% 0 0.0% 0 0.0% 0 0.0% 0
Less cafes 0.1% 1 1.4% 1 0.0% 0 0.0% 0 0.0% 0 0.0% 0 0.0% 0 0.0% 0 0.0% 0 0.0% 0 0.0% 0Less charity shops 0.0% 1 0.8% 1 0.0% 0 0.0% 0 0.0% 0 0.0% 0 0.0% 0 0.0% 0 0.0% 0 0.0% 0 0.0% 0Less empty shops 0.5% 9 0.8% 1 0.0% 0 0.0% 0 0.0% 0 2.7% 3 0.0% 0 0.0% 0 0.0% 0 0.0% 0 0.0% 0Less estate agents 0.0% 1 0.0% 0 0.0% 0 0.0% 0 0.0% 0 0.0% 0 0.0% 0 0.0% 0 0.0% 0 0.0% 0 0.0% 0Less traffic congestion 4.3% 68 9.7% 8 7.5% 5 5.7% 5 8.6% 4 9.4% 9 1.0% 0 2.8% 1 1.1% 0 8.5% 5 6.3% 2Library 0.2% 2 0.0% 0 0.0% 0 0.0% 0 0.0% 0 0.7% 1 0.0% 0 0.0% 0 0.6% 0 0.0% 0 2.7% 1Marks & Spencer 0.0% 0 0.0% 0 0.0% 0 0.0% 0 0.0% 0 0.0% 0 0.0% 0 0.0% 0 0.0% 0 0.0% 0 0.7% 0McDonald's 0.0% 1 0.8% 1 0.0% 0 0.0% 0 0.0% 0 0.0% 0 0.0% 0 0.0% 0 0.0% 0 0.0% 0 0.0% 0More independent shops 2.8% 44 8.0% 6 1.6% 1 0.0% 0 1.6% 1 3.0% 3 1.6% 0 0.0% 0 0.0% 0 9.2% 5 6.2% 2More traffic lights 0.0% 0 0.0% 0 0.0% 0 0.0% 0 0.0% 0 0.0% 0 0.0% 0 0.0% 0 0.0% 0 0.0% 0 0.0% 0More undercover shopping 0.3% 4 0.0% 0 0.0% 0 0.0% 0 0.7% 0 2.7% 3 1.6% 0 0.0% 0 0.7% 0 0.0% 0 0.0% 0Mothercare 0.1% 2 0.0% 0 0.0% 0 0.0% 0 0.0% 0 0.0% 0 0.0% 0 0.0% 0 0.0% 0 0.0% 0 0.0% 0Next 0.1% 1 0.0% 0 0.0% 0 0.0% 0 0.0% 0 0.0% 0 0.0% 0 0.0% 0 0.0% 0 0.0% 0 0.0% 0Park & Ride 0.3% 5 0.0% 0 0.0% 0 0.0% 0 0.0% 0 2.7% 3 0.0% 0 0.0% 0 0.0% 0 1.6% 1 0.7% 0Petrol station 0.0% 1 0.6% 1 0.0% 0 0.0% 0 0.0% 0 0.0% 0 0.0% 0 0.0% 0 0.0% 0 0.0% 0 0.0% 0Pizza Express 0.0% 0 0.0% 0 0.0% 0 0.0% 0 0.0% 0 0.0% 0 0.0% 0 0.0% 0 0.0% 0 0.0% 0 0.8% 0Primark 0.5% 7 0.0% 0 0.0% 0 0.0% 0 0.0% 0 6.2% 6 0.0% 0 2.6% 1 0.0% 0 0.0% 0 0.0% 0Reduce the cost of Park &
Ride 0.0% 1 0.8% 1 0.0% 0 0.0% 0 0.0% 0 0.0% 0 0.0% 0 0.0% 0 0.0% 0 0.0% 0 0.0% 0
Remove intrusive CCTV 0.0% 1 0.0% 0 0.0% 0 0.0% 0 0.0% 0 0.0% 0 0.0% 0 0.0% 0 0.0% 0 0.0% 0 0.0% 0Remove the bus lanes 0.3% 4 0.0% 0 0.0% 0 0.0% 0 0.0% 0 0.0% 0 0.0% 0 0.0% 0 0.0% 0 0.0% 0 0.0% 0Remove the disabled bays 0.0% 1 0.8% 1 0.0% 0 0.0% 0 0.0% 0 0.0% 0 0.0% 0 0.0% 0 0.0% 0 0.0% 0 0.0% 0Repair the pavements 0.0% 0 0.0% 0 0.0% 0 0.0% 0 0.0% 0 0.0% 0 0.0% 0 0.0% 0 0.0% 0 0.0% 0 0.7% 0Repair the roads 0.2% 3 0.0% 0 0.0% 0 0.0% 0 0.0% 0 0.0% 0 0.0% 0 0.6% 0 0.0% 0 0.0% 0 0.0% 0Restrict number of houses
being built 0.1% 2 0.0% 0 0.0% 0 0.0% 0 0.0% 0 0.0% 0 0.0% 0 0.0% 0 0.0% 0 0.7% 0 0.0% 0
Shops closer together 0.4% 6 0.0% 0 1.2% 1 0.0% 0 0.0% 0 0.0% 0 0.0% 0 0.0% 0 0.0% 0 1.7% 1 0.7% 0Speed up the renovations 0.3% 5 0.0% 0 0.0% 0 0.0% 0 0.0% 0 0.0% 0 0.0% 0 0.0% 0 0.0% 0 0.0% 0 0.0% 0Stop people smoking outside
shops 0.1% 1 0.0% 0 1.2% 1 0.0% 0 0.0% 0 0.0% 0 0.0% 0 0.0% 0 0.0% 0 0.0% 0 0.0% 0
Stop the new development 0.2% 3 1.3% 1 0.0% 0 0.0% 0 0.0% 0 0.0% 0 0.0% 0 0.0% 0 0.0% 0 0.0% 0 0.0% 0
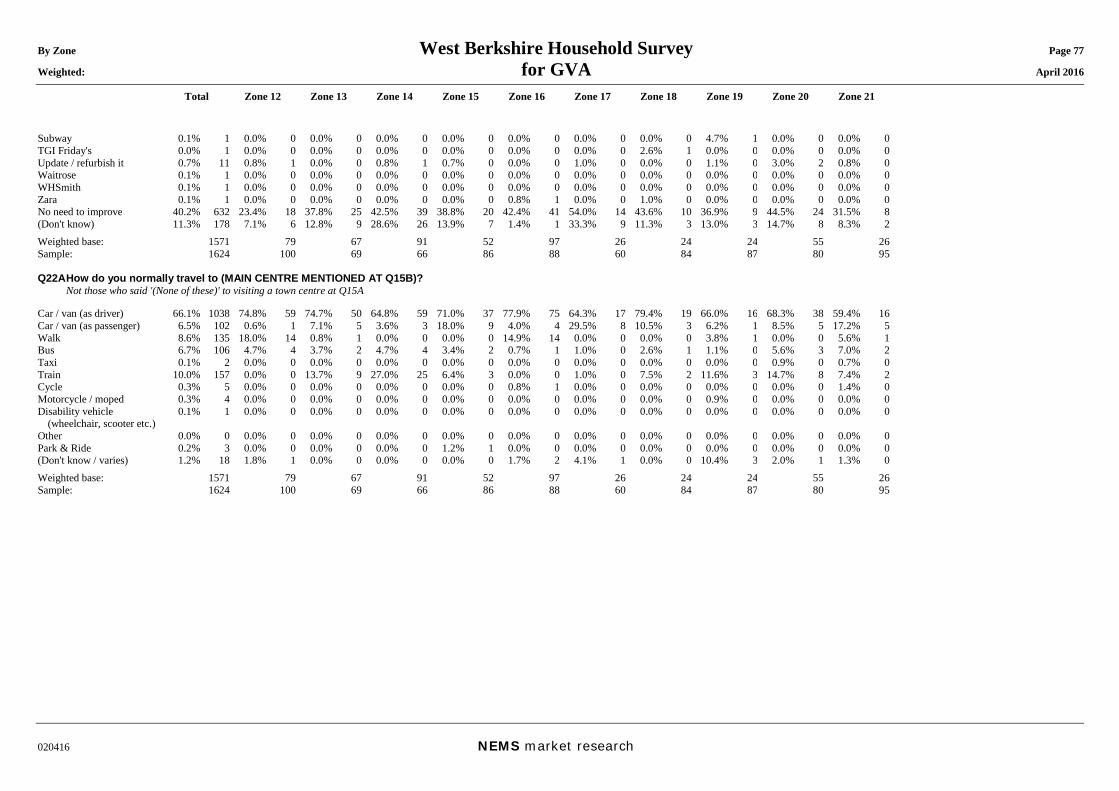
By Zone West Berkshire Household Survey Page 77 Weighted: for GVA April 2016
Total Zone 12 Zone 13 Zone 14 Zone 15 Zone 16 Zone 17 Zone 18 Zone 19 Zone 20 Zone 21
020416 NEMS market research
Subway 0.1% 1 0.0% 0 0.0% 0 0.0% 0 0.0% 0 0.0% 0 0.0% 0 0.0% 0 4.7% 1 0.0% 0 0.0% 0TGI Friday's 0.0% 1 0.0% 0 0.0% 0 0.0% 0 0.0% 0 0.0% 0 0.0% 0 2.6% 1 0.0% 0 0.0% 0 0.0% 0Update / refurbish it 0.7% 11 0.8% 1 0.0% 0 0.8% 1 0.7% 0 0.0% 0 1.0% 0 0.0% 0 1.1% 0 3.0% 2 0.8% 0Waitrose 0.1% 1 0.0% 0 0.0% 0 0.0% 0 0.0% 0 0.0% 0 0.0% 0 0.0% 0 0.0% 0 0.0% 0 0.0% 0WHSmith 0.1% 1 0.0% 0 0.0% 0 0.0% 0 0.0% 0 0.0% 0 0.0% 0 0.0% 0 0.0% 0 0.0% 0 0.0% 0Zara 0.1% 1 0.0% 0 0.0% 0 0.0% 0 0.0% 0 0.8% 1 0.0% 0 1.0% 0 0.0% 0 0.0% 0 0.0% 0No need to improve 40.2% 632 23.4% 18 37.8% 25 42.5% 39 38.8% 20 42.4% 41 54.0% 14 43.6% 10 36.9% 9 44.5% 24 31.5% 8(Don't know) 11.3% 178 7.1% 6 12.8% 9 28.6% 26 13.9% 7 1.4% 1 33.3% 9 11.3% 3 13.0% 3 14.7% 8 8.3% 2Weighted base: 1571 79 67 91 52 97 26 24 24 55 26Sample: 1624 100 69 66 86 88 60 84 87 80 95 Q22A How do you normally travel to (MAIN CENTRE MENTIONED AT Q15B)? Not those who said '(None of these)' to visiting a town centre at Q15A Car / van (as driver) 66.1% 1038 74.8% 59 74.7% 50 64.8% 59 71.0% 37 77.9% 75 64.3% 17 79.4% 19 66.0% 16 68.3% 38 59.4% 16Car / van (as passenger) 6.5% 102 0.6% 1 7.1% 5 3.6% 3 18.0% 9 4.0% 4 29.5% 8 10.5% 3 6.2% 1 8.5% 5 17.2% 5Walk 8.6% 135 18.0% 14 0.8% 1 0.0% 0 0.0% 0 14.9% 14 0.0% 0 0.0% 0 3.8% 1 0.0% 0 5.6% 1Bus 6.7% 106 4.7% 4 3.7% 2 4.7% 4 3.4% 2 0.7% 1 1.0% 0 2.6% 1 1.1% 0 5.6% 3 7.0% 2Taxi 0.1% 2 0.0% 0 0.0% 0 0.0% 0 0.0% 0 0.0% 0 0.0% 0 0.0% 0 0.0% 0 0.9% 0 0.7% 0Train 10.0% 157 0.0% 0 13.7% 9 27.0% 25 6.4% 3 0.0% 0 1.0% 0 7.5% 2 11.6% 3 14.7% 8 7.4% 2Cycle 0.3% 5 0.0% 0 0.0% 0 0.0% 0 0.0% 0 0.8% 1 0.0% 0 0.0% 0 0.0% 0 0.0% 0 1.4% 0Motorcycle / moped 0.3% 4 0.0% 0 0.0% 0 0.0% 0 0.0% 0 0.0% 0 0.0% 0 0.0% 0 0.9% 0 0.0% 0 0.0% 0Disability vehicle
(wheelchair, scooter etc.) 0.1% 1 0.0% 0 0.0% 0 0.0% 0 0.0% 0 0.0% 0 0.0% 0 0.0% 0 0.0% 0 0.0% 0 0.0% 0
Other 0.0% 0 0.0% 0 0.0% 0 0.0% 0 0.0% 0 0.0% 0 0.0% 0 0.0% 0 0.0% 0 0.0% 0 0.0% 0Park & Ride 0.2% 3 0.0% 0 0.0% 0 0.0% 0 1.2% 1 0.0% 0 0.0% 0 0.0% 0 0.0% 0 0.0% 0 0.0% 0(Don't know / varies) 1.2% 18 1.8% 1 0.0% 0 0.0% 0 0.0% 0 1.7% 2 4.1% 1 0.0% 0 10.4% 3 2.0% 1 1.3% 0Weighted base: 1571 79 67 91 52 97 26 24 24 55 26Sample: 1624 100 69 66 86 88 60 84 87 80 95
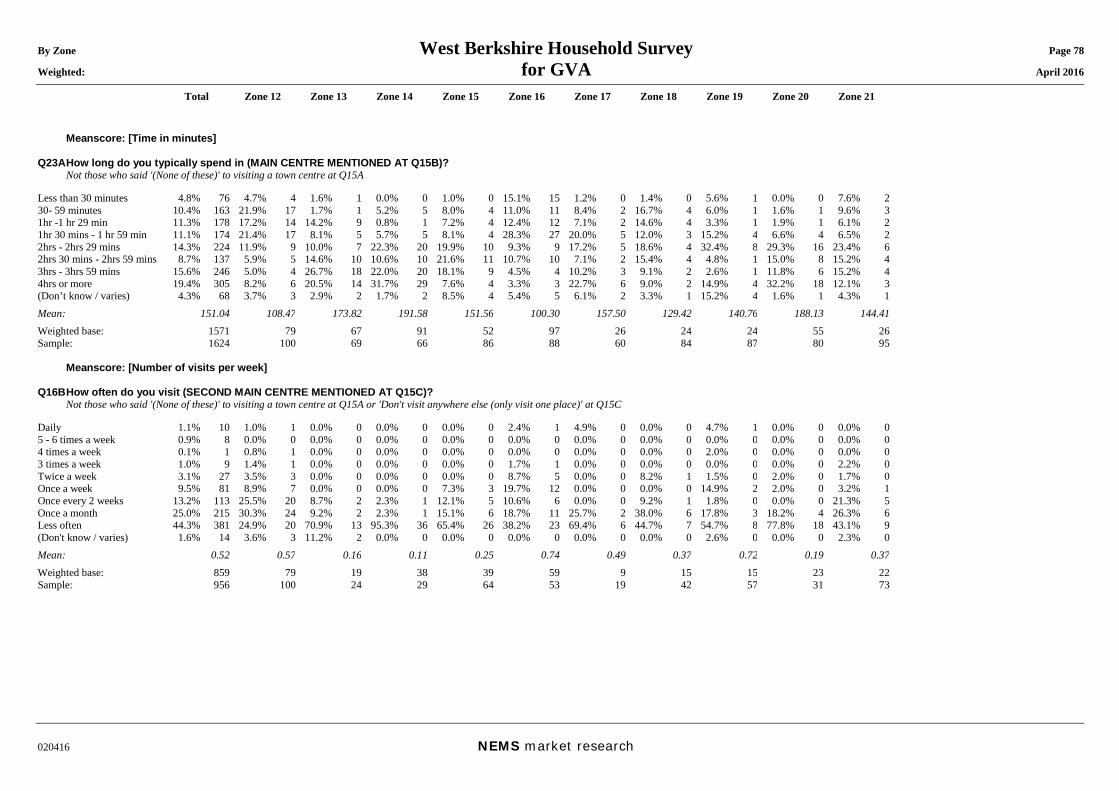
By Zone West Berkshire Household Survey Page 78 Weighted: for GVA April 2016
Total Zone 12 Zone 13 Zone 14 Zone 15 Zone 16 Zone 17 Zone 18 Zone 19 Zone 20 Zone 21
020416 NEMS market research
Meanscore: [Time in minutes] Q23A How long do you typically spend in (MAIN CENTRE MENTIONED AT Q15B)? Not those who said '(None of these)' to visiting a town centre at Q15A Less than 30 minutes 4.8% 76 4.7% 4 1.6% 1 0.0% 0 1.0% 0 15.1% 15 1.2% 0 1.4% 0 5.6% 1 0.0% 0 7.6% 230- 59 minutes 10.4% 163 21.9% 17 1.7% 1 5.2% 5 8.0% 4 11.0% 11 8.4% 2 16.7% 4 6.0% 1 1.6% 1 9.6% 31hr -1 hr 29 min 11.3% 178 17.2% 14 14.2% 9 0.8% 1 7.2% 4 12.4% 12 7.1% 2 14.6% 4 3.3% 1 1.9% 1 6.1% 21hr 30 mins - 1 hr 59 min 11.1% 174 21.4% 17 8.1% 5 5.7% 5 8.1% 4 28.3% 27 20.0% 5 12.0% 3 15.2% 4 6.6% 4 6.5% 22hrs - 2hrs 29 mins 14.3% 224 11.9% 9 10.0% 7 22.3% 20 19.9% 10 9.3% 9 17.2% 5 18.6% 4 32.4% 8 29.3% 16 23.4% 62hrs 30 mins - 2hrs 59 mins 8.7% 137 5.9% 5 14.6% 10 10.6% 10 21.6% 11 10.7% 10 7.1% 2 15.4% 4 4.8% 1 15.0% 8 15.2% 43hrs - 3hrs 59 mins 15.6% 246 5.0% 4 26.7% 18 22.0% 20 18.1% 9 4.5% 4 10.2% 3 9.1% 2 2.6% 1 11.8% 6 15.2% 44hrs or more 19.4% 305 8.2% 6 20.5% 14 31.7% 29 7.6% 4 3.3% 3 22.7% 6 9.0% 2 14.9% 4 32.2% 18 12.1% 3(Don’t know / varies) 4.3% 68 3.7% 3 2.9% 2 1.7% 2 8.5% 4 5.4% 5 6.1% 2 3.3% 1 15.2% 4 1.6% 1 4.3% 1Mean: 151.04 108.47 173.82 191.58 151.56 100.30 157.50 129.42 140.76 188.13 144.41Weighted base: 1571 79 67 91 52 97 26 24 24 55 26Sample: 1624 100 69 66 86 88 60 84 87 80 95 Meanscore: [Number of visits per week] Q16B How often do you visit (SECOND MAIN CENTRE MENTIONED AT Q15C)? Not those who said '(None of these)' to visiting a town centre at Q15A or 'Don't visit anywhere else (only visit one place)' at Q15C Daily 1.1% 10 1.0% 1 0.0% 0 0.0% 0 0.0% 0 2.4% 1 4.9% 0 0.0% 0 4.7% 1 0.0% 0 0.0% 05 - 6 times a week 0.9% 8 0.0% 0 0.0% 0 0.0% 0 0.0% 0 0.0% 0 0.0% 0 0.0% 0 0.0% 0 0.0% 0 0.0% 04 times a week 0.1% 1 0.8% 1 0.0% 0 0.0% 0 0.0% 0 0.0% 0 0.0% 0 0.0% 0 2.0% 0 0.0% 0 0.0% 03 times a week 1.0% 9 1.4% 1 0.0% 0 0.0% 0 0.0% 0 1.7% 1 0.0% 0 0.0% 0 0.0% 0 0.0% 0 2.2% 0Twice a week 3.1% 27 3.5% 3 0.0% 0 0.0% 0 0.0% 0 8.7% 5 0.0% 0 8.2% 1 1.5% 0 2.0% 0 1.7% 0Once a week 9.5% 81 8.9% 7 0.0% 0 0.0% 0 7.3% 3 19.7% 12 0.0% 0 0.0% 0 14.9% 2 2.0% 0 3.2% 1Once every 2 weeks 13.2% 113 25.5% 20 8.7% 2 2.3% 1 12.1% 5 10.6% 6 0.0% 0 9.2% 1 1.8% 0 0.0% 0 21.3% 5Once a month 25.0% 215 30.3% 24 9.2% 2 2.3% 1 15.1% 6 18.7% 11 25.7% 2 38.0% 6 17.8% 3 18.2% 4 26.3% 6Less often 44.3% 381 24.9% 20 70.9% 13 95.3% 36 65.4% 26 38.2% 23 69.4% 6 44.7% 7 54.7% 8 77.8% 18 43.1% 9(Don't know / varies) 1.6% 14 3.6% 3 11.2% 2 0.0% 0 0.0% 0 0.0% 0 0.0% 0 0.0% 0 2.6% 0 0.0% 0 2.3% 0Mean: 0.52 0.57 0.16 0.11 0.25 0.74 0.49 0.37 0.72 0.19 0.37Weighted base: 859 79 19 38 39 59 9 15 15 23 22Sample: 956 100 24 29 64 53 19 42 57 31 73
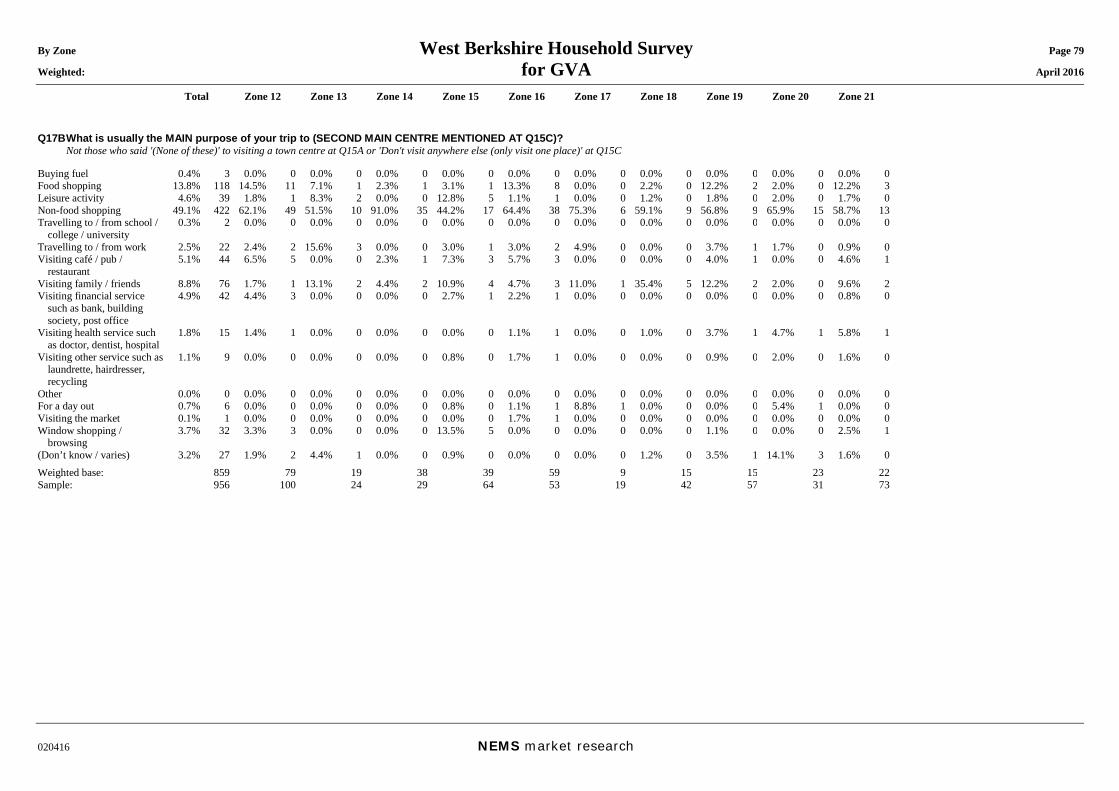
By Zone West Berkshire Household Survey Page 79 Weighted: for GVA April 2016
Total Zone 12 Zone 13 Zone 14 Zone 15 Zone 16 Zone 17 Zone 18 Zone 19 Zone 20 Zone 21
020416 NEMS market research
Q17B What is usually the MAIN purpose of your trip to (SECOND MAIN CENTRE MENTIONED AT Q15C)? Not those who said '(None of these)' to visiting a town centre at Q15A or 'Don't visit anywhere else (only visit one place)' at Q15C Buying fuel 0.4% 3 0.0% 0 0.0% 0 0.0% 0 0.0% 0 0.0% 0 0.0% 0 0.0% 0 0.0% 0 0.0% 0 0.0% 0Food shopping 13.8% 118 14.5% 11 7.1% 1 2.3% 1 3.1% 1 13.3% 8 0.0% 0 2.2% 0 12.2% 2 2.0% 0 12.2% 3Leisure activity 4.6% 39 1.8% 1 8.3% 2 0.0% 0 12.8% 5 1.1% 1 0.0% 0 1.2% 0 1.8% 0 2.0% 0 1.7% 0Non-food shopping 49.1% 422 62.1% 49 51.5% 10 91.0% 35 44.2% 17 64.4% 38 75.3% 6 59.1% 9 56.8% 9 65.9% 15 58.7% 13Travelling to / from school /
college / university 0.3% 2 0.0% 0 0.0% 0 0.0% 0 0.0% 0 0.0% 0 0.0% 0 0.0% 0 0.0% 0 0.0% 0 0.0% 0
Travelling to / from work 2.5% 22 2.4% 2 15.6% 3 0.0% 0 3.0% 1 3.0% 2 4.9% 0 0.0% 0 3.7% 1 1.7% 0 0.9% 0Visiting café / pub /
restaurant 5.1% 44 6.5% 5 0.0% 0 2.3% 1 7.3% 3 5.7% 3 0.0% 0 0.0% 0 4.0% 1 0.0% 0 4.6% 1
Visiting family / friends 8.8% 76 1.7% 1 13.1% 2 4.4% 2 10.9% 4 4.7% 3 11.0% 1 35.4% 5 12.2% 2 2.0% 0 9.6% 2Visiting financial service
such as bank, building society, post office
4.9% 42 4.4% 3 0.0% 0 0.0% 0 2.7% 1 2.2% 1 0.0% 0 0.0% 0 0.0% 0 0.0% 0 0.8% 0
Visiting health service such as doctor, dentist, hospital
1.8% 15 1.4% 1 0.0% 0 0.0% 0 0.0% 0 1.1% 1 0.0% 0 1.0% 0 3.7% 1 4.7% 1 5.8% 1
Visiting other service such as laundrette, hairdresser, recycling
1.1% 9 0.0% 0 0.0% 0 0.0% 0 0.8% 0 1.7% 1 0.0% 0 0.0% 0 0.9% 0 2.0% 0 1.6% 0
Other 0.0% 0 0.0% 0 0.0% 0 0.0% 0 0.0% 0 0.0% 0 0.0% 0 0.0% 0 0.0% 0 0.0% 0 0.0% 0For a day out 0.7% 6 0.0% 0 0.0% 0 0.0% 0 0.8% 0 1.1% 1 8.8% 1 0.0% 0 0.0% 0 5.4% 1 0.0% 0Visiting the market 0.1% 1 0.0% 0 0.0% 0 0.0% 0 0.0% 0 1.7% 1 0.0% 0 0.0% 0 0.0% 0 0.0% 0 0.0% 0Window shopping /
browsing 3.7% 32 3.3% 3 0.0% 0 0.0% 0 13.5% 5 0.0% 0 0.0% 0 0.0% 0 1.1% 0 0.0% 0 2.5% 1
(Don’t know / varies) 3.2% 27 1.9% 2 4.4% 1 0.0% 0 0.9% 0 0.0% 0 0.0% 0 1.2% 0 3.5% 1 14.1% 3 1.6% 0Weighted base: 859 79 19 38 39 59 9 15 15 23 22Sample: 956 100 24 29 64 53 19 42 57 31 73
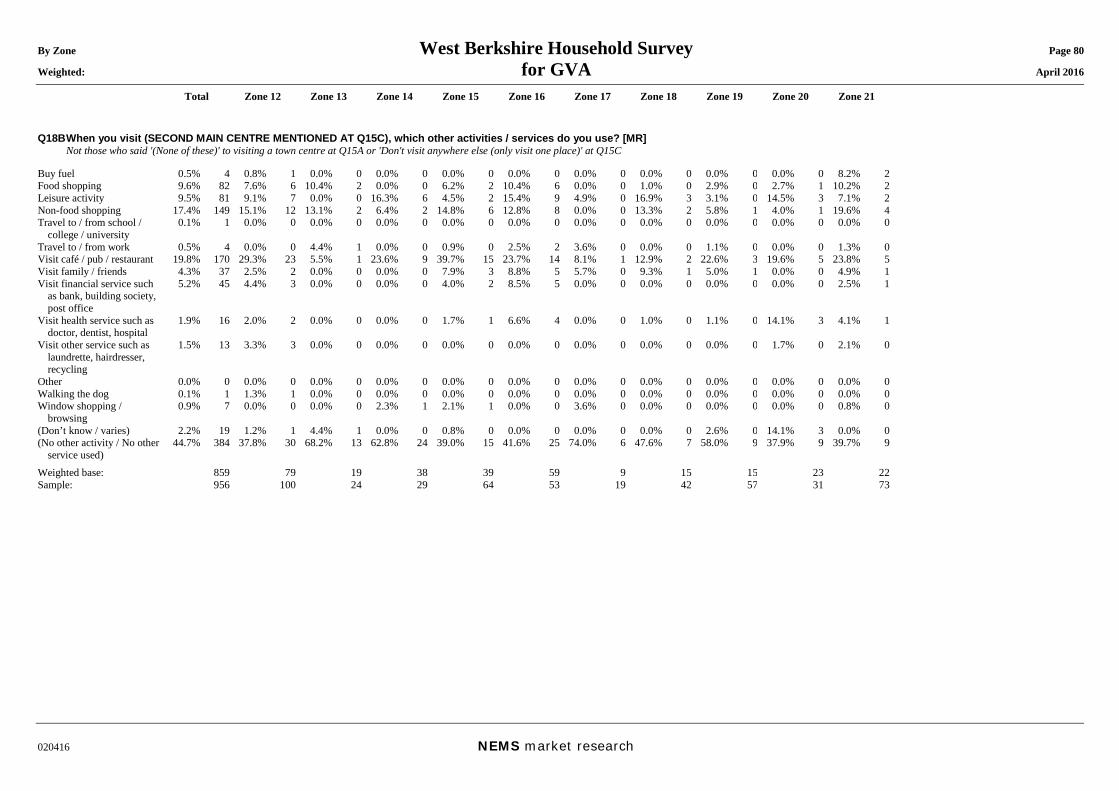
By Zone West Berkshire Household Survey Page 80 Weighted: for GVA April 2016
Total Zone 12 Zone 13 Zone 14 Zone 15 Zone 16 Zone 17 Zone 18 Zone 19 Zone 20 Zone 21
020416 NEMS market research
Q18B When you visit (SECOND MAIN CENTRE MENTIONED AT Q15C), which other activities / services do you use? [MR] Not those who said '(None of these)' to visiting a town centre at Q15A or 'Don't visit anywhere else (only visit one place)' at Q15C Buy fuel 0.5% 4 0.8% 1 0.0% 0 0.0% 0 0.0% 0 0.0% 0 0.0% 0 0.0% 0 0.0% 0 0.0% 0 8.2% 2Food shopping 9.6% 82 7.6% 6 10.4% 2 0.0% 0 6.2% 2 10.4% 6 0.0% 0 1.0% 0 2.9% 0 2.7% 1 10.2% 2Leisure activity 9.5% 81 9.1% 7 0.0% 0 16.3% 6 4.5% 2 15.4% 9 4.9% 0 16.9% 3 3.1% 0 14.5% 3 7.1% 2Non-food shopping 17.4% 149 15.1% 12 13.1% 2 6.4% 2 14.8% 6 12.8% 8 0.0% 0 13.3% 2 5.8% 1 4.0% 1 19.6% 4Travel to / from school /
college / university 0.1% 1 0.0% 0 0.0% 0 0.0% 0 0.0% 0 0.0% 0 0.0% 0 0.0% 0 0.0% 0 0.0% 0 0.0% 0
Travel to / from work 0.5% 4 0.0% 0 4.4% 1 0.0% 0 0.9% 0 2.5% 2 3.6% 0 0.0% 0 1.1% 0 0.0% 0 1.3% 0Visit café / pub / restaurant 19.8% 170 29.3% 23 5.5% 1 23.6% 9 39.7% 15 23.7% 14 8.1% 1 12.9% 2 22.6% 3 19.6% 5 23.8% 5Visit family / friends 4.3% 37 2.5% 2 0.0% 0 0.0% 0 7.9% 3 8.8% 5 5.7% 0 9.3% 1 5.0% 1 0.0% 0 4.9% 1Visit financial service such
as bank, building society, post office
5.2% 45 4.4% 3 0.0% 0 0.0% 0 4.0% 2 8.5% 5 0.0% 0 0.0% 0 0.0% 0 0.0% 0 2.5% 1
Visit health service such as doctor, dentist, hospital
1.9% 16 2.0% 2 0.0% 0 0.0% 0 1.7% 1 6.6% 4 0.0% 0 1.0% 0 1.1% 0 14.1% 3 4.1% 1
Visit other service such as laundrette, hairdresser, recycling
1.5% 13 3.3% 3 0.0% 0 0.0% 0 0.0% 0 0.0% 0 0.0% 0 0.0% 0 0.0% 0 1.7% 0 2.1% 0
Other 0.0% 0 0.0% 0 0.0% 0 0.0% 0 0.0% 0 0.0% 0 0.0% 0 0.0% 0 0.0% 0 0.0% 0 0.0% 0Walking the dog 0.1% 1 1.3% 1 0.0% 0 0.0% 0 0.0% 0 0.0% 0 0.0% 0 0.0% 0 0.0% 0 0.0% 0 0.0% 0Window shopping /
browsing 0.9% 7 0.0% 0 0.0% 0 2.3% 1 2.1% 1 0.0% 0 3.6% 0 0.0% 0 0.0% 0 0.0% 0 0.8% 0
(Don’t know / varies) 2.2% 19 1.2% 1 4.4% 1 0.0% 0 0.8% 0 0.0% 0 0.0% 0 0.0% 0 2.6% 0 14.1% 3 0.0% 0(No other activity / No other
service used) 44.7% 384 37.8% 30 68.2% 13 62.8% 24 39.0% 15 41.6% 25 74.0% 6 47.6% 7 58.0% 9 37.9% 9 39.7% 9
Weighted base: 859 79 19 38 39 59 9 15 15 23 22Sample: 956 100 24 29 64 53 19 42 57 31 73
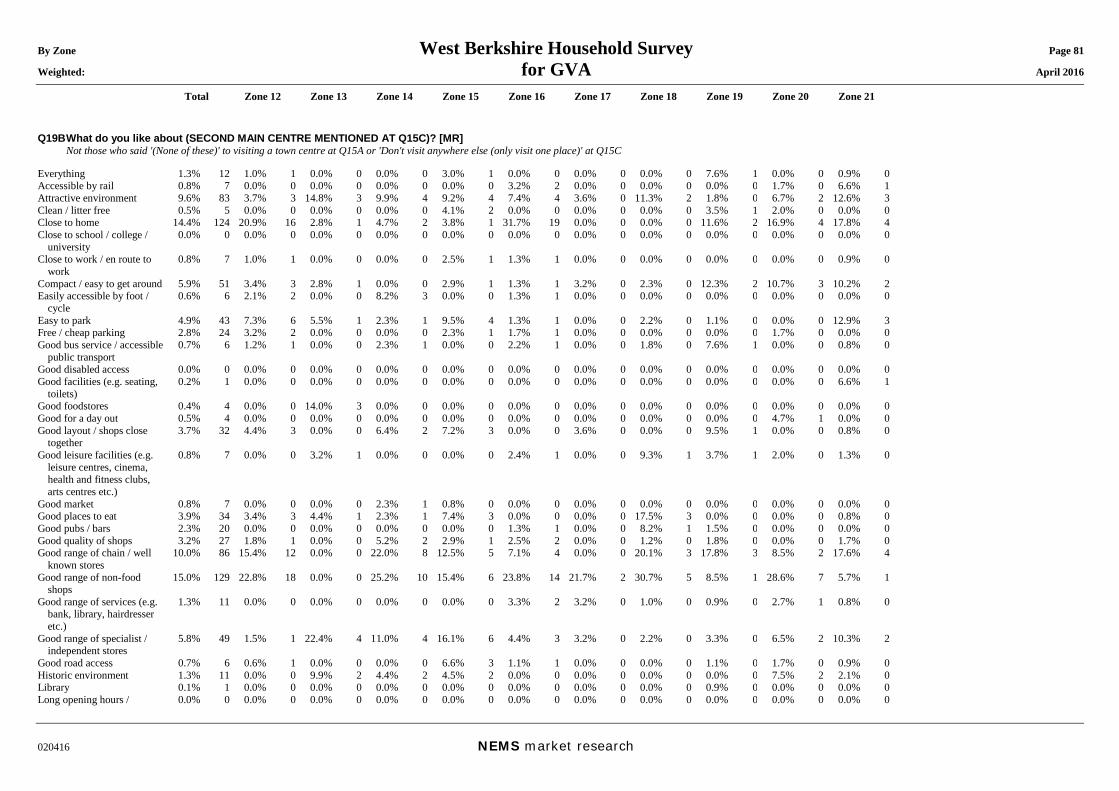
By Zone West Berkshire Household Survey Page 81 Weighted: for GVA April 2016
Total Zone 12 Zone 13 Zone 14 Zone 15 Zone 16 Zone 17 Zone 18 Zone 19 Zone 20 Zone 21
020416 NEMS market research
Q19B What do you like about (SECOND MAIN CENTRE MENTIONED AT Q15C)? [MR] Not those who said '(None of these)' to visiting a town centre at Q15A or 'Don't visit anywhere else (only visit one place)' at Q15C Everything 1.3% 12 1.0% 1 0.0% 0 0.0% 0 3.0% 1 0.0% 0 0.0% 0 0.0% 0 7.6% 1 0.0% 0 0.9% 0Accessible by rail 0.8% 7 0.0% 0 0.0% 0 0.0% 0 0.0% 0 3.2% 2 0.0% 0 0.0% 0 0.0% 0 1.7% 0 6.6% 1Attractive environment 9.6% 83 3.7% 3 14.8% 3 9.9% 4 9.2% 4 7.4% 4 3.6% 0 11.3% 2 1.8% 0 6.7% 2 12.6% 3Clean / litter free 0.5% 5 0.0% 0 0.0% 0 0.0% 0 4.1% 2 0.0% 0 0.0% 0 0.0% 0 3.5% 1 2.0% 0 0.0% 0Close to home 14.4% 124 20.9% 16 2.8% 1 4.7% 2 3.8% 1 31.7% 19 0.0% 0 0.0% 0 11.6% 2 16.9% 4 17.8% 4Close to school / college /
university 0.0% 0 0.0% 0 0.0% 0 0.0% 0 0.0% 0 0.0% 0 0.0% 0 0.0% 0 0.0% 0 0.0% 0 0.0% 0
Close to work / en route to work
0.8% 7 1.0% 1 0.0% 0 0.0% 0 2.5% 1 1.3% 1 0.0% 0 0.0% 0 0.0% 0 0.0% 0 0.9% 0
Compact / easy to get around 5.9% 51 3.4% 3 2.8% 1 0.0% 0 2.9% 1 1.3% 1 3.2% 0 2.3% 0 12.3% 2 10.7% 3 10.2% 2Easily accessible by foot /
cycle 0.6% 6 2.1% 2 0.0% 0 8.2% 3 0.0% 0 1.3% 1 0.0% 0 0.0% 0 0.0% 0 0.0% 0 0.0% 0
Easy to park 4.9% 43 7.3% 6 5.5% 1 2.3% 1 9.5% 4 1.3% 1 0.0% 0 2.2% 0 1.1% 0 0.0% 0 12.9% 3Free / cheap parking 2.8% 24 3.2% 2 0.0% 0 0.0% 0 2.3% 1 1.7% 1 0.0% 0 0.0% 0 0.0% 0 1.7% 0 0.0% 0Good bus service / accessible
public transport 0.7% 6 1.2% 1 0.0% 0 2.3% 1 0.0% 0 2.2% 1 0.0% 0 1.8% 0 7.6% 1 0.0% 0 0.8% 0
Good disabled access 0.0% 0 0.0% 0 0.0% 0 0.0% 0 0.0% 0 0.0% 0 0.0% 0 0.0% 0 0.0% 0 0.0% 0 0.0% 0Good facilities (e.g. seating,
toilets) 0.2% 1 0.0% 0 0.0% 0 0.0% 0 0.0% 0 0.0% 0 0.0% 0 0.0% 0 0.0% 0 0.0% 0 6.6% 1
Good foodstores 0.4% 4 0.0% 0 14.0% 3 0.0% 0 0.0% 0 0.0% 0 0.0% 0 0.0% 0 0.0% 0 0.0% 0 0.0% 0Good for a day out 0.5% 4 0.0% 0 0.0% 0 0.0% 0 0.0% 0 0.0% 0 0.0% 0 0.0% 0 0.0% 0 4.7% 1 0.0% 0Good layout / shops close
together 3.7% 32 4.4% 3 0.0% 0 6.4% 2 7.2% 3 0.0% 0 3.6% 0 0.0% 0 9.5% 1 0.0% 0 0.8% 0
Good leisure facilities (e.g. leisure centres, cinema, health and fitness clubs, arts centres etc.)
0.8% 7 0.0% 0 3.2% 1 0.0% 0 0.0% 0 2.4% 1 0.0% 0 9.3% 1 3.7% 1 2.0% 0 1.3% 0
Good market 0.8% 7 0.0% 0 0.0% 0 2.3% 1 0.8% 0 0.0% 0 0.0% 0 0.0% 0 0.0% 0 0.0% 0 0.0% 0Good places to eat 3.9% 34 3.4% 3 4.4% 1 2.3% 1 7.4% 3 0.0% 0 0.0% 0 17.5% 3 0.0% 0 0.0% 0 0.8% 0Good pubs / bars 2.3% 20 0.0% 0 0.0% 0 0.0% 0 0.0% 0 1.3% 1 0.0% 0 8.2% 1 1.5% 0 0.0% 0 0.0% 0Good quality of shops 3.2% 27 1.8% 1 0.0% 0 5.2% 2 2.9% 1 2.5% 2 0.0% 0 1.2% 0 1.8% 0 0.0% 0 1.7% 0Good range of chain / well
known stores 10.0% 86 15.4% 12 0.0% 0 22.0% 8 12.5% 5 7.1% 4 0.0% 0 20.1% 3 17.8% 3 8.5% 2 17.6% 4
Good range of non-food shops
15.0% 129 22.8% 18 0.0% 0 25.2% 10 15.4% 6 23.8% 14 21.7% 2 30.7% 5 8.5% 1 28.6% 7 5.7% 1
Good range of services (e.g. bank, library, hairdresser etc.)
1.3% 11 0.0% 0 0.0% 0 0.0% 0 0.0% 0 3.3% 2 3.2% 0 1.0% 0 0.9% 0 2.7% 1 0.8% 0
Good range of specialist / independent stores
5.8% 49 1.5% 1 22.4% 4 11.0% 4 16.1% 6 4.4% 3 3.2% 0 2.2% 0 3.3% 0 6.5% 2 10.3% 2
Good road access 0.7% 6 0.6% 1 0.0% 0 0.0% 0 6.6% 3 1.1% 1 0.0% 0 0.0% 0 1.1% 0 1.7% 0 0.9% 0Historic environment 1.3% 11 0.0% 0 9.9% 2 4.4% 2 4.5% 2 0.0% 0 0.0% 0 0.0% 0 0.0% 0 7.5% 2 2.1% 0Library 0.1% 1 0.0% 0 0.0% 0 0.0% 0 0.0% 0 0.0% 0 0.0% 0 0.0% 0 0.9% 0 0.0% 0 0.0% 0Long opening hours / 0.0% 0 0.0% 0 0.0% 0 0.0% 0 0.0% 0 0.0% 0 0.0% 0 0.0% 0 0.0% 0 0.0% 0 0.0% 0
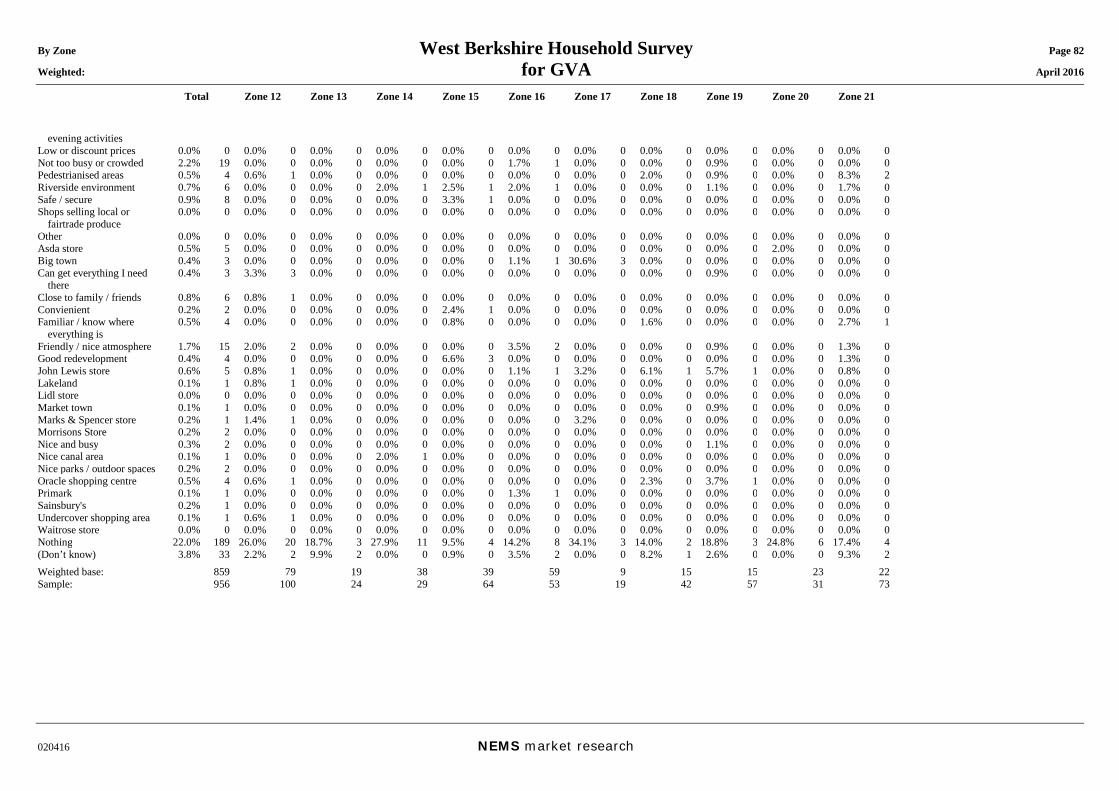
By Zone West Berkshire Household Survey Page 82 Weighted: for GVA April 2016
Total Zone 12 Zone 13 Zone 14 Zone 15 Zone 16 Zone 17 Zone 18 Zone 19 Zone 20 Zone 21
020416 NEMS market research
evening activities Low or discount prices 0.0% 0 0.0% 0 0.0% 0 0.0% 0 0.0% 0 0.0% 0 0.0% 0 0.0% 0 0.0% 0 0.0% 0 0.0% 0Not too busy or crowded 2.2% 19 0.0% 0 0.0% 0 0.0% 0 0.0% 0 1.7% 1 0.0% 0 0.0% 0 0.9% 0 0.0% 0 0.0% 0Pedestrianised areas 0.5% 4 0.6% 1 0.0% 0 0.0% 0 0.0% 0 0.0% 0 0.0% 0 2.0% 0 0.9% 0 0.0% 0 8.3% 2Riverside environment 0.7% 6 0.0% 0 0.0% 0 2.0% 1 2.5% 1 2.0% 1 0.0% 0 0.0% 0 1.1% 0 0.0% 0 1.7% 0Safe / secure 0.9% 8 0.0% 0 0.0% 0 0.0% 0 3.3% 1 0.0% 0 0.0% 0 0.0% 0 0.0% 0 0.0% 0 0.0% 0Shops selling local or
fairtrade produce 0.0% 0 0.0% 0 0.0% 0 0.0% 0 0.0% 0 0.0% 0 0.0% 0 0.0% 0 0.0% 0 0.0% 0 0.0% 0
Other 0.0% 0 0.0% 0 0.0% 0 0.0% 0 0.0% 0 0.0% 0 0.0% 0 0.0% 0 0.0% 0 0.0% 0 0.0% 0Asda store 0.5% 5 0.0% 0 0.0% 0 0.0% 0 0.0% 0 0.0% 0 0.0% 0 0.0% 0 0.0% 0 2.0% 0 0.0% 0Big town 0.4% 3 0.0% 0 0.0% 0 0.0% 0 0.0% 0 1.1% 1 30.6% 3 0.0% 0 0.0% 0 0.0% 0 0.0% 0Can get everything I need
there 0.4% 3 3.3% 3 0.0% 0 0.0% 0 0.0% 0 0.0% 0 0.0% 0 0.0% 0 0.9% 0 0.0% 0 0.0% 0
Close to family / friends 0.8% 6 0.8% 1 0.0% 0 0.0% 0 0.0% 0 0.0% 0 0.0% 0 0.0% 0 0.0% 0 0.0% 0 0.0% 0Convienient 0.2% 2 0.0% 0 0.0% 0 0.0% 0 2.4% 1 0.0% 0 0.0% 0 0.0% 0 0.0% 0 0.0% 0 0.0% 0Familiar / know where
everything is 0.5% 4 0.0% 0 0.0% 0 0.0% 0 0.8% 0 0.0% 0 0.0% 0 1.6% 0 0.0% 0 0.0% 0 2.7% 1
Friendly / nice atmosphere 1.7% 15 2.0% 2 0.0% 0 0.0% 0 0.0% 0 3.5% 2 0.0% 0 0.0% 0 0.9% 0 0.0% 0 1.3% 0Good redevelopment 0.4% 4 0.0% 0 0.0% 0 0.0% 0 6.6% 3 0.0% 0 0.0% 0 0.0% 0 0.0% 0 0.0% 0 1.3% 0John Lewis store 0.6% 5 0.8% 1 0.0% 0 0.0% 0 0.0% 0 1.1% 1 3.2% 0 6.1% 1 5.7% 1 0.0% 0 0.8% 0Lakeland 0.1% 1 0.8% 1 0.0% 0 0.0% 0 0.0% 0 0.0% 0 0.0% 0 0.0% 0 0.0% 0 0.0% 0 0.0% 0Lidl store 0.0% 0 0.0% 0 0.0% 0 0.0% 0 0.0% 0 0.0% 0 0.0% 0 0.0% 0 0.0% 0 0.0% 0 0.0% 0Market town 0.1% 1 0.0% 0 0.0% 0 0.0% 0 0.0% 0 0.0% 0 0.0% 0 0.0% 0 0.9% 0 0.0% 0 0.0% 0Marks & Spencer store 0.2% 1 1.4% 1 0.0% 0 0.0% 0 0.0% 0 0.0% 0 3.2% 0 0.0% 0 0.0% 0 0.0% 0 0.0% 0Morrisons Store 0.2% 2 0.0% 0 0.0% 0 0.0% 0 0.0% 0 0.0% 0 0.0% 0 0.0% 0 0.0% 0 0.0% 0 0.0% 0Nice and busy 0.3% 2 0.0% 0 0.0% 0 0.0% 0 0.0% 0 0.0% 0 0.0% 0 0.0% 0 1.1% 0 0.0% 0 0.0% 0Nice canal area 0.1% 1 0.0% 0 0.0% 0 2.0% 1 0.0% 0 0.0% 0 0.0% 0 0.0% 0 0.0% 0 0.0% 0 0.0% 0Nice parks / outdoor spaces 0.2% 2 0.0% 0 0.0% 0 0.0% 0 0.0% 0 0.0% 0 0.0% 0 0.0% 0 0.0% 0 0.0% 0 0.0% 0Oracle shopping centre 0.5% 4 0.6% 1 0.0% 0 0.0% 0 0.0% 0 0.0% 0 0.0% 0 2.3% 0 3.7% 1 0.0% 0 0.0% 0Primark 0.1% 1 0.0% 0 0.0% 0 0.0% 0 0.0% 0 1.3% 1 0.0% 0 0.0% 0 0.0% 0 0.0% 0 0.0% 0Sainsbury's 0.2% 1 0.0% 0 0.0% 0 0.0% 0 0.0% 0 0.0% 0 0.0% 0 0.0% 0 0.0% 0 0.0% 0 0.0% 0Undercover shopping area 0.1% 1 0.6% 1 0.0% 0 0.0% 0 0.0% 0 0.0% 0 0.0% 0 0.0% 0 0.0% 0 0.0% 0 0.0% 0Waitrose store 0.0% 0 0.0% 0 0.0% 0 0.0% 0 0.0% 0 0.0% 0 0.0% 0 0.0% 0 0.0% 0 0.0% 0 0.0% 0Nothing 22.0% 189 26.0% 20 18.7% 3 27.9% 11 9.5% 4 14.2% 8 34.1% 3 14.0% 2 18.8% 3 24.8% 6 17.4% 4(Don’t know) 3.8% 33 2.2% 2 9.9% 2 0.0% 0 0.9% 0 3.5% 2 0.0% 0 8.2% 1 2.6% 0 0.0% 0 9.3% 2Weighted base: 859 79 19 38 39 59 9 15 15 23 22Sample: 956 100 24 29 64 53 19 42 57 31 73
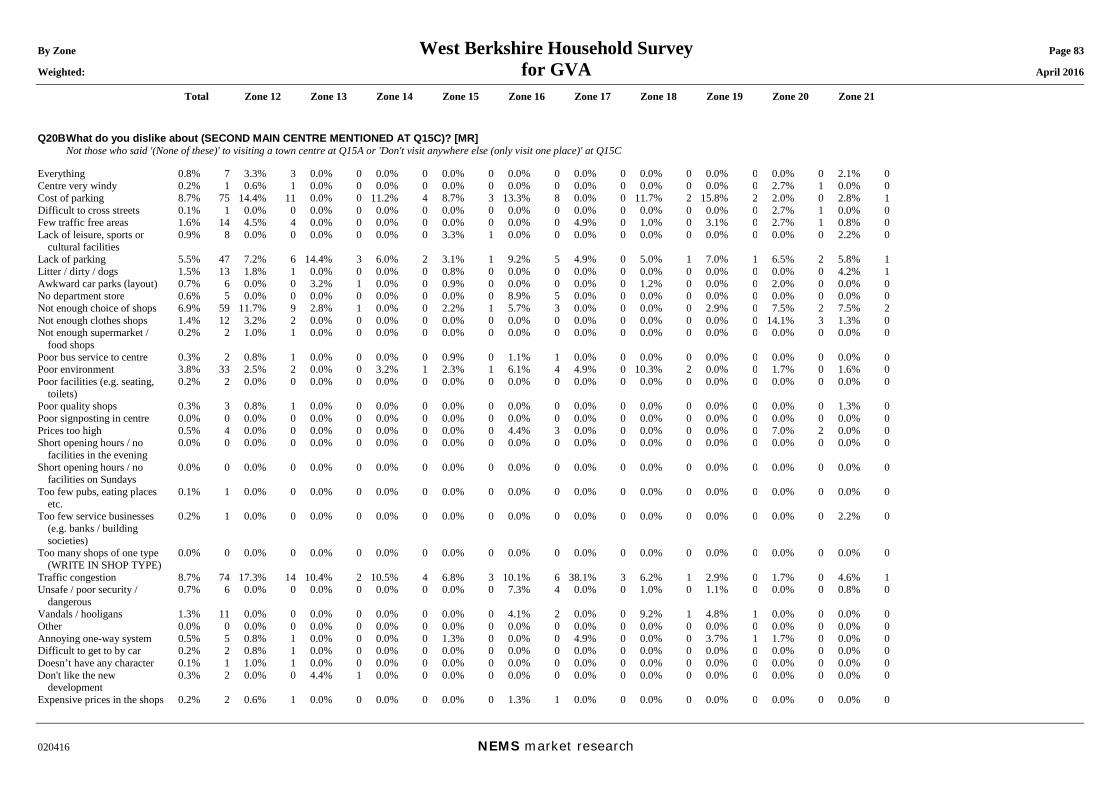
By Zone West Berkshire Household Survey Page 83 Weighted: for GVA April 2016
Total Zone 12 Zone 13 Zone 14 Zone 15 Zone 16 Zone 17 Zone 18 Zone 19 Zone 20 Zone 21
020416 NEMS market research
Q20B What do you dislike about (SECOND MAIN CENTRE MENTIONED AT Q15C)? [MR] Not those who said '(None of these)' to visiting a town centre at Q15A or 'Don't visit anywhere else (only visit one place)' at Q15C Everything 0.8% 7 3.3% 3 0.0% 0 0.0% 0 0.0% 0 0.0% 0 0.0% 0 0.0% 0 0.0% 0 0.0% 0 2.1% 0Centre very windy 0.2% 1 0.6% 1 0.0% 0 0.0% 0 0.0% 0 0.0% 0 0.0% 0 0.0% 0 0.0% 0 2.7% 1 0.0% 0Cost of parking 8.7% 75 14.4% 11 0.0% 0 11.2% 4 8.7% 3 13.3% 8 0.0% 0 11.7% 2 15.8% 2 2.0% 0 2.8% 1Difficult to cross streets 0.1% 1 0.0% 0 0.0% 0 0.0% 0 0.0% 0 0.0% 0 0.0% 0 0.0% 0 0.0% 0 2.7% 1 0.0% 0Few traffic free areas 1.6% 14 4.5% 4 0.0% 0 0.0% 0 0.0% 0 0.0% 0 4.9% 0 1.0% 0 3.1% 0 2.7% 1 0.8% 0Lack of leisure, sports or
cultural facilities 0.9% 8 0.0% 0 0.0% 0 0.0% 0 3.3% 1 0.0% 0 0.0% 0 0.0% 0 0.0% 0 0.0% 0 2.2% 0
Lack of parking 5.5% 47 7.2% 6 14.4% 3 6.0% 2 3.1% 1 9.2% 5 4.9% 0 5.0% 1 7.0% 1 6.5% 2 5.8% 1Litter / dirty / dogs 1.5% 13 1.8% 1 0.0% 0 0.0% 0 0.8% 0 0.0% 0 0.0% 0 0.0% 0 0.0% 0 0.0% 0 4.2% 1Awkward car parks (layout) 0.7% 6 0.0% 0 3.2% 1 0.0% 0 0.9% 0 0.0% 0 0.0% 0 1.2% 0 0.0% 0 2.0% 0 0.0% 0No department store 0.6% 5 0.0% 0 0.0% 0 0.0% 0 0.0% 0 8.9% 5 0.0% 0 0.0% 0 0.0% 0 0.0% 0 0.0% 0Not enough choice of shops 6.9% 59 11.7% 9 2.8% 1 0.0% 0 2.2% 1 5.7% 3 0.0% 0 0.0% 0 2.9% 0 7.5% 2 7.5% 2Not enough clothes shops 1.4% 12 3.2% 2 0.0% 0 0.0% 0 0.0% 0 0.0% 0 0.0% 0 0.0% 0 0.0% 0 14.1% 3 1.3% 0Not enough supermarket /
food shops 0.2% 2 1.0% 1 0.0% 0 0.0% 0 0.0% 0 0.0% 0 0.0% 0 0.0% 0 0.0% 0 0.0% 0 0.0% 0
Poor bus service to centre 0.3% 2 0.8% 1 0.0% 0 0.0% 0 0.9% 0 1.1% 1 0.0% 0 0.0% 0 0.0% 0 0.0% 0 0.0% 0Poor environment 3.8% 33 2.5% 2 0.0% 0 3.2% 1 2.3% 1 6.1% 4 4.9% 0 10.3% 2 0.0% 0 1.7% 0 1.6% 0Poor facilities (e.g. seating,
toilets) 0.2% 2 0.0% 0 0.0% 0 0.0% 0 0.0% 0 0.0% 0 0.0% 0 0.0% 0 0.0% 0 0.0% 0 0.0% 0
Poor quality shops 0.3% 3 0.8% 1 0.0% 0 0.0% 0 0.0% 0 0.0% 0 0.0% 0 0.0% 0 0.0% 0 0.0% 0 1.3% 0Poor signposting in centre 0.0% 0 0.0% 0 0.0% 0 0.0% 0 0.0% 0 0.0% 0 0.0% 0 0.0% 0 0.0% 0 0.0% 0 0.0% 0Prices too high 0.5% 4 0.0% 0 0.0% 0 0.0% 0 0.0% 0 4.4% 3 0.0% 0 0.0% 0 0.0% 0 7.0% 2 0.0% 0Short opening hours / no
facilities in the evening 0.0% 0 0.0% 0 0.0% 0 0.0% 0 0.0% 0 0.0% 0 0.0% 0 0.0% 0 0.0% 0 0.0% 0 0.0% 0
Short opening hours / no facilities on Sundays
0.0% 0 0.0% 0 0.0% 0 0.0% 0 0.0% 0 0.0% 0 0.0% 0 0.0% 0 0.0% 0 0.0% 0 0.0% 0
Too few pubs, eating places etc.
0.1% 1 0.0% 0 0.0% 0 0.0% 0 0.0% 0 0.0% 0 0.0% 0 0.0% 0 0.0% 0 0.0% 0 0.0% 0
Too few service businesses (e.g. banks / building societies)
0.2% 1 0.0% 0 0.0% 0 0.0% 0 0.0% 0 0.0% 0 0.0% 0 0.0% 0 0.0% 0 0.0% 0 2.2% 0
Too many shops of one type (WRITE IN SHOP TYPE)
0.0% 0 0.0% 0 0.0% 0 0.0% 0 0.0% 0 0.0% 0 0.0% 0 0.0% 0 0.0% 0 0.0% 0 0.0% 0
Traffic congestion 8.7% 74 17.3% 14 10.4% 2 10.5% 4 6.8% 3 10.1% 6 38.1% 3 6.2% 1 2.9% 0 1.7% 0 4.6% 1Unsafe / poor security /
dangerous 0.7% 6 0.0% 0 0.0% 0 0.0% 0 0.0% 0 7.3% 4 0.0% 0 1.0% 0 1.1% 0 0.0% 0 0.8% 0
Vandals / hooligans 1.3% 11 0.0% 0 0.0% 0 0.0% 0 0.0% 0 4.1% 2 0.0% 0 9.2% 1 4.8% 1 0.0% 0 0.0% 0Other 0.0% 0 0.0% 0 0.0% 0 0.0% 0 0.0% 0 0.0% 0 0.0% 0 0.0% 0 0.0% 0 0.0% 0 0.0% 0Annoying one-way system 0.5% 5 0.8% 1 0.0% 0 0.0% 0 1.3% 0 0.0% 0 4.9% 0 0.0% 0 3.7% 1 1.7% 0 0.0% 0Difficult to get to by car 0.2% 2 0.8% 1 0.0% 0 0.0% 0 0.0% 0 0.0% 0 0.0% 0 0.0% 0 0.0% 0 0.0% 0 0.0% 0Doesn’t have any character 0.1% 1 1.0% 1 0.0% 0 0.0% 0 0.0% 0 0.0% 0 0.0% 0 0.0% 0 0.0% 0 0.0% 0 0.0% 0Don't like the new
development 0.3% 2 0.0% 0 4.4% 1 0.0% 0 0.0% 0 0.0% 0 0.0% 0 0.0% 0 0.0% 0 0.0% 0 0.0% 0
Expensive prices in the shops 0.2% 2 0.6% 1 0.0% 0 0.0% 0 0.0% 0 1.3% 1 0.0% 0 0.0% 0 0.0% 0 0.0% 0 0.0% 0
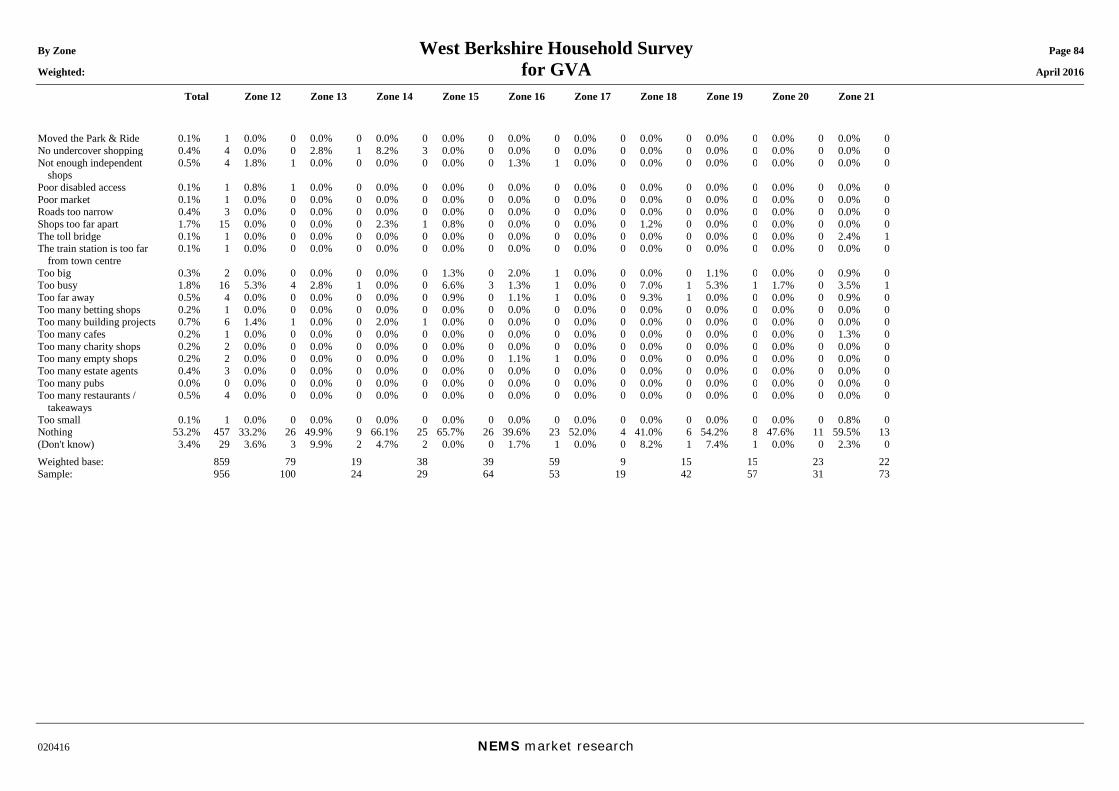
By Zone West Berkshire Household Survey Page 84 Weighted: for GVA April 2016
Total Zone 12 Zone 13 Zone 14 Zone 15 Zone 16 Zone 17 Zone 18 Zone 19 Zone 20 Zone 21
020416 NEMS market research
Moved the Park & Ride 0.1% 1 0.0% 0 0.0% 0 0.0% 0 0.0% 0 0.0% 0 0.0% 0 0.0% 0 0.0% 0 0.0% 0 0.0% 0No undercover shopping 0.4% 4 0.0% 0 2.8% 1 8.2% 3 0.0% 0 0.0% 0 0.0% 0 0.0% 0 0.0% 0 0.0% 0 0.0% 0Not enough independent
shops 0.5% 4 1.8% 1 0.0% 0 0.0% 0 0.0% 0 1.3% 1 0.0% 0 0.0% 0 0.0% 0 0.0% 0 0.0% 0
Poor disabled access 0.1% 1 0.8% 1 0.0% 0 0.0% 0 0.0% 0 0.0% 0 0.0% 0 0.0% 0 0.0% 0 0.0% 0 0.0% 0Poor market 0.1% 1 0.0% 0 0.0% 0 0.0% 0 0.0% 0 0.0% 0 0.0% 0 0.0% 0 0.0% 0 0.0% 0 0.0% 0Roads too narrow 0.4% 3 0.0% 0 0.0% 0 0.0% 0 0.0% 0 0.0% 0 0.0% 0 0.0% 0 0.0% 0 0.0% 0 0.0% 0Shops too far apart 1.7% 15 0.0% 0 0.0% 0 2.3% 1 0.8% 0 0.0% 0 0.0% 0 1.2% 0 0.0% 0 0.0% 0 0.0% 0The toll bridge 0.1% 1 0.0% 0 0.0% 0 0.0% 0 0.0% 0 0.0% 0 0.0% 0 0.0% 0 0.0% 0 0.0% 0 2.4% 1The train station is too far
from town centre 0.1% 1 0.0% 0 0.0% 0 0.0% 0 0.0% 0 0.0% 0 0.0% 0 0.0% 0 0.0% 0 0.0% 0 0.0% 0
Too big 0.3% 2 0.0% 0 0.0% 0 0.0% 0 1.3% 0 2.0% 1 0.0% 0 0.0% 0 1.1% 0 0.0% 0 0.9% 0Too busy 1.8% 16 5.3% 4 2.8% 1 0.0% 0 6.6% 3 1.3% 1 0.0% 0 7.0% 1 5.3% 1 1.7% 0 3.5% 1Too far away 0.5% 4 0.0% 0 0.0% 0 0.0% 0 0.9% 0 1.1% 1 0.0% 0 9.3% 1 0.0% 0 0.0% 0 0.9% 0Too many betting shops 0.2% 1 0.0% 0 0.0% 0 0.0% 0 0.0% 0 0.0% 0 0.0% 0 0.0% 0 0.0% 0 0.0% 0 0.0% 0Too many building projects 0.7% 6 1.4% 1 0.0% 0 2.0% 1 0.0% 0 0.0% 0 0.0% 0 0.0% 0 0.0% 0 0.0% 0 0.0% 0Too many cafes 0.2% 1 0.0% 0 0.0% 0 0.0% 0 0.0% 0 0.0% 0 0.0% 0 0.0% 0 0.0% 0 0.0% 0 1.3% 0Too many charity shops 0.2% 2 0.0% 0 0.0% 0 0.0% 0 0.0% 0 0.0% 0 0.0% 0 0.0% 0 0.0% 0 0.0% 0 0.0% 0Too many empty shops 0.2% 2 0.0% 0 0.0% 0 0.0% 0 0.0% 0 1.1% 1 0.0% 0 0.0% 0 0.0% 0 0.0% 0 0.0% 0Too many estate agents 0.4% 3 0.0% 0 0.0% 0 0.0% 0 0.0% 0 0.0% 0 0.0% 0 0.0% 0 0.0% 0 0.0% 0 0.0% 0Too many pubs 0.0% 0 0.0% 0 0.0% 0 0.0% 0 0.0% 0 0.0% 0 0.0% 0 0.0% 0 0.0% 0 0.0% 0 0.0% 0Too many restaurants /
takeaways 0.5% 4 0.0% 0 0.0% 0 0.0% 0 0.0% 0 0.0% 0 0.0% 0 0.0% 0 0.0% 0 0.0% 0 0.0% 0
Too small 0.1% 1 0.0% 0 0.0% 0 0.0% 0 0.0% 0 0.0% 0 0.0% 0 0.0% 0 0.0% 0 0.0% 0 0.8% 0Nothing 53.2% 457 33.2% 26 49.9% 9 66.1% 25 65.7% 26 39.6% 23 52.0% 4 41.0% 6 54.2% 8 47.6% 11 59.5% 13(Don't know) 3.4% 29 3.6% 3 9.9% 2 4.7% 2 0.0% 0 1.7% 1 0.0% 0 8.2% 1 7.4% 1 0.0% 0 2.3% 0Weighted base: 859 79 19 38 39 59 9 15 15 23 22Sample: 956 100 24 29 64 53 19 42 57 31 73
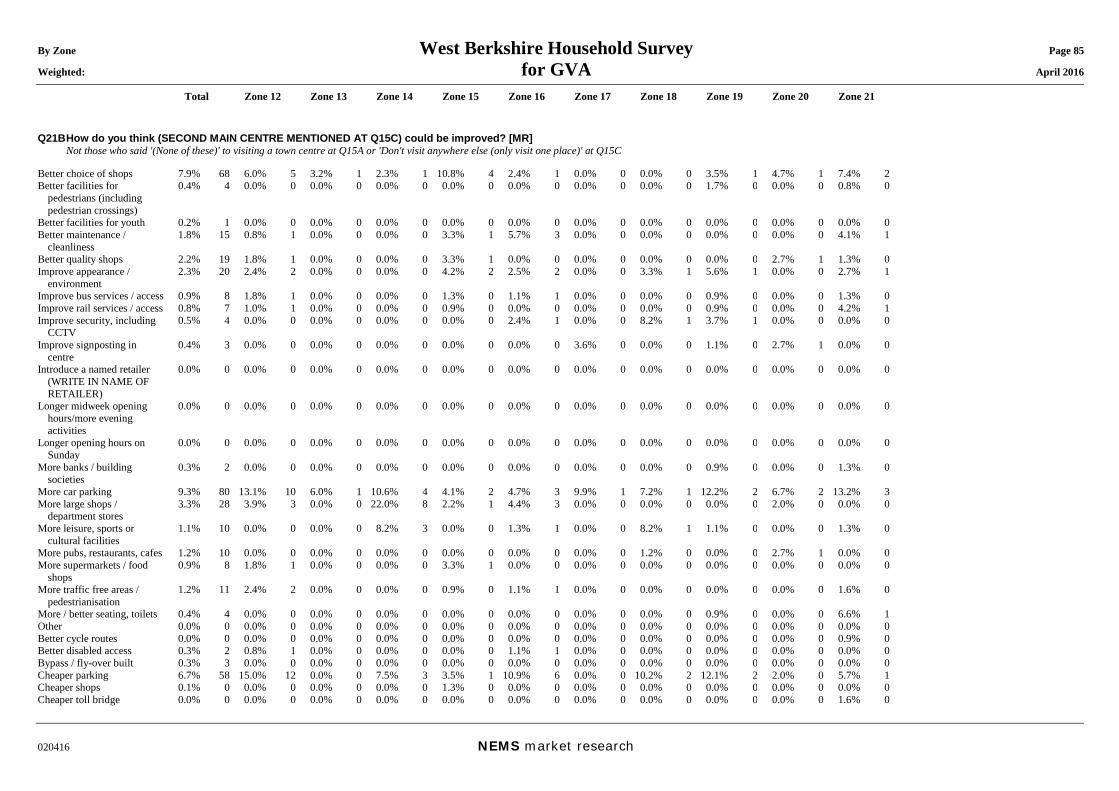
By Zone West Berkshire Household Survey Page 85 Weighted: for GVA April 2016
Total Zone 12 Zone 13 Zone 14 Zone 15 Zone 16 Zone 17 Zone 18 Zone 19 Zone 20 Zone 21
020416 NEMS market research
Q21B How do you think (SECOND MAIN CENTRE MENTIONED AT Q15C) could be improved? [MR] Not those who said '(None of these)' to visiting a town centre at Q15A or 'Don't visit anywhere else (only visit one place)' at Q15C Better choice of shops 7.9% 68 6.0% 5 3.2% 1 2.3% 1 10.8% 4 2.4% 1 0.0% 0 0.0% 0 3.5% 1 4.7% 1 7.4% 2Better facilities for
pedestrians (including pedestrian crossings)
0.4% 4 0.0% 0 0.0% 0 0.0% 0 0.0% 0 0.0% 0 0.0% 0 0.0% 0 1.7% 0 0.0% 0 0.8% 0
Better facilities for youth 0.2% 1 0.0% 0 0.0% 0 0.0% 0 0.0% 0 0.0% 0 0.0% 0 0.0% 0 0.0% 0 0.0% 0 0.0% 0Better maintenance /
cleanliness 1.8% 15 0.8% 1 0.0% 0 0.0% 0 3.3% 1 5.7% 3 0.0% 0 0.0% 0 0.0% 0 0.0% 0 4.1% 1
Better quality shops 2.2% 19 1.8% 1 0.0% 0 0.0% 0 3.3% 1 0.0% 0 0.0% 0 0.0% 0 0.0% 0 2.7% 1 1.3% 0Improve appearance /
environment 2.3% 20 2.4% 2 0.0% 0 0.0% 0 4.2% 2 2.5% 2 0.0% 0 3.3% 1 5.6% 1 0.0% 0 2.7% 1
Improve bus services / access 0.9% 8 1.8% 1 0.0% 0 0.0% 0 1.3% 0 1.1% 1 0.0% 0 0.0% 0 0.9% 0 0.0% 0 1.3% 0Improve rail services / access 0.8% 7 1.0% 1 0.0% 0 0.0% 0 0.9% 0 0.0% 0 0.0% 0 0.0% 0 0.9% 0 0.0% 0 4.2% 1Improve security, including
CCTV 0.5% 4 0.0% 0 0.0% 0 0.0% 0 0.0% 0 2.4% 1 0.0% 0 8.2% 1 3.7% 1 0.0% 0 0.0% 0
Improve signposting in centre
0.4% 3 0.0% 0 0.0% 0 0.0% 0 0.0% 0 0.0% 0 3.6% 0 0.0% 0 1.1% 0 2.7% 1 0.0% 0
Introduce a named retailer (WRITE IN NAME OF RETAILER)
0.0% 0 0.0% 0 0.0% 0 0.0% 0 0.0% 0 0.0% 0 0.0% 0 0.0% 0 0.0% 0 0.0% 0 0.0% 0
Longer midweek opening hours/more evening activities
0.0% 0 0.0% 0 0.0% 0 0.0% 0 0.0% 0 0.0% 0 0.0% 0 0.0% 0 0.0% 0 0.0% 0 0.0% 0
Longer opening hours on Sunday
0.0% 0 0.0% 0 0.0% 0 0.0% 0 0.0% 0 0.0% 0 0.0% 0 0.0% 0 0.0% 0 0.0% 0 0.0% 0
More banks / building societies
0.3% 2 0.0% 0 0.0% 0 0.0% 0 0.0% 0 0.0% 0 0.0% 0 0.0% 0 0.9% 0 0.0% 0 1.3% 0
More car parking 9.3% 80 13.1% 10 6.0% 1 10.6% 4 4.1% 2 4.7% 3 9.9% 1 7.2% 1 12.2% 2 6.7% 2 13.2% 3More large shops /
department stores 3.3% 28 3.9% 3 0.0% 0 22.0% 8 2.2% 1 4.4% 3 0.0% 0 0.0% 0 0.0% 0 2.0% 0 0.0% 0
More leisure, sports or cultural facilities
1.1% 10 0.0% 0 0.0% 0 8.2% 3 0.0% 0 1.3% 1 0.0% 0 8.2% 1 1.1% 0 0.0% 0 1.3% 0
More pubs, restaurants, cafes 1.2% 10 0.0% 0 0.0% 0 0.0% 0 0.0% 0 0.0% 0 0.0% 0 1.2% 0 0.0% 0 2.7% 1 0.0% 0More supermarkets / food
shops 0.9% 8 1.8% 1 0.0% 0 0.0% 0 3.3% 1 0.0% 0 0.0% 0 0.0% 0 0.0% 0 0.0% 0 0.0% 0
More traffic free areas / pedestrianisation
1.2% 11 2.4% 2 0.0% 0 0.0% 0 0.9% 0 1.1% 1 0.0% 0 0.0% 0 0.0% 0 0.0% 0 1.6% 0
More / better seating, toilets 0.4% 4 0.0% 0 0.0% 0 0.0% 0 0.0% 0 0.0% 0 0.0% 0 0.0% 0 0.9% 0 0.0% 0 6.6% 1Other 0.0% 0 0.0% 0 0.0% 0 0.0% 0 0.0% 0 0.0% 0 0.0% 0 0.0% 0 0.0% 0 0.0% 0 0.0% 0Better cycle routes 0.0% 0 0.0% 0 0.0% 0 0.0% 0 0.0% 0 0.0% 0 0.0% 0 0.0% 0 0.0% 0 0.0% 0 0.9% 0Better disabled access 0.3% 2 0.8% 1 0.0% 0 0.0% 0 0.0% 0 1.1% 1 0.0% 0 0.0% 0 0.0% 0 0.0% 0 0.0% 0Bypass / fly-over built 0.3% 3 0.0% 0 0.0% 0 0.0% 0 0.0% 0 0.0% 0 0.0% 0 0.0% 0 0.0% 0 0.0% 0 0.0% 0Cheaper parking 6.7% 58 15.0% 12 0.0% 0 7.5% 3 3.5% 1 10.9% 6 0.0% 0 10.2% 2 12.1% 2 2.0% 0 5.7% 1Cheaper shops 0.1% 0 0.0% 0 0.0% 0 0.0% 0 1.3% 0 0.0% 0 0.0% 0 0.0% 0 0.0% 0 0.0% 0 0.0% 0Cheaper toll bridge 0.0% 0 0.0% 0 0.0% 0 0.0% 0 0.0% 0 0.0% 0 0.0% 0 0.0% 0 0.0% 0 0.0% 0 1.6% 0
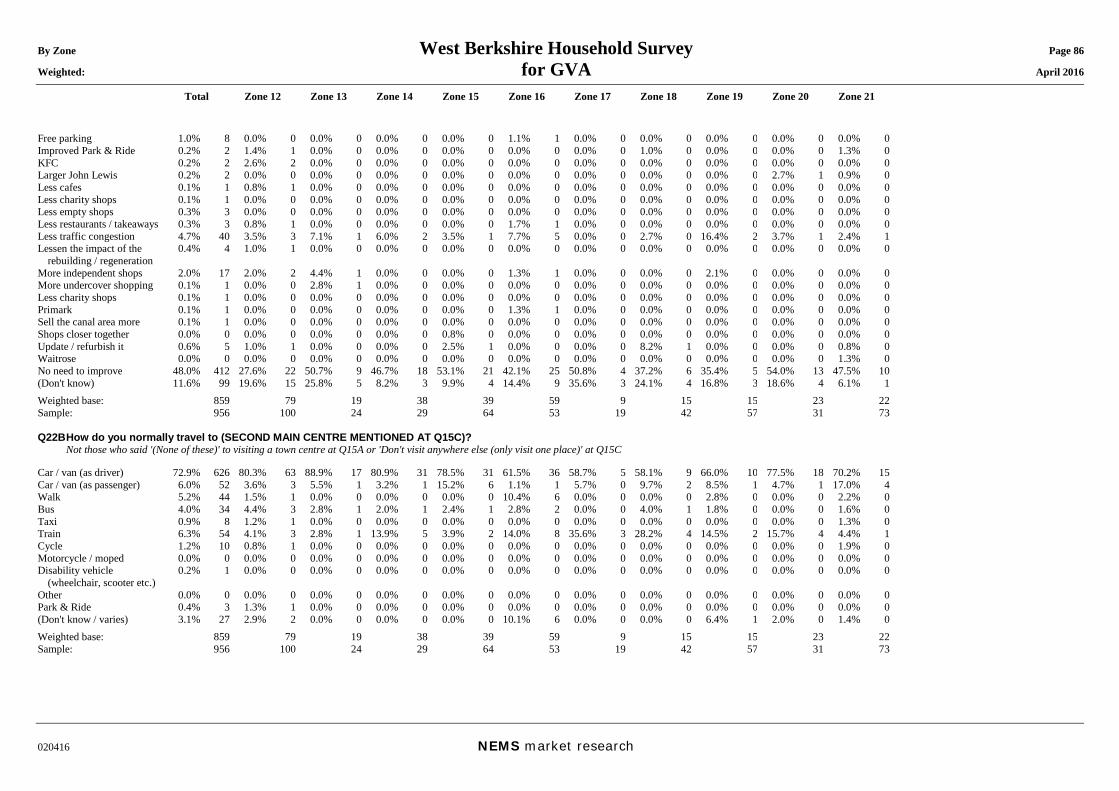
By Zone West Berkshire Household Survey Page 86 Weighted: for GVA April 2016
Total Zone 12 Zone 13 Zone 14 Zone 15 Zone 16 Zone 17 Zone 18 Zone 19 Zone 20 Zone 21
020416 NEMS market research
Free parking 1.0% 8 0.0% 0 0.0% 0 0.0% 0 0.0% 0 1.1% 1 0.0% 0 0.0% 0 0.0% 0 0.0% 0 0.0% 0Improved Park & Ride 0.2% 2 1.4% 1 0.0% 0 0.0% 0 0.0% 0 0.0% 0 0.0% 0 1.0% 0 0.0% 0 0.0% 0 1.3% 0KFC 0.2% 2 2.6% 2 0.0% 0 0.0% 0 0.0% 0 0.0% 0 0.0% 0 0.0% 0 0.0% 0 0.0% 0 0.0% 0Larger John Lewis 0.2% 2 0.0% 0 0.0% 0 0.0% 0 0.0% 0 0.0% 0 0.0% 0 0.0% 0 0.0% 0 2.7% 1 0.9% 0Less cafes 0.1% 1 0.8% 1 0.0% 0 0.0% 0 0.0% 0 0.0% 0 0.0% 0 0.0% 0 0.0% 0 0.0% 0 0.0% 0Less charity shops 0.1% 1 0.0% 0 0.0% 0 0.0% 0 0.0% 0 0.0% 0 0.0% 0 0.0% 0 0.0% 0 0.0% 0 0.0% 0Less empty shops 0.3% 3 0.0% 0 0.0% 0 0.0% 0 0.0% 0 0.0% 0 0.0% 0 0.0% 0 0.0% 0 0.0% 0 0.0% 0Less restaurants / takeaways 0.3% 3 0.8% 1 0.0% 0 0.0% 0 0.0% 0 1.7% 1 0.0% 0 0.0% 0 0.0% 0 0.0% 0 0.0% 0Less traffic congestion 4.7% 40 3.5% 3 7.1% 1 6.0% 2 3.5% 1 7.7% 5 0.0% 0 2.7% 0 16.4% 2 3.7% 1 2.4% 1Lessen the impact of the
rebuilding / regeneration 0.4% 4 1.0% 1 0.0% 0 0.0% 0 0.0% 0 0.0% 0 0.0% 0 0.0% 0 0.0% 0 0.0% 0 0.0% 0
More independent shops 2.0% 17 2.0% 2 4.4% 1 0.0% 0 0.0% 0 1.3% 1 0.0% 0 0.0% 0 2.1% 0 0.0% 0 0.0% 0More undercover shopping 0.1% 1 0.0% 0 2.8% 1 0.0% 0 0.0% 0 0.0% 0 0.0% 0 0.0% 0 0.0% 0 0.0% 0 0.0% 0Less charity shops 0.1% 1 0.0% 0 0.0% 0 0.0% 0 0.0% 0 0.0% 0 0.0% 0 0.0% 0 0.0% 0 0.0% 0 0.0% 0Primark 0.1% 1 0.0% 0 0.0% 0 0.0% 0 0.0% 0 1.3% 1 0.0% 0 0.0% 0 0.0% 0 0.0% 0 0.0% 0Sell the canal area more 0.1% 1 0.0% 0 0.0% 0 0.0% 0 0.0% 0 0.0% 0 0.0% 0 0.0% 0 0.0% 0 0.0% 0 0.0% 0Shops closer together 0.0% 0 0.0% 0 0.0% 0 0.0% 0 0.8% 0 0.0% 0 0.0% 0 0.0% 0 0.0% 0 0.0% 0 0.0% 0Update / refurbish it 0.6% 5 1.0% 1 0.0% 0 0.0% 0 2.5% 1 0.0% 0 0.0% 0 8.2% 1 0.0% 0 0.0% 0 0.8% 0Waitrose 0.0% 0 0.0% 0 0.0% 0 0.0% 0 0.0% 0 0.0% 0 0.0% 0 0.0% 0 0.0% 0 0.0% 0 1.3% 0No need to improve 48.0% 412 27.6% 22 50.7% 9 46.7% 18 53.1% 21 42.1% 25 50.8% 4 37.2% 6 35.4% 5 54.0% 13 47.5% 10(Don't know) 11.6% 99 19.6% 15 25.8% 5 8.2% 3 9.9% 4 14.4% 9 35.6% 3 24.1% 4 16.8% 3 18.6% 4 6.1% 1Weighted base: 859 79 19 38 39 59 9 15 15 23 22Sample: 956 100 24 29 64 53 19 42 57 31 73 Q22B How do you normally travel to (SECOND MAIN CENTRE MENTIONED AT Q15C)? Not those who said '(None of these)' to visiting a town centre at Q15A or 'Don't visit anywhere else (only visit one place)' at Q15C Car / van (as driver) 72.9% 626 80.3% 63 88.9% 17 80.9% 31 78.5% 31 61.5% 36 58.7% 5 58.1% 9 66.0% 10 77.5% 18 70.2% 15Car / van (as passenger) 6.0% 52 3.6% 3 5.5% 1 3.2% 1 15.2% 6 1.1% 1 5.7% 0 9.7% 2 8.5% 1 4.7% 1 17.0% 4Walk 5.2% 44 1.5% 1 0.0% 0 0.0% 0 0.0% 0 10.4% 6 0.0% 0 0.0% 0 2.8% 0 0.0% 0 2.2% 0Bus 4.0% 34 4.4% 3 2.8% 1 2.0% 1 2.4% 1 2.8% 2 0.0% 0 4.0% 1 1.8% 0 0.0% 0 1.6% 0Taxi 0.9% 8 1.2% 1 0.0% 0 0.0% 0 0.0% 0 0.0% 0 0.0% 0 0.0% 0 0.0% 0 0.0% 0 1.3% 0Train 6.3% 54 4.1% 3 2.8% 1 13.9% 5 3.9% 2 14.0% 8 35.6% 3 28.2% 4 14.5% 2 15.7% 4 4.4% 1Cycle 1.2% 10 0.8% 1 0.0% 0 0.0% 0 0.0% 0 0.0% 0 0.0% 0 0.0% 0 0.0% 0 0.0% 0 1.9% 0Motorcycle / moped 0.0% 0 0.0% 0 0.0% 0 0.0% 0 0.0% 0 0.0% 0 0.0% 0 0.0% 0 0.0% 0 0.0% 0 0.0% 0Disability vehicle
(wheelchair, scooter etc.) 0.2% 1 0.0% 0 0.0% 0 0.0% 0 0.0% 0 0.0% 0 0.0% 0 0.0% 0 0.0% 0 0.0% 0 0.0% 0
Other 0.0% 0 0.0% 0 0.0% 0 0.0% 0 0.0% 0 0.0% 0 0.0% 0 0.0% 0 0.0% 0 0.0% 0 0.0% 0Park & Ride 0.4% 3 1.3% 1 0.0% 0 0.0% 0 0.0% 0 0.0% 0 0.0% 0 0.0% 0 0.0% 0 0.0% 0 0.0% 0(Don't know / varies) 3.1% 27 2.9% 2 0.0% 0 0.0% 0 0.0% 0 10.1% 6 0.0% 0 0.0% 0 6.4% 1 2.0% 0 1.4% 0Weighted base: 859 79 19 38 39 59 9 15 15 23 22Sample: 956 100 24 29 64 53 19 42 57 31 73
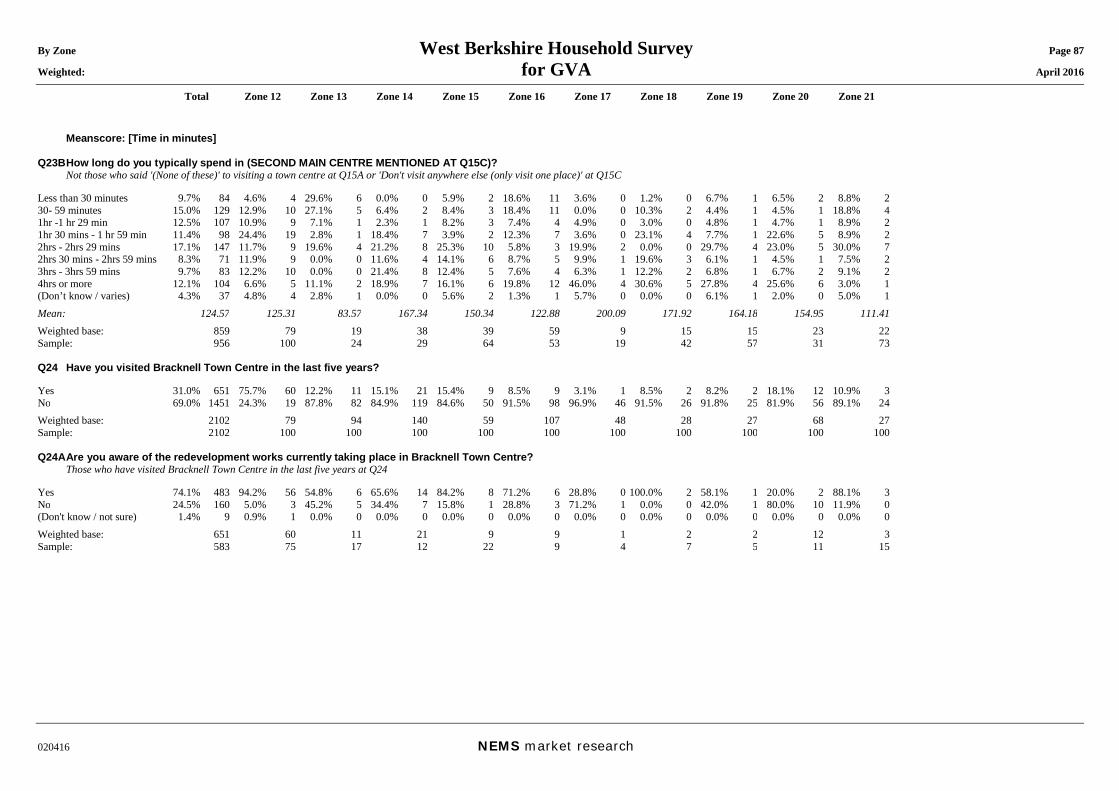
By Zone West Berkshire Household Survey Page 87 Weighted: for GVA April 2016
Total Zone 12 Zone 13 Zone 14 Zone 15 Zone 16 Zone 17 Zone 18 Zone 19 Zone 20 Zone 21
020416 NEMS market research
Meanscore: [Time in minutes] Q23B How long do you typically spend in (SECOND MAIN CENTRE MENTIONED AT Q15C)? Not those who said '(None of these)' to visiting a town centre at Q15A or 'Don't visit anywhere else (only visit one place)' at Q15C Less than 30 minutes 9.7% 84 4.6% 4 29.6% 6 0.0% 0 5.9% 2 18.6% 11 3.6% 0 1.2% 0 6.7% 1 6.5% 2 8.8% 230- 59 minutes 15.0% 129 12.9% 10 27.1% 5 6.4% 2 8.4% 3 18.4% 11 0.0% 0 10.3% 2 4.4% 1 4.5% 1 18.8% 41hr -1 hr 29 min 12.5% 107 10.9% 9 7.1% 1 2.3% 1 8.2% 3 7.4% 4 4.9% 0 3.0% 0 4.8% 1 4.7% 1 8.9% 21hr 30 mins - 1 hr 59 min 11.4% 98 24.4% 19 2.8% 1 18.4% 7 3.9% 2 12.3% 7 3.6% 0 23.1% 4 7.7% 1 22.6% 5 8.9% 22hrs - 2hrs 29 mins 17.1% 147 11.7% 9 19.6% 4 21.2% 8 25.3% 10 5.8% 3 19.9% 2 0.0% 0 29.7% 4 23.0% 5 30.0% 72hrs 30 mins - 2hrs 59 mins 8.3% 71 11.9% 9 0.0% 0 11.6% 4 14.1% 6 8.7% 5 9.9% 1 19.6% 3 6.1% 1 4.5% 1 7.5% 23hrs - 3hrs 59 mins 9.7% 83 12.2% 10 0.0% 0 21.4% 8 12.4% 5 7.6% 4 6.3% 1 12.2% 2 6.8% 1 6.7% 2 9.1% 24hrs or more 12.1% 104 6.6% 5 11.1% 2 18.9% 7 16.1% 6 19.8% 12 46.0% 4 30.6% 5 27.8% 4 25.6% 6 3.0% 1(Don’t know / varies) 4.3% 37 4.8% 4 2.8% 1 0.0% 0 5.6% 2 1.3% 1 5.7% 0 0.0% 0 6.1% 1 2.0% 0 5.0% 1Mean: 124.57 125.31 83.57 167.34 150.34 122.88 200.09 171.92 164.18 154.95 111.41Weighted base: 859 79 19 38 39 59 9 15 15 23 22Sample: 956 100 24 29 64 53 19 42 57 31 73 Q24 Have you visited Bracknell Town Centre in the last five years? Yes 31.0% 651 75.7% 60 12.2% 11 15.1% 21 15.4% 9 8.5% 9 3.1% 1 8.5% 2 8.2% 2 18.1% 12 10.9% 3No 69.0% 1451 24.3% 19 87.8% 82 84.9% 119 84.6% 50 91.5% 98 96.9% 46 91.5% 26 91.8% 25 81.9% 56 89.1% 24Weighted base: 2102 79 94 140 59 107 48 28 27 68 27Sample: 2102 100 100 100 100 100 100 100 100 100 100 Q24A Are you aware of the redevelopment works currently taking place in Bracknell Town Centre? Those who have visited Bracknell Town Centre in the last five years at Q24 Yes 74.1% 483 94.2% 56 54.8% 6 65.6% 14 84.2% 8 71.2% 6 28.8% 0 100.0% 2 58.1% 1 20.0% 2 88.1% 3No 24.5% 160 5.0% 3 45.2% 5 34.4% 7 15.8% 1 28.8% 3 71.2% 1 0.0% 0 42.0% 1 80.0% 10 11.9% 0(Don't know / not sure) 1.4% 9 0.9% 1 0.0% 0 0.0% 0 0.0% 0 0.0% 0 0.0% 0 0.0% 0 0.0% 0 0.0% 0 0.0% 0Weighted base: 651 60 11 21 9 9 1 2 2 12 3Sample: 583 75 17 12 22 9 4 7 5 11 15
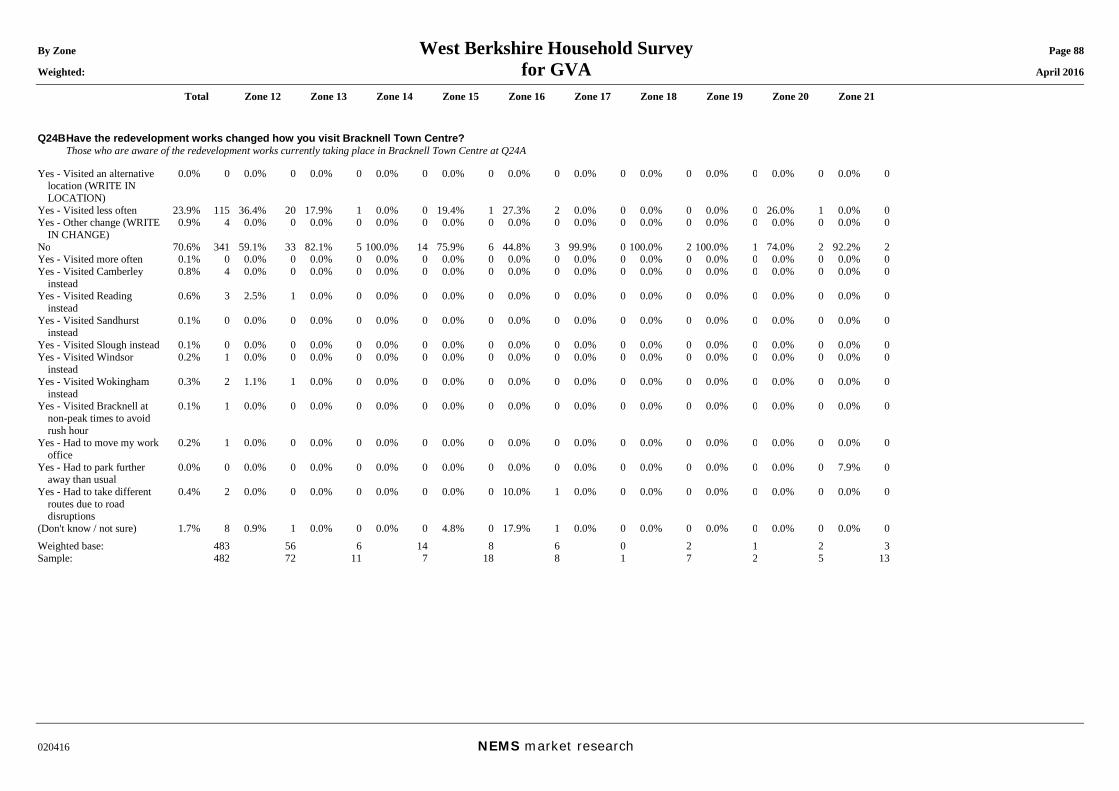
By Zone West Berkshire Household Survey Page 88 Weighted: for GVA April 2016
Total Zone 12 Zone 13 Zone 14 Zone 15 Zone 16 Zone 17 Zone 18 Zone 19 Zone 20 Zone 21
020416 NEMS market research
Q24B Have the redevelopment works changed how you visit Bracknell Town Centre? Those who are aware of the redevelopment works currently taking place in Bracknell Town Centre at Q24A Yes - Visited an alternative
location (WRITE IN LOCATION)
0.0% 0 0.0% 0 0.0% 0 0.0% 0 0.0% 0 0.0% 0 0.0% 0 0.0% 0 0.0% 0 0.0% 0 0.0% 0
Yes - Visited less often 23.9% 115 36.4% 20 17.9% 1 0.0% 0 19.4% 1 27.3% 2 0.0% 0 0.0% 0 0.0% 0 26.0% 1 0.0% 0Yes - Other change (WRITE
IN CHANGE) 0.9% 4 0.0% 0 0.0% 0 0.0% 0 0.0% 0 0.0% 0 0.0% 0 0.0% 0 0.0% 0 0.0% 0 0.0% 0
No 70.6% 341 59.1% 33 82.1% 5 100.0% 14 75.9% 6 44.8% 3 99.9% 0 100.0% 2 100.0% 1 74.0% 2 92.2% 2Yes - Visited more often 0.1% 0 0.0% 0 0.0% 0 0.0% 0 0.0% 0 0.0% 0 0.0% 0 0.0% 0 0.0% 0 0.0% 0 0.0% 0Yes - Visited Camberley
instead 0.8% 4 0.0% 0 0.0% 0 0.0% 0 0.0% 0 0.0% 0 0.0% 0 0.0% 0 0.0% 0 0.0% 0 0.0% 0
Yes - Visited Reading instead
0.6% 3 2.5% 1 0.0% 0 0.0% 0 0.0% 0 0.0% 0 0.0% 0 0.0% 0 0.0% 0 0.0% 0 0.0% 0
Yes - Visited Sandhurst instead
0.1% 0 0.0% 0 0.0% 0 0.0% 0 0.0% 0 0.0% 0 0.0% 0 0.0% 0 0.0% 0 0.0% 0 0.0% 0
Yes - Visited Slough instead 0.1% 0 0.0% 0 0.0% 0 0.0% 0 0.0% 0 0.0% 0 0.0% 0 0.0% 0 0.0% 0 0.0% 0 0.0% 0Yes - Visited Windsor
instead 0.2% 1 0.0% 0 0.0% 0 0.0% 0 0.0% 0 0.0% 0 0.0% 0 0.0% 0 0.0% 0 0.0% 0 0.0% 0
Yes - Visited Wokingham instead
0.3% 2 1.1% 1 0.0% 0 0.0% 0 0.0% 0 0.0% 0 0.0% 0 0.0% 0 0.0% 0 0.0% 0 0.0% 0
Yes - Visited Bracknell at non-peak times to avoid rush hour
0.1% 1 0.0% 0 0.0% 0 0.0% 0 0.0% 0 0.0% 0 0.0% 0 0.0% 0 0.0% 0 0.0% 0 0.0% 0
Yes - Had to move my work office
0.2% 1 0.0% 0 0.0% 0 0.0% 0 0.0% 0 0.0% 0 0.0% 0 0.0% 0 0.0% 0 0.0% 0 0.0% 0
Yes - Had to park further away than usual
0.0% 0 0.0% 0 0.0% 0 0.0% 0 0.0% 0 0.0% 0 0.0% 0 0.0% 0 0.0% 0 0.0% 0 7.9% 0
Yes - Had to take different routes due to road disruptions
0.4% 2 0.0% 0 0.0% 0 0.0% 0 0.0% 0 10.0% 1 0.0% 0 0.0% 0 0.0% 0 0.0% 0 0.0% 0
(Don't know / not sure) 1.7% 8 0.9% 1 0.0% 0 0.0% 0 4.8% 0 17.9% 1 0.0% 0 0.0% 0 0.0% 0 0.0% 0 0.0% 0Weighted base: 483 56 6 14 8 6 0 2 1 2 3Sample: 482 72 11 7 18 8 1 7 2 5 13
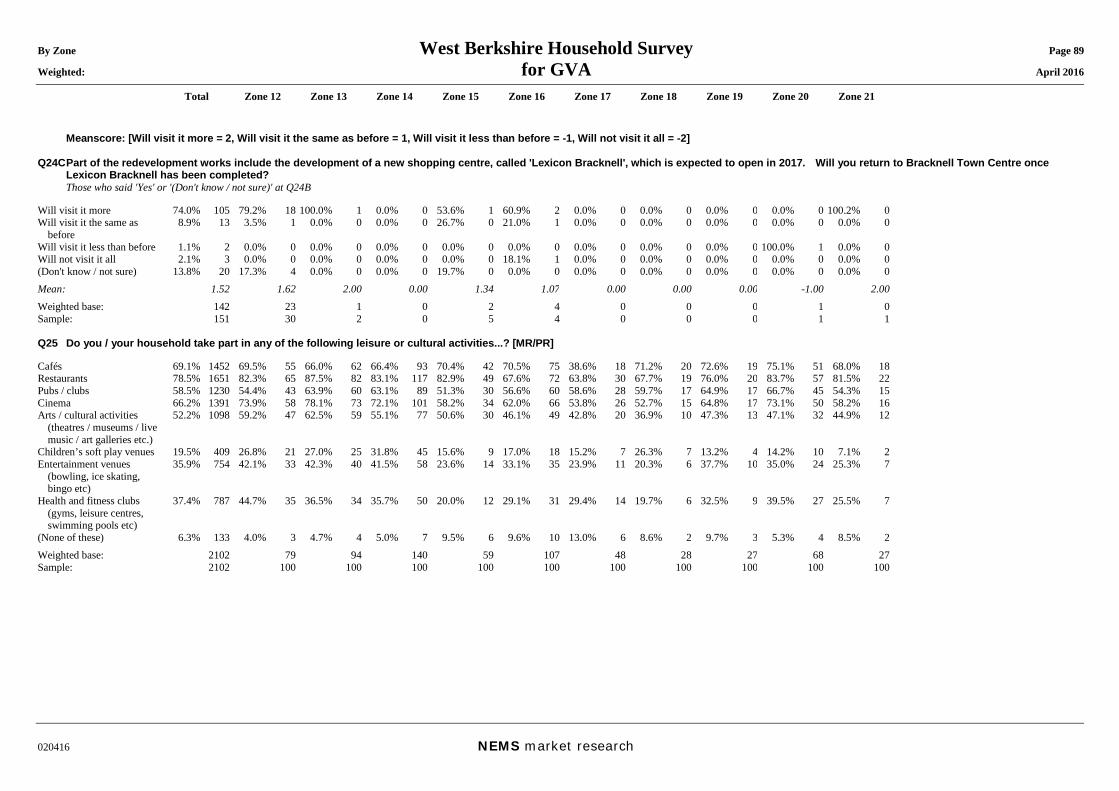
By Zone West Berkshire Household Survey Page 89 Weighted: for GVA April 2016
Total Zone 12 Zone 13 Zone 14 Zone 15 Zone 16 Zone 17 Zone 18 Zone 19 Zone 20 Zone 21
020416 NEMS market research
Meanscore: [Will visit it more = 2, Will visit it the same as before = 1, Will visit it less than before = -1, Will not visit it all = -2] Q24C Part of the redevelopment works include the development of a new shopping centre, called 'Lexicon Bracknell', which is expected to open in 2017. Will you return to Bracknell Town Centre once
Lexicon Bracknell has been completed? Those who said 'Yes' or '(Don't know / not sure)' at Q24B Will visit it more 74.0% 105 79.2% 18 100.0% 1 0.0% 0 53.6% 1 60.9% 2 0.0% 0 0.0% 0 0.0% 0 0.0% 0 100.2% 0Will visit it the same as
before 8.9% 13 3.5% 1 0.0% 0 0.0% 0 26.7% 0 21.0% 1 0.0% 0 0.0% 0 0.0% 0 0.0% 0 0.0% 0
Will visit it less than before 1.1% 2 0.0% 0 0.0% 0 0.0% 0 0.0% 0 0.0% 0 0.0% 0 0.0% 0 0.0% 0 100.0% 1 0.0% 0Will not visit it all 2.1% 3 0.0% 0 0.0% 0 0.0% 0 0.0% 0 18.1% 1 0.0% 0 0.0% 0 0.0% 0 0.0% 0 0.0% 0(Don't know / not sure) 13.8% 20 17.3% 4 0.0% 0 0.0% 0 19.7% 0 0.0% 0 0.0% 0 0.0% 0 0.0% 0 0.0% 0 0.0% 0Mean: 1.52 1.62 2.00 0.00 1.34 1.07 0.00 0.00 0.00 -1.00 2.00Weighted base: 142 23 1 0 2 4 0 0 0 1 0Sample: 151 30 2 0 5 4 0 0 0 1 1 Q25 Do you / your household take part in any of the following leisure or cultural activities...? [MR/PR] Cafés 69.1% 1452 69.5% 55 66.0% 62 66.4% 93 70.4% 42 70.5% 75 38.6% 18 71.2% 20 72.6% 19 75.1% 51 68.0% 18Restaurants 78.5% 1651 82.3% 65 87.5% 82 83.1% 117 82.9% 49 67.6% 72 63.8% 30 67.7% 19 76.0% 20 83.7% 57 81.5% 22Pubs / clubs 58.5% 1230 54.4% 43 63.9% 60 63.1% 89 51.3% 30 56.6% 60 58.6% 28 59.7% 17 64.9% 17 66.7% 45 54.3% 15Cinema 66.2% 1391 73.9% 58 78.1% 73 72.1% 101 58.2% 34 62.0% 66 53.8% 26 52.7% 15 64.8% 17 73.1% 50 58.2% 16Arts / cultural activities
(theatres / museums / live music / art galleries etc.)
52.2% 1098 59.2% 47 62.5% 59 55.1% 77 50.6% 30 46.1% 49 42.8% 20 36.9% 10 47.3% 13 47.1% 32 44.9% 12
Children’s soft play venues 19.5% 409 26.8% 21 27.0% 25 31.8% 45 15.6% 9 17.0% 18 15.2% 7 26.3% 7 13.2% 4 14.2% 10 7.1% 2Entertainment venues
(bowling, ice skating, bingo etc)
35.9% 754 42.1% 33 42.3% 40 41.5% 58 23.6% 14 33.1% 35 23.9% 11 20.3% 6 37.7% 10 35.0% 24 25.3% 7
Health and fitness clubs (gyms, leisure centres, swimming pools etc)
37.4% 787 44.7% 35 36.5% 34 35.7% 50 20.0% 12 29.1% 31 29.4% 14 19.7% 6 32.5% 9 39.5% 27 25.5% 7
(None of these) 6.3% 133 4.0% 3 4.7% 4 5.0% 7 9.5% 6 9.6% 10 13.0% 6 8.6% 2 9.7% 3 5.3% 4 8.5% 2Weighted base: 2102 79 94 140 59 107 48 28 27 68 27Sample: 2102 100 100 100 100 100 100 100 100 100 100
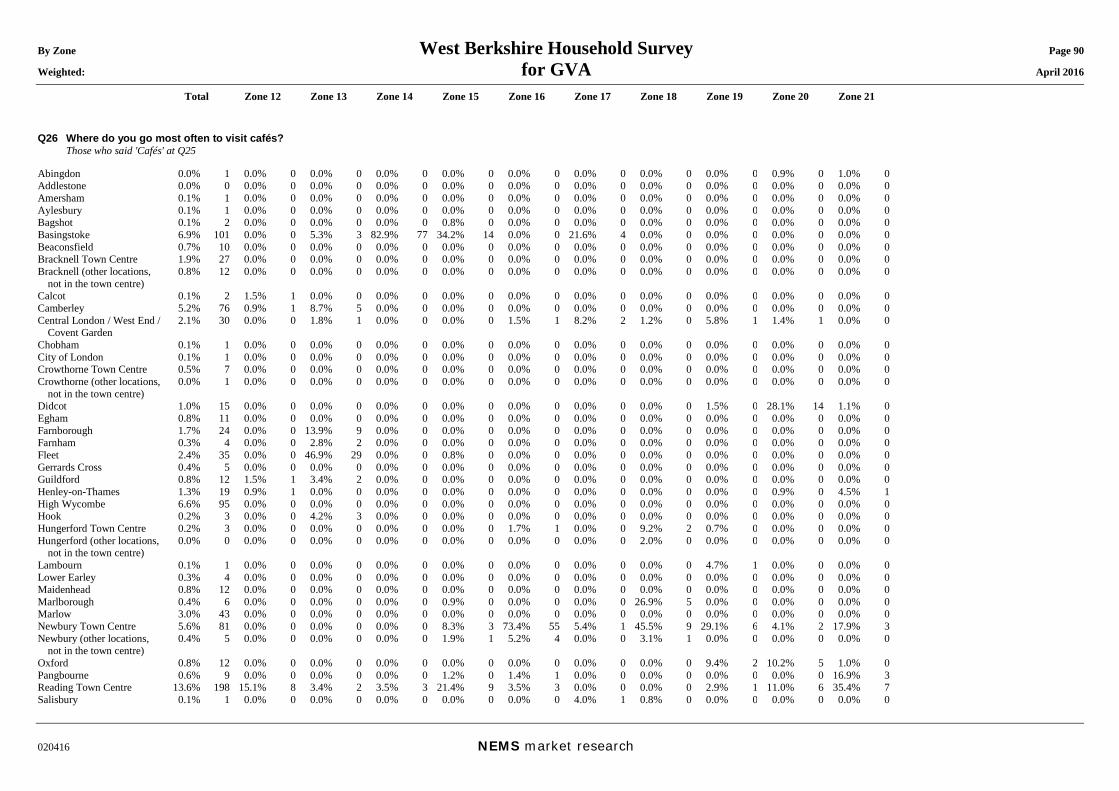
By Zone West Berkshire Household Survey Page 90 Weighted: for GVA April 2016
Total Zone 12 Zone 13 Zone 14 Zone 15 Zone 16 Zone 17 Zone 18 Zone 19 Zone 20 Zone 21
020416 NEMS market research
Q26 Where do you go most often to visit cafés? Those who said 'Cafés' at Q25 Abingdon 0.0% 1 0.0% 0 0.0% 0 0.0% 0 0.0% 0 0.0% 0 0.0% 0 0.0% 0 0.0% 0 0.9% 0 1.0% 0Addlestone 0.0% 0 0.0% 0 0.0% 0 0.0% 0 0.0% 0 0.0% 0 0.0% 0 0.0% 0 0.0% 0 0.0% 0 0.0% 0Amersham 0.1% 1 0.0% 0 0.0% 0 0.0% 0 0.0% 0 0.0% 0 0.0% 0 0.0% 0 0.0% 0 0.0% 0 0.0% 0Aylesbury 0.1% 1 0.0% 0 0.0% 0 0.0% 0 0.0% 0 0.0% 0 0.0% 0 0.0% 0 0.0% 0 0.0% 0 0.0% 0Bagshot 0.1% 2 0.0% 0 0.0% 0 0.0% 0 0.8% 0 0.0% 0 0.0% 0 0.0% 0 0.0% 0 0.0% 0 0.0% 0Basingstoke 6.9% 101 0.0% 0 5.3% 3 82.9% 77 34.2% 14 0.0% 0 21.6% 4 0.0% 0 0.0% 0 0.0% 0 0.0% 0Beaconsfield 0.7% 10 0.0% 0 0.0% 0 0.0% 0 0.0% 0 0.0% 0 0.0% 0 0.0% 0 0.0% 0 0.0% 0 0.0% 0Bracknell Town Centre 1.9% 27 0.0% 0 0.0% 0 0.0% 0 0.0% 0 0.0% 0 0.0% 0 0.0% 0 0.0% 0 0.0% 0 0.0% 0Bracknell (other locations,
not in the town centre) 0.8% 12 0.0% 0 0.0% 0 0.0% 0 0.0% 0 0.0% 0 0.0% 0 0.0% 0 0.0% 0 0.0% 0 0.0% 0
Calcot 0.1% 2 1.5% 1 0.0% 0 0.0% 0 0.0% 0 0.0% 0 0.0% 0 0.0% 0 0.0% 0 0.0% 0 0.0% 0Camberley 5.2% 76 0.9% 1 8.7% 5 0.0% 0 0.0% 0 0.0% 0 0.0% 0 0.0% 0 0.0% 0 0.0% 0 0.0% 0Central London / West End /
Covent Garden 2.1% 30 0.0% 0 1.8% 1 0.0% 0 0.0% 0 1.5% 1 8.2% 2 1.2% 0 5.8% 1 1.4% 1 0.0% 0
Chobham 0.1% 1 0.0% 0 0.0% 0 0.0% 0 0.0% 0 0.0% 0 0.0% 0 0.0% 0 0.0% 0 0.0% 0 0.0% 0City of London 0.1% 1 0.0% 0 0.0% 0 0.0% 0 0.0% 0 0.0% 0 0.0% 0 0.0% 0 0.0% 0 0.0% 0 0.0% 0Crowthorne Town Centre 0.5% 7 0.0% 0 0.0% 0 0.0% 0 0.0% 0 0.0% 0 0.0% 0 0.0% 0 0.0% 0 0.0% 0 0.0% 0Crowthorne (other locations,
not in the town centre) 0.0% 1 0.0% 0 0.0% 0 0.0% 0 0.0% 0 0.0% 0 0.0% 0 0.0% 0 0.0% 0 0.0% 0 0.0% 0
Didcot 1.0% 15 0.0% 0 0.0% 0 0.0% 0 0.0% 0 0.0% 0 0.0% 0 0.0% 0 1.5% 0 28.1% 14 1.1% 0Egham 0.8% 11 0.0% 0 0.0% 0 0.0% 0 0.0% 0 0.0% 0 0.0% 0 0.0% 0 0.0% 0 0.0% 0 0.0% 0Farnborough 1.7% 24 0.0% 0 13.9% 9 0.0% 0 0.0% 0 0.0% 0 0.0% 0 0.0% 0 0.0% 0 0.0% 0 0.0% 0Farnham 0.3% 4 0.0% 0 2.8% 2 0.0% 0 0.0% 0 0.0% 0 0.0% 0 0.0% 0 0.0% 0 0.0% 0 0.0% 0Fleet 2.4% 35 0.0% 0 46.9% 29 0.0% 0 0.8% 0 0.0% 0 0.0% 0 0.0% 0 0.0% 0 0.0% 0 0.0% 0Gerrards Cross 0.4% 5 0.0% 0 0.0% 0 0.0% 0 0.0% 0 0.0% 0 0.0% 0 0.0% 0 0.0% 0 0.0% 0 0.0% 0Guildford 0.8% 12 1.5% 1 3.4% 2 0.0% 0 0.0% 0 0.0% 0 0.0% 0 0.0% 0 0.0% 0 0.0% 0 0.0% 0Henley-on-Thames 1.3% 19 0.9% 1 0.0% 0 0.0% 0 0.0% 0 0.0% 0 0.0% 0 0.0% 0 0.0% 0 0.9% 0 4.5% 1High Wycombe 6.6% 95 0.0% 0 0.0% 0 0.0% 0 0.0% 0 0.0% 0 0.0% 0 0.0% 0 0.0% 0 0.0% 0 0.0% 0Hook 0.2% 3 0.0% 0 4.2% 3 0.0% 0 0.0% 0 0.0% 0 0.0% 0 0.0% 0 0.0% 0 0.0% 0 0.0% 0Hungerford Town Centre 0.2% 3 0.0% 0 0.0% 0 0.0% 0 0.0% 0 1.7% 1 0.0% 0 9.2% 2 0.7% 0 0.0% 0 0.0% 0Hungerford (other locations,
not in the town centre) 0.0% 0 0.0% 0 0.0% 0 0.0% 0 0.0% 0 0.0% 0 0.0% 0 2.0% 0 0.0% 0 0.0% 0 0.0% 0
Lambourn 0.1% 1 0.0% 0 0.0% 0 0.0% 0 0.0% 0 0.0% 0 0.0% 0 0.0% 0 4.7% 1 0.0% 0 0.0% 0Lower Earley 0.3% 4 0.0% 0 0.0% 0 0.0% 0 0.0% 0 0.0% 0 0.0% 0 0.0% 0 0.0% 0 0.0% 0 0.0% 0Maidenhead 0.8% 12 0.0% 0 0.0% 0 0.0% 0 0.0% 0 0.0% 0 0.0% 0 0.0% 0 0.0% 0 0.0% 0 0.0% 0Marlborough 0.4% 6 0.0% 0 0.0% 0 0.0% 0 0.9% 0 0.0% 0 0.0% 0 26.9% 5 0.0% 0 0.0% 0 0.0% 0Marlow 3.0% 43 0.0% 0 0.0% 0 0.0% 0 0.0% 0 0.0% 0 0.0% 0 0.0% 0 0.0% 0 0.0% 0 0.0% 0Newbury Town Centre 5.6% 81 0.0% 0 0.0% 0 0.0% 0 8.3% 3 73.4% 55 5.4% 1 45.5% 9 29.1% 6 4.1% 2 17.9% 3Newbury (other locations,
not in the town centre) 0.4% 5 0.0% 0 0.0% 0 0.0% 0 1.9% 1 5.2% 4 0.0% 0 3.1% 1 0.0% 0 0.0% 0 0.0% 0
Oxford 0.8% 12 0.0% 0 0.0% 0 0.0% 0 0.0% 0 0.0% 0 0.0% 0 0.0% 0 9.4% 2 10.2% 5 1.0% 0Pangbourne 0.6% 9 0.0% 0 0.0% 0 0.0% 0 1.2% 0 1.4% 1 0.0% 0 0.0% 0 0.0% 0 0.0% 0 16.9% 3Reading Town Centre 13.6% 198 15.1% 8 3.4% 2 3.5% 3 21.4% 9 3.5% 3 0.0% 0 0.0% 0 2.9% 1 11.0% 6 35.4% 7Salisbury 0.1% 1 0.0% 0 0.0% 0 0.0% 0 0.0% 0 0.0% 0 4.0% 1 0.8% 0 0.0% 0 0.0% 0 0.0% 0
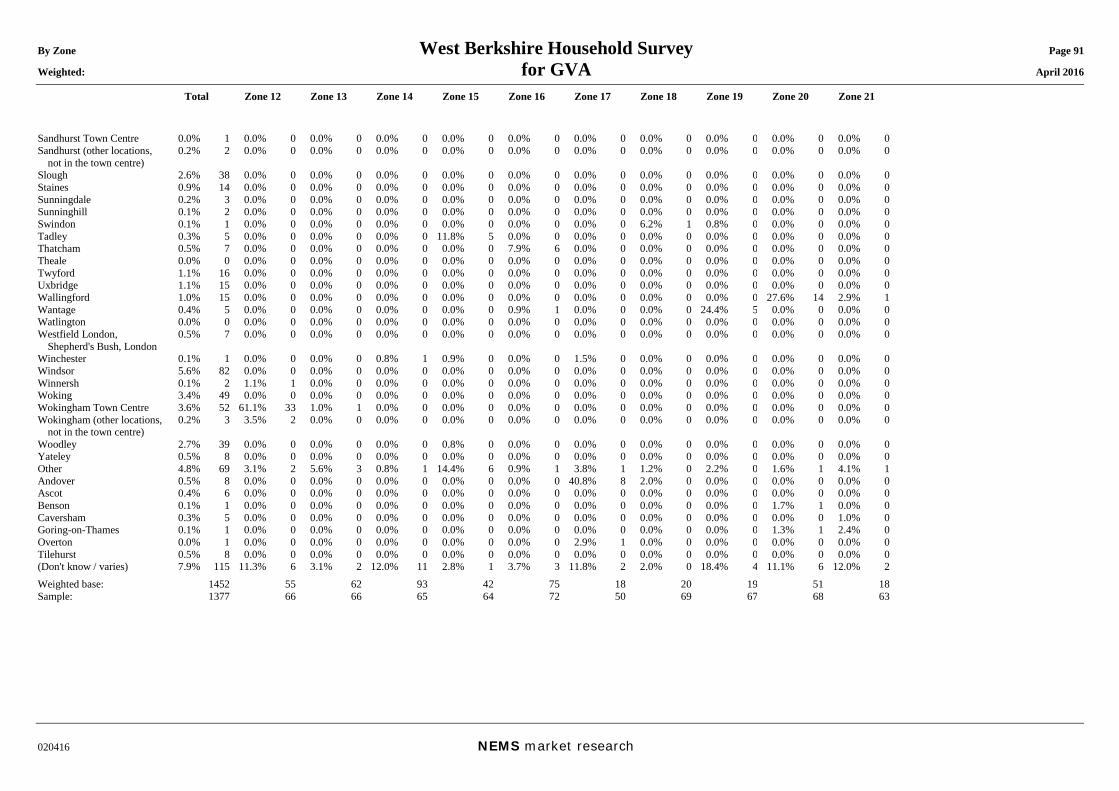
By Zone West Berkshire Household Survey Page 91 Weighted: for GVA April 2016
Total Zone 12 Zone 13 Zone 14 Zone 15 Zone 16 Zone 17 Zone 18 Zone 19 Zone 20 Zone 21
020416 NEMS market research
Sandhurst Town Centre 0.0% 1 0.0% 0 0.0% 0 0.0% 0 0.0% 0 0.0% 0 0.0% 0 0.0% 0 0.0% 0 0.0% 0 0.0% 0Sandhurst (other locations,
not in the town centre) 0.2% 2 0.0% 0 0.0% 0 0.0% 0 0.0% 0 0.0% 0 0.0% 0 0.0% 0 0.0% 0 0.0% 0 0.0% 0
Slough 2.6% 38 0.0% 0 0.0% 0 0.0% 0 0.0% 0 0.0% 0 0.0% 0 0.0% 0 0.0% 0 0.0% 0 0.0% 0Staines 0.9% 14 0.0% 0 0.0% 0 0.0% 0 0.0% 0 0.0% 0 0.0% 0 0.0% 0 0.0% 0 0.0% 0 0.0% 0Sunningdale 0.2% 3 0.0% 0 0.0% 0 0.0% 0 0.0% 0 0.0% 0 0.0% 0 0.0% 0 0.0% 0 0.0% 0 0.0% 0Sunninghill 0.1% 2 0.0% 0 0.0% 0 0.0% 0 0.0% 0 0.0% 0 0.0% 0 0.0% 0 0.0% 0 0.0% 0 0.0% 0Swindon 0.1% 1 0.0% 0 0.0% 0 0.0% 0 0.0% 0 0.0% 0 0.0% 0 6.2% 1 0.8% 0 0.0% 0 0.0% 0Tadley 0.3% 5 0.0% 0 0.0% 0 0.0% 0 11.8% 5 0.0% 0 0.0% 0 0.0% 0 0.0% 0 0.0% 0 0.0% 0Thatcham 0.5% 7 0.0% 0 0.0% 0 0.0% 0 0.0% 0 7.9% 6 0.0% 0 0.0% 0 0.0% 0 0.0% 0 0.0% 0Theale 0.0% 0 0.0% 0 0.0% 0 0.0% 0 0.0% 0 0.0% 0 0.0% 0 0.0% 0 0.0% 0 0.0% 0 0.0% 0Twyford 1.1% 16 0.0% 0 0.0% 0 0.0% 0 0.0% 0 0.0% 0 0.0% 0 0.0% 0 0.0% 0 0.0% 0 0.0% 0Uxbridge 1.1% 15 0.0% 0 0.0% 0 0.0% 0 0.0% 0 0.0% 0 0.0% 0 0.0% 0 0.0% 0 0.0% 0 0.0% 0Wallingford 1.0% 15 0.0% 0 0.0% 0 0.0% 0 0.0% 0 0.0% 0 0.0% 0 0.0% 0 0.0% 0 27.6% 14 2.9% 1Wantage 0.4% 5 0.0% 0 0.0% 0 0.0% 0 0.0% 0 0.9% 1 0.0% 0 0.0% 0 24.4% 5 0.0% 0 0.0% 0Watlington 0.0% 0 0.0% 0 0.0% 0 0.0% 0 0.0% 0 0.0% 0 0.0% 0 0.0% 0 0.0% 0 0.0% 0 0.0% 0Westfield London,
Shepherd's Bush, London 0.5% 7 0.0% 0 0.0% 0 0.0% 0 0.0% 0 0.0% 0 0.0% 0 0.0% 0 0.0% 0 0.0% 0 0.0% 0
Winchester 0.1% 1 0.0% 0 0.0% 0 0.8% 1 0.9% 0 0.0% 0 1.5% 0 0.0% 0 0.0% 0 0.0% 0 0.0% 0Windsor 5.6% 82 0.0% 0 0.0% 0 0.0% 0 0.0% 0 0.0% 0 0.0% 0 0.0% 0 0.0% 0 0.0% 0 0.0% 0Winnersh 0.1% 2 1.1% 1 0.0% 0 0.0% 0 0.0% 0 0.0% 0 0.0% 0 0.0% 0 0.0% 0 0.0% 0 0.0% 0Woking 3.4% 49 0.0% 0 0.0% 0 0.0% 0 0.0% 0 0.0% 0 0.0% 0 0.0% 0 0.0% 0 0.0% 0 0.0% 0Wokingham Town Centre 3.6% 52 61.1% 33 1.0% 1 0.0% 0 0.0% 0 0.0% 0 0.0% 0 0.0% 0 0.0% 0 0.0% 0 0.0% 0Wokingham (other locations,
not in the town centre) 0.2% 3 3.5% 2 0.0% 0 0.0% 0 0.0% 0 0.0% 0 0.0% 0 0.0% 0 0.0% 0 0.0% 0 0.0% 0
Woodley 2.7% 39 0.0% 0 0.0% 0 0.0% 0 0.8% 0 0.0% 0 0.0% 0 0.0% 0 0.0% 0 0.0% 0 0.0% 0Yateley 0.5% 8 0.0% 0 0.0% 0 0.0% 0 0.0% 0 0.0% 0 0.0% 0 0.0% 0 0.0% 0 0.0% 0 0.0% 0Other 4.8% 69 3.1% 2 5.6% 3 0.8% 1 14.4% 6 0.9% 1 3.8% 1 1.2% 0 2.2% 0 1.6% 1 4.1% 1Andover 0.5% 8 0.0% 0 0.0% 0 0.0% 0 0.0% 0 0.0% 0 40.8% 8 2.0% 0 0.0% 0 0.0% 0 0.0% 0Ascot 0.4% 6 0.0% 0 0.0% 0 0.0% 0 0.0% 0 0.0% 0 0.0% 0 0.0% 0 0.0% 0 0.0% 0 0.0% 0Benson 0.1% 1 0.0% 0 0.0% 0 0.0% 0 0.0% 0 0.0% 0 0.0% 0 0.0% 0 0.0% 0 1.7% 1 0.0% 0Caversham 0.3% 5 0.0% 0 0.0% 0 0.0% 0 0.0% 0 0.0% 0 0.0% 0 0.0% 0 0.0% 0 0.0% 0 1.0% 0Goring-on-Thames 0.1% 1 0.0% 0 0.0% 0 0.0% 0 0.0% 0 0.0% 0 0.0% 0 0.0% 0 0.0% 0 1.3% 1 2.4% 0Overton 0.0% 1 0.0% 0 0.0% 0 0.0% 0 0.0% 0 0.0% 0 2.9% 1 0.0% 0 0.0% 0 0.0% 0 0.0% 0Tilehurst 0.5% 8 0.0% 0 0.0% 0 0.0% 0 0.0% 0 0.0% 0 0.0% 0 0.0% 0 0.0% 0 0.0% 0 0.0% 0(Don't know / varies) 7.9% 115 11.3% 6 3.1% 2 12.0% 11 2.8% 1 3.7% 3 11.8% 2 2.0% 0 18.4% 4 11.1% 6 12.0% 2Weighted base: 1452 55 62 93 42 75 18 20 19 51 18Sample: 1377 66 66 65 64 72 50 69 67 68 63
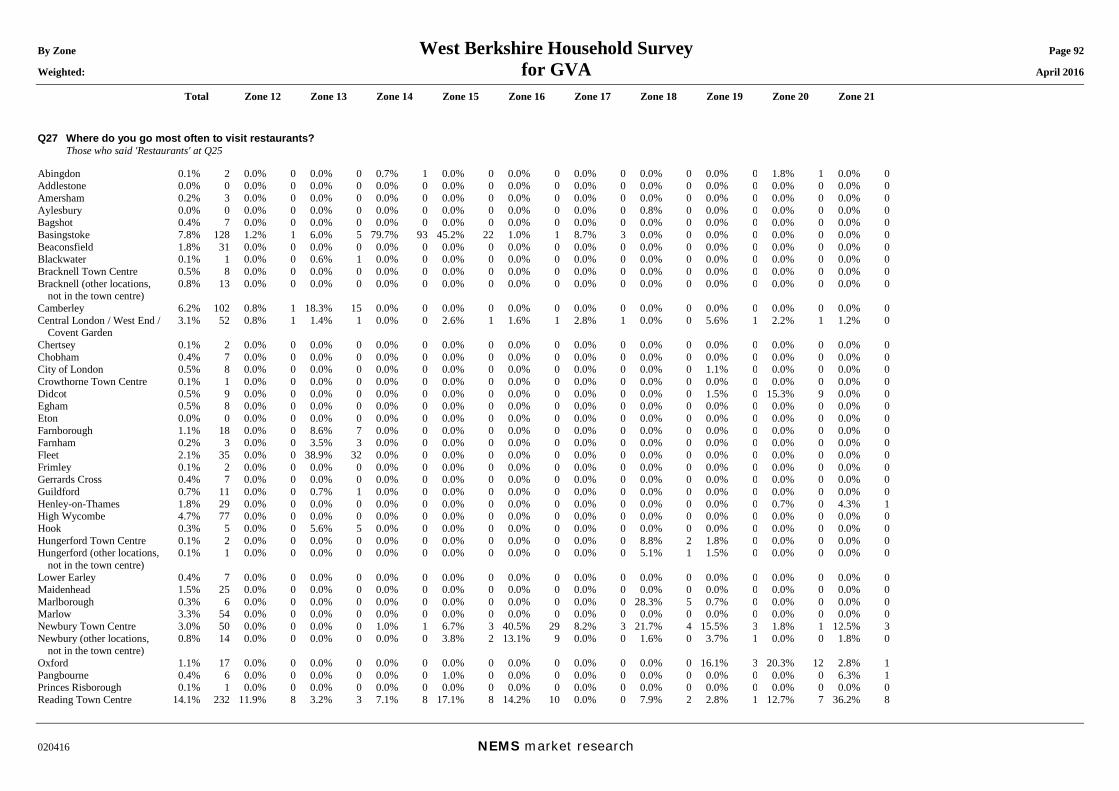
By Zone West Berkshire Household Survey Page 92 Weighted: for GVA April 2016
Total Zone 12 Zone 13 Zone 14 Zone 15 Zone 16 Zone 17 Zone 18 Zone 19 Zone 20 Zone 21
020416 NEMS market research
Q27 Where do you go most often to visit restaurants? Those who said 'Restaurants' at Q25 Abingdon 0.1% 2 0.0% 0 0.0% 0 0.7% 1 0.0% 0 0.0% 0 0.0% 0 0.0% 0 0.0% 0 1.8% 1 0.0% 0Addlestone 0.0% 0 0.0% 0 0.0% 0 0.0% 0 0.0% 0 0.0% 0 0.0% 0 0.0% 0 0.0% 0 0.0% 0 0.0% 0Amersham 0.2% 3 0.0% 0 0.0% 0 0.0% 0 0.0% 0 0.0% 0 0.0% 0 0.0% 0 0.0% 0 0.0% 0 0.0% 0Aylesbury 0.0% 0 0.0% 0 0.0% 0 0.0% 0 0.0% 0 0.0% 0 0.0% 0 0.8% 0 0.0% 0 0.0% 0 0.0% 0Bagshot 0.4% 7 0.0% 0 0.0% 0 0.0% 0 0.0% 0 0.0% 0 0.0% 0 0.0% 0 0.0% 0 0.0% 0 0.0% 0Basingstoke 7.8% 128 1.2% 1 6.0% 5 79.7% 93 45.2% 22 1.0% 1 8.7% 3 0.0% 0 0.0% 0 0.0% 0 0.0% 0Beaconsfield 1.8% 31 0.0% 0 0.0% 0 0.0% 0 0.0% 0 0.0% 0 0.0% 0 0.0% 0 0.0% 0 0.0% 0 0.0% 0Blackwater 0.1% 1 0.0% 0 0.6% 1 0.0% 0 0.0% 0 0.0% 0 0.0% 0 0.0% 0 0.0% 0 0.0% 0 0.0% 0Bracknell Town Centre 0.5% 8 0.0% 0 0.0% 0 0.0% 0 0.0% 0 0.0% 0 0.0% 0 0.0% 0 0.0% 0 0.0% 0 0.0% 0Bracknell (other locations,
not in the town centre) 0.8% 13 0.0% 0 0.0% 0 0.0% 0 0.0% 0 0.0% 0 0.0% 0 0.0% 0 0.0% 0 0.0% 0 0.0% 0
Camberley 6.2% 102 0.8% 1 18.3% 15 0.0% 0 0.0% 0 0.0% 0 0.0% 0 0.0% 0 0.0% 0 0.0% 0 0.0% 0Central London / West End /
Covent Garden 3.1% 52 0.8% 1 1.4% 1 0.0% 0 2.6% 1 1.6% 1 2.8% 1 0.0% 0 5.6% 1 2.2% 1 1.2% 0
Chertsey 0.1% 2 0.0% 0 0.0% 0 0.0% 0 0.0% 0 0.0% 0 0.0% 0 0.0% 0 0.0% 0 0.0% 0 0.0% 0Chobham 0.4% 7 0.0% 0 0.0% 0 0.0% 0 0.0% 0 0.0% 0 0.0% 0 0.0% 0 0.0% 0 0.0% 0 0.0% 0City of London 0.5% 8 0.0% 0 0.0% 0 0.0% 0 0.0% 0 0.0% 0 0.0% 0 0.0% 0 1.1% 0 0.0% 0 0.0% 0Crowthorne Town Centre 0.1% 1 0.0% 0 0.0% 0 0.0% 0 0.0% 0 0.0% 0 0.0% 0 0.0% 0 0.0% 0 0.0% 0 0.0% 0Didcot 0.5% 9 0.0% 0 0.0% 0 0.0% 0 0.0% 0 0.0% 0 0.0% 0 0.0% 0 1.5% 0 15.3% 9 0.0% 0Egham 0.5% 8 0.0% 0 0.0% 0 0.0% 0 0.0% 0 0.0% 0 0.0% 0 0.0% 0 0.0% 0 0.0% 0 0.0% 0Eton 0.0% 0 0.0% 0 0.0% 0 0.0% 0 0.0% 0 0.0% 0 0.0% 0 0.0% 0 0.0% 0 0.0% 0 0.0% 0Farnborough 1.1% 18 0.0% 0 8.6% 7 0.0% 0 0.0% 0 0.0% 0 0.0% 0 0.0% 0 0.0% 0 0.0% 0 0.0% 0Farnham 0.2% 3 0.0% 0 3.5% 3 0.0% 0 0.0% 0 0.0% 0 0.0% 0 0.0% 0 0.0% 0 0.0% 0 0.0% 0Fleet 2.1% 35 0.0% 0 38.9% 32 0.0% 0 0.0% 0 0.0% 0 0.0% 0 0.0% 0 0.0% 0 0.0% 0 0.0% 0Frimley 0.1% 2 0.0% 0 0.0% 0 0.0% 0 0.0% 0 0.0% 0 0.0% 0 0.0% 0 0.0% 0 0.0% 0 0.0% 0Gerrards Cross 0.4% 7 0.0% 0 0.0% 0 0.0% 0 0.0% 0 0.0% 0 0.0% 0 0.0% 0 0.0% 0 0.0% 0 0.0% 0Guildford 0.7% 11 0.0% 0 0.7% 1 0.0% 0 0.0% 0 0.0% 0 0.0% 0 0.0% 0 0.0% 0 0.0% 0 0.0% 0Henley-on-Thames 1.8% 29 0.0% 0 0.0% 0 0.0% 0 0.0% 0 0.0% 0 0.0% 0 0.0% 0 0.0% 0 0.7% 0 4.3% 1High Wycombe 4.7% 77 0.0% 0 0.0% 0 0.0% 0 0.0% 0 0.0% 0 0.0% 0 0.0% 0 0.0% 0 0.0% 0 0.0% 0Hook 0.3% 5 0.0% 0 5.6% 5 0.0% 0 0.0% 0 0.0% 0 0.0% 0 0.0% 0 0.0% 0 0.0% 0 0.0% 0Hungerford Town Centre 0.1% 2 0.0% 0 0.0% 0 0.0% 0 0.0% 0 0.0% 0 0.0% 0 8.8% 2 1.8% 0 0.0% 0 0.0% 0Hungerford (other locations,
not in the town centre) 0.1% 1 0.0% 0 0.0% 0 0.0% 0 0.0% 0 0.0% 0 0.0% 0 5.1% 1 1.5% 0 0.0% 0 0.0% 0
Lower Earley 0.4% 7 0.0% 0 0.0% 0 0.0% 0 0.0% 0 0.0% 0 0.0% 0 0.0% 0 0.0% 0 0.0% 0 0.0% 0Maidenhead 1.5% 25 0.0% 0 0.0% 0 0.0% 0 0.0% 0 0.0% 0 0.0% 0 0.0% 0 0.0% 0 0.0% 0 0.0% 0Marlborough 0.3% 6 0.0% 0 0.0% 0 0.0% 0 0.0% 0 0.0% 0 0.0% 0 28.3% 5 0.7% 0 0.0% 0 0.0% 0Marlow 3.3% 54 0.0% 0 0.0% 0 0.0% 0 0.0% 0 0.0% 0 0.0% 0 0.0% 0 0.0% 0 0.0% 0 0.0% 0Newbury Town Centre 3.0% 50 0.0% 0 0.0% 0 1.0% 1 6.7% 3 40.5% 29 8.2% 3 21.7% 4 15.5% 3 1.8% 1 12.5% 3Newbury (other locations,
not in the town centre) 0.8% 14 0.0% 0 0.0% 0 0.0% 0 3.8% 2 13.1% 9 0.0% 0 1.6% 0 3.7% 1 0.0% 0 1.8% 0
Oxford 1.1% 17 0.0% 0 0.0% 0 0.0% 0 0.0% 0 0.0% 0 0.0% 0 0.0% 0 16.1% 3 20.3% 12 2.8% 1Pangbourne 0.4% 6 0.0% 0 0.0% 0 0.0% 0 1.0% 0 0.0% 0 0.0% 0 0.0% 0 0.0% 0 0.0% 0 6.3% 1Princes Risborough 0.1% 1 0.0% 0 0.0% 0 0.0% 0 0.0% 0 0.0% 0 0.0% 0 0.0% 0 0.0% 0 0.0% 0 0.0% 0Reading Town Centre 14.1% 232 11.9% 8 3.2% 3 7.1% 8 17.1% 8 14.2% 10 0.0% 0 7.9% 2 2.8% 1 12.7% 7 36.2% 8
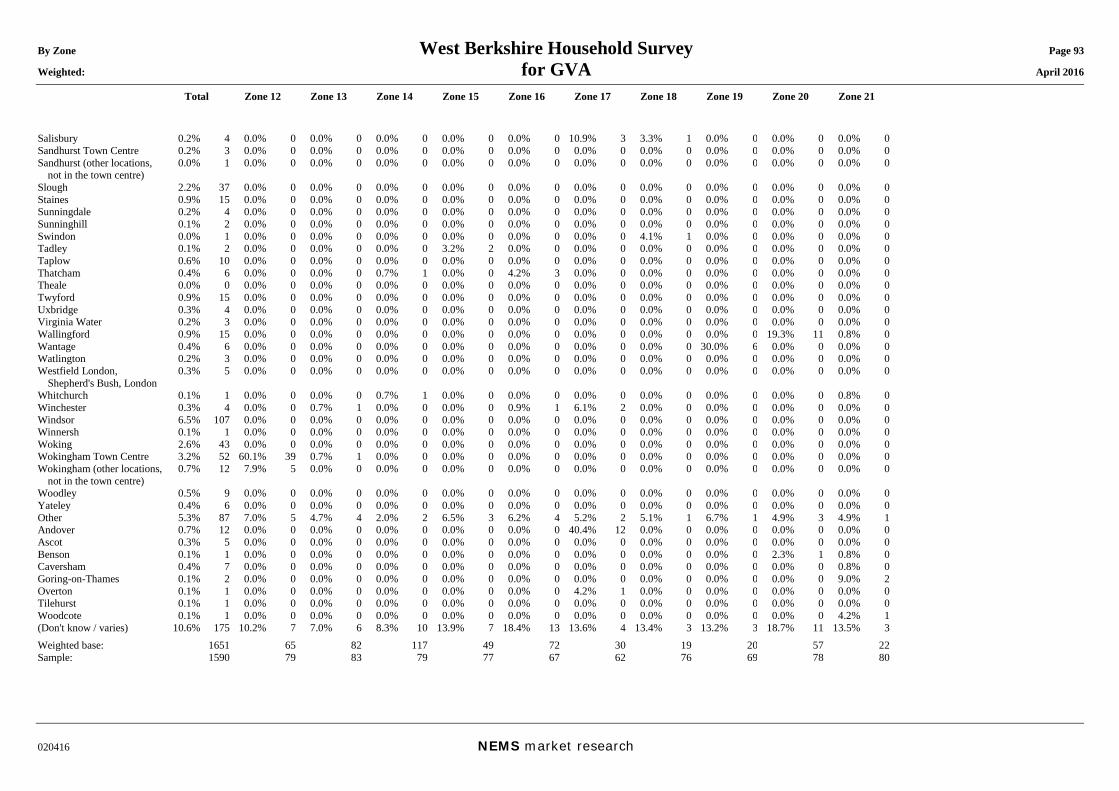
By Zone West Berkshire Household Survey Page 93 Weighted: for GVA April 2016
Total Zone 12 Zone 13 Zone 14 Zone 15 Zone 16 Zone 17 Zone 18 Zone 19 Zone 20 Zone 21
020416 NEMS market research
Salisbury 0.2% 4 0.0% 0 0.0% 0 0.0% 0 0.0% 0 0.0% 0 10.9% 3 3.3% 1 0.0% 0 0.0% 0 0.0% 0Sandhurst Town Centre 0.2% 3 0.0% 0 0.0% 0 0.0% 0 0.0% 0 0.0% 0 0.0% 0 0.0% 0 0.0% 0 0.0% 0 0.0% 0Sandhurst (other locations,
not in the town centre) 0.0% 1 0.0% 0 0.0% 0 0.0% 0 0.0% 0 0.0% 0 0.0% 0 0.0% 0 0.0% 0 0.0% 0 0.0% 0
Slough 2.2% 37 0.0% 0 0.0% 0 0.0% 0 0.0% 0 0.0% 0 0.0% 0 0.0% 0 0.0% 0 0.0% 0 0.0% 0Staines 0.9% 15 0.0% 0 0.0% 0 0.0% 0 0.0% 0 0.0% 0 0.0% 0 0.0% 0 0.0% 0 0.0% 0 0.0% 0Sunningdale 0.2% 4 0.0% 0 0.0% 0 0.0% 0 0.0% 0 0.0% 0 0.0% 0 0.0% 0 0.0% 0 0.0% 0 0.0% 0Sunninghill 0.1% 2 0.0% 0 0.0% 0 0.0% 0 0.0% 0 0.0% 0 0.0% 0 0.0% 0 0.0% 0 0.0% 0 0.0% 0Swindon 0.0% 1 0.0% 0 0.0% 0 0.0% 0 0.0% 0 0.0% 0 0.0% 0 4.1% 1 0.0% 0 0.0% 0 0.0% 0Tadley 0.1% 2 0.0% 0 0.0% 0 0.0% 0 3.2% 2 0.0% 0 0.0% 0 0.0% 0 0.0% 0 0.0% 0 0.0% 0Taplow 0.6% 10 0.0% 0 0.0% 0 0.0% 0 0.0% 0 0.0% 0 0.0% 0 0.0% 0 0.0% 0 0.0% 0 0.0% 0Thatcham 0.4% 6 0.0% 0 0.0% 0 0.7% 1 0.0% 0 4.2% 3 0.0% 0 0.0% 0 0.0% 0 0.0% 0 0.0% 0Theale 0.0% 0 0.0% 0 0.0% 0 0.0% 0 0.0% 0 0.0% 0 0.0% 0 0.0% 0 0.0% 0 0.0% 0 0.0% 0Twyford 0.9% 15 0.0% 0 0.0% 0 0.0% 0 0.0% 0 0.0% 0 0.0% 0 0.0% 0 0.0% 0 0.0% 0 0.0% 0Uxbridge 0.3% 4 0.0% 0 0.0% 0 0.0% 0 0.0% 0 0.0% 0 0.0% 0 0.0% 0 0.0% 0 0.0% 0 0.0% 0Virginia Water 0.2% 3 0.0% 0 0.0% 0 0.0% 0 0.0% 0 0.0% 0 0.0% 0 0.0% 0 0.0% 0 0.0% 0 0.0% 0Wallingford 0.9% 15 0.0% 0 0.0% 0 0.0% 0 0.0% 0 0.0% 0 0.0% 0 0.0% 0 0.0% 0 19.3% 11 0.8% 0Wantage 0.4% 6 0.0% 0 0.0% 0 0.0% 0 0.0% 0 0.0% 0 0.0% 0 0.0% 0 30.0% 6 0.0% 0 0.0% 0Watlington 0.2% 3 0.0% 0 0.0% 0 0.0% 0 0.0% 0 0.0% 0 0.0% 0 0.0% 0 0.0% 0 0.0% 0 0.0% 0Westfield London,
Shepherd's Bush, London 0.3% 5 0.0% 0 0.0% 0 0.0% 0 0.0% 0 0.0% 0 0.0% 0 0.0% 0 0.0% 0 0.0% 0 0.0% 0
Whitchurch 0.1% 1 0.0% 0 0.0% 0 0.7% 1 0.0% 0 0.0% 0 0.0% 0 0.0% 0 0.0% 0 0.0% 0 0.8% 0Winchester 0.3% 4 0.0% 0 0.7% 1 0.0% 0 0.0% 0 0.9% 1 6.1% 2 0.0% 0 0.0% 0 0.0% 0 0.0% 0Windsor 6.5% 107 0.0% 0 0.0% 0 0.0% 0 0.0% 0 0.0% 0 0.0% 0 0.0% 0 0.0% 0 0.0% 0 0.0% 0Winnersh 0.1% 1 0.0% 0 0.0% 0 0.0% 0 0.0% 0 0.0% 0 0.0% 0 0.0% 0 0.0% 0 0.0% 0 0.0% 0Woking 2.6% 43 0.0% 0 0.0% 0 0.0% 0 0.0% 0 0.0% 0 0.0% 0 0.0% 0 0.0% 0 0.0% 0 0.0% 0Wokingham Town Centre 3.2% 52 60.1% 39 0.7% 1 0.0% 0 0.0% 0 0.0% 0 0.0% 0 0.0% 0 0.0% 0 0.0% 0 0.0% 0Wokingham (other locations,
not in the town centre) 0.7% 12 7.9% 5 0.0% 0 0.0% 0 0.0% 0 0.0% 0 0.0% 0 0.0% 0 0.0% 0 0.0% 0 0.0% 0
Woodley 0.5% 9 0.0% 0 0.0% 0 0.0% 0 0.0% 0 0.0% 0 0.0% 0 0.0% 0 0.0% 0 0.0% 0 0.0% 0Yateley 0.4% 6 0.0% 0 0.0% 0 0.0% 0 0.0% 0 0.0% 0 0.0% 0 0.0% 0 0.0% 0 0.0% 0 0.0% 0Other 5.3% 87 7.0% 5 4.7% 4 2.0% 2 6.5% 3 6.2% 4 5.2% 2 5.1% 1 6.7% 1 4.9% 3 4.9% 1Andover 0.7% 12 0.0% 0 0.0% 0 0.0% 0 0.0% 0 0.0% 0 40.4% 12 0.0% 0 0.0% 0 0.0% 0 0.0% 0Ascot 0.3% 5 0.0% 0 0.0% 0 0.0% 0 0.0% 0 0.0% 0 0.0% 0 0.0% 0 0.0% 0 0.0% 0 0.0% 0Benson 0.1% 1 0.0% 0 0.0% 0 0.0% 0 0.0% 0 0.0% 0 0.0% 0 0.0% 0 0.0% 0 2.3% 1 0.8% 0Caversham 0.4% 7 0.0% 0 0.0% 0 0.0% 0 0.0% 0 0.0% 0 0.0% 0 0.0% 0 0.0% 0 0.0% 0 0.8% 0Goring-on-Thames 0.1% 2 0.0% 0 0.0% 0 0.0% 0 0.0% 0 0.0% 0 0.0% 0 0.0% 0 0.0% 0 0.0% 0 9.0% 2Overton 0.1% 1 0.0% 0 0.0% 0 0.0% 0 0.0% 0 0.0% 0 4.2% 1 0.0% 0 0.0% 0 0.0% 0 0.0% 0Tilehurst 0.1% 1 0.0% 0 0.0% 0 0.0% 0 0.0% 0 0.0% 0 0.0% 0 0.0% 0 0.0% 0 0.0% 0 0.0% 0Woodcote 0.1% 1 0.0% 0 0.0% 0 0.0% 0 0.0% 0 0.0% 0 0.0% 0 0.0% 0 0.0% 0 0.0% 0 4.2% 1(Don't know / varies) 10.6% 175 10.2% 7 7.0% 6 8.3% 10 13.9% 7 18.4% 13 13.6% 4 13.4% 3 13.2% 3 18.7% 11 13.5% 3Weighted base: 1651 65 82 117 49 72 30 19 20 57 22Sample: 1590 79 83 79 77 67 62 76 69 78 80
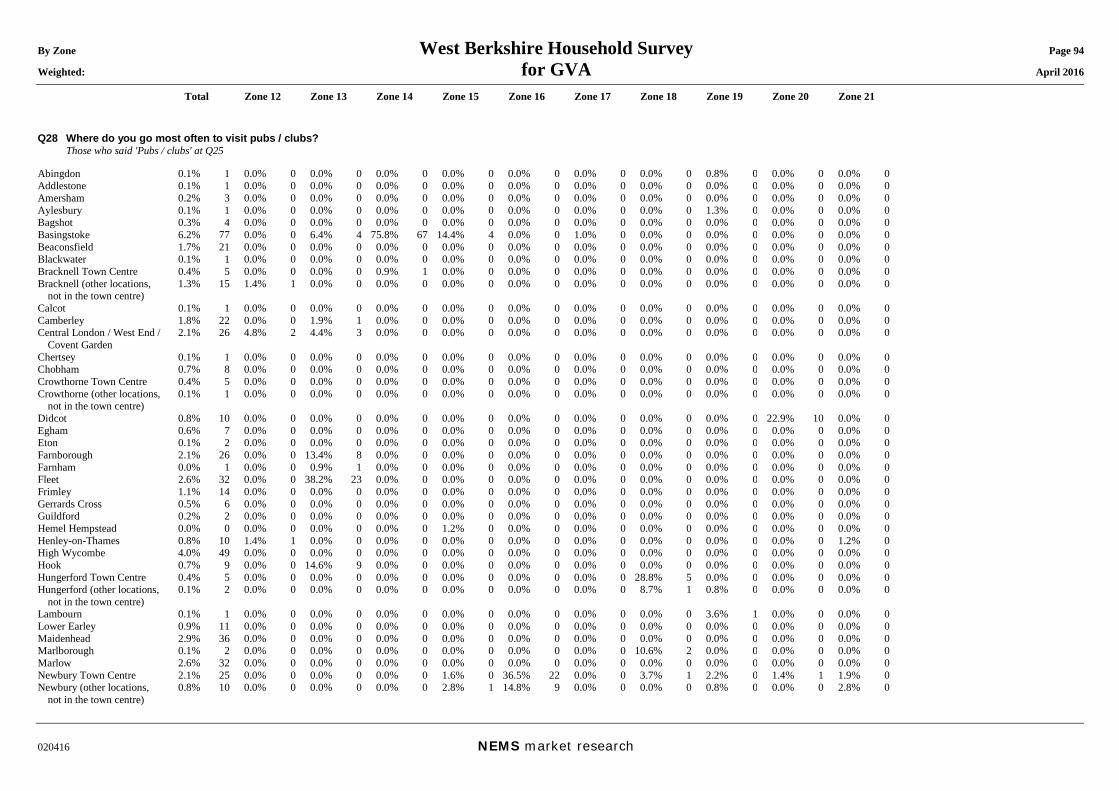
By Zone West Berkshire Household Survey Page 94 Weighted: for GVA April 2016
Total Zone 12 Zone 13 Zone 14 Zone 15 Zone 16 Zone 17 Zone 18 Zone 19 Zone 20 Zone 21
020416 NEMS market research
Q28 Where do you go most often to visit pubs / clubs? Those who said 'Pubs / clubs' at Q25 Abingdon 0.1% 1 0.0% 0 0.0% 0 0.0% 0 0.0% 0 0.0% 0 0.0% 0 0.0% 0 0.8% 0 0.0% 0 0.0% 0Addlestone 0.1% 1 0.0% 0 0.0% 0 0.0% 0 0.0% 0 0.0% 0 0.0% 0 0.0% 0 0.0% 0 0.0% 0 0.0% 0Amersham 0.2% 3 0.0% 0 0.0% 0 0.0% 0 0.0% 0 0.0% 0 0.0% 0 0.0% 0 0.0% 0 0.0% 0 0.0% 0Aylesbury 0.1% 1 0.0% 0 0.0% 0 0.0% 0 0.0% 0 0.0% 0 0.0% 0 0.0% 0 1.3% 0 0.0% 0 0.0% 0Bagshot 0.3% 4 0.0% 0 0.0% 0 0.0% 0 0.0% 0 0.0% 0 0.0% 0 0.0% 0 0.0% 0 0.0% 0 0.0% 0Basingstoke 6.2% 77 0.0% 0 6.4% 4 75.8% 67 14.4% 4 0.0% 0 1.0% 0 0.0% 0 0.0% 0 0.0% 0 0.0% 0Beaconsfield 1.7% 21 0.0% 0 0.0% 0 0.0% 0 0.0% 0 0.0% 0 0.0% 0 0.0% 0 0.0% 0 0.0% 0 0.0% 0Blackwater 0.1% 1 0.0% 0 0.0% 0 0.0% 0 0.0% 0 0.0% 0 0.0% 0 0.0% 0 0.0% 0 0.0% 0 0.0% 0Bracknell Town Centre 0.4% 5 0.0% 0 0.0% 0 0.9% 1 0.0% 0 0.0% 0 0.0% 0 0.0% 0 0.0% 0 0.0% 0 0.0% 0Bracknell (other locations,
not in the town centre) 1.3% 15 1.4% 1 0.0% 0 0.0% 0 0.0% 0 0.0% 0 0.0% 0 0.0% 0 0.0% 0 0.0% 0 0.0% 0
Calcot 0.1% 1 0.0% 0 0.0% 0 0.0% 0 0.0% 0 0.0% 0 0.0% 0 0.0% 0 0.0% 0 0.0% 0 0.0% 0Camberley 1.8% 22 0.0% 0 1.9% 1 0.0% 0 0.0% 0 0.0% 0 0.0% 0 0.0% 0 0.0% 0 0.0% 0 0.0% 0Central London / West End /
Covent Garden 2.1% 26 4.8% 2 4.4% 3 0.0% 0 0.0% 0 0.0% 0 0.0% 0 0.0% 0 0.0% 0 0.0% 0 0.0% 0
Chertsey 0.1% 1 0.0% 0 0.0% 0 0.0% 0 0.0% 0 0.0% 0 0.0% 0 0.0% 0 0.0% 0 0.0% 0 0.0% 0Chobham 0.7% 8 0.0% 0 0.0% 0 0.0% 0 0.0% 0 0.0% 0 0.0% 0 0.0% 0 0.0% 0 0.0% 0 0.0% 0Crowthorne Town Centre 0.4% 5 0.0% 0 0.0% 0 0.0% 0 0.0% 0 0.0% 0 0.0% 0 0.0% 0 0.0% 0 0.0% 0 0.0% 0Crowthorne (other locations,
not in the town centre) 0.1% 1 0.0% 0 0.0% 0 0.0% 0 0.0% 0 0.0% 0 0.0% 0 0.0% 0 0.0% 0 0.0% 0 0.0% 0
Didcot 0.8% 10 0.0% 0 0.0% 0 0.0% 0 0.0% 0 0.0% 0 0.0% 0 0.0% 0 0.0% 0 22.9% 10 0.0% 0Egham 0.6% 7 0.0% 0 0.0% 0 0.0% 0 0.0% 0 0.0% 0 0.0% 0 0.0% 0 0.0% 0 0.0% 0 0.0% 0Eton 0.1% 2 0.0% 0 0.0% 0 0.0% 0 0.0% 0 0.0% 0 0.0% 0 0.0% 0 0.0% 0 0.0% 0 0.0% 0Farnborough 2.1% 26 0.0% 0 13.4% 8 0.0% 0 0.0% 0 0.0% 0 0.0% 0 0.0% 0 0.0% 0 0.0% 0 0.0% 0Farnham 0.0% 1 0.0% 0 0.9% 1 0.0% 0 0.0% 0 0.0% 0 0.0% 0 0.0% 0 0.0% 0 0.0% 0 0.0% 0Fleet 2.6% 32 0.0% 0 38.2% 23 0.0% 0 0.0% 0 0.0% 0 0.0% 0 0.0% 0 0.0% 0 0.0% 0 0.0% 0Frimley 1.1% 14 0.0% 0 0.0% 0 0.0% 0 0.0% 0 0.0% 0 0.0% 0 0.0% 0 0.0% 0 0.0% 0 0.0% 0Gerrards Cross 0.5% 6 0.0% 0 0.0% 0 0.0% 0 0.0% 0 0.0% 0 0.0% 0 0.0% 0 0.0% 0 0.0% 0 0.0% 0Guildford 0.2% 2 0.0% 0 0.0% 0 0.0% 0 0.0% 0 0.0% 0 0.0% 0 0.0% 0 0.0% 0 0.0% 0 0.0% 0Hemel Hempstead 0.0% 0 0.0% 0 0.0% 0 0.0% 0 1.2% 0 0.0% 0 0.0% 0 0.0% 0 0.0% 0 0.0% 0 0.0% 0Henley-on-Thames 0.8% 10 1.4% 1 0.0% 0 0.0% 0 0.0% 0 0.0% 0 0.0% 0 0.0% 0 0.0% 0 0.0% 0 1.2% 0High Wycombe 4.0% 49 0.0% 0 0.0% 0 0.0% 0 0.0% 0 0.0% 0 0.0% 0 0.0% 0 0.0% 0 0.0% 0 0.0% 0Hook 0.7% 9 0.0% 0 14.6% 9 0.0% 0 0.0% 0 0.0% 0 0.0% 0 0.0% 0 0.0% 0 0.0% 0 0.0% 0Hungerford Town Centre 0.4% 5 0.0% 0 0.0% 0 0.0% 0 0.0% 0 0.0% 0 0.0% 0 28.8% 5 0.0% 0 0.0% 0 0.0% 0Hungerford (other locations,
not in the town centre) 0.1% 2 0.0% 0 0.0% 0 0.0% 0 0.0% 0 0.0% 0 0.0% 0 8.7% 1 0.8% 0 0.0% 0 0.0% 0
Lambourn 0.1% 1 0.0% 0 0.0% 0 0.0% 0 0.0% 0 0.0% 0 0.0% 0 0.0% 0 3.6% 1 0.0% 0 0.0% 0Lower Earley 0.9% 11 0.0% 0 0.0% 0 0.0% 0 0.0% 0 0.0% 0 0.0% 0 0.0% 0 0.0% 0 0.0% 0 0.0% 0Maidenhead 2.9% 36 0.0% 0 0.0% 0 0.0% 0 0.0% 0 0.0% 0 0.0% 0 0.0% 0 0.0% 0 0.0% 0 0.0% 0Marlborough 0.1% 2 0.0% 0 0.0% 0 0.0% 0 0.0% 0 0.0% 0 0.0% 0 10.6% 2 0.0% 0 0.0% 0 0.0% 0Marlow 2.6% 32 0.0% 0 0.0% 0 0.0% 0 0.0% 0 0.0% 0 0.0% 0 0.0% 0 0.0% 0 0.0% 0 0.0% 0Newbury Town Centre 2.1% 25 0.0% 0 0.0% 0 0.0% 0 1.6% 0 36.5% 22 0.0% 0 3.7% 1 2.2% 0 1.4% 1 1.9% 0Newbury (other locations,
not in the town centre) 0.8% 10 0.0% 0 0.0% 0 0.0% 0 2.8% 1 14.8% 9 0.0% 0 0.0% 0 0.8% 0 0.0% 0 2.8% 0
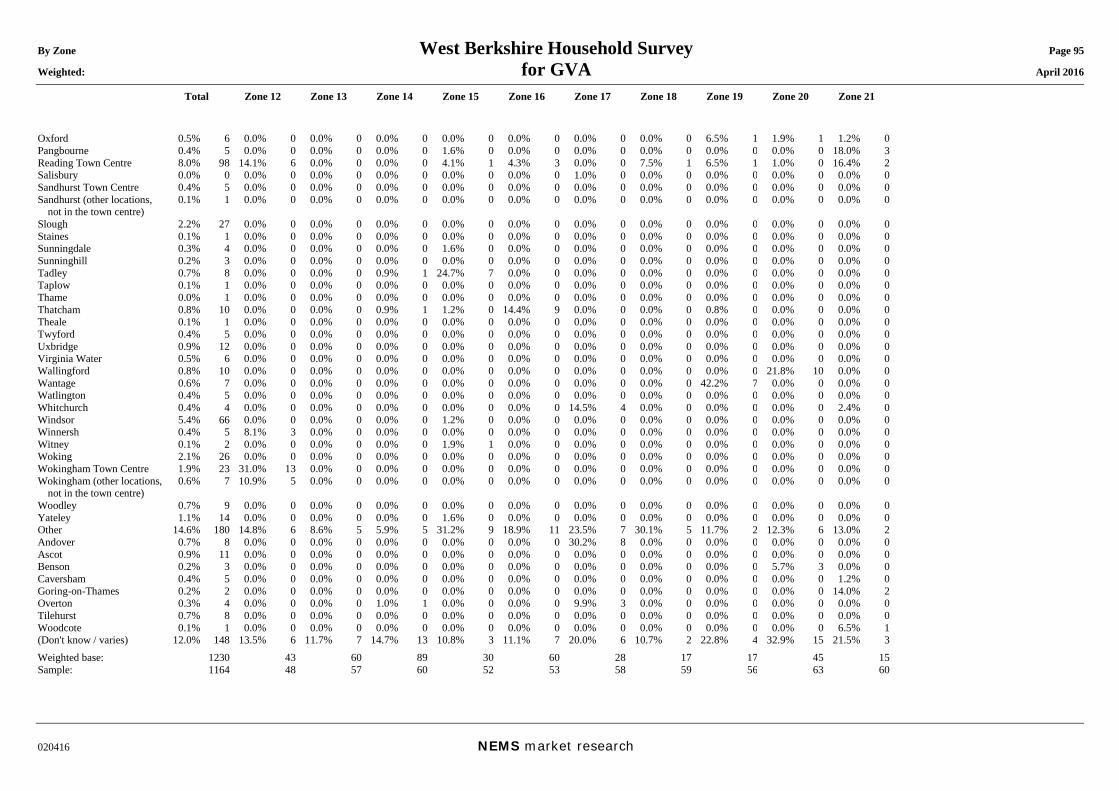
By Zone West Berkshire Household Survey Page 95 Weighted: for GVA April 2016
Total Zone 12 Zone 13 Zone 14 Zone 15 Zone 16 Zone 17 Zone 18 Zone 19 Zone 20 Zone 21
020416 NEMS market research
Oxford 0.5% 6 0.0% 0 0.0% 0 0.0% 0 0.0% 0 0.0% 0 0.0% 0 0.0% 0 6.5% 1 1.9% 1 1.2% 0Pangbourne 0.4% 5 0.0% 0 0.0% 0 0.0% 0 1.6% 0 0.0% 0 0.0% 0 0.0% 0 0.0% 0 0.0% 0 18.0% 3Reading Town Centre 8.0% 98 14.1% 6 0.0% 0 0.0% 0 4.1% 1 4.3% 3 0.0% 0 7.5% 1 6.5% 1 1.0% 0 16.4% 2Salisbury 0.0% 0 0.0% 0 0.0% 0 0.0% 0 0.0% 0 0.0% 0 1.0% 0 0.0% 0 0.0% 0 0.0% 0 0.0% 0Sandhurst Town Centre 0.4% 5 0.0% 0 0.0% 0 0.0% 0 0.0% 0 0.0% 0 0.0% 0 0.0% 0 0.0% 0 0.0% 0 0.0% 0Sandhurst (other locations,
not in the town centre) 0.1% 1 0.0% 0 0.0% 0 0.0% 0 0.0% 0 0.0% 0 0.0% 0 0.0% 0 0.0% 0 0.0% 0 0.0% 0
Slough 2.2% 27 0.0% 0 0.0% 0 0.0% 0 0.0% 0 0.0% 0 0.0% 0 0.0% 0 0.0% 0 0.0% 0 0.0% 0Staines 0.1% 1 0.0% 0 0.0% 0 0.0% 0 0.0% 0 0.0% 0 0.0% 0 0.0% 0 0.0% 0 0.0% 0 0.0% 0Sunningdale 0.3% 4 0.0% 0 0.0% 0 0.0% 0 1.6% 0 0.0% 0 0.0% 0 0.0% 0 0.0% 0 0.0% 0 0.0% 0Sunninghill 0.2% 3 0.0% 0 0.0% 0 0.0% 0 0.0% 0 0.0% 0 0.0% 0 0.0% 0 0.0% 0 0.0% 0 0.0% 0Tadley 0.7% 8 0.0% 0 0.0% 0 0.9% 1 24.7% 7 0.0% 0 0.0% 0 0.0% 0 0.0% 0 0.0% 0 0.0% 0Taplow 0.1% 1 0.0% 0 0.0% 0 0.0% 0 0.0% 0 0.0% 0 0.0% 0 0.0% 0 0.0% 0 0.0% 0 0.0% 0Thame 0.0% 1 0.0% 0 0.0% 0 0.0% 0 0.0% 0 0.0% 0 0.0% 0 0.0% 0 0.0% 0 0.0% 0 0.0% 0Thatcham 0.8% 10 0.0% 0 0.0% 0 0.9% 1 1.2% 0 14.4% 9 0.0% 0 0.0% 0 0.8% 0 0.0% 0 0.0% 0Theale 0.1% 1 0.0% 0 0.0% 0 0.0% 0 0.0% 0 0.0% 0 0.0% 0 0.0% 0 0.0% 0 0.0% 0 0.0% 0Twyford 0.4% 5 0.0% 0 0.0% 0 0.0% 0 0.0% 0 0.0% 0 0.0% 0 0.0% 0 0.0% 0 0.0% 0 0.0% 0Uxbridge 0.9% 12 0.0% 0 0.0% 0 0.0% 0 0.0% 0 0.0% 0 0.0% 0 0.0% 0 0.0% 0 0.0% 0 0.0% 0Virginia Water 0.5% 6 0.0% 0 0.0% 0 0.0% 0 0.0% 0 0.0% 0 0.0% 0 0.0% 0 0.0% 0 0.0% 0 0.0% 0Wallingford 0.8% 10 0.0% 0 0.0% 0 0.0% 0 0.0% 0 0.0% 0 0.0% 0 0.0% 0 0.0% 0 21.8% 10 0.0% 0Wantage 0.6% 7 0.0% 0 0.0% 0 0.0% 0 0.0% 0 0.0% 0 0.0% 0 0.0% 0 42.2% 7 0.0% 0 0.0% 0Watlington 0.4% 5 0.0% 0 0.0% 0 0.0% 0 0.0% 0 0.0% 0 0.0% 0 0.0% 0 0.0% 0 0.0% 0 0.0% 0Whitchurch 0.4% 4 0.0% 0 0.0% 0 0.0% 0 0.0% 0 0.0% 0 14.5% 4 0.0% 0 0.0% 0 0.0% 0 2.4% 0Windsor 5.4% 66 0.0% 0 0.0% 0 0.0% 0 1.2% 0 0.0% 0 0.0% 0 0.0% 0 0.0% 0 0.0% 0 0.0% 0Winnersh 0.4% 5 8.1% 3 0.0% 0 0.0% 0 0.0% 0 0.0% 0 0.0% 0 0.0% 0 0.0% 0 0.0% 0 0.0% 0Witney 0.1% 2 0.0% 0 0.0% 0 0.0% 0 1.9% 1 0.0% 0 0.0% 0 0.0% 0 0.0% 0 0.0% 0 0.0% 0Woking 2.1% 26 0.0% 0 0.0% 0 0.0% 0 0.0% 0 0.0% 0 0.0% 0 0.0% 0 0.0% 0 0.0% 0 0.0% 0Wokingham Town Centre 1.9% 23 31.0% 13 0.0% 0 0.0% 0 0.0% 0 0.0% 0 0.0% 0 0.0% 0 0.0% 0 0.0% 0 0.0% 0Wokingham (other locations,
not in the town centre) 0.6% 7 10.9% 5 0.0% 0 0.0% 0 0.0% 0 0.0% 0 0.0% 0 0.0% 0 0.0% 0 0.0% 0 0.0% 0
Woodley 0.7% 9 0.0% 0 0.0% 0 0.0% 0 0.0% 0 0.0% 0 0.0% 0 0.0% 0 0.0% 0 0.0% 0 0.0% 0Yateley 1.1% 14 0.0% 0 0.0% 0 0.0% 0 1.6% 0 0.0% 0 0.0% 0 0.0% 0 0.0% 0 0.0% 0 0.0% 0Other 14.6% 180 14.8% 6 8.6% 5 5.9% 5 31.2% 9 18.9% 11 23.5% 7 30.1% 5 11.7% 2 12.3% 6 13.0% 2Andover 0.7% 8 0.0% 0 0.0% 0 0.0% 0 0.0% 0 0.0% 0 30.2% 8 0.0% 0 0.0% 0 0.0% 0 0.0% 0Ascot 0.9% 11 0.0% 0 0.0% 0 0.0% 0 0.0% 0 0.0% 0 0.0% 0 0.0% 0 0.0% 0 0.0% 0 0.0% 0Benson 0.2% 3 0.0% 0 0.0% 0 0.0% 0 0.0% 0 0.0% 0 0.0% 0 0.0% 0 0.0% 0 5.7% 3 0.0% 0Caversham 0.4% 5 0.0% 0 0.0% 0 0.0% 0 0.0% 0 0.0% 0 0.0% 0 0.0% 0 0.0% 0 0.0% 0 1.2% 0Goring-on-Thames 0.2% 2 0.0% 0 0.0% 0 0.0% 0 0.0% 0 0.0% 0 0.0% 0 0.0% 0 0.0% 0 0.0% 0 14.0% 2Overton 0.3% 4 0.0% 0 0.0% 0 1.0% 1 0.0% 0 0.0% 0 9.9% 3 0.0% 0 0.0% 0 0.0% 0 0.0% 0Tilehurst 0.7% 8 0.0% 0 0.0% 0 0.0% 0 0.0% 0 0.0% 0 0.0% 0 0.0% 0 0.0% 0 0.0% 0 0.0% 0Woodcote 0.1% 1 0.0% 0 0.0% 0 0.0% 0 0.0% 0 0.0% 0 0.0% 0 0.0% 0 0.0% 0 0.0% 0 6.5% 1(Don't know / varies) 12.0% 148 13.5% 6 11.7% 7 14.7% 13 10.8% 3 11.1% 7 20.0% 6 10.7% 2 22.8% 4 32.9% 15 21.5% 3Weighted base: 1230 43 60 89 30 60 28 17 17 45 15Sample: 1164 48 57 60 52 53 58 59 56 63 60
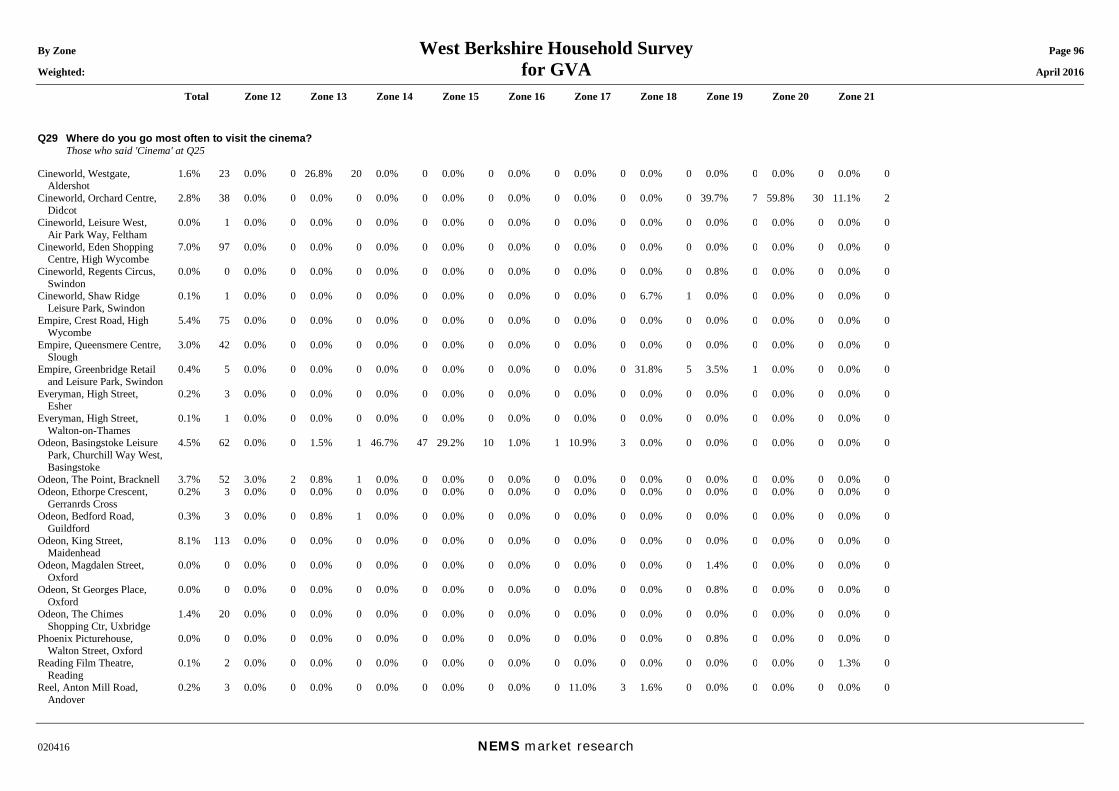
By Zone West Berkshire Household Survey Page 96 Weighted: for GVA April 2016
Total Zone 12 Zone 13 Zone 14 Zone 15 Zone 16 Zone 17 Zone 18 Zone 19 Zone 20 Zone 21
020416 NEMS market research
Q29 Where do you go most often to visit the cinema? Those who said 'Cinema' at Q25 Cineworld, Westgate,
Aldershot 1.6% 23 0.0% 0 26.8% 20 0.0% 0 0.0% 0 0.0% 0 0.0% 0 0.0% 0 0.0% 0 0.0% 0 0.0% 0
Cineworld, Orchard Centre, Didcot
2.8% 38 0.0% 0 0.0% 0 0.0% 0 0.0% 0 0.0% 0 0.0% 0 0.0% 0 39.7% 7 59.8% 30 11.1% 2
Cineworld, Leisure West, Air Park Way, Feltham
0.0% 1 0.0% 0 0.0% 0 0.0% 0 0.0% 0 0.0% 0 0.0% 0 0.0% 0 0.0% 0 0.0% 0 0.0% 0
Cineworld, Eden Shopping Centre, High Wycombe
7.0% 97 0.0% 0 0.0% 0 0.0% 0 0.0% 0 0.0% 0 0.0% 0 0.0% 0 0.0% 0 0.0% 0 0.0% 0
Cineworld, Regents Circus, Swindon
0.0% 0 0.0% 0 0.0% 0 0.0% 0 0.0% 0 0.0% 0 0.0% 0 0.0% 0 0.8% 0 0.0% 0 0.0% 0
Cineworld, Shaw Ridge Leisure Park, Swindon
0.1% 1 0.0% 0 0.0% 0 0.0% 0 0.0% 0 0.0% 0 0.0% 0 6.7% 1 0.0% 0 0.0% 0 0.0% 0
Empire, Crest Road, High Wycombe
5.4% 75 0.0% 0 0.0% 0 0.0% 0 0.0% 0 0.0% 0 0.0% 0 0.0% 0 0.0% 0 0.0% 0 0.0% 0
Empire, Queensmere Centre, Slough
3.0% 42 0.0% 0 0.0% 0 0.0% 0 0.0% 0 0.0% 0 0.0% 0 0.0% 0 0.0% 0 0.0% 0 0.0% 0
Empire, Greenbridge Retail and Leisure Park, Swindon
0.4% 5 0.0% 0 0.0% 0 0.0% 0 0.0% 0 0.0% 0 0.0% 0 31.8% 5 3.5% 1 0.0% 0 0.0% 0
Everyman, High Street, Esher
0.2% 3 0.0% 0 0.0% 0 0.0% 0 0.0% 0 0.0% 0 0.0% 0 0.0% 0 0.0% 0 0.0% 0 0.0% 0
Everyman, High Street, Walton-on-Thames
0.1% 1 0.0% 0 0.0% 0 0.0% 0 0.0% 0 0.0% 0 0.0% 0 0.0% 0 0.0% 0 0.0% 0 0.0% 0
Odeon, Basingstoke Leisure Park, Churchill Way West, Basingstoke
4.5% 62 0.0% 0 1.5% 1 46.7% 47 29.2% 10 1.0% 1 10.9% 3 0.0% 0 0.0% 0 0.0% 0 0.0% 0
Odeon, The Point, Bracknell 3.7% 52 3.0% 2 0.8% 1 0.0% 0 0.0% 0 0.0% 0 0.0% 0 0.0% 0 0.0% 0 0.0% 0 0.0% 0Odeon, Ethorpe Crescent,
Gerranrds Cross 0.2% 3 0.0% 0 0.0% 0 0.0% 0 0.0% 0 0.0% 0 0.0% 0 0.0% 0 0.0% 0 0.0% 0 0.0% 0
Odeon, Bedford Road, Guildford
0.3% 3 0.0% 0 0.8% 1 0.0% 0 0.0% 0 0.0% 0 0.0% 0 0.0% 0 0.0% 0 0.0% 0 0.0% 0
Odeon, King Street, Maidenhead
8.1% 113 0.0% 0 0.0% 0 0.0% 0 0.0% 0 0.0% 0 0.0% 0 0.0% 0 0.0% 0 0.0% 0 0.0% 0
Odeon, Magdalen Street, Oxford
0.0% 0 0.0% 0 0.0% 0 0.0% 0 0.0% 0 0.0% 0 0.0% 0 0.0% 0 1.4% 0 0.0% 0 0.0% 0
Odeon, St Georges Place, Oxford
0.0% 0 0.0% 0 0.0% 0 0.0% 0 0.0% 0 0.0% 0 0.0% 0 0.0% 0 0.8% 0 0.0% 0 0.0% 0
Odeon, The Chimes Shopping Ctr, Uxbridge
1.4% 20 0.0% 0 0.0% 0 0.0% 0 0.0% 0 0.0% 0 0.0% 0 0.0% 0 0.0% 0 0.0% 0 0.0% 0
Phoenix Picturehouse, Walton Street, Oxford
0.0% 0 0.0% 0 0.0% 0 0.0% 0 0.0% 0 0.0% 0 0.0% 0 0.0% 0 0.8% 0 0.0% 0 0.0% 0
Reading Film Theatre, Reading
0.1% 2 0.0% 0 0.0% 0 0.0% 0 0.0% 0 0.0% 0 0.0% 0 0.0% 0 0.0% 0 0.0% 0 1.3% 0
Reel, Anton Mill Road, Andover
0.2% 3 0.0% 0 0.0% 0 0.0% 0 0.0% 0 0.0% 0 11.0% 3 1.6% 0 0.0% 0 0.0% 0 0.0% 0
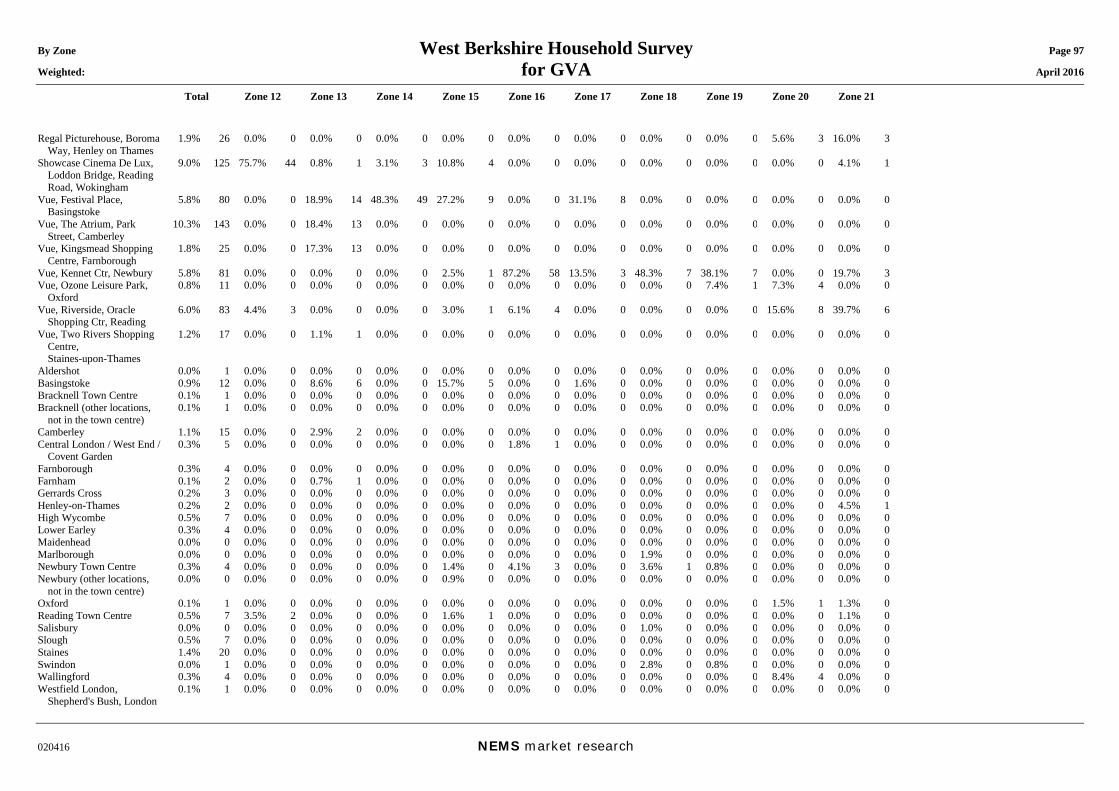
By Zone West Berkshire Household Survey Page 97 Weighted: for GVA April 2016
Total Zone 12 Zone 13 Zone 14 Zone 15 Zone 16 Zone 17 Zone 18 Zone 19 Zone 20 Zone 21
020416 NEMS market research
Regal Picturehouse, Boroma Way, Henley on Thames
1.9% 26 0.0% 0 0.0% 0 0.0% 0 0.0% 0 0.0% 0 0.0% 0 0.0% 0 0.0% 0 5.6% 3 16.0% 3
Showcase Cinema De Lux, Loddon Bridge, Reading Road, Wokingham
9.0% 125 75.7% 44 0.8% 1 3.1% 3 10.8% 4 0.0% 0 0.0% 0 0.0% 0 0.0% 0 0.0% 0 4.1% 1
Vue, Festival Place, Basingstoke
5.8% 80 0.0% 0 18.9% 14 48.3% 49 27.2% 9 0.0% 0 31.1% 8 0.0% 0 0.0% 0 0.0% 0 0.0% 0
Vue, The Atrium, Park Street, Camberley
10.3% 143 0.0% 0 18.4% 13 0.0% 0 0.0% 0 0.0% 0 0.0% 0 0.0% 0 0.0% 0 0.0% 0 0.0% 0
Vue, Kingsmead Shopping Centre, Farnborough
1.8% 25 0.0% 0 17.3% 13 0.0% 0 0.0% 0 0.0% 0 0.0% 0 0.0% 0 0.0% 0 0.0% 0 0.0% 0
Vue, Kennet Ctr, Newbury 5.8% 81 0.0% 0 0.0% 0 0.0% 0 2.5% 1 87.2% 58 13.5% 3 48.3% 7 38.1% 7 0.0% 0 19.7% 3Vue, Ozone Leisure Park,
Oxford 0.8% 11 0.0% 0 0.0% 0 0.0% 0 0.0% 0 0.0% 0 0.0% 0 0.0% 0 7.4% 1 7.3% 4 0.0% 0
Vue, Riverside, Oracle Shopping Ctr, Reading
6.0% 83 4.4% 3 0.0% 0 0.0% 0 3.0% 1 6.1% 4 0.0% 0 0.0% 0 0.0% 0 15.6% 8 39.7% 6
Vue, Two Rivers Shopping Centre, Staines-upon-Thames
1.2% 17 0.0% 0 1.1% 1 0.0% 0 0.0% 0 0.0% 0 0.0% 0 0.0% 0 0.0% 0 0.0% 0 0.0% 0
Aldershot 0.0% 1 0.0% 0 0.0% 0 0.0% 0 0.0% 0 0.0% 0 0.0% 0 0.0% 0 0.0% 0 0.0% 0 0.0% 0Basingstoke 0.9% 12 0.0% 0 8.6% 6 0.0% 0 15.7% 5 0.0% 0 1.6% 0 0.0% 0 0.0% 0 0.0% 0 0.0% 0Bracknell Town Centre 0.1% 1 0.0% 0 0.0% 0 0.0% 0 0.0% 0 0.0% 0 0.0% 0 0.0% 0 0.0% 0 0.0% 0 0.0% 0Bracknell (other locations,
not in the town centre) 0.1% 1 0.0% 0 0.0% 0 0.0% 0 0.0% 0 0.0% 0 0.0% 0 0.0% 0 0.0% 0 0.0% 0 0.0% 0
Camberley 1.1% 15 0.0% 0 2.9% 2 0.0% 0 0.0% 0 0.0% 0 0.0% 0 0.0% 0 0.0% 0 0.0% 0 0.0% 0Central London / West End /
Covent Garden 0.3% 5 0.0% 0 0.0% 0 0.0% 0 0.0% 0 1.8% 1 0.0% 0 0.0% 0 0.0% 0 0.0% 0 0.0% 0
Farnborough 0.3% 4 0.0% 0 0.0% 0 0.0% 0 0.0% 0 0.0% 0 0.0% 0 0.0% 0 0.0% 0 0.0% 0 0.0% 0Farnham 0.1% 2 0.0% 0 0.7% 1 0.0% 0 0.0% 0 0.0% 0 0.0% 0 0.0% 0 0.0% 0 0.0% 0 0.0% 0Gerrards Cross 0.2% 3 0.0% 0 0.0% 0 0.0% 0 0.0% 0 0.0% 0 0.0% 0 0.0% 0 0.0% 0 0.0% 0 0.0% 0Henley-on-Thames 0.2% 2 0.0% 0 0.0% 0 0.0% 0 0.0% 0 0.0% 0 0.0% 0 0.0% 0 0.0% 0 0.0% 0 4.5% 1High Wycombe 0.5% 7 0.0% 0 0.0% 0 0.0% 0 0.0% 0 0.0% 0 0.0% 0 0.0% 0 0.0% 0 0.0% 0 0.0% 0Lower Earley 0.3% 4 0.0% 0 0.0% 0 0.0% 0 0.0% 0 0.0% 0 0.0% 0 0.0% 0 0.0% 0 0.0% 0 0.0% 0Maidenhead 0.0% 0 0.0% 0 0.0% 0 0.0% 0 0.0% 0 0.0% 0 0.0% 0 0.0% 0 0.0% 0 0.0% 0 0.0% 0Marlborough 0.0% 0 0.0% 0 0.0% 0 0.0% 0 0.0% 0 0.0% 0 0.0% 0 1.9% 0 0.0% 0 0.0% 0 0.0% 0Newbury Town Centre 0.3% 4 0.0% 0 0.0% 0 0.0% 0 1.4% 0 4.1% 3 0.0% 0 3.6% 1 0.8% 0 0.0% 0 0.0% 0Newbury (other locations,
not in the town centre) 0.0% 0 0.0% 0 0.0% 0 0.0% 0 0.9% 0 0.0% 0 0.0% 0 0.0% 0 0.0% 0 0.0% 0 0.0% 0
Oxford 0.1% 1 0.0% 0 0.0% 0 0.0% 0 0.0% 0 0.0% 0 0.0% 0 0.0% 0 0.0% 0 1.5% 1 1.3% 0Reading Town Centre 0.5% 7 3.5% 2 0.0% 0 0.0% 0 1.6% 1 0.0% 0 0.0% 0 0.0% 0 0.0% 0 0.0% 0 1.1% 0Salisbury 0.0% 0 0.0% 0 0.0% 0 0.0% 0 0.0% 0 0.0% 0 0.0% 0 1.0% 0 0.0% 0 0.0% 0 0.0% 0Slough 0.5% 7 0.0% 0 0.0% 0 0.0% 0 0.0% 0 0.0% 0 0.0% 0 0.0% 0 0.0% 0 0.0% 0 0.0% 0Staines 1.4% 20 0.0% 0 0.0% 0 0.0% 0 0.0% 0 0.0% 0 0.0% 0 0.0% 0 0.0% 0 0.0% 0 0.0% 0Swindon 0.0% 1 0.0% 0 0.0% 0 0.0% 0 0.0% 0 0.0% 0 0.0% 0 2.8% 0 0.8% 0 0.0% 0 0.0% 0Wallingford 0.3% 4 0.0% 0 0.0% 0 0.0% 0 0.0% 0 0.0% 0 0.0% 0 0.0% 0 0.0% 0 8.4% 4 0.0% 0Westfield London,
Shepherd's Bush, London 0.1% 1 0.0% 0 0.0% 0 0.0% 0 0.0% 0 0.0% 0 0.0% 0 0.0% 0 0.0% 0 0.0% 0 0.0% 0
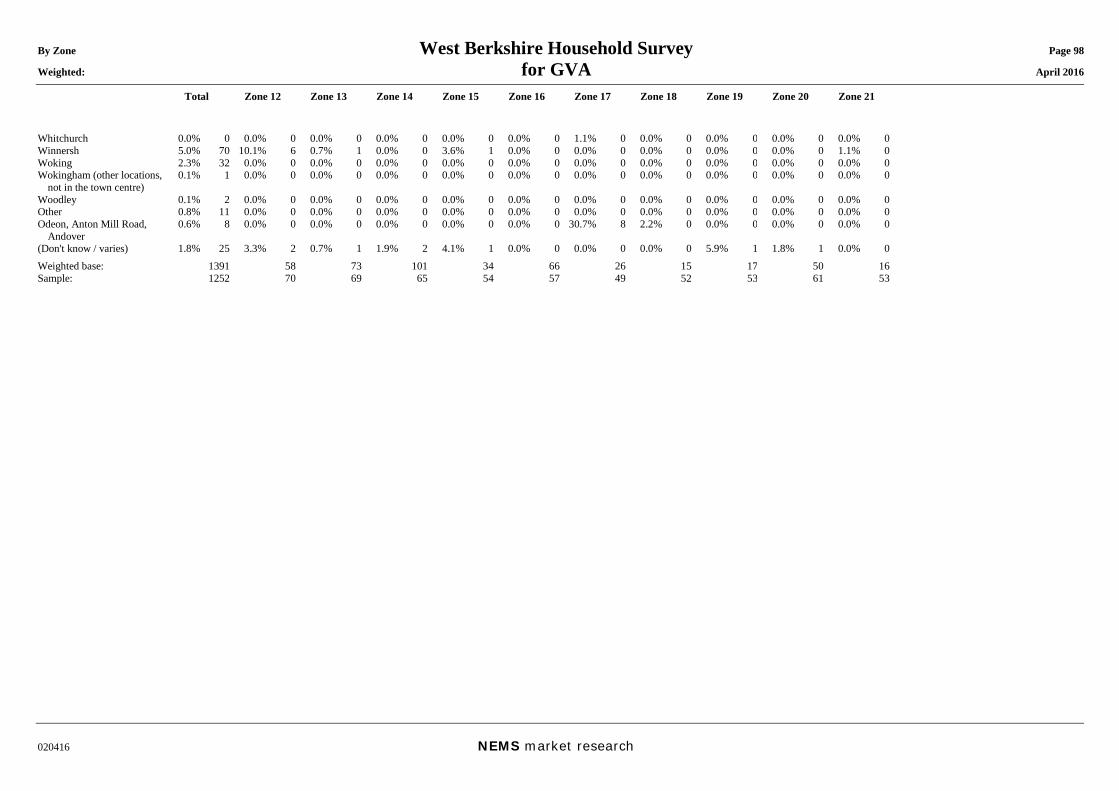
By Zone West Berkshire Household Survey Page 98 Weighted: for GVA April 2016
Total Zone 12 Zone 13 Zone 14 Zone 15 Zone 16 Zone 17 Zone 18 Zone 19 Zone 20 Zone 21
020416 NEMS market research
Whitchurch 0.0% 0 0.0% 0 0.0% 0 0.0% 0 0.0% 0 0.0% 0 1.1% 0 0.0% 0 0.0% 0 0.0% 0 0.0% 0Winnersh 5.0% 70 10.1% 6 0.7% 1 0.0% 0 3.6% 1 0.0% 0 0.0% 0 0.0% 0 0.0% 0 0.0% 0 1.1% 0Woking 2.3% 32 0.0% 0 0.0% 0 0.0% 0 0.0% 0 0.0% 0 0.0% 0 0.0% 0 0.0% 0 0.0% 0 0.0% 0Wokingham (other locations,
not in the town centre) 0.1% 1 0.0% 0 0.0% 0 0.0% 0 0.0% 0 0.0% 0 0.0% 0 0.0% 0 0.0% 0 0.0% 0 0.0% 0
Woodley 0.1% 2 0.0% 0 0.0% 0 0.0% 0 0.0% 0 0.0% 0 0.0% 0 0.0% 0 0.0% 0 0.0% 0 0.0% 0Other 0.8% 11 0.0% 0 0.0% 0 0.0% 0 0.0% 0 0.0% 0 0.0% 0 0.0% 0 0.0% 0 0.0% 0 0.0% 0Odeon, Anton Mill Road,
Andover 0.6% 8 0.0% 0 0.0% 0 0.0% 0 0.0% 0 0.0% 0 30.7% 8 2.2% 0 0.0% 0 0.0% 0 0.0% 0
(Don't know / varies) 1.8% 25 3.3% 2 0.7% 1 1.9% 2 4.1% 1 0.0% 0 0.0% 0 0.0% 0 5.9% 1 1.8% 1 0.0% 0Weighted base: 1391 58 73 101 34 66 26 15 17 50 16Sample: 1252 70 69 65 54 57 49 52 53 61 53
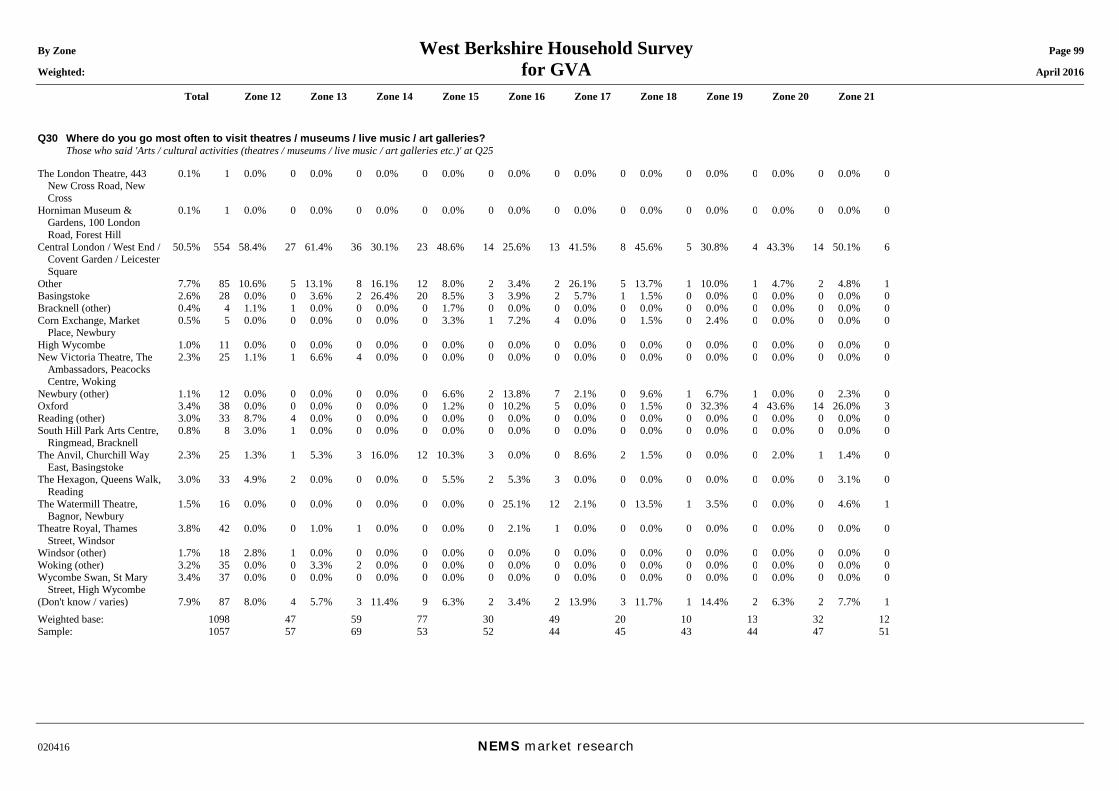
By Zone West Berkshire Household Survey Page 99 Weighted: for GVA April 2016
Total Zone 12 Zone 13 Zone 14 Zone 15 Zone 16 Zone 17 Zone 18 Zone 19 Zone 20 Zone 21
020416 NEMS market research
Q30 Where do you go most often to visit theatres / museums / live music / art galleries? Those who said 'Arts / cultural activities (theatres / museums / live music / art galleries etc.)' at Q25 The London Theatre, 443
New Cross Road, New Cross
0.1% 1 0.0% 0 0.0% 0 0.0% 0 0.0% 0 0.0% 0 0.0% 0 0.0% 0 0.0% 0 0.0% 0 0.0% 0
Horniman Museum & Gardens, 100 London Road, Forest Hill
0.1% 1 0.0% 0 0.0% 0 0.0% 0 0.0% 0 0.0% 0 0.0% 0 0.0% 0 0.0% 0 0.0% 0 0.0% 0
Central London / West End / Covent Garden / Leicester Square
50.5% 554 58.4% 27 61.4% 36 30.1% 23 48.6% 14 25.6% 13 41.5% 8 45.6% 5 30.8% 4 43.3% 14 50.1% 6
Other 7.7% 85 10.6% 5 13.1% 8 16.1% 12 8.0% 2 3.4% 2 26.1% 5 13.7% 1 10.0% 1 4.7% 2 4.8% 1Basingstoke 2.6% 28 0.0% 0 3.6% 2 26.4% 20 8.5% 3 3.9% 2 5.7% 1 1.5% 0 0.0% 0 0.0% 0 0.0% 0Bracknell (other) 0.4% 4 1.1% 1 0.0% 0 0.0% 0 1.7% 0 0.0% 0 0.0% 0 0.0% 0 0.0% 0 0.0% 0 0.0% 0Corn Exchange, Market
Place, Newbury 0.5% 5 0.0% 0 0.0% 0 0.0% 0 3.3% 1 7.2% 4 0.0% 0 1.5% 0 2.4% 0 0.0% 0 0.0% 0
High Wycombe 1.0% 11 0.0% 0 0.0% 0 0.0% 0 0.0% 0 0.0% 0 0.0% 0 0.0% 0 0.0% 0 0.0% 0 0.0% 0New Victoria Theatre, The
Ambassadors, Peacocks Centre, Woking
2.3% 25 1.1% 1 6.6% 4 0.0% 0 0.0% 0 0.0% 0 0.0% 0 0.0% 0 0.0% 0 0.0% 0 0.0% 0
Newbury (other) 1.1% 12 0.0% 0 0.0% 0 0.0% 0 6.6% 2 13.8% 7 2.1% 0 9.6% 1 6.7% 1 0.0% 0 2.3% 0Oxford 3.4% 38 0.0% 0 0.0% 0 0.0% 0 1.2% 0 10.2% 5 0.0% 0 1.5% 0 32.3% 4 43.6% 14 26.0% 3Reading (other) 3.0% 33 8.7% 4 0.0% 0 0.0% 0 0.0% 0 0.0% 0 0.0% 0 0.0% 0 0.0% 0 0.0% 0 0.0% 0South Hill Park Arts Centre,
Ringmead, Bracknell 0.8% 8 3.0% 1 0.0% 0 0.0% 0 0.0% 0 0.0% 0 0.0% 0 0.0% 0 0.0% 0 0.0% 0 0.0% 0
The Anvil, Churchill Way East, Basingstoke
2.3% 25 1.3% 1 5.3% 3 16.0% 12 10.3% 3 0.0% 0 8.6% 2 1.5% 0 0.0% 0 2.0% 1 1.4% 0
The Hexagon, Queens Walk, Reading
3.0% 33 4.9% 2 0.0% 0 0.0% 0 5.5% 2 5.3% 3 0.0% 0 0.0% 0 0.0% 0 0.0% 0 3.1% 0
The Watermill Theatre, Bagnor, Newbury
1.5% 16 0.0% 0 0.0% 0 0.0% 0 0.0% 0 25.1% 12 2.1% 0 13.5% 1 3.5% 0 0.0% 0 4.6% 1
Theatre Royal, Thames Street, Windsor
3.8% 42 0.0% 0 1.0% 1 0.0% 0 0.0% 0 2.1% 1 0.0% 0 0.0% 0 0.0% 0 0.0% 0 0.0% 0
Windsor (other) 1.7% 18 2.8% 1 0.0% 0 0.0% 0 0.0% 0 0.0% 0 0.0% 0 0.0% 0 0.0% 0 0.0% 0 0.0% 0Woking (other) 3.2% 35 0.0% 0 3.3% 2 0.0% 0 0.0% 0 0.0% 0 0.0% 0 0.0% 0 0.0% 0 0.0% 0 0.0% 0Wycombe Swan, St Mary
Street, High Wycombe 3.4% 37 0.0% 0 0.0% 0 0.0% 0 0.0% 0 0.0% 0 0.0% 0 0.0% 0 0.0% 0 0.0% 0 0.0% 0
(Don't know / varies) 7.9% 87 8.0% 4 5.7% 3 11.4% 9 6.3% 2 3.4% 2 13.9% 3 11.7% 1 14.4% 2 6.3% 2 7.7% 1Weighted base: 1098 47 59 77 30 49 20 10 13 32 12Sample: 1057 57 69 53 52 44 45 43 44 47 51
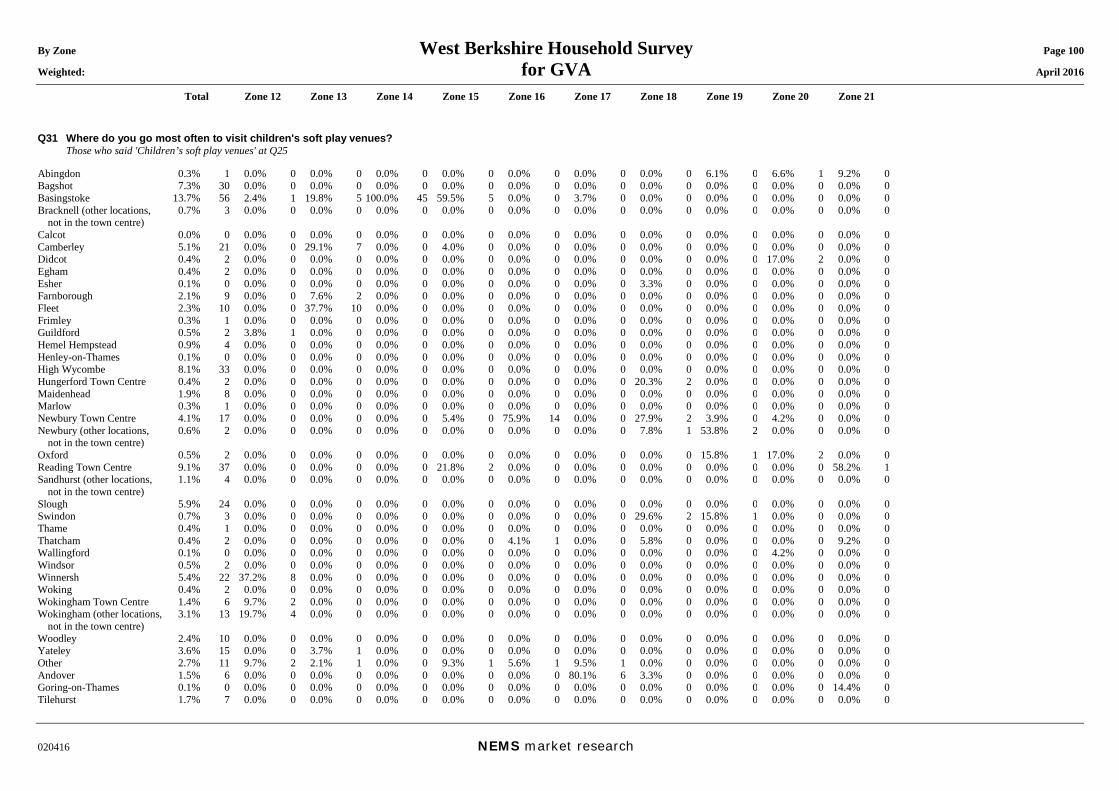
By Zone West Berkshire Household Survey Page 100 Weighted: for GVA April 2016
Total Zone 12 Zone 13 Zone 14 Zone 15 Zone 16 Zone 17 Zone 18 Zone 19 Zone 20 Zone 21
020416 NEMS market research
Q31 Where do you go most often to visit children's soft play venues? Those who said 'Children’s soft play venues' at Q25 Abingdon 0.3% 1 0.0% 0 0.0% 0 0.0% 0 0.0% 0 0.0% 0 0.0% 0 0.0% 0 6.1% 0 6.6% 1 9.2% 0Bagshot 7.3% 30 0.0% 0 0.0% 0 0.0% 0 0.0% 0 0.0% 0 0.0% 0 0.0% 0 0.0% 0 0.0% 0 0.0% 0Basingstoke 13.7% 56 2.4% 1 19.8% 5 100.0% 45 59.5% 5 0.0% 0 3.7% 0 0.0% 0 0.0% 0 0.0% 0 0.0% 0Bracknell (other locations,
not in the town centre) 0.7% 3 0.0% 0 0.0% 0 0.0% 0 0.0% 0 0.0% 0 0.0% 0 0.0% 0 0.0% 0 0.0% 0 0.0% 0
Calcot 0.0% 0 0.0% 0 0.0% 0 0.0% 0 0.0% 0 0.0% 0 0.0% 0 0.0% 0 0.0% 0 0.0% 0 0.0% 0Camberley 5.1% 21 0.0% 0 29.1% 7 0.0% 0 4.0% 0 0.0% 0 0.0% 0 0.0% 0 0.0% 0 0.0% 0 0.0% 0Didcot 0.4% 2 0.0% 0 0.0% 0 0.0% 0 0.0% 0 0.0% 0 0.0% 0 0.0% 0 0.0% 0 17.0% 2 0.0% 0Egham 0.4% 2 0.0% 0 0.0% 0 0.0% 0 0.0% 0 0.0% 0 0.0% 0 0.0% 0 0.0% 0 0.0% 0 0.0% 0Esher 0.1% 0 0.0% 0 0.0% 0 0.0% 0 0.0% 0 0.0% 0 0.0% 0 3.3% 0 0.0% 0 0.0% 0 0.0% 0Farnborough 2.1% 9 0.0% 0 7.6% 2 0.0% 0 0.0% 0 0.0% 0 0.0% 0 0.0% 0 0.0% 0 0.0% 0 0.0% 0Fleet 2.3% 10 0.0% 0 37.7% 10 0.0% 0 0.0% 0 0.0% 0 0.0% 0 0.0% 0 0.0% 0 0.0% 0 0.0% 0Frimley 0.3% 1 0.0% 0 0.0% 0 0.0% 0 0.0% 0 0.0% 0 0.0% 0 0.0% 0 0.0% 0 0.0% 0 0.0% 0Guildford 0.5% 2 3.8% 1 0.0% 0 0.0% 0 0.0% 0 0.0% 0 0.0% 0 0.0% 0 0.0% 0 0.0% 0 0.0% 0Hemel Hempstead 0.9% 4 0.0% 0 0.0% 0 0.0% 0 0.0% 0 0.0% 0 0.0% 0 0.0% 0 0.0% 0 0.0% 0 0.0% 0Henley-on-Thames 0.1% 0 0.0% 0 0.0% 0 0.0% 0 0.0% 0 0.0% 0 0.0% 0 0.0% 0 0.0% 0 0.0% 0 0.0% 0High Wycombe 8.1% 33 0.0% 0 0.0% 0 0.0% 0 0.0% 0 0.0% 0 0.0% 0 0.0% 0 0.0% 0 0.0% 0 0.0% 0Hungerford Town Centre 0.4% 2 0.0% 0 0.0% 0 0.0% 0 0.0% 0 0.0% 0 0.0% 0 20.3% 2 0.0% 0 0.0% 0 0.0% 0Maidenhead 1.9% 8 0.0% 0 0.0% 0 0.0% 0 0.0% 0 0.0% 0 0.0% 0 0.0% 0 0.0% 0 0.0% 0 0.0% 0Marlow 0.3% 1 0.0% 0 0.0% 0 0.0% 0 0.0% 0 0.0% 0 0.0% 0 0.0% 0 0.0% 0 0.0% 0 0.0% 0Newbury Town Centre 4.1% 17 0.0% 0 0.0% 0 0.0% 0 5.4% 0 75.9% 14 0.0% 0 27.9% 2 3.9% 0 4.2% 0 0.0% 0Newbury (other locations,
not in the town centre) 0.6% 2 0.0% 0 0.0% 0 0.0% 0 0.0% 0 0.0% 0 0.0% 0 7.8% 1 53.8% 2 0.0% 0 0.0% 0
Oxford 0.5% 2 0.0% 0 0.0% 0 0.0% 0 0.0% 0 0.0% 0 0.0% 0 0.0% 0 15.8% 1 17.0% 2 0.0% 0Reading Town Centre 9.1% 37 0.0% 0 0.0% 0 0.0% 0 21.8% 2 0.0% 0 0.0% 0 0.0% 0 0.0% 0 0.0% 0 58.2% 1Sandhurst (other locations,
not in the town centre) 1.1% 4 0.0% 0 0.0% 0 0.0% 0 0.0% 0 0.0% 0 0.0% 0 0.0% 0 0.0% 0 0.0% 0 0.0% 0
Slough 5.9% 24 0.0% 0 0.0% 0 0.0% 0 0.0% 0 0.0% 0 0.0% 0 0.0% 0 0.0% 0 0.0% 0 0.0% 0Swindon 0.7% 3 0.0% 0 0.0% 0 0.0% 0 0.0% 0 0.0% 0 0.0% 0 29.6% 2 15.8% 1 0.0% 0 0.0% 0Thame 0.4% 1 0.0% 0 0.0% 0 0.0% 0 0.0% 0 0.0% 0 0.0% 0 0.0% 0 0.0% 0 0.0% 0 0.0% 0Thatcham 0.4% 2 0.0% 0 0.0% 0 0.0% 0 0.0% 0 4.1% 1 0.0% 0 5.8% 0 0.0% 0 0.0% 0 9.2% 0Wallingford 0.1% 0 0.0% 0 0.0% 0 0.0% 0 0.0% 0 0.0% 0 0.0% 0 0.0% 0 0.0% 0 4.2% 0 0.0% 0Windsor 0.5% 2 0.0% 0 0.0% 0 0.0% 0 0.0% 0 0.0% 0 0.0% 0 0.0% 0 0.0% 0 0.0% 0 0.0% 0Winnersh 5.4% 22 37.2% 8 0.0% 0 0.0% 0 0.0% 0 0.0% 0 0.0% 0 0.0% 0 0.0% 0 0.0% 0 0.0% 0Woking 0.4% 2 0.0% 0 0.0% 0 0.0% 0 0.0% 0 0.0% 0 0.0% 0 0.0% 0 0.0% 0 0.0% 0 0.0% 0Wokingham Town Centre 1.4% 6 9.7% 2 0.0% 0 0.0% 0 0.0% 0 0.0% 0 0.0% 0 0.0% 0 0.0% 0 0.0% 0 0.0% 0Wokingham (other locations,
not in the town centre) 3.1% 13 19.7% 4 0.0% 0 0.0% 0 0.0% 0 0.0% 0 0.0% 0 0.0% 0 0.0% 0 0.0% 0 0.0% 0
Woodley 2.4% 10 0.0% 0 0.0% 0 0.0% 0 0.0% 0 0.0% 0 0.0% 0 0.0% 0 0.0% 0 0.0% 0 0.0% 0Yateley 3.6% 15 0.0% 0 3.7% 1 0.0% 0 0.0% 0 0.0% 0 0.0% 0 0.0% 0 0.0% 0 0.0% 0 0.0% 0Other 2.7% 11 9.7% 2 2.1% 1 0.0% 0 9.3% 1 5.6% 1 9.5% 1 0.0% 0 0.0% 0 0.0% 0 0.0% 0Andover 1.5% 6 0.0% 0 0.0% 0 0.0% 0 0.0% 0 0.0% 0 80.1% 6 3.3% 0 0.0% 0 0.0% 0 0.0% 0Goring-on-Thames 0.1% 0 0.0% 0 0.0% 0 0.0% 0 0.0% 0 0.0% 0 0.0% 0 0.0% 0 0.0% 0 0.0% 0 14.4% 0Tilehurst 1.7% 7 0.0% 0 0.0% 0 0.0% 0 0.0% 0 0.0% 0 0.0% 0 0.0% 0 0.0% 0 0.0% 0 0.0% 0
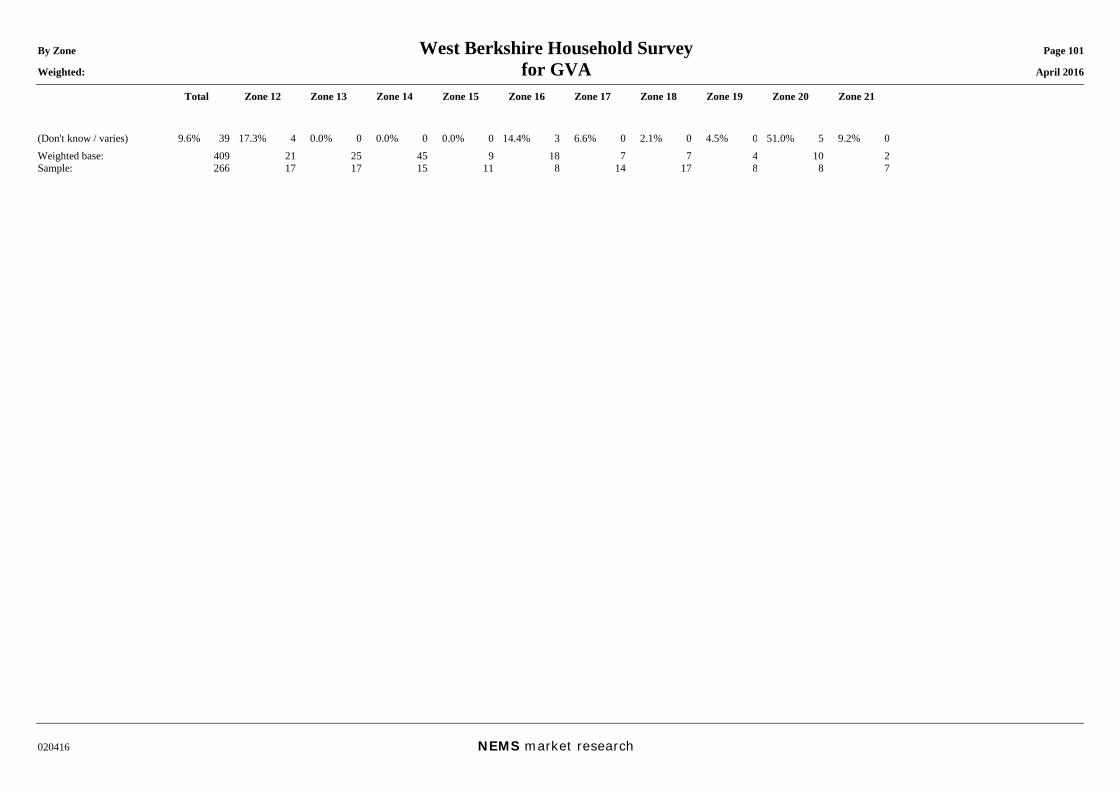
By Zone West Berkshire Household Survey Page 101 Weighted: for GVA April 2016
Total Zone 12 Zone 13 Zone 14 Zone 15 Zone 16 Zone 17 Zone 18 Zone 19 Zone 20 Zone 21
020416 NEMS market research
(Don't know / varies) 9.6% 39 17.3% 4 0.0% 0 0.0% 0 0.0% 0 14.4% 3 6.6% 0 2.1% 0 4.5% 0 51.0% 5 9.2% 0Weighted base: 409 21 25 45 9 18 7 7 4 10 2Sample: 266 17 17 15 11 8 14 17 8 8 7
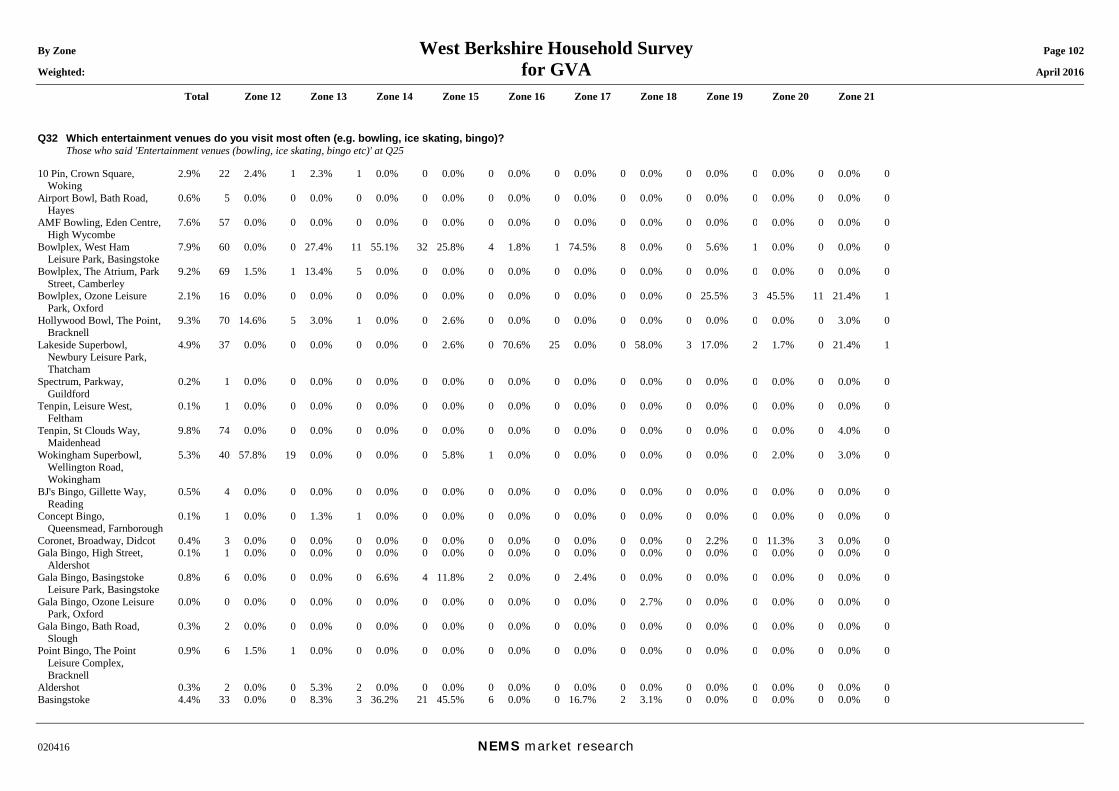
By Zone West Berkshire Household Survey Page 102 Weighted: for GVA April 2016
Total Zone 12 Zone 13 Zone 14 Zone 15 Zone 16 Zone 17 Zone 18 Zone 19 Zone 20 Zone 21
020416 NEMS market research
Q32 Which entertainment venues do you visit most often (e.g. bowling, ice skating, bingo)? Those who said 'Entertainment venues (bowling, ice skating, bingo etc)' at Q25 10 Pin, Crown Square,
Woking 2.9% 22 2.4% 1 2.3% 1 0.0% 0 0.0% 0 0.0% 0 0.0% 0 0.0% 0 0.0% 0 0.0% 0 0.0% 0
Airport Bowl, Bath Road, Hayes
0.6% 5 0.0% 0 0.0% 0 0.0% 0 0.0% 0 0.0% 0 0.0% 0 0.0% 0 0.0% 0 0.0% 0 0.0% 0
AMF Bowling, Eden Centre, High Wycombe
7.6% 57 0.0% 0 0.0% 0 0.0% 0 0.0% 0 0.0% 0 0.0% 0 0.0% 0 0.0% 0 0.0% 0 0.0% 0
Bowlplex, West Ham Leisure Park, Basingstoke
7.9% 60 0.0% 0 27.4% 11 55.1% 32 25.8% 4 1.8% 1 74.5% 8 0.0% 0 5.6% 1 0.0% 0 0.0% 0
Bowlplex, The Atrium, Park Street, Camberley
9.2% 69 1.5% 1 13.4% 5 0.0% 0 0.0% 0 0.0% 0 0.0% 0 0.0% 0 0.0% 0 0.0% 0 0.0% 0
Bowlplex, Ozone Leisure Park, Oxford
2.1% 16 0.0% 0 0.0% 0 0.0% 0 0.0% 0 0.0% 0 0.0% 0 0.0% 0 25.5% 3 45.5% 11 21.4% 1
Hollywood Bowl, The Point, Bracknell
9.3% 70 14.6% 5 3.0% 1 0.0% 0 2.6% 0 0.0% 0 0.0% 0 0.0% 0 0.0% 0 0.0% 0 3.0% 0
Lakeside Superbowl, Newbury Leisure Park, Thatcham
4.9% 37 0.0% 0 0.0% 0 0.0% 0 2.6% 0 70.6% 25 0.0% 0 58.0% 3 17.0% 2 1.7% 0 21.4% 1
Spectrum, Parkway, Guildford
0.2% 1 0.0% 0 0.0% 0 0.0% 0 0.0% 0 0.0% 0 0.0% 0 0.0% 0 0.0% 0 0.0% 0 0.0% 0
Tenpin, Leisure West, Feltham
0.1% 1 0.0% 0 0.0% 0 0.0% 0 0.0% 0 0.0% 0 0.0% 0 0.0% 0 0.0% 0 0.0% 0 0.0% 0
Tenpin, St Clouds Way, Maidenhead
9.8% 74 0.0% 0 0.0% 0 0.0% 0 0.0% 0 0.0% 0 0.0% 0 0.0% 0 0.0% 0 0.0% 0 4.0% 0
Wokingham Superbowl, Wellington Road, Wokingham
5.3% 40 57.8% 19 0.0% 0 0.0% 0 5.8% 1 0.0% 0 0.0% 0 0.0% 0 0.0% 0 2.0% 0 3.0% 0
BJ's Bingo, Gillette Way, Reading
0.5% 4 0.0% 0 0.0% 0 0.0% 0 0.0% 0 0.0% 0 0.0% 0 0.0% 0 0.0% 0 0.0% 0 0.0% 0
Concept Bingo, Queensmead, Farnborough
0.1% 1 0.0% 0 1.3% 1 0.0% 0 0.0% 0 0.0% 0 0.0% 0 0.0% 0 0.0% 0 0.0% 0 0.0% 0
Coronet, Broadway, Didcot 0.4% 3 0.0% 0 0.0% 0 0.0% 0 0.0% 0 0.0% 0 0.0% 0 0.0% 0 2.2% 0 11.3% 3 0.0% 0Gala Bingo, High Street,
Aldershot 0.1% 1 0.0% 0 0.0% 0 0.0% 0 0.0% 0 0.0% 0 0.0% 0 0.0% 0 0.0% 0 0.0% 0 0.0% 0
Gala Bingo, Basingstoke Leisure Park, Basingstoke
0.8% 6 0.0% 0 0.0% 0 6.6% 4 11.8% 2 0.0% 0 2.4% 0 0.0% 0 0.0% 0 0.0% 0 0.0% 0
Gala Bingo, Ozone Leisure Park, Oxford
0.0% 0 0.0% 0 0.0% 0 0.0% 0 0.0% 0 0.0% 0 0.0% 0 2.7% 0 0.0% 0 0.0% 0 0.0% 0
Gala Bingo, Bath Road, Slough
0.3% 2 0.0% 0 0.0% 0 0.0% 0 0.0% 0 0.0% 0 0.0% 0 0.0% 0 0.0% 0 0.0% 0 0.0% 0
Point Bingo, The Point Leisure Complex, Bracknell
0.9% 6 1.5% 1 0.0% 0 0.0% 0 0.0% 0 0.0% 0 0.0% 0 0.0% 0 0.0% 0 0.0% 0 0.0% 0
Aldershot 0.3% 2 0.0% 0 5.3% 2 0.0% 0 0.0% 0 0.0% 0 0.0% 0 0.0% 0 0.0% 0 0.0% 0 0.0% 0Basingstoke 4.4% 33 0.0% 0 8.3% 3 36.2% 21 45.5% 6 0.0% 0 16.7% 2 3.1% 0 0.0% 0 0.0% 0 0.0% 0
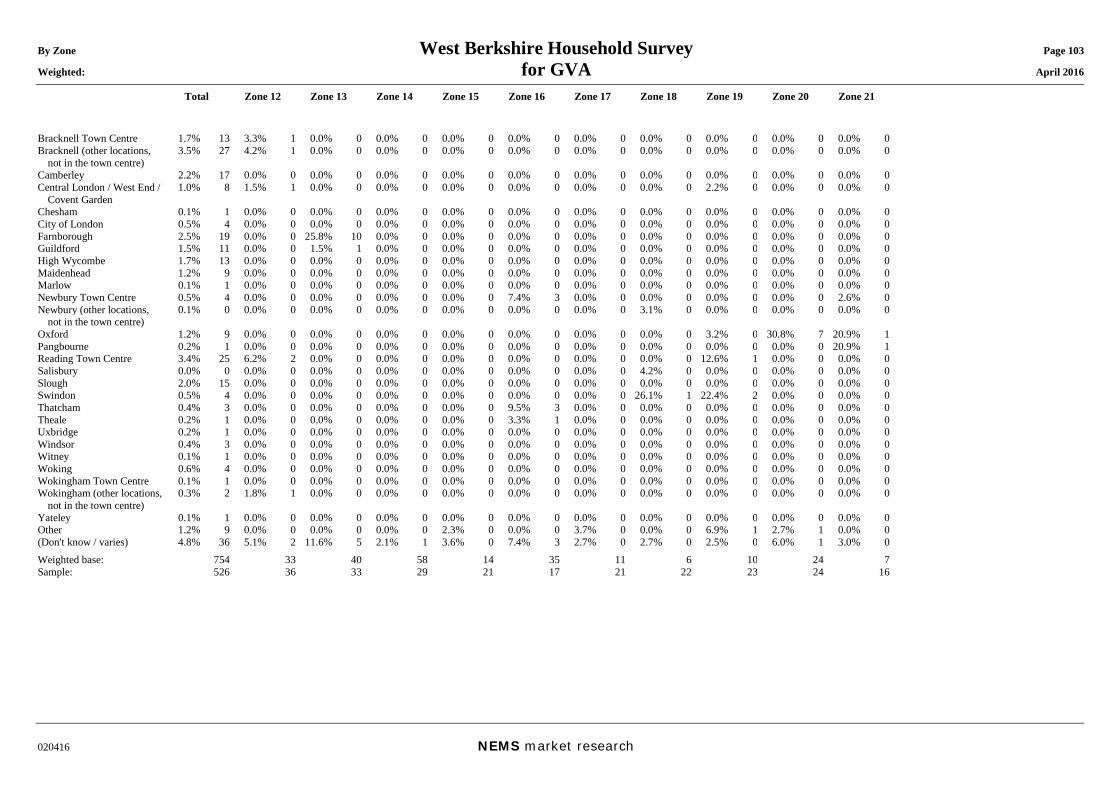
By Zone West Berkshire Household Survey Page 103 Weighted: for GVA April 2016
Total Zone 12 Zone 13 Zone 14 Zone 15 Zone 16 Zone 17 Zone 18 Zone 19 Zone 20 Zone 21
020416 NEMS market research
Bracknell Town Centre 1.7% 13 3.3% 1 0.0% 0 0.0% 0 0.0% 0 0.0% 0 0.0% 0 0.0% 0 0.0% 0 0.0% 0 0.0% 0Bracknell (other locations,
not in the town centre) 3.5% 27 4.2% 1 0.0% 0 0.0% 0 0.0% 0 0.0% 0 0.0% 0 0.0% 0 0.0% 0 0.0% 0 0.0% 0
Camberley 2.2% 17 0.0% 0 0.0% 0 0.0% 0 0.0% 0 0.0% 0 0.0% 0 0.0% 0 0.0% 0 0.0% 0 0.0% 0Central London / West End /
Covent Garden 1.0% 8 1.5% 1 0.0% 0 0.0% 0 0.0% 0 0.0% 0 0.0% 0 0.0% 0 2.2% 0 0.0% 0 0.0% 0
Chesham 0.1% 1 0.0% 0 0.0% 0 0.0% 0 0.0% 0 0.0% 0 0.0% 0 0.0% 0 0.0% 0 0.0% 0 0.0% 0City of London 0.5% 4 0.0% 0 0.0% 0 0.0% 0 0.0% 0 0.0% 0 0.0% 0 0.0% 0 0.0% 0 0.0% 0 0.0% 0Farnborough 2.5% 19 0.0% 0 25.8% 10 0.0% 0 0.0% 0 0.0% 0 0.0% 0 0.0% 0 0.0% 0 0.0% 0 0.0% 0Guildford 1.5% 11 0.0% 0 1.5% 1 0.0% 0 0.0% 0 0.0% 0 0.0% 0 0.0% 0 0.0% 0 0.0% 0 0.0% 0High Wycombe 1.7% 13 0.0% 0 0.0% 0 0.0% 0 0.0% 0 0.0% 0 0.0% 0 0.0% 0 0.0% 0 0.0% 0 0.0% 0Maidenhead 1.2% 9 0.0% 0 0.0% 0 0.0% 0 0.0% 0 0.0% 0 0.0% 0 0.0% 0 0.0% 0 0.0% 0 0.0% 0Marlow 0.1% 1 0.0% 0 0.0% 0 0.0% 0 0.0% 0 0.0% 0 0.0% 0 0.0% 0 0.0% 0 0.0% 0 0.0% 0Newbury Town Centre 0.5% 4 0.0% 0 0.0% 0 0.0% 0 0.0% 0 7.4% 3 0.0% 0 0.0% 0 0.0% 0 0.0% 0 2.6% 0Newbury (other locations,
not in the town centre) 0.1% 0 0.0% 0 0.0% 0 0.0% 0 0.0% 0 0.0% 0 0.0% 0 3.1% 0 0.0% 0 0.0% 0 0.0% 0
Oxford 1.2% 9 0.0% 0 0.0% 0 0.0% 0 0.0% 0 0.0% 0 0.0% 0 0.0% 0 3.2% 0 30.8% 7 20.9% 1Pangbourne 0.2% 1 0.0% 0 0.0% 0 0.0% 0 0.0% 0 0.0% 0 0.0% 0 0.0% 0 0.0% 0 0.0% 0 20.9% 1Reading Town Centre 3.4% 25 6.2% 2 0.0% 0 0.0% 0 0.0% 0 0.0% 0 0.0% 0 0.0% 0 12.6% 1 0.0% 0 0.0% 0Salisbury 0.0% 0 0.0% 0 0.0% 0 0.0% 0 0.0% 0 0.0% 0 0.0% 0 4.2% 0 0.0% 0 0.0% 0 0.0% 0Slough 2.0% 15 0.0% 0 0.0% 0 0.0% 0 0.0% 0 0.0% 0 0.0% 0 0.0% 0 0.0% 0 0.0% 0 0.0% 0Swindon 0.5% 4 0.0% 0 0.0% 0 0.0% 0 0.0% 0 0.0% 0 0.0% 0 26.1% 1 22.4% 2 0.0% 0 0.0% 0Thatcham 0.4% 3 0.0% 0 0.0% 0 0.0% 0 0.0% 0 9.5% 3 0.0% 0 0.0% 0 0.0% 0 0.0% 0 0.0% 0Theale 0.2% 1 0.0% 0 0.0% 0 0.0% 0 0.0% 0 3.3% 1 0.0% 0 0.0% 0 0.0% 0 0.0% 0 0.0% 0Uxbridge 0.2% 1 0.0% 0 0.0% 0 0.0% 0 0.0% 0 0.0% 0 0.0% 0 0.0% 0 0.0% 0 0.0% 0 0.0% 0Windsor 0.4% 3 0.0% 0 0.0% 0 0.0% 0 0.0% 0 0.0% 0 0.0% 0 0.0% 0 0.0% 0 0.0% 0 0.0% 0Witney 0.1% 1 0.0% 0 0.0% 0 0.0% 0 0.0% 0 0.0% 0 0.0% 0 0.0% 0 0.0% 0 0.0% 0 0.0% 0Woking 0.6% 4 0.0% 0 0.0% 0 0.0% 0 0.0% 0 0.0% 0 0.0% 0 0.0% 0 0.0% 0 0.0% 0 0.0% 0Wokingham Town Centre 0.1% 1 0.0% 0 0.0% 0 0.0% 0 0.0% 0 0.0% 0 0.0% 0 0.0% 0 0.0% 0 0.0% 0 0.0% 0Wokingham (other locations,
not in the town centre) 0.3% 2 1.8% 1 0.0% 0 0.0% 0 0.0% 0 0.0% 0 0.0% 0 0.0% 0 0.0% 0 0.0% 0 0.0% 0
Yateley 0.1% 1 0.0% 0 0.0% 0 0.0% 0 0.0% 0 0.0% 0 0.0% 0 0.0% 0 0.0% 0 0.0% 0 0.0% 0Other 1.2% 9 0.0% 0 0.0% 0 0.0% 0 2.3% 0 0.0% 0 3.7% 0 0.0% 0 6.9% 1 2.7% 1 0.0% 0(Don't know / varies) 4.8% 36 5.1% 2 11.6% 5 2.1% 1 3.6% 0 7.4% 3 2.7% 0 2.7% 0 2.5% 0 6.0% 1 3.0% 0Weighted base: 754 33 40 58 14 35 11 6 10 24 7Sample: 526 36 33 29 21 17 21 22 23 24 16
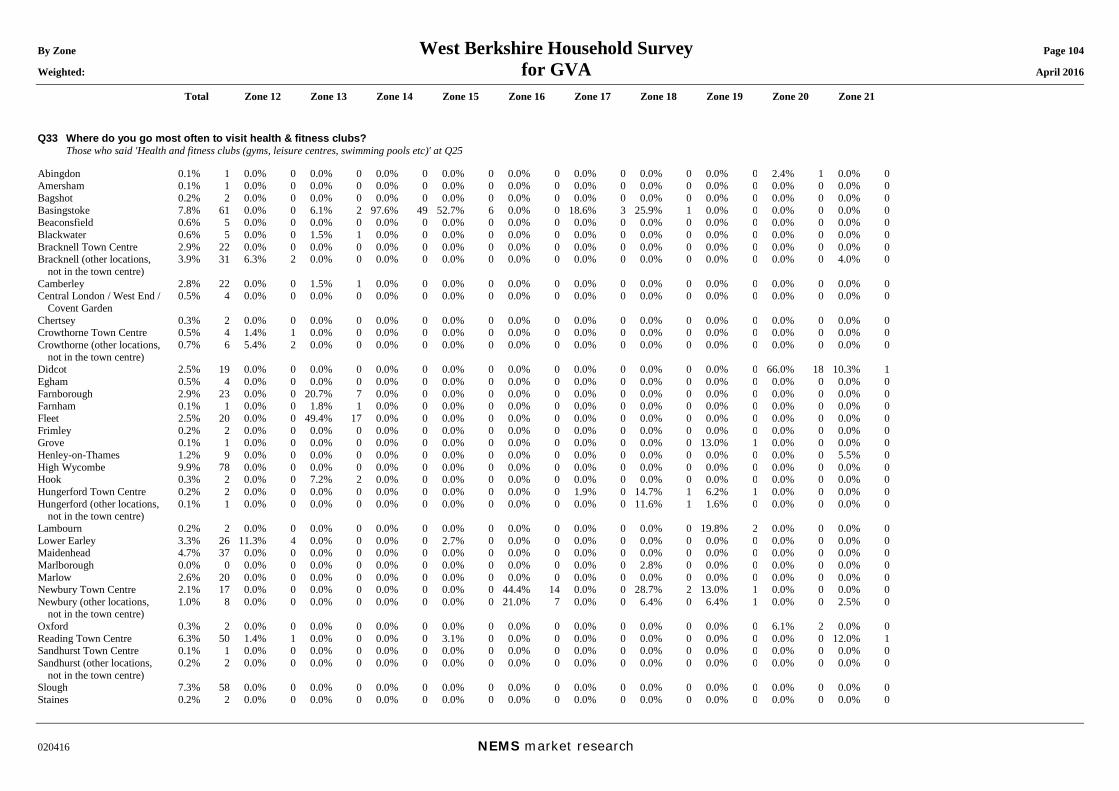
By Zone West Berkshire Household Survey Page 104 Weighted: for GVA April 2016
Total Zone 12 Zone 13 Zone 14 Zone 15 Zone 16 Zone 17 Zone 18 Zone 19 Zone 20 Zone 21
020416 NEMS market research
Q33 Where do you go most often to visit health & fitness clubs? Those who said 'Health and fitness clubs (gyms, leisure centres, swimming pools etc)' at Q25 Abingdon 0.1% 1 0.0% 0 0.0% 0 0.0% 0 0.0% 0 0.0% 0 0.0% 0 0.0% 0 0.0% 0 2.4% 1 0.0% 0Amersham 0.1% 1 0.0% 0 0.0% 0 0.0% 0 0.0% 0 0.0% 0 0.0% 0 0.0% 0 0.0% 0 0.0% 0 0.0% 0Bagshot 0.2% 2 0.0% 0 0.0% 0 0.0% 0 0.0% 0 0.0% 0 0.0% 0 0.0% 0 0.0% 0 0.0% 0 0.0% 0Basingstoke 7.8% 61 0.0% 0 6.1% 2 97.6% 49 52.7% 6 0.0% 0 18.6% 3 25.9% 1 0.0% 0 0.0% 0 0.0% 0Beaconsfield 0.6% 5 0.0% 0 0.0% 0 0.0% 0 0.0% 0 0.0% 0 0.0% 0 0.0% 0 0.0% 0 0.0% 0 0.0% 0Blackwater 0.6% 5 0.0% 0 1.5% 1 0.0% 0 0.0% 0 0.0% 0 0.0% 0 0.0% 0 0.0% 0 0.0% 0 0.0% 0Bracknell Town Centre 2.9% 22 0.0% 0 0.0% 0 0.0% 0 0.0% 0 0.0% 0 0.0% 0 0.0% 0 0.0% 0 0.0% 0 0.0% 0Bracknell (other locations,
not in the town centre) 3.9% 31 6.3% 2 0.0% 0 0.0% 0 0.0% 0 0.0% 0 0.0% 0 0.0% 0 0.0% 0 0.0% 0 4.0% 0
Camberley 2.8% 22 0.0% 0 1.5% 1 0.0% 0 0.0% 0 0.0% 0 0.0% 0 0.0% 0 0.0% 0 0.0% 0 0.0% 0Central London / West End /
Covent Garden 0.5% 4 0.0% 0 0.0% 0 0.0% 0 0.0% 0 0.0% 0 0.0% 0 0.0% 0 0.0% 0 0.0% 0 0.0% 0
Chertsey 0.3% 2 0.0% 0 0.0% 0 0.0% 0 0.0% 0 0.0% 0 0.0% 0 0.0% 0 0.0% 0 0.0% 0 0.0% 0Crowthorne Town Centre 0.5% 4 1.4% 1 0.0% 0 0.0% 0 0.0% 0 0.0% 0 0.0% 0 0.0% 0 0.0% 0 0.0% 0 0.0% 0Crowthorne (other locations,
not in the town centre) 0.7% 6 5.4% 2 0.0% 0 0.0% 0 0.0% 0 0.0% 0 0.0% 0 0.0% 0 0.0% 0 0.0% 0 0.0% 0
Didcot 2.5% 19 0.0% 0 0.0% 0 0.0% 0 0.0% 0 0.0% 0 0.0% 0 0.0% 0 0.0% 0 66.0% 18 10.3% 1Egham 0.5% 4 0.0% 0 0.0% 0 0.0% 0 0.0% 0 0.0% 0 0.0% 0 0.0% 0 0.0% 0 0.0% 0 0.0% 0Farnborough 2.9% 23 0.0% 0 20.7% 7 0.0% 0 0.0% 0 0.0% 0 0.0% 0 0.0% 0 0.0% 0 0.0% 0 0.0% 0Farnham 0.1% 1 0.0% 0 1.8% 1 0.0% 0 0.0% 0 0.0% 0 0.0% 0 0.0% 0 0.0% 0 0.0% 0 0.0% 0Fleet 2.5% 20 0.0% 0 49.4% 17 0.0% 0 0.0% 0 0.0% 0 0.0% 0 0.0% 0 0.0% 0 0.0% 0 0.0% 0Frimley 0.2% 2 0.0% 0 0.0% 0 0.0% 0 0.0% 0 0.0% 0 0.0% 0 0.0% 0 0.0% 0 0.0% 0 0.0% 0Grove 0.1% 1 0.0% 0 0.0% 0 0.0% 0 0.0% 0 0.0% 0 0.0% 0 0.0% 0 13.0% 1 0.0% 0 0.0% 0Henley-on-Thames 1.2% 9 0.0% 0 0.0% 0 0.0% 0 0.0% 0 0.0% 0 0.0% 0 0.0% 0 0.0% 0 0.0% 0 5.5% 0High Wycombe 9.9% 78 0.0% 0 0.0% 0 0.0% 0 0.0% 0 0.0% 0 0.0% 0 0.0% 0 0.0% 0 0.0% 0 0.0% 0Hook 0.3% 2 0.0% 0 7.2% 2 0.0% 0 0.0% 0 0.0% 0 0.0% 0 0.0% 0 0.0% 0 0.0% 0 0.0% 0Hungerford Town Centre 0.2% 2 0.0% 0 0.0% 0 0.0% 0 0.0% 0 0.0% 0 1.9% 0 14.7% 1 6.2% 1 0.0% 0 0.0% 0Hungerford (other locations,
not in the town centre) 0.1% 1 0.0% 0 0.0% 0 0.0% 0 0.0% 0 0.0% 0 0.0% 0 11.6% 1 1.6% 0 0.0% 0 0.0% 0
Lambourn 0.2% 2 0.0% 0 0.0% 0 0.0% 0 0.0% 0 0.0% 0 0.0% 0 0.0% 0 19.8% 2 0.0% 0 0.0% 0Lower Earley 3.3% 26 11.3% 4 0.0% 0 0.0% 0 2.7% 0 0.0% 0 0.0% 0 0.0% 0 0.0% 0 0.0% 0 0.0% 0Maidenhead 4.7% 37 0.0% 0 0.0% 0 0.0% 0 0.0% 0 0.0% 0 0.0% 0 0.0% 0 0.0% 0 0.0% 0 0.0% 0Marlborough 0.0% 0 0.0% 0 0.0% 0 0.0% 0 0.0% 0 0.0% 0 0.0% 0 2.8% 0 0.0% 0 0.0% 0 0.0% 0Marlow 2.6% 20 0.0% 0 0.0% 0 0.0% 0 0.0% 0 0.0% 0 0.0% 0 0.0% 0 0.0% 0 0.0% 0 0.0% 0Newbury Town Centre 2.1% 17 0.0% 0 0.0% 0 0.0% 0 0.0% 0 44.4% 14 0.0% 0 28.7% 2 13.0% 1 0.0% 0 0.0% 0Newbury (other locations,
not in the town centre) 1.0% 8 0.0% 0 0.0% 0 0.0% 0 0.0% 0 21.0% 7 0.0% 0 6.4% 0 6.4% 1 0.0% 0 2.5% 0
Oxford 0.3% 2 0.0% 0 0.0% 0 0.0% 0 0.0% 0 0.0% 0 0.0% 0 0.0% 0 0.0% 0 6.1% 2 0.0% 0Reading Town Centre 6.3% 50 1.4% 1 0.0% 0 0.0% 0 3.1% 0 0.0% 0 0.0% 0 0.0% 0 0.0% 0 0.0% 0 12.0% 1Sandhurst Town Centre 0.1% 1 0.0% 0 0.0% 0 0.0% 0 0.0% 0 0.0% 0 0.0% 0 0.0% 0 0.0% 0 0.0% 0 0.0% 0Sandhurst (other locations,
not in the town centre) 0.2% 2 0.0% 0 0.0% 0 0.0% 0 0.0% 0 0.0% 0 0.0% 0 0.0% 0 0.0% 0 0.0% 0 0.0% 0
Slough 7.3% 58 0.0% 0 0.0% 0 0.0% 0 0.0% 0 0.0% 0 0.0% 0 0.0% 0 0.0% 0 0.0% 0 0.0% 0Staines 0.2% 2 0.0% 0 0.0% 0 0.0% 0 0.0% 0 0.0% 0 0.0% 0 0.0% 0 0.0% 0 0.0% 0 0.0% 0
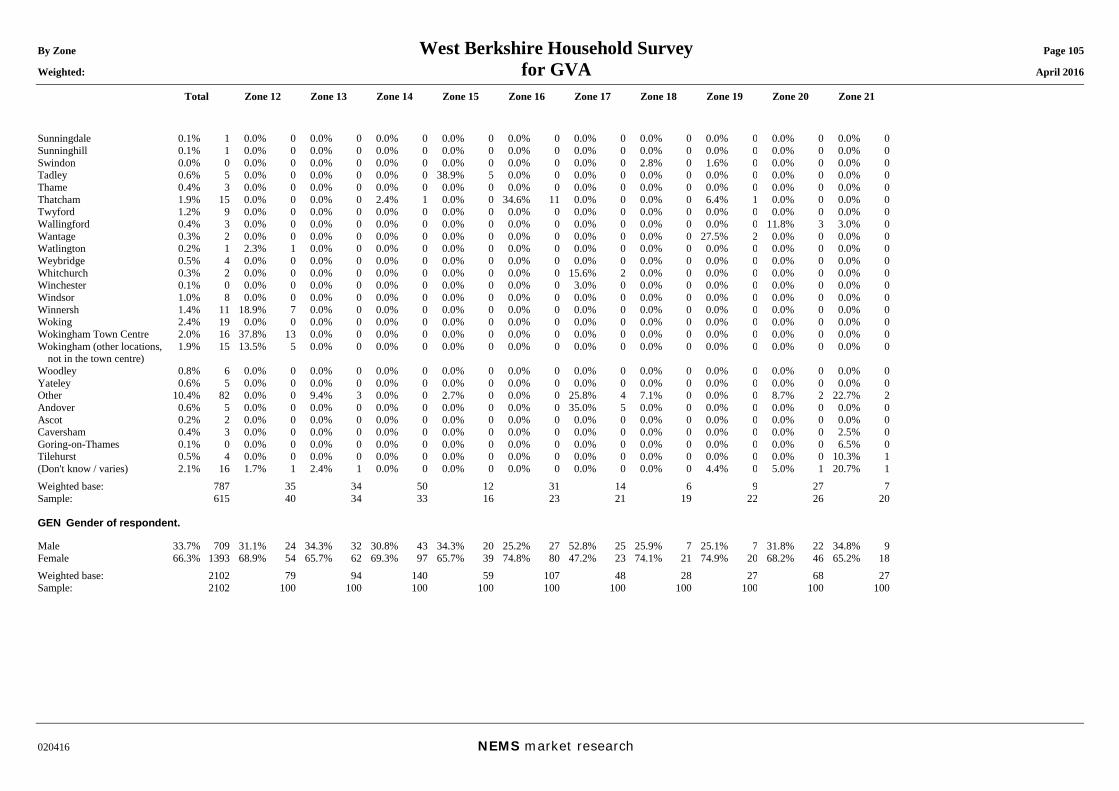
By Zone West Berkshire Household Survey Page 105 Weighted: for GVA April 2016
Total Zone 12 Zone 13 Zone 14 Zone 15 Zone 16 Zone 17 Zone 18 Zone 19 Zone 20 Zone 21
020416 NEMS market research
Sunningdale 0.1% 1 0.0% 0 0.0% 0 0.0% 0 0.0% 0 0.0% 0 0.0% 0 0.0% 0 0.0% 0 0.0% 0 0.0% 0Sunninghill 0.1% 1 0.0% 0 0.0% 0 0.0% 0 0.0% 0 0.0% 0 0.0% 0 0.0% 0 0.0% 0 0.0% 0 0.0% 0Swindon 0.0% 0 0.0% 0 0.0% 0 0.0% 0 0.0% 0 0.0% 0 0.0% 0 2.8% 0 1.6% 0 0.0% 0 0.0% 0Tadley 0.6% 5 0.0% 0 0.0% 0 0.0% 0 38.9% 5 0.0% 0 0.0% 0 0.0% 0 0.0% 0 0.0% 0 0.0% 0Thame 0.4% 3 0.0% 0 0.0% 0 0.0% 0 0.0% 0 0.0% 0 0.0% 0 0.0% 0 0.0% 0 0.0% 0 0.0% 0Thatcham 1.9% 15 0.0% 0 0.0% 0 2.4% 1 0.0% 0 34.6% 11 0.0% 0 0.0% 0 6.4% 1 0.0% 0 0.0% 0Twyford 1.2% 9 0.0% 0 0.0% 0 0.0% 0 0.0% 0 0.0% 0 0.0% 0 0.0% 0 0.0% 0 0.0% 0 0.0% 0Wallingford 0.4% 3 0.0% 0 0.0% 0 0.0% 0 0.0% 0 0.0% 0 0.0% 0 0.0% 0 0.0% 0 11.8% 3 3.0% 0Wantage 0.3% 2 0.0% 0 0.0% 0 0.0% 0 0.0% 0 0.0% 0 0.0% 0 0.0% 0 27.5% 2 0.0% 0 0.0% 0Watlington 0.2% 1 2.3% 1 0.0% 0 0.0% 0 0.0% 0 0.0% 0 0.0% 0 0.0% 0 0.0% 0 0.0% 0 0.0% 0Weybridge 0.5% 4 0.0% 0 0.0% 0 0.0% 0 0.0% 0 0.0% 0 0.0% 0 0.0% 0 0.0% 0 0.0% 0 0.0% 0Whitchurch 0.3% 2 0.0% 0 0.0% 0 0.0% 0 0.0% 0 0.0% 0 15.6% 2 0.0% 0 0.0% 0 0.0% 0 0.0% 0Winchester 0.1% 0 0.0% 0 0.0% 0 0.0% 0 0.0% 0 0.0% 0 3.0% 0 0.0% 0 0.0% 0 0.0% 0 0.0% 0Windsor 1.0% 8 0.0% 0 0.0% 0 0.0% 0 0.0% 0 0.0% 0 0.0% 0 0.0% 0 0.0% 0 0.0% 0 0.0% 0Winnersh 1.4% 11 18.9% 7 0.0% 0 0.0% 0 0.0% 0 0.0% 0 0.0% 0 0.0% 0 0.0% 0 0.0% 0 0.0% 0Woking 2.4% 19 0.0% 0 0.0% 0 0.0% 0 0.0% 0 0.0% 0 0.0% 0 0.0% 0 0.0% 0 0.0% 0 0.0% 0Wokingham Town Centre 2.0% 16 37.8% 13 0.0% 0 0.0% 0 0.0% 0 0.0% 0 0.0% 0 0.0% 0 0.0% 0 0.0% 0 0.0% 0Wokingham (other locations,
not in the town centre) 1.9% 15 13.5% 5 0.0% 0 0.0% 0 0.0% 0 0.0% 0 0.0% 0 0.0% 0 0.0% 0 0.0% 0 0.0% 0
Woodley 0.8% 6 0.0% 0 0.0% 0 0.0% 0 0.0% 0 0.0% 0 0.0% 0 0.0% 0 0.0% 0 0.0% 0 0.0% 0Yateley 0.6% 5 0.0% 0 0.0% 0 0.0% 0 0.0% 0 0.0% 0 0.0% 0 0.0% 0 0.0% 0 0.0% 0 0.0% 0Other 10.4% 82 0.0% 0 9.4% 3 0.0% 0 2.7% 0 0.0% 0 25.8% 4 7.1% 0 0.0% 0 8.7% 2 22.7% 2Andover 0.6% 5 0.0% 0 0.0% 0 0.0% 0 0.0% 0 0.0% 0 35.0% 5 0.0% 0 0.0% 0 0.0% 0 0.0% 0Ascot 0.2% 2 0.0% 0 0.0% 0 0.0% 0 0.0% 0 0.0% 0 0.0% 0 0.0% 0 0.0% 0 0.0% 0 0.0% 0Caversham 0.4% 3 0.0% 0 0.0% 0 0.0% 0 0.0% 0 0.0% 0 0.0% 0 0.0% 0 0.0% 0 0.0% 0 2.5% 0Goring-on-Thames 0.1% 0 0.0% 0 0.0% 0 0.0% 0 0.0% 0 0.0% 0 0.0% 0 0.0% 0 0.0% 0 0.0% 0 6.5% 0Tilehurst 0.5% 4 0.0% 0 0.0% 0 0.0% 0 0.0% 0 0.0% 0 0.0% 0 0.0% 0 0.0% 0 0.0% 0 10.3% 1(Don't know / varies) 2.1% 16 1.7% 1 2.4% 1 0.0% 0 0.0% 0 0.0% 0 0.0% 0 0.0% 0 4.4% 0 5.0% 1 20.7% 1Weighted base: 787 35 34 50 12 31 14 6 9 27 7Sample: 615 40 34 33 16 23 21 19 22 26 20 GEN Gender of respondent. Male 33.7% 709 31.1% 24 34.3% 32 30.8% 43 34.3% 20 25.2% 27 52.8% 25 25.9% 7 25.1% 7 31.8% 22 34.8% 9Female 66.3% 1393 68.9% 54 65.7% 62 69.3% 97 65.7% 39 74.8% 80 47.2% 23 74.1% 21 74.9% 20 68.2% 46 65.2% 18Weighted base: 2102 79 94 140 59 107 48 28 27 68 27Sample: 2102 100 100 100 100 100 100 100 100 100 100
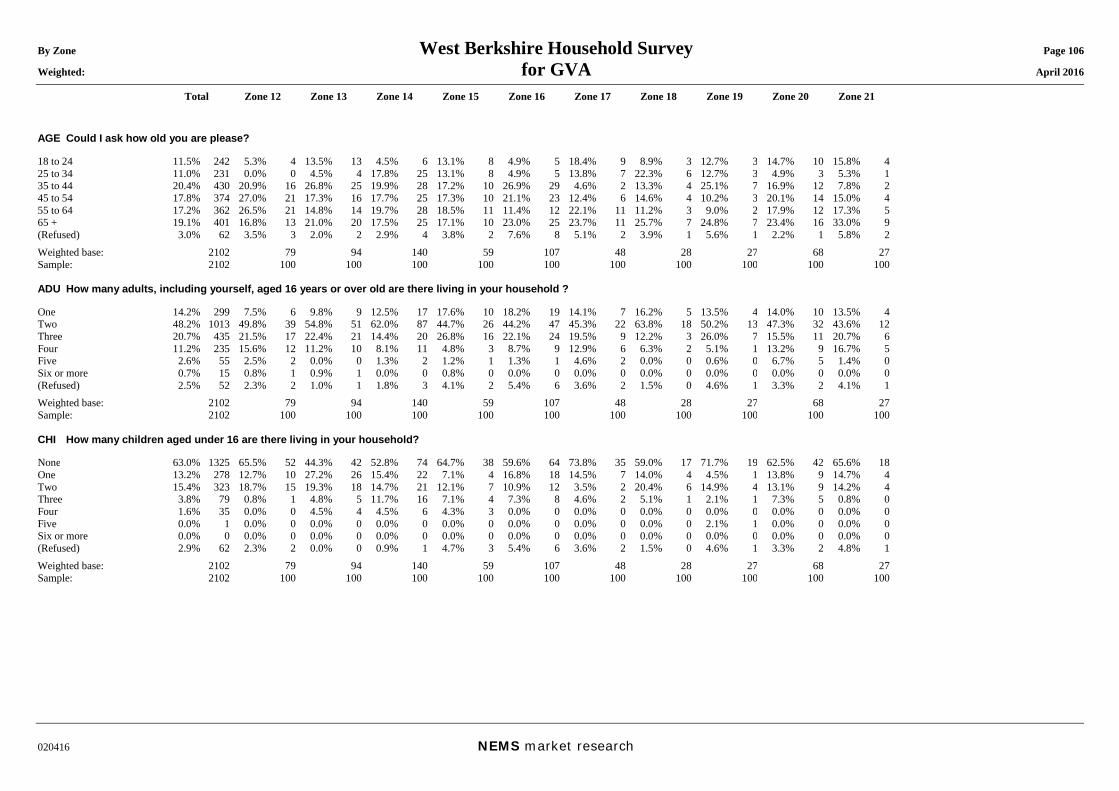
By Zone West Berkshire Household Survey Page 106 Weighted: for GVA April 2016
Total Zone 12 Zone 13 Zone 14 Zone 15 Zone 16 Zone 17 Zone 18 Zone 19 Zone 20 Zone 21
020416 NEMS market research
AGE Could I ask how old you are please? 18 to 24 11.5% 242 5.3% 4 13.5% 13 4.5% 6 13.1% 8 4.9% 5 18.4% 9 8.9% 3 12.7% 3 14.7% 10 15.8% 425 to 34 11.0% 231 0.0% 0 4.5% 4 17.8% 25 13.1% 8 4.9% 5 13.8% 7 22.3% 6 12.7% 3 4.9% 3 5.3% 135 to 44 20.4% 430 20.9% 16 26.8% 25 19.9% 28 17.2% 10 26.9% 29 4.6% 2 13.3% 4 25.1% 7 16.9% 12 7.8% 245 to 54 17.8% 374 27.0% 21 17.3% 16 17.7% 25 17.3% 10 21.1% 23 12.4% 6 14.6% 4 10.2% 3 20.1% 14 15.0% 455 to 64 17.2% 362 26.5% 21 14.8% 14 19.7% 28 18.5% 11 11.4% 12 22.1% 11 11.2% 3 9.0% 2 17.9% 12 17.3% 565 + 19.1% 401 16.8% 13 21.0% 20 17.5% 25 17.1% 10 23.0% 25 23.7% 11 25.7% 7 24.8% 7 23.4% 16 33.0% 9(Refused) 3.0% 62 3.5% 3 2.0% 2 2.9% 4 3.8% 2 7.6% 8 5.1% 2 3.9% 1 5.6% 1 2.2% 1 5.8% 2Weighted base: 2102 79 94 140 59 107 48 28 27 68 27Sample: 2102 100 100 100 100 100 100 100 100 100 100 ADU How many adults, including yourself, aged 16 years or over old are there living in your household ? One 14.2% 299 7.5% 6 9.8% 9 12.5% 17 17.6% 10 18.2% 19 14.1% 7 16.2% 5 13.5% 4 14.0% 10 13.5% 4Two 48.2% 1013 49.8% 39 54.8% 51 62.0% 87 44.7% 26 44.2% 47 45.3% 22 63.8% 18 50.2% 13 47.3% 32 43.6% 12Three 20.7% 435 21.5% 17 22.4% 21 14.4% 20 26.8% 16 22.1% 24 19.5% 9 12.2% 3 26.0% 7 15.5% 11 20.7% 6Four 11.2% 235 15.6% 12 11.2% 10 8.1% 11 4.8% 3 8.7% 9 12.9% 6 6.3% 2 5.1% 1 13.2% 9 16.7% 5Five 2.6% 55 2.5% 2 0.0% 0 1.3% 2 1.2% 1 1.3% 1 4.6% 2 0.0% 0 0.6% 0 6.7% 5 1.4% 0Six or more 0.7% 15 0.8% 1 0.9% 1 0.0% 0 0.8% 0 0.0% 0 0.0% 0 0.0% 0 0.0% 0 0.0% 0 0.0% 0(Refused) 2.5% 52 2.3% 2 1.0% 1 1.8% 3 4.1% 2 5.4% 6 3.6% 2 1.5% 0 4.6% 1 3.3% 2 4.1% 1Weighted base: 2102 79 94 140 59 107 48 28 27 68 27Sample: 2102 100 100 100 100 100 100 100 100 100 100 CHI How many children aged under 16 are there living in your household? None 63.0% 1325 65.5% 52 44.3% 42 52.8% 74 64.7% 38 59.6% 64 73.8% 35 59.0% 17 71.7% 19 62.5% 42 65.6% 18One 13.2% 278 12.7% 10 27.2% 26 15.4% 22 7.1% 4 16.8% 18 14.5% 7 14.0% 4 4.5% 1 13.8% 9 14.7% 4Two 15.4% 323 18.7% 15 19.3% 18 14.7% 21 12.1% 7 10.9% 12 3.5% 2 20.4% 6 14.9% 4 13.1% 9 14.2% 4Three 3.8% 79 0.8% 1 4.8% 5 11.7% 16 7.1% 4 7.3% 8 4.6% 2 5.1% 1 2.1% 1 7.3% 5 0.8% 0Four 1.6% 35 0.0% 0 4.5% 4 4.5% 6 4.3% 3 0.0% 0 0.0% 0 0.0% 0 0.0% 0 0.0% 0 0.0% 0Five 0.0% 1 0.0% 0 0.0% 0 0.0% 0 0.0% 0 0.0% 0 0.0% 0 0.0% 0 2.1% 1 0.0% 0 0.0% 0Six or more 0.0% 0 0.0% 0 0.0% 0 0.0% 0 0.0% 0 0.0% 0 0.0% 0 0.0% 0 0.0% 0 0.0% 0 0.0% 0(Refused) 2.9% 62 2.3% 2 0.0% 0 0.9% 1 4.7% 3 5.4% 6 3.6% 2 1.5% 0 4.6% 1 3.3% 2 4.8% 1Weighted base: 2102 79 94 140 59 107 48 28 27 68 27Sample: 2102 100 100 100 100 100 100 100 100 100 100
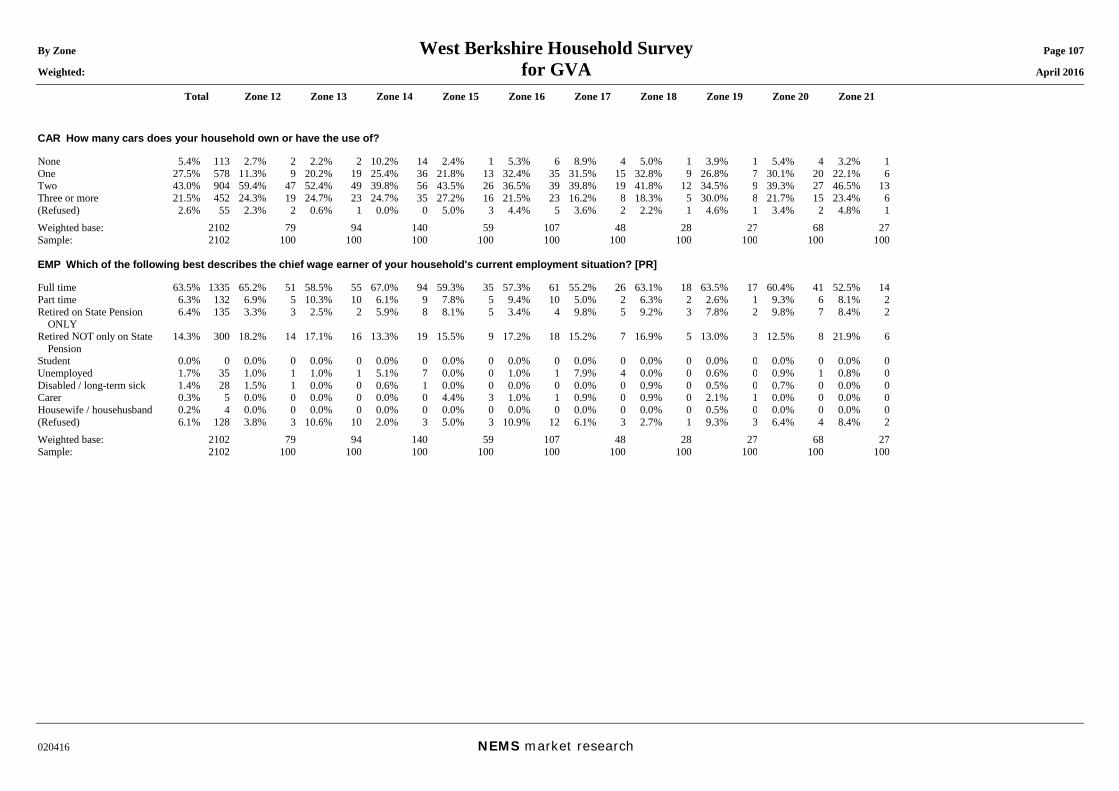
By Zone West Berkshire Household Survey Page 107 Weighted: for GVA April 2016
Total Zone 12 Zone 13 Zone 14 Zone 15 Zone 16 Zone 17 Zone 18 Zone 19 Zone 20 Zone 21
020416 NEMS market research
CAR How many cars does your household own or have the use of? None 5.4% 113 2.7% 2 2.2% 2 10.2% 14 2.4% 1 5.3% 6 8.9% 4 5.0% 1 3.9% 1 5.4% 4 3.2% 1One 27.5% 578 11.3% 9 20.2% 19 25.4% 36 21.8% 13 32.4% 35 31.5% 15 32.8% 9 26.8% 7 30.1% 20 22.1% 6Two 43.0% 904 59.4% 47 52.4% 49 39.8% 56 43.5% 26 36.5% 39 39.8% 19 41.8% 12 34.5% 9 39.3% 27 46.5% 13Three or more 21.5% 452 24.3% 19 24.7% 23 24.7% 35 27.2% 16 21.5% 23 16.2% 8 18.3% 5 30.0% 8 21.7% 15 23.4% 6(Refused) 2.6% 55 2.3% 2 0.6% 1 0.0% 0 5.0% 3 4.4% 5 3.6% 2 2.2% 1 4.6% 1 3.4% 2 4.8% 1Weighted base: 2102 79 94 140 59 107 48 28 27 68 27Sample: 2102 100 100 100 100 100 100 100 100 100 100 EMP Which of the following best describes the chief wage earner of your household's current employment situation? [PR] Full time 63.5% 1335 65.2% 51 58.5% 55 67.0% 94 59.3% 35 57.3% 61 55.2% 26 63.1% 18 63.5% 17 60.4% 41 52.5% 14Part time 6.3% 132 6.9% 5 10.3% 10 6.1% 9 7.8% 5 9.4% 10 5.0% 2 6.3% 2 2.6% 1 9.3% 6 8.1% 2Retired on State Pension
ONLY 6.4% 135 3.3% 3 2.5% 2 5.9% 8 8.1% 5 3.4% 4 9.8% 5 9.2% 3 7.8% 2 9.8% 7 8.4% 2
Retired NOT only on State Pension
14.3% 300 18.2% 14 17.1% 16 13.3% 19 15.5% 9 17.2% 18 15.2% 7 16.9% 5 13.0% 3 12.5% 8 21.9% 6
Student 0.0% 0 0.0% 0 0.0% 0 0.0% 0 0.0% 0 0.0% 0 0.0% 0 0.0% 0 0.0% 0 0.0% 0 0.0% 0Unemployed 1.7% 35 1.0% 1 1.0% 1 5.1% 7 0.0% 0 1.0% 1 7.9% 4 0.0% 0 0.6% 0 0.9% 1 0.8% 0Disabled / long-term sick 1.4% 28 1.5% 1 0.0% 0 0.6% 1 0.0% 0 0.0% 0 0.0% 0 0.9% 0 0.5% 0 0.7% 0 0.0% 0Carer 0.3% 5 0.0% 0 0.0% 0 0.0% 0 4.4% 3 1.0% 1 0.9% 0 0.9% 0 2.1% 1 0.0% 0 0.0% 0Housewife / househusband 0.2% 4 0.0% 0 0.0% 0 0.0% 0 0.0% 0 0.0% 0 0.0% 0 0.0% 0 0.5% 0 0.0% 0 0.0% 0(Refused) 6.1% 128 3.8% 3 10.6% 10 2.0% 3 5.0% 3 10.9% 12 6.1% 3 2.7% 1 9.3% 3 6.4% 4 8.4% 2Weighted base: 2102 79 94 140 59 107 48 28 27 68 27Sample: 2102 100 100 100 100 100 100 100 100 100 100
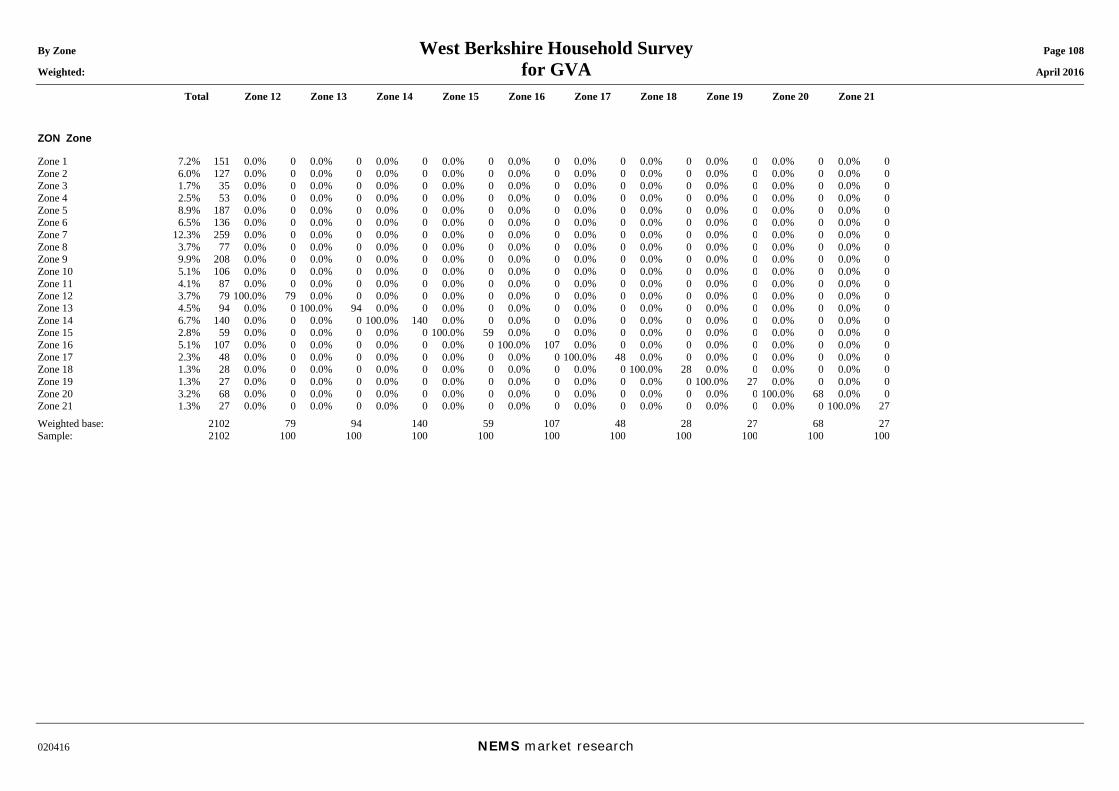
By Zone West Berkshire Household Survey Page 108 Weighted: for GVA April 2016
Total Zone 12 Zone 13 Zone 14 Zone 15 Zone 16 Zone 17 Zone 18 Zone 19 Zone 20 Zone 21
020416 NEMS market research
ZON Zone Zone 1 7.2% 151 0.0% 0 0.0% 0 0.0% 0 0.0% 0 0.0% 0 0.0% 0 0.0% 0 0.0% 0 0.0% 0 0.0% 0Zone 2 6.0% 127 0.0% 0 0.0% 0 0.0% 0 0.0% 0 0.0% 0 0.0% 0 0.0% 0 0.0% 0 0.0% 0 0.0% 0Zone 3 1.7% 35 0.0% 0 0.0% 0 0.0% 0 0.0% 0 0.0% 0 0.0% 0 0.0% 0 0.0% 0 0.0% 0 0.0% 0Zone 4 2.5% 53 0.0% 0 0.0% 0 0.0% 0 0.0% 0 0.0% 0 0.0% 0 0.0% 0 0.0% 0 0.0% 0 0.0% 0Zone 5 8.9% 187 0.0% 0 0.0% 0 0.0% 0 0.0% 0 0.0% 0 0.0% 0 0.0% 0 0.0% 0 0.0% 0 0.0% 0Zone 6 6.5% 136 0.0% 0 0.0% 0 0.0% 0 0.0% 0 0.0% 0 0.0% 0 0.0% 0 0.0% 0 0.0% 0 0.0% 0Zone 7 12.3% 259 0.0% 0 0.0% 0 0.0% 0 0.0% 0 0.0% 0 0.0% 0 0.0% 0 0.0% 0 0.0% 0 0.0% 0Zone 8 3.7% 77 0.0% 0 0.0% 0 0.0% 0 0.0% 0 0.0% 0 0.0% 0 0.0% 0 0.0% 0 0.0% 0 0.0% 0Zone 9 9.9% 208 0.0% 0 0.0% 0 0.0% 0 0.0% 0 0.0% 0 0.0% 0 0.0% 0 0.0% 0 0.0% 0 0.0% 0Zone 10 5.1% 106 0.0% 0 0.0% 0 0.0% 0 0.0% 0 0.0% 0 0.0% 0 0.0% 0 0.0% 0 0.0% 0 0.0% 0Zone 11 4.1% 87 0.0% 0 0.0% 0 0.0% 0 0.0% 0 0.0% 0 0.0% 0 0.0% 0 0.0% 0 0.0% 0 0.0% 0Zone 12 3.7% 79 100.0% 79 0.0% 0 0.0% 0 0.0% 0 0.0% 0 0.0% 0 0.0% 0 0.0% 0 0.0% 0 0.0% 0Zone 13 4.5% 94 0.0% 0 100.0% 94 0.0% 0 0.0% 0 0.0% 0 0.0% 0 0.0% 0 0.0% 0 0.0% 0 0.0% 0Zone 14 6.7% 140 0.0% 0 0.0% 0 100.0% 140 0.0% 0 0.0% 0 0.0% 0 0.0% 0 0.0% 0 0.0% 0 0.0% 0Zone 15 2.8% 59 0.0% 0 0.0% 0 0.0% 0 100.0% 59 0.0% 0 0.0% 0 0.0% 0 0.0% 0 0.0% 0 0.0% 0Zone 16 5.1% 107 0.0% 0 0.0% 0 0.0% 0 0.0% 0 100.0% 107 0.0% 0 0.0% 0 0.0% 0 0.0% 0 0.0% 0Zone 17 2.3% 48 0.0% 0 0.0% 0 0.0% 0 0.0% 0 0.0% 0 100.0% 48 0.0% 0 0.0% 0 0.0% 0 0.0% 0Zone 18 1.3% 28 0.0% 0 0.0% 0 0.0% 0 0.0% 0 0.0% 0 0.0% 0 100.0% 28 0.0% 0 0.0% 0 0.0% 0Zone 19 1.3% 27 0.0% 0 0.0% 0 0.0% 0 0.0% 0 0.0% 0 0.0% 0 0.0% 0 100.0% 27 0.0% 0 0.0% 0Zone 20 3.2% 68 0.0% 0 0.0% 0 0.0% 0 0.0% 0 0.0% 0 0.0% 0 0.0% 0 0.0% 0 100.0% 68 0.0% 0Zone 21 1.3% 27 0.0% 0 0.0% 0 0.0% 0 0.0% 0 0.0% 0 0.0% 0 0.0% 0 0.0% 0 0.0% 0 100.0% 27Weighted base: 2102 79 94 140 59 107 48 28 27 68 27Sample: 2102 100 100 100 100 100 100 100 100 100 100
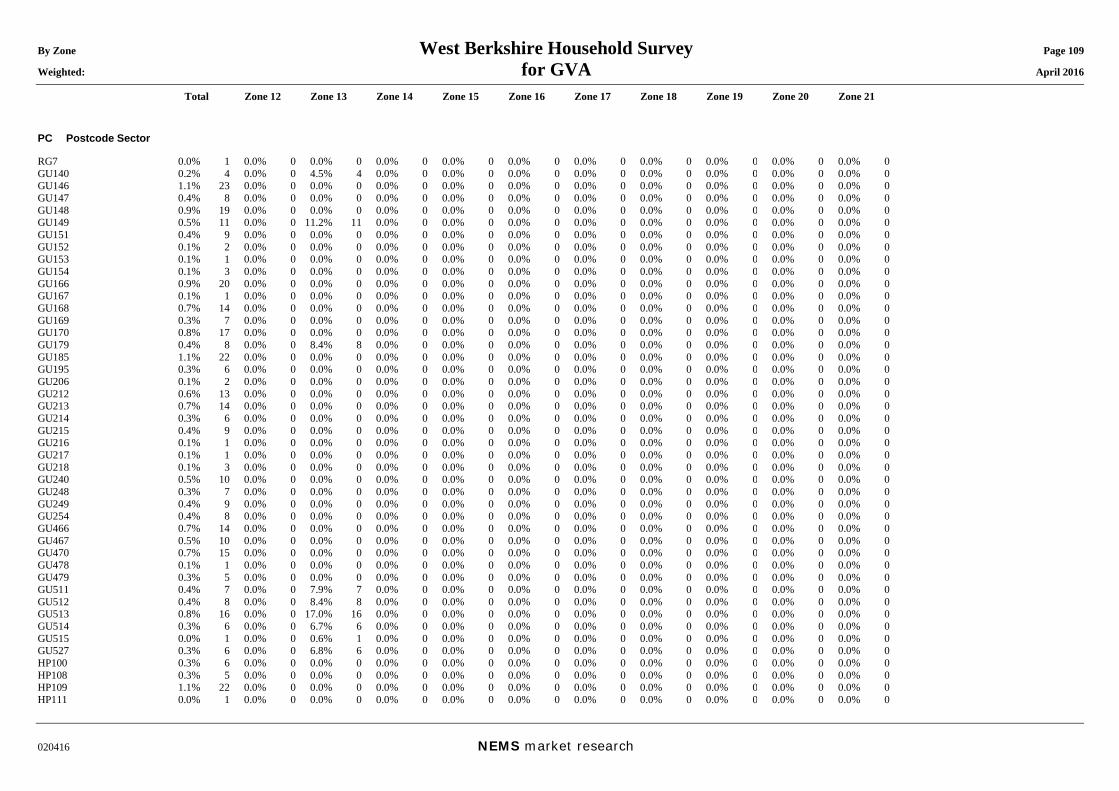
By Zone West Berkshire Household Survey Page 109 Weighted: for GVA April 2016
Total Zone 12 Zone 13 Zone 14 Zone 15 Zone 16 Zone 17 Zone 18 Zone 19 Zone 20 Zone 21
020416 NEMS market research
PC Postcode Sector RG7 0.0% 1 0.0% 0 0.0% 0 0.0% 0 0.0% 0 0.0% 0 0.0% 0 0.0% 0 0.0% 0 0.0% 0 0.0% 0GU140 0.2% 4 0.0% 0 4.5% 4 0.0% 0 0.0% 0 0.0% 0 0.0% 0 0.0% 0 0.0% 0 0.0% 0 0.0% 0GU146 1.1% 23 0.0% 0 0.0% 0 0.0% 0 0.0% 0 0.0% 0 0.0% 0 0.0% 0 0.0% 0 0.0% 0 0.0% 0GU147 0.4% 8 0.0% 0 0.0% 0 0.0% 0 0.0% 0 0.0% 0 0.0% 0 0.0% 0 0.0% 0 0.0% 0 0.0% 0GU148 0.9% 19 0.0% 0 0.0% 0 0.0% 0 0.0% 0 0.0% 0 0.0% 0 0.0% 0 0.0% 0 0.0% 0 0.0% 0GU149 0.5% 11 0.0% 0 11.2% 11 0.0% 0 0.0% 0 0.0% 0 0.0% 0 0.0% 0 0.0% 0 0.0% 0 0.0% 0GU151 0.4% 9 0.0% 0 0.0% 0 0.0% 0 0.0% 0 0.0% 0 0.0% 0 0.0% 0 0.0% 0 0.0% 0 0.0% 0GU152 0.1% 2 0.0% 0 0.0% 0 0.0% 0 0.0% 0 0.0% 0 0.0% 0 0.0% 0 0.0% 0 0.0% 0 0.0% 0GU153 0.1% 1 0.0% 0 0.0% 0 0.0% 0 0.0% 0 0.0% 0 0.0% 0 0.0% 0 0.0% 0 0.0% 0 0.0% 0GU154 0.1% 3 0.0% 0 0.0% 0 0.0% 0 0.0% 0 0.0% 0 0.0% 0 0.0% 0 0.0% 0 0.0% 0 0.0% 0GU166 0.9% 20 0.0% 0 0.0% 0 0.0% 0 0.0% 0 0.0% 0 0.0% 0 0.0% 0 0.0% 0 0.0% 0 0.0% 0GU167 0.1% 1 0.0% 0 0.0% 0 0.0% 0 0.0% 0 0.0% 0 0.0% 0 0.0% 0 0.0% 0 0.0% 0 0.0% 0GU168 0.7% 14 0.0% 0 0.0% 0 0.0% 0 0.0% 0 0.0% 0 0.0% 0 0.0% 0 0.0% 0 0.0% 0 0.0% 0GU169 0.3% 7 0.0% 0 0.0% 0 0.0% 0 0.0% 0 0.0% 0 0.0% 0 0.0% 0 0.0% 0 0.0% 0 0.0% 0GU170 0.8% 17 0.0% 0 0.0% 0 0.0% 0 0.0% 0 0.0% 0 0.0% 0 0.0% 0 0.0% 0 0.0% 0 0.0% 0GU179 0.4% 8 0.0% 0 8.4% 8 0.0% 0 0.0% 0 0.0% 0 0.0% 0 0.0% 0 0.0% 0 0.0% 0 0.0% 0GU185 1.1% 22 0.0% 0 0.0% 0 0.0% 0 0.0% 0 0.0% 0 0.0% 0 0.0% 0 0.0% 0 0.0% 0 0.0% 0GU195 0.3% 6 0.0% 0 0.0% 0 0.0% 0 0.0% 0 0.0% 0 0.0% 0 0.0% 0 0.0% 0 0.0% 0 0.0% 0GU206 0.1% 2 0.0% 0 0.0% 0 0.0% 0 0.0% 0 0.0% 0 0.0% 0 0.0% 0 0.0% 0 0.0% 0 0.0% 0GU212 0.6% 13 0.0% 0 0.0% 0 0.0% 0 0.0% 0 0.0% 0 0.0% 0 0.0% 0 0.0% 0 0.0% 0 0.0% 0GU213 0.7% 14 0.0% 0 0.0% 0 0.0% 0 0.0% 0 0.0% 0 0.0% 0 0.0% 0 0.0% 0 0.0% 0 0.0% 0GU214 0.3% 6 0.0% 0 0.0% 0 0.0% 0 0.0% 0 0.0% 0 0.0% 0 0.0% 0 0.0% 0 0.0% 0 0.0% 0GU215 0.4% 9 0.0% 0 0.0% 0 0.0% 0 0.0% 0 0.0% 0 0.0% 0 0.0% 0 0.0% 0 0.0% 0 0.0% 0GU216 0.1% 1 0.0% 0 0.0% 0 0.0% 0 0.0% 0 0.0% 0 0.0% 0 0.0% 0 0.0% 0 0.0% 0 0.0% 0GU217 0.1% 1 0.0% 0 0.0% 0 0.0% 0 0.0% 0 0.0% 0 0.0% 0 0.0% 0 0.0% 0 0.0% 0 0.0% 0GU218 0.1% 3 0.0% 0 0.0% 0 0.0% 0 0.0% 0 0.0% 0 0.0% 0 0.0% 0 0.0% 0 0.0% 0 0.0% 0GU240 0.5% 10 0.0% 0 0.0% 0 0.0% 0 0.0% 0 0.0% 0 0.0% 0 0.0% 0 0.0% 0 0.0% 0 0.0% 0GU248 0.3% 7 0.0% 0 0.0% 0 0.0% 0 0.0% 0 0.0% 0 0.0% 0 0.0% 0 0.0% 0 0.0% 0 0.0% 0GU249 0.4% 9 0.0% 0 0.0% 0 0.0% 0 0.0% 0 0.0% 0 0.0% 0 0.0% 0 0.0% 0 0.0% 0 0.0% 0GU254 0.4% 8 0.0% 0 0.0% 0 0.0% 0 0.0% 0 0.0% 0 0.0% 0 0.0% 0 0.0% 0 0.0% 0 0.0% 0GU466 0.7% 14 0.0% 0 0.0% 0 0.0% 0 0.0% 0 0.0% 0 0.0% 0 0.0% 0 0.0% 0 0.0% 0 0.0% 0GU467 0.5% 10 0.0% 0 0.0% 0 0.0% 0 0.0% 0 0.0% 0 0.0% 0 0.0% 0 0.0% 0 0.0% 0 0.0% 0GU470 0.7% 15 0.0% 0 0.0% 0 0.0% 0 0.0% 0 0.0% 0 0.0% 0 0.0% 0 0.0% 0 0.0% 0 0.0% 0GU478 0.1% 1 0.0% 0 0.0% 0 0.0% 0 0.0% 0 0.0% 0 0.0% 0 0.0% 0 0.0% 0 0.0% 0 0.0% 0GU479 0.3% 5 0.0% 0 0.0% 0 0.0% 0 0.0% 0 0.0% 0 0.0% 0 0.0% 0 0.0% 0 0.0% 0 0.0% 0GU511 0.4% 7 0.0% 0 7.9% 7 0.0% 0 0.0% 0 0.0% 0 0.0% 0 0.0% 0 0.0% 0 0.0% 0 0.0% 0GU512 0.4% 8 0.0% 0 8.4% 8 0.0% 0 0.0% 0 0.0% 0 0.0% 0 0.0% 0 0.0% 0 0.0% 0 0.0% 0GU513 0.8% 16 0.0% 0 17.0% 16 0.0% 0 0.0% 0 0.0% 0 0.0% 0 0.0% 0 0.0% 0 0.0% 0 0.0% 0GU514 0.3% 6 0.0% 0 6.7% 6 0.0% 0 0.0% 0 0.0% 0 0.0% 0 0.0% 0 0.0% 0 0.0% 0 0.0% 0GU515 0.0% 1 0.0% 0 0.6% 1 0.0% 0 0.0% 0 0.0% 0 0.0% 0 0.0% 0 0.0% 0 0.0% 0 0.0% 0GU527 0.3% 6 0.0% 0 6.8% 6 0.0% 0 0.0% 0 0.0% 0 0.0% 0 0.0% 0 0.0% 0 0.0% 0 0.0% 0HP100 0.3% 6 0.0% 0 0.0% 0 0.0% 0 0.0% 0 0.0% 0 0.0% 0 0.0% 0 0.0% 0 0.0% 0 0.0% 0HP108 0.3% 5 0.0% 0 0.0% 0 0.0% 0 0.0% 0 0.0% 0 0.0% 0 0.0% 0 0.0% 0 0.0% 0 0.0% 0HP109 1.1% 22 0.0% 0 0.0% 0 0.0% 0 0.0% 0 0.0% 0 0.0% 0 0.0% 0 0.0% 0 0.0% 0 0.0% 0HP111 0.0% 1 0.0% 0 0.0% 0 0.0% 0 0.0% 0 0.0% 0 0.0% 0 0.0% 0 0.0% 0 0.0% 0 0.0% 0
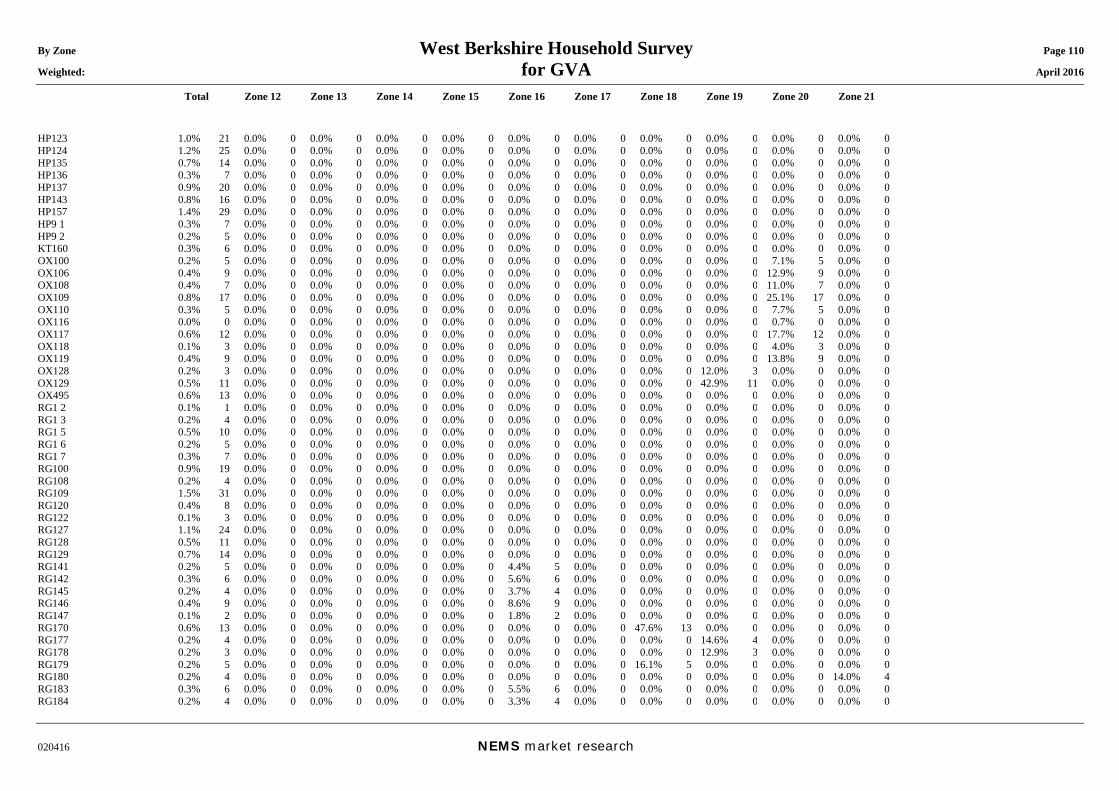
By Zone West Berkshire Household Survey Page 110 Weighted: for GVA April 2016
Total Zone 12 Zone 13 Zone 14 Zone 15 Zone 16 Zone 17 Zone 18 Zone 19 Zone 20 Zone 21
020416 NEMS market research
HP123 1.0% 21 0.0% 0 0.0% 0 0.0% 0 0.0% 0 0.0% 0 0.0% 0 0.0% 0 0.0% 0 0.0% 0 0.0% 0HP124 1.2% 25 0.0% 0 0.0% 0 0.0% 0 0.0% 0 0.0% 0 0.0% 0 0.0% 0 0.0% 0 0.0% 0 0.0% 0HP135 0.7% 14 0.0% 0 0.0% 0 0.0% 0 0.0% 0 0.0% 0 0.0% 0 0.0% 0 0.0% 0 0.0% 0 0.0% 0HP136 0.3% 7 0.0% 0 0.0% 0 0.0% 0 0.0% 0 0.0% 0 0.0% 0 0.0% 0 0.0% 0 0.0% 0 0.0% 0HP137 0.9% 20 0.0% 0 0.0% 0 0.0% 0 0.0% 0 0.0% 0 0.0% 0 0.0% 0 0.0% 0 0.0% 0 0.0% 0HP143 0.8% 16 0.0% 0 0.0% 0 0.0% 0 0.0% 0 0.0% 0 0.0% 0 0.0% 0 0.0% 0 0.0% 0 0.0% 0HP157 1.4% 29 0.0% 0 0.0% 0 0.0% 0 0.0% 0 0.0% 0 0.0% 0 0.0% 0 0.0% 0 0.0% 0 0.0% 0HP9 1 0.3% 7 0.0% 0 0.0% 0 0.0% 0 0.0% 0 0.0% 0 0.0% 0 0.0% 0 0.0% 0 0.0% 0 0.0% 0HP9 2 0.2% 5 0.0% 0 0.0% 0 0.0% 0 0.0% 0 0.0% 0 0.0% 0 0.0% 0 0.0% 0 0.0% 0 0.0% 0KT160 0.3% 6 0.0% 0 0.0% 0 0.0% 0 0.0% 0 0.0% 0 0.0% 0 0.0% 0 0.0% 0 0.0% 0 0.0% 0OX100 0.2% 5 0.0% 0 0.0% 0 0.0% 0 0.0% 0 0.0% 0 0.0% 0 0.0% 0 0.0% 0 7.1% 5 0.0% 0OX106 0.4% 9 0.0% 0 0.0% 0 0.0% 0 0.0% 0 0.0% 0 0.0% 0 0.0% 0 0.0% 0 12.9% 9 0.0% 0OX108 0.4% 7 0.0% 0 0.0% 0 0.0% 0 0.0% 0 0.0% 0 0.0% 0 0.0% 0 0.0% 0 11.0% 7 0.0% 0OX109 0.8% 17 0.0% 0 0.0% 0 0.0% 0 0.0% 0 0.0% 0 0.0% 0 0.0% 0 0.0% 0 25.1% 17 0.0% 0OX110 0.3% 5 0.0% 0 0.0% 0 0.0% 0 0.0% 0 0.0% 0 0.0% 0 0.0% 0 0.0% 0 7.7% 5 0.0% 0OX116 0.0% 0 0.0% 0 0.0% 0 0.0% 0 0.0% 0 0.0% 0 0.0% 0 0.0% 0 0.0% 0 0.7% 0 0.0% 0OX117 0.6% 12 0.0% 0 0.0% 0 0.0% 0 0.0% 0 0.0% 0 0.0% 0 0.0% 0 0.0% 0 17.7% 12 0.0% 0OX118 0.1% 3 0.0% 0 0.0% 0 0.0% 0 0.0% 0 0.0% 0 0.0% 0 0.0% 0 0.0% 0 4.0% 3 0.0% 0OX119 0.4% 9 0.0% 0 0.0% 0 0.0% 0 0.0% 0 0.0% 0 0.0% 0 0.0% 0 0.0% 0 13.8% 9 0.0% 0OX128 0.2% 3 0.0% 0 0.0% 0 0.0% 0 0.0% 0 0.0% 0 0.0% 0 0.0% 0 12.0% 3 0.0% 0 0.0% 0OX129 0.5% 11 0.0% 0 0.0% 0 0.0% 0 0.0% 0 0.0% 0 0.0% 0 0.0% 0 42.9% 11 0.0% 0 0.0% 0OX495 0.6% 13 0.0% 0 0.0% 0 0.0% 0 0.0% 0 0.0% 0 0.0% 0 0.0% 0 0.0% 0 0.0% 0 0.0% 0RG1 2 0.1% 1 0.0% 0 0.0% 0 0.0% 0 0.0% 0 0.0% 0 0.0% 0 0.0% 0 0.0% 0 0.0% 0 0.0% 0RG1 3 0.2% 4 0.0% 0 0.0% 0 0.0% 0 0.0% 0 0.0% 0 0.0% 0 0.0% 0 0.0% 0 0.0% 0 0.0% 0RG1 5 0.5% 10 0.0% 0 0.0% 0 0.0% 0 0.0% 0 0.0% 0 0.0% 0 0.0% 0 0.0% 0 0.0% 0 0.0% 0RG1 6 0.2% 5 0.0% 0 0.0% 0 0.0% 0 0.0% 0 0.0% 0 0.0% 0 0.0% 0 0.0% 0 0.0% 0 0.0% 0RG1 7 0.3% 7 0.0% 0 0.0% 0 0.0% 0 0.0% 0 0.0% 0 0.0% 0 0.0% 0 0.0% 0 0.0% 0 0.0% 0RG100 0.9% 19 0.0% 0 0.0% 0 0.0% 0 0.0% 0 0.0% 0 0.0% 0 0.0% 0 0.0% 0 0.0% 0 0.0% 0RG108 0.2% 4 0.0% 0 0.0% 0 0.0% 0 0.0% 0 0.0% 0 0.0% 0 0.0% 0 0.0% 0 0.0% 0 0.0% 0RG109 1.5% 31 0.0% 0 0.0% 0 0.0% 0 0.0% 0 0.0% 0 0.0% 0 0.0% 0 0.0% 0 0.0% 0 0.0% 0RG120 0.4% 8 0.0% 0 0.0% 0 0.0% 0 0.0% 0 0.0% 0 0.0% 0 0.0% 0 0.0% 0 0.0% 0 0.0% 0RG122 0.1% 3 0.0% 0 0.0% 0 0.0% 0 0.0% 0 0.0% 0 0.0% 0 0.0% 0 0.0% 0 0.0% 0 0.0% 0RG127 1.1% 24 0.0% 0 0.0% 0 0.0% 0 0.0% 0 0.0% 0 0.0% 0 0.0% 0 0.0% 0 0.0% 0 0.0% 0RG128 0.5% 11 0.0% 0 0.0% 0 0.0% 0 0.0% 0 0.0% 0 0.0% 0 0.0% 0 0.0% 0 0.0% 0 0.0% 0RG129 0.7% 14 0.0% 0 0.0% 0 0.0% 0 0.0% 0 0.0% 0 0.0% 0 0.0% 0 0.0% 0 0.0% 0 0.0% 0RG141 0.2% 5 0.0% 0 0.0% 0 0.0% 0 0.0% 0 4.4% 5 0.0% 0 0.0% 0 0.0% 0 0.0% 0 0.0% 0RG142 0.3% 6 0.0% 0 0.0% 0 0.0% 0 0.0% 0 5.6% 6 0.0% 0 0.0% 0 0.0% 0 0.0% 0 0.0% 0RG145 0.2% 4 0.0% 0 0.0% 0 0.0% 0 0.0% 0 3.7% 4 0.0% 0 0.0% 0 0.0% 0 0.0% 0 0.0% 0RG146 0.4% 9 0.0% 0 0.0% 0 0.0% 0 0.0% 0 8.6% 9 0.0% 0 0.0% 0 0.0% 0 0.0% 0 0.0% 0RG147 0.1% 2 0.0% 0 0.0% 0 0.0% 0 0.0% 0 1.8% 2 0.0% 0 0.0% 0 0.0% 0 0.0% 0 0.0% 0RG170 0.6% 13 0.0% 0 0.0% 0 0.0% 0 0.0% 0 0.0% 0 0.0% 0 47.6% 13 0.0% 0 0.0% 0 0.0% 0RG177 0.2% 4 0.0% 0 0.0% 0 0.0% 0 0.0% 0 0.0% 0 0.0% 0 0.0% 0 14.6% 4 0.0% 0 0.0% 0RG178 0.2% 3 0.0% 0 0.0% 0 0.0% 0 0.0% 0 0.0% 0 0.0% 0 0.0% 0 12.9% 3 0.0% 0 0.0% 0RG179 0.2% 5 0.0% 0 0.0% 0 0.0% 0 0.0% 0 0.0% 0 0.0% 0 16.1% 5 0.0% 0 0.0% 0 0.0% 0RG180 0.2% 4 0.0% 0 0.0% 0 0.0% 0 0.0% 0 0.0% 0 0.0% 0 0.0% 0 0.0% 0 0.0% 0 14.0% 4RG183 0.3% 6 0.0% 0 0.0% 0 0.0% 0 0.0% 0 5.5% 6 0.0% 0 0.0% 0 0.0% 0 0.0% 0 0.0% 0RG184 0.2% 4 0.0% 0 0.0% 0 0.0% 0 0.0% 0 3.3% 4 0.0% 0 0.0% 0 0.0% 0 0.0% 0 0.0% 0
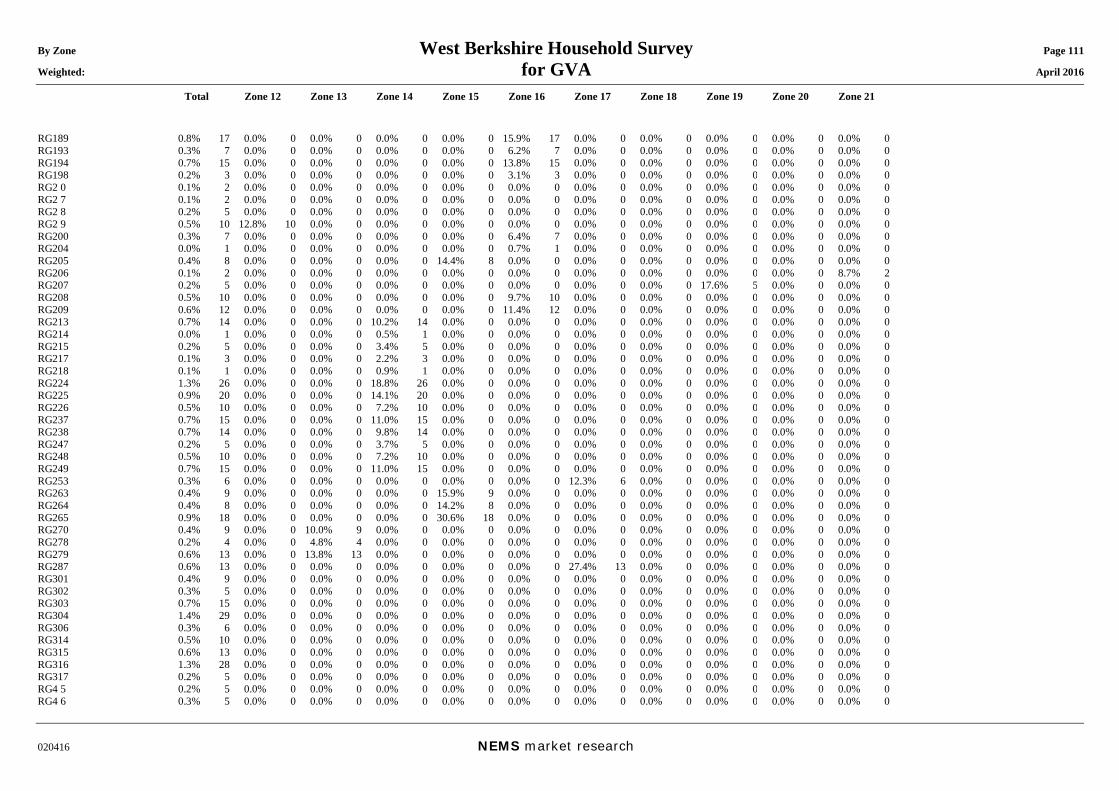
By Zone West Berkshire Household Survey Page 111 Weighted: for GVA April 2016
Total Zone 12 Zone 13 Zone 14 Zone 15 Zone 16 Zone 17 Zone 18 Zone 19 Zone 20 Zone 21
020416 NEMS market research
RG189 0.8% 17 0.0% 0 0.0% 0 0.0% 0 0.0% 0 15.9% 17 0.0% 0 0.0% 0 0.0% 0 0.0% 0 0.0% 0RG193 0.3% 7 0.0% 0 0.0% 0 0.0% 0 0.0% 0 6.2% 7 0.0% 0 0.0% 0 0.0% 0 0.0% 0 0.0% 0RG194 0.7% 15 0.0% 0 0.0% 0 0.0% 0 0.0% 0 13.8% 15 0.0% 0 0.0% 0 0.0% 0 0.0% 0 0.0% 0RG198 0.2% 3 0.0% 0 0.0% 0 0.0% 0 0.0% 0 3.1% 3 0.0% 0 0.0% 0 0.0% 0 0.0% 0 0.0% 0RG2 0 0.1% 2 0.0% 0 0.0% 0 0.0% 0 0.0% 0 0.0% 0 0.0% 0 0.0% 0 0.0% 0 0.0% 0 0.0% 0RG2 7 0.1% 2 0.0% 0 0.0% 0 0.0% 0 0.0% 0 0.0% 0 0.0% 0 0.0% 0 0.0% 0 0.0% 0 0.0% 0RG2 8 0.2% 5 0.0% 0 0.0% 0 0.0% 0 0.0% 0 0.0% 0 0.0% 0 0.0% 0 0.0% 0 0.0% 0 0.0% 0RG2 9 0.5% 10 12.8% 10 0.0% 0 0.0% 0 0.0% 0 0.0% 0 0.0% 0 0.0% 0 0.0% 0 0.0% 0 0.0% 0RG200 0.3% 7 0.0% 0 0.0% 0 0.0% 0 0.0% 0 6.4% 7 0.0% 0 0.0% 0 0.0% 0 0.0% 0 0.0% 0RG204 0.0% 1 0.0% 0 0.0% 0 0.0% 0 0.0% 0 0.7% 1 0.0% 0 0.0% 0 0.0% 0 0.0% 0 0.0% 0RG205 0.4% 8 0.0% 0 0.0% 0 0.0% 0 14.4% 8 0.0% 0 0.0% 0 0.0% 0 0.0% 0 0.0% 0 0.0% 0RG206 0.1% 2 0.0% 0 0.0% 0 0.0% 0 0.0% 0 0.0% 0 0.0% 0 0.0% 0 0.0% 0 0.0% 0 8.7% 2RG207 0.2% 5 0.0% 0 0.0% 0 0.0% 0 0.0% 0 0.0% 0 0.0% 0 0.0% 0 17.6% 5 0.0% 0 0.0% 0RG208 0.5% 10 0.0% 0 0.0% 0 0.0% 0 0.0% 0 9.7% 10 0.0% 0 0.0% 0 0.0% 0 0.0% 0 0.0% 0RG209 0.6% 12 0.0% 0 0.0% 0 0.0% 0 0.0% 0 11.4% 12 0.0% 0 0.0% 0 0.0% 0 0.0% 0 0.0% 0RG213 0.7% 14 0.0% 0 0.0% 0 10.2% 14 0.0% 0 0.0% 0 0.0% 0 0.0% 0 0.0% 0 0.0% 0 0.0% 0RG214 0.0% 1 0.0% 0 0.0% 0 0.5% 1 0.0% 0 0.0% 0 0.0% 0 0.0% 0 0.0% 0 0.0% 0 0.0% 0RG215 0.2% 5 0.0% 0 0.0% 0 3.4% 5 0.0% 0 0.0% 0 0.0% 0 0.0% 0 0.0% 0 0.0% 0 0.0% 0RG217 0.1% 3 0.0% 0 0.0% 0 2.2% 3 0.0% 0 0.0% 0 0.0% 0 0.0% 0 0.0% 0 0.0% 0 0.0% 0RG218 0.1% 1 0.0% 0 0.0% 0 0.9% 1 0.0% 0 0.0% 0 0.0% 0 0.0% 0 0.0% 0 0.0% 0 0.0% 0RG224 1.3% 26 0.0% 0 0.0% 0 18.8% 26 0.0% 0 0.0% 0 0.0% 0 0.0% 0 0.0% 0 0.0% 0 0.0% 0RG225 0.9% 20 0.0% 0 0.0% 0 14.1% 20 0.0% 0 0.0% 0 0.0% 0 0.0% 0 0.0% 0 0.0% 0 0.0% 0RG226 0.5% 10 0.0% 0 0.0% 0 7.2% 10 0.0% 0 0.0% 0 0.0% 0 0.0% 0 0.0% 0 0.0% 0 0.0% 0RG237 0.7% 15 0.0% 0 0.0% 0 11.0% 15 0.0% 0 0.0% 0 0.0% 0 0.0% 0 0.0% 0 0.0% 0 0.0% 0RG238 0.7% 14 0.0% 0 0.0% 0 9.8% 14 0.0% 0 0.0% 0 0.0% 0 0.0% 0 0.0% 0 0.0% 0 0.0% 0RG247 0.2% 5 0.0% 0 0.0% 0 3.7% 5 0.0% 0 0.0% 0 0.0% 0 0.0% 0 0.0% 0 0.0% 0 0.0% 0RG248 0.5% 10 0.0% 0 0.0% 0 7.2% 10 0.0% 0 0.0% 0 0.0% 0 0.0% 0 0.0% 0 0.0% 0 0.0% 0RG249 0.7% 15 0.0% 0 0.0% 0 11.0% 15 0.0% 0 0.0% 0 0.0% 0 0.0% 0 0.0% 0 0.0% 0 0.0% 0RG253 0.3% 6 0.0% 0 0.0% 0 0.0% 0 0.0% 0 0.0% 0 12.3% 6 0.0% 0 0.0% 0 0.0% 0 0.0% 0RG263 0.4% 9 0.0% 0 0.0% 0 0.0% 0 15.9% 9 0.0% 0 0.0% 0 0.0% 0 0.0% 0 0.0% 0 0.0% 0RG264 0.4% 8 0.0% 0 0.0% 0 0.0% 0 14.2% 8 0.0% 0 0.0% 0 0.0% 0 0.0% 0 0.0% 0 0.0% 0RG265 0.9% 18 0.0% 0 0.0% 0 0.0% 0 30.6% 18 0.0% 0 0.0% 0 0.0% 0 0.0% 0 0.0% 0 0.0% 0RG270 0.4% 9 0.0% 0 10.0% 9 0.0% 0 0.0% 0 0.0% 0 0.0% 0 0.0% 0 0.0% 0 0.0% 0 0.0% 0RG278 0.2% 4 0.0% 0 4.8% 4 0.0% 0 0.0% 0 0.0% 0 0.0% 0 0.0% 0 0.0% 0 0.0% 0 0.0% 0RG279 0.6% 13 0.0% 0 13.8% 13 0.0% 0 0.0% 0 0.0% 0 0.0% 0 0.0% 0 0.0% 0 0.0% 0 0.0% 0RG287 0.6% 13 0.0% 0 0.0% 0 0.0% 0 0.0% 0 0.0% 0 27.4% 13 0.0% 0 0.0% 0 0.0% 0 0.0% 0RG301 0.4% 9 0.0% 0 0.0% 0 0.0% 0 0.0% 0 0.0% 0 0.0% 0 0.0% 0 0.0% 0 0.0% 0 0.0% 0RG302 0.3% 5 0.0% 0 0.0% 0 0.0% 0 0.0% 0 0.0% 0 0.0% 0 0.0% 0 0.0% 0 0.0% 0 0.0% 0RG303 0.7% 15 0.0% 0 0.0% 0 0.0% 0 0.0% 0 0.0% 0 0.0% 0 0.0% 0 0.0% 0 0.0% 0 0.0% 0RG304 1.4% 29 0.0% 0 0.0% 0 0.0% 0 0.0% 0 0.0% 0 0.0% 0 0.0% 0 0.0% 0 0.0% 0 0.0% 0RG306 0.3% 6 0.0% 0 0.0% 0 0.0% 0 0.0% 0 0.0% 0 0.0% 0 0.0% 0 0.0% 0 0.0% 0 0.0% 0RG314 0.5% 10 0.0% 0 0.0% 0 0.0% 0 0.0% 0 0.0% 0 0.0% 0 0.0% 0 0.0% 0 0.0% 0 0.0% 0RG315 0.6% 13 0.0% 0 0.0% 0 0.0% 0 0.0% 0 0.0% 0 0.0% 0 0.0% 0 0.0% 0 0.0% 0 0.0% 0RG316 1.3% 28 0.0% 0 0.0% 0 0.0% 0 0.0% 0 0.0% 0 0.0% 0 0.0% 0 0.0% 0 0.0% 0 0.0% 0RG317 0.2% 5 0.0% 0 0.0% 0 0.0% 0 0.0% 0 0.0% 0 0.0% 0 0.0% 0 0.0% 0 0.0% 0 0.0% 0RG4 5 0.2% 5 0.0% 0 0.0% 0 0.0% 0 0.0% 0 0.0% 0 0.0% 0 0.0% 0 0.0% 0 0.0% 0 0.0% 0RG4 6 0.3% 5 0.0% 0 0.0% 0 0.0% 0 0.0% 0 0.0% 0 0.0% 0 0.0% 0 0.0% 0 0.0% 0 0.0% 0
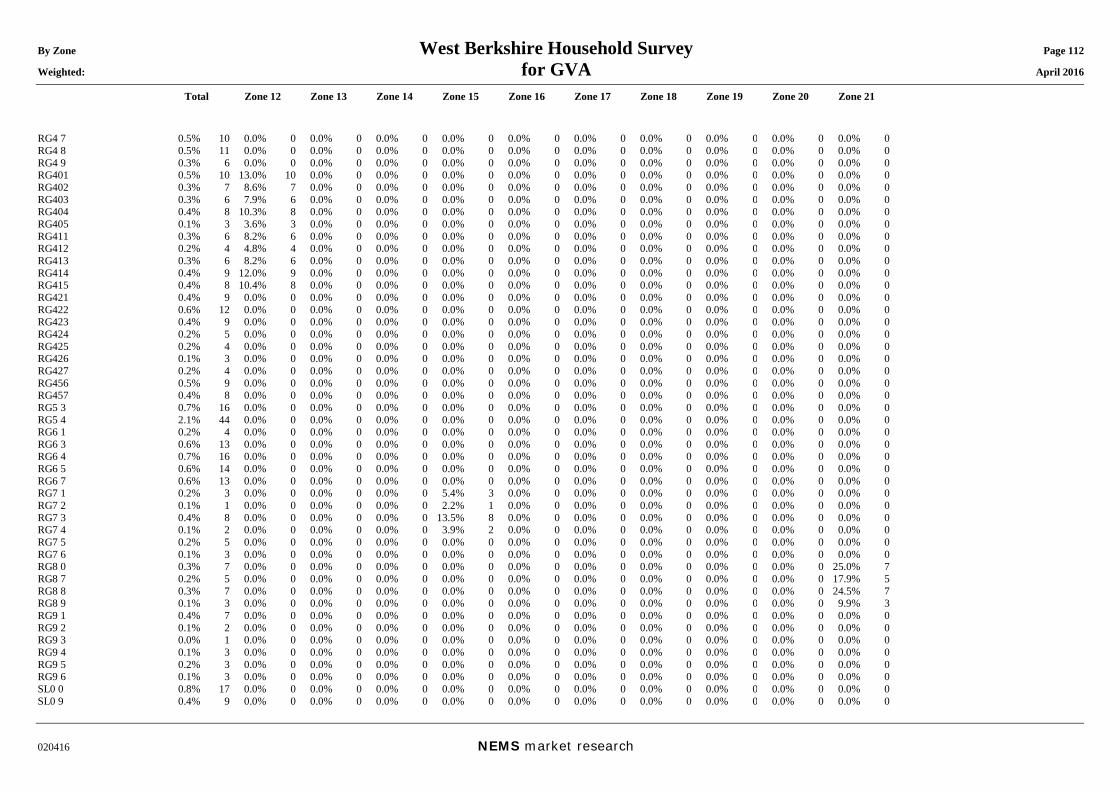
By Zone West Berkshire Household Survey Page 112 Weighted: for GVA April 2016
Total Zone 12 Zone 13 Zone 14 Zone 15 Zone 16 Zone 17 Zone 18 Zone 19 Zone 20 Zone 21
020416 NEMS market research
RG4 7 0.5% 10 0.0% 0 0.0% 0 0.0% 0 0.0% 0 0.0% 0 0.0% 0 0.0% 0 0.0% 0 0.0% 0 0.0% 0RG4 8 0.5% 11 0.0% 0 0.0% 0 0.0% 0 0.0% 0 0.0% 0 0.0% 0 0.0% 0 0.0% 0 0.0% 0 0.0% 0RG4 9 0.3% 6 0.0% 0 0.0% 0 0.0% 0 0.0% 0 0.0% 0 0.0% 0 0.0% 0 0.0% 0 0.0% 0 0.0% 0RG401 0.5% 10 13.0% 10 0.0% 0 0.0% 0 0.0% 0 0.0% 0 0.0% 0 0.0% 0 0.0% 0 0.0% 0 0.0% 0RG402 0.3% 7 8.6% 7 0.0% 0 0.0% 0 0.0% 0 0.0% 0 0.0% 0 0.0% 0 0.0% 0 0.0% 0 0.0% 0RG403 0.3% 6 7.9% 6 0.0% 0 0.0% 0 0.0% 0 0.0% 0 0.0% 0 0.0% 0 0.0% 0 0.0% 0 0.0% 0RG404 0.4% 8 10.3% 8 0.0% 0 0.0% 0 0.0% 0 0.0% 0 0.0% 0 0.0% 0 0.0% 0 0.0% 0 0.0% 0RG405 0.1% 3 3.6% 3 0.0% 0 0.0% 0 0.0% 0 0.0% 0 0.0% 0 0.0% 0 0.0% 0 0.0% 0 0.0% 0RG411 0.3% 6 8.2% 6 0.0% 0 0.0% 0 0.0% 0 0.0% 0 0.0% 0 0.0% 0 0.0% 0 0.0% 0 0.0% 0RG412 0.2% 4 4.8% 4 0.0% 0 0.0% 0 0.0% 0 0.0% 0 0.0% 0 0.0% 0 0.0% 0 0.0% 0 0.0% 0RG413 0.3% 6 8.2% 6 0.0% 0 0.0% 0 0.0% 0 0.0% 0 0.0% 0 0.0% 0 0.0% 0 0.0% 0 0.0% 0RG414 0.4% 9 12.0% 9 0.0% 0 0.0% 0 0.0% 0 0.0% 0 0.0% 0 0.0% 0 0.0% 0 0.0% 0 0.0% 0RG415 0.4% 8 10.4% 8 0.0% 0 0.0% 0 0.0% 0 0.0% 0 0.0% 0 0.0% 0 0.0% 0 0.0% 0 0.0% 0RG421 0.4% 9 0.0% 0 0.0% 0 0.0% 0 0.0% 0 0.0% 0 0.0% 0 0.0% 0 0.0% 0 0.0% 0 0.0% 0RG422 0.6% 12 0.0% 0 0.0% 0 0.0% 0 0.0% 0 0.0% 0 0.0% 0 0.0% 0 0.0% 0 0.0% 0 0.0% 0RG423 0.4% 9 0.0% 0 0.0% 0 0.0% 0 0.0% 0 0.0% 0 0.0% 0 0.0% 0 0.0% 0 0.0% 0 0.0% 0RG424 0.2% 5 0.0% 0 0.0% 0 0.0% 0 0.0% 0 0.0% 0 0.0% 0 0.0% 0 0.0% 0 0.0% 0 0.0% 0RG425 0.2% 4 0.0% 0 0.0% 0 0.0% 0 0.0% 0 0.0% 0 0.0% 0 0.0% 0 0.0% 0 0.0% 0 0.0% 0RG426 0.1% 3 0.0% 0 0.0% 0 0.0% 0 0.0% 0 0.0% 0 0.0% 0 0.0% 0 0.0% 0 0.0% 0 0.0% 0RG427 0.2% 4 0.0% 0 0.0% 0 0.0% 0 0.0% 0 0.0% 0 0.0% 0 0.0% 0 0.0% 0 0.0% 0 0.0% 0RG456 0.5% 9 0.0% 0 0.0% 0 0.0% 0 0.0% 0 0.0% 0 0.0% 0 0.0% 0 0.0% 0 0.0% 0 0.0% 0RG457 0.4% 8 0.0% 0 0.0% 0 0.0% 0 0.0% 0 0.0% 0 0.0% 0 0.0% 0 0.0% 0 0.0% 0 0.0% 0RG5 3 0.7% 16 0.0% 0 0.0% 0 0.0% 0 0.0% 0 0.0% 0 0.0% 0 0.0% 0 0.0% 0 0.0% 0 0.0% 0RG5 4 2.1% 44 0.0% 0 0.0% 0 0.0% 0 0.0% 0 0.0% 0 0.0% 0 0.0% 0 0.0% 0 0.0% 0 0.0% 0RG6 1 0.2% 4 0.0% 0 0.0% 0 0.0% 0 0.0% 0 0.0% 0 0.0% 0 0.0% 0 0.0% 0 0.0% 0 0.0% 0RG6 3 0.6% 13 0.0% 0 0.0% 0 0.0% 0 0.0% 0 0.0% 0 0.0% 0 0.0% 0 0.0% 0 0.0% 0 0.0% 0RG6 4 0.7% 16 0.0% 0 0.0% 0 0.0% 0 0.0% 0 0.0% 0 0.0% 0 0.0% 0 0.0% 0 0.0% 0 0.0% 0RG6 5 0.6% 14 0.0% 0 0.0% 0 0.0% 0 0.0% 0 0.0% 0 0.0% 0 0.0% 0 0.0% 0 0.0% 0 0.0% 0RG6 7 0.6% 13 0.0% 0 0.0% 0 0.0% 0 0.0% 0 0.0% 0 0.0% 0 0.0% 0 0.0% 0 0.0% 0 0.0% 0RG7 1 0.2% 3 0.0% 0 0.0% 0 0.0% 0 5.4% 3 0.0% 0 0.0% 0 0.0% 0 0.0% 0 0.0% 0 0.0% 0RG7 2 0.1% 1 0.0% 0 0.0% 0 0.0% 0 2.2% 1 0.0% 0 0.0% 0 0.0% 0 0.0% 0 0.0% 0 0.0% 0RG7 3 0.4% 8 0.0% 0 0.0% 0 0.0% 0 13.5% 8 0.0% 0 0.0% 0 0.0% 0 0.0% 0 0.0% 0 0.0% 0RG7 4 0.1% 2 0.0% 0 0.0% 0 0.0% 0 3.9% 2 0.0% 0 0.0% 0 0.0% 0 0.0% 0 0.0% 0 0.0% 0RG7 5 0.2% 5 0.0% 0 0.0% 0 0.0% 0 0.0% 0 0.0% 0 0.0% 0 0.0% 0 0.0% 0 0.0% 0 0.0% 0RG7 6 0.1% 3 0.0% 0 0.0% 0 0.0% 0 0.0% 0 0.0% 0 0.0% 0 0.0% 0 0.0% 0 0.0% 0 0.0% 0RG8 0 0.3% 7 0.0% 0 0.0% 0 0.0% 0 0.0% 0 0.0% 0 0.0% 0 0.0% 0 0.0% 0 0.0% 0 25.0% 7RG8 7 0.2% 5 0.0% 0 0.0% 0 0.0% 0 0.0% 0 0.0% 0 0.0% 0 0.0% 0 0.0% 0 0.0% 0 17.9% 5RG8 8 0.3% 7 0.0% 0 0.0% 0 0.0% 0 0.0% 0 0.0% 0 0.0% 0 0.0% 0 0.0% 0 0.0% 0 24.5% 7RG8 9 0.1% 3 0.0% 0 0.0% 0 0.0% 0 0.0% 0 0.0% 0 0.0% 0 0.0% 0 0.0% 0 0.0% 0 9.9% 3RG9 1 0.4% 7 0.0% 0 0.0% 0 0.0% 0 0.0% 0 0.0% 0 0.0% 0 0.0% 0 0.0% 0 0.0% 0 0.0% 0RG9 2 0.1% 2 0.0% 0 0.0% 0 0.0% 0 0.0% 0 0.0% 0 0.0% 0 0.0% 0 0.0% 0 0.0% 0 0.0% 0RG9 3 0.0% 1 0.0% 0 0.0% 0 0.0% 0 0.0% 0 0.0% 0 0.0% 0 0.0% 0 0.0% 0 0.0% 0 0.0% 0RG9 4 0.1% 3 0.0% 0 0.0% 0 0.0% 0 0.0% 0 0.0% 0 0.0% 0 0.0% 0 0.0% 0 0.0% 0 0.0% 0RG9 5 0.2% 3 0.0% 0 0.0% 0 0.0% 0 0.0% 0 0.0% 0 0.0% 0 0.0% 0 0.0% 0 0.0% 0 0.0% 0RG9 6 0.1% 3 0.0% 0 0.0% 0 0.0% 0 0.0% 0 0.0% 0 0.0% 0 0.0% 0 0.0% 0 0.0% 0 0.0% 0SL0 0 0.8% 17 0.0% 0 0.0% 0 0.0% 0 0.0% 0 0.0% 0 0.0% 0 0.0% 0 0.0% 0 0.0% 0 0.0% 0SL0 9 0.4% 9 0.0% 0 0.0% 0 0.0% 0 0.0% 0 0.0% 0 0.0% 0 0.0% 0 0.0% 0 0.0% 0 0.0% 0
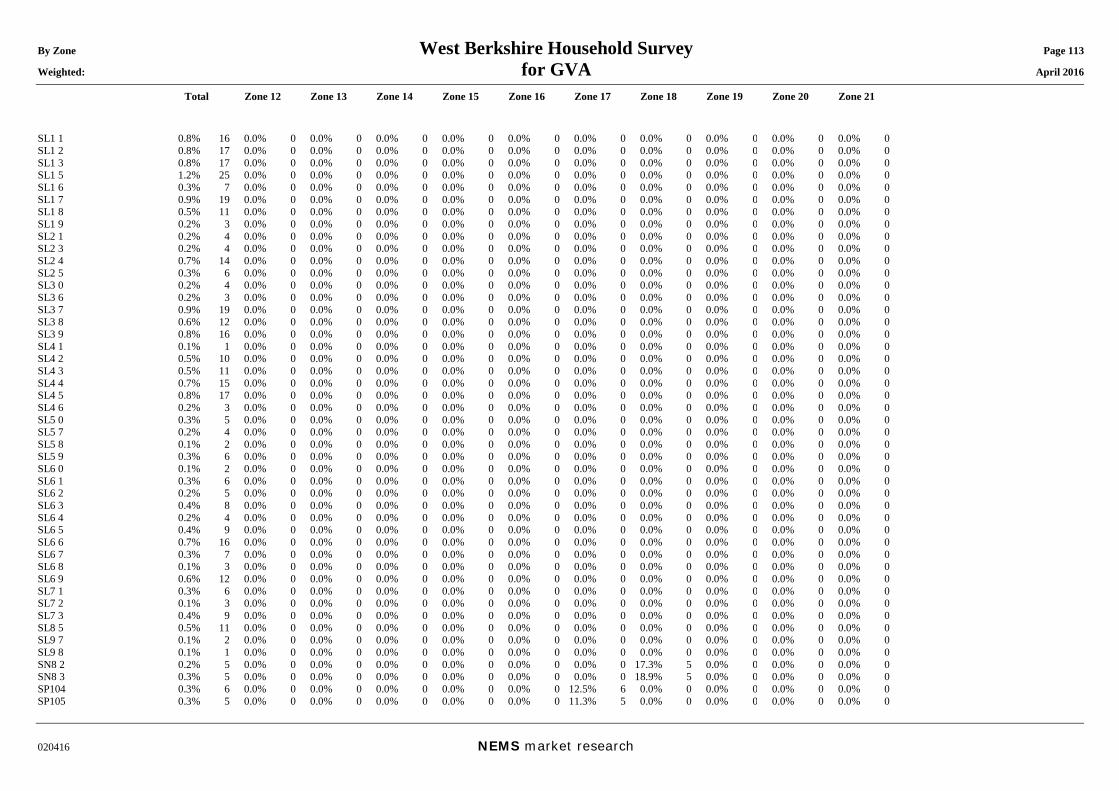
By Zone West Berkshire Household Survey Page 113 Weighted: for GVA April 2016
Total Zone 12 Zone 13 Zone 14 Zone 15 Zone 16 Zone 17 Zone 18 Zone 19 Zone 20 Zone 21
020416 NEMS market research
SL1 1 0.8% 16 0.0% 0 0.0% 0 0.0% 0 0.0% 0 0.0% 0 0.0% 0 0.0% 0 0.0% 0 0.0% 0 0.0% 0SL1 2 0.8% 17 0.0% 0 0.0% 0 0.0% 0 0.0% 0 0.0% 0 0.0% 0 0.0% 0 0.0% 0 0.0% 0 0.0% 0SL1 3 0.8% 17 0.0% 0 0.0% 0 0.0% 0 0.0% 0 0.0% 0 0.0% 0 0.0% 0 0.0% 0 0.0% 0 0.0% 0SL1 5 1.2% 25 0.0% 0 0.0% 0 0.0% 0 0.0% 0 0.0% 0 0.0% 0 0.0% 0 0.0% 0 0.0% 0 0.0% 0SL1 6 0.3% 7 0.0% 0 0.0% 0 0.0% 0 0.0% 0 0.0% 0 0.0% 0 0.0% 0 0.0% 0 0.0% 0 0.0% 0SL1 7 0.9% 19 0.0% 0 0.0% 0 0.0% 0 0.0% 0 0.0% 0 0.0% 0 0.0% 0 0.0% 0 0.0% 0 0.0% 0SL1 8 0.5% 11 0.0% 0 0.0% 0 0.0% 0 0.0% 0 0.0% 0 0.0% 0 0.0% 0 0.0% 0 0.0% 0 0.0% 0SL1 9 0.2% 3 0.0% 0 0.0% 0 0.0% 0 0.0% 0 0.0% 0 0.0% 0 0.0% 0 0.0% 0 0.0% 0 0.0% 0SL2 1 0.2% 4 0.0% 0 0.0% 0 0.0% 0 0.0% 0 0.0% 0 0.0% 0 0.0% 0 0.0% 0 0.0% 0 0.0% 0SL2 3 0.2% 4 0.0% 0 0.0% 0 0.0% 0 0.0% 0 0.0% 0 0.0% 0 0.0% 0 0.0% 0 0.0% 0 0.0% 0SL2 4 0.7% 14 0.0% 0 0.0% 0 0.0% 0 0.0% 0 0.0% 0 0.0% 0 0.0% 0 0.0% 0 0.0% 0 0.0% 0SL2 5 0.3% 6 0.0% 0 0.0% 0 0.0% 0 0.0% 0 0.0% 0 0.0% 0 0.0% 0 0.0% 0 0.0% 0 0.0% 0SL3 0 0.2% 4 0.0% 0 0.0% 0 0.0% 0 0.0% 0 0.0% 0 0.0% 0 0.0% 0 0.0% 0 0.0% 0 0.0% 0SL3 6 0.2% 3 0.0% 0 0.0% 0 0.0% 0 0.0% 0 0.0% 0 0.0% 0 0.0% 0 0.0% 0 0.0% 0 0.0% 0SL3 7 0.9% 19 0.0% 0 0.0% 0 0.0% 0 0.0% 0 0.0% 0 0.0% 0 0.0% 0 0.0% 0 0.0% 0 0.0% 0SL3 8 0.6% 12 0.0% 0 0.0% 0 0.0% 0 0.0% 0 0.0% 0 0.0% 0 0.0% 0 0.0% 0 0.0% 0 0.0% 0SL3 9 0.8% 16 0.0% 0 0.0% 0 0.0% 0 0.0% 0 0.0% 0 0.0% 0 0.0% 0 0.0% 0 0.0% 0 0.0% 0SL4 1 0.1% 1 0.0% 0 0.0% 0 0.0% 0 0.0% 0 0.0% 0 0.0% 0 0.0% 0 0.0% 0 0.0% 0 0.0% 0SL4 2 0.5% 10 0.0% 0 0.0% 0 0.0% 0 0.0% 0 0.0% 0 0.0% 0 0.0% 0 0.0% 0 0.0% 0 0.0% 0SL4 3 0.5% 11 0.0% 0 0.0% 0 0.0% 0 0.0% 0 0.0% 0 0.0% 0 0.0% 0 0.0% 0 0.0% 0 0.0% 0SL4 4 0.7% 15 0.0% 0 0.0% 0 0.0% 0 0.0% 0 0.0% 0 0.0% 0 0.0% 0 0.0% 0 0.0% 0 0.0% 0SL4 5 0.8% 17 0.0% 0 0.0% 0 0.0% 0 0.0% 0 0.0% 0 0.0% 0 0.0% 0 0.0% 0 0.0% 0 0.0% 0SL4 6 0.2% 3 0.0% 0 0.0% 0 0.0% 0 0.0% 0 0.0% 0 0.0% 0 0.0% 0 0.0% 0 0.0% 0 0.0% 0SL5 0 0.3% 5 0.0% 0 0.0% 0 0.0% 0 0.0% 0 0.0% 0 0.0% 0 0.0% 0 0.0% 0 0.0% 0 0.0% 0SL5 7 0.2% 4 0.0% 0 0.0% 0 0.0% 0 0.0% 0 0.0% 0 0.0% 0 0.0% 0 0.0% 0 0.0% 0 0.0% 0SL5 8 0.1% 2 0.0% 0 0.0% 0 0.0% 0 0.0% 0 0.0% 0 0.0% 0 0.0% 0 0.0% 0 0.0% 0 0.0% 0SL5 9 0.3% 6 0.0% 0 0.0% 0 0.0% 0 0.0% 0 0.0% 0 0.0% 0 0.0% 0 0.0% 0 0.0% 0 0.0% 0SL6 0 0.1% 2 0.0% 0 0.0% 0 0.0% 0 0.0% 0 0.0% 0 0.0% 0 0.0% 0 0.0% 0 0.0% 0 0.0% 0SL6 1 0.3% 6 0.0% 0 0.0% 0 0.0% 0 0.0% 0 0.0% 0 0.0% 0 0.0% 0 0.0% 0 0.0% 0 0.0% 0SL6 2 0.2% 5 0.0% 0 0.0% 0 0.0% 0 0.0% 0 0.0% 0 0.0% 0 0.0% 0 0.0% 0 0.0% 0 0.0% 0SL6 3 0.4% 8 0.0% 0 0.0% 0 0.0% 0 0.0% 0 0.0% 0 0.0% 0 0.0% 0 0.0% 0 0.0% 0 0.0% 0SL6 4 0.2% 4 0.0% 0 0.0% 0 0.0% 0 0.0% 0 0.0% 0 0.0% 0 0.0% 0 0.0% 0 0.0% 0 0.0% 0SL6 5 0.4% 9 0.0% 0 0.0% 0 0.0% 0 0.0% 0 0.0% 0 0.0% 0 0.0% 0 0.0% 0 0.0% 0 0.0% 0SL6 6 0.7% 16 0.0% 0 0.0% 0 0.0% 0 0.0% 0 0.0% 0 0.0% 0 0.0% 0 0.0% 0 0.0% 0 0.0% 0SL6 7 0.3% 7 0.0% 0 0.0% 0 0.0% 0 0.0% 0 0.0% 0 0.0% 0 0.0% 0 0.0% 0 0.0% 0 0.0% 0SL6 8 0.1% 3 0.0% 0 0.0% 0 0.0% 0 0.0% 0 0.0% 0 0.0% 0 0.0% 0 0.0% 0 0.0% 0 0.0% 0SL6 9 0.6% 12 0.0% 0 0.0% 0 0.0% 0 0.0% 0 0.0% 0 0.0% 0 0.0% 0 0.0% 0 0.0% 0 0.0% 0SL7 1 0.3% 6 0.0% 0 0.0% 0 0.0% 0 0.0% 0 0.0% 0 0.0% 0 0.0% 0 0.0% 0 0.0% 0 0.0% 0SL7 2 0.1% 3 0.0% 0 0.0% 0 0.0% 0 0.0% 0 0.0% 0 0.0% 0 0.0% 0 0.0% 0 0.0% 0 0.0% 0SL7 3 0.4% 9 0.0% 0 0.0% 0 0.0% 0 0.0% 0 0.0% 0 0.0% 0 0.0% 0 0.0% 0 0.0% 0 0.0% 0SL8 5 0.5% 11 0.0% 0 0.0% 0 0.0% 0 0.0% 0 0.0% 0 0.0% 0 0.0% 0 0.0% 0 0.0% 0 0.0% 0SL9 7 0.1% 2 0.0% 0 0.0% 0 0.0% 0 0.0% 0 0.0% 0 0.0% 0 0.0% 0 0.0% 0 0.0% 0 0.0% 0SL9 8 0.1% 1 0.0% 0 0.0% 0 0.0% 0 0.0% 0 0.0% 0 0.0% 0 0.0% 0 0.0% 0 0.0% 0 0.0% 0SN8 2 0.2% 5 0.0% 0 0.0% 0 0.0% 0 0.0% 0 0.0% 0 0.0% 0 17.3% 5 0.0% 0 0.0% 0 0.0% 0SN8 3 0.3% 5 0.0% 0 0.0% 0 0.0% 0 0.0% 0 0.0% 0 0.0% 0 18.9% 5 0.0% 0 0.0% 0 0.0% 0SP104 0.3% 6 0.0% 0 0.0% 0 0.0% 0 0.0% 0 0.0% 0 12.5% 6 0.0% 0 0.0% 0 0.0% 0 0.0% 0SP105 0.3% 5 0.0% 0 0.0% 0 0.0% 0 0.0% 0 0.0% 0 11.3% 5 0.0% 0 0.0% 0 0.0% 0 0.0% 0
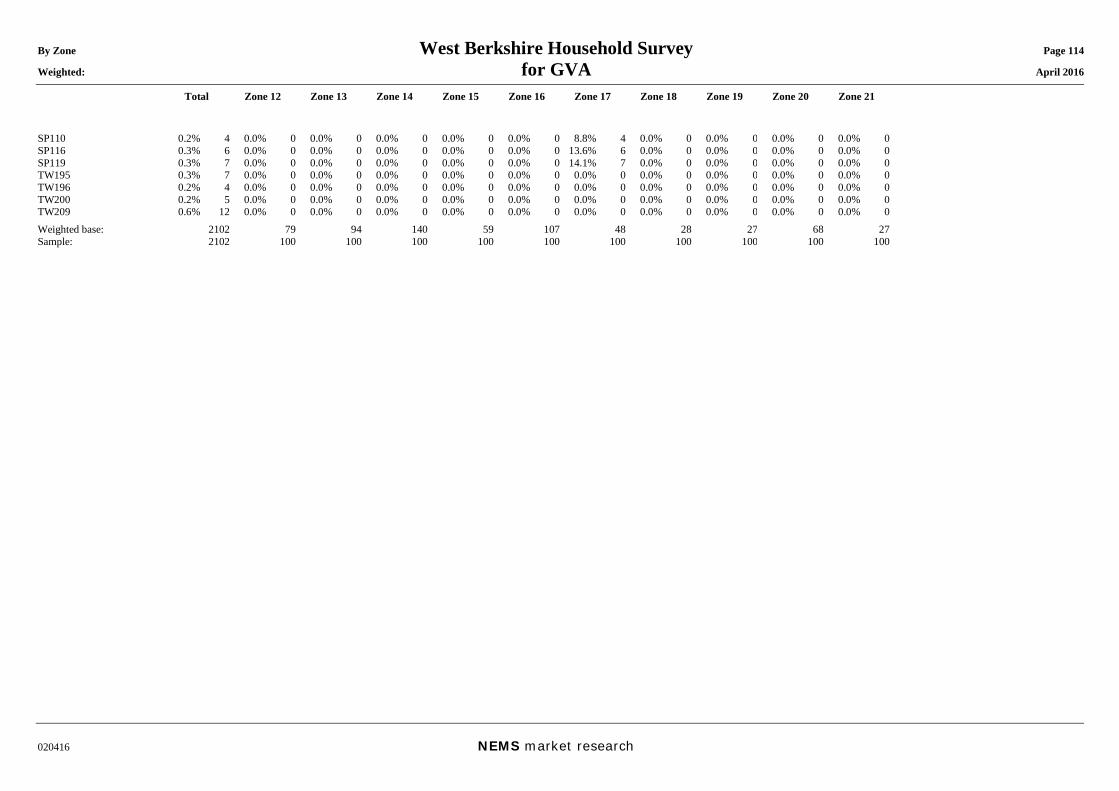
By Zone West Berkshire Household Survey Page 114 Weighted: for GVA April 2016
Total Zone 12 Zone 13 Zone 14 Zone 15 Zone 16 Zone 17 Zone 18 Zone 19 Zone 20 Zone 21
020416 NEMS market research
SP110 0.2% 4 0.0% 0 0.0% 0 0.0% 0 0.0% 0 0.0% 0 8.8% 4 0.0% 0 0.0% 0 0.0% 0 0.0% 0SP116 0.3% 6 0.0% 0 0.0% 0 0.0% 0 0.0% 0 0.0% 0 13.6% 6 0.0% 0 0.0% 0 0.0% 0 0.0% 0SP119 0.3% 7 0.0% 0 0.0% 0 0.0% 0 0.0% 0 0.0% 0 14.1% 7 0.0% 0 0.0% 0 0.0% 0 0.0% 0TW195 0.3% 7 0.0% 0 0.0% 0 0.0% 0 0.0% 0 0.0% 0 0.0% 0 0.0% 0 0.0% 0 0.0% 0 0.0% 0TW196 0.2% 4 0.0% 0 0.0% 0 0.0% 0 0.0% 0 0.0% 0 0.0% 0 0.0% 0 0.0% 0 0.0% 0 0.0% 0TW200 0.2% 5 0.0% 0 0.0% 0 0.0% 0 0.0% 0 0.0% 0 0.0% 0 0.0% 0 0.0% 0 0.0% 0 0.0% 0TW209 0.6% 12 0.0% 0 0.0% 0 0.0% 0 0.0% 0 0.0% 0 0.0% 0 0.0% 0 0.0% 0 0.0% 0 0.0% 0Weighted base: 2102 79 94 140 59 107 48 28 27 68 27Sample: 2102 100 100 100 100 100 100 100 100 100 100
gva.co.uk/planning
WESTERN BERKSHIRE AUTHORITIES | RETAIL & COMMERCIAL LEISURE ASSESSMENT 2016 | FINAL REPORT | APRIL 2017
Western Berkshire Retail & Commercial Leisure Assessment 2016 Volume 4 — Bracknell In-Centre Survey Results NEMS Market Research April 2017
GVA on behalf of Bracknell Forest Council | Reading Borough Council | West Berkshire Council | Wokingham Borough Council
WESTERN BERKSHIRE AUTHORITIES | RETAIL & COMMERCIAL LEISURE ASSESSMENT 2016 | VOLUME FOUR | AUGUST 2016
3 gva.co.uk/planning
INTRODUCTION & KEY FINDINGS 1
Introduction
1.1 The findings of the Western Berkshire Retail & Commercial Leisure Assessment (set out in full in Volume 1 of this study) were supported by a household telephone survey of shopping patterns. This household survey established where residents living across the survey area which we have used for the purposes of our assessment — which covers the four Western Berkshire authorities of Bracknell Forest, Reading, West Berkshire and Wokingham in their entirety, plus a wider surrounding catchment area — are undertaking their shopping and leisure visits, and what they like and dislike about the centres in Western Berkshire within which they undertake their shopping.
1.2 In addition to the above survey work, Bracknell Forest Council have separately commissioned an in-centre survey of users of Bracknell town centre, to gain a deeper understanding of the key reasons people use the centre, their likes and dislikes in the centre, and areas in which they consider improvements would be beneficial. Importantly, the survey also considers the extent to which the regeneration works which are currently taking place in Bracknell town centre, as a result of the construction of the Lexicon Bracknell development, are impacting on how visitors use the centre.
1.3 The survey work was undertaken in Bracknell town centre in April 2016 by NEMS Market Research. A total of 151 interviews were successfully completed.
1.4 We provide a headline summary of the key messages below; the full survey results form Appendix A to this volume to the study. It is recommended that further survey work is undertaken following the opening of Lexicon Bracknell (allowing for a suitable period of time for users of the centre to adjust to the new development), following the same format as the survey undertaken for this study, to ascertain how the views of users of centre have changed following the opening of the new development, and whether users consider whether there continue there to be any qualitative gaps in the offer of the centre or areas for improvement.
Reasons for visiting Bracknell town centre (Question 2)
1.5 The survey results identified that:
• Over 50% of respondents stated that they planned to undertake food shopping; 48% in the town centre, and 5% at the Peel Centre (where there is large Morrisons store)
• 38% of residents stated that they planned to undertake non-food shopping, split between 34% in the town centre and 3% at the Peel Centre.
• 21% of respondents were window shopping
• 18% of respondents were visiting financial services such as banks and building societies
• 15% stated they worked in the centre.
1.6 Of the responses given to question 2, respondents were then invited to state the main reason for visiting Bracknell town centre:
• The main purpose of visiting the centre is for food shopping — 32% visit stores in Bracknell town centre, and 3% visit the Peel Centre (Morrisons).
• By contrast, the proportion of visitors for whom non-food shopping is the main purpose of visit is low – 11% of respondents stated they were undertaking non-food shopping in the town centre, and 2% at the Peel Centre. This confirms that, at present, non-food shopping plays an important role as a secondary/linked reason for visiting, but not as the principle reason for visiting.
• 15% of respondents stated the principle reason they were in Bracknell town centre was because of work (reflecting the figure in Question 2).
Main stores visited (Question 4)
1.7 When asked what main stores they were intending to visit, the following stores attracted the highest responses:
• Almost two thirds of respondents (65%) stated they planned to visit Sainsbury’s, supporting the responses to question 3 that food shopping was the principle reason for many residents’ visiting the centre. 13% stated they planned to visit the new Waitrose store.
• The other retailer which scored a noticeably high number of responses was Poundworld (40%)
• Bentalls Department Store (which will convert to a branch of Fenwick as part of the Lexicon Bracknell) drew 22% of responses, followed by Superdrug (19%) and Boots (11%)
• Stores which scored between 5 and 10% of responses included WH Smith, Argos, Peacocks and the market.
Mode of access (Question 5)
1.8 32% of visitors to the centre arrived by bus, and 24% by walking, suggesting the town centre is largely drawing from a fairly localised catchment at present. 34% of visitors arrived by car.
WESTERN BERKSHIRE AUTHORITIES | RETAIL & COMMERCIAL LEISURE ASSESSMENT 2016 | VOLUME FOUR | AUGUST 2016
4 gva.co.uk/planning
Parking (Questions 7 and 8)
1.9 Question 7 asked where visitors who arrived by car choose to park. Two car parks were by some margin the most popular responses – 26% park in the mutli-storey car park adjacent to Princes Square Shopping Centre, and 23% park in Charles Square multi-storey. Other facilities achieved a response rate of under 10%.
1.10 74% of visitors do not have a preferred car park in the centre – but for those that do, the overwhelming majority (24%) stated they were able to park in their preferred car park.
Dwell time (Question 9)
1.11 Question 9 asked users of the centre how long they planned to stay in the centre:
• 30% of users of the centre planned to spend under one hour in the centre; a further 33% planned to spend between 1 and 2 hours.
• 18% of visitors planned to spend between 2 and 5 hours in the centre
• 3% planned to spend all day in the centre.
1.12 These can be considered relatively low dwell times. We would anticipate that, following the opening of Lexicon Bracknell, dwell times in the centre will increase on account of the opening of a broader range of commercial leisure facilities, such as a new cinema, and several new casual dining restaurants, which will help to increase the duration of time many users are likely to spend in the centre – as well as extending the trading hours of the centre beyond that of retailers.
Impact of redevelopment works (Questions 11 and 12)
1.13 Of the 151 people surveyed, only 1 person was not aware of the redevelopment works which are currently taking place. The survey asked whether the redevelopment works had changed the way in which users of Bracknell town centre visit the centre. Positively, the vast majority of users of the centre (83%) have not changed their usage of the centre as a consequence of the redevelopment works. 13% of respondents stated that they have changed how they use the centre. For 3% of respondents, it was their first visit to the centre.
Frequency of visit (Questions 13 and 14)
1.14 Questions 13 and 14 asked users of Bracknell town centre how often they visit in the daytime (question 13) and evening (question 14):
• Question 13 shows that the majority of users visit either once a week (30%) or 2-3 times a week (also 30%). A further 17% visit 4-6 times a week; just 5% visit daily.
• Question 14 shows that frequency of visits to Bracknell town centre in the evening is very different, and currently points to very low levels of patronage to the town centre outside retail hours. 43% of users visit the centre in the evening less than once a year; a further 13% never visit the centre in the evening. Only 13% of respondents visit the centre in the evening once a month or more.
1.15 Again, it would be expected that following the opening of the Lexicon Bracknell development the frequency of visits to the centre outside of retail hours will improve; currently there is little offer in the centre to attract users, and therefore the trends identified in the survey results are not particularly surprising.
Likes and dislikes about Bracknell town centre (Questions 15-17)
1.16 Question 15 asked users of the centre what they liked about the centre. The top five responses were as follows:
• Close to home: 27%
• Nothing / very little: 25%
• Good bus service / accessible public transport: 13%
• Compact / easy to get around: 8%
• Easily accessible by foot: 7% / close to work: 7%
1.17 Question 16 asked which of the various responses given to question 15 users most like about Bracknell town centre — unfortunately, the most popular response to this question was ‘nothing / very little’ (25%), followed by ‘close to home’ (20%). Other responses scored below 10%.
1.18 Question 17 asked users what they disliked about Bracknell town centre. The top five responses were as follows:
• Not enough choice of shops: 39%
• Poor quality of shops: 23%
• Too few cafes, pubs or eating places: 17%
• Nothing / very little: 17%
• Not enough supermarket / food shops: 14%
WESTERN BERKSHIRE AUTHORITIES | RETAIL & COMMERCIAL LEISURE ASSESSMENT 2016 | VOLUME FOUR | AUGUST 2016
5 gva.co.uk/planning
1.19 A number of respondents also identified that the current redevelopment works were impacting their enjoyment of the centre — 13% stated that they disliked the building works, and 12% stated too many shops had closed.
1.20 Positively, it can be seen however that most of the shortcomings in the town centre identified above will, at least in part, be rectified by the opening of the Lexicon Bracknell development (and future further development in the centre). The closure of many shops in the existing centre was required to facilitate the new development.
How Bracknell town centre could be improved (Question 19)
1.21 Question 19 asked how Bracknell town centre could be improved. By far the most popular responses to this question were related to improving the range/quality of the retail offer — almost two thirds of respondents wanted to see a better choice of shops, and over one third a better quality of shops:
• Better choice of shops: 63%
• Better quality shops: 37%
• More specialist / independent stores: 20%
• More pubs, restaurants and cafes: 18%
• Better facilities for older people: 17%
1.22 Other responses to this question which attracted over 10% of responses are:
• Improved appearance / environment: 15%
• Better seating / toilets facilities: 12%
• Addition of a Primark store: 12%
• Fewer charity shops: 12%
• Better maintenance / cleanliness: 12%
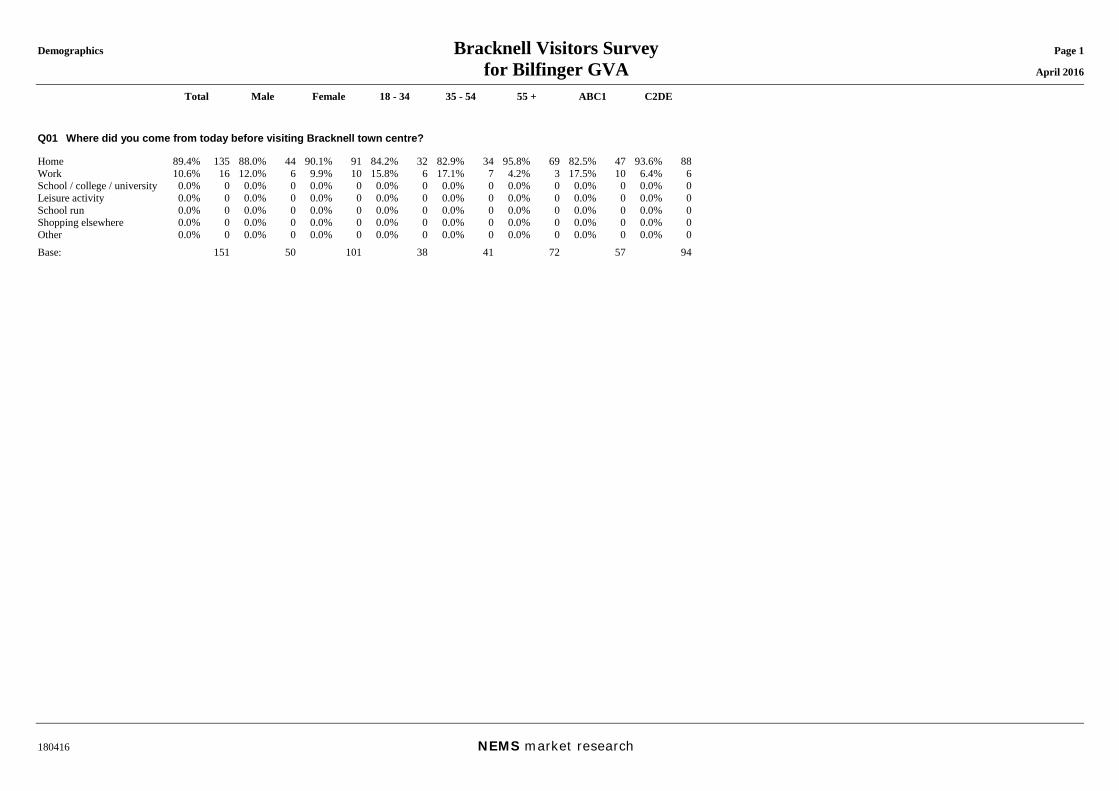
Demographics Bracknell Visitors Survey Page 1 for Bilfinger GVA April 2016
Total Male Female 18 - 34 35 - 54 55 + ABC1 C2DE
180416 NEMS market research
Q01 Where did you come from today before visiting Bracknell town centre? Home 89.4% 135 88.0% 44 90.1% 91 84.2% 32 82.9% 34 95.8% 69 82.5% 47 93.6% 88Work 10.6% 16 12.0% 6 9.9% 10 15.8% 6 17.1% 7 4.2% 3 17.5% 10 6.4% 6School / college / university 0.0% 0 0.0% 0 0.0% 0 0.0% 0 0.0% 0 0.0% 0 0.0% 0 0.0% 0Leisure activity 0.0% 0 0.0% 0 0.0% 0 0.0% 0 0.0% 0 0.0% 0 0.0% 0 0.0% 0School run 0.0% 0 0.0% 0 0.0% 0 0.0% 0 0.0% 0 0.0% 0 0.0% 0 0.0% 0Shopping elsewhere 0.0% 0 0.0% 0 0.0% 0 0.0% 0 0.0% 0 0.0% 0 0.0% 0 0.0% 0Other 0.0% 0 0.0% 0 0.0% 0 0.0% 0 0.0% 0 0.0% 0 0.0% 0 0.0% 0Base: 151 50 101 38 41 72 57 94
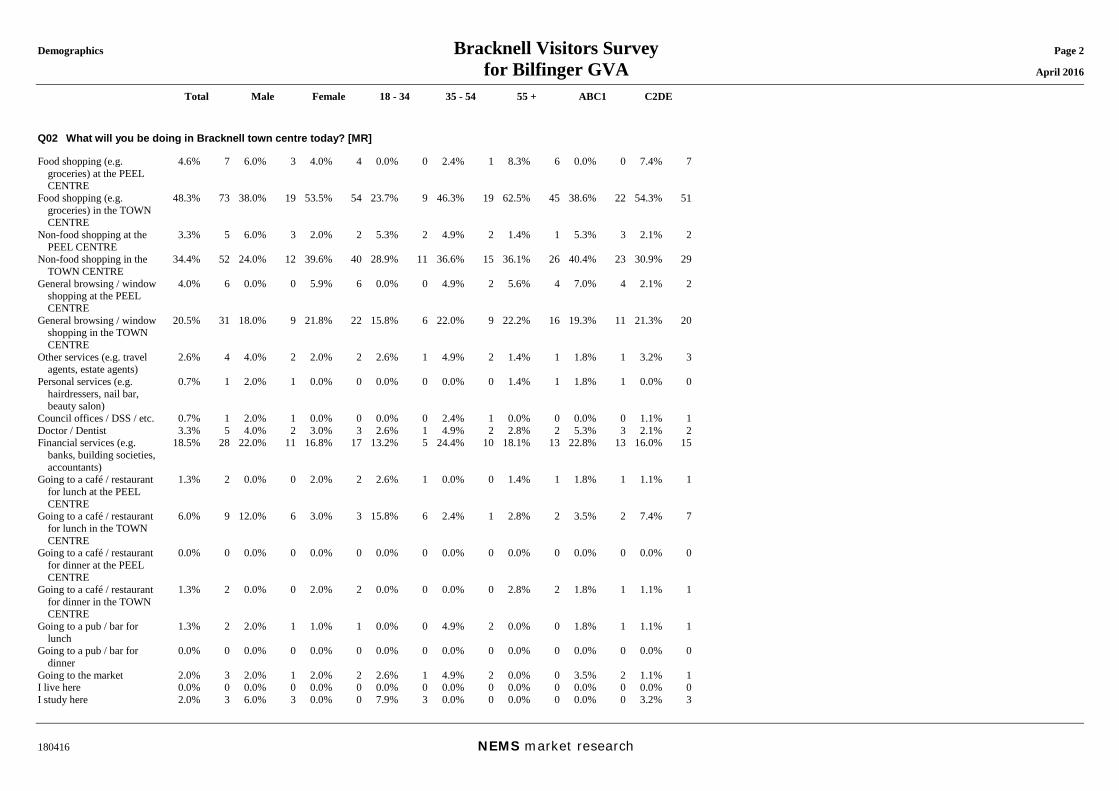
Demographics Bracknell Visitors Survey Page 2 for Bilfinger GVA April 2016
Total Male Female 18 - 34 35 - 54 55 + ABC1 C2DE
180416 NEMS market research
Q02 What will you be doing in Bracknell town centre today? [MR] Food shopping (e.g.
groceries) at the PEEL CENTRE
4.6% 7 6.0% 3 4.0% 4 0.0% 0 2.4% 1 8.3% 6 0.0% 0 7.4% 7
Food shopping (e.g. groceries) in the TOWN CENTRE
48.3% 73 38.0% 19 53.5% 54 23.7% 9 46.3% 19 62.5% 45 38.6% 22 54.3% 51
Non-food shopping at the PEEL CENTRE
3.3% 5 6.0% 3 2.0% 2 5.3% 2 4.9% 2 1.4% 1 5.3% 3 2.1% 2
Non-food shopping in the TOWN CENTRE
34.4% 52 24.0% 12 39.6% 40 28.9% 11 36.6% 15 36.1% 26 40.4% 23 30.9% 29
General browsing / window shopping at the PEEL CENTRE
4.0% 6 0.0% 0 5.9% 6 0.0% 0 4.9% 2 5.6% 4 7.0% 4 2.1% 2
General browsing / window shopping in the TOWN CENTRE
20.5% 31 18.0% 9 21.8% 22 15.8% 6 22.0% 9 22.2% 16 19.3% 11 21.3% 20
Other services (e.g. travel agents, estate agents)
2.6% 4 4.0% 2 2.0% 2 2.6% 1 4.9% 2 1.4% 1 1.8% 1 3.2% 3
Personal services (e.g. hairdressers, nail bar, beauty salon)
0.7% 1 2.0% 1 0.0% 0 0.0% 0 0.0% 0 1.4% 1 1.8% 1 0.0% 0
Council offices / DSS / etc. 0.7% 1 2.0% 1 0.0% 0 0.0% 0 2.4% 1 0.0% 0 0.0% 0 1.1% 1Doctor / Dentist 3.3% 5 4.0% 2 3.0% 3 2.6% 1 4.9% 2 2.8% 2 5.3% 3 2.1% 2Financial services (e.g.
banks, building societies, accountants)
18.5% 28 22.0% 11 16.8% 17 13.2% 5 24.4% 10 18.1% 13 22.8% 13 16.0% 15
Going to a café / restaurant for lunch at the PEEL CENTRE
1.3% 2 0.0% 0 2.0% 2 2.6% 1 0.0% 0 1.4% 1 1.8% 1 1.1% 1
Going to a café / restaurant for lunch in the TOWN CENTRE
6.0% 9 12.0% 6 3.0% 3 15.8% 6 2.4% 1 2.8% 2 3.5% 2 7.4% 7
Going to a café / restaurant for dinner at the PEEL CENTRE
0.0% 0 0.0% 0 0.0% 0 0.0% 0 0.0% 0 0.0% 0 0.0% 0 0.0% 0
Going to a café / restaurant for dinner in the TOWN CENTRE
1.3% 2 0.0% 0 2.0% 2 0.0% 0 0.0% 0 2.8% 2 1.8% 1 1.1% 1
Going to a pub / bar for lunch
1.3% 2 2.0% 1 1.0% 1 0.0% 0 4.9% 2 0.0% 0 1.8% 1 1.1% 1
Going to a pub / bar for dinner
0.0% 0 0.0% 0 0.0% 0 0.0% 0 0.0% 0 0.0% 0 0.0% 0 0.0% 0
Going to the market 2.0% 3 2.0% 1 2.0% 2 2.6% 1 4.9% 2 0.0% 0 3.5% 2 1.1% 1I live here 0.0% 0 0.0% 0 0.0% 0 0.0% 0 0.0% 0 0.0% 0 0.0% 0 0.0% 0I study here 2.0% 3 6.0% 3 0.0% 0 7.9% 3 0.0% 0 0.0% 0 0.0% 0 3.2% 3
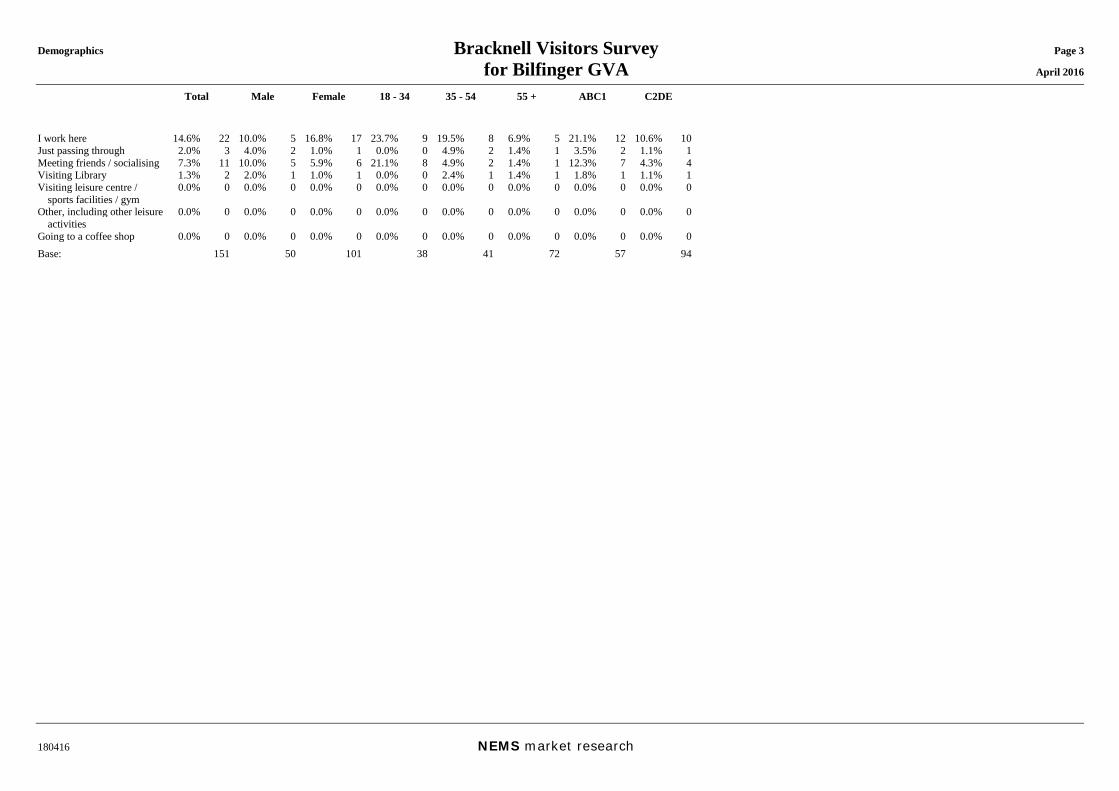
Demographics Bracknell Visitors Survey Page 3 for Bilfinger GVA April 2016
Total Male Female 18 - 34 35 - 54 55 + ABC1 C2DE
180416 NEMS market research
I work here 14.6% 22 10.0% 5 16.8% 17 23.7% 9 19.5% 8 6.9% 5 21.1% 12 10.6% 10Just passing through 2.0% 3 4.0% 2 1.0% 1 0.0% 0 4.9% 2 1.4% 1 3.5% 2 1.1% 1Meeting friends / socialising 7.3% 11 10.0% 5 5.9% 6 21.1% 8 4.9% 2 1.4% 1 12.3% 7 4.3% 4Visiting Library 1.3% 2 2.0% 1 1.0% 1 0.0% 0 2.4% 1 1.4% 1 1.8% 1 1.1% 1Visiting leisure centre /
sports facilities / gym 0.0% 0 0.0% 0 0.0% 0 0.0% 0 0.0% 0 0.0% 0 0.0% 0 0.0% 0
Other, including other leisure activities
0.0% 0 0.0% 0 0.0% 0 0.0% 0 0.0% 0 0.0% 0 0.0% 0 0.0% 0
Going to a coffee shop 0.0% 0 0.0% 0 0.0% 0 0.0% 0 0.0% 0 0.0% 0 0.0% 0 0.0% 0Base: 151 50 101 38 41 72 57 94
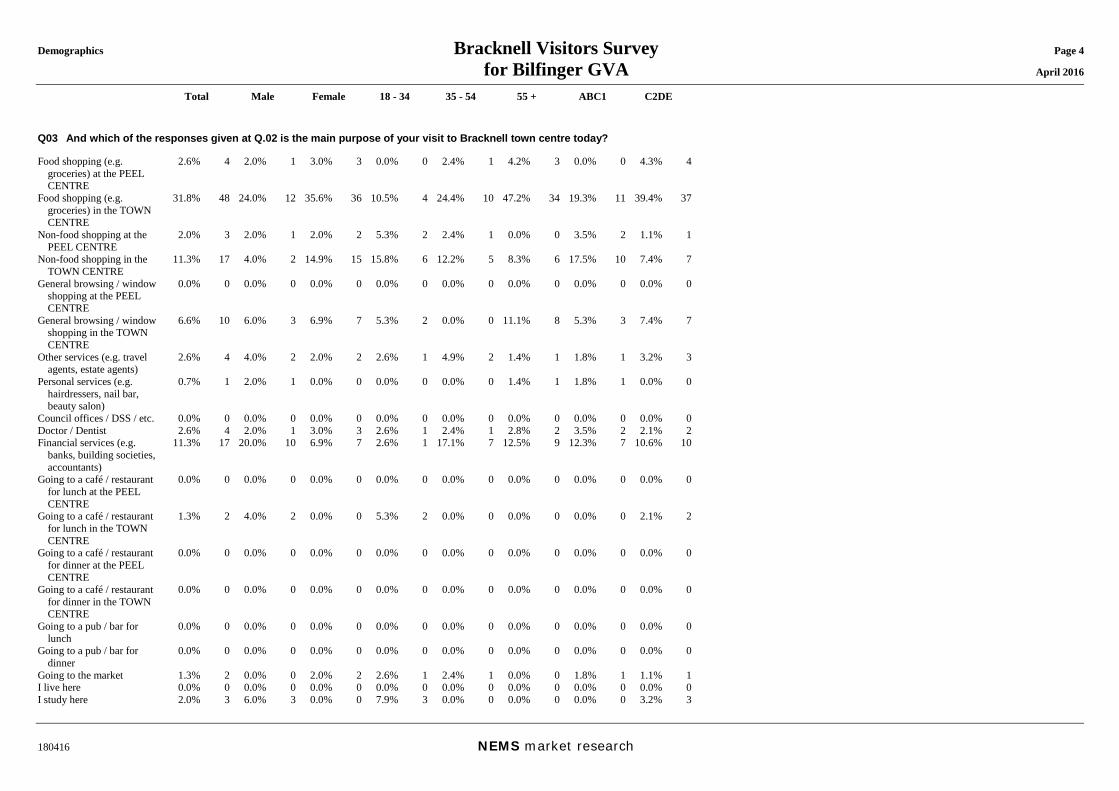
Demographics Bracknell Visitors Survey Page 4 for Bilfinger GVA April 2016
Total Male Female 18 - 34 35 - 54 55 + ABC1 C2DE
180416 NEMS market research
Q03 And which of the responses given at Q.02 is the main purpose of your visit to Bracknell town centre today? Food shopping (e.g.
groceries) at the PEEL CENTRE
2.6% 4 2.0% 1 3.0% 3 0.0% 0 2.4% 1 4.2% 3 0.0% 0 4.3% 4
Food shopping (e.g. groceries) in the TOWN CENTRE
31.8% 48 24.0% 12 35.6% 36 10.5% 4 24.4% 10 47.2% 34 19.3% 11 39.4% 37
Non-food shopping at the PEEL CENTRE
2.0% 3 2.0% 1 2.0% 2 5.3% 2 2.4% 1 0.0% 0 3.5% 2 1.1% 1
Non-food shopping in the TOWN CENTRE
11.3% 17 4.0% 2 14.9% 15 15.8% 6 12.2% 5 8.3% 6 17.5% 10 7.4% 7
General browsing / window shopping at the PEEL CENTRE
0.0% 0 0.0% 0 0.0% 0 0.0% 0 0.0% 0 0.0% 0 0.0% 0 0.0% 0
General browsing / window shopping in the TOWN CENTRE
6.6% 10 6.0% 3 6.9% 7 5.3% 2 0.0% 0 11.1% 8 5.3% 3 7.4% 7
Other services (e.g. travel agents, estate agents)
2.6% 4 4.0% 2 2.0% 2 2.6% 1 4.9% 2 1.4% 1 1.8% 1 3.2% 3
Personal services (e.g. hairdressers, nail bar, beauty salon)
0.7% 1 2.0% 1 0.0% 0 0.0% 0 0.0% 0 1.4% 1 1.8% 1 0.0% 0
Council offices / DSS / etc. 0.0% 0 0.0% 0 0.0% 0 0.0% 0 0.0% 0 0.0% 0 0.0% 0 0.0% 0Doctor / Dentist 2.6% 4 2.0% 1 3.0% 3 2.6% 1 2.4% 1 2.8% 2 3.5% 2 2.1% 2Financial services (e.g.
banks, building societies, accountants)
11.3% 17 20.0% 10 6.9% 7 2.6% 1 17.1% 7 12.5% 9 12.3% 7 10.6% 10
Going to a café / restaurant for lunch at the PEEL CENTRE
0.0% 0 0.0% 0 0.0% 0 0.0% 0 0.0% 0 0.0% 0 0.0% 0 0.0% 0
Going to a café / restaurant for lunch in the TOWN CENTRE
1.3% 2 4.0% 2 0.0% 0 5.3% 2 0.0% 0 0.0% 0 0.0% 0 2.1% 2
Going to a café / restaurant for dinner at the PEEL CENTRE
0.0% 0 0.0% 0 0.0% 0 0.0% 0 0.0% 0 0.0% 0 0.0% 0 0.0% 0
Going to a café / restaurant for dinner in the TOWN CENTRE
0.0% 0 0.0% 0 0.0% 0 0.0% 0 0.0% 0 0.0% 0 0.0% 0 0.0% 0
Going to a pub / bar for lunch
0.0% 0 0.0% 0 0.0% 0 0.0% 0 0.0% 0 0.0% 0 0.0% 0 0.0% 0
Going to a pub / bar for dinner
0.0% 0 0.0% 0 0.0% 0 0.0% 0 0.0% 0 0.0% 0 0.0% 0 0.0% 0
Going to the market 1.3% 2 0.0% 0 2.0% 2 2.6% 1 2.4% 1 0.0% 0 1.8% 1 1.1% 1I live here 0.0% 0 0.0% 0 0.0% 0 0.0% 0 0.0% 0 0.0% 0 0.0% 0 0.0% 0I study here 2.0% 3 6.0% 3 0.0% 0 7.9% 3 0.0% 0 0.0% 0 0.0% 0 3.2% 3
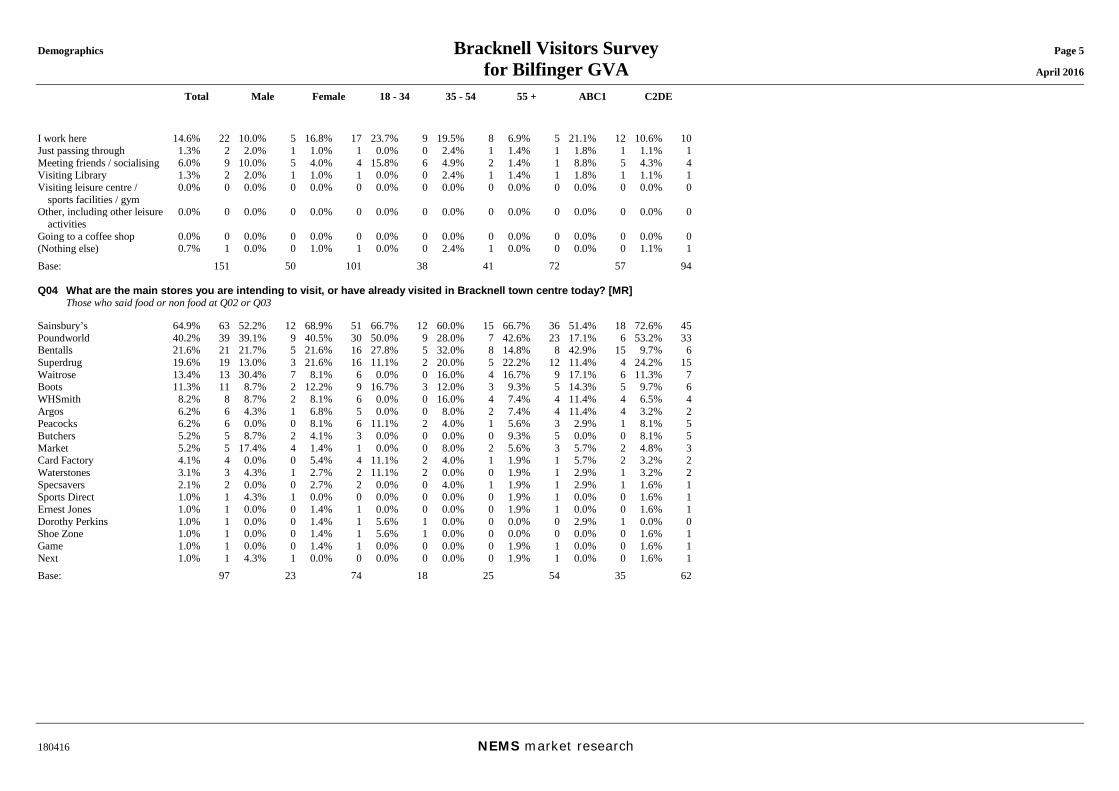
Demographics Bracknell Visitors Survey Page 5 for Bilfinger GVA April 2016
Total Male Female 18 - 34 35 - 54 55 + ABC1 C2DE
180416 NEMS market research
I work here 14.6% 22 10.0% 5 16.8% 17 23.7% 9 19.5% 8 6.9% 5 21.1% 12 10.6% 10Just passing through 1.3% 2 2.0% 1 1.0% 1 0.0% 0 2.4% 1 1.4% 1 1.8% 1 1.1% 1Meeting friends / socialising 6.0% 9 10.0% 5 4.0% 4 15.8% 6 4.9% 2 1.4% 1 8.8% 5 4.3% 4Visiting Library 1.3% 2 2.0% 1 1.0% 1 0.0% 0 2.4% 1 1.4% 1 1.8% 1 1.1% 1Visiting leisure centre /
sports facilities / gym 0.0% 0 0.0% 0 0.0% 0 0.0% 0 0.0% 0 0.0% 0 0.0% 0 0.0% 0
Other, including other leisure activities
0.0% 0 0.0% 0 0.0% 0 0.0% 0 0.0% 0 0.0% 0 0.0% 0 0.0% 0
Going to a coffee shop 0.0% 0 0.0% 0 0.0% 0 0.0% 0 0.0% 0 0.0% 0 0.0% 0 0.0% 0(Nothing else) 0.7% 1 0.0% 0 1.0% 1 0.0% 0 2.4% 1 0.0% 0 0.0% 0 1.1% 1Base: 151 50 101 38 41 72 57 94 Q04 What are the main stores you are intending to visit, or have already visited in Bracknell town centre today? [MR] Those who said food or non food at Q02 or Q03 Sainsbury’s 64.9% 63 52.2% 12 68.9% 51 66.7% 12 60.0% 15 66.7% 36 51.4% 18 72.6% 45Poundworld 40.2% 39 39.1% 9 40.5% 30 50.0% 9 28.0% 7 42.6% 23 17.1% 6 53.2% 33Bentalls 21.6% 21 21.7% 5 21.6% 16 27.8% 5 32.0% 8 14.8% 8 42.9% 15 9.7% 6Superdrug 19.6% 19 13.0% 3 21.6% 16 11.1% 2 20.0% 5 22.2% 12 11.4% 4 24.2% 15Waitrose 13.4% 13 30.4% 7 8.1% 6 0.0% 0 16.0% 4 16.7% 9 17.1% 6 11.3% 7Boots 11.3% 11 8.7% 2 12.2% 9 16.7% 3 12.0% 3 9.3% 5 14.3% 5 9.7% 6WHSmith 8.2% 8 8.7% 2 8.1% 6 0.0% 0 16.0% 4 7.4% 4 11.4% 4 6.5% 4Argos 6.2% 6 4.3% 1 6.8% 5 0.0% 0 8.0% 2 7.4% 4 11.4% 4 3.2% 2Peacocks 6.2% 6 0.0% 0 8.1% 6 11.1% 2 4.0% 1 5.6% 3 2.9% 1 8.1% 5Butchers 5.2% 5 8.7% 2 4.1% 3 0.0% 0 0.0% 0 9.3% 5 0.0% 0 8.1% 5Market 5.2% 5 17.4% 4 1.4% 1 0.0% 0 8.0% 2 5.6% 3 5.7% 2 4.8% 3Card Factory 4.1% 4 0.0% 0 5.4% 4 11.1% 2 4.0% 1 1.9% 1 5.7% 2 3.2% 2Waterstones 3.1% 3 4.3% 1 2.7% 2 11.1% 2 0.0% 0 1.9% 1 2.9% 1 3.2% 2Specsavers 2.1% 2 0.0% 0 2.7% 2 0.0% 0 4.0% 1 1.9% 1 2.9% 1 1.6% 1Sports Direct 1.0% 1 4.3% 1 0.0% 0 0.0% 0 0.0% 0 1.9% 1 0.0% 0 1.6% 1Ernest Jones 1.0% 1 0.0% 0 1.4% 1 0.0% 0 0.0% 0 1.9% 1 0.0% 0 1.6% 1Dorothy Perkins 1.0% 1 0.0% 0 1.4% 1 5.6% 1 0.0% 0 0.0% 0 2.9% 1 0.0% 0Shoe Zone 1.0% 1 0.0% 0 1.4% 1 5.6% 1 0.0% 0 0.0% 0 0.0% 0 1.6% 1Game 1.0% 1 0.0% 0 1.4% 1 0.0% 0 0.0% 0 1.9% 1 0.0% 0 1.6% 1Next 1.0% 1 4.3% 1 0.0% 0 0.0% 0 0.0% 0 1.9% 1 0.0% 0 1.6% 1Base: 97 23 74 18 25 54 35 62
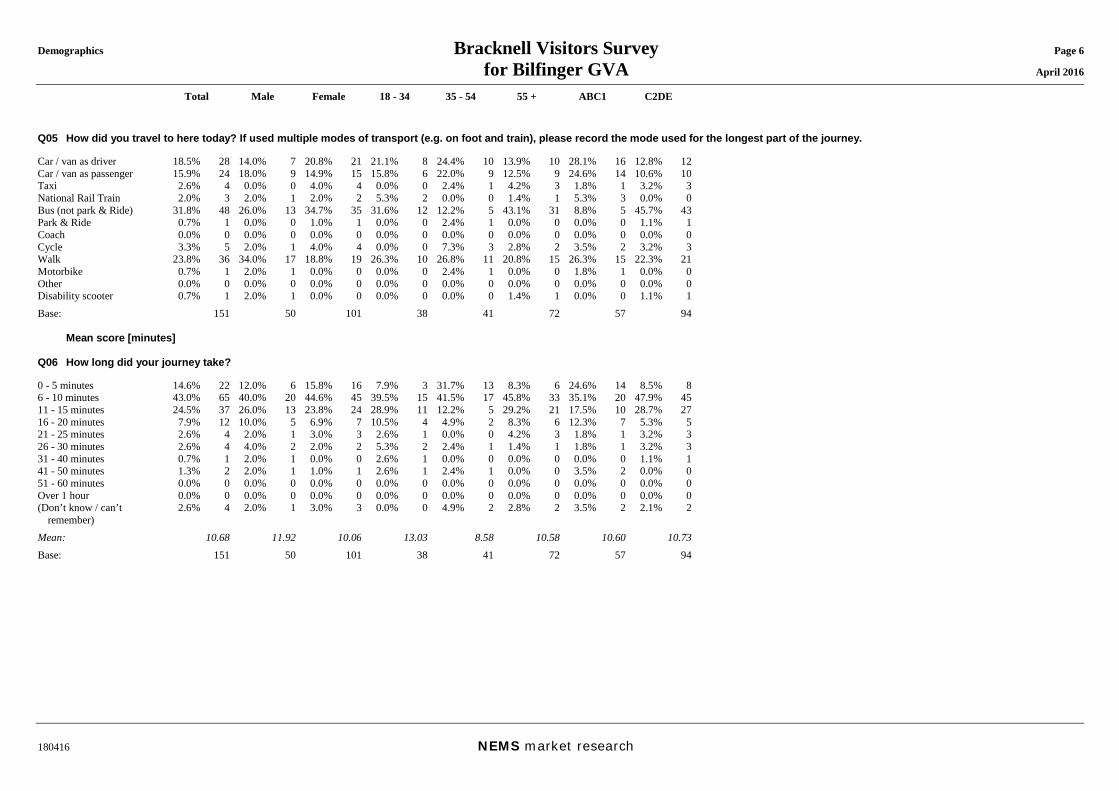
Demographics Bracknell Visitors Survey Page 6 for Bilfinger GVA April 2016
Total Male Female 18 - 34 35 - 54 55 + ABC1 C2DE
180416 NEMS market research
Q05 How did you travel to here today? If used multiple modes of transport (e.g. on foot and train), please record the mode used for the longest part of the journey. Car / van as driver 18.5% 28 14.0% 7 20.8% 21 21.1% 8 24.4% 10 13.9% 10 28.1% 16 12.8% 12Car / van as passenger 15.9% 24 18.0% 9 14.9% 15 15.8% 6 22.0% 9 12.5% 9 24.6% 14 10.6% 10Taxi 2.6% 4 0.0% 0 4.0% 4 0.0% 0 2.4% 1 4.2% 3 1.8% 1 3.2% 3National Rail Train 2.0% 3 2.0% 1 2.0% 2 5.3% 2 0.0% 0 1.4% 1 5.3% 3 0.0% 0Bus (not park & Ride) 31.8% 48 26.0% 13 34.7% 35 31.6% 12 12.2% 5 43.1% 31 8.8% 5 45.7% 43Park & Ride 0.7% 1 0.0% 0 1.0% 1 0.0% 0 2.4% 1 0.0% 0 0.0% 0 1.1% 1Coach 0.0% 0 0.0% 0 0.0% 0 0.0% 0 0.0% 0 0.0% 0 0.0% 0 0.0% 0Cycle 3.3% 5 2.0% 1 4.0% 4 0.0% 0 7.3% 3 2.8% 2 3.5% 2 3.2% 3Walk 23.8% 36 34.0% 17 18.8% 19 26.3% 10 26.8% 11 20.8% 15 26.3% 15 22.3% 21Motorbike 0.7% 1 2.0% 1 0.0% 0 0.0% 0 2.4% 1 0.0% 0 1.8% 1 0.0% 0Other 0.0% 0 0.0% 0 0.0% 0 0.0% 0 0.0% 0 0.0% 0 0.0% 0 0.0% 0Disability scooter 0.7% 1 2.0% 1 0.0% 0 0.0% 0 0.0% 0 1.4% 1 0.0% 0 1.1% 1Base: 151 50 101 38 41 72 57 94 Mean score [minutes] Q06 How long did your journey take? 0 - 5 minutes 14.6% 22 12.0% 6 15.8% 16 7.9% 3 31.7% 13 8.3% 6 24.6% 14 8.5% 86 - 10 minutes 43.0% 65 40.0% 20 44.6% 45 39.5% 15 41.5% 17 45.8% 33 35.1% 20 47.9% 4511 - 15 minutes 24.5% 37 26.0% 13 23.8% 24 28.9% 11 12.2% 5 29.2% 21 17.5% 10 28.7% 2716 - 20 minutes 7.9% 12 10.0% 5 6.9% 7 10.5% 4 4.9% 2 8.3% 6 12.3% 7 5.3% 521 - 25 minutes 2.6% 4 2.0% 1 3.0% 3 2.6% 1 0.0% 0 4.2% 3 1.8% 1 3.2% 326 - 30 minutes 2.6% 4 4.0% 2 2.0% 2 5.3% 2 2.4% 1 1.4% 1 1.8% 1 3.2% 331 - 40 minutes 0.7% 1 2.0% 1 0.0% 0 2.6% 1 0.0% 0 0.0% 0 0.0% 0 1.1% 141 - 50 minutes 1.3% 2 2.0% 1 1.0% 1 2.6% 1 2.4% 1 0.0% 0 3.5% 2 0.0% 051 - 60 minutes 0.0% 0 0.0% 0 0.0% 0 0.0% 0 0.0% 0 0.0% 0 0.0% 0 0.0% 0Over 1 hour 0.0% 0 0.0% 0 0.0% 0 0.0% 0 0.0% 0 0.0% 0 0.0% 0 0.0% 0(Don’t know / can’t
remember) 2.6% 4 2.0% 1 3.0% 3 0.0% 0 4.9% 2 2.8% 2 3.5% 2 2.1% 2
Mean: 10.68 11.92 10.06 13.03 8.58 10.58 10.60 10.73Base: 151 50 101 38 41 72 57 94
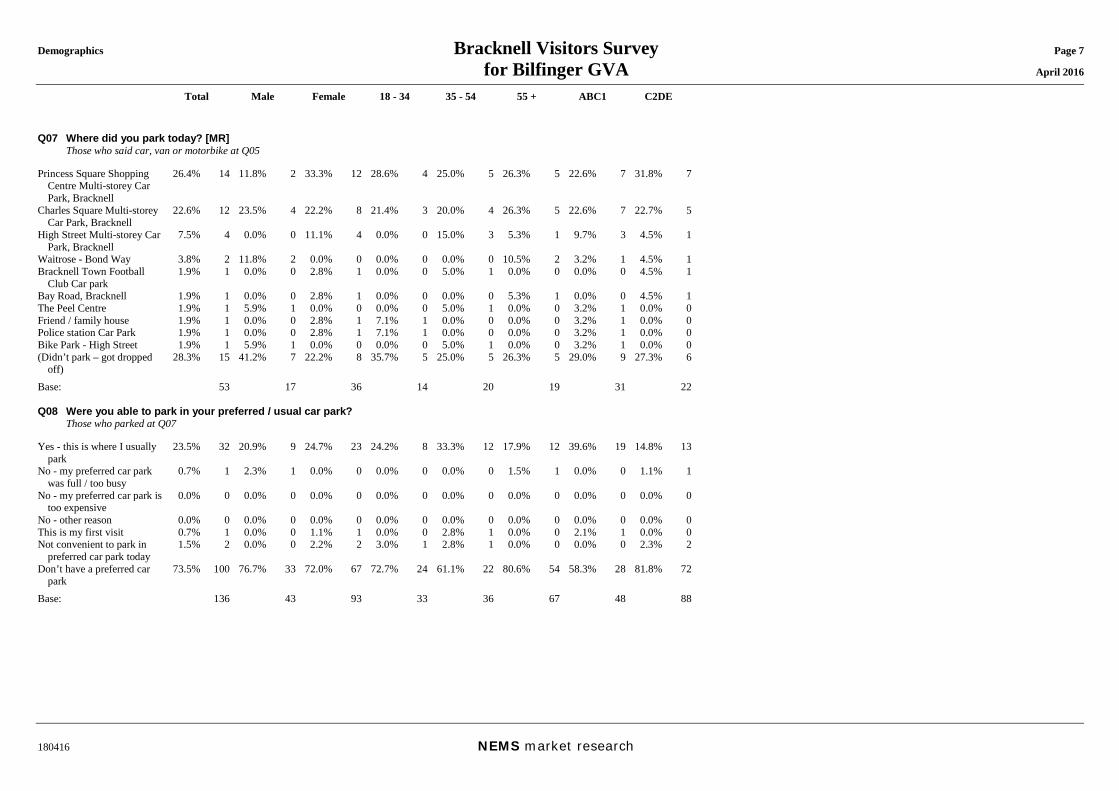
Demographics Bracknell Visitors Survey Page 7 for Bilfinger GVA April 2016
Total Male Female 18 - 34 35 - 54 55 + ABC1 C2DE
180416 NEMS market research
Q07 Where did you park today? [MR] Those who said car, van or motorbike at Q05 Princess Square Shopping
Centre Multi-storey Car Park, Bracknell
26.4% 14 11.8% 2 33.3% 12 28.6% 4 25.0% 5 26.3% 5 22.6% 7 31.8% 7
Charles Square Multi-storey Car Park, Bracknell
22.6% 12 23.5% 4 22.2% 8 21.4% 3 20.0% 4 26.3% 5 22.6% 7 22.7% 5
High Street Multi-storey Car Park, Bracknell
7.5% 4 0.0% 0 11.1% 4 0.0% 0 15.0% 3 5.3% 1 9.7% 3 4.5% 1
Waitrose - Bond Way 3.8% 2 11.8% 2 0.0% 0 0.0% 0 0.0% 0 10.5% 2 3.2% 1 4.5% 1Bracknell Town Football
Club Car park 1.9% 1 0.0% 0 2.8% 1 0.0% 0 5.0% 1 0.0% 0 0.0% 0 4.5% 1
Bay Road, Bracknell 1.9% 1 0.0% 0 2.8% 1 0.0% 0 0.0% 0 5.3% 1 0.0% 0 4.5% 1The Peel Centre 1.9% 1 5.9% 1 0.0% 0 0.0% 0 5.0% 1 0.0% 0 3.2% 1 0.0% 0Friend / family house 1.9% 1 0.0% 0 2.8% 1 7.1% 1 0.0% 0 0.0% 0 3.2% 1 0.0% 0Police station Car Park 1.9% 1 0.0% 0 2.8% 1 7.1% 1 0.0% 0 0.0% 0 3.2% 1 0.0% 0Bike Park - High Street 1.9% 1 5.9% 1 0.0% 0 0.0% 0 5.0% 1 0.0% 0 3.2% 1 0.0% 0(Didn’t park – got dropped
off) 28.3% 15 41.2% 7 22.2% 8 35.7% 5 25.0% 5 26.3% 5 29.0% 9 27.3% 6
Base: 53 17 36 14 20 19 31 22 Q08 Were you able to park in your preferred / usual car park? Those who parked at Q07 Yes - this is where I usually
park 23.5% 32 20.9% 9 24.7% 23 24.2% 8 33.3% 12 17.9% 12 39.6% 19 14.8% 13
No - my preferred car park was full / too busy
0.7% 1 2.3% 1 0.0% 0 0.0% 0 0.0% 0 1.5% 1 0.0% 0 1.1% 1
No - my preferred car park is too expensive
0.0% 0 0.0% 0 0.0% 0 0.0% 0 0.0% 0 0.0% 0 0.0% 0 0.0% 0
No - other reason 0.0% 0 0.0% 0 0.0% 0 0.0% 0 0.0% 0 0.0% 0 0.0% 0 0.0% 0This is my first visit 0.7% 1 0.0% 0 1.1% 1 0.0% 0 2.8% 1 0.0% 0 2.1% 1 0.0% 0Not convenient to park in
preferred car park today 1.5% 2 0.0% 0 2.2% 2 3.0% 1 2.8% 1 0.0% 0 0.0% 0 2.3% 2
Don’t have a preferred car park
73.5% 100 76.7% 33 72.0% 67 72.7% 24 61.1% 22 80.6% 54 58.3% 28 81.8% 72
Base: 136 43 93 33 36 67 48 88
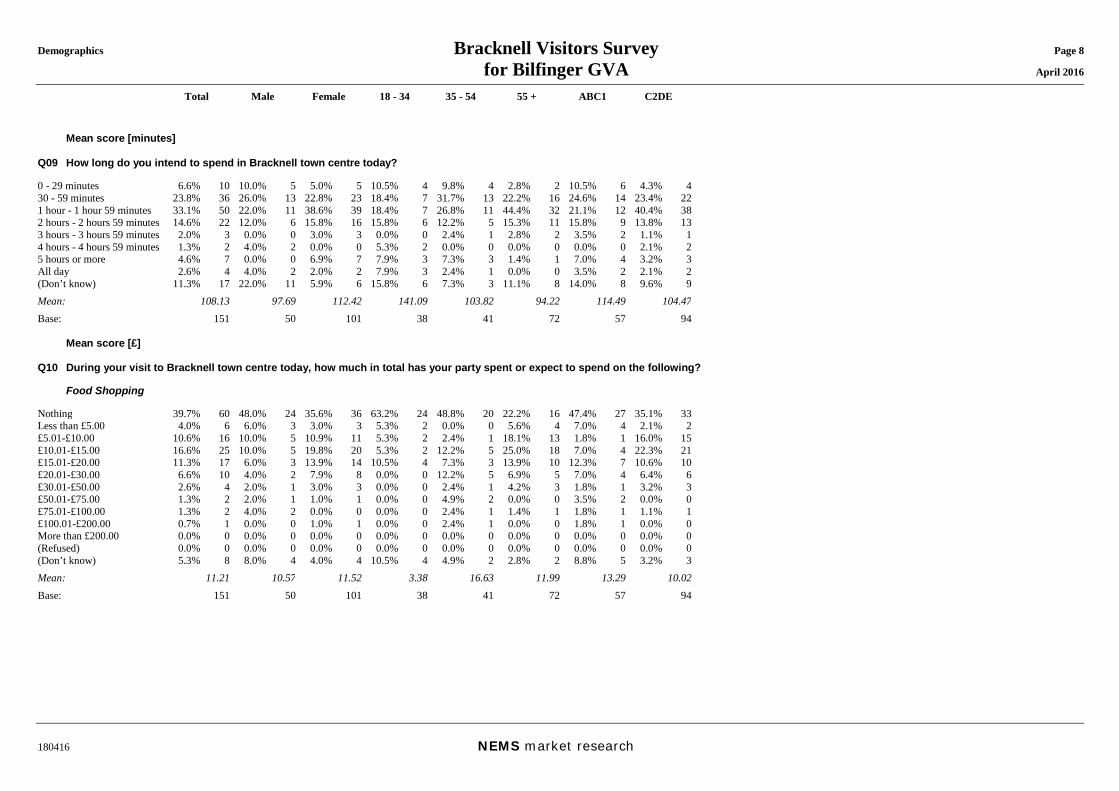
Demographics Bracknell Visitors Survey Page 8 for Bilfinger GVA April 2016
Total Male Female 18 - 34 35 - 54 55 + ABC1 C2DE
180416 NEMS market research
Mean score [minutes] Q09 How long do you intend to spend in Bracknell town centre today? 0 - 29 minutes 6.6% 10 10.0% 5 5.0% 5 10.5% 4 9.8% 4 2.8% 2 10.5% 6 4.3% 430 - 59 minutes 23.8% 36 26.0% 13 22.8% 23 18.4% 7 31.7% 13 22.2% 16 24.6% 14 23.4% 221 hour - 1 hour 59 minutes 33.1% 50 22.0% 11 38.6% 39 18.4% 7 26.8% 11 44.4% 32 21.1% 12 40.4% 382 hours - 2 hours 59 minutes 14.6% 22 12.0% 6 15.8% 16 15.8% 6 12.2% 5 15.3% 11 15.8% 9 13.8% 133 hours - 3 hours 59 minutes 2.0% 3 0.0% 0 3.0% 3 0.0% 0 2.4% 1 2.8% 2 3.5% 2 1.1% 14 hours - 4 hours 59 minutes 1.3% 2 4.0% 2 0.0% 0 5.3% 2 0.0% 0 0.0% 0 0.0% 0 2.1% 25 hours or more 4.6% 7 0.0% 0 6.9% 7 7.9% 3 7.3% 3 1.4% 1 7.0% 4 3.2% 3All day 2.6% 4 4.0% 2 2.0% 2 7.9% 3 2.4% 1 0.0% 0 3.5% 2 2.1% 2(Don’t know) 11.3% 17 22.0% 11 5.9% 6 15.8% 6 7.3% 3 11.1% 8 14.0% 8 9.6% 9Mean: 108.13 97.69 112.42 141.09 103.82 94.22 114.49 104.47Base: 151 50 101 38 41 72 57 94 Mean score [£] Q10 During your visit to Bracknell town centre today, how much in total has your party spent or expect to spend on the following? Food Shopping Nothing 39.7% 60 48.0% 24 35.6% 36 63.2% 24 48.8% 20 22.2% 16 47.4% 27 35.1% 33Less than £5.00 4.0% 6 6.0% 3 3.0% 3 5.3% 2 0.0% 0 5.6% 4 7.0% 4 2.1% 2£5.01-£10.00 10.6% 16 10.0% 5 10.9% 11 5.3% 2 2.4% 1 18.1% 13 1.8% 1 16.0% 15£10.01-£15.00 16.6% 25 10.0% 5 19.8% 20 5.3% 2 12.2% 5 25.0% 18 7.0% 4 22.3% 21£15.01-£20.00 11.3% 17 6.0% 3 13.9% 14 10.5% 4 7.3% 3 13.9% 10 12.3% 7 10.6% 10£20.01-£30.00 6.6% 10 4.0% 2 7.9% 8 0.0% 0 12.2% 5 6.9% 5 7.0% 4 6.4% 6£30.01-£50.00 2.6% 4 2.0% 1 3.0% 3 0.0% 0 2.4% 1 4.2% 3 1.8% 1 3.2% 3£50.01-£75.00 1.3% 2 2.0% 1 1.0% 1 0.0% 0 4.9% 2 0.0% 0 3.5% 2 0.0% 0£75.01-£100.00 1.3% 2 4.0% 2 0.0% 0 0.0% 0 2.4% 1 1.4% 1 1.8% 1 1.1% 1£100.01-£200.00 0.7% 1 0.0% 0 1.0% 1 0.0% 0 2.4% 1 0.0% 0 1.8% 1 0.0% 0More than £200.00 0.0% 0 0.0% 0 0.0% 0 0.0% 0 0.0% 0 0.0% 0 0.0% 0 0.0% 0(Refused) 0.0% 0 0.0% 0 0.0% 0 0.0% 0 0.0% 0 0.0% 0 0.0% 0 0.0% 0(Don’t know) 5.3% 8 8.0% 4 4.0% 4 10.5% 4 4.9% 2 2.8% 2 8.8% 5 3.2% 3Mean: 11.21 10.57 11.52 3.38 16.63 11.99 13.29 10.02Base: 151 50 101 38 41 72 57 94
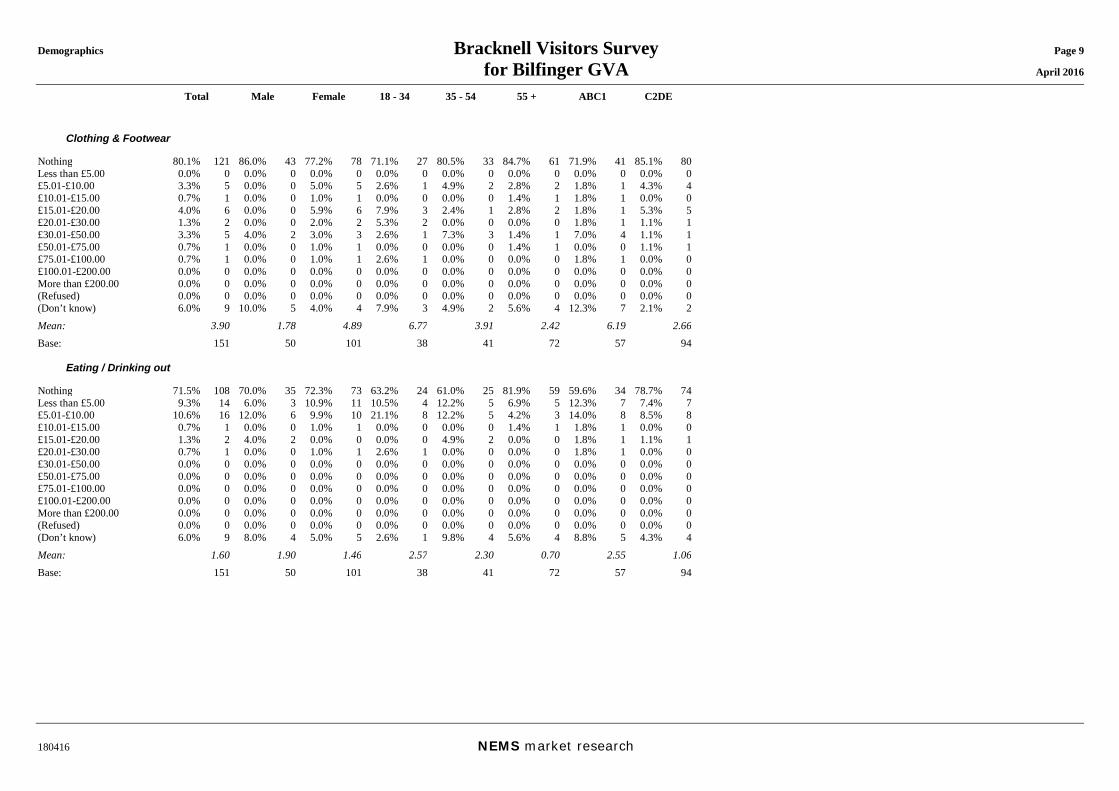
Demographics Bracknell Visitors Survey Page 9 for Bilfinger GVA April 2016
Total Male Female 18 - 34 35 - 54 55 + ABC1 C2DE
180416 NEMS market research
Clothing & Footwear Nothing 80.1% 121 86.0% 43 77.2% 78 71.1% 27 80.5% 33 84.7% 61 71.9% 41 85.1% 80Less than £5.00 0.0% 0 0.0% 0 0.0% 0 0.0% 0 0.0% 0 0.0% 0 0.0% 0 0.0% 0£5.01-£10.00 3.3% 5 0.0% 0 5.0% 5 2.6% 1 4.9% 2 2.8% 2 1.8% 1 4.3% 4£10.01-£15.00 0.7% 1 0.0% 0 1.0% 1 0.0% 0 0.0% 0 1.4% 1 1.8% 1 0.0% 0£15.01-£20.00 4.0% 6 0.0% 0 5.9% 6 7.9% 3 2.4% 1 2.8% 2 1.8% 1 5.3% 5£20.01-£30.00 1.3% 2 0.0% 0 2.0% 2 5.3% 2 0.0% 0 0.0% 0 1.8% 1 1.1% 1£30.01-£50.00 3.3% 5 4.0% 2 3.0% 3 2.6% 1 7.3% 3 1.4% 1 7.0% 4 1.1% 1£50.01-£75.00 0.7% 1 0.0% 0 1.0% 1 0.0% 0 0.0% 0 1.4% 1 0.0% 0 1.1% 1£75.01-£100.00 0.7% 1 0.0% 0 1.0% 1 2.6% 1 0.0% 0 0.0% 0 1.8% 1 0.0% 0£100.01-£200.00 0.0% 0 0.0% 0 0.0% 0 0.0% 0 0.0% 0 0.0% 0 0.0% 0 0.0% 0More than £200.00 0.0% 0 0.0% 0 0.0% 0 0.0% 0 0.0% 0 0.0% 0 0.0% 0 0.0% 0(Refused) 0.0% 0 0.0% 0 0.0% 0 0.0% 0 0.0% 0 0.0% 0 0.0% 0 0.0% 0(Don’t know) 6.0% 9 10.0% 5 4.0% 4 7.9% 3 4.9% 2 5.6% 4 12.3% 7 2.1% 2Mean: 3.90 1.78 4.89 6.77 3.91 2.42 6.19 2.66Base: 151 50 101 38 41 72 57 94 Eating / Drinking out Nothing 71.5% 108 70.0% 35 72.3% 73 63.2% 24 61.0% 25 81.9% 59 59.6% 34 78.7% 74Less than £5.00 9.3% 14 6.0% 3 10.9% 11 10.5% 4 12.2% 5 6.9% 5 12.3% 7 7.4% 7£5.01-£10.00 10.6% 16 12.0% 6 9.9% 10 21.1% 8 12.2% 5 4.2% 3 14.0% 8 8.5% 8£10.01-£15.00 0.7% 1 0.0% 0 1.0% 1 0.0% 0 0.0% 0 1.4% 1 1.8% 1 0.0% 0£15.01-£20.00 1.3% 2 4.0% 2 0.0% 0 0.0% 0 4.9% 2 0.0% 0 1.8% 1 1.1% 1£20.01-£30.00 0.7% 1 0.0% 0 1.0% 1 2.6% 1 0.0% 0 0.0% 0 1.8% 1 0.0% 0£30.01-£50.00 0.0% 0 0.0% 0 0.0% 0 0.0% 0 0.0% 0 0.0% 0 0.0% 0 0.0% 0£50.01-£75.00 0.0% 0 0.0% 0 0.0% 0 0.0% 0 0.0% 0 0.0% 0 0.0% 0 0.0% 0£75.01-£100.00 0.0% 0 0.0% 0 0.0% 0 0.0% 0 0.0% 0 0.0% 0 0.0% 0 0.0% 0£100.01-£200.00 0.0% 0 0.0% 0 0.0% 0 0.0% 0 0.0% 0 0.0% 0 0.0% 0 0.0% 0More than £200.00 0.0% 0 0.0% 0 0.0% 0 0.0% 0 0.0% 0 0.0% 0 0.0% 0 0.0% 0(Refused) 0.0% 0 0.0% 0 0.0% 0 0.0% 0 0.0% 0 0.0% 0 0.0% 0 0.0% 0(Don’t know) 6.0% 9 8.0% 4 5.0% 5 2.6% 1 9.8% 4 5.6% 4 8.8% 5 4.3% 4Mean: 1.60 1.90 1.46 2.57 2.30 0.70 2.55 1.06Base: 151 50 101 38 41 72 57 94
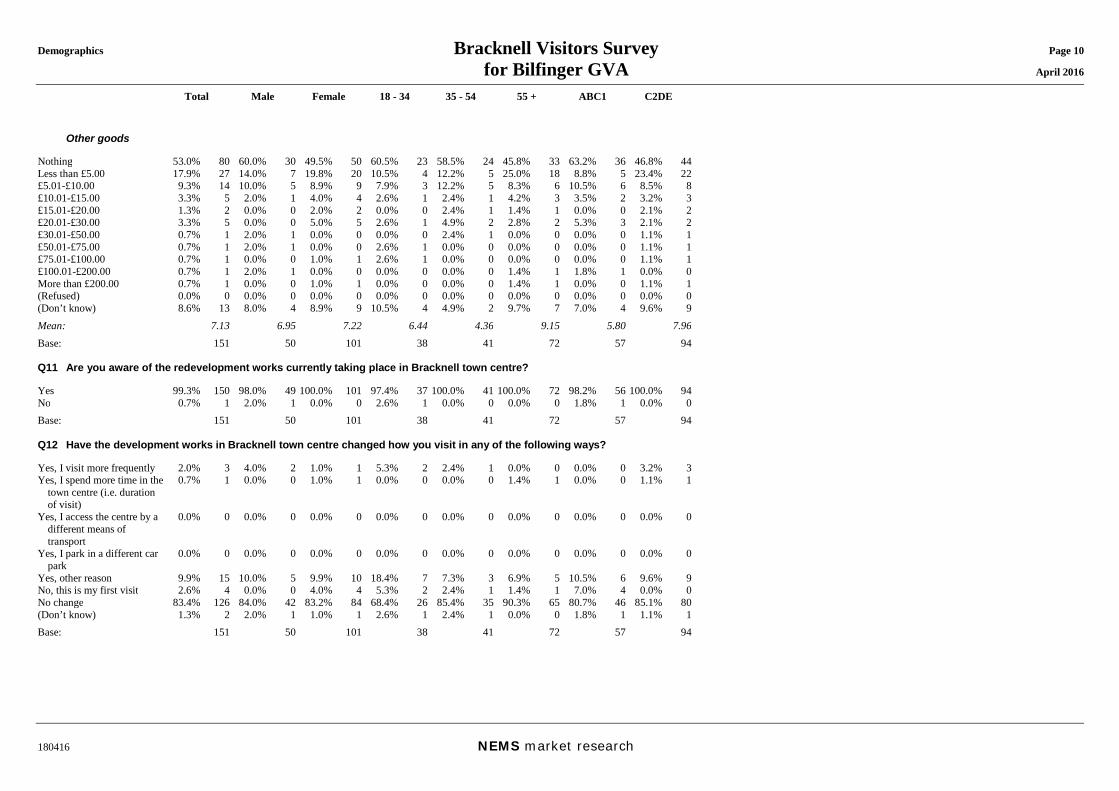
Demographics Bracknell Visitors Survey Page 10 for Bilfinger GVA April 2016
Total Male Female 18 - 34 35 - 54 55 + ABC1 C2DE
180416 NEMS market research
Other goods Nothing 53.0% 80 60.0% 30 49.5% 50 60.5% 23 58.5% 24 45.8% 33 63.2% 36 46.8% 44Less than £5.00 17.9% 27 14.0% 7 19.8% 20 10.5% 4 12.2% 5 25.0% 18 8.8% 5 23.4% 22£5.01-£10.00 9.3% 14 10.0% 5 8.9% 9 7.9% 3 12.2% 5 8.3% 6 10.5% 6 8.5% 8£10.01-£15.00 3.3% 5 2.0% 1 4.0% 4 2.6% 1 2.4% 1 4.2% 3 3.5% 2 3.2% 3£15.01-£20.00 1.3% 2 0.0% 0 2.0% 2 0.0% 0 2.4% 1 1.4% 1 0.0% 0 2.1% 2£20.01-£30.00 3.3% 5 0.0% 0 5.0% 5 2.6% 1 4.9% 2 2.8% 2 5.3% 3 2.1% 2£30.01-£50.00 0.7% 1 2.0% 1 0.0% 0 0.0% 0 2.4% 1 0.0% 0 0.0% 0 1.1% 1£50.01-£75.00 0.7% 1 2.0% 1 0.0% 0 2.6% 1 0.0% 0 0.0% 0 0.0% 0 1.1% 1£75.01-£100.00 0.7% 1 0.0% 0 1.0% 1 2.6% 1 0.0% 0 0.0% 0 0.0% 0 1.1% 1£100.01-£200.00 0.7% 1 2.0% 1 0.0% 0 0.0% 0 0.0% 0 1.4% 1 1.8% 1 0.0% 0More than £200.00 0.7% 1 0.0% 0 1.0% 1 0.0% 0 0.0% 0 1.4% 1 0.0% 0 1.1% 1(Refused) 0.0% 0 0.0% 0 0.0% 0 0.0% 0 0.0% 0 0.0% 0 0.0% 0 0.0% 0(Don’t know) 8.6% 13 8.0% 4 8.9% 9 10.5% 4 4.9% 2 9.7% 7 7.0% 4 9.6% 9Mean: 7.13 6.95 7.22 6.44 4.36 9.15 5.80 7.96Base: 151 50 101 38 41 72 57 94 Q11 Are you aware of the redevelopment works currently taking place in Bracknell town centre? Yes 99.3% 150 98.0% 49 100.0% 101 97.4% 37 100.0% 41 100.0% 72 98.2% 56 100.0% 94No 0.7% 1 2.0% 1 0.0% 0 2.6% 1 0.0% 0 0.0% 0 1.8% 1 0.0% 0Base: 151 50 101 38 41 72 57 94 Q12 Have the development works in Bracknell town centre changed how you visit in any of the following ways? Yes, I visit more frequently 2.0% 3 4.0% 2 1.0% 1 5.3% 2 2.4% 1 0.0% 0 0.0% 0 3.2% 3Yes, I spend more time in the
town centre (i.e. duration of visit)
0.7% 1 0.0% 0 1.0% 1 0.0% 0 0.0% 0 1.4% 1 0.0% 0 1.1% 1
Yes, I access the centre by a different means of transport
0.0% 0 0.0% 0 0.0% 0 0.0% 0 0.0% 0 0.0% 0 0.0% 0 0.0% 0
Yes, I park in a different car park
0.0% 0 0.0% 0 0.0% 0 0.0% 0 0.0% 0 0.0% 0 0.0% 0 0.0% 0
Yes, other reason 9.9% 15 10.0% 5 9.9% 10 18.4% 7 7.3% 3 6.9% 5 10.5% 6 9.6% 9No, this is my first visit 2.6% 4 0.0% 0 4.0% 4 5.3% 2 2.4% 1 1.4% 1 7.0% 4 0.0% 0No change 83.4% 126 84.0% 42 83.2% 84 68.4% 26 85.4% 35 90.3% 65 80.7% 46 85.1% 80(Don’t know) 1.3% 2 2.0% 1 1.0% 1 2.6% 1 2.4% 1 0.0% 0 1.8% 1 1.1% 1Base: 151 50 101 38 41 72 57 94
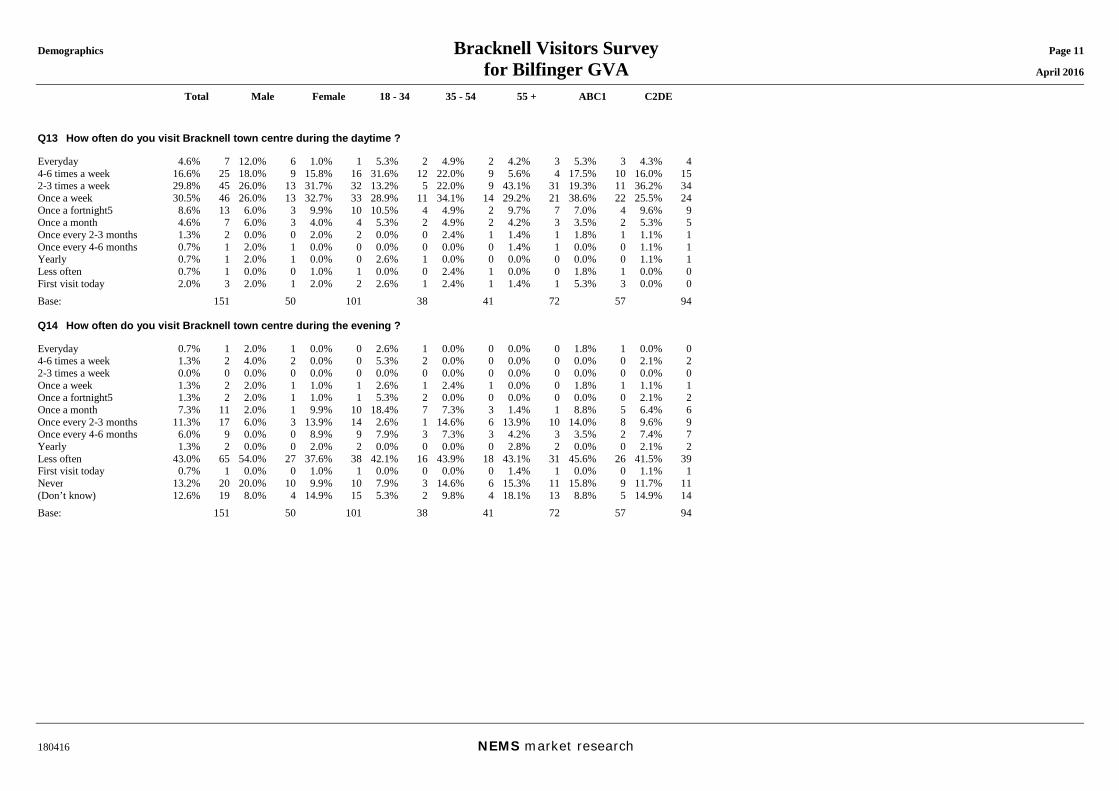
Demographics Bracknell Visitors Survey Page 11 for Bilfinger GVA April 2016
Total Male Female 18 - 34 35 - 54 55 + ABC1 C2DE
180416 NEMS market research
Q13 How often do you visit Bracknell town centre during the daytime ? Everyday 4.6% 7 12.0% 6 1.0% 1 5.3% 2 4.9% 2 4.2% 3 5.3% 3 4.3% 44-6 times a week 16.6% 25 18.0% 9 15.8% 16 31.6% 12 22.0% 9 5.6% 4 17.5% 10 16.0% 152-3 times a week 29.8% 45 26.0% 13 31.7% 32 13.2% 5 22.0% 9 43.1% 31 19.3% 11 36.2% 34Once a week 30.5% 46 26.0% 13 32.7% 33 28.9% 11 34.1% 14 29.2% 21 38.6% 22 25.5% 24Once a fortnight5 8.6% 13 6.0% 3 9.9% 10 10.5% 4 4.9% 2 9.7% 7 7.0% 4 9.6% 9Once a month 4.6% 7 6.0% 3 4.0% 4 5.3% 2 4.9% 2 4.2% 3 3.5% 2 5.3% 5Once every 2-3 months 1.3% 2 0.0% 0 2.0% 2 0.0% 0 2.4% 1 1.4% 1 1.8% 1 1.1% 1Once every 4-6 months 0.7% 1 2.0% 1 0.0% 0 0.0% 0 0.0% 0 1.4% 1 0.0% 0 1.1% 1Yearly 0.7% 1 2.0% 1 0.0% 0 2.6% 1 0.0% 0 0.0% 0 0.0% 0 1.1% 1Less often 0.7% 1 0.0% 0 1.0% 1 0.0% 0 2.4% 1 0.0% 0 1.8% 1 0.0% 0First visit today 2.0% 3 2.0% 1 2.0% 2 2.6% 1 2.4% 1 1.4% 1 5.3% 3 0.0% 0Base: 151 50 101 38 41 72 57 94 Q14 How often do you visit Bracknell town centre during the evening ? Everyday 0.7% 1 2.0% 1 0.0% 0 2.6% 1 0.0% 0 0.0% 0 1.8% 1 0.0% 04-6 times a week 1.3% 2 4.0% 2 0.0% 0 5.3% 2 0.0% 0 0.0% 0 0.0% 0 2.1% 22-3 times a week 0.0% 0 0.0% 0 0.0% 0 0.0% 0 0.0% 0 0.0% 0 0.0% 0 0.0% 0Once a week 1.3% 2 2.0% 1 1.0% 1 2.6% 1 2.4% 1 0.0% 0 1.8% 1 1.1% 1Once a fortnight5 1.3% 2 2.0% 1 1.0% 1 5.3% 2 0.0% 0 0.0% 0 0.0% 0 2.1% 2Once a month 7.3% 11 2.0% 1 9.9% 10 18.4% 7 7.3% 3 1.4% 1 8.8% 5 6.4% 6Once every 2-3 months 11.3% 17 6.0% 3 13.9% 14 2.6% 1 14.6% 6 13.9% 10 14.0% 8 9.6% 9Once every 4-6 months 6.0% 9 0.0% 0 8.9% 9 7.9% 3 7.3% 3 4.2% 3 3.5% 2 7.4% 7Yearly 1.3% 2 0.0% 0 2.0% 2 0.0% 0 0.0% 0 2.8% 2 0.0% 0 2.1% 2Less often 43.0% 65 54.0% 27 37.6% 38 42.1% 16 43.9% 18 43.1% 31 45.6% 26 41.5% 39First visit today 0.7% 1 0.0% 0 1.0% 1 0.0% 0 0.0% 0 1.4% 1 0.0% 0 1.1% 1Never 13.2% 20 20.0% 10 9.9% 10 7.9% 3 14.6% 6 15.3% 11 15.8% 9 11.7% 11(Don’t know) 12.6% 19 8.0% 4 14.9% 15 5.3% 2 9.8% 4 18.1% 13 8.8% 5 14.9% 14Base: 151 50 101 38 41 72 57 94
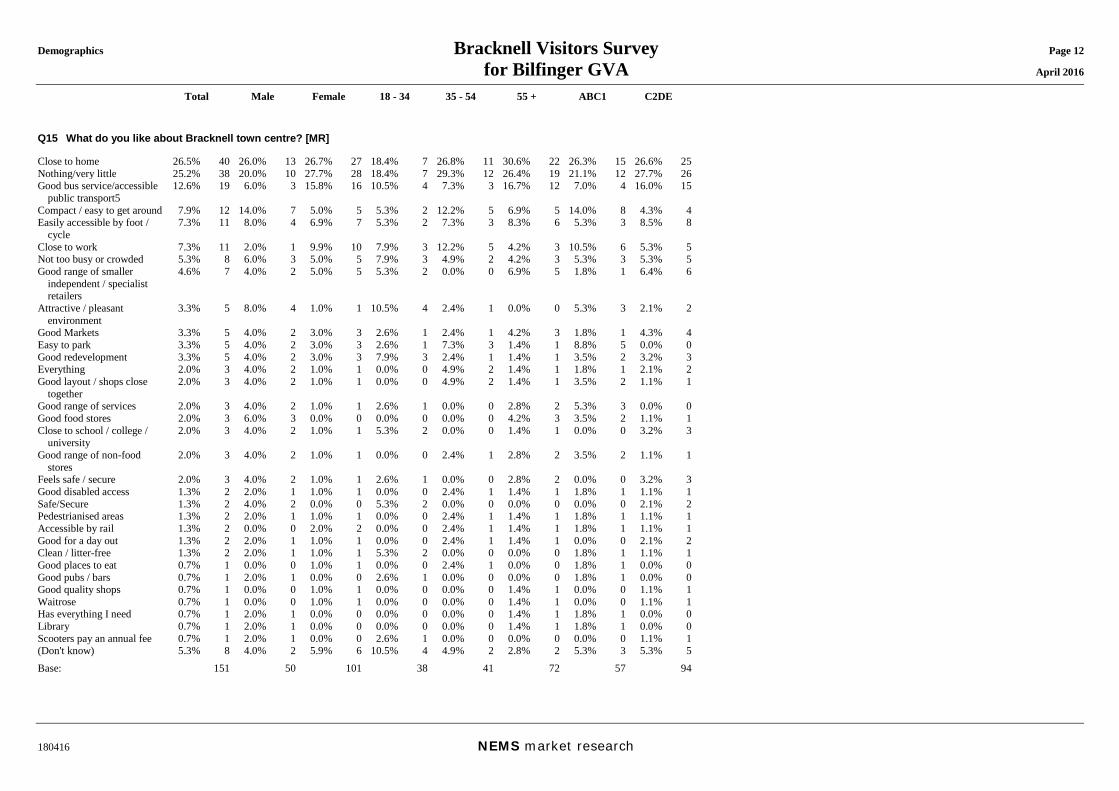
Demographics Bracknell Visitors Survey Page 12 for Bilfinger GVA April 2016
Total Male Female 18 - 34 35 - 54 55 + ABC1 C2DE
180416 NEMS market research
Q15 What do you like about Bracknell town centre? [MR] Close to home 26.5% 40 26.0% 13 26.7% 27 18.4% 7 26.8% 11 30.6% 22 26.3% 15 26.6% 25Nothing/very little 25.2% 38 20.0% 10 27.7% 28 18.4% 7 29.3% 12 26.4% 19 21.1% 12 27.7% 26Good bus service/accessible
public transport5 12.6% 19 6.0% 3 15.8% 16 10.5% 4 7.3% 3 16.7% 12 7.0% 4 16.0% 15
Compact / easy to get around 7.9% 12 14.0% 7 5.0% 5 5.3% 2 12.2% 5 6.9% 5 14.0% 8 4.3% 4Easily accessible by foot /
cycle 7.3% 11 8.0% 4 6.9% 7 5.3% 2 7.3% 3 8.3% 6 5.3% 3 8.5% 8
Close to work 7.3% 11 2.0% 1 9.9% 10 7.9% 3 12.2% 5 4.2% 3 10.5% 6 5.3% 5Not too busy or crowded 5.3% 8 6.0% 3 5.0% 5 7.9% 3 4.9% 2 4.2% 3 5.3% 3 5.3% 5Good range of smaller
independent / specialist retailers
4.6% 7 4.0% 2 5.0% 5 5.3% 2 0.0% 0 6.9% 5 1.8% 1 6.4% 6
Attractive / pleasant environment
3.3% 5 8.0% 4 1.0% 1 10.5% 4 2.4% 1 0.0% 0 5.3% 3 2.1% 2
Good Markets 3.3% 5 4.0% 2 3.0% 3 2.6% 1 2.4% 1 4.2% 3 1.8% 1 4.3% 4Easy to park 3.3% 5 4.0% 2 3.0% 3 2.6% 1 7.3% 3 1.4% 1 8.8% 5 0.0% 0Good redevelopment 3.3% 5 4.0% 2 3.0% 3 7.9% 3 2.4% 1 1.4% 1 3.5% 2 3.2% 3Everything 2.0% 3 4.0% 2 1.0% 1 0.0% 0 4.9% 2 1.4% 1 1.8% 1 2.1% 2Good layout / shops close
together 2.0% 3 4.0% 2 1.0% 1 0.0% 0 4.9% 2 1.4% 1 3.5% 2 1.1% 1
Good range of services 2.0% 3 4.0% 2 1.0% 1 2.6% 1 0.0% 0 2.8% 2 5.3% 3 0.0% 0Good food stores 2.0% 3 6.0% 3 0.0% 0 0.0% 0 0.0% 0 4.2% 3 3.5% 2 1.1% 1Close to school / college /
university 2.0% 3 4.0% 2 1.0% 1 5.3% 2 0.0% 0 1.4% 1 0.0% 0 3.2% 3
Good range of non-food stores
2.0% 3 4.0% 2 1.0% 1 0.0% 0 2.4% 1 2.8% 2 3.5% 2 1.1% 1
Feels safe / secure 2.0% 3 4.0% 2 1.0% 1 2.6% 1 0.0% 0 2.8% 2 0.0% 0 3.2% 3Good disabled access 1.3% 2 2.0% 1 1.0% 1 0.0% 0 2.4% 1 1.4% 1 1.8% 1 1.1% 1Safe/Secure 1.3% 2 4.0% 2 0.0% 0 5.3% 2 0.0% 0 0.0% 0 0.0% 0 2.1% 2Pedestrianised areas 1.3% 2 2.0% 1 1.0% 1 0.0% 0 2.4% 1 1.4% 1 1.8% 1 1.1% 1Accessible by rail 1.3% 2 0.0% 0 2.0% 2 0.0% 0 2.4% 1 1.4% 1 1.8% 1 1.1% 1Good for a day out 1.3% 2 2.0% 1 1.0% 1 0.0% 0 2.4% 1 1.4% 1 0.0% 0 2.1% 2Clean / litter-free 1.3% 2 2.0% 1 1.0% 1 5.3% 2 0.0% 0 0.0% 0 1.8% 1 1.1% 1Good places to eat 0.7% 1 0.0% 0 1.0% 1 0.0% 0 2.4% 1 0.0% 0 1.8% 1 0.0% 0Good pubs / bars 0.7% 1 2.0% 1 0.0% 0 2.6% 1 0.0% 0 0.0% 0 1.8% 1 0.0% 0Good quality shops 0.7% 1 0.0% 0 1.0% 1 0.0% 0 0.0% 0 1.4% 1 0.0% 0 1.1% 1Waitrose 0.7% 1 0.0% 0 1.0% 1 0.0% 0 0.0% 0 1.4% 1 0.0% 0 1.1% 1Has everything I need 0.7% 1 2.0% 1 0.0% 0 0.0% 0 0.0% 0 1.4% 1 1.8% 1 0.0% 0Library 0.7% 1 2.0% 1 0.0% 0 0.0% 0 0.0% 0 1.4% 1 1.8% 1 0.0% 0Scooters pay an annual fee 0.7% 1 2.0% 1 0.0% 0 2.6% 1 0.0% 0 0.0% 0 0.0% 0 1.1% 1(Don't know) 5.3% 8 4.0% 2 5.9% 6 10.5% 4 4.9% 2 2.8% 2 5.3% 3 5.3% 5Base: 151 50 101 38 41 72 57 94
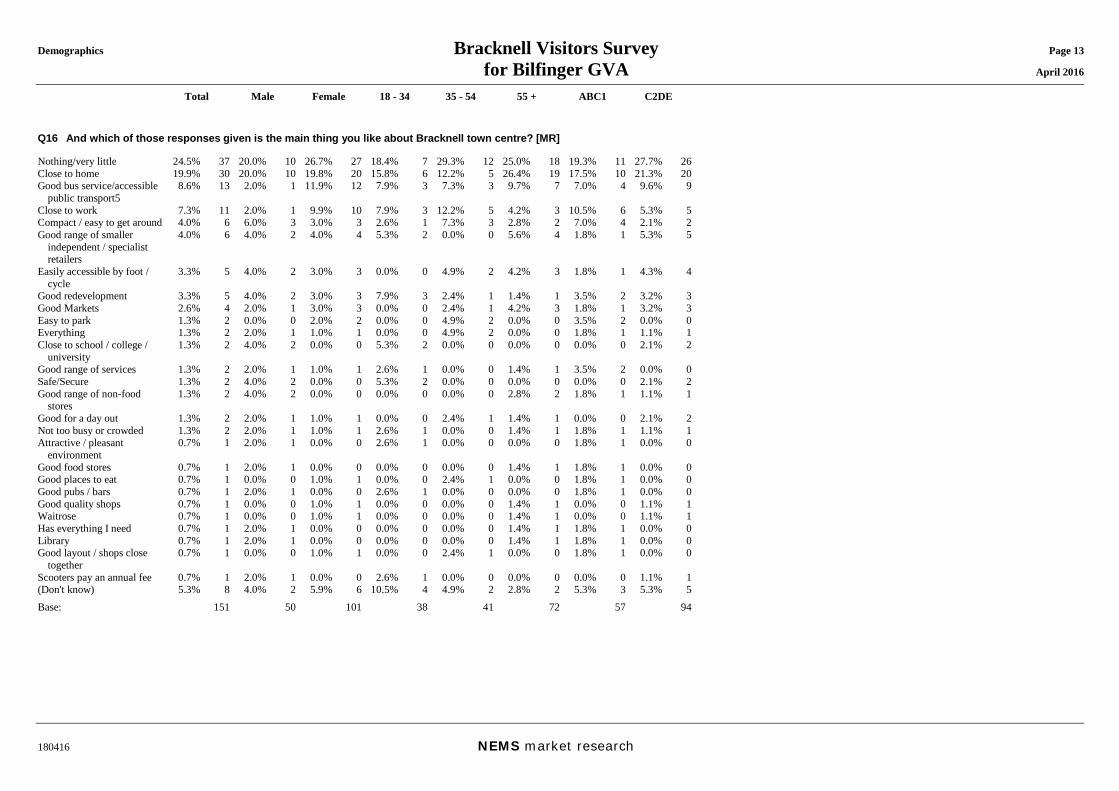
Demographics Bracknell Visitors Survey Page 13 for Bilfinger GVA April 2016
Total Male Female 18 - 34 35 - 54 55 + ABC1 C2DE
180416 NEMS market research
Q16 And which of those responses given is the main thing you like about Bracknell town centre? [MR] Nothing/very little 24.5% 37 20.0% 10 26.7% 27 18.4% 7 29.3% 12 25.0% 18 19.3% 11 27.7% 26Close to home 19.9% 30 20.0% 10 19.8% 20 15.8% 6 12.2% 5 26.4% 19 17.5% 10 21.3% 20Good bus service/accessible
public transport5 8.6% 13 2.0% 1 11.9% 12 7.9% 3 7.3% 3 9.7% 7 7.0% 4 9.6% 9
Close to work 7.3% 11 2.0% 1 9.9% 10 7.9% 3 12.2% 5 4.2% 3 10.5% 6 5.3% 5Compact / easy to get around 4.0% 6 6.0% 3 3.0% 3 2.6% 1 7.3% 3 2.8% 2 7.0% 4 2.1% 2Good range of smaller
independent / specialist retailers
4.0% 6 4.0% 2 4.0% 4 5.3% 2 0.0% 0 5.6% 4 1.8% 1 5.3% 5
Easily accessible by foot / cycle
3.3% 5 4.0% 2 3.0% 3 0.0% 0 4.9% 2 4.2% 3 1.8% 1 4.3% 4
Good redevelopment 3.3% 5 4.0% 2 3.0% 3 7.9% 3 2.4% 1 1.4% 1 3.5% 2 3.2% 3Good Markets 2.6% 4 2.0% 1 3.0% 3 0.0% 0 2.4% 1 4.2% 3 1.8% 1 3.2% 3Easy to park 1.3% 2 0.0% 0 2.0% 2 0.0% 0 4.9% 2 0.0% 0 3.5% 2 0.0% 0Everything 1.3% 2 2.0% 1 1.0% 1 0.0% 0 4.9% 2 0.0% 0 1.8% 1 1.1% 1Close to school / college /
university 1.3% 2 4.0% 2 0.0% 0 5.3% 2 0.0% 0 0.0% 0 0.0% 0 2.1% 2
Good range of services 1.3% 2 2.0% 1 1.0% 1 2.6% 1 0.0% 0 1.4% 1 3.5% 2 0.0% 0Safe/Secure 1.3% 2 4.0% 2 0.0% 0 5.3% 2 0.0% 0 0.0% 0 0.0% 0 2.1% 2Good range of non-food
stores 1.3% 2 4.0% 2 0.0% 0 0.0% 0 0.0% 0 2.8% 2 1.8% 1 1.1% 1
Good for a day out 1.3% 2 2.0% 1 1.0% 1 0.0% 0 2.4% 1 1.4% 1 0.0% 0 2.1% 2Not too busy or crowded 1.3% 2 2.0% 1 1.0% 1 2.6% 1 0.0% 0 1.4% 1 1.8% 1 1.1% 1Attractive / pleasant
environment 0.7% 1 2.0% 1 0.0% 0 2.6% 1 0.0% 0 0.0% 0 1.8% 1 0.0% 0
Good food stores 0.7% 1 2.0% 1 0.0% 0 0.0% 0 0.0% 0 1.4% 1 1.8% 1 0.0% 0Good places to eat 0.7% 1 0.0% 0 1.0% 1 0.0% 0 2.4% 1 0.0% 0 1.8% 1 0.0% 0Good pubs / bars 0.7% 1 2.0% 1 0.0% 0 2.6% 1 0.0% 0 0.0% 0 1.8% 1 0.0% 0Good quality shops 0.7% 1 0.0% 0 1.0% 1 0.0% 0 0.0% 0 1.4% 1 0.0% 0 1.1% 1Waitrose 0.7% 1 0.0% 0 1.0% 1 0.0% 0 0.0% 0 1.4% 1 0.0% 0 1.1% 1Has everything I need 0.7% 1 2.0% 1 0.0% 0 0.0% 0 0.0% 0 1.4% 1 1.8% 1 0.0% 0Library 0.7% 1 2.0% 1 0.0% 0 0.0% 0 0.0% 0 1.4% 1 1.8% 1 0.0% 0Good layout / shops close
together 0.7% 1 0.0% 0 1.0% 1 0.0% 0 2.4% 1 0.0% 0 1.8% 1 0.0% 0
Scooters pay an annual fee 0.7% 1 2.0% 1 0.0% 0 2.6% 1 0.0% 0 0.0% 0 0.0% 0 1.1% 1(Don't know) 5.3% 8 4.0% 2 5.9% 6 10.5% 4 4.9% 2 2.8% 2 5.3% 3 5.3% 5Base: 151 50 101 38 41 72 57 94
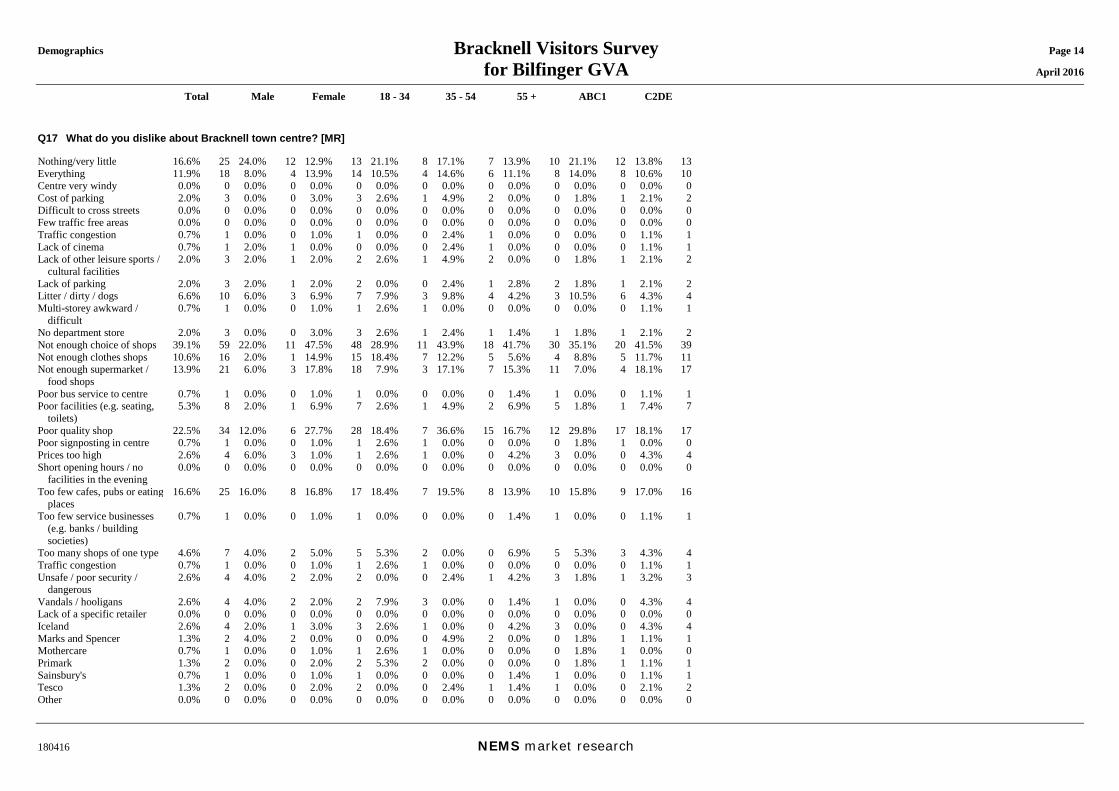
Demographics Bracknell Visitors Survey Page 14 for Bilfinger GVA April 2016
Total Male Female 18 - 34 35 - 54 55 + ABC1 C2DE
180416 NEMS market research
Q17 What do you dislike about Bracknell town centre? [MR] Nothing/very little 16.6% 25 24.0% 12 12.9% 13 21.1% 8 17.1% 7 13.9% 10 21.1% 12 13.8% 13Everything 11.9% 18 8.0% 4 13.9% 14 10.5% 4 14.6% 6 11.1% 8 14.0% 8 10.6% 10Centre very windy 0.0% 0 0.0% 0 0.0% 0 0.0% 0 0.0% 0 0.0% 0 0.0% 0 0.0% 0Cost of parking 2.0% 3 0.0% 0 3.0% 3 2.6% 1 4.9% 2 0.0% 0 1.8% 1 2.1% 2Difficult to cross streets 0.0% 0 0.0% 0 0.0% 0 0.0% 0 0.0% 0 0.0% 0 0.0% 0 0.0% 0Few traffic free areas 0.0% 0 0.0% 0 0.0% 0 0.0% 0 0.0% 0 0.0% 0 0.0% 0 0.0% 0Traffic congestion 0.7% 1 0.0% 0 1.0% 1 0.0% 0 2.4% 1 0.0% 0 0.0% 0 1.1% 1Lack of cinema 0.7% 1 2.0% 1 0.0% 0 0.0% 0 2.4% 1 0.0% 0 0.0% 0 1.1% 1Lack of other leisure sports /
cultural facilities 2.0% 3 2.0% 1 2.0% 2 2.6% 1 4.9% 2 0.0% 0 1.8% 1 2.1% 2
Lack of parking 2.0% 3 2.0% 1 2.0% 2 0.0% 0 2.4% 1 2.8% 2 1.8% 1 2.1% 2Litter / dirty / dogs 6.6% 10 6.0% 3 6.9% 7 7.9% 3 9.8% 4 4.2% 3 10.5% 6 4.3% 4Multi-storey awkward /
difficult 0.7% 1 0.0% 0 1.0% 1 2.6% 1 0.0% 0 0.0% 0 0.0% 0 1.1% 1
No department store 2.0% 3 0.0% 0 3.0% 3 2.6% 1 2.4% 1 1.4% 1 1.8% 1 2.1% 2Not enough choice of shops 39.1% 59 22.0% 11 47.5% 48 28.9% 11 43.9% 18 41.7% 30 35.1% 20 41.5% 39Not enough clothes shops 10.6% 16 2.0% 1 14.9% 15 18.4% 7 12.2% 5 5.6% 4 8.8% 5 11.7% 11Not enough supermarket /
food shops 13.9% 21 6.0% 3 17.8% 18 7.9% 3 17.1% 7 15.3% 11 7.0% 4 18.1% 17
Poor bus service to centre 0.7% 1 0.0% 0 1.0% 1 0.0% 0 0.0% 0 1.4% 1 0.0% 0 1.1% 1Poor facilities (e.g. seating,
toilets) 5.3% 8 2.0% 1 6.9% 7 2.6% 1 4.9% 2 6.9% 5 1.8% 1 7.4% 7
Poor quality shop 22.5% 34 12.0% 6 27.7% 28 18.4% 7 36.6% 15 16.7% 12 29.8% 17 18.1% 17Poor signposting in centre 0.7% 1 0.0% 0 1.0% 1 2.6% 1 0.0% 0 0.0% 0 1.8% 1 0.0% 0Prices too high 2.6% 4 6.0% 3 1.0% 1 2.6% 1 0.0% 0 4.2% 3 0.0% 0 4.3% 4Short opening hours / no
facilities in the evening 0.0% 0 0.0% 0 0.0% 0 0.0% 0 0.0% 0 0.0% 0 0.0% 0 0.0% 0
Too few cafes, pubs or eating places
16.6% 25 16.0% 8 16.8% 17 18.4% 7 19.5% 8 13.9% 10 15.8% 9 17.0% 16
Too few service businesses (e.g. banks / building societies)
0.7% 1 0.0% 0 1.0% 1 0.0% 0 0.0% 0 1.4% 1 0.0% 0 1.1% 1
Too many shops of one type 4.6% 7 4.0% 2 5.0% 5 5.3% 2 0.0% 0 6.9% 5 5.3% 3 4.3% 4Traffic congestion 0.7% 1 0.0% 0 1.0% 1 2.6% 1 0.0% 0 0.0% 0 0.0% 0 1.1% 1Unsafe / poor security /
dangerous 2.6% 4 4.0% 2 2.0% 2 0.0% 0 2.4% 1 4.2% 3 1.8% 1 3.2% 3
Vandals / hooligans 2.6% 4 4.0% 2 2.0% 2 7.9% 3 0.0% 0 1.4% 1 0.0% 0 4.3% 4Lack of a specific retailer 0.0% 0 0.0% 0 0.0% 0 0.0% 0 0.0% 0 0.0% 0 0.0% 0 0.0% 0Iceland 2.6% 4 2.0% 1 3.0% 3 2.6% 1 0.0% 0 4.2% 3 0.0% 0 4.3% 4Marks and Spencer 1.3% 2 4.0% 2 0.0% 0 0.0% 0 4.9% 2 0.0% 0 1.8% 1 1.1% 1Mothercare 0.7% 1 0.0% 0 1.0% 1 2.6% 1 0.0% 0 0.0% 0 1.8% 1 0.0% 0Primark 1.3% 2 0.0% 0 2.0% 2 5.3% 2 0.0% 0 0.0% 0 1.8% 1 1.1% 1Sainsbury's 0.7% 1 0.0% 0 1.0% 1 0.0% 0 0.0% 0 1.4% 1 0.0% 0 1.1% 1Tesco 1.3% 2 0.0% 0 2.0% 2 0.0% 0 2.4% 1 1.4% 1 0.0% 0 2.1% 2Other 0.0% 0 0.0% 0 0.0% 0 0.0% 0 0.0% 0 0.0% 0 0.0% 0 0.0% 0
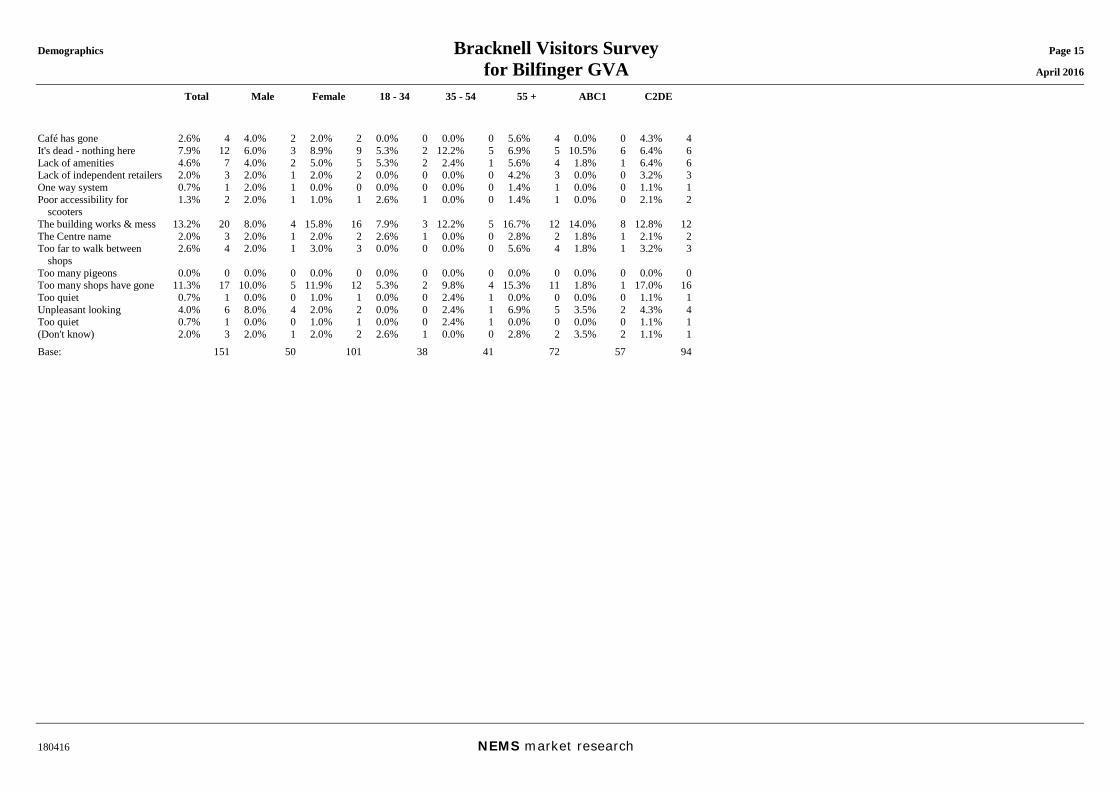
Demographics Bracknell Visitors Survey Page 15 for Bilfinger GVA April 2016
Total Male Female 18 - 34 35 - 54 55 + ABC1 C2DE
180416 NEMS market research
Café has gone 2.6% 4 4.0% 2 2.0% 2 0.0% 0 0.0% 0 5.6% 4 0.0% 0 4.3% 4It's dead - nothing here 7.9% 12 6.0% 3 8.9% 9 5.3% 2 12.2% 5 6.9% 5 10.5% 6 6.4% 6Lack of amenities 4.6% 7 4.0% 2 5.0% 5 5.3% 2 2.4% 1 5.6% 4 1.8% 1 6.4% 6Lack of independent retailers 2.0% 3 2.0% 1 2.0% 2 0.0% 0 0.0% 0 4.2% 3 0.0% 0 3.2% 3One way system 0.7% 1 2.0% 1 0.0% 0 0.0% 0 0.0% 0 1.4% 1 0.0% 0 1.1% 1Poor accessibility for
scooters 1.3% 2 2.0% 1 1.0% 1 2.6% 1 0.0% 0 1.4% 1 0.0% 0 2.1% 2
The building works & mess 13.2% 20 8.0% 4 15.8% 16 7.9% 3 12.2% 5 16.7% 12 14.0% 8 12.8% 12The Centre name 2.0% 3 2.0% 1 2.0% 2 2.6% 1 0.0% 0 2.8% 2 1.8% 1 2.1% 2Too far to walk between
shops 2.6% 4 2.0% 1 3.0% 3 0.0% 0 0.0% 0 5.6% 4 1.8% 1 3.2% 3
Too many pigeons 0.0% 0 0.0% 0 0.0% 0 0.0% 0 0.0% 0 0.0% 0 0.0% 0 0.0% 0Too many shops have gone 11.3% 17 10.0% 5 11.9% 12 5.3% 2 9.8% 4 15.3% 11 1.8% 1 17.0% 16Too quiet 0.7% 1 0.0% 0 1.0% 1 0.0% 0 2.4% 1 0.0% 0 0.0% 0 1.1% 1Unpleasant looking 4.0% 6 8.0% 4 2.0% 2 0.0% 0 2.4% 1 6.9% 5 3.5% 2 4.3% 4Too quiet 0.7% 1 0.0% 0 1.0% 1 0.0% 0 2.4% 1 0.0% 0 0.0% 0 1.1% 1(Don't know) 2.0% 3 2.0% 1 2.0% 2 2.6% 1 0.0% 0 2.8% 2 3.5% 2 1.1% 1Base: 151 50 101 38 41 72 57 94
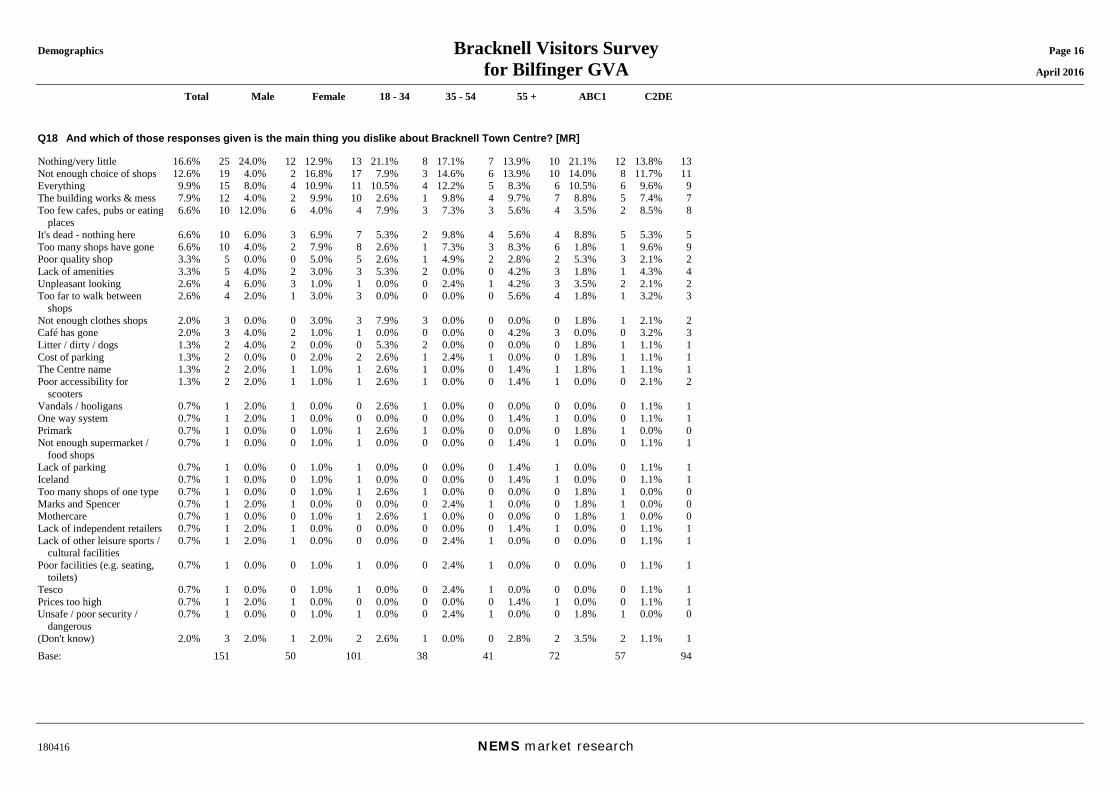
Demographics Bracknell Visitors Survey Page 16 for Bilfinger GVA April 2016
Total Male Female 18 - 34 35 - 54 55 + ABC1 C2DE
180416 NEMS market research
Q18 And which of those responses given is the main thing you dislike about Bracknell Town Centre? [MR] Nothing/very little 16.6% 25 24.0% 12 12.9% 13 21.1% 8 17.1% 7 13.9% 10 21.1% 12 13.8% 13Not enough choice of shops 12.6% 19 4.0% 2 16.8% 17 7.9% 3 14.6% 6 13.9% 10 14.0% 8 11.7% 11Everything 9.9% 15 8.0% 4 10.9% 11 10.5% 4 12.2% 5 8.3% 6 10.5% 6 9.6% 9The building works & mess 7.9% 12 4.0% 2 9.9% 10 2.6% 1 9.8% 4 9.7% 7 8.8% 5 7.4% 7Too few cafes, pubs or eating
places 6.6% 10 12.0% 6 4.0% 4 7.9% 3 7.3% 3 5.6% 4 3.5% 2 8.5% 8
It's dead - nothing here 6.6% 10 6.0% 3 6.9% 7 5.3% 2 9.8% 4 5.6% 4 8.8% 5 5.3% 5Too many shops have gone 6.6% 10 4.0% 2 7.9% 8 2.6% 1 7.3% 3 8.3% 6 1.8% 1 9.6% 9Poor quality shop 3.3% 5 0.0% 0 5.0% 5 2.6% 1 4.9% 2 2.8% 2 5.3% 3 2.1% 2Lack of amenities 3.3% 5 4.0% 2 3.0% 3 5.3% 2 0.0% 0 4.2% 3 1.8% 1 4.3% 4Unpleasant looking 2.6% 4 6.0% 3 1.0% 1 0.0% 0 2.4% 1 4.2% 3 3.5% 2 2.1% 2Too far to walk between
shops 2.6% 4 2.0% 1 3.0% 3 0.0% 0 0.0% 0 5.6% 4 1.8% 1 3.2% 3
Not enough clothes shops 2.0% 3 0.0% 0 3.0% 3 7.9% 3 0.0% 0 0.0% 0 1.8% 1 2.1% 2Café has gone 2.0% 3 4.0% 2 1.0% 1 0.0% 0 0.0% 0 4.2% 3 0.0% 0 3.2% 3Litter / dirty / dogs 1.3% 2 4.0% 2 0.0% 0 5.3% 2 0.0% 0 0.0% 0 1.8% 1 1.1% 1Cost of parking 1.3% 2 0.0% 0 2.0% 2 2.6% 1 2.4% 1 0.0% 0 1.8% 1 1.1% 1The Centre name 1.3% 2 2.0% 1 1.0% 1 2.6% 1 0.0% 0 1.4% 1 1.8% 1 1.1% 1Poor accessibility for
scooters 1.3% 2 2.0% 1 1.0% 1 2.6% 1 0.0% 0 1.4% 1 0.0% 0 2.1% 2
Vandals / hooligans 0.7% 1 2.0% 1 0.0% 0 2.6% 1 0.0% 0 0.0% 0 0.0% 0 1.1% 1One way system 0.7% 1 2.0% 1 0.0% 0 0.0% 0 0.0% 0 1.4% 1 0.0% 0 1.1% 1Primark 0.7% 1 0.0% 0 1.0% 1 2.6% 1 0.0% 0 0.0% 0 1.8% 1 0.0% 0Not enough supermarket /
food shops 0.7% 1 0.0% 0 1.0% 1 0.0% 0 0.0% 0 1.4% 1 0.0% 0 1.1% 1
Lack of parking 0.7% 1 0.0% 0 1.0% 1 0.0% 0 0.0% 0 1.4% 1 0.0% 0 1.1% 1Iceland 0.7% 1 0.0% 0 1.0% 1 0.0% 0 0.0% 0 1.4% 1 0.0% 0 1.1% 1Too many shops of one type 0.7% 1 0.0% 0 1.0% 1 2.6% 1 0.0% 0 0.0% 0 1.8% 1 0.0% 0Marks and Spencer 0.7% 1 2.0% 1 0.0% 0 0.0% 0 2.4% 1 0.0% 0 1.8% 1 0.0% 0Mothercare 0.7% 1 0.0% 0 1.0% 1 2.6% 1 0.0% 0 0.0% 0 1.8% 1 0.0% 0Lack of independent retailers 0.7% 1 2.0% 1 0.0% 0 0.0% 0 0.0% 0 1.4% 1 0.0% 0 1.1% 1Lack of other leisure sports /
cultural facilities 0.7% 1 2.0% 1 0.0% 0 0.0% 0 2.4% 1 0.0% 0 0.0% 0 1.1% 1
Poor facilities (e.g. seating, toilets)
0.7% 1 0.0% 0 1.0% 1 0.0% 0 2.4% 1 0.0% 0 0.0% 0 1.1% 1
Tesco 0.7% 1 0.0% 0 1.0% 1 0.0% 0 2.4% 1 0.0% 0 0.0% 0 1.1% 1Prices too high 0.7% 1 2.0% 1 0.0% 0 0.0% 0 0.0% 0 1.4% 1 0.0% 0 1.1% 1Unsafe / poor security /
dangerous 0.7% 1 0.0% 0 1.0% 1 0.0% 0 2.4% 1 0.0% 0 1.8% 1 0.0% 0
(Don't know) 2.0% 3 2.0% 1 2.0% 2 2.6% 1 0.0% 0 2.8% 2 3.5% 2 1.1% 1Base: 151 50 101 38 41 72 57 94
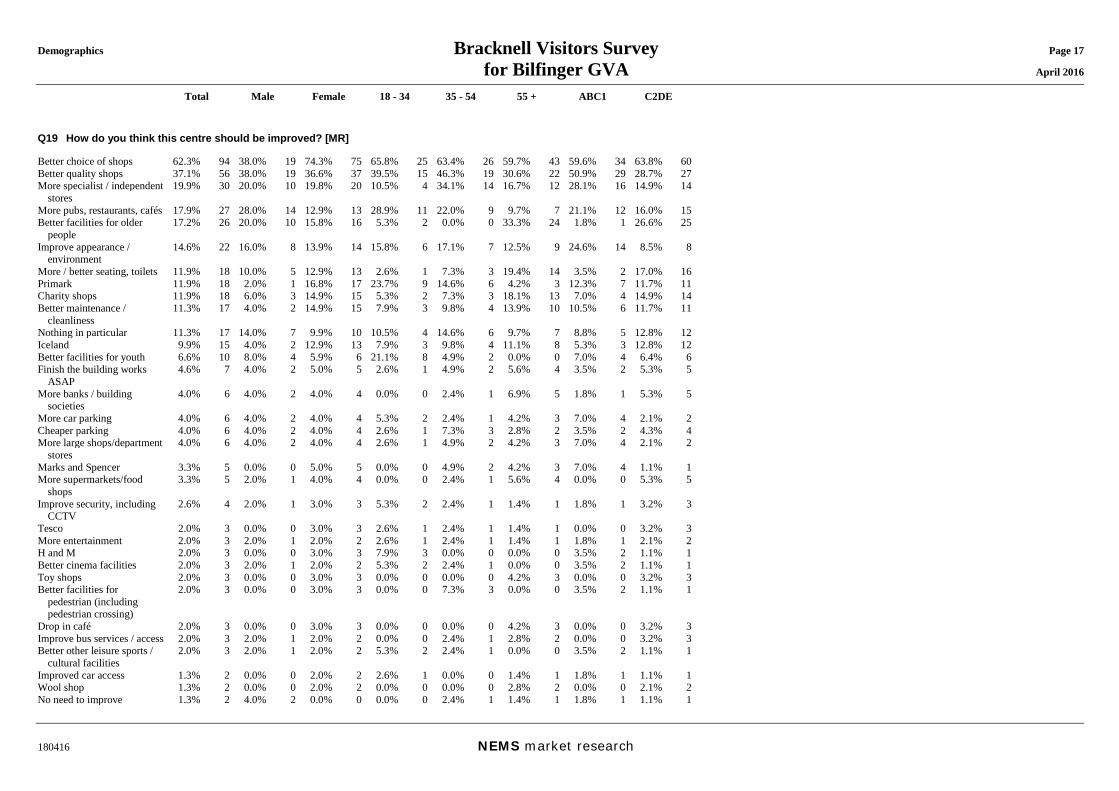
Demographics Bracknell Visitors Survey Page 17 for Bilfinger GVA April 2016
Total Male Female 18 - 34 35 - 54 55 + ABC1 C2DE
180416 NEMS market research
Q19 How do you think this centre should be improved? [MR] Better choice of shops 62.3% 94 38.0% 19 74.3% 75 65.8% 25 63.4% 26 59.7% 43 59.6% 34 63.8% 60Better quality shops 37.1% 56 38.0% 19 36.6% 37 39.5% 15 46.3% 19 30.6% 22 50.9% 29 28.7% 27More specialist / independent
stores 19.9% 30 20.0% 10 19.8% 20 10.5% 4 34.1% 14 16.7% 12 28.1% 16 14.9% 14
More pubs, restaurants, cafés 17.9% 27 28.0% 14 12.9% 13 28.9% 11 22.0% 9 9.7% 7 21.1% 12 16.0% 15Better facilities for older
people 17.2% 26 20.0% 10 15.8% 16 5.3% 2 0.0% 0 33.3% 24 1.8% 1 26.6% 25
Improve appearance / environment
14.6% 22 16.0% 8 13.9% 14 15.8% 6 17.1% 7 12.5% 9 24.6% 14 8.5% 8
More / better seating, toilets 11.9% 18 10.0% 5 12.9% 13 2.6% 1 7.3% 3 19.4% 14 3.5% 2 17.0% 16Primark 11.9% 18 2.0% 1 16.8% 17 23.7% 9 14.6% 6 4.2% 3 12.3% 7 11.7% 11Charity shops 11.9% 18 6.0% 3 14.9% 15 5.3% 2 7.3% 3 18.1% 13 7.0% 4 14.9% 14Better maintenance /
cleanliness 11.3% 17 4.0% 2 14.9% 15 7.9% 3 9.8% 4 13.9% 10 10.5% 6 11.7% 11
Nothing in particular 11.3% 17 14.0% 7 9.9% 10 10.5% 4 14.6% 6 9.7% 7 8.8% 5 12.8% 12Iceland 9.9% 15 4.0% 2 12.9% 13 7.9% 3 9.8% 4 11.1% 8 5.3% 3 12.8% 12Better facilities for youth 6.6% 10 8.0% 4 5.9% 6 21.1% 8 4.9% 2 0.0% 0 7.0% 4 6.4% 6Finish the building works
ASAP 4.6% 7 4.0% 2 5.0% 5 2.6% 1 4.9% 2 5.6% 4 3.5% 2 5.3% 5
More banks / building societies
4.0% 6 4.0% 2 4.0% 4 0.0% 0 2.4% 1 6.9% 5 1.8% 1 5.3% 5
More car parking 4.0% 6 4.0% 2 4.0% 4 5.3% 2 2.4% 1 4.2% 3 7.0% 4 2.1% 2Cheaper parking 4.0% 6 4.0% 2 4.0% 4 2.6% 1 7.3% 3 2.8% 2 3.5% 2 4.3% 4More large shops/department
stores 4.0% 6 4.0% 2 4.0% 4 2.6% 1 4.9% 2 4.2% 3 7.0% 4 2.1% 2
Marks and Spencer 3.3% 5 0.0% 0 5.0% 5 0.0% 0 4.9% 2 4.2% 3 7.0% 4 1.1% 1More supermarkets/food
shops 3.3% 5 2.0% 1 4.0% 4 0.0% 0 2.4% 1 5.6% 4 0.0% 0 5.3% 5
Improve security, including CCTV
2.6% 4 2.0% 1 3.0% 3 5.3% 2 2.4% 1 1.4% 1 1.8% 1 3.2% 3
Tesco 2.0% 3 0.0% 0 3.0% 3 2.6% 1 2.4% 1 1.4% 1 0.0% 0 3.2% 3More entertainment 2.0% 3 2.0% 1 2.0% 2 2.6% 1 2.4% 1 1.4% 1 1.8% 1 2.1% 2H and M 2.0% 3 0.0% 0 3.0% 3 7.9% 3 0.0% 0 0.0% 0 3.5% 2 1.1% 1Better cinema facilities 2.0% 3 2.0% 1 2.0% 2 5.3% 2 2.4% 1 0.0% 0 3.5% 2 1.1% 1Toy shops 2.0% 3 0.0% 0 3.0% 3 0.0% 0 0.0% 0 4.2% 3 0.0% 0 3.2% 3Better facilities for
pedestrian (including pedestrian crossing)
2.0% 3 0.0% 0 3.0% 3 0.0% 0 7.3% 3 0.0% 0 3.5% 2 1.1% 1
Drop in café 2.0% 3 0.0% 0 3.0% 3 0.0% 0 0.0% 0 4.2% 3 0.0% 0 3.2% 3Improve bus services / access 2.0% 3 2.0% 1 2.0% 2 0.0% 0 2.4% 1 2.8% 2 0.0% 0 3.2% 3Better other leisure sports /
cultural facilities 2.0% 3 2.0% 1 2.0% 2 5.3% 2 2.4% 1 0.0% 0 3.5% 2 1.1% 1
Improved car access 1.3% 2 0.0% 0 2.0% 2 2.6% 1 0.0% 0 1.4% 1 1.8% 1 1.1% 1Wool shop 1.3% 2 0.0% 0 2.0% 2 0.0% 0 0.0% 0 2.8% 2 0.0% 0 2.1% 2No need to improve 1.3% 2 4.0% 2 0.0% 0 0.0% 0 2.4% 1 1.4% 1 1.8% 1 1.1% 1
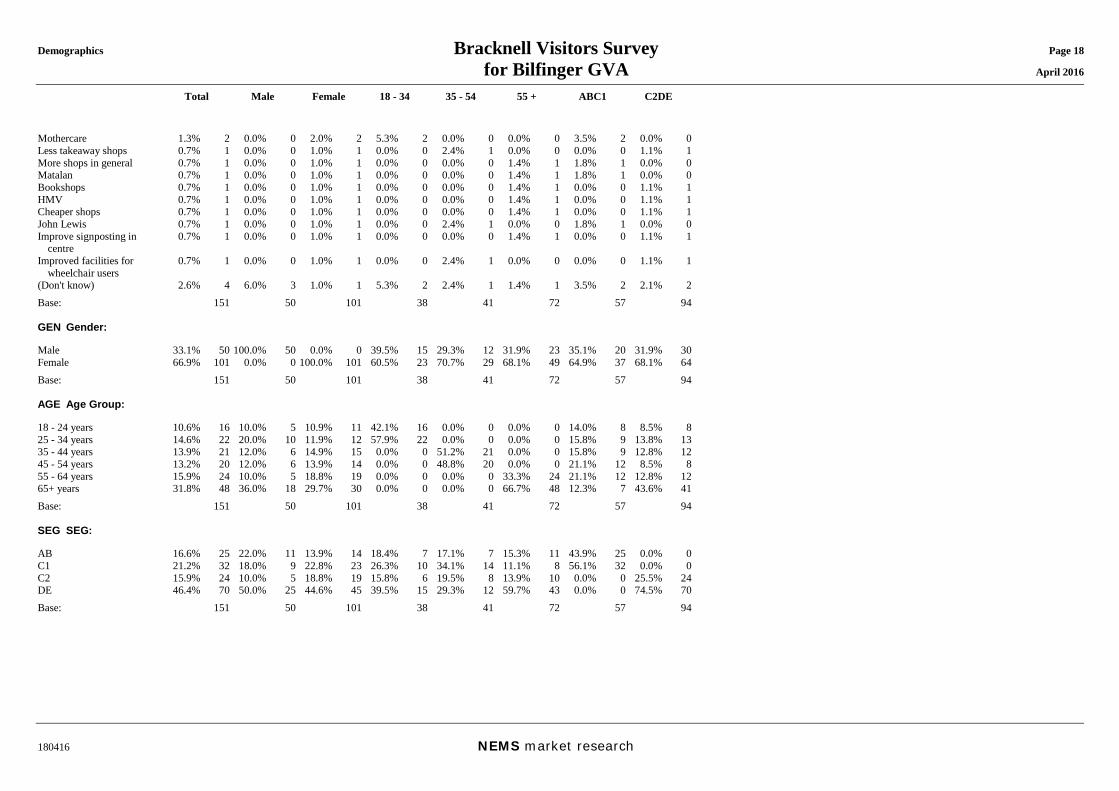
Demographics Bracknell Visitors Survey Page 18 for Bilfinger GVA April 2016
Total Male Female 18 - 34 35 - 54 55 + ABC1 C2DE
180416 NEMS market research
Mothercare 1.3% 2 0.0% 0 2.0% 2 5.3% 2 0.0% 0 0.0% 0 3.5% 2 0.0% 0Less takeaway shops 0.7% 1 0.0% 0 1.0% 1 0.0% 0 2.4% 1 0.0% 0 0.0% 0 1.1% 1More shops in general 0.7% 1 0.0% 0 1.0% 1 0.0% 0 0.0% 0 1.4% 1 1.8% 1 0.0% 0Matalan 0.7% 1 0.0% 0 1.0% 1 0.0% 0 0.0% 0 1.4% 1 1.8% 1 0.0% 0Bookshops 0.7% 1 0.0% 0 1.0% 1 0.0% 0 0.0% 0 1.4% 1 0.0% 0 1.1% 1HMV 0.7% 1 0.0% 0 1.0% 1 0.0% 0 0.0% 0 1.4% 1 0.0% 0 1.1% 1Cheaper shops 0.7% 1 0.0% 0 1.0% 1 0.0% 0 0.0% 0 1.4% 1 0.0% 0 1.1% 1John Lewis 0.7% 1 0.0% 0 1.0% 1 0.0% 0 2.4% 1 0.0% 0 1.8% 1 0.0% 0Improve signposting in
centre 0.7% 1 0.0% 0 1.0% 1 0.0% 0 0.0% 0 1.4% 1 0.0% 0 1.1% 1
Improved facilities for wheelchair users
0.7% 1 0.0% 0 1.0% 1 0.0% 0 2.4% 1 0.0% 0 0.0% 0 1.1% 1
(Don't know) 2.6% 4 6.0% 3 1.0% 1 5.3% 2 2.4% 1 1.4% 1 3.5% 2 2.1% 2Base: 151 50 101 38 41 72 57 94 GEN Gender: Male 33.1% 50 100.0% 50 0.0% 0 39.5% 15 29.3% 12 31.9% 23 35.1% 20 31.9% 30Female 66.9% 101 0.0% 0 100.0% 101 60.5% 23 70.7% 29 68.1% 49 64.9% 37 68.1% 64Base: 151 50 101 38 41 72 57 94 AGE Age Group: 18 - 24 years 10.6% 16 10.0% 5 10.9% 11 42.1% 16 0.0% 0 0.0% 0 14.0% 8 8.5% 825 - 34 years 14.6% 22 20.0% 10 11.9% 12 57.9% 22 0.0% 0 0.0% 0 15.8% 9 13.8% 1335 - 44 years 13.9% 21 12.0% 6 14.9% 15 0.0% 0 51.2% 21 0.0% 0 15.8% 9 12.8% 1245 - 54 years 13.2% 20 12.0% 6 13.9% 14 0.0% 0 48.8% 20 0.0% 0 21.1% 12 8.5% 855 - 64 years 15.9% 24 10.0% 5 18.8% 19 0.0% 0 0.0% 0 33.3% 24 21.1% 12 12.8% 1265+ years 31.8% 48 36.0% 18 29.7% 30 0.0% 0 0.0% 0 66.7% 48 12.3% 7 43.6% 41Base: 151 50 101 38 41 72 57 94 SEG SEG: AB 16.6% 25 22.0% 11 13.9% 14 18.4% 7 17.1% 7 15.3% 11 43.9% 25 0.0% 0C1 21.2% 32 18.0% 9 22.8% 23 26.3% 10 34.1% 14 11.1% 8 56.1% 32 0.0% 0C2 15.9% 24 10.0% 5 18.8% 19 15.8% 6 19.5% 8 13.9% 10 0.0% 0 25.5% 24DE 46.4% 70 50.0% 25 44.6% 45 39.5% 15 29.3% 12 59.7% 43 0.0% 0 74.5% 70Base: 151 50 101 38 41 72 57 94
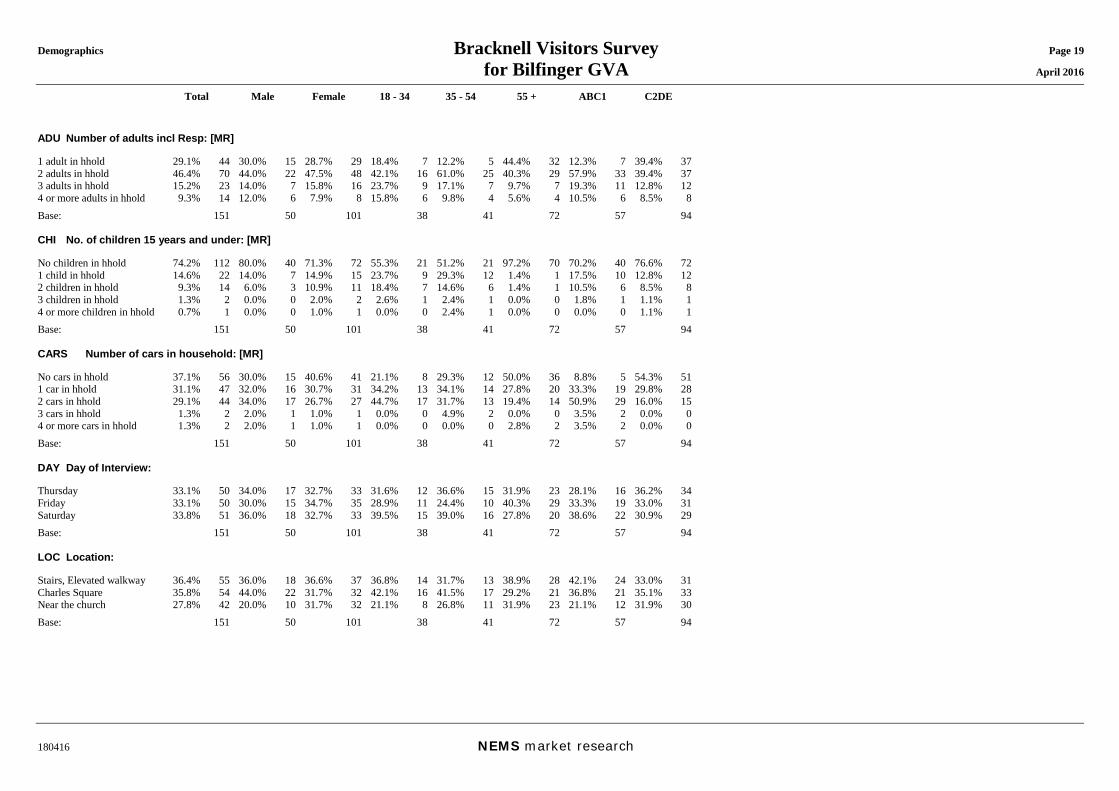
Demographics Bracknell Visitors Survey Page 19 for Bilfinger GVA April 2016
Total Male Female 18 - 34 35 - 54 55 + ABC1 C2DE
180416 NEMS market research
ADU Number of adults incl Resp: [MR] 1 adult in hhold 29.1% 44 30.0% 15 28.7% 29 18.4% 7 12.2% 5 44.4% 32 12.3% 7 39.4% 372 adults in hhold 46.4% 70 44.0% 22 47.5% 48 42.1% 16 61.0% 25 40.3% 29 57.9% 33 39.4% 373 adults in hhold 15.2% 23 14.0% 7 15.8% 16 23.7% 9 17.1% 7 9.7% 7 19.3% 11 12.8% 124 or more adults in hhold 9.3% 14 12.0% 6 7.9% 8 15.8% 6 9.8% 4 5.6% 4 10.5% 6 8.5% 8Base: 151 50 101 38 41 72 57 94 CHI No. of children 15 years and under: [MR] No children in hhold 74.2% 112 80.0% 40 71.3% 72 55.3% 21 51.2% 21 97.2% 70 70.2% 40 76.6% 721 child in hhold 14.6% 22 14.0% 7 14.9% 15 23.7% 9 29.3% 12 1.4% 1 17.5% 10 12.8% 122 children in hhold 9.3% 14 6.0% 3 10.9% 11 18.4% 7 14.6% 6 1.4% 1 10.5% 6 8.5% 83 children in hhold 1.3% 2 0.0% 0 2.0% 2 2.6% 1 2.4% 1 0.0% 0 1.8% 1 1.1% 14 or more children in hhold 0.7% 1 0.0% 0 1.0% 1 0.0% 0 2.4% 1 0.0% 0 0.0% 0 1.1% 1Base: 151 50 101 38 41 72 57 94 CARS Number of cars in household: [MR] No cars in hhold 37.1% 56 30.0% 15 40.6% 41 21.1% 8 29.3% 12 50.0% 36 8.8% 5 54.3% 511 car in hhold 31.1% 47 32.0% 16 30.7% 31 34.2% 13 34.1% 14 27.8% 20 33.3% 19 29.8% 282 cars in hhold 29.1% 44 34.0% 17 26.7% 27 44.7% 17 31.7% 13 19.4% 14 50.9% 29 16.0% 153 cars in hhold 1.3% 2 2.0% 1 1.0% 1 0.0% 0 4.9% 2 0.0% 0 3.5% 2 0.0% 04 or more cars in hhold 1.3% 2 2.0% 1 1.0% 1 0.0% 0 0.0% 0 2.8% 2 3.5% 2 0.0% 0Base: 151 50 101 38 41 72 57 94 DAY Day of Interview: Thursday 33.1% 50 34.0% 17 32.7% 33 31.6% 12 36.6% 15 31.9% 23 28.1% 16 36.2% 34Friday 33.1% 50 30.0% 15 34.7% 35 28.9% 11 24.4% 10 40.3% 29 33.3% 19 33.0% 31Saturday 33.8% 51 36.0% 18 32.7% 33 39.5% 15 39.0% 16 27.8% 20 38.6% 22 30.9% 29Base: 151 50 101 38 41 72 57 94 LOC Location: Stairs, Elevated walkway 36.4% 55 36.0% 18 36.6% 37 36.8% 14 31.7% 13 38.9% 28 42.1% 24 33.0% 31Charles Square 35.8% 54 44.0% 22 31.7% 32 42.1% 16 41.5% 17 29.2% 21 36.8% 21 35.1% 33Near the church 27.8% 42 20.0% 10 31.7% 32 21.1% 8 26.8% 11 31.9% 23 21.1% 12 31.9% 30Base: 151 50 101 38 41 72 57 94
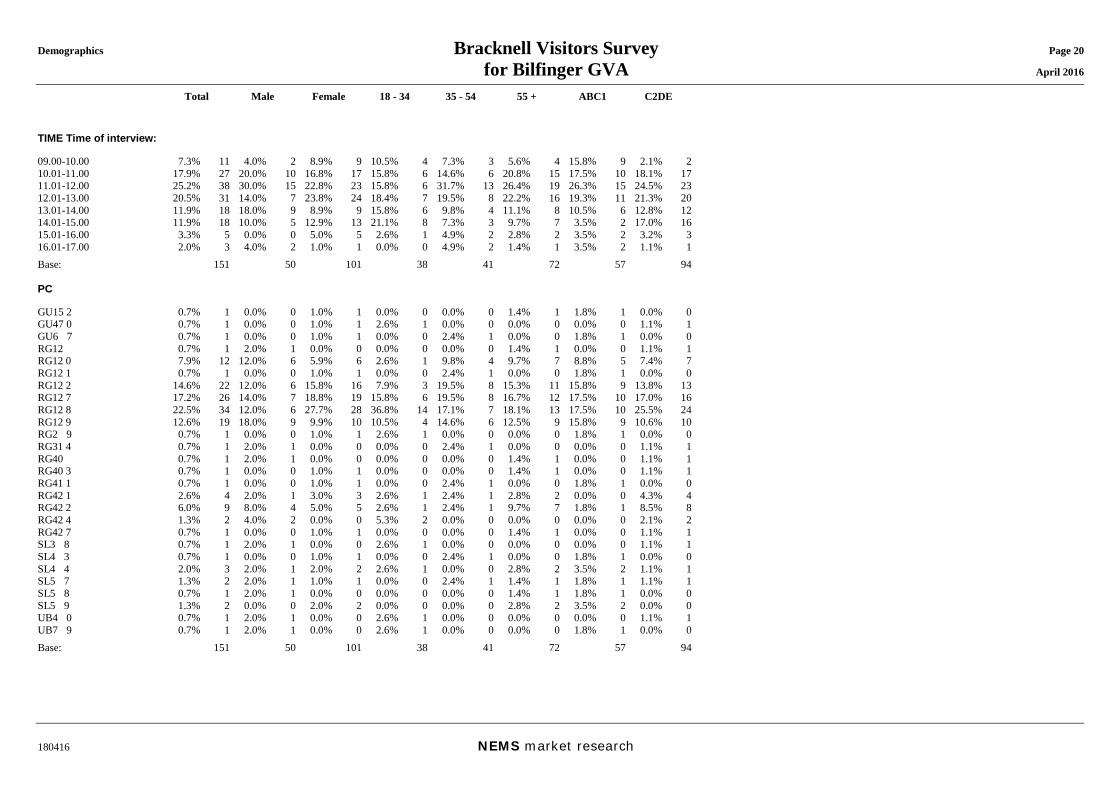
Demographics Bracknell Visitors Survey Page 20 for Bilfinger GVA April 2016
Total Male Female 18 - 34 35 - 54 55 + ABC1 C2DE
180416 NEMS market research
TIME Time of interview: 09.00-10.00 7.3% 11 4.0% 2 8.9% 9 10.5% 4 7.3% 3 5.6% 4 15.8% 9 2.1% 210.01-11.00 17.9% 27 20.0% 10 16.8% 17 15.8% 6 14.6% 6 20.8% 15 17.5% 10 18.1% 1711.01-12.00 25.2% 38 30.0% 15 22.8% 23 15.8% 6 31.7% 13 26.4% 19 26.3% 15 24.5% 2312.01-13.00 20.5% 31 14.0% 7 23.8% 24 18.4% 7 19.5% 8 22.2% 16 19.3% 11 21.3% 2013.01-14.00 11.9% 18 18.0% 9 8.9% 9 15.8% 6 9.8% 4 11.1% 8 10.5% 6 12.8% 1214.01-15.00 11.9% 18 10.0% 5 12.9% 13 21.1% 8 7.3% 3 9.7% 7 3.5% 2 17.0% 1615.01-16.00 3.3% 5 0.0% 0 5.0% 5 2.6% 1 4.9% 2 2.8% 2 3.5% 2 3.2% 316.01-17.00 2.0% 3 4.0% 2 1.0% 1 0.0% 0 4.9% 2 1.4% 1 3.5% 2 1.1% 1Base: 151 50 101 38 41 72 57 94 PC GU15 2 0.7% 1 0.0% 0 1.0% 1 0.0% 0 0.0% 0 1.4% 1 1.8% 1 0.0% 0GU47 0 0.7% 1 0.0% 0 1.0% 1 2.6% 1 0.0% 0 0.0% 0 0.0% 0 1.1% 1GU6 7 0.7% 1 0.0% 0 1.0% 1 0.0% 0 2.4% 1 0.0% 0 1.8% 1 0.0% 0RG12 0.7% 1 2.0% 1 0.0% 0 0.0% 0 0.0% 0 1.4% 1 0.0% 0 1.1% 1RG12 0 7.9% 12 12.0% 6 5.9% 6 2.6% 1 9.8% 4 9.7% 7 8.8% 5 7.4% 7RG12 1 0.7% 1 0.0% 0 1.0% 1 0.0% 0 2.4% 1 0.0% 0 1.8% 1 0.0% 0RG12 2 14.6% 22 12.0% 6 15.8% 16 7.9% 3 19.5% 8 15.3% 11 15.8% 9 13.8% 13RG12 7 17.2% 26 14.0% 7 18.8% 19 15.8% 6 19.5% 8 16.7% 12 17.5% 10 17.0% 16RG12 8 22.5% 34 12.0% 6 27.7% 28 36.8% 14 17.1% 7 18.1% 13 17.5% 10 25.5% 24RG12 9 12.6% 19 18.0% 9 9.9% 10 10.5% 4 14.6% 6 12.5% 9 15.8% 9 10.6% 10RG2 9 0.7% 1 0.0% 0 1.0% 1 2.6% 1 0.0% 0 0.0% 0 1.8% 1 0.0% 0RG31 4 0.7% 1 2.0% 1 0.0% 0 0.0% 0 2.4% 1 0.0% 0 0.0% 0 1.1% 1RG40 0.7% 1 2.0% 1 0.0% 0 0.0% 0 0.0% 0 1.4% 1 0.0% 0 1.1% 1RG40 3 0.7% 1 0.0% 0 1.0% 1 0.0% 0 0.0% 0 1.4% 1 0.0% 0 1.1% 1RG41 1 0.7% 1 0.0% 0 1.0% 1 0.0% 0 2.4% 1 0.0% 0 1.8% 1 0.0% 0RG42 1 2.6% 4 2.0% 1 3.0% 3 2.6% 1 2.4% 1 2.8% 2 0.0% 0 4.3% 4RG42 2 6.0% 9 8.0% 4 5.0% 5 2.6% 1 2.4% 1 9.7% 7 1.8% 1 8.5% 8RG42 4 1.3% 2 4.0% 2 0.0% 0 5.3% 2 0.0% 0 0.0% 0 0.0% 0 2.1% 2RG42 7 0.7% 1 0.0% 0 1.0% 1 0.0% 0 0.0% 0 1.4% 1 0.0% 0 1.1% 1SL3 8 0.7% 1 2.0% 1 0.0% 0 2.6% 1 0.0% 0 0.0% 0 0.0% 0 1.1% 1SL4 3 0.7% 1 0.0% 0 1.0% 1 0.0% 0 2.4% 1 0.0% 0 1.8% 1 0.0% 0SL4 4 2.0% 3 2.0% 1 2.0% 2 2.6% 1 0.0% 0 2.8% 2 3.5% 2 1.1% 1SL5 7 1.3% 2 2.0% 1 1.0% 1 0.0% 0 2.4% 1 1.4% 1 1.8% 1 1.1% 1SL5 8 0.7% 1 2.0% 1 0.0% 0 0.0% 0 0.0% 0 1.4% 1 1.8% 1 0.0% 0SL5 9 1.3% 2 0.0% 0 2.0% 2 0.0% 0 0.0% 0 2.8% 2 3.5% 2 0.0% 0UB4 0 0.7% 1 2.0% 1 0.0% 0 2.6% 1 0.0% 0 0.0% 0 0.0% 0 1.1% 1UB7 9 0.7% 1 2.0% 1 0.0% 0 2.6% 1 0.0% 0 0.0% 0 1.8% 1 0.0% 0Base: 151 50 101 38 41 72 57 94
Related Documents