Welcome message from author
This document is posted to help you gain knowledge. Please leave a comment to let me know what you think about it! Share it to your friends and learn new things together.
Transcript

WELCOME TO THE SHOW
ANNUAL REPORT 2016

In 2016, MGM Resorts reported consolidated Net Revenue of $9.5
billion, Net Income attributable to MGM Resorts of $1.1 billion,
and Adjusted Property EBITDA of $3.1 billion. Our domestic
resorts achieved Net Revenue of $7.1 billion and Adjusted Property
EBITDA of $2.1 billion, an increase year-over-year of 9% and 22%,
respectively. CityCenter resort operations experienced a record year
with strong financial performance campus-wide and completed
the sale of The Shops at Crystals for $1.1 billion, resulting in a
$540 million dividend to MGM Resorts. In August, we acquired
the remaining 50% interest in Borgata, and in December opened
MGM National Harbor, expanding our presence on the East Coast.
In Macau, MGM China continues to shine earning Net Revenue
and Adjusted EBITDA of $1.9 billion and $521 million, respectively.
In September, MGM purchased an additional 5% stake in
MGM China—increasing its ownership to 56% and is a direct
reflection of our continued confidence in the future of the Macau
marketplace and the ongoing success of MGM China as we expand
into Cotai in 2017.
MGM Resorts International has evolved into one of the world’s
leading entertainment companies, widely regarded for creating
unforgettable experiences through our iconic suite of resort brands.
This success is rooted in a deeply held belief that the desire for fun
and enjoyment is more than a pastime, it’s a fundamental human
need. It’s born of our refusal to accept the status quo and our passion
for delivering with excellence. It also stems from our commitment to
corporate responsibility that ensures the greatest possible return to
you, our shareholders. So with each new endeavor, we ask ourselves:
Will it endure? Is it transformational to the destination? Does it meet
the standard of discipline required to deliver greater value?
This past year, we celebrated several new and exciting additions that
met both our high creative standards and our commitment to fiscal
responsibility. We also accomplished many strategic objectives that
strengthened our balance sheet, assured our leading position in
new markets and further cemented our reputation among the most
recognizable hospitality brands in the U.S. and around the world.
DEAR SHAREHOLDERS,
MGM National Harbor, Maryland
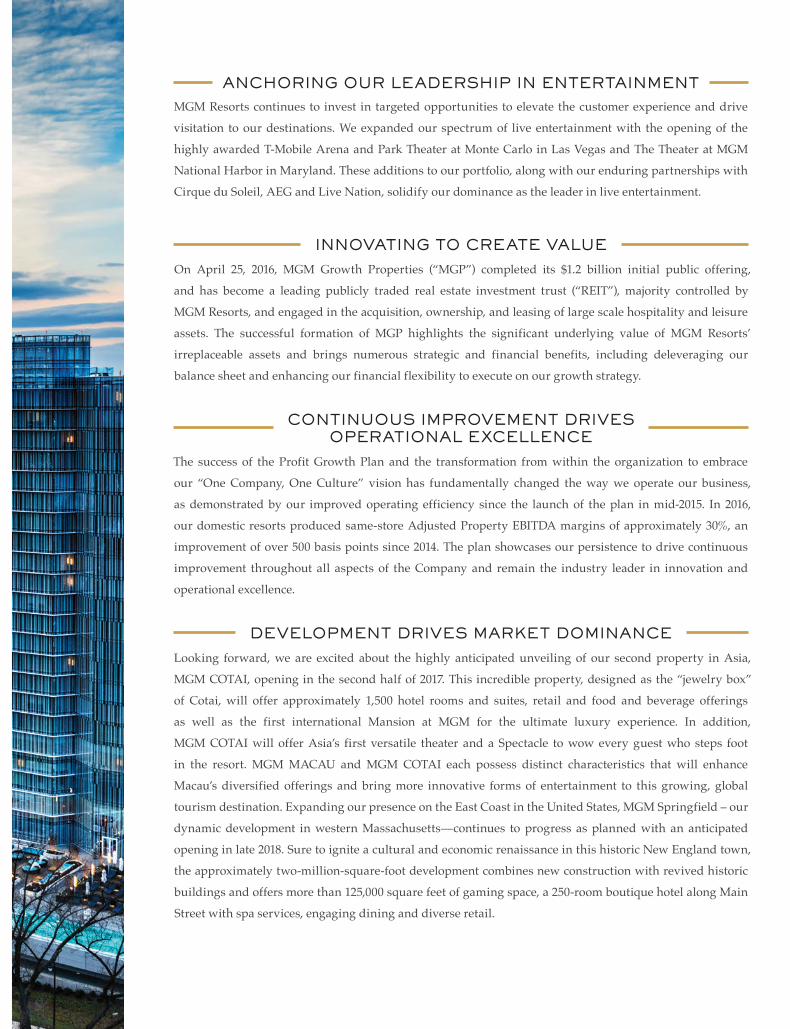
MGM Resorts continues to invest in targeted opportunities to elevate the customer experience and drive
visitation to our destinations. We expanded our spectrum of live entertainment with the opening of the
highly awarded T-Mobile Arena and Park Theater at Monte Carlo in Las Vegas and The Theater at MGM
National Harbor in Maryland. These additions to our portfolio, along with our enduring partnerships with
Cirque du Soleil, AEG and Live Nation, solidify our dominance as the leader in live entertainment.
ANCHORING OUR LEADERSHIP IN ENTERTAINMENT
On April 25, 2016, MGM Growth Properties (“MGP”) completed its $1.2 billion initial public offering,
and has become a leading publicly traded real estate investment trust (“REIT”), majority controlled by
MGM Resorts, and engaged in the acquisition, ownership, and leasing of large scale hospitality and leisure
assets. The successful formation of MGP highlights the significant underlying value of MGM Resorts’
irreplaceable assets and brings numerous strategic and financial benefits, including deleveraging our
balance sheet and enhancing our financial flexibility to execute on our growth strategy.
The success of the Profit Growth Plan and the transformation from within the organization to embrace
our “One Company, One Culture” vision has fundamentally changed the way we operate our business,
as demonstrated by our improved operating efficiency since the launch of the plan in mid-2015. In 2016,
our domestic resorts produced same-store Adjusted Property EBITDA margins of approximately 30%, an
improvement of over 500 basis points since 2014. The plan showcases our persistence to drive continuous
improvement throughout all aspects of the Company and remain the industry leader in innovation and
operational excellence.
Looking forward, we are excited about the highly anticipated unveiling of our second property in Asia,
MGM COTAI, opening in the second half of 2017. This incredible property, designed as the “jewelry box”
of Cotai, will offer approximately 1,500 hotel rooms and suites, retail and food and beverage offerings
as well as the first international Mansion at MGM for the ultimate luxury experience. In addition,
MGM COTAI will offer Asia’s first versatile theater and a Spectacle to wow every guest who steps foot
in the resort. MGM MACAU and MGM COTAI each possess distinct characteristics that will enhance
Macau’s diversified offerings and bring more innovative forms of entertainment to this growing, global
tourism destination. Expanding our presence on the East Coast in the United States, MGM Springfield – our
dynamic development in western Massachusetts—continues to progress as planned with an anticipated
opening in late 2018. Sure to ignite a cultural and economic renaissance in this historic New England town,
the approximately two-million-square-foot development combines new construction with revived historic
buildings and offers more than 125,000 square feet of gaming space, a 250-room boutique hotel along Main
Street with spa services, engaging dining and diverse retail.
INNOVATING TO CREATE VALUE
CONTINUOUS IMPROVEMENT DRIVES OPERATIONAL EXCELLENCE
DEVELOPMENT DRIVES MARKET DOMINANCE

TODAY: A STRONGER COMPANY
A strong operational foundation built through our Profit Growth Plan, the successful initial public offering of MGM Growth
Properties, our disciplined approach to value-generating opportunities and our focus on reducing leverage have significantly
improved the Company’s financial position and resulted in a more sustainable, enduring organization. This has resulted in
upgrades to our corporate credit rating by the Big Three rating agencies—Moody’s, Standard & Poor’s and Fitch Ratings. Your
Company’s keen focus in executing on these strategic milestones has created a path to free cash flow and returning value to you,
our shareholders, and is exemplified by the Company’s adoption of a quarterly dividend policy with the first dividend of $0.11 per
share paid on March 15, 2017.
As we expand our presence across the U.S. and around the world, our reputation as a leading corporate citizen continues to grow.
We are once again named among FORTUNE® Magazine’s Most Admired Companies® and we remain committed to the
fundamental imperative of helping build and strengthen the communities in which we operate through our commitments to
corporate social responsibility, diversity and inclusion. I’d like to thank our shareholders for their continued support and
acknowledge the dedication it takes from each of our 77,000 employees to make MGM Resorts a leader in global hospitality. The
future has never been more exciting.
Jim MurrenChairman and Chief Executive Officer

2016 Annual Report — Financial Section
CONTENTS
Selected Financial Data . . . . . . . . . . . . . . . . . . . . . . . . . . . . . . . . . . . . . . . . . . . . . . . . . . . . . . . . . . . . . . . . . . . . . . . . . . . . . . . . . . . . . . . . . . . . . . . . 2
Management’s Discussion and Analysis of Financial Condition and Results of Operations . . . . . . . . . . . . . . . . . . . . . 4
Management’s Annual Report on Internal Control Over Financial Reporting . . . . . . . . . . . . . . . . . . . . . . . . . . . . . . . . . . . . 34
Reports of Independent Registered Public Accounting Firm . . . . . . . . . . . . . . . . . . . . . . . . . . . . . . . . . . . . . . . . . . . . . . . . . . . . . . . 35
Consolidated Balance Sheets . . . . . . . . . . . . . . . . . . . . . . . . . . . . . . . . . . . . . . . . . . . . . . . . . . . . . . . . . . . . . . . . . . . . . . . . . . . . . . . . . . . . . . . . . . 37
Consolidated Statements of Operations . . . . . . . . . . . . . . . . . . . . . . . . . . . . . . . . . . . . . . . . . . . . . . . . . . . . . . . . . . . . . . . . . . . . . . . . . . . . . . . 38
Consolidated Statements of Comprehensive Income (Loss) . . . . . . . . . . . . . . . . . . . . . . . . . . . . . . . . . . . . . . . . . . . . . . . . . . . . . . . . 39
Consolidated Statements of Cash Flows . . . . . . . . . . . . . . . . . . . . . . . . . . . . . . . . . . . . . . . . . . . . . . . . . . . . . . . . . . . . . . . . . . . . . . . . . . . . . . 40
Consolidated Statements of Stockholders’ Equity . . . . . . . . . . . . . . . . . . . . . . . . . . . . . . . . . . . . . . . . . . . . . . . . . . . . . . . . . . . . . . . . . . . 41
Notes to Consolidated Financial Statements . . . . . . . . . . . . . . . . . . . . . . . . . . . . . . . . . . . . . . . . . . . . . . . . . . . . . . . . . . . . . . . . . . . . . . . . . 42
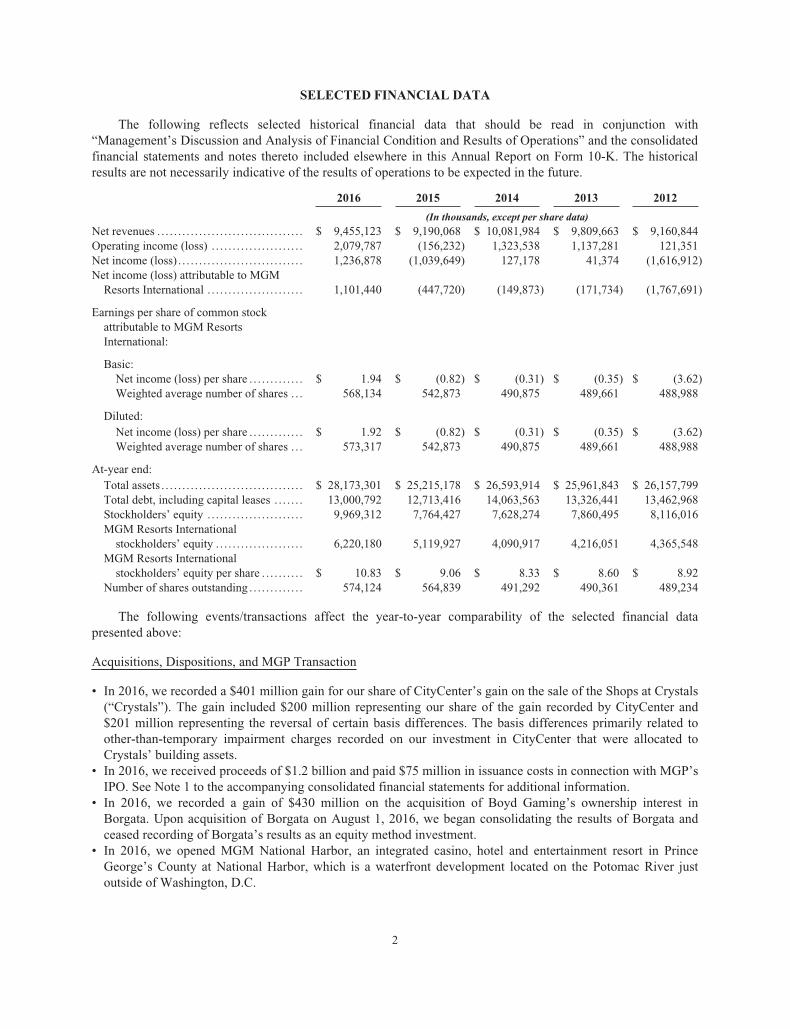
SELECTED FINANCIAL DATA
The following reflects selected historical financial data that should be read in conjunction with“Management’s Discussion and Analysis of Financial Condition and Results of Operations” and the consolidatedfinancial statements and notes thereto included elsewhere in this Annual Report on Form 10-K. The historicalresults are not necessarily indicative of the results of operations to be expected in the future.
2016 2015 2014 2013 2012
(In thousands, except per share data)
Net revenues . . . . . . . . . . . . . . . . . . . . . . . . . . . . . . . . . . . $ 9,455,123 $ 9,190,068 $ 10,081,984 $ 9,809,663 $ 9,160,844Operating income (loss) . . . . . . . . . . . . . . . . . . . . . . 2,079,787 (156,232) 1,323,538 1,137,281 121,351Net income (loss) . . . . . . . . . . . . . . . . . . . . . . . . . . . . . . 1,236,878 (1,039,649) 127,178 41,374 (1,616,912)Net income (loss) attributable to MGMResorts International . . . . . . . . . . . . . . . . . . . . . . . 1,101,440 (447,720) (149,873) (171,734) (1,767,691)
Earnings per share of common stockattributable to MGM ResortsInternational:
Basic:Net income (loss) per share . . . . . . . . . . . . . $ 1.94 $ (0.82) $ (0.31) $ (0.35) $ (3.62)Weighted average number of shares . . . 568,134 542,873 490,875 489,661 488,988
Diluted:Net income (loss) per share . . . . . . . . . . . . . $ 1.92 $ (0.82) $ (0.31) $ (0.35) $ (3.62)Weighted average number of shares . . . 573,317 542,873 490,875 489,661 488,988
At-year end:Total assets . . . . . . . . . . . . . . . . . . . . . . . . . . . . . . . . . . $ 28,173,301 $ 25,215,178 $ 26,593,914 $ 25,961,843 $ 26,157,799Total debt, including capital leases . . . . . . . 13,000,792 12,713,416 14,063,563 13,326,441 13,462,968Stockholders’ equity . . . . . . . . . . . . . . . . . . . . . . . 9,969,312 7,764,427 7,628,274 7,860,495 8,116,016MGM Resorts Internationalstockholders’ equity . . . . . . . . . . . . . . . . . . . . . 6,220,180 5,119,927 4,090,917 4,216,051 4,365,548
MGM Resorts Internationalstockholders’ equity per share . . . . . . . . . . $ 10.83 $ 9.06 $ 8.33 $ 8.60 $ 8.92
Number of shares outstanding . . . . . . . . . . . . . 574,124 564,839 491,292 490,361 489,234
The following events/transactions affect the year-to-year comparability of the selected financial datapresented above:
Acquisitions, Dispositions, and MGP Transaction
• In 2016, we recorded a $401 million gain for our share of CityCenter’s gain on the sale of the Shops at Crystals(“Crystals”). The gain included $200 million representing our share of the gain recorded by CityCenter and$201 million representing the reversal of certain basis differences. The basis differences primarily related toother-than-temporary impairment charges recorded on our investment in CityCenter that were allocated toCrystals’ building assets.
• In 2016, we received proceeds of $1.2 billion and paid $75 million in issuance costs in connection with MGP’sIPO. See Note 1 to the accompanying consolidated financial statements for additional information.
• In 2016, we recorded a gain of $430 million on the acquisition of Boyd Gaming’s ownership interest inBorgata. Upon acquisition of Borgata on August 1, 2016, we began consolidating the results of Borgata andceased recording of Borgata’s results as an equity method investment.
• In 2016, we opened MGM National Harbor, an integrated casino, hotel and entertainment resort in PrinceGeorge’s County at National Harbor, which is a waterfront development located on the Potomac River justoutside of Washington, D.C.
2

Other
• In 2012, we recorded non-cash impairment charges of $85 million related to our investment in Grand Victoria,$65 million related to our investment in Borgata, $366 million related to our land on the north end of the LasVegas Strip, $167 million related to our Atlantic City land and $47 million for the South Jersey TransportationAuthority special revenue bonds we hold.
• In 2012, we recorded a charge of $18 million related to our share of the CityCenter residential real estateimpairment charge and a charge of $16 million related to our share of CityCenter’s Harmon demolition costs.
• In 2012, we recorded a $563 million loss on debt retirement in connection with the February 2012 amendmentand restatement of our senior credit facility and in connection with our December 2012 refinancingtransactions.
• In 2013, we recorded non-cash impairment charges of $37 million related to our investment in Grand Victoria,$20 million related to our land in Jean and Sloan, Nevada, and $45 million related to corporate buildingsexpected to be removed from service.
• In 2013, we recorded a $70 million loss for our share of CityCenter’s non-operating loss on retirement of long-term debt, primarily consisting of premiums associated with the redemption of the existing first and secondlien notes as well as the write-off of previously unamortized debt issuance costs and a gain of $12 millionrelated to our share of Silver Legacy’s non-operating gain on retirement of long-term debt.
• In 2014, we recorded a non-cash impairment charge of $29 million related to our investment in Grand Victoria.• In 2015, we recorded non-cash impairment charges of $1.5 billion to reduce the historical carrying value of
goodwill related to the MGM China reporting unit and $17 million related to our investment in Grand Victoria.• In 2015, we recorded an $80 million gain for our share of CityCenter’s gain resulting from the final resolutionof its construction litigation and related settlements.
• In 2015, we recorded a gain of $23 million related to the sale of Circus Circus Reno and our 50% interest inSilver Legacy and associated real property.
• In 2016, we recorded a $22 million loss related to our redemption of outstanding 7.50% senior notes due 2016and 10% senior notes due 2016, and a $16 million loss on the early retirement of debt related to outstanding7.625% senior notes due 2017.
• In 2016, we recorded a $28 million loss on debt retirement in connection with the amendment and restatementof our senior credit facility.
• In 2016, we recorded a $152 million expense related to our strategic decision to exit the fully bundled salessystem of NV Energy, which included $13 million related to our share of CityCenter’s portion of the payment.
3
MANAGEMENT’S DISCUSSION AND ANALYSIS OF FINANCIAL CONDITION ANDRESULTS OF OPERATIONS
Executive Overview
Our primary business is the ownership and operation of casino resorts, which offer gaming, hotel,convention, dining, entertainment, retail and other resort amenities. We own or invest in several of the finestcasino resorts in the world and we continually reinvest in our resorts to maintain our competitive advantage.Most of our revenue is cash-based, through customers wagering with cash or paying for non-gaming serviceswith cash or credit cards. We rely heavily on the ability of our resorts to generate operating cash flow to fundcapital expenditures, provide excess cash flow for future development and repay debt financings. We makesignificant investments in our resorts through newly remodeled hotel rooms, restaurants, entertainment andnightlife offerings, as well as other new features and amenities.
During the year ended December 31, 2016, Las Vegas visitor volume increased 1%, Las Vegas StripREVPAR increased 6% and Las Vegas Strip gaming revenue increased by less than 1% compared to the prioryear period according to information published by the Las Vegas Convention and Visitors Authority. Results ofoperations for our domestic resorts during 2016 benefited from an increase in operating margins resulting fromincreases in gaming revenue and REVPAR, and the results of our Profit Growth Plan, discussed below. Ourrooms revenue benefited from increased visitation to the Las Vegas market and robust convention business at ourLas Vegas Strip resorts, which allowed us to yield higher room rates across our portfolio of resorts.
Gross gaming revenues in the Macau market decreased 3% in 2016 compared to 2015, and gross gamingrevenues decreased 34% in 2015 compared to 2014. As a significant number of MGM Macau’s customers arefrom mainland China, we believe operating results were negatively affected by economic conditions in mainlandChina as well as certain policy initiatives in mainland China and Macau. Specifically, a continuing slowdown inChina’s economic growth rate, the Chinese government’s restrictions on travel and cross-border currencytransactions, new compliance regulations for gaming promoters and gaming operators enacted by the Macaugovernment and implemented in late 2015 and in 2016 and a ban on mobile phone usage at gaming tables in anattempt to eliminate “proxy” bets have all negatively affected MGM Macau’s high-end customers and thegaming promoters with which we conduct our VIP casino gaming operations. In addition, the Chinesegovernment’s anti-corruption campaign has changed consumption patterns and affected the propensity of ourclients to spend on certain areas like gaming or luxury items. The Macau government also implemented a fullmain floor casino smoking ban in October 2014. These factors led to a continued decrease in gross gamingrevenues for the Macau market beginning in the second half of 2014 and lasted into 2016 primarily impactingVIP casino gaming operations and, to a lesser extent, main floor operations throughout the Macau market.Despite concerns over the recent events and the sustainability of economic growth in China, we expect theMacau market to grow on a long-term basis due to further development, penetration of the mainland Chinamarket and infrastructure improvements expected to facilitate more convenient travel to and within Macau, andwe believe recent trends reflect stabilization within the Macau market. According to statistics published by theStatistics and Census Service of the Macau Government, after several quarters of declines in visitationthroughout 2015, visitor arrivals increased slightly by 1% and overnight visitors increased 10% in 2016compared to 2015. Additionally, gross gaming revenue increased year over year in each of the months fromAugust 2016 through December 2016.
Our results of operations are affected by decisions we make related to our capital allocation, our access tocapital and our cost of capital. While we continue to be focused on improving our financial position, we are alsodedicated to capitalizing on development opportunities. In Macau, we estimate costs to develop MGM Cotai willbe approximately $3.3 billion, excluding development fees eliminated in consolidation, capitalized interest andland related costs. MGM Cotai is a casino resort with capacity for up to 500 gaming tables and up to 1,500 slots,and featuring approximately 1,500 hotel rooms, built on an approximately 18 acre site on the Cotai Strip inMacau. The actual number of gaming tables allocated to MGM Cotai will be determined by the Macaugovernment prior to opening, and such allocation is expected to be less than our 500 gaming table capacity.MGM Cotai is expected to open in the second half of 2017.
4
We were awarded a casino license to build and operate MGM Springfield in Springfield, Massachusetts.MGM Springfield will be developed on approximately 14 acres of land in downtown Springfield. MGM’s plansfor the resort currently include a casino with approximately 3,000 slots and 100 table games including poker; a250-room hotel; 100,000 square feet of retail and restaurant space; 44,000 square feet of meeting and eventspace; and a 3,375-space parking garage; with an expected development and construction cost of approximately$865 million, excluding capitalized interest and land-related costs. Construction of MGM Springfield is expectedto be completed in late 2018.
In August 2015, we announced the implementation of a Profit Growth Plan for sustained growth and marginenhancement. The Profit Growth Plan’s initiatives focused on improving business processes to leverage our scalefor greater efficiency and lower costs, and to identify areas of opportunity to organically drive incrementalrevenue growth. The Profit Growth Plan included a large number of initiatives to optimize operations and wecontinue to explore additional opportunities to drive further improvement. In June 2016, we announced that weexpect to achieve approximately $400 million of annualized Adjusted EBITDA benefit compared to our baseline,which we expect to be fully realized by the end of 2017.
Formation and Initial Public Offering of MGP
On April 25, 2016, MGM Growth Properties LLC (“MGP”) completed its IPO of 57,500,000 of its Class Ashares representing limited liability company interests (inclusive of the full exercise by the underwriters of theiroption to purchase 7,500,000 Class A shares) at an initial offering price of $21 per share. MGP used the proceedsfrom the IPO to purchase Operating Partnership units in MGM Growth Properties Operating Partnership LP (the“Operating Partnership”), to which we contributed the real estate assets associated with The Mirage, MandalayBay, Luxor, New York-New York, Monte Carlo, Excalibur, The Park, Gold Strike Tunica, MGM Grand Detroitand Beau Rivage in exchange for Operating Partnership units in the Operating Partnership in connection with theIPO.
MGP is organized as an umbrella partnership REIT (commonly referred to as an “UPREIT”) structure inwhich substantially all of its assets are owned by, and substantially all of its businesses are conducted through theOperating Partnership. MGP contributed the proceeds from the IPO to the Operating Partnership in exchange for26.7% of the units in the Operating Partnership. The general partner of the Operating Partnership is also awholly-owned subsidiary of MGP. As a result, MGP controls and consolidates the Operating Partnership. MGPhas two classes of authorized and outstanding voting common shares (collectively, the “shares”): Class A sharesand a single Class B share. We own MGP’s Class B share, which does not provide its holder any rights to profitsor losses or any rights to receive distributions from operations of MGP or upon liquidation or winding up ofMGP. MGP’s Class A shareholders are entitled to one vote per share, while we, as the owner of the Class Bshare, are entitled to an amount of votes representing a majority of the total voting power of MGP’s shares solong as our and our controlled affiliates’ (excluding MGP) aggregate beneficial ownership of the combinedeconomic interests in MGP and the Operating Partnership does not fall below 30%. As such, we control MGPthrough our majority voting rights and consolidate MGP in our financial results. Subsequent to our acquisition ofBorgata and subsequent contribution of Borgata’s real estate assets to MGP as discussed below, our ownership inthe Operating Partnership, increased from 73.3% to 76.3%. As a result of the Borgata transaction, MGP’sownership in the Operating Partnership was correspondingly reduced from 26.7% to 23.7%.
In connection with the formation of MGP, we borrowed $4.0 billion under certain bridge facilities, theproceeds of which were used to repay outstanding obligations under our prior senior credit facility and to redeemour 7.5% senior notes due 2016 and our 10% senior notes due 2016. The bridge facilities were subsequentlyassumed by the Operating Partnership pursuant to the master contribution agreement. The Operating Partnershiprepaid the bridge facilities with a combination of proceeds from certain financing transactions and the proceedsfrom the IPO.
5
Acquisition of Borgata Hotel Casino & Spa
On August 1, 2016, we completed the acquisition of Boyd Gaming Corporation’s (“Boyd Gaming”)ownership interest in Borgata, at which time Borgata became a consolidated subsidiary of ours. Accordingly, werecorded a gain of approximately $430 million as a result of the acquisition of Borgata and resultingconsolidation of Borgata, which we previously accounted for under the equity method. See Note 4 in theaccompanying consolidated financial statements for additional information. Following completion of theacquisition, MGP subsequently acquired Borgata’s real property from a subsidiary of ours in exchange forMGP’s assumption of $545 million of indebtedness from our subsidiary and the issuance of $27.4 millionOperating Partnership units to our subsidiary. In connection with the Borgata transaction, we borrowed $545million under certain bridge facilities, which were subsequently contributed to the Operating Partnership. TheOperating Partnership repaid the bridge facilities with a combination of cash on hand and a draw down on theirrevolving credit facility, which it subsequently refinanced with proceeds from its offering of its 4.5% senior notesdue 2026. Pursuant to an amendment to the master lease, MGP leased back the real property of Borgata to asubsidiary of ours and as a result, initial rent payments to MGP increased by $100 million, prorated for theremainder of the first lease year after the Borgata transaction. Consistent with the master lease terms, 90% of thisrent is fixed and will contractually grow at 2% per year until 2022.
Reportable Segments
We have two reportable segments: domestic resorts and MGM China. We currently own and operate 14resorts in the United States. MGM China’s operations consist of MGM Macau resort and the development ofMGM Cotai on the Cotai Strip in Macau. We have additional business activities including investments inunconsolidated affiliates, and certain other corporate and management operations. CityCenter is our mostsignificant unconsolidated affiliate, which we also manage for a fee. Our operations that are not segregated intoseparate reportable segments are reported as “corporate and other” operations in our reconciliations of segmentresults to consolidated results.
Domestic resorts. At December 31, 2016, our domestic resorts consisted of the following casino resorts:
Las Vegas, Nevada: Bellagio, MGM Grand Las Vegas (including The Signature), Mandalay Bay(including Delano and Four Seasons), The Mirage, Luxor, New York-New York,Excalibur, Monte Carlo and Circus Circus Las Vegas.
Other: MGM Grand Detroit in Detroit, Michigan; Beau Rivage in Biloxi, Mississippi;Gold Strike Tunica in Tunica, Mississippi; Borgata in Atlantic City, New Jersey;and MGM National Harbor in Prince George’s County, Maryland.
Over half of the net revenue from our domestic resorts is derived from non-gaming operations includinghotel, food and beverage, entertainment and other non-gaming amenities. We market to different customergroups and utilize our significant convention and meeting facilities to maximize hotel occupancy and customervolumes which also leads to better labor utilization. Our operating results are highly dependent on demand forour services, and the volume of customers at our resorts, which in turn affects the price we can charge for ourhotel rooms and other amenities. Also, we generate a significant portion of our revenue from our domestic resortsin Las Vegas, Nevada, which exposes us to certain risks, such as increased competition from new or expandedLas Vegas resorts, and from the expansion of gaming in the United States generally.
Key performance indicators related to gaming and hotel revenue at our domestic resorts are:
• Gaming revenue indicators: table games drop and slots handle (volume indicators); “win” or “hold”percentage, which is not fully controllable by us. Our normal table games hold percentage is in the rangeof 19% to 23% of table games drop and our normal slots hold percentage is in the range of 8.5% to 9% ofslots handle; and
6

• Hotel revenue indicators: hotel occupancy (a volume indicator); average daily rate (“ADR,” a priceindicator); and revenue per available room (“REVPAR,” a summary measure of hotel results, combiningADR and occupancy rate). Our calculation of ADR, which is the average price of occupied rooms perday, includes the impact of complimentary rooms. Complimentary room rates are determined based on ananalysis of retail or “cash” rates for each customer segment and each type of room product to estimatecomplimentary rates which are consistent with retail rates. Complimentary rates are reviewed at leastannually and on an interim basis if there are significant changes in market conditions. Because the mix ofrooms provided on a complimentary basis, particularly to casino customers, includes a disproportionatesuite component, the composite ADR including complimentary rooms is slightly higher than the ADR forcash rooms, reflecting the higher retail value of suites.
MGM China. Subsequent to the acquisition of an additional 4.95% of the outstanding common shares ofour MGM China subsidiary in September 2016, we own an approximate 56% controlling interest in MGMChina, which owns MGM Grand Paradise, the Macau company that owns and operates MGM Macau and therelated gaming subconcession and land concessions, and is in the process of developing MGM Cotai. We believeour investment in MGM China plays an important role in extending our reach internationally and will fosterfuture growth and profitability.
Revenues at MGM Macau are generated from three primary customer segments in the Macau gaming market:VIP casino gaming operations, main floor gaming operations, and slot machine operations. VIP players play mostlyin dedicated VIP rooms or designated gaming areas. VIP customers can be further divided into customers sourcedby in-house VIP programs and those sourced through gaming promoters. A significant portion of our VIP volume isgenerated through the use of gaming promoters. Gaming promoters introduce VIP gaming players to MGM Macau,assist these customers with travel arrangements, and extend gaming credit to these players. In exchange for theirservices, gaming promoters are compensated through payment of revenue-sharing arrangements or rolling chipturnover based commissions. In-house VIP players also typically receive a commission based on the program inwhich they participate. MGMMacau main floor operations primarily consist of walk-in and day trip visitors. Unlikegaming promoters and in-house VIP players, main floor players do not receive commissions. The profit contributionfrom the main floor segment exceeds the VIP segment due to commission costs paid to gaming promoters. Gamingrevenues from the main floor segment have become an increasingly significant portion of total gaming revenues inrecent years and we believe this segment represents the most potential for sustainable growth in the future.
VIP gaming at MGM Macau is conducted by the use of special purpose nonnegotiable gaming chips.Gaming promoters purchase these nonnegotiable chips from MGM Macau and in turn they sell these chips totheir players. The nonnegotiable chips allow MGM Macau to track the amount of wagering conducted by eachgaming promoters’ clients in order to determine VIP gaming play. Gaming promoter commissions are based on apercentage of the gross table games win or a percentage of the table games turnover they generate. They alsoreceive a complimentary allowance based on a percentage of the table games turnover they generate, which canbe applied to hotel rooms, food and beverage and other discretionary customers-related expenses. The estimatedportion of the gaming promoter payments that represent amounts passed through to VIP customers is recorded asa reduction of casino revenue, and the estimated portion retained by the gaming promoter for its compensation isrecorded as casino expense. In-house VIP commissions are based on a percentage of rolling chip turnover and arerecorded as a reduction of casino revenue.
In addition to the key performance indicators used by our domestic resorts, MGM Macau utilizes“turnover,” which is the sum of nonnegotiable chip wagers won by MGM Macau calculated as nonnegotiablechips purchased plus nonnegotiable chips exchanged less nonnegotiable chips returned. Turnover provides abasis for measuring VIP casino win percentage. Win for VIP gaming operations at MGM Macau is typically inthe range of 2.7% to 3.0% of turnover.
Corporate and other. Corporate and other includes our investments in unconsolidated affiliates and certainmanagement and other operations. See Note 1 and Note 7 to the accompanying consolidated financial statementsfor discussion of the Company’s unconsolidated affiliates.
7

Results of Operations
The following discussion is based on our consolidated financial statements for the years endedDecember 31, 2016, 2015 and 2014.
Summary Operating Results
The following table summarizes our operating results:
Year Ended December 31,
2016 2015 2014(In thousands)
Net revenues . . . . . . . . . . . . . . . . . . . . . . . . . . . . . . . . . . . . . . . . . . . . . . . . . . . . . $ 9,455,123 $ 9,190,068 $ 10,081,984Operating income (loss) . . . . . . . . . . . . . . . . . . . . . . . . . . . . . . . . . . . . . . . . 2,079,787 (156,232) 1,323,538
Consolidated net revenues for 2016 increased 3% compared to 2015 due primarily to the Borgata transactionon August 1, 2016, the opening of MGM National Harbor in December 2016 and an increase in casino revenue,rooms revenue, food and beverage revenue, and other revenue including parking fee revenue at our domesticresorts, partially offset by a decrease in casino revenue at MGM China. Consolidated net revenues for 2015decreased 9% compared to 2014 due primarily to a decrease in casino revenue at MGM China, offset byincreases in casino and non-casino revenue at our domestic resorts. See “Operating Results – Detailed SegmentInformation” below for additional information related to segment revenues.
Consolidated operating income of $2.1 billion in 2016 compared to an operating loss of $156 million in2015. Operating income in 2016 benefited from $39 million of operating income from Borgata subsequent to theacquisition, a $430 million gain recognized on the Borgata transaction, and an increase in income fromunconsolidated affiliates primarily due to a $401 million gain related to the sale of Crystals at CityCenter (see“Operating Results – Income (Loss) from Unconsolidated Affiliates” for further discussion). Operating income in2016 was also negatively affected by charges of $152 million of NV Energy exit expense associated with theCompany’s strategic decision to exit the fully bundled sales system of NV Energy, which includes expense at ourdomestic resorts as well as our 50% share of expense recognized at CityCenter, an increase in preopeningexpense, and an increase in corporate expense. See “Operating Results – Details of Certain Charges” below foradditional detail on our preopening expense. Corporate expense increased to $313 million in 2016, due primarilyto costs incurred to implement initiatives related to the Profit Growth Plan of $23 million, costs associated withthe initial public offering of MGP of $25 million, transaction costs incurred in connection with the Borgatatransaction, incremental performance-based compensation expense, and costs associated with a litigationsettlement.
Consolidated operating loss of $156 million in 2015 was negatively affected by an operating loss for MGMChina that included a $1.5 billion non-cash impairment charge to goodwill recognized in the acquisition of acontrolling interest in MGM China in 2011. In connection with that acquisition, we recorded a $3.5 billion non-cash gain. The 2015 impairment charge, which represents approximately 42% of the amount of the previouslyrecognized gain, resulted from our annual review of our goodwill carrying values and was incurred as a result ofreduced cash flow forecasts for MGM China’s resorts based on market conditions at that time and lowervaluation multiples for gaming assets in the Macau market. In addition, the operating loss was affected by adecrease in operating results at MGM Macau. The operating loss for MGM China was partially offset by anincrease in operating income at our domestic resorts and an increase in income from unconsolidated affiliates,primarily from CityCenter, which included $80 million related to our share of the gain recognized by CityCenteras a result of the final resolution of its construction litigation and related settlements. In addition, corporateexpense increased 15% to $275 million in 2015, due primarily to costs incurred to implement initiatives inrelation to the Profit Growth Plan of $24 million and $20 million in costs associated with the MGP transaction.Preopening expense, primarily related to our MGM Cotai, MGM Springfield and MGM National Harbordevelopment projects, increased to $71 million in 2015 compared to $39 million in 2014. Consolidated operating
8
loss in 2015 was also negatively affected by impairment charges and losses on disposal of certain assets recordedin “Property transactions, net.” See “Operating Results – Details of Certain Changes” below for additional detailrelated to property transactions.
Operating Results – Detailed Segment Information
The following table presents a detail by segment of consolidated net revenue and Adjusted EBITDA.Management uses Adjusted Property EBITDA as the primary profit measure for its reportable segments. See“Non-GAAP Measures” for additional information:
Year Ended December 31,
2016 2015 2014(In thousands)
Net RevenuesDomestic resorts . . . . . . . . . . . . . . . . . . . . . . . . . . . . . . . . . . . . . . . . . . . . . . . . $ 7,055,718 $ 6,497,361 $ 6,342,084MGM China . . . . . . . . . . . . . . . . . . . . . . . . . . . . . . . . . . . . . . . . . . . . . . . . . . . . 1,920,487 2,214,767 3,282,329
Reportable segment net revenues . . . . . . . . . . . . . . . . . . . . . . . . . . 8,976,205 8,712,128 9,624,413Corporate and other . . . . . . . . . . . . . . . . . . . . . . . . . . . . . . . . . . . . . . . . . . . . 478,918 477,940 457,571
$ 9,455,123 $ 9,190,068 $ 10,081,984
Adjusted EBITDADomestic resorts . . . . . . . . . . . . . . . . . . . . . . . . . . . . . . . . . . . . . . . . . . . . . . . . $ 2,063,016 $ 1,689,966 $ 1,518,307MGM China . . . . . . . . . . . . . . . . . . . . . . . . . . . . . . . . . . . . . . . . . . . . . . . . . . . . 520,736 539,881 850,471
Reportable segment Adjusted Property EBITDA .. . . . . . . 2,583,752 2,229,847 2,368,778Corporate and other . . . . . . . . . . . . . . . . . . . . . . . . . . . . . . . . . . . . . . . . . . . . 211,932 9,073 (149,216)
$ 2,795,684 $ 2,238,920 $ 2,219,562
Domestic resorts. The following table is a reconciliation of domestic resorts net revenues to domesticresorts same-store net revenues:
Year Ended December 31,
2016 2015 2014(In thousands)
Domestic resorts net revenues . . . . . . . . . . . . . . . . . . . . . . . . . . . . . . . . . . . . . . . . $ 7,055,718 $ 6,497,361 $ 6,342,084Net revenues related to Borgata . . . . . . . . . . . . . . . . . . . . . . . . . . . . . . . . . . . (348,462) - -Net revenues related to National Harbor . . . . . . . . . . . . . . . . . . . . . . . . . (53,005) - -Net revenues related to sold resort operations . . . . . . . . . . . . . . . . . . . - (78,792) (118,035)
Domestic resorts same-store net revenues . . . . . . . . . . . . . . . . . . . . . . . . . . . $ 6,654,251 $ 6,418,569 $ 6,224,049
9

The following table presents detailed net revenues at our domestic resorts:
Year Ended December 31,
2016 2015 2014(In thousands)
Casino revenue, netTable games . . . . . . . . . . . . . . . . . . . . . . . . . . . . . . . . . . . . . . . . . . . . . . . . . . . . . . . . . $ 1,051,147 $ 880,318 $ 892,842Slots . . . . . . . . . . . . . . . . . . . . . . . . . . . . . . . . . . . . . . . . . . . . . . . . . . . . . . . . . . . . . . . . . 1,920,284 1,720,028 1,679,981Other . . . . . . . . . . . . . . . . . . . . . . . . . . . . . . . . . . . . . . . . . . . . . . . . . . . . . . . . . . . . . . . . . 83,020 70,148 64,419
Casino revenue, net . . . . . . . . . . . . . . . . . . . . . . . . . . . . . . . . . . . . . . . . . . . . . . 3,054,451 2,670,494 2,637,242Non-casino revenueRooms . . . . . . . . . . . . . . . . . . . . . . . . . . . . . . . . . . . . . . . . . . . . . . . . . . . . . . . . . . . . . . . 1,965,378 1,813,838 1,705,395Food and beverage . . . . . . . . . . . . . . . . . . . . . . . . . . . . . . . . . . . . . . . . . . . . . . . . . 1,578,704 1,500,039 1,470,315Entertainment, retail and other . . . . . . . . . . . . . . . . . . . . . . . . . . . . . . . . . . . . 1,166,477 1,167,488 1,184,343
Non-casino revenue . . . . . . . . . . . . . . . . . . . . . . . . . . . . . . . . . . . . . . . . . . . . . 4,710,559 4,481,365 4,360,053
7,765,010 7,151,859 6,997,295Less: Promotional allowances . . . . . . . . . . . . . . . . . . . . . . . . . . . . . . . . . . . . . . . . (709,292) (654,498) (655,211)
$ 7,055,718 $ 6,497,361 $ 6,342,084
The following table presents detailed domestic resorts same-store net revenues:
Year Ended December 31,
2016 2015 2014(In thousands)
Casino revenue, netTable games . . . . . . . . . . . . . . . . . . . . . . . . . . . . . . . . . . . . . . . . . . . . . . . . . . . . . . . . . $ 951,836 $ 874,879 $ 886,449Slots . . . . . . . . . . . . . . . . . . . . . . . . . . . . . . . . . . . . . . . . . . . . . . . . . . . . . . . . . . . . . . . . . 1,723,576 1,693,717 1,641,268Other . . . . . . . . . . . . . . . . . . . . . . . . . . . . . . . . . . . . . . . . . . . . . . . . . . . . . . . . . . . . . . . . . 60,398 69,114 62,705
Casino revenue, net . . . . . . . . . . . . . . . . . . . . . . . . . . . . . . . . . . . . . . . . . . . . . . 2,735,810 2,637,710 2,590,422Non-casino revenueRooms . . . . . . . . . . . . . . . . . . . . . . . . . . . . . . . . . . . . . . . . . . . . . . . . . . . . . . . . . . . . . . . 1,910,765 1,794,289 1,682,677Food and beverage . . . . . . . . . . . . . . . . . . . . . . . . . . . . . . . . . . . . . . . . . . . . . . . . . 1,511,189 1,486,175 1,450,086Entertainment, retail and other . . . . . . . . . . . . . . . . . . . . . . . . . . . . . . . . . . . . 1,143,361 1,148,877 1,145,672
Non-casino revenue . . . . . . . . . . . . . . . . . . . . . . . . . . . . . . . . . . . . . . . . . . . . . 4,565,315 4,429,341 4,278,435
7,301,125 7,067,051 6,868,857Less: Promotional allowances . . . . . . . . . . . . . . . . . . . . . . . . . . . . . . . . . . . . . . . . (646,874) (648,482) (644,808)
$ 6,654,251 $ 6,418,569 $ 6,224,049
Casino revenue increased 14% in 2016 compared to 2015 due primarily to the Borgata transaction and anincrease in both table games revenue and slots revenue on a same-store basis. Same-store casino revenueincreased 4% compared to prior year due primarily to an increase in table games revenue. Same-store tablegames revenue increased 9% in 2016 compared to 2015 due to an increase in same-store table games holdpercentage to 23.2% from 20.5% in 2015. On a same-store basis, slots revenue increased 2% compared to theprior year.
Casino revenue increased 1% in 2015 compared to 2014 due to a 2% increase in slots revenue as a result ofa 3% increase in slots volume. Same-store casino revenue in 2015 increased 2% compared to 2014 due primarilyto a 3% increase in slots revenue as a result of a 4% increase in slots volume.
10
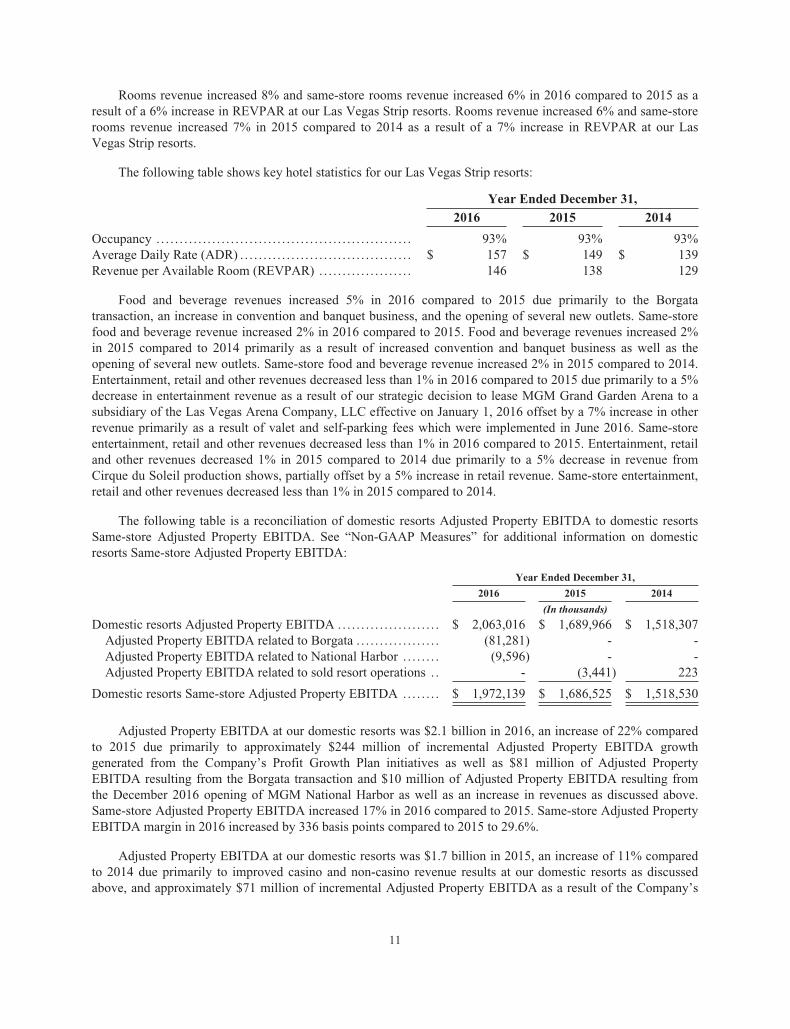
Rooms revenue increased 8% and same-store rooms revenue increased 6% in 2016 compared to 2015 as aresult of a 6% increase in REVPAR at our Las Vegas Strip resorts. Rooms revenue increased 6% and same-storerooms revenue increased 7% in 2015 compared to 2014 as a result of a 7% increase in REVPAR at our LasVegas Strip resorts.
The following table shows key hotel statistics for our Las Vegas Strip resorts:
Year Ended December 31,
2016 2015 2014
Occupancy . . . . . . . . . . . . . . . . . . . . . . . . . . . . . . . . . . . . . . . . . . . . . . . . . . . . . . . 93% 93% 93%Average Daily Rate (ADR) . . . . . . . . . . . . . . . . . . . . . . . . . . . . . . . . . . . . . $ 157 $ 149 $ 139Revenue per Available Room (REVPAR) . . . . . . . . . . . . . . . . . . . . 146 138 129
Food and beverage revenues increased 5% in 2016 compared to 2015 due primarily to the Borgatatransaction, an increase in convention and banquet business, and the opening of several new outlets. Same-storefood and beverage revenue increased 2% in 2016 compared to 2015. Food and beverage revenues increased 2%in 2015 compared to 2014 primarily as a result of increased convention and banquet business as well as theopening of several new outlets. Same-store food and beverage revenue increased 2% in 2015 compared to 2014.Entertainment, retail and other revenues decreased less than 1% in 2016 compared to 2015 due primarily to a 5%decrease in entertainment revenue as a result of our strategic decision to lease MGM Grand Garden Arena to asubsidiary of the Las Vegas Arena Company, LLC effective on January 1, 2016 offset by a 7% increase in otherrevenue primarily as a result of valet and self-parking fees which were implemented in June 2016. Same-storeentertainment, retail and other revenues decreased less than 1% in 2016 compared to 2015. Entertainment, retailand other revenues decreased 1% in 2015 compared to 2014 due primarily to a 5% decrease in revenue fromCirque du Soleil production shows, partially offset by a 5% increase in retail revenue. Same-store entertainment,retail and other revenues decreased less than 1% in 2015 compared to 2014.
The following table is a reconciliation of domestic resorts Adjusted Property EBITDA to domestic resortsSame-store Adjusted Property EBITDA. See “Non-GAAP Measures” for additional information on domesticresorts Same-store Adjusted Property EBITDA:
Year Ended December 31,
2016 2015 2014
(In thousands)
Domestic resorts Adjusted Property EBITDA .. . . . . . . . . . . . . . . . . . . . . $ 2,063,016 $ 1,689,966 $ 1,518,307Adjusted Property EBITDA related to Borgata . . . . . . . . . . . . . . . . . . (81,281) - -Adjusted Property EBITDA related to National Harbor . . . . . . . . (9,596) - -Adjusted Property EBITDA related to sold resort operations . . - (3,441) 223
Domestic resorts Same-store Adjusted Property EBITDA .. . . . . . . $ 1,972,139 $ 1,686,525 $ 1,518,530
Adjusted Property EBITDA at our domestic resorts was $2.1 billion in 2016, an increase of 22% comparedto 2015 due primarily to approximately $244 million of incremental Adjusted Property EBITDA growthgenerated from the Company’s Profit Growth Plan initiatives as well as $81 million of Adjusted PropertyEBITDA resulting from the Borgata transaction and $10 million of Adjusted Property EBITDA resulting fromthe December 2016 opening of MGM National Harbor as well as an increase in revenues as discussed above.Same-store Adjusted Property EBITDA increased 17% in 2016 compared to 2015. Same-store Adjusted PropertyEBITDA margin in 2016 increased by 336 basis points compared to 2015 to 29.6%.
Adjusted Property EBITDA at our domestic resorts was $1.7 billion in 2015, an increase of 11% comparedto 2014 due primarily to improved casino and non-casino revenue results at our domestic resorts as discussedabove, and approximately $71 million of incremental Adjusted Property EBITDA as a result of the Company’s
11
Profit Growth Plan initiatives. Same-store Adjusted Property EBITDA increased 11% in 2015 compared to 2014and Same-store Adjusted Property EBITDA margin in 2015 increased by 188 basis points compared to 2014 to26.3%.
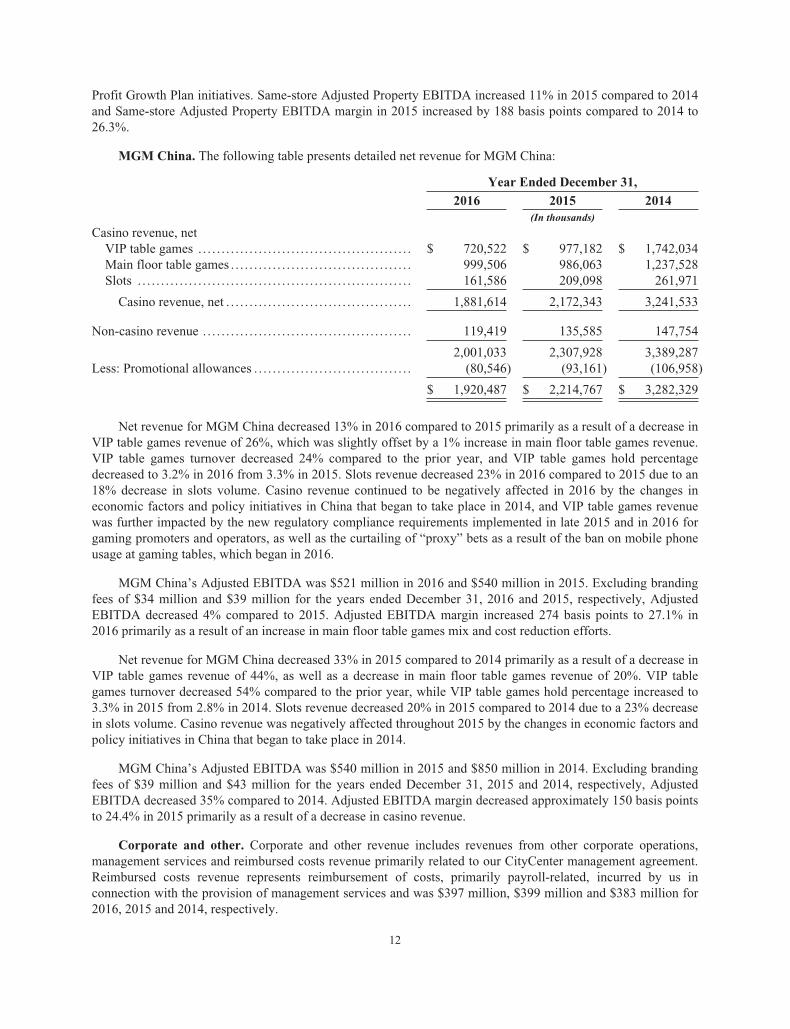
MGM China. The following table presents detailed net revenue for MGM China:
Year Ended December 31,
2016 2015 2014(In thousands)
Casino revenue, netVIP table games . . . . . . . . . . . . . . . . . . . . . . . . . . . . . . . . . . . . . . . . . . . . . . $ 720,522 $ 977,182 $ 1,742,034Main floor table games . . . . . . . . . . . . . . . . . . . . . . . . . . . . . . . . . . . . . . . 999,506 986,063 1,237,528Slots . . . . . . . . . . . . . . . . . . . . . . . . . . . . . . . . . . . . . . . . . . . . . . . . . . . . . . . . . . . 161,586 209,098 261,971
Casino revenue, net . . . . . . . . . . . . . . . . . . . . . . . . . . . . . . . . . . . . . . . . 1,881,614 2,172,343 3,241,533
Non-casino revenue . . . . . . . . . . . . . . . . . . . . . . . . . . . . . . . . . . . . . . . . . . . . . 119,419 135,585 147,754
2,001,033 2,307,928 3,389,287Less: Promotional allowances . . . . . . . . . . . . . . . . . . . . . . . . . . . . . . . . . . (80,546) (93,161) (106,958)
$ 1,920,487 $ 2,214,767 $ 3,282,329
Net revenue for MGM China decreased 13% in 2016 compared to 2015 primarily as a result of a decrease inVIP table games revenue of 26%, which was slightly offset by a 1% increase in main floor table games revenue.VIP table games turnover decreased 24% compared to the prior year, and VIP table games hold percentagedecreased to 3.2% in 2016 from 3.3% in 2015. Slots revenue decreased 23% in 2016 compared to 2015 due to an18% decrease in slots volume. Casino revenue continued to be negatively affected in 2016 by the changes ineconomic factors and policy initiatives in China that began to take place in 2014, and VIP table games revenuewas further impacted by the new regulatory compliance requirements implemented in late 2015 and in 2016 forgaming promoters and operators, as well as the curtailing of “proxy” bets as a result of the ban on mobile phoneusage at gaming tables, which began in 2016.
MGM China’s Adjusted EBITDA was $521 million in 2016 and $540 million in 2015. Excluding brandingfees of $34 million and $39 million for the years ended December 31, 2016 and 2015, respectively, AdjustedEBITDA decreased 4% compared to 2015. Adjusted EBITDA margin increased 274 basis points to 27.1% in2016 primarily as a result of an increase in main floor table games mix and cost reduction efforts.
Net revenue for MGM China decreased 33% in 2015 compared to 2014 primarily as a result of a decrease inVIP table games revenue of 44%, as well as a decrease in main floor table games revenue of 20%. VIP tablegames turnover decreased 54% compared to the prior year, while VIP table games hold percentage increased to3.3% in 2015 from 2.8% in 2014. Slots revenue decreased 20% in 2015 compared to 2014 due to a 23% decreasein slots volume. Casino revenue was negatively affected throughout 2015 by the changes in economic factors andpolicy initiatives in China that began to take place in 2014.
MGM China’s Adjusted EBITDA was $540 million in 2015 and $850 million in 2014. Excluding brandingfees of $39 million and $43 million for the years ended December 31, 2015 and 2014, respectively, AdjustedEBITDA decreased 35% compared to 2014. Adjusted EBITDA margin decreased approximately 150 basis pointsto 24.4% in 2015 primarily as a result of a decrease in casino revenue.
Corporate and other. Corporate and other revenue includes revenues from other corporate operations,management services and reimbursed costs revenue primarily related to our CityCenter management agreement.Reimbursed costs revenue represents reimbursement of costs, primarily payroll-related, incurred by us inconnection with the provision of management services and was $397 million, $399 million and $383 million for2016, 2015 and 2014, respectively.
12
Adjusted EBITDA related to corporate and other in 2016 increased due to our gain recognized from the saleof Crystals at CityCenter. See “Operating Results – Income (Loss) from Unconsolidated Affiliates” for furtherdiscussion. The increase in income from unconsolidated affiliates was partially offset by an increase in corporateexpense discussed previously under “Summary Operating Results” and an increase in stock-based compensation.
Adjusted EBITDA related to corporate and other in 2015 included our share of operating income fromCityCenter, including certain basis difference adjustments, compared to our share of operating loss fromCityCenter in the prior year, and an increase in our share of operating income from Borgata in 2015 compared to2014. See “Operating Results – Income (Loss) from Unconsolidated Affiliates” for further discussion. Theincreases in income from CityCenter and Borgata were partially offset by increased corporate expenses asdiscussed previously under “Summary Operating Results.”
Operating Results – Details of Certain Charges
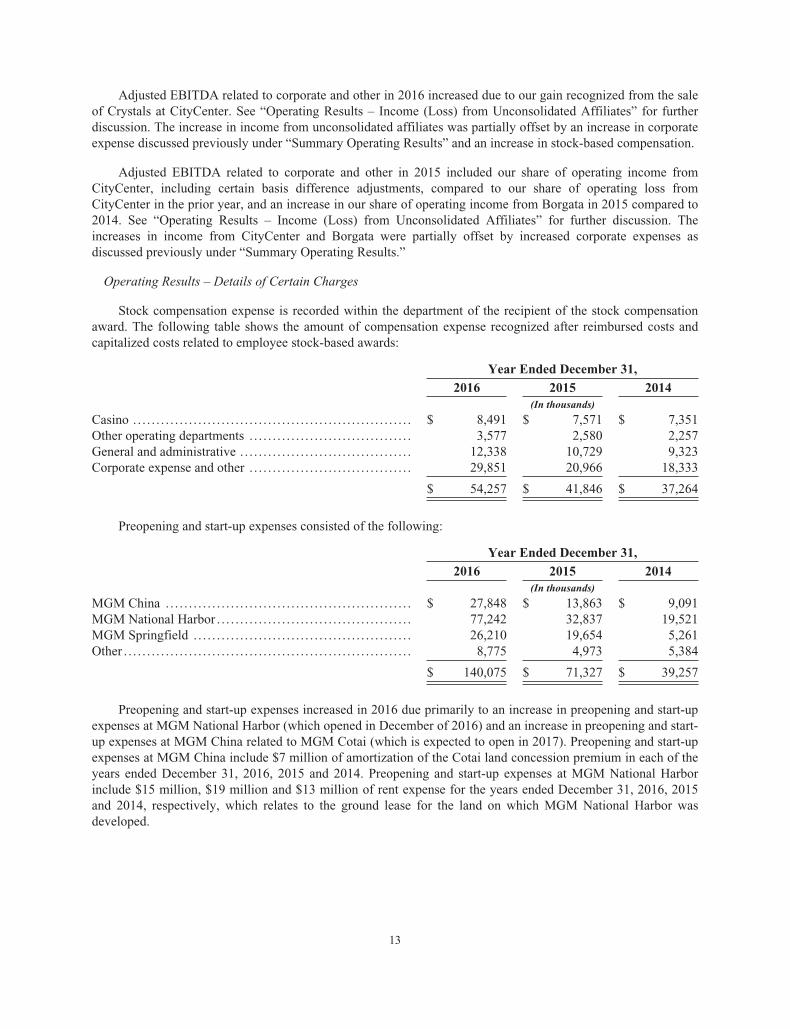
Stock compensation expense is recorded within the department of the recipient of the stock compensationaward. The following table shows the amount of compensation expense recognized after reimbursed costs andcapitalized costs related to employee stock-based awards:
Year Ended December 31,
2016 2015 2014(In thousands)
Casino . . . . . . . . . . . . . . . . . . . . . . . . . . . . . . . . . . . . . . . . . . . . . . . . . . . . . . . . . . . . $ 8,491 $ 7,571 $ 7,351Other operating departments . . . . . . . . . . . . . . . . . . . . . . . . . . . . . . . . . . . 3,577 2,580 2,257General and administrative . . . . . . . . . . . . . . . . . . . . . . . . . . . . . . . . . . . . . 12,338 10,729 9,323Corporate expense and other . . . . . . . . . . . . . . . . . . . . . . . . . . . . . . . . . . . 29,851 20,966 18,333
$ 54,257 $ 41,846 $ 37,264
Preopening and start-up expenses consisted of the following:
Year Ended December 31,
2016 2015 2014(In thousands)
MGM China . . . . . . . . . . . . . . . . . . . . . . . . . . . . . . . . . . . . . . . . . . . . . . . . . . . . . $ 27,848 $ 13,863 $ 9,091MGM National Harbor . . . . . . . . . . . . . . . . . . . . . . . . . . . . . . . . . . . . . . . . . . 77,242 32,837 19,521MGM Springfield . . . . . . . . . . . . . . . . . . . . . . . . . . . . . . . . . . . . . . . . . . . . . . . 26,210 19,654 5,261Other . . . . . . . . . . . . . . . . . . . . . . . . . . . . . . . . . . . . . . . . . . . . . . . . . . . . . . . . . . . . . . 8,775 4,973 5,384
$ 140,075 $ 71,327 $ 39,257
Preopening and start-up expenses increased in 2016 due primarily to an increase in preopening and start-upexpenses at MGM National Harbor (which opened in December of 2016) and an increase in preopening and start-up expenses at MGM China related to MGM Cotai (which is expected to open in 2017). Preopening and start-upexpenses at MGM China include $7 million of amortization of the Cotai land concession premium in each of theyears ended December 31, 2016, 2015 and 2014. Preopening and start-up expenses at MGM National Harborinclude $15 million, $19 million and $13 million of rent expense for the years ended December 31, 2016, 2015and 2014, respectively, which relates to the ground lease for the land on which MGM National Harbor wasdeveloped.
13
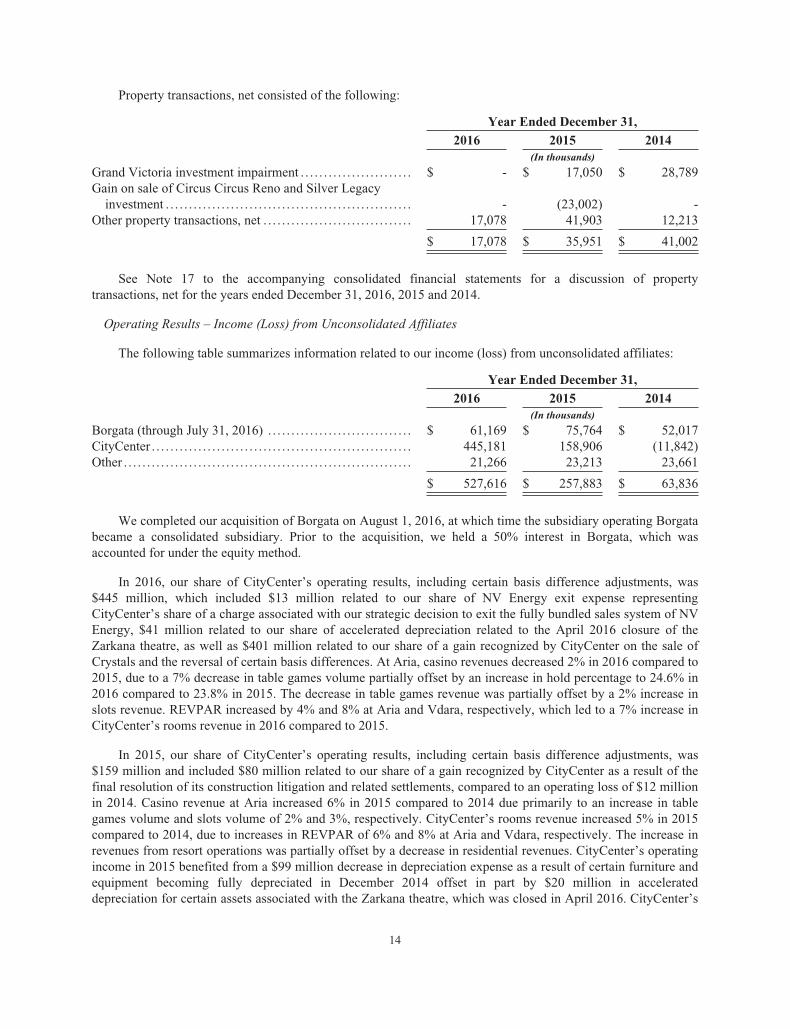
Property transactions, net consisted of the following:
Year Ended December 31,
2016 2015 2014(In thousands)
Grand Victoria investment impairment . . . . . . . . . . . . . . . . . . . . . . . . $ - $ 17,050 $ 28,789Gain on sale of Circus Circus Reno and Silver Legacyinvestment . . . . . . . . . . . . . . . . . . . . . . . . . . . . . . . . . . . . . . . . . . . . . . . . . . . . . - (23,002) -
Other property transactions, net . . . . . . . . . . . . . . . . . . . . . . . . . . . . . . . . 17,078 41,903 12,213
$ 17,078 $ 35,951 $ 41,002
See Note 17 to the accompanying consolidated financial statements for a discussion of propertytransactions, net for the years ended December 31, 2016, 2015 and 2014.
Operating Results – Income (Loss) from Unconsolidated Affiliates
The following table summarizes information related to our income (loss) from unconsolidated affiliates:
Year Ended December 31,
2016 2015 2014(In thousands)
Borgata (through July 31, 2016) . . . . . . . . . . . . . . . . . . . . . . . . . . . . . . . $ 61,169 $ 75,764 $ 52,017CityCenter . . . . . . . . . . . . . . . . . . . . . . . . . . . . . . . . . . . . . . . . . . . . . . . . . . . . . . . . 445,181 158,906 (11,842)Other . . . . . . . . . . . . . . . . . . . . . . . . . . . . . . . . . . . . . . . . . . . . . . . . . . . . . . . . . . . . . . 21,266 23,213 23,661
$ 527,616 $ 257,883 $ 63,836
We completed our acquisition of Borgata on August 1, 2016, at which time the subsidiary operating Borgatabecame a consolidated subsidiary. Prior to the acquisition, we held a 50% interest in Borgata, which wasaccounted for under the equity method.
In 2016, our share of CityCenter’s operating results, including certain basis difference adjustments, was$445 million, which included $13 million related to our share of NV Energy exit expense representingCityCenter’s share of a charge associated with our strategic decision to exit the fully bundled sales system of NVEnergy, $41 million related to our share of accelerated depreciation related to the April 2016 closure of theZarkana theatre, as well as $401 million related to our share of a gain recognized by CityCenter on the sale ofCrystals and the reversal of certain basis differences. At Aria, casino revenues decreased 2% in 2016 compared to2015, due to a 7% decrease in table games volume partially offset by an increase in hold percentage to 24.6% in2016 compared to 23.8% in 2015. The decrease in table games revenue was partially offset by a 2% increase inslots revenue. REVPAR increased by 4% and 8% at Aria and Vdara, respectively, which led to a 7% increase inCityCenter’s rooms revenue in 2016 compared to 2015.
In 2015, our share of CityCenter’s operating results, including certain basis difference adjustments, was$159 million and included $80 million related to our share of a gain recognized by CityCenter as a result of thefinal resolution of its construction litigation and related settlements, compared to an operating loss of $12 millionin 2014. Casino revenue at Aria increased 6% in 2015 compared to 2014 due primarily to an increase in tablegames volume and slots volume of 2% and 3%, respectively. CityCenter’s rooms revenue increased 5% in 2015compared to 2014, due to increases in REVPAR of 6% and 8% at Aria and Vdara, respectively. The increase inrevenues from resort operations was partially offset by a decrease in residential revenues. CityCenter’s operatingincome in 2015 benefited from a $99 million decrease in depreciation expense as a result of certain furniture andequipment becoming fully depreciated in December 2014 offset in part by $20 million in accelerateddepreciation for certain assets associated with the Zarkana theatre, which was closed in April 2016. CityCenter’s
14
operating income also benefited from a $26 million decrease in legal and professional fees as a result of the finalresolution of construction litigation and related settlements. Our share of Borgata’s operating income increased in2015 compared to 2014 due to an increase in casino and non-casino revenues and improved operating margins.
Non-operating Results
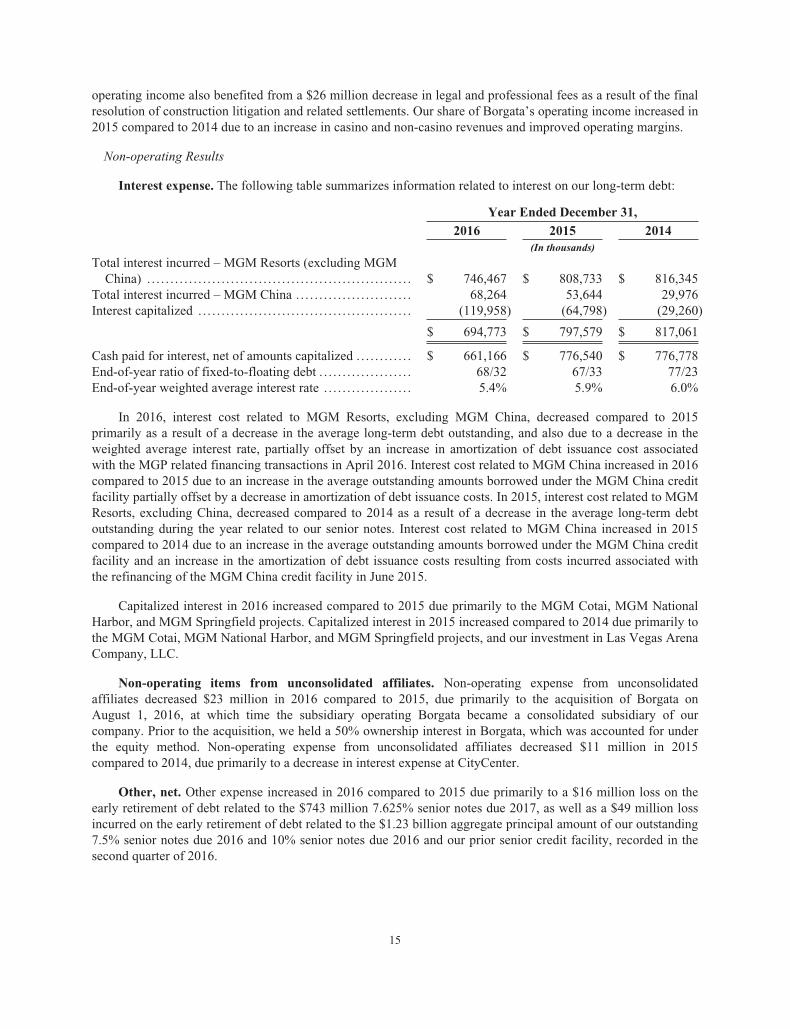
Interest expense. The following table summarizes information related to interest on our long-term debt:
Year Ended December 31,
2016 2015 2014(In thousands)
Total interest incurred – MGM Resorts (excluding MGMChina) . . . . . . . . . . . . . . . . . . . . . . . . . . . . . . . . . . . . . . . . . . . . . . . . . . . . . . . . . $ 746,467 $ 808,733 $ 816,345
Total interest incurred – MGM China . . . . . . . . . . . . . . . . . . . . . . . . . 68,264 53,644 29,976Interest capitalized . . . . . . . . . . . . . . . . . . . . . . . . . . . . . . . . . . . . . . . . . . . . . . (119,958) (64,798) (29,260)
$ 694,773 $ 797,579 $ 817,061
Cash paid for interest, net of amounts capitalized . . . . . . . . . . . . $ 661,166 $ 776,540 $ 776,778End-of-year ratio of fixed-to-floating debt . . . . . . . . . . . . . . . . . . . . 68/32 67/33 77/23End-of-year weighted average interest rate . . . . . . . . . . . . . . . . . . . 5.4% 5.9% 6.0%
In 2016, interest cost related to MGM Resorts, excluding MGM China, decreased compared to 2015primarily as a result of a decrease in the average long-term debt outstanding, and also due to a decrease in theweighted average interest rate, partially offset by an increase in amortization of debt issuance cost associatedwith the MGP related financing transactions in April 2016. Interest cost related to MGM China increased in 2016compared to 2015 due to an increase in the average outstanding amounts borrowed under the MGM China creditfacility partially offset by a decrease in amortization of debt issuance costs. In 2015, interest cost related to MGMResorts, excluding China, decreased compared to 2014 as a result of a decrease in the average long-term debtoutstanding during the year related to our senior notes. Interest cost related to MGM China increased in 2015compared to 2014 due to an increase in the average outstanding amounts borrowed under the MGM China creditfacility and an increase in the amortization of debt issuance costs resulting from costs incurred associated withthe refinancing of the MGM China credit facility in June 2015.
Capitalized interest in 2016 increased compared to 2015 due primarily to the MGM Cotai, MGM NationalHarbor, and MGM Springfield projects. Capitalized interest in 2015 increased compared to 2014 due primarily tothe MGM Cotai, MGM National Harbor, and MGM Springfield projects, and our investment in Las Vegas ArenaCompany, LLC.
Non-operating items from unconsolidated affiliates. Non-operating expense from unconsolidatedaffiliates decreased $23 million in 2016 compared to 2015, due primarily to the acquisition of Borgata onAugust 1, 2016, at which time the subsidiary operating Borgata became a consolidated subsidiary of ourcompany. Prior to the acquisition, we held a 50% ownership interest in Borgata, which was accounted for underthe equity method. Non-operating expense from unconsolidated affiliates decreased $11 million in 2015compared to 2014, due primarily to a decrease in interest expense at CityCenter.
Other, net. Other expense increased in 2016 compared to 2015 due primarily to a $16 million loss on theearly retirement of debt related to the $743 million 7.625% senior notes due 2017, as well as a $49 million lossincurred on the early retirement of debt related to the $1.23 billion aggregate principal amount of our outstanding7.5% senior notes due 2016 and 10% senior notes due 2016 and our prior senior credit facility, recorded in thesecond quarter of 2016.
15
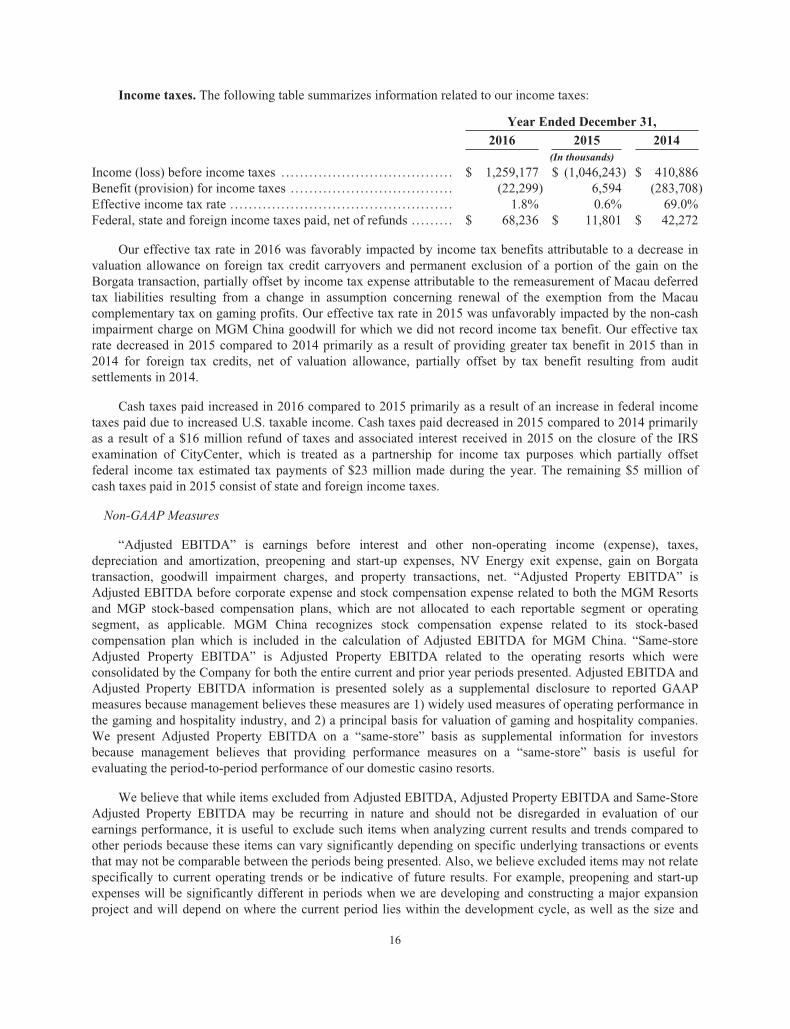
Income taxes. The following table summarizes information related to our income taxes:
Year Ended December 31,
2016 2015 2014(In thousands)
Income (loss) before income taxes . . . . . . . . . . . . . . . . . . . . . . . . . . . . . . . . . . . . . $ 1,259,177 $ (1,046,243) $ 410,886Benefit (provision) for income taxes . . . . . . . . . . . . . . . . . . . . . . . . . . . . . . . . . . . (22,299) 6,594 (283,708)Effective income tax rate . . . . . . . . . . . . . . . . . . . . . . . . . . . . . . . . . . . . . . . . . . . . . . . . 1.8% 0.6% 69.0%Federal, state and foreign income taxes paid, net of refunds . . . . . . . . . $ 68,236 $ 11,801 $ 42,272
Our effective tax rate in 2016 was favorably impacted by income tax benefits attributable to a decrease invaluation allowance on foreign tax credit carryovers and permanent exclusion of a portion of the gain on theBorgata transaction, partially offset by income tax expense attributable to the remeasurement of Macau deferredtax liabilities resulting from a change in assumption concerning renewal of the exemption from the Macaucomplementary tax on gaming profits. Our effective tax rate in 2015 was unfavorably impacted by the non-cashimpairment charge on MGM China goodwill for which we did not record income tax benefit. Our effective taxrate decreased in 2015 compared to 2014 primarily as a result of providing greater tax benefit in 2015 than in2014 for foreign tax credits, net of valuation allowance, partially offset by tax benefit resulting from auditsettlements in 2014.
Cash taxes paid increased in 2016 compared to 2015 primarily as a result of an increase in federal incometaxes paid due to increased U.S. taxable income. Cash taxes paid decreased in 2015 compared to 2014 primarilyas a result of a $16 million refund of taxes and associated interest received in 2015 on the closure of the IRSexamination of CityCenter, which is treated as a partnership for income tax purposes which partially offsetfederal income tax estimated tax payments of $23 million made during the year. The remaining $5 million ofcash taxes paid in 2015 consist of state and foreign income taxes.
Non-GAAP Measures
“Adjusted EBITDA” is earnings before interest and other non-operating income (expense), taxes,depreciation and amortization, preopening and start-up expenses, NV Energy exit expense, gain on Borgatatransaction, goodwill impairment charges, and property transactions, net. “Adjusted Property EBITDA” isAdjusted EBITDA before corporate expense and stock compensation expense related to both the MGM Resortsand MGP stock-based compensation plans, which are not allocated to each reportable segment or operatingsegment, as applicable. MGM China recognizes stock compensation expense related to its stock-basedcompensation plan which is included in the calculation of Adjusted EBITDA for MGM China. “Same-storeAdjusted Property EBITDA” is Adjusted Property EBITDA related to the operating resorts which wereconsolidated by the Company for both the entire current and prior year periods presented. Adjusted EBITDA andAdjusted Property EBITDA information is presented solely as a supplemental disclosure to reported GAAPmeasures because management believes these measures are 1) widely used measures of operating performance inthe gaming and hospitality industry, and 2) a principal basis for valuation of gaming and hospitality companies.We present Adjusted Property EBITDA on a “same-store” basis as supplemental information for investorsbecause management believes that providing performance measures on a “same-store” basis is useful forevaluating the period-to-period performance of our domestic casino resorts.
We believe that while items excluded from Adjusted EBITDA, Adjusted Property EBITDA and Same-StoreAdjusted Property EBITDA may be recurring in nature and should not be disregarded in evaluation of ourearnings performance, it is useful to exclude such items when analyzing current results and trends compared toother periods because these items can vary significantly depending on specific underlying transactions or eventsthat may not be comparable between the periods being presented. Also, we believe excluded items may not relatespecifically to current operating trends or be indicative of future results. For example, preopening and start-upexpenses will be significantly different in periods when we are developing and constructing a major expansionproject and will depend on where the current period lies within the development cycle, as well as the size and
16
scope of the project(s). Property transactions, net includes normal recurring disposals, gains and losses on salesof assets related to specific assets within our resorts, but also includes gains or losses on sales of an entireoperating resort or a group of resorts and impairment charges on entire asset groups or investments inunconsolidated affiliates, which may not be comparable period over period. In addition, capital allocation, taxplanning, financing and stock compensation awards are all managed at the corporate level. Therefore, we useAdjusted Property EBITDA and Same-store Adjusted Property EBITDA as the primary measure of domesticresorts operating performance.
Adjusted EBITDA, Adjusted Property EBITDA or Same-store Adjusted Property EBITDA should not beconstrued as an alternative to operating income or net income, as an indicator of our performance; or as analternative to cash flows from operating activities, as a measure of liquidity; or as any other measure determinedin accordance with generally accepted accounting principles. We have significant uses of cash flows, includingcapital expenditures, interest payments, taxes and debt principal repayments, which are not reflected in AdjustedEBITDA, Adjusted Property EBITDA, or Same-store Adjusted Property EBITDA. Also, other companies in thegaming and hospitality industries that report Adjusted EBITDA, Adjusted Property EBITDA or Same-storeAdjusted Property EBITDA information may calculate Adjusted EBITDA, Adjusted Property EBITDA or Same-store Adjusted Property EBITDA in a different manner.
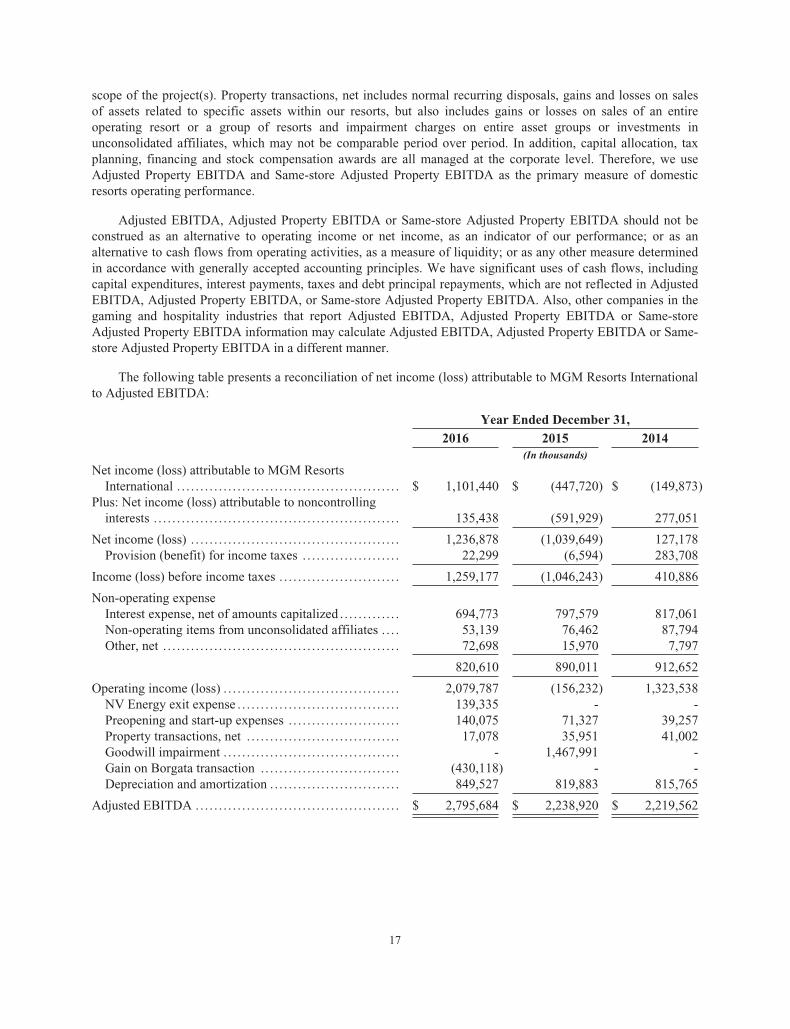
The following table presents a reconciliation of net income (loss) attributable to MGM Resorts Internationalto Adjusted EBITDA:
Year Ended December 31,
2016 2015 2014(In thousands)
Net income (loss) attributable to MGM ResortsInternational . . . . . . . . . . . . . . . . . . . . . . . . . . . . . . . . . . . . . . . . . . . . . . . . $ 1,101,440 $ (447,720) $ (149,873)
Plus: Net income (loss) attributable to noncontrollinginterests . . . . . . . . . . . . . . . . . . . . . . . . . . . . . . . . . . . . . . . . . . . . . . . . . . . . . 135,438 (591,929) 277,051
Net income (loss) . . . . . . . . . . . . . . . . . . . . . . . . . . . . . . . . . . . . . . . . . . . . . 1,236,878 (1,039,649) 127,178Provision (benefit) for income taxes . . . . . . . . . . . . . . . . . . . . . 22,299 (6,594) 283,708
Income (loss) before income taxes . . . . . . . . . . . . . . . . . . . . . . . . . . 1,259,177 (1,046,243) 410,886
Non-operating expenseInterest expense, net of amounts capitalized . . . . . . . . . . . . . 694,773 797,579 817,061Non-operating items from unconsolidated affiliates . . . . 53,139 76,462 87,794Other, net . . . . . . . . . . . . . . . . . . . . . . . . . . . . . . . . . . . . . . . . . . . . . . . . . . . 72,698 15,970 7,797
820,610 890,011 912,652
Operating income (loss) . . . . . . . . . . . . . . . . . . . . . . . . . . . . . . . . . . . . . . 2,079,787 (156,232) 1,323,538NV Energy exit expense . . . . . . . . . . . . . . . . . . . . . . . . . . . . . . . . . . . 139,335 - -Preopening and start-up expenses . . . . . . . . . . . . . . . . . . . . . . . . 140,075 71,327 39,257Property transactions, net . . . . . . . . . . . . . . . . . . . . . . . . . . . . . . . . . 17,078 35,951 41,002Goodwill impairment . . . . . . . . . . . . . . . . . . . . . . . . . . . . . . . . . . . . . . - 1,467,991 -Gain on Borgata transaction . . . . . . . . . . . . . . . . . . . . . . . . . . . . . . (430,118) - -Depreciation and amortization . . . . . . . . . . . . . . . . . . . . . . . . . . . . 849,527 819,883 815,765
Adjusted EBITDA .. . . . . . . . . . . . . . . . . . . . . . . . . . . . . . . . . . . . . . . . . . . $ 2,795,684 $ 2,238,920 $ 2,219,562
17
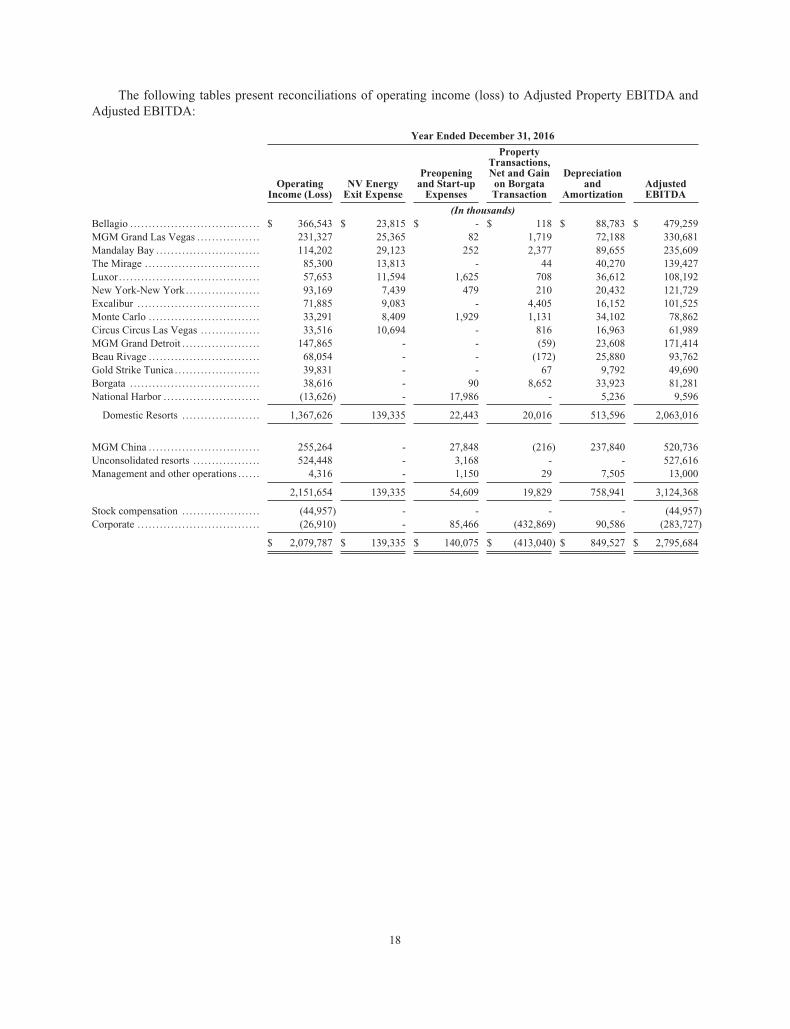
The following tables present reconciliations of operating income (loss) to Adjusted Property EBITDA andAdjusted EBITDA:
Year Ended December 31, 2016
OperatingIncome (Loss)
NV EnergyExit Expense
Preopeningand Start-upExpenses
PropertyTransactions,Net and Gainon BorgataTransaction
Depreciationand
AmortizationAdjustedEBITDA
(In thousands)Bellagio . . . . . . . . . . . . . . . . . . . . . . . . . . . . . . . . . . . $ 366,543 $ 23,815 $ - $ 118 $ 88,783 $ 479,259MGM Grand Las Vegas . . . . . . . . . . . . . . . . . 231,327 25,365 82 1,719 72,188 330,681Mandalay Bay . . . . . . . . . . . . . . . . . . . . . . . . . . . . 114,202 29,123 252 2,377 89,655 235,609The Mirage . . . . . . . . . . . . . . . . . . . . . . . . . . . . . . . 85,300 13,813 - 44 40,270 139,427Luxor . . . . . . . . . . . . . . . . . . . . . . . . . . . . . . . . . . . . . . 57,653 11,594 1,625 708 36,612 108,192New York-New York . . . . . . . . . . . . . . . . . . . . 93,169 7,439 479 210 20,432 121,729Excalibur . . . . . . . . . . . . . . . . . . . . . . . . . . . . . . . . . 71,885 9,083 - 4,405 16,152 101,525Monte Carlo . . . . . . . . . . . . . . . . . . . . . . . . . . . . . . 33,291 8,409 1,929 1,131 34,102 78,862Circus Circus Las Vegas . . . . . . . . . . . . . . . . 33,516 10,694 - 816 16,963 61,989MGM Grand Detroit . . . . . . . . . . . . . . . . . . . . . 147,865 - - (59) 23,608 171,414Beau Rivage . . . . . . . . . . . . . . . . . . . . . . . . . . . . . . 68,054 - - (172) 25,880 93,762Gold Strike Tunica . . . . . . . . . . . . . . . . . . . . . . . 39,831 - - 67 9,792 49,690Borgata . . . . . . . . . . . . . . . . . . . . . . . . . . . . . . . . . . . 38,616 - 90 8,652 33,923 81,281National Harbor . . . . . . . . . . . . . . . . . . . . . . . . . . (13,626) - 17,986 - 5,236 9,596
Domestic Resorts . . . . . . . . . . . . . . . . . . . . . 1,367,626 139,335 22,443 20,016 513,596 2,063,016
MGM China . . . . . . . . . . . . . . . . . . . . . . . . . . . . . . 255,264 - 27,848 (216) 237,840 520,736Unconsolidated resorts . . . . . . . . . . . . . . . . . . 524,448 - 3,168 - - 527,616Management and other operations . . . . . . 4,316 - 1,150 29 7,505 13,000
2,151,654 139,335 54,609 19,829 758,941 3,124,368
Stock compensation . . . . . . . . . . . . . . . . . . . . . (44,957) - - - - (44,957)Corporate . . . . . . . . . . . . . . . . . . . . . . . . . . . . . . . . . (26,910) - 85,466 (432,869) 90,586 (283,727)
$ 2,079,787 $ 139,335 $ 140,075 $ (413,040) $ 849,527 $ 2,795,684
18
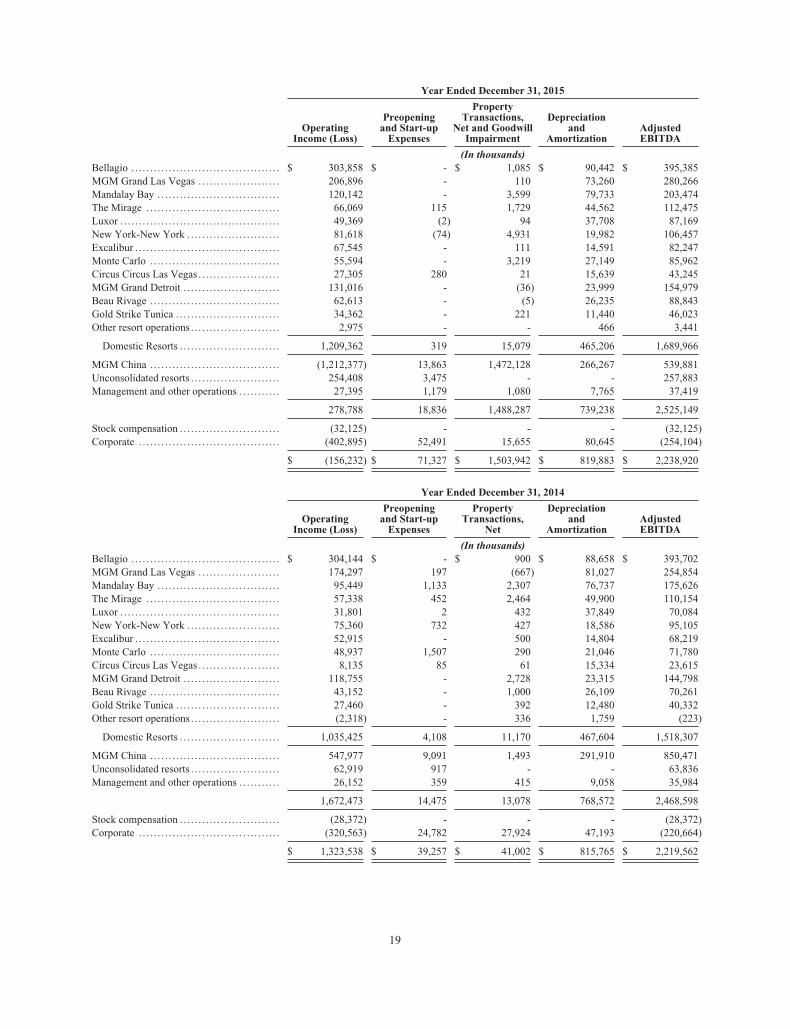
Year Ended December 31, 2015
OperatingIncome (Loss)
Preopeningand Start-upExpenses
PropertyTransactions,
Net and GoodwillImpairment
Depreciationand
AmortizationAdjustedEBITDA
(In thousands)Bellagio . . . . . . . . . . . . . . . . . . . . . . . . . . . . . . . . . . . . . . . . $ 303,858 $ - $ 1,085 $ 90,442 $ 395,385MGM Grand Las Vegas . . . . . . . . . . . . . . . . . . . . . . 206,896 - 110 73,260 280,266Mandalay Bay . . . . . . . . . . . . . . . . . . . . . . . . . . . . . . . . . 120,142 - 3,599 79,733 203,474The Mirage . . . . . . . . . . . . . . . . . . . . . . . . . . . . . . . . . . . . 66,069 115 1,729 44,562 112,475Luxor . . . . . . . . . . . . . . . . . . . . . . . . . . . . . . . . . . . . . . . . . . . 49,369 (2) 94 37,708 87,169New York-New York . . . . . . . . . . . . . . . . . . . . . . . . . 81,618 (74) 4,931 19,982 106,457Excalibur . . . . . . . . . . . . . . . . . . . . . . . . . . . . . . . . . . . . . . . 67,545 - 111 14,591 82,247Monte Carlo . . . . . . . . . . . . . . . . . . . . . . . . . . . . . . . . . . . 55,594 - 3,219 27,149 85,962Circus Circus Las Vegas . . . . . . . . . . . . . . . . . . . . . . 27,305 280 21 15,639 43,245MGM Grand Detroit . . . . . . . . . . . . . . . . . . . . . . . . . . 131,016 - (36) 23,999 154,979Beau Rivage . . . . . . . . . . . . . . . . . . . . . . . . . . . . . . . . . . . 62,613 - (5) 26,235 88,843Gold Strike Tunica . . . . . . . . . . . . . . . . . . . . . . . . . . . . 34,362 - 221 11,440 46,023Other resort operations . . . . . . . . . . . . . . . . . . . . . . . . 2,975 - - 466 3,441
Domestic Resorts . . . . . . . . . . . . . . . . . . . . . . . . . . . 1,209,362 319 15,079 465,206 1,689,966
MGM China . . . . . . . . . . . . . . . . . . . . . . . . . . . . . . . . . . . (1,212,377) 13,863 1,472,128 266,267 539,881Unconsolidated resorts . . . . . . . . . . . . . . . . . . . . . . . . 254,408 3,475 - - 257,883Management and other operations . . . . . . . . . . . 27,395 1,179 1,080 7,765 37,419
278,788 18,836 1,488,287 739,238 2,525,149
Stock compensation . . . . . . . . . . . . . . . . . . . . . . . . . . . (32,125) - - - (32,125)Corporate . . . . . . . . . . . . . . . . . . . . . . . . . . . . . . . . . . . . . . (402,895) 52,491 15,655 80,645 (254,104)
$ (156,232) $ 71,327 $ 1,503,942 $ 819,883 $ 2,238,920
Year Ended December 31, 2014
OperatingIncome (Loss)
Preopeningand Start-upExpenses
PropertyTransactions,
Net
Depreciationand
AmortizationAdjustedEBITDA
(In thousands)Bellagio . . . . . . . . . . . . . . . . . . . . . . . . . . . . . . . . . . . . . . . . $ 304,144 $ - $ 900 $ 88,658 $ 393,702MGM Grand Las Vegas . . . . . . . . . . . . . . . . . . . . . . 174,297 197 (667) 81,027 254,854Mandalay Bay . . . . . . . . . . . . . . . . . . . . . . . . . . . . . . . . . 95,449 1,133 2,307 76,737 175,626The Mirage . . . . . . . . . . . . . . . . . . . . . . . . . . . . . . . . . . . . 57,338 452 2,464 49,900 110,154Luxor . . . . . . . . . . . . . . . . . . . . . . . . . . . . . . . . . . . . . . . . . . . 31,801 2 432 37,849 70,084New York-New York . . . . . . . . . . . . . . . . . . . . . . . . . 75,360 732 427 18,586 95,105Excalibur . . . . . . . . . . . . . . . . . . . . . . . . . . . . . . . . . . . . . . . 52,915 - 500 14,804 68,219Monte Carlo . . . . . . . . . . . . . . . . . . . . . . . . . . . . . . . . . . . 48,937 1,507 290 21,046 71,780Circus Circus Las Vegas . . . . . . . . . . . . . . . . . . . . . . 8,135 85 61 15,334 23,615MGM Grand Detroit . . . . . . . . . . . . . . . . . . . . . . . . . . 118,755 - 2,728 23,315 144,798Beau Rivage . . . . . . . . . . . . . . . . . . . . . . . . . . . . . . . . . . . 43,152 - 1,000 26,109 70,261Gold Strike Tunica . . . . . . . . . . . . . . . . . . . . . . . . . . . . 27,460 - 392 12,480 40,332Other resort operations . . . . . . . . . . . . . . . . . . . . . . . . (2,318) - 336 1,759 (223)
Domestic Resorts . . . . . . . . . . . . . . . . . . . . . . . . . . . 1,035,425 4,108 11,170 467,604 1,518,307
MGM China . . . . . . . . . . . . . . . . . . . . . . . . . . . . . . . . . . . 547,977 9,091 1,493 291,910 850,471Unconsolidated resorts . . . . . . . . . . . . . . . . . . . . . . . . 62,919 917 - - 63,836Management and other operations . . . . . . . . . . . 26,152 359 415 9,058 35,984
1,672,473 14,475 13,078 768,572 2,468,598
Stock compensation . . . . . . . . . . . . . . . . . . . . . . . . . . . (28,372) - - - (28,372)Corporate . . . . . . . . . . . . . . . . . . . . . . . . . . . . . . . . . . . . . . (320,563) 24,782 27,924 47,193 (220,664)
$ 1,323,538 $ 39,257 $ 41,002 $ 815,765 $ 2,219,562
19

Liquidity and Capital Resources
Cash Flows – Summary
We require a certain amount of cash on hand to operate our resorts. In addition to required cash on hand foroperations, we utilize company-wide cash management procedures to minimize the amount of cash held on hand orin banks. Funds are swept from accounts at our resorts daily into central bank accounts, and excess funds areinvested overnight or are used to repay borrowings under our senior credit facility. In addition, from time to time wemay use excess funds to repurchase our outstanding debt securities subject to limitations in our senior credit facility.At December 31, 2016 and 2015, we held cash and cash equivalents of $1.4 billion and $1.7 billion, respectively.Cash and cash equivalents related to MGM China at December 31, 2016 and 2015 was $454 million and$700 million, respectively. Cash and cash equivalents related to MGP at December 31, 2016 was $360 million.
Our cash flows consisted of the following:
Year Ended December 31,
2016 2015 2014(In thousands)
Net cash provided by operating activities . . . . . . . . . . . . . . . . . . . . . . . . . . . . . . . . . . . $ 1,533,972 $ 1,005,079 $ 1,130,670
Investing cash flows:Capital expenditures, net of construction payable . . . . . . . . . . . . . . . . . . . . . . . (2,262,473) (1,466,819) (872,041)Dispositions of property and equipment . . . . . . . . . . . . . . . . . . . . . . . . . . . . . . . . . 3,944 8,032 7,651Proceeds from partial disposition of investment in unconsolidatedaffiliate . . . . . . . . . . . . . . . . . . . . . . . . . . . . . . . . . . . . . . . . . . . . . . . . . . . . . . . . . . . . . . . . . . . 15,000 - -
Proceeds from sale of business units and investment inunconsolidated affiliate . . . . . . . . . . . . . . . . . . . . . . . . . . . . . . . . . . . . . . . . . . . . . . . . . - 92,207 -
Acquisition of Borgata, net of cash acquired . . . . . . . . . . . . . . . . . . . . . . . . . . . . (559,443) - -Investments in and advances to unconsolidated affiliates . . . . . . . . . . . . . . (3,633) (196,062) (103,040)Distributions from unconsolidated affiliates in excess of cumulativeearnings . . . . . . . . . . . . . . . . . . . . . . . . . . . . . . . . . . . . . . . . . . . . . . . . . . . . . . . . . . . . . . . . . . 542,097 201,612 132
Net proceeds from treasury securities - maturities longer than 90days . . . . . . . . . . . . . . . . . . . . . . . . . . . . . . . . . . . . . . . . . . . . . . . . . . . . . . . . . . . . . . . . . . . . . . - - 87,167
Net proceeds (investments) from (in) cash deposits - originalmaturities longer than 90 days . . . . . . . . . . . . . . . . . . . . . . . . . . . . . . . . . . . . . . . . . - 570,000 (570,000)
Payments for gaming licenses . . . . . . . . . . . . . . . . . . . . . . . . . . . . . . . . . . . . . . . . . . . . - - (85,000)Other . . . . . . . . . . . . . . . . . . . . . . . . . . . . . . . . . . . . . . . . . . . . . . . . . . . . . . . . . . . . . . . . . . . . . . . . (11,696) (4,028) 10,981
Net cash used in investing activities . . . . . . . . . . . . . . . . . . . . . . . . . . . . . . . . . . . (2,276,204) (795,058) (1,524,150)
Financing cash flows:Net borrowings (repayments) under bank credit facilities . . . . . . . . . . . . . . 491,032 977,275 (28,000)Issuance of long-term debt . . . . . . . . . . . . . . . . . . . . . . . . . . . . . . . . . . . . . . . . . . . . . . . . 2,050,000 - 1,250,750Retirement of senior notes . . . . . . . . . . . . . . . . . . . . . . . . . . . . . . . . . . . . . . . . . . . . . . . . (2,258,053) (875,504) (508,900)Repayment of Borgata credit facility . . . . . . . . . . . . . . . . . . . . . . . . . . . . . . . . . . . . . (583,598) - -Debt issuance costs . . . . . . . . . . . . . . . . . . . . . . . . . . . . . . . . . . . . . . . . . . . . . . . . . . . . . . . . (139,584) (46,170) (13,681)Issuance of MGM Growth Properties common stock in publicoffering . . . . . . . . . . . . . . . . . . . . . . . . . . . . . . . . . . . . . . . . . . . . . . . . . . . . . . . . . . . . . . . . . . 1,207,500 - -
MGM Growth Properties common stock issuance costs . . . . . . . . . . . . . . . (75,032) - -Acquisition of MGM China shares . . . . . . . . . . . . . . . . . . . . . . . . . . . . . . . . . . . . . . . (100,000) - -Distributions to noncontrolling interest owners . . . . . . . . . . . . . . . . . . . . . . . . . (103,367) (307,227) (386,709)Excess tax benefit from exercise of stock options . . . . . . . . . . . . . . . . . . . . . . 13,277 12,369 4,671Proceeds from issuance of redeemable noncontrolling interests . . . . . . . 47,325 6,250 -Other . . . . . . . . . . . . . . . . . . . . . . . . . . . . . . . . . . . . . . . . . . . . . . . . . . . . . . . . . . . . . . . . . . . . . . . . (30,078) (24,872) (10,054)
Net cash provided by (used in) financing activities . . . . . . . . . . . . . . . . . . 519,422 (257,879) 308,077
Effect of exchange rate on cash . . . . . . . . . . . . . . . . . . . . . . . . . . . . . . . . . . . . . . . . . . . . . (921) 793 (889)
Net decrease in cash and cash equivalents . . . . . . . . . . . . . . . . . . . . . . . . . . . . . . . . . . $ (223,731) $ (47,065) $ (86,292)
20
Cash Flows
Operating activities. Trends in our operating cash flows tend to follow trends in operating income,excluding non-cash charges, but can be affected by changes in working capital, cash paid for interest, the timingof significant tax payments or refunds, and distributions from unconsolidated affiliates. Cash provided byoperating activities was $1.5 billion in 2016 compared to $1.0 billion in 2015. Operating cash flows increased inthe current period due to an increase in operating income at our domestic resorts and a decrease in cash paid forinterest, partially offset by an increase in cash paid for taxes. Cash provided by operating activities in the prioryear was negatively affected by changes in working capital primarily related to short-term gaming liabilities.
Cash provided by operating activities in 2015 decreased due to a decrease in operating cash flows at MGMChina which were $383 million in 2015 compared to $642 million in 2014, partially offset by an increase inoperating cash flows at our domestic resorts. In 2015, cash provided by operating activities at MGM China wasnegatively affected by changes in working capital related to short-term gaming liabilities but to a lesser extentthan in 2014.
We paid net taxes of $68 million, $12 million and $42 million in 2016, 2015 and 2014, respectively.
Investing activities. Our investing cash flows can fluctuate significantly from year to year depending on ourdecisions with respect to strategic capital investments in new or existing resorts, business acquisitions ordispositions, and the timing of more regular capital investments to maintain the quality of our resorts. Capitalexpenditures related to more regular investments in our existing resorts can also vary depending on timing oflarger remodel projects related to our public spaces and hotel rooms. Most of such costs relate to constructionmaterials, furniture and fixtures, and external labor costs.
• In 2016, we had capital expenditures of $2.3 billion, which included $971 million at MGM China,excluding development fees and capitalized interest on development fees eliminated in consolidation.Capital expenditures at MGM China included $948 million related to the construction of MGM Cotai and$23 million related to improvements at MGM Macau. Capital expenditures at our domestic resorts andcorporate entities of $1.3 billion included $741 million related to the construction of MGM NationalHarbor, $121 million related to the construction of MGM Springfield, $39 million related to theconstruction of The Park, as well as various room remodels including the tower rooms at Mandalay Bay,construction of additional exhibit space at the Mandalay Bay Convention Center, construction of the ParkTheater and rebranding at Monte Carlo, construction of the parking garage at Excalibur and restaurantand entertainment venue remodels.
• In 2015, we had capital expenditures of $1.5 billion, which included $579 million at MGM China,excluding development fees and capitalized interest on development fees eliminated in consolidation.Capital expenditures at MGM China included $543 million related to the construction of MGM Cotai and$36 million related to improvements at MGM Macau. Capital expenditures at our domestic resorts andcorporate entities of $888 million included $361 million and $35 million related to the construction ofMGM National Harbor and MGM Springfield, respectively, various room remodels including the towerrooms at Mandalay Bay and the suites at Bellagio, construction of additional exhibit space at theMandalay Bay Convention Center, construction of the Park Theatre, construction of The Parkentertainment district, and restaurant and entertainment venue remodels.
• In 2014, we had capital expenditures of $872 million, which included $346 million at MGM China,excluding capitalized interest on development fees eliminated in consolidation. Capital expenditures atMGM China included $301 million related to the construction of MGM Cotai and $45 million related toimprovements at MGM Macau. Capital expenditures at our domestic resorts and corporate entitiesincluded $97 million related to the construction of MGM National Harbor, various room remodelsincluding the Delano rooms at Mandalay Bay and suites at Bellagio, a remodel of the facades of NewYork-New York and Monte Carlo, construction of The Park entertainment district, restaurant andentertainment venue remodels and costs incurred to relocate and renovate certain corporate offices.
21
During 2016, we received $15 million of proceeds related to the sale of a portion of our investment in theLas Vegas Arena Company, LLC, and we paid approximately $604 million and acquired cash of approximately$43 million in connection with the acquisition of Boyd Gaming’s ownership interest in Borgata. Distributionsfrom unconsolidated affiliates for 2016 primarily related to a $540 million distribution paid by CityCenter inMay 2016.
In 2015, investments in and advances to unconsolidated affiliates primarily represented investments inCityCenter pursuant to the completion guarantee of $141 million and investments in the Las Vegas ArenaCompany, LLC of $50 million. In 2014, investments and advances to unconsolidated affiliates primarilyrepresented investments in CityCenter of $56 million, investments in the Las Vegas Arena Company, LLC of$36 million, and investments in MGM Hakkasan of $10 million.
In 2015, investing activities also included proceeds of $20 million related to the sale of Railroad Pass andGold Strike Jean, proceeds of $72 million (net of cash included in the sale) related to the sale of Circus CircusReno and the Company’s 50% interest in Silver Legacy, and $202 million of distributions received fromunconsolidated affiliates, which includes a $200 million distribution paid by CityCenter in April 2015. Inaddition, we invested $200 million in certificates of deposit with original maturities longer than 90 days andreceived proceeds of $770 million related to the maturity of certificates of deposit with original maturities longerthan 90 days.
Investing activities also include activity related to investments of funds held by the trust that held our 50%ownership interest in Borgata prior to its dissolution in September 2014. In addition, in 2014 we invested $570million in certificates of deposit with original maturities longer than 90 days.
Financing activities. In 2016, we repaid net debt of $301 million. In April 2016, in connection with theMGP IPO and related financing transactions we permanently repaid $2.7 billion under our prior senior creditfacility and entered into an amended and restated senior credit facility under which we borrowed $250 million.The Operating Partnership borrowed net debt of $2.1 billion during 2016 under its senior credit facility. Inaddition, MGM National Harbor borrowed $450 million under its credit facility, MGM China borrowed $374million under its revolving credit facility, and we permanently repaid $584 million under Borgata’s creditfacility. The following senior notes were issued during 2016:
• $500 million 4.625% senior notes, due 2026 issued by us;• $500 million 4.5% senior notes, due 2026 issued by the Operating Partnership; and• $1.05 billion 5.625% senior notes, due 2024 issued by the Operating Partnership.
We redeemed the following senior notes during 2016:
• $743 million 7.625% senior notes, due 2017 at a premium;• $732.7 million 7.5% senior notes, due 2016 at a premium;• $500 million 10% senior notes, due 2016 at a premium; and• $242.9 million 6.875% senior notes in April 2016 at maturity.
Additionally, we paid $140 million of debt issuance costs related to the senior notes issued in August 2016,the MGP financing transactions, the MGM National Harbor credit facility and the February 2016 amendment tothe MGM China credit facility.
In 2015, we had net borrowings of $102 million, including $1.0 billion of borrowings under the MGMChina credit facility, the repayment of $28 million under our senior credit facility and the repayment of the $875million 6.625% senior notes at maturity in July 2015 using cash on hand. Additionally, we paid $46 million ofdebt issuance costs related to the refinancing of the MGM China credit facility. In 2014, we had net borrowingsof $714 million, including the repayment of $28 million under our senior credit facility. During the year werepaid our $509 million 5.875% senior notes at maturity and issued $1.25 billion of 6% senior notes, due 2023for net proceeds of $1.24 billion.
22
During the year ended 2016, MGP received proceeds of $1.2 billion in connection with the MGP IPO inApril 2016 and paid $75 million of issuance costs related to the IPO, and we paid $100 million as part of theconsideration for the purchase of an additional 188.1 million common shares of our MGM China subsidiary.MGP paid a $15 million dividend and a $22 million dividend to its Class A shareholders in July 2016 andOctober 2016, respectively. In August 2016, MGM China paid an interim dividend of $58 million, of which $29million was distributed to noncontrolling interests. In June 2016, MGM China paid a final dividend of $46million of which $23 million was distributed to noncontrolling interests.
MGM China paid a $400 million special dividend in March 2015, a $120 million final dividend in June2015 and a $76 million interim dividend in August 2015, of which $196 million, $59 million and $37 million wasdistributed to noncontrolling interests, respectively. Additionally, we received $6 million in 2015 related toproceeds from the issuance of non-voting membership interests in MGM National Harbor. MGM China paid a$499 million special dividend in March 2014, a $127 million final dividend in June 2014, and a $137 millioninterim dividend in September 2014, of which $245 million, $62 million and $67 million was distributed tononcontrolling interests, respectively.
Other Factors Affecting Liquidity
Anticipated uses of cash. We have significant outstanding debt and contractual obligations in addition toplanned capital expenditures. At December 31, 2016, we had $13.1 billion in principal amount of indebtedness,including $250 million of borrowings outstanding under our $1.5 billion senior credit facility, $2.1 billionoutstanding under the $2.73 billion Operating Partnership credit facility, $1.9 billion outstanding under the $3.0billion MGM China credit facility and $450 million outstanding under the $525 million MGM National Harborcredit facility. We have an estimated $751 million of cash interest payments based on current outstanding debtand applicable interest rates within the next twelve months including the estimated impact of changes in ourinterest rates on the MGP term loan B and new interest rate swap agreements entered into subsequent to year end.We believe we have the ability to meet known obligations, including principal and interest obligations as well asplanned capital expenditures over the next twelve months from the balance sheet date with existing cash and cashdeposits, cash flows from operations, dividends and distributions from MGM China and the OperatingPartnership, and availability under our senior credit facility, the MGM China credit facility, the OperatingPartnership credit facility and the MGM National Harbor credit facility.
In addition, we have made significant investments through December 31, 2016 and we expect to makecapital investments as described below during 2017. See “Executive Overview” for further information regardingthe scope and timing of our significant development projects.
• Approximately $530 million in capital expenditures at our domestic resorts and corporate entities,excluding MGM National Harbor and MGM Springfield;
• Approximately $270 million in capital expenditures related to the MGM Springfield project; and• Approximately $150 million in capital expenditures related to MGM National Harbor.
During 2017, MGM China expects to spend approximately $100 million in maintenance capitalimprovements at MGM Macau and MGM Cotai once opened, and $990 million on the MGM Cotai project,excluding capitalized interest, development fees and land related costs.
Our capital expenditures fluctuate depending on our decisions with respect to strategic capital investmentsin new or existing resorts and the timing of capital investments to maintain the quality of our resorts, the amountsof which can vary depending on timing of larger remodel projects related to our public spaces and hotel rooms.Future capital expenditures could vary from our current expectations depending on the progress of ourdevelopment efforts and the structure of our ownership interests in future developments.
MGM Resorts International dividends. On February 15, 2017 the Board of Directors approved a quarterlydividend to holders of record on March 10, 2017 of $0.11 per share, totaling $63 million, which will be paid on
23

March 15, 2017. Our intention is to pay a quarterly dividend in each future quarter subject to our operatingresults, cash requirements and financial conditions, any applicable provisions of state law that may limit theamount of funds available to us, and compliance with covenants and financial ratios related to existing or futureagreements governing the indebtedness at our subsidiaries and any limitations in other agreements suchsubsidiaries may have with third parties.
MGP distributions. On December 15, 2016, MGP’s Board of Directors declared a quarterly dividend of$0.3875 per Class A share totaling $22 million, which was paid on January 16, 2017 to holders of record onDecember 31, 2016. We concurrently received a $72 million distribution attributable to Operating Partnershipunits owned by us from the Operating Partnership, which remained within the consolidated entity. MGP expectsto pay quarterly distributions in cash of approximately $22 million, equal to $0.3875 per share ($89 million on anannualized basis, equal to $1.55 per share) to its Class A shareholders, which amount may be changed in thefuture without advance notice.
MGM China dividend. On February 16, 2017, as part of its regular dividend policy, the Board of Directorsof MGM China announced it will recommend a final dividend for 2016 of $78 million to MGM Chinashareholders subject to approval at the MGM China 2017 annual shareholders meeting to be held in May. Ifapproved, we will receive our 56% share or $44 million, of which $4 million will be paid to Grand ParadiseMacau under the $50 million deferred cash payment arrangement related to our acquisition of the additional4.95% of MGM China shares in August of 2016. See Note 13 in the accompanying consolidated financialstatements for additional information regarding the deferred cash payment.
Principal Debt Arrangements
As discussed in “Executive Overview” in connection with the formation and IPO of MGP, we and MGPentered into several financing transactions including new principal debt agreements. See Note 10 to theaccompanying consolidated financial statements for additional information regarding those agreements.
In April 2016, we entered into an amended and restated credit agreement comprised of a $1.25 billionrevolving facility and a $250 million term loan A facility. The revolving facility and the term loan A facility bearinterest determined by reference to a total net leverage ratio pricing grid which results in an interest rate ofLIBOR plus 1.75% to 2.75%. Both the term loan A facility and the revolving facility will mature in April 2021.The term loan A facility is subject to amortization of principal in equal quarterly installments (commencing withthe fiscal quarter ended March 31, 2017), with 5.0% of the initial aggregate principal amount of the term loan Afacility to be payable each year. No amounts have been drawn on the revolving credit facility.
The amended and restated credit agreement contains customary representations and warranties, events ofdefault, and positive, negative and financial covenants, including that we maintain compliance with a maximumtotal net leverage ratio, a maximum first lien net leverage ratio and a minimum interest coverage ratio. We werein compliance with our amended and restated credit agreement covenants at December 31, 2016.
The amended and restated credit agreement is secured by (i) a mortgage on the real properties comprisingthe MGM Grand Las Vegas and the Bellagio, (ii) a pledge of substantially all existing and future personalproperty of our subsidiaries that own the MGM Grand Las Vegas and the Bellagio; and (iii) a pledge of theequity or limited liability company interests of the entities that own MGM Grand Las Vegas and the Bellagio.
Mandatory prepayments of the credit facilities will be required upon the occurrence of certain events,including sales of certain assets, casualty events and the incurrence of certain additional indebtedness, subject tocertain exceptions and reinvestment rights.
In April 2016, the Operating Partnership entered into a credit agreement comprised of a $300 million seniorsecured term loan A facility, a $1.85 billion senior secured term loan B facility, and a $600 million seniorsecured revolving credit facility. The term loan B facility was originally issued at 99.75% to initial leaders. The
24
revolving credit facility and term loan A facility bear interest determined by reference to a total net leverage ratiopricing grid which results in an interest rate of LIBOR plus 2.25% to 2.75%. On October 26, 2016 the term loanB facility was re-priced at par and bore interest at LIBOR plus 2.75%, with a LIBOR floor of 0.75%, whichrepresented a 50 basis point reduction compared to the prior rate. In addition, the Operating Partnership receiveda further reduction in pricing to LIBOR plus 2.50%, with a LIBOR floor of 0.75%, as a result of it achieving aminimum corporate family rating of Ba3/BB- in February 2017. The revolving credit facility and the term loan Afacility will mature in 2021 and the term loan B facility will mature in 2023. The term loan facilities are subjectto amortization of principal in equal quarterly installments, with 5.0% of the initial aggregate principal amount ofthe term loan A facility and 1.0% of the initial aggregate principal amount of the term loan B facility to bepayable each year.
The Operating Partnership credit agreement contains customary representations and warranties, events ofdefault, and positive, negative and financial covenants, including that the Operating Partnership maintaincompliance with a maximum senior secured net debt to adjusted total assets ratio, maximum total net debt toadjusted assets ratio and a minimum interest coverage ratio. The Operating Partnership was in compliance withits credit agreement covenants at December 31, 2016.
MGM China and MGM Grand Paradise, as co-borrowers, are parties to a fourth amended and restated creditfacility which consists of $1.55 billion of term loans and a $1.45 billion revolving credit facility. The interest rateon the facility fluctuates annually based on HIBOR plus a margin that ranges between 1.375% and 2.5% basedon MGM China’s leverage ratio. The credit facility matures in April 2019, with scheduled amortization paymentsof the term loans beginning in October 2017. The MGM China credit facility is secured by MGM GrandParadise’s interest in the Cotai land use right, and MGM China, MGM Grand Paradise and their guarantorsubsidiaries have granted a security interest in substantially all of their assets to secure the facility.
The MGM China credit facility contains customary representations and warranties, events of default, andpositive, negative and financial covenants, including that MGM China maintains compliance with a maximumleverage ratio and a minimum interest coverage ratio. MGM China was in compliance with its credit facilitycovenants at December 31, 2016. In February 2017, the MGM China credit facility was amended to increase themaximum total leverage ratio to 6.00 to 1.00 through December 31, 2017, declining to 5.50 to 1.00 at March 31,2018, 5.00 to 1.00 at June 30, 2018 and 4.50 to 1.00 at September 30, 2018 and thereafter.
In January 2016, MGM National Harbor, LLC entered into a credit agreement consisting of a $100 millionrevolving credit facility and a $425 million term loan facility. The revolving and term loan facilities bear interestat LIBOR plus an applicable rate determined by MGM National Harbor, LLC’s total leverage ratio (2.25% as ofDecember 31, 2016). The term loan and revolving facilities are scheduled to mature in January 2021 and the termloan facilities are subject to scheduled amortization payments on the last day of each calendar quarter beginningthe fourth full fiscal quarter following the opening date of MGM National Harbor, initially in an amount equal to1.25% of the aggregate principal balance and increasing to 1.875% and 2.50% of the aggregate principal balanceon the last day of the twelfth and sixteenth full fiscal quarters, respectively.
The MGM National Harbor credit agreement is secured by a leasehold mortgage on MGM National Harborand substantially all of the existing and future property of MGM National Harbor. Mandatory prepayments willbe required upon the occurrence of certain events, including sales of certain assets, casualty events and theincurrence of certain additional indebtedness, subject to certain exceptions and reinvestment rights. In addition,to the extent MGM National Harbor generates excess cash flow (as defined in the MGM National Harbor creditagreement), a percentage of such excess cash flow (ranging from 0% to 50% based on a total leverage ratio) willbe required to be used to prepay the term loan facilities commencing with the fiscal year ending 2017.
The MGM National Harbor credit agreement contains customary representations and warranties, events ofdefault, and positive, negative and financial covenants, including that MGM National Harbor, LLC and its restrictedsubsidiaries maintain compliance with a maximum total leverage ratio and a minimum interest coverage ratio.MGM National Harbor, LLC was in compliance with its credit agreement covenants at December 31, 2016.
25
Off Balance Sheet Arrangements
Our off-balance sheet arrangements consist primarily of investments in unconsolidated affiliates, whichconsist primarily of our investments in CityCenter, Grand Victoria, and Las Vegas Arena Company, LLC. Wehave not entered into any transactions with special purpose entities, nor have we engaged in any derivativetransactions, other than our MGP cash flow hedges. See Note 11 to the accompanying consolidated financialstatements for additional information. Our unconsolidated affiliate investments allow us to realize theproportionate benefits of owning a full-scale resort or other entertainment properties in a manner that minimizesour initial investment. We guarantee the T-Mobile Arena credit facility as described below. In addition, there areno other provisions in the agreements with our investees which we believe are unusual or subject us to risks towhich we would not be subjected if we had full ownership of the resort.
In conjunction with the Las Vegas Arena Company, LLC entering into a senior secured credit facility inSeptember 2014, we and AEG each entered into joint and several completion guarantees for the project (whichwere subsequently terminated in February 2017), as well as a repayment guarantee for the term loan B (which issubject to increases and decreases in the event of a rebalancing of the principal amount of indebtedness betweenthe term loan A and term loan B facilities). As of December 31, 2016, term loan A was $150 million and termloan B was $50 million.
Commitments and Contractual Obligations
The following table summarizes our scheduled contractual obligations as of December 31, 2016:
2017 2018 2019 2020 2021 Thereafter(In millions)
Long-term debt . . . . . . . . . . . . . . . . . . . . . . . . . . . . . . . . . . . . . . $ 138 $ 1,323 $ 1,997 $ 1,583 $ 2,057 $ 6,046Estimated interest payments on long-termdebt (1) 745 722 612 550 437 656
Construction commitments (2) . . . . . . . . . . . . . . . . . . . . . 643 79 - - - -Operating Leases (3) . . . . . . . . . . . . . . . . . . . . . . . . . . . . . . . . 37 33 30 30 32 1,380Capital leases . . . . . . . . . . . . . . . . . . . . . . . . . . . . . . . . . . . . . . . . 9 3 2 - - -Tax liabilities (4) . . . . . . . . . . . . . . . . . . . . . . . . . . . . . . . . . . . . 21 - - - - -Long-term liabilities . . . . . . . . . . . . . . . . . . . . . . . . . . . . . . . . 4 5 5 4 52 39Other obligations (5) . . . . . . . . . . . . . . . . . . . . . . . . . . . . . . . . 406 100 47 21 17 96
$ 2,003 $ 2,265 $ 2,693 $ 2,188 $ 2,595 $ 8,217
(1) Estimated interest payments are based on principal amounts and expected maturities of debt outstanding at December 31, 2016 andmanagement’s forecasted LIBOR rates for our senior credit facility and HIBOR rates for the MGM China credit facility. In December2016, the Operating Partnership entered into interest rate swap agreements to mitigate the interest rate risk inherent in its senior securedterm loan B facility. These interest rate swaps are designated as cash flow hedges and have a notional value of $500 million and matureon November 30, 2021. The weighted average fixed rate paid is 1.825%, and the variable rate received resets monthly to the one-monthLIBOR subject to a minimum rate of 0.75%.
(2) The amount for 2017 includes $471 million related to MGM Cotai and $39 million and $76 million related to MGM National Harborand MGM Springfield, respectively.
(3) The table above excludes our future lease obligations to a subsidiary of the Operating Partnership pursuant to the master leaseagreement discussed in Note 19 to the accompanying consolidated financial statements. We own 76.3% of the Operating Partnershipunits as of December 31, 2016. MGM National Harbor is located on land subject to a long-term ground lease. See Note 13 to theaccompanying consolidated financial statements for further discussion.
(4) Approximately $12 million of liabilities related to uncertain tax positions and other tax liabilities are excluded from the table as we cannotreasonably estimate when examination and other activity related to these amounts will conclude or when these amounts will be paid, if ever.
(5) The amount for 2017 includes $124 million related to employment agreements, $129 million for entertainment agreements and$120 million of open purchase orders. Other commitments include various contracted amounts, including information technology,advertising, maintenance and other service agreements. Our largest entertainment commitments consist of minimum contractualpayments to Cirque du Soleil, which performs shows at several of our resorts. Our contractual commitments for these shows generallydo not exceed 12 months and are based on our ability to exercise certain termination rights; however, we expect these shows to continuefor longer periods.
26
While we have significant indebtedness and other obligations, we believe we have the ability to meet knownobligations, including principal and interest obligations as well as planned capital expenditures over the nexttwelve months from the balance sheet date with existing cash and cash deposits, cash flows from operations,dividends and distributions from MGM China and the Operating Partnership, and availability under our seniorcredit facility, the MGM China credit facility, the Operating Partnership credit facility and the MGM NationalHarbor credit facility. We have $138 million of maturities of long-term debt in 2017. See “Liquidity and CapitalResources – Other Factors Affecting Liquidity” for further discussion of anticipated uses of cash.
Critical Accounting Policies and Estimates
Management’s discussion and analysis of our results of operations and liquidity and capital resources arebased on our consolidated financial statements. To prepare our consolidated financial statements in accordancewith accounting principles generally accepted in the United States of America, we must make estimates andassumptions that affect the amounts reported in the consolidated financial statements. We regularly evaluatethese estimates and assumptions, particularly in areas we consider to be critical accounting estimates, wherechanges in the estimates and assumptions could have a material effect on our results of operations, financialposition or cash flows. Senior management and the Audit Committee of the Board of Directors have reviewed thedisclosures included herein about our critical accounting estimates, and have reviewed the processes to determinethose estimates. However, by their nature, judgments are subject to an inherent degree of uncertainty andtherefore actual results can differ from our estimates.
Allowance for Doubtful Casino Accounts Receivable
Marker play represents a significant portion of the table games volume at certain of our Las Vegas resorts.Our other casinos do not emphasize marker play to the same extent, although we offer markers to customers atthose casinos as well. MGM China extends credit to certain in-house VIP gaming customers and gamingpromoters. We maintain strict controls over the issuance of markers and aggressively pursue collection from ourcustomers who fail to pay their marker balances timely. These collection efforts are similar to those used by mostlarge corporations when dealing with overdue customer accounts, including the mailing of statements anddelinquency notices, personal contacts, the use of outside collection agencies and civil litigation. Markers aregenerally legally enforceable instruments in the United States and Macau. At December 31, 2016 and 2015,approximately 53% and 42%, respectively, of our casino accounts receivable at our domestic resorts were owedby customers from the United States. Markers are not legally enforceable instruments in some foreign countries,but the United States assets of foreign customers may be reached to satisfy judgments entered in the UnitedStates. At December 31, 2016 and 2015, approximately 35% and 37%, respectively, of our casino accountsreceivable at our domestic resorts were owed by customers from the Far East. We consider the likelihood anddifficulty of enforceability, among other factors, when we issue credit to customers at our domestic resorts whoare not residents of the United States. MGM China performs background checks and investigates the creditworthiness of gaming promoters and casino customers prior to issuing credit.
We maintain an allowance, or reserve, for doubtful casino accounts at all of our operating casino resorts.The provision for doubtful accounts, an operating expense, increases the allowance for doubtful accounts. Weregularly evaluate the allowance for doubtful casino accounts. At domestic resorts where marker play is notsignificant, the allowance is generally established by applying standard reserve percentages to aged accountbalances. At domestic resorts where marker play is significant, we apply standard reserve percentages to agedaccount balances under a specified dollar amount and specifically analyze the collectability of each account witha balance over the specified dollar amount, based on the age of the account, the customer’s financial condition,collection history and any other known information. MGM China specifically analyzes the collectability ofcasino receivables on an individual basis taking into account the age of the account, the financial condition andthe collection history of the gaming promoter or casino customer.
In addition to enforceability issues, the collectability of unpaid markers given by foreign customers at ourdomestic resorts is affected by a number of factors, including changes in currency exchange rates and economic
27
conditions in the customers’ home countries. Because individual customer account balances can be significant,the allowance and the provision can change significantly between periods, as information about a certaincustomer becomes known or as changes in a region’s economy occur.
The following table shows key statistics related to our casino receivables:
December 31,
2016 2015(In thousands)
Casino receivables . . . . . . . . . . . . . . . . . . . . . . . . . . . . . . . . . . . . . . . . . . . . . . . . . . . . . . . . . . . . . . . . . . . . . . . . . . $ 332,443 $ 285,182Allowance for doubtful casino accounts receivable . . . . . . . . . . . . . . . . . . . . . . . . . . . . . . . . . . . . . 92,424 86,010Allowance as a percentage of casino accounts receivable . . . . . . . . . . . . . . . . . . . . . . . . . . . . . . . 28% 30%Percentage of casino accounts outstanding over 180 days . . . . . . . . . . . . . . . . . . . . . . . . . . . . . . 21% 26%
Approximately $35 million and $40 million of casino receivables and $8 million and $9 million of theallowance for doubtful casino accounts receivable relate to MGM China at December 31, 2016 and 2015,respectively. Casino receivables increased in the current year as a result of the Borgata transaction and theopening of MGM National Harbor. The allowance for doubtful accounts as a percentage of casino accountsreceivable has decreased in the current year due to a decrease in the age of outstanding account balances. AtDecember 31, 2016, a 100 basis-point change in the allowance for doubtful accounts as a percentage of casinoaccounts receivable would change income before income taxes by $3 million.
Fixed Asset Capitalization and Depreciation Policies
Property and equipment are stated at cost. For the majority of our property and equipment, cost wasdetermined at the acquisition date based on estimated fair values in connection with the August 2016 Borgataacquisition, the June 2011 MGM China acquisition, the April 2005 Mandalay acquisition and the May 2000Mirage Resorts acquisition. Maintenance and repairs that neither materially add to the value of the property norappreciably prolong its life are charged to expense as incurred. Depreciation and amortization are provided on astraight-line basis over the estimated useful lives of the assets. When we construct assets, we capitalize directcosts of the project, including fees paid to architects and contractors, property taxes, and certain costs of ourdesign and construction subsidiaries. In addition, interest cost associated with major development andconstruction projects is capitalized as part of the cost of the project. Interest is typically capitalized on amountsexpended on the project using the weighted-average cost of our outstanding borrowings. Capitalization of intereststarts when construction activities begin and ceases when construction is substantially complete or developmentactivity is suspended for more than a brief period.
We must make estimates and assumptions when accounting for capital expenditures. Whether anexpenditure is considered a maintenance expense or a capital asset is a matter of judgment. When constructing orpurchasing assets, we must determine whether existing assets are being replaced or otherwise impaired, whichalso may be a matter of judgment. In addition, our depreciation expense is highly dependent on the assumptionswe make about our assets’ estimated useful lives. We determine the estimated useful lives based on ourexperience with similar assets, engineering studies, and our estimate of the usage of the asset. Whenever eventsor circumstances occur which change the estimated useful life of an asset, we account for the changeprospectively.
Impairment of Long-lived Assets, Goodwill and Indefinite-lived Intangible Assets
We evaluate our property and equipment and other long-lived assets for impairment based on ourclassification as held for sale or to be held and used. Several criteria must be met before an asset is classified asheld for sale, including that management with the appropriate authority commits to a plan to sell the asset at areasonable price in relation to its fair value and is actively seeking a buyer. For assets classified as held for sale,we recognize the asset at the lower of carrying value or fair market value less costs of disposal, as estimated
28
based on comparable asset sales, offers received, or a discounted cash flow model. For assets to be held and used,we review for impairment whenever indicators of impairment exist. We then compare the estimated future cashflows of the asset, on an undiscounted basis, to the carrying value of the asset. If the undiscounted cash flowsexceed the carrying value, no impairment is indicated. If the undiscounted cash flows do not exceed the carryingvalue, then an impairment is recorded based on the fair value of the asset. For operating assets, fair value istypically measured using a discounted cash flow model whereby future cash flows are discounted using aweighted-average cost of capital, developed using a standard capital asset pricing model, based on guidelinecompanies in our industry. If an asset is still under development, future cash flows include remainingconstruction costs. All recognized impairment losses, whether for assets to be held for sale or assets to be heldand used, are recorded as operating expenses.
There are several estimates, assumptions and decisions in measuring impairments of long-lived assets. First,management must determine the usage of the asset. To the extent management decides that an asset will be sold,it is more likely that an impairment may be recognized. Assets must be tested at the lowest level for whichidentifiable cash flows exist. This means that some assets must be grouped, and management has some discretionin the grouping of assets. Future cash flow estimates are, by their nature, subjective and actual results may differmaterially from our estimates.
On a quarterly basis, we review our major long-lived assets to determine if events have occurred orcircumstances exist that indicate a potential impairment. Potential factors which could trigger an impairmentinclude underperformance compared to historical or projected operating results, negative industry or economicfactors, significant changes to our operating environment, or changes in intended use of the asset group. Weestimate future cash flows using our internal budgets and probability weight cash flows in certain circumstancesto consider alternative outcomes associated with recoverability of the asset group, including potential sale.Historically, undiscounted cash flows of our significant operating asset groups have exceeded their carryingvalues by a substantial margin.
We review indefinite-lived intangible assets and goodwill at least annually and between annual test dates incertain circumstances. We perform our annual impairment test for indefinite-lived intangible assets in the fourthquarter of each fiscal year. Indefinite-lived intangible assets consist primarily of license rights, which are testedfor impairment using a discounted cash flow approach, and trademarks, which are tested for impairment usingthe relief-from-royalty method. See Note 8 to the accompanying consolidated financial statements for furtherdiscussion of goodwill and other intangible assets.
Goodwill represents the excess of purchase price over the fair market value of net assets acquired inbusiness combinations. We test goodwill for relevant reporting units for impairment in the fourth quarter of eachyear and in interim periods if circumstances exist such that it is more likely than not that the carrying value of areporting unit exceeds its fair value. Accounting guidance provides entities the option to perform a qualitativeassessment of goodwill (commonly referred to as “step zero”) in order to determine whether further impairmenttesting is necessary. In performing the step zero analysis we take into account macroeconomic conditions,industry and market considerations, current and forecasted financial performance, entity-specific events, andchanges in the composition or carrying amount of net assets of reporting units. In addition, management takesinto consideration the amount of excess of fair value over carrying value determined in the last quantitativeanalysis that was performed, as well as the period of time that has passed since the last quantitative analysis. Ifthe step zero analysis indicates that it is more likely than not that the fair value of a reporting unit exceeds itscarrying value, further quantitative analysis is not required. If the step zero analysis indicates that it is morelikely than not that the fair value of a reporting unit is less than its carrying amount, the entity would proceed to atwo-step quantitative analysis.
Under the two-step quantitative analysis, goodwill for relevant reporting units is tested for impairment usinga discounted cash flow analysis based on our budgeted future results discounted using a weighted average cost ofcapital, developed using a standard capital asset pricing model based on guideline companies in our industry, andmarket indicators of terminal year capitalization rates, as well as a market approach that utilizes business
29
enterprise value multiples based on a range of multiples in our peer group. If the carrying value of the reportingunit exceeds its fair value, an indication of impairment exists and we must proceed to measure an impairmentloss, if any. In measuring an impairment loss, the implied fair value of a reporting unit’s goodwill is compared tothe carrying value of that goodwill. The implied fair value of goodwill is determined by allocating the fair valueof the reporting unit to its assets and liabilities and the amount remaining, if any, is the implied fair value ofgoodwill. If the implied fair value of goodwill is less than its carrying value then it must be written down to itsimplied fair value.
With the exception of our MGM China reporting unit, discussed below, none of our other reporting unitsincurred any goodwill impairment charges in 2016, 2015 or 2014. For our 2016 annual impairment test, weutilized the option to perform a step zero analysis for certain of our domestic resorts reporting units andconcluded it was more likely than not that the fair values of such reporting units exceeded their carrying valuesby a substantial margin. The estimated fair values of reporting units for which we elected to forego the step zeroanalysis and instead utilized the two-step quantitative analysis were substantially in excess of their carryingvalues. As discussed below, management makes significant judgments and estimates as part of these analyses. Iffuture operating results of our reporting units do not meet current expectations it could cause carrying values ofour reporting units to exceed their fair values in future periods, potentially resulting in a goodwill impairmentcharge.
During the fourth quarter of 2015, we conducted our annual impairment tests of goodwill by reviewing eachof our reporting units, including our MGM China reporting unit. The step one goodwill analysis of the MGMChina reporting unit indicated the fair value was less than its carrying value by 4%. The decrease in fair valueresulted from a decrease in forecasted cash flows based on then current market conditions and a sustained declinein the enterprise value multiples of the MGM China reporting unit as well as those of the MGM China reportingunit’s peer group. As a result of the indication of impairment from the step one analysis, we proceeded toperform a step two impairment analysis to measure the impairment loss. As such, we determined the fair valuesof all assets of the MGM China reporting unit, including its separately identifiable intangible assets. The fairvalues of each of the separately identifiable intangible assets exceeded their respective carrying values by asignificant amount, leading to a lower implied fair value of goodwill. Therefore, we recorded a $1.5 billion non-cash impairment charge to reduce the historical carrying value of goodwill related to the MGM China reportingunit to its implied fair value in 2015.
There are several estimates inherent in evaluating these assets for impairment. In particular, future cash flowestimates are, by their nature, subjective and actual results may differ materially from our estimates. In addition,the determination of multiples, capitalization rates and the discount rates used in the impairment tests are highlyjudgmental and dependent in large part on expectations of future market conditions.
See Note 8 to the accompanying consolidated financial statements for further discussion of goodwillimpairment.
Impairment of Investments in Unconsolidated Affiliates
We evaluate our investments in unconsolidated affiliates for impairment whenever events or changes incircumstances indicate that the carrying value of our investment may have experienced an other-than-temporarydecline in value. If such conditions exist, we compare the estimated fair value of the investment to its carryingvalue to determine whether an impairment is indicated and determine whether the impairment is other-than-temporary based on our assessment of relevant factors, including consideration of our intent and ability to retainour investment. We estimate fair value using a discounted cash flow analysis based on estimates of future cashflows and market indicators of discount rates and terminal year capitalization rates, as well as a market approachthat utilizes business enterprise value multiples based on a range of multiples in our peer group. See Note 7 andNote 17 to the accompanying consolidated financial statements for discussion of other-than-temporaryimpairment charges.
30

Income Taxes
We recognize deferred tax assets, net of applicable reserves, related to net operating loss and tax creditcarryforwards and certain temporary differences with a future tax benefit to the extent that realization of suchbenefit is more likely than not. Otherwise, a valuation allowance is applied.
As of December 31, 2016, we have a foreign tax credit carryover of $2.8 billion against which we haverecorded a valuation allowance of $2.5 billion based upon our assessment of future realization. The foreign taxcredits are attributable to the Macau Special Gaming Tax which is 35% of gross gaming revenue in Macau.Because MGM Grand Paradise is presently exempt from the Macau 12% complementary tax on gaming profits,we believe that payment of the Macau Special Gaming Tax qualifies as a tax paid in lieu of an income tax that iscreditable against U.S. taxes.
On September 7, 2016, MGM Grand Paradise was granted an additional extension of the complementary taxexemption through March 31, 2020, concurrent with the end of the term of its current gaming subconcession. Acompetitor of MGM Grand Paradise subsequently received an additional extension of its exemption throughMarch 31, 2020, which also runs concurrent with the end of the term of its current gaming concession. Basedupon these developments and the uncertainty concerning taxation after the concession renewal process, we haveconcluded that we can no longer assume that MGM Grand Paradise will be entitled to additional exemptionperiods beyond the end of the extension recently granted. Thus, for all periods beyond March 31, 2020, we haveassumed that MGM Grand Paradise will pay the Macau 12% complementary tax on gaming profits and will thusnot be able to credit the Macau Special Gaming Tax in such years, and have factored that assumption into ourassessment of the realization of the foreign tax credit deferred tax asset and the measurement of Macau deferredtax liabilities.
Due to improvements in our U.S. operations, we have generated U.S. operating profits for the past eightconsecutive quarters and as of June 30, 2016 we no longer had cumulative U.S. losses in recent years.Consequently, during 2016 we began to rely on future U.S. source operating income in assessing future foreigntax credit realization during the 10-year foreign tax credit carryover period.
Our assessment of realization of our foreign tax credit deferred tax asset is based on available evidence,including assumptions about future profitability of and distributions from MGM China and assumptionsconcerning future U.S. operating profits. As a result, significant judgment is required in assessing the possibleneed for a valuation allowance and changes to our assumptions may have a material impact on the amount of thevaluation allowance. For example, a change to our forecasts of future profitability of and distributions fromMGM China or a change in our assumptions concerning U.S. profitability could result in a material change in thevaluation allowance with a corresponding impact on the provision for income taxes in such period. In addition,should we in a future period actually receive an additional exemption from the complementary tax, an additionalvaluation allowance would likely need to be provided on some portion or all of the foreign tax credit deferred taxasset, resulting in an increase in the provision for income taxes in such period and such increase may bematerial.
In addition, there is a $3 million valuation allowance, after federal effect, provided on certain state deferredtax assets, a valuation allowance of $71 million on certain Macau deferred tax assets, and a valuation allowanceof $2 million on Hong Kong net operating losses because we believe these assets do not meet the “more likelythan not” criteria for recognition.
We file income tax returns in the U.S. federal jurisdiction, various state and local jurisdictions, and foreignjurisdictions, although the income taxes paid in foreign jurisdictions are not material. Our income tax returns aresubject to examination by the Internal Revenue Service (“IRS”) and other tax authorities. Positions taken in taxreturns are sometimes subject to uncertainty in the tax laws and may not ultimately be accepted by the IRS orother tax authorities. See Note 12 in the accompanying consolidated financial statements for a discussion of thestatus and impact of examinations by tax authorities.
31
We assess our tax positions using a two-step process. A tax position is recognized if it meets a “more likelythan not” threshold, and is measured at the largest amount of benefit that is greater than fifty percent likely ofbeing realized. Uncertain tax positions must be reviewed at each balance sheet date. Liabilities we record as aresult of this analysis are recorded separately from any current or deferred income tax accounts, and are classifiedas current in “Other accrued liabilities” or long-term in “Other long-term liabilities” based on the time untilexpected payment. Additionally, we recognize accrued interest and penalties, if any, related to unrecognized taxbenefits in income tax expense.
Stock-based Compensation
We account for stock options and stock appreciation rights (“SARs”) measuring fair value using the Black-Scholes model. For restricted share units (“RSUs”), compensation expense is calculated based on the fair marketvalue of our stock on the date of grant. We account for performance stock units (“PSUs”) measuring fair valueusing the Monte Carlo valuation model. There are several management assumptions required to determine theinputs into the Black-Scholes model and Monte Carlo valuation model. Our volatility and expected termassumptions used in the Black-Scholes model can significantly affect the fair value of stock options and SARs.The Monte Carlo valuation model also utilizes multiple assumptions, including volatility, to determine the fairvalue of the award. Changes in the subjective assumptions can materially affect the estimate of the fair value ofshare-based compensation and consequently, the related amount recognized in the consolidated financialstatements. The extent of the impact will depend, in part, on the extent of awards in any given year.
Market Risk
In addition to the inherent risks associated with our normal operations, we are also exposed to additionalmarket risks. Market risk is the risk of loss arising from adverse changes in market rates and prices, such asinterest rates and foreign currency exchange rates. Our primary exposure to market risk is interest rate riskassociated with our variable rate long-term debt. We attempt to limit our exposure to interest rate risk bymanaging the mix of our long-term fixed rate borrowings and short-term borrowings under our bank creditfacilities. A change in interest rates generally does not have an impact upon our future earnings and cash flow forfixed-rate debt instruments. As fixed-rate debt matures, however, and if additional debt is acquired to fund thedebt repayment, future earnings and cash flow may be affected by changes in interest rates. This effect would berealized in the periods subsequent to the periods when the debt matures. We do not hold or issue financialinstruments for trading purposes and do not enter into derivative transactions that would be consideredspeculative positions.
In December 2016, the Operating Partnership entered into interest rate swap agreements to mitigate theinterest rate risk inherent in its senior secured term loan B facility. These interest rate swaps are designated ascash flow hedges and have a notional value of $500 million and mature on November 30, 2021. The weightedaverage fixed rate paid is 1.825%, and the variable rate received resets monthly to the one-month LIBOR subjectto a minimum rate of 0.75%. In January 2017, the Operating Partnership entered into additional interest rate swapagreements through November 2021 with a total $700 million notional amount to pay a fixed rate of 1.964% andreceive the 1-month LIBOR rate in order to mitigate the interest rate risk inherent in its senior secured term loanB facility. The Company does not currently have any master netting arrangements related to its derivativecontracts. See Note 11 for additional information.
As of December 31, 2016, variable rate borrowings represented approximately 32% of our total borrowingsafter giving effect to the $500 million notional amount Operating Partnership interest rate swaps discussed above.Assuming a 100 basis-point increase in LIBOR (in the case of the MGP term loan B facility, over the 0.75%floor specified in the Operating Partnership credit facility and after giving effect to the $500 million notionalamount Operating Partnership interest rate swaps discussed above), our annual interest cost would increase by$23 million based on gross amounts outstanding at December 31, 2016. Assuming a 100 basis-point increase inHIBOR for the MGM China credit facility, our annual interest cost would increase by $19 million based onamounts outstanding at December 31, 2016. The following table provides additional information about our gross
32
long-term debt subject to changes in interest rates excluding the effect of the Operating Partnership interest rateswaps discussed above:
Debt maturing in, Fair ValueDecember 31,
20162017 2018 2019 2020 2021 Thereafter Total(In millions)
Fixed-rate . . . . . . . . . . . . . . . . . . . . . . . . . . $ - $ 475 $ 850 $ 1,500 $ 1,250 $ 4,303 $ 8,378 $ 9,114Average interest rate . . . . . . . . . . . . . . N/A 11.4% 8.6% 6.3% 6.6% 6.0% 6.7%Variable rate . . . . . . . . . . . . . . . . . . . . . . . $ 138 $ 848 $ 1,147 $ 82 $ 807 $ 1,744 $ 4,766 $ 4,772Average interest rate . . . . . . . . . . . . . . 3.0% 2.8% 2.7% 3.2% 3.2% 3.5% 3.1%
In addition to the risk associated with our variable interest rate debt, we are also exposed to risks related tochanges in foreign currency exchange rates, mainly related to MGM China and to our operations at MGM Macauand the development of MGM Cotai. While recent fluctuations in exchange rates have not been significant,potential changes in policy by governments or fluctuations in the economies of the United States, China, Macauor Hong Kong could cause variability in these exchange rates. We cannot assure you that the Hong Kong dollarwill continue to be pegged to the U.S. dollar or the current peg rate for the Hong Kong dollar will remain at thesame level. The possible changes to the peg of the Hong Kong dollar may result in severe fluctuations in theexchange rate thereof. As of December 31, 2016, a 1% increase in the Hong Kong dollar (the functional currencyof MGM China) to the U.S. dollar exchange rate would impact the carrying value of our cash balance by $4million and a 1% decrease in the exchange rate would impact the carrying value of our debt balance by $20million.
33
MANAGEMENT’S ANNUAL REPORTON INTERNAL CONTROL OVER FINANCIAL REPORTING
Management’s Responsibilities
Management is responsible for establishing and maintaining adequate internal control over financialreporting (as defined in Sections 13a-15(f) and 15d-15(f) of the Exchange Act) for MGM Resorts Internationaland subsidiaries (the “Company”).
Objective of Internal Control over Financial Reporting
In establishing adequate internal control over financial reporting, management has developed andmaintained a system of internal control, policies and procedures designed to provide reasonable assurance thatinformation contained in the accompanying consolidated financial statements and other information presented inthis annual report is reliable, does not contain any untrue statement of a material fact or omit to state a materialfact, and fairly presents in all material respects the financial condition, results of operations and cash flows of theCompany as of and for the periods presented in this annual report. These include controls and proceduresdesigned to ensure that this information is accumulated and communicated to the Company’s management,including its principal executive officer and principal financial officer, as appropriate for all timely decisionsregarding required disclosure. Significant elements of the Company’s internal control over financial reportinginclude, for example:
• Hiring skilled accounting personnel and training them appropriately;• Written accounting policies;• Written documentation of accounting systems and procedures;• Segregation of incompatible duties;• Internal audit function to monitor the effectiveness of the system of internal control; and• Oversight by an independent Audit Committee of the Board of Directors.
Management’s Evaluation
Management, with the participation of the Company’s principal executive officer and principal financialofficer, has evaluated the Company’s internal control over financial reporting using the criteria established inInternal Control - Integrated Framework (2013) issued by the Committee of Sponsoring Organizations of theTreadway Commission. In making its assessment of internal control over financial reporting as of December 31,2016, the Company has excluded the operations of Marina District Development Company, LLC, which ownsand operates Borgata Hotel Casino & Spa (“Borgata”) because these operations were acquired in a businesscombination on August 1, 2016. These operations represent approximately 7% of the Company’s total assets atDecember 31, 2016 and approximately 4% of the Company’s total net revenues for the year ended December 31,2016. The Company intends to disclose any material changes in internal control over financial reporting withrespect to the Borgata operations in the year ending December 31, 2017, the first annual assessment of internalcontrol over financial reporting in which it is required to include Borgata.
Based on its evaluation as of December 31, 2016, management believes that the Company’s internal controlover financial reporting is effective in achieving the objectives described above.
Report of Independent Registered Public Accounting Firm
Deloitte & Touche LLP audited the Company’s consolidated financial statements as of and for the yearended December 31, 2016 and issued their report thereon, which is included in this annual report. Deloitte &Touche LLP has also issued an attestation report on the effectiveness of the Company’s internal control overfinancial reporting and such report is also included in this annual report.
34
REPORT OF INDEPENDENT REGISTERED PUBLIC ACCOUNTING FIRM
To the Board of Directors and Stockholders ofMGM Resorts International
We have audited the internal control over financial reporting of MGM Resorts International and subsidiaries(the “Company”) as of December 31, 2016, based on criteria established in Internal Control — IntegratedFramework (2013) issued by the Committee of Sponsoring Organizations of the Treadway Commission. Asdescribed in Management’s Annual Report on Internal Control Over Financial Reporting, management excludedfrom its assessment the internal control over financial reporting at Marina District Development Company, LLC(the Borgata Hotel Casino & Spa), which was acquired on August 1, 2016, and whose financial statementsconstitute 7% of total assets and 4% of total net revenues of the Company’s consolidated financial statementamounts as of and for the year ended December 31, 2016. Accordingly, our audit did not include the internalcontrol over financial reporting at Marina District Development Company, LLC. The Company’s management isresponsible for maintaining effective internal control over financial reporting and for its assessment of theeffectiveness of internal control over financial reporting, included in the accompanying Management’s AnnualReport on Internal Control Over Financial Reporting. Our responsibility is to express an opinion on theeffectiveness of the Company’s internal control over financial reporting based on our audit.
We conducted our audit in accordance with the standards of the Public Company Accounting OversightBoard (United States). Those standards require that we plan and perform the audit to obtain reasonable assuranceabout whether effective internal control over financial reporting was maintained in all material respects. Ouraudit included obtaining an understanding of internal control over financial reporting, assessing the risk that amaterial weakness exists, testing and evaluating the design and operating effectiveness of internal control basedon the assessed risk, and performing such other procedures as we considered necessary in the circumstances. Webelieve that our audit provides a reasonable basis for our opinion.
A company’s internal control over financial reporting is a process designed by, or under the supervision of,the company’s principal executive and principal financial officers, or persons performing similar functions, andeffected by the company’s board of directors, management, and other personnel to provide reasonable assuranceregarding the reliability of financial reporting and the preparation of financial statements for external purposes inaccordance with generally accepted accounting principles. A company’s internal control over financial reportingincludes those policies and procedures that (1) pertain to the maintenance of records that, in reasonable detail,accurately and fairly reflect the transactions and dispositions of the assets of the company; (2) provide reasonableassurance that transactions are recorded as necessary to permit preparation of financial statements in accordancewith generally accepted accounting principles, and that receipts and expenditures of the company are being madeonly in accordance with authorizations of management and directors of the company; and (3) provide reasonableassurance regarding prevention or timely detection of unauthorized acquisition, use, or disposition of thecompany’s assets that could have a material effect on the financial statements.
Because of the inherent limitations of internal control over financial reporting, including the possibility ofcollusion or improper management override of controls, material misstatements due to error or fraud may not beprevented or detected on a timely basis. Also, projections of any evaluation of the effectiveness of the internalcontrol over financial reporting to future periods are subject to the risk that the controls may become inadequatebecause of changes in conditions, or that the degree of compliance with the policies or procedures may deteriorate.
In our opinion, the Company maintained, in all material respects, effective internal control over financialreporting as of December 31, 2016, based on the criteria established in Internal Control — Integrated Framework(2013) issued by the Committee of Sponsoring Organizations of the Treadway Commission.
We have also audited, in accordance with the standards of the Public Company Accounting Oversight Board(United States), the consolidated financial statements as of and for the year ended December 31, 2016. Our reportdated March 1, 2017 expressed an unqualified opinion on those financial statements.
/s/ DELOITTE & TOUCHE LLP
Las Vegas, NevadaMarch 1, 2017
35
REPORT OF INDEPENDENT REGISTERED PUBLIC ACCOUNTING FIRM
To the Board of Directors and Stockholders ofMGM Resorts International
We have audited the accompanying consolidated balance sheets of MGM Resorts International andsubsidiaries (the “Company”) as of December 31, 2016 and 2015, and the related consolidated statements ofoperations, comprehensive income (loss), stockholders’ equity, and cash flows for each of the three years in theperiod ended December 31, 2016. These financial statements are the responsibility of the Company’smanagement. Our responsibility is to express an opinion on the financial statements based on our audits.
We conducted our audits in accordance with the standards of the Public Company Accounting OversightBoard (United States). Those standards require that we plan and perform the audit to obtain reasonable assuranceabout whether the financial statements are free of material misstatement. An audit includes examining, on a testbasis, evidence supporting the amounts and disclosures in the financial statements. An audit also includesassessing the accounting principles used and significant estimates made by management, as well as evaluatingthe overall financial statement presentation. We believe that our audits provide a reasonable basis for ouropinion.
In our opinion, such consolidated financial statements present fairly, in all material respects, the financialposition of MGM Resorts International and subsidiaries as of December 31, 2016 and 2015, and the results oftheir operations and their cash flows for each of the three years in the period ended December 31, 2016, inconformity with accounting principles generally accepted in the United States of America.
We have also audited, in accordance with the standards of the Public Company Accounting Oversight Board(United States), the Company’s internal control over financial reporting as of December 31, 2016, based on thecriteria established in Internal Control — Integrated Framework (2013) issued by the Committee of SponsoringOrganizations of the Treadway Commission and our report dated March 1, 2017, expressed an unqualifiedopinion on the Company’s internal control over financial reporting.
/s/ DELOITTE & TOUCHE LLP
Las Vegas, NevadaMarch 1, 2017
36

MGM RESORTS INTERNATIONAL AND SUBSIDIARIESCONSOLIDATED BALANCE SHEETS
(In thousands, except share data)
December 31,
2016 2015
ASSETSCurrent assetsCash and cash equivalents . . . . . . . . . . . . . . . . . . . . . . . . . . . . . . . . . . . . . . . . . . . . . . . . . . . . . . . . . . . . . $ 1,446,581 $ 1,670,312Accounts receivable, net . . . . . . . . . . . . . . . . . . . . . . . . . . . . . . . . . . . . . . . . . . . . . . . . . . . . . . . . . . . . . . . 542,924 480,559Inventories . . . . . . . . . . . . . . . . . . . . . . . . . . . . . . . . . . . . . . . . . . . . . . . . . . . . . . . . . . . . . . . . . . . . . . . . . . . . . . . 97,733 104,200Income tax receivable . . . . . . . . . . . . . . . . . . . . . . . . . . . . . . . . . . . . . . . . . . . . . . . . . . . . . . . . . . . . . . . . . . - 15,993Prepaid expenses and other . . . . . . . . . . . . . . . . . . . . . . . . . . . . . . . . . . . . . . . . . . . . . . . . . . . . . . . . . . . . 142,349 137,685
Total current assets . . . . . . . . . . . . . . . . . . . . . . . . . . . . . . . . . . . . . . . . . . . . . . . . . . . . . . . . . . . . . . . . . . 2,229,587 2,408,749
Property and equipment, net . . . . . . . . . . . . . . . . . . . . . . . . . . . . . . . . . . . . . . . . . . . . . . . . . . . . . . . . . . . 18,425,023 15,371,795
Other assetsInvestments in and advances to unconsolidated affiliates . . . . . . . . . . . . . . . . . . . . . . . . . . . 1,220,443 1,491,497Goodwill . . . . . . . . . . . . . . . . . . . . . . . . . . . . . . . . . . . . . . . . . . . . . . . . . . . . . . . . . . . . . . . . . . . . . . . . . . . . . . . . . 1,817,119 1,430,767Other intangible assets, net . . . . . . . . . . . . . . . . . . . . . . . . . . . . . . . . . . . . . . . . . . . . . . . . . . . . . . . . . . . . 4,087,706 4,164,781Other long-term assets, net . . . . . . . . . . . . . . . . . . . . . . . . . . . . . . . . . . . . . . . . . . . . . . . . . . . . . . . . . . . . . 393,423 347,589
Total other assets . . . . . . . . . . . . . . . . . . . . . . . . . . . . . . . . . . . . . . . . . . . . . . . . . . . . . . . . . . . . . . . . . . . . . 7,518,691 7,434,634
$28,173,301 $25,215,178
LIABILITIES AND STOCKHOLDERS’ EQUITYCurrent liabilitiesAccounts payable . . . . . . . . . . . . . . . . . . . . . . . . . . . . . . . . . . . . . . . . . . . . . . . . . . . . . . . . . . . . . . . . . . . . . . . $ 250,477 $ 182,031Construction payable . . . . . . . . . . . . . . . . . . . . . . . . . . . . . . . . . . . . . . . . . . . . . . . . . . . . . . . . . . . . . . . . . . . 270,361 250,120Income taxes payable . . . . . . . . . . . . . . . . . . . . . . . . . . . . . . . . . . . . . . . . . . . . . . . . . . . . . . . . . . . . . . . . . . . 10,654 -Current portion of long-term debt . . . . . . . . . . . . . . . . . . . . . . . . . . . . . . . . . . . . . . . . . . . . . . . . . . . . . 8,375 328,442Accrued interest on long-term debt . . . . . . . . . . . . . . . . . . . . . . . . . . . . . . . . . . . . . . . . . . . . . . . . . . . 159,028 165,914Other accrued liabilities . . . . . . . . . . . . . . . . . . . . . . . . . . . . . . . . . . . . . . . . . . . . . . . . . . . . . . . . . . . . . . . . 1,594,526 1,311,444
Total current liabilities . . . . . . . . . . . . . . . . . . . . . . . . . . . . . . . . . . . . . . . . . . . . . . . . . . . . . . . . . . . . . . 2,293,421 2,237,951
Deferred income taxes, net . . . . . . . . . . . . . . . . . . . . . . . . . . . . . . . . . . . . . . . . . . . . . . . . . . . . . . . . . . . . . . 2,551,228 2,680,576Long-term debt . . . . . . . . . . . . . . . . . . . . . . . . . . . . . . . . . . . . . . . . . . . . . . . . . . . . . . . . . . . . . . . . . . . . . . . . . . . 12,979,220 12,368,311Other long-term obligations . . . . . . . . . . . . . . . . . . . . . . . . . . . . . . . . . . . . . . . . . . . . . . . . . . . . . . . . . . . . 325,981 157,663Commitments and contingencies (Note 13)Redeemable noncontrolling interests . . . . . . . . . . . . . . . . . . . . . . . . . . . . . . . . . . . . . . . . . . . . . . . . . . 54,139 6,250Stockholders’ equityCommon stock, $.01 par value: authorized 1,000,000,000 shares, issued andoutstanding 574,123,706 and 564,838,893 shares . . . . . . . . . . . . . . . . . . . . . . . . . . . . . . . . . 5,741 5,648
Capital in excess of par value . . . . . . . . . . . . . . . . . . . . . . . . . . . . . . . . . . . . . . . . . . . . . . . . . . . . . . . . . . 5,653,575 5,655,886Retained earnings (accumulated deficit) . . . . . . . . . . . . . . . . . . . . . . . . . . . . . . . . . . . . . . . . . . . . . . 545,811 (555,629)Accumulated other comprehensive income . . . . . . . . . . . . . . . . . . . . . . . . . . . . . . . . . . . . . . . . . . 15,053 14,022
Total MGM Resorts International stockholders’ equity . . . . . . . . . . . . . . . . . . . . . . . . . . 6,220,180 5,119,927Noncontrolling interests . . . . . . . . . . . . . . . . . . . . . . . . . . . . . . . . . . . . . . . . . . . . . . . . . . . . . . . . . . . . . . . . 3,749,132 2,644,500
Total stockholders’ equity . . . . . . . . . . . . . . . . . . . . . . . . . . . . . . . . . . . . . . . . . . . . . . . . . . . . . . . . . . . 9,969,312 7,764,427
$28,173,301 $25,215,178
The accompanying notes are an integral part of these consolidated financial statements.
37
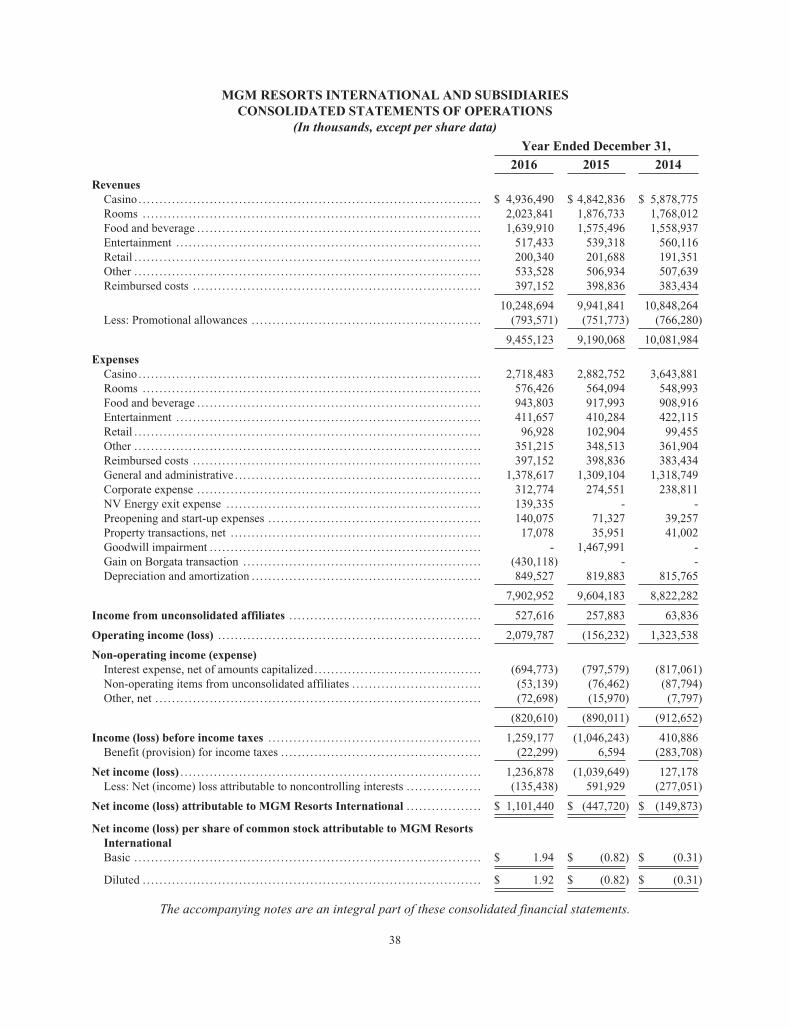
MGM RESORTS INTERNATIONAL AND SUBSIDIARIESCONSOLIDATED STATEMENTS OF OPERATIONS
(In thousands, except per share data)
Year Ended December 31,
2016 2015 2014
RevenuesCasino . . . . . . . . . . . . . . . . . . . . . . . . . . . . . . . . . . . . . . . . . . . . . . . . . . . . . . . . . . . . . . . . . . . . . . . . . . . . . . . . . . $ 4,936,490 $ 4,842,836 $ 5,878,775Rooms . . . . . . . . . . . . . . . . . . . . . . . . . . . . . . . . . . . . . . . . . . . . . . . . . . . . . . . . . . . . . . . . . . . . . . . . . . . . . . . . . 2,023,841 1,876,733 1,768,012Food and beverage . . . . . . . . . . . . . . . . . . . . . . . . . . . . . . . . . . . . . . . . . . . . . . . . . . . . . . . . . . . . . . . . . . . . 1,639,910 1,575,496 1,558,937Entertainment . . . . . . . . . . . . . . . . . . . . . . . . . . . . . . . . . . . . . . . . . . . . . . . . . . . . . . . . . . . . . . . . . . . . . . . . . 517,433 539,318 560,116Retail . . . . . . . . . . . . . . . . . . . . . . . . . . . . . . . . . . . . . . . . . . . . . . . . . . . . . . . . . . . . . . . . . . . . . . . . . . . . . . . . . . . 200,340 201,688 191,351Other . . . . . . . . . . . . . . . . . . . . . . . . . . . . . . . . . . . . . . . . . . . . . . . . . . . . . . . . . . . . . . . . . . . . . . . . . . . . . . . . . . . 533,528 506,934 507,639Reimbursed costs . . . . . . . . . . . . . . . . . . . . . . . . . . . . . . . . . . . . . . . . . . . . . . . . . . . . . . . . . . . . . . . . . . . . . 397,152 398,836 383,434
10,248,694 9,941,841 10,848,264Less: Promotional allowances . . . . . . . . . . . . . . . . . . . . . . . . . . . . . . . . . . . . . . . . . . . . . . . . . . . . . . . (793,571) (751,773) (766,280)
9,455,123 9,190,068 10,081,984
ExpensesCasino . . . . . . . . . . . . . . . . . . . . . . . . . . . . . . . . . . . . . . . . . . . . . . . . . . . . . . . . . . . . . . . . . . . . . . . . . . . . . . . . . . 2,718,483 2,882,752 3,643,881Rooms . . . . . . . . . . . . . . . . . . . . . . . . . . . . . . . . . . . . . . . . . . . . . . . . . . . . . . . . . . . . . . . . . . . . . . . . . . . . . . . . . 576,426 564,094 548,993Food and beverage . . . . . . . . . . . . . . . . . . . . . . . . . . . . . . . . . . . . . . . . . . . . . . . . . . . . . . . . . . . . . . . . . . . . 943,803 917,993 908,916Entertainment . . . . . . . . . . . . . . . . . . . . . . . . . . . . . . . . . . . . . . . . . . . . . . . . . . . . . . . . . . . . . . . . . . . . . . . . . 411,657 410,284 422,115Retail . . . . . . . . . . . . . . . . . . . . . . . . . . . . . . . . . . . . . . . . . . . . . . . . . . . . . . . . . . . . . . . . . . . . . . . . . . . . . . . . . . . 96,928 102,904 99,455Other . . . . . . . . . . . . . . . . . . . . . . . . . . . . . . . . . . . . . . . . . . . . . . . . . . . . . . . . . . . . . . . . . . . . . . . . . . . . . . . . . . . 351,215 348,513 361,904Reimbursed costs . . . . . . . . . . . . . . . . . . . . . . . . . . . . . . . . . . . . . . . . . . . . . . . . . . . . . . . . . . . . . . . . . . . . . 397,152 398,836 383,434General and administrative . . . . . . . . . . . . . . . . . . . . . . . . . . . . . . . . . . . . . . . . . . . . . . . . . . . . . . . . . . . 1,378,617 1,309,104 1,318,749Corporate expense . . . . . . . . . . . . . . . . . . . . . . . . . . . . . . . . . . . . . . . . . . . . . . . . . . . . . . . . . . . . . . . . . . . . 312,774 274,551 238,811NV Energy exit expense . . . . . . . . . . . . . . . . . . . . . . . . . . . . . . . . . . . . . . . . . . . . . . . . . . . . . . . . . . . . . 139,335 - -Preopening and start-up expenses . . . . . . . . . . . . . . . . . . . . . . . . . . . . . . . . . . . . . . . . . . . . . . . . . . . 140,075 71,327 39,257Property transactions, net . . . . . . . . . . . . . . . . . . . . . . . . . . . . . . . . . . . . . . . . . . . . . . . . . . . . . . . . . . . . 17,078 35,951 41,002Goodwill impairment . . . . . . . . . . . . . . . . . . . . . . . . . . . . . . . . . . . . . . . . . . . . . . . . . . . . . . . . . . . . . . . . . - 1,467,991 -Gain on Borgata transaction . . . . . . . . . . . . . . . . . . . . . . . . . . . . . . . . . . . . . . . . . . . . . . . . . . . . . . . . . (430,118) - -Depreciation and amortization . . . . . . . . . . . . . . . . . . . . . . . . . . . . . . . . . . . . . . . . . . . . . . . . . . . . . . . 849,527 819,883 815,765
7,902,952 9,604,183 8,822,282
Income from unconsolidated affiliates . . . . . . . . . . . . . . . . . . . . . . . . . . . . . . . . . . . . . . . . . . . . . . 527,616 257,883 63,836
Operating income (loss) . . . . . . . . . . . . . . . . . . . . . . . . . . . . . . . . . . . . . . . . . . . . . . . . . . . . . . . . . . . . . . . 2,079,787 (156,232) 1,323,538
Non-operating income (expense)Interest expense, net of amounts capitalized. . . . . . . . . . . . . . . . . . . . . . . . . . . . . . . . . . . . . . . . (694,773) (797,579) (817,061)Non-operating items from unconsolidated affiliates . . . . . . . . . . . . . . . . . . . . . . . . . . . . . . . (53,139) (76,462) (87,794)Other, net . . . . . . . . . . . . . . . . . . . . . . . . . . . . . . . . . . . . . . . . . . . . . . . . . . . . . . . . . . . . . . . . . . . . . . . . . . . . . . (72,698) (15,970) (7,797)
(820,610) (890,011) (912,652)
Income (loss) before income taxes . . . . . . . . . . . . . . . . . . . . . . . . . . . . . . . . . . . . . . . . . . . . . . . . . . . 1,259,177 (1,046,243) 410,886Benefit (provision) for income taxes . . . . . . . . . . . . . . . . . . . . . . . . . . . . . . . . . . . . . . . . . . . . . . . . (22,299) 6,594 (283,708)
Net income (loss) . . . . . . . . . . . . . . . . . . . . . . . . . . . . . . . . . . . . . . . . . . . . . . . . . . . . . . . . . . . . . . . . . . . . . . . . 1,236,878 (1,039,649) 127,178Less: Net (income) loss attributable to noncontrolling interests . . . . . . . . . . . . . . . . . . (135,438) 591,929 (277,051)
Net income (loss) attributable to MGM Resorts International . . . . . . . . . . . . . . . . . . $ 1,101,440 $ (447,720) $ (149,873)
Net income (loss) per share of common stock attributable to MGM ResortsInternationalBasic . . . . . . . . . . . . . . . . . . . . . . . . . . . . . . . . . . . . . . . . . . . . . . . . . . . . . . . . . . . . . . . . . . . . . . . . . . . . . . . . . . . $ 1.94 $ (0.82) $ (0.31)
Diluted . . . . . . . . . . . . . . . . . . . . . . . . . . . . . . . . . . . . . . . . . . . . . . . . . . . . . . . . . . . . . . . . . . . . . . . . . . . . . . . . . $ 1.92 $ (0.82) $ (0.31)
The accompanying notes are an integral part of these consolidated financial statements.
38
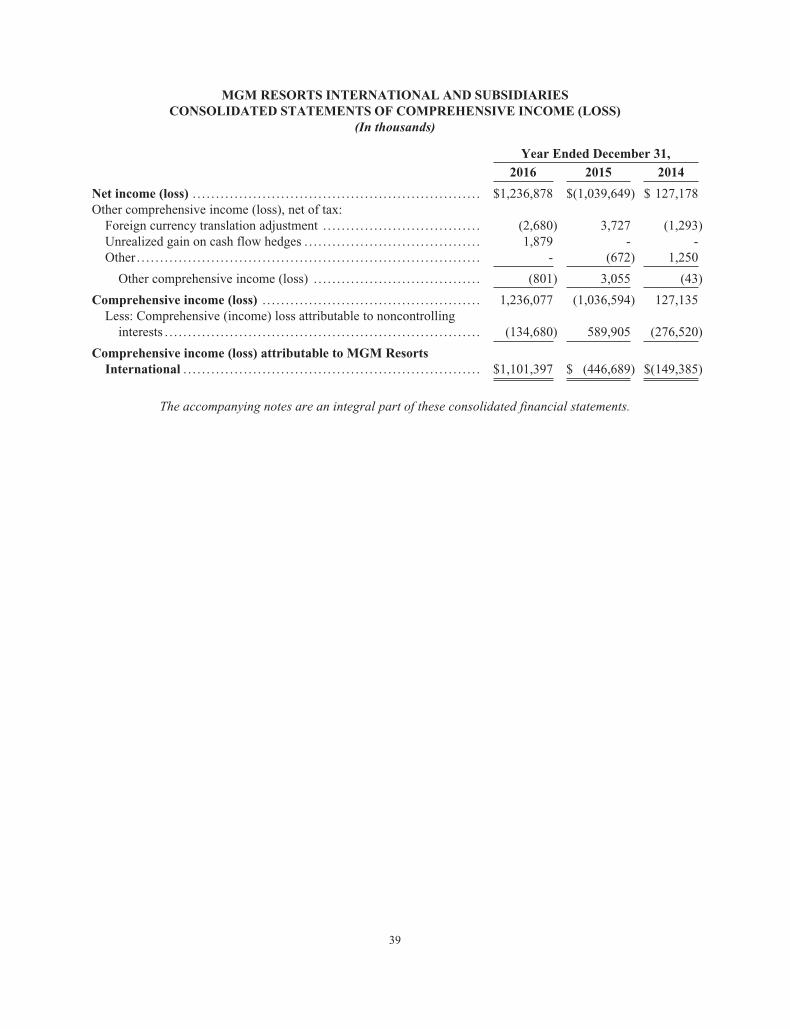
MGM RESORTS INTERNATIONAL AND SUBSIDIARIESCONSOLIDATED STATEMENTS OF COMPREHENSIVE INCOME (LOSS)
(In thousands)
Year Ended December 31,
2016 2015 2014
Net income (loss) . . . . . . . . . . . . . . . . . . . . . . . . . . . . . . . . . . . . . . . . . . . . . . . . . . . . . . . . . . . . . . $1,236,878 $(1,039,649) $ 127,178Other comprehensive income (loss), net of tax:Foreign currency translation adjustment . . . . . . . . . . . . . . . . . . . . . . . . . . . . . . . . . . (2,680) 3,727 (1,293)Unrealized gain on cash flow hedges . . . . . . . . . . . . . . . . . . . . . . . . . . . . . . . . . . . . . . 1,879 - -Other . . . . . . . . . . . . . . . . . . . . . . . . . . . . . . . . . . . . . . . . . . . . . . . . . . . . . . . . . . . . . . . . . . . . . . . . . . - (672) 1,250
Other comprehensive income (loss) . . . . . . . . . . . . . . . . . . . . . . . . . . . . . . . . . . . . (801) 3,055 (43)
Comprehensive income (loss) . . . . . . . . . . . . . . . . . . . . . . . . . . . . . . . . . . . . . . . . . . . . . . . 1,236,077 (1,036,594) 127,135Less: Comprehensive (income) loss attributable to noncontrollinginterests . . . . . . . . . . . . . . . . . . . . . . . . . . . . . . . . . . . . . . . . . . . . . . . . . . . . . . . . . . . . . . . . . . . . (134,680) 589,905 (276,520)
Comprehensive income (loss) attributable to MGM ResortsInternational . . . . . . . . . . . . . . . . . . . . . . . . . . . . . . . . . . . . . . . . . . . . . . . . . . . . . . . . . . . . . . . . $1,101,397 $ (446,689) $(149,385)
The accompanying notes are an integral part of these consolidated financial statements.
39
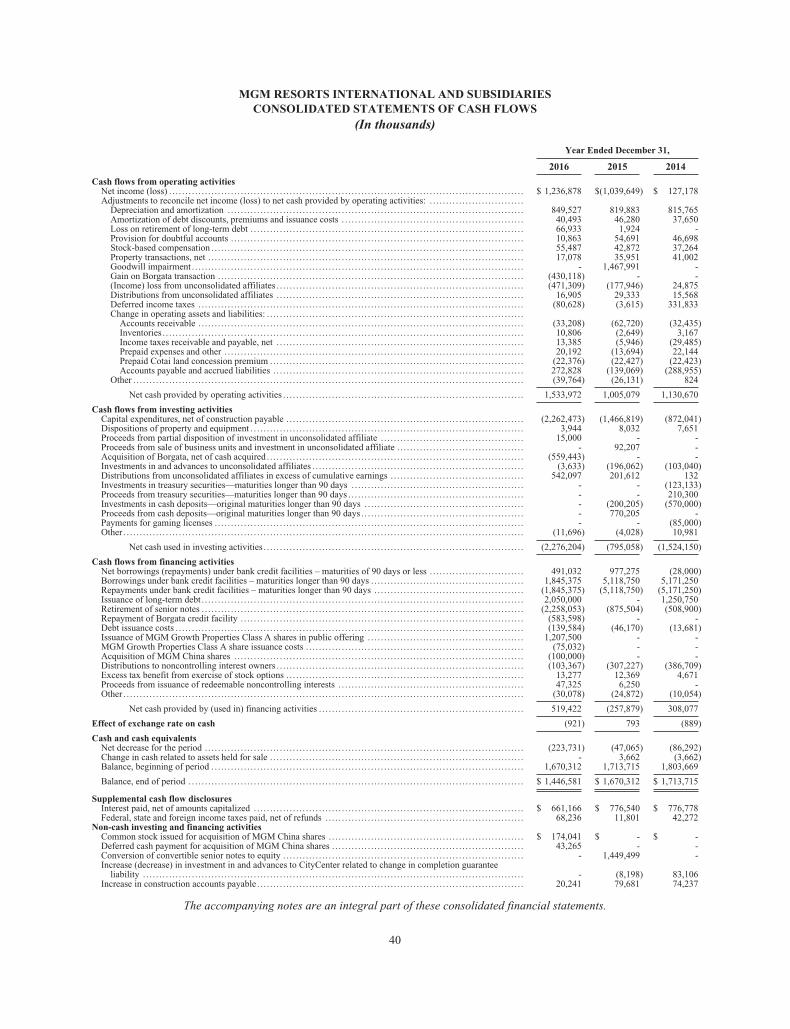
MGM RESORTS INTERNATIONAL AND SUBSIDIARIESCONSOLIDATED STATEMENTS OF CASH FLOWS
(In thousands)
Year Ended December 31,
2016 2015 2014
Cash flows from operating activitiesNet income (loss) . . . . . . . . . . . . . . . . . . . . . . . . . . . . . . . . . . . . . . . . . . . . . . . . . . . . . . . . . . . . . . . . . . . . . . . . . . . . . . . . . . . . . . . . . . . . . . . . . . . . . . . . . . . . . $ 1,236,878 $(1,039,649) $ 127,178Adjustments to reconcile net income (loss) to net cash provided by operating activities: . . . . . . . . . . . . . . . . . . . . . . . . . . . . .
Depreciation and amortization . . . . . . . . . . . . . . . . . . . . . . . . . . . . . . . . . . . . . . . . . . . . . . . . . . . . . . . . . . . . . . . . . . . . . . . . . . . . . . . . . . . . . . . . . . . 849,527 819,883 815,765Amortization of debt discounts, premiums and issuance costs . . . . . . . . . . . . . . . . . . . . . . . . . . . . . . . . . . . . . . . . . . . . . . . . . . . . . . . . 40,493 46,280 37,650Loss on retirement of long-term debt . . . . . . . . . . . . . . . . . . . . . . . . . . . . . . . . . . . . . . . . . . . . . . . . . . . . . . . . . . . . . . . . . . . . . . . . . . . . . . . . . . . . 66,933 1,924 -Provision for doubtful accounts . . . . . . . . . . . . . . . . . . . . . . . . . . . . . . . . . . . . . . . . . . . . . . . . . . . . . . . . . . . . . . . . . . . . . . . . . . . . . . . . . . . . . . . . . . 10,863 54,691 46,698Stock-based compensation . . . . . . . . . . . . . . . . . . . . . . . . . . . . . . . . . . . . . . . . . . . . . . . . . . . . . . . . . . . . . . . . . . . . . . . . . . . . . . . . . . . . . . . . . . . . . . . . 55,487 42,872 37,264Property transactions, net . . . . . . . . . . . . . . . . . . . . . . . . . . . . . . . . . . . . . . . . . . . . . . . . . . . . . . . . . . . . . . . . . . . . . . . . . . . . . . . . . . . . . . . . . . . . . . . . . 17,078 35,951 41,002Goodwill impairment . . . . . . . . . . . . . . . . . . . . . . . . . . . . . . . . . . . . . . . . . . . . . . . . . . . . . . . . . . . . . . . . . . . . . . . . . . . . . . . . . . . . . . . . . . . . . . . . . . . . . . - 1,467,991 -Gain on Borgata transaction . . . . . . . . . . . . . . . . . . . . . . . . . . . . . . . . . . . . . . . . . . . . . . . . . . . . . . . . . . . . . . . . . . . . . . . . . . . . . . . . . . . . . . . . . . . . . . (430,118) - -(Income) loss from unconsolidated affiliates . . . . . . . . . . . . . . . . . . . . . . . . . . . . . . . . . . . . . . . . . . . . . . . . . . . . . . . . . . . . . . . . . . . . . . . . . . . . (471,309) (177,946) 24,875Distributions from unconsolidated affiliates . . . . . . . . . . . . . . . . . . . . . . . . . . . . . . . . . . . . . . . . . . . . . . . . . . . . . . . . . . . . . . . . . . . . . . . . . . . . 16,905 29,333 15,568Deferred income taxes . . . . . . . . . . . . . . . . . . . . . . . . . . . . . . . . . . . . . . . . . . . . . . . . . . . . . . . . . . . . . . . . . . . . . . . . . . . . . . . . . . . . . . . . . . . . . . . . . . . . (80,628) (3,615) 331,833Change in operating assets and liabilities: . . . . . . . . . . . . . . . . . . . . . . . . . . . . . . . . . . . . . . . . . . . . . . . . . . . . . . . . . . . . . . . . . . . . . . . . . . . . . . .Accounts receivable . . . . . . . . . . . . . . . . . . . . . . . . . . . . . . . . . . . . . . . . . . . . . . . . . . . . . . . . . . . . . . . . . . . . . . . . . . . . . . . . . . . . . . . . . . . . . . . . . . . . (33,208) (62,720) (32,435)Inventories . . . . . . . . . . . . . . . . . . . . . . . . . . . . . . . . . . . . . . . . . . . . . . . . . . . . . . . . . . . . . . . . . . . . . . . . . . . . . . . . . . . . . . . . . . . . . . . . . . . . . . . . . . . . . . . 10,806 (2,649) 3,167Income taxes receivable and payable, net . . . . . . . . . . . . . . . . . . . . . . . . . . . . . . . . . . . . . . . . . . . . . . . . . . . . . . . . . . . . . . . . . . . . . . . . . . . . 13,385 (5,946) (29,485)Prepaid expenses and other . . . . . . . . . . . . . . . . . . . . . . . . . . . . . . . . . . . . . . . . . . . . . . . . . . . . . . . . . . . . . . . . . . . . . . . . . . . . . . . . . . . . . . . . . . . . 20,192 (13,694) 22,144Prepaid Cotai land concession premium .. . . . . . . . . . . . . . . . . . . . . . . . . . . . . . . . . . . . . . . . . . . . . . . . . . . . . . . . . . . . . . . . . . . . . . . . . . . . . (22,376) (22,427) (22,423)Accounts payable and accrued liabilities . . . . . . . . . . . . . . . . . . . . . . . . . . . . . . . . . . . . . . . . . . . . . . . . . . . . . . . . . . . . . . . . . . . . . . . . . . . . . 272,828 (139,069) (288,955)
Other . . . . . . . . . . . . . . . . . . . . . . . . . . . . . . . . . . . . . . . . . . . . . . . . . . . . . . . . . . . . . . . . . . . . . . . . . . . . . . . . . . . . . . . . . . . . . . . . . . . . . . . . . . . . . . . . . . . . . . . . (39,764) (26,131) 824
Net cash provided by operating activities . . . . . . . . . . . . . . . . . . . . . . . . . . . . . . . . . . . . . . . . . . . . . . . . . . . . . . . . . . . . . . . . . . . . . . . . . . 1,533,972 1,005,079 1,130,670
Cash flows from investing activitiesCapital expenditures, net of construction payable . . . . . . . . . . . . . . . . . . . . . . . . . . . . . . . . . . . . . . . . . . . . . . . . . . . . . . . . . . . . . . . . . . . . . . . . . (2,262,473) (1,466,819) (872,041)Dispositions of property and equipment . . . . . . . . . . . . . . . . . . . . . . . . . . . . . . . . . . . . . . . . . . . . . . . . . . . . . . . . . . . . . . . . . . . . . . . . . . . . . . . . . . . . 3,944 8,032 7,651Proceeds from partial disposition of investment in unconsolidated affiliate . . . . . . . . . . . . . . . . . . . . . . . . . . . . . . . . . . . . . . . . . . . . 15,000 - -Proceeds from sale of business units and investment in unconsolidated affiliate . . . . . . . . . . . . . . . . . . . . . . . . . . . . . . . . . . . . . . . - 92,207 -Acquisition of Borgata, net of cash acquired . . . . . . . . . . . . . . . . . . . . . . . . . . . . . . . . . . . . . . . . . . . . . . . . . . . . . . . . . . . . . . . . . . . . . . . . . . . . . . . (559,443) - -Investments in and advances to unconsolidated affiliates . . . . . . . . . . . . . . . . . . . . . . . . . . . . . . . . . . . . . . . . . . . . . . . . . . . . . . . . . . . . . . . . . (3,633) (196,062) (103,040)Distributions from unconsolidated affiliates in excess of cumulative earnings . . . . . . . . . . . . . . . . . . . . . . . . . . . . . . . . . . . . . . . . . 542,097 201,612 132Investments in treasury securities—maturities longer than 90 days . . . . . . . . . . . . . . . . . . . . . . . . . . . . . . . . . . . . . . . . . . . . . . . . . . . . . - - (123,133)Proceeds from treasury securities—maturities longer than 90 days . . . . . . . . . . . . . . . . . . . . . . . . . . . . . . . . . . . . . . . . . . . . . . . . . . . . . . - - 210,300Investments in cash deposits—original maturities longer than 90 days . . . . . . . . . . . . . . . . . . . . . . . . . . . . . . . . . . . . . . . . . . . . . . . . . - (200,205) (570,000)Proceeds from cash deposits—original maturities longer than 90 days . . . . . . . . . . . . . . . . . . . . . . . . . . . . . . . . . . . . . . . . . . . . . . . . . . - 770,205 -Payments for gaming licenses . . . . . . . . . . . . . . . . . . . . . . . . . . . . . . . . . . . . . . . . . . . . . . . . . . . . . . . . . . . . . . . . . . . . . . . . . . . . . . . . . . . . . . . . . . . . . . . - - (85,000)Other . . . . . . . . . . . . . . . . . . . . . . . . . . . . . . . . . . . . . . . . . . . . . . . . . . . . . . . . . . . . . . . . . . . . . . . . . . . . . . . . . . . . . . . . . . . . . . . . . . . . . . . . . . . . . . . . . . . . . . . . . . . (11,696) (4,028) 10,981
Net cash used in investing activities . . . . . . . . . . . . . . . . . . . . . . . . . . . . . . . . . . . . . . . . . . . . . . . . . . . . . . . . . . . . . . . . . . . . . . . . . . . . . . . . (2,276,204) (795,058) (1,524,150)
Cash flows from financing activitiesNet borrowings (repayments) under bank credit facilities – maturities of 90 days or less . . . . . . . . . . . . . . . . . . . . . . . . . . . . . 491,032 977,275 (28,000)Borrowings under bank credit facilities – maturities longer than 90 days . . . . . . . . . . . . . . . . . . . . . . . . . . . . . . . . . . . . . . . . . . . . . . . 1,845,375 5,118,750 5,171,250Repayments under bank credit facilities – maturities longer than 90 days . . . . . . . . . . . . . . . . . . . . . . . . . . . . . . . . . . . . . . . . . . . . . . (1,845,375) (5,118,750) (5,171,250)Issuance of long-term debt . . . . . . . . . . . . . . . . . . . . . . . . . . . . . . . . . . . . . . . . . . . . . . . . . . . . . . . . . . . . . . . . . . . . . . . . . . . . . . . . . . . . . . . . . . . . . . . . . . . 2,050,000 - 1,250,750Retirement of senior notes . . . . . . . . . . . . . . . . . . . . . . . . . . . . . . . . . . . . . . . . . . . . . . . . . . . . . . . . . . . . . . . . . . . . . . . . . . . . . . . . . . . . . . . . . . . . . . . . . . . (2,258,053) (875,504) (508,900)Repayment of Borgata credit facility . . . . . . . . . . . . . . . . . . . . . . . . . . . . . . . . . . . . . . . . . . . . . . . . . . . . . . . . . . . . . . . . . . . . . . . . . . . . . . . . . . . . . . . (583,598) - -Debt issuance costs . . . . . . . . . . . . . . . . . . . . . . . . . . . . . . . . . . . . . . . . . . . . . . . . . . . . . . . . . . . . . . . . . . . . . . . . . . . . . . . . . . . . . . . . . . . . . . . . . . . . . . . . . . . (139,584) (46,170) (13,681)Issuance of MGM Growth Properties Class A shares in public offering . . . . . . . . . . . . . . . . . . . . . . . . . . . . . . . . . . . . . . . . . . . . . . . . 1,207,500 - -MGM Growth Properties Class A share issuance costs . . . . . . . . . . . . . . . . . . . . . . . . . . . . . . . . . . . . . . . . . . . . . . . . . . . . . . . . . . . . . . . . . . . (75,032) - -Acquisition of MGM China shares . . . . . . . . . . . . . . . . . . . . . . . . . . . . . . . . . . . . . . . . . . . . . . . . . . . . . . . . . . . . . . . . . . . . . . . . . . . . . . . . . . . . . . . . . (100,000) - -Distributions to noncontrolling interest owners . . . . . . . . . . . . . . . . . . . . . . . . . . . . . . . . . . . . . . . . . . . . . . . . . . . . . . . . . . . . . . . . . . . . . . . . . . . . (103,367) (307,227) (386,709)Excess tax benefit from exercise of stock options . . . . . . . . . . . . . . . . . . . . . . . . . . . . . . . . . . . . . . . . . . . . . . . . . . . . . . . . . . . . . . . . . . . . . . . . . 13,277 12,369 4,671Proceeds from issuance of redeemable noncontrolling interests . . . . . . . . . . . . . . . . . . . . . . . . . . . . . . . . . . . . . . . . . . . . . . . . . . . . . . . . . 47,325 6,250 -Other . . . . . . . . . . . . . . . . . . . . . . . . . . . . . . . . . . . . . . . . . . . . . . . . . . . . . . . . . . . . . . . . . . . . . . . . . . . . . . . . . . . . . . . . . . . . . . . . . . . . . . . . . . . . . . . . . . . . . . . . . . . (30,078) (24,872) (10,054)
Net cash provided by (used in) financing activities . . . . . . . . . . . . . . . . . . . . . . . . . . . . . . . . . . . . . . . . . . . . . . . . . . . . . . . . . . . . . . . 519,422 (257,879) 308,077
Effect of exchange rate on cash (921) 793 (889)
Cash and cash equivalentsNet decrease for the period . . . . . . . . . . . . . . . . . . . . . . . . . . . . . . . . . . . . . . . . . . . . . . . . . . . . . . . . . . . . . . . . . . . . . . . . . . . . . . . . . . . . . . . . . . . . . . . . . . (223,731) (47,065) (86,292)Change in cash related to assets held for sale . . . . . . . . . . . . . . . . . . . . . . . . . . . . . . . . . . . . . . . . . . . . . . . . . . . . . . . . . . . . . . . . . . . . . . . . . . . . . . - 3,662 (3,662)Balance, beginning of period . . . . . . . . . . . . . . . . . . . . . . . . . . . . . . . . . . . . . . . . . . . . . . . . . . . . . . . . . . . . . . . . . . . . . . . . . . . . . . . . . . . . . . . . . . . . . . . . 1,670,312 1,713,715 1,803,669
Balance, end of period . . . . . . . . . . . . . . . . . . . . . . . . . . . . . . . . . . . . . . . . . . . . . . . . . . . . . . . . . . . . . . . . . . . . . . . . . . . . . . . . . . . . . . . . . . . . . . . . . . . . . . . $ 1,446,581 $ 1,670,312 $ 1,713,715
Supplemental cash flow disclosuresInterest paid, net of amounts capitalized . . . . . . . . . . . . . . . . . . . . . . . . . . . . . . . . . . . . . . . . . . . . . . . . . . . . . . . . . . . . . . . . . . . . . . . . . . . . . . . . . . . $ 661,166 $ 776,540 $ 776,778Federal, state and foreign income taxes paid, net of refunds . . . . . . . . . . . . . . . . . . . . . . . . . . . . . . . . . . . . . . . . . . . . . . . . . . . . . . . . . . . . . 68,236 11,801 42,272
Non-cash investing and financing activitiesCommon stock issued for acquisition of MGM China shares . . . . . . . . . . . . . . . . . . . . . . . . . . . . . . . . . . . . . . . . . . . . . . . . . . . . . . . . . . . . $ 174,041 $ - $ -Deferred cash payment for acquisition of MGM China shares . . . . . . . . . . . . . . . . . . . . . . . . . . . . . . . . . . . . . . . . . . . . . . . . . . . . . . . . . . . 43,265 - -Conversion of convertible senior notes to equity . . . . . . . . . . . . . . . . . . . . . . . . . . . . . . . . . . . . . . . . . . . . . . . . . . . . . . . . . . . . . . . . . . . . . . . . . . - 1,449,499 -Increase (decrease) in investment in and advances to CityCenter related to change in completion guaranteeliability . . . . . . . . . . . . . . . . . . . . . . . . . . . . . . . . . . . . . . . . . . . . . . . . . . . . . . . . . . . . . . . . . . . . . . . . . . . . . . . . . . . . . . . . . . . . . . . . . . . . . . . . . . . . . . . . . . . . . - (8,198) 83,106
Increase in construction accounts payable. . . . . . . . . . . . . . . . . . . . . . . . . . . . . . . . . . . . . . . . . . . . . . . . . . . . . . . . . . . . . . . . . . . . . . . . . . . . . . . . . . 20,241 79,681 74,237
The accompanying notes are an integral part of these consolidated financial statements.
40

MGM RESORTS INTERNATIONAL AND SUBSIDIARIESCONSOLIDATED STATEMENTS OF STOCKHOLDERS’ EQUITY
For the Years ended December 31, 2016, 2015 and 2014(In thousands)
CommonStock
Capital inExcess of Par
Value
RetainedEarnings
(AccumulatedDeficit)
AccumulatedOther
ComprehensiveIncome
TotalMGM ResortsInternationalStockholders’
Equity
Non-ControllingInterests
TotalStockholders’
EquitySharesParValue
Balances, January 1, 2014 . . . . . . . . . . . . 490,361 $ 4,904 $ 4,156,680 $ 41,964 $ 12,503 $ 4,216,051 $ 3,644,444 $ 7,860,495Net income (loss) . . . . . . . . . . . . . . . . . . . . - - - (149,873) - (149,873) 277,051 127,178Currency translation adjustment . . . . - - - - (762) (762) (531) (1,293)Other comprehensive income fromunconsolidated affiliates, net . . . . . - - - - 1,250 1,250 - 1,250
Stock-based compensation . . . . . . . . . . - - 34,102 - - 34,102 4,266 38,368Tax effect of stock-basedcompensation . . . . . . . . . . . . . . . . . . . . . . - - (7,807) - - (7,807) - (7,807)
Issuance of common stock pursuantto stock-based compensationawards . . . . . . . . . . . . . . . . . . . . . . . . . . . . . . 931 9 (8,893) - - (8,884) - (8,884)
Cash distributions to noncontrollinginterest owners . . . . . . . . . . . . . . . . . . . . - - - - - - (387,211) (387,211)
Issuance of performance shareunits . . . . . . . . . . . . . . . . . . . . . . . . . . . . . . . . 7,529 7,529 - 7,529
Other . . . . . . . . . . . . . . . . . . . . . . . . . . . . . . . . . . - - (689) - - (689) (662) (1,351)
Balances, December 31, 2014 . . . . . . . . 491,292 4,913 4,180,922 (107,909) 12,991 4,090,917 3,537,357 7,628,274Net loss . . . . . . . . . . . . . . . . . . . . . . . . . . . . . . . - - - (447,720) - (447,720) (591,929) (1,039,649)Currency translation adjustment . . . . - - - - 1,703 1,703 2,024 3,727Other comprehensive loss fromunconsolidated affiliates, net . . . . . - - - - (672) (672) - (672)
Stock-based compensation . . . . . . . . . . - - 38,464 - - 38,464 4,538 43,002Tax effect of stock-basedcompensation . . . . . . . . . . . . . . . . . . . . . . - - 7,740 - - 7,740 - 7,740
Issuance of common stock pursuantto stock-based compensationawards . . . . . . . . . . . . . . . . . . . . . . . . . . . . . . 1,844 18 (24,896) - - (24,878) - (24,878)
Conversion of convertible debt tocommon stock . . . . . . . . . . . . . . . . . . . . . 71,703 717 1,448,779 - - 1,449,496 - 1,449,496
Cash distributions to noncontrollinginterest owners . . . . . . . . . . . . . . . . . . . . - - - - - - (307,494) (307,494)
Issuance of performance shareunits . . . . . . . . . . . . . . . . . . . . . . . . . . . . . . . . - - 4,872 - - 4,872 - 4,872
Other . . . . . . . . . . . . . . . . . . . . . . . . . . . . . . . . . . - - 5 - - 5 4 9
Balances, December 31, 2015 . . . . . . . . 564,839 5,648 5,655,886 (555,629) 14,022 5,119,927 2,644,500 7,764,427Net income . . . . . . . . . . . . . . . . . . . . . . . . . . . - - - 1,101,440 - 1,101,440 134,902 1,236,342Currency translation adjustment . . . . - - - - (1,477) (1,477) (1,203) (2,680)Stock-based compensation . . . . . . . . . . - - 51,460 - - 51,460 4,147 55,607Tax effect of stock-basedcompensation . . . . . . . . . . . . . . . . . . . . . . - - 13,580 - - 13,580 - 13,580
Issuance of common stock pursuantto stock-based compensationawards . . . . . . . . . . . . . . . . . . . . . . . . . . . . . . 9,285 22 (30,065) - - (30,043) - (30,043)
Issuance of performance shareunits . . . . . . . . . . . . . . . . . . . . . . . . . . . . . . . . - - 5,817 - - 5,817 - 5,817
Cash distributions to noncontrollinginterest owners . . . . . . . . . . . . . . . . . . . . - - - - - - (103,457) (103,457)
MGM Growth Properties IPO .. . . . . - - (150,414) - - (150,414) 1,334,252 1,183,838MGP dividend payable to Class Ashareholders . . . . . . . . . . . . . . . . . . . . . . . - - - - - - (22,281) (22,281)
MGM China common stockacquisition . . . . . . . . . . . . . . . . . . . . . . . . . - 71 127,146 - 1,074 128,291 (270,903) (142,612)
Borgata transaction . . . . . . . . . . . . . . . . . . - (18,385) - - (18,385) 28,752 10,367Other comprehensive income - cashflow hedges . . . . . . . . . . . . . . . . . . . . . . . . - - - - 1,434 1,434 445 1,879
Other . . . . . . . . . . . . . . . . . . . . . . . . . . . . . . . . . . - - (1,450) - - (1,450) (22) (1,472)
Balances, December 31, 2016 . . . . . . . . 574,124 $ 5,741 $ 5,653,575 $ 545,811 $ 15,053 $ 6,220,180 $ 3,749,132 $ 9,969,312
The accompanying notes are an integral part of these consolidated financial statements.
41
MGM RESORTS INTERNATIONAL AND SUBSIDIARIESNOTES TO CONSOLIDATED FINANCIAL STATEMENTS
NOTE 1 — ORGANIZATION
Organization. MGM Resorts International (the “Company” together with its consolidated subsidiaries) is aDelaware corporation that acts largely as a holding company and, through subsidiaries, owns and operates casinoresorts. The Company owns and operates the following integrated casino, hotel and entertainment resorts in LasVegas, Nevada: Bellagio, MGM Grand Las Vegas, The Mirage, Mandalay Bay, Luxor, New York-New York,Monte Carlo, Excalibur and Circus Circus Las Vegas. Operations at MGM Grand Las Vegas includemanagement of The Signature at MGM Grand Las Vegas, a condominium-hotel consisting of three towers.Along with local investors, the Company owns and operates MGM Grand Detroit in Detroit, Michigan. TheCompany owns and operates the following resorts in Mississippi: Beau Rivage in Biloxi and Gold Strike inTunica. Subsequent to its acquisition on August 1, 2016, the Company owns and operates the Borgata HotelCasino & Spa (“Borgata”), located on Renaissance Pointe in the Marina area of Atlantic City, New Jersey. SeeNote 4 for additional information on the Borgata transaction. The Company owns and operates Shadow Creek, anexclusive world-class golf course located approximately ten miles north of its Las Vegas Strip resorts, PrimmValley Golf Club at the California/Nevada state line and Fallen Oak golf course in Saucier, Mississippi.Additionally, the Company owns and operates MGM National Harbor in Prince George’s County, Maryland,which opened on December 8, 2016.
On April 25, 2016, MGM Growth Properties LLC (“MGP”), a consolidated subsidiary of the Company,completed its initial public offering (“IPO”) of 57,500,000 of its Class A shares representing limited liabilitycompany interests (inclusive of the full exercise by the underwriters of their option to purchase 7,500,000Class A shares) at an initial offering price of $21 per share. In connection with the IPO, the Company and MGPentered into a series of transactions and several agreements that, among other things, set forth the terms andconditions of the IPO and provide a framework for the Company’s relationship with MGP.
MGP is organized as an umbrella partnership REIT (commonly referred to as an “UPREIT”) structure inwhich substantially all of its assets are owned by, and substantially all of its businesses are conducted through, itsOperating Partnership subsidiary, MGM Growth Properties Operating Partnership LP (the “OperatingPartnership”). MGP contributed the proceeds from the IPO to the Operating Partnership in exchange for 26.7%of the Operating Partnership units representing limited partner interests in the Operating Partnership. The generalpartner of the Operating Partnership is also a subsidiary of MGP. MGP has two classes of authorized andoutstanding voting common shares (collectively, the “shares”): Class A shares and a single Class B share. TheCompany owns MGP’s Class B share, which does not provide its holder any rights to profits or losses or anyrights to receive distributions from operations of MGP or upon liquidation or winding up of MGP. MGP’sClass A shareholders are entitled to one vote per share, while the Company, as the owner of the Class B share, isentitled to an amount of votes representing a majority of the total voting power of MGP’s shares so long as theCompany and its controlled affiliates’ (excluding MGP) aggregate beneficial ownership of the combinedeconomic interests in MGP and the Operating Partnership does not fall below 30%.
Pursuant to a master contribution agreement entered into in connection with the IPO by and between theCompany, MGP and the Operating Partnership, the Company contributed the real estate assets of The Mirage,Mandalay Bay, Luxor, New York-New York, Monte Carlo, Excalibur, The Park, Gold Strike Tunica, MGMGrand Detroit and Beau Rivage to newly formed subsidiaries and subsequently transferred 100% ownershipinterest in such subsidiaries to the Operating Partnership in exchange for 73.3% of the Operating Partnershipunits in the Operating Partnership on the closing date of the IPO. In addition, on August 1, 2016, the Companycompleted its acquisition of Borgata and subsequently contributed Borgata’s real estate assets to MGP, asdiscussed in Note 4. As a result of the Borgata transaction, as discussed in Note 20, the Company’s indirectownership in the Operating Partnership units increased to 76.3% and MGP’s Class A shareholders’ ownershipinterest in Operating Partnership units was reduced to 23.7%. The Operating Partnership units held by theCompany are exchangeable into Class A shares of MGP on a one-to-one basis, or cash at the fair value of a
42

Class A share. The determination of settlement method is at the option of MGP’s independent conflictscommittee. See Note 10 and Note 19 for additional information related to MGP, the IPO and certain otherintercompany agreements and debt financing transactions entered into in connection therewith.
The Company acquired an additional 4.95% interest in MGM China Holdings Limited (“MGM China”) onSeptember 1, 2016, which increased its ownership to approximately 56%. See Note 14 for additional information.The Company has a controlling interest in MGM China, which owns MGM Grand Paradise, S.A. (“MGM GrandParadise”), the Macau company that owns and operates the MGM Macau resort and casino and the relatedgaming subconcession and land concessions, and is in the process of developing an 18 acre site on the Cotai Stripin Macau (“MGM Cotai”). MGM Cotai will be an integrated casino, hotel and entertainment resort with capacityfor up to 500 gaming tables and up to 1,500 slots, and featuring approximately 1,500 hotel rooms. The actualnumber of gaming tables allocated to MGM Cotai will be determined by the Macau government prior to opening,and such allocation is expected to be less than MGM Cotai’s 500 gaming table capacity. The total estimatedproject budget is $3.3 billion excluding development fees eliminated in consolidation, capitalized interest andland related costs.
The Company owns 50% of and manages CityCenter Holdings, LLC (“CityCenter”), located betweenBellagio and Monte Carlo. The other 50% of CityCenter is owned by Infinity World Development Corp, awholly owned subsidiary of Dubai World, a Dubai, United Arab Emirates government decree entity. CityCenterconsists of Aria, an integrated casino, hotel and entertainment resort; Mandarin Oriental Las Vegas, a non-gaming boutique hotel; and Vdara, a luxury condominium-hotel. In addition, CityCenter features residential unitsin the Residences at Mandarin Oriental and Veer. In April 2016, CityCenter closed the sale of The Shops atCrystals (“Crystals”), a retail, dining and entertainment district. See Note 7 and Note 19 for additionalinformation related to CityCenter.
The Company and a subsidiary of Anschutz Entertainment Group, Inc. (“AEG”) each own 42.5% of the LasVegas Arena Company, LLC (“Las Vegas Arena Company”), the entity which owns the T-Mobile Arena,subsequent to the sale of a 7.5% ownership interest by each of the Company and AEG to Athena Arena, LLC onSeptember 1, 2016. The Company manages the T-Mobile Arena, which is located on a parcel of the Company’sland between Frank Sinatra Drive and New York-New York, adjacent to the Las Vegas Strip. The T-MobileArena is a 20,000 seat venue designed to host world-class events – from mixed martial arts, boxing, hockey,basketball and bull riding, to high profile awards shows and top-name concerts. T-Mobile Arena commencedoperations in April 2016. Effective January 1, 2016, the Company leases the MGM Grand Garden Arena, locatedadjacent to the MGM Grand Las Vegas, to the Las Vegas Arena Company. See Note 7 and Note 13 for additionalinformation regarding the Company’s investment in the Las Vegas Arena Company. In addition, the Companyowns and operates The Park, a dining and entertainment district, which opened in April 2016 and which connectsto T-Mobile Arena, New York-New York, Monte Carlo and the Park Theater, a 5,200 seat entertainment venuewhich opened in December 2016.
The Company also has a 50% interest in Grand Victoria. Grand Victoria is a riverboat casino in Elgin,Illinois; an affiliate of Hyatt Gaming owns the other 50% of Grand Victoria and also operates the resort. SeeNote 7 for additional information regarding the Company’s investment in Grand Victoria.
A subsidiary of the Company was awarded a casino license to build and operate MGM Springfield inSpringfield, Massachusetts. MGM Springfield will be developed on approximately 14 acres of land in downtownSpringfield. The Company’s plans for the resort currently include a casino with approximately 3,000 slots and100 table games including poker; a 250-room hotel; 100,000 square feet of retail and restaurant space; 44,000square feet of meeting and event space; and a 3,375 space parking garage, with an expected development andconstruction cost of approximately $865 million, excluding capitalized interest and land related costs.
The Company has two reportable segments: domestic resorts and MGM China. See Note 18 for additionalinformation about the Company’s segments.
43

NOTE 2 — BASIS OF PRESENTATION AND SIGNIFICANT ACCOUNTING POLICIES
Principles of consolidation. For entities not determined to be a variable interest entity (“VIE”), theCompany consolidates such entities in which the Company owns 100% of the equity. For entities in which theCompany owns less than 100% of the equity interest, the Company consolidates the entity if it has the direct orindirect ability to control the entities’ activities based upon the terms of the respective entities’ ownershipagreements. For these entities, the Company records a noncontrolling interest in the consolidated balance sheets.The Company’s investments in unconsolidated affiliates which are 50% or less owned are accounted for underthe equity method when the Company can exercise significant influence over or has joint control of theunconsolidated affiliate. All intercompany balances and transactions are eliminated in consolidation.
The Company evaluates entities for which control is achieved through means other than voting rights todetermine if it is the primary beneficiary of a VIE. A VIE is an entity in which either (i) the equity investors as agroup, if any, lack the power through voting or similar rights to direct the activities of such entity that mostsignificantly impact such entity’s economic performance or (ii) the equity investment at risk is insufficient tofinance that entity’s activities without additional subordinated financial support. The Company identifies theprimary beneficiary of a VIE as the enterprise that has both of the following characteristics: (i) the power todirect the activities of the VIE that most significantly impact the entity’s economic performance; and (ii) theobligation to absorb losses or receive benefits of the VIE that could potentially be significant to the entity. TheCompany consolidates its investment in a VIE when it determines that it is its primary beneficiary. For theseVIEs, the Company records a noncontrolling interest in the consolidated balance sheets. The Company maychange its original assessment of a VIE upon subsequent events such as the modification of contractualarrangements that affect the characteristics or adequacy of the entity’s equity investments at risk and thedisposition of all or a portion of an interest held by the primary beneficiary. The Company performs this analysison an ongoing basis.
Management has determined that MGP is a VIE because the Class A equity investors as a group lack thepower through voting or similar rights to direct the activities of such entity that most significantly impact suchentity’s economic performance. The Company has determined that it is the primary beneficiary of MGP andconsolidates MGP because (i) its ownership of MGP’s single Class B share entitles it to a majority of the totalvoting power of MGP’s shares, and (ii) the exchangeable nature of the Operating Partnership units ownedprovide the Company the right to receive benefits from MGP that could potentially be significant to MGP. TheCompany has recorded MGP’s 26.7% interest in the Operating Partnership prior to the Borgata transaction and23.7% interest subsequent to the Borgata transaction as noncontrolling interest in the Company’s consolidatedfinancial statements. As of December 31, 2016, on a consolidated basis MGP had total assets of $9.5 billion,primarily related to its real estate investments, and total liabilities of $3.9 billion, primarily related to itsindebtedness.
Management’s use of estimates. The consolidated financial statements have been prepared in conformitywith accounting principles generally accepted in the United States of America. These principles require theCompany’s management to make estimates and assumptions that affect the reported amounts of assets andliabilities and disclosure of contingent assets and liabilities at the date of the financial statements and the reportedamounts of revenues and expenses during the reporting period. Actual results could differ from those estimates.
44
Fair value measurements. Fair value measurements affect the Company’s accounting and impairmentassessments of its long-lived assets, investments in unconsolidated affiliates, cost method investments, assetsacquired and liabilities assumed in an acquisition, and goodwill and other intangible assets. Fair valuemeasurements also affect the Company’s accounting for certain of its financial assets and liabilities. Fair value isdefined as the price that would be received to sell an asset or paid to transfer a liability in an orderly transactionbetween market participants at the measurement date and is measured according to a hierarchy that includes:Level 1 inputs, such as quoted prices in an active market; Level 2 inputs, which are observable inputs for similarassets; or Level 3 inputs, which are unobservable inputs. The Company used the following inputs in its fair valuemeasurements:
• Level 1 and Level 2 inputs for its long-term debt fair value disclosures. See Note 10;• Level 2 inputs when measuring the fair value of its interest rate swaps. See Note 11;• Level 2 and Level 3 inputs when assessing the fair value of assets acquired and liabilities assumed duringthe Borgata transaction. See Note 4;
• Level 2 and Level 3 inputs when measuring the impairment of goodwill related to the MGM Chinareporting unit. See Note 8; and
• Level 3 inputs when assessing the fair value of its investment in Grand Victoria. See Note 7
Cash and cash equivalents. Cash and cash equivalents include investments and interest bearinginstruments with maturities of 90 days or less at the date of acquisition. Such investments are carried at cost,which approximates market value. Book overdraft balances resulting from the Company’s cash managementprogram are recorded as accounts payable or construction payable as applicable.
Accounts receivable and credit risk. Financial instruments that potentially subject the Company toconcentrations of credit risk consist primarily of casino accounts receivable. The Company issues credit toapproved casino customers and gaming promoters following background checks and investigations ofcreditworthiness. At December 31, 2016, 47% of the Company’s casino receivables at its domestic resorts weredue from customers residing in foreign countries and 9% of the Company’s casino receivables related to MGMChina. Business or economic conditions or other significant events in these countries could affect thecollectability of such receivables.
Accounts receivable are typically non-interest bearing and are initially recorded at cost. Accounts arewritten off when management deems the account to be uncollectible. Recoveries of accounts previously writtenoff are recorded when received. An estimated allowance for doubtful accounts is maintained to reduce theCompany’s receivables to their net carrying amount, which approximates fair value. The allowance is estimatedbased on both a specific review of customer accounts as well as historical collection experience and currenteconomic and business conditions. Management believes that as of December 31, 2016, no significantconcentrations of credit risk existed for which an allowance had not already been recorded.
Inventories. Inventories consist primarily of food and beverage, retail merchandise and operating supplies,and are stated at the lower of cost or net realizable value. Cost is determined primarily using the average costmethod for food and beverage and operating supplies. Cost for retail merchandise is determined using the costmethod.
Property and equipment. Property and equipment are stated at cost. A significant amount of theCompany’s property and equipment was acquired through business combinations and therefore recognized at fairvalue at the acquisition date. Gains or losses on dispositions of property and equipment are included in thedetermination of income or loss. Maintenance costs are expensed as incurred. As of December 31, 2016 and2015, the Company had accrued $36 million and $17 million for property and equipment within accounts payableand $32 million and $44 million related to construction retention accrued in other long-term liabilities,respectively.
45
Property and equipment are generally depreciated over the following estimated useful lives on a straight-linebasis:
Buildings and improvements . . . . . . . . . . . . . . . . . . . . . . . . . . . . . . . . . . . . 20 to 40 yearsLand improvements . . . . . . . . . . . . . . . . . . . . . . . . . . . . . . . . . . . . . . . . . . . . . . 10 to 20 yearsFurniture and fixtures . . . . . . . . . . . . . . . . . . . . . . . . . . . . . . . . . . . . . . . . . . . . 3 to 20 yearsEquipment . . . . . . . . . . . . . . . . . . . . . . . . . . . . . . . . . . . . . . . . . . . . . . . . . . . . . . . . . 3 to 15 years
The Company evaluates its property and equipment and other long-lived assets for impairment based on itsclassification as held for sale or to be held and used. Several criteria must be met before an asset is classified asheld for sale, including that management with the appropriate authority commits to a plan to sell the asset at areasonable price in relation to its fair value and is actively seeking a buyer. For assets held for sale, the Companyrecognizes the asset at the lower of carrying value or fair market value less costs to sell, as estimated based oncomparable asset sales, offers received, or a discounted cash flow model. For assets to be held and used, theCompany reviews for impairment whenever indicators of impairment exist. The Company then compares theestimated future cash flows of the asset, on an undiscounted basis, to the carrying value of the asset. If theundiscounted cash flows exceed the carrying value, no impairment is indicated. If the undiscounted cash flows donot exceed the carrying value, then an impairment charge is recorded based on the fair value of the asset,typically measured using a discounted cash flow model. If an asset is still under development, future cash flowsinclude remaining construction costs. All recognized impairment losses, whether for assets held for sale or assetsto be held and used, are recorded as operating expenses.
Capitalized interest. The interest cost associated with major development and construction projects iscapitalized and included in the cost of the project. When no debt is incurred specifically for a project, interest iscapitalized on amounts expended on the project using the weighted-average cost of the Company’s outstandingborrowings. Capitalization of interest ceases when the project is substantially complete or development activity issuspended for more than a brief period.
Investments in and advances to unconsolidated affiliates. The Company has investments inunconsolidated affiliates accounted for under the equity method. Under the equity method, carrying value isadjusted for the Company’s share of the investees’ earnings and losses, amortization of certain basis differences,as well as capital contributions to and distributions from these companies. Distributions in excess of equitymethod earnings are recognized as a return of investment and recorded as investing cash inflows in theaccompanying consolidated statements of cash flows. The Company classifies operating income and losses aswell as gains and impairments related to its investments in unconsolidated affiliates as a component of operatingincome or loss, as the Company’s investments in such unconsolidated affiliates are an extension of theCompany’s core business operations.
The Company evaluates its investments in unconsolidated affiliates for impairment whenever events orchanges in circumstances indicate that the carrying value of its investment may have experienced an “other-than-temporary” decline in value. If such conditions exist, the Company compares the estimated fair value of theinvestment to its carrying value to determine if an impairment is indicated and determines whether theimpairment is “other-than-temporary” based on its assessment of all relevant factors, including consideration ofthe Company’s intent and ability to retain its investment. The Company estimates fair value using a discountedcash flow analysis based on estimated future results of the investee and market indicators of terminal yearcapitalization rates, and a market approach that utilizes business enterprise value multiples based on a range ofmultiples from the Company’s peer group. See Note 7 and Note 17 for results of the Company’s review of itsinvestment in certain of its unconsolidated affiliates.
Goodwill and other intangible assets. Goodwill represents the excess of purchase price over fair marketvalue of net assets acquired in business combinations. Goodwill and indefinite-lived intangible assets must bereviewed for impairment at least annually and between annual test dates in certain circumstances. The Companyperforms its annual impairment tests in the fourth quarter of each fiscal year. No impairments were indicated or
46
recorded as a result of the annual impairment review for goodwill and indefinite-lived intangible assets in 2016and 2014. An impairment of goodwill related to the MGM China reporting unit was recorded as a result of theannual impairment review in 2015. See Note 8.
Accounting guidance provides entities the option to perform a qualitative assessment of goodwill(commonly referred to as “step zero”) in order to determine whether further impairment testing is necessary. Inperforming the step zero analysis the Company considers macroeconomic conditions, industry and marketconsiderations, current and forecasted financial performance, entity-specific events, and changes in thecomposition or carrying amount of net assets of reporting units. In addition, the Company takes intoconsideration the amount of excess of fair value over carrying value determined in the last quantitative analysisthat was performed, as well as the period of time that has passed since the last quantitative analysis. If the stepzero analysis indicates that it is more likely than not that the fair value of a reporting unit is less than its carryingamount, the entity would proceed to a two-step quantitative analysis.
Under the two-step quantitative analysis, goodwill for relevant reporting units is tested for impairment usinga discounted cash flow analysis based on the estimated future results of the Company’s reporting unitsdiscounted using market discount rates and market indicators of terminal year capitalization rates, and a marketapproach that utilizes business enterprise value multiples based on a range of multiples from the Company’s peergroup. If the carrying value of the reporting unit exceeds its fair value, an indication of impairment exists and theCompany must proceed to measure an impairment loss, if any. To measure an impairment loss, the implied fairvalue of a reporting unit’s goodwill is compared to the carrying value of that goodwill. The implied fair value ofgoodwill is determined by allocating the fair value of the reporting unit to its assets and liabilities and the amountremaining, if any, is the implied fair value of goodwill. If the implied fair value of goodwill is less than itscarrying value then it must be written down to its implied fair value. License rights are tested for impairmentusing a discounted cash flow approach, and trademarks are tested for impairment using the relief-from-royaltymethod. If the fair value of an indefinite-lived intangible asset is less than its carrying amount, an impairmentloss is recognized equal to the difference.
Revenue recognition and promotional allowances. Casino revenue is the aggregate net differencebetween gaming wins and losses, with liabilities recognized for funds deposited by customers before gaming playoccurs (“casino front money”) and for chips in the customers’ possession (“outstanding chip liability”). Hotel,food and beverage, entertainment, retail and other operating revenues are recognized as services are performedand goods are provided. Advance deposits on rooms and advance ticket sales are recorded as accrued liabilitiesuntil services are provided to the customer.
Gaming revenues are recognized net of certain sales incentives, including discounts and points earned inpoint-loyalty programs. The retail value of hotel rooms, food and beverage, and other services furnished to guestswithout charge is included in gross revenue and then deducted as promotional allowances. The estimated cost ofproviding promotional allowances is primarily included in casino expenses as follows:
Year Ended December 31,
2016 2015 2014(In thousands)
Rooms . . . . . . . . . . . . . . . . . . . . . . . . . . . . . . . . . . . . . . . . . . . . . . . . . . . . . . . . . . . . . . . . . $ 120,369 $ 112,313 $ 115,463Food and beverage . . . . . . . . . . . . . . . . . . . . . . . . . . . . . . . . . . . . . . . . . . . . . . . . . . . 283,598 279,041 295,667Entertainment, retail and other . . . . . . . . . . . . . . . . . . . . . . . . . . . . . . . . . . . . . . 39,611 39,388 39,673
$ 443,578 $ 430,742 $ 450,803
47

Gaming promoters. A significant portion of the high-end (“VIP”) gaming volume at MGM Macau isgenerated through the use of gaming promoters, also known as junket operators. These operators introduce VIPgaming players to MGM Macau, assist these customers with travel arrangements, and extend gaming credit tothese players. VIP gaming at MGM Macau is conducted by the use of special purpose nonnegotiable gamingchips. Gaming promoters purchase these nonnegotiable chips from MGM Macau and in turn sell these chips totheir players. The nonnegotiable chips allow MGM Macau to track the amount of wagering conducted by eachgaming promoter’s clients in order to determine VIP gaming play volume, or rolling chip turnover, which is theamount of nonnegotiable chips wagered and lost. In exchange for the gaming promoters’ services, MGM Macaucompensates the gaming promoters through revenue-sharing arrangements and rolling chip turnover-basedcommissions. The estimated portion of the gaming promoter commissions that represent amounts passed throughto VIP customers is recorded as a reduction of casino revenue, and the estimated portion retained by the gamingpromoter for its compensation is recorded as casino expense.
Reimbursed costs. The Company recognizes costs reimbursed pursuant to management services as revenuein the period it incurs the costs. Reimbursed costs related primarily to the Company’s management of CityCenter.
Loyalty programs. The Company’s primary loyalty program is “M life Rewards” and is available topatrons at most of the Company’s domestic resorts and CityCenter. Members may earn points and/or ExpressComps for their gaming play which can be redeemed at restaurants, box offices or the M life Rewards front deskat participating properties. Points may also be redeemed for free slot play on participating machines. TheCompany records a liability based on the points earned multiplied by the redemption value, less an estimate forpoints not expected to be redeemed, and records a corresponding reduction in casino revenue. Customers alsoearn Express Comps based on their gaming play which can be redeemed for complimentary goods and services,including hotel rooms, food and beverage, and entertainment. The Company records a liability for the estimatedcosts of providing goods and services for Express Comps based on the Express Comps earned multiplied by acost margin, less an estimate for Express Comps not expected to be redeemed and records a correspondingexpense in the casino department. MGM Macau also has a loyalty program, whereby patrons earn rewards thatcan be redeemed for complimentary services, including hotel rooms, food and beverage, and entertainment.
Advertising. The Company expenses advertising costs the first time the advertising takes place. Advertisingexpense, which is generally included in general and administrative expenses, was $171 million for 2016 and$156 million for 2015 and 2014.
Corporate expense. Corporate expense represents unallocated payroll, aircraft costs, professional fees andvarious other expenses not directly related to the Company’s casino resort operations. In addition, corporateexpense includes the costs associated with the Company’s evaluation and pursuit of new business opportunities,which are expensed as incurred.
Preopening and start-up expenses. Preopening and start-up costs, including organizational costs, areexpensed as incurred. Costs classified as preopening and start-up expenses include payroll, outside services,advertising, and other expenses related to new or start-up operations.
Property transactions, net. The Company classifies transactions such as write-downs and impairments,demolition costs, and normal gains and losses on the sale of assets as “Property transactions, net.” See Note 17for a detailed discussion of these amounts.
Redeemable noncontrolling interest. In 2015, MGM National Harbor issued non-voting economicinterests in MGM National Harbor (“Interests”) to noncontrolling interest parties, for a total purchase price of $6million. In 2016, MGM National Harbor issued Interests to noncontrolling interest parties for a purchase price of$47 million. Net income attributable to noncontrolling interests includes $0.5 million relating to redeemablenoncontrolling interests for the year ended December 31, 2016.
48
The Interests provide for annual preferred distributions by MGM National Harbor to the noncontrollinginterest parties based on a percentage of its annual net gaming revenue (as defined in the MGM National Harboroperating agreement). Such distributions will begin within ninety days after the end of the fiscal year in whichthe opening date of MGM National Harbor occurs, and after the end of each subsequent fiscal year. Also,beginning on the third anniversary of the last day of the calendar quarter in which the opening date of MGMNational Harbor occurs (and on each subsequent anniversary thereof) the noncontrolling interest parties will eachhave the ability to require MGM National Harbor to purchase all or a portion of their Interests for a purchaseprice based on a contractually agreed upon formula. Certain noncontrolling interest parties each have the right tosell back all or a portion of their Interests prior to such date if MGM National Harbor were to guarantee or grantliens to secure any indebtedness of the Company or its affiliates other than the indebtedness of MGM NationalHarbor.
The Company has recorded the Interests as “Redeemable noncontrolling interests” in the mezzanine sectionof the accompanying consolidated balance sheets and not stockholders’ equity because their redemption is notexclusively in the Company’s control. Interests are initially accounted for at fair value. Subsequently, theCompany will recognize changes in the redemption value as they occur and adjust the carrying amount of theredeemable noncontrolling interests to equal the maximum redemption value, provided such amount does not fallbelow the initial carrying value, at the end of each reporting period. The Company records any changes causedby such an adjustment in retained earnings or accumulated deficit. Additionally the carrying amount of theredeemable noncontrolling interests is adjusted for annual preferred distributions, with changes caused by suchadjustments recorded within net income (loss) attributable to noncontrolling interests.
Income (loss) per share of common stock. The table below reconciles basic and diluted income (loss) pershare of common stock. Diluted net income (loss) attributable to common stockholders includes adjustments forredeemable noncontrolling interests and the potentially dilutive effect on the Company’s equity interests in MGPand MGM China due to shares outstanding under their respective stock compensation plans. Diluted weighted-average common and common equivalent shares includes adjustments for potential dilution of share-basedawards outstanding under the Company’s stock compensation plan.
Year Ended December 31,
2016 2015 2014(In thousands)
Numerator:Net income (loss) attributable to MGM Resorts International . . . . . . $ 1,101,440 $ (447,720) $ (149,873)Adjustment related to redeemable noncontrolling interests . . . . . . . . . (28) - -
Net income (loss) available to common stockholders - basic . . . . . . . 1,101,412 (447,720) (149,873)Potentially dilutive effect due to MGP Omnibus Plan . . . . . . . . . . . . . . . (40) - -Potentially dilutive effect due to MGMChina Share Option Plan . . . . . (11) - (340)
Net income (loss) attributable to common stockholders - diluted . . . . . . $ 1,101,361 $ (447,720) $ (150,213)
Denominator:Weighted-average common shares outstanding basic . . . . . . . . . . . . . . . 568,134 542,873 490,875Potential dilution from share-based awards . . . . . . . . . . . . . . . . . . . . . . . . . . 5,183 - -Weighted-average common and common equivalent shares - diluted . . . 573,317 542,873 490,875
Antidilutive share-based awards excluded from the calculation ofdiluted earnings per share . . . . . . . . . . . . . . . . . . . . . . . . . . . . . . . . . . . . . . . . . . . 4,207 18,276 19,254
The weighted-average common shares outstanding for the year ended December 31, 2015 included theweighted average impact of the $300 million 4.25% convertible senior notes issued in June 2011 and the $1.15billion 4.25% convertible senior notes issued in April 2010 from the date of their conversion on April 15, 2015.The weighted-average impact of the assumed conversion of the convertible senior notes was excluded from the
49
calculation of diluted earnings per share for the years ended December 31, 2015 and 2014 as their effect wouldbe antidilutive. See Note 10 for additional information.
Currency translation. The Company translates the financial statements of foreign subsidiaries that are notdenominated in U.S. dollars. Balance sheet accounts are translated at the exchange rate in effect at each balancesheet date. Income statement accounts are translated at the average rate of exchange prevailing during the period.Translation adjustments resulting from this process are recorded to other comprehensive income (loss).
Derivative financial instruments. The Company reflects all derivative instruments at fair value as eitherassets or liabilities. For derivative instruments that are designated and qualify as hedging instruments, theeffective portion of the gain or loss on the cash flow hedge instruments is recorded as a component ofaccumulated other comprehensive income. Any ineffective portion of a derivative’s change in fair value isimmediately recognized within net income. As of December 31, 2016, all of the Company’s derivative financialinstruments are interest rate swap agreements which have been designated as cash flow hedges and qualify forhedge accounting.
Accumulated other comprehensive income (loss). Comprehensive income (loss) includes net income(loss) and all other non-stockholder changes in equity, or other comprehensive income (loss). Elements of theCompany’s accumulated other comprehensive income are reported in the accompanying consolidated statementsof stockholders’ equity. The following table summarizes the changes in the accumulated balance of othercomprehensive income:
Currencytranslationadjustments
Cash FlowHedges Other Total
(In thousands)
Balance, December 31, 2014 $ 12,319 $ - $ 672 $ 12,991Other comprehensive income (loss) beforereclassifications . . . . . . . . . . . . . . . . . . . . . . . . . . . . . . . . . . . . . . . . . . . 3,727 - (672) 3,055
Amounts reclassified from accumulated othercomprehensive income . . . . . . . . . . . . . . . . . . . . . . . . . . . . . . . . . . . - - - -
Other comprehensive income (loss), net of tax . . . . . . . . . . . . 3,727 - (672) 3,055Other comprehensive income (loss) attributable tononcontrolling interest . . . . . . . . . . . . . . . . . . . . . . . . . . . . . . . . . . . . (2,024) - - (2,024)
Balance, December 31, 2015 14,022 - - 14,022Other comprehensive income (loss) beforereclassifications . . . . . . . . . . . . . . . . . . . . . . . . . . . . . . . . . . . . . . . . . . . (2,680) 1,521 1,074 (85)
Amounts reclassified from accumulated othercomprehensive income . . . . . . . . . . . . . . . . . . . . . . . . . . . . . . . . . . . - 358 - 358
Other comprehensive income (loss), net of tax . . . . . . . . . . . . (2,680) 1,879 1,074 273Other comprehensive income (loss) attributable tononcontrolling interest . . . . . . . . . . . . . . . . . . . . . . . . . . . . . . . . . . . . 1,203 (445) - 758
Balance, December 31, 2016 $ 12,545 $ 1,434 $ 1,074 $ 15,053
Recently issued accounting standards. In August 2014, the Financial Accounting Standards Board(“FASB”) issued Accounting Standards Update (“ASU”) No. 2014-15, “Presentation of Financial Statements-Going Concern (Subtopic 205-40).” The guidance is intended to define management’s responsibility to evaluatewhether there is substantial doubt about an organization’s ability to continue as a going concern and to providerelated footnote disclosures. This ASU provides guidance to an organization’s management, with principles anddefinitions that are intended to reduce diversity in the timing and content of disclosures that are commonlyprovided by organizations today in the financial statement footnotes. The Company adopted this guidance
50

prospectively at the beginning of the fourth quarter of 2016. The adoption of this guidance did not have an effecton the Company’s financial condition, results of operations, cash flows, or disclosures.
In 2015 and 2016, the FASB issued the following ASUs related to revenue recognition, effective for fiscalyears beginning after December 15, 2017, pursuant to ASU 2015-14, “Revenue from Contracts with Customers(Topic 606): Deferral of the Effective Date”:
• ASU 2014-09, “Revenue from Contracts with Customers (Topic 606),” outlines a new, singlecomprehensive model for entities to use in accounting for revenue arising from contracts with customersand supersedes most current revenue recognition guidance, including industry-specific guidance. ASU2014-09 provides for a new revenue recognition model which includes a five-step analysis in determiningwhen and how revenue is recognized, including identification of separate performance obligations foreach contract with a customer. Additionally, the new model will require revenue recognition to depict thetransfer of promised goods or services to customers in an amount that reflects the consideration acompany expects to receive in exchange for those goods or services;
• ASU 2016-08, “Revenue from Contracts with Customers (Topic 606): Principal versus AgentConsiderations (Reporting Revenue Gross versus Net),” clarifies the implementation guidance onprincipal versus agent considerations as it relates to ASU 2014-09. ASU 2016-08 provides guidancerelated to the assessment an entity is required to perform to determine whether the nature of its promise isto provide the specified good or service itself (that is, the entity is a principal) or to arrange for that goodor service to be provided by the other party (that is, the entity is an agent) when another party is involvedin providing goods or services to a customer;
• ASU 2016-10, “Revenue from Contracts with Customers (Topic 606): Identifying PerformanceObligations and Licensing,” clarifies guidance related to identifying performance obligations andlicensing implementation guidance as it relates to ASU 2014-09. ASU 2016-10 includes targetedimprovements based on input the FASB received from the Transition Resource Group for RevenueRecognition and other stakeholders. It seeks to proactively address areas in which diversity in practicepotentially could arise, as well as to reduce the cost and complexity of applying certain aspects of theguidance both at implementation and on an ongoing basis; and
• ASU 2016-12, “Revenue from Contracts with Customers (Topic 606): Narrow-Scope Improvements andPractical Expedients,” addresses narrow-scope improvements to the guidance on collectability, noncashconsideration and completed contracts at transition as it relates to ASU 2014-09. ASU 2016-12 providesfor a practical expedient for contract modifications at transition and an accounting policy election relatedto the presentation of sales taxes and other similar taxes collected from customers.
The Company is currently assessing the impact that the adoption of the above ASUs related to revenuerecognition will have on its consolidated financial statements and footnote disclosures. However, the Companyhas identified a few significant impacts. Under the new guidance the Company expects it will no longer bepermitted to recognize revenues for goods and services provided to customers for free as an inducement togamble as gross revenue with a corresponding offset to promotional allowances to arrive at net revenues asdiscussed above. The Company expects the majority of such amounts will offset casino revenues. In addition,accounting for Express Comps granted under the Company’s M life Rewards program as outlined above will alsochange. Under the new guidance Express Comps earned by customers through past revenue transactions will beidentified as separate performance obligations and recorded as a reduction in gaming revenues when earned atthe retail value of such benefits owed to the customer (less estimated breakage). When customers redeem suchbenefits and the performance obligation is fulfilled by the Company, revenue will be recognized in thedepartment that provides the goods or services (i.e. hotel, food and beverage, entertainment). In addition, giventhat M life Rewards is an aspirational loyalty program with multiple customer tiers which provide certainbenefits to tier members, the Company will need to assess if such benefits are deemed to be separate performanceobligations under the new guidance.
In February 2016, the FASB issued ASU No. 2016-02, “Leases (Topic 842),” (“ASU 2016-02”), whichreplaces the existing guidance in Accounting Standards Codification (“ASC”) 840, “Leases.” ASU 2016-02 is
51
effective for fiscal years, and interim periods within those years, beginning after December 15, 2018. ASU 2016-02 requires a dual approach for lessee accounting under which a lessee would account for leases as finance leasesor operating leases. Both finance leases and operating leases will result in the lessee recognizing a right-of-use(“ROU”) asset and a corresponding lease liability. For finance leases the lessee would recognize interest expenseand amortization of the ROU asset and for operating leases the lessee would recognize a straight-line total leaseexpense. The Company is currently assessing the impact that adoption of ASU 2016-02 will have on itsconsolidated financial statements and footnote disclosures.
In August 2016, the FASB issued ASU No. 2016-15, “Statement of Cash Flows (Topic 230): Classificationof Certain Cash Receipts and Cash Payments (a consensus of the Emerging Issues Task Force),” (“ASU 2016-15”), effective for fiscal years beginning after December 15, 2017. ASU 2016-15 amends the guidance of ASC230 on the classification of certain cash receipts and payments in the statement of cash flows. The primarypurpose of ASU 2016-15 is to reduce the diversity in practice that has resulted from the lack of consistentprinciples, specifically clarifying the guidance on eight cash flow issues. The Company does not expect theadoption of ASU 2016-15 to have a material effect on its consolidated financial statements.
In January 2017, the Company adopted ASU No. 2016-09, “Compensation – Stock Compensation (Topic718),” (“ASU 2016-09”). ASU 2016-09 simplifies the accounting for share-based payment transactions,including the income tax consequences, accounting for forfeitures, classification of awards as either equity orliabilities, and classification on the statement of cash flows. ASU 2016-09 has separate transition guidance foreach element of the new standard. The adoption of ASU 2016-09 will not have a material effect on theCompany’s consolidated financial statements and footnote disclosures.
In January 2017, the Company adopted ASU No. 2016-17, “Consolidation (Topic 810): Interests HeldThrough Related Parties that are Under Common Control,” (“ASU 2016-17”). The amendments affect theevaluation of whether to consolidate a VIE in certain situations involving entities under common control.Specifically, the amendments change the evaluation of whether an entity is the primary beneficiary of a VIE foran entity that is a single decision maker of a variable interest by changing how an entity treats indirect interests inthe VIE held through related parties that are under common control with the reporting entity. The guidance inASU 2016-17 must be applied retrospectively to all relevant periods. The adoption of ASU 2016-17 will not havea material effect on the Company’s consolidated financial statements and footnote disclosures.
In January 2017, the FASB issued ASU No. 2017-04, “Intangibles-Goodwill and Other (Topic 350):Simplifying the Test for Goodwill Impairment.” The amended guidance simplifies the subsequent measurementof goodwill by eliminating step two from the goodwill impairment test. Under the amended guidance, theCompany will perform its annual or interim goodwill impairment test by comparing the fair value of a reportingunit with its carrying value, and an impairment charge will be recognized for the amount by which the carryingvalue exceeds the reporting unit’s fair value, not to exceed the total amount of goodwill allocated to thatreporting unit. This guidance is effective for annual or any interim goodwill impairment tests in fiscal yearsbeginning after December 15, 2021, with early adoption permitted for interim or annual goodwill impairmenttests performed on testing dates after January 1, 2017. The Company is currently evaluating the impact andtiming of adopting this guidance, but anticipates early adoption in 2017.
52
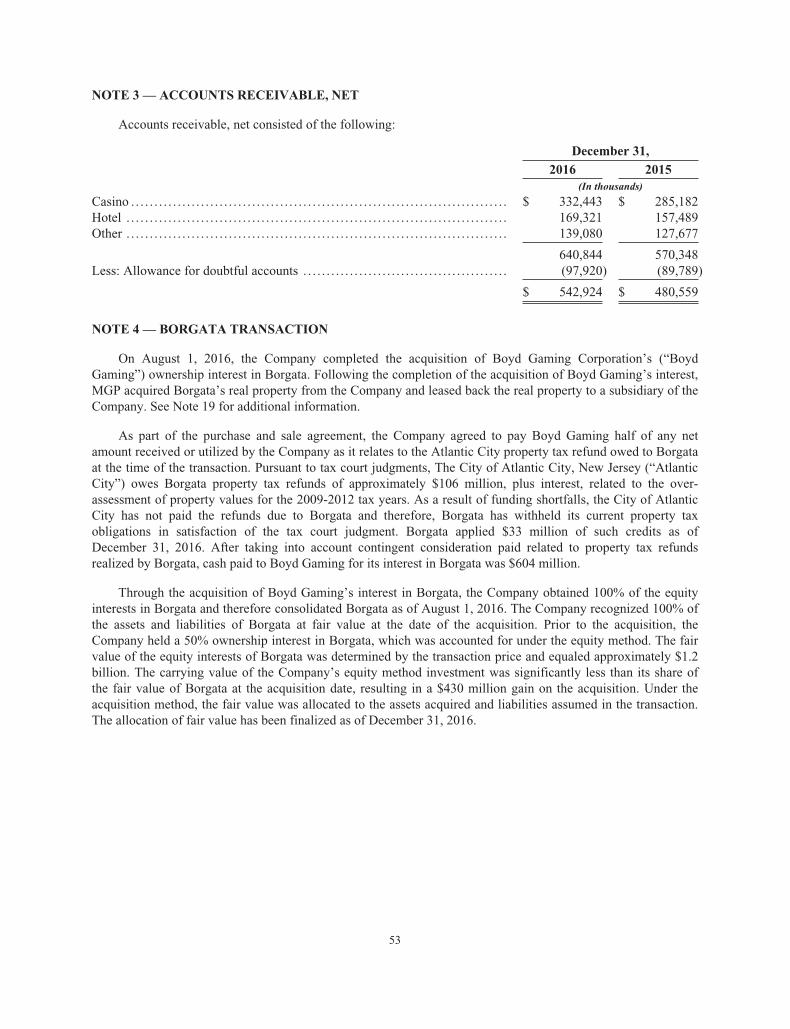
NOTE 3 — ACCOUNTS RECEIVABLE, NET
Accounts receivable, net consisted of the following:
December 31,
2016 2015(In thousands)
Casino . . . . . . . . . . . . . . . . . . . . . . . . . . . . . . . . . . . . . . . . . . . . . . . . . . . . . . . . . . . . . . . . . . . . . . . . . . . . . . . . . $ 332,443 $ 285,182Hotel . . . . . . . . . . . . . . . . . . . . . . . . . . . . . . . . . . . . . . . . . . . . . . . . . . . . . . . . . . . . . . . . . . . . . . . . . . . . . . . . . . 169,321 157,489Other . . . . . . . . . . . . . . . . . . . . . . . . . . . . . . . . . . . . . . . . . . . . . . . . . . . . . . . . . . . . . . . . . . . . . . . . . . . . . . . . . . 139,080 127,677
640,844 570,348Less: Allowance for doubtful accounts . . . . . . . . . . . . . . . . . . . . . . . . . . . . . . . . . . . . . . . . . . . . (97,920) (89,789)
$ 542,924 $ 480,559
NOTE 4 — BORGATA TRANSACTION
On August 1, 2016, the Company completed the acquisition of Boyd Gaming Corporation’s (“BoydGaming”) ownership interest in Borgata. Following the completion of the acquisition of Boyd Gaming’s interest,MGP acquired Borgata’s real property from the Company and leased back the real property to a subsidiary of theCompany. See Note 19 for additional information.
As part of the purchase and sale agreement, the Company agreed to pay Boyd Gaming half of any netamount received or utilized by the Company as it relates to the Atlantic City property tax refund owed to Borgataat the time of the transaction. Pursuant to tax court judgments, The City of Atlantic City, New Jersey (“AtlanticCity”) owes Borgata property tax refunds of approximately $106 million, plus interest, related to the over-assessment of property values for the 2009-2012 tax years. As a result of funding shortfalls, the City of AtlanticCity has not paid the refunds due to Borgata and therefore, Borgata has withheld its current property taxobligations in satisfaction of the tax court judgment. Borgata applied $33 million of such credits as ofDecember 31, 2016. After taking into account contingent consideration paid related to property tax refundsrealized by Borgata, cash paid to Boyd Gaming for its interest in Borgata was $604 million.
Through the acquisition of Boyd Gaming’s interest in Borgata, the Company obtained 100% of the equityinterests in Borgata and therefore consolidated Borgata as of August 1, 2016. The Company recognized 100% ofthe assets and liabilities of Borgata at fair value at the date of the acquisition. Prior to the acquisition, theCompany held a 50% ownership interest in Borgata, which was accounted for under the equity method. The fairvalue of the equity interests of Borgata was determined by the transaction price and equaled approximately $1.2billion. The carrying value of the Company’s equity method investment was significantly less than its share ofthe fair value of Borgata at the acquisition date, resulting in a $430 million gain on the acquisition. Under theacquisition method, the fair value was allocated to the assets acquired and liabilities assumed in the transaction.The allocation of fair value has been finalized as of December 31, 2016.
53
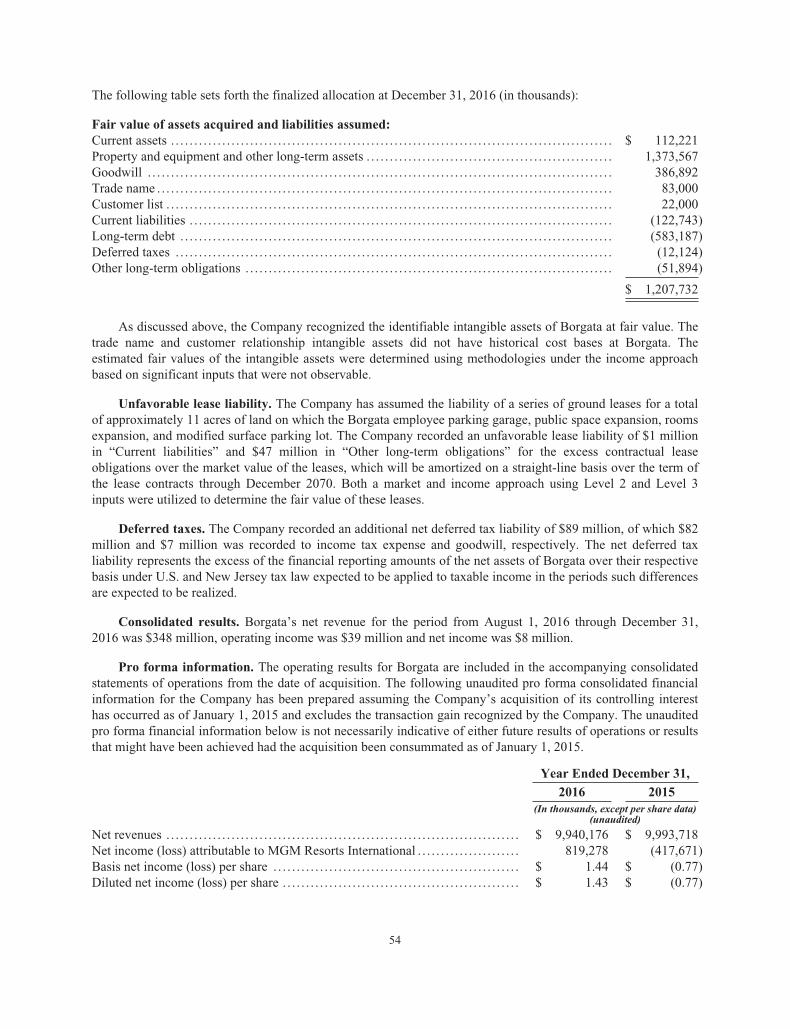
The following table sets forth the finalized allocation at December 31, 2016 (in thousands):
Fair value of assets acquired and liabilities assumed:Current assets . . . . . . . . . . . . . . . . . . . . . . . . . . . . . . . . . . . . . . . . . . . . . . . . . . . . . . . . . . . . . . . . . . . . . . . . . . . . . . . . . . . . . . . . . . . . . . . $ 112,221Property and equipment and other long-term assets . . . . . . . . . . . . . . . . . . . . . . . . . . . . . . . . . . . . . . . . . . . . . . . . . . . . . 1,373,567Goodwill . . . . . . . . . . . . . . . . . . . . . . . . . . . . . . . . . . . . . . . . . . . . . . . . . . . . . . . . . . . . . . . . . . . . . . . . . . . . . . . . . . . . . . . . . . . . . . . . . . . . 386,892Trade name . . . . . . . . . . . . . . . . . . . . . . . . . . . . . . . . . . . . . . . . . . . . . . . . . . . . . . . . . . . . . . . . . . . . . . . . . . . . . . . . . . . . . . . . . . . . . . . . . . 83,000Customer list . . . . . . . . . . . . . . . . . . . . . . . . . . . . . . . . . . . . . . . . . . . . . . . . . . . . . . . . . . . . . . . . . . . . . . . . . . . . . . . . . . . . . . . . . . . . . . . . 22,000Current liabilities . . . . . . . . . . . . . . . . . . . . . . . . . . . . . . . . . . . . . . . . . . . . . . . . . . . . . . . . . . . . . . . . . . . . . . . . . . . . . . . . . . . . . . . . . . . (122,743)Long-term debt . . . . . . . . . . . . . . . . . . . . . . . . . . . . . . . . . . . . . . . . . . . . . . . . . . . . . . . . . . . . . . . . . . . . . . . . . . . . . . . . . . . . . . . . . . . . . (583,187)Deferred taxes . . . . . . . . . . . . . . . . . . . . . . . . . . . . . . . . . . . . . . . . . . . . . . . . . . . . . . . . . . . . . . . . . . . . . . . . . . . . . . . . . . . . . . . . . . . . . . (12,124)Other long-term obligations . . . . . . . . . . . . . . . . . . . . . . . . . . . . . . . . . . . . . . . . . . . . . . . . . . . . . . . . . . . . . . . . . . . . . . . . . . . . . . . (51,894)
$ 1,207,732
As discussed above, the Company recognized the identifiable intangible assets of Borgata at fair value. Thetrade name and customer relationship intangible assets did not have historical cost bases at Borgata. Theestimated fair values of the intangible assets were determined using methodologies under the income approachbased on significant inputs that were not observable.
Unfavorable lease liability. The Company has assumed the liability of a series of ground leases for a totalof approximately 11 acres of land on which the Borgata employee parking garage, public space expansion, roomsexpansion, and modified surface parking lot. The Company recorded an unfavorable lease liability of $1 millionin “Current liabilities” and $47 million in “Other long-term obligations” for the excess contractual leaseobligations over the market value of the leases, which will be amortized on a straight-line basis over the term ofthe lease contracts through December 2070. Both a market and income approach using Level 2 and Level 3inputs were utilized to determine the fair value of these leases.
Deferred taxes. The Company recorded an additional net deferred tax liability of $89 million, of which $82million and $7 million was recorded to income tax expense and goodwill, respectively. The net deferred taxliability represents the excess of the financial reporting amounts of the net assets of Borgata over their respectivebasis under U.S. and New Jersey tax law expected to be applied to taxable income in the periods such differencesare expected to be realized.
Consolidated results. Borgata’s net revenue for the period from August 1, 2016 through December 31,2016 was $348 million, operating income was $39 million and net income was $8 million.
Pro forma information. The operating results for Borgata are included in the accompanying consolidatedstatements of operations from the date of acquisition. The following unaudited pro forma consolidated financialinformation for the Company has been prepared assuming the Company’s acquisition of its controlling interesthas occurred as of January 1, 2015 and excludes the transaction gain recognized by the Company. The unauditedpro forma financial information below is not necessarily indicative of either future results of operations or resultsthat might have been achieved had the acquisition been consummated as of January 1, 2015.
Year Ended December 31,
2016 2015(In thousands, except per share data)
(unaudited)
Net revenues . . . . . . . . . . . . . . . . . . . . . . . . . . . . . . . . . . . . . . . . . . . . . . . . . . . . . . . . . . . . . . . . . . . . . . . . . . . . $ 9,940,176 $ 9,993,718Net income (loss) attributable to MGM Resorts International . . . . . . . . . . . . . . . . . . . . . . 819,278 (417,671)Basis net income (loss) per share . . . . . . . . . . . . . . . . . . . . . . . . . . . . . . . . . . . . . . . . . . . . . . . . . . . . . $ 1.44 $ (0.77)Diluted net income (loss) per share . . . . . . . . . . . . . . . . . . . . . . . . . . . . . . . . . . . . . . . . . . . . . . . . . . . $ 1.43 $ (0.77)
54
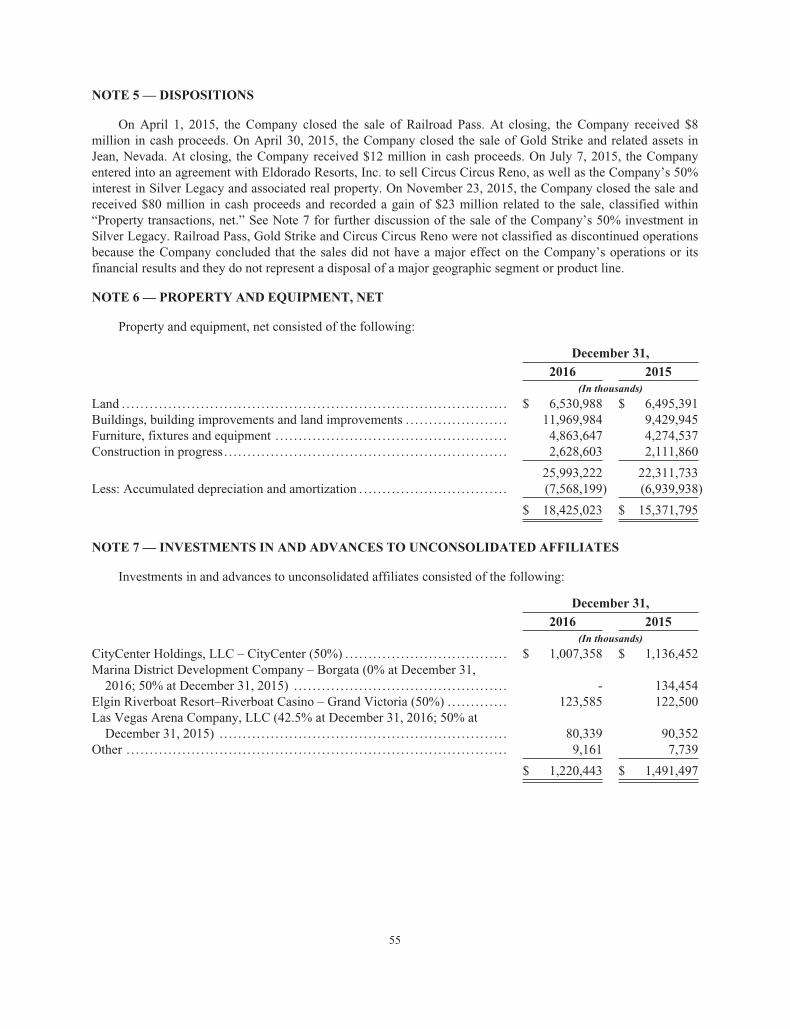
NOTE 5 — DISPOSITIONS
On April 1, 2015, the Company closed the sale of Railroad Pass. At closing, the Company received $8million in cash proceeds. On April 30, 2015, the Company closed the sale of Gold Strike and related assets inJean, Nevada. At closing, the Company received $12 million in cash proceeds. On July 7, 2015, the Companyentered into an agreement with Eldorado Resorts, Inc. to sell Circus Circus Reno, as well as the Company’s 50%interest in Silver Legacy and associated real property. On November 23, 2015, the Company closed the sale andreceived $80 million in cash proceeds and recorded a gain of $23 million related to the sale, classified within“Property transactions, net.” See Note 7 for further discussion of the sale of the Company’s 50% investment inSilver Legacy. Railroad Pass, Gold Strike and Circus Circus Reno were not classified as discontinued operationsbecause the Company concluded that the sales did not have a major effect on the Company’s operations or itsfinancial results and they do not represent a disposal of a major geographic segment or product line.
NOTE 6 — PROPERTY AND EQUIPMENT, NET
Property and equipment, net consisted of the following:
December 31,
2016 2015(In thousands)
Land . . . . . . . . . . . . . . . . . . . . . . . . . . . . . . . . . . . . . . . . . . . . . . . . . . . . . . . . . . . . . . . . . . . . . . . . . . . . . . . . . . . $ 6,530,988 $ 6,495,391Buildings, building improvements and land improvements . . . . . . . . . . . . . . . . . . . . . . 11,969,984 9,429,945Furniture, fixtures and equipment . . . . . . . . . . . . . . . . . . . . . . . . . . . . . . . . . . . . . . . . . . . . . . . . . . 4,863,647 4,274,537Construction in progress . . . . . . . . . . . . . . . . . . . . . . . . . . . . . . . . . . . . . . . . . . . . . . . . . . . . . . . . . . . . . 2,628,603 2,111,860
25,993,222 22,311,733Less: Accumulated depreciation and amortization . . . . . . . . . . . . . . . . . . . . . . . . . . . . . . . . (7,568,199) (6,939,938)
$ 18,425,023 $ 15,371,795
NOTE 7 — INVESTMENTS IN AND ADVANCES TO UNCONSOLIDATED AFFILIATES
Investments in and advances to unconsolidated affiliates consisted of the following:
December 31,
2016 2015(In thousands)
CityCenter Holdings, LLC – CityCenter (50%) . . . . . . . . . . . . . . . . . . . . . . . . . . . . . . . . . . . $ 1,007,358 $ 1,136,452Marina District Development Company – Borgata (0% at December 31,
2016; 50% at December 31, 2015) . . . . . . . . . . . . . . . . . . . . . . . . . . . . . . . . . . . . . . . . . . . . . . - 134,454Elgin Riverboat Resort–Riverboat Casino – Grand Victoria (50%) . . . . . . . . . . . . . 123,585 122,500Las Vegas Arena Company, LLC (42.5% at December 31, 2016; 50% atDecember 31, 2015) . . . . . . . . . . . . . . . . . . . . . . . . . . . . . . . . . . . . . . . . . . . . . . . . . . . . . . . . . . . . . . 80,339 90,352
Other . . . . . . . . . . . . . . . . . . . . . . . . . . . . . . . . . . . . . . . . . . . . . . . . . . . . . . . . . . . . . . . . . . . . . . . . . . . . . . . . . . 9,161 7,739
$ 1,220,443 $ 1,491,497
55

The Company recorded its share of the net income (loss) from unconsolidated affiliates, includingadjustments for basis differences, as follows:
Year Ended December 31,
2016 2015 2014(In thousands)
Income from unconsolidated affiliates . . . . . . . . . . . . . . . . . . . . . . . . $ 527,616 $ 257,883 $ 63,836Preopening and start-up expenses . . . . . . . . . . . . . . . . . . . . . . . . . . . . . . (3,168) (3,475) (917)Non-operating items from unconsolidated affiliates . . . . . . . . . (53,139) (76,462) (87,794)
$ 471,309 $ 177,946 $ (24,875)
CityCenter
Crystals sale. In April 2016, CityCenter closed the sale of Crystals for approximately $1.1 billion. Duringthe year ended December 31, 2016, CityCenter recognized a gain on the sale of Crystals of $400 million and theCompany recognized a $401 million gain, which included $200 million representing its 50% share of the gainrecorded by CityCenter and $201 million representing the reversal of certain basis differences. The basisdifferences primarily related to other-than-temporary impairment charges previously recorded on the Company’sinvestment in CityCenter that were allocated to Crystals’ building assets.
CityCenter distribution. In March 2016, a $90 million distribution was declared in accordance withCityCenter’s annual distribution policy and in April 2016, CityCenter declared a $990 million special distributionin connection with the Crystals sale. The Company’s $540 million share of such distributions was paid in May2016. In April 2015, CityCenter declared a special distribution of $400 million, of which the Company receivedits 50% share of $200 million.
CityCenter litigation settlement. During the first quarter of 2015, CityCenter recognized a $160 milliongain as a result of the final resolution of its construction litigation and related settlements, of which the Companyrecorded $80 million, its 50% share of the gain.
CityCenter credit facility. CityCenter’s senior secured credit facility consisted of a $75 million revolvingcredit facility, maturing in October 2018 and a $1.2 billion term loan B facility maturing in October 2020.CityCenter used cash on hand to permanently repay $266 million of the term loan B facility during 2016. OnJanuary 27, 2017, CityCenter completed an amendment to re-price its $1.2 billion term loan B senior creditfacility and re-price and extend its $75 million revolving facility. The term loan B facility was re-priced at parand will now bear interest at LIBOR plus 2.75%, with a LIBOR floor of 0.75% which represents a 50 basis pointreduction compared to the prior rate and a 25 basis point reduction compared to the prior LIBOR floor. Therevolving facility was re-priced at LIBOR plus 2.00%, which represents a 175 basis point reduction compared tothe prior rate. The revolving facility was also extended to July 2020. All other principal provisions of the existingcredit facility remain unchanged.
Borgata
As discussed in Note 4, the Company acquired Boyd Gaming’s ownership interest in Borgata on August 1,2016, and therefore began to consolidate Borgata beginning on that date. Prior thereto, the Company’sinvestment in Borgata was accounted for under the equity method.
Grand Victoria
At December 31, 2015, the Company reviewed the carrying value of its Grand Victoria investment forimpairment due to a greater than anticipated decline in operating results due in part to a continued loss of marketshare to video gaming terminals, as well as a decrease in forecasted cash flows compared to the prior forecast.The Company used a blended discounted cash flow analysis and guideline public company method to determine
56
the estimated fair value from a market participant’s viewpoint. Key assumptions included in the discounted cashflow analysis were estimates of future cash flows including outflows for capital expenditures, a long-term growthrate of 2% and a discount rate of 10.5%. Key assumptions in the guideline public company method includedbusiness enterprise value multiples selected based on the range of multiples in Grand Victoria’s peer group. As aresult of the analysis, the Company determined that it was necessary to record an other-than-temporaryimpairment charge of $17 million at December 31, 2015, based on an estimated fair value of $123 million for theCompany’s 50% interest. The Company performed a sensitivity analysis surrounding its long-term growth rateassumption and noted that if a long-term growth rate of 1.5% had been used, the resulting estimated fair value ofthe Company’s 50% interest in Grand Victoria would have been approximately $120 million. The Companyintends to, and believes it will be able to, retain its investment in Grand Victoria; however, due to the extent ofthe shortfall and the Company’s assessment of the uncertainty of fully recovering its investment, the Companyhas determined that the impairment was other-than-temporary.
At June 30, 2014, the Company reviewed the carrying value of its Grand Victoria investment forimpairment due to a greater than anticipated decline in operating results and loss of market share due to theproliferation of video gaming terminals in the Illinois market, as well as a decrease in forecasted cash flowscompared to the prior forecast. The Company used a blended discounted cash flow analysis and guideline publiccompany method to determine the estimated fair value from a market participant’s viewpoint. Key assumptionsincluded in the discounted cash flow analysis were estimates of future cash flows including outflows for capitalexpenditures, a long-term growth rate of 2% and a discount rate of 10.5%. Key assumptions in the guidelinepublic company method included business enterprise value multiples selected based on the range of multiples inGrand Victoria’s peer group. As a result of the analysis, the Company determined that it was necessary to recordan other-than-temporary impairment charge of $29 million at June 30, 2014, based on an estimated fair value of$140 million for the Company’s 50% interest.
Las Vegas Arena Company, LLC
Athena Arena transaction. On September 1, 2016, the Company and AEG each sold a 7.5% membershipinterest in the Las Vegas Arena Company, LLC to Athena Arena, LLC. As a result of this transaction, theCompany received $15 million in proceeds and recorded a $3 million gain in “Property transactions, net”.
Arena financing. In September 2014, a subsidiary of Las Vegas Arena Company entered into a seniorsecured credit facility to finance construction of the T-Mobile Arena. In connection with this senior creditfacility, MGM Resorts International and AEG each entered into a repayment guarantee for the term loan B(which is subject to increases and decreases in the event of rebalancing of the principal amount of indebtednessbetween the term loan A and term loan B facilities). As of December 31, 2016, the senior secured credit facilityconsisted of a $150 million term loan A and a $50 million term loan B. The senior secured credit facility maturesin September 2019. The senior secured credit facility is secured by substantially all the assets of the Las VegasArena Company, and contains certain financial covenants which became applicable upon the opening of the T-Mobile Arena in April 2016. In accordance with the Las Vegas Arena Company’s senior secured credit facility,the Company and AEG contributed equal amounts totaling $175 million for construction, all of which had beencontributed as of December 31, 2015. See Note 13 for discussion of the Company’s joint and several completionand repayment guarantees related to the Las Vegas Arena Company.
Silver Legacy
Silver Legacy sale. As discussed in Note 5, the Company closed the sale of its 50% interest in SilverLegacy on November 23, 2015, received proceeds of $58 million, and recorded a gain of $20 million. TheCompany’s investment in Silver Legacy was not classified as discontinued operations because the Companyconcluded that the sale would not have a major effect on the Company’s operations or its financial results and itdid not represent a disposal of a major geographic segment or product line.
57
Unconsolidated Affiliate Financial Information
Summarized balance sheet information of the unconsolidated affiliates is as follows:
December 31,
2016 2015(In thousands)
Current assets . . . . . . . . . . . . . . . . . . . . . . . . . . . . . . . . . . . . . . . . . . . . . . . . . . . . . . . . . . . . . . . . . . . . . . . . . $ 518,632 $ 1,260,834Property and other assets, net . . . . . . . . . . . . . . . . . . . . . . . . . . . . . . . . . . . . . . . . . . . . . . . . . . . . . . . 7,106,361 8,460,915Current liabilities . . . . . . . . . . . . . . . . . . . . . . . . . . . . . . . . . . . . . . . . . . . . . . . . . . . . . . . . . . . . . . . . . . . . . 384,370 482,633Long-term debt and other long-term obligations . . . . . . . . . . . . . . . . . . . . . . . . . . . . . . . . . . 1,454,575 2,268,157Equity . . . . . . . . . . . . . . . . . . . . . . . . . . . . . . . . . . . . . . . . . . . . . . . . . . . . . . . . . . . . . . . . . . . . . . . . . . . . . . . . . 5,786,048 6,970,959
As of December 31, 2015, assets held for sale related to Crystals of $668 million and associated liabilities ofCrystals were classified as current within the summarized balance sheet information.
Summarized results of operations of the unconsolidated affiliates are as follows:
Year Ended December 31,
2016 2015 2014(In thousands)
Net revenues . . . . . . . . . . . . . . . . . . . . . . . . . . . . . . . . . . . . . . . . . . . . . . . . . . . . . $ 1,944,127 $ 2,298,179 $ 2,238,419Operating expenses . . . . . . . . . . . . . . . . . . . . . . . . . . . . . . . . . . . . . . . . . . . . . . (1,781,809) (1,901,044) (2,237,921)
Operating income . . . . . . . . . . . . . . . . . . . . . . . . . . . . . . . . . . . . . . . . . . . . . 162,318 397,135 498Interest expense . . . . . . . . . . . . . . . . . . . . . . . . . . . . . . . . . . . . . . . . . . . . . . . . . . (92,014) (141,925) (163,723)Non-operating expenses . . . . . . . . . . . . . . . . . . . . . . . . . . . . . . . . . . . . . . . . (12,851) (14,942) (13,669)
Net income (loss) . . . . . . . . . . . . . . . . . . . . . . . . . . . . . . . . . . . . . . . . . . . . . 57,453 240,268 (176,894)Income from discontinued operations . . . . . . . . . . . . . . . . . . . . . . . . . 407,187 22,681 21,161
Net income (loss) . . . . . . . . . . . . . . . . . . . . . . . . . . . . . . . . . . . . . . . . . . . . . $ 464,640 $ 262,949 $ (155,733)
Results of operations of the unconsolidated affiliates includes the results of Silver Legacy through the dateof disposition on November 23, 2015 and the results of Borgata through the date of acquisition on August 1,2016. The results of Crystals, including the gain on sale recognized in 2016, are classified as discontinuedoperations in the summarized results of operations for all periods presented.
Basis Differences
The Company’s investments in unconsolidated affiliates do not equal the Company’s share of venture-levelequity due to various basis differences. Basis differences related to depreciable assets are being amortized basedon the useful lives of the related assets and liabilities and basis differences related to non–depreciable assets, such
58

as land and indefinite-lived intangible assets, are not being amortized. Differences between the Company’s shareof venture-level equity and investment balances are as follows:
December 31,
2016 2015(In thousands)
Venture-level equity attributable to the Company . . . . . . . . . . . . . . . . . . . . . . . . . . . . . . . . $ 2,883,324 $ 3,486,117Adjustment to CityCenter equity upon contribution of net assets by MGMResorts International (1) . . . . . . . . . . . . . . . . . . . . . . . . . . . . . . . . . . . . . . . . . . . . . . . . . . . . . . . . . . (537,819) (573,163)
CityCenter capitalized interest (2) . . . . . . . . . . . . . . . . . . . . . . . . . . . . . . . . . . . . . . . . . . . . . . . . . . 215,467 241,374CityCenter completion guarantee (3) . . . . . . . . . . . . . . . . . . . . . . . . . . . . . . . . . . . . . . . . . . . . . . . 337,223 372,785CityCenter deferred gain (4) . . . . . . . . . . . . . . . . . . . . . . . . . . . . . . . . . . . . . . . . . . . . . . . . . . . . . . . . (221,638) (236,327)CityCenter capitalized interest on sponsor notes (5) . . . . . . . . . . . . . . . . . . . . . . . . . . . . . . (42,095) (47,158)Other-than-temporary impairments of CityCenter investment (6) . . . . . . . . . . . . . . . (1,555,509) (1,800,191)Other-than-temporary impairments of Borgata investment (7) . . . . . . . . . . . . . . . . . . - (126,446)Acquisition fair value adjustments net of other-than-temporary impairments
of Grand Victoria investment (8) . . . . . . . . . . . . . . . . . . . . . . . . . . . . . . . . . . . . . . . . . . . . . . . . 99,619 99,619Other adjustments . . . . . . . . . . . . . . . . . . . . . . . . . . . . . . . . . . . . . . . . . . . . . . . . . . . . . . . . . . . . . . . . . . . . 41,871 74,887
$ 1,220,443 $ 1,491,497
(1) Primarily relates to land and fixed assets.(2) Relates to interest capitalized on the Company’s investment balance during development and construction stages.(3) Created by contributions to CityCenter under the completion guarantee recognized as equity contributions by CityCenter split
between the members.(4) Relates to a deferred gain on assets contributed to CityCenter upon formation of CityCenter.(5) Relates to interest on the sponsor notes capitalized by CityCenter during development. Such sponsor notes were converted to
equity in 2013.(6) The impairment of the Company’s CityCenter investment includes $379 million and $426 million of impairments allocated to
land as of December 31, 2016 and December 31, 2015, respectively.(7) The impairment of the Company’s Borgata investment included $90 million of impairments allocated to land as of December 31,
2015.(8) Relates to indefinite-lived gaming license rights for Grand Victoria and other-than-temporary impairments of the Company’s
investment in Grand Victoria.
59
NOTE 8 — GOODWILL AND OTHER INTANGIBLE ASSETS
Goodwill and other intangible assets consisted of the following:
December 31,
2016 2015(In thousands)
Goodwill:Domestic resorts . . . . . . . . . . . . . . . . . . . . . . . . . . . . . . . . . . . . . . . . . . . . . . . . . . . . . . . . . . . . . . . . . . $ 457,867 $ 70,975MGM China . . . . . . . . . . . . . . . . . . . . . . . . . . . . . . . . . . . . . . . . . . . . . . . . . . . . . . . . . . . . . . . . . . . . . . . 1,359,252 1,359,792
$ 1,817,119 $ 1,430,767
Indefinite-lived intangible assets:Detroit development rights . . . . . . . . . . . . . . . . . . . . . . . . . . . . . . . . . . . . . . . . . . . . . . . . . . . . . . . $ 98,098 $ 98,098Trademarks, license rights and other . . . . . . . . . . . . . . . . . . . . . . . . . . . . . . . . . . . . . . . . . . . . 312,022 229,022
Total indefinite-lived intangible assets . . . . . . . . . . . . . . . . . . . . . . . . . . . . . . . . . . . . . . . 410,120 327,120
Finite-lived intangible assets:MGM Grand Paradise gaming subconcession . . . . . . . . . . . . . . . . . . . . . . . . . . . . . . . . . . 4,514,073 4,515,867Less: Accumulated amortization . . . . . . . . . . . . . . . . . . . . . . . . . . . . . . . . . . . . . . . . . . . . . . . . . (1,024,185) (858,531)
3,489,888 3,657,336MGMMacau land concession . . . . . . . . . . . . . . . . . . . . . . . . . . . . . . . . . . . . . . . . . . . . . . . . . . . 84,736 84,769Less: Accumulated amortization . . . . . . . . . . . . . . . . . . . . . . . . . . . . . . . . . . . . . . . . . . . . . . . . . (23,817) (19,554)
60,919 65,215MGM China customer lists . . . . . . . . . . . . . . . . . . . . . . . . . . . . . . . . . . . . . . . . . . . . . . . . . . . . . . . 128,974 129,025Borgata customer list . . . . . . . . . . . . . . . . . . . . . . . . . . . . . . . . . . . . . . . . . . . . . . . . . . . . . . . . . . . . . 22,000 -Less: Accumulated amortization . . . . . . . . . . . . . . . . . . . . . . . . . . . . . . . . . . . . . . . . . . . . . . . . . (135,574) (126,003)
15,400 3,022Maryland license, Massachusetts license and other intangible assets . . . . . . . . 136,127 136,127Less: Accumulated amortization . . . . . . . . . . . . . . . . . . . . . . . . . . . . . . . . . . . . . . . . . . . . . . . . . (24,748) (24,039)
111,379 112,088
Total finite-lived intangible assets, net . . . . . . . . . . . . . . . . . . . . . . . . . . . . . . . . . . . . . . . 3,677,586 3,837,661
Total other intangible assets, net . . . . . . . . . . . . . . . . . . . . . . . . . . . . . . . . . . . . . . . . . . . . . . $ 4,087,706 $ 4,164,781
Goodwill. A summary of changes in the Company’s goodwill by reportable segment is as follows for 2016and 2015:
2016
Balance atJanuary 1 Acquisitions
Currencyexchange
Balance atDecember 31
(In thousands)
Goodwill, net by reportable segment:Domestic resorts . . . . . . . . . . . . . . . . . . . . . . . . . . . . . $ 70,975 $ 386,892 $ - $ 457,867MGM China . . . . . . . . . . . . . . . . . . . . . . . . . . . . . . . . . 1,359,792 - (540) 1,359,252
$ 1,430,767 $ 386,892 $ (540) $ 1,817,119
60
2015
Balance atJanuary 1 Acquisitions
Impairments andcurrency exchange
Balance atDecember 31
(In thousands)
Goodwill, net by reportable segment:Domestic resorts . . . . . . . . . . . . . . . . . . . . . . . . . $ 70,975 $ - $ - $ 70,975MGM China . . . . . . . . . . . . . . . . . . . . . . . . . . . . . 2,826,135 - (1,466,343) 1,359,792
$ 2,897,110 $ - $ (1,466,343) $ 1,430,767
Goodwill concerning domestic resorts relates to the acquisition of Mirage Resorts in 2001, the acquisition ofMandalay Resort Group in 2005, and the acquisition of Borgata in August 2016. See Note 4 for goodwillrecognized in connection with the Borgata transaction. The Company recognized goodwill resulting from itsacquisition of a controlling interest in MGM China in 2011.
During the fourth quarter of 2015, the Company conducted its annual impairment tests of goodwill byreviewing each of its reporting units, including its MGM China reporting unit. The step one goodwill analysis ofthe MGM China reporting unit indicated the fair value was less than its carrying value by 4%. The decrease infair value resulted from a decrease in forecasted cash flows based on then current market conditions and asustained decline in the enterprise value multiples of the MGM China reporting unit as well as the multiples ofthe reporting unit’s peer group.
As a result of the indication of impairment from its step one analysis, the Company performed a step twoimpairment analysis to measure the impairment loss. As such, the Company determined the fair values of allassets of the MGM China reporting unit, including its separately identifiable intangible assets. The fair values ofeach of the separately identifiable intangible assets exceeded their respective carrying values by a significantamount, leading to a lower implied fair value of goodwill. Therefore, the Company recorded a $1.5 billion non-cash impairment charge to reduce the historical carrying value of goodwill related to the MGM China reportingunit to its implied fair value. The carrying value of goodwill related to the MGM China reporting unit as ofDecember 31, 2015 following the impairment charge was $1.4 billion.
Indefinite-lived intangible assets. The Company’s indefinite-lived intangible assets consist primarily ofdevelopment rights in Detroit, trademarks and license rights, of which $210 million consists of trademarks andtrade names related to the Mandalay Resort Group acquisition and $83 million related to the Borgata trade name.
MGM Grand Paradise gaming subconcession. Pursuant to the agreement dated June 19, 2004 betweenMGM Grand Paradise and Sociedade de Jogos de Macau, S.A., a gaming subconcession was acquired by MGMGrand Paradise for the right to operate casino games of chance and other casino games for a period of 15 yearscommencing on April 20, 2005. The Company cannot provide any assurance that the gaming subconcession willbe extended beyond the original terms of the agreement; however, management believes that the gamingsubconcession will be extended, given that the Cotai land concession agreement with the government extendssignificantly beyond the gaming subconcession. As such, the Company is amortizing the gaming subconcessionintangible asset on a straight-line basis over the term of the Cotai land concession, ending in January 2038.
MGM Macau land concession. MGM Grand Paradise entered into a contract with the Macau governmentto use the land under MGM Macau commencing from April 6, 2006. The land use right has an initial termthrough April 6, 2031, subject to renewal for additional periods. The land concession intangible asset isamortized on a straight-line basis over the remaining initial contractual term.
Customer lists. The Company recognized an intangible asset related to MGM China’s customer lists, whichwas amortized on an accelerated basis over its estimated useful life of five years. The MGM China customer listintangible asset became fully amortized in 2016. The Company recognized an intangible asset related to the
61

Borgata customer list, which is amortized on an accelerated basis over its estimated useful life of two years andfive months.
Gaming licenses. The Company was granted a license to operate a casino in Maryland. The considerationpaid to the State of Maryland for the license fee of $22 million is considered a finite-lived intangible asset that isamortized on a straight-line basis over a period of 15 years, beginning in December 2016, when the casino startedoperations. The Company was granted a license to operate a casino in Massachusetts. The consideration paid tothe State of Massachusetts for the license fee of $85 million is considered a finite-lived intangible asset that willbe amortized over a period of 15 years beginning upon the opening of the casino resort.
Other. The Company’s other finite–lived intangible assets consist primarily of lease acquisition costsamortized over the life of the related leases, and certain license rights amortized over their contractual life.
Total amortization expense related to intangible assets was $180 million, $199 million and $232 million for2016, 2015, and 2014, respectively. Estimated future amortization is as follows:
(In thousands)
Years ending December 31,2017 . . . . . . . . . . . . . . . . . . . . . . . . . . . . . . . . . . . . . . . . . . . . . . . . . . . . . . . . . . . . . . . . . . . . . . . . . . . . . . . . . . . . . . . . . . . . . . . . . . . . . $ 183,4142018 . . . . . . . . . . . . . . . . . . . . . . . . . . . . . . . . . . . . . . . . . . . . . . . . . . . . . . . . . . . . . . . . . . . . . . . . . . . . . . . . . . . . . . . . . . . . . . . . . . . . . 177,7582019 . . . . . . . . . . . . . . . . . . . . . . . . . . . . . . . . . . . . . . . . . . . . . . . . . . . . . . . . . . . . . . . . . . . . . . . . . . . . . . . . . . . . . . . . . . . . . . . . . . . . . 178,0812020 . . . . . . . . . . . . . . . . . . . . . . . . . . . . . . . . . . . . . . . . . . . . . . . . . . . . . . . . . . . . . . . . . . . . . . . . . . . . . . . . . . . . . . . . . . . . . . . . . . . . . 178,0812021 . . . . . . . . . . . . . . . . . . . . . . . . . . . . . . . . . . . . . . . . . . . . . . . . . . . . . . . . . . . . . . . . . . . . . . . . . . . . . . . . . . . . . . . . . . . . . . . . . . . . . 178,081Thereafter . . . . . . . . . . . . . . . . . . . . . . . . . . . . . . . . . . . . . . . . . . . . . . . . . . . . . . . . . . . . . . . . . . . . . . . . . . . . . . . . . . . . . . . . . . . . . . 2,782,171
$ 3,677,586
NOTE 9 — OTHER ACCRUED LIABILITIES
Other accrued liabilities consisted of the following:
December 31,
2016 2015(In thousands)
Payroll and related . . . . . . . . . . . . . . . . . . . . . . . . . . . . . . . . . . . . . . . . . . . . . . . . . . . . . . . . . . . . . . . . . . . $ 483,194 $ 370,672Advance deposits and ticket sales . . . . . . . . . . . . . . . . . . . . . . . . . . . . . . . . . . . . . . . . . . . . . . . . . . 135,592 104,461Casino outstanding chip liability . . . . . . . . . . . . . . . . . . . . . . . . . . . . . . . . . . . . . . . . . . . . . . . . . . . 227,538 282,810Casino front money deposits . . . . . . . . . . . . . . . . . . . . . . . . . . . . . . . . . . . . . . . . . . . . . . . . . . . . . . . . 214,727 127,947MGM China gaming promoter commissions . . . . . . . . . . . . . . . . . . . . . . . . . . . . . . . . . . . . . . 31,445 33,064Other gaming related accruals . . . . . . . . . . . . . . . . . . . . . . . . . . . . . . . . . . . . . . . . . . . . . . . . . . . . . . 119,446 91,318Taxes, other than income taxes . . . . . . . . . . . . . . . . . . . . . . . . . . . . . . . . . . . . . . . . . . . . . . . . . . . . . 166,916 153,531Other . . . . . . . . . . . . . . . . . . . . . . . . . . . . . . . . . . . . . . . . . . . . . . . . . . . . . . . . . . . . . . . . . . . . . . . . . . . . . . . . . . 215,668 147,641
$ 1,594,526 $ 1,311,444
62

NOTE 10 — LONG-TERM DEBT
Long-term debt consisted of the following:
December 31,
2016 2015(In thousands)
Senior credit facility term loans . . . . . . . . . . . . . . . . . . . . . . . . . . . . . . . . . . . . . . . . . . . . . . . . . . . . . . $ 250,000 $ 2,716,000MGM Growth Properties senior credit facility . . . . . . . . . . . . . . . . . . . . . . . . . . . . . . . . . . . . . 2,133,250 -MGM China credit facility . . . . . . . . . . . . . . . . . . . . . . . . . . . . . . . . . . . . . . . . . . . . . . . . . . . . . . . . . . . 1,933,313 1,559,909MGM National Harbor credit facility . . . . . . . . . . . . . . . . . . . . . . . . . . . . . . . . . . . . . . . . . . . . . . . 450,000 -$242.9 million 6.875% senior notes, due 2016 . . . . . . . . . . . . . . . . . . . . . . . . . . . . . . . . . . . . . - 242,900$732.7 million 7.5% senior notes, due 2016 . . . . . . . . . . . . . . . . . . . . . . . . . . . . . . . . . . . . . . . . - 732,749$500 million 10% senior notes, due 2016 . . . . . . . . . . . . . . . . . . . . . . . . . . . . . . . . . . . . . . . . . . . - 500,000$743 million 7.625% senior notes, due 2017 . . . . . . . . . . . . . . . . . . . . . . . . . . . . . . . . . . . . . . . - 743,000$475 million 11.375% senior notes, due 2018 . . . . . . . . . . . . . . . . . . . . . . . . . . . . . . . . . . . . . . 475,000 475,000$850 million 8.625% senior notes, due 2019 . . . . . . . . . . . . . . . . . . . . . . . . . . . . . . . . . . . . . . . 850,000 850,000$500 million 5.25% senior notes, due 2020 . . . . . . . . . . . . . . . . . . . . . . . . . . . . . . . . . . . . . . . . . 500,000 500,000$1,000 million 6.75% senior notes, due 2020 . . . . . . . . . . . . . . . . . . . . . . . . . . . . . . . . . . . . . . 1,000,000 1,000,000$1,250 million 6.625% senior notes, due 2021 . . . . . . . . . . . . . . . . . . . . . . . . . . . . . . . . . . . . . 1,250,000 1,250,000$1,000 million 7.75% senior notes, due 2022 . . . . . . . . . . . . . . . . . . . . . . . . . . . . . . . . . . . . . . 1,000,000 1,000,000$1,250 million 6% senior notes, due 2023 . . . . . . . . . . . . . . . . . . . . . . . . . . . . . . . . . . . . . . . . . . 1,250,000 1,250,000$1,050 million 5.625% MGM Growth Properties senior notes, due 2024 . . . . . . . 1,050,000 -$500 million 4.5% MGM Growth Properties senior notes, due 2026 . . . . . . . . . . . . 500,000 -$500 million 4.625% senior notes, due 2026 . . . . . . . . . . . . . . . . . . . . . . . . . . . . . . . . . . . . . . . 500,000 -$0.6 million 7% debentures, due 2036 . . . . . . . . . . . . . . . . . . . . . . . . . . . . . . . . . . . . . . . . . . . . . . 552 552$2.3 million 6.7% debentures ($4.3 million at December 31, 2015), due2096 . . . . . . . . . . . . . . . . . . . . . . . . . . . . . . . . . . . . . . . . . . . . . . . . . . . . . . . . . . . . . . . . . . . . . . . . . . . . . . . . . 2,265 4,265
13,144,380 12,824,375Less: premiums, discounts, and unamortized debt issuance costs, net . . . . . . . . . . . (156,785) (127,622)
12,987,595 12,696,753Less: Current portion . . . . . . . . . . . . . . . . . . . . . . . . . . . . . . . . . . . . . . . . . . . . . . . . . . . . . . . . . . . . . . . . . (8,375) (328,442)
$ 12,979,220 $ 12,368,311
Debt due within one year of the December 31, 2016 balance sheet was classified as long-term as theCompany has both the intent and ability to refinance current maturities on a long-term basis under its revolvingsenior credit facilities with the exception that $8 million of MGP’s quarterly amortization payments under itssenior credit facility were classified as current because MGP used cash to make such amortization payments inJanuary 2017. At December 31, 2015, the amount available under the Company’s revolving senior credit facilitywas less than current maturities related to the Company’s term loan credit facilities and senior notes. TheCompany excluded from the December 31, 2015 current portion of long-term debt the amount available forrefinancing under its revolving credit facility.
Interest expense, net consisted of the following:
Year Ended December 31,
2016 2015 2014(In thousands)
Total interest incurred . . . . . . . . . . . . . . . . . . . . . . . . . . . . . . . . . . . . . . . . . . . . $ 814,731 $ 862,377 $ 846,321Interest capitalized . . . . . . . . . . . . . . . . . . . . . . . . . . . . . . . . . . . . . . . . . . . . . . . . (119,958) (64,798) (29,260)
$ 694,773 $ 797,579 $ 817,061
63
Senior credit facility. In April 2016, the Company entered into an amended and restated credit agreementcomprised of a $1.25 billion revolving facility and a $250 million term loan A facility. The revolving facility andthe term loan A facility bear interest determined by reference to a total net leverage ratio pricing grid whichresults in an interest rate of LIBOR plus 1.75% to 2.75%. Both the term loan A facility and the revolving facilitywill mature in April 2021. The term loan A facility is subject to amortization of principal in equal quarterlyinstallments (commencing with the fiscal quarter ended March 31, 2017), with 5.0% of the initial aggregateprincipal amount of the term loan A facility to be payable each year. No amounts have been drawn on therevolving credit facility. The Company incurred a loss on early retirement of its prior credit facility ofapproximately $28 million recorded in “Other, net” in the consolidated statements of operations. AtDecember 31, 2016, the interest rate on the term loan A facility was 3.02%.
The amended and restated credit agreement contains representations and warranties, customary events ofdefault, and positive, negative and financial covenants, including that the Company maintain compliance with amaximum total net leverage ratio, a maximum first lien net leverage ratio and a minimum interest coverage ratio.The Company was in compliance with its credit agreement covenants at December 31, 2016.
The amended and restated credit agreement is secured by (i) a mortgage on the real properties comprisingthe MGM Grand Las Vegas and the Bellagio, (ii) a pledge of substantially all existing and future personalproperty of the subsidiaries of the Company that own the MGM Grand Las Vegas and the Bellagio; and (iii) apledge of the equity or limited liability company interests of the entities that own MGM Grand Las Vegas andthe Bellagio.
Mandatory prepayments of the credit facilities will be required upon the occurrence of certain events,including sales of certain assets, casualty events and the incurrence of certain additional indebtedness, subject tocertain exceptions and reinvestment rights.
MGM Growth Properties senior credit facility. In April 2016, the Operating Partnership entered into acredit agreement comprised of a $300 million senior secured term loan A facility, a $1.85 billion senior securedterm loan B facility, and a $600 million senior secured revolving credit facility. The term loan B facility wasoriginally issued at 99.75% to initial lenders. The revolving credit facility and term loan A facility bear interestdetermined by reference to a total net leverage ratio pricing grid which results in an interest rate of LIBOR plus2.25% to 2.75%. On October 26, 2016 the term loan B facility was re-priced at par and bore interest at LIBORplus 2.75%, with a LIBOR floor of 0.75%, which represented a 50 basis point reduction compared to the priorrate. In addition, the Operating Partnership received a further reduction in pricing to LIBOR plus 2.50%, with aLIBOR floor of 0.75% as a result of it achieving a minimum corporate family rating of Ba3/BB- in February2017. All other principal provisions of the existing credit facility remain unchanged. The revolving credit facilityand the term loan A facility will mature in 2021 and the term loan B facility will mature in 2023.
The term loan facilities are subject to amortization of principal in equal quarterly installments, with 5.0% ofthe initial aggregate principal amount of the term loan A facility and 1.0% of the initial aggregate principalamount of the term loan B facility to be payable each year. The Company permanently repaid $8 million of theterm loan A facility and $9 million of the term loan B facility for the year ended December 31, 2016. AtDecember 31, 2016, the term loan A facility had an amount outstanding of $293 million with an interest rate of3.52% and the term loan B facility had an amount outstanding of $1.84 billion with an interest rate of 3.52%. Noamounts were drawn on the revolving credit facility as of December 31, 2016.
The credit agreement contains customary representations and warranties, events of default, and positive,negative and financial covenants, including that the Operating Partnership maintain compliance with a maximumsenior secured net debt to adjusted total assets ratio, maximum total net debt to adjusted assets ratio and aminimum interest coverage ratio. The Operating Partnership was in compliance with its credit agreementcovenants at December 31, 2016.
64
MGM China credit facility. At December 31, 2016, the MGM China credit facility consisted of $1.55billion of term loans and a $1.45 billion revolving credit facility, which bear interest at a fluctuating rate perannum based on HIBOR plus a margin that ranges between 1.375% and 2.5% based on MGM China’s leverageratio. The MGM China credit facility matures in April 2019, with scheduled amortization payments of the termloans beginning in October 2017. The MGM China credit facility is secured by MGM Grand Paradise’s interestin the Cotai land use right, and MGM China, MGM Grand Paradise and their guarantor subsidiaries have granteda security interest in substantially all of their assets to secure the facility. The outstanding balance atDecember 31, 2016 was comprised of $1.56 billion of term loans and $374 million drawn on the revolving creditfacility. At December 31, 2016, the weighted average interest rate on the term loans was 2.73% and the interestrate on the revolving credit facility was 2.50%.
The MGM China credit facility contains customary representations and warranties, events of default, andpositive, negative and financial covenants, including that MGM China maintains compliance with a maximumleverage ratio and a minimum interest coverage ratio. MGM China was in compliance with its credit facilitycovenants at December 31, 2016. In February 2017, the MGM China credit facility was amended to increase themaximum total leverage ratio to 6.00 to 1.00 through December 31, 2017, declining to 5.50 to 1.00 at March 31,2018, 5.00 to 1.00 at June 30, 2018 and 4.50 to 1.00 at September 30, 2018 and thereafter.
MGM National Harbor credit agreement. In January 2016, MGM National Harbor, LLC entered into acredit agreement consisting of a $100 million revolving credit facility and a $425 million term loan facility. Therevolving and term loan facilities bear interest at LIBOR plus an applicable rate determined by MGM NationalHarbor, LLC’s total leverage ratio (2.25% as of December 31, 2016). The term loan and revolving facilities arescheduled to mature in January 2021 and the term loan facilities are subject to scheduled amortization paymentson the last day of each calendar quarter beginning the fourth full fiscal quarter following the opening date ofMGM National Harbor, initially in an amount equal to 1.25% of the aggregate principal balance and increasing to1.875% and 2.50% of the aggregate principal balance on the last day of the twelfth and sixteenth full fiscalquarters, respectively. The outstanding balance at December 31, 2016 was comprised of $425 million of termloans and $25 million drawn on the revolving credit facility. At December 31, 2016, the interest rate on the termloan was 3.02% and the interest rate on the revolving credit facility was 2.90%.
The credit agreement is secured by a leasehold mortgage on MGM National Harbor and substantially all ofthe existing and future property of MGM National Harbor. Mandatory prepayments will be required upon theoccurrence of certain events, including sales of certain assets, casualty events and the incurrence of certainadditional indebtedness, subject to certain exceptions and reinvestment rights. In addition, to the extent MGMNational Harbor generates excess cash flow (as defined in the credit agreement), a percentage of such excesscash flow (ranging from 0% to 50% based on a total leverage ratio) will be required to be used to prepay the termloan facilities commencing with the fiscal year ending 2017.
The credit agreement contains customary representations and warranties, events of default, and positive,negative and financial covenants, including that MGM National Harbor, LLC and its restricted subsidiariesmaintain compliance with a maximum total leverage ratio and a minimum interest coverage ratio. MGM NationalHarbor, LLC was in compliance with its credit agreement covenants at December 31, 2016.
Senior Notes. On August 19, 2016, the Company issued $500 million in aggregate principal amount of4.625% senior notes due 2026 for net proceeds of $493 million. In September 2016, the Company used the netproceeds, together with cash on hand, to redeem the $743 million outstanding aggregate principal amount of its7.625% senior notes due 2017. The Company incurred a loss on early retirement of the 7.625% senior notes ofapproximately $16 million recorded in “Other, net” in the consolidated statements of operations. In connectionwith the closing of the IPO, on May 25, 2016 (the “Redemption Date”) the Company redeemed for cash all $1.23billion aggregate principal amount of its outstanding 7.5% senior notes due 2016 and 10% senior notes due 2016in accordance with the terms of the applicable indenture. The Company incurred a loss on early retirement ofsuch notes of approximately $22 million recorded in “Other, net” in the consolidated statements of operations.
65
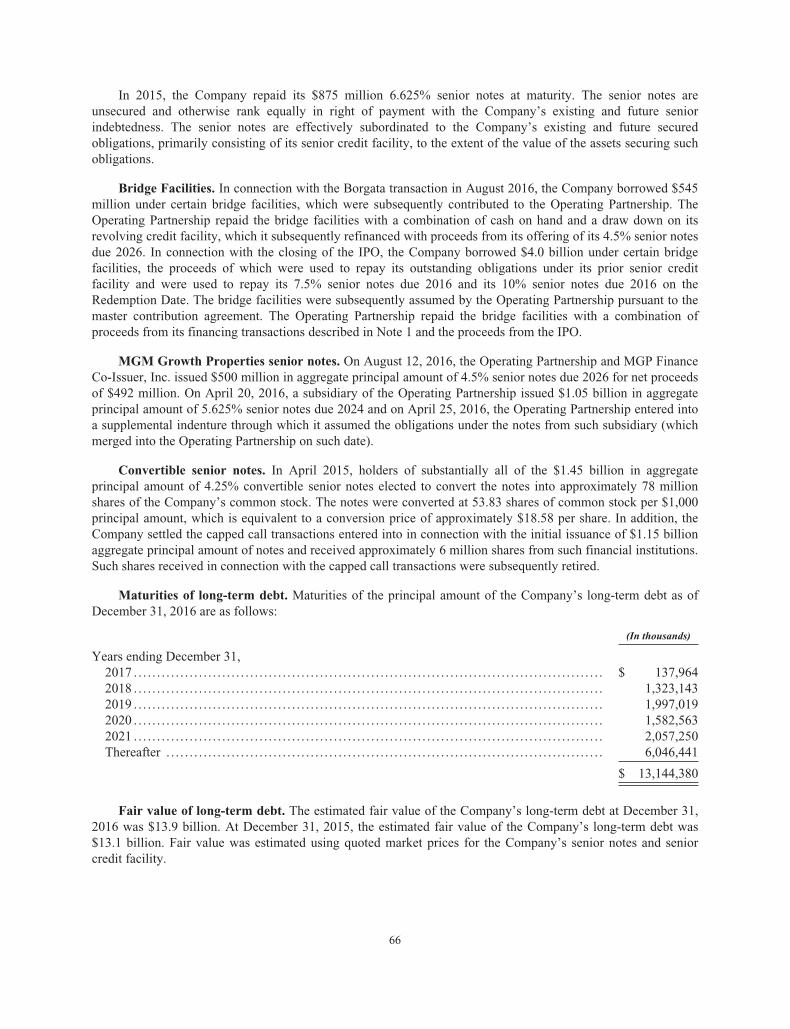
In 2015, the Company repaid its $875 million 6.625% senior notes at maturity. The senior notes areunsecured and otherwise rank equally in right of payment with the Company’s existing and future seniorindebtedness. The senior notes are effectively subordinated to the Company’s existing and future securedobligations, primarily consisting of its senior credit facility, to the extent of the value of the assets securing suchobligations.
Bridge Facilities. In connection with the Borgata transaction in August 2016, the Company borrowed $545million under certain bridge facilities, which were subsequently contributed to the Operating Partnership. TheOperating Partnership repaid the bridge facilities with a combination of cash on hand and a draw down on itsrevolving credit facility, which it subsequently refinanced with proceeds from its offering of its 4.5% senior notesdue 2026. In connection with the closing of the IPO, the Company borrowed $4.0 billion under certain bridgefacilities, the proceeds of which were used to repay its outstanding obligations under its prior senior creditfacility and were used to repay its 7.5% senior notes due 2016 and its 10% senior notes due 2016 on theRedemption Date. The bridge facilities were subsequently assumed by the Operating Partnership pursuant to themaster contribution agreement. The Operating Partnership repaid the bridge facilities with a combination ofproceeds from its financing transactions described in Note 1 and the proceeds from the IPO.
MGM Growth Properties senior notes. On August 12, 2016, the Operating Partnership and MGP FinanceCo-Issuer, Inc. issued $500 million in aggregate principal amount of 4.5% senior notes due 2026 for net proceedsof $492 million. On April 20, 2016, a subsidiary of the Operating Partnership issued $1.05 billion in aggregateprincipal amount of 5.625% senior notes due 2024 and on April 25, 2016, the Operating Partnership entered intoa supplemental indenture through which it assumed the obligations under the notes from such subsidiary (whichmerged into the Operating Partnership on such date).
Convertible senior notes. In April 2015, holders of substantially all of the $1.45 billion in aggregateprincipal amount of 4.25% convertible senior notes elected to convert the notes into approximately 78 millionshares of the Company’s common stock. The notes were converted at 53.83 shares of common stock per $1,000principal amount, which is equivalent to a conversion price of approximately $18.58 per share. In addition, theCompany settled the capped call transactions entered into in connection with the initial issuance of $1.15 billionaggregate principal amount of notes and received approximately 6 million shares from such financial institutions.Such shares received in connection with the capped call transactions were subsequently retired.
Maturities of long-term debt. Maturities of the principal amount of the Company’s long-term debt as ofDecember 31, 2016 are as follows:
(In thousands)
Years ending December 31,2017 . . . . . . . . . . . . . . . . . . . . . . . . . . . . . . . . . . . . . . . . . . . . . . . . . . . . . . . . . . . . . . . . . . . . . . . . . . . . . . . . . . . . . . . . . . . . . . . . . . . . . $ 137,9642018 . . . . . . . . . . . . . . . . . . . . . . . . . . . . . . . . . . . . . . . . . . . . . . . . . . . . . . . . . . . . . . . . . . . . . . . . . . . . . . . . . . . . . . . . . . . . . . . . . . . . . 1,323,1432019 . . . . . . . . . . . . . . . . . . . . . . . . . . . . . . . . . . . . . . . . . . . . . . . . . . . . . . . . . . . . . . . . . . . . . . . . . . . . . . . . . . . . . . . . . . . . . . . . . . . . . 1,997,0192020 . . . . . . . . . . . . . . . . . . . . . . . . . . . . . . . . . . . . . . . . . . . . . . . . . . . . . . . . . . . . . . . . . . . . . . . . . . . . . . . . . . . . . . . . . . . . . . . . . . . . . 1,582,5632021 . . . . . . . . . . . . . . . . . . . . . . . . . . . . . . . . . . . . . . . . . . . . . . . . . . . . . . . . . . . . . . . . . . . . . . . . . . . . . . . . . . . . . . . . . . . . . . . . . . . . . 2,057,250Thereafter . . . . . . . . . . . . . . . . . . . . . . . . . . . . . . . . . . . . . . . . . . . . . . . . . . . . . . . . . . . . . . . . . . . . . . . . . . . . . . . . . . . . . . . . . . . . . . 6,046,441
$ 13,144,380
Fair value of long-term debt. The estimated fair value of the Company’s long-term debt at December 31,2016 was $13.9 billion. At December 31, 2015, the estimated fair value of the Company’s long-term debt was$13.1 billion. Fair value was estimated using quoted market prices for the Company’s senior notes and seniorcredit facility.
66

NOTE 11 — DERIVATIVES AND HEDGING ACTIVITIES
The Operating Partnership uses derivative instruments to mitigate the effects of interest rate volatilityinherent in its variable rate debt, which could unfavorably impact its future earnings and forecasted cash flows.The Operating Partnership does not use derivative instruments for speculative or trading purposes.
In December 2016, the Operating Partnership entered into interest rate swap agreements to mitigate theinterest rate risk inherent in its senior secured term loan B facility. These interest rate swaps are designated ascash flow hedges and have a notional value of $500 million and mature on November 30, 2021. The weightedaverage fixed rate paid is 1.825%, and the variable rate received resets monthly to the one-month LIBOR subjectto a minimum rate of 0.75%.
The following table summarizes the fair value and the presentation in the Company’s balance sheet:
Location on Balance Sheet December 31, 2016
(In thousands)
Interest rate swaps - cash flow hedges Other long-term assets, net $ 1,879
As of December 31, 2016, all of the interest rate swaps were valued in net unrealized gain positions andrecognized as asset balances within “Other long-term assets, net.” For the year ended December 31, 2016, theamount recorded in other comprehensive income related to the gain on derivative instruments was $2 million.For the year ended December 31, 2016, there was no ineffective portion of the change in fair value derivatives.During the fourth quarter of 2016, the Company recorded interest expense of $0.4 million related to the swapagreements.
Amounts reported in accumulated other comprehensive income related to derivatives will be reclassified tointerest expense as interest payments are made on our variable-rate debt. During the twelve months beginningJanuary 1, 2017, the Company estimates that $4 million will be reclassified as an increase to interest expense.
In January 2017, the Operating Partnership entered into additional interest rate swap agreements throughNovember 2021 with a total $700 million notional amount to pay a fixed rate of 1.964%, and the variable ratereceived resets monthly to the one-month LIBOR, subject to a minimum rate of 0.75%, in order to mitigate theinterest rate risk inherent in its senior secured term loan B facility.
NOTE 12 — INCOME TAXES
The Company recognizes deferred income tax assets, net of applicable reserves, related to net operatinglosses, tax credit carryforwards and certain temporary differences. The Company recognizes future tax benefits tothe extent that realization of such benefit is more likely than not. Otherwise, a valuation allowance is applied.
Income (loss) before income taxes for domestic and foreign operations consisted of the following:
Year Ended December 31,
2016 2015 2014(In thousands)
Domestic operations . . . . . . . . . . . . . . . . . . . . . . . . . . . . . . . . . . . . . . . . . . . . $ 985,683 $ 155,296 $ (168,135)Foreign operations . . . . . . . . . . . . . . . . . . . . . . . . . . . . . . . . . . . . . . . . . . . . . . . 273,494 (1,201,539) 579,021
$ 1,259,177 $ (1,046,243) $ 410,886
67
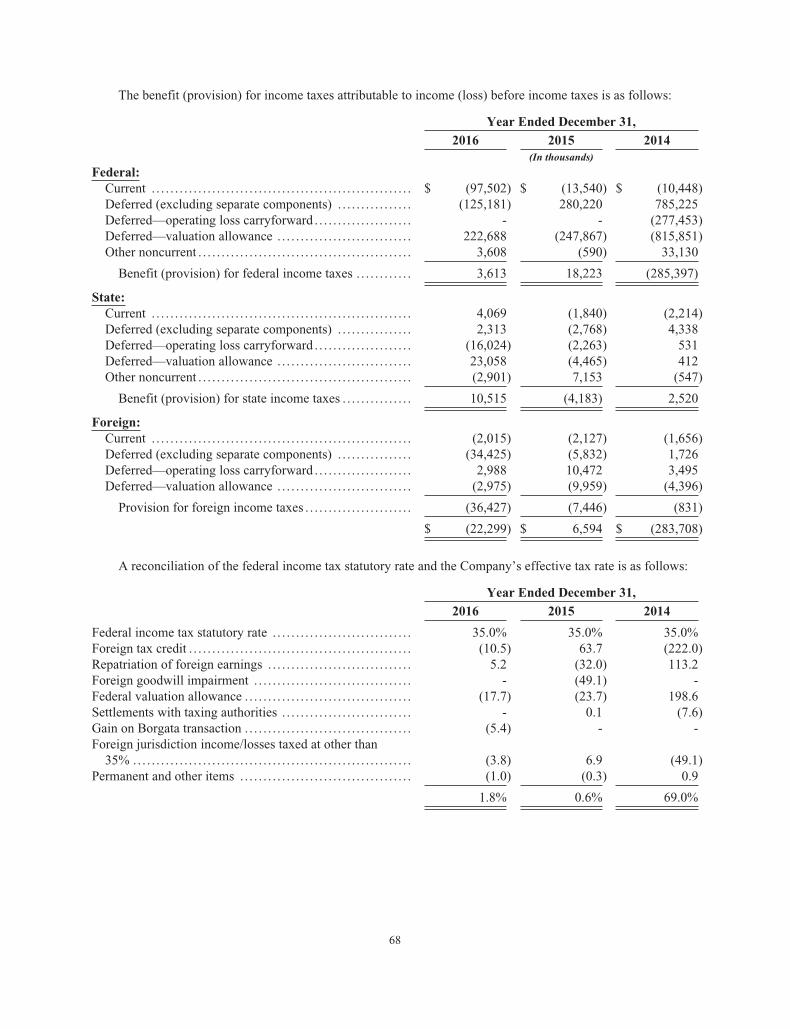
The benefit (provision) for income taxes attributable to income (loss) before income taxes is as follows:
Year Ended December 31,
2016 2015 2014(In thousands)
Federal:Current . . . . . . . . . . . . . . . . . . . . . . . . . . . . . . . . . . . . . . . . . . . . . . . . . . . . . . . . $ (97,502) $ (13,540) $ (10,448)Deferred (excluding separate components) . . . . . . . . . . . . . . . . (125,181) 280,220 785,225Deferred—operating loss carryforward . . . . . . . . . . . . . . . . . . . . . - - (277,453)Deferred—valuation allowance . . . . . . . . . . . . . . . . . . . . . . . . . . . . . 222,688 (247,867) (815,851)Other noncurrent . . . . . . . . . . . . . . . . . . . . . . . . . . . . . . . . . . . . . . . . . . . . . . 3,608 (590) 33,130
Benefit (provision) for federal income taxes . . . . . . . . . . . . 3,613 18,223 (285,397)
State:Current . . . . . . . . . . . . . . . . . . . . . . . . . . . . . . . . . . . . . . . . . . . . . . . . . . . . . . . . 4,069 (1,840) (2,214)Deferred (excluding separate components) . . . . . . . . . . . . . . . . 2,313 (2,768) 4,338Deferred—operating loss carryforward . . . . . . . . . . . . . . . . . . . . . (16,024) (2,263) 531Deferred—valuation allowance . . . . . . . . . . . . . . . . . . . . . . . . . . . . . 23,058 (4,465) 412Other noncurrent . . . . . . . . . . . . . . . . . . . . . . . . . . . . . . . . . . . . . . . . . . . . . . (2,901) 7,153 (547)
Benefit (provision) for state income taxes . . . . . . . . . . . . . . . 10,515 (4,183) 2,520
Foreign:Current . . . . . . . . . . . . . . . . . . . . . . . . . . . . . . . . . . . . . . . . . . . . . . . . . . . . . . . . (2,015) (2,127) (1,656)Deferred (excluding separate components) . . . . . . . . . . . . . . . . (34,425) (5,832) 1,726Deferred—operating loss carryforward . . . . . . . . . . . . . . . . . . . . . 2,988 10,472 3,495Deferred—valuation allowance . . . . . . . . . . . . . . . . . . . . . . . . . . . . . (2,975) (9,959) (4,396)
Provision for foreign income taxes . . . . . . . . . . . . . . . . . . . . . . . (36,427) (7,446) (831)
$ (22,299) $ 6,594 $ (283,708)
A reconciliation of the federal income tax statutory rate and the Company’s effective tax rate is as follows:
Year Ended December 31,
2016 2015 2014
Federal income tax statutory rate . . . . . . . . . . . . . . . . . . . . . . . . . . . . . . 35.0% 35.0% 35.0%Foreign tax credit . . . . . . . . . . . . . . . . . . . . . . . . . . . . . . . . . . . . . . . . . . . . . . . . (10.5) 63.7 (222.0)Repatriation of foreign earnings . . . . . . . . . . . . . . . . . . . . . . . . . . . . . . . 5.2 (32.0) 113.2Foreign goodwill impairment . . . . . . . . . . . . . . . . . . . . . . . . . . . . . . . . . . - (49.1) -Federal valuation allowance . . . . . . . . . . . . . . . . . . . . . . . . . . . . . . . . . . . . (17.7) (23.7) 198.6Settlements with taxing authorities . . . . . . . . . . . . . . . . . . . . . . . . . . . . - 0.1 (7.6)Gain on Borgata transaction . . . . . . . . . . . . . . . . . . . . . . . . . . . . . . . . . . . . (5.4) - -Foreign jurisdiction income/losses taxed at other than
35% .. . . . . . . . . . . . . . . . . . . . . . . . . . . . . . . . . . . . . . . . . . . . . . . . . . . . . . . . . . . (3.8) 6.9 (49.1)Permanent and other items . . . . . . . . . . . . . . . . . . . . . . . . . . . . . . . . . . . . . (1.0) (0.3) 0.9
1.8% 0.6% 69.0%
68

The major tax-effected components of the Company’s net deferred tax liability are as follows:
December 31,
2016 2015(In thousands)
Deferred tax assets - federal and state:Bad debt reserve . . . . . . . . . . . . . . . . . . . . . . . . . . . . . . . . . . . . . . . . . . . . . . . . . . . . . . . . . . . . . . . . . . . $ 40,330 $ 42,133Deferred compensation . . . . . . . . . . . . . . . . . . . . . . . . . . . . . . . . . . . . . . . . . . . . . . . . . . . . . . . . . . . 6,881 4,719Net operating loss carryforward . . . . . . . . . . . . . . . . . . . . . . . . . . . . . . . . . . . . . . . . . . . . . . . . . 9,669 20,084Capital loss carryforward . . . . . . . . . . . . . . . . . . . . . . . . . . . . . . . . . . . . . . . . . . . . . . . . . . . . . . . . . - 2,827Accruals, reserves and other . . . . . . . . . . . . . . . . . . . . . . . . . . . . . . . . . . . . . . . . . . . . . . . . . . . . . 168,712 42,614Investments in unconsolidated affiliates . . . . . . . . . . . . . . . . . . . . . . . . . . . . . . . . . . . . . . . . 152,092 198,594Stock-based compensation . . . . . . . . . . . . . . . . . . . . . . . . . . . . . . . . . . . . . . . . . . . . . . . . . . . . . . . 33,311 32,108Tax credits . . . . . . . . . . . . . . . . . . . . . . . . . . . . . . . . . . . . . . . . . . . . . . . . . . . . . . . . . . . . . . . . . . . . . . . . . 2,824,312 2,883,839
3,235,307 3,226,918Less: Valuation allowance . . . . . . . . . . . . . . . . . . . . . . . . . . . . . . . . . . . . . . . . . . . . . . . . . . . . . . . . . . (2,510,140) (2,736,972)
725,167 489,946
Deferred tax assets - foreign:Bad debt reserve . . . . . . . . . . . . . . . . . . . . . . . . . . . . . . . . . . . . . . . . . . . . . . . . . . . . . . . . . . . . . . . . . . . 895 976Net operating loss carryforward . . . . . . . . . . . . . . . . . . . . . . . . . . . . . . . . . . . . . . . . . . . . . . . . . 72,788 69,800Accruals, reserves and other . . . . . . . . . . . . . . . . . . . . . . . . . . . . . . . . . . . . . . . . . . . . . . . . . . . . . 3,945 1,270Property and equipment . . . . . . . . . . . . . . . . . . . . . . . . . . . . . . . . . . . . . . . . . . . . . . . . . . . . . . . . . . - 2,837Stock-based compensation . . . . . . . . . . . . . . . . . . . . . . . . . . . . . . . . . . . . . . . . . . . . . . . . . . . . . . . 3,830 -
81,458 74,883Less: Valuation allowance . . . . . . . . . . . . . . . . . . . . . . . . . . . . . . . . . . . . . . . . . . . . . . . . . . . . . . . . . . (73,134) (70,159)
8,324 4,724
Total deferred tax assets . . . . . . . . . . . . . . . . . . . . . . . . . . . . . . . . . . . . . . . . . . . . . . . . . . . . . . . . . . $ 733,491 $ 494,670
Deferred tax liabilities - federal and state:Property and equipment . . . . . . . . . . . . . . . . . . . . . . . . . . . . . . . . . . . . . . . . . . . . . . . . . . . . . . . . . . $ (2,657,230) $ (2,536,724)Long-term debt . . . . . . . . . . . . . . . . . . . . . . . . . . . . . . . . . . . . . . . . . . . . . . . . . . . . . . . . . . . . . . . . . . . . (146,018) (220,245)Intangibles . . . . . . . . . . . . . . . . . . . . . . . . . . . . . . . . . . . . . . . . . . . . . . . . . . . . . . . . . . . . . . . . . . . . . . . . . (124,729) (99,419)
(2,927,977) (2,856,388)
Deferred tax liabilities - foreign:Property and equipment . . . . . . . . . . . . . . . . . . . . . . . . . . . . . . . . . . . . . . . . . . . . . . . . . . . . . . . . . . (4,691) -Intangibles . . . . . . . . . . . . . . . . . . . . . . . . . . . . . . . . . . . . . . . . . . . . . . . . . . . . . . . . . . . . . . . . . . . . . . . . . (352,051) (318,858)
(356,742) (318,858)
Total deferred tax liability . . . . . . . . . . . . . . . . . . . . . . . . . . . . . . . . . . . . . . . . . . . . . . . . . . . . . . . . $ (3,284,719) $ (3,175,246)
Net deferred tax liability . . . . . . . . . . . . . . . . . . . . . . . . . . . . . . . . . . . . . . . . . . . . . . . . . . . . . . . . . . $ (2,551,228) $ (2,680,576)
Income generated from gaming operations of MGM Grand Paradise, which is owned by MGM China, isexempted from Macau’s 12% complementary tax, pursuant to approval from the Macau government. Absent thisexemption, “Net income attributable to MGM Resorts International” would have decreased by $25 million in2016, and “Net loss attributable to MGM Resorts International” would have increased by $25 million in 2015and net income per share (diluted) would have decreased by $0.04 in 2016 and net loss per share (diluted) wouldhave increased by $0.04 in 2015.
69
Non-gaming operations remain subject to the Macau complementary tax. MGM Grand Paradise had atDecember 31, 2016 a complementary tax net operating loss carryforward of $593 million resulting from non-gaming operations that will expire if not utilized against non-gaming income in years 2017 through 2019.
MGM Grand Paradise’s exemption from the Macau 12% complementary tax on gaming profits does notapply to dividend distributions of such profits to MGM China. However, MGM Grand Paradise has an agreementwith the Macau government to settle the 12% complementary tax that would otherwise be due by its shareholder,MGM China, on distributions of its gaming profits by paying a flat annual payment (“annual fee arrangement”)regardless of the amount of distributable dividends. Such annual fee arrangement was effective untilDecember 31, 2016. MGM China was not subject to the complementary tax on distributions it received duringthe covered period as a result of the annual fee arrangement. Annual payments of $2 million were required underthe annual fee arrangement. The $2 million annual payments for 2016 and 2015 were accrued and acorresponding provision for income taxes was recorded in each year. MGM Grand Paradise intends to file for anextension of this agreement in the first quarter of 2017. However, no assurance can be given that an extensionwill be granted or that the terms if granted will not be less favorable than the prior agreement.
The Company repatriated $53 million and $304 million of foreign earnings and profits in 2016 and 2015,respectively. At December 31, 2016, there were approximately $363 million of unrepatriated foreign earningsand profits, all of which the Company anticipates will be repatriated without the incurrence of additional U.S.income tax expense due to creditable foreign taxes associated with such earnings and profits. Such foreign taxesconsist of the Macau Special Gaming Tax, which the Company believes qualifies as a tax paid in lieu of anincome tax that is creditable against U.S. income taxes. Accordingly, no deferred tax liability had been recordedfor those earnings. The Company had foreign tax credit carryovers of $2.8 billion as of December 31, 2016which will expire as follows: $731 million in 2022; $976 million in 2023; $786 million in 2024; and $331million in 2025. The foreign tax credit carryovers are subject to valuation allowance as described further below.
For state income tax purposes, the Company had Illinois, New Jersey, and Michigan net operating losscarryforwards of $93 million, $166 million, and $77 million at December 31, 2016, respectively, which equatesto deferred tax assets after federal tax effect and before valuation allowance, of $5 million, $3 million, and $3million, respectively. The Illinois net operating loss carryforwards will expire if not utilized by 2021 through2026. The New Jersey net operating loss carryforwards will expire if not utilized by 2029 through 2036. TheMichigan net operating loss carryforwards will expire if not utilized by 2022 through 2024.
The Company recorded a valuation allowance of $2.5 billion against the $2.8 billion foreign tax creditdeferred tax asset at December 31, 2016. In addition, there was a $3 million valuation allowance, after federaleffect, provided on certain state deferred tax assets, a valuation allowance of $71 million on certain Macaudeferred tax assets, and a valuation allowance of $2 million on Hong Kong net operating losses because theCompany believes these assets do not meet the “more likely than not” criteria for recognition.
The foreign tax credits are attributable to the Macau Special Gaming Tax, which is 35% of gross gamingrevenue in Macau. Because MGM Grand Paradise is presently exempt from the Macau 12% complementary taxon gaming profits, the Company believes that payment of the Macau Special Gaming Tax qualifies as a tax paidin lieu of an income tax that is creditable against U.S. taxes. On September 7, 2016, MGM Grand Paradise wasgranted an additional extension of the complementary tax exemption through March 31, 2020, concurrent withthe end of the term of its current gaming subconcession. A competitor of MGM Grand Paradise subsequentlyreceived an additional extension of its exemption through March 31, 2020, which also runs concurrent with theend of the term of its current gaming concession. Based upon these developments and the uncertainty concerningtaxation after the concession renewal process, the Company has concluded that it can no longer assume thatMGM Grand Paradise will be entitled to additional exemption periods beyond the end of the extension recentlygranted. Thus, for all periods beyond March 31, 2020, the Company has assumed that MGM Grand Paradise willpay the Macau 12% complementary tax on gaming profits and will thus not be able to credit the Macau SpecialGaming Tax in such years, and has factored that assumption into the assessment of the realization of the foreign
70

tax credit deferred tax asset. This change resulted in a reduction in the valuation allowance against the foreign taxcredit deferred tax asset in the amount of $169 million with a corresponding reduction in the provision forincome taxes in 2016.
Due to improvements in its U.S. operations, the Company has generated U.S. operating profits for the pasteight consecutive quarters and as of June 30, 2016 no longer had cumulative U.S. losses in recent years.Consequently, during the quarter ended June 30, 2016 the Company began to rely on future U.S. source operatingincome in assessing future foreign tax credit realization during the 10-year foreign tax credit carryover period.This change resulted in a reduction in the valuation allowance and a corresponding reduction in the provision forincome taxes of $85 million in 2016.
A reconciliation of the beginning and ending amounts of gross unrecognized tax benefits is as follows:
Year Ended December 31,
2016 2015 2014(In thousands)
Gross unrecognized tax benefits at January 1 . . . . . . . . . . . . . . . . . . . . . . . . . . . $ 13,724 $ 31,143 $ 106,246Gross increases - prior period tax positions . . . . . . . . . . . . . . . . . . . . . . . . . . - - 1,626Gross decreases - prior period tax positions . . . . . . . . . . . . . . . . . . . . . . . . . . (3,375) (14,158) (43,098)Gross increases - current period tax positions . . . . . . . . . . . . . . . . . . . . . . . . 3,677 1,222 5,066Settlements with taxing authorities . . . . . . . . . . . . . . . . . . . . . . . . . . . . . . . . . . . . - (2,408) (38,697)Lapse in Statutes of Limitations . . . . . . . . . . . . . . . . . . . . . . . . . . . . . . . . . . . . . . . - (2,075) -
Gross unrecognized tax benefits at December 31 . . . . . . . . . . . . . . . . . . . . . . . $ 14,026 $ 13,724 $ 31,143
The total amount of unrecognized tax benefits that, if recognized, would affect the effective tax rate was$9 million and $8 million at December 31, 2016 and 2015, respectively.
The Company recognizes accrued interest and penalties related to unrecognized tax benefits in income taxexpense. The Company accrued less than $1 million in interest related to unrecognized tax benefits atDecember 31, 2016 and 2015. No amounts were accrued for penalties as of either date. Income tax expense forthe years ended December 31, 2016, 2015 and 2014 includes interest benefit and expense related to unrecognizedtax benefits as follows: less than $1 million expense in 2016, $4 million benefit in 2015, and $13 million benefitin 2014.
The Company files income tax returns in the U.S. federal jurisdiction, various state and local jurisdictions,and foreign jurisdictions, although the income taxes paid in foreign jurisdictions are not material. As ofDecember 31, 2016, the Company is no longer subject to examination of its U.S. consolidated federal income taxreturns filed for years ended prior to 2010. During 2016, the IRS opened an examination of the Company’s 2014U.S. consolidated federal income tax return and notified the Company that it would open an examination of the2014 income tax return of CityCenter Holdings, LLC, an unconsolidated affiliate treated as a partnership forincome tax purposes. During 2015, the Company received final approval from the Joint Committee on Taxationof the results of the IRS examination of the 2009 tax year and agreed to all IRS adjustments to the 2010 and 2011tax years of CityCenter Holdings, LLC. The Company received a refund of $16 million of taxes and associatedinterest in connection with the settlement of these examinations, which are now considered settled for financialaccounting purposes. During 2014, the Company received final approval from the Joint Committee on Taxationof the results of the IRS examination of its consolidated federal income tax returns for the 2005 through 2009 taxyears; the 2007 through 2008 tax years of CityCenter Holdings, LLC; the 2008 through 2009 tax years of MGMGrand Detroit, LLC, a subsidiary treated as a partnership for income tax purposes; and the 2005 through 2009 taxyears of Marina District Development Holding Company, LLC, an unconsolidated affiliate treated as apartnership for income tax purposes during such years. These examinations are now considered settled forfinancial reporting purposes. The Company previously deposited $30 million with the IRS to cover the expectedcash taxes and interest resulting from the tentatively agreed adjustments for these examinations.
71
As of December 31, 2016, other than adjustments resulting from the federal income tax audits discussedabove, the Company was no longer subject to examination of its various state and local tax returns filed for yearsended prior to 2012. During 2015, the state of New Jersey completed its examination of Marina DistrictDevelopment Holding Company, LLC for the 2003 through 2009 tax years. All adjustments were agreed to bythe members of Marina District Development Holding Company, LLC and the examination is now consideredsettled for financial accounting purposes. The Company made a $1 million payment of tax and associated interestas a result of this settlement. No other state or local income tax returns are currently under examination.
The Company does not anticipate that the total amounts of unrecognized tax benefits at December 31, 2016will change materially within the next twelve months.
NOTE 13 — COMMITMENTS AND CONTINGENCIES
Leases. The Company leases real estate and various equipment under operating and, to a lesser extent,capital lease arrangements. Certain real estate leases provide for escalation of rent based upon a specified priceindex and/or based upon periodic appraisals.
At December 31, 2016, the Company was obligated under non-cancellable operating leases to make futureminimum lease payments as follows:
(In thousands)
Years ending December 31,2017. . . . . . . . . . . . . . . . . . . . . . . . . . . . . . . . . . . . . . . . . . . . . . . . . . . . . . . . . . . . . . . . . . . . . . . . . . . . . . . . . . . . . . . . . . . . . . . . . . . . . . . . . . $ 37,1732018. . . . . . . . . . . . . . . . . . . . . . . . . . . . . . . . . . . . . . . . . . . . . . . . . . . . . . . . . . . . . . . . . . . . . . . . . . . . . . . . . . . . . . . . . . . . . . . . . . . . . . . . . . 33,0182019. . . . . . . . . . . . . . . . . . . . . . . . . . . . . . . . . . . . . . . . . . . . . . . . . . . . . . . . . . . . . . . . . . . . . . . . . . . . . . . . . . . . . . . . . . . . . . . . . . . . . . . . . . 29,7222020. . . . . . . . . . . . . . . . . . . . . . . . . . . . . . . . . . . . . . . . . . . . . . . . . . . . . . . . . . . . . . . . . . . . . . . . . . . . . . . . . . . . . . . . . . . . . . . . . . . . . . . . . . 29,9762021. . . . . . . . . . . . . . . . . . . . . . . . . . . . . . . . . . . . . . . . . . . . . . . . . . . . . . . . . . . . . . . . . . . . . . . . . . . . . . . . . . . . . . . . . . . . . . . . . . . . . . . . . . 32,416Thereafter . . . . . . . . . . . . . . . . . . . . . . . . . . . . . . . . . . . . . . . . . . . . . . . . . . . . . . . . . . . . . . . . . . . . . . . . . . . . . . . . . . . . . . . . . . . . . . . . . . . 1,380,274
Total minimum lease payments . . . . . . . . . . . . . . . . . . . . . . . . . . . . . . . . . . . . . . . . . . . . . . . . . . . . . . . . . . . . . . . . . . . . . . . . $ 1,542,579
The table above excludes the Company’s future lease obligations to a subsidiary of the OperatingPartnership pursuant to the master lease agreement discussed in Note 19. The Company owns 76.3% of theOperating Partnership units as of December 31, 2016. The current obligations of $9 million under capital leasesdue within one year are included in “Other accrued liabilities” and the long-term obligations of $5 million undercapital leases due after one year are included in “Other long-term obligations”. Rental expense for operatingleases was $80 million, $74 million and $65 million for 2016, 2015 and 2014, respectively. Amounts includedshort term rentals charged to rent expense. Rental expense in 2016, 2015, and 2014 includes $7 million related tothe Cotai land concession. The Company accounts for the Cotai land concession contract as an operating leasefor which the required upfront payments are amortized over the initial 25-year contract term. Rent recognized forthe Cotai land concession is included in “Preopening and start-up expenses” prior to opening.
In August 2016, in connection with the Borgata transaction, the Company has assumed the liability of aseries of ground leases for a total of approximately 11 acres of land on which the Borgata employee parkinggarage, public space expansion, rooms expansion, and modified surface parking lot. The Company recorded anunfavorable lease liability for the excess contractual lease obligations over the market value of the leases, whichwill be amortized on a straight-line basis over the term of the lease contracts through December 2070. Theground lease is accounted for as an operating lease with rental expense of $2 million for the year endedDecember 31, 2016.
In April 2013, the Company entered into a ground lease agreement for an approximate 23 acre parcel of landin connection with the MGM National Harbor project. The ground lease has an initial term of 25 years and theright to extend for up to 13 additional six year periods with the first 7 of those additional periods considered to be
72
reasonably assured. The Company therefore amortizes the lease on a straight line basis over a 67 year term. Theground lease is accounted for as an operating lease with rental expense of $16 million, $19 million and $13million recorded for the years ended December 31, 2016, 2015 and 2014, respectively. Rent recognized for theground lease was included in “Preopening and start-up expenses” prior to opening.
Borgata property tax reimbursement agreement. On February 15, 2017, Borgata, the Department ofCommunity Affairs of the State of New Jersey and Atlantic City entered into an agreement wherein Borgata willbe reimbursed $72 million as settlement for property tax refunds subject to certain terms and conditions. Thepayment of the settlement amount is in satisfaction of existing New Jersey Tax Court and Superior Courtjudgments totaling approximately $106 million, plus interest for the 2009-2012 tax years and the settlement ofpending tax appeals for the tax years 2013-2015. Those pending tax appeals could potentially have resulted inBorgata being awarded additional refunds due amounting to approximately $65 million. Under the terms of theagreement, Atlantic City will pay Borgata the reimbursement amount of $72 million in up to two installments,with the first installment of $52 million due on or before July 31, 2017 and the second installment for theremaining balance of $20 million due on or before October 1, 2017. In order to finance the reimbursement,Atlantic City and the State of New Jersey have agreed to use their best efforts to issue and sell bonds to pay thereimbursement. Should Atlantic City fail to pay either of the installment payments or petition for relief fromcreditors under state or federal law, or should any other event occur that would cause termination of theagreement, Borgata will be entitled to enforce a consent judgment that is being entered into as part of thesettlement for the 2009-2015 tax years in an amount totaling $158 million.
As part of the purchase and sale agreement, the Company agreed to pay Boyd Gaming half of any netamount received by the Company as it relates to the property tax refund owed to Borgata. The Company willrecognize the amounts received pursuant to the reimbursement agreement and amounts paid to Boyd Gaming incurrent earnings in the periods in which payments are received and paid.
NV Energy. In July 2016, the Company filed its notice to exit the fully bundled sales system of NV Energyand will purchase energy, capacity, and/or ancillary services from a provider other than NV Energy. TheCompany elected to pay the upfront impact payment of $83 million, including $14 million related to CityCenter.The upfront payments were made in September 2016. The Company and CityCenter are required to makeongoing payments to NV Energy for non-bypassable rate charges which primarily relate to each entity’s share ofNV Energy’s portfolio of renewable energy contracts which extend through 2040 and each entity’s share of thecosts of decommissioning and remediation of coal-fired power plants in Nevada. As of December 31, 2016, theCompany recorded an estimate of such liability on a discounted basis of $8 million in “Other accrued liabilities”and $63 million in “Other long-term obligations.” The expense recognized related to the upfront payment and theinitial accrual for the non-bypassable charges liability has been recognized within “NV Energy exit expense” inthe accompanying consolidated statements of operations. Subsequent accretion of the liability and changes inestimates will be recognized within general and administrative expenses.
Grand Paradise Macau deferred cash payment. On September 1, 2016, the Company purchased188.1 million common shares of its MGM China subsidiary from Grand Paradise Macau (“GPM”), an entitycontrolled by Ms. Ho, Pansy Catilina Chiu King (“Ms. Ho”). As part of the consideration for the purchase, theCompany agreed to pay GPM a deferred cash payment of $50 million, which will be paid in amounts equal to theordinary dividends received on such shares, with a final lump sum payment due on the fifth anniversary of theclosing date of the transaction if any portion of the deferred cash payment remains unpaid at that time. As ofDecember 31, 2016, the Company recorded a liability on a discounted basis of $43 million in “Other long-termobligations.”
Cotai land concession contract. MGM Grand Paradise’s land concession contract for an approximate 18acre site on the Cotai Strip in Macau became effective on January 9, 2013 and has an initial term of 25 years. Thetotal land premium payable to the Macau government for the land concession contract is $161 million and iscomposed of a down payment and eight additional semi-annual payments. As of December 31, 2016, MGMChina had paid $159 million of the contract’s premium, including interest due on the semi-annual installments,
73
and the amount paid is recorded within “Other long-term assets, net.” In January 2017, MGM China paid thefinal semi-annual installment of $15 million under the contract. Under the terms of the land concession contract,MGM Grand Paradise is required to build and open MGM Cotai by January 2018.
T-Mobile Arena. In conjunction with the Las Vegas Arena Company entering a senior secured creditfacility in 2014, the Company and AEG each entered joint and several completion guarantees for the project, aswell as a repayment guarantee for term loan B (which is subject to increases and decreases in the event of arebalancing of the principal amount of indebtedness between the term loan A and term loan B facilities). As ofDecember 31, 2016, term loan A was $150 million and term loan B was $50 million. The completion guaranteeswere terminated in February 2017.
Other guarantees. The Company is party to various guarantee contracts in the normal course of business,which are generally supported by letters of credit issued by financial institutions. The Company’s senior creditfacility limits the amount of letters of credit that can be issued to $250 million, MGP’s senior credit facility limitsthe amount to $75 million, MGM China’s credit facility limits the amount to $100 million, and MGM NationalHarbor’s credit facility limits the amount to $30 million. At December 31, 2016, the Company had $15 million inletters of credit outstanding under the Company’s senior credit facility and $39 million in letters of creditoutstanding under MGM China’s credit facility. No amounts were outstanding under the MGP senior creditfacility and the MGM National Harbor credit facility at December 31, 2016. The amount of available borrowingsunder each of the credit facilities is reduced by any outstanding letters of credit.
Other litigation. The Company is a party to various legal proceedings, most of which relate to routinematters incidental to its business. Management does not believe that the outcome of such proceedings will have amaterial adverse effect on the Company’s financial position, results of operations or cash flows.
NOTE 14 — STOCKHOLDERS’ EQUITY
The following is a summary of net income attributable to MGM Resorts International and transfers tononcontrolling interest for the year ended December 31, 2016:
(In thousands)
Net income attributable to MGM Resorts International . . . . . . . . . . . . . . . . . . . . . . . . . . . . . . . . . . . . . . . . . . . . . . . . $ 1,101,440Transfers to noncontrolling interest:MGP formation transactions . . . . . . . . . . . . . . . . . . . . . . . . . . . . . . . . . . . . . . . . . . . . . . . . . . . . . . . . . . . . . . . . . . . . . . . . (150,414)Borgata transaction . . . . . . . . . . . . . . . . . . . . . . . . . . . . . . . . . . . . . . . . . . . . . . . . . . . . . . . . . . . . . . . . . . . . . . . . . . . . . . . . . . (18,385)MGM China transaction . . . . . . . . . . . . . . . . . . . . . . . . . . . . . . . . . . . . . . . . . . . . . . . . . . . . . . . . . . . . . . . . . . . . . . . . . . . . . (45,554)
Net transfers to noncontrolling interest . . . . . . . . . . . . . . . . . . . . . . . . . . . . . . . . . . . . . . . . . . . . . . . . . . . . . . . . . . . . . . . (214,353)
Change from net income attributable to MGM Resorts International and transfers tononcontrolling interest . . . . . . . . . . . . . . . . . . . . . . . . . . . . . . . . . . . . . . . . . . . . . . . . . . . . . . . . . . . . . . . . . . . . . . . . . . . . . . . . . . $ 887,087
MGM Growth Properties IPO. The Company adjusted the carrying value of the noncontrolling interests toreflect MGP’s Class A shareholders’ 26.7% initial ownership interest in the consolidated net assets of MGPrelated to the IPO and related transactions discussed in Note 1, with an offsetting adjustment to additional paid incapital.
Borgata transaction. The Company has adjusted the carrying value of the noncontrolling interests as aresult of the Borgata transaction to adjust for the change in noncontrolling interests ownership percentage of theOperating Partnership’s net assets, as discussed in Note 1, including assets and liabilities transferred as a part ofthe Borgata transaction, with an offsetting adjustment to additional paid in capital.
MGM China common stock acquisition. In September 2016, the Company acquired 188.1 millionordinary shares of MGM China from GPM. As a result of the transaction, the Company owns approximately 56%
74
of MGM China’s outstanding common shares and Ms. Ho owned approximately 22.5% immediately followingthe transaction. As consideration for the MGM China shares, the Company issued 7,060,492 shares of itscommon stock and paid $100 million to GPM. In addition, the Company agreed to pay GPM a deferred cashpayment of $50 million. See Note 13 for additional information regarding the deferred cash payment. TheCompany adjusted the carrying value of the noncontrolling interest and accumulated other comprehensiveincome to reflect the change in MGM China’s noncontrolling ownership interest resulting from the transaction.The difference between the fair value of the consideration paid and the aforementioned adjustments wasrecognized as a reduction to additional paid in capital.
MGM Resorts International dividends. On February 15, 2017 the Company’s Board of Directorsapproved a quarterly dividend to holders of record on March 10, 2017 of $0.11 per share, totaling $63 million,which will be paid on March 15, 2017. The Company intends to pay a quarterly dividend in each future quartersubject to the Company’s operating results, cash requirements and financial conditions, any applicable provisionsof state law that may limit the amount of available funds, and compliance with covenants and financial ratiosrelated to existing or future agreements governing the indebtedness at the Company’s subsidiaries and anylimitations in other agreements such subsidiaries may have with third parties.
MGM China dividends. MGM China paid the following dividends:
• $46 million final dividend in May 2016, of which $23 million was distributed to noncontrolling interests;• $58 million interim dividend in August 2016, of which $29 million was distributed to noncontrollinginterests;
• $400 million special dividend in March 2015, of which $196 million was distributed to noncontrollinginterests;
• $120 million final dividend in June 2015, of which $59 million was distributed to noncontrollinginterests;
• $76 million interim dividend in August 2015, of which $37 million was distributed to noncontrollinginterests;
• $499 million special dividend in March 2014, of which $245 million was distributed to noncontrollinginterests;
• $127 million final dividend in June 2014, of which $62 million was distributed to noncontrollinginterests; and
• $137 million interim dividend in September 2014, of which $67 million was distributed to noncontrollinginterests.
On February 16, 2017, as part of its regular dividend policy, MGM China’s Board of Directors announced itwill recommend a final dividend for 2016 of $78 million to MGM China shareholders subject to approval at theMGM China 2017 annual shareholders meeting to be held in May. If approved, the Company will receive its56% share, or $44 million, of which $4 million will be paid to GPM under the deferred cash paymentarrangement. See Note 13 for additional information.
MGP dividends. In January 2017 and October 2016, MGP paid quarterly dividends of $0.3875 per Class Acommon share, each totaling $22 million. The Company concurrently received $72 million in distributionsattributable to the Operating Partnership units owned by the Company from the Operating Partnership, whichremained within the consolidated entity at each period. In July 2016 MGP paid a $15 million pro-rated quarterlydividend of $0.2632 per Class A common share. The Company concurrently received a $42 million distributionattributable to the Operating Partnership units owned by the Company from the Operating Partnership, whichremained within the consolidated entity.
NOTE 15 — STOCK-BASED COMPENSATION
MGM Resorts 2005 Omnibus Incentive Plan. The Company’s omnibus incentive plan, as amended (the“Omnibus Plan”), allows it to grant stock options, stock appreciation rights (“SARs”), restricted stock units
75
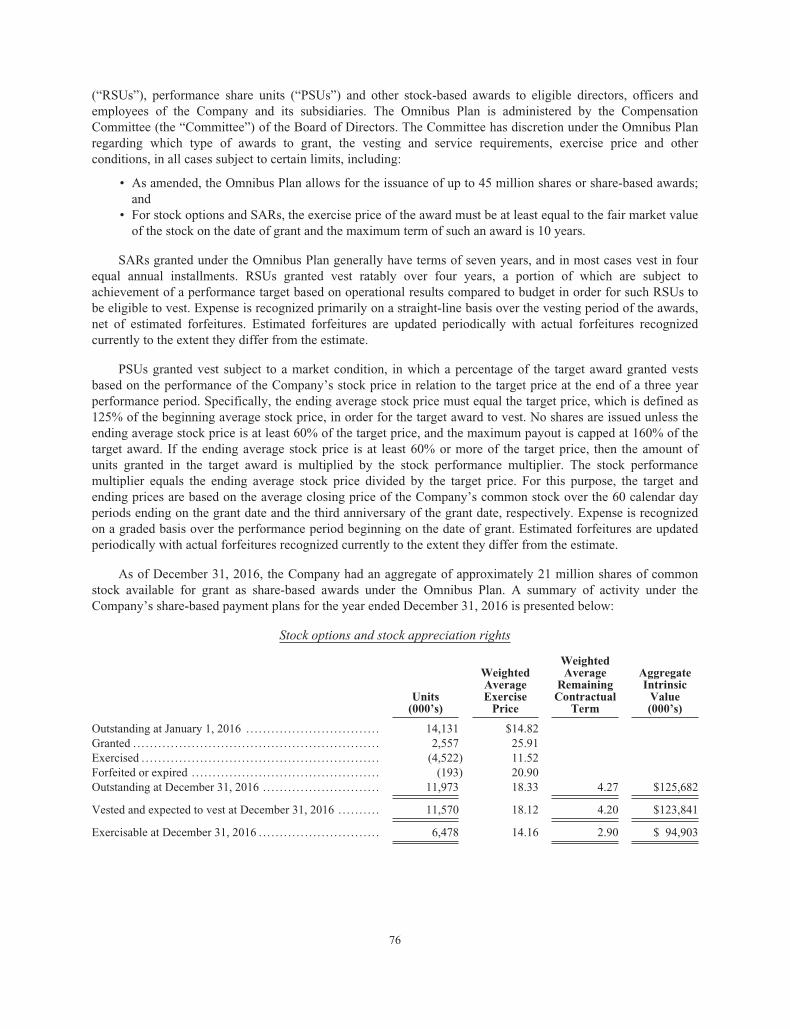
(“RSUs”), performance share units (“PSUs”) and other stock-based awards to eligible directors, officers andemployees of the Company and its subsidiaries. The Omnibus Plan is administered by the CompensationCommittee (the “Committee”) of the Board of Directors. The Committee has discretion under the Omnibus Planregarding which type of awards to grant, the vesting and service requirements, exercise price and otherconditions, in all cases subject to certain limits, including:
• As amended, the Omnibus Plan allows for the issuance of up to 45 million shares or share-based awards;and
• For stock options and SARs, the exercise price of the award must be at least equal to the fair market valueof the stock on the date of grant and the maximum term of such an award is 10 years.
SARs granted under the Omnibus Plan generally have terms of seven years, and in most cases vest in fourequal annual installments. RSUs granted vest ratably over four years, a portion of which are subject toachievement of a performance target based on operational results compared to budget in order for such RSUs tobe eligible to vest. Expense is recognized primarily on a straight-line basis over the vesting period of the awards,net of estimated forfeitures. Estimated forfeitures are updated periodically with actual forfeitures recognizedcurrently to the extent they differ from the estimate.
PSUs granted vest subject to a market condition, in which a percentage of the target award granted vestsbased on the performance of the Company’s stock price in relation to the target price at the end of a three yearperformance period. Specifically, the ending average stock price must equal the target price, which is defined as125% of the beginning average stock price, in order for the target award to vest. No shares are issued unless theending average stock price is at least 60% of the target price, and the maximum payout is capped at 160% of thetarget award. If the ending average stock price is at least 60% or more of the target price, then the amount ofunits granted in the target award is multiplied by the stock performance multiplier. The stock performancemultiplier equals the ending average stock price divided by the target price. For this purpose, the target andending prices are based on the average closing price of the Company’s common stock over the 60 calendar dayperiods ending on the grant date and the third anniversary of the grant date, respectively. Expense is recognizedon a graded basis over the performance period beginning on the date of grant. Estimated forfeitures are updatedperiodically with actual forfeitures recognized currently to the extent they differ from the estimate.
As of December 31, 2016, the Company had an aggregate of approximately 21 million shares of commonstock available for grant as share-based awards under the Omnibus Plan. A summary of activity under theCompany’s share-based payment plans for the year ended December 31, 2016 is presented below:
Stock options and stock appreciation rights
WeightedWeightedAverage Aggregate
Average Remaining IntrinsicUnits Exercise Contractual Value(000’s) Price Term (000’s)
Outstanding at January 1, 2016 . . . . . . . . . . . . . . . . . . . . . . . . . . . . . . . . 14,131 $14.82Granted . . . . . . . . . . . . . . . . . . . . . . . . . . . . . . . . . . . . . . . . . . . . . . . . . . . . . . . . . . . 2,557 25.91Exercised . . . . . . . . . . . . . . . . . . . . . . . . . . . . . . . . . . . . . . . . . . . . . . . . . . . . . . . . . (4,522) 11.52Forfeited or expired . . . . . . . . . . . . . . . . . . . . . . . . . . . . . . . . . . . . . . . . . . . . . (193) 20.90Outstanding at December 31, 2016 . . . . . . . . . . . . . . . . . . . . . . . . . . . . 11,973 18.33 4.27 $125,682
Vested and expected to vest at December 31, 2016 . . . . . . . . . . 11,570 18.12 4.20 $123,841
Exercisable at December 31, 2016 . . . . . . . . . . . . . . . . . . . . . . . . . . . . . 6,478 14.16 2.90 $ 94,903
76
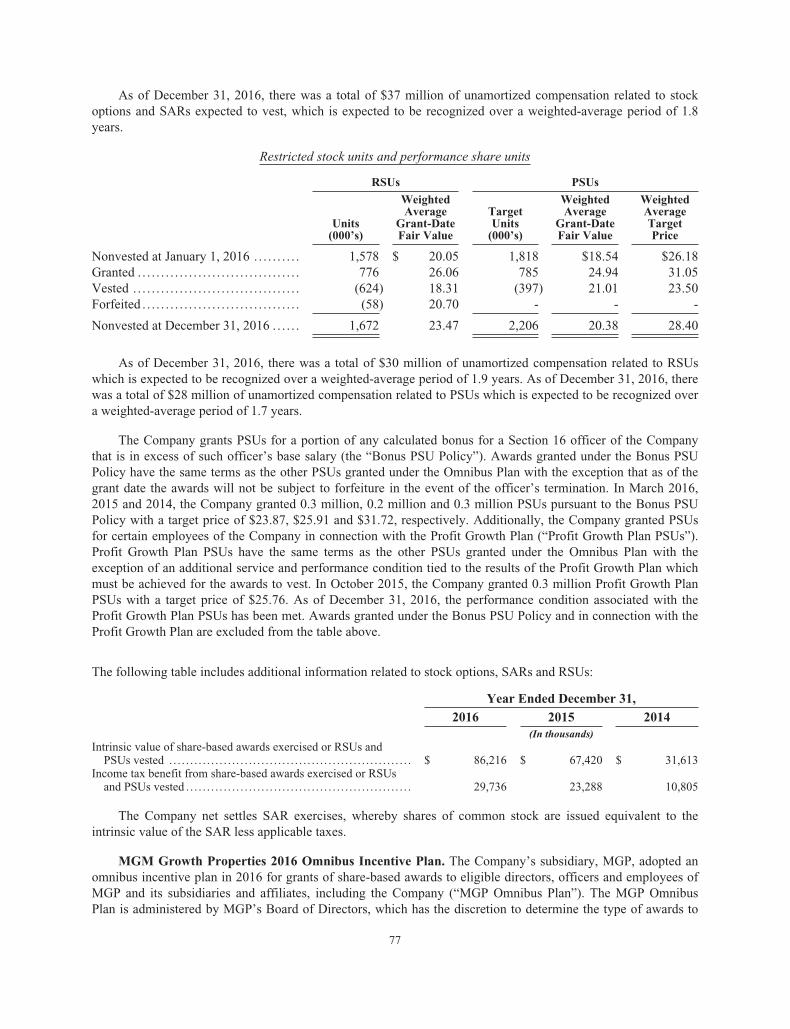
As of December 31, 2016, there was a total of $37 million of unamortized compensation related to stockoptions and SARs expected to vest, which is expected to be recognized over a weighted-average period of 1.8years.
Restricted stock units and performance share units
RSUs PSUs
Weighted Weighted WeightedAverage Target Average Average
Units Grant-Date Units Grant-Date Target(000’s) Fair Value (000’s) Fair Value Price
Nonvested at January 1, 2016 . . . . . . . . . . 1,578 $ 20.05 1,818 $18.54 $26.18Granted . . . . . . . . . . . . . . . . . . . . . . . . . . . . . . . . . . . 776 26.06 785 24.94 31.05Vested . . . . . . . . . . . . . . . . . . . . . . . . . . . . . . . . . . . . (624) 18.31 (397) 21.01 23.50Forfeited . . . . . . . . . . . . . . . . . . . . . . . . . . . . . . . . . . (58) 20.70 - - -
Nonvested at December 31, 2016 . . . . . . 1,672 23.47 2,206 20.38 28.40
As of December 31, 2016, there was a total of $30 million of unamortized compensation related to RSUswhich is expected to be recognized over a weighted-average period of 1.9 years. As of December 31, 2016, therewas a total of $28 million of unamortized compensation related to PSUs which is expected to be recognized overa weighted-average period of 1.7 years.
The Company grants PSUs for a portion of any calculated bonus for a Section 16 officer of the Companythat is in excess of such officer’s base salary (the “Bonus PSU Policy”). Awards granted under the Bonus PSUPolicy have the same terms as the other PSUs granted under the Omnibus Plan with the exception that as of thegrant date the awards will not be subject to forfeiture in the event of the officer’s termination. In March 2016,2015 and 2014, the Company granted 0.3 million, 0.2 million and 0.3 million PSUs pursuant to the Bonus PSUPolicy with a target price of $23.87, $25.91 and $31.72, respectively. Additionally, the Company granted PSUsfor certain employees of the Company in connection with the Profit Growth Plan (“Profit Growth Plan PSUs”).Profit Growth Plan PSUs have the same terms as the other PSUs granted under the Omnibus Plan with theexception of an additional service and performance condition tied to the results of the Profit Growth Plan whichmust be achieved for the awards to vest. In October 2015, the Company granted 0.3 million Profit Growth PlanPSUs with a target price of $25.76. As of December 31, 2016, the performance condition associated with theProfit Growth Plan PSUs has been met. Awards granted under the Bonus PSU Policy and in connection with theProfit Growth Plan are excluded from the table above.
The following table includes additional information related to stock options, SARs and RSUs:
Year Ended December 31,
2016 2015 2014(In thousands)
Intrinsic value of share-based awards exercised or RSUs andPSUs vested . . . . . . . . . . . . . . . . . . . . . . . . . . . . . . . . . . . . . . . . . . . . . . . . . . . . . . . . . . $ 86,216 $ 67,420 $ 31,613
Income tax benefit from share-based awards exercised or RSUsand PSUs vested . . . . . . . . . . . . . . . . . . . . . . . . . . . . . . . . . . . . . . . . . . . . . . . . . . . . . . 29,736 23,288 10,805
The Company net settles SAR exercises, whereby shares of common stock are issued equivalent to theintrinsic value of the SAR less applicable taxes.
MGM Growth Properties 2016 Omnibus Incentive Plan. The Company’s subsidiary, MGP, adopted anomnibus incentive plan in 2016 for grants of share-based awards to eligible directors, officers and employees ofMGP and its subsidiaries and affiliates, including the Company (“MGP Omnibus Plan”). The MGP OmnibusPlan is administered by MGP’s Board of Directors, which has the discretion to determine the type of awards to
77
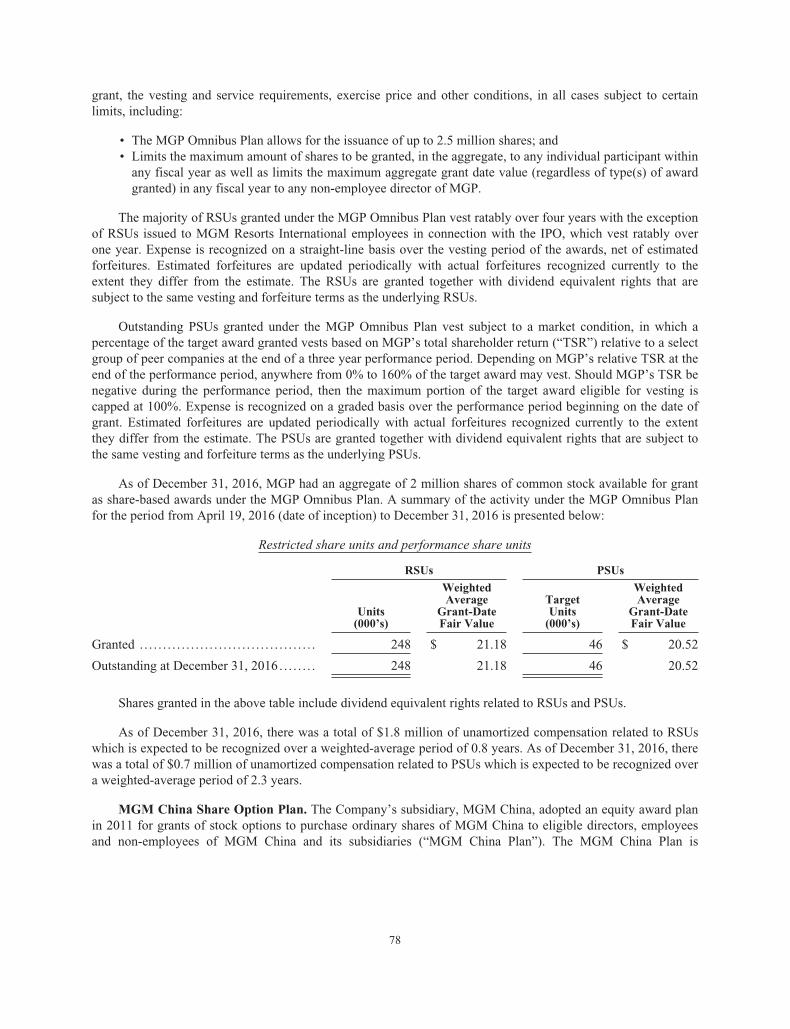
grant, the vesting and service requirements, exercise price and other conditions, in all cases subject to certainlimits, including:
• The MGP Omnibus Plan allows for the issuance of up to 2.5 million shares; and• Limits the maximum amount of shares to be granted, in the aggregate, to any individual participant withinany fiscal year as well as limits the maximum aggregate grant date value (regardless of type(s) of awardgranted) in any fiscal year to any non-employee director of MGP.
The majority of RSUs granted under the MGP Omnibus Plan vest ratably over four years with the exceptionof RSUs issued to MGM Resorts International employees in connection with the IPO, which vest ratably overone year. Expense is recognized on a straight-line basis over the vesting period of the awards, net of estimatedforfeitures. Estimated forfeitures are updated periodically with actual forfeitures recognized currently to theextent they differ from the estimate. The RSUs are granted together with dividend equivalent rights that aresubject to the same vesting and forfeiture terms as the underlying RSUs.
Outstanding PSUs granted under the MGP Omnibus Plan vest subject to a market condition, in which apercentage of the target award granted vests based on MGP’s total shareholder return (“TSR”) relative to a selectgroup of peer companies at the end of a three year performance period. Depending on MGP’s relative TSR at theend of the performance period, anywhere from 0% to 160% of the target award may vest. Should MGP’s TSR benegative during the performance period, then the maximum portion of the target award eligible for vesting iscapped at 100%. Expense is recognized on a graded basis over the performance period beginning on the date ofgrant. Estimated forfeitures are updated periodically with actual forfeitures recognized currently to the extentthey differ from the estimate. The PSUs are granted together with dividend equivalent rights that are subject tothe same vesting and forfeiture terms as the underlying PSUs.
As of December 31, 2016, MGP had an aggregate of 2 million shares of common stock available for grantas share-based awards under the MGP Omnibus Plan. A summary of the activity under the MGP Omnibus Planfor the period from April 19, 2016 (date of inception) to December 31, 2016 is presented below:
Restricted share units and performance share units
RSUs PSUs
Units(000’s)
WeightedAverage
Grant-DateFair Value
TargetUnits(000’s)
WeightedAverage
Grant-DateFair Value
Granted . . . . . . . . . . . . . . . . . . . . . . . . . . . . . . . . . . . . . . 248 $ 21.18 46 $ 20.52
Outstanding at December 31, 2016 . . . . . . . . 248 21.18 46 20.52
Shares granted in the above table include dividend equivalent rights related to RSUs and PSUs.
As of December 31, 2016, there was a total of $1.8 million of unamortized compensation related to RSUswhich is expected to be recognized over a weighted-average period of 0.8 years. As of December 31, 2016, therewas a total of $0.7 million of unamortized compensation related to PSUs which is expected to be recognized overa weighted-average period of 2.3 years.
MGM China Share Option Plan. The Company’s subsidiary, MGM China, adopted an equity award planin 2011 for grants of stock options to purchase ordinary shares of MGM China to eligible directors, employeesand non-employees of MGM China and its subsidiaries (“MGM China Plan”). The MGM China Plan is
78
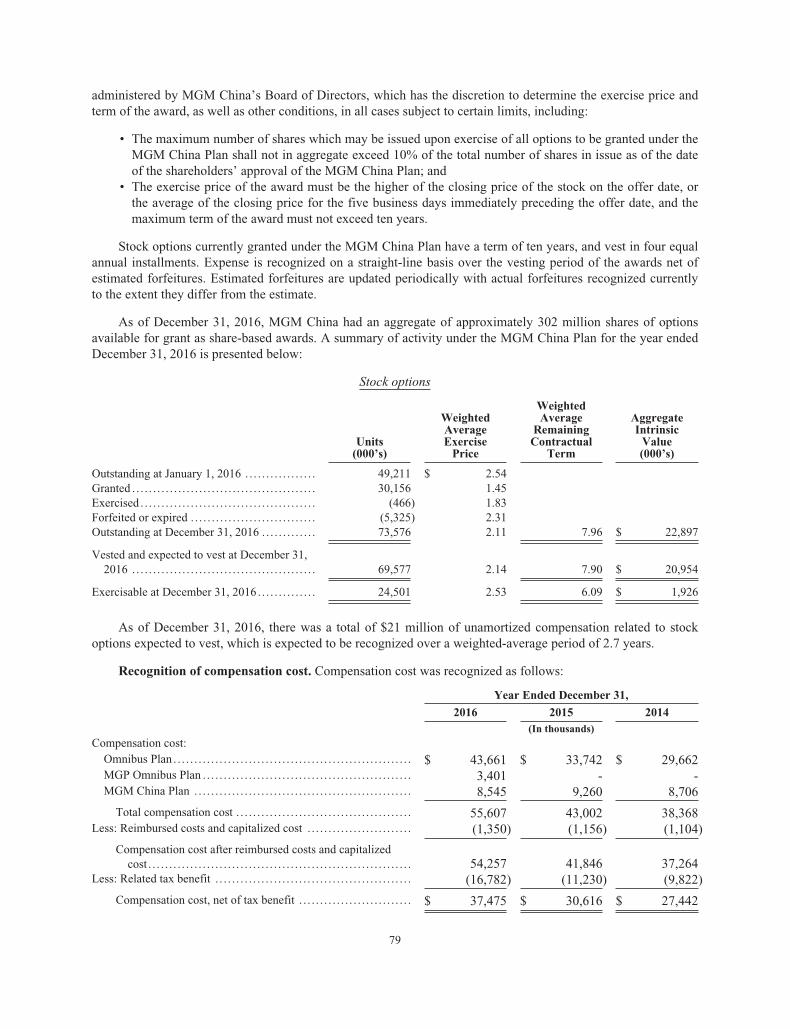
administered by MGM China’s Board of Directors, which has the discretion to determine the exercise price andterm of the award, as well as other conditions, in all cases subject to certain limits, including:
• The maximum number of shares which may be issued upon exercise of all options to be granted under theMGM China Plan shall not in aggregate exceed 10% of the total number of shares in issue as of the dateof the shareholders’ approval of the MGM China Plan; and
• The exercise price of the award must be the higher of the closing price of the stock on the offer date, orthe average of the closing price for the five business days immediately preceding the offer date, and themaximum term of the award must not exceed ten years.
Stock options currently granted under the MGM China Plan have a term of ten years, and vest in four equalannual installments. Expense is recognized on a straight-line basis over the vesting period of the awards net ofestimated forfeitures. Estimated forfeitures are updated periodically with actual forfeitures recognized currentlyto the extent they differ from the estimate.
As of December 31, 2016, MGM China had an aggregate of approximately 302 million shares of optionsavailable for grant as share-based awards. A summary of activity under the MGM China Plan for the year endedDecember 31, 2016 is presented below:
Stock options
WeightedWeightedAverage Aggregate
Average Remaining IntrinsicUnits Exercise Contractual Value(000’s) Price Term (000’s)
Outstanding at January 1, 2016 . . . . . . . . . . . . . . . . . 49,211 $ 2.54Granted . . . . . . . . . . . . . . . . . . . . . . . . . . . . . . . . . . . . . . . . . . . . 30,156 1.45Exercised . . . . . . . . . . . . . . . . . . . . . . . . . . . . . . . . . . . . . . . . . . (466) 1.83Forfeited or expired . . . . . . . . . . . . . . . . . . . . . . . . . . . . . . (5,325) 2.31Outstanding at December 31, 2016 . . . . . . . . . . . . . 73,576 2.11 7.96 $ 22,897
Vested and expected to vest at December 31,2016 . . . . . . . . . . . . . . . . . . . . . . . . . . . . . . . . . . . . . . . . . . . . 69,577 2.14 7.90 $ 20,954
Exercisable at December 31, 2016 . . . . . . . . . . . . . . 24,501 2.53 6.09 $ 1,926
As of December 31, 2016, there was a total of $21 million of unamortized compensation related to stockoptions expected to vest, which is expected to be recognized over a weighted-average period of 2.7 years.
Recognition of compensation cost. Compensation cost was recognized as follows:
Year Ended December 31,
2016 2015 2014(In thousands)
Compensation cost:Omnibus Plan . . . . . . . . . . . . . . . . . . . . . . . . . . . . . . . . . . . . . . . . . . . . . . . . . . . . . . . . . $ 43,661 $ 33,742 $ 29,662MGP Omnibus Plan . . . . . . . . . . . . . . . . . . . . . . . . . . . . . . . . . . . . . . . . . . . . . . . . . . 3,401 - -MGM China Plan . . . . . . . . . . . . . . . . . . . . . . . . . . . . . . . . . . . . . . . . . . . . . . . . . . . . 8,545 9,260 8,706
Total compensation cost . . . . . . . . . . . . . . . . . . . . . . . . . . . . . . . . . . . . . . . . . . 55,607 43,002 38,368Less: Reimbursed costs and capitalized cost . . . . . . . . . . . . . . . . . . . . . . . . . (1,350) (1,156) (1,104)
Compensation cost after reimbursed costs and capitalizedcost . . . . . . . . . . . . . . . . . . . . . . . . . . . . . . . . . . . . . . . . . . . . . . . . . . . . . . . . . . . . . . . 54,257 41,846 37,264
Less: Related tax benefit . . . . . . . . . . . . . . . . . . . . . . . . . . . . . . . . . . . . . . . . . . . . . . . (16,782) (11,230) (9,822)
Compensation cost, net of tax benefit . . . . . . . . . . . . . . . . . . . . . . . . . . . $ 37,475 $ 30,616 $ 27,442
79
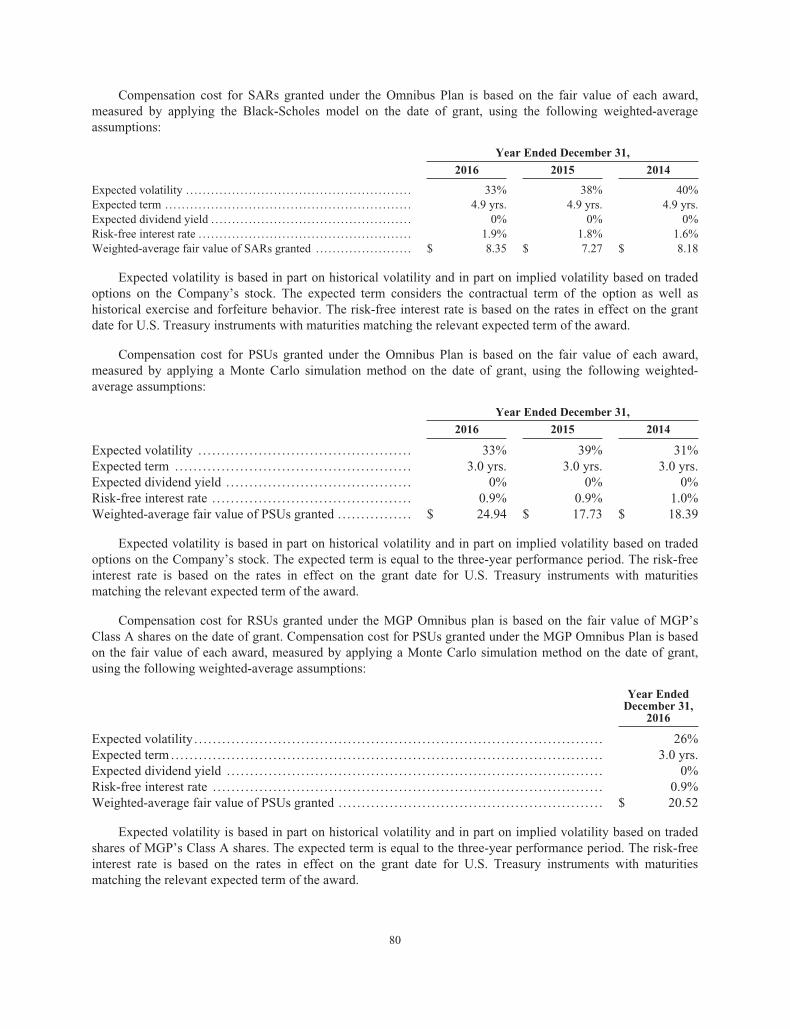
Compensation cost for SARs granted under the Omnibus Plan is based on the fair value of each award,measured by applying the Black-Scholes model on the date of grant, using the following weighted-averageassumptions:
Year Ended December 31,
2016 2015 2014
Expected volatility . . . . . . . . . . . . . . . . . . . . . . . . . . . . . . . . . . . . . . . . . . . . . . . . . . . . . . 33% 38% 40%Expected term . . . . . . . . . . . . . . . . . . . . . . . . . . . . . . . . . . . . . . . . . . . . . . . . . . . . . . . . . . . 4.9 yrs. 4.9 yrs. 4.9 yrs.Expected dividend yield . . . . . . . . . . . . . . . . . . . . . . . . . . . . . . . . . . . . . . . . . . . . . . . . 0% 0% 0%Risk-free interest rate . . . . . . . . . . . . . . . . . . . . . . . . . . . . . . . . . . . . . . . . . . . . . . . . . . . 1.9% 1.8% 1.6%Weighted-average fair value of SARs granted . . . . . . . . . . . . . . . . . . . . . . . $ 8.35 $ 7.27 $ 8.18
Expected volatility is based in part on historical volatility and in part on implied volatility based on tradedoptions on the Company’s stock. The expected term considers the contractual term of the option as well ashistorical exercise and forfeiture behavior. The risk-free interest rate is based on the rates in effect on the grantdate for U.S. Treasury instruments with maturities matching the relevant expected term of the award.
Compensation cost for PSUs granted under the Omnibus Plan is based on the fair value of each award,measured by applying a Monte Carlo simulation method on the date of grant, using the following weighted-average assumptions:
Year Ended December 31,
2016 2015 2014
Expected volatility . . . . . . . . . . . . . . . . . . . . . . . . . . . . . . . . . . . . . . . . . . . . . . 33% 39% 31%Expected term . . . . . . . . . . . . . . . . . . . . . . . . . . . . . . . . . . . . . . . . . . . . . . . . . . . 3.0 yrs. 3.0 yrs. 3.0 yrs.Expected dividend yield . . . . . . . . . . . . . . . . . . . . . . . . . . . . . . . . . . . . . . . . 0% 0% 0%Risk-free interest rate . . . . . . . . . . . . . . . . . . . . . . . . . . . . . . . . . . . . . . . . . . . 0.9% 0.9% 1.0%Weighted-average fair value of PSUs granted . . . . . . . . . . . . . . . . $ 24.94 $ 17.73 $ 18.39
Expected volatility is based in part on historical volatility and in part on implied volatility based on tradedoptions on the Company’s stock. The expected term is equal to the three-year performance period. The risk-freeinterest rate is based on the rates in effect on the grant date for U.S. Treasury instruments with maturitiesmatching the relevant expected term of the award.
Compensation cost for RSUs granted under the MGP Omnibus plan is based on the fair value of MGP’sClass A shares on the date of grant. Compensation cost for PSUs granted under the MGP Omnibus Plan is basedon the fair value of each award, measured by applying a Monte Carlo simulation method on the date of grant,using the following weighted-average assumptions:
Year EndedDecember 31,
2016
Expected volatility . . . . . . . . . . . . . . . . . . . . . . . . . . . . . . . . . . . . . . . . . . . . . . . . . . . . . . . . . . . . . . . . . . . . . . . . . . . . . . . . . . . . . . . . 26%Expected term . . . . . . . . . . . . . . . . . . . . . . . . . . . . . . . . . . . . . . . . . . . . . . . . . . . . . . . . . . . . . . . . . . . . . . . . . . . . . . . . . . . . . . . . . . . . . 3.0 yrs.Expected dividend yield . . . . . . . . . . . . . . . . . . . . . . . . . . . . . . . . . . . . . . . . . . . . . . . . . . . . . . . . . . . . . . . . . . . . . . . . . . . . . . . . . 0%Risk-free interest rate . . . . . . . . . . . . . . . . . . . . . . . . . . . . . . . . . . . . . . . . . . . . . . . . . . . . . . . . . . . . . . . . . . . . . . . . . . . . . . . . . . . . 0.9%Weighted-average fair value of PSUs granted . . . . . . . . . . . . . . . . . . . . . . . . . . . . . . . . . . . . . . . . . . . . . . . . . . . . . . . . . $ 20.52
Expected volatility is based in part on historical volatility and in part on implied volatility based on tradedshares of MGP’s Class A shares. The expected term is equal to the three-year performance period. The risk-freeinterest rate is based on the rates in effect on the grant date for U.S. Treasury instruments with maturitiesmatching the relevant expected term of the award.
80

Compensation cost for stock options granted under the MGM China Plan is based on the fair value of eachaward, measured by applying the Black-Scholes model on the date of grant, using the following weighted-average assumptions:
Year Ended December 31,
2016 2015 2014
Expected volatility . . . . . . . . . . . . . . . . . . . . . . . . . . . . . . . . . . . . . . . . . . . . . . 45% 43% 39%Expected term . . . . . . . . . . . . . . . . . . . . . . . . . . . . . . . . . . . . . . . . . . . . . . . . . . . 5.6 yrs. 5.8 yrs. 7.9 yrs.Expected dividend yield . . . . . . . . . . . . . . . . . . . . . . . . . . . . . . . . . . . . . . . . 3.1% 2.4% 1.6%Risk-free interest rate . . . . . . . . . . . . . . . . . . . . . . . . . . . . . . . . . . . . . . . . . . . 0.9% 1.3% 1.8%Weighted-average fair value of options granted . . . . . . . . . . . . . . $ 0.44 $ 0.55 $ 1.06
Expected volatilities are based on the historical volatility of MGM China’s stock price. Expected termconsiders the contractual term of the option as well as historical exercise and forfeiture behavior of previouslygranted options. Dividend yield is based on the estimate of annual dividends expected to be paid at the time ofthe grant. The risk-free interest rate is based on rates in effect at the valuation date for the Hong Kong ExchangeFund Notes with maturities matching the relevant expected term of the award.
NOTE 16 — EMPLOYEE BENEFIT PLANS
Multi-employer benefit plans. Employees of the Company who are members of various unions are coveredby union-sponsored, collectively bargained, multiemployer health and welfare and defined benefit pension plans.Of these plans, the Company considers the Southern Nevada Culinary and Bartenders Pension Plan (the “PensionPlan”), under the terms of collective bargaining agreements with the Local Joint Executive Board of Las Vegasfor and on behalf of Culinary Workers Union Local No. 226 and Bartenders Union Local No. 165, to beindividually significant. The risk of participating in the Pension Plan differs from single-employer plans in thefollowing aspects:
a) Assets contributed to the multiemployer plan by one employer may be used to provide benefits toemployees of other participating employers;
b) If a participating employer stops contributing to the plan, the unfunded obligations of the plan may beborne by the remaining participating employers;
c) If an entity chooses to stop participating in some of its multiemployer plans, the entity may be requiredto pay those plans an amount based on the underfunded status of the plan, referred to as a withdrawalliability; and
d) If the Pension Plan is terminated by withdrawal of all employers and if the value of the nonforfeitablebenefits exceeds plan assets and withdrawal liability payments, employers are required by law to makeup the insufficient difference.
Pursuant to its collective bargaining agreements referenced above, the Company also contributes to UNITEHERE Health (the “Health Fund”), which provides healthcare benefits to its active and retired members. TheCompany’s participation in the Pension Plan is outlined in the table below.
EIN/PensionPlan Number
Pension Protection Act ZoneStatus (1)
Expiration Dateof CollectiveBargaining
Agreements (2)Pension Fund 2015 2014
Southern Nevada Culinary andBartenders Pension Plan 88-6016617/001 Green Green 5/31/2018
(1) In 2014, the trustees of the Pension Plan elected to apply the extended amortization and the special ten-year asset smoothing rules underthe Pension Relief Act of 2010.
(2) The Company is party to ten collective bargaining agreements that require contributions to the Pension Plan. The agreements betweenCityCenter Hotel Casino, LLC, Bellagio, Mandalay Corp., MGM Grand Hotel, LLC and the Local Joint Executive Board of Las Vegasare the most significant because more than half of the Company’s employee participants in the Pension Plan are covered by those fouragreements.
81
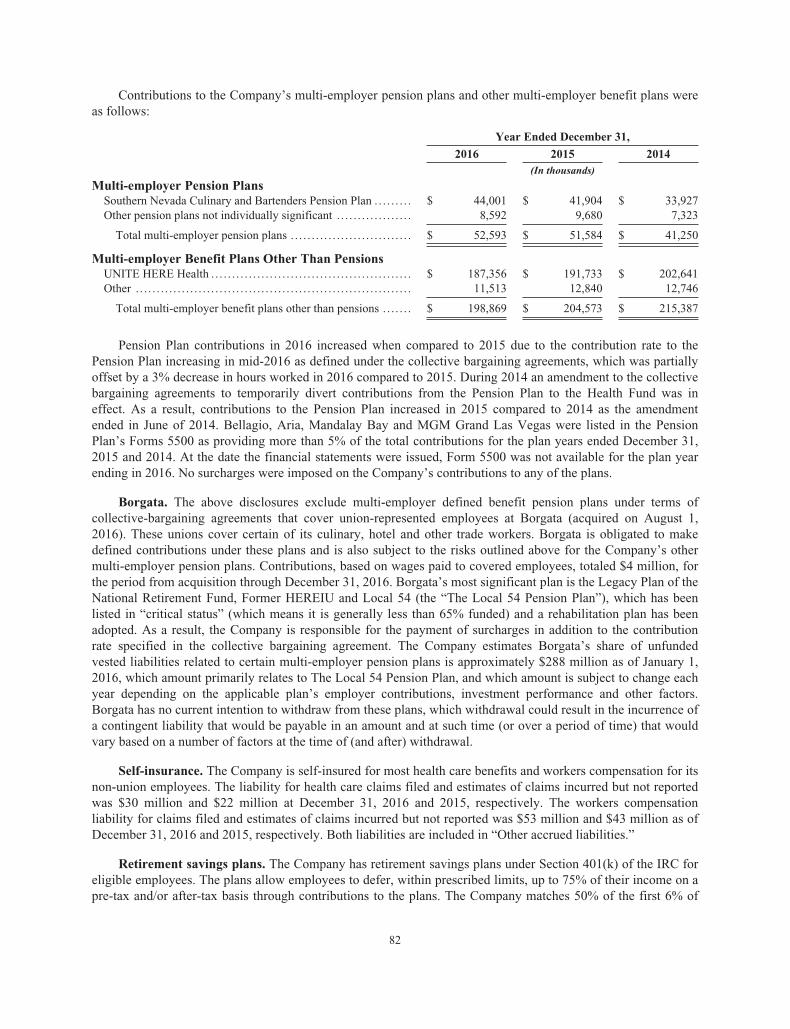
Contributions to the Company’s multi-employer pension plans and other multi-employer benefit plans wereas follows:
Year Ended December 31,
2016 2015 2014(In thousands)
Multi-employer Pension PlansSouthern Nevada Culinary and Bartenders Pension Plan . . . . . . . . . $ 44,001 $ 41,904 $ 33,927Other pension plans not individually significant . . . . . . . . . . . . . . . . . . 8,592 9,680 7,323
Total multi-employer pension plans . . . . . . . . . . . . . . . . . . . . . . . . . . . . . $ 52,593 $ 51,584 $ 41,250
Multi-employer Benefit Plans Other Than PensionsUNITE HERE Health . . . . . . . . . . . . . . . . . . . . . . . . . . . . . . . . . . . . . . . . . . . . . . . . $ 187,356 $ 191,733 $ 202,641Other . . . . . . . . . . . . . . . . . . . . . . . . . . . . . . . . . . . . . . . . . . . . . . . . . . . . . . . . . . . . . . . . . . 11,513 12,840 12,746
Total multi-employer benefit plans other than pensions . . . . . . . $ 198,869 $ 204,573 $ 215,387
Pension Plan contributions in 2016 increased when compared to 2015 due to the contribution rate to thePension Plan increasing in mid-2016 as defined under the collective bargaining agreements, which was partiallyoffset by a 3% decrease in hours worked in 2016 compared to 2015. During 2014 an amendment to the collectivebargaining agreements to temporarily divert contributions from the Pension Plan to the Health Fund was ineffect. As a result, contributions to the Pension Plan increased in 2015 compared to 2014 as the amendmentended in June of 2014. Bellagio, Aria, Mandalay Bay and MGM Grand Las Vegas were listed in the PensionPlan’s Forms 5500 as providing more than 5% of the total contributions for the plan years ended December 31,2015 and 2014. At the date the financial statements were issued, Form 5500 was not available for the plan yearending in 2016. No surcharges were imposed on the Company’s contributions to any of the plans.
Borgata. The above disclosures exclude multi-employer defined benefit pension plans under terms ofcollective-bargaining agreements that cover union-represented employees at Borgata (acquired on August 1,2016). These unions cover certain of its culinary, hotel and other trade workers. Borgata is obligated to makedefined contributions under these plans and is also subject to the risks outlined above for the Company’s othermulti-employer pension plans. Contributions, based on wages paid to covered employees, totaled $4 million, forthe period from acquisition through December 31, 2016. Borgata’s most significant plan is the Legacy Plan of theNational Retirement Fund, Former HEREIU and Local 54 (the “The Local 54 Pension Plan”), which has beenlisted in “critical status” (which means it is generally less than 65% funded) and a rehabilitation plan has beenadopted. As a result, the Company is responsible for the payment of surcharges in addition to the contributionrate specified in the collective bargaining agreement. The Company estimates Borgata’s share of unfundedvested liabilities related to certain multi-employer pension plans is approximately $288 million as of January 1,2016, which amount primarily relates to The Local 54 Pension Plan, and which amount is subject to change eachyear depending on the applicable plan’s employer contributions, investment performance and other factors.Borgata has no current intention to withdraw from these plans, which withdrawal could result in the incurrence ofa contingent liability that would be payable in an amount and at such time (or over a period of time) that wouldvary based on a number of factors at the time of (and after) withdrawal.
Self-insurance. The Company is self-insured for most health care benefits and workers compensation for itsnon-union employees. The liability for health care claims filed and estimates of claims incurred but not reportedwas $30 million and $22 million at December 31, 2016 and 2015, respectively. The workers compensationliability for claims filed and estimates of claims incurred but not reported was $53 million and $43 million as ofDecember 31, 2016 and 2015, respectively. Both liabilities are included in “Other accrued liabilities.”
Retirement savings plans. The Company has retirement savings plans under Section 401(k) of the IRC foreligible employees. The plans allow employees to defer, within prescribed limits, up to 75% of their income on apre-tax and/or after-tax basis through contributions to the plans. The Company matches 50% of the first 6% of
82
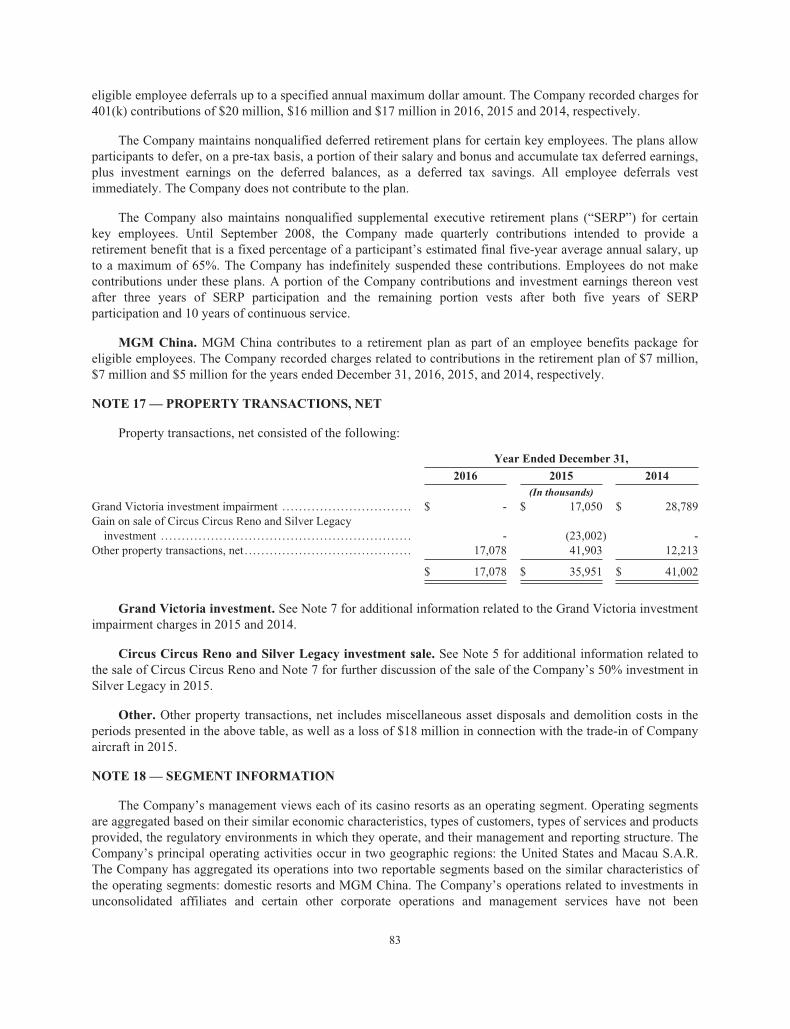
eligible employee deferrals up to a specified annual maximum dollar amount. The Company recorded charges for401(k) contributions of $20 million, $16 million and $17 million in 2016, 2015 and 2014, respectively.
The Company maintains nonqualified deferred retirement plans for certain key employees. The plans allowparticipants to defer, on a pre-tax basis, a portion of their salary and bonus and accumulate tax deferred earnings,plus investment earnings on the deferred balances, as a deferred tax savings. All employee deferrals vestimmediately. The Company does not contribute to the plan.
The Company also maintains nonqualified supplemental executive retirement plans (“SERP”) for certainkey employees. Until September 2008, the Company made quarterly contributions intended to provide aretirement benefit that is a fixed percentage of a participant’s estimated final five-year average annual salary, upto a maximum of 65%. The Company has indefinitely suspended these contributions. Employees do not makecontributions under these plans. A portion of the Company contributions and investment earnings thereon vestafter three years of SERP participation and the remaining portion vests after both five years of SERPparticipation and 10 years of continuous service.
MGM China. MGM China contributes to a retirement plan as part of an employee benefits package foreligible employees. The Company recorded charges related to contributions in the retirement plan of $7 million,$7 million and $5 million for the years ended December 31, 2016, 2015, and 2014, respectively.
NOTE 17 — PROPERTY TRANSACTIONS, NET
Property transactions, net consisted of the following:
Year Ended December 31,
2016 2015 2014(In thousands)
Grand Victoria investment impairment . . . . . . . . . . . . . . . . . . . . . . . . . . . . . . . $ - $ 17,050 $ 28,789Gain on sale of Circus Circus Reno and Silver Legacyinvestment . . . . . . . . . . . . . . . . . . . . . . . . . . . . . . . . . . . . . . . . . . . . . . . . . . . . . . . . . . . . - (23,002) -
Other property transactions, net . . . . . . . . . . . . . . . . . . . . . . . . . . . . . . . . . . . . . . . . 17,078 41,903 12,213
$ 17,078 $ 35,951 $ 41,002
Grand Victoria investment. See Note 7 for additional information related to the Grand Victoria investmentimpairment charges in 2015 and 2014.
Circus Circus Reno and Silver Legacy investment sale. See Note 5 for additional information related tothe sale of Circus Circus Reno and Note 7 for further discussion of the sale of the Company’s 50% investment inSilver Legacy in 2015.
Other. Other property transactions, net includes miscellaneous asset disposals and demolition costs in theperiods presented in the above table, as well as a loss of $18 million in connection with the trade-in of Companyaircraft in 2015.
NOTE 18 — SEGMENT INFORMATION
The Company’s management views each of its casino resorts as an operating segment. Operating segmentsare aggregated based on their similar economic characteristics, types of customers, types of services and productsprovided, the regulatory environments in which they operate, and their management and reporting structure. TheCompany’s principal operating activities occur in two geographic regions: the United States and Macau S.A.R.The Company has aggregated its operations into two reportable segments based on the similar characteristics ofthe operating segments: domestic resorts and MGM China. The Company’s operations related to investments inunconsolidated affiliates and certain other corporate operations and management services have not been
83
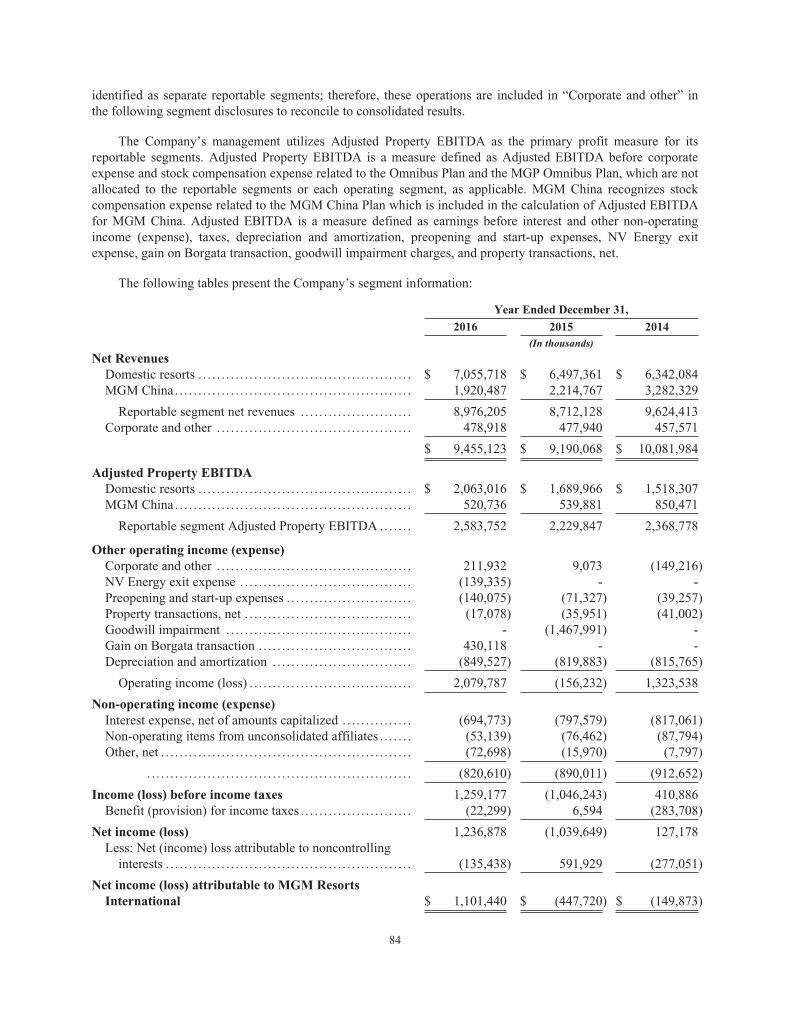
identified as separate reportable segments; therefore, these operations are included in “Corporate and other” inthe following segment disclosures to reconcile to consolidated results.
The Company’s management utilizes Adjusted Property EBITDA as the primary profit measure for itsreportable segments. Adjusted Property EBITDA is a measure defined as Adjusted EBITDA before corporateexpense and stock compensation expense related to the Omnibus Plan and the MGP Omnibus Plan, which are notallocated to the reportable segments or each operating segment, as applicable. MGM China recognizes stockcompensation expense related to the MGM China Plan which is included in the calculation of Adjusted EBITDAfor MGM China. Adjusted EBITDA is a measure defined as earnings before interest and other non-operatingincome (expense), taxes, depreciation and amortization, preopening and start-up expenses, NV Energy exitexpense, gain on Borgata transaction, goodwill impairment charges, and property transactions, net.
The following tables present the Company’s segment information:
Year Ended December 31,
2016 2015 2014(In thousands)
Net RevenuesDomestic resorts . . . . . . . . . . . . . . . . . . . . . . . . . . . . . . . . . . . . . . . . . . . . . . $ 7,055,718 $ 6,497,361 $ 6,342,084MGM China . . . . . . . . . . . . . . . . . . . . . . . . . . . . . . . . . . . . . . . . . . . . . . . . . . . 1,920,487 2,214,767 3,282,329
Reportable segment net revenues . . . . . . . . . . . . . . . . . . . . . . . . 8,976,205 8,712,128 9,624,413Corporate and other . . . . . . . . . . . . . . . . . . . . . . . . . . . . . . . . . . . . . . . . . . 478,918 477,940 457,571
$ 9,455,123 $ 9,190,068 $ 10,081,984
Adjusted Property EBITDADomestic resorts . . . . . . . . . . . . . . . . . . . . . . . . . . . . . . . . . . . . . . . . . . . . . . $ 2,063,016 $ 1,689,966 $ 1,518,307MGM China . . . . . . . . . . . . . . . . . . . . . . . . . . . . . . . . . . . . . . . . . . . . . . . . . . . 520,736 539,881 850,471
Reportable segment Adjusted Property EBITDA .. . . . . . 2,583,752 2,229,847 2,368,778
Other operating income (expense)Corporate and other . . . . . . . . . . . . . . . . . . . . . . . . . . . . . . . . . . . . . . . . . . 211,932 9,073 (149,216)NV Energy exit expense . . . . . . . . . . . . . . . . . . . . . . . . . . . . . . . . . . . . . (139,335) - -Preopening and start-up expenses . . . . . . . . . . . . . . . . . . . . . . . . . . . (140,075) (71,327) (39,257)Property transactions, net . . . . . . . . . . . . . . . . . . . . . . . . . . . . . . . . . . . . (17,078) (35,951) (41,002)Goodwill impairment . . . . . . . . . . . . . . . . . . . . . . . . . . . . . . . . . . . . . . . . - (1,467,991) -Gain on Borgata transaction . . . . . . . . . . . . . . . . . . . . . . . . . . . . . . . . . 430,118 - -Depreciation and amortization . . . . . . . . . . . . . . . . . . . . . . . . . . . . . . (849,527) (819,883) (815,765)
Operating income (loss) . . . . . . . . . . . . . . . . . . . . . . . . . . . . . . . . . . . 2,079,787 (156,232) 1,323,538
Non-operating income (expense)Interest expense, net of amounts capitalized . . . . . . . . . . . . . . . (694,773) (797,579) (817,061)Non-operating items from unconsolidated affiliates . . . . . . . (53,139) (76,462) (87,794)Other, net . . . . . . . . . . . . . . . . . . . . . . . . . . . . . . . . . . . . . . . . . . . . . . . . . . . . . . (72,698) (15,970) (7,797)
. . . . . . . . . . . . . . . . . . . . . . . . . . . . . . . . . . . . . . . . . . . . . . . . . . . . . . . . . (820,610) (890,011) (912,652)
Income (loss) before income taxes 1,259,177 (1,046,243) 410,886Benefit (provision) for income taxes . . . . . . . . . . . . . . . . . . . . . . . . (22,299) 6,594 (283,708)
Net income (loss) 1,236,878 (1,039,649) 127,178Less: Net (income) loss attributable to noncontrollinginterests . . . . . . . . . . . . . . . . . . . . . . . . . . . . . . . . . . . . . . . . . . . . . . . . . . . . . (135,438) 591,929 (277,051)
Net income (loss) attributable to MGM ResortsInternational $ 1,101,440 $ (447,720) $ (149,873)
84
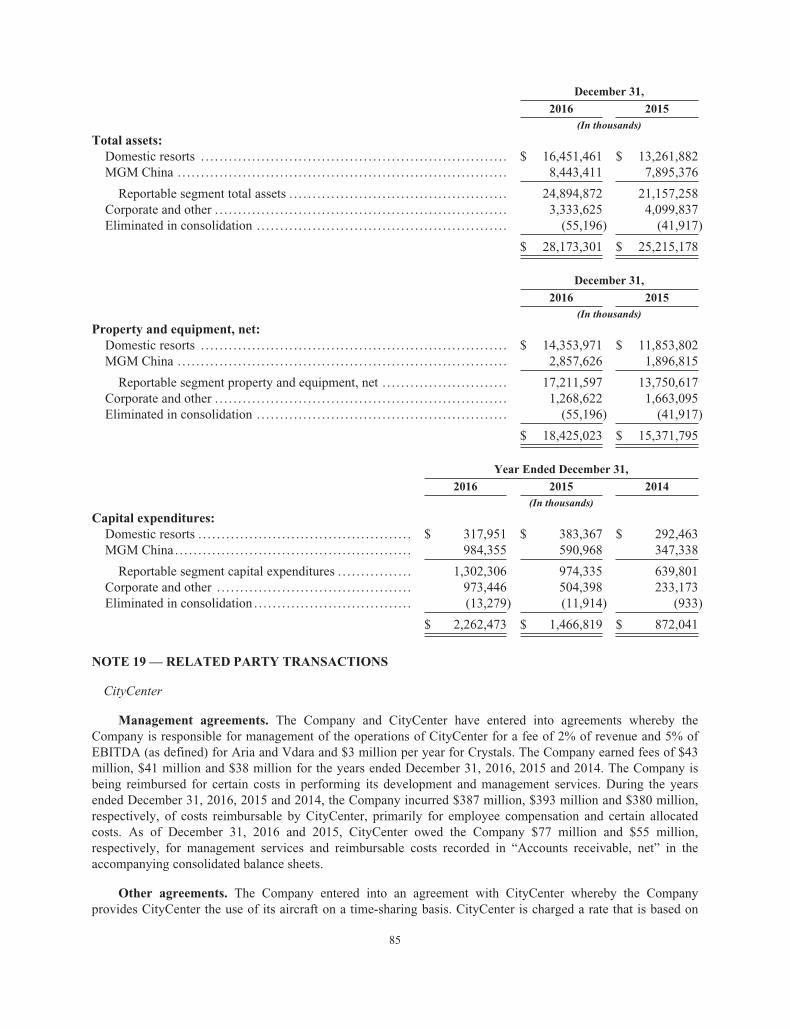
December 31,
2016 2015(In thousands)
Total assets:Domestic resorts . . . . . . . . . . . . . . . . . . . . . . . . . . . . . . . . . . . . . . . . . . . . . . . . . . . . . . . . . . . . . . . . . . $ 16,451,461 $ 13,261,882MGM China . . . . . . . . . . . . . . . . . . . . . . . . . . . . . . . . . . . . . . . . . . . . . . . . . . . . . . . . . . . . . . . . . . . . . . . 8,443,411 7,895,376
Reportable segment total assets . . . . . . . . . . . . . . . . . . . . . . . . . . . . . . . . . . . . . . . . . . . . . . . 24,894,872 21,157,258Corporate and other . . . . . . . . . . . . . . . . . . . . . . . . . . . . . . . . . . . . . . . . . . . . . . . . . . . . . . . . . . . . . . . 3,333,625 4,099,837Eliminated in consolidation . . . . . . . . . . . . . . . . . . . . . . . . . . . . . . . . . . . . . . . . . . . . . . . . . . . . . . (55,196) (41,917)
$ 28,173,301 $ 25,215,178
December 31,
2016 2015(In thousands)
Property and equipment, net:Domestic resorts . . . . . . . . . . . . . . . . . . . . . . . . . . . . . . . . . . . . . . . . . . . . . . . . . . . . . . . . . . . . . . . . . . $ 14,353,971 $ 11,853,802MGM China . . . . . . . . . . . . . . . . . . . . . . . . . . . . . . . . . . . . . . . . . . . . . . . . . . . . . . . . . . . . . . . . . . . . . . . 2,857,626 1,896,815
Reportable segment property and equipment, net . . . . . . . . . . . . . . . . . . . . . . . . . . . 17,211,597 13,750,617Corporate and other . . . . . . . . . . . . . . . . . . . . . . . . . . . . . . . . . . . . . . . . . . . . . . . . . . . . . . . . . . . . . . . 1,268,622 1,663,095Eliminated in consolidation . . . . . . . . . . . . . . . . . . . . . . . . . . . . . . . . . . . . . . . . . . . . . . . . . . . . . . (55,196) (41,917)
$ 18,425,023 $ 15,371,795
Year Ended December 31,
2016 2015 2014(In thousands)
Capital expenditures:Domestic resorts . . . . . . . . . . . . . . . . . . . . . . . . . . . . . . . . . . . . . . . . . . . . . . $ 317,951 $ 383,367 $ 292,463MGM China . . . . . . . . . . . . . . . . . . . . . . . . . . . . . . . . . . . . . . . . . . . . . . . . . . . 984,355 590,968 347,338
Reportable segment capital expenditures . . . . . . . . . . . . . . . . 1,302,306 974,335 639,801Corporate and other . . . . . . . . . . . . . . . . . . . . . . . . . . . . . . . . . . . . . . . . . . 973,446 504,398 233,173Eliminated in consolidation . . . . . . . . . . . . . . . . . . . . . . . . . . . . . . . . . . (13,279) (11,914) (933)
$ 2,262,473 $ 1,466,819 $ 872,041
NOTE 19 — RELATED PARTY TRANSACTIONS
CityCenter
Management agreements. The Company and CityCenter have entered into agreements whereby theCompany is responsible for management of the operations of CityCenter for a fee of 2% of revenue and 5% ofEBITDA (as defined) for Aria and Vdara and $3 million per year for Crystals. The Company earned fees of $43million, $41 million and $38 million for the years ended December 31, 2016, 2015 and 2014. The Company isbeing reimbursed for certain costs in performing its development and management services. During the yearsended December 31, 2016, 2015 and 2014, the Company incurred $387 million, $393 million and $380 million,respectively, of costs reimbursable by CityCenter, primarily for employee compensation and certain allocatedcosts. As of December 31, 2016 and 2015, CityCenter owed the Company $77 million and $55 million,respectively, for management services and reimbursable costs recorded in “Accounts receivable, net” in theaccompanying consolidated balance sheets.
Other agreements. The Company entered into an agreement with CityCenter whereby the Companyprovides CityCenter the use of its aircraft on a time-sharing basis. CityCenter is charged a rate that is based on
85
Federal Aviation Administration regulations, which provides for reimbursement for specific costs incurred by theCompany. For the years ended December 31, 2016, 2015 and 2014, the Company was reimbursed $2 million, $2million, and $3 million, respectively, for aircraft-related expenses. The Company has certain other arrangementswith CityCenter for the provision of certain shared services, reimbursement of costs and other transactionsundertaken in the ordinary course of business.
MGM China
Ms. Ho is a member of the Board of Directors of, and holds a minority ownership interest in, MGM China.Ms. Ho is also the managing director of Shun Tak Holdings Limited (together with its subsidiaries “Shun Tak”),a leading conglomerate in Hong Kong with core businesses in transportation, property, hospitality andinvestments. Shun Tak provides various services and products, including ferry tickets, travel products, rental ofhotel rooms, laundry services, advertising services and property cleaning services to MGM China and MGMChina provides rental of hotel rooms at wholesale room rates to Shun Tak and receives rebates for ferry ticketsfrom Shun Tak. MGM China incurred expenses of $10 million, $16 million and $28 million for the years endedDecember 31, 2016, 2015 and 2014, respectively. MGM China recorded revenue of less than $1 million relatedto hotel rooms provided to Shun Tak for each of the years ended December 31, 2016, 2015 and 2014. As ofDecember 31, 2016 and 2015, MGM China did not have a material payable to or receivable from Shun Tak.
MGM Branding and Development Holdings, Ltd. (together with its subsidiary MGM DevelopmentServices, Ltd., “MGM Branding and Development”), an entity included in the Company’s consolidated financialstatements in which Ms. Ho indirectly holds a noncontrolling interest, is party to a brand license agreement withMGM China. MGM China pays a license fee to MGM Branding and Development equal to 1.75% of MGMMacau’s consolidated net revenue, subject to an annual cap of $62 million in 2016 with a 20% increase perannum for each subsequent calendar year during the term of the agreement. During the years endedDecember 31, 2016, 2015 and 2014, MGM China incurred total license fees of $34 million, $39 million and $43million, respectively. Such amounts have been eliminated in consolidation.
MGM China is party to a development services agreement with MGM Branding and Development toprovide certain development services to MGM China in connection with future expansion of existing projectsand development of future resort gaming projects. Such services are subject to a development fee which iscalculated separately for each casino resort property upon commencement of development. For each suchproperty, the fee is 2.625% of project costs, to be paid in installments as certain benchmarks are achieved. Projectcosts are the total costs incurred for the design, development and construction of the casino, casino hotel,integrated resort and other related sites associated with each project, including costs of construction, fixtures andfittings, signage, gaming and other supplies and equipment and all costs associated with the opening of thebusiness to be conducted at each project but excluding the cost of land and gaming concessions and financingcosts. The development fee is subject to an annual cap of $29 million in 2016, which will increase by 10% perannum for each year during the term of the agreement. For the years ended December 31, 2016 and 2015, MGMChina incurred $12 million and $10 million of fees, respectively, to MGM Branding and Development related todevelopment services. Such amount is eliminated in consolidation. No fee was paid for the year endedDecember 31, 2014.
An entity owned by Ms. Ho received distributions of $15 million, $15 million and $13 million during theyears ended December 31, 2016, 2015 and 2014, respectively, in connection with the ownership of anoncontrolling interest in MGM Branding and Development Holdings, Ltd.
MGP
Pursuant to a master lease agreement by and between a subsidiary of the Company (the “Tenant”) and asubsidiary of the Operating Partnership (the “Landlord”), the Tenant has leased the contributed real estate assetsfrom the Landlord. The master lease has an initial lease term of ten years with the potential to extend the term forfour additional five-year terms thereafter at the option of the Tenant. The master lease provides that any
86
extension of its term must apply to all of the real estate under the master lease at the time of the extension. Themaster lease has a triple-net structure, which requires the Tenant to pay substantially all costs associated with thelease, including real estate taxes, insurance, utilities and routine maintenance, in addition to the base rent.Additionally, the master lease provides the Landlord with a right of first offer with respect to MGM NationalHarbor and the Company’s development property located in Springfield, Massachusetts, which the Landlord mayexercise should the Company elect to sell these properties in the future.
Subsequent to the Company completing its acquisition of Borgata on August 1, 2016, MGP acquiredBorgata’s real property from a subsidiary of the Company in exchange for MGP’s assumption of $545 million ofindebtedness and the issuance of 27.4 million Operating Partnership units to a subsidiary of the Company. Inconnection with this transaction, the Tenant and Landlord entered into an amendment to the master lease toinclude the Borgata real property.
The annual rent payments due under the master lease were $550 million prior to MGP’s acquisition ofBorgata’s real property on August 1, 2016. Subsequent to the acquisition, annual rent payments under the masterlease increased to $650 million, prorated for the remainder of the first lease year after the Borgata transaction. Rentunder the master lease consists of a “base rent” component and a “percentage rent” component. For the first year,the base rent will represent 90% of the initial total rent payments due under the master lease and the percentage rentwill represent 10% of the initial total rent payments due under the master lease. The base rent includes a fixedannual rent escalator of 2.0% for the second through the sixth lease years (as defined in the master lease).Thereafter, the annual escalator of 2.0% will be subject to the Tenant and, without duplication, the operatingsubsidiary sublessees of the Tenant, collectively meeting an adjusted net revenue to rent ratio of 6.25:1.00 based ontheir net revenue from the leased properties subject to the master lease (as determined in accordance with generallyaccepted accounting principles, adjusted to exclude net revenue attributable to certain scheduled subleases and, atthe Company’s option, reimbursed cost revenue). The percentage rent will initially be a fixed amount forapproximately the first six years and will then be adjusted every five years based on the average actual annual netrevenues of the Tenant and, without duplication, the operating subsidiary sublessees of the Tenant, from the leasedproperties subject to the master lease at such time for the trailing five calendar-year period (calculated bymultiplying the average annual net revenues, excluding net revenue attributable to certain scheduled subleases and,at the Landlord’s option, reimbursed cost revenue, for the trailing five calendar-year period by 1.4%). During theyear ended December 31, 2016, the Company made rent payments to the Landlord in the amount of $418 million.
Pursuant to the master lease, upon an event of default the Landlord may, at its option (i) terminate themaster lease, repossess any leased property, relet any leased property to a third party and require that the Tenantpay damages; (ii) require that the Tenant pay to the Landlord rent and other sums payable with interest calculatedat the overdue rate provided for in the master lease or terminate the Tenant’s right to possession of the leasedproperty and seek damages; and/or (iii) seek any and all other rights and remedies available under law or inequity. An event of default will be deemed to occur upon certain events, including: (1) the failure by the Tenantto pay rent or other additional charges when due; (2) failure by the Tenant to comply with the covenants set forthin the master lease; (3) certain events of bankruptcy or insolvency with respect to a Tenant or the guarantor;(4) the occurrence of a default under the guaranty of the master lease; (5) the loss or suspension of a materiallicense that causes cessation of gaming activity that would reasonably be expected to have a material adverseeffect on the Tenant, the facilities or the leased properties taken as a whole; and (6) the failure of the Company,on a consolidated basis with Tenant, to maintain an EBITDAR to rent ratio (as described in the master lease) ofat least 1.10:1.00 for two consecutive test periods, beginning with the test periods ending December 31, 2016 andMarch 31, 2017. The Company was in compliance with all applicable covenants as of December 31, 2016.
Pursuant to a corporate services agreement, the Company provides MGP and its subsidiaries with financial,administrative and operational support services, including accounting and finance support, human resourcessupport, legal and regulatory compliance support, insurance advisory services, internal audit services,governmental affairs monitoring and reporting services, information technology support, construction services,and various other support services. The Company is reimbursed for all costs it incurs directly related to providingthe services thereunder.
87
All intercompany transactions, including transactions under the corporate services agreement and masterlease, have been eliminated in the Company’s consolidation of MGP. The public ownership of MGP’s Class Ashares is recognized as non-controlling interests in the Company’s consolidated financial statements.
T-Mobile Arena
The Las Vegas Arena Company leases the land underlying the T-Mobile Arena from the Company under a50 year operating lease, which commenced upon the opening of the Arena. In conjunction with Las Vegas ArenaCompany obtaining financing and beginning construction in 2014, the Company began accruing rental income.For the years ended December 31, 2016, 2015 and 2014, the Company recorded income of $3 million, $3 millionand $1 million, respectively, for the T-Mobile Arena ground lease. The Company leases the MGM Grand GardenArena to Las Vegas Arena Company. For the year ended December 31, 2016, the Company recorded income of$2 million.
NOTE 20 — CONSOLIDATING CONDENSED FINANCIAL INFORMATION
As of December 31, 2016, all of the Company’s principal debt arrangements are guaranteed by each of itsmaterial domestic subsidiaries, other than MGP and the Operating Partnership, MGM Grand Detroit, LLC, MGMNational Harbor, LLC and Blue Tarp reDevelopment, LLC (the company that will own and operate theCompany’s proposed casino in Springfield, Massachusetts), and each of their respective subsidiaries. TheCompany’s international subsidiaries, including MGM China and its subsidiaries, are not guarantors of suchindebtedness. Separate condensed financial statement information for the subsidiary guarantors and non-guarantors as of December 31, 2016 and 2015 and for the years ended December 31, 2016, 2015 and 2014, arepresented below. Within the Condensed Consolidating Statements of Cash Flows for the periods endingDecember 31, 2016 and 2015, the Company has presented net changes in intercompany accounts as investingactivities if the applicable entities have a net asset in intercompany accounts and as a financing activity if theapplicable entities have a net intercompany liability balance.
Certain of the Company’s subsidiaries (“OPCOs”) collectively own 76.3% of the Operating Partnershipunits as of December 31, 2016, and each subsidiary accounts for its respective investment under the equitymethod within the condensed consolidating financial information presented below. At these subsidiaries, suchinvestment constitutes continuing involvement, and accordingly, the contribution and leaseback of the real estateassets do not qualify for sale-leaseback accounting. The real estate assets that were contributed to and owned bythe Operating Partnership in connection with the IPO, along with the related transactions, are reflected in thebalance sheets of the MGM subsidiaries that contributed such assets. In addition, such subsidiaries recognizedfinance liabilities within “Other long-term obligations” related to rent payments due under the Master Lease andrecognized the related interest expense component of such payments. These real estate assets are also reflectedon the balance sheet of the MGP subsidiary that received such assets in connection with the contribution. Thecondensed consolidating financial information presented below therefore includes the accounting for suchactivity within the respective columns presented and in the elimination column. For all periods prior to thecommencement of the Master Lease arrangement, the condensed consolidating financial information set forthherein has been retrospectively adjusted to conform prior periods to the current presentation, as the transactionsoccurred between entities, which are considered businesses under common control. Accordingly, the real estateassets and associated operations in all periods prior to the IPO date were reclassified to conform to the currentorganizational structure, and are reflected in the MGP subsidiary that currently has legal title to such assets.
88
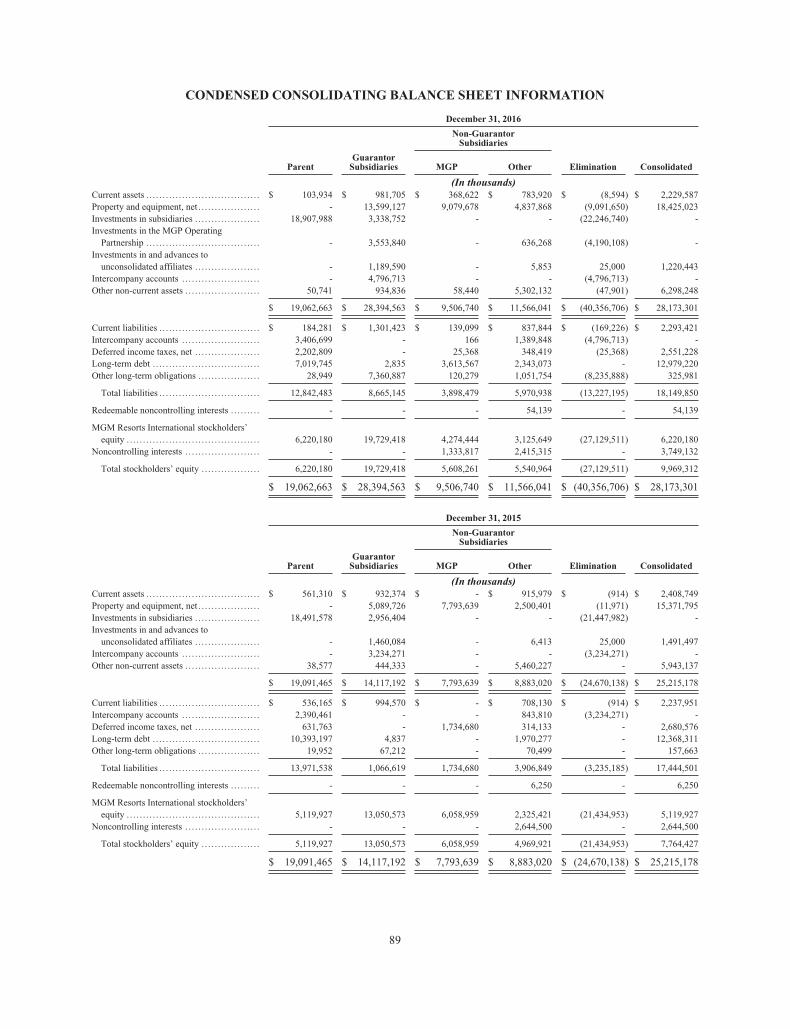
CONDENSED CONSOLIDATING BALANCE SHEET INFORMATION
December 31, 2016
Non-GuarantorSubsidiaries
ParentGuarantorSubsidiaries MGP Other Elimination Consolidated
(In thousands)Current assets . . . . . . . . . . . . . . . . . . . . . . . . . . . . . . . . . . . $ 103,934 $ 981,705 $ 368,622 $ 783,920 $ (8,594) $ 2,229,587Property and equipment, net . . . . . . . . . . . . . . . . . . . - 13,599,127 9,079,678 4,837,868 (9,091,650) 18,425,023Investments in subsidiaries . . . . . . . . . . . . . . . . . . . . 18,907,988 3,338,752 - - (22,246,740) -Investments in the MGP OperatingPartnership . . . . . . . . . . . . . . . . . . . . . . . . . . . . . . . . . . . - 3,553,840 - 636,268 (4,190,108) -
Investments in and advances tounconsolidated affiliates . . . . . . . . . . . . . . . . . . . . - 1,189,590 - 5,853 25,000 1,220,443
Intercompany accounts . . . . . . . . . . . . . . . . . . . . . . . . - 4,796,713 - - (4,796,713) -Other non-current assets . . . . . . . . . . . . . . . . . . . . . . . 50,741 934,836 58,440 5,302,132 (47,901) 6,298,248
$ 19,062,663 $ 28,394,563 $ 9,506,740 $ 11,566,041 $ (40,356,706) $ 28,173,301
Current liabilities . . . . . . . . . . . . . . . . . . . . . . . . . . . . . . . $ 184,281 $ 1,301,423 $ 139,099 $ 837,844 $ (169,226) $ 2,293,421Intercompany accounts . . . . . . . . . . . . . . . . . . . . . . . . 3,406,699 - 166 1,389,848 (4,796,713) -Deferred income taxes, net . . . . . . . . . . . . . . . . . . . . 2,202,809 - 25,368 348,419 (25,368) 2,551,228Long-term debt . . . . . . . . . . . . . . . . . . . . . . . . . . . . . . . . . 7,019,745 2,835 3,613,567 2,343,073 - 12,979,220Other long-term obligations . . . . . . . . . . . . . . . . . . . 28,949 7,360,887 120,279 1,051,754 (8,235,888) 325,981
Total liabilities . . . . . . . . . . . . . . . . . . . . . . . . . . . . . . . 12,842,483 8,665,145 3,898,479 5,970,938 (13,227,195) 18,149,850
Redeemable noncontrolling interests . . . . . . . . . - - - 54,139 - 54,139
MGM Resorts International stockholders’equity . . . . . . . . . . . . . . . . . . . . . . . . . . . . . . . . . . . . . . . . . 6,220,180 19,729,418 4,274,444 3,125,649 (27,129,511) 6,220,180
Noncontrolling interests . . . . . . . . . . . . . . . . . . . . . . . - - 1,333,817 2,415,315 - 3,749,132
Total stockholders’ equity . . . . . . . . . . . . . . . . . . 6,220,180 19,729,418 5,608,261 5,540,964 (27,129,511) 9,969,312
$ 19,062,663 $ 28,394,563 $ 9,506,740 $ 11,566,041 $ (40,356,706) $ 28,173,301
December 31, 2015
Non-GuarantorSubsidiaries
ParentGuarantorSubsidiaries MGP Other Elimination Consolidated
(In thousands)Current assets . . . . . . . . . . . . . . . . . . . . . . . . . . . . . . . . . . . $ 561,310 $ 932,374 $ - $ 915,979 $ (914) $ 2,408,749Property and equipment, net . . . . . . . . . . . . . . . . . . . - 5,089,726 7,793,639 2,500,401 (11,971) 15,371,795Investments in subsidiaries . . . . . . . . . . . . . . . . . . . . 18,491,578 2,956,404 - - (21,447,982) -Investments in and advances tounconsolidated affiliates . . . . . . . . . . . . . . . . . . . . - 1,460,084 - 6,413 25,000 1,491,497
Intercompany accounts . . . . . . . . . . . . . . . . . . . . . . . . - 3,234,271 - - (3,234,271) -Other non-current assets . . . . . . . . . . . . . . . . . . . . . . . 38,577 444,333 - 5,460,227 - 5,943,137
$ 19,091,465 $ 14,117,192 $ 7,793,639 $ 8,883,020 $ (24,670,138) $ 25,215,178
Current liabilities . . . . . . . . . . . . . . . . . . . . . . . . . . . . . . . $ 536,165 $ 994,570 $ - $ 708,130 $ (914) $ 2,237,951Intercompany accounts . . . . . . . . . . . . . . . . . . . . . . . . 2,390,461 - - 843,810 (3,234,271) -Deferred income taxes, net . . . . . . . . . . . . . . . . . . . . 631,763 - 1,734,680 314,133 - 2,680,576Long-term debt . . . . . . . . . . . . . . . . . . . . . . . . . . . . . . . . . 10,393,197 4,837 - 1,970,277 - 12,368,311Other long-term obligations . . . . . . . . . . . . . . . . . . . 19,952 67,212 - 70,499 - 157,663
Total liabilities . . . . . . . . . . . . . . . . . . . . . . . . . . . . . . . 13,971,538 1,066,619 1,734,680 3,906,849 (3,235,185) 17,444,501
Redeemable noncontrolling interests . . . . . . . . . - - - 6,250 - 6,250
MGM Resorts International stockholders’equity . . . . . . . . . . . . . . . . . . . . . . . . . . . . . . . . . . . . . . . . . 5,119,927 13,050,573 6,058,959 2,325,421 (21,434,953) 5,119,927
Noncontrolling interests . . . . . . . . . . . . . . . . . . . . . . . - - - 2,644,500 - 2,644,500
Total stockholders’ equity . . . . . . . . . . . . . . . . . . 5,119,927 13,050,573 6,058,959 4,969,921 (21,434,953) 7,764,427
$ 19,091,465 $ 14,117,192 $ 7,793,639 $ 8,883,020 $ (24,670,138) $ 25,215,178
89
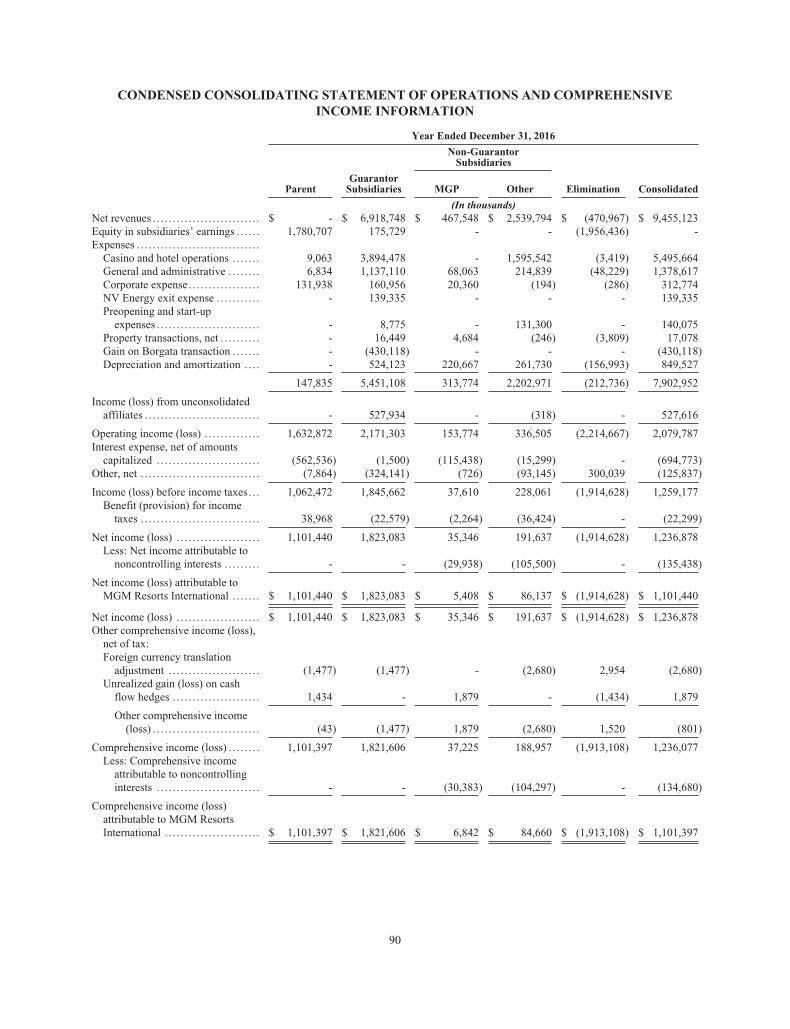
CONDENSED CONSOLIDATING STATEMENT OF OPERATIONS AND COMPREHENSIVEINCOME INFORMATION
Year Ended December 31, 2016
Non-GuarantorSubsidiaries
ParentGuarantorSubsidiaries MGP Other Elimination Consolidated
(In thousands)Net revenues . . . . . . . . . . . . . . . . . . . . . . . . . . . $ - $ 6,918,748 $ 467,548 $ 2,539,794 $ (470,967) $ 9,455,123Equity in subsidiaries’ earnings . . . . . . 1,780,707 175,729 - - (1,956,436) -Expenses . . . . . . . . . . . . . . . . . . . . . . . . . . . . . . .Casino and hotel operations . . . . . . . 9,063 3,894,478 - 1,595,542 (3,419) 5,495,664General and administrative . . . . . . . . 6,834 1,137,110 68,063 214,839 (48,229) 1,378,617Corporate expense. . . . . . . . . . . . . . . . . . 131,938 160,956 20,360 (194) (286) 312,774NV Energy exit expense . . . . . . . . . . . - 139,335 - - - 139,335Preopening and start-upexpenses . . . . . . . . . . . . . . . . . . . . . . . . . . - 8,775 - 131,300 - 140,075
Property transactions, net . . . . . . . . . . - 16,449 4,684 (246) (3,809) 17,078Gain on Borgata transaction . . . . . . . - (430,118) - - - (430,118)Depreciation and amortization . . . . - 524,123 220,667 261,730 (156,993) 849,527
147,835 5,451,108 313,774 2,202,971 (212,736) 7,902,952
Income (loss) from unconsolidatedaffiliates . . . . . . . . . . . . . . . . . . . . . . . . . . . . . - 527,934 - (318) - 527,616
Operating income (loss) . . . . . . . . . . . . . . 1,632,872 2,171,303 153,774 336,505 (2,214,667) 2,079,787Interest expense, net of amountscapitalized . . . . . . . . . . . . . . . . . . . . . . . . . . (562,536) (1,500) (115,438) (15,299) - (694,773)
Other, net . . . . . . . . . . . . . . . . . . . . . . . . . . . . . . (7,864) (324,141) (726) (93,145) 300,039 (125,837)
Income (loss) before income taxes. . . 1,062,472 1,845,662 37,610 228,061 (1,914,628) 1,259,177Benefit (provision) for incometaxes . . . . . . . . . . . . . . . . . . . . . . . . . . . . . . 38,968 (22,579) (2,264) (36,424) - (22,299)
Net income (loss) . . . . . . . . . . . . . . . . . . . . . 1,101,440 1,823,083 35,346 191,637 (1,914,628) 1,236,878Less: Net income attributable tononcontrolling interests . . . . . . . . . - - (29,938) (105,500) - (135,438)
Net income (loss) attributable toMGM Resorts International . . . . . . . $ 1,101,440 $ 1,823,083 $ 5,408 $ 86,137 $ (1,914,628) $ 1,101,440
Net income (loss) . . . . . . . . . . . . . . . . . . . . . $ 1,101,440 $ 1,823,083 $ 35,346 $ 191,637 $ (1,914,628) $ 1,236,878Other comprehensive income (loss),net of tax:Foreign currency translationadjustment . . . . . . . . . . . . . . . . . . . . . . . (1,477) (1,477) - (2,680) 2,954 (2,680)
Unrealized gain (loss) on cashflow hedges . . . . . . . . . . . . . . . . . . . . . . 1,434 - 1,879 - (1,434) 1,879
Other comprehensive income(loss) . . . . . . . . . . . . . . . . . . . . . . . . . . . (43) (1,477) 1,879 (2,680) 1,520 (801)
Comprehensive income (loss) . . . . . . . . 1,101,397 1,821,606 37,225 188,957 (1,913,108) 1,236,077Less: Comprehensive incomeattributable to noncontrollinginterests . . . . . . . . . . . . . . . . . . . . . . . . . . - - (30,383) (104,297) - (134,680)
Comprehensive income (loss)attributable to MGM ResortsInternational . . . . . . . . . . . . . . . . . . . . . . . . $ 1,101,397 $ 1,821,606 $ 6,842 $ 84,660 $ (1,913,108) $ 1,101,397
90
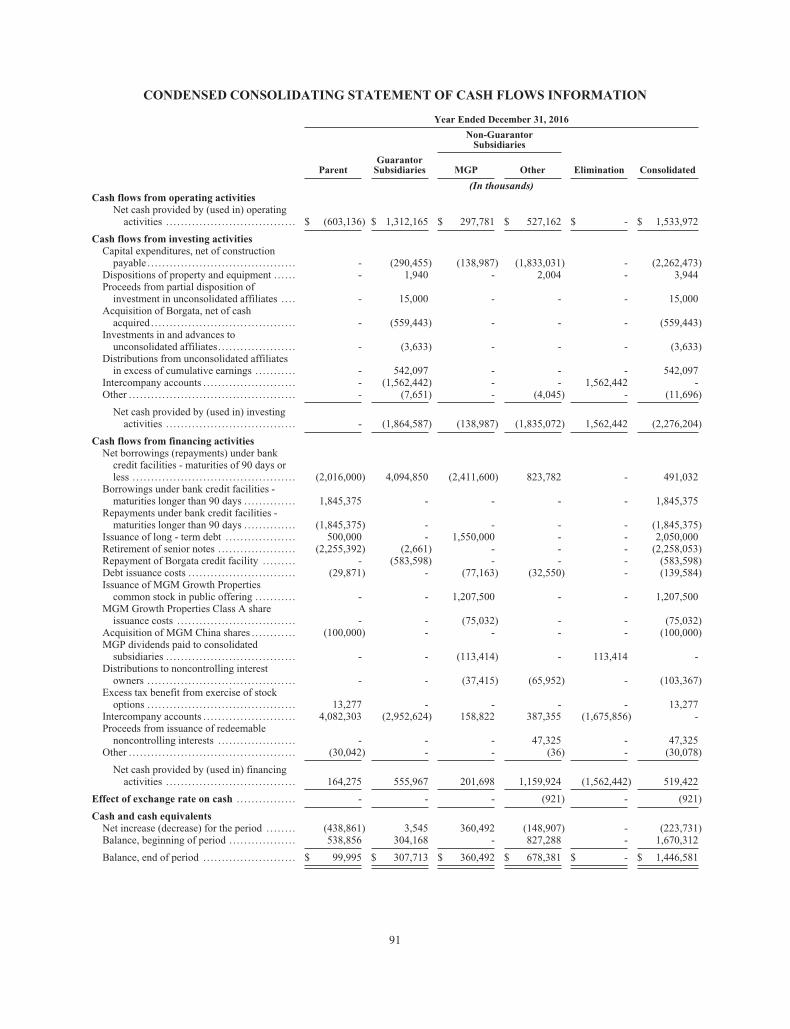
CONDENSED CONSOLIDATING STATEMENT OF CASH FLOWS INFORMATION
Year Ended December 31, 2016
Non-GuarantorSubsidiaries
ParentGuarantorSubsidiaries MGP Other Elimination Consolidated
(In thousands)Cash flows from operating activities
Net cash provided by (used in) operatingactivities . . . . . . . . . . . . . . . . . . . . . . . . . . . . . . . . . . . $ (603,136) $ 1,312,165 $ 297,781 $ 527,162 $ - $ 1,533,972
Cash flows from investing activitiesCapital expenditures, net of constructionpayable . . . . . . . . . . . . . . . . . . . . . . . . . . . . . . . . . . . . . . . . - (290,455) (138,987) (1,833,031) - (2,262,473)
Dispositions of property and equipment . . . . . . - 1,940 - 2,004 - 3,944Proceeds from partial disposition ofinvestment in unconsolidated affiliates . . . . - 15,000 - - - 15,000
Acquisition of Borgata, net of cashacquired . . . . . . . . . . . . . . . . . . . . . . . . . . . . . . . . . . . . . . . - (559,443) - - - (559,443)
Investments in and advances tounconsolidated affiliates. . . . . . . . . . . . . . . . . . . . . - (3,633) - - - (3,633)
Distributions from unconsolidated affiliatesin excess of cumulative earnings . . . . . . . . . . . - 542,097 - - - 542,097
Intercompany accounts . . . . . . . . . . . . . . . . . . . . . . . . . - (1,562,442) - - 1,562,442 -Other . . . . . . . . . . . . . . . . . . . . . . . . . . . . . . . . . . . . . . . . . . . . . - (7,651) - (4,045) - (11,696)
Net cash provided by (used in) investingactivities . . . . . . . . . . . . . . . . . . . . . . . . . . . . . . . . . . . - (1,864,587) (138,987) (1,835,072) 1,562,442 (2,276,204)
Cash flows from financing activitiesNet borrowings (repayments) under bankcredit facilities - maturities of 90 days orless . . . . . . . . . . . . . . . . . . . . . . . . . . . . . . . . . . . . . . . . . . . . (2,016,000) 4,094,850 (2,411,600) 823,782 - 491,032
Borrowings under bank credit facilities -maturities longer than 90 days . . . . . . . . . . . . . . 1,845,375 - - - - 1,845,375
Repayments under bank credit facilities -maturities longer than 90 days . . . . . . . . . . . . . . (1,845,375) - - - - (1,845,375)
Issuance of long - term debt . . . . . . . . . . . . . . . . . . . 500,000 - 1,550,000 - - 2,050,000Retirement of senior notes . . . . . . . . . . . . . . . . . . . . . (2,255,392) (2,661) - - - (2,258,053)Repayment of Borgata credit facility . . . . . . . . . - (583,598) - - - (583,598)Debt issuance costs . . . . . . . . . . . . . . . . . . . . . . . . . . . . . (29,871) - (77,163) (32,550) - (139,584)Issuance of MGM Growth Propertiescommon stock in public offering . . . . . . . . . . . - - 1,207,500 - - 1,207,500
MGM Growth Properties Class A shareissuance costs . . . . . . . . . . . . . . . . . . . . . . . . . . . . . . . . - - (75,032) - - (75,032)
Acquisition of MGM China shares . . . . . . . . . . . . (100,000) - - - - (100,000)MGP dividends paid to consolidatedsubsidiaries . . . . . . . . . . . . . . . . . . . . . . . . . . . . . . . . . . . - - (113,414) - 113,414 -
Distributions to noncontrolling interestowners . . . . . . . . . . . . . . . . . . . . . . . . . . . . . . . . . . . . . . . . - - (37,415) (65,952) - (103,367)
Excess tax benefit from exercise of stockoptions . . . . . . . . . . . . . . . . . . . . . . . . . . . . . . . . . . . . . . . . 13,277 - - - - 13,277
Intercompany accounts . . . . . . . . . . . . . . . . . . . . . . . . . 4,082,303 (2,952,624) 158,822 387,355 (1,675,856) -Proceeds from issuance of redeemablenoncontrolling interests . . . . . . . . . . . . . . . . . . . . . - - - 47,325 - 47,325
Other . . . . . . . . . . . . . . . . . . . . . . . . . . . . . . . . . . . . . . . . . . . . . (30,042) - - (36) - (30,078)
Net cash provided by (used in) financingactivities . . . . . . . . . . . . . . . . . . . . . . . . . . . . . . . . . . . 164,275 555,967 201,698 1,159,924 (1,562,442) 519,422
Effect of exchange rate on cash . . . . . . . . . . . . . . . . - - - (921) - (921)
Cash and cash equivalentsNet increase (decrease) for the period . . . . . . . . (438,861) 3,545 360,492 (148,907) - (223,731)Balance, beginning of period . . . . . . . . . . . . . . . . . . 538,856 304,168 - 827,288 - 1,670,312
Balance, end of period . . . . . . . . . . . . . . . . . . . . . . . . . $ 99,995 $ 307,713 $ 360,492 $ 678,381 $ - $ 1,446,581
91

CONDENSED CONSOLIDATING STATEMENT OF OPERATIONS AND COMPREHENSIVEINCOME INFORMATION
Year Ended December 31, 2015
Non-GuarantorSubsidiaries
ParentGuarantorSubsidiaries MGP Other Elimination Consolidated
(In thousands)Net revenues . . . . . . . . . . . . . . . . . . . . . . . . . . . . . . . . . $ - $ 6,429,103 $ - $ 2,763,862 $ (2,897) $ 9,190,068Equity in subsidiaries’ earnings . . . . . . . . . . . . 376,074 (566,270) - - 190,196 -ExpensesCasino and hotel operations . . . . . . . . . . . . . . 6,717 3,807,569 - 1,813,987 (2,897) 5,625,376General and administrative. . . . . . . . . . . . . . . 4,959 1,038,053 58,473 207,619 - 1,309,104Corporate expense . . . . . . . . . . . . . . . . . . . . . . . . 120,615 154,424 - (488) - 274,551Preopening and start-up expenses . . . . . . . - 4,973 - 66,354 - 71,327Property transactions, net . . . . . . . . . . . . . . . . - 24,688 6,665 1,472,589 - 1,503,942Depreciation and amortization . . . . . . . . . . . - 348,159 196,816 274,908 - 819,883
132,291 5,377,866 261,954 3,834,969 (2,897) 9,604,183
Income (loss) from unconsolidatedaffiliates . . . . . . . . . . . . . . . . . . . . . . . . . . . . . . . . . . . - 259,002 - (1,119) - 257,883
Operating income (loss) . . . . . . . . . . . . . . . . . . . . . 243,783 743,969 (261,954) (1,072,226) 190,196 (156,232)Interest expense, net of amountscapitalized . . . . . . . . . . . . . . . . . . . . . . . . . . . . . . . . . (762,529) (1,057) - (33,993) - (797,579)
Other, net . . . . . . . . . . . . . . . . . . . . . . . . . . . . . . . . . . . . . 49,497 (84,958) - (56,971) - (92,432)
Income (loss) before income taxes . . . . . . . . . (469,249) 657,954 (261,954) (1,163,190) 190,196 (1,046,243)Benefit (provision) for income taxes . . . . 21,529 (7,125) - (7,810) - 6,594
Net income (loss) . . . . . . . . . . . . . . . . . . . . . . . . . . . . (447,720) 650,829 (261,954) (1,171,000) 190,196 (1,039,649)Less: Net loss attributable tononcontrolling interests . . . . . . . . . . . . . . . . - - - 591,929 - 591,929
Net income (loss) attributable to MGMResorts International . . . . . . . . . . . . . . . . . . . . . . $ (447,720) $ 650,829 $ (261,954) $ (579,071) $ 190,196 $ (447,720)
Net income (loss) . . . . . . . . . . . . . . . . . . . . . . . . . . . . $ (447,720) $ 650,829 $ (261,954) $ (1,171,000) $ 190,196 $ (1,039,649)Other comprehensive income (loss), net oftax:Foreign currency translationadjustment . . . . . . . . . . . . . . . . . . . . . . . . . . . . . . 1,703 1,703 - 3,727 (3,406) 3,727
Other . . . . . . . . . . . . . . . . . . . . . . . . . . . . . . . . . . . . . . . (672) (672) - - 672 (672)
Other comprehensive income(loss) . . . . . . . . . . . . . . . . . . . . . . . . . . . . . . . . . 1,031 1,031 - 3,727 (2,734) 3,055
Comprehensive income (loss) . . . . . . . . . . . . . . (446,689) 651,860 (261,954) (1,167,273) 187,462 (1,036,594)Less: Comprehensive loss attributableto noncontrolling interests . . . . . . . . . . . . . - - - 589,905 - 589,905
Comprehensive income (loss) attributableto MGM Resorts International . . . . . . . . . . . $ (446,689) $ 651,860 $ (261,954) $ (577,368) $ 187,462 $ (446,689)
92
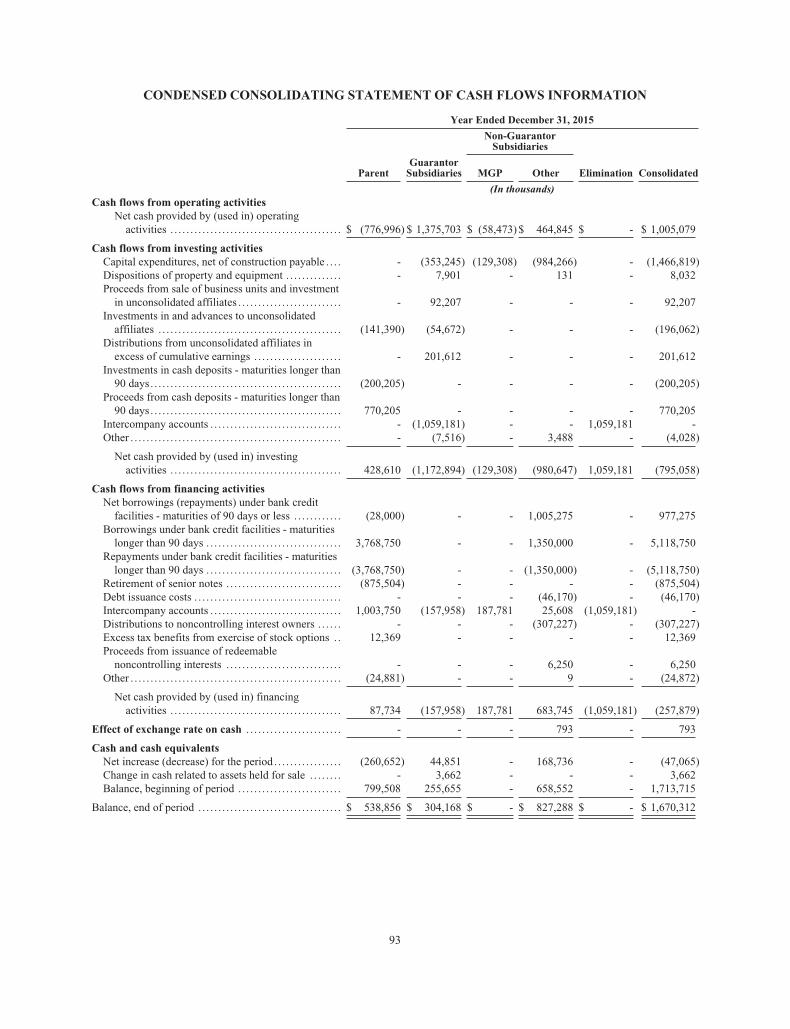
CONDENSED CONSOLIDATING STATEMENT OF CASH FLOWS INFORMATION
Year Ended December 31, 2015
Non-GuarantorSubsidiaries
ParentGuarantorSubsidiaries MGP Other Elimination Consolidated
(In thousands)Cash flows from operating activities
Net cash provided by (used in) operatingactivities . . . . . . . . . . . . . . . . . . . . . . . . . . . . . . . . . . . . . . . . . . . $ (776,996) $ 1,375,703 $ (58,473) $ 464,845 $ - $ 1,005,079
Cash flows from investing activitiesCapital expenditures, net of construction payable . . . . - (353,245) (129,308) (984,266) - (1,466,819)Dispositions of property and equipment . . . . . . . . . . . . . . - 7,901 - 131 - 8,032Proceeds from sale of business units and investmentin unconsolidated affiliates . . . . . . . . . . . . . . . . . . . . . . . . . . - 92,207 - - - 92,207
Investments in and advances to unconsolidatedaffiliates . . . . . . . . . . . . . . . . . . . . . . . . . . . . . . . . . . . . . . . . . . . . . . (141,390) (54,672) - - - (196,062)
Distributions from unconsolidated affiliates inexcess of cumulative earnings . . . . . . . . . . . . . . . . . . . . . . - 201,612 - - - 201,612
Investments in cash deposits - maturities longer than90 days. . . . . . . . . . . . . . . . . . . . . . . . . . . . . . . . . . . . . . . . . . . . . . . . (200,205) - - - - (200,205)
Proceeds from cash deposits - maturities longer than90 days. . . . . . . . . . . . . . . . . . . . . . . . . . . . . . . . . . . . . . . . . . . . . . . . 770,205 - - - - 770,205
Intercompany accounts . . . . . . . . . . . . . . . . . . . . . . . . . . . . . . . . . - (1,059,181) - - 1,059,181 -Other . . . . . . . . . . . . . . . . . . . . . . . . . . . . . . . . . . . . . . . . . . . . . . . . . . . . . - (7,516) - 3,488 - (4,028)
Net cash provided by (used in) investingactivities . . . . . . . . . . . . . . . . . . . . . . . . . . . . . . . . . . . . . . . . . . . 428,610 (1,172,894) (129,308) (980,647) 1,059,181 (795,058)
Cash flows from financing activitiesNet borrowings (repayments) under bank creditfacilities - maturities of 90 days or less . . . . . . . . . . . . (28,000) - - 1,005,275 - 977,275
Borrowings under bank credit facilities - maturitieslonger than 90 days . . . . . . . . . . . . . . . . . . . . . . . . . . . . . . . . . . 3,768,750 - - 1,350,000 - 5,118,750
Repayments under bank credit facilities - maturitieslonger than 90 days . . . . . . . . . . . . . . . . . . . . . . . . . . . . . . . . . . (3,768,750) - - (1,350,000) - (5,118,750)
Retirement of senior notes . . . . . . . . . . . . . . . . . . . . . . . . . . . . . (875,504) - - - - (875,504)Debt issuance costs . . . . . . . . . . . . . . . . . . . . . . . . . . . . . . . . . . . . . - - - (46,170) - (46,170)Intercompany accounts . . . . . . . . . . . . . . . . . . . . . . . . . . . . . . . . . 1,003,750 (157,958) 187,781 25,608 (1,059,181) -Distributions to noncontrolling interest owners . . . . . . - - - (307,227) - (307,227)Excess tax benefits from exercise of stock options . . 12,369 - - - - 12,369Proceeds from issuance of redeemablenoncontrolling interests . . . . . . . . . . . . . . . . . . . . . . . . . . . . . - - - 6,250 - 6,250
Other . . . . . . . . . . . . . . . . . . . . . . . . . . . . . . . . . . . . . . . . . . . . . . . . . . . . . (24,881) - - 9 - (24,872)
Net cash provided by (used in) financingactivities . . . . . . . . . . . . . . . . . . . . . . . . . . . . . . . . . . . . . . . . . . . 87,734 (157,958) 187,781 683,745 (1,059,181) (257,879)
Effect of exchange rate on cash . . . . . . . . . . . . . . . . . . . . . . . . - - - 793 - 793
Cash and cash equivalentsNet increase (decrease) for the period . . . . . . . . . . . . . . . . . (260,652) 44,851 - 168,736 - (47,065)Change in cash related to assets held for sale . . . . . . . . - 3,662 - - - 3,662Balance, beginning of period . . . . . . . . . . . . . . . . . . . . . . . . . . 799,508 255,655 - 658,552 - 1,713,715
Balance, end of period . . . . . . . . . . . . . . . . . . . . . . . . . . . . . . . . . . . . $ 538,856 $ 304,168 $ - $ 827,288 $ - $ 1,670,312
93

CONDENSED CONSOLIDATING STATEMENT OF OPERATIONS AND COMPREHENSIVEINCOME INFORMATION
Year Ended December 31, 2014
Non-GuarantorSubsidiaries
ParentGuarantorSubsidiaries MGP Other Elimination Consolidated
(In thousands)Net revenues . . . . . . . . . . . . . . . . . . . . . . . . . $ - $ 6,270,708 $ - $ 3,813,736 $ (2,460) $ 10,081,984Equity in subsidiaries’ earnings . . . . 938,712 339,312 - - (1,278,024) -Expenses . . . . . . . . . . . . . . . . . . . . . . . . . . . . .Casino and hotel operations . . . . . . 5,482 3,810,711 - 2,554,965 (2,460) 6,368,698General and administrative. . . . . . . 4,743 1,046,803 59,980 207,223 - 1,318,749Corporate expense . . . . . . . . . . . . . . . . 72,116 150,938 - 15,757 - 238,811Preopening and start-upexpenses . . . . . . . . . . . . . . . . . . . . . . . . - 5,384 - 33,873 - 39,257
Property transactions, net . . . . . . . . - 36,612 - 4,390 - 41,002Depreciation and amortization . . . - 329,589 186,262 299,914 - 815,765
82,341 5,380,037 246,242 3,116,122 (2,460) 8,822,282
Income (loss) from unconsolidatedaffiliates . . . . . . . . . . . . . . . . . . . . . . . . . . . - 64,014 - (178) - 63,836
Operating income (loss) . . . . . . . . . . . . . 856,371 `1,293,997 (246,242) 697,436 (1,278,024) 1,323,538Interest expense, net of amountscapitalized . . . . . . . . . . . . . . . . . . . . . . . . . (794,826) (574) - (21,661) - (817,061)
Other, net . . . . . . . . . . . . . . . . . . . . . . . . . . . . . 50,793 (90,679) - (55,705) - (95,591)
Income (loss) before incometaxes . . . . . . . . . . . . . . . . . . . . . . . . . . . . . . . 112,338 1,202,744 (246,242) 620,070 (1,278,024) 410,886Provision for income taxes . . . . . . . (262,211) (20,735) - (762) - (283,708)
Net income (loss) . . . . . . . . . . . . . . . . . . . . (149,873) 1,182,009 (246,242) 619,308 (1,278,024) 127,178Less: Net income attributable tononcontrolling interests . . . . . . . . - - - (277,051) - (277,051)
Net income (loss) attributable toMGM Resorts International . . . . . . $ (149,873) $ 1,182,009 $ (246,242) $ 342,257 $ (1,278,024) $ (149,873)
Net income (loss) . . . . . . . . . . . . . . . . . . . . $ (149,873) $ 1,182,009 $ (246,242) $ 619,308 $ (1,278,024) $ 127,178Other comprehensive income(loss), net of tax:Foreign currency translationadjustment . . . . . . . . . . . . . . . . . . . . . . (762) (762) - (1,293) 1,524 (1,293)
Other . . . . . . . . . . . . . . . . . . . . . . . . . . . . . . . 1,250 1,250 - - (1,250) 1,250
Other comprehensive income(loss) . . . . . . . . . . . . . . . . . . . . . . . . . 488 488 - (1,293) 274 (43)
Comprehensive income (loss) . . . . . . (149,385) 1,182,497 (246,242) 618,015 (1,277,750) 127,135Less: Comprehensive incomeattributable to noncontrollinginterests . . . . . . . . . . . . . . . . . . . . . . . . . - - - (276,520) - (276,520)
Comprehensive income (loss)attributable to MGM ResortsInternational . . . . . . . . . . . . . . . . . . . . . . . $ (149,385) $ 1,182,497 $ (246,242) $ 341,495 $ (1,277,750) $ (149,385)
94

CONDENSED CONSOLIDATING STATEMENT OF CASH FLOWS INFORMATION
Year Ended December 31, 2014
Non-GuarantorSubsidiaries
ParentGuarantorSubsidiaries MGP Other Elimination Consolidated
(In thousands)
Cash flows from operating activitiesNet cash provided by (used in) operatingactivities . . . . . . . . . . . . . . . . . . . . . . . . . . . . . . . . . $ (718,756) $1,163,402 $ (59,980) $ 721,004 $ 25,000 $ 1,130,670
Cash flows from investing activitiesCapital expenditures, net of constructionpayable . . . . . . . . . . . . . . . . . . . . . . . . . . . . . . . . . . . . . - (289,431) (90,504) (492,106) - (872,041)
Dispositions of property and equipment . . . . - 6,631 - 1,020 - 7,651Investments in and advances tounconsolidated affiliates . . . . . . . . . . . . . . . . . . (31,400) (46,640) - - (25,000) (103,040)
Distributions from unconsolidatedaffiliates in excess of cumulativeearnings . . . . . . . . . . . . . . . . . . . . . . . . . . . . . . . . . . . . . - 132 - - - 132
Investments in treasury securities -maturities longer than 90 days . . . . . . . . . . . . - (123,133) - - - (123,133)
Proceeds from treasury securities -maturities longer than 90 days . . . . . . . . . . . . - 210,300 - - - 210,300
Investments in cash deposits - originalmaturities longer than 90 days . . . . . . . . . . . . (570,000) - - - - (570,000)
Intercompany accounts . . . . . . . . . . . . . . . . . . . . . . . - (704,785) - - 704,785 -Payments for gaming licenses . . . . . . . . . . . . . . . - - - (85,000) - (85,000)Other . . . . . . . . . . . . . . . . . . . . . . . . . . . . . . . . . . . . . . . . . . . - 10,981 - - - 10,981
Net cash provided by (used in) investingactivities . . . . . . . . . . . . . . . . . . . . . . . . . . . . . . . . . (601,400) (935,945) (90,504) (576,086) 679,785 (1,524,150)
Cash flows from financing activitiesNet repayments under bank credit facilities- maturities of 90 days or less . . . . . . . . . . . . . (28,000) - - - - (28,000)
Borrowings under bank credit facilities -maturities longer than 90 days . . . . . . . . . . . . 3,821,250 - - 1,350,000 - 5,171,250
Repayments under bank credit facilities -maturities longer than 90 days . . . . . . . . . . . . (3,821,250) - - (1,350,000) - (5,171,250)
Issuance of long-term debt . . . . . . . . . . . . . . . . . . . 1,250,750 - - - - 1,250,750Retirement of senior notes . . . . . . . . . . . . . . . . . . . (508,900) - - - - (508,900)Debt issuance costs . . . . . . . . . . . . . . . . . . . . . . . . . . . (13,681) - - - - (13,681)Intercompany accounts . . . . . . . . . . . . . . . . . . . . . . . 1,045,048 (204,794) 150,484 (285,953) (704,785) -Distributions to noncontrolling interestowners . . . . . . . . . . . . . . . . . . . . . . . . . . . . . . . . . . . . . . - - - (386,709) - (386,709)
Other . . . . . . . . . . . . . . . . . . . . . . . . . . . . . . . . . . . . . . . . . . . (4,213) (803) - (367) - (5,383)
Net cash provided by (used in) financingactivities . . . . . . . . . . . . . . . . . . . . . . . . . . . . . . . . . 1,741,004 (205,597) 150,484 (673,029) (704,785) 308,077
Effect of exchange rate on cash . . . . . . . . . - - - (889) - (889)
Cash and cash equivalents -Net increase (decrease) for the period . . . . . . 420,848 21,860 - (529,000) - (86,292)Change in cash related to assets held forsale . . . . . . . . . . . . . . . . . . . . . . . . . . . . . . . . . . . . . . . . . . - (3,662) - - - (3,662)
Balance, beginning of period . . . . . . . . . . . . . . . . 378,660 237,457 - 1,187,552 - 1,803,669
Balance, end of period . . . . . . . . . . . . . . . . . . . . . . . $ 799,508 $ 255,655 $ - $ 658,552 $ - $ 1,713,715
95
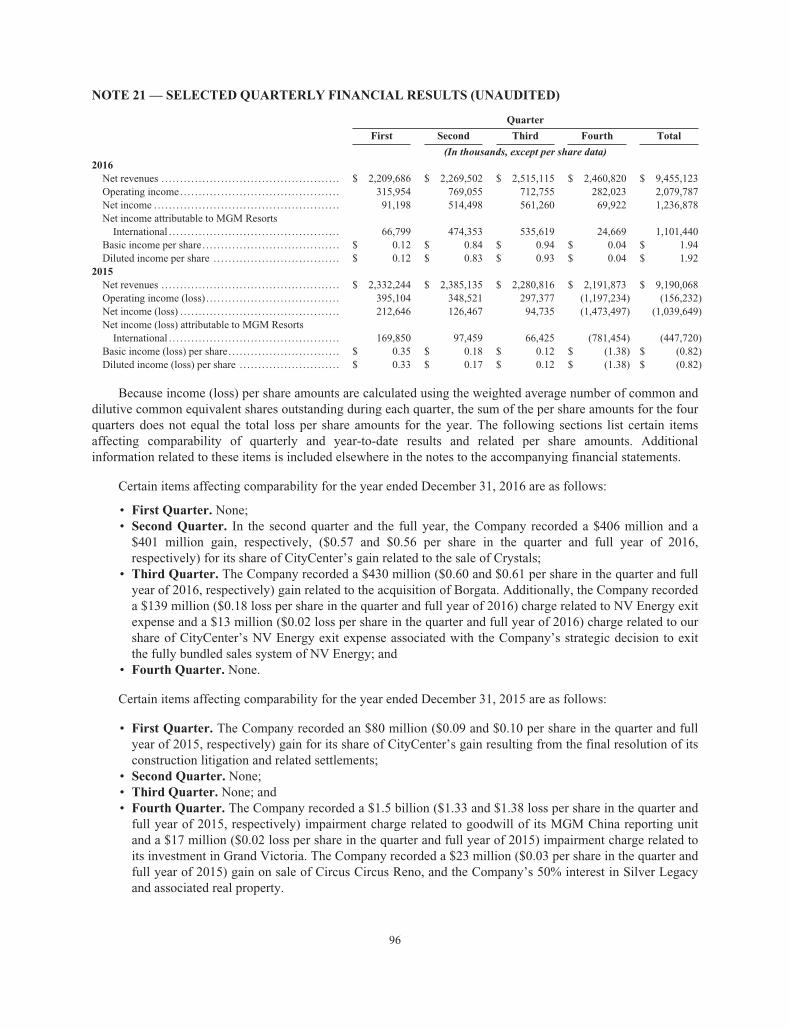
NOTE 21 — SELECTED QUARTERLY FINANCIAL RESULTS (UNAUDITED)
Quarter
First Second Third Fourth Total
(In thousands, except per share data)2016Net revenues . . . . . . . . . . . . . . . . . . . . . . . . . . . . . . . . . . . . . . . . . . . . . . . . $ 2,209,686 $ 2,269,502 $ 2,515,115 $ 2,460,820 $ 9,455,123Operating income. . . . . . . . . . . . . . . . . . . . . . . . . . . . . . . . . . . . . . . . . . . 315,954 769,055 712,755 282,023 2,079,787Net income . . . . . . . . . . . . . . . . . . . . . . . . . . . . . . . . . . . . . . . . . . . . . . . . . . 91,198 514,498 561,260 69,922 1,236,878Net income attributable to MGM ResortsInternational . . . . . . . . . . . . . . . . . . . . . . . . . . . . . . . . . . . . . . . . . . . . . . 66,799 474,353 535,619 24,669 1,101,440
Basic income per share . . . . . . . . . . . . . . . . . . . . . . . . . . . . . . . . . . . . . $ 0.12 $ 0.84 $ 0.94 $ 0.04 $ 1.94Diluted income per share . . . . . . . . . . . . . . . . . . . . . . . . . . . . . . . . . . $ 0.12 $ 0.83 $ 0.93 $ 0.04 $ 1.92
2015Net revenues . . . . . . . . . . . . . . . . . . . . . . . . . . . . . . . . . . . . . . . . . . . . . . . . $ 2,332,244 $ 2,385,135 $ 2,280,816 $ 2,191,873 $ 9,190,068Operating income (loss) . . . . . . . . . . . . . . . . . . . . . . . . . . . . . . . . . . . . 395,104 348,521 297,377 (1,197,234) (156,232)Net income (loss) . . . . . . . . . . . . . . . . . . . . . . . . . . . . . . . . . . . . . . . . . . . 212,646 126,467 94,735 (1,473,497) (1,039,649)Net income (loss) attributable to MGM ResortsInternational . . . . . . . . . . . . . . . . . . . . . . . . . . . . . . . . . . . . . . . . . . . . . . 169,850 97,459 66,425 (781,454) (447,720)
Basic income (loss) per share. . . . . . . . . . . . . . . . . . . . . . . . . . . . . . $ 0.35 $ 0.18 $ 0.12 $ (1.38) $ (0.82)Diluted income (loss) per share . . . . . . . . . . . . . . . . . . . . . . . . . . . $ 0.33 $ 0.17 $ 0.12 $ (1.38) $ (0.82)
Because income (loss) per share amounts are calculated using the weighted average number of common anddilutive common equivalent shares outstanding during each quarter, the sum of the per share amounts for the fourquarters does not equal the total loss per share amounts for the year. The following sections list certain itemsaffecting comparability of quarterly and year-to-date results and related per share amounts. Additionalinformation related to these items is included elsewhere in the notes to the accompanying financial statements.
Certain items affecting comparability for the year ended December 31, 2016 are as follows:
• First Quarter. None;• Second Quarter. In the second quarter and the full year, the Company recorded a $406 million and a$401 million gain, respectively, ($0.57 and $0.56 per share in the quarter and full year of 2016,respectively) for its share of CityCenter’s gain related to the sale of Crystals;
• Third Quarter. The Company recorded a $430 million ($0.60 and $0.61 per share in the quarter and fullyear of 2016, respectively) gain related to the acquisition of Borgata. Additionally, the Company recordeda $139 million ($0.18 loss per share in the quarter and full year of 2016) charge related to NV Energy exitexpense and a $13 million ($0.02 loss per share in the quarter and full year of 2016) charge related to ourshare of CityCenter’s NV Energy exit expense associated with the Company’s strategic decision to exitthe fully bundled sales system of NV Energy; and
• Fourth Quarter. None.
Certain items affecting comparability for the year ended December 31, 2015 are as follows:
• First Quarter. The Company recorded an $80 million ($0.09 and $0.10 per share in the quarter and fullyear of 2015, respectively) gain for its share of CityCenter’s gain resulting from the final resolution of itsconstruction litigation and related settlements;
• Second Quarter. None;• Third Quarter. None; and• Fourth Quarter. The Company recorded a $1.5 billion ($1.33 and $1.38 loss per share in the quarter andfull year of 2015, respectively) impairment charge related to goodwill of its MGM China reporting unitand a $17 million ($0.02 loss per share in the quarter and full year of 2015) impairment charge related toits investment in Grand Victoria. The Company recorded a $23 million ($0.03 per share in the quarter andfull year of 2015) gain on sale of Circus Circus Reno, and the Company’s 50% interest in Silver Legacyand associated real property.
96

The graph below matches MGM Resorts International’s cumulative 5-Year total shareholder return on common stock with the cumulative total returns of the Dow Jones US Total Return index and the Dow Jones US Gambling index. The graph tracks the performance of a $100 investment in our common stock and in each index (with the reinvestment of all dividends) from 12/31/2011 to 12/31/2016.
The stock price performance included in this graph is not necessarily indicative of future stock price performance.
12/11 12/12 12/13 12/14 12/15 12/16
MGM Resorts International 100.00 111.60 225.50 204.99 217.83 276.41 Dow Jones U.S. 100.00 116.32 154.68 174.71 175.81 197.35 Dow Jones U.S. Gambling 100.00 110.52 189.80 154.10 118.14 151.45
The following table represents the high and low trading prices of the Company’s common stock.
FOR THE YEARS ENDED DECEMBER 31 2016 2015
HIGH LOW HIGH LOW
FIRST QUARTER $22.97 $16.18 $23.25 $18.82SECOND QUARTER $25.29 $20.59 $22.65 $17.50THIRD QUARTER $26.49 $22.33 $22.77 $16.84FOURTH QUARTER $30.62 $25.25 $24.41 $18.19
The Company’s common stock is listed on the New York Stock Exchange under the symbol “MGM.” There were approximately 3,881 record holders of our common stock as of February 24, 2017. On February 15, 2017, the Board of Directors approved a quarterly dividend of $0.11 per share. This dividend was paid on March 15, 2017, to stockholders of record as of the close of business on March 10, 2017. The amount, declaration and payment of any future dividends will be subject to the discretion of the Company’s Board of Directors who will evaluate our dividend policy from time to time based on factors it deems relevant. In addition, as a holding company with no independent operations, the Company’s ability to pay dividends will depend upon the receipt of cash from the Company’s operating subsidiaries to generate the funds from operations necessary to pay dividends on the Company’s common stock. Furthermore, the Company’s senior credit facility contains financial covenants and restrictive covenants that could restrict the Company’s ability to pay dividends, subject to certain exceptions. In addition, the MGM National Harbor, MGM Growth Properties Operating Partnership, and MGM China credit facilities each contain limitations on the ability of the applicable subsidiary under each credit agreement to pay dividends to the Company. There can be no assurance that the Company will continue to pay dividends in the future.
CAUTIONARY LANGUAGE CONCERNING FORWARD-LOOKING STATEMENTS: Statements in this annual report that are not historical facts are “forward-looking” statements and “safe harbor statements” within the meaning of the Private Securities Litigation Reform Act of 1995 and other related laws that involve risks and/or uncertainties, including risks and/ or uncertainties described in the Company’s public filings with the Securities and Exchange Commission. The Company has based these forward-looking statements on management’s current expectations and assumptions and not on historical facts. Examples of these statements include, but are not limited to, statements regarding the Company’s expectations regarding future results and the Company’s financial outlook, the payment of any future cash dividends on the Company’s common stock, its ability to generate future cash flow growth and to execute on future development and other projects and the Company’s ability to execute its strategic plan and improve its financial flexibility. Among the important factors that could cause actual results to differ materially from those indicated in such forward-looking statements include effects of economic conditions and market conditions in the markets in which the Company operates and competition with other destination travel locations throughout the United States and the world, the design, timing and costs of expansion projects, risks relating to international operations, permits, licenses, financings, approvals and other contingencies in connection with growth in new or existing jurisdictions and additional risks and uncertainties described in the Company’s Form 10-K, Form 10-Q and Form 8-K reports (including all amendments to those reports). In providing forward-looking statements, the Company is not undertaking any duty or obligation to update these statements publicly as a result of new information, future events or otherwise except as required by law.
COMMON STOCK INFORMATION
INVESTOR INFORMATION
TRANSFER AGENT AND REGISTRAR FOR COMMON STOCK
Shareholder correspondence should be mailed to: Computershare
211 Quality Circle, Suite 210 College Station, TX 77845
1.800.358.2066 Toll Free within the U.S. 1.201.680.6578 Foreign Shareholders
INDEPENDENT REGISTERED PUBLIC ACCOUNTING FIRM
Deloitte & Touche LLP 3883 Howard Hughes Parkway, Suite 400
Las Vegas, NV 89169
FORM 10-K A copy of the Company’s annual report on Form 10-K, as filed with
the Securities and Exchange Commission, will be furnished without charge to any stockholder upon written request to:
Mr. John M. McManus Executive Vice President – General Counsel and Secretary
MGM Resorts International 3600 Las Vegas Blvd, South
Las Vegas, NV 89109
*$100 invested on 12/31/11 in stock or index, including reinvestment of dividends. Fiscal year ending December 31.
Copyright© 2017 S&P Dow Jones Indices LLC, a division of S&P Global. All rights reserved.

CORPORATE INFORMATION
James J. Murren Director/Officer
Chairman of the Board, Chief Executive Officer, MGM Resorts International
Robert H. Baldwin Director/Officer
Chief Customer Development Officer, MGM Resorts International
William A. Bible Director
Mary Chris Gay Director
William W. Grounds Director
President, Infinity World Development Corp,
a private investment entity
Willie D. Davis Director Emeritus
William J. Hornbuckle President
Corey I. Sanders Chief Operating Officer
MGM Resorts International 3600 Las Vegas Blvd. South
Las Vegas, NV 89109 1.702.693.7120
mgmresorts.com
Bellagio Las Vegas, NV 1.702.693.7111 bellagio.com
ARIA Las Vegas, NV 1.866.359.7757
aria.com
Vdara Las Vegas, NV 1.866.745.7111
vdara.com
Mandarin Oriental Las Vegas Las Vegas, NV 1.702.590.8888
mandarinoriental.com/lasvegas
MGM Grand Las Vegas Las Vegas, NV 1.702.891.1111
mgmgrand.com
Alexis M. Herman Director
President and Chief Executive Officer, New Ventures, a corporate consulting company
Roland Hernandez Director
President, Hernandez Media Ventures, a privately held media assets company
John B. Kilroy, Jr. Director
Chairman, President and CEO, Kilroy Realty Corp.
Anthony L. Mandekic Director
President and Chief Executive Officer, Tracinda Corporation,
a private investment company
Melvin B. Wolzinger Director Emeritus
Daniel J. D’Arrigo Executive Vice President,
Chief Financial Officer
Phyllis A. James Chief Diversity and
Corporate Responsibility Officer
The Signature at MGM Grand Las Vegas, NV 1.877.612.2121
signaturemgmgrand.com
Mandalay Bay Las Vegas, NV 1.702.632.7777
mandalaybay.com
Four Seasons Hotel Las Vegas, NV 1.702.632.5000
fourseasons.com/lasvegas
Delano Las Vegas Las Vegas, NV 1.702.632.7400
delanolasvegas.com
The Mirage Las Vegas, NV 1.702.791.7111 mirage.com
Monte Carlo Las Vegas, NV 1.702.730.7777
montecarlo.com
Rose McKinney-James Director
Managing Principal, McKinney-James and Associates,
a government affairs firm
Gregory M. Spierkel Director
Daniel J. Taylor Director
Executive, Tracinda Corporation, a private investment company
John M. McManus Executive Vice President,
General Counsel and Secretary
Robert C. Selwood Executive Vice President and
Chief Accounting Officer
New York-New York Las Vegas, NV 1.702.740.6969
nynyhotelcasino.com
Luxor Las Vegas, NV 1.702.262.4000
luxor.com
Excalibur Las Vegas, NV 1.702.597.7777 excalibur.com
Circus Circus Las Vegas Las Vegas, NV 1.702.734.0410
circuscircus.com
Beau Rivage Biloxi, MS
1.228.386.7111 beaurivage.com
Gold Strike Tunica Tunica, MS
1.662.357.1111 goldstrikemississippi.com
MGM Grand Detroit Detroit, MI
1.877.888.2121 mgmgranddetroit.com
Borgata Hotel Casino & Spa Atlantic City, NJ
1.609.317.1000 theborgata.com
MGM National Harbor National Harbor, MD
1.301.971.5000 mgmnationalharbor.com
Grand Victoria Elgin, IL
1.847.468.7000 grandvictoriacasino.com
MGM Macau Macau, S.A.R. 853.8802.8888
mgmmacau.com
MGM Grand Sanya Yalong Bay National
Resort District, China +86.898.8863.9999
mgmgrandsanya.com
DIRECTORS
DIRECTORS EMERITUS
OFFICERS
CORPORATE DIRECTORY


mgmresorts.com
Related Documents