Live Entertainment Industry in Australia 2008 Ticket Attendance and Revenue Survey 2008 Report Live Performance Australia 21 July 2009

Welcome message from author
This document is posted to help you gain knowledge. Please leave a comment to let me know what you think about it! Share it to your friends and learn new things together.
Transcript
Live Entertainment Industry in Australia 2008 Ticket Attendance and Revenue Survey 2008 Report Live Performance Australia
21 July 2009
Liability limited by a scheme approved under Professional Standards Legislation
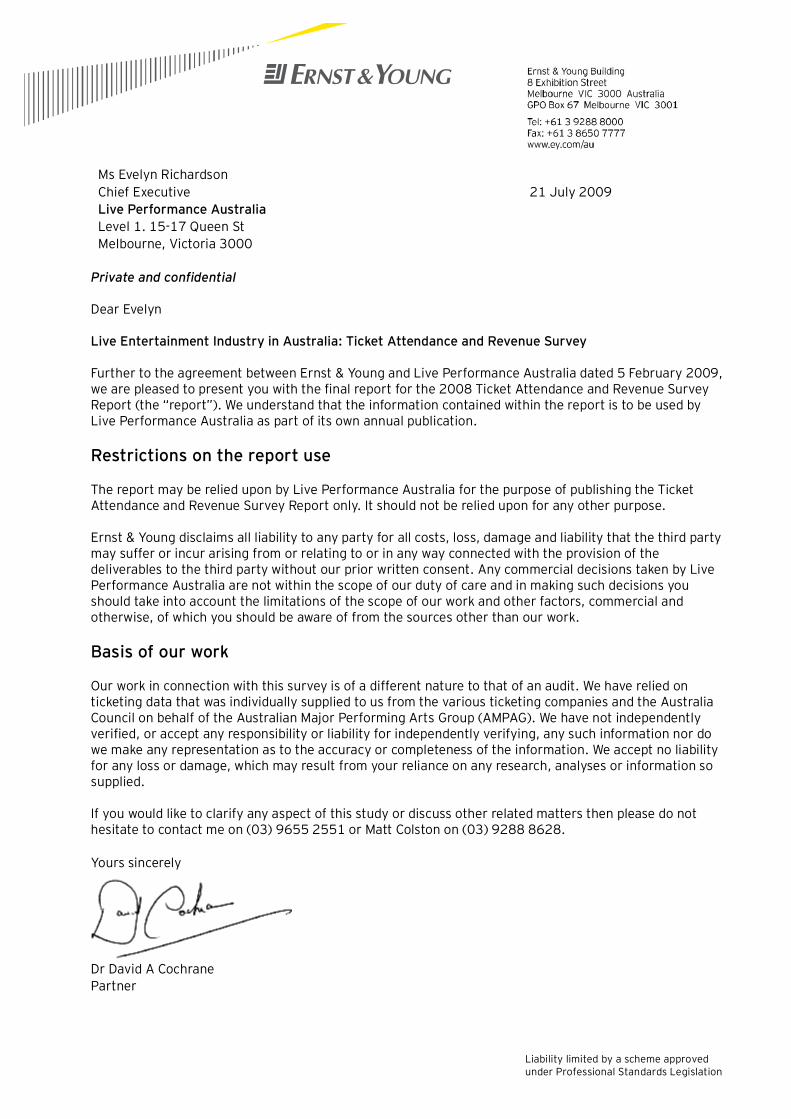
Ms Evelyn Richardson Chief Executive Live Performance Australia Level 1. 15-17 Queen St Melbourne, Victoria 3000
21 July 2009
Private and confidential
Dear Evelyn
Live Entertainment Industry in Australia: Ticket Attendance and Revenue Survey
Further to the agreement between Ernst & Young and Live Performance Australia dated 5 February 2009, we are pleased to present you with the final report for the 2008 Ticket Attendance and Revenue Survey Report (the “report”). We understand that the information contained within the report is to be used by Live Performance Australia as part of its own annual publication. Restrictions on the report use
The report may be relied upon by Live Performance Australia for the purpose of publishing the Ticket Attendance and Revenue Survey Report only. It should not be relied upon for any other purpose. Ernst & Young disclaims all liability to any party for all costs, loss, damage and liability that the third party may suffer or incur arising from or relating to or in any way connected with the provision of the deliverables to the third party without our prior written consent. Any commercial decisions taken by Live Performance Australia are not within the scope of our duty of care and in making such decisions you should take into account the limitations of the scope of our work and other factors, commercial and otherwise, of which you should be aware of from the sources other than our work. Basis of our work
Our work in connection with this survey is of a different nature to that of an audit. We have relied on ticketing data that was individually supplied to us from the various ticketing companies and the Australia Council on behalf of the Australian Major Performing Arts Group (AMPAG). We have not independently verified, or accept any responsibility or liability for independently verifying, any such information nor do we make any representation as to the accuracy or completeness of the information. We accept no liability for any loss or damage, which may result from your reliance on any research, analyses or information so supplied. If you would like to clarify any aspect of this study or discuss other related matters then please do not hesitate to contact me on (03) 9655 2551 or Matt Colston on (03) 9288 8628.
Yours sincerely
Dr David A Cochrane Partner
Live Performance Australia Live Entertainment Industry in Australia 2008 Ernst & Young i
Contents
1. Introduction........................................................................................................4 2. Ticket Attendance and Revenue Results ..............................................................7 3. Category Analysis...............................................................................................9
Live Performance Australia Live Entertainment Industry in Australia 2008 Ernst & Young ii
Index of Tables
Table 1 Category Descriptor Guide (2008) ...................................................................5
Table 2: Total Revenue and Attendance (2004–2008) ..................................................7
Table 3: Total Revenue and Attendances by Category (2008) .......................................9
Table 4: Ballet and Dance – Revenue and Attendance (2004-2008).............................12
Table 5: Children’s/Family Events – Revenue and Attendance (2004-2008).................13
Table 6: Classical Music – Revenue and Attendance (2004-2008)................................14
Table 7: Festivals (Multi-Category) – Revenue and Attendance (2004-2008) ...............15
Table 8: Festivals (Single-Category) – Revenue and Attendance (2004-2008) .............16
Table 9: Musical Theatre – Revenue and Attendance (2004-2008) ..............................17
Table 10: Non-Classical Music – Revenue and Attendance (2004-2008) ......................18
Table 11: Opera – Revenue and Attendance (2004-2008) ...........................................19
Table 12: Special Events/Other – Revenue and Attendance (2004-2008) ....................20
Table 13: Theatre – Revenue and Attendance (2004-2008) ........................................21
Live Performance Australia Live Entertainment Industry in Australia 2008 Ernst & Young iii
Index of Figures
Figure 1: Gross Revenue (2004-2008).........................................................................8
Figure 2: Total Attendances (2004-2008)....................................................................8
Figure 3: Gross Revenue by Category (2008).............................................................10
Figure 4: Gross Revenue by Category (2007).............................................................10
Figure 5: Market Shares (Gross Revenue) by Category (2004-2008) ...........................11
Figure 6: Market Shares (Attendances) by Category (2004-2008)...............................11
Figure 7: Ballet and Dance – Gross Revenue (2004-2008)...........................................12
Figure 8: Ballet and Dance – Total Attendance (2004-2008) .......................................12
Figure 9: Children’s/Family Events – Gross Revenue (2004-2008) ..............................13
Figure 10: Children’s/Family Events – Total Attendance (2004-2008) .........................13
Figure 11: Classical Music – Gross Revenue (2004-2008) ...........................................14
Figure 12: Classical Music – Total Attendance (2004-2008)........................................14
Figure 13: Festivals (Multi-Category) – Gross Revenue (2004-2008) ...........................15
Figure 14: Festivals (Multi-Category) – Total Attendance (2004-2008) .......................15
Figure 15: Festivals (Single-Category) – Gross Revenue (2004-2008) .........................16
Figure 16: Festivals (Single-Category) – Total Attendance (2004-2008)......................16
Figure 17: Musical Theatre – Gross Revenue (2004-2008) ..........................................17
Figure 18: Musical Theatre – Total Attendance (2004-2008) ......................................17
Figure 19: Non-Classical Music – Gross Revenue (2004-2008) ....................................18
Figure 20: Non-Classical Music – Total Attendance (2004-2008).................................18
Figure 21: Opera – Gross Revenue (2004-2008).........................................................19
Figure 22: Opera – Total Attendance (2004-2008) .....................................................19
Figure 23: Special Events/Other – Gross Revenue (2004-2008)..................................20
Figure 24: Special Events/Other – Gross Revenue (2004-2008)..................................20
Figure 25: Theatre – Gross Revenue (2004-2008) ......................................................21
Figure 26: Theatre – Total Attendance (2004-2008) ..................................................21
© 2009 Ernst & Young Australia.
Liability limited by a scheme approved under Professional Standards Legislation.
Live Performance Australia Live Entertainment Industry in Australia 2008 Ernst & Young
4
1. Introduction
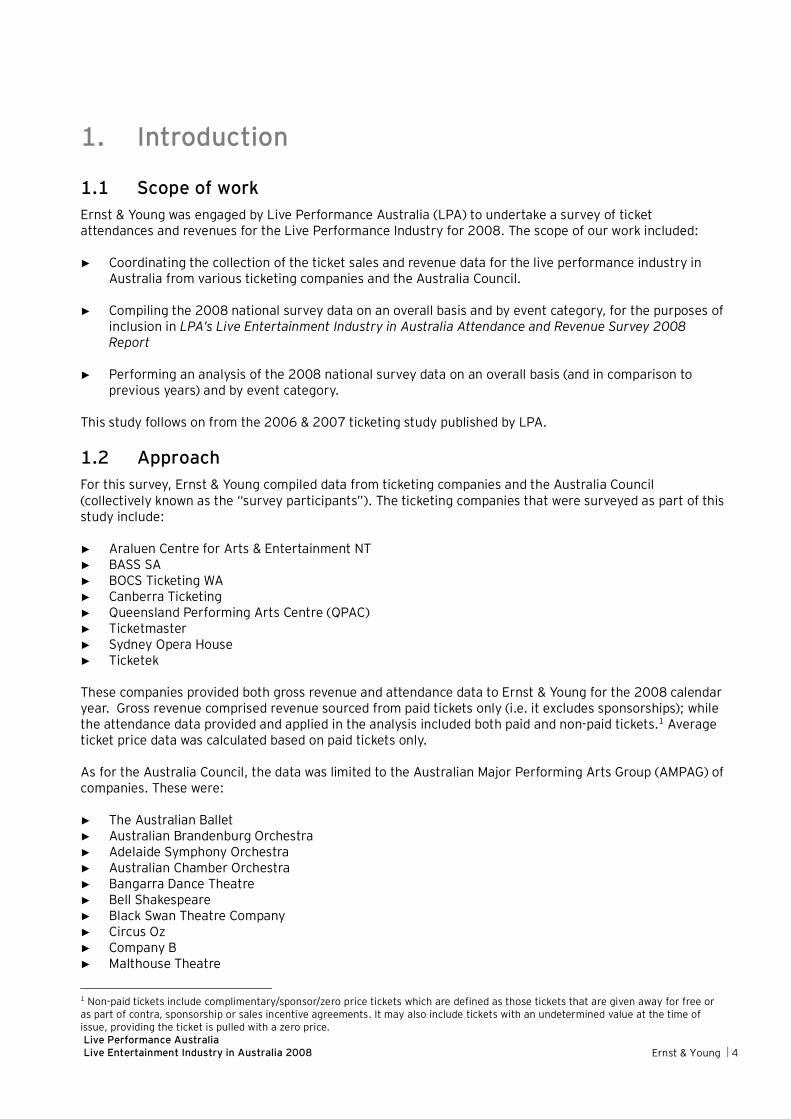
1.1 Scope of work Ernst & Young was engaged by Live Performance Australia (LPA) to undertake a survey of ticket attendances and revenues for the Live Performance Industry for 2008. The scope of our work included:
► Coordinating the collection of the ticket sales and revenue data for the live performance industry in Australia from various ticketing companies and the Australia Council.
► Compiling the 2008 national survey data on an overall basis and by event category, for the purposes of inclusion in LPA’s Live Entertainment Industry in Australia Attendance and Revenue Survey 2008 Report
► Performing an analysis of the 2008 national survey data on an overall basis (and in comparison to previous years) and by event category.
This study follows on from the 2006 & 2007 ticketing study published by LPA.
1.2 Approach For this survey, Ernst & Young compiled data from ticketing companies and the Australia Council (collectively known as the “survey participants”). The ticketing companies that were surveyed as part of this study include:
► Araluen Centre for Arts & Entertainment NT ► BASS SA ► BOCS Ticketing WA ► Canberra Ticketing ► Queensland Performing Arts Centre (QPAC) ► Ticketmaster ► Sydney Opera House ► Ticketek These companies provided both gross revenue and attendance data to Ernst & Young for the 2008 calendar year. Gross revenue comprised revenue sourced from paid tickets only (i.e. it excludes sponsorships); while the attendance data provided and applied in the analysis included both paid and non-paid tickets.1 Average ticket price data was calculated based on paid tickets only.
As for the Australia Council, the data was limited to the Australian Major Performing Arts Group (AMPAG) of companies. These were:
► The Australian Ballet ► Australian Brandenburg Orchestra ► Adelaide Symphony Orchestra ► Australian Chamber Orchestra ► Bangarra Dance Theatre ► Bell Shakespeare ► Black Swan Theatre Company ► Circus Oz ► Company B ► Malthouse Theatre
1 Non-paid tickets include complimentary/sponsor/zero price tickets which are defined as those tickets that are given away for free or as part of contra, sponsorship or sales incentive agreements. It may also include tickets with an undetermined value at the time of issue, providing the ticket is pulled with a zero price.
Live Performance Australia Live Entertainment Industry in Australia 2008 Ernst & Young
5
► Melbourne Symphony Orchestra ► Melbourne Theatre Company ► Musica Viva ► Opera Australia ► Opera Queensland ► Orchestra Victoria ► Queensland Ballet ► The Queensland Orchestra ► Queensland Theatre Company ► State Opera of South Australia ► State Theatre Company of South Australia ► Sydney Dance Company ► Sydney Symphony Orchestra ► Sydney Theatre Company ► Tasmanian Symphony Orchestra ► The West Australian Opera ► West Australian Ballet ► West Australian Symphony Orchestra
For these AMPAG companies, the gross revenue includes both single ticket sales as well as subscription revenues.
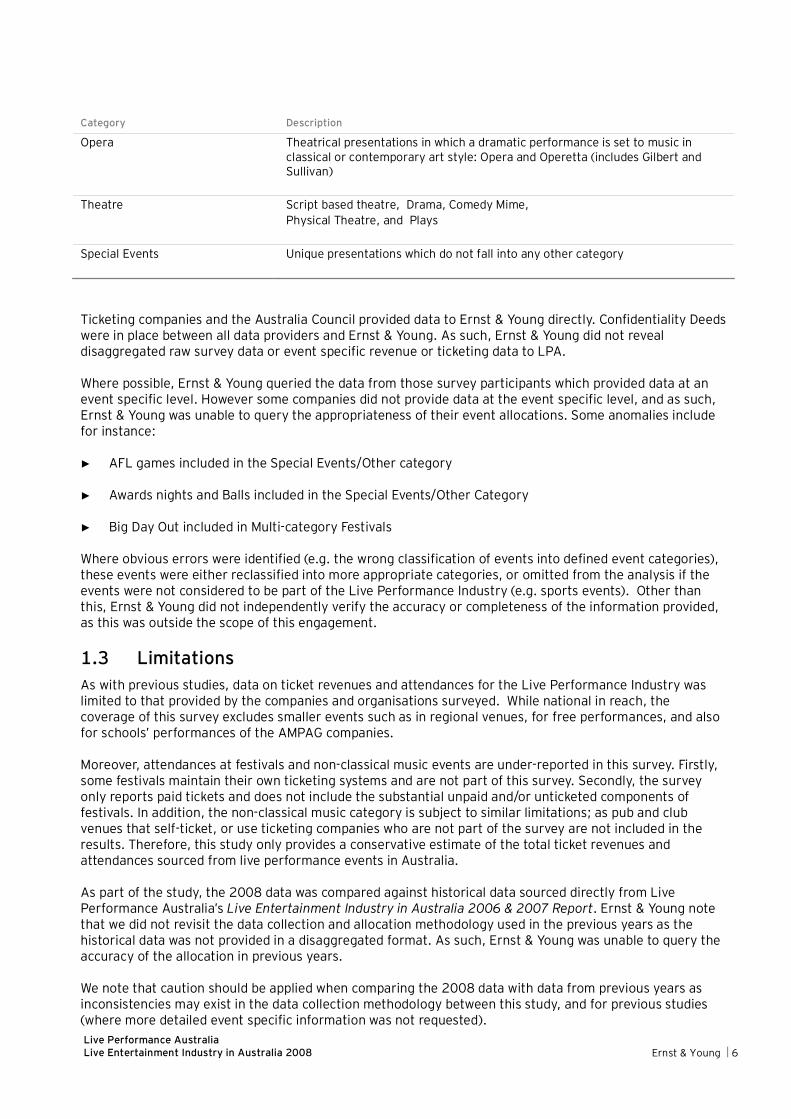
Ticketing data was assigned by the ticketing companies and the Australia Council to event categorises based on the guidelines established between LPA and these organisations. Table 1 presents a description of these event categories.
Table 1 Category Descriptor Guide (2008)
Category Description
Ballet and Dance Traditional forms, Ethnic dance, Folk dance, Ballet, Ballroom, Latin dance, Liturgical dance, Modern dance, Ballet, Tap, and Breakdancing
Children’s/Family Live entertainment for children, Interactive performances for children and Workshops for children
Classical Music Any of the following in classical/contemporary art (i.e. current, but not ‘pop’) style: Orchestral music, Chamber music, Choirs and choral music, Recitals, and Singing/playing. All styles of the following: Sacred music and Traditional music/ethnic music/world music.
Festivals (Multi-Category) Festivals/events which contains a number of different types of events which fall into two or more categories
Festivals (Single-Category) Festivals/events which contain a number of events but which fall into one category only
Musical Theatre Staged productions which include music/drama/movement in popular form, primarily (but not limited to): Musicals Cabarets in cabaret mode/style
Non-Classical Music All forms of the following, performed by any type of ensemble or soloist (including any ensemble/chorus/solo musicians advertising a program which is exclusively one of the following categories, e.g. ‘pop’ or ‘jazz,’ as in The Australian Jazz Orchestra): Pop, Jazz, Blues, Country, Rock, Folk, Soul, R&B, Techno, Hip hop, Rap, Heavy Metal, and Dance parties.
Live Performance Australia Live Entertainment Industry in Australia 2008 Ernst & Young
6
Category Description
Opera Theatrical presentations in which a dramatic performance is set to music in classical or contemporary art style: Opera and Operetta (includes Gilbert and Sullivan)
Theatre Script based theatre, Drama, Comedy Mime, Physical Theatre, and Plays
Special Events Unique presentations which do not fall into any other category
Ticketing companies and the Australia Council provided data to Ernst & Young directly. Confidentiality Deeds were in place between all data providers and Ernst & Young. As such, Ernst & Young did not reveal disaggregated raw survey data or event specific revenue or ticketing data to LPA.
Where possible, Ernst & Young queried the data from those survey participants which provided data at an event specific level. However some companies did not provide data at the event specific level, and as such, Ernst & Young was unable to query the appropriateness of their event allocations. Some anomalies include for instance:
► AFL games included in the Special Events/Other category
► Awards nights and Balls included in the Special Events/Other Category
► Big Day Out included in Multi-category Festivals Where obvious errors were identified (e.g. the wrong classification of events into defined event categories), these events were either reclassified into more appropriate categories, or omitted from the analysis if the events were not considered to be part of the Live Performance Industry (e.g. sports events). Other than this, Ernst & Young did not independently verify the accuracy or completeness of the information provided, as this was outside the scope of this engagement.
1.3 Limitations As with previous studies, data on ticket revenues and attendances for the Live Performance Industry was limited to that provided by the companies and organisations surveyed. While national in reach, the coverage of this survey excludes smaller events such as in regional venues, for free performances, and also for schools’ performances of the AMPAG companies.
Moreover, attendances at festivals and non-classical music events are under-reported in this survey. Firstly, some festivals maintain their own ticketing systems and are not part of this survey. Secondly, the survey only reports paid tickets and does not include the substantial unpaid and/or unticketed components of festivals. In addition, the non-classical music category is subject to similar limitations; as pub and club venues that self-ticket, or use ticketing companies who are not part of the survey are not included in the results. Therefore, this study only provides a conservative estimate of the total ticket revenues and attendances sourced from live performance events in Australia.
As part of the study, the 2008 data was compared against historical data sourced directly from Live Performance Australia’s Live Entertainment Industry in Australia 2006 & 2007 Report. Ernst & Young note that we did not revisit the data collection and allocation methodology used in the previous years as the historical data was not provided in a disaggregated format. As such, Ernst & Young was unable to query the accuracy of the allocation in previous years.
We note that caution should be applied when comparing the 2008 data with data from previous years as inconsistencies may exist in the data collection methodology between this study, and for previous studies (where more detailed event specific information was not requested).
Live Performance Australia Live Entertainment Industry in Australia 2008 Ernst & Young
7
2. Ticket Attendance and Revenue Results
2.1 Overview The beginning of 2008 saw the deterioration of global financial markets as a result of the sub-prime mortgage lending crisis in the United States. As a result, consumer confidence has fallen around the world, leading to a dramatic downturn in economic activity. Generally, Australia has weathered this financial crisis better than most other countries. Nevertheless, statistics released by the ABS show a 0.53% contraction in GDP for the December Quarter of 2008, and a rise in the unemployment rate.
The Live Performance Industry is not immune from the global financial crisis and the overall downturn in the global and national economy. In fact, it has been shown that the industry is particularly sensitive to changes in the growth of household disposable income (which is influenced by changes in employment growth and the employment rate). 2
The analysis that follows show that a decline occurred in revenues and attendances in the Australian Live Performance Industry for 2008. However, the extent to which this decline is due to economic factors is unclear. Changes in ticket revenues and attendances may have also occurred due to more detailed data being supplied to Ernst & Young. This has enabled Ernst & Young in consultation with the survey participants and LPA to exclude events from the original data that were not considered to be Live Performance events.
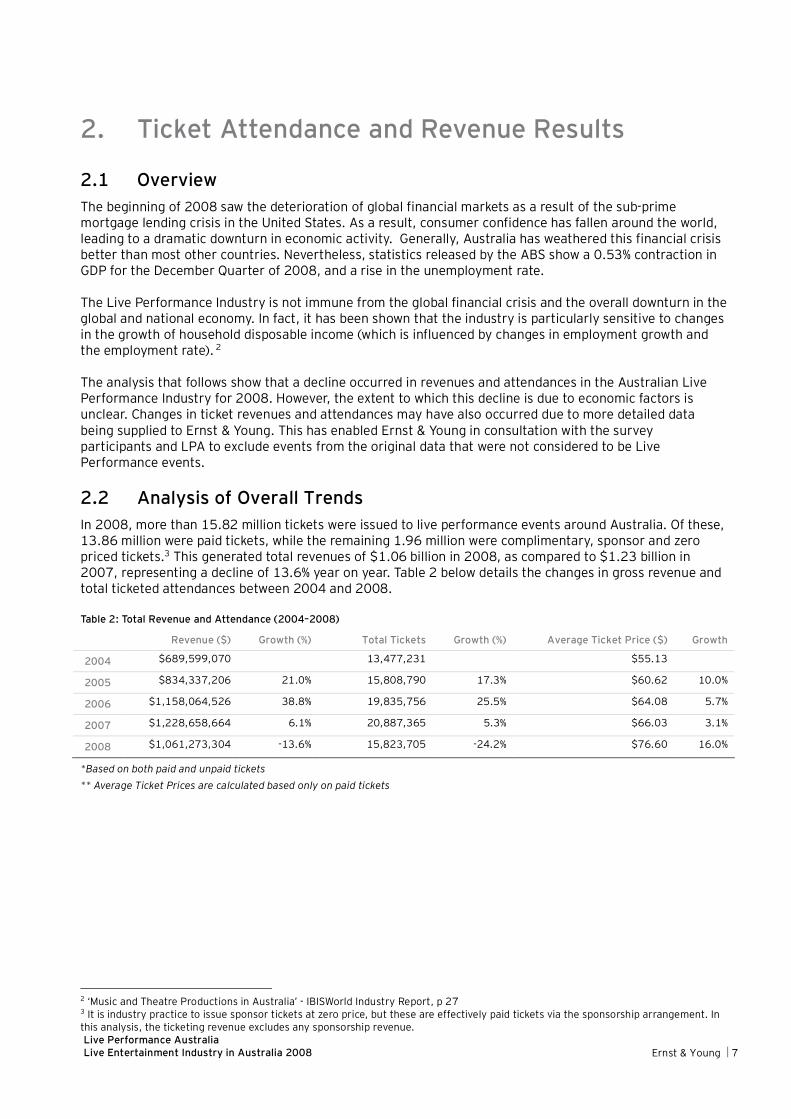
2.2 Analysis of Overall Trends In 2008, more than 15.82 million tickets were issued to live performance events around Australia. Of these, 13.86 million were paid tickets, while the remaining 1.96 million were complimentary, sponsor and zero priced tickets.3 This generated total revenues of $1.06 billion in 2008, as compared to $1.23 billion in 2007, representing a decline of 13.6% year on year. Table 2 below details the changes in gross revenue and total ticketed attendances between 2004 and 2008.
Table 2: Total Revenue and Attendance (2004–2008)
Revenue ($) Growth (%) Total Tickets Growth (%) Average Ticket Price ($) Growth
2004 $689,599,070 13,477,231 $55.13
2005 $834,337,206 21.0% 15,808,790 17.3% $60.62 10.0%
2006 $1,158,064,526 38.8% 19,835,756 25.5% $64.08 5.7%
2007 $1,228,658,664 6.1% 20,887,365 5.3% $66.03 3.1%
2008 $1,061,273,304 -13.6% 15,823,705 -24.2% $76.60 16.0%
*Based on both paid and unpaid tickets ** Average Ticket Prices are calculated based only on paid tickets
2 ‘Music and Theatre Productions in Australia’ - IBISWorld Industry Report, p 27 3 It is industry practice to issue sponsor tickets at zero price, but these are effectively paid tickets via the sponsorship arrangement. In this analysis, the ticketing revenue excludes any sponsorship revenue.
Live Performance Australia Live Entertainment Industry in Australia 2008 Ernst & Young
8
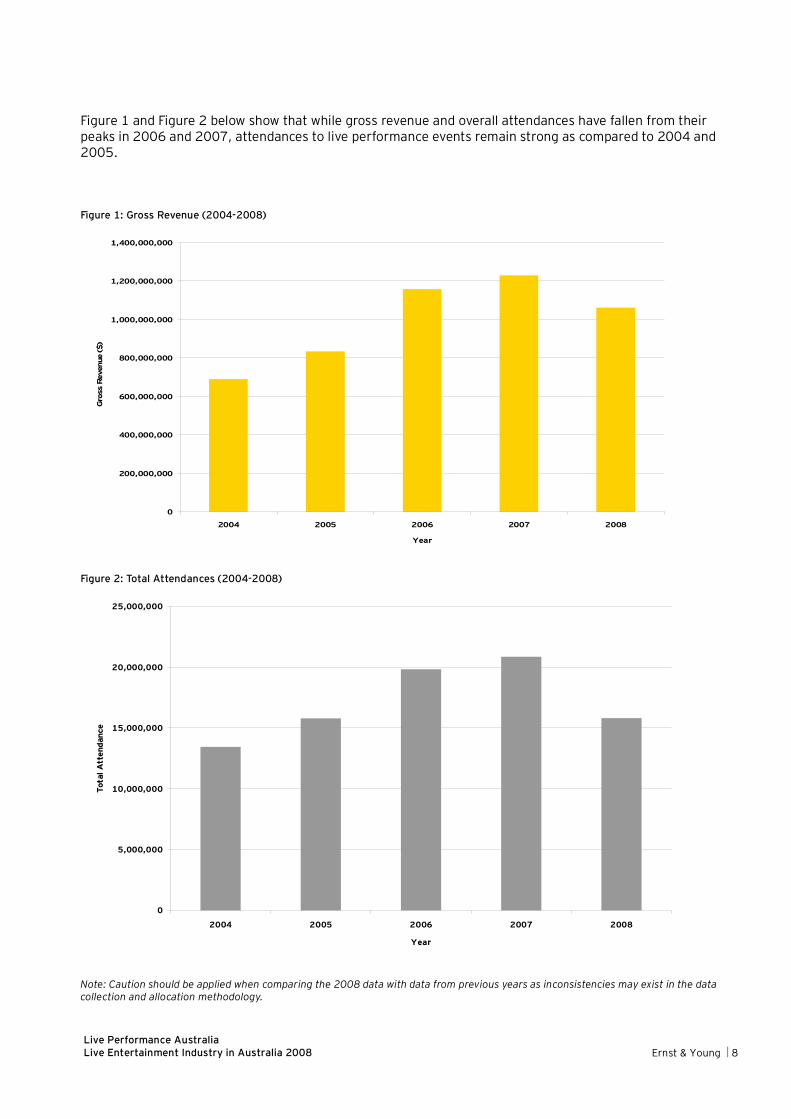
Figure 1 and Figure 2 below show that while gross revenue and overall attendances have fallen from their peaks in 2006 and 2007, attendances to live performance events remain strong as compared to 2004 and 2005.
Figure 1: Gross Revenue (2004-2008)
0
200,000,000
400,000,000
600,000,000
800,000,000
1,000,000,000
1,200,000,000
1,400,000,000
2004 2005 2006 2007 2008
Year
Gro
ss R
even
ue ($
)
Figure 2: Total Attendances (2004-2008)
0
5,000,000
10,000,000
15,000,000
20,000,000
25,000,000
2004 2005 2006 2007 2008
Year
Tota
l Att
enda
nce
Note: Caution should be applied when comparing the 2008 data with data from previous years as inconsistencies may exist in the data collection and allocation methodology.
Live Performance Australia Live Entertainment Industry in Australia 2008 Ernst & Young
9
3. Category Analysis
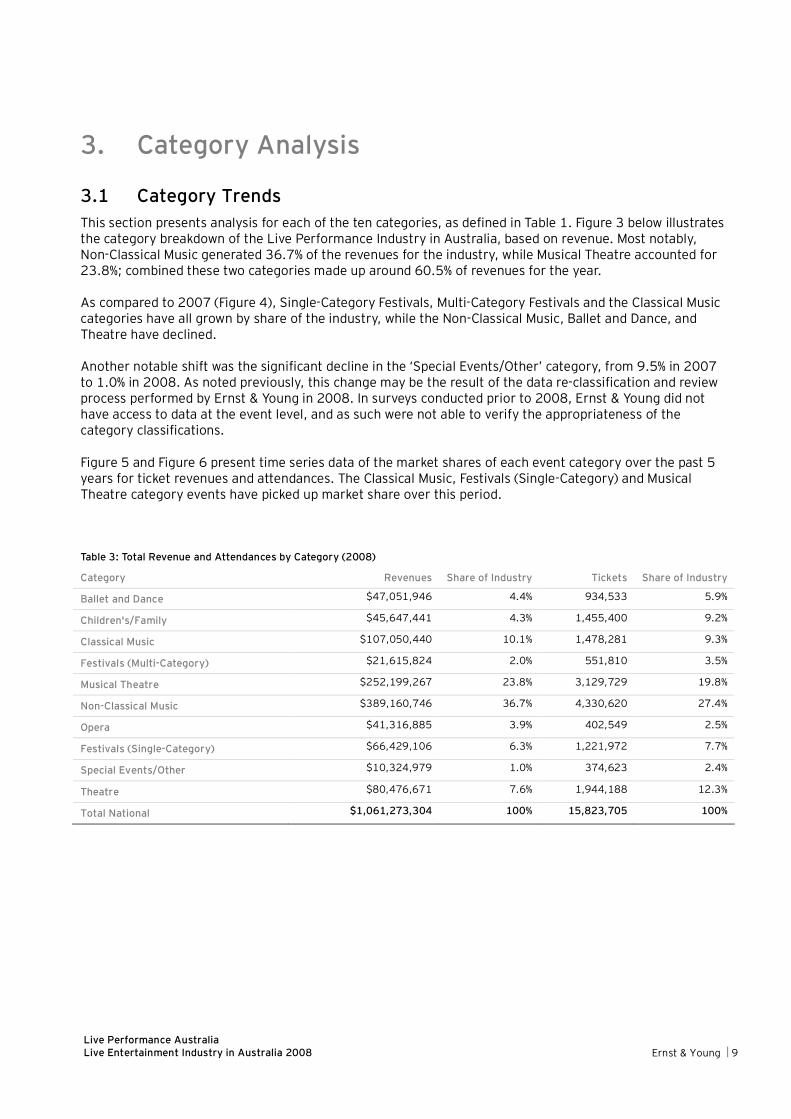
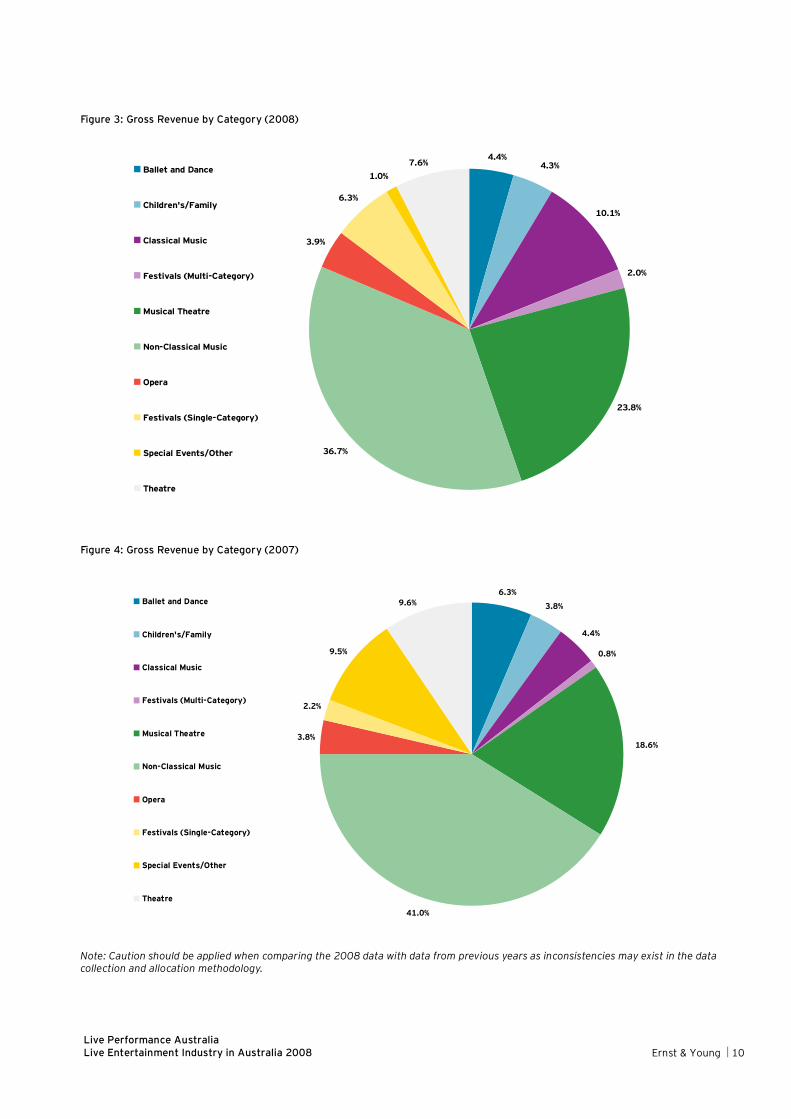
3.1 Category Trends This section presents analysis for each of the ten categories, as defined in Table 1. Figure 3 below illustrates the category breakdown of the Live Performance Industry in Australia, based on revenue. Most notably, Non-Classical Music generated 36.7% of the revenues for the industry, while Musical Theatre accounted for 23.8%; combined these two categories made up around 60.5% of revenues for the year.
As compared to 2007 (Figure 4), Single-Category Festivals, Multi-Category Festivals and the Classical Music categories have all grown by share of the industry, while the Non-Classical Music, Ballet and Dance, and Theatre have declined.
Another notable shift was the significant decline in the ‘Special Events/Other’ category, from 9.5% in 2007 to 1.0% in 2008. As noted previously, this change may be the result of the data re-classification and review process performed by Ernst & Young in 2008. In surveys conducted prior to 2008, Ernst & Young did not have access to data at the event level, and as such were not able to verify the appropriateness of the category classifications.
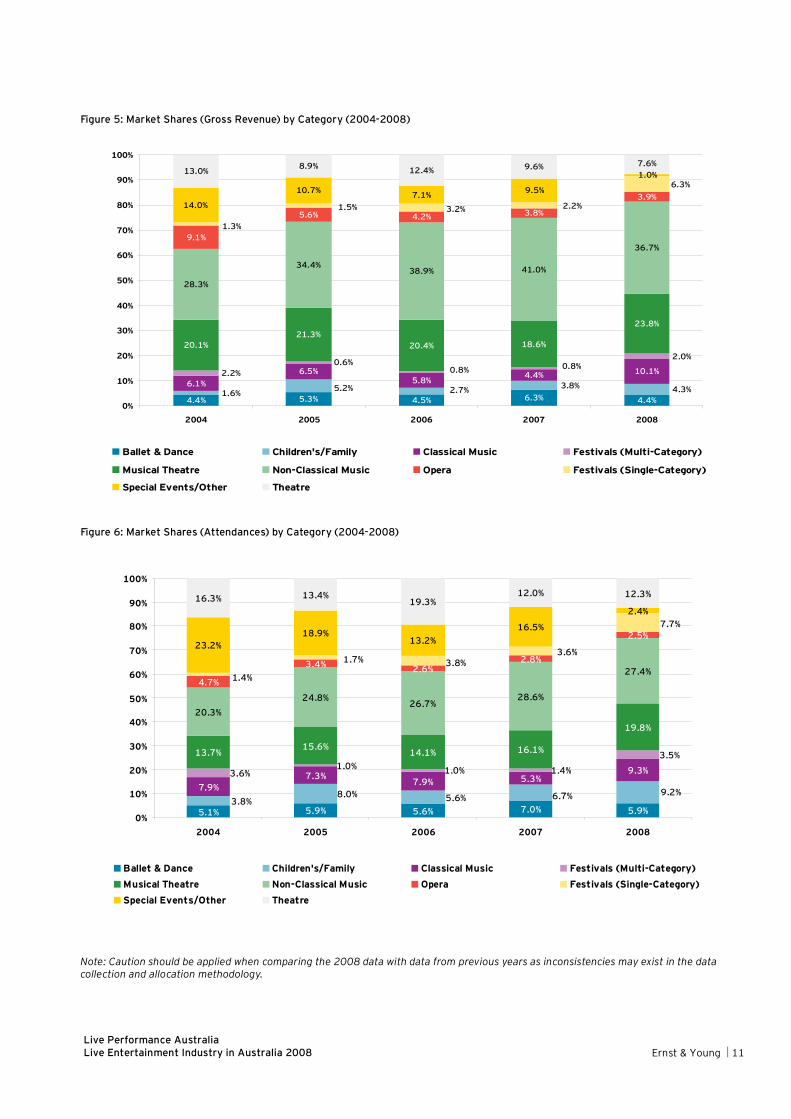
Figure 5 and Figure 6 present time series data of the market shares of each event category over the past 5 years for ticket revenues and attendances. The Classical Music, Festivals (Single-Category) and Musical Theatre category events have picked up market share over this period.
Table 3: Total Revenue and Attendances by Category (2008)
Category Revenues Share of Industry Tickets Share of Industry
Ballet and Dance $47,051,946 4.4% 934,533 5.9%
Children's/Family $45,647,441 4.3% 1,455,400 9.2%
Classical Music $107,050,440 10.1% 1,478,281 9.3%
Festivals (Multi-Category) $21,615,824 2.0% 551,810 3.5%
Musical Theatre $252,199,267 23.8% 3,129,729 19.8%
Non-Classical Music $389,160,746 36.7% 4,330,620 27.4%
Opera $41,316,885 3.9% 402,549 2.5%
Festivals (Single-Category) $66,429,106 6.3% 1,221,972 7.7%
Special Events/Other $10,324,979 1.0% 374,623 2.4%
Theatre $80,476,671 7.6% 1,944,188 12.3%
Total National $1,061,273,304 100% 15,823,705 100%
Live Performance Australia Live Entertainment Industry in Australia 2008 Ernst & Young
10
Figure 3: Gross Revenue by Category (2008)
4.4%
10.1%
2.0%
36.7%
3.9%
6.3%
23.8%
4.3%7.6%1.0%
Ballet and Dance
Children's/Family
Classical Music
Festivals (Multi-Category)
Musical Theatre
Non-Classical Music
Opera
Festivals (Single-Category)
Special Events/Other
Theatre
Figure 4: Gross Revenue by Category (2007)
6.3%
4.4%
0.8%
41.0%
3.8%
2.2%
9.5%
9.6% 3.8%
18.6%
Ballet and Dance
Children's/Family
Classical Music
Festivals (Multi-Category)
Musical Theatre
Non-Classical Music
Opera
Festivals (Single-Category)
Special Events/Other
Theatre
Note: Caution should be applied when comparing the 2008 data with data from previous years as inconsistencies may exist in the data collection and allocation methodology.
Live Performance Australia Live Entertainment Industry in Australia 2008 Ernst & Young
11
Figure 5: Market Shares (Gross Revenue) by Category (2004-2008)
4.4% 5.3% 4.5% 6.3% 4.4%
6.5%5.8%
4.4% 10.1%
20.1%21.3%
20.4% 18.6%
23.8%
28.3%
34.4%38.9% 41.0%
36.7%9.1%
5.6% 4.2% 3.8%
3.9%
13.0% 8.9% 12.4%
4.3%3.8%2.7%5.2%1.6%6.1%
0.8%0.8%0.6%
2.2%
2.0%
1.3%
6.3%
1.5% 2.2%3.2%
9.5%7.1%10.7%
14.0%
1.0%9.6% 7.6%
0%
10%
20%
30%
40%
50%
60%
70%
80%
90%
100%
2004 2005 2006 2007 2008
Ballet & Dance Children's/Family Classical Music Festivals (Multi-Category)
Musical Theatre Non-Classical Music Opera Festivals (Single-Category)
Special Events/Other Theatre
Figure 6: Market Shares (Attendances) by Category (2004-2008)
5.1% 5.9% 5.6% 7.0% 5.9%
7.3%7.9% 5.3%
9.3%
13.7%15.6%
14.1% 16.1%
19.8%
20.3%24.8%
26.7%28.6%
27.4%4.7%
3.4% 2.6%2.8%
2.5%
16.3% 13.4%19.3%
9.2%6.7%5.6%8.0%3.8%
7.9%
1.4%1.0%1.0%3.6%
3.5%
3.8%3.6%
1.7%
7.7%
1.4%
2.4%
23.2%18.9%
13.2%16.5%
12.3%12.0%
0%
10%
20%
30%
40%
50%
60%
70%
80%
90%
100%
2004 2005 2006 2007 2008
Ballet & Dance Children's/Family Classical Music Festivals (Multi-Category)Musical Theatre Non-Classical Music Opera Festivals (Single-Category)Special Events/Other Theatre
Note: Caution should be applied when comparing the 2008 data with data from previous years as inconsistencies may exist in the data collection and allocation methodology.
Live Performance Australia Live Entertainment Industry in Australia 2008 Ernst & Young
12
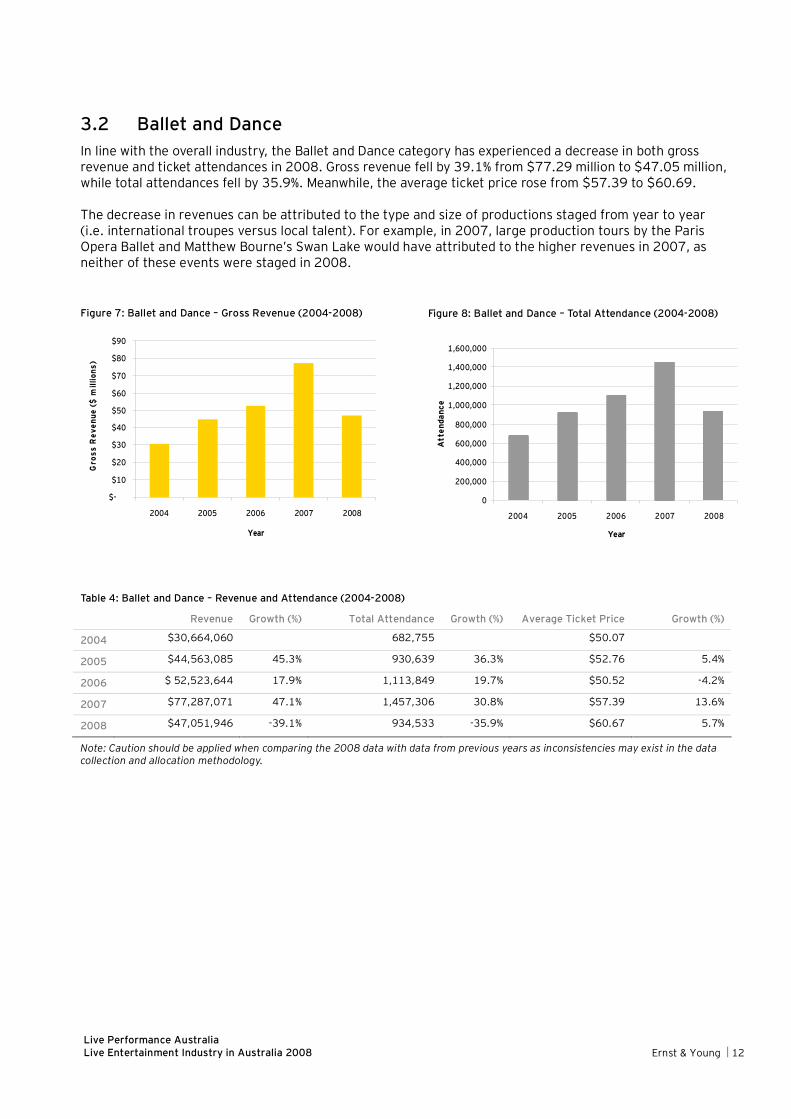
3.2 Ballet and Dance In line with the overall industry, the Ballet and Dance category has experienced a decrease in both gross revenue and ticket attendances in 2008. Gross revenue fell by 39.1% from $77.29 million to $47.05 million, while total attendances fell by 35.9%. Meanwhile, the average ticket price rose from $57.39 to $60.69.
The decrease in revenues can be attributed to the type and size of productions staged from year to year (i.e. international troupes versus local talent). For example, in 2007, large production tours by the Paris Opera Ballet and Matthew Bourne’s Swan Lake would have attributed to the higher revenues in 2007, as neither of these events were staged in 2008. Figure 7: Ballet and Dance – Gross Revenue (2004-2008)
$-
$10
$20
$30
$40
$50
$60
$70
$80
$90
2004 2005 2006 2007 2008
Year
Gro
ss R
even
ue ($
mill
ions
)
Figure 8: Ballet and Dance – Total Attendance (2004-2008)
0
200,000
400,000
600,000
800,000
1,000,000
1,200,000
1,400,000
1,600,000
2004 2005 2006 2007 2008
Year
Att
enda
nce
Table 4: Ballet and Dance – Revenue and Attendance (2004-2008)
Revenue Growth (%) Total Attendance Growth (%) Average Ticket Price Growth (%)
2004 $30,664,060 682,755 $50.07
2005 $44,563,085 45.3% 930,639 36.3% $52.76 5.4%
2006 $ 52,523,644 17.9% 1,113,849 19.7% $50.52 -4.2%
2007 $77,287,071 47.1% 1,457,306 30.8% $57.39 13.6%
2008 $47,051,946 -39.1% 934,533 -35.9% $60.67 5.7%
Note: Caution should be applied when comparing the 2008 data with data from previous years as inconsistencies may exist in the data collection and allocation methodology.
Live Performance Australia Live Entertainment Industry in Australia 2008 Ernst & Young
13
3.3 Children’s/Family Events
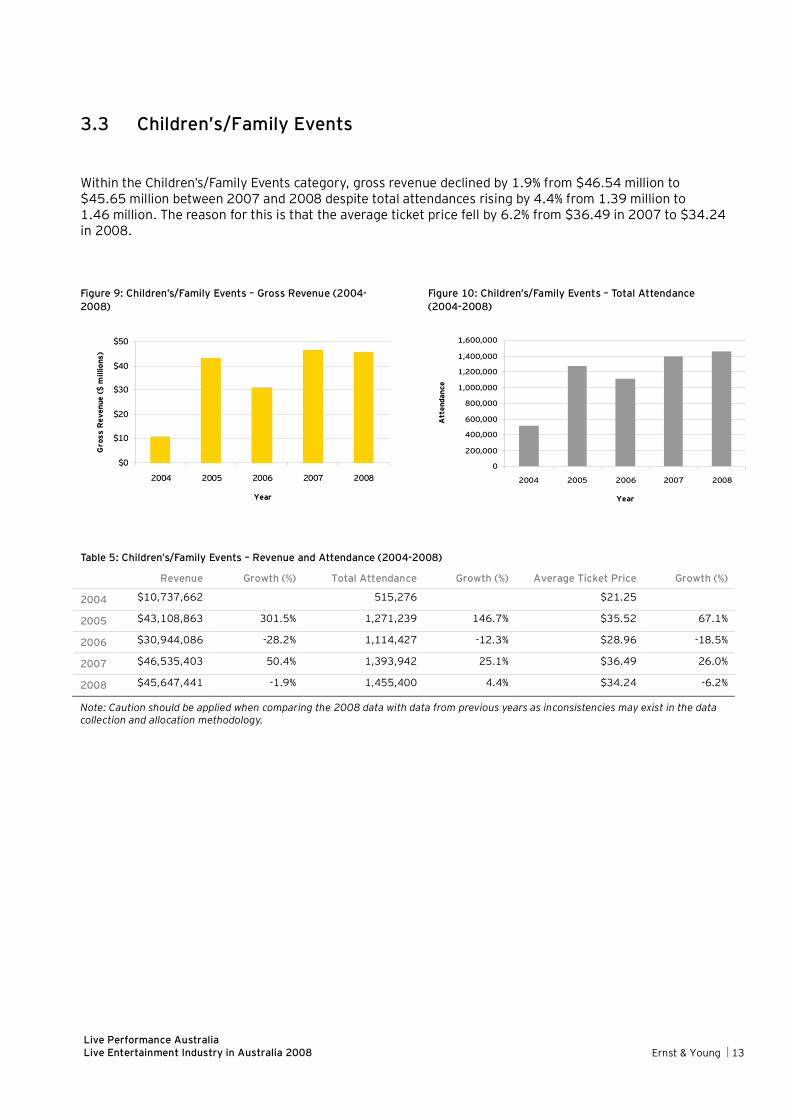
Within the Children’s/Family Events category, gross revenue declined by 1.9% from $46.54 million to $45.65 million between 2007 and 2008 despite total attendances rising by 4.4% from 1.39 million to 1.46 million. The reason for this is that the average ticket price fell by 6.2% from $36.49 in 2007 to $34.24 in 2008.
Figure 9: Children’s/Family Events – Gross Revenue (2004-2008)
$0
$10
$20
$30
$40
$50
2004 2005 2006 2007 2008
Year
Gro
ss R
even
ue ($
mill
ions
)
Figure 10: Children’s/Family Events – Total Attendance (2004-2008)
0
200,000
400,000
600,000
800,000
1,000,000
1,200,000
1,400,000
1,600,000
2004 2005 2006 2007 2008
Year
Att
enda
nce
Table 5: Children’s/Family Events – Revenue and Attendance (2004-2008)
Revenue Growth (%) Total Attendance Growth (%) Average Ticket Price Growth (%)
2004 $10,737,662 515,276 $21.25
2005 $43,108,863 301.5% 1,271,239 146.7% $35.52 67.1%
2006 $30,944,086 -28.2% 1,114,427 -12.3% $28.96 -18.5%
2007 $46,535,403 50.4% 1,393,942 25.1% $36.49 26.0%
2008 $45,647,441 -1.9% 1,455,400 4.4% $34.24 -6.2%
Note: Caution should be applied when comparing the 2008 data with data from previous years as inconsistencies may exist in the data collection and allocation methodology.
Live Performance Australia Live Entertainment Industry in Australia 2008 Ernst & Young
14
3.4 Classical Music
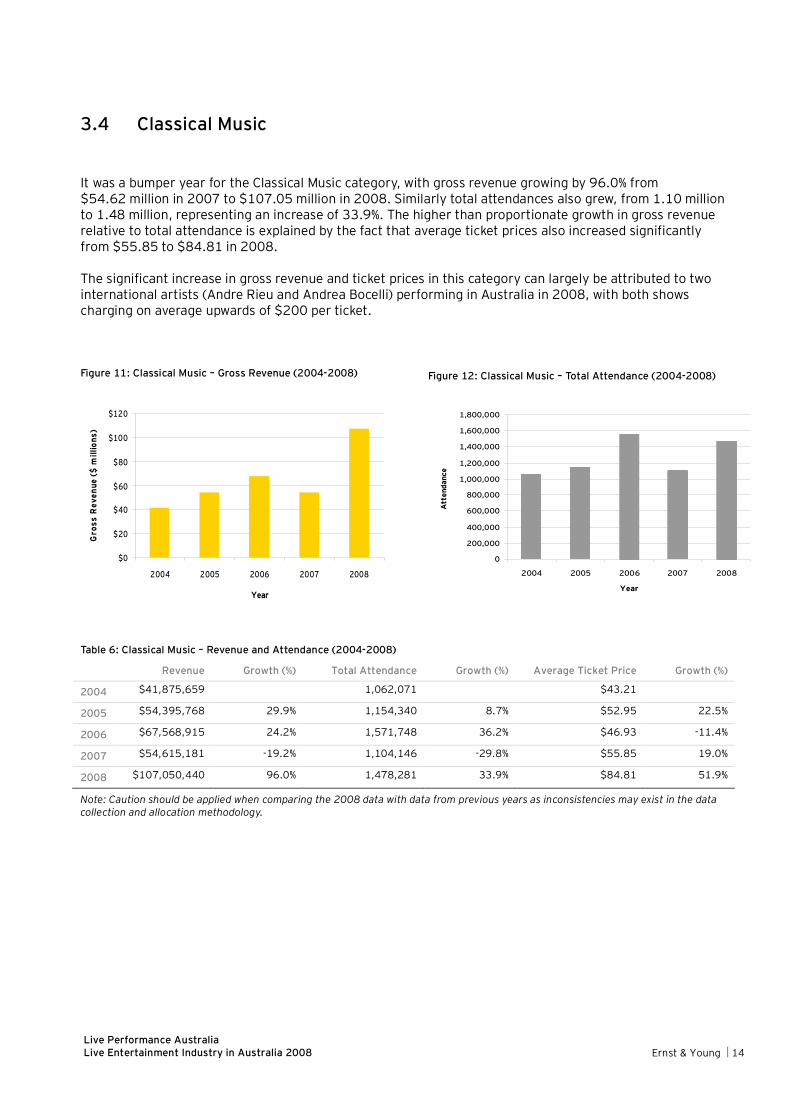
It was a bumper year for the Classical Music category, with gross revenue growing by 96.0% from $54.62 million in 2007 to $107.05 million in 2008. Similarly total attendances also grew, from 1.10 million to 1.48 million, representing an increase of 33.9%. The higher than proportionate growth in gross revenue relative to total attendance is explained by the fact that average ticket prices also increased significantly from $55.85 to $84.81 in 2008.
The significant increase in gross revenue and ticket prices in this category can largely be attributed to two international artists (Andre Rieu and Andrea Bocelli) performing in Australia in 2008, with both shows charging on average upwards of $200 per ticket.
Figure 11: Classical Music – Gross Revenue (2004-2008)
$0
$20
$40
$60
$80
$100
$120
2004 2005 2006 2007 2008
Year
Gro
ss R
even
ue ($
mill
ions
)
Figure 12: Classical Music – Total Attendance (2004-2008)
0
200,000
400,000
600,000
800,000
1,000,000
1,200,000
1,400,000
1,600,000
1,800,000
2004 2005 2006 2007 2008
Year
Att
enda
nce
Table 6: Classical Music – Revenue and Attendance (2004-2008)
Revenue Growth (%) Total Attendance Growth (%) Average Ticket Price Growth (%)
2004 $41,875,659 1,062,071 $43.21
2005 $54,395,768 29.9% 1,154,340 8.7% $52.95 22.5%
2006 $67,568,915 24.2% 1,571,748 36.2% $46.93 -11.4%
2007 $54,615,181 -19.2% 1,104,146 -29.8% $55.85 19.0%
2008 $107,050,440 96.0% 1,478,281 33.9% $84.81 51.9%
Note: Caution should be applied when comparing the 2008 data with data from previous years as inconsistencies may exist in the data collection and allocation methodology.
Live Performance Australia Live Entertainment Industry in Australia 2008 Ernst & Young
15
3.5 Festivals (Multi-Category)
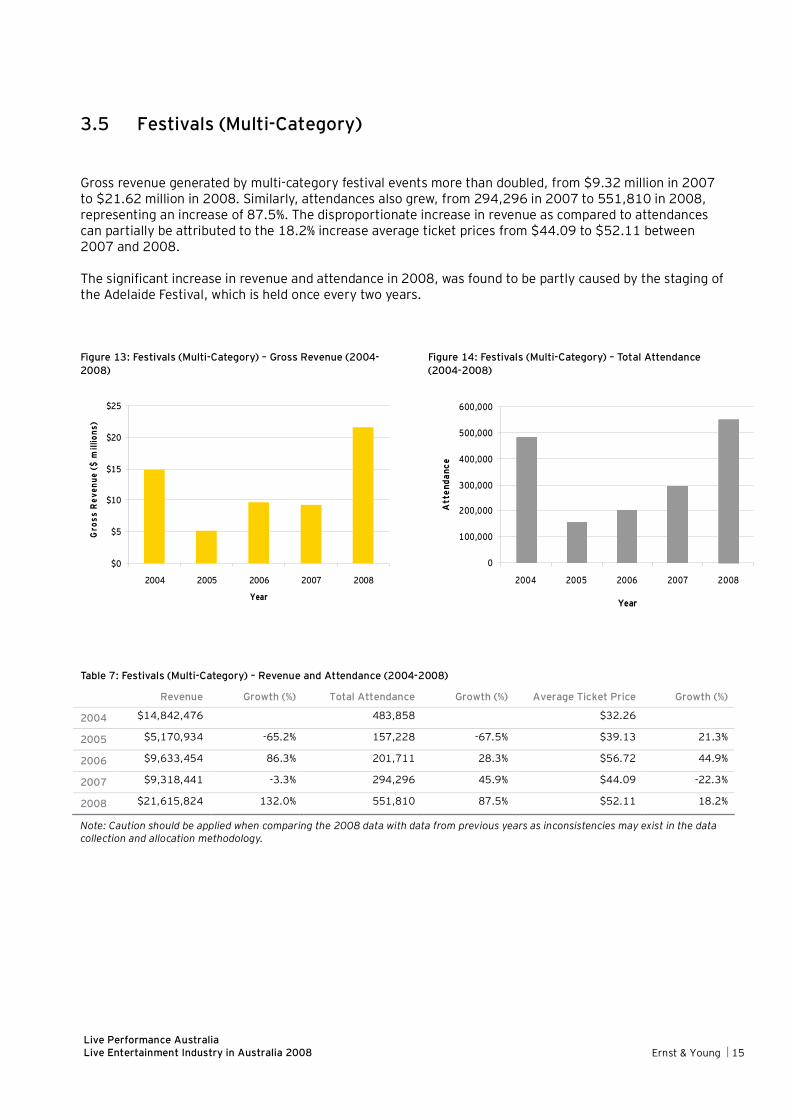
Gross revenue generated by multi-category festival events more than doubled, from $9.32 million in 2007 to $21.62 million in 2008. Similarly, attendances also grew, from 294,296 in 2007 to 551,810 in 2008, representing an increase of 87.5%. The disproportionate increase in revenue as compared to attendances can partially be attributed to the 18.2% increase average ticket prices from $44.09 to $52.11 between 2007 and 2008.
The significant increase in revenue and attendance in 2008, was found to be partly caused by the staging of the Adelaide Festival, which is held once every two years.
Figure 13: Festivals (Multi-Category) – Gross Revenue (2004-2008)
$0
$5
$10
$15
$20
$25
2004 2005 2006 2007 2008
Year
Gro
ss R
even
ue ($
mill
ions
)
Figure 14: Festivals (Multi-Category) – Total Attendance (2004-2008)
0
100,000
200,000
300,000
400,000
500,000
600,000
2004 2005 2006 2007 2008
Year
Att
enda
nce
Table 7: Festivals (Multi-Category) – Revenue and Attendance (2004-2008)
Revenue Growth (%) Total Attendance Growth (%) Average Ticket Price Growth (%)
2004 $14,842,476 483,858 $32.26
2005 $5,170,934 -65.2% 157,228 -67.5% $39.13 21.3%
2006 $9,633,454 86.3% 201,711 28.3% $56.72 44.9%
2007 $9,318,441 -3.3% 294,296 45.9% $44.09 -22.3%
2008 $21,615,824 132.0% 551,810 87.5% $52.11 18.2%
Note: Caution should be applied when comparing the 2008 data with data from previous years as inconsistencies may exist in the data collection and allocation methodology.
Live Performance Australia Live Entertainment Industry in Australia 2008 Ernst & Young
16
3.6 Festivals (Single-Category)
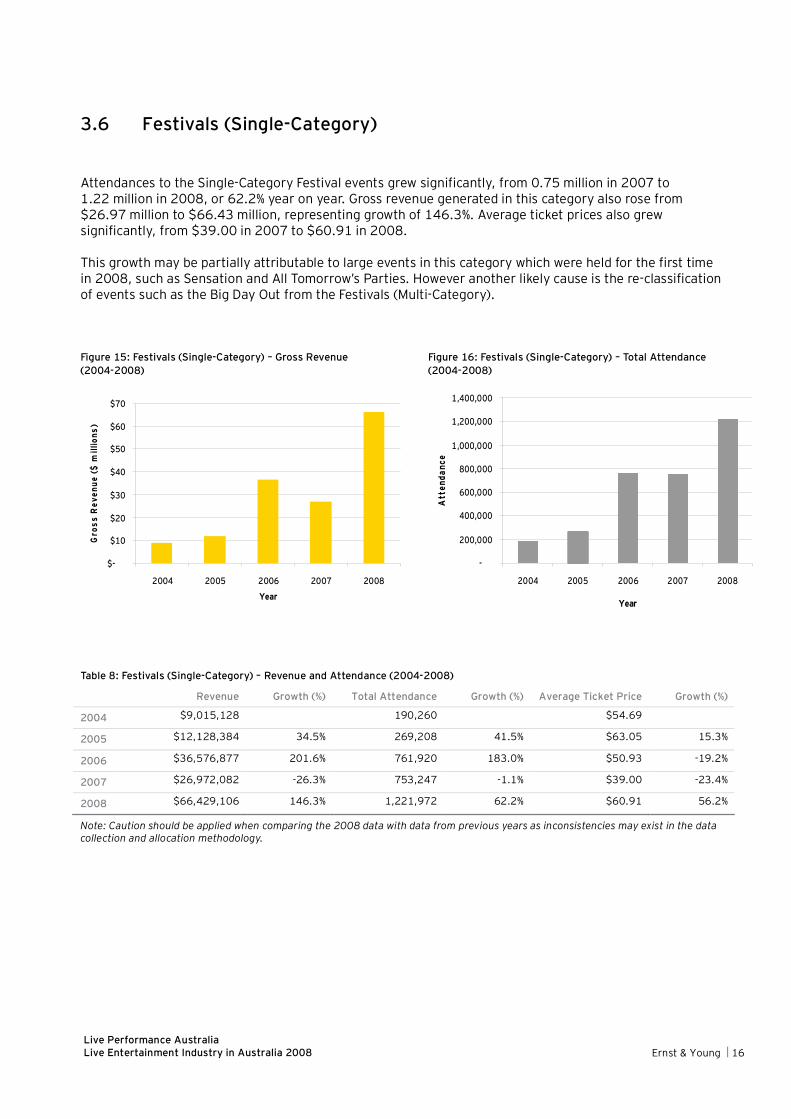
Attendances to the Single-Category Festival events grew significantly, from 0.75 million in 2007 to 1.22 million in 2008, or 62.2% year on year. Gross revenue generated in this category also rose from $26.97 million to $66.43 million, representing growth of 146.3%. Average ticket prices also grew significantly, from $39.00 in 2007 to $60.91 in 2008.
This growth may be partially attributable to large events in this category which were held for the first time in 2008, such as Sensation and All Tomorrow’s Parties. However another likely cause is the re-classification of events such as the Big Day Out from the Festivals (Multi-Category).
Figure 15: Festivals (Single-Category) – Gross Revenue (2004-2008)
$-
$10
$20
$30
$40
$50
$60
$70
2004 2005 2006 2007 2008
Year
Gro
ss R
even
ue ($
mill
ions
)
Figure 16: Festivals (Single-Category) – Total Attendance (2004-2008)
-
200,000
400,000
600,000
800,000
1,000,000
1,200,000
1,400,000
2004 2005 2006 2007 2008
Year
Att
enda
nce
Table 8: Festivals (Single-Category) – Revenue and Attendance (2004-2008)
Revenue Growth (%) Total Attendance Growth (%) Average Ticket Price Growth (%)
2004 $9,015,128 190,260 $54.69
2005 $12,128,384 34.5% 269,208 41.5% $63.05 15.3%
2006 $36,576,877 201.6% 761,920 183.0% $50.93 -19.2%
2007 $26,972,082 -26.3% 753,247 -1.1% $39.00 -23.4%
2008 $66,429,106 146.3% 1,221,972 62.2% $60.91 56.2%
Note: Caution should be applied when comparing the 2008 data with data from previous years as inconsistencies may exist in the data collection and allocation methodology.
Live Performance Australia Live Entertainment Industry in Australia 2008 Ernst & Young
17
3.7 Musical Theatre
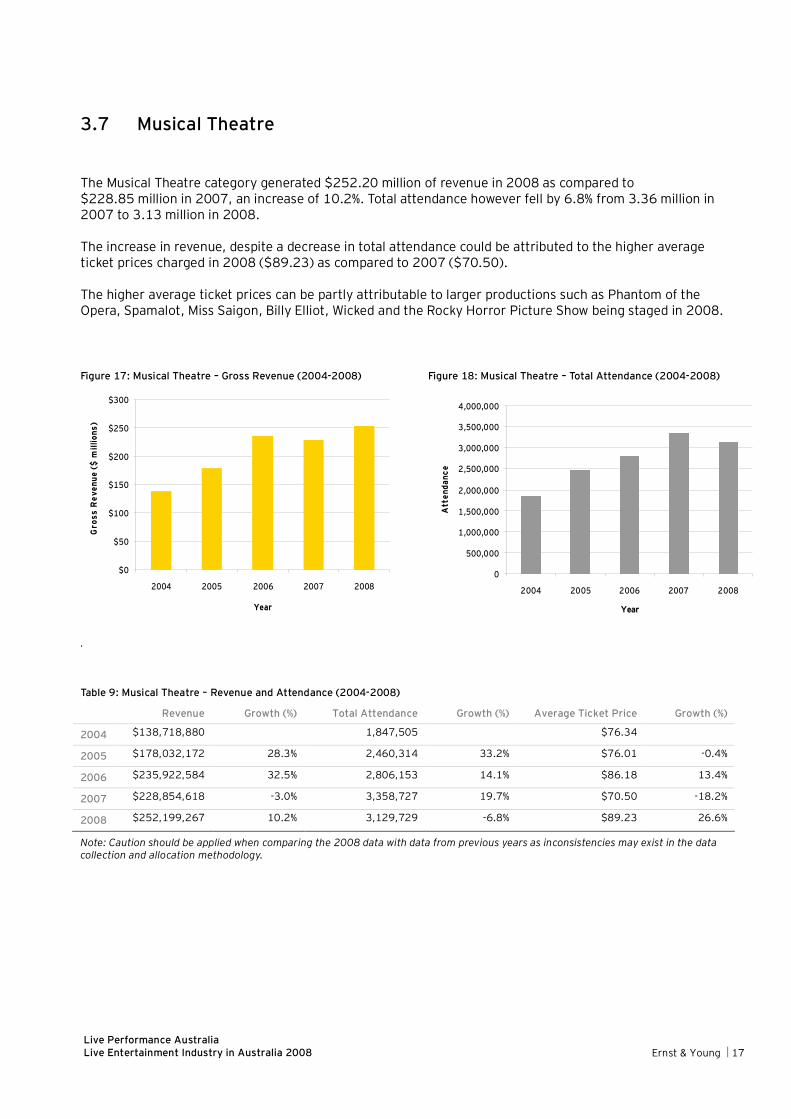
The Musical Theatre category generated $252.20 million of revenue in 2008 as compared to $228.85 million in 2007, an increase of 10.2%. Total attendance however fell by 6.8% from 3.36 million in 2007 to 3.13 million in 2008.
The increase in revenue, despite a decrease in total attendance could be attributed to the higher average ticket prices charged in 2008 ($89.23) as compared to 2007 ($70.50).
The higher average ticket prices can be partly attributable to larger productions such as Phantom of the Opera, Spamalot, Miss Saigon, Billy Elliot, Wicked and the Rocky Horror Picture Show being staged in 2008.
Figure 17: Musical Theatre – Gross Revenue (2004-2008)
$0
$50
$100
$150
$200
$250
$300
2004 2005 2006 2007 2008
Year
Gro
ss R
even
ue ($
mill
ions
)
Figure 18: Musical Theatre – Total Attendance (2004-2008)
0
500,000
1,000,000
1,500,000
2,000,000
2,500,000
3,000,000
3,500,000
4,000,000
2004 2005 2006 2007 2008
Year
Att
enda
nce
.
Table 9: Musical Theatre – Revenue and Attendance (2004-2008)
Revenue Growth (%) Total Attendance Growth (%) Average Ticket Price Growth (%)
2004 $138,718,880 1,847,505 $76.34
2005 $178,032,172 28.3% 2,460,314 33.2% $76.01 -0.4%
2006 $235,922,584 32.5% 2,806,153 14.1% $86.18 13.4%
2007 $228,854,618 -3.0% 3,358,727 19.7% $70.50 -18.2%
2008 $252,199,267 10.2% 3,129,729 -6.8% $89.23 26.6%
Note: Caution should be applied when comparing the 2008 data with data from previous years as inconsistencies may exist in the data collection and allocation methodology.
Live Performance Australia Live Entertainment Industry in Australia 2008 Ernst & Young
18
3.8 Non-Classical Music
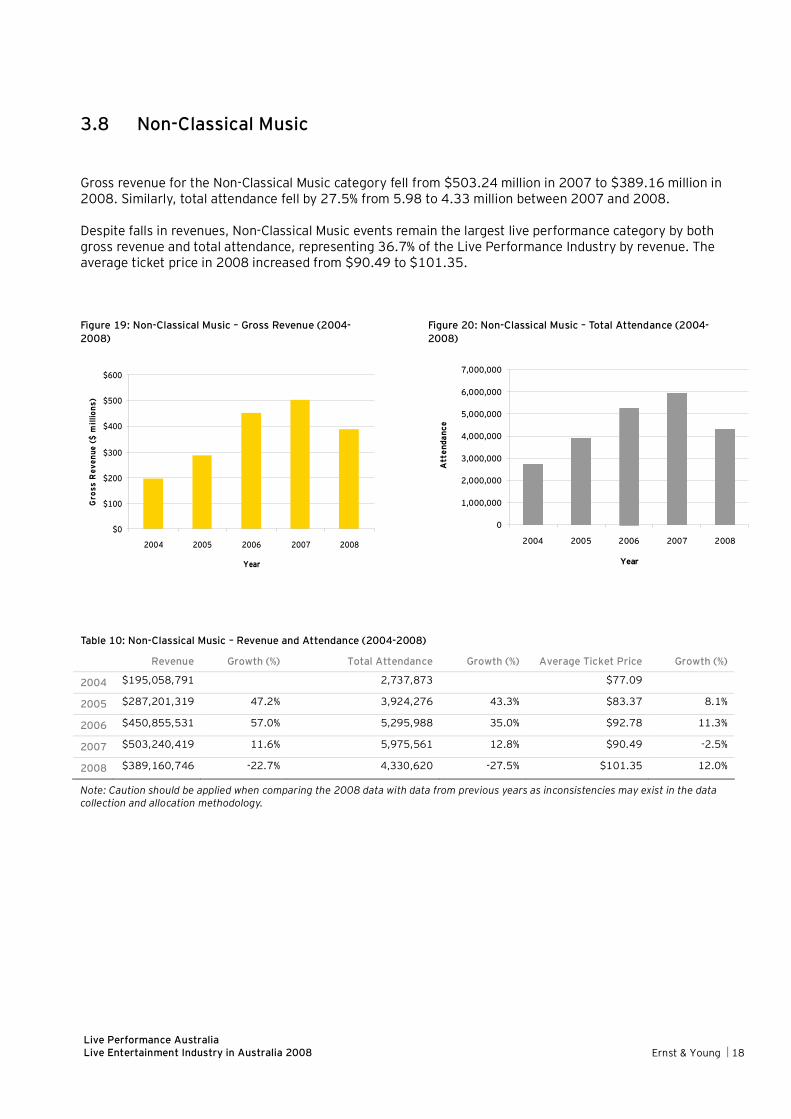
Gross revenue for the Non-Classical Music category fell from $503.24 million in 2007 to $389.16 million in 2008. Similarly, total attendance fell by 27.5% from 5.98 to 4.33 million between 2007 and 2008.
Despite falls in revenues, Non-Classical Music events remain the largest live performance category by both gross revenue and total attendance, representing 36.7% of the Live Performance Industry by revenue. The average ticket price in 2008 increased from $90.49 to $101.35.
Figure 19: Non-Classical Music – Gross Revenue (2004-2008)
$0
$100
$200
$300
$400
$500
$600
2004 2005 2006 2007 2008
Year
Gro
ss R
even
ue ($
mill
ions
)
Figure 20: Non-Classical Music – Total Attendance (2004-2008)
0
1,000,000
2,000,000
3,000,000
4,000,000
5,000,000
6,000,000
7,000,000
2004 2005 2006 2007 2008
Year
Att
enda
nce
Table 10: Non-Classical Music – Revenue and Attendance (2004-2008)
Revenue Growth (%) Total Attendance Growth (%) Average Ticket Price Growth (%)
2004 $195,058,791 2,737,873 $77.09
2005 $287,201,319 47.2% 3,924,276 43.3% $83.37 8.1%
2006 $450,855,531 57.0% 5,295,988 35.0% $92.78 11.3%
2007 $503,240,419 11.6% 5,975,561 12.8% $90.49 -2.5%
2008 $389,160,746 -22.7% 4,330,620 -27.5% $101.35 12.0%
Note: Caution should be applied when comparing the 2008 data with data from previous years as inconsistencies may exist in the data collection and allocation methodology.
Live Performance Australia Live Entertainment Industry in Australia 2008 Ernst & Young
19
3.9 Opera
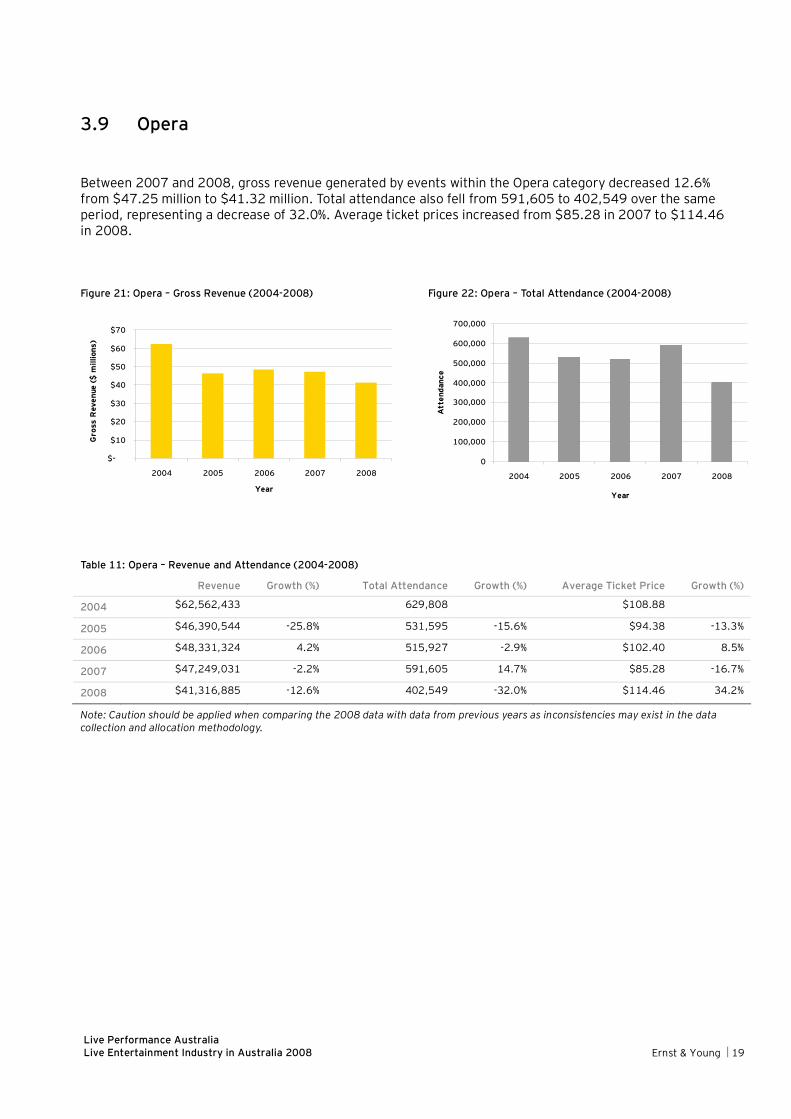
Between 2007 and 2008, gross revenue generated by events within the Opera category decreased 12.6% from $47.25 million to $41.32 million. Total attendance also fell from 591,605 to 402,549 over the same period, representing a decrease of 32.0%. Average ticket prices increased from $85.28 in 2007 to $114.46 in 2008.
Figure 21: Opera – Gross Revenue (2004-2008)
$-
$10
$20
$30
$40
$50
$60
$70
2004 2005 2006 2007 2008
Year
Gro
ss R
even
ue ($
mill
ions
)
Figure 22: Opera – Total Attendance (2004-2008)
0
100,000
200,000
300,000
400,000
500,000
600,000
700,000
2004 2005 2006 2007 2008
Year
Att
enda
nce
Table 11: Opera – Revenue and Attendance (2004-2008)
Revenue Growth (%) Total Attendance Growth (%) Average Ticket Price Growth (%)
2004 $62,562,433 629,808 $108.88
2005 $46,390,544 -25.8% 531,595 -15.6% $94.38 -13.3%
2006 $48,331,324 4.2% 515,927 -2.9% $102.40 8.5%
2007 $47,249,031 -2.2% 591,605 14.7% $85.28 -16.7%
2008 $41,316,885 -12.6% 402,549 -32.0% $114.46 34.2%
Note: Caution should be applied when comparing the 2008 data with data from previous years as inconsistencies may exist in the data collection and allocation methodology.
Live Performance Australia Live Entertainment Industry in Australia 2008 Ernst & Young
20
3.10 Special Events/Other
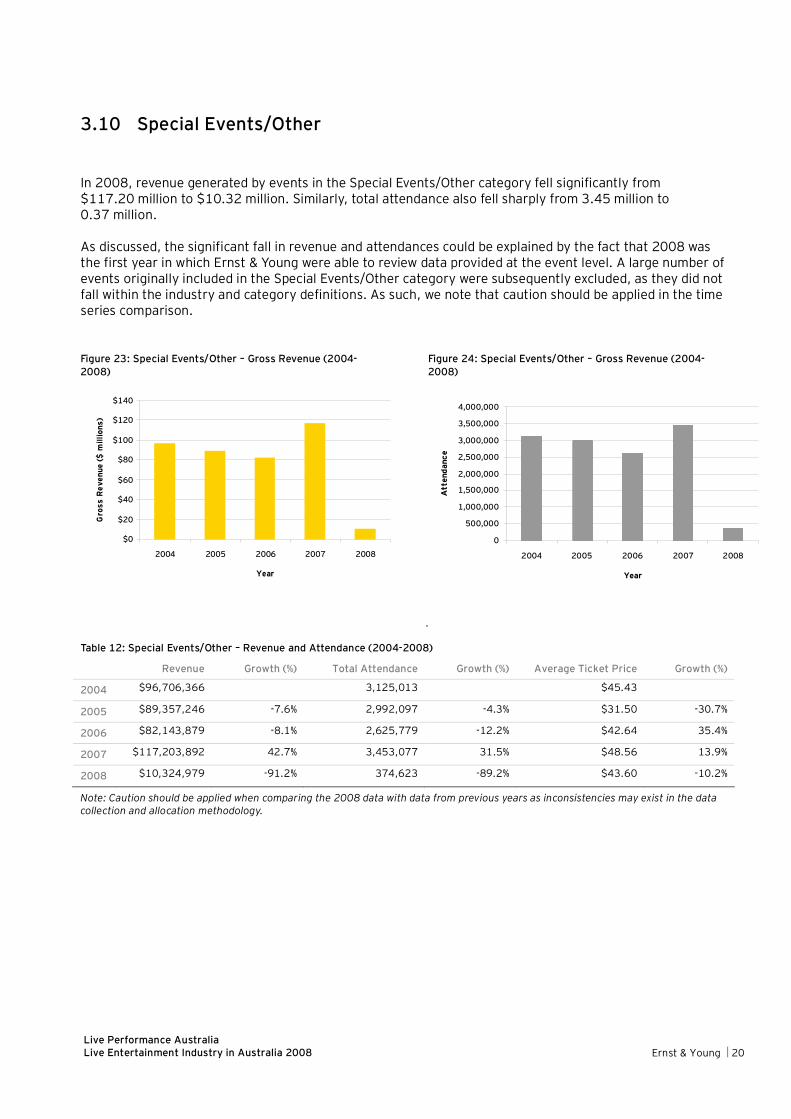
In 2008, revenue generated by events in the Special Events/Other category fell significantly from $117.20 million to $10.32 million. Similarly, total attendance also fell sharply from 3.45 million to 0.37 million.
As discussed, the significant fall in revenue and attendances could be explained by the fact that 2008 was the first year in which Ernst & Young were able to review data provided at the event level. A large number of events originally included in the Special Events/Other category were subsequently excluded, as they did not fall within the industry and category definitions. As such, we note that caution should be applied in the time series comparison.
Figure 23: Special Events/Other – Gross Revenue (2004-2008)
$0
$20
$40
$60
$80
$100
$120
$140
2004 2005 2006 2007 2008
Year
Gro
ss R
even
ue ($
mill
ions
)
Figure 24: Special Events/Other – Gross Revenue (2004-2008)
0
500,000
1,000,000
1,500,000
2,000,000
2,500,000
3,000,000
3,500,000
4,000,000
2004 2005 2006 2007 2008
Year
Att
enda
nce
.
Table 12: Special Events/Other – Revenue and Attendance (2004-2008)
Revenue Growth (%) Total Attendance Growth (%) Average Ticket Price Growth (%)
2004 $96,706,366 3,125,013 $45.43
2005 $89,357,246 -7.6% 2,992,097 -4.3% $31.50 -30.7%
2006 $82,143,879 -8.1% 2,625,779 -12.2% $42.64 35.4%
2007 $117,203,892 42.7% 3,453,077 31.5% $48.56 13.9%
2008 $10,324,979 -91.2% 374,623 -89.2% $43.60 -10.2%
Note: Caution should be applied when comparing the 2008 data with data from previous years as inconsistencies may exist in the data collection and allocation methodology.
Live Performance Australia Live Entertainment Industry in Australia 2008 Ernst & Young
21
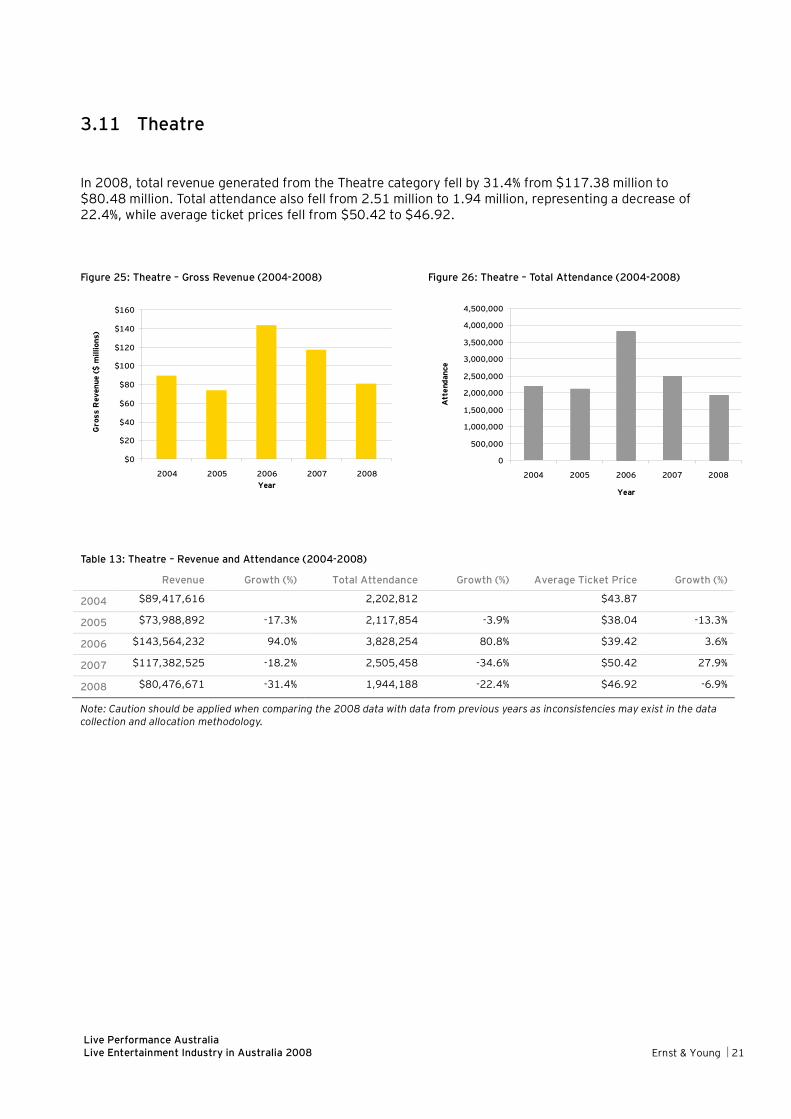
3.11 Theatre
In 2008, total revenue generated from the Theatre category fell by 31.4% from $117.38 million to $80.48 million. Total attendance also fell from 2.51 million to 1.94 million, representing a decrease of 22.4%, while average ticket prices fell from $50.42 to $46.92.
Figure 25: Theatre – Gross Revenue (2004-2008)
$0
$20
$40
$60
$80
$100
$120
$140
$160
2004 2005 2006 2007 2008Year
Gro
ss R
even
ue ($
mill
ions
)
Figure 26: Theatre – Total Attendance (2004-2008)
0
500,000
1,000,000
1,500,000
2,000,000
2,500,000
3,000,000
3,500,000
4,000,000
4,500,000
2004 2005 2006 2007 2008
Year
Att
enda
nce
Table 13: Theatre – Revenue and Attendance (2004-2008)
Revenue Growth (%) Total Attendance Growth (%) Average Ticket Price Growth (%)
2004 $89,417,616 2,202,812 $43.87
2005 $73,988,892 -17.3% 2,117,854 -3.9% $38.04 -13.3%
2006 $143,564,232 94.0% 3,828,254 80.8% $39.42 3.6%
2007 $117,382,525 -18.2% 2,505,458 -34.6% $50.42 27.9%
2008 $80,476,671 -31.4% 1,944,188 -22.4% $46.92 -6.9%
Note: Caution should be applied when comparing the 2008 data with data from previous years as inconsistencies may exist in the data collection and allocation methodology.
Ernst & Young
Assurance | Tax | Transactions | Advisory
About Ernst & Young Ernst & Young is a global leader in assurance, tax, transaction and advisory services. Worldwide, our 135,000 people are united by our shared values and an unwavering commitment to quality. We make a difference by helping our people, our clients and our wider communities achieve their potential. For more information, please visit www.ey.com/au © 2009 Ernst & Young Australia.
Liability limited by a scheme approved under Professional Standards Legislation.
Adelaide Ernst & Young Building 121 King William Street Adelaide SA 5000 Tel: +61 8 8417 1600 Fax: +61 8 8417 1775
Brisbane 1 Eagle Street Brisbane QLD 4000 Tel: +61 7 3011 3333 Fax: +61 7 3011 3100
Canberra Ernst & Young House 51 Allara Street Canberra ACT 2600 Tel: +61 2 6267 3888 Fax: +61 2 6246 1500
Gold Coast 12-14 Marine Parade Southport QLD 4215 Tel: +61 7 5571 3000 Fax: +61 7 5571 3033
Melbourne Ernst & Young Building 8 Exhibition Street Melbourne VIC 3000 Tel: +61 3 9288 8000 Fax: +61 3 8650 7777
Perth Ernst & Young Building 11 Mounts Bay Road Perth WA 6000 Tel: +61 8 9429 2222 Fax: +61 8 9429 2436
Sydney Ernst & Young Centre 680 George Street Sydney NSW 2000 Tel: +61 2 9248 5555 Fax: +61 2 9248 5959
Related Documents