Weighing the Scenarios: The Costs and Benefits of Future Transit Service Produced for MTDB by The Mission Group © 2000 by The Mission Group. 1 San Diego’s I-15 Managed Lanes Project Integrating Bus Rapid Transit, Ridesharing, & Value Pricing Washington D.C. Value Pricing Workshop June 4, 2003

Weighing the Scenarios: The Costs and Benefits of Future Transit Service Produced for MTDB by The Mission Group © 2000 by The Mission Group. 1 San Diego’s.
Dec 18, 2015
Welcome message from author
This document is posted to help you gain knowledge. Please leave a comment to let me know what you think about it! Share it to your friends and learn new things together.
Transcript
Weighing the Scenarios: The Costs and Benefits of Future Transit Service Produced for MTDB by The Mission Group © 2000 by The Mission Group. 1
San Diego’s I-15 Managed Lanes Project
Integrating Bus Rapid Transit,Ridesharing, & Value Pricing
Washington D.C. Value Pricing WorkshopJune 4, 2003

Weighing the Scenarios: The Costs and Benefits of Future Transit Service Produced for MTDB by The Mission Group © 2000 by The Mission Group. 2
Centre City
NorthI-15 Corridor
NorthI-15 Corridor
Suburban landuse patterns with
long travel distances
I-15 is only continuousnorth-south artery
along 20 mile corridor
PROBLEM
- Existing congestion
- Existing 8-10 lanes doesn’t meet demand
- 350,000 future ADT

Weighing the Scenarios: The Costs and Benefits of Future Transit Service Produced for MTDB by The Mission Group © 2000 by The Mission Group. 3
ExistingHOV Lanes
• Opened in 1987
• 8 miles long
• Two lanes, one-way reversible
• Barrier separated
‘FasTrak’ value pricing began in 1997
Dynamic pricing ensures priority for carpools & transit
CHP Pullover Ratio = 15.3%Violations Ratio = 2.6%

Weighing the Scenarios: The Costs and Benefits of Future Transit Service Produced for MTDB by The Mission Group © 2000 by The Mission Group. 4
ExistingHOV Lanes
FasTrak Annual Revenues
Commuter Express Bus $1,200,000
Customer Service Center& ETC Maintenance $ 600,000
Equipment $ 200,000
Administration $ 60,000
Other $ 140,000
Total: $2,200,000

Weighing the Scenarios: The Costs and Benefits of Future Transit Service Produced for MTDB by The Mission Group © 2000 by The Mission Group. 5
Increased Use of HOV Lanes21,300 Vehicles; 16,100 2+HOVs
Funds transit service100% costs of
commuter express route
I-15 Value Pricing SuccessesI-15 Value Pricing Successes
Improved trip reliability
Facilitates carpools, transit,and solo driving
Weighing the Scenarios: The Costs and Benefits of Future Transit Service Produced for MTDB by The Mission Group © 2000 by The Mission Group. 6
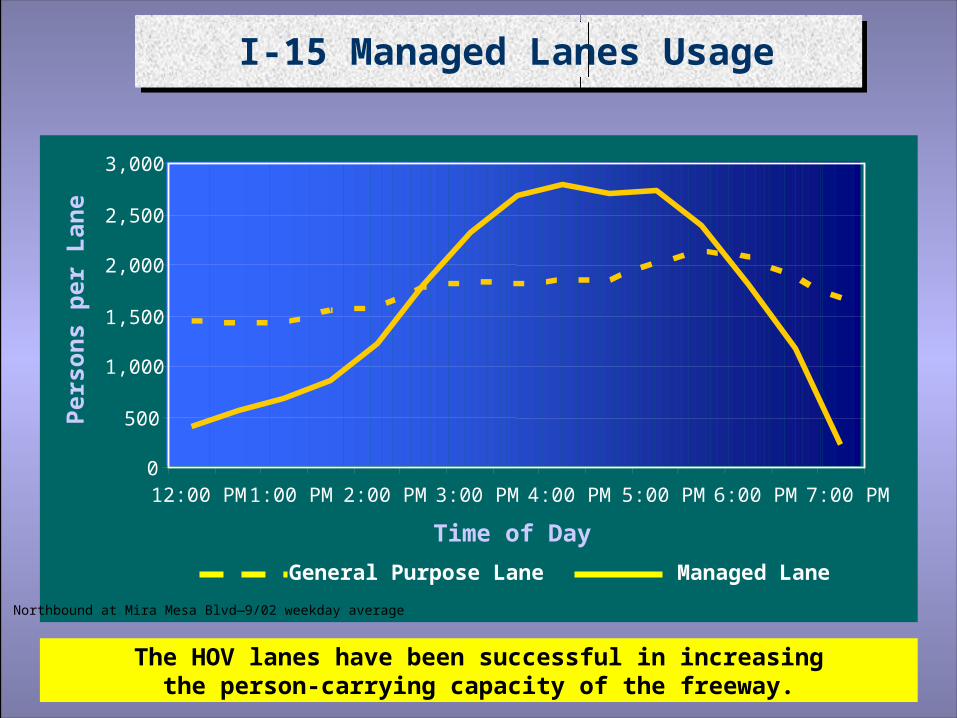
The HOV lanes have been successful in increasingthe person-carrying capacity of the freeway.
I-15 Managed Lanes UsageI-15 Managed Lanes Usage
0
500
1,000
1,500
2,000
2,500
3,000
12:00 PM 1:00 PM 2:00 PM 3:00 PM 4:00 PM 5:00 PM 6:00 PM 7:00 PM
Time of Day
Per
son
s p
er L
ane
General Purpose Lane Managed Lane
Northbound at Mira Mesa Blvd—9/02 weekday average

Weighing the Scenarios: The Costs and Benefits of Future Transit Service Produced for MTDB by The Mission Group © 2000 by The Mission Group. 7
Origin of FasTrak Value Pricing Program
• Local elected official wanting to improve transit services• Saw the excess capacity on HOV lanes as an opportunity
Fastrak demo program successfully implemented due to:
Addressed HOVempty-lanesyndrome
+ +Past
community leadersmeetings
Elected officialswillingness to try
demo program

Weighing the Scenarios: The Costs and Benefits of Future Transit Service Produced for MTDB by The Mission Group © 2000 by The Mission Group. 8
North I-15Corridor Issues
Existing 8-mile HOV Lane
Growth shows need to extendHOV Lanes north additional 12 miles
Escondido
Rancho BernardoBusiness Park
Penasquitos
Poway
Mira Mesa
Kearny MesaBusiness Park
SR 78 CorridorBusiness Park
Issues
• Demand for reverse commute on HOV lanes
• Need for intermediate access points on HOV lanes
• Desire for Bus Rapid Transit system that is ‘rail-like’
Weighing the Scenarios: The Costs and Benefits of Future Transit Service Produced for MTDB by The Mission Group © 2000 by The Mission Group. 9North
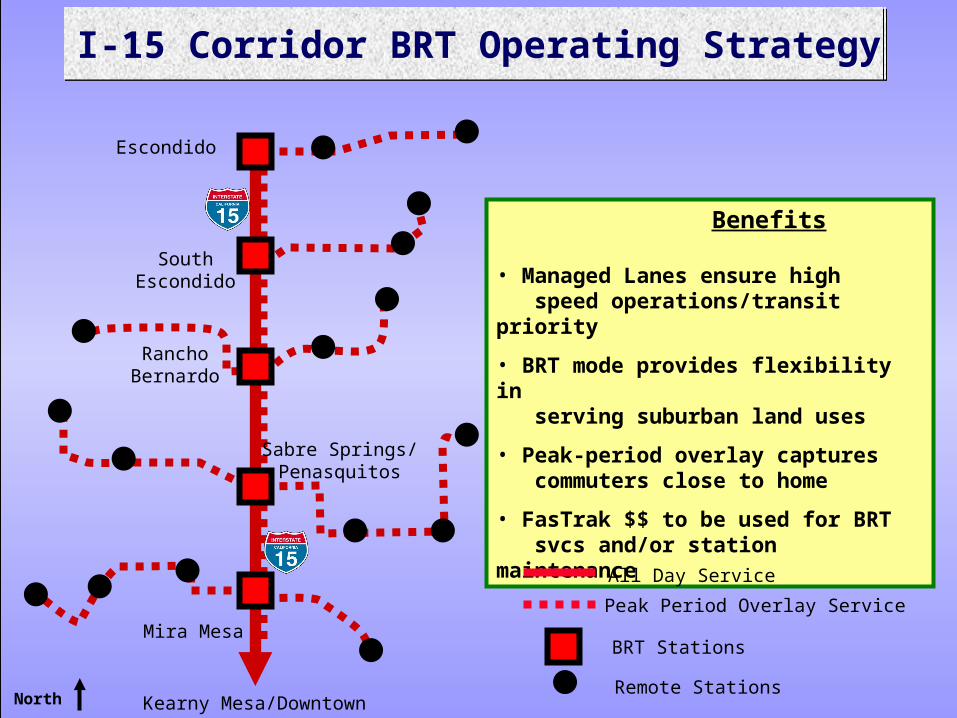
Benefits
• Managed Lanes ensure high speed operations/transit priority
• BRT mode provides flexibility in serving suburban land uses
• Peak-period overlay captures commuters close to home
• FasTrak $$ to be used for BRT svcs and/or station maintenance
I-15 Corridor BRT Operating Strategy
Remote Stations
BRT Stations
Kearny Mesa/Downtown
Escondido
SouthEscondido
RanchoBernardo
Sabre Springs/Penasquitos
Mira Mesa
All Day Service
Peak Period Overlay Service

Weighing the Scenarios: The Costs and Benefits of Future Transit Service Produced for MTDB by The Mission Group © 2000 by The Mission Group. 10
North I-15 CorridorHOV/Managed Lanes Design
North I-15 CorridorHOV/Managed Lanes Design
Issues
• Need to ensure free-flow conditions for BRT
• Desire to extend Fastrak value pricing program
• Ability to respond to traffic emergencies
• Design for long-term needs
Conclusions
• Pursue 4-lane managed lanes facility with moveable barrier
• Extend FasTrak value pricing program
• Incorporate direct access ramps and BRT stations as integral part of project
Weighing the Scenarios: The Costs and Benefits of Future Transit Service Produced for MTDB by The Mission Group © 2000 by The Mission Group. 11
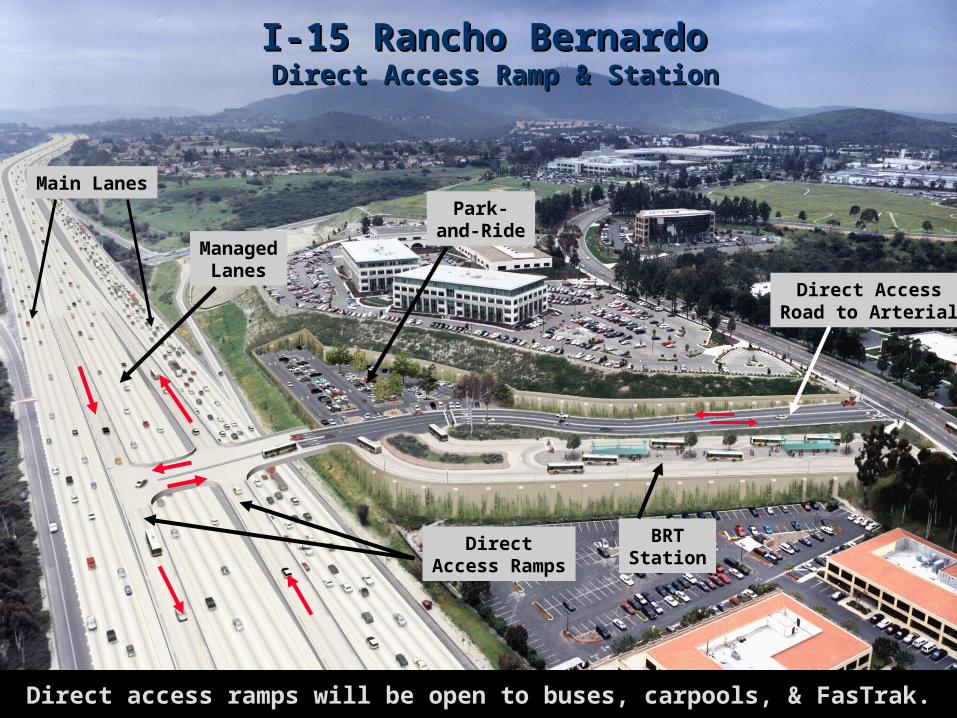
I-15 Rancho Bernardo I-15 Rancho Bernardo Direct Access Ramp & StationDirect Access Ramp & Station
Direct access ramps will be open to buses, carpools, & FasTrak.
Main Lanes
ManagedLanes
DirectAccess Ramps
Direct AccessRoad to Arterial
BRTStation
Park-and-Ride
Weighing the Scenarios: The Costs and Benefits of Future Transit Service Produced for MTDB by The Mission Group © 2000 by The Mission Group. 12
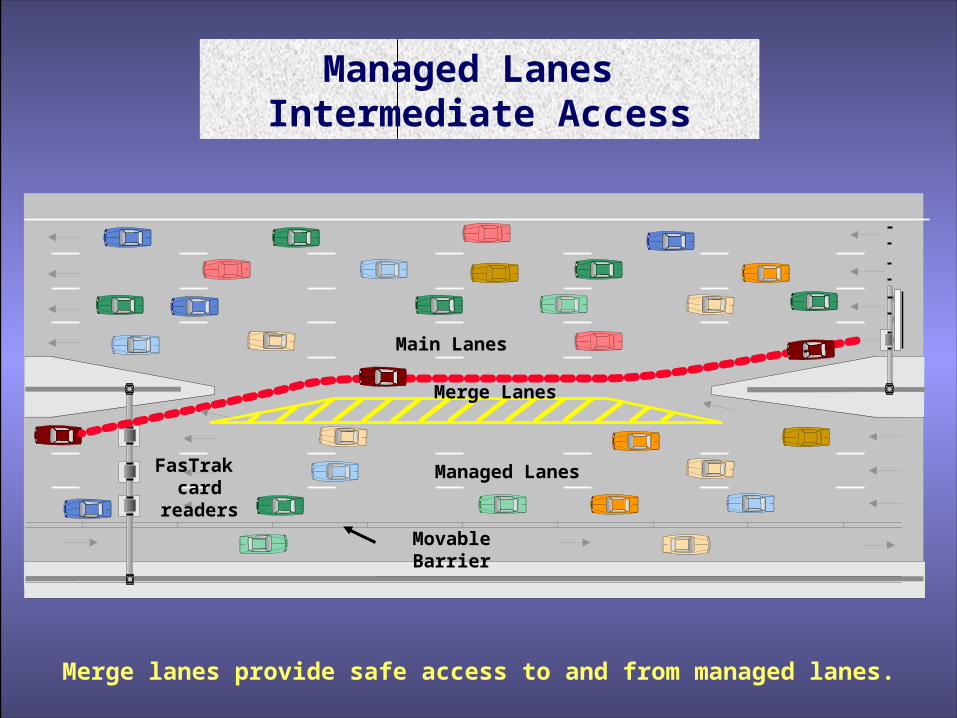
Movable Barrier
Managed Lanes Intermediate Access
Managed Lanes Intermediate Access
Main Lanes
Managed Lanes
Merge Lanes
Merge lanes provide safe access to and from managed lanes.
FasTrak card
readers
Weighing the Scenarios: The Costs and Benefits of Future Transit Service Produced for MTDB by The Mission Group © 2000 by The Mission Group. 13
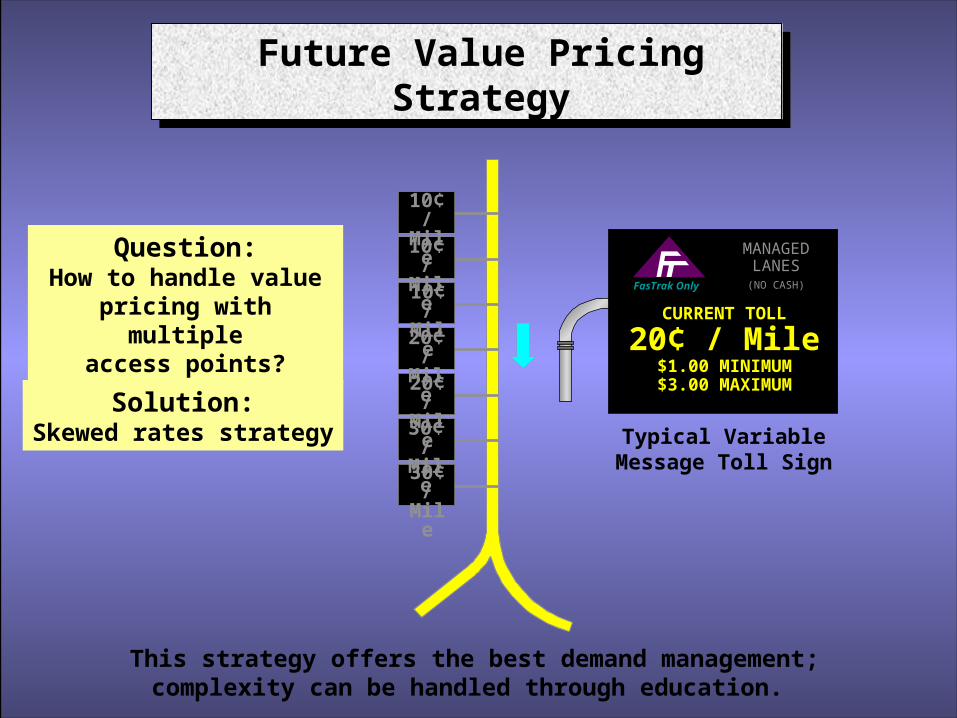
FasTrak Only
Typical VariableMessage Toll Sign
CURRENT TOLL
20¢ / Mile$1.00 MINIMUM$3.00 MAXIMUM
MANAGEDLANES(NO CASH)
20¢ /Mile
20¢ /Mile
10¢ /Mile
10¢ /Mile
10¢ /Mile
30¢ /Mile
30¢ /Mile
Future Value PricingStrategy
This strategy offers the best demand management;complexity can be handled through education.
Question:How to handle valuepricing with multiple
access points?
Solution:Skewed rates strategy

Weighing the Scenarios: The Costs and Benefits of Future Transit Service Produced for MTDB by The Mission Group © 2000 by The Mission Group. 14
Approval of I-15 CorridorFasTrak Program
Approval of I-15 CorridorFasTrak Program
Approve88%
Don’tKnow
1%
Disapprove11%
FasTrak Customer
Don’tKnow
6%Disapprove
28%
Other I-15 Users
Approve66%
There is strong support for the FasTrak program among all user groups.

Weighing the Scenarios: The Costs and Benefits of Future Transit Service Produced for MTDB by The Mission Group © 2000 by The Mission Group. 15
“Good Idea to Have Time Saving Option on I-15”
“Good Idea to Have Time Saving Option on I-15”
Don’t Know
2%
Strongly Disagree
3% Somewhat Disagree
4%
Somewhat Agree21%
Strongly Agree70%
I-15 corridor residents & employees like having FasTrakwhen late for their child’s soccer game or business meeting.

Weighing the Scenarios: The Costs and Benefits of Future Transit Service Produced for MTDB by The Mission Group © 2000 by The Mission Group. 16
Transit Users: Carpool Users:
An awareness of the “value” of carpool lanes has resultedin higher carpool usage since FasTrak program began.
Community InvolvementIntercept Surveys
94% considerpricing fair
Want increased transit services
92% considerpricing fair
70% say HOV lanes afactor in their
decision to carpool
Weighing the Scenarios: The Costs and Benefits of Future Transit Service Produced for MTDB by The Mission Group © 2000 by The Mission Group. 17
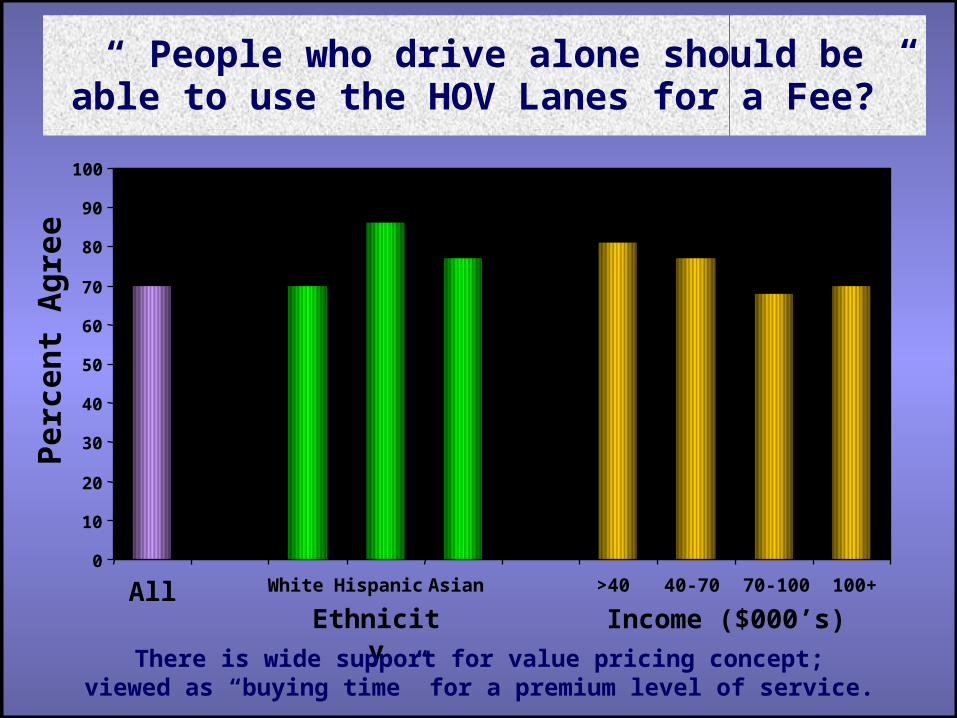
“ People who drive alone should beable to use the HOV Lanes for a Fee?”
Ethnicity
Perc
en
t A
gre
e
0
10
20
30
40
50
60
70
80
90
100
All White Hispanic Asian >40 40-70 70-100 100+
Income ($000’s)
There is wide support for value pricing concept;viewed as “buying time” for a premium level of service.
Weighing the Scenarios: The Costs and Benefits of Future Transit Service Produced for MTDB by The Mission Group © 2000 by The Mission Group. 18
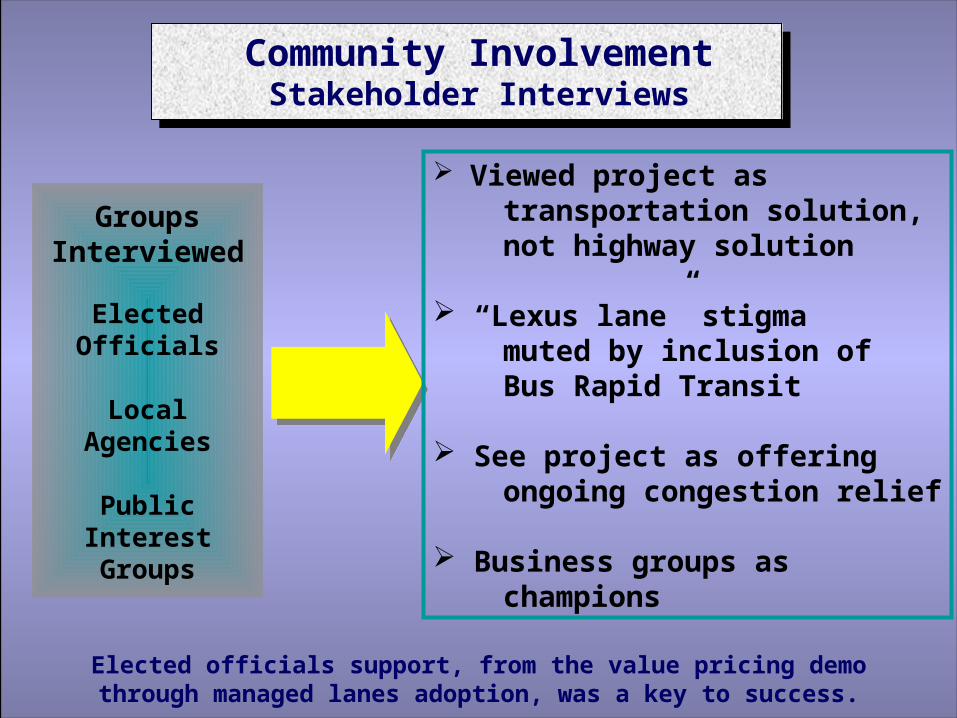
Elected officials support, from the value pricing demothrough managed lanes adoption, was a key to success.
GroupsInterviewed
ElectedOfficials
LocalAgencies
PublicInterestGroups
Viewed project as transportation solution, not highway solution
“Lexus lane” stigma muted by inclusion of Bus Rapid Transit
See project as offering ongoing congestion relief
Business groups as champions
Community InvolvementStakeholder Interviews

Weighing the Scenarios: The Costs and Benefits of Future Transit Service Produced for MTDB by The Mission Group © 2000 by The Mission Group. 19
Community InvolvementManaged Lanes/Bus Rapid TransitCommunity InvolvementManaged Lanes/Bus Rapid Transit
• Developing first-name relationships with community leaders
• Developing elected official champions
• Ongoing contact with community newspapers
• One-on-one communications w/community & business leaders
• Presented united front of public agencies to public
Venues
EstablishedCommunity Groups
Public Hearings(w/elected officials)
CommunityNewspaper Articles
One-on-onecommunications
Strategy
Multiple agencyparticipation
Weighing the Scenarios: The Costs and Benefits of Future Transit Service Produced for MTDB by The Mission Group © 2000 by The Mission Group. 20
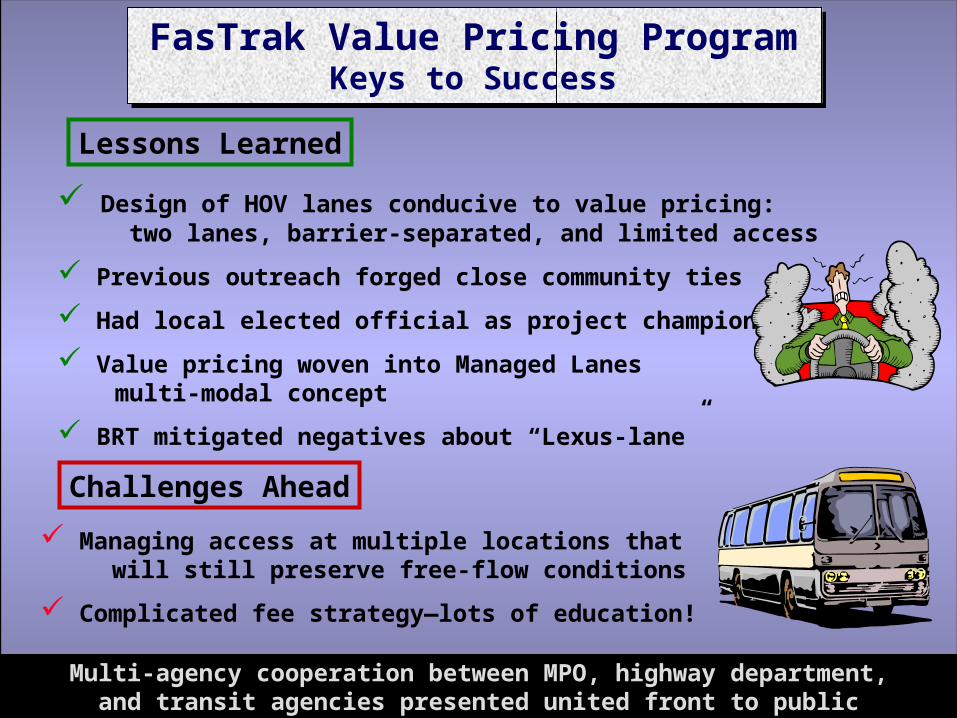
Design of HOV lanes conducive to value pricing: two lanes, barrier-separated, and limited access
Previous outreach forged close community ties
Had local elected official as project champion
Value pricing woven into Managed Lanes multi-modal concept
BRT mitigated negatives about “Lexus-lane”
Multi-agency cooperation between MPO, highway department,and transit agencies presented united front to public
FasTrak Value Pricing ProgramKeys to Success
Managing access at multiple locations that will still preserve free-flow conditions
Complicated fee strategy—lots of education!
Challenges Ahead
Lessons Learned
Weighing the Scenarios: The Costs and Benefits of Future Transit Service Produced for MTDB by The Mission Group © 2000 by The Mission Group. 21
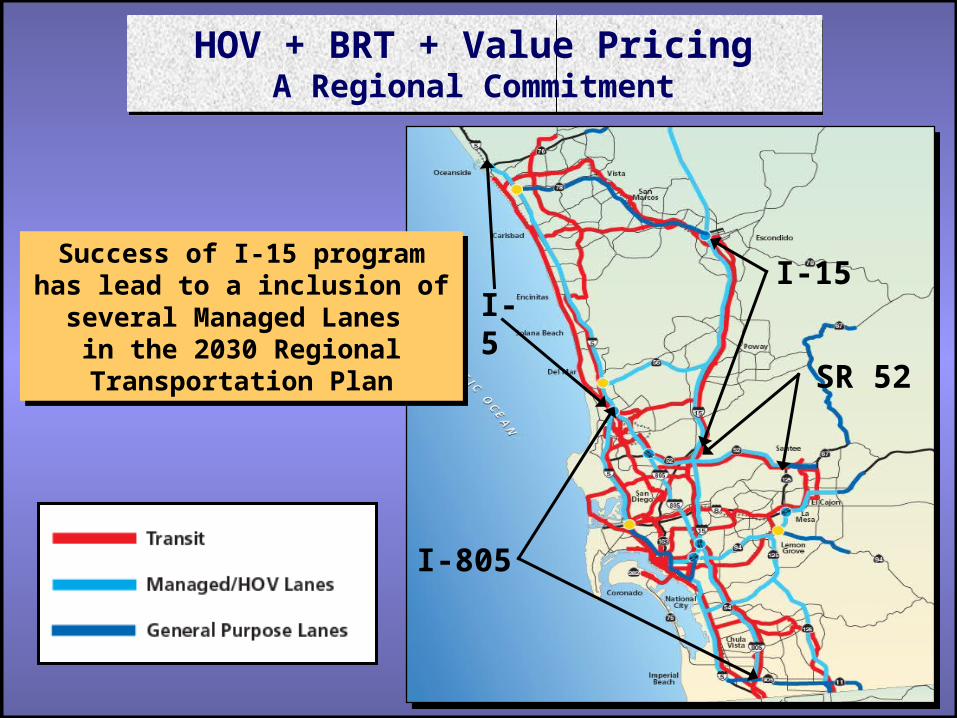
I-15I-5
I-805
SR 52
HOV + BRT + Value PricingA Regional Commitment
Success of I-15 programhas lead to a inclusion of several Managed Lanes
in the 2030 Regional Transportation Plan
Success of I-15 programhas lead to a inclusion of several Managed Lanes
in the 2030 Regional Transportation Plan

Weighing the Scenarios: The Costs and Benefits of Future Transit Service Produced for MTDB by The Mission Group © 2000 by The Mission Group. 22
California Department of Transportation Metropolitan Transit Development BoardNorth County Transit District San Diego Association of Governments
Related Documents