121 Conference – London UK November 27-28, 2017 TSX:TGZ

Welcome message from author
This document is posted to help you gain knowledge. Please leave a comment to let me know what you think about it! Share it to your friends and learn new things together.
Transcript
121 Conference – London UKNovember 27-28, 2017TSX:TGZ
Forward-Looking Statements
2
This presentation contains certain statements that constitute forward-looking information within the meaning of applicable securities laws (“forward-looking statements”), which
reflects management’s expectations regarding Teranga Gold Corporation’s (“Teranga” or the “Company”) future growth, results of operations (including, without limitation, future
production and capital expenditures), performance (both operational and financial) and business prospects (including the timing and development of new deposits and the
success of exploration activities) and opportunities. Wherever possible, words such as “plans”, “expects”, “does not expect”, “budget”, “scheduled”, “trends”, “indications”,
“potential”, “estimates”, “predicts”, “forecasts”, “focused on”, “anticipate” or “does not anticipate”, “believe”, “intend”, “ability to”, “intended to”, “objective to” and similar expressions
or statements that certain actions, events or results “may”, “could”, “would”, “might”, “will”, or are “likely” to be taken, occur or be achieved, have been used to identify such forward
looking information. Specific forward-looking statements in this presentation include the commencement of expected drill programs, net present value, anticipated future cash
flows, anticipated construction readiness activities for the Company’s Banfora gold project in Burkina Faso as well as the anticipated completion of construction of the Banfora
project - including the first gold pour, the anticipated discovery of reserves at the Banfora project, and Teranga’s estimated full year financial and operating totals, as well as
anticipated 2017 operating results. Although the forward-looking information contained in this presentation reflect management’s current beliefs based upon information currently
available to management and based upon what management believes to be reasonable assumptions, Teranga cannot be certain that actual results will be consistent with such
forward looking information. Such forward-looking statements are based upon assumptions, opinions and analysis made by management in light of its experience, current
conditions and its expectations of future developments that management believe to be reasonable and relevant but that may prove to be incorrect. These assumptions include,
among other things, the ability to obtain any requisite governmental approvals, the accuracy of mineral reserve and mineral resource estimates, gold price, exchange rates, fuel
and energy costs, future economic conditions, anticipated future estimates of free cash flow, and courses of action. Teranga cautions you not to place undue reliance upon any
such forward-looking statements.
The risks and uncertainties that may affect forward-looking statements include, among others: the inherent risks involved in exploration and development of mineral properties,
including government approvals and permitting, changes in economic conditions, changes in the worldwide price of gold and other key inputs, changes in mine plans and other
factors, such as project execution delays, many of which are beyond the control of Teranga, as well as other risks and uncertainties which are more fully described in Teranga’s
Annual Information Form dated March 29, 2017, and in other filings of Teranga with securities and regulatory authorities which are available at www.sedar.com. Teranga does not
undertake any obligation to update forward-looking statements should assumptions related to these plans, estimates, projections, beliefs and opinions change. Nothing in this
report should be construed as either an offer to sell or a solicitation to buy or sell Teranga securities.
This presentation is as of November 27, 2017. All references to Teranga include its subsidiaries unless the context requires otherwise. This presentation contains references to
Teranga using the words “we”, “us”, “our” and similar words and the reader is referred to using the words “you”, “your” and similar words. All dollar amounts stated are
denominated in U.S. dollars unless specified otherwise.
3
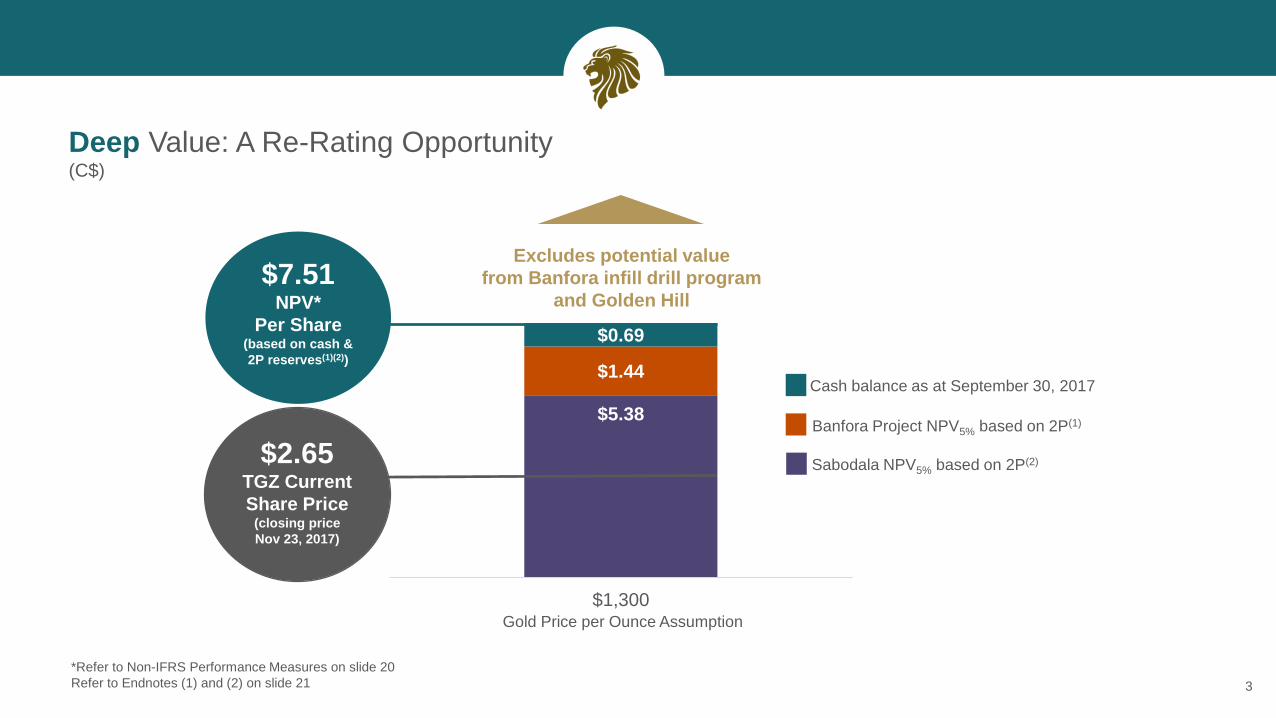
Deep Value: A Re-Rating Opportunity(C$)
Gold Price per Ounce Assumption
Cash balance as at September 30, 2017
Banfora Project NPV5% based on 2P(1)
Sabodala NPV5% based on 2P(2)
$5.38
$1.44
$0.69
$1,300
$2.65TGZ Current
Share Price(closing price
Nov 23, 2017)
$7.51NPV*
Per Share(based on cash &
2P reserves(1)(2))
Excludes potential value
from Banfora infill drill program
and Golden Hill
*Refer to Non-IFRS Performance Measures on slide 20
Refer to Endnotes (1) and (2) on slide 21
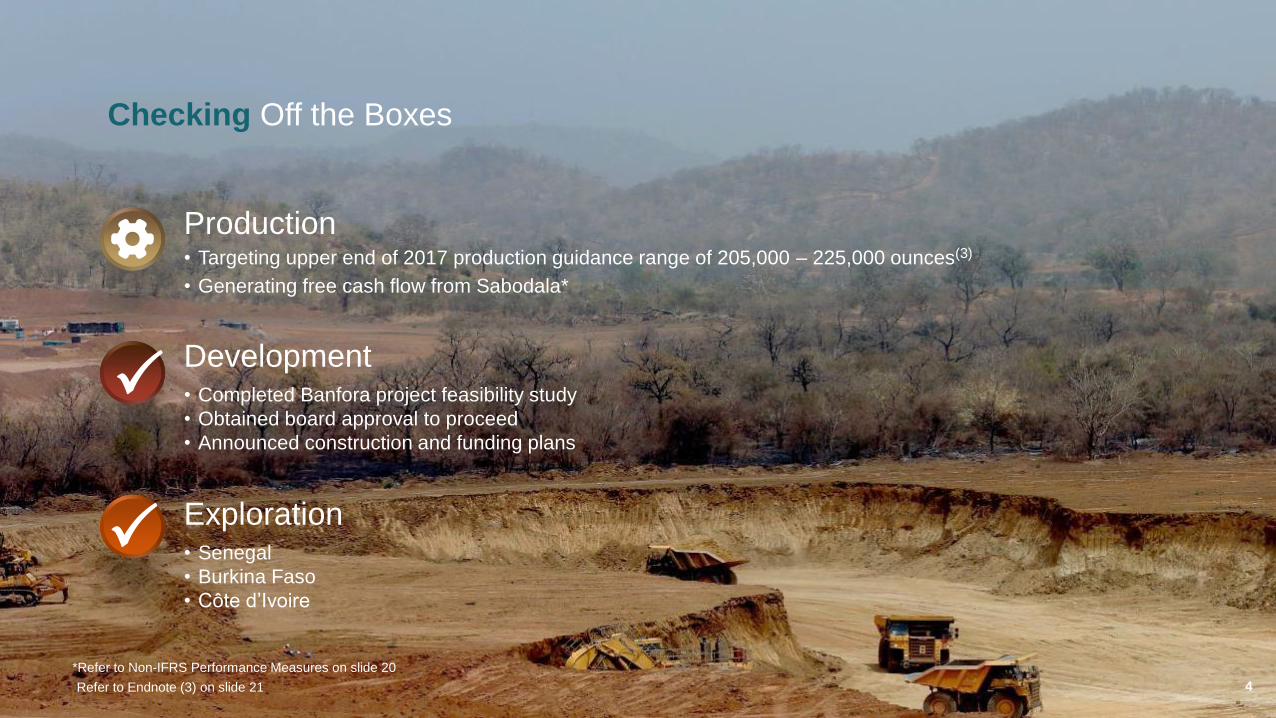
Exploration• Senegal
• Burkina Faso
• Côte d’Ivoire
Development• Completed Banfora project feasibility study
• Obtained board approval to proceed
• Announced construction and funding plans
Production• Targeting upper end of 2017 production guidance range of 205,000 – 225,000 ounces(3)
• Generating free cash flow from Sabodala*
Checking Off the Boxes
Refer to Endnote (3) on slide 21
*Refer to Non-IFRS Performance Measures on slide 20
4

Golden HillBurkina Faso
5
6
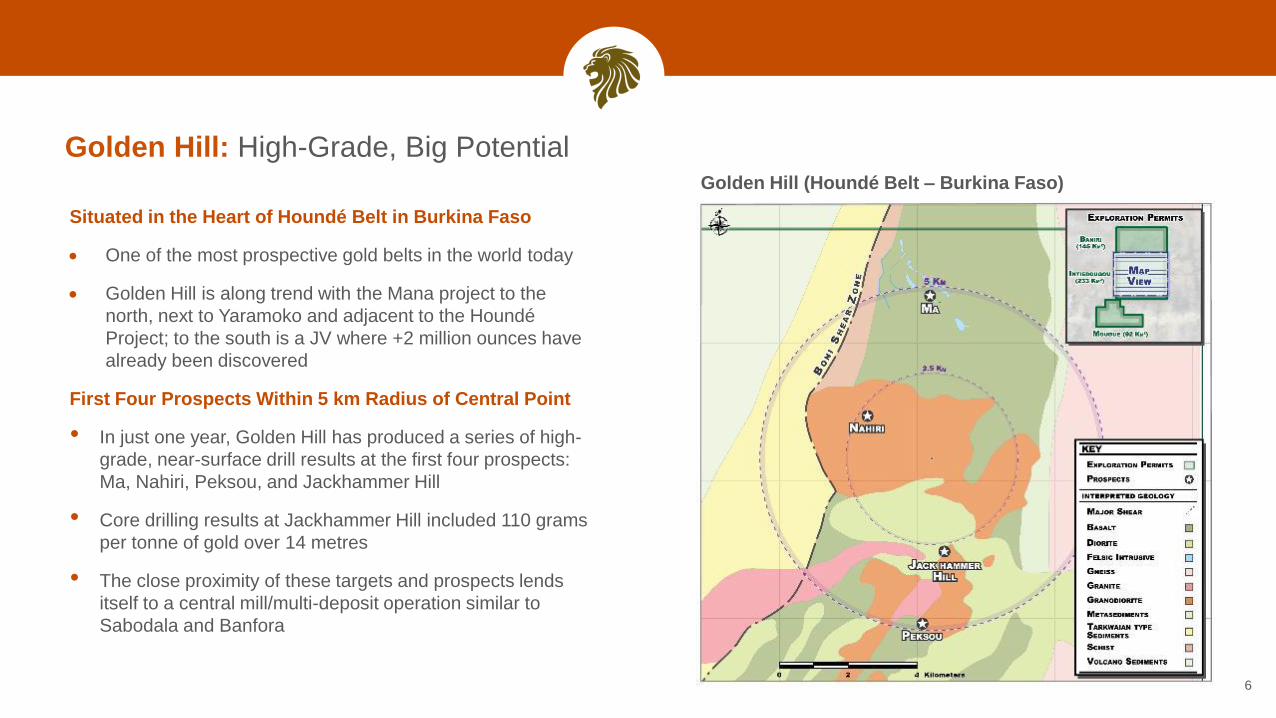
Golden Hill: High-Grade, Big PotentialGolden Hill (Houndé Belt – Burkina Faso)
Situated in the Heart of Houndé Belt in Burkina Faso
One of the most prospective gold belts in the world today
Golden Hill is along trend with the Mana project to the
north, next to Yaramoko and adjacent to the Houndé
Project; to the south is a JV where +2 million ounces have
already been discovered
First Four Prospects Within 5 km Radius of Central Point
• In just one year, Golden Hill has produced a series of high-
grade, near-surface drill results at the first four prospects:
Ma, Nahiri, Peksou, and Jackhammer Hill
• Core drilling results at Jackhammer Hill included 110 grams
per tonne of gold over 14 metres
• The close proximity of these targets and prospects lends
itself to a central mill/multi-deposit operation similar to
Sabodala and Banfora
77
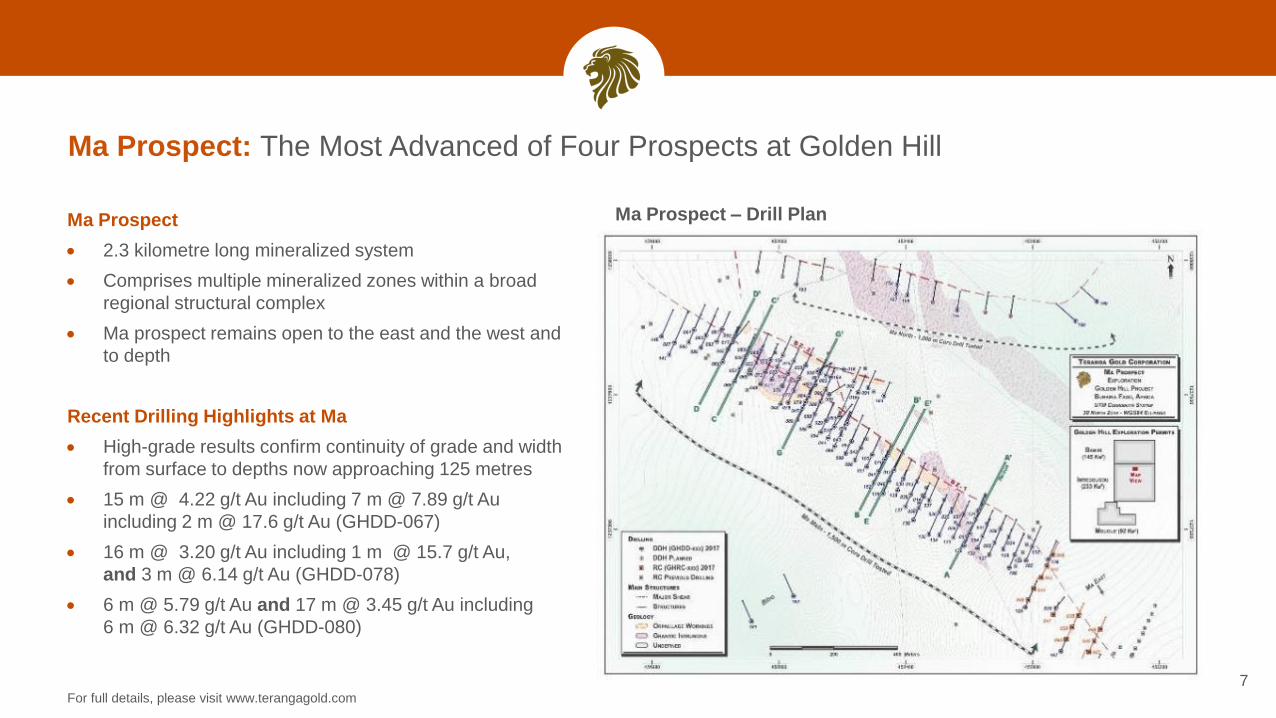
Ma Prospect – Drill Plan
For full details, please visit www.terangagold.com
Ma Prospect
2.3 kilometre long mineralized system
Comprises multiple mineralized zones within a broad
regional structural complex
Ma prospect remains open to the east and the west and
to depth
Recent Drilling Highlights at Ma
High-grade results confirm continuity of grade and width
from surface to depths now approaching 125 metres
15 m @ 4.22 g/t Au including 7 m @ 7.89 g/t Au
including 2 m @ 17.6 g/t Au (GHDD-067)
16 m @ 3.20 g/t Au including 1 m @ 15.7 g/t Au,
and 3 m @ 6.14 g/t Au (GHDD-078)
6 m @ 5.79 g/t Au and 17 m @ 3.45 g/t Au including
6 m @ 6.32 g/t Au (GHDD-080)
Ma Prospect: The Most Advanced of Four Prospects at Golden Hill
88
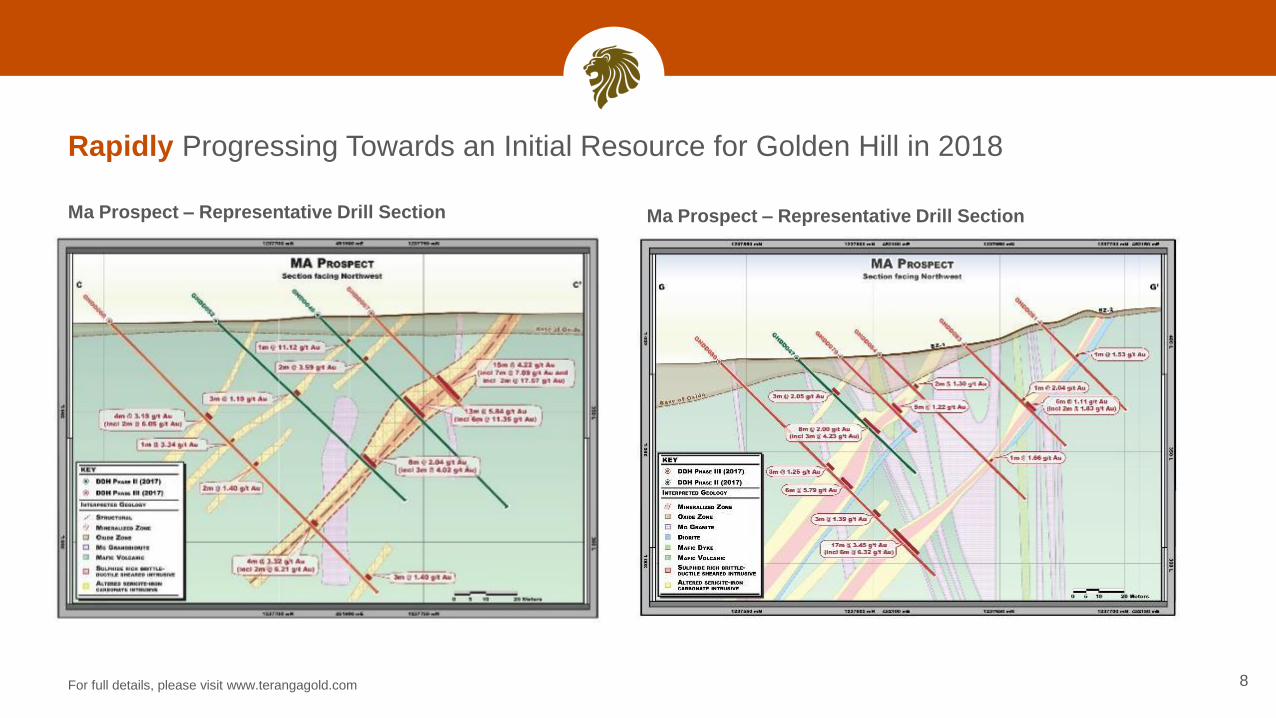
Ma Prospect – Representative Drill Section
For full details, please visit www.terangagold.com
Ma Prospect – Representative Drill Section
Rapidly Progressing Towards an Initial Resource for Golden Hill in 2018
Banfora ProjectBurkina Faso, West Africa
9
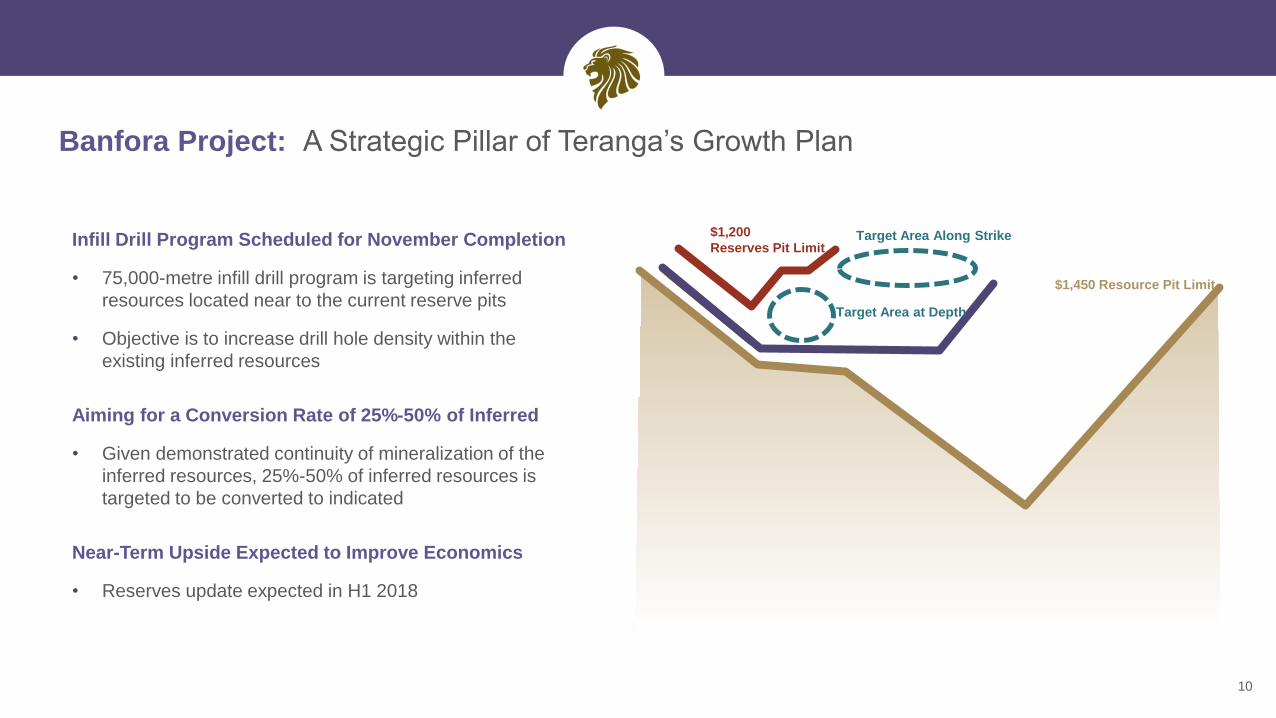
Banfora Project: A Strategic Pillar of Teranga’s Growth Plan
10
Infill Drill Program Scheduled for November Completion
• 75,000-metre infill drill program is targeting inferred
resources located near to the current reserve pits
• Objective is to increase drill hole density within the
existing inferred resources
Aiming for a Conversion Rate of 25%-50% of Inferred
• Given demonstrated continuity of mineralization of the
inferred resources, 25%-50% of inferred resources is
targeted to be converted to indicated
Near-Term Upside Expected to Improve Economics
• Reserves update expected in H1 2018
Target Area Along Strike
Target Area at Depth
$1,450 Resource Pit Limit
$1,200
Reserves Pit Limit
Kafina West
RaulHillside
11
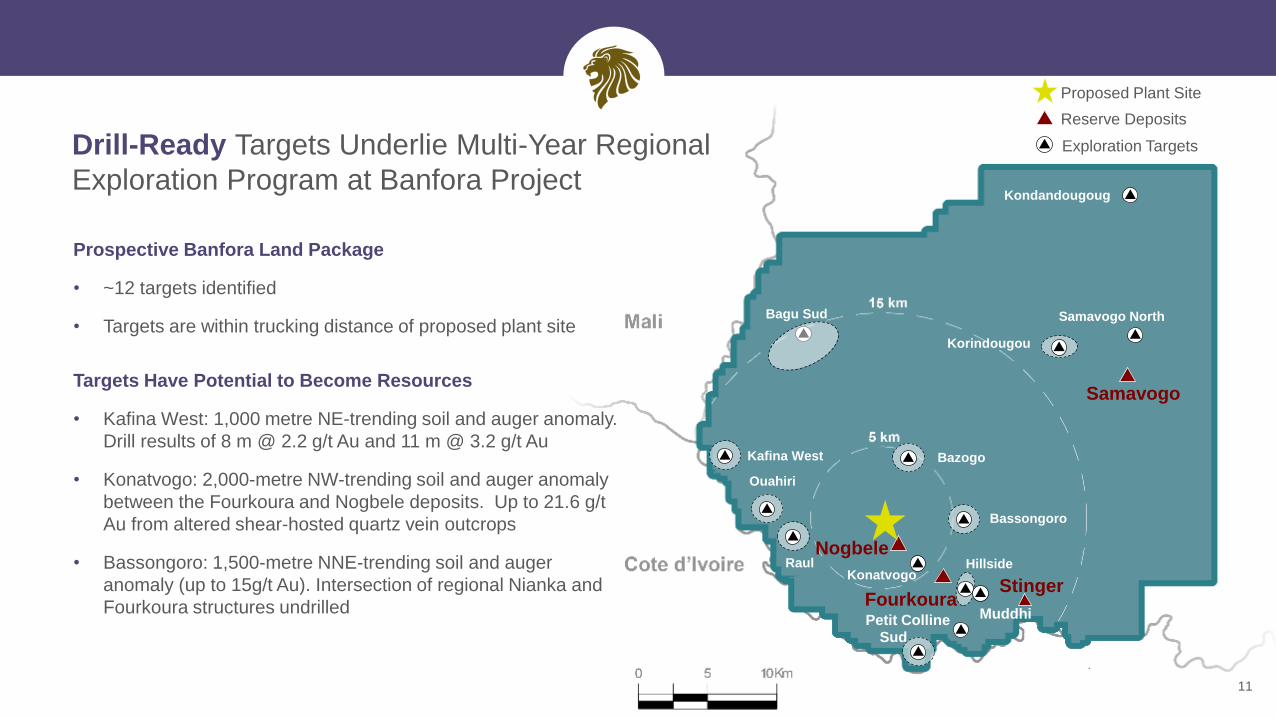
Drill-Ready Targets Underlie Multi-Year Regional
Exploration Program at Banfora Project
Samavogo
Nogbele
FourkouraStinger
Bagu Sud
Korindougou
Ouahiri
Sud
Prospective Banfora Land Package
• ~12 targets identified
• Targets are within trucking distance of proposed plant site
Targets Have Potential to Become Resources
• Kafina West: 1,000 metre NE-trending soil and auger anomaly.
Drill results of 8 m @ 2.2 g/t Au and 11 m @ 3.2 g/t Au
• Konatvogo: 2,000-metre NW-trending soil and auger anomaly
between the Fourkoura and Nogbele deposits. Up to 21.6 g/t
Au from altered shear-hosted quartz vein outcrops
• Bassongoro: 1,500-metre NNE-trending soil and auger
anomaly (up to 15g/t Au). Intersection of regional Nianka and
Fourkoura structures undrilled
Raul
Proposed Plant Site
Kondandougoug
Konatvogo
Bazogo
Bassongoro
Samavogo North
MuddhiPetit Colline
Reserve Deposits
Exploration Targets
2018 2019 2020 2021 2022 2023 2024 2025 2026 2027 2028
Sabodala Banfora
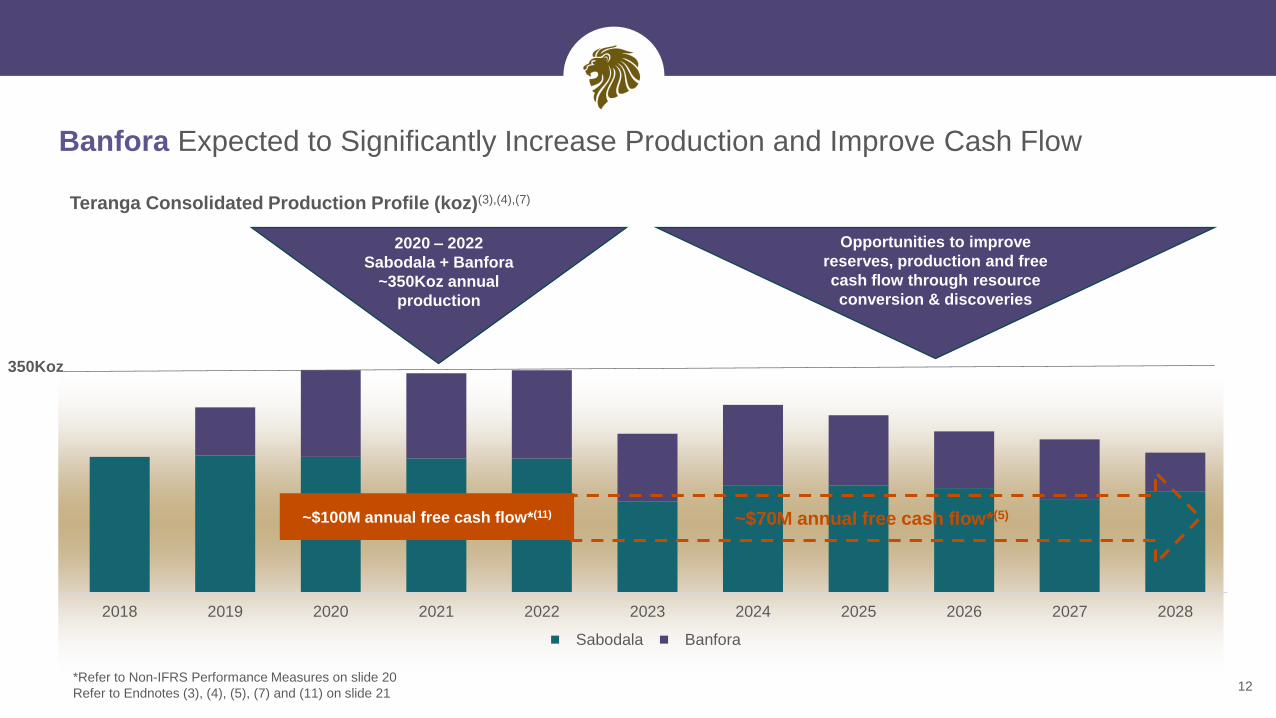
~$100M annual free cash flow*(11)
Banfora Expected to Significantly Increase Production and Improve Cash Flow
12*Refer to Non-IFRS Performance Measures on slide 20
Refer to Endnotes (3), (4), (5), (7) and (11) on slide 21
Teranga Consolidated Production Profile (koz)(3),(4),(7)
350Koz
~$70M annual free cash flow*(5)
2020 – 2022
Sabodala + Banfora
~350Koz annual
production
Opportunities to improve
reserves, production and free
cash flow through resource
conversion & discoveries

SabodalaSenegal, West Africa
13
14
Exploration Prospects
Mineral Resources
Masato Style Bulk
Tonnage Gold Trend
Golouma Style High-
Grade Gold Trend
Mining Concession
Exploration Permits
Previous Mine License
Sabodala
Mill
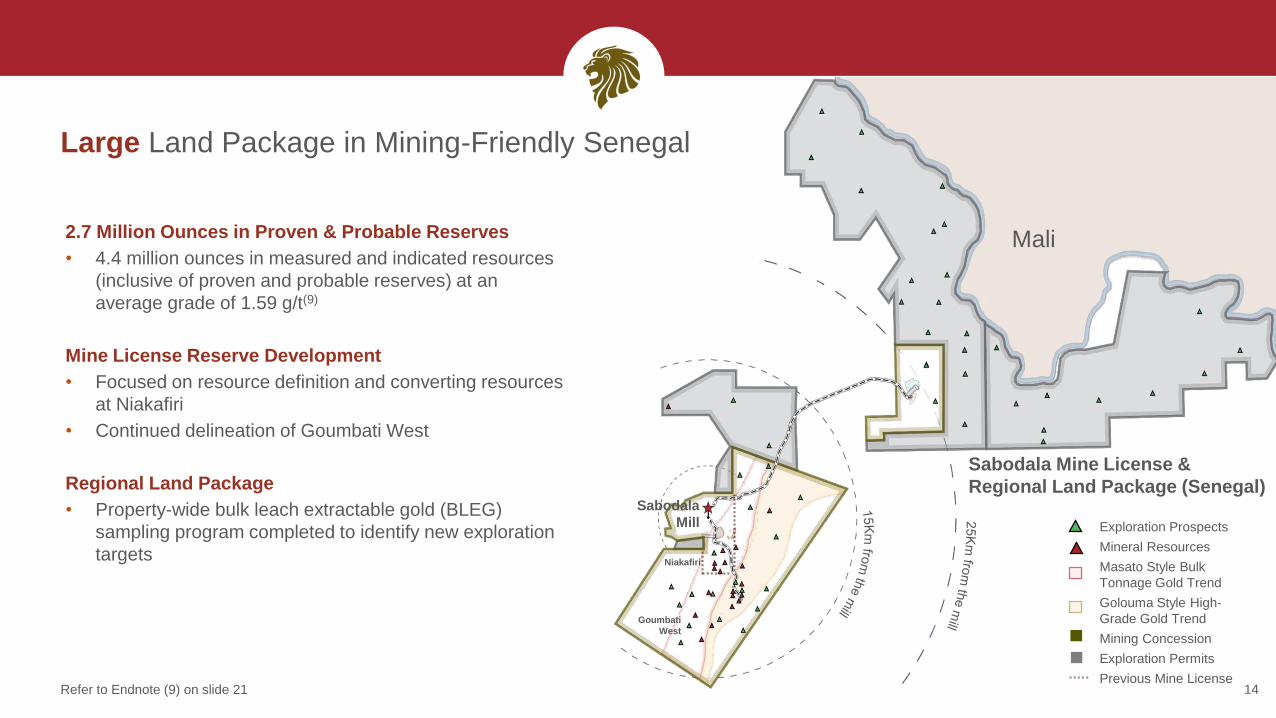
Sabodala Mine License &
Regional Land Package (Senegal)
2.7 Million Ounces in Proven & Probable Reserves
• 4.4 million ounces in measured and indicated resources
(inclusive of proven and probable reserves) at an
average grade of 1.59 g/t(9)
Mine License Reserve Development
• Focused on resource definition and converting resources
at Niakafiri
• Continued delineation of Goumbati West
Regional Land Package
• Property-wide bulk leach extractable gold (BLEG)
sampling program completed to identify new exploration
targets
Large Land Package in Mining-Friendly Senegal
Refer to Endnote (9) on slide 21
Mali
Niakafiri
Goumbati
West
(8)
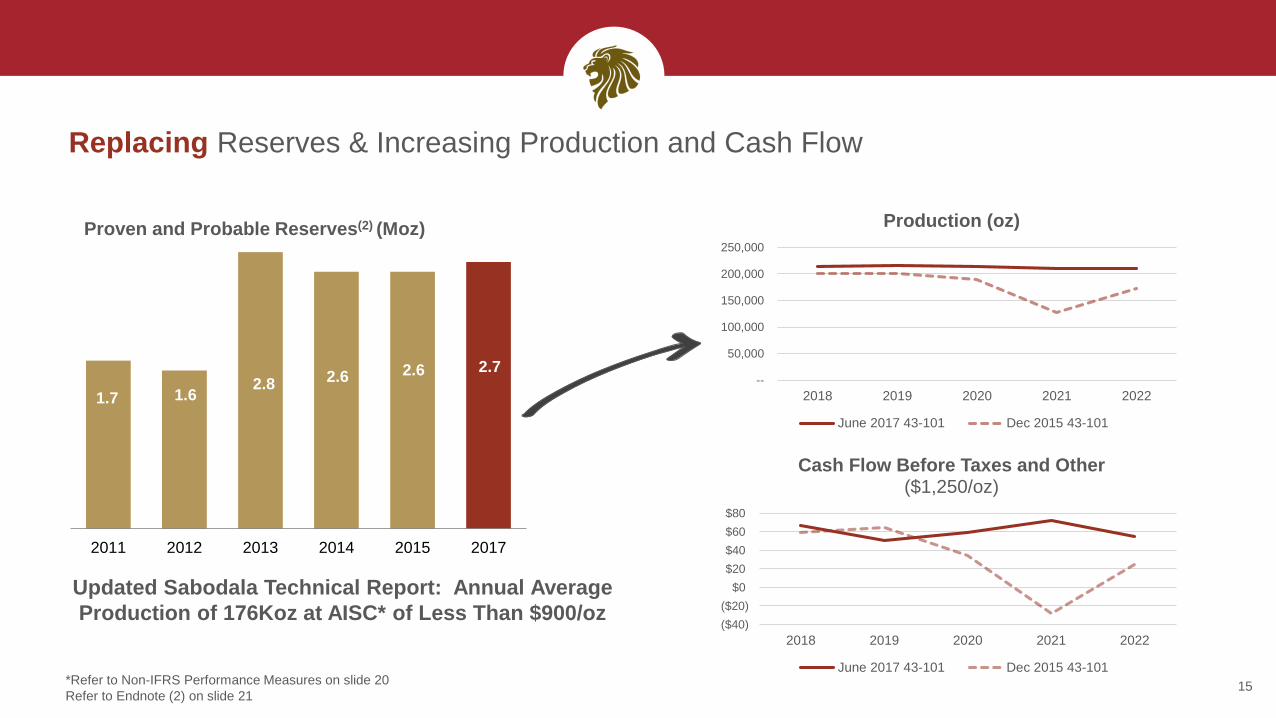
Proven and Probable Reserves(2) (Moz)
Replacing Reserves & Increasing Production and Cash Flow
1.7 1.62.8 2.6 2.6 2.7
2011 2012 2013 2014 2015 2017
Updated Sabodala Technical Report: Annual Average
Production of 176Koz at AISC* of Less Than $900/oz
Maki
Medina
15*Refer to Non-IFRS Performance Measures on slide 20
Refer to Endnote (2) on slide 21
($40)
($20)
$0
$20
$40
$60
$80
2018 2019 2020 2021 2022
Cash Flow Before Taxes and Other ($1,250/oz)
June 2017 43-101 Dec 2015 43-101
--
50,000
100,000
150,000
200,000
250,000
2018 2019 2020 2021 2022
Production (oz)
June 2017 43-101 Dec 2015 43-101
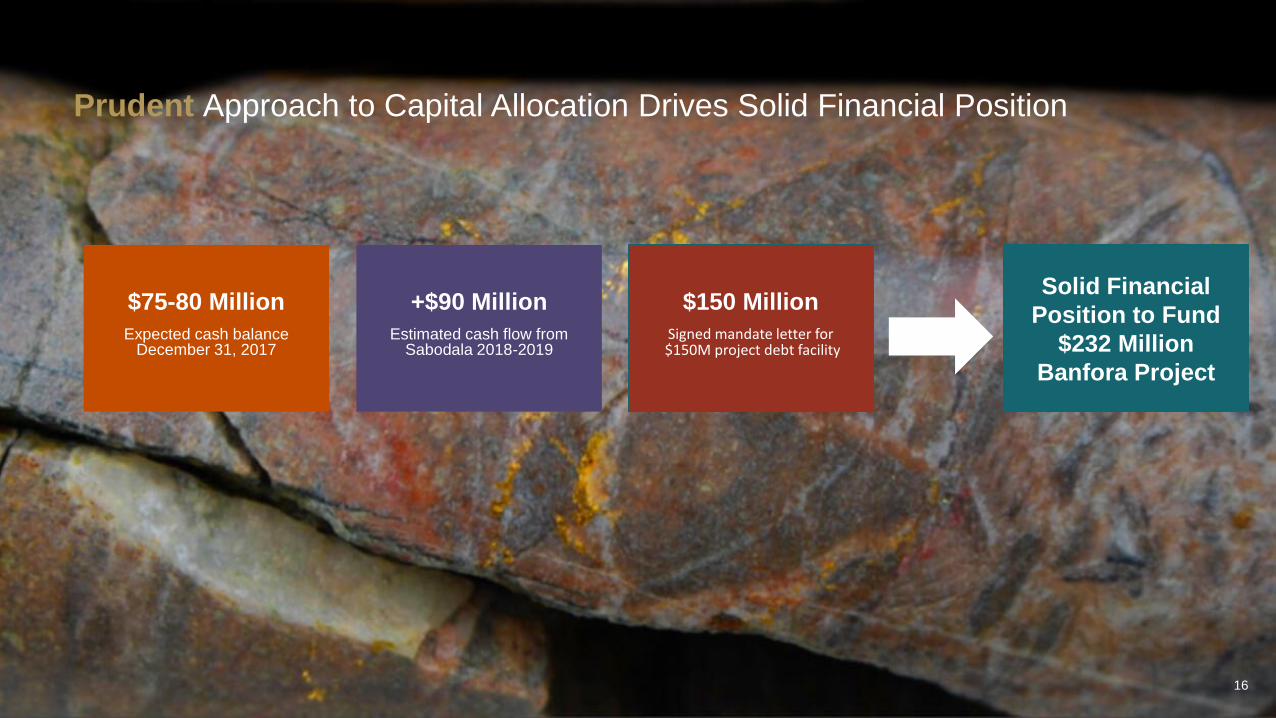
Prudent Approach to Capital Allocation Drives Solid Financial Position
16
$75-80 Million
Expected cash balance December 31, 2017
+$90 Million
Estimated cash flow from Sabodala 2018-2019
$150 Million
Signed mandate letter for$150M project debt facility
Solid Financial
Position to Fund
$232 Million
Banfora Project
17
Senegal
Côte d’Ivoire
Burkina Faso
Mali
Guinea
Guinea-
Bisseau
The Gambia
GhanaBenin
Niger
Sierra
Leone
Liberia
Togo
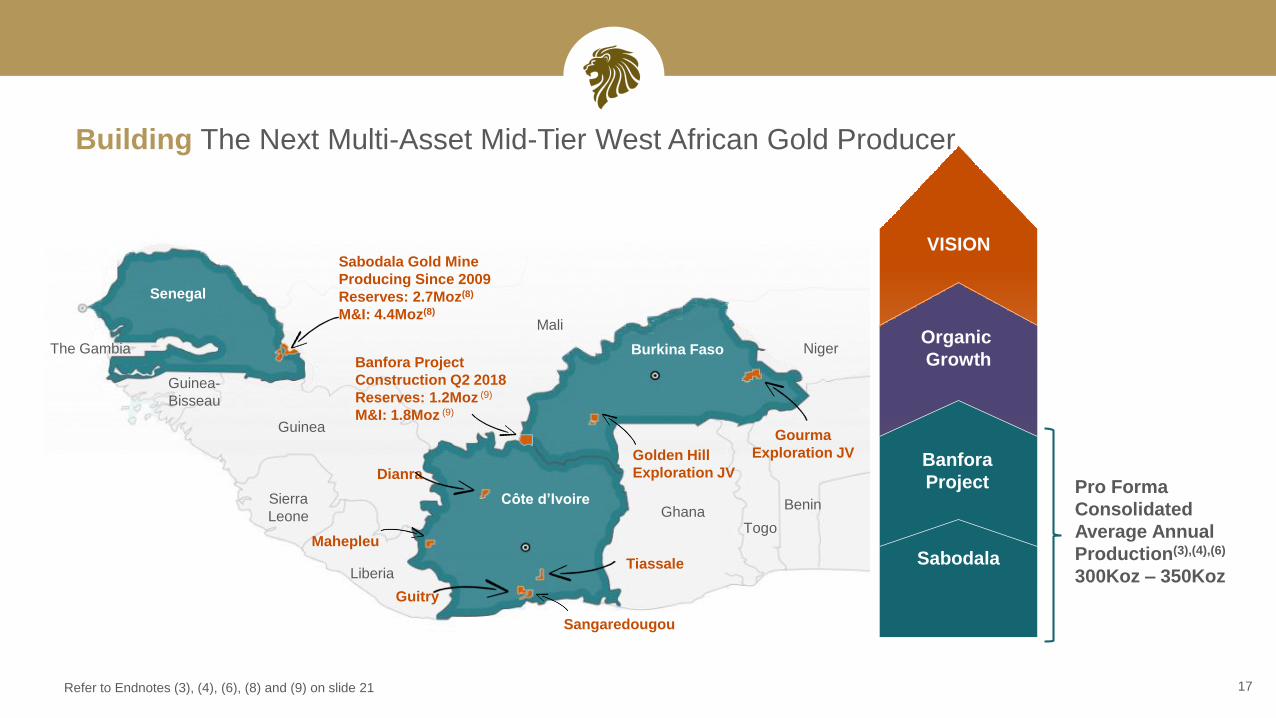
Sabodala Gold Mine
Producing Since 2009
Reserves: 2.7Moz(8)
M&I: 4.4Moz(8)
Banfora Project
Construction Q2 2018
Reserves: 1.2Moz (9)
M&I: 1.8Moz (9)
Golden Hill
Exploration JV
Gourma
Exploration JV
Guitry
Dianra
Mahepleu
Tiassale
Sangaredougou
Organic
Growth
Sabodala
VISION
Building The Next Multi-Asset Mid-Tier West African Gold Producer
Pro Forma
Consolidated
Average Annual
Production(3),(4),(6)
300Koz – 350Koz
Banfora
Project
Refer to Endnotes (3), (4), (6), (8) and (9) on slide 21

Appendix
19
Non-IFRS Performance Measures
The Company has included non-IFRS measures in this document, including “total cash cost per ounce of gold sold”, “all-in sustaining costs per ounce”, “free cash flow from operations” and “EBITDA”. The
Company believes that these measures, in addition to conventional measures prepared in accordance with IFRS, provide investors an improved ability to evaluate the underlying performance of the Company.
The non-IFRS measures are intended to provide additional information and should not be considered in isolation or as a substitute for measures of performance prepared in accordance with IFRS. These
measures do not have any standardized meaning prescribed under IFRS, and therefore may not be comparable to other issuers.
Total cash costs figures are calculated in accordance with a standard developed by The Gold Institute, which was a worldwide association of suppliers of gold and gold products and included leading North
American gold producers. The Gold Institute ceased operations in 2002, but the standard is considered the accepted standard of reporting cash cost of production in North America. Adoption of the standard is
voluntary and the cost measures presented may not be comparable to other similarly titled measure of other companies. The World Gold Council (“WGC”) definition of all-in sustaining costs seeks to extend
the definition of total cash costs by adding corporate general and administrative costs, reclamation and remediation costs (including accretion and amortization), exploration and study costs (capital and
expensed), capitalized stripping costs and sustaining capital expenditures and represents the total costs of producing gold from current operations. All-in sustaining cost excludes income tax payments, interest
costs, costs related to business acquisitions and items needed to normalize earnings. Consequently, this measure is not representative of all of the Company’s cash expenditures. In addition, the calculation of
all-in sustaining costs does not include depreciation expense as it does not reflect the impact of expenditures incurred in prior periods. Therefore, it is not indicative of the Company’s overall profitability. For
Sabodala and Banfora, life of mine total cash costs and all-in sustaining costs figures used in this presentation are before cash/non-cash inventory movements and exclude any allocation of corporate
overheads. Total cash costs and all-in sustaining costs figures for Sabodala further excludes amortized advanced royalty costs. Other companies may calculate this measure differently. Consolidated total cash
costs and all-in sustaining cost figures add corporate overhead costs. Other companies may calculate this measure differently.
The Company calculates free cash flow from operations as net cash flow provided by operating activities less sustaining capital expenditures. The Company believes this to be a useful indicator of its ability to
generate cash for growth initiatives. “Earnings before interest, taxes, depreciation and amortization” (“EBITDA”) is a non-IFRS financial measure, which excludes income tax, finance costs (before unwinding of
discounts), interest income, depreciation and amortization, and non-cash impairment charges from net earnings. EBITDA is intended to provide additional information to investors and analysts and do not have
any standardized definition under IFRS and should not be considered in isolation or as a substitute for measures of performance prepared in accordance with IFRS. Management believes that EBITDA is a
valuable indicator of our ability to generate liquidity by producing operating cash flow to: fund working capital needs, service debt obligations, and fund capital expenditures.
Net asset value (“NAV”) per share and net present value (“NPV”) per share are non-IFRS financial measures. NAV per share is equal to NPV per share and is calculated using the NPV of the life of mine
(“LOM”) cash flows based on the Banfora and Sabodala 43-101 technical reports. The NPV calculation assumes a long-term gold price of $1,300 per ounce, a 5% discount rate, a 0.79 CAD/USD exchange
rate, a 1.10 Euro/USD exchange rate, and current cash on hand. It includes interest, income taxes, and changes in working capital and excludes corporate administration, exploration expenditures, minority
interest payments and debt repayments. The Banfora and Sabodala NPV are based on reserves only.
For more information regarding these measures, please refer to the Company’s management’s discussion and analysis accessible on the Company’s website at www.terangagold.com.
Endnotes
20
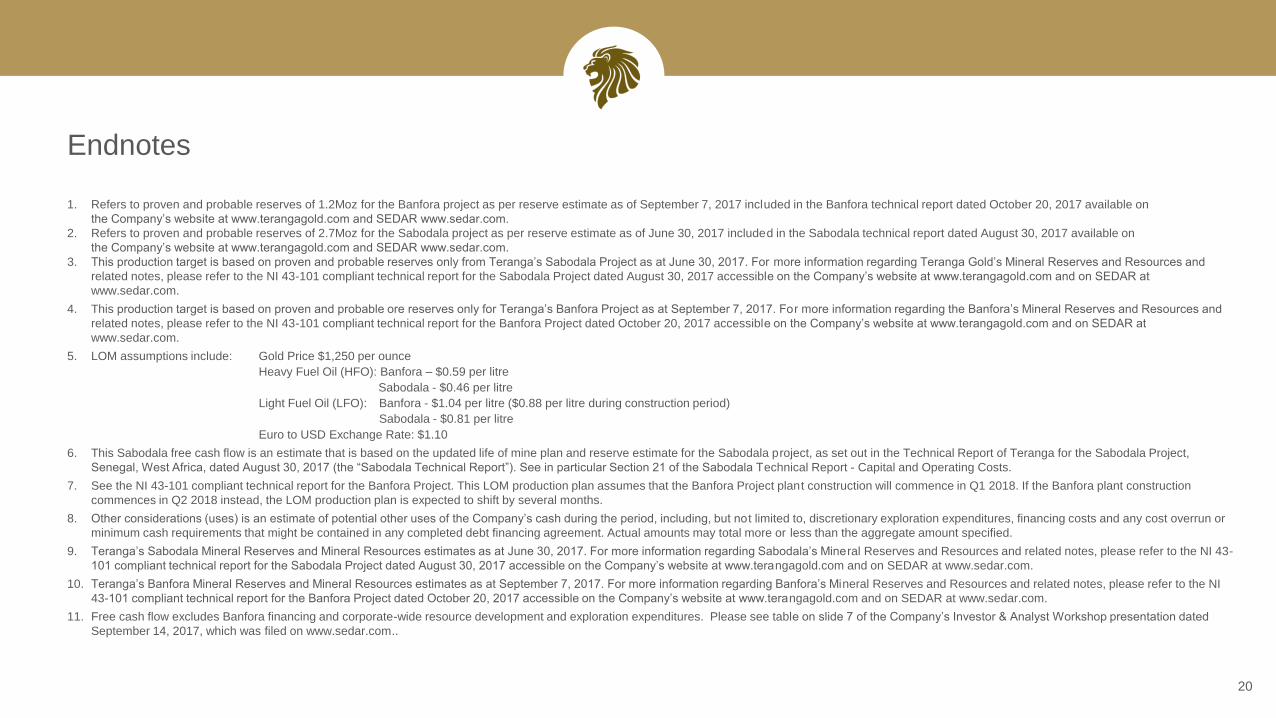
1. Refers to proven and probable reserves of 1.2Moz for the Banfora project as per reserve estimate as of September 7, 2017 included in the Banfora technical report dated October 20, 2017 available on
the Company’s website at www.terangagold.com and SEDAR www.sedar.com.
2. Refers to proven and probable reserves of 2.7Moz for the Sabodala project as per reserve estimate as of June 30, 2017 included in the Sabodala technical report dated August 30, 2017 available on
the Company’s website at www.terangagold.com and SEDAR www.sedar.com.
3. This production target is based on proven and probable reserves only from Teranga’s Sabodala Project as at June 30, 2017. For more information regarding Teranga Gold’s Mineral Reserves and Resources and
related notes, please refer to the NI 43-101 compliant technical report for the Sabodala Project dated August 30, 2017 accessible on the Company’s website at www.terangagold.com and on SEDAR at
www.sedar.com.
4. This production target is based on proven and probable ore reserves only for Teranga’s Banfora Project as at September 7, 2017. For more information regarding the Banfora’s Mineral Reserves and Resources and
related notes, please refer to the NI 43-101 compliant technical report for the Banfora Project dated October 20, 2017 accessible on the Company’s website at www.terangagold.com and on SEDAR at
www.sedar.com.
5. LOM assumptions include: Gold Price $1,250 per ounce
Heavy Fuel Oil (HFO): Banfora – $0.59 per litre
Sabodala - $0.46 per litre
Light Fuel Oil (LFO): Banfora - $1.04 per litre ($0.88 per litre during construction period)
Sabodala - $0.81 per litre
Euro to USD Exchange Rate: $1.10
6. This Sabodala free cash flow is an estimate that is based on the updated life of mine plan and reserve estimate for the Sabodala project, as set out in the Technical Report of Teranga for the Sabodala Project,
Senegal, West Africa, dated August 30, 2017 (the “Sabodala Technical Report”). See in particular Section 21 of the Sabodala Technical Report - Capital and Operating Costs.
7. See the NI 43-101 compliant technical report for the Banfora Project. This LOM production plan assumes that the Banfora Project plant construction will commence in Q1 2018. If the Banfora plant construction
commences in Q2 2018 instead, the LOM production plan is expected to shift by several months.
8. Other considerations (uses) is an estimate of potential other uses of the Company’s cash during the period, including, but not limited to, discretionary exploration expenditures, financing costs and any cost overrun or
minimum cash requirements that might be contained in any completed debt financing agreement. Actual amounts may total more or less than the aggregate amount specified.
9. Teranga’s Sabodala Mineral Reserves and Mineral Resources estimates as at June 30, 2017. For more information regarding Sabodala’s Mineral Reserves and Resources and related notes, please refer to the NI 43-
101 compliant technical report for the Sabodala Project dated August 30, 2017 accessible on the Company’s website at www.terangagold.com and on SEDAR at www.sedar.com.
10. Teranga’s Banfora Mineral Reserves and Mineral Resources estimates as at September 7, 2017. For more information regarding Banfora’s Mineral Reserves and Resources and related notes, please refer to the NI
43-101 compliant technical report for the Banfora Project dated October 20, 2017 accessible on the Company’s website at www.terangagold.com and on SEDAR at www.sedar.com.
11. Free cash flow excludes Banfora financing and corporate-wide resource development and exploration expenditures. Please see table on slide 7 of the Company’s Investor & Analyst Workshop presentation dated
September 14, 2017, which was filed on www.sedar.com..
Trish Moran
Head of Investor Relations
121 King Street West, Suite 2600
Toronto, ON M5H 3T9
T: +1.416.607.4507
W: terangagold.com
TSX:TGZ
Related Documents