Webappendix: Supplementary figures and tables for “Comparisons between different polychemotherapy regimens for early breast cancer: meta-analyses of long-term outcome among 100 000 women in 123 randomised trials” CONTENTS LIST (Click on any listed item with a page number to jump to it.) Taxanes: Taxane-plus-anthracycline-based regimen vs the same, or more, non-taxane chemotherapy Anth vs CMF: Any anthracycline-based regimen vs standard CMF (or near-standard CMF) Anth vs nil: Any anthracycline-based regimen vs no adjuvant chemotherapy CMF vs nil: Standard CMF (or near-standard CMF) vs no adjuvant chemotherapy Pp 2-6: Main subgroup analyses: splits x regimen, age, nodes, ER, grade Results just for breast cancer mortality (ie, mortality with recurrence, as calculated by logrank subtraction) 2 Taxanes (as text-figure 2) 3 Anth vs CMF (as text-figure 4) 4 Anth vs nil (as text-figure 6) 5 CMF vs nil 6 Anth or CMF vs nil Pp 7-14: More detailed subgroup analyses (with ER and FU duration further split) Results both for recurrence and for breast cancer mortality; compressed for highly magnified online viewing 7-8 Taxanes 9-10 Anth vs CMF 11-12 Anth vs nil 13-14 CMF vs nil Pp 15-17: 8-year or 10-year Kaplan-Meier-related graphs for 6 selected subgroups (age <55 / 55-69 years, ER-poor / ER+, poorly differentiated / not) Results for breast cancer mortality, 6 subgroups / page 15 Taxanes 16 Anth vs nil 17 CMF vs nil Pp 18-20: Kaplan-Meier-related graphs contrasting selected treatment effects (i) recurrence, (ii) breast cancer mortality, (iii) overall mortality: 3 outcomes x 2 effects (as text figures 1, 3, 5) 18 Taxanes (left , control = SAME non-taxane chemo; right , control = MORE non-taxane chemo) 19 Anth vs CMF (left , dose/cycle ≥A60/E90 & total dose >A240/E360 [eg CAF/CEF]; right , Anth=4A60C) 20 Anth vs nil or CMF vs nil (left, Anth [NB on average, the effect is like that of 4A60C]; right, CMF) Pp 21-62: 42 forest plots, one line per trial, for 6 different endpoints (Grey square = data last sent before 2001) Results for early recurrence (years 0-4), any recurrence, breast cancer mortality, death without recurrence in year 0, death without recurrence, overall mortality: 1 outcome / page = 6 endpoints x 7 comparisons 21-26 Taxanes 27-32 Anth vs CMF 33-38 Anth vs nil 39-44 Anth vs nil or CMF vs nil 45-50 One anthracycline-based regimen vs another (6 trials) 51-56 CMF vs nil and any other CMF regimen (with lower dose/cycle than CMF) vs nil 57-62 Any prolonged (>1 cycle) polychemotherapy regimen vs nil Page 63: Table of non-breast-cancer mortality without recurrence during the first year after randomisation, by age for various chemotherapy comparisons Pp 64-68: One or more references for each trial in the forest plots on pp 21-50 of breast cancer mortality (in the same order as in those forest plots) Pp 69-110 (end): Powerpoint-format presentation of selected figures or parts of figures (Download powerpoint presentation from EBCTCG website ) Notes on statistical methods: Annual breast cancer mortality rates are by subtraction of mortality rates among women without recurrence from those among all women. Likewise, breast cancer mortality rate ratios (RR±1SE, newer treatment vs control) derive from logrank subtraction (ie, subtraction of logrank analyses of mortality without recurrence from logrank analyses of overall mortality). Forest plots of recurrence (or of mortality without recurrence) give woman-years before first recurrence, those of overall mortality give woman-years before death and those of mortality without recurrence give numbers randomised. Numbers of women randomised, woman-years and first events generally double-count controls in 2:1 comparisons (and triple-count those in 3:1 comparisons), but calculations of the logrank statistic (O-E) and its variance V are unaffected by this, and do not double- or triple-count controls. If a logrank statistic (O−E) has variance V, then, defining z=(O−E)/√V and b=(O−E)/V, RR=exp(b) is the event rate ratio, and is taken to have SE=(RR−1)/z and 95% CI exp(b±1.96/√V). P-values (all of which are two-sided) are obtained by comparing z with a standard normal distribution (so z=1.96 yields 2p=0.05). In calculating p-values for side-effects (before recurrence), a continuity correction of 0.5 is applied to (O-E).

Welcome message from author
This document is posted to help you gain knowledge. Please leave a comment to let me know what you think about it! Share it to your friends and learn new things together.
Transcript
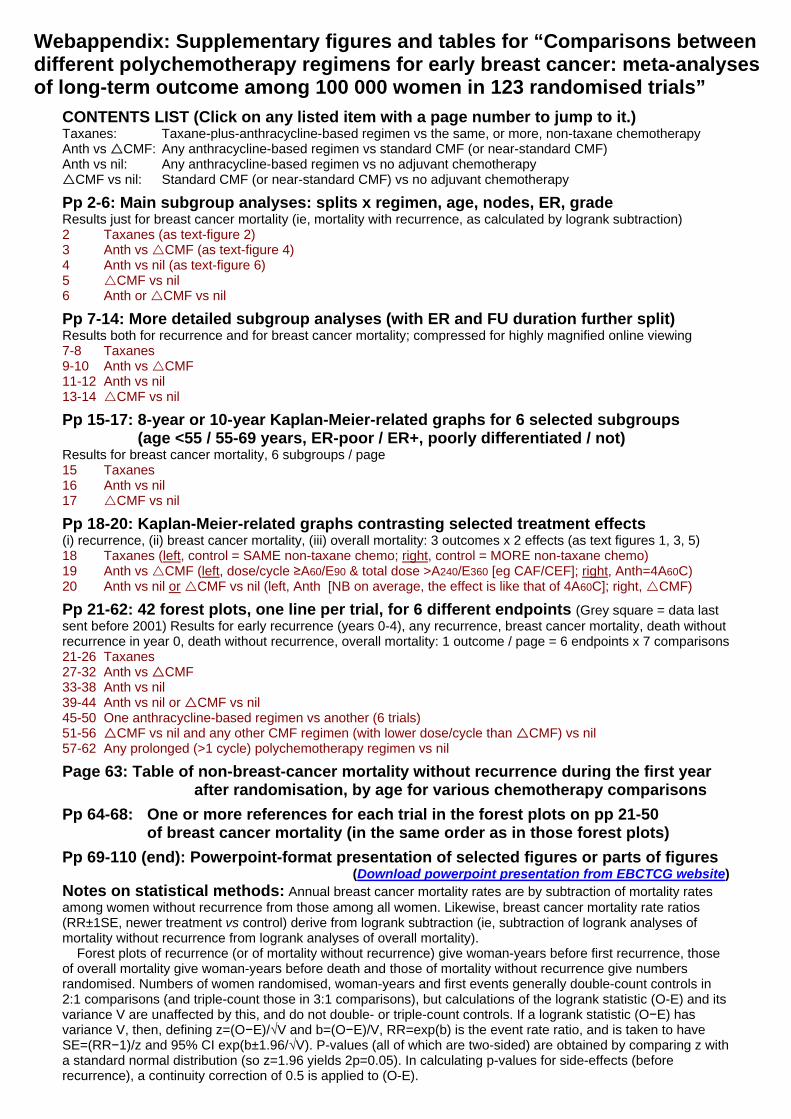
Webappendix: Supplementary figures and tables for “Comparisons between different polychemotherapy regimens for early breast cancer: meta-analyses of long-term outcome among 100 000 women in 123 randomised trials”
CONTENTS LIST (Click on any listed item with a page number to jump to it.) Taxanes: Taxane-plus-anthracycline-based regimen vs the same, or more, non-taxane chemotherapy Anth vs CMF: Any anthracycline-based regimen vs standard CMF (or near-standard CMF) Anth vs nil: Any anthracycline-based regimen vs no adjuvant chemotherapy CMF vs nil: Standard CMF (or near-standard CMF) vs no adjuvant chemotherapy
Pp 2-6: Main subgroup analyses: splits x regimen, age, nodes, ER, grade Results just for breast cancer mortality (ie, mortality with recurrence, as calculated by logrank subtraction) 2 Taxanes (as text-figure 2) 3 Anth vs CMF (as text-figure 4) 4 Anth vs nil (as text-figure 6) 5 CMF vs nil 6 Anth or CMF vs nil
Pp 7-14: More detailed subgroup analyses (with ER and FU duration further split) Results both for recurrence and for breast cancer mortality; compressed for highly magnified online viewing 7-8 Taxanes 9-10 Anth vs CMF 11-12 Anth vs nil 13-14 CMF vs nil
Pp 15-17: 8-year or 10-year Kaplan-Meier-related graphs for 6 selected subgroups (age <55 / 55-69 years, ER-poor / ER+, poorly differentiated / not) Results for breast cancer mortality, 6 subgroups / page 15 Taxanes 16 Anth vs nil 17 CMF vs nil
Pp 18-20: Kaplan-Meier-related graphs contrasting selected treatment effects (i) recurrence, (ii) breast cancer mortality, (iii) overall mortality: 3 outcomes x 2 effects (as text figures 1, 3, 5) 18 Taxanes (left, control = SAME non-taxane chemo; right, control = MORE non-taxane chemo) 19 Anth vs CMF (left, dose/cycle ≥A60/E90 & total dose >A240/E360 [eg CAF/CEF]; right, Anth=4A60C) 20 Anth vs nil or CMF vs nil (left, Anth [NB on average, the effect is like that of 4A60C]; right, CMF)
Pp 21-62: 42 forest plots, one line per trial, for 6 different endpoints (Grey square = data last sent before 2001) Results for early recurrence (years 0-4), any recurrence, breast cancer mortality, death without recurrence in year 0, death without recurrence, overall mortality: 1 outcome / page = 6 endpoints x 7 comparisons 21-26 Taxanes 27-32 Anth vs CMF 33-38 Anth vs nil 39-44 Anth vs nil or CMF vs nil 45-50 One anthracycline-based regimen vs another (6 trials) 51-56 CMF vs nil and any other CMF regimen (with lower dose/cycle than CMF) vs nil 57-62 Any prolonged (>1 cycle) polychemotherapy regimen vs nil
Page 63: Table of non-breast-cancer mortality without recurrence during the first year after randomisation, by age for various chemotherapy comparisons
Pp 64-68: One or more references for each trial in the forest plots on pp 21-50 of breast cancer mortality (in the same order as in those forest plots)
Pp 69-110 (end): Powerpoint-format presentation of selected figures or parts of figures (Download powerpoint presentation from EBCTCG website)
Notes on statistical methods: Annual breast cancer mortality rates are by subtraction of mortality rates among women without recurrence from those among all women. Likewise, breast cancer mortality rate ratios (RR±1SE, newer treatment vs control) derive from logrank subtraction (ie, subtraction of logrank analyses of mortality without recurrence from logrank analyses of overall mortality). Forest plots of recurrence (or of mortality without recurrence) give woman-years before first recurrence, those of overall mortality give woman-years before death and those of mortality without recurrence give numbers randomised. Numbers of women randomised, woman-years and first events generally double-count controls in 2:1 comparisons (and triple-count those in 3:1 comparisons), but calculations of the logrank statistic (O-E) and its variance V are unaffected by this, and do not double- or triple-count controls. If a logrank statistic (O−E) has variance V, then, defining z=(O−E)/√V and b=(O−E)/V, RR=exp(b) is the event rate ratio, and is taken to have SE=(RR−1)/z and 95% CI exp(b±1.96/√V). P-values (all of which are two-sided) are obtained by comparing z with a standard normal distribution (so z=1.96 yields 2p=0.05). In calculating p-values for side-effects (before recurrence), a continuity correction of 0.5 is applied to (O-E).

P 2: Subgroup analyses of BREAST CANCER MORTALITY (mortality with recurrence, by logrank subtraction), taxane-plus-anthracycline-based regimen vs SAME, or MORE (< doubled or ~doubled) non-taxane cytotoxic chemotherapy NB First four subgroups are as in forest plots*.
Category
Deaths/WomenAllocated
taxane non-tax.Ratio of annual death rates
Taxane : Non-tax.Logrank Variance
O−E of O−E
Taxane deaths
(a) Same, or more, non-taxane chemo. for controls* (χ 23 = 2·0; p = 0·6; NS)
Same (1×) †ie, unconfounded
1169/5590 1306/5577(20·9%) (23·4%)
520·8−79·8 0·86 (SE 0·04)
More (<2×) † 339/4282 407/4302(7·9%) (9·5%)
172·3−31·3 0·83 (SE 0·07)
More (<2×) © 587/7071 665/7076(8·3%) (9·4%)
278·9−32·1 0·89 (SE 0·06)
More (≈2×) † 546/5185 590/5168(10·5%) (11·4%)
259·3−15·8 0·94 (SE 0·06)
(b) Taxane (D/P*) schedule (χ23 = 1·0; p = 0·8; NS)
4(D100) q3w † 816/6480 887/6476(12·6%) (13·7%)
338·1−31·6 0·91 (SE 0·05)
Other docetaxel 716/8396 844/8409(8·5%) (10·0%)
366·9−58·4 0·85 (SE 0·05)
4(P175) q3w † 572/3528 612/3502(16·2%) (17·5%)
274·4−30·1 0·90 (SE 0·06)
Other paclitaxel 537/3724 625/3736(14·4%) (16·7%)
251·9−38·9 0·86 (SE 0·06)
(c) Concurrent endocrine therapy if ER+? (χ21 = 0·2; 2p = 0·6; NS)
Yes 87/713 93/723(12·2%) (12·9%)
40·5−2·7
No (any endocrine onlyafter chemo ended)
2554/21415 2875/21400(11·9%) (13·4%)
1136·0−158·3 0·87 (SE 0·03)
(d) Entry age (trend χ21 = 3·5; 2p = 0·06)
Age < 45 871/5930 928/5927(14·7%) (15·7%)
384·6−36·7 0·91 (SE 0·05)
45 − 54 835/7747 932/7720(10·8%) (12·1%)
372·3−41·4 0·89 (SE 0·05)
55 − 69 735/6572 877/6570(11·2%) (13·3%)
346·5−69·0 0·82 (SE 0·05)
70+ 51/314 81/343(16·2%) (23·6%)
24·4−11·4 0·63 (SE 0·16)
Age unknown 149/1565 150/1563(9·5%) (9·6%)
48·6−2·5
(e) Nodal status before chemo (trend χ21 = 0·3; 2p = 0·6; NS)
N0/N− 120/2104 132/2070(5·7%) (6·4%)
61·0−6·0 0·91 (SE 0·12)
N1−3 520/6981 599/6977(7·4%) (8·6%)
262·1−41·9 0·85 (SE 0·06)
N4+ 783/5012 849/5062(15·6%) (16·8%)
338·8−29·9 0·92 (SE 0·05)
Other / unknown 1218/8031 1388/8014(15·2%) (17·3%)
514·6−83·1 0·85 (SE 0·04)
(f) ER status (χ21 = 0·1; 2p = 0·7; NS)
ER-poor 1087/5883 1271/6027(18·5%) (21·1%)
505·0−78·0 0·86 (SE 0·04)
ER+ 1044/12848 1164/12790(8·1%) (9·1%)
502·3−67·1 0·87 (SE 0·04)
ER unknown 510/3397 533/3306(15·0%) (16·1%)
169·1−15·9 0·91 (SE 0·07)
Subsets of ER+
ER+ HER2− 273/4613 296/4656(5·9%) (6·4%)
136·2−11·3 0·92 (SE 0·08)
ER+ HER2+ 98/978 114/1022(10·0%) (11·2%)
47·5−6·2 0·88 (SE 0·14)
ER+, age < 55 666/8316 725/8223(8·0%) (8·8%)
317·9−37·7 0·89 (SE 0·05)
ER+, 55 − 69 355/4338 413/4368(8·2%) (9·5%)
174·5−25·8 0·86 (SE 0·07)
ER+, poorly differentiated
440/3362 398/3330(13·1%) (12·0%)
189·814·8 1·08 (SE 0·08)
ER+, moderately differentiated
273/5552 354/5595(4·9%) (6·3%)
143·0−38·0 0·77 (SE 0·07)
ER+, well differentiated
48/1501 74/1430(3·2%) (5·2%)
28·7−11·1 0·68 (SE 0·16)
2641/22128
2968/22123
(11·9%) (13·4%)
−161·0 1176·5 0·872 (SE 0·027)2p < 0·00001
Total
Allocated
99% or 95% confidence intervals .0·5 1·0 1·5
Taxane better Non-tax. better
Treatment effect 2p < 0·00001
Global heterogeneity: χ210
= 7·1; p = 0·7
* Forest plots (webappendix pp 21-26) give details of each trial’s cytotoxic regimensD = docetaxel; P = paclitaxel; 4(D100) q3w means 4 doses of docetaxel 100 mg/m² at intervals of 3 weeks
† Taxane courses do not overlap other chemotherapy courses© Taxane given concurrently with anthracycline

P 3: Subgroup analyses of BREAST CANCER MORTALITY (mortality with recurrence, by logrank subtraction), any anthracycline-based regimen vs. standard CMF (or near-standard CMF). NB First four subgroups are as in forest plots*.
Category
Deaths/WomenAllocated
anthr. CMFRatio of annual death rates
Anthr. : CMFLogrank Variance
O−E of O−E
Anthr. deaths
(a) Cumulative anthracycline dosage, if dose/cycle ≥A60/E90* (trend χ2
1 = 8·0; 2p = 0·005)
A360 or E720-800:eg, CAF/CEF
378/2082 475/2097(18·2%) (22·7%)
198·0−50·0 0·78 (SE 0·06)
A300 or E400-480 396/2766 472/2770(14·3%) (17·0%)
183·1−35·9 0·82 (SE 0·07)
A240: standard 4AC 877/2565 886/2557(34·2%) (34·6%)
405·6−8·5 0·98 (SE 0·05)
White: dose/cycle< A60/E90
358/1530 357/1502(23·4%) (23·8%)
160·1−11·1 0·93 (SE 0·08)
(b) Cyclophosphamide in CMF oral/iv (χ21 = 0·9; 2p = 0·3; NS)
C100×14 oral/cycle 1651/6530 1834/6525(25·3%) (28·1%)
788·8−98·8 0·88 (SE 0·03)
C600×2 iv/cycle 358/2413 356/2401(14·8%) (14·8%)
157·9−6·6 0·96 (SE 0·08)
(c) Concurrent endocrine therapy if ER+? (χ21 = 0·0; 2p = 1·0; NS)
Yes 57/502 62/502(11·4%) (12·4%)
29·0−2·9
No (any endocrine onlyafter chemo ended)
1952/8441 2128/8424(23·1%) (25·3%)
917·8−102·5 0·89 (SE 0·03)
(d) Entry age (trend χ21 = 0·0; 2p = 0·9; NS)
Age < 45 871/3398 991/3454(25·6%) (28·7%)
422·8−54·8 0·88 (SE 0·05)
45 − 54 738/3399 773/3356(21·7%) (23·0%)
344·3−30·6 0·91 (SE 0·05)
55 − 69 375/1961 396/1920(19·1%) (20·6%)
169·3−20·2 0·89 (SE 0·07)
70+ 18/106 25/112(17·0%) (22·3%)
8·7−2·2
Age unknown 7/79 5/84(8·9%) (6·0%)
1·82·4
(e) Nodal status (trend χ21 = 0·9; 2p = 0·3; NS)
N0/N− 461/3865 541/3869(11·9%) (14·0%)
233·1−40·5 0·84 (SE 0·06)
N1−3 520/2442 543/2418(21·3%) (22·5%)
243·4−10·0 0·96 (SE 0·06)
N4+ 612/1234 647/1233(49·6%) (52·5%)
273·4−23·1 0·92 (SE 0·06)
Other / unknown 416/1402 459/1406(29·7%) (32·6%)
196·8−31·9 0·85 (SE 0·07)
(f) ER status (χ21 = 0·1; 2p = 0·8; NS)
ER-poor 1201/4488 1287/4518(26·8%) (28·5%)
564·6−43·7 0·93 (SE 0·04)
ER+ 569/3279 610/3257(17·4%) (18·7%)
267·0−26·5 0·91 (SE 0·06)
ER unknown 239/1176 293/1151(20·3%) (25·5%)
115·2−35·2 0·74 (SE 0·08)
Subsets of ER+
ER10−99 fmol/mg 247/1072 279/1094(23·0%) (25·5%)
108·3−21·2 0·82 (SE 0·09)
ER100+ fmol/mg 86/450 116/450(19·1%) (25·8%)
42·0−15·4 0·69 (SE 0·13)
ER+, age < 55 426/2359 461/2345(18·1%) (19·7%)
202·3−22·9 0·89 (SE 0·07)
ER+, 55 − 69 134/846 140/847(15·8%) (16·5%)
61·1−3·6 0·94 (SE 0·12)
ER+, poorly differentiated
131/868 130/793(15·1%) (16·4%)
52·7−4·1
ER+, moderately/well differentiated
125/952 136/1047(13·1%) (13·0%)
58·3−1·8
2009/8943
2190/8926
(22·5%) (24·5%)
−105·4 946·8 0·895 (SE 0·031)2p = 0·0006
Total
Allocated
99% or 95% confidence intervals .0·5 1·0 1·5
Anthr. better CMF better
Treatment effect 2p = 0·0006
Global heterogeneity: χ26 = 9·9; p = 0·1
* Forest plots (webappendix pp 27-32) give details of each trial’s cytotoxic regimensAnthracyclines: A = doxorubicin (Adriamycin), E = epirubicin. Other cytotoxics: C = cyclophosphamide, M = methotrexate, F = fluorouracilDose/cycle (and cumulative dosage) is given after the drug name in mg/m²; A60/E90 means 60 mg/m² of doxorubicin or 90 mg/m² of epirubicin

P 4: Subgroup analyses of BREAST CANCER MORTALITY (mortality with recurrence, by logrank subtraction), any anthracycline-based regimen vs No chemotherapy NB First four subgroups are as in forest plots*.
Category
Deaths/WomenAllocated
anth. controlRatio of annual death rates
Anth. : ControlLogrank Variance
O−E of O−E
Anth. deaths
(a) Cumulative anthracycline dosage, if dose/cycle ≥A60/E90* (χ2
1 = 1·5; 2p = 0·2; NS)
A360: CAF 324/1177 456/1143(27·5%) (39·9%)
80·3−35·3 0·64 (SE 0·09)
A300 (no trials)
A240/E360:standard 4AC/EC
212/747 265/792(28·4%) (33·5%)
100·5−25·6 0·78 (SE 0·09)
White: dose/cycle< A60/E90
880/2830 980/2798(31·1%) (35·0%)
400·5−79·0 0·82 (SE 0·05)
(b) Anthracycline tested* (χ21 = 1·9; 2p = 0·2; NS)
Doxorubicin (A) 973/2626 1185/2570(37·1%) (46·1%)
370·4−106·1 0·75 (SE 0·05)
Epirubicin (E) 293/1283 318/1283(22·8%) (24·8%)
138·4−20·5 0·86 (SE 0·08)
A or E 150/845 198/880(17·8%) (22·5%)
72·5−13·3 0·83 (SE 0·11)
(c) Concurrent endocrine therapy if ER+? (χ21 = 0·3; 2p = 0·6; NS)
Yes 607/2004 693/2014(30·3%) (34·4%)
288·0−54·4 0·83 (SE 0·05)
No (any endocrine onlyafter chemo ended)
462/1431 514/1398(32·3%) (36·8%)
203·8−48·2 0·79 (SE 0·06)
Random † 347/1319 494/1321(26·3%) (37·4%)
89·4−37·2 0·66 (SE 0·09)
(d) Entry age (trend χ21 = 2·0; 2p = 0·2; NS)
Age < 45 135/402 127/353(33·6%) (36·0%)
53·0−4·9 0·91 (SE 0·13)
45 − 54 338/1115 419/1175(30·3%) (35·7%)
139·8−34·9 0·78 (SE 0·07)
55 − 69 899/2995 1071/2956(30·0%) (36·2%)
377·0−88·5 0·79 (SE 0·05)
70+ 43/225 84/232(19·1%) (36·2%)
11·4−11·7 0·36 (SE 0·19)
Age unknown 1/17 0/17(5·9%) (0·0%)
0·10·2
(e) Nodal status (trend χ21 = 0·0; 2p = 0·9; NS)
N0/N− 122/789 137/761(15·5%) (18·0%)
56·9−12·0 0·81 (SE 0·12)
N1−3 513/2257 604/2217(22·7%) (27·2%)
214·1−51·3 0·79 (SE 0·06)
N4+ 575/1226 741/1295(46·9%) (57·2%)
222·3−53·7 0·79 (SE 0·06)
Other / unknown 206/482 219/460(42·7%) (47·6%)
88·0−22·8 0·77 (SE 0·09)
(f) ER status (χ21 = 0·1; 2p = 0·7; NS)
ER-poor 403/1095 464/1043(36·8%) (44·5%)
180·4−40·5 0·80 (SE 0·07)
ER+ 831/3100 1063/3177(26·8%) (33·5%)
328·5−84·6 0·77 (SE 0·05)
ER unknown 182/559 174/513(32·6%) (33·9%)
72·3−14·9 0·81 (SE 0·11)
Subsets of ER+
ER+, chemo+end. vs end. only ‡
659/2622 853/2675(25·1%) (31·9%)
247·0−56·2 0·80 (SE 0·06)
ER10−99 fmol/mg 416/1371 544/1442(30·3%) (37·7%)
162·5−35·3 0·80 (SE 0·07)
ER100+ fmol/mg 274/1146 337/1160(23·9%) (29·1%)
95·6−20·6 0·81 (SE 0·09)
ER+, age < 55 250/845 316/943(29·6%) (33·5%)
102·4−19·4 0·83 (SE 0·09)
ER+, 55 − 69 542/2071 677/2055(26·2%) (32·9%)
215·3−53·9 0·78 (SE 0·06)
ER+, poorly differentiated
100/461 120/477(21·7%) (25·2%)
45·8−12·2 0·77 (SE 0·13)
ER+, moderately/well differentiated
228/985 286/1026(23·1%) (27·9%)
112·8−27·8 0·78 (SE 0·08)
1416/4754
1701/4733
(29·8%) (35·9%)
−139·9 581·3 0·786 (SE 0·037)2p < 0·00001
Total
Allocated
99% or 95% confidence intervals .0·5 1·0 1·5
Anth. better Anth. worse
Treatment effect 2p < 0·00001
Global heterogeneity: χ26 = 5·8; p = 0·4
* Forest plots (webappendix pp 33-38) give details of each trial’s cytotoxic regimensAnthracyclines: A = doxorubicin (Adriamycin), E = epirubicin. Other cytotoxics: C = cyclophosphamide, M = methotrexate, F = fluorouracilDose/cycle (and cumulative dosage) is given after the drug name in mg/m²; A60/E90 means 60 mg/m² of doxorubicin or 90 mg/m² of epirubicin
† In the SWOG 8814 trial of CAF in postmenopausal ER+ disease, tamoxifen started randomly with or after the chemotherapy.‡ chem+end. = chemo-endocrine therapy

P 5: Subgroup analyses of BREAST CANCER MORTALITY (mortality with recurrence), standard CMF (or near-standard CMF)* vs. No chemotherapy
CategoryDeaths/Women
AllocatedCMF control
Ratio of annual death ratesCMF : Control
Logrank VarianceO−E of O−E
CMF deaths
(a) Standard CMF (or near−standard CMF)? * (χ21 = 4·4; 2p = 0·04)
Yes (shown below) 658/2665 790/2588(24·7%) (30·5%)
320·1−89·1 0·76 (SE 0·05)
No (excluded) 1512/4378 1643/4372(34·5%) (37·6%)
611·1−81·4 0·88 (SE 0·04)
(b) Cyclophosphamide oral/iv (χ21 = 0·1; 2p = 0·7; NS)
C100×14 oral/cycle 617/2562 756/2497(24·1%) (30·3%)
305·1−89·9 0·74 (SE 0·05)
C600×2 iv/cycle 15/40 18/39(37·5%) (46·2%)
6·1−2·6
Optional (oral/iv) 26/63 16/52(41·3%) (30·8%)
8·93·3
(c) Concurrent endocrine therapy if ER+? (χ21 = 0·3; 2p = 0·6; NS)
Yes 301/1342 391/1338(22·4%) (29·2%)
151·2−47·2 0·73 (SE 0·07)
No (any endocrine onlyafter chemo ended)
357/1323 399/1250(27·0%) (31·9%)
168·9−41·9 0·78 (SE 0·07)
(d) Entry age (trend χ21 = 10·0; 2p = 0·002)
Age < 45 115/739 150/635(15·6%) (23·6%)
62·2−33·0 0·59 (SE 0·10)
45 − 54 165/803 230/853(20·5%) (27·0%)
86·1−35·5 0·66 (SE 0·09)
55 − 69 356/1043 385/994(34·1%) (38·7%)
163·0−21·8 0·87 (SE 0·07)
70+ 22/77 25/105(28·6%) (23·8%)
8·81·2
Age unknown 0/3 0/1(0·0%) (0·0%)
(e) Nodal status (trend χ21 = 6·5; 2p = 0·01)
N0/N− 197/1754 294/1711(11·2%) (17·2%)
117·2−54·0 0·63 (SE 0·07)
N1−3 218/513 257/499(42·5%) (51·5%)
105·7−27·8 0·77 (SE 0·09)
N4+ 231/365 230/351(63·3%) (65·5%)
93·5−10·4 0·90 (SE 0·10)
Other / unknown 12/33 9/27(36·4%) (33·3%)
3·63·1
(f) ER status (χ21 = 0·3; 2p = 0·6; NS)
ER−poor 167/629 209/617(26·6%) (33·9%)
79·2−17·6 0·80 (SE 0·10)
ER+ 295/1646 387/1635(17·9%) (23·7%)
155·7−47·2 0·74 (SE 0·07)
ER unknown 196/390 194/336(50·3%) (57·7%)
85·2−24·3 0·75 (SE 0·09)
Subsets of ER+
ER+, chem+end. vs end. only ‡
225/1379 285/1358(16·3%) (21·0%)
117·6−34·3 0·75 (SE 0·08)
Ditto, age < 55 85/778 129/754(10·9%) (17·1%)
50·3−28·2 0·57 (SE 0·11)
Ditto, 55 − 69 129/550 146/540(23·5%) (27·0%)
62·6−6·3 0·90 (SE 0·12)
ER10−99 fmol/mg 130/884 207/888(14·7%) (23·3%)
73·8−39·9 0·58 (SE 0·09)
ER100+ fmol/mg 100/493 120/494(20·3%) (24·3%)
48·2−6·2 0·88 (SE 0·14)
ER+, age < 55 107/922 184/918(11·6%) (20·0%)
67·1−40·7 0·55 (SE 0·09)
ER+, 55 − 69 176/664 192/646(26·5%) (29·7%)
83·5−6·6 0·92 (SE 0·11)
ER+, poorly differentiated
75/311 114/361(24·1%) (31·6%)
43·8−14·5 0·72 (SE 0·13)
ER+, moderately/well differentiated
89/879 136/850(10·1%) (16·0%)
53·4−23·2 0·65 (SE 0·11)
658/2665
790/2588
(24·7%) (30·5%)−89·1 320·1 0·757 (SE 0·049)
2p < 0·00001 Total
Allocated
99% or 95% confidence intervals .0·5 1·0 1·5
CMF better CMF worse
Treatment effect 2p < 0·00001
Global heterogeneity: χ26 = 21·6; p = 0·001
* See forest plots (webappendix pp 51−56) for details of regimens tested. Except in the first section, all analyses are ofstandard CMF (or near standard CMF). Trials of other CMF regimens (all with lower dose/cycle of at least one drug)are shown only in the first section (as a white square), and are then excluded.
‡ chem+end. = chemo−endocrine therapy

P 6: Subgroup analyses of BREAST CANCER MORTALITY (mortality with recurrence), anthracycline-based regimen (eg, standard 4AC) or standard CMF (or near-standard CMF) vs. No chemotherapy
CategoryDeaths/Women
Allocatedchemo. control
Ratio of annual death ratesChemo. : Control
Logrank VarianceO−E of O−E
Chemo. deaths
(a) Cumulative anthracycline dosage, if dose/cycle ≥A60/E90* (χ2
1 = 1·5; 2p = 0·2; NS)A360: CAF 324/1177 456/1143
(27·5%) (39·9%)80·3−35·3 0·64 (SE 0·09)
A300 (no trials)
A240/E360:standard 4AC/EC
212/747 265/792(28·4%) (33·5%)
100·5−25·6 0·78 (SE 0·09)
White: dose/cycle< A60 or E90
880/2830 980/2798(31·1%) (35·0%)
400·5−79·0 0·82 (SE 0·05)
(Excludes CMF trials)
(b) Anthracycline tested* (χ22 = 2·1; 2p = 0·4; NS)
Doxorubicin (A) 973/2626 1185/2570(37·1%) (46·1%)
370·4−106·1 0·75 (SE 0·05)
Epirubicin (E) 293/1283 318/1283(22·8%) (24·8%)
138·4−20·5 0·86 (SE 0·08)
A or E 150/845 198/880(17·8%) (22·5%)
72·5−13·3 0·83 (SE 0·11)
No anthracycline (standard CMF or
near−standard CMF)658/2665 790/2588(24·7%) (30·5%)
320·1−89·1 0·76 (SE 0·05)
(c) Concurrent endocrine therapy if ER+? (χ21 = 0·0; 2p = 1·0; NS)
Yes 922/3515 1107/3518(26·2%) (31·5%)
448·2−106·4 0·79 (SE 0·04)
No (any endocrine onlyafter chemo ended)
805/2585 890/2482(31·1%) (35·9%)
363·7−85·4 0·79 (SE 0·05)
Random † 347/1319 494/1321(26·3%) (37·4%)
89·4−37·2 0·66 (SE 0·09)
(d) Entry age (trend χ21 = 1·2; 2p = 0·3; NS)
Age < 45 250/1141 277/988(21·9%) (28·0%)
115·2−37·9 0·72 (SE 0·08)
45 − 54 503/1918 649/2028(26·2%) (32·0%)
225·8−70·4 0·73 (SE 0·06)
55 − 69 1255/4038 1456/3950(31·1%) (36·9%)
540·0−110·4 0·82 (SE 0·04)
70+ 65/302 109/337(21·5%) (32·3%)
20·2−10·5 0·59 (SE 0·17)
Age unknown 1/20 0/18(5·0%) (0·0%)
0·10·2
(e) Nodal status (trend χ21 = 3·2; 2p = 0·07)
N0/N− 319/2543 431/2472(12·5%) (17·4%)
174·1−66·0 0·68 (SE 0·06)
N1−3 731/2770 861/2716(26·4%) (31·7%)
319·8−79·1 0·78 (SE 0·05)
N4+ 806/1591 971/1646(50·7%) (59·0%)
315·8−64·0 0·82 (SE 0·05)
Other / unknown 218/515 228/487(42·3%) (46·8%)
91·7−19·7 0·81 (SE 0·09)
(f) ER status (χ21 = 0·4; 2p = 0·5; NS)
ER−poor 570/1724 673/1660(33·1%) (40·5%)
259·6−58·0 0·80 (SE 0·06)
ER+ 1126/4746 1450/4812(23·7%) (30·1%)
484·2−131·8 0·76 (SE 0·04)
ER unknown 378/949 368/849(39·8%) (43·3%)
157·5−39·2 0·78 (SE 0·07)
Subsets of ER+
ER+, chem+5yr end. vs 5yr end. only ‡
686/2964 926/3026(23·1%) (30·6%)
271·6−80·0 0·74 (SE 0·05)
Ditto, age < 55 196/984 282/1068(19·9%) (26·4%)
87·7−28·4 0·72 (SE 0·09)
Ditto, 55 − 69 444/1756 571/1743(25·3%) (32·8%)
170·0−41·8 0·78 (SE 0·07)
ER10−99 fmol/mg 546/2255 751/2330(24·2%) (32·2%)
236·3−75·2 0·73 (SE 0·06)
ER100+ fmol/mg 374/1639 457/1654(22·8%) (27·6%)
143·8−26·8 0·83 (SE 0·08)
ER+, poorly differentiated
175/772 234/838(22·7%) (27·9%)
89·6−26·6 0·74 (SE 0·09)
ER+, moderately/well differentiated
317/1864 422/1876(17·0%) (22·5%)
166·2−51·0 0·74 (SE 0·07)
2074/7419
2491/7321
(28·0%) (34·0%)−229·0 901·4 0·776 (SE 0·029)
2p < 0·00001 Total
Allocated
99% or 95% confidence intervals .0·5 1·0 1·5
Chemo. better Chemo. worse
Treatment effect 2p < 0·00001
Global heterogeneity: χ27 = 8·4; p = 0·3
* Forest plots (webappendix pp 39−44) give details of each trial’s cytotoxic regimensAnthracyclines: A = doxorubicin (Adriamycin), E = epirubicin. Other cytotoxics: C = cyclophosphamide, M = methotrexate, F = fluorouracilDose/cycle (and cumulative dosage) is given after the drug name in mg/m²; A60/E90 means 60 mg/m² of doxorubicin or 90 mg/m² of epirubicin
† In the SWOG 8814 trial of CAF in postmenopausal ER+ disease, tamoxifen started randomly with or after the chemotherapy.‡ chem+end. = chemo−endocrine therapy; 5yr end. = 5 years of tamoxifen (or, in part of one trial, toremifine)

P 7: Subgroup analyses of RECURRENCE, taxane-plus-anthracycline-based regimen vs SAME, or MORE (< doubled or ~doubled) non-taxane cytotoxic chemotherapy NB First four subgroups are as in forest plots*.
Early recurrence (first 5 years) Any recurrence Category
Events/woman−yearsAllocated
taxane non-tax.Ratio of annual event rates
Taxane : Non-tax.Logrank Variance
O−E of O−E
Taxane events
(a) Same, or more, non-taxane chemo. for controls* (χ 23 = 11·2; p = 0·01)
Same (1×) †ie, unconfounded
1280/23191 1449/22515(5·5%/y) (6·4%/y)
557·3−95·6 0·84 (SE 0·04)
More (<2×) † 582/14214 762/13901(4·1%/y) (5·5%/y)
304·5−89·6 0·75 (SE 0·05)
More (<2×) © 1093/27383 1251/27092(4·0%/y) (4·6%/y)
513·8−74·2 0·87 (SE 0·04)
More (≈2×) † 932/17824 979/17520(5·2%/y) (5·6%/y)
428·4−19·6 0·96 (SE 0·05)
(b) Taxane (D/P*) schedule (χ23 = 7·7; p = 0·05)
4(D100) q3w † 1148/22573 1264/22003(5·1%/y) (5·7%/y)
483·8−61·7 0·88 (SE 0·04)
Other docetaxel 1319/33659 1591/33143(3·9%/y) (4·8%/y)
668·8−137·9 0·81 (SE 0·03)
4(P175) q3w † 764/12139 787/11916(6·3%/y) (6·6%/y)
350·9−14·8 0·96 (SE 0·05)
Other paclitaxel 656/14241 799/13966(4·6%/y) (5·7%/y)
300·4−64·6 0·81 (SE 0·05)
(c) Concurrent endocrine therapy if ER+? (χ21 = 0·4; 2p = 0·5; NS)
Yes 117/2491 145/2393(4·7%/y) (6·1%/y)
58·3−14·2 0·78 (SE 0·12)
No (any endocrine onlyafter chemo ended)
3770/80121 4296/78635(4·7%/y) (5·5%/y)
1652·8−262·8 0·85 (SE 0·02)
(d) Entry age (trend χ21 = 1·4; 2p = 0·2; NS)
Age < 45 1387/23865 1545/23392(5·8%/y) (6·6%/y)
595·5−87·3 0·86 (SE 0·04)
45 − 54 1337/31982 1506/31433(4·2%/y) (4·8%/y)
581·7−79·6 0·87 (SE 0·04)
55 − 69 1104/25592 1296/24985(4·3%/y) (5·2%/y)
506·4−97·4 0·83 (SE 0·04)
70+ 59/1168 94/1218(5·1%/y) (7·7%/y)
27·5−12·8 0·63 (SE 0·15)
Age unknown 0/5 0/0(0·0%/y)
(e) Nodal status before chemo (trend χ21 = 0·0; 2p = 0·8; NS)
N0/N− 244/10064 267/9929(2·4%/y) (2·7%/y)
117·7−15·7 0·87 (SE 0·09)
N1−3 866/28034 1000/27588(3·1%/y) (3·6%/y)
429·4−67·4 0·85 (SE 0·04)
N4+ 1216/17834 1393/17572(6·8%/y) (7·9%/y)
519·2−83·2 0·85 (SE 0·04)
Other / unknown 1561/26680 1781/25939(5·9%/y) (6·9%/y)
644·9−110·7 0·84 (SE 0·04)
(f) ER status (χ21 = 0·0; 2p = 0·8; NS)
ER-poor 1600/22984 1856/22731(7·0%/y) (8·2%/y)
695·8−108·3 0·86 (SE 0·04)
ER+ 1863/52444 2123/51609(3·6%/y) (4·1%/y)
874·6−144·7 0·85 (SE 0·03)
ER unknown 424/7184 462/6688(5·9%/y) (6·9%/y)
140·7−24·0 0·84 (SE 0·08)
Subsets of ER+
ER+ PR-poor 374/8277 454/8063(4·5%/y) (5·6%/y)
178·9−46·1 0·77 (SE 0·07)
ER+ PR+ 1279/39301 1458/38676(3·3%/y) (3·8%/y)
605·0−96·5 0·85 (SE 0·04)
ER+ N0/N− 94/5441 105/5619(1·7%/y) (1·9%/y)
47·6−4·8
ER+ N1−3 472/20845 566/20543(2·3%/y) (2·8%/y)
245·7−47·9 0·82 (SE 0·06)
ER+ N4+ 681/12769 772/12383(5·3%/y) (6·2%/y)
302·5−51·8 0·84 (SE 0·05)
ER10−99 fmol/mg 69/1758 73/1600(3·9%/y) (4·6%/y)
30·0−4·9
ER100+ fmol/mg 5/133 8/117(3·8%/y) (6·8%/y)
1·8−1·5
ER+, unknown level (eg, by IHC)
1789/50541 2042/49898(3·5%/y) (4·1%/y)
846·9−135·1 0·85 (SE 0·03)
ER+ HER2− 510/16780 579/16890(3·0%/y) (3·4%/y)
257·8−33·9 0·88 (SE 0·06)
ER+ HER2+ 183/3579 227/3589(5·1%/y) (6·3%/y)
90·4−22·1 0·78 (SE 0·09)
ER+ HER2 unk. 1170/32045 1317/31093(3·7%/y) (4·2%/y)
524·4−86·2 0·85 (SE 0·04)
(g) Tumour differentiation (χ21 = 2·7; 2p = 0·10; NS)
Poorly-diff. 1429/22556 1568/22202(6·3%/y) (7·1%/y)
648·3−70·9 0·90 (SE 0·04)
Moderately-diff. 827/26164 1042/25819(3·2%/y) (4·0%/y)
415·0−103·9 0·78 (SE 0·04)
Well-diff. 215/8517 231/8205(2·5%/y) (2·8%/y)
103·0−6·3 0·94 (SE 0·10)
Grade unknown 1416/25523 1600/24961(5·5%/y) (6·4%/y)
579·3−97·0 0·85 (SE 0·04)
(h) Tumour diameter (trend χ21 = 0·0; 2p = 1·0; NS)
1 − 20 mm (T1) 909/28139 1041/27942(3·2%/y) (3·7%/y)
431·2−61·1 0·87 (SE 0·04)
21 − 50 mm (T2) 1672/30190 1923/29716(5·5%/y) (6·5%/y)
762·9−132·4 0·84 (SE 0·03)
> 50 mm (T3/T4) 547/9090 582/8704(6·0%/y) (6·7%/y)
229·8−28·6 0·88 (SE 0·06)
Other / unknown 759/15179 895/14650(5·0%/y) (6·1%/y)
289·9−64·3 0·80 (SE 0·05)
(i) Tumour differentiation and ER (χ23 = 11·0; p = 0·01)
Poorly, ER-poor 705/9494 833/9408(7·4%/y) (8·9%/y)
322·4−54·8 0·84 (SE 0·05)
Poorly, ER+ 683/12480 690/12286(5·5%/y) (5·6%/y)
303·0−13·0 0·96 (SE 0·06)
Mod./Well ER-poor 341/5643 370/5665(6·0%/y) (6·5%/y)
150·7−6·9 0·96 (SE 0·08)
Mod./Well ER+ 672/28074 874/27536(2·4%/y) (3·2%/y)
349·2−97·2 0·76 (SE 0·05)
Any unknown 1486/26931 1674/26157(5·5%/y) (6·4%/y)
598·0−103·9 0·84 (SE 0·04)
(j) Entry age and ER status (χ27 = 5·8; p = 0·6; NS)
Age < 45, ER-poor 574/7537 654/7702(7·6%/y) (8·5%/y)
247·6−25·1 0·90 (SE 0·06)
< 45, ER+ 629/13925 723/13444(4·5%/y) (5·4%/y)
292·1−61·4 0·81 (SE 0·05)
45 − 54, ER-poor 555/8476 652/8322(6·5%/y) (7·8%/y)
241·9−43·6 0·83 (SE 0·06)
45 − 54, ER+ 641/20627 682/20467(3·1%/y) (3·3%/y)
291·5−22·1 0·93 (SE 0·06)
55 − 69, ER-poor 445/6678 508/6382(6·7%/y) (8·0%/y)
195·1−34·3 0·84 (SE 0·07)
55 − 69, ER+ 566/17135 683/16953(3·3%/y) (4·0%/y)
277·9−56·7 0·82 (SE 0·05)
70+, ER-poor 26/292 42/325(8·9%/y) (12·9%/y)
11·2−5·2
70+, ER+ 27/753 35/745(3·6%/y) (4·7%/y)
13·0−4·5
Any unknown 424/7189 462/6688(5·9%/y) (6·9%/y)
140·7−24·0 0·84 (SE 0·08)
(k) Site of first recurrence (χ22 = 1·3; p = 0·5; NS)
Isolated local 597/80546 741/79033(0·7%/y) (0·9%/y)
294·4−61·8 0·81 (SE 0·05)
Contralateral 221/80534 260/79030(0·3%/y) (0·3%/y)
107·2−20·7 0·82 (SE 0·09)
Distant/Multiple 2872/82612 3199/81028(3·5%/y) (3·9%/y)
1217·7−171·3 0·87 (SE 0·03)
Unknown 197/82288 241/80749(0·2%/y) (0·3%/y)
91·7−23·2 0·78 (SE 0·09)
(l) Time since randomisation (χ21 = 0·8; 2p = 0·4; NS)
Years 0 − 1 1964/41153 2213/40791(4·8%/y) (5·4%/y)
844·6−118·5 0·87 (SE 0·03)
2 − 4 1923/41256 2228/40024(4·7%/y) (5·6%/y)
866·5−158·5 0·83 (SE 0·03)
3887/82612
4441/81028
(4·7%/y) (5·5%/y)
−277·0 1711·1 0·851 (SE 0·022)2p < 0·00001
Total
Allocated
99% or 95% confidence intervals .0·5 1·0 1·5
Taxane better Non-tax. better
Treatment effect 2p < 0·00001
Global heterogeneity: χ225
= 42·1; p = 0·02
* Forest plots (webappendix pp 21-26) give details of each trial’s cytotoxic regimensD = docetaxel; P = paclitaxel; 4(D100) q3w means 4 doses of docetaxel 100 mg/m² at intervals of 3 weeks
† Taxane courses do not overlap other chemotherapy courses© Taxane given concurrently with anthracycline
Category
Events/woman−yearsAllocated
taxane non-tax.Ratio of annual event rates
Taxane : Non-tax.Logrank Variance
O−E of O−E
Taxane events
(a) Same, or more, non-taxane chemo. for controls* (χ 23 = 11·2; p = 0·01)
Same (1×) †ie, unconfounded
1693/36543 1897/34877(4·6%/y) (5·4%/y)
740·1−126·0 0·84 (SE 0·03)
More (<2×) † 613/14791 794/14444(4·1%/y) (5·5%/y)
318·8−90·5 0·75 (SE 0·05)
More (<2×) © 1183/30976 1332/30674(3·8%/y) (4·3%/y)
552·7−71·7 0·88 (SE 0·04)
More (≈2×) † 964/18750 1010/18477(5·1%/y) (5·5%/y)
442·8−19·5 0·96 (SE 0·05)
(b) Taxane (D/P*) schedule (χ23 = 4·8; p = 0·2; NS)
4(D100) q3w † 1305/27034 1421/26148(4·8%/y) (5·4%/y)
536·8−64·0 0·89 (SE 0·04)
Other docetaxel 1420/37570 1685/36993(3·8%/y) (4·6%/y)
714·8−136·5 0·83 (SE 0·03)
4(P175) q3w † 875/16282 921/15641(5·4%/y) (5·9%/y)
409·0−30·6 0·93 (SE 0·05)
Other paclitaxel 853/20174 1006/19690(4·2%/y) (5·1%/y)
393·7−76·6 0·82 (SE 0·05)
(c) Concurrent endocrine therapy if ER+? (χ21 = 0·5; 2p = 0·5; NS)
Yes 130/2870 162/2738(4·5%/y) (5·9%/y)
65·1−15·7 0·79 (SE 0·11)
No (any endocrine onlyafter chemo ended)
4323/98190 4871/95734(4·4%/y) (5·1%/y)
1892·4−289·9 0·86 (SE 0·02)
(d) Entry age (trend χ21 = 2·3; 2p = 0·1; NS)
Age < 45 1599/29442 1741/28676(5·4%/y) (6·1%/y)
683·4−89·9 0·88 (SE 0·04)
45 − 54 1526/39201 1710/38249(3·9%/y) (4·5%/y)
664·0−90·1 0·87 (SE 0·04)
55 − 69 1254/30822 1468/29987(4·1%/y) (4·9%/y)
576·1−110·4 0·83 (SE 0·04)
70+ 74/1586 114/1560(4·7%/y) (7·3%/y)
34·0−15·2 0·64 (SE 0·14)
Age unknown 0/9 0/0(0·0%/y)
(e) Nodal status before chemo (trend χ21 = 0·0; 2p = 0·9; NS)
N0/N− 273/12000 296/11818(2·3%/y) (2·5%/y)
131·2−16·4 0·88 (SE 0·08)
N1−3 1014/33831 1165/33153(3·0%/y) (3·5%/y)
503·7−77·5 0·86 (SE 0·04)
N4+ 1342/20106 1510/19714(6·7%/y) (7·7%/y)
570·7−83·7 0·86 (SE 0·04)
Other / unknown 1824/35123 2062/33787(5·2%/y) (6·1%/y)
751·9−128·0 0·84 (SE 0·03)
(f) ER status (χ21 = 0·1; 2p = 0·7; NS)
ER-poor 1751/28414 2006/27845(6·2%/y) (7·2%/y)
759·9−111·6 0·86 (SE 0·03)
ER+ 2175/62322 2462/61080(3·5%/y) (4·0%/y)
1025·0−167·3 0·85 (SE 0·03)
ER unknown 527/10324 565/9547(5·1%/y) (5·9%/y)
172·6−26·7 0·86 (SE 0·07)
Subsets of ER+
ER+ PR-poor 440/9902 504/9452(4·4%/y) (5·3%/y)
205·2−45·2 0·80 (SE 0·06)
ER+ PR+ 1515/47333 1743/46525(3·2%/y) (3·7%/y)
727·7−124·0 0·84 (SE 0·03)
ER+ N0/N− 111/6594 124/6798(1·7%/y) (1·8%/y)
56·1−5·3 0·91 (SE 0·13)
ER+ N1−3 580/25061 683/24553(2·3%/y) (2·8%/y)
299·5−55·3 0·83 (SE 0·05)
ER+ N4+ 778/14355 864/13965(5·4%/y) (6·2%/y)
343·4−51·1 0·86 (SE 0·05)
ER10−99 fmol/mg 77/2073 82/1872(3·7%/y) (4·4%/y)
33·6−5·6
ER100+ fmol/mg 7/175 8/150(4·0%/y) (5·3%/y)
1·8−1·5
ER+, unknown level (eg, by IHC)
2091/60066 2372/59065(3·5%/y) (4·0%/y)
994·2−157·5 0·85 (SE 0·03)
ER+ HER2− 558/18751 635/18806(3·0%/y) (3·4%/y)
282·5−38·5 0·87 (SE 0·06)
ER+ HER2+ 197/4126 243/4074(4·8%/y) (6·0%/y)
97·0−22·8 0·79 (SE 0·09)
ER+ HER2 unk. 1420/39407 1584/38168(3·6%/y) (4·2%/y)
643·5−100·6 0·86 (SE 0·04)
(g) Tumour differentiation (χ21 = 2·3; 2p = 0·1; NS)
Poorly-diff. 1549/25964 1686/25293(6·0%/y) (6·7%/y)
703·6−74·5 0·90 (SE 0·04)
Moderately-diff. 958/30323 1172/29868(3·2%/y) (3·9%/y)
476·1−107·3 0·80 (SE 0·04)
Well-diff. 253/10407 276/10090(2·4%/y) (2·7%/y)
122·5−9·5 0·93 (SE 0·09)
Grade unknown 1693/34489 1899/33359(4·9%/y) (5·7%/y)
694·2−115·8 0·85 (SE 0·03)
(h) Tumour diameter (trend χ21 = 0·0; 2p = 0·9; NS)
1 − 20 mm (T1) 1069/34736 1224/34447(3·1%/y) (3·6%/y)
511·7−73·8 0·87 (SE 0·04)
21 − 50 mm (T2) 1883/36233 2132/35251(5·2%/y) (6·0%/y)
860·0−137·8 0·85 (SE 0·03)
> 50 mm (T3/T4) 573/10008 612/9469(5·7%/y) (6·5%/y)
242·6−34·6 0·87 (SE 0·06)
Other / unknown 928/20056 1065/19281(4·6%/y) (5·5%/y)
348·3−68·3 0·82 (SE 0·05)
(i) Tumour differentiation and ER (χ23 = 10·2; p = 0·02)
Poorly, ER-poor 746/11023 881/10730(6·8%/y) (8·2%/y)
342·9−59·7 0·84 (SE 0·05)
Poorly, ER+ 758/14309 760/14040(5·3%/y) (5·4%/y)
336·5−11·6 0·97 (SE 0·05)
Mod./Well ER-poor 371/6903 401/7000(5·4%/y) (5·7%/y)
164·8−8·2 0·95 (SE 0·08)
Mod./Well ER+ 810/32821 1016/32098(2·5%/y) (3·2%/y)
414·6−102·2 0·78 (SE 0·04)
Any unknown 1768/36016 1975/34614(4·9%/y) (5·7%/y)
713·2−122·3 0·84 (SE 0·03)
(j) Entry age and ER status (χ27 = 6·5; p = 0·5; NS)
Age < 45, ER-poor 632/9393 707/9610(6·7%/y) (7·4%/y)
272·8−22·6 0·92 (SE 0·06)
< 45, ER+ 740/16573 828/15826(4·5%/y) (5·2%/y)
341·9−67·3 0·82 (SE 0·05)
45 − 54, ER-poor 604/10486 703/10123(5·8%/y) (6·9%/y)
262·2−46·7 0·84 (SE 0·06)
45 − 54, ER+ 742/24550 798/24352(3·0%/y) (3·3%/y)
342·1−28·4 0·92 (SE 0·05)
55 − 69, ER-poor 487/8136 548/7692(6·0%/y) (7·1%/y)
212·2−36·1 0·84 (SE 0·06)
55 − 69, ER+ 654/20182 793/19969(3·2%/y) (4·0%/y)
324·0−67·1 0·81 (SE 0·05)
70+, ER-poor 28/398 48/420(7·0%/y) (11·4%/y)
12·8−6·2 0·61 (SE 0·22)
70+, ER+ 39/1009 43/933(3·9%/y) (4·6%/y)
17·1−4·5
Any unknown 527/10333 565/9547(5·1%/y) (5·9%/y)
172·6−26·7 0·86 (SE 0·07)
(k) Site of first recurrence (χ22 = 0·8; p = 0·7; NS)
Isolated local 686/98994 831/96477(0·7%/y) (0·9%/y)
334·0−65·6 0·82 (SE 0·05)
Contralateral 314/98976 350/96474(0·3%/y) (0·4%/y)
146·8−21·0 0·87 (SE 0·08)
Distant/Multiple 3230/101060 3583/98472(3·2%/y) (3·6%/y)
1373·9−193·8 0·87 (SE 0·03)
Unknown 223/100718 269/98176(0·2%/y) (0·3%/y)
103·4−25·2 0·78 (SE 0·09)
(l) Time since randomisation (trend χ21 = 0·0; 2p = 0·9; NS)
Years 0 − 1 1964/41153 2213/40791(4·8%/y) (5·4%/y)
844·6−118·5 0·87 (SE 0·03)
2 − 4 1923/41256 2228/40024(4·7%/y) (5·6%/y)
866·5−158·5 0·83 (SE 0·03)
5 − 9 534/17686 561/16702(3·0%/y) (3·4%/y)
232·9−26·8 0·89 (SE 0·06)
10+ 32/533 31/497(6·0%/y) (6·2%/y)
13·5−1·8
4453/101060
5033/98472
(4·4%/y) (5·1%/y)
−305·6 1957·5 0·855 (SE 0·021)2p < 0·00001
Total
Allocated
99% or 95% confidence intervals .0·5 1·0 1·5
Taxane better Non-tax. better
Treatment effect 2p < 0·00001
Global heterogeneity: χ225
= 38·7; p = 0·04
* Forest plots (webappendix pp 21-26) give details of each trial’s cytotoxic regimensD = docetaxel; P = paclitaxel; 4(D100) q3w means 4 doses of docetaxel 100 mg/m² at intervals of 3 weeks
† Taxane courses do not overlap other chemotherapy courses© Taxane given concurrently with anthracycline

P 8: Subgroup analyses of BREAST CANCER MORTALITY (mortality with recurrence, by logrank subtraction), taxane-plus-anthracycline-based regimen vs SAME, or MORE (< doubled or ~doubled) non-taxane cytotoxic chemotherapy NB First four subgroups are as in forest plots*.
CategoryDeaths/Women
Allocatedtaxane non-tax.
Ratio of annual death ratesTaxane : Non-tax.
Logrank VarianceO−E of O−E
Taxane deaths
(a) Same, or more, non-taxane chemo. for controls* (χ 23 = 2·0; p = 0·6; NS)
Same (1×) †ie, unconfounded
1169/5590 1306/5577(20·9%) (23·4%)
520·8−79·8 0·86 (SE 0·04)
More (<2×) † 339/4282 407/4302(7·9%) (9·5%)
172·3−31·3 0·83 (SE 0·07)
More (<2×) © 587/7071 665/7076(8·3%) (9·4%)
278·9−32·1 0·89 (SE 0·06)
More (≈2×) † 546/5185 590/5168(10·5%) (11·4%)
259·3−15·8 0·94 (SE 0·06)
(b) Taxane (D/P*) schedule (χ23 = 1·0; p = 0·8; NS)
4(D100) q3w † 816/6480 887/6476(12·6%) (13·7%)
338·1−31·6 0·91 (SE 0·05)
Other docetaxel 716/8396 844/8409(8·5%) (10·0%)
366·9−58·4 0·85 (SE 0·05)
4(P175) q3w † 572/3528 612/3502(16·2%) (17·5%)
274·4−30·1 0·90 (SE 0·06)
Other paclitaxel 537/3724 625/3736(14·4%) (16·7%)
251·9−38·9 0·86 (SE 0·06)
(c) Concurrent endocrine therapy if ER+? (χ21 = 0·2; 2p = 0·6; NS)
Yes 87/713 93/723(12·2%) (12·9%)
40·5−2·7
No (any endocrine onlyafter chemo ended)
2554/21415 2875/21400(11·9%) (13·4%)
1136·0−158·3 0·87 (SE 0·03)
(d) Entry age (trend χ21 = 3·5; 2p = 0·06)
Age < 45 871/5930 928/5927(14·7%) (15·7%)
384·6−36·7 0·91 (SE 0·05)
45 − 54 835/7747 932/7720(10·8%) (12·1%)
372·3−41·4 0·89 (SE 0·05)
55 − 69 735/6572 877/6570(11·2%) (13·3%)
346·5−69·0 0·82 (SE 0·05)
70+ 51/314 81/343(16·2%) (23·6%)
24·4−11·4 0·63 (SE 0·16)Age unknown 149/1565 150/1563
(9·5%) (9·6%)48·6−2·5
(e) Nodal status before chemo (trend χ21 = 0·3; 2p = 0·6; NS)
N0/N− 120/2104 132/2070(5·7%) (6·4%)
61·0−6·0 0·91 (SE 0·12)
N1−3 520/6981 599/6977(7·4%) (8·6%)
262·1−41·9 0·85 (SE 0·06)
N4+ 783/5012 849/5062(15·6%) (16·8%)
338·8−29·9 0·92 (SE 0·05)
Other / unknown 1218/8031 1388/8014(15·2%) (17·3%)
514·6−83·1 0·85 (SE 0·04)
(f) ER status (χ21 = 0·1; 2p = 0·7; NS)
ER-poor 1087/5883 1271/6027(18·5%) (21·1%)
505·0−78·0 0·86 (SE 0·04)
ER+ 1044/12848 1164/12790(8·1%) (9·1%)
502·3−67·1 0·87 (SE 0·04)
ER unknown 510/3397 533/3306(15·0%) (16·1%)
169·1−15·9 0·91 (SE 0·07)
Subsets of ER+
ER+ PR-poor 229/2056 280/2064(11·1%) (13·6%)
113·7−30·2 0·77 (SE 0·08)
ER+ PR+ 710/9553 768/9492(7·4%) (8·1%)
340·7−29·8 0·92 (SE 0·05)
ER+ N0/N− 43/1155 49/1175(3·7%) (4·2%)
22·5−1·9
ER+ N1−3 241/5109 296/5096(4·7%) (5·8%)
129·5−30·7 0·79 (SE 0·08)
ER+ N4+ 405/3460 421/3435(11·7%) (12·3%)
177·2−9·8 0·95 (SE 0·07)
ER10−99 fmol/mg 24/424 26/387(5·7%) (6·7%)
9·9−1·4
ER100+ fmol/mg 4/29 3/25(13·8%) (12·0%)
0·70·8
ER+, unknown level (eg, by IHC)
1016/12395 1135/12378(8·2%) (9·2%)
494·0−63·7 0·88 (SE 0·04)
ER+ HER2− 273/4613 296/4656(5·9%) (6·4%)
136·2−11·3 0·92 (SE 0·08)
ER+ HER2+ 98/978 114/1022(10·0%) (11·2%)
47·5−6·2 0·88 (SE 0·14)
ER+ HER2 unk. 673/7257 754/7112(9·3%) (10·6%)
317·5−45·2 0·87 (SE 0·05)
(g) Tumour differentiation (trend χ21 = 2·5; 2p = 0·1; NS)
Poorly-diff. 974/6230 1019/6253(15·6%) (16·3%)
443·9−23·5 0·95 (SE 0·05)
Moderately-diff. 442/6730 539/6744(6·6%) (8·0%)
222·7−46·1 0·81 (SE 0·06)
Well-diff. 121/2056 144/1981(5·9%) (7·3%)
62·3−9·6 0·86 (SE 0·12)Grade unknown 1104/7112 1266/7145
(15·5%) (17·7%)467·9−83·5 0·84 (SE 0·04)
(h) Tumour diameter (trend χ21 = 0·7; 2p = 0·4; NS)
1 − 20 mm (T1) 537/6606 638/6627(8·1%) (9·6%)
268·1−41·7 0·86 (SE 0·06)
21 − 50 mm (T2) 1094/7406 1247/7443(14·8%) (16·8%)
520·7−78·6 0·86 (SE 0·04)
> 50 mm (T3/T4) 318/2578 301/2494(12·3%) (12·1%)
130·2−7·0 0·95 (SE 0·09)
Other / unknown 692/5538 782/5559(12·5%) (14·1%)
255·6−41·1 0·85 (SE 0·06)
(i) Tumour differentiation and ER (χ23 = 12·5; p = 0·006)
Poorly, ER-poor 509/2699 591/2778(18·9%) (21·3%)
239·2−34·9 0·86 (SE 0·06)
Poorly, ER+ 440/3362 398/3330(13·1%) (12·0%)
189·814·8 1·08 (SE 0·08)
Mod./Well ER-poor 225/1495 238/1494(15·1%) (15·9%)
102·4−7·3 0·93 (SE 0·10)
Mod./Well ER+ 321/7053 428/7025(4·6%) (6·1%)
171·6−49·0 0·75 (SE 0·07)
Any unknown 1146/7519 1313/7496(15·2%) (17·5%)
480·5−86·1 0·84 (SE 0·04)
(j) Entry age and ER status (χ27 = 7·2; p = 0·2; NS) x
Age < 45, ER-poor 381/1889 418/2006(20·2%) (20·8%)
175·0−9·0 0·95 (SE 0·07)
< 45, ER+ 334/3415 373/3349(9·8%) (11·1%)
161·5−30·2 0·83 (SE 0·07)
45 − 54, ER-poor 387/2133 439/2157(18·1%) (20·4%)
175·7−22·5 0·88 (SE 0·07)
45 − 54, ER+ 332/4901 352/4874(6·8%) (7·2%)
156·4−7·5 0·95 (SE 0·08)
55 − 69, ER-poor 297/1771 380/1765(16·8%) (21·5%)
143·5−42·5 0·74 (SE 0·07)
55 − 69, ER+ 355/4338 413/4368(8·2%) (9·5%)
174·5−25·8 0·86 (SE 0·07)
70+, ER-poor 22/89 34/99(24·7%) (34·3%)
10·8−3·9
70+, ER+ 23/193 26/198(11·9%) (13·1%)
9·9−3·7
Any unknown 510/3399 533/3307(15·0%) (16·1%)
169·1−15·9 0·91 (SE 0·07)
(k) Time since randomisation (trend χ21 = 0·3; 2p = 0·6; NS)
Years 0 − 1 646/20565 715/20561(3·1%) (3·5%)
285·9−24·1 0·92 (SE 0·06)
2 − 4 1339/18838 1538/18691(7·1%) (8·2%)
612·1−99·3 0·85 (SE 0·04)
5 − 9 483/8823 553/8630(5·5%) (6·4%)
221·7−40·3 0·83 (SE 0·06)
10+ 24/1011 12/928(2·4%) (1·3%)
8·05·3
2641/22128
2968/22123
(11·9%) (13·4%)−161·0 1176·5 0·872 (SE 0·027)
2p < 0·00001 Total
Allocated
99% or 95% confidence intervals .0·5 1·0 1·5
Taxane better Non−tax. better
Treatment effect 2p < 0·00001
Global heterogeneity: χ223 = 30·3; p = 0·1
* Forest plots (webappendix pp 21-26) give details of each trial’s cytotoxic regimensD = docetaxel; P = paclitaxel; 4(D100) q3w means 4 doses of docetaxel 100 mg/m² at intervals of 3 weeks
† Taxane courses do not overlap other chemotherapy courses© Taxane given concurrently with anthracycline

P 9: Subgroup analyses of RECURRENCE, any anthracycline-based regimen vs. standard CMF (or near-standard CMF). NB First four subgroups are as in forest plots*.
Early recurrence (first 5 years) Any recurrence Category
Events/woman−yearsAllocated
anthr. CMFRatio of annual event rates
Anthr. : CMFLogrank Variance
O−E of O−E
Anthr. events
(a) Cumulative anthracycline dosage, if dose/cycle ≥A60/E90* (trend χ2
1 = 6·7; 2p = 0·01)A360 or E720−800:
eg, CAF/CEF381/9229 473/9038(4·1%/y) (5·2%/y)
194·3−50·9 0·77 (SE 0·06)
A300 or E400−480 608/10194 669/9997(6·0%/y) (6·7%/y)
262·7−24·0 0·91 (SE 0·06)
A240: standard 4AC 820/10274 830/10090(8·0%/y) (8·2%/y)
355·5−8·7 0·98 (SE 0·05)
White: dose/cycle< A60/E90
398/6194 389/6021(6·4%/y) (6·5%/y)
170·9−10·0 0·94 (SE 0·07)
(b) Cyclophosphamide in CMF oral/iv (χ21 = 1·2; 2p = 0·3; NS)
C100×14 oral 1708/26046 1859/25377(6·6%/y) (7·3%/y)
768·7−87·1 0·89 (SE 0·03)
C600×2 iv 499/9845 502/9769(5·1%/y) (5·1%/y)
214·8−6·5 0·97 (SE 0·07)
(c) Concurrent endocrine therapy if ER+? (χ21 = 0·8; 2p = 0·4; NS)
Yes 73/2251 70/2231(3·2%/y) (3·1%/y)
34·21·9
No (any endocrine onlyafter chemo ended)
2134/33730 2291/32915(6·3%/y) (7·0%/y)
949·3−95·5 0·90 (SE 0·03)
(d) Entry age (trend χ21 = 0·1; 2p = 0·8; NS)
Age < 45 963/13406 1067/13306(7·2%/y) (8·0%/y)
433·2−43·7 0·90 (SE 0·05)
45 − 54 802/13866 824/13475(5·8%/y) (6·1%/y)
357·6−25·9 0·93 (SE 0·05)
55 − 69 406/8013 430/7708(5·1%/y) (5·6%/y)
178·9−26·2 0·86 (SE 0·07)
70+ 20/427 23/426(4·7%/y) (5·4%/y)
8·2−0·1
Age unknown 16/179 17/231(8·9%/y) (7·4%/y)
5·52·3
(e) Nodal status (trend χ21 = 0·3; 2p = 0·6; NS)
N0/N− 558/16757 593/16587(3·3%/y) (3·6%/y)
265·3−16·0 0·94 (SE 0·06)
N1−3 583/9794 603/9587(6·0%/y) (6·3%/y)
259·9−13·5 0·95 (SE 0·06)
N4+ 613/3996 663/3798(15·3%/y) (17·5%/y)
253·4−27·2 0·90 (SE 0·06)
Other / unknown 453/5344 502/5174(8·5%/y) (9·7%/y)
204·9−36·9 0·84 (SE 0·06)
(f) ER status (χ21 = 0·0; 2p = 0·9; NS)
ER−poor 1241/18040 1304/17790(6·9%/y) (7·3%/y)
547·2−34·7 0·94 (SE 0·04)
ER+ 688/13372 712/13152(5·1%/y) (5·4%/y)
305·3−17·3 0·95 (SE 0·06)
ER unknown 278/4479 345/4204(6·2%/y) (8·2%/y)
131·0−41·6 0·73 (SE 0·07)
Subsets of ER+
ER+ PR−poor 124/1805 119/1570(6·9%/y) (7·6%/y)
48·4−4·0
ER+ PR+ 404/8942 451/9074(4·5%/y) (5·0%/y)
189·8−20·1 0·90 (SE 0·07)
ER+ N0/N− 170/5561 187/5459(3·1%/y) (3·4%/y)
81·1−12·1 0·86 (SE 0·10) ER+ N1−3 181/4184 181/4197
(4·3%/y) (4·3%/y)77·91·7
ER+ N4+ 135/1168 138/1061(11·6%/y) (13·0%/y)
56·3−4·0
ER10−99 fmol/mg 246/4549 269/4532(5·4%/y) (5·9%/y)
103·2−17·5 0·84 (SE 0·09)
ER100+ fmol/mg 85/1973 119/1876(4·3%/y) (6·3%/y)
42·1−16·6 0·67 (SE 0·13) ER+, unknown
level (eg, by IHC)357/6752 324/6649(5·3%/y) (4·9%/y)
147·017·0
(g) Tumour differentiation (χ21 = 2·7; 2p = 0·10; NS)
Poorly−diff. 523/9730 593/9461(5·4%/y) (6·3%/y)
231·7−29·1 0·88 (SE 0·06)
Moderately/Well 352/7555 334/7521(4·7%/y) (4·4%/y)
150·57·0 1·05 (SE 0·08)
Grade unknown 1332/18564 1434/18133(7·2%/y) (7·9%/y)
607·8−70·1 0·89 (SE 0·04)
(h) Tumour diameter (trend χ21 = 0·3; 2p = 0·6; NS)
1 − 20 mm (T1) 579/13819 622/13741(4·2%/y) (4·5%/y)
269·4−13·8 0·95 (SE 0·06)
21 − 50 mm (T2) 964/13436 1019/13296(7·2%/y) (7·7%/y)
425·1−32·1 0·93 (SE 0·05)
> 50 mm (T3/T4) 123/1055 133/939(11·7%/y) (14·2%/y)
42·7−6·7 0·86 (SE 0·14)
Other / unknown 541/7551 587/7142(7·2%/y) (8·2%/y)
246·3−44·8 0·83 (SE 0·06)
(i) Tumour differentiation and ER (χ23 = 2·1; p = 0·6; NS)
Poorly, ER−poor 252/5157 269/5235(4·9%/y) (5·1%/y)
112·0−1·1 0·99 (SE 0·09)
Poorly, ER+ 183/3343 193/2970(5·5%/y) (6·5%/y)
73·9−10·5 0·87 (SE 0·11)Mod./Well ER−poor 120/2679 110/2328
(4·5%/y) (4·7%/y)50·2−2·5
Mod./Well ER+ 172/3768 171/4160(4·6%/y) (4·1%/y)
77·46·9
Any unknown 1480/20902 1618/20422(7·1%/y) (7·9%/y)
676·4−84·9 0·88 (SE 0·04)
(j) Entry age and ER status (χ27 = 1·8; p = 1·0; NS)
Age < 45, ER−poor 579/7496 633/7620(7·7%/y) (8·3%/y)
259·5−10·2 0·96 (SE 0·06)
< 45, ER+ 269/4310 280/4315(6·2%/y) (6·5%/y)
118·4−7·2 0·94 (SE 0·09)
45 − 54, ER−poor 460/6754 444/6477(6·8%/y) (6·9%/y)
197·5−7·7 0·96 (SE 0·07)
45 − 54, ER+ 248/5302 260/5145(4·7%/y) (5·1%/y)
112·6−7·3 0·94 (SE 0·09)
55 − 69, ER−poor 190/3535 205/3382(5·4%/y) (6·1%/y)
83·9−15·1 0·84 (SE 0·10)55 − 69, ER+ 157/3503 161/3470
(4·5%/y) (4·6%/y)69·3−3·7 0·95 (SE 0·12)
70+, ER−poor 8/219 17/265(3·7%/y) (6·4%/y)
4·9−1·5
70+, ER+ 9/171 5/119(5·3%/y) (4·2%/y)
2·80·5
Any unknown 287/4601 356/4353(6·2%/y) (8·2%/y)
134·7−41·4 0·74 (SE 0·07)
(k) Site of first recurrence (χ22 = 3·4; p = 0·2; NS)
Isolated local 279/25593 286/25046(1·1%/y) (1·1%/y)
130·8−8·3 0·94 (SE 0·08)
Contralateral 172/35881 160/35142(0·5%/y) (0·5%/y)
78·56·3
Distant/Multiple 1637/35891 1800/35146(4·6%/y) (5·1%/y)
717·8−93·5 0·88 (SE 0·03)
Unknown 119/35866 115/35124(0·3%/y) (0·3%/y)
56·31·9
(l) Time since randomisation (χ21 = 9·2; 2p = 0·002)
Years 0 − 1 1064/16586 1257/16378(6·4%/y) (7·7%/y)
490·8−94·4 0·83 (SE 0·04)
2 − 4 1143/19183 1104/18621(6·0%/y) (5·9%/y)
492·60·8 1·00 (SE 0·05)
2207/35891
2361/35146
(6·1%/y) (6·7%/y)−93·6 983·5 0·909 (SE 0·030)
2p = 0·003 Total
Allocated
99% or 95% confidence intervals .0·5 1·0 1·5
Anthr. better CMF better
Treatment effect 2p = 0·003
Global heterogeneity: χ221 = 28·6; p = 0·1
* Forest plots (webappendix pp 27−32) give details of each trial’s cytotoxic regimensAnthracyclines: A = doxorubicin (Adriamycin), E = epirubicin. Other cytotoxics: C = cyclophosphamide, M = methotrexate, F = fluorouracilDose/cycle (and cumulative dosage) is given after the drug name in mg/m²; A60/E90 means 60 mg/m² of doxorubicin or 90 mg/m² of epirubicin
CategoryEvents/woman−yearsAllocated
anthr. CMFRatio of annual event rates
Anthr. : CMFLogrank Variance
O−E of O−E
Anthr. events
(a) Cumulative anthracycline dosage, if dose/cycle ≥A60/E90* (trend χ2
1 = 4·8; 2p = 0·03)A360 or E720−800:
eg, CAF/CEF585/20175 670/19703(2·9%/y) (3·4%/y)
288·0−51·5 0·84 (SE 0·05)
A300 or E400−480 707/12972 767/12810(5·5%/y) (6·0%/y)
302·3−20·5 0·93 (SE 0·06)
A240: standard 4AC 1114/21307 1105/20804(5·2%/y) (5·3%/y)
489·9−6·8 0·99 (SE 0·04)
White: dose/cycle< A60/E90
525/10219 522/9961(5·1%/y) (5·2%/y)
227·6−13·3 0·94 (SE 0·06)
(b) Cyclophosphamide in CMF oral/iv (χ21 = 1·1; 2p = 0·3; NS)
C100×14 oral 2293/50195 2430/48833(4·6%/y) (5·0%/y)
1032·7−87·9 0·92 (SE 0·03)
C600×2 iv 638/14478 634/14445(4·4%/y) (4·4%/y)
275·2−4·2 0·99 (SE 0·06)
(c) Concurrent endocrine therapy if ER+? (χ21 = 2·7; 2p = 0·1; NS)
Yes 101/4053 87/4067(2·5%/y) (2·1%/y)
45·27·6
No (any endocrine onlyafter chemo ended)
2830/64673 2977/59211(4·4%/y) (5·0%/y)
1262·7−99·7 0·92 (SE 0·03)
(d) Entry age (trend χ21 = 0·2; 2p = 0·6; NS)
Age < 45 1267/25005 1367/24995(5·1%/y) (5·5%/y)
572·4−42·7 0·93 (SE 0·04)
45 − 54 1092/24816 1091/23939(4·4%/y) (4·6%/y)
484·7−20·2 0·96 (SE 0·04)
55 − 69 526/13869 558/13275(3·8%/y) (4·2%/y)
233·4−32·2 0·87 (SE 0·06)
70+ 28/789 31/808(3·5%/y) (3·8%/y)
11·3−0·2
Age unknown 18/194 17/261(9·3%/y) (6·5%/y)
6·03·3
(e) Nodal status (trend χ21 = 0·9; 2p = 0·3; NS)
N0/N− 804/31296 819/30996(2·6%/y) (2·6%/y)
375·8−8·5 0·98 (SE 0·05)
N1−3 798/17484 815/17250(4·6%/y) (4·7%/y)
358·3−12·8 0·96 (SE 0·05)
N4+ 745/7090 795/6512(10·5%/y) (12·2%/y)
310·0−30·6 0·91 (SE 0·05)
Other / unknown 584/8803 635/8520(6·6%/y) (7·5%/y)
263·9−40·1 0·86 (SE 0·06)
(f) ER status (χ21 = 0·1; 2p = 0·8; NS)
ER−poor 1619/35068 1669/34555(4·6%/y) (4·8%/y)
721·0−30·1 0·96 (SE 0·04)
ER+ 931/22500 967/22322(4·1%/y) (4·3%/y)
418·1−24·8 0·94 (SE 0·05)
ER unknown 381/7105 428/6401(5·4%/y) (6·7%/y)
168·7−37·1 0·80 (SE 0·07)
Subsets of ER+
ER+ PR−poor 167/3412 144/3053(4·9%/y) (4·7%/y)
62·81·0
ER+ PR+ 581/15853 641/16096(3·7%/y) (4·0%/y)
276·7−26·8 0·91 (SE 0·06)
ER+ N0/N− 271/10580 285/10464(2·6%/y) (2·7%/y)
127·4−12·0 0·91 (SE 0·08)
ER+ N1−3 236/6118 236/6093(3·9%/y) (3·9%/y)
102·2−0·3 1·00 (SE 0·10)
ER+ N4+ 166/1776 160/1615(9·3%/y) (9·9%/y)
67·7−0·3
ER10−99 fmol/mg 372/9657 383/9697(3·9%/y) (3·9%/y)
152·5−12·6 0·92 (SE 0·08)
ER100+ fmol/mg 147/4067 172/3792(3·6%/y) (4·5%/y)
66·4−16·9 0·78 (SE 0·11) ER+, unknown
level (eg, by IHC)412/8710 412/8755(4·7%/y) (4·7%/y)
177·83·8 1·02 (SE 0·08)
(g) Tumour differentiation (χ21 = 2·2; 2p = 0·1; NS)
Poorly−diff. 623/13923 677/13701(4·5%/y) (4·9%/y)
270·6−22·9 0·92 (SE 0·06)
Moderately/Well 465/11687 445/11639(4·0%/y) (3·8%/y)
196·110·6 1·06 (SE 0·07)
Grade unknown 1843/39038 1942/37924(4·7%/y) (5·1%/y)
846·9−78·9 0·91 (SE 0·03)
(h) Tumour diameter (trend χ21 = 0·4; 2p = 0·5; NS)
1 − 20 mm (T1) 842/25557 890/25285(3·3%/y) (3·5%/y)
392·2−13·6 0·97 (SE 0·05)
21 − 50 mm (T2) 1227/24532 1282/24601(5·0%/y) (5·2%/y)
542·2−33·8 0·94 (SE 0·04)
> 50 mm (T3/T4) 146/1942 152/1712(7·5%/y) (8·9%/y)
50·5−6·3 0·88 (SE 0·13)
Other / unknown 716/12612 740/11660(5·7%/y) (6·3%/y)
320·9−42·2 0·88 (SE 0·05)
(i) Tumour differentiation and ER (χ23 = 2·5; p = 0·5; NS)
Poorly, ER−poor 303/7951 310/8207(3·8%/y) (3·8%/y)
132·84·8 1·04 (SE 0·09)
Poorly, ER+ 218/4358 224/3890(5·0%/y) (5·8%/y)
86·7−10·5 0·89 (SE 0·10)Mod./Well ER−poor 159/4540 140/3922
(3·5%/y) (3·6%/y)65·1−0·8
Mod./Well ER+ 227/5514 231/6223(4·1%/y) (3·7%/y)
101·510·5
Any unknown 2024/42285 2159/41022(4·8%/y) (5·3%/y)
927·6−95·2 0·90 (SE 0·03)
(j) Entry age and ER status (χ27 = 6·0; p = 0·5; NS)
Age < 45, ER−poor 764/14966 815/15437(5·1%/y) (5·3%/y)
347·1−3·3 0·99 (SE 0·05)
< 45, ER+ 352/7380 380/7374(4·8%/y) (5·2%/y)
158·9−18·0 0·89 (SE 0·08)
45 − 54, ER−poor 597/13157 576/12364(4·5%/y) (4·7%/y)
259·1−13·0 0·95 (SE 0·06)
45 − 54, ER+ 359/8860 347/8780(4·1%/y) (4·0%/y)
158·75·9 1·04 (SE 0·08)
55 − 69, ER−poor 241/6522 255/6186(3·7%/y) (4·1%/y)
107·0−14·8 0·87 (SE 0·09)
55 − 69, ER+ 202/5820 223/5840(3·5%/y) (3·8%/y)
93·6−11·1 0·89 (SE 0·10)
70+, ER−poor 13/382 18/522(3·4%/y) (3·4%/y)
6·31·3
70+, ER+ 11/347 11/208(3·2%/y) (5·3%/y)
4·3−3·0
Any unknown 392/7239 439/6567(5·4%/y) (6·7%/y)
172·9−35·9 0·81 (SE 0·07)
(k) Site of first recurrence (χ22 = 13·2; p = 0·001)
Isolated local 343/43329 344/42463(0·8%/y) (0·8%/y)
159·6−8·6 0·95 (SE 0·08)
Contralateral 339/64648 271/63274(0·5%/y) (0·4%/y)
144·128·6
Distant/Multiple 2021/64673 2227/63278(3·1%/y) (3·5%/y)
896·7−113·5 0·88 (SE 0·03)
Unknown 228/64618 222/63244(0·4%/y) (0·4%/y)
107·91·7 1·02 (SE 0·10)
(l) Time since randomisation (trend χ21 = 10·4; 2p = 0·001)
Years 0 − 1 1064/16586 1257/16378(6·4%/y) (7·7%/y)
490·8−94·4 0·83 (SE 0·04)
2 − 4 1143/19183 1104/18621(6·0%/y) (5·9%/y)
492·60·8 1·00 (SE 0·05)
5 − 9 535/19578 552/19106(2·7%/y) (2·9%/y)
247·6−12·7 0·95 (SE 0·06)
10+ 189/8935 151/8766(2·1%/y) (1·7%/y)
76·814·2
2931/64673
3064/63278
(4·5%/y) (4·8%/y)−92·0 1307·9 0·932 (SE 0·027)
2p = 0·01 Total
Allocated
99% or 95% confidence intervals .0·5 1·0 1·5
Anthr. better CMF better
Treatment effect 2p = 0·01
Global heterogeneity: χ221 = 44·5; p = 0·002
* Forest plots (webappendix pp 27−32) give details of each trial’s cytotoxic regimensAnthracyclines: A = doxorubicin (Adriamycin), E = epirubicin. Other cytotoxics: C = cyclophosphamide, M = methotrexate, F = fluorouracilDose/cycle (and cumulative dosage) is given after the drug name in mg/m²; A60/E90 means 60 mg/m² of doxorubicin or 90 mg/m² of epirubicin

P 10: Subgroup analyses of BREAST CANCER MORTALITY (mortality with recurrence, by logrank subtraction), any anthracycline-based regimen vs. standard CMF (or near-standard CMF).NB First four subgroups are as in forest plots*.
CategoryDeaths/Women
Allocatedanthr. CMF
Ratio of annual death ratesAnthr. : CMF
Logrank VarianceO−E of O−E
Anthr. deaths
(a) Cumulative anthracycline dosage, if dose/cycle ≥A60/E90* (trend χ2
1 = 8·0; 2p = 0·005)A360 or E720−800:
eg, CAF/CEF378/2082 475/2097(18·2%) (22·7%)
198·0−50·0 0·78 (SE 0·06)
A300 or E400−480 396/2766 472/2770(14·3%) (17·0%)
183·1−35·9 0·82 (SE 0·07)
A240: standard 4AC 877/2565 886/2557(34·2%) (34·6%)
405·6−8·5 0·98 (SE 0·05)
White: dose/cycle< A60/E90
358/1530 357/1502(23·4%) (23·8%)
160·1−11·1 0·93 (SE 0·08)
(b) Cyclophosphamide in CMF oral/iv (χ21 = 0·9; 2p = 0·3; NS)
C100×14 oral 1651/6530 1834/6525(25·3%) (28·1%)
788·8−98·8 0·88 (SE 0·03)
C600×2 iv 358/2413 356/2401(14·8%) (14·8%)
157·9−6·6 0·96 (SE 0·08)
(c) Concurrent endocrine therapy if ER+? (χ21 = 0·0; 2p = 1·0; NS)
Yes 57/502 62/502(11·4%) (12·4%)
29·0−2·9
No (any endocrine onlyafter chemo ended)
1952/8441 2128/8424(23·1%) (25·3%)
917·8−102·5 0·89 (SE 0·03)
(d) Entry age (trend χ21 = 0·0; 2p = 0·9; NS)
Age < 45 871/3398 991/3454(25·6%) (28·7%)
422·8−54·8 0·88 (SE 0·05)
45 − 54 738/3399 773/3356(21·7%) (23·0%)
344·3−30·6 0·91 (SE 0·05)
55 − 69 375/1961 396/1920(19·1%) (20·6%)
169·3−20·2 0·89 (SE 0·07)
70+ 18/106 25/112(17·0%) (22·3%)
8·7−2·2
Age unknown 7/79 5/84(8·9%) (6·0%)
1·82·4
(e) Nodal status (trend χ21 = 0·9; 2p = 0·3; NS)
N0/N− 461/3865 541/3869(11·9%) (14·0%)
233·1−40·5 0·84 (SE 0·06)
N1−3 520/2442 543/2418(21·3%) (22·5%)
243·4−10·0 0·96 (SE 0·06)
N4+ 612/1234 647/1233(49·6%) (52·5%)
273·4−23·1 0·92 (SE 0·06)
Other / unknown 416/1402 459/1406(29·7%) (32·6%)
196·8−31·9 0·85 (SE 0·07)
(f) ER status (χ21 = 0·1; 2p = 0·8; NS)
ER−poor 1201/4488 1287/4518(26·8%) (28·5%)
564·6−43·7 0·93 (SE 0·04)
ER+ 569/3279 610/3257(17·4%) (18·7%)
267·0−26·5 0·91 (SE 0·06)
ER unknown 239/1176 293/1151(20·3%) (25·5%)
115·2−35·2 0·74 (SE 0·08)
Subsets of ER+
ER+ PR−poor 120/442 110/396(27·1%) (27·8%)
48·9−3·8
ER+ PR+ 323/2079 390/2146(15·5%) (18·2%)
166·0−29·7 0·84 (SE 0·07)
ER+ N0/N− 152/1285 170/1269(11·8%) (13·4%)
74·9−12·9 0·84 (SE 0·11) ER+ N1−3 123/1028 126/1033
(12·0%) (12·2%)54·4−1·9
ER+ N4+ 119/342 121/326(34·8%) (37·1%)
52·3−5·7 0·90 (SE 0·13)
ER10−99 fmol/mg 247/1072 279/1094(23·0%) (25·5%)
108·3−21·2 0·82 (SE 0·09)
ER100+ fmol/mg 86/450 116/450(19·1%) (25·8%)
42·0−15·4 0·69 (SE 0·13) ER+, unknown
level (eg, by IHC)236/1757 215/1713(13·4%) (12·6%)
99·77·6
(g) Tumour differentiation (trend χ21 = 0·9; 2p = 0·4; NS)
Poorly−diff. 395/2466 455/2471(16·0%) (18·4%)
190·2−27·9 0·86 (SE 0·07)
Moderately−diff. 221/1555 238/1546(14·2%) (15·4%)
105·5−12·8 0·89 (SE 0·09)
Well−diff. 39/318 39/330(12·3%) (11·8%)
17·22·9
Grade unknown 1354/4604 1458/4579(29·4%) (31·8%)
659·6−67·3 0·90 (SE 0·04)
(h) Tumour diameter (trend χ21 = 0·0; 2p = 1·0; NS)
1 − 20 mm (T1) 515/3263 586/3278(15·8%) (17·9%)
254·5−25·1 0·91 (SE 0·06)
21 − 50 mm (T2) 880/3439 952/3468(25·6%) (27·5%)
412·0−37·1 0·91 (SE 0·05)
> 50 mm (T3/T4) 123/311 125/296(39·5%) (42·2%)
45·0−4·9
Other / unknown 491/1930 527/1884(25·4%) (28·0%)
231·0−35·2 0·86 (SE 0·06)
(i) Tumour differentiation and ER (χ23 = 0·3; p = 1·0; NS)
Mod./Well ER−poor 91/637 95/572(14·3%) (16·6%)
40·2−5·7 0·87 (SE 0·15)
Poorly, ER−poor 198/1258 222/1308(15·7%) (17·0%)
93·5−5·7 0·94 (SE 0·10)
Mod./Well ER+ 125/952 136/1047(13·1%) (13·0%)
58·3−1·8
Poorly, ER+ 131/868 130/793(15·1%) (16·4%)
52·7−4·1
Any unknown 1464/5228 1607/5206(28·0%) (30·9%)
706·1−82·8 0·89 (SE 0·04)
(j) Entry age and ER status (χ27 = 1·9; p = 1·0; NS)
Age < 45, ER−poor 551/1895 629/1961(29·1%) (32·1%)
269·2−20·2 0·93 (SE 0·06)
< 45, ER+ 218/1077 237/1090(20·2%) (21·7%)
104·1−14·5 0·87 (SE 0·09)
45 − 54, ER−poor 447/1663 447/1626(26·9%) (27·5%)
204·0−16·1 0·92 (SE 0·07)
45 − 54, ER+ 208/1282 224/1255(16·2%) (17·8%)
98·2−8·4 0·92 (SE 0·10)
55 − 69, ER−poor 194/865 193/844(22·4%) (22·9%)
86·0−4·7 0·95 (SE 0·10)
55 − 69, ER+ 134/846 140/847(15·8%) (16·5%)
61·1−3·6 0·94 (SE 0·12)
70+, ER−poor 7/51 17/69(13·7%) (24·6%)
5·1−3·1
70+, ER+ 7/45 7/30(15·6%) (23·3%)
2·8−0·7
Any unknown 243/1219 296/1204(19·9%) (24·6%)
116·3−34·2 0·75 (SE 0·08)
(k) Time since randomisation (trend χ21 = 0·4; 2p = 0·5; NS)
Years 0 − 1 359/8943 402/8926(4·0%) (4·5%)
171·9−22·1 0·88 (SE 0·07)
2 − 4 891/8307 972/8216(10·7%) (11·8%)
416·5−49·7 0·89 (SE 0·05)
5 − 9 579/6253 641/6140(9·3%) (10·4%)
277·1−32·3 0·89 (SE 0·06)
10+ 180/3216 175/3096(5·6%) (5·7%)
81·3−1·3 0·98 (SE 0·11)
Denominators: women entering time period
2009/8943
2190/8926
(22·5%) (24·5%)−105·4 946·8 0·895 (SE 0·031)
2p = 0·0006 Total
Allocated
99% or 95% confidence intervals .0·5 1·0 1·5
Anthr. better CMF better
Treatment effect 2p = 0·0006
Global heterogeneity: χ219 = 13·4; p = 0·8
* Forest plots (webappendix pp 27−32) give details of each trial’s cytotoxic regimensAnthracyclines: A = doxorubicin (Adriamycin), E = epirubicin. Other cytotoxics: C = cyclophosphamide, M = methotrexate, F = fluorouracilDose/cycle (and cumulative dosage) is given after the drug name in mg/m²; A60/E90 means 60 mg/m² of doxorubicin or 90 mg/m² of epirubicin

P 11: RECURRENCE in trials of any anthracycline-based regimen (eg, standard 4AC) vs. No chemotherapy
Early recurrence (first 5 years) Any recurrence
CategoryEvents/woman−yearsAllocated
anth. controlRatio of annual event rates
Anth. : ControlLogrank Variance
O−E of O−E
Anth. events
(a) Cumulative anthracycline dosage, if dose/cycle ≥A60/E90* (χ2
1 = 0·1; 2p = 0·8; NS)A360: CAF 231/5196 324/4785
(4·4%/y) (6·8%/y)55·7−26·3 0·62 (SE 0·11)
A300 (no trials)
A240/E360:standard 4AC/EC
163/3225 233/3130(5·1%/y) (7·4%/y)
79·5−33·5 0·66 (SE 0·09)
White: dose/cycle< A60/E90
785/10611 955/9649(7·4%/y) (9·9%/y)
354·6−125·4 0·70 (SE 0·04)
(b) Anthracycline tested* (χ21 = 2·9; 2p = 0·09)
Doxorubicin (A) 758/10735 968/9627(7·1%/y) (10·1%/y)
283·4−122·9 0·65 (SE 0·05)
Epirubicin (E) 283/4597 330/4304(6·2%/y) (7·7%/y)
133·5−33·9 0·78 (SE 0·08)
A or E 138/3700 214/3633(3·7%/y) (5·9%/y)
72·9−28·4 0·68 (SE 0·10)
(c) Concurrent endocrine therapy if ER+? (χ21 = 0·2; 2p = 0·6; NS)
Yes 461/7617 583/7050(6·1%/y) (8·3%/y)
225·1−76·1 0·71 (SE 0·06)
No (any endocrine onlyafter chemo ended)
468/5563 561/4975(8·4%/y) (11·3%/y)
200·2−76·9 0·68 (SE 0·06)
Random † 250/5852 368/5539(4·3%/y) (6·6%/y)
64·6−32·2 0·61 (SE 0·10)
(d) Entry age (trend χ21 = 0·0; 2p = 0·9; NS)
Age < 45 133/1565 147/1237(8·5%/y) (11·9%/y)
50·0−20·2 0·67 (SE 0·12)45 − 54 292/4491 379/4463
(6·5%/y) (8·5%/y)122·8−43·9 0·70 (SE 0·08)
55 − 69 713/12122 923/11063(5·9%/y) (8·3%/y)
306·5−115·8 0·69 (SE 0·05)
70+ 35/819 56/788(4·3%/y) (7·1%/y)
9·0−5·2
Age unknown 6/35 7/13(17·1%/y) (53·8%/y)
1·6−0·2
(e) Nodal status (trend χ21 = 0·1; 2p = 0·7; NS)
N0/N− 136/3243 178/2966(4·2%/y) (6·0%/y)
67·0−28·8 0·65 (SE 0·10)N1−3 393/9908 484/9257
(4·0%/y) (5·2%/y)171·0−48·2 0·75 (SE 0·07)
N4+ 450/4775 620/4450(9·4%/y) (13·9%/y)
174·0−73·2 0·66 (SE 0·06)
Other / unknown 200/1106 230/891(18·1%/y) (25·8%/y)
77·9−35·0 0·64 (SE 0·09)
(f) ER status (χ21 = 0·1; 2p = 0·8; NS)
ER−poor 357/4282 437/3612(8·3%/y) (12·1%/y)
154·1−58·4 0·68 (SE 0·07)
ER+ 658/13126 912/12584(5·0%/y) (7·2%/y)
274·5−112·3 0·66 (SE 0·05)
ER unknown 164/1624 163/1368(10·1%/y) (11·9%/y)
61·3−14·6 0·79 (SE 0·11)
Subsets of ER+
ER+, chem+end. vs end. only ‡
491/11266 682/10831(4·4%/y) (6·3%/y)
196·0−71·1 0·70 (SE 0·06)
Ditto, age < 55 128/2498 172/2776(5·1%/y) (6·2%/y)
50·6−8·1 0·85 (SE 0·13) Ditto, 55 − 69 331/8021 472/7409
(4·1%/y) (6·4%/y)137·5−59·3 0·65 (SE 0·07)
ER+ PR−poor 163/2592 259/2684(6·3%/y) (9·6%/y)
77·3−41·9 0·58 (SE 0·09) ER+ PR+ 445/9616 599/9207
(4·6%/y) (6·5%/y)186·0−71·0 0·68 (SE 0·06)
ER+ N0/N− 49/1563 80/1568(3·1%/y) (5·1%/y)
28·3−15·1 0·59 (SE 0·15) ER+ N1−3 240/7518 301/7176
(3·2%/y) (4·2%/y)102·5−28·8 0·76 (SE 0·09)
ER+ N4+ 291/3514 420/3369(8·3%/y) (12·5%/y)
106·7−47·3 0·64 (SE 0·08)
ER10−99 fmol/mg 305/5880 455/5622(5·2%/y) (8·1%/y)
130·0−62·4 0·62 (SE 0·07)
ER100+ fmol/mg 224/4984 280/4957(4·5%/y) (5·6%/y)
82·3−16·5 0·82 (SE 0·10) ER+, unknown
level (eg, by IHC)129/2174 177/1877(5·9%/y) (9·4%/y)
56·1−27·9 0·61 (SE 0·11)
(g) Tumour differentiation (χ21 = 0·1; 2p = 0·7; NS)
Poorly−diff. 223/2977 272/2627(7·5%/y) (10·4%/y)
96·4−35·8 0·69 (SE 0·09)
Moderately/Well 322/5564 402/5281(5·8%/y) (7·6%/y)
148·5−48·5 0·72 (SE 0·07)
Grade unknown 634/10504 838/9666(6·0%/y) (8·7%/y)
255·5−98·0 0·68 (SE 0·05)
(h) Tumour diameter (trend χ21 = 0·4; 2p = 0·5; NS)
1 − 20 mm (T1) 328/8420 425/7831(3·9%/y) (5·4%/y)
147·4−53·3 0·70 (SE 0·07)
21 − 50 mm (T2) 659/8880 865/8166(7·4%/y) (10·6%/y)
281·0−108·8 0·68 (SE 0·05)
> 50 mm (T3/T4) 107/764 114/693(14·0%/y) (16·5%/y)
31·5−3·9
Other / unknown 85/965 108/865(8·8%/y) (12·5%/y)
34·9−14·9 0·65 (SE 0·14)
(i) Tumour differentiation and ER (χ23 = 1·4; p = 0·7; NS)
Poorly, ER−poor 87/1014 108/880(8·6%/y) (12·3%/y)
37·4−15·1 0·67 (SE 0·13)Poorly, ER+ 107/1680 143/1535
(6·4%/y) (9·3%/y)49·6−20·9 0·66 (SE 0·12)
Mod./Well ER−poor 63/624 62/516(10·1%/y) (12·0%/y)
23·1−3·3
Mod./Well ER+ 207/4204 286/4153(4·9%/y) (6·9%/y)
104·1−39·5 0·68 (SE 0·08)
Any unknown 715/11523 913/10490(6·2%/y) (8·7%/y)
286·2−103·6 0·70 (SE 0·05)
(j) Entry age and ER status (χ27 = 2·6; p = 0·9; NS)
Age < 45, ER−poor 49/564 48/343(8·7%/y) (14·0%/y)
15·8−8·7 0·58 (SE 0·19)< 45, ER+ 57/757 68/657
(7·5%/y) (10·4%/y)24·5−8·2 0·72 (SE 0·17)
45 − 54, ER−poor 95/1256 110/1007(7·6%/y) (10·9%/y)
39·4−15·6 0·67 (SE 0·13)45 − 54, ER+ 157/2757 222/3094
(5·7%/y) (7·2%/y)66·5−20·2 0·74 (SE 0·11)
55 − 69, ER−poor 211/2393 265/2176(8·8%/y) (12·2%/y)
98·1−33·2 0·71 (SE 0·09)
55 − 69, ER+ 411/8860 580/8145(4·6%/y) (7·1%/y)
175·2−79·6 0·63 (SE 0·06)
70+, ER−poor 2/65 14/86(3·1%/y) (16·3%/y)
0·7−0·9
70+, ER+ 33/748 41/687(4·4%/y) (6·0%/y)
8·3−4·3
Any unknown 164/1632 164/1369(10·0%/y) (12·0%/y)
61·3−14·6 0·79 (SE 0·11)
(k) Site of first recurrence (χ22 = 0·1; p = 1·0; NS)
Isolated local 144/14360 210/13303(1·0%/y) (1·6%/y)
65·6−24·7 0·69 (SE 0·10)Contralateral 73/18624 101/17175
(0·4%/y) (0·6%/y)35·1−12·2 0·71 (SE 0·14)
Distant/Multiple 886/19032 1115/17564(4·7%/y) (6·3%/y)
364·6−142·3 0·68 (SE 0·04)
Unknown 76/18653 86/17294(0·4%/y) (0·5%/y)
24·6−6·0
(l) Time since randomisation (χ21 = 13·4; 2p = 0·0003)
Years 0 − 1 525/8630 804/8255(6·1%/y) (9·7%/y)
243·4−132·5 0·58 (SE 0·05)
2 − 4 654/10319 708/9215(6·3%/y) (7·7%/y)
246·4−52·7 0·81 (SE 0·06)
1179/19032
1512/17564
(6·2%/y) (8·6%/y)−185·2 489·8 0·685 (SE 0·038)
2p < 0·00001 Total
Allocated
99% or 95% confidence intervals .0·5 1·0 1·5
Anth. better Anth. worse
Treatment effect 2p < 0·00001
Global heterogeneity: χ221 = 21·5; p = 0·4
* Forest plots (webappendix pp 33−38) give details of each trial’s cytotoxic regimensAnthracyclines: A = doxorubicin (Adriamycin), E = epirubicin. Other cytotoxics: C = cyclophosphamide, M = methotrexate, F = fluorouracilDose/cycle (and cumulative dosage) is given after the drug name in mg/m²; A60/E90 means 60 mg/m² of doxorubicin or 90 mg/m² of epirubicin
† In the SWOG 8814 trial of CAF in postmenopausal ER+ disease, tamoxifen started randomly with or after the chemotherapy.‡ chem+end. = chemo−endocrine therapy
CategoryEvents/woman−yearsAllocated
anth. controlRatio of annual event rates
Anth. : ControlLogrank Variance
O−E of O−E
Anth. events
(a) Cumulative anthracycline dosage, if dose/cycle ≥A60/E90* (χ2
1 = 1·4; 2p = 0·2; NS)A360: CAF 409/10308 552/9195
(4·0%/y) (6·0%/y)96·8−46·8 0·62 (SE 0·08)
A300 (no trials)
A240/E360:standard 4AC/EC
278/6259 345/5787(4·4%/y) (6·0%/y)
128·0−41·5 0·72 (SE 0·08)
White: dose/cycle< A60/E90
1140/20007 1300/17987(5·7%/y) (7·2%/y)
505·2−138·2 0·76 (SE 0·04)
(b) Anthracycline tested* (χ21 = 5·9; 2p = 0·01)
Doxorubicin (A) 1166/21977 1429/19154(5·3%/y) (7·5%/y)
424·0−161·7 0·68 (SE 0·04)
Epirubicin (E) 427/8215 462/7719(5·2%/y) (6·0%/y)
193·7−33·0 0·84 (SE 0·07)
A or E 234/6382 306/6096(3·7%/y) (5·0%/y)
112·3−31·8 0·75 (SE 0·08)
(c) Concurrent endocrine therapy if ER+? (χ21 = 0·2; 2p = 0·7; NS)
Yes 763/15212 895/13901(5·0%/y) (6·4%/y)
360·2−96·0 0·77 (SE 0·05)
No (any endocrine onlyafter chemo ended)
621/9986 694/8763(6·2%/y) (7·9%/y)
259·9−78·3 0·74 (SE 0·05)
Random † 443/11376 608/10305(3·9%/y) (5·9%/y)
109·9−52·2 0·62 (SE 0·08)
(d) Entry age (trend χ21 = 0·2; 2p = 0·7; NS)
Age < 45 176/2869 193/2352(6·1%/y) (8·2%/y)
68·1−21·9 0·73 (SE 0·10)45 − 54 455/8922 548/8542
(5·1%/y) (6·4%/y)181·5−53·8 0·74 (SE 0·06)
55 − 69 1131/23233 1357/20590(4·9%/y) (6·6%/y)
464·7−140·2 0·74 (SE 0·04)
70+ 57/1493 92/1463(3·8%/y) (6·3%/y)
13·9−10·8 0·46 (SE 0·19)Age unknown 8/57 7/22
(14·0%/y) (31·8%/y)1·80·2
(e) Nodal status (trend χ21 = 1·2; 2p = 0·3; NS)
N0/N− 209/5919 243/5505(3·5%/y) (4·4%/y)
97·4−29·0 0·74 (SE 0·09)
N1−3 709/20045 825/18342(3·5%/y) (4·5%/y)
293·6−70·5 0·79 (SE 0·05)
N4+ 670/8752 873/7692(7·7%/y) (11·3%/y)
247·9−93·5 0·69 (SE 0·05)
Other / unknown 239/1858 256/1430(12·9%/y) (17·9%/y)
91·1−33·4 0·69 (SE 0·09)
(f) ER status (χ21 = 0·7; 2p = 0·4; NS)
ER−poor 484/8593 578/7009(5·6%/y) (8·2%/y)
211·2−80·2 0·68 (SE 0·06)
ER+ 1118/24872 1408/23352(4·5%/y) (6·0%/y)
436·5−135·2 0·73 (SE 0·04)
ER unknown 225/3109 211/2608(7·2%/y) (8·1%/y)
82·3−11·1 0·87 (SE 0·10)
Subsets of ER+
ER+, chem+end. vs end. only ‡
882/21412 1121/20163(4·1%/y) (5·6%/y)
330·3−92·3 0·76 (SE 0·05)
Ditto, age < 55 223/4838 293/5256(4·6%/y) (5·6%/y)
84·9−16·2 0·83 (SE 0·10) Ditto, 55 − 69 607/15225 756/13728
(4·0%/y) (5·5%/y)232·9−66·8 0·75 (SE 0·06)
ER+ PR−poor 273/5019 369/4983(5·4%/y) (7·4%/y)
117·7−44·6 0·68 (SE 0·08)
ER+ PR+ 759/18187 964/17051(4·2%/y) (5·7%/y)
305·2−92·9 0·74 (SE 0·05)
ER+ N0/N− 92/2822 121/2853(3·3%/y) (4·2%/y)
47·6−16·9 0·70 (SE 0·12) ER+ N1−3 470/14782 544/13971
(3·2%/y) (3·9%/y)184·7−36·5 0·82 (SE 0·07)
ER+ N4+ 460/6404 619/5786(7·2%/y) (10·7%/y)
160·7−60·7 0·69 (SE 0·07)
ER10−99 fmol/mg 540/11773 729/11074(4·6%/y) (6·6%/y)
213·5−74·8 0·70 (SE 0·06)
ER100+ fmol/mg 398/9488 471/9242(4·2%/y) (5·1%/y)
139·5−25·2 0·83 (SE 0·08)
ER+, unknown level (eg, by IHC)
180/3530 208/2947(5·1%/y) (7·1%/y)
70·5−26·7 0·68 (SE 0·10)
(g) Tumour differentiation (χ21 = 0·5; 2p = 0·5; NS)
Poorly−diff. 278/5005 317/4343(5·6%/y) (7·3%/y)
117·8−35·8 0·74 (SE 0·08)
Moderately/Well 499/9823 573/9205(5·1%/y) (6·2%/y)
222·3−49·1 0·80 (SE 0·06)
Grade unknown 1050/21757 1307/19429(4·8%/y) (6·7%/y)
406·6−136·6 0·71 (SE 0·04)
(h) Tumour diameter (trend χ21 = 0·6; 2p = 0·5; NS)
1 − 20 mm (T1) 574/16624 720/15248(3·5%/y) (4·7%/y)
247·7−78·0 0·73 (SE 0·05)
21 − 50 mm (T2) 975/16645 1188/14894(5·9%/y) (8·0%/y)
401·0−129·6 0·72 (SE 0·04)
> 50 mm (T3/T4) 146/1394 146/1151(10·5%/y) (12·7%/y)
39·0−3·0
Other / unknown 132/1904 143/1661(6·9%/y) (8·6%/y)
49·1−11·9 0·79 (SE 0·13)
(i) Tumour differentiation and ER (χ23 = 1·1; p = 0·8; NS)
Poorly, ER−poor 97/1789 120/1499(5·4%/y) (8·0%/y)
42·0−17·1 0·67 (SE 0·13)Poorly, ER+ 145/2707 171/2446
(5·4%/y) (7·0%/y)64·1−19·3 0·74 (SE 0·11)
Mod./Well ER−poor 77/1090 79/899(7·1%/y) (8·8%/y)
29·1−5·1
Mod./Well ER+ 340/7386 417/7247(4·6%/y) (5·8%/y)
162·2−41·5 0·77 (SE 0·07)
Any unknown 1168/23613 1410/20886(4·9%/y) (6·8%/y)
449·4−138·6 0·73 (SE 0·04)
(j) Entry age and ER status (χ27 = 5·3; p = 0·6; NS)
Age < 45, ER−poor 56/1034 58/637(5·4%/y) (9·1%/y)
19·5−11·1 0·57 (SE 0·17)< 45, ER+ 84/1378 97/1240
(6·1%/y) (7·8%/y)36·2−9·1 0·78 (SE 0·15)
45 − 54, ER−poor 138/2629 138/2026(5·2%/y) (6·8%/y)
54·5−14·7 0·76 (SE 0·12)45 − 54, ER+ 259/5333 350/5812
(4·9%/y) (6·0%/y)104·7−31·7 0·74 (SE 0·08)
55 − 69, ER−poor 286/4783 368/4186(6·0%/y) (8·8%/y)
136·2−53·8 0·67 (SE 0·07)
55 − 69, ER+ 722/16800 884/15022(4·3%/y) (5·9%/y)
282·7−84·3 0·74 (SE 0·05)
70+, ER−poor 4/135 14/160(3·0%/y) (8·8%/y)
1·0−0·6
70+, ER+ 53/1352 76/1277(3·9%/y) (6·0%/y)
12·9−10·2 0·46 (SE 0·19)Any unknown 225/3130 212/2609
(7·2%/y) (8·1%/y)82·3−11·1 0·87 (SE 0·10)
(k) Site of first recurrence (χ22 = 6·0; p = 0·05)
Isolated local 194/26565 267/23918(0·7%/y) (1·1%/y)
87·1−30·9 0·70 (SE 0·09)Contralateral 190/36112 187/32556
(0·5%/y) (0·6%/y)75·9−5·4 0·93 (SE 0·11)
Distant/Multiple 1222/36574 1531/32969(3·3%/y) (4·6%/y)
504·6−188·4 0·69 (SE 0·04)
Unknown 221/36041 212/32644(0·6%/y) (0·6%/y)
62·5−1·8
(l) Time since randomisation (trend χ21 = 11·9; 2p = 0·0006)
Years 0 − 1 525/8630 804/8255(6·1%/y) (9·7%/y)
243·4−132·5 0·58 (SE 0·05)
2 − 4 654/10319 708/9215(6·3%/y) (7·7%/y)
246·4−52·7 0·81 (SE 0·06)
5 − 9 487/11893 487/10385(4·1%/y) (4·7%/y)
174·7−20·1 0·89 (SE 0·07)
10+ 161/5449 198/4819(3·0%/y) (4·1%/y)
65·5−21·2 0·72 (SE 0·11)
1827/36574
2197/32969
(5·0%/y) (6·7%/y)−226·5 730·0 0·733 (SE 0·032)
2p < 0·00001 Total
Allocated
99% or 95% confidence intervals .0·5 1·0 1·5
Anth. better Anth. worse
Treatment effect 2p < 0·00001
Global heterogeneity: χ221 = 35·0; p = 0·03
* Forest plots (webappendix pp 33−38) give details of each trial’s cytotoxic regimensAnthracyclines: A = doxorubicin (Adriamycin), E = epirubicin. Other cytotoxics: C = cyclophosphamide, M = methotrexate, F = fluorouracilDose/cycle (and cumulative dosage) is given after the drug name in mg/m²; A60/E90 means 60 mg/m² of doxorubicin or 90 mg/m² of epirubicin
† In the SWOG 8814 trial of CAF in postmenopausal ER+ disease, tamoxifen started randomly with or after the chemotherapy.‡ chem+end. = chemo−endocrine therapy

P 12: BREAST CANCER MORTALITY (MORTALITY WITH RECURRENCE) in trials of any anthracycline-based regimen (eg, standard 4AC) vs. No chemotherapy
CategoryDeaths/Women
Allocatedanth. control
Ratio of annual death ratesAnth. : Control
Logrank VarianceO−E of O−E
Anth. deaths
(a) Cumulative anthracycline dosage, if dose/cycle ≥A60/E90* (χ2
1 = 1·5; 2p = 0·2; NS)A360: CAF 324/1177 456/1143
(27·5%) (39·9%)80·3−35·3 0·64 (SE 0·09)
A300 (no trials)
A240/E360:standard 4AC/EC
212/747 265/792(28·4%) (33·5%)
100·5−25·6 0·78 (SE 0·09)
White: dose/cycle< A60/E90
880/2830 980/2798(31·1%) (35·0%)
400·5−79·0 0·82 (SE 0·05)
(b) Anthracycline tested* (χ21 = 1·9; 2p = 0·2; NS)
Doxorubicin (A) 973/2626 1185/2570(37·1%) (46·1%)
370·4−106·1 0·75 (SE 0·05)
Epirubicin (E) 293/1283 318/1283(22·8%) (24·8%)
138·4−20·5 0·86 (SE 0·08)
A or E 150/845 198/880(17·8%) (22·5%)
72·5−13·3 0·83 (SE 0·11)
(c) Concurrent endocrine therapy if ER+? (χ21 = 0·3; 2p = 0·6; NS)
Yes 607/2004 693/2014(30·3%) (34·4%)
288·0−54·4 0·83 (SE 0·05)
No (any endocrine onlyafter chemo ended)
462/1431 514/1398(32·3%) (36·8%)
203·8−48·2 0·79 (SE 0·06)
Random † 347/1319 494/1321(26·3%) (37·4%)
89·4−37·2 0·66 (SE 0·09)
(d) Entry age (trend χ21 = 2·0; 2p = 0·2; NS)
Age < 45 135/402 127/353(33·6%) (36·0%)
53·0−4·9 0·91 (SE 0·13)
45 − 54 338/1115 419/1175(30·3%) (35·7%)
139·8−34·9 0·78 (SE 0·07)
55 − 69 899/2995 1071/2956(30·0%) (36·2%)
377·0−88·5 0·79 (SE 0·05)
70+ 43/225 84/232(19·1%) (36·2%)
11·4−11·7 0·36 (SE 0·19)Age unknown 1/17 0/17
(5·9%) (0·0%)0·10·2
(e) Nodal status (trend χ21 = 0·0; 2p = 0·9; NS)
N0/N− 122/789 137/761(15·5%) (18·0%)
56·9−12·0 0·81 (SE 0·12)N1−3 513/2257 604/2217
(22·7%) (27·2%)214·1−51·3 0·79 (SE 0·06)
N4+ 575/1226 741/1295(46·9%) (57·2%)
222·3−53·7 0·79 (SE 0·06)
Other / unknown 206/482 219/460(42·7%) (47·6%)
88·0−22·8 0·77 (SE 0·09)
(f) ER status (χ21 = 0·1; 2p = 0·7; NS)
ER−poor 403/1095 464/1043(36·8%) (44·5%)
180·4−40·5 0·80 (SE 0·07)
ER+ 831/3100 1063/3177(26·8%) (33·5%)
328·5−84·6 0·77 (SE 0·05)
ER unknown 182/559 174/513(32·6%) (33·9%)
72·3−14·9 0·81 (SE 0·11)
Subsets of ER+
ER+, chem+end. vs end. only ‡
659/2622 853/2675(25·1%) (31·9%)
247·0−56·2 0·80 (SE 0·06)
Ditto, age < 55 166/585 212/672(28·4%) (31·5%)
62·5−6·9 0·90 (SE 0·12) Ditto, 55 − 69 455/1855 575/1836
(24·5%) (31·3%)174·1−38·8 0·80 (SE 0·07)
ER+ PR−poor 215/650 297/730(33·1%) (40·7%)
93·8−26·7 0·75 (SE 0·09)
ER+ PR+ 546/2225 699/2264(24·5%) (30·9%)
219·9−57·0 0·77 (SE 0·06)
ER+ N0/N− 46/378 62/399(12·2%) (15·5%)
24·1−7·8 0·72 (SE 0·17) ER+ N1−3 320/1682 375/1668
(19·0%) (22·5%)124·3−20·7 0·85 (SE 0·08)
ER+ N4+ 388/872 525/931(44·5%) (56·4%)
140·7−40·1 0·75 (SE 0·07)
ER10−99 fmol/mg 416/1371 544/1442(30·3%) (37·7%)
162·5−35·3 0·80 (SE 0·07)
ER100+ fmol/mg 274/1146 337/1160(23·9%) (29·1%)
95·6−20·6 0·81 (SE 0·09)
ER+, unknown level (eg, by IHC)
141/583 182/575(24·2%) (31·7%)
62·5−25·7 0·66 (SE 0·10)
(g) Tumour differentiation (trend χ21 = 0·1; 2p = 0·8; NS)
Poorly−diff. 203/929 229/904(21·9%) (25·3%)
92·7−21·9 0·79 (SE 0·09)
Moderately−diff. 308/1084 354/1082(28·4%) (32·7%)
146·6−29·5 0·82 (SE 0·07)
Well−diff. 48/253 56/256(19·0%) (21·9%)
23·0−4·1
Grade unknown 857/2488 1062/2491(34·4%) (42·6%)
341·8−89·1 0·77 (SE 0·05)
(h) Tumour diameter (trend χ21 = 3·6; 2p = 0·06)
1 − 20 mm (T1) 398/1935 516/1892(20·6%) (27·3%)
174·2−53·7 0·73 (SE 0·07)
21 − 50 mm (T2) 785/2221 951/2240(35·3%) (42·5%)
331·0−80·1 0·79 (SE 0·05)
> 50 mm (T3/T4) 134/228 125/229(58·8%) (54·6%)
39·04·0
Other / unknown 99/370 109/372(26·8%) (29·3%)
39·1−10·4 0·77 (SE 0·14)
(i) Tumour differentiation and ER (χ23 = 0·6; p = 0·9; NS)
Poorly, ER−poor 77/275 90/262(28·0%) (34·4%)
34·7−6·9 0·82 (SE 0·15)
Poorly, ER+ 100/461 120/477(21·7%) (25·2%)
45·8−12·2 0·77 (SE 0·13)Mod./Well ER−poor 62/167 66/150
(37·1%) (44·0%)25·7−2·3
Mod./Well ER+ 228/985 286/1026(23·1%) (27·9%)
112·8−27·8 0·78 (SE 0·08)
Any unknown 949/2866 1139/2818(33·1%) (40·4%)
373·2−95·2 0·77 (SE 0·05)
(j) Entry age and ER status (χ27 = 8·0; p = 0·3; NS)
Age < 45, ER−poor 44/148 38/107(29·7%) (35·5%)
15·8−2·9
< 45, ER+ 61/186 61/175(32·8%) (34·9%)
26·0−1·7
45 − 54, ER−poor 105/316 112/281(33·2%) (39·9%)
44·2−8·0 0·83 (SE 0·14)45 − 54, ER+ 189/659 255/768
(28·7%) (33·2%)76·5−17·7 0·79 (SE 0·10)
55 − 69, ER−poor 250/612 302/626(40·8%) (48·2%)
119·8−29·0 0·78 (SE 0·08)
55 − 69, ER+ 542/2071 677/2055(26·2%) (32·9%)
215·3−53·9 0·78 (SE 0·06)
70+, ER−poor 4/18 12/29(22·2%) (41·4%)
0·6−0·5
70+, ER+ 39/183 70/178(21·3%) (39·3%)
10·8−11·2 0·35 (SE 0·19)Any unknown 182/561 174/514
(32·4%) (33·9%)72·3−14·9 0·81 (SE 0·11)
(k) Time since randomisation (trend χ21 = 3·9; 2p = 0·05)
Years 0 − 1 184/4754 249/4733(3·9%) (5·3%)
87·6−28·1 0·73 (SE 0·09)2 − 4 516/4305 661/4216
(12·0%) (15·7%)219·5−69·3 0·73 (SE 0·06)
5 − 9 499/3494 560/3277(14·3%) (17·1%)
193·2−35·9 0·83 (SE 0·07)
10+ 217/2013 231/1844(10·8%) (12·5%)
81·0−6·7 0·92 (SE 0·11)Denominators: women entering time period
1416/4754
1701/4733
(29·8%) (35·9%)−139·9 581·3 0·786 (SE 0·037)
2p < 0·00001 Total
Allocated
99% or 95% confidence intervals .0·5 1·0 1·5
Anth. better Anth. worse
Treatment effect 2p < 0·00001
Global heterogeneity: χ219 = 22·0; p = 0·3
* Forest plots (webappendix pp 33−38) give details of each trial’s cytotoxic regimensAnthracyclines: A = doxorubicin (Adriamycin), E = epirubicin. Other cytotoxics: C = cyclophosphamide, M = methotrexate, F = fluorouracilDose/cycle (and cumulative dosage) is given after the drug name in mg/m²; A60/E90 means 60 mg/m² of doxorubicin or 90 mg/m² of epirubicin
† In the SWOG 8814 trial of CAF in postmenopausal ER+ disease, tamoxifen started randomly with or after the chemotherapy.‡ chem+end. = chemo−endocrine therapy
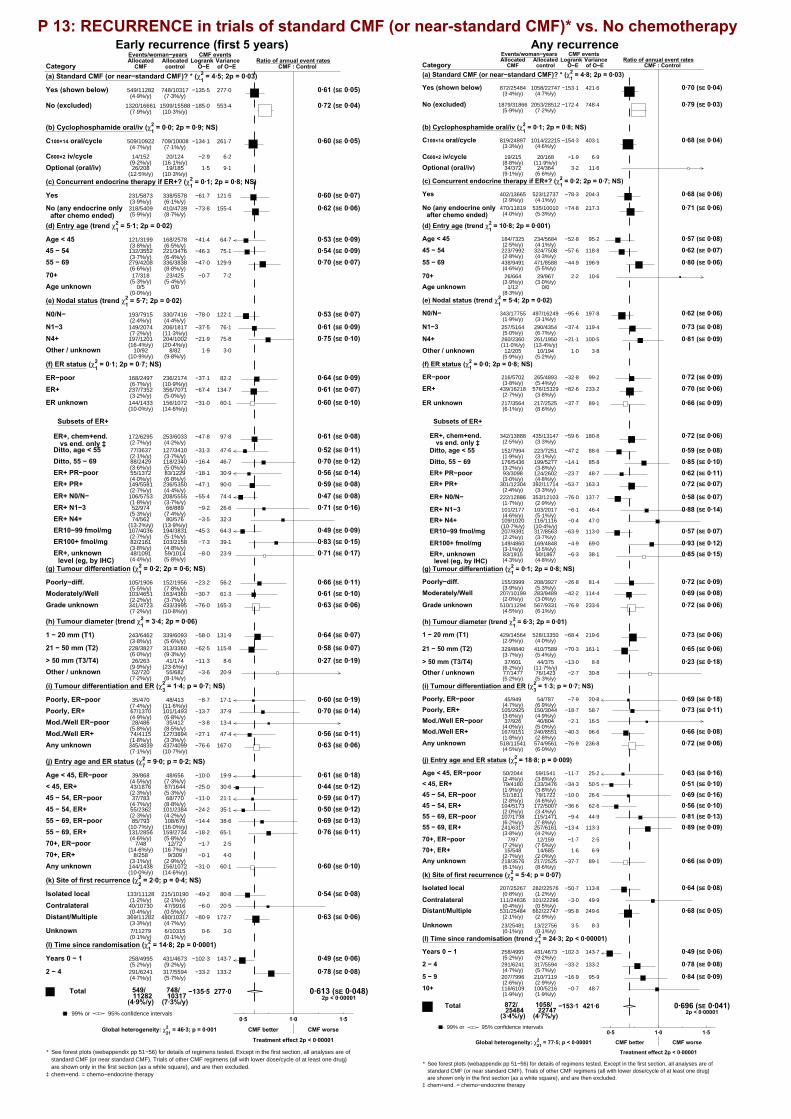
P 13: RECURRENCE in trials of standard CMF (or near-standard CMF)* vs. No chemotherapy Early recurrence (first 5 years) Any recurrence
CategoryEvents/woman−yearsAllocated
CMF controlRatio of annual event rates
CMF : ControlLogrank Variance
O−E of O−E
CMF events
(a) Standard CMF (or near−standard CMF)? * (χ21 = 4·5; 2p = 0·03)
Yes (shown below) 549/11282 748/10317(4·9%/y) (7·3%/y)
277·0−135·5 0·61 (SE 0·05)
No (excluded) 1320/16661 1599/15588(7·9%/y) (10·3%/y)
553·4−185·0 0·72 (SE 0·04)
(b) Cyclophosphamide oral/iv (χ21 = 0·0; 2p = 0·9; NS)
C100×14 oral/cycle 509/10922 709/10008(4·7%/y) (7·1%/y)
261·7−134·1 0·60 (SE 0·05)
C600×2 iv/cycle 14/152 20/124(9·2%/y) (16·1%/y)
6·2−2·9
Optional (oral/iv) 26/208 19/185(12·5%/y) (10·3%/y)
9·11·5
(c) Concurrent endocrine therapy if ER+? (χ21 = 0·1; 2p = 0·8; NS)
Yes 231/5873 338/5578(3·9%/y) (6·1%/y)
121·5−61·7 0·60 (SE 0·07)
No (any endocrine onlyafter chemo ended)
318/5409 410/4739(5·9%/y) (8·7%/y)
155·4−73·8 0·62 (SE 0·06)
(d) Entry age (trend χ21 = 5·1; 2p = 0·02)
Age < 45 121/3199 168/2578(3·8%/y) (6·5%/y)
64·7−41·4 0·53 (SE 0·09)45 − 54 132/3552 221/3476
(3·7%/y) (6·4%/y)75·1−46·3 0·54 (SE 0·09)
55 − 69 279/4208 336/3838(6·6%/y) (8·8%/y)
129·9−47·0 0·70 (SE 0·07)
70+ 17/318 23/425(5·3%/y) (5·4%/y)
7·2−0·7
Age unknown 0/5 0/0(0·0%/y)
(e) Nodal status (trend χ21 = 5·7; 2p = 0·02)
N0/N− 193/7915 330/7416(2·4%/y) (4·4%/y)
122·1−78·0 0·53 (SE 0·07)
N1−3 149/2074 206/1817(7·2%/y) (11·3%/y)
76·1−37·5 0·61 (SE 0·09)N4+ 197/1201 204/1002
(16·4%/y) (20·4%/y)75·8−21·9 0·75 (SE 0·10)
Other / unknown 10/92 8/82(10·9%/y) (9·8%/y)
3·01·9
(f) ER status (χ21 = 0·1; 2p = 0·7; NS)
ER−poor 168/2497 236/2174(6·7%/y) (10·9%/y)
82·2−37·1 0·64 (SE 0·09)ER+ 237/7352 356/7071
(3·2%/y) (5·0%/y)134·7−67·4 0·61 (SE 0·07)
ER unknown 144/1433 156/1072(10·0%/y) (14·6%/y)
60·1−31·0 0·60 (SE 0·10)
Subsets of ER+
ER+, chem+end. vs end. only ‡
172/6295 253/6033(2·7%/y) (4·2%/y)
97·8−47·8 0·61 (SE 0·08)
Ditto, age < 55 77/3637 127/3410(2·1%/y) (3·7%/y)
47·6−31·3 0·52 (SE 0·11) Ditto, 55 − 69 88/2429 118/2340
(3·6%/y) (5·0%/y)46·7−16·4 0·70 (SE 0·12)
ER+ PR−poor 55/1372 83/1229(4·0%/y) (6·8%/y)
30·9−18·1 0·56 (SE 0·14) ER+ PR+ 149/5581 236/5350
(2·7%/y) (4·4%/y)90·0−47·1 0·59 (SE 0·08)
ER+ N0/N− 106/5753 208/5555(1·8%/y) (3·7%/y)
74·4−55·4 0·47 (SE 0·08) ER+ N1−3 52/974 66/889
(5·3%/y) (7·4%/y)26·6−9·2 0·71 (SE 0·16)
ER+ N4+ 74/562 80/576(13·2%/y) (13·9%/y)
32·3−3·5
ER10−99 fmol/mg 107/4036 194/3831(2·7%/y) (5·1%/y)
64·3−45·3 0·49 (SE 0·09) ER100+ fmol/mg 82/2161 103/2158
(3·8%/y) (4·8%/y)39·1−7·3 0·83 (SE 0·15)
ER+, unknown level (eg, by IHC)
48/1091 59/1014(4·4%/y) (5·8%/y)
23·9−8·0 0·71 (SE 0·17)
(g) Tumour differentiation (χ21 = 0·2; 2p = 0·6; NS)
Poorly−diff. 105/1906 152/1956(5·5%/y) (7·8%/y)
56·2−23·2 0·66 (SE 0·11)Moderately/Well 103/4651 163/4360
(2·2%/y) (3·7%/y)61·3−30·7 0·61 (SE 0·10)
Grade unknown 341/4723 433/3995(7·2%/y) (10·8%/y)
165·3−76·0 0·63 (SE 0·06)
(h) Tumour diameter (trend χ21 = 3·4; 2p = 0·06)
1 − 20 mm (T1) 243/6462 339/6093(3·8%/y) (5·6%/y)
131·9−58·0 0·64 (SE 0·07)
21 − 50 mm (T2) 228/3827 313/3360(6·0%/y) (9·3%/y)
115·8−62·5 0·58 (SE 0·07)
> 50 mm (T3/T4) 26/263 41/174(9·9%/y) (23·6%/y)
8·6−11·3 0·27 (SE 0·19)Other / unknown 52/720 55/682
(7·2%/y) (8·1%/y)20·9−3·6
(i) Tumour differentiation and ER (χ23 = 1·4; p = 0·7; NS)
Poorly, ER−poor 35/470 48/413(7·4%/y) (11·6%/y)
17·1−8·7 0·60 (SE 0·19)Poorly, ER+ 67/1370 101/1493
(4·9%/y) (6·8%/y)37·9−13·7 0·70 (SE 0·14)
Mod./Well ER−poor 28/486 35/412(5·8%/y) (8·5%/y)
13·4−3·8
Mod./Well ER+ 74/4115 127/3894(1·8%/y) (3·3%/y)
47·4−27·1 0·56 (SE 0·11)Any unknown 345/4839 437/4099
(7·1%/y) (10·7%/y)167·0−76·6 0·63 (SE 0·06)
(j) Entry age and ER status (χ27 = 9·0; p = 0·2; NS)
Age < 45, ER−poor 39/868 48/656(4·5%/y) (7·3%/y)
19·9−10·0 0·61 (SE 0·18)< 45, ER+ 43/1876 87/1644
(2·3%/y) (5·3%/y)30·6−25·0 0·44 (SE 0·12)
45 − 54, ER−poor 37/783 68/770(4·7%/y) (8·8%/y)
21·1−11·0 0·59 (SE 0·17)45 − 54, ER+ 55/2362 101/2384
(2·3%/y) (4·2%/y)35·1−24·2 0·50 (SE 0·12)
55 − 69, ER−poor 85/793 108/676(10·7%/y) (16·0%/y)
38·6−14·4 0·69 (SE 0·13)55 − 69, ER+ 131/2856 159/2734
(4·6%/y) (5·8%/y)65·1−18·2 0·76 (SE 0·11)
70+, ER−poor 7/48 12/72(14·6%/y) (16·7%/y)
2·5−1·7
70+, ER+ 8/258 9/309(3·1%/y) (2·9%/y)
4·0−0·1
Any unknown 144/1438 156/1072(10·0%/y) (14·6%/y)
60·1−31·0 0·60 (SE 0·10)
(k) Site of first recurrence (χ22 = 2·0; p = 0·4; NS)
Isolated local 133/11128 215/10190(1·2%/y) (2·1%/y)
80·8−49·2 0·54 (SE 0·08)Contralateral 40/10730 47/9916
(0·4%/y) (0·5%/y)20·5−6·0
Distant/Multiple 369/11282 480/10317(3·3%/y) (4·7%/y)
172·7−80·9 0·63 (SE 0·06)
Unknown 7/11279 6/10315(0·1%/y) (0·1%/y)
3·00·6
(l) Time since randomisation (χ21 = 14·8; 2p = 0·0001)
Years 0 − 1 258/4995 431/4673(5·2%/y) (9·2%/y)
143·7−102·3 0·49 (SE 0·06)
2 − 4 291/6241 317/5594(4·7%/y) (5·7%/y)
133·2−33·2 0·78 (SE 0·08)
549/11282
748/10317
(4·9%/y) (7·3%/y)−135·5 277·0 0·613 (SE 0·048)
2p < 0·00001 Total
Allocated
99% or 95% confidence intervals .0·5 1·0 1·5
CMF better CMF worse
Treatment effect 2p < 0·00001
Global heterogeneity: χ221 = 46·3; p = 0·001
* See forest plots (webappendix pp 51−56) for details of regimens tested. Except in the first section, all analyses are ofstandard CMF (or near standard CMF). Trials of other CMF regimens (all with lower dose/cycle of at least one drug)are shown only in the first section (as a white square), and are then excluded.
‡ chem+end. = chemo−endocrine therapy
CategoryEvents/woman−yearsAllocated
CMF controlRatio of annual event rates
CMF : ControlLogrank Variance
O−E of O−E
CMF events
(a) Standard CMF (or near−standard CMF)? * (χ21 = 4·8; 2p = 0·03)
Yes (shown below) 872/25484 1058/22747(3·4%/y) (4·7%/y)
421·6−153·1 0·70 (SE 0·04)
No (excluded) 1879/31866 2053/28512(5·9%/y) (7·2%/y)
748·4−172·4 0·79 (SE 0·03)
(b) Cyclophosphamide oral/iv (χ21 = 0·1; 2p = 0·8; NS)
C100×14 oral/cycle 819/24897 1014/22215(3·3%/y) (4·6%/y)
403·1−154·3 0·68 (SE 0·04)
C600×2 iv/cycle 19/215 20/168(8·8%/y) (11·9%/y)
6·9−1·9
Optional (oral/iv) 34/372 24/364(9·1%/y) (6·6%/y)
11·63·2
(c) Concurrent endocrine therapy if ER+? (χ21 = 0·2; 2p = 0·7; NS)
Yes 402/13665 523/12737(2·9%/y) (4·1%/y)
204·3−78·3 0·68 (SE 0·06)
No (any endocrine onlyafter chemo ended)
470/11819 535/10010(4·0%/y) (5·3%/y)
217·3−74·8 0·71 (SE 0·06)
(d) Entry age (trend χ21 = 10·8; 2p = 0·001)
Age < 45 184/7325 234/5684(2·5%/y) (4·1%/y)
95·2−52·8 0·57 (SE 0·08)
45 − 54 223/7992 324/7508(2·8%/y) (4·3%/y)
118·8−57·6 0·62 (SE 0·07)
55 − 69 438/9491 471/8588(4·6%/y) (5·5%/y)
196·9−44·9 0·80 (SE 0·06)
70+ 26/664 29/967(3·9%/y) (3·0%/y)
10·62·2
Age unknown 1/12 0/0(8·3%/y)
(e) Nodal status (trend χ21 = 5·4; 2p = 0·02)
N0/N− 343/17755 497/16249(1·9%/y) (3·1%/y)
197·8−95·6 0·62 (SE 0·06)
N1−3 257/5164 290/4354(5·0%/y) (6·7%/y)
119·4−37·4 0·73 (SE 0·08)
N4+ 260/2360 261/1950(11·0%/y) (13·4%/y)
100·5−21·1 0·81 (SE 0·09)
Other / unknown 12/205 10/194(5·9%/y) (5·2%/y)
3·81·0
(f) ER status (χ21 = 0·0; 2p = 0·8; NS)
ER−poor 216/5702 265/4893(3·8%/y) (5·4%/y)
99·2−32·8 0·72 (SE 0·09)
ER+ 439/16218 576/15329(2·7%/y) (3·8%/y)
233·2−82·6 0·70 (SE 0·06)
ER unknown 217/3564 217/2525(6·1%/y) (8·6%/y)
89·1−37·7 0·66 (SE 0·09)
Subsets of ER+
ER+, chem+end. vs end. only ‡
342/13888 435/13147(2·5%/y) (3·3%/y)
180·8−59·6 0·72 (SE 0·06)
Ditto, age < 55 152/7994 223/7251(1·9%/y) (3·1%/y)
88·6−47·2 0·59 (SE 0·08) Ditto, 55 − 69 176/5436 199/5277
(3·2%/y) (3·8%/y)85·8−14·1 0·85 (SE 0·10)
ER+ PR−poor 93/3098 124/2602(3·0%/y) (4·8%/y)
48·7−23·7 0·62 (SE 0·11) ER+ PR+ 301/12304 392/11714
(2·4%/y) (3·3%/y)163·3−53·7 0·72 (SE 0·07)
ER+ N0/N− 222/12886 353/12103(1·7%/y) (2·9%/y)
137·7−76·0 0·58 (SE 0·07)
ER+ N1−3 101/2177 103/2017(4·6%/y) (5·1%/y)
46·4−6·1 0·88 (SE 0·14) ER+ N4+ 109/1020 116/1116
(10·7%/y) (10·4%/y)47·0−0·4
ER10−99 fmol/mg 207/9391 317/8563(2·2%/y) (3·7%/y)
113·0−63·9 0·57 (SE 0·07)
ER100+ fmol/mg 149/4860 169/4848(3·1%/y) (3·5%/y)
69·0−4·9 0·93 (SE 0·12) ER+, unknown
level (eg, by IHC)83/1915 90/1867(4·3%/y) (4·8%/y)
38·1−6·3 0·85 (SE 0·15)
(g) Tumour differentiation (χ21 = 0·1; 2p = 0·8; NS)
Poorly−diff. 155/3999 208/3927(3·9%/y) (5·3%/y)
81·4−26·8 0·72 (SE 0·09)Moderately/Well 207/10199 283/9489
(2·0%/y) (3·0%/y)114·4−42·2 0·69 (SE 0·08)
Grade unknown 510/11294 567/9331(4·5%/y) (6·1%/y)
233·6−76·9 0·72 (SE 0·06)
(h) Tumour diameter (trend χ21 = 6·3; 2p = 0·01)
1 − 20 mm (T1) 429/14564 528/13350(2·9%/y) (4·0%/y)
219·6−68·4 0·73 (SE 0·06)
21 − 50 mm (T2) 329/8840 410/7589(3·7%/y) (5·4%/y)
161·1−70·3 0·65 (SE 0·06)
> 50 mm (T3/T4) 37/601 44/375(6·2%/y) (11·7%/y)
8·8−13·0 0·23 (SE 0·18)Other / unknown 77/1477 76/1423
(5·2%/y) (5·3%/y)30·8−2·7
(i) Tumour differentiation and ER (χ23 = 1·3; p = 0·7; NS)
Poorly, ER−poor 45/949 54/787(4·7%/y) (6·9%/y)
20·8−7·9 0·69 (SE 0·18)Poorly, ER+ 105/2925 150/3044
(3·6%/y) (4·9%/y)58·7−18·7 0·73 (SE 0·11)
Mod./Well ER−poor 37/926 40/804(4·0%/y) (5·0%/y)
16·5−2·1
Mod./Well ER+ 167/9151 240/8551(1·8%/y) (2·8%/y)
96·6−40·3 0·66 (SE 0·08)
Any unknown 518/11541 574/9561(4·5%/y) (6·0%/y)
236·8−76·9 0·72 (SE 0·06)
(j) Entry age and ER status (χ27 = 18·8; p = 0·009)
Age < 45, ER−poor 50/2044 59/1541(2·4%/y) (3·8%/y)
25·2−11·7 0·63 (SE 0·16)< 45, ER+ 79/4180 133/3476
(1·9%/y) (3·8%/y)50·5−34·3 0·51 (SE 0·10)
45 − 54, ER−poor 51/1811 79/1722(2·8%/y) (4·6%/y)
26·6−10·0 0·69 (SE 0·16)45 − 54, ER+ 104/5173 172/5007
(2·0%/y) (3·4%/y)62·6−36·6 0·56 (SE 0·10)
55 − 69, ER−poor 107/1738 115/1471(6·2%/y) (7·8%/y)
44·9−9·4 0·81 (SE 0·13)55 − 69, ER+ 241/6317 257/6161
(3·8%/y) (4·2%/y)113·3−13·4 0·89 (SE 0·09)
70+, ER−poor 7/97 12/159(7·2%/y) (7·5%/y)
2·5−1·7
70+, ER+ 15/548 14/685(2·7%/y) (2·0%/y)
6·91·6
Any unknown 218/3576 217/2525(6·1%/y) (8·6%/y)
89·1−37·7 0·66 (SE 0·09)
(k) Site of first recurrence (χ22 = 5·4; p = 0·07)
Isolated local 207/25267 282/22576(0·8%/y) (1·2%/y)
113·8−50·7 0·64 (SE 0·08)
Contralateral 111/24836 101/22296(0·4%/y) (0·5%/y)
49·9−3·0
Distant/Multiple 531/25484 662/22747(2·1%/y) (2·9%/y)
249·6−95·8 0·68 (SE 0·05)
Unknown 23/25481 13/22756(0·1%/y) (0·1%/y)
8·33·5
(l) Time since randomisation (trend χ21 = 24·3; 2p < 0·00001)
Years 0 − 1 258/4995 431/4673(5·2%/y) (9·2%/y)
143·7−102·3 0·49 (SE 0·06)
2 − 4 291/6241 317/5594(4·7%/y) (5·7%/y)
133·2−33·2 0·78 (SE 0·08)
5 − 9 207/7996 210/7119(2·6%/y) (2·9%/y)
95·9−16·9 0·84 (SE 0·09)
10+ 116/6109 100/5216(1·9%/y) (1·9%/y)
48·7−0·7
872/25484
1058/22747
(3·4%/y) (4·7%/y)−153·1 421·6 0·696 (SE 0·041)
2p < 0·00001 Total
Allocated
99% or 95% confidence intervals .0·5 1·0 1·5
CMF better CMF worse
Treatment effect 2p < 0·00001
Global heterogeneity: χ221 = 77·5; p < 0·00001
* See forest plots (webappendix pp 51−56) for details of regimens tested. Except in the first section, all analyses are ofstandard CMF (or near standard CMF). Trials of other CMF regimens (all with lower dose/cycle of at least one drug)are shown only in the first section (as a white square), and are then excluded.
‡ chem+end. = chemo−endocrine therapy

P 14: BREAST CANCER MORTALITY (MORTALITY WITH RECURRENCE) in trials of standard CMF (or near-standard CMF)* vs. No chemotherapy
Category
Deaths/WomenAllocated
CMF controlRatio of annual death rates
CMF : ControlLogrank Variance
O−E of O−E
CMF deaths
(a) Standard CMF (or near−standard CMF)? * (χ21 = 4·4; 2p = 0·04)
Yes (shown below) 658/2665 790/2588(24·7%) (30·5%)
320·1−89·1 0·76 (SE 0·05)
No (excluded) 1512/4378 1643/4372(34·5%) (37·6%)
611·1−81·4 0·88 (SE 0·04)
(b) Cyclophosphamide oral/iv (χ21 = 0·1; 2p = 0·7; NS)
C100×14 oral/cycle 617/2562 756/2497(24·1%) (30·3%)
305·1−89·9 0·74 (SE 0·05)
C600×2 iv/cycle 15/40 18/39(37·5%) (46·2%)
6·1−2·6
Optional (oral/iv) 26/63 16/52(41·3%) (30·8%)
8·93·3
(c) Concurrent endocrine therapy if ER+? (χ21 = 0·3; 2p = 0·6; NS)
Yes 301/1342 391/1338(22·4%) (29·2%)
151·2−47·2 0·73 (SE 0·07)
No (any endocrine onlyafter chemo ended)
357/1323 399/1250(27·0%) (31·9%)
168·9−41·9 0·78 (SE 0·07)
(d) Entry age (trend χ21 = 10·0; 2p = 0·002)
Age < 45 115/739 150/635(15·6%) (23·6%)
62·2−33·0 0·59 (SE 0·10)45 − 54 165/803 230/853
(20·5%) (27·0%)86·1−35·5 0·66 (SE 0·09)
55 − 69 356/1043 385/994(34·1%) (38·7%)
163·0−21·8 0·87 (SE 0·07)
70+ 22/77 25/105(28·6%) (23·8%)
8·81·2
Age unknown 0/3 0/1(0·0%) (0·0%)
(e) Nodal status (trend χ21 = 6·5; 2p = 0·01)
N0/N− 197/1754 294/1711(11·2%) (17·2%)
117·2−54·0 0·63 (SE 0·07)
N1−3 218/513 257/499(42·5%) (51·5%)
105·7−27·8 0·77 (SE 0·09)
N4+ 231/365 230/351(63·3%) (65·5%)
93·5−10·4 0·90 (SE 0·10)
Other / unknown 12/33 9/27(36·4%) (33·3%)
3·63·1
(f) ER status (χ21 = 0·3; 2p = 0·6; NS)
ER−poor 167/629 209/617(26·6%) (33·9%)
79·2−17·6 0·80 (SE 0·10)ER+ 295/1646 387/1635
(17·9%) (23·7%)155·7−47·2 0·74 (SE 0·07)
ER unknown 196/390 194/336(50·3%) (57·7%)
85·2−24·3 0·75 (SE 0·09)
Subsets of ER+
ER+, chem+end. vs end. only ‡
225/1379 285/1358(16·3%) (21·0%)
117·6−34·3 0·75 (SE 0·08)
Ditto, age < 55 85/778 129/754(10·9%) (17·1%)
50·3−28·2 0·57 (SE 0·11) Ditto, 55 − 69 129/550 146/540
(23·5%) (27·0%)62·6−6·3 0·90 (SE 0·12)
ER+ PR−poor 77/314 95/301(24·5%) (31·6%)
38·7−12·9 0·72 (SE 0·14) ER+ PR+ 180/1224 246/1205
(14·7%) (20·4%)100·2−33·3 0·72 (SE 0·08)
ER+ N0/N− 119/1239 201/1234(9·6%) (16·3%)
77·3−42·5 0·58 (SE 0·09) ER+ N1−3 77/228 84/218
(33·8%) (38·5%)35·6−5·6
ER+ N4+ 92/162 99/169(56·8%) (58·6%)
40·70·1
ER10−99 fmol/mg 130/884 207/888(14·7%) (23·3%)
73·8−39·9 0·58 (SE 0·09) ER100+ fmol/mg 100/493 120/494
(20·3%) (24·3%)48·2−6·2 0·88 (SE 0·14)
ER+, unknown level (eg, by IHC)
65/269 60/253(24·2%) (23·7%)
27·51·1
(g) Tumour differentiation (trend χ21 = 0·0; 2p = 0·9; NS)
Poorly−diff. 115/444 160/488(25·9%) (32·8%)
64·1−17·3 0·76 (SE 0·11)Moderately−diff. 101/755 145/750
(13·4%) (19·3%)58·6−22·4 0·68 (SE 0·11)
Well−diff. 17/254 20/221(6·7%) (9·0%)
8·7−1·1
Grade unknown 425/1212 465/1129(35·1%) (41·2%)
202·5−41·6 0·81 (SE 0·06)
(h) Tumour diameter (trend χ21 = 5·2; 2p = 0·02)
1 − 20 mm (T1) 307/1457 369/1443(21·1%) (25·6%)
155·7−35·5 0·80 (SE 0·07)
21 − 50 mm (T2) 264/937 329/893(28·2%) (36·8%)
134·8−43·0 0·73 (SE 0·07)
> 50 mm (T3/T4) 28/72 36/68(38·9%) (52·9%)
8·7−12·7 0·23 (SE 0·18)Other / unknown 59/199 56/184
(29·6%) (30·4%)24·3−0·4
(i) Tumour differentiation and ER (χ23 = 0·8; p = 0·8; NS)
Poorly, ER−poor 36/118 44/115(30·5%) (38·3%)
17·4−5·4
Poorly, ER+ 75/311 114/361(24·1%) (31·6%)
43·8−14·5 0·72 (SE 0·13)Mod./Well ER−poor 28/118 29/108
(23·7%) (26·9%)12·8−2·2
Mod./Well ER+ 89/879 136/850(10·1%) (16·0%)
53·4−23·2 0·65 (SE 0·11)Any unknown 430/1239 467/1154
(34·7%) (40·5%)202·2−38·6 0·83 (SE 0·06)
(j) Entry age and ER status (χ27 = 13·7; p = 0·06)
Age < 45, ER−poor 30/210 38/174(14·3%) (21·8%)
16·3−7·8 0·62 (SE 0·20)< 45, ER+ 42/409 74/379
(10·3%) (19·5%)28·1−18·8 0·51 (SE 0·14)
45 − 54, ER−poor 38/186 58/206(20·4%) (28·2%)
19·5−5·8
45 − 54, ER+ 65/513 110/539(12·7%) (20·4%)
39·0−21·9 0·57 (SE 0·12)55 − 69, ER−poor 93/217 102/213
(42·9%) (47·9%)41·0−2·9
55 − 69, ER+ 176/664 192/646(26·5%) (29·7%)
83·5−6·6 0·92 (SE 0·11)70+, ER−poor 6/14 11/23
(42·9%) (47·8%)2·3−1·0
70+, ER+ 12/59 11/71(20·3%) (15·5%)
5·10·2
Any unknown 196/393 194/337(49·9%) (57·6%)
85·2−24·3 0·75 (SE 0·09)
(k) Time since randomisation (trend χ21 = 0·2; 2p = 0·6)
Years 0 − 1 82/2665 110/2588(3·1%) (4·3%)
41·7−14·0 0·72 (SE 0·13)2 − 4 224/2501 270/2423
(9·0%) (11·1%)109·6−29·5 0·76 (SE 0·08)
5 − 9 220/2146 271/2047(10·3%) (13·2%)
109·6−33·7 0·74 (SE 0·08)
10+ 132/1513 139/1442(8·7%) (9·6%)
59·1−11·9 0·82 (SE 0·12)Denominators: women entering time period
658/2665
790/2588
(24·7%) (30·5%)−89·1 320·1 0·757 (SE 0·049)
2p < 0·00001 Total
Allocated
99% or 95% confidence intervals .0·5 1·0 1·5
CMF better CMF worse
Treatment effect 2p < 0·00001
Global heterogeneity: χ219 = 41·5; p = 0·002
* See forest plots (webappendix pp 51−56) for details of regimens tested. Except in the first section, all analyses are ofstandard CMF (or near standard CMF). Trials of other CMF regimens (all with lower dose/cycle of at least one drug)are shown only in the first section (as a white square), and are then excluded.
‡ chem+end. = chemo−endocrine therapy

P 15: Any taxane-plus-anthracycline-based regimen vs control with the SAME or MORE non-taxane chemotherapy (all trials combined): subgroup analyses of 8-year breast cancer mortality RR (and its 95% CI): event rate ratio, from summed logrank statistics for all time periods. Gain (and its SE): absolute difference between ends of graphs.
Entry age<55 or 55-69 years25757 women, age < 55(87% N+)
Death rates (% / year: total rate − rate in women without recurrence) and logrank analyses
Tax + anthControl
Allocation
Rate ratio(O−E) / V
0 1 2 3Years 0 − 42·42 SE 0·072·62 SE 0·070·91 SE 0·04−58·4 / 604·0
4 5 6 7Year 5+
2·36 SE 0·132·63 SE 0·150·88 SE 0·08−19·6 / 152·8
8 years0
10
20
30
40
50
Bre
ast c
ance
r mor
talit
y
%± SE
8-y gain 1·6% (SE 0·7)
Control
Tax + anth
19·2%17·6%
Logrank 2p = 0·005RR 0·90 (0·84−0·97)
12·8%
11·7%
12514 women, age 55-69(89% N+)
0 1 2 3Years 0 − 42·21 SE 0·092·69 SE 0·110·81 SE 0·05−57·7 / 275·4
4 5 6 7Year 5+
2·64 SE 0·213·14 SE 0·250·85 SE 0·11−11·4 / 71·0
8 years0
10
20
30
40
50
Bre
ast c
ance
r mor
talit
y
%± SE
8-y gain 3·3% (SE 1·1)
Control
Tax + anth
21·0%17·7%
Logrank 2p = 0·0002RR 0·82 (0·74−0·91)
13·5%
11·0%
ER status, mainly by immunohistochemistry11258 women, ER-poor(81% N+)
Death rates (% / year: total rate − rate in women without recurrence) and logrank analyses
Tax + anthControl
Allocation
Rate ratio(O−E) / V
0 1 2 3Years 0 − 44·00 SE 0·134·86 SE 0·150·85 SE 0·04−71·7 / 438·8
4 5 6 7Year 5+
2·44 SE 0·202·67 SE 0·230·91 SE 0·12−6·2 / 66·1
8 years0
10
20
30
40
50
Bre
ast c
ance
r mor
talit
y
%± SE
8-y gain 3·7% (SE 1·1)
Control
Tax + anth
27·7%24·0%
Logrank 2p = 0·0005RR 0·86 (0·79−0·94)
21·4%
18·6%
24762 women, ER+(90% N+)
0 1 2 3Years 0 − 41·45 SE 0·051·62 SE 0·060·89 SE 0·05−44·3 / 365·5
4 5 6 7Year 5+
2·51 SE 0·152·87 SE 0·160·85 SE 0·08−22·8 / 136·8
8 years0
10
20
30
40
50B
reas
t can
cer m
orta
lity
%± SE
8-y gain 1·4% (SE 0·8)
Control
Tax + anth
15·7%14·3%
Logrank 2p = 0·003RR 0·87 (0·80−0·95)
8·6%
7·6%
Tumour grade (few were well-differentiated)12052 women, poorly-diff.(86% N+)
Death rates (% / year: total rate − rate in women without recurrence) and logrank analyses
Tax + anthControl
Allocation
Rate ratio(O−E) / V
0 1 2 3Years 0 − 43·53 SE 0·123·79 SE 0·130·93 SE 0·05−29·3 / 390·0
4 5 6 7Year 5+
3·07 SE 0·282·69 SE 0·281·16 SE 0·15
7·3 / 49·1
8 years0
10
20
30
40
50
Bre
ast c
ance
r mor
talit
y
%± SE
8-y gain 0·4% (SE 1·3)
Control
Tax + anth
24·6%24·2%
Logrank 2p = 0·29RR 0·95 (0·87−1·04)
18·2%
16·8%
17017 women, moderately-(or well-) differentiated(85% N+)
0 1 2 3Years 0 − 41·22 SE 0·061·45 SE 0·070·84 SE 0·06−37·5 / 216·0
4 5 6 7Year 5+
1·85 SE 0·172·37 SE 0·190·75 SE 0·11−19·0 / 64·9
8 years0
10
20
30
40
50
Bre
ast c
ance
r mor
talit
y
%± SE
8-y gain 2·6% (SE 0·9)
Control
Tax + anth
13·9%11·4%
Logrank 2p = 0·0007RR 0·82 (0·73−0·92)
7·6%
6·5%
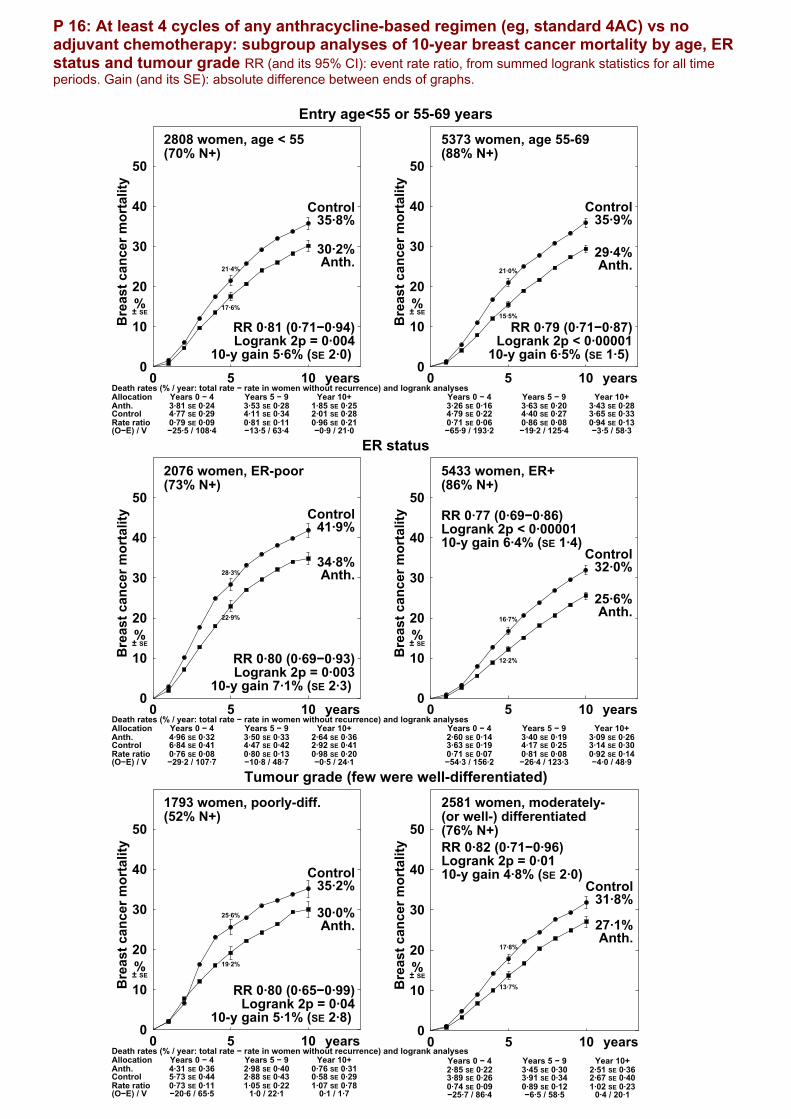
P 16: At least 4 cycles of any anthracycline-based regimen (eg, standard 4AC) vs no adjuvant chemotherapy: subgroup analyses of 10-year breast cancer mortality by age, ER status and tumour grade RR (and its 95% CI): event rate ratio, from summed logrank statistics for all time periods. Gain (and its SE): absolute difference between ends of graphs.
Entry age<55 or 55-69 years2808 women, age < 55(70% N+)
Death rates (% / year: total rate − rate in women without recurrence) and logrank analyses
Anth.Control
Allocation
Rate ratio(O−E) / V
0Years 0 − 43·81 SE 0·244·77 SE 0·290·79 SE 0·09−25·5 / 108·4
5Years 5 − 93·53 SE 0·284·11 SE 0·340·81 SE 0·11−13·5 / 63·4
Year 10+1·85 SE 0·252·01 SE 0·280·96 SE 0·21−0·9 / 21·0
10 years0
10
20
30
40
50
Bre
ast c
ance
r mor
talit
y
%± SE
10-y gain 5·6% (SE 2·0)
Control
Anth.
35·8%
30·2%
Logrank 2p = 0·004RR 0·81 (0·71−0·94)
21·4%
17·6%
5373 women, age 55-69(88% N+)
0Years 0 − 43·26 SE 0·164·79 SE 0·220·71 SE 0·06−65·9 / 193·2
5Years 5 − 93·63 SE 0·204·40 SE 0·270·86 SE 0·08−19·2 / 125·4
Year 10+3·43 SE 0·283·65 SE 0·330·94 SE 0·13−3·5 / 58·3
10 years0
10
20
30
40
50
Bre
ast c
ance
r mor
talit
y
%± SE
10-y gain 6·5% (SE 1·5)
Control
Anth.
35·9%
29·4%
Logrank 2p < 0·00001RR 0·79 (0·71−0·87)
21·0%
15·5%
ER status2076 women, ER-poor(73% N+)
Death rates (% / year: total rate − rate in women without recurrence) and logrank analyses
Anth.Control
Allocation
Rate ratio(O−E) / V
0Years 0 − 44·96 SE 0·326·84 SE 0·410·76 SE 0·08−29·2 / 107·7
5Years 5 − 93·50 SE 0·334·47 SE 0·420·80 SE 0·13−10·8 / 48·7
Year 10+2·64 SE 0·362·92 SE 0·410·98 SE 0·20−0·5 / 24·1
10 years0
10
20
30
40
50
Bre
ast c
ance
r mor
talit
y
%± SE
10-y gain 7·1% (SE 2·3)
Control
Anth.
41·9%
34·8%
Logrank 2p = 0·003RR 0·80 (0·69−0·93)
28·3%
22·9%
5433 women, ER+(86% N+)
0Years 0 − 42·60 SE 0·143·63 SE 0·190·71 SE 0·07−54·3 / 156·2
5Years 5 − 93·40 SE 0·194·17 SE 0·250·81 SE 0·08−26·4 / 123·3
Year 10+3·09 SE 0·263·14 SE 0·300·92 SE 0·14−4·0 / 48·9
10 years0
10
20
30
40
50
Bre
ast c
ance
r mor
talit
y
%± SE
10-y gain 6·4% (SE 1·4)Control
Anth.
32·0%
25·6%
Logrank 2p < 0·00001RR 0·77 (0·69−0·86)
16·7%
12·2%
Tumour grade (few were well-differentiated)1793 women, poorly-diff.(52% N+)
Death rates (% / year: total rate − rate in women without recurrence) and logrank analyses
Anth.Control
Allocation
Rate ratio(O−E) / V
0Years 0 − 44·31 SE 0·365·73 SE 0·440·73 SE 0·11−20·6 / 65·5
5Years 5 − 92·98 SE 0·402·88 SE 0·431·05 SE 0·22
1·0 / 22·1
Year 10+0·76 SE 0·310·58 SE 0·291·07 SE 0·78
0·1 / 1·7
10 years0
10
20
30
40
50
Bre
ast c
ance
r mor
talit
y
%± SE
10-y gain 5·1% (SE 2·8)
Control
Anth.
35·2%
30·0%
Logrank 2p = 0·04RR 0·80 (0·65−0·99)
25·6%
19·2%
2581 women, moderately-(or well-) differentiated(76% N+)
0Years 0 − 42·85 SE 0·223·89 SE 0·260·74 SE 0·09−25·7 / 86·4
5Years 5 − 93·45 SE 0·303·91 SE 0·340·89 SE 0·12−6·5 / 58·5
Year 10+2·51 SE 0·362·67 SE 0·401·02 SE 0·23
0·4 / 20·1
10 years0
10
20
30
40
50
Bre
ast c
ance
r mor
talit
y
%± SE
10-y gain 4·8% (SE 2·0)Control
Anth.
31·8%
27·1%
Logrank 2p = 0·01RR 0·82 (0·71−0·96)
17·8%
13·7%

P 17: Standard CMF (or near-standard CMF) vs no adjuvant chemotherapy: subgroup analyses of 10-year breast cancer mortality by age, ER status and tumour grade RR (and its 95% CI): event rate ratio, from summed logrank statistics for all time periods. Gain (and its SE): absolute difference between ends of graphs.
Entry age<55 or 55-69 years3030 women, age < 55(16% N+)
Death rates (% / year: total rate − rate in women without recurrence) and logrank analyses
CMFControl
Allocation
Rate ratio(O−E) / V
0Years 0 − 41·85 SE 0·162·75 SE 0·200·64 SE 0·10−32·1 / 71·9
5Years 5 − 91·62 SE 0·172·43 SE 0·220·60 SE 0·11−24·3 / 47·5
Year 10+1·38 SE 0·181·89 SE 0·230·66 SE 0·15−11·9 / 28·9
10 years0
10
20
30
40
50
Bre
ast c
ance
r mor
talit
y
%± SE
10-y gain 8·2% (SE 1·5)
Control
CMF
23·4%
15·2%
Logrank 2p < 0·00001RR 0·63 (0·54−0·74)
13·3%
8·7%
2037 women, age 55-69(60% N+)
0Years 0 − 43·59 SE 0·283·97 SE 0·300·89 SE 0·11−8·9 / 75·9
5Years 5 − 93·60 SE 0·334·33 SE 0·360·83 SE 0·12−11·0 / 58·5
Year 10+2·32 SE 0·282·54 SE 0·310·93 SE 0·18−1·9 / 28·5
10 years0
10
20
30
40
50
Bre
ast c
ance
r mor
talit
y
%± SE
10-y gain 3·7% (SE 2·2)
Control
CMF
33·9%30·3%
Logrank 2p = 0·09RR 0·87 (0·75−1·02)
18·3%
16·7%
ER status1246 women, ER-poor(32% N+)
Death rates (% / year: total rate − rate in women without recurrence) and logrank analyses
CMFControl
Allocation
Rate ratio(O−E) / V
0Years 0 − 44·08 SE 0·395·67 SE 0·470·78 SE 0·12−13·4 / 54·1
5Years 5 − 92·20 SE 0·342·71 SE 0·390·79 SE 0·20−4·5 / 19·2
Year 10+0·77 SE 0·210·96 SE 0·251·05 SE 0·43
0·3 / 5·8
10 years0
10
20
30
40
50
Bre
ast c
ance
r mor
talit
y
%± SE
10-y gain 5·7% (SE 2·8)
Control
CMF
33·3%
27·6%
Logrank 2p = 0·05RR 0·80 (0·64−1·00)
24·0%
19·6%
3281 women, ER+(25% N+)
0Years 0 − 41·42 SE 0·141·84 SE 0·150·73 SE 0·11−18·4 / 58·9
5Years 5 − 92·02 SE 0·182·87 SE 0·220·71 SE 0·10−23·2 / 67·5
Year 10+1·58 SE 0·201·85 SE 0·220·83 SE 0·17−5·6 / 29·3
10 years0
10
20
30
40
50
Bre
ast c
ance
r mor
talit
y
%± SE
10-y gain 5·5% (SE 1·4)
Control
CMF
21·2%
15·6%
Logrank 2p = 0·0002RR 0·74 (0·63−0·86)
9·1%
6·7%
Tumour grade (few were well-differentiated)932 women, poorly-diff.(26% N+)
Death rates (% / year: total rate − rate in women without recurrence) and logrank analyses
CMFControl
Allocation
Rate ratio(O−E) / V
0Years 0 − 42·71 SE 0·363·76 SE 0·410·65 SE 0·15−13·5 / 31·4
5Years 5 − 93·26 SE 0·464·09 SE 0·510·82 SE 0·18−5·3 / 26·5
Year 10+1·01 SE 0·361·40 SE 0·420·85 SE 0·43−0·7 / 4·6
10 years0
10
20
30
40
50
Bre
ast c
ance
r mor
talit
y
%± SE
10-y gain 7·6% (SE 3·1) Control
CMF
32·7%
25·2%
Logrank 2p = 0·01RR 0·73 (0·57−0·94)
18·2%
12·1%
1980 women, moderately-(or well-) differentiated(20% N+)
0Years 0 − 40·99 SE 0·141·21 SE 0·160·78 SE 0·18−5·9 / 24·1
5Years 5 − 91·06 SE 0·161·89 SE 0·220·58 SE 0·15−15·0 / 27·2
Year 10+1·29 SE 0·241·69 SE 0·280·77 SE 0·23−3·9 / 15·1
10 years0
10
20
30
40
50
Bre
ast c
ance
r mor
talit
y
%± SE
10-y gain 4·7% (SE 1·6)
Control
CMF
14·4%
9·7%
Logrank 2p = 0·002RR 0·69 (0·54−0·88)
6·0%
4·8%

P 18: Taxane-plus-anthracycline-based regimen vs control with Left: the SAME, or Right: MORE, non-taxane chemotherapy Time to recurrence, breast cancer mortality and overall mortality. Trials vs the SAME non-taxane chemotherapy (usually 4AC) just added 4 extra taxane-only cycles. RR (and its 95% CI): event rate ratio, from summed logrank statistics for all time periods. Gain (and its SE): absolute difference between ends of graphs.
Recurrence
11167 women: control withthe SAME non-taxane chemo,ie, unconfounded (100% N+)
Recurrence rates (% / year) and logrank analyses
Tax + anthControl
Allocation
Rate ratio(O−E) / V
0 1 2 3Years 0 − 4
5·51 (1280 / 23249)6·43 (1239 / 19259)
0·84 SE 0·04−95·5 / 557·3
4 5 6 7Year 5+
3·10 (413 / 13343)3·62 (381 / 10534)
0·85 SE 0·07−30·5 / 182·8
8 years0
10
20
30
40
50
Rec
urre
nce
%± SE
8-y gain 4·6% (SE 1·0)
Control
Tax + anth
34·8%
30·2%
Logrank 2p < 0·00001RR 0·84 (0·78−0·91)
27·3%
23·7%
33084 women: control withMORE non-taxane chemo(82% N+)
0 1 2 3Years 0 − 4
4·37 (2607 / 59665)5·02 (2586 / 51508)
0·85 SE 0·03−181·4 / 1153·8
4Year 5+
3·01 (153 / 5082)2·69 (127 / 4727)
1·03 SE 0·131·9 / 63·6
5 years0
10
20
30
40
50
Rec
urre
nce
%± SE
5-y gain 2·9% (SE 0·6)
Control
Tax + anth
22·0%19·2%
Logrank 2p < 0·00001RR 0·86 (0·82−0·91)
Breast cancer mortality
11167 women
Death rates (% / year: total rate − rate in women without recurrence) and logrank analyses
Tax + anthControl
Allocation
Rate ratio(O−E) / V
0 1 2 3Years 0 − 43·21 SE 0·113·58 SE 0·130·88 SE 0·05−46·4 / 348·5
4 5 6 7Year 5+
2·48 SE 0·133·06 SE 0·160·82 SE 0·07−33·3 / 172·3
8 years0
10
20
30
40
50
Bre
ast c
ance
r mor
talit
y
%± SE
8-y gain 2·8% (SE 0·9)
Control
Tax + anth
23·9%21·1%
Logrank 2p = 0·0005RR 0·86 (0·79−0·93)
16·7%
14·8%
33084 women
0 1 2 3Years 0 − 42·01 SE 0·062·30 SE 0·070·87 SE 0·04−77·0 / 549·5
4Year 5+
2·37 SE 0·202·26 SE 0·210·97 SE 0·13−1·7 / 57·4
5 years0
10
20
30
40
50
Bre
ast c
ance
r mor
talit
y
%± SE
5-y gain 1·4% (SE 0·4)
Control
Tax + anth
11·5%10·1%
Logrank 2p = 0·001RR 0·88 (0·81−0·95)
Overall mortality
11167 women
Death rates (% / year) and logrank analyses
Tax + anthControl
Allocation
Rate ratio(O−E) / V
0 1 2 3Years 0 − 4
3·55 (881 / 24821)3·93 (819 / 20850)
0·88 SE 0·05−48·6 / 386·0
4 5 6 7Year 5+
3·09 (465 / 15061)3·76 (458 / 12178)
0·82 SE 0·06−41·3 / 213·4
8 years0
10
20
30
40
50
Any
dea
th
%± SE
8-y gain 3·2% (SE 0·9)
Control
Tax + anth
26·7%23·5%
Logrank 2p = 0·0002RR 0·86 (0·79−0·93)
18·2%
16·3%
33084 women
0 1 2 3Years 0 − 4
2·24 (1326 / 59104)2·51 (1326 / 52888)
0·90 SE 0·04−66·3 / 608·4
4Year 5+
2·85 (161 / 5658)2·84 (152 / 5358)
0·96 SE 0·12−3·1 / 70·9
5 years0
10
20
30
40
50
Any
dea
th
%± SE
5-y gain 1·2% (SE 0·5)
Control
Tax + anth
12·4%11·2%
Logrank 2p = 0·008RR 0·90 (0·84−0·97)

P 19: Selected anthracycline-based regimens vs standard CMF (or near-standard CMF) Left: regimens with cumulative dosage > 240 mg/m2 doxorubicin or 360 mg/m2 epirubicin (eg, CAF or CEF), Right: standard 4AC (cumulative dosage 240 mg/m2 doxorubicin) (All graphs exclude regimens with < 60 mg/m2 doxorubicin or 90 mg/m2 epirubicin per cycle) Time to recurrence, breast cancer mortality and overall mortality. RR (and its 95% CI): event rate ratio, from summed logrank statistics for all time periods. Gain (and its SE): absolute difference between ends of graphs.
Recurrence9527 women: regimenswith high cumulativeanthracycline dosage(53% N+)
Recurrence rates (% / year) and logrank analyses
Anthr.CMF
Allocation
Rate ratio(O−E) / V
0Years 0 − 4
5·05 (989 / 19575)6·01 (1104 / 18377)
0·85 SE 0·04−74·9 / 457·0
5Years 5 − 9
2·45 (238 / 9723)2·57 (237 / 9236)
1·00 SE 0·100·1 / 106·9
Year 10+1·64 (65 / 3973)1·35 (54 / 4007)
1·12 SE 0·212·9 / 26·4
10 years0
10
20
30
40
50
Rec
urre
nce
%± SE
10-y gain 2·6% (SE 1·1)
CMF
Anthr.
33·8%31·2%
Logrank 2p = 0·003RR 0·89 (0·82−0·96)
25·5%
22·3%
5122 women: standard 4ACvs standard CMF(61% N+)
0Years 0 − 4
7·97 (820 / 10292)8·21 (830 / 10108)
0·98 SE 0·05−8·7 / 355·5
5Years 5 − 9
2·86 (194 / 6795)2·99 (199 / 6658)
0·91 SE 0·10−8·5 / 92·1
Year 10+2·36 (100 / 4237)1·87 (76 / 4054)
1·28 SE 0·1710·4 / 42·3
10 years0
10
20
30
40
50
Rec
urre
nce
%± SE
10-y gain 1·1% (SE 1·5)
CMF
4AC
42·1%41·0%
Logrank 2p = 0·76RR 0·99 (0·90−1·08)
32·9%
32·4%
Breast cancer mortality9527 women
Death rates (% / year: total rate − rate in women without recurrence) and logrank analyses
Anthr.CMF
Allocation
Rate ratio(O−E) / V
0Years 0 − 42·39 SE 0·113·06 SE 0·120·78 SE 0·06−62·9 / 248·9
5Years 5 − 92·08 SE 0·142·50 SE 0·150·84 SE 0·09−19·3 / 111·5
Year 10+0·91 SE 0·141·11 SE 0·160·84 SE 0·20−3·5 / 20·8
10 years0
10
20
30
40
50
Bre
ast c
ance
r mor
talit
y
%± SE
10-y gain 4·1% (SE 1·0)
CMF
Anthr.
24·1%20·0%
Logrank 2p = 0·00001RR 0·80 (0·72−0·88)
14·5%
11·5%
5122 women
0Years 0 − 44·65 SE 0·204·81 SE 0·210·97 SE 0·06−6·3 / 245·2
5Years 5 − 92·94 SE 0·193·04 SE 0·200·97 SE 0·09−3·7 / 111·6
Year 10+2·06 SE 0·201·96 SE 0·201·03 SE 0·15
1·5 / 48·9
10 years0
10
20
30
40
50
Bre
ast c
ance
r mor
talit
y
%± SE
10-y gain 0·9% (SE 1·4)CMF
4AC32·5%31·6%
Logrank 2p = 0·67RR 0·98 (0·89−1·08)
21·7%
21·2%
Overall mortality9527 women
Death rates (% / year) and logrank analyses
Anthr.CMF
Allocation
Rate ratio(O−E) / V
0Years 0 − 4
2·67 (561 / 20977)3·36 (669 / 19894)
0·79 SE 0·05−65·0 / 277·4
5Years 5 − 9
2·60 (290 / 11151)2·99 (319 / 10661)
0·88 SE 0·08−17·8 / 137·2
Year 10+1·99 (90 / 4528)1·92 (87 / 4523)
1·06 SE 0·162·5 / 40·9
10 years0
10
20
30
40
50
Any
dea
th
%± SE
10-y gain 3·9% (SE 1·1)
CMF
Anthr.
27·1%23·2%
Logrank 2p = 0·0002RR 0·84 (0·76−0·92)
15·7%
12·8%
5122 women
0Years 0 − 4
4·81 (551 / 11458)5·00 (567 / 11351)
0·97 SE 0·06−8·1 / 254·9
5Years 5 − 9
3·33 (266 / 7994)3·48 (274 / 7883)
0·96 SE 0·09−5·3 / 127·6
Year 10+2·67 (141 / 5281)2·57 (131 / 5106)
1·01 SE 0·130·8 / 64·2
10 years0
10
20
30
40
50
Any
dea
th
%± SE
10-y gain 1·2% (SE 1·4) CMF
4AC
34·6%33·4%
Logrank 2p = 0·55RR 0·97 (0·89−1·07)
22·4%
21·8%

P 20: Chemotherapy vs no adjuvant chemotherapy (no CTX) Left: ≥4 cycles of any anthracycline-based regimen, eg standard 4AC, Right: standard CMF (or near-standard CMF) Time to recurrence, breast cancer mortality and overall mortality. RR (and its 95% CI): event rate ratio, from summed logrank statistics for all time periods. Gain (and its SE): absolute difference between ends of graphs.
Recurrence 8575 women: anyanth.-based regimen(82% N+)
Recurrence rates (% / year) and logrank analyses
Anth.No CTX
Allocation
Rate ratio(O−E) / V
0Years 0 − 4
6·14 (1179 / 19190)9·06 (1259 / 13899)
0·69 SE 0·04−185·2 / 489·8
5Years 5 − 9
4·06 (487 / 11981)4·56 (365 / 8011)
0·89 SE 0·07−20·0 / 174·7
Year 10+2·91 (161 / 5530)3·87 (159 / 4104)
0·72 SE 0·11−21·2 / 65·5
10 years0
10
20
30
40
50
Rec
urre
nce
%± SE
10-y gain 8·0% (SE 1·2)
No CTX
Anth.
47·4%
39·4%
Logrank 2p < 0·00001RR 0·73 (0·68−0·79)
34·6%
26·1%
5253 women: standard CMF(or near-standard CMF)(34% N+)
CMFNo CTX
Allocation
Rate ratio(O−E) / V
0Years 0 − 4
4·83 (549 / 11357)7·20 (748 / 10385)
0·61 SE 0·05−135·5 / 277·0
5Years 5 − 9
2·58 (207 / 8038)2·93 (210 / 7158)
0·84 SE 0·09−16·9 / 95·9
Year 10+1·88 (116 / 6155)1·90 (100 / 5260)
0·99 SE 0·14−0·7 / 48·7
10 years0
10
20
30
40
50
Rec
urre
nce
%± SE
10-y gain 10·2% (SE 1·4)
No CTX
CMF
39·8%
29·6%
Logrank 2p < 0·00001RR 0·70 (0·63−0·77)
30·2%
20·3%
Breast cancer mortality 8575 women
Death rates (% / year: total rate − rate in women without recurrence) and logrank analyses
Anth.No CTX
Allocation
Rate ratio(O−E) / V
0Years 0 − 43·38 SE 0·134·77 SE 0·170·73 SE 0·05−97·5 / 307·0
5Years 5 − 93·57 SE 0·164·31 SE 0·210·83 SE 0·07−35·9 / 193·2
Year 10+2·83 SE 0·192·98 SE 0·220·92 SE 0·11−6·7 / 81·0
10 years0
10
20
30
40
50
Bre
ast c
ance
r mor
talit
y
%± SE
10-y gain 6·5% (SE 1·2)
No CTX
Anth.
35·8%
29·3%
Logrank 2p < 0·00001RR 0·79 (0·72−0·85)
21·0%
15·9%
5253 women
CMFNo CTX
Allocation
Rate ratio(O−E) / V
0Years 0 − 42·51 SE 0·143·23 SE 0·170·75 SE 0·07−43·5 / 151·3
5Years 5 − 92·42 SE 0·163·14 SE 0·190·74 SE 0·08−33·7 / 109·6
Year 10+1·80 SE 0·162·10 SE 0·180·82 SE 0·12−11·9 / 59·1
10 years0
10
20
30
40
50
Bre
ast c
ance
r mor
talit
y
%± SE
10-y gain 6·2% (SE 1·3)
No CTX
CMF
27·6%
21·5%
Logrank 2p < 0·00001RR 0·76 (0·68−0·84)
15·3%
11·8%
Overall mortality
8575 women
Death rates (% / year) and logrank analyses
Anth.No CTX
Allocation
Rate ratio(O−E) / V
0Years 0 − 4
3·91 (811 / 20718)5·25 (834 / 15889)
0·75 SE 0·05−99·0 / 346·4
5Years 5 − 9
4·62 (645 / 13969)4·93 (492 / 9975)
0·92 SE 0·06−19·1 / 234·6
Year 10+4·39 (337 / 7680)4·34 (259 / 5969)
1·00 SE 0·09−0·1 / 120·2
10 years0
10
20
30
40
50
Any
dea
th
%± SE
10-y gain 5·0% (SE 1·2)
No CTX
Anth.
39·6%
34·6%
Logrank 2p < 0·00001RR 0·84 (0·78−0·91)
23·1%
18·0%
5253 women
CMFNo CTX
Allocation
Rate ratio(O−E) / V
0Years 0 − 4
2·93 (357 / 12167)3·49 (410 / 11756)
0·82 SE 0·07−33·6 / 170·7
5Years 5 − 9
3·15 (286 / 9091)3·78 (326 / 8617)
0·81 SE 0·08−28·5 / 137·2
Year 10+3·14 (230 / 7318)3·39 (224 / 6612)
0·91 SE 0·10−8·8 / 96·2
10 years0
10
20
30
40
50
Any
dea
th
%± SE
10-y gain 4·7% (SE 1·3)No CTX
CMF
30·7%
26·0%
Logrank 2p = 0·0004RR 0·84 (0·76−0·93)
16·4%
13·7%
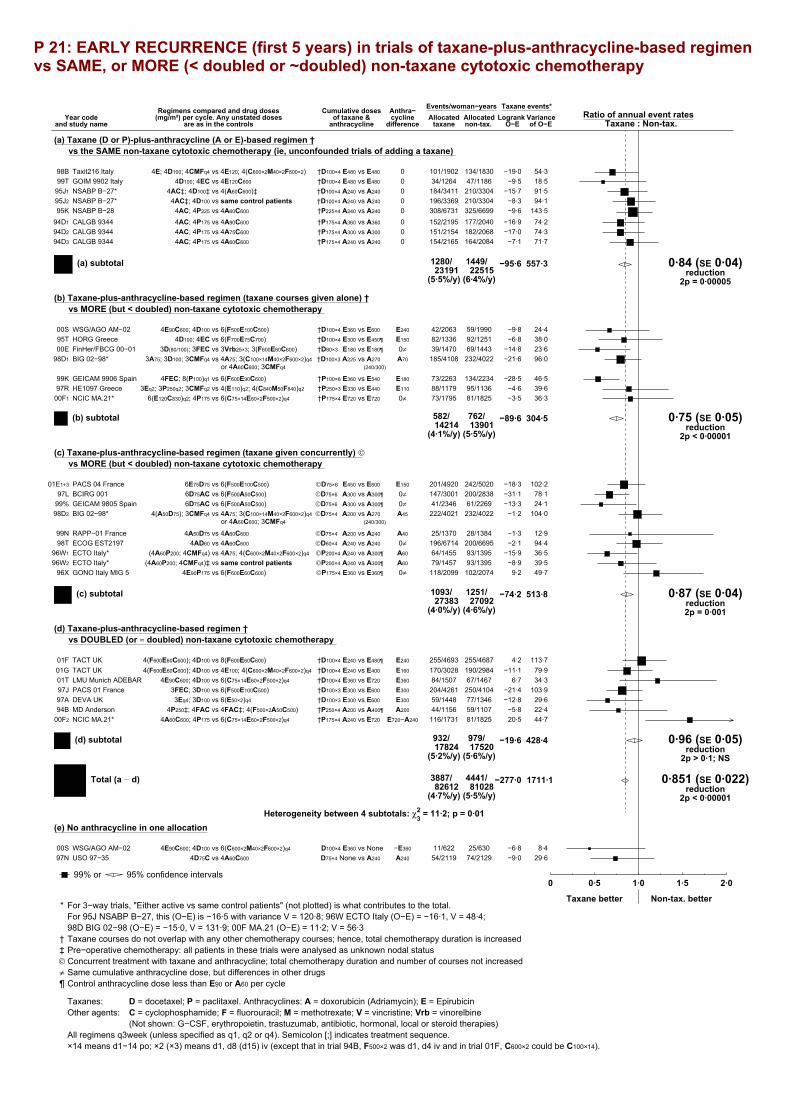
P 21: EARLY RECURRENCE (first 5 years) in trials of taxane-plus-anthracycline-based regimen vs SAME, or MORE (< doubled or ~doubled) non-taxane cytotoxic chemotherapy
Year codeand study name
Regimens compared and drug doses(mg/m²) per cycle. Any unstated doses
are as in the controls
Cumulative dosesof taxane &
anthracycline
Anthra−cycline
difference
Events/woman−yearsAllocated
taxane non-tax.Ratio of annual event rates
Taxane : Non-tax.Logrank Variance
O−E of O−E
Taxane events*
(a) Taxane (D or P)-plus-anthracycline (A or E)-based regimen † vs the SAME non-taxane cytotoxic chemotherapy (ie, unconfounded trials of adding a taxane)
Taxit216 Italy 4E; 4D100; 4CMFq4 vs 4E120; 4(C600×2M40×2F600×2) †D100×4 E480 vs E480 0 101/1902 134/183098B 54·3−19·0GOIM 9902 Italy 4D100; 4EC vs 4E120C600 †D100×4 E480 vs E480 0 34/1264 47/118699T 18·5−9·5NSABP B−27* 4AC‡; 4D100‡ vs 4(A60C600)‡ †D100×4 A240 vs A240 0 184/3411 210/330495J1 91·5−15·7NSABP B−27* 4AC‡; 4D100 vs same control patients †D100×4 A240 vs A240 0 196/3369 210/330495J2 94·1−8·3NSABP B−28 4AC; 4P225 vs 4A60C600 †P225×4 A240 vs A240 0 308/6731 325/669995K 143·5−9·6CALGB 9344 4AC; 4P175 vs 4A90C600 †P175×4 A360 vs A360 0 152/2195 177/204094D1 74·2−16·9CALGB 9344 4AC; 4P175 vs 4A75C600 †P175×4 A300 vs A300 0 151/2154 182/206894D2 74·3−17·0CALGB 9344 4AC; 4P175 vs 4A60C600 †P175×4 A240 vs A240 0 154/2165 164/208494D3 71·7−7·1
1280/23191
1449/22515
(5·5%/y) (6·4%/y)
−95·6 557·3 0·84 (SE 0·04)reduction
2p = 0·00005
(a) subtotal
(b) Taxane-plus-anthracycline-based regimen (taxane courses given alone) † vs MORE (but < doubled) non-taxane cytotoxic chemotherapy
WSG/AGO AM−02 4E90C600; 4D100 vs 6(F500E100C500) †D100×4 E360 vs E600 E240 42/2063 59/199000S 24·4−9·8HORG Greece 4D100; 4EC vs 6(F700E75C700) †D100×4 E300 vs E450¶ E150 82/1336 92/125195T 38·0−6·8FinHer/FBCG 00−01 3D(80/100); 3FEC vs 3Vrb25×3; 3(F600E60C600) †D80×3 E180 vs E180¶ 0≠ 39/1470 69/144300E 23·6−14·8BIG 02−98* 3A75; 3D100; 3CMFq4 vs 4A75; 3(C100×14M40×2F600×2)q4
or 4A60C600; 3CMFq4†D100×3 A225 vs A270
(240/300)A70 185/4108 232/402298D1 96·0−21·6
GEICAM 9906 Spain 4FEC; 8(P100)q1 vs 6(F600E90C600) †P100×8 E360 vs E540 E180 73/2263 134/223499K 46·5−28·5HE1097 Greece 3Eq2; 3P250q2; 3CMFq2 vs 4(E110)q2; 4(C840M50F840)q2 †P250×3 E330 vs E440 E110 88/1179 95/113697R 39·6−4·6NCIC MA.21* 6(E120C830)q2; 4P175 vs 6(C75×14E60×2F500×2)q4 †P175×4 E720 vs E720 0≠ 73/1795 81/182500F1 36·3−3·5
582/14214
762/13901
(4·1%/y) (5·5%/y)
−89·6 304·5 0·75 (SE 0·05)reduction
2p < 0·00001
(b) subtotal
(c) Taxane-plus-anthracycline-based regimen (taxane given concurrently) © vs MORE (but < doubled) non-taxane cytotoxic chemotherapy
PACS 04 France 6E75D75 vs 6(F500E100C500) ©D75×6 E450 vs E600 E150 201/4920 242/502001E1+3 102·2−18·3BCIRG 001 6D75AC vs 6(F500A50C500) ©D75×6 A300 vs A300¶ 0≠ 147/3001 200/283897L 78·1−31·1GEICAM 9805 Spain 6D75AC vs 6(F500A50C500) ©D75×6 A300 vs A300¶ 0≠ 41/2346 61/226999% 24·1−13·3BIG 02−98* 4(A50D75); 3CMFq4 vs 4A75; 3(C100×14M40×2F600×2)q4
or 4A60C600; 3CMFq4©D75×4 A200 vs A270
(240/300)A45 222/4021 232/402298D2 104·0−1·2
RAPP−01 France 4A50D75 vs 4A60C600 ©D75×4 A200 vs A240 A40 25/1370 28/138499N 12·9−1·3ECOG EST2197 4AD60 vs 4A60C600 ©D60×4 A240 vs A240 0≠ 196/6714 200/669598T 94·4−2·1ECTO Italy* (4A60P200; 4CMFq4) vs 4A75; 4(C600×2M40×2F600×2)q4 ©P200×4 A240 vs A300¶ A60 64/1455 93/139596W1 36·5−15·9ECTO Italy* (4A60P200; 4CMFq4)‡ vs same control patients ©P200×4 A240 vs A300¶ A60 79/1457 93/139596W2 39·5−8·9GONO Italy MIG 5 4E90P175 vs 6(F600E60C600) ©P175×4 E360 vs E360¶ 0≠ 118/2099 102/207496X 49·79·2
1093/27383
1251/27092
(4·0%/y) (4·6%/y)
−74·2 513·8 0·87 (SE 0·04)reduction2p = 0·001
(c) subtotal
(d) Taxane-plus-anthracycline-based regimen † vs DOUBLED (or ≈ doubled) non-taxane cytotoxic chemotherapy
TACT UK 4(F600E60C600); 4D100 vs 8(F600E60C600) †D100×4 E240 vs E480¶ E240 255/4693 255/468701F 113·74·2TACT UK 4(F600E60C600); 4D100 vs 4E100; 4(C600×2M40×2F600×2)q4 †D100×4 E240 vs E400 E160 170/3028 190/298401G 79·9−11·1LMU Munich ADEBAR 4E90C600; 4D100 vs 6(C75×14E60×2F500×2)q4 †D100×4 E360 vs E720 E360 84/1507 67/146701T 34·36·7PACS 01 France 3FEC; 3D100 vs 6(F500E100C500) †D100×3 E300 vs E600 E300 204/4261 250/410497J 103·9−21·4DEVA UK 3Eq4; 3D100 vs 6(E50×2)q4 †D100×3 E300 vs E600 E300 59/1448 77/134697A 29·6−12·8MD Anderson 4P250‡; 4FAC vs 4FAC‡; 4(F500×2A50C500) †P250×4 A200 vs A400¶ A200 44/1156 59/110794B 22·4−5·8NCIC MA.21* 4A60C600; 4P175 vs 6(C75×14E60×2F500×2)q4 †P175×4 A240 vs E720 E720−A240 116/1731 81/182500F2 44·720·5
932/17824
979/17520
(5·2%/y) (5·6%/y)
−19·6 428·4 0·96 (SE 0·05)reduction
2p > 0·1; NS
(d) subtotal
3887/82612
4441/81028
(4·7%/y) (5·5%/y)
−277·0 1711·1 0·851 (SE 0·022)reduction
2p < 0·00001
Total (a � d)
Heterogeneity between 4 subtotals: χ23 = 11·2; p = 0·01
(e) No anthracycline in one allocation
WSG/AGO AM−02 4E90C600; 4D100 vs 6(C600×2M40×2F600×2)q4 D100×4 E360 vs None −E360 11/622 25/63000S 8·4−6·8USO 97−35 4D75C vs 4A60C600 D75×4 None vs A240 A240 54/2119 74/212997N 29·6−9·0
Allocated
99% or 95% confidence intervals .0 0·5 1·0 1·5 2·0
Taxane better Non-tax. better* For 3−way trials, "Either active vs same control patients" (not plotted) is what contributes to the total.
For 95J NSABP B−27, this (O−E) is −16·5 with variance V = 120·8; 96W ECTO Italy (O−E) = −16·1, V = 48·4;98D BIG 02−98 (O−E) = −15·0, V = 131·9; 00F MA.21 (O−E) = 11·2; V = 56·3
† Taxane courses do not overlap with any other chemotherapy courses; hence, total chemotherapy duration is increased‡ Pre−operative chemotherapy: all patients in these trials were analysed as unknown nodal status© Concurrent treatment with taxane and anthracycline; total chemotherapy duration and number of courses not increased≠ Same cumulative anthracycline dose, but differences in other drugs¶ Control anthracycline dose less than E90 or A60 per cycle
Taxanes: D = docetaxel; P = paclitaxel. Anthracyclines: A = doxorubicin (Adriamycin); E = EpirubicinOther agents: C = cyclophosphamide; F = fluorouracil; M = methotrexate; V = vincristine; Vrb = vinorelbine
(Not shown: G−CSF, erythropoietin, trastuzumab, antibiotic, hormonal, local or steroid therapies)All regimens q3week (unless specified as q1, q2 or q4). Semicolon [;] indicates treatment sequence.×14 means d1−14 po; ×2 (×3) means d1, d8 (d15) iv (except that in trial 94B, F500×2 was d1, d4 iv and in trial 01F, C600×2 could be C100×14).

P 22: RECURRENCE in trials of taxane-plus-anthracycline-based regimen vs SAME, or MORE (< doubled or ~doubled) non-taxane cytotoxic chemotherapy
Year codeand study name
Regimens compared and drug doses(mg/m²) per cycle. Any unstated doses
are as in the controls
Cumulative dosesof taxane &
anthracycline
Anthra−cycline
difference
Events/woman−yearsAllocated
taxane non-tax.Ratio of annual event rates
Taxane : Non-tax.Logrank Variance
O−E of O−E
Taxane events*
(a) Taxane (D or P)-plus-anthracycline (A or E)-based regimen † vs the SAME non-taxane cytotoxic chemotherapy (ie, unconfounded trials of adding a taxane)
Taxit216 Italy 4E; 4D100; 4CMFq4 vs 4E120; 4(C600×2M40×2F600×2) †D100×4 E480 vs E480 0 112/2089 139/200798B 58·0−16·8GOIM 9902 Italy 4D100; 4EC vs 4E120C600 †D100×4 E480 vs E480 0 38/1369 52/128099T 20·5−9·7NSABP B−27* 4AC‡; 4D100‡ vs 4(A60C600)‡ †D100×4 A240 vs A240 0 252/5361 277/512795J1 124·1−17·8NSABP B−27* 4AC‡; 4D100 vs same control patients †D100×4 A240 vs A240 0 257/5318 277/512795J2 124·7−12·7NSABP B−28 4AC; 4P225 vs 4A60C600 †P225×4 A240 vs A240 0 476/12066 507/1174495K 225·9−22·4
CALGB 9344 4AC; 4P175 vs 4A90C600 †P175×4 A360 vs A360 0 184/3462 208/319094D1 89·2−18·4CALGB 9344 4AC; 4P175 vs 4A75C600 †P175×4 A300 vs A300 0 182/3437 223/318894D2 91·5−23·5CALGB 9344 4AC; 4P175 vs 4A60C600 †P175×4 A240 vs A240 0 192/3441 214/321494D3 92·9−14·7
1693/36543
1897/34877
(4·6%/y) (5·4%/y)
−126·0 740·1 0·84 (SE 0·03)reduction
2p < 0·00001
(a) subtotal
(b) Taxane-plus-anthracycline-based regimen (taxane courses given alone) † vs MORE (but < doubled) non-taxane cytotoxic chemotherapy
WSG/AGO AM−02 4E90C600; 4D100 vs 6(F500E100C500) †D100×4 E360 vs E600 E240 42/2063 59/199000S 24·4−9·8HORG Greece 4D100; 4EC vs 6(F700E75C700) †D100×4 E300 vs E450¶ E150 92/1548 105/142395T 43·2−8·5FinHer/FBCG 00−01 3D(80/100); 3FEC vs 3Vrb25×3; 3(F600E60C600) †D80×3 E180 vs E180¶ 0≠ 39/1470 69/144300E 23·6−14·8BIG 02−98* 3A75; 3D100; 3CMFq4 vs 4A75; 3(C100×14M40×2F600×2)q4
or 4A60C600; 3CMFq4†D100×3 A225 vs A270
(240/300)A70 197/4376 245/429098D1 102·0−22·0
GEICAM 9906 Spain 4FEC; 8(P100)q1 vs 6(F600E90C600) †P100×8 E360 vs E540 E180 73/2265 134/223699K 46·5−28·5HE1097 Greece 3Eq2; 3P250q2; 3CMFq2 vs 4(E110)q2; 4(C840M50F840)q2 †P250×3 E330 vs E440 E110 96/1271 100/123397R 42·3−3·5NCIC MA.21* 6(E120C830)q2; 4P175 vs 6(C75×14E60×2F500×2)q4 †P175×4 E720 vs E720 0≠ 74/1798 82/182900F1 36·8−3·5
613/14791
794/14444
(4·1%/y) (5·5%/y)
−90·5 318·8 0·75 (SE 0·05)reduction
2p < 0·00001
(b) subtotal
(c) Taxane-plus-anthracycline-based regimen (taxane given concurrently) © vs MORE (but < doubled) non-taxane cytotoxic chemotherapy
PACS 04 France 6E75D75 vs 6(F500E100C500) ©D75×6 E450 vs E600 E150 202/4952 243/504601E1+3 102·7−18·2BCIRG 001 6D75AC vs 6(F500A50C500) ©D75×6 A300 vs A300¶ 0≠ 151/3042 202/288097L 79·5−30·3GEICAM 9805 Spain 6D75AC vs 6(F500A50C500) ©D75×6 A300 vs A300¶ 0≠ 44/2608 63/250499% 25·2−13·3BIG 02−98* 4(A50D75); 3CMFq4 vs 4A75; 3(C100×14M40×2F600×2)q4
or 4A60C600; 3CMFq4©D75×4 A200 vs A270
(240/300)A45 236/4270 245/429098D2 110·2−1·2
RAPP−01 France 4A50D75 vs 4A60C600 ©D75×4 A200 vs A240 A40 26/1430 31/144099N 13·9−2·4ECOG EST2197 4AD60 vs 4A60C600 ©D60×4 A240 vs A240 0≠ 245/9235 244/920998T 116·4−0·4ECTO Italy* (4A60P200; 4CMFq4) vs 4A75; 4(C600×2M40×2F600×2)q4 ©P200×4 A240 vs A300¶ A60 66/1517 96/145796W1 37·6−16·5ECTO Italy* (4A60P200; 4CMFq4)‡ vs same control patients ©P200×4 A240 vs A300¶ A60 86/1510 96/145796W2 41·6−6·9GONO Italy MIG 5 4E90P175 vs 6(F600E60C600) ©P175×4 E360 vs E360¶ 0≠ 127/2412 112/239196X 54·09·0
1183/30976
1332/30674
(3·8%/y) (4·3%/y)
−71·7 552·7 0·88 (SE 0·04)reduction2p = 0·002
(c) subtotal
(d) Taxane-plus-anthracycline-based regimen † vs DOUBLED (or ≈ doubled) non-taxane cytotoxic chemotherapy
TACT UK 4(F600E60C600); 4D100 vs 8(F600E60C600) †D100×4 E240 vs E480¶ E240 255/4731 255/472101F 113·74·2TACT UK 4(F600E60C600); 4D100 vs 4E100; 4(C600×2M40×2F600×2)q4 †D100×4 E240 vs E400 E160 173/3048 190/300601G 80·6−9·7LMU Munich ADEBAR 4E90C600; 4D100 vs 6(C75×14E60×2F500×2)q4 †D100×4 E360 vs E720 E360 84/1507 67/146701T 34·36·7PACS 01 France 3FEC; 3D100 vs 6(F500E100C500) †D100×3 E300 vs E600 E300 215/4525 261/434797J 109·2−21·8DEVA UK 3Eq4; 3D100 vs 6(E50×2)q4 †D100×3 E300 vs E600 E300 65/1662 82/154497A 32·1−12·2MD Anderson 4P250‡; 4FAC vs 4FAC‡; 4(F500×2A50C500) †P250×4 A200 vs A400¶ A200 56/1545 73/156394B 28·3−7·2NCIC MA.21* 4A60C600; 4P175 vs 6(C75×14E60×2F500×2)q4 †P175×4 A240 vs E720 E720−A240 116/1732 82/182900F2 44·720·5
964/18750
1010/18477
(5·1%/y) (5·5%/y)
−19·5 442·8 0·96 (SE 0·05)reduction
2p > 0·1; NS
(d) subtotal
4453/101060
5033/98472
(4·4%/y) (5·1%/y)
−305·6 1957·5 0·855 (SE 0·021)reduction
2p < 0·00001
Total (a � d)
Heterogeneity between 4 subtotals: χ23 = 11·2; p = 0·01
(e) No anthracycline in one allocation
WSG/AGO AM−02 4E90C600; 4D100 vs 6(C600×2M40×2F600×2)q4 D100×4 E360 vs None −E360 12/655 25/66300S 8·6−6·3USO 97−35 4D75C vs 4A60C600 D75×4 None vs A240 A240 63/2433 82/242797N 33·8−8·7
Allocated
99% or 95% confidence intervals .0 0·5 1·0 1·5 2·0
Taxane better Non-tax. better* For 3−way trials, "Either active vs same control patients" (not plotted) is what contributes to the total.
For 95J NSABP B−27, this (O−E) is −20·6 with variance V = 162·1; 96W ECTO Italy (O−E) = −15·0, V = 50·8;98D BIG 02−98 (O−E) = −15·2, V = 140·0; 00F MA.21 (O−E) = 11·2; V = 56·7
† Taxane courses do not overlap with any other chemotherapy courses; hence, total chemotherapy duration is increased‡ Pre−operative chemotherapy: all patients in these trials were analysed as unknown nodal status© Concurrent treatment with taxane and anthracycline; total chemotherapy duration and number of courses not increased≠ Same cumulative anthracycline dose, but differences in other drugs¶ Control anthracycline dose less than E90 or A60 per cycle
Taxanes: D = docetaxel; P = paclitaxel. Anthracyclines: A = doxorubicin (Adriamycin); E = EpirubicinOther agents: C = cyclophosphamide; F = fluorouracil; M = methotrexate; V = vincristine; Vrb = vinorelbine
(Not shown: G−CSF, erythropoietin, trastuzumab, antibiotic, hormonal, local or steroid therapies)All regimens q3week (unless specified as q1, q2 or q4). Semicolon [;] indicates treatment sequence.×14 means d1−14 po; ×2 (×3) means d1, d8 (d15) iv (except that in trial 94B, F500×2 was d1, d4 iv and in trial 01F, C600×2 could be C100×14).

P 23: Breast cancer mortality (mortality with recurrence, by logrank subtraction), any taxane-plus-anthracycline-based regimen vs control with the SAME, or MORE (<doubled or ~doubled) non-taxane cytotoxic chemotherapy
Year codeand study name
Regimens compared and drug doses(mg/m²) per cycle. Any unstated doses
are as in the controls
Cumulative dosesof taxane &
anthracycline
Anthra−cycline
difference
Deaths/WomenAllocated
taxane non-tax.Ratio of annual death rates
Taxane : Non-tax.Logrank Variance
O−E of O−E
Taxane deaths*
(a) Taxane (D or P)-plus-anthracycline (A or E)-based regimen † vs the SAME non-taxane cytotoxic chemotherapy (ie, unconfounded trials of adding a taxane)
Taxit216 Italy 4E; 4D100; 4CMFq4 vs 4E120; 4(C600×2M40×2F600×2) †D100×4 E480 vs E480 0 50/486 79/48698B 30·8−14·4GOIM 9902 Italy 4D100; 4EC vs 4E120C600 †D100×4 E480 vs E480 0 26/376 30/37499T 12·8−3·9NSABP B−27* 4AC‡; 4D100‡ vs 4(A60C600)‡ †D100×4 A240 vs A240 0 170/805 186/80495J1 84·9−9·8NSABP B−27* 4AC‡; 4D100 vs same control patients †D100×4 A240 vs A240 0 177/802 186/80495J2 86·2−5·2NSABP B−28 4AC; 4P225 vs 4A60C600 †P225×4 A240 vs A240 0 333/1531 353/152995K 159·5−13·0
CALGB 9344 4AC; 4P175 vs 4A90C600 †P175×4 A360 vs A360 0 133/531 166/52694D1 69·6−20·3CALGB 9344 4AC; 4P175 vs 4A75C600 †P175×4 A300 vs A300 0 136/525 156/52894D2 67·4−11·7CALGB 9344 4AC; 4P175 vs 4A60C600 †P175×4 A240 vs A240 0 144/534 150/52694D3 68·5−5·9
1169/5590
1306/5577
(20·9%) (23·4%)
−79·8 520·8 0·86 (SE 0·04)reduction
2p = 0·0005
(a) subtotal
(b) Taxane-plus-anthracycline-based regimen (taxane courses given alone) † vs MORE (but < doubled) non-taxane cytotoxic chemotherapy
WSG/AGO AM−02 4E90C600; 4D100 vs 6(F500E100C500) †D100×4 E360 vs E600 E240 11/811 22/79500S 8·1−5·7HORG Greece 4D100; 4EC vs 6(F700E75C700) †D100×4 E300 vs E450¶ E150 65/391 62/39795T 28·91·9FinHer/FBCG 00−01 3D(80/100); 3FEC vs 3Vrb25×3; 3(F600E60C600) †D80×3 E180 vs E180¶ 0≠ 18/502 29/50700E 10·1−6·4BIG 02−98* 3A75; 3D100; 3CMFq4 vs 4A75; 3(C100×14M40×2F600×2)q4
or 4A60C600; 3CMFq4†D100×3 A225 vs A270
(240/300)A70 112/959 131/96898D1 57·8−6·9
GEICAM 9906 Spain 4FEC; 8(P100)q1 vs 6(F600E90C600) †P100×8 E360 vs E540 E180 32/614 52/63499K 19·1−7·5HE1097 Greece 3Eq2; 3P250q2; 3CMFq2 vs 4(E110)q2; 4(C840M50F840)q2 †P250×3 E330 vs E440 E110 54/304 61/30097R 25·8−5·2NCIC MA.21* 6(E120C830)q2; 4P175 vs 6(C75×14E60×2F500×2)q4 †P175×4 E720 vs E720 0≠ 47/701 50/70100F1 22·6−1·5
AERO B−2000 France 4FEC; 4P175 vs 6(F500E100C500) †P175×4 E400 vs E600 E20000U (837 patients) (no data)
GIM 1 Italy 4E90C; 4D100 vs 6(F600E75C600) †D100×4 E360 vs E450¶ E9003R (1636 patients) (no data)
339/4282
407/4302
(7·9%) (9·5%)
−31·3 172·3 0·83 (SE 0·07)reduction2p = 0·02
(b) subtotal with data on numbers dead
(c) Taxane-plus-anthracycline-based regimen (taxane given concurrently) © vs MORE (but < doubled) non-taxane cytotoxic chemotherapy
PACS 04 France 6E75D75 vs 6(F500E100C500) ©D75×6 E450 vs E600 E150 80/1495 79/151501E1+3 38·11·7BCIRG 001 6D75AC vs 6(F500A50C500) ©D75×6 A300 vs A300¶ 0≠ 79/745 122/74697L 46·7−21·7GEICAM 9805 Spain 6D75AC vs 6(F500A50C500) ©D75×6 A300 vs A300¶ 0≠ 18/539 19/52199% 8·7−1·6BIG 02−98* 4(A50D75); 3CMFq4 vs 4A75; 3(C100×14M40×2F600×2)q4
or 4A60C600; 3CMFq4©D75×4 A200 vs A270
(240/300)A45 137/960 131/96898D2 62·87·4
RAPP−01 France 4A50D75 vs 4A60C600 ©D75×4 A200 vs A240 A40 8/311 15/31699N 5·6−3·7ECOG EST2197 4AD60 vs 4A60C600 ©D60×4 A240 vs A240 0≠ 130/1476 137/147698T 64·4−4·3ECTO Italy* (4A60P200; 4CMFq4) vs 4A75; 4(C600×2M40×2F600×2)q4 ©P200×4 A240 vs A300¶ A60 26/451 42/45396W1 16·4−8·0ECTO Italy* (4A60P200; 4CMFq4)‡ vs same control patients ©P200×4 A240 vs A300¶ A60 29/451 42/45396W2 16·7−6·3Multicentre Germany 4(EP175)q2; 3CMFq2 vs 4(E90C600); 3(C600M40F600) ©P175×4 E360 vs E360 0≠ 33/108 38/10896% 12·0−2·5
GONO Italy MIG 5 4E90P175 vs 6(F600E60C600) ©P175×4 E360 vs E360¶ 0≠ 47/535 40/52096X 19·81·9
587/7071
665/7076
(8·3%) (9·4%)
−32·1 278·9 0·89 (SE 0·06)reduction2p = 0·05
(c) subtotal
(d) Taxane-plus-anthracycline-based regimen † vs DOUBLED (or ≈ doubled) non-taxane cytotoxic chemotherapy
TACT UK 4(F600E60C600); 4D100 vs 8(F600E60C600) †D100×4 E240 vs E480¶ E240 165/1258 164/126501F 74·54·2TACT UK 4(F600E60C600); 4D100 vs 4E100; 4(C600×2M40×2F600×2)q4 †D100×4 E240 vs E400 E160 108/815 122/82401G 52·4−6·0LMU Munich ADEBAR 4E90C600; 4D100 vs 6(C75×14E60×2F500×2)q4 †D100×4 E360 vs E720 E360 40/684 24/67501T 15·06·9Aberdeen Scotland 4VAC‡; 4D100 vs 4VAC‡; 4(V1·5A50C1000) †D100×4 A200 vs A400¶ A200 4/52 12/5296F 3·4−4·0
PACS 01 France 3FEC; 3D100 vs 6(F500E100C500) †D100×3 E300 vs E600 E300 96/1003 131/99597J 53·4−14·4DEVA UK 3Eq4; 3D100 vs 6(E50×2)q4 †D100×3 E300 vs E600 E300 38/406 50/39797A 19·4−8·6MD Anderson 4P250‡; 4FAC vs 4FAC‡; 4(F500×2A50C500) †P250×4 A200 vs A400¶ A200 30/265 37/25994B 14·8−1·3NCIC MA.21* 4A60C600; 4P175 vs 6(C75×14E60×2F500×2)q4 †P175×4 A240 vs E720 E720−A240 65/702 50/70100F2 26·47·5
GBG 42 / NNBC 3−Eur. 3FEC; 3D100 vs 6(F500E100C500) †D100×3 E300 vs E600 E30002D (4149 patients) (no data)
546/5185
590/5168
(10·5%) (11·4%)
−15·8 259·3 0·94 (SE 0·06)reduction
2p > 0·1; NS
(d) subtotal with data on numbers dead
2641/22128
2968/22123
(11·9%) (13·4%)
−161·0 1176·5 0·872 (SE 0·027)reduction
2p < 0·00001
Total (a � d) with data on numbers dead (some with time to event unknown)
Heterogeneity between 4 subtotals: χ23 = 2·0; p > 0·1; NS
(e) No anthracycline in one allocation
WSG/AGO AM−02 4E90C600; 4D100 vs 6(C600×2M40×2F600×2)q4 D100×4 E360 vs None −E360 4/167 12/17700S 3·6−3·3USO 97−35 4D75C vs 4A60C600 D75×4 None vs A240 A240 47/506 53/51097N 23·5−1·9
Allocated
99% or 95% confidence intervals99% confidence intervals, time to event unknown
.0 0·5 1·0 1·5 2·0
Taxane better Non-tax. better* For 3−way trials, "Either active vs same control patients" (not plotted) is what contributes to the total.
For 95J NSABP B−27, this (O−E) is −10·5 with variance V = 112·2; 96W ECTO Italy (O−E) = −9·3, V = 20·8;98D BIG 02−98 (O−E) = 0·4, V = 81·5; 00F MA.21 (O−E) = 4·0; V = 33·2
† Taxane courses do not overlap with any other chemotherapy courses; hence, total chemotherapy duration is increased‡ Pre−operative chemotherapy: all patients in these trials were analysed as unknown nodal status© Concurrent treatment with taxane and anthracycline; total chemotherapy duration and number of courses not increased≠ Same cumulative anthracycline dose, but differences in other drugs¶ Control anthracycline dose less than E90 or A60 per cycle
Taxanes: D = docetaxel; P = paclitaxel. Anthracyclines: A = doxorubicin (Adriamycin); E = EpirubicinOther agents: C = cyclophosphamide; F = fluorouracil; M = methotrexate; V = vincristine; Vrb = vinorelbine
(Not shown: G−CSF, erythropoietin, trastuzumab, antibiotic, hormonal, local or steroid therapies)All regimens q3week (unless specified as q1, q2 or q4). Semicolon [;] indicates treatment sequence.×14 means d1−14 po; ×2 (×3) means d1, d8 (d15) iv (except that in trial 94B, F500×2 was d1, d4 iv and in trial 01F, C600×2 could be C100×14).

P 24: MORTALITY WITHOUT RECURRENCE IN FIRST YEAR in trials of taxane-plus-anthracycline-based regimen vs SAME, or MORE (< doubled or ~doubled) non-taxane cytotoxic chemotherapy
Year codeand study name
Regimens compared and drug doses(mg/m²) per cycle. Any unstated doses
are as in the controls
Cumulative dosesof taxane &
anthracycline
Anthra−cycline
difference
Deaths/woman−yearsAllocated
taxane non−tax.Ratio of annual death rates
Taxane : Non−tax.Logrank Variance
O−E of O−E
Taxane deaths*
(a) Taxane (D or P)-plus-anthracycline (A or E)-based regimen † vs the SAME non-taxane cytotoxic chemotherapy (ie, unconfounded trials of adding a taxane)
Taxit216 Italy 4E; 4D100; 4CMFq4 vs 4E120; 4(C600×2M40×2F600×2) †D100×4 E480 vs E480 0 1/458 1/45898B 0·50·0GOIM 9902 Italy 4D100; 4EC vs 4E120C600 †D100×4 E480 vs E480 0 0/350 0/33999TNSABP B−27* 4AC‡; 4D100‡ vs 4(A60C600)‡ †D100×4 A240 vs A240 0 5/789 1/78395J1 1·52·0NSABP B−27* 4AC‡; 4D100 vs same control patients †D100×4 A240 vs A240 0 5/779 1/78395J2 1·52·0NSABP B−28 4AC; 4P225 vs 4A60C600 †P225×4 A240 vs A240 0 5/1500 4/149995K 2·20·4CALGB 9344 4AC; 4P175 vs 4A90C600 †P175×4 A360 vs A360 0 2/513 4/50894D1 1·5−0·9CALGB 9344 4AC; 4P175 vs 4A75C600 †P175×4 A300 vs A300 0 1/510 1/50494D2 0·50·0CALGB 9344 4AC; 4P175 vs 4A60C600 †P175×4 A240 vs A240 0 1/518 1/50694D3 0·50·0
20/5417
13/5380
(0·4%/y) (0·2%/y)
2·2 7·61·34 (SE 0·42)
increase2p > 0·1; NS
(a) subtotal
(b) Taxane-plus-anthracycline-based regimen (taxane courses given alone) † vs MORE (but < doubled) non-taxane cytotoxic chemotherapy
WSG/AGO AM−02 4E90C600; 4D100 vs 6(F500E100C500) †D100×4 E360 vs E600 E240 2/769 2/75200S 1·00·1HORG Greece 4D100; 4EC vs 6(F700E75C700) †D100×4 E300 vs E450¶ E150 0/356 3/35695T 0·7−1·2FinHer/FBCG 00−01 3D(80/100); 3FEC vs 3Vrb25×3; 3(F600E60C600) †D80×3 E180 vs E180¶ 0≠ 2/449 0/45200E 0·51·0BIG 02−98* 3A75; 3D100; 3CMFq4 vs 4A75; 3(C100×14M40×2F600×2)q4
or 4A60C600; 3CMFq4†D100×3 A225 vs A270
(240/300)A70 1/928 1/93698D1 0·50·1
GEICAM 9906 Spain 4FEC; 8(P100)q1 vs 6(F600E90C600) †P100×8 E360 vs E540 E180 4/579 1/60299K 1·21·6HE1097 Greece 3Eq2; 3P250q2; 3CMFq2 vs 4(E110)q2; 4(C840M50F840)q2 †P250×3 E330 vs E440 E110 1/276 0/27597R 0·20·5
10/3357
7/3373
(0·3%/y) (0·2%/y)
2·0 4·11·64 (SE 0·64)
increase2p > 0·1; NS
(b) subtotal
(c) Taxane-plus-−anthracycline-based regimen (taxane given concurrently) © vs MORE (but < doubled) non-taxane cytotoxic chemotherapy
PACS 04 France 6E75D75 vs 6(F500E100C500) ©D75×6 E450 vs E600 E150 5/1451 2/147901E1+3 1·81·6BCIRG 001 6D75AC vs 6(F500A50C500) ©D75×6 A300 vs A300¶ 0≠ 4/720 5/71697L 2·2−0·5GEICAM 9805 Spain 6D75AC vs 6(F500A50C500) ©D75×6 A300 vs A300¶ 0≠ 0/516 0/50399%BIG 02−98* 4(A50D75); 3CMFq4 vs 4A75; 3(C100×14M40×2F600×2)q4
or 4A60C600; 3CMFq4©D75×4 A200 vs A270
(240/300)A45 2/931 1/93698D2 0·80·5
RAPP−01 France 4A50D75 vs 4A60C600 ©D75×4 A200 vs A240 A40 2/298 0/30299N 0·51·0ECOG EST2197 4AD60 vs 4A60C600 ©D60×4 A240 vs A240 0≠ 6/1440 2/144598T 2·02·0ECTO Italy* (4A60P200; 4CMFq4) vs 4A75; 4(C600×2M40×2F600×2)q4 ©P200×4 A240 vs A300¶ A60 2/434 1/43096W1 0·70·5ECTO Italy* (4A60P200; 4CMFq4)‡ vs same control patients ©P200×4 A240 vs A300¶ A60 1/437 1/43096W2 0·5−0·1GONO Italy MIG 5 4E90P175 vs 6(F600E60C600) ©P175×4 E360 vs E360¶ 0≠ 0/507 3/48896X 0·8−1·5
22/6734
15/6729
(0·3%/y) (0·2%/y)
3·6 8·81·50 (SE 0·42)
increase2p > 0·1; NS
(c) subtotal
(d) Taxane-plus-anthracycline-based regimen † vs DOUBLED (or ≈ doubled) non-taxane cytotoxic chemotherapy
TACT UK 4(F600E60C600); 4D100 vs 8(F600E60C600) †D100×4 E240 vs E480¶ E240 5/1220 1/122701F 1·52·2TACT UK 4(F600E60C600); 4D100 vs 4E100; 4(C600×2M40×2F600×2)q4 †D100×4 E240 vs E400 E160 4/783 1/78601G 1·21·5LMU Munich ADEBAR 4E90C600; 4D100 vs 6(C75×14E60×2F500×2)q4 †D100×4 E360 vs E720 E360 4/605 5/58201T 2·2−0·1PACS 01 France 3FEC; 3D100 vs 6(F500E100C500) †D100×3 E300 vs E600 E300 0/984 0/97597JDEVA UK 3Eq4; 3D100 vs 6(E50×2)q4 †D100×3 E300 vs E600 E300 1/379 4/36897A 1·2−1·4MD Anderson 4P250‡; 4FAC vs 4FAC‡; 4(F500×2A50C500) †P250×4 A200 vs A400¶ A200 0/242 0/23094B
14/4213
11/4168
(0·3%/y) (0·3%/y)
2·2 6·11·44 (SE 0·49)
increase2p > 0·1; NS
(d) subtotal
66/19721
46/19650
(0·3%/y) (0·2%/y)
9·8 26·31·452 (SE 0·236)
increase2p = 0·06
Total (a � d)
Heterogeneity between 4 subtotals: χ23 = 0·1; p > 0·1; NS
(e) No anthracycline in one allocation
WSG/AGO AM−02 4E90C600; 4D100 vs 6(C600×2M40×2F600×2)q4 D100×4 E360 vs None −E360 0/154 0/16400SUSO 97−35 4D75C vs 4A60C600 D75×4 None vs A240 A240 3/482 1/48797N 1·00·9
Allocated
99% or 95% confidence intervals .0 0·5 1·0 1·5 2·0
Taxane better Non-tax. better* For 3−way trials, "Either active vs same control patients" (not plotted) is what contributes to the total.
For 95J NSABP B−27, this (O−E) is 2·7 with variance V = 2·4; 96W ECTO Italy (O−E) = 0·3, V = 0·9;98D BIG 02−98 (O−E) = 0·4, V = 0·9; 00F MA.21 (O−E) = 0·0; V = 0·0
† Taxane courses do not overlap with any other chemotherapy courses; hence, total chemotherapy duration is increased‡ Pre−operative chemotherapy: all patients in these trials were analysed as unknown nodal status© Concurrent treatment with taxane and anthracycline; total chemotherapy duration and number of courses not increased≠ Same cumulative anthracycline dose, but differences in other drugs¶ Control anthracycline dose less than E90 or A60 per cycle
Taxanes: D = docetaxel; P = paclitaxel. Anthracyclines: A = doxorubicin (Adriamycin); E = EpirubicinOther agents: C = cyclophosphamide; F = fluorouracil; M = methotrexate; V = vincristine; Vrb = vinorelbine
(Not shown: G−CSF, erythropoietin, trastuzumab, antibiotic, hormonal, local or steroid therapies)All regimens q3week (unless specified as q1, q2 or q4). Semicolon [;] indicates treatment sequence.×14 means d1−14 po; ×2 (×3) means d1, d8 (d15) iv (except that in trial 94B, F500×2 was d1, d4 iv and in trial 01F, C600×2 could be C100×14).
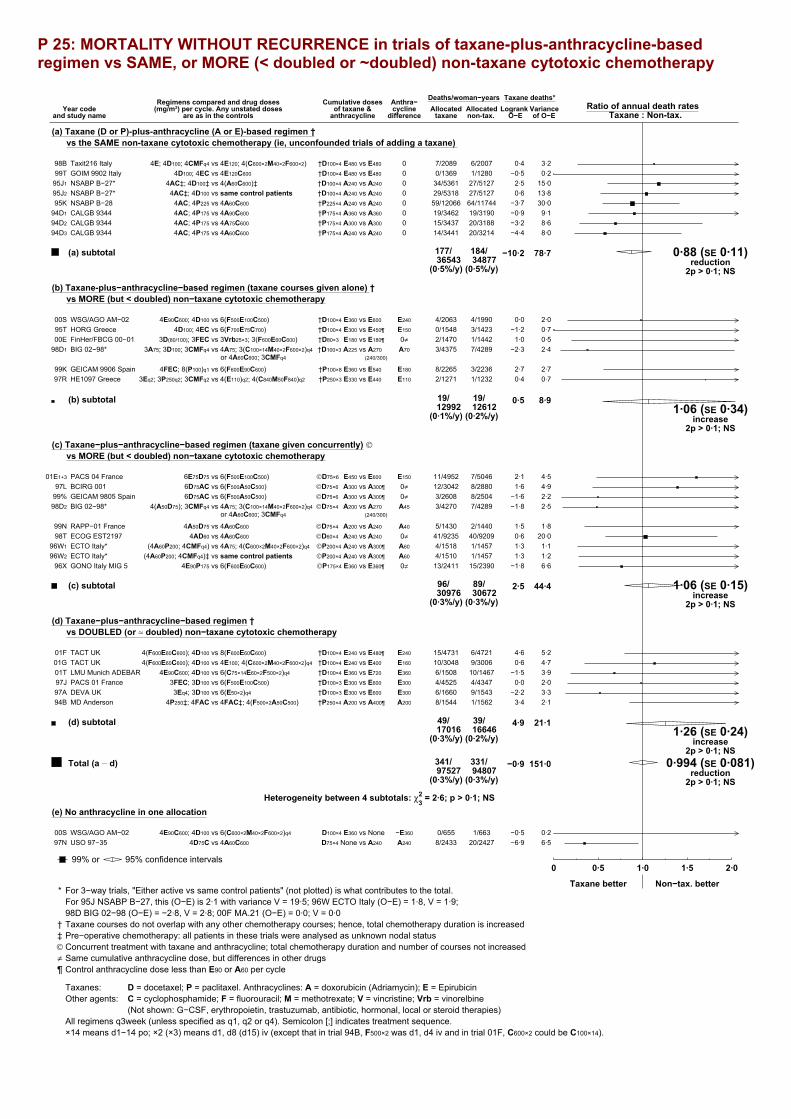
P 25: MORTALITY WITHOUT RECURRENCE in trials of taxane-plus-anthracycline-based regimen vs SAME, or MORE (< doubled or ~doubled) non-taxane cytotoxic chemotherapy
Year codeand study name
Regimens compared and drug doses(mg/m²) per cycle. Any unstated doses
are as in the controls
Cumulative dosesof taxane &
anthracycline
Anthra−cycline
difference
Deaths/woman−yearsAllocated
taxane non-tax.Ratio of annual death rates
Taxane : Non-tax.Logrank Variance
O−E of O−E
Taxane deaths*
(a) Taxane (D or P)-plus-anthracycline (A or E)-based regimen † vs the SAME non-taxane cytotoxic chemotherapy (ie, unconfounded trials of adding a taxane)
Taxit216 Italy 4E; 4D100; 4CMFq4 vs 4E120; 4(C600×2M40×2F600×2) †D100×4 E480 vs E480 0 7/2089 6/200798B 3·20·4GOIM 9902 Italy 4D100; 4EC vs 4E120C600 †D100×4 E480 vs E480 0 0/1369 1/128099T 0·2−0·5NSABP B−27* 4AC‡; 4D100‡ vs 4(A60C600)‡ †D100×4 A240 vs A240 0 34/5361 27/512795J1 15·02·5NSABP B−27* 4AC‡; 4D100 vs same control patients †D100×4 A240 vs A240 0 29/5318 27/512795J2 13·80·6NSABP B−28 4AC; 4P225 vs 4A60C600 †P225×4 A240 vs A240 0 59/12066 64/1174495K 30·0−3·7CALGB 9344 4AC; 4P175 vs 4A90C600 †P175×4 A360 vs A360 0 19/3462 19/319094D1 9·1−0·9CALGB 9344 4AC; 4P175 vs 4A75C600 †P175×4 A300 vs A300 0 15/3437 20/318894D2 8·6−3·2CALGB 9344 4AC; 4P175 vs 4A60C600 †P175×4 A240 vs A240 0 14/3441 20/321494D3 8·0−4·4
177/36543
184/34877
(0·5%/y) (0·5%/y)
−10·2 78·7 0·88 (SE 0·11)reduction
2p > 0·1; NS
(a) subtotal
(b) Taxane-plus−anthracycline−based regimen (taxane courses given alone) † vs MORE (but < doubled) non−taxane cytotoxic chemotherapy
WSG/AGO AM−02 4E90C600; 4D100 vs 6(F500E100C500) †D100×4 E360 vs E600 E240 4/2063 4/199000S 2·00·0HORG Greece 4D100; 4EC vs 6(F700E75C700) †D100×4 E300 vs E450¶ E150 0/1548 3/142395T 0·7−1·2FinHer/FBCG 00−01 3D(80/100); 3FEC vs 3Vrb25×3; 3(F600E60C600) †D80×3 E180 vs E180¶ 0≠ 2/1470 1/144200E 0·51·0BIG 02−98* 3A75; 3D100; 3CMFq4 vs 4A75; 3(C100×14M40×2F600×2)q4
or 4A60C600; 3CMFq4†D100×3 A225 vs A270
(240/300)A70 3/4375 7/428998D1 2·4−2·3
GEICAM 9906 Spain 4FEC; 8(P100)q1 vs 6(F600E90C600) †P100×8 E360 vs E540 E180 8/2265 3/223699K 2·72·7HE1097 Greece 3Eq2; 3P250q2; 3CMFq2 vs 4(E110)q2; 4(C840M50F840)q2 †P250×3 E330 vs E440 E110 2/1271 1/123297R 0·70·4
19/12992
19/12612
(0·1%/y) (0·2%/y)
0·5 8·91·06 (SE 0·34)
increase2p > 0·1; NS
(b) subtotal
(c) Taxane−plus−anthracycline−based regimen (taxane given concurrently) © vs MORE (but < doubled) non−taxane cytotoxic chemotherapy
PACS 04 France 6E75D75 vs 6(F500E100C500) ©D75×6 E450 vs E600 E150 11/4952 7/504601E1+3 4·52·1BCIRG 001 6D75AC vs 6(F500A50C500) ©D75×6 A300 vs A300¶ 0≠ 12/3042 8/288097L 4·91·6GEICAM 9805 Spain 6D75AC vs 6(F500A50C500) ©D75×6 A300 vs A300¶ 0≠ 3/2608 8/250499% 2·2−1·6BIG 02−98* 4(A50D75); 3CMFq4 vs 4A75; 3(C100×14M40×2F600×2)q4
or 4A60C600; 3CMFq4©D75×4 A200 vs A270
(240/300)A45 3/4270 7/428998D2 2·5−1·8
RAPP−01 France 4A50D75 vs 4A60C600 ©D75×4 A200 vs A240 A40 5/1430 2/144099N 1·81·5ECOG EST2197 4AD60 vs 4A60C600 ©D60×4 A240 vs A240 0≠ 41/9235 40/920998T 20·00·6ECTO Italy* (4A60P200; 4CMFq4) vs 4A75; 4(C600×2M40×2F600×2)q4 ©P200×4 A240 vs A300¶ A60 4/1518 1/145796W1 1·11·3ECTO Italy* (4A60P200; 4CMFq4)‡ vs same control patients ©P200×4 A240 vs A300¶ A60 4/1510 1/145796W2 1·21·3GONO Italy MIG 5 4E90P175 vs 6(F600E60C600) ©P175×4 E360 vs E360¶ 0≠ 13/2411 15/239096X 6·6−1·8
96/30976
89/30672
(0·3%/y) (0·3%/y)
2·5 44·4 1·06 (SE 0·15)increase
2p > 0·1; NS
(c) subtotal
(d) Taxane−plus−anthracycline−based regimen † vs DOUBLED (or ≈ doubled) non−taxane cytotoxic chemotherapy
TACT UK 4(F600E60C600); 4D100 vs 8(F600E60C600) †D100×4 E240 vs E480¶ E240 15/4731 6/472101F 5·24·6TACT UK 4(F600E60C600); 4D100 vs 4E100; 4(C600×2M40×2F600×2)q4 †D100×4 E240 vs E400 E160 10/3048 9/300601G 4·70·6LMU Munich ADEBAR 4E90C600; 4D100 vs 6(C75×14E60×2F500×2)q4 †D100×4 E360 vs E720 E360 6/1508 10/146701T 3·9−1·5PACS 01 France 3FEC; 3D100 vs 6(F500E100C500) †D100×3 E300 vs E600 E300 4/4525 4/434797J 2·00·0DEVA UK 3Eq4; 3D100 vs 6(E50×2)q4 †D100×3 E300 vs E600 E300 6/1660 9/154397A 3·3−2·2MD Anderson 4P250‡; 4FAC vs 4FAC‡; 4(F500×2A50C500) †P250×4 A200 vs A400¶ A200 8/1544 1/156294B 2·13·4
49/17016
39/16646
(0·3%/y) (0·2%/y)
4·9 21·11·26 (SE 0·24)
increase2p > 0·1; NS
(d) subtotal
341/97527
331/94807
(0·3%/y) (0·3%/y)
−0·9 151·0 0·994 (SE 0·081)reduction
2p > 0·1; NS
Total (a � d)
Heterogeneity between 4 subtotals: χ23 = 2·6; p > 0·1; NS
(e) No anthracycline in one allocation
WSG/AGO AM−02 4E90C600; 4D100 vs 6(C600×2M40×2F600×2)q4 D100×4 E360 vs None −E360 0/655 1/66300S 0·2−0·5USO 97−35 4D75C vs 4A60C600 D75×4 None vs A240 A240 8/2433 20/242797N 6·5−6·9
Allocated
99% or 95% confidence intervals .0 0·5 1·0 1·5 2·0
Taxane better Non−tax. better* For 3−way trials, "Either active vs same control patients" (not plotted) is what contributes to the total.
For 95J NSABP B−27, this (O−E) is 2·1 with variance V = 19·5; 96W ECTO Italy (O−E) = 1·8, V = 1·9;98D BIG 02−98 (O−E) = −2·8, V = 2·8; 00F MA.21 (O−E) = 0·0; V = 0·0
† Taxane courses do not overlap with any other chemotherapy courses; hence, total chemotherapy duration is increased‡ Pre−operative chemotherapy: all patients in these trials were analysed as unknown nodal status© Concurrent treatment with taxane and anthracycline; total chemotherapy duration and number of courses not increased≠ Same cumulative anthracycline dose, but differences in other drugs¶ Control anthracycline dose less than E90 or A60 per cycle
Taxanes: D = docetaxel; P = paclitaxel. Anthracyclines: A = doxorubicin (Adriamycin); E = EpirubicinOther agents: C = cyclophosphamide; F = fluorouracil; M = methotrexate; V = vincristine; Vrb = vinorelbine
(Not shown: G−CSF, erythropoietin, trastuzumab, antibiotic, hormonal, local or steroid therapies)All regimens q3week (unless specified as q1, q2 or q4). Semicolon [;] indicates treatment sequence.×14 means d1−14 po; ×2 (×3) means d1, d8 (d15) iv (except that in trial 94B, F500×2 was d1, d4 iv and in trial 01F, C600×2 could be C100×14).
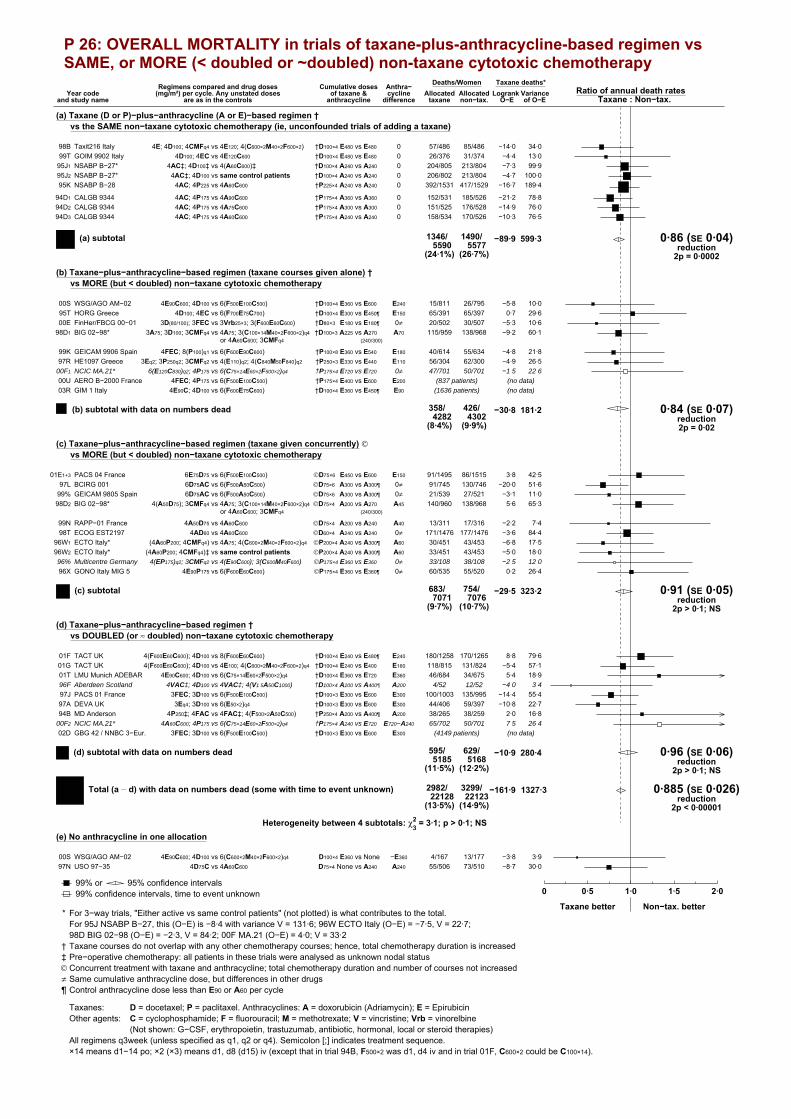
P 26: OVERALL MORTALITY in trials of taxane-plus-anthracycline-based regimen vs SAME, or MORE (< doubled or ~doubled) non-taxane cytotoxic chemotherapy
Year codeand study name
Regimens compared and drug doses(mg/m²) per cycle. Any unstated doses
are as in the controls
Cumulative dosesof taxane &
anthracycline
Anthra−cycline
difference
Deaths/WomenAllocated
taxane non−tax.Ratio of annual death rates
Taxane : Non−tax.Logrank Variance
O−E of O−E
Taxane deaths*
(a) Taxane (D or P)−plus−anthracycline (A or E)−based regimen † vs the SAME non−taxane cytotoxic chemotherapy (ie, unconfounded trials of adding a taxane)
Taxit216 Italy 4E; 4D100; 4CMFq4 vs 4E120; 4(C600×2M40×2F600×2) †D100×4 E480 vs E480 0 57/486 85/48698B 34·0−14·0GOIM 9902 Italy 4D100; 4EC vs 4E120C600 †D100×4 E480 vs E480 0 26/376 31/37499T 13·0−4·4NSABP B−27* 4AC‡; 4D100‡ vs 4(A60C600)‡ †D100×4 A240 vs A240 0 204/805 213/80495J1 99·9−7·3NSABP B−27* 4AC‡; 4D100 vs same control patients †D100×4 A240 vs A240 0 206/802 213/80495J2 100·0−4·7NSABP B−28 4AC; 4P225 vs 4A60C600 †P225×4 A240 vs A240 0 392/1531 417/152995K 189·4−16·7
CALGB 9344 4AC; 4P175 vs 4A90C600 †P175×4 A360 vs A360 0 152/531 185/52694D1 78·8−21·2CALGB 9344 4AC; 4P175 vs 4A75C600 †P175×4 A300 vs A300 0 151/525 176/52894D2 76·0−14·9CALGB 9344 4AC; 4P175 vs 4A60C600 †P175×4 A240 vs A240 0 158/534 170/52694D3 76·5−10·3
1346/5590
1490/5577
(24·1%) (26·7%)
−89·9 599·3 0·86 (SE 0·04)reduction
2p = 0·0002
(a) subtotal
(b) Taxane−plus−anthracycline−based regimen (taxane courses given alone) † vs MORE (but < doubled) non−taxane cytotoxic chemotherapy
WSG/AGO AM−02 4E90C600; 4D100 vs 6(F500E100C500) †D100×4 E360 vs E600 E240 15/811 26/79500S 10·0−5·8HORG Greece 4D100; 4EC vs 6(F700E75C700) †D100×4 E300 vs E450¶ E150 65/391 65/39795T 29·60·7FinHer/FBCG 00−01 3D(80/100); 3FEC vs 3Vrb25×3; 3(F600E60C600) †D80×3 E180 vs E180¶ 0≠ 20/502 30/50700E 10·6−5·3BIG 02−98* 3A75; 3D100; 3CMFq4 vs 4A75; 3(C100×14M40×2F600×2)q4
or 4A60C600; 3CMFq4†D100×3 A225 vs A270
(240/300)A70 115/959 138/96898D1 60·1−9·2
GEICAM 9906 Spain 4FEC; 8(P100)q1 vs 6(F600E90C600) †P100×8 E360 vs E540 E180 40/614 55/63499K 21·8−4·8HE1097 Greece 3Eq2; 3P250q2; 3CMFq2 vs 4(E110)q2; 4(C840M50F840)q2 †P250×3 E330 vs E440 E110 56/304 62/30097R 26·5−4·9NCIC MA.21* 6(E120C830)q2; 4P175 vs 6(C75×14E60×2F500×2)q4 †P175×4 E720 vs E720 0≠ 47/701 50/70100F1 22·6−1·5
AERO B−2000 France 4FEC; 4P175 vs 6(F500E100C500) †P175×4 E400 vs E600 E20000U (837 patients) (no data)
GIM 1 Italy 4E90C; 4D100 vs 6(F600E75C600) †D100×4 E360 vs E450¶ E9003R (1636 patients) (no data)
358/4282
426/4302
(8·4%) (9·9%)
−30·8 181·2 0·84 (SE 0·07)reduction2p = 0·02
(b) subtotal with data on numbers dead
(c) Taxane−plus−anthracycline−based regimen (taxane given concurrently) © vs MORE (but < doubled) non−taxane cytotoxic chemotherapy
PACS 04 France 6E75D75 vs 6(F500E100C500) ©D75×6 E450 vs E600 E150 91/1495 86/151501E1+3 42·53·8BCIRG 001 6D75AC vs 6(F500A50C500) ©D75×6 A300 vs A300¶ 0≠ 91/745 130/74697L 51·6−20·0GEICAM 9805 Spain 6D75AC vs 6(F500A50C500) ©D75×6 A300 vs A300¶ 0≠ 21/539 27/52199% 11·0−3·1BIG 02−98* 4(A50D75); 3CMFq4 vs 4A75; 3(C100×14M40×2F600×2)q4
or 4A60C600; 3CMFq4©D75×4 A200 vs A270
(240/300)A45 140/960 138/96898D2 65·35·6
RAPP−01 France 4A50D75 vs 4A60C600 ©D75×4 A200 vs A240 A40 13/311 17/31699N 7·4−2·2ECOG EST2197 4AD60 vs 4A60C600 ©D60×4 A240 vs A240 0≠ 171/1476 177/147698T 84·4−3·6ECTO Italy* (4A60P200; 4CMFq4) vs 4A75; 4(C600×2M40×2F600×2)q4 ©P200×4 A240 vs A300¶ A60 30/451 43/45396W1 17·5−6·8ECTO Italy* (4A60P200; 4CMFq4)‡ vs same control patients ©P200×4 A240 vs A300¶ A60 33/451 43/45396W2 18·0−5·0Multicentre Germany 4(EP175)q2; 3CMFq2 vs 4(E90C600); 3(C600M40F600) ©P175×4 E360 vs E360 0≠ 33/108 38/10896% 12·0−2·5
GONO Italy MIG 5 4E90P175 vs 6(F600E60C600) ©P175×4 E360 vs E360¶ 0≠ 60/535 55/52096X 26·40·2
683/7071
754/7076
(9·7%) (10·7%)
−29·5 323·2 0·91 (SE 0·05)reduction
2p > 0·1; NS
(c) subtotal
(d) Taxane−plus−anthracycline−based regimen † vs DOUBLED (or ≈ doubled) non−taxane cytotoxic chemotherapy
TACT UK 4(F600E60C600); 4D100 vs 8(F600E60C600) †D100×4 E240 vs E480¶ E240 180/1258 170/126501F 79·68·8TACT UK 4(F600E60C600); 4D100 vs 4E100; 4(C600×2M40×2F600×2)q4 †D100×4 E240 vs E400 E160 118/815 131/82401G 57·1−5·4LMU Munich ADEBAR 4E90C600; 4D100 vs 6(C75×14E60×2F500×2)q4 †D100×4 E360 vs E720 E360 46/684 34/67501T 18·95·4Aberdeen Scotland 4VAC‡; 4D100 vs 4VAC‡; 4(V1·5A50C1000) †D100×4 A200 vs A400¶ A200 4/52 12/5296F 3·4−4·0
PACS 01 France 3FEC; 3D100 vs 6(F500E100C500) †D100×3 E300 vs E600 E300 100/1003 135/99597J 55·4−14·4DEVA UK 3Eq4; 3D100 vs 6(E50×2)q4 †D100×3 E300 vs E600 E300 44/406 59/39797A 22·7−10·8MD Anderson 4P250‡; 4FAC vs 4FAC‡; 4(F500×2A50C500) †P250×4 A200 vs A400¶ A200 38/265 38/25994B 16·82·0NCIC MA.21* 4A60C600; 4P175 vs 6(C75×14E60×2F500×2)q4 †P175×4 A240 vs E720 E720−A240 65/702 50/70100F2 26·47·5
GBG 42 / NNBC 3−Eur. 3FEC; 3D100 vs 6(F500E100C500) †D100×3 E300 vs E600 E30002D (4149 patients) (no data)
595/5185
629/5168
(11·5%) (12·2%)
−10·9 280·4 0·96 (SE 0·06)reduction
2p > 0·1; NS
(d) subtotal with data on numbers dead
2982/22128
3299/22123
(13·5%) (14·9%)
−161·9 1327·3 0·885 (SE 0·026)reduction
2p < 0·00001
Total (a � d) with data on numbers dead (some with time to event unknown)
Heterogeneity between 4 subtotals: χ23 = 3·1; p > 0·1; NS
(e) No anthracycline in one allocation
WSG/AGO AM−02 4E90C600; 4D100 vs 6(C600×2M40×2F600×2)q4 D100×4 E360 vs None −E360 4/167 13/17700S 3·9−3·8USO 97−35 4D75C vs 4A60C600 D75×4 None vs A240 A240 55/506 73/51097N 30·0−8·7
Allocated
99% or 95% confidence intervals99% confidence intervals, time to event unknown
.0 0·5 1·0 1·5 2·0
Taxane better Non−tax. better* For 3−way trials, "Either active vs same control patients" (not plotted) is what contributes to the total.
For 95J NSABP B−27, this (O−E) is −8·4 with variance V = 131·6; 96W ECTO Italy (O−E) = −7·5, V = 22·7;98D BIG 02−98 (O−E) = −2·3, V = 84·2; 00F MA.21 (O−E) = 4·0; V = 33·2
† Taxane courses do not overlap with any other chemotherapy courses; hence, total chemotherapy duration is increased‡ Pre−operative chemotherapy: all patients in these trials were analysed as unknown nodal status© Concurrent treatment with taxane and anthracycline; total chemotherapy duration and number of courses not increased≠ Same cumulative anthracycline dose, but differences in other drugs¶ Control anthracycline dose less than E90 or A60 per cycle
Taxanes: D = docetaxel; P = paclitaxel. Anthracyclines: A = doxorubicin (Adriamycin); E = EpirubicinOther agents: C = cyclophosphamide; F = fluorouracil; M = methotrexate; V = vincristine; Vrb = vinorelbine
(Not shown: G−CSF, erythropoietin, trastuzumab, antibiotic, hormonal, local or steroid therapies)All regimens q3week (unless specified as q1, q2 or q4). Semicolon [;] indicates treatment sequence.×14 means d1−14 po; ×2 (×3) means d1, d8 (d15) iv (except that in trial 94B, F500×2 was d1, d4 iv and in trial 01F, C600×2 could be C100×14).

P 27: EARLY RECURRENCE (first 5 years) in trials of any anthracycline-based regimen vs. standard CMF (or near-standard CMF)
Year codeand study name
Regimens compared anddrug doses (mg/m²) per cycle
Cumulativedosage, E/A
Events/woman−yearsAllocated
anthr. CMFRatio of annual event rates
Anthr. : CMFLogrank Variance
O−E of O−E
Anthr. events
(a) Anthracycline dose/cycle ≥ A60 or E90
i. Cumulative anthracycline dosage A360 or E720−800
Brussels Belgium 8E100C830 vs 6(C100×14M40×2F600×2)q4 E800 64/1131 82/107388R 31·6−11·5NCIC MA.5 6(C75×14E60×2F500×2)q4 vs 6(C100×14M40×2F600×2)q4 E720 135/1373 168/127889R 65·2−19·8SWOG 8897 6(C100×14A30×2F500×2)q4 vs 6(C100×14M40×2F600×2)q4 A360 182/6725 223/668789B2 97·5−19·6
381/9229
473/9038
(4·1%/y) (5·2%/y)
−50·9 194·3 0·77 (SE 0·06)reduction
2p = 0·0003
Subtotal i
ii. Cumulative anthracycline dosage A300 or E400−480
GOCCNE Italy 4E120C600 vs 6(C100×14M40×2F600×2)q4 E480 47/363 54/33486S 20·6−3·7FM Italy GMB1 4E120; 4CMFq4 vs 6(C600×2M40×2F600×2)q4 E480 36/940 45/92597G 18·8−3·2GOIRC SANG 2 Italy 16(E30)q1 vs 6(C600×2M40×2F600×2)q4 E480 47/688 51/74090Z 21·2−1·2GUN−3 Naples 3(CMFq4; [E75×2V1·4×2]q3) vs 6(C100×14M40×2F600×2)q4 E450 57/320 60/36084K1 21·43·6GOCSI MAM2 Italy 4E110; 4CMFq4 vs 6(C600×2M40×2F600×2)q4 E440 91/2019 85/203096N 40·21·9NEAT, UK 4E100; 4CMFq4 vs 6(C100×14M40×2F600×2)q4 E400 188/3481 225/331696A 91·8−20·6IBIS 03 Italy * 4E100; 4CMFq4 vs 6(C600×2M40×2F600×2)q4 E400 76/1682 2(38/795)97U1+2 23·0−0·5GOCSI MAM1 Italy 4A75; 6CMFq4 vs 6(C100×14M40×2F600×2)q4 A300 66/701 73/70291Q 25·8−0·3
608/10194
669/9997
(6·0%/y) (6·7%/y)
−24·0 262·7 0·91 (SE 0·06)reduction
2p > 0·1; NS
Subtotal ii
iii. Cumulative anthracycline dosage A240
NSABP B−15 4A60C600 vs 6(C100×14M40×2F600×2)q4 A240 350/2843 347/279984B1 146·40·4NSABP B−15 4(A60C600)q3; 3CMFq4 vs 6(C100×14M40×2F600×2)q4 A240 326/2907 347/279984B2 141·7−13·3NSABP B−23 4A60C600 vs 6(C100×14M40×2F600×2)q4 A240 144/4524 136/449291H 67·34·2
820/10274
830/10090
(8·0%/y) (8·2%/y)
−8·7 355·5 0·98 (SE 0·05)reduction
2p > 0·1; NS
Subtotal iii
1809/29697
1972/29125
(6·1%/y) (6·8%/y)
−83·6 812·5 0·90 (SE 0·03)reduction2p = 0·003
Subtotal (i + ii + iii)
Trend between 3 subtotals: χ21 = 6·7; 2p = 0·010
(b) Anthracycline dose/cycle < A60 or E90
ONCOFRANCE 12(F400×4A30C300×4V1)q4 vs 12(C100×14M40×2F600×2)q4 A360¶ 48/537 54/38578L2 21·4−11·5Brussels Belgium 8E60C500 vs 6(C100×14M40×2F600×2)q4 E480¶ 94/1064 82/107388R 35·74·4GOIRC SANG 2B R1 6(C§M§F§V1·4E40×2)q4 vs 6(C600×2M40×2F600×2)q4 E480¶ 40/1105 38/109294J1+2+3 17·60·0ICCG C/2/84 UK 8(FE50C)q4 vs 8(C600×2M40×2F600×2)q4 E400¶ 136/1465 142/140384L 61·3−7·0SE Sweden BCG A 8A40C200×4 vs 8(C100×14M40×2F600×2)q4 A320¶ 7/77 8/7980C1 2·20·6ICCG C/6/89 UK 6FE50Cq4 vs 6(C600×2M40×2F600×2)q4 E300¶ 73/1946 65/198984N 32·83·6
398/6194
389/6021
(6·4%/y) (6·5%/y)
−10·0 170·9 0·94 (SE 0·07)reduction
2p > 0·1; NS
(b) subtotal
2207/35891
2361/35146
(6·1%/y) (6·7%/y)
−93·6 983·5 0·909 (SE 0·030)reduction2p = 0·003
Total (a + b)
Adjusted
99% or 95% confidence intervals .0 0·5 1·0 1·5 2·0
Anthr. better CMF better
Treatment effect 2p = 0·003Heterogeneity between 20 trials: χ219 = 21·3; p > 0·1; NS
Heterogeneity between 4 subtotals: χ23 = 7·4; p = 0·06
Heterogeneity within subtotals: χ216 = 13·9; p > 0·1; NS
* 97U was (4E; 4CMF) vs (4CMF; 4E) vs (6CMF), and its controls count twice in subtotal and in total of events/woman−years; the study included womenwith highly proliferative disease, and slightly updated results from it have recently been published (webappendix p66)
Anthracyclines: A = doxorubicin (Adriamycin); E = EpirubicinOther agents: C = cyclophosphamide; F = fluorouracil; M = methotrexate; V = vincristine
(Not shown: antibiotic, hormonal, local or steroid therapies)All regimens q3week (unless specified as q4). Semicolon [;] indicates treatment sequence
×2 means d1,8 iv; ×4 means d3−6 iv¶ Dose less than E90 or A60 per cycle of anthracycline§ 94J interwoven drug schedule: anthracycline group omitted C, M or F respectively on cycles (3, 2 or 1) and (6, 5 or 4)

P 28: RECURRENCE in trials of any anthracycline-based regimen vs. standard CMF (or near-standard CMF)
Year codeand study name
Regimens compared anddrug doses (mg/m²) per cycle
Cumulativedosage, E/A
Events/woman−yearsAllocated
anthr. CMFRatio of annual event rates
Anthr. : CMFLogrank Variance
O−E of O−E
Anthr. events
(a) Anthracycline dose/cycle ≥ A60 or E90
i. Cumulative anthracycline dosage A360 or E720−800
Brussels Belgium 8E100C830 vs 6(C100×14M40×2F600×2)q4 E800 104/2293 116/217288R 46·2−9·4NCIC MA.5 6(C75×14E60×2F500×2)q4 vs 6(C100×14M40×2F600×2)q4 E720 173/2285 203/211589R 82·5−19·4SWOG 8897 6(C100×14A30×2F500×2)q4 vs 6(C100×14M40×2F600×2)q4 A360 308/15597 351/1541689B2 159·4−22·6
585/20175
670/19703
(2·9%/y) (3·4%/y)
−51·5 288·0 0·84 (SE 0·05)reduction2p = 0·002
Subtotal i
ii. Cumulative anthracycline dosage A300 or E400−480
GOCCNE Italy 4E120C600 vs 6(C100×14M40×2F600×2)q4 E480 59/500 65/45686S 25·6−2·9FM Italy GMB1 4E120; 4CMFq4 vs 6(C600×2M40×2F600×2)q4 E480 39/1025 53/100197G 20·7−4·8GOIRC SANG 2 Italy 16(E30)q1 vs 6(C600×2M40×2F600×2)q4 E480 66/1518 66/159890Z 28·50·4GUN−3 Naples 3(CMFq4; [E75×2V1·4×2]q3) vs 6(C100×14M40×2F600×2)q4 E450 66/497 78/56184K1 26·0−0·1GOCSI MAM2 Italy 4E110; 4CMFq4 vs 6(C600×2M40×2F600×2)q4 E440 124/2881 102/293396N 51·910·1NEAT, UK 4E100; 4CMFq4 vs 6(C100×14M40×2F600×2)q4 E400 193/3634 241/344896A 95·7−24·3IBIS 03 Italy * 4E100; 4CMFq4 vs 6(C600×2M40×2F600×2)q4 E400 90/2159 2(42/1026)97U1+2 26·51·1GOCSI MAM1 Italy 4A75; 6CMFq4 vs 6(C100×14M40×2F600×2)q4 A300 70/758 78/76191Q 27·50·1
707/12972
767/12810
(5·5%/y) (6·0%/y)
−20·5 302·3 0·93 (SE 0·06)reduction
2p > 0·1; NS
Subtotal ii
iii. Cumulative anthracycline dosage A240
NSABP B−15 4A60C600 vs 6(C100×14M40×2F600×2)q4 A240 468/6501 465/632384B1 202·3−2·9
NSABP B−15 4(A60C600)q3; 3CMFq4 vs 6(C100×14M40×2F600×2)q4 A240 444/6643 465/632384B2 196·4−17·6
NSABP B−23 4A60C600 vs 6(C100×14M40×2F600×2)q4 A240 202/8163 175/815891H 91·213·8
1114/21307
1105/20804
(5·2%/y) (5·3%/y)
−6·8 489·9 0·99 (SE 0·04)reduction
2p > 0·1; NS
Subtotal iii
2406/54454
2542/53317
(4·4%/y) (4·8%/y)
−78·8 1080·3 0·93 (SE 0·03)reduction2p = 0·02
Subtotal (i + ii + iii)
Trend between 3 subtotals: χ21 = 4·8; 2p = 0·03
(b) Anthracycline dose/cycle < A60 or E90
ONCOFRANCE 12(F400×4A30C300×4V1)q4 vs 12(C100×14M40×2F600×2)q4 A360¶ 67/989 66/67178L2 28·2−10·8Brussels Belgium 8E60C500 vs 6(C100×14M40×2F600×2)q4 E480¶ 129/2049 116/217288R 48·69·0GOIRC SANG 2B R1 6(C§M§F§V1·4E40×2)q4 vs 6(C600×2M40×2F600×2)q4 E480¶ 48/1669 57/164694J1+2+3 23·8−5·9ICCG C/2/84 UK 8(FE50C)q4 vs 8(C600×2M40×2F600×2)q4 E400¶ 178/2527 190/242684L 82·0−10·4SE Sweden BCG A 8A40C200×4 vs 8(C100×14M40×2F600×2)q4 A320¶ 10/286 11/25780C1 3·2−0·6ICCG C/6/89 UK 6FE50Cq4 vs 6(C600×2M40×2F600×2)q4 E300¶ 93/2699 82/278984N 41·85·5
525/10219
522/9961
(5·1%/y) (5·2%/y)
−13·3 227·6 0·94 (SE 0·06)reduction
2p > 0·1; NS
(b) subtotal
2931/64673
3064/63278
(4·5%/y) (4·8%/y)
−92·0 1307·9 0·932 (SE 0·027)reduction2p = 0·01
Total (a + b)
Adjusted
99% or 95% confidence intervals .0 0·5 1·0 1·5 2·0
Anthr. better CMF better
Treatment effect 2p = 0·01Heterogeneity between 20 trials: χ219 = 26·0; p > 0·1; NS
Heterogeneity between 4 subtotals: χ23 = 5·0; p > 0·1; NS
Heterogeneity within subtotals: χ216 = 21·0; p > 0·1; NS
* 97U was (4E; 4CMF) vs (4CMF; 4E) vs (6CMF), and its controls count twice in subtotal and in total of events/woman−years; the study included womenwith highly proliferative disease, and slightly updated results from it have recently been published (webappendix p66)
Anthracyclines: A = doxorubicin (Adriamycin); E = EpirubicinOther agents: C = cyclophosphamide; F = fluorouracil; M = methotrexate; V = vincristine
(Not shown: antibiotic, hormonal, local or steroid therapies)All regimens q3week (unless specified as q4). Semicolon [;] indicates treatment sequence
×2 means d1,8 iv; ×4 means d3−6 iv¶ Dose less than E90 or A60 per cycle of anthracycline§ 94J interwoven drug schedule: anthracycline group omitted C, M or F respectively on cycles (3, 2 or 1) and (6, 5 or 4)

P 29: BREAST CANCER MORTALITY (MORTALITY WITH RECURRENCE) in trials of any anthracycline-based regimen vs. standard CMF (or near-standard CMF)
Year codeand study name
Regimens compared anddrug doses (mg/m²) per cycle
Cumulativedosage, E/A
Deaths/WomenAllocated
anthr. CMFRatio of annual death rates
Anthr. : CMFLogrank Variance
O−E of O−E
Anthr. deaths
(a) Anthracycline dose/cycle ≥ A60 or E90
i. Cumulative anthracycline dosage A360 or E720−800
Brussels Belgium 8E100C830 vs 6(C100×14M40×2F600×2)q4 E800 73/265 91/26788R 35·0−10·6NCIC MA.5 6(C75×14E60×2F500×2)q4 vs 6(C100×14M40×2F600×2)q4 E720 130/356 151/36089R 64·3−11·2SWOG 8897 6(C100×14A30×2F500×2)q4 vs 6(C100×14M40×2F600×2)q4 A360 175/1461 233/147089B2 98·6−28·2
378/2082
475/2097
(18·2%) (22·7%)
−50·0 198·0 0·78 (SE 0·06)reduction
2p = 0·0004
Subtotal i
ii. Cumulative anthracycline dosage A300 or E400−480
GOCCNE Italy 4E120C600 vs 6(C100×14M40×2F600×2)q4 E480 39/103 47/10486S 18·5−2·8FM Italy GMB1 4E120; 4CMFq4 vs 6(C600×2M40×2F600×2)q4 E480 17/226 21/22497G 9·0−0·7GOIRC SANG 2 Italy 16(E30)q1 vs 6(C600×2M40×2F600×2)q4 E480 40/170 46/17890Z 18·7−3·2GUN−3 Naples 3(CMFq4; [E75×2V1·4×2]q3) vs 6(C100×14M40×2F600×2)q4 E450 41/105 55/11584K1 18·7−3·5GOCSI MAM2 Italy 4E110; 4CMFq4 vs 6(C600×2M40×2F600×2)q4 E440 41/521 48/52396N 20·8−4·1NEAT, UK 4E100; 4CMFq4 vs 6(C100×14M40×2F600×2)q4 E400 134/1011 175/101696A 69·4−21·3IBIS 03 Italy * 4E100; 4CMFq4 vs 6(C600×2M40×2F600×2)q4 E400 52/398 2(21/188)97U1+2 14·52·2GOCSI MAM1 Italy 4A75; 6CMFq4 vs 6(C100×14M40×2F600×2)q4 A300 32/232 38/23491Q 13·6−2·6
396/2766
472/2770
(14·3%) (17·0%)
−35·9 183·1 0·82 (SE 0·07)reduction2p = 0·008
Subtotal ii
iii. Cumulative anthracycline dosage A240
NSABP B−15 4A60C600 vs 6(C100×14M40×2F600×2)q4 A240 385/781 381/77684B1 175·20·5
NSABP B−15 4(A60C600)q3; 3CMFq4 vs 6(C100×14M40×2F600×2)q4 A240 371/781 381/77684B2 170·7−6·5
NSABP B−23 4A60C600 vs 6(C100×14M40×2F600×2)q4 A240 121/1003 124/100591H 59·7−2·4
877/2565
886/2557
(34·2%) (34·6%)
−8·5 405·6 0·98 (SE 0·05)reduction
2p > 0·1; NS
Subtotal iii
1651/7413
1833/7424
(22·3%) (24·7%)
−94·3 786·7 0·89 (SE 0·03)reduction
2p = 0·0008
Subtotal (i + ii + iii)
Trend between 3 subtotals: χ21 = 8·0; 2p = 0·005
(b) Anthracycline dose/cycle < A60 or E90
ONCOFRANCE 12(F400×4A30C300×4V1)q4 vs 12(C100×14M40×2F600×2)q4 A360¶ 50/138 56/11378L2 23·6−11·6Brussels Belgium 8E60C500 vs 6(C100×14M40×2F600×2)q4 E480¶ 92/272 91/26788R 37·62·9GOIRC SANG 2B R1 6(C§M§F§V1·4E40×2)q4 vs 6(C600×2M40×2F600×2)q4 E480¶ 29/245 30/24494J1+2+3 13·2−0·7ICCG C/2/84 UK 8(FE50C)q4 vs 8(C600×2M40×2F600×2)q4 E400¶ 133/380 125/37984L 60·20·0SE Sweden BCG A 8A40C200×4 vs 8(C100×14M40×2F600×2)q4 A320¶ 8/22 11/2280C1 3·8−1·6ICCG C/6/89 UK 6FE50Cq4 vs 6(C600×2M40×2F600×2)q4 E300¶ 46/473 44/47784N 21·6−0·2
358/1530
357/1502
(23·4%) (23·8%)
−11·1 160·1 0·93 (SE 0·08)reduction
2p > 0·1; NS
(b) subtotal
2009/8943
2190/8926
(22·5%) (24·5%)
−105·4 946·8 0·895 (SE 0·031)reduction
2p = 0·0006
Total (a + b)
Adjusted
99% or 95% confidence intervals .0 0·5 1·0 1·5 2·0
Anthr. better CMF better
Treatment effect 2p = 0·0006Heterogeneity between 20 trials: χ219 = 18·2; p > 0·1; NS
Heterogeneity between 4 subtotals: χ23 = 8·9; p = 0·03
Heterogeneity within subtotals: χ216 = 9·3; p > 0·1; NS
* 97U was (4E; 4CMF) vs (4CMF; 4E) vs (6CMF), and its controls count twice in subtotal and in total of deaths/women; the study included womenwith highly proliferative disease, and slightly updated results from it have recently been published (webappendix p66)
Anthracyclines: A = doxorubicin (Adriamycin); E = EpirubicinOther agents: C = cyclophosphamide; F = fluorouracil; M = methotrexate; V = vincristine
(Not shown: antibiotic, hormonal, local or steroid therapies)All regimens q3week (unless specified as q4). Semicolon [;] indicates treatment sequence
×2 means d1,8 iv; ×4 means d3−6 iv¶ Dose less than E90 or A60 per cycle of anthracycline§ 94J interwoven drug schedule: anthracycline group omitted C, M or F respectively on cycles (3, 2 or 1) and (6, 5 or 4)

P 30: MORTALITY WITHOUT RECURRENCE IN FIRST YEAR in trials of any anthracycline-based regimen vs. standard CMF (or near-standard CMF)
Year codeand study name
Regimens compared anddrug doses (mg/m²) per cycle
Cumulativedosage, E/A
Deaths/woman−yearsAllocated
anthr. CMFRatio of annual death rates
Anthr. : CMFLogrank Variance
O−E of O−E
Anthr. deaths
(a) Anthracycline dose/cycle ≥ A60 or E90
i. Cumulative anthracycline dosage A360 or E720−800
Brussels Belgium 8E100C830 vs 6(C100×14M40×2F600×2)q4 E800 0/230 0/22988RNCIC MA.5 6(C75×14E60×2F500×2)q4 vs 6(C100×14M40×2F600×2)q4 E720 1/340 0/34189R 0·20·5SWOG 8897 6(C100×14A30×2F500×2)q4 vs 6(C100×14M40×2F600×2)q4 A360 3/1432 6/143889B2 2·2−1·5
4/2002
6/2008
(0·2%/y) (0·3%/y)
−1·0 2·50·66 (SE 0·52)
reduction2p > 0·1; NS
Subtotal i
ii. Cumulative anthracycline dosage A300 or E400−480
GOCCNE Italy 4E120C600 vs 6(C100×14M40×2F600×2)q4 E480 1/93 1/9186S 0·5−0·2FM Italy GMB1 4E120; 4CMFq4 vs 6(C600×2M40×2F600×2)q4 E480 0/215 1/21497G 0·2−0·5GOIRC SANG 2 Italy 16(E30)q1 vs 6(C600×2M40×2F600×2)q4 E480 2/145 2/15690Z 1·00·0GUN−3 Naples 3(CMFq4; [E75×2V1·4×2]q3) vs 6(C100×14M40×2F600×2)q4 E450 1/87 1/9284K1 0·5−0·1GOCSI MAM2 Italy 4E110; 4CMFq4 vs 6(C600×2M40×2F600×2)q4 E440 1/448 1/44596N 0·50·1NEAT, UK 4E100; 4CMFq4 vs 6(C100×14M40×2F600×2)q4 E400 2/965 10/96596A 3·0−4·2IBIS 03 Italy * 4E100; 4CMFq4 vs 6(C600×2M40×2F600×2)q4 E400 2/361 2(1/173)97U1+2 0·6−0·1GOCSI MAM1 Italy 4A75; 6CMFq4 vs 6(C100×14M40×2F600×2)q4 A300 1/171 0/17891Q 0·20·3
10/2485
18/2487
(0·4%/y) (0·7%/y)
−4·8 6·4 0·47 (SE 0·28)reduction2p = 0·06
Subtotal ii
iii. Cumulative anthracycline dosage A240
NSABP B−15 4A60C600 vs 6(C100×14M40×2F600×2)q4 A240 2/746 0/74084B1 0·51·0NSABP B−15 4(A60C600)q3; 3CMFq4 vs 6(C100×14M40×2F600×2)q4 A240 1/741 0/74084B2 0·20·6NSABP B−23 4A60C600 vs 6(C100×14M40×2F600×2)q4 A240 2/982 3/97891H 1·2−0·6
5/2469
3/2458
(0·2%/y) (0·1%/y)
1·0 2·01·62 (SE 0·91)
increase2p > 0·1; NS
Subtotal iii
19/6956
27/6953
(0·3%/y) (0·4%/y)
−4·9 10·9 0·64 (SE 0·24)reduction
2p > 0·1; NS
Subtotal (i + ii + iii)
Trend between 3 subtotals: χ21 = 0·7; 2p > 0·1; NS
(b) Anthracycline dose/cycle < A60 or E90
ONCOFRANCE 12(F400×4A30C300×4V1)q4 vs 12(C100×14M40×2F600×2)q4 A360¶ 1/131 0/10378L2 0·20·5Brussels Belgium 8E60C500 vs 6(C100×14M40×2F600×2)q4 E480¶ 0/236 0/22988RGOIRC SANG 2B R1 6(C§M§F§V1·4E40×2)q4 vs 6(C600×2M40×2F600×2)q4 E480¶ 0/219 0/21494J1+2+3
ICCG C/2/84 UK 8(FE50C)q4 vs 8(C600×2M40×2F600×2)q4 E400¶ 1/360 0/35584LSE Sweden BCG A 8A40C200×4 vs 8(C100×14M40×2F600×2)q4 A320¶ 0/11 0/1080C1
ICCG C/6/89 UK 6FE50Cq4 vs 6(C600×2M40×2F600×2)q4 E300¶ 2/445 0/45784N 0·51·0
4/1402
0/1368
(0·3%/y) (0·0%/y)
1·6 0·88·00 (SE 3·89)
increase2p = 0·07
(b) subtotal
23/8358
27/8321
(0·3%/y) (0·3%/y)
−3·3 11·7 0·752 (SE 0·255)reduction
2p > 0·1; NS
Total (a + b)
Adjusted
99% or 95% confidence intervals .0 0·5 1·0 1·5 2·0
Anthr. better CMF better
Treatment effect 2p > 0·1; NSHeterogeneity between 15 trials: χ214 = 15·3; p > 0·1; NS
Heterogeneity between 4 subtotals: χ23 = 6·8; p = 0·08
Heterogeneity within subtotals: χ211 = 8·5; p > 0·1; NS
* 97U was (4E; 4CMF) vs (4CMF; 4E) vs (6CMF), and its controls count twice in subtotal and in total of deaths/woman−years; the study included womenwith highly proliferative disease, and slightly updated results from it have recently been published (webappendix p66)
Anthracyclines: A = doxorubicin (Adriamycin); E = EpirubicinOther agents: C = cyclophosphamide; F = fluorouracil; M = methotrexate; V = vincristine
(Not shown: antibiotic, hormonal, local or steroid therapies)All regimens q3week (unless specified as q4). Semicolon [;] indicates treatment sequence
×2 means d1,8 iv; ×4 means d3−6 iv¶ Dose less than E90 or A60 per cycle of anthracycline§ 94J interwoven drug schedule: anthracycline group omitted C, M or F respectively on cycles (3, 2 or 1) and (6, 5 or 4)

P 31: MORTALITY WITHOUT RECURRENCE in trials of any anthracycline-based regimen vs. standard CMF (or near-standard CMF)
Year codeand study name
Regimens compared anddrug doses (mg/m²) per cycle
Cumulativedosage, E/A
Deaths/woman−yearsAllocated
anthr. CMFRatio of annual death rates
Anthr. : CMFLogrank Variance
O−E of O−E
Anthr. deaths
(a) Anthracycline dose/cycle ≥ A60 or E90
i. Cumulative anthracycline dosage A360 or E720−800
Brussels Belgium 8E100C830 vs 6(C100×14M40×2F600×2)q4 E800 18/2293 10/217288R 6·62·7NCIC MA.5 6(C75×14E60×2F500×2)q4 vs 6(C100×14M40×2F600×2)q4 E720 4/2285 2/211589R 1·50·9SWOG 8897 6(C100×14A30×2F500×2)q4 vs 6(C100×14M40×2F600×2)q4 A360 105/15597 84/1541689B2 45·210·1
127/20175
96/19703
(0·6%/y) (0·5%/y)
13·7 53·21·29 (SE 0·16)
increase2p = 0·06
Subtotal i
ii. Cumulative anthracycline dosage A300 or E400−480
GOCCNE Italy 4E120C600 vs 6(C100×14M40×2F600×2)q4 E480 3/500 2/45686S 1·10·0FM Italy GMB1 4E120; 4CMFq4 vs 6(C600×2M40×2F600×2)q4 E480 1/1025 2/100197G 0·7−0·4GOIRC SANG 2 Italy 16(E30)q1 vs 6(C600×2M40×2F600×2)q4 E480 10/1518 10/159890Z 4·80·2GUN−3 Naples 3(CMFq4; [E75×2V1·4×2]q3) vs 6(C100×14M40×2F600×2)q4 E450 4/497 3/56084K1 1·20·5GOCSI MAM2 Italy 4E110; 4CMFq4 vs 6(C600×2M40×2F600×2)q4 E440 9/2881 13/293396N 5·3−1·9NEAT, UK 4E100; 4CMFq4 vs 6(C100×14M40×2F600×2)q4 E400 7/3634 14/344896A 5·1−3·8IBIS 03 Italy * 4E100; 4CMFq4 vs 6(C600×2M40×2F600×2)q4 E400 4/2159 2(4/1026)97U1+2 1·7−1·4GOCSI MAM1 Italy 4A75; 6CMFq4 vs 6(C100×14M40×2F600×2)q4 A300 2/758 5/75991Q 1·2−1·4
40/12972
57/12807
(0·3%/y) (0·4%/y)
−8·3 21·1 0·68 (SE 0·18)reduction2p = 0·07
Subtotal ii
iii. Cumulative anthracycline dosage A240
NSABP B−15 4A60C600 vs 6(C100×14M40×2F600×2)q4 A240 23/6501 22/632384B1 11·10·3NSABP B−15 4(A60C600)q3; 3CMFq4 vs 6(C100×14M40×2F600×2)q4 A240 20/6643 22/632384B2 10·2−1·8NSABP B−23 4A60C600 vs 6(C100×14M40×2F600×2)q4 A240 38/8163 42/815891H 19·8−2·6
81/21307
86/20804
(0·4%/y) (0·4%/y)
−4·1 41·1 0·90 (SE 0·15)reduction
2p > 0·1; NS
Subtotal iii
248/54454
239/53314
(0·5%/y) (0·4%/y)
1·3 115·5 1·01 (SE 0·09)increase
2p > 0·1; NS
Subtotal (i + ii + iii)
Trend between 3 subtotals: χ21 = 3·4; 2p = 0·07
(b) Anthracycline dose/cycle < A60 or E90
ONCOFRANCE 12(F400×4A30C300×4V1)q4 vs 12(C100×14M40×2F600×2)q4 A360¶ 2/989 2/67178L2 1·0−0·2Brussels Belgium 8E60C500 vs 6(C100×14M40×2F600×2)q4 E480¶ 10/2049 10/217288R 4·22·3GOIRC SANG 2B R1 6(C§M§F§V1·4E40×2)q4 vs 6(C600×2M40×2F600×2)q4 E480¶ 1/1669 3/164694J1+2+3 1·0−0·9ICCG C/2/84 UK 8(FE50C)q4 vs 8(C600×2M40×2F600×2)q4 E400¶ 3/2528 2/242684L 0·9−0·4SE Sweden BCG A 8A40C200×4 vs 8(C100×14M40×2F600×2)q4 A320¶ 2/286 4/25680C1 1·2−0·6ICCG C/6/89 UK 6FE50Cq4 vs 6(C600×2M40×2F600×2)q4 E300¶ 5/2699 3/278984N 2·01·0
23/10220
24/9960
(0·2%/y) (0·2%/y)
1·2 10·21·12 (SE 0·33)
increase2p > 0·1; NS
(b) subtotal
271/64674
263/63274
(0·4%/y) (0·4%/y)
2·5 125·7 1·020 (SE 0·090)increase
2p > 0·1; NS
Total (a + b)
Adjusted
99% or 95% confidence intervals .0 0·5 1·0 1·5 2·0
Anthr. better CMF better
Treatment effect 2p > 0·1; NS, adverseHeterogeneity between 20 trials: χ219 = 14·5; p > 0·1; NS
Heterogeneity between 4 subtotals: χ23 = 7·3; p = 0·06
Heterogeneity within subtotals: χ216 = 7·2; p > 0·1; NS
* 97U was (4E; 4CMF) vs (4CMF; 4E) vs (6CMF), and its controls count twice in subtotal and in total of deaths/woman−years; the study included womenwith highly proliferative disease, and slightly updated results from it have recently been published (webappendix p66)
Anthracyclines: A = doxorubicin (Adriamycin); E = EpirubicinOther agents: C = cyclophosphamide; F = fluorouracil; M = methotrexate; V = vincristine
(Not shown: antibiotic, hormonal, local or steroid therapies)All regimens q3week (unless specified as q4). Semicolon [;] indicates treatment sequence
×2 means d1,8 iv; ×4 means d3−6 iv¶ Dose less than E90 or A60 per cycle of anthracycline§ 94J interwoven drug schedule: anthracycline group omitted C, M or F respectively on cycles (3, 2 or 1) and (6, 5 or 4)
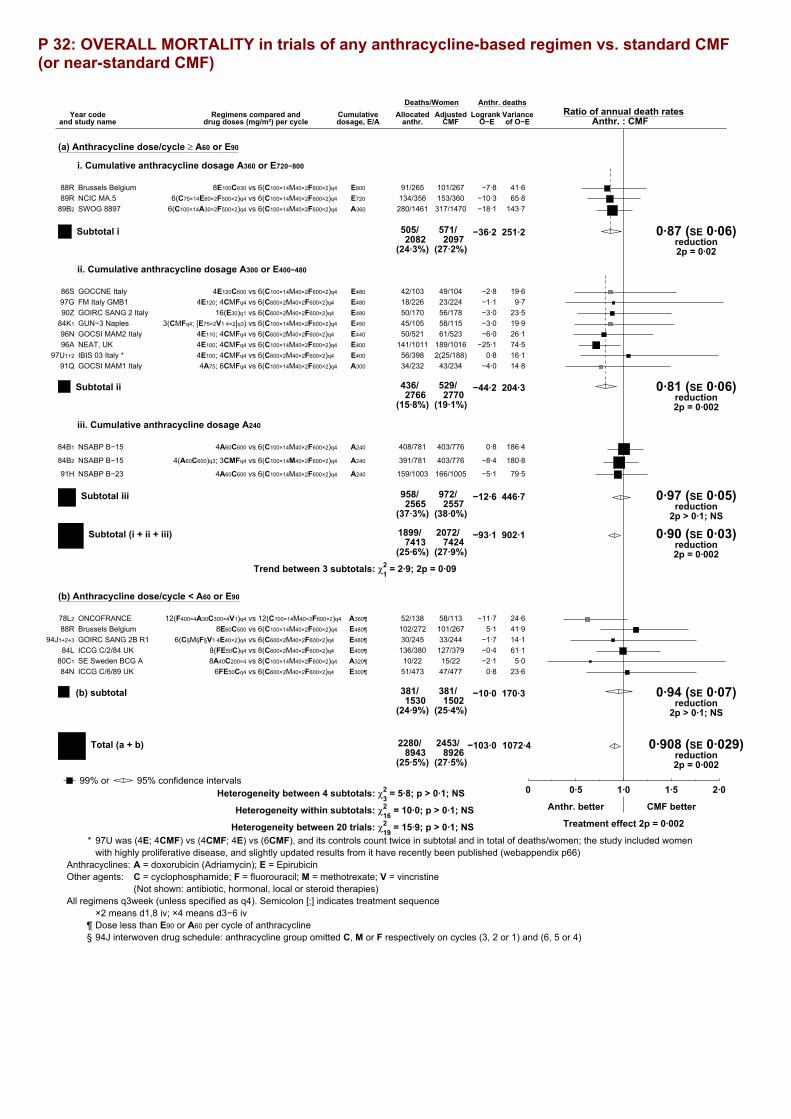
P 32: OVERALL MORTALITY in trials of any anthracycline-based regimen vs. standard CMF (or near-standard CMF)
Year codeand study name
Regimens compared anddrug doses (mg/m²) per cycle
Cumulativedosage, E/A
Deaths/WomenAllocated
anthr. CMFRatio of annual death rates
Anthr. : CMFLogrank Variance
O−E of O−E
Anthr. deaths
(a) Anthracycline dose/cycle ≥ A60 or E90
i. Cumulative anthracycline dosage A360 or E720−800
Brussels Belgium 8E100C830 vs 6(C100×14M40×2F600×2)q4 E800 91/265 101/26788R 41·6−7·8NCIC MA.5 6(C75×14E60×2F500×2)q4 vs 6(C100×14M40×2F600×2)q4 E720 134/356 153/36089R 65·8−10·3SWOG 8897 6(C100×14A30×2F500×2)q4 vs 6(C100×14M40×2F600×2)q4 A360 280/1461 317/147089B2 143·7−18·1
505/2082
571/2097
(24·3%) (27·2%)
−36·2 251·2 0·87 (SE 0·06)reduction2p = 0·02
Subtotal i
ii. Cumulative anthracycline dosage A300 or E400−480
GOCCNE Italy 4E120C600 vs 6(C100×14M40×2F600×2)q4 E480 42/103 49/10486S 19·6−2·8FM Italy GMB1 4E120; 4CMFq4 vs 6(C600×2M40×2F600×2)q4 E480 18/226 23/22497G 9·7−1·1GOIRC SANG 2 Italy 16(E30)q1 vs 6(C600×2M40×2F600×2)q4 E480 50/170 56/17890Z 23·5−3·0GUN−3 Naples 3(CMFq4; [E75×2V1·4×2]q3) vs 6(C100×14M40×2F600×2)q4 E450 45/105 58/11584K1 19·9−3·0GOCSI MAM2 Italy 4E110; 4CMFq4 vs 6(C600×2M40×2F600×2)q4 E440 50/521 61/52396N 26·1−6·0NEAT, UK 4E100; 4CMFq4 vs 6(C100×14M40×2F600×2)q4 E400 141/1011 189/101696A 74·5−25·1IBIS 03 Italy * 4E100; 4CMFq4 vs 6(C600×2M40×2F600×2)q4 E400 56/398 2(25/188)97U1+2 16·10·8GOCSI MAM1 Italy 4A75; 6CMFq4 vs 6(C100×14M40×2F600×2)q4 A300 34/232 43/23491Q 14·8−4·0
436/2766
529/2770
(15·8%) (19·1%)
−44·2 204·3 0·81 (SE 0·06)reduction2p = 0·002
Subtotal ii
iii. Cumulative anthracycline dosage A240
NSABP B−15 4A60C600 vs 6(C100×14M40×2F600×2)q4 A240 408/781 403/77684B1 186·40·8
NSABP B−15 4(A60C600)q3; 3CMFq4 vs 6(C100×14M40×2F600×2)q4 A240 391/781 403/77684B2 180·8−8·4
NSABP B−23 4A60C600 vs 6(C100×14M40×2F600×2)q4 A240 159/1003 166/100591H 79·5−5·1
958/2565
972/2557
(37·3%) (38·0%)
−12·6 446·7 0·97 (SE 0·05)reduction
2p > 0·1; NS
Subtotal iii
1899/7413
2072/7424
(25·6%) (27·9%)
−93·1 902·1 0·90 (SE 0·03)reduction2p = 0·002
Subtotal (i + ii + iii)
Trend between 3 subtotals: χ21 = 2·9; 2p = 0·09
(b) Anthracycline dose/cycle < A60 or E90
ONCOFRANCE 12(F400×4A30C300×4V1)q4 vs 12(C100×14M40×2F600×2)q4 A360¶ 52/138 58/11378L2 24·6−11·7Brussels Belgium 8E60C500 vs 6(C100×14M40×2F600×2)q4 E480¶ 102/272 101/26788R 41·95·1GOIRC SANG 2B R1 6(C§M§F§V1·4E40×2)q4 vs 6(C600×2M40×2F600×2)q4 E480¶ 30/245 33/24494J1+2+3 14·1−1·7ICCG C/2/84 UK 8(FE50C)q4 vs 8(C600×2M40×2F600×2)q4 E400¶ 136/380 127/37984L 61·1−0·4SE Sweden BCG A 8A40C200×4 vs 8(C100×14M40×2F600×2)q4 A320¶ 10/22 15/2280C1 5·0−2·1ICCG C/6/89 UK 6FE50Cq4 vs 6(C600×2M40×2F600×2)q4 E300¶ 51/473 47/47784N 23·60·8
381/1530
381/1502
(24·9%) (25·4%)
−10·0 170·3 0·94 (SE 0·07)reduction
2p > 0·1; NS
(b) subtotal
2280/8943
2453/8926
(25·5%) (27·5%)
−103·0 1072·4 0·908 (SE 0·029)reduction2p = 0·002
Total (a + b)
Adjusted
99% or 95% confidence intervals .0 0·5 1·0 1·5 2·0
Anthr. better CMF better
Treatment effect 2p = 0·002Heterogeneity between 20 trials: χ219 = 15·9; p > 0·1; NS
Heterogeneity between 4 subtotals: χ23 = 5·8; p > 0·1; NS
Heterogeneity within subtotals: χ216 = 10·0; p > 0·1; NS
* 97U was (4E; 4CMF) vs (4CMF; 4E) vs (6CMF), and its controls count twice in subtotal and in total of deaths/women; the study included womenwith highly proliferative disease, and slightly updated results from it have recently been published (webappendix p66)
Anthracyclines: A = doxorubicin (Adriamycin); E = EpirubicinOther agents: C = cyclophosphamide; F = fluorouracil; M = methotrexate; V = vincristine
(Not shown: antibiotic, hormonal, local or steroid therapies)All regimens q3week (unless specified as q4). Semicolon [;] indicates treatment sequence
×2 means d1,8 iv; ×4 means d3−6 iv¶ Dose less than E90 or A60 per cycle of anthracycline§ 94J interwoven drug schedule: anthracycline group omitted C, M or F respectively on cycles (3, 2 or 1) and (6, 5 or 4)
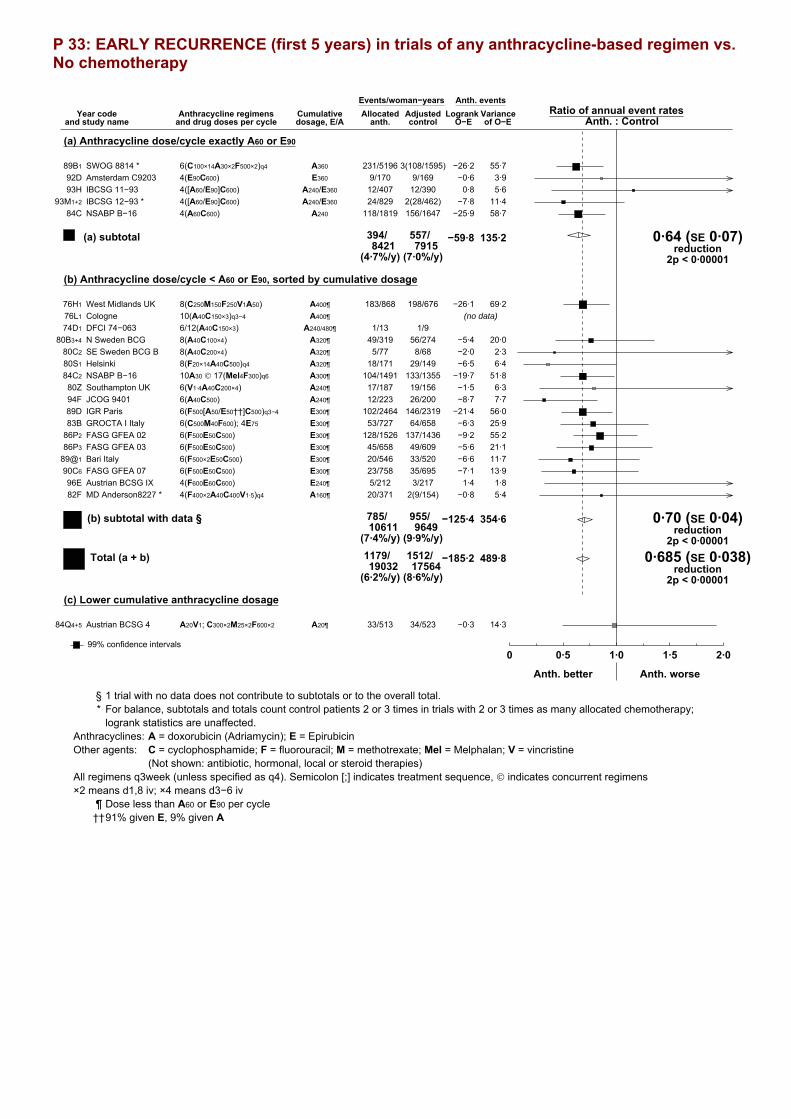
P 33: EARLY RECURRENCE (first 5 years) in trials of any anthracycline-based regimen vs. No chemotherapy
Year codeand study name
Anthracycline regimensand drug doses per cycle
Cumulativedosage, E/A
Events/woman−yearsAllocated
anth. controlRatio of annual event rates
Anth. : ControlLogrank Variance
O−E of O−E
Anth. events
(a) Anthracycline dose/cycle exactly A60 or E90
SWOG 8814 * 6(C100×14A30×2F500×2)q4 A360 231/5196 3(108/1595)89B1 55·7−26·2Amsterdam C9203 4(E90C600) E360 9/170 9/16992D 3·9−0·6IBCSG 11−93 4([A60/E90]C600) A240/E360 12/407 12/39093H 5·60·8IBCSG 12−93 * 4([A60/E90]C600) A240/E360 24/829 2(28/462)93M1+2 11·4−7·8NSABP B−16 4(A60C600) A240 118/1819 156/164784C 58·7−25·9
394/8421
557/7915
(4·7%/y) (7·0%/y)
−59·8 135·2 0·64 (SE 0·07)reduction
2p < 0·00001
(a) subtotal
(b) Anthracycline dose/cycle < A60 or E90, sorted by cumulative dosage
West Midlands UK 8(C250M150F250V1A50) A400¶ 183/868 198/67676H1 69·2−26·1Cologne 10(A40C150×3)q3−4 A400¶76L1 (no data)
DFCI 74−063 6/12(A40C150×3) A240/480¶ 1/13 1/974D1
N Sweden BCG 8(A40C100×4) A320¶ 49/319 56/27480B3+4 20·0−5·4SE Sweden BCG B 8(A40C200×4) A320¶ 5/77 8/6880C2 2·3−2·0Helsinki 8(F20×14A40C500)q4 A320¶ 18/171 29/14980S1 6·4−6·5NSABP B−16 10A30 © 17(Mel4F300)q6 A300¶ 104/1491 133/135584C2 51·8−19·7Southampton UK 6(V1·4A40C200×4) A240¶ 17/187 19/15680Z 6·3−1·5JCOG 9401 6(A40C500) A240¶ 12/223 26/20094F 7·7−8·7IGR Paris 6(F500[A50/E50††]C500)q3−4 E300¶ 102/2464 146/231989D 56·0−21·4GROCTA I Italy 6(C500M40F600); 4E75 E300¶ 53/727 64/65883B 25·9−6·3FASG GFEA 02 6(F500E50C500) E300¶ 128/1526 137/143686P2 55·2−9·2FASG GFEA 03 6(F500E50C500) E300¶ 45/658 49/60986P3 21·1−5·6Bari Italy 6(F500×2E50C500) E300¶ 20/546 33/52089@1 11·7−6·6FASG GFEA 07 6(F500E50C500) E300¶ 23/758 35/69590C6 13·9−7·1Austrian BCSG IX 4(F600E60C600) E240¶ 5/212 3/21796E 1·81·4MD Anderson8227 * 4(F400×2A40C400V1·5)q4 A160¶ 20/371 2(9/154)82F 5·4−0·8
785/10611
955/9649
(7·4%/y) (9·9%/y)
−125·4 354·6 0·70 (SE 0·04)reduction
2p < 0·00001
(b) subtotal with data §
1179/19032
1512/17564
(6·2%/y) (8·6%/y)
−185·2 489·8 0·685 (SE 0·038)reduction
2p < 0·00001
Total (a + b)
(c) Lower cumulative anthracycline dosage
Austrian BCSG 4 A20V1; C300×2M25×2F600×2 A20¶ 33/513 34/52384Q4+5 14·3−0·3
Adjusted
99% confidence intervals .0 0·5 1·0 1·5 2·0
Anth. better Anth. worse
§ 1 trial with no data does not contribute to subtotals or to the overall total.* For balance, subtotals and totals count control patients 2 or 3 times in trials with 2 or 3 times as many allocated chemotherapy;
logrank statistics are unaffected.Anthracyclines: A = doxorubicin (Adriamycin); E = EpirubicinOther agents: C = cyclophosphamide; F = fluorouracil; M = methotrexate; Mel = Melphalan; V = vincristine
(Not shown: antibiotic, hormonal, local or steroid therapies)All regimens q3week (unless specified as q4). Semicolon [;] indicates treatment sequence, © indicates concurrent regimens×2 means d1,8 iv; ×4 means d3−6 iv
¶ Dose less than A60 or E90 per cycle††91% given E, 9% given A

P 34: RECURRENCE in trials of any anthracycline-based regimen vs. No chemotherapy
Year codeand study name
Anthracycline regimensand drug doses per cycle
Cumulativedosage, E/A
Events/woman−yearsAllocated
anth. controlRatio of annual event rates
Anth. : ControlLogrank Variance
O−E of O−E
Anth. events
(a) Anthracycline dose/cycle exactly A60 or E90
SWOG 8814 * 6(C100×14A30×2F500×2)q4 A360 409/103083(184/3065)89B1 96·8−46·8Amsterdam C9203 4(E90C600) E360 9/177 9/17492D 3·9−0·6IBCSG 11−93 4([A60/E90]C600) A240/E360 20/628 17/60893H 8·41·8IBCSG 12−93 * 4([A60/E90]C600) A240/E360 44/1353 2(35/686)93M1+2 16·6−6·9NSABP B−16 4(A60C600) A240 205/4101 249/363384C 99·2−35·7
687/16567
897/14982
(4·1%/y) (6·0%/y)
−88·3 224·8 0·68 (SE 0·06)reduction
2p < 0·00001
(a) subtotal
(b) Anthracycline dose/cycle < A60 or E90, sorted by cumulative dosage
West Midlands UK 8(C250M150F250V1A50) A400¶ 219/1605 222/118976H1 82·2−25·0Cologne 10(A40C150×3)q3−4 A400¶76L1 (no data)
DFCI 74−063 6/12(A40C150×3) A240/480¶ 1/47 2/1774D1
N Sweden BCG 8(A40C100×4) A320¶ 65/721 70/61680B3+4 26·3−7·3SE Sweden BCG B 8(A40C200×4) A320¶ 7/273 14/18780C2 3·9−3·5Helsinki 8(F20×14A40C500)q4 A320¶ 24/308 32/24980S1 7·3−6·2NSABP B−16 10A30 © 17(Mel4F300)q6 A300¶ 170/3330 211/294984C2 84·0−28·8Southampton UK 6(V1·4A40C200×4) A240¶ 29/452 29/39080Z 9·90·6JCOG 9401 6(A40C500) A240¶ 13/236 26/21194F 8·0−8·2IGR Paris 6(F500[A50/E50††]C500)q3−4 E300¶ 170/4401 219/411689D 87·3−26·6GROCTA I Italy 6(C500M40F600); 4E75 E300¶ 109/1668 108/152783B 47·8−1·5FASG GFEA 02 6(F500E50C500) E300¶ 191/2781 194/262286P2 80·6−8·5FASG GFEA 03 6(F500E50C500) E300¶ 55/1185 60/107886P3 26·0−6·8Bari Italy 6(F500×2E50C500) E300¶ 28/1058 39/109189@1 14·8−6·1FASG GFEA 07 6(F500E50C500) E300¶ 30/1134 49/101090C6 18·8−10·9Austrian BCSG IX 4(F600E60C600) E240¶ 5/212 3/21796E 1·81·4MD Anderson8227 * 4(F400×2A40C400V1·5)q4 A160¶ 24/596 2(11/259)82F 6·6−0·8
1140/20007
1300/17987
(5·7%/y) (7·2%/y)
−138·2 505·2 0·76 (SE 0·04)reduction
2p < 0·00001
(b) subtotal with data §
1827/36574
2197/32969
(5·0%/y) (6·7%/y)
−226·4 730·0 0·733 (SE 0·032)reduction
2p < 0·00001
Total (a + b)
(c) Lower cumulative anthracycline dosage
Austrian BCSG 4 A20V1; C300×2M25×2F600×2 A20¶ 45/764 42/76184Q4+5 18·40·1
Adjusted
99% confidence intervals .0 0·5 1·0 1·5 2·0
Anth. better Anth. worse
§ 1 trial with no data does not contribute to subtotals or to the overall total.* For balance, subtotals and totals count control patients 2 or 3 times in trials with 2 or 3 times as many allocated chemotherapy;
logrank statistics are unaffected.Anthracyclines: A = doxorubicin (Adriamycin); E = EpirubicinOther agents: C = cyclophosphamide; F = fluorouracil; M = methotrexate; Mel = Melphalan; V = vincristine
(Not shown: antibiotic, hormonal, local or steroid therapies)All regimens q3week (unless specified as q4). Semicolon [;] indicates treatment sequence, © indicates concurrent regimens×2 means d1,8 iv; ×4 means d3−6 iv
¶ Dose less than A60 or E90 per cycle††91% given E, 9% given A

P 35: BREAST CANCER MORTALITY (MORTALITY WITH RECURRENCE) in trials of any anthracycline-based regimen vs. No chemotherapy
Year codeand study name
Anthracycline regimensand drug doses per cycle
Cumulativedosage, E/A
Deaths/WomenAllocated
anth. controlRatio of annual death rates
Anth. : ControlLogrank Variance
O−E of O−E
Anth. deaths
(a) Anthracycline dose/cycle exactly A60 or E90
SWOG 8814 * 6(C100×14A30×2F500×2)q4 A360 324/1177 3(152/381)89B1 80·3−35·3Amsterdam C9203 4(E90C600) E360 6/49 6/5392D 2·8−0·3IBCSG 11−93 4([A60/E90]C600) A240/E360 10/89 10/8593H 4·60·5IBCSG 12−93 * 4([A60/E90]C600) A240/E360 27/180 2(25/110)93M1+2 11·2−4·5NSABP B−16 4(A60C600) A240 169/429 199/43484C 81·9−21·3
536/1924
721/1935
(27·9%) (37·3%)
−60·9 180·8 0·71 (SE 0·06)reduction
2p < 0·00001
(a) subtotal
(b) Anthracycline dose/cycle < A60 or E90, sorted by cumulative dosage
West Midlands UK 8(C250M150F250V1A50) A400¶ 197/294 205/27476H1 84·2−19·3Cologne 10(A40C150×3)q3−4 A400¶76L1 (61 patients) (no data)
DFCI 74−063 6/12(A40C150×3) A240/480¶ 1/4 2/474D1
N Sweden BCG 8(A40C100×4) A320¶ 60/92 68/9580B3+4 25·9−10·0SE Sweden BCG B 8(A40C200×4) A320¶ 7/21 13/2180C2 4·0−2·6Helsinki 8(F20×14A40C500)q4 A320¶ 22/47 30/5080S1 7·0−4·7NSABP B−16 10A30 © 17(Mel4F300)q6 A300¶ 148/358 165/36084C2 70·4−9·3Southampton UK 6(V1·4A40C200×4) A240¶ 19/48 23/4580Z 7·8−1·8JCOG 9401 6(A40C500) A240¶ 7/65 12/6494F 3·8−3·5IGR Paris 6(F500[A50/E50††]C500)q3−4 E300¶ 113/576 138/57589D 56·7−9·2GROCTA I Italy 6(C500M40F600); 4E75 E300¶ 93/171 89/17183B 41·40·5FASG GFEA 02 6(F500E50C500) E300¶ 133/384 142/39286P2 60·7−10·1FASG GFEA 03 6(F500E50C500) E300¶ 35/167 34/16186P3 16·1−0·5Bari Italy 6(F500×2E50C500) E300¶ 11/123 23/12189@1 7·8−5·1FASG GFEA 07 6(F500E50C500) E300¶ 14/169 23/16690C6 9·0−4·8Austrian BCSG IX 4(F600E60C600) E240¶ 1/220 1/21996E 0·5−0·2MD Anderson8227 * 4(F400×2A40C400V1·5)q4 A160¶ 19/91 2(6/40)82F 5·01·7
880/2830
980/2798
(31·1%) (35·0%)
−79·0 400·5 0·82 (SE 0·05)reduction
2p = 0·00008
(b) subtotal with data §
1416/4754
1701/4733
(29·8%) (35·9%)
−139·9 581·3 0·786 (SE 0·037)reduction
2p < 0·00001
Total (a + b)
(c) Lower cumulative anthracycline dosage
Austrian BCSG 4 A20V1; C300×2M25×2F600×2 A20¶ 34/131 31/12984Q4+5 13·42·5
Adjusted
99% confidence intervals .0 0·5 1·0 1·5 2·0
Anth. better Anth. worse
§ 1 trial with no data does not contribute to subtotals or to the overall total.* For balance, subtotals and totals count control patients 2 or 3 times in trials with 2 or 3 times as many allocated chemotherapy;
logrank statistics are unaffected.Anthracyclines: A = doxorubicin (Adriamycin); E = EpirubicinOther agents: C = cyclophosphamide; F = fluorouracil; M = methotrexate; Mel = Melphalan; V = vincristine
(Not shown: antibiotic, hormonal, local or steroid therapies)All regimens q3week (unless specified as q4). Semicolon [;] indicates treatment sequence, © indicates concurrent regimens×2 means d1,8 iv; ×4 means d3−6 iv
¶ Dose less than A60 or E90 per cycle††91% given E, 9% given A

P 36: MORTALITY WITHOUT RECURRENCE IN FIRST YEAR in trials of any anthracycline-based regimen vs. No chemotherapy
Year codeand study name
Anthracycline regimensand drug doses per cycle
Cumulativedosage, E/A
Deaths/woman−yearsAllocated
anth. controlRatio of annual death rates
Anth. : ControlLogrank Variance
O−E of O−E
Anth. deaths
(a) Anthracycline dose/cycle exactly A60 or E90
SWOG 8814 * 6(C100×14A30×2F500×2)q4 A360 11/1154 3(0/363)89B1 1·92·5Amsterdam C9203 4(E90C600) E360 1/35 1/4092D 0·50·1IBCSG 11−93 4([A60/E90]C600) A240/E360 0/82 0/7993HIBCSG 12−93 * 4([A60/E90]C600) A240/E360 0/160 2(0/93)93M1+2
NSABP B−16 4(A60C600) A240 2/402 2/40284C 1·0−0·1
14/1833
3/1796
(0·8%/y) (0·2%/y)
2·5 3·42·10 (SE 0·81)
increase2p > 0·1; NS
(a) subtotal
(b) Anthracycline dose/cycle < A60 or E90, sorted by cumulative dosage
West Midlands UK 8(C250M150F250V1A50) A400¶ 1/270 0/23676H1 0·20·5Cologne 10(A40C150×3)q3−4 A400¶76L1 (no data)
DFCI 74−063 6/12(A40C150×3) A240/480¶74D1 (no data)
N Sweden BCG 8(A40C100×4) A320¶ 0/81 3/7980B3+4 0·7−1·6SE Sweden BCG B 8(A40C200×4) A320¶ 1/14 0/1380C2 0·20·5Helsinki 8(F20×14A40C500)q4 A320¶ 0/31 0/3180S1
NSABP B−16 10A30 © 17(Mel4F300)q6 A300¶ 1/344 2/33884C2 0·8−0·5Southampton UK 6(V1·4A40C200×4) A240¶ 1/34 1/3380Z 0·20·5JCOG 9401 6(A40C500) A240¶ 0/57 0/5894FIGR Paris 6(F500[A50/E50††]C500)q3−4 E300¶ 4/536 3/52989D 1·70·7GROCTA I Italy 6(C500M40F600); 4E75 E300¶ 0/163 0/15583BFASG GFEA 02 6(F500E50C500) E300¶ 1/343 2/34286P2 0·7−0·8FASG GFEA 03 6(F500E50C500) E300¶ 0/156 0/14786P3
Bari Italy 6(F500×2E50C500) E300¶ 0/112 0/11089@1
FASG GFEA 07 6(F500E50C500) E300¶ 0/160 0/15690C6
Austrian BCSG IX 4(F600E60C600) E240¶ 1/80 0/8696E 0·20·6MD Anderson8227 * 4(F400×2A40C400V1·5)q4 A160¶ 0/82 2(0/28)82F
10/2463
11/2369
(0·4%/y) (0·5%/y)
−0·1 4·90·97 (SE 0·45)
reduction2p > 0·1; NS
(b) subtotal with data §
24/4296
14/4165
(0·6%/y) (0·3%/y)
2·4 8·21·331 (SE 0·403)
increase2p > 0·1; NS
Total (a + b)
(c) Lower cumulative anthracycline dosage
Austrian BCSG 4 A20V1; C300×2M25×2F600×2 A20¶ 4/114 2/11584Q4+5 1·20·5
Adjusted
99% confidence intervals .0 0·5 1·0 1·5 2·0
Anth. better Anth. worse
§ 2 trials with no data do not contribute to subtotals or to the overall total.* For balance, subtotals and totals count control patients 2 or 3 times in trials with 2 or 3 times as many allocated chemotherapy;
logrank statistics are unaffected.Anthracyclines: A = doxorubicin (Adriamycin); E = EpirubicinOther agents: C = cyclophosphamide; F = fluorouracil; M = methotrexate; Mel = Melphalan; V = vincristine
(Not shown: antibiotic, hormonal, local or steroid therapies)All regimens q3week (unless specified as q4). Semicolon [;] indicates treatment sequence, © indicates concurrent regimens×2 means d1,8 iv; ×4 means d3−6 iv
¶ Dose less than A60 or E90 per cycle††91% given E, 9% given A

P 37: MORTALITY WITHOUT RECURRENCE in trials of any anthracycline-based regimen vs. No chemotherapy
Year codeand study name
Anthracycline regimensand drug doses per cycle
Cumulativedosage, E/A
Deaths/woman−yearsAllocated
anth. controlRatio of annual death rates
Anth. : ControlLogrank Variance
O−E of O−E
Anth. deaths
(a) Anthracycline dose/cycle exactly A60 or E90
SWOG 8814 * 6(C100×14A30×2F500×2)q4 A360 162/10308 3(33/3065)89B1 33·311·9Amsterdam C9203 4(E90C600) E360 2/177 2/17492D 0·90·2IBCSG 11−93 4([A60/E90]C600) A240/E360 0/628 1/60893H 0·2−0·4IBCSG 12−93 * 4([A60/E90]C600) A240/E360 8/1353 2(1/684)93M1+2 1·72·4NSABP B−16 4(A60C600) A240 61/4101 51/363284C 24·70·7
233/16567
155/14977
(1·4%/y) (1·0%/y)
14·8 60·91·27 (SE 0·14)
increase2p = 0·06
(a) subtotal
(b) Anthracycline dose/cycle < A60 or E90, sorted by cumulative dosage
West Midlands UK 8(C250M150F250V1A50) A400¶ 6/2324 4/169176H1 2·40·3Cologne 10(A40C150×3)q3−4 A400¶76L1 (no data)
DFCI 74−063 6/12(A40C150×3) A240/480¶ 2/46 1/1674D1
N Sweden BCG 8(A40C100×4) A320¶ 14/721 11/61680B3+4 5·61·3SE Sweden BCG B 8(A40C200×4) A320¶ 7/272 3/18780C2 1·21·2Helsinki 8(F20×14A40C500)q4 A320¶ 2/308 6/24980S1 0·4−0·2NSABP B−16 10A30 © 17(Mel4F300)q6 A300¶ 46/3330 43/294884C2 20·5−0·1Southampton UK 6(V1·4A40C200×4) A240¶ 5/452 2/39180Z 1·41·9JCOG 9401 6(A40C500) A240¶ 1/235 2/21094F 0·50·1IGR Paris 6(F500[A50/E50††]C500)q3−4 E300¶ 25/4401 21/411689D 11·22·1GROCTA I Italy 6(C500M40F600); 4E75 E300¶ 1/1668 0/152683B 0·20·5FASG GFEA 02 6(F500E50C500) E300¶ 13/2780 20/261986P2 7·2−3·8FASG GFEA 03 6(F500E50C500) E300¶ 9/1185 6/107886P3 3·71·6Bari Italy 6(F500×2E50C500) E300¶ 5/1058 6/109089@1 2·01·3FASG GFEA 07 6(F500E50C500) E300¶ 5/1134 3/101090C6 1·80·4Austrian BCSG IX 4(F600E60C600) E240¶ 1/212 1/21796E 0·30·5MD Anderson8227 * 4(F400×2A40C400V1·5)q4 A160¶ 2/596 2(2/259)82F 0·60·0
144/20722
133/18482
(0·7%/y) (0·7%/y)
7·0 59·2 1·13 (SE 0·14)increase
2p > 0·1; NS
(b) subtotal with data §
377/37289
288/33459
(1·0%/y) (0·9%/y)
21·7 120·1 1·198 (SE 0·100)increase2p = 0·05
Total (a + b)
(c) Lower cumulative anthracycline dosage
Austrian BCSG 4 A20V1; C300×2M25×2F600×2 A20¶ 20/764 16/76184Q4+5 7·51·5
Adjusted
99% confidence intervals .0 0·5 1·0 1·5 2·0
Anth. better Anth. worse
§ 1 trial with no data does not contribute to subtotals or to the overall total.* For balance, subtotals and totals count control patients 2 or 3 times in trials with 2 or 3 times as many allocated chemotherapy;
logrank statistics are unaffected.Anthracyclines: A = doxorubicin (Adriamycin); E = EpirubicinOther agents: C = cyclophosphamide; F = fluorouracil; M = methotrexate; Mel = Melphalan; V = vincristine
(Not shown: antibiotic, hormonal, local or steroid therapies)All regimens q3week (unless specified as q4). Semicolon [;] indicates treatment sequence, © indicates concurrent regimens×2 means d1,8 iv; ×4 means d3−6 iv
¶ Dose less than A60 or E90 per cycle††91% given E, 9% given A

P 38: OVERALL MORTALITY in trials of any anthracycline-based regimen vs. No chemotherapy
Year codeand study name
Anthracycline regimensand drug doses per cycle
Cumulativedosage, E/A
Deaths/WomenAllocated
anth. controlRatio of annual death rates
Anth. : ControlLogrank Variance
O−E of O−E
Anth. deaths
(a) Anthracycline dose/cycle exactly A60 or E90
SWOG 8814 * 6(C100×14A30×2F500×2)q4 A360 486/1177 3(185/381)89B1 113·7−23·5Amsterdam C9203 4(E90C600) E360 8/49 8/5392D 3·80·0IBCSG 11−93 4([A60/E90]C600) A240/E360 10/89 11/8593H 4·90·0IBCSG 12−93 * 4([A60/E90]C600) A240/E360 35/180 2(26/110)93M1+2 12·9−2·1NSABP B−16 4(A60C600) A240 230/429 250/43484C 106·6−20·7
769/1924
876/1935
(40·0%) (45·3%)
−46·2 241·7 0·83 (SE 0·06)reduction2p = 0·003
(a) subtotal
(b) Anthracycline dose/cycle < A60 or E90, sorted by cumulative dosage
West Midlands UK 8(C250M150F250V1A50) A400¶ 203/294 209/27476H1 86·6−19·0Cologne 10(A40C150×3)q3−4 A400¶76L1 (61 patients) (no data)
DFCI 74−063 6/12(A40C150×3) A240/480¶ 3/4 3/474D1
N Sweden BCG 8(A40C100×4) A320¶ 74/92 79/9580B3+4 31·6−8·6SE Sweden BCG B 8(A40C200×4) A320¶ 14/21 16/2180C2 5·2−1·4Helsinki 8(F20×14A40C500)q4 A320¶ 24/47 36/5080S1 7·5−4·9NSABP B−16 10A30 © 17(Mel4F300)q6 A300¶ 194/358 208/36084C2 90·8−9·4Southampton UK 6(V1·4A40C200×4) A240¶ 24/48 25/4580Z 9·20·0JCOG 9401 6(A40C500) A240¶ 8/65 14/6494F 4·3−3·5IGR Paris 6(F500[A50/E50††]C500)q3−4 E300¶ 138/576 159/57589D 67·9−7·1GROCTA I Italy 6(C500M40F600); 4E75 E300¶ 94/171 89/17183B 41·60·9FASG GFEA 02 6(F500E50C500) E300¶ 146/384 162/39286P2 67·9−13·9FASG GFEA 03 6(F500E50C500) E300¶ 44/167 40/16186P3 19·81·0Bari Italy 6(F500×2E50C500) E300¶ 16/123 29/12189@1 9·9−3·8FASG GFEA 07 6(F500E50C500) E300¶ 19/169 26/16690C6 10·8−4·4Austrian BCSG IX 4(F600E60C600) E240¶ 2/220 2/21996E 0·80·3MD Anderson8227 * 4(F400×2A40C400V1·5)q4 A160¶ 21/91 2(8/40)82F 5·61·7
1024/2830
1113/2798
(36·2%) (39·8%)
−72·0 459·6 0·86 (SE 0·04)reduction
2p = 0·0008
(b) subtotal with data §
1793/4754
1989/4733
(37·7%) (42·0%)
−118·2 701·4 0·845 (SE 0·035)reduction
2p < 0·00001
Total (a + b)
(c) Lower cumulative anthracycline dosage
Austrian BCSG 4 A20V1; C300×2M25×2F600×2 A20¶ 54/131 47/12984Q4+5 20·84·0
Adjusted
99% confidence intervals .0 0·5 1·0 1·5 2·0
Anth. better Anth. worse
§ 1 trial with no data does not contribute to subtotals or to the overall total.* For balance, subtotals and totals count control patients 2 or 3 times in trials with 2 or 3 times as many allocated chemotherapy;
logrank statistics are unaffected.Anthracyclines: A = doxorubicin (Adriamycin); E = EpirubicinOther agents: C = cyclophosphamide; F = fluorouracil; M = methotrexate; Mel = Melphalan; V = vincristine
(Not shown: antibiotic, hormonal, local or steroid therapies)All regimens q3week (unless specified as q4). Semicolon [;] indicates treatment sequence, © indicates concurrent regimens×2 means d1,8 iv; ×4 means d3−6 iv
¶ Dose less than A60 or E90 per cycle††91% given E, 9% given A
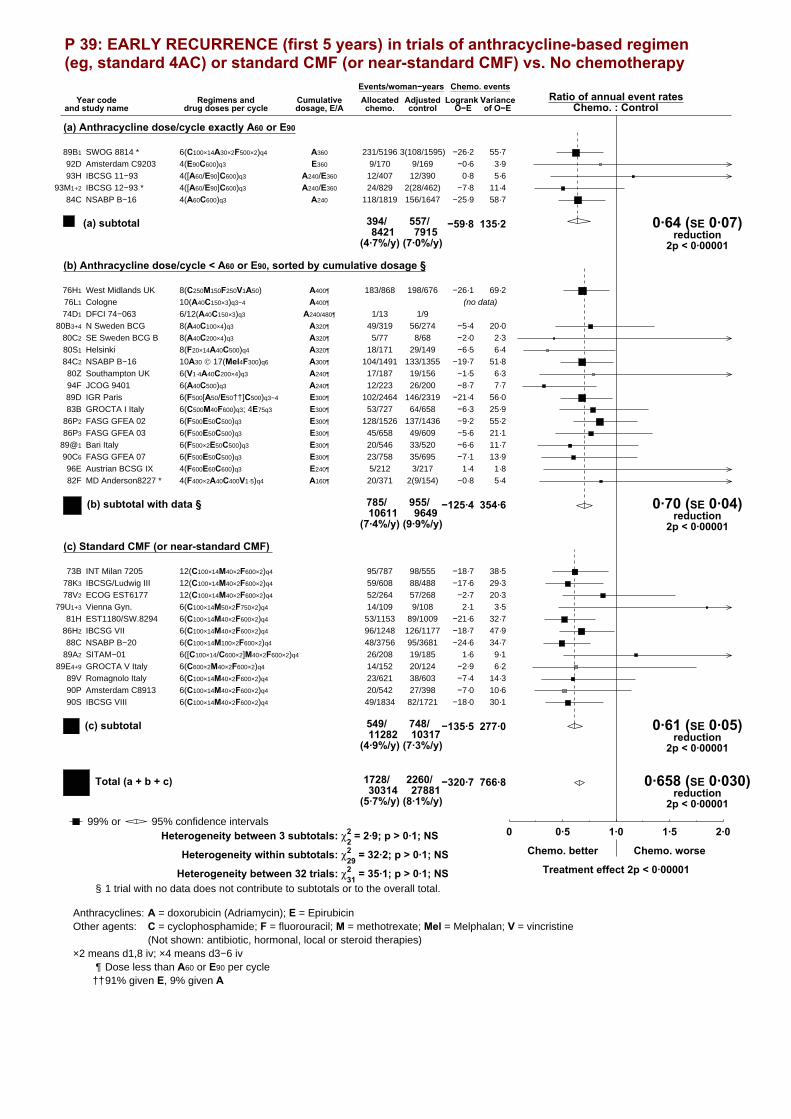
P 39: EARLY RECURRENCE (first 5 years) in trials of anthracycline-based regimen (eg, standard 4AC) or standard CMF (or near-standard CMF) vs. No chemotherapy
Year codeand study name
Regimens anddrug doses per cycle
Cumulativedosage, E/A
Events/woman−yearsAllocatedchemo. control
Ratio of annual event ratesChemo. : Control
Logrank VarianceO−E of O−E
Chemo. events
(a) Anthracycline dose/cycle exactly A60 or E90
SWOG 8814 * 6(C100×14A30×2F500×2)q4 A360 231/5196 3(108/1595)89B1 55·7−26·2
Amsterdam C9203 4(E90C600)q3 E360 9/170 9/16992D 3·9−0·6
IBCSG 11−93 4([A60/E90]C600)q3 A240/E360 12/407 12/39093H 5·60·8
IBCSG 12−93 * 4([A60/E90]C600)q3 A240/E360 24/829 2(28/462)93M1+2 11·4−7·8
NSABP B−16 4(A60C600)q3 A240 118/1819 156/164784C 58·7−25·9
394/8421
557/7915
(4·7%/y) (7·0%/y)
−59·8 135·2 0·64 (SE 0·07)reduction
2p < 0·00001
(a) subtotal
(b) Anthracycline dose/cycle < A60 or E90, sorted by cumulative dosage §
West Midlands UK 8(C250M150F250V1A50) A400¶ 183/868 198/67676H1 69·2−26·1
Cologne 10(A40C150×3)q3−4 A400¶76L1 (no data)
DFCI 74−063 6/12(A40C150×3)q3 A240/480¶ 1/13 1/974D1
N Sweden BCG 8(A40C100×4)q3 A320¶ 49/319 56/27480B3+4 20·0−5·4
SE Sweden BCG B 8(A40C200×4)q3 A320¶ 5/77 8/6880C2 2·3−2·0
Helsinki 8(F20×14A40C500)q4 A320¶ 18/171 29/14980S1 6·4−6·5
NSABP B−16 10A30 © 17(Mel4F300)q6 A300¶ 104/1491 133/135584C2 51·8−19·7
Southampton UK 6(V1·4A40C200×4)q3 A240¶ 17/187 19/15680Z 6·3−1·5
JCOG 9401 6(A40C500)q3 A240¶ 12/223 26/20094F 7·7−8·7
IGR Paris 6(F500[A50/E50††]C500)q3−4 E300¶ 102/2464 146/231989D 56·0−21·4
GROCTA I Italy 6(C500M40F600)q3; 4E75q3 E300¶ 53/727 64/65883B 25·9−6·3
FASG GFEA 02 6(F500E50C500)q3 E300¶ 128/1526 137/143686P2 55·2−9·2
FASG GFEA 03 6(F500E50C500)q3 E300¶ 45/658 49/60986P3 21·1−5·6
Bari Italy 6(F500×2E50C500)q3 E300¶ 20/546 33/52089@1 11·7−6·6
FASG GFEA 07 6(F500E50C500)q3 E300¶ 23/758 35/69590C6 13·9−7·1
Austrian BCSG IX 4(F600E60C600)q3 E240¶ 5/212 3/21796E 1·81·4
MD Anderson8227 * 4(F400×2A40C400V1·5)q4 A160¶ 20/371 2(9/154)82F 5·4−0·8
785/10611
955/9649
(7·4%/y) (9·9%/y)
−125·4 354·6 0·70 (SE 0·04)reduction
2p < 0·00001
(b) subtotal with data §
(c) Standard CMF (or near-standard CMF)
INT Milan 7205 12(C100×14M40×2F600×2)q4 95/787 98/55573B 38·5−18·7
IBCSG/Ludwig III 12(C100×14M40×2F600×2)q4 59/608 88/48878K3 29·3−17·6
ECOG EST6177 12(C100×14M40×2F600×2)q4 52/264 57/26878V2 20·3−2·7
Vienna Gyn. 6(C100×14M50×2F750×2)q4 14/109 9/10879U1+3 3·52·1
EST1180/SW.8294 6(C100×14M40×2F600×2)q4 53/1153 89/100981H 32·7−21·6
IBCSG VII 6(C100×14M40×2F600×2)q4 96/1248 126/117786H2 47·9−18·7
NSABP B−20 6(C100×14M100×2F600×2)q4 48/3756 95/368188C 34·7−24·6
SITAM−01 6([C100×14/C600×2]M40×2F600×2)q4 26/208 19/18589A2 9·11·6
GROCTA V Italy 6(C600×2M40×2F600×2)q4 14/152 20/12489E4+9 6·2−2·9
Romagnolo Italy 6(C100×14M40×2F600×2)q4 23/621 38/60389V 14·3−7·4
Amsterdam C8913 6(C100×14M40×2F600×2)q4 20/542 27/39890P 10·6−7·0
IBCSG VIII 6(C100×14M40×2F600×2)q4 49/1834 82/172190S 30·1−18·0
549/11282
748/10317
(4·9%/y) (7·3%/y)
−135·5 277·0 0·61 (SE 0·05)reduction
2p < 0·00001
(c) subtotal
1728/30314
2260/27881
(5·7%/y) (8·1%/y)
−320·7 766·8 0·658 (SE 0·030)reduction
2p < 0·00001
Total (a + b + c)
Adjusted
99% or 95% confidence intervals .0 0·5 1·0 1·5 2·0
Chemo. better Chemo. worse
Treatment effect 2p < 0·00001Heterogeneity between 32 trials: χ231 = 35·1; p > 0·1; NS
Heterogeneity between 3 subtotals: χ22 = 2·9; p > 0·1; NS
Heterogeneity within subtotals: χ229 = 32·2; p > 0·1; NS
§ 1 trial with no data does not contribute to subtotals or to the overall total.
Anthracyclines: A = doxorubicin (Adriamycin); E = EpirubicinOther agents: C = cyclophosphamide; F = fluorouracil; M = methotrexate; Mel = Melphalan; V = vincristine
(Not shown: antibiotic, hormonal, local or steroid therapies)×2 means d1,8 iv; ×4 means d3−6 iv
¶ Dose less than A60 or E90 per cycle††91% given E, 9% given A
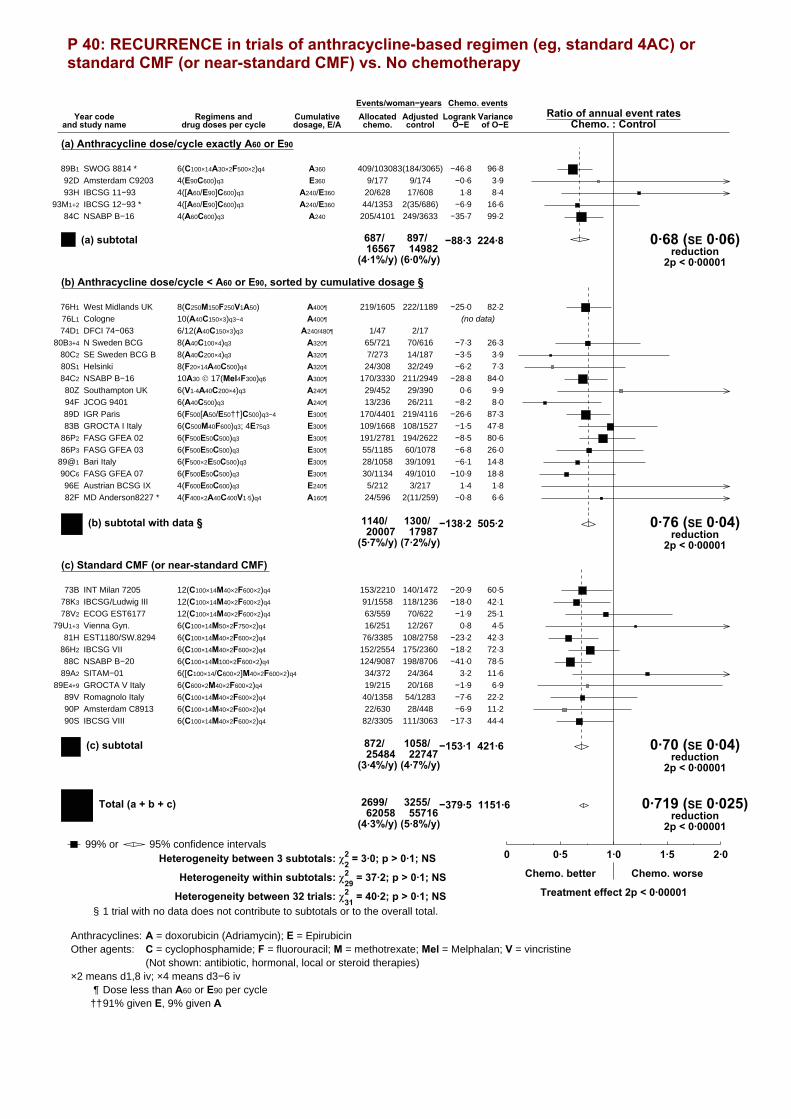
P 40: RECURRENCE in trials of anthracycline-based regimen (eg, standard 4AC) or standard CMF (or near-standard CMF) vs. No chemotherapy
Year codeand study name
Regimens anddrug doses per cycle
Cumulativedosage, E/A
Events/woman−yearsAllocatedchemo. control
Ratio of annual event ratesChemo. : Control
Logrank VarianceO−E of O−E
Chemo. events
(a) Anthracycline dose/cycle exactly A60 or E90
SWOG 8814 * 6(C100×14A30×2F500×2)q4 A360 409/103083(184/3065)89B1 96·8−46·8
Amsterdam C9203 4(E90C600)q3 E360 9/177 9/17492D 3·9−0·6
IBCSG 11−93 4([A60/E90]C600)q3 A240/E360 20/628 17/60893H 8·41·8
IBCSG 12−93 * 4([A60/E90]C600)q3 A240/E360 44/1353 2(35/686)93M1+2 16·6−6·9
NSABP B−16 4(A60C600)q3 A240 205/4101 249/363384C 99·2−35·7
687/16567
897/14982
(4·1%/y) (6·0%/y)
−88·3 224·8 0·68 (SE 0·06)reduction
2p < 0·00001
(a) subtotal
(b) Anthracycline dose/cycle < A60 or E90, sorted by cumulative dosage §
West Midlands UK 8(C250M150F250V1A50) A400¶ 219/1605 222/118976H1 82·2−25·0
Cologne 10(A40C150×3)q3−4 A400¶76L1 (no data)
DFCI 74−063 6/12(A40C150×3)q3 A240/480¶ 1/47 2/1774D1
N Sweden BCG 8(A40C100×4)q3 A320¶ 65/721 70/61680B3+4 26·3−7·3
SE Sweden BCG B 8(A40C200×4)q3 A320¶ 7/273 14/18780C2 3·9−3·5
Helsinki 8(F20×14A40C500)q4 A320¶ 24/308 32/24980S1 7·3−6·2
NSABP B−16 10A30 © 17(Mel4F300)q6 A300¶ 170/3330 211/294984C2 84·0−28·8
Southampton UK 6(V1·4A40C200×4)q3 A240¶ 29/452 29/39080Z 9·90·6
JCOG 9401 6(A40C500)q3 A240¶ 13/236 26/21194F 8·0−8·2
IGR Paris 6(F500[A50/E50††]C500)q3−4 E300¶ 170/4401 219/411689D 87·3−26·6
GROCTA I Italy 6(C500M40F600)q3; 4E75q3 E300¶ 109/1668 108/152783B 47·8−1·5
FASG GFEA 02 6(F500E50C500)q3 E300¶ 191/2781 194/262286P2 80·6−8·5
FASG GFEA 03 6(F500E50C500)q3 E300¶ 55/1185 60/107886P3 26·0−6·8
Bari Italy 6(F500×2E50C500)q3 E300¶ 28/1058 39/109189@1 14·8−6·1
FASG GFEA 07 6(F500E50C500)q3 E300¶ 30/1134 49/101090C6 18·8−10·9
Austrian BCSG IX 4(F600E60C600)q3 E240¶ 5/212 3/21796E 1·81·4
MD Anderson8227 * 4(F400×2A40C400V1·5)q4 A160¶ 24/596 2(11/259)82F 6·6−0·8
1140/20007
1300/17987
(5·7%/y) (7·2%/y)
−138·2 505·2 0·76 (SE 0·04)reduction
2p < 0·00001
(b) subtotal with data §
(c) Standard CMF (or near-standard CMF)
INT Milan 7205 12(C100×14M40×2F600×2)q4 153/2210 140/147273B 60·5−20·9
IBCSG/Ludwig III 12(C100×14M40×2F600×2)q4 91/1558 118/123678K3 42·1−18·0
ECOG EST6177 12(C100×14M40×2F600×2)q4 63/559 70/62278V2 25·1−1·9
Vienna Gyn. 6(C100×14M50×2F750×2)q4 16/251 12/26779U1+3 4·50·8
EST1180/SW.8294 6(C100×14M40×2F600×2)q4 76/3385 108/275881H 42·3−23·2
IBCSG VII 6(C100×14M40×2F600×2)q4 152/2554 175/236086H2 72·3−18·2
NSABP B−20 6(C100×14M100×2F600×2)q4 124/9087 198/870688C 78·5−41·0
SITAM−01 6([C100×14/C600×2]M40×2F600×2)q4 34/372 24/36489A2 11·63·2
GROCTA V Italy 6(C600×2M40×2F600×2)q4 19/215 20/16889E4+9 6·9−1·9
Romagnolo Italy 6(C100×14M40×2F600×2)q4 40/1358 54/128389V 22·2−7·6
Amsterdam C8913 6(C100×14M40×2F600×2)q4 22/630 28/44890P 11·2−6·9
IBCSG VIII 6(C100×14M40×2F600×2)q4 82/3305 111/306390S 44·4−17·3
872/25484
1058/22747
(3·4%/y) (4·7%/y)
−153·1 421·6 0·70 (SE 0·04)reduction
2p < 0·00001
(c) subtotal
2699/62058
3255/55716
(4·3%/y) (5·8%/y)
−379·5 1151·6 0·719 (SE 0·025)reduction
2p < 0·00001
Total (a + b + c)
Adjusted
99% or 95% confidence intervals .0 0·5 1·0 1·5 2·0
Chemo. better Chemo. worse
Treatment effect 2p < 0·00001Heterogeneity between 32 trials: χ231 = 40·2; p > 0·1; NS
Heterogeneity between 3 subtotals: χ22 = 3·0; p > 0·1; NS
Heterogeneity within subtotals: χ229 = 37·2; p > 0·1; NS
§ 1 trial with no data does not contribute to subtotals or to the overall total.
Anthracyclines: A = doxorubicin (Adriamycin); E = EpirubicinOther agents: C = cyclophosphamide; F = fluorouracil; M = methotrexate; Mel = Melphalan; V = vincristine
(Not shown: antibiotic, hormonal, local or steroid therapies)×2 means d1,8 iv; ×4 means d3−6 iv
¶ Dose less than A60 or E90 per cycle††91% given E, 9% given A
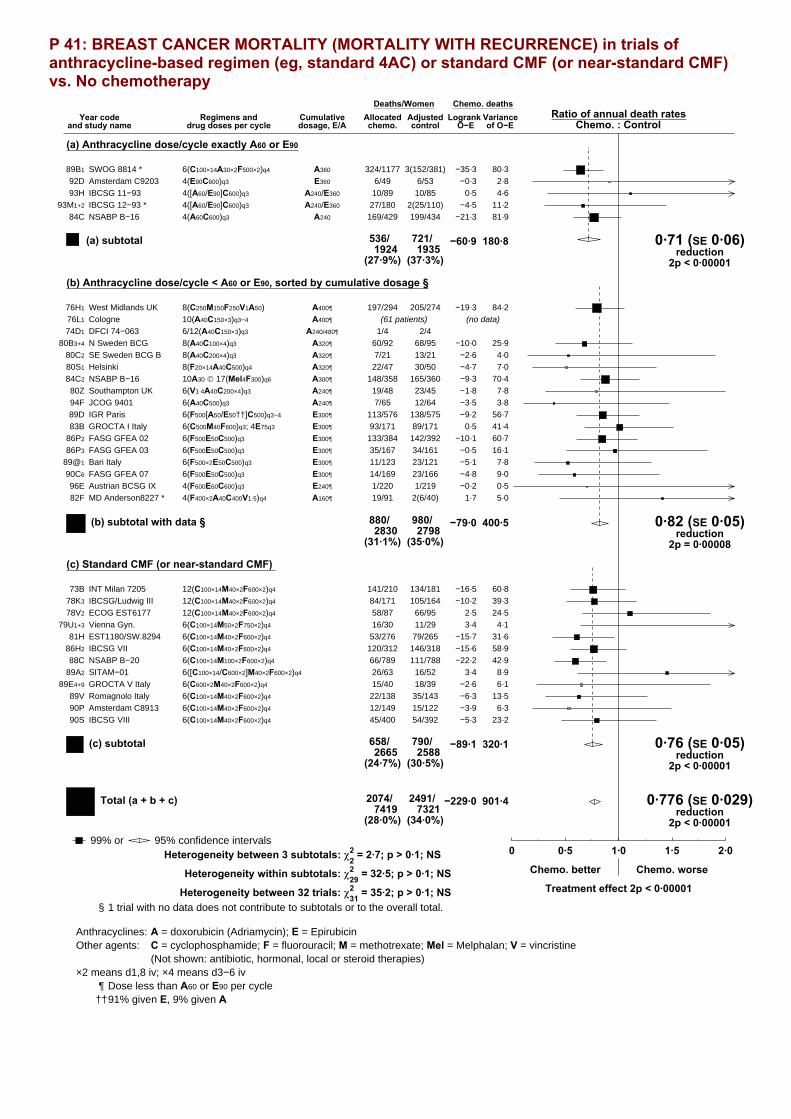
P 41: BREAST CANCER MORTALITY (MORTALITY WITH RECURRENCE) in trials of anthracycline-based regimen (eg, standard 4AC) or standard CMF (or near-standard CMF) vs. No chemotherapy
Year codeand study name
Regimens anddrug doses per cycle
Cumulativedosage, E/A
Deaths/WomenAllocatedchemo. control
Ratio of annual death ratesChemo. : Control
Logrank VarianceO−E of O−E
Chemo. deaths
(a) Anthracycline dose/cycle exactly A60 or E90
SWOG 8814 * 6(C100×14A30×2F500×2)q4 A360 324/1177 3(152/381)89B1 80·3−35·3
Amsterdam C9203 4(E90C600)q3 E360 6/49 6/5392D 2·8−0·3
IBCSG 11−93 4([A60/E90]C600)q3 A240/E360 10/89 10/8593H 4·60·5
IBCSG 12−93 * 4([A60/E90]C600)q3 A240/E360 27/180 2(25/110)93M1+2 11·2−4·5
NSABP B−16 4(A60C600)q3 A240 169/429 199/43484C 81·9−21·3
536/1924
721/1935
(27·9%) (37·3%)
−60·9 180·8 0·71 (SE 0·06)reduction
2p < 0·00001
(a) subtotal
(b) Anthracycline dose/cycle < A60 or E90, sorted by cumulative dosage §
West Midlands UK 8(C250M150F250V1A50) A400¶ 197/294 205/27476H1 84·2−19·3
Cologne 10(A40C150×3)q3−4 A400¶76L1 (61 patients) (no data)
DFCI 74−063 6/12(A40C150×3)q3 A240/480¶ 1/4 2/474D1
N Sweden BCG 8(A40C100×4)q3 A320¶ 60/92 68/9580B3+4 25·9−10·0
SE Sweden BCG B 8(A40C200×4)q3 A320¶ 7/21 13/2180C2 4·0−2·6
Helsinki 8(F20×14A40C500)q4 A320¶ 22/47 30/5080S1 7·0−4·7
NSABP B−16 10A30 © 17(Mel4F300)q6 A300¶ 148/358 165/36084C2 70·4−9·3
Southampton UK 6(V1·4A40C200×4)q3 A240¶ 19/48 23/4580Z 7·8−1·8
JCOG 9401 6(A40C500)q3 A240¶ 7/65 12/6494F 3·8−3·5
IGR Paris 6(F500[A50/E50††]C500)q3−4 E300¶ 113/576 138/57589D 56·7−9·2
GROCTA I Italy 6(C500M40F600)q3; 4E75q3 E300¶ 93/171 89/17183B 41·40·5
FASG GFEA 02 6(F500E50C500)q3 E300¶ 133/384 142/39286P2 60·7−10·1
FASG GFEA 03 6(F500E50C500)q3 E300¶ 35/167 34/16186P3 16·1−0·5
Bari Italy 6(F500×2E50C500)q3 E300¶ 11/123 23/12189@1 7·8−5·1
FASG GFEA 07 6(F500E50C500)q3 E300¶ 14/169 23/16690C6 9·0−4·8
Austrian BCSG IX 4(F600E60C600)q3 E240¶ 1/220 1/21996E 0·5−0·2
MD Anderson8227 * 4(F400×2A40C400V1·5)q4 A160¶ 19/91 2(6/40)82F 5·01·7
880/2830
980/2798
(31·1%) (35·0%)
−79·0 400·5 0·82 (SE 0·05)reduction
2p = 0·00008
(b) subtotal with data §
(c) Standard CMF (or near-standard CMF)
INT Milan 7205 12(C100×14M40×2F600×2)q4 141/210 134/18173B 60·8−16·5
IBCSG/Ludwig III 12(C100×14M40×2F600×2)q4 84/171 105/16478K3 39·3−10·2
ECOG EST6177 12(C100×14M40×2F600×2)q4 58/87 66/9578V2 24·52·5
Vienna Gyn. 6(C100×14M50×2F750×2)q4 16/30 11/2979U1+3 4·13·4
EST1180/SW.8294 6(C100×14M40×2F600×2)q4 53/276 79/26581H 31·6−15·7
IBCSG VII 6(C100×14M40×2F600×2)q4 120/312 146/31886H2 58·9−15·6
NSABP B−20 6(C100×14M100×2F600×2)q4 66/789 111/78888C 42·9−22·2
SITAM−01 6([C100×14/C600×2]M40×2F600×2)q4 26/63 16/5289A2 8·93·4
GROCTA V Italy 6(C600×2M40×2F600×2)q4 15/40 18/3989E4+9 6·1−2·6
Romagnolo Italy 6(C100×14M40×2F600×2)q4 22/138 35/14389V 13·5−6·3
Amsterdam C8913 6(C100×14M40×2F600×2)q4 12/149 15/12290P 6·3−3·9
IBCSG VIII 6(C100×14M40×2F600×2)q4 45/400 54/39290S 23·2−5·3
658/2665
790/2588
(24·7%) (30·5%)
−89·1 320·1 0·76 (SE 0·05)reduction
2p < 0·00001
(c) subtotal
2074/7419
2491/7321
(28·0%) (34·0%)
−229·0 901·4 0·776 (SE 0·029)reduction
2p < 0·00001
Total (a + b + c)
Adjusted
99% or 95% confidence intervals .0 0·5 1·0 1·5 2·0
Chemo. better Chemo. worse
Treatment effect 2p < 0·00001Heterogeneity between 32 trials: χ231 = 35·2; p > 0·1; NS
Heterogeneity between 3 subtotals: χ22 = 2·7; p > 0·1; NS
Heterogeneity within subtotals: χ229 = 32·5; p > 0·1; NS
§ 1 trial with no data does not contribute to subtotals or to the overall total.
Anthracyclines: A = doxorubicin (Adriamycin); E = EpirubicinOther agents: C = cyclophosphamide; F = fluorouracil; M = methotrexate; Mel = Melphalan; V = vincristine
(Not shown: antibiotic, hormonal, local or steroid therapies)×2 means d1,8 iv; ×4 means d3−6 iv
¶ Dose less than A60 or E90 per cycle††91% given E, 9% given A
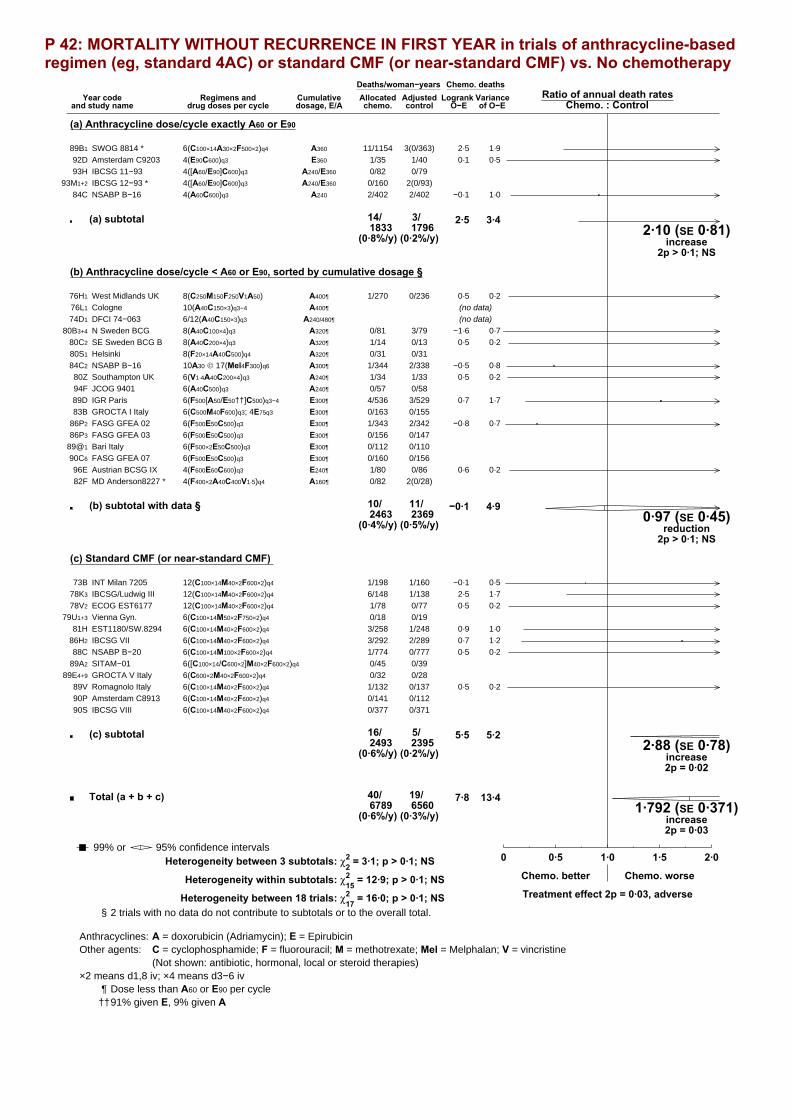
P 42: MORTALITY WITHOUT RECURRENCE IN FIRST YEAR in trials of anthracycline-based regimen (eg, standard 4AC) or standard CMF (or near-standard CMF) vs. No chemotherapy
Year codeand study name
Regimens anddrug doses per cycle
Cumulativedosage, E/A
Deaths/woman−yearsAllocatedchemo. control
Ratio of annual death ratesChemo. : Control
Logrank VarianceO−E of O−E
Chemo. deaths
(a) Anthracycline dose/cycle exactly A60 or E90
SWOG 8814 * 6(C100×14A30×2F500×2)q4 A360 11/1154 3(0/363)89B1 1·92·5
Amsterdam C9203 4(E90C600)q3 E360 1/35 1/4092D 0·50·1
IBCSG 11−93 4([A60/E90]C600)q3 A240/E360 0/82 0/7993H
IBCSG 12−93 * 4([A60/E90]C600)q3 A240/E360 0/160 2(0/93)93M1+2
NSABP B−16 4(A60C600)q3 A240 2/402 2/40284C 1·0−0·1
14/1833
3/1796
(0·8%/y) (0·2%/y)
2·5 3·42·10 (SE 0·81)
increase2p > 0·1; NS
(a) subtotal
(b) Anthracycline dose/cycle < A60 or E90, sorted by cumulative dosage §
West Midlands UK 8(C250M150F250V1A50) A400¶ 1/270 0/23676H1 0·20·5
Cologne 10(A40C150×3)q3−4 A400¶76L1 (no data)
DFCI 74−063 6/12(A40C150×3)q3 A240/480¶74D1 (no data)
N Sweden BCG 8(A40C100×4)q3 A320¶ 0/81 3/7980B3+4 0·7−1·6
SE Sweden BCG B 8(A40C200×4)q3 A320¶ 1/14 0/1380C2 0·20·5
Helsinki 8(F20×14A40C500)q4 A320¶ 0/31 0/3180S1
NSABP B−16 10A30 © 17(Mel4F300)q6 A300¶ 1/344 2/33884C2 0·8−0·5
Southampton UK 6(V1·4A40C200×4)q3 A240¶ 1/34 1/3380Z 0·20·5
JCOG 9401 6(A40C500)q3 A240¶ 0/57 0/5894F
IGR Paris 6(F500[A50/E50††]C500)q3−4 E300¶ 4/536 3/52989D 1·70·7
GROCTA I Italy 6(C500M40F600)q3; 4E75q3 E300¶ 0/163 0/15583B
FASG GFEA 02 6(F500E50C500)q3 E300¶ 1/343 2/34286P2 0·7−0·8
FASG GFEA 03 6(F500E50C500)q3 E300¶ 0/156 0/14786P3
Bari Italy 6(F500×2E50C500)q3 E300¶ 0/112 0/11089@1
FASG GFEA 07 6(F500E50C500)q3 E300¶ 0/160 0/15690C6
Austrian BCSG IX 4(F600E60C600)q3 E240¶ 1/80 0/8696E 0·20·6
MD Anderson8227 * 4(F400×2A40C400V1·5)q4 A160¶ 0/82 2(0/28)82F
10/2463
11/2369
(0·4%/y) (0·5%/y)
−0·1 4·90·97 (SE 0·45)
reduction2p > 0·1; NS
(b) subtotal with data §
(c) Standard CMF (or near-standard CMF)
INT Milan 7205 12(C100×14M40×2F600×2)q4 1/198 1/16073B 0·5−0·1
IBCSG/Ludwig III 12(C100×14M40×2F600×2)q4 6/148 1/13878K3 1·72·5
ECOG EST6177 12(C100×14M40×2F600×2)q4 1/78 0/7778V2 0·20·5
Vienna Gyn. 6(C100×14M50×2F750×2)q4 0/18 0/1979U1+3
EST1180/SW.8294 6(C100×14M40×2F600×2)q4 3/258 1/24881H 1·00·9
IBCSG VII 6(C100×14M40×2F600×2)q4 3/292 2/28986H2 1·20·7
NSABP B−20 6(C100×14M100×2F600×2)q4 1/774 0/77788C 0·20·5
SITAM−01 6([C100×14/C600×2]M40×2F600×2)q4 0/45 0/3989A2
GROCTA V Italy 6(C600×2M40×2F600×2)q4 0/32 0/2889E4+9
Romagnolo Italy 6(C100×14M40×2F600×2)q4 1/132 0/13789V 0·20·5
Amsterdam C8913 6(C100×14M40×2F600×2)q4 0/141 0/11290P
IBCSG VIII 6(C100×14M40×2F600×2)q4 0/377 0/37190S
16/2493
5/2395
(0·6%/y) (0·2%/y)
5·5 5·22·88 (SE 0·78)
increase2p = 0·02
(c) subtotal
40/6789
19/6560
(0·6%/y) (0·3%/y)
7·8 13·41·792 (SE 0·371)
increase2p = 0·03
Total (a + b + c)
Adjusted
99% or 95% confidence intervals .0 0·5 1·0 1·5 2·0
Chemo. better Chemo. worse
Treatment effect 2p = 0·03, adverseHeterogeneity between 18 trials: χ217 = 16·0; p > 0·1; NS
Heterogeneity between 3 subtotals: χ22 = 3·1; p > 0·1; NS
Heterogeneity within subtotals: χ215 = 12·9; p > 0·1; NS
§ 2 trials with no data do not contribute to subtotals or to the overall total.
Anthracyclines: A = doxorubicin (Adriamycin); E = EpirubicinOther agents: C = cyclophosphamide; F = fluorouracil; M = methotrexate; Mel = Melphalan; V = vincristine
(Not shown: antibiotic, hormonal, local or steroid therapies)×2 means d1,8 iv; ×4 means d3−6 iv
¶ Dose less than A60 or E90 per cycle††91% given E, 9% given A

P 43: MORTALITY WITHOUT RECURRENCE in trials of anthracycline-based regimen (eg, standard 4AC) or standard CMF (or near-standard CMF) vs. No chemotherapy
Year codeand study name
Regimens anddrug doses per cycle
Cumulativedosage, E/A
Deaths/woman−yearsAllocatedchemo. control
Ratio of annual death ratesChemo. : Control
Logrank VarianceO−E of O−E
Chemo. deaths
(a) Anthracycline dose/cycle exactly A60 or E90
SWOG 8814 * 6(C100×14A30×2F500×2)q4 A360 162/10308 3(33/3065)89B1 33·311·9
Amsterdam C9203 4(E90C600)q3 E360 2/177 2/17492D 0·90·2
IBCSG 11−93 4([A60/E90]C600)q3 A240/E360 0/628 1/60893H 0·2−0·4
IBCSG 12−93 * 4([A60/E90]C600)q3 A240/E360 8/1353 2(1/684)93M1+2 1·72·4
NSABP B−16 4(A60C600)q3 A240 61/4101 51/363284C 24·70·7
233/16567
155/14977
(1·4%/y) (1·0%/y)
14·8 60·91·27 (SE 0·14)
increase2p = 0·06
(a) subtotal
(b) Anthracycline dose/cycle < A60 or E90, sorted by cumulative dosage §
West Midlands UK 8(C250M150F250V1A50) A400¶ 6/2324 4/169176H1 2·40·3
Cologne 10(A40C150×3)q3−4 A400¶76L1 (no data)
DFCI 74−063 6/12(A40C150×3)q3 A240/480¶ 2/46 1/1674D1
N Sweden BCG 8(A40C100×4)q3 A320¶ 14/721 11/61680B3+4 5·61·3
SE Sweden BCG B 8(A40C200×4)q3 A320¶ 7/272 3/18780C2 1·21·2
Helsinki 8(F20×14A40C500)q4 A320¶ 2/308 6/24980S1 0·4−0·2
NSABP B−16 10A30 © 17(Mel4F300)q6 A300¶ 46/3330 43/294884C2 20·5−0·1
Southampton UK 6(V1·4A40C200×4)q3 A240¶ 5/452 2/39180Z 1·41·9
JCOG 9401 6(A40C500)q3 A240¶ 1/235 2/21094F 0·50·1
IGR Paris 6(F500[A50/E50††]C500)q3−4 E300¶ 25/4401 21/411689D 11·22·1
GROCTA I Italy 6(C500M40F600)q3; 4E75q3 E300¶ 1/1668 0/152683B 0·20·5
FASG GFEA 02 6(F500E50C500)q3 E300¶ 13/2780 20/261986P2 7·2−3·8
FASG GFEA 03 6(F500E50C500)q3 E300¶ 9/1185 6/107886P3 3·71·6
Bari Italy 6(F500×2E50C500)q3 E300¶ 5/1058 6/109089@1 2·01·3
FASG GFEA 07 6(F500E50C500)q3 E300¶ 5/1134 3/101090C6 1·80·4
Austrian BCSG IX 4(F600E60C600)q3 E240¶ 1/212 1/21796E 0·30·5
MD Anderson8227 * 4(F400×2A40C400V1·5)q4 A160¶ 2/596 2(2/259)82F 0·60·0
144/20722
133/18482
(0·7%/y) (0·7%/y)
7·0 59·2 1·13 (SE 0·14)increase
2p > 0·1; NS
(b) subtotal with data §
(c) Standard CMF (or near-standard CMF)
INT Milan 7205 12(C100×14M40×2F600×2)q4 24/2210 19/147273B 8·20·7
IBCSG/Ludwig III 12(C100×14M40×2F600×2)q4 37/1558 20/123578K3 11·64·0
ECOG EST6177 12(C100×14M40×2F600×2)q4 8/559 7/62278V2 3·01·8
Vienna Gyn. 6(C100×14M50×2F750×2)q4 4/250 10/26679U1+3 1·00·7
EST1180/SW.8294 6(C100×14M40×2F600×2)q4 31/3385 25/275881H 12·50·7
IBCSG VII 6(C100×14M40×2F600×2)q4 40/2554 28/235986H2 16·05·9
NSABP B−20 6(C100×14M100×2F600×2)q4 54/9087 51/870688C 25·92·1
SITAM−01 6([C100×14/C600×2]M40×2F600×2)q4 5/370 3/36489A2 1·3−0·2
GROCTA V Italy 6(C600×2M40×2F600×2)q4 0/215 1/16789E4+9 0·2−0·6
Romagnolo Italy 6(C100×14M40×2F600×2)q4 8/1358 4/128389V 2·91·8
Amsterdam C8913 6(C100×14M40×2F600×2)q4 0/630 0/44890P
IBCSG VIII 6(C100×14M40×2F600×2)q4 4/3305 2/306390S 1·41·4
215/25481
170/22743
(0·8%/y) (0·7%/y)
18·1 84·01·24 (SE 0·12)
increase2p = 0·05
(c) subtotal
592/62770
458/56202
(0·9%/y) (0·8%/y)
39·9 204·1 1·216 (SE 0·077)increase
2p = 0·005
Total (a + b + c)
Adjusted
99% or 95% confidence intervals .0 0·5 1·0 1·5 2·0
Chemo. better Chemo. worse
Treatment effect 2p = 0·005, adverseHeterogeneity between 31 trials: χ230 = 19·7; p > 0·1; NS
Heterogeneity between 3 subtotals: χ22 = 0·5; p > 0·1; NS
Heterogeneity within subtotals: χ228 = 19·1; p > 0·1; NS
§ 1 trial with no data does not contribute to subtotals or to the overall total.
Anthracyclines: A = doxorubicin (Adriamycin); E = EpirubicinOther agents: C = cyclophosphamide; F = fluorouracil; M = methotrexate; Mel = Melphalan; V = vincristine
(Not shown: antibiotic, hormonal, local or steroid therapies)×2 means d1,8 iv; ×4 means d3−6 iv
¶ Dose less than A60 or E90 per cycle††91% given E, 9% given A

P 44: OVERALL MORTALITY in trials of anthracycline-based regimen (eg, standard 4AC) or standard CMF (or near-standard CMF) vs. No chemotherapy
Year codeand study name
Regimens anddrug doses per cycle
Cumulativedosage, E/A
Deaths/WomenAllocatedchemo. control
Ratio of annual death ratesChemo. : Control
Logrank VarianceO−E of O−E
Chemo. deaths
(a) Anthracycline dose/cycle exactly A60 or E90
SWOG 8814 * 6(C100×14A30×2F500×2)q4 A360 486/1177 3(185/381)89B1 113·7−23·5
Amsterdam C9203 4(E90C600)q3 E360 8/49 8/5392D 3·80·0
IBCSG 11−93 4([A60/E90]C600)q3 A240/E360 10/89 11/8593H 4·90·0
IBCSG 12−93 * 4([A60/E90]C600)q3 A240/E360 35/180 2(26/110)93M1+2 12·9−2·1
NSABP B−16 4(A60C600)q3 A240 230/429 250/43484C 106·6−20·7
769/1924
876/1935
(40·0%) (45·3%)
−46·2 241·7 0·83 (SE 0·06)reduction2p = 0·003
(a) subtotal
(b) Anthracycline dose/cycle < A60 or E90, sorted by cumulative dosage §
West Midlands UK 8(C250M150F250V1A50) A400¶ 203/294 209/27476H1 86·6−19·0
Cologne 10(A40C150×3)q3−4 A400¶76L1 (61 patients) (no data)
DFCI 74−063 6/12(A40C150×3)q3 A240/480¶ 3/4 3/474D1
N Sweden BCG 8(A40C100×4)q3 A320¶ 74/92 79/9580B3+4 31·6−8·6
SE Sweden BCG B 8(A40C200×4)q3 A320¶ 14/21 16/2180C2 5·2−1·4
Helsinki 8(F20×14A40C500)q4 A320¶ 24/47 36/5080S1 7·5−4·9
NSABP B−16 10A30 © 17(Mel4F300)q6 A300¶ 194/358 208/36084C2 90·8−9·4
Southampton UK 6(V1·4A40C200×4)q3 A240¶ 24/48 25/4580Z 9·20·0
JCOG 9401 6(A40C500)q3 A240¶ 8/65 14/6494F 4·3−3·5
IGR Paris 6(F500[A50/E50††]C500)q3−4 E300¶ 138/576 159/57589D 67·9−7·1
GROCTA I Italy 6(C500M40F600)q3; 4E75q3 E300¶ 94/171 89/17183B 41·60·9
FASG GFEA 02 6(F500E50C500)q3 E300¶ 146/384 162/39286P2 67·9−13·9
FASG GFEA 03 6(F500E50C500)q3 E300¶ 44/167 40/16186P3 19·81·0
Bari Italy 6(F500×2E50C500)q3 E300¶ 16/123 29/12189@1 9·9−3·8
FASG GFEA 07 6(F500E50C500)q3 E300¶ 19/169 26/16690C6 10·8−4·4
Austrian BCSG IX 4(F600E60C600)q3 E240¶ 2/220 2/21996E 0·80·3
MD Anderson8227 * 4(F400×2A40C400V1·5)q4 A160¶ 21/91 2(8/40)82F 5·61·7
1024/2830
1113/2798
(36·2%) (39·8%)
−72·0 459·6 0·86 (SE 0·04)reduction
2p = 0·0008
(b) subtotal with data §
(c) Standard CMF (or near-standard CMF)
INT Milan 7205 12(C100×14M40×2F600×2)q4 165/210 153/18173B 69·0−15·8
IBCSG/Ludwig III 12(C100×14M40×2F600×2)q4 121/171 125/16478K3 50·9−6·1
ECOG EST6177 12(C100×14M40×2F600×2)q4 66/87 73/9578V2 27·54·3
Vienna Gyn. 6(C100×14M50×2F750×2)q4 20/30 21/2979U1+3 5·14·1
EST1180/SW.8294 6(C100×14M40×2F600×2)q4 84/276 104/26581H 44·1−15·0
IBCSG VII 6(C100×14M40×2F600×2)q4 160/312 174/31886H2 74·9−9·7
NSABP B−20 6(C100×14M100×2F600×2)q4 120/789 162/78888C 68·7−20·2
SITAM−01 6([C100×14/C600×2]M40×2F600×2)q4 31/63 19/5289A2 10·33·1
GROCTA V Italy 6(C600×2M40×2F600×2)q4 15/40 19/3989E4+9 6·3−3·2
Romagnolo Italy 6(C100×14M40×2F600×2)q4 30/138 39/14389V 16·4−4·5
Amsterdam C8913 6(C100×14M40×2F600×2)q4 12/149 15/12290P 6·3−3·9
IBCSG VIII 6(C100×14M40×2F600×2)q4 49/400 56/39290S 24·6−4·0
873/2665
960/2588
(32·8%) (37·1%)
−70·9 404·1 0·84 (SE 0·05)reduction
2p = 0·0004
(c) subtotal
2666/7419
2949/7321
(35·9%) (40·3%)
−189·1 1105·5 0·843 (SE 0·028)reduction
2p < 0·00001
Total (a + b + c)
Adjusted
99% or 95% confidence intervals .0 0·5 1·0 1·5 2·0
Chemo. better Chemo. worse
Treatment effect 2p < 0·00001Heterogeneity between 32 trials: χ231 = 25·7; p > 0·1; NS
Heterogeneity between 3 subtotals: χ22 = 0·2; p > 0·1; NS
Heterogeneity within subtotals: χ229 = 25·5; p > 0·1; NS
§ 1 trial with no data does not contribute to subtotals or to the overall total.
Anthracyclines: A = doxorubicin (Adriamycin); E = EpirubicinOther agents: C = cyclophosphamide; F = fluorouracil; M = methotrexate; Mel = Melphalan; V = vincristine
(Not shown: antibiotic, hormonal, local or steroid therapies)×2 means d1,8 iv; ×4 means d3−6 iv
¶ Dose less than A60 or E90 per cycle††91% given E, 9% given A

P 45: EARLY RECURRENCE (first 5 years) in trials of anthracycline dosage
Year codeand study name
Regimens compared anddrug doses (mg/m²) per cycle
Cumulativedosages, E/A Difference
Events/woman−yearsAllocated
trt. ‘A’ trt. ‘B’Ratio of annual event rates
Trt. ‘A’ : Trt. ‘B’Logrank Variance
O−E of O−E
Trt. ‘A’ events
(a) Unconfounded comparisons
FASG GFEA 01 3(FE75C) vs 3(F500E50C500) E225 vs E150¶ E75 93/713 93/70286P1 38·2−0·5FASG GFEA 05 6(FE100C) vs 6(F500E50C500) E600 vs E300¶ E300 94/1031 135/95190C3+5 46·4−23·3ICCG C/9/91 UK 8(FE75C) vs 8(F600E50C600) E600 vs E400¶ E200 −/1549 −/155692N 35·0blind
CALGB 9344 * 4(A90C) vs 4(A60C600) A360 vs A240 A120 177/2040 164/208494D1 75·75·5CALGB 9344 * 4(A90C); 4P vs 4(A60C600); 4P175 A360 vs A240 A120 152/2195 154/216594D2 69·6−4·4
591/7528
634/7458
(7·9%/y) (8·5%/y)
−27·1 264·9 0·90 (SE 0·06)reduction2p = 0·10
(a) subtotal
(b) Confounded comparisons
CALGB CLB−8541 4(F600A60C600)q4 vs 4(F300A30C300)q4 A240 vs A120¶ A120≠ 170/2131 225/188185A 85·0−39·9Brussels Belgium 8(E100C830) vs 8(E60C500) E800 vs E480¶ E320≠ 64/1131 94/106488R 32·4−14·9NCIC MA.21 6(C75×14E60×2F500×2)q2; 4P vs 4A60C600; 4P175 E720 vs A240 E720−A240≠ 81/1825 116/173100F 44·7−20·5
Allocated
99% or 95% confidence intervals .0 0·5 1·0 1·5 2·0
Trt. ‘A’ better Trt. ‘B’ better
Anthracyclines: A = doxorubicin (Adriamycin); E = EpirubicinOther agents: C = cyclophosphamide; F = fluorouracil; P = paclitaxel
(Not shown: antibiotic, hormonal, local or steroid therapies)All regimens q3w (unless specified as q4). Semicolon [;] indicates treatment sequence×2 means d1,8 iv; ×4 means d3−6 iv
¶ Dose less than E90 or A60 per q3w (E120 or A75 per q4w) cycle≠ Taxane and control regimens differ in ways other than cumulative anthracycline dose* These analyses compare the highest and lowest of the 3 anthracycline doses studied in 94D CALGB 9344, ignoring the middle dose

P 46: RECURRENCE in trials of anthracycline dosage
Year codeand study name
Regimens compared anddrug doses (mg/m²) per cycle
Cumulativedosages, E/A Difference
Events/woman−yearsAllocated
trt. ‘A’ trt. ‘B’Ratio of annual event rates
Trt. ‘A’ : Trt. ‘B’Logrank Variance
O−E of O−E
Trt. ‘A’ events
(a) Unconfounded comparisons
FASG GFEA 01 3(FE75C) vs 3(F500E50C500) E225 vs E150¶ E75 119/1313 116/128086P1 48·40·1FASG GFEA 05 6(FE100C) vs 6(F500E50C500) E600 vs E300¶ E300 127/1510 156/132590C3+5 57·5−19·5ICCG C/9/91 UK 8(FE75C) vs 8(F600E50C600) E600 vs E400¶ E200 −/2280 −/226992N 48·0blind
CALGB 9344 * 4(A90C) vs 4(A60C600) A360 vs A240 A120 208/3190 214/321494D1 94·7−2·8CALGB 9344 * 4(A90C); 4P vs 4(A60C600); 4P175 A360 vs A240 A120 184/3462 192/344194D2 86·5−8·2
737/11755
803/11529
(6·3%/y) (7·0%/y)
−41·2 335·2 0·88 (SE 0·05)reduction2p = 0·02
(a) subtotal
(b) Confounded comparisons
CALGB CLB−8541 4(F600A60C600)q4 vs 4(F300A30C300)q4 A240 vs A120¶ A120≠ 269/5037 306/434185A 126·5−39·4Brussels Belgium 8(E100C830) vs 8(E60C500) E800 vs E480¶ E320≠ 104/2293 129/204988R 47·5−18·8NCIC MA.21 6(C75×14E60×2F500×2)q2; 4P vs 4A60C600; 4P175 E720 vs A240 E720−A240≠ 82/1829 116/173200F 44·7−20·5
Allocated
99% or 95% confidence intervals0 0·5 1·0 1·5 2·0
Trt. ‘A’ better Trt. ‘B’ better
Anthracyclines: A = doxorubicin (Adriamycin); E = EpirubicinOther agents: C = cyclophosphamide; F = fluorouracil; P = paclitaxel
(Not shown: antibiotic, hormonal, local or steroid therapies)All regimens q3w (unless specified as q4). Semicolon [;] indicates treatment sequence×2 means d1,8 iv; ×4 means d3−6 iv
¶ Dose less than E90 or A60 per q3w (E120 or A75 per q4w) cycle≠ Taxane and control regimens differ in ways other than cumulative anthracycline dose* These analyses compare the highest and lowest of the 3 anthracycline doses studied in 94D CALGB 9344, ignoring the middle dose

P 47: BREAST CANCER MORTALITY (MORTALITY WITH RECURRENCE) in trials of anthracycline dosage
Year codeand study name
Regimens compared anddrug doses (mg/m²) per cycle
Cumulativedosages, E/A Difference
Deaths/WomenAllocated
trt. ‘A’ trt. ‘B’Ratio of annual death rates
Trt. ‘A’ : Trt. ‘B’Logrank Variance
O−E of O−E
Trt. ‘A’ deaths
(a) Unconfounded comparisons
FASG GFEA 01 3(FE75C) vs 3(F500E50C500) E225 vs E150¶ E75 77/200 82/20986P1 35·7−5·9FASG GFEA 05 6(FE100C) vs 6(F500E50C500) E600 vs E300¶ E300 88/276 108/28990C3+5 42·3−13·8ICCG C/9/91 UK 8(FE75C) vs 8(F600E50C600) E600 vs E400¶ E200 −/390 −/39592N 26·8blind
CALGB 9344 * 4(A90C) vs 4(A60C600) A360 vs A240 A120 166/526 150/52694D1 72·67·4CALGB 9344 * 4(A90C); 4P vs 4(A60C600); 4P175 A360 vs A240 A120 133/531 144/53494D2 64·8−7·5
521/1923
548/1953
(27·1%) (28·1%)
−19·6 242·2 0·92 (SE 0·06)reduction
2p > 0·1; NS
(a) subtotal
(b) Confounded comparisons
CALGB CLB−8541 4(F600A60C600)q4 vs 4(F300A30C300)q4 A240 vs A120¶ A120≠ 220/528 265/52285A 110·3−35·7Brussels Belgium 8(E100C830) vs 8(E60C500) E800 vs E480¶ E320≠ 73/265 92/27288R 33·2−11·4NCIC MA.21 6(C75×14E60×2F500×2)q2; 4P vs 4A60C600; 4P175 E720 vs A240 E720−A240≠ 50/701 65/70200F 26·4−7·5
Allocated
99% or 95% confidence intervals .0 0·5 1·0 1·5 2·0
Trt. ‘A’ better Trt. ‘B’ better
Anthracyclines: A = doxorubicin (Adriamycin); E = EpirubicinOther agents: C = cyclophosphamide; F = fluorouracil; P = paclitaxel
(Not shown: antibiotic, hormonal, local or steroid therapies)All regimens q3w (unless specified as q4). Semicolon [;] indicates treatment sequence×2 means d1,8 iv; ×4 means d3−6 iv
¶ Dose less than E90 or A60 per q3w (E120 or A75 per q4w) cycle≠ Taxane and control regimens differ in ways other than cumulative anthracycline dose* These analyses compare the highest and lowest of the 3 anthracycline doses studied in 94D CALGB 9344, ignoring the middle dose

P 48: MORTALITY WITHOUT RECURRENCE IN FIRST YEAR in trials of anthracycline dosage
Year codeand study name
Regimens compared anddrug doses (mg/m²) per cycle
Cumulativedosages, E/A Difference
Deaths/woman−yearsAllocated
trt. ‘A’ trt. ‘B’Ratio of annual death rates
Trt. ‘A’ : Trt. ‘B’Logrank Variance
O−E of O−E
Trt. ‘A’ deaths
(a) Unconfounded comparisons
FASG GFEA 01 3(FE75C) vs 3(F500E50C500) E225 vs E150¶ E75 0/183 1/18386P1 0·2−0·5FASG GFEA 05 6(FE100C) vs 6(F500E50C500) E600 vs E300¶ E300 2/244 1/24590C3+5 0·80·5ICCG C/9/91 UK 8(FE75C) vs 8(F600E50C600) E600 vs E400¶ E200 −/339 −/34392NCALGB 9344 * 4(A90C) vs 4(A60C600) A360 vs A240 A120 4/508 1/50694D1 1·21·2CALGB 9344 * 4(A90C); 4P vs 4(A60C600); 4P175 A360 vs A240 A120 2/513 1/51894D2 0·70·4
8/1787
4/1795
(0·4%/y) (0·2%/y)
1·7 3·01·79 (SE 0·79)
increase2p > 0·1; NS
(a) subtotal
(b) Confounded comparisons
CALGB CLB−8541 4(F600A60C600)q4 vs 4(F300A30C300)q4 A240 vs A120¶ A120≠ 0/498 2/48385A 0·5−1·0Brussels Belgium 8(E100C830) vs 8(E60C500) E800 vs E480¶ E320≠ 0/230 0/23688RNCIC MA.21 6(C75×14E60×2F500×2)q2; 4P vs 4A60C600; 4P175 E720 vs A240 E720−A240≠00F (no data)
Allocated
99% or 95% confidence intervals .0 0·5 1·0 1·5 2·0
Trt. ‘A’ better Trt. ‘B’ better
§ 1 trial with no data does not contribute to subtotals or to the overall total.Anthracyclines: A = doxorubicin (Adriamycin); E = EpirubicinOther agents: C = cyclophosphamide; F = fluorouracil; P = paclitaxel
(Not shown: antibiotic, hormonal, local or steroid therapies)All regimens q3w (unless specified as q4). Semicolon [;] indicates treatment sequence×2 means d1,8 iv; ×4 means d3−6 iv
¶ Dose less than E90 or A60 per q3w (E120 or A75 per q4w) cycle≠ Taxane and control regimens differ in ways other than cumulative anthracycline dose* These analyses compare the highest and lowest of the 3 anthracycline doses studied in 94D CALGB 9344, ignoring the middle dose

P 49: MORTALITY WITHOUT RECURRENCE in trials of anthracycline dosage
Year codeand study name
Regimens compared anddrug doses (mg/m²) per cycle
Cumulativedosages, E/A Difference
Deaths/woman−yearsAllocated
trt. ‘A’ trt. ‘B’Ratio of annual death rates
Trt. ‘A’ : Trt. ‘B’Logrank Variance
O−E of O−E
Trt. ‘A’ deaths
(a) Unconfounded comparisons
FASG GFEA 01 3(FE75C) vs 3(F500E50C500) E225 vs E150¶ E75 3/1312 4/127886P1 1·6−0·9FASG GFEA 05 6(FE100C) vs 6(F500E50C500) E600 vs E300¶ E300 6/1509 7/132490C3+5 3·2−1·0ICCG C/9/91 UK 8(FE75C) vs 8(F600E50C600) E600 vs E400¶ E200 −/2280 −/226892N 0·9blind
CALGB 9344 * 4(A90C) vs 4(A60C600) A360 vs A240 A120 19/3190 20/321494D1 9·5−0·7CALGB 9344 * 4(A90C); 4P vs 4(A60C600); 4P175 A360 vs A240 A120 19/3462 14/344194D2 7·72·6
49/11753
47/11525
(0·4%/y) (0·4%/y)
0·1 22·9 1·00 (SE 0·21)increase
2p > 0·1; NS
(a) subtotal
(b) Confounded comparisons
CALGB CLB−8541 4(F600A60C600)q4 vs 4(F300A30C300)q4 A240 vs A120¶ A120≠ 39/5037 25/434085A 14·44·2Brussels Belgium 8(E100C830) vs 8(E60C500) E800 vs E480¶ E320≠ 18/2293 10/204988R 6·32·9NCIC MA.21 6(C75×14E60×2F500×2)q2; 4P vs 4A60C600; 4P175 E720 vs A240 E720−A240≠00F (no data)
Allocated
99% or 95% confidence intervals .0 0·5 1·0 1·5 2·0
Trt. ‘A’ better Trt. ‘B’ better
§ 1 trial with no data does not contribute to subtotals or to the overall total.Anthracyclines: A = doxorubicin (Adriamycin); E = EpirubicinOther agents: C = cyclophosphamide; F = fluorouracil; P = paclitaxel
(Not shown: antibiotic, hormonal, local or steroid therapies)All regimens q3w (unless specified as q4). Semicolon [;] indicates treatment sequence×2 means d1,8 iv; ×4 means d3−6 iv
¶ Dose less than E90 or A60 per q3w (E120 or A75 per q4w) cycle≠ Taxane and control regimens differ in ways other than cumulative anthracycline dose* These analyses compare the highest and lowest of the 3 anthracycline doses studied in 94D CALGB 9344, ignoring the middle dose

P 50: OVERALL MORTALITY in trials of anthracycline dosage
Year codeand study name
Regimens compared anddrug doses (mg/m²) per cycle
Cumulativedosages, E/A Difference
Deaths/WomenAllocated
trt. ‘A’ trt. ‘B’Ratio of annual death rates
Trt. ‘A’ : Trt. ‘B’Logrank Variance
O−E of O−E
Trt. ‘A’ deaths
(a) Unconfounded comparisons
FASG GFEA 01 3(FE75C) vs 3(F500E50C500) E225 vs E150¶ E75 80/200 86/20986P1 37·4−6·8FASG GFEA 05 6(FE100C) vs 6(F500E50C500) E600 vs E300¶ E300 94/276 115/28990C3+5 45·5−14·9ICCG C/9/91 UK 8(FE75C) vs 8(F600E50C600) E600 vs E400¶ E200 −/390 −/39592N 27·7blind
CALGB 9344 * 4(A90C) vs 4(A60C600) A360 vs A240 A120 185/526 170/52694D1 82·06·7CALGB 9344 * 4(A90C); 4P vs 4(A60C600); 4P175 A360 vs A240 A120 152/531 158/53494D2 72·5−4·8
570/1923
595/1953
(29·6%) (30·5%)
−19·4 265·1 0·93 (SE 0·06)reduction
2p > 0·1; NS
(a) subtotal
(b) Confounded comparisons
CALGB CLB−8541 4(F600A60C600)q4 vs 4(F300A30C300)q4 A240 vs A120¶ A120≠ 259/528 290/52285A 124·7−31·5Brussels Belgium 8(E100C830) vs 8(E60C500) E800 vs E480¶ E320≠ 91/265 102/27288R 39·5−8·5NCIC MA.21 6(C75×14E60×2F500×2)q2; 4P vs 4A60C600; 4P175 E720 vs A240 E720−A240≠ 50/701 65/70200F 26·4−7·5
Allocated
99% or 95% confidence intervals0 0·5 1·0 1·5 2·0
Trt. ‘A’ better Trt. ‘B’ better
Anthracyclines: A = doxorubicin (Adriamycin); E = EpirubicinOther agents: C = cyclophosphamide; F = fluorouracil; P = paclitaxel
(Not shown: antibiotic, hormonal, local or steroid therapies)All regimens q3w (unless specified as q4). Semicolon [;] indicates treatment sequence×2 means d1,8 iv; ×4 means d3−6 iv
¶ Dose less than E90 or A60 per q3w (E120 or A75 per q4w) cycle≠ Taxane and control regimens differ in ways other than cumulative anthracycline dose* These analyses compare the highest and lowest of the 3 anthracycline doses studied in 94D CALGB 9344, ignoring the middle dose

P 51: EARLY RECURRENCE (first 5 years) in trials of CMF regimen vs. No chemotherapy
Year codeand study name
CMF regimensand doses per cycle
Events/woman−yearsAllocated
CMF controlRatio of annual event rates
CMF : ControlLogrank Variance
O−E of O−E
CMF events
(a) Standard CMF (or near-standard CMF) regimens
INT Milan 7205 12(C100×14M40×2F600×2)q4 95/787 98/55573B 38·5−18·7IBCSG/Ludwig III 12(C100×14M40×2F600×2)q4 59/608 88/48878K3 29·3−17·6ECOG EST6177 12(C100×14M40×2F600×2)q4 52/264 57/26878V2 20·3−2·7Vienna Gyn. 6(C100×14M50×2F750×2)q4 14/109 9/10879U1+3 3·52·1EST1180/SW.8294 6(C100×14M40×2F600×2)q4 53/1153 89/100981H 32·7−21·6IBCSG VII 6(C100×14M40×2F600×2)q4 96/1248 126/117786H2 47·9−18·7NSABP B−20 6(C100×14M100×2F600×2)q4 48/3756 95/368188C 34·7−24·6SITAM−01 6([C100×14/C600×2]M40×2F600×2)q4 26/208 19/18589A2 9·11·6GROCTA V Italy 6(C600×2M40×2F600×2)q4 14/152 20/12489E4+9 6·2−2·9Romagnolo Italy 6(C100×14M40×2F600×2)q4 23/621 38/60389V 14·3−7·4Amsterdam C8913 6(C100×14M40×2F600×2)q4 20/542 27/39890P 10·6−7·0IBCSG VIII 6(C100×14M40×2F600×2)q4 49/1834 82/172190S 30·1−18·0
549/11282
748/10317
(4·9%/y) (7·3%/y)
−135·5 277·0 0·61 (SE 0·05)reduction
2p < 0·00001
(a) subtotal
(b) Other CMF regimens
Manchester I 12(C80×14M32×2F480×2)q4 23/195 24/17375E2 8·3−1·5Glasgow 12(C300×2M40×2F600×2)q4 53/384 62/27976C 19·4−12·9EORTC 09771 24(C50×14M15×2F350×2)q4 92/869 109/76576E 43·0−14·4Danish BCG 77b 12(C80×14M30×2F500×2)q4 76/754 100/64977B1+2 31·7−17·8UK/Asia Collab. 8(C50M25F600)q3; 16(C100×4M25F600)q4 88/674 108/60278E 33·9−9·4Guy’s/Manch. II 6(C80×14M32×2F480×2)q4 77/672 125/57779E 33·4−25·5Paris 6(C400×2M40×2F400×2)q4 35/716 46/65979H 18·1−7·8FM Italy 8004 12(C600M40F600)q3 9/218 23/15580F 6·9−8·7DBCG 82c postmenop. 9(C600M40×2F400×2)q4 350/2476 392/241482C 145·2−31·0NCIC MA.4 8(C600M40F600)q3 125/1427 143/135984D 58·8−12·2IBCSG VII * 3(C100×14M40×2F600×2)q4 224/2471 2(126/1177)86H2 65·2−16·7GABG 3 Germany 6(C500×2M40×2F600×2)q4 45/943 51/82187D3 21·6−5·8IBCSG IX 3(C100×14M40×2F600×2)q4 90/3903 125/379988D 51·7−18·9CRCRAMS Moscow 6(C550×2M25×2F500×2)q3−4 2/37 4/2489J1 1·4−1·1Tokyo CIH 6(C500M30F500)q3 16/545 14/55290X1 6·91·2Sweden−Finland 9(C600M40F600)q390£ (no data)
Hamburg, Germany 6(C500×2M40×2F600×2)q4 15/377 21/40693S 8·0−2·4INC Brazil 6(C600M40F600)q393X (no data)
Charles U Prague 6(C500×2M40×2F600×2)q494P (no data)
1320/16661
1599/15588
(7·9%/y)(10·3%/y)
−185·0 553·4 0·72 (SE 0·04)reduction
2p < 0·00001
(b) subtotal with data §
1869/27943
2347/25905
(6·7%/y) (9·1%/y)
−320·5 830·3 0·680 (SE 0·029)reduction
2p < 0·00001
Total (a + b)
Adjusted
99% or 95% confidence intervals .0 0·5 1·0 1·5 2·0
CMF better CMF worse
Treatment effect 2p < 0·00001Heterogeneity between 28 trials: χ2
27 = 41·3; p = 0·04
Difference betweentreatment effects in 2 subtotals: χ2
1 = 4·4; 2p = 0·04
Heterogeneity within subtotals: χ226 = 36·9; p = 0·08
§ 3 trials with no data do not contribute to subtotals or to the overall total.* For balance, control patients in 3−way trials or trial strata count half or twice in subtotal(s)
and in final total of events/woman−years.Agents: C = cyclophosphamide; F = fluorouracil; M = methotrexate
(Not shown: antibiotic, hormonal, local or steroid therapies)Semicolon [;] indicates treatment sequence; ×2 means d1,8 iv; ×4 means d3−6 iv

P 52: RECURRENCE in trials of CMF regimen vs. No chemotherapy
Year codeand study name
CMF regimensand doses per cycle
Events/woman−yearsAllocated
CMF controlRatio of annual event rates
CMF : ControlLogrank Variance
O−E of O−E
CMF events
(a) Standard CMF (or near-standard CMF) regimens
INT Milan 7205 12(C100×14M40×2F600×2)q4 153/2210 140/147273B 60·5−20·9IBCSG/Ludwig III 12(C100×14M40×2F600×2)q4 91/1558 118/123678K3 42·1−18·0ECOG EST6177 12(C100×14M40×2F600×2)q4 63/559 70/62278V2 25·1−1·9Vienna Gyn. 6(C100×14M50×2F750×2)q4 16/251 12/26779U1+3 4·50·8EST1180/SW.8294 6(C100×14M40×2F600×2)q4 76/3385 108/275881H 42·3−23·2IBCSG VII 6(C100×14M40×2F600×2)q4 152/2554 175/236086H2 72·3−18·2NSABP B−20 6(C100×14M100×2F600×2)q4 124/9087 198/870688C 78·5−41·0SITAM−01 6([C100×14/C600×2]M40×2F600×2)q4 34/372 24/36489A2 11·63·2GROCTA V Italy 6(C600×2M40×2F600×2)q4 19/215 20/16889E4+9 6·9−1·9Romagnolo Italy 6(C100×14M40×2F600×2)q4 40/1358 54/128389V 22·2−7·6Amsterdam C8913 6(C100×14M40×2F600×2)q4 22/630 28/44890P 11·2−6·9IBCSG VIII 6(C100×14M40×2F600×2)q4 82/3305 111/306390S 44·4−17·3
872/25484
1058/22747
(3·4%/y) (4·7%/y)
−153·1 421·6 0·70 (SE 0·04)reduction
2p < 0·00001
(a) subtotal
(b) Other CMF regimens
Manchester I 12(C80×14M32×2F480×2)q4 35/426 34/43075E2 12·3−0·8Glasgow 12(C300×2M40×2F600×2)q4 67/828 73/61876C 23·9−13·2EORTC 09771 24(C50×14M15×2F350×2)q4 134/1482 132/123276E 57·5−9·8Danish BCG 77b 12(C80×14M30×2F500×2)q4 108/2590 133/196477B1+2 41·9−19·3UK/Asia Collab. 8(C50M25F600)q3; 16(C100×4M25F600)q4 118/1310 132/117678E 42·2−7·7Guy’s/Manch. II 6(C80×14M32×2F480×2)q4 118/1751 160/120979E 45·8−33·2Paris 6(C400×2M40×2F400×2)q4 49/1111 63/98379H 24·8−10·4FM Italy 8004 12(C600M40F600)q3 20/725 30/45480F 10·3−8·2DBCG 82c postmenop. 9(C600M40×2F400×2)q4 490/5039 498/483982C 198·6−19·0
NCIC MA.4 8(C600M40F600)q3 164/1828 168/170784D 72·9−7·4IBCSG VII * 3(C100×14M40×2F600×2)q4 335/5135 2(175/2360)86H2 96·2−18·4GABG 3 Germany 6(C500×2M40×2F600×2)q4 56/1064 59/91187D3 25·9−5·3IBCSG IX 3(C100×14M40×2F600×2)q4 147/7488 178/715788D 78·5−18·4CRCRAMS Moscow 6(C550×2M25×2F500×2)q3−4 2/38 4/2589J1 1·4−1·1Tokyo CIH 6(C500M30F500)q3 20/608 17/63290X1 8·02·0Sweden−Finland 9(C600M40F600)q390£ (no data)
Hamburg, Germany 6(C500×2M40×2F600×2)q4 15/397 22/42893S 8·1−2·5INC Brazil 6(C600M40F600)q393X (no data)
Charles U Prague 6(C500×2M40×2F600×2)q494P (no data)
1878/31820
2053/28485
(5·9%/y) (7·2%/y)
−172·5 748·3 0·79 (SE 0·03)reduction
2p < 0·00001
(b) subtotal with data §
2750/57304
3111/51232
(4·8%/y) (6·1%/y)
−325·6 1169·9 0·757 (SE 0·026)reduction
2p < 0·00001
Total (a + b)
Adjusted
99% or 95% confidence intervals .0 0·5 1·0 1·5 2·0
CMF better CMF worse
Treatment effect 2p < 0·00001Heterogeneity between 28 trials: χ2
27 = 46·3; p = 0·01
Difference betweentreatment effects in 2 subtotals: χ2
1 = 4·7; 2p = 0·03
Heterogeneity within subtotals: χ226 = 41·5; p = 0·03
§ 3 trials with no data do not contribute to subtotals or to the overall total.* For balance, control patients in 3−way trials or trial strata count half or twice in subtotal(s)
and in final total of events/woman−years.Agents: C = cyclophosphamide; F = fluorouracil; M = methotrexate
(Not shown: antibiotic, hormonal, local or steroid therapies)Semicolon [;] indicates treatment sequence; ×2 means d1,8 iv; ×4 means d3−6 iv
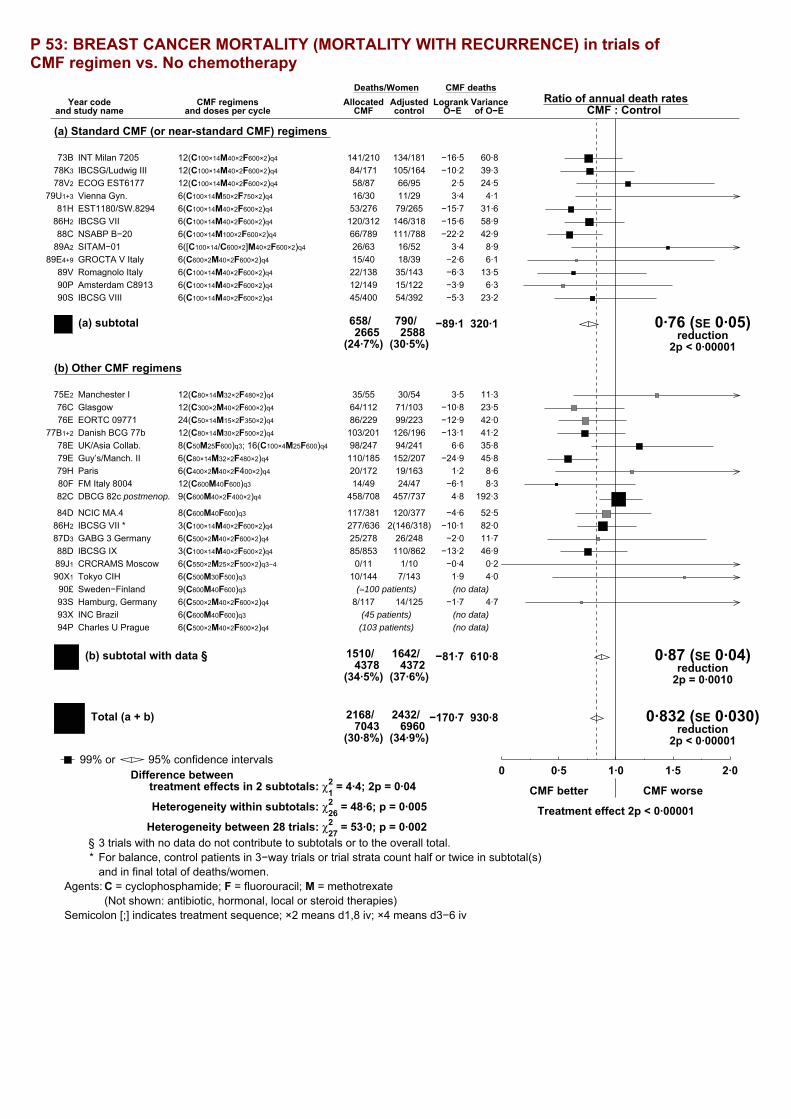
P 53: BREAST CANCER MORTALITY (MORTALITY WITH RECURRENCE) in trials of CMF regimen vs. No chemotherapy
Year codeand study name
CMF regimensand doses per cycle
Deaths/WomenAllocated
CMF controlRatio of annual death rates
CMF : ControlLogrank Variance
O−E of O−E
CMF deaths
(a) Standard CMF (or near-standard CMF) regimens
INT Milan 7205 12(C100×14M40×2F600×2)q4 141/210 134/18173B 60·8−16·5IBCSG/Ludwig III 12(C100×14M40×2F600×2)q4 84/171 105/16478K3 39·3−10·2ECOG EST6177 12(C100×14M40×2F600×2)q4 58/87 66/9578V2 24·52·5Vienna Gyn. 6(C100×14M50×2F750×2)q4 16/30 11/2979U1+3 4·13·4EST1180/SW.8294 6(C100×14M40×2F600×2)q4 53/276 79/26581H 31·6−15·7IBCSG VII 6(C100×14M40×2F600×2)q4 120/312 146/31886H2 58·9−15·6NSABP B−20 6(C100×14M100×2F600×2)q4 66/789 111/78888C 42·9−22·2SITAM−01 6([C100×14/C600×2]M40×2F600×2)q4 26/63 16/5289A2 8·93·4GROCTA V Italy 6(C600×2M40×2F600×2)q4 15/40 18/3989E4+9 6·1−2·6Romagnolo Italy 6(C100×14M40×2F600×2)q4 22/138 35/14389V 13·5−6·3Amsterdam C8913 6(C100×14M40×2F600×2)q4 12/149 15/12290P 6·3−3·9IBCSG VIII 6(C100×14M40×2F600×2)q4 45/400 54/39290S 23·2−5·3
658/2665
790/2588
(24·7%) (30·5%)
−89·1 320·1 0·76 (SE 0·05)reduction
2p < 0·00001
(a) subtotal
(b) Other CMF regimens
Manchester I 12(C80×14M32×2F480×2)q4 35/55 30/5475E2 11·33·5Glasgow 12(C300×2M40×2F600×2)q4 64/112 71/10376C 23·5−10·8EORTC 09771 24(C50×14M15×2F350×2)q4 86/229 99/22376E 42·0−12·9Danish BCG 77b 12(C80×14M30×2F500×2)q4 103/201 126/19677B1+2 41·2−13·1UK/Asia Collab. 8(C50M25F600)q3; 16(C100×4M25F600)q4 98/247 94/24178E 35·86·6Guy’s/Manch. II 6(C80×14M32×2F480×2)q4 110/185 152/20779E 45·8−24·9Paris 6(C400×2M40×2F400×2)q4 20/172 19/16379H 8·61·2FM Italy 8004 12(C600M40F600)q3 14/49 24/4780F 8·3−6·1DBCG 82c postmenop. 9(C600M40×2F400×2)q4 458/708 457/73782C 192·34·8
NCIC MA.4 8(C600M40F600)q3 117/381 120/37784D 52·5−4·6IBCSG VII * 3(C100×14M40×2F600×2)q4 277/636 2(146/318)86H2 82·0−10·1GABG 3 Germany 6(C500×2M40×2F600×2)q4 25/278 26/24887D3 11·7−2·0IBCSG IX 3(C100×14M40×2F600×2)q4 85/853 110/86288D 46·9−13·2CRCRAMS Moscow 6(C550×2M25×2F500×2)q3−4 0/11 1/1089J1 0·2−0·4Tokyo CIH 6(C500M30F500)q3 10/144 7/14390X1 4·01·9Sweden−Finland 9(C600M40F600)q390£ (≈100 patients) (no data)
Hamburg, Germany 6(C500×2M40×2F600×2)q4 8/117 14/12593S 4·7−1·7INC Brazil 6(C600M40F600)q393X (45 patients) (no data)
Charles U Prague 6(C500×2M40×2F600×2)q494P (103 patients) (no data)
1510/4378
1642/4372
(34·5%) (37·6%)
−81·7 610·8 0·87 (SE 0·04)reduction
2p = 0·0010
(b) subtotal with data §
2168/7043
2432/6960
(30·8%) (34·9%)
−170·7 930·8 0·832 (SE 0·030)reduction
2p < 0·00001
Total (a + b)
Adjusted
99% or 95% confidence intervals .0 0·5 1·0 1·5 2·0
CMF better CMF worse
Treatment effect 2p < 0·00001Heterogeneity between 28 trials: χ2
27 = 53·0; p = 0·002
Difference betweentreatment effects in 2 subtotals: χ2
1 = 4·4; 2p = 0·04
Heterogeneity within subtotals: χ226 = 48·6; p = 0·005
§ 3 trials with no data do not contribute to subtotals or to the overall total.* For balance, control patients in 3−way trials or trial strata count half or twice in subtotal(s)
and in final total of deaths/women.Agents: C = cyclophosphamide; F = fluorouracil; M = methotrexate
(Not shown: antibiotic, hormonal, local or steroid therapies)Semicolon [;] indicates treatment sequence; ×2 means d1,8 iv; ×4 means d3−6 iv

P 54: MORTALITY WITHOUT RECURRENCE IN FIRST YEAR in trials of CMF regimen vs. No chemotherapy
Year codeand study name
CMF regimensand doses per cycle
Deaths/woman−yearsAllocated
CMF controlRatio of annual death rates
CMF : ControlLogrank Variance
O−E of O−E
CMF deaths
(a) Standard CMF (or near-standard CMF) regimens
INT Milan 7205 12(C100×14M40×2F600×2)q4 1/198 1/16073B 0·5−0·1IBCSG/Ludwig III 12(C100×14M40×2F600×2)q4 6/148 1/13878K3 1·72·5ECOG EST6177 12(C100×14M40×2F600×2)q4 1/78 0/7778V2 0·20·5Vienna Gyn. 6(C100×14M50×2F750×2)q4 0/18 0/1979U1+3
EST1180/SW.8294 6(C100×14M40×2F600×2)q4 3/258 1/24881H 1·00·9IBCSG VII 6(C100×14M40×2F600×2)q4 3/292 2/28986H2 1·20·7NSABP B−20 6(C100×14M100×2F600×2)q4 1/774 0/77788C 0·20·5SITAM−01 6([C100×14/C600×2]M40×2F600×2)q4 0/45 0/3989A2
GROCTA V Italy 6(C600×2M40×2F600×2)q4 0/32 0/2889E4+9
Romagnolo Italy 6(C100×14M40×2F600×2)q4 1/132 0/13789V 0·20·5Amsterdam C8913 6(C100×14M40×2F600×2)q4 0/141 0/11290PIBCSG VIII 6(C100×14M40×2F600×2)q4 0/377 0/37190S
16/2493
5/2395
(0·6%/y) (0·2%/y)
5·5 5·22·88 (SE 0·78)
increase2p = 0·02
(a) subtotal
(b) Other CMF regimens
Manchester I 12(C80×14M32×2F480×2)q4 1/34 0/3575E2 0·20·6Glasgow 12(C300×2M40×2F600×2)q4 1/90 0/7876C 0·20·5EORTC 09771 24(C50×14M15×2F350×2)q4 0/212 0/20576EDanish BCG 77b 12(C80×14M30×2F500×2)q4 0/148 0/15377B1+2
UK/Asia Collab. 8(C50M25F600)q3; 16(C100×4M25F600)q4 1/180 3/16978E 0·7−0·8Guy’s/Manch. II 6(C80×14M32×2F480×2)q4 0/138 0/15179EParis 6(C400×2M40×2F400×2)q4 0/160 1/15479H 0·2−0·6FM Italy 8004 12(C600M40F600)q3 0/44 0/4280FDBCG 82c postmenop. 9(C600M40×2F400×2)q4 4/651 6/65682C 2·5−0·6NCIC MA.4 8(C600M40F600)q3 1/356 0/34984D 0·20·4IBCSG VII * 3(C100×14M40×2F600×2)q4 2/592 2(2/289)86H2 0·9−0·6GABG 3 Germany 6(C500×2M40×2F600×2)q4 0/250 3/22087D3 0·7−1·3IBCSG IX 3(C100×14M40×2F600×2)q4 6/832 3/83688D 2·21·6CRCRAMS Moscow 6(C550×2M25×2F500×2)q3−4 0/7 0/689J1
Tokyo CIH 6(C500M30F500)q3 0/132 0/13290X1
Sweden−Finland 9(C600M40F600)q390£ (no data)
Hamburg, Germany 6(C500×2M40×2F600×2)q4 1/110 0/11993S 0·20·5INC Brazil 6(C600M40F600)q393X (no data)
Charles U Prague 6(C500×2M40×2F600×2)q494P (no data)
17/3936
20/3883
(0·4%/y) (0·5%/y)
−0·3 8·20·97 (SE 0·34)
reduction2p > 0·1; NS
(b) subtotal with data §
33/6429
25/6278
(0·5%/y) (0·4%/y)
5·2 13·41·472 (SE 0·333)
increase2p > 0·1; NS
Total (a + b)
Adjusted
99% or 95% confidence intervals .0 0·5 1·0 1·5 2·0
CMF better CMF worse
Treatment effect 2p > 0·1; NS, adverseHeterogeneity between 17 trials: χ2
16 = 15·9; p > 0·1; NS
Difference betweentreatment effects in 2 subtotals: χ2
1 = 3·8; 2p = 0·05
Heterogeneity within subtotals: χ215 = 12·2; p > 0·1; NS
§ 3 trials with no data do not contribute to subtotals or to the overall total.* For balance, control patients in 3−way trials or trial strata count half or twice in subtotal(s)
and in final total of deaths/woman−years.Agents: C = cyclophosphamide; F = fluorouracil; M = methotrexate
(Not shown: antibiotic, hormonal, local or steroid therapies)Semicolon [;] indicates treatment sequence; ×2 means d1,8 iv; ×4 means d3−6 iv
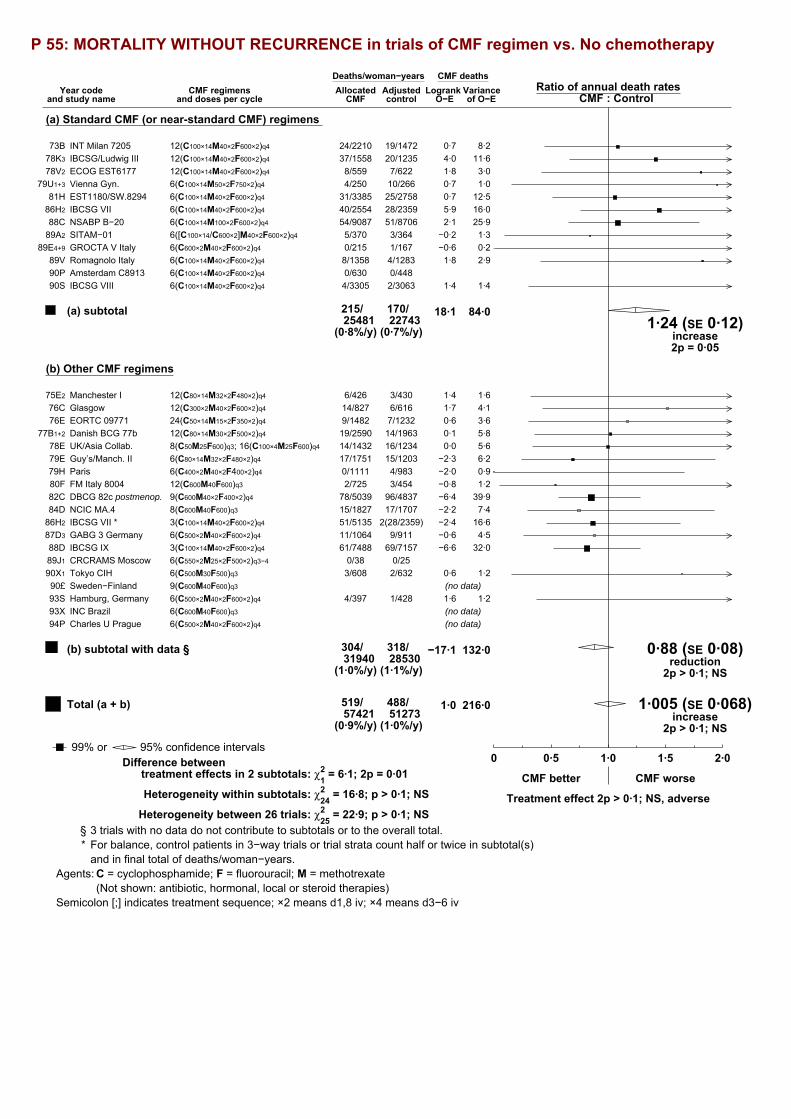
P 55: MORTALITY WITHOUT RECURRENCE in trials of CMF regimen vs. No chemotherapy
Year codeand study name
CMF regimensand doses per cycle
Deaths/woman−yearsAllocated
CMF controlRatio of annual death rates
CMF : ControlLogrank Variance
O−E of O−E
CMF deaths
(a) Standard CMF (or near-standard CMF) regimens
INT Milan 7205 12(C100×14M40×2F600×2)q4 24/2210 19/147273B 8·20·7IBCSG/Ludwig III 12(C100×14M40×2F600×2)q4 37/1558 20/123578K3 11·64·0ECOG EST6177 12(C100×14M40×2F600×2)q4 8/559 7/62278V2 3·01·8Vienna Gyn. 6(C100×14M50×2F750×2)q4 4/250 10/26679U1+3 1·00·7EST1180/SW.8294 6(C100×14M40×2F600×2)q4 31/3385 25/275881H 12·50·7IBCSG VII 6(C100×14M40×2F600×2)q4 40/2554 28/235986H2 16·05·9NSABP B−20 6(C100×14M100×2F600×2)q4 54/9087 51/870688C 25·92·1SITAM−01 6([C100×14/C600×2]M40×2F600×2)q4 5/370 3/36489A2 1·3−0·2GROCTA V Italy 6(C600×2M40×2F600×2)q4 0/215 1/16789E4+9 0·2−0·6Romagnolo Italy 6(C100×14M40×2F600×2)q4 8/1358 4/128389V 2·91·8Amsterdam C8913 6(C100×14M40×2F600×2)q4 0/630 0/44890PIBCSG VIII 6(C100×14M40×2F600×2)q4 4/3305 2/306390S 1·41·4
215/25481
170/22743
(0·8%/y) (0·7%/y)
18·1 84·01·24 (SE 0·12)
increase2p = 0·05
(a) subtotal
(b) Other CMF regimens
Manchester I 12(C80×14M32×2F480×2)q4 6/426 3/43075E2 1·61·4Glasgow 12(C300×2M40×2F600×2)q4 14/827 6/61676C 4·11·7EORTC 09771 24(C50×14M15×2F350×2)q4 9/1482 7/123276E 3·60·6Danish BCG 77b 12(C80×14M30×2F500×2)q4 19/2590 14/196377B1+2 5·80·1UK/Asia Collab. 8(C50M25F600)q3; 16(C100×4M25F600)q4 14/1432 16/123478E 5·60·0Guy’s/Manch. II 6(C80×14M32×2F480×2)q4 17/1751 15/120379E 6·2−2·3Paris 6(C400×2M40×2F400×2)q4 0/1111 4/98379H 0·9−2·0FM Italy 8004 12(C600M40F600)q3 2/725 3/45480F 1·2−0·8DBCG 82c postmenop. 9(C600M40×2F400×2)q4 78/5039 96/483782C 39·9−6·4NCIC MA.4 8(C600M40F600)q3 15/1827 17/170784D 7·4−2·2IBCSG VII * 3(C100×14M40×2F600×2)q4 51/5135 2(28/2359)86H2 16·6−2·4GABG 3 Germany 6(C500×2M40×2F600×2)q4 11/1064 9/91187D3 4·5−0·6IBCSG IX 3(C100×14M40×2F600×2)q4 61/7488 69/715788D 32·0−6·6CRCRAMS Moscow 6(C550×2M25×2F500×2)q3−4 0/38 0/2589J1
Tokyo CIH 6(C500M30F500)q3 3/608 2/63290X1 1·20·6Sweden−Finland 9(C600M40F600)q390£ (no data)
Hamburg, Germany 6(C500×2M40×2F600×2)q4 4/397 1/42893S 1·21·6INC Brazil 6(C600M40F600)q393X (no data)
Charles U Prague 6(C500×2M40×2F600×2)q494P (no data)
304/31940
318/28530
(1·0%/y) (1·1%/y)
−17·1 132·0 0·88 (SE 0·08)reduction
2p > 0·1; NS
(b) subtotal with data §
519/57421
488/51273
(0·9%/y) (1·0%/y)
1·0 216·0 1·005 (SE 0·068)increase
2p > 0·1; NS
Total (a + b)
Adjusted
99% or 95% confidence intervals .0 0·5 1·0 1·5 2·0
CMF better CMF worse
Treatment effect 2p > 0·1; NS, adverseHeterogeneity between 26 trials: χ2
25 = 22·9; p > 0·1; NS
Difference betweentreatment effects in 2 subtotals: χ2
1 = 6·1; 2p = 0·01
Heterogeneity within subtotals: χ224 = 16·8; p > 0·1; NS
§ 3 trials with no data do not contribute to subtotals or to the overall total.* For balance, control patients in 3−way trials or trial strata count half or twice in subtotal(s)
and in final total of deaths/woman−years.Agents: C = cyclophosphamide; F = fluorouracil; M = methotrexate
(Not shown: antibiotic, hormonal, local or steroid therapies)Semicolon [;] indicates treatment sequence; ×2 means d1,8 iv; ×4 means d3−6 iv

P 56: OVERALL MORTALITY in trials of CMF regimen vs. No chemotherapy
Year codeand study name
CMF regimensand doses per cycle
Deaths/WomenAllocated
CMF controlRatio of annual death rates
CMF : ControlLogrank Variance
O−E of O−E
CMF deaths
(a) Standard CMF (or near-standard CMF) regimens
INT Milan 7205 12(C100×14M40×2F600×2)q4 165/210 153/18173B 69·0−15·8IBCSG/Ludwig III 12(C100×14M40×2F600×2)q4 121/171 125/16478K3 50·9−6·1ECOG EST6177 12(C100×14M40×2F600×2)q4 66/87 73/9578V2 27·54·3Vienna Gyn. 6(C100×14M50×2F750×2)q4 20/30 21/2979U1+3 5·14·1EST1180/SW.8294 6(C100×14M40×2F600×2)q4 84/276 104/26581H 44·1−15·0IBCSG VII 6(C100×14M40×2F600×2)q4 160/312 174/31886H2 74·9−9·7NSABP B−20 6(C100×14M100×2F600×2)q4 120/789 162/78888C 68·7−20·2SITAM−01 6([C100×14/C600×2]M40×2F600×2)q4 31/63 19/5289A2 10·33·1GROCTA V Italy 6(C600×2M40×2F600×2)q4 15/40 19/3989E4+9 6·3−3·2Romagnolo Italy 6(C100×14M40×2F600×2)q4 30/138 39/14389V 16·4−4·5Amsterdam C8913 6(C100×14M40×2F600×2)q4 12/149 15/12290P 6·3−3·9IBCSG VIII 6(C100×14M40×2F600×2)q4 49/400 56/39290S 24·6−4·0
873/2665
960/2588
(32·8%) (37·1%)
−70·9 404·1 0·84 (SE 0·05)reduction
2p = 0·0004
(a) subtotal
(b) Other CMF regimens
Manchester I 12(C80×14M32×2F480×2)q4 41/55 33/5475E2 12·94·9Glasgow 12(C300×2M40×2F600×2)q4 78/112 77/10376C 27·6−9·1EORTC 09771 24(C50×14M15×2F350×2)q4 95/229 106/22376E 45·6−12·3Danish BCG 77b 12(C80×14M30×2F500×2)q4 122/201 140/19677B1+2 47·0−13·0UK/Asia Collab. 8(C50M25F600)q3; 16(C100×4M25F600)q4 112/247 110/24178E 41·56·6Guy’s/Manch. II 6(C80×14M32×2F480×2)q4 127/185 167/20779E 52·0−27·2Paris 6(C400×2M40×2F400×2)q4 20/172 23/16379H 9·5−0·8FM Italy 8004 12(C600M40F600)q3 16/49 27/4780F 9·5−6·8DBCG 82c postmenop. 9(C600M40×2F400×2)q4 536/708 553/73782C 232·3−1·6
NCIC MA.4 8(C600M40F600)q3 132/381 137/37784D 59·9−6·7IBCSG VII * 3(C100×14M40×2F600×2)q4 328/636 2(174/318)86H2 98·6−12·4GABG 3 Germany 6(C500×2M40×2F600×2)q4 36/278 35/24887D3 16·2−2·6IBCSG IX 3(C100×14M40×2F600×2)q4 146/853 179/86288D 78·8−19·7CRCRAMS Moscow 6(C550×2M25×2F500×2)q3−4 0/11 1/1089J1 0·2−0·4Tokyo CIH 6(C500M30F500)q3 13/144 9/14390X1 5·22·5Sweden−Finland 9(C600M40F600)q390£ (≈100 patients) (no data)
Hamburg, Germany 6(C500×2M40×2F600×2)q4 12/117 15/12593S 5·90·0INC Brazil 6(C600M40F600)q393X (45 patients) (no data)
Charles U Prague 6(C500×2M40×2F600×2)q494P (103 patients) (no data)
1814/4378
1960/4372
(41·4%) (44·8%)
−98·7 742·8 0·88 (SE 0·03)reduction
2p = 0·0003
(b) subtotal with data §
2687/7043
2920/6960
(38·2%) (42·0%)
−169·7 1146·9 0·862 (SE 0·027)reduction
2p < 0·00001
Total (a + b)
Adjusted
99% or 95% confidence intervals .0 0·5 1·0 1·5 2·0
CMF better CMF worse
Treatment effect 2p < 0·00001Heterogeneity between 28 trials: χ2
27 = 44·1; p = 0·02
Difference betweentreatment effects in 2 subtotals: χ2
1 = 0·5; 2p > 0·1; NS
Heterogeneity within subtotals: χ226 = 43·6; p = 0·02
§ 3 trials with no data do not contribute to subtotals or to the overall total.* For balance, control patients in 3−way trials or trial strata count half or twice in subtotal(s)
and in final total of deaths/women.Agents: C = cyclophosphamide; F = fluorouracil; M = methotrexate
(Not shown: antibiotic, hormonal, local or steroid therapies)Semicolon [;] indicates treatment sequence; ×2 means d1,8 iv; ×4 means d3−6 iv

P 57: EARLY RECURRENCE (first 5 years) in trials of polychemotherapy vs. No chemotherapy
Year codeand study name
Months &treatment
Events/woman−yearsAllocated
polychemo. controlRatio of annual event ratesPolychemo. : Control
Logrank VarianceO−E of O−E
Polychemo. events
(a) Anthracycline regimens
DFCI 74−063 * 7/3·5 AC 1/13 2(1/9)74D1West Midlands UK 6 CMFVAFol 183/868 198/67676H1 69·2−26·1Cologne ?? AC 76L1 (no data)N Sweden BCG † 8 AC 49/319 56/27480B3+4 20·0−5·4SE Sweden BCG B 8 AC 5/77 8/6880C2 2·3−2·0Helsinki 8 FAC 18/171 29/14980S1 6·4−6·5Southampton UK † 6 VAP/VAC 17/187 19/15680Z 6·3−1·5MD Anderson8227 * 4 FACVPr 20/371 2(9/154)82F 5·4−0·8GROCTA I Italy † 6 CMF; 4 E 53/727 64/65883B 25·9−6·3NSABP B−16 * †24 MelF±A / 4
AC251/3620 2(156/1647)84C 75·8−30·4
FASG GFEA 02 † 6 FEC 128/1526 137/143686P2 55·2−9·2FASG GFEA 03 6 FEC 45/658 49/60986P3 21·1−5·6Bari Italy 6 FEC 20/546 33/52089@1 11·7−6·6SWOG 8814 * † 6 FAC 231/5196 3(108/1595)89B1 55·7−26·2IGR Paris † 6 FAC/FEC 102/2464 146/231989D 56·0−21·4FASG GFEA 07 † 6 FEC 23/758 35/69590C6 13·9−7·1Amsterdam C9203 † 4 EC 9/170 9/16992D 3·9−0·6IBCSG 11−93 † 4 AC 12/407 12/39093H 5·60·8IBCSG 12−93 * † 4 AC 24/829 2(28/462)93M1+2 11·4−7·8JCOG 9401 † 6 AC 12/223 26/20094F 7·7−8·7Austrian BCSG IX † 4 FEC 5/212 3/21796E 1·81·4
1208/19342
1536/17865
(6·2%/y) (8·6%/y)
−170·0 455·2 0·69 (SE 0·04)reduction
2p < 0·00001
(a) subtotal with data §
(b) Low-dose anthracycline regimens
Austrian BCSG 4 † 1 AV; 1 CMF 33/513 34/52384Q4+5 14·3−0·3
33/513
34/523
(6·4%/y) (6·5%/y)
−0·3 14·3 0·98 (SE 0·26)reduction
2p > 0·1; NS
(b) subtotal
(c) CMF regimens
INT Milan 7205 12 CMF 95/787 98/55573B 38·5−18·7Manchester I 12 CMF 23/195 24/17375E2 8·3−1·5Glasgow 12 CMF 53/384 62/27976C 19·4−12·9EORTC 09771 24 CMF 92/869 109/76576E 43·0−14·4Danish BCG 77b 12 CMF 76/754 100/64977B1+2 31·7−17·8UK/Asia Collab. †24 CMF 88/674 108/60278E 33·9−9·4IBCSG/Ludwig III †12 CMF 59/608 88/48878K3 29·3−17·6ECOG EST6177 12 CMFPr 52/264 57/26878V2 20·3−2·7Guy’s/Manch. II 6 CMF 77/672 125/57779E 33·4−25·5Paris 6 CMF 35/716 46/65979H 18·1−7·8Vienna Gyn. † 6 CMF 14/109 9/10879U1+3 3·52·1FM Italy 8004 12 CMF 9/218 23/15580F 6·9−8·7EST1180/SW.8294 6 CMFPr 53/1153 89/100981H 32·7−21·6DBCG 82c postmenop.† 9 CMF 350/2476 392/241482C 145·2−31·0NCIC MA.4 † 8 CMF 125/1427 143/135984D 58·8−12·2IBCSG VII * †3/6 CMF 320/3725 3(126/1177)86H2 70·1−22·0GABG 3 Germany † 6 CMF 45/943 51/82187D3 21·6−5·8NSABP B−20 † 6 CMF 48/3756 95/368188C 34·7−24·6IBCSG IX † 3 CMF 90/3903 125/379988D 51·7−18·9SITAM−01 † 6 CMF 26/208 19/18589A2 9·11·6GROCTA V Italy † 6 CMF 14/152 20/12489E4+9 6·2−2·9CRCRAMS Moscow 6 CMF 2/37 4/2489J1 1·4−1·1Romagnolo Italy 6 CMF 23/621 38/60389V 14·3−7·4Amsterdam C8913 6 CMF 20/542 27/39890P 10·6−7·0IBCSG VIII 6 CMF 49/1834 82/172190S 30·1−18·0Tokyo CIH 6 CMF 16/545 14/55290X1 6·91·2Sweden−Finland 9 CMF 90£ (no data)Hamburg, Germany 6 CMF 15/377 21/40693S 8·0−2·4INC Brazil 6 CMF 93X (no data)Charles U Prague † 6 CMF 94P (no data)
1869/27949
2347/25905
(6·7%/y) (9·1%/y)
−307·0 787·4 0·68 (SE 0·03)reduction
2p < 0·00001
(c) subtotal with data §
(d) Other regimens
Mayo 70−56−32 12 CFPr 10/63 6/4273C1 1·60·2UK MCCG 003 6 CVF/CVM 85/420 79/37074E 31·3−2·4Northwick Park 12 MelV 22/258 28/29175G 9·6−1·5West Midlands UK 6 ChlMF 79/1215 86/118976H2 37·8−3·1HD 1 W. Germany 24 ChlF 27/212 38/18476K 13·0−7·0King’s CRC M/M 24 MelM 129/612 135/57976P 51·9−6·3Oxford 24 MelMF 48/378 56/31977E 20·6−5·7Vienna 36 CMFV 30/302 32/28777G1 10·0−6·0Montpellier France 12 CVF 77W2 (no data)NCCTG−773051 10 CFPr 40/301 59/30578M3 17·3−6·8SWOG 7827 A †12 CMFVPr 114/1272 118/121579B1 49·9−4·5Case Western B †12 CMFVPr 18/248 25/27779C 8·5−2·5SWOG 7985 ?? CMFV 80L (no data)NSABP B−13 11 MFFol 77/1615 119/148881E 44·7−23·5PetrovStPetersb’g † 4 CMF; 2
TtMF33/856 44/82885J1+3 17·6−5·5
UK Multicentre † 6 CVF/CVM 11/328 13/29486D1 5·7−2·1NSABP B−20 †?? MFFol 52/3769 95/368188C 35·8−22·0HE1092 Greece † 6 CMzF 34/489 26/54992B2 13·65·4NCRI ABC †various 242/3424 279/342192G1245 110·7−23·3
1051/15762
1238/15319
(6·7%/y) (8·1%/y)
−116·5 479·8 0·78 (SE 0·04)reduction
2p < 0·00001
(d) subtotal with data §
4161/63566
5155/59612
(6·5%/y) (8·6%/y)
−593·8 1736·7 0·710 (SE 0·020)reduction
2p < 0·00001
Total (a + b + c + d)
Adjusted
99% or 95% confidence intervals .0 0·5 1·0 1·5 2·0
Polychemo. better Polychemo. worse
Treatment effect 2p < 0·00001Heterogeneity between 64 trials: χ263 = 88·1; p = 0·02
Heterogeneity between 4 subtotals: χ23 = 8·5; p = 0·04
Heterogeneity within subtotals: χ260 = 79·6; p = 0·05
§ 6 trials with no data do not contribute to subtotals or to the overall total.* For balance, control patients in 3−way trials or trial strata count half or twice in subtotal(s)
and in final total of events/woman−years.† Chemotherapy plus tamoxifen versus same tamoxifen alone

P 58: RECURRENCE in trials of polychemotherapy vs. No chemotherapy
Year codeand study name
Months &treatment
Events/woman−yearsAllocated
polychemo. controlRatio of annual event ratesPolychemo. : Control
Logrank VarianceO−E of O−E
Polychemo. events
(a) Anthracycline regimens
DFCI 74−063 * 7/3·5 AC 1/47 2(2/17)74D1West Midlands UK 6 CMFVAFol 219/1605 222/118976H1 82·2−25·0Cologne ?? AC 76L1 (no data)N Sweden BCG † 8 AC 65/721 70/61680B3+4 26·3−7·3SE Sweden BCG B 8 AC 7/273 14/18780C2 3·9−3·5Helsinki 8 FAC 24/308 32/24980S1 7·3−6·2Southampton UK † 6 VAP/VAC 29/452 29/39080Z 9·90·6MD Anderson8227 * 4 FACVPr 24/596 2(11/259)82F 6·6−0·8GROCTA I Italy † 6 CMF; 4 E 109/1668 108/152783B 47·8−1·5NSABP B−16 * †24 MelF±A / 4
AC417/8120 2(249/3633)84C 125·9−44·0
FASG GFEA 02 † 6 FEC 191/2781 194/262286P2 80·6−8·5FASG GFEA 03 6 FEC 55/1185 60/107886P3 26·0−6·8Bari Italy 6 FEC 28/1058 39/109189@1 14·8−6·1SWOG 8814 * † 6 FAC 409/103083(184/3065)89B1 96·8−46·8IGR Paris † 6 FAC/FEC 170/4401 219/411689D 87·3−26·6FASG GFEA 07 † 6 FEC 30/1134 49/101090C6 18·8−10·9Amsterdam C9203 † 4 EC 9/177 9/17492D 3·9−0·6IBCSG 11−93 † 4 AC 20/628 17/60893H 8·41·8IBCSG 12−93 * † 4 AC 44/1353 2(35/686)93M1+2 16·6−6·9JCOG 9401 † 6 AC 13/236 26/21194F 8·0−8·2Austrian BCSG IX † 4 FEC 5/212 3/21796E 1·81·4
1869/37263
2237/33670
(5·0%/y) (6·6%/y)
−205·9 672·8 0·74 (SE 0·03)reduction
2p < 0·00001
(a) subtotal with data §
(b) Low-dose anthracycline regimens
Austrian BCSG 4 † 1 AV; 1 CMF 45/764 42/76184Q4+5 18·40·1
45/764
42/761
(5·9%/y) (5·5%/y)
0·1 18·4 1·01 (SE 0·23)increase
2p > 0·1; NS
(b) subtotal
(c) CMF regimens
INT Milan 7205 12 CMF 153/2210 140/147273B 60·5−20·9Manchester I 12 CMF 35/426 34/43075E2 12·3−0·8Glasgow 12 CMF 67/828 73/61876C 23·9−13·2EORTC 09771 24 CMF 134/1482 132/123276E 57·5−9·8Danish BCG 77b 12 CMF 108/2590 133/196477B1+2 41·9−19·3UK/Asia Collab. †24 CMF 118/1310 132/117678E 42·2−7·7IBCSG/Ludwig III †12 CMF 91/1558 118/123678K3 42·1−18·0ECOG EST6177 12 CMFPr 63/559 70/62278V2 25·1−1·9Guy’s/Manch. II 6 CMF 118/1751 160/120979E 45·8−33·2Paris 6 CMF 49/1111 63/98379H 24·8−10·4Vienna Gyn. † 6 CMF 16/251 12/26779U1+3 4·50·8FM Italy 8004 12 CMF 20/725 30/45480F 10·3−8·2EST1180/SW.8294 6 CMFPr 76/3385 108/275881H 42·3−23·2DBCG 82c postmenop.† 9 CMF 490/5039 498/483982C 198·6−19·0
NCIC MA.4 † 8 CMF 164/1828 168/170784D 72·9−7·4IBCSG VII * †3/6 CMF 487/7696 3(175/2360)86H2 105·2−22·9GABG 3 Germany † 6 CMF 56/1064 59/91187D3 25·9−5·3NSABP B−20 † 6 CMF 124/9087 198/870688C 78·5−41·0IBCSG IX † 3 CMF 147/7488 178/715788D 78·5−18·4SITAM−01 † 6 CMF 34/372 24/36489A2 11·63·2GROCTA V Italy † 6 CMF 19/215 20/16889E4+9 6·9−1·9CRCRAMS Moscow 6 CMF 2/38 4/2589J1 1·4−1·1Romagnolo Italy 6 CMF 40/1358 54/128389V 22·2−7·6Amsterdam C8913 6 CMF 22/630 28/44890P 11·2−6·9IBCSG VIII 6 CMF 82/3305 111/306390S 44·4−17·3Tokyo CIH 6 CMF 20/608 17/63290X1 8·02·0Sweden−Finland 9 CMF 90£ (no data)Hamburg, Germany 6 CMF 15/397 22/42893S 8·1−2·5INC Brazil 6 CMF 93X (no data)Charles U Prague † 6 CMF 94P (no data)
2750/57311
3111/51232
(4·8%/y) (6·1%/y)
−311·9 1106·6 0·75 (SE 0·03)reduction
2p < 0·00001
(c) subtotal with data §
(d) Other regimens
Mayo 70−56−32 12 CFPr 15/162 8/13573C1 2·90·5UK MCCG 003 6 CVF/CVM 95/710 97/56874E 37·3−7·9Northwick Park 12 MelV 25/549 35/60175G 11·7−3·0West Midlands UK 6 ChlMF 107/2978 117/287976H2 51·8−4·0HD 1 W. Germany 24 ChlF 39/452 45/37376K 17·2−5·7King’s CRC M/M 24 MelM 149/747 164/74776P 61·0−7·6Oxford 24 MelMF 63/776 66/60177E 25·8−5·6Vienna 36 CMFV 64/705 66/63977G1 20·4−6·7Montpellier France 12 CVF 77W2 (no data)NCCTG−773051 10 CFPr 61/633 79/72278M3 24·9−4·0SWOG 7827 A †12 CMFVPr 167/2973 175/270579B1 74·6−8·7Case Western B †12 CMFVPr 24/426 32/46079C 11·2−3·3SWOG 7985 ?? CMFV 80L (no data)NSABP B−13 11 MFFol 113/4733 169/410681E 65·8−33·7PetrovStPetersb’g † 4 CMF; 2
TtMF54/1838 62/170085J1+3 26·7−3·8
UK Multicentre † 6 CVF/CVM 13/352 14/32986D1 6·4−1·5NSABP B−20 †?? MFFol 164/9059 198/870688C 88·0−20·7HE1092 Greece † 6 CMzF 38/538 28/63192B2 15·16·8NCRI ABC †various 282/4438 318/439992G1245 127·4−24·6
1473/32069
1673/30301
(4·6%/y) (5·5%/y)
−133·5 668·0 0·82 (SE 0·04)reduction
2p < 0·00001
(d) subtotal with data §
6137/127407
7063/115964
(4·8%/y) (6·1%/y)
−651·2 2465·8 0·768 (SE 0·018)reduction
2p < 0·00001
Total (a + b + c + d)
Adjusted
99% or 95% confidence intervals .0 0·5 1·0 1·5 2·0
Polychemo. better Polychemo. worse
Treatment effect 2p < 0·00001Heterogeneity between 64 trials: χ263 = 93·2; p = 0·008
Heterogeneity between 4 subtotals: χ23 = 5·6; p > 0·1; NS
Heterogeneity within subtotals: χ260 = 87·5; p = 0·01
§ 6 trials with no data do not contribute to subtotals or to the overall total.* For balance, control patients in 3−way trials or trial strata count half or twice in subtotal(s)
and in final total of events/woman−years.† Chemotherapy plus tamoxifen versus same tamoxifen alone
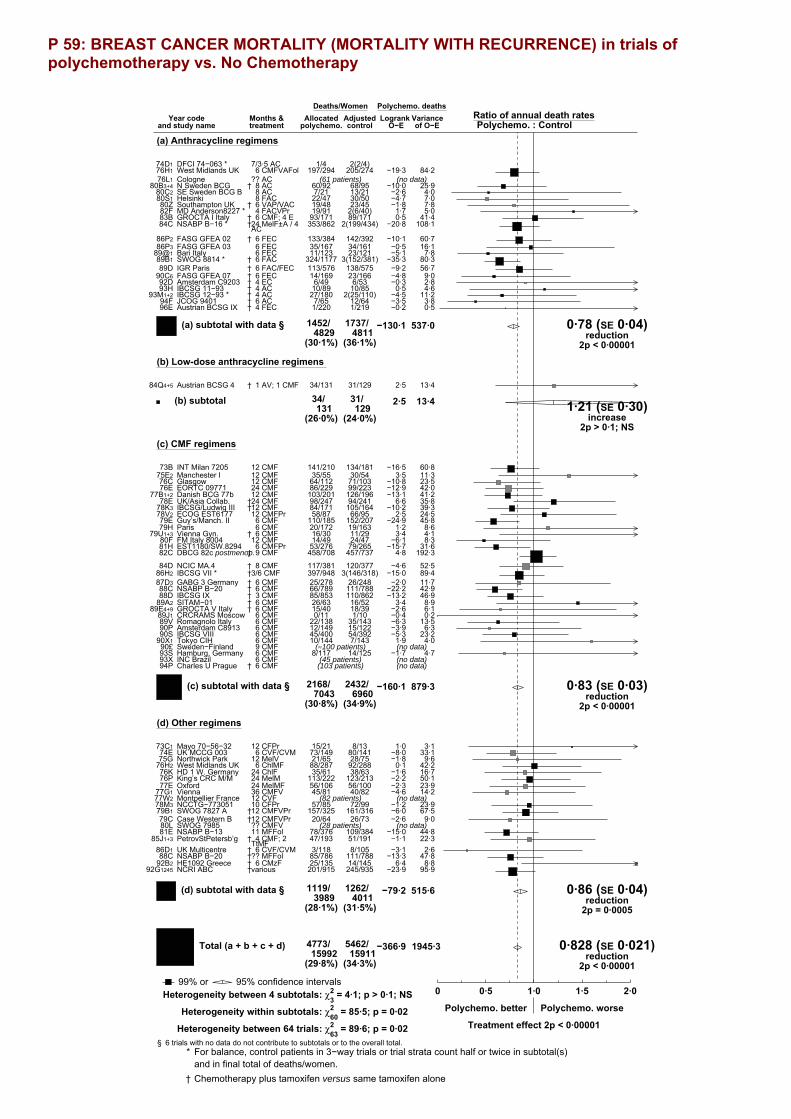
P 59: BREAST CANCER MORTALITY (MORTALITY WITH RECURRENCE) in trials of polychemotherapy vs. No Chemotherapy
Year codeand study name
Months &treatment
Deaths/WomenAllocated
polychemo. controlRatio of annual death ratesPolychemo. : Control
Logrank VarianceO−E of O−E
Polychemo. deaths
(a) Anthracycline regimens
DFCI 74−063 * 7/3·5 AC 1/4 2(2/4)74D1West Midlands UK 6 CMFVAFol 197/294 205/27476H1 84·2−19·3Cologne ?? AC 76L1 (61 patients) (no data)N Sweden BCG † 8 AC 60/92 68/9580B3+4 25·9−10·0SE Sweden BCG B 8 AC 7/21 13/2180C2 4·0−2·6Helsinki 8 FAC 22/47 30/5080S1 7·0−4·7Southampton UK † 6 VAP/VAC 19/48 23/4580Z 7·8−1·8MD Anderson8227 * 4 FACVPr 19/91 2(6/40)82F 5·01·7GROCTA I Italy † 6 CMF; 4 E 93/171 89/17183B 41·40·5NSABP B−16 * †24 MelF±A / 4
AC353/862 2(199/434)84C 108·1−20·8
FASG GFEA 02 † 6 FEC 133/384 142/39286P2 60·7−10·1FASG GFEA 03 6 FEC 35/167 34/16186P3 16·1−0·5Bari Italy 6 FEC 11/123 23/12189@1 7·8−5·1SWOG 8814 * † 6 FAC 324/1177 3(152/381)89B1 80·3−35·3IGR Paris † 6 FAC/FEC 113/576 138/57589D 56·7−9·2FASG GFEA 07 † 6 FEC 14/169 23/16690C6 9·0−4·8Amsterdam C9203 † 4 EC 6/49 6/5392D 2·8−0·3IBCSG 11−93 † 4 AC 10/89 10/8593H 4·60·5IBCSG 12−93 * † 4 AC 27/180 2(25/110)93M1+2 11·2−4·5JCOG 9401 † 6 AC 7/65 12/6494F 3·8−3·5Austrian BCSG IX † 4 FEC 1/220 1/21996E 0·5−0·2
1452/4829
1737/4811
(30·1%) (36·1%)
−130·1 537·0 0·78 (SE 0·04)reduction
2p < 0·00001
(a) subtotal with data §
(b) Low-dose anthracycline regimens
Austrian BCSG 4 † 1 AV; 1 CMF 34/131 31/12984Q4+5 13·42·5
34/131
31/129
(26·0%) (24·0%)
2·5 13·4 1·21 (SE 0·30)increase
2p > 0·1; NS
(b) subtotal
(c) CMF regimens
INT Milan 7205 12 CMF 141/210 134/18173B 60·8−16·5Manchester I 12 CMF 35/55 30/5475E2 11·33·5Glasgow 12 CMF 64/112 71/10376C 23·5−10·8EORTC 09771 24 CMF 86/229 99/22376E 42·0−12·9Danish BCG 77b 12 CMF 103/201 126/19677B1+2 41·2−13·1UK/Asia Collab. †24 CMF 98/247 94/24178E 35·86·6IBCSG/Ludwig III †12 CMF 84/171 105/16478K3 39·3−10·2ECOG EST6177 12 CMFPr 58/87 66/9578V2 24·52·5Guy’s/Manch. II 6 CMF 110/185 152/20779E 45·8−24·9Paris 6 CMF 20/172 19/16379H 8·61·2Vienna Gyn. † 6 CMF 16/30 11/2979U1+3 4·13·4FM Italy 8004 12 CMF 14/49 24/4780F 8·3−6·1EST1180/SW.8294 6 CMFPr 53/276 79/26581H 31·6−15·7DBCG 82c postmenop.† 9 CMF 458/708 457/73782C 192·34·8
NCIC MA.4 † 8 CMF 117/381 120/37784D 52·5−4·6IBCSG VII * †3/6 CMF 397/948 3(146/318)86H2 89·4−15·0GABG 3 Germany † 6 CMF 25/278 26/24887D3 11·7−2·0NSABP B−20 † 6 CMF 66/789 111/78888C 42·9−22·2IBCSG IX † 3 CMF 85/853 110/86288D 46·9−13·2SITAM−01 † 6 CMF 26/63 16/5289A2 8·93·4GROCTA V Italy † 6 CMF 15/40 18/3989E4+9 6·1−2·6CRCRAMS Moscow 6 CMF 0/11 1/1089J1 0·2−0·4Romagnolo Italy 6 CMF 22/138 35/14389V 13·5−6·3Amsterdam C8913 6 CMF 12/149 15/12290P 6·3−3·9IBCSG VIII 6 CMF 45/400 54/39290S 23·2−5·3Tokyo CIH 6 CMF 10/144 7/14390X1 4·01·9Sweden−Finland 9 CMF 90£ (≈100 patients) (no data)Hamburg, Germany 6 CMF 8/117 14/12593S 4·7−1·7INC Brazil 6 CMF 93X (45 patients) (no data)Charles U Prague † 6 CMF 94P (103 patients) (no data)
2168/7043
2432/6960
(30·8%) (34·9%)
−160·1 879·3 0·83 (SE 0·03)reduction
2p < 0·00001
(c) subtotal with data §
(d) Other regimens
Mayo 70−56−32 12 CFPr 15/21 8/1373C1 3·11·0UK MCCG 003 6 CVF/CVM 73/149 80/14174E 33·1−8·0Northwick Park 12 MelV 21/65 28/7575G 9·6−1·8West Midlands UK 6 ChlMF 88/287 92/28876H2 42·20·1HD 1 W. Germany 24 ChlF 35/61 38/6376K 16·7−1·6King’s CRC M/M 24 MelM 113/222 123/21376P 50·1−2·2Oxford 24 MelMF 56/106 56/10077E 23·9−2·3Vienna 36 CMFV 45/81 40/8277G1 14·2−4·6Montpellier France 12 CVF 77W2 (82 patients) (no data)NCCTG−773051 10 CFPr 57/85 72/9978M3 23·9−1·2SWOG 7827 A †12 CMFVPr 157/325 161/31679B1 67·5−6·0Case Western B †12 CMFVPr 20/64 26/7379C 9·0−2·6SWOG 7985 ?? CMFV 80L (28 patients) (no data)NSABP B−13 11 MFFol 78/376 109/38481E 44·8−15·0PetrovStPetersb’g † 4 CMF; 2
TtMF47/193 51/19185J1+3 22·3−1·1
UK Multicentre † 6 CVF/CVM 3/118 8/10586D1 2·6−3·1NSABP B−20 †?? MFFol 85/786 111/78888C 47·8−13·3HE1092 Greece † 6 CMzF 25/135 14/14592B2 8·86·4NCRI ABC †various 201/915 245/93592G1245 95·9−23·9
1119/3989
1262/4011
(28·1%) (31·5%)
−79·2 515·6 0·86 (SE 0·04)reduction
2p = 0·0005
(d) subtotal with data §
4773/15992
5462/15911
(29·8%) (34·3%)
−366·9 1945·3 0·828 (SE 0·021)reduction
2p < 0·00001
Total (a + b + c + d)
Adjusted
99% or 95% confidence intervals .0 0·5 1·0 1·5 2·0
Polychemo. better Polychemo. worse
Treatment effect 2p < 0·00001Heterogeneity between 64 trials: χ263 = 89·6; p = 0·02
Heterogeneity between 4 subtotals: χ23 = 4·1; p > 0·1; NS
Heterogeneity within subtotals: χ260 = 85·5; p = 0·02
§ 6 trials with no data do not contribute to subtotals or to the overall total.* For balance, control patients in 3−way trials or trial strata count half or twice in subtotal(s)
and in final total of deaths/women.† Chemotherapy plus tamoxifen versus same tamoxifen alone

P 60: MORTALITY WITHOUT RECURRENCE IN FIRST YEAR in trials of polychemotherapy vs. No chemotherapy
Year codeand study name
Months &treatment
Deaths/woman−yearsAllocated
polychemo. controlRatio of annual death ratesPolychemo. : Control
Logrank VarianceO−E of O−E
Polychemo. deaths
(a) Anthracycline regimens
DFCI 74−063 7/3·5 AC 74D1 (no data)West Midlands UK 6 CMFVAFol 1/270 0/23676H1 0·20·5Cologne ?? AC 76L1 (no data)N Sweden BCG † 8 AC 0/81 3/7980B3+4 0·7−1·6SE Sweden BCG B 8 AC 1/14 0/1380C2 0·20·5Helsinki 8 FAC 0/31 0/3180S1Southampton UK † 6 VAP/VAC 1/34 1/3380Z 0·20·5MD Anderson8227 * 4 FACVPr 0/82 2(0/28)82FGROCTA I Italy † 6 CMF; 4 E 0/163 0/15583BNSABP B−16 * †24 MelF±A / 4
AC3/829 2(2/402)84C 1·1−0·4
FASG GFEA 02 † 6 FEC 1/343 2/34286P2 0·7−0·8FASG GFEA 03 6 FEC 0/156 0/14786P3Bari Italy 6 FEC 0/112 0/11089@1SWOG 8814 * † 6 FAC 11/1154 3(0/363)89B1 1·92·5IGR Paris † 6 FAC/FEC 4/536 3/52989D 1·70·7FASG GFEA 07 † 6 FEC 0/160 0/15690C6Amsterdam C9203 † 4 EC 1/35 1/4092D 0·50·1IBCSG 11−93 † 4 AC 0/82 0/7993HIBCSG 12−93 * † 4 AC 0/160 2(0/93)93M1+2JCOG 9401 † 6 AC 0/57 0/5894FAustrian BCSG IX † 4 FEC 1/80 0/8696E 0·20·6
24/4379
14/4229
(0·5%/y) (0·3%/y)
2·6 7·6 1·40 (SE 0·43)increase
2p > 0·1; NS
(a) subtotal with data §
(b) Low-dose anthracycline regimens
Austrian BCSG 4 † 1 AV; 1 CMF 4/114 2/11584Q4+5 1·20·5
4/114
2/115
(3·5%/y) (1·7%/y)
0·5 1·2 1·53 (SE 1·13)increase
2p > 0·1; NS
(b) subtotal
(c) CMF regimens
INT Milan 7205 12 CMF 1/198 1/16073B 0·5−0·1Manchester I 12 CMF 1/34 0/3575E2 0·20·6Glasgow 12 CMF 1/90 0/7876C 0·20·5EORTC 09771 24 CMF 0/212 0/20576EDanish BCG 77b 12 CMF 0/148 0/15377B1+2UK/Asia Collab. †24 CMF 1/180 3/16978E 0·7−0·8IBCSG/Ludwig III †12 CMF 6/148 1/13878K3 1·72·5ECOG EST6177 12 CMFPr 1/78 0/7778V2 0·20·5Guy’s/Manch. II 6 CMF 0/138 0/15179EParis 6 CMF 0/160 1/15479H 0·2−0·6Vienna Gyn. † 6 CMF 0/18 0/1979U1+3FM Italy 8004 12 CMF 0/44 0/4280FEST1180/SW.8294 6 CMFPr 3/258 1/24881H 1·00·9DBCG 82c postmenop.† 9 CMF 4/651 6/65682C 2·5−0·6NCIC MA.4 † 8 CMF 1/356 0/34984D 0·20·4IBCSG VII * †3/6 CMF 5/898 3(2/289)86H2 1·4−0·1GABG 3 Germany † 6 CMF 0/250 3/22087D3 0·7−1·3NSABP B−20 † 6 CMF 1/774 0/77788C 0·20·5IBCSG IX † 3 CMF 6/832 3/83688D 2·21·6SITAM−01 † 6 CMF 0/45 0/3989A2GROCTA V Italy † 6 CMF 0/32 0/2889E4+9CRCRAMS Moscow 6 CMF 0/7 0/689J1Romagnolo Italy 6 CMF 1/132 0/13789V 0·20·5Amsterdam C8913 6 CMF 0/141 0/11290PIBCSG VIII 6 CMF 0/377 0/37190STokyo CIH 6 CMF 0/132 0/13290X1Sweden−Finland 9 CMF 90£ (no data)Hamburg, Germany 6 CMF 1/110 0/11993S 0·20·5INC Brazil 6 CMF 93X (no data)Charles U Prague † 6 CMF 94P (no data)
33/6443
25/6278
(0·5%/y) (0·4%/y)
5·0 12·6 1·48 (SE 0·35)increase
2p > 0·1; NS
(c) subtotal with data §
(d) Other regimens
Mayo 70−56−32 12 CFPr 0/11 0/773C1UK MCCG 003 6 CVF/CVM 1/124 0/12074E 0·20·5Northwick Park 12 MelV 0/56 0/6475GWest Midlands UK 6 ChlMF 0/274 0/27576H2HD 1 W. Germany 24 ChlF 0/56 0/5676KKing’s CRC M/M 24 MelM 2/197 0/18976P 0·51·0Oxford 24 MelMF 0/98 0/8877EVienna 36 CMFV 0/56 0/5977G1Montpellier France 12 CVF 77W2 (no data)NCCTG−773051 10 CFPr 1/71 1/8178M3 0·4−0·2SWOG 7827 A †12 CMFVPr 7/298 1/29279B1 2·02·8Case Western B †12 CMFVPr 2/48 0/5679C 0·51·0SWOG 7985 ?? CMFV 80L (no data)NSABP B−13 11 MFFol 0/362 1/35981E 0·2−0·5PetrovStPetersb’g † 4 CMF; 2
TtMF0/172 2/16985J1+3 0·5−1·0
UK Multicentre † 6 CVF/CVM 0/102 0/9086D1NSABP B−20 †?? MFFol 1/774 0/77788C 0·20·5HE1092 Greece † 6 CMzF 0/128 1/13492B2 0·2−0·5NCRI ABC †various 8/799 4/81092G1245 2·82·4
22/3626
10/3626
(0·6%/y) (0·3%/y)
6·0 7·7 2·19 (SE 0·55)increase2p = 0·03
(d) subtotal with data §
83/14562
51/14248
(0·6%/y) (0·4%/y)
14·1 29·1 1·623 (SE 0·239)increase
2p = 0·009
Total (a + b + c + d)
Adjusted
99% or 95% confidence intervals .0 0·5 1·0 1·5 2·0
Polychemo. better Polychemo. worse
Treatment effect 2p = 0·009, adverseHeterogeneity between 37 trials: χ236 = 39·1; p > 0·1; NS
Heterogeneity between 4 subtotals: χ23 = 1·0; p > 0·1; NS
Heterogeneity within subtotals: χ233 = 38·2; p > 0·1; NS
§ 7 trials with no data do not contribute to subtotals or to the overall total.* For balance, control patients in 3−way trials or trial strata count half or twice in subtotal(s)
and in final total of deaths/woman−years.† Chemotherapy plus tamoxifen versus same tamoxifen alone

P 61: MORTALITY WITHOUT RECURRENCE in trials of polychemotherapy vs. No chemotherapy
Year codeand study name
Months &treatment
Deaths/woman−yearsAllocated
polychemo. controlRatio of annual death ratesPolychemo. : Control
Logrank VarianceO−E of O−E
Polychemo. deaths
(a) Anthracycline regimens
DFCI 74−063 * 7/3·5 AC 2/46 2(1/16)74D1West Midlands UK 6 CMFVAFol 6/2324 4/169176H1 2·40·3Cologne ?? AC 76L1 (no data)N Sweden BCG † 8 AC 14/721 11/61680B3+4 5·61·3SE Sweden BCG B 8 AC 7/272 3/18780C2 1·21·2Helsinki 8 FAC 2/308 6/24980S1 0·4−0·2Southampton UK † 6 VAP/VAC 5/452 2/39180Z 1·41·9MD Anderson8227 * 4 FACVPr 2/596 2(2/259)82F 0·60·0GROCTA I Italy † 6 CMF; 4 E 1/1668 0/152683B 0·20·5NSABP B−16 * †24 MelF±A / 4
AC115/8120 2(51/3632)84C 32·1−0·1
FASG GFEA 02 † 6 FEC 13/2780 20/261986P2 7·2−3·8FASG GFEA 03 6 FEC 9/1185 6/107886P3 3·71·6Bari Italy 6 FEC 5/1058 6/109089@1 2·01·3SWOG 8814 * † 6 FAC 162/10308 3(33/3065)89B1 33·311·9IGR Paris † 6 FAC/FEC 25/4401 21/411689D 11·22·1FASG GFEA 07 † 6 FEC 5/1134 3/101090C6 1·80·4Amsterdam C9203 † 4 EC 2/177 2/17492D 0·90·2IBCSG 11−93 † 4 AC 0/628 1/60893H 0·2−0·4IBCSG 12−93 * † 4 AC 8/1353 2(1/684)93M1+2 1·72·4JCOG 9401 † 6 AC 1/235 2/21094F 0·50·1Austrian BCSG IX † 4 FEC 1/212 1/21796E 0·30·5
385/37978
297/34159
(1·0%/y) (0·9%/y)
21·0 107·0 1·22 (SE 0·11)increase2p = 0·04
(a) subtotal with data §
(b) Low−dose anthracycline regimens
Austrian BCSG 4 † 1 AV; 1 CMF 20/764 16/76184Q4+5 7·51·5
20/764
16/761
(2·6%/y) (2·1%/y)
1·5 7·5 1·22 (SE 0·41)increase
2p > 0·1; NS
(b) subtotal
(c) CMF regimens
INT Milan 7205 12 CMF 24/2210 19/147273B 8·20·7Manchester I 12 CMF 6/426 3/43075E2 1·61·4Glasgow 12 CMF 14/827 6/61676C 4·11·7EORTC 09771 24 CMF 9/1482 7/123276E 3·60·6Danish BCG 77b 12 CMF 19/2590 14/196377B1+2 5·80·1UK/Asia Collab. †24 CMF 14/1432 16/123478E 5·60·0IBCSG/Ludwig III †12 CMF 37/1558 20/123578K3 11·64·0ECOG EST6177 12 CMFPr 8/559 7/62278V2 3·01·8Guy’s/Manch. II 6 CMF 17/1751 15/120379E 6·2−2·3Paris 6 CMF 0/1111 4/98379H 0·9−2·0Vienna Gyn. † 6 CMF 4/250 10/26679U1+3 1·00·7FM Italy 8004 12 CMF 2/725 3/45480F 1·2−0·8EST1180/SW.8294 6 CMFPr 31/3385 25/275881H 12·50·7DBCG 82c postmenop.† 9 CMF 78/5039 96/483782C 39·9−6·4NCIC MA.4 † 8 CMF 15/1827 17/170784D 7·4−2·2IBCSG VII * †3/6 CMF 91/7696 3(28/2359)86H2 20·90·5GABG 3 Germany † 6 CMF 11/1064 9/91187D3 4·5−0·6NSABP B−20 † 6 CMF 54/9087 51/870688C 25·92·1IBCSG IX † 3 CMF 61/7488 69/715788D 32·0−6·6SITAM−01 † 6 CMF 5/370 3/36489A2 1·3−0·2GROCTA V Italy † 6 CMF 0/215 1/16789E4+9 0·2−0·6CRCRAMS Moscow 6 CMF 0/38 0/2589J1Romagnolo Italy 6 CMF 8/1358 4/128389V 2·91·8Amsterdam C8913 6 CMF 0/630 0/44890PIBCSG VIII 6 CMF 4/3305 2/306390S 1·41·4Tokyo CIH 6 CMF 3/608 2/63290X1 1·20·6Sweden−Finland 9 CMF 90£ (no data)Hamburg, Germany 6 CMF 4/397 1/42893S 1·21·6INC Brazil 6 CMF 93X (no data)Charles U Prague † 6 CMF 94P (no data)
519/57428
488/51273
(0·9%/y) (1·0%/y)
−2·0 204·3 0·99 (SE 0·07)reduction
2p > 0·1; NS
(c) subtotal with data §
(d) Other regimens
Mayo 70−56−32 12 CFPr 5/161 4/13473C1 1·01·7UK MCCG 003 6 CVF/CVM 6/710 5/56874E 2·70·1Northwick Park 12 MelV 6/549 3/60175G 1·70·4West Midlands UK 6 ChlMF 12/4671 11/452376H2 5·4−0·3HD 1 W. Germany 24 ChlF 4/452 3/37376K 1·6−0·1King’s CRC M/M 24 MelM 5/747 2/74776P 1·52·0Oxford 24 MelMF 5/776 6/60177E 2·2−1·4Vienna 36 CMFV 7/704 10/63877G1 2·9−1·3Montpellier France 12 CVF 77W2 (no data)NCCTG−773051 10 CFPr 12/633 9/71978M3 3·62·5SWOG 7827 A †12 CMFVPr 74/2973 84/270479B1 34·6−4·4Case Western B †12 CMFVPr 5/426 7/45979C 2·9−0·9SWOG 7985 ?? CMFV 80L (no data)NSABP B−13 11 MFFol 31/4732 32/410681E 15·3−2·8PetrovStPetersb’g † 4 CMF; 2
TtMF27/1838 28/170085J1+3 12·8−3·5
UK Multicentre † 6 CVF/CVM 1/352 3/32986D1 1·0−1·2NSABP B−20 †?? MFFol 40/9059 51/870688C 22·3−5·8HE1092 Greece † 6 CMzF 2/538 6/63192B2 1·5−1·0NCRI ABC †various 32/4437 23/439592G1245 12·65·4
274/33758
287/31934
(0·8%/y) (0·9%/y)
−10·6 125·5 0·92 (SE 0·09)reduction
2p > 0·1; NS
(d) subtotal with data §
1198/129928
1088/118127
(0·9%/y) (0·9%/y)
9·9 444·2 1·022 (SE 0·048)increase
2p > 0·1; NS
Total (a + b + c + d)
Adjusted
99% or 95% confidence intervals .0 0·5 1·0 1·5 2·0
Polychemo. better Polychemo. worse
Treatment effect 2p > 0·1; NS, adverseHeterogeneity between 62 trials: χ261 = 55·8; p > 0·1; NS
Heterogeneity between 4 subtotals: χ23 = 5·1; p > 0·1; NS
Heterogeneity within subtotals: χ258 = 50·7; p > 0·1; NS
§ 6 trials with no data do not contribute to subtotals or to the overall total.* For balance, control patients in 3−way trials or trial strata count half or twice in subtotal(s)
and in final total of deaths/woman−years.† Chemotherapy plus tamoxifen versus same tamoxifen alone

P 62: OVERALL MORTALITY in trials of polychemotherapy vs. No chemotherapy
Year codeand study name
Months &treatment
Deaths/WomenAllocated
polychemo. controlRatio of annual death ratesPolychemo. : Control
Logrank VarianceO−E of O−E
Polychemo. deaths
(a) Anthracycline regimens
DFCI 74−063 * 7/3·5 AC 3/4 2(3/4)74D1West Midlands UK 6 CMFVAFol 203/294 209/27476H1 86·6−19·0Cologne ?? AC 76L1 (61 patients) (no data)N Sweden BCG † 8 AC 74/92 79/9580B3+4 31·6−8·6SE Sweden BCG B 8 AC 14/21 16/2180C2 5·2−1·4Helsinki 8 FAC 24/47 36/5080S1 7·5−4·9Southampton UK † 6 VAP/VAC 24/48 25/4580Z 9·20·0MD Anderson8227 * 4 FACVPr 21/91 2(8/40)82F 5·61·7GROCTA I Italy † 6 CMF; 4 E 94/171 89/17183B 41·60·9NSABP B−16 * †24 MelF±A / 4
AC468/862 2(250/434)84C 140·1−21·0
FASG GFEA 02 † 6 FEC 146/384 162/39286P2 67·9−13·9FASG GFEA 03 6 FEC 44/167 40/16186P3 19·81·0Bari Italy 6 FEC 16/123 29/12189@1 9·9−3·8SWOG 8814 * † 6 FAC 486/1177 3(185/381)89B1 113·7−23·5IGR Paris † 6 FAC/FEC 138/576 159/57589D 67·9−7·1FASG GFEA 07 † 6 FEC 19/169 26/16690C6 10·8−4·4Amsterdam C9203 † 4 EC 8/49 8/5392D 3·80·0IBCSG 11−93 † 4 AC 10/89 11/8593H 4·90·0IBCSG 12−93 * † 4 AC 35/180 2(26/110)93M1+2 12·9−2·1JCOG 9401 † 6 AC 8/65 14/6494F 4·3−3·5Austrian BCSG IX † 4 FEC 2/220 2/21996E 0·80·3
1837/4829
2034/4811
(38·0%) (42·3%)
−109·1 644·1 0·84 (SE 0·04)reduction
2p = 0·00002
(a) subtotal with data §
(b) Low-dose anthracycline regimens
Austrian BCSG 4 † 1 AV; 1 CMF 54/131 47/12984Q4+5 20·84·0
54/131
47/129
(41·2%) (36·4%)
4·0 20·8 1·21 (SE 0·24)increase
2p > 0·1; NS
(b) subtotal
(c) CMF regimens
INT Milan 7205 12 CMF 165/210 153/18173B 69·0−15·8Manchester I 12 CMF 41/55 33/5475E2 12·94·9Glasgow 12 CMF 78/112 77/10376C 27·6−9·1EORTC 09771 24 CMF 95/229 106/22376E 45·6−12·3Danish BCG 77b 12 CMF 122/201 140/19677B1+2 47·0−13·0UK/Asia Collab. †24 CMF 112/247 110/24178E 41·56·6IBCSG/Ludwig III †12 CMF 121/171 125/16478K3 50·9−6·1ECOG EST6177 12 CMFPr 66/87 73/9578V2 27·54·3Guy’s/Manch. II 6 CMF 127/185 167/20779E 52·0−27·2Paris 6 CMF 20/172 23/16379H 9·5−0·8Vienna Gyn. † 6 CMF 20/30 21/2979U1+3 5·14·1FM Italy 8004 12 CMF 16/49 27/4780F 9·5−6·8EST1180/SW.8294 6 CMFPr 84/276 104/26581H 44·1−15·0DBCG 82c postmenop.† 9 CMF 536/708 553/73782C 232·3−1·6
NCIC MA.4 † 8 CMF 132/381 137/37784D 59·9−6·7IBCSG VII * †3/6 CMF 488/948 3(174/318)86H2 110·2−14·6GABG 3 Germany † 6 CMF 36/278 35/24887D3 16·2−2·6NSABP B−20 † 6 CMF 120/789 162/78888C 68·7−20·2IBCSG IX † 3 CMF 146/853 179/86288D 78·8−19·7SITAM−01 † 6 CMF 31/63 19/5289A2 10·33·1GROCTA V Italy † 6 CMF 15/40 19/3989E4+9 6·3−3·2CRCRAMS Moscow 6 CMF 0/11 1/1089J1 0·2−0·4Romagnolo Italy 6 CMF 30/138 39/14389V 16·4−4·5Amsterdam C8913 6 CMF 12/149 15/12290P 6·3−3·9IBCSG VIII 6 CMF 49/400 56/39290S 24·6−4·0Tokyo CIH 6 CMF 13/144 9/14390X1 5·22·5Sweden−Finland 9 CMF 90£ (≈100 patients) (no data)Hamburg, Germany 6 CMF 12/117 15/12593S 5·90·0INC Brazil 6 CMF 93X (45 patients) (no data)Charles U Prague † 6 CMF 94P (103 patients) (no data)
2687/7043
2920/6960
(38·2%) (42·0%)
−162·1 1083·5 0·86 (SE 0·03)reduction
2p < 0·00001
(c) subtotal with data §
(d) Other regimens
Mayo 70−56−32 12 CFPr 20/21 12/1373C1 4·02·8UK MCCG 003 6 CVF/CVM 79/149 85/14174E 35·8−7·9Northwick Park 12 MelV 27/65 31/7575G 11·2−1·4West Midlands UK 6 ChlMF 100/287 103/28876H2 47·6−0·1HD 1 W. Germany 24 ChlF 39/61 41/6376K 18·3−1·7King’s CRC M/M 24 MelM 118/222 125/21376P 51·6−0·3Oxford 24 MelMF 61/106 62/10077E 26·1−3·6Vienna 36 CMFV 52/81 50/8277G1 17·1−5·9Montpellier France 12 CVF 77W2 (82 patients) (no data)NCCTG−773051 10 CFPr 69/85 81/9978M3 27·51·2SWOG 7827 A †12 CMFVPr 231/325 245/31679B1 102·1−10·4Case Western B †12 CMFVPr 25/64 33/7379C 11·9−3·5SWOG 7985 ?? CMFV 80L (28 patients) (no data)NSABP B−13 11 MFFol 109/376 141/38481E 60·1−17·8PetrovStPetersb’g † 4 CMF; 2
TtMF74/193 79/19185J1+3 35·1−4·6
UK Multicentre † 6 CVF/CVM 4/118 11/10586D1 3·5−4·2NSABP B−20 †?? MFFol 125/786 162/78888C 70·1−19·1HE1092 Greece † 6 CMzF 27/135 20/14592B2 10·35·4NCRI ABC †various 233/915 268/93592G1245 108·5−18·5
1393/3989
1549/4011
(34·9%) (38·6%)
−89·8 641·0 0·87 (SE 0·04)reduction
2p = 0·0004
(d) subtotal with data §
5971/15992
6550/15911
(37·3%) (41·2%)
−357·0 2389·4 0·861 (SE 0·019)reduction
2p < 0·00001
Total (a + b + c + d)
Adjusted
99% or 95% confidence intervals .0 0·5 1·0 1·5 2·0
Polychemo. better Polychemo. worse
Treatment effect 2p < 0·00001Heterogeneity between 64 trials: χ263 = 75·2; p > 0·1; NS
Heterogeneity between 4 subtotals: χ23 = 2·7; p > 0·1; NS
Heterogeneity within subtotals: χ260 = 72·5; p > 0·1; NS
§ 6 trials with no data do not contribute to subtotals or to the overall total.* For balance, control patients in 3−way trials or trial strata count half or twice in subtotal(s)
and in final total of deaths/women.† Chemotherapy plus tamoxifen versus same tamoxifen alone

P63: Table of non-breast-cancer mortality without recurrence during the first year after randomisation, by age for various chemotherapy comparisons
Treatments compared (Active vs Control)
Entry age (years)*
Deaths/woman-years Active Control**
1.
Taxane-plus-anthracycline-based regimen vs same or more non-taxane chemotherapy
<55
28/13174 (0·2%)
21/13117 (0·2%)
55-69 31/6303 (0·5%) 19/6269 (0·3%) 70+ 7/244 (2·9%) 6/264 (2·3%) All 66/19721 (0·3%) 46/19650 (0·2%) 2. Any anthracycline-based regimen*
vs standard CMF
<55 12/6416 (0·2%)
13/6405 (0·2%)
55-69 11/1821 (0·6%) 13/1780 (0·7%) 70+ 0/78 (0·0%) 1/80 (1·3%) All 23/8358 (0·3%) 27/8321 (0·3%) 3. Any anthracycline-based regimen
vs no chemotherapy
<55 3/1356 (0·2%)
4/1324 (0·3%)
55-69 17/2766 (0·6%) 10/2677 (0·4%) 70+ 4/168 (2·4%) 0/162 (0·0%) All 24/4296 (0·6%) 14/4165 (0·3%) 4. Any CMF regimen
vs no chemotherapy†
<55 3/2748 (0·1%)
5/2613 (0·2%)
55-69 27/3452 (0·8%) 15/3435 (0·4%) 70+ 3/228 (1·3%) 5/231 (2·2%) All 33/6429 (0·5%) 25/6279 (0·4%) * The few women of unknown age are excluded from the age-specific subgroups but included in the totals; none of them died in year 0 without recurrence. ** For balance, control patients count twice in the few trials with allocation ratio 2:1. † 8/468 (2·1%) vs 2/540 (0·4%) in 3 small, old (began 1973-78) trials of 12 cycles of standard CMF, 8/2194 (0·4%) vs 3/2047 (0·15%) in trials of 6 cycles of standard CMF, and 14/4374 (0·4%) vs 20/4370 (0·5%) in trials of other CMF regimens.
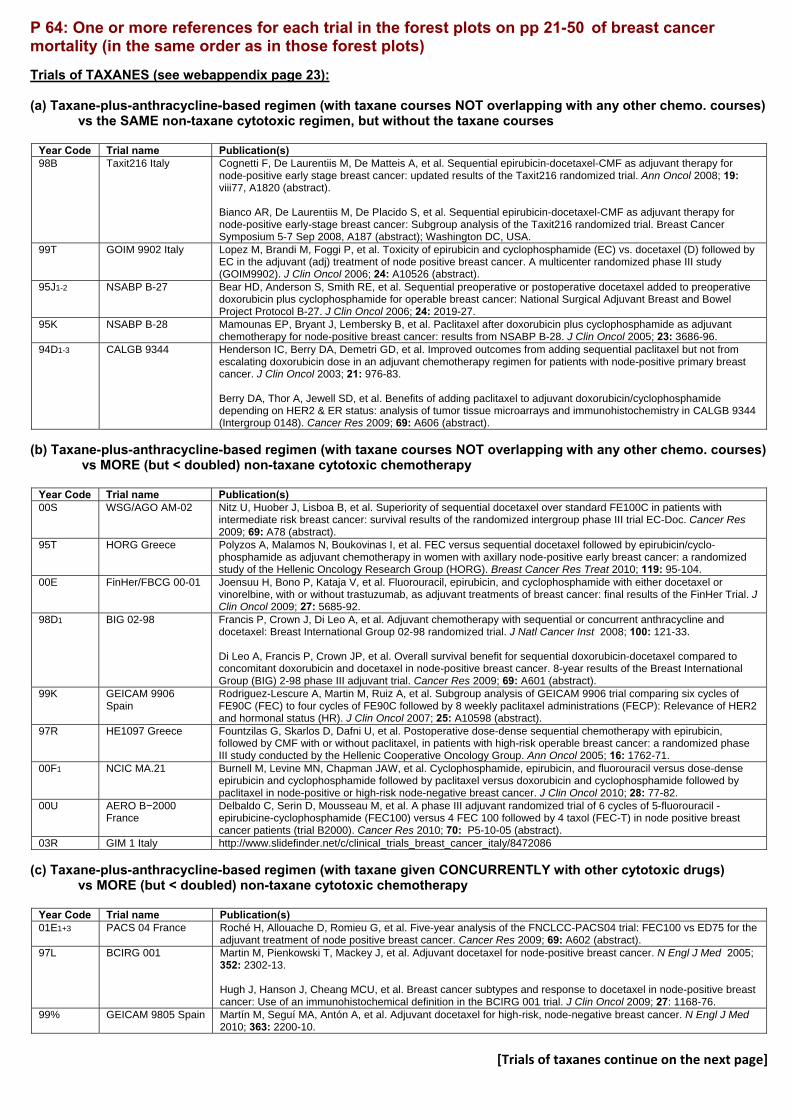
P 64: One or more references for each trial in the forest plots on pp 21-50 of breast cancer mortality (in the same order as in those forest plots) Trials of TAXANES (see webappendix page 23): (a) Taxane-plus-anthracycline-based regimen (with taxane courses NOT overlapping with any other chemo. courses)
vs the SAME non-taxane cytotoxic regimen, but without the taxane courses
Year Code Trial name Publication(s) 98B Taxit216 Italy Cognetti F, De Laurentiis M, De Matteis A, et al. Sequential epirubicin-docetaxel-CMF as adjuvant therapy for
node-positive early stage breast cancer: updated results of the Taxit216 randomized trial. Ann Oncol 2008; 19: viii77, A1820 (abstract). Bianco AR, De Laurentiis M, De Placido S, et al. Sequential epirubicin-docetaxel-CMF as adjuvant therapy for node-positive early-stage breast cancer: Subgroup analysis of the Taxit216 randomized trial. Breast Cancer Symposium 5-7 Sep 2008, A187 (abstract); Washington DC, USA.
99T GOIM 9902 Italy Lopez M, Brandi M, Foggi P, et al. Toxicity of epirubicin and cyclophosphamide (EC) vs. docetaxel (D) followed by EC in the adjuvant (adj) treatment of node positive breast cancer. A multicenter randomized phase III study (GOIM9902). J Clin Oncol 2006; 24: A10526 (abstract).
95J1-2 NSABP B-27 Bear HD, Anderson S, Smith RE, et al. Sequential preoperative or postoperative docetaxel added to preoperative doxorubicin plus cyclophosphamide for operable breast cancer: National Surgical Adjuvant Breast and Bowel Project Protocol B-27. J Clin Oncol 2006; 24: 2019-27.
95K NSABP B-28 Mamounas EP, Bryant J, Lembersky B, et al. Paclitaxel after doxorubicin plus cyclophosphamide as adjuvant chemotherapy for node-positive breast cancer: results from NSABP B-28. J Clin Oncol 2005; 23: 3686-96.
94D1-3 CALGB 9344 Henderson IC, Berry DA, Demetri GD, et al. Improved outcomes from adding sequential paclitaxel but not from escalating doxorubicin dose in an adjuvant chemotherapy regimen for patients with node-positive primary breast cancer. J Clin Oncol 2003; 21: 976-83. Berry DA, Thor A, Jewell SD, et al. Benefits of adding paclitaxel to adjuvant doxorubicin/cyclophosphamide depending on HER2 & ER status: analysis of tumor tissue microarrays and immunohistochemistry in CALGB 9344 (Intergroup 0148). Cancer Res 2009; 69: A606 (abstract).
(b) Taxane-plus-anthracycline-based regimen (with taxane courses NOT overlapping with any other chemo. courses)
vs MORE (but < doubled) non-taxane cytotoxic chemotherapy
Year Code Trial name Publication(s) 00S WSG/AGO AM-02 Nitz U, Huober J, Lisboa B, et al. Superiority of sequential docetaxel over standard FE100C in patients with
intermediate risk breast cancer: survival results of the randomized intergroup phase III trial EC-Doc. Cancer Res 2009; 69: A78 (abstract).
95T HORG Greece Polyzos A, Malamos N, Boukovinas I, et al. FEC versus sequential docetaxel followed by epirubicin/cyclo-phosphamide as adjuvant chemotherapy in women with axillary node-positive early breast cancer: a randomized study of the Hellenic Oncology Research Group (HORG). Breast Cancer Res Treat 2010; 119: 95-104.
00E FinHer/FBCG 00-01 Joensuu H, Bono P, Kataja V, et al. Fluorouracil, epirubicin, and cyclophosphamide with either docetaxel or vinorelbine, with or without trastuzumab, as adjuvant treatments of breast cancer: final results of the FinHer Trial. J Clin Oncol 2009; 27: 5685-92.
98D1 BIG 02-98 Francis P, Crown J, Di Leo A, et al. Adjuvant chemotherapy with sequential or concurrent anthracycline and docetaxel: Breast International Group 02-98 randomized trial. J Natl Cancer Inst 2008; 100: 121-33. Di Leo A, Francis P, Crown JP, et al. Overall survival benefit for sequential doxorubicin-docetaxel compared to concomitant doxorubicin and docetaxel in node-positive breast cancer. 8-year results of the Breast International Group (BIG) 2-98 phase III adjuvant trial. Cancer Res 2009; 69: A601 (abstract).
99K GEICAM 9906 Spain
Rodriguez-Lescure A, Martin M, Ruiz A, et al. Subgroup analysis of GEICAM 9906 trial comparing six cycles of FE90C (FEC) to four cycles of FE90C followed by 8 weekly paclitaxel administrations (FECP): Relevance of HER2 and hormonal status (HR). J Clin Oncol 2007; 25: A10598 (abstract).
97R HE1097 Greece Fountzilas G, Skarlos D, Dafni U, et al. Postoperative dose-dense sequential chemotherapy with epirubicin, followed by CMF with or without paclitaxel, in patients with high-risk operable breast cancer: a randomized phase III study conducted by the Hellenic Cooperative Oncology Group. Ann Oncol 2005; 16: 1762-71.
00F1 NCIC MA.21 Burnell M, Levine MN, Chapman JAW, et al. Cyclophosphamide, epirubicin, and fluorouracil versus dose-dense epirubicin and cyclophosphamide followed by paclitaxel versus doxorubicin and cyclophosphamide followed by paclitaxel in node-positive or high-risk node-negative breast cancer. J Clin Oncol 2010; 28: 77-82.
00U AERO B−2000 France
Delbaldo C, Serin D, Mousseau M, et al. A phase III adjuvant randomized trial of 6 cycles of 5-fluorouracil - epirubicine-cyclophosphamide (FEC100) versus 4 FEC 100 followed by 4 taxol (FEC-T) in node positive breast cancer patients (trial B2000). Cancer Res 2010; 70: P5-10-05 (abstract).
03R GIM 1 Italy http://www.slidefinder.net/c/clinical_trials_breast_cancer_italy/8472086 (c) Taxane-plus-anthracycline-based regimen (with taxane given CONCURRENTLY with other cytotoxic drugs)
vs MORE (but < doubled) non-taxane cytotoxic chemotherapy
Year Code Trial name Publication(s) 01E1+3 PACS 04 France Roché H, Allouache D, Romieu G, et al. Five-year analysis of the FNCLCC-PACS04 trial: FEC100 vs ED75 for the
adjuvant treatment of node positive breast cancer. Cancer Res 2009; 69: A602 (abstract). 97L BCIRG 001 Martin M, Pienkowski T, Mackey J, et al. Adjuvant docetaxel for node-positive breast cancer. N Engl J Med 2005;
352: 2302-13. Hugh J, Hanson J, Cheang MCU, et al. Breast cancer subtypes and response to docetaxel in node-positive breast cancer: Use of an immunohistochemical definition in the BCIRG 001 trial. J Clin Oncol 2009; 27: 1168-76.
99% GEICAM 9805 Spain Martín M, Seguí MA, Antón A, et al. Adjuvant docetaxel for high-risk, node-negative breast cancer. N Engl J Med 2010; 363: 2200-10.
[Trials of taxanes continue on the next page]

98D2 BIG 02-98 Francis P, Crown J, Di Leo A, et al. Adjuvant chemotherapy with sequential or concurrent anthracycline and docetaxel: Breast International Group 02-98 randomized trial. J Natl Cancer Inst 2008; 100: 121-33. Di Leo A, Francis P, Crown JP, et al. Overall survival benefit for sequential doxorubicin-docetaxel compared to concomitant doxorubicin and docetaxel in node-positive breast cancer. 8-yr. Results of the Breast International Group (BIG) 2-98 phase III adjuvant trial. Cancer Res 2009; 69: A601 (abstract).
99N RAPP-01 France Brain EGC, Bachelot T, Serin D, et al. Life-threatening sepsis associated with adjuvant doxorubicin plus docetaxel for intermediate-risk breast cancer. JAMA 2005; 293: 2367-71. Brain EG, Debled M, Eymard J, et al. Final results of the RAPP-01 phase III trial comparing doxorubicin and docetaxel with doxorubicin and cyclophosphamide in the adjuvant treatment of high-risk node negative and limited node positive (<=3) breast cancer patients. Cancer Res 2009; 69: A4101.
98T ECOG EST2197 Goldstein LJ, O'Neill A, Sparano JA, et al. Concurrent doxorubicin plus docetaxel is not more effective than concurrent doxorubicin plus cyclophosphamide in operable breast cancer with 0 to 3 positive axillary nodes: North American Breast Cancer Intergroup trial E 2197. J Clin Oncol 2008; 26: 4092-99. Badve SS, Baehner FL, Gray RP, et al. Estrogen- and progesterone-receptor status in ECOG 2197: comparison of immunohistochemistry by local and central laboratories and quantitative reverse transcription polymerase chain reaction by central laboratory. J Clin Oncol 2008; 26: 2473-81.
96W1-2 ECTO Italy Gianni L, Baselga J, Eiermann W, et al. Phase III trial evaluating the addition of paclitaxel to doxorubicin followed by cyclophosphamide, methotrexate, and fluorouracil, as adjuvant or primary systemic therapy: European Cooperative Trial in Operable Breast Cancer. J Clin Oncol 2009; 27: 2474-81.
96% Multicentre Germany Kümmel S, Krocker J, Kohls A, et al. Randomised trial: survival benefit and safety of adjuvant dose-dense chemotherapy for node-positive breast cancer. Br J Cancer 2006; 94: 1237-44.
96X GONO Italy MIG 5 Del Mastro L, Costantini M, Durando A, et al. Cyclophosphamide, epirubicin, and 5-fluorouracil versus epirubicin plus paclitaxel in node-positive early breast cancer patients: A randomized, phase III study of Gruppo Oncologico Nord Ovest-Mammella Intergruppo Group. J Clin Oncol 2008; 26: 10s, A516 (abstract).
(d) Taxane-plus-anthracycline-based regimen (with taxane courses NOT overlapping with any other chemo. courses)
vs DOUBLED (or ≈ doubled) non−taxane cytotoxic chemotherapy
Year Code Trial name Publication(s) 01F TACT UK
(Control A) Ellis P, Barrett-Lee P, Johnson L, et al. Sequential docetaxel as adjuvant chemotherapy for early breast cancer (TACT): an open-label, phase III, randomised controlled trial. Lancet 2009; 373: 1681-92. Tutt A, Gillett C, Pinder S, et al. Microtubule associated protein tau expression as a predictive and prognostic marker in a trial assessing sequential docetaxel as adjuvant chemotherapy for early breast cancer (TACT). Cancer Res 2009; 69: A607 (abstract).
01G TACT UK (Control B)
Ellis P, Barrett-Lee P, Johnson L, et al. Sequential docetaxel as adjuvant chemotherapy for early breast cancer (TACT): an open-label, phase III, randomised controlled trial. Lancet 2009; 373: 1681-92. Tutt A, Gillett C, Pinder S, et al. Microtubule associated protein tau expression as a predictive and prognostic marker in a trial assessing sequential docetaxel as adjuvant chemotherapy for early breast cancer (TACT). Cancer Res 2009; 69: A607 (abstract).
01T LMU Munich ADEBAR
Sommer HL, Jueckstock JK, Genss E, et al. Influence of sequencing of chemotherapy and radiotherapy regarding adverse effects of cytostatic treatment: Results of the ADEBAR trial. J Clin Oncol 2007; 25: 17s, A559 (abstract). Janni WJ, Harbeck N, Sommer H, et al. Sequential treatment with epirubicin/cyclophosphamide followed by docetaxel is equi-effective, but less toxic, than FEC120 in the adjuvant treatment of breast cancer patients with extensive lymph node involvement: The German ADEBAR phase III study. Cancer Res 2009; 69: A604 (abstract).
96F Aberdeen Scotland Walker LG, Walker MB, Anderson J, et al. Quality of life during primary chemotherapy for breast cancer with continuing cyclophosphamide, vincristine, adriamycin and prednisolone versus sequential docetaxel: a randomised trial. Breast Cancer Res Treat 2002; 76: S52, A160 (abstract).
97J PACS 01 France Coudert B, Campone M, Spielmann M, et al. Benefit of the sequential administration of docetaxel after standard FEC regimen for node-positive breast cancer: long-term follow-up results of the FNCLCC-PACS 01 trial. Cancer Res 2009; 69: A603 (abstract).
97A DEVA UK Coombes RC, Bliss JM, Espie M, et al. DEVA: Randomized trial of sequential epirubicin and docetaxel versus epirubicin alone in node-positive postmenopausal early breast cancer (EBC) patients. J Clin Oncol 2010; 28: 76S, A536 (abstract).
94B MD Anderson Buzdar AU, Singletary SE, Valero V, et al. Evaluation of paclitaxel in adjuvant chemotherapy for patients with operable breast cancer: preliminary data of a prospective randomized trial. Clin Cancer Res 2002; 8: 1073-79.
00F2 NCIC MA.21 Burnell M, Levine MN, Chapman JAW, et al. Cyclophosphamide, epirubicin, and fluorouracil versus dose-dense epirubicin and cyclophosphamide followed by paclitaxel versus doxorubicin and cyclophosphamide followed by paclitaxel in node-positive or high-risk node-negative breast cancer. J Clin Oncol 2010; 28: 77-82.
02D GBG 42 / NNBC 3−Eur.
Thomssen C, Kantelhardt EJ, Plueckhahn K, et al. Report of toxicities from the multicenter, randomized NNBC 3-Europe trial: 6xFEC versus 3xFEC-3xDoc for high-risk node-negative breast cancer patients. J Clin Oncol 2010; 28: 80S, A554 (abstract). Kantelhardt EJ, Thomssen C, Vetter M, et al. Molecular types and prognostic markers uPA/PAI-1 for 2,497 early breast cancer patients in the multicenter, randomized NNBC 3-Europe trial. J Clin Oncol 2010; 28: A10539.
(e) Taxane trial with no anthracycline in one allocation
Year Code Trial name Publication(s) 00S WSG/AGO AM-02 Nitz U, Huober J, Lisboa B, et al. Superiority of sequential docetaxel over standard FE100C in patients with
intermediate risk breast cancer: survival results of the randomized intergroup phase III trial EC-Doc. Cancer Res 2009; 69: A78 (abstract).
97N USO 97-35 Jones S, Holmes FA, O'Shaughnessy J, et al. Docetaxel with cyclophosphamide is associated with an overall survival benefit compared with doxorubicin and cyclophsphamide: 7-year follow-up of US Oncology Research Trial 9735. J Clin Oncol 2009; 27: 1177-83.

Trials of any anthracycline-based regimen vs. standard CMF (or near-standard CMF) (see webappendix page 29):
(a) Anthracycline dose/cycle ≥ A60 or E90
i. Cumulative anthracycline dose A360 or E720-800 Year Code Trial name Publication(s) 88R Brussels Belgium Bernard Marty C, Mano M, Paesmans M, et al. Second malignancies following adjuvant chemotherapy: 6-year
results from a Belgian randomized study comparing cyclophosphamide, methotrexate and 5-fluorouracil (CMF) with an anthracycline-based regimen in adjuvant treatment of node-positive breast cancer patients. Ann Oncol 2003; 14: 693-98.
89R NCIC MA.5 Pritchard KI, Shepherd LE, O'Malley FP, et al. HER2 and responsiveness of breast cancer to adjuvant chemotherapy. N Engl J Med 2006; 354: 2103-11.
89B2 SWOG 8897 Hutchins LF, Green SJ, Ravdin PM, et al. Randomized, controlled trial of cyclophosphamide, methotrexate, and fluorouracil versus cyclophosphamide, doxorubicin, and fluorouracil with and without tamoxifen for high-risk, node-negative breast cancer: treatment results of Intergroup protocol INT-0102. J Clin Oncol 2005; 23: 8313-21.
ii. Cumulative anthracycline dose A300 or E400-480
Year Code Trial name Publication(s) 86S GOCCNE Italy Galligioni E, Cetto G, Nascimben O, et al. High dose epirubicin and cyclophosphamide (EC) vs cyclophosphamide,
methotrexate, fluorouracil (CMF) as adjuvant chemotherapy in high risk premenopausal breast cancer patients (PTS). A prospective randomized trial. Eur J Cancer 1998; 34 (suppl 1): 84 (abstract).
97G FM Italy GMB1 Personal communication 90Z GOIRC SANG2 Italy Colozza M, Bisagni G, Mosconi AM, et al. Epirubicin versus CMF as adjuvant therapy for stage I and II breast
cancer: a prospective randomised study. Eur J Cancer 2002; 38: 2279-88. 84K1 GUN-3 Naples De Placido S, Perrone F, Carlomagno C, et al. CMF vs alternating CMF/EV in the adjuvant treatment of operable
breast cancer. A single centre randomised clinical trial (Naples GUN-3 study). Br J Cancer 1995; 71: 1283-87. 96N GOCSI MAM2 Italy De Matteis A, De Laurentiis M, Nuzzo F, et al. Preliminary results from the IMPACT-B01/MAM2 GOCSI
randomized trial of adjuvant therapy for breast cancer. Ann Oncol 2002; 13: 16, A53 (abstract). 96A NEAT, UK Earl HM, Hiller L, Dunn JA, et al. NEAT: National Epirubicin Adjuvant Trial-toxicity, delivered dose intensity and
quality of life. Br J Cancer 2008; 99: 1226-31. 97U1+2 IBIS 03 Italy Cyclophosphamide, Methotrexate, and Fluorouracil, With or Without Epirubicin Hydrochloride, in Treating Women
Who Have Undergone Surgery for Breast Cancer [Internet] 2009 [updated 2009 Dec 13; cited 2011 Jun 16]. Available from: http://clinicaltrials.gov/ct2/show/study/NCT01031030?term=ibis+03&rank=1 Amadori D, Silvestrini R, De Lena M, et al. Randomized phase III trial of adjuvant epirubicin followed by cyclophosphamide, methotrexate, and 5-fluorouracil (CMF) versus CMF followed by epirubicin in patients with node-negative or 1–3 node-positive rapidly proliferating breast cancer. Breast Cancer Res Treat 2011; 125: 775-84.
91Q GOCSI MAM1 Italy De Placido S, De Laurentiis M, De Lena M, et al. A randomised factorial trial of sequential doxorubicin and CMF vs CMF and chemotherapy alone vs chemotherapy followed by goserelin plus tamoxifen as adjuvant treatment of node-positive breast cancer. Br J Cancer 2005; 92: 467-74.
iii. Cumulative anthracycline dose A240
Year Code Trial name Publication(s) 84B1 NSABP B-15 Wickerham D, Fisher B, Brown A, et al. Two months of adriamycin + cyclophosphamide (AC) with and without
interval reinduction therapy vs 6 months of conventional CMF in positive node breast cancer patients (pts) nonresponsive to tamoxifen: results of NSABP B-15. Proc Annu Meet Am Soc Clin Oncol 1990; 9: A73 (abstract).
84B2 NSABP B-15 Wickerham D, Fisher B, Brown A, et al. Two months of adriamycin + cyclophosphamide (AC) with and without interval reinduction therapy vs 6 months of conventional CMF in positive node breast cancer patients (pts) nonresponsive to tamoxifen: results of NSABP B-15. Proc Annu Meet Am Soc Clin Oncol 1990; 9: A73 (abstract).
91H NSABP B-23 Fisher B, Anderson S, Tan Chiu E, et al. Tamoxifen and chemotherapy for axillary node-negative, estrogen receptor-negative breast cancer: findings from National Surgical Adjuvant Breast and Bowel Project B-23. J Clin Oncol 2001; 19: 931-42.
(b) Anthracycline dose/cycle < A60 or E90
Year Code
Trial name Publication(s)
78L2 ONCOFRANCE Misset JL, di Palma M, Delgado M, et al. Adjuvant treatment of node-positive breast cancer with cyclophosphamide, doxorubicin, fluorouracil, and vincristine versus cyclophosphamide, methotrexate, and fluorouracil: final report after a 16-year median follow-up duration. J Clin Oncol 1996; 14: 1136-45.
88R Brussels Belgium Bernard Marty C, Mano M, Paesmans M, et al. Second malignancies following adjuvant chemotherapy: 6-year results from a Belgian randomized study comparing cyclophosphamide, methotrexate and 5-fluorouracil (CMF) with an anthracycline-based regimen in adjuvant treatment of node-positive breast cancer patients. Ann Oncol 2003; 14: 693-98.
94J1+2+3 GOIRC SANG 2B R1
Personal communication
84L ICCG C/2/84 UK Coombes RC, Bliss JM, Wils J, et al. Adjuvant cyclophosphamide, methotrexate, and fluorouracil versus fluorouracil, epirubicin, and cyclophosphamide chemotherapy in premenopausal women with axillary node-positive operable breast cancer: results of a randomized trial. The International Collaborative Cancer Group. J Clin Oncol 1996; 14: 35-45.
80C1 SE Sweden BCG A Hrafnkelsson J, Nilsson K, Soderberg M. Tolerance of radiotherapy combined with adjuvant chemotherapy in breast cancer. Acta Oncol 1987; 26: 269-72.
84N ICCG C/6/89 UK Marty M, Hall E, Wils J, et al. Evaluation of tolerability of CMF versus FEC in a randomised trial in node negative poor risk primary breast cancer patients. Proc Annu Meet Am Soc Clin Oncol 2002; 21: 69a, A273 (abstract).
[End of anthracycline vs CMF; anthracycline vs nil follows]
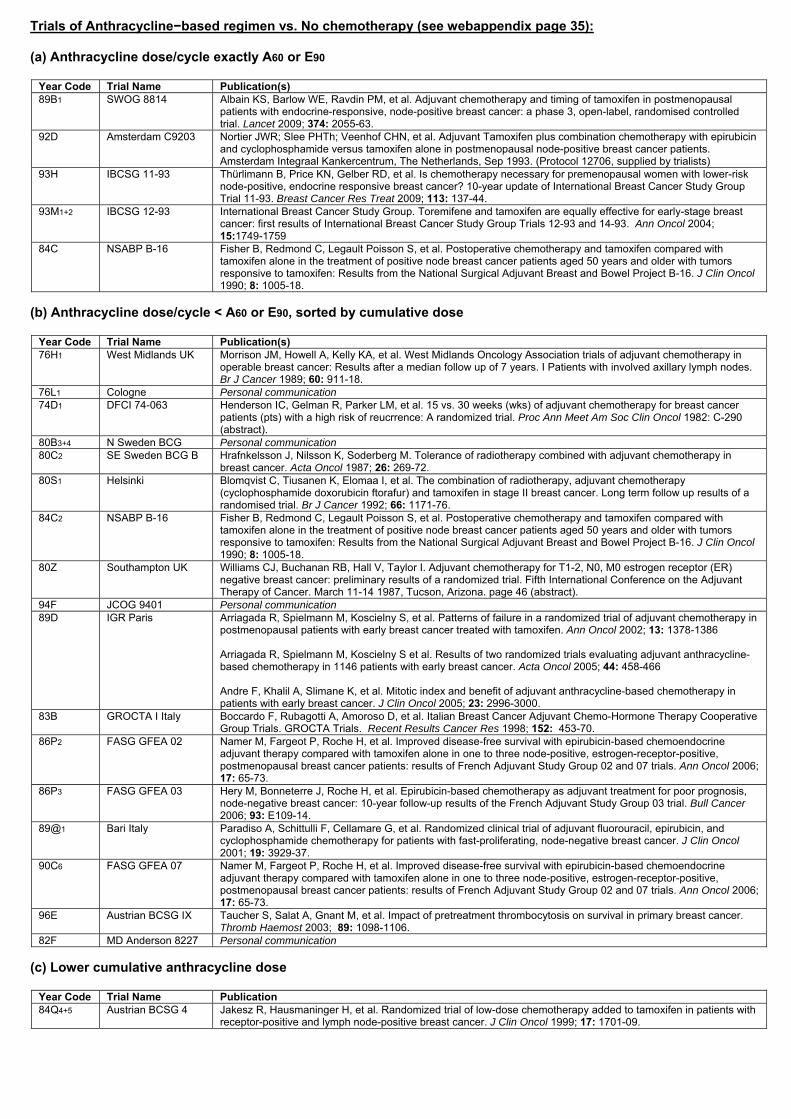
Trials of Anthracycline−based regimen vs. No chemotherapy (see webappendix page 35):
(a) Anthracycline dose/cycle exactly A60 or E90
Year Code Trial Name Publication(s) 89B1 SWOG 8814 Albain KS, Barlow WE, Ravdin PM, et al. Adjuvant chemotherapy and timing of tamoxifen in postmenopausal
patients with endocrine-responsive, node-positive breast cancer: a phase 3, open-label, randomised controlled trial. Lancet 2009; 374: 2055-63.
92D Amsterdam C9203 Nortier JWR; Slee PHTh; Veenhof CHN, et al. Adjuvant Tamoxifen plus combination chemotherapy with epirubicin and cyclophosphamide versus tamoxifen alone in postmenopausal node-positive breast cancer patients. Amsterdam Integraal Kankercentrum, The Netherlands, Sep 1993. (Protocol 12706, supplied by trialists)
93H IBCSG 11-93 Thürlimann B, Price KN, Gelber RD, et al. Is chemotherapy necessary for premenopausal women with lower-risk node-positive, endocrine responsive breast cancer? 10-year update of International Breast Cancer Study Group Trial 11-93. Breast Cancer Res Treat 2009; 113: 137-44.
93M1+2 IBCSG 12-93 International Breast Cancer Study Group. Toremifene and tamoxifen are equally effective for early-stage breast cancer: first results of International Breast Cancer Study Group Trials 12-93 and 14-93. Ann Oncol 2004; 15:1749-1759
84C NSABP B-16 Fisher B, Redmond C, Legault Poisson S, et al. Postoperative chemotherapy and tamoxifen compared with tamoxifen alone in the treatment of positive node breast cancer patients aged 50 years and older with tumors responsive to tamoxifen: Results from the National Surgical Adjuvant Breast and Bowel Project B-16. J Clin Oncol 1990; 8: 1005-18.
(b) Anthracycline dose/cycle < A60 or E90, sorted by cumulative dose
Year Code Trial Name Publication(s) 76H1 West Midlands UK Morrison JM, Howell A, Kelly KA, et al. West Midlands Oncology Association trials of adjuvant chemotherapy in
operable breast cancer: Results after a median follow up of 7 years. I Patients with involved axillary lymph nodes. Br J Cancer 1989; 60: 911-18.
76L1 Cologne Personal communication74D1 DFCI 74-063 Henderson IC, Gelman R, Parker LM, et al. 15 vs. 30 weeks (wks) of adjuvant chemotherapy for breast cancer
patients (pts) with a high risk of reucrrence: A randomized trial. Proc Ann Meet Am Soc Clin Oncol 1982: C-290 (abstract).
80B3+4 N Sweden BCG Personal communication 80C2 SE Sweden BCG B Hrafnkelsson J, Nilsson K, Soderberg M. Tolerance of radiotherapy combined with adjuvant chemotherapy in
breast cancer. Acta Oncol 1987; 26: 269-72. 80S1 Helsinki Blomqvist C, Tiusanen K, Elomaa I, et al. The combination of radiotherapy, adjuvant chemotherapy
(cyclophosphamide doxorubicin ftorafur) and tamoxifen in stage II breast cancer. Long term follow up results of a randomised trial. Br J Cancer 1992; 66: 1171-76.
84C2 NSABP B-16 Fisher B, Redmond C, Legault Poisson S, et al. Postoperative chemotherapy and tamoxifen compared with tamoxifen alone in the treatment of positive node breast cancer patients aged 50 years and older with tumors responsive to tamoxifen: Results from the National Surgical Adjuvant Breast and Bowel Project B-16. J Clin Oncol 1990; 8: 1005-18.
80Z Southampton UK Williams CJ, Buchanan RB, Hall V, Taylor I. Adjuvant chemotherapy for T1-2, N0, M0 estrogen receptor (ER) negative breast cancer: preliminary results of a randomized trial. Fifth International Conference on the Adjuvant Therapy of Cancer. March 11-14 1987, Tucson, Arizona. page 46 (abstract).
94F JCOG 9401 Personal communication 89D IGR Paris Arriagada R, Spielmann M, Koscielny S, et al. Patterns of failure in a randomized trial of adjuvant chemotherapy in
postmenopausal patients with early breast cancer treated with tamoxifen. Ann Oncol 2002; 13: 1378-1386 Arriagada R, Spielmann M, Koscielny S et al. Results of two randomized trials evaluating adjuvant anthracycline-based chemotherapy in 1146 patients with early breast cancer. Acta Oncol 2005; 44: 458-466 Andre F, Khalil A, Slimane K, et al. Mitotic index and benefit of adjuvant anthracycline-based chemotherapy in patients with early breast cancer. J Clin Oncol 2005; 23: 2996-3000.
83B GROCTA I Italy Boccardo F, Rubagotti A, Amoroso D, et al. Italian Breast Cancer Adjuvant Chemo-Hormone Therapy Cooperative Group Trials. GROCTA Trials. Recent Results Cancer Res 1998; 152: 453-70.
86P2 FASG GFEA 02 Namer M, Fargeot P, Roche H, et al. Improved disease-free survival with epirubicin-based chemoendocrine adjuvant therapy compared with tamoxifen alone in one to three node-positive, estrogen-receptor-positive, postmenopausal breast cancer patients: results of French Adjuvant Study Group 02 and 07 trials. Ann Oncol 2006; 17: 65-73.
86P3 FASG GFEA 03 Hery M, Bonneterre J, Roche H, et al. Epirubicin-based chemotherapy as adjuvant treatment for poor prognosis, node-negative breast cancer: 10-year follow-up results of the French Adjuvant Study Group 03 trial. Bull Cancer 2006; 93: E109-14.
89@1 Bari Italy Paradiso A, Schittulli F, Cellamare G, et al. Randomized clinical trial of adjuvant fluorouracil, epirubicin, and cyclophosphamide chemotherapy for patients with fast-proliferating, node-negative breast cancer. J Clin Oncol 2001; 19: 3929-37.
90C6 FASG GFEA 07 Namer M, Fargeot P, Roche H, et al. Improved disease-free survival with epirubicin-based chemoendocrine adjuvant therapy compared with tamoxifen alone in one to three node-positive, estrogen-receptor-positive, postmenopausal breast cancer patients: results of French Adjuvant Study Group 02 and 07 trials. Ann Oncol 2006; 17: 65-73.
96E Austrian BCSG IX Taucher S, Salat A, Gnant M, et al. Impact of pretreatment thrombocytosis on survival in primary breast cancer. Thromb Haemost 2003; 89: 1098-1106.
82F MD Anderson 8227 Personal communication (c) Lower cumulative anthracycline dose
Year Code Trial Name Publication 84Q4+5 Austrian BCSG 4 Jakesz R, Hausmaninger H, et al. Randomized trial of low-dose chemotherapy added to tamoxifen in patients with
receptor-positive and lymph node-positive breast cancer. J Clin Oncol 1999; 17: 1701-09.

Trials of Standard CMF vs. No chemotherapy (see webappendix page 41):
Year Code Trial name Publication(s) 73B INT Milan 7205 Bonadonna G, Zambetti M, Moliterni A, et al. Clinical relevance of different sequencing of doxorubicin and
cyclophosphamide, methotrexate, and fluorouracil in operable breast cancer. J Clin Oncol 2004; 22:1614-20. Bonadonna G, Moliterni A, Zambetti M, et al. 30 years' follow up of randomised studies of adjuvant CMF in operable breast cancer: cohort study. BMJ 2005; 330: 217-23.
78K3 IBCSG/Ludwig III Pagani O, Price KN, Gelber RD, et al. Patterns of recurrence of early breast cancer according to estrogen receptor status: A therapeutic target for a quarter of a century. Breast Cancer Res Treat 2009; 117: 319–324.
78V2 ECOG EST6177 Taylor SG, Knuiman MW, Sleeper LA, et al. Six-year results of the Eastern Cooperative Oncology Group trial of observation versus CMFP versus CMFPT in postmenopausal patients with node-positive breast cancer. J Clin Oncol 1989; 7: 879-89.
79U1+3 Vienna Gyn. Kubista E, Salzer H, Fischl F, et al. [Treatment of breast cancer at the 1st Gynecology Clinic at the University of Vienna]. Wien Med Wochenschr 1984; 134: 251-5.
81H EST1180/SW.8294 Mansour EG, Gray R, Shatila AH, et al. Efficacy of adjuvant chemotherapy in high-risk node-negative breast cancer. An Intergroup study. N Engl J Med 1989; 320: 485-90.
86H2 IBCSG VII The International Breast Cancer Study Group. Effectiveness of adjuvant chemotherapy in combination with tamoxifen for node-positive postmenopausal breast cancer patients. J Clin Oncol 1997; 15: 1385-93.
88C NSABP B-20 Mamounas EP, Tang G, Fisher B, et al. Association between the 21-gene recurrence score assay and risk of locoregional recurrence in node-negative, estrogen receptor-positive breast cancer: results from NSABP B-14 and NSABP B-20. J Clin Oncol 2010; 28: 1677-83.
89A2 SITAM-01 Belfiglio M, Mari E, Nicolucci A, et al. Sitam-01 adjuvant breast trial for patients > 50 years. Eur J Cancer 1996; 32 (suppl 1): 21 (abstract).
89E4+9 GROCTA V Italy Boccardo F, Rubagotti A, Amoroso D, et al. Italian Breast Cancer Adjuvant Chemo-Hormone Therapy Cooperative Group Trials. GROCTA Trials. Recent Results Cancer Res 1998; 152: 453-70.
89V Romagnolo Italy Amadori D, Nanni O, Volpi A, et al. Phase III randomized multicenter study on the effects of adjuvant CMF in patients with node-negative, rapidly proliferating breast cancer: twelve-year results and retrospective subgroup analysis. Breast Cancer Res Treat 2008; 108: 259-64.
90P Amsterdam C8913 Personal communication 90S IBCSG VIII Karlsson P, Sun Z, Braun D, et al. Long term results of International Breast Cancer Study Group Trial VIII:
adjuvant chemotherapy plus goserelin compared with either therapy alone for premenopausal patients with node-negative breast cancer, Ann Oncol 2011; 22: 2216-26.
Trials of Anthracycline Dosage (see webappendix page 47): (a) Unconfounded comparisons
Year Code Trial name Publication(s) 86P1
FASG GFEA 01
Benchalal M, Le Prise E, De Lafontan B, et al. Influence of the time between surgery and radiotherapy on local recurrence in patients with lymph node-positive, early-stage, invasive breast carcinoma undergoing breast-conserving surgery: Results of the French Adjuvant Study Group. Cancer 2005; 104: 240-250. Fumoleau P, Devaux Y, Vo-Van ML, et al. Premenopausal patients with node positive resectable breast cancer: a randomized trial comparing three adjuvant regimens: FEC50 x 6 cycles vs FEC50 x 3 cycles vs FEC75 x 3 cycles, preliminary results. Ann Oncol 1992; 3: 203 (abstract).
90C3+5
FASG GFEA 05
Bonneterre J, Roche H, Kerbrat P, et al. French Adjuvant Study Group 05 trial (FEC 50 vs FEC 100): 10-year update of benefit/risk ratio after adjuvant chemotherapy (CT) in node-positive (N+), early breast cancer (EBC) patients (pts). Proc Annu Meet Am Soc Clin Oncol 2003; 22: 24, A93 (abstract). Bonneterre JM, French Adjuvant Study Group. Long-term efficacy and toxicity of the FEC100 regimen. Oncology (Williston Park) 2004; 18(14), suppl 14: 56-58.
92N ICCG C/9/91 UK Bliss JM, Wils J, Marty M, et al. Evaluation of the tolerability of FE50C versus FE75C in a prospective randomised trial in adjuvant breast cancer patients. Proc Annu Meet Am Soc Clin Oncol 2002; 21: 51b, A2017 (abstract).
94D1&2 CALGB 9344 Henderson IC, Berry DA, Demetri GD, et al. Improved outcomes from adding sequential paclitaxel but not from escalating doxorubicin dose in an adjuvant chemotherapy regimen for patients with node-positive primary breast cancer. J Clin Oncol 2003; 21: 976-83. Berry DA, Thor A, Jewell SD, et al. Benefits of adding paclitaxel to adjuvant doxorubicin/cyclophosphamide depending on HER2 & ER status: analysis of tumor tissue microarrays and immunohistochemistry in CALGB 9344 (Intergroup 0148). Cancer Res 2009; 69: A606 (abstract).
(b) Confounded comparisons
Year Code Trial name Publication(s) 85A
CALGB CLB-8541 Muss HB, Berry DA, Cirrincione C, et al. Toxicity of older and younger patients treated with adjuvant chemotherapy for node-positive breast cancer: the Cancer and Leukemia Group B experience. J Clin Oncol 2007; 25: 3699-3704. Wood WC, Budman DR, Korzun AH, et al. Dose and dose intensity of adjuvant chemotherapy for stage II, node positive breast carcinoma. N Engl J Med 1994; 330: 1253-59.
88R Brussels Belgium Bernard Marty C, Mano M, Paesmans M, et al. Second malignancies following adjuvant chemotherapy: 6-year results from a Belgian randomized study comparing cyclophosphamide, methotrexate and 5-fluorouracil (CMF) with an anthracycline-based regimen in adjuvant treatment of node-positive breast cancer patients. Ann Oncol 2003; 14: 693-98.
00F NCIC MA21 Burnell M, Levine MN, Chapman JAW, et al. Cyclophosphamide, epirubicin, and fluorouracil versus dose-dense epirubicin and cyclophosphamide followed by paclitaxel versus doxorubicin and cyclophosphamide followed by paclitaxel in node-positive or high-risk node-negative breast cancer. J Clin Oncol 2010; 28: 77-82.
[End of webappendix]

Local and systyseveral MODERA
MODERATE improvein local control, in e
in chemotherapyin chemotherapySUBSTANTIALLY reduc
emic therapies:pATE survival gains
ments in early detection,endocrine therapy andy have in aggregatey have, in aggregate,ced national mortality rates
EBCTCG, Lancet 2011

EBCTCG, Lancet 2011
1950 1960 1970 1980 1990 2000 20100
15
30
45
60
75
UK
USA
2.5%
2.0%
1.5%
1.0%
0.5%
35−yearrisk
Dea
th ra
te /
100
000
wom
en, a
ge s
tand
ardi
sed*
*Mean of annual rates in the seven component 5−year age groups
Breast cancer mortality at ages 35−69UK 1950−2009 and USA (to 2008):
WHO (& 2008 US NCHS) mortalityand UN population estimates
LARGE effect on UK/USAbreast cancer mortalityby combining severalMODERATE effects.
Further MODERATE effectsare still worthwhile andachievable.
Reliable assessmdifferences in LOby the 5-yearly woby the 5 yearly wo
(with tens of thous
Need all the main ranboth to get big eno
avoid undue emphasisp
ent of MODERATE NG-TERM survival orldwide overvieworldwide overview sands randomised)
ndomised trial results,ugh numbers and to s on particular studiesp
EBCTCG, Lancet 2011

Early Breast CaCollaborative G
So as not to missdifferences in lonthe world’s triali
their data every 5
1985, 1990, 1995,, , ,
ancer Trialists’ roup (EBCTCG)
s any MODERATE ng-term survival,sts have shared years since 1985
2000, 2005, 2010, ,
EBCTCG, Lancet 2011

620 names of EBCTCG collaborators listed alphabetically by institution, t
ACETBC, Tokyo, Japan O Abe, R Abe, K Enomoto, K Kikuchi, H Koyama, H Masuda, Y Nomura, German Breast Cancer Study Group (BMFT),ACETBC, Tokyo, Japan O Abe, R Abe, K Enomoto, K Kikuchi, H Koyama, H Masuda, Y Nomura, Y Ohashi, K Sakai, K Sugimachi, M Toi, T Tominaga, J Uchino, M Yoshida. Addenbrooke’s Hospital, Cambridge, UK J L Haybittle. Anglo‐Celtic Cooperative Oncology Group, UK C F Leonard. ARCOSEIN Group, France G Calais, P Geraud. ATLAS Trial Collaborative Study Group, Oxford, UK V Collett, C Davies, A Delmestri, J Sayer. Auckland Breast Cancer Study Group, New Zealand V J Harvey,I M Holdaway, R G Kay, B H Mason. Australian New Zealand Breast Cancer Trials Group, Sydney, Australia J F Forbes, N Wilcken. Austrian Breast Cancer Study Group, Vienna, Austria R Bartsch, P Dubsky, C Fesl, H Fohler, M Gnant, R Greil, R Jakesz, A Lang, G Luschin‐Ebengreuth, C Marth, B Mlineritsch H Samonigg C F Singer G G Steger H Stoger Beatson Oncology Centre Glasgow
German Breast Cancer Study Group (BMFT),R Sauer, W Sauerbrei, A Schauer, M SchumaNeuIsenburg, Germany J U Blohmer, S D CosG von Minckwitz. Ghent University Hospital,Interdisciplinary Group for Cancer Care EvalF Pellegrini, M C Pirozzoli, M Sacco, M ValenC S McArdle, D C Smith, S Stallard. Groote SD M Dent, C A Gudgeon, A Hacking, E MurraInvestigación en Cáncer de Mama (GEICAM)B Mlineritsch, H Samonigg, C F Singer, G G Steger, H Stoger. Beatson Oncology Centre, Glasgow,
UK P Canney, H M A Yosef. Belgian Adjuvant Breast Cancer Project, Liège, Belgium C Focan. Berlin‐Buch Akademie der Wissenschaften, Germany U Peek. Birmingham General Hospital, UK G D Oates, J Powell. Bordeaux Institut Bergonié, France M Durand, L Mauriac. Bordet Institute, Brussels, Belgium A Di Leo, S Dolci, D Larsimont, J M Nogaret, C Philippson, M J Piccart. Bradford Royal Infirmary, UK M B Masood, D Parker, J J Price. Breast Cancer International Research Group (BCIRG) M A Lindsay, J Mackey, M Martin. Breast Cancer Study Group of the Comprehensive Cancer Centre, Limburg, Netherlands P S G J Hupperets. British Association of Surgical Oncology BASO II Trialists London UK T Bates R W Blamey U Chetty I O Ellis E Mallon D A L Morgan
Investigación en Cáncer de Mama (GEICAM)Gruppo Oncologico Clinico Cooperativo del NOncologico Dell’Italia Meridionale (GOIM), R20 Noviembre, Mexico A Erazo, J Y Medina. Guy’s Hospital, London, UK I S Fentiman, J LUniversity I, Germany H Scheurlen. HeidelbeH C Sohn. Helios Klinikum Berlin‐Buch, GermGreece U Dafni, C Markopoulos. Hellenic CoU Dafni G Fountzilas Hellenic Oncology ResBASO II Trialists, London, UK T Bates, R W Blamey, U Chetty, I O Ellis, E Mallon, D A L Morgan,
J Patnick, S Pinder. British Columbia Cancer Agency, Vancouver, Canada I Olivotto, J Ragaz. Cancer and Leukemia Group B, Washington DC, USA D Berry, G Broadwater, C Cirrincione, H Muss, L Norton, R B Weiss. Cancer Care Ontario, Canada H T Abu‐Zahra. Cancer Research Centre of the Russian Academy of Medical Sciences, Moscow, Russia S M Portnoj. Cancer Research UK Clinical Trials Unit (CRCTU), NCRI, Birmingham, UK S Bowden, C Brookes, J Dunn, I Fernando, M Lee, C Poole, D Rea, D Spooner. Cardiff Trialists Group, UK P J Barrett‐Lee, R E Mansel, I J Monypenny. Case Western Reserve University, Cleveland, OH, USA N H Gordon. Central Oncology Group, Mil k WI USA H L D i C t f C P ti W lf I tit t f P ti
U Dafni, G Fountzilas. Hellenic Oncology ResDeaconess Medical Centre, Finland P KlefstrT Saarto. Hospital del Mar, Barcelona, SpainR Margreiter. Institut Claudius Regaud, ToulInstitut Curie, Paris, France B Asselain, R J SaFrance R Arriagada, C. Bourgier, C Hill, S KosInstitute of Cancer Research Clinical Trials aA’Hern, J Bliss, P Ellis, L Kilburn, J R YarnolN th l dMilwaukee, WI, USA H L Davis. Centre for Cancer Prevention, Wolfson Institute of Preventive
Medicine, Queen Mary, University of London, UK J Cuzick. Centre Léon‐Bérard, Lyon, France Y Lehingue, P Romestaing. Centre Paul Lamarque, Montpellier, France J B Dubois. Centre Regional François Baclesse, Caen, France T Delozier, B Griffon, J Mace Lesec’h. Centre René Huguenin, Paris, St Cloud, France P Rambert. Centro Oncologico, Trieste, Italy G Mustacchi. Charles University in Prague, First Faculty of Medicine, Department of Oncology of the First Faculty of Medicine and General Teaching Hospital, Czech Republic L Petruzelka, O Pribylova. Cheltenham General Hospital, UK J R Owen. Chemo N0 Trial Group, Germany N Harbeck, F Janicke, C Meisner,
Netherlands J Benraadt, M Kooi, A O van de Velde, J A vaCancer Study Group (IBCSG), Bern, SwitzerlaJ Collins, J Forbes, R D Gelber, A Goldhirsch,C M Rudenstam, H J Senn, B Thuerlimann. InCharing Cross Hospital, London, UK J M BlissInternational Drug Development Institute, LInternational TABLE Study Group, Berlin, Ge
M Schmitt, C Thomssen. Chicago University, IL, USA P Meier. Chinese Academy of Medical Sciences, Beijing, People’s Republic of China (in collaboration with the Oxford CTSU) Y Shan, Y F Shao, X Wang, D B Zhao (CTSU: Z M Chen, H C Pan). Christie Hospital and Holt Radium Institute, Manchester, UK A Howell, R Swindell. Clinical Trial Service Unit, Oxford, UK (ie, EBCTCG Secretariat) J A Burrett, M Clarke, R Collins, C Correa, D Cutter, S Darby, C Davies, K Davies, A Delmestri, P Elphinstone, V Evans, L Gettins, J Godwin, R Gray, C Gregory, D Hermans, C Hicks, S James, A Kerr, E MacKinnon, M Lay, P McGale, T McHugh, R Peto, J Sayer, C Taylor, Y Wang. Coimbra Instituto de Oncologia, Portugal J Albano, C F de Oliveira, H Gervasio, J Gordilho.
D Wallwiener. ISD Cancer Clinical Trials TeamTherapy Network), Edinburgh, UK L Foster, WNSABC, Tel Aviv, Israel R Borovik, H Hayat, MRicerca sul Cancro, Genova, Italy P Bruzzi, L M Venturini. Istituto Nazionale per lo StudioG De Palo, M G Di Mauro, F Formelli, P ValaItaly D Amadori. Italian Cooperative ChemoF Pannuti. Italian Oncology Group for Clinica
Copenhagen Radium Centre, Denmark H Johansen, H T Mouridsen. Dana‐Farber Cancer Institute, Boston, MA, USA R S Gelman, J R Harris, D Hayes, C Henderson, C L Shapiro, E Winer. Danish Breast Cancer Cooperative Group, Copenhagen, Denmark P Christiansen, B Ejlertsen, M Ewertz, M‐B Jensen, S Moller, H T Mouridsen. Danish Cancer Registry, Copenhagen, Denmark B Carstensen, T Palshof. Düsseldorf University, Germany H J Trampisch. Dutch Working Party for Autologous Bone Marrow Transplant in Solid Tumours, Amsterdam & Groningen, Netherlands O Dalesio, E G E de Vries, S Rodenhuis, H van Tinteren. Eastern Cooperative Oncology Group, Boston, MA, USA R L Comis, N E Davidson, R Gray, N Robert, G Sledge, L J Solin, J A Sparano,
G Cocconi, A Colozza, R Passalacqua. Japan Group, Matsuyama, Japan K Aogi, S TakashiTreatment of Cancer, Tokyo, Japan O Abe, TMedical School, Japan H Sonoo. Krakow InsJ Skolyszewski. Kumamoto University GroupUniversity Medical Center, Netherlands E BaJ G H van Nes. Leuven Akademisch ZiekenhuP Neven, R Paridaens, W Van den Bogaert. Ly g p
D C Tormey, W Wood. Edinburgh Breast Unit, UK D Cameron, U Chetty, J M Dixon, P Forrest, W Jack, I Kunkler. Elim Hospital, Hamburg, Germany J Rossbach. Erasmus MC/Daniel den Hoed Cancer Center, Rotterdam, Netherlands J G M Klijn, A D Treurniet‐Donker, W L J van Putten. European Institute of Oncology, Milan, Italy N Rotmensz, U Veronesi, G Viale. European Organization for Research and Treatment of Cancer, Brussels, Belgium H Bartelink, N Bijker, J Bogaerts, F Cardoso, T Cufer, J P Julien, E Rutgers, C J H van de Velde. Evanston Hospital, IL, USA M P Cunningham. Finnish Breast Cancer Group, Finland R Huovinen, H Joensuu. Fondazione Maugeri Pavia, Italy A Costa, C Tinterri. Fondazione Michelangelo, Milan, Italy G Bonadonna,
gGermany S Braun, W Janni. Marseille LaboraP Martin, S Romain. Medical University VienObstetrics and Gynaecology and DepartmenM Seifert, P Sevelda, C C Zielinski. MemoriaUSA T Hakes, C A Hudis, L Norton, R Wittes. Greece G Giokas, D Kondylis, B Lissaios. MexMexico R de la Huerta, M G Sainz. National K Camphausen, K Cowan, D Danforth, A Lichg , y , g , , y ,
L Gianni, P Valagussa. Fox Chase Cancer Center, Philadelphia, PA, USA L J Goldstein. French Adjuvant Study Group (GFEA), Guyancourt, France J Bonneterre, P Fargeot, P Fumoleau,P Kerbrat, E Luporsi, M Namer. German Adjuvant Breast Group (GABG), Frankfurt, Germany W Eiermann, J Hilfrich, W Jonat, M Kaufmann, R Kreienberg, M Schumacher.
K Camphausen, K Cowan, anforth, A ichS Steinberg, D Venzon, J A Zujewski. NationaM Lioce, A Paradiso. NCIC Clinical Trials GroK Gelmon, P E Goss, M N Levine, R Meyer, WL E Shepherd, D Tu, T Whelan. National KyusNational Surgical Adjuvant Breast and Bowe
in local and systemic therapy trials,then name. Lancet 2011; 378: 771-84., Freiburg, Germany G Bastert, H Rauschecker, S Anderson, G Bass, A Brown (deceased), J Bryant (deceased), J Costantino, J Dignam,, Freiburg, Germany G Bastert, H Rauschecker, acher. German Breast Group (GBG), sta, H Eidtmann, B Gerber, C Jackisch, S Loibl, , Belgium A de Schryver, L Vakaet. GIVIO luation, Chieti, Italy M Belfiglio, A Nicolucci, ntini. Glasgow Victoria Infirmary, UK chuur Hospital, Cape Town, South Africa ay, E Panieri, ID Werner. Grupo Español de ) Spain E Carrasco M Martin M A Segui
S Anderson, G Bass, A Brown (deceased), J Bryant (deceased), J Costantino, J Dignam, B Fisher, C Geyer, E P Mamounas, S Paik, C Redmond, S Swain, L Wickerham, N Wolmark. Nolvadex Adjuvant Trial Organisation, London, UK M Baum, I M Jackson (deceased), M K Palmer. North Central Cancer Treatment Group, Mayo Clinic, Rochester, MN, USA E Perez, J N Ingle, V J Suman. North Sweden Breast Cancer Group, Umeå, Sweden N O Bengtsson, S Emdin, H Jonsson. North‐West Oncology Group (GONO), Italy L Del Mastro, M Venturini. North‐Western British Surgeons, Manchester, UK J P Lythgoe, R Swindell. Northwick Park Hospital, London, UK M Kissin. Norwegian Breast Cancer Group, Oslo, Norway B Erikstein E Hannisdal A B Jacobsen J E Varhaug Norwegian Radium Hospital Oslo), Spain E Carrasco, M Martin, M A Segui.
Nord Est, Aviano, Italy E Galligioni. Gruppo Rome, Italy M Lopez. Guadalajara Hospital de Gunma University, Japan J Horiguchi, H Takei. L Hayward, R D Rubens, D Skilton. Heidelberg erg University II, Germany M Kaufmann, many M Untch. Hellenic Breast Surgeons Society, ooperative Oncology Group, Athens, Greece search Group Greece D Mavroudis Helsinki
B Erikstein, E Hannisdal, A B Jacobsen, J E Varhaug. Norwegian Radium Hospital, Oslo, Norway B Erikstein, S Gundersen, M Hauer‐Jensen, H Host, A B Jacobsen, R Nissen‐Meyer. Nottingham City Hospital, UK R W Blamey, A K Mitchell, D A L Morgan, J F R Robertson. Oita Prefectural Hospital, Japan H Ueo. Oncofrance, Paris, France M Di Palma, G Mathe (deceased), J L Misset. Ontario Clinical Oncology Group, Hamilton, Canada M Levine, K I Pritchard, T Whelan. Osaka City University, Japan K Morimoto. Osaka National Hospital, Japan K Sawa, Y Takatsuka. Oxford Radcliffe Hospitals NHS Trust, Churchill Hospital, Oxford, UK E Crossley, A Harris, D Talbot, M Taylor. PACS Adjuvant Study Group, France A L Martin, H Roche Parma Hospital Italy G Cocconi B di Blasio Petrov Research Institute of Oncologysearch Group, Greece D Mavroudis. Helsinki
rom. Helsinki University, Finland C Blomqvist, n M Gallen. Innsbruck University, Austria louse, France B de Lafontan, J Mihura, H Roche. almon, J R Vilcoq. Institut Gustave‐Roussy, Paris, scielny, A Laplanche, M G Le, M Spielmann. and Statistics Unit (ICR‐CTSU, NCRI), UK R d. Integraal Kankercentrum, Amsterdam,
H Roche. Parma Hospital, Italy G Cocconi, B di Blasio. Petrov Research Institute of Oncology, St Petersburg, Russia V Ivanov, R Paltuev, V Semiglazov. Piedmont Oncology Association, Winston‐Salem, NC, USA J Brockschmidt, M R Cooper. Pretoria University, South Africa C I Falkson. Royal Marsden NHS Trust, London and Sutton, UK R A’Hern, S Ashley, M Dowsett, A Makris, T J Powles, I E Smith, J R Yarnold. St George’s Hospital, London, UK J C Gazet. St George Hospital, Sydney, Australia L Browne, P Graham. St Luke’s Hospital, Dublin, Ireland N Corcoran. Sardinia Oncology Hospital A Businico, Cagliari, Sardinia N Deshpande, L di M ti SASIB I t ti l T i li t C T S th Af i P D l A H ki
an Dongen, J B Vermorken. International Breast and M Castiglione, A Coates, M Colleoni, , J Lindtner, K N Price, M M Regan, nternational Collaborative Cancer Group, s, C E D Chilvers, R C Coombes, E Hall, M Marty. Louvain‐la‐Neuve, Belgium M Buyse. ermany K Possinger, P Schmid, M Untch,
L di Martino. SASIB International Trialists, Cape Town, South Africa P Douglas, A Hacking, H Host, A Lindtner, G Notter. Saskatchewan Cancer Foundation, Regina, Canada A J S Bryant, G H Ewing, L A Firth, J L Krushen‐Kosloski. Scandinavian Adjuvant Chemotherapy Study Group, Oslo, Norway R Nissen‐Meyer. South Sweden Breast Cancer Group, Lund, H Anderson, F Killander, P Malmstrom, L Ryden. South‐East Sweden Breast Cancer Group, Linköping, Sweden L‐G Arnesson, J Carstensen, M Dufmats, H Fohlin, B Nordenskjold, M Soderberg. South‐Eastern Cancer Study Group and Alabama Breast Cancer Project, Birmingham, AL, USA J T Carpenter. Southampton Oncology Centre, UK N Murray, G T Royle, P D Simmonds.
m (incorporating the former Scottish Cancer W D George, H J Stewart, P Stroner. Israel M J Inbar, E Robinson. Istituto Nazionale per la Del Mastro, P Pronzato, M R Sertoli, o e la Cura dei Tumori, Milan, Italy T Camerini, agussa. Istituto Oncologico Romagnolo, Forli, ‐Radio‐Surgical Group, Bologna, Italy A Martoni, al Research (GOIRC), Parma, Italy R Camisa,
Southwest Oncology Group, San Antonio, TX, USA K Albain, W Barlow, J Crowley, D Hayes, J Gralow, S Green, G Hortobagyi, R Livingston, S Martino, C K Osborne, P M Ravdin. Stockholm Breast Cancer Study Group, Sweden J Adolfsson, J Bergh, T Bondesson, F Celebioglu, K Dahlberg, T Fornander, I Fredriksson, J Frisell, E Goransson, M Iiristo, U Johansson, E Lenner, L Lofgren, P Nikolaidis, L Perbeck, S Rotstein, K Sandelin, L Skoog, G Svane, E af Trampe, C Wadstrom. Swiss Group for Clinical Cancer Research (SAKK), Bern, and OSAKO, St Gallen, Switzerland M Castiglione, A Goldhirsch, R Maibach, H J Senn, B Thurlimann.
Clinical Oncology Group– Breast Cancer Study ima. Japanese Foundation for Multidisciplinary T Ikeda, K Inokuchi, K Kikuchi, K Sawa. Kawasaki titute of Oncology, Poland S Korzeniowski, p, Japan M Ogawa, J Yamashita. Leiden astiaannet, C J H van de Velde, W van de Water, uis, Gasthuisberg, Belgium R Christiaens, Ludwig‐Maximilians University, Munich,
Tampere University Hospital, Finland M Hakama, K Holli, J Isola, K Rouhento, R Saaristo. Tel Aviv University, Israel H Brenner, A Hercbergs. The High‐Dose Chemotherapy for Breast Cancer Study Group (PEGASE), France A L Martin, H Roche. Tokyo Cancer Institute Hospital, Japan M Yoshimoto. Toronto‐Edmonton Breast Cancer Study Group, Canada A H G Paterson, K I Pritchard. Toronto Princess Margaret Hospital, Canada A Fyles, J W Meakin, T Panzarella, K I Pritchard. Tunis Institut Salah Azaiz, Tunisia J Bahi. UK Multicentre Cancer Chemotherapy Study Group, London, UK M Reid, M Spittle. UK/ANZ DCIS Trial H Bishop, N J Bundred, J Cuzick, I O Ellis, I S Fentiman, J F Forbes, S Forsyth, W D George, S E Pinder, I Sestak. g y
atoire de Cancérologie Biologique APM, France nna – General Hospital ‐ Department of nt of Medicine I, Vienna, Austria M Janauer, l Sloan‐Kettering Cancer Center, New York, NY, Metaxas Memorial Cancer Hospital, Athens, xican National Medical Center, Mexico City, Cancer Institute, Bethesda, MD, USA R Altemus, hter, M Lippman, J O’Shaughnessy, L J Pierce,
y gUK/Asia Collaborative Breast Cancer Group, London, UK G P Deutsch, R Gray, D L W Kwong, V R Pai, R Peto, F Senanayake. University and Istituto Nazionale per la Ricerca sul Cancro, Genoa, Italy on behalf of GROCTA trialists F Boccardo, A Rubagotti. University College London, UK M Baum, S Forsyth, A Hackshaw, J Houghton, J Ledermann, K Monson, JS Tobias. University Federico II, Naples, Italy C Carlomagno, M De Laurentiis, S De Placido. University of Edinburgh, UK L Williams. University of Michigan, USA D Hayes, L J Pierce. University of Texas MD Anderson Cancer Center, Houston, TX, USA K Broglio, A U Buzdar. University of Wisconsin, USA R R Love. Uppsala‐Örebro Breast Cancer Study Group, Sweden hter, M ippman, J O Shaughnessy, J Pierce,
al Cancer Institute of Bari, Italy C D’Amico, oup, Kingston, Ontario, Canada J‐A W Chapman, W Parulekar, J L Pater, K I Pritchard, shu Cancer Center, Japan Y Nomura, S Ohno. el Project (NSABP), Pittsburgh, PA, USA
y f , pp y p,J Ahlgren, H Garmo, L Holmberg, G Liljegren, H Lindman, F Warnberg. US Oncology, Houston, USA L Asmar, S E Jones. West German Study Group (WSG), Germany O Gluz, N Harbeck, C Liedtke, U Nitz. West of Scotland Breast Trial Group, Glasgow, UK A Litton. West Sweden Breast Cancer Study Group, Gothenburg, Sweden A Wallgren, P Karlsson, B K Linderholm. Western Cancer Study Group, Torrance, CA, USA R T Chlebowski. Würzburg University, Germany H Caffier. EBCTCG, Lancet 2011
C i b tComparisons betweentherapy regimens forpy g
meta-analyses of long100,000 women in 1
Early Breast Cancer Trial(EBC
P bli h d li DPublished online Decem
DOI 10 1016/S014DOI:10.1016/S014
diff t l hn different polychemo-r early breast cancer:y
g-term outcome among23 randomised trials
lists’ Collaborative Group CTCG)
b 6 2011 i Th L tber 6, 2011 in The Lancet
0 6736(11)61625 50-6736(11)61625-5EBCTCG, Lancet 2011

Direct and indirect codiff t l hdifferent polychemobased on ~100,000 r
45,000 taxane v(44,000 with anthracy
22 000 anthracy22,000 anthracy(18,000 vs “sta
5 000 l5,000 more vs les(2000 comparing curre
31,000 polychemotherapy(13,000 CMF vs Nil; 10,000 a(13,000 CMF vs Nil; 10,000 a
* Excludes trials of one tax
omparisons between th iotherapy regimens,
randomised women
vs no taxane*ycline in both arms)
ycline vs CMFycline vs CMFandard” CMF)
h liss anthracyclineently relevant doses)
y vs no adjuvant chemoanthr.-based regimen vs Nil)anthr. based regimen vs Nil)
xane regimen vs anotherg
EBCTCG, Lancet 2011
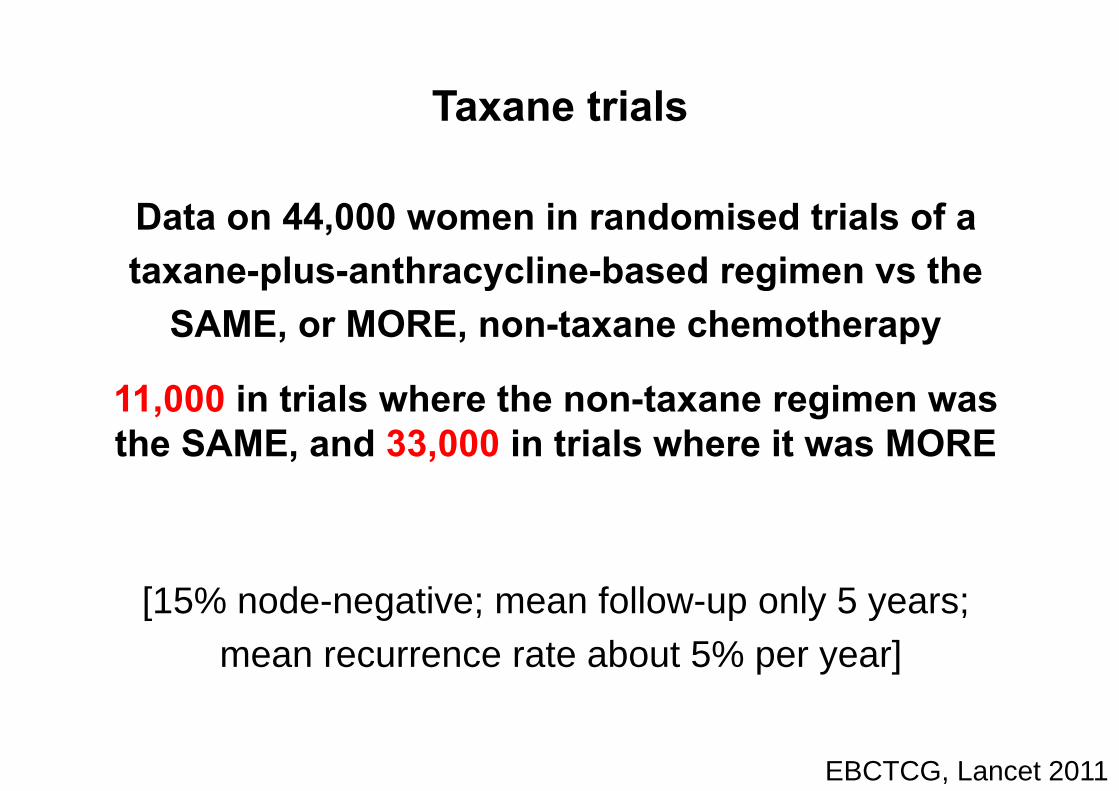
Taxane
Data on 44,000 women inta ane pl s anthrac clintaxane-plus-anthracyclin
SAME, or MORE, non-t
11,000 in trials where the the SAME and 33 000 in tthe SAME, and 33,000 in t
[15% node-negative; mea[ g ;
mean recurrence rate
e trials
n randomised trials of ane based regimen s thene-based regimen vs thetaxane chemotherapy
non-taxane regimen was trials where it was MOREtrials where it was MORE
an follow-up only 5 years;p y y ;
e about 5% per year]
EBCTCG, Lancet 2011

EBCTCG, Lancet 2011
Taxane-plus-anthracycline-based regimens vs
(L) the SAME, or (R) MORE, non-taxane chemo.
11167 women: control withthe SAME non−taxane chemo,ie, unconfounded (100% N+)
Recurrence rates (% / year) and logrank analyses
Tax + anthControl
Allocation
Rate ratio(O−E) / V
0 1 2 3Years 0 − 4
5·51 (1280 / 23249)6·43 (1239 / 19259)
0·84 SE 0·04−95·5 / 557·3
4 5 6 7Year 5+
3·10 (413 / 13343)3·62 (381 / 10534)
0·85 SE 0·07−30·5 / 182·8
8 years0
10
20
30
40
50
Rec
urre
nce
%± SE
8−y gain 4·6% (SE 1·0)
Control
Tax + anth
34·8%
30·2%
Logrank 2p < 0·00001RR 0·84 (0·78−0·91)
27·3%
23·7%
33084 women: control withMORE non−taxane chemo(82% N+)
0 1 2 3Years 0 − 4
4·37 (2607 / 59665)5·02 (2586 / 51508)
0·85 SE 0·03−181·4 / 1153·8
4Year 5+
3·01 (153 / 5082)2·69 (127 / 4727)
1·03 SE 0·131·9 / 63·6
5 years0
10
20
30
40
50
Rec
urre
nce
%± SE
5−y gain 2·9% (SE 0·6)
Control
Tax + anth
22·0%19·2%
Logrank 2p < 0·00001RR 0·86 (0·82−0·91)

EBCTCG, Lancet 2011
Taxane-plus-anthracycline-based regimens vs
(L) the SAME, or (R) MORE, non-taxane chemo. 11167 women
Death rates (% / year: total rate − rate in women without recurrence) and logrank analyses
Tax + anthControl
Allocation
Rate ratio(O−E) / V
0 1 2 3Years 0 − 43·21 SE 0·113·58 SE 0·130·88 SE 0·05−46·4 / 348·5
4 5 6 7Year 5+
2·48 SE 0·133·06 SE 0·160·82 SE 0·07−33·3 / 172·3
8 years0
10
20
30
40
50
Bre
ast c
ance
r mor
talit
y
%± SE
8−y gain 2·8% (SE 0·9)
Control
Tax + anth
23·9%21·1%
Logrank 2p = 0·0005RR 0·86 (0·79−0·93)
16·7%
14·8%
33084 women
0 1 2 3Years 0 − 42·01 SE 0·062·30 SE 0·070·87 SE 0·04−77·0 / 549·5
4Year 5+
2·37 SE 0·202·26 SE 0·210·97 SE 0·13−1·7 / 57·4
5 years0
10
20
30
40
50
Bre
ast c
ance
r mor
talit
y
%± SE
5−y gain 1·4% (SE 0·4)
Control
Tax + anth
11·5%10·1%
Logrank 2p = 0·001RR 0·88 (0·81−0·95)
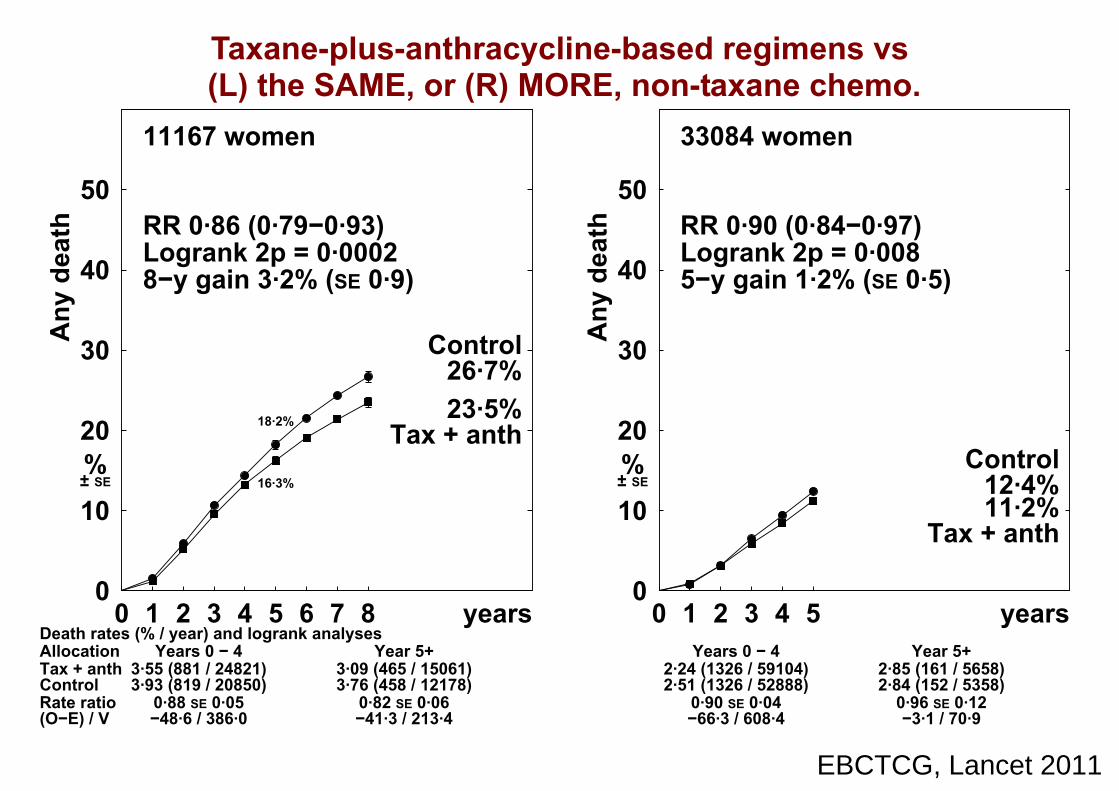
EBCTCG, Lancet 2011
Taxane-plus-anthracycline-based regimens vs
(L) the SAME, or (R) MORE, non-taxane chemo. 11167 women
Death rates (% / year) and logrank analyses
Tax + anthControl
Allocation
Rate ratio(O−E) / V
0 1 2 3Years 0 − 4
3·55 (881 / 24821)3·93 (819 / 20850)
0·88 SE 0·05−48·6 / 386·0
4 5 6 7Year 5+
3·09 (465 / 15061)3·76 (458 / 12178)
0·82 SE 0·06−41·3 / 213·4
8 years0
10
20
30
40
50
Any
dea
th
%± SE
8−y gain 3·2% (SE 0·9)
Control
Tax + anth
26·7%23·5%
Logrank 2p = 0·0002RR 0·86 (0·79−0·93)
18·2%
16·3%
33084 women
0 1 2 3Years 0 − 4
2·24 (1326 / 59104)2·51 (1326 / 52888)
0·90 SE 0·04−66·3 / 608·4
4Year 5+
2·85 (161 / 5658)2·84 (152 / 5358)
0·96 SE 0·12−3·1 / 70·9
5 years0
10
20
30
40
50
Any
dea
th
%± SE
5−y gain 1·2% (SE 0·5)
Control
Tax + anth
12·4%11·2%
Logrank 2p = 0·008RR 0·90 (0·84−0·97)

Taxane comTaxane comsubdivided a
(a) how the non-taxane( )(active = control, a
or an intermed
(b) whether the cycle( ) yconcurrently (©) witor whether taxanesor whether taxanes
mparisonsmparisons, according to:
e treatments compare pactive = ½ control, iate ratio), and),
s of taxane are given gh the anthracycline, are given alone (†).are given alone (†).
EBCTCG, Lancet 2011
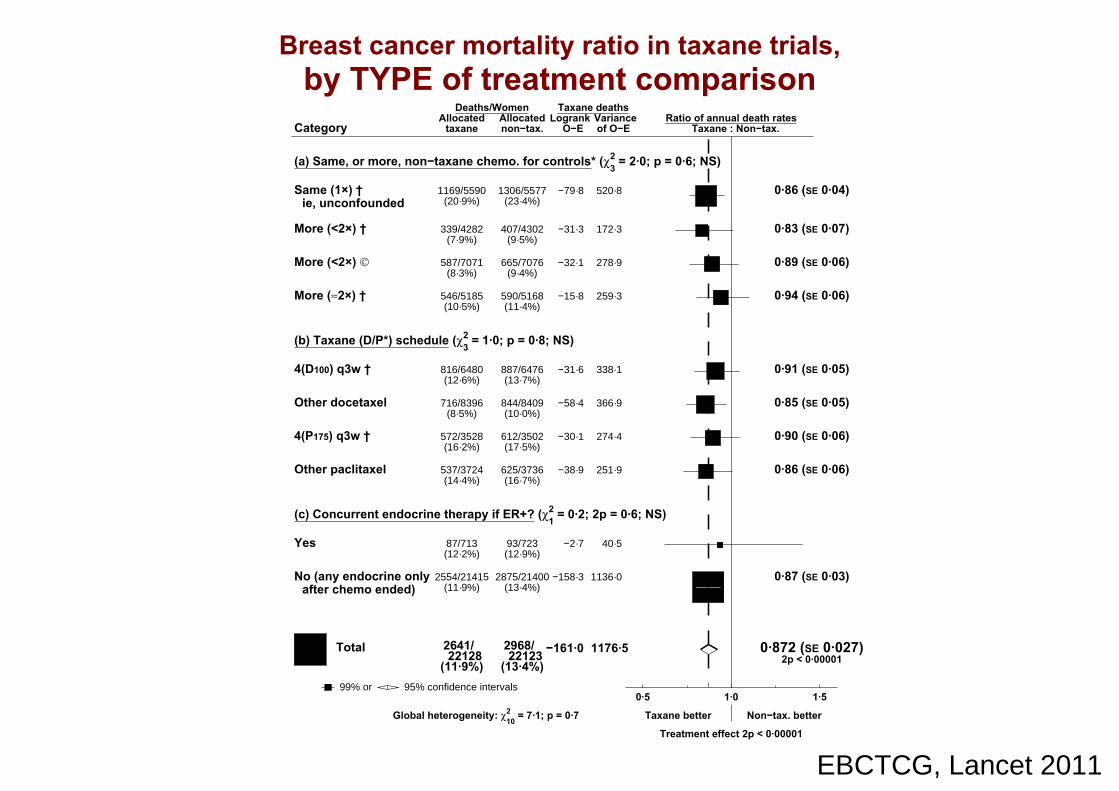
EBCTCG, Lancet 2011
Breast cancer mortality ratio in taxane trials, by TYPE of treatment comparison
CategoryDeaths/Women
Allocatedtaxane non−tax.
Ratio of annual death ratesTaxane : Non−tax.
Logrank VarianceO−E of O−E
Taxane deaths
(a) Same, or more, non−taxane chemo. for controls* (χ23 = 2·0; p = 0·6; NS)
Same (1×) †ie, unconfounded
1169/5590 1306/5577(20·9%) (23·4%)
520·8−79·8 0·86 (SE 0·04)
More (<2×) † 339/4282 407/4302(7·9%) (9·5%)
172·3−31·3 0·83 (SE 0·07)
More (<2×) © 587/7071 665/7076(8·3%) (9·4%)
278·9−32·1 0·89 (SE 0·06)
More (≈2×) † 546/5185 590/5168(10·5%) (11·4%)
259·3−15·8 0·94 (SE 0·06)
(b) Taxane (D/P*) schedule (χ23 = 1·0; p = 0·8; NS)
4(D100) q3w † 816/6480 887/6476(12·6%) (13·7%)
338·1−31·6 0·91 (SE 0·05)
Other docetaxel 716/8396 844/8409(8·5%) (10·0%)
366·9−58·4 0·85 (SE 0·05)
4(P175) q3w † 572/3528 612/3502(16·2%) (17·5%)
274·4−30·1 0·90 (SE 0·06)
Other paclitaxel 537/3724 625/3736(14·4%) (16·7%)
251·9−38·9 0·86 (SE 0·06)
(c) Concurrent endocrine therapy if ER+? (χ21 = 0·2; 2p = 0·6; NS)
Yes 87/713 93/723(12·2%) (12·9%)
40·5−2·7
No (any endocrine onlyafter chemo ended)
2554/21415 2875/21400(11·9%) (13·4%)
1136·0−158·3 0·87 (SE 0·03)
2641/22128
2968/22123
(11·9%) (13·4%)−161·0 1176·5 0·872 (SE 0·027)
2p < 0·00001 Total
Allocated
99% or 95% confidence intervals .0·5 1·0 1·5
Taxane better Non−tax. better
Treatment effect 2p < 0·00001
Global heterogeneity: χ210 = 7·1; p = 0·7

Taxane trials: suby age stageby age, stage
Taxane-plus-anthracyv
an anthracycline-baswith the SAME, o
non-taxane cy
bgroup analysesand ER statusand ER status
ycline-based regimenssed control regimen
or MORE, of eachytotoxic drug
EBCTCG, Lancet 2011

EBCTCG, Lancet 2011
Taxane-plus-anthracycline-based regimen
vs the SAME, or MORE, non-taxane chemo,
by ENTRY AGE
25757 women, age < 55(87% N+)
Death rates (% / year: total rate − rate in women without recurrence) and logrank analyses
Tax + anthControl
Allocation
Rate ratio(O−E) / V
0 1 2 3Years 0 − 42·42 SE 0·072·62 SE 0·070·91 SE 0·04−58·4 / 604·0
4 5 6 7Year 5+
2·36 SE 0·132·63 SE 0·150·88 SE 0·08−19·6 / 152·8
8 years0
10
20
30
40
50
Bre
ast c
ance
r mor
talit
y
%± SE
8−y gain 1·6% (SE 0·7)
Control
Tax + anth
19·2%17·6%
Logrank 2p = 0·005RR 0·90 (0·84−0·97)
12·8%
11·7%
12514 women, age 55−69(89% N+)
0 1 2 3Years 0 − 42·21 SE 0·092·69 SE 0·110·81 SE 0·05−57·7 / 275·4
4 5 6 7Year 5+
2·64 SE 0·213·14 SE 0·250·85 SE 0·11−11·4 / 71·0
8 years0
10
20
30
40
50
Bre
ast c
ance
r mor
talit
y
%± SE
8−y gain 3·3% (SE 1·1)
Control
Tax + anth
21·0%17·7%
Logrank 2p = 0·0002RR 0·82 (0·74−0·91)
13·5%
11·0%
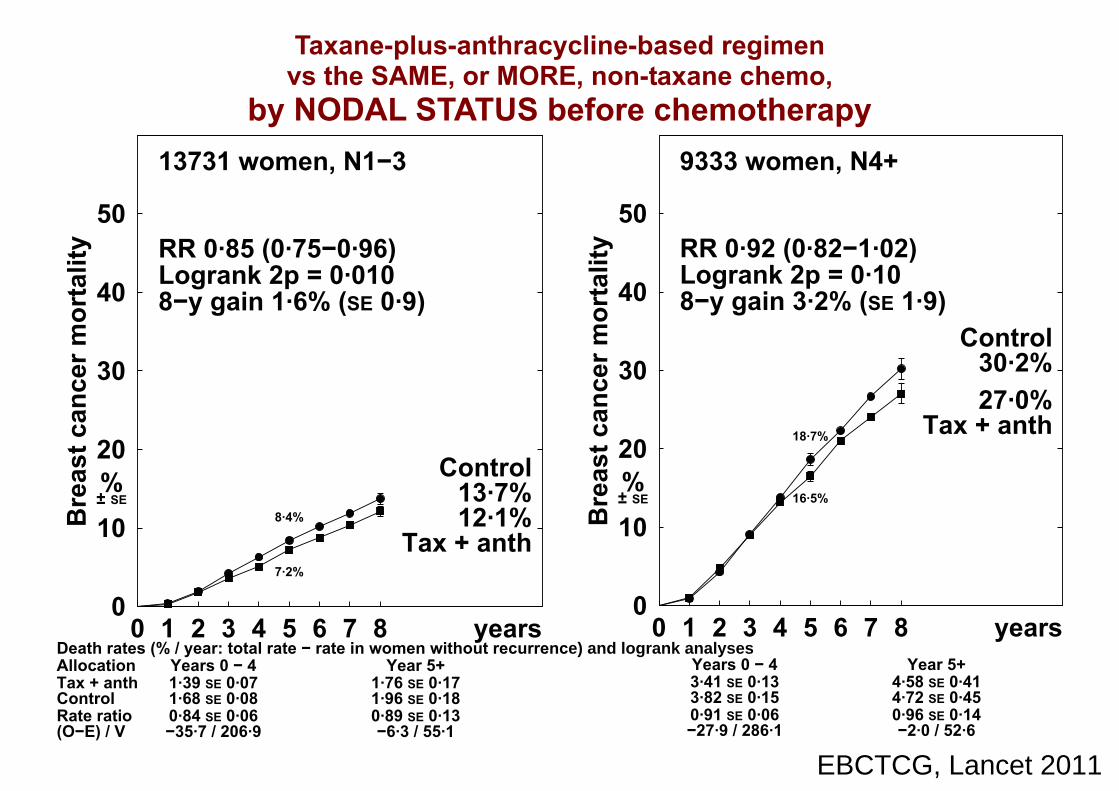
EBCTCG, Lancet 2011
Taxane-plus-anthracycline-based regimen
vs the SAME, or MORE, non-taxane chemo,
by NODAL STATUS before chemotherapy
13731 women, N1−3
Death rates (% / year: total rate − rate in women without recurrence) and logrank analyses
Tax + anthControl
Allocation
Rate ratio(O−E) / V
0 1 2 3Years 0 − 41·39 SE 0·071·68 SE 0·080·84 SE 0·06−35·7 / 206·9
4 5 6 7Year 5+
1·76 SE 0·171·96 SE 0·180·89 SE 0·13−6·3 / 55·1
8 years0
10
20
30
40
50
Bre
ast c
ance
r mor
talit
y
%± SE
8−y gain 1·6% (SE 0·9)
Control
Tax + anth
13·7%12·1%
Logrank 2p = 0·010RR 0·85 (0·75−0·96)
8·4%
7·2%
9333 women, N4+
0 1 2 3Years 0 − 43·41 SE 0·133·82 SE 0·150·91 SE 0·06−27·9 / 286·1
4 5 6 7Year 5+
4·58 SE 0·414·72 SE 0·450·96 SE 0·14−2·0 / 52·6
8 years0
10
20
30
40
50
Bre
ast c
ance
r mor
talit
y
%± SE
8−y gain 3·2% (SE 1·9)Control
Tax + anth
30·2%27·0%
Logrank 2p = 0·10RR 0·92 (0·82−1·02)
18·7%
16·5%

EBCTCG, Lancet 2011
Breast cancer mortality ratio in taxane trials, by AGE and STAGE
CategoryDeaths/Women
Allocatedtaxane non−tax.
Ratio of annual death ratesTaxane : Non−tax.
Logrank VarianceO−E of O−E
Taxane deaths
(d) Entry age (trend χ21 = 3·5; 2p = 0·06)
Age < 45 871/5930 928/5927(14·7%) (15·7%)
384·6−36·7 0·91 (SE 0·05)
45 − 54 835/7747 932/7720(10·8%) (12·1%)
372·3−41·4 0·89 (SE 0·05)
55 − 69 735/6572 877/6570(11·2%) (13·3%)
346·5−69·0 0·82 (SE 0·05)
70+ 51/314 81/343(16·2%) (23·6%)
24·4−11·4 0·63 (SE 0·16)
Age unknown 149/1565 150/1563(9·5%) (9·6%)
48·6−2·5
(e) Nodal status before chemo (trend χ21 = 0·3; 2p = 0·6; NS)
N0/N− 120/2104 132/2070(5·7%) (6·4%)
61·0−6·0 0·91 (SE 0·12)
N1−3 520/6981 599/6977(7·4%) (8·6%)
262·1−41·9 0·85 (SE 0·06)
N4+ 783/5012 849/5062(15·6%) (16·8%)
338·8−29·9 0·92 (SE 0·05)
Other / unknown 1218/8031 1388/8014(15·2%) (17·3%)
514·6−83·1 0·85 (SE 0·04)
2641/22128
2968/22123
(11·9%) (13·4%)−161·0 1176·5 0·872 (SE 0·027)
2p < 0·00001 Total
Allocated
99% or 95% confidence intervals .0·5 1·0 1·5
Taxane better Non−tax. better
Treatment effect 2p < 0·00001
Global heterogeneity: χ210 = 7·1; p = 0·7

EBCTCG, Lancet 2011
Taxane-plus-anthracycline-based regimen
vs the SAME, or MORE, non-taxane chemo,
by ER STATUS
11258 women, ER−poor(81% N+)
Death rates (% / year: total rate − rate in women without recurrence) and logrank analyses
Tax + anthControl
Allocation
Rate ratio(O−E) / V
0 1 2 3Years 0 − 44·00 SE 0·134·86 SE 0·150·85 SE 0·04−71·7 / 438·8
4 5 6 7Year 5+
2·44 SE 0·202·67 SE 0·230·91 SE 0·12−6·2 / 66·1
8 years0
10
20
30
40
50
Bre
ast c
ance
r mor
talit
y
%± SE
8−y gain 3·7% (SE 1·1)
Control
Tax + anth
27·7%24·0%
Logrank 2p = 0·0005RR 0·86 (0·79−0·94)
21·4%
18·6%
24762 women, ER+(90% N+)
0 1 2 3Years 0 − 41·45 SE 0·051·62 SE 0·060·89 SE 0·05−44·3 / 365·5
4 5 6 7Year 5+
2·51 SE 0·152·87 SE 0·160·85 SE 0·08−22·8 / 136·8
8 years0
10
20
30
40
50
Bre
ast c
ance
r mor
talit
y
%± SE
8−y gain 1·4% (SE 0·8)
Control
Tax + anth
15·7%14·3%
Logrank 2p = 0·003RR 0·87 (0·80−0·95)
8·6%
7·6%

EBCTCG, Lancet 2011
Breast cancer mortality ratio in taxane trials, by ER STATUS and subsets of ER+
CategoryDeaths/Women
Allocatedtaxane non−tax.
Ratio of annual death ratesTaxane : Non−tax.
Logrank VarianceO−E of O−E
Taxane deaths
(f) ER status (χ21 = 0·1; 2p = 0·7; NS)
ER−poor 1087/5883 1271/6027(18·5%) (21·1%)
505·0−78·0 0·86 (SE 0·04)
ER+ 1044/12848 1164/12790(8·1%) (9·1%)
502·3−67·1 0·87 (SE 0·04)
ER unknown 510/3397 533/3306(15·0%) (16·1%)
169·1−15·9 0·91 (SE 0·07)
Subsets of ER+
ER+ HER2− 273/4613 296/4656(5·9%) (6·4%)
136·2−11·3 0·92 (SE 0·08)
ER+ HER2+ 98/978 114/1022(10·0%) (11·2%)
47·5−6·2 0·88 (SE 0·14)
ER+, age < 55 666/8316 725/8223(8·0%) (8·8%)
317·9−37·7 0·89 (SE 0·05)
ER+, 55 − 69 355/4338 413/4368(8·2%) (9·5%)
174·5−25·8 0·86 (SE 0·07)
ER+, poorly differentiated
440/3362 398/3330(13·1%) (12·0%)
189·814·8 1·08 (SE 0·08)
ER+, moderately differentiated
273/5552 354/5595(4·9%) (6·3%)
143·0−38·0 0·77 (SE 0·07)
ER+, well differentiated
48/1501 74/1430(3·2%) (5·2%)
28·7−11·1 0·68 (SE 0·16)
2641/22128
2968/22123
(11·9%) (13·4%)−161·0 1176·5 0·872 (SE 0·027)
2p < 0·00001 Total
Allocated
99% or 95% confidence intervals .0·5 1·0 1·5
Taxane better Non−tax. better
Treatment effect 2p < 0·00001
Global heterogeneity: χ210 = 7·1; p = 0·7

Trials of any anthregimen* vs s
*Standard 4AC,or higher-cumor higher-cumregimens (eg,
hracycline-based standard CMF
, standard 4EC,ulative-dosageulative-dosage, CAF or CEF)
EBCTCG, Lancet 2011

Definitions of “stand(mg/m2 x frequ( g q
StandardSix 4-weekly cycles of C100
StandardFour 3-weekly cycle
Approximate ein the trials of standardin the trials of standardboth appeared to be of
dard” CMF and 4AC uency/cycle)y y )
d CMF:0x14 oral M40x2 iv F600x2 iv
d 4AC:es of A60 iv C600 iv
equivalence: AC vs standard CMF AC vs standard CMF,
f comparable efficacy
EBCTCG, Lancet 2011

EBCTCG, Lancet 2011
Standard 4AC vs standard CMF: approximate equivalence
5122 women
Recurrence rates (% / year) and logrank analyses
4ACCMF
Allocation
Rate ratio(O−E) / V
0Years 0 − 4
7·97 (820 / 10292)8·21 (830 / 10108)
0·98 SE 0·05−8·7 / 355·5
5Years 5 − 9
2·86 (194 / 6795)2·99 (199 / 6658)
0·91 SE 0·10−8·5 / 92·1
Year 10+2·36 (100 / 4237)1·87 (76 / 4054)
1·28 SE 0·1710·4 / 42·3
10 years0
10
20
30
40
50
Rec
urre
nce
%± SE
10−y gain 1·1% (SE 1·5)
CMF
4AC
42·1%41·0%
Logrank 2p = 0·76RR 0·99 (0·90−1·08)
32·9%
32·4%
5122 women
0Years 0 − 44·65 SE 0·204·81 SE 0·210·97 SE 0·06−6·3 / 245·2
5Years 5 − 92·94 SE 0·193·04 SE 0·200·97 SE 0·09−3·7 / 111·6
Year 10+2·06 SE 0·201·96 SE 0·201·03 SE 0·15
1·5 / 48·9
10 years0
10
20
30
40
50
Bre
ast c
ance
r mor
talit
y
%± SE
10−y gain 0·9% (SE 1·4)CMF
4AC32·5%31·6%
Logrank 2p = 0·67RR 0·98 (0·89−1·08)
21·7%
21·2%

Examples of higheranthracycline-b
(mg/m2 x freq(mg/m x freq
CASix 4-weekly cycles of C10y y
CESix 4-weekly cycles of C7
* Higher dosage than sg ganthracycline but also
scheduled dosages couscheduled dosages cou
r-cumulative-dosage* based regimensquency/cycle)quency/cycle)
AF:00x14 oral A40x2 iv F500x2 iv
EF:75x14 oral E60x2 iv F500x2 iv
standard 4AC not only of yof other cytotoxic drugs;
uld be reduced for toxicityuld be reduced for toxicity
EBCTCG, Lancet 2011
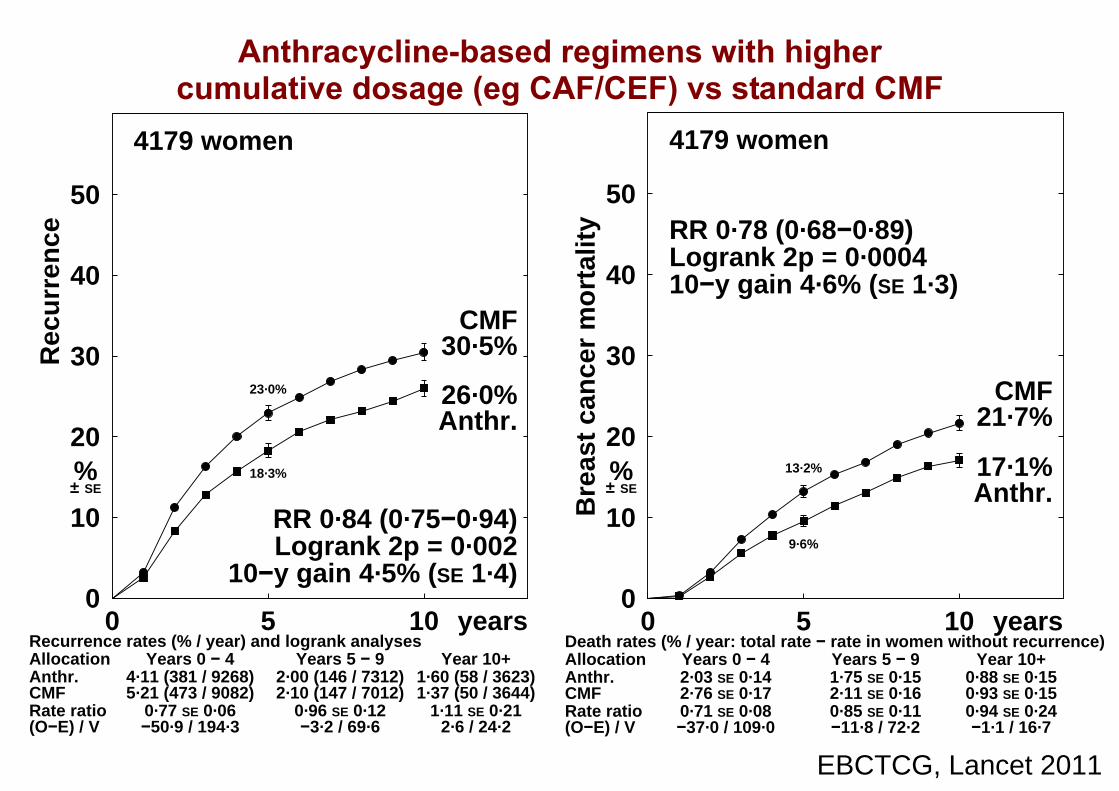
EBCTCG, Lancet 2011
Anthracycline-based regimens with higher
cumulative dosage (eg CAF/CEF) vs standard CMF
4179 women
Recurrence rates (% / year) and logrank analyses
Anthr.CMF
Allocation
Rate ratio(O−E) / V
0Years 0 − 4
4·11 (381 / 9268)5·21 (473 / 9082)
0·77 SE 0·06−50·9 / 194·3
5Years 5 − 9
2·00 (146 / 7312)2·10 (147 / 7012)
0·96 SE 0·12−3·2 / 69·6
Year 10+1·60 (58 / 3623)1·37 (50 / 3644)
1·11 SE 0·212·6 / 24·2
10 years0
10
20
30
40
50
Rec
urr
ence
%± SE
10−y gain 4·5% (SE 1·4)
CMF
Anthr.
30·5%
26·0%
Logrank 2p = 0·002RR 0·84 (0·75−0·94)
23·0%
18·3%
4179 women
Death rates (% / year: total rate − rate in women without recurrence)
Anthr.CMF
Allocation
Rate ratio(O−E) / V
0Years 0 − 42·03 SE 0·142·76 SE 0·170·71 SE 0·08−37·0 / 109·0
5Years 5 − 91·75 SE 0·152·11 SE 0·160·85 SE 0·11−11·8 / 72·2
Year 10+0·88 SE 0·150·93 SE 0·150·94 SE 0·24−1·1 / 16·7
10 years0
10
20
30
40
50
Bre
ast
can
cer
mo
rtal
ity
%± SE
10−y gain 4·6% (SE 1·3)
CMF
Anthr.
21·7%
17·1%
Logrank 2p = 0·0004RR 0·78 (0·68−0·89)
13·2%
9·6%
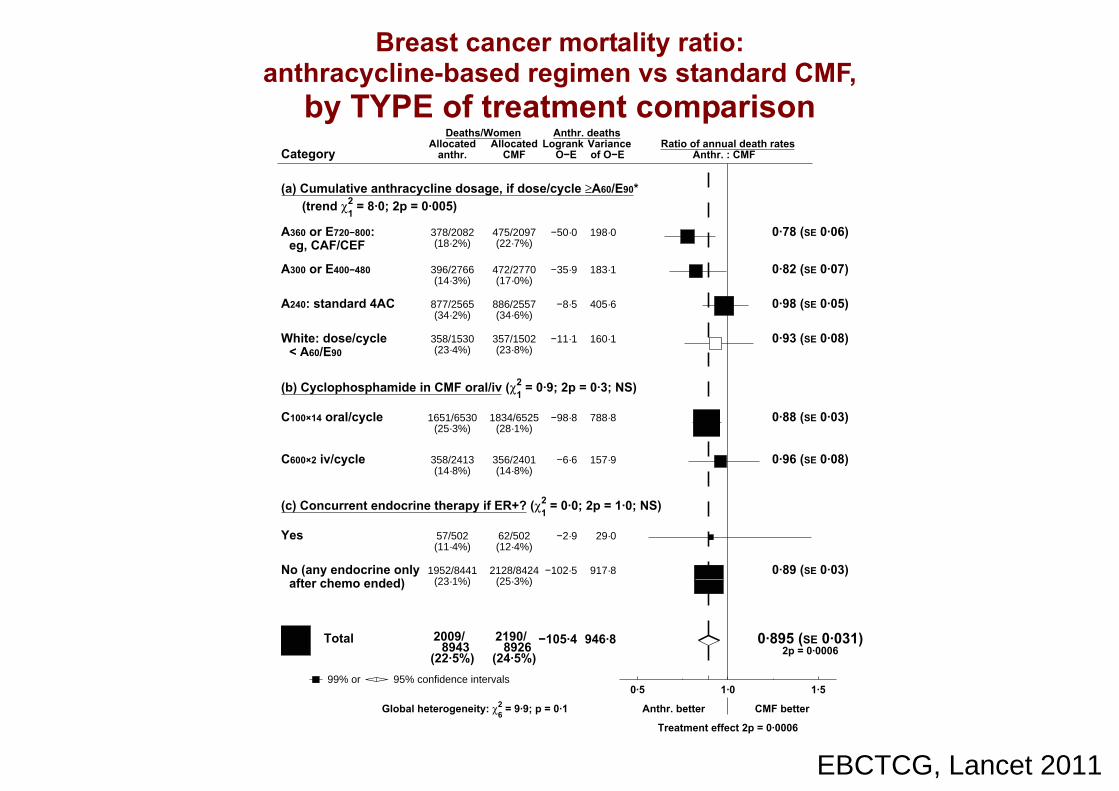
EBCTCG, Lancet 2011
Breast cancer mortality ratio:
anthracycline-based regimen vs standard CMF,
by TYPE of treatment comparison
CategoryDeaths/Women
Allocatedanthr. CMF
Ratio of annual death ratesAnthr. : CMF
Logrank VarianceO−E of O−E
Anthr. deaths
(a) Cumulative anthracycline dosage, if dose/cycle ≥A60/E90* (trend χ2
1 = 8·0; 2p = 0·005)
A360 or E720−800:eg, CAF/CEF
378/2082 475/2097(18·2%) (22·7%)
198·0−50·0 0·78 (SE 0·06)
A300 or E400−480 396/2766 472/2770(14·3%) (17·0%)
183·1−35·9 0·82 (SE 0·07)
A240: standard 4AC 877/2565 886/2557(34·2%) (34·6%)
405·6−8·5 0·98 (SE 0·05)
White: dose/cycle< A60/E90
358/1530 357/1502(23·4%) (23·8%)
160·1−11·1 0·93 (SE 0·08)
(b) Cyclophosphamide in CMF oral/iv (χ21 = 0·9; 2p = 0·3; NS)
C100×14 oral/cycle 1651/6530 1834/6525(25·3%) (28·1%)
788·8−98·8 0·88 (SE 0·03)
C600×2 iv/cycle 358/2413 356/2401(14·8%) (14·8%)
157·9−6·6 0·96 (SE 0·08)
(c) Concurrent endocrine therapy if ER+? (χ21 = 0·0; 2p = 1·0; NS)
Yes 57/502 62/502(11·4%) (12·4%)
29·0−2·9
No (any endocrine onlyafter chemo ended)
1952/8441 2128/8424(23·1%) (25·3%)
917·8−102·5 0·89 (SE 0·03)
2009/8943
2190/8926
(22·5%) (24·5%)−105·4 946·8 0·895 (SE 0·031)
2p = 0·0006 Total
Allocated
99% or 95% confidence intervals .0·5 1·0 1·5
Anthr. better CMF better
Treatment effect 2p = 0·0006
Global heterogeneity: χ26 = 9·9; p = 0·1
Trials of any anthrregimen vs staregimen vs sta
bsubgroup aby age, stage a
racycline-based andard CMF:andard CMF:
lanalysesand ER status
EBCTCG, Lancet 2011

EBCTCG, Lancet 2011
Breast cancer mortality ratio:
anthracycline-based regimen vs standard CMF,
by AGE and STAGE
CategoryDeaths/Women
Allocatedanthr. CMF
Ratio of annual death ratesAnthr. : CMF
Logrank VarianceO−E of O−E
Anthr. deaths
(d) Entry age (trend χ21 = 0·0; 2p = 0·9; NS)
Age < 45 871/3398 991/3454(25·6%) (28·7%)
422·8−54·8 0·88 (SE 0·05)
45 − 54 738/3399 773/3356(21·7%) (23·0%)
344·3−30·6 0·91 (SE 0·05)
55 − 69 375/1961 396/1920(19·1%) (20·6%)
169·3−20·2 0·89 (SE 0·07)
70+ 18/106 25/112(17·0%) (22·3%)
8·7−2·2
Age unknown 7/79 5/84(8·9%) (6·0%)
1·82·4
(e) Nodal status (trend χ21 = 0·9; 2p = 0·3; NS)
N0/N− 461/3865 541/3869(11·9%) (14·0%)
233·1−40·5 0·84 (SE 0·06)
N1−3 520/2442 543/2418(21·3%) (22·5%)
243·4−10·0 0·96 (SE 0·06)
N4+ 612/1234 647/1233(49·6%) (52·5%)
273·4−23·1 0·92 (SE 0·06)
Other / unknown 416/1402 459/1406(29·7%) (32·6%)
196·8−31·9 0·85 (SE 0·07)
2009/8943
2190/8926
(22·5%) (24·5%)−105·4 946·8 0·895 (SE 0·031)
2p = 0·0006 Total
Allocated
99% or 95% confidence intervals .0·5 1·0 1·5
Anthr. better CMF better
Treatment effect 2p = 0·0006
Global heterogeneity: χ26 = 9·9; p = 0·1

EBCTCG, Lancet 2011
Breast cancer mortality ratio:
anthracycline-based regimen vs standard CMF,
by ER STATUS and subsets of ER+
CategoryDeaths/Women
Allocatedanthr. CMF
Ratio of annual death ratesAnthr. : CMF
Logrank VarianceO−E of O−E
Anthr. deaths
(f) ER status (χ21 = 0·1; 2p = 0·8; NS)
ER−poor 1201/4488 1287/4518(26·8%) (28·5%)
564·6−43·7 0·93 (SE 0·04)
ER+ 569/3279 610/3257(17·4%) (18·7%)
267·0−26·5 0·91 (SE 0·06)
ER unknown 239/1176 293/1151(20·3%) (25·5%)
115·2−35·2 0·74 (SE 0·08)
Subsets of ER+
ER10−99 fmol/mg 247/1072 279/1094(23·0%) (25·5%)
108·3−21·2 0·82 (SE 0·09)
ER100+ fmol/mg 86/450 116/450(19·1%) (25·8%)
42·0−15·4 0·69 (SE 0·13)
ER+, age < 55 426/2359 461/2345(18·1%) (19·7%)
202·3−22·9 0·89 (SE 0·07)
ER+, 55 − 69 134/846 140/847(15·8%) (16·5%)
61·1−3·6 0·94 (SE 0·12)
ER+, poorly differentiated
131/868 130/793(15·1%) (16·4%)
52·7−4·1
ER+, moderately/well differentiated
125/952 136/1047(13·1%) (13·0%)
58·3−1·8
2009/8943
2190/8926
(22·5%) (24·5%)−105·4 946·8 0·895 (SE 0·031)
2p = 0·0006 Total
Allocated
99% or 95% confidence intervals .0·5 1·0 1·5
Anthr. better CMF better
Treatment effect 2p = 0·0006
Global heterogeneity: χ26 = 9·9; p = 0·1

Trials of chemno adjuvant chno adjuvant ch
- Any anthracycline- Any anthracycline(eg, standard
- Standard C
otherapy vs hemotherapyhemotherapy
e-based regimene-based regimen 4AC) vs nil
CMF vs nil
EBCTCG, Lancet 2011
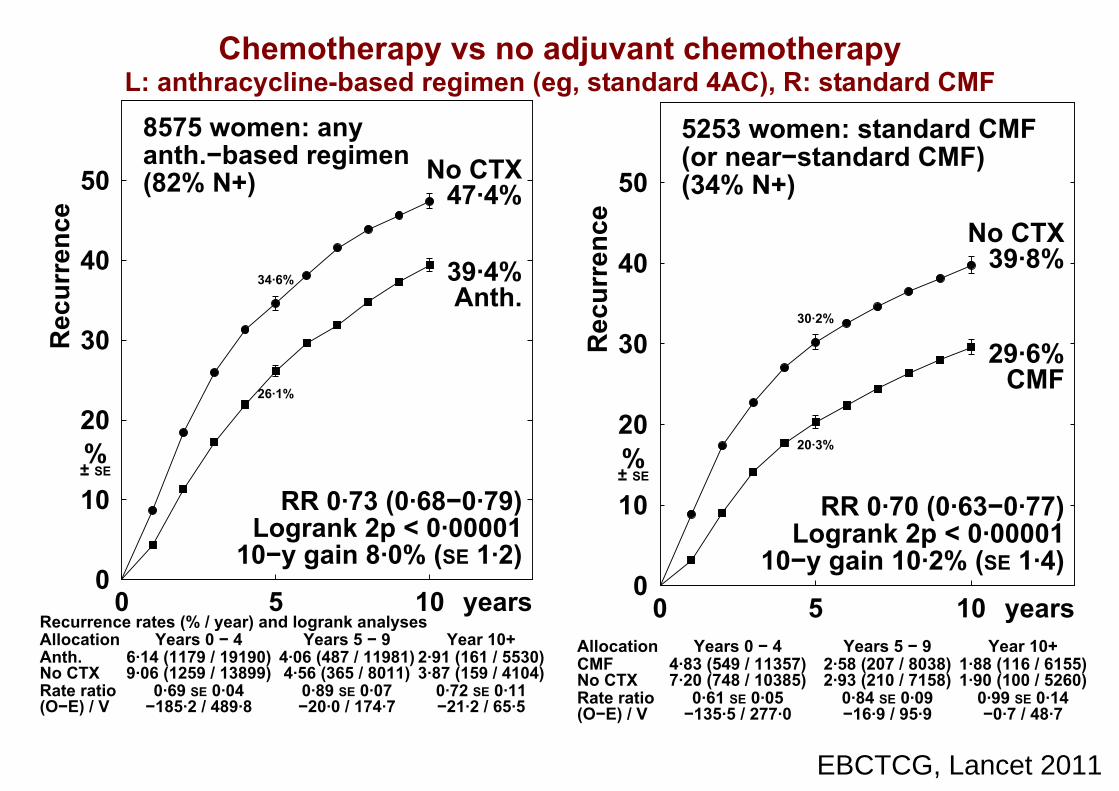
EBCTCG, Lancet 2011
Chemotherapy vs no adjuvant chemotherapy
L: anthracycline-based regimen (eg, standard 4AC), R: standard CMF
8575 women: anyanth.−based regimen(82% N+)
Recurrence rates (% / year) and logrank analyses
Anth.No CTX
Allocation
Rate ratio(O−E) / V
0Years 0 − 4
6·14 (1179 / 19190)9·06 (1259 / 13899)
0·69 SE 0·04−185·2 / 489·8
5Years 5 − 9
4·06 (487 / 11981)4·56 (365 / 8011)
0·89 SE 0·07−20·0 / 174·7
Year 10+2·91 (161 / 5530)3·87 (159 / 4104)
0·72 SE 0·11−21·2 / 65·5
10 years0
10
20
30
40
50
Rec
urre
nce
%± SE
10−y gain 8·0% (SE 1·2)
No CTX
Anth.
47·4%
39·4%
Logrank 2p < 0·00001RR 0·73 (0·68−0·79)
34·6%
26·1%
5253 women: standard CMF(or near−standard CMF)(34% N+)
CMFNo CTX
Allocation
Rate ratio(O−E) / V
0Years 0 − 4
4·83 (549 / 11357)7·20 (748 / 10385)
0·61 SE 0·05−135·5 / 277·0
5Years 5 − 9
2·58 (207 / 8038)2·93 (210 / 7158)
0·84 SE 0·09−16·9 / 95·9
Year 10+1·88 (116 / 6155)1·90 (100 / 5260)
0·99 SE 0·14−0·7 / 48·7
10 years0
10
20
30
40
50
Rec
urre
nce
%± SE
10−y gain 10·2% (SE 1·4)
No CTX
CMF
39·8%
29·6%
Logrank 2p < 0·00001RR 0·70 (0·63−0·77)
30·2%
20·3%
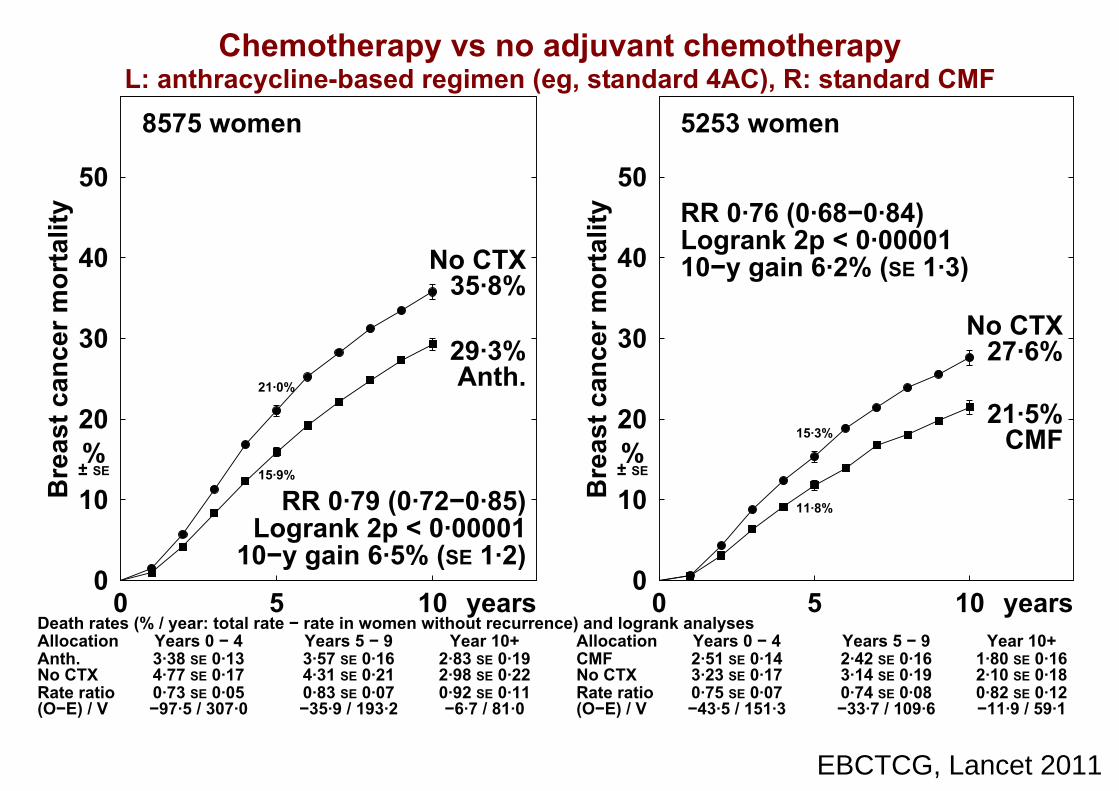
EBCTCG, Lancet 2011
Chemotherapy vs no adjuvant chemotherapy
L: anthracycline-based regimen (eg, standard 4AC), R: standard CMF
8575 women
Death rates (% / year: total rate − rate in women without recurrence) and logrank analyses
Anth.No CTX
Allocation
Rate ratio(O−E) / V
0Years 0 − 43·38 SE 0·134·77 SE 0·170·73 SE 0·05−97·5 / 307·0
5Years 5 − 93·57 SE 0·164·31 SE 0·210·83 SE 0·07−35·9 / 193·2
Year 10+2·83 SE 0·192·98 SE 0·220·92 SE 0·11−6·7 / 81·0
10 years0
10
20
30
40
50
Bre
ast c
ance
r mor
talit
y
%± SE
10−y gain 6·5% (SE 1·2)
No CTX
Anth.
35·8%
29·3%
Logrank 2p < 0·00001RR 0·79 (0·72−0·85)
21·0%
15·9%
5253 women
CMFNo CTX
Allocation
Rate ratio(O−E) / V
0Years 0 − 42·51 SE 0·143·23 SE 0·170·75 SE 0·07−43·5 / 151·3
5Years 5 − 92·42 SE 0·163·14 SE 0·190·74 SE 0·08−33·7 / 109·6
Year 10+1·80 SE 0·162·10 SE 0·180·82 SE 0·12−11·9 / 59·1
10 years0
10
20
30
40
50
Bre
ast c
ance
r mor
talit
y
%± SE
10−y gain 6·2% (SE 1·3)
No CTX
CMF
27·6%
21·5%
Logrank 2p < 0·00001RR 0·76 (0·68−0·84)
15·3%
11·8%
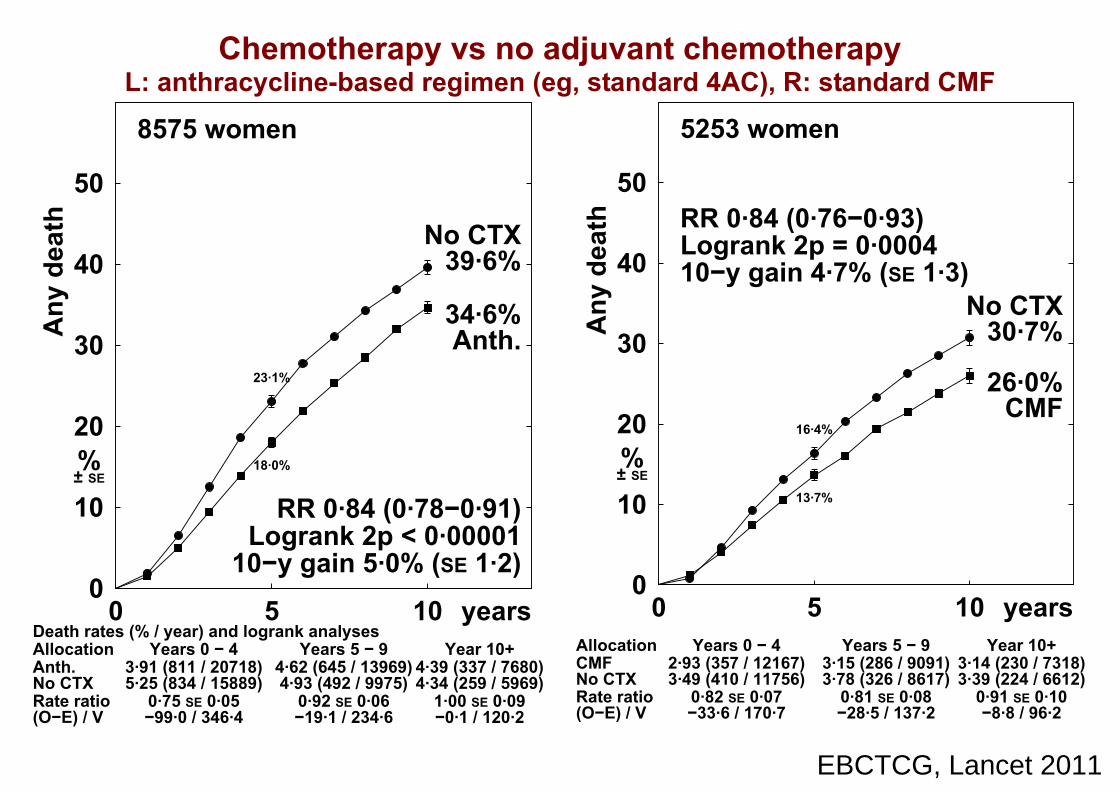
EBCTCG, Lancet 2011
Chemotherapy vs no adjuvant chemotherapy
L: anthracycline-based regimen (eg, standard 4AC), R: standard CMF
8575 women
Death rates (% / year) and logrank analyses
Anth.No CTX
Allocation
Rate ratio(O−E) / V
0Years 0 − 4
3·91 (811 / 20718)5·25 (834 / 15889)
0·75 SE 0·05−99·0 / 346·4
5Years 5 − 9
4·62 (645 / 13969)4·93 (492 / 9975)
0·92 SE 0·06−19·1 / 234·6
Year 10+4·39 (337 / 7680)4·34 (259 / 5969)
1·00 SE 0·09−0·1 / 120·2
10 years0
10
20
30
40
50
Any
dea
th
%± SE
10−y gain 5·0% (SE 1·2)
No CTX
Anth.
39·6%
34·6%
Logrank 2p < 0·00001RR 0·84 (0·78−0·91)
23·1%
18·0%
5253 women
CMFNo CTX
Allocation
Rate ratio(O−E) / V
0Years 0 − 4
2·93 (357 / 12167)3·49 (410 / 11756)
0·82 SE 0·07−33·6 / 170·7
5Years 5 − 9
3·15 (286 / 9091)3·78 (326 / 8617)
0·81 SE 0·08−28·5 / 137·2
Year 10+3·14 (230 / 7318)3·39 (224 / 6612)
0·91 SE 0·10−8·8 / 96·2
10 years0
10
20
30
40
50
Any
dea
th
%± SE
10−y gain 4·7% (SE 1·3)No CTX
CMF
30·7%
26·0%
Logrank 2p = 0·0004RR 0·84 (0·76−0·93)
16·4%
13·7%

EBCTCG, Lancet 2011
Breast cancer mortality ratio: anthracycline-based regimen(eg, standard 4AC) or standard CMF vs no chemotherapy,
by TYPE of treatment comparison
CategoryDeaths/Women
Allocatedchemo. control
Ratio of annual death ratesChemo. : Control
Logrank VarianceO−E of O−E
Chemo. deaths
(a) Cumulative anthracycline dosage, if dose/cycle ≥A60/E90* (χ2
1 = 1·5; 2p = 0·2; NS)
A360: CAF 324/1177 456/1143(27·5%) (39·9%)
80·3−35·3 0·64 (SE 0·09)
A300 (no trials)
A240/E360:standard 4AC/EC
212/747 265/792(28·4%) (33·5%)
100·5−25·6 0·78 (SE 0·09)
White: dose/cycle< A60 or E90
880/2830 980/2798(31·1%) (35·0%)
400·5−79·0 0·82 (SE 0·05)
(Excludes CMF trials)
(b) Anthracycline tested* (χ22 = 2·1; 2p = 0·4; NS)
Doxorubicin (A) 973/2626 1185/2570(37·1%) (46·1%)
370·4−106·1 0·75 (SE 0·05)
Epirubicin (E) 293/1283 318/1283(22·8%) (24·8%)
138·4−20·5 0·86 (SE 0·08)
A or E 150/845 198/880(17·8%) (22·5%)
72·5−13·3 0·83 (SE 0·11)
No anthracycline
(standard CMF ornear−standard CMF)
658/2665 790/2588(24·7%) (30·5%)
320·1−89·1 0·76 (SE 0·05)
(c) Concurrent endocrine therapy if ER+? (χ21 = 0·0; 2p = 1·0; NS)
Yes 922/3515 1107/3518(26·2%) (31·5%)
448·2−106·4 0·79 (SE 0·04)
No (any endocrine onlyafter chemo ended)
805/2585 890/2482(31·1%) (35·9%)
363·7−85·4 0·79 (SE 0·05)
Random † 347/1319 494/1321(26·3%) (37·4%)
89·4−37·2 0·66 (SE 0·09)
2074/7419
2491/7321
(28·0%) (34·0%)−229·0 901·4 0·776 (SE 0·029)
2p < 0·00001 Total
Allocated
99% or 95% confidence intervals .0·5 1·0 1·5
Chemo. better Chemo. worse
Treatment effect 2p < 0·00001
Global heterogeneity: χ27 = 8·4; p = 0·3

EBCTCG, Lancet 2011
Chemotherapy (anthracycline-based regimen or standard CMF) + 5 year endocrine therapy vs 5 year endocrine therapy only,
ER+ disease only: by ENTRY AGE
1853 women, age < 55
Death rates (% / year: total rate − rate in women without recurrence) and logrank analyses
Chem+end.End. only
Allocation
Rate ratio(O−E) / V
0Years 0 − 41·72 SE 0·192·20 SE 0·230·71 SE 0·14−13·0 / 37·8
5Years 5 − 91·99 SE 0·232·53 SE 0·280·65 SE 0·14−14·7 / 33·8
Year 10+1·77 SE 0·281·69 SE 0·290·96 SE 0·24−0·6 / 16·2
10 years0
10
20
30
40
50
Bre
ast c
ance
r mor
talit
y
%± SE
10−y gain 6·8% (SE 1·9)
End. only
Chem+end.
22·3%
15·5%
Logrank 2p = 0·002RR 0·72 (0·59−0·89)
11·0%
7·8%
2954 women, age 55−69
0Years 0 − 42·09 SE 0·162·75 SE 0·230·70 SE 0·10−23·1 / 66·0
5Years 5 − 92·88 SE 0·223·96 SE 0·320·75 SE 0·10−19·7 / 69·4
Year 10+3·03 SE 0·312·88 SE 0·351·03 SE 0·17
1·0 / 34·5
10 years0
10
20
30
40
50
Bre
ast c
ance
r mor
talit
y
%± SE
10−y gain 6·5% (SE 1·8)
End. only
Chem+end.
28·0%
21·5%
Logrank 2p = 0·001RR 0·78 (0·67−0·91)
13·3%
9·6%

Trials of any anthraregimen (eg, stan
no adjuvant cheno adjuvant che
Subgroup anaSubgroup anaage, stage and
and by subsets of
acycline-based ndard 4AC) vs emotherapy:emotherapy:
alyses byalyses by ER status, f ER+ disease
EBCTCG, Lancet 2011

EBCTCG, Lancet 2011
Any anthracycline-based regimen (eg, standard 4AC) vs no adjuvant chemotherapy,
by ENTRY AGE
2808 women, age < 55(70% N+)
Death rates (% / year: total rate − rate in women without recurrence) and logrank analyses
Anth.Control
Allocation
Rate ratio(O−E) / V
0Years 0 − 43·81 SE 0·244·77 SE 0·290·79 SE 0·09−25·5 / 108·4
5Years 5 − 93·53 SE 0·284·11 SE 0·340·81 SE 0·11−13·5 / 63·4
Year 10+1·85 SE 0·252·01 SE 0·280·96 SE 0·21−0·9 / 21·0
10 years0
10
20
30
40
50
Bre
ast c
ance
r mor
talit
y
%± SE
10−y gain 5·6% (SE 2·0)
Control
Anth.
35·8%
30·2%
Logrank 2p = 0·004RR 0·81 (0·71−0·94)
21·4%
17·6%
5373 women, age 55−69(88% N+)
0Years 0 − 43·26 SE 0·164·79 SE 0·220·71 SE 0·06−65·9 / 193·2
5Years 5 − 93·63 SE 0·204·40 SE 0·270·86 SE 0·08−19·2 / 125·4
Year 10+3·43 SE 0·283·65 SE 0·330·94 SE 0·13−3·5 / 58·3
10 years0
10
20
30
40
50
Bre
ast c
ance
r mor
talit
y
%± SE
10−y gain 6·5% (SE 1·5)
Control
Anth.
35·9%
29·4%
Logrank 2p < 0·00001RR 0·79 (0·71−0·87)
21·0%
15·5%

EBCTCG, Lancet 2011
Any anthracycline-based regimen (eg, standard 4AC) vs no adjuvant chemotherapy,
by NODAL STATUS
3955 women, N1−3
Death rates (% / year: total rate − rate in women without recurrence) and logrank analyses
Anth.Control
Allocation
Rate ratio(O−E) / V
0Years 0 − 41·91 SE 0·142·92 SE 0·200·71 SE 0·09−32·3 / 92·9
5Years 5 − 92·62 SE 0·193·22 SE 0·250·85 SE 0·10−12·4 / 78·4
Year 10+2·91 SE 0·273·16 SE 0·330·86 SE 0·14−6·6 / 42·7
10 years0
10
20
30
40
50
Bre
ast c
ance
r mor
talit
y
%± SE
10−y gain 5·0% (SE 1·5)
Control
Anth.
25·4%
20·3%
Logrank 2p = 0·0004RR 0·79 (0·69−0·90)
13·0%
9·4%
2168 women, N4+
0Years 0 − 45·53 SE 0·327·87 SE 0·450·74 SE 0·08−36·7 / 120·7
5Years 5 − 96·15 SE 0·438·11 SE 0·610·78 SE 0·10−19·0 / 75·5
Year 10+4·61 SE 0·534·72 SE 0·611·07 SE 0·20
1·9 / 26·0
10 years0
10
20
30
40
50
Bre
ast c
ance
r mor
talit
y
%± SE
10−y gain 8·8% (SE 2·4)
Control
Anth.
53·6%
44·8%
Logrank 2p = 0·0003RR 0·78 (0·69−0·90)
32·2%
25·4%

EBCTCG, Lancet 2011
Breast cancer mortality ratio: any anthracycline-based
regimen (eg, standard 4AC) vs no adjuvant chemotherapy,
by AGE and STAGE
CategoryDeaths/Women
Allocatedanth. control
Ratio of annual death ratesAnth. : Control
Logrank VarianceO−E of O−E
Anth. deaths
(d) Entry age (trend χ21 = 2·0; 2p = 0·2; NS)
Age < 45 135/402 127/353(33·6%) (36·0%)
53·0−4·9 0·91 (SE 0·13)
45 − 54 338/1115 419/1175(30·3%) (35·7%)
139·8−34·9 0·78 (SE 0·07)
55 − 69 899/2995 1071/2956(30·0%) (36·2%)
377·0−88·5 0·79 (SE 0·05)
70+ 43/225 84/232(19·1%) (36·2%)
11·4−11·7 0·36 (SE 0·19)
Age unknown 1/17 0/17(5·9%) (0·0%)
0·10·2
(e) Nodal status (trend χ21 = 0·0; 2p = 0·9; NS)
N0/N− 122/789 137/761(15·5%) (18·0%)
56·9−12·0 0·81 (SE 0·12)
N1−3 513/2257 604/2217(22·7%) (27·2%)
214·1−51·3 0·79 (SE 0·06)
N4+ 575/1226 741/1295(46·9%) (57·2%)
222·3−53·7 0·79 (SE 0·06)
Other / unknown 206/482 219/460(42·7%) (47·6%)
88·0−22·8 0·77 (SE 0·09)
1416/4754
1701/4733
(29·8%) (35·9%)−139·9 581·3 0·786 (SE 0·037)
2p < 0·00001 Total
Allocated
99% or 95% confidence intervals .0·5 1·0 1·5
Anth. better Anth. worse
Treatment effect 2p < 0·00001
Global heterogeneity: χ26 = 5·8; p = 0·4

EBCTCG, Lancet 2011
Any anthracycline-based regimen (eg, standard 4AC) vs no adjuvant chemotherapy,
by ER STATUS
2076 women, ER−poor(73% N+)
Death rates (% / year: total rate − rate in women without recurrence) and logrank analyses
Anth.Control
Allocation
Rate ratio(O−E) / V
0Years 0 − 44·96 SE 0·326·84 SE 0·410·76 SE 0·08−29·2 / 107·7
5Years 5 − 93·50 SE 0·334·47 SE 0·420·80 SE 0·13−10·8 / 48·7
Year 10+2·64 SE 0·362·92 SE 0·410·98 SE 0·20−0·5 / 24·1
10 years0
10
20
30
40
50
Bre
ast c
ance
r mor
talit
y
%± SE
10−y gain 7·1% (SE 2·3)
Control
Anth.
41·9%
34·8%
Logrank 2p = 0·003RR 0·80 (0·69−0·93)
28·3%
22·9%
5433 women, ER+(86% N+)
0Years 0 − 42·60 SE 0·143·63 SE 0·190·71 SE 0·07−54·3 / 156·2
5Years 5 − 93·40 SE 0·194·17 SE 0·250·81 SE 0·08−26·4 / 123·3
Year 10+3·09 SE 0·263·14 SE 0·300·92 SE 0·14−4·0 / 48·9
10 years0
10
20
30
40
50
Bre
ast c
ance
r mor
talit
y
%± SE
10−y gain 6·4% (SE 1·4)Control
Anth.
32·0%
25·6%
Logrank 2p < 0·00001RR 0·77 (0·69−0·86)
16·7%
12·2%

EBCTCG, Lancet 2011
Breast cancer mortality ratio: any anthracycline-based
regimen (eg, standard 4AC) vs no adjuvant chemotherapy,
by ER STATUS and subsets of ER+
CategoryDeaths/Women
Allocatedanth. control
Ratio of annual death ratesAnth. : Control
Logrank VarianceO−E of O−E
Anth. deaths
(f) ER status (χ21 = 0·1; 2p = 0·7; NS)
ER−poor 403/1095 464/1043(36·8%) (44·5%)
180·4−40·5 0·80 (SE 0·07)
ER+ 831/3100 1063/3177(26·8%) (33·5%)
328·5−84·6 0·77 (SE 0·05)
ER unknown 182/559 174/513(32·6%) (33·9%)
72·3−14·9 0·81 (SE 0·11)
Subsets of ER+
ER+, chemo+end. vs end. only ‡
659/2622 853/2675(25·1%) (31·9%)
247·0−56·2 0·80 (SE 0·06)
ER10−99 fmol/mg 416/1371 544/1442(30·3%) (37·7%)
162·5−35·3 0·80 (SE 0·07)
ER100+ fmol/mg 274/1146 337/1160(23·9%) (29·1%)
95·6−20·6 0·81 (SE 0·09)
ER+, age < 55 250/845 316/943(29·6%) (33·5%)
102·4−19·4 0·83 (SE 0·09)
ER+, 55 − 69 542/2071 677/2055(26·2%) (32·9%)
215·3−53·9 0·78 (SE 0·06)
ER+, poorly differentiated
100/461 120/477(21·7%) (25·2%)
45·8−12·2 0·77 (SE 0·13)
ER+, moderately/well differentiated
228/985 286/1026(23·1%) (27·9%)
112·8−27·8 0·78 (SE 0·08)
1416/4754
1701/4733
(29·8%) (35·9%)−139·9 581·3 0·786 (SE 0·037)
2p < 0·00001 Total
Allocated
99% or 95% confidence intervals .0·5 1·0 1·5
Anth. better Anth. worse
Treatment effect 2p < 0·00001
Global heterogeneity: χ26 = 5·8; p = 0·4

EBCTCG, Lancet 2011
Any anthracycline-based regimen (eg, standard 4AC) vs no adjuvant chemotherapy,
ER+ disease only: by ENTRY AGE
1582 women, ER+, age < 55(77% N+)
Death rates (% / year: total rate − rate in women without recurrence) and logrank analyses
Anth.Control
Allocation
Rate ratio(O−E) / V
0Years 0 − 43·12 SE 0·283·76 SE 0·340·79 SE 0·12−12·4 / 52·9
5Years 5 − 93·76 SE 0·384·14 SE 0·440·80 SE 0·14−8·5 / 38·8
Year 10+2·19 SE 0·391·93 SE 0·391·14 SE 0·33
1·4 / 10·8
10 years0
10
20
30
40
50
Bre
ast c
ance
r mor
talit
y
%± SE
10−y gain 5·6% (SE 2·6)Control
Anth.
33·7%
28·1%
Logrank 2p = 0·05RR 0·83 (0·68−1·00)
17·8%
14·4%
3578 women, ER+, age 55−69(90% N+)
0Years 0 − 42·44 SE 0·163·54 SE 0·230·69 SE 0·08−36·8 / 98·4
5Years 5 − 93·31 SE 0·234·12 SE 0·320·84 SE 0·10−14·0 / 80·4
Year 10+3·42 SE 0·343·76 SE 0·430·92 SE 0·16−3·1 / 36·4
10 years0
10
20
30
40
50
Bre
ast c
ance
r mor
talit
y
%± SE
10−y gain 6·0% (SE 1·8)Control
Anth.
31·0%
25·0%
Logrank 2p = 0·0002RR 0·78 (0·68−0·89)
16·2%
11·5%

Halving big rissmall risks by
• Proportional risk reducmuch on age ER statumuch on age, ER statu(or on tumour grade or
• Absolute risk reductioon the prognosis – andon the prognosis andthis is the prognosis w
• Information lacking on tuand on quantitative imm
sks and halving y chemotherapy
ction does not depend us or nodal statusus or nodal status r tumour diameter)
on, however, depends d, for ER+ disease,d, for ER disease,
with endocrine therapy
umour gene expression munohistochemistry
EBCTCG, Lancet 2011
Related Documents