WEARABLE AND MOBILE APPROACH TO STRESS AND FATIGUE MONITORING GONÇALO DE OLIVEIRA PIMENTEL DISSERTAÇÃO DE MESTRADO APRESENTADA À FACULDADE DE ENGENHARIA DA UNIVERSIDADE DO PORTO EM ENGENHARIA BIOMÉDICA M 2015

Welcome message from author
This document is posted to help you gain knowledge. Please leave a comment to let me know what you think about it! Share it to your friends and learn new things together.
Transcript
WEARABLE AND MOBILE APPROACH TO STRESS AND FATIGUE MONITORING
GONÇALO DE OLIVEIRA PIMENTEL DISSERTAÇÃO DE MESTRADO APRESENTADA À FACULDADE DE ENGENHARIA DA UNIVERSIDADE DO PORTO EM ENGENHARIA BIOMÉDICA
M 2015


FACULDADE DE ENGENHARIA DA UNIVERSIDADE DO PORTO
Wearable and Mobile Approach toStress and Fatigue Monitoring
Gonçalo de Oliveira Pimentel
Mestrado em Engenharia Biomédica
Supervisor: PhD João Paulo Trigueiros da Silva Cunha
October, 2015

c© Gonçalo de Oliveira Pimentel, 2015
Wearable and Mobile Approach to Stress and FatigueMonitoring
Gonçalo de Oliveira Pimentel
Mestrado em Engenharia Biomédica
Faculdade de Engenharia da Universidade do Porto
October, 2015

Resumo
Há hoje uma preocupação crescente com os problemas de saúde que ocorrem devido a stress efadiga no trabalho. Em todo o mundo, trabalhadores sofrem destes distúrbios e isso afeta, semdúvida, o seu desempenho e a sua saúde. O stress, por exemplo, está na origem de diversasdoenças cardiovasculares e neurológicas. Por outro lado, a fadiga tem sido amplamente relatadacomo causa de vários acidentes de trabalho e de viação.
Com isto em mente, este trabalho tem o visa usar o estado da arte da tecnologia vestívele móvel para monitorar parâmetros de stress e fadiga durante as rotinas normais de diferentesprofissionais. Questionários já validados na literatura também foram utilizados para avaliar afunção cognitiva do participante que também é importante em estudos nesta área.
Para estudar melhor os eventos que podem induzir stress e fadiga, uma aplicação Android(chamada VJ E-Diary) foi desenvolvida que permite o registo de eventos no smartphone paraque depois sejam sincronizados com outros dados. Além disso, uma pequena aplicação infor-mática (chamada VJ Assembly) foi desenvolvida para sincronizar os dados de diferentes sensorese apresentá-los para o usuário de forma eficiente. Esta ferramenta também foi projetada paraaceitar os dados gerados pela aplicaçao Android para que os eventos registados possam ser auto-maticamente sincronizados com outros dados.
Estudos com 3 tipos diferentes de profissionais (6 polícias, 3 Neurocirurgiões e 4 Bombeiros)foram desenvolvidos com o objetivo de monitorizar tanto stress como fadiga.
Diferentes Polícias foram monitorizados durante rotinas de trabalho e dias de folga. Dois even-tos foram detectados como sendo stressantes, mas apenas um destes foi relatado pelo profissional.Foram observadas mudanças significativas nos valores de racio entre baixas frequências e altasfrequências (LF/HF) entre os dias de trabalho e de folga. A monitorização dos neurocirurgiões foifeita durante cirurgias de aneurisma intracraniano e diferentes eventos foram identificados comostressantes. Os resultados também apoiam o facto de uma cirurgia mais stressante induzir umamaior fadiga mental. Quatro Bombeiros foram submetidos a um protocolo no qual eles tinhamde completar diferentes tarefas que eram mentalmente e fisicamente exigentes, de modo que suasrespostas psicológicas e fisiológicas podessem ser estudadas. O Trial Social Stress Test (TSST) ea tarefa de fitness parecem cumprir os seus papéis como indutures de stress e fadiga física, respec-tivamente. No entanto, é necessário realizar algumas mudanças no protocolo para obter de formafiável dados de basais fidedignos.
Foi possível retirar importantes conclusões destes e que podem ser de enorme importância paraa concepção de intervenções eficazes que possam reduzir os níveis de stress e fadiga em diferentesprofissionais. As ferramentas desenvolvidas também mostraram grande potencial na melhoriadeste tipo de estudos e vários objetivos foram propostos como trabalho futuro para atingir isso.São também apresentadas diferentes sugestões para melhorar os estudos desenvolvidos.
Keywords: Stress. Fadiga. Variabilidade Cardíaca. ECG Vestível. Profissionais.
i

ii
Abstract
There is a growing concern about the health problems that occur due to stress and fatigue at work.Around the world, workers suffer from this disorders and this undoubtedly affects their perfor-mance and health. Stress, for example, is the cause of various cardiovascular and neurologicaldiseases. Furthermore, fatigue has been widely reported to cause several work and car accidents.
With this in mind, this work aims to use state of the art wearable and mobile technology tomonitor parameters of stress and fatigue during normal routines of different professionals. Surveysalready validated in the literature were also used to assess the subject’s cognitive function whichis also important in studies in this area.
To better study events that can induce stress and fatigue, an Android app (called VJ E-Diary)to enable the registration of events in the phone so that later they can be synchronized with otherdata was developed. Furthermore, a small computer application (VJ Assembly) was developedto synchronize data from different sensors and present it to the user efficiently. This tool wasalso designed to accept the files generated by the VJ E-Diary so that the registered events can beautomatically synchronized with the other data.
Studies with 3 different types of professionals (6 Police Officers, 3 Neurosurgeons and 4 Fire-fighters) were developed with the goal of monitoring both Stress and Fatigue.
Police Officers were monitored during their work routines and days off. Two events weredetected as being stressful, but only one was reported by the officer. Significant changes in theratios between Low Frequencies and High Frequencies (LF/HF) values were observed betweenwork days and day offs. Neurosurgeons were monitored during intracranial aneurysm proceduresand different stressful events were identified. Results also support the fact that a more stressfulprocedure induces higher mental fatigue in the surgeon. Four Firefighters underwent a protocolwhere they had to complete different tasks which were mentally and physically demanding, sothat their psychological and physiological responses could be studied. The Trial Social StressTest (TSST) and Fitness tasks seem to fulfill their roles as stress and physical fatigue inducers.However, some changes need to be done to the protocol to reliably obtain unbiased baseline data.
It was possible to draw important conclusions which may be of enormous importance for thedesign of effective interventions in order to reduce stress and fatigue levels in different profession-als. The tools developed also shown great potential in improving this type of studies and severalgoals were proposed as future work to achieve this. Furthermore, various suggestions are alsopresented with the aim of improving the developed studies.
Keywords: Stress. Fatigue. Heart Rate Variability. Wearable ECG. Professionals.
iii

iv
Acknowledgments
Primeiro, gostaria de começar por deixar os meus mais sinceros agradecimentos ao Professor JoãoPaulo Cunha pela enorme oportunidade que me deu ao me acolher no seu grupo de investigação econfiar em mim para levar este trabalho até ao fim. A sua confiança em mim e no meu trabalho foiuma constante e foi sem dúvida essencial para conseguir chegar até aqui. Quero também agradecerao serviço de Neurocirurgia do Hospital de São João, em especial ao Dr. Vilarinho e ao Dr.Pedro Silva, pela enorme disponibilidade e paciência mostradas, assim como pela oportunidadede presenciar algumas das suas ínumeras cirurgias.
A todos os elementos do BRAIN que me foram apoiando e acompanhando durante este últimoano deixo também o meu mais sincero obrigado. Ao Hugo Choupina quero deixar um especialagradecimento não só pelas contagiante alegria, mas também pelo exemplo de vida e força quesempre mostrou. Um grande Obrigado ao grande ano de 2013 do MEB que muitos sorrisos e aven-turas me proporcionaram. Em especial, quero agradecer à Joana, à Inês e aos meus eternos colegasdo edifício I - Luís, Hélder e Diogo -pela enorme amizade. Sem eles nunca teria conseguido chegara este momento.
Sendo este o culminar de um longo período académico não posso deixar de agradecer às pes-soas que, durante a minha licenciatura, e mesmo agora, contribuíram para a conclusão desta tese.Primeiro, quero agradecer ao Professor João Ventura por tudo aquilo que me ensinou e que, aindaagora, aplico constantemente em todo o trabalho que realizo. Se hoje estou a apresentar uma tesede Mestrado, muito devo a ele. Também quero agradecer à Catarina Dias por ter sido a melhorparceira que poderia ter tido para iniciar a minha carreira na investigação. A sua curiosidade eempenho sem dúvida me contagiaram e me marcaram. Quero também deixar um sincero agradec-imento à minha família do 5oA - Gui, Élia e Ana Luísa - por todos os sorrisos e apoio dados.
A todos os meus colegas de Vagos, Ílhavo, Aveiro e Porto, muito obrigado por sempre se pre-ocuparem comigo e mostrarem interesse naquilo que faço. Em especial, quero deixar um sinceroObrigado àqueles que sempre fizeram questão de nunca se esquecer de mim, quer fosse na praia,ou quando se juntavam. Obrigado por tudo malta !
Aos Vagueirudos, uma palavra de agradecimento pela contagiante vontade de viver que sempreme transmitiram e por me acolherem como um de vós.
À Maria Pedro, ao Tochá e à Júlia, quero agradecer por todo o amor e disponibilidade quesempre ofereceram. Não há como descrever a gratidão e adoração que sinto para com vocês.Muito vos devo. Obrigado.
Às minhas tias, primas e Avó quero agradecer pelo apoio e amor que sempre me deram e quetanto me motivou. Nunca saí sem um sorriso (ou fome) de vossas casas.
Ao meu Pai e Irmão, tenho a agradecer por serem os meus grandes pilares desta vida e nuncame deixarem ir abaixo. Pela sua força e vida que me trazem esperança e alegria. Pelo apoio eamor incondicional e por serem o meu porto seguro e a minha luz - Obrigado.
À minha Mãe, por tudo, Obrigado.
v

vi

“If opportunity doesn’t knock, build a door.”
Milton Berle
vii

viii

Contents
Contents ix
List of Figures xiii
List of Tables xv
List of Abbreviations xviii
List of Symbols xx
1 Introduction 11.1 Context and Motivation . . . . . . . . . . . . . . . . . . . . . . . . . . . . . . . 11.2 Objectives . . . . . . . . . . . . . . . . . . . . . . . . . . . . . . . . . . . . . . 21.3 Publications . . . . . . . . . . . . . . . . . . . . . . . . . . . . . . . . . . . . . 21.4 Structure . . . . . . . . . . . . . . . . . . . . . . . . . . . . . . . . . . . . . . . 3
I State of the Art 5
2 Background 72.1 Stress . . . . . . . . . . . . . . . . . . . . . . . . . . . . . . . . . . . . . . . . 7
2.1.1 Physiology . . . . . . . . . . . . . . . . . . . . . . . . . . . . . . . . . 72.1.2 Psychological Interpretation . . . . . . . . . . . . . . . . . . . . . . . . 102.1.3 Clinical Relevance . . . . . . . . . . . . . . . . . . . . . . . . . . . . . 11
2.2 Fatigue . . . . . . . . . . . . . . . . . . . . . . . . . . . . . . . . . . . . . . . 112.2.1 Definition . . . . . . . . . . . . . . . . . . . . . . . . . . . . . . . . . . 112.2.2 Clinical relevance of mental fatigue . . . . . . . . . . . . . . . . . . . . 112.2.3 Causes of mental fatigue . . . . . . . . . . . . . . . . . . . . . . . . . . 12
2.3 Cardiac Monitoring . . . . . . . . . . . . . . . . . . . . . . . . . . . . . . . . . 122.3.1 Physiology . . . . . . . . . . . . . . . . . . . . . . . . . . . . . . . . . 122.3.2 Electrocardiogram . . . . . . . . . . . . . . . . . . . . . . . . . . . . . 132.3.3 Cardiac Wave . . . . . . . . . . . . . . . . . . . . . . . . . . . . . . . . 14
2.4 Conclusions . . . . . . . . . . . . . . . . . . . . . . . . . . . . . . . . . . . . . 15
3 Relevant Studies and Tools 173.1 Monitoring Parameters . . . . . . . . . . . . . . . . . . . . . . . . . . . . . . . 17
3.1.1 Heart Rate Variability . . . . . . . . . . . . . . . . . . . . . . . . . . . 173.1.2 Blood Volume Pressure . . . . . . . . . . . . . . . . . . . . . . . . . . . 213.1.3 Electrodermal Activity . . . . . . . . . . . . . . . . . . . . . . . . . . . 21
ix

x CONTENTS
3.1.4 Skin Temperature . . . . . . . . . . . . . . . . . . . . . . . . . . . . . . 223.1.5 Salivary Cortisol . . . . . . . . . . . . . . . . . . . . . . . . . . . . . . 233.1.6 Oculomotor Measurements . . . . . . . . . . . . . . . . . . . . . . . . . 233.1.7 Electroencephalography . . . . . . . . . . . . . . . . . . . . . . . . . . 243.1.8 Subjective Measurements . . . . . . . . . . . . . . . . . . . . . . . . . 25
3.2 Monitoring Systems . . . . . . . . . . . . . . . . . . . . . . . . . . . . . . . . . 263.2.1 Smartphones and Wristbands . . . . . . . . . . . . . . . . . . . . . . . . 263.2.2 Wearable Biometrical Shirts . . . . . . . . . . . . . . . . . . . . . . . . 273.2.3 Others . . . . . . . . . . . . . . . . . . . . . . . . . . . . . . . . . . . . 293.2.4 Fatigue Monitoring oriented devices . . . . . . . . . . . . . . . . . . . . 29
3.3 Studies . . . . . . . . . . . . . . . . . . . . . . . . . . . . . . . . . . . . . . . . 303.3.1 Police Officers . . . . . . . . . . . . . . . . . . . . . . . . . . . . . . . 303.3.2 Nurses . . . . . . . . . . . . . . . . . . . . . . . . . . . . . . . . . . . 313.3.3 Surgeons . . . . . . . . . . . . . . . . . . . . . . . . . . . . . . . . . . 313.3.4 Firefighters . . . . . . . . . . . . . . . . . . . . . . . . . . . . . . . . . 323.3.5 Car Drivers . . . . . . . . . . . . . . . . . . . . . . . . . . . . . . . . . 333.3.6 Crowd Sensing . . . . . . . . . . . . . . . . . . . . . . . . . . . . . . . 33
3.4 Conclusions . . . . . . . . . . . . . . . . . . . . . . . . . . . . . . . . . . . . . 34
II Monitoring Stress and Fatigue 35
4 Developed Tools 374.1 VJ E-Diary . . . . . . . . . . . . . . . . . . . . . . . . . . . . . . . . . . . . . 37
4.1.1 Structure . . . . . . . . . . . . . . . . . . . . . . . . . . . . . . . . . . 374.1.2 Database . . . . . . . . . . . . . . . . . . . . . . . . . . . . . . . . . . 384.1.3 Workflow . . . . . . . . . . . . . . . . . . . . . . . . . . . . . . . . . . 39
4.2 VJ Assembly . . . . . . . . . . . . . . . . . . . . . . . . . . . . . . . . . . . . 434.2.1 Structure . . . . . . . . . . . . . . . . . . . . . . . . . . . . . . . . . . 434.2.2 Motionless Segments . . . . . . . . . . . . . . . . . . . . . . . . . . . . 444.2.3 Workflow . . . . . . . . . . . . . . . . . . . . . . . . . . . . . . . . . . 45
4.3 Conclusions . . . . . . . . . . . . . . . . . . . . . . . . . . . . . . . . . . . . . 46
5 Developed Studies 495.1 Police Officers . . . . . . . . . . . . . . . . . . . . . . . . . . . . . . . . . . . . 49
5.1.1 Dataset . . . . . . . . . . . . . . . . . . . . . . . . . . . . . . . . . . . 495.1.2 Protocol and Tools . . . . . . . . . . . . . . . . . . . . . . . . . . . . . 495.1.3 Results . . . . . . . . . . . . . . . . . . . . . . . . . . . . . . . . . . . 515.1.4 Discussion . . . . . . . . . . . . . . . . . . . . . . . . . . . . . . . . . 525.1.5 Conclusion . . . . . . . . . . . . . . . . . . . . . . . . . . . . . . . . . 53
5.2 Surgeons . . . . . . . . . . . . . . . . . . . . . . . . . . . . . . . . . . . . . . 545.2.1 Intracranial Aneurysm Clipping Procedure . . . . . . . . . . . . . . . . 545.2.2 Study 1 (Pilot) . . . . . . . . . . . . . . . . . . . . . . . . . . . . . . . 555.2.3 Study 2 . . . . . . . . . . . . . . . . . . . . . . . . . . . . . . . . . . . 585.2.4 Conclusion . . . . . . . . . . . . . . . . . . . . . . . . . . . . . . . . . 64
5.3 Firefighters . . . . . . . . . . . . . . . . . . . . . . . . . . . . . . . . . . . . . 655.3.1 Protocol and Tools . . . . . . . . . . . . . . . . . . . . . . . . . . . . . 655.3.2 Results and Discussion . . . . . . . . . . . . . . . . . . . . . . . . . . . 675.3.3 Conclusion . . . . . . . . . . . . . . . . . . . . . . . . . . . . . . . . . 69

CONTENTS xi
6 Conclusions and Future Work 71
Bibliography 73
Index 87
A SPNC’15 - Monitorização do Stress Cardiovascular em Cirurgias de Clipagem deAneurismas 87
B IEEE EMBC 2015 - Cardiovascular Strain and Autonomic Imbalance in Neurosur-geons 91
C IEEE EMBC 2015 - Cardiovascular Strain and Autonomic Imbalance in Neurosur-geons during Intracranial Aneurysm Procedures - 4 Page Paper (Rejected) 95
D Full Activity Diagram for the VJ E-Diary app 101
E Surveys Used for Appraisal of Surgeons Stress and Cognitive Workload 105
F Visual Analog Scale for Assesment of Stress and Fatigue during the Firefighters Lab-oratorial Tasks 109

xii CONTENTS
List of Figures
2.1 Illustration of the General Adaptation Syndrome process. Source: [18] . . . . . . 92.2 (a) Physiology of the Heart. (b) Autonomic innervation of the Heart. . . . . . . . 132.3 (a) Vector view of the available 12 leads. Frontal leads are light blue while pre
cordials leads are dark blue. (b) Identification of the placement of electrodes toform the frontal ECG leads and the Einthoven’s triangle. RA stands for RightArm, LA for Left Arm, RL for Right Leg and LL for Left Leg. . . . . . . . . . . 14
2.4 ECG Sample, with the different wave components identified. Source: [64] . . . . 14
3.1 Log Plot of the HRV spectrum over 24 hours. Source: [77]. . . . . . . . . . . . . 193.2 SMH’s pipeline block diagram. Source: [84] . . . . . . . . . . . . . . . . . . . . 213.3 Example of a EDA graph where the three peaks identified are associated with
stressful events. SM and SD are features of the signal (Signal Magnitude andSignal Duration, respectively) that are also relevant for its study. Source : [90] . . 22
3.4 Standard Electrode Placing for EEG. Source:[108] . . . . . . . . . . . . . . . . 243.5 Correlation results between PSS score and Alpha Power Ratio (a) and Beta Power
Ratio (b). Source: [109] . . . . . . . . . . . . . . . . . . . . . . . . . . . . . . . 253.6 Mean Valence (a) and Arousal (b) levels in one of the LSN surgeries. Source: [107] 253.7 In (a) Samsung Galaxy S6 (left) and Gear 2 (right) and in (b) the Basis Peak. . . 273.8 Biodevice’s Vital Jacket R©. Source: [123] . . . . . . . . . . . . . . . . . . . . . 283.9 In (a) SHL’s SmartHeart R© Pro and in (b) the Edansafe’s SmartCap R©. . . . . . . 303.10 Imperial Stress Assessment Tool structure illustration. Source: [94] . . . . . . . 32
4.1 Use Case Diagram for VJ E-Diary . . . . . . . . . . . . . . . . . . . . . . . . . 384.2 Database structure. . . . . . . . . . . . . . . . . . . . . . . . . . . . . . . . . . 394.3 Different activities of the VJ E-Diary app. . . . . . . . . . . . . . . . . . . . . . 404.4 Different activities of the VJ E-Diary app. . . . . . . . . . . . . . . . . . . . . . 414.5 Different activities of the VJ E-Diary app. . . . . . . . . . . . . . . . . . . . . . 424.6 Simplified Activity Diagram for the VJ E-Diary App. . . . . . . . . . . . . . . . 424.7 VJ Assembly’s Use Case Diagram. . . . . . . . . . . . . . . . . . . . . . . . . . 434.8 Simplified Diagram for VJ Assembly. . . . . . . . . . . . . . . . . . . . . . . . 444.9 Algorithm for generating RR interval files correspondent to times where no con-
siderable motion was detected. . . . . . . . . . . . . . . . . . . . . . . . . . . . 454.10 VJ Assembly’s interface. . . . . . . . . . . . . . . . . . . . . . . . . . . . . . . 46
5.1 Diagram of the followed protocol during monitoring sessions. . . . . . . . . . . 505.2 ECG signal analysis for Participant 4 (P4), reporting one stressful event (driving
late). On top, results regarding pNN20 over time. Below results regarding LF/HF. 525.3 ECG signal analysis for Participant 5 (P5), reporting one stressful event (driving
fast). On top, results regarding pNN20 over time. Below results regarding LF/HF. 52
xiii
xiv LIST OF FIGURES
5.4 Picture taken from one of the microscope’s recordings of an aneurysm surgery,after an aneurysm (1) was successfully corrected with the placement of a clip (2)in its neck. . . . . . . . . . . . . . . . . . . . . . . . . . . . . . . . . . . . . . 54
5.5 Workflow of an intracranial aneurysm procedure recurring to the clipping tech-nique. . . . . . . . . . . . . . . . . . . . . . . . . . . . . . . . . . . . . . . . . 55
5.6 Surgeons’ pNN20 changes registered over one of the surgeries. First incision andthe opening of the Dura Mater occurred in (1) and (2), respectively, and per-formed by surgeon M. Afterwards, surgeon L stepped in as the main surgeon (3).Aneurysm was reached in (4), and dissection near that area was perfomed as wellto expose the aneurysm. Several provisory clippings (5) were placed by surgeonL in order to obtain an optimal environment for the final clipping. Definitive clipwas placed in (6). . . . . . . . . . . . . . . . . . . . . . . . . . . . . . . . . . . 56
5.7 HF and LF distribution for the Main Surgeon (A), as well as for the assistantsurgeon (B), during one of the procedures. . . . . . . . . . . . . . . . . . . . . . 57
5.8 Surgeons’ pNN20 changes registered over one of the surgeries. Time starts at firstincision and the opening of the Dura Mater occurred in (1), both performed bysurgeon XL. Afterwards, surgeon L stepped in as the main surgeon (2). Aneurysmwas definitively clipped in (3). However the clip needed to be repositioned dueto bad placement (4). When finally L was able to place the clip correctly, theaneurysm ruptured (5). During this time, L had to correctly place the definitiveclip to stop the bleeding as soon as possible. Finally, with the problem corrected,close up began at (6). . . . . . . . . . . . . . . . . . . . . . . . . . . . . . . . . 59
5.9 Surgeon L’s SURG-TLX scores for each procedure he was present. Surgery P5, P7and P8 were the ones in which an aneurysm rupture occurred during the surgeons’intervention. L was main during those. . . . . . . . . . . . . . . . . . . . . . . 62
5.10 Surgeon XL’s SURG-TLX scores for each procedure he was present. SurgeryP5, P7 and P8 were the ones in which an aneurysm rupture occurred during thesurgeons’ intervention. XL was Assistant during those. . . . . . . . . . . . . . . 62
5.11 Structure of each monitored Run. . . . . . . . . . . . . . . . . . . . . . . . . . 655.12 Protocol’s Worklow. . . . . . . . . . . . . . . . . . . . . . . . . . . . . . . . . 66

List of Tables
2.1 Common symptoms and signs of stress. Adapted from [21]. . . . . . . . . . . . . 102.2 Examples of disorders related to chronic stress. . . . . . . . . . . . . . . . . . . 112.3 Some of the diseases to have fatigue reported as symptom. . . . . . . . . . . . . 12
3.1 Specifications of some biometrical shirts available in the market for continuousmonitoring. . . . . . . . . . . . . . . . . . . . . . . . . . . . . . . . . . . . . . 29
5.1 Average LF/HF during the motionless moments during shift and days off. Thesame number of 5 minute segments (N) was extracted for each subject. Corre-sponding total minutes are also presented. . . . . . . . . . . . . . . . . . . . . . 51
5.2 Average CI and HRV parameters from surgeon L . . . . . . . . . . . . . . . . . 565.3 Average CI and HRV parameters from Surgeon L (Assistant to Main) and XL
(Main to Assistant) Before and After Trading (N=6). . . . . . . . . . . . . . . . 595.4 Average CI, HRV and LF/HF parameters from Surgeon L . . . . . . . . . . . . . 605.5 Average CI, HRV and LF/HF parameters from Surgeon XL . . . . . . . . . . . . 605.6 STAI scores for surgeon L and surgeon XL. . . . . . . . . . . . . . . . . . . . . 615.7 Surgeon L’s Spearman’s correlation coefficients between physiological and psy-
chological parameters . . . . . . . . . . . . . . . . . . . . . . . . . . . . . . . . 625.8 Overall results for subject FF1, 59 years old. . . . . . . . . . . . . . . . . . . . . 685.9 Overall results for subject FF3, 25 years old. . . . . . . . . . . . . . . . . . . . . 685.10 Overall results for subject FF4, 27 years old. . . . . . . . . . . . . . . . . . . . . 685.11 Overall results for subject FF6, 28 years old. . . . . . . . . . . . . . . . . . . . . 69
xv

xvi LIST OF TABLES

List of Abbreviations
ACC AccelerometerANS Autonomic Nervous SystemAPI Application Program InterfaceAV AtrioventricularBVP Blood Volume PressureCI Cardiac IntensityECG ElectrocardiogramEDA Electrodermal ActivityEEG ElectroencephalogramEU-OSHA European Agency for Safety and Health at WorkGPS Global Positioning SystemHR Heart RateHRV Heart Rate VariabilityIDC International Data CorporationIR InfraredLF/HF Ratio between Low Frequency (LF) and High Frequency (HF)NASA-TLX National Aeronautics and Space Administration - Task Load IndexPC Portable ComputerPPG PhotoplethysmogramPSNS Parasympathetic Nervous SystemPSS Perceived Stress ScaleRSA Respiratory Sinus ArrhythmiaRT Reaction TimeSA SinoatrialSCL Skin Conductance LevelSD Standard DeviationSDK Software Development KitSNS Sympathetic Nervous SystemSPSS Statistical Package for the Social SciencesSTAI State-Trait Anxiety InventoryStressor Stress FactorSURG TLX Surgery - Task Load IndexUI User InterfaceUML Unified Modeling LanguageVAS Visual Analog ScaleVJ Vital Jacket R©
xvii

xviii List of Abbreviations

List of Symbols
◦C Celsius% PercentageµS microSiemensbpm Beats per Minuteg GramHz Hertzmm milliMeterms milliSeconds SecondV Volt
xix

xx List of Symbols
Chapter 1
Introduction
1.1 Context and Motivation
Every day millions of people struggle with the demanding roles their jobs require, either is because
of the extremely high performance they have to give every day (e.g. surgeons), or the dangerous
environments that they are exposed to (e.g. firefighters, police officers), or even just to make sure
their job is done correctly and on time. Many situations, like conflicting demands or excessive
workload, may exceed the workers’ coping ability, leading them to feel stressed and worried with
the outcome. This “job stress” is undoubtedly a source of health problems, being already associ-
ated with a range of mental and psychological health outcomes like including anxiety, depression
and chronic fatigue [1]. Therefore, it has already been identified by the European Agency for
Safety and Health at Work (EU-OSHA) as a major issue to be addressed [2]. According to the
2013 EU-OSHA pan-European opinion pool, which covered different professionals over 30 coun-
tries, about 51% of them find work-related stress to be common in their workplace and 40% think
that this stress is not handled well in their organization [3]. This factor is crucial, as in the health
of the professionals, as for the health of the organization. According to a 2013 European Union
funded project, the cost to Europe of work related depression, which can be due to prolonged
exposures to stress, was estimated to be of approximately 800 billion dollars annually [1]. All
this lead to the launch of the two year (2014-2015) Europe-Wide Campaign “Healthy Workplaces
Manage Stress” [2].
Also, due to really highly demanding, repetitive tasks experienced during work, fatigue may
also be experienced in different professions. This factor has been reported to be associated with
health problems, and is a constant between the working population [4] [5]. In the United States,
a study involving around 29,000 employees concluded that 65.7% of the workers with fatigue
reported health-related lost productive time, while only 26.4% of the ones without reported the
same. This translated into a cost to fatigued worker’s employers of about 136.4 billion dollars
annually – 101.1 billion dollars more when compared with workers without fatigue [6].
Besides this financial impact, fatigue and stress have shown to be crucial factors in the per-
formance of healthcare professionals, like surgeons, which interfere with the success of surgical
1
2 Introduction
operations, putting the patient’s life at risk [7] [8].
These facts support the development of continuous studies of stress and fatigue during work
routines in order to identify the main causes for these problems and correct them.
However, the monitoring of a professional’s health during their daily routine is not a simple
task. Besides the various sensors that devices should have in order to collect information, one also
needs to know which measures are significant for detecting stress and fatigue. Furthermore, if
these typical available devices interfere too much with the person’s movements, it will affect the
way they perform and, therefore, influence the results. Thus, non-intrusive, comfortable technol-
ogy is very relevant for a study of these disorders. With the mobile technology industry experi-
encing an amazing growth, smartphones and wearable devices are gaining market and worldwide
interest. This has led to the development of better non-intrusive ways to study the human body
and its behavior.
Therefore, using state-of-the-art mobile and wearable technology, one can study how stress
and fatigue relate to various events in different professions. With this kind of information, it will
be possible to identify the “stressors” (stress factors) that lead to associated disorders during the
daily routine of different professionals and increase their performance while providing a better
quality of life for them as well.
1.2 Objectives
Given the subjective and objective nature of stress and fatigue, this thesis will include many con-
cepts from Psychology and Medicine, that will be studied recurring to engineering, in order to:
• Identify events that induce stress and fatigue in professionals through assessment of differ-
ent physiological variables, namely Heart Rate Variability (HRV), as well as the subjective
appraisal of the subjects;
• Develop tools that enable the monitoring of stress and fatigue events in uncontrolled envi-
ronments during the professional’s daily routines;
• Study the relationships between physiological and psychological variables related to stress
and fatigue.
1.3 Publications
The present thesis resulted in the following publications in conferences:
• R.Tuna, G.Pimentel, A.Vilarinho, R.Vaz and J.P. Cunha, “Monitorização do Stress Car-
diovascular em Cirurgias de Clipagem de Aneurismas” In 30o Congresso Nacional da So-
ciedade Portuguesa de Neurocirurgia, 2015. (see Appendix A) ;

1.4 Structure 3
• G.Pimentel, A.Vilarinho, R.Vaz and J.P. Cunha, “Cardiovascular Strain and Autonomic Im-
balance in Neurosurgeons” In 37th Annual International IEEE EMBS Conference , 2015.
(see Appendix B).
Furthermore, one publication was submitted to a conference but was rejected :
• G.Pimentel, A.Vilarinho, R.Vaz and J.P. Cunha, “Cardiovascular Strain and Autonomic Im-
balance in Neurosurgeons during Intracranial Aneurysm Procedures” In 37th Annual Inter-
national IEEE EMBS Conference , 2015. - Rejected (see Appendix C).
Finally, two articles are being finished in order to be submitted to 2 different indexed journals,
which present some of the results shown in this thesis. However, up until the submission of this
thesis, these articles were still being reviewed by other authors. Therefore, they are not available
in this document.
1.4 Structure
This thesis is divided in two major parts. The first, composed by chapters 2 and 3, introduces
essential concepts of physiology for stress and fatigue assessment as well as a literature review
of relevant parameters, systems and studies which successfully monitor different professionals to
interesting results.
The second part of this thesis includes chapter 4 and 5. The first focuses on the tools that were
developed in order to better assess stress and fatigue while the latter addresses the results obtained
through the monitoring of different professionals recurring to these same tools, as well as others.
Finally, in chapter 6 the overall results from this work are discussed and conclusions are taken
from these. Furthermore, several goals are proposed as future work and follow-up to this thesis.

4 Introduction

Part I
State of the Art
5


Chapter 2
Background
Psychology and medicine have different views over the concepts of stress and fatigue. Since
one of the purposes of this work is to support the physiological behavior analysis with subjective
appraisal of this events, it becomes important to define and explain their basis. Furthermore,
cardiac behavior will be an important part of this work as well. Therefore, basic physiology
concepts about it and how it can be monitored are also presented.
2.1 Stress
2.1.1 Physiology
Hans Selye first defined stress, in a biological context, as being “the non-specific response of the
body to any demand placed upon it” [9]. This definition was recently complemented by Koolhaas
et al. who suggested that it “should be restricted to conditions where an environmental demand
exceeds the natural regulatory capacity of an organism” [10]. Independently of the way we look at
it, stress seems to be a response of our body to external stimuli that disrupt the human homeostasis,
or, in other words, the equilibrium that exists in the human organism.
2.1.1.1 Autonomic Nervous System
Internally, responses to stressful situations are regulated by the brain. When we are exposed to a
stressor, it will release specific chemicals (Noradrenaline, Adrenaline, Cortisol) into our body to
alter the activity of some organs, enabling appropriate responses to the event [11].
The Autonomic Nervous System (ANS), a part of the Peripheral Nervous System, which be-
longs to the organism’s nervous system, responsible for regulation of the body’s major physio-
logical unconscious activities (like blood pressure, respiration, gland secretion, heart’s electrical
activity, etc.) [12], has a very important role in this behavior, by making sure that vital body
processes are adjusted accordingly with changing conditions imposed by the stressor [11]. This
system is divided in three major components, which can operate independently or co-operatively
[13]:
7

8 Background
• Enteric Nervous System — responsible for the gastrointestinal system [14].
• Parasympathetic Nervous System (PSNS) — regulates body functions related to “rest-
and-digest” events, or in other words, basic bodily functions while one is at rest. This
includes salivation, urination, digestion, lacrimation and sexual arousal [13]. The PSNS has
ramifications in the heart that come from the Vagus nerve [12]. The influence of the PSNS in
the cardiac activity is mediated via the release of acetylcholine by the parasympathetic nerve
fibers, which act on the sinoatrial (SA) and atrioventricular (AV) nodes [12], modulating
heart rate.
• Sympathetic Nervous System (SNS) — regulates many of the homeostasis mechanisms,
controlling the response of the organism to a perceived attack, dangerous event or survival
threat, preparing the body to “fight” or “flight” (“fight-or-flight” response) [15]. Because of
this, the SNS is also known as the “fight-or-flight” system. Specifically, the SNS supplies
nerves to the adrenal medulla and controls the release of both adrenaline and noradrenaline.
It is the mixture of this chemicals that prepares the body to respond accordingly [11]. This
changes in organ and tissue function throughout the body are coordinated so that there is an
increase in the delivery of well oxygenated and nutrient rich blood to the working skeletal
muscles. Example of this is the increase of the heart rate and myocardial contractility, so
that the heart pumps more blood per minute and the release and creation of glucose in the
liver to increase the concentration of glucose molecules in the blood, thus providing the
organism of extra energy to respond [13].
2.1.1.2 General Adaptation Syndrome
The “fight-or-flight” response is recognized as being the first stage of the General Adaptation
Syndrome, which regulates the responses of vertebrates and other organisms to stress [9][16].
This specific behavior, discovered by Hans Selye, and illustrated in Figure 2.1, is characterized by
three distinct stages [16][17][18]:
1. Alarm — This stage is divided in two phases. The first, known as the Shock phase, is
characterized by the initial endurance of the body to changes. Afterwards the organism
response to the stressor drops temporarily and some level of shock may be experienced.
The second phase, the Antishock phase, begins when the threat is identified by the organism
and it starts to develop methods to respond to the event. It is when the mechanisms of the
“fight-or-flight” response, mentioned earlier, are activated.
2. Resistance — In this stage, the body begins to try to adapt to the strains of the environ-
ment, by increasing the secretion of certain chemicals, which end increasing glucose, fat
and protein concentration in the blood. Even using the extra resources available due to the
aforementioned mechanism, the organism cannot keep up indefinitely, leading to a third and
final stage in this process.
2.1 Stress 9
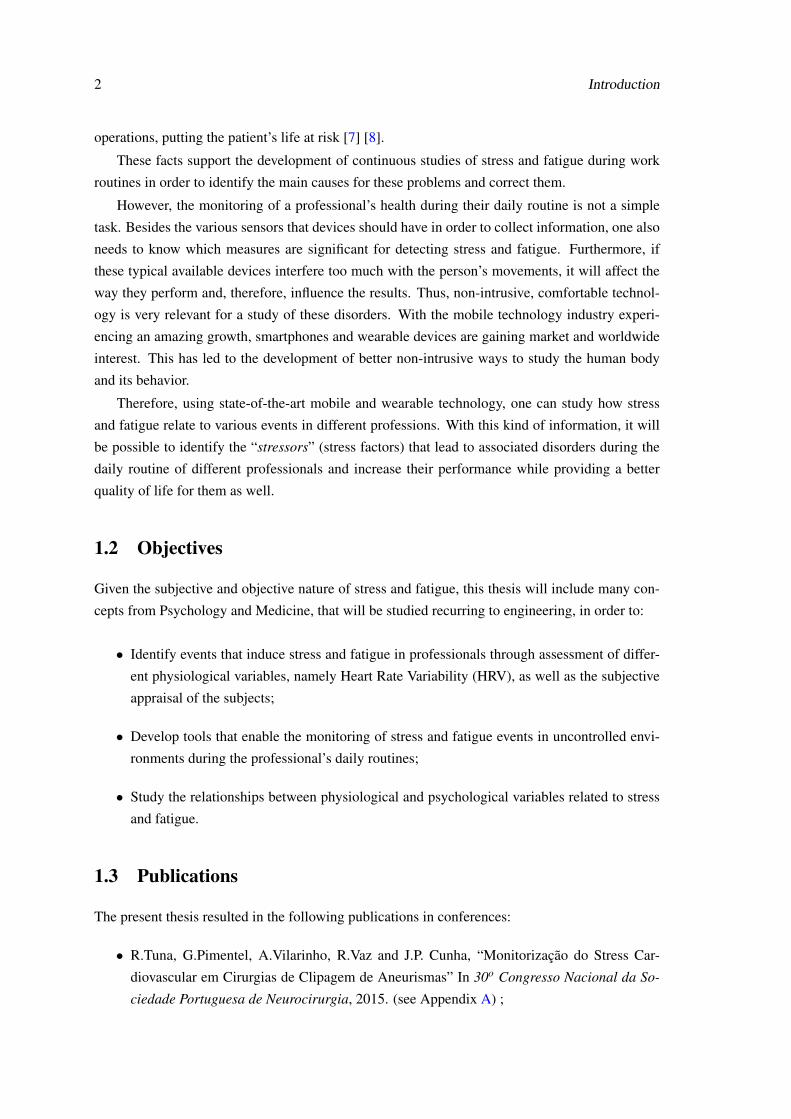
3. Exhaustion — This stage can be defined as Recovery as well, depending on the success of
the body to overcome the stressor effect. If the system successfully overcomes it, then will
enter a recovery stage. When in it, the organism will use the high amounts of amino acids,
fat and glucose in blood, which are available due to the mechanisms activated in the resis-
tance stage, for anabolic reactions, regeneration of cells and restoration of the homeostasis.
Otherwise, it will enter the Exhaustion stage. This happens when the body is unable to over-
come the adverse situation, and eventually depletes all its physiological resources trying to
fight the stressor. Due to this, it will be unable to maintain normal function, possibly leading
to serious health problems. A prolongation of this stage may result in the exhaustion of the
organism’s immune system and impairment of bodily functions, decompensating [17].
Figure 2.1: Illustration of the General Adaptation Syndrome process. Source: [18]
2.1.1.3 Respiratory Sinys Arrythmia
Under resting conditions, the variation between consecutive human heart beats varies periodically
with the phase of respiration - it increases during inspiration and decreases during expiration.
This mechanism, known as Respiratory Sinys Arrythmia (RSA) is predominantly mediated by the
PSNS, whose activity is absent during the inspiration (leading to decreases in the interval between
beats) and present during expiration, increasing that same interval.
Furthermore, during the ”fight-or-flight” response, the sympathetic branch of the ANS is much
more active than the PSNS, even existing an inhibition of parasympathetic activity during this pe-
riod [19]. Without the interference of the PSNS, the RSA mechanism will not be present and
therefore, Heart Rate Variability (HRV) will decrease, which can therefore be defined as a symp-
tom of stress as mentioned in Table 2.1.
Resuming, during the response to adverse external stimuli, the activity of the SNS is increased
while vagal activity is inhibited. After the stress has passed, the PSNS is responsible for reversing
the processes stimulated by the SNS, in order to reset the body to its natural equilibrium [20]. It
10 Background
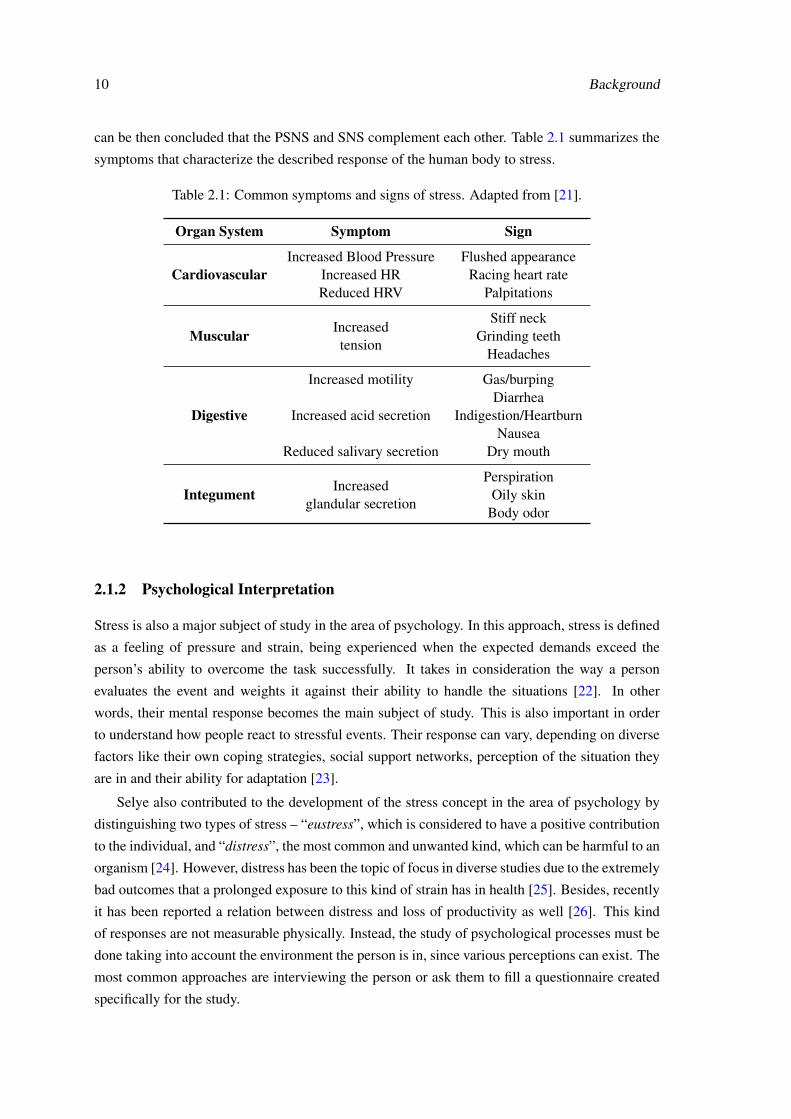
can be then concluded that the PSNS and SNS complement each other. Table 2.1 summarizes the
symptoms that characterize the described response of the human body to stress.
Table 2.1: Common symptoms and signs of stress. Adapted from [21].
Organ System Symptom Sign
CardiovascularIncreased Blood Pressure
Increased HRReduced HRV
Flushed appearanceRacing heart rate
Palpitations
Muscular Increasedtension
Stiff neckGrinding teeth
Headaches
Digestive
Increased motility
Increased acid secretion
Reduced salivary secretion
Gas/burpingDiarrhea
Indigestion/HeartburnNausea
Dry mouth
Integument Increasedglandular secretion
PerspirationOily skin
Body odor
2.1.2 Psychological Interpretation
Stress is also a major subject of study in the area of psychology. In this approach, stress is defined
as a feeling of pressure and strain, being experienced when the expected demands exceed the
person’s ability to overcome the task successfully. It takes in consideration the way a person
evaluates the event and weights it against their ability to handle the situations [22]. In other
words, their mental response becomes the main subject of study. This is also important in order
to understand how people react to stressful events. Their response can vary, depending on diverse
factors like their own coping strategies, social support networks, perception of the situation they
are in and their ability for adaptation [23].
Selye also contributed to the development of the stress concept in the area of psychology by
distinguishing two types of stress – “eustress”, which is considered to have a positive contribution
to the individual, and “distress”, the most common and unwanted kind, which can be harmful to an
organism [24]. However, distress has been the topic of focus in diverse studies due to the extremely
bad outcomes that a prolonged exposure to this kind of strain has in health [25]. Besides, recently
it has been reported a relation between distress and loss of productivity as well [26]. This kind
of responses are not measurable physically. Instead, the study of psychological processes must be
done taking into account the environment the person is in, since various perceptions can exist. The
most common approaches are interviewing the person or ask them to fill a questionnaire created
specifically for the study.
2.2 Fatigue 11
2.1.3 Clinical Relevance
It has been proven that chronic stress, derived from long exposures to stress, can lead to serious
health problems. Some of them are presented in Table 2.2. Since it has been reported that workers
experience stress during their daily tasks, there should be a concern with preventing this kind of
health problems from affecting the working population.
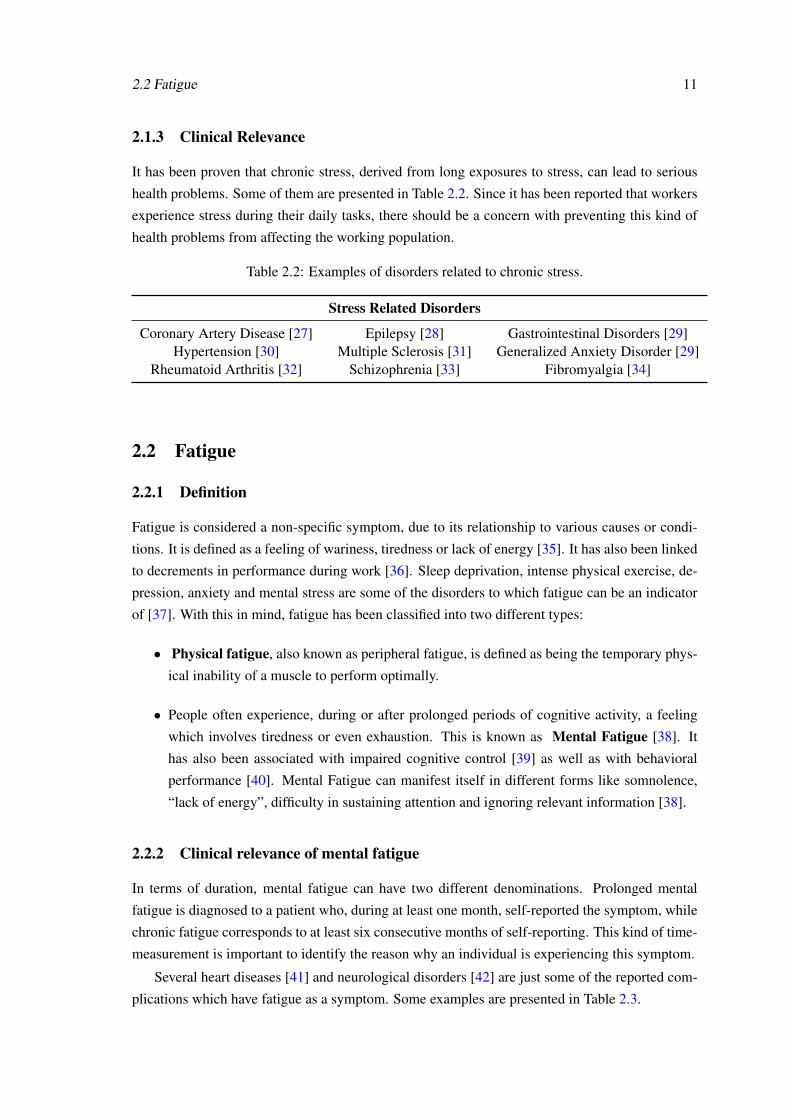
Table 2.2: Examples of disorders related to chronic stress.
Stress Related Disorders
Coronary Artery Disease [27] Epilepsy [28] Gastrointestinal Disorders [29]Hypertension [30] Multiple Sclerosis [31] Generalized Anxiety Disorder [29]
Rheumatoid Arthritis [32] Schizophrenia [33] Fibromyalgia [34]
2.2 Fatigue
2.2.1 Definition
Fatigue is considered a non-specific symptom, due to its relationship to various causes or condi-
tions. It is defined as a feeling of wariness, tiredness or lack of energy [35]. It has also been linked
to decrements in performance during work [36]. Sleep deprivation, intense physical exercise, de-
pression, anxiety and mental stress are some of the disorders to which fatigue can be an indicator
of [37]. With this in mind, fatigue has been classified into two different types:
• Physical fatigue, also known as peripheral fatigue, is defined as being the temporary phys-
ical inability of a muscle to perform optimally.
• People often experience, during or after prolonged periods of cognitive activity, a feeling
which involves tiredness or even exhaustion. This is known as Mental Fatigue [38]. It
has also been associated with impaired cognitive control [39] as well as with behavioral
performance [40]. Mental Fatigue can manifest itself in different forms like somnolence,
“lack of energy”, difficulty in sustaining attention and ignoring relevant information [38].
2.2.2 Clinical relevance of mental fatigue
In terms of duration, mental fatigue can have two different denominations. Prolonged mental
fatigue is diagnosed to a patient who, during at least one month, self-reported the symptom, while
chronic fatigue corresponds to at least six consecutive months of self-reporting. This kind of time-
measurement is important to identify the reason why an individual is experiencing this symptom.
Several heart diseases [41] and neurological disorders [42] are just some of the reported com-
plications which have fatigue as a symptom. Some examples are presented in Table 2.3.

12 Background
Table 2.3: Some of the diseases to have fatigue reported as symptom.
Cardiovascular Disorders Neurological Disorders Others
Cardiomyopathy [43] Multiple Sclerosis [44]Acquired Immunodeficiency
Syndrome [45]Myocarditis [46] Narcolepsy [47] Lyme Disease [48]
Angina [49] Parkinson’s Disease [50] Anemia [51]Coronary Artery Disease [52] Postpoliomyelitis [53] Hodgkin Lymphoma [54]
2.2.3 Causes of mental fatigue
High mental workload, mental stress, jet lag, depression, sleep deprivation and even boredom
are some of the possible causes of mental fatigue. However, none of these explain this symptom
physiologically.
Several studies where physiological changes are analyzed have been carried out in subjects
with chronic fatigue and other disorders. Yet, very few physiological relationships have been
found for healthy people. Only recently a study has provided evidence that mental fatigue induced
by prolonged cognitive load in healthy adults is associated with changes in the activity of the
parasympathetic and sympathetic branches of the ANS [55].
Concluding, being a consequence of subjective behaviors and conditions, Mental Fatigue
should be defined psychologically. Nonetheless, it can be related with the different physiologi-
cal parameters that make the user experience the “feeling” of fatigue and help identify it.
2.3 Cardiac Monitoring
2.3.1 Physiology
As it is known, the heart is the organ responsible for pumping blood to every part of the body.
Normally, this action is done in a constant cycle, composed by contraction and relaxation of dif-
ferent parts of the organ, at different times. This are coordinated by a series of electric charges,
from specific localized nodes within the myocardium [12].
The cardiac cycle starts with the stimulation of the SA node, located in the right atrium, as
presented in Figure 2.2a, which leads to the depolarization of the cardiac muscle in that area (i.e.
they are electrically stimulated), changing their resting potential from negative to positive thus
contracting. This process occurs regularly and spontaneously, at an intrinsic frequency, which is
generally defined as the human heart rate. The average resting HR is 60 to 80 beats per minute
(bpm) [56]. Afterwards, the impulse spreads to the upper two cavities of the heart known as the
atria, reaching the AV node, located in the right atrium, causing contraction of the mentioned
area. Then it passes the bundle of His, spreading out into the inter-ventricular septum and dividing
itself into the left and right bundle branches. As it moves through this region it stimulates the
depolarization of both ventricles. After this, a transient period is followed, which lasts, at least,
200 milliseconds (ms). There is a repolarization of the ventricular myocardium afterwards (i.e.
2.3 Cardiac Monitoring 13
they relax), returning it to its resting electrical potential. The heart is then ready to repeat the
described cycle of contraction and relaxation [12].
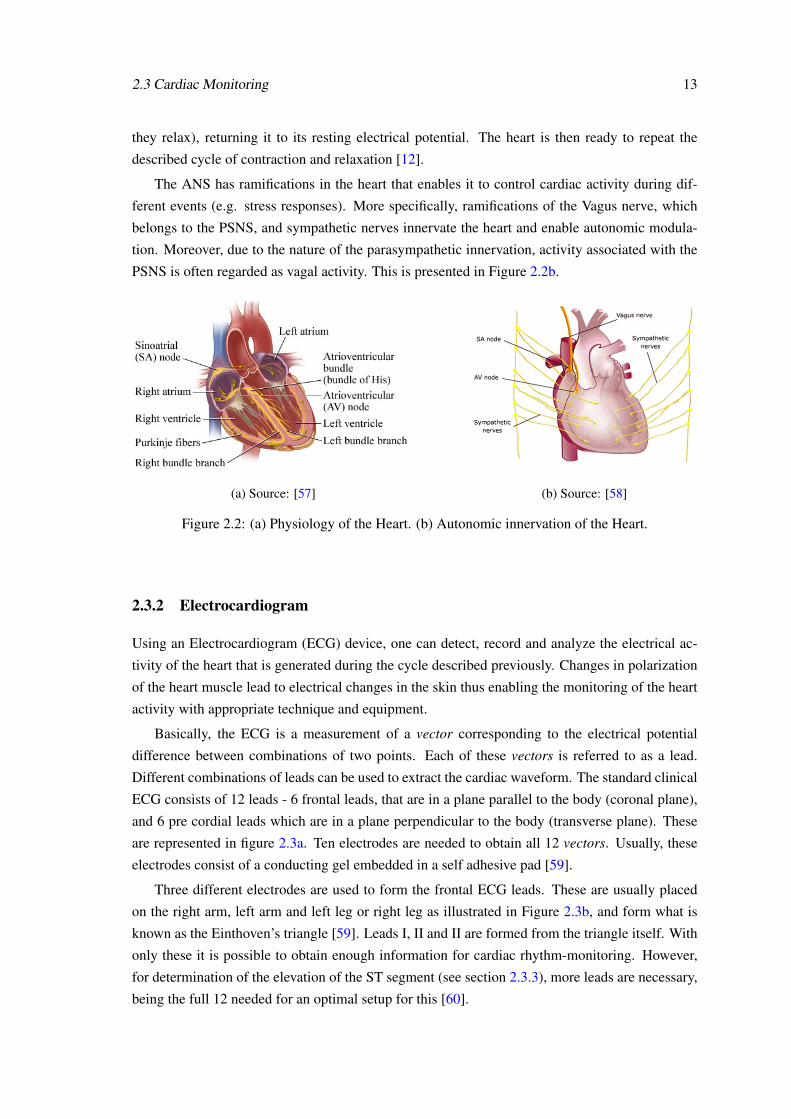
The ANS has ramifications in the heart that enables it to control cardiac activity during dif-
ferent events (e.g. stress responses). More specifically, ramifications of the Vagus nerve, which
belongs to the PSNS, and sympathetic nerves innervate the heart and enable autonomic modula-
tion. Moreover, due to the nature of the parasympathetic innervation, activity associated with the
PSNS is often regarded as vagal activity. This is presented in Figure 2.2b.
(a) Source: [57] (b) Source: [58]
Figure 2.2: (a) Physiology of the Heart. (b) Autonomic innervation of the Heart.
2.3.2 Electrocardiogram
Using an Electrocardiogram (ECG) device, one can detect, record and analyze the electrical ac-
tivity of the heart that is generated during the cycle described previously. Changes in polarization
of the heart muscle lead to electrical changes in the skin thus enabling the monitoring of the heart
activity with appropriate technique and equipment.
Basically, the ECG is a measurement of a vector corresponding to the electrical potential
difference between combinations of two points. Each of these vectors is referred to as a lead.
Different combinations of leads can be used to extract the cardiac waveform. The standard clinical
ECG consists of 12 leads - 6 frontal leads, that are in a plane parallel to the body (coronal plane),
and 6 pre cordial leads which are in a plane perpendicular to the body (transverse plane). These
are represented in figure 2.3a. Ten electrodes are needed to obtain all 12 vectors. Usually, these
electrodes consist of a conducting gel embedded in a self adhesive pad [59].
Three different electrodes are used to form the frontal ECG leads. These are usually placed
on the right arm, left arm and left leg or right leg as illustrated in Figure 2.3b, and form what is
known as the Einthoven’s triangle [59]. Leads I, II and II are formed from the triangle itself. With
only these it is possible to obtain enough information for cardiac rhythm-monitoring. However,
for determination of the elevation of the ST segment (see section 2.3.3), more leads are necessary,
being the full 12 needed for an optimal setup for this [60].
14 Background
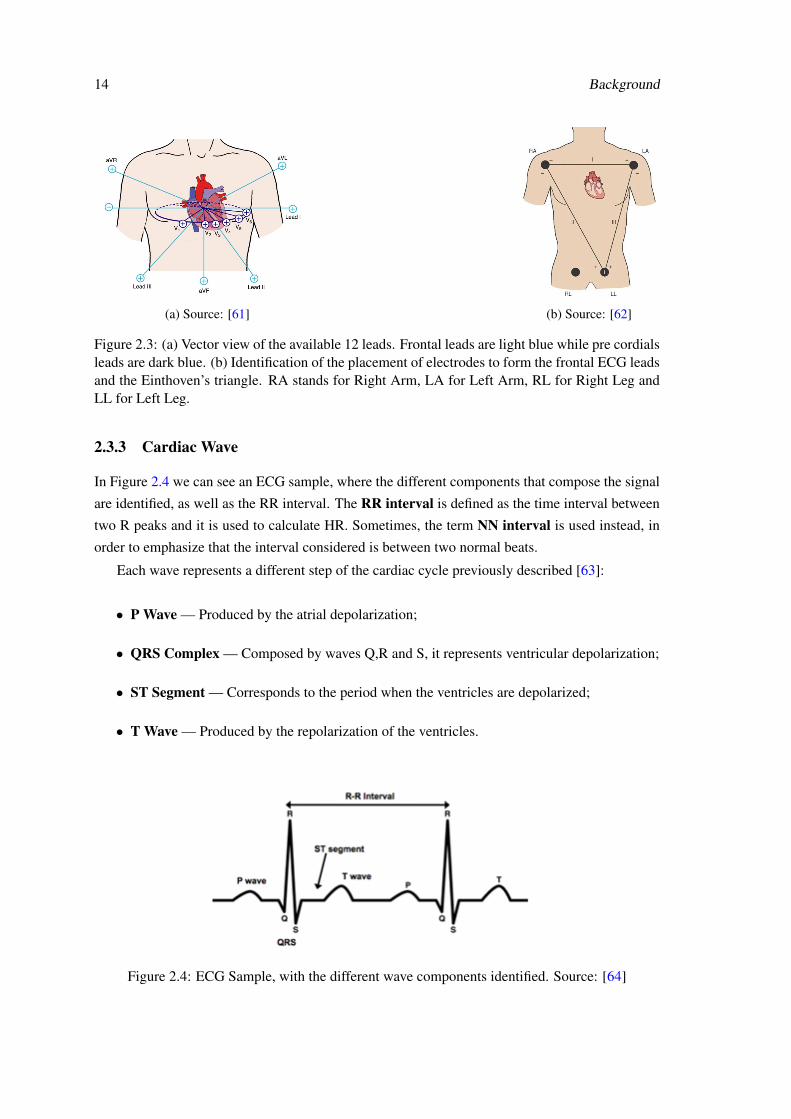
(a) Source: [61] (b) Source: [62]
Figure 2.3: (a) Vector view of the available 12 leads. Frontal leads are light blue while pre cordialsleads are dark blue. (b) Identification of the placement of electrodes to form the frontal ECG leadsand the Einthoven’s triangle. RA stands for Right Arm, LA for Left Arm, RL for Right Leg andLL for Left Leg.
2.3.3 Cardiac Wave
In Figure 2.4 we can see an ECG sample, where the different components that compose the signal
are identified, as well as the RR interval. The RR interval is defined as the time interval between
two R peaks and it is used to calculate HR. Sometimes, the term NN interval is used instead, in
order to emphasize that the interval considered is between two normal beats.
Each wave represents a different step of the cardiac cycle previously described [63]:
• P Wave — Produced by the atrial depolarization;
• QRS Complex — Composed by waves Q,R and S, it represents ventricular depolarization;
• ST Segment — Corresponds to the period when the ventricles are depolarized;
• T Wave — Produced by the repolarization of the ventricles.
Figure 2.4: ECG Sample, with the different wave components identified. Source: [64]

2.4 Conclusions 15
2.4 Conclusions
To fully understand stress and fatigue, different concepts from distinct areas must be taken into
consideration. A physiological approach should be performed together with a psychological one in
order to take into consideration the individual’s perception of the events. The autonomic behavior
seems to be physiologically correlated with both these disorders. Furthermore, several body mech-
anisms occur as a consequence of the imposing demands by the environment therefore opening an
window to study the ANS during the exposure to this disorders. According to the literature, the
heart is one of the most interesting organs to study stress due to the strong, noticeable changes im-
posed by the ANS during stressful events. Fatigue has also been correlated with cardiac changes.
Consequently, the study of the cardiac behavior appears as one of the main windows to study both
stress and fatigue.

16 Background
Chapter 3
Relevant Studies and Tools
As explained in chapter 2, stress and fatigue are associated with different changes in the human
system that are controlled by the brain. Knowing this, different studies have been made to un-
derstand the behavior of different physiological parameters during exposure of an individual to
stress and fatigue. Therefore, it becomes essential to know how this information can be collected,
through assessment of the current monitoring systems available, and how the literature is designing
their studies to identify these disorders.
3.1 Monitoring Parameters
3.1.1 Heart Rate Variability
With the information present in an ECG, one can obtain the beat-to-beat variation, or in other
words, the HRV. Different time-domain and spectral-domain parameters can be extracted from
this to better understand the cardiac behavior.
However, in order to study the spectral domain features of the signal, some processing has to
be done. The most common methods to do this are the Fast Fourier Transform [65], the Lomb
Periodogram [66] and the Auto Regressive spectral estimation [67].
The following presented measures were considered relevant by the task force of the European
Society of Cardiology and the North American Society of Pacing and Electrophysiology for the
purposes of HRV analysis [19].
3.1.1.1 Time-Domain Parameters
Simple time domain variables that can be calculated with only the NN intervals (see section 2.3.3)
are:
• Mean NN (ms) – Mean Heart beat interval
• Mean HR (bpm) – Mean Heart Rate.
17
18 Relevant Studies and Tools
Some statistical measures can be obtained as well. Normally these are obtained from a predefined
time window (e.g. 5 minutes). This include:
• SDNN (ms) – Standard Deviation of all NN intervals. Reflects all the cyclic components
responsible for variability in the analyzed period of recording.
• RMSSD (ms) – Root Mean Square of Successive Differences between adjacent NN inter-
vals.
• SDSD (ms) – Standard Deviation of Successive Differences between adjacent NN intervals.
• NNx – number of pairs of successive NN intervals that differ by more than x ms (for example
50 ms (NN50)).
• pNNx (%) – percentage of NNx compared to the total number of NN intervals (for example
50 ms (pNN50)).
3.1.1.2 Spectral-Domain Parameters
As mentioned in 2.3.1, it is in the SA node that the cardiac cycle begins. In this region, there is a
periodical generation of action potentials at an almost constant frequency (which are propagated to
the other areas of the heart) due to the unstable membrane potential of the myocytes (muscle cells)
that exist there [68]. This apparent constant frequency is modulated by diverse factors that add
variability, at different frequencies, to the signal. As discussed earlier in section 2.3.1, the ANS
can influence the cardiac behavior. Therefore, the study of the mentioned frequency modulation
can be very interesting to understand the autonomic activity that is related to the heart beat.
Of the possible frequency related features, the most relevant are:
• ULF (ms2) – Spectral Power in the Ultra Low Frequency (ULF) range ( 0.003 Hz). It is
related to the circadian rhythm [69].
• VLF (ms2) – Spectral Power in the Very Low Frequency (VLF) range (0.003 Hz - 0.04 Hz),
which is supposedly associated with regulation of temperature and humoral systems [70].
• LF (ms2) - Spectral Power in the Low Frequency (LF) range (0.04 Hz - 0.15 Hz). There are
studies that relate LF to changes in cardiac sympathetic and parasympathetic nerve activity
[71]. This is due to the fact that the SNS has a longer response time when compared to
the PSNS, which is also capable of very short responses. Because of this, low frequency
fluctuations in heart rate can be mediated both by the PSNS and SNS [72].
• HF (ms2) - Spectral Power in the High Frequency (HF) range (0.15 Hz - 0.4 Hz). The
PSNS has a lower response time compared to the SNS [73], which enables it to react rapidly
enough to mediate high frequency fluctuations in heart rate. Besides, it has been reported
that high frequencies are synchronized with the respiratory rhythm [74], which is expected
since vagal activity is also related to RSA (as verified in section 2.1.1.3).
3.1 Monitoring Parameters 19
• LF/HF – Ratio of LF for HF. Considering that the SNS activity is reflected in the LF power
of the spectrum while the PSNS exert their influence more quickly on the heart and princi-
pally affect the HF power, the LF/HF ratio can be taken as a measurement of sympathovagal
balance [15][75][76]. Therefore, increases in sympathetic activity (e.g. during the fight-or-
flight response) translate in the increase of the LF/HF values.
• Total Power ((ms2) – Variance of all NN intervals (frequency range 0.4 Hz).
• LF norm – LF power in normalized units (obtained by dividing the LF power by the differ-
ence between the Total Power and VLF power).
• HF norm - HF power in normalized units (obtained by dividing the HF power by the dif-
ference between the Total Power and VLF power).
It is also important to distinguish between short term recording (2 to 5 minutes) and long term
recordings (usually 24 hours long) [19].
If considering the first one, three main spectral components may be distinguished: The VLF,
LF and HF. The normalized measures presented (normalized LF and HF power) are used to em-
phasize the mentioned behavior of two of the branches of the ANS during short term recordings.
Besides, this normalization tends to minimize the effect that changes in total power have in the
values of the LF and HF components (since it does not take in consideration the VLF compo-
nent). The reason why the VLF power is discarded is because its non-harmonic component, one
of the VLF major constituents, does not have coherent properties and is affected by algorithms of
baseline or trend removal [19].
Otherwise, when analyzing day-long (24 hour) recordings, besides the three major components
mentioned, one should also take in consideration the ULF component of the signal, which is related
to the circadian rhythm, as stated, which cannot be seen, obviously, when considering recordings
of just a few minutes.
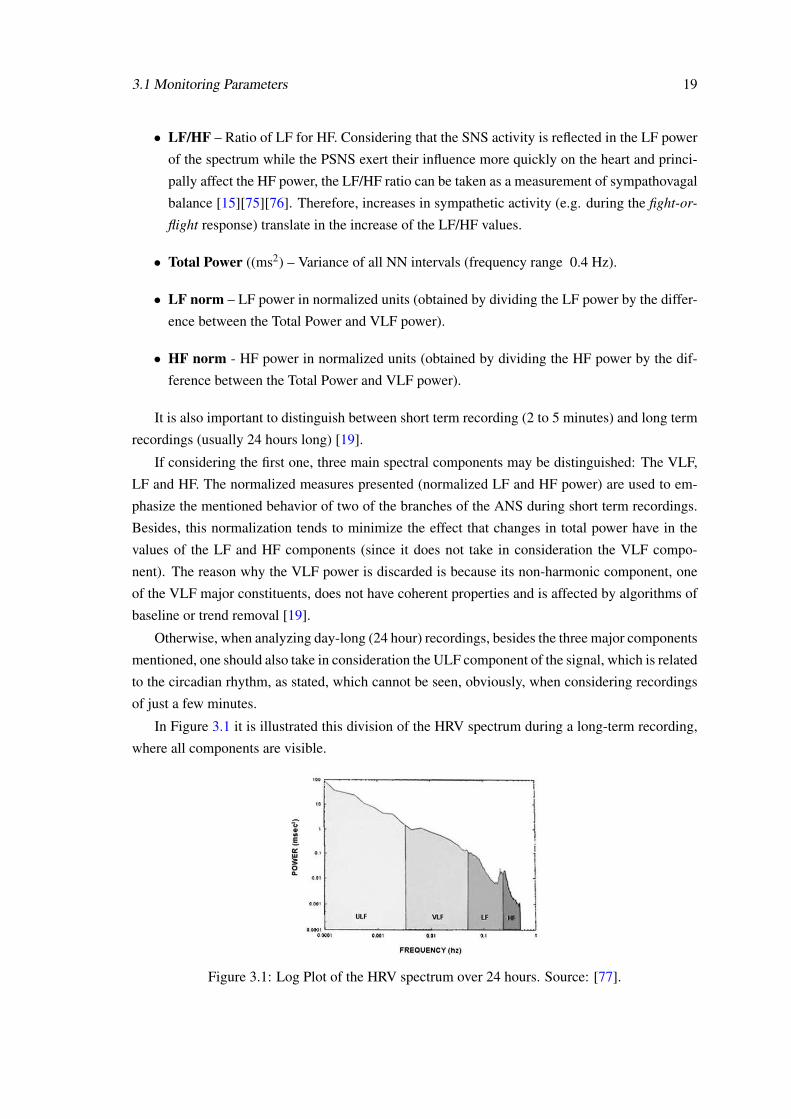
In Figure 3.1 it is illustrated this division of the HRV spectrum during a long-term recording,
where all components are visible.
Figure 3.1: Log Plot of the HRV spectrum over 24 hours. Source: [77].
20 Relevant Studies and Tools
3.1.1.3 Cardiovascular Intensity
Another interesting value that can be extracted from the HR is the Cardiovascular Intensity (CI),
which takes in consideration the maximum HR recommended for a person and is an indicator of
the challenge to the cardiovascular system that a certain event or exercise represents. According
to Tanaka et al., the maximum HR is given by [78]:
HRmax = 208−0.7×age (3.1)
With this, and having the baseline value during rest (HRrest) to compare to, it is possible to
obtain the CI by applying the following equation:
CIi =HRi−HRrest
HRmax−HRrest×100% (3.2)
3.1.1.4 Relevant Factors
Besides the mentioned autonomic influence on HRV, other factors may, as well, affect the cardiac
output. The subject’s details like age [78], exercise routines [79], and caffeine consumption [80]
are very important to have when assessing stress and fatigue through cardiac parameters. Their
history of hearth-related disorders is, obviously, also important.
3.1.1.5 Application
Due to the high correlation with ANS, HRV has been widely used in the literature to assess stress.
However, fatigue can also be identified using it. A study developed by Yvonne Tran et al. sug-
gest fatigue is associated with psychological factors and increased sympathetic activity in healthy
populations [81]. Furthermore, it has been reported that HRV is also correlated with the psycho-
logical cognitive performance of an individual [82]. These findings suggest that the study of the
heart behavior can be used as a physiological factor for the study of fatigue.
3.1.1.6 SenseMyHeart
Taking into account all the available variables that can be extracted from HRV, it becomes viable
to develop tools that can allow researchers to easily access feasible information concerning the
cardiac wave’s time and spectral components. Physionet developed a software library for pro-
cess and analyze physiological signals, including ECG [83]. However, this software requires an
Unix environment (e.g. Linux), as well as computation skills in that operating system, which
can make difficult its usage by researchers. With this in mind, Pinto Silva and Silva Cunha de-
veloped a cloud service that, ultimately, provides an Application Programming Interface (API)
for a Physionet-based pipeline for ECG processing and HRV measurement [84]. By creating a
WaveFrom Database record from the raw ECG signal input, this tool recurs to PhysionetToolkit
to extract different HRV measurements through a simple user-friendly interface. QRS detection
can be done recurring to three different detectors (labelled sqrs, swqrs and sgqrs). It also accepts
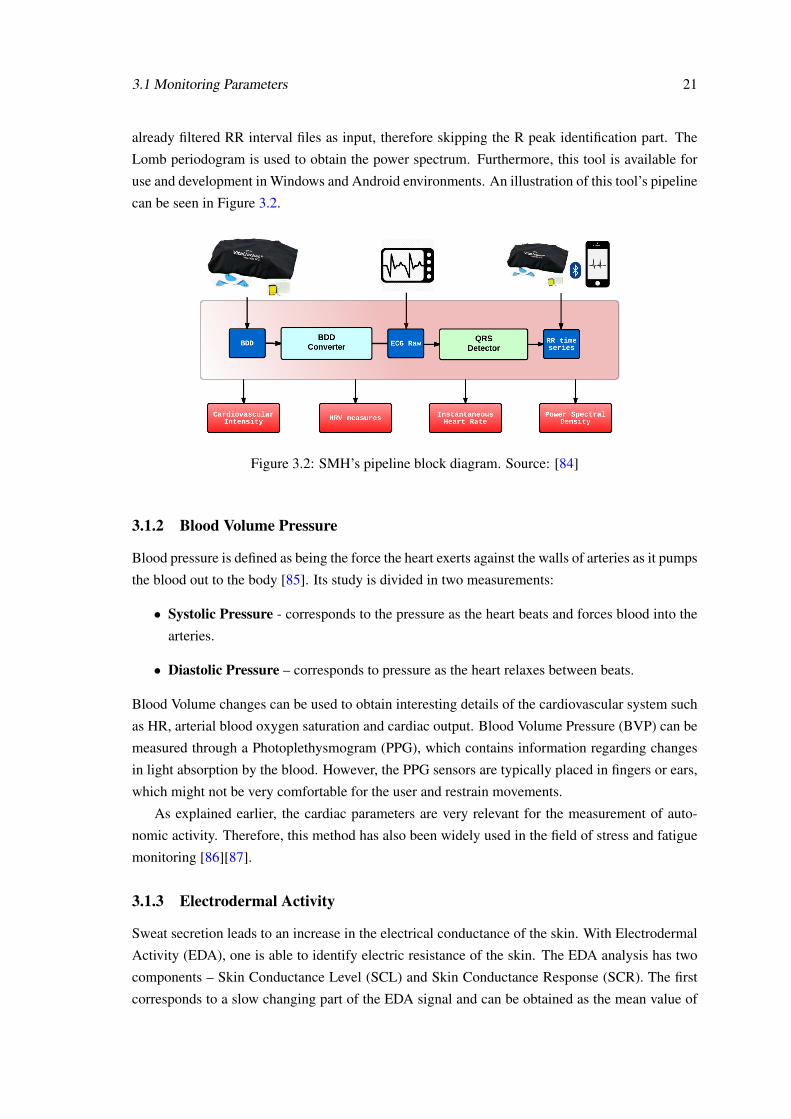
3.1 Monitoring Parameters 21
already filtered RR interval files as input, therefore skipping the R peak identification part. The
Lomb periodogram is used to obtain the power spectrum. Furthermore, this tool is available for
use and development in Windows and Android environments. An illustration of this tool’s pipeline
can be seen in Figure 3.2.
Figure 3.2: SMH’s pipeline block diagram. Source: [84]
3.1.2 Blood Volume Pressure
Blood pressure is defined as being the force the heart exerts against the walls of arteries as it pumps
the blood out to the body [85]. Its study is divided in two measurements:
• Systolic Pressure - corresponds to the pressure as the heart beats and forces blood into the
arteries.
• Diastolic Pressure – corresponds to pressure as the heart relaxes between beats.
Blood Volume changes can be used to obtain interesting details of the cardiovascular system such
as HR, arterial blood oxygen saturation and cardiac output. Blood Volume Pressure (BVP) can be
measured through a Photoplethysmogram (PPG), which contains information regarding changes
in light absorption by the blood. However, the PPG sensors are typically placed in fingers or ears,
which might not be very comfortable for the user and restrain movements.
As explained earlier, the cardiac parameters are very relevant for the measurement of auto-
nomic activity. Therefore, this method has also been widely used in the field of stress and fatigue
monitoring [86][87].
3.1.3 Electrodermal Activity
Sweat secretion leads to an increase in the electrical conductance of the skin. With Electrodermal
Activity (EDA), one is able to identify electric resistance of the skin. The EDA analysis has two
components – Skin Conductance Level (SCL) and Skin Conductance Response (SCR). The first
corresponds to a slow changing part of the EDA signal and can be obtained as the mean value of
22 Relevant Studies and Tools
skin conductance over a defined data window. SCR is associated with the fast changing part of the
signal and occurs in relation to a single stimulus [88]. Latency and magnitude of SCR and average
SCL are the most used values to analyze in EDA studies.
Since, when experiencing stress, one of the reactions of the ANS, as depicted in Table 2.1, is
to increase the glandular secretion through the SNS (which results in oily skin, for example), EDA
can be used to assess sympathetic activity.
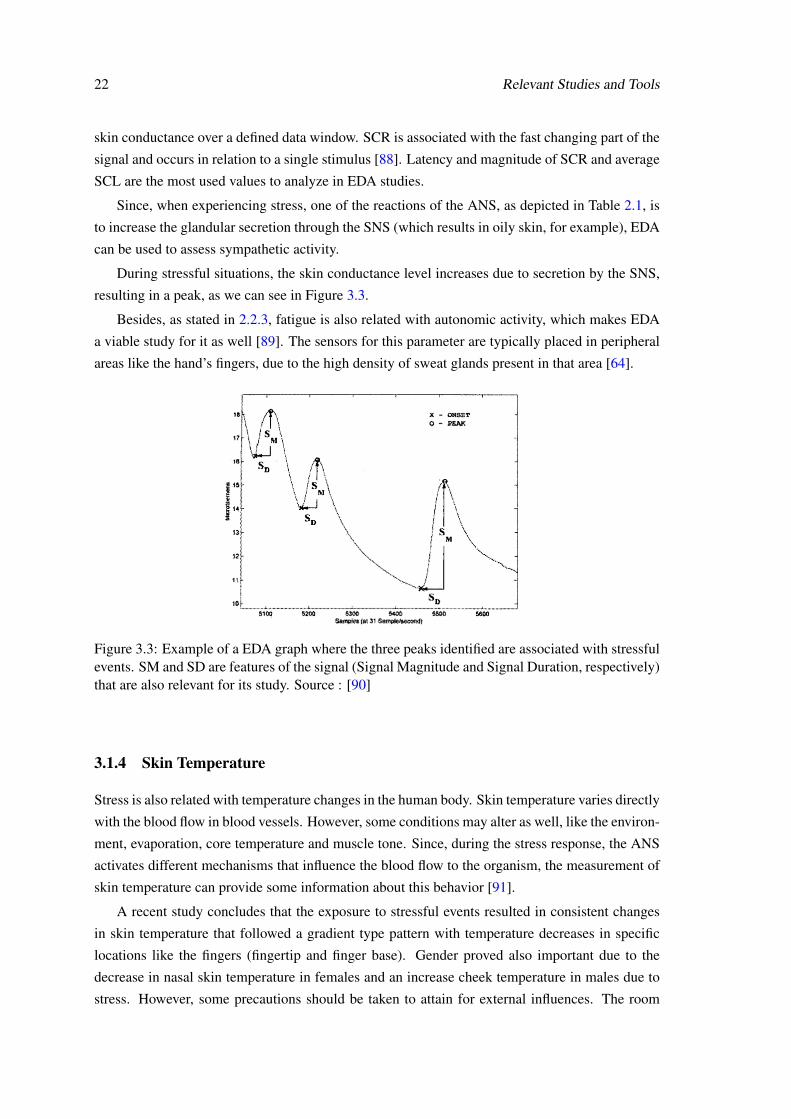
During stressful situations, the skin conductance level increases due to secretion by the SNS,
resulting in a peak, as we can see in Figure 3.3.
Besides, as stated in 2.2.3, fatigue is also related with autonomic activity, which makes EDA
a viable study for it as well [89]. The sensors for this parameter are typically placed in peripheral
areas like the hand’s fingers, due to the high density of sweat glands present in that area [64].
Figure 3.3: Example of a EDA graph where the three peaks identified are associated with stressfulevents. SM and SD are features of the signal (Signal Magnitude and Signal Duration, respectively)that are also relevant for its study. Source : [90]
3.1.4 Skin Temperature
Stress is also related with temperature changes in the human body. Skin temperature varies directly
with the blood flow in blood vessels. However, some conditions may alter as well, like the environ-
ment, evaporation, core temperature and muscle tone. Since, during the stress response, the ANS
activates different mechanisms that influence the blood flow to the organism, the measurement of
skin temperature can provide some information about this behavior [91].
A recent study concludes that the exposure to stressful events resulted in consistent changes
in skin temperature that followed a gradient type pattern with temperature decreases in specific
locations like the fingers (fingertip and finger base). Gender proved also important due to the
decrease in nasal skin temperature in females and an increase cheek temperature in males due to
stress. However, some precautions should be taken to attain for external influences. The room
3.1 Monitoring Parameters 23
temperature should stay the same throughout the whole experiment (approximately 24 oC), and a
clear distinction between male and female subject should be done as well [91][92].
3.1.5 Salivary Cortisol
During the stress response, the ANS change the secretion of some hormones in our body, as
described earlier in 2.1.1. Changes in Salivary Cortisol may occur possibly due to this mechanism.
Therefore, it has been used for several studies of stress. This parameter is known to increase
with psychological stress differently in males and females as well [93]. However, even being a
non-intrusive parameter, the study of Salivary Cortisol implies following a protocol to guarantee
reliable results. In [94], for example, it starts by collecting saliva from the surgeon into a cotton
swab or salivette, immediately before and after each procedure, with the correspondent times of
collection recorded as well. Samples were then stored at -20oC prior to the analysis, which is then
performed in different steps:
• First, the saliva is removed from the swab by centrifuging the samples at 1000x during 5
minutes;
• Afterwards they are stored at 4 oC;
• Cortisol concentrations are then determined by luminescence assay.
Furthermore, subjects were instructed to report activities that may influence the final outcome (e.g.
recent food, caffeine intake, tooth brushing, exercise, etc.) A total of 54 procedures were observed
with 11 surgeons, where 23 of those procedures were self reported as stressful. Results show
that salivary cortisol had an specificity of 91% and sensitivity of 70% for detecting stress during
surgery [94].
3.1.6 Oculomotor Measurements
Ocular muscles are highly innervated by the ANS, therefore it is natural that the analysis of the eye
can provide information of autonomic activity. There are different parameters that are controlled
unconsciously, and have been reported to be related with fatigue in humans:
• Pupil size has been successfully used as measure of cognitive workload [95];
• Recently, in 2011, a study developed by the United States Air Force Research Laboratory
concluded that the pupil position can be used to detect fatigue in relevant military aviation
tasks [96];
• Blink frequency has been reportedly associated with both fatigue (where it becomes slower
(i.e. frequency decreases)) [97] and stress ( where it increases) [98]. Blink duration has also
been used to assess fatigue [99];
• Schmidt et al. reported an overall slowing of saccadic velocities due to mental fatigue
[100];
24 Relevant Studies and Tools
• Eyelid closure has been also used, together with HRV, to estimate the driver’s drowsiness
level [101] with high accuracy.
3.1.7 Electroencephalography
Electroencephalography (EEG) is a common method to assess brain activity. More specifically, to
assess voltage fluctuations resulting from ionic current flows within the neurons of the brain [102].
The different recorded signals can be categorized into 4 frequency bands [103]:
• Delta band (0.5 – 3 Hz);
• Theta band (4 - 7 Hz);
• Alpha band (8– 13 Hz);
• Beta band (13 – 30 Hz).
The amplitude of the signals ranges from 2 to 100 V. Data above this superior limit can be due
to the addition of noises or artifacts (e.g. eye movement, electrode noise). Therefore, a filtering
(e.g. threshold) of the signal must be done previously to obtain reliable data [103]. Fast Fourier
Transform can be used, as with ECG, to obtain the signals’ spectrum.
By comparing the amplitudes of EEG alpha and beta bands, one is able to monitor the subject’s
emotion state [104]. An increase in the Alpha band power has been reported to be related with
relax and conscious conditions [105] while stress due to anxiety, excitement and tension lead to a
higher Beta band power [106]. A decrease of power of both bands seems to be related with intense
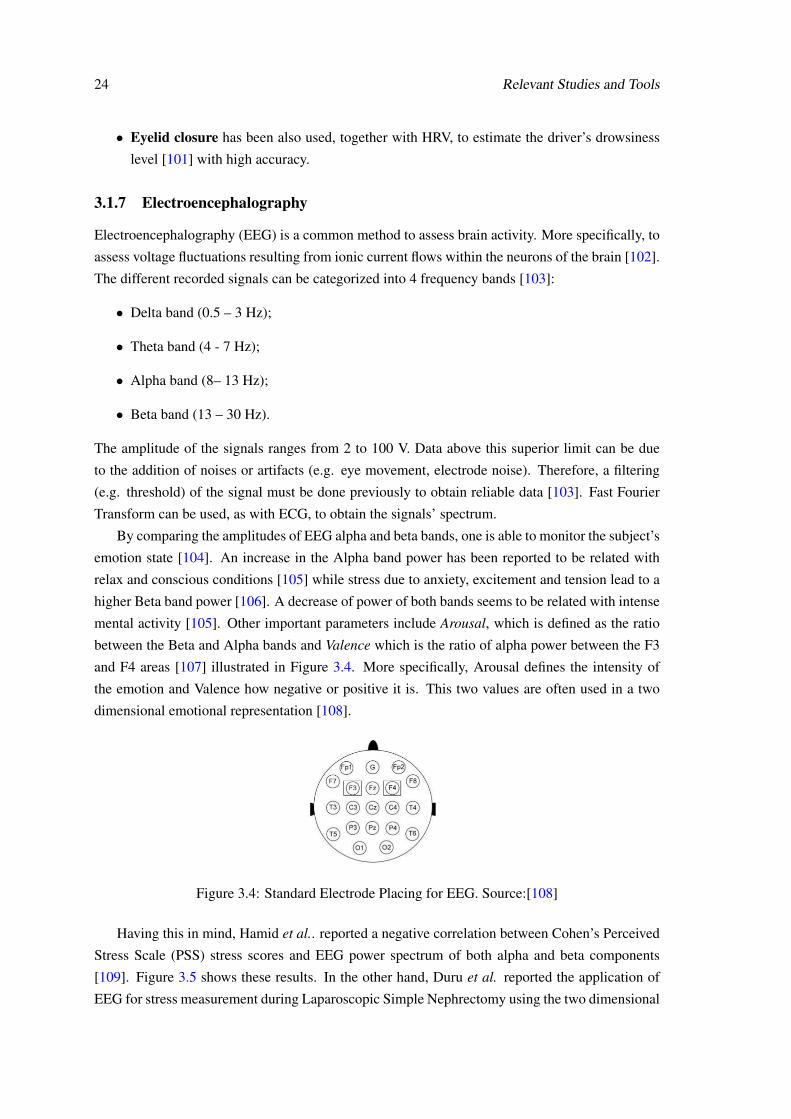
mental activity [105]. Other important parameters include Arousal, which is defined as the ratio
between the Beta and Alpha bands and Valence which is the ratio of alpha power between the F3
and F4 areas [107] illustrated in Figure 3.4. More specifically, Arousal defines the intensity of
the emotion and Valence how negative or positive it is. This two values are often used in a two
dimensional emotional representation [108].
Figure 3.4: Standard Electrode Placing for EEG. Source:[108]
Having this in mind, Hamid et al.. reported a negative correlation between Cohen’s Perceived
Stress Scale (PSS) stress scores and EEG power spectrum of both alpha and beta components
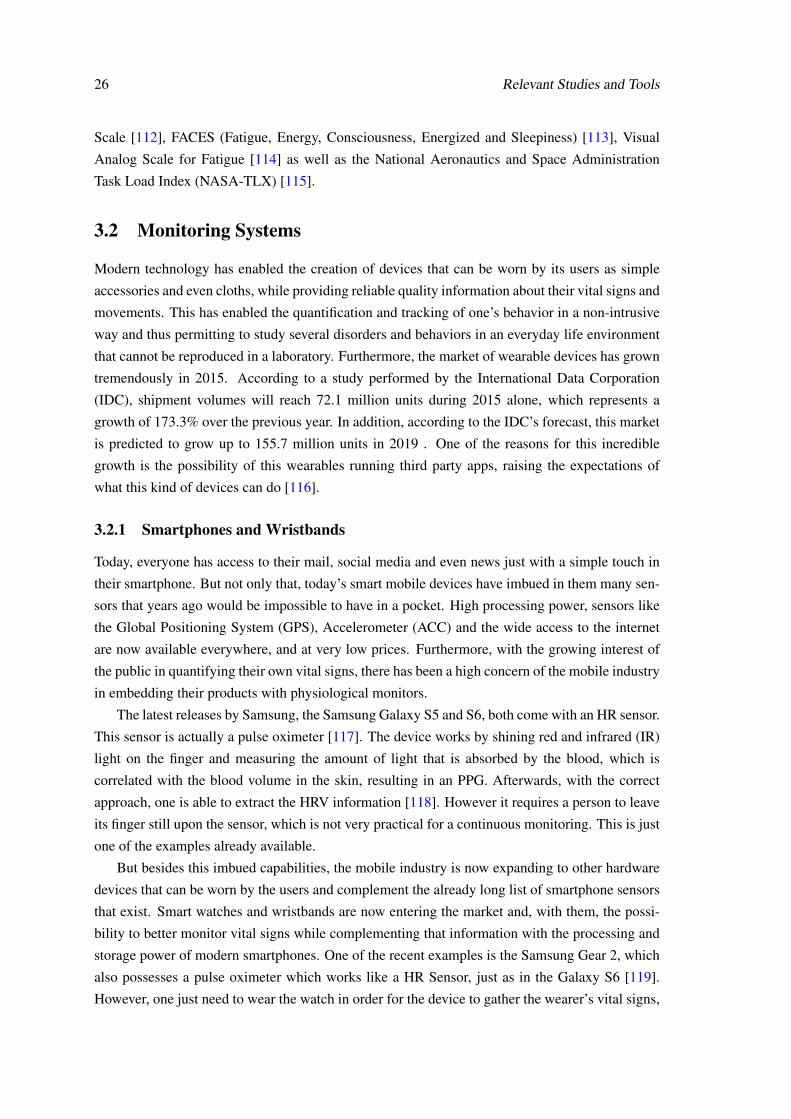
[109]. Figure 3.5 shows these results. In the other hand, Duru et al. reported the application of
EEG for stress measurement during Laparoscopic Simple Nephrectomy using the two dimensional
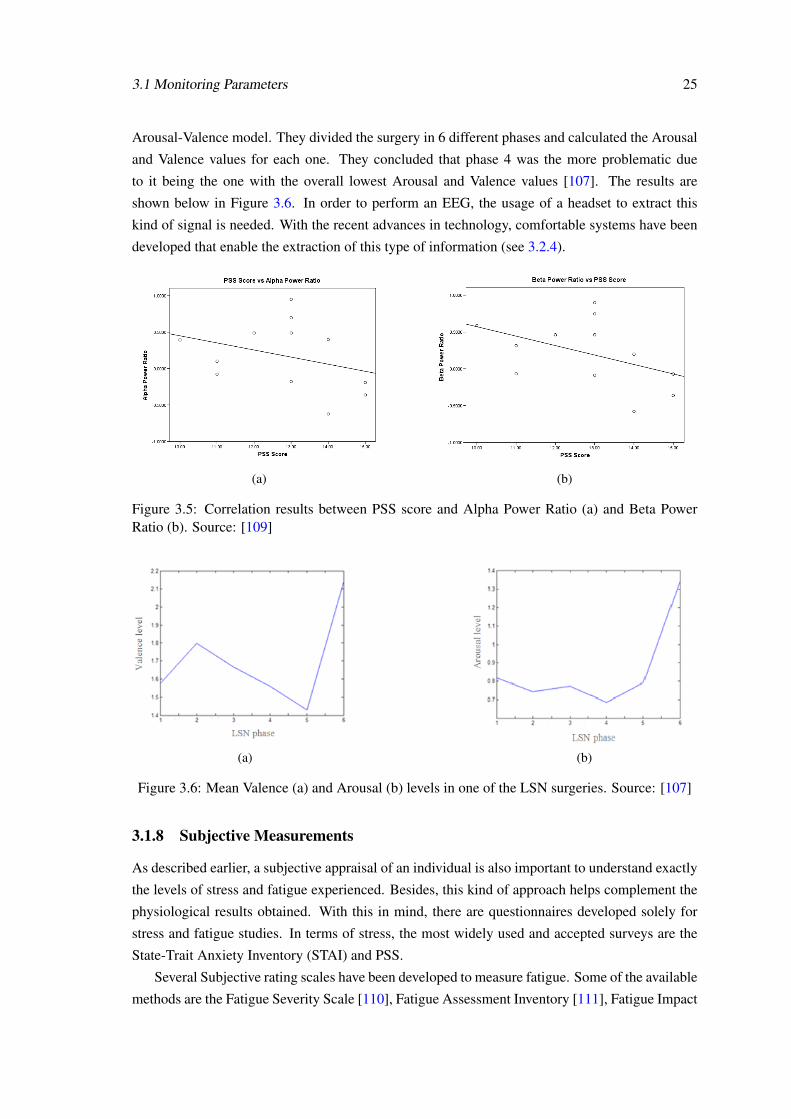
3.1 Monitoring Parameters 25
Arousal-Valence model. They divided the surgery in 6 different phases and calculated the Arousal
and Valence values for each one. They concluded that phase 4 was the more problematic due
to it being the one with the overall lowest Arousal and Valence values [107]. The results are
shown below in Figure 3.6. In order to perform an EEG, the usage of a headset to extract this
kind of signal is needed. With the recent advances in technology, comfortable systems have been
developed that enable the extraction of this type of information (see 3.2.4).
(a) (b)
Figure 3.5: Correlation results between PSS score and Alpha Power Ratio (a) and Beta PowerRatio (b). Source: [109]
(a) (b)
Figure 3.6: Mean Valence (a) and Arousal (b) levels in one of the LSN surgeries. Source: [107]
3.1.8 Subjective Measurements
As described earlier, a subjective appraisal of an individual is also important to understand exactly
the levels of stress and fatigue experienced. Besides, this kind of approach helps complement the
physiological results obtained. With this in mind, there are questionnaires developed solely for
stress and fatigue studies. In terms of stress, the most widely used and accepted surveys are the
State-Trait Anxiety Inventory (STAI) and PSS.
Several Subjective rating scales have been developed to measure fatigue. Some of the available
methods are the Fatigue Severity Scale [110], Fatigue Assessment Inventory [111], Fatigue Impact
26 Relevant Studies and Tools
Scale [112], FACES (Fatigue, Energy, Consciousness, Energized and Sleepiness) [113], Visual
Analog Scale for Fatigue [114] as well as the National Aeronautics and Space Administration
Task Load Index (NASA-TLX) [115].
3.2 Monitoring Systems
Modern technology has enabled the creation of devices that can be worn by its users as simple
accessories and even cloths, while providing reliable quality information about their vital signs and
movements. This has enabled the quantification and tracking of one’s behavior in a non-intrusive
way and thus permitting to study several disorders and behaviors in an everyday life environment
that cannot be reproduced in a laboratory. Furthermore, the market of wearable devices has grown
tremendously in 2015. According to a study performed by the International Data Corporation
(IDC), shipment volumes will reach 72.1 million units during 2015 alone, which represents a
growth of 173.3% over the previous year. In addition, according to the IDC’s forecast, this market
is predicted to grow up to 155.7 million units in 2019 . One of the reasons for this incredible
growth is the possibility of this wearables running third party apps, raising the expectations of
what this kind of devices can do [116].
3.2.1 Smartphones and Wristbands
Today, everyone has access to their mail, social media and even news just with a simple touch in
their smartphone. But not only that, today’s smart mobile devices have imbued in them many sen-
sors that years ago would be impossible to have in a pocket. High processing power, sensors like
the Global Positioning System (GPS), Accelerometer (ACC) and the wide access to the internet
are now available everywhere, and at very low prices. Furthermore, with the growing interest of
the public in quantifying their own vital signs, there has been a high concern of the mobile industry
in embedding their products with physiological monitors.
The latest releases by Samsung, the Samsung Galaxy S5 and S6, both come with an HR sensor.
This sensor is actually a pulse oximeter [117]. The device works by shining red and infrared (IR)
light on the finger and measuring the amount of light that is absorbed by the blood, which is
correlated with the blood volume in the skin, resulting in an PPG. Afterwards, with the correct
approach, one is able to extract the HRV information [118]. However it requires a person to leave
its finger still upon the sensor, which is not very practical for a continuous monitoring. This is just
one of the examples already available.
But besides this imbued capabilities, the mobile industry is now expanding to other hardware
devices that can be worn by the users and complement the already long list of smartphone sensors
that exist. Smart watches and wristbands are now entering the market and, with them, the possi-
bility to better monitor vital signs while complementing that information with the processing and
storage power of modern smartphones. One of the recent examples is the Samsung Gear 2, which
also possesses a pulse oximeter which works like a HR Sensor, just as in the Galaxy S6 [119].
However, one just need to wear the watch in order for the device to gather the wearer’s vital signs,
3.2 Monitoring Systems 27
enabling a continuous monitoring during everyday events and complement that information with
the localization and movement sensors. Apple (through Apple Watch), has also been investing
in this market. Other companies have been focusing only in development of the smartwatches.
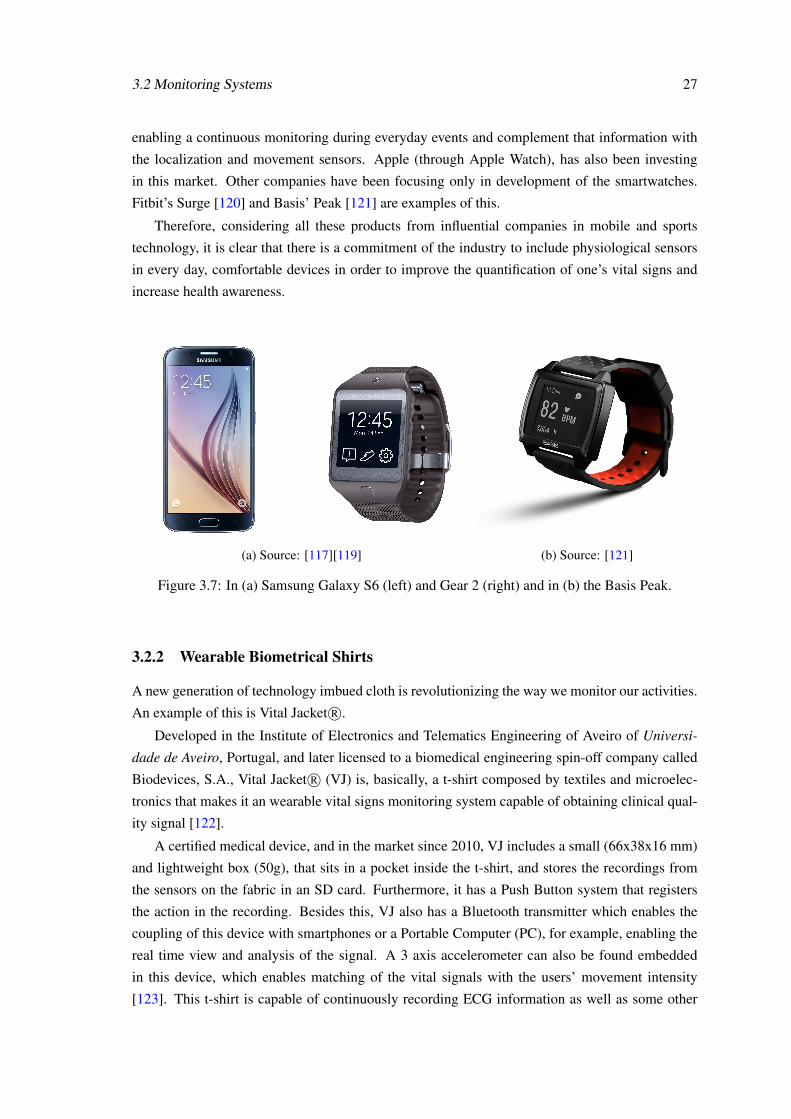
Fitbit’s Surge [120] and Basis’ Peak [121] are examples of this.
Therefore, considering all these products from influential companies in mobile and sports
technology, it is clear that there is a commitment of the industry to include physiological sensors
in every day, comfortable devices in order to improve the quantification of one’s vital signs and
increase health awareness.
(a) Source: [117][119] (b) Source: [121]
Figure 3.7: In (a) Samsung Galaxy S6 (left) and Gear 2 (right) and in (b) the Basis Peak.
3.2.2 Wearable Biometrical Shirts
A new generation of technology imbued cloth is revolutionizing the way we monitor our activities.
An example of this is Vital Jacket R©.
Developed in the Institute of Electronics and Telematics Engineering of Aveiro of Universi-
dade de Aveiro, Portugal, and later licensed to a biomedical engineering spin-off company called
Biodevices, S.A., Vital Jacket R© (VJ) is, basically, a t-shirt composed by textiles and microelec-
tronics that makes it an wearable vital signs monitoring system capable of obtaining clinical qual-
ity signal [122].
A certified medical device, and in the market since 2010, VJ includes a small (66x38x16 mm)
and lightweight box (50g), that sits in a pocket inside the t-shirt, and stores the recordings from
the sensors on the fabric in an SD card. Furthermore, it has a Push Button system that registers
the action in the recording. Besides this, VJ also has a Bluetooth transmitter which enables the
coupling of this device with smartphones or a Portable Computer (PC), for example, enabling the
real time view and analysis of the signal. A 3 axis accelerometer can also be found embedded
in this device, which enables matching of the vital signals with the users’ movement intensity
[123]. This t-shirt is capable of continuously recording ECG information as well as some other
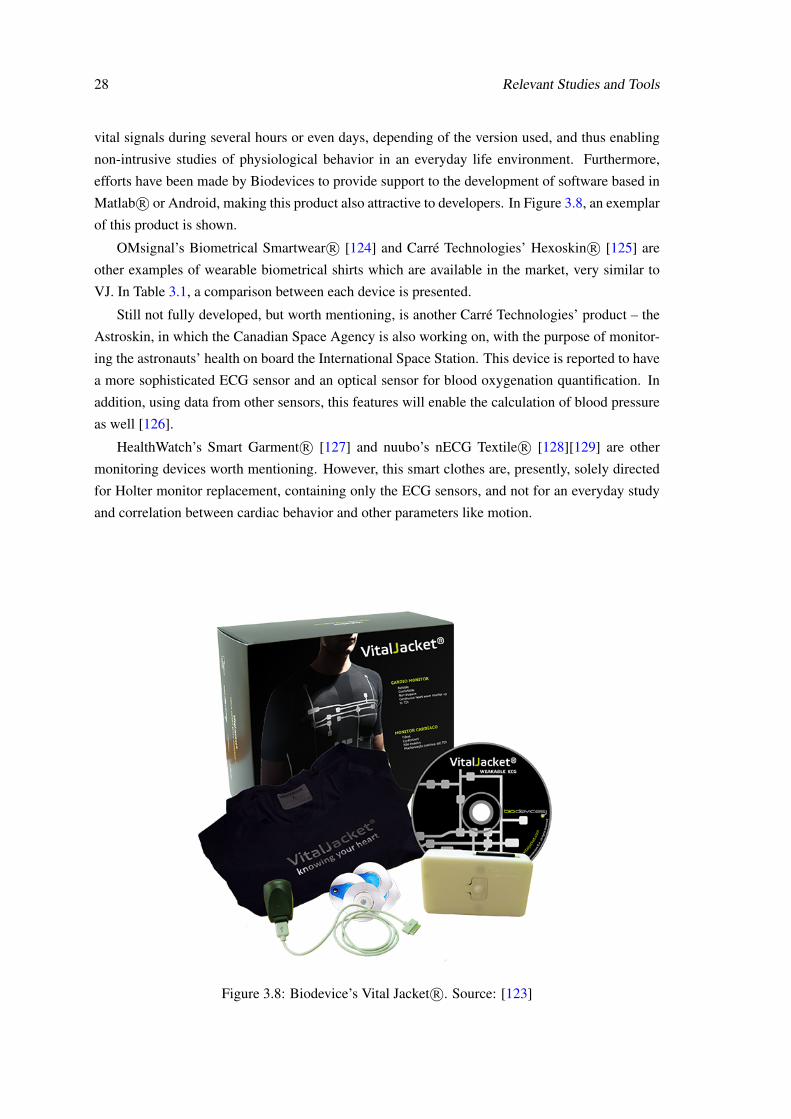
28 Relevant Studies and Tools
vital signals during several hours or even days, depending of the version used, and thus enabling
non-intrusive studies of physiological behavior in an everyday life environment. Furthermore,
efforts have been made by Biodevices to provide support to the development of software based in
Matlab R© or Android, making this product also attractive to developers. In Figure 3.8, an exemplar
of this product is shown.
OMsignal’s Biometrical Smartwear R© [124] and Carré Technologies’ Hexoskin R© [125] are
other examples of wearable biometrical shirts which are available in the market, very similar to
VJ. In Table 3.1, a comparison between each device is presented.
Still not fully developed, but worth mentioning, is another Carré Technologies’ product – the
Astroskin, in which the Canadian Space Agency is also working on, with the purpose of monitor-
ing the astronauts’ health on board the International Space Station. This device is reported to have
a more sophisticated ECG sensor and an optical sensor for blood oxygenation quantification. In
addition, using data from other sensors, this features will enable the calculation of blood pressure
as well [126].
HealthWatch’s Smart Garment R© [127] and nuubo’s nECG Textile R© [128][129] are other
monitoring devices worth mentioning. However, this smart clothes are, presently, solely directed
for Holter monitor replacement, containing only the ECG sensors, and not for an everyday study
and correlation between cardiac behavior and other parameters like motion.
Figure 3.8: Biodevice’s Vital Jacket R©. Source: [123]
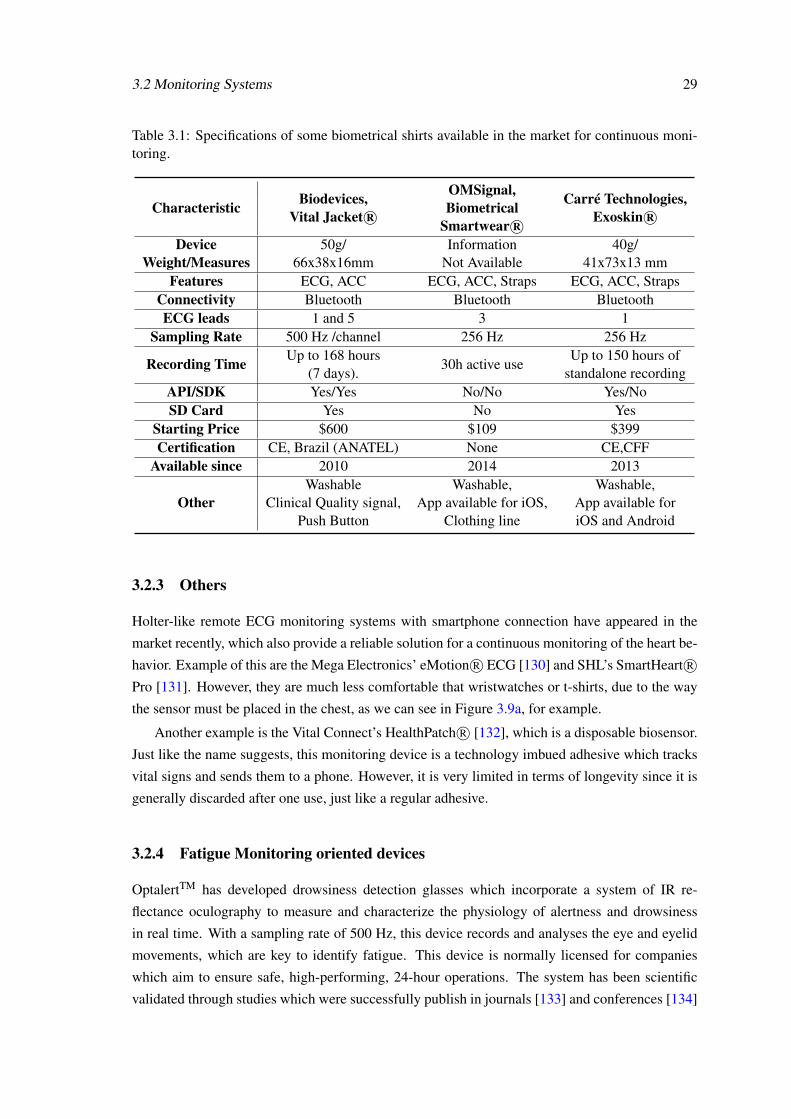
3.2 Monitoring Systems 29
Table 3.1: Specifications of some biometrical shirts available in the market for continuous moni-toring.
Characteristic Biodevices,Vital Jacket R©
OMSignal,Biometrical
Smartwear R©
Carré Technologies,Exoskin R©
DeviceWeight/Measures
50g/66x38x16mm
InformationNot Available
40g/41x73x13 mm
Features ECG, ACC ECG, ACC, Straps ECG, ACC, StrapsConnectivity Bluetooth Bluetooth BluetoothECG leads 1 and 5 3 1
Sampling Rate 500 Hz /channel 256 Hz 256 Hz
Recording Time Up to 168 hours(7 days).
30h active useUp to 150 hours of
standalone recordingAPI/SDK Yes/Yes No/No Yes/NoSD Card Yes No Yes
Starting Price $600 $109 $399Certification CE, Brazil (ANATEL) None CE,CFF
Available since 2010 2014 2013
OtherWashable
Clinical Quality signal,Push Button
Washable,App available for iOS,
Clothing line
Washable,App available foriOS and Android
3.2.3 Others
Holter-like remote ECG monitoring systems with smartphone connection have appeared in the
market recently, which also provide a reliable solution for a continuous monitoring of the heart be-
havior. Example of this are the Mega Electronics’ eMotion R© ECG [130] and SHL’s SmartHeart R©Pro [131]. However, they are much less comfortable that wristwatches or t-shirts, due to the way
the sensor must be placed in the chest, as we can see in Figure 3.9a, for example.
Another example is the Vital Connect’s HealthPatch R© [132], which is a disposable biosensor.
Just like the name suggests, this monitoring device is a technology imbued adhesive which tracks
vital signs and sends them to a phone. However, it is very limited in terms of longevity since it is
generally discarded after one use, just like a regular adhesive.
3.2.4 Fatigue Monitoring oriented devices
OptalertTM has developed drowsiness detection glasses which incorporate a system of IR re-
flectance oculography to measure and characterize the physiology of alertness and drowsiness
in real time. With a sampling rate of 500 Hz, this device records and analyses the eye and eyelid
movements, which are key to identify fatigue. This device is normally licensed for companies
which aim to ensure safe, high-performing, 24-hour operations. The system has been scientific
validated through studies which were successfully publish in journals [133] and conferences [134]
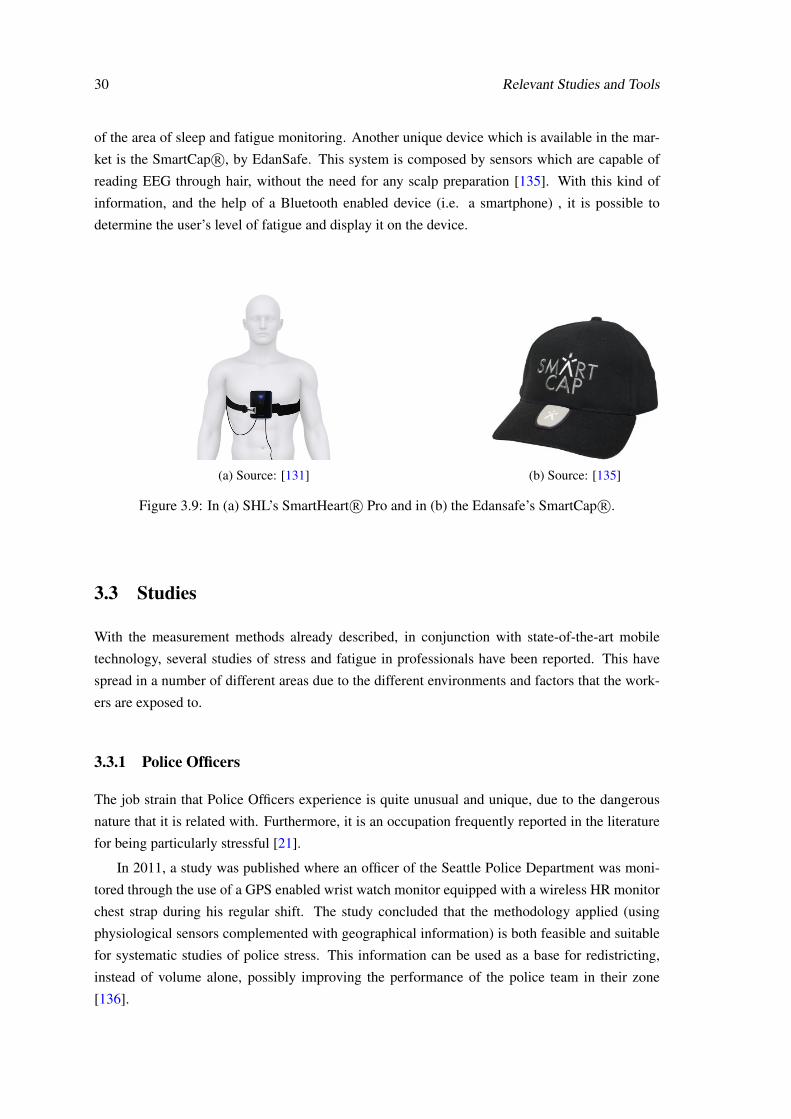
30 Relevant Studies and Tools
of the area of sleep and fatigue monitoring. Another unique device which is available in the mar-
ket is the SmartCap R©, by EdanSafe. This system is composed by sensors which are capable of
reading EEG through hair, without the need for any scalp preparation [135]. With this kind of
information, and the help of a Bluetooth enabled device (i.e. a smartphone) , it is possible to
determine the user’s level of fatigue and display it on the device.
(a) Source: [131] (b) Source: [135]
Figure 3.9: In (a) SHL’s SmartHeart R© Pro and in (b) the Edansafe’s SmartCap R©.
3.3 Studies
With the measurement methods already described, in conjunction with state-of-the-art mobile
technology, several studies of stress and fatigue in professionals have been reported. This have
spread in a number of different areas due to the different environments and factors that the work-
ers are exposed to.
3.3.1 Police Officers
The job strain that Police Officers experience is quite unusual and unique, due to the dangerous
nature that it is related with. Furthermore, it is an occupation frequently reported in the literature
for being particularly stressful [21].
In 2011, a study was published where an officer of the Seattle Police Department was moni-
tored through the use of a GPS enabled wrist watch monitor equipped with a wireless HR monitor
chest strap during his regular shift. The study concluded that the methodology applied (using
physiological sensors complemented with geographical information) is both feasible and suitable
for systematic studies of police stress. This information can be used as a base for redistricting,
instead of volume alone, possibly improving the performance of the police team in their zone
[136].
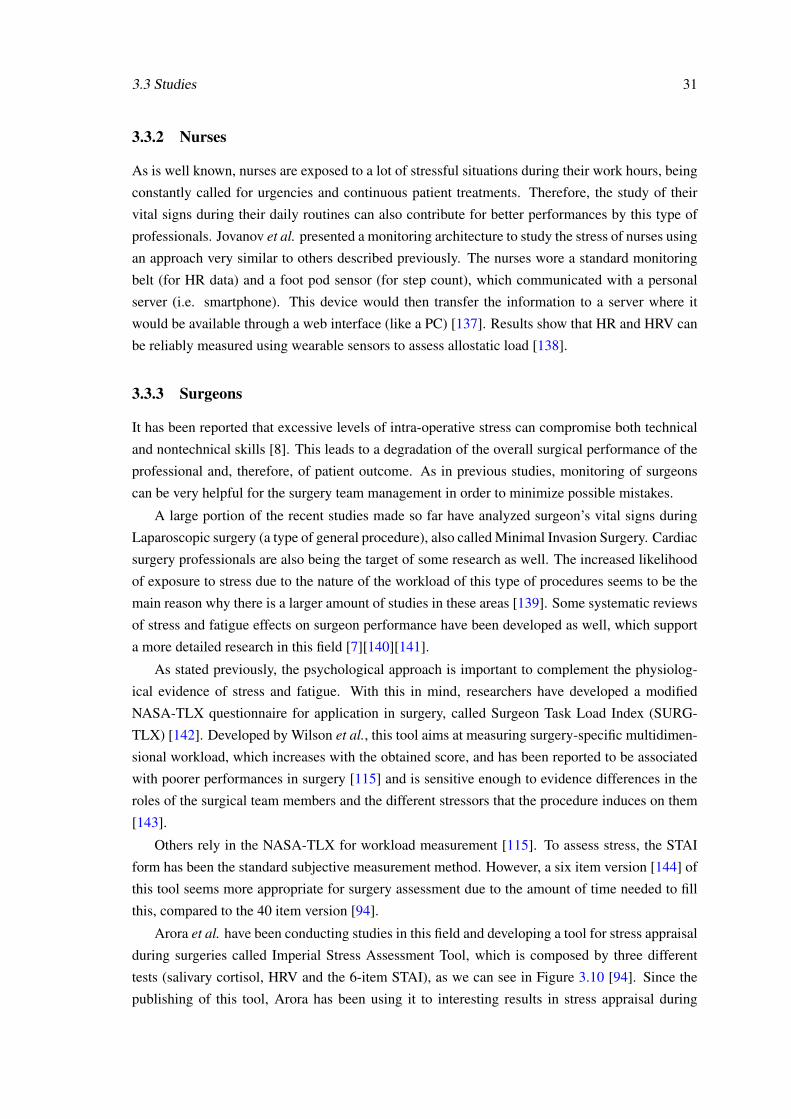
3.3 Studies 31
3.3.2 Nurses
As is well known, nurses are exposed to a lot of stressful situations during their work hours, being
constantly called for urgencies and continuous patient treatments. Therefore, the study of their
vital signs during their daily routines can also contribute for better performances by this type of
professionals. Jovanov et al. presented a monitoring architecture to study the stress of nurses using
an approach very similar to others described previously. The nurses wore a standard monitoring
belt (for HR data) and a foot pod sensor (for step count), which communicated with a personal
server (i.e. smartphone). This device would then transfer the information to a server where it
would be available through a web interface (like a PC) [137]. Results show that HR and HRV can
be reliably measured using wearable sensors to assess allostatic load [138].
3.3.3 Surgeons
It has been reported that excessive levels of intra-operative stress can compromise both technical
and nontechnical skills [8]. This leads to a degradation of the overall surgical performance of the
professional and, therefore, of patient outcome. As in previous studies, monitoring of surgeons
can be very helpful for the surgery team management in order to minimize possible mistakes.
A large portion of the recent studies made so far have analyzed surgeon’s vital signs during
Laparoscopic surgery (a type of general procedure), also called Minimal Invasion Surgery. Cardiac
surgery professionals are also being the target of some research as well. The increased likelihood
of exposure to stress due to the nature of the workload of this type of procedures seems to be the
main reason why there is a larger amount of studies in these areas [139]. Some systematic reviews
of stress and fatigue effects on surgeon performance have been developed as well, which support
a more detailed research in this field [7][140][141].
As stated previously, the psychological approach is important to complement the physiolog-
ical evidence of stress and fatigue. With this in mind, researchers have developed a modified
NASA-TLX questionnaire for application in surgery, called Surgeon Task Load Index (SURG-
TLX) [142]. Developed by Wilson et al., this tool aims at measuring surgery-specific multidimen-
sional workload, which increases with the obtained score, and has been reported to be associated
with poorer performances in surgery [115] and is sensitive enough to evidence differences in the
roles of the surgical team members and the different stressors that the procedure induces on them
[143].
Others rely in the NASA-TLX for workload measurement [115]. To assess stress, the STAI
form has been the standard subjective measurement method. However, a six item version [144] of
this tool seems more appropriate for surgery assessment due to the amount of time needed to fill
this, compared to the 40 item version [94].
Arora et al. have been conducting studies in this field and developing a tool for stress appraisal
during surgeries called Imperial Stress Assessment Tool, which is composed by three different
tests (salivary cortisol, HRV and the 6-item STAI), as we can see in Figure 3.10 [94]. Since the
publishing of this tool, Arora has been using it to interesting results in stress appraisal during
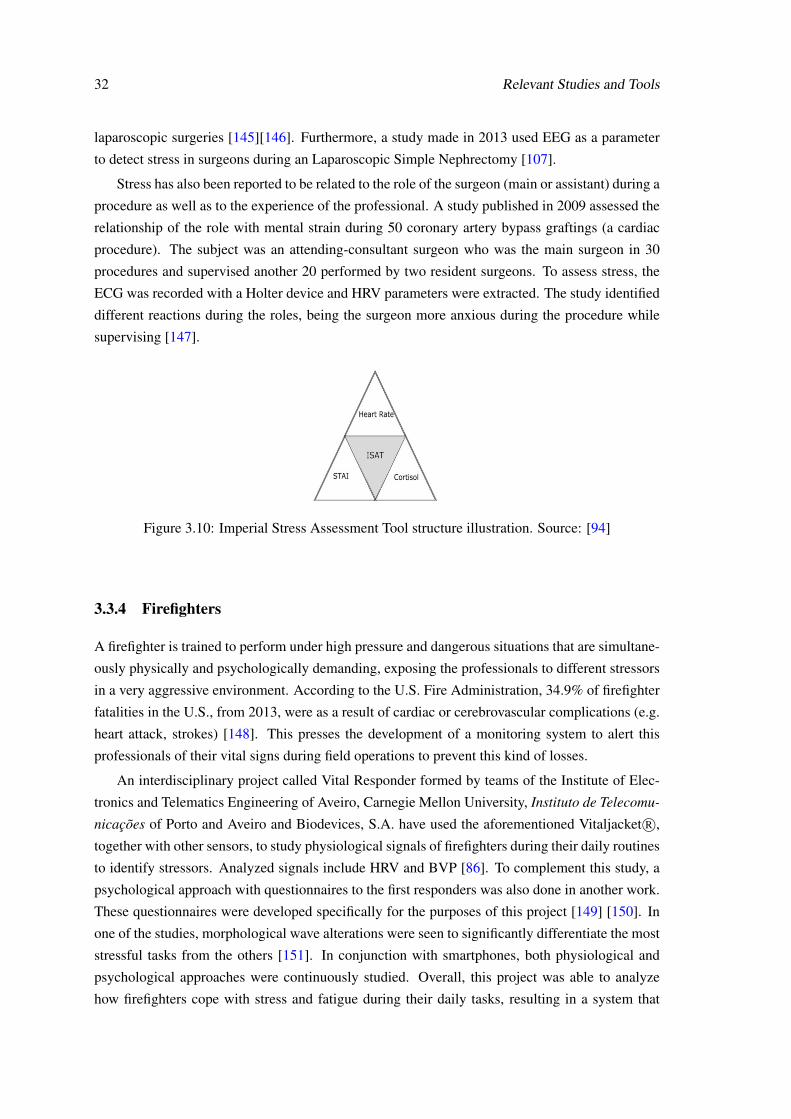
32 Relevant Studies and Tools
laparoscopic surgeries [145][146]. Furthermore, a study made in 2013 used EEG as a parameter
to detect stress in surgeons during an Laparoscopic Simple Nephrectomy [107].
Stress has also been reported to be related to the role of the surgeon (main or assistant) during a
procedure as well as to the experience of the professional. A study published in 2009 assessed the
relationship of the role with mental strain during 50 coronary artery bypass graftings (a cardiac
procedure). The subject was an attending-consultant surgeon who was the main surgeon in 30
procedures and supervised another 20 performed by two resident surgeons. To assess stress, the
ECG was recorded with a Holter device and HRV parameters were extracted. The study identified
different reactions during the roles, being the surgeon more anxious during the procedure while
supervising [147].
Figure 3.10: Imperial Stress Assessment Tool structure illustration. Source: [94]
3.3.4 Firefighters
A firefighter is trained to perform under high pressure and dangerous situations that are simultane-
ously physically and psychologically demanding, exposing the professionals to different stressors
in a very aggressive environment. According to the U.S. Fire Administration, 34.9% of firefighter
fatalities in the U.S., from 2013, were as a result of cardiac or cerebrovascular complications (e.g.
heart attack, strokes) [148]. This presses the development of a monitoring system to alert this
professionals of their vital signs during field operations to prevent this kind of losses.
An interdisciplinary project called Vital Responder formed by teams of the Institute of Elec-
tronics and Telematics Engineering of Aveiro, Carnegie Mellon University, Instituto de Telecomu-
nicações of Porto and Aveiro and Biodevices, S.A. have used the aforementioned Vitaljacket R©,
together with other sensors, to study physiological signals of firefighters during their daily routines
to identify stressors. Analyzed signals include HRV and BVP [86]. To complement this study, a
psychological approach with questionnaires to the first responders was also done in another work.
These questionnaires were developed specifically for the purposes of this project [149] [150]. In
one of the studies, morphological wave alterations were seen to significantly differentiate the most
stressful tasks from the others [151]. In conjunction with smartphones, both physiological and
psychological approaches were continuously studied. Overall, this project was able to analyze
how firefighters cope with stress and fatigue during their daily tasks, resulting in a system that
3.3 Studies 33
measures the professional’s vital signs during uncontrolled environments with the help of wear-
able technologies .
3.3.5 Car Drivers
Fatigue in drivers has been a subject of great interest due to the high life risks related to it. A
recent study used eyelid movement, mouth movement and HR as the parameters to successfully
detect stress in drivers. However some modifications on the system’s hardware are needed to be
able to cover all possible cases of use [87]. Recently, EEG has also being used to assess fatigue in
drivers [152][153].
Another recent study used the OptalertTM system to assess the relationship between sleepiness
and the incidence of adverse driving events in nurses commuting to and from night and rotating
shifts during 2 weeks. The maximum total blink duration was associated with greater incidence of
sleep-related events. This study concluded that, under real-world driving conditions, shift working
nurses experience high levels of drowsiness as indicated by ocular measures [133].
A study in the city of Porto, Portugal, has been conducted to detect bus driver stress during
daily routines. The study used VitalJjacket R© for physiological signal (HR) gathering, a GPS to
obtain geographical data and an On Board Diagnostics unit. In one specific exit of a bridge called
“Ponte do Freixo”, high levels of stress were identified. The existance of high traffic in the area
may be the reason for this finding. This type of information can be used to improve road signals, to
increase drivers’ awareness of dangerous places or to detect and prevent imminent accidents [154].
A different approach to driver monitoring is being developed by Plessey Semiconductors. Instead
of using an wearable monitor device, they are embedding the car seat with their EPIC TM sensors
which are capable of extracting the driver’s EEG, ECG, and other physiological parameters [155].
3.3.6 Crowd Sensing
As we have seen, the monitoring of different professionals is possible and wearable technology is
of great importance for this. Two recent projects have taken the concept of continuous monitoring
to another level, by increasing the area of study from a few individuals and buildings to a whole
city. Crowd sensing is a concept that very well describes the aim of these studies.
In Rome, a real time urban monitoring system was implemented using the Telecom Italia
LocHNESs platform. This system was able to obtain a set of maps describing the vehicular traffic
status and the movements of pedestrians and foreigners, as well as the instantaneous location of
buses and taxis and the voice and data traffic served by all the base transceiver stations of the
network. All the data collected was anonymous. However no vital signs were extracted in this
project [156].
A more complex infrastructure was built in Porto. The project, called FutureCities, imple-
mented a network of sensors through the city, which include:
• 802.11p technology, WiFi or 3G in taxis, buses and harbor trucks for vehicle traffic, inter-
communication and provide WIFI access,
34 Relevant Studies and Tools
• Vital Jackets, Smartphones and On Board Diagnostics units for vital sign monitoring of
different individuals and professionals;
• A large scale infrastructure for local monitoring of a dedicated environment using heteroge-
neous sensors to cover a fixed area.
All this information and monitoring has turned the city into an urban-scale living lab, enabling
a true sensing of their citizens or, in other words, crowd sensing. With this project, researchers
and companies can develop and test technologies, products and services, exploring such subjects
as sustainable mobility, urban-scale sensing, safety and privacy, as well as the quality of life for
citizens and their families [157].
3.4 Conclusions
Besides cardiac behavior, several other parameters have been used, with success, in the literature
to identify stress and fatigue. Some even reported these results backed up with the subjects’ per-
ception of the events as well, making a complete and rigorous assessment of these disorders, as
advised in Chapter 2. The great growth that mobile and wearable technology have been suffering
has also helped the improvement of studies in this area, enabling non-intrusive monitoring of pro-
fessionals and different parameters in ways never possible before. This concept of physiological
monitoring is also being spread to accommodate physiological data of entire cities, instead of one
or two individuals, further enabling the study of human habits and improve the overall quality of
life of the citizens.
Part II
Monitoring Stress and Fatigue
35

Chapter 4
Developed Tools
4.1 VJ E-Diary
One of the problems that arises with real-time monitoring is the correct registering of relevant
events. One of the great features of the aforementioned VJ (see Section 3.2.2) is the possibil-
ity of registering events through the Push Button. Furthermore, the Android library released by
Biodevices enables the developer to trigger the event associated to the button programmatically,
therefore enabling the customization of highly precise event registration.
Therefore, a VJ electronic diary (VJ E-Diary) was developed in Android, in order to help
researchers register events throughout their monitoring sessions in a feasible and practical way.
4.1.1 Structure
As a first step towards the conception of the application, requirements were collected from re-
searchers who work in the area of physiological monitoring and recur to VJ during their sessions.
The possibility to add details to certain session events as well as to save other types of information
besides text (i.e. photos, video and audio) have been shown to be of interest to them. Furthermore,
the synchronization with the information that VJ saves in the SD card through push button events
was requested.
Besides the aforementioned feature, it seemed relevant to save the data following a certain
structure. Therefore, in order to establish this, a Database also needed to be implemented. Finally,
the possibility to send the content through the internet so that the data is not lost, and further
enabling the researcher to access the data as soon as the session ends, without needing to recur to
external tools, showed to be an relevant addition to the application. Finally, implementation of an
User Login and Password framework was also considered.
Figure 4.1 shows the final Use Case Diagram (developed with Visual Paradigm for Unified
Modeling Language (UML) 11.0) for the application resultant of the requirements gathering pro-
cess.
37
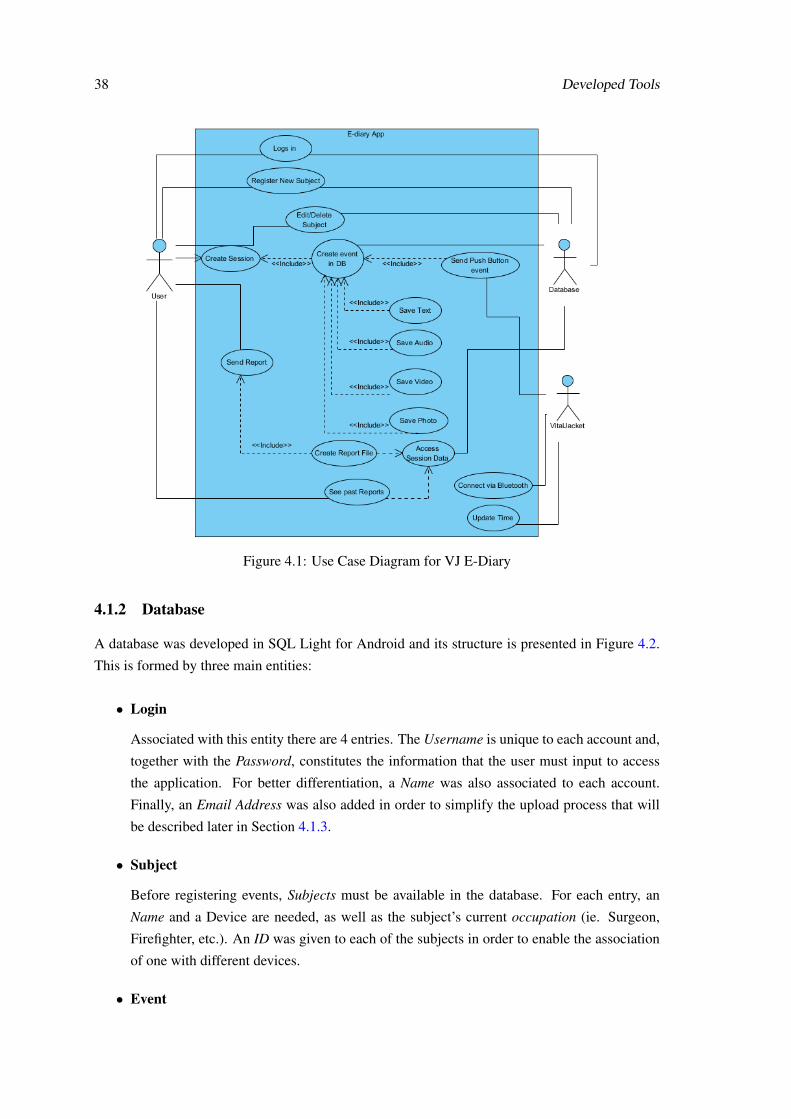
38 Developed Tools
Figure 4.1: Use Case Diagram for VJ E-Diary
4.1.2 Database
A database was developed in SQL Light for Android and its structure is presented in Figure 4.2.
This is formed by three main entities:
• Login
Associated with this entity there are 4 entries. The Username is unique to each account and,
together with the Password, constitutes the information that the user must input to access
the application. For better differentiation, a Name was also associated to each account.
Finally, an Email Address was also added in order to simplify the upload process that will
be described later in Section 4.1.3.
• Subject
Before registering events, Subjects must be available in the database. For each entry, an
Name and a Device are needed, as well as the subject’s current occupation (ie. Surgeon,
Firefighter, etc.). An ID was given to each of the subjects in order to enable the association
of one with different devices.
• Event
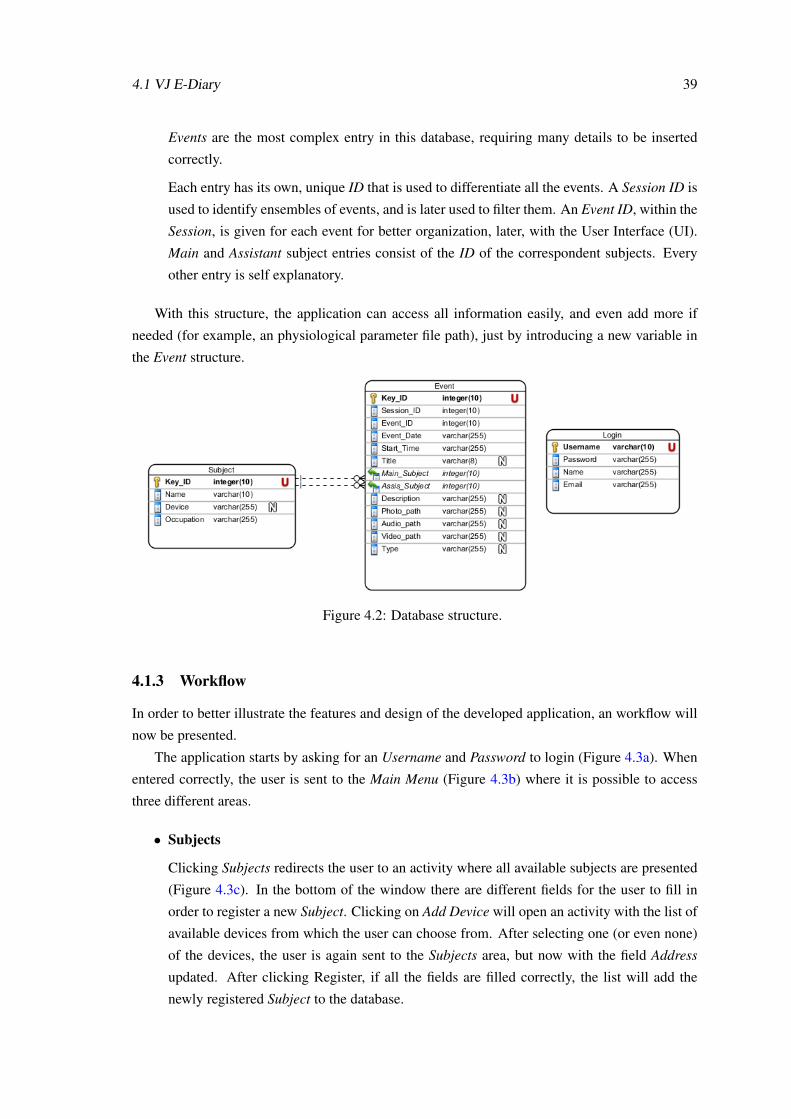
4.1 VJ E-Diary 39
Events are the most complex entry in this database, requiring many details to be inserted
correctly.
Each entry has its own, unique ID that is used to differentiate all the events. A Session ID is
used to identify ensembles of events, and is later used to filter them. An Event ID, within the
Session, is given for each event for better organization, later, with the User Interface (UI).
Main and Assistant subject entries consist of the ID of the correspondent subjects. Every
other entry is self explanatory.
With this structure, the application can access all information easily, and even add more if
needed (for example, an physiological parameter file path), just by introducing a new variable in
the Event structure.
Figure 4.2: Database structure.
4.1.3 Workflow
In order to better illustrate the features and design of the developed application, an workflow will
now be presented.
The application starts by asking for an Username and Password to login (Figure 4.3a). When
entered correctly, the user is sent to the Main Menu (Figure 4.3b) where it is possible to access
three different areas.
• Subjects
Clicking Subjects redirects the user to an activity where all available subjects are presented
(Figure 4.3c). In the bottom of the window there are different fields for the user to fill in
order to register a new Subject. Clicking on Add Device will open an activity with the list of
available devices from which the user can choose from. After selecting one (or even none)
of the devices, the user is again sent to the Subjects area, but now with the field Address
updated. After clicking Register, if all the fields are filled correctly, the list will add the
newly registered Subject to the database.
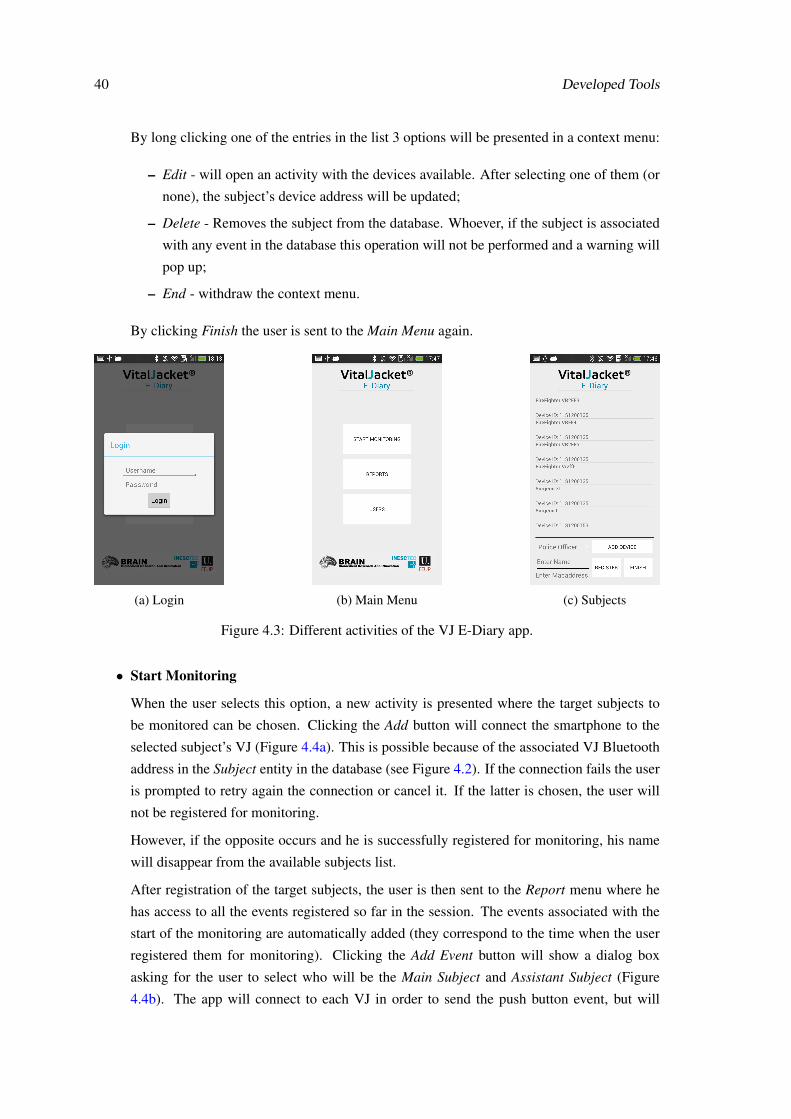
40 Developed Tools
By long clicking one of the entries in the list 3 options will be presented in a context menu:
– Edit - will open an activity with the devices available. After selecting one of them (or
none), the subject’s device address will be updated;
– Delete - Removes the subject from the database. Whoever, if the subject is associated
with any event in the database this operation will not be performed and a warning will
pop up;
– End - withdraw the context menu.
By clicking Finish the user is sent to the Main Menu again.
(a) Login (b) Main Menu (c) Subjects
Figure 4.3: Different activities of the VJ E-Diary app.
• Start Monitoring
When the user selects this option, a new activity is presented where the target subjects to
be monitored can be chosen. Clicking the Add button will connect the smartphone to the
selected subject’s VJ (Figure 4.4a). This is possible because of the associated VJ Bluetooth
address in the Subject entity in the database (see Figure 4.2). If the connection fails the user
is prompted to retry again the connection or cancel it. If the latter is chosen, the user will
not be registered for monitoring.
However, if the opposite occurs and he is successfully registered for monitoring, his name
will disappear from the available subjects list.
After registration of the target subjects, the user is then sent to the Report menu where he
has access to all the events registered so far in the session. The events associated with the
start of the monitoring are automatically added (they correspond to the time when the user
registered them for monitoring). Clicking the Add Event button will show a dialog box
asking for the user to select who will be the Main Subject and Assistant Subject (Figure
4.4b). The app will connect to each VJ in order to send the push button event, but will
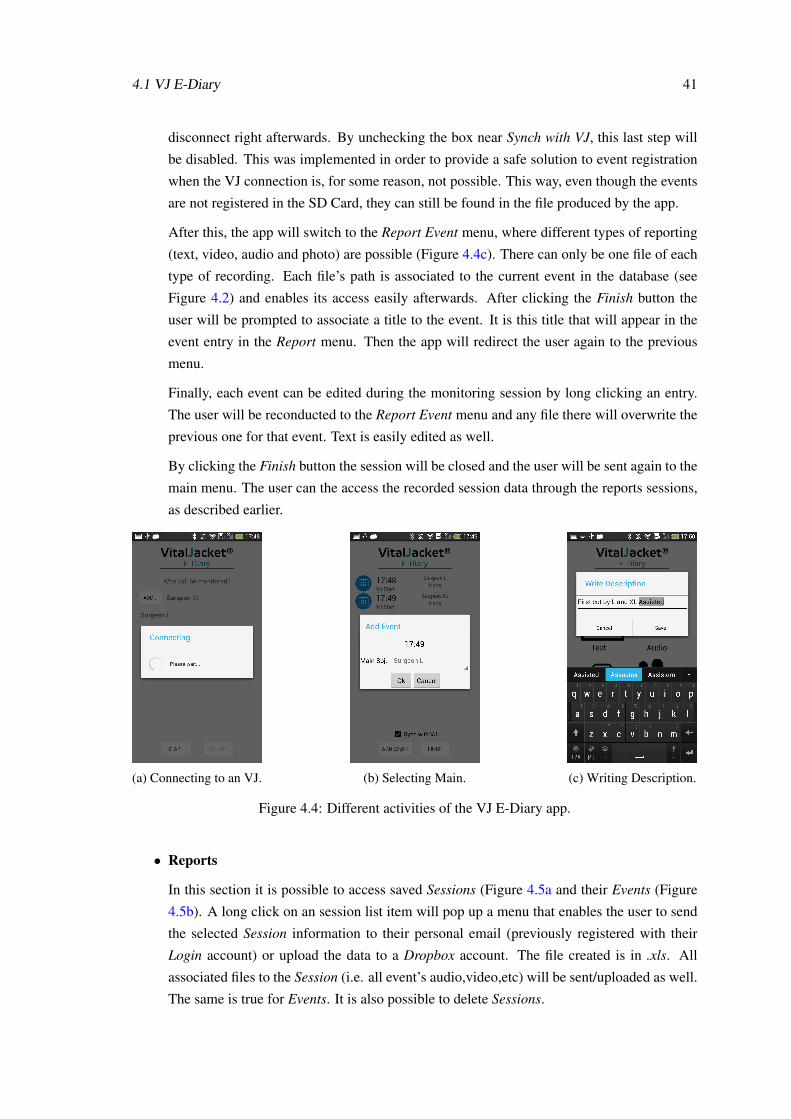
4.1 VJ E-Diary 41
disconnect right afterwards. By unchecking the box near Synch with VJ, this last step will
be disabled. This was implemented in order to provide a safe solution to event registration
when the VJ connection is, for some reason, not possible. This way, even though the events
are not registered in the SD Card, they can still be found in the file produced by the app.
After this, the app will switch to the Report Event menu, where different types of reporting
(text, video, audio and photo) are possible (Figure 4.4c). There can only be one file of each
type of recording. Each file’s path is associated to the current event in the database (see
Figure 4.2) and enables its access easily afterwards. After clicking the Finish button the
user will be prompted to associate a title to the event. It is this title that will appear in the
event entry in the Report menu. Then the app will redirect the user again to the previous
menu.
Finally, each event can be edited during the monitoring session by long clicking an entry.
The user will be reconducted to the Report Event menu and any file there will overwrite the
previous one for that event. Text is easily edited as well.
By clicking the Finish button the session will be closed and the user will be sent again to the
main menu. The user can the access the recorded session data through the reports sessions,
as described earlier.
(a) Connecting to an VJ. (b) Selecting Main. (c) Writing Description.
Figure 4.4: Different activities of the VJ E-Diary app.
• Reports
In this section it is possible to access saved Sessions (Figure 4.5a and their Events (Figure
4.5b). A long click on an session list item will pop up a menu that enables the user to send
the selected Session information to their personal email (previously registered with their
Login account) or upload the data to a Dropbox account. The file created is in .xls. All
associated files to the Session (i.e. all event’s audio,video,etc) will be sent/uploaded as well.
The same is true for Events. It is also possible to delete Sessions.
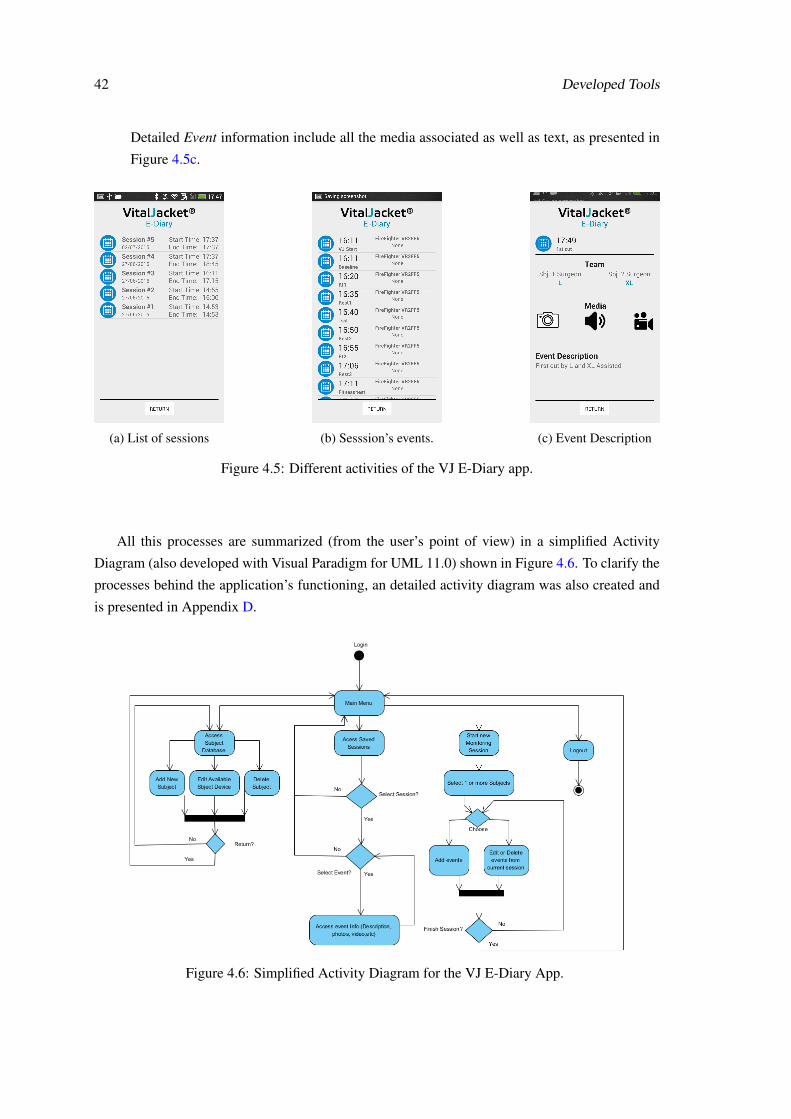
42 Developed Tools
Detailed Event information include all the media associated as well as text, as presented in
Figure 4.5c.
(a) List of sessions (b) Sesssion’s events. (c) Event Description
Figure 4.5: Different activities of the VJ E-Diary app.
All this processes are summarized (from the user’s point of view) in a simplified Activity
Diagram (also developed with Visual Paradigm for UML 11.0) shown in Figure 4.6. To clarify the
processes behind the application’s functioning, an detailed activity diagram was also created and
is presented in Appendix D.
Figure 4.6: Simplified Activity Diagram for the VJ E-Diary App.
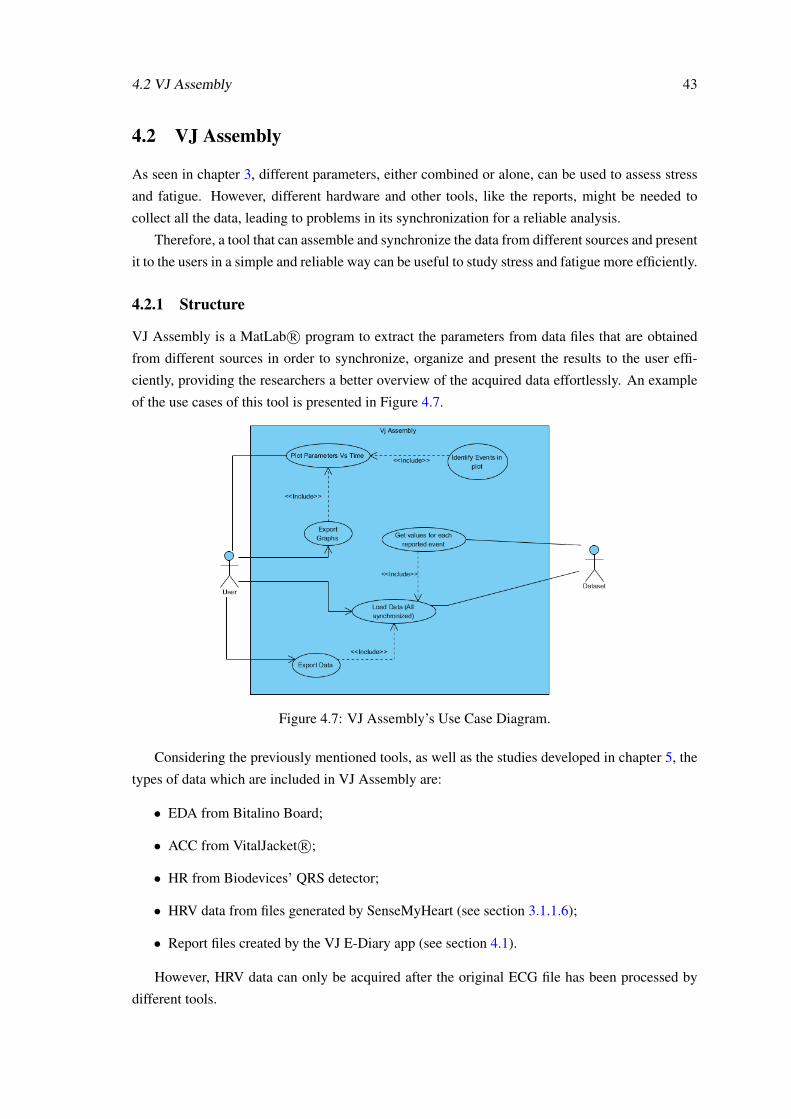
4.2 VJ Assembly 43
4.2 VJ Assembly
As seen in chapter 3, different parameters, either combined or alone, can be used to assess stress
and fatigue. However, different hardware and other tools, like the reports, might be needed to
collect all the data, leading to problems in its synchronization for a reliable analysis.
Therefore, a tool that can assemble and synchronize the data from different sources and present
it to the users in a simple and reliable way can be useful to study stress and fatigue more efficiently.
4.2.1 Structure
VJ Assembly is a MatLab R© program to extract the parameters from data files that are obtained
from different sources in order to synchronize, organize and present the results to the user effi-
ciently, providing the researchers a better overview of the acquired data effortlessly. An example
of the use cases of this tool is presented in Figure 4.7.
Figure 4.7: VJ Assembly’s Use Case Diagram.
Considering the previously mentioned tools, as well as the studies developed in chapter 5, the
types of data which are included in VJ Assembly are:
• EDA from Bitalino Board;
• ACC from VitalJacket R©;
• HR from Biodevices’ QRS detector;
• HRV data from files generated by SenseMyHeart (see section 3.1.1.6);
• Report files created by the VJ E-Diary app (see section 4.1).
However, HRV data can only be acquired after the original ECG file has been processed by
different tools.
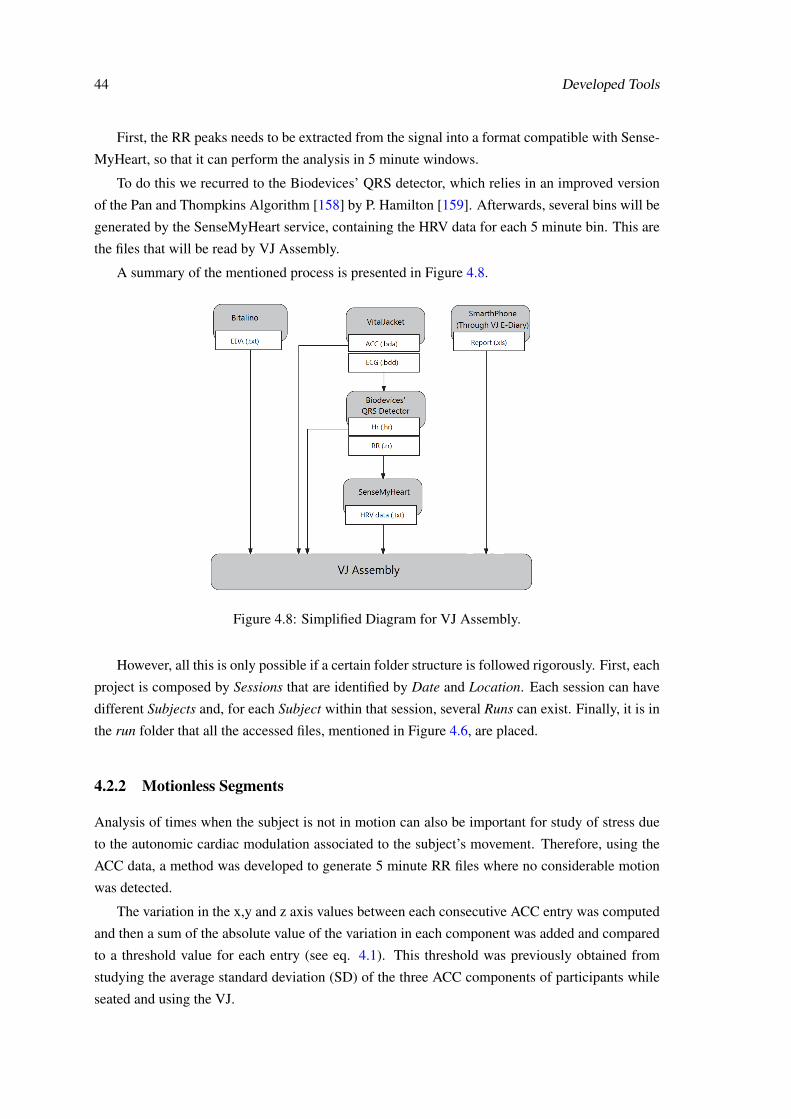
44 Developed Tools
First, the RR peaks needs to be extracted from the signal into a format compatible with Sense-
MyHeart, so that it can perform the analysis in 5 minute windows.
To do this we recurred to the Biodevices’ QRS detector, which relies in an improved version
of the Pan and Thompkins Algorithm [158] by P. Hamilton [159]. Afterwards, several bins will be
generated by the SenseMyHeart service, containing the HRV data for each 5 minute bin. This are
the files that will be read by VJ Assembly.
A summary of the mentioned process is presented in Figure 4.8.
Figure 4.8: Simplified Diagram for VJ Assembly.
However, all this is only possible if a certain folder structure is followed rigorously. First, each
project is composed by Sessions that are identified by Date and Location. Each session can have
different Subjects and, for each Subject within that session, several Runs can exist. Finally, it is in
the run folder that all the accessed files, mentioned in Figure 4.6, are placed.
4.2.2 Motionless Segments
Analysis of times when the subject is not in motion can also be important for study of stress due
to the autonomic cardiac modulation associated to the subject’s movement. Therefore, using the
ACC data, a method was developed to generate 5 minute RR files where no considerable motion
was detected.
The variation in the x,y and z axis values between each consecutive ACC entry was computed
and then a sum of the absolute value of the variation in each component was added and compared
to a threshold value for each entry (see eq. 4.1). This threshold was previously obtained from
studying the average standard deviation (SD) of the three ACC components of participants while
seated and using the VJ.
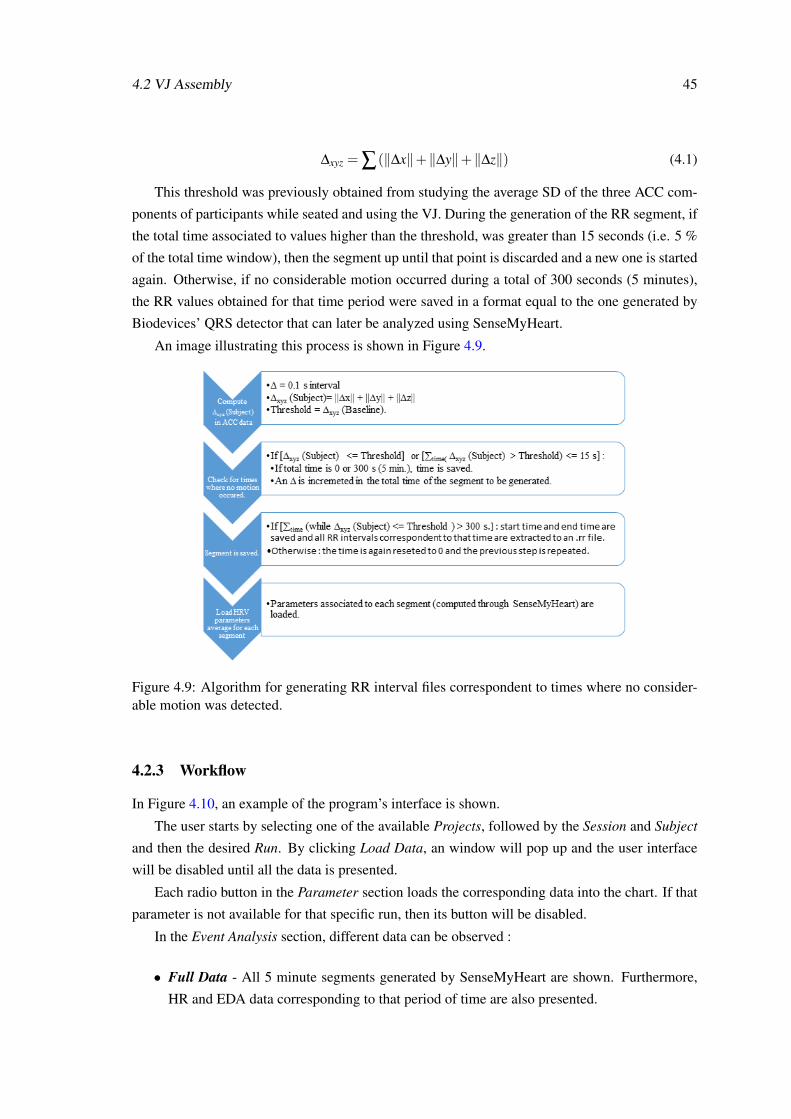
4.2 VJ Assembly 45
∆xyz = ∑(‖∆x‖+‖∆y‖+‖∆z‖) (4.1)
This threshold was previously obtained from studying the average SD of the three ACC com-
ponents of participants while seated and using the VJ. During the generation of the RR segment, if
the total time associated to values higher than the threshold, was greater than 15 seconds (i.e. 5 %
of the total time window), then the segment up until that point is discarded and a new one is started
again. Otherwise, if no considerable motion occurred during a total of 300 seconds (5 minutes),
the RR values obtained for that time period were saved in a format equal to the one generated by
Biodevices’ QRS detector that can later be analyzed using SenseMyHeart.
An image illustrating this process is shown in Figure 4.9.
Figure 4.9: Algorithm for generating RR interval files correspondent to times where no consider-able motion was detected.
4.2.3 Workflow
In Figure 4.10, an example of the program’s interface is shown.
The user starts by selecting one of the available Projects, followed by the Session and Subject
and then the desired Run. By clicking Load Data, an window will pop up and the user interface
will be disabled until all the data is presented.
Each radio button in the Parameter section loads the corresponding data into the chart. If that
parameter is not available for that specific run, then its button will be disabled.
In the Event Analysis section, different data can be observed :
• Full Data - All 5 minute segments generated by SenseMyHeart are shown. Furthermore,
HR and EDA data corresponding to that period of time are also presented.
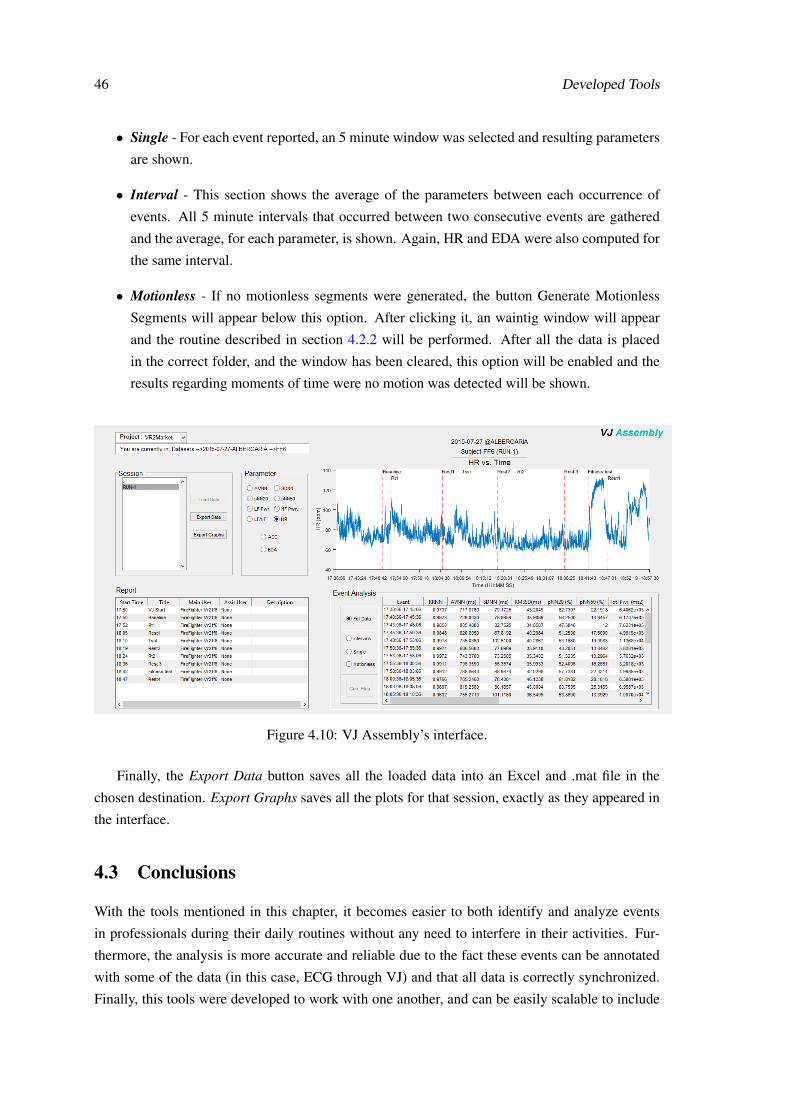
46 Developed Tools
• Single - For each event reported, an 5 minute window was selected and resulting parameters
are shown.
• Interval - This section shows the average of the parameters between each occurrence of
events. All 5 minute intervals that occurred between two consecutive events are gathered
and the average, for each parameter, is shown. Again, HR and EDA were also computed for
the same interval.
• Motionless - If no motionless segments were generated, the button Generate Motionless
Segments will appear below this option. After clicking it, an waintig window will appear
and the routine described in section 4.2.2 will be performed. After all the data is placed
in the correct folder, and the window has been cleared, this option will be enabled and the
results regarding moments of time were no motion was detected will be shown.
Figure 4.10: VJ Assembly’s interface.
Finally, the Export Data button saves all the loaded data into an Excel and .mat file in the
chosen destination. Export Graphs saves all the plots for that session, exactly as they appeared in
the interface.
4.3 Conclusions
With the tools mentioned in this chapter, it becomes easier to both identify and analyze events
in professionals during their daily routines without any need to interfere in their activities. Fur-
thermore, the analysis is more accurate and reliable due to the fact these events can be annotated
with some of the data (in this case, ECG through VJ) and that all data is correctly synchronized.
Finally, this tools were developed to work with one another, and can be easily scalable to include

4.3 Conclusions 47
other parameters from different sources as well as different methods of analysis, therefore showing
great potential in the development of studies regarding physiological monitoring.

48 Developed Tools
Chapter 5
Developed Studies
Since the purpose of this work is to identify events that induce stress and fatigue in professionals
through assessment of physiological variables, different subjects (with different occupations) were
monitored during daily activities. Also, an in-lab test was performed with the purpose of obtaining
reactions in an controlled environment and find more about the physiological behavior of the
individuals before going to the working field.
Two of the datasets (police officers and the pilot study in neurosurgeons) were obtained prior
to this thesis. However, their analysis was part of the developed work and therefore was included
in this section as well.
5.1 Police Officers
As mentioned earlier in section 3.3.1, police officers are exposed to stressful events regularly and is
reported in the literature as a stressful occupation. Therefore, it becomes interesting to understand
how these professionals react to stressors. One of the purposes of the SCOPE project is to study
police officers’ physiological variables during their work routines. Using their acquired dataset
we performed an analysis in the ECG and ACC signals to assess which events can induce stress in
this occupation.
5.1.1 Dataset
The available dataset is composed by 6 male police officers, aged between 31 and 44 years, and
was gathered in the framework of the SCOPE project from July, 2013 to May, 2014.
5.1.2 Protocol and Tools
To obtain this dataset a specific protocol was followed:
• Data was collected during one shift and one day off, using the full “kit” (SCOPE app + VJ)
only during the working shift. On the day off the participants were required to only use the
VJ, in order to collect baseline physiological data.
49
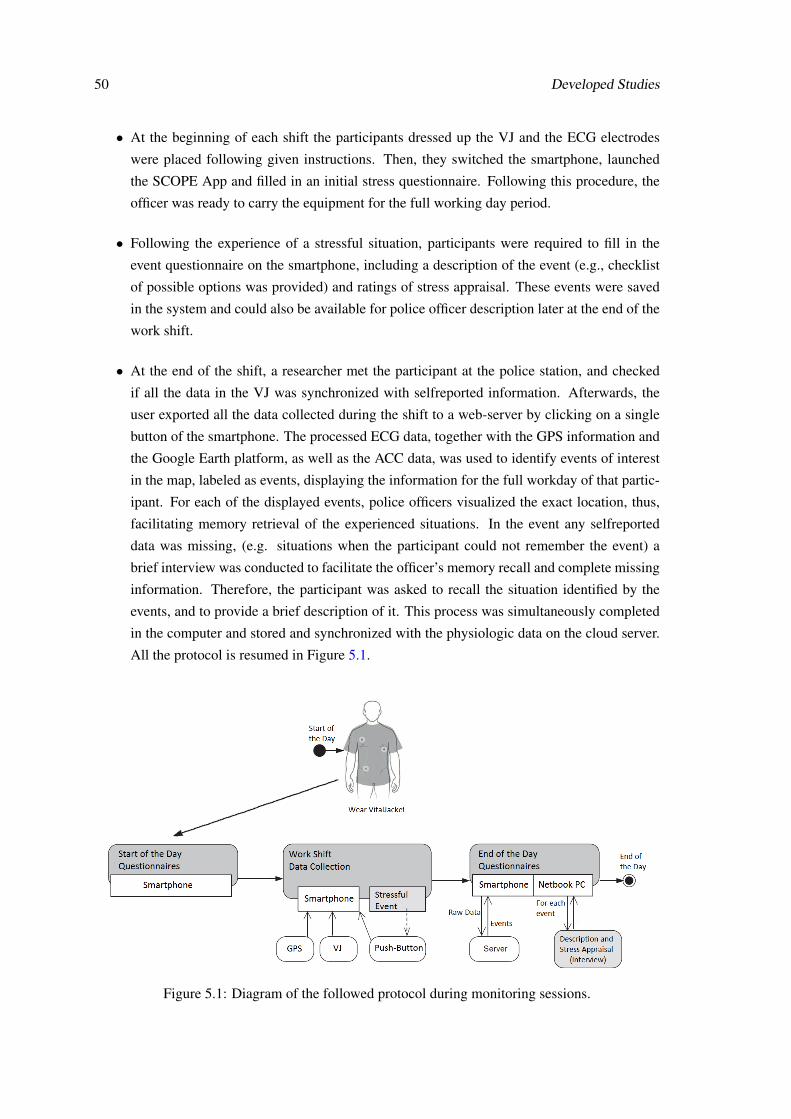
50 Developed Studies
• At the beginning of each shift the participants dressed up the VJ and the ECG electrodes
were placed following given instructions. Then, they switched the smartphone, launched
the SCOPE App and filled in an initial stress questionnaire. Following this procedure, the
officer was ready to carry the equipment for the full working day period.
• Following the experience of a stressful situation, participants were required to fill in the
event questionnaire on the smartphone, including a description of the event (e.g., checklist
of possible options was provided) and ratings of stress appraisal. These events were saved
in the system and could also be available for police officer description later at the end of the
work shift.
• At the end of the shift, a researcher met the participant at the police station, and checked
if all the data in the VJ was synchronized with selfreported information. Afterwards, the
user exported all the data collected during the shift to a web-server by clicking on a single
button of the smartphone. The processed ECG data, together with the GPS information and
the Google Earth platform, as well as the ACC data, was used to identify events of interest
in the map, labeled as events, displaying the information for the full workday of that partic-
ipant. For each of the displayed events, police officers visualized the exact location, thus,
facilitating memory retrieval of the experienced situations. In the event any selfreported
data was missing, (e.g. situations when the participant could not remember the event) a
brief interview was conducted to facilitate the officer’s memory recall and complete missing
information. Therefore, the participant was asked to recall the situation identified by the
events, and to provide a brief description of it. This process was simultaneously completed
in the computer and stored and synchronized with the physiologic data on the cloud server.
All the protocol is resumed in Figure 5.1.
Figure 5.1: Diagram of the followed protocol during monitoring sessions.
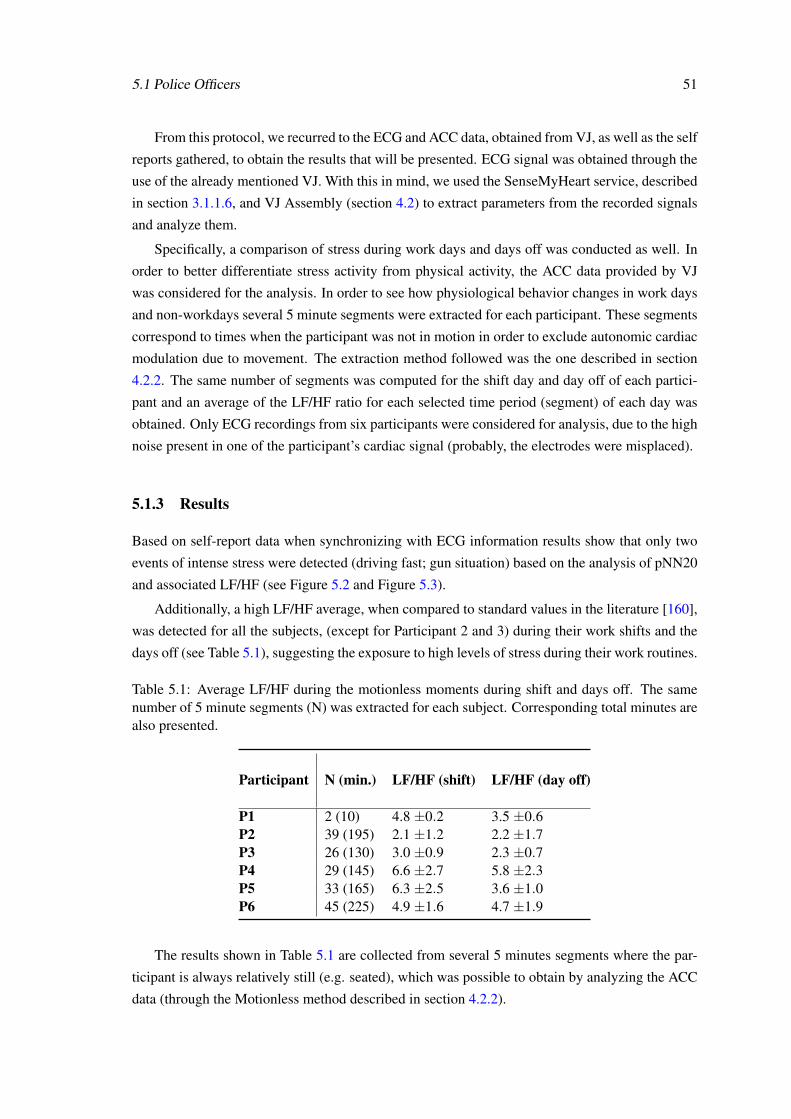
5.1 Police Officers 51
From this protocol, we recurred to the ECG and ACC data, obtained from VJ, as well as the self
reports gathered, to obtain the results that will be presented. ECG signal was obtained through the
use of the already mentioned VJ. With this in mind, we used the SenseMyHeart service, described
in section 3.1.1.6, and VJ Assembly (section 4.2) to extract parameters from the recorded signals
and analyze them.
Specifically, a comparison of stress during work days and days off was conducted as well. In
order to better differentiate stress activity from physical activity, the ACC data provided by VJ
was considered for the analysis. In order to see how physiological behavior changes in work days
and non-workdays several 5 minute segments were extracted for each participant. These segments
correspond to times when the participant was not in motion in order to exclude autonomic cardiac
modulation due to movement. The extraction method followed was the one described in section
4.2.2. The same number of segments was computed for the shift day and day off of each partici-
pant and an average of the LF/HF ratio for each selected time period (segment) of each day was
obtained. Only ECG recordings from six participants were considered for analysis, due to the high
noise present in one of the participant’s cardiac signal (probably, the electrodes were misplaced).
5.1.3 Results
Based on self-report data when synchronizing with ECG information results show that only two
events of intense stress were detected (driving fast; gun situation) based on the analysis of pNN20
and associated LF/HF (see Figure 5.2 and Figure 5.3).
Additionally, a high LF/HF average, when compared to standard values in the literature [160],
was detected for all the subjects, (except for Participant 2 and 3) during their work shifts and the
days off (see Table 5.1), suggesting the exposure to high levels of stress during their work routines.
Table 5.1: Average LF/HF during the motionless moments during shift and days off. The samenumber of 5 minute segments (N) was extracted for each subject. Corresponding total minutes arealso presented.
Participant N (min.) LF/HF (shift) LF/HF (day off)
P1 2 (10) 4.8 ±0.2 3.5 ±0.6P2 39 (195) 2.1 ±1.2 2.2 ±1.7P3 26 (130) 3.0 ±0.9 2.3 ±0.7P4 29 (145) 6.6 ±2.7 5.8 ±2.3P5 33 (165) 6.3 ±2.5 3.6 ±1.0P6 45 (225) 4.9 ±1.6 4.7 ±1.9
The results shown in Table 5.1 are collected from several 5 minutes segments where the par-
ticipant is always relatively still (e.g. seated), which was possible to obtain by analyzing the ACC
data (through the Motionless method described in section 4.2.2).
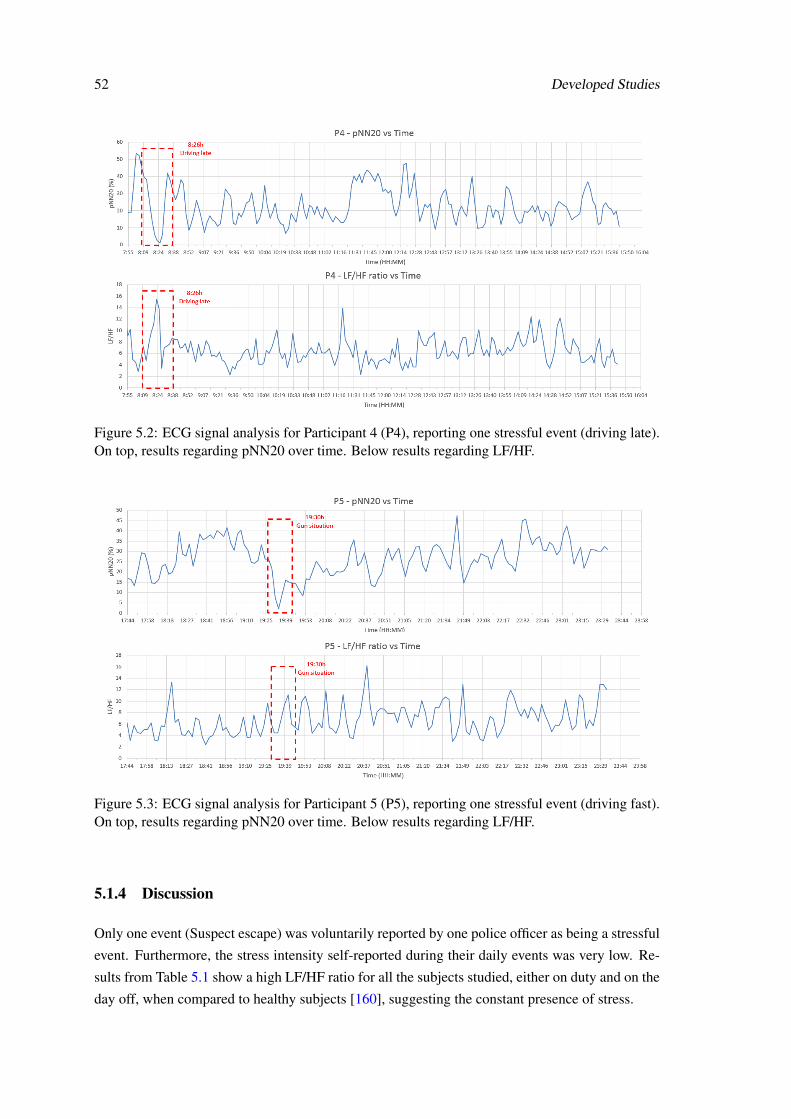
52 Developed Studies
Figure 5.2: ECG signal analysis for Participant 4 (P4), reporting one stressful event (driving late).On top, results regarding pNN20 over time. Below results regarding LF/HF.
Figure 5.3: ECG signal analysis for Participant 5 (P5), reporting one stressful event (driving fast).On top, results regarding pNN20 over time. Below results regarding LF/HF.
5.1.4 Discussion
Only one event (Suspect escape) was voluntarily reported by one police officer as being a stressful
event. Furthermore, the stress intensity self-reported during their daily events was very low. Re-
sults from Table 5.1 show a high LF/HF ratio for all the subjects studied, either on duty and on the
day off, when compared to healthy subjects [160], suggesting the constant presence of stress.
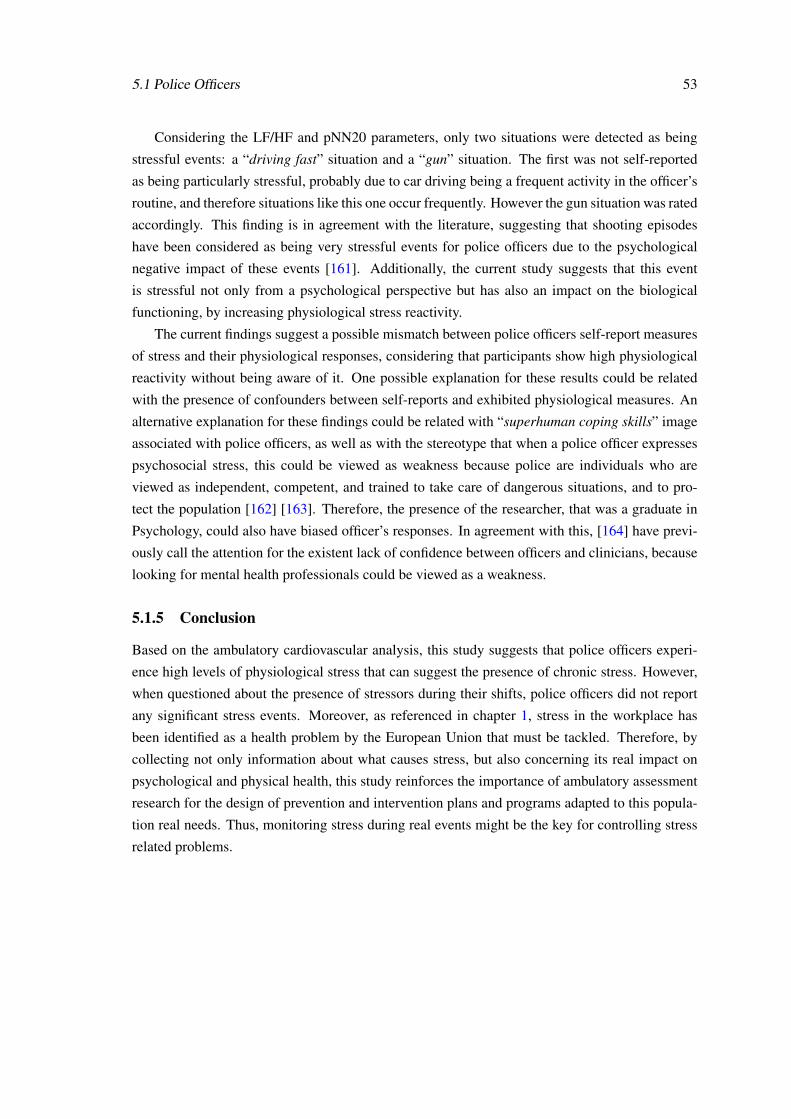
5.1 Police Officers 53
Considering the LF/HF and pNN20 parameters, only two situations were detected as being
stressful events: a “driving fast” situation and a “gun” situation. The first was not self-reported
as being particularly stressful, probably due to car driving being a frequent activity in the officer’s
routine, and therefore situations like this one occur frequently. However the gun situation was rated
accordingly. This finding is in agreement with the literature, suggesting that shooting episodes
have been considered as being very stressful events for police officers due to the psychological
negative impact of these events [161]. Additionally, the current study suggests that this event
is stressful not only from a psychological perspective but has also an impact on the biological
functioning, by increasing physiological stress reactivity.
The current findings suggest a possible mismatch between police officers self-report measures
of stress and their physiological responses, considering that participants show high physiological
reactivity without being aware of it. One possible explanation for these results could be related
with the presence of confounders between self-reports and exhibited physiological measures. An
alternative explanation for these findings could be related with “superhuman coping skills” image
associated with police officers, as well as with the stereotype that when a police officer expresses
psychosocial stress, this could be viewed as weakness because police are individuals who are
viewed as independent, competent, and trained to take care of dangerous situations, and to pro-
tect the population [162] [163]. Therefore, the presence of the researcher, that was a graduate in
Psychology, could also have biased officer’s responses. In agreement with this, [164] have previ-
ously call the attention for the existent lack of confidence between officers and clinicians, because
looking for mental health professionals could be viewed as a weakness.
5.1.5 Conclusion
Based on the ambulatory cardiovascular analysis, this study suggests that police officers experi-
ence high levels of physiological stress that can suggest the presence of chronic stress. However,
when questioned about the presence of stressors during their shifts, police officers did not report
any significant stress events. Moreover, as referenced in chapter 1, stress in the workplace has
been identified as a health problem by the European Union that must be tackled. Therefore, by
collecting not only information about what causes stress, but also concerning its real impact on
psychological and physical health, this study reinforces the importance of ambulatory assessment
research for the design of prevention and intervention plans and programs adapted to this popula-
tion real needs. Thus, monitoring stress during real events might be the key for controlling stress
related problems.
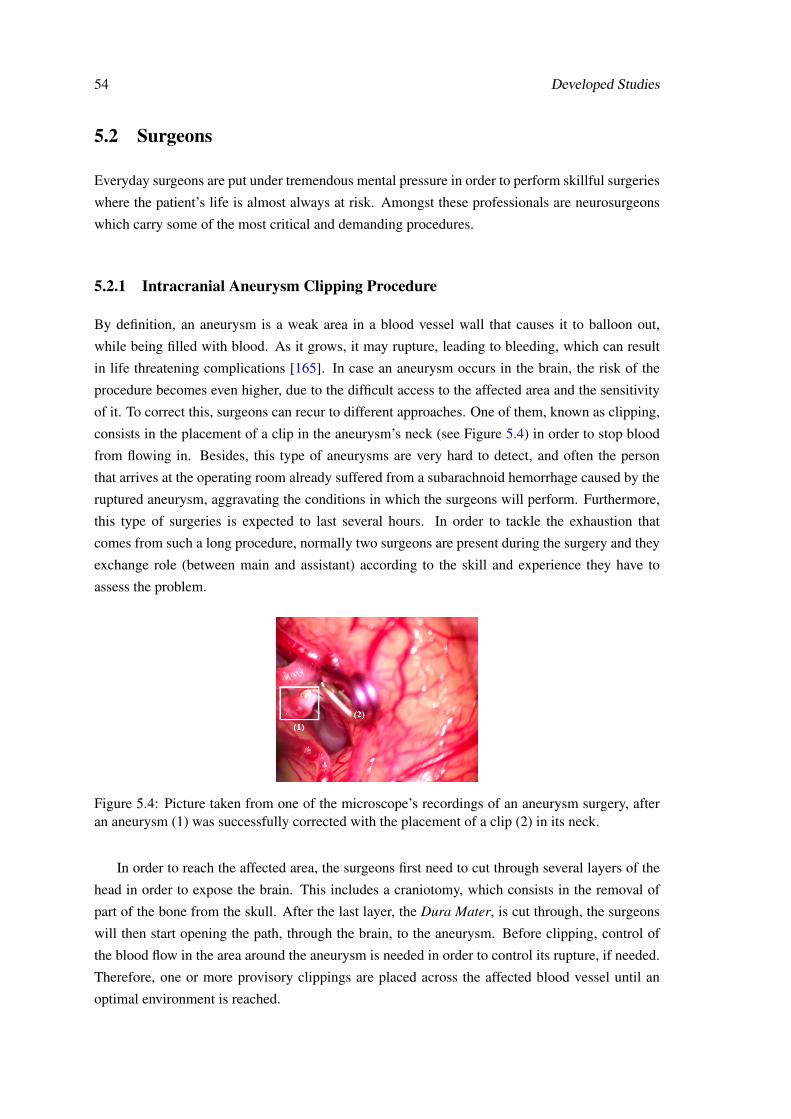
54 Developed Studies
5.2 Surgeons
Everyday surgeons are put under tremendous mental pressure in order to perform skillful surgeries
where the patient’s life is almost always at risk. Amongst these professionals are neurosurgeons
which carry some of the most critical and demanding procedures.
5.2.1 Intracranial Aneurysm Clipping Procedure
By definition, an aneurysm is a weak area in a blood vessel wall that causes it to balloon out,
while being filled with blood. As it grows, it may rupture, leading to bleeding, which can result
in life threatening complications [165]. In case an aneurysm occurs in the brain, the risk of the
procedure becomes even higher, due to the difficult access to the affected area and the sensitivity
of it. To correct this, surgeons can recur to different approaches. One of them, known as clipping,
consists in the placement of a clip in the aneurysm’s neck (see Figure 5.4) in order to stop blood
from flowing in. Besides, this type of aneurysms are very hard to detect, and often the person
that arrives at the operating room already suffered from a subarachnoid hemorrhage caused by the
ruptured aneurysm, aggravating the conditions in which the surgeons will perform. Furthermore,
this type of surgeries is expected to last several hours. In order to tackle the exhaustion that
comes from such a long procedure, normally two surgeons are present during the surgery and they
exchange role (between main and assistant) according to the skill and experience they have to
assess the problem.
Figure 5.4: Picture taken from one of the microscope’s recordings of an aneurysm surgery, afteran aneurysm (1) was successfully corrected with the placement of a clip (2) in its neck.
In order to reach the affected area, the surgeons first need to cut through several layers of the
head in order to expose the brain. This includes a craniotomy, which consists in the removal of
part of the bone from the skull. After the last layer, the Dura Mater, is cut through, the surgeons
will then start opening the path, through the brain, to the aneurysm. Before clipping, control of
the blood flow in the area around the aneurysm is needed in order to control its rupture, if needed.
Therefore, one or more provisory clippings are placed across the affected blood vessel until an
optimal environment is reached.
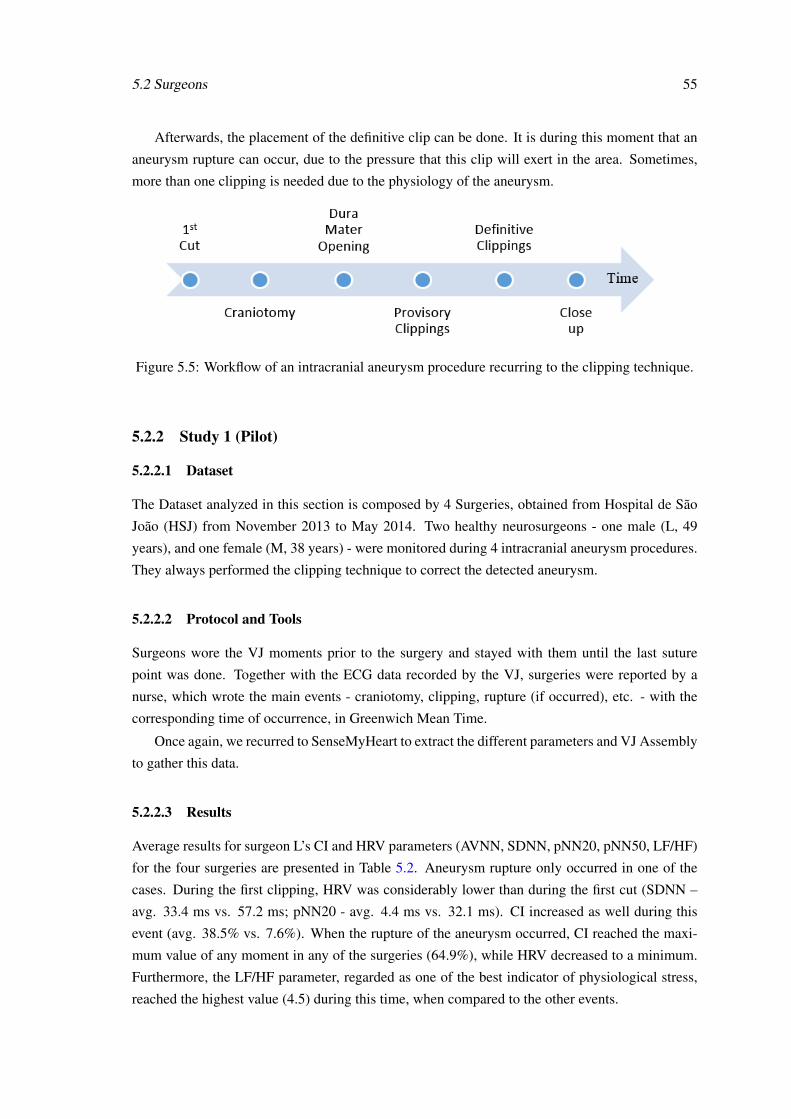
5.2 Surgeons 55
Afterwards, the placement of the definitive clip can be done. It is during this moment that an
aneurysm rupture can occur, due to the pressure that this clip will exert in the area. Sometimes,
more than one clipping is needed due to the physiology of the aneurysm.
Figure 5.5: Workflow of an intracranial aneurysm procedure recurring to the clipping technique.
5.2.2 Study 1 (Pilot)
5.2.2.1 Dataset
The Dataset analyzed in this section is composed by 4 Surgeries, obtained from Hospital de São
João (HSJ) from November 2013 to May 2014. Two healthy neurosurgeons - one male (L, 49
years), and one female (M, 38 years) - were monitored during 4 intracranial aneurysm procedures.
They always performed the clipping technique to correct the detected aneurysm.
5.2.2.2 Protocol and Tools
Surgeons wore the VJ moments prior to the surgery and stayed with them until the last suture
point was done. Together with the ECG data recorded by the VJ, surgeries were reported by a
nurse, which wrote the main events - craniotomy, clipping, rupture (if occurred), etc. - with the
corresponding time of occurrence, in Greenwich Mean Time.
Once again, we recurred to SenseMyHeart to extract the different parameters and VJ Assembly
to gather this data.
5.2.2.3 Results
Average results for surgeon L’s CI and HRV parameters (AVNN, SDNN, pNN20, pNN50, LF/HF)
for the four surgeries are presented in Table 5.2. Aneurysm rupture only occurred in one of the
cases. During the first clipping, HRV was considerably lower than during the first cut (SDNN –
avg. 33.4 ms vs. 57.2 ms; pNN20 - avg. 4.4 ms vs. 32.1 ms). CI increased as well during this
event (avg. 38.5% vs. 7.6%). When the rupture of the aneurysm occurred, CI reached the maxi-
mum value of any moment in any of the surgeries (64.9%), while HRV decreased to a minimum.
Furthermore, the LF/HF parameter, regarded as one of the best indicator of physiological stress,
reached the highest value (4.5) during this time, when compared to the other events.
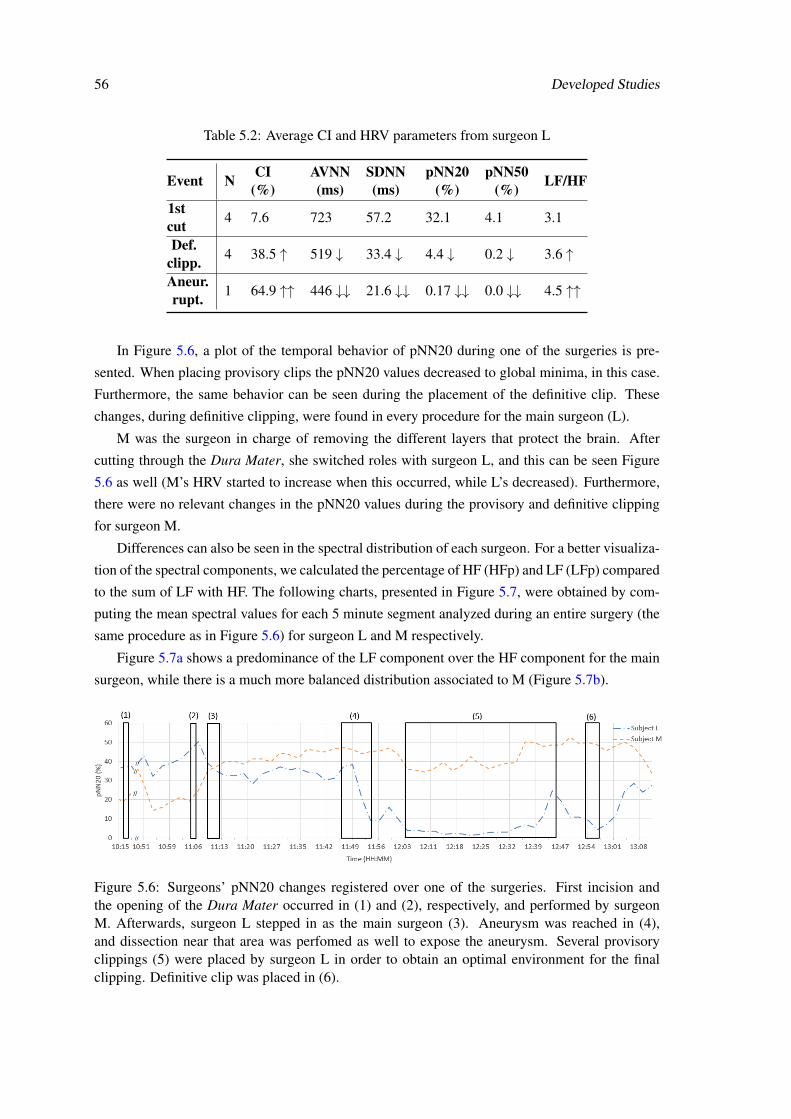
56 Developed Studies
Table 5.2: Average CI and HRV parameters from surgeon L
Event N CI(%)
AVNN(ms)
SDNN(ms)
pNN20(%)
pNN50(%) LF/HF
1stcut 4 7.6 723 57.2 32.1 4.1 3.1
Def.clipp. 4 38.5 ↑ 519 ↓ 33.4 ↓ 4.4 ↓ 0.2 ↓ 3.6 ↑
Aneur.rupt. 1 64.9 ↑↑ 446 ↓↓ 21.6 ↓↓ 0.17 ↓↓ 0.0 ↓↓ 4.5 ↑↑
In Figure 5.6, a plot of the temporal behavior of pNN20 during one of the surgeries is pre-
sented. When placing provisory clips the pNN20 values decreased to global minima, in this case.
Furthermore, the same behavior can be seen during the placement of the definitive clip. These
changes, during definitive clipping, were found in every procedure for the main surgeon (L).
M was the surgeon in charge of removing the different layers that protect the brain. After
cutting through the Dura Mater, she switched roles with surgeon L, and this can be seen Figure
5.6 as well (M’s HRV started to increase when this occurred, while L’s decreased). Furthermore,
there were no relevant changes in the pNN20 values during the provisory and definitive clipping
for surgeon M.
Differences can also be seen in the spectral distribution of each surgeon. For a better visualiza-
tion of the spectral components, we calculated the percentage of HF (HFp) and LF (LFp) compared
to the sum of LF with HF. The following charts, presented in Figure 5.7, were obtained by com-
puting the mean spectral values for each 5 minute segment analyzed during an entire surgery (the
same procedure as in Figure 5.6) for surgeon L and M respectively.
Figure 5.7a shows a predominance of the LF component over the HF component for the main
surgeon, while there is a much more balanced distribution associated to M (Figure 5.7b).
Figure 5.6: Surgeons’ pNN20 changes registered over one of the surgeries. First incision andthe opening of the Dura Mater occurred in (1) and (2), respectively, and performed by surgeonM. Afterwards, surgeon L stepped in as the main surgeon (3). Aneurysm was reached in (4),and dissection near that area was perfomed as well to expose the aneurysm. Several provisoryclippings (5) were placed by surgeon L in order to obtain an optimal environment for the finalclipping. Definitive clip was placed in (6).
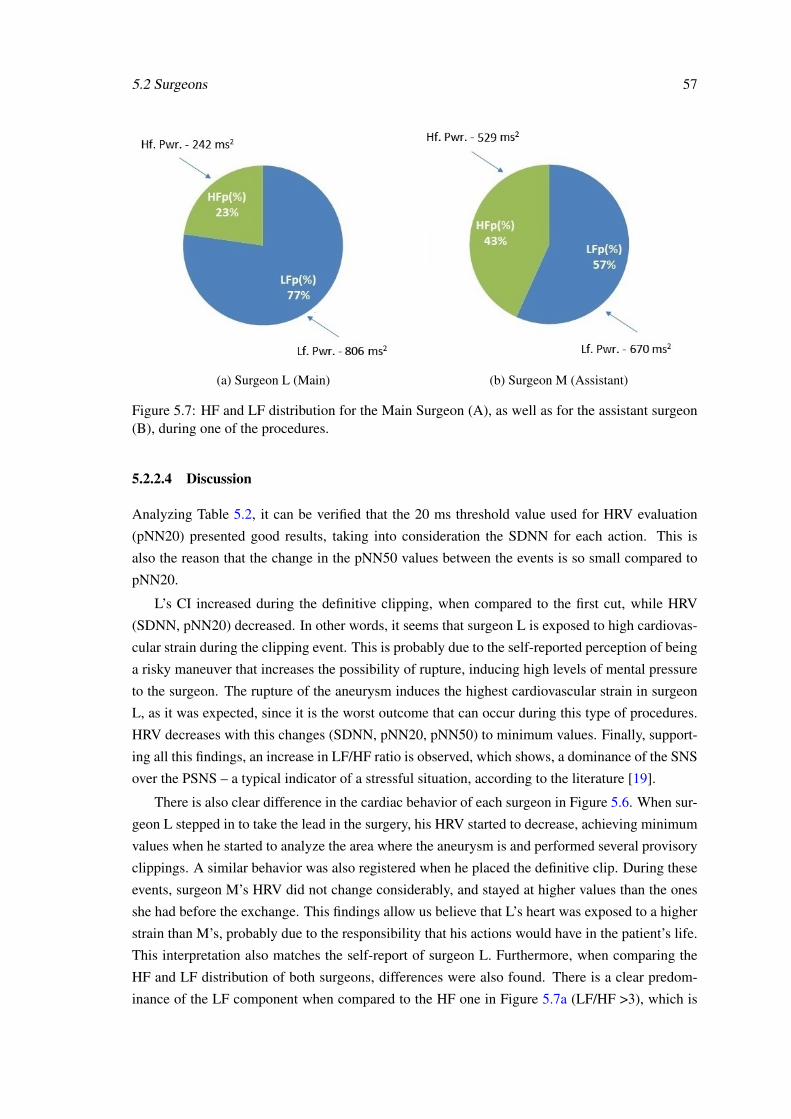
5.2 Surgeons 57
(a) Surgeon L (Main) (b) Surgeon M (Assistant)
Figure 5.7: HF and LF distribution for the Main Surgeon (A), as well as for the assistant surgeon(B), during one of the procedures.
5.2.2.4 Discussion
Analyzing Table 5.2, it can be verified that the 20 ms threshold value used for HRV evaluation
(pNN20) presented good results, taking into consideration the SDNN for each action. This is
also the reason that the change in the pNN50 values between the events is so small compared to
pNN20.
L’s CI increased during the definitive clipping, when compared to the first cut, while HRV
(SDNN, pNN20) decreased. In other words, it seems that surgeon L is exposed to high cardiovas-
cular strain during the clipping event. This is probably due to the self-reported perception of being
a risky maneuver that increases the possibility of rupture, inducing high levels of mental pressure
to the surgeon. The rupture of the aneurysm induces the highest cardiovascular strain in surgeon
L, as it was expected, since it is the worst outcome that can occur during this type of procedures.
HRV decreases with this changes (SDNN, pNN20, pNN50) to minimum values. Finally, support-
ing all this findings, an increase in LF/HF ratio is observed, which shows, a dominance of the SNS
over the PSNS – a typical indicator of a stressful situation, according to the literature [19].
There is also clear difference in the cardiac behavior of each surgeon in Figure 5.6. When sur-
geon L stepped in to take the lead in the surgery, his HRV started to decrease, achieving minimum
values when he started to analyze the area where the aneurysm is and performed several provisory
clippings. A similar behavior was also registered when he placed the definitive clip. During these
events, surgeon M’s HRV did not change considerably, and stayed at higher values than the ones
she had before the exchange. This findings allow us believe that L’s heart was exposed to a higher
strain than M’s, probably due to the responsibility that his actions would have in the patient’s life.
This interpretation also matches the self-report of surgeon L. Furthermore, when comparing the
HF and LF distribution of both surgeons, differences were also found. There is a clear predom-
inance of the LF component when compared to the HF one in Figure 5.7a (LF/HF >3), which is
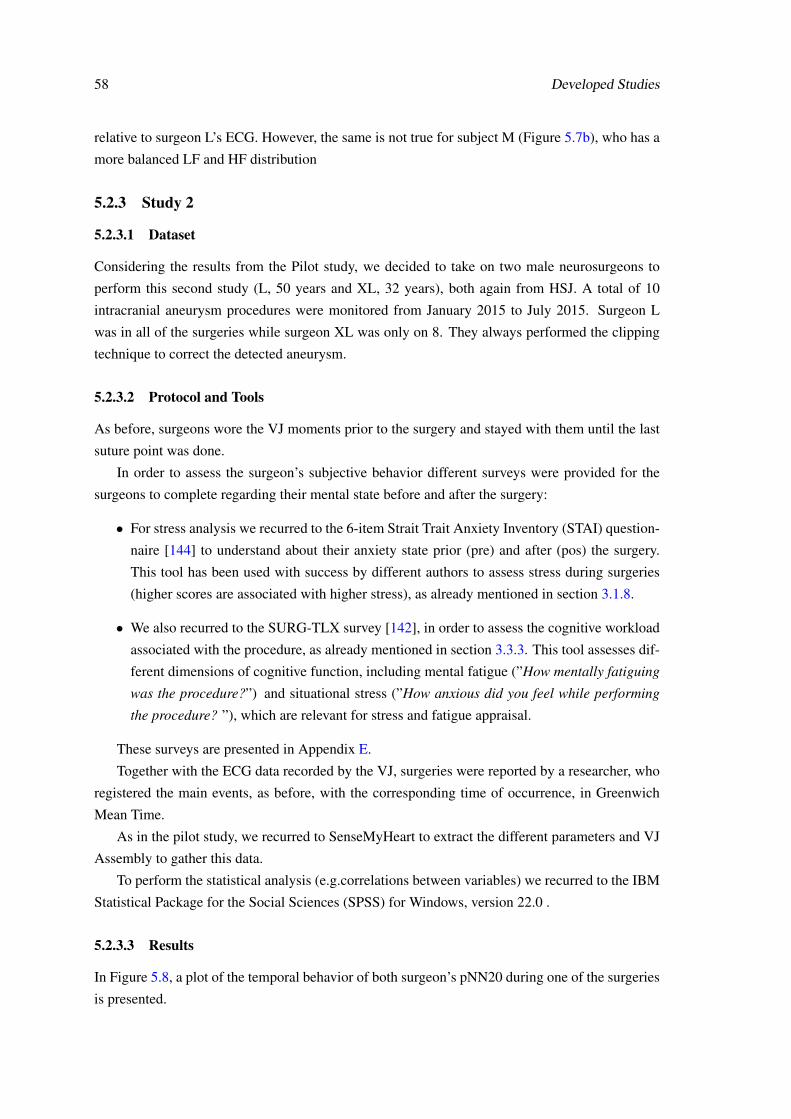
58 Developed Studies
relative to surgeon L’s ECG. However, the same is not true for subject M (Figure 5.7b), who has a
more balanced LF and HF distribution
5.2.3 Study 2
5.2.3.1 Dataset
Considering the results from the Pilot study, we decided to take on two male neurosurgeons to
perform this second study (L, 50 years and XL, 32 years), both again from HSJ. A total of 10
intracranial aneurysm procedures were monitored from January 2015 to July 2015. Surgeon L
was in all of the surgeries while surgeon XL was only on 8. They always performed the clipping
technique to correct the detected aneurysm.
5.2.3.2 Protocol and Tools
As before, surgeons wore the VJ moments prior to the surgery and stayed with them until the last
suture point was done.
In order to assess the surgeon’s subjective behavior different surveys were provided for the
surgeons to complete regarding their mental state before and after the surgery:
• For stress analysis we recurred to the 6-item Strait Trait Anxiety Inventory (STAI) question-
naire [144] to understand about their anxiety state prior (pre) and after (pos) the surgery.
This tool has been used with success by different authors to assess stress during surgeries
(higher scores are associated with higher stress), as already mentioned in section 3.1.8.
• We also recurred to the SURG-TLX survey [142], in order to assess the cognitive workload
associated with the procedure, as already mentioned in section 3.3.3. This tool assesses dif-
ferent dimensions of cognitive function, including mental fatigue (”How mentally fatiguing
was the procedure?”) and situational stress (”How anxious did you feel while performing
the procedure? ”), which are relevant for stress and fatigue appraisal.
These surveys are presented in Appendix E.
Together with the ECG data recorded by the VJ, surgeries were reported by a researcher, who
registered the main events, as before, with the corresponding time of occurrence, in Greenwich
Mean Time.
As in the pilot study, we recurred to SenseMyHeart to extract the different parameters and VJ
Assembly to gather this data.
To perform the statistical analysis (e.g.correlations between variables) we recurred to the IBM
Statistical Package for the Social Sciences (SPSS) for Windows, version 22.0 .
5.2.3.3 Results
In Figure 5.8, a plot of the temporal behavior of both surgeon’s pNN20 during one of the surgeries
is presented.
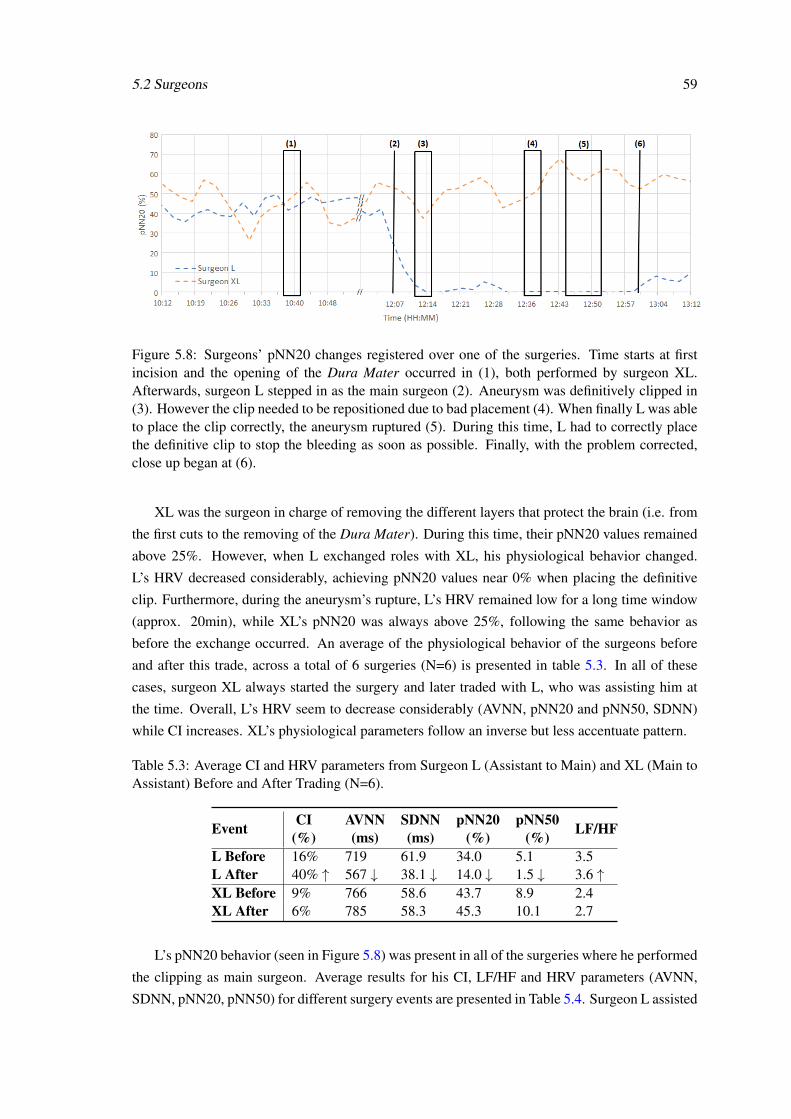
5.2 Surgeons 59
Figure 5.8: Surgeons’ pNN20 changes registered over one of the surgeries. Time starts at firstincision and the opening of the Dura Mater occurred in (1), both performed by surgeon XL.Afterwards, surgeon L stepped in as the main surgeon (2). Aneurysm was definitively clipped in(3). However the clip needed to be repositioned due to bad placement (4). When finally L was ableto place the clip correctly, the aneurysm ruptured (5). During this time, L had to correctly placethe definitive clip to stop the bleeding as soon as possible. Finally, with the problem corrected,close up began at (6).
XL was the surgeon in charge of removing the different layers that protect the brain (i.e. from
the first cuts to the removing of the Dura Mater). During this time, their pNN20 values remained
above 25%. However, when L exchanged roles with XL, his physiological behavior changed.
L’s HRV decreased considerably, achieving pNN20 values near 0% when placing the definitive
clip. Furthermore, during the aneurysm’s rupture, L’s HRV remained low for a long time window
(approx. 20min), while XL’s pNN20 was always above 25%, following the same behavior as
before the exchange occurred. An average of the physiological behavior of the surgeons before
and after this trade, across a total of 6 surgeries (N=6) is presented in table 5.3. In all of these
cases, surgeon XL always started the surgery and later traded with L, who was assisting him at
the time. Overall, L’s HRV seem to decrease considerably (AVNN, pNN20 and pNN50, SDNN)
while CI increases. XL’s physiological parameters follow an inverse but less accentuate pattern.
Table 5.3: Average CI and HRV parameters from Surgeon L (Assistant to Main) and XL (Main toAssistant) Before and After Trading (N=6).
Event CI(%)
AVNN(ms)
SDNN(ms)
pNN20(%)
pNN50(%) LF/HF
L Before 16% 719 61.9 34.0 5.1 3.5L After 40% ↑ 567 ↓ 38.1 ↓ 14.0 ↓ 1.5 ↓ 3.6 ↑XL Before 9% 766 58.6 43.7 8.9 2.4XL After 6% 785 58.3 45.3 10.1 2.7
L’s pNN20 behavior (seen in Figure 5.8) was present in all of the surgeries where he performed
the clipping as main surgeon. Average results for his CI, LF/HF and HRV parameters (AVNN,
SDNN, pNN20, pNN50) for different surgery events are presented in Table 5.4. Surgeon L assisted
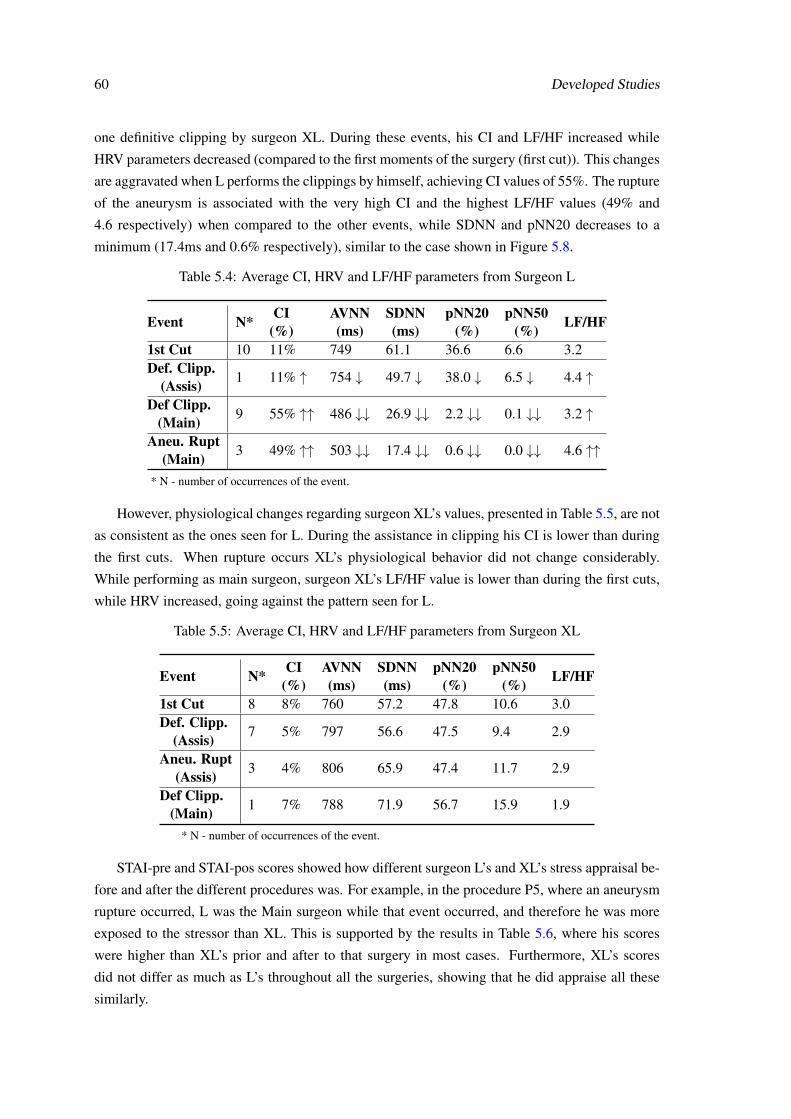
60 Developed Studies
one definitive clipping by surgeon XL. During these events, his CI and LF/HF increased while
HRV parameters decreased (compared to the first moments of the surgery (first cut)). This changes
are aggravated when L performs the clippings by himself, achieving CI values of 55%. The rupture
of the aneurysm is associated with the very high CI and the highest LF/HF values (49% and
4.6 respectively) when compared to the other events, while SDNN and pNN20 decreases to a
minimum (17.4ms and 0.6% respectively), similar to the case shown in Figure 5.8.
Table 5.4: Average CI, HRV and LF/HF parameters from Surgeon L
Event N* CI(%)
AVNN(ms)
SDNN(ms)
pNN20(%)
pNN50(%) LF/HF
1st Cut 10 11% 749 61.1 36.6 6.6 3.2Def. Clipp.
(Assis) 1 11% ↑ 754 ↓ 49.7 ↓ 38.0 ↓ 6.5 ↓ 4.4 ↑
Def Clipp.(Main) 9 55% ↑↑ 486 ↓↓ 26.9 ↓↓ 2.2 ↓↓ 0.1 ↓↓ 3.2 ↑
Aneu. Rupt(Main) 3 49% ↑↑ 503 ↓↓ 17.4 ↓↓ 0.6 ↓↓ 0.0 ↓↓ 4.6 ↑↑
* N - number of occurrences of the event.
However, physiological changes regarding surgeon XL’s values, presented in Table 5.5, are not
as consistent as the ones seen for L. During the assistance in clipping his CI is lower than during
the first cuts. When rupture occurs XL’s physiological behavior did not change considerably.
While performing as main surgeon, surgeon XL’s LF/HF value is lower than during the first cuts,
while HRV increased, going against the pattern seen for L.
Table 5.5: Average CI, HRV and LF/HF parameters from Surgeon XL
Event N* CI(%)
AVNN(ms)
SDNN(ms)
pNN20(%)
pNN50(%) LF/HF
1st Cut 8 8% 760 57.2 47.8 10.6 3.0Def. Clipp.
(Assis) 7 5% 797 56.6 47.5 9.4 2.9
Aneu. Rupt(Assis) 3 4% 806 65.9 47.4 11.7 2.9
Def Clipp.(Main) 1 7% 788 71.9 56.7 15.9 1.9
* N - number of occurrences of the event.
STAI-pre and STAI-pos scores showed how different surgeon L’s and XL’s stress appraisal be-
fore and after the different procedures was. For example, in the procedure P5, where an aneurysm
rupture occurred, L was the Main surgeon while that event occurred, and therefore he was more
exposed to the stressor than XL. This is supported by the results in Table 5.6, where his scores
were higher than XL’s prior and after to that surgery in most cases. Furthermore, XL’s scores
did not differ as much as L’s throughout all the surgeries, showing that he did appraise all these
similarly.
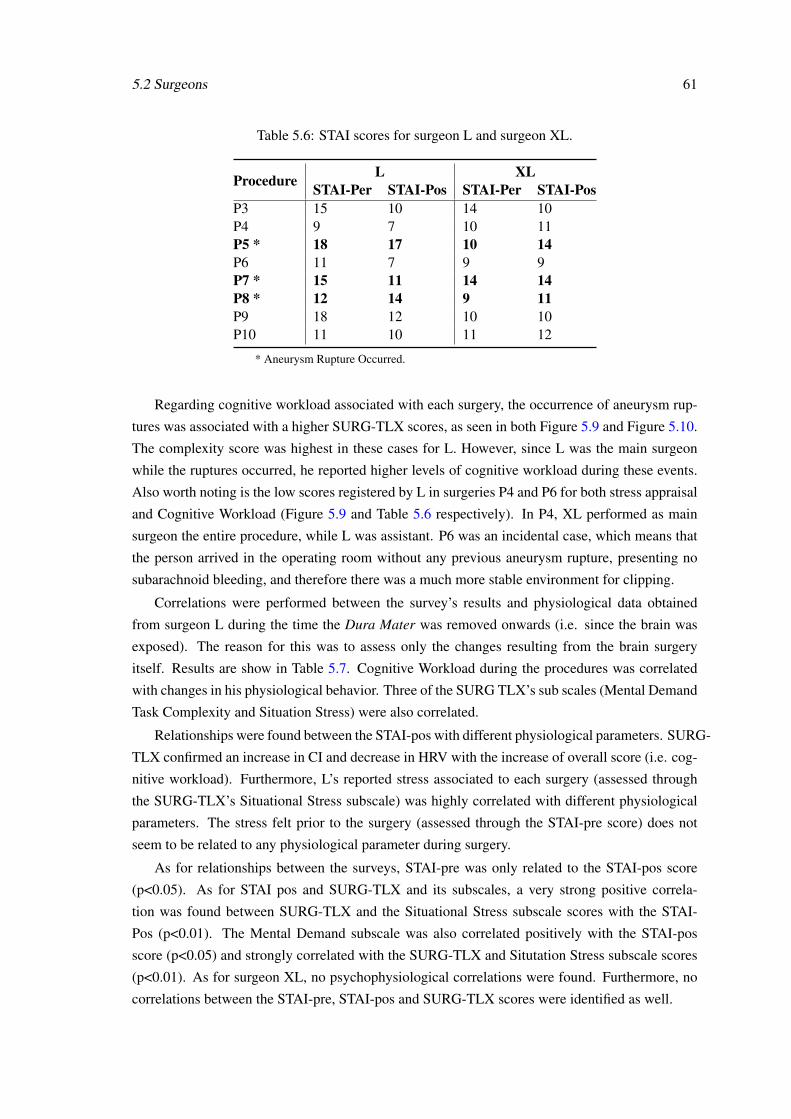
5.2 Surgeons 61
Table 5.6: STAI scores for surgeon L and surgeon XL.
Procedure L XLSTAI-Per STAI-Pos STAI-Per STAI-Pos
P3 15 10 14 10P4 9 7 10 11P5 * 18 17 10 14P6 11 7 9 9P7 * 15 11 14 14P8 * 12 14 9 11P9 18 12 10 10P10 11 10 11 12
* Aneurysm Rupture Occurred.
Regarding cognitive workload associated with each surgery, the occurrence of aneurysm rup-
tures was associated with a higher SURG-TLX scores, as seen in both Figure 5.9 and Figure 5.10.
The complexity score was highest in these cases for L. However, since L was the main surgeon
while the ruptures occurred, he reported higher levels of cognitive workload during these events.
Also worth noting is the low scores registered by L in surgeries P4 and P6 for both stress appraisal
and Cognitive Workload (Figure 5.9 and Table 5.6 respectively). In P4, XL performed as main
surgeon the entire procedure, while L was assistant. P6 was an incidental case, which means that
the person arrived in the operating room without any previous aneurysm rupture, presenting no
subarachnoid bleeding, and therefore there was a much more stable environment for clipping.
Correlations were performed between the survey’s results and physiological data obtained
from surgeon L during the time the Dura Mater was removed onwards (i.e. since the brain was
exposed). The reason for this was to assess only the changes resulting from the brain surgery
itself. Results are show in Table 5.7. Cognitive Workload during the procedures was correlated
with changes in his physiological behavior. Three of the SURG TLX’s sub scales (Mental Demand
Task Complexity and Situation Stress) were also correlated.
Relationships were found between the STAI-pos with different physiological parameters. SURG-
TLX confirmed an increase in CI and decrease in HRV with the increase of overall score (i.e. cog-
nitive workload). Furthermore, L’s reported stress associated to each surgery (assessed through
the SURG-TLX’s Situational Stress subscale) was highly correlated with different physiological
parameters. The stress felt prior to the surgery (assessed through the STAI-pre score) does not
seem to be related to any physiological parameter during surgery.
As for relationships between the surveys, STAI-pre was only related to the STAI-pos score
(p<0.05). As for STAI pos and SURG-TLX and its subscales, a very strong positive correla-
tion was found between SURG-TLX and the Situational Stress subscale scores with the STAI-
Pos (p<0.01). The Mental Demand subscale was also correlated positively with the STAI-pos
score (p<0.05) and strongly correlated with the SURG-TLX and Situtation Stress subscale scores
(p<0.01). As for surgeon XL, no psychophysiological correlations were found. Furthermore, no
correlations between the STAI-pre, STAI-pos and SURG-TLX scores were identified as well.
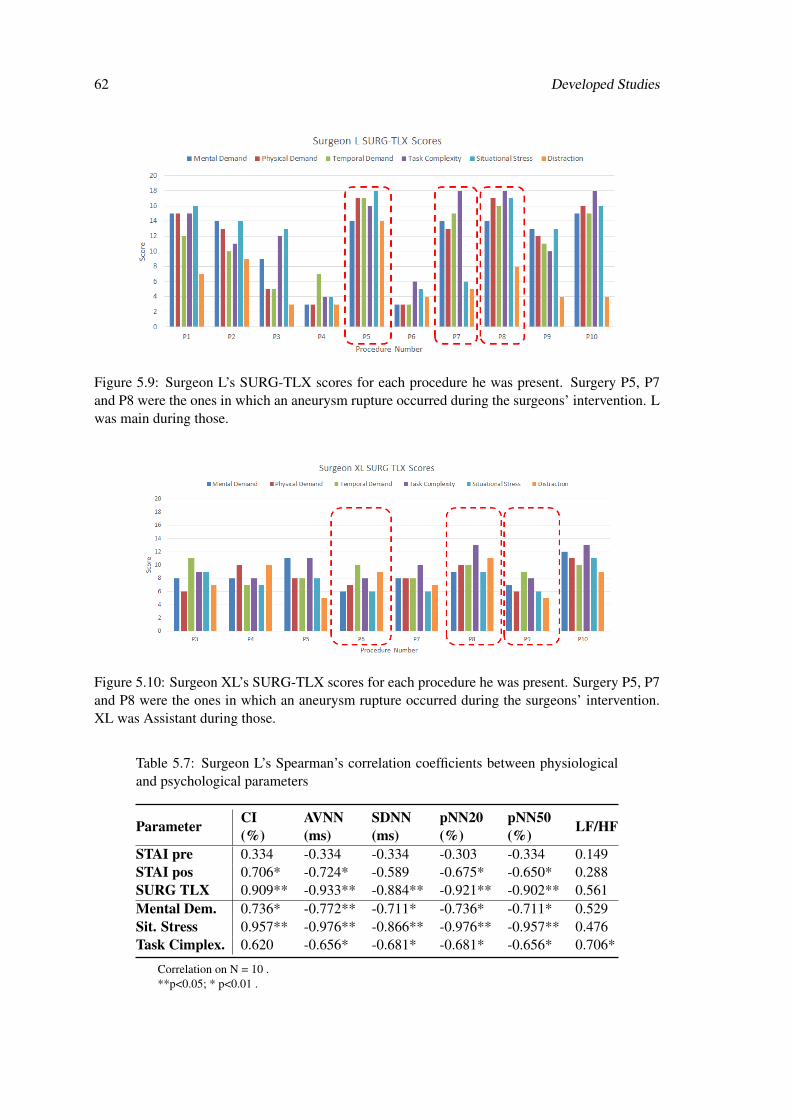
62 Developed Studies
Figure 5.9: Surgeon L’s SURG-TLX scores for each procedure he was present. Surgery P5, P7and P8 were the ones in which an aneurysm rupture occurred during the surgeons’ intervention. Lwas main during those.
Figure 5.10: Surgeon XL’s SURG-TLX scores for each procedure he was present. Surgery P5, P7and P8 were the ones in which an aneurysm rupture occurred during the surgeons’ intervention.XL was Assistant during those.
Table 5.7: Surgeon L’s Spearman’s correlation coefficients between physiologicaland psychological parameters
Parameter CI(%)
AVNN(ms)
SDNN(ms)
pNN20(%)
pNN50(%) LF/HF
STAI pre 0.334 -0.334 -0.334 -0.303 -0.334 0.149STAI pos 0.706* -0.724* -0.589 -0.675* -0.650* 0.288SURG TLX 0.909** -0.933** -0.884** -0.921** -0.902** 0.561Mental Dem. 0.736* -0.772** -0.711* -0.736* -0.711* 0.529Sit. Stress 0.957** -0.976** -0.866** -0.976** -0.957** 0.476Task Cimplex. 0.620 -0.656* -0.681* -0.681* -0.656* 0.706*
Correlation on N = 10 .**p<0.05; * p<0.01 .
5.2 Surgeons 63
5.2.3.4 Discussion
Regarding the physiological behavior associated to exchanges between the surgeons, one can infer
an increase in cardiovascular strain occurs in surgeon L after he exchanges to main surgeon – his
CI increases considerably while HRV (AVNN, SDNN, pNN20 and pNN50) decreases. The case
shown in Figure 5.8 shows how noticeable this change is regarding pNN20, supporting the results
from Table 5.3. This behavior can be due to surgeon L taking on a more active and responsible
role, which should take a much higher mental focus, compared to the previous one. However, we
should address this fact on the surveys in future work in order to prove this assumption, since no
similar study was found in the literature.
This stress-associated pattern (increase in CI and LF/HF ratio and decrease in several other
HRV parameters) is even more noticeable when L is clipping the aneurysm. That moment is cru-
cial, since a wrong placement of the clip can lead to a rupture of the aneurysm, which is the worst
possible outcome. When rupture occurs, the cardiovascular strain is even higher, with HRV pa-
rameters reaching minimum values and LF/HF ratio reaching the highest overall. Furthermore,
L reported a higher cognitive workload in the procedures where a rupture occurred, identify-
ing those with some of the highest task complexity and situational stress scores as well as with
some of the highest STAI values (see Figure 5.9 and Table 5.6). Supporting these findings, Ta-
ble 5.7 shows strong correlations (p<0.05) between the complexity score and some of the stress
parameters mentioned – it is positively correlated with LF/HF and negatively correlated with the
mentioned HRV parameters. Furthermore, increases in CI and decreases in several HRV parame-
ters (AVNN, SDNN, pNN20 and pNN50) are very strongly correlated (p<0.01) with the increase
in the Situational Stress score (i.e. how anxious did they feel while performing the procedure).
Comparing this with results in Table 5.3, one can infer that aneurysm clipping and rupture indeed
induce stress in surgeon L. Cognitive workload and STAI-pos scores relative to moments after the
procedure are very strongly correlated (p<0.01) with most of the mentioned parameters as well,
supporting a relationship between the complexity associated with the procedure and the induced
mental and physiological stress.
Furthermore, the mental demand score seems to be correlated with the same physiological
changes as well. It has been also positively correlated with cognitive workload and the situational
stress subscale and the STAI-POS score. It can then be concluded that surgeries reported as being
more stressful can also induce considerable levels of cognitive workload and mental fatigue in the
subjects.
As for XL’s physiological behavior, changes between the surgery’s different moments do not
follow L’s pattern, but are still interesting to discuss nonetheless.
First, his physiological behavior does not suffer any significant alteration following the mo-
ments before and after the exchange in role (compared to surgeon L). Second, results from Table
5.5 show no noticeable changes between events (compared to the first cuts moment). One possible
explanation for this can be related to the fact that he perceives both parts of the procedure (as
main and as assistant) as equally demanding, therefore not triggering practically any changes in
64 Developed Studies
his behavior. This is supported by the SURG-TLX scores presented in Figure 5.10 – they are very
similar and lower than L’s in most cases. Since stress is not caused by the event itself, but by the
individual’s perception of it, this result goes in agreement with the work of Lazarus and Folkamn
[166].
Regarding the usage of pNN20 for stress event identification, interesting results were obtained.
In Table 5.4 and Figure 5.8 it is noticeable how this parameter changes with the events, unlike the
one which is more recurred to in the literature (pNN50). Analyzing the SDNN, we can see that this
parameter decreases to values much lower than 50ms during the more stressful events (clipping
and rupture), supporting the usage of a lower threshold for a better evaluation of HRV.
5.2.4 Conclusion
Both studies show that neurosurgery can be a stressful and mentally demanding procedure, leading
to different changes in cardiac behavior and cognitive function.
Regarding the differences between both studies (moreover, the different genders of the sur-
geons), the changes in LF and HF distributions seen in 5.7 seem to be related to the surgeon’s
genders which is also supported by the literature [167]. however, more cases are needed with a
male and a female surgeon to better solidify this finding. Exchanging role, from assistant to main
surgeon, seems to induce a measurable degree of cardiac strain in one of the subjects. However,
this situation should be addressed subjectively as well in order to confirm the relationship between
the changes in role with increase in stress. Furthermore, there are also noticeable changes when
one of the surgeons (L) is operating the brain directly. The other (XL) does not seem to be as
exposed to stressful events, showing practically no physiological changes between the different
events. However, his subjective appraisal also does not change with the procedures, unlike L’s.
More cases are needed to ensure that this behavior is consistent, especially when he is performing
as main surgeon.
SURG-TLX shows to be a feasible tool to address cognitive workload and its relation with dif-
ferent physiological parameters as well as with stress and fatigue. Furthermore, it supports the fact
that the more stressful situations in intracranial aneurysm procedures are highly mentally demand-
ing as well. Again, more cases are needed in order to obtain better correlations and consolidate our
findings. This tool also shows interesting results in mental fatigue assessment. Furthermore, stress
leads to a significant decrease in the surgeons SDNN, leading us to believe that a lower threshold
(like 20ms) should be used to assess this kind of behavior instead of the 50ms widely used in the
literature.
Concluding, this study shows the feasibility of using wearable technology to identify stressful
events in surgery procedures, as well as to study physiological responses according to the role
(main or assistant). Furthermore, we complement this approach with the surgeons’ subjective
appraisal of stress and cognitive workload, which have shown to be correlated.
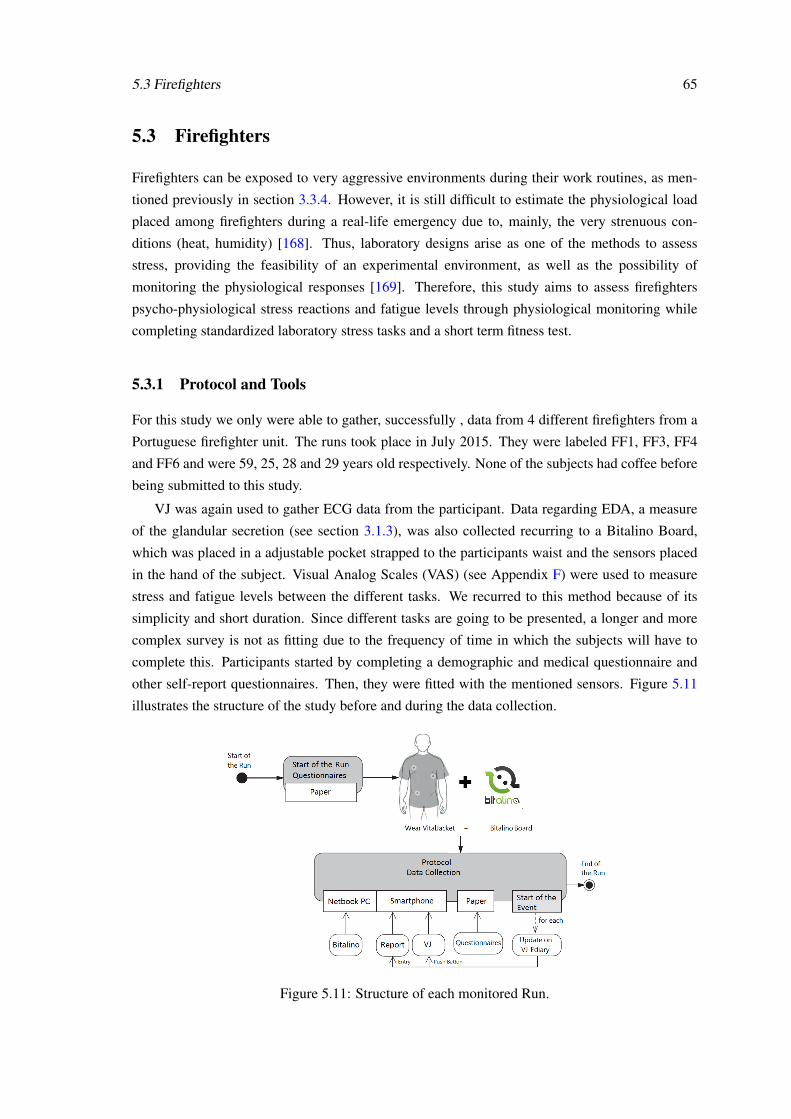
5.3 Firefighters 65
5.3 Firefighters
Firefighters can be exposed to very aggressive environments during their work routines, as men-
tioned previously in section 3.3.4. However, it is still difficult to estimate the physiological load
placed among firefighters during a real-life emergency due to, mainly, the very strenuous con-
ditions (heat, humidity) [168]. Thus, laboratory designs arise as one of the methods to assess
stress, providing the feasibility of an experimental environment, as well as the possibility of
monitoring the physiological responses [169]. Therefore, this study aims to assess firefighters
psycho-physiological stress reactions and fatigue levels through physiological monitoring while
completing standardized laboratory stress tasks and a short term fitness test.
5.3.1 Protocol and Tools
For this study we only were able to gather, successfully , data from 4 different firefighters from a
Portuguese firefighter unit. The runs took place in July 2015. They were labeled FF1, FF3, FF4
and FF6 and were 59, 25, 28 and 29 years old respectively. None of the subjects had coffee before
being submitted to this study.
VJ was again used to gather ECG data from the participant. Data regarding EDA, a measure
of the glandular secretion (see section 3.1.3), was also collected recurring to a Bitalino Board,
which was placed in a adjustable pocket strapped to the participants waist and the sensors placed
in the hand of the subject. Visual Analog Scales (VAS) (see Appendix F) were used to measure
stress and fatigue levels between the different tasks. We recurred to this method because of its
simplicity and short duration. Since different tasks are going to be presented, a longer and more
complex survey is not as fitting due to the frequency of time in which the subjects will have to
complete this. Participants started by completing a demographic and medical questionnaire and
other self-report questionnaires. Then, they were fitted with the mentioned sensors. Figure 5.11
illustrates the structure of the study before and during the data collection.
Figure 5.11: Structure of each monitored Run.
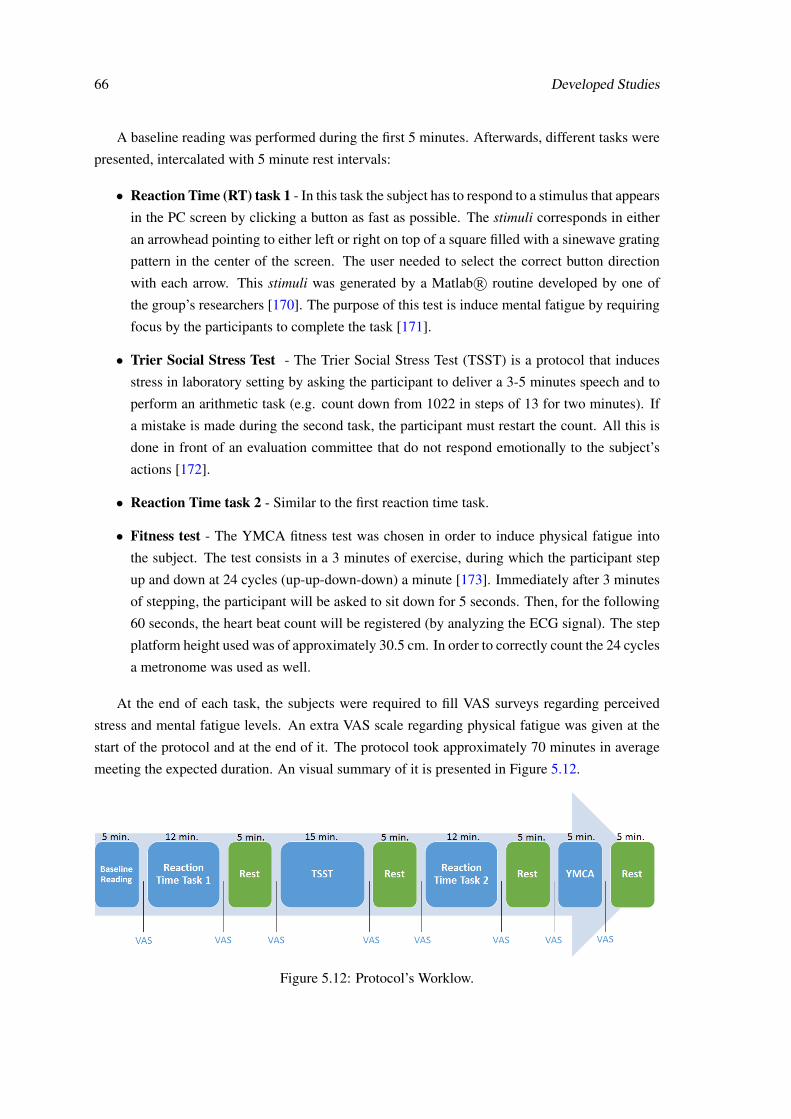
66 Developed Studies
A baseline reading was performed during the first 5 minutes. Afterwards, different tasks were
presented, intercalated with 5 minute rest intervals:
• Reaction Time (RT) task 1 - In this task the subject has to respond to a stimulus that appears
in the PC screen by clicking a button as fast as possible. The stimuli corresponds in either
an arrowhead pointing to either left or right on top of a square filled with a sinewave grating
pattern in the center of the screen. The user needed to select the correct button direction
with each arrow. This stimuli was generated by a Matlab R© routine developed by one of
the group’s researchers [170]. The purpose of this test is induce mental fatigue by requiring
focus by the participants to complete the task [171].
• Trier Social Stress Test - The Trier Social Stress Test (TSST) is a protocol that induces
stress in laboratory setting by asking the participant to deliver a 3-5 minutes speech and to
perform an arithmetic task (e.g. count down from 1022 in steps of 13 for two minutes). If
a mistake is made during the second task, the participant must restart the count. All this is
done in front of an evaluation committee that do not respond emotionally to the subject’s
actions [172].
• Reaction Time task 2 - Similar to the first reaction time task.
• Fitness test - The YMCA fitness test was chosen in order to induce physical fatigue into
the subject. The test consists in a 3 minutes of exercise, during which the participant step
up and down at 24 cycles (up-up-down-down) a minute [173]. Immediately after 3 minutes
of stepping, the participant will be asked to sit down for 5 seconds. Then, for the following
60 seconds, the heart beat count will be registered (by analyzing the ECG signal). The step
platform height used was of approximately 30.5 cm. In order to correctly count the 24 cycles
a metronome was used as well.
At the end of each task, the subjects were required to fill VAS surveys regarding perceived
stress and mental fatigue levels. An extra VAS scale regarding physical fatigue was given at the
start of the protocol and at the end of it. The protocol took approximately 70 minutes in average
meeting the expected duration. An visual summary of it is presented in Figure 5.12.
Figure 5.12: Protocol’s Worklow.

5.3 Firefighters 67
5.3.2 Results and Discussion
Since it was only possible to submit 4 different firefighters to this protocol, no correlation between
physical and psychological variables was possible (because there was only 1 case for each subject).
However, their individual responses to each task can still be discussed. Furthermore, unlike in
other studies, HR is assessed instead of CI, due to the fact that, as we will see, the baseline values
obtained were biased by the psychological state of the subjects.
Looking at the subject FF1’s results from Table 5.8, it can be noted that there is a low HRV
accompanied by an high HR during the Baseline time, compared to other tasks. Moreover, the
Stress VAS score is higher than in the first task as well. From this result, it can be concluded that
the subject was not completely relaxed in the beginning of the study. A possible explanation for
this is the anxiety he experienced due to the fact that they did not know any information about this
experiment and what tasks he would have to perform and what he would be exposed to. Also, the
presence of evaluation panel could also induce more pressure in the subject, making him feel more
stressed. This physiological pattern was seen with subject with FF4, who shows considerable low
levels of HRV (SDNN = 23.1 ms, pNN20 = 7.7%)and high HR (99 bpm) during this time compared
to any other subject. However, both reports of Stress did not match this finding. Subjects FF3 and
FF6 do not show such accentuate changes from baseline to other events.
At the end of the first RT, subject FF1 reported an higher value for mental fatigue but an lower
one for stress. Regarding the first, this was expected, since an RT does require some focus and
therefore, can induce some mental fatigue. The decrease in the reported stress is followed by an
increase in HRV (SDNN and pNN20 increase) and decrease in HR and the LF/HF ratio, which, as
discussed before [19], is an behavior associated with relaxation. However, subjects FF3 and FF4,
reported the same stress and mental fatigue values, while their LF/HF decreased. The possible
reason for this is due to the fact that after performing the first task the subjects’ anxiety decreases
due to the fact that they now have the notion of the type of tasks to which they will be subjected.
Furthermore, they do not feel this anxiety as stressful therefore they do not perceive themselves as
being less stressed. FF6 reports matches his physiological behavior since the changes registered
are not as considerable as in the other subjects. Regarding the changes in Mental Fatigue values,
only FF1 reported a change. But, since he was also exposed to some stress, no conclusion can be
taken from this results.
The TSST task is, supposedly the more stressful task, as mentioned in the previous section.
The reported stress VAS value value increases in all subjects after this task SDNN and pNN20
values decrease, with an increase in HR and LF/HF, which support that the goal of this task was
achieved, even though the subject seems to feel more stressed in the beginning of the study. Fur-
thermore, it is during this task the skin conductance experiences the greatest increase, which means
that there is an increase in glandular secretion during this time. Again, as stated before, this is a
symptom of stress and thereby corroborates the fact of the subjects experiencing stress while per-
forming the TSST. However, an increase in mental fatigue is also reported by subjects FF3 and
FF4. Since they are demanded to develop a speech, this is possible. However, this happens while
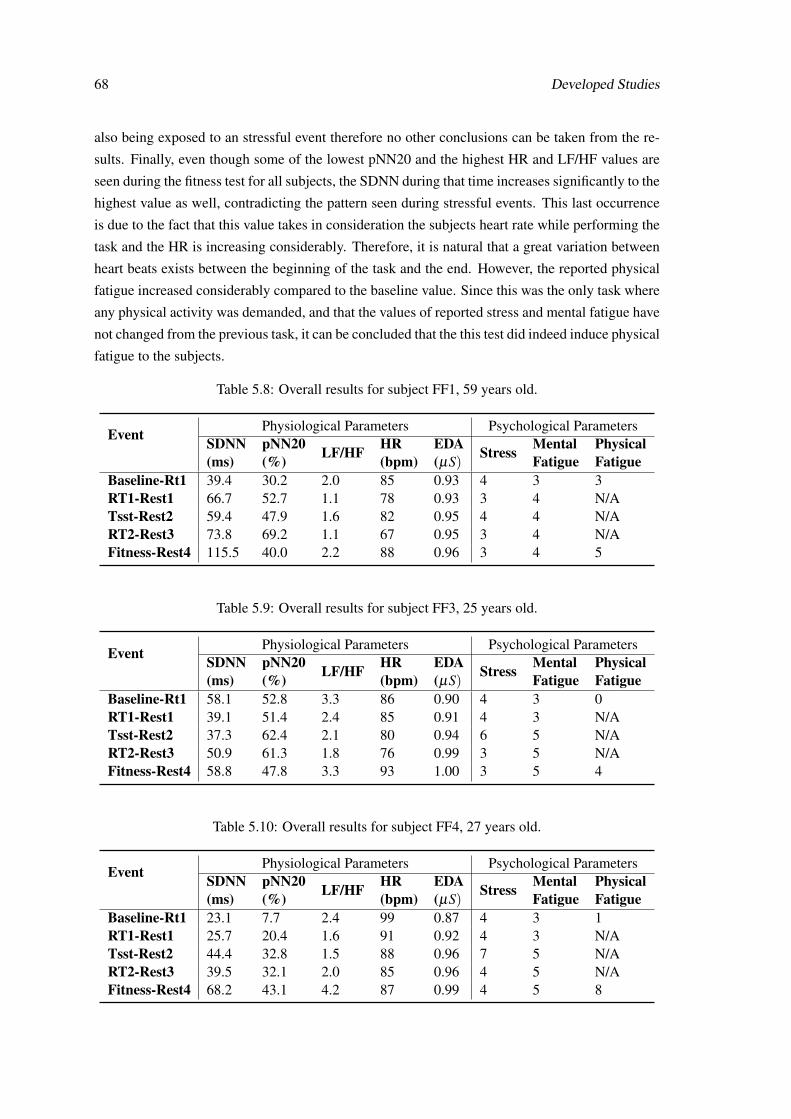
68 Developed Studies
also being exposed to an stressful event therefore no other conclusions can be taken from the re-
sults. Finally, even though some of the lowest pNN20 and the highest HR and LF/HF values are
seen during the fitness test for all subjects, the SDNN during that time increases significantly to the
highest value as well, contradicting the pattern seen during stressful events. This last occurrence
is due to the fact that this value takes in consideration the subjects heart rate while performing the
task and the HR is increasing considerably. Therefore, it is natural that a great variation between
heart beats exists between the beginning of the task and the end. However, the reported physical
fatigue increased considerably compared to the baseline value. Since this was the only task where
any physical activity was demanded, and that the values of reported stress and mental fatigue have
not changed from the previous task, it can be concluded that the this test did indeed induce physical
fatigue to the subjects.
Table 5.8: Overall results for subject FF1, 59 years old.
Event Physiological Parameters Psychological ParametersSDNN(ms)
pNN20(%) LF/HF HR
(bpm)EDA(µS)
Stress MentalFatigue
PhysicalFatigue
Baseline-Rt1 39.4 30.2 2.0 85 0.93 4 3 3RT1-Rest1 66.7 52.7 1.1 78 0.93 3 4 N/ATsst-Rest2 59.4 47.9 1.6 82 0.95 4 4 N/ART2-Rest3 73.8 69.2 1.1 67 0.95 3 4 N/AFitness-Rest4 115.5 40.0 2.2 88 0.96 3 4 5
Table 5.9: Overall results for subject FF3, 25 years old.
Event Physiological Parameters Psychological ParametersSDNN(ms)
pNN20(%) LF/HF HR
(bpm)EDA(µS)
Stress MentalFatigue
PhysicalFatigue
Baseline-Rt1 58.1 52.8 3.3 86 0.90 4 3 0RT1-Rest1 39.1 51.4 2.4 85 0.91 4 3 N/ATsst-Rest2 37.3 62.4 2.1 80 0.94 6 5 N/ART2-Rest3 50.9 61.3 1.8 76 0.99 3 5 N/AFitness-Rest4 58.8 47.8 3.3 93 1.00 3 5 4
Table 5.10: Overall results for subject FF4, 27 years old.
Event Physiological Parameters Psychological ParametersSDNN(ms)
pNN20(%) LF/HF HR
(bpm)EDA(µS)
Stress MentalFatigue
PhysicalFatigue
Baseline-Rt1 23.1 7.7 2.4 99 0.87 4 3 1RT1-Rest1 25.7 20.4 1.6 91 0.92 4 3 N/ATsst-Rest2 44.4 32.8 1.5 88 0.96 7 5 N/ART2-Rest3 39.5 32.1 2.0 85 0.96 4 5 N/AFitness-Rest4 68.2 43.1 4.2 87 0.99 4 5 8
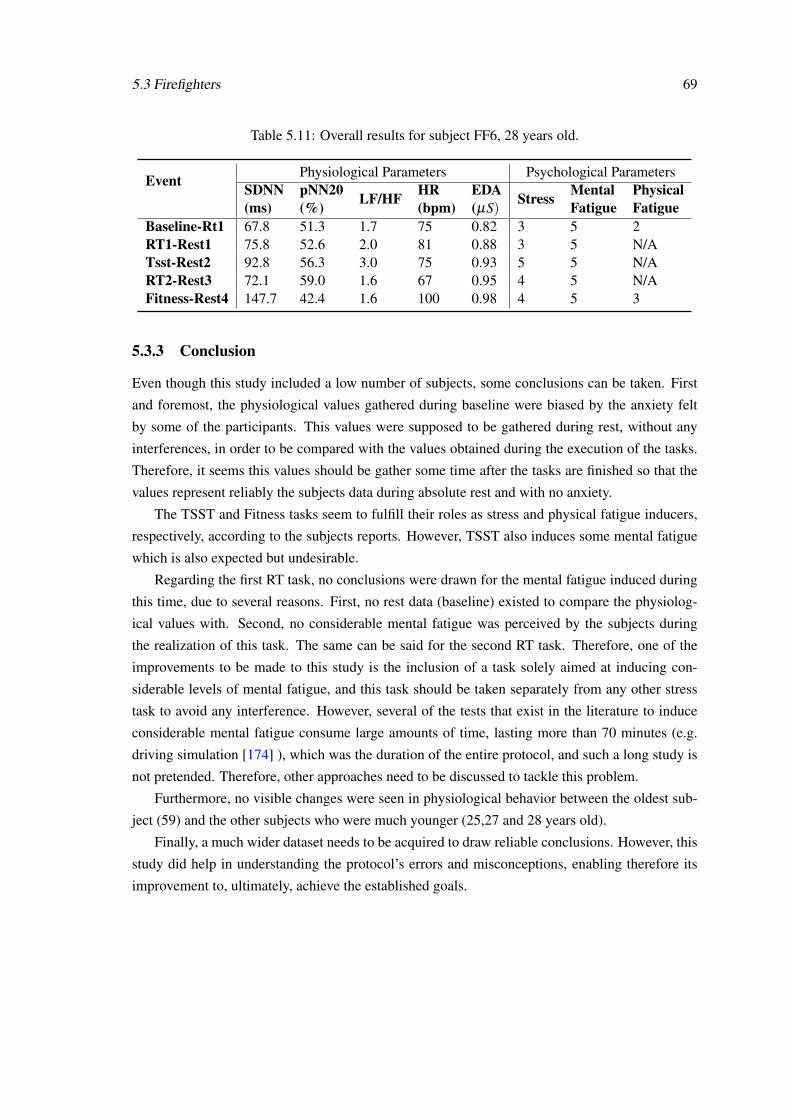
5.3 Firefighters 69
Table 5.11: Overall results for subject FF6, 28 years old.
Event Physiological Parameters Psychological ParametersSDNN(ms)
pNN20(%) LF/HF HR
(bpm)EDA(µS)
Stress MentalFatigue
PhysicalFatigue
Baseline-Rt1 67.8 51.3 1.7 75 0.82 3 5 2RT1-Rest1 75.8 52.6 2.0 81 0.88 3 5 N/ATsst-Rest2 92.8 56.3 3.0 75 0.93 5 5 N/ART2-Rest3 72.1 59.0 1.6 67 0.95 4 5 N/AFitness-Rest4 147.7 42.4 1.6 100 0.98 4 5 3
5.3.3 Conclusion
Even though this study included a low number of subjects, some conclusions can be taken. First
and foremost, the physiological values gathered during baseline were biased by the anxiety felt
by some of the participants. This values were supposed to be gathered during rest, without any
interferences, in order to be compared with the values obtained during the execution of the tasks.
Therefore, it seems this values should be gather some time after the tasks are finished so that the
values represent reliably the subjects data during absolute rest and with no anxiety.
The TSST and Fitness tasks seem to fulfill their roles as stress and physical fatigue inducers,
respectively, according to the subjects reports. However, TSST also induces some mental fatigue
which is also expected but undesirable.
Regarding the first RT task, no conclusions were drawn for the mental fatigue induced during
this time, due to several reasons. First, no rest data (baseline) existed to compare the physiolog-
ical values with. Second, no considerable mental fatigue was perceived by the subjects during
the realization of this task. The same can be said for the second RT task. Therefore, one of the
improvements to be made to this study is the inclusion of a task solely aimed at inducing con-
siderable levels of mental fatigue, and this task should be taken separately from any other stress
task to avoid any interference. However, several of the tests that exist in the literature to induce
considerable mental fatigue consume large amounts of time, lasting more than 70 minutes (e.g.
driving simulation [174] ), which was the duration of the entire protocol, and such a long study is
not pretended. Therefore, other approaches need to be discussed to tackle this problem.
Furthermore, no visible changes were seen in physiological behavior between the oldest sub-
ject (59) and the other subjects who were much younger (25,27 and 28 years old).
Finally, a much wider dataset needs to be acquired to draw reliable conclusions. However, this
study did help in understanding the protocol’s errors and misconceptions, enabling therefore its
improvement to, ultimately, achieve the established goals.

70 Developed Studies
Chapter 6
Conclusions and Future Work
This thesis provides insight to the physiological changes associated with stress and also tries to
approach mental fatigue in professionals in different environments through the use of different
protocols.
A deep review of the state-of-the-art in this area has been presented. This addresses different
vital points for the successful development of a study of Stress and Fatigue, such as the more
reliable monitoring parameters, tools and also how, recently, other authors have been successfully
approaching this problem.
As for the developed tools, these can improve the reliability of the studies performed, as well
as decrease the errors associated with the registering of events and its analysis. Nonetheless, there
is still room for several improvements that should be addressed as future work as well:
• Regarding the VJ E-Diary app, one possible improvement is the connection of the app to an
online, private database, where all the saved data is archived, so that information regarding
all the runs can be assessed. This would be shared with the VJ Assembly so that the report
could automatically be upload to the correct folder without any interference from the user.
• VJ Assembly is still a very primitive tool, in the way that it just reads already processed data
in order to present it to the user. Therefore, several improvements can be made in order to
turn it more reliable and time efficient. Integrating the QRS detector and the SenseMyHeart
service with the Matlab routine is one of the goals established for the near future. This will
require constant cooperation with the developer of the service so that some adjustments can
be made considering the Matlab R© platform. Ultimately, the user will only need to provide
the raw files generated by the hardware and VJ E-Diary, and VJ Assembly will perform all
the other steps required to arrive at the final results.
As for the developed studies, one main improvement to be made is the increase of the number
of monitored subjects so that reliable conclusion can be drawn. However, the data collected from
different professionals was still valuable and worth of interesting discussion.
71
72 Conclusions and Future Work
Regarding police officer’s monitoring, some stressful events were identified. Also, it seems
that this professionals are exposed to stress frequently enough to experience chronic stress. How-
ever, further studies need to be done to this same individuals to reliable diagnose such disorders.
Other parameters, besides HRV,should be used, since this professionals are in frequent motion
during their activities, which has influences in the autonomic balance. One of the possibilities is
to implement an EDA monitor to evaluate changes in glandular secretion.
The study of surgeons in an operating room is highly innovative and has provided relevant
conclusions. Stressful events were successfully identified and the relationships with cognitive
workload and mental fatigue were also interesting to discuss. The SURG-TLX shows to be a
very reliable tool to identify both Stress and Fatigue in surgical procedures. Furthermore, due to
the interesting results here presented, there is considerable interest from the surgeons to further
develop this study to an wider range of surgical procedures, therefore enabling the comparison of
induced stress and cognitive workload with each surgery. It is expected to intrude a protocol based
on the one here presented.
The developed experimental protocol for firefighters still needs to be improved. The biased
baseline data influences the analysis of the dataset greatly since there is no feasible data to compare
with. This disable an reliable study of how significant are the subjects’ changes both psycholog-
ically as physiologically when performing the different tasks. Furthermore, mental fatigue was
not addressed successfully in this experiment. However, stress was identified during the different
tasks, as was physical fatigue.
Overall, another interesting conclusion from this studies is that the LF/HF parameter, even
though it has been regarded as a good parameter for stress appraisal, should not be the only vari-
able used to draw conclusions in this area, as some studies in the literature have done. It is also
important to look to other parameters that translate symptoms associated with stress, (e.g. vari-
ation between heart beats and skin conductance). Also, it is shown that the change of the pNNx
threshold from 50 ms (pNN50) to 20 ms(pNN20) appears to be more adequate for identification
of acute stress.
It can be concluded that stressful events were successfully identified, in some cases, both phys-
iologically and psychologically, in the different studies. Furthermore, the development of tools to
better identify events with monitored physiological parameters has shown to be an improvement
to this type of studies and helped researchers have a more efficient analysis of the data. Mental
fatigue is still a topic of discussing in the area, and the methods for its physiological monitoring
still need to be improved. However, the SURG-TLX questionnaire seems to be an reliable tool to
identify it during surgical procedures.
Concluding, the present work has enable the improvement of different studies in Stress and
Fatigue monitoring which may be of enormous importance for the design of effective interventions
in order to reduce stress and fatigue levels in different professionals.
Bibliography
[1] M. Cosmar, R. Gründler, D. Flemming, B. Cosemans, and K. V. den Broek, “Calculatingthe cost of work-related stress and psychosocial risks - A Literature Review,” EuropeanRisk Observatory, Tech. Rep., 2014.
[2] European Agency for Safety and Health, “Work-related stress – EU-OSHA campaign calls on employers and workers to tackle it to-gether.” [Online]. Available: https://osha.europa.eu/en/press/press-releases/work-related-stress-eu-osha-campaign-calls-on-employers-and-workers-to-tackle-it-together[Accessed: 2014-10-06]
[3] E. A. for Safety and Health, “European Opinion Poll on Occupational Safety and Health,”Tech. Rep. May, 2013.
[4] G. E. Hardy, D. a. Shapiro, and C. S. Borrill, “Fatigue in the workforce of national healthservice trusts: levels of symptomatology and links with minor psychiatric disorder, demo-graphic, occupational and work role factors,” Journal of psychosomatic research, vol. 43,no. 1, pp. 83–92, Jul. 1997.
[5] U. Bültmann, I. Kant, S. V. Kasl, A. J. H. M. Beurskens, and P. a. van den Brandt, “Fa-tigue and psychological distress in the working population: psychometrics, prevalence, andcorrelates,” Journal of psychosomatic research, vol. 52, no. 6, pp. 445–52, Jun. 2002.
[6] J. A. Ricci, E. Chee, A. L. Lorandeau, and J. Berger, “Fatigue in the us workforce: preva-lence and implications for lost productive work time,” Journal of Occupational and Envi-ronmental Medicine, vol. 49, no. 1, pp. 1–10, 2007.
[7] C. Sugden, T. Athanasiou, and A. Darzi, “What are the effects of sleep deprivation andfatigue in surgical practice?” Seminars in thoracic and cardiovascular surgery, vol. 24,no. 3, pp. 166–75, Jan. 2012.
[8] C. M. Wetzel, R. L. Kneebone, M. Woloshynowych, D. Nestel, K. Moorthy, J. Kidd, andA. Darzi, “The effects of stress on surgical performance.” American journal of surgery, vol.191, no. 1, pp. 5–10, Jan. 2006.
[9] H. Selye, “The physiology and pathology of exposure to stress,” 1950.
[10] J. M. Koolhaas, A. Bartolomucci, B. Buwalda, S. F. de Boer, G. Flügge, S. M. Korte,P. Meerlo, R. Murison, B. Olivier, P. Palanza, G. Richter-Levin, A. Sgoifo, T. Steimer,O. Stiedl, G. van Dijk, M. Wöhr, and E. Fuchs, “Stress revisited: a critical evaluation ofthe stress concept,” Neuroscience and biobehavioral reviews, vol. 35, no. 5, pp. 1291–301,Apr. 2011.
73
74 BIBLIOGRAPHY
[11] O. Gregson and T. Looker, “The biological basis of stress management,” British Journal ofGuidance and Counselling, no. February 2013, pp. 37–41, 1994.
[12] J. D. Allen, “Human Physiology - the Basis of Medicine,” in The Ulster medical journal,2008, vol. 77, ch. Ch. 17: Th, p. 216.
[13] L. K. McCorry, “Physiology of the autonomic nervous system,” American Journal of Phar-maceutical Education, vol. 71, 2007.
[14] J. Furness, “The enteric nervous system: normal functions and enteric neuropathies,” Neu-rogastroenterology & Motility, vol. 20, no. January, pp. 32–38, 2008.
[15] A. S. Jansen, X. V. Nguyen, V. Karpitskiy, T. C. Mettenleiter, and A. D. Loewy, “Centralcommand neurons of the sympathetic nervous system: basis of the fight-or-flight response,”Science (New York, N.Y.), vol. 270, pp. 644–646, 1995.
[16] H. Selye, “A syndrome produced by diverse nocuous agents,” The Journal of neuropsychi-atry and clinical neurosciences, vol. 10, pp. 230–231, 1998.
[17] ——, “The general adaptation syndrome and the diseases of adaptation,” The Journal ofClinical Endocrinology & Metabolism, vol. 6, no. 2, pp. 117–230, 1946.
[18] “General adaptation syndrome.” [Online]. Available: http://www.stress-management-for-peak-performance.com/general-adaptation-syndrome.html [Ac-cessed: 2014-10-09]
[19] M. Malik, J. Bigger, and A. Camm, “Heart rate variability standards of measurement, phys-iological interpretation, and clinical use,” European Heart Journal, pp. 354–381, 1996.
[20] G. Pocock, C. D. Richards, and D. A. Richards, Human physiology. Oxford universitypress, 2013.
[21] G. S. Anderson, R. Litzenberger, and D. Plecas, “Physical evidence of police officer stress,”Policing: an international journal of police strategies & management, vol. 25, no. 2, pp.399–420, 2002.
[22] S. Folkman, Stress, appraisal, and coping. Springer Publishing Company LLC, 1984.
[23] M. R. Rosenzweig, A. L. Leiman, and S. M. Breedlove, Biological psychology. SinauerAssociates, 1996.
[24] H. Selye, “Stress without Distress,” Psychopathology of Human Adaptation, pp. pp 137–146, 1976.
[25] T. C. Russ, E. Stamatakis, M. Hamer, J. M. Starr, M. Kivimäki, and G. D. Batty, “Associ-ation between psychological distress and mortality: individual participant pooled analysisof 10 prospective cohort studies,” British Medical Journal (Clinical research ed.), vol. 345,no. July, p. e4933, Jan. 2012.
[26] L. Holden, P. a. Scuffham, M. F. Hilton, R. S. Ware, N. Vecchio, and H. a. Whiteford,“Health-related productivity losses increase when the health condition is co-morbid withpsychological distress: findings from a large cross-sectional sample of working australians,”BMC public health, vol. 11, no. 1, p. 417, Jan. 2011.

BIBLIOGRAPHY 75
[27] S. D. Holmes, D. S. Krantz, H. Rogers, J. Gottdiener, and R. J. Contrada, “Mental stress andcoronary artery disease: a multidisciplinary guide,” Progress in cardiovascular diseases,vol. 49, no. 2, pp. 106–22, 2006.
[28] M. Joëls, “Stress, the hippocampus, and epilepsy,” Epilepsia, vol. 50, no. 4, pp. 586–597,2009.
[29] J. Herbert, “Stress, the brain, and mental illness,” British Medical Journal, vol. 315, pp. 530–535, 1997.
[30] T. G. Pickering, “Mental stress as a causal factor in the development of hypertension andcardiovascular disease,” Current Hypertension Reports, vol. 3, no. 3, pp. 249–254, Jun.2001.
[31] D. C. Mohr, “Stress and multiple sclerosis,” Journal of Neurology, vol. 254, no. 2, pp.II65–II68, 2007.
[32] A. J. Zautra, B. P. Parrish, C. M. Van Puymbroeck, H. Tennen, M. C. Davis, J. W. Reich,and M. Irwin, “Depression history, stress, and pain in rheumatoid arthritis patients,” Journalof Behavioral Medicine, vol. 30, pp. 187–197, 2007.
[33] K. Yuii, M. Suzuki, and M. Kurachi, “Stress sensitization in schizophrenia,” in Annals ofthe New York Academy of Sciences, vol. 1113, 2007, pp. 276–290.
[34] B. Van Houdenhove, U. Egle, and P. Luyten, “The role of life stress in fibromyalgia,” Cur-rent rheumatology reports, vol. 7, pp. 365–370, 2005.
[35] “Fatigue.” [Online]. Available: http://www.nlm.nih.gov/medlineplus/ency/article/003088.htm [Accessed: 2014-10-22]
[36] M. J. Stokes, R. G. Copper, and R. H. Edwards, “Normal muscle strength and fatigabilityin patients with effort syndromes,” British Medical Journal, vol. 297, pp. 1014–1017.
[37] S. Torres-Harding and L. A. Jason, “What is fatigue? history and epidemiology,” Fatigueas a window to the brain, vol. 1, pp. 3–17, 2005.
[38] M. A. Boksem and M. Tops, “Mental fatigue: costs and benefits,” Brain research reviews,vol. 59, no. 1, pp. 125–39, Nov. 2008.
[39] M. M. Lorist, M. A. Boksem, and K. R. Ridderinkhof, “Impaired cognitive control andreduced cingulate activity during mental fatigue,” Cognitive Brain Research, vol. 24, no. 2,pp. 199–205, 2005.
[40] D. van der Linden and P. Eling, “Mental fatigue disturbs local processing more than globalprocessing,” Psychological research, vol. 70, no. 5, pp. 395–402, Sep. 2006.
[41] J. Casillas, S. Damak, J. Chauvet-Gelinier, G. Deley, and P. Ornetti, “Fatigue inpatients withcardiovascular disease,” Ann Readapt Med Phys., vol. 49, no. 6, pp. 392–402, Jul. 2006.
[42] A. Chaudhuri and P. O. Behan, “Fatigue in neurological disorders,” The Lancet, vol. 363,no. 9413, pp. 978–988, 2004.
[43] “Tiredness and cardiomyopathy.” [Online]. Available: http://www.cardiomyopathy.org/Tiredness-and-cardiomyopathy.html [Accessed: 2014-12-02]

76 BIBLIOGRAPHY
[44] R. Bakshi, “Fatigue associated with multiple sclerosis: diagnosis, impact and management,”Multiple Sclerosis, vol. 9, no. 3, pp. 219–227, 2003.
[45] J. Barroso and J. G. Voss, “Fatigue in HIV and AIDS: An Analysis of Evidence,” Journalof the Association of Nurses in AIDS Care, vol. 24, 2013.
[46] J. M. Testani, D. M. Kolansky, H. Litt, and E. P. Gerstenfeld, “Focal myocarditis mimick-ing acute st-elevation myocardial infarction: diagnosis using cardiac magnetic resonanceimaging,” Texas Heart Institute Journal, vol. 33, no. 2, p. 256, 2006.
[47] H. A. Droogleever Fortuyn, R. Fronczek, M. Smitshoek, S. Overeem, M. Lappenschaar,J. Kalkman, W. Renier, J. Buitelaar, G. J. Lammers, and G. Bleijenberg, “Severe fatigue innarcolepsy with cataplexy,” Journal of Sleep Research, vol. 21, pp. 163–169, 2012.
[48] D. L. Depietropaolo, J. H. Powers, J. M. Gill, and A. J. Foy, “Diagnosis of lyme disease,”American family physician, vol. 72, no. 2, pp. 297–304, 2005.
[49] L. P. Kimble, S. B. Dunbar, W. S. Weintraub, D. B. Mcguire, S. F. Manzo, and O. L. Strick-land, “Symptom clusters and health-related quality of life in people with chronic stableangina,” Journal of Advanced Nursing, vol. 67, pp. 1000–1011, 2011.
[50] G. Fabbrini, A. Latorre, A. Suppa, M. Bloise, M. Frontoni, and A. Berardelli, “Fatigue inparkinson’s disease: Motor or non-motor symptom?” Parkinsonism & related disorders,vol. 19, no. 2, pp. 148–152, 2013.
[51] L. Balducci, “Anemia, fatigue and aging,” Transfusion clinique et biologique, vol. 17, no. 5,pp. 375–381, 2010.
[52] A. Bunevicius, V. Gintauskiene, A. Podlipskyte, R. Zaliunas, J. Brozaitiene, A. J. Prange,and R. Bunevicius, “Fatigue in patients with coronary artery disease: association with thy-roid axis hormones and cortisol,” Psychosomatic medicine, vol. 74, pp. 848–53, 2012.
[53] D. A. Trojan, S. Narayanan, S. J. Francis, Z. Caramanos, A. Robinson, M. Cardoso, andD. L. Arnold, “Brain volume and fatigue in patients with postpoliomyelitis syndrome,”PM&R, vol. 6, no. 3, pp. 215–220, 2014.
[54] L. A. Daniëls, S. Oerlemans, A. D. Krol, L. V. van de Poll-Franse, and C. L. Creutzberg,“Persisting fatigue in hodgkin lymphoma survivors: a systematic review,” Annals of hema-tology, vol. 92, no. 8, pp. 1023–1032, 2013.
[55] K. Mizuno, M. Tanaka, K. Yamaguti, O. Kajimoto, H. Kuratsune, and Y. Watanabe, “Men-tal fatigue caused by prolonged cognitive load associated with sympathetic hyperactivity,”Behavioral and brain functions : BBF, vol. 7, p. 17, 2011.
[56] “Target heart rates.” [Online]. Available: http://www.heart.org/HEARTORG/GettingHealthy/PhysicalActivity/FitnessBasics/Target-Heart-Rates_UCM_434341_Article.jsp [Accessed: 2014-10-18]
[57] “Electrical system of the heart.” [Online]. Available: http://www.webmd.com/heart/conduction-system-of-the-heart [Accessed: 2014-10-13]
[58] “Sympathetic and parasympathetic innervation of the heart.” [Online]. Available:http://nuclearcardiologyseminars.com/electrophysiology/autonomic/ [Accessed: 2014-12-17]
BIBLIOGRAPHY 77
[59] M. B. Conover, Understanding electrocardiography. Elsevier Health Sciences, 2003.
[60] P. Kligfield, L. S. Gettes, J. J. Bailey, R. Childers, B. J. Deal, E. W. Hancock, G. van Her-pen, J. A. Kors, P. Macfarlane, D. M. Mirvis et al., “Recommendations for the standard-ization and interpretation of the electrocardiogram: part i: the electrocardiogram and itstechnology a scientific statement from the american heart association electrocardiographyand arrhythmias committee, council on clinical cardiology; the american college of cardi-ology foundation; and the heart rhythm society endorsed by the international society forcomputerized electrocardiology,” Journal of the American College of Cardiology, vol. 49,no. 10, pp. 1109–1127, 2007.
[61] P. G. Morton, D. K. Fontaine, C. Hudak, and B. Gallo, Critical care nursing: a holisticapproach. Lippincott Williams & Wilkins Philadelphia, 2005, vol. 1.
[62] “Limb leads.” [Online]. Available: http://what-when-how.com/paramedic-care/diagnostic-ecgthe-12-lead-clinical-essentials-paramedic-care-part-1/ [Accessed: 2015-07-30]
[63] J. W. Hurst, “Naming of the Waves in the ECG, With a Brief Account of Their Genesis,”Circulation, vol. 98, no. 18, pp. 1937–1942, Nov. 1998.
[64] F. Sun, C. Kuo, and H. Cheng, “Activity-aware mental stress detection using physiologicalsensors,” in Mobile Computing, Applications, and Services. Springer Berlin Heidelberg,2012, pp. 211–230.
[65] P. Albrecht and R. Cohen, “Estimation of heart rate power spectrum bands from real-worlddata: dealing with ectopic beats and noisy data,” Proceedings. Computers in Cardiology,1988.
[66] P. Castiglioni and M. D. Rienzo, “On the evaluation of heart rate spectra: the Lomb peri-odogram,” Computers in Cardiology, 1996.
[67] A. Boardman, F. S. Schlindwein, A. P. Rocha, and A. Leite, “A study on the optimum orderof autoregressive models for heart rate variability,” Physiological Measurement, vol. 23,no. 2, pp. 325–336, May 2002.
[68] M. B. Cannell, H. Cheng, and W. J. Lederer, “Spatial non-uniformities in [ca2+]i duringexcitation-contraction coupling in cardiac myocytes,” Biophysical journal, no. 5, pp. 1942–56, Nov. 1994.
[69] A. N. G. Braga, M. D. S. Lemos, J. R. Da Silva, W. R. P. Fontes, and R. A. S. Dos San-tos, “Effects of angiotensins on day-night fluctuations and stress-induced changes in bloodpressure,” American Journal of Physiology-Regulatory, Integrative and Comparative Phys-iology, vol. 282, no. 6, pp. R1663–R1671, 2002.
[70] K. Aoki, D. P. Stephens, and J. M. Johnson, “Diurnal variation in cutaneous vasodilator andvasoconstrictor systems during heat stress,” American Journal of Physiology-Regulatory,Integrative and Comparative Physiology, vol. 281, no. 2, pp. R591–R595, 2001.
[71] S. C. Malpas, “Neural influences on cardiovascular variability: possibilities and pitfalls,”American Journal of Physiology-Heart and . . . , no. 17, pp. 6–20, 2002.

78 BIBLIOGRAPHY
[72] S. Akselrod, D. Gordon, F. A. Ubel, D. C. Shannon, A. Berger, and R. J. Cohen, “Powerspectrum analysis of heart rate fluctuation: a quantitative probe of beat-to-beat cardiovas-cular control,” science, vol. 213, no. 4504, pp. 220–222, 1981.
[73] H. R. Warner and A. Cox, “A mathematical model of heart rate control by sympathetic andvagus efferent information,” Journal of Applied Physiology, vol. 17, no. 2, pp. 349–355,1962.
[74] R. Barbieri, J. K. Triedman, and J. P. Saul, “Heart rate control and mechanical car-diopulmonary coupling to assess central volume: a systems analysis,” American Journalof Physiology-Regulatory, Integrative and Comparative Physiology, vol. 283, no. 5, pp.R1210–R1220, 2002.
[75] A. Malliani, M. Pagani, F. Lombardi, and S. Cerutti, “Cardiovascular neural regulationexplored in the frequency domain,” Circulation, vol. 84, no. 2, pp. 482–492, Aug. 1991.
[76] M. Pagani, F. Lombardi, S. Guzzetti, O. Rimoldi, R. Furlan, P. Pizzinelli, G. Sandrone,G. Malfatto, S. Dell’Orto, and E. Piccaluga, “Power spectral analysis of heart rate and arte-rial pressure variabilities as a marker of sympatho-vagal interaction in man and consciousdog,” Circulation Research, vol. 59, no. 2, pp. 178–193, Aug. 1986.
[77] P. Stein and A. Reddy, “Non-linear heart rate variability and risk stratification in cardio-vascular disease,” Indian pacing and electrophysiology journal, vol. 5, no. 3, pp. 210–220,2005.
[78] H. Tanaka, K. D. Monahan, and D. R. Seals, “Age-predicted maximal heart rate revisited,”Journal of the American College of Cardiology, vol. 37, no. 1, pp. 153–156, Jan. 2001.
[79] L. Bernardi, F. Valle, M. Coco, a. Calciati, and P. Sleight, “Physical activity influencesheart rate variability and very-low-frequency components in holter electrocardiograms,”Cardiovascular research, vol. 32, no. 2, pp. 234–7, Aug. 1996.
[80] N. Michael, M. Johns, C. Owen, and J. Patterson, “Effects of caffeine on alertness as mea-sured by infrared reflectance oculography.” Psychopharmacology, vol. 200, no. 2, pp. 255–60, Oct. 2008.
[81] Y. Tran and N. Wijesuriya, “The relationship between spectral changes in heart rate vari-ability and fatigue,” Journal of Psychophysiology, vol. 23, no. 3, pp. 143–151, Jan. 2009.
[82] K. Kahol, M. J. Leyba, M. Deka, V. Deka, S. Mayes, M. Smith, J. J. Ferrara, and S. Pan-chanathan, “Effect of fatigue on psychomotor and cognitive skills.” American journal ofsurgery, vol. 195, no. 2, pp. 195–204, Feb. 2008.
[83] A. L. Goldberger, L. A. Amaral, L. Glass, J. M. Hausdorff, P. C. Ivanov, R. G. Mark,J. E. Mietus, G. B. Moody, C.-K. Peng, and H. E. Stanley, “Physiobank, physiotoolkit,and physionet components of a new research resource for complex physiologic signals,”Circulation, vol. 101, no. 23, pp. e215–e220, 2000.
[84] P. M. Pinto Silva and J. P. Silva Cunha, “Sensemyheart: A cloud service and api for wear-able heart monitors,” Engineering in Medicine and Biology Society (EMBC), 2015 AnnualInternational Conference of the IEEE, 2015.
BIBLIOGRAPHY 79
[85] “Blood pressure vs heart rate.” [Online]. Available: http://www.heart.org/HEARTORG/Conditions/HighBloodPressure/AboutHighBloodPressure/Blood-Pressure-vs-Heart-Rate_UCM_301804_Article.jsp. [Accessed: 2014-10-31]
[86] D. Ribeiro, M. F. Colunas, F. A. F. Marques, J. M. Fernandes, and J. P. S. Cunha, “A realtime, wearable ecg and continous blood pressure monitoring system for first responders,”in Engineering in Medicine and Biology Society, EMBC, 2011 Annual International Con-ference of the IEEE, 2011, pp. 6894–6898.
[87] S. Anumas and S.-c. Kim, “Driver fatigue monitoring system using video face images &physiological information,” in Biomedical Engineering International Conference (BME-iCON), 2011, 2011, pp. 125–130.
[88] C. W. Darrow, “The Rationale for treating the change in Galvanic Skin Response as achange in Conductance,” Psychophysiology, vol. 1, pp. 31–38, 1964.
[89] Y. Shi, T. Park, N. Ruiz, R. Taib, E. H. C. Choi, and F. Chen, “Galvanic Skin Response (GSR ) as an Index of Cognitive Load,” CHI EA ’07 CHI ’07 Extended Abstracts on HumanFactors in Computing Systems, pp. 2651–2656, 2007.
[90] J. Healey and R. Picard, “Smartcar: detecting driver stress,” in Proceedings of the 15thInternational Conference on Pattern Recognition, vol. 4. IEEE, 2000, pp. 218–221.
[91] P. Karthikeyan, M. Murugappan, and S. Yaacob, “Descriptive Analysis of Skin TemperatureVariability of Sympathetic Nervous System Activity in Stress,” Journal of Physical TherapyScience, vol. 24, no. 12, pp. 1341–1344, 2012.
[92] C. H. Vinkers, R. Penning, J. Hellhammer, J. C. Verster, J. H. G. M. Klaessens, B. Olivier,and C. J. Kalkman, “The effect of stress on core and peripheral body temperature in hu-mans,” Stress (Amsterdam, Netherlands), vol. 16, pp. 520–30, 2013.
[93] L. R. Stroud, P. Salovey, and E. S. Epel, “Sex differences in stress responses: social rejectionversus achievement stress,” Biological Psychiatry, vol. 52, no. 4, pp. 318–327, Aug. 2002.
[94] S. Arora, T. Tierney, N. Sevdalis, R. Aggarwal, D. Nestel, M. Woloshynowych, A. Darzi,and R. Kneebone, “The imperial stress assessment tool (isat): a feasible, reliable and validapproach to measuring stress in the operating room,” World journal of surgery, vol. 34,no. 8, pp. 1756–63, Aug. 2010.
[95] M. Pomplun, S. Sunkara, A. V. Fairley, and M. Xiao, “Using pupil size as a measure ofcognitive workload in video-based eye-tracking studies.”
[96] R. a. McKinley, L. K. McIntire, R. Schmidt, D. W. Repperger, and J. a. Caldwell, “Evalua-tion of Eye Metrics as a Detector of Fatigue,” Human Factors: The Journal of the HumanFactors and Ergonomics Society, vol. 53, no. 4, pp. 403–414, Jul. 2011.
[97] J. A. Stern, D. Boyer, and D. Schroeder, “Blink rate: a possible measure of fatigue.” Humanfactors, vol. 36, pp. 285–297, 1994.
[98] M. Haak, S. Bos, S. Panic, and L. J. M. Rothkrantz, “Detecting Stress Using Eye BlinksAnd Brain Activity From EEG Signals,” Game-On 2009, vol. 10th Inter, pp. 75–82, 2009.
[99] H. Häkkänen, H. Summala, M. Partinen, M. Tiihonen, and J. Silvo, “Blink duration as anindicator of driver sleepiness in professional bus drivers.” Sleep, vol. 22, pp. 798–802, 1999.

80 BIBLIOGRAPHY
[100] D. Schmidt, L. A. Abel, L. F. Dell’Osso, and R. B. Daroff, “Saccadic velocity characteris-tics: Intrinsic variability and fatigue,” Aviation Space and Environmental Medicine, vol. 50,pp. 393–395, 1979.
[101] A. Tsuchida, M. S. Bhuiyan, and K. Oguri, “Estimation of drowsiness level based on eyelidclosure and heart rate variability,” in Proceedings of the 31st Annual International Confer-ence of the IEEE Engineering in Medicine and Biology Society, EMBC, 2009, pp. 2543–2546.
[102] E. Niedermeyer and F. H. L. D. Silva, Electroencephalography: Basic Principles, ClinicalApplications, and Related Fields, 2004, vol. 1.
[103] M. Teplan, “Fundamentals of EEG measurement,” Measurement Science Review, vol. 2, pp.1–11, 2002.
[104] K. S. Park, H. Choi, K. J. Lee, J. Y. Lee, K. O. An, and E. J. Kim, “Emotion recognitionbased on the asymmetric left and right activation,” International Journal of Medicine andMedical Sciences, vol. 3, pp. 201–209, 2011.
[105] A. J. Niemiec and B. J. Lithgow, “Alpha-band characteristics in eeg spectrum indicate relia-bility of frontal brain asymmetry measures in diagnosis of depression.” in 7th Annual Inter-national Conference of the Engineering in Medicine and Biology Society, EMBS. IEEE,2005, pp. 7517–7520.
[106] N. Sulaiman, N. H. A. Hamid, Z. H. Murat, and M. N. Taib, “Initial investigation of humanphysical stress level using brainwaves,” pp. 16–18, 2009.
[107] D. G. Duru, A. Deniz Duru, D. E. Barkana, O. Sanli, and M. Ozkan, “Assessment of sur-geon’s stress level and alertness using eeg during laparoscopic simple nephrectomy,” in2013 6th International IEEE/EMBS Conference on Neural Engineering (NER). IEEE,2013, pp. 452–455.
[108] A. Kirke and E. R. Miranda, “Combining EEG Frontal Asymmetry Studies with AffectiveAlgorithmic Composition and Expressive Performance Models,” in Proceedings of 37thInternational Computer Music Conference (ICMC), 2011, pp. 1–4.
[109] N. Hamid, N. Sulaiman, S. A. M. Aris, Z. H. Murat, and M. N. Taib, “Evaluation of humanstress using eeg power spectrum,” in 6th International Colloquium on Signal Processingand Its Applications (CSPA). IEEE, 2010, pp. 1–4.
[110] L. B. Krupp, N. G. LaRocca, J. Muir-Nash, and A. D. Steinberg, “The fatigue severity scale:Application to patients with multiple sclerosis and systemic lupus erythematosus,” Archivesof neurology, vol. 46, pp. 1121–1123, 1989.
[111] J. E. Schwartz, L. Jandorf, and L. B. Krupp, “The measurement of fatigue: A new instru-ment,” Journal of Psychosomatic Research, vol. 37, pp. 753–762, 1993.
[112] J. D. Fisk, P. G. Ritvo, L. Ross, D. a. Haase, T. J. Marrie, and W. F. Schlech, “Measuringthe functional impact of fatigue: initial validation of the fatigue impact scale,” ClinicalInfectious Diseases, vol. 18 Suppl 1, pp. S79–83, 1994.
[113] C. M. Shapiro, M. Flanigan, J. A. E. Fleming, R. Morehouse, A. Moscovitch, J. Plamondon,L. Reinish, and G. M. Devins, “Development of an adjective checklist to measure five
BIBLIOGRAPHY 81
FACES of fatigue and sleepiness: Data from a national survey of insomniacs,” Journal ofPsychosomatic Research, vol. 52, pp. 467–473, 2002.
[114] C. Maxwell, “Sensitivity and accuracy of the visual analogue scale: a psycho-physicalclassroom experiment,” British journal of clinical pharmacology, vol. 6, pp. 15–24, 1978.
[115] Y. Y. Yurko, M. W. Scerbo, A. S. Prabhu, C. E. Acker, and D. Stefanidis, “Higher mentalworkload is associated with poorer laparoscopic performance as measured by the nasa-tlxtool,” Simulation in healthcare : journal of the Society for Simulation in Healthcare, vol. 5,no. 5, pp. 267–71, Oct. 2010.
[116] “Worldwide wearables market forecast.” [Online]. Available: http://www.idc.com/getdoc.jsp?containerId=prUS25696715 [Accessed: 2015-08-01]
[117] “Galaxy s6.” [Online]. Available: http://www.samsung.com/us/explore/galaxy-s-6-features-and-specs/ [Accessed: 2015-08-01]
[118] W. Johnston and Y. Mendelson, “Extracting heart rate variability from a wearable re-flectance pulse oximeter,” Proceedings of the IEEE 31st Annual Northeast BioengineeringConference, 2005., 2005.
[119] “Samsung gear.” [Online]. Available: http://www.samsung.com/global/microsite/gear/gear2_specs.html [Accessed: 2015-08-01]
[120] “Fitbit surge.” [Online]. Available: https://www.fitbit.com/surge#features [Accessed:2015-08-01]
[121] “Basis peak.” [Online]. Available: https://store.mybasis.com/ [Accessed: 2015-08-01]
[122] J. Cunha, B. Cunha, A. S. Pereira, X. William, N. Ferreira, and L. Meireles, “Vital-Jacket R©:A wearable wireless vital signs monitor for patients’ mobility in cardiology and sports,”Proceedings of the 4th International ICST Conference on Pervasive Computing Technolo-gies for Healthcare, pp. 1–2, 2010.
[123] “Vital jacket.” [Online]. Available: http://www.vitaljacket.com/?page_id=156 [Accessed:2014-10-31]
[124] “Omsignal.” [Online]. Available: http://www.omsignal.com/pages/lifestyle [Accessed:2014-10-31]
[125] “Hexoskin.” [Online]. Available: http://www.hexoskin.com/ [Accessed: 2014-11-04]
[126] “Astroskin: Canada’s smart shirt for space - canadian space agency.” [Online]. Available:http://www.asc-csa.gc.ca/eng/sciences/astroskin.asp [Accessed: 2014-11-04]
[127] “Healthwatch.” [Online]. Available: http://www.personal-healthwatch.com/products.aspx[Accessed: 2014-11-03]
[128] “Nuubo.” [Online]. Available: http://www.nuubo.com/?q=en/node/153 [Accessed: 2014-11-03]
[129] C. Olmos, E. Franco, A. Suárez-Barrientos, E. Fortuny, A. Martín-García, D. Viliani,C. Macaya, and L. Pérez de Isla, “Wearable wireless remote monitoring system: an alter-native for prolonged electrocardiographic monitoring.” International journal of cardiology,vol. 172, no. 1, pp. e43–4, Mar. 2014.
82 BIBLIOGRAPHY
[130] “emotion ecg.” [Online]. Available: http://www.megaemg.com/products/emotion-ecg/[Accessed: 2014-11-03]
[131] “Smartheart pro.” [Online]. Available: https://www.smartheartpro.com/about/ [Accessed:2014-11-04]
[132] “Healthpatch.” [Online]. Available: http://www.vitalconnect.com/healthpatch [Accessed:2014-11-04]
[133] S. Ftouni, T. L. Sletten, M. Howard, C. Anderson, M. G. Lenné, S. W. Lockley, and S. M. W.Rajaratnam, “Objective and subjective measures of sleepiness, and their associations withon-road driving events in shift workers.” Journal of sleep research, vol. 22, no. 1, pp. 58–69,Feb. 2013.
[134] C. Anderson, C. A, R. JM, and Czeisler CA, “Real-time Drowsiness as Determined byInfra-reflectance Oculography is Commensurate with Gold Standard Laboratory Measures:A Validation Study,” in SLEEP 2010, 24th Annual Meeting of the Associated ProfessionalSleep Societies, San Antonio, Texas, United States., 2010.
[135] “Smartcap.” [Online]. Available: http://smartcap.com.au/smartcap-overview/ [Accessed:2014-11-06]
[136] M. J. Hickman, J. Fricas, K. J. Strom, and M. W. Pope, “Mapping Police Stress,” PoliceQuarterly, vol. 14, no. 3, pp. 227–250, Jul. 2011.
[137] E. Jovanov, K. Frith, F. Anderson, M. Milosevic, and M. T. Shrove, “Real-time monitoringof occupational stress of nurses.” Engineering in Medicine and Biology Society (EMBC),2011 Annual International Conference of the IEEE., vol. 2011, pp. 3640–3, Jan. 2011.
[138] M. Milosevic, E. Jovanov, and K. H. Frith, “Research methodology for real-time stressassessment of nurses,” Computers Informatics Nursing, vol. 31, no. 12, pp. 615–621, 2013.
[139] S. Arora, N. Sevdalis, D. Nestel, T. Tierney, M. Woloshynowych, and R. Kneebone, “Man-aging intraoperative stress: what do surgeons want from a crisis training program?” Amer-ican journal of surgery, vol. 197, no. 4, pp. 537–43, Apr. 2009.
[140] S. Arora, N. Sevdalis, D. Nestel, M. Woloshynowych, A. Darzi, and R. Kneebone, “Theimpact of stress on surgical performance: a systematic review of the literature,” Surgery,vol. 147, no. 3, pp. 318–30, 330.e1–6, Mar. 2010.
[141] L. Sturm, D. Dawson, R. Vaughan, P. Hewett, A. G. Hill, J. C. Graham, and G. J. Maddern,“Effects of fatigue on surgeon performance and surgical outcomes: a systematic review,”ANZ Journal of Surgery, vol. 81, no. 7-8, pp. 502–509, Jul. 2011.
[142] M. R. Wilson, J. M. Poolton, N. Malhotra, K. Ngo, E. Bright, and R. S. W. Masters, “Devel-opment and validation of a surgical workload measure: the surgery task load index (SURG-TLX).” World journal of surgery, vol. 35, no. 9, pp. 1961–9, Sep. 2011.
[143] S. Hallbeck, B. Lowndes, and J. Bingener, “Laparoscopic Surgical Team Stress MeasuresDuring Randomized Controlled Trials of 4-port vs. Single Incision Cholecystecomies: APilot Study,” Proceedings of the Human Factors and Ergonomics Society Annual Meeting,vol. 57, no. 1, pp. 654–657, Sep. 2013.
BIBLIOGRAPHY 83
[144] T. M. Marteau and H. Bekker, “The development of a six-item short-form of the state scaleof the Spielberger State-Trait Anxiety Inventory (STAI),” British Journal of Clinical Psy-chology, vol. 31, no. 3, pp. 301–306, Sep. 1992.
[145] S. Arora, N. Sevdalis, R. Aggarwal, P. Sirimanna, A. Darzi, and R. Kneebone, “Stressimpairs psychomotor performance in novice laparoscopic surgeons.” Surgical endoscopy,vol. 24, no. 10, pp. 2588–93, Oct. 2010.
[146] S. Arora, R. Aggarwal, A. Moran, P. Sirimanna, P. Crochet, A. Darzi, R. Kneebone, andN. Sevdalis, “Mental practice: effective stress management training for novice surgeons.”Journal of the American College of Surgeons, vol. 212, no. 2, pp. 225–33, Feb. 2011.
[147] M.-H. Song, Y. Tokuda, T. Nakayama, M. Sato, and K. Hattori, “Intraoperative heart ratevariability of a cardiac surgeon himself in coronary artery bypass grafting surgery.” Inter-active cardiovascular and thoracic surgery, vol. 8, no. 6, pp. 639–41, Jun. 2009.
[148] “2013 us firefighter fatalities statistics and reports.” [Online]. Available: http://www.usfa.fema.gov/downloads/pdf/publications/ff_fat13.pdf [Accessed: 2015-08-11]
[149] J. Pallauf, P. Gomes, S. Brás, J. P. S. Cunha, and M. Coimbra, “Associating ECG featureswith firefighter’s activities.” Engineering in Medicine and Biology Society (EMBC), 2011Annual International Conference of the IEEE, vol. 2011, pp. 6009–12, Jan. 2011.
[150] P. Gomes, M. Kaiseler, C. Queirós, M. Oliveira, B. Lopes, and M. Coimbra, “Vital anal-ysis: annotating sensed physiological signals with the stress levels of first responders inaction.” Engineering in Medicine and Biology Society (EMBC), 2012 Annual InternationalConference of the IEEE, vol. 2012, pp. 6695–8, Jan. 2012.
[151] S. Bras, J. M. Fernandes, and J. P. Cunha, “Ecg delineation and morphological analysis forfirefighters tasks differentiation,” in Proceedings of the 26th IEEE International Symposiumon Computer-Based Medical Systems.
[152] B. P. Nayak, S. Kar, A. Routray, and A. K. Padhi, “A biomedical approach to retrieveinformation on driver’s fatigue by integrating EEG, ECG and blood biomarkers during sim-ulated driving session,” 2012 4th International Conference on Intelligent Human ComputerInteraction (IHCI), pp. 1–6, Dec. 2012.
[153] G. Borghini, G. Vecchiato, J. Toppi, L. Astolfi, A. Maglione, R. Isabella, C. Caltagirone,W. Kong, D. Wei, Z. Zhou et al., “Assessment of mental fatigue during car driving by usinghigh resolution eeg activity and neurophysiologic indices,” in Engineering in Medicine andBiology Society (EMBC), 2012 Annual International Conference of the IEEE. IEEE, 2012,pp. 6442–6445.
[154] J. G. P. Rodrigues, F. Vieira, T. T. V. Vinhoza, J. Barros, and J. P. S. Cunha, “A non-intrusive multi-sensor system for characterizing driver behavior,” 13th International IEEEConference on Intelligent Transportation Systems, pp. 1620–1624, Sep. 2010.
[155] “Epic automotive - plessey semiconductors.” [Online]. Available: http://www.plesseysemiconductors.com/epic-automotive-plessey-semiconductors.php [Ac-cessed: 2014-11-10]
[156] F. Calabrese, M. Colonna, P. Lovisolo, D. Parata, and C. Ratti, “Real-Time Urban Monitor-ing Using Cell Phones: A Case Study in Rome,” IEEE Transactions on Intelligent Trans-portation Systems, vol. 12, no. 1, pp. 141–151, Mar. 2011.

84 BIBLIOGRAPHY
[157] “Future cities.” [Online]. Available: http://futurecities.up.pt/site/ [Accessed: 2014-11-11]
[158] J. Pan and W. J. Tompkins, “A real-time QRS detection algorithm.” IEEE transactions onbio-medical engineering, vol. 32, pp. 230–236, 1985.
[159] P. Hamilton, “Open source ECG analysis,” Proc. Computers in Cardiology, pp. 101–104,2002.
[160] D. Nunan, G. R. Sandercock, and D. A. Brodie, “A quantitative systematic review of normalvalues for short-term heart rate variability in healthy adults,” Pacing and Clinical Electro-physiology, vol. 33, no. 11, pp. 1407–1417, 2010.
[161] J. M. Violanti and F. Aron, “Police stressors: Variations in perception among police person-nel,” Journal of Criminal Justice, vol. 23, no. 3, pp. 287–294, 1995.
[162] M. H. Anshel, “A conceptual model and implications for coping with stressful events inpolice work,” Criminal Justice and Behavior, vol. 27, no. 3, pp. 375–400, 2000.
[163] F. H. Biggam, K. G. Power, R. R. Macdonald, W. B. Carcary, and E. Moodie, “Self-perceived occupational stress and distress in a scottish police force,” Work & Stress, vol. 11,no. 2, pp. 118–133, 1997.
[164] R. Burke, J. A. Waters, and W. Ussery, “Police stress: History, contributing factors, symp-toms, and interventions,” Policing: an international journal of police strategies & manage-ment, vol. 30, no. 2, pp. 169–188, 2007.
[165] “Cerebral aneurysms fact sheet: National institute of neurological disorders and stroke(ninds).” [Online]. Available: http://www.ninds.nih.gov/disorders/cerebral_aneurysm/detail_cerebral_aneurysms.htm [Accessed: 2015-03-31]
[166] R. S. Lazarus and S. Folkman, Stress, appraisal and coping. Springer, 1984.
[167] J. Zhang, “Effect of age and sex on heart rate variability in healthy subjects,” Journal ofmanipulative and physiological therapeutics, vol. 30, no. 5, pp. 374–379, 2007.
[168] J. Bugajska, K. Zuzewicz, M. Szmauz-Dybko, and M. Konarska, “Cardiovascular stress,energy expenditure and subjective perceived ratings of fire fighters during typical fire sup-pression and rescue tasks,” International Journal of Occupational Safety and Ergonomics,vol. 13, no. 3, pp. 323–331, 2007.
[169] Y. J. Zanstra and D. W. Johnston, “Cardiovascular reactivity in real life settings: Measure-ment, mechanisms and meaning,” Biological psychology, vol. 86, no. 2, pp. 98–105, 2011.
[170] J. I. S. Paiva, “Predicting lapses in attention: a study of brain oscillations, neural synchronyand eye measures,” 2014.
[171] R. Langner, M. B. Steinborn, A. Chatterjee, W. Sturm, and K. Willmes, “Mental fatigueand temporal preparation in simple reaction-time performance,” Acta Psychologica, vol.133, no. 1, pp. 64–72, 2010.
[172] M. A. Birkett, “The trier social stress test protocol for inducing psychological stress,” Jour-nal of visualized experiments: JoVE, no. 56, 2011.
[173] L. A. Golding, YMCA fitness testing and assessment manual, 2000.

BIBLIOGRAPHY 85
[174] C. Zhao, M. Zhao, J. Liu, and C. Zheng, “Electroencephalogram and electrocardiograph as-sessment of mental fatigue in a driving simulator,” Accident Analysis & Prevention, vol. 45,pp. 83–90, 2012.

86 BIBLIOGRAPHY
Appendix A
SPNC’15 - Monitorização do StressCardiovascular em Cirurgias deClipagem de Aneurismas
87

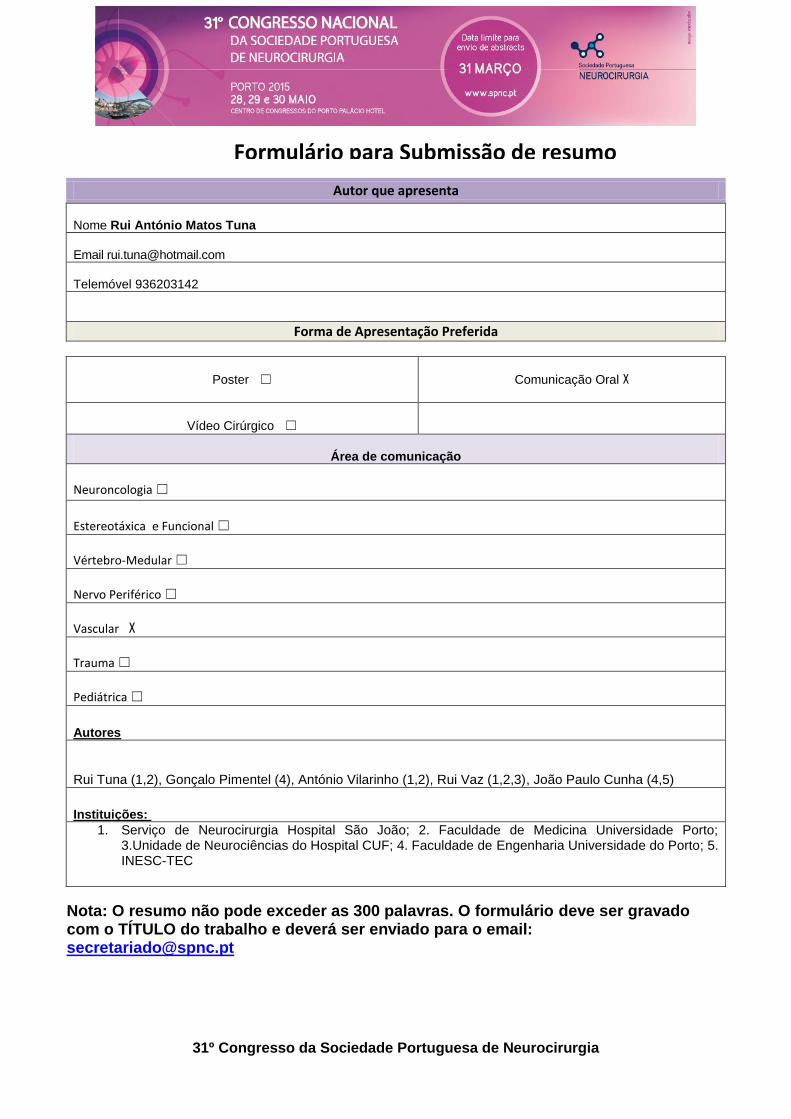
31º Congresso da Sociedade Portuguesa de Neurocirurgia
Autor que apresenta
Nome Rui António Matos Tuna
Email [email protected]
Telemóvel 936203142
Forma de Apresentação Preferida
Poster ☐
Comunicação Oral X
Vídeo Cirúrgico ☐
Área de comunicação
Neuroncologia ☐
Estereotáxica e Funcional ☐
Vértebro-Medular ☐
Nervo Periférico ☐
Vascular X
Trauma ☐
Pediátrica ☐
Autores
Rui Tuna (1,2), Gonçalo Pimentel (4), António Vilarinho (1,2), Rui Vaz (1,2,3), João Paulo Cunha (4,5)
Instituições:
1. Serviço de Neurocirurgia Hospital São João; 2. Faculdade de Medicina Universidade Porto; 3.Unidade de Neurociências do Hospital CUF; 4. Faculdade de Engenharia Universidade do Porto; 5. INESC-TEC
Nota: O resumo não pode exceder as 300 palavras. O formulário deve ser gravado com o TÍTULO do trabalho e deverá ser enviado para o email: [email protected]
Formulário para Submissão de resumo
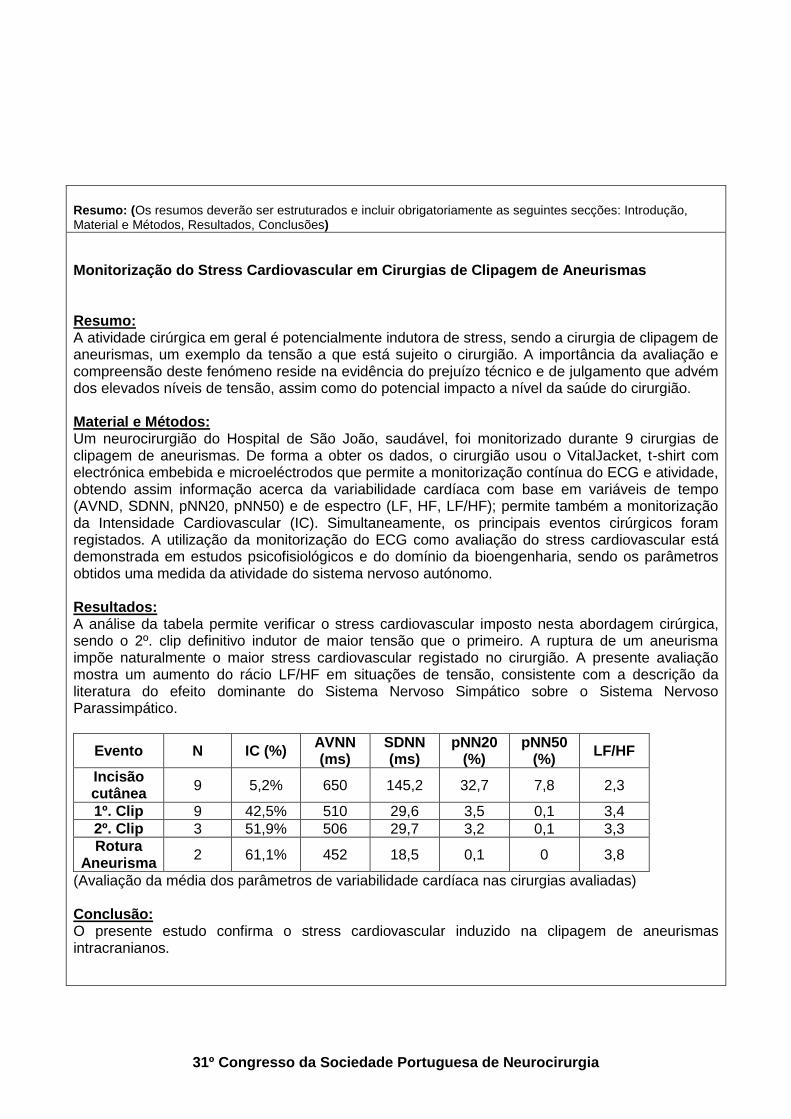
31º Congresso da Sociedade Portuguesa de Neurocirurgia
Resumo: (Os resumos deverão ser estruturados e incluir obrigatoriamente as seguintes secções: Introdução, Material e Métodos, Resultados, Conclusões)
Monitorização do Stress Cardiovascular em Cirurgias de Clipagem de Aneurismas Resumo: A atividade cirúrgica em geral é potencialmente indutora de stress, sendo a cirurgia de clipagem de aneurismas, um exemplo da tensão a que está sujeito o cirurgião. A importância da avaliação e compreensão deste fenómeno reside na evidência do prejuízo técnico e de julgamento que advém dos elevados níveis de tensão, assim como do potencial impacto a nível da saúde do cirurgião. Material e Métodos: Um neurocirurgião do Hospital de São João, saudável, foi monitorizado durante 9 cirurgias de clipagem de aneurismas. De forma a obter os dados, o cirurgião usou o VitalJacket, t-shirt com electrónica embebida e microeléctrodos que permite a monitorização contínua do ECG e atividade, obtendo assim informação acerca da variabilidade cardíaca com base em variáveis de tempo (AVND, SDNN, pNN20, pNN50) e de espectro (LF, HF, LF/HF); permite também a monitorização da Intensidade Cardiovascular (IC). Simultaneamente, os principais eventos cirúrgicos foram registados. A utilização da monitorização do ECG como avaliação do stress cardiovascular está demonstrada em estudos psicofisiológicos e do domínio da bioengenharia, sendo os parâmetros obtidos uma medida da atividade do sistema nervoso autónomo. Resultados: A análise da tabela permite verificar o stress cardiovascular imposto nesta abordagem cirúrgica, sendo o 2º. clip definitivo indutor de maior tensão que o primeiro. A ruptura de um aneurisma impõe naturalmente o maior stress cardiovascular registado no cirurgião. A presente avaliação mostra um aumento do rácio LF/HF em situações de tensão, consistente com a descrição da literatura do efeito dominante do Sistema Nervoso Simpático sobre o Sistema Nervoso Parassimpático.
Evento N IC (%) AVNN (ms)
SDNN (ms)
pNN20 (%)
pNN50 (%)
LF/HF
Incisão cutânea
9 5,2% 650 145,2 32,7 7,8 2,3
1º. Clip 9 42,5% 510 29,6 3,5 0,1 3,4
2º. Clip 3 51,9% 506 29,7 3,2 0,1 3,3
Rotura Aneurisma
2 61,1% 452 18,5 0,1 0 3,8
(Avaliação da média dos parâmetros de variabilidade cardíaca nas cirurgias avaliadas) Conclusão: O presente estudo confirma o stress cardiovascular induzido na clipagem de aneurismas intracranianos.


90 SPNC’15 - Monitorização do Stress Cardiovascular em Cirurgias de Clipagem de Aneurismas

Appendix B
IEEE EMBC 2015 - CardiovascularStrain and Autonomic Imbalance inNeurosurgeons
91

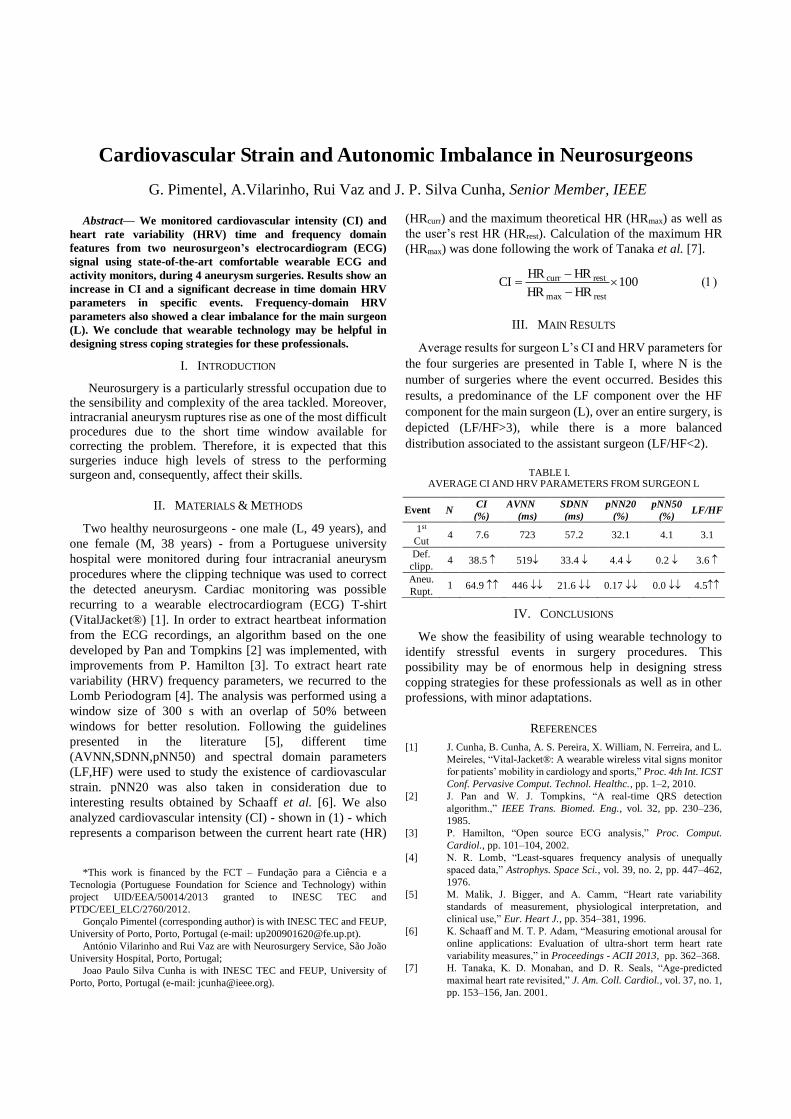
Abstract— We monitored cardiovascular intensity (CI) and
heart rate variability (HRV) time and frequency domain
features from two neurosurgeon’s electrocardiogram (ECG)
signal using state-of-the-art comfortable wearable ECG and
activity monitors, during 4 aneurysm surgeries. Results show an
increase in CI and a significant decrease in time domain HRV
parameters in specific events. Frequency-domain HRV
parameters also showed a clear imbalance for the main surgeon
(L). We conclude that wearable technology may be helpful in
designing stress coping strategies for these professionals.
I. INTRODUCTION
Neurosurgery is a particularly stressful occupation due to the sensibility and complexity of the area tackled. Moreover, intracranial aneurysm ruptures rise as one of the most difficult procedures due to the short time window available for correcting the problem. Therefore, it is expected that this surgeries induce high levels of stress to the performing surgeon and, consequently, affect their skills.
II. MATERIALS & METHODS
Two healthy neurosurgeons - one male (L, 49 years), and
one female (M, 38 years) - from a Portuguese university
hospital were monitored during four intracranial aneurysm
procedures where the clipping technique was used to correct
the detected aneurysm. Cardiac monitoring was possible
recurring to a wearable electrocardiogram (ECG) T-shirt
(VitalJacket®) [1]. In order to extract heartbeat information
from the ECG recordings, an algorithm based on the one
developed by Pan and Tompkins [2] was implemented, with
improvements from P. Hamilton [3]. To extract heart rate
variability (HRV) frequency parameters, we recurred to the
Lomb Periodogram [4]. The analysis was performed using a
window size of 300 s with an overlap of 50% between
windows for better resolution. Following the guidelines
presented in the literature [5], different time
(AVNN,SDNN,pNN50) and spectral domain parameters
(LF,HF) were used to study the existence of cardiovascular
strain. pNN20 was also taken in consideration due to
interesting results obtained by Schaaff et al. [6]. We also
analyzed cardiovascular intensity (CI) - shown in (1) - which
represents a comparison between the current heart rate (HR)
*This work is financed by the FCT – Fundação para a Ciência e a
Tecnologia (Portuguese Foundation for Science and Technology) within
project UID/EEA/50014/2013 granted to INESC TEC and
PTDC/EEI_ELC/2760/2012.
Gonçalo Pimentel (corresponding author) is with INESC TEC and FEUP,
University of Porto, Porto, Portugal (e-mail: [email protected]).
António Vilarinho and Rui Vaz are with Neurosurgery Service, São João
University Hospital, Porto, Portugal;
Joao Paulo Silva Cunha is with INESC TEC and FEUP, University of
Porto, Porto, Portugal (e-mail: [email protected]).
(HRcurr) and the maximum theoretical HR (HRmax) as well as
the user’s rest HR (HRrest). Calculation of the maximum HR
(HRmax) was done following the work of Tanaka et al. [7].
100HRHR
HRHRCI
restmax
restcurr
III. MAIN RESULTS
Average results for surgeon L’s CI and HRV parameters for
the four surgeries are presented in Table I, where N is the
number of surgeries where the event occurred. Besides this
results, a predominance of the LF component over the HF
component for the main surgeon (L), over an entire surgery, is
depicted (LF/HF>3), while there is a more balanced
distribution associated to the assistant surgeon (LF/HF<2).
TABLE I. AVERAGE CI AND HRV PARAMETERS FROM SURGEON L
Event N CI
(%)
AVNN
(ms)
SDNN
(ms)
pNN20
(%)
pNN50
(%) LF/HF
1st
Cut 4 7.6 723 57.2 32.1 4.1 3.1
Def.
clipp. 4 38.5 519 33.4 4.4 0.2 3.6
Aneu.
Rupt. 1 64.9 446 21.6 0.17 0.0 4.5
IV. CONCLUSIONS
We show the feasibility of using wearable technology to
identify stressful events in surgery procedures. This
possibility may be of enormous help in designing stress
copping strategies for these professionals as well as in other
professions, with minor adaptations.
REFERENCES
[1] J. Cunha, B. Cunha, A. S. Pereira, X. William, N. Ferreira, and L.
Meireles, “Vital-Jacket®: A wearable wireless vital signs monitor
for patients’ mobility in cardiology and sports,” Proc. 4th Int. ICST
Conf. Pervasive Comput. Technol. Healthc., pp. 1–2, 2010.
[2] J. Pan and W. J. Tompkins, “A real-time QRS detection
algorithm.,” IEEE Trans. Biomed. Eng., vol. 32, pp. 230–236,
1985.
[3] P. Hamilton, “Open source ECG analysis,” Proc. Comput.
Cardiol., pp. 101–104, 2002.
[4] N. R. Lomb, “Least-squares frequency analysis of unequally
spaced data,” Astrophys. Space Sci., vol. 39, no. 2, pp. 447–462,
1976.
[5] M. Malik, J. Bigger, and A. Camm, “Heart rate variability
standards of measurement, physiological interpretation, and
clinical use,” Eur. Heart J., pp. 354–381, 1996.
[6] K. Schaaff and M. T. P. Adam, “Measuring emotional arousal for
online applications: Evaluation of ultra-short term heart rate
variability measures,” in Proceedings - ACII 2013, pp. 362–368.
[7] H. Tanaka, K. D. Monahan, and D. R. Seals, “Age-predicted
maximal heart rate revisited,” J. Am. Coll. Cardiol., vol. 37, no. 1,
pp. 153–156, Jan. 2001.
Cardiovascular Strain and Autonomic Imbalance in Neurosurgeons
G. Pimentel, A.Vilarinho, Rui Vaz and J. P. Silva Cunha, Senior Member, IEEE
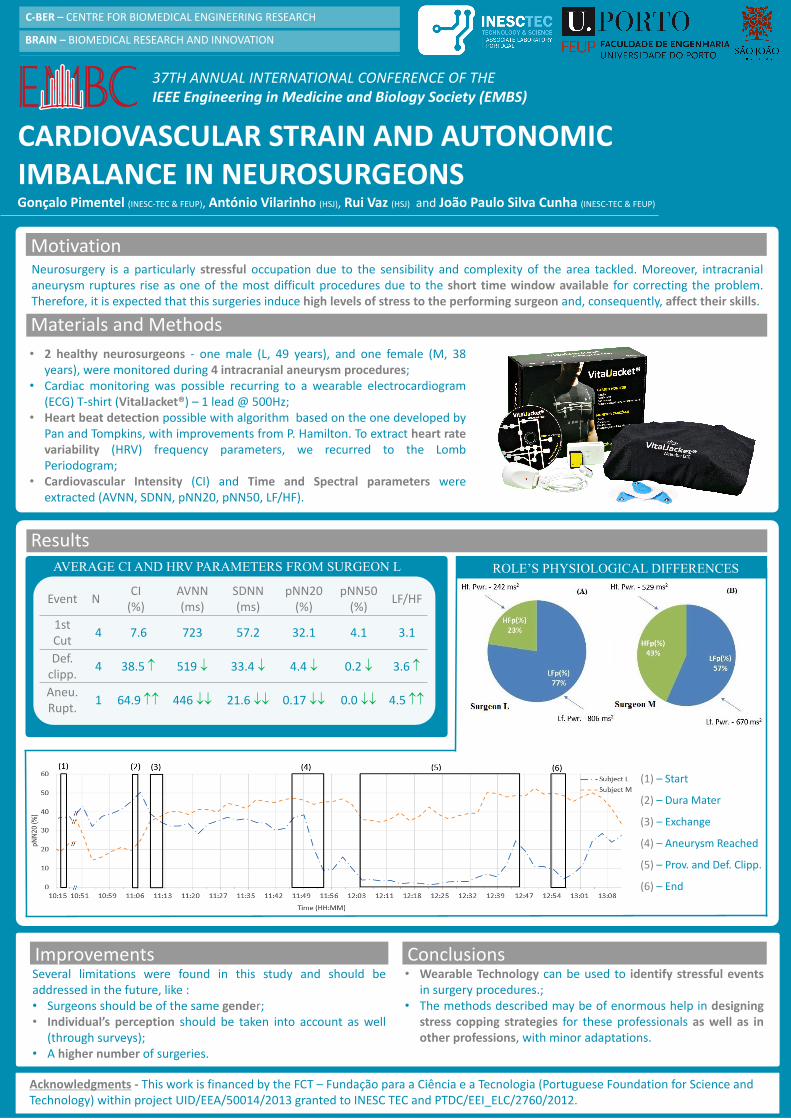
CARDIOVASCULAR STRAIN AND AUTONOMIC IMBALANCE IN NEUROSURGEONS
Neurosurgery is a particularly stressful occupation due to the sensibility and complexity of the area tackled. Moreover, intracranialaneurysm ruptures rise as one of the most difficult procedures due to the short time window available for correcting the problem.Therefore, it is expected that this surgeries induce high levels of stress to the performing surgeon and, consequently, affect their skills.
Motivation
Materials and Methods
Project papers
Gonçalo Pimentel (INESC-TEC & FEUP), António Vilarinho (HSJ), Rui Vaz (HSJ) and João Paulo Silva Cunha (INESC-TEC & FEUP)
Results
Conclusions
• 2 healthy neurosurgeons - one male (L, 49 years), and one female (M, 38years), were monitored during 4 intracranial aneurysm procedures;
• Cardiac monitoring was possible recurring to a wearable electrocardiogram(ECG) T-shirt (VitalJacket®) – 1 lead @ 500Hz;
• Heart beat detection possible with algorithm based on the one developed byPan and Tompkins, with improvements from P. Hamilton. To extract heart ratevariability (HRV) frequency parameters, we recurred to the LombPeriodogram;
• Cardiovascular Intensity (CI) and Time and Spectral parameters wereextracted (AVNN, SDNN, pNN20, pNN50, LF/HF).
Event NCI
(%)AVNN(ms)
SDNN(ms)
pNN20(%)
pNN50 (%)
LF/HF
1st Cut
4 7.6 723 57.2 32.1 4.1 3.1
Def. clipp.
4 38.5 519 33.4 4.4 0.2 3.6
Aneu.Rupt.
1 64.9 446 21.6 0.17 0.0 4.5
AVERAGE CI AND HRV PARAMETERS FROM SURGEON L
(1) – Start
(2) – Dura Mater
(3) – Exchange
(4) – Aneurysm Reached
(5) – Prov. and Def. Clipp.
(6) – End
Several limitations were found in this study and should beaddressed in the future, like :• Surgeons should be of the same gender;• Individual’s perception should be taken into account as well
(through surveys);• A higher number of surgeries.
ROLE’S PHYSIOLOGICAL DIFFERENCES
Improvements• Wearable Technology can be used to identify stressful events
in surgery procedures.;• The methods described may be of enormous help in designing
stress copping strategies for these professionals as well as inother professions, with minor adaptations.
Acknowledgments - This work is financed by the FCT – Fundação para a Ciência e a Tecnologia (Portuguese Foundation for Science and Technology) within project UID/EEA/50014/2013 granted to INESC TEC and PTDC/EEI_ELC/2760/2012.
37TH ANNUAL INTERNATIONAL CONFERENCE OF THE IEEE Engineering in Medicine and Biology Society (EMBS)
C-BER – CENTRE FOR BIOMEDICAL ENGINEERING RESEARCH
BRAIN – BIOMEDICAL RESEARCH AND INNOVATION


94 IEEE EMBC 2015 - Cardiovascular Strain and Autonomic Imbalance in Neurosurgeons

Appendix C
IEEE EMBC 2015 - CardiovascularStrain and Autonomic Imbalance inNeurosurgeons during IntracranialAneurysm Procedures - 4 Page Paper(Rejected)
95

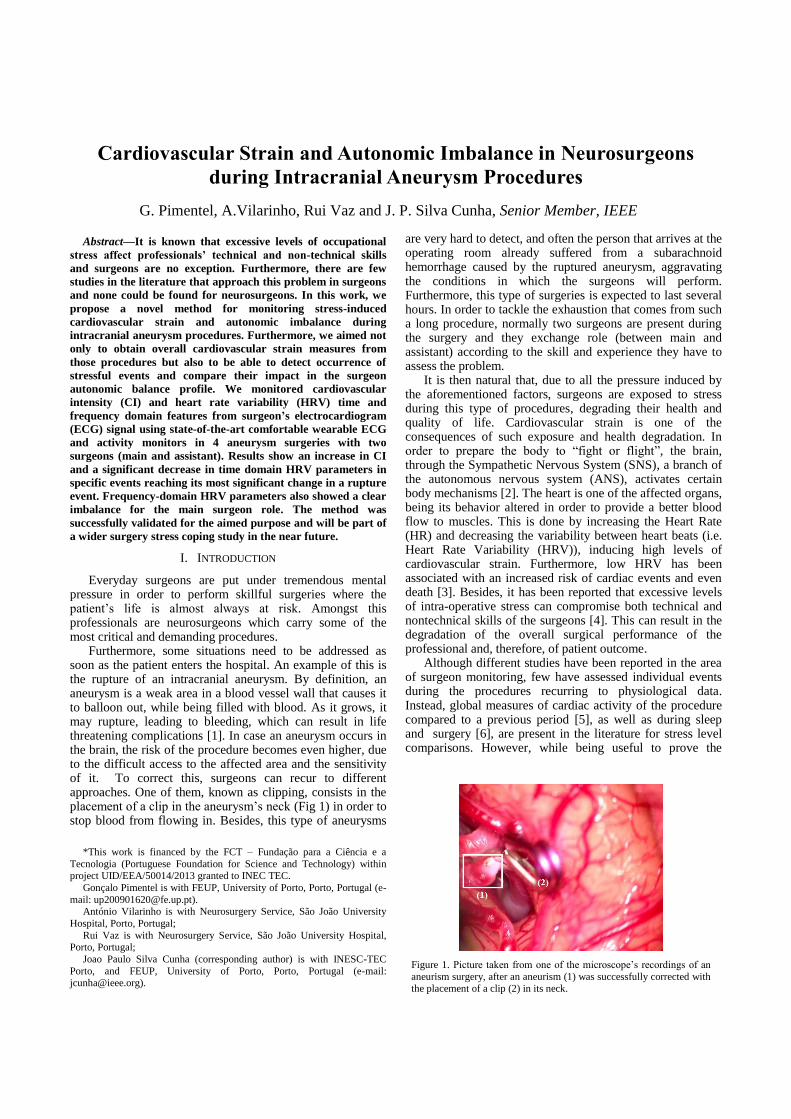
Abstract—It is known that excessive levels of occupational
stress affect professionals’ technical and non-technical skills
and surgeons are no exception. Furthermore, there are few
studies in the literature that approach this problem in surgeons
and none could be found for neurosurgeons. In this work, we
propose a novel method for monitoring stress-induced
cardiovascular strain and autonomic imbalance during
intracranial aneurysm procedures. Furthermore, we aimed not
only to obtain overall cardiovascular strain measures from
those procedures but also to be able to detect occurrence of
stressful events and compare their impact in the surgeon
autonomic balance profile. We monitored cardiovascular
intensity (CI) and heart rate variability (HRV) time and
frequency domain features from surgeon’s electrocardiogram
(ECG) signal using state-of-the-art comfortable wearable ECG
and activity monitors in 4 aneurysm surgeries with two
surgeons (main and assistant). Results show an increase in CI
and a significant decrease in time domain HRV parameters in
specific events reaching its most significant change in a rupture
event. Frequency-domain HRV parameters also showed a clear
imbalance for the main surgeon role. The method was
successfully validated for the aimed purpose and will be part of
a wider surgery stress coping study in the near future.
I. INTRODUCTION
Everyday surgeons are put under tremendous mental pressure in order to perform skillful surgeries where the patient’s life is almost always at risk. Amongst this professionals are neurosurgeons which carry some of the most critical and demanding procedures.
Furthermore, some situations need to be addressed as soon as the patient enters the hospital. An example of this is the rupture of an intracranial aneurysm. By definition, an aneurysm is a weak area in a blood vessel wall that causes it to balloon out, while being filled with blood. As it grows, it may rupture, leading to bleeding, which can result in life threatening complications [1]. In case an aneurysm occurs in the brain, the risk of the procedure becomes even higher, due to the difficult access to the affected area and the sensitivity of it. To correct this, surgeons can recur to different approaches. One of them, known as clipping, consists in the placement of a clip in the aneurysm’s neck (Fig 1) in order to stop blood from flowing in. Besides, this type of aneurysms
*This work is financed by the FCT – Fundação para a Ciência e a
Tecnologia (Portuguese Foundation for Science and Technology) within project UID/EEA/50014/2013 granted to INEC TEC.
Gonçalo Pimentel is with FEUP, University of Porto, Porto, Portugal (e-
mail: [email protected]). António Vilarinho is with Neurosurgery Service, São João University
Hospital, Porto, Portugal;
Rui Vaz is with Neurosurgery Service, São João University Hospital, Porto, Portugal;
Joao Paulo Silva Cunha (corresponding author) is with INESC-TEC
Porto, and FEUP, University of Porto, Porto, Portugal (e-mail: [email protected]).
are very hard to detect, and often the person that arrives at the operating room already suffered from a subarachnoid hemorrhage caused by the ruptured aneurysm, aggravating the conditions in which the surgeons will perform. Furthermore, this type of surgeries is expected to last several hours. In order to tackle the exhaustion that comes from such a long procedure, normally two surgeons are present during the surgery and they exchange role (between main and assistant) according to the skill and experience they have to assess the problem.
It is then natural that, due to all the pressure induced by the aforementioned factors, surgeons are exposed to stress during this type of procedures, degrading their health and quality of life. Cardiovascular strain is one of the consequences of such exposure and health degradation. In order to prepare the body to “fight or flight”, the brain, through the Sympathetic Nervous System (SNS), a branch of the autonomous nervous system (ANS), activates certain body mechanisms [2]. The heart is one of the affected organs, being its behavior altered in order to provide a better blood flow to muscles. This is done by increasing the Heart Rate (HR) and decreasing the variability between heart beats (i.e. Heart Rate Variability (HRV)), inducing high levels of cardiovascular strain. Furthermore, low HRV has been associated with an increased risk of cardiac events and even death [3]. Besides, it has been reported that excessive levels of intra-operative stress can compromise both technical and nontechnical skills of the surgeons [4]. This can result in the degradation of the overall surgical performance of the professional and, therefore, of patient outcome.
Although different studies have been reported in the area of surgeon monitoring, few have assessed individual events during the procedures recurring to physiological data. Instead, global measures of cardiac activity of the procedure compared to a previous period [5], as well as during sleep and surgery [6], are present in the literature for stress level comparisons. However, while being useful to prove the
Cardiovascular Strain and Autonomic Imbalance in Neurosurgeons
during Intracranial Aneurysm Procedures
G. Pimentel, A.Vilarinho, Rui Vaz and J. P. Silva Cunha, Senior Member, IEEE
Figure 1. Picture taken from one of the microscope’s recordings of an
aneurism surgery, after an aneurism (1) was successfully corrected with the placement of a clip (2) in its neck.
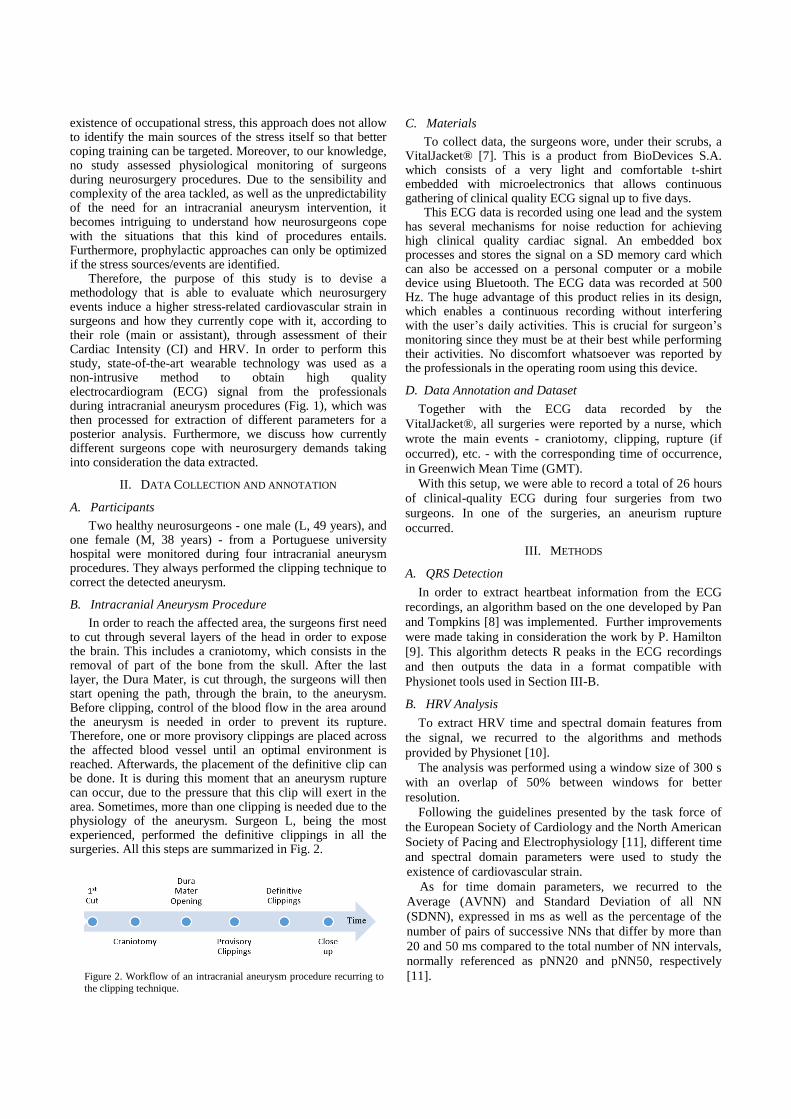
existence of occupational stress, this approach does not allow to identify the main sources of the stress itself so that better coping training can be targeted. Moreover, to our knowledge, no study assessed physiological monitoring of surgeons during neurosurgery procedures. Due to the sensibility and complexity of the area tackled, as well as the unpredictability of the need for an intracranial aneurysm intervention, it becomes intriguing to understand how neurosurgeons cope with the situations that this kind of procedures entails. Furthermore, prophylactic approaches can only be optimized if the stress sources/events are identified.
Therefore, the purpose of this study is to devise a methodology that is able to evaluate which neurosurgery events induce a higher stress-related cardiovascular strain in surgeons and how they currently cope with it, according to their role (main or assistant), through assessment of their Cardiac Intensity (CI) and HRV. In order to perform this study, state-of-the-art wearable technology was used as a non-intrusive method to obtain high quality electrocardiogram (ECG) signal from the professionals during intracranial aneurysm procedures (Fig. 1), which was then processed for extraction of different parameters for a posterior analysis. Furthermore, we discuss how currently different surgeons cope with neurosurgery demands taking into consideration the data extracted.
II. DATA COLLECTION AND ANNOTATION
A. Participants
Two healthy neurosurgeons - one male (L, 49 years), and one female (M, 38 years) - from a Portuguese university hospital were monitored during four intracranial aneurysm procedures. They always performed the clipping technique to correct the detected aneurysm.
B. Intracranial Aneurysm Procedure
In order to reach the affected area, the surgeons first need to cut through several layers of the head in order to expose the brain. This includes a craniotomy, which consists in the removal of part of the bone from the skull. After the last layer, the Dura Mater, is cut through, the surgeons will then start opening the path, through the brain, to the aneurysm. Before clipping, control of the blood flow in the area around the aneurysm is needed in order to prevent its rupture. Therefore, one or more provisory clippings are placed across the affected blood vessel until an optimal environment is reached. Afterwards, the placement of the definitive clip can be done. It is during this moment that an aneurysm rupture can occur, due to the pressure that this clip will exert in the area. Sometimes, more than one clipping is needed due to the physiology of the aneurysm. Surgeon L, being the most experienced, performed the definitive clippings in all the surgeries. All this steps are summarized in Fig. 2.
C. Materials
To collect data, the surgeons wore, under their scrubs, a VitalJacket® [7]. This is a product from BioDevices S.A. which consists of a very light and comfortable t-shirt embedded with microelectronics that allows continuous gathering of clinical quality ECG signal up to five days.
This ECG data is recorded using one lead and the system has several mechanisms for noise reduction for achieving high clinical quality cardiac signal. An embedded box processes and stores the signal on a SD memory card which can also be accessed on a personal computer or a mobile device using Bluetooth. The ECG data was recorded at 500 Hz. The huge advantage of this product relies in its design, which enables a continuous recording without interfering with the user’s daily activities. This is crucial for surgeon’s monitoring since they must be at their best while performing their activities. No discomfort whatsoever was reported by the professionals in the operating room using this device.
D. Data Annotation and Dataset
Together with the ECG data recorded by the
VitalJacket®, all surgeries were reported by a nurse, which
wrote the main events - craniotomy, clipping, rupture (if
occurred), etc. - with the corresponding time of occurrence,
in Greenwich Mean Time (GMT).
With this setup, we were able to record a total of 26 hours
of clinical-quality ECG during four surgeries from two
surgeons. In one of the surgeries, an aneurism rupture
occurred.
III. METHODS
A. QRS Detection
In order to extract heartbeat information from the ECG
recordings, an algorithm based on the one developed by Pan
and Tompkins [8] was implemented. Further improvements
were made taking in consideration the work by P. Hamilton
[9]. This algorithm detects R peaks in the ECG recordings
and then outputs the data in a format compatible with
Physionet tools used in Section III-B.
B. HRV Analysis
To extract HRV time and spectral domain features from
the signal, we recurred to the algorithms and methods
provided by Physionet [10].
The analysis was performed using a window size of 300 s
with an overlap of 50% between windows for better
resolution.
Following the guidelines presented by the task force of
the European Society of Cardiology and the North American
Society of Pacing and Electrophysiology [11], different time
and spectral domain parameters were used to study the
existence of cardiovascular strain.
As for time domain parameters, we recurred to the
Average (AVNN) and Standard Deviation of all NN
(SDNN), expressed in ms as well as the percentage of the
number of pairs of successive NNs that differ by more than
20 and 50 ms compared to the total number of NN intervals,
normally referenced as pNN20 and pNN50, respectively
[11].
Figure 2. Workflow of an intracranial aneurysm procedure recurring to
the clipping technique.
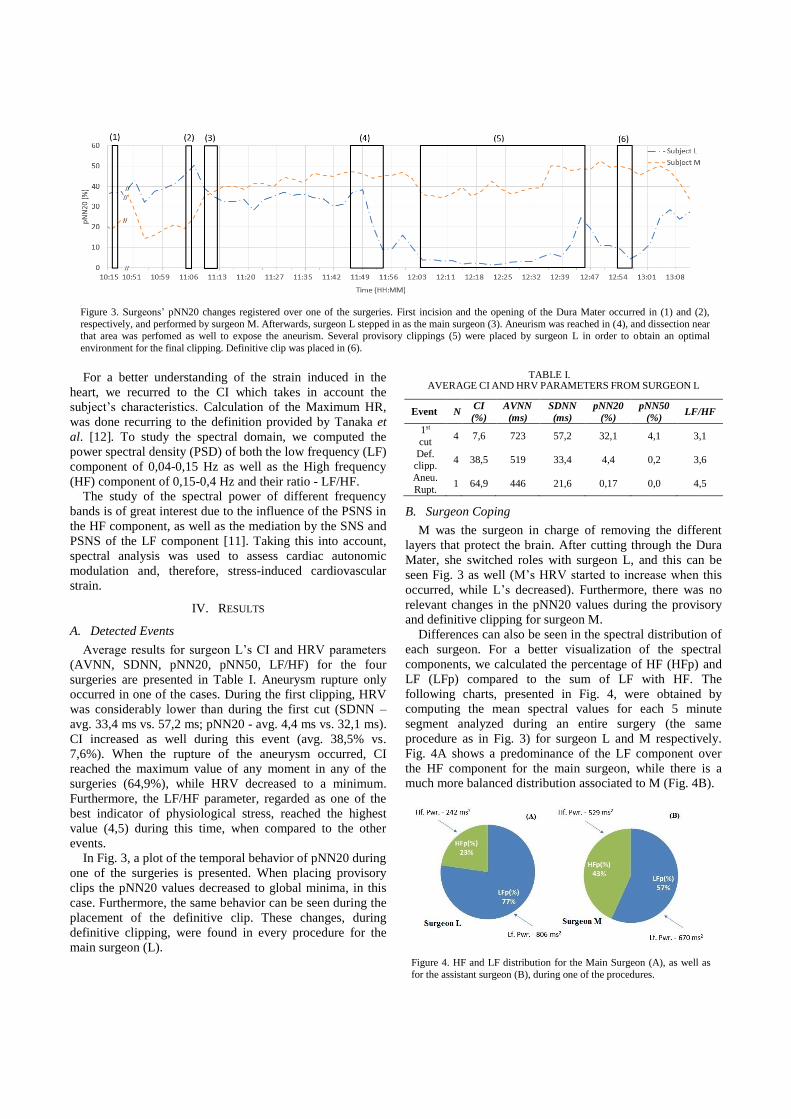
Figure 3. Surgeons’ pNN20 changes registered over one of the surgeries. First incision and the opening of the Dura Mater occurred in (1) and (2),
respectively, and performed by surgeon M. Afterwards, surgeon L stepped in as the main surgeon (3). Aneurism was reached in (4), and dissection near
that area was perfomed as well to expose the aneurism. Several provisory clippings (5) were placed by surgeon L in order to obtain an optimal
environment for the final clipping. Definitive clip was placed in (6).
For a better understanding of the strain induced in the
heart, we recurred to the CI which takes in account the
subject’s characteristics. Calculation of the Maximum HR,
was done recurring to the definition provided by Tanaka et
al. [12]. To study the spectral domain, we computed the
power spectral density (PSD) of both the low frequency (LF)
component of 0,04-0,15 Hz as well as the High frequency
(HF) component of 0,15-0,4 Hz and their ratio - LF/HF.
The study of the spectral power of different frequency
bands is of great interest due to the influence of the PSNS in
the HF component, as well as the mediation by the SNS and
PSNS of the LF component [11]. Taking this into account,
spectral analysis was used to assess cardiac autonomic
modulation and, therefore, stress-induced cardiovascular
strain.
IV. RESULTS
A. Detected Events
Average results for surgeon L’s CI and HRV parameters
(AVNN, SDNN, pNN20, pNN50, LF/HF) for the four
surgeries are presented in Table I. Aneurysm rupture only
occurred in one of the cases. During the first clipping, HRV
was considerably lower than during the first cut (SDNN –
avg. 33,4 ms vs. 57,2 ms; pNN20 - avg. 4,4 ms vs. 32,1 ms).
CI increased as well during this event (avg. 38,5% vs.
7,6%). When the rupture of the aneurysm occurred, CI
reached the maximum value of any moment in any of the
surgeries (64,9%), while HRV decreased to a minimum.
Furthermore, the LF/HF parameter, regarded as one of the
best indicator of physiological stress, reached the highest
value (4,5) during this time, when compared to the other
events.
In Fig. 3, a plot of the temporal behavior of pNN20 during
one of the surgeries is presented. When placing provisory
clips the pNN20 values decreased to global minima, in this
case. Furthermore, the same behavior can be seen during the
placement of the definitive clip. These changes, during
definitive clipping, were found in every procedure for the
main surgeon (L).
TABLE I. AVERAGE CI AND HRV PARAMETERS FROM SURGEON L
Event N CI
(%)
AVNN
(ms)
SDNN
(ms)
pNN20
(%)
pNN50
(%) LF/HF
1st
cut 4 7,6 723 57,2 32,1 4,1 3,1
Def. clipp.
4 38,5 519 33,4 4,4 0,2 3,6
Aneu.
Rupt. 1 64,9 446 21,6 0,17 0,0 4,5
B. Surgeon Coping
M was the surgeon in charge of removing the different
layers that protect the brain. After cutting through the Dura
Mater, she switched roles with surgeon L, and this can be
seen Fig. 3 as well (M’s HRV started to increase when this
occurred, while L’s decreased). Furthermore, there was no
relevant changes in the pNN20 values during the provisory
and definitive clipping for surgeon M.
Differences can also be seen in the spectral distribution of
each surgeon. For a better visualization of the spectral
components, we calculated the percentage of HF (HFp) and
LF (LFp) compared to the sum of LF with HF. The
following charts, presented in Fig. 4, were obtained by
computing the mean spectral values for each 5 minute
segment analyzed during an entire surgery (the same
procedure as in Fig. 3) for surgeon L and M respectively.
Fig. 4A shows a predominance of the LF component over
the HF component for the main surgeon, while there is a
much more balanced distribution associated to M (Fig. 4B).
Figure 4. HF and LF distribution for the Main Surgeon (A), as well as
for the assistant surgeon (B), during one of the procedures.
V. DISCUSSION
Analyzing Table I, it can be verified that the 20 ms
threshold value used for HRV evaluation (pNN20) presented
good results, taking into consideration the SDNN for each
action. This is also the reason that the change in the pNN50
values between the events is so small compared to pNN20.
L’s CI increased during the definitive clipping, when
compared to the first cut, while HRV (SDNN, pNN20)
decreased. In other words, it seems that surgeon L is
exposed to high cardiovascular strain during the clipping
event. This is probably due to the self-reported perception of
being a risky maneuver that increases the possibility of
rupture, inducing high levels of mental pressure to the
surgeon. The rupture of the aneurysm induces the highest
cardiovascular strain in surgeon L, as it was expected, since
it is the worst outcome that can occur during this type of
procedures. HRV decreases with this changes (SDNN,
pNN20, pNN50) to minimum values. Finally, supporting all
this findings, an increase in LF/HF ratio is observed, which
shows, a dominance of the SNS over the PSNS – a typical
indicator of a stressful situation, according to the literature
[11].
There is also clear difference in the cardiac behavior of
each surgeon in Fig 3. When surgeon L stepped in to take
the lead in the surgery, his HRV started to decrease,
achieving minimum values when he started to analyze the
area where the aneurysm is and performed several provisory
clippings. A similar behavior was also registered when he
placed the definitive clip. During these events, surgeon M’s
HRV did not change considerably, and stayed at higher
values than the ones she had before the exchange. This
findings allow us believe that L’s heart was exposed to a
higher strain than M’s, probably due to the responsibility
that his actions would have in the patient’s life. This
interpretation also matches the self-report of surgeon L.
Furthermore, when comparing the HF and LF distribution of
both surgeons, differences were also found. There is a clear
predominance of the LF component when compared to the
HF one in Fig 4A (LF/HF >3), which is relative to surgeon
L’s ECG. However, the same is not true for subject M (Fig.
4B), who has a more balanced LF and HF distribution.
VI. CONCLUSION + FUTURE WORK
We have developed a method for detection of stressful
events and have shown its capacity to detect that some
events are more “stressful” than others for the performing
surgeon. An overall measure of cardiovascular strain during
a neurosurgery procedure is also possible to obtain. This
study shows that there is a clear possibility of occurrence of
cardiovascular strain in neurosurgeons, which can lead to an
overall decay of their skills and health, impacting,
ultimately, surgery outcome. Even though this is a
preliminary study, some results could already been deducted
from the data obtained, showing the usefulness of the
developed methodology. However, several improvements
are still needed in order to assess, reliably, how and when
cardiovascular strain occurs in neurosurgeons. In this cases,
we have only studied stress as a physiological response.
According to Lazarus and Folkman [13], stress should take
into account the individual’s perception as well. Even
though we considered the self-report of the surgeons, no
structured protocol for subjective assessment was followed.
Therefore, a subjective literature-approved survey for the
analysis of the professional’s perceived stress before, during
and after the surgeries should be implemented with the
support of psychologists. Finally, future studies should use a
larger sample and focus in only one gender, in order to
obtain more accurate and feasible data. These results have
also practical implications, drawing the attention for the
need to understand surgeons stress levels, identify sources of
cardiovascular strain, and thus opening the possibility to
design a psychological intervention in order to better help
them coping with daily working stress and consequently
perform better. A wider surgery stress coping study will be
performed in the near future using the presented
methodology.
REFERENCES
[1] “Cerebral Aneurysms Fact Sheet: National Institute of Neurological Disorders and Stroke (NINDS).” [Online].
Available:http://www.ninds.nih.gov/disorders/cerebral_aneurysm/
detail_cerebral_aneurysms.htm. [Accessed: 31-Mar-2015]. [2] A. S. Jansen, X. V Nguyen, V. Karpitskiy, T. C. Mettenleiter, and
A. D. Loewy, “Central command neurons of the sympathetic
nervous system: basis of the fight-or-flight response,” Science, vol. 270, pp. 644–646, 1995.
[3] J. M. Dekker, E. G. Schouten, P. Klootwijk, J. Pool, C. A.
Swenne, and D. Kromhout, “Heart rate variability from short electrocardiographic recordings predicts mortality from all causes
in middle-aged and elderly men. The Zutphen Study.,” Am. J.
Epidemiol., vol. 145, pp. 899–908, 1997. [4] C. M. Wetzel, R. L. Kneebone, M. Woloshynowych, D. Nestel,
K. Moorthy, J. Kidd, and A. Darzi, “The effects of stress on
surgical performance.,” Am. J. Surg., vol. 191, no. 1, pp. 5–10, Jan. 2006.
[5] C. Langelotz, M. Scharfenberg, O. Haase, and W. Schwenk,
“Stress and heart rate variability in surgeons during a 24-hour shift.,” Arch. Surg., vol. 143, pp. 751–755, 2008.
[6] A. Rieger, R. Stoll, S. Kreuzfeld, K. Behrens, and M. Weippert,
“Heart rate and heart rate variability as indirect markers of surgeons’ intraoperative stress,” Int. Arch. Occup. Environ.
Health, vol. 87, pp. 165–174, 2014.
[7] J. Cunha, B. Cunha, A. S. Pereira, X. William, N. Ferreira, and L. Meireles, “Vital-Jacket®: A wearable wireless vital signs monitor
for patients’ mobility in cardiology and sports,” Proc. 4th Int.
ICST Conf. Pervasive Comput. Technol. Healthc., pp. 1–2, 2010. [8] J. Pan and W. J. Tompkins, “A real-time QRS detection
algorithm.,” IEEE Trans. Biomed. Eng., vol. 32, pp. 230–236,
1985. [9] P. Hamilton, “Open source ECG analysis,” Proc. Comput.
Cardiol., pp. 101–104, 2002.
[10] A. L. Goldberger, L. A. Amaral, L. Glass, J. M. Hausdorff, P. C. Ivanov, R. G. Mark, J. E. Mietus, G. B. Moody, C. K. Peng, and
H. E. Stanley, “PhysioBank, PhysioToolkit, and PhysioNet:
components of a new research resource for complex physiologic signals.,” Circulation, vol. 101, pp. E215–E220, 2000.
[11] M. Malik, J. Bigger, and A. Camm, “Heart rate variability
standards of measurement, physiological interpretation, and clinical use,” Eur. Heart J., pp. 354–381, 1996.
[12] H. Tanaka, K. D. Monahan, and D. R. Seals, “Age-predicted
maximal heart rate revisited,” J. Am. Coll. Cardiol., vol. 37, no. 1, pp. 153–156, Jan. 2001.
[13] R. S. Lazarus and S. Folkman, Stress, appraisal and coping. Springer, 1984.

100IEEE EMBC 2015 - Cardiovascular Strain and Autonomic Imbalance in Neurosurgeons during
Intracranial Aneurysm Procedures - 4 Page Paper (Rejected)

Appendix D
Full Activity Diagram for the VJE-Diary app
101

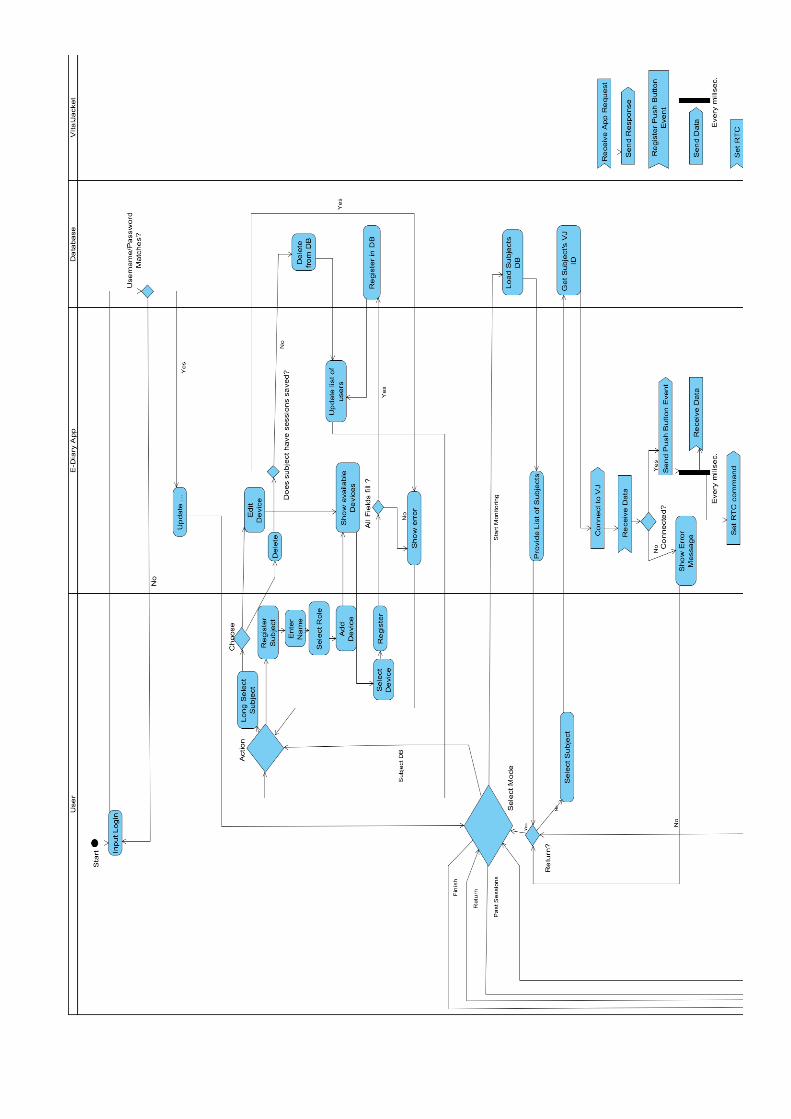
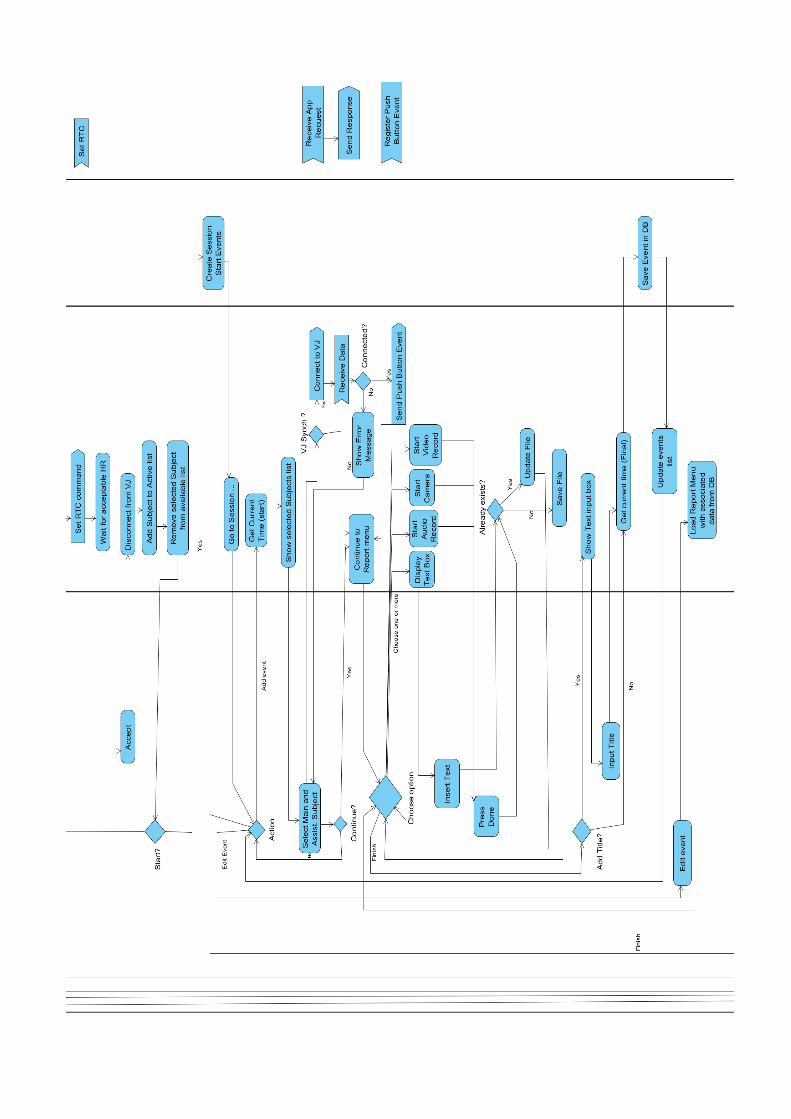
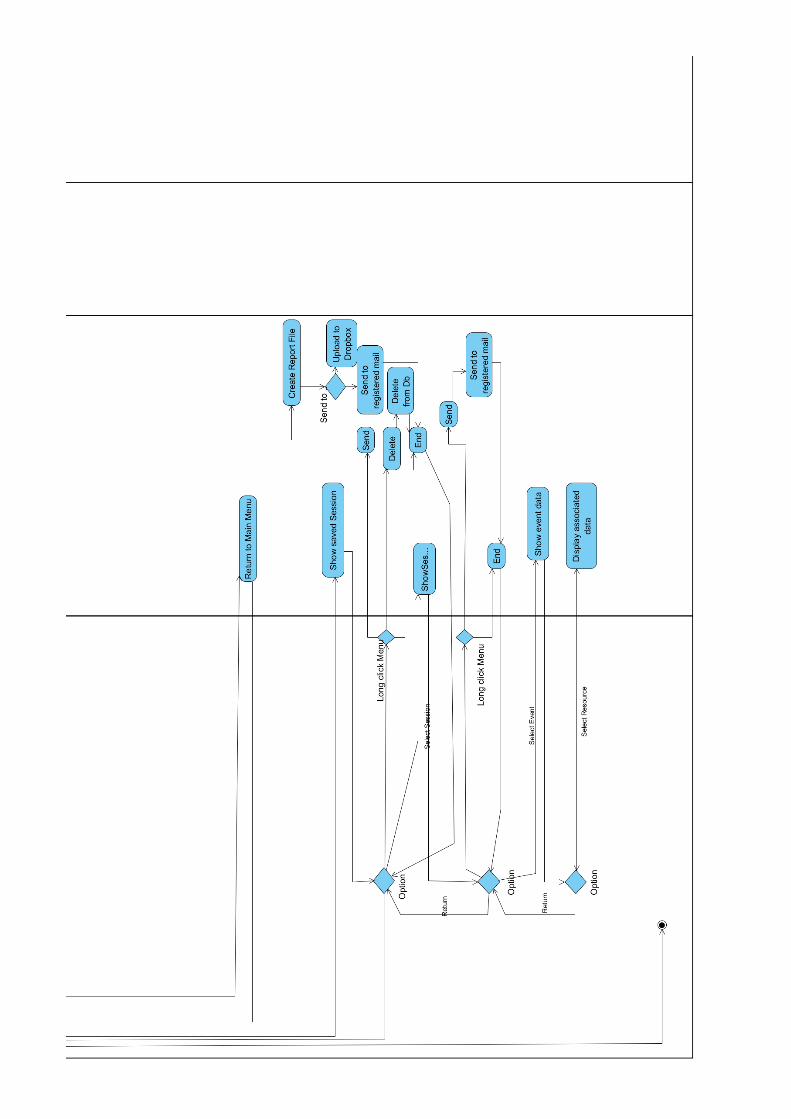
Appendix E
Surveys Used for Appraisal of SurgeonsStress and Cognitive Workload
105

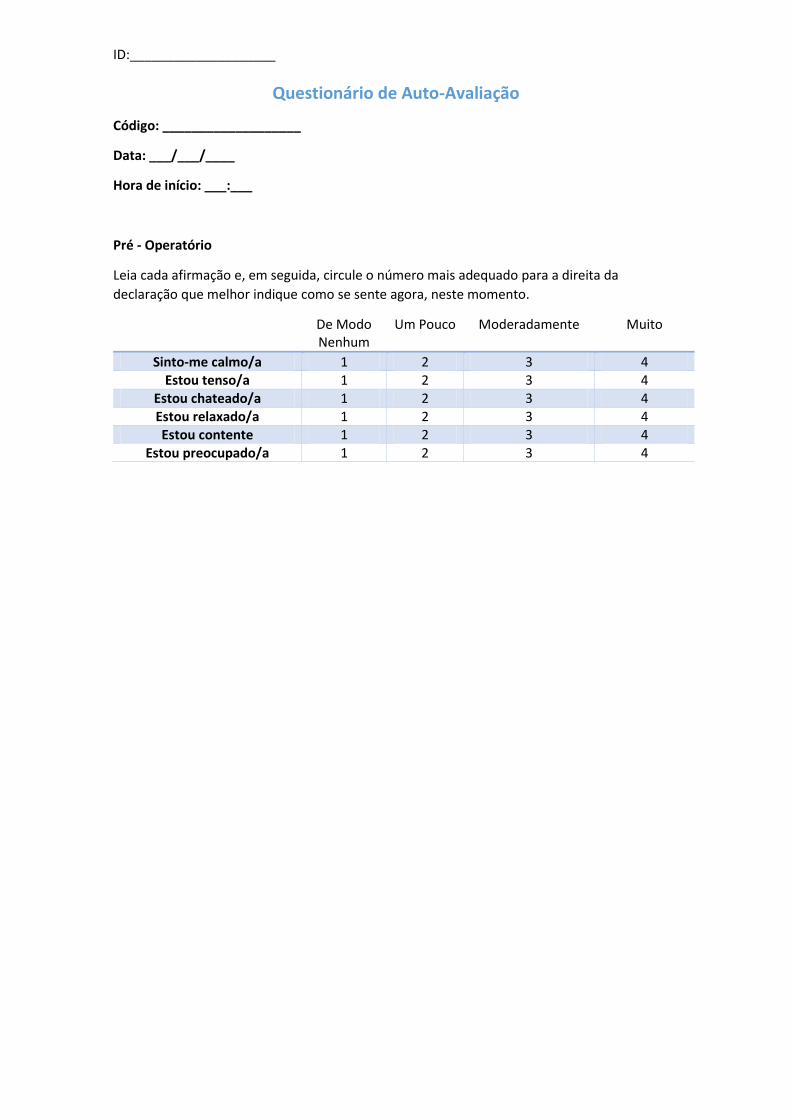
ID:____________________
Questionário de Auto-Avaliação
Código: ___________________
Data: ___/___/____
Hora de início: ___:___
Pré - Operatório
Leia cada afirmação e, em seguida, circule o número mais adequado para a direita da
declaração que melhor indique como se sente agora, neste momento.
De Modo Nenhum
Um Pouco Moderadamente Muito
Sinto-me calmo/a 1 2 3 4 Estou tenso/a 1 2 3 4
Estou chateado/a 1 2 3 4 Estou relaxado/a 1 2 3 4 Estou contente 1 2 3 4
Estou preocupado/a 1 2 3 4
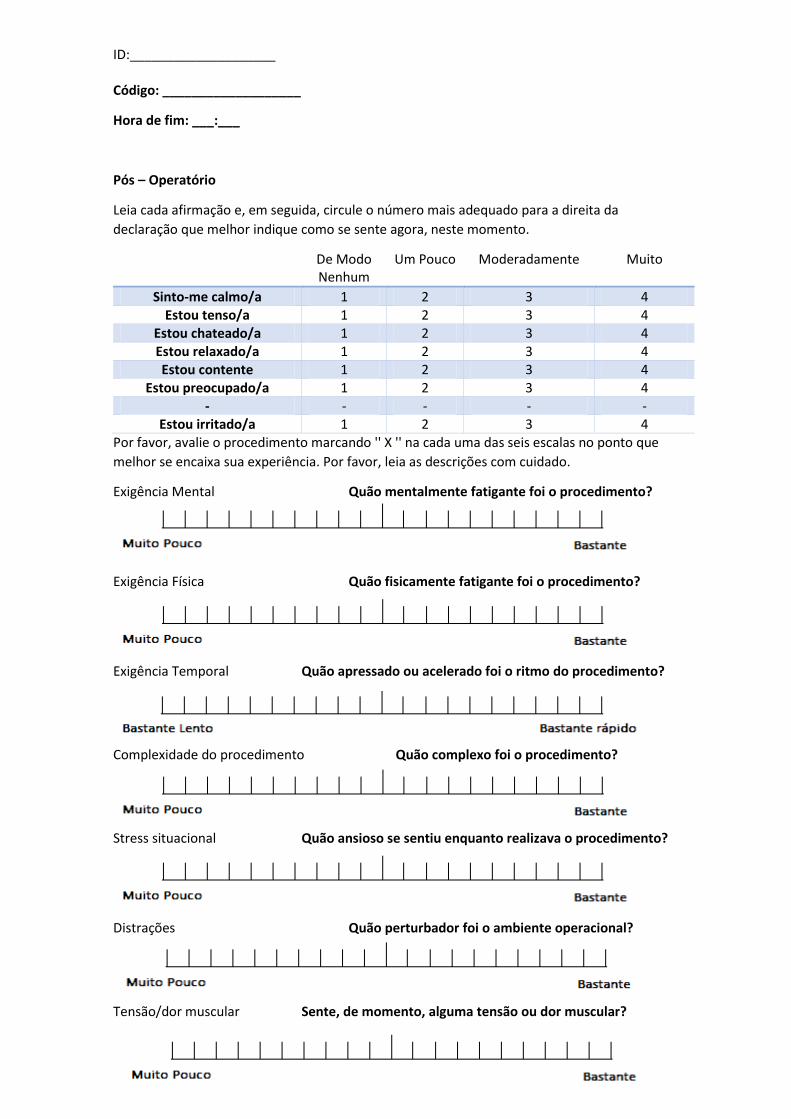
ID:____________________ Código: ___________________
Hora de fim: ___:___
Pós – Operatório
Leia cada afirmação e, em seguida, circule o número mais adequado para a direita da
declaração que melhor indique como se sente agora, neste momento.
De Modo Nenhum
Um Pouco Moderadamente Muito
Sinto-me calmo/a 1 2 3 4 Estou tenso/a 1 2 3 4
Estou chateado/a 1 2 3 4 Estou relaxado/a 1 2 3 4 Estou contente 1 2 3 4
Estou preocupado/a 1 2 3 4 - - - - -
Estou irritado/a 1 2 3 4 Por favor, avalie o procedimento marcando '' X '' na cada uma das seis escalas no ponto que
melhor se encaixa sua experiência. Por favor, leia as descrições com cuidado.
Exigência Mental Quão mentalmente fatigante foi o procedimento?
Exigência Física Quão fisicamente fatigante foi o procedimento?
Exigência Temporal Quão apressado ou acelerado foi o ritmo do procedimento?
Complexidade do procedimento Quão complexo foi o procedimento?
Stress situacional Quão ansioso se sentiu enquanto realizava o procedimento?
Distrações Quão perturbador foi o ambiente operacional?
Tensão/dor muscular Sente, de momento, alguma tensão ou dor muscular?

108 Surveys Used for Appraisal of Surgeons Stress and Cognitive Workload
Appendix F
Visual Analog Scale for Assesment ofStress and Fatigue during theFirefighters Laboratorial Tasks
109

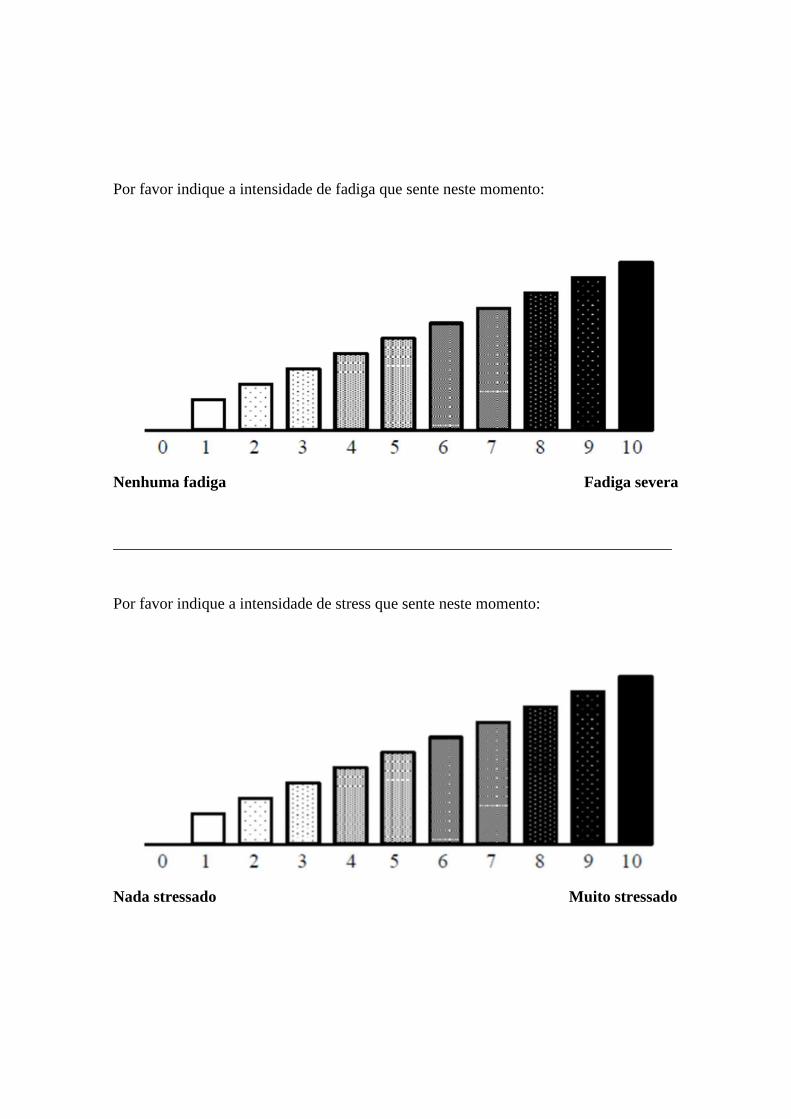
Por favor indique a intensidade de fadiga que sente neste momento:
Nenhuma fadiga Fadiga severa
______________________________________________________________________
Por favor indique a intensidade de stress que sente neste momento:
Nada stressado Muito stressado
Related Documents


